Embed Size (px)
Citation preview
“Our Sustainable Future”
The Case for Wind Energy
Proposed Integrated Resource Plan 2010
Submission by the Wind Energy Industry
13 May 2010
Endorsed by the Global Wind Energy Council
About SAWEA:
SAWEA is the leading trade and professional body representing the wind industry in South
Africa. Acting as the voice of the South Africa’s wind industry, SAWEA’s primary purpose is to
promote the sustainable use of wind energy in South Africa acting as a central point of contact
for information for its members and as a group promoting wind energy to government,
industry, the media and the public whilst facilitating the exchange of technical information,
expertise and experience in the wind energy sector. SAWEA’s members comprise of both
national and international developers, manufacturers and stakeholders working in the industry
and aggregates a substantial amount of knowledge and expertise in a wide range of areas.
This paper has been authored, reviewed and is endorsed by the members of SAWEA, all of whom are active
investors in the South African markets. Contributors include the following:
Mainstream Renewable Power South Africa
Windlab
G7 Renewable Energies
RES Southern Africa
Rainmaker Energy
Red Cap Investments
Bio Therm Energy
African Clean Energy Developments
Terra Power Solutions
Promethium
1 | P a g e
Contents Executive Summary ........................................................................................................................................... 2
1. Wind Energy: An Overview ................................................................................................................. 88
2. Wind Energy Policy Studies ................................................................................................................ 16
Case study 1: Germany ....................................................................................................................... 17
Case study 2: US ................................................................................................................................. 18
Case Study 3: UK ................................................................................................................................. 19
Case Study 4: China ............................................................................................................................ 21
Conclusion: ......................................................................................................................................... 22
3. The Economic Costs and Benefits of RE Implementation .................................................................. 23
The Regulatory Environment Context ................................................................................................ 23
Electricity Generation Portfolio: The Appropriate Mix ...................................................................... 25
The Economic Costs of a 30,000 MWs or 80 TWh 2025 Wind Energy Target .................................... 29
4. Wind Industry Employment Study ..................................................................................................... 35
5. Technical Review ................................................................................................................................ 39
Wind Resource in South Africa ........................................................................................................... 39
Baseload, Capacity Credits and Variability of Wind Power ................................................................ 45
Dispatchability of Wind Power ........................................................................................................... 60
System Adequacy ............................................................................................................................... 65
Grid Accessibility and Proposed Solutions ......................................................................................... 69
4. Implementing and Deploying Wind Energy ........................................................................................ 73
Market Status ..................................................................................................................................... 73
The Wind Farm Development Process ............................................................................................... 75
Proposed Timeline for Meeting the target of 30,000 MW of Wind Energy ....................................... 76
5. Conclusion: ......................................................................................................................................... 79
APPENDIX 1: The Global Wind Industry .......................................................................................................... 80
APPENDIX 2: South Africa Electricity Demand ................................................................................................ 81
APPENDIX 3: Short-Term Forecasting Note (Prevailing Analysis, February 2010) .......................................... 83
2 | P a g e
Executive Summary
“South Africa will undertake mitigation actions which will result in a deviation below the current emissions
baseline of around 34% by 2020 and by around 42% by 2025. This level of effort enables South Africa’s
emissions to peak between 2020 and 2025, plateau for approximately a decade and decline in absolute
terms thereafter.”
The Presidency of South Africa, Proposal to Copenhagen COP, 6 December 2009
The challenge
South Africa’s electricity market is at a cross roads and the challenges facing energy policy makers are formidable.
The current installed electricity generation capacity is primarily based on coal, reserve margins are low and the market is dominated by Eskom, the vertically integrated utility that controls the generation, transmission and supply of electricity across the country. As a result of the coal dependency, the country is highly exposed, directly or indirectly, to long-term coal price volatility, the financial consequences of the resulting greenhouse gas emissions and the unsustainable volume of water consumed by this form of electricity generation.
The immediate answer to South Africa’s electricity challenges lie in Renewable Energy (RE), and in particular wind and solar energy. The technology exists, is proven, and has decades of operating experience. It can be deployed quickly and at scale by the private sector. Wind energy is currently one of the leading forms of power generation being installed world-wide, with 150+GW installed to date and 40-60 GW1 expected to be installed annually across the globe for the foreseeable future.
Recent initiatives by Government, through the various ministries and NERSA, to attract Independent Power Producers (IPPs) and to promote renewable energy have been highly welcomed by the investment community. As a result of these initiatives, a number of domestic and international renewable energy companies are investing in South Africa, developing local projects, working with local companies and recruiting local people, with the assumption that these Government initiatives will continue. The private sector can develop and finance projects from Greenfield through to commissioning, manage all the project-related risks and own and operate projects throughout the project lifecycle at no capital cost to Government and probably faster and cheaper than a state-owned body could ever do, due to the natural competencies and resources of IPPs.
The immediate requirement is for Government to have a clear long-term commitment to renewable energy in order to attract long-term investors and manufacturers, with the accompanying investor-ready policies and infrastructure plans to ensure that the goals can be met. This long term vision for the renewable energy sector must be incorporated into the proposed National Integrated Resource Plan (IRP) thus ensuring that renewable energy and in particular wind energy is a core component of the future national electricity generation portfolio with appropriate medium-term and long-term targets.
To ensure that South Africa meets its future electricity needs, the country needs to set an ambitious target: 25% of all power consumed to be from Renewable Energy by 2025
Wind energy can provide 20% of the country’s energy demand by 2025, equivalent to 80 TWh, or 30,000 MW.
1 Emerging Energy Research 2009 Global Forecasts; Global Wind 2009 Report, GWEC 2010
3 | P a g e
Wind Energy: The Facts
Few countries are as ideally suited to renewable energy development as South Africa. The country’s abundant renewable and natural resources, ample suitable sites and modern high voltage electrical infrastructure make it the ideal candidate for such an industry. The technical review section of this paper utilises numerous pieces of research carried out by industry and independent experts to address some of the most commonly quoted misconceptions and myths surrounding renewable energy.
Wind Power Potential
A privately-funded study by members of the wind industry, referred to in this document, confirms that a
high wind resource is evident in large parts of South Africa, particularly in coastal areas but also in large
inland areas. Further industry analysis concludes that South Africa has enough economically viable and
suitable wind energy sites to generate 70,000 MW of indigenous, sustainable wind energy if there were no
electricity network or political constraints. Providing the provision of a suitable regulatory regime, Wind
energy can provide 20% of the country’s energy demand by 2025, equivalent to 80 TWh, through the
funding, installing and operating of 30,000 MW by the private sector.
Wind Power & Variability
A further study set out to examine the variability of wind power generation from a geographically dispersed
30,000 MW portfolio of wind farms in South Africa, to answer the typical question of ‘what happens if the
wind doesn’t blow’. The results highlighted that the level of variability in wind power production in South
Africa is comparable to that observed in international markets with existing high levels of wind penetration
and that the existing electricity generation plant and electricity system can absorb this without any
negative consequences. Wind power can be forecasted ahead of time very accurately, at both a project and
portfolio level and studies based on publicly available meteorological data show that a 30,000 MW national
wind energy capacity would have an average daily minimum power output of 7,000 MW displacing up to
6,000MW of conventional baseload, (ie oil and coal).2
Wind Power & Dispatchability
The question whether wind energy is a dispatchable form of generation is also addressed. While wind energy is a variable source of generation it is not intermittent and the key in terms of wind dispatchability lies in the ability of system operators to be able to predict the resource, as is done in many markets. System operators dealing with large amounts of wind penetration utilise sophisticated and modern wind prediction software thus allowing them to predict 24 to 72 hours in advance what power wind will be generating, allowing it to be dispatched on the system along with other forms of power generation to meet demand.
Adequacy of the SA Grid
The final section of the technical review examines the adequacy of South Africa’s current electricity
network to accept wind generation onto the system. International experience shows that national
electricity systems can typically achieve up to 15% wind penetration without any notable grid upgrades.
Based on a review of the existing generation infrastructure it is proposed that the existing electricity
2 Assuming a capacity credit estimate in the range of 10% to 20%.
4 | P a g e
system could immediately accommodate 6,600 MW of geographically dispersed wind capacity without
any significant system upgrades, a figure based on utilising existing thermal units and hydro to maintain
adequate short term reserve requirements. This 6,600 MW should represent a short-term (2015-2016)
target, providing system planners adequate time to plan future network design to accommodate the
proposed and achievable 30,000 MW of wind energy by 2025.
Market Status and Project Schedule
SAWEA estimates3 that there is currently a total wind energy capacity in excess of 7,000 MW at various
stages of development in South Africa. Experienced IPPs and investors have already commenced
developing large portfolios of projects. Some of these projects are well established and are approaching the
construction stage of activities, while others have, at a very minimum, commenced with an Environmental
Impact Assessment process. Many projects will be ready for construction within the next 12-18 months
with the necessary financing, technology and service providers lined up to deliver as soon as they get
confirmation of a grid connection and a Power Purchase Agreement (PPA). As has been seen in all
international markets, wind energy can be deployed very rapidly by the private sector, once three things
occur – a clear commitment by government for renewable energy, a sufficiently developed regulatory
environment and clear and open rules for grid access.
SAWEA estimates that approximately 5,000 MWs of wind plant could be commissioned by the end of 2015
ramping up to 30,000 MWs by 2025.
Growth of a new Industry & Job Creation
An additional study examines the potential of a wind power industry to make a significant contribution to
the local employment sector in South Africa. The study draws on international research examining job
creation from countries that promoted renewable energy. In addition to this, focus was placed on the top
11 international wind turbine manufacturers that accounted for 85% of the global turbine delivery in 2009
and examined the key reasons decision in setting up dedicated local manufacturing facilities. It is clear that
the countries’ national wind and renewable policies momentum is behind such rapid development and the
fact that they have successfully attracted investment in the manufacturing sector.
The study concludes that the wind power industry has the potential to make a significant contribution to
the local employment sector in South Africa and has the ability to offer more jobs than the conventional
energy industry should the South Africa government’s political will and support prove to be sufficient. In
summary, countries with strong, long term political will and substantial pipeline are able to attract
international turbine producers. The study concludes that should South Africa wish to create jobs in the
capital intensity renewable energy sector, a strong, long term incentive without a cap on the industry is
crucial.
3 SAWEA Estimates Based on input from members- 10,000 denotes projects who have at minimum, embarked on an EIA
5 | P a g e
Economic Benefits and Cost:
The long-term economic benefits of having wind energy as a core element of the national generation
portfolio are many:
Renewable Energy creates jobs and boosts industrial development, particularly in rural areas.
Adopting a 25% Renewable Energy (RE) target (i.e. 100 TWh) for South Africa is expected to create
up to 40,000 jobs directly relating to the renewable energy industry, 12,000 of which will be in
rural areas. Conventional economic analysis would also suggest that each of these jobs will
generate one other.
Diversification of a country’s portfolio of generation plants is proven to lower overall generation
cost, lower portfolio risk and lower marginal costs of electricity by displacing the most expensive
electricity units on the system. Renewable energy has a marginal fuel price of zero since the fuel is
free and there is no additional cost to supplying an additional unit of electricity.
Wind Farms, as opposed to thermal plants, save water that would have been used for coal-fired
power generation. It is estimated that the 30,000 MWs of wind power, a figure central to the 25%
RE target by 2025, would save in excess of 80 Billion litres of water each year.
Renewable Energy generates significant and predictable tax income for the National Treasury.
Renewable Energy decreases greenhouse gas emissions resulting in avoided costs to the economy
in terms of global carbon emission obligations and the domestic social and economic impacts of
such.
So what is the cost to the Economy?
Using a number of assumptions contained in this report, the cost to the electricity consumer of
implementing a target of 30,000 MW of wind energy to facilitate meeting the 25% by 2025 for Renewable
Energy as a whole amounts to less between 1% and 3% of the wholesale electricity price depending
whether carbon fines are applied in the future to the South African economy. This could arguably be
considered immaterial when compared to the immense benefits to the South African economy and dispels
the myth that renewables are expensive and a burden to the consumer and the economy as a whole.
6 | P a g e
Conclusion
The setting of an appropriate long-term electricity generation portfolio mix through an
independent public consultation process and the incorporation of a 25% or 100 TWh target for
renewable energy by 2025 will create very significant economic benefits to the country in both
rural and urban areas.
Wind energy, being the most competitive form of renewable energy power generation, can make
up 80% of this target, fully funded and managed by the private sector.
7 | P a g e
A long-term target is necessary via the IRP along with an appropriate regulatory framework to
facilitate the achievement of this target. The existing electricity network and the abundance of
wind energy can easily facilitate such a target.
The wind energy industry proposes delivering 30,000 MW or 80 TWh by 2025 (equivalent to 20%
of the country’s forecast energy demand by 2025) by developing, funding, building and operating
these power plants at no capital cost to the Government.
The current South African electricity network could accommodate 6,000 MWs of wind energy
today without significant upgrading. Government should adopt this as a short term target to
develop this amount of wind energy by 2015, while working with industry to identify and develop
the necessary grid upgrades to accommodate the 30,000MW 2025 target.
The private sector has already mobilised to ensure these targets can be met.
By publicly setting the right targets and providing regulatory certainty and open access to the
grid, the Government will immediately stimulate the growth of the industry, creating up to
40,000 jobs, 12,000 of which are in rural areas.
The benefits of achieving this target are the saving of 80 Billion litres of water per annum, a
significant reduction in greenhouse gas emissions and a stable and predictable cost of electricity.
The cost to the electricity consumer of going down this route will be negligible while providing
considerable long-term benefits to the South African economy.
8 | P a g e
1. Wind Energy: An Overview
The Energy Challenges
The challenges facing South African energy policy makers are formidable. Maintaining a secure supply of
electricity in the face of increasing demand is the most basic task. Keeping the electricity price at a level
people can afford is another key challenge. Mitigating the carbon emissions from power generation is
growing in importance as a national goal.
Providing electricity for all is an enduring objective of government, notably through rural electrification
programmes. The achievement of energy independence is an aim shared with all developing countries.
Using energy as the basis for economic development and the creation of well paid secure employment is a
fundamental national objective.
All these challenges are interrelated and require a solution that addresses each of them simultaneously and
comprehensively.
The South African Electricity Market
Current forecasts4 are that by 2025, South Africa will need almost twice today’s electricity demand,
increasing from 249 TWh to 437 TWh and a peak demand increasing from 38,000 to 68,000 MW. The
country currently has 44,157 MWs of power generation capacity installed. The expected growth in demand
will require almost doubling the current installed power generation capacity to approximately 74,000 MW.
Considering that South Africa is currently the 13th largest polluter in the world5 and the largest in Africa, if
the planned growth under the “business-as usual” coal-based scenario ^6 were to take place, emissions will
quadruple6 by 2050 and water shortages will increase. Under a scenario where there are no constraints to
the national emissions, the country’s greenhouse gas emissions are likely to increase from 440 Mt CO2e7 in
2003 to approximately 850 Mt CO2e by 20258. In such a scenario, emissions due to electricity generation
alone will increase by 80% from 200 Mt CO2e to 360 Mt CO2e and the water consumed by electricity
generation is likely to increase by at least 25%^4.
How this increase in power generation is to be achieved in a stable, efficient and sustainable manner whilst
meeting the stated emission reduction targets is one of the biggest challenges Government faces in
charting the long-term economic development plan for the country.
The “Business-as-Usual”4 scenario for the future energy policy of South Africa is not an economically or
socially viable option. A bold and dramatic departure is required.
4 Eskom NIRP Submission 2009 – policy adjusted scenario
5 Carbon Dioxide Information Analysis Centre – http://cdiac.ornl.gov/
6 DEAT - Long-Term Mitigation Scenarios (2007)
7 Million Tonnes of Carbon Dioxide-equivalent
8 Growth Without Constraints scenario, as per the Long-Term Mitigation Scenario study carried out by the Department of Environment and Water Affairs in 2007
9 | P a g e
South Africa’s electricity market is at a cross roads. The current installed electricity generation base is
primarily based on coal, reserve margins are low and the market is dominated by Eskom, a state-owned
monopoly utility that controls the generation, transmission and supply of electricity across the country. As a
result of the coal dependency, the country is highly exposed, directly or indirectly, to long-term coal price
volatility, the financial consequences of the resulting greenhouse gas emissions and the unsustainable
volume of water consumed by this form of electricity generation. The electricity market itself and thus the
South African economy is currently highly dependent on Eskom’s financial strengths and weaknesses and
Eskom’s abilities to respond quickly to a growing need for deployable and sustainable electricity generation
and distribution. As a result of the current monopolistic nature of the market, the private sector cannot do
what it is best at doing – developing, building, owning and operating modern large-scale sustainable
electricity generation infrastructure quickly, efficiently and effectively.
The Regulatory Environment
Recent initiatives by Government, through the various ministries and NERSA, to attract Independent Power
Producers (IPPs) and to promote renewable energy have been highly welcomed by the investment
community. As a result of these initiatives, a number of domestic and international renewable energy
companies have been investing in South Africa, developing local projects, working with local companies and
recruiting local people, with the assumption that these Government initiatives will continue. The key
assumption is that a clear, logical, sustainable and balanced long-term Integrated Resource Plan will be
issued, with appropriate medium-term and long-term targets and a creating a transparent regulatory
environment, thus opening the doors for experienced IPPs to meet these targets quickly and effectively.
While the private sector is very capable of responding quickly to Government needs in any market or
country and finding appropriate solutions to key problems, one thing that the private sector cannot do is
take significant regulatory risk. The private sector can develop and finance projects from Greenfield
through to commissioning, manage all the project-related risks and own and operate projects throughout
the project lifecycle. These projects can be typically built at no capital cost to Government and possibly
faster and cheaper than a state-owned body could ever do, due to the natural competencies and resources
of IPPs. However, to do so IPPs need an appropriate and clear regulatory framework, something that only
the relevant and current energy policy makers (The Department of Energy, NERSA and Treasury) can and
are mandated to do. If politicians, government bodies and civil servants do not fulfill this mandate in a
transparent, appropriate and timely manner, no targets will ever be met and market failure is likely.
From a South African perspective this means three things, assuming that, in line with international best
practice, IPPs and developers will be welcomed and unhindered and that they will get the required returns
on their investment for the risk that they take:
1) Electricity Portfolio Plans: A clear and public long-term commitment to a rational and sustainable
future electricity generation portfolio.
2) Power Purchase Agreements: An appropriate and credit-worthy long-term power purchase
mechanism from an independent and government-supported entity.
3) Grid Access and Grid Rules: An open and clear set of rules for IPPs to access and connect to the
electricity network.
10 | P a g e
The implementation of each of these key aspects will have a direct and immediate impact on the electricity
sector, with a visible growth in the operating generation portfolio seen within 18 months of these three
issues being addressed.
The Solution
The immediate answer to South Africa’s electricity challenges lies in renewable energy, and in particular
wind and solar energy. The technology exists, is technically and commercially proven, has stood the test of
time with decades of operating hours and can be deployed immediately and at scale, as is currently being
done all over the world. Wind energy is currently one of the leading forms of power generation being
installed world-wide, with 150+GW installed to date and 40-60 GW9 expected to be installed annually
across the globe for the foreseeable future.
The immediate requirement in order for this to happen is for Government to have a clear long-term vision
for the renewable energy sector to attract long-term investors and manufacturers, with the accompanying
investor-ready policies and infrastructure plans to ensure that the goals can be met. This can be done
through the proposed National Integrated Resource Plan.
The vision should be one of leadership, allowing the country to meets it moral responsibility with regards to
climate change mitigation whilst creating a high-growth new domestic industry and increasing national
energy security and stability.
The “business-as-usual” scenario will result in continued and increasing dependence on a state-run
monopoly utility, increasing exposure to volatile global fossil fuel prices, an estimated quadrupling of
greenhouse gas emissions and the indiscriminate wastage of billions of litres of water to meet these
electricity needs.
The alternative is the creation of a transparent, competitive electricity market and ensuring that renewable
energy and in particular wind energy is a core component of the national electricity generation portfolio.
The “business-as-usual” option will be economically crippling over the long-term as fossil fuel prices and
global emission costs increase exponentially, creating long-term uncertainty and price risk in power prices
to investors and governments alike.
The alternative will create an independent, cost-effective and stable electricity market, along with the
significant accelerated economic development that a well-proven industry will bring to the country.
73 countries now have long-term renewable energy targets and at least 64 have policies to encourage and
facilitate renewable energy10. The majority of these have feed-in tariffs similar to those adopted in South
Africa. Some countries such as Denmark and Ireland have up to 20% of their current power coming from
wind energy. Ireland in particular, an island electricity network with 1,300 MW of wind energy installed and
national peak demand of 4,950 MW has a target to have 40% of all electricity consumed to be from
renewable sources by 2020, the majority of which will be wind energy. Europe has a whole expects to have
34% of its electricity sourced from renewables by 2020, approximately 150 GW of which is estimated to be
from wind energy.
9 Emerging Energy Research 2009 Global Forecasts; Global Wind 2009 Report (GWEC 2010)
10 REN21 Global Status Report 2009 - www.ren21.net/pdf/RE_GSR_2009_Update.pdf
11 | P a g e
To ensure that South Africa meets its future electricity needs in a secure and sustainable manner, the
country needs to set an ambitious but realistic target:
25% of electricity demand from renewable sources by 2025
The Opportunity
South Africa is endowed with some of the best renewable energy resources in the world because of its
geographical location and geological formation. South Africa has vast reserves of wind and solar energy. If
properly exploited, these resources can provide the country with secure, reliable and clean sources of
power while stimulating economic growth and job creation. The above target, approximately 100 TWh of
energy based on current projections, is economically and technically possible.
Recent technical assessments of economically-viable locations for wind farms using independently sourced
meteorological and topographical data show that South Africa has the potential to generate up to 70,000
MWs11 (184 TWh) of wind energy if there were no electricity network or political constraints. This would
amount up to 42% of the total electricity required in 2025.
The private sector is ready and preparing to build at least 5,000 MWs of wind power by 201512, assuming
the right regulatory environment is created by the Government and Eskom facilitates the grid connection in
a timely manner. With a long-term and binding government commitment to renewable energy, installed
onshore wind energy capacity could be increased six-fold to approximately 30,000 MWs by 2025, or an
average of 2,000 MWs installed per annum over 15 years. This would equate to approximately 80 TWh
generated each year by wind energy by 2025. To put the scale in context, the UK, with just under 4,000
MWs installed today is targeting a further 30,000 MWs by 2020, or 2,500 MWs per annum, most of it
offshore which is significantly more challenging and costly than onshore wind energy. Spain, an electricity
market that is similar in size to that of South Africa, between 1998 and 2008 added 18,000 MWs of onshore
wind energy over the ten years, or approximately 2,000 MWs per annum when the industry was still in its
infancy. It is continuing to add more wind energy to the system.
This wind energy programme for South Africa would result in localising manufacturing and services,
transferring knowledge and capital into the country, creating up to 40,000+ jobs13 over this period and
generating significant long-term economic benefits to the country. If done correctly, the private sector
would be entirely responsible for the R 600 Billion investment to deliver this programme.
FACT: In 2008 & 2009, more wind energy capacity was installed in Europe than any other form of
conventional or renewable form of power.
11 Mainstream Renewable Power Technical Analysis of South African wind resources; Kilian Hagemann/WWF Study
12 Market Estimates
13 Using equivalent EWEA Employment figures for the industry in Europe
and modifying for South Africa – www.ewea.org
12 | P a g e
Essential Steps
A close relationship between the Government, Industry and other stakeholders is essential for success. The
following initiatives are required in particular from Government and Industry:
Government to provide regulatory certainty to encourage long-term investment, particularly in the
areas of planning, grid connection and support mechanisms.
Government and industry to work together to provide leadership to build investor confidence.
Government and industry to work together to incentivise the development of a South African-
based supply chain.
Private Sector Investment
It is important to stress that, if this is done, then the private sector will meet all the costs of achieving the
25% Renewable Energy Target. This is of course entirely dependent on the continuation of the REFIT
scheme and a proper regulatory framework being put in place by Government.
Providing the Government plays its part, the private sector will do likewise. The wind energy industry has
the experience, the skills, the know-how and the financial resources to build at the required pace and to
maintain and operate the installed capacity. This combination of a public policy framework and private
sector entrepreneurship will ensure that the RE target is met on time, at least cost and with maximum
benefit to the Government and to society at large.
Agriculture and Rural Development
Wind farms will be mostly located in rural areas and will often be remote from urban centres. They
represent a significant investment in local communities and farms which frequently lack employment
opportunities, skills development and adequate infrastructure.
The installation of large numbers of turbines in a given area is entirely complementary to the existing
agricultural use of that land, requiring less than 5% of land usage and thus having no impact on the ongoing
farming activities. This development would also provide land owners, in particular emerging farmers, with
additional revenue streams to support ongoing agricultural development and improved farming activity.
As European statistics show, every 1,000 MWs of installed wind power capacity can create hundreds of
jobs, with more than 150,000 people employed in a market with 74,000 MWs of wind energy installed. It is
estimated 500,000 people currently work in the wind energy industry and this is estimated to increase to
2.7 Million by 2030. The 25% Renewable Energy (RE) target for South Africa is expected to create up to
40,000 jobs, 12,000 of which will be permanent jobs in rural areas. Conventional economic analysis would
suggest that each of these jobs will generate one other. The total employment effort would therefore be
estimated to be around 25,000 full time jobs in rural regions in a wide range of skills.
This new employment would help stabilise rural communities and halt rural depopulation. It would have
the added advantage of increasing the skill levels in the rural communities and of creating the basis for
managerial and entrepreneurial skills development that would otherwise be absent. All studies in
community development confirm that this is one of the many benefits arising from economic development
in rural communities.
13 | P a g e
Inward Investment
Inward investment will be stimulated by a Government target of 25% Renewable Energy by 2025. Major
power companies and global investors will invest in the economy and will provide most, if not all, of the
equity required.
Being the most competitive of RE technologies, it is estimated that the 25% Renewable Energy target will
be met mainly from wind power and it is reasonable to assume that approximately 30,000 MWs will be
required by 2025. The balance of the target, approximately 20 TWh, could be met primarily through solar
energy, with photovoltaic (PV) technology and concentrated solar thermal power (CSP).
This would give rise to a capital investment of some R 600 Billion which would be split between private
sector equity and private sector debt in an indicative ratio of 30%:70%. Most, if not all, of the equity would
be provided by domestic and international investors and would amount to approximately R 180 Billion in
total.
This would represent a substantial saving for the Government in terms of capital expenditure on essential
infrastructure.
The balance of R 420 Billion would come from debt provided by local and international banks and financiers
in accordance with established business models for the wind and infrastructure industry. This debt would
represent an even greater saving on state capital expenditure and it would free up scarce resources for
other infrastructure projects.
Water Consumption
Water is a scarce valuable resource that will grow even scarcer with the impact of climate change and
increased living standards. Unlike coal-fired or nuclear power generation, wind power requires no water to
generate electricity.
It is estimated that the 30,000 MWs of wind power which are central to the 25% RE target by 2025,
equivalent to 80 TWh, would save in excess of 80 Billion litres of water each year which would be required
for alternative forms of power generation. Eskom, at present, consumes approximately 1,350 litres per
MWh. The water consumed by an equivalent 80 TWh of conventional power is equivalent to the water
required every year by a city of 280,000+ people14. Communities and agriculture will be competing directly
with coal-fired and nuclear power stations for water under current plans.
14 FAO Report 29 – 264,000 litres of water per capita for South Africa
Barclays Capital Global Carbon Index Guide
14 | P a g e
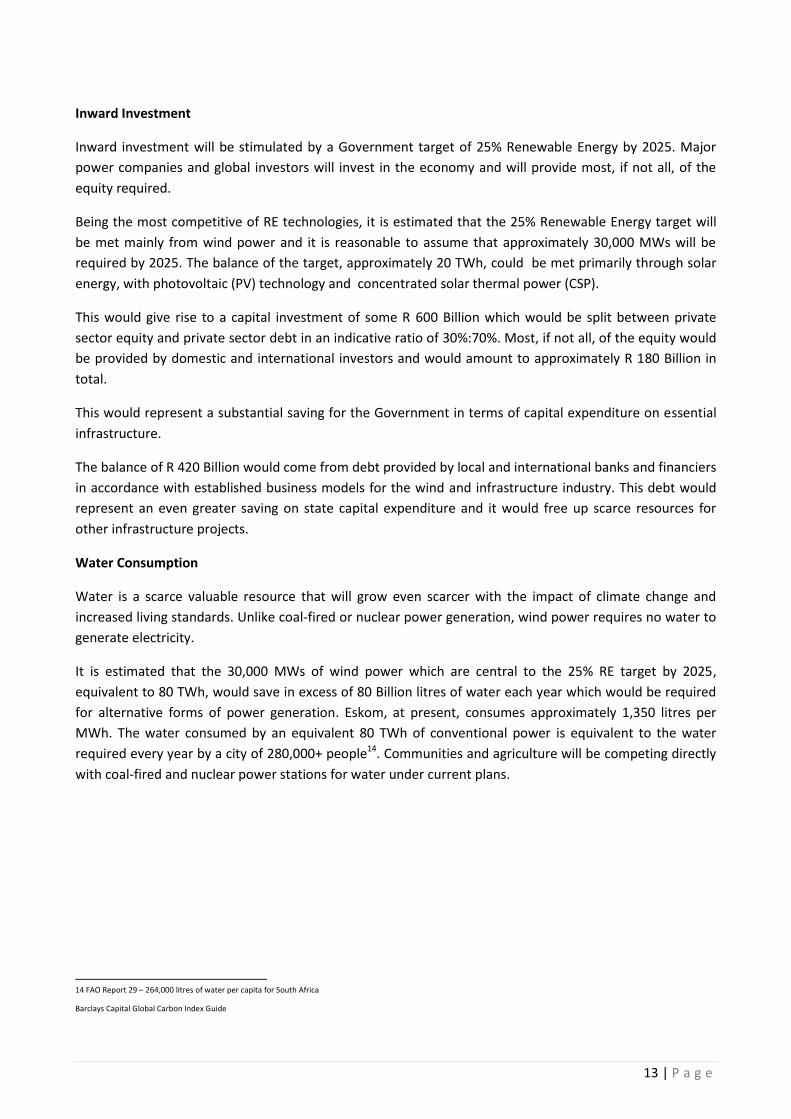
Emission Reductions
Barclays Capitals most recent monthly carbon report has forecast 2012-2020 emission allowances to be
worth €35 (approx. Rand 350) per ton of CO2. The penalties on South Africa for non-compliance with the
proposed global treaty for emission reductions could vary anywhere between 100 and 400 Rand per tonne
of CO2 equivalent. If 80 TWh of electricity each year is generated from wind power (30,000 MWs) as
opposed to coal-fired power generation, the Government would be avoiding annual carbon fines in the
region of up to 29 Billion Rand a year.
Estimated Global
Price per Tonne of
CO2 (Rand)
Tonne CO2 produced
Per coal-fired
electricity unit (MWh)
for South Africa
Power Generated
by 30,000 MWs of
Wind Power
(MWh)
Est. Tonnes of CO2
avoided by Wind
Power
Annual Total Cost
Savings to
Government (Rand)
100 0.9 80 Million 72 Million 7.20 Billion
200 0.9 80 Million 72 Million 14.4 Billion
300 0.9 80 Million 72 Million 21.6 Billion
400 0.9 80 Million 72 Million 28.8 Billion
Economic Benefits
The RE target of 25% by 2025 is realistic, achievable and aligned with international practice. This target
will lead the economy into the future with certainty and growth.
The long-term economic benefits of having wind energy as a core element of the national generation
portfolio are as follows:
Renewable Energy Decreases Greenhouse Gas Emissions: Renewable energy reduces carbon
emissions, resulting in avoided costs to the economy in terms of global obligations and the domestic
social and economic impacts of such emissions.
Renewable Energy Increases Water Availability: Agricultural and economic yield is increased due to an
increased availability of water resources that would have alternatively been used for coal-fired power
generation.
Renewable Energy Creates Jobs and Industrial Development: Large-scale renewable energy creates
significant employment in the development, construction and operation of the power plants,
significantly contributing to rural development, transferring skills and knowledge from abroad and
enhancing a domestic manufacturing supply chain.
Renewable Energy Reduces Electricity Generation Costs15: Diversification within a country’s portfolio
of generation plants leads to lower overall generation cost, lower portfolio risk and lower marginal
costs of electricity by displacing the most expensive electricity units on the system (Diesel via Open-
Cycle Gas Turbines plants as is the case in South Africa.
Renewable Energy Reduces Fossil Fuel Prices: Increased levels of renewable energy generation on an
electricity system lower the demand for oil and gas, thus reducing the price of these commodities.
15 Shimon Awerbuch - http://www.awerbuch.com/shimonpages/sareseach.html
15 | P a g e
Renewable Energy Provides Technical Benefits to the Electricity System: Renewable energy generates
power and provides voltage support to consumer loads far from current centralised power generation,
avoiding electricity transmission losses and providing highly responsive, predictable and reliable plant.
Renewable Energy Generates Tax Income: Renewable energy plants will generate significant
predictable and reliable corporate tax income to the National Treasury.
Renewable Energy Supports Agriculture and Rural Development: Renewable Energy provides
additional sources of income to farmers, both emerging and established farmers, through revenues
from the leasing of land for energy developments.
When each of these above elements is quantified and taken into account, it is clearly demonstrable that
electricity generated from renewable energy plants is highly competitive, sustainable and reliable
compared to fossil-based higher-risk alternatives.
Based on international experience16, the South African economy will directly benefit as a result of
establishing a commitment to Renewable Energy:
40,000+ new jobs in the renewable energy industry as international companies invest in local
manufacturing plants, projects are built in rural areas and complementary service businesses are
created.
A significant increase in long-term power production and price stability, with reduced
dependence on volatile coal and oil prices and scarce water reserves.
A reduction in the greenhouse gas emissions projected under the existing plans for power
generation and the significant avoided-cost implications.
16 EWEA Employment Statistics – 15 people/MW for EU. 375k employed by 2030
16 | P a g e
2. Wind Energy Policy Studies
In 2009, South Africa introduced a REFIT (Renewable Energy Feed-In Tariff) to incentivize the renewable
energy industry. We welcome such supportive policy towards an industry that we believe is playing and will
continue to play a crucial role in combating climate change, securing national energy interest and
addressing the need for new electricity capacity as well as contributing to socioeconomic development
across the world.
However, the incentive policy is only one aspect of many that will dictate the level of development of a
renewable energy industry in South Africa. This paper presents four case studies on different markets,
each with its specific wind power development history, that demonstrate the strong correlation between a
clear policy relating to renewable energy and the successful development of the required additional
capacity.
In each of the case studies, a brief description on the evolution of each government’s incentive policy is
presented together with the correlation between such policies and their impact on the growth of the wind
power capacity. These case studies also demonstrate that there is a direct correlation between policies
(and therefore increase in new capacity) and the jobs created by development of a local manufacturing
industry.
17 | P a g e
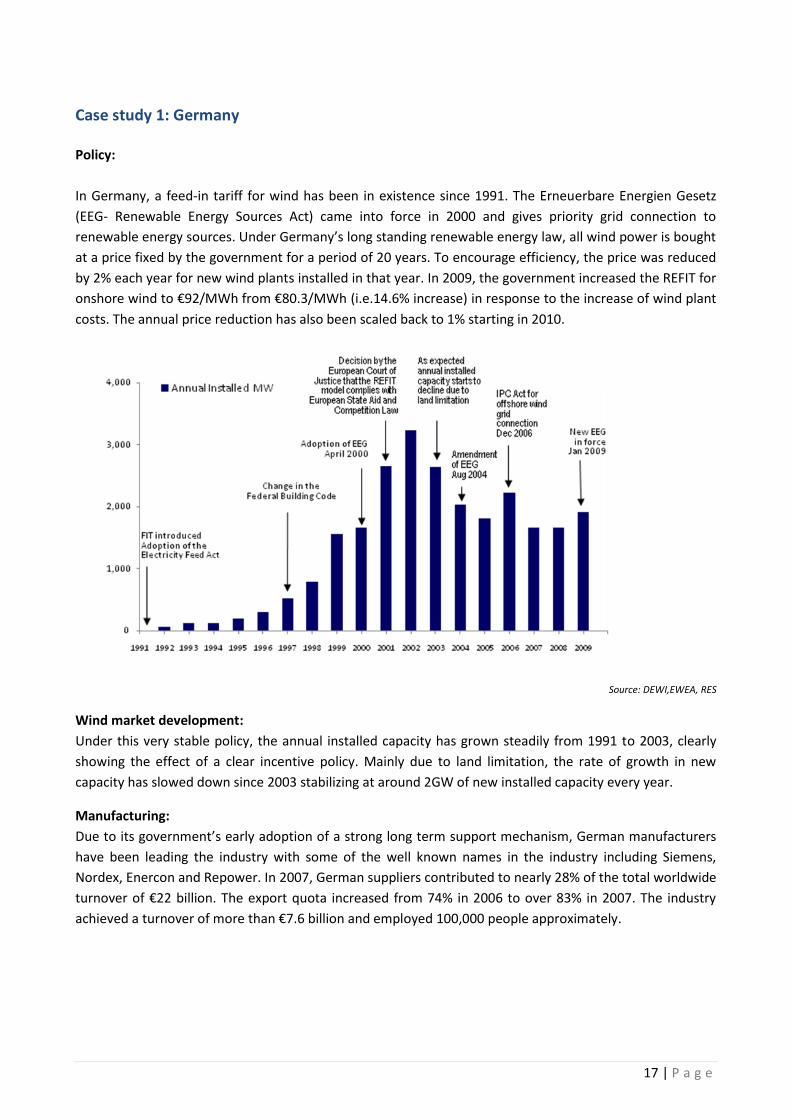
Case study 1: Germany
Policy:
In Germany, a feed-in tariff for wind has been in existence since 1991. The Erneuerbare Energien Gesetz
(EEG- Renewable Energy Sources Act) came into force in 2000 and gives priority grid connection to
renewable energy sources. Under Germany’s long standing renewable energy law, all wind power is bought
at a price fixed by the government for a period of 20 years. To encourage efficiency, the price was reduced
by 2% each year for new wind plants installed in that year. In 2009, the government increased the REFIT for
onshore wind to €92/MWh from €80.3/MWh (i.e.14.6% increase) in response to the increase of wind plant
costs. The annual price reduction has also been scaled back to 1% starting in 2010.
Source: DEWI,EWEA, RES
Wind market development:
Under this very stable policy, the annual installed capacity has grown steadily from 1991 to 2003, clearly
showing the effect of a clear incentive policy. Mainly due to land limitation, the rate of growth in new
capacity has slowed down since 2003 stabilizing at around 2GW of new installed capacity every year.
Manufacturing:
Due to its government’s early adoption of a strong long term support mechanism, German manufacturers
have been leading the industry with some of the well known names in the industry including Siemens,
Nordex, Enercon and Repower. In 2007, German suppliers contributed to nearly 28% of the total worldwide
turnover of €22 billion. The export quota increased from 74% in 2006 to over 83% in 2007. The industry
achieved a turnover of more than €7.6 billion and employed 100,000 people approximately.
18 | P a g e
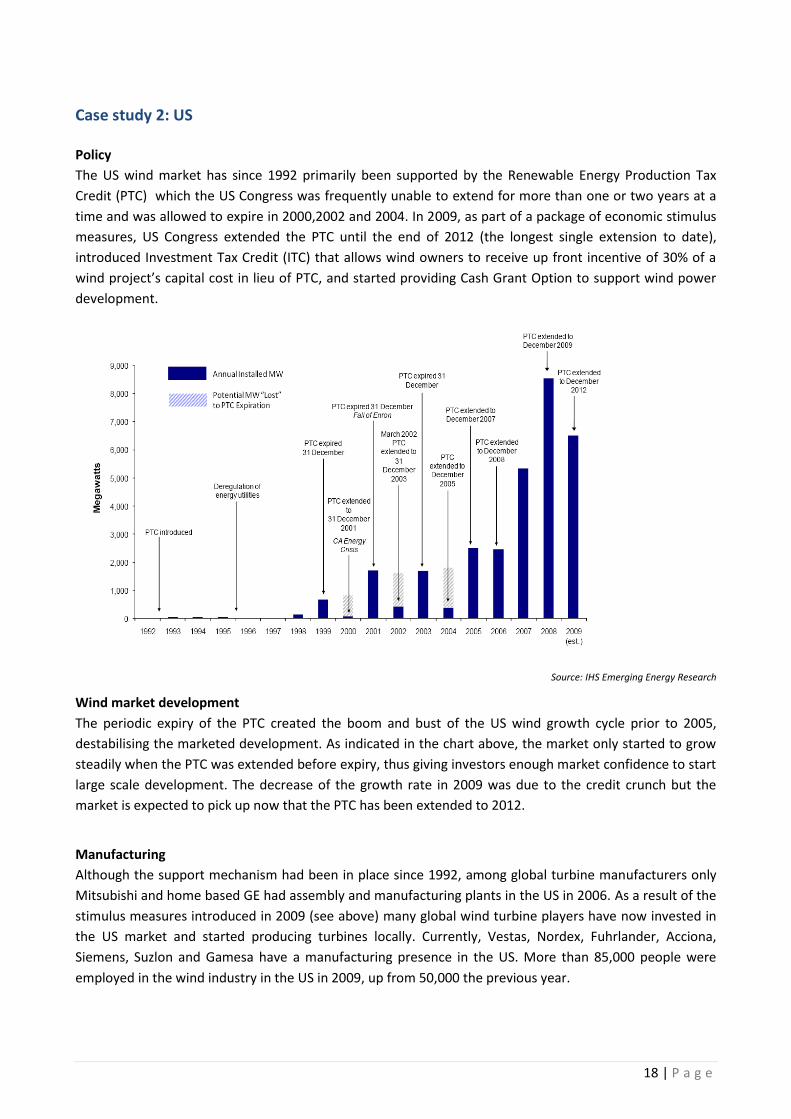
Case study 2: US
Policy
The US wind market has since 1992 primarily been supported by the Renewable Energy Production Tax
Credit (PTC) which the US Congress was frequently unable to extend for more than one or two years at a
time and was allowed to expire in 2000,2002 and 2004. In 2009, as part of a package of economic stimulus
measures, US Congress extended the PTC until the end of 2012 (the longest single extension to date),
introduced Investment Tax Credit (ITC) that allows wind owners to receive up front incentive of 30% of a
wind project’s capital cost in lieu of PTC, and started providing Cash Grant Option to support wind power
development.
Source: IHS Emerging Energy Research
Wind market development
The periodic expiry of the PTC created the boom and bust of the US wind growth cycle prior to 2005,
destabilising the marketed development. As indicated in the chart above, the market only started to grow
steadily when the PTC was extended before expiry, thus giving investors enough market confidence to start
large scale development. The decrease of the growth rate in 2009 was due to the credit crunch but the
market is expected to pick up now that the PTC has been extended to 2012.
Manufacturing
Although the support mechanism had been in place since 1992, among global turbine manufacturers only
Mitsubishi and home based GE had assembly and manufacturing plants in the US in 2006. As a result of the
stimulus measures introduced in 2009 (see above) many global wind turbine players have now invested in
the US market and started producing turbines locally. Currently, Vestas, Nordex, Fuhrlander, Acciona,
Siemens, Suzlon and Gamesa have a manufacturing presence in the US. More than 85,000 people were
employed in the wind industry in the US in 2009, up from 50,000 the previous year.
19 | P a g e
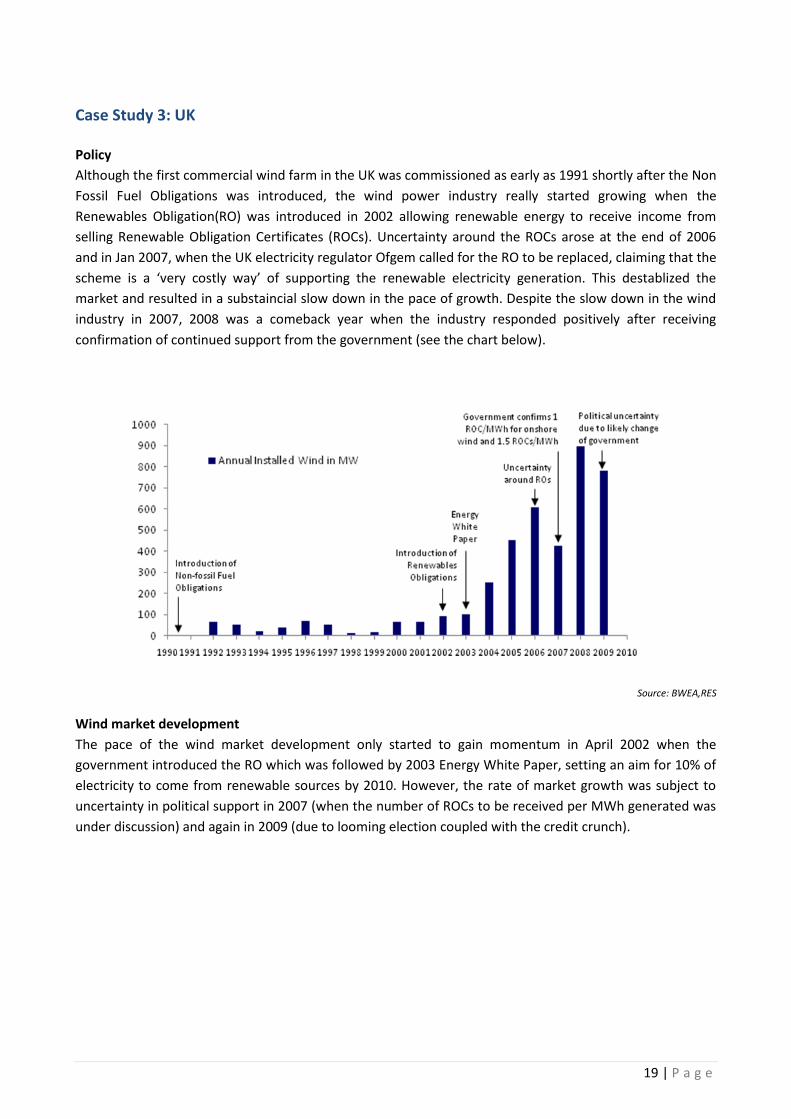
Case Study 3: UK
Policy
Although the first commercial wind farm in the UK was commissioned as early as 1991 shortly after the Non
Fossil Fuel Obligations was introduced, the wind power industry really started growing when the
Renewables Obligation(RO) was introduced in 2002 allowing renewable energy to receive income from
selling Renewable Obligation Certificates (ROCs). Uncertainty around the ROCs arose at the end of 2006
and in Jan 2007, when the UK electricity regulator Ofgem called for the RO to be replaced, claiming that the
scheme is a ‘very costly way’ of supporting the renewable electricity generation. This destablized the
market and resulted in a substaincial slow down in the pace of growth. Despite the slow down in the wind
industry in 2007, 2008 was a comeback year when the industry responded positively after receiving
confirmation of continued support from the government (see the chart below).
Source: BWEA,RES
Wind market development
The pace of the wind market development only started to gain momentum in April 2002 when the
government introduced the RO which was followed by 2003 Energy White Paper, setting an aim for 10% of
electricity to come from renewable sources by 2010. However, the rate of market growth was subject to
uncertainty in political support in 2007 (when the number of ROCs to be received per MWh generated was
under discussion) and again in 2009 (due to looming election coupled with the credit crunch).
20 | P a g e
Manufacturing
On the the manufacturing side, no significant wind turbine players have sustained their local presence in
the UK. Industry experts claim that the lack of a proper long term support scheme, with elements such as
feed-in-tariff, was the primary reason for the lack of suppliers’ commitment. Wind power manufacturing
sector hit the bottom when Vestas announced in Aug 2009 that it was to withdraw the UK market by
closing down its Isle of Wight factory stating that ‘the present market is not large enough to justify the
required investment…’. The situation has started to improve since the announcement of the sucessful
bidders for the third round of UK offshore wind power development of up to 32GW of potential installed
capacity. GE and Mitsubishi have all announced their plans to establish local offshore turbine
manufacturing plants to capture the huge potential. According to a recent study, Employment
Opportunities and Challenges in the Context of Rapid Industry Growth by Bain & Co., the UK wind industry
can potentially create 50,000 new jobs, if the sector is promoted in the right way.
21 | P a g e
Case Study 4: China
Policy
China is a relatively late comer in the wind industry. The wind energy development only started
accelerating in 2004, when a draft Renewable Energy Law was being discussed. The Renewable Law came
into effect in 2006 with further regulations, elaborations of the original energy law being enacted in
subsequent years. Improving policies such as the Medium and Long Term Development Plan for Renewable
Energy was introduced in 2007, stipulating a mandatory market share of electricity from non-hydro
renewable sources. The market received further boost when the government announced plans for 10 key
zones each with over 10GW installed capacity to capture the six rich resource regions and tackle the
transmission complexity. Currently, the country is targeting 150GW (increased from 30GW) of onshore
wind power by 2020 and it is mandating large power producers to produce 3% of electricity from non-
hydro renewable sources by 2010, rising to 8% by 2020.
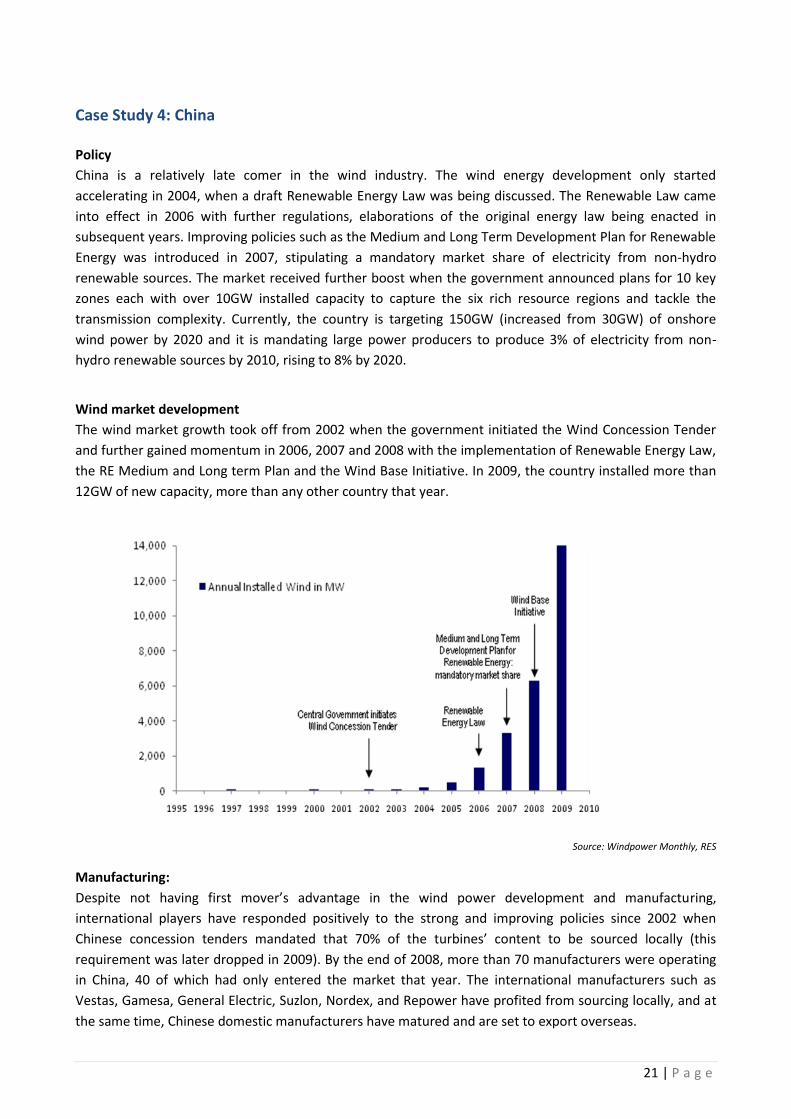
Wind market development
The wind market growth took off from 2002 when the government initiated the Wind Concession Tender
and further gained momentum in 2006, 2007 and 2008 with the implementation of Renewable Energy Law,
the RE Medium and Long term Plan and the Wind Base Initiative. In 2009, the country installed more than
12GW of new capacity, more than any other country that year.
Source: Windpower Monthly, RES
Manufacturing:
Despite not having first mover’s advantage in the wind power development and manufacturing,
international players have responded positively to the strong and improving policies since 2002 when
Chinese concession tenders mandated that 70% of the turbines’ content to be sourced locally (this
requirement was later dropped in 2009). By the end of 2008, more than 70 manufacturers were operating
in China, 40 of which had only entered the market that year. The international manufacturers such as
Vestas, Gamesa, General Electric, Suzlon, Nordex, and Repower have profited from sourcing locally, and at
the same time, Chinese domestic manufacturers have matured and are set to export overseas.
22 | P a g e
Conclusion:
The analysis of the above case studies, have explored four very different markets, each with their
distinctive support mechanism and development timeline and path. However, one common observation
from these case studies is that wind farm development and its underlying manufacturing respond positively
to long term, proactive policies that will lead to a more stable wind market. Conversely, political
uncertainty and lack of financial support generally have an immediated adverse impact on the industry,
creating unfortunate boom and bust.
In conclusion, wind power is not only capable of contributing towards combating climate change, improving
security of supply and addressing the need for new electricity capacity, it will also, provided that the right
policy is in place, bring considerable benefits to the social economic development of South Africa.
23 | P a g e
3. The Economic Costs and Benefits of RE Implementation
The Regulatory Environment Context
According to existing growth projections17, as mentioned previously, the South African economy is
expected to consume 76% more electrical power in 2025 than it is today, increasing from 249 TWh per
annum to 437 TWh per annum. The peak electricity demand is expected to increase from today’s 38,000
MWs to 68,000 MWs in 2025. The country’s greenhouse gas emissions are predicted to increase from 440
Mt CO2e18 in 2003 to approximately 850 Mt CO2e by 2025 if no constraints are introduced to rein in
emissions19. In such a scenario, emissions due to electricity generation will increase by 80% from 200 Mt
CO2e to 360 Mt CO2e and the amount of water consumed by electricity generation will increase by at least
25%.
Considering the global and national imperative to reduce emissions, manage the increasing scarcity of
water in South Africa and mitigate the financial implications of continuing on the current electricity demand
trajectory, there is a huge challenge for the country’s energy policy makers and planners.
Electricity is a fundamental element to society and ensuring electricity is affordable, reliable and available
to all is a key requirement for any stable economy. A very comprehensive and committed plan to ensure
electricity supplies remain stable and predictable and that the societal, environmental and financial
consequences of any such plan are sustainable is critical.
Electricity Generation Portfolio: Risk Assessment
Traditionally, the element of risk associated with each form of electricity generation, the correlation
between them and the resulting portfolio risk is often excluded from planning models, with the primary
focus being on the Cost or Levelised Cost of each type of generation. With such a methodology, two
different types of electricity generation can have very different lifecycle uncertainties and risks but can
actually have identical Levelised Costs – an outcome that can misguide planners towards lower cost, higher
risk solutions over more rational options. Rational financial investors would look at the same assets and
apply different discount rates to each, in accordance with their risk profile. This is not often the case from
an energy planning perspective where the same discount rate is used for all generation types and a linear
fuel cost is assumed over the long-term, irrespective of the actual fuel price volatility.
17 NIRP 1 Eskom Submission
18 Million Tonnes of Carbon Dioxide-equivalent
19 Growth Without Constraints scenario, as per the Long-Term Mitigation Scenario study carried out by the Department of Environment and Water Affairs in 2007
24 | P a g e
This has resulted in national generation portfolios that are highly exposed to volatile external costs (i.e.
fuel, capital costs, operating costs, delays, emissions) which at the time of investment appeared to be
relatively low and predictable, but have since shown that they are not, resulting in rapid increases in
electricity tariffs to unwilling consumers and society as a whole. An unpredictable escalation in external fuel
or emission prices, as has happened in recent years, can have very negative implications for most
economies that have often assumed a somewhat linear and incremental growth in external costs. The
harsh reality of a global economy and the unpredictable externalities associated with such has resulted in a
very different outcome to what was expected for many economies. The power plant investors have often
been sheltered from such variations, with the risk and price increases typically passed on to electricity
consumers and the economy as a whole. This is a hidden but very significant burden, often resulting in
societal or political unrest whenever the resulting electricity prices are increased to take into account these
externalities.
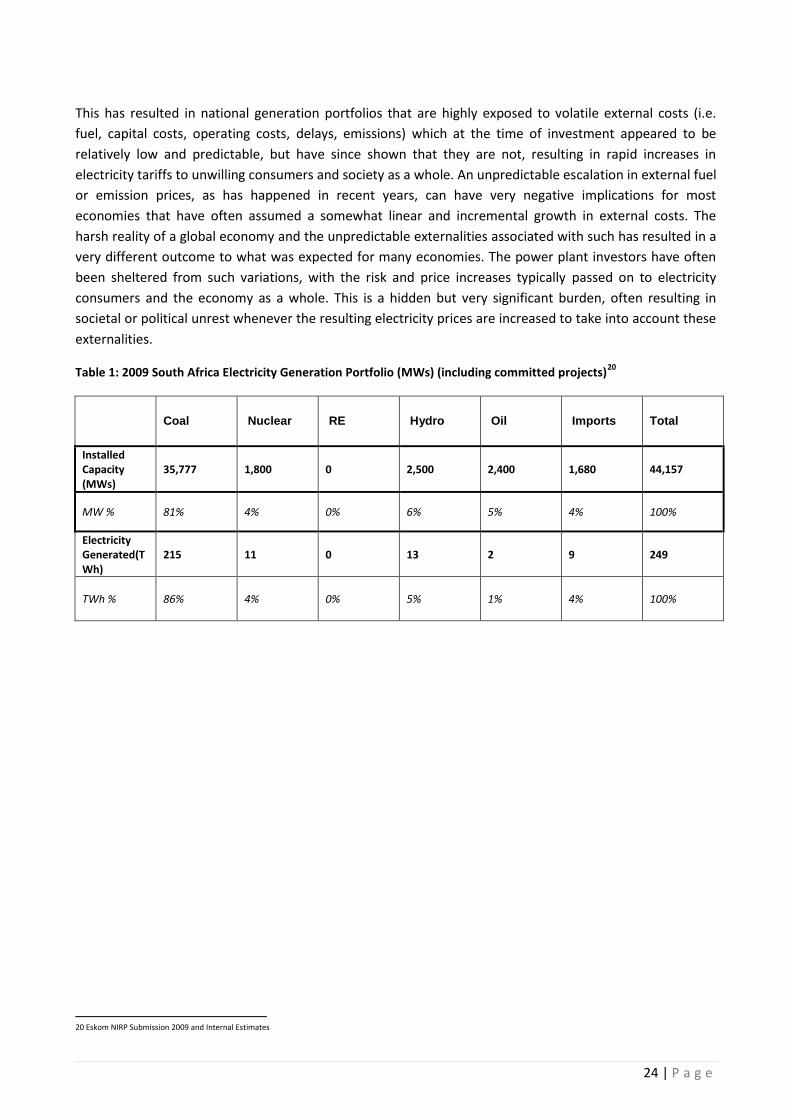
Table 1: 2009 South Africa Electricity Generation Portfolio (MWs) (including committed projects)20
Coal Nuclear RE Hydro Oil Imports Total
Installed Capacity (MWs)
35,777 1,800 0 2,500 2,400 1,680 44,157
MW % 81% 4% 0% 6% 5% 4% 100%
Electricity Generated(TWh)
215 11 0 13 2 9 249
TWh % 86% 4% 0% 5% 1% 4% 100%
20 Eskom NIRP Submission 2009 and Internal Estimates
25 | P a g e
Electricity Generation Portfolio: The Appropriate Mix
The design of an adequately diversified and suitably low-risk and low-cost electricity generation portfolio
requires open and ongoing consultation amongst all key national and international stakeholders and
experts to ensure that the chosen plan is the correct one for the country and that it can adapt and change
as necessary. It also needs extensive input from independent international experts, without any vested
interests in the domestic market, to ensure a reliable and sustainable electricity future. Determining the
appropriate portfolio mix of electricity generation technologies varies significantly from market to market,
depending on the existing legacy generation plant, the natural resources available in the country, the
economy’s tolerance to risk and the acceptable and realistic cost of electricity for each type of generation.
The uncertainties associated with the four key components of any power plant – the long-term fuel costs,
the emissions costs, the capital costs and the operational costs - play a key role in determining the risk
associated with each type of generation. The correlations between each of the different types of electricity
generation also play a significant role in determining the total risk and cost profile of the national
generation portfolio.
Every country will have varying constraints and tolerances for different types of electricity generation
options, given the natural resources at their disposal and risk tolerance as an economy. The more diversity
there is in a generation portfolio, especially if there is limited correlation between the chosen options, the
lower the portfolio risk.
26 | P a g e
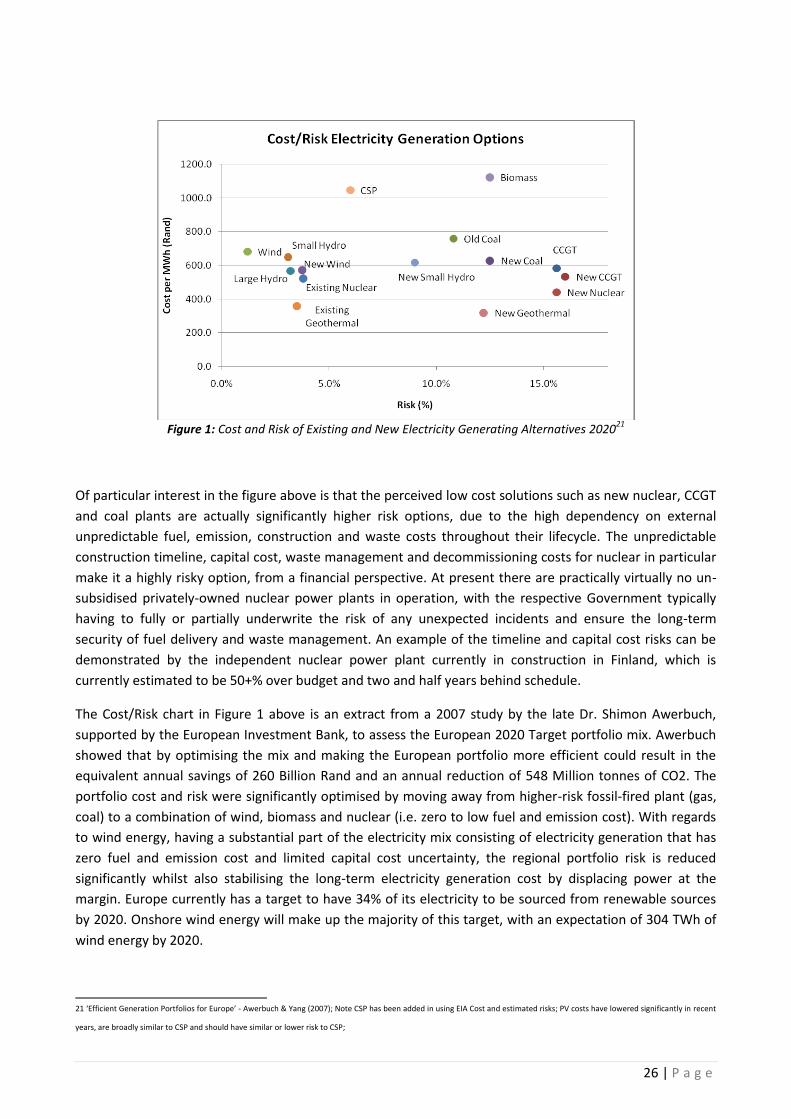
Figure 1: Cost and Risk of Existing and New Electricity Generating Alternatives 2020
21
Of particular interest in the figure above is that the perceived low cost solutions such as new nuclear, CCGT
and coal plants are actually significantly higher risk options, due to the high dependency on external
unpredictable fuel, emission, construction and waste costs throughout their lifecycle. The unpredictable
construction timeline, capital cost, waste management and decommissioning costs for nuclear in particular
make it a highly risky option, from a financial perspective. At present there are practically virtually no un-
subsidised privately-owned nuclear power plants in operation, with the respective Government typically
having to fully or partially underwrite the risk of any unexpected incidents and ensure the long-term
security of fuel delivery and waste management. An example of the timeline and capital cost risks can be
demonstrated by the independent nuclear power plant currently in construction in Finland, which is
currently estimated to be 50+% over budget and two and half years behind schedule.
The Cost/Risk chart in Figure 1 above is an extract from a 2007 study by the late Dr. Shimon Awerbuch,
supported by the European Investment Bank, to assess the European 2020 Target portfolio mix. Awerbuch
showed that by optimising the mix and making the European portfolio more efficient could result in the
equivalent annual savings of 260 Billion Rand and an annual reduction of 548 Million tonnes of CO2. The
portfolio cost and risk were significantly optimised by moving away from higher-risk fossil-fired plant (gas,
coal) to a combination of wind, biomass and nuclear (i.e. zero to low fuel and emission cost). With regards
to wind energy, having a substantial part of the electricity mix consisting of electricity generation that has
zero fuel and emission cost and limited capital cost uncertainty, the regional portfolio risk is reduced
significantly whilst also stabilising the long-term electricity generation cost by displacing power at the
margin. Europe currently has a target to have 34% of its electricity to be sourced from renewable sources
by 2020. Onshore wind energy will make up the majority of this target, with an expectation of 304 TWh of
wind energy by 2020.
21 ‘Efficient Generation Portfolios for Europe’ - Awerbuch & Yang (2007); Note CSP has been added in using EIA Cost and estimated risks; PV costs have lowered significantly in recent
years, are broadly similar to CSP and should have similar or lower risk to CSP;
27 | P a g e
While a similar detailed generation portfolio cost and risk study on South Africa has yet to be carried out by
Government and assuming that South Africa electricity prices will reach international averages over time as
reflected in the recent NERSA 3-year plan to increase national prices, it can be assumed that similar
economic benefits will accrue to the country as seen in other markets.
Once the technology options are clearly outlined and the respective public and private sectors are aware of
what is both desirable and achievable over the long-term, system planners and policy makers have a critical
role to ensure the goals are monitored and implemented. The close interaction, transparency and openness
between the public sector that determines the rules of the game and the international private sector that
invests and delivers what is needed is critical to the successful implementation of any long-term goals.
Water Consumption
As mentioned, the current electricity generation portfolio in South Africa is heavily dependent on highly-
polluting and water-consuming coal generation. Under the current business-as-usual plans22 the installed
capacity of coal-fired power is expected to increase from 35 GWs to 45 GWs by 2017 and remain relatively
constant thereafter, with new plant coming on and an equivalent amount of old plant coming off the
system. This will result in an approximately 25% increase in the power generated from coal-fired power
plant, from 245 GWh to just over 300 GWh. With Eskom already consuming 32323 Billion litres of water
each year (equivalent to 1300 litres/MWh generated), this increase in coal plant will result in consumption
of an additional 80 Billion litres of water each year. This excludes the proposals made for a further 12,000
MWs of nuclear power generation by 2028 and the 5,000 MWs of solar thermal plant, both of which will
have a further demand for water. Water withdrawal in the year 2000 was approximately 284,000 litres per
annum per capita24, so that this increase in water consumption is equivalent to the water consumed each
year by a population of 280,000 people. Water is already a scarce resource in South Africa, and the
consequence of continuing in this water-intensive manner is likely to have severe political, environmental
and economic repercussions.
Current and Proposed Electricity Mix
In the scenario proposed below, which would generate sufficient power to meet the country’s 2025
expected demand of approximately 437 TWh, up from today’s 249 TWh, renewable energy plays a key
role, generating 25% of the country’s electricity or just over 100 TWh. Wind power would make up 80%
of the Renewable Energy target, being the cheapest and most deployable form of renewable energy. It is
expected that solar energy will make up the balance, 20 TWh, primarily photovoltaic (PV) and Concentrated
Solar Power (CSP). This wind penetration will result in an installation of just over 30 GWs of generating
capacity over the next 15 years and will generate approximately 80 TWh by 2025. This is something that is
readily and immediately possible given South Africa’s potential and existing infrastructure and with today’s
technology and available private sector capital.
22 ESKOM NIRP Recommendation 2009 – Policy-Adjusted IRP MYPD Scenario
23 Eskom Annual Report 2009
24 FAO Report 29 (2005)
28 | P a g e
Solar PV is highly bankable and scalable but currently has a cost of power that is almost twice that of wind
power. Concentrated Solar Power (CSP) is growing significantly, especially parabolic trough plants that are
being deployed at scale in Spain, although not yet on a non-recourse project finance basis. The cost of
power from parabolic trough CSP plant is slightly lower than PV but still considerably higher than wind
energy. CSP tower technology is still at an early stage of development in Spain and USA and will not be
ready for mass-deployment or for financing on a non-recourse basis for a number of years.
The capital cost of PV has dropped dramatically in the past year and its cost of power is likely to match and
be lower than that of CSP in the coming years. PV plants are also considerably easier to build and operate
at varying levels of scale and with no water consumption, making it a preferred technology by most
investors, as demonstrated by the exponential growth of this technology globally.
The proposed electricity mix shown in the table below assumes that all Renewable Energy has a capacity
factor of 30%. This is expected to be broadly the case for wind energy but solar energy tends to be closer to
18-22% in practice, based on today’s technology.
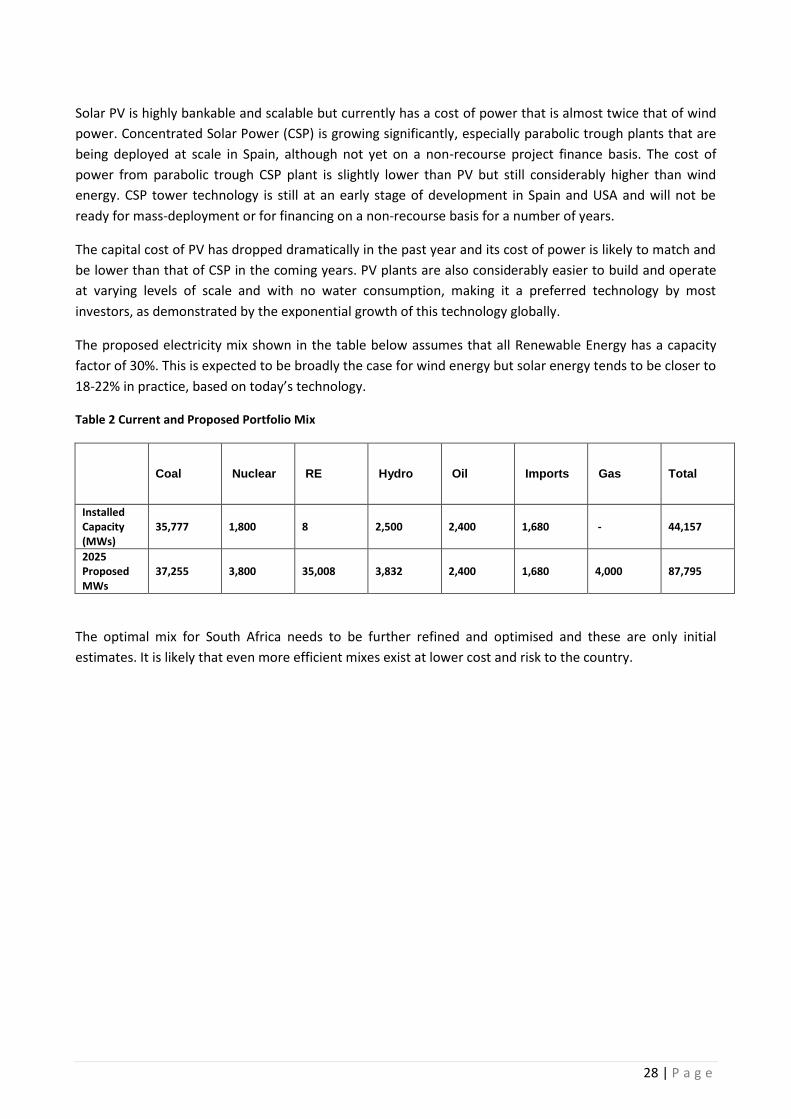
Table 2 Current and Proposed Portfolio Mix
Coal Nuclear RE Hydro Oil Imports Gas Total
Installed Capacity (MWs)
35,777 1,800 8 2,500 2,400 1,680 - 44,157
2025 Proposed MWs
37,255 3,800 35,008 3,832 2,400 1,680 4,000 87,795
The optimal mix for South Africa needs to be further refined and optimised and these are only initial
estimates. It is likely that even more efficient mixes exist at lower cost and risk to the country.
29 | P a g e
The Economic Costs of a 30,000 MWs or 80 TWh 2025 Wind Energy Target
The proposed target to have wind energy generating 80 TWh by 2025 and displacing the equivalent amount
of coal-fired generation. A combination of displacing existing coal plant (by reducing the output) and
avoiding the cost of new coal plant would generate considerable economic benefits to the nation – from
the avoidance of emissions costs, increased water savings, a reduction in the national portfolio risk,
technical benefits and income and corporate tax income.
1. Emission Costs
The proposal to have wind energy generating 20% of the national electricity by 2025 (approx. 80 TWh) will
avoid the emitting of at least 70 Mt CO2e per annum25 or 16% of today’s emissions. Global emissions costs
are expected to increase to between €10-40 per Tonne of CO2 emitted post 2012 and thus the avoided cost
to the country by significant wind energy penetration could be up to 32 Billion Rand a year. Further
reductions would be possible if the existing coal plants were to be upgraded with more efficient and less
polluting technology.
2. Water Savings
Unlike coal-fired or nuclear power generation, wind power requires no water to generate electricity. Eskom
currently consumes up to 1,350 litres of water per MWh26. It is estimated that the 30,000 MWs of wind
power which are central to the 25% RE target by 2025 would generate 80 TWh a year, saving at least 80
Billion litres of water each year which would be consumed for alternative forms of power generation. This
is equivalent to the annual water required by a city of 300,000 people27. With a cost of at least 3 Rand per
kilolitre28, this equates to an amount in excess of 300 Million Rand per annum.
3. Employment and Tax Income
European statistics29 show that setting a 30,000 MWs target by 2025 is likely to create at least 40,000 jobs
in the country. Just over a quarter of these jobs (12,000) would be in rural areas and involving the
operations and maintenance of the wind farms. Each of these jobs would create tax income for the
economy and the power plants themselves would generate considerable corporate tax income for the
economy. To put this in context, Europe had 74,000 MWs installed in 2008 and an estimate of 154,000
employed in the sector. Every job created will also create indirect jobs through rural and urban
development and the provision of services for each new employee. Thus a multiplier effect will happen
with each new role creating significant benefit to the wider economy, all due to the setting of an
appropriate long-term commitment by the Government and energy policy makers.
25 Assuming an emission factor of 0.9 t CO2e /MWh for South Africa
26 Eskom Annual Report 2008
27 www.cia.gov/library/publications/the-world-factbook/geos/sf.html
28 Rand Water – current water tariffs for private industry
29 EWEA Factsheet - http://www.ewea.org/fileadmin/ewea_documents/documents/publications/factsheets/EWEA_FS-employment.pdf
30 | P a g e
4. Transmission Loss Avoidance
Renewable energy plants are located in rural areas – communities that are typically remote from the main
generation plants in the country. In South Africa, these will be primarily along the coast lines. By generating
electricity in these areas rather than transporting the electricity 500+ km as is currently done, transmission
losses of 5-10%30 that are incurred today in transmitting electricity from the northern coal-fired power
stations to the coastal load centres are avoided.
5. Displacing Alternative forms of Power at the Margin31
All things being equal, renewable energy has a marginal fuel price of zero since the fuel is free and there is
no additional cost to supplying an additional unit of electricity. Thus, in a merit-order assessment of the
system based on a bid-offer mechanism between electricity buyers and sellers, electricity from renewable
resources will always displace the more expensive unit of electricity on the system and thus drive wholesale
prices down. Studies in Europe measure this merit-order effect of between €3 and 23 per MWh (Rand 30-
230/MWh). This merit-order effect has been calculated in markets such as Germany and Spain to have a
very significant value32 by driving down electricity costs as a whole. The estimated value of this merit-order
effect for Germany in 2006 was estimated to be in the region of Rand 30-60 Billion. In South Africa’s case,
the OCGT plants that are running on aviation fuel are generating the most expensive form of electricity in
the market (estimated to be 2-3 Rand/ kWh) and their output will be displaced at times by wind energy.
Thus, they will not be needed to the same extent since renewable energy will supplant this cost whenever
possible. The next most expensive form of electricity will be coal-fired electricity and the fuel, emission and
water costs that come with this. Wind power will be able to replace some of the baseload due to its
dispersed nature across the region. This is estimated to be 6GW for a national wind energy portfolio of 30
GW (see chapter focussing on Variability, Baseload and Dispersed Baseload Motivation).
6. Fuel Price Reduction
As well as supplanting the more expensive forms of electricity on the system, renewable energy also
displaces conventional power, thus allowing for the backing up of coal inventory and hydropower potential.
The reduced usage of coal will result in a lower demand for coal which in turn will result in lower cost of
coal in the market, thus driving down the electricity price for coal-fired power stations. This has been
observed in countries such as Mexico, where renewable energy drove fuel prices down by almost 10%33.
7. Corporate Tax Income
Each and every wind power plant generates regional and national corporate tax income, income that can
be dispersed into the rural region where the projects are based and supporting economic developments in
such.
30 International Estimates; Nationmaster suggests 6% based on World Development Indicators
31 Wind Energy and Electricity Prices - http://www.ewea.org/fileadmin/ewea_documents/documents/publications/reports/MeritOrder.pdf
32 Fraunhofer Institute Merit Order Study - http://isi.fraunhofer.de/isi/publ/download/isi07a18/merit-order-effect.pdf?pathAlias=/publ/downloads/isi07a18/merit-order-effect.pdf
33 True Cost of Fossil Fuels – (Awerbuch) - http://www.awerbuch.com/shimonpages/shimondocs/VGlobal_0305.pdf
31 | P a g e
8. Transmission Upgrade Costs
Conventional experience shows that a typical national electricity system can have a wind energy
penetration of 10-15% of the current installed capacity without requiring any notable electricity network
upgrades. Assuming that the installed capacity in 2025 is 74 GW, this would suggest up to 10GW of wind
energy can be connected during this period without any significant grid upgrades. Surpassing this
penetration will require appropriate grid infrastructure and system planning to accommodate and optimise
this level of penetration as with any new generation capacity. Studies34 show that this can vary from $0 to
$79 per MWh (0-159 Rand/MWh), with a median cost of $15/MWh (112 Rand/MWh).
The Total Cost to the Economy:
To model the total economic benefits and summing up the range of economic benefits of renewable energy
in order to quantify the total cost and benefits of such, the following assumptions have been made:
Assumptions:
1) Wholesale electricity to increase by 25% p.a. for next three years from approx. Rand 0.33 to 0.64
per kWh. It is assumed that there is a further 2% annual increase through to 2025, ahead of CPI,
reaching 0.83/kWh by this date.
2) Emission Reductions: Carbon prices are expected to be in a range of €20-40 over the long-term. This
equates to Rand 180+/MWh emitted in South Africa that could have been avoided. Emission factor
of 0.91 t/MWh assumed and R 180/MWh emission cost avoided.
3) Water Savings35: 80 TWh of renewable power will displace the coal equivalent, saving at least 80
Billion litres of water per annum and the related water charges of consuming such. Estimated price
is Rand 3.23 per kilolitre of water.
4) Employment & Income Taxes: 40,000 jobs, resulting in income tax revenue for Government,
corporate tax and economic development in rural areas. Income tax assumed to be 30% with an
average salary of R200k p.a.
5) Corporate Taxes: Corporate taxes of 30% are assumed, equating to 4.5% of revenue (approx.).
Based on project financial models.
6) Electricity Portfolio Risk Reductions36: 9% reduction due to the portfolio effect and the reduction in
marginal37 and wholesale electricity prices.
7) Transmission Loss Avoidance38: Generating electricity in rural areas will generate local voltage
support and avoid transmission losses of at least 6%.
34 The Cost of Transmission for Wind Energy: http://eetd.lbl.gov/ea/emp/reports/lbnl-1471e.pdf
35 Potable Bulk Water Tariff (Rand Water Annual Report 2009) - http://www.randwater.co.za/Annual%20Reports/2009%20Annual%20Report/Annual%20Report%202009%20-
%20Financial%20Statements.pdf
36 Efficient electricity generating portfolios for Europe: Maximising energy security and climate change mitigation (2007) (Awerbuch, Yang) – based on 9% reduction in cost if
maintaining the same portfolio risk
37 Wind Energy and Electricity Prices - http://www.ewea.org/fileadmin/ewea_documents/documents/publications/reports/MeritOrder.pdf
32 | P a g e
8) Fuel Price Reduction39: Studies show that 20 % wind power can reduce national fossil fuel (oil & gas)
prices by up to 10% due to the lower demand for such fuels. 7% is used for South Africa for a 30 %
(80 TWh) wind target. Assume 2025 coal consumption for power is same as today (121 Million x 160
Rand/tonne = 19 Billion Rand); Thus, 7% = Rand 1.27 Billion per annum.
9) Transmission Upgrades: With the assumption that the wholesale electricity price will be Rand
834/MWh in 2025 (2009 money, see assumption above) and that only the latter 20 GW of the
proposed 30GW of wind energy will require this upgrade, assumption is approx. 9% of the wholesale
price is required for transmission upgrades (66% x 112=75 Rand/MWh = 9% of 834/MWh)
Further independent studies are needed to fully quantify each of these elements and other and the above
assumptions are all approximations based on external publicly available information.
Taking all of the above assumptions into account and assuming 30 GW of wind energy by 2025 (i.e. 80TWh)
can be installed by the private sector at no capital cost to Government, the following cost/benefit analysis
can be approximated as follows (today’s money):
38 Nationmaster - http://www.nationmaster.com/graph/ene_ele_pow_tra_and_dis_los_of_out-power-transmission-distribution-losses-output?=-1&date=1962
39 Exploiting the Oil-GDP effect to Support Renewables Deployment (Awerbuch Sauter) (2005)
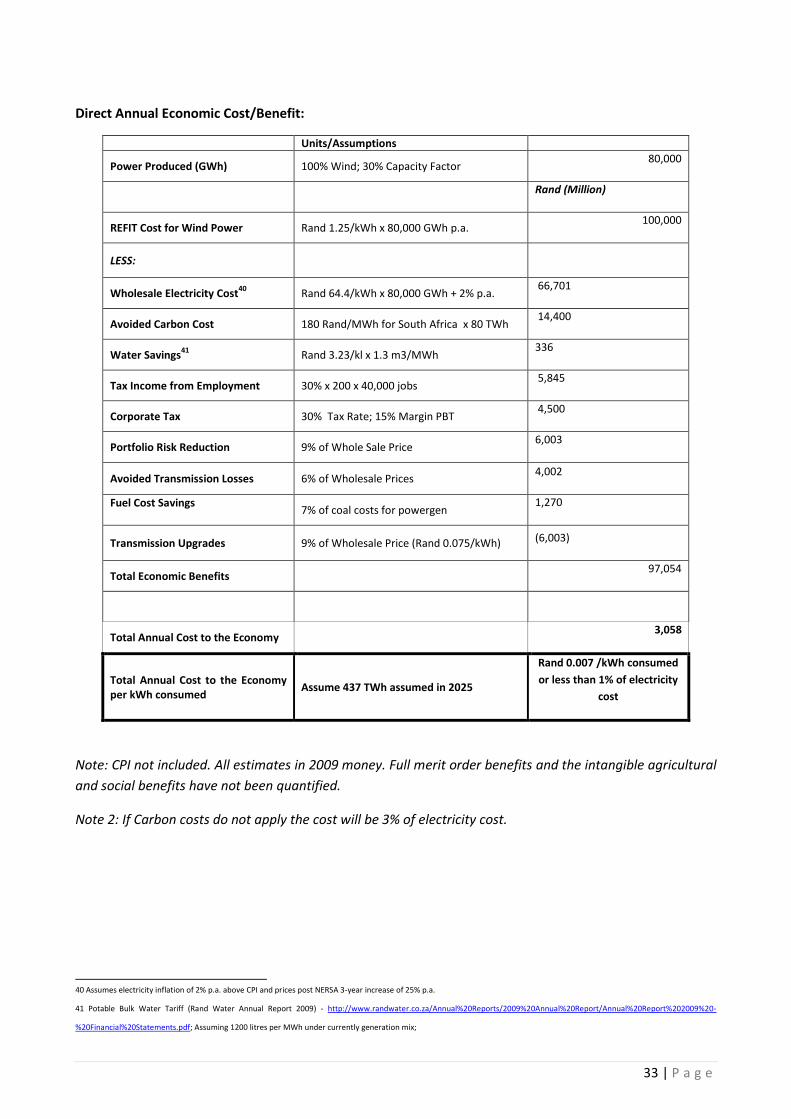
33 | P a g e
Direct Annual Economic Cost/Benefit:
Units/Assumptions
Power Produced (GWh) 100% Wind; 30% Capacity Factor 80,000
Rand (Million)
REFIT Cost for Wind Power Rand 1.25/kWh x 80,000 GWh p.a. 100,000
LESS:
Wholesale Electricity Cost40
Rand 64.4/kWh x 80,000 GWh + 2% p.a. 66,701
Avoided Carbon Cost 180 Rand/MWh for South Africa x 80 TWh 14,400
Water Savings41
Rand 3.23/kl x 1.3 m3/MWh 336
Tax Income from Employment 30% x 200 x 40,000 jobs 5,845
Corporate Tax 30% Tax Rate; 15% Margin PBT 4,500
Portfolio Risk Reduction 9% of Whole Sale Price 6,003
Avoided Transmission Losses 6% of Wholesale Prices 4,002
Fuel Cost Savings
7% of coal costs for powergen 1,270
Transmission Upgrades 9% of Wholesale Price (Rand 0.075/kWh) (6,003)
Total Economic Benefits 97,054
Total Annual Cost to the Economy 3,058
Total Annual Cost to the Economy per kWh consumed
Assume 437 TWh assumed in 2025
Rand 0.007 /kWh consumed
or less than 1% of electricity
cost
Note: CPI not included. All estimates in 2009 money. Full merit order benefits and the intangible agricultural
and social benefits have not been quantified.
Note 2: If Carbon costs do not apply the cost will be 3% of electricity cost.
40 Assumes electricity inflation of 2% p.a. above CPI and prices post NERSA 3-year increase of 25% p.a.
41 Potable Bulk Water Tariff (Rand Water Annual Report 2009) - http://www.randwater.co.za/Annual%20Reports/2009%20Annual%20Report/Annual%20Report%202009%20-
%20Financial%20Statements.pdf; Assuming 1200 litres per MWh under currently generation mix;
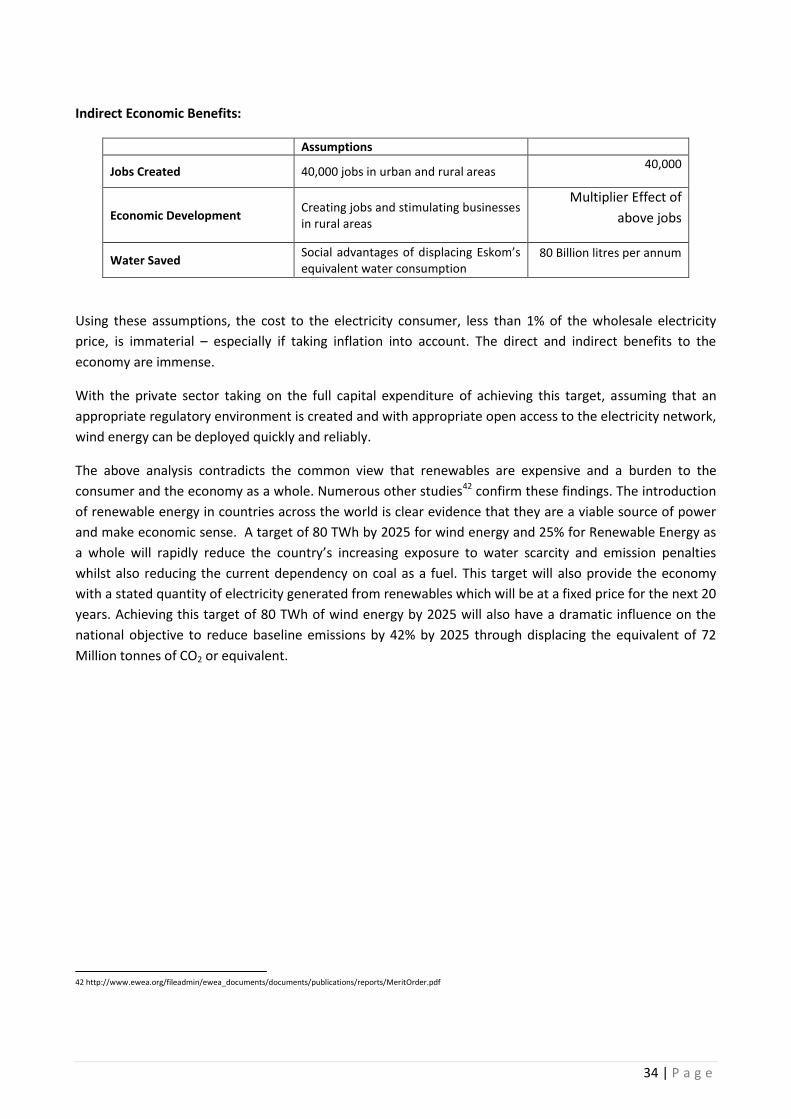
34 | P a g e
Indirect Economic Benefits:
Assumptions
Jobs Created 40,000 jobs in urban and rural areas 40,000
Economic Development Creating jobs and stimulating businesses in rural areas
Multiplier Effect of
above jobs
Water Saved Social advantages of displacing Eskom’s equivalent water consumption
80 Billion litres per annum
Using these assumptions, the cost to the electricity consumer, less than 1% of the wholesale electricity
price, is immaterial – especially if taking inflation into account. The direct and indirect benefits to the
economy are immense.
With the private sector taking on the full capital expenditure of achieving this target, assuming that an
appropriate regulatory environment is created and with appropriate open access to the electricity network,
wind energy can be deployed quickly and reliably.
The above analysis contradicts the common view that renewables are expensive and a burden to the
consumer and the economy as a whole. Numerous other studies42 confirm these findings. The introduction
of renewable energy in countries across the world is clear evidence that they are a viable source of power
and make economic sense. A target of 80 TWh by 2025 for wind energy and 25% for Renewable Energy as
a whole will rapidly reduce the country’s increasing exposure to water scarcity and emission penalties
whilst also reducing the current dependency on coal as a fuel. This target will also provide the economy
with a stated quantity of electricity generated from renewables which will be at a fixed price for the next 20
years. Achieving this target of 80 TWh of wind energy by 2025 will also have a dramatic influence on the
national objective to reduce baseline emissions by 42% by 2025 through displacing the equivalent of 72
Million tonnes of CO2 or equivalent.
42 http://www.ewea.org/fileadmin/ewea_documents/documents/publications/reports/MeritOrder.pdf
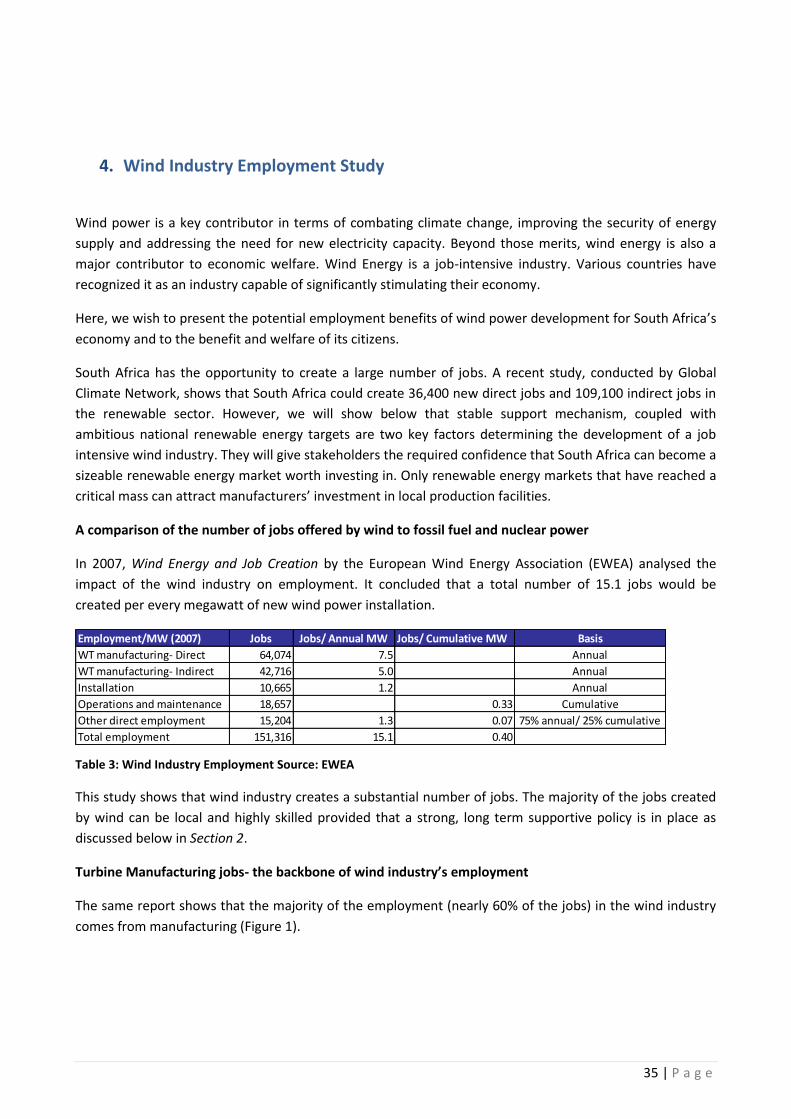
35 | P a g e
4. Wind Industry Employment Study
Wind power is a key contributor in terms of combating climate change, improving the security of energy
supply and addressing the need for new electricity capacity. Beyond those merits, wind energy is also a
major contributor to economic welfare. Wind Energy is a job-intensive industry. Various countries have
recognized it as an industry capable of significantly stimulating their economy.
Here, we wish to present the potential employment benefits of wind power development for South Africa’s
economy and to the benefit and welfare of its citizens.
South Africa has the opportunity to create a large number of jobs. A recent study, conducted by Global
Climate Network, shows that South Africa could create 36,400 new direct jobs and 109,100 indirect jobs in
the renewable sector. However, we will show below that stable support mechanism, coupled with
ambitious national renewable energy targets are two key factors determining the development of a job
intensive wind industry. They will give stakeholders the required confidence that South Africa can become a
sizeable renewable energy market worth investing in. Only renewable energy markets that have reached a
critical mass can attract manufacturers’ investment in local production facilities.
A comparison of the number of jobs offered by wind to fossil fuel and nuclear power
In 2007, Wind Energy and Job Creation by the European Wind Energy Association (EWEA) analysed the
impact of the wind industry on employment. It concluded that a total number of 15.1 jobs would be
created per every megawatt of new wind power installation.
Employment/MW (2007) Jobs Jobs/ Annual MW Jobs/ Cumulative MW Basis
WT manufacturing- Direct 64,074 7.5 Annual
WT manufacturing- Indirect 42,716 5.0 Annual
Installation 10,665 1.2 Annual
Operations and maintenance 18,657 0.33 Cumulative
Other direct employment 15,204 1.3 0.07 75% annual/ 25% cumulative
Total employment 151,316 15.1 0.40
Table 3: Wind Industry Employment Source: EWEA
This study shows that wind industry creates a substantial number of jobs. The majority of the jobs created
by wind can be local and highly skilled provided that a strong, long term supportive policy is in place as
discussed below in Section 2.
Turbine Manufacturing jobs- the backbone of wind industry’s employment
The same report shows that the majority of the employment (nearly 60% of the jobs) in the wind industry
comes from manufacturing (Figure 1).
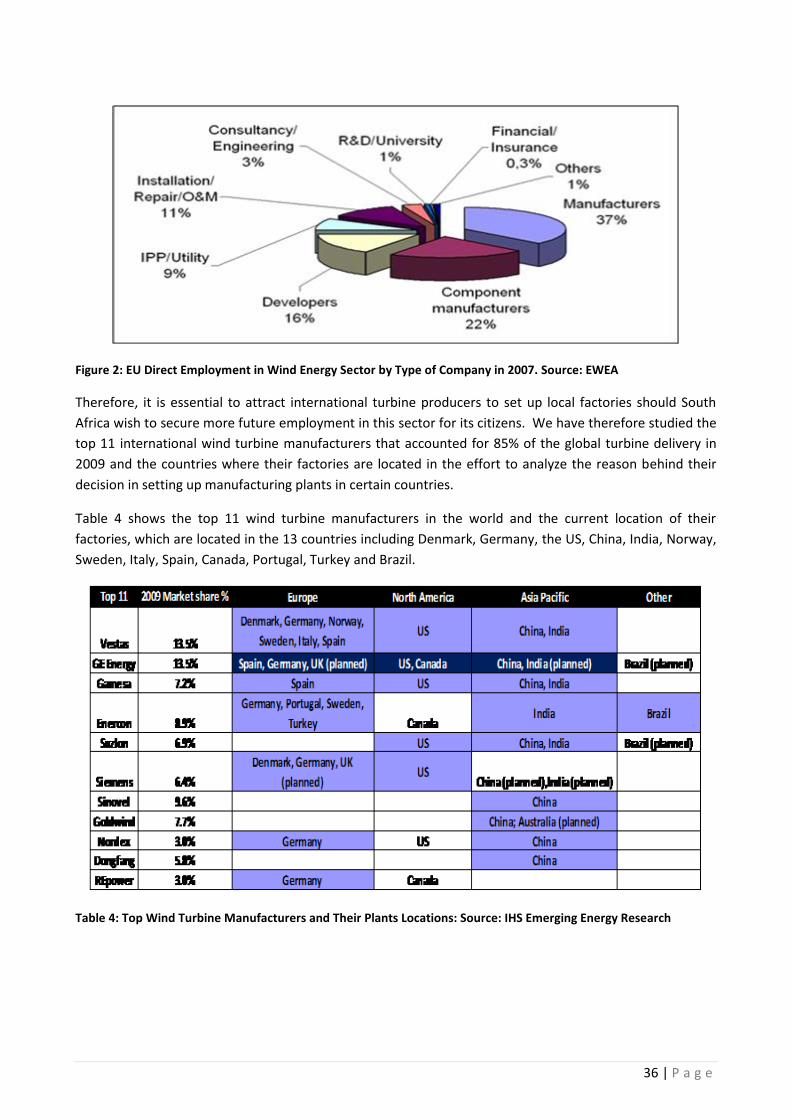
36 | P a g e
Figure 2: EU Direct Employment in Wind Energy Sector by Type of Company in 2007. Source: EWEA
Therefore, it is essential to attract international turbine producers to set up local factories should South
Africa wish to secure more future employment in this sector for its citizens. We have therefore studied the
top 11 international wind turbine manufacturers that accounted for 85% of the global turbine delivery in
2009 and the countries where their factories are located in the effort to analyze the reason behind their
decision in setting up manufacturing plants in certain countries.
Table 4 shows the top 11 wind turbine manufacturers in the world and the current location of their
factories, which are located in the 13 countries including Denmark, Germany, the US, China, India, Norway,
Sweden, Italy, Spain, Canada, Portugal, Turkey and Brazil.
Table 4: Top Wind Turbine Manufacturers and Their Plants Locations: Source: IHS Emerging Energy Research
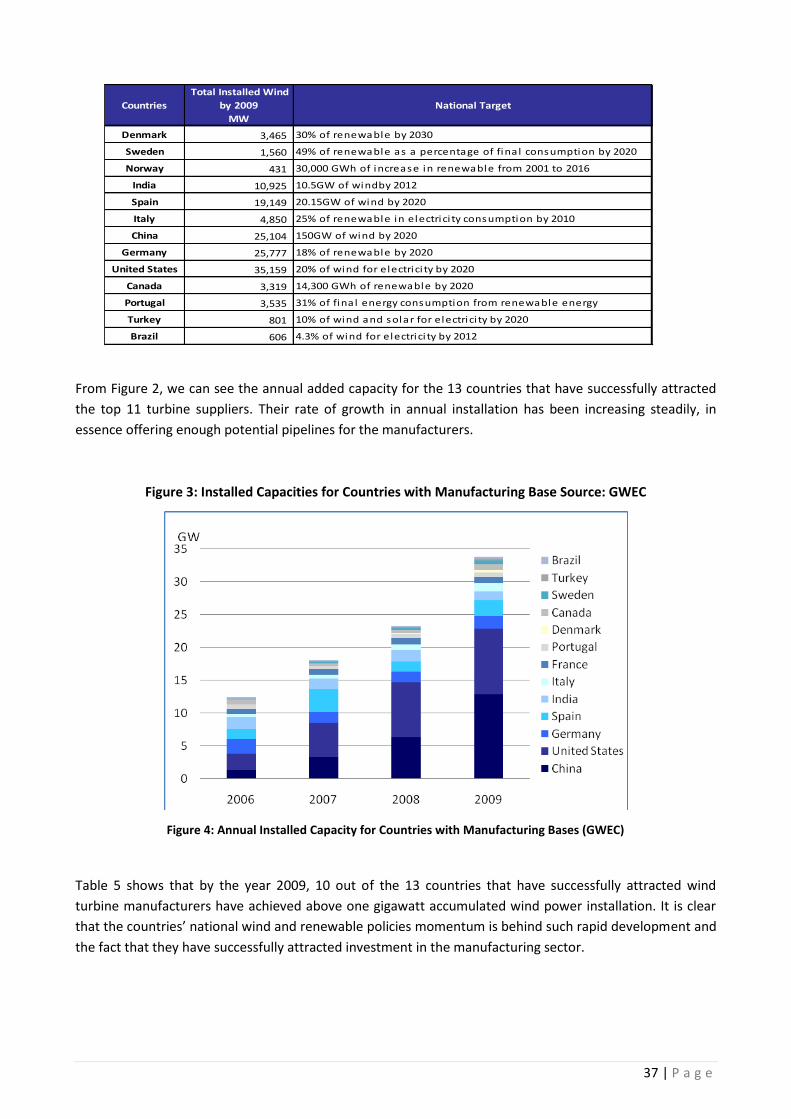
37 | P a g e
From Figure 2, we can see the annual added capacity for the 13 countries that have successfully attracted
the top 11 turbine suppliers. Their rate of growth in annual installation has been increasing steadily, in
essence offering enough potential pipelines for the manufacturers.
Figure 3: Installed Capacities for Countries with Manufacturing Base Source: GWEC
Figure 4: Annual Installed Capacity for Countries with Manufacturing Bases (GWEC)
Table 5 shows that by the year 2009, 10 out of the 13 countries that have successfully attracted wind
turbine manufacturers have achieved above one gigawatt accumulated wind power installation. It is clear
that the countries’ national wind and renewable policies momentum is behind such rapid development and
the fact that they have successfully attracted investment in the manufacturing sector.
Countries
Total Installed Wind
by 2009
MW
National Target
Denmark 3,465 30% of renewable by 2030
Sweden 1,560 49% of renewable as a percentage of fina l consumption by 2020
Norway 431 30,000 GWh of increase in renewable from 2001 to 2016
India 10,925 10.5GW of windby 2012
Spain 19,149 20.15GW of wind by 2020
Italy 4,850 25% of renewable in electrici ty consumption by 2010
China 25,104 150GW of wind by 2020
Germany 25,777 18% of renewable by 2020
United States 35,159 20% of wind for electrici ty by 2020
Canada 3,319 14,300 GWh of renewable by 2020
Portugal 3,535 31% of fina l energy consumption from renewable energy
Turkey 801 10% of wind and solar for electrici ty by 2020
Brazil 606 4.3% of wind for electrici ty by 2012

38 | P a g e
Conclusion:
The wind power industry has the potential to make a significant contribution the local employment sector
in South Africa and has the ability to offer more jobs than the conventional energy industry should the
South Africa government’s political will and support prove to be sufficient, since countries with strong, long
term political will and substantial pipeline are able to attract international turbine producers.
We strongly advise that should South Africa wish to create jobs in the capital intensity renewable energy
sector, a strong, long term incentive without a cap on the industry is crucial.
39 | P a g e
5. Technical Review
Based on a number of resource assessments and technical studies, SAWEA proposes that the
private-sector wind energy industry can realistically deliver 30,000 MW by 2025, generating 80
TWh per annum.
Such an objective is technically and economically feasible and generating significant benefits to
the nation.
This objective can only be met under the following market conditions:
A public commitment by Government to a long-term Renewable Energy target.
An investor-friendly regulatory environment with a Government-backed creditworthy and
independent Power Purchasing agency.
A long-term commitment to the current Feed-In tariff of 1.25 Rand/kWh.
An open and clear access process to the electricity network, in line with international best
practice.
This proposal is in line with what has and is being achieved in other international markets of
similar size and scale as South Africa.
Wind Resource in South Africa
Key Points:
A high wind resource is evident in large parts of South Africa
Coastal areas and large inland areas have an excellent wind resource where high average wind
speeds are predicted.
A range of independent technical assessments have been performed with the conclusion that
South Africa has very significant technical potential (56-70 GW) for indigenous, sustainable wind
energy, given no constraints on the electricity network.
Methodology
A number of studies have been carried out to estimate the technical wind energy potential for South Africa.
These studies have been carried out independently or sponsored by SAWEA members and the outcome of
each study has been summarised below.
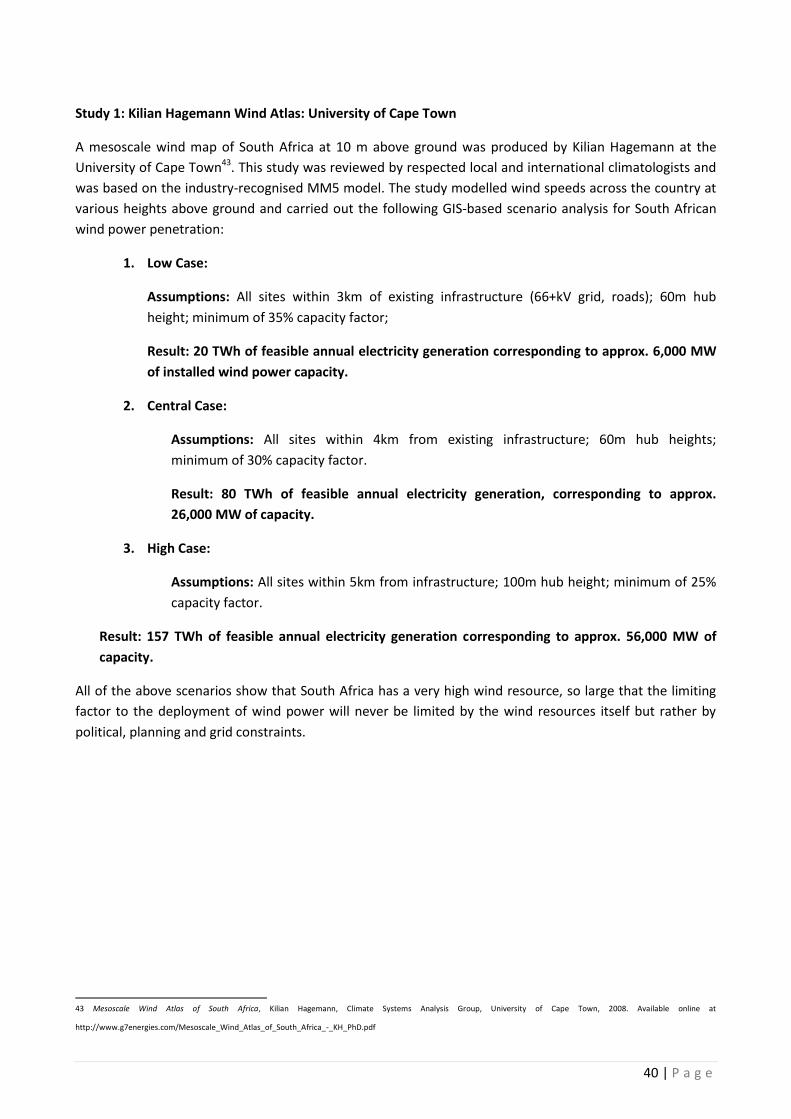
40 | P a g e
Study 1: Kilian Hagemann Wind Atlas: University of Cape Town
A mesoscale wind map of South Africa at 10 m above ground was produced by Kilian Hagemann at the
University of Cape Town43. This study was reviewed by respected local and international climatologists and
was based on the industry-recognised MM5 model. The study modelled wind speeds across the country at
various heights above ground and carried out the following GIS-based scenario analysis for South African
wind power penetration:
1. Low Case:
Assumptions: All sites within 3km of existing infrastructure (66+kV grid, roads); 60m hub
height; minimum of 35% capacity factor;
Result: 20 TWh of feasible annual electricity generation corresponding to approx. 6,000 MW
of installed wind power capacity.
2. Central Case:
Assumptions: All sites within 4km from existing infrastructure; 60m hub heights;
minimum of 30% capacity factor.
Result: 80 TWh of feasible annual electricity generation, corresponding to approx.
26,000 MW of capacity.
3. High Case:
Assumptions: All sites within 5km from infrastructure; 100m hub height; minimum of 25%
capacity factor.
Result: 157 TWh of feasible annual electricity generation corresponding to approx. 56,000 MW of
capacity.
All of the above scenarios show that South Africa has a very high wind resource, so large that the limiting
factor to the deployment of wind power will never be limited by the wind resources itself but rather by
political, planning and grid constraints.
43 Mesoscale Wind Atlas of South Africa, Kilian Hagemann, Climate Systems Analysis Group, University of Cape Town, 2008. Available online at
http://www.g7energies.com/Mesoscale_Wind_Atlas_of_South_Africa_-_KH_PhD.pdf
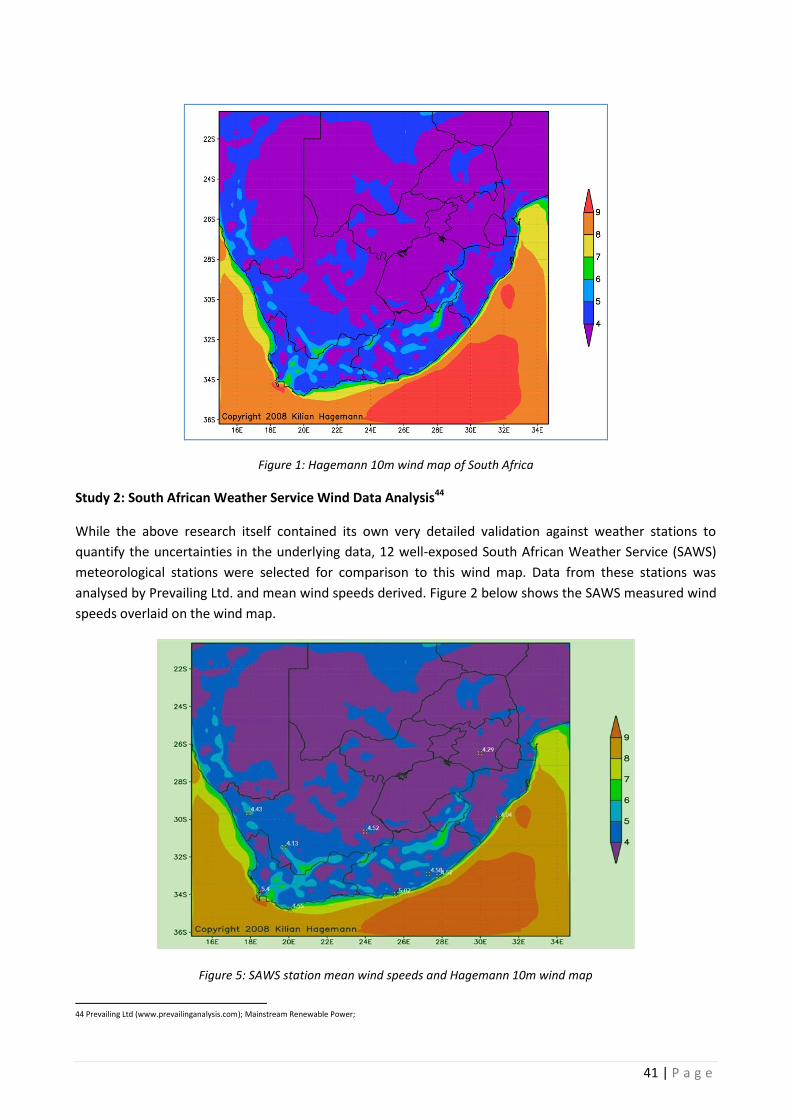
41 | P a g e
Figure 1: Hagemann 10m wind map of South Africa
Study 2: South African Weather Service Wind Data Analysis44
While the above research itself contained its own very detailed validation against weather stations to
quantify the uncertainties in the underlying data, 12 well-exposed South African Weather Service (SAWS)
meteorological stations were selected for comparison to this wind map. Data from these stations was
analysed by Prevailing Ltd. and mean wind speeds derived. Figure 2 below shows the SAWS measured wind
speeds overlaid on the wind map.
Figure 5: SAWS station mean wind speeds and Hagemann 10m wind map
44 Prevailing Ltd (www.prevailinganalysis.com); Mainstream Renewable Power;
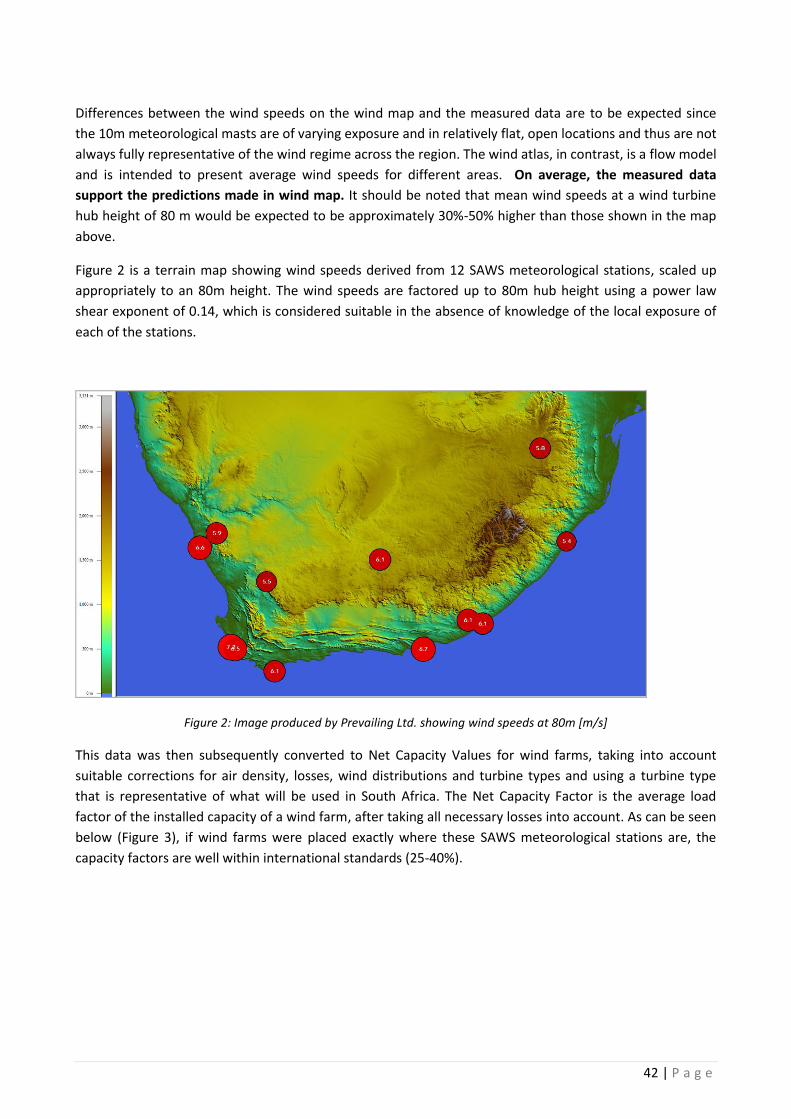
42 | P a g e
Differences between the wind speeds on the wind map and the measured data are to be expected since
the 10m meteorological masts are of varying exposure and in relatively flat, open locations and thus are not
always fully representative of the wind regime across the region. The wind atlas, in contrast, is a flow model
and is intended to present average wind speeds for different areas. On average, the measured data
support the predictions made in wind map. It should be noted that mean wind speeds at a wind turbine
hub height of 80 m would be expected to be approximately 30%-50% higher than those shown in the map
above.
Figure 2 is a terrain map showing wind speeds derived from 12 SAWS meteorological stations, scaled up
appropriately to an 80m height. The wind speeds are factored up to 80m hub height using a power law
shear exponent of 0.14, which is considered suitable in the absence of knowledge of the local exposure of
each of the stations.
Figure 2: Image produced by Prevailing Ltd. showing wind speeds at 80m [m/s]
This data was then subsequently converted to Net Capacity Values for wind farms, taking into account
suitable corrections for air density, losses, wind distributions and turbine types and using a turbine type
that is representative of what will be used in South Africa. The Net Capacity Factor is the average load
factor of the installed capacity of a wind farm, after taking all necessary losses into account. As can be seen
below (Figure 3), if wind farms were placed exactly where these SAWS meteorological stations are, the
capacity factors are well within international standards (25-40%).
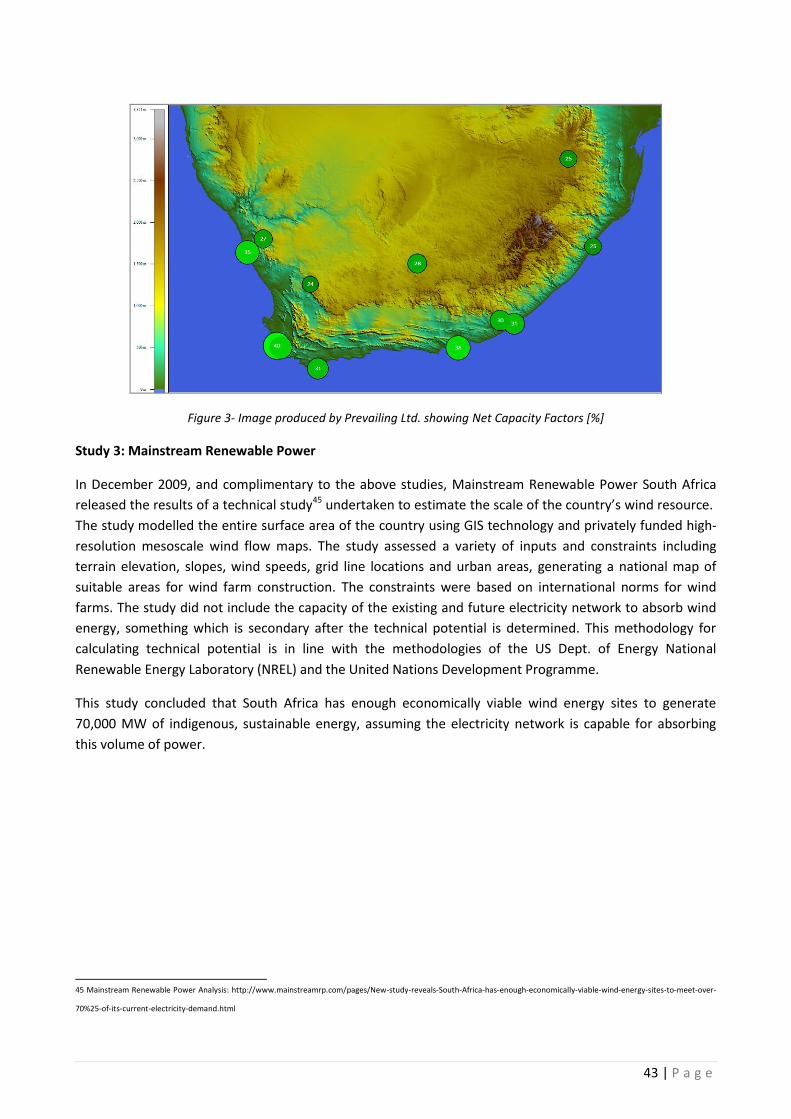
43 | P a g e
Figure 3- Image produced by Prevailing Ltd. showing Net Capacity Factors [%]
Study 3: Mainstream Renewable Power
In December 2009, and complimentary to the above studies, Mainstream Renewable Power South Africa
released the results of a technical study45 undertaken to estimate the scale of the country’s wind resource.
The study modelled the entire surface area of the country using GIS technology and privately funded high-
resolution mesoscale wind flow maps. The study assessed a variety of inputs and constraints including
terrain elevation, slopes, wind speeds, grid line locations and urban areas, generating a national map of
suitable areas for wind farm construction. The constraints were based on international norms for wind
farms. The study did not include the capacity of the existing and future electricity network to absorb wind
energy, something which is secondary after the technical potential is determined. This methodology for
calculating technical potential is in line with the methodologies of the US Dept. of Energy National
Renewable Energy Laboratory (NREL) and the United Nations Development Programme.
This study concluded that South Africa has enough economically viable wind energy sites to generate
70,000 MW of indigenous, sustainable energy, assuming the electricity network is capable for absorbing
this volume of power.
45 Mainstream Renewable Power Analysis: http://www.mainstreamrp.com/pages/New-study-reveals-South-Africa-has-enough-economically-viable-wind-energy-sites-to-meet-over-
70%25-of-its-current-electricity-demand.html
44 | P a g e
Conclusions
Several studies based on measured and public data confirm that South Africa has abundant wind energy
resources despite statements to the contrary. Wind farms typically need a mean wind speed at 60-100
metre hub height of 6.5 m/s or higher for optimal efficiency (28-45% capacity factor) and this wind speeds
can be used as a typical lower limit for technical potential estimates. Combining this limit with the
necessary constraints such as terrain type, zones, proximity to grid lines and related infrastructure, studies
have shown that South Africa has the technical potential for 56-70 GW of indigenous, sustainable wind
energy, generating 157-184 TWh, if the electricity network were adapted accordingly and there no
constraints in dispatching this energy. The suitable areas for wind energy are specifically along the coast
lines and the large inland areas where large wind farms are technically and commercially viable.
In terms of deployment, delivering 30,000 MW of operating wind farms over a 15 year period up to 2025,
as currently being proposed by the wind industry, is in line with what is being achieved in countries such as
Germany, Spain and the UK and is technically viable.
45 | P a g e
Baseload, Capacity Credits and Variability of Wind Power
Key Points:
The predicted level of variability in wind power production in South Africa is comparable to that
observed in international markets with high levels of wind energy penetration.
The wind across the country never stops blowing instantaneously. Changes in wind speed can be
predicted. Implementing wind forecasting systems allows system operators to schedule dispatch of
fossil plants well in advance of changes in wind power generation levels.
A comparison was made between the South Africa national electricity demand and the power
variation of the above wind farms. This shows that the power generated from the wind farms is on
average available at all times of the day, and particularly during periods of high demand in the late
afternoon.
Wind generation will supply power year round. It will generate power during the critical winter peak
demand periods.
Based on the studies detailed below, a minimum of 7,000 MW of wind capacity will be available on a
daily basis out of installed capacity of 30,000 MW.
Wind power can make a significant contribution to total national generation supply.
Introduction to studies:
A number of studies and assessments were carried out by various industry experts to address the question
being posed by incumbent players in the electricity market in South Africa about the baseload or capacity
credit that wind energy can provide and managing the so-called variable nature of wind energy. Each of the
studies are summarised below to address these questions.
46 | P a g e
Study 1: Wind Power and Capacity Credit46
Wind energy generating the equivalent of 10% of today’s electricity consumption:
o 27 TWh from 10.5-12.5 GW wind power installed
o 1.3-2.1 GW “firm” capacity
Wind energy generating the equivalent of 20% of today’s electricity consumption:
o 60 TWh from 23-27 GW wind power installed
o 2.7-6.8 GW “firm” capacity
30,000MW wind in 437 TWh/year demand scenario
o 15%-18% energy penetration
o 66-79TWh/year from wind
o 3 – 9GW “firm capacity” (or 3-6GW if max 20% Capacity Credit is assumed)
The claim that wind power cannot contribute to “firm” or “baseload” capacity is demonstrated
to be without merit.
Wind energy, in terms of kWh, has clearly quantifiable value in the saving of units of fuel consumed in fuel-
based power generation and in the displacement of carbon emissions. However, what of the value of the
installed power, in MW?
Although wind power has a capacity credit both physically and technically, this characteristic currently has
no value in the power market as wind power producers are not generally rewarded for providing firm
capacity in the system. Nevertheless, it is of some interest to planners. The question of the relevance in
planning is one of degree – if the relative amount of capacity on the system is low then the variation in the
output is taken up within the scale of the normal variation in demand that the system is designed to handle
anyway. As the penetration level increases, then the value of the capacity credit takes on more significance
in planning for demand-matching.
Definition of Capacity Credit
By definition:
“The Capacity Credit assigned to a power plant is the fraction of installed capacity by which the existing
conventional power generation capacity can be reduced without affecting the loss of load probability.”
46
Submission by Windlab, May 2010
47 | P a g e
How can it be calculated?
In order to calculate the Capacity Credit of any power generating unit on a system (not just variable types
such as wind), a system-wide study is performed, taking into account demand profile, generation profile,
unit availability and other constraints. Methods include calculation of Loss of Load Probability (LOLP) and
Loss of Load Expectancy (LOLE) to yield either an
Equivalent Firm Capacity (EFC):
o the increase in firm capacity resulting in the same LOLP/LOLE reduction as the actual
additional wind capacity
Effective Load Carrying Capability (ELCC):
o the amount by which the load may be increased in the presence of non-firm capacity while
the original LOLP/LOLE remains constant
Capacity Credit gives us a number, in MW, to assign to the contribution that the installed wind power on
the network makes to “firm capacity”, also known as “baseload”. This is a non-zero value since wind power
reduces the probability of our demand not being met by our production by a quantifiable amount.
How much is it?
Without having performed a detailed analysis of this type, certain fundamentals can be applied to indicate
the capacity credit in the range of interest. These include:
At low levels of penetration, Capacity Credit = Capacity Factor
As penetration increases, Capacity Credit (as a relative measure) decreases
The decrease is asymptotic, reaching a point where it effectively levels off
As a percentage of installed wind capacity, the relative “firm capacity” starts at the Capacity Factor and
then decreases as more wind power is installed. However, the absolute amount of “firm” capacity is still
increasing in MW as installed wind capacity increases.
Figure 6: Capacity credit estimates from a range of studies47
47 IEA, “Impacts of large amounts of wind power on design and operation of power systems, results of IEA collaboration”, 2009
48 | P a g e
Figure 6 shows a range of Capacity Credit values from studies included in the IEA report: “Impacts of large
amounts of wind power on design and operation of power systems, results of IEA collaboration”, 2009.
Since Capacity Credit is linked to Capacity Factor, different levels evident in the scatter can in part be
attributed to the wind regime at the wind sites and the dimensioning of the wind turbine48. This is one
explanation for low German Capacity Credit results shown. Future studies may show that Capacity Factors
within South Africa are comparable to those of Ireland and UK, however a study specific to local grid will
need to confirm that this translates to Capacity Credit in the range as indicated in Figure 6. General trends:
Higher capacity credit if wind power production peaks at high load
Lower capacity credit if negative correlation
Wind power’s Capacity Credit can be taken as a reduction in the requirement for other “firm” capacity in
the reserve margin. In this form the Capacity Credit can be considered as “baseload”. Due to decreasing
relative Capacity Credit with increasing penetration, the amount contributing to reserve margin decreases
at higher penetration levels. Hence, while wind energy can replace the energy penetration of other forms
of generation, at high penetration, wind power cannot entirely replace the need for dispatchable power
capacity49. This balance can be adjusted with the inclusion of measures such as pumped storage, cross-
border trading and other flexible forms of power generation when there is significantly high wind
penetration.
-
10 000
20 000
30 000
40 000
50 000
60 000
Base case Base case with wind at 10% penetration
MW
wind not credited
wind credit
dispatchable reserve
peak load
capacity credit
Figure 7: For the purposes of security of supply, Capacity Credit can contribute to reserve margin50
The relative capacity credit decreases from a value approximately equal to the load factor at high load (25-
35 per cent) for low penetrations, to approximately 10-15 per cent at high penetrations.
48 Capacity Factor itself is not an absolute measure since turbine models optimised for different wind regimes will give different capacity factors in the same site.
49 Boyle (2007), “Renewable Electricity and the Grid”, Earthscan, London
50
Boyle (2007), “Renewable Electricity and the Grid”, Earthscan, London
49 | P a g e
Sample scenarios
In order to illustrate the concept, sample scenarios are presented. The first two are based on an increase
from an estimated South African base case and the third is based on 30 GW wind in a high demand scenario
(e.g. 2025).
Increase from current base case:
38,000 MW peak demand
249 TWh annual energy consumption
19% reserve margin (ideal)
45,220 MW conventional capacity installed
Wind is added in Optimistic and Conservative scenarios, reflecting the fact that at best, Capacity Credit
cannot exceed the Capacity Factor for the average wind farm (assumed to be 30% in the Optimistic
scenario and 25% in the Conservative scenario for this study) and that at penetration levels of 20% it could
be significantly less.
No conventional capacity is added and it is assumed that Capacity Credit on top of existing firm capacity
yields a new equivalent gross capacity from which an increase in peak demand can be approximated, with
19% of that gross firm capacity taken as reserve margin.
Optimistic Conservative
Capacity Factor 30% 25%
Capacity Credit 30% 10%
Table 5: Optimistic and Conservative scenarios
Disclaimer: The figures given are for illustration of principles and ballpark figures only. Based on multiple
assumptions and not a substitute for robust system studies. These are artificial scenarios, not representing a
detailed portfolio mix, however they serve to illustrate the principle of capacity credit and the range of
numbers that can be borne in mind.
With these assumptions, the resulting outcome of adding 10% of the base case annual electricity
consumption (274 TWh) sourced from wind energy (i.e. generating 27.4 TWh annually) can be described as
follows:
No wind Optimistic Conservative
Demand (TWh) 249 274 274
Peak Demand (MW) 38 000 40 627 39 051
Wind installed (MW) 10 422 12 507
AEP (TWh) 27 27
Power penetration (%) 26% 32%
Capacity credit (wind) (MW) 3 127 1 251
Wind not credited (MW) 7 296 11 256
Peak demand increase (MW) 2 627 1 051
Total "firm" capacity (MW) 45 220 48 347 46 471
Reserve (at 19%) (MW) 7 220 7 719 7 420
Conventional reserve (MW) 7 220 4 593 6 169
Figure 8: 10% Wind Energy Penetration Scenario
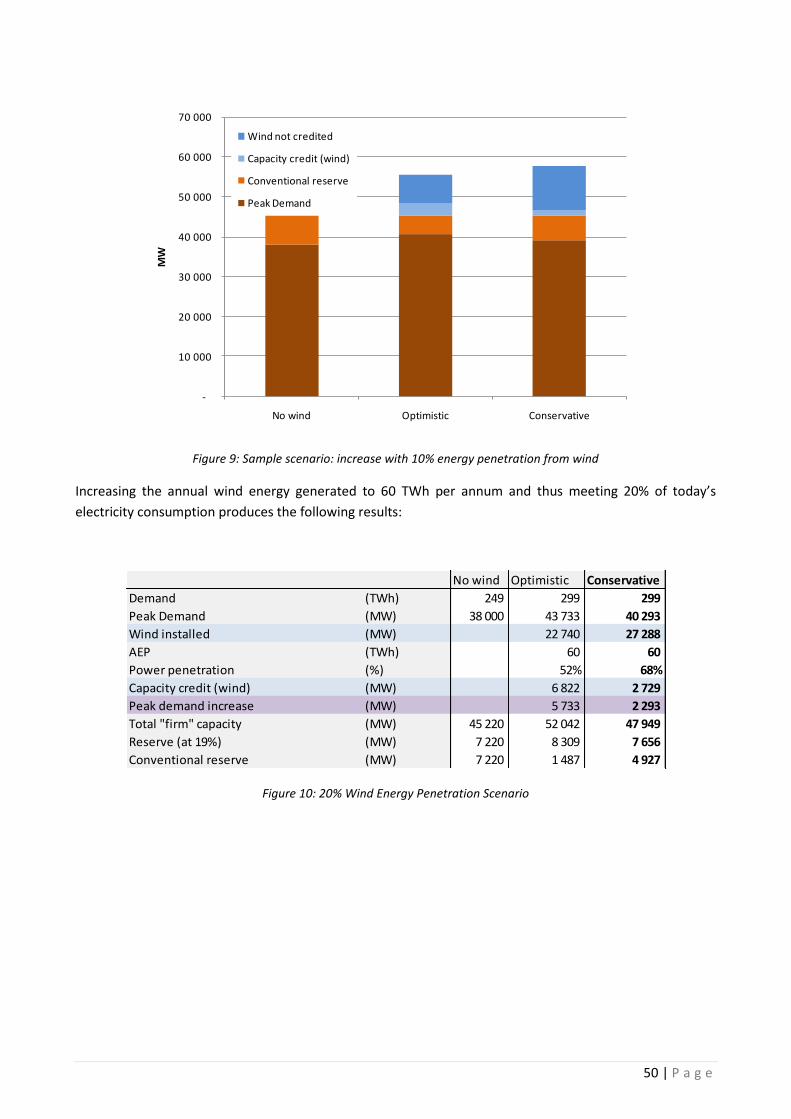
50 | P a g e
-
10 000
20 000
30 000
40 000
50 000
60 000
70 000
No wind Optimistic Conservative
MW
Wind not credited
Capacity credit (wind)
Conventional reserve
Peak Demand
Figure 9: Sample scenario: increase with 10% energy penetration from wind
Increasing the annual wind energy generated to 60 TWh per annum and thus meeting 20% of today’s
electricity consumption produces the following results:
No wind Optimistic Conservative
Demand (TWh) 249 299 299
Peak Demand (MW) 38 000 43 733 40 293
Wind installed (MW) 22 740 27 288
AEP (TWh) 60 60
Power penetration (%) 52% 68%
Capacity credit (wind) (MW) 6 822 2 729
Peak demand increase (MW) 5 733 2 293
Total "firm" capacity (MW) 45 220 52 042 47 949
Reserve (at 19%) (MW) 7 220 8 309 7 656
Conventional reserve (MW) 7 220 1 487 4 927
Figure 10: 20% Wind Energy Penetration Scenario
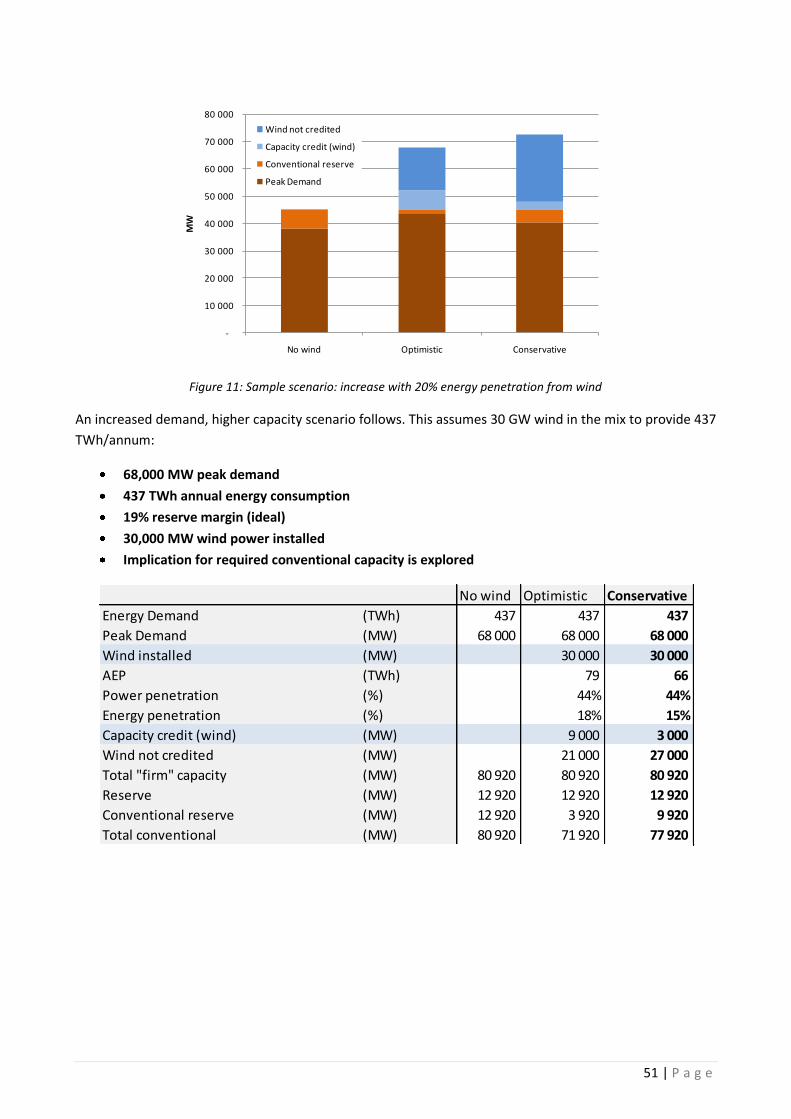
51 | P a g e
-
10 000
20 000
30 000
40 000
50 000
60 000
70 000
80 000
No wind Optimistic Conservative
MW
Wind not credited
Capacity credit (wind)
Conventional reserve
Peak Demand
Figure 11: Sample scenario: increase with 20% energy penetration from wind
An increased demand, higher capacity scenario follows. This assumes 30 GW wind in the mix to provide 437
TWh/annum:
68,000 MW peak demand
437 TWh annual energy consumption
19% reserve margin (ideal)
30,000 MW wind power installed
Implication for required conventional capacity is explored
No wind Optimistic Conservative
Energy Demand (TWh) 437 437 437
Peak Demand (MW) 68 000 68 000 68 000
Wind installed (MW) 30 000 30 000
AEP (TWh) 79 66
Power penetration (%) 44% 44%
Energy penetration (%) 18% 15%
Capacity credit (wind) (MW) 9 000 3 000
Wind not credited (MW) 21 000 27 000
Total "firm" capacity (MW) 80 920 80 920 80 920
Reserve (MW) 12 920 12 920 12 920
Conventional reserve (MW) 12 920 3 920 9 920
Total conventional (MW) 80 920 71 920 77 920
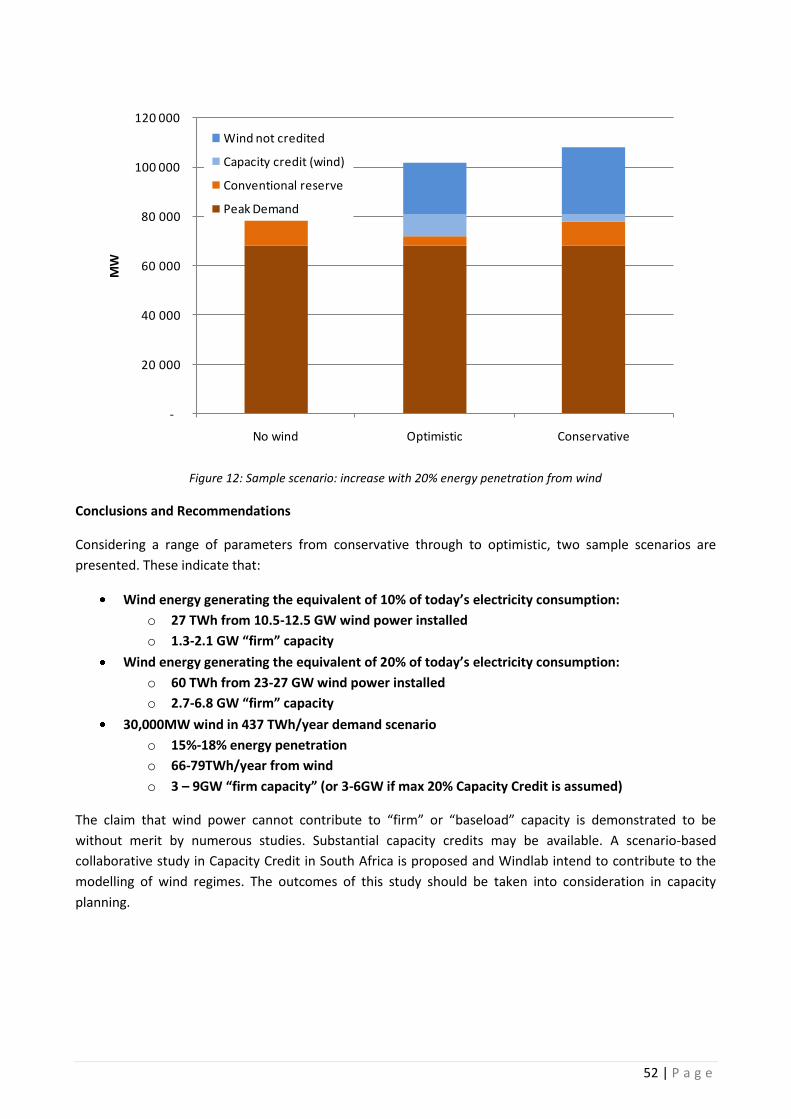
52 | P a g e
-
20 000
40 000
60 000
80 000
100 000
120 000
No wind Optimistic Conservative
MW
Wind not credited
Capacity credit (wind)
Conventional reserve
Peak Demand
Figure 12: Sample scenario: increase with 20% energy penetration from wind
Conclusions and Recommendations
Considering a range of parameters from conservative through to optimistic, two sample scenarios are
presented. These indicate that:
Wind energy generating the equivalent of 10% of today’s electricity consumption:
o 27 TWh from 10.5-12.5 GW wind power installed
o 1.3-2.1 GW “firm” capacity
Wind energy generating the equivalent of 20% of today’s electricity consumption:
o 60 TWh from 23-27 GW wind power installed
o 2.7-6.8 GW “firm” capacity
30,000MW wind in 437 TWh/year demand scenario
o 15%-18% energy penetration
o 66-79TWh/year from wind
o 3 – 9GW “firm capacity” (or 3-6GW if max 20% Capacity Credit is assumed)
The claim that wind power cannot contribute to “firm” or “baseload” capacity is demonstrated to be
without merit by numerous studies. Substantial capacity credits may be available. A scenario-based
collaborative study in Capacity Credit in South Africa is proposed and Windlab intend to contribute to the
modelling of wind regimes. The outcomes of this study should be taken into consideration in capacity
planning.
53 | P a g e
Study 2: Resource Assessment: Enhancing Baseload from Wind Power
Key Points
Despite the variability in the wind the geographical size of South Africa results in a capacity credit
of distributed wind farms of greater than 10%, guaranteed within 100% certainty
Within 85% certainty at least 20% of 37GW of installed wind power capacity is always available
for the winter evening demand peak
Introduction
As a follow up work to the Mesoscale Wind Atlas described above, the WWF commissioned a study in 2008
to investigate the economic and technical feasibility of a 15% Renewable Energy target by 202051. As part of
that study Kilian Hagemann quantified the availability of widely distributed wind power capacity during the
winter peak demand period in order to obtain estimates for the capacity credit that may be assigned to
wind farms.
Methodology
The study used a fairly similar approach taken in the wind atlas by converting the four dimensional (space
and time) wind speed time-series for the entire country during a single but demonstrably representative
365 day time period and converting it into an instantaneous power output time-series of a typical 2MW
wind turbine (Vestas V80 with a standard calculated power curve).
It further picks out the 6 day period from 1 July until 31 August, the winter peak demand period during
which the national electricity grid is most vulnerable. The 18x18km data grid is then interpolated to 4x4km
for the analysis stage. For this purpose three different wind power classes are defined:
Wind35: Locations with capacity factors greater or equal to 35% (similar to Low Case above)
Wind30: Locations with capacity factors between 30% and 35% (similar to Central Case above)
Wind25: Locations with capacity factors between 25% and 30% (similar to High Case above)
The remaining assumptions are standardised to 80m hub height and 4km maximum distance to road and
grid infrastructure which clearly results in different amounts of feasible capacity in each class (larger for
pessimistic scenario). For each technology the calculation then sums up the hourly instantaneous wind
power generation time-series for all grid cells that satisfy these conditions and extracts the 62 values which
coincide with the 8pm evening peak. For these a probability density (pdf) and cumulative distribution
function (cdf) are derived and presented.
51 Costing a 2020 Target of 15% Renewable Electricity for South Africa, Energy Research Institute, University of Cape Town, 2008.
http://www.erc.uct.ac.za/Research/publications/08-Marquardetal-costing_a_2020_target.pdf
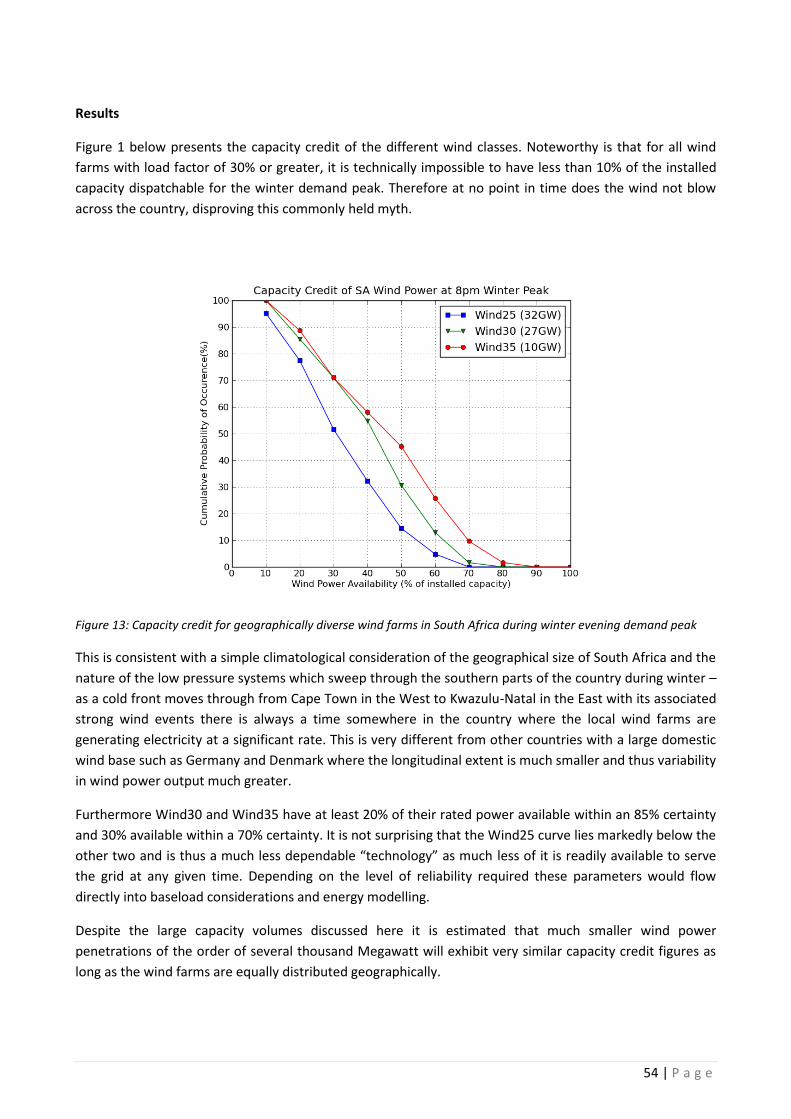
54 | P a g e
Results
Figure 1 below presents the capacity credit of the different wind classes. Noteworthy is that for all wind
farms with load factor of 30% or greater, it is technically impossible to have less than 10% of the installed
capacity dispatchable for the winter demand peak. Therefore at no point in time does the wind not blow
across the country, disproving this commonly held myth.
Figure 13: Capacity credit for geographically diverse wind farms in South Africa during winter evening demand peak
This is consistent with a simple climatological consideration of the geographical size of South Africa and the
nature of the low pressure systems which sweep through the southern parts of the country during winter –
as a cold front moves through from Cape Town in the West to Kwazulu-Natal in the East with its associated
strong wind events there is always a time somewhere in the country where the local wind farms are
generating electricity at a significant rate. This is very different from other countries with a large domestic
wind base such as Germany and Denmark where the longitudinal extent is much smaller and thus variability
in wind power output much greater.
Furthermore Wind30 and Wind35 have at least 20% of their rated power available within an 85% certainty
and 30% available within a 70% certainty. It is not surprising that the Wind25 curve lies markedly below the
other two and is thus a much less dependable “technology” as much less of it is readily available to serve
the grid at any given time. Depending on the level of reliability required these parameters would flow
directly into baseload considerations and energy modelling.
Despite the large capacity volumes discussed here it is estimated that much smaller wind power
penetrations of the order of several thousand Megawatt will exhibit very similar capacity credit figures as
long as the wind farms are equally distributed geographically.

55 | P a g e
Study 3: Wind Power: Variabilty & Baseload52
Key Points:
With a national wind energy portfolio of 30,000 MW, the average daily power output will always
be above an estimated 6,600 MW, with a peak of approximately 17,000 MW.
The variability of the wind in South Africa on a minute and hourly basis is similar to that of other
international electricity markets with significant and planned wind energy penetration.
The monthly power generated from the above portfolio does not vary more than 20% around the
annual average.
Large drops in power output from a wind portfolio do not occur instantaneously.
Introduction
In a recent privately-funded study carried out by a member of the wind industry, researchers set out to
examine the variability of wind power generation from a geographically dispersed portfolio of wind farms
in South Africa, considered possible by 2025. In order to create a future scenario for the installed wind
power capacity in 2025, values for installed capacity were assumed for the different sites, with a total
generating power of 30,000 MW. The wind climate in South Africa varies greatly from one region to the
next, and therefore geographic dispersion of wind power plants will reduce the overall power variability.
The study uses South African Weather Service (SAWS) data from different areas of South Africa to examine
the likely variation of the combined power output from a future scenario of wind power generation. The
wind data was converted into a power series. The variability of this power generation data has been
examined and the results reported.
Methodology
Eight meteorological stations were been selected from the network of SAWS stations, based on their
exposure, their geographical dispersion and their reasonable proximity to areas suitable for wind farm
development.
The chosen stations are listed below:
1. Beaufort West
2. Calvinia
3. DeAar
4. Laangebaanweg
5. Port Elizabeth
6. Welkom
7. Springbok
52
Mainstream Renewable Power Study: March 2010
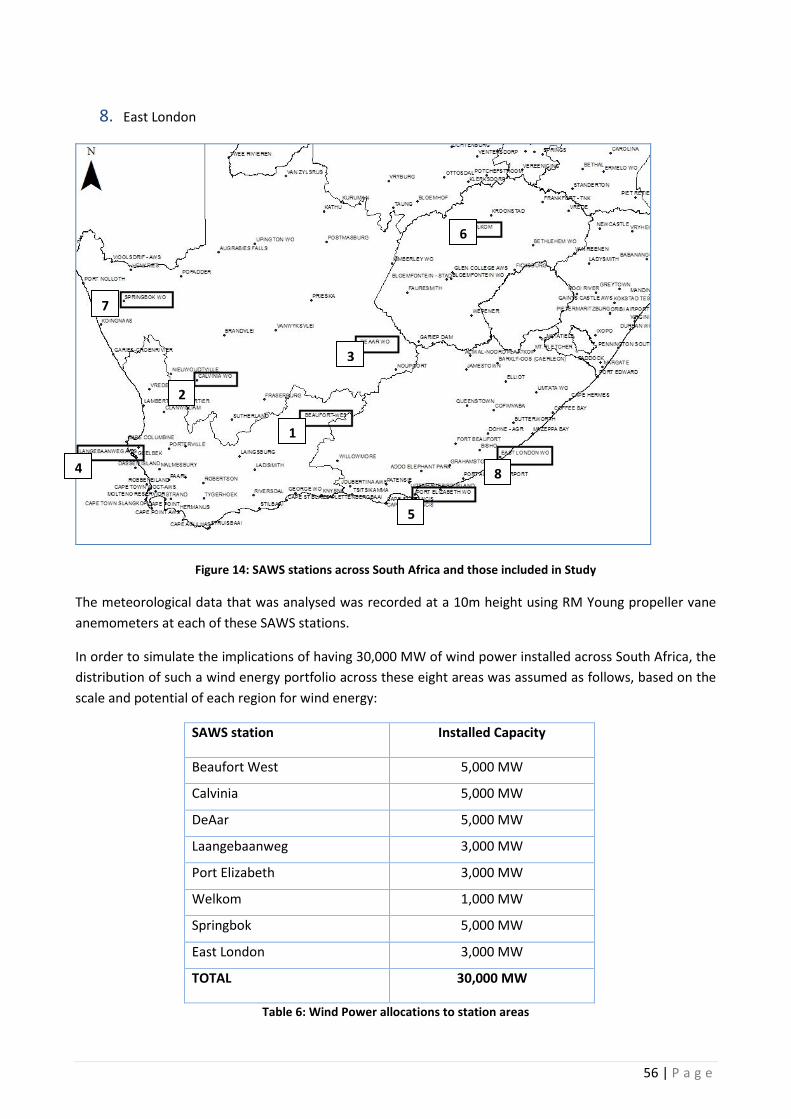
56 | P a g e
8. East London
Figure 14: SAWS stations across South Africa and those included in Study
The meteorological data that was analysed was recorded at a 10m height using RM Young propeller vane
anemometers at each of these SAWS stations.
In order to simulate the implications of having 30,000 MW of wind power installed across South Africa, the
distribution of such a wind energy portfolio across these eight areas was assumed as follows, based on the
scale and potential of each region for wind energy:
SAWS station Installed Capacity
Beaufort West 5,000 MW
Calvinia 5,000 MW
DeAar 5,000 MW
Laangebaanweg 3,000 MW
Port Elizabeth 3,000 MW
Welkom 1,000 MW
Springbok 5,000 MW
East London 3,000 MW
TOTAL 30,000 MW
Table 6: Wind Power allocations to station areas
1
2
4
5
6
7
3
8
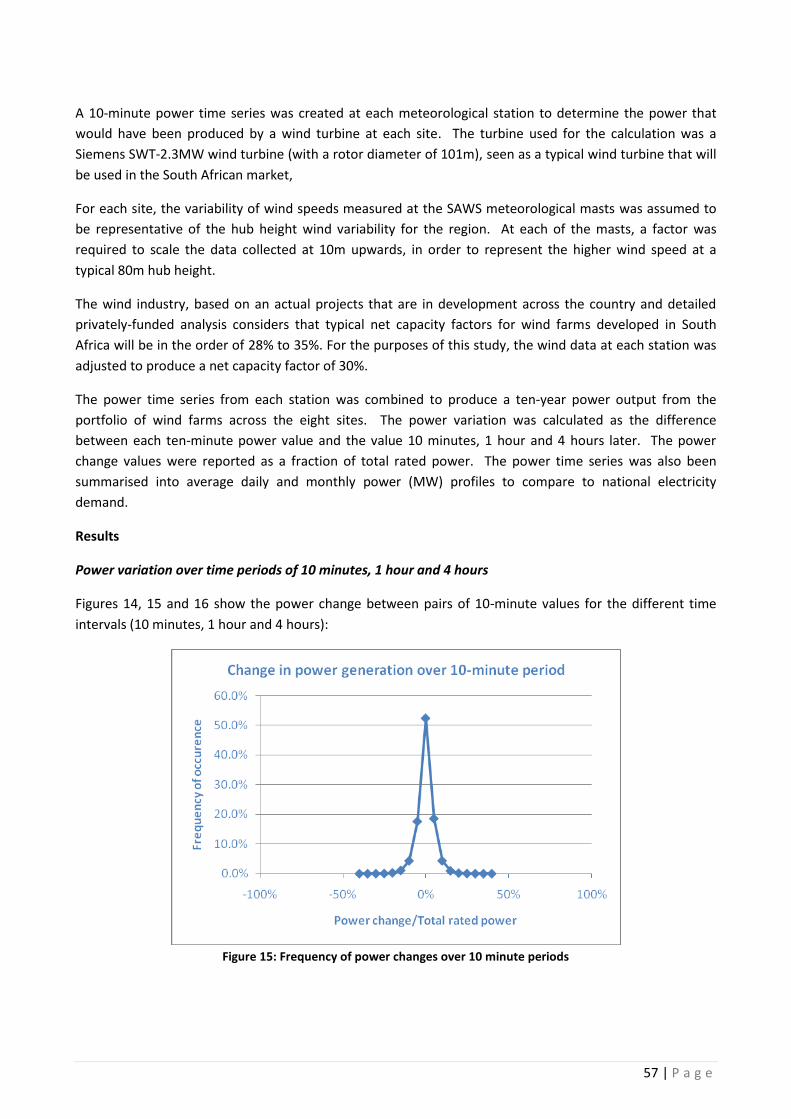
57 | P a g e
A 10-minute power time series was created at each meteorological station to determine the power that
would have been produced by a wind turbine at each site. The turbine used for the calculation was a
Siemens SWT-2.3MW wind turbine (with a rotor diameter of 101m), seen as a typical wind turbine that will
be used in the South African market,
For each site, the variability of wind speeds measured at the SAWS meteorological masts was assumed to
be representative of the hub height wind variability for the region. At each of the masts, a factor was
required to scale the data collected at 10m upwards, in order to represent the higher wind speed at a
typical 80m hub height.
The wind industry, based on an actual projects that are in development across the country and detailed
privately-funded analysis considers that typical net capacity factors for wind farms developed in South
Africa will be in the order of 28% to 35%. For the purposes of this study, the wind data at each station was
adjusted to produce a net capacity factor of 30%.
The power time series from each station was combined to produce a ten-year power output from the
portfolio of wind farms across the eight sites. The power variation was calculated as the difference
between each ten-minute power value and the value 10 minutes, 1 hour and 4 hours later. The power
change values were reported as a fraction of total rated power. The power time series was also been
summarised into average daily and monthly power (MW) profiles to compare to national electricity
demand.
Results
Power variation over time periods of 10 minutes, 1 hour and 4 hours
Figures 14, 15 and 16 show the power change between pairs of 10-minute values for the different time
intervals (10 minutes, 1 hour and 4 hours):
Figure 15: Frequency of power changes over 10 minute periods
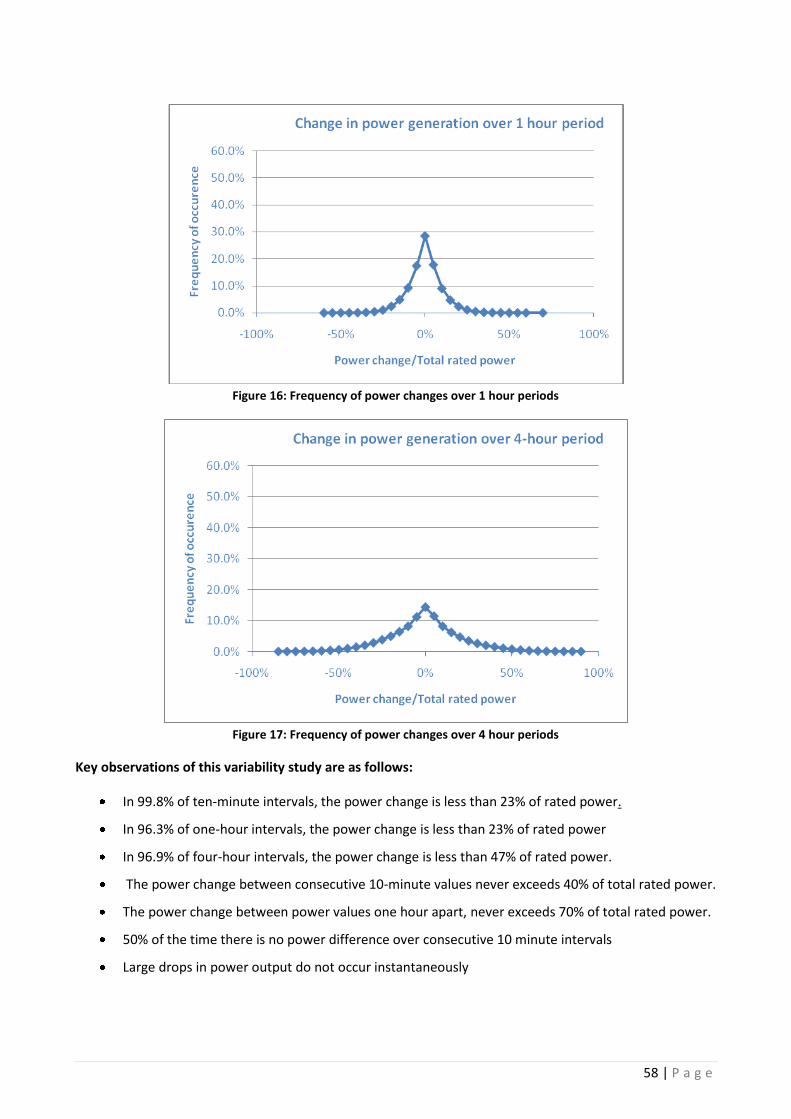
58 | P a g e
Figure 16: Frequency of power changes over 1 hour periods
Figure 17: Frequency of power changes over 4 hour periods
Key observations of this variability study are as follows:
In 99.8% of ten-minute intervals, the power change is less than 23% of rated power.
In 96.3% of one-hour intervals, the power change is less than 23% of rated power
In 96.9% of four-hour intervals, the power change is less than 47% of rated power.
The power change between consecutive 10-minute values never exceeds 40% of total rated power.
The power change between power values one hour apart, never exceeds 70% of total rated power.
50% of the time there is no power difference over consecutive 10 minute intervals
Large drops in power output do not occur instantaneously
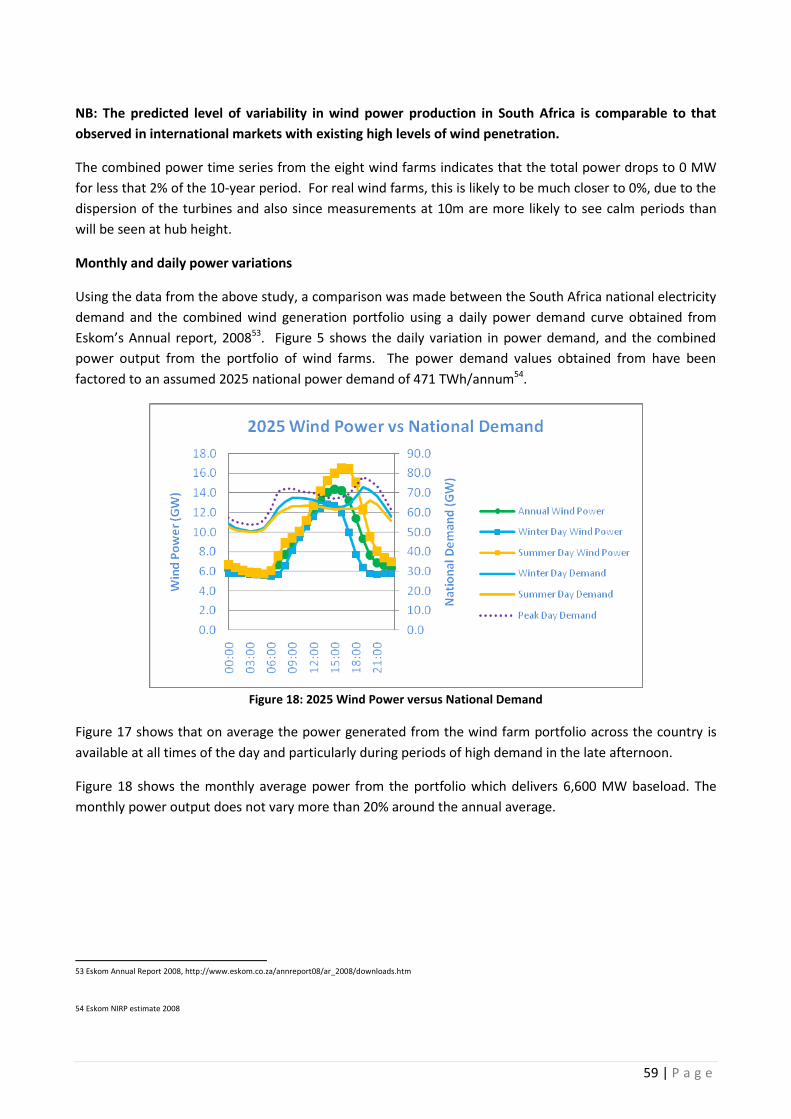
59 | P a g e
NB: The predicted level of variability in wind power production in South Africa is comparable to that
observed in international markets with existing high levels of wind penetration.
The combined power time series from the eight wind farms indicates that the total power drops to 0 MW
for less that 2% of the 10-year period. For real wind farms, this is likely to be much closer to 0%, due to the
dispersion of the turbines and also since measurements at 10m are more likely to see calm periods than
will be seen at hub height.
Monthly and daily power variations
Using the data from the above study, a comparison was made between the South Africa national electricity
demand and the combined wind generation portfolio using a daily power demand curve obtained from
Eskom’s Annual report, 200853. Figure 5 shows the daily variation in power demand, and the combined
power output from the portfolio of wind farms. The power demand values obtained from have been
factored to an assumed 2025 national power demand of 471 TWh/annum54.
Figure 18: 2025 Wind Power versus National Demand
Figure 17 shows that on average the power generated from the wind farm portfolio across the country is
available at all times of the day and particularly during periods of high demand in the late afternoon.
Figure 18 shows the monthly average power from the portfolio which delivers 6,600 MW baseload. The
monthly power output does not vary more than 20% around the annual average.
53 Eskom Annual Report 2008, http://www.eskom.co.za/annreport08/ar_2008/downloads.htm
54 Eskom NIRP estimate 2008
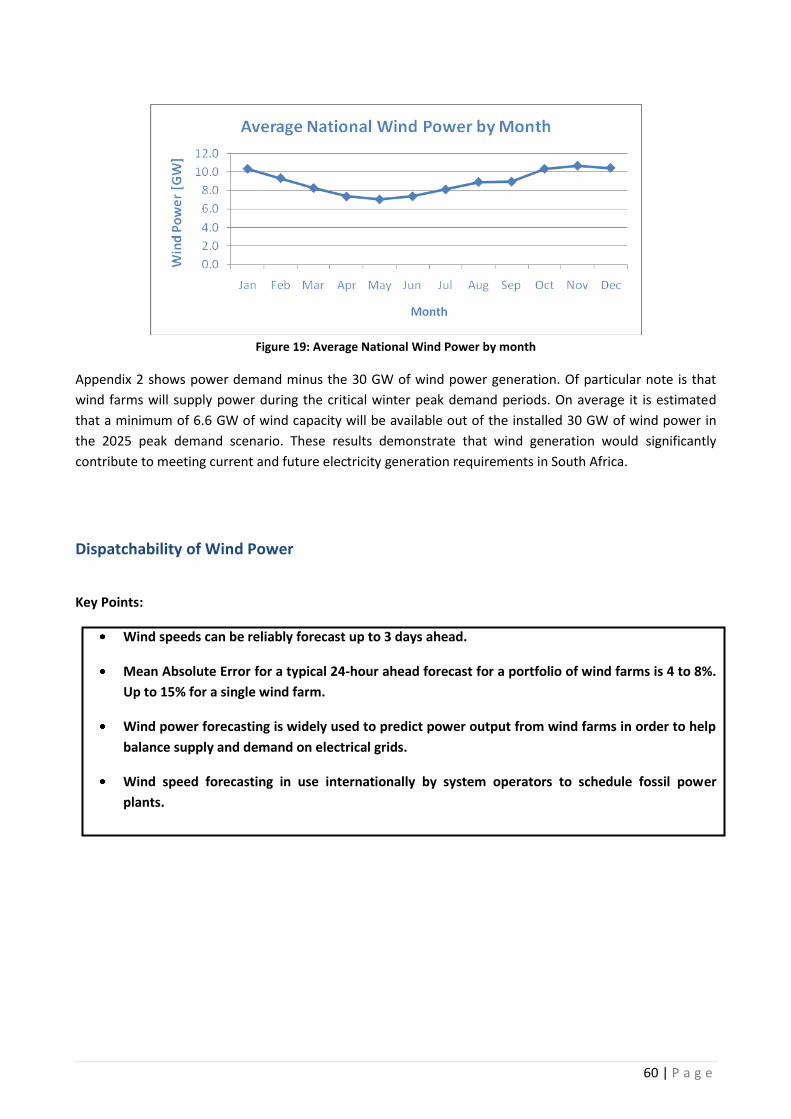
60 | P a g e
Figure 19: Average National Wind Power by month
Appendix 2 shows power demand minus the 30 GW of wind power generation. Of particular note is that
wind farms will supply power during the critical winter peak demand periods. On average it is estimated
that a minimum of 6.6 GW of wind capacity will be available out of the installed 30 GW of wind power in
the 2025 peak demand scenario. These results demonstrate that wind generation would significantly
contribute to meeting current and future electricity generation requirements in South Africa.
Dispatchability of Wind Power
Key Points:
Wind speeds can be reliably forecast up to 3 days ahead.
Mean Absolute Error for a typical 24-hour ahead forecast for a portfolio of wind farms is 4 to 8%.
Up to 15% for a single wind farm.
Wind power forecasting is widely used to predict power output from wind farms in order to help
balance supply and demand on electrical grids.
Wind speed forecasting in use internationally by system operators to schedule fossil power
plants.
61 | P a g e
Introduction
Dispatchability refers to the ability of the system operator to dispatch power onto the electricity system to
meet system demand for electricity. Whether wind energy is dispatchable or not is a question often raised
when discussing the challenges of integrating wind energy onto the electrical network.
System operators favour generation with predictability and generally view wind energy as a variable source
of generation since it is the speed of the wind that determines the generation output at any particular time.
Numerous studies have examined the feasibility of operating power systems with the so called
‘intermittent’ sources of renewable energy. It should be noted however, that wind is variable and not
intermittent since it will never suddenly stop or start blowing and that wind forecasts allow for predicting
the wind speeds at each wind farm. It is the output from conventional sources of power that can be
intermittent; problems with mechanical and electrical equipment mean that, sudden shutdowns or trips up
to 1,000MW are not inconceivable. Modern wind power plants include a number of features which make
them operate in a similar manner to conventional dispatchable power plants, including reactive power
contribution, voltage regulation, disturbance ride-through, grid frequency response, smoothing wind
ramps, and controlled start-up/shut-down.
Dispatchability of wind power generation should be viewed as the ability to predict the wind resource in
advance of its generation. The prediction enables the system operator to know well in advance what
capacity wind power can provide at any particular time, allowing it to be dispatched on the system to meet
demand.
Predictability and Short term forecasting of wind
Short-term forecasting of wind power is an indispensable tool for every system operator and market actor
in places where wind power penetration surpasses some 5 or 10% of the total demand. Wind power
forecasts from 1 hour to 3 days ahead are reliably used to help balance energy supply and demand on grids.
Accuracy improves with multiple wind farms.
Forecasting wind farm production
Modern wind prediction systems have much improved in recent years. Key points taken from a
memorandum on short-term forecasting by an independent wind energy consultancy, Prevailing Analysis,
are noted below. The full memo is included in this report as an Appendix.55
Accurate short term power forecasts of wind farms rely on advanced weather prediction models and real
time production data. Typically a range of numerical and statistical methods are used to combine a
meteorological forecast feed with detailed knowledge of the performance of the wind turbines.
The model typically uses input data from different sources, including results from numerical weather
prediction models (NWPs), SCADA data describing the real-time state of the wind power plants and local
real-time meteorological conditions, and additional information about the characteristics of the wind
power plants and the nearby terrain and topography. The accuracy ultimately relies on well validated
weather prediction models and good quality production data relayed from the wind farms. There are a
number of forecast suppliers providing increasingly accurate forecasts globally and from both private and
government sectors.
55 “Short-term forecasting memo”, Prevailing Analysis, February 2010
62 | P a g e
A common measure of wind farm forecast accuracy is the average difference between actual production
and what was forecast, known as Mean Absolute Error (MAE).
The accuracy improves greatly if forecasts are combined across a portfolio of wind farms, since random
fluctuations are averaged out. These groups of wind farms, within similar areas of the grid, may be treated
as a single source of generation for grid operators as they are mainly interested in balancing overall supply
and demand. Further improvements are possible when geographically diverse portfolios are combined.
Mean Absolute Error for a typical 24-hour ahead forecast for a single wind farm is approximately
15%
Mean Absolute Error for a typical 24-hour ahead forecast for a portfolio of wind farms is 4 to 8%
Wind speeds can be reliably forecast up to 3 days ahead.
Wind power forecasting is widely used to predict power output from wind farms in order to help
balance supply and demand on electrical grids.
Wind speed forecasting in use internationally by system operators to schedule fossil power
plants.
Case Study: UK
The UK currently has around 4 GW of installed wind capacity out of 80 GW. Balancing of the grid is
undertaken by the system operator, the UK National Grid. In the UK wind plant is treated in two ways
depending on the size and connection:
Wind farms < 50 MW are connected to the distribution network (embedded generation) and are
managed by electricity suppliers (e.g. the utility companies such as SSE and Scottish Power). It is
therefore left to suppliers to match generation to demand. For embedded generation, this is
generally done by treating the wind farm power output as negative demand.
Wind farms > 50 MW are connected to the transmission (high voltage) network and are treated in
the same way as other generation plant of this size. The wind farm operators are required to
provide the National Grid with a forecast (known as a Physical Notification - PN) every half hour,
one hour before gate closure. This informs the National Grid what power will be supplied to the
grid each half hour.
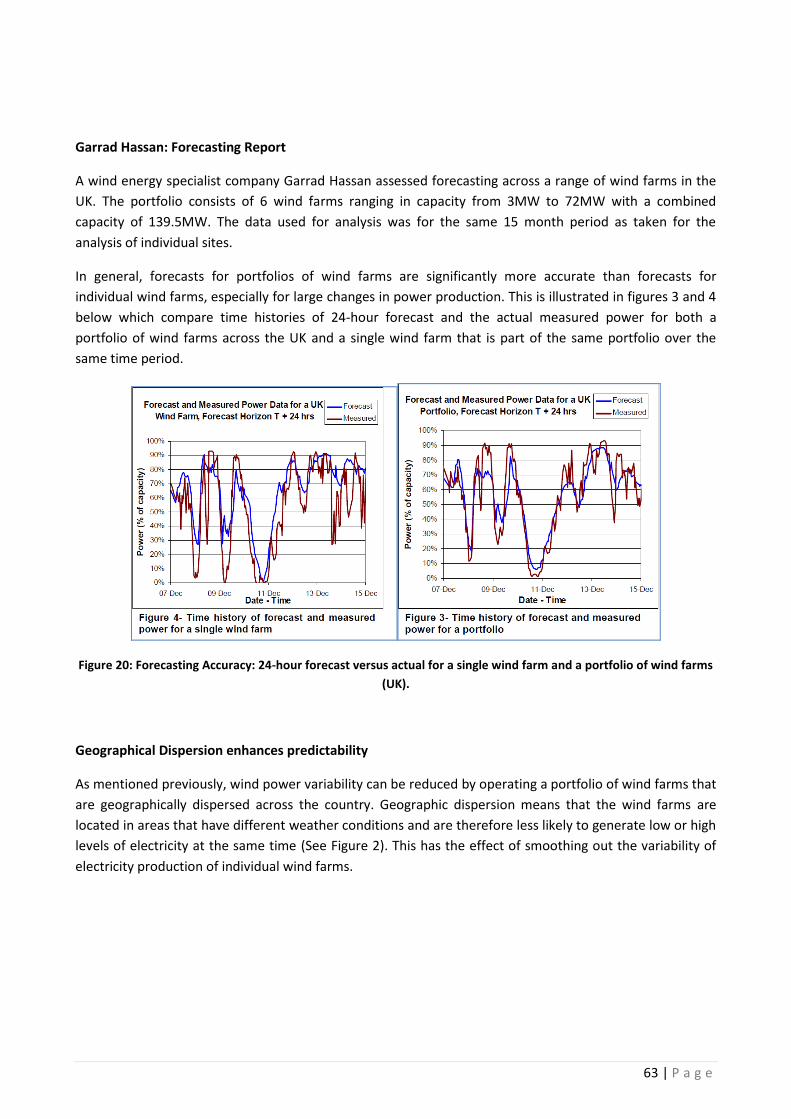
63 | P a g e
Garrad Hassan: Forecasting Report
A wind energy specialist company Garrad Hassan assessed forecasting across a range of wind farms in the
UK. The portfolio consists of 6 wind farms ranging in capacity from 3MW to 72MW with a combined
capacity of 139.5MW. The data used for analysis was for the same 15 month period as taken for the
analysis of individual sites.
In general, forecasts for portfolios of wind farms are significantly more accurate than forecasts for
individual wind farms, especially for large changes in power production. This is illustrated in figures 3 and 4
below which compare time histories of 24-hour forecast and the actual measured power for both a
portfolio of wind farms across the UK and a single wind farm that is part of the same portfolio over the
same time period.
Figure 20: Forecasting Accuracy: 24-hour forecast versus actual for a single wind farm and a portfolio of wind farms
(UK).
Geographical Dispersion enhances predictability
As mentioned previously, wind power variability can be reduced by operating a portfolio of wind farms that
are geographically dispersed across the country. Geographic dispersion means that the wind farms are
located in areas that have different weather conditions and are therefore less likely to generate low or high
levels of electricity at the same time (See Figure 2). This has the effect of smoothing out the variability of
electricity production of individual wind farms.
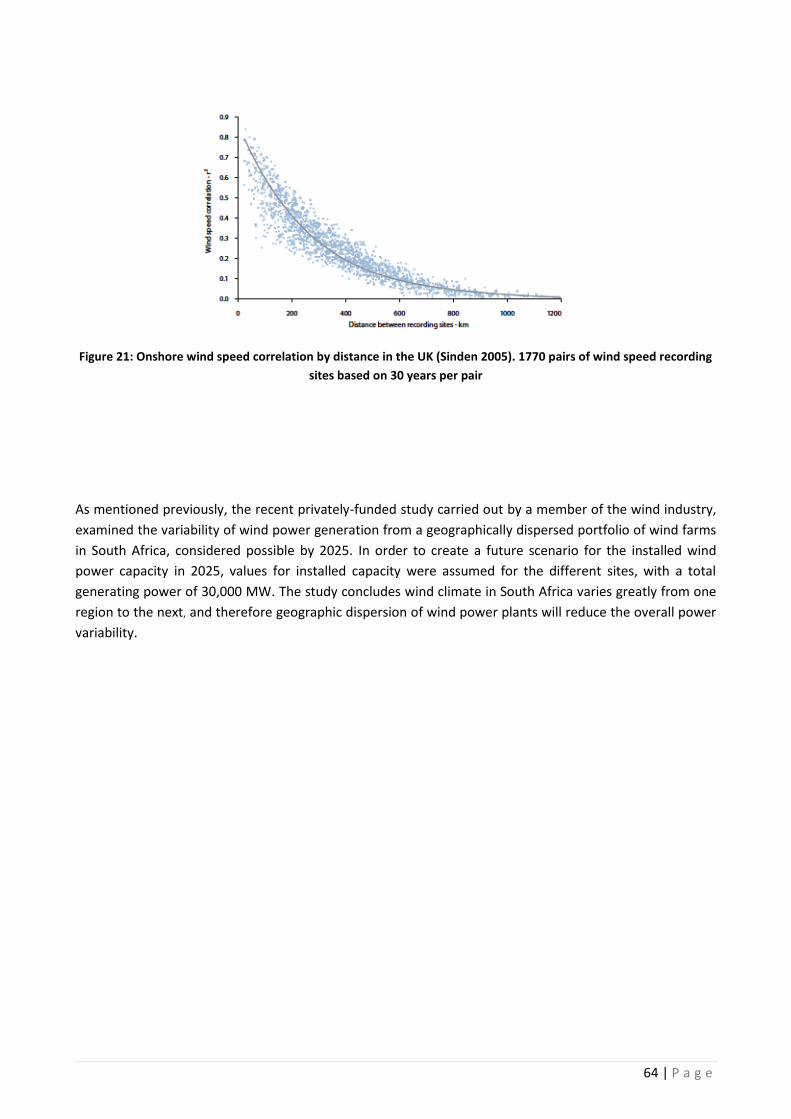
64 | P a g e
Figure 21: Onshore wind speed correlation by distance in the UK (Sinden 2005). 1770 pairs of wind speed recording
sites based on 30 years per pair
As mentioned previously, the recent privately-funded study carried out by a member of the wind industry,
examined the variability of wind power generation from a geographically dispersed portfolio of wind farms
in South Africa, considered possible by 2025. In order to create a future scenario for the installed wind
power capacity in 2025, values for installed capacity were assumed for the different sites, with a total
generating power of 30,000 MW. The study concludes wind climate in South Africa varies greatly from one
region to the next, and therefore geographic dispersion of wind power plants will reduce the overall power
variability.
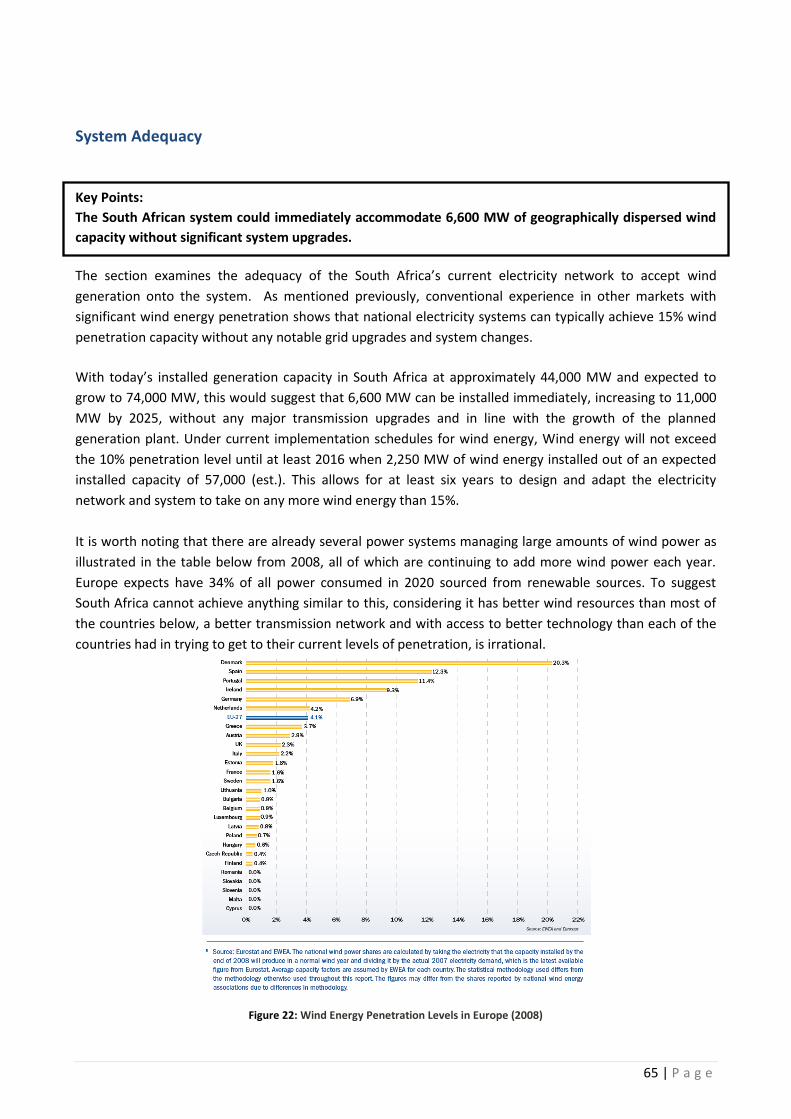
65 | P a g e
System Adequacy
Key Points:
The South African system could immediately accommodate 6,600 MW of geographically dispersed wind
capacity without significant system upgrades.
The section examines the adequacy of the South Africa’s current electricity network to accept wind
generation onto the system. As mentioned previously, conventional experience in other markets with
significant wind energy penetration shows that national electricity systems can typically achieve 15% wind
penetration capacity without any notable grid upgrades and system changes.
With today’s installed generation capacity in South Africa at approximately 44,000 MW and expected to
grow to 74,000 MW, this would suggest that 6,600 MW can be installed immediately, increasing to 11,000
MW by 2025, without any major transmission upgrades and in line with the growth of the planned
generation plant. Under current implementation schedules for wind energy, Wind energy will not exceed
the 10% penetration level until at least 2016 when 2,250 MW of wind energy installed out of an expected
installed capacity of 57,000 (est.). This allows for at least six years to design and adapt the electricity
network and system to take on any more wind energy than 15%.
It is worth noting that there are already several power systems managing large amounts of wind power as
illustrated in the table below from 2008, all of which are continuing to add more wind power each year.
Europe expects have 34% of all power consumed in 2020 sourced from renewable sources. To suggest
South Africa cannot achieve anything similar to this, considering it has better wind resources than most of
the countries below, a better transmission network and with access to better technology than each of the
countries had in trying to get to their current levels of penetration, is irrational.
Figure 22: Wind Energy Penetration Levels in Europe (2008)
66 | P a g e
Wind Penetration Studies of the Western Cape:
In December 2009, the GTZ, Department of Environmental Affairs and Development Planning and Eskom
released the results of a study entitled ‘Grid Integration of Wind Energy in the Western Cape’56 The study
examined, among other scenarios, the feasibility of connecting up to 2,800 MW of wind generation in the
Western Cape on the existing electricity network. The results show that no considerable impact on the
transmission grid should be expected and that it will be possible to accommodate such a high level of wind
generation without any major upgrades of the 400kV transmission grid. The study concludes that the
Western Cape transmission system is generally very well suited for the integration of high amounts of wind
generation even if some of these aspects still have to be confirmed by additional, more detailed studies.
The results from the GTZ study were promising despite being confined purely to the Western region. It is
worth noting that this 2, 800 MW of wind energy on the system would represent 14% of the current
generation mix in the region. There is a need for similar studies to be carried out for primarily the Eastern
and Northern Capes.
Increase in short term reserve requirements?
There is often reference made to the need of system operators to carry additional operating ‘spinning’
reserves to balance wind energy’s inherent variability. In a report57 compiled by the International Energy
Association (IEA), the authors summarised the finding of a number of case studies detailing countries
experiences integrating wind energy onto their systems. The estimated increase in short term reserve
requirements in the studies summarized ranged from: 1–15 % of installed wind power capacity at 10 % of
gross demand and 4–18 % of installed wind power capacity at 20 % penetration.
An important issue is that the term “increase in reserve requirements” does not necessarily mean
additional investment. The amount of wind-caused reserves is at its highest when wind power is at a high
production level. In these situations, the other power stations (coal, hydro, imports, OCGT) on the system
will naturally operate at an acceptable lower output level, meaning that they can act as a reserve and
increase their own generation when wind power decreases. This must be considered when “increased
reserve margins” are to be estimated.
On this basis, the existing South African system could immediately accommodate 6,600 MW of
geographically dispersed wind capacity without notable additional electricity generation plant to
compensate.
56
“Grid Integration of Wind Energy in the Western Cape” commissioned by GTZ, DEA, DEADP and Eskom and carried out by DIgSILENT GmbH was
published in December 2009.
57 Design and operation of power systems with large amounts of wind power - http://www.ieawind.org/GWEC_PDF/GWEC%20Annex25.pdf
67 | P a g e
Wind will be displacing other more expensive forms of generation
Economic dispatching of electricity is the method for determining the most efficient, low-cost and reliable
operation of a power system for dispatching the available electricity generation resources to supply the
load on the system. The primary objective of economic dispatching is to minimize the total cost of
generation while honouring the operational constraints of the available generation resources.
Each unit of electricity (kWh) of wind produced will displace an equivalent unit generated by coal or any
other form of generation. Units operating as primary and secondary reserve and diesel-fuelled gas turbines
on the margin will be scaled back due to wind energy being able to meet some of the current peak demand
that these units are currently scheduled to meet.
Future System Planning to accommodate 30GW Wind Target,
The key for system operators is how to develop the future power system so that wind power can be
integrated efficiently technically and economically. With current technology, new wind power plants are
able to meet system operator grid code expectations such as fault ride-through, reactive power/voltage
control to the system, frequency response and ramp rate control. The draft grid code presented at the
Tomorrow’s Leaders Convention Sandton on the 18 March 2010, although challenging, can be met by
modern wind generation technology. In fact it is probable that older “conventional” generation plants in SA
could struggle to meet the ‘new’ grid code.
Electrical Losses
South Africa’s current electrical system is characterized by huge coal-fired generation sources located in the
North of the country between Johannesburg and Swaziland. From here the power is transported to every
load centre in South Africa. There are considerable electrical losses in the system, typically in the range of
5-10% of all electricity generated. Losses in alternating current systems are dependent on voltage and
distance travelled, and their exact calculation will also take into account the electrical loads along the way.
By connecting wind farms in the south of these plants and closer to the load centres will significantly
reduce electrical line losses due to less power needing to be transmitted from the northern generation
plants. For example, building a 150MW wind farm in Jeffrey’s Bay area will save an estimated 11 Million
kWh each year in electrical losses in transmitting electricity from the coal fired stations in the North to the
demand in the South-East Coast. This is estimated to be enough to power more than 4,000 residential
households for 1 year. If the wind energy output is scaled up to 1,000 MW in the South-East (still less than
3% of the system) then the losses avoided rise to 137 million kilo-watt-hours each year, equivalent to the
power required for 50,000 homes.
Other tangible technical benefits of adding wind power to the system will include voltage support nearer to
the load centres and the reactive power generated.
68 | P a g e
Proposed Requirements for Storage and Back-Up for Wind Energy
Storage has no intrinsic merits for coupling with wind energy, as an early analysis by Farmer et all (1980)
made clear: ‘there is no operational necessity in associating storage plant with wind power generation up
to a wind output capacity of at least 20% of system peak demand.
The International Energy Association has stated that: ‘for wind penetration levels of 10–20 % of gross
demand in power systems, the cost effectiveness of building new electricity storage is low. With higher wind
penetration levels the extra flexibility that also storages can provide will be beneficial for the power system
operation, provided they are economically competitive with other forms of flexibility. It is important to
notice, however, that any storage should be operated according to the needs of aggregated system
balancing. It is not cost effective to provide dedicated back-up for wind power in large power systems where
the variability of all loads and generators are effectively reduced by aggregating, in the same way as it is
not effective to have dedicated storage for outages in a certain thermal power plant, or having specific
plants following the variation of a certain load’.
Before any suggestion is made that South Africa automatically needs back-up generation plant to
compensate for the variable nature of wind power, as has been made in recent times by local entities, it is
important that the appropriate technical evaluation is carried out internationally and by established and
independent experts. Initial studies such as the Western Cape study sponsored by Eskom and other studies
by independent parties, combined with experience in other markets, suggest that this is not the case until
wind energy reaches very significant levels of penetration.
69 | P a g e
Grid Accessibility and Proposed Solutions
Overview
An open, clear and efficient process for connecting new electricity generation plant to the electricity
network is paramount for the successful deployment of large-scale renewable energy and to facilitate
national power system planners and operators. Such a process is critical for both the system operators as
well as the project investors. System operators need the appropriate level of certainty that new electricity
plant will come on line when planned and in compliance with the agreed system rules. Similarly, project
investors need certainty that the system operator will allow them to connect up within a defined period of
time and at an agreed and acceptable cost, if technically appropriate.
Due to the fluid and dynamic nature of energy project development - securing land rights, energy resource
measurements and projections, securing the necessary environmental, construction and generation
permits, negotiating power purchase agreements and so forth - the required dates for grid connection can
only be determined as these activities progress and are completed. Thus, the grid connection process needs
to be integral part of the project development activities and aligned with specific project milestones.
Of paramount importance to the system operator is the issuing of grid connection offers to project
developers that are both time- and scale-bounded, tied to a specific project and committing the project
sponsor to a specific set of connection and operational rules. The offer also needs to be tied in with the
receipt of the necessary permits allowing the project to get built. The risk of grid ‘squatting’ whereby
isolated grid offers have been made for projects that are either non-existent or have very little chance of
being built has resulted in system blockages, holding up genuine project developers and on occasion
creating a secondary market for the trade of these grid offers58.
From a project sponsor perspective, it is paramount to know that rules exist to ensure that the project will
be connected up within a defined period of time and at a reasonable cost, assuming that the technical
conditions allow for such. This allows the investor to invest accordingly and manage the project activities in
line with these timelines. Without this certainty, investors are unlikely to commit capital and resources
since taking regulatory risk is a key deterrent for most project sponsors.
As a result, any grid connection process needs to set the appropriate obligations on both the system
operator and the project sponsors, time-limiting both of them where appropriate and using appropriate
and agreed project milestones or deliverables to monitor and manage project progress.
The Role of the System Operator
For an electricity market to work effectively and facilitate the deployment of renewable energy across the
region by independent investors, it is important for a System Operator to have public and specific targets
and commitments to do such over the medium term. This involves having sufficient resources and
capabilities to ensure any publicly-stated objectives or targets are met, within the agreed timelines and
costs, fully aligned with the national targets and objectives for renewable energy.
58
This secondary market has been seen in markets such as Turkey, Poland, Ireland and Canada
70 | P a g e
To maximise the benefits and speed that the private sector can move in, this means putting in clear rules,
specification and conditions to allow project investors to self-build and self-finance their own
interconnection to the existing electricity network, once they have received the necessary grid connection
offers.
Grid Connection Process Proposal
The grid connection process, as seen in conventional markets, generally consists of three stages – a
preliminary assessment, a system study and a contractual phase. It is important to standardise this process
with defined time limits, information requests and financial obligations from the relevant parties.
A detailed process map can be seen in Appendix A which is an example for the Alberta Electricity System
Operator (‘AESO’) rules for wind farm grid connection.
At a high-level, the three stages can be described below.
Stage 1: A Preliminary Assessment and feasibility study based on the proposed plant size, specifications and
the local generation, load and voltage levels and capacity, along with an appropriate load-flow analysis and
indicative cost estimate (Proposal: 30-Day completion; Application Fee: Rand 50,000)
Stage 2: A System Impact Study including detailed Load Flow and dynamic studies (Short Circuit and
Stability) to identify network upgrades (shallow and deep) and associated cost estimates (Proposal: 90-Day
completion; Application Fee: Rand 250,000 < 100 MW; Rand 500,000 > 100 MW)
Stage 3: Grid Connection Offer and Contract, including a quotation for shallow grid work or an agreement
for self-build. (Proposal: 120-Day Completion; Application Fee: Letter of Credit)
Timelines should be associated with the completion of each stage to ensure both the system operator and
the project sponsor provide the necessary information and resources to complete each phase. The
application fees should cover the cost of the system operator completing such studies whilst also
committing the project sponsors.
Entry criteria need to be publicly stated to enter each stage. For example, for a Preliminary Assessment
study to be carried out, the project sponsor should be able to demonstrate that they have the rights to
develop and build on the land in question and that an Environmental Impact Assessment and on-site wind
measurement activities have begun. Such criteria ensure that only real projects enter the process or queue.
The interdependency between the grid connection process, the power purchase agreement process and
the permitting process, all of which are government-regulated, requires very close collaboration between
government bodies to ensure that projects do not get held up due to a lack of communication between the
various entities. For example, a license to generate should not be issued without having a grid offer agreed.
Similarly, a grid offer should not be offered until the necessary permits are received.
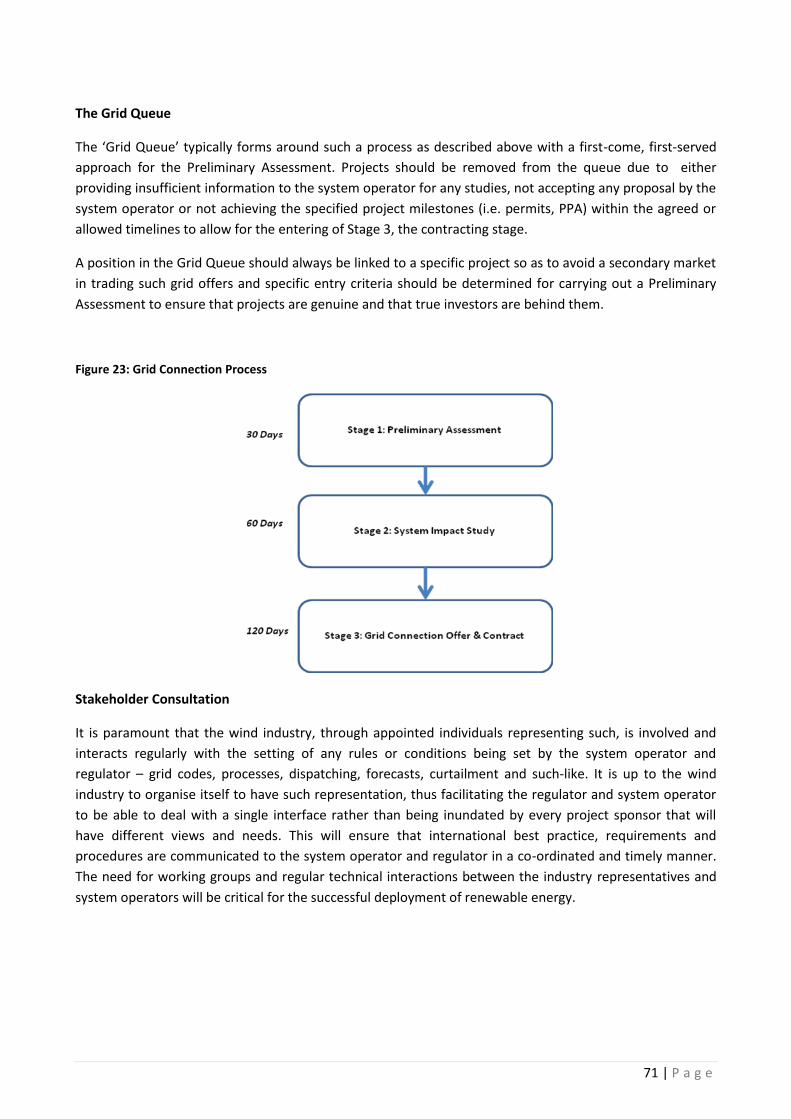
71 | P a g e
The Grid Queue
The ‘Grid Queue’ typically forms around such a process as described above with a first-come, first-served
approach for the Preliminary Assessment. Projects should be removed from the queue due to either
providing insufficient information to the system operator for any studies, not accepting any proposal by the
system operator or not achieving the specified project milestones (i.e. permits, PPA) within the agreed or
allowed timelines to allow for the entering of Stage 3, the contracting stage.
A position in the Grid Queue should always be linked to a specific project so as to avoid a secondary market
in trading such grid offers and specific entry criteria should be determined for carrying out a Preliminary
Assessment to ensure that projects are genuine and that true investors are behind them.
Figure 23: Grid Connection Process
Stakeholder Consultation
It is paramount that the wind industry, through appointed individuals representing such, is involved and
interacts regularly with the setting of any rules or conditions being set by the system operator and
regulator – grid codes, processes, dispatching, forecasts, curtailment and such-like. It is up to the wind
industry to organise itself to have such representation, thus facilitating the regulator and system operator
to be able to deal with a single interface rather than being inundated by every project sponsor that will
have different views and needs. This will ensure that international best practice, requirements and
procedures are communicated to the system operator and regulator in a co-ordinated and timely manner.
The need for working groups and regular technical interactions between the industry representatives and
system operators will be critical for the successful deployment of renewable energy.
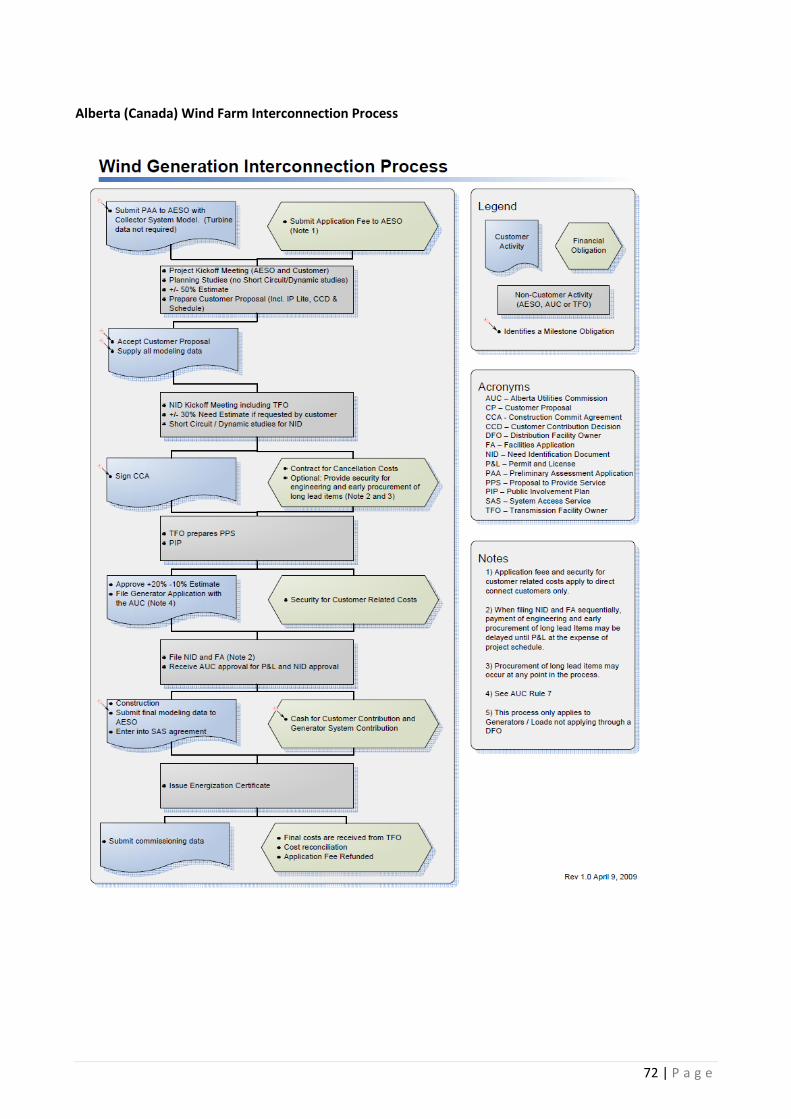
72 | P a g e
Alberta (Canada) Wind Farm Interconnection Process
73 | P a g e
4. Implementing and Deploying Wind Energy
Market Status
SAWEA estimates59 that there are in excess of 7,000 MW of material wind energy plants at various stages
of development in South Africa – some of these are well established and are approaching the construction
stage, while others have, at minimum, commenced with an Environmental Impact Assessment process. As
mentioned in previous chapters, the wind energy potential for South Africa is enormous, several multiples
of the above capacity in development, based on a range of independent studies by both experienced
investors and academic studies.
As has been seen in all international markets with a feed-in tariff such as that proposed for South Africa,
wind energy can be deployed very rapidly by the private sector, once three things occur – a clear
commitment by government for renewable energy, a sufficiently developed regulatory environment and
clear and open rules for grid access.
Experienced IPPs and investors have already commenced developing large portfolios of wind projects,
waiting for these three aspects to settle. Many of these projects will be ready for construction within the
next 18 months with the necessary financing, technology and service providers lined up to deliver as soon
as they get confirmation of a grid connection and a Power Purchase Agreement (PPA). Initial estimates
based on market and competitor analysis suggest that over 7,000 MW of wind energy projects will be in
such a position within this time frame, with a similar number following closely behind.
As mentioned in previous chapters, conventional experience in a number of international markets that
demonstrates that wind energy can make up 10-15% of the national installed generation capacity without
the need for any material electricity grid upgrades. With an existing demand of installed capacity of 43 GW
and an estimated60 capacity of approximately 75 GW to meet the electricity demand in 2025, this would
suggest that at the very least, 7.5-10.5 GW of wind energy can be installed over this period of time
without any significant grid upgrades. This is supported by the recent study61 on the Western Cape that
stated that 2,800 MW of wind energy was feasible in the region, where the peak demand is currently
approx. 5,800 MW.
Countries such as Denmark currently have at least 20% of their national energy from wind and are
expecting to increase this further. Ireland has a target of 40% of all power generated to come from
renewables by 2020, the majority of this being from wind farms. The UK has a target of 20% of Renewable
Energy by 2020, with a goal of 33 GW from wind energy, onshore and offshore. Spain already has nearly 20
GW of wind power installed and Germany has approximately 25 GW installed, with both countries looking
to expand further.
59 SAWEA Estimates Based on input from members- 10,000 denotes projects who have at minimum, embarked on an EIA-
-based on actual commissioned EIA Data.
60 Eskom NIRP Submission
61 Grid Integration of the Western Cape (2009) - http://www.gtz.de/de/dokumente/gtz2009-en-grid-study-western-cape.pdf

74 | P a g e
Striving for a target of having 20% of the national electricity demand met by wind energy target by 2025
(i.e. 30 GW of wind energy, generating 80 TWh per annum) is in line with many other international markets,
is highly feasible and using the combination of skills within Eskom and international system operators, is
necessary in order to achieve the stated emission reduction goals. Such a target is in line or actually lower
than that of many other markets. It will involve close interaction between the private and public sector to
ensure technical parameters and electricity grid designs are appropriate to facilitate such.
75 | P a g e
The Wind Farm Development Process
There are typically five key phases of activities with respect to the delivery of a typical operating wind farm.
They can be listed as follows:
1. Feasibility State (0-6 months)
Identifying Greenfield sites suitable for wind energy
Securing commercial agreements for existing sites
2. Development Stage (12-24 months)
Securing the land rights
On-site wind measurements
Environmental, construction and generation permits
Grid connection applications
Project design and layout
3. Pre-Construction Stage (3-9 months)
Completing civil, electrical and procurement contracts
Approving a grid connection offer
Agreeing to a Power Purchase Agreement
Securing the debt and equity funding for the project
4. Construction Stage (9-18 months)
Site Management
Contract Monitoring
Stakeholder Management
5. Operational Stage (25+ years)
Asset Management
Asset Operation
Asset Engineering
The time required to go from the initial identification of a suitable site to getting a wind farm into
construction is a minimum of 24 months, depending primarily on the ability and experience of the project
owners, procurement lead times, the development challenges and the regulatory environment. On-site
wind energy measurements at typically 60-80m are required for at least 12 months, with the data having a
close correlation to a long-term reference site (airport or weather station). The key uncertainties are the
time required to get all the necessary permits in any market and the time to connect up to the electricity
network – two issues that are primarily in the hands of regulatory and ministerial bodies. Investors have
already been allocating capital and resources to projects across the country, assuming that these
uncertainties will be resolved by Government in due course.
As mentioned, it is estimated that there are 5,000 MW at the second stage of activities in South Africa,
expecting to enter the third stage within the next 6-12 months, with the assumption that the regulatory
environment and grid connection process becomes clear. In parallel, other projects are continuing to be
developed and it is expected that the same scale again can be achieved and ready for construction by 2015,
given all external requirements (grid, permits, PPA) are achievable.
76 | P a g e
Proposed Timeline for Meeting the target of 30,000 MW of Wind Energy
Implementation Schedule
With a goal of having 80 TWh from wind energy by 2025, this will involve the installation of 30,000 MW or
30 GW over the next 15 years, equating to approximately 2,000 MW per year. To put this in context, the UK
is expecting62 to go from 4 GW today to 33GW by 2020 of wind energy, the majority of this being offshore
wind which is more expensive and technically more challenging to install, or just under 2,900 MW per
annum. Spain went from 0.8 GW in 1998 to 16.7 GW in 2008, or 1,600 MW per annum, and aiming for 20
GW by the end of 2010. Germany went from 4 GW in 1998 to 24 GW in 2009, or 1,800 MW per annum.
Over the past decade, machines have gotten both bigger in terms of capacity and technically more
advanced, suggesting that installing the same scale over a shorter period of time is entirely possible.
With the vast land and wind resources suitable for wind energy in South Africa, the increasing national
electricity demand, the advancement of technology over the past decade and the significant engineering
and skills legacy in the country, it is the belief of the wind energy industry and the private sector
responsible for delivering the above target that this is wholly achievable and technically and financially
viable.
The assumptions are that all regulatory issues are resolved by the end of 2010 and in particular the points
below are addressed:
The setting of long-term (2025) targets and public commitments for renewable energy and in
particular wind and solar energy.
A clear, open and reasonable electricity grid connection process with the necessary technical and
financial obligations on all stakeholders, best on international best practice.
An appropriate process and terms for an independent and government-backed Power Purchase
Agreement (PPA) for all new plants.
It is also assumed that the proposed feed-in tariff remains and that there are no unexpected regulatory
changes that alter the investment risk profile of any projects throughout their lifetime. The generic
assumption is that all projects will have a 30% capacity factor, something that will vary project by project
depending on location, turbines and wind resources, and that a grid connection will be offered by the
system operator or network owner during the Pre-Construction process and that the connection is made
within the estimated 12-month construction period.
Current estimates are that there are no weather windows in South Africa that may hold up construction
(unlike offshore and other northern markets) and that the domestic and international supply chain for
components and services grows to meet the demand. Procurement lead times are typically 8-14 months for
turbines and transformers so project investors need to be certain that projects are going ahead and have
the approvals from the regulator and the system operator well before committing themselves.
62
http://www.bwea.com/onshore/index.html
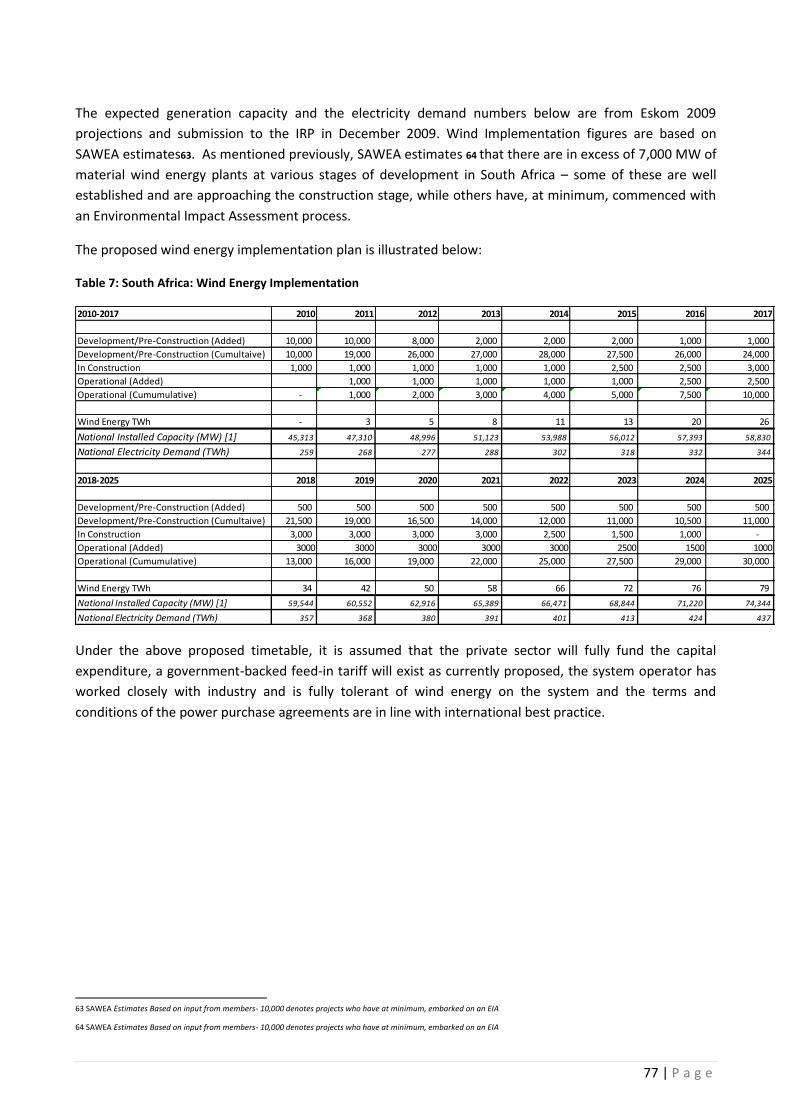
77 | P a g e
The expected generation capacity and the electricity demand numbers below are from Eskom 2009
projections and submission to the IRP in December 2009. Wind Implementation figures are based on
SAWEA estimates63. As mentioned previously, SAWEA estimates 64 that there are in excess of 7,000 MW of
material wind energy plants at various stages of development in South Africa – some of these are well
established and are approaching the construction stage, while others have, at minimum, commenced with
an Environmental Impact Assessment process.
The proposed wind energy implementation plan is illustrated below:
Table 7: South Africa: Wind Energy Implementation
2010-2017 2010 2011 2012 2013 2014 2015 2016 2017
Development/Pre-Construction (Added) 10,000 10,000 8,000 2,000 2,000 2,000 1,000 1,000
Development/Pre-Construction (Cumultaive) 10,000 19,000 26,000 27,000 28,000 27,500 26,000 24,000
In Construction 1,000 1,000 1,000 1,000 1,000 2,500 2,500 3,000
Operational (Added) 1,000 1,000 1,000 1,000 1,000 2,500 2,500
Operational (Cumumulative) - 1,000 2,000 3,000 4,000 5,000 7,500 10,000
Wind Energy TWh - 3 5 8 11 13 20 26
National Installed Capacity (MW) [1] 45,313 47,310 48,996 51,123 53,988 56,012 57,393 58,830
National Electricity Demand (TWh) 259 268 277 288 302 318 332 344
2018-2025 2018 2019 2020 2021 2022 2023 2024 2025
Development/Pre-Construction (Added) 500 500 500 500 500 500 500 500
Development/Pre-Construction (Cumultaive) 21,500 19,000 16,500 14,000 12,000 11,000 10,500 11,000
In Construction 3,000 3,000 3,000 3,000 2,500 1,500 1,000 -
Operational (Added) 3000 3000 3000 3000 3000 2500 1500 1000
Operational (Cumumulative) 13,000 16,000 19,000 22,000 25,000 27,500 29,000 30,000
Wind Energy TWh 34 42 50 58 66 72 76 79
National Installed Capacity (MW) [1] 59,544 60,552 62,916 65,389 66,471 68,844 71,220 74,344
National Electricity Demand (TWh) 357 368 380 391 401 413 424 437
Under the above proposed timetable, it is assumed that the private sector will fully fund the capital
expenditure, a government-backed feed-in tariff will exist as currently proposed, the system operator has
worked closely with industry and is fully tolerant of wind energy on the system and the terms and
conditions of the power purchase agreements are in line with international best practice.
63 SAWEA Estimates Based on input from members- 10,000 denotes projects who have at minimum, embarked on an EIA
64 SAWEA Estimates Based on input from members- 10,000 denotes projects who have at minimum, embarked on an EIA

78 | P a g e
Reality Check
As mentioned previously, conventional experience shows that a national electricity systems can typically achieve up to 15% wind penetration without any notable grid upgrades and system changes. With today’s capacity at approximately 44,000 MW and expected to grow to 74,000 MW by 2025, this would suggest that 6,600 GW can be installed immediately, increasing to 10,000+ GW by 2025, without any major transmission upgrades and in line with the growth of the planned generation plant. Assuming that South Africa wishes to go beyond the 10% target in terms of wind energy penetration and in
line with the above schedule proposed above and other international markets, wind energy will not exceed
the 15% penetration until at least 2016. Thus, this allows for at least six years of interaction with the wind
industry to discuss, plan and design the electricity network accordingly. Given the amount of new capacity
required for the country, both conventional and renewable, required to meet the 2025 electricity demand,
it is expected that the network design and planning process is sufficiently open and adaptable to allow for
such growth.
79 | P a g e
5. Conclusion:
The setting of an appropriate long-term electricity generation portfolio mix through an independent public
consultation process and the incorporation of a 25% target for renewable energy will create very significant
economic benefits to the country in both rural and urban areas.
Once a long-term target is committed to and an appropriate regulatory framework is created, the private
sector will fully mobilise and ensure these targets are met at no capital cost to the Government. Without
these, the private sector cannot progress.
As part of the implementation of a long-term target for renewable energy penetration for South Africa,
achieving the 4,000 MWs of wind power by 2013 is possible, as also is achieving the 10,000 GWh per
annum target set by the Renewable Energy White Paper and 80,000 GWh by 2025 to meet the 20% target
for 2025 being proposed here by the industry, with an installation of 30,000 MW of wind power.
Technically, this in line with what has been achieved in other markets from a system perspective and is
entirely viable. This target can be deployed and managed quickly and effectively by the private sector.
The private sector and global industry have already mobilised ahead of any confirmation of such by
Government and is ready to fund, develop, build and operate this generation capacity. By publicly setting
the right targets and providing regulatory certainty and open access to the grid, the Government will be
immediately stimulating the growth of the industry and ensuring that the stated targets are met.
The long-term cost to the electricity consumer will be negligible whilst providing considerable benefits to
the South African economy.
80 | P a g e
APPENDIX 1: The Global Wind Industry
The Global Wind Energy Industry
• Wind Energy is the fastest growing form of power generation in the world with 150+GWs installed
and 40-60GWs being installed per annum over the next decade.
• In 2009, more wind energy capacity was installed in Europe and the US than any other form of
conventional or renewable form of power.
• Wind energy provides 20% of Denmark’s electricity demand; 15% in Spain and Ireland, 13% in
Portugal, 7% in Germany. All of these countries fully intend to increase this share in the next
decade.
• Europe has a target to have 20% of its primary energy sourced from renewable sources by 2020.
This target means that 34% of Europe’s electricity will be generated from renewable sources by
2020. This target will increase energy security, create independence from fossil fuels, reduce
greenhouse gas emissions and stimulate economic development.
• From the current 74GWs of wind power installed in Europe, this is expected to grow to 218 GWs by
2020.
• Ireland, an island-nation, is planning to have 40% of its power generated by wind power. This
objective is technically viable and has been proven to make clear and economic sense.
• 500,000 people work in the wind energy industry world-wide; 154,000 of which are in Europe. The
number in Europe is expected to grow to 375,000 by 2030. Globally, this is estimated to increase to
2.7 Million by 2030.
• Thousands of communities, farmers, landowners and municipalities around the world have
benefitted from wind power and the rural regeneration it brings.
• Wind power has been responsible for driving electricity prices down, reducing losses on systems,
reducing emission costs and significant water savings.
• Wind power is a highly reliable form of power, with annual power projections being predictable
within a 5-10% error margin, zero fuel costs, zero emissions and generating electricity at a fixed
power price for 20+ years. Wind power is a hedge against volatile fossil fuels.
• The technical availability of wind turbines is typically 97%. The technical availability of a
conventional fossil-fired generation portfolio is typically in the range of 80-90%.
• Wind power needs insignificant amounts of water for generating power compared to conventional
power plants (Inland Coal Plant-> 1,000+ Litres/MWh)
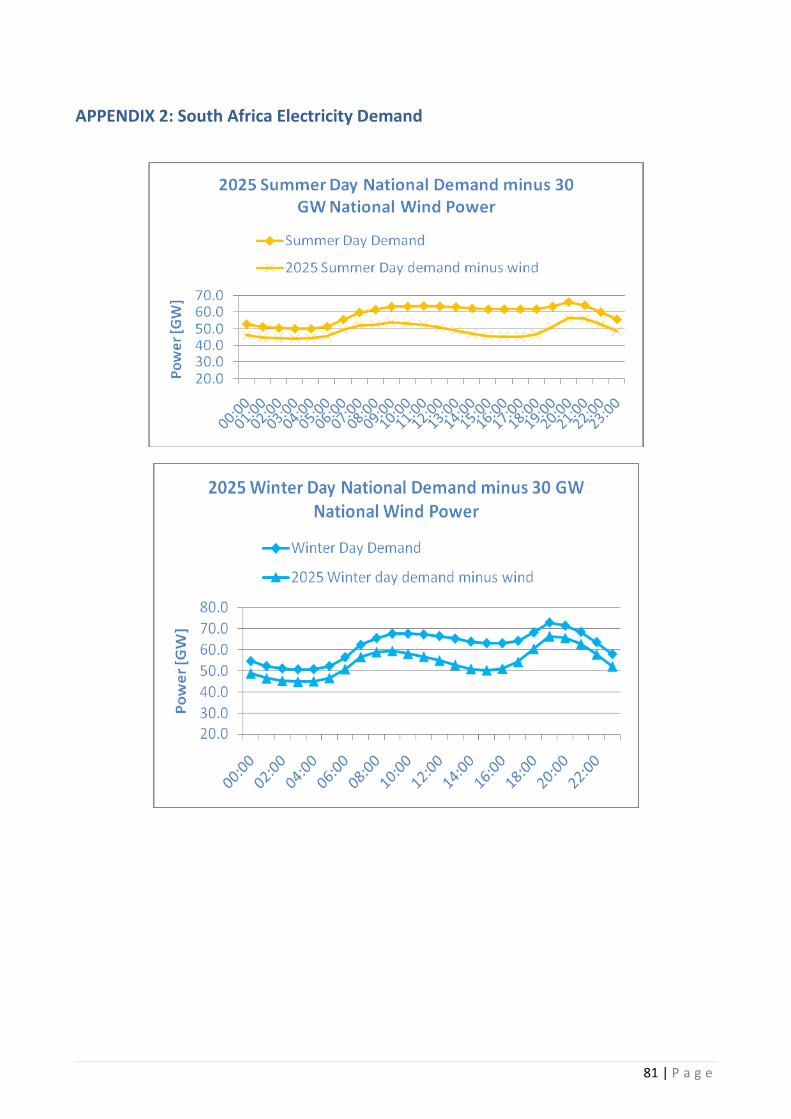
81 | P a g e
APPENDIX 2: South Africa Electricity Demand
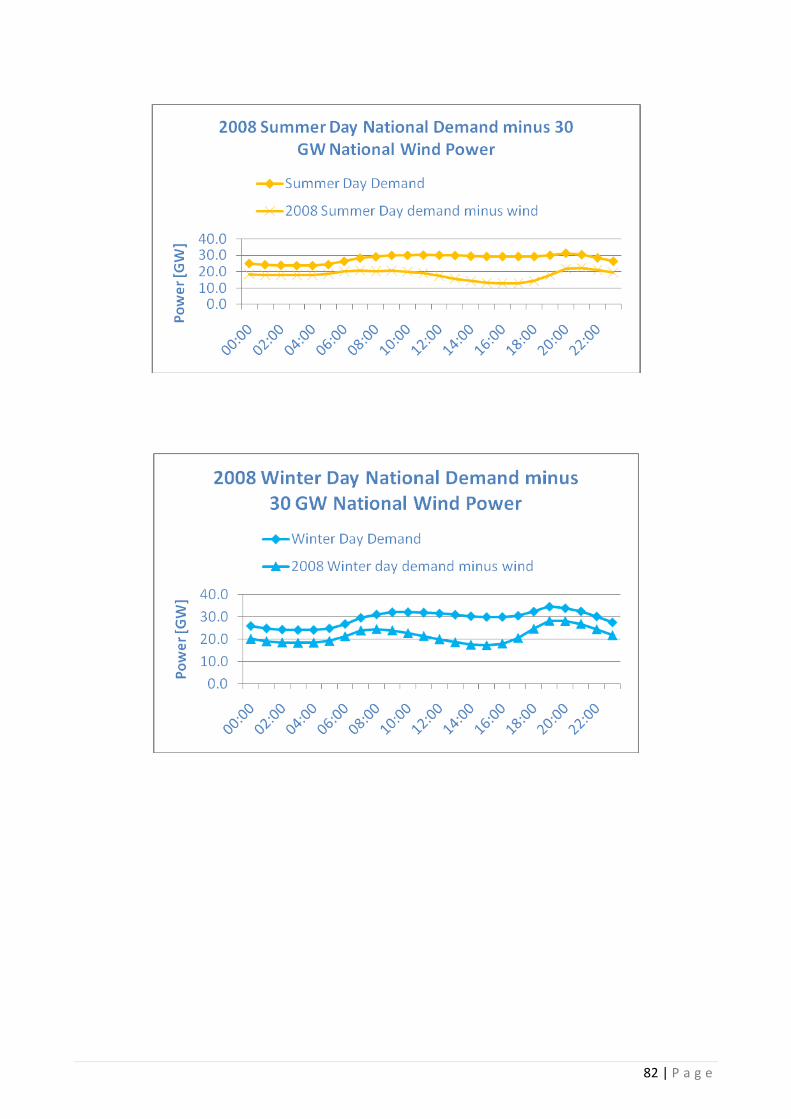
82 | P a g e
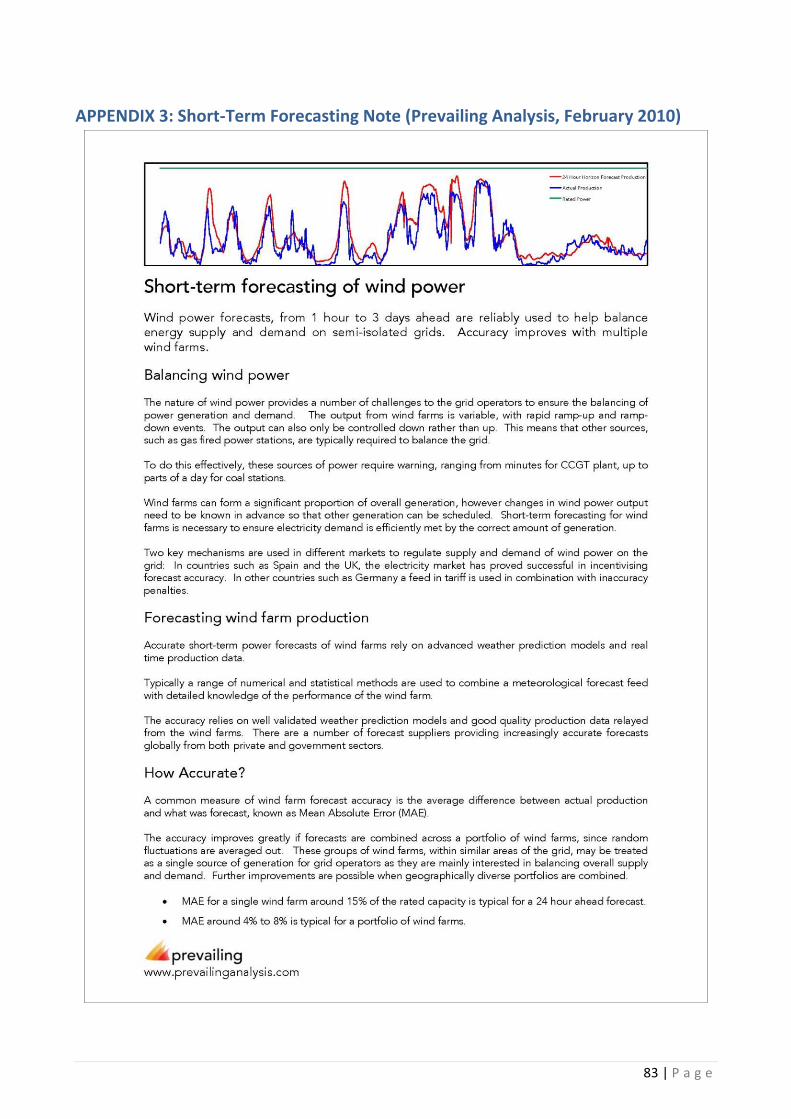
83 | P a g e
APPENDIX 3: Short-Term Forecasting Note (Prevailing Analysis, February 2010)
84 | P a g e