Embed Size (px)
Citation preview
Anti-money laundering (AML)Transaction Monitoring2018 EMEIA Survey ReportOctober 2018
3 AML Transaction Monitoring 2018 EMEIA Survey Report
Contents
Executive summary
0 1Detailed analysis
0 4
Conclusion
20Contacts
22

1AML Transaction Monitoring 2018 EMEIA Survey Report
Executive summary
1
AML Transaction Monitoring 2018 EMEIA Survey Report 1
2 AML Transaction Monitoring 2018 EMEIA Survey Report
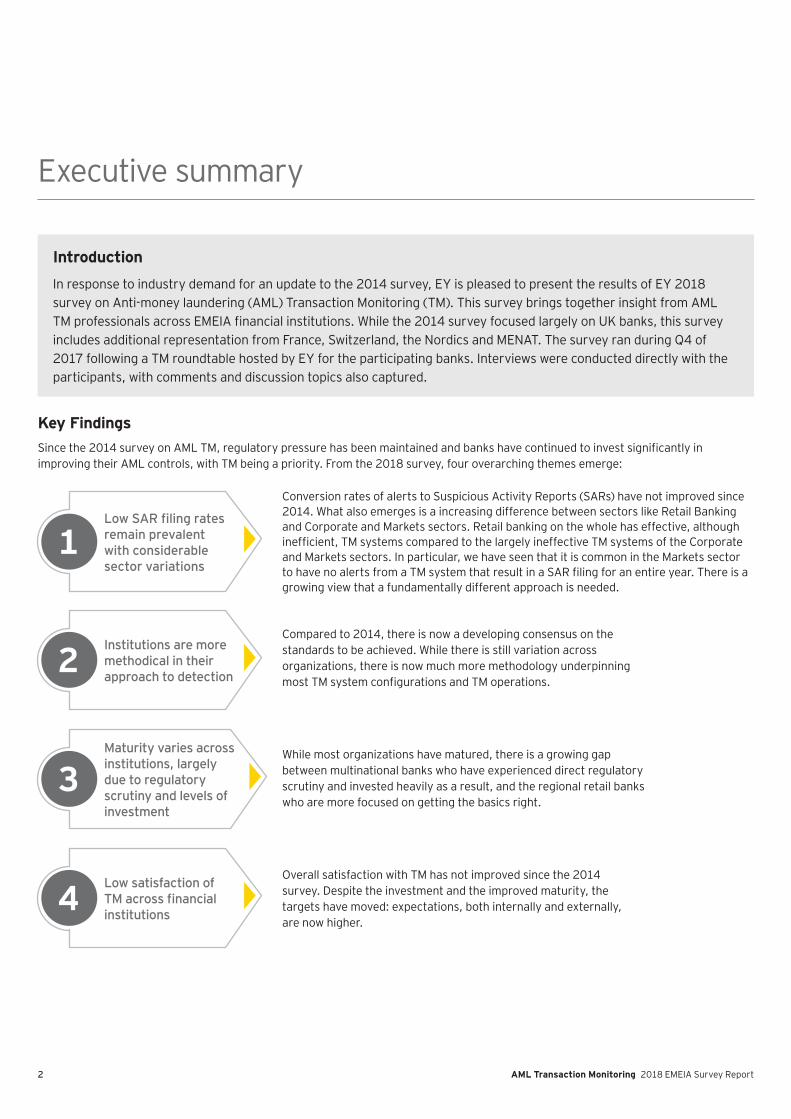
I ntrod u ctionIn response to industry demand for an update to the 2014 survey, EY is pleased to present the results of EY 2018 survey on Anti-money laundering (AML) Transaction Monitoring (TM). This survey brings together insight from AML
fiincludes additional representation from France, Switzerland, the Nordics and MENAT. The survey ran during Q4 of 2017 following a TM roundtable hosted by EY for the participating banks. Interviews were conducted directly with the participants, with comments and discussion topics also captured.
K ey F ind ings fi
improving their AML controls, with TM being a priority. From the 2018 survey, four overarching themes emerge:
Executive summary
Conversion rates of alerts to Suspicious Activity Reports (SARs) have not improved since 2014. What also emerges is a increasing difference between sectors like Retail Banking and Corporate and Markets sectors. Retail banking on the whole has effective, although
fiand Markets sectors. In particular, we have seen that it is common in the Markets sector
figrowing view that a fundamentally different approach is needed.
Compared to 2014, there is now a developing consensus on the standards to be achieved. While there is still variation across organizations, there is now much more methodology underpinning
fi
While most organizations have matured, there is a growing gap between multinational banks who have experienced direct regulatory scrutiny and invested heavily as a result, and the regional retail banks who are more focused on getting the basics right.
Overall satisfaction with TM has not improved since the 2014 survey. Despite the investment and the improved maturity, the targets have moved: expectations, both internally and externally, are now higher.
1Low SAR filing rates remain prevalent with considerable sector variations
2Institutions are more methodical in their approach to detection
3Maturity varies across institutions, largely due to regulatory scrutiny and levels of investment
4Low satisfaction of TM across financial institutions
3AML Transaction Monitoring 2018 EMEIA Survey Report
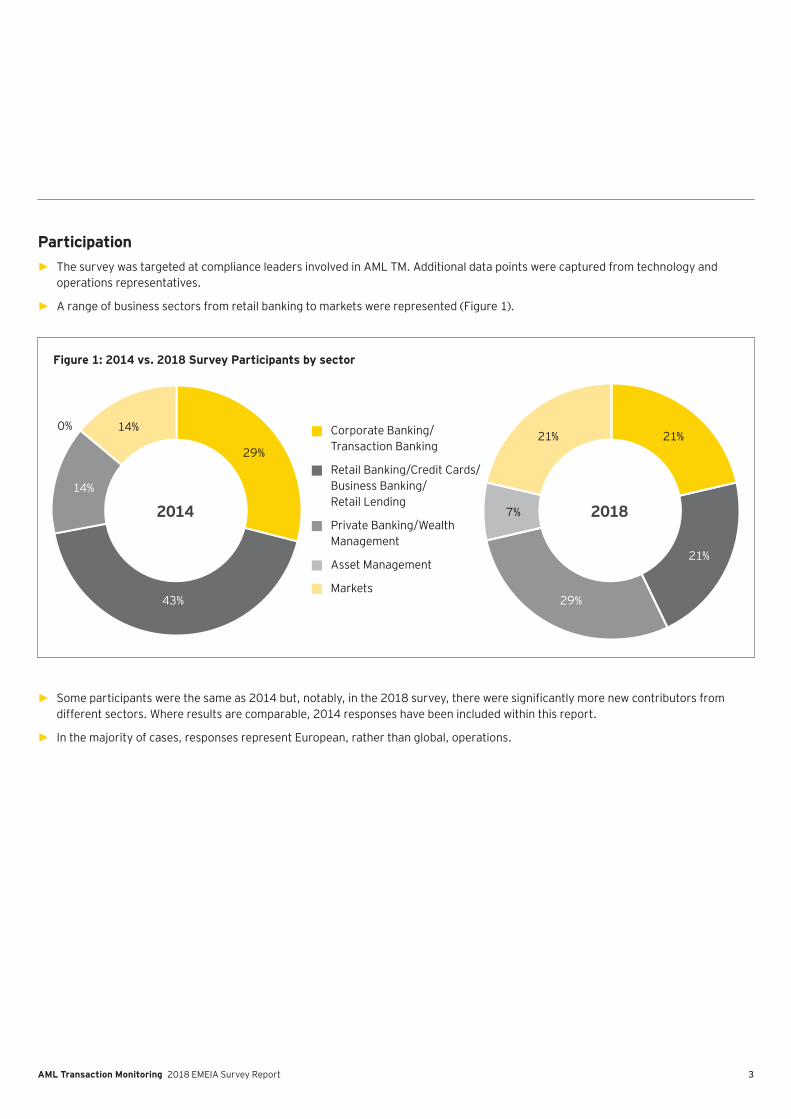
P articipation ► The survey was targeted at compliance leaders involved in AML TM. Additional data points were captured from technology and
operations representatives.
► A range of business sectors from retail banking to markets were represented (Figure 1).
F igu re 1: 20 14 v s. 20 18 Su rv ey P articipants b y sector
► fidifferent sectors. Where results are comparable, 2014 responses have been included within this report.
► In the majority of cases, responses represent European, rather than global, operations.
20 14
29%
43%
14%
14%21% 21%
21%
29%
7%
0%
20 18
Corporate Banking/Transaction Banking
Retail Banking/Credit Cards/Business Banking/ Retail Lending
Private Banking/Wealth Management
Asset Management
Markets
AML Transaction Monitoring 2018 EMEIA Survey Report 4
Detailed analysis
2
5AML Transaction Monitoring 2018 EMEIA Survey Report
Detailed analysis
fi
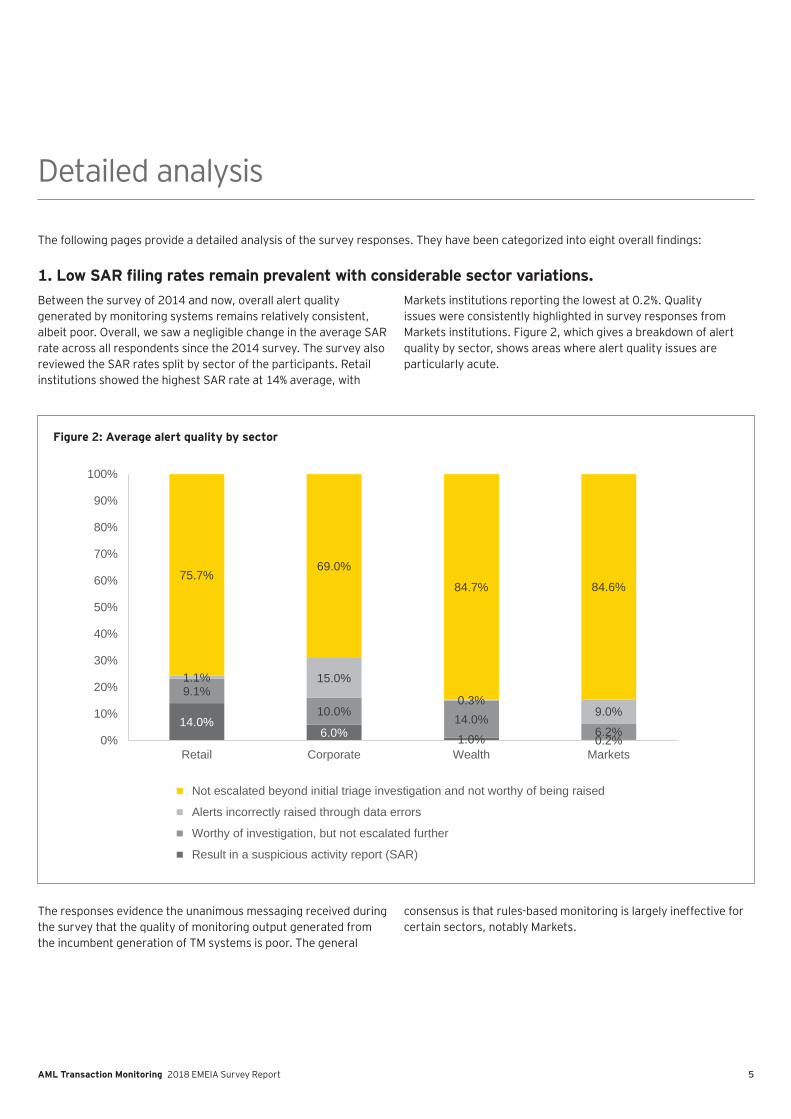
1. Low SAR filing rates remain prevalent with considerable sector variations.Between the survey of 2014 and now, overall alert quality generated by monitoring systems remains relatively consistent, albeit poor. Overall, we saw a negligible change in the average SAR rate across all respondents since the 2014 survey. The survey also reviewed the SAR rates split by sector of the participants. Retail institutions showed the highest SAR rate at 14% average, with
Markets institutions reporting the lowest at 0.2%. Quality issues were consistently highlighted in survey responses from Markets institutions. Figure 2, which gives a breakdown of alert quality by sector, shows areas where alert quality issues are particularly acute.
The responses evidence the unanimous messaging received during the survey that the quality of monitoring output generated from the incumbent generation of TM systems is poor. The general
consensus is that rules-based monitoring is largely ineffective for certain sectors, notably Markets.
F igu re 2: Av erage alert q u ality b y sector
14.0%6.0% 1.0% 0.2%
9.1%10.0% 14.0%
6.2%
1.1% 15.0%
0.3%9.0%
75.7%69.0%
84.7% 84.6%
0%
10%
20%
30%
40%
50%
60%
70%
80%
90%
100%
Retail Corporate Wealth Markets
Not escalated beyond initial triage investigation and not worthy of being raised
Alerts incorrectly raised through data errors
Worthy of investigation, but not escalated further
Result in a suspicious activity report (SAR)
6 AML Transaction Monitoring 2018 EMEIA Survey Report
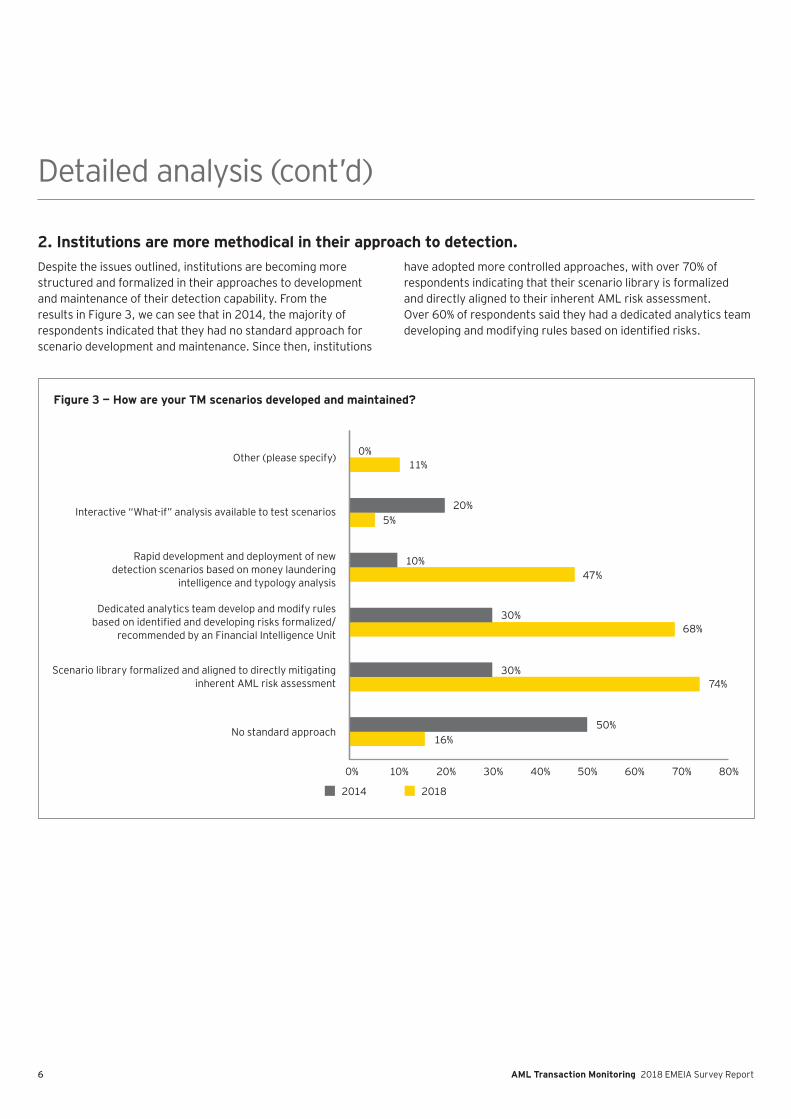
2. Institutions are more methodical in their approach to detection.Despite the issues outlined, institutions are becoming more structured and formalized in their approaches to development and maintenance of their detection capability. From the results in Figure 3, we can see that in 2014, the majority of respondents indicated that they had no standard approach for scenario development and maintenance. Since then, institutions
have adopted more controlled approaches, with over 70% of respondents indicating that their scenario library is formalized and directly aligned to their inherent AML risk assessment. Over 60% of respondents said they had a dedicated analytics team
fi
Detailed analysis (cont’ d)
F igu re 3 — H ow are y ou r TM scenarios d ev eloped and m aintained ?
Other (please specify)
Interactive “ What-if” analysis available to test scenarios
Rapid development and deployment of new detection scenarios based on money laundering
intelligence and typology analysis
Dedicated analytics team develop and modify rules fi
recommended by an Financial Intelligence Unit
Scenario library formalized and aligned to directly mitigating inherent AML risk assessment
No standard approach
0%11%
20%
10%47%
30%
30%
50%16%
74%
68%
5%
2014 2018
0% 10% 20% 30% 40% 50% 60% 70% 80%
7AML Transaction Monitoring 2018 EMEIA Survey Report
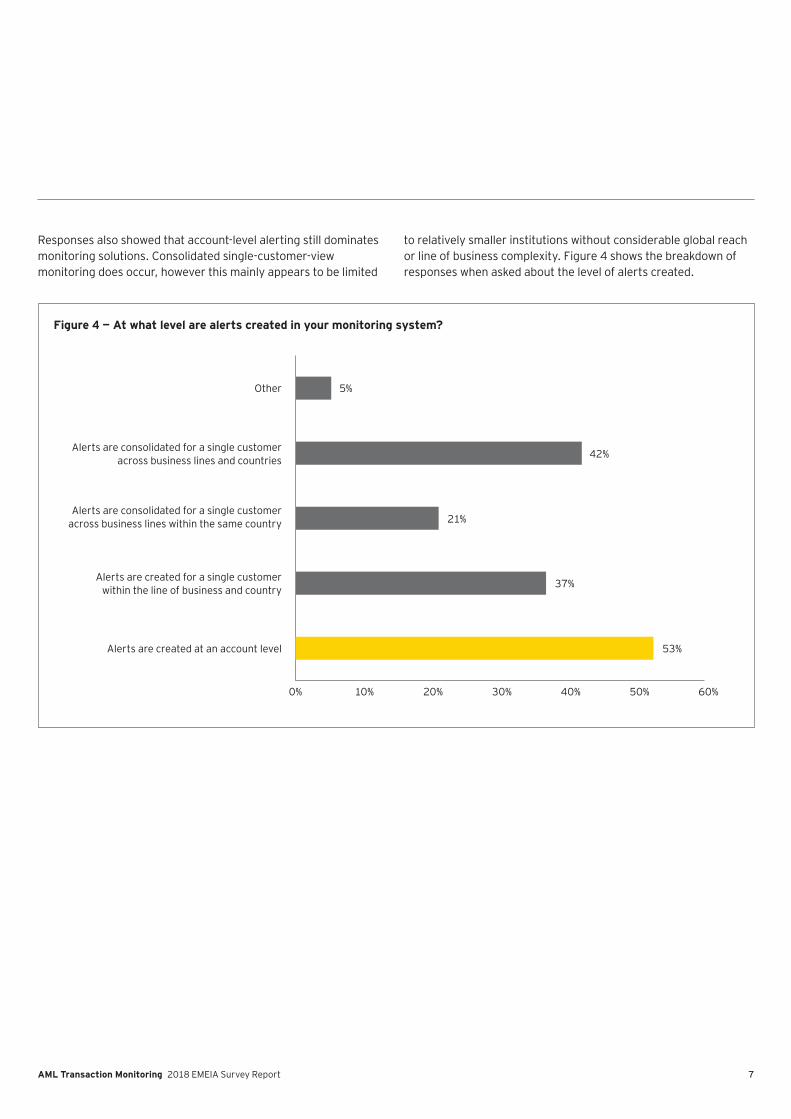
Responses also showed that account-level alerting still dominates monitoring solutions. Consolidated single-customer-view monitoring does occur, however this mainly appears to be limited
to relatively smaller institutions without considerable global reach or line of business complexity. Figure 4 shows the breakdown of responses when asked about the level of alerts created.
Figure 4 — At what level are alerts created in your monitoring system?
5%
42%
21%
37%
53%
Other
Alerts are consolidated for a single customer across business lines and countries
Alerts are consolidated for a single customer across business lines within the same country
Alerts are created for a single customer within the line of business and country
Alerts are created at an account level
60%50%40%30%20%10%0%
8 AML Transaction Monitoring 2018 EMEIA Survey Report
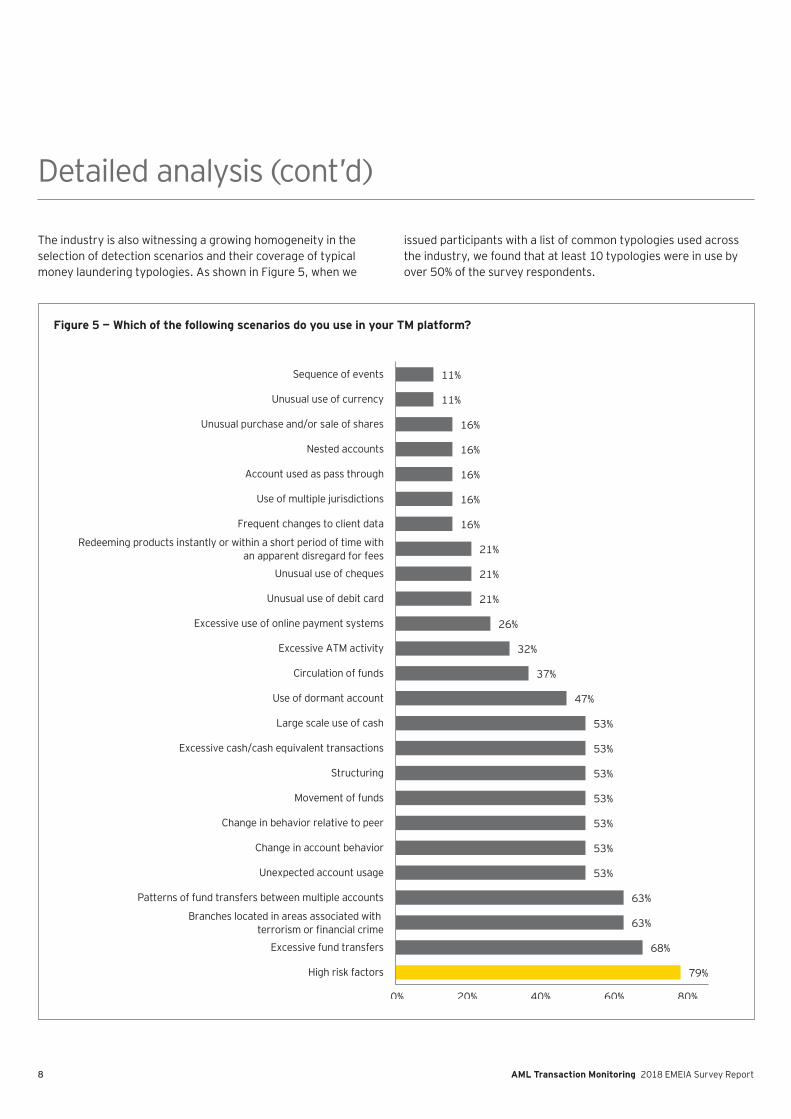
The industry is also witnessing a growing homogeneity in the selection of detection scenarios and their coverage of typical money laundering typologies. As shown in Figure 5, when we
issued participants with a list of common typologies used across the industry, we found that at least 10 typologies were in use by over 50% of the survey respondents.
Detailed analysis (cont’ d)
Figure 5 — Which of the following scenarios do you use in your TM platform?
79%
80%60%40%20%0%
68%
63%
63%
53%
53%
53%
53%
53%
53%
53%
47%
37%
32%
26%
21%
21%
21%
16%
16%
16%
16%
16%
11%
11%
High risk factors
Excessive fund transfers
Branches located in areas associated with terrorism or financial crime
Patterns of fund transfers between multiple accounts
Unexpected account usage
Change in account behavior
Change in behavior relative to peer
Movement of funds
Structuring
Excessive cash/cash equivalent transactions
Large scale use of cash
Use of dormant account
Circulation of funds
Excessive ATM activity
Excessive use of online payment systems
Unusual use of debit card
Unusual use of cheques
Redeeming products instantly or within a short period of time withan apparent disregard for fees
Frequent changes to client data
Use of multiple jurisdictions
Account used as pass through
Nested accounts
Unusual purchase and/or sale of shares
Unusual use of currency
Sequence of events
9AML Transaction Monitoring 2018 EMEIA Survey Report
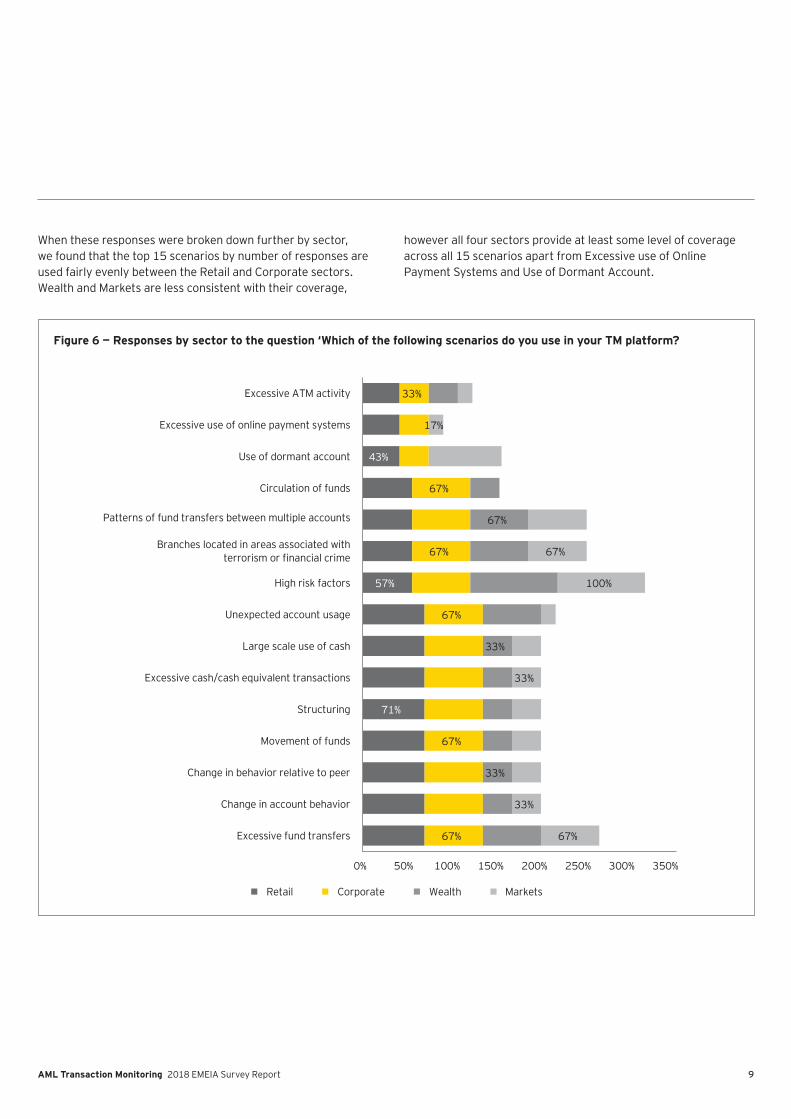
When these responses were broken down further by sector, we found that the top 15 scenarios by number of responses are used fairly evenly between the Retail and Corporate sectors. Wealth and Markets are less consistent with their coverage,
however all four sectors provide at least some level of coverage across all 15 scenarios apart from Excessive use of Online Payment Systems and Use of Dormant Account.
Figure 6 — Responses by sector to the question ‘Which of the following scenarios do you use in your TM platform?
71%
57%
43%
67%
67%
67%
67%
67%
33%
33%
33%
67%
67%
33%
33%
100%
67%
17%
Excessive fund transfers
Change in account behavior
Change in behavior relative to peer
Movement of funds
Structuring
Excessive cash/cash equivalent transactions
Large scale use of cash
Unexpected account usage
High risk factors
Branches located in areas associated withterrorism or financial crime
Patterns of fund transfers between multiple accounts
Circulation of funds
Use of dormant account
Excessive use of online payment systems
Excessive ATM activity
Retail Corporate Wealth Markets
0% 50% 100% 150% 200% 250% 300% 350%
10 AML Transaction Monitoring 2018 EMEIA Survey Report
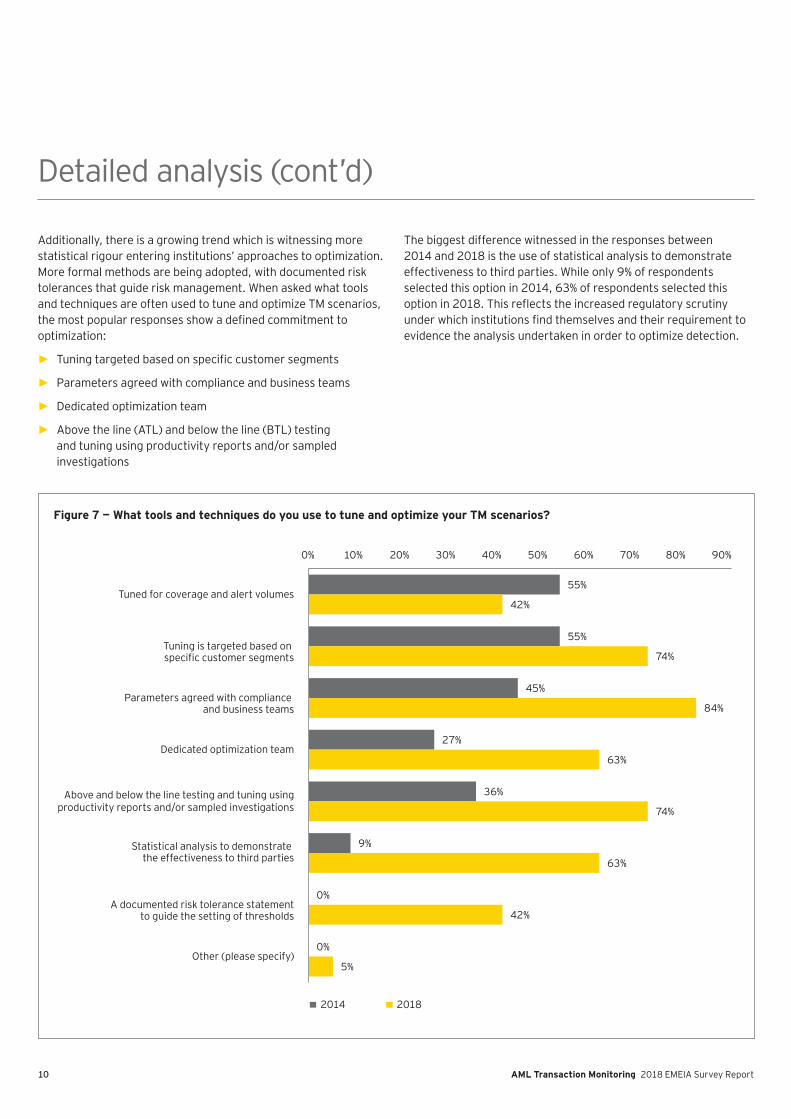
Additionally, there is a growing trend which is witnessing more statistical rigour entering institutions’ approaches to optimization. More formal methods are being adopted, with documented risk tolerances that guide risk management. When asked what tools and techniques are often used to tune and optimize TM scenarios,
fioptimization:
► fi
► Parameters agreed with compliance and business teams
► Dedicated optimization team
► Above the line (ATL) and below the line (BTL) testing and tuning using productivity reports and/or sampled investigations
The biggest difference witnessed in the responses between 2014 and 2018 is the use of statistical analysis to demonstrate effectiveness to third parties. While only 9% of respondents selected this option in 2014, 63% of respondents selected this
fievidence the analysis undertaken in order to optimize detection.
Detailed analysis (cont’ d)
Figure 7 — What tools and techniques do you use to tune and optimize your TM scenarios?
55%
55%
45%
27%
36%
9%
0%
0%
42%
74%
84%
63%
74%
63%
42%
5%
0% 10% 20% 30% 40% 50% 60% 70% 80% 90%
Tuned for coverage and alert volumes
Tuning is targeted based on fi
Parameters agreed with compliance and business teams
Dedicated optimization team
Above and below the line testing and tuning using productivity reports and/or sampled investigations
Statistical analysis to demonstrate the effectiveness to third parties
A documented risk tolerance statement to guide the setting of thresholds
Other (please specify)
2014 2018
11AML Transaction Monitoring 2018 EMEIA Survey Report
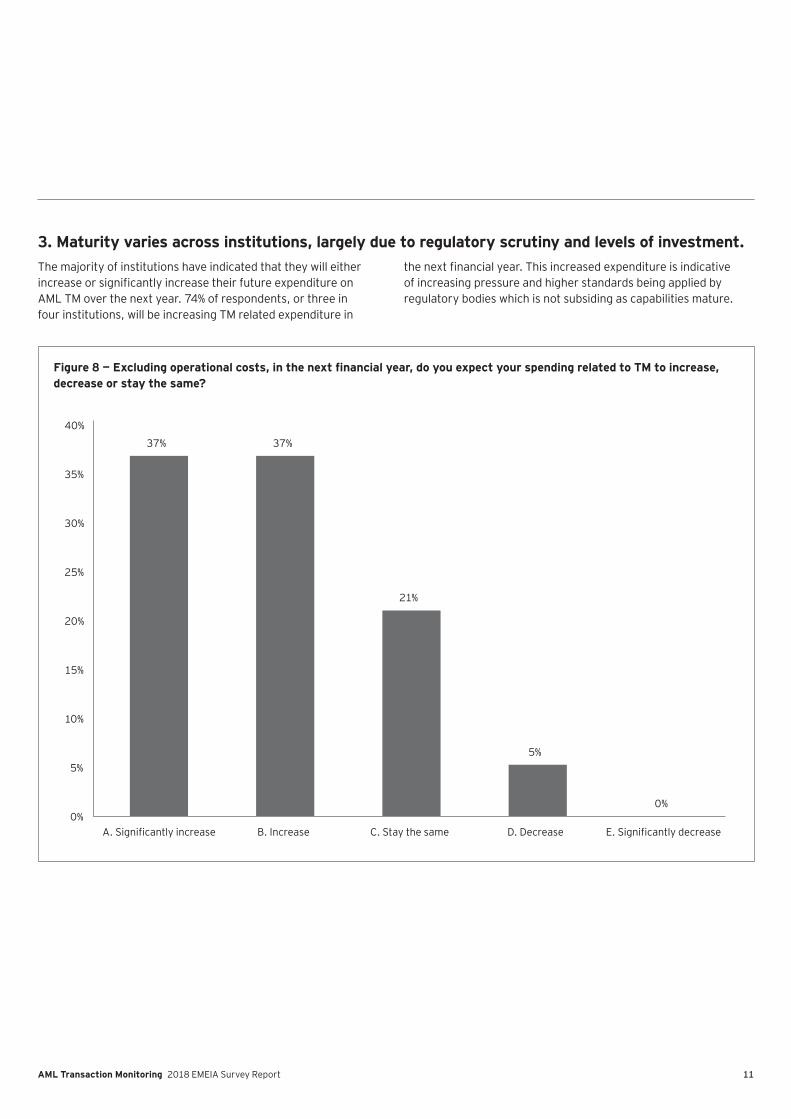
3. Maturity varies across institutions, largely due to regulatory scrutiny and levels of investment.The majority of institutions have indicated that they will either
fiAML TM over the next year. 74% of respondents, or three in four institutions, will be increasing TM related expenditure in
fiof increasing pressure and higher standards being applied by regulatory bodies which is not subsiding as capabilities mature.
Figure 8 — Excluding operational costs, in the next financial year, do you expect your spending related to TM to increase, decrease or stay the same?
37% 37%
21%
5%
0%0%
5%
10%
15%
20%
25%
30%
35%
40%
fi fi
12 AML Transaction Monitoring 2018 EMEIA Survey Report
That said, a number of institutions have indicated that they will maintain current expenditure levels. These institutions have reached a level of maturity which means that maintaining current
fiprevious or existing expenditure levels. The majority of these organizations have invested in very large transformation programs previously and are moving to a steady state, even as new TM
techniques and technologies emerge. Only 5% of respondents indicated that they would be decreasing TM expenditure over the
fi
The responses seem to suggest that the current cycle of increasing TM spend shows no sign of passing: we think this is due to increased appetite to invest in more advanced technology as well as ongoing regulatory pressure.
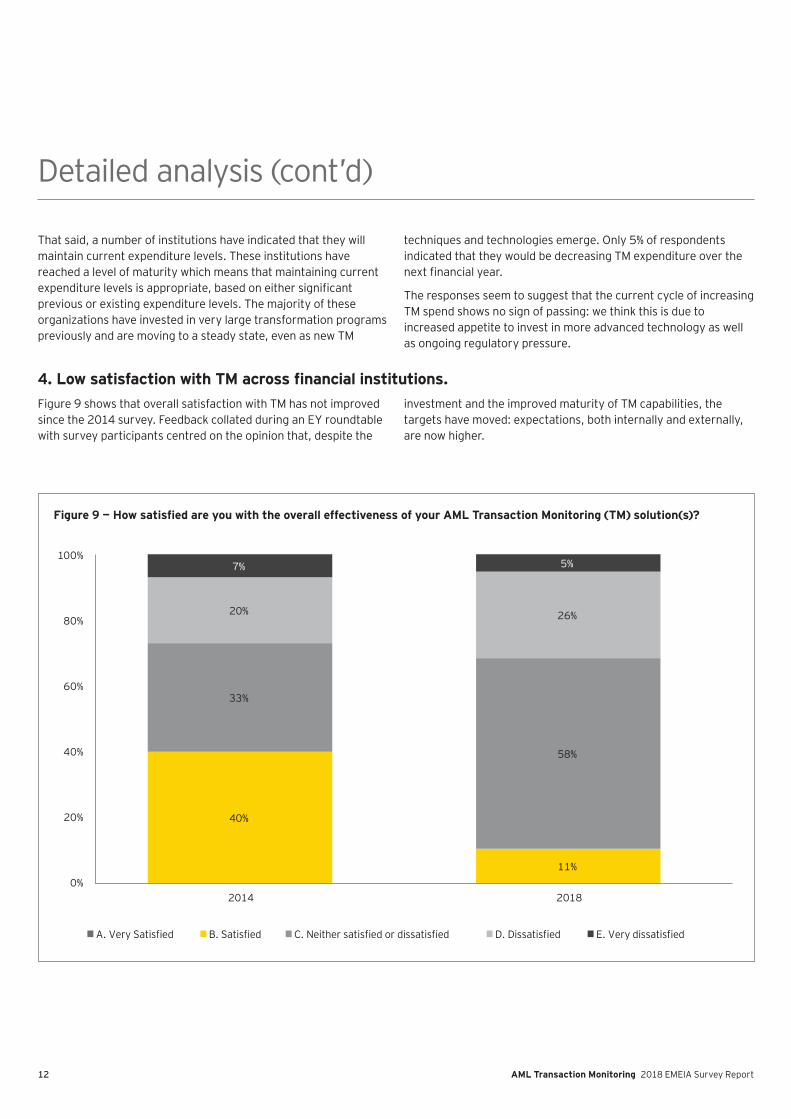
4. Low satisfaction with TM across financial institutions.Figure 9 shows that overall satisfaction with TM has not improved since the 2014 survey. Feedback collated during an EY roundtable with survey participants centred on the opinion that, despite the
investment and the improved maturity of TM capabilities, the targets have moved: expectations, both internally and externally, are now higher.
Detailed analysis (cont’ d)
Figure 9 — How satisfied are you with the overall effectiveness of your AML Transaction Monitoring (TM) solution(s)?
40%
0%
20%
40%
60%
80%
100%
11%
33%
58%
20% 26%
7% 5%
2014 2018
A. Very Satisfied B. Satisfied C. Neither satisfied or dissatisfied D. Dissatisfied E. Very dissatisfied
13AML Transaction Monitoring 2018 EMEIA Survey Report
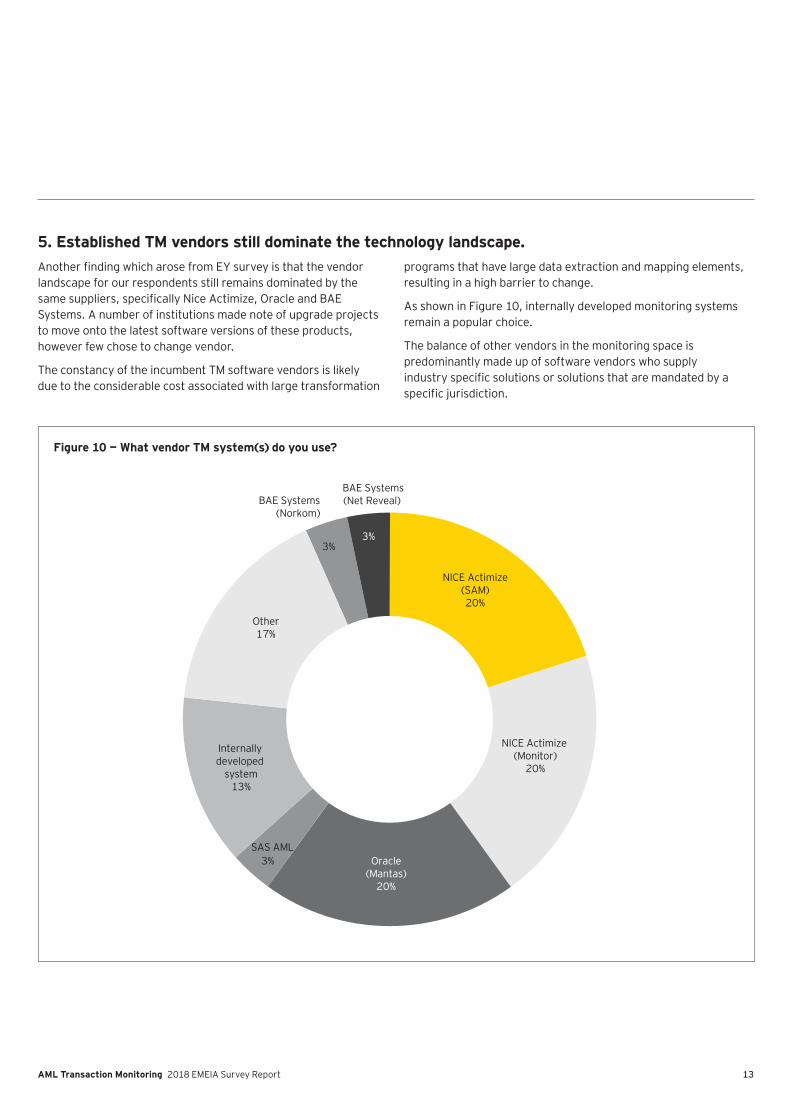
5. Established TM vendors still dominate the technology landscape.fi
landscape for our respondents still remains dominated by the fi
Systems. A number of institutions made note of upgrade projects to move onto the latest software versions of these products, however few chose to change vendor.
The constancy of the incumbent TM software vendors is likely due to the considerable cost associated with large transformation
programs that have large data extraction and mapping elements, resulting in a high barrier to change.
As shown in Figure 10, internally developed monitoring systems remain a popular choice.
The balance of other vendors in the monitoring space is predominantly made up of software vendors who supply
fifi
Figure 10 — What vendor TM system(s) do you use?
BAE Systems(Norkom)
3%
BAE Systems(Net Reveal)
3%
NICE Actimize(SAM)20%
NICE Actimize (Monitor)
20%
Oracle(Mantas)
20%
SAS AML3%
Internally developed
system13%
Other17%

14 AML Transaction Monitoring 2018 EMEIA Survey Report
6. Considerable and growing investment in other non-rules based technologies, such as advanced analytics.Some institutions are beginning to implement detection mechanisms using alternative approaches to rules-based
fitypology or detection pattern, for example, upstream custom analytics for money mule detection. However, a minority have developed more generalized anomaly detection mechanisms that are more broadly applied.
When questioned about the use of other advanced techniques, respondents’ answers suggest that permanent or mature solutions are not yet in place, with several respondents suggesting pilot phases were still ongoing.
Detailed analysis (cont’ d)
Figure 11 — Are you using any other advanced techniques to detect money laundering beyond the use of traditional rules?
53%47%
Yes No
15AML Transaction Monitoring 2018 EMEIA Survey Report
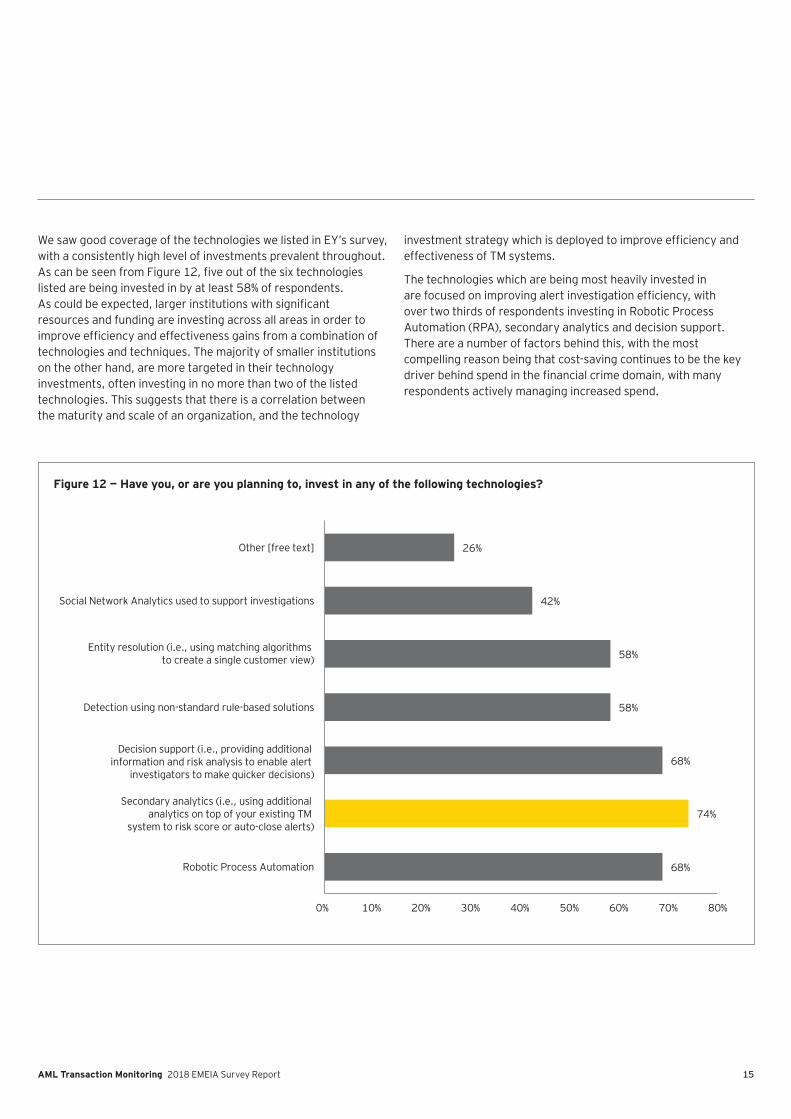
We saw good coverage of the technologies we listed in EY’ s survey, with a consistently high level of investments prevalent throughout.
filisted are being invested in by at least 58% of respondents.
firesources and funding are investing across all areas in order to
fitechnologies and techniques. The majority of smaller institutions on the other hand, are more targeted in their technology investments, often investing in no more than two of the listed technologies. This suggests that there is a correlation between the maturity and scale of an organization, and the technology
fieffectiveness of TM systems.
The technologies which are being most heavily invested in fi
over two thirds of respondents investing in Robotic Process Automation (RPA), secondary analytics and decision support. There are a number of factors behind this, with the most compelling reason being that cost-saving continues to be the key
firespondents actively managing increased spend.
Figure 12 — Have you, or are you planning to, invest in any of the following technologies?
68%
74%
68%
58%
58%
42%
26%
0% 10% 20% 30% 40% 50% 60% 70% 80%
Robotic Process Automation
Secondary analytics (i.e., using additional analytics on top of your existing TM
system to risk score or auto-close alerts)
Decision support (i.e., providing additional information and risk analysis to enable alert
investigators to make quicker decisions)
Detection using non-standard rule-based solutions
Entity resolution (i.e., using matching algorithms to create a single customer view)
Social Network Analytics used to support investigations
Other [free text]
16 AML Transaction Monitoring 2018 EMEIA Survey Report
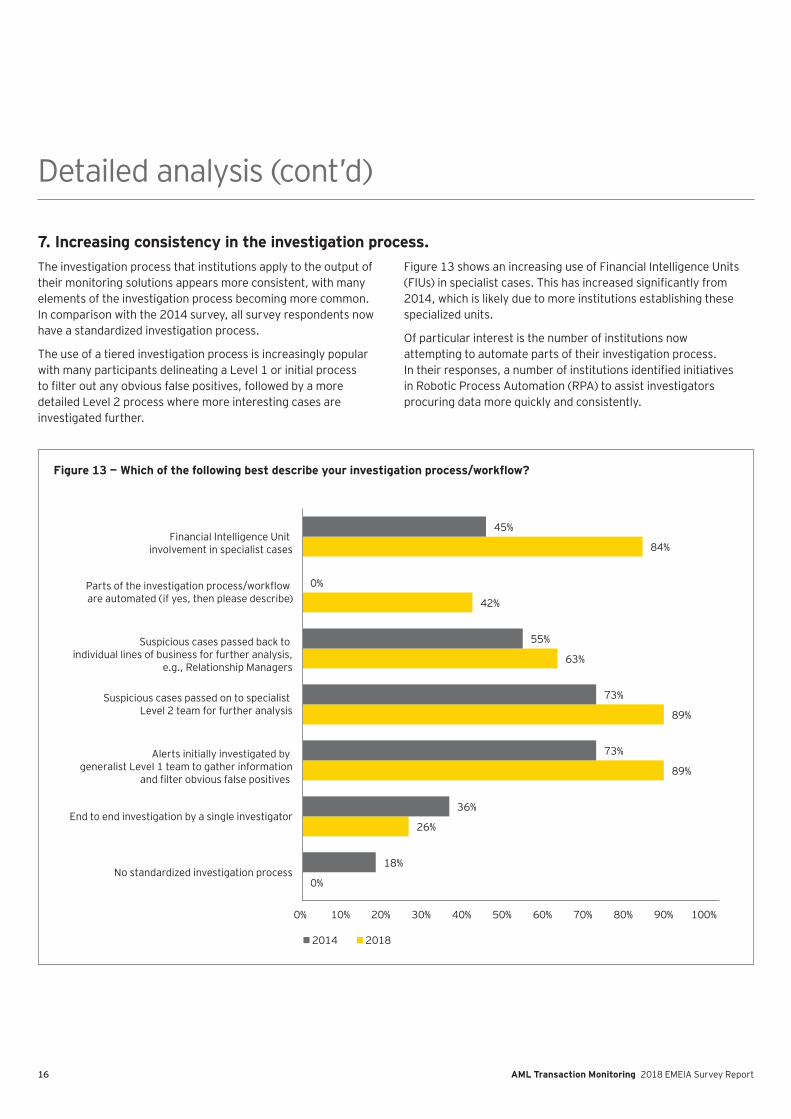
7. Increasing consistency in the investigation process.The investigation process that institutions apply to the output of their monitoring solutions appears more consistent, with many elements of the investigation process becoming more common. In comparison with the 2014 survey, all survey respondents now have a standardized investigation process.
The use of a tiered investigation process is increasingly popular with many participants delineating a Level 1 or initial process
fidetailed Level 2 process where more interesting cases are investigated further.
Figure 13 shows an increasing use of Financial Intelligence Units fi
2014, which is likely due to more institutions establishing these specialized units.
Of particular interest is the number of institutions now attempting to automate parts of their investigation process.
fiin Robotic Process Automation (RPA) to assist investigators procuring data more quickly and consistently.
Detailed analysis (cont’ d)
Figure 13 — Which of the following best describe your investigation process/workflow?
0%
26%
89%
89%
63%
42%
84%
18%
36%
73%
73%
55%
0%
45%
0% 10% 20% 30% 40% 50% 60% 70% 80% 90% 100%
No standardized investigation process
End to end investigation by a single investigator
Alerts initially investigated by generalist Level 1 team to gather information
fi
Financial Intelligence Unit involvement in specialist cases
2014 2018
17AML Transaction Monitoring 2018 EMEIA Survey Report
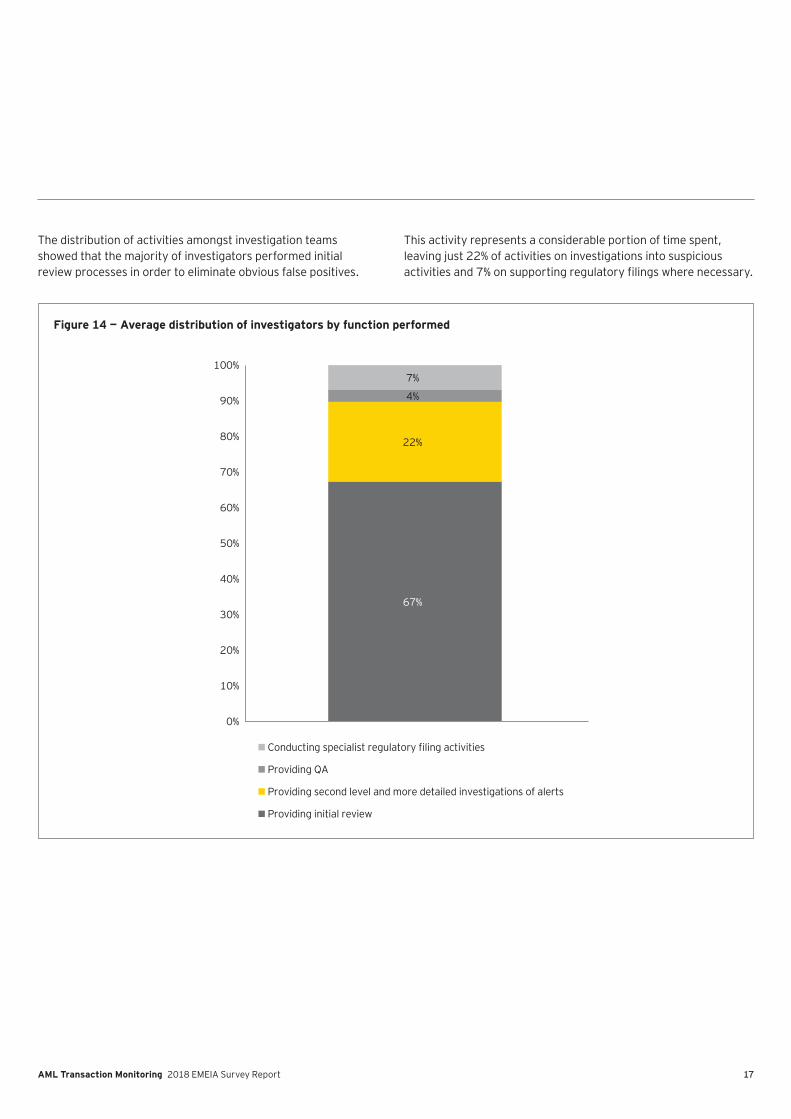
The distribution of activities amongst investigation teams showed that the majority of investigators performed initial review processes in order to eliminate obvious false positives.
This activity represents a considerable portion of time spent, leaving just 22% of activities on investigations into suspicious
fi
Figure 14 — Average distribution of investigators by function performed
67%
22%
4%
7%
0%
10%
20%
30%
40%
50%
60%
70%
80%
90%
100%
Conducting specialist regulatory filing activities
Providing QA
Providing second level and more detailed investigations of alerts
Providing initial review
18 AML Transaction Monitoring 2018 EMEIA Survey Report
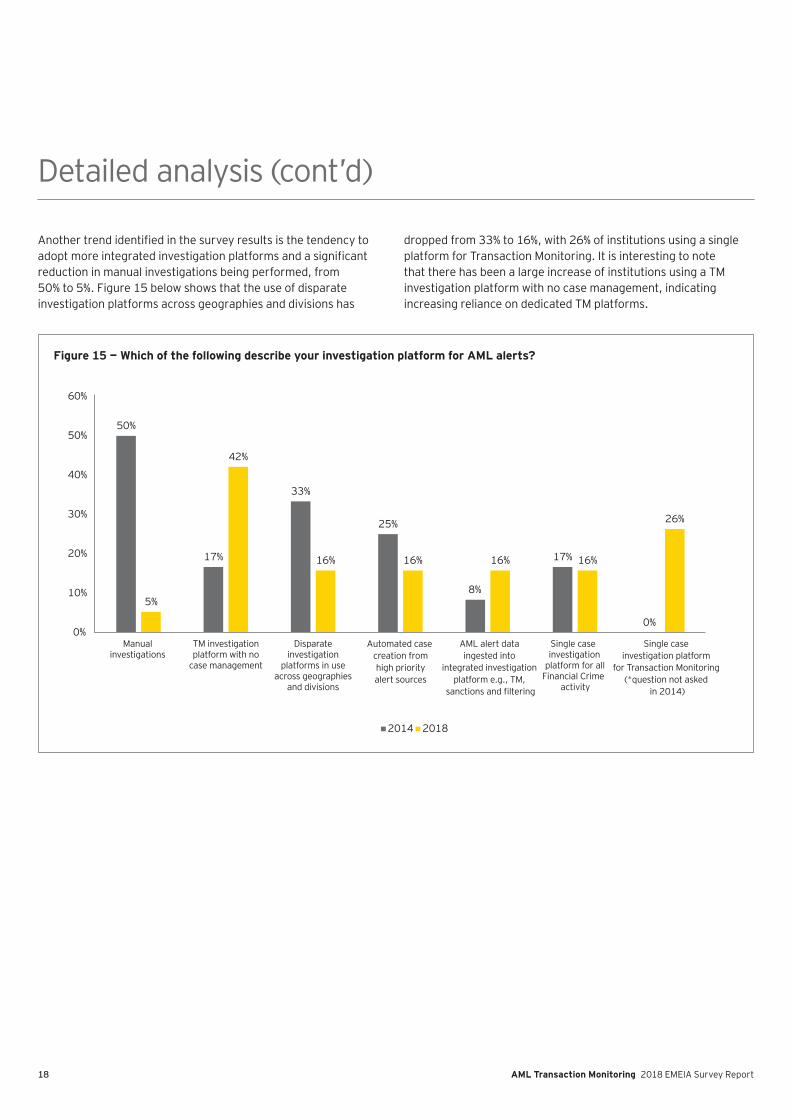
fifi
reduction in manual investigations being performed, from 50% to 5%. Figure 15 below shows that the use of disparate investigation platforms across geographies and divisions has
dropped from 33% to 16%, with 26% of institutions using a single platform for Transaction Monitoring. It is interesting to note that there has been a large increase of institutions using a TM investigation platform with no case management, indicating increasing reliance on dedicated TM platforms.
Detailed analysis (cont’ d)
Figure 15 — Which of the following describe your investigation platform for AML alerts?
50%
17%
33%
25%
8%
17%
0%
5%
42%
16% 16% 16% 16%
26%
0%
10%
20%
30%
40%
50%
60%
Manualinvestigations
TM investigationplatform with no
case management
Disparateinvestigation
platforms in useacross geographies
and divisions
Single caseinvestigation
platform for allFinancial Crime
activity
2014 2018
AML alert dataingested into
integrated investigationplatform e.g., TM,
fi
Single case investigation platform
for Transaction Monitoring (*question not asked
in 2014)
Automated case creation fromhigh priorityalert sources
19AML Transaction Monitoring 2018 EMEIA Survey Report
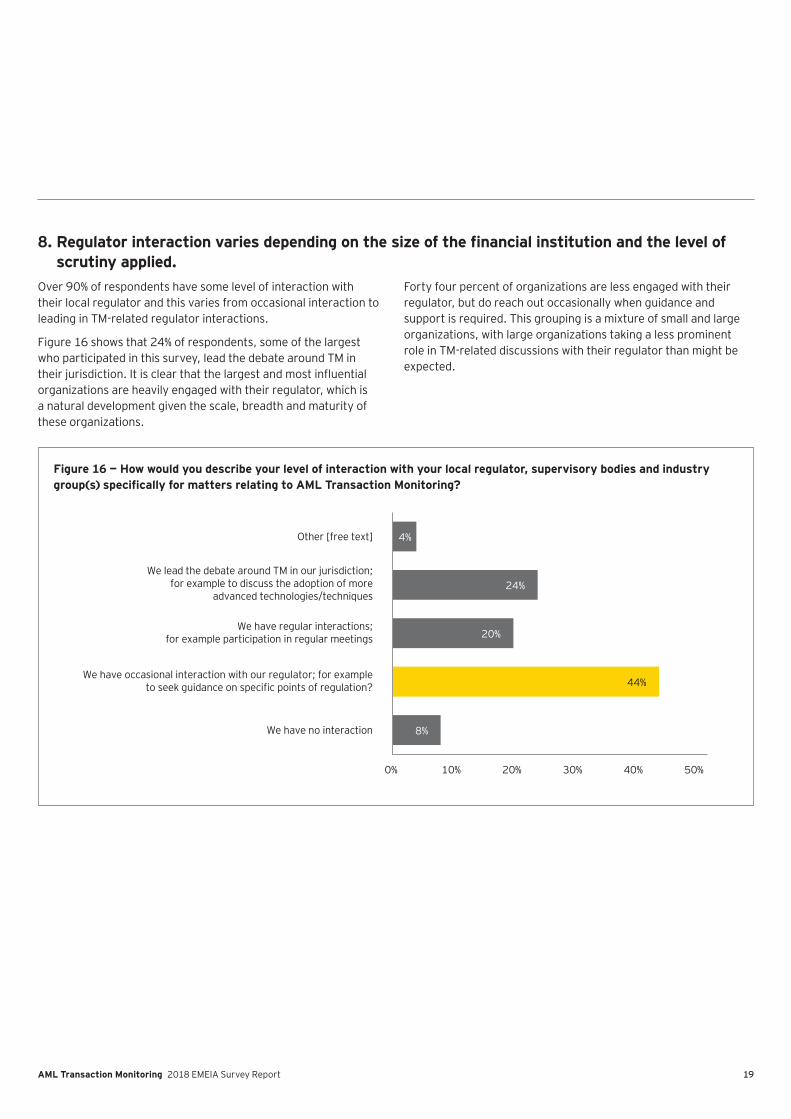
8. Regulator interaction varies depending on the size of the financial institution and the level of scru tiny applied .
Over 90% of respondents have some level of interaction with their local regulator and this varies from occasional interaction to leading in TM-related regulator interactions.
Figure 16 shows that 24% of respondents, some of the largest who participated in this survey, lead the debate around TM in
organizations are heavily engaged with their regulator, which is a natural development given the scale, breadth and maturity of these organizations.
Forty four percent of organizations are less engaged with their regulator, but do reach out occasionally when guidance and support is required. This grouping is a mixture of small and large organizations, with large organizations taking a less prominent role in TM-related discussions with their regulator than might be expected.
Figure 16 — How would you describe your level of interaction with your local regulator, supervisory bodies and industry group(s) specifically for matters relating to AML Transaction Monitoring?
8%
44%
20%
24%
4%
0% 10% 20% 30% 40% 50%
We have no interaction
We have occasional interaction with our regulator; for exampleto seek guidance on specific points of regulation?
We have regular interactions;for example participation in regular meetings
We lead the debate around TM in our jurisdiction;for example to discuss the adoption of more
advanced technologies/techniques
Other [free text]

AML Transaction Monitoring 2018 EMEIA Survey Report 20
Conclusion3
21AML Transaction Monitoring 2018 EMEIA Survey Report
Conclusion
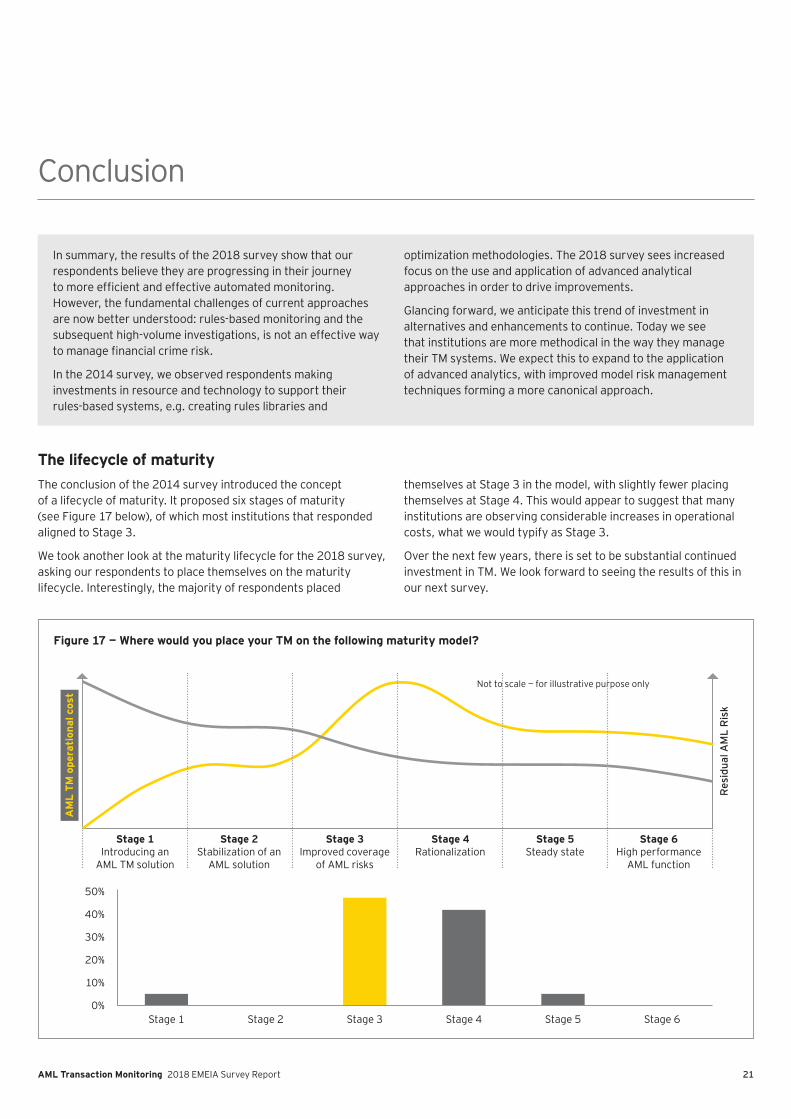
The lifecycle of maturityThe conclusion of the 2014 survey introduced the concept of a lifecycle of maturity. It proposed six stages of maturity (see Figure 17 below), of which most institutions that responded aligned to Stage 3.
We took another look at the maturity lifecycle for the 2018 survey, asking our respondents to place themselves on the maturity lifecycle. Interestingly, the majority of respondents placed
themselves at Stage 3 in the model, with slightly fewer placing themselves at Stage 4. This would appear to suggest that many institutions are observing considerable increases in operational costs, what we would typify as Stage 3.
Over the next few years, there is set to be substantial continued investment in TM. We look forward to seeing the results of this in our next survey.
In summary, the results of the 2018 survey show that our respondents believe they are progressing in their journey
fiHowever, the fundamental challenges of current approaches are now better understood: rules-based monitoring and the subsequent high-volume investigations, is not an effective way
fi
In the 2014 survey, we observed respondents making investments in resource and technology to support their rules-based systems, e.g. creating rules libraries and
optimization methodologies. The 2018 survey sees increased focus on the use and application of advanced analytical approaches in order to drive improvements.
G lancing forward, we anticipate this trend of investment in alternatives and enhancements to continue. Today we see that institutions are more methodical in the way they manage their TM systems. We expect this to expand to the application of advanced analytics, with improved model risk management techniques forming a more canonical approach.
Figure 17 — Where would you place your TM on the following maturity model?
0%
10%
20%
30%
40%
50%
Stage 1 Stage 2 Stage 3 Stage 4 Stage 5 Stage 6
Stage 1Introducing an
AML TM solution
Stage 2Stabilization of an
AML solution
Stage 3Improved coverage
of AML risks
Stage 4Rationalization
Stage 5Steady state
Stage 6High performance
AML function
AM
L TM
ope
rati
onal
cos
t
Res
idua
l AM
L R
isk
Not to scale — for illustrative purpose only
22 AML Transaction Monitoring 2018 EMEIA Survey Report
Contact informationEY Financial Services advisory practices have dedicated highly integrated teams across the globe seasoned in Financial Crime Technology, and Information Security. EY draws on deep industry knowledge and technical skills to provide services in areas including Anti-Money Laundering, K now Your Customer, Sanctions, Fraud Detection, Trader/Market Surveillance and Cyber Security. EY services include risk assessment, regulatory response, target operating models, technology strategy, model development and improvement, technology services, remediation, controls effectiveness testing and independent review.
For readers with further questions or interest in understanding the more detailed aspects of EY survey, please contact Matt Reed or Becky Marvell.
Patrick Craig Partner Financial Services Advisory EY UK LLP
pcraig@ uk.ey.com + 44 20 7951 9999
J od ie F orb es Director Financial Services Advisory EY UK LLP
jforbes1@ uk.ey.com + 44 20 7783 0744
Matt R eed Senior Manager Financial Services Advisory EY UK LLP
mreed@ uk.ey.com + 44 20 7951 7870
E am on H ow ard Manager Financial Services Advisory EY UK LLP
ehoward@ uk.ey.com + 44 (0) 7900 703085
Becky Marvell Senior Consultant Financial Services Advisory EY UK LLP
bmarvell@ uk.ey.com + 44 (0) 7831 136613


24 AML Transaction Monitoring 2018 EMEIA Survey Report
Notes

25AML Transaction Monitoring 2018 EMEIA Survey Report
Notes
EY | Assurance | Tax | Transactions | Advisory
About EYEY is a global leader in assurance, tax, transaction and advisory services. The insights and quality services we deliver help build trust and confidence in the capital markets and in economies the world over. We develop outstanding leaders who team to deliver on our promises to all of our stakeholders. In so doing, we play a critical role in building a better working world for our people, for our clients and for our communities.
EY refers to the global organization, and may refer to one or more, of the member firms of Ernst & Young G lobal Limited, each of which is a separate legal entity. Ernst & Young G lobal Limited, a UK company limited by guarantee, does not provide services to clients. For more information about our organization, please visit ey.com.
© 2018 EYG M Limited. All Rights Reserved.
EYG No. 011464-18G bl
EY-000071931.indd (UK ) 10/18. Artwork by Creative Services G roup London.
ED None
In line with EY’ s commitment to minimize its impact on the environment, this document has been printed on paper with a high recycled content.
This material has been prepared for general informational purposes only and is not intended to be relied upon as accounting, tax or other professional advice. Please refer to your advisors for specific advice.
ey.com