Embed Size (px)
Citation preview

Antenna Group Delay Variation Bias Effect on Advanced RAIM
Eugene Bang, Mihaela-Simona Circiu, Stefano Caizzone and Markus Rippl German Aerospace Center (DLR), Germany
BIOGRAPHY (IES) Dr. Eugene Bang received his PhD degree in Aerospace Engineering from Korea Advanced Institute of Science and Technology (KAIST), Republic of Korea, in 2017. He is currently an associate researcher with the Institute of Communications and Navigation (IKN) at the German Aerospace Center (DLR) in Oberpfaffenhofen, Germany. His areas of interest include high integrity applications of GNSS and advanced receiver autonomous integrity monitoring (ARAIM). He is a recipient of the Institute of Navigation (ION) GNSS+ Student Paper Award (2016). Dr. Mihaela-Simona Circiu graduated Computer Engineering at Technical University, Iasi, Romania in 2011 and a 2nd level Master in Satellite Navigation and Related Application at Politecnico di Torino, Italy in 2012. In 2020 she received her PhD Degree in Electrical Engineering and Information Technology at RWTH Aachen, Germany. Since 2013 she is working as a Navigation Research Engineer at the German Aerospace Center, in Oberpfaffenhofen near Munich. Her main area of interest include integrity for aviation application with focus on GBAS. She is participant in different working groups and since March 2020, she is leading the Augmentation Systems Group. Stefano Caizzone received the M.Sc. in Telecommunications Engineering and the Ph.D. degree in Geoinformation from the University of Rome “Tor Vergata”, Italy, in 2009 and 2015, respectively. Since 2010, he is with the Antenna group of the Institute of Communications and Navigation of the German Aerospace Center (DLR), Wessling, Germany, where he has been responsible for the development of innovative miniaturized antennas. Since July 2020, he leads the Antenna Group. His main research interests concern small antennas for satellite navigation, controlled radiation pattern antennas for robust satellite navigation and high-performance antenna design for precise satellite navigation, antenna arrays for satellite communication. Markus Rippl received his Diploma in Electrical Engineering and Information Technology from Technische Universität München (TUM) in 2007. Since then, he has been a research associate with the Institute of Communications and Navigation (IKN) at the German Aerospace Center (DLR) in Oberpfaffenhofen near Munich. His areas of interest include GNSS integrity using receiver-side algorithms, next generation Receiver Autonomous Integrity Monitoring (RAIM) algorithms and architectures, and the development of a future integrity architecture supporting Advanced Receiver Autonomous Integrity Monitoring (ARAIM) with an Integrity Support Message (ISM).
ABSTRACT This paper investigates the impact of the range error caused by the antenna group delay variations (noted as AGDV) on the advanced receiver autonomous integrity monitoring (ARAIM). The new multipath and AGDV error models for aviation use of new GPS and Galileo signals developed within the Dual Frequency Multipath Model for Aviation (DUFMAN) project and relevant AGDV measurements analyzed in DUFMAN [1], [2] are applied for the assessment of the impact. In this work, several approaches are taken to address the contribution of the AGDV error in the current ARAIM airborne algorithm: consideration of the user antenna bias error as a measurement bias term or as a random process sigma term. We performed ARAIM service volume simulations for Localizer Performance with Vertical guidance (LPV)-200 by applying the proposed error modeling methodologies and integrity support message (ISM) parameters in line with the current ARAIM framework. We compared availability performances as well as protection levels between the methods. It was found that 99.5% LPV-200 availability increased by approximately 5% when the newly derived
Proceedings of the 2021 International Technical Meeting,ION ITM 2021, January 25-28, 2021
688 https://doi.org/10.33012/2021.17860

DUFMAN multipath and AGDV error models were applied. On the other hand, despite the maximum improvement of roughly one meter in the vertical protection level, the AGDV effect considered as the bias term in the worst-case sense appears to be marginal to the ARAIM availability performance.
1. INTRODUCTION The currently proposed ARAIM baseline algorithm, introduced in the recently updated (v3.1) Reference Airborne Algorithm Description Document from the WG-C Advanced RAIM Technical Subgroup (ATSG) [3], takes into account a deterministic nominal bias term, ����, in its measurement error budget to characterize slow varying bias-like errors in GNSS measurements due to several sources, including clock and ephemeris errors, nominal signal deformation, and satellite antenna biases [4]. However, range error due to user antenna group delay variation (AGDV) is currently considered to be integrated into the receiver code noise and multipath (CNMP) term within the legacy error model [3], [5], which may lead to underestimation of user protection levels (PLs). Therefore, during the ARAIM development, it is crucial to predict and review the performance with respect to the modeling of error sources in the worst case. Within the Dual Frequency Multipath Model for Aviation (DUFMAN) project funded by European Commission, dual-frequency, dual-constellation (DFDC) airborne multipath models were developed by collecting GPS and Galileo measurements from several test flights using aviation GNSS antenna and receivers [6], [7]. The multipath error models were derived by characterizing the errors introduced by the user antenna biases for the antennas used during the flights and separating their contribution from the observed multipath errors. In [8], Griggs et al. addressed the impact of the preliminary DFDC multipath and user antenna error models from the DUFMAN project on the performance of ARAIM. Particularly, the antenna induced error contribution was considered in the nominal bias term (i.e., ����) of the current ARAIM user algorithm; however, it has been discussed that accounting for the antenna effect within the bias term may not be completely optimal [8]. More recently, for the final proposed DUFMAN models, the antenna errors were accounted for with a sigma term, which is root sum squared (RSSed) with the multipath only models [2]. Although the models were constructed based on extensive DFDC data collection and precise estimation processes of the multipath and antenna errors, they were derived in terms of root-mean-square (RMS) of the corresponding error distributions in order to keep compliance with the existing GPS L1 model. Thus, if the new models appear to be overly optimistic for ARAIM implementation, more rigorous methods for integrity purposes might be needed. This paper examines the impact of user error caused by the antenna range error on ARAIM by extending the existing approach [8] and presents different approaches to account for antenna errors for ARAIM. For this purpose, user-satellite geometries are first simulated based on 24 GPS/Galileo constellations and a predefined global user grid formation for ten sidereal days, which corresponds to the repetition period of the Galileo constellation [3]. Next, user AGDV errors in signals propagated to the users are computed based on actual antenna measurements as presented in our previous investigation [9], [10]. In this study, we take two different approaches to the assessment of the AGDV range errors and the new multipath model effect on ARAIM performance: measurement and position domain characterization of the AGDV errors. We first characterize the position error due to the antenna errors as a Gaussian distribution based on instantaneous user geometry and the corresponding set of AGDV error measurements. In this study, we investigate the user antenna errors for different constellations and frequencies, such as GPS L1/L5 and Galileo E1/E5a frequencies and GPS/Galileo dual-frequency ionosphere-free combination. Based on the empirical observations for the different cases, the statistical properties of the antenna error projected to the position domain are analyzed. Relevant overbounding distributions are also constructed by applying the Gaussian Cumulative Distribution Function (CDF) overbounding method. We then apply the resulting Gaussian parameters for the overbounding distributions for the current user PL computation. In addition to the bias effect, the newly developed DFMC multipath model is also applied for the ARAIM airborne error model. Next, a Gaussian overbounding model of the antenna errors is derived in the measurement domain as a function of satellite elevation angles. For this, the ionosphere-free combination measurements of GPS L1/L5 and Galileo E1/E5a antenna residual error are collected using the same user-satellite geometries as examined for the position domain analysis. The AGDV induced bias measurements collected are then sorted into elevation bins of five-degree separation, and the mean and standard deviation of bias errors in each bin are computed. They are used to normalize the bias errors. Based on the distribution of normalized antenna error,
689
Gaussian overbounds are determined for different elevation bins. In this case, we apply sum of squares of the upper bound on the antenna range errors and the DUFMAN multipath model for the airborne error model. To examine the impact of newly proposed AGDV error models on ARAIM performance, we conduct ARAIM service volume simulations for Localizer Performance with Vertical guidance (LPV)-200, and all simulations are carried out using the Stanford MAAST for ARAIM [11] with some modifications and the key simulation parameters outlined in [3]. Several simulation scenarios are investigated in our approach: 1. Baseline case: current CNMP model [5]
2. New DUFMAN model for the multipath and AGDV errors (i.e., RSSed) instead of the legacy CNMP
3. DUFMAN multipath model implemented in the CNMP term and the overbounding model for the antenna induced position errors
in the PL computation
4. Root sum of squares of the DUFMAN multipath model and the overbounding antenna pseudorange error
5. DUFMAN multipath model implemented in the CNMP term and the AGDV error considered within a bias term added to PLs
This study examines how much increase in the PL can be exptected in the scope of ARAIM by rigorously considering the effect of user antenna bias error. This paper is organized as follows. In the following section the new DUFMAN error model is briefly introduced, then the methodologies for the AGDV bias error modeling are presented. Simulation results are then discussed, and the last section concludes with remarks for future work. 2. METHODOLOGY In this section, we present a few methods for assessing the impact of AGDV bias error on ARAIM using the proposed method. This section first briefly describes the new multipath and AGDV bias error models derived from the DUFMAN project Three different approaches to modeling the user antenna bias error are then explained. The details of each step are described in the following sections. DUFMAN multipath and user antenna error models The current baseline ARAIM airborne algorithm [5] employs the Airborne Accuracy Designator – Model A (AAD-A) [12] for the user pseudorange error budget that consists of the airborne multipath (���) contribution and receiver tracking noise (������) contribution:
����� = �(���, ������) (1)
As mentioned in the Introduction, the ��� term in the legacy airborne error model contains the antenna error contribution due to the AGDV. However, the antenna error contribution might have been underestimated within the existing model. The multipath estimation process includes a step of removal of the carrier phase cycle ambiguity by leveling of data processed, and some of the slowly-varying (i.e., bias like) AGDV induced error would have been eliminated during the step. Therefore, in the derivation of the DUFMAN models, the AGDV error contribution was separated from the multipath error for the rigorous error characterization, and a new model was proposed which is calculated as RSS of the two error contributions as follows.
��� & ���� = ����� + �����
� (2) In this paper, the exiting ��� term within the airborne user error model in (1) will be replaced by the newly proposed ��� & ���� for the simulation purpose.
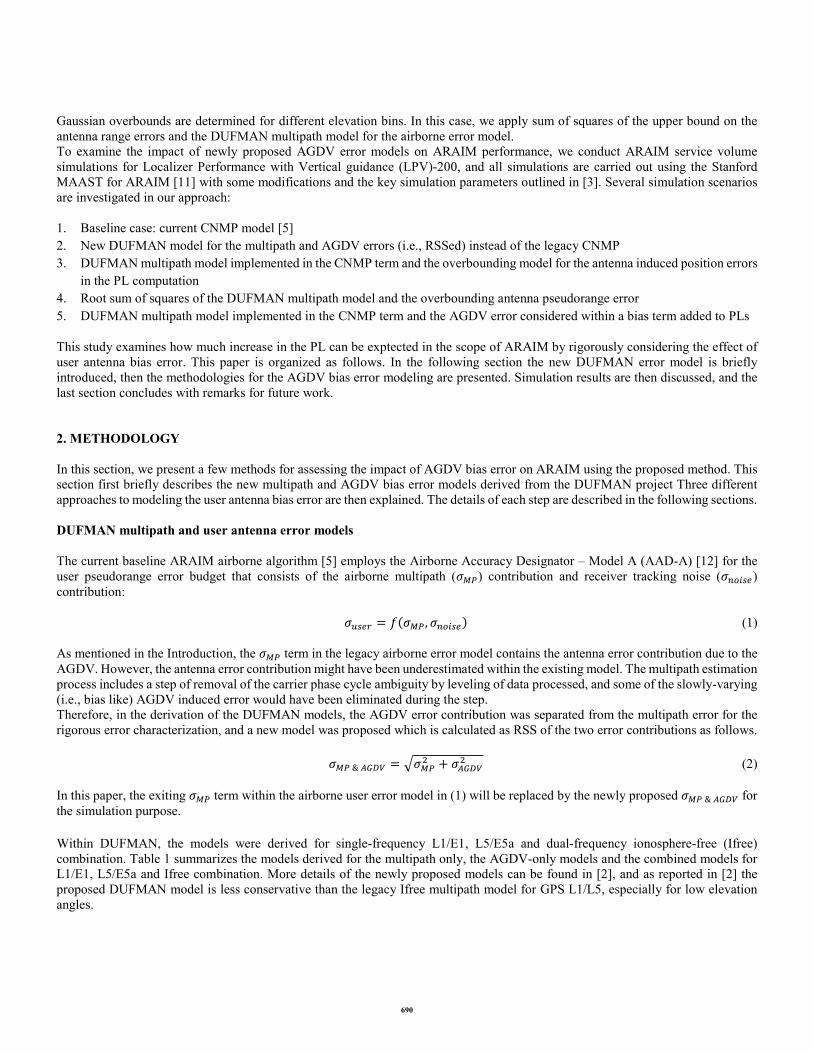
Within DUFMAN, the models were derived for single-frequency L1/E1, L5/E5a and dual-frequency ionosphere-free (Ifree) combination. Table 1 summarizes the models derived for the multipath only, the AGDV-only models and the combined models for L1/E1, L5/E5a and Ifree combination. More details of the newly proposed models can be found in [2], and as reported in [2] the proposed DUFMAN model is less conservative than the legacy Ifree multipath model for GPS L1/L5, especially for low elevation angles.
690
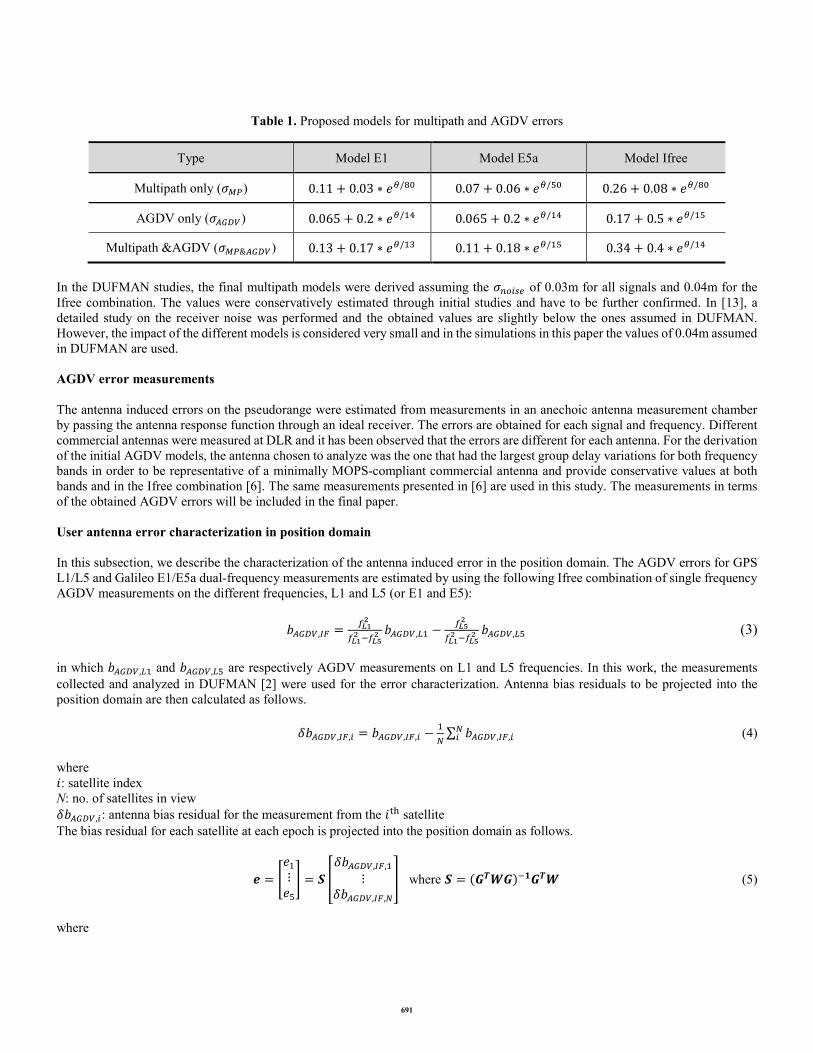
Table 1. Proposed models for multipath and AGDV errors
Type Model E1 Model E5a Model Ifree
Multipath only (���) 0.11 + 0.03 ∗ ��/�� 0.07 + 0.06 ∗ ��/�� 0.26 + 0.08 ∗ ��/��
AGDV only (�����) 0.065 + 0.2 ∗ ��/�� 0.065 + 0.2 ∗ ��/�� 0.17 + 0.5 ∗ ��/��
Multipath &AGDV (���&����) 0.13 + 0.17 ∗ ��/�� 0.11 + 0.18 ∗ ��/�� 0.34 + 0.4 ∗ ��/��
In the DUFMAN studies, the final multipath models were derived assuming the ������ of 0.03m for all signals and 0.04m for the Ifree combination. The values were conservatively estimated through initial studies and have to be further confirmed. In [13], a detailed study on the receiver noise was performed and the obtained values are slightly below the ones assumed in DUFMAN. However, the impact of the different models is considered very small and in the simulations in this paper the values of 0.04m assumed in DUFMAN are used. AGDV error measurements The antenna induced errors on the pseudorange were estimated from measurements in an anechoic antenna measurement chamber by passing the antenna response function through an ideal receiver. The errors are obtained for each signal and frequency. Different commercial antennas were measured at DLR and it has been observed that the errors are different for each antenna. For the derivation of the initial AGDV models, the antenna chosen to analyze was the one that had the largest group delay variations for both frequency bands in order to be representative of a minimally MOPS-compliant commercial antenna and provide conservative values at both bands and in the Ifree combination [6]. The same measurements presented in [6] are used in this study. The measurements in terms of the obtained AGDV errors will be included in the final paper. User antenna error characterization in position domain In this subsection, we describe the characterization of the antenna induced error in the position domain. The AGDV errors for GPS L1/L5 and Galileo E1/E5a dual-frequency measurements are estimated by using the following Ifree combination of single frequency AGDV measurements on the different frequencies, L1 and L5 (or E1 and E5):
�����,�� =���
�
���� ����
� �����,�� −���
�
���� ����
� �����,�� (3)
in which �����,�� and �����,�� are respectively AGDV measurements on L1 and L5 frequencies. In this work, the measurements collected and analyzed in DUFMAN [2] were used for the error characterization. Antenna bias residuals to be projected into the position domain are then calculated as follows.
������,��,� = �����,��,� −�
�∑ �����,��,�
�� (4)
where �: satellite index N: no. of satellites in view ������,�: antenna bias residual for the measurement from the ��� satellite The bias residual for each satellite at each epoch is projected into the position domain as follows.
� = �
��
⋮��
� = � �
������,��,�
⋮������,��,�
� where � = (����)����� (5)
where
691
� : state vector (i.e., position errors and clock biases) � : geometry matrix � : weight matrix determined based on pseudorange measurement error models More specifically, � = ��� (6)
where
� = ���
� ⋯ 0⋮ ⋱ ⋮0 ⋯ ��
�� (7)
For the dual-frequency based ARAIM, variances for each measurement, ��
�, are constructed by considering the satellite ephemeris and clock error, tropospheric error, and code noise and multipath error components [5]. The bias effect should be considered in addition to the existing error components in (7) to construct the projection from the measurement domain to the position domain as follows. ∆�� = ��� − �� = ��� = ��(������� + �����) = ��������� + ������� (8) where � : index for the state, e.g., the east, north, and up components �� : a row vector of the projection matrix for the ��� state ∆��: position error ��� and �� : position estimate and actual position � : measurement error vector �������: measurement error due to satellite ephemeris/clock error, tropospheric error, and multipath �����: antenna bias residual contribution In the rest of the paper, for simplicity, we assume the state of interest as the vertical position coordinate. In (8), the error vector, �, contains the error sources considered within the measurement error model in (7). As shown in (8), since the projection via the matrix � is a linear transformation, if the antenna error, represented as �����, is statistically independent of � in the range domain, they are also independent in the position domain. The vertical protection level equation for the ARAIM [5] is shown in (9)
2� �������
��� + ∑ ������,�� �
���������
����
��� = ������������� (9)
where � : tail probability of a zero mean unit Gaussian distribution ��: standard deviation of all-in-view position solution (��) ��: standard deviation of fault-tolerant position solution for �� (� = 1, ⋯ , �) ��: nominal bias for �� (� = 1, ⋯ , �) ��: threshold for SS test for the ��� fault mode �������������: integrity risk allocation for monitored faults (in this example, it’s for vertical coordinate) If the position error due to the AGDV effect in the measurement domain is Gaussian distributed for the ��� fault mode, i.e., �(��,����, ��,����), the standard deviation and the mean should be incorporated in the protection level equation shown in (10).
2� �����(�����,����)
�������,����
�� + ∑ ������,�� �
�������(�����,����)
�������,����
���
��� = ������������� (10)
692
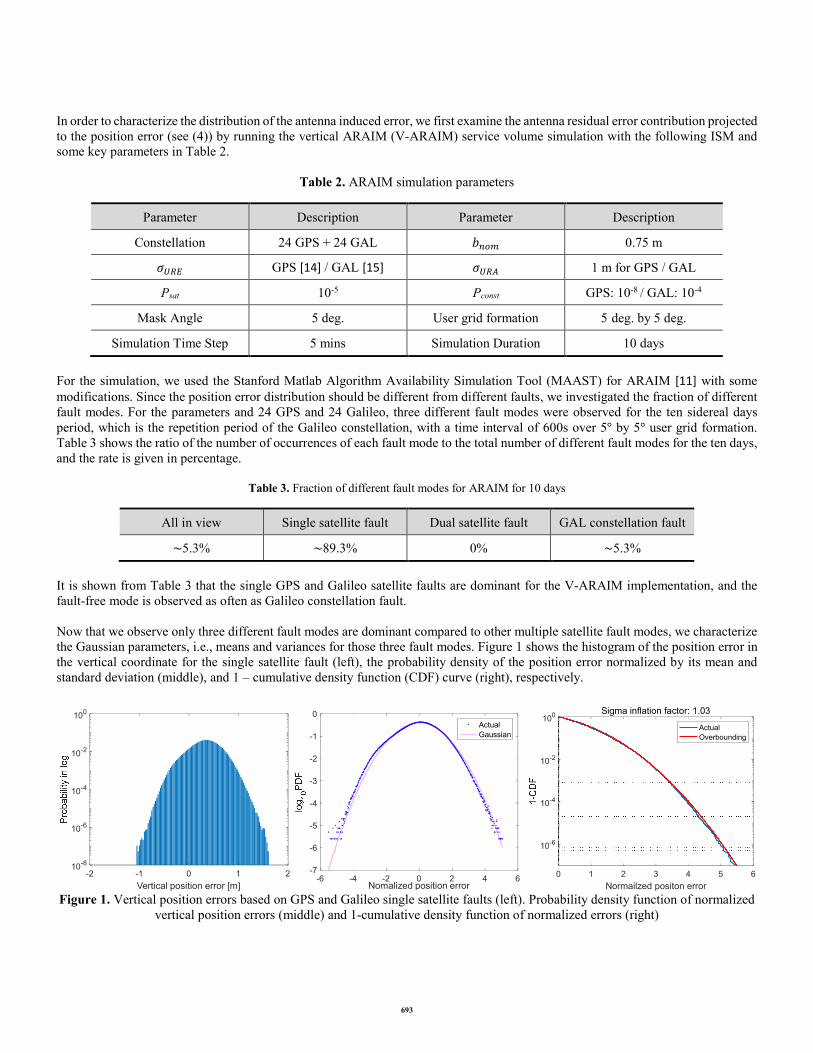
In order to characterize the distribution of the antenna induced error, we first examine the antenna residual error contribution projected to the position error (see (4)) by running the vertical ARAIM (V-ARAIM) service volume simulation with the following ISM and some key parameters in Table 2.
Table 2. ARAIM simulation parameters
Parameter Description Parameter Description
Constellation 24 GPS + 24 GAL ���� 0.75 m
���� GPS [14] / GAL [15] ���� 1 m for GPS / GAL
Psat 10-5 Pconst GPS: 10-8 / GAL: 10-4
Mask Angle 5 deg. User grid formation 5 deg. by 5 deg.
Simulation Time Step 5 mins Simulation Duration 10 days
For the simulation, we used the Stanford Matlab Algorithm Availability Simulation Tool (MAAST) for ARAIM [11] with some modifications. Since the position error distribution should be different from different faults, we investigated the fraction of different fault modes. For the parameters and 24 GPS and 24 Galileo, three different fault modes were observed for the ten sidereal days period, which is the repetition period of the Galileo constellation, with a time interval of 600s over 5° by 5° user grid formation. Table 3 shows the ratio of the number of occurrences of each fault mode to the total number of different fault modes for the ten days, and the rate is given in percentage.
Table 3. Fraction of different fault modes for ARAIM for 10 days
All in view Single satellite fault Dual satellite fault GAL constellation fault
~5.3% ~89.3% 0% ~5.3%
It is shown from Table 3 that the single GPS and Galileo satellite faults are dominant for the V-ARAIM implementation, and the fault-free mode is observed as often as Galileo constellation fault. Now that we observe only three different fault modes are dominant compared to other multiple satellite fault modes, we characterize the Gaussian parameters, i.e., means and variances for those three fault modes. Figure 1 shows the histogram of the position error in the vertical coordinate for the single satellite fault (left), the probability density of the position error normalized by its mean and standard deviation (middle), and 1 – cumulative density function (CDF) curve (right), respectively.
Figure 1. Vertical position errors based on GPS and Galileo single satellite faults (left). Probability density function of normalized
vertical position errors (middle) and 1-cumulative density function of normalized errors (right)
-2 -1 0 1 2
Vertical position error [m]
10-8
10-6
10-4
10-2
100
-6 -4 -2 0 2 4 6Nomalized position error
-7
-6
-5
-4
-3
-2
-1
0Actual
Gaussian
0 1 2 3 4 5 6
Normailzed positon error
10-6
10-4
10-2
100Sigma inflation factor: 1.03
Actual
Overbounding
693

The histogram shows that the maximum position error due to the antenna error in the vertical coordinate is approximately 1.7 m for the single satellite fault. Also, in Figure 1 (middle), the blue dotted curve indicates the probability density function (PDF) of normalized position errors in the log scale. The magenta sloid curve is the PDF of unit Gaussian distribution. Comparison of the empirical PDF and the theoretical standard Gaussian PDF shows that the position error due to the AGDV effect has a non-Gaussian tail, particularly for the probability of lower than 10��. Therefore, we derive an overbounding variance for the empirical error distribution using the 1-CDF overbounding method. In Figure 1 (right), the empirical error distribution with the non-Gaussian tail (blue curve) is bounded by the distribution with the inflated variance by a factor of 1.03 (red curve). Similarly, Figure 2 shows the same type of plots, as shown in Figure 1 for the Galileo constellation fault mode. In this case, the maximum vertical position error is approximately 2m because, under the constellation fault mode, fewer satellites are used for the position estimation. Such errors result in a heavy non-Gaussian tail in Figure 2 (middle), which significantly exceeds the theoretical unit Gaussian PDF (magenta curve). Thus, the inflation by a factor of 1.45 is needed for the inflated distribution (red curve) that overbounds the empirical one (blue curve), as shown in the right figure.
Figure 2. Histogram of vertical position errors obtained from the Galileo constellation fault (left). Relevant probability density
function (middle) and 1-cumulative density function (right) of normalized vertical errors
Table 4 summarizes the standard deviations and means of the position error distributions examined for the horizontal and vertical coordinates.
Table 4. Position error statistics for the fault-free case, single satellite fault, and Galileo constellation fault mode
Fault mode Vertical Horizontal (East) Horizontal (North)
����� [m] ����� [m] ����� [m] ����� [m] ����� [m] ����� [m]
Fault free (H0) 0.34 0.25 0.05 0.10 0.16 0.11
Single sat. fault 0.33 0.26 0.05 0.10 0.12 0.144
GAL cons. fault 0.37 0.51 0.05 0.12 0.16 0.197
In addition to the position error distributions, we need to consider the AGDV bias effect on the fault detection threshold, � in (9). The ARAIM fault detection threshold, ��, for the ��� fault mode is determined based on the standard deviation of the solution separation (SS), σ��,�, as shown in (11). �� = �����,� for � = 1,2, ⋯ , ℎ (11)
-3 -2 -1 0 1 2 3
Vertical position error [m]
10-6
10-4
10-2
-6 -4 -2 0 2 4Nomalized position error
-12
-10
-8
-6
-4
-2
0
Actual
Gaussian
0 2 4 6 8
Normailzed positon error
10-6
10-4
10-2
100Sigma inflation factor: 1.45
Actual
Overbounding
694
Here the factor �� is obtained based on the continuity requirement allocated to the ��� fault hypothesis. The SS, denoted as ���� in (12), is defined as the difference between the all-in-view solution, ���, and the subset solution, ���, which is determined using all satellites except the faulty satellites under the hypothesis [5]. ���� = ��� − ��� = (�� − ��)� for � = 1,2, ⋯ , ℎ (12)
Here � indicates the vector whose components are pseudorange measurements for satellites in view. Therefore, we can examine the AGDV bias effect on the SS domain as the position errors due to the AGDV bias error were characterized based on the relationships in (5) and (8). AGVD bias errors are projected from the measurement domain to the position domain as follows.
�� = (�� − ��) �
������,��,�
⋮������,��,�
� (13)
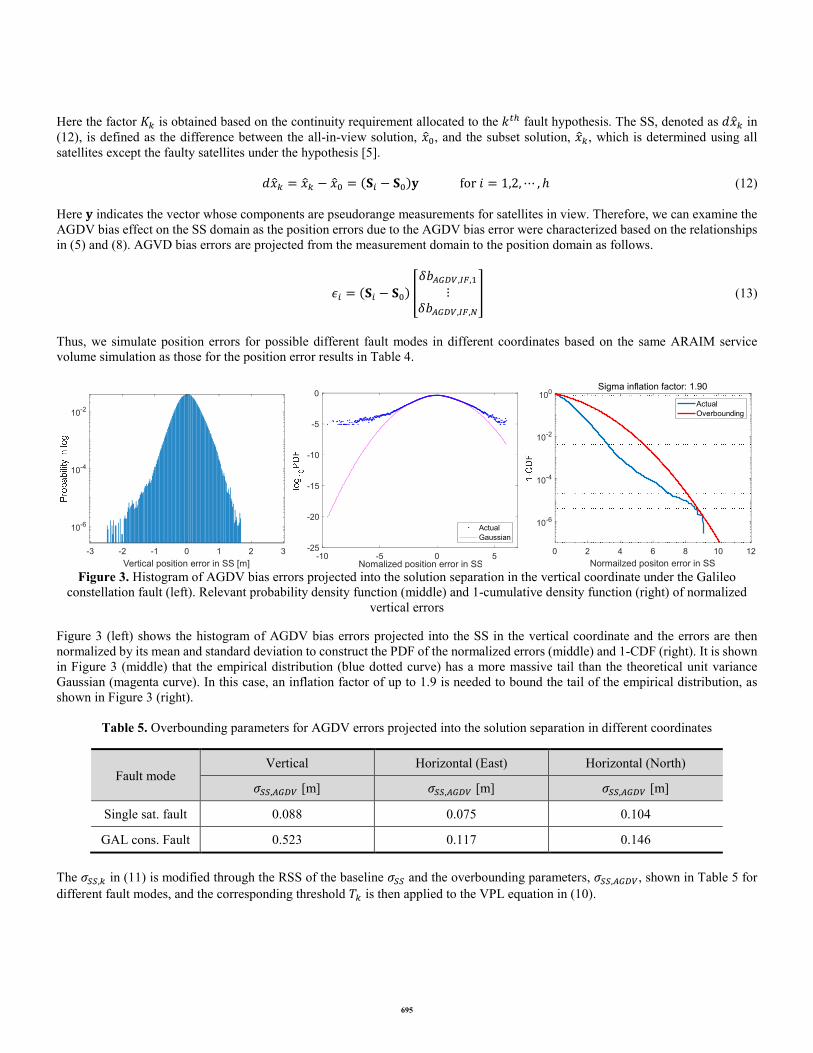
Thus, we simulate position errors for possible different fault modes in different coordinates based on the same ARAIM service volume simulation as those for the position error results in Table 4.
Figure 3. Histogram of AGDV bias errors projected into the solution separation in the vertical coordinate under the Galileo
constellation fault (left). Relevant probability density function (middle) and 1-cumulative density function (right) of normalized vertical errors
Figure 3 (left) shows the histogram of AGDV bias errors projected into the SS in the vertical coordinate and the errors are then normalized by its mean and standard deviation to construct the PDF of the normalized errors (middle) and 1-CDF (right). It is shown in Figure 3 (middle) that the empirical distribution (blue dotted curve) has a more massive tail than the theoretical unit variance Gaussian (magenta curve). In this case, an inflation factor of up to 1.9 is needed to bound the tail of the empirical distribution, as shown in Figure 3 (right).
Table 5. Overbounding parameters for AGDV errors projected into the solution separation in different coordinates
Fault mode Vertical Horizontal (East) Horizontal (North)
���,���� [m] ���,���� [m] ���,���� [m]
Single sat. fault 0.088 0.075 0.104
GAL cons. Fault 0.523 0.117 0.146
The ���,� in (11) is modified through the RSS of the baseline ��� and the overbounding parameters, ���,����, shown in Table 5 for
different fault modes, and the corresponding threshold �� is then applied to the VPL equation in (10).
-3 -2 -1 0 1 2 3
Vertical position error in SS [m]
10-6
10-4
10-2
-10 -5 0 5Nomalized position error in SS
-25
-20
-15
-10
-5
0
Actual
Gaussian
0 2 4 6 8 10 12
Normailzed positon error in SS
10-6
10-4
10-2
100Sigma inflation factor: 1.90
Actual
Overbounding
695

User antenna error characterization in range domain This subsection describes another approach to the error characterization where the AGDV bias errors are modeled in the range domain. For this purpose, the AGDV bias residuals in (3) are first collected in the range domain based on the ARAIM simulation described in the previous section. Figure 4 shows the two-dimensional histogram of the number of observations as a function of both the AGDV bias residual and the elevation angle. The horizontal axis divides the elevation angles into bins, and the vertical axis divides observations of the residuals into bins. The color of each pixel indicates the number of measurements counted.
Figure 4. AGDV bias residual measurements as a function of satellite elevation angle (left) and ����� overbound results from the
bias measurements (right).
Next, the sigma overbounding method is used to characterize the AGDV bias residual errors as follows. The mean (�����) and standard deviation (�����) of the residuals in each bin are calculated, and they are used to normalize the residuals by removing their mean and dividing them by their standard deviation in each bin. In this step, an additional margin for the sample means and standard deviations, i.e., ����� and ����� is taken into account since the amount of data could be insufficient to ensure the stringent integrity requirement of 10�� for ARAIM applications. The upper bound of the sample standard deviation can be derived by considering χ�-distributed-based confidence interval with the 1 − α confidence level. In this work, 95% confidence level was considered.
������ = �(���)
���,���
� ����� (14)
The upper bound of the sample mean can be calculated based on a two-sided t-interval with the 1 − α confidence level, as shown below:
�̂���� = ����� + ���
�,���
√�� ����� (15)
Based on the distribution of normalized AGDV bias residuals, the inflation factor (�) is then determined in each bin, as shown in the previous position domain analysis. Lastly, the “����� overbound” for each bin is computed as: ����� = |�̂����| + ������� (16)
10 20 30 40 50 60 70 80 90
Elevation angle (Deg)
-0.4
-0.2
0
0.2
0.4
0.6
0.8
AGDV overbound
AGDV
AGDV
696
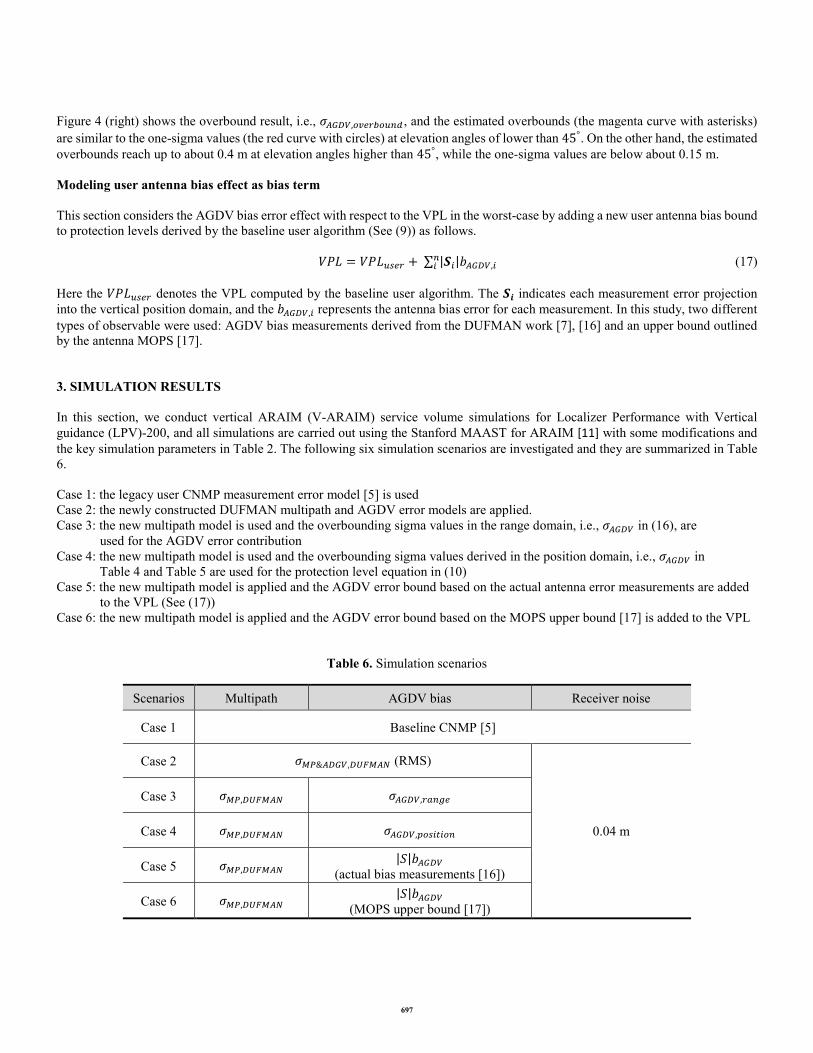
Figure 4 (right) shows the overbound result, i.e., �����,��������� , and the estimated overbounds (the magenta curve with asterisks)
are similar to the one-sigma values (the red curve with circles) at elevation angles of lower than 45°. On the other hand, the estimated overbounds reach up to about 0.4 m at elevation angles higher than 45°, while the one-sigma values are below about 0.15 m. Modeling user antenna bias effect as bias term This section considers the AGDV bias error effect with respect to the VPL in the worst-case by adding a new user antenna bias bound to protection levels derived by the baseline user algorithm (See (9)) as follows. ��� = ������� + ∑ |��|�����,�
�� (17)
Here the ������� denotes the VPL computed by the baseline user algorithm. The �� indicates each measurement error projection into the vertical position domain, and the �����,� represents the antenna bias error for each measurement. In this study, two different types of observable were used: AGDV bias measurements derived from the DUFMAN work [7], [16] and an upper bound outlined by the antenna MOPS [17]. 3. SIMULATION RESULTS In this section, we conduct vertical ARAIM (V-ARAIM) service volume simulations for Localizer Performance with Vertical guidance (LPV)-200, and all simulations are carried out using the Stanford MAAST for ARAIM [11] with some modifications and the key simulation parameters in Table 2. The following six simulation scenarios are investigated and they are summarized in Table 6. Case 1: the legacy user CNMP measurement error model [5] is used Case 2: the newly constructed DUFMAN multipath and AGDV error models are applied. Case 3: the new multipath model is used and the overbounding sigma values in the range domain, i.e., ����� in (16), are used for the AGDV error contribution Case 4: the new multipath model is used and the overbounding sigma values derived in the position domain, i.e., ����� in Table 4 and Table 5 are used for the protection level equation in (10) Case 5: the new multipath model is applied and the AGDV error bound based on the actual antenna error measurements are added to the VPL (See (17)) Case 6: the new multipath model is applied and the AGDV error bound based on the MOPS upper bound [17] is added to the VPL
Table 6. Simulation scenarios
Scenarios Multipath AGDV bias Receiver noise
Case 1 Baseline CNMP [5]
Case 2 ���&����,������ (RMS)
0.04 m
Case 3 ���,������ �����,�����
Case 4 ���,������ �����,��������
Case 5 ���,������ |�|�����
(actual bias measurements [16])
Case 6 ���,������ |�|�����
(MOPS upper bound [17])
697

Also, in this investigation, a constant sigma value of 0.04m is applied for the receiver tracking noise component (������) within the airborne pseudorange error model described in (1). We first assess the baseline performance based on the legacy CNMP model. Figure 5 (left) shows the 99.5% LPV-200 availability map as a function of user location when the legacy model is applied as described for Case 1. Figure 5 (right) shows the map obtained when the newly derived multipath and user antenna error models are used. The availability indicates the percentage of time that the user H/VPL is less than the corresponding horizontal/vertical alert limit (H/VAL). In the availability map, the 99.5% coverage is approximately 90.54%. The coverage indicates the fraction of users within which had a time availability of 99.5% or greater, represented as the purple or dark purple regions. It can be shown in Figure 5 that the global availability increases by around 5% if the new DUFMAN multipath and user antenna error models are applied for the ARAIM fault detection and protection level computation. This is because the modified multipath model for GPS L1/L5 and Galileo E1/E5a has lower bounds than the legacy GPS L1 multipath model, particularly for low satellite elevation angles [6].
Figure 5. 99.5% availability map for LPV-200 when the legacy noise and multipath model is applied (left) and the availability map if the newly derived multipath and user antenna model (i.e., DUFMAN ���&���� in (2)) are used for ARAIM fault detection algorithm (right)
Figure 6. VPLs based on different error models: Case 2 (blue) and Case 3 (green)
0 2 4 6 8 10 12 14 16 18 20 22 24
Time (hours)
10
15
20
25
30
35
40
DUFMAN, MP&AGDV
Overbounding,Range
698
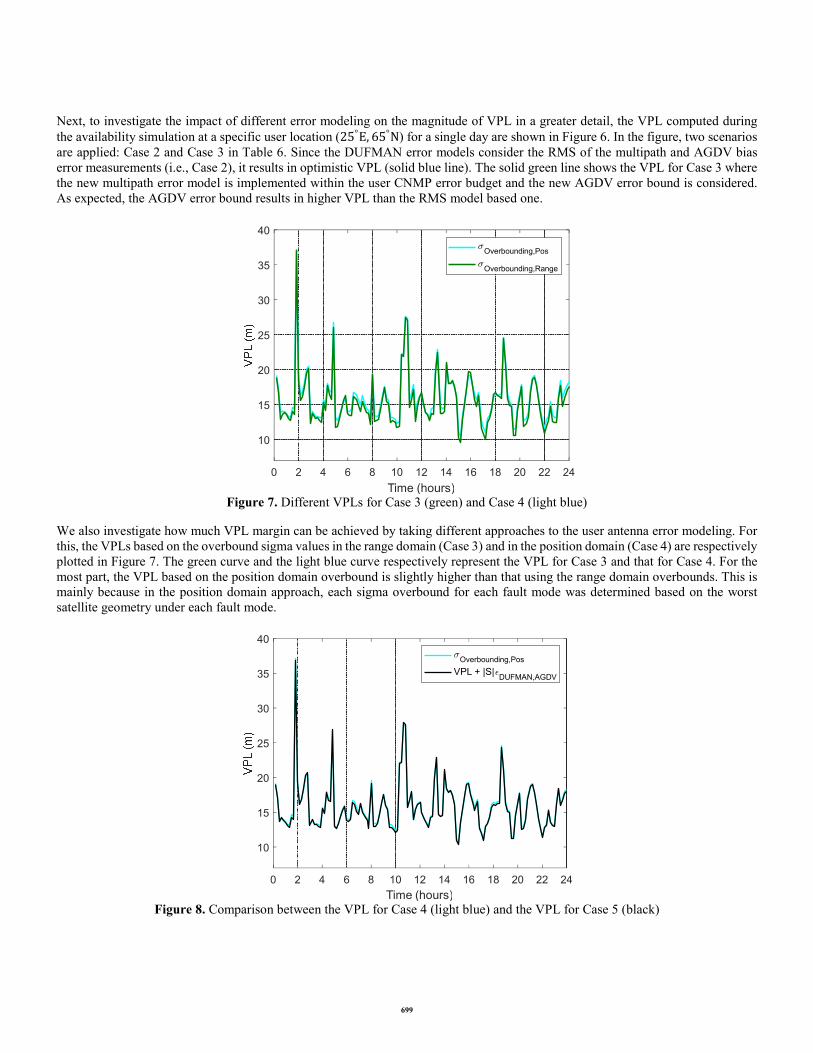
Next, to investigate the impact of different error modeling on the magnitude of VPL in a greater detail, the VPL computed during the availability simulation at a specific user location (25°E, 65°N) for a single day are shown in Figure 6. In the figure, two scenarios are applied: Case 2 and Case 3 in Table 6. Since the DUFMAN error models consider the RMS of the multipath and AGDV bias error measurements (i.e., Case 2), it results in optimistic VPL (solid blue line). The solid green line shows the VPL for Case 3 where the new multipath error model is implemented within the user CNMP error budget and the new AGDV error bound is considered. As expected, the AGDV error bound results in higher VPL than the RMS model based one.
Figure 7. Different VPLs for Case 3 (green) and Case 4 (light blue)
We also investigate how much VPL margin can be achieved by taking different approaches to the user antenna error modeling. For this, the VPLs based on the overbound sigma values in the range domain (Case 3) and in the position domain (Case 4) are respectively plotted in Figure 7. The green curve and the light blue curve respectively represent the VPL for Case 3 and that for Case 4. For the most part, the VPL based on the position domain overbound is slightly higher than that using the range domain overbounds. This is mainly because in the position domain approach, each sigma overbound for each fault mode was determined based on the worst satellite geometry under each fault mode.
Figure 8. Comparison between the VPL for Case 4 (light blue) and the VPL for Case 5 (black)
0 2 4 6 8 10 12 14 16 18 20 22 24
Time (hours)
10
15
20
25
30
35
40
Overbounding,Pos
Overbounding,Range
0 2 4 6 8 10 12 14 16 18 20 22 24
Time (hours)
10
15
20
25
30
35
40
Overbounding,Pos
VPL + |S|DUFMAN,AGDV
699
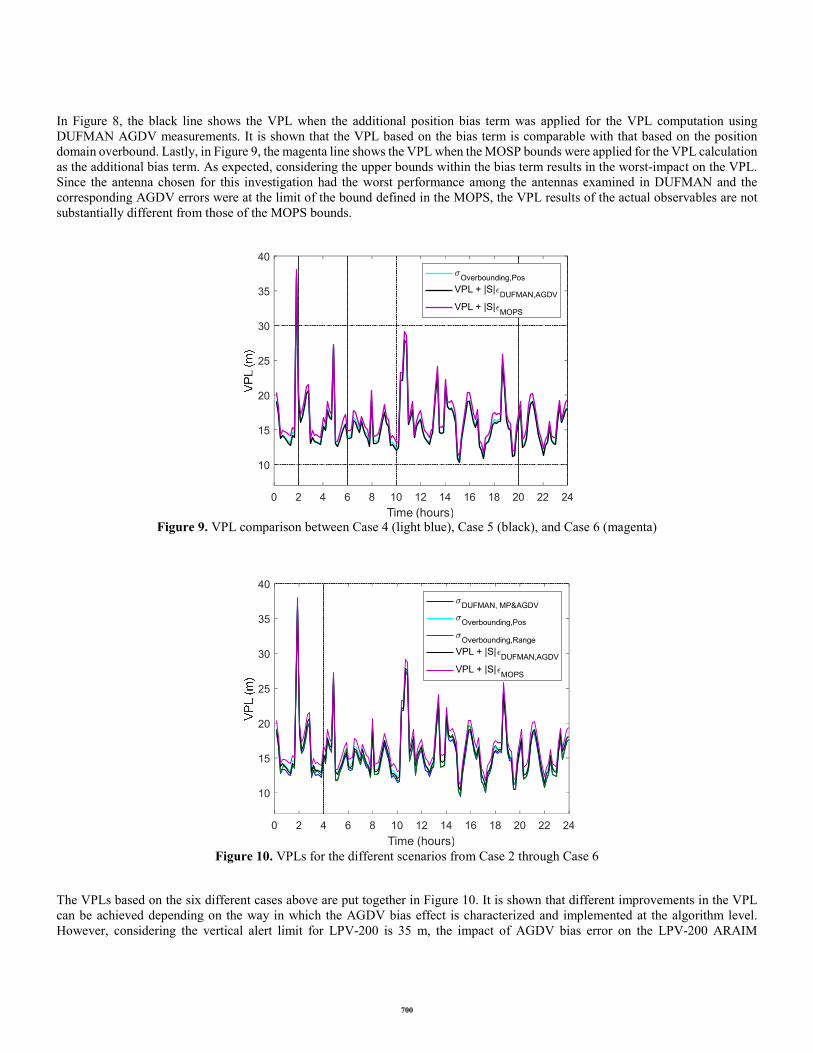
In Figure 8, the black line shows the VPL when the additional position bias term was applied for the VPL computation using DUFMAN AGDV measurements. It is shown that the VPL based on the bias term is comparable with that based on the position domain overbound. Lastly, in Figure 9, the magenta line shows the VPL when the MOSP bounds were applied for the VPL calculation as the additional bias term. As expected, considering the upper bounds within the bias term results in the worst-impact on the VPL. Since the antenna chosen for this investigation had the worst performance among the antennas examined in DUFMAN and the corresponding AGDV errors were at the limit of the bound defined in the MOPS, the VPL results of the actual observables are not substantially different from those of the MOPS bounds.
Figure 9. VPL comparison between Case 4 (light blue), Case 5 (black), and Case 6 (magenta)
Figure 10. VPLs for the different scenarios from Case 2 through Case 6
The VPLs based on the six different cases above are put together in Figure 10. It is shown that different improvements in the VPL can be achieved depending on the way in which the AGDV bias effect is characterized and implemented at the algorithm level. However, considering the vertical alert limit for LPV-200 is 35 m, the impact of AGDV bias error on the LPV-200 ARAIM
0 2 4 6 8 10 12 14 16 18 20 22 24
Time (hours)
10
15
20
25
30
35
40
Overbounding,Pos
VPL + |S|DUFMAN,AGDV
VPL + |S|MOPS
0 2 4 6 8 10 12 14 16 18 20 22 24
Time (hours)
10
15
20
25
30
35
40
DUFMAN, MP&AGDV
Overbounding,Pos
Overbounding,Range
VPL + |S|DUFMAN,AGDV
VPL + |S|MOPS
700

availability performance could be marginal if we employ the newly proposed (or less conservative) multipath and noise models. Moreover, it should be noted that this analysis is based on limited results (e.g., the AGDV error model for a specific antenna type) and variation in parameters such as the URA value used for the simulations could lead to different results. 4. CONCLUSION This paper examines the impact of the newly proposed multipath and AGDV bias model on the ARAIM performance. The results showed the maximum increase of approximately 5% of the 99.5% availability for LPV-200 when the newly constructed DUFMAN multipath and antenna error models for GPS L1/L5 and Galileo E1/E5a signals are accounted for the future ARAIM implementation. On the other hand, it appears that although conservative error modeling methods result in higher protection levels, the impact of AGDV induced error on the LPV-200 availability performance is marginal, compared to the GPS L1 multipath and the receiver noise contribution. Future work should include the investigation of the impact of the new airborne measurement error models on other high integrity aviation applications such as dual-frequency multi-constellation Satellite-based Augmentation System.
701
REFERENCES
[1] M.-S. Circiu et al., “Airborne multipath and antenna error models from the DUFMAN project.” NSP meeting, Jun. 2020. [2] M.-S. Circiu et al., “Final Results on Airborne Multipath Models for Dual-constellation Dual-frequency Aviation Applications,” San Diego,
California, Jan. 2021. [3] Working Group C. ARAIM Technical Subgroup, “Milestone 3.0 report. Technical Report.” EU-US Cooperation on Satellite Navigation, 2016. [4] T. Walter, K. Gunning, R. Eric Phelts, and J. Blanch, “Validation of the Unfaulted Error Bounds for ARAIM: Validation of the Unfaulted
Error Bounds for ARAIM,” Navigation, vol. 65, no. 1, pp. 117–133, Mar. 2018, doi: 10.1002/navi.214. [5] J. Blanch et al., “Baseline advanced RAIM user algorithm and possible improvements,” IEEE Trans. Aerosp. Electron. Syst., vol. 51, no. 1,
pp. 713–732, Jan. 2015, doi: 10.1109/TAES.2014.130739. [6] M. Circiu, S. Caizzone, M. Felux, C. Enneking, M. Rippl, and M. Meurer, “Development of the dual‐frequency dual‐constellation airborne
multipath models,” Navigation, vol. 67, no. 1, pp. 61–81, Mar. 2020, doi: 10.1002/navi.344. [7] M.-S. Circiu et al., “Initial Results for Dual Constellation Dual-frequency Multipath Models,” in 32nd International Technical Meeting of the
Satellite Division of The Institute of Navigation (ION GNSS+ 2019), Miami, Florida, Oct. 2019, pp. 1401–1417, doi: 10.33012/2019.16906. [8] J. Griggs, M. Rippl, S. Caizzone, and M.-S. Circiu, “Effects of Preliminary DFMC Multipath Models on ARAIM Performance,” in 2020
International Technical Meeting of The Institute of Navigation, San Diego, California, Feb. 2020, pp. 174–188, doi: 10.33012/2020.17136. [9] M.-S. Circiu et al., “Initial Results for Dual Constellation Dual-frequency Multipath Models,” in 32nd International Technical Meeting of the
Satellite Division of The Institute of Navigation (ION GNSS+ 2019), Miami, Florida, Oct. 2019, pp. 1401–1417, doi: 10.33012/2019.16906. [10] M. Circiu, S. Caizzone, M. Felux, C. Enneking, M. Rippl, and M. Meurer, “Development of the dual‐frequency dual‐constellation airborne
multipath models,” Navigation, vol. 67, no. 1, pp. 61–81, Mar. 2020, doi: 10.1002/navi.344. [11] “MatLab Algorithm Availability Simulation Tool.” https://gps.stanford.edu/resources/tools/maast (accessed Aug. 05, 2020). [12] T. Murphy, M. Brenner, H. Cas-Spo, and D. S. Pullen, “Development of the LAAS Accuracy Models,” in Proceedings of the 13th International
Technical Meeting of the Satellite Division of The Institute of Navigation (ION GPS 2000), Salt Lake City, UT, Sep. 2000, pp. 1212–1223. [13] M. Harris, P. Schlais, T. Murphy, A. Joseph, J. Kazmierczak, and C. Aerospace, “GPS and GALILEO Airframe Multipath Error Bounding
Method and Test Results,” in Proceedings of the 33rd International Technical Meeting of the Satellite Division of The Institute of Navigation (ION GNSS+ 2020), Sep. 2020, pp. 114–139.
[14] T. Walter and J. Blanch, “KEYNOTE - Characterization of GNSS Clock and Ephemeris Errors to Support ARAIM,” in Proceedings of the ION 2015 Pacific PNT Meeting, Honolulu, Hawaii, Apr. 2015, pp. 920–931.
[15] S. Perea, M. Meurer, M. Rippl, B. Belabbas, and M. Joerger, “URA/SISA Analysis for GPS and Galileo to Support ARAIM: URA/SISA Analysis for GPS and Galileo ARAIM,” Navigation, vol. 64, no. 2, pp. 237–254, Jun. 2017, doi: 10.1002/navi.199.
[16] S. Caizzone, M.-S. Circiu, W. Elmarissi, C. Enneking, and A. Winterstein, “Airborne Antenna and Multipath Error Characterization for DFMC Error Standardization,” in 32nd International Technical Meeting of the Satellite Division of The Institute of Navigation (ION GNSS+ 2019), Miami, Florida, Oct. 2019, pp. 1453–1463, doi: 10.33012/2019.16908.
[17] RTCA SC-159, “MOPS for GNSS Airborne Active Antenna Equipment for the L1/E1 and L5/E5a Frequency Bands.” Jun. 2018.
702