Embed Size (px)
Citation preview
1
Annual US Geothermal Power Production and Development Report
April 2012
Geothermal Energy Association
2
GEOTHERMAL ENERGY ASSOCIATION
209 Pennsylvania Avenue SE, Washington, D.C. 20003 USA Phone: (202) 454-5261 Fax: (202) 454-5265 Web Site: www.geo-energy.org
ANNUAL GEOTHERMAL POWER PRODUCTION AND DEVELOPMENT
REPORT: APRIL 2012
Contents 1. Methodology and Terms ........................................................................................................................................... 3
Geothermal Resource Types and their Definitions .................................................................................................... 3
Tracking Projects through the Development Timeline .............................................................................................. 4
Planned Capacity Addition (PCA) and Resource Capacity ......................................................................................... 4
2. The US Geothermal Industry .................................................................................................................................... 6
Installed Capacity ....................................................................................................................................................... 6
Capacity in Development ........................................................................................................................................... 9
3. State Tables: Capacity in Development ................................................................................................................... 16
4. Emerging Technology Demonstration Projects ....................................................................................................... 32
5. Appendix: Glossary of Terms Used in this Report ................................................................................................... 34
6. References ............................................................................................................................................................... 35
Please Note: GEA is reporting project information that is provided by developers or public sources. We do not independently verify the data provided or warrant its accuracy.
Cover photo courtesy of Gradient Resources.
3
1. Methodology and Terms To increase the accuracy and value of information presented in its annual US Geothermal Power Production and Development Report, the Geothermal Energy Association (GEA) developed a reporting system, known as the Geothermal Reporting Terms and Definitions, in 2010. The Geothermal Reporting Terms and Definitions serve as a guideline to project developers in reporting geothermal project development information to the GEA. A basic understanding of the Geothermal Reporting Terms and Definitions will also aid the reader in fully understanding the information presented in this annual report. The Geothermal Reporting Terms and Definitions serve to increase reporting clarity and accuracy by providing industry and the public with a lexicon of definitions relating to the types of different geothermal projects, and a guideline for determining which phase of development a geothermal resource is in. These two tools help to characterize resource development by type and technology. They also help to determine a geothermal project’s position in the typical project development timeline.
Geothermal Resource Types and their Definitions In reporting a project in development to the GEA, the developer of a geothermal resource is asked to indicate which of the following definitions the project falls under:
Conventional Hydrothermal (Unproduced Resource): the development of a
geothermal resource where levels of geothermal reservoir temperature and reservoir flow capacity are naturally sufficient to produce electricity and where development of the geothermal reservoir has not previously occurred to the extent that it supported the operation of geothermal power plant(s). Such a project will be labeled as “CH Unproduced” in this report.
Conventional Hydrothermal (Produced Resource): the development of a
geothermal resource where levels of geothermal reservoir temperature and reservoir flow capacity are naturally sufficient to produce electricity and where development of the geothermal reservoir has previously occurred to the extent that it currently supports or has supported the operation of geothermal power plant(s). Such a project will be labeled as “CH Produced” in this report.
Conventional Hydrothermal Expansion: the expansion of an existing geothermal
power plant and its associated drilled area so as to increase the level of power that the power plant produces. Such a project will be labeled as “CH Expansion” in this report.
Geothermal Energy Association
4
Geothermal Energy and Hydrocarbon Coproduction: the utilization of
produced fluids resulting from oil and/or gas-field development for the production of geothermal power. Such a project will be labeled as “Coproduction” in this report.
Geopressured Systems: the utilization of kinetic energy, hydrothermal energy, and
energy produced from the associated gas resulting from geopressured gas development to produce geothermal electricity. Such projects will be labeled as “Geopressure” in this report.
Enhanced Geothermal Systems: the development of a geothermal system where
the natural flow capacity of the system is not sufficient to support adequate power production but where hydraulic fracturing of the system can allow production at a commercial level. Such a project will be labeled as “EGS” in this report.
Tracking Projects through the Development Timeline In addition to defining their projects according the above list of definitions, developers also indicate to GEA their projects’ current status in the project development timeline using a four-phase system. This system captures how much, and what type of, work has been performed on that particular geothermal resource up until the present time. These four phases of project development are:
Phase I: Resource Procurement and Identification Phase II: Resource Exploration and Confirmation Phase III: Permitting and Initial Development Phase IV: Resource Production and Power Plant Construction Each of the four phases of project development is comprised of three separate sections, each of which contains phase sub-criteria. The three separate sections of sub criteria are resource development, transmission development, and external development (acquiring access to land, permitting, signing PPA’s and EPC contracts, securing a portion of project financing, etc.). For a project to be considered as being in any particular phase of development a combination of sub-criteria, specific to each individual project phase, must be met.
Planned Capacity Addition (PCA) and Resource Capacity Finally, at each phase of a project’s development a geothermal developer has the opportunity to report two project capacity estimates: a Resource Capacity estimate and a Planned Capacity Addition (PCA) estimate. At each project phase the geothermal resource capacity estimate may be thought of as the megawatt (MW) value of the total recoverable energy of the subsurface
Geothermal Energy Association
5
geothermal resource. It should not be confused with the PCA estimate, which is defined as the portion of a geothermal resource that “the developer deems to be viable for the economic production of electricity under existing economic conditions.” In other words, if the developer were to utilize the geothermal resource under its control to produce electricity via a geothermal power plant, the PCA estimate would be the power plant’s estimated installed capacity. In the case of an expansion to a conventional hydrothermal geothermal plant, the PCA estimate would be the estimated capacity to be added to the plant’s current installed capacity. In each phase of development the resource and installed capacity estimates are given different titles that reflect the level of certainty of successful project completion. The different titles as they correspond to the separate phases are as follows:
Phase I: “Possible Resource Estimate” and “Possible PCA Estimate” Phase II: “Possible Resource Estimate” and “Possible PCA Estimate”
Phase III: “Delineated Resource Estimate” and “Delineated PCA Estimate” Phase IV: “Confirmed Resource Estimate” and “Confirmed PCA Estimate” This section outlines how the Geothermal Reporting Terms and Definitions influence the reporting and presentation of project in development information in this report. For a detailed explanation of each phase of development and the outline of its sub-criteria please consult GEA’s Geothermal Reporting Terms and Definitions, available at http://geo-energy.org/pdf/NewGeothermalTermsandDefinitions_January2011.pdf.
Geothermal Energy Association
6
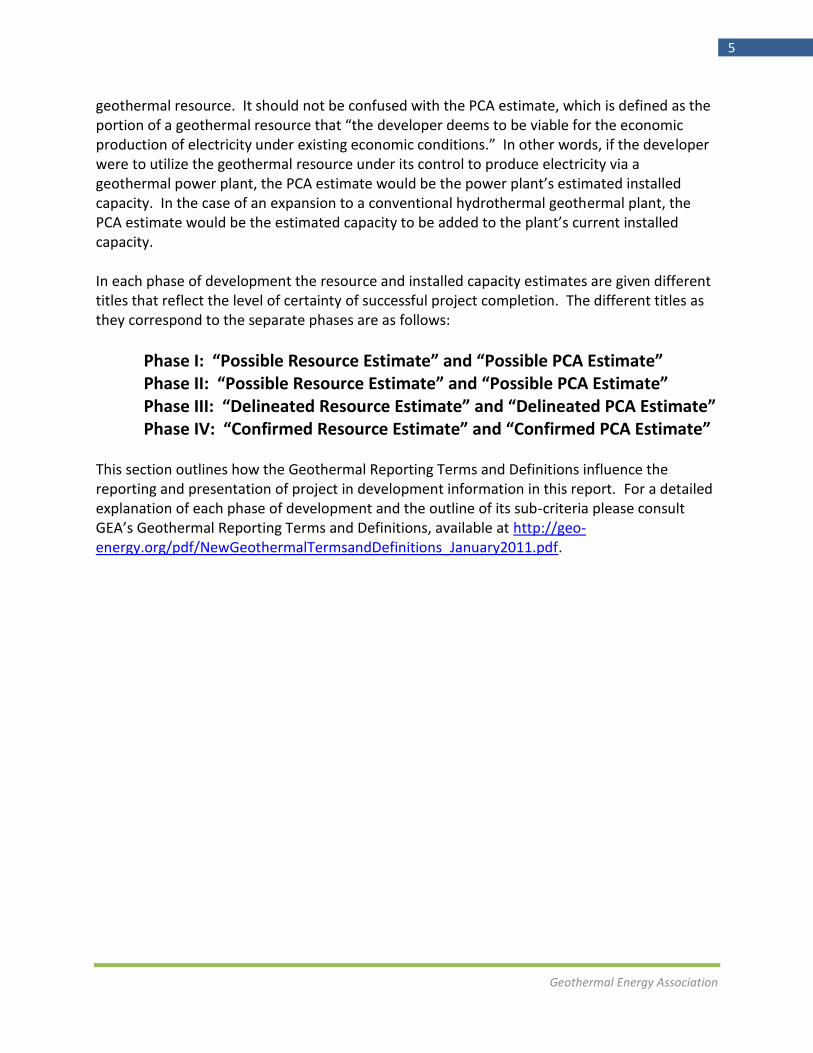
2. The US Geothermal Industry The development of geothermal energy resources for utility-scale electricity production in the United States began in the 1960’s. Since that time, the continual development of geothermal resources and technology has positioned the US as a leader in the global geothermal industry. The US currently has approximately 3187 MW of installed geothermal capacity, more than any other country in the world. Figure 1: Global Context of US Geothermal Installed Capacity 1960 – 2012
Source: GEA
Installed Capacity Geothermal companies continue to increase the development of geothermal resources in the US. In 2010 geothermal energy accounted for 3% of renewable energy-based electricity consumption in the United States.i While the majority of geothermal installed capacity in the US is concentrated in California and Nevada, geothermal power plants are also operating in Alaska, Hawaii, Idaho, Oregon, Utah, and Wyoming.
0
2000
4000
6000
8000
10000
12000
1960 1965 1970 1975 1980 1985 1990 1995 2000 2005 2010 2012
Inst
alle
d C
apac
ity
(MW
)
United States Other
2012 Global Capacity: ~11224 MW 2012 US Capacity: ~3187 MW
Geothermal Energy Association
7
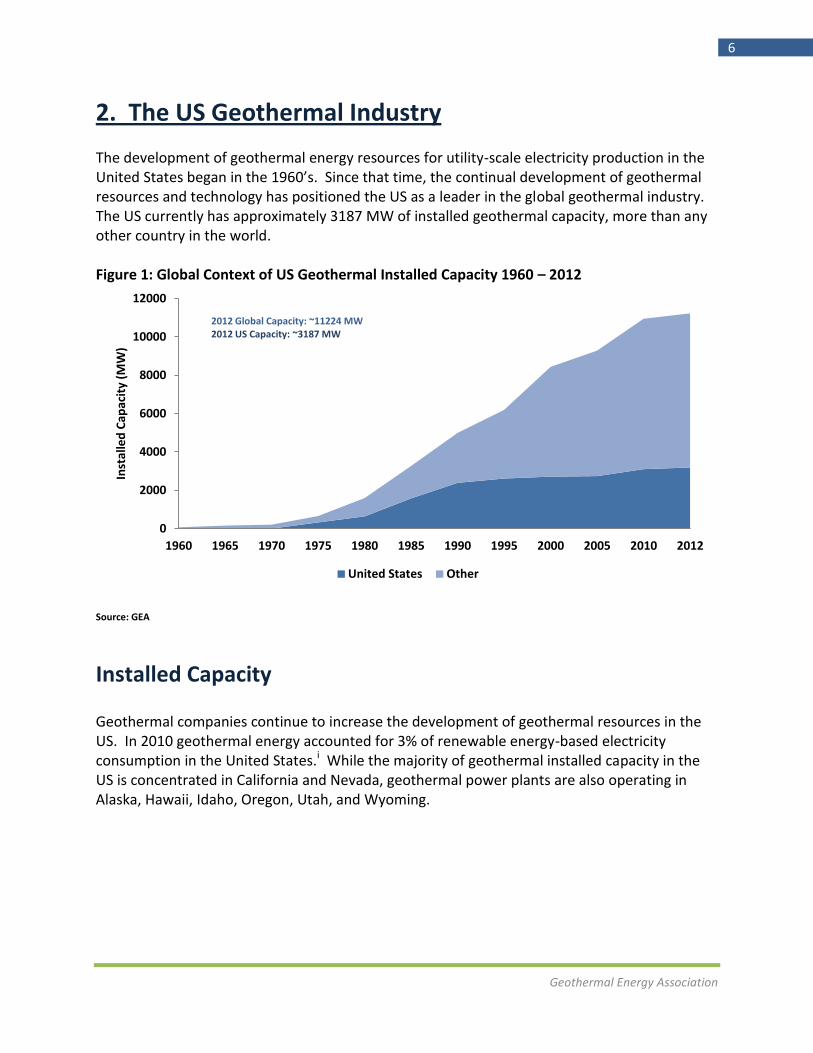
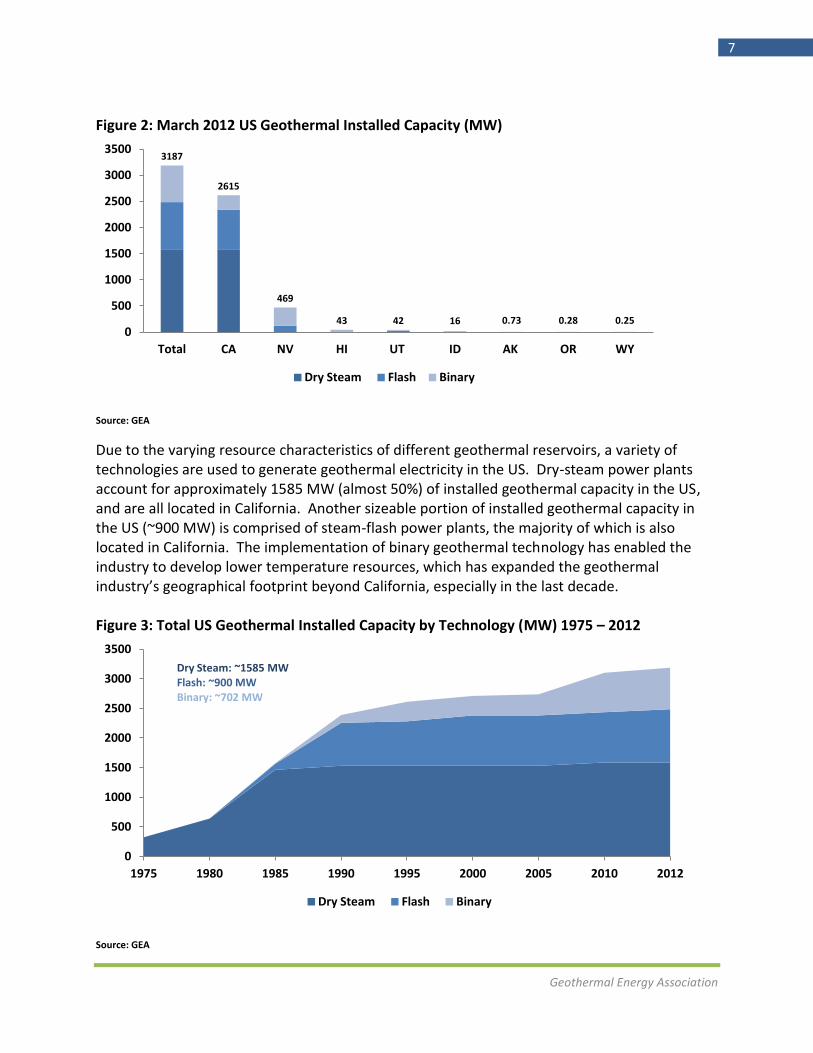
Figure 2: March 2012 US Geothermal Installed Capacity (MW)
Source: GEA
Due to the varying resource characteristics of different geothermal reservoirs, a variety of technologies are used to generate geothermal electricity in the US. Dry-steam power plants account for approximately 1585 MW (almost 50%) of installed geothermal capacity in the US, and are all located in California. Another sizeable portion of installed geothermal capacity in the US (~900 MW) is comprised of steam-flash power plants, the majority of which is also located in California. The implementation of binary geothermal technology has enabled the industry to develop lower temperature resources, which has expanded the geothermal industry’s geographical footprint beyond California, especially in the last decade. Figure 3: Total US Geothermal Installed Capacity by Technology (MW) 1975 – 2012
Source: GEA
3187
2615
469
43 42 16 0.73 0.28 0.25 0
500
1000
1500
2000
2500
3000
3500
Total CA NV HI UT ID AK OR WY
Dry Steam Flash Binary
0
500
1000
1500
2000
2500
3000
3500
1975 1980 1985 1990 1995 2000 2005 2010 2012
Dry Steam Flash Binary
Dry Steam: ~1585 MW Flash: ~900 MW Binary: ~702 MW
Geothermal Energy Association
8
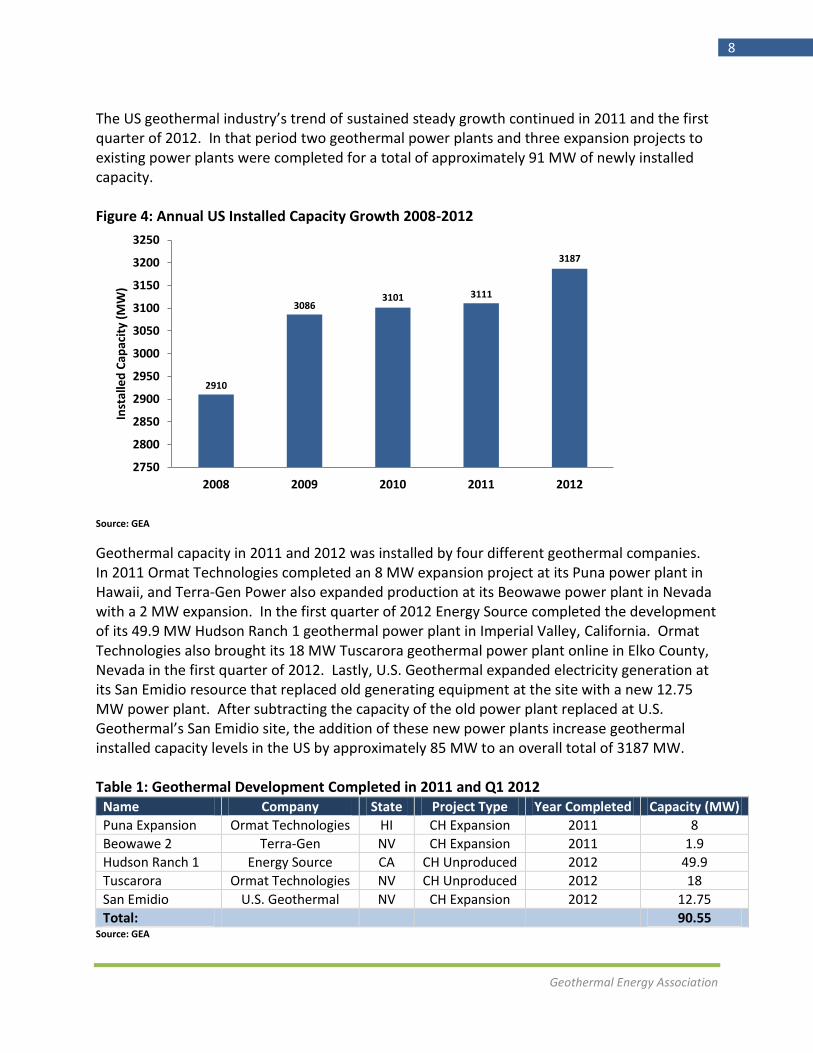
The US geothermal industry’s trend of sustained steady growth continued in 2011 and the first quarter of 2012. In that period two geothermal power plants and three expansion projects to existing power plants were completed for a total of approximately 91 MW of newly installed capacity. Figure 4: Annual US Installed Capacity Growth 2008-2012
Source: GEA
Geothermal capacity in 2011 and 2012 was installed by four different geothermal companies. In 2011 Ormat Technologies completed an 8 MW expansion project at its Puna power plant in Hawaii, and Terra-Gen Power also expanded production at its Beowawe power plant in Nevada with a 2 MW expansion. In the first quarter of 2012 Energy Source completed the development of its 49.9 MW Hudson Ranch 1 geothermal power plant in Imperial Valley, California. Ormat Technologies also brought its 18 MW Tuscarora geothermal power plant online in Elko County, Nevada in the first quarter of 2012. Lastly, U.S. Geothermal expanded electricity generation at its San Emidio resource that replaced old generating equipment at the site with a new 12.75 MW power plant. After subtracting the capacity of the old power plant replaced at U.S. Geothermal’s San Emidio site, the addition of these new power plants increase geothermal installed capacity levels in the US by approximately 85 MW to an overall total of 3187 MW. Table 1: Geothermal Development Completed in 2011 and Q1 2012
Name Company State Project Type Year Completed Capacity (MW)
Puna Expansion Ormat Technologies HI CH Expansion 2011 8
Beowawe 2 Terra-Gen NV CH Expansion 2011 1.9
Hudson Ranch 1 Energy Source CA CH Unproduced 2012 49.9
Tuscarora Ormat Technologies NV CH Unproduced 2012 18
San Emidio U.S. Geothermal NV CH Expansion 2012 12.75
Total:
90.55 Source: GEA
2910
3086 3101 3111
3187
2750
2800
2850
2900
2950
3000
3050
3100
3150
3200
3250
2008 2009 2010 2011 2012
Inst
alle
d C
apac
ity
(MW
)
Geothermal Energy Association
9
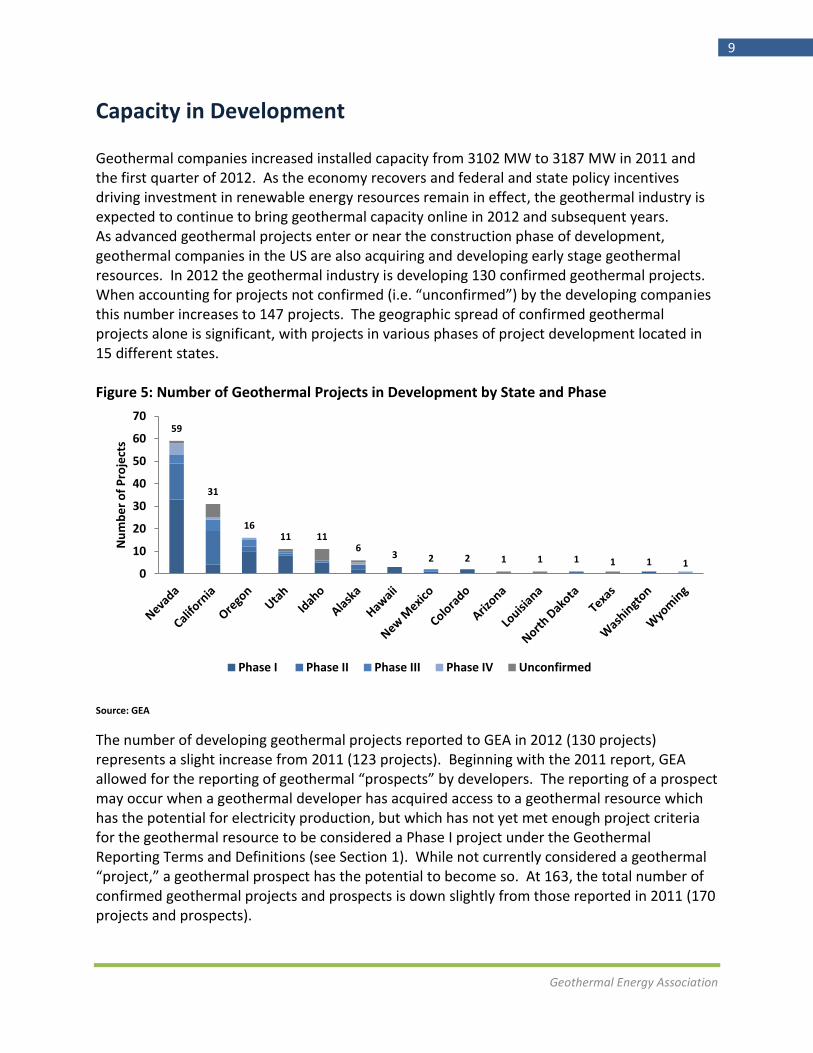
Capacity in Development Geothermal companies increased installed capacity from 3102 MW to 3187 MW in 2011 and the first quarter of 2012. As the economy recovers and federal and state policy incentives driving investment in renewable energy resources remain in effect, the geothermal industry is expected to continue to bring geothermal capacity online in 2012 and subsequent years. As advanced geothermal projects enter or near the construction phase of development, geothermal companies in the US are also acquiring and developing early stage geothermal resources. In 2012 the geothermal industry is developing 130 confirmed geothermal projects. When accounting for projects not confirmed (i.e. “unconfirmed”) by the developing companies this number increases to 147 projects. The geographic spread of confirmed geothermal projects alone is significant, with projects in various phases of project development located in 15 different states. Figure 5: Number of Geothermal Projects in Development by State and Phase
Source: GEA
The number of developing geothermal projects reported to GEA in 2012 (130 projects) represents a slight increase from 2011 (123 projects). Beginning with the 2011 report, GEA allowed for the reporting of geothermal “prospects” by developers. The reporting of a prospect may occur when a geothermal developer has acquired access to a geothermal resource which has the potential for electricity production, but which has not yet met enough project criteria for the geothermal resource to be considered a Phase I project under the Geothermal Reporting Terms and Definitions (see Section 1). While not currently considered a geothermal “project,” a geothermal prospect has the potential to become so. At 163, the total number of confirmed geothermal projects and prospects is down slightly from those reported in 2011 (170 projects and prospects).
59
31
16 11 11
6 3 2 2 1 1 1 1 1 1
0
10
20
30
40
50
60
70
Nu
mb
er
of
Pro
ject
s
Phase I Phase II Phase III Phase IV Unconfirmed
Geothermal Energy Association
10
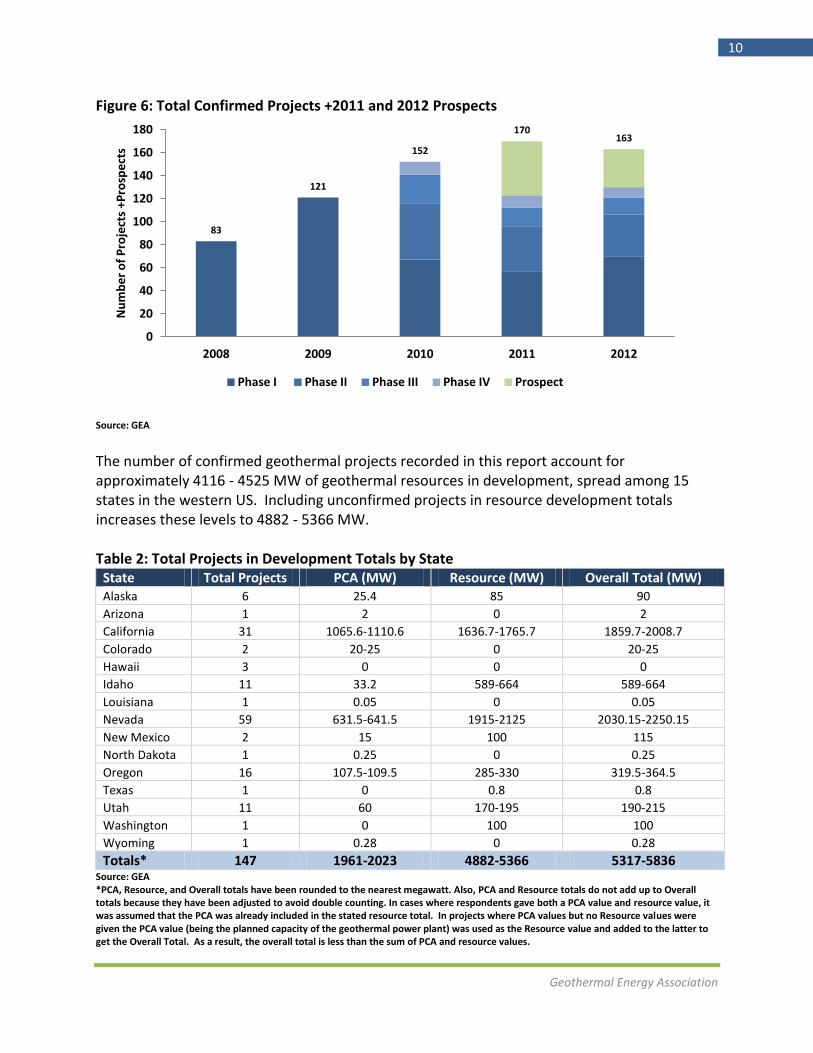
Figure 6: Total Confirmed Projects +2011 and 2012 Prospects
Source: GEA
The number of confirmed geothermal projects recorded in this report account for approximately 4116 - 4525 MW of geothermal resources in development, spread among 15 states in the western US. Including unconfirmed projects in resource development totals increases these levels to 4882 - 5366 MW. Table 2: Total Projects in Development Totals by State
State Total Projects PCA (MW) Resource (MW) Overall Total (MW) Alaska 6 25.4 85 90
Arizona 1 2 0 2
California 31 1065.6-1110.6 1636.7-1765.7 1859.7-2008.7
Colorado 2 20-25 0 20-25
Hawaii 3 0 0 0
Idaho 11 33.2 589-664 589-664
Louisiana 1 0.05 0 0.05
Nevada 59 631.5-641.5 1915-2125 2030.15-2250.15
New Mexico 2 15 100 115
North Dakota 1 0.25 0 0.25
Oregon 16 107.5-109.5 285-330 319.5-364.5
Texas 1 0 0.8 0.8
Utah 11 60 170-195 190-215
Washington 1 0 100 100
Wyoming 1 0.28 0 0.28
Totals* 147 1961-2023 4882-5366 5317-5836 Source: GEA *PCA, Resource, and Overall totals have been rounded to the nearest megawatt. Also, PCA and Resource totals do not add up to Overall totals because they have been adjusted to avoid double counting. In cases where respondents gave both a PCA value and resource value, it was assumed that the PCA was already included in the stated resource total. In projects where PCA values but no Resource values were given the PCA value (being the planned capacity of the geothermal power plant) was used as the Resource value and added to the latter to get the Overall Total. As a result, the overall total is less than the sum of PCA and resource values.
83
121
152
170 163
0
20
40
60
80
100
120
140
160
180
2008 2009 2010 2011 2012
Nu
mb
er
of
Pro
ject
s +P
rosp
ect
s
Phase I Phase II Phase III Phase IV Prospect
Geothermal Energy Association
11
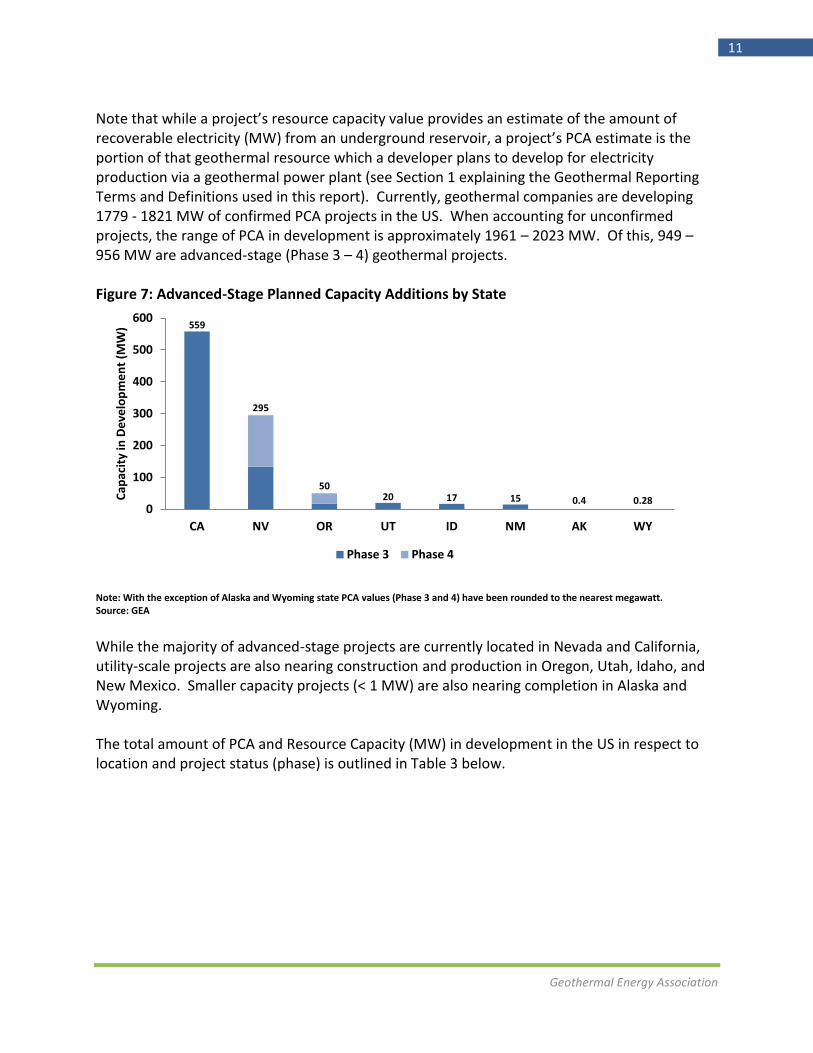
Note that while a project’s resource capacity value provides an estimate of the amount of recoverable electricity (MW) from an underground reservoir, a project’s PCA estimate is the portion of that geothermal resource which a developer plans to develop for electricity production via a geothermal power plant (see Section 1 explaining the Geothermal Reporting Terms and Definitions used in this report). Currently, geothermal companies are developing 1779 - 1821 MW of confirmed PCA projects in the US. When accounting for unconfirmed projects, the range of PCA in development is approximately 1961 – 2023 MW. Of this, 949 – 956 MW are advanced-stage (Phase 3 – 4) geothermal projects. Figure 7: Advanced-Stage Planned Capacity Additions by State
Note: With the exception of Alaska and Wyoming state PCA values (Phase 3 and 4) have been rounded to the nearest megawatt. Source: GEA
While the majority of advanced-stage projects are currently located in Nevada and California, utility-scale projects are also nearing construction and production in Oregon, Utah, Idaho, and New Mexico. Smaller capacity projects (< 1 MW) are also nearing completion in Alaska and Wyoming. The total amount of PCA and Resource Capacity (MW) in development in the US in respect to location and project status (phase) is outlined in Table 3 below.
559
295
50 20 17 15 0.4 0.28
0
100
200
300
400
500
600
CA NV OR UT ID NM AK WY
Cap
acit
y in
De
velo
pm
en
t (M
W)
Phase 3 Phase 4
Geothermal Energy Association
12
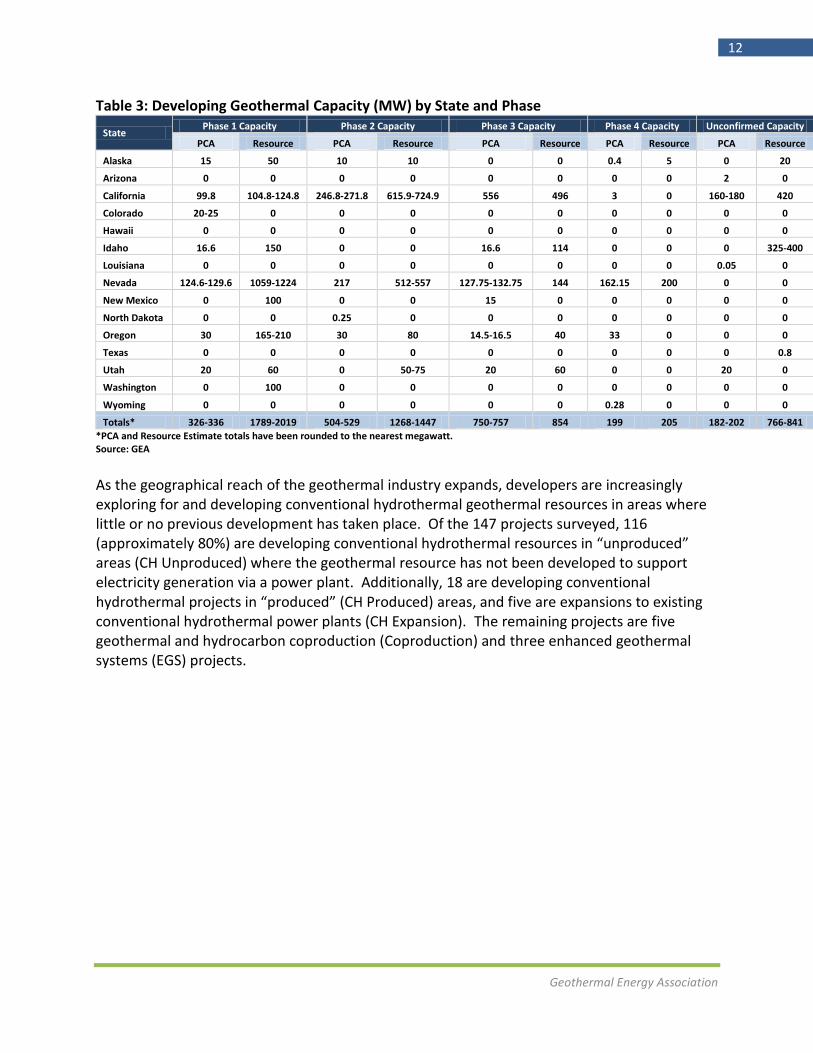
Table 3: Developing Geothermal Capacity (MW) by State and Phase
State Phase 1 Capacity Phase 2 Capacity Phase 3 Capacity Phase 4 Capacity Unconfirmed Capacity
PCA Resource PCA Resource PCA Resource PCA Resource PCA Resource
Alaska 15 50 10 10 0 0 0.4 5 0 20
Arizona 0 0 0 0 0 0 0 0 2 0
California 99.8 104.8-124.8 246.8-271.8 615.9-724.9 556 496 3 0 160-180 420
Colorado 20-25 0 0 0 0 0 0 0 0 0
Hawaii 0 0 0 0 0 0 0 0 0 0
Idaho 16.6 150 0 0 16.6 114 0 0 0 325-400
Louisiana 0 0 0 0 0 0 0 0 0.05 0
Nevada 124.6-129.6 1059-1224 217 512-557 127.75-132.75 144 162.15 200 0 0
New Mexico 0 100 0 0 15 0 0 0 0 0
North Dakota 0 0 0.25 0 0 0 0 0 0 0
Oregon 30 165-210 30 80 14.5-16.5 40 33 0 0 0
Texas 0 0 0 0 0 0 0 0 0 0.8
Utah 20 60 0 50-75 20 60 0 0 20 0
Washington 0 100 0 0 0 0 0 0 0 0
Wyoming 0 0 0 0 0 0 0.28 0 0 0
Totals* 326-336 1789-2019 504-529 1268-1447 750-757 854 199 205 182-202 766-841
*PCA and Resource Estimate totals have been rounded to the nearest megawatt. Source: GEA
As the geographical reach of the geothermal industry expands, developers are increasingly exploring for and developing conventional hydrothermal geothermal resources in areas where little or no previous development has taken place. Of the 147 projects surveyed, 116 (approximately 80%) are developing conventional hydrothermal resources in “unproduced” areas (CH Unproduced) where the geothermal resource has not been developed to support electricity generation via a power plant. Additionally, 18 are developing conventional hydrothermal projects in “produced” (CH Produced) areas, and five are expansions to existing conventional hydrothermal power plants (CH Expansion). The remaining projects are five geothermal and hydrocarbon coproduction (Coproduction) and three enhanced geothermal systems (EGS) projects.
Geothermal Energy Association
13
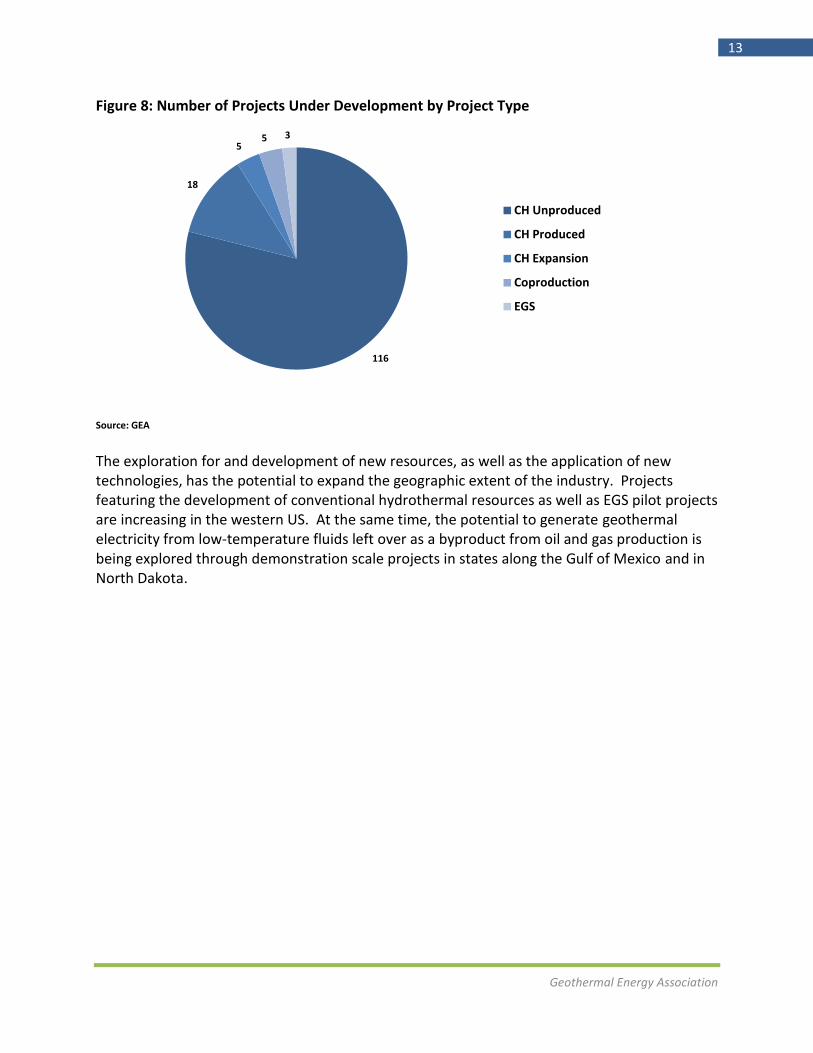
Figure 8: Number of Projects Under Development by Project Type
Source: GEA
The exploration for and development of new resources, as well as the application of new technologies, has the potential to expand the geographic extent of the industry. Projects featuring the development of conventional hydrothermal resources as well as EGS pilot projects are increasing in the western US. At the same time, the potential to generate geothermal electricity from low-temperature fluids left over as a byproduct from oil and gas production is being explored through demonstration scale projects in states along the Gulf of Mexico and in North Dakota.
116
18
5 5 3
CH Unproduced
CH Produced
CH Expansion
Coproduction
EGS
Geothermal Energy Association
14
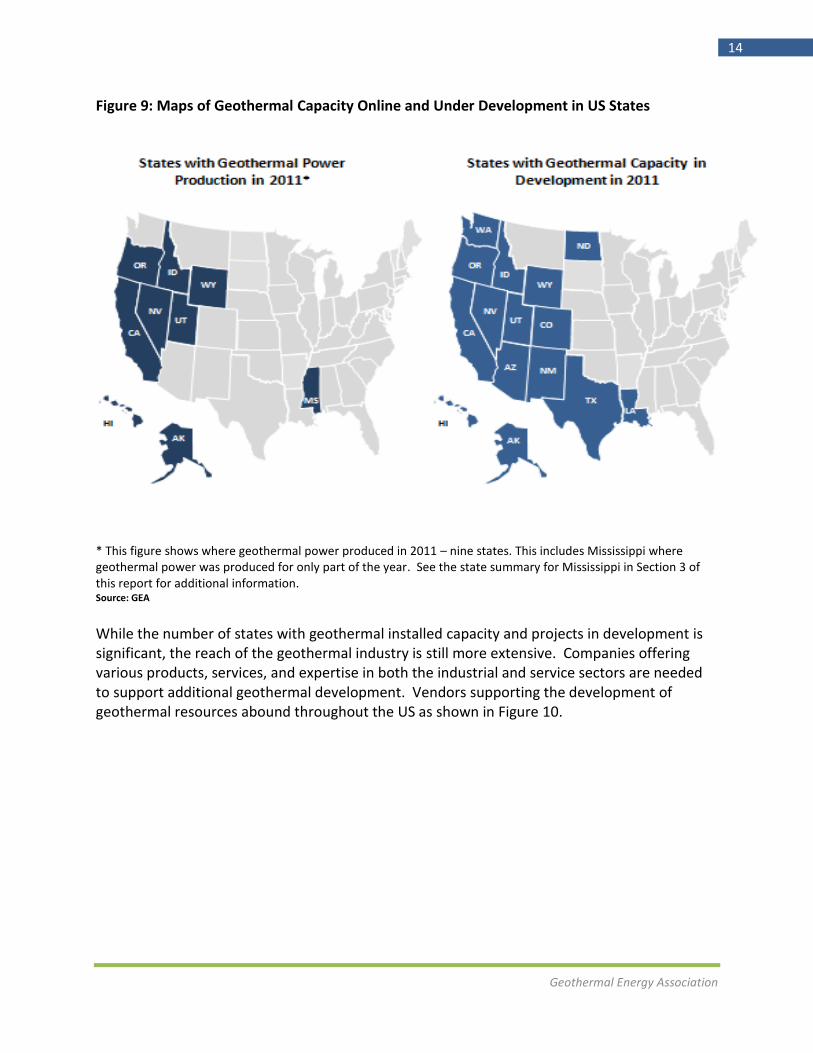
Figure 9: Maps of Geothermal Capacity Online and Under Development in US States
* This figure shows where geothermal power produced in 2011 – nine states. This includes Mississippi where geothermal power was produced for only part of the year. See the state summary for Mississippi in Section 3 of this report for additional information. Source: GEA
While the number of states with geothermal installed capacity and projects in development is significant, the reach of the geothermal industry is still more extensive. Companies offering various products, services, and expertise in both the industrial and service sectors are needed to support additional geothermal development. Vendors supporting the development of geothermal resources abound throughout the US as shown in Figure 10.
Geothermal Energy Association
15
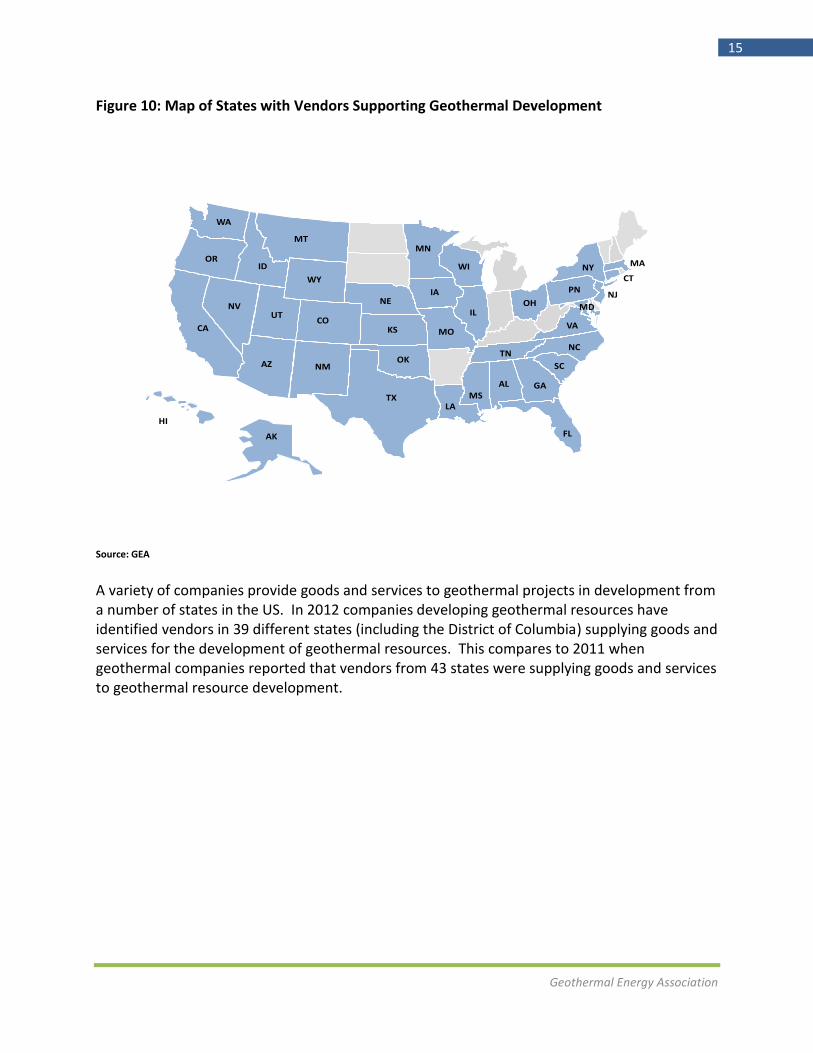
Figure 10: Map of States with Vendors Supporting Geothermal Development
WA
NE
OK
WA
OK
WA
ORID
WY
CO
TX
NMAZ
UTNV
CA
AK
HI
LAMS
MT
KS
MN
IA
MO
WI
IL
TN
AL
FL
GA
SC
NC
VA
OH
PN
NY
MD
MA
CT
NJNE
OK
WA
Source: GEA
A variety of companies provide goods and services to geothermal projects in development from a number of states in the US. In 2012 companies developing geothermal resources have identified vendors in 39 different states (including the District of Columbia) supplying goods and services for the development of geothermal resources. This compares to 2011 when geothermal companies reported that vendors from 43 states were supplying goods and services to geothermal resource development.
Geothermal Energy Association
16
3. State Tables: Capacity in Development The following results identify 4116 – 4525 MW of confirmed geothermal resource capacity under development in the United States. Unconfirmed projects increase the resource capacity estimate to 4882 – 5366 MW. There are 15 states with projects currently in various stages of development: Alaska, Arizona, California, Colorado, Hawaii, Idaho, Louisiana, Nevada, New Mexico, North Dakota, Oregon, Texas, Utah, Washington, and Wyoming. Between confirmed and unconfirmed projects there are a total of 147 geothermal projects in development. Per GEA’s Geothermal Reporting Terms and Definitions (outlined in Section 1 of this report) the projects listed for each state are categorized by the following phases:
Phase I: Resource Procurement and Identification (i.e. identifying resource, secured rights to resource, pre-drilling exploration, internal transmission analysis complete).
Phase II: Resource Exploration and Confirmation (i.e. exploration and/or drilling permits approved, exploration drilling conducted/in progress, transmission feasibility studies underway).
Phase III: Permitting and Initial Development(i.e. securing PPA and final permits, full size wells drilled, financing secured for portion of project construction, interconnection feasibility study complete).
Phase IV: Resource Production and Power Plant Construction (i.e. plant permit approved, facility in construction, production and injection drilling underway, interconnection agreement signed).
Unconfirmed: Project information obtained by GEA from publicly available sources but not verified by the project developer
To properly identify a project’s “project type” please refer to the following key:
CH Unproduced: Conventional Hydrothermal Unproduced Resource
CH Produced: Conventional Hydrothermal Produced Resource
CH Expansion: Conventional Hydrothermal Expansion
Coproduction: Geothermal Energy and Hydrocarbon Coproduction
Geopressured: Geopressured System
EGS: Enhanced Geothermal System The following sections list 15 states with geothermal projects in various stages of development. It should be noted that “NA” (i.e. “not available”) is provided in the place of resource capacity or planned capacity addition (PCA) estimates where none was provided by the developer when the project was reported to GEA.
Geothermal Energy Association
17
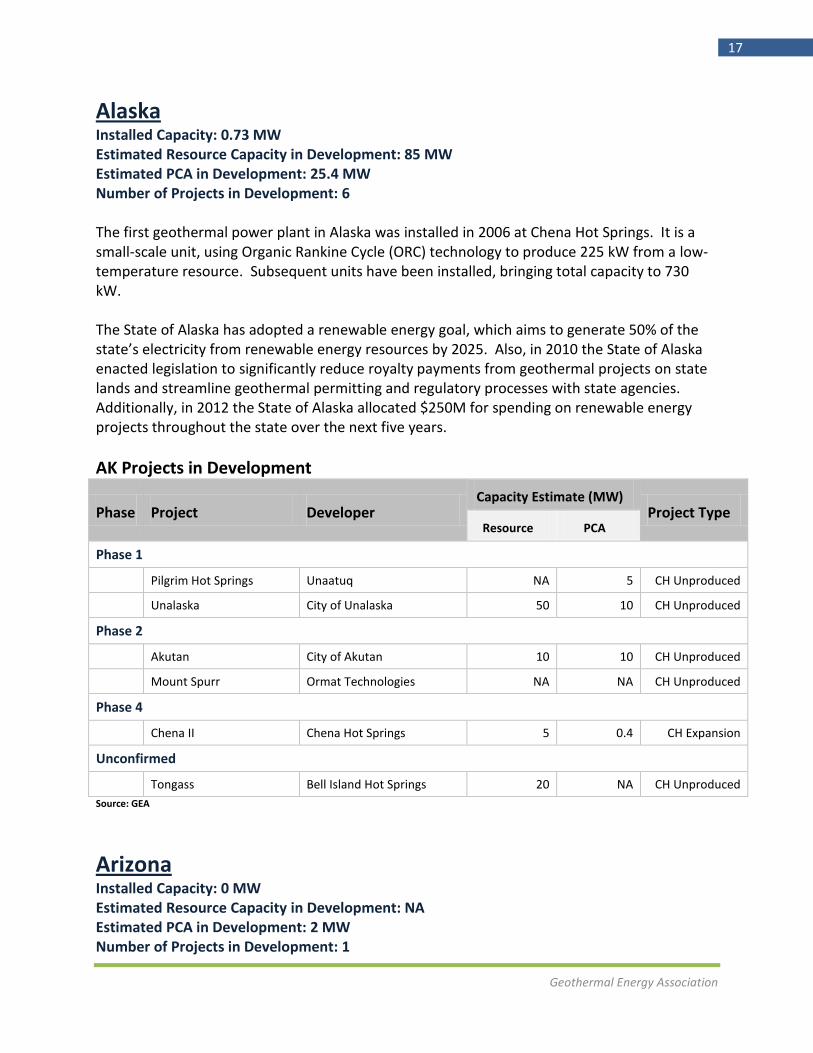
Alaska Installed Capacity: 0.73 MW Estimated Resource Capacity in Development: 85 MW Estimated PCA in Development: 25.4 MW Number of Projects in Development: 6 The first geothermal power plant in Alaska was installed in 2006 at Chena Hot Springs. It is a small-scale unit, using Organic Rankine Cycle (ORC) technology to produce 225 kW from a low-temperature resource. Subsequent units have been installed, bringing total capacity to 730 kW. The State of Alaska has adopted a renewable energy goal, which aims to generate 50% of the state’s electricity from renewable energy resources by 2025. Also, in 2010 the State of Alaska enacted legislation to significantly reduce royalty payments from geothermal projects on state lands and streamline geothermal permitting and regulatory processes with state agencies. Additionally, in 2012 the State of Alaska allocated $250M for spending on renewable energy projects throughout the state over the next five years.
AK Projects in Development
Phase Project Developer Capacity Estimate (MW)
Project Type Resource PCA
Phase 1
Pilgrim Hot Springs Unaatuq NA 5 CH Unproduced
Unalaska City of Unalaska 50 10 CH Unproduced
Phase 2
Akutan City of Akutan 10 10 CH Unproduced
Mount Spurr Ormat Technologies NA NA CH Unproduced
Phase 4
Chena II Chena Hot Springs 5 0.4 CH Expansion
Unconfirmed
Tongass Bell Island Hot Springs 20 NA CH Unproduced
Source: GEA
Arizona Installed Capacity: 0 MW Estimated Resource Capacity in Development: NA Estimated PCA in Development: 2 MW Number of Projects in Development: 1
Geothermal Energy Association
18
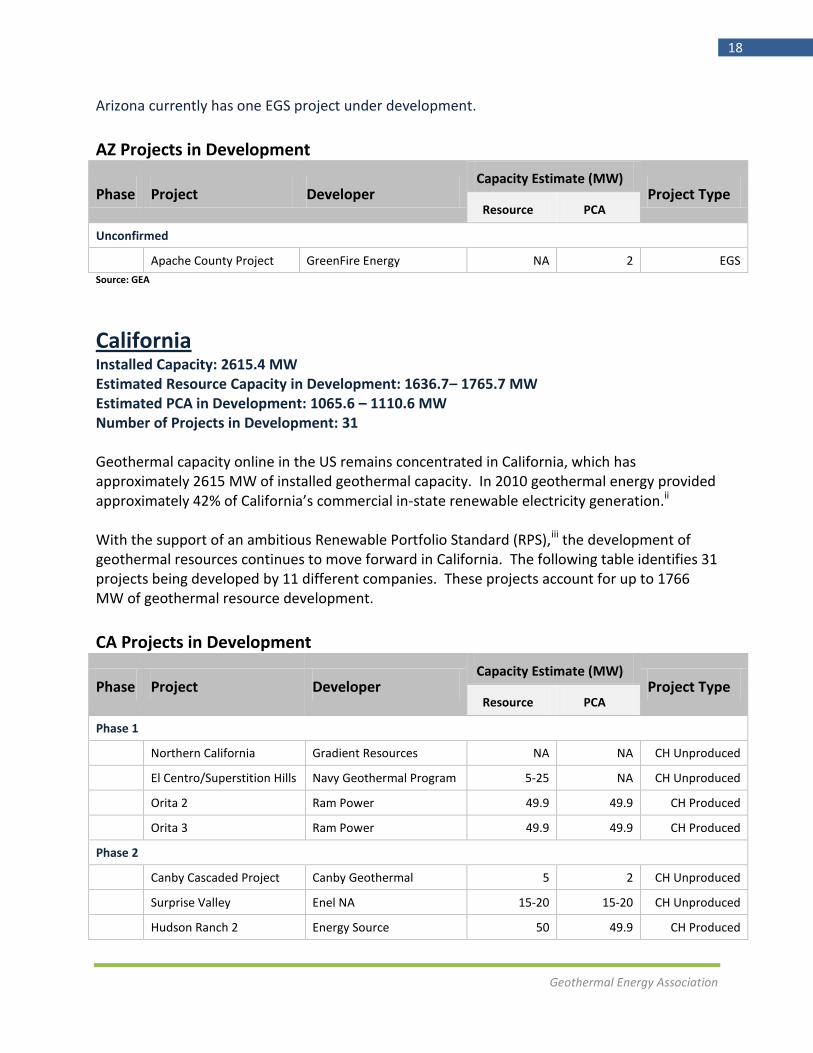
Arizona currently has one EGS project under development.
AZ Projects in Development
Phase Project Developer Capacity Estimate (MW)
Project Type Resource PCA
Unconfirmed
Apache County Project GreenFire Energy NA 2 EGS
Source: GEA
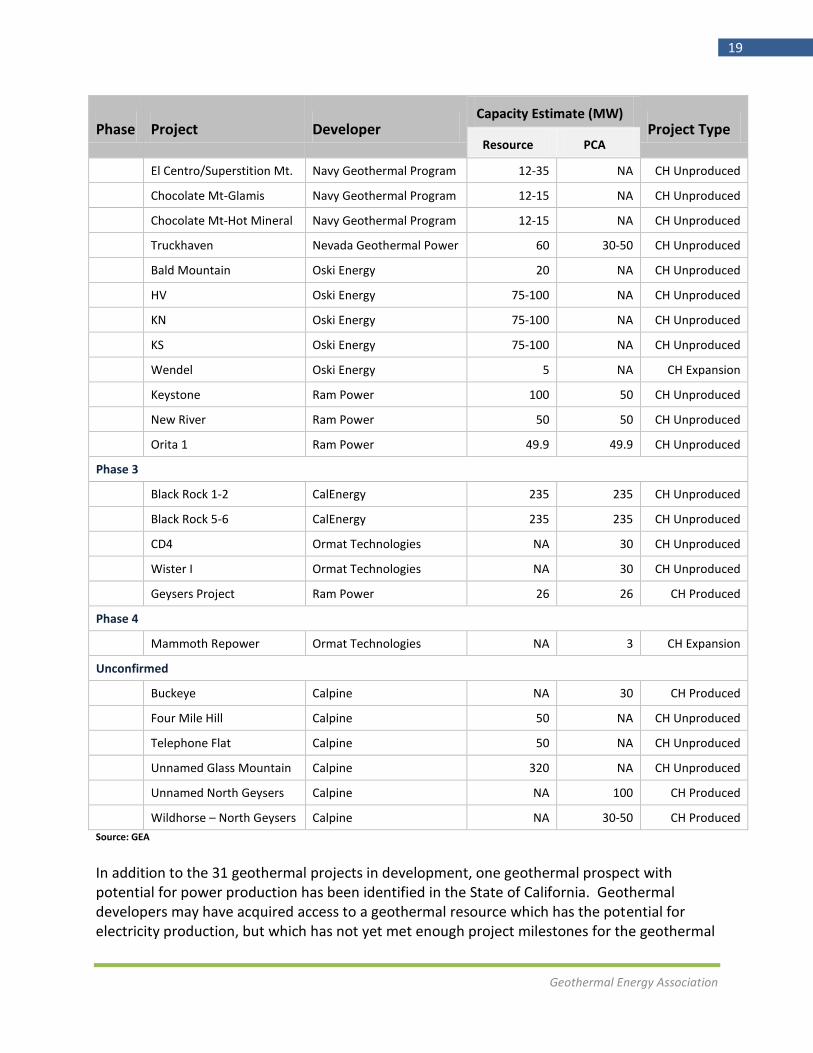
California Installed Capacity: 2615.4 MW Estimated Resource Capacity in Development: 1636.7– 1765.7 MW Estimated PCA in Development: 1065.6 – 1110.6 MW Number of Projects in Development: 31 Geothermal capacity online in the US remains concentrated in California, which has approximately 2615 MW of installed geothermal capacity. In 2010 geothermal energy provided approximately 42% of California’s commercial in-state renewable electricity generation.ii With the support of an ambitious Renewable Portfolio Standard (RPS),iii the development of geothermal resources continues to move forward in California. The following table identifies 31 projects being developed by 11 different companies. These projects account for up to 1766 MW of geothermal resource development.
CA Projects in Development
Phase Project Developer Capacity Estimate (MW)
Project Type Resource PCA
Phase 1
Northern California Gradient Resources NA NA CH Unproduced
El Centro/Superstition Hills Navy Geothermal Program 5-25 NA CH Unproduced
Orita 2 Ram Power 49.9 49.9 CH Produced
Orita 3 Ram Power 49.9 49.9 CH Produced
Phase 2
Canby Cascaded Project Canby Geothermal 5 2 CH Unproduced
Surprise Valley Enel NA 15-20 15-20 CH Unproduced
Hudson Ranch 2 Energy Source 50 49.9 CH Produced
Geothermal Energy Association
19
Phase Project Developer Capacity Estimate (MW)
Project Type Resource PCA
El Centro/Superstition Mt. Navy Geothermal Program 12-35 NA CH Unproduced
Chocolate Mt-Glamis Navy Geothermal Program 12-15 NA CH Unproduced
Chocolate Mt-Hot Mineral Navy Geothermal Program 12-15 NA CH Unproduced
Truckhaven Nevada Geothermal Power 60 30-50 CH Unproduced
Bald Mountain Oski Energy 20 NA CH Unproduced
HV Oski Energy 75-100 NA CH Unproduced
KN Oski Energy 75-100 NA CH Unproduced
KS Oski Energy 75-100 NA CH Unproduced
Wendel Oski Energy 5 NA CH Expansion
Keystone Ram Power 100 50 CH Unproduced
New River Ram Power 50 50 CH Unproduced
Orita 1 Ram Power 49.9 49.9 CH Unproduced
Phase 3
Black Rock 1-2 CalEnergy 235 235 CH Unproduced
Black Rock 5-6 CalEnergy 235 235 CH Unproduced
CD4 Ormat Technologies NA 30 CH Unproduced
Wister I Ormat Technologies NA 30 CH Unproduced
Geysers Project Ram Power 26 26 CH Produced
Phase 4
Mammoth Repower Ormat Technologies NA 3 CH Expansion
Unconfirmed
Buckeye Calpine NA 30 CH Produced
Four Mile Hill Calpine 50 NA CH Unproduced
Telephone Flat Calpine 50 NA CH Unproduced
Unnamed Glass Mountain Calpine 320 NA CH Unproduced
Unnamed North Geysers Calpine NA 100 CH Produced
Wildhorse – North Geysers Calpine NA 30-50 CH Produced
Source: GEA
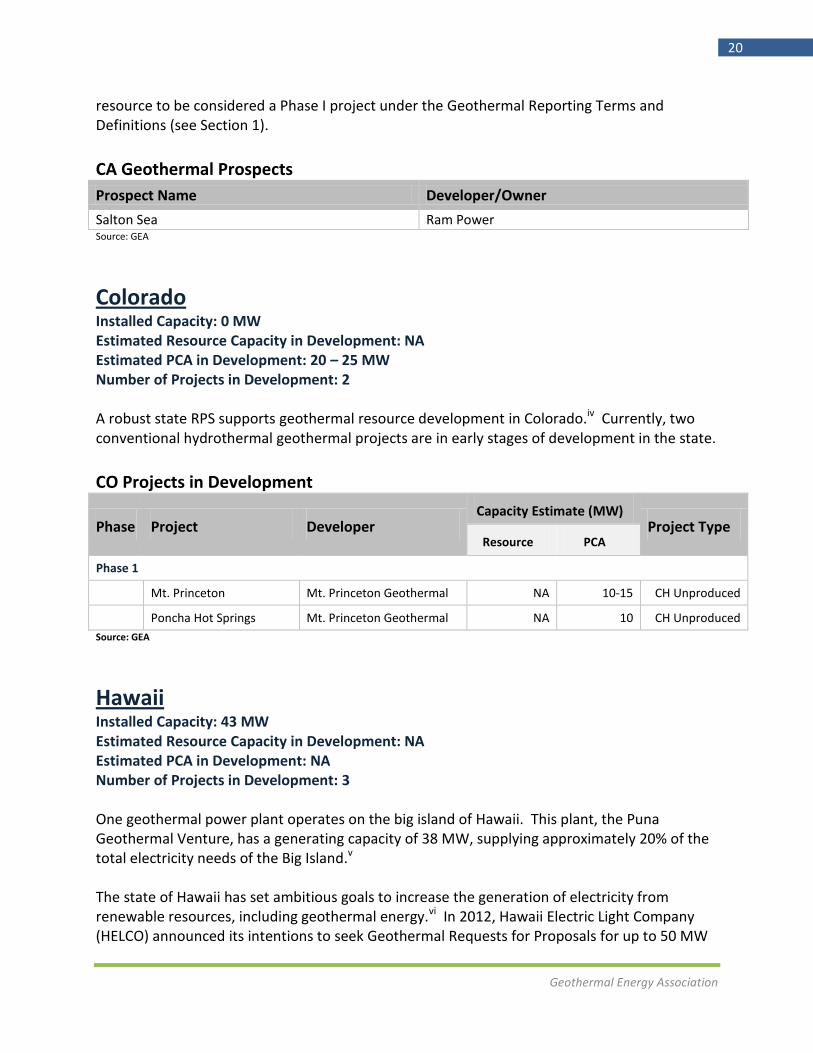
In addition to the 31 geothermal projects in development, one geothermal prospect with potential for power production has been identified in the State of California. Geothermal developers may have acquired access to a geothermal resource which has the potential for electricity production, but which has not yet met enough project milestones for the geothermal
Geothermal Energy Association
20
resource to be considered a Phase I project under the Geothermal Reporting Terms and Definitions (see Section 1).
CA Geothermal Prospects
Prospect Name Developer/Owner
Salton Sea Ram Power Source: GEA
Colorado Installed Capacity: 0 MW Estimated Resource Capacity in Development: NA Estimated PCA in Development: 20 – 25 MW Number of Projects in Development: 2 A robust state RPS supports geothermal resource development in Colorado.iv Currently, two conventional hydrothermal geothermal projects are in early stages of development in the state.
CO Projects in Development
Phase Project Developer Capacity Estimate (MW)
Project Type Resource PCA
Phase 1
Mt. Princeton Mt. Princeton Geothermal NA 10-15 CH Unproduced
Poncha Hot Springs Mt. Princeton Geothermal NA 10 CH Unproduced
Source: GEA
Hawaii Installed Capacity: 43 MW Estimated Resource Capacity in Development: NA Estimated PCA in Development: NA Number of Projects in Development: 3 One geothermal power plant operates on the big island of Hawaii. This plant, the Puna Geothermal Venture, has a generating capacity of 38 MW, supplying approximately 20% of the total electricity needs of the Big Island.v The state of Hawaii has set ambitious goals to increase the generation of electricity from renewable resources, including geothermal energy.vi In 2012, Hawaii Electric Light Company (HELCO) announced its intentions to seek Geothermal Requests for Proposals for up to 50 MW
Geothermal Energy Association
21
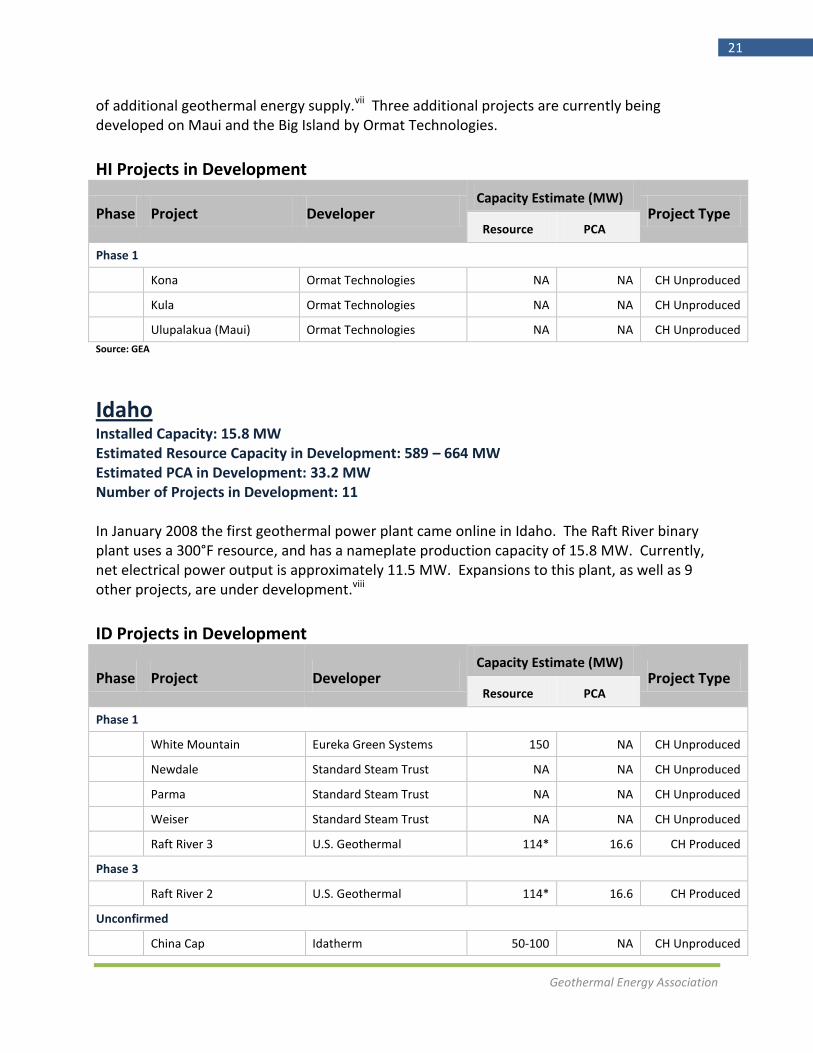
of additional geothermal energy supply.vii Three additional projects are currently being developed on Maui and the Big Island by Ormat Technologies.
HI Projects in Development
Phase Project Developer Capacity Estimate (MW)
Project Type Resource PCA
Phase 1
Kona Ormat Technologies NA NA CH Unproduced
Kula Ormat Technologies NA NA CH Unproduced
Ulupalakua (Maui) Ormat Technologies NA NA CH Unproduced
Source: GEA
Idaho Installed Capacity: 15.8 MW Estimated Resource Capacity in Development: 589 – 664 MW Estimated PCA in Development: 33.2 MW Number of Projects in Development: 11 In January 2008 the first geothermal power plant came online in Idaho. The Raft River binary plant uses a 300°F resource, and has a nameplate production capacity of 15.8 MW. Currently, net electrical power output is approximately 11.5 MW. Expansions to this plant, as well as 9 other projects, are under development.viii
ID Projects in Development
Phase Project Developer Capacity Estimate (MW)
Project Type Resource PCA
Phase 1
White Mountain Eureka Green Systems 150 NA CH Unproduced
Newdale Standard Steam Trust NA NA CH Unproduced
Parma Standard Steam Trust NA NA CH Unproduced
Weiser Standard Steam Trust NA NA CH Unproduced
Raft River 3 U.S. Geothermal 114* 16.6 CH Produced
Phase 3
Raft River 2 U.S. Geothermal 114* 16.6 CH Produced
Unconfirmed
China Cap Idatherm 50-100 NA CH Unproduced
Geothermal Energy Association
22
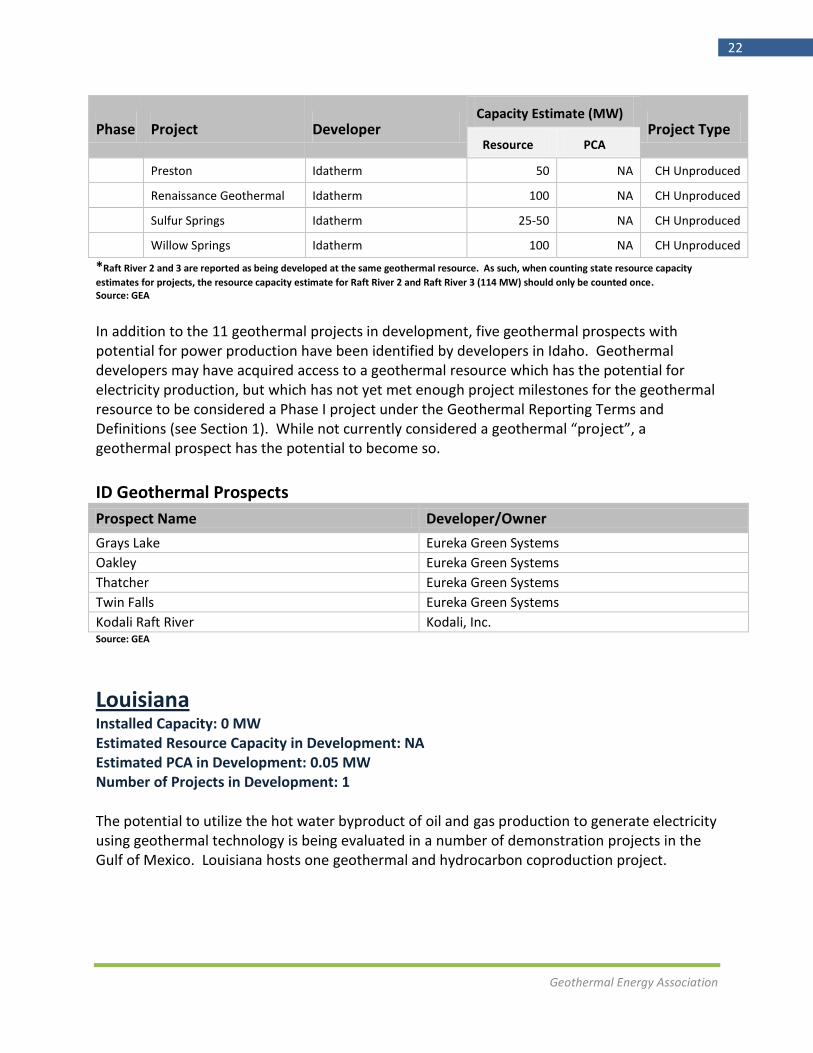
Phase Project Developer Capacity Estimate (MW)
Project Type Resource PCA
Preston Idatherm 50 NA CH Unproduced
Renaissance Geothermal Idatherm 100 NA CH Unproduced
Sulfur Springs Idatherm 25-50 NA CH Unproduced
Willow Springs Idatherm 100 NA CH Unproduced
*Raft River 2 and 3 are reported as being developed at the same geothermal resource. As such, when counting state resource capacity
estimates for projects, the resource capacity estimate for Raft River 2 and Raft River 3 (114 MW) should only be counted once. Source: GEA
In addition to the 11 geothermal projects in development, five geothermal prospects with potential for power production have been identified by developers in Idaho. Geothermal developers may have acquired access to a geothermal resource which has the potential for electricity production, but which has not yet met enough project milestones for the geothermal resource to be considered a Phase I project under the Geothermal Reporting Terms and Definitions (see Section 1). While not currently considered a geothermal “project”, a geothermal prospect has the potential to become so.
ID Geothermal Prospects
Prospect Name Developer/Owner
Grays Lake Eureka Green Systems
Oakley Eureka Green Systems
Thatcher Eureka Green Systems
Twin Falls Eureka Green Systems
Kodali Raft River Kodali, Inc. Source: GEA
Louisiana Installed Capacity: 0 MW Estimated Resource Capacity in Development: NA Estimated PCA in Development: 0.05 MW Number of Projects in Development: 1 The potential to utilize the hot water byproduct of oil and gas production to generate electricity using geothermal technology is being evaluated in a number of demonstration projects in the Gulf of Mexico. Louisiana hosts one geothermal and hydrocarbon coproduction project.
Geothermal Energy Association
23
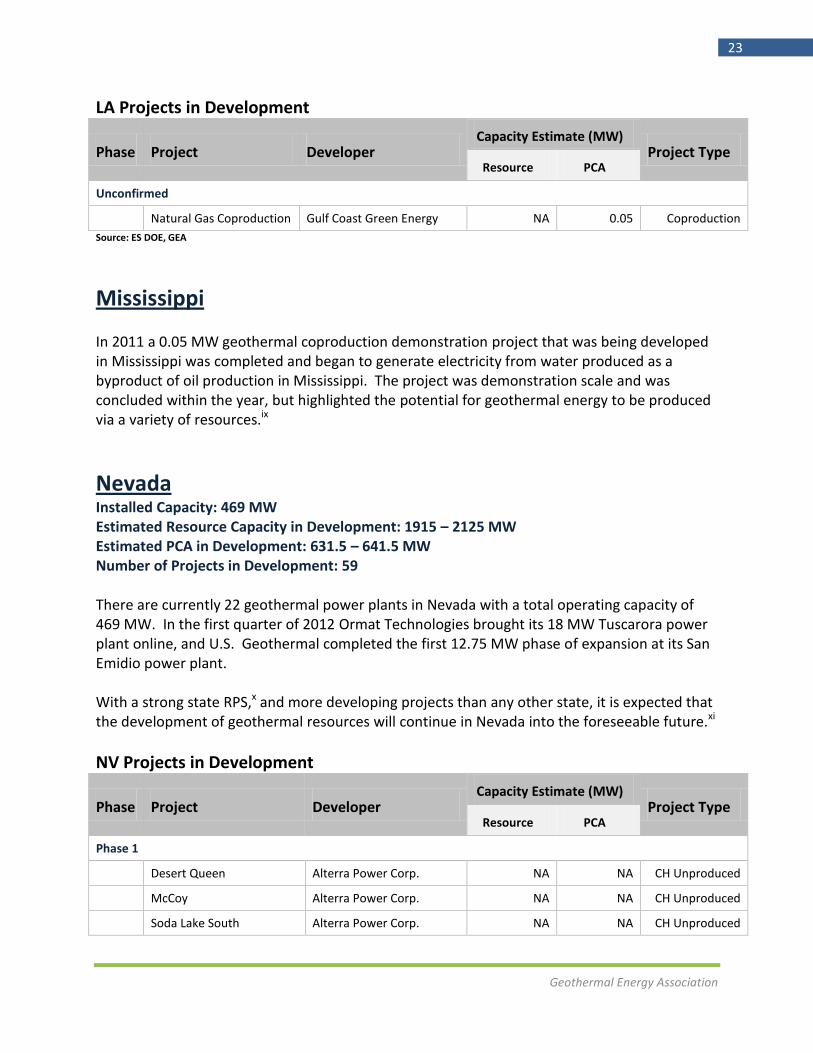
LA Projects in Development
Phase Project Developer Capacity Estimate (MW)
Project Type Resource PCA
Unconfirmed
Natural Gas Coproduction Gulf Coast Green Energy NA 0.05 Coproduction
Source: ES DOE, GEA
Mississippi In 2011 a 0.05 MW geothermal coproduction demonstration project that was being developed in Mississippi was completed and began to generate electricity from water produced as a byproduct of oil production in Mississippi. The project was demonstration scale and was concluded within the year, but highlighted the potential for geothermal energy to be produced via a variety of resources.ix
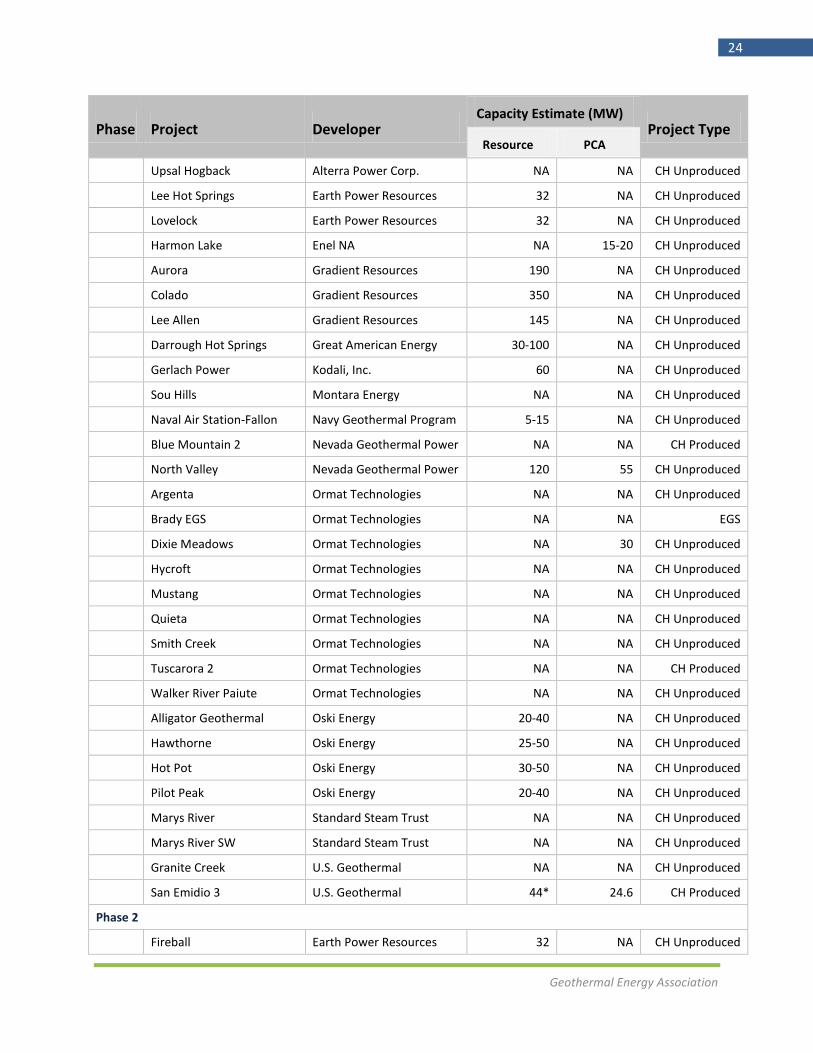
Nevada Installed Capacity: 469 MW Estimated Resource Capacity in Development: 1915 – 2125 MW Estimated PCA in Development: 631.5 – 641.5 MW Number of Projects in Development: 59 There are currently 22 geothermal power plants in Nevada with a total operating capacity of 469 MW. In the first quarter of 2012 Ormat Technologies brought its 18 MW Tuscarora power plant online, and U.S. Geothermal completed the first 12.75 MW phase of expansion at its San Emidio power plant. With a strong state RPS,x and more developing projects than any other state, it is expected that the development of geothermal resources will continue in Nevada into the foreseeable future.xi
NV Projects in Development
Phase Project Developer Capacity Estimate (MW)
Project Type Resource PCA
Phase 1
Desert Queen Alterra Power Corp. NA NA CH Unproduced
McCoy Alterra Power Corp. NA NA CH Unproduced
Soda Lake South Alterra Power Corp. NA NA CH Unproduced
Geothermal Energy Association
24
Phase Project Developer Capacity Estimate (MW)
Project Type Resource PCA
Upsal Hogback Alterra Power Corp. NA NA CH Unproduced
Lee Hot Springs Earth Power Resources 32 NA CH Unproduced
Lovelock Earth Power Resources 32 NA CH Unproduced
Harmon Lake Enel NA NA 15-20 CH Unproduced
Aurora Gradient Resources 190 NA CH Unproduced
Colado Gradient Resources 350 NA CH Unproduced
Lee Allen Gradient Resources 145 NA CH Unproduced
Darrough Hot Springs Great American Energy 30-100 NA CH Unproduced
Gerlach Power Kodali, Inc. 60 NA CH Unproduced
Sou Hills Montara Energy NA NA CH Unproduced
Naval Air Station-Fallon Navy Geothermal Program 5-15 NA CH Unproduced
Blue Mountain 2 Nevada Geothermal Power NA NA CH Produced
North Valley Nevada Geothermal Power 120 55 CH Unproduced
Argenta Ormat Technologies NA NA CH Unproduced
Brady EGS Ormat Technologies NA NA EGS
Dixie Meadows Ormat Technologies NA 30 CH Unproduced
Hycroft Ormat Technologies NA NA CH Unproduced
Mustang Ormat Technologies NA NA CH Unproduced
Quieta Ormat Technologies NA NA CH Unproduced
Smith Creek Ormat Technologies NA NA CH Unproduced
Tuscarora 2 Ormat Technologies NA NA CH Produced
Walker River Paiute Ormat Technologies NA NA CH Unproduced
Alligator Geothermal Oski Energy 20-40 NA CH Unproduced
Hawthorne Oski Energy 25-50 NA CH Unproduced
Hot Pot Oski Energy 30-50 NA CH Unproduced
Pilot Peak Oski Energy 20-40 NA CH Unproduced
Marys River Standard Steam Trust NA NA CH Unproduced
Marys River SW Standard Steam Trust NA NA CH Unproduced
Granite Creek U.S. Geothermal NA NA CH Unproduced
San Emidio 3 U.S. Geothermal 44* 24.6 CH Produced
Phase 2
Fireball Earth Power Resources 32 NA CH Unproduced
Geothermal Energy Association
25
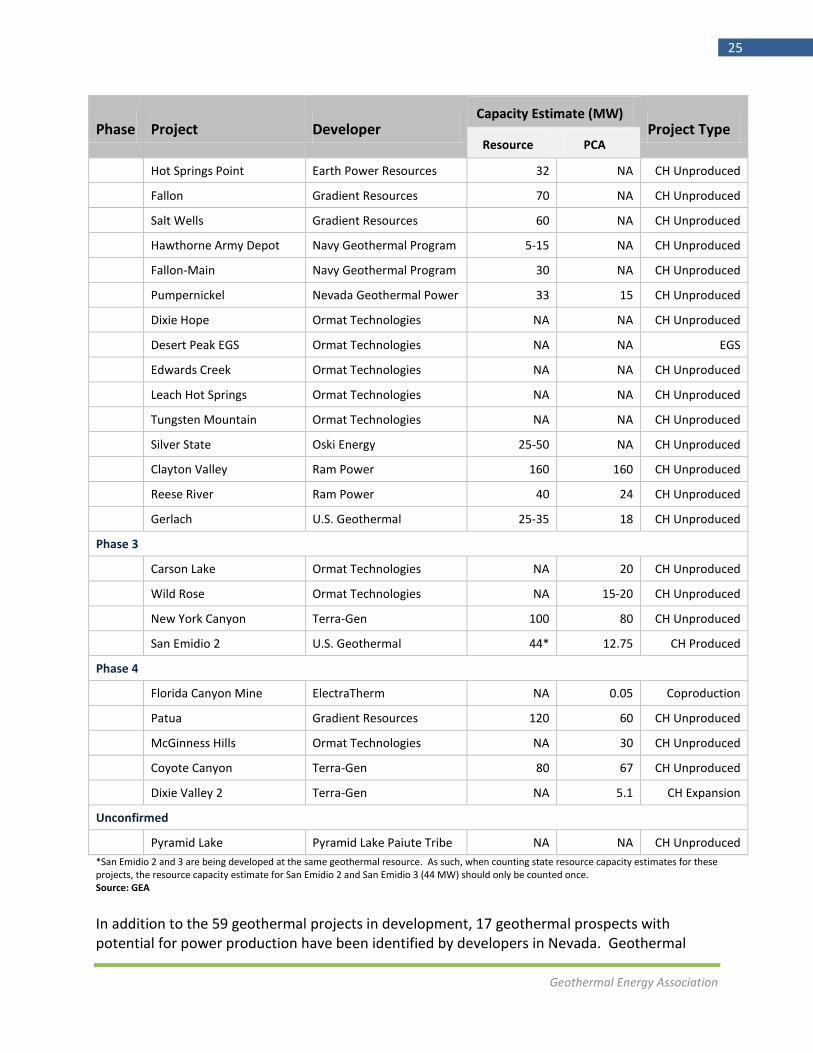
Phase Project Developer Capacity Estimate (MW)
Project Type Resource PCA
Hot Springs Point Earth Power Resources 32 NA CH Unproduced
Fallon Gradient Resources 70 NA CH Unproduced
Salt Wells Gradient Resources 60 NA CH Unproduced
Hawthorne Army Depot Navy Geothermal Program 5-15 NA CH Unproduced
Fallon-Main Navy Geothermal Program 30 NA CH Unproduced
Pumpernickel Nevada Geothermal Power 33 15 CH Unproduced
Dixie Hope Ormat Technologies NA NA CH Unproduced
Desert Peak EGS Ormat Technologies NA NA EGS
Edwards Creek Ormat Technologies NA NA CH Unproduced
Leach Hot Springs Ormat Technologies NA NA CH Unproduced
Tungsten Mountain Ormat Technologies NA NA CH Unproduced
Silver State Oski Energy 25-50 NA CH Unproduced
Clayton Valley Ram Power 160 160 CH Unproduced
Reese River Ram Power 40 24 CH Unproduced
Gerlach U.S. Geothermal 25-35 18 CH Unproduced
Phase 3
Carson Lake Ormat Technologies NA 20 CH Unproduced
Wild Rose Ormat Technologies NA 15-20 CH Unproduced
New York Canyon Terra-Gen 100 80 CH Unproduced
San Emidio 2 U.S. Geothermal 44* 12.75 CH Produced
Phase 4
Florida Canyon Mine ElectraTherm NA 0.05 Coproduction
Patua Gradient Resources 120 60 CH Unproduced
McGinness Hills Ormat Technologies NA 30 CH Unproduced
Coyote Canyon Terra-Gen 80 67 CH Unproduced
Dixie Valley 2 Terra-Gen NA 5.1 CH Expansion
Unconfirmed
Pyramid Lake Pyramid Lake Paiute Tribe NA NA CH Unproduced
*San Emidio 2 and 3 are being developed at the same geothermal resource. As such, when counting state resource capacity estimates for these projects, the resource capacity estimate for San Emidio 2 and San Emidio 3 (44 MW) should only be counted once. Source: GEA
In addition to the 59 geothermal projects in development, 17 geothermal prospects with potential for power production have been identified by developers in Nevada. Geothermal
Geothermal Energy Association
26
developers may have acquired access to a geothermal resource which has the potential for electricity production, but which has not yet met enough project milestones for the geothermal resource to be considered a Phase I project under the Geothermal Reporting Terms and Definitions (see Section 1).
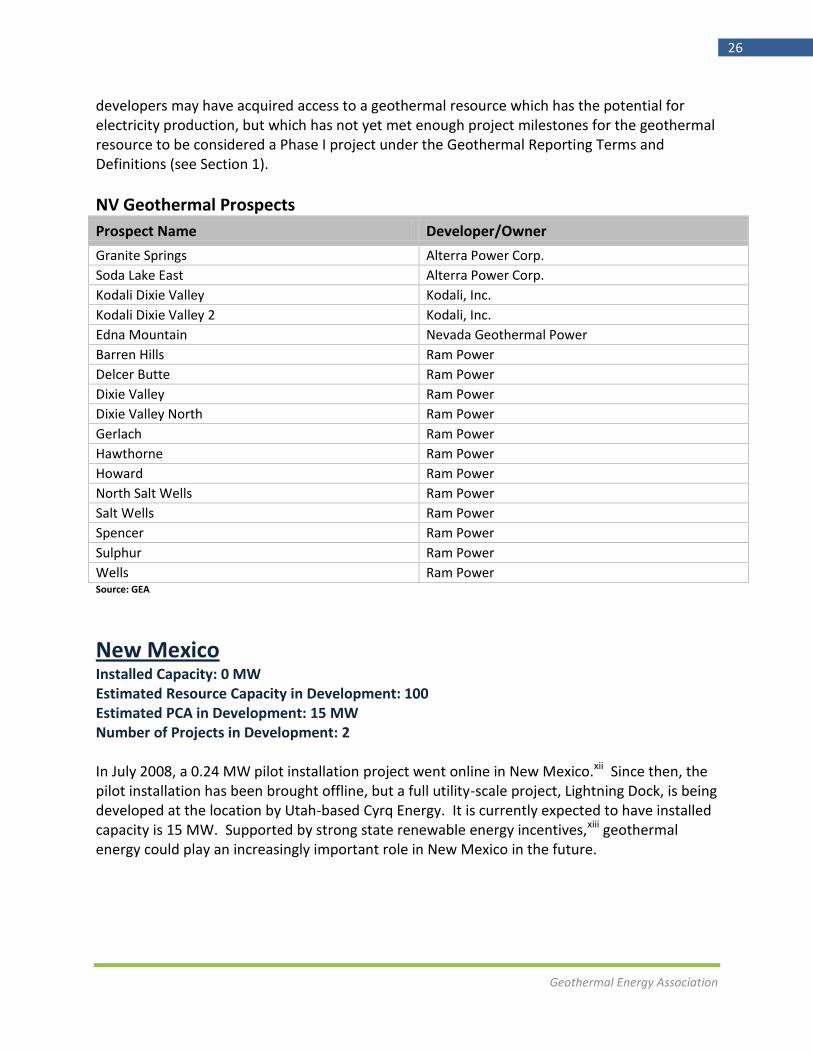
NV Geothermal Prospects
Prospect Name Developer/Owner
Granite Springs Alterra Power Corp.
Soda Lake East Alterra Power Corp.
Kodali Dixie Valley Kodali, Inc.
Kodali Dixie Valley 2 Kodali, Inc.
Edna Mountain Nevada Geothermal Power
Barren Hills Ram Power
Delcer Butte Ram Power
Dixie Valley Ram Power
Dixie Valley North Ram Power
Gerlach Ram Power
Hawthorne Ram Power
Howard Ram Power
North Salt Wells Ram Power
Salt Wells Ram Power
Spencer Ram Power
Sulphur Ram Power
Wells Ram Power Source: GEA
New Mexico Installed Capacity: 0 MW Estimated Resource Capacity in Development: 100 Estimated PCA in Development: 15 MW Number of Projects in Development: 2 In July 2008, a 0.24 MW pilot installation project went online in New Mexico.xii Since then, the pilot installation has been brought offline, but a full utility-scale project, Lightning Dock, is being developed at the location by Utah-based Cyrq Energy. It is currently expected to have installed capacity is 15 MW. Supported by strong state renewable energy incentives,xiii geothermal energy could play an increasingly important role in New Mexico in the future.
Geothermal Energy Association
27
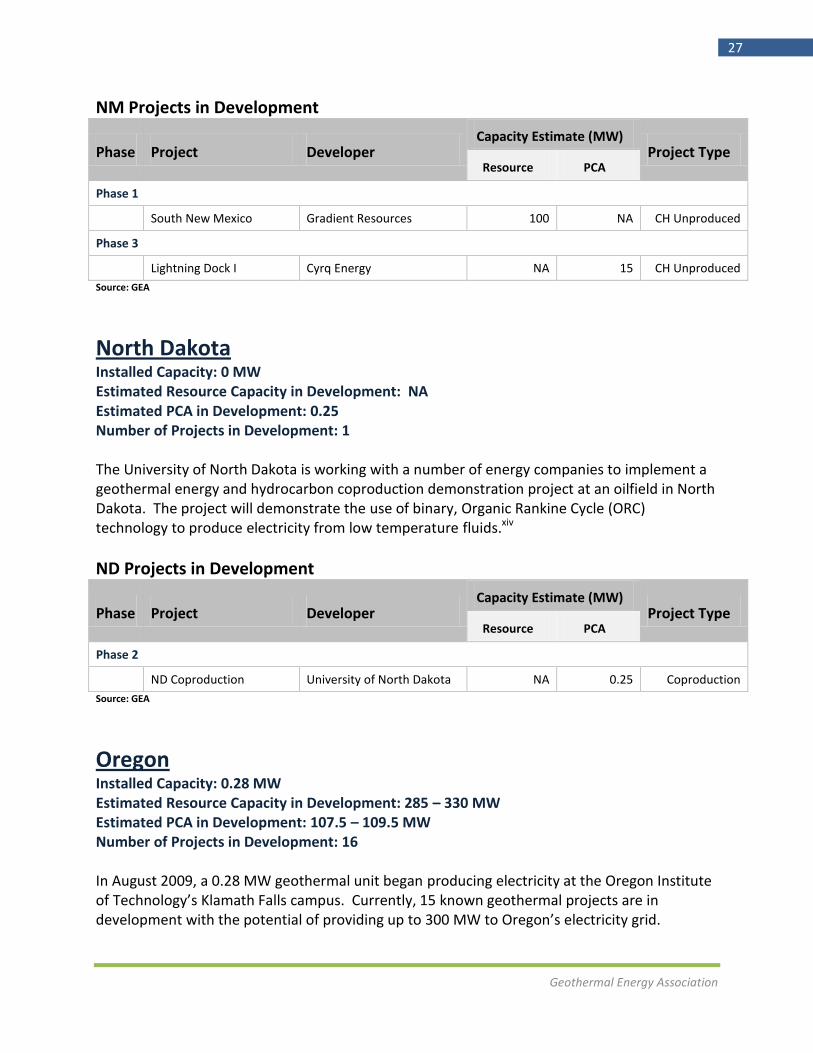
NM Projects in Development
Phase Project Developer Capacity Estimate (MW)
Project Type Resource PCA
Phase 1
South New Mexico Gradient Resources 100 NA CH Unproduced
Phase 3
Lightning Dock I Cyrq Energy NA 15 CH Unproduced
Source: GEA
North Dakota Installed Capacity: 0 MW Estimated Resource Capacity in Development: NA Estimated PCA in Development: 0.25 Number of Projects in Development: 1 The University of North Dakota is working with a number of energy companies to implement a geothermal energy and hydrocarbon coproduction demonstration project at an oilfield in North Dakota. The project will demonstrate the use of binary, Organic Rankine Cycle (ORC) technology to produce electricity from low temperature fluids.xiv
ND Projects in Development
Phase Project Developer Capacity Estimate (MW)
Project Type Resource PCA
Phase 2
ND Coproduction University of North Dakota NA 0.25 Coproduction
Source: GEA
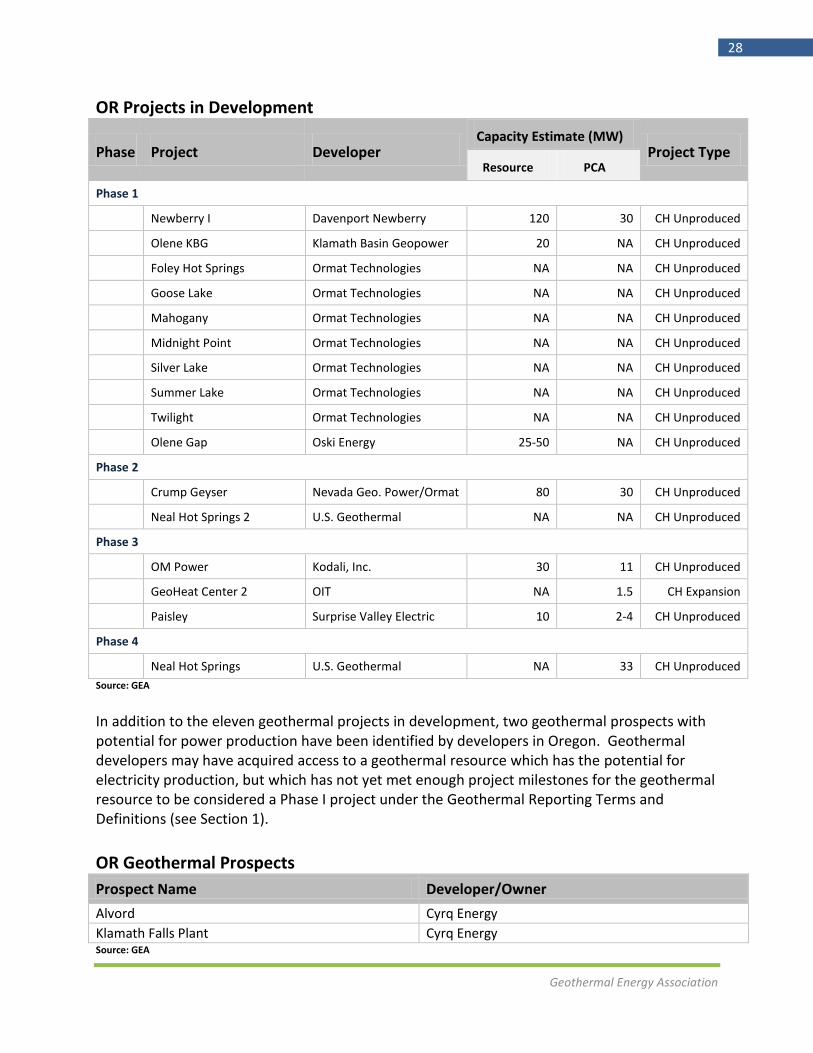
Oregon Installed Capacity: 0.28 MW Estimated Resource Capacity in Development: 285 – 330 MW Estimated PCA in Development: 107.5 – 109.5 MW Number of Projects in Development: 16 In August 2009, a 0.28 MW geothermal unit began producing electricity at the Oregon Institute of Technology’s Klamath Falls campus. Currently, 15 known geothermal projects are in development with the potential of providing up to 300 MW to Oregon’s electricity grid.
Geothermal Energy Association
28
OR Projects in Development
Phase Project Developer Capacity Estimate (MW)
Project Type Resource PCA
Phase 1
Newberry I Davenport Newberry 120 30 CH Unproduced
Olene KBG Klamath Basin Geopower 20 NA CH Unproduced
Foley Hot Springs Ormat Technologies NA NA CH Unproduced
Goose Lake Ormat Technologies NA NA CH Unproduced
Mahogany Ormat Technologies NA NA CH Unproduced
Midnight Point Ormat Technologies NA NA CH Unproduced
Silver Lake Ormat Technologies NA NA CH Unproduced
Summer Lake Ormat Technologies NA NA CH Unproduced
Twilight Ormat Technologies NA NA CH Unproduced
Olene Gap Oski Energy 25-50 NA CH Unproduced
Phase 2
Crump Geyser Nevada Geo. Power/Ormat 80 30 CH Unproduced
Neal Hot Springs 2 U.S. Geothermal NA NA CH Unproduced
Phase 3
OM Power Kodali, Inc. 30 11 CH Unproduced
GeoHeat Center 2 OIT NA 1.5 CH Expansion
Paisley Surprise Valley Electric 10 2-4 CH Unproduced
Phase 4
Neal Hot Springs U.S. Geothermal NA 33 CH Unproduced
Source: GEA
In addition to the eleven geothermal projects in development, two geothermal prospects with potential for power production have been identified by developers in Oregon. Geothermal developers may have acquired access to a geothermal resource which has the potential for electricity production, but which has not yet met enough project milestones for the geothermal resource to be considered a Phase I project under the Geothermal Reporting Terms and Definitions (see Section 1).
OR Geothermal Prospects
Prospect Name Developer/Owner
Alvord Cyrq Energy
Klamath Falls Plant Cyrq Energy Source: GEA
Geothermal Energy Association
29
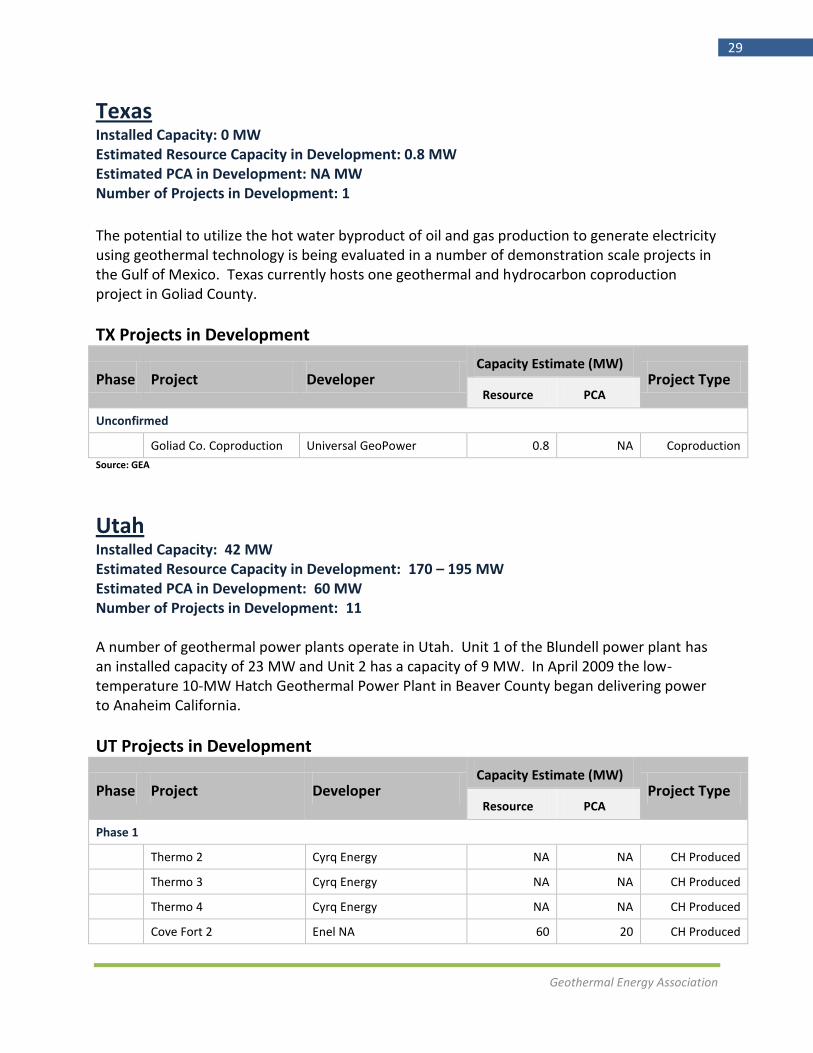
Texas Installed Capacity: 0 MW Estimated Resource Capacity in Development: 0.8 MW Estimated PCA in Development: NA MW Number of Projects in Development: 1
The potential to utilize the hot water byproduct of oil and gas production to generate electricity using geothermal technology is being evaluated in a number of demonstration scale projects in the Gulf of Mexico. Texas currently hosts one geothermal and hydrocarbon coproduction project in Goliad County.
TX Projects in Development
Phase Project Developer Capacity Estimate (MW)
Project Type Resource PCA
Unconfirmed
Goliad Co. Coproduction Universal GeoPower 0.8 NA Coproduction
Source: GEA
Utah Installed Capacity: 42 MW Estimated Resource Capacity in Development: 170 – 195 MW Estimated PCA in Development: 60 MW Number of Projects in Development: 11 A number of geothermal power plants operate in Utah. Unit 1 of the Blundell power plant has an installed capacity of 23 MW and Unit 2 has a capacity of 9 MW. In April 2009 the low-temperature 10-MW Hatch Geothermal Power Plant in Beaver County began delivering power to Anaheim California.
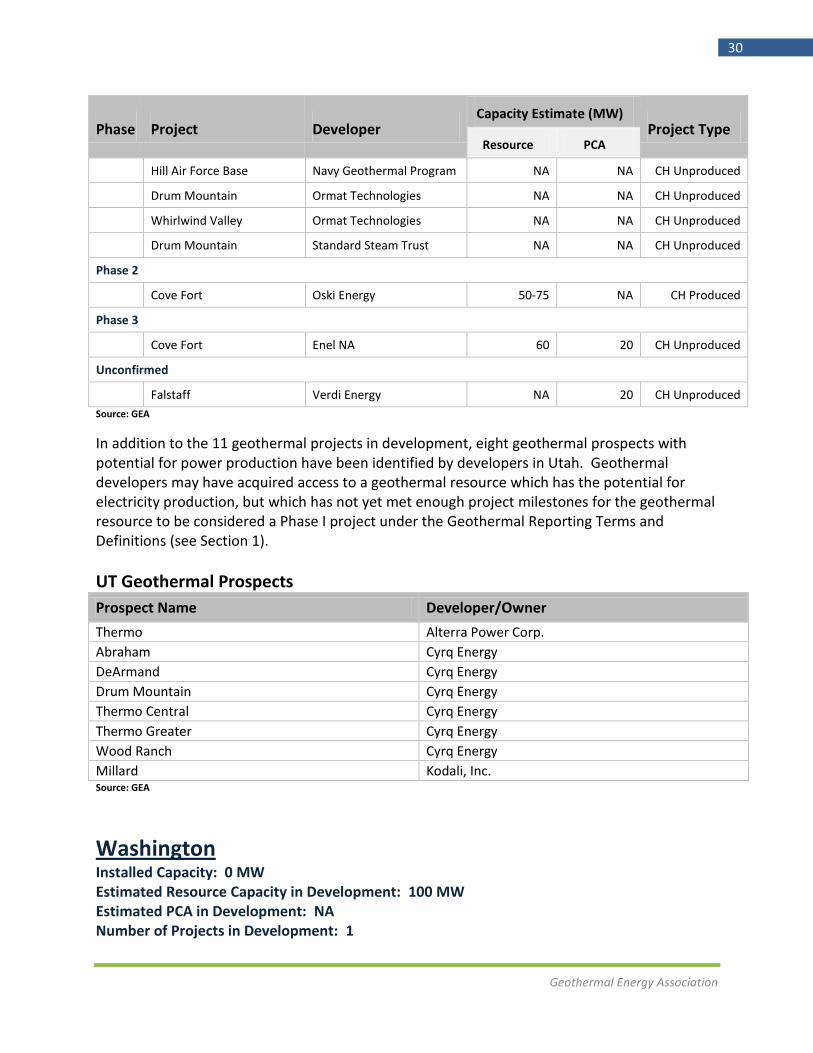
UT Projects in Development
Phase Project Developer Capacity Estimate (MW)
Project Type Resource PCA
Phase 1
Thermo 2 Cyrq Energy NA NA CH Produced
Thermo 3 Cyrq Energy NA NA CH Produced
Thermo 4 Cyrq Energy NA NA CH Produced
Cove Fort 2 Enel NA 60 20 CH Produced
Geothermal Energy Association
30
Phase Project Developer Capacity Estimate (MW)
Project Type Resource PCA
Hill Air Force Base Navy Geothermal Program NA NA CH Unproduced
Drum Mountain Ormat Technologies NA NA CH Unproduced
Whirlwind Valley Ormat Technologies NA NA CH Unproduced
Drum Mountain Standard Steam Trust NA NA CH Unproduced
Phase 2
Cove Fort Oski Energy 50-75 NA CH Produced
Phase 3
Cove Fort Enel NA 60 20 CH Unproduced
Unconfirmed
Falstaff Verdi Energy NA 20 CH Unproduced
Source: GEA
In addition to the 11 geothermal projects in development, eight geothermal prospects with potential for power production have been identified by developers in Utah. Geothermal developers may have acquired access to a geothermal resource which has the potential for electricity production, but which has not yet met enough project milestones for the geothermal resource to be considered a Phase I project under the Geothermal Reporting Terms and Definitions (see Section 1).
UT Geothermal Prospects
Prospect Name Developer/Owner
Thermo Alterra Power Corp.
Abraham Cyrq Energy
DeArmand Cyrq Energy
Drum Mountain Cyrq Energy
Thermo Central Cyrq Energy
Thermo Greater Cyrq Energy
Wood Ranch Cyrq Energy
Millard Kodali, Inc. Source: GEA
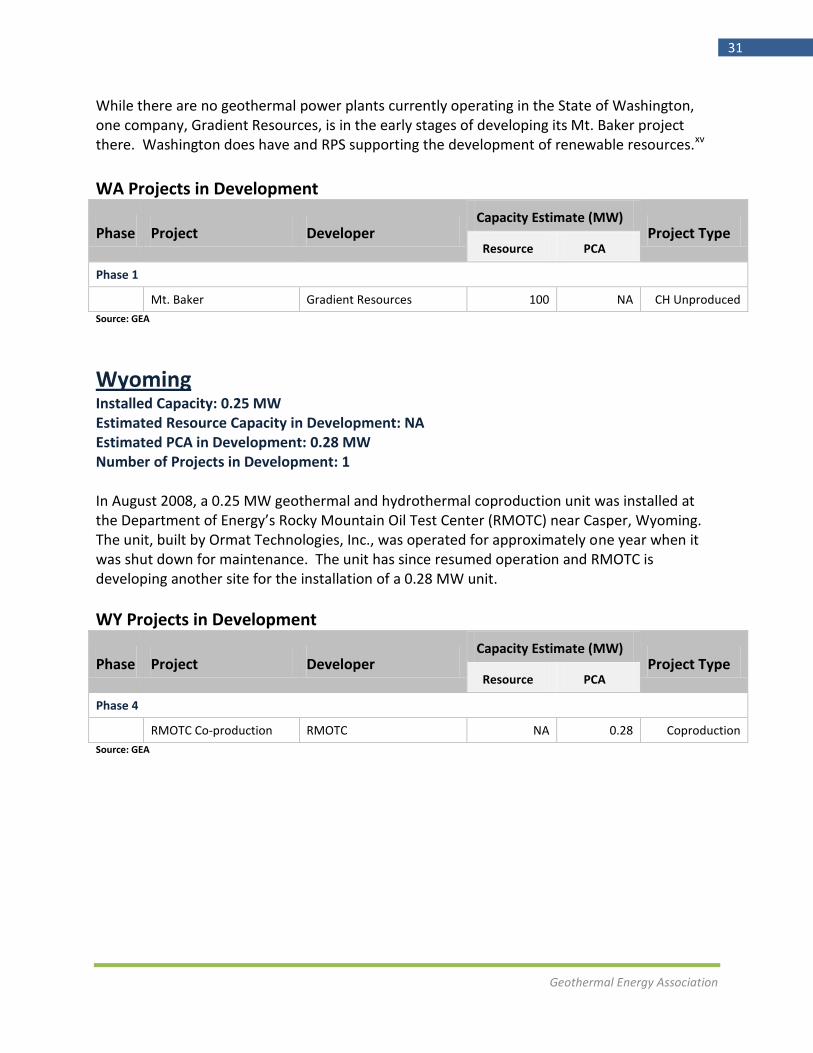
Washington Installed Capacity: 0 MW Estimated Resource Capacity in Development: 100 MW Estimated PCA in Development: NA Number of Projects in Development: 1
Geothermal Energy Association
31
While there are no geothermal power plants currently operating in the State of Washington, one company, Gradient Resources, is in the early stages of developing its Mt. Baker project there. Washington does have and RPS supporting the development of renewable resources.xv
WA Projects in Development
Phase Project Developer Capacity Estimate (MW)
Project Type Resource PCA
Phase 1
Mt. Baker Gradient Resources 100 NA CH Unproduced
Source: GEA
Wyoming Installed Capacity: 0.25 MW Estimated Resource Capacity in Development: NA Estimated PCA in Development: 0.28 MW Number of Projects in Development: 1 In August 2008, a 0.25 MW geothermal and hydrothermal coproduction unit was installed at the Department of Energy’s Rocky Mountain Oil Test Center (RMOTC) near Casper, Wyoming. The unit, built by Ormat Technologies, Inc., was operated for approximately one year when it was shut down for maintenance. The unit has since resumed operation and RMOTC is developing another site for the installation of a 0.28 MW unit.
WY Projects in Development
Phase Project Developer Capacity Estimate (MW)
Project Type Resource PCA
Phase 4
RMOTC Co-production RMOTC NA 0.28 Coproduction
Source: GEA
Geothermal Energy Association
32
4. Emerging Technology Demonstration Projects
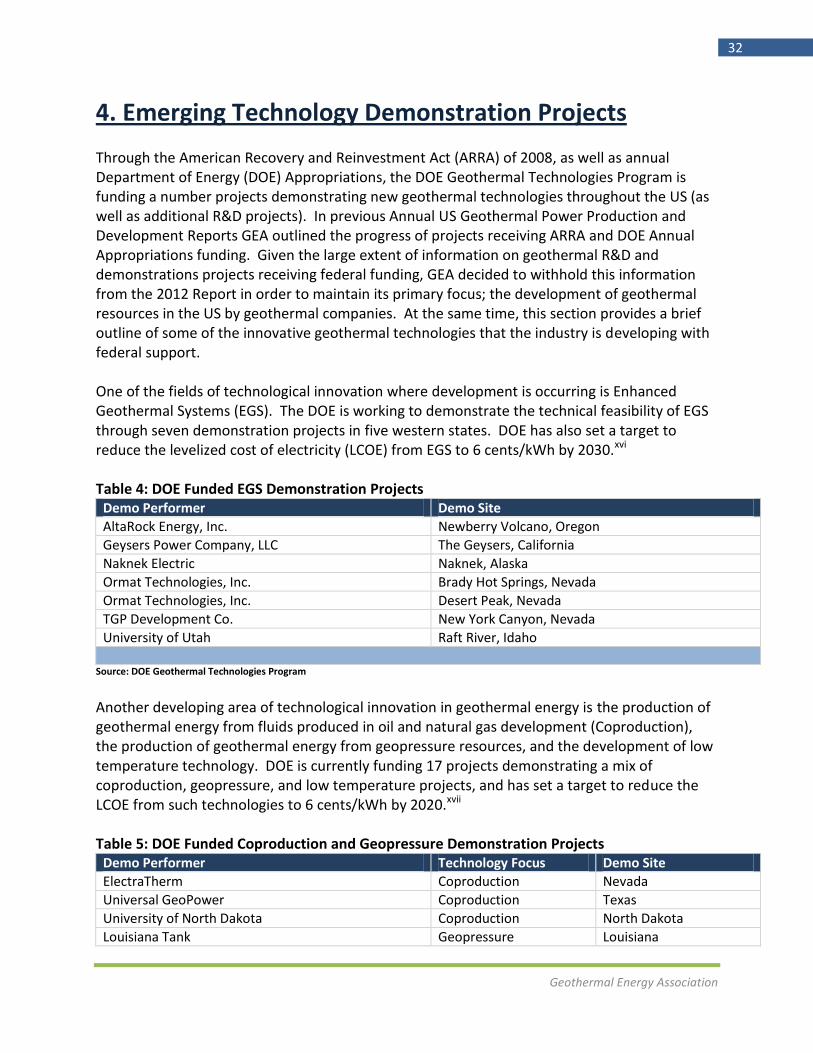
Through the American Recovery and Reinvestment Act (ARRA) of 2008, as well as annual Department of Energy (DOE) Appropriations, the DOE Geothermal Technologies Program is funding a number projects demonstrating new geothermal technologies throughout the US (as well as additional R&D projects). In previous Annual US Geothermal Power Production and Development Reports GEA outlined the progress of projects receiving ARRA and DOE Annual Appropriations funding. Given the large extent of information on geothermal R&D and demonstrations projects receiving federal funding, GEA decided to withhold this information from the 2012 Report in order to maintain its primary focus; the development of geothermal resources in the US by geothermal companies. At the same time, this section provides a brief outline of some of the innovative geothermal technologies that the industry is developing with federal support. One of the fields of technological innovation where development is occurring is Enhanced Geothermal Systems (EGS). The DOE is working to demonstrate the technical feasibility of EGS through seven demonstration projects in five western states. DOE has also set a target to reduce the levelized cost of electricity (LCOE) from EGS to 6 cents/kWh by 2030.xvi Table 4: DOE Funded EGS Demonstration Projects
Demo Performer Demo Site
AltaRock Energy, Inc. Newberry Volcano, Oregon
Geysers Power Company, LLC The Geysers, California
Naknek Electric Naknek, Alaska
Ormat Technologies, Inc. Brady Hot Springs, Nevada
Ormat Technologies, Inc. Desert Peak, Nevada
TGP Development Co. New York Canyon, Nevada
University of Utah Raft River, Idaho
Source: DOE Geothermal Technologies Program
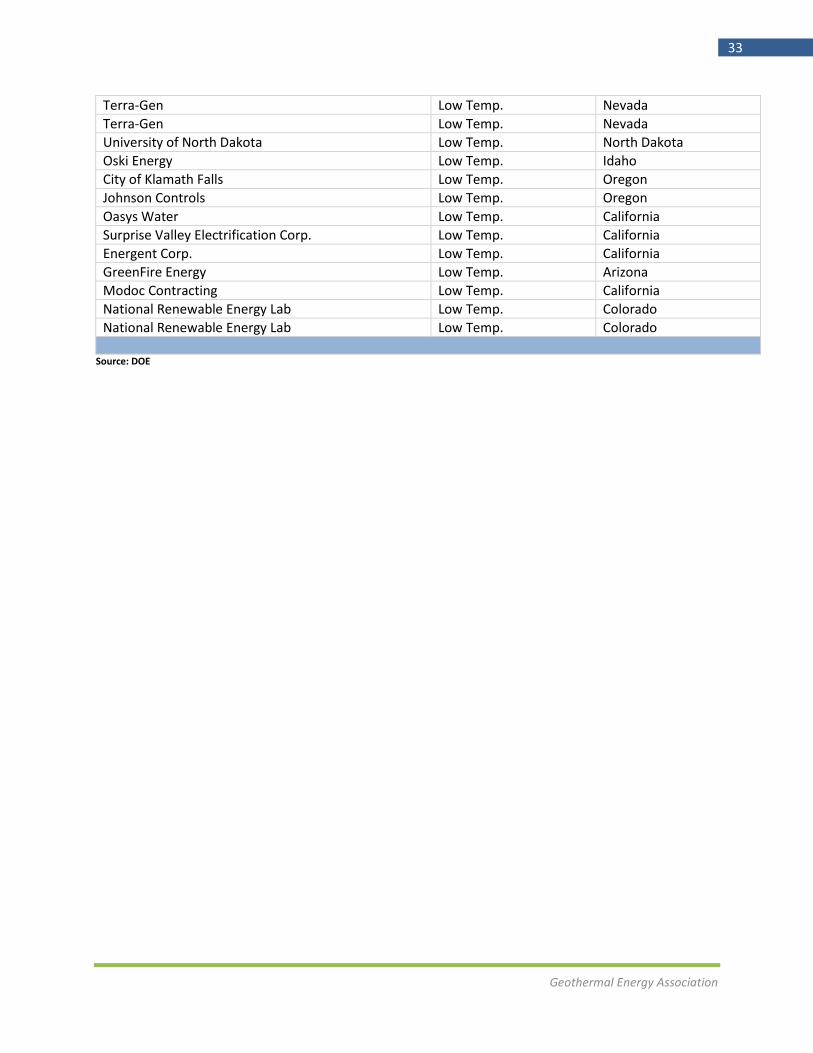
Another developing area of technological innovation in geothermal energy is the production of geothermal energy from fluids produced in oil and natural gas development (Coproduction), the production of geothermal energy from geopressure resources, and the development of low temperature technology. DOE is currently funding 17 projects demonstrating a mix of coproduction, geopressure, and low temperature projects, and has set a target to reduce the LCOE from such technologies to 6 cents/kWh by 2020.xvii Table 5: DOE Funded Coproduction and Geopressure Demonstration Projects
Demo Performer Technology Focus Demo Site
ElectraTherm Coproduction Nevada
Universal GeoPower Coproduction Texas
University of North Dakota Coproduction North Dakota
Louisiana Tank Geopressure Louisiana
Geothermal Energy Association
33
Terra-Gen Low Temp. Nevada
Terra-Gen Low Temp. Nevada
University of North Dakota Low Temp. North Dakota
Oski Energy Low Temp. Idaho
City of Klamath Falls Low Temp. Oregon
Johnson Controls Low Temp. Oregon
Oasys Water Low Temp. California
Surprise Valley Electrification Corp. Low Temp. California
Energent Corp. Low Temp. California
GreenFire Energy Low Temp. Arizona
Modoc Contracting Low Temp. California
National Renewable Energy Lab Low Temp. Colorado
National Renewable Energy Lab Low Temp. Colorado
Source: DOE
Geothermal Energy Association
34
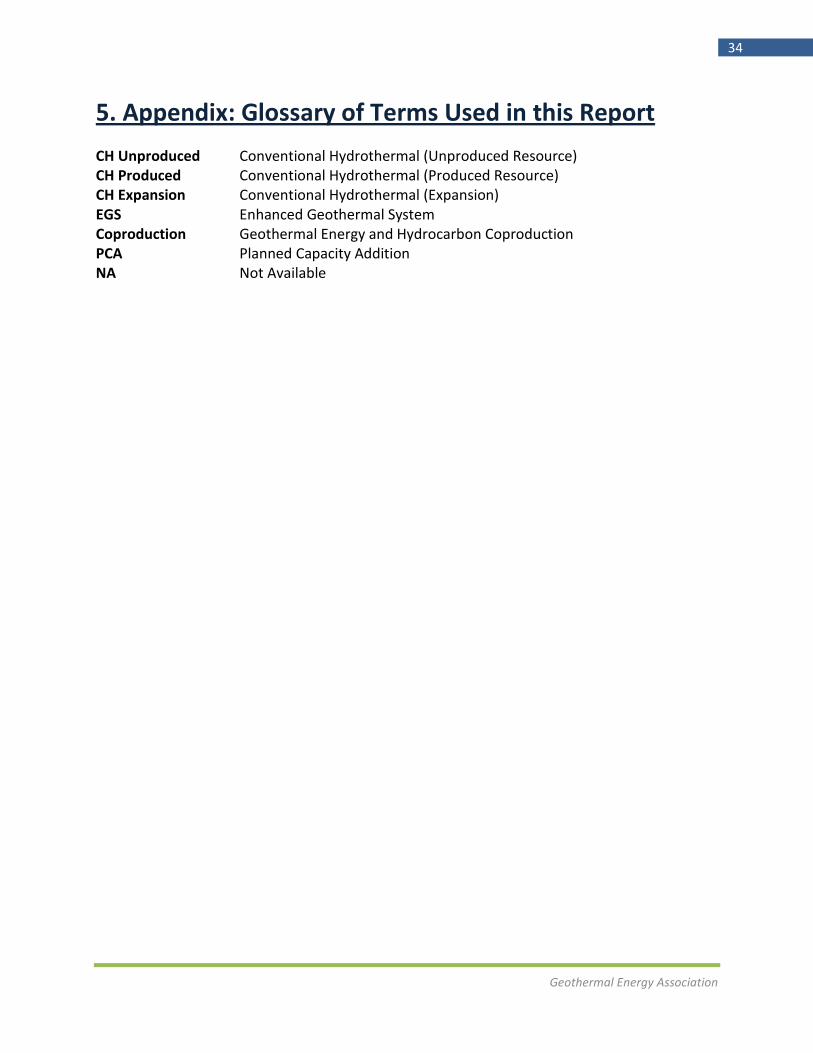
5. Appendix: Glossary of Terms Used in this Report
CH Unproduced Conventional Hydrothermal (Unproduced Resource) CH Produced Conventional Hydrothermal (Produced Resource) CH Expansion Conventional Hydrothermal (Expansion) EGS Enhanced Geothermal System Coproduction Geothermal Energy and Hydrocarbon Coproduction PCA Planned Capacity Addition NA Not Available

Geothermal Energy Association
35
6. References i US Energy Information Administration. Renewable Energy Consumption and Electricity Statistics 2010. ii California Energy Commission. Renewable Power in California: Status and Issues, Lead Commissioner Report.
December 2011. iii In 2005, California’s Energy Action Plan recommended a state RPS goal of 33% of electricity generation from
renewable sources by 2020. In April 2011California’s 33% by 2020 RPS goal was codified by Governor Edmund Brown. California Energy Commission. iv Colorado’s RPS requires investor owned utilities, municipal utilities, and rural electric cooperatives to derive 30%,
10%, and 10%, of their electricity from renewable resources (respectively) by 2020. DSIRE.org vPuna Geothermal Venture.
vi Hawaii passed legislation in 2009 that expanded its RPS goals to require 40% of electricity generation from
renewable resources by 2030. DSIRE.org vii
Hawaii Electric Light Company viii
Idaho Office of Energy Resources ix ElectraTherm. Mississippi Oilfield is Home to Innovative Lower-Temp Geothermal Energy Production.
x In 2009 the State of Nevada revised its RPS to require 25% of electricity generation from renewable resources by
2025. DSIRE.org xiNevada Commission on Mineral Resources Division of Minerals
xii New Mexico Energy, Minerals, and Natural Resources Department:
http://www.emnrd.state.nm.us/main/index.htm xiii
The State of New Mexico has established an RPS that requires investor owned utilities and rural electric cooperatives to derive 20% and 10% of their electricity mix respectively from renewable resources by 2020. DSIRE.org xiv
US Department of Energy Geothermal Technologies Program. xv
The State of Washington has established an RPS requiring 15% of its electricity to be derived from renewable resources by 2020. DSIRE.org xvi
DOE Geothermal Technologies Program. Fiscal Year 2013 Budget Request Briefing. xvii
DOE Geothermal Technologies Program. Fiscal Year 2013 Budget Request Briefing.