Embed Size (px)
Citation preview
NSW Department of Education & Training
1596
2010 Annual School Report Colyton Public School
NSW Public Schools – Leading the way
1
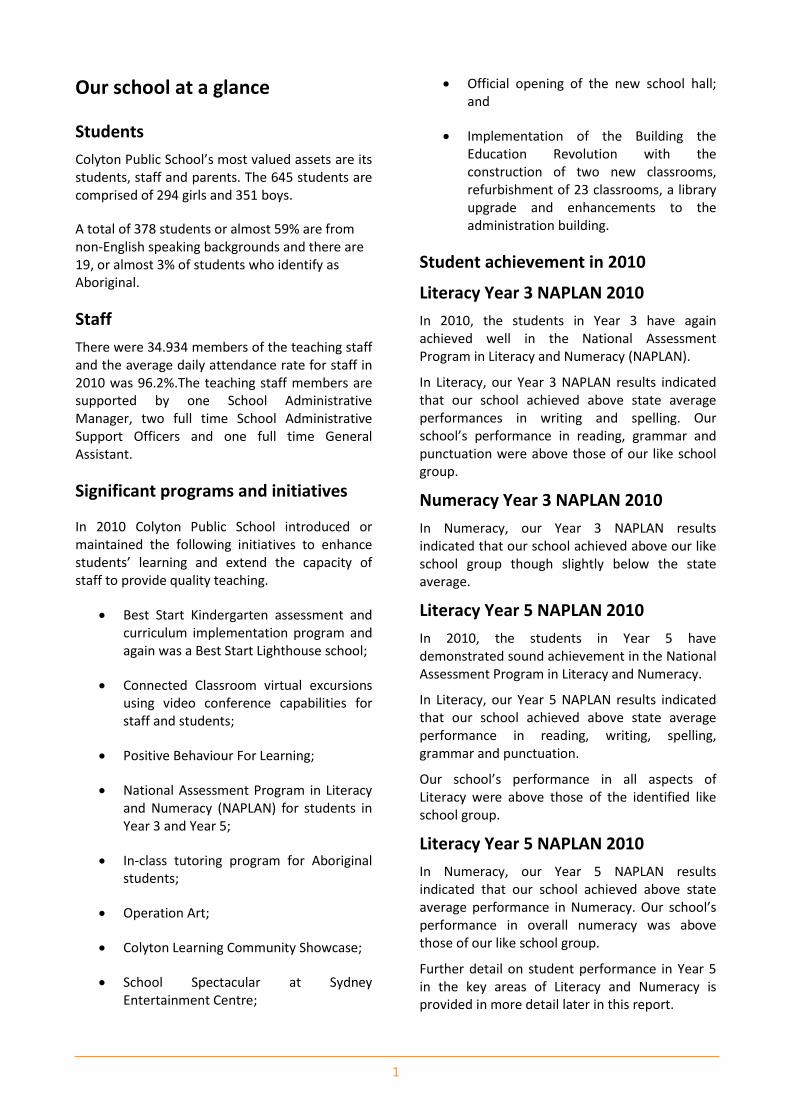
Our school at a glance
Students
Colyton Public School’s most valued assets are its students, staff and parents. The 645 students are comprised of 294 girls and 351 boys.
A total of 378 students or almost 59% are from non-English speaking backgrounds and there are 19, or almost 3% of students who identify as Aboriginal.
Staff
There were 34.934 members of the teaching staff and the average daily attendance rate for staff in 2010 was 96.2%.The teaching staff members are supported by one School Administrative Manager, two full time School Administrative Support Officers and one full time General Assistant.
Significant programs and initiatives
In 2010 Colyton Public School introduced or maintained the following initiatives to enhance students’ learning and extend the capacity of staff to provide quality teaching.
Best Start Kindergarten assessment and curriculum implementation program and again was a Best Start Lighthouse school;
Connected Classroom virtual excursions using video conference capabilities for staff and students;
Positive Behaviour For Learning;
National Assessment Program in Literacy and Numeracy (NAPLAN) for students in Year 3 and Year 5;
In-class tutoring program for Aboriginal students;
Operation Art;
Colyton Learning Community Showcase;
School Spectacular at Sydney Entertainment Centre;
Official opening of the new school hall; and
Implementation of the Building the Education Revolution with the construction of two new classrooms, refurbishment of 23 classrooms, a library upgrade and enhancements to the administration building.
Student achievement in 2010
Literacy Year 3 NAPLAN 2010
In 2010, the students in Year 3 have again achieved well in the National Assessment Program in Literacy and Numeracy (NAPLAN).
In Literacy, our Year 3 NAPLAN results indicated that our school achieved above state average performances in writing and spelling. Our school’s performance in reading, grammar and punctuation were above those of our like school group.
Numeracy Year 3 NAPLAN 2010
In Numeracy, our Year 3 NAPLAN results indicated that our school achieved above our like school group though slightly below the state average.
Literacy Year 5 NAPLAN 2010
In 2010, the students in Year 5 have demonstrated sound achievement in the National Assessment Program in Literacy and Numeracy.
In Literacy, our Year 5 NAPLAN results indicated that our school achieved above state average performance in reading, writing, spelling, grammar and punctuation.
Our school’s performance in all aspects of Literacy were above those of the identified like school group.
Literacy Year 5 NAPLAN 2010
In Numeracy, our Year 5 NAPLAN results indicated that our school achieved above state average performance in Numeracy. Our school’s performance in overall numeracy was above those of our like school group.
Further detail on student performance in Year 5 in the key areas of Literacy and Numeracy is provided in more detail later in this report.
2
Messages
Principal’s message
Throughout 2010, Colyton Public School has continued its long and proud history and extended its established connectedness with the local community.
During 2010, the school has continued to expand and grow to meet the changing needs and aspirations of our diverse urban and multicultural community.
We remain committed to enhancing teacher quality through a focus on students’ learning thereby ensuring that all students are encouraged and supported to achieve their full potential. Our school environment is calm, warm and welcoming in order to help all students, staff and parent volunteers support each other in achieving their best.
At Colyton Public School we continue to value:
an attractive, stimulating, organised learning environment where students feel valued, respected and safe;
students who are actively involved in and enthusiastic about their learning, who display a willingness to Go Safely, Go Respectfully, Go Responsibly and Go as a Learner;
staff who are keen and committed to the continual development of their professional knowledge and skill, thereby making the school an increasingly effective organisation;
parents and teachers who work individually, collectively and collaboratively as team members to optimise learning for our students; and
involvement in the Colyton Learning Community of schools.
Throughout the year, a number of new or existing programs have been modified and expanded. As a Best Start Lighthouse school we shared our learning and knowledge regarding the Best Start assessment and early learning program with teachers from across Western Sydney Region and presented our experience with school staff from across NSW at the Best Start Lighthouse schools’ state conference.
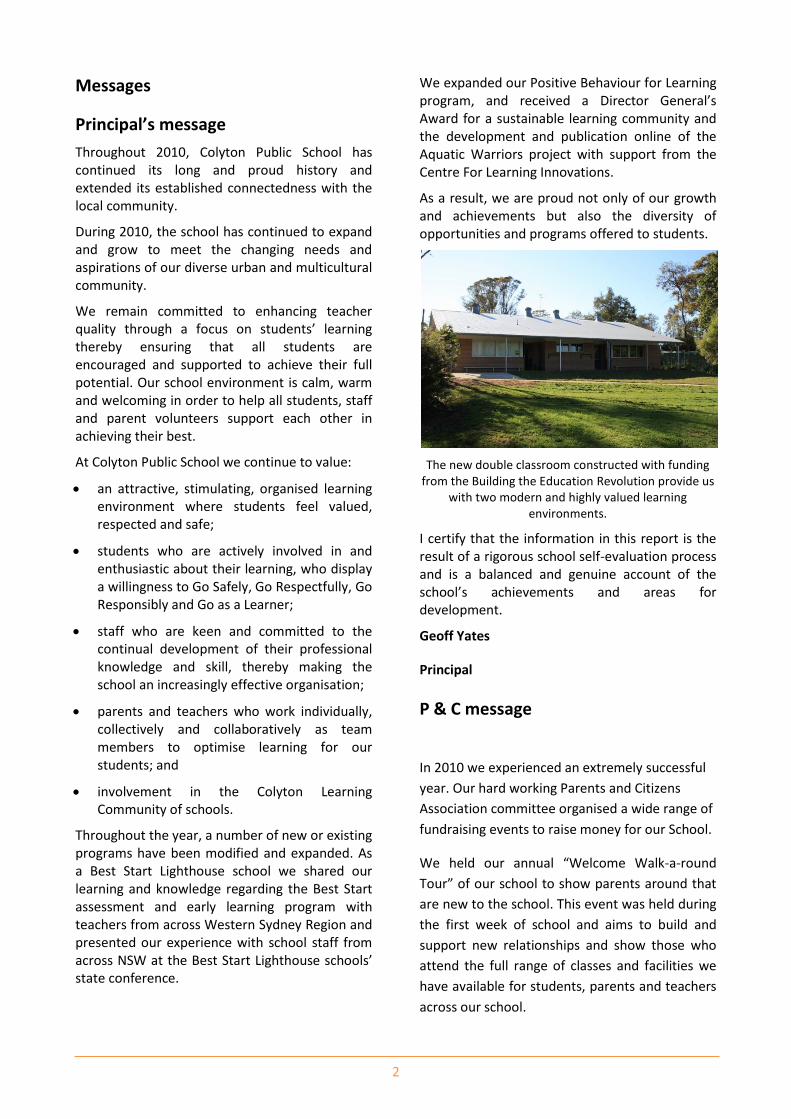
We expanded our Positive Behaviour for Learning program, and received a Director General’s Award for a sustainable learning community and the development and publication online of the Aquatic Warriors project with support from the Centre For Learning Innovations.
As a result, we are proud not only of our growth and achievements but also the diversity of opportunities and programs offered to students.
The new double classroom constructed with funding from the Building the Education Revolution provide us
with two modern and highly valued learning environments.
I certify that the information in this report is the result of a rigorous school self-evaluation process and is a balanced and genuine account of the school’s achievements and areas for development.
Geoff Yates
Principal
P & C message
In 2010 we experienced an extremely successful
year. Our hard working Parents and Citizens
Association committee organised a wide range of
fundraising events to raise money for our School.
We held our annual “Welcome Walk-a-round
Tour” of our school to show parents around that
are new to the school. This event was held during
the first week of school and aims to build and
support new relationships and show those who
attend the full range of classes and facilities we
have available for students, parents and teachers
across our school.
3
We arranged one disco in March this year to
welcome all new children to the school involving
all who attended a light fun filled afternoon of
dancing.
At Easter we held another very successful Easter
raffle to raise money and a provided a snack bar
at the Easter hat parade as we also did at the end
of year festivities for Christmas. Our Fathers’ Day
and Mothers’ Day stalls were again very well
supported and successful.
Our big fundraisers were Krispy Kreme donuts,
Cadbury chocolates and the official hall opening
commemorative pavers.
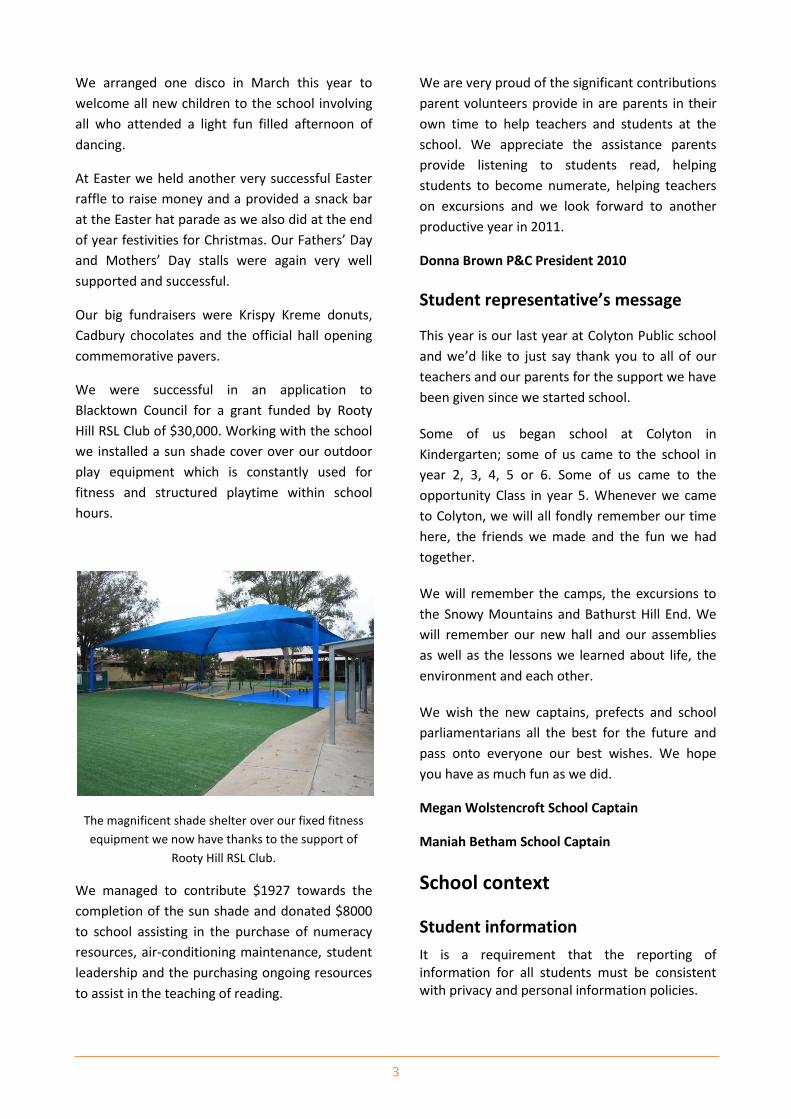
We were successful in an application to
Blacktown Council for a grant funded by Rooty
Hill RSL Club of $30,000. Working with the school
we installed a sun shade cover over our outdoor
play equipment which is constantly used for
fitness and structured playtime within school
hours.
The magnificent shade shelter over our fixed fitness
equipment we now have thanks to the support of
Rooty Hill RSL Club.
We managed to contribute $1927 towards the
completion of the sun shade and donated $8000
to school assisting in the purchase of numeracy
resources, air-conditioning maintenance, student
leadership and the purchasing ongoing resources
to assist in the teaching of reading.
We are very proud of the significant contributions
parent volunteers provide in are parents in their
own time to help teachers and students at the
school. We appreciate the assistance parents
provide listening to students read, helping
students to become numerate, helping teachers
on excursions and we look forward to another
productive year in 2011.
Donna Brown P&C President 2010
Student representative’s message
This year is our last year at Colyton Public school
and we’d like to just say thank you to all of our
teachers and our parents for the support we have
been given since we started school.
Some of us began school at Colyton in
Kindergarten; some of us came to the school in
year 2, 3, 4, 5 or 6. Some of us came to the
opportunity Class in year 5. Whenever we came
to Colyton, we will all fondly remember our time
here, the friends we made and the fun we had
together.
We will remember the camps, the excursions to
the Snowy Mountains and Bathurst Hill End. We
will remember our new hall and our assemblies
as well as the lessons we learned about life, the
environment and each other.
We wish the new captains, prefects and school
parliamentarians all the best for the future and
pass onto everyone our best wishes. We hope
you have as much fun as we did.
Megan Wolstencroft School Captain
Maniah Betham School Captain
School context
Student information
It is a requirement that the reporting of information for all students must be consistent with privacy and personal information policies.
4
Student enrolment profile
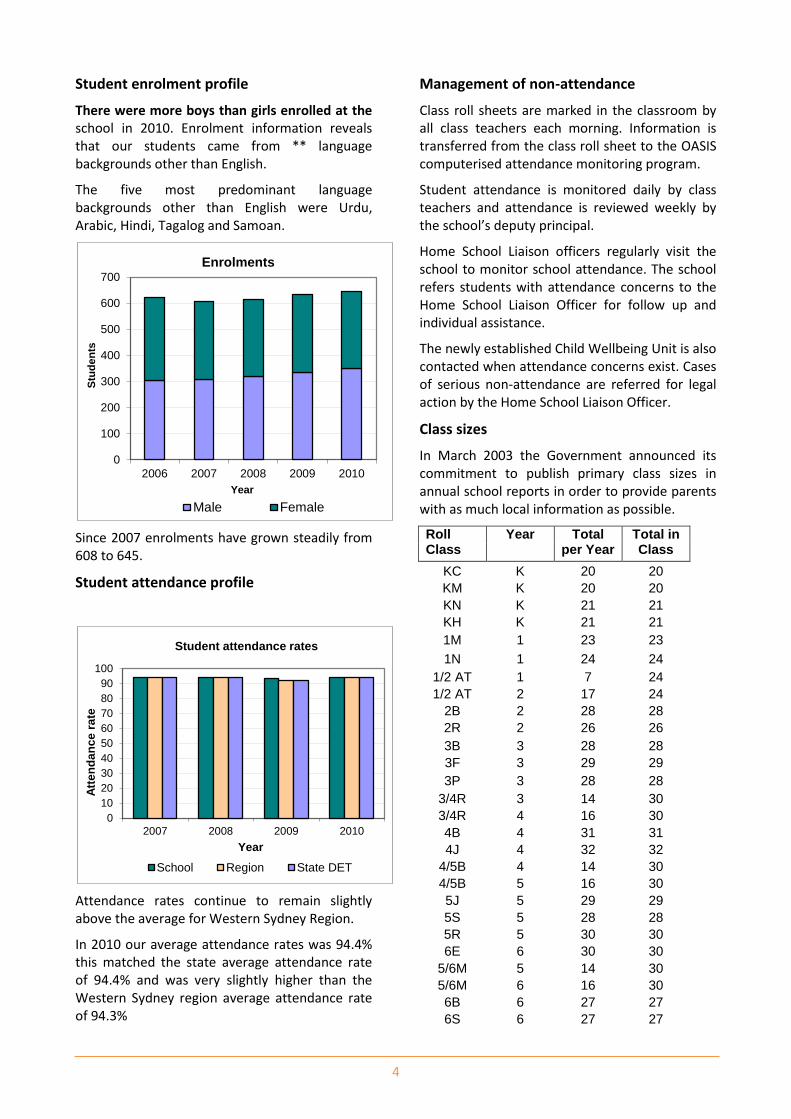
There were more boys than girls enrolled at the school in 2010. Enrolment information reveals that our students came from ** language backgrounds other than English.
The five most predominant language backgrounds other than English were Urdu, Arabic, Hindi, Tagalog and Samoan.
Since 2007 enrolments have grown steadily from 608 to 645.
Student attendance profile
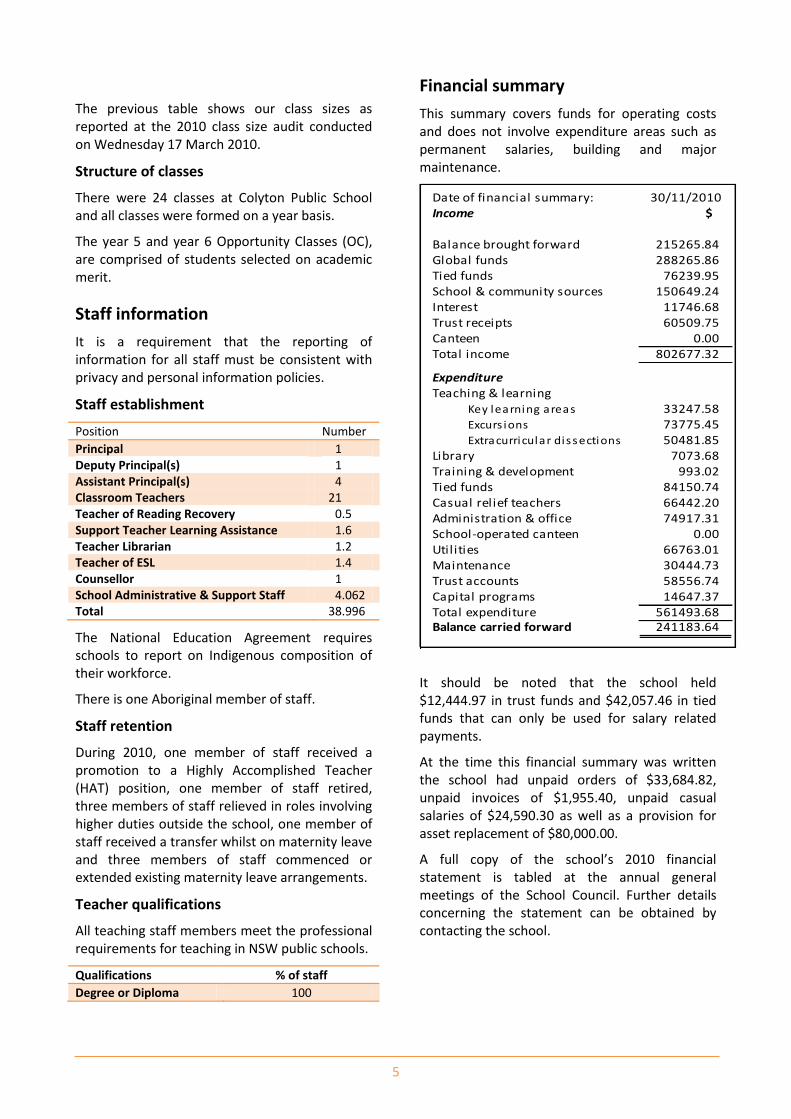
Attendance rates continue to remain slightly above the average for Western Sydney Region.
In 2010 our average attendance rates was 94.4% this matched the state average attendance rate of 94.4% and was very slightly higher than the Western Sydney region average attendance rate of 94.3%
Management of non-attendance
Class roll sheets are marked in the classroom by all class teachers each morning. Information is transferred from the class roll sheet to the OASIS computerised attendance monitoring program.
Student attendance is monitored daily by class teachers and attendance is reviewed weekly by the school’s deputy principal.
Home School Liaison officers regularly visit the school to monitor school attendance. The school refers students with attendance concerns to the Home School Liaison Officer for follow up and individual assistance.
The newly established Child Wellbeing Unit is also contacted when attendance concerns exist. Cases of serious non-attendance are referred for legal action by the Home School Liaison Officer.
Class sizes
In March 2003 the Government announced its commitment to publish primary class sizes in annual school reports in order to provide parents with as much local information as possible.
Roll Class
Year Total per Year
Total in Class
KC K 20 20
KM K 20 20
KN K 21 21
KH K 21 21
1M 1 23 23
1N 1 24 24
1/2 AT 1 7 24
1/2 AT 2 17 24
2B 2 28 28
2R 2 26 26
3B 3 28 28
3F 3 29 29
3P 3 28 28
3/4R 3 14 30
3/4R 4 16 30
4B 4 31 31
4J 4 32 32
4/5B 4 14 30
4/5B 5 16 30
5J 5 29 29
5S 5 28 28
5R 5 30 30
6E 6 30 30
5/6M 5 14 30
5/6M 6 16 30
6B 6 27 27
6S 6 27 27
0
100
200
300
400
500
600
700
2006 2007 2008 2009 2010
Stu
de
nts
Year
Enrolments
Male Female
0
10
20
30
40
50
60
70
80
90
100
2007 2008 2009 2010
Att
en
da
nc
e r
ate
Year
Student attendance rates
School Region State DET
5
The previous table shows our class sizes as reported at the 2010 class size audit conducted on Wednesday 17 March 2010.
Structure of classes
There were 24 classes at Colyton Public School and all classes were formed on a year basis.
The year 5 and year 6 Opportunity Classes (OC), are comprised of students selected on academic merit.
Staff information
It is a requirement that the reporting of information for all staff must be consistent with privacy and personal information policies.
Staff establishment
Position Number
Principal 1 Deputy Principal(s) 1 Assistant Principal(s) 4 Classroom Teachers 21 Teacher of Reading Recovery 0.5 Support Teacher Learning Assistance 1.6 Teacher Librarian 1.2 Teacher of ESL 1.4 Counsellor 1 School Administrative & Support Staff 4.062 Total 38.996
The National Education Agreement requires schools to report on Indigenous composition of their workforce.
There is one Aboriginal member of staff.
Staff retention
During 2010, one member of staff received a promotion to a Highly Accomplished Teacher (HAT) position, one member of staff retired, three members of staff relieved in roles involving higher duties outside the school, one member of staff received a transfer whilst on maternity leave and three members of staff commenced or extended existing maternity leave arrangements.
Teacher qualifications
All teaching staff members meet the professional requirements for teaching in NSW public schools.
Qualifications % of staff
Degree or Diploma 100
Financial summary
This summary covers funds for operating costs and does not involve expenditure areas such as permanent salaries, building and major maintenance.
Date of financial summary: 30/11/2010Income $
Balance brought forward 215265.84Global funds 288265.86Tied funds 76239.95School & community sources 150649.24Interest 11746.68Trust receipts 60509.75Canteen 0.00Total income 802677.32
ExpenditureTeaching & learning Key learning areas 33247.58 Excurs ions 73775.45 Extracurricular dissections 50481.85Library 7073.68Training & development 993.02Tied funds 84150.74Casual relief teachers 66442.20Administration & office 74917.31School-operated canteen 0.00Utilities 66763.01Maintenance 30444.73Trust accounts 58556.74Capital programs 14647.37Total expenditure 561493.68Balance carried forward 241183.64
It should be noted that the school held $12,444.97 in trust funds and $42,057.46 in tied funds that can only be used for salary related payments.
At the time this financial summary was written the school had unpaid orders of $33,684.82, unpaid invoices of $1,955.40, unpaid casual salaries of $24,590.30 as well as a provision for asset replacement of $80,000.00.
A full copy of the school’s 2010 financial statement is tabled at the annual general meetings of the School Council. Further details concerning the statement can be obtained by contacting the school.
6
School performance 2010
The school has again had a very successful year. The refurbishment of 23 classrooms, construction of a double classroom, upgrade and refurbishment of the Library and administration areas was conducted safely and with a great amount of cooperation, flexibility and goodwill from students, staff, and parents.
Achievements
Arts
Operation Art continues to provide our students with the opportunity to express their creativity, interests and reflections using the visual arts.
Each year students continue to provide an amazing presentation of art works. For your enjoyment we include the following samples of students’ art work.
In 2010 we will seek to train another staff member in the knowledge, skills and contacts required to manage and organise our Operation Art program.
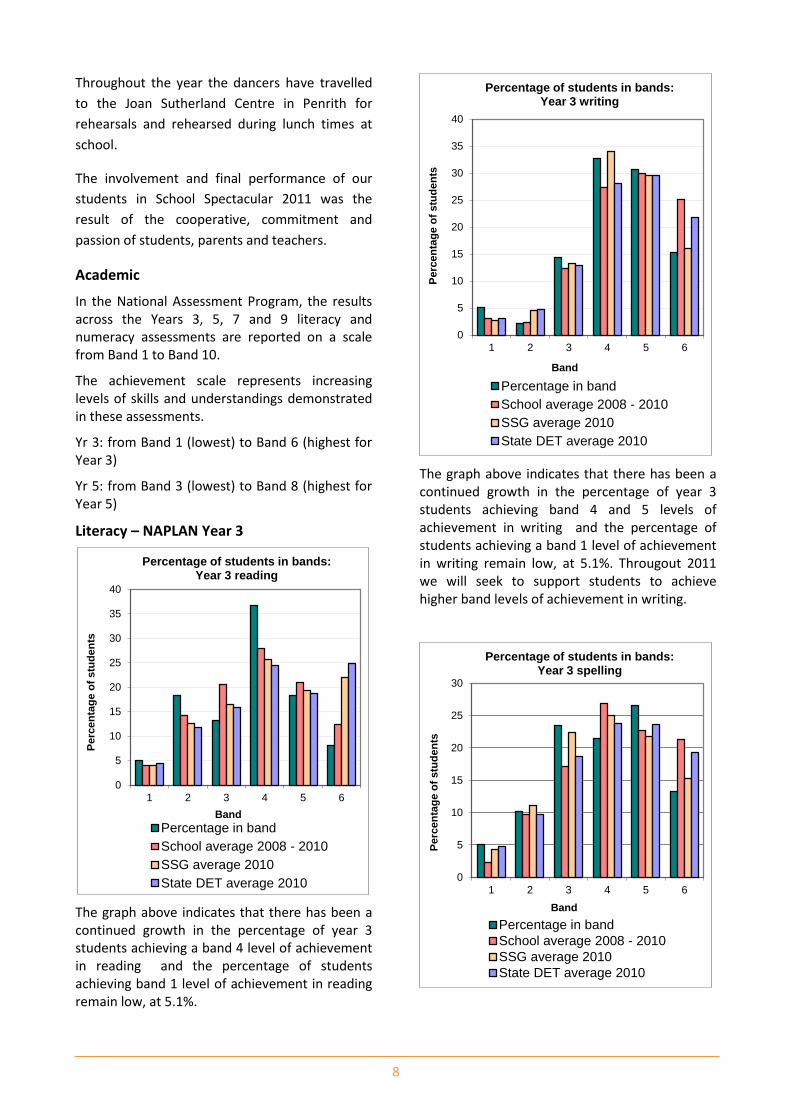
Delicious
Nadia Mukhtar from year 4 painted this picture because she sees this scene every morning in the dining room at her home. Nadia loved the way the colours mix together.
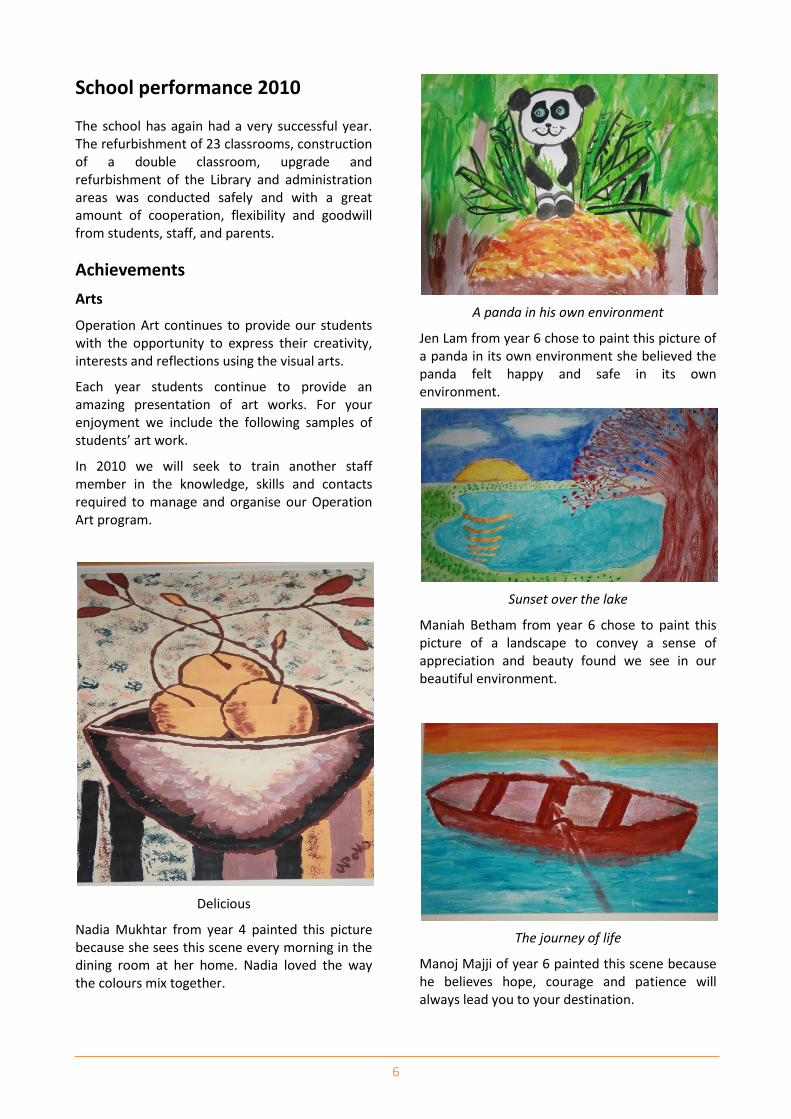
A panda in his own environment
Jen Lam from year 6 chose to paint this picture of a panda in its own environment she believed the panda felt happy and safe in its own environment.
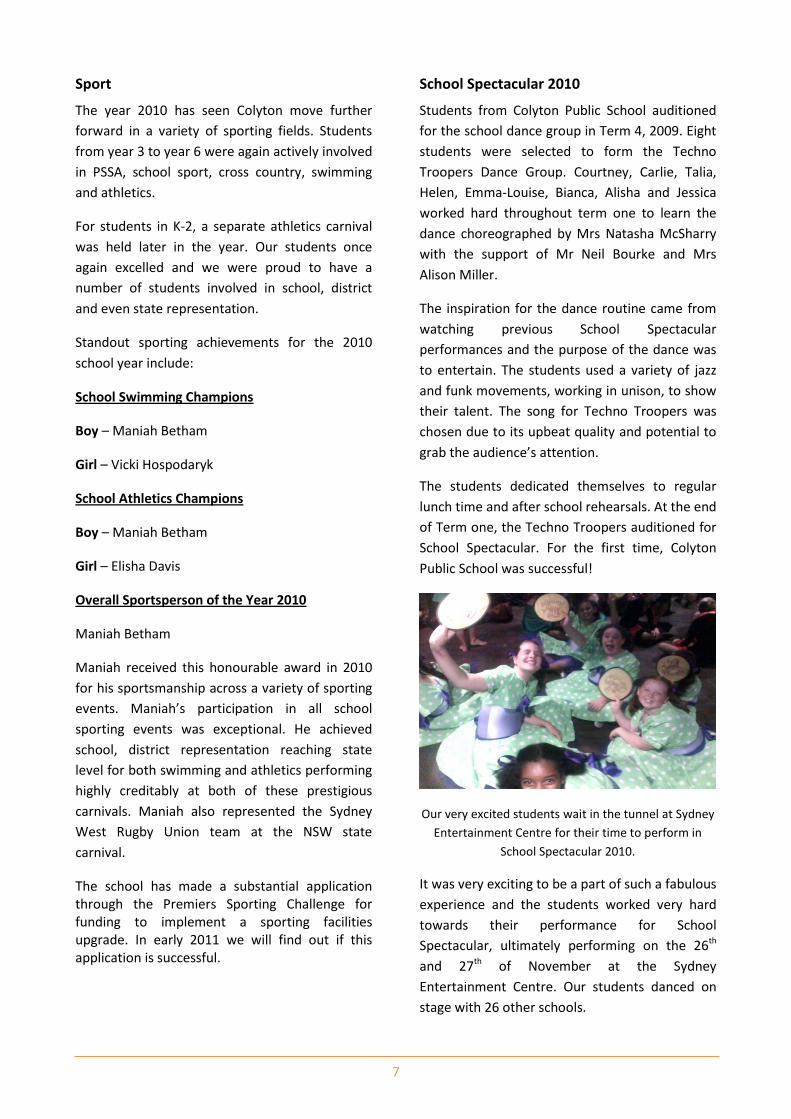
Sunset over the lake
Maniah Betham from year 6 chose to paint this picture of a landscape to convey a sense of appreciation and beauty found we see in our beautiful environment.
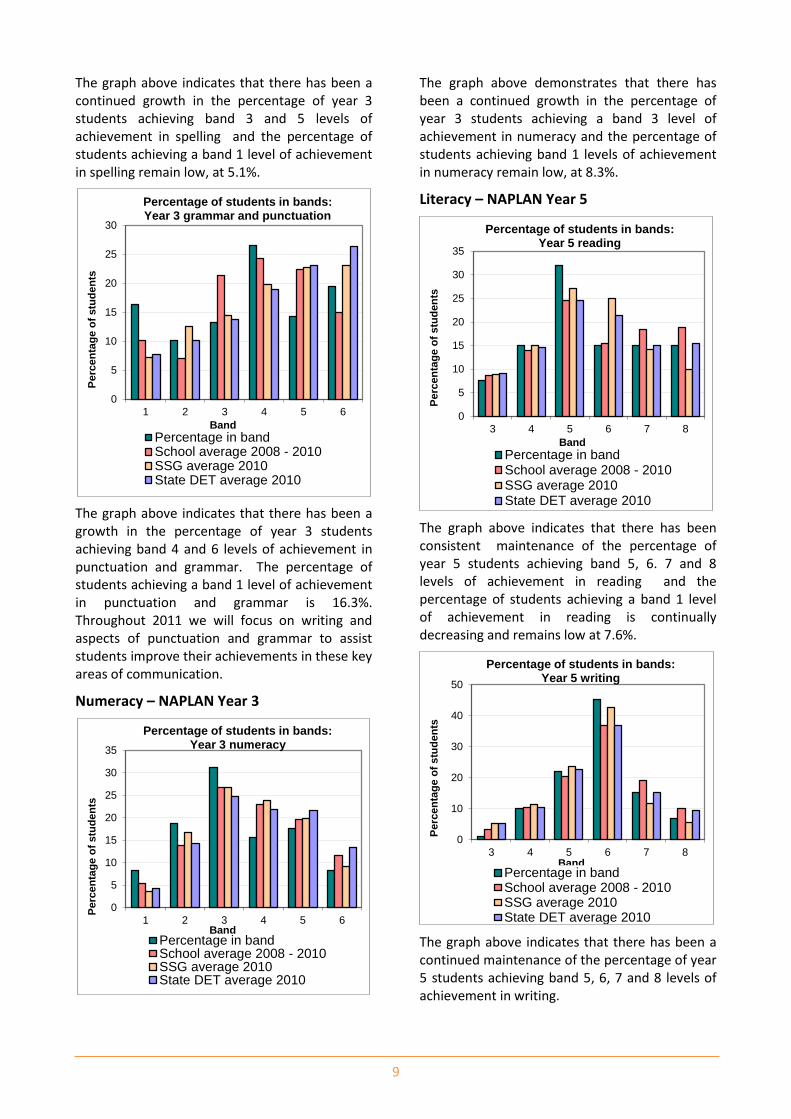
The journey of life
Manoj Majji of year 6 painted this scene because he believes hope, courage and patience will always lead you to your destination.
7
Sport
The year 2010 has seen Colyton move further
forward in a variety of sporting fields. Students
from year 3 to year 6 were again actively involved
in PSSA, school sport, cross country, swimming
and athletics.
For students in K-2, a separate athletics carnival
was held later in the year. Our students once
again excelled and we were proud to have a
number of students involved in school, district
and even state representation.
Standout sporting achievements for the 2010
school year include:
School Swimming Champions
Boy – Maniah Betham
Girl – Vicki Hospodaryk
School Athletics Champions
Boy – Maniah Betham
Girl – Elisha Davis
Overall Sportsperson of the Year 2010
Maniah Betham
Maniah received this honourable award in 2010
for his sportsmanship across a variety of sporting
events. Maniah’s participation in all school
sporting events was exceptional. He achieved
school, district representation reaching state
level for both swimming and athletics performing
highly creditably at both of these prestigious
carnivals. Maniah also represented the Sydney
West Rugby Union team at the NSW state
carnival.
The school has made a substantial application through the Premiers Sporting Challenge for funding to implement a sporting facilities upgrade. In early 2011 we will find out if this application is successful.
School Spectacular 2010
Students from Colyton Public School auditioned
for the school dance group in Term 4, 2009. Eight
students were selected to form the Techno
Troopers Dance Group. Courtney, Carlie, Talia,
Helen, Emma-Louise, Bianca, Alisha and Jessica
worked hard throughout term one to learn the
dance choreographed by Mrs Natasha McSharry
with the support of Mr Neil Bourke and Mrs
Alison Miller.
The inspiration for the dance routine came from
watching previous School Spectacular
performances and the purpose of the dance was
to entertain. The students used a variety of jazz
and funk movements, working in unison, to show
their talent. The song for Techno Troopers was
chosen due to its upbeat quality and potential to
grab the audience’s attention.
The students dedicated themselves to regular
lunch time and after school rehearsals. At the end
of Term one, the Techno Troopers auditioned for
School Spectacular. For the first time, Colyton
Public School was successful!
Our very excited students wait in the tunnel at Sydney
Entertainment Centre for their time to perform in
School Spectacular 2010.
It was very exciting to be a part of such a fabulous
experience and the students worked very hard
towards their performance for School
Spectacular, ultimately performing on the 26th
and 27th of November at the Sydney
Entertainment Centre. Our students danced on
stage with 26 other schools.
8
Throughout the year the dancers have travelled
to the Joan Sutherland Centre in Penrith for
rehearsals and rehearsed during lunch times at
school.
The involvement and final performance of our
students in School Spectacular 2011 was the
result of the cooperative, commitment and
passion of students, parents and teachers.
Academic
In the National Assessment Program, the results across the Years 3, 5, 7 and 9 literacy and numeracy assessments are reported on a scale from Band 1 to Band 10.
The achievement scale represents increasing levels of skills and understandings demonstrated in these assessments.
Yr 3: from Band 1 (lowest) to Band 6 (highest for Year 3)
Yr 5: from Band 3 (lowest) to Band 8 (highest for Year 5)
Literacy – NAPLAN Year 3
The graph above indicates that there has been a continued growth in the percentage of year 3 students achieving a band 4 level of achievement in reading and the percentage of students achieving band 1 level of achievement in reading remain low, at 5.1%.
The graph above indicates that there has been a continued growth in the percentage of year 3 students achieving band 4 and 5 levels of achievement in writing and the percentage of students achieving a band 1 level of achievement in writing remain low, at 5.1%. Througout 2011 we will seek to support students to achieve higher band levels of achievement in writing.
0
5
10
15
20
25
30
35
40
1 2 3 4 5 6
Perc
en
tag
e o
f stu
de
nts
Band
Percentage of students in bands: Year 3 reading
Percentage in band
School average 2008 - 2010
SSG average 2010
State DET average 2010
0
5
10
15
20
25
30
35
40
1 2 3 4 5 6
Perc
en
tag
e o
f stu
de
nts
Band
Percentage of students in bands: Year 3 writing
Percentage in band
School average 2008 - 2010
SSG average 2010
State DET average 2010
0
5
10
15
20
25
30
1 2 3 4 5 6
Perc
en
tag
e o
f stu
de
nts
Band
Percentage of students in bands: Year 3 spelling
Percentage in band
School average 2008 - 2010
SSG average 2010
State DET average 2010
9
The graph above indicates that there has been a continued growth in the percentage of year 3 students achieving band 3 and 5 levels of achievement in spelling and the percentage of students achieving a band 1 level of achievement in spelling remain low, at 5.1%.
The graph above indicates that there has been a growth in the percentage of year 3 students achieving band 4 and 6 levels of achievement in punctuation and grammar. The percentage of students achieving a band 1 level of achievement in punctuation and grammar is 16.3%. Throughout 2011 we will focus on writing and aspects of punctuation and grammar to assist students improve their achievements in these key areas of communication.
Numeracy – NAPLAN Year 3
The graph above demonstrates that there has been a continued growth in the percentage of year 3 students achieving a band 3 level of achievement in numeracy and the percentage of students achieving band 1 levels of achievement in numeracy remain low, at 8.3%.
Literacy – NAPLAN Year 5
The graph above indicates that there has been consistent maintenance of the percentage of year 5 students achieving band 5, 6. 7 and 8 levels of achievement in reading and the percentage of students achieving a band 1 level of achievement in reading is continually decreasing and remains low at 7.6%.
The graph above indicates that there has been a continued maintenance of the percentage of year 5 students achieving band 5, 6, 7 and 8 levels of achievement in writing.
0
5
10
15
20
25
30
1 2 3 4 5 6
Perc
en
tag
e o
f stu
de
nts
Band
Percentage of students in bands: Year 3 grammar and punctuation
Percentage in bandSchool average 2008 - 2010SSG average 2010State DET average 2010
0
5
10
15
20
25
30
35
1 2 3 4 5 6
Perc
en
tag
e o
f stu
de
nts
Band
Percentage of students in bands: Year 3 numeracy
Percentage in bandSchool average 2008 - 2010SSG average 2010State DET average 2010
0
5
10
15
20
25
30
35
3 4 5 6 7 8P
erc
en
tag
e o
f stu
de
nts
Band
Percentage of students in bands: Year 5 reading
Percentage in bandSchool average 2008 - 2010SSG average 2010State DET average 2010
0
10
20
30
40
50
3 4 5 6 7 8
Perc
en
tag
e o
f stu
de
nts
Band
Percentage of students in bands: Year 5 writing
Percentage in bandSchool average 2008 - 2010SSG average 2010State DET average 2010
10
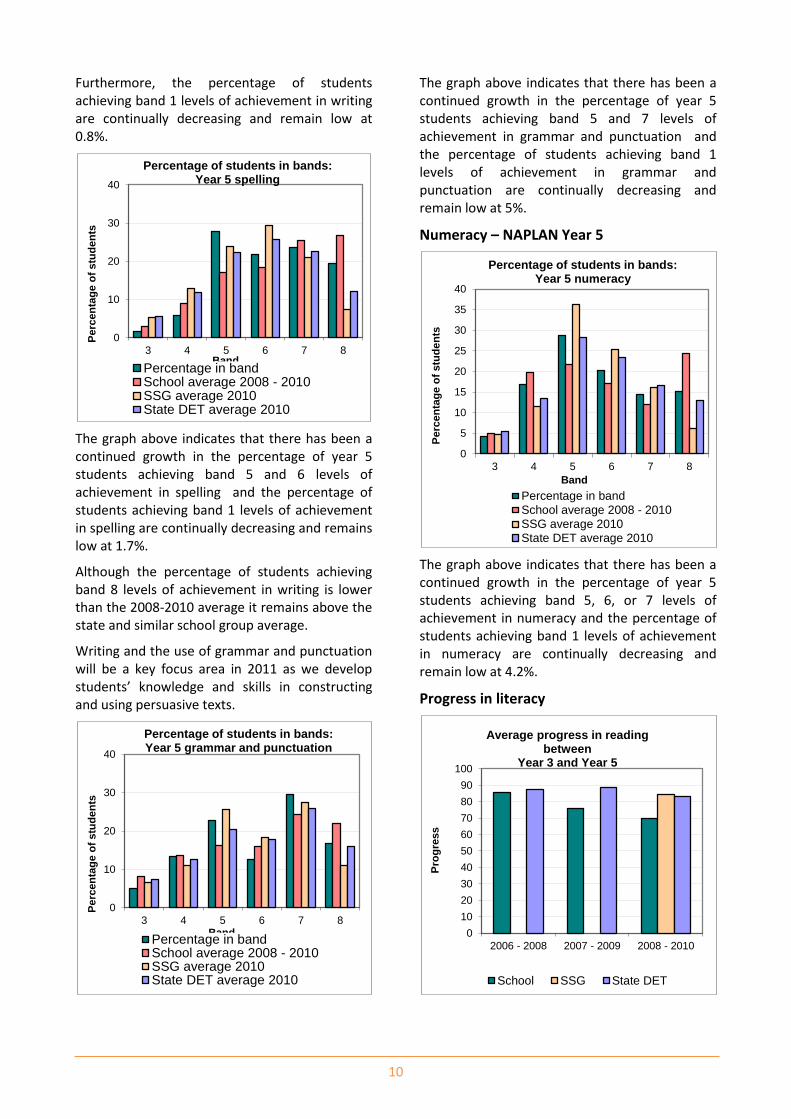
Furthermore, the percentage of students achieving band 1 levels of achievement in writing are continually decreasing and remain low at 0.8%.
The graph above indicates that there has been a continued growth in the percentage of year 5 students achieving band 5 and 6 levels of achievement in spelling and the percentage of students achieving band 1 levels of achievement in spelling are continually decreasing and remains low at 1.7%.
Although the percentage of students achieving band 8 levels of achievement in writing is lower than the 2008-2010 average it remains above the state and similar school group average.
Writing and the use of grammar and punctuation will be a key focus area in 2011 as we develop students’ knowledge and skills in constructing and using persuasive texts.
The graph above indicates that there has been a continued growth in the percentage of year 5 students achieving band 5 and 7 levels of achievement in grammar and punctuation and the percentage of students achieving band 1 levels of achievement in grammar and punctuation are continually decreasing and remain low at 5%.
Numeracy – NAPLAN Year 5
The graph above indicates that there has been a continued growth in the percentage of year 5 students achieving band 5, 6, or 7 levels of achievement in numeracy and the percentage of students achieving band 1 levels of achievement in numeracy are continually decreasing and remain low at 4.2%.
Progress in literacy
0
10
20
30
40
3 4 5 6 7 8
Perc
en
tag
e o
f stu
de
nts
Band
Percentage of students in bands: Year 5 spelling
Percentage in bandSchool average 2008 - 2010SSG average 2010State DET average 2010
0
10
20
30
40
3 4 5 6 7 8
Perc
en
tag
e o
f stu
de
nts
Band
Percentage of students in bands: Year 5 grammar and punctuation
Percentage in bandSchool average 2008 - 2010SSG average 2010State DET average 2010
0
5
10
15
20
25
30
35
40
3 4 5 6 7 8
Perc
en
tag
e o
f stu
de
nts
Band
Percentage of students in bands: Year 5 numeracy
Percentage in band
School average 2008 - 2010
SSG average 2010
State DET average 2010
0
10
20
30
40
50
60
70
80
90
100
2006 - 2008 2007 - 2009 2008 - 2010
Pro
gre
ss
Average progress in reading between
Year 3 and Year 5
School SSG State DET
11
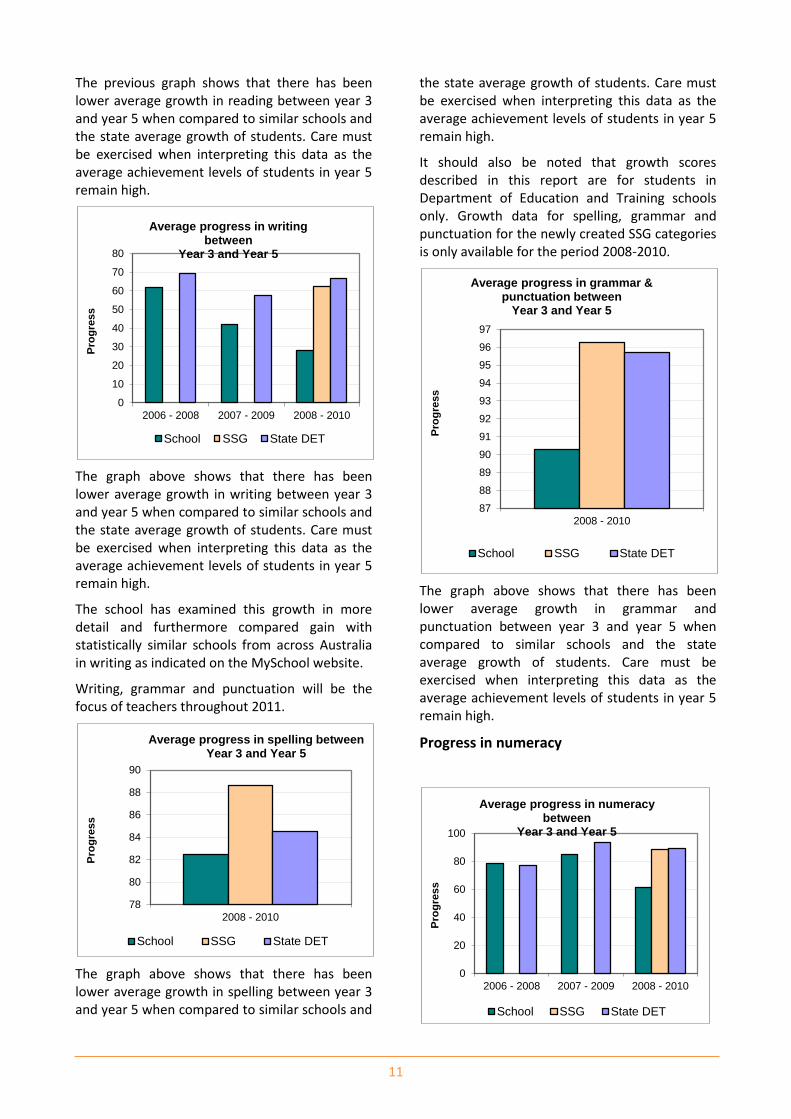
The previous graph shows that there has been lower average growth in reading between year 3 and year 5 when compared to similar schools and the state average growth of students. Care must be exercised when interpreting this data as the average achievement levels of students in year 5 remain high.
The graph above shows that there has been lower average growth in writing between year 3 and year 5 when compared to similar schools and the state average growth of students. Care must be exercised when interpreting this data as the average achievement levels of students in year 5 remain high.
The school has examined this growth in more detail and furthermore compared gain with statistically similar schools from across Australia in writing as indicated on the MySchool website.
Writing, grammar and punctuation will be the focus of teachers throughout 2011.
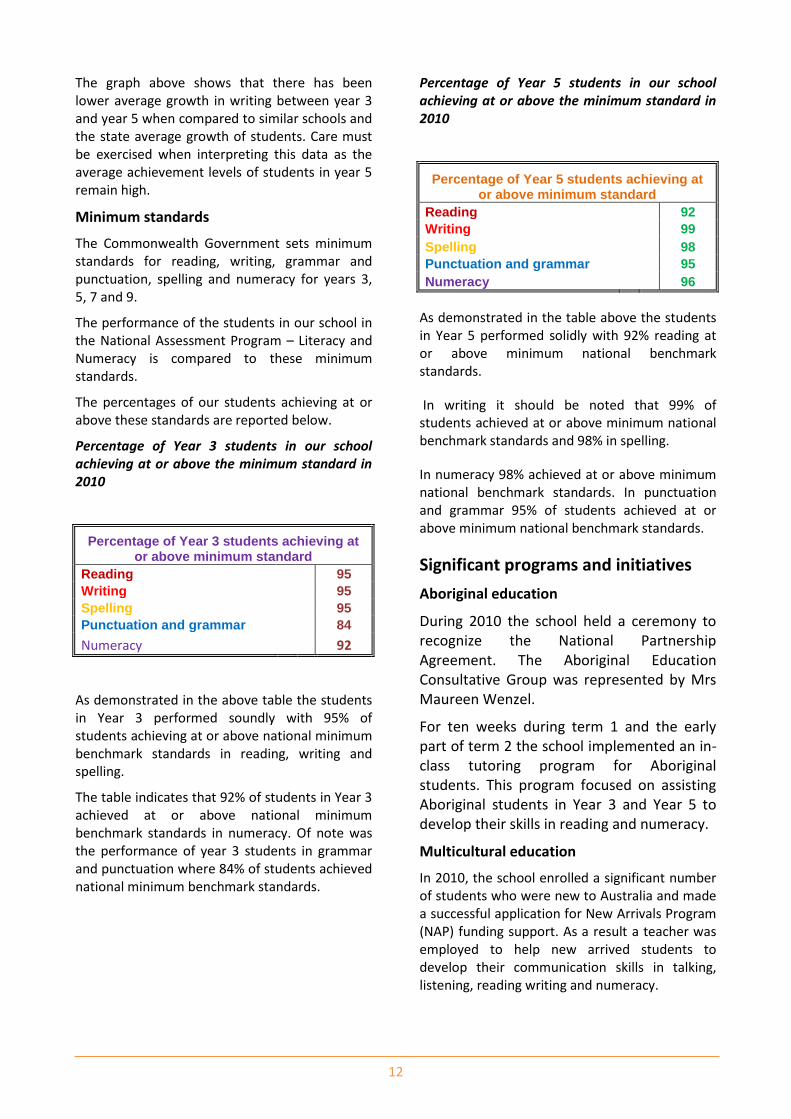
The graph above shows that there has been lower average growth in spelling between year 3 and year 5 when compared to similar schools and
the state average growth of students. Care must be exercised when interpreting this data as the average achievement levels of students in year 5 remain high.
It should also be noted that growth scores described in this report are for students in Department of Education and Training schools only. Growth data for spelling, grammar and punctuation for the newly created SSG categories is only available for the period 2008-2010.
The graph above shows that there has been lower average growth in grammar and punctuation between year 3 and year 5 when compared to similar schools and the state average growth of students. Care must be exercised when interpreting this data as the average achievement levels of students in year 5 remain high.
Progress in numeracy
0
10
20
30
40
50
60
70
80
2006 - 2008 2007 - 2009 2008 - 2010
Pro
gre
ss
Average progress in writing between
Year 3 and Year 5
School SSG State DET
78
80
82
84
86
88
90
2008 - 2010
Pro
gre
ss
Average progress in spelling between Year 3 and Year 5
School SSG State DET
87
88
89
90
91
92
93
94
95
96
97
2008 - 2010
Pro
gre
ss
Average progress in grammar & punctuation between
Year 3 and Year 5
School SSG State DET
0
20
40
60
80
100
2006 - 2008 2007 - 2009 2008 - 2010
Pro
gre
ss
Average progress in numeracy between
Year 3 and Year 5
School SSG State DET
12
The graph above shows that there has been lower average growth in writing between year 3 and year 5 when compared to similar schools and the state average growth of students. Care must be exercised when interpreting this data as the average achievement levels of students in year 5 remain high.
Minimum standards
The Commonwealth Government sets minimum standards for reading, writing, grammar and punctuation, spelling and numeracy for years 3, 5, 7 and 9.
The performance of the students in our school in the National Assessment Program – Literacy and Numeracy is compared to these minimum standards.
The percentages of our students achieving at or above these standards are reported below.
Percentage of Year 3 students in our school achieving at or above the minimum standard in 2010
Percentage of Year 3 students achieving at or above minimum standard
Reading
95
Writing
95
Spelling
95
Punctuation and grammar
84
Numeracy 92
As demonstrated in the above table the students in Year 3 performed soundly with 95% of students achieving at or above national minimum benchmark standards in reading, writing and spelling.
The table indicates that 92% of students in Year 3 achieved at or above national minimum benchmark standards in numeracy. Of note was the performance of year 3 students in grammar and punctuation where 84% of students achieved national minimum benchmark standards.
Percentage of Year 5 students in our school achieving at or above the minimum standard in 2010
Percentage of Year 5 students achieving at or above minimum standard
Reading
92
Writing
99
Spelling
98
Punctuation and grammar
95
Numeracy 96
As demonstrated in the table above the students in Year 5 performed solidly with 92% reading at or above minimum national benchmark standards.
In writing it should be noted that 99% of students achieved at or above minimum national benchmark standards and 98% in spelling.
In numeracy 98% achieved at or above minimum national benchmark standards. In punctuation and grammar 95% of students achieved at or above minimum national benchmark standards.
Significant programs and initiatives
Aboriginal education
During 2010 the school held a ceremony to recognize the National Partnership Agreement. The Aboriginal Education Consultative Group was represented by Mrs Maureen Wenzel.
For ten weeks during term 1 and the early part of term 2 the school implemented an in-class tutoring program for Aboriginal students. This program focused on assisting Aboriginal students in Year 3 and Year 5 to develop their skills in reading and numeracy.
Multicultural education
In 2010, the school enrolled a significant number of students who were new to Australia and made a successful application for New Arrivals Program (NAP) funding support. As a result a teacher was employed to help new arrived students to develop their communication skills in talking, listening, reading writing and numeracy.
13
The school also developed and presented in-service courses for parents, contacted translation services personnel for assistance and engaged the NAP teacher and English as a Second Language teachers in a comprehensive team approach to delivering support for students.
Respect and responsibility
The school continues to encourage all students to actively adopt the key messages contained and enmeshed within and promoted across the school through our Positive Behaviour for Learning (PBL) program.
Go as a learner
Go safely
Go responsibly
Go respectfully
An evaluation of the Colyton Public School’s
Student Welfare Policy saw modifications made
to the referral system and discipline code within
the school. Inservicing of staff at staff meetings
ensured all teachers were aware of the changes.
The school participated in an Anti-Bullying
performance called “The Power of One”. Nearly
90% of students attended this performance
which was aimed at empowering all students to
stop bullying by teaching specific skills for both
the person being bullied and bystanders.
Our much valued parents at the morning tea for
parent helpers and volunteers, 2010
We are fortunate to have many volunteers who assist the teachers and students in their respective teaching and learning endeavours. The assistance of volunteers is greatly valued and
helps to promote the values we have for learning and each other’s’ contributions.
National partnership programs
In October 2010, the Minister of Education and Training, The Hon Verity Firth MP, announced that Colyton Public School would become a Centre for Excellence (C4E) 2011-2012 under the Smarter Schools National Partnership Improving Teacher Quality.
The school has developed a C4E Plan, advertised and merit selected a Highly Accomplished Teacher. Mrs. Sharon Gordon is our Highly Accomplished Teacher and will work with teachers throughout 2011 and 2012. An Operational Paraprofessional two days per week and Educational Paraprofessional 3 days per week will be employed during term 1, 2011.
The school as a hub school will work with spoke schools to help teachers’ refine and enhance their teaching strategies, knowledge and skills throughout pre service, early career training and leadership development.
The spoke schools in the Colyton Centre for Excellence national partnership are: St Mary’s Senior High School, Penrith Selective High School, Erskine Park High School, Bennett Road and St Mary’s South Public Schools.
Connected learning
The school has one interactive whiteboard and a video conferencing center and interactive whiteboard.
Members of staff made excellent use of the video conferencing facility whilst engaging in awareness raising and consultation regarding the proposed Australian Curriculum.
Students used the video conferencing technology to engage in virtual excursions and network with other class in schools across NSW.
The Building the Education Revolution funds enabled the school to refurbish the Library and 23 classrooms. As part of this initiative a video conferencing centre with an interactive whiteboard will be installed in the library in early 2011.
The school has begun training staff in Notebook1.0 in preparation for planned
14
interactive whiteboards to be installed in classrooms refurbished under the Building the Education Revolution program.
In 2011, we will install fibre optic cable to connect the headmaster’s residence, HAT office and reading recovery teaching space to the schools intranet and the internet. This will enable more staff and students to actively use the support materials available through TaLe, the internet and to access their email and online learning activities.
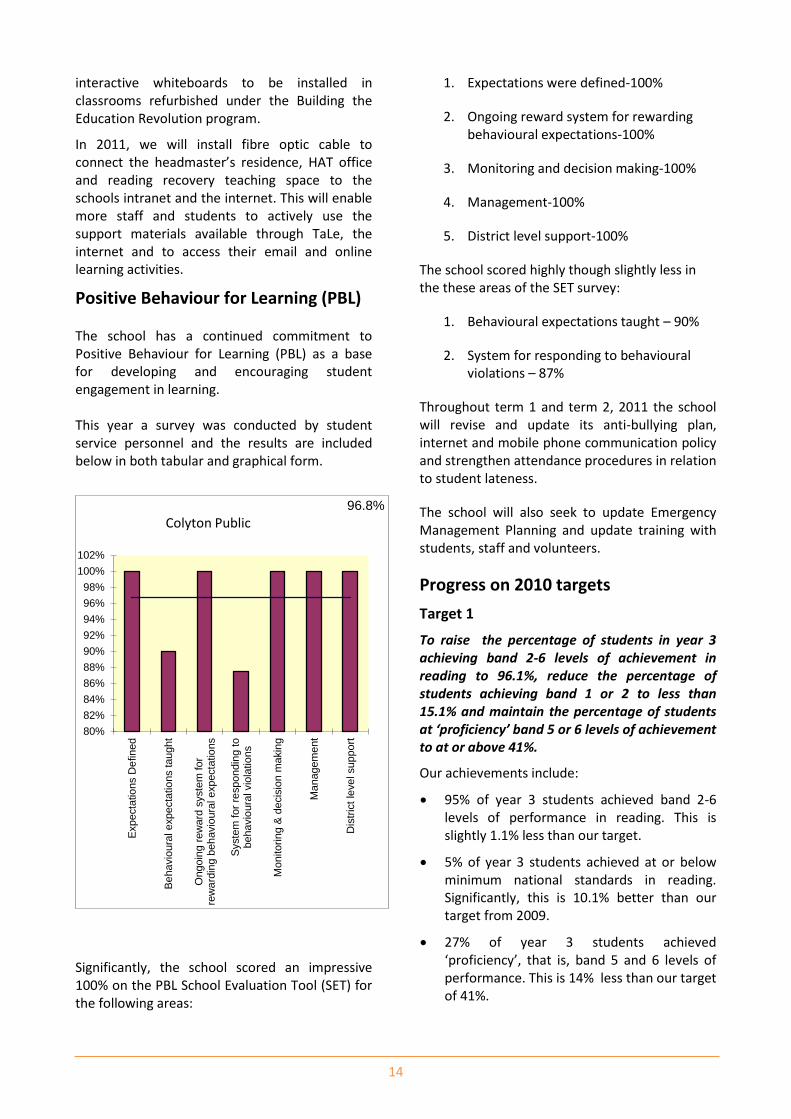
Positive Behaviour for Learning (PBL) The school has a continued commitment to Positive Behaviour for Learning (PBL) as a base for developing and encouraging student engagement in learning. This year a survey was conducted by student service personnel and the results are included below in both tabular and graphical form.
Significantly, the school scored an impressive 100% on the PBL School Evaluation Tool (SET) for the following areas:
1. Expectations were defined-100%
2. Ongoing reward system for rewarding behavioural expectations-100%
3. Monitoring and decision making-100%
4. Management-100%
5. District level support-100%
The school scored highly though slightly less in the these areas of the SET survey:
1. Behavioural expectations taught – 90%
2. System for responding to behavioural violations – 87%
Throughout term 1 and term 2, 2011 the school will revise and update its anti-bullying plan, internet and mobile phone communication policy and strengthen attendance procedures in relation to student lateness.
The school will also seek to update Emergency Management Planning and update training with students, staff and volunteers.
Progress on 2010 targets
Target 1
To raise the percentage of students in year 3 achieving band 2-6 levels of achievement in reading to 96.1%, reduce the percentage of students achieving band 1 or 2 to less than 15.1% and maintain the percentage of students at ‘proficiency’ band 5 or 6 levels of achievement to at or above 41%.
Our achievements include:
95% of year 3 students achieved band 2-6 levels of performance in reading. This is slightly 1.1% less than our target.
5% of year 3 students achieved at or below minimum national standards in reading. Significantly, this is 10.1% better than our target from 2009.
27% of year 3 students achieved ‘proficiency’, that is, band 5 and 6 levels of performance. This is 14% less than our target of 41%.
96.8%
80%
82%
84%
86%
88%
90%
92%
94%
96%
98%
100%
102%
Expecta
tio
ns D
efin
ed
Be
havio
ura
l expecta
tio
ns taught
Ongoin
g r
ew
ard
syste
m for
rew
ard
ing b
eh
avio
ura
l expecta
tio
ns
Syste
m for
respondin
g to
behavio
ura
l vio
latio
ns
Mo
nitorin
g &
decis
ion m
akin
g
Ma
nagem
ent
Dis
tric
t le
ve
l suppo
rt
Colyton Public
15
Target 2
To raise the percentage of students in year 5 achieving band 4-8 levels of achievement in reading to 91.5%, reduce the percentage of students achieving band 1or 2 to less than 22.4% and maintain the percentage of students at ‘proficiency’ band 7 or 8 levels of achievement to at or above 33.3%.
Our achievements include:
92% of year 5 students achieved band 4-8 levels of achievement in reading. This is 0.5% or slightly above our target.
8% of students in year 5 achieved at or below minimum standards in reading. Significantly, this is 14.4% better than our target for 2009.
30% of year 5 students achieved band 7 and 8 levels of achievement in reading. This is 3.3% less than our target of 33.3% from 2009.
Target 3
To raise the percentage of students in year 3 achieving band 2-6 levels of achievement in overall numeracy to 93.5%; reduce the percentage of students achieving band 1 or 2 to less than 20.1% and maintain the percentage of students at ‘proficiency’ band 5 or 6 levels of achievement to at or above 34.7%.
To raise the percentage of students in year 5 achieving band 4-8 levels of achievement in overall numeracy to 96.1%; reduce the percentage of students achieving band 3 or 4 to less than 20.7% and maintain the percentage of students at ‘proficiency’ band 7 or 8 levels of achievement to at or above 30.8%.
Our achievements include:
92% of year 3 students achieved band 2-6 levels of achievement in overall numeracy. This is slightly less than our 2009 target of 93.5%
Significantly, the percentage of students achieving at or below national minimum standards in numeracy was reduced to 8%. This was 12.1% better than our target.
26% of year 3 students achieved band 5 and 6 levels of achievement in numeracy. This was 8.7% less than our target of 34.7%
96% of year 5 students achieved band 4-8 levels of achievement in overall numeracy. This almost equal to our 2009 target of 96.1%
Significantly, the percentage of year 5 students achieving at or below national minimum standards in numeracy was reduced to 4%. This was 16.7%% better than our target of 20.7%.
30% of year 5 students achieved band 7 and 8 levels of achievement in numeracy. This was almost equal to our target from 2009 of 30.8%
Target 4
Modernise the school for the ongoing and future benefit of students and the community. Implement the Building the Education Revolution (BER) program.
Our achievements include:
The school Library was refurbished. Improved access to the internet and online learning was created. New lighting, carpet, shelving and blinds were installed and the library now has a much more open plan feel. A video conferencing centre will be fully installed during term 1, 2011.
A double classroom was installed for senior students.
A total of 23 classrooms were refurbished. The administration building received a refurbishment to make better use of available work space. We look forward to the installation of Interactive Whiteboards in refurbished classroom during 2011-2012.
Key evaluations
It is a requirement for all NSW public schools to conduct at least two annual evaluations – one related to educational and management practice and the other related to curriculum.
In 2010 our school carried out evaluations of the Creative and Practical Arts (CAPA) key learning area. In order to seek the views of many we surveyed parents, students and staff. The results of three questions are reported for comparison across each group.
16
CAPA parent survey results
Twelve statements were given to Colyton parents
to investigate how Creative and Practical Arts are
implemented at our school. A total of 66 parents
responded to the following statements:
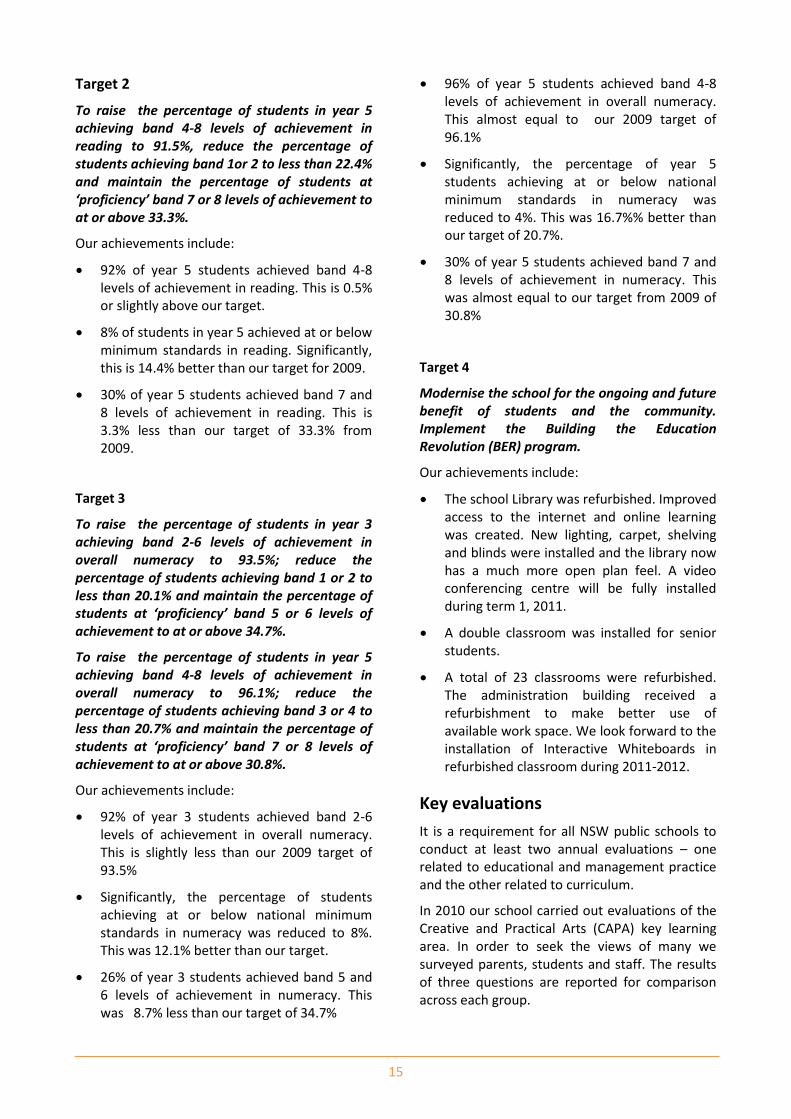
1. Creative and Practical Arts is an important learning area at school.
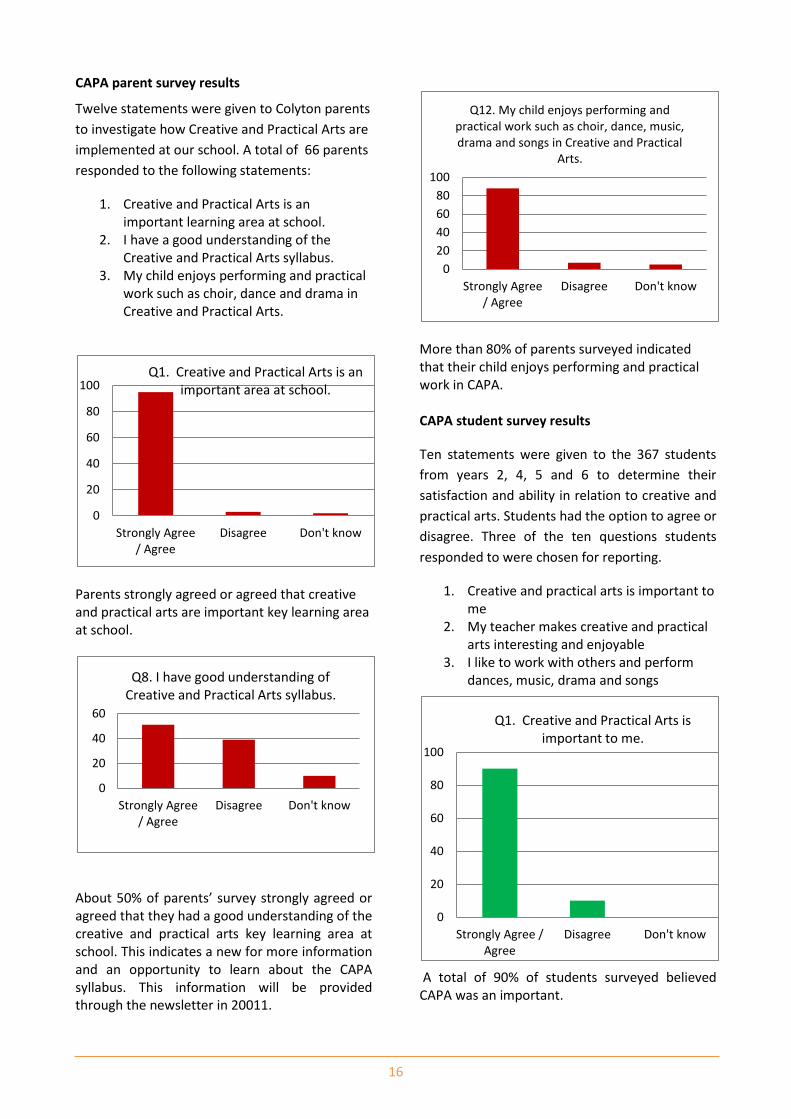
2. I have a good understanding of the Creative and Practical Arts syllabus.
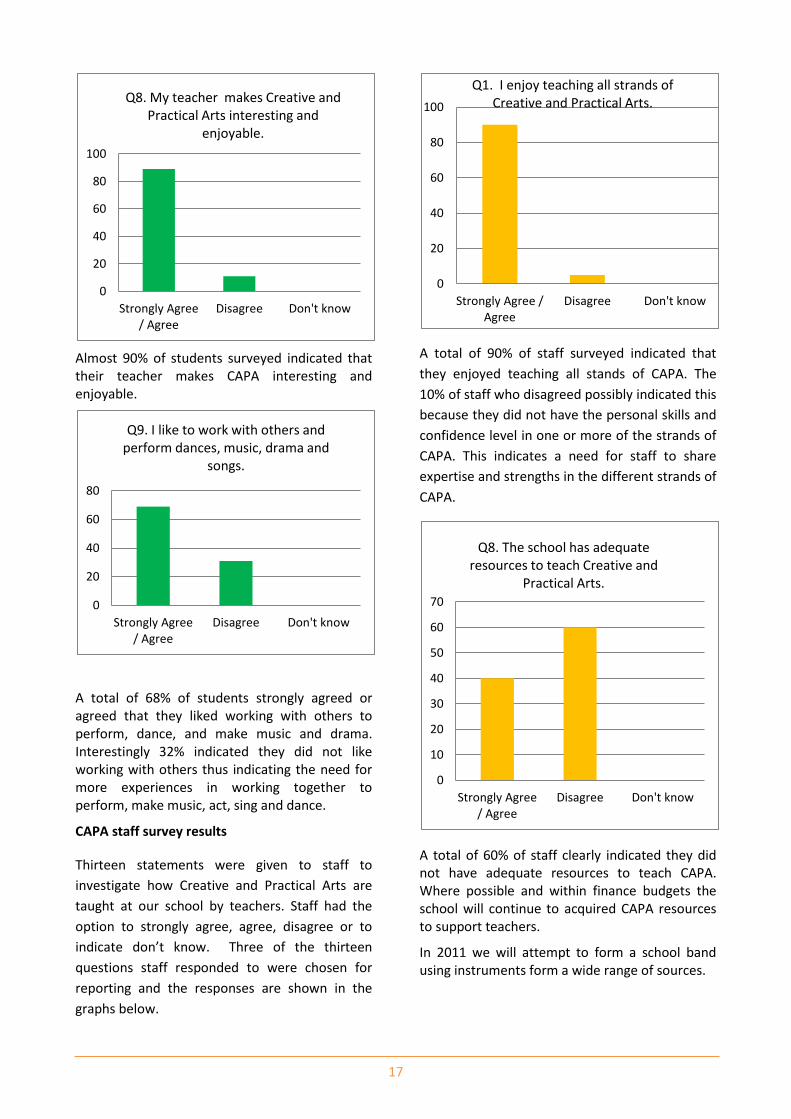
3. My child enjoys performing and practical work such as choir, dance and drama in Creative and Practical Arts.
Parents strongly agreed or agreed that creative and practical arts are important key learning area at school.
About 50% of parents’ survey strongly agreed or agreed that they had a good understanding of the creative and practical arts key learning area at school. This indicates a new for more information and an opportunity to learn about the CAPA syllabus. This information will be provided through the newsletter in 20011.
More than 80% of parents surveyed indicated that their child enjoys performing and practical work in CAPA. CAPA student survey results
Ten statements were given to the 367 students
from years 2, 4, 5 and 6 to determine their
satisfaction and ability in relation to creative and
practical arts. Students had the option to agree or
disagree. Three of the ten questions students
responded to were chosen for reporting.
1. Creative and practical arts is important to me
2. My teacher makes creative and practical arts interesting and enjoyable
3. I like to work with others and perform dances, music, drama and songs
A total of 90% of students surveyed believed CAPA was an important.
0
20
40
60
80
100
Strongly Agree/ Agree
Disagree Don't know
Q1. Creative and Practical Arts is an important area at school.
0
20
40
60
Strongly Agree/ Agree
Disagree Don't know
Q8. I have good understanding of Creative and Practical Arts syllabus.
0
20
40
60
80
100
Strongly Agree/ Agree
Disagree Don't know
Q12. My child enjoys performing and practical work such as choir, dance, music, drama and songs in Creative and Practical
Arts.
0
20
40
60
80
100
Strongly Agree /Agree
Disagree Don't know
Q1. Creative and Practical Arts is important to me.
17
Almost 90% of students surveyed indicated that their teacher makes CAPA interesting and enjoyable.
A total of 68% of students strongly agreed or agreed that they liked working with others to perform, dance, and make music and drama. Interestingly 32% indicated they did not like working with others thus indicating the need for more experiences in working together to perform, make music, act, sing and dance.
CAPA staff survey results
Thirteen statements were given to staff to
investigate how Creative and Practical Arts are
taught at our school by teachers. Staff had the
option to strongly agree, agree, disagree or to
indicate don’t know. Three of the thirteen
questions staff responded to were chosen for
reporting and the responses are shown in the
graphs below.
A total of 90% of staff surveyed indicated that
they enjoyed teaching all stands of CAPA. The
10% of staff who disagreed possibly indicated this
because they did not have the personal skills and
confidence level in one or more of the strands of
CAPA. This indicates a need for staff to share
expertise and strengths in the different strands of
CAPA.
A total of 60% of staff clearly indicated they did not have adequate resources to teach CAPA. Where possible and within finance budgets the school will continue to acquired CAPA resources to support teachers.
In 2011 we will attempt to form a school band using instruments form a wide range of sources.
0
20
40
60
80
100
Strongly Agree/ Agree
Disagree Don't know
Q8. My teacher makes Creative and Practical Arts interesting and
enjoyable.
0
20
40
60
80
Strongly Agree/ Agree
Disagree Don't know
Q9. I like to work with others and perform dances, music, drama and
songs.
0
20
40
60
80
100
Strongly Agree /Agree
Disagree Don't know
Q1. I enjoy teaching all strands of Creative and Practical Arts.
0
10
20
30
40
50
60
70
Strongly Agree/ Agree
Disagree Don't know
Q8. The school has adequate resources to teach Creative and
Practical Arts.
18
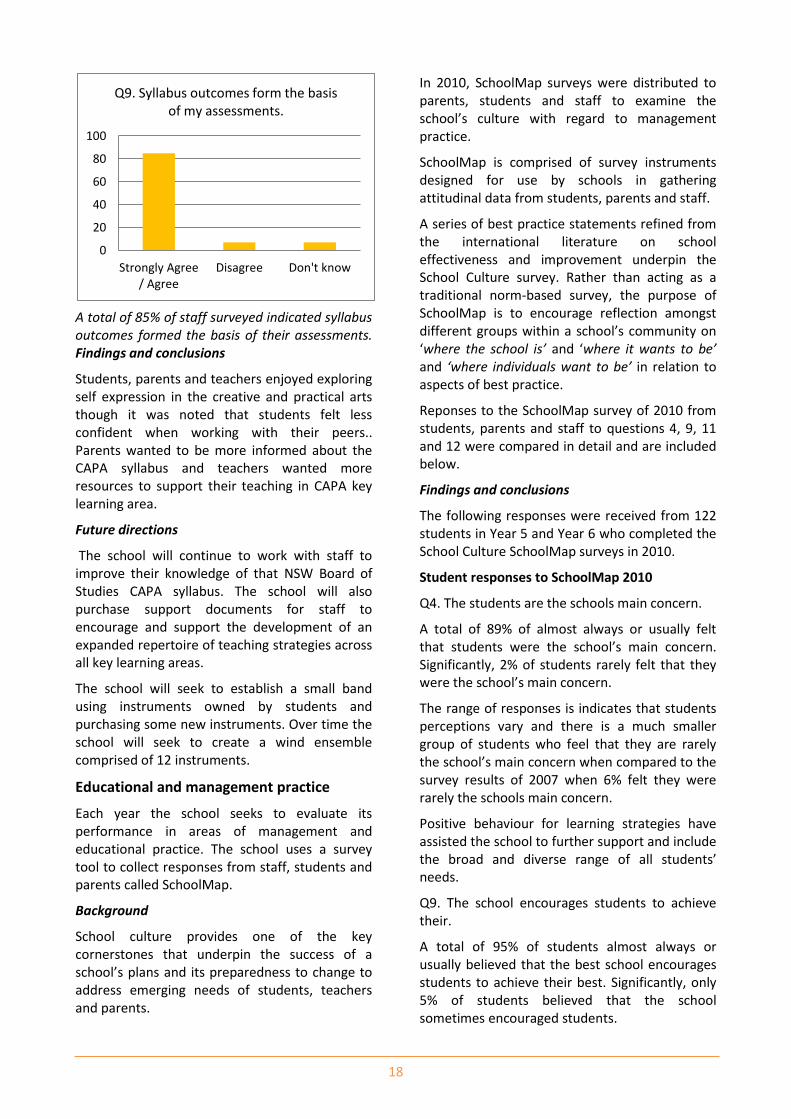
A total of 85% of staff surveyed indicated syllabus outcomes formed the basis of their assessments. Findings and conclusions
Students, parents and teachers enjoyed exploring self expression in the creative and practical arts though it was noted that students felt less confident when working with their peers.. Parents wanted to be more informed about the CAPA syllabus and teachers wanted more resources to support their teaching in CAPA key learning area.
Future directions
The school will continue to work with staff to improve their knowledge of that NSW Board of Studies CAPA syllabus. The school will also purchase support documents for staff to encourage and support the development of an expanded repertoire of teaching strategies across all key learning areas.
The school will seek to establish a small band using instruments owned by students and purchasing some new instruments. Over time the school will seek to create a wind ensemble comprised of 12 instruments.
Educational and management practice
Each year the school seeks to evaluate its performance in areas of management and educational practice. The school uses a survey tool to collect responses from staff, students and parents called SchoolMap.
Background
School culture provides one of the key cornerstones that underpin the success of a school’s plans and its preparedness to change to address emerging needs of students, teachers and parents.
In 2010, SchoolMap surveys were distributed to parents, students and staff to examine the school’s culture with regard to management practice.
SchoolMap is comprised of survey instruments designed for use by schools in gathering attitudinal data from students, parents and staff.
A series of best practice statements refined from the international literature on school effectiveness and improvement underpin the School Culture survey. Rather than acting as a traditional norm-based survey, the purpose of SchoolMap is to encourage reflection amongst different groups within a school’s community on ‘where the school is’ and ‘where it wants to be’ and ‘where individuals want to be’ in relation to aspects of best practice.
Reponses to the SchoolMap survey of 2010 from students, parents and staff to questions 4, 9, 11 and 12 were compared in detail and are included below.
Findings and conclusions
The following responses were received from 122 students in Year 5 and Year 6 who completed the School Culture SchoolMap surveys in 2010.
Student responses to SchoolMap 2010
Q4. The students are the schools main concern.
A total of 89% of almost always or usually felt that students were the school’s main concern. Significantly, 2% of students rarely felt that they were the school’s main concern.
The range of responses is indicates that students perceptions vary and there is a much smaller group of students who feel that they are rarely the school’s main concern when compared to the survey results of 2007 when 6% felt they were rarely the schools main concern.
Positive behaviour for learning strategies have assisted the school to further support and include the broad and diverse range of all students’ needs.
Q9. The school encourages students to achieve their.
A total of 95% of students almost always or usually believed that the best school encourages students to achieve their best. Significantly, only 5% of students believed that the school sometimes encouraged students.
0
20
40
60
80
100
Strongly Agree/ Agree
Disagree Don't know
Q9. Syllabus outcomes form the basis of my assessments.
19
Q11. The school caters for the learning needs of all students.
A total of 65% of students felt that the school catered for the learning needs of all students. Of significance was the fact that 3% of students felt that the school sometimes or rarely catered for the learning needs of all students.
Parent responses to SchoolMap 2010
The following responses were received from 94 parents who completed the School Culture SchoolMap surveys in 2010. Parent responses have been converted to a percentage and are described below.
Q4. The students are the schools main concern.
A total 95% of parents indicated that they almost always or usually felt that felt students are the school’s main concern.
Q. 9. The school encourages students to achieve their best.
94% of parents who responded to the survey felt that the school almost always or usually encouraged students to achieve their best.
Of note is the fact that 4% of parents who returned the survey sometimes felt the school encouraged students to achieve their best and 2% indicated that they rarely felt students were encouraged to achieve their best.
Q.11. The school caters for the learning needs of all students.
Detailed analysis revealed 95% of parents who responded to the survey felt that the school caters for the learning needs of all students.
Of note is the fact that 5% of parents who returned the survey sometimes felt the school catered for the learning needs of all students.
In 2008, the school will seek to reinvigorate its strategies for catering for the needs of all students. Significantly, the school will report in more detail on how it caters for the learning needs of all students.
Staff responses to SchoolMap 2010
The following responses were received from staff members who completed the School Culture SchoolMap surveys in 2010.
Q4. The school encourages me to do my best.
The survey results indicated that 78 % of staff felt that they almost always felt that meeting the needs of students is the school’s main priority.
Q. 9. The school encourages students to achieve their best.
Significantly, 91% of staff respondents indicated that the school almost always or usually encourages students to achieve their best.
Q.11. The school caters for the learning needs of all students.
64% staff respondents clearly indicated that the school meets the needs of all students.
It is anticipated that during 2010 new strategies will be developed and implemented to support the development of teacher capacity to deliver quality learning experiences for all students. The Centre for Excellence National Partnership has as its focus improving teacher quality, relationships across a range of schools settings and partnerships with the University of Western Sydney and the University of Technology Sydney.
Parent, student, and teacher satisfaction
In 2010 the school sought the opinions of parents, students and teachers about the school.
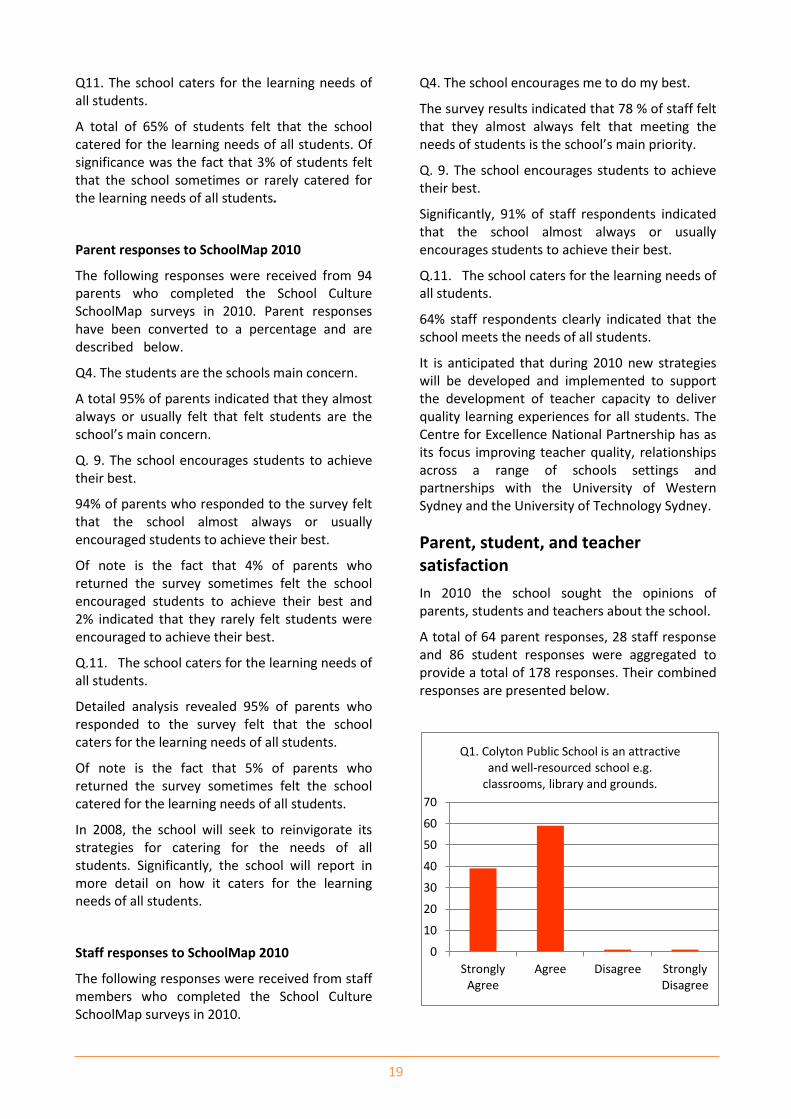
A total of 64 parent responses, 28 staff response and 86 student responses were aggregated to provide a total of 178 responses. Their combined responses are presented below.
0
10
20
30
40
50
60
70
StronglyAgree
Agree Disagree StronglyDisagree
Q1. Colyton Public School is an attractive and well-resourced school e.g.
classrooms, library and grounds.
20
As can be clearly seen in the previous graph almost all respondents surveyed thought that Colyton Public School was an attractive well-resourced schools.
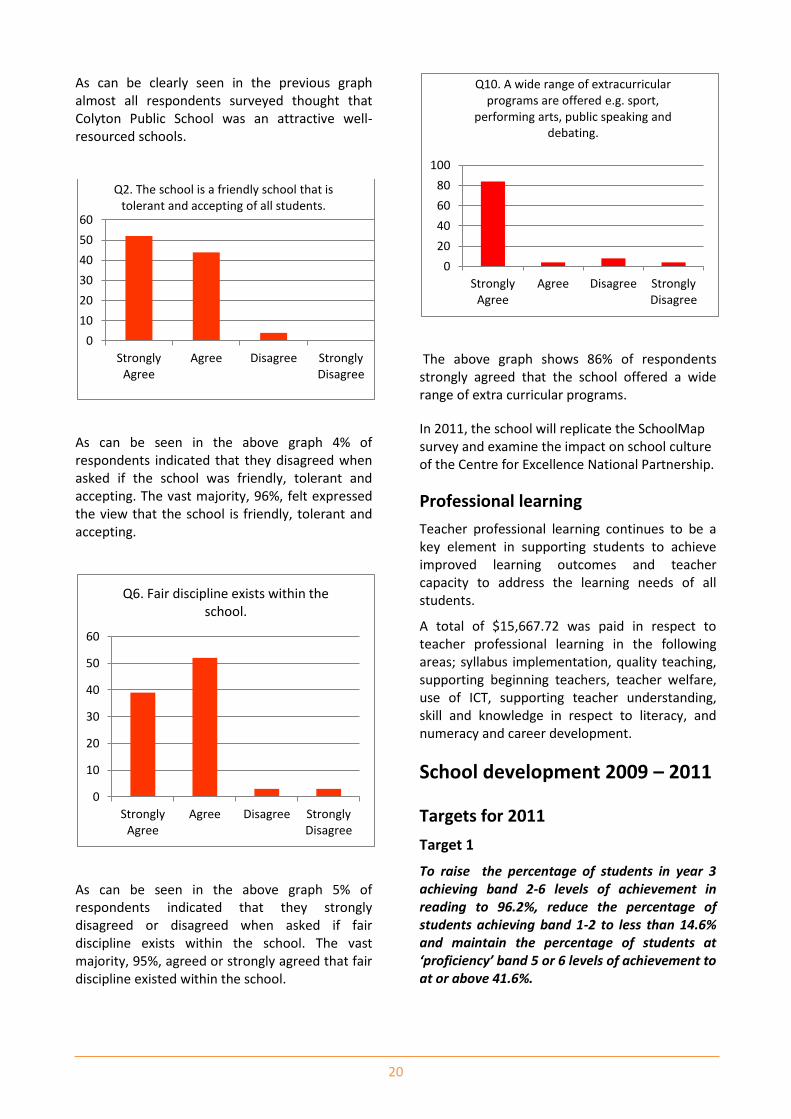
As can be seen in the above graph 4% of respondents indicated that they disagreed when asked if the school was friendly, tolerant and accepting. The vast majority, 96%, felt expressed the view that the school is friendly, tolerant and accepting.
As can be seen in the above graph 5% of respondents indicated that they strongly disagreed or disagreed when asked if fair discipline exists within the school. The vast majority, 95%, agreed or strongly agreed that fair discipline existed within the school.
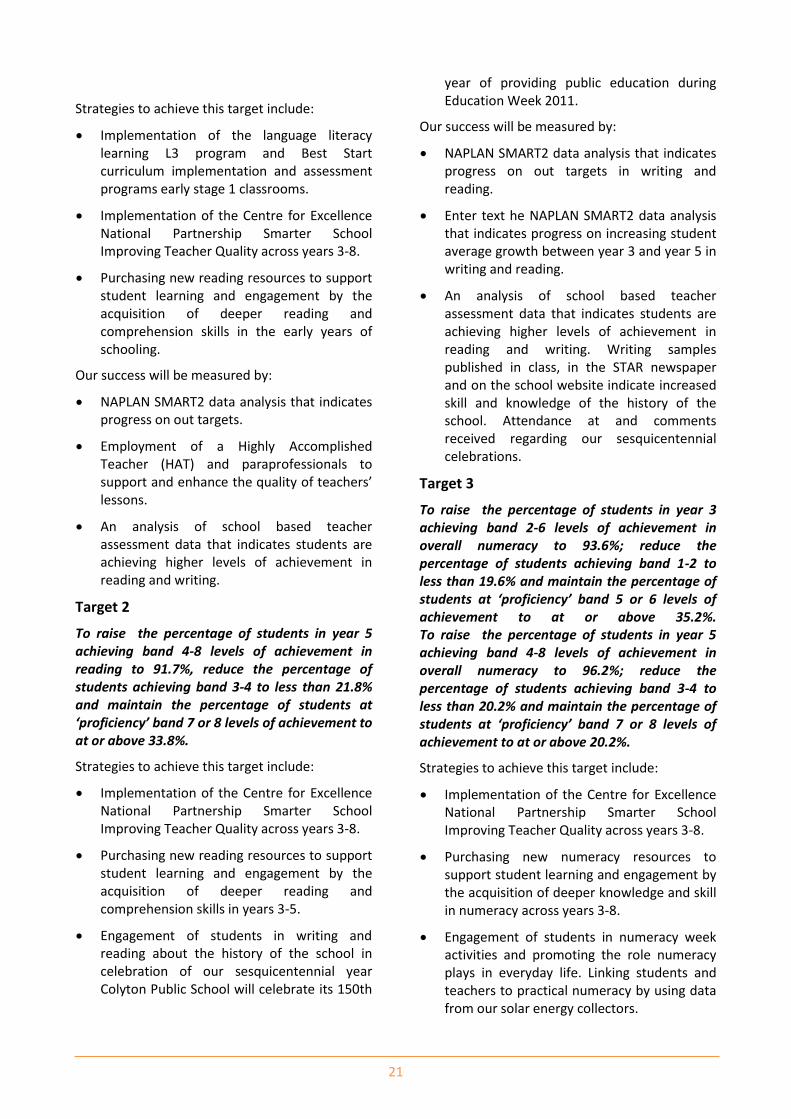
The above graph shows 86% of respondents strongly agreed that the school offered a wide range of extra curricular programs.
In 2011, the school will replicate the SchoolMap survey and examine the impact on school culture of the Centre for Excellence National Partnership.
Professional learning
Teacher professional learning continues to be a key element in supporting students to achieve improved learning outcomes and teacher capacity to address the learning needs of all students.
A total of $15,667.72 was paid in respect to teacher professional learning in the following areas; syllabus implementation, quality teaching, supporting beginning teachers, teacher welfare, use of ICT, supporting teacher understanding, skill and knowledge in respect to literacy, and numeracy and career development.
School development 2009 – 2011
Targets for 2011
Target 1
To raise the percentage of students in year 3 achieving band 2-6 levels of achievement in reading to 96.2%, reduce the percentage of students achieving band 1-2 to less than 14.6% and maintain the percentage of students at ‘proficiency’ band 5 or 6 levels of achievement to at or above 41.6%.
0
10
20
30
40
50
60
StronglyAgree
Agree Disagree StronglyDisagree
Q2. The school is a friendly school that is tolerant and accepting of all students.
0
10
20
30
40
50
60
StronglyAgree
Agree Disagree StronglyDisagree
Q6. Fair discipline exists within the school.
0
20
40
60
80
100
StronglyAgree
Agree Disagree StronglyDisagree
Q10. A wide range of extracurricular programs are offered e.g. sport,
performing arts, public speaking and debating.
21
Strategies to achieve this target include:
Implementation of the language literacy learning L3 program and Best Start curriculum implementation and assessment programs early stage 1 classrooms.
Implementation of the Centre for Excellence National Partnership Smarter School Improving Teacher Quality across years 3-8.
Purchasing new reading resources to support student learning and engagement by the acquisition of deeper reading and comprehension skills in the early years of schooling.
Our success will be measured by:
NAPLAN SMART2 data analysis that indicates progress on out targets.
Employment of a Highly Accomplished Teacher (HAT) and paraprofessionals to support and enhance the quality of teachers’ lessons.
An analysis of school based teacher assessment data that indicates students are achieving higher levels of achievement in reading and writing.
Target 2
To raise the percentage of students in year 5 achieving band 4-8 levels of achievement in reading to 91.7%, reduce the percentage of students achieving band 3-4 to less than 21.8% and maintain the percentage of students at ‘proficiency’ band 7 or 8 levels of achievement to at or above 33.8%.
Strategies to achieve this target include:
Implementation of the Centre for Excellence National Partnership Smarter School Improving Teacher Quality across years 3-8.
Purchasing new reading resources to support student learning and engagement by the acquisition of deeper reading and comprehension skills in years 3-5.
Engagement of students in writing and reading about the history of the school in celebration of our sesquicentennial year Colyton Public School will celebrate its 150th
year of providing public education during Education Week 2011.
Our success will be measured by:
NAPLAN SMART2 data analysis that indicates progress on out targets in writing and reading.
Enter text he NAPLAN SMART2 data analysis that indicates progress on increasing student average growth between year 3 and year 5 in writing and reading.
An analysis of school based teacher assessment data that indicates students are achieving higher levels of achievement in reading and writing. Writing samples published in class, in the STAR newspaper and on the school website indicate increased skill and knowledge of the history of the school. Attendance at and comments received regarding our sesquicentennial celebrations.
Target 3
To raise the percentage of students in year 3 achieving band 2-6 levels of achievement in overall numeracy to 93.6%; reduce the percentage of students achieving band 1-2 to less than 19.6% and maintain the percentage of students at ‘proficiency’ band 5 or 6 levels of achievement to at or above 35.2%. To raise the percentage of students in year 5 achieving band 4-8 levels of achievement in overall numeracy to 96.2%; reduce the percentage of students achieving band 3-4 to less than 20.2% and maintain the percentage of students at ‘proficiency’ band 7 or 8 levels of achievement to at or above 20.2%.
Strategies to achieve this target include:
Implementation of the Centre for Excellence National Partnership Smarter School Improving Teacher Quality across years 3-8.
Purchasing new numeracy resources to support student learning and engagement by the acquisition of deeper knowledge and skill in numeracy across years 3-8.
Engagement of students in numeracy week activities and promoting the role numeracy plays in everyday life. Linking students and teachers to practical numeracy by using data from our solar energy collectors.
22
Our success will be measured by:
NAPLAN SMART2 data analysis that indicates progress on out targets in numeracy.
NAPLAN SMART2 data analysis that indicates progress on increasing student average growth between year 3 and year 5 in writing and reading.
An analysis of school based teacher assessment data that indicates students are achieving higher levels of achievement in numeracy and participation and comments of students regarding their participation in numeracy week and practical numeracy activities.
Target 4
To increase student engagement in learning and the achievement of higher bands of performance through increased school attendance improved punctuality by raising the average attendance rate from 93.7% to 94.4%
Strategies to achieve this target include:
Conducting a review of the school’s attendance, mobile phone and internet usage polices and anti-bullying plan within the context of our student welfare and discipline policy.
Contacting parents and carers regarding student lateness.
Involving the whole school community in the reviewing the school’s anti-bullying plan. Using Positive Behaviour for Learning strategies as a platform for implementing consistent approaches for addressing perceived or real conflict.
Our success will be measured by:
The documentation and communication to students, parents, staff of revised attendance and anti-bullying procedures.
Student’s comments regarding their awareness of using communication devices and the internet respectfully.
About this report
In preparing this report, the self-evaluation committee has gathered information from evaluations conducted during the year and
analysed other information about the school's practices and student learning outcomes. The self-evaluation committee and school planning committee have determined targets for the school's future development.
Donna Brown P&C President
Neil Bourke Class Teacher
Cobi Candy Assistant Principal
Greg Edwards Assistant Principal
Donna Reid Assistant Principal
Tracy Kemp Deputy Principal
Geoff Yates Principal
School contact information
Colyton Public School
Nelson Street Mount Druitt 2770
Ph: 02 96258185
Fax: 02 98322403
Email: [email protected]
Web: http://www.colyton-p.schools.nsw.edu.au
School Code: 1596
Parents can find out more information about Annual School Reports, how to interpret information in the reports and have the opportunity to provide feedback about these reports at:
http://www.schools.nsw.edu.au/asr
m
Our history and our past are important aspects of our present and future lives. We look forward to
celebrating our sesquicentennial year and turning 150 years old in 2011.
23
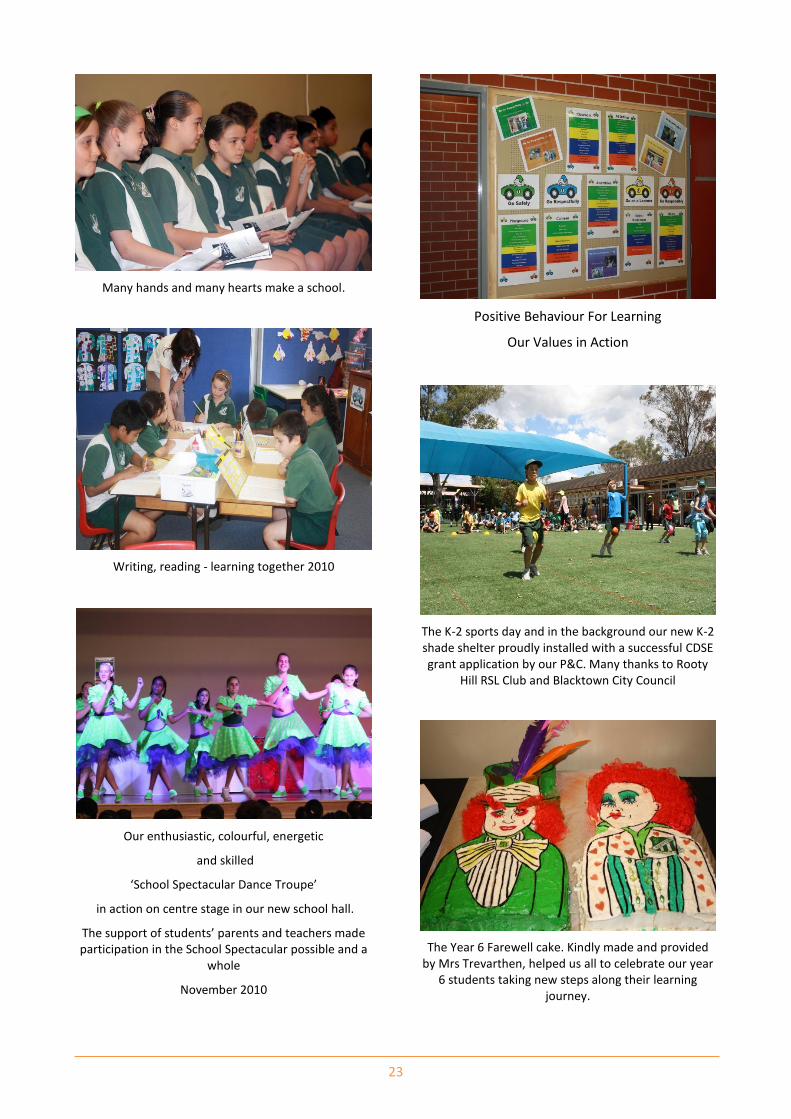
Many hands and many hearts make a school.
Writing, reading - learning together 2010
Our enthusiastic, colourful, energetic
and skilled
‘School Spectacular Dance Troupe’
in action on centre stage in our new school hall.
The support of students’ parents and teachers made participation in the School Spectacular possible and a
whole
November 2010
Positive Behaviour For Learning
Our Values in Action
The K-2 sports day and in the background our new K-2 shade shelter proudly installed with a successful CDSE grant application by our P&C. Many thanks to Rooty
Hill RSL Club and Blacktown City Council
The Year 6 Farewell cake. Kindly made and provided by Mrs Trevarthen, helped us all to celebrate our year
6 students taking new steps along their learning journey.
24
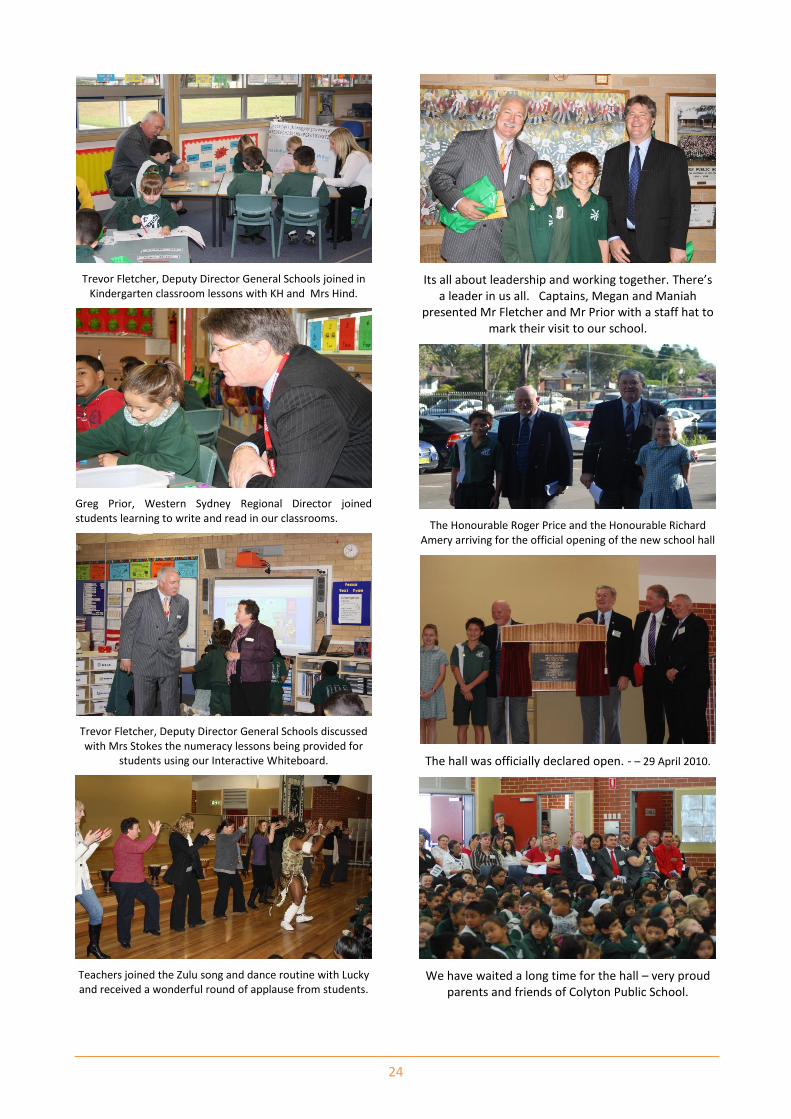
Trevor Fletcher, Deputy Director General Schools joined in Kindergarten classroom lessons with KH and Mrs Hind.
Greg Prior, Western Sydney Regional Director joined students learning to write and read in our classrooms.
Trevor Fletcher, Deputy Director General Schools discussed with Mrs Stokes the numeracy lessons being provided for
students using our Interactive Whiteboard.
Teachers joined the Zulu song and dance routine with Lucky and received a wonderful round of applause from students.
Its all about leadership and working together. There’s a leader in us all. Captains, Megan and Maniah
presented Mr Fletcher and Mr Prior with a staff hat to mark their visit to our school.
The Honourable Roger Price and the Honourable Richard Amery arriving for the official opening of the new school hall
The hall was officially declared open. - – 29 April 2010.
We have waited a long time for the hall – very proud parents and friends of Colyton Public School.