Embed Size (px)
Citation preview
aviation
Annual Review of Aircraft Accident DataU.S. General Aviation, Calendar Year 2002
NTSB/ARG-06/02PB2007-100696


Annual Review of Aircraft Accident Data
U.S. General Aviation, Calendar Year 2002
NTSB/ARG-06/02PB2007-100696Notation 7534EAdopted November 29, 2006
National Transportation Safety Board490 L’Enfant Plaza, S.W.
Washington, D.C. 20594

National Transportation Safety Board. 2006. U.S. General Aviation, Calendar Year 2002. Annual Review of Aircraft Accident Data NTSB/ARG-06/02. Washington, D.C.
Abstract: The National Transportation Safety Board’s 2002 Annual Review of Aircraft Accident Data for U.S. General Aviation is a statistical compilation and review of general aviation accidents that occurred in 2002 involving U.S.-registered aircraft. As a summary of all U.S. general aviation accidents for 2002, the review is designed to inform general aviation pilots and their passengers and to provide detailed information to support future government, industry, and private research efforts and safety improvement initiatives.
The National Transportation Safety Board is an independent Federal agency dedicated to promoting aviation, railroad, highway, marine, pipeline, and hazardous materials safety. Established in 1967, the agency is mandated by Congress through the Independent Safety Board Act of 1974 to investigate transportation accidents, determine the probable causes of the accidents, issue safety recommendations, study transportation safety issues, and evaluate the safety effectiveness of government agencies involved in transportation. The Safety Board makes public its actions and decisions through accident reports, safety studies, special investigation reports, safety recommendations, and statistical reviews.
Recent publications are available in their entirety on the Web at <http://www.ntsb.gov>. Other information about available publications also may be obtained from the Web site or by contacting:
National Transportation Safety Board Records Management Division, CIO-40 490 L’Enfant Plaza, S.W. Washington, D.C. 20594 (800) 877-6799 or (202) 314-6551
Safety Board publications may be purchased, by individual copy or by subscription, from the National Technical Information Service. To purchase this publication, order report number PB2007-100696 from:
National Technical Information Service 5285 Port Royal Road Springfield, Virginia 22161 (800) 553-6847 or (703) 605-6000
The Independent Safety Board Act, as codified at 49 U.S.C. Section 1154(b), precludes the admission into evidence or use of Board reports related to an incident or accident in a civil action for damages resulting from a matter mentioned in the report.
Contents
2002 General Aviation Accident Summary ....................1
Introduction ........................................................................2Purpose of the Review .......................................................2What Is General Aviation? .................................................2Which Operations Are Included in this Review? ....................2Which Aircraft Are Included in this Review? ..........................2Organization of the Review ................................................3
The General Aviation Environment in 2002 ...................4General Economic and Aviation Industry Indicators .............4Fleet Makeup ....................................................................5General Aviation Activity ....................................................6
Historical Trends in Accident Data ..................................8Accident Rates ..................................................................8Number of Accidents and Fatalities .....................................9Accident Rate by Type of Operation ..................................10
2002 in Depth .................................................................. 13Location of General Aviation Accidents in 2002.................13
United States Aircraft Accidents .................................13Foreign Aircraft Accidents .........................................14
Aircraft Type ....................................................................15Purpose of Flight .............................................................15
Flight Plan ................................................................16Airport Involvement ...................................................17Environmental Conditions ..........................................18Lighting Conditions ...................................................19
Injuries and Damage for 2002 .........................................20Aircraft Damage .......................................................20Accident Injuries........................................................21
Injuries by Role for 2002 ..................................................21Accident Pilots .................................................................22
Rating ......................................................................22Total Time ................................................................24
Time in Type of Aircraft ..............................................25Age .........................................................................26
Accident Occurrences for 2002 ........................................27Phase of Flight ..........................................................30
Chain of Occurrences .....................................................31Most Prevalent Causes/Factors for 2002 ...........................32
Probable Causes, Factors, Findings, and the Broad Cause/Factor Classification ...................................32
Human Performance ........................................................36Weather as a Cause/Factor ..............................................37
Focus on General Aviation Safety: Stall/Spin Accidents ........................................................ 38
What is a Stall? ...............................................................38What is a Spin? ...............................................................39Stall/Spin Accidents .........................................................41Accident Severity .............................................................42Accident Occurrences .....................................................43Phase of Flight ................................................................45Type of Operation ...........................................................45Accident Pilot Experience .................................................46Stall/Spin Accident Causes/Factors ...................................47Human Performance ........................................................49Stall/Spin Awareness and Avoidance Training ....................49Summary ........................................................................50
Appendix A ...................................................................... 51The National Transportation Safety Board Aviation
Accident/Incident Database ...................................51
Appendix B ..................................................................... 52Definitions ......................................................................52
Appendix C ....................................................................... 53The National Transportation Safety Board
Investigative Process ..............................................53
Appendix D ...................................................................... 54National Transportation Safety Board Regional Offices .......54


Annual Review of Aircraft Accident Data1
2002 General aviation accident Summary
A total of 1,715 general aviation accidents occurred during calendar year 2002, involving 1,724 aircraft.1 The total number of general aviation accidents in 2002 was lower than in 2001, with a 1% decrease of 12 accidents. Of the total number of accidents, 345 were fatal, resulting in a total of 581 fatalities. The number of fatal general aviation accidents in 2002 increased 6% from calendar year 2001, and the total number of fatalities increased by 3%. The circumstances of these accidents and details related to the aircraft, pilots, and locations are presented throughout this review.
1 In this review, a collision between two aircraft is counted as a single accident. The 6 midair collision accidents that occurred in 2002 involved 12 general aviation aircraft. In addition, 3 ground collision accidents involved 6 general aviation aircraft.
1 In this review, a collision between two aircraft is counted as a single accident. The 6 midair collision accidents that occurred in 2002 involved 12 general aviation aircraft. In addition, 3 ground collision accidents involved 6 general aviation aircraft
2002 General Aviation Accident Statistics
General Aviation Accidents Total 1,715 Fatal 345 General Aviation Accident Injuries Minor 448 Serious 297 Fatal 581 Persons involved in GA accidents with no injuries 1,817 General Aviation Accident Rate General Aviation Hours Flown 25,545,000 All Accidents 6.69/100,000 hours Fatal Accidents 1.33/100,000 hours Accidents per Pilot 2.71/1,000 active pilots Fatal Accidents per Pilot 0.55/1,000 active pilots Federal Aviation Administration, General Aviation and Air Taxi Survey, 2002. Excludes events involving suicide, sabotage, and stolen/unauthorized use.
bb
a
ab
2
introduction
Purpose of the Review
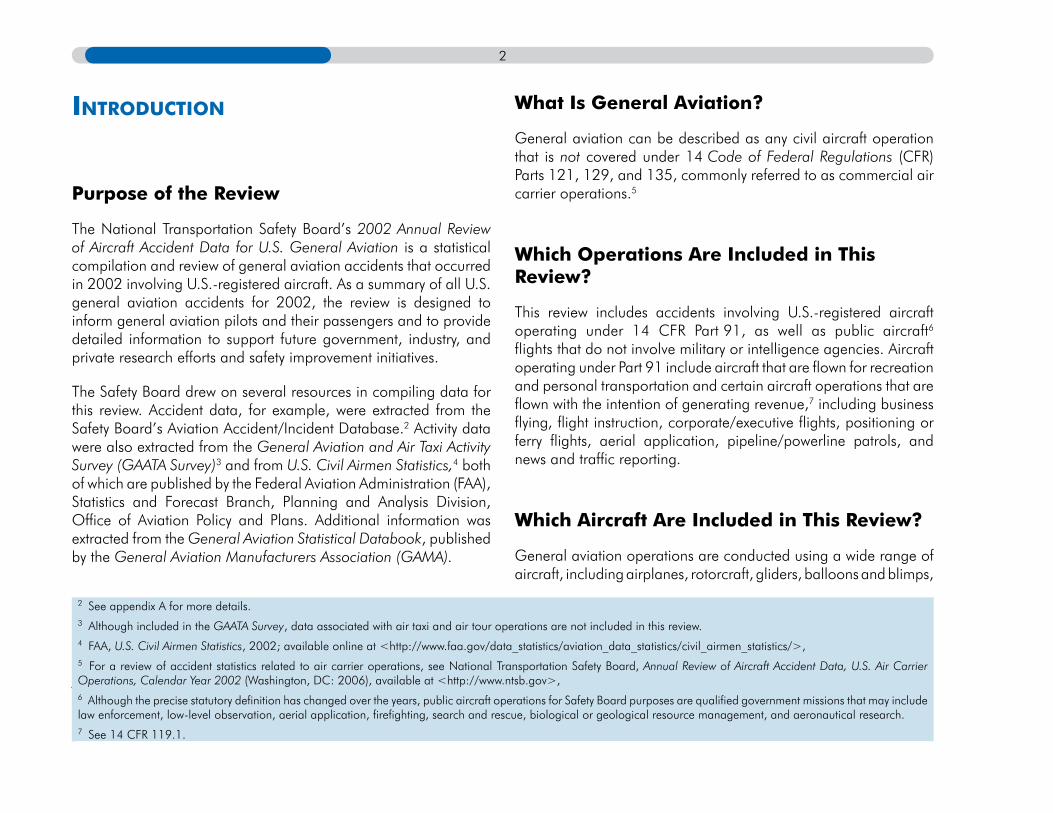
The National Transportation Safety Board’s 2002 Annual Review of Aircraft Accident Data for U.S. General Aviation is a statistical compilation and review of general aviation accidents that occurred in 2002 involving U.S.-registered aircraft. As a summary of all U.S. general aviation accidents for 2002, the review is designed to inform general aviation pilots and their passengers and to provide detailed information to support future government, industry, and private research efforts and safety improvement initiatives.
The Safety Board drew on several resources in compiling data for this review. Accident data, for example, were extracted from the Safety Board’s Aviation Accident/Incident Database.2 Activity data were also extracted from the General Aviation and Air Taxi Activity Survey (GAATA Survey)3 and from U.S. Civil Airmen Statistics,4 both of which are published by the Federal Aviation Administration (FAA), Statistics and Forecast Branch, Planning and Analysis Division, Office of Aviation Policy and Plans. Additional information was extracted from the General Aviation Statistical Databook, published by the General Aviation Manufacturers Association (GAMA).
.
What Is General Aviation?
General aviation can be described as any civil aircraft operation that is not covered under 14 Code of Federal Regulations (CFR) Parts 121, 129, and 135, commonly referred to as commercial air carrier operations.5
Which Operations Are Included in This Review?
This review includes accidents involving U.S.-registered aircraft operating under 14 CFR Part 91, as well as public aircraft6 flights that do not involve military or intelligence agencies. Aircraft operating under Part 91 include aircraft that are flown for recreation and personal transportation and certain aircraft operations that are flown with the intention of generating revenue,7 including business flying, flight instruction, corporate/executive flights, positioning or ferry flights, aerial application, pipeline/powerline patrols, and news and traffic reporting.
Which Aircraft Are Included in This Review?
General aviation operations are conducted using a wide range of aircraft, including airplanes, rotorcraft, gliders, balloons and blimps,
.
2 See appendix A for more details.3 Although included in the GAATA Survey, data associated with air taxi and air tour operations are not included in this review.4 FAA, U.S. Civil Airmen Statistics, 2002; available online at <http://www.faa.gov/data_statistics/aviation_data_statistics/civil_airmen_statistics/>,5 For a review of accident statistics related to air carrier operations, see National Transportation Safety Board, Annual Review of Aircraft Accident Data, U.S. Air Carrier Operations, Calendar Year 2002 (Washington, DC: 2006), available at <http://www.ntsb.gov>,6 Although the precise statutory definition has changed over the years, public aircraft operations for Safety Board purposes are qualified government missions that may include law enforcement, low-level observation, aerial application, firefighting, search and rescue, biological or geological resource management, and aeronautical research. 7 See 14 CFR 119.1.
Annual Review of Aircraft Accident Data3
and registered ultralight, experimental, or amateur-built aircraft. The diverse set of operations and aircraft types included within the scope of general aviation must be considered when interpreting the data in this review. The type of aircraft being flown is usually closely related to the type of flight operation being conducted. Jet and turboprop aircraft are commonly used for corporate/executive transportation, smaller single-engine piston aircraft are commonly used for instructional flights, and a variety of aircraft types are used for personal and business flights.
Not included in this review are any accident data associated with aircraft operating under 14 CFR Parts 121, 129, or 135. Also not included are data for military or intelligence agencies, non-U.S.-registered aircraft, unregistered ultralights, and commercial space launches, unless the accident also involved aircraft conducting general aviation operations. Crashes involving illegal operations, stolen aircraft, suicide, or sabotage are included in the accident total, but not in accident rates.8
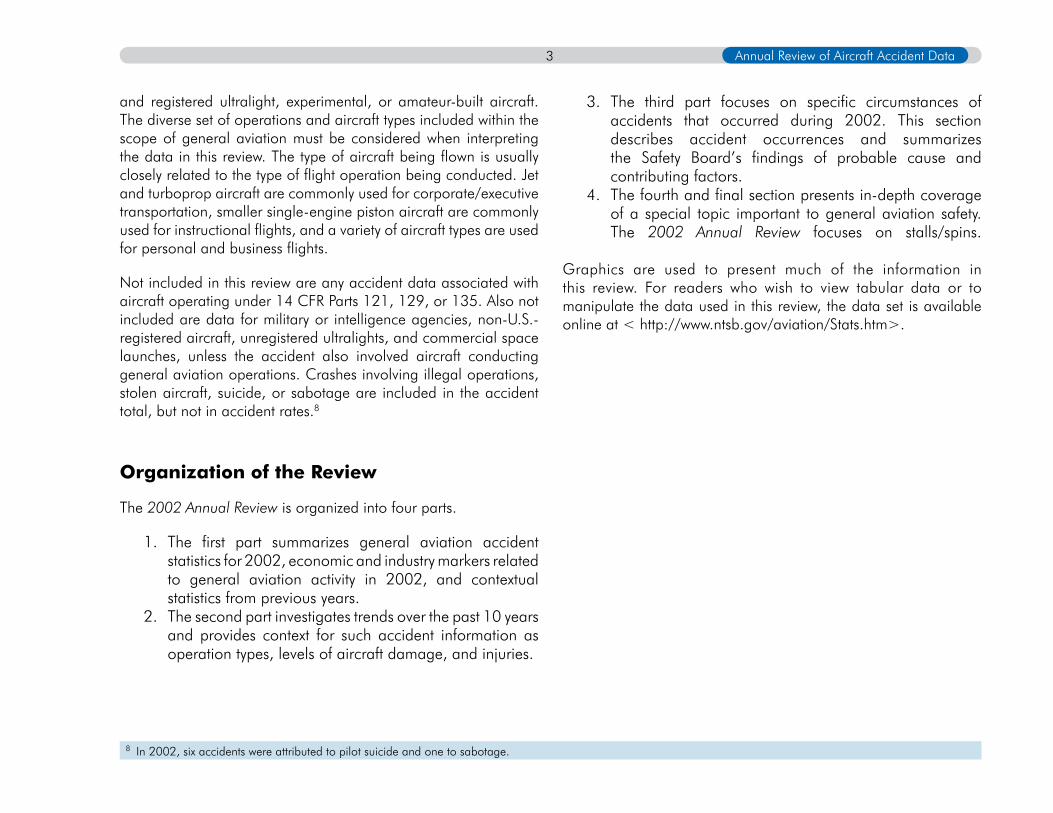
Organization of the Review
The 2002 Annual Review is organized into four parts.
The first part summarizes general aviation accident statistics for 2002, economic and industry markers related to general aviation activity in 2002, and contextual statistics from previous years. The second part investigates trends over the past 10 years and provides context for such accident information as operation types, levels of aircraft damage, and injuries.
1.
2.
The third part focuses on specific circumstances of accidents that occurred during 2002. This section describes accident occurrences and summarizes the Safety Board’s findings of probable cause and contributing factors.The fourth and final section presents in-depth coverage of a special topic important to general aviation safety. The 2002 Annual Review focuses on stalls/spins.
Graphics are used to present much of the information in this review. For readers who wish to view tabular data or to manipulate the data used in this review, the data set is available online at < http://www.ntsb.gov/aviation/Stats.htm>.
3.
4.
8 In 2002, six accidents were attributed to pilot suicide and one to sabotage.

4
the General aviation environment in 2002
General Economic and Aviation Industry Indicators
Repeated throughout this review is the theme that general aviation accident numbers should be interpreted in light of related information, such as aircraft type, type of operation, and operating
environment. Because personal and business flying account for the largest percentage of general aviation flying, prevailing economic conditions and/or trends may noticeably affect both the general aviation industry and flight operations.
U.S. industrial and personal incomes grew steadily from 1980 through 2002. Between 1990 and 2002, the U.S. resident population increased almost 16%, the gross domestic product rose by 41%, and disposable personal income per capita rose by 23%.
Economic indicators for the general aviation industry either declined or remained generally steady between 1980 and the mid-1990s. Production and sale of light piston aircraft, which
historically account for most of the general aviation fleet, decreased substantially from more than 10,750 in 1983 to about 500 in 1994, and the total number of new general aviation aircraft shipped in 1994 was about 7% of the number shipped in 1980. However, by 2002, general aviation industry indicators had increased noticeably. Aircraft shipments nearly tripled between 1995 and 2002, and the percent increase in net factory billings between 1995 and 2002 was equal to the total increase observed over the previous 20 years. This rapid growth was likely motivated by a combination of generally favorable economic conditions and increased general aviation aircraft production following the 1994 passage of the General Aviation Revitalization Act9 limiting manufacturer liability.
9 The General Aviation Revitalization Act, signed into law August 17, 1994, limited the liability of general aviation manufacturers to 18 years.
General Economic and Aviation Industry Indicators,1980-2002
1980 1990 2002Resident Population (Millions) 227 249 288 Gross Domestic Product (Billions) $5,162 $7,112 $10,049 Disposable Personal Income (Billions) $3,858 $5,324 $7,562 Disposable Personal Income Per Capita $16,940 $21,281 $26,236 Number of GA Aircraft Sold 11,877 1,144 2,207 Net Factory Billings for GA Aircraft (Millions) $2,486 $2,008 $7,719 Value of New GA Aircraft Sold: Piston (Millions) $794 $92 $389 Value of New GA Aircraft Sold: Turbine (Millions) $1,691 $1,916 $7,330 U.S. Bureau of Transportation Statistics; data are available at http://www.bts.gov/publications/national_transportation_statistics/2005/html/table_a.html. Bureau of Economic Analysis, real gross domestic product, using chained 2002 dollars; data are available at http://www.bea.gov/bea/dn/gdplev.xls. Bureau of Economic Analysis, chained 2002 dollars; data are available at http://www.bea.gov/bea/dn/nipaweb/. General Aviation Manufacturers Association, General Aviation Statistical Databook, 2005 (Washington, D.C.).
a
b
c
c
d
d
d
d
a
b
c
d
Annual Review of Aircraft Accident Data5
Fleet Makeup
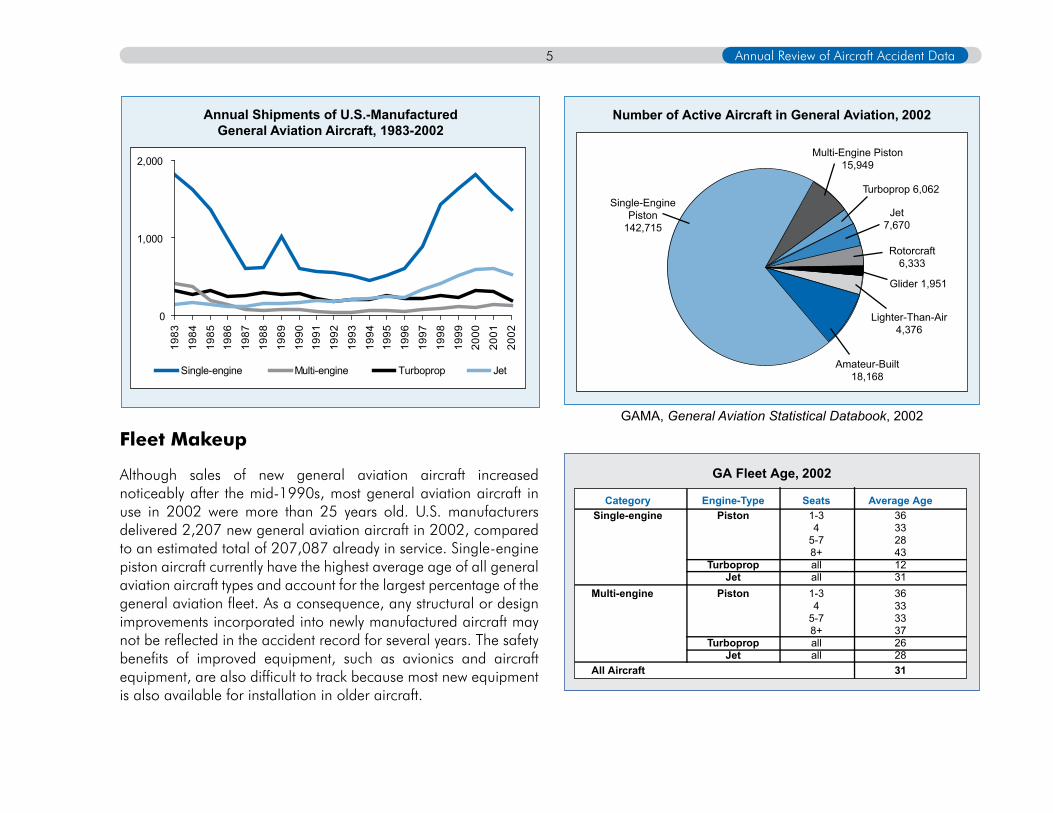
Although sales of new general aviation aircraft increased noticeably after the mid-1990s, most general aviation aircraft in use in 2002 were more than 25 years old. U.S. manufacturers delivered 2,207 new general aviation aircraft in 2002, compared to an estimated total of 207,087 already in service. Single-engine piston aircraft currently have the highest average age of all general aviation aircraft types and account for the largest percentage of the general aviation fleet. As a consequence, any structural or design improvements incorporated into newly manufactured aircraft may not be reflected in the accident record for several years. The safety benefits of improved equipment, such as avionics and aircraft equipment, are also difficult to track because most new equipment is also available for installation in older aircraft.
GAMA, General Aviation Statistical Databook, 2002
Annual Shipments of U.S.-ManufacturedGeneral Aviation Aircraft, 1983-2002
0
1,000
2,00019
83
1984
1985
1986
1987
1988
1989
1990
1991
1992
1993
1994
1995
1996
1997
1998
1999
2000
2001
2002
Single-engine Multi-engine Turboprop Jet
Number of Active Aircraft in General Aviation, 2002
Turboprop 6,062
Rotorcraft6,333
Single-EnginePiston
142,715
Multi-Engine Piston15,949
Jet7,670
Glider 1,951
Lighter-Than-Air4,376
Amateur-Built18,168
GA Fleet Age, 2002
Category Engine-Type Seats Average AgeSingle-engine Piston 1-3 36 4 33 5-7 28 8+ 43 Turboprop all 12 Jet all 31Multi-engine Piston 1-3 36 4 33 5-7 33 8+ 37 Turboprop all 26 Jet all 28All Aircraft 31

6The General Aviation Environment In 2002
General Aviation Activity
Because general aviation includes such a diverse group of aircraft types and operations, some measure of exposure must be considered to make meaningful comparisons of accident numbers. Flight activity is typically used to normalize accident numbers across different groups, with the level of activity corresponding to the level of exposure to potential accident risk. Total flight hours, departures, and miles flown are common indicators used to measure activity. As this graph shows, annual general aviation flight hour estimates began to increase in 1994 after a decline during the preceding years. In 2002, the estimated number of general aviation flight hours was 25.5 million, up slightly from 2001.10
It should be noted that activity data for general aviation are far less reliable than data available for commercial air carriers. Unlike Part 121 and scheduled Part 135 air carriers, which are required to report total flight hours, departures, and miles flown to the Department of Transportation (DOT),11 operators of general aviation aircraft are not required to report actual flight activity data. As a result, activity for this group of aircraft must be estimated using data from the GAATA Survey.12 The GAATA Survey was established in 1978 to gather information about aircraft use, flight hours, and avionics equipment installations from owners of general aviation and on-demand Part 135 aircraft. General aviation activity data are considered less reliable because a limited sample13 of aircraft is selected from the registry of aircraft owners for use in the GAATA Survey, and reporting is not required.
In addition, specific general aviation activity data could not be calculated in many cases because the survey data represented an aggregate of all aircraft activity, including on-demand Part 135 operations (which are not included in this review of general aviation accidents). Such aggregate data included the number of landings, flight hours by state or region, and flight hours by day/night or weather conditions. For this review, therefore, general aviation activity measures were determined by subtracting on-demand Part 135 data from activity totals whenever possible. Such data are not included in this review.
In addition to flight-hour estimates, the number of pilots can be used to establish the level of exposure to risk for the various types of operations included in general aviation. Available measures of
Number of General Aviation HoursFlown Annually, 1993-2002
100,
000
Hou
rs
350
300
250
200
150
100
01993 1994 1995 1996 1997 1998 1999 2000 2001 2002
10 The decrease in flight hours in 2002 was partly due to decreased flight activity following the events of September 11, 2001. For about 20 days after September 11, many flight operations, including those of air carriers, were suspended and gradually re-introduced.11 Part 121 operators report activity on a monthly basis, and scheduled Part 135 operators report quarterly.12 Available at < http://www.faa.gov/data_statistics/aviation_data_statistics/general_aviation/CY2002/>. 13 The 2002 GAATA Survey sample frame consisted of 273,870 registered aircraft, from which 29,491 records (11%) were selected in a sample stratified by state/territory and aircraft type. From that sample, 15,254 (54% of the sample and 6% of the total population) completed surveys were collected (GAATA Survey, Calendar Year 2002).

Annual Review of Aircraft Accident Data7
the pilot population include both the number of certificates issued to new pilots and medical certificates issued to active pilots. The number of new student pilot certificates represents positive growth in the pilot population, and the number of medical certificates issued represents an informal census of all active pilots.
From 1993 through 1996, the number of new student pilot certificates each year decreased steadily from 69,178 to 56,653.14 The number fluctuated after 1996, but remained generally even, with a total of 65,421 new student certificates issued in 2002.
Based on the number of medical certificates, the estimated total number of active pilots in U.S. general aviation decreased steadily throughout the early and mid-1990s, from 702,659 in 1990 to
622,261 in 1996. Between 1997 and 2002, the number of active pilots fluctuated, with an estimated total of 631,762 active U.S. pilots in 2002.
In summary, general aviation indicators—flight hours and the total number of active and newly issued pilot certificates—decreased annually between 1990 and 1996. From 1996 through 2002, the number of active and new student pilots fluctuated annually, with little overall change, during a period with a noticeable increase in estimated flight activity. The increase in estimated activity over the period had a noticeable effect on accident rate and should be considered when attempting to interpret the general aviation accident record for 2002 in the context of previous years.
Number of New Student PilotCertificates Issued, 1993-2002
0
20
40
60
80
1993 1994 1995 1996 1997 1998 1999 2000 2001 2002
Thou
sand
s of
Cer
tific
ates
Thou
sand
s of
Cer
tific
ates
Estimated Number of Active PilotCertificates, 1993-2002
2002200120001999199819971996199519941993
750
700
650
600
550
500
14 U.S. Civil Airmen Statistics.
8
hiStorical trendS in accident data
Accident Rates
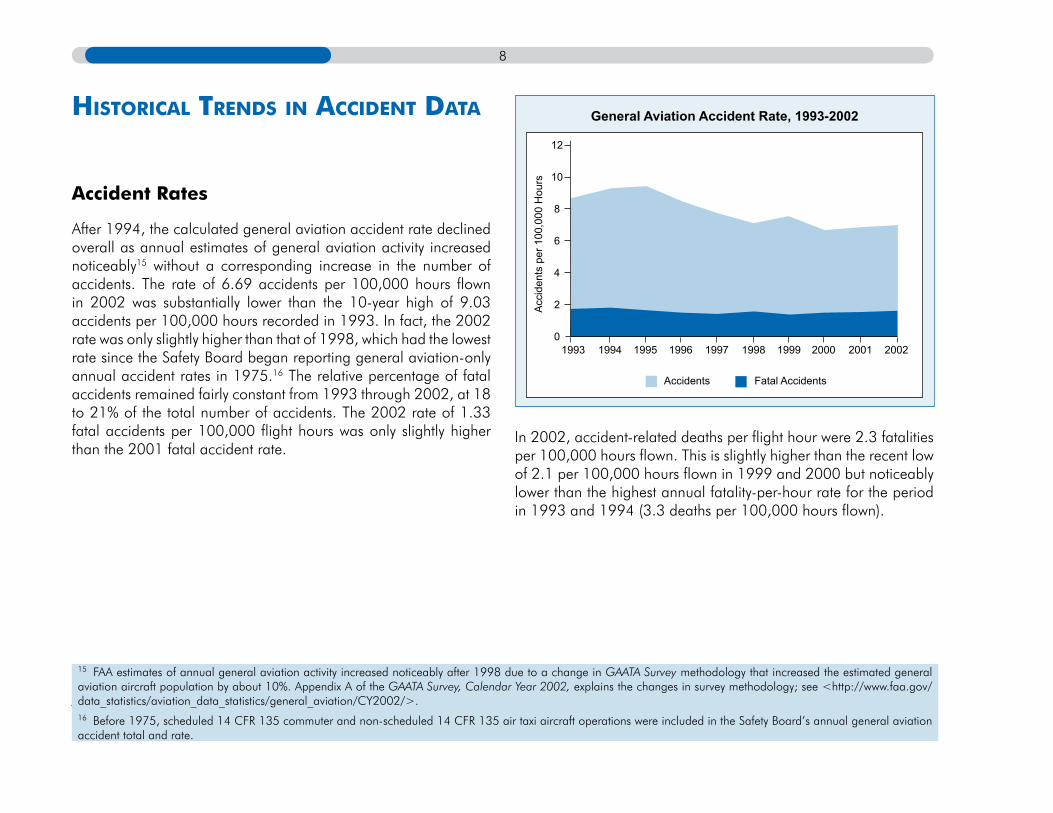
After 1994, the calculated general aviation accident rate declined overall as annual estimates of general aviation activity increased noticeably15 without a corresponding increase in the number of accidents. The rate of 6.69 accidents per 100,000 hours flown in 2002 was substantially lower than the 10-year high of 9.03 accidents per 100,000 hours recorded in 1993. In fact, the 2002 rate was only slightly higher than that of 1998, which had the lowest rate since the Safety Board began reporting general aviation-only annual accident rates in 1975.16 The relative percentage of fatal accidents remained fairly constant from 1993 through 2002, at 18 to 21% of the total number of accidents. The 2002 rate of 1.33 fatal accidents per 100,000 flight hours was only slightly higher than the 2001 fatal accident rate.
In 2002, accident-related deaths per flight hour were 2.3 fatalities per 100,000 hours flown. This is slightly higher than the recent low of 2.1 per 100,000 hours flown in 1999 and 2000 but noticeably lower than the highest annual fatality-per-hour rate for the period in 1993 and 1994 (3.3 deaths per 100,000 hours flown).
15 FAA estimates of annual general aviation activity increased noticeably after 1998 due to a change in GAATA Survey methodology that increased the estimated general aviation aircraft population by about 10%. Appendix A of the GAATA Survey, Calendar Year 2002, explains the changes in survey methodology; see <http://www.faa.gov/data_statistics/aviation_data_statistics/general_aviation/CY2002/>.16 Before 1975, scheduled 14 CFR 135 commuter and non-scheduled 14 CFR 135 air taxi aircraft operations were included in the Safety Board’s annual general aviation accident total and rate.
General Aviation Accident Rate, 1993-2002
Acc
iden
ts p
er 1
00,0
00 H
ours
12
10
8
6
4
2
01993 1994 1995 1996 1997 1998 1999 2000 2001 2002
Accidents Fatal Accidents
Annual Review of Aircraft Accident Data9
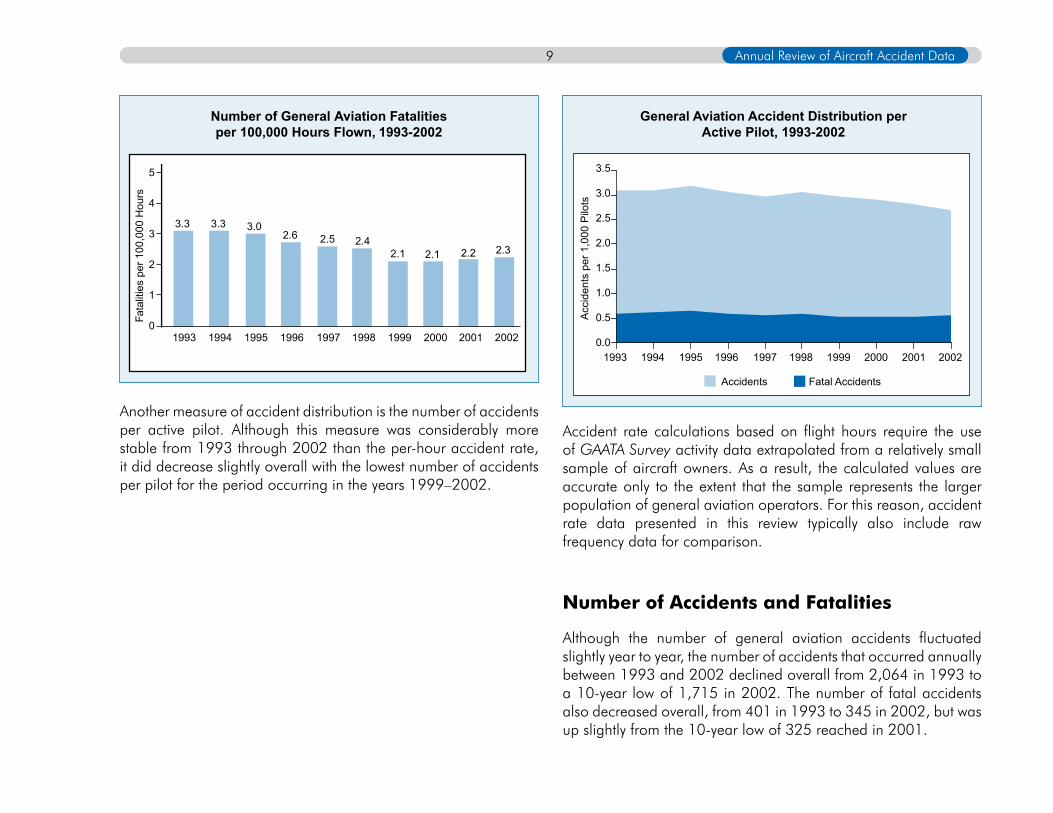
Another measure of accident distribution is the number of accidents per active pilot. Although this measure was considerably more stable from 1993 through 2002 than the per-hour accident rate, it did decrease slightly overall with the lowest number of accidents per pilot for the period occurring in the years 1999–2002.
Accident rate calculations based on flight hours require the use of GAATA Survey activity data extrapolated from a relatively small sample of aircraft owners. As a result, the calculated values are accurate only to the extent that the sample represents the larger population of general aviation operators. For this reason, accident rate data presented in this review typically also include raw frequency data for comparison.
Number of Accidents and Fatalities
Although the number of general aviation accidents fluctuated slightly year to year, the number of accidents that occurred annually between 1993 and 2002 declined overall from 2,064 in 1993 to a 10-year low of 1,715 in 2002. The number of fatal accidents also decreased overall, from 401 in 1993 to 345 in 2002, but was up slightly from the 10-year low of 325 reached in 2001.
Number of General Aviation Fatalitiesper 100,000 Hours Flown, 1993-2002
1993 1994 1995 1996 1997 1998 1999 2000 2001 2002
Fata
litie
s pe
r 100
,000
Hou
rs
5
4
3
2
1
0
2.22.12.1
3.03.33.3
2.32.42.52.6
General Aviation Accident Distribution perActive Pilot, 1993-2002
Acc
iden
ts p
er 1
,000
Pilo
ts
3.5
3.0
2.5
2.0
1.5
1.0
0.5
0.0
Accidents Fatal Accidents
2002200120001999199819971996 199519941993

10Historical Trends in Accident Data
The number of fatalities also exhibited a generally downward trend from the high of 744 deaths in 1993 to a low of 581 deaths in 2002. This observed decline in fatalities was consistent with other trends for the 10-year period, which showed a decline in the number of active pilots, the number of accidents, and the number of fatal accidents.
Accident Rate by Type of Operation
General aviation includes a wide range of operations, each with unique aircraft types, flight profiles, and operating procedures. This diversity is evident in the accident record. However, the flight data collected in the GAATA Survey allow for only a coarse representation of the many types of general aviation operations. For some types of operations, such as public aircraft flights,17 no activity data are available. The data presented here include four operational categories selected because they are representative of general aviation and have activity information available. The categories selected as being typical of general aviation activity include personal/business flying,18 corporate flying, aerial application, and instructional flights.
Number of General Aviation Accidents 1993-2002
2,500
2,000
1,500
1,000
500
0
Accidents Fatal Accidents
2002200120001999199819971996199519941993
Number of Fatal General Aviation Accidentsand Fatalities, 1993-2002
1993 1994 1995 1996 1997 1998 1999 2000 2001 2002
1,000
750
500
250
0
Fatal Accidents Fatalities
17 The Annual Review, 2002, data include 40 public aircraft accidents, 7 of which resulted in one or more fatalities. Public aircraft activity is well documented for federal aircraft but not for state and local government aircraft.18 Because of the difficulty of accurately distinguishing between personal and business flying for both the activity survey and the accident record, the rate presented in this review is calculated using combined exposure data (hours flown).
Annual Review of Aircraft Accident Data11
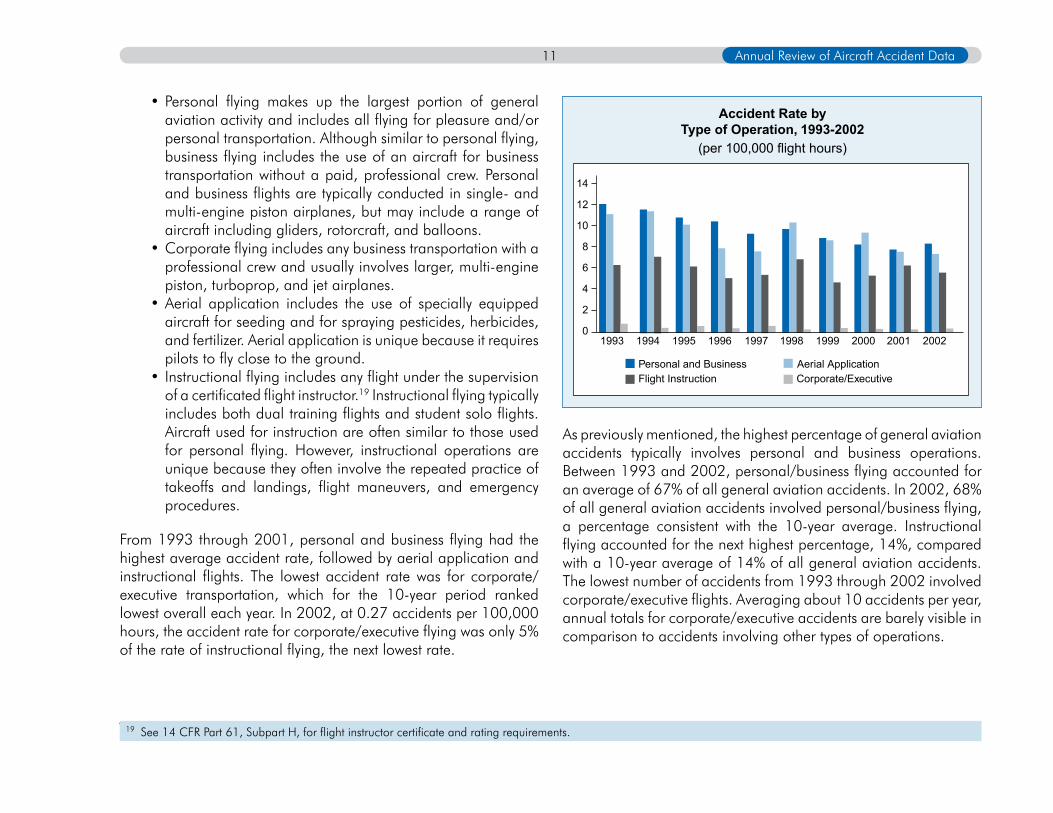
Personal flying makes up the largest portion of general aviation activity and includes all flying for pleasure and/or personal transportation. Although similar to personal flying, business flying includes the use of an aircraft for business transportation without a paid, professional crew. Personal and business flights are typically conducted in single- and multi-engine piston airplanes, but may include a range of aircraft including gliders, rotorcraft, and balloons. Corporate flying includes any business transportation with a professional crew and usually involves larger, multi-engine piston, turboprop, and jet airplanes. Aerial application includes the use of specially equipped aircraft for seeding and for spraying pesticides, herbicides, and fertilizer. Aerial application is unique because it requires pilots to fly close to the ground. Instructional flying includes any flight under the supervision of a certificated flight instructor.19 Instructional flying typically includes both dual training flights and student solo flights. Aircraft used for instruction are often similar to those used for personal flying. However, instructional operations are unique because they often involve the repeated practice of takeoffs and landings, flight maneuvers, and emergency procedures.
From 1993 through 2001, personal and business flying had the highest average accident rate, followed by aerial application and instructional flights. The lowest accident rate was for corporate/executive transportation, which for the 10-year period ranked lowest overall each year. In 2002, at 0.27 accidents per 100,000 hours, the accident rate for corporate/executive flying was only 5% of the rate of instructional flying, the next lowest rate.
•
•
•
•
As previously mentioned, the highest percentage of general aviation accidents typically involves personal and business operations. Between 1993 and 2002, personal/business flying accounted for an average of 67% of all general aviation accidents. In 2002, 68% of all general aviation accidents involved personal/business flying, a percentage consistent with the 10-year average. Instructional flying accounted for the next highest percentage, 14%, compared with a 10-year average of 14% of all general aviation accidents. The lowest number of accidents from 1993 through 2002 involved corporate/executive flights. Averaging about 10 accidents per year, annual totals for corporate/executive accidents are barely visible in comparison to accidents involving other types of operations.
19 See 14 CFR Part 61, Subpart H, for flight instructor certificate and rating requirements.
Accident Rate byType of Operation, 1993-2002
(per 100,000 flight hours)
Personal and Business Aerial ApplicationFlight Instruction Corporate/Executive
1993 1994 1995 1996 1997 1998 1999 2000 2001 2002
14
12
10
8
6
4
2
0
12Historical Trends in Accident Data
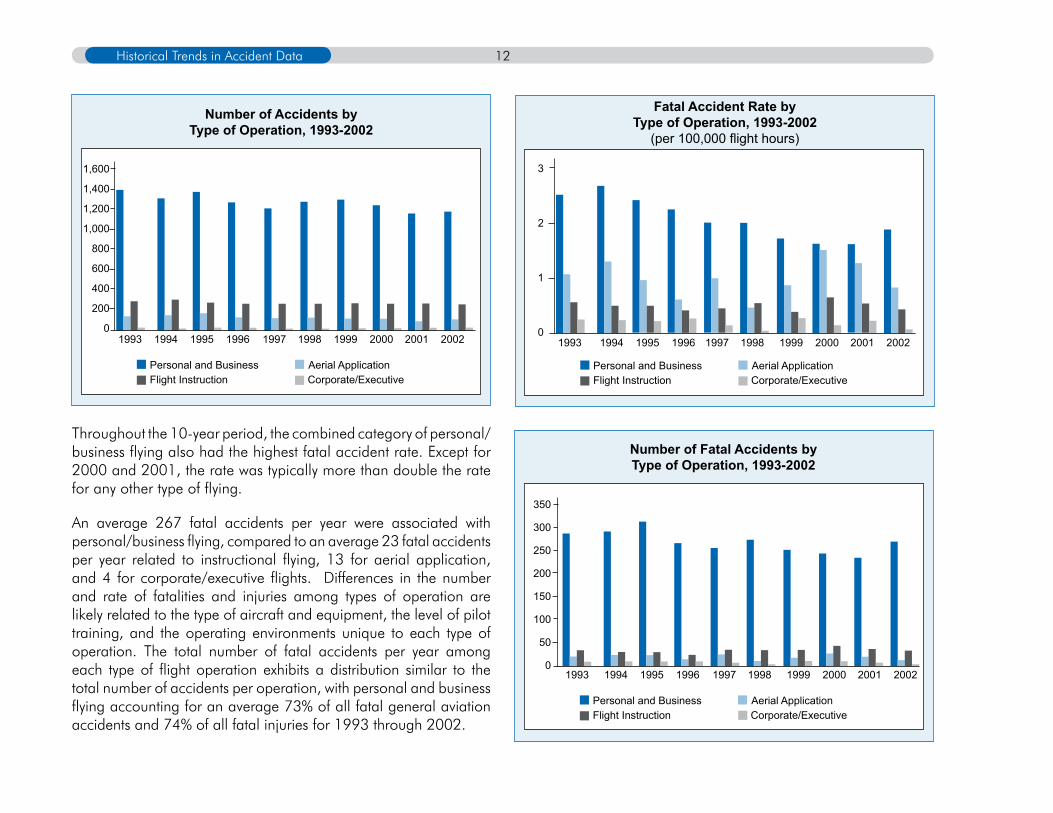
Throughout the 10-year period, the combined category of personal/business flying also had the highest fatal accident rate. Except for 2000 and 2001, the rate was typically more than double the rate for any other type of flying.
An average 267 fatal accidents per year were associated with personal/business flying, compared to an average 23 fatal accidents per year related to instructional flying, 13 for aerial application, and 4 for corporate/executive flights. Differences in the number and rate of fatalities and injuries among types of operation are likely related to the type of aircraft and equipment, the level of pilot training, and the operating environments unique to each type of operation. The total number of fatal accidents per year among each type of flight operation exhibits a distribution similar to the total number of accidents per operation, with personal and business flying accounting for an average 73% of all fatal general aviation accidents and 74% of all fatal injuries for 1993 through 2002.
Number of Accidents byType of Operation, 1993-2002
1,600
1,400
1,200
1,000
800
600
400
200
0
Personal and Business Aerial ApplicationFlight Instruction Corporate/Executive
1993 1994 1995 1996 1997 1998 1999 2000 2001 2002
Personal and Business Aerial ApplicationFlight Instruction Corporate/Executive
Fatal Accident Rate byType of Operation, 1993-2002
(per 100,000 flight hours)
3
2
1
01993 1994 1995 1996 1997 1998 1999 2000 2001 2002
350
300
250
200
150
100
50
0
Personal and Business Aerial ApplicationFlight Instruction Corporate/Executive
1993 1994 1995 1996 1997 1998 1999 2000 2001 2002
Number of Fatal Accidents byType of Operation, 1993-2002
Annual Review of Aircraft Accident Data13
2002 in depth
Location of General Aviation Accidents in 2002
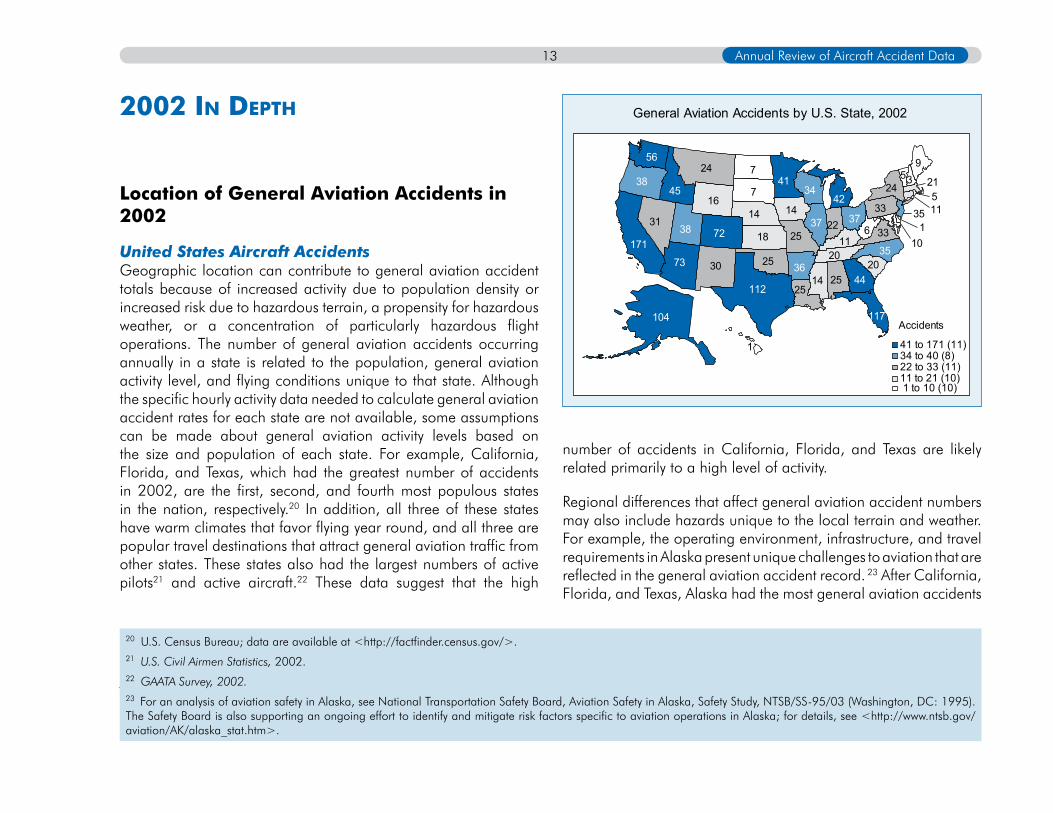
United States Aircraft Accidents Geographic location can contribute to general aviation accident totals because of increased activity due to population density or increased risk due to hazardous terrain, a propensity for hazardous weather, or a concentration of particularly hazardous flight operations. The number of general aviation accidents occurring annually in a state is related to the population, general aviation activity level, and flying conditions unique to that state. Although the specific hourly activity data needed to calculate general aviation accident rates for each state are not available, some assumptions can be made about general aviation activity levels based on the size and population of each state. For example, California, Florida, and Texas, which had the greatest number of accidents in 2002, are the first, second, and fourth most populous states in the nation, respectively.20 In addition, all three of these states have warm climates that favor flying year round, and all three are popular travel destinations that attract general aviation traffic from other states. These states also had the largest numbers of active pilots21 and active aircraft.22 These data suggest that the high
number of accidents in California, Florida, and Texas are likely related primarily to a high level of activity.
Regional differences that affect general aviation accident numbers may also include hazards unique to the local terrain and weather. For example, the operating environment, infrastructure, and travel requirements in Alaska present unique challenges to aviation that are reflected in the general aviation accident record. 23 After California, Florida, and Texas, Alaska had the most general aviation accidents
20 U.S. Census Bureau; data are available at <http://factfinder.census.gov/>.21 U.S. Civil Airmen Statistics, 2002.22 GAATA Survey, 2002. 23 For an analysis of aviation safety in Alaska, see National Transportation Safety Board, Aviation Safety in Alaska, Safety Study, NTSB/SS-95/03 (Washington, DC: 1995). The Safety Board is also supporting an ongoing effort to identify and mitigate risk factors specific to aviation operations in Alaska; for details, see <http://www.ntsb.gov/aviation/AK/alaska_stat.htm>.
104
171
385
10
21
11351
539
24
33
6 33
3520
117
44
37
42
22
2514
2011
37
3441
14
25
36
25
1
112
25
18
14
7
724
16
72
3073
38
45
31
56
Accidents
41 to 171 (11)34 to 40 (8) 22 to 33 (11) 11 to 21 (10) 1 to 10 (10)
General Aviation Accidents by U.S. State, 2002
14
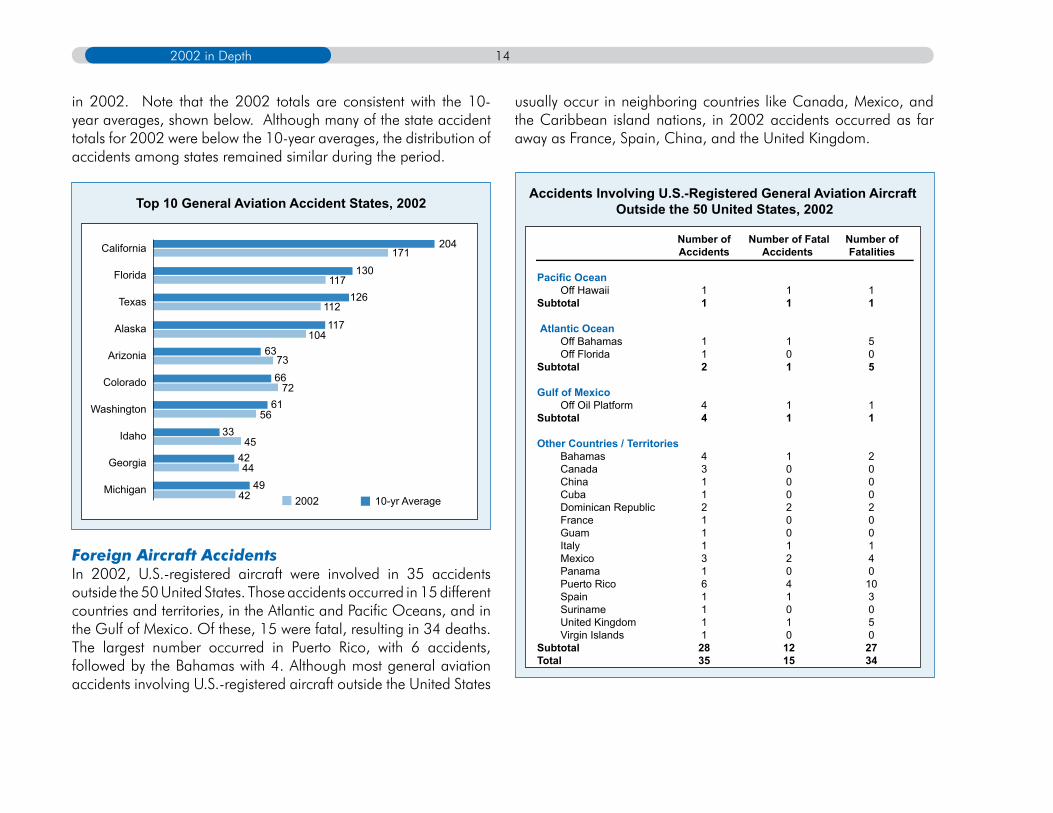
in 2002. Note that the 2002 totals are consistent with the 10-year averages, shown below. Although many of the state accident totals for 2002 were below the 10-year averages, the distribution of accidents among states remained similar during the period.
Foreign Aircraft Accidents In 2002, U.S.-registered aircraft were involved in 35 accidents outside the 50 United States. Those accidents occurred in 15 different countries and territories, in the Atlantic and Pacific Oceans, and in the Gulf of Mexico. Of these, 15 were fatal, resulting in 34 deaths. The largest number occurred in Puerto Rico, with 6 accidents, followed by the Bahamas with 4. Although most general aviation accidents involving U.S.-registered aircraft outside the United States
usually occur in neighboring countries like Canada, Mexico, and the Caribbean island nations, in 2002 accidents occurred as far away as France, Spain, China, and the United Kingdom.
Top 10 General Aviation Accident States, 2002
204California
Florida
Texas
Alaska
Arizonia
Colorado
Washington
Idaho
Georgia
Michigan
171
130117
126112
117104
637366
7261
5633
454244
4942 2002 10-yr Average
2002 in Depth
Accidents Involving U.S.-Registered General Aviation Aircraft Outside the 50 United States, 2002
Number of Number of Fatal Number of Accidents Accidents Fatalities Pacific Ocean Off Hawaii 1 1 1Subtotal 1 1 1
Atlantic Ocean Off Bahamas 1 1 5 Off Florida 1 0 0Subtotal 2 1 5
Gulf of Mexico Off Oil Platform 4 1 1Subtotal 4 1 1 Other Countries / Territories Bahamas 4 1 2 Canada 3 0 0 China 1 0 0 Cuba 1 0 0 Dominican Republic 2 2 2 France 1 0 0 Guam 1 0 0 Italy 1 1 1 Mexico 3 2 4 Panama 1 0 0 Puerto Rico 6 4 10 Spain 1 1 3 Suriname 1 0 0 United Kingdom 1 1 5 Virgin Islands 1 0 0Subtotal 28 12 27Total 35 15 34

Annual Review of Aircraft Accident Data15
Aircraft Type
The following graph summarizes the total number of general aviation accidents and the number of fatal accidents occurring in 2002 by type of aircraft. Most notable is the large number of accidents involving single-engine piston airplanes, which accounted for 72% of all accident aircraft and 67% of all fatal accident aircraft.
In 2002, the per-aircraft accident rate for all aircraft types was 6.72 accidents and 1.34 fatal accidents per 100,000 hours flown.24 Among fixed-wing powered aircraft, the rate for single-engine piston airplanes, the category representing the largest number of aircraft, was 7.79 accidents and 1.43 fatal accidents per 100,000
hours flown. Amateur-built aircraft had the highest accident rate in 2002 with 22.49 accidents and 6.57 fatal accidents per 100,000 flight hours.25 Rotorcraft had the second-highest rate among powered aircraft, with 11.61 accidents and 1.68 fatal accidents per 100,000 hours flown. However, glider operations had the second-highest accident rate overall, with 19.67 accidents and 3.81 fatal accidents per 100,000 hours flown.
Accident Rate per Aircraft Type, 2002(per 100,000 Flight Hours)
All Aircraft
Airplane Single Piston
Airplane Multi-Engine Piston
AirplaneTurboprop
AirplaneTurbine
Amateur-Built
Rotorcraft
Gliders
Lighter-Than-Air
TotalFatal
6.721.34
7.791.43
5.101.88
4.331.29
0.720.12
6.57
11.611.68
3.81
6.420.58
22.49
19.67
24 Note that the reported rates are per aircraft and differ from per-accident rates because each aircraft is counted separately in the event of a collision. Included in the accident totals, but excluded from the associated rates, are six single-engine piston aircraft accidents with a probable cause attributed to suicide, sabotage, or stolen/unauthorized use. 25 Title 14 CFR Part 21 (21.191(g)) provides for the issuance of a Special Airworthiness Certificate in the experimental category to permit the operation of amateur-built aircraft. Amateur-built aircraft may be fabricated from plans or assembled from a kit, so long as the major portion (51%) of construction is completed by the amateur builder(s).
Number of Accidents by Type of Aircraft, 2002
1,724All Aircraft
Airplane Single Piston
Airplane Multi-Engine Piston
AirplaneTurboprop
AirplaneTurbine
Amateur-Built
Rotorcraft
Gliders
Lighter-Than-Air
349
1,247234
11141
6720
183
21964
20129
316
110
TotalFatal
162002 in Depth
Purpose of Flight
As previously mentioned, general aviation includes a wide range of operation types, each with unique aircraft types, flight profiles, and operating procedures. The total number of accidents and the accident rates can vary considerably as a result of these differences. To allow comparisons among different operations, risk exposure is standardized across different operations by using flight hours as a common measure of activity.
The type of operation or purpose of flight can be defined as the reason a flight is initiated. Activity data by purpose of flight are derived from the GAATA Survey, which includes 14 purpose/use categories. Two of these categories, air taxis and air tours, are covered under 14 CFR Part 135 and are therefore not included in this review. The remaining 12 categories include the previously mentioned categories of “personal,” “business,” “instructional,” “corporate,” and “aerial application,” which together accounted for 90% of all general aviation operations in 2002. The remaining 10% of general aviation operations are included in more specific categories, such as “external load” and “medical use.” A limitation of the GAATA activity data is that those categories provide only a coarse representation of the range of possible flight operations. For example, “personal flying” includes but does not distinguish between travel, recreation, or proficiency flying. At the same time, the differences between similar categories like “personal” and “business flying” are not easily identified. Accordingly, the purpose-of-flight information presented in this review is limited to the combined categories of personal and business flying, as well as corporate, instructional, and aerial application flights.
According to the GAATA Survey, most general aviation operations are conducted for personal and/or business purposes. Of the estimated 25.5 million general aviation hours flown in 2002, more
than half—14.3 million—were conducted for personal or business reasons.26 A result of this level of activity is that a large percentage of general aviation accidents involve personal/business flying. However, personal/business flying is still over-represented in the accident record: although this segment represented only about 56% of the general aviation hours in 2002, it accounted for 68% (1,170) of all general aviation accidents and 76% (263) of all fatal accidents in 2002.
The accident rate for flight instruction operations was substantially less than aerial application and personal/business flights. This relatively low rate is surprising because student pilots could be expected to make more mistakes than experienced pilots while they are learning to fly. Flight instruction accidents were also less likely to be fatal. Only 9% of the flight instruction accidents that occurred in 2002 resulted in fatalities, compared to almost 22% of personal/business accidents. When compared with the number of hours flown, the fatal accident rate for instructional flights was 0.45 fatal accidents per 100,000 hours flown. The fatal accident rate for personal/business flying remained the highest in general aviation with 1.82 fatal accidents per 100,000 hours flown.
Flight PlanOf the 1,724 pilots involved in general aviation accidents in 2002, 1,363 (79%) did not file a flight plan. In most cases, a flight plan is required only for flight under instrument flight rules (IFR). However, pilots operating under visual flight rules (VFR) on point-to-point flights have the option of filing a flight plan, which aids search and rescue efforts for pilots who fail to arrive at their intended destinations. VFR flight plans are typically not filed for local flights.
26 GAATA Survey, 2002.

Annual Review of Aircraft Accident Data17
Airport InvolvementAircraft accident locations were closely split between those occurring away from an airport (52%) and those occurring on airport property (45%). Comparing accident risk based on location is difficult because of the exposure differences between different operations and aircraft types. For example, a single-engine piston aircraft used for instructional flights will spend a large percentage of its operating time near an airport while a jet aircraft used for corporate transportation will not. However, a relationship can be observed between the location and severity of accidents. Accidents on or near an airport or airstrip typically involve aircraft operating at relatively low altitudes and airspeeds while taking off, landing, or maneuvering to land. Accidents that occur away from an airport typically involve aircraft in the climb, cruise, maneuvering, and descent phases of flight, which typically occur at higher altitudes and higher airspeeds. As a result, accidents that occur away from an airport are more likely to result in higher
levels of injury and aircraft damage than accidents that occur on an airstrip or near an airport. Most aircraft involved in fatal accidents in 2002 (81%) were located away from an airport or airstrip.
Another distinction that can be drawn between flight profiles is between local and point-to-point operations. A local flight departs from and lands at the same airport, and a point-to-point flight lands at an airport other than the one from which it departed. Typical local flight operations include sightseeing, flight instruction, proficiency flights, pleasure flights, and most aerial observation and aerial application flights. Conversely, point-to-point flights include any operation conducted to move people, cargo, or equipment from one place to another. Typical point-to-point operations include corporate/executive transportation, personal and business travel, and aircraft repositioning flights.
Location of Accident Aircraft, 2002
774
49
904283
4617
TotalFatal
0 200 400 600 800 1000
Number of Aircraft
Unknown
Off Airport
On Airport
Flight Plan Filed by Accident Pilot, 2002
Unknown2%
IFR9%
VFR11%
None79%
182002 in Depth
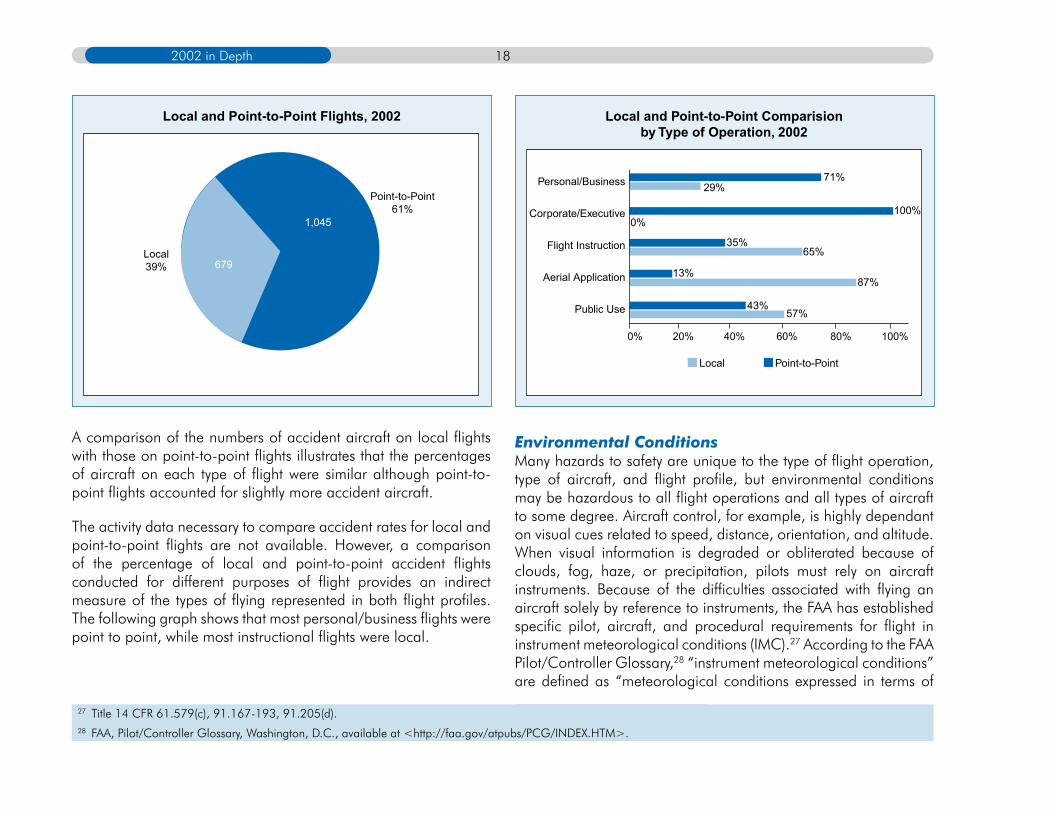
A comparison of the numbers of accident aircraft on local flights with those on point-to-point flights illustrates that the percentages of aircraft on each type of flight were similar although point-to-point flights accounted for slightly more accident aircraft.
The activity data necessary to compare accident rates for local and point-to-point flights are not available. However, a comparison of the percentage of local and point-to-point accident flights conducted for different purposes of flight provides an indirect measure of the types of flying represented in both flight profiles. The following graph shows that most personal/business flights were point to point, while most instructional flights were local.
Environmental ConditionsMany hazards to safety are unique to the type of flight operation, type of aircraft, and flight profile, but environmental conditions may be hazardous to all flight operations and all types of aircraft to some degree. Aircraft control, for example, is highly dependant on visual cues related to speed, distance, orientation, and altitude. When visual information is degraded or obliterated because of clouds, fog, haze, or precipitation, pilots must rely on aircraft instruments. Because of the difficulties associated with flying an aircraft solely by reference to instruments, the FAA has established specific pilot, aircraft, and procedural requirements for flight in instrument meteorological conditions (IMC).27 According to the FAA Pilot/Controller Glossary,28 “instrument meteorological conditions” are defined as “meteorological conditions expressed in terms of
Local and Point-to-Point Comparisionby Type of Operation, 2002
71%Personal/Business
Corporate/Executive
Flight Instruction
Aerial Application
Public Use
0% 20% 40% 60% 80% 100%
Local Point-to-Point
100%0%
29%
35%65%
13%87%
43%57%
27 Title 14 CFR 61.579(c), 91.167-193, 91.205(d).28 FAA, Pilot/Controller Glossary, Washington, D.C., available at <http://faa.gov/atpubs/PCG/INDEX.HTM>.
Local and Point-to-Point Flights, 2002
Local39%
Point-to-Point61%
1,045
679
Annual Review of Aircraft Accident Data19
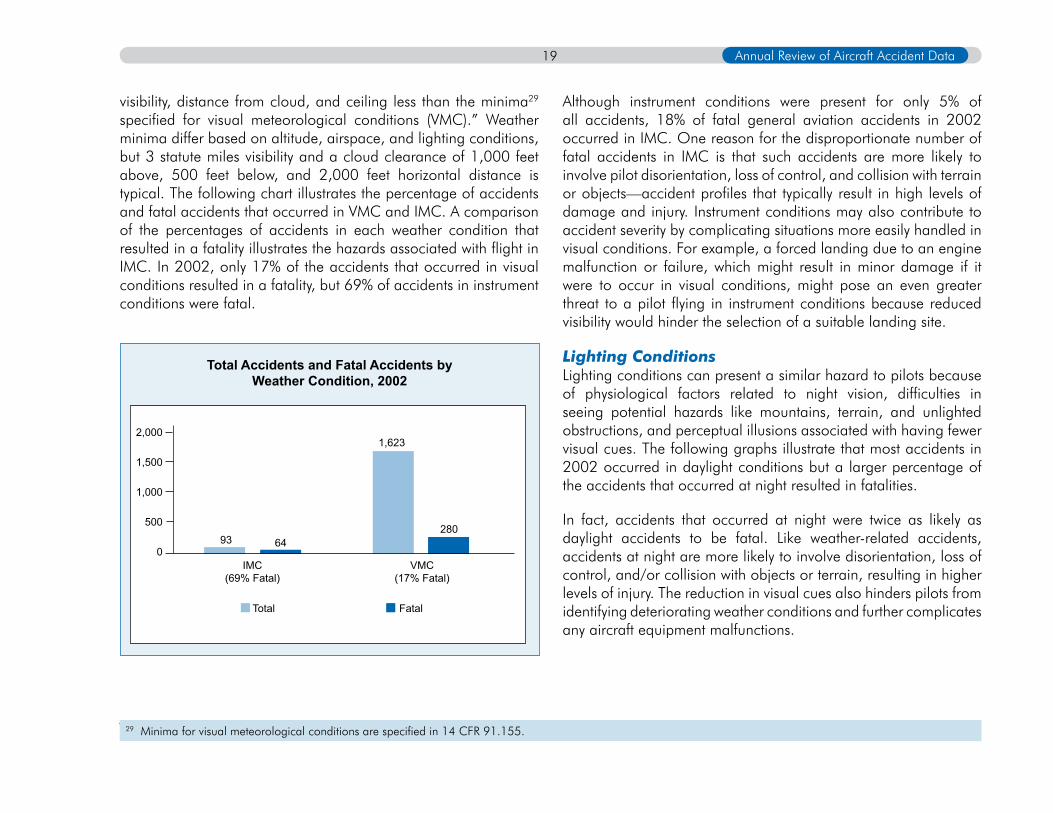
visibility, distance from cloud, and ceiling less than the minima29 specified for visual meteorological conditions (VMC).” Weather minima differ based on altitude, airspace, and lighting conditions, but 3 statute miles visibility and a cloud clearance of 1,000 feet above, 500 feet below, and 2,000 feet horizontal distance is typical. The following chart illustrates the percentage of accidents and fatal accidents that occurred in VMC and IMC. A comparison of the percentages of accidents in each weather condition that resulted in a fatality illustrates the hazards associated with flight in IMC. In 2002, only 17% of the accidents that occurred in visual conditions resulted in a fatality, but 69% of accidents in instrument conditions were fatal.
Although instrument conditions were present for only 5% of all accidents, 18% of fatal general aviation accidents in 2002 occurred in IMC. One reason for the disproportionate number of fatal accidents in IMC is that such accidents are more likely to involve pilot disorientation, loss of control, and collision with terrain or objects—accident profiles that typically result in high levels of damage and injury. Instrument conditions may also contribute to accident severity by complicating situations more easily handled in visual conditions. For example, a forced landing due to an engine malfunction or failure, which might result in minor damage if it were to occur in visual conditions, might pose an even greater threat to a pilot flying in instrument conditions because reduced visibility would hinder the selection of a suitable landing site.
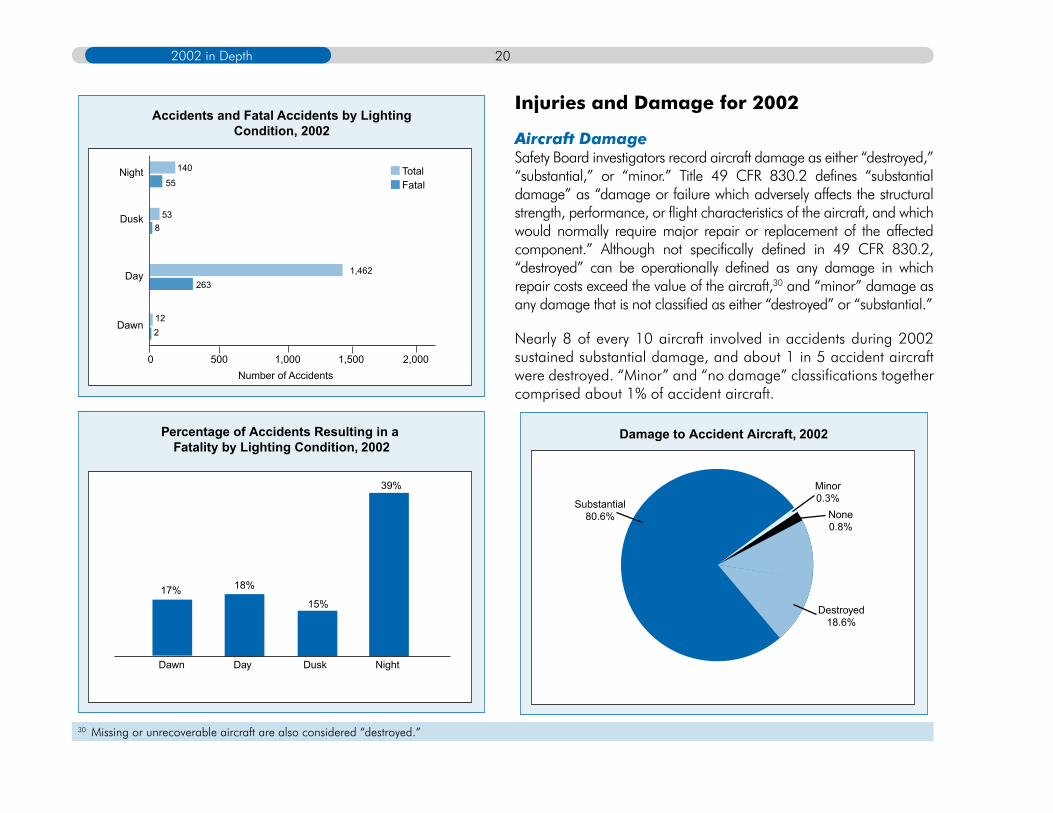
Lighting ConditionsLighting conditions can present a similar hazard to pilots because of physiological factors related to night vision, difficulties in seeing potential hazards like mountains, terrain, and unlighted obstructions, and perceptual illusions associated with having fewer visual cues. The following graphs illustrate that most accidents in 2002 occurred in daylight conditions but a larger percentage of the accidents that occurred at night resulted in fatalities.
In fact, accidents that occurred at night were twice as likely as daylight accidents to be fatal. Like weather-related accidents, accidents at night are more likely to involve disorientation, loss of control, and/or collision with objects or terrain, resulting in higher levels of injury. The reduction in visual cues also hinders pilots from identifying deteriorating weather conditions and further complicates any aircraft equipment malfunctions.
Total Accidents and Fatal Accidents byWeather Condition, 2002
93 64
1,623
280
IMC(69% Fatal)
VMC(17% Fatal)
2,000
1,500
1,000
500
0
Total Fatal
29 Minima for visual meteorological conditions are specified in 14 CFR 91.155.
202002 in Depth
Injuries and Damage for 2002
Aircraft DamageSafety Board investigators record aircraft damage as either “destroyed,” “substantial,” or “minor.” Title 49 CFR 830.2 defines “substantial damage” as “damage or failure which adversely affects the structural strength, performance, or flight characteristics of the aircraft, and which would normally require major repair or replacement of the affected component.” Although not specifically defined in 49 CFR 830.2, “destroyed” can be operationally defined as any damage in which repair costs exceed the value of the aircraft,30 and “minor” damage as any damage that is not classified as either “destroyed” or “substantial.”
Nearly 8 of every 10 aircraft involved in accidents during 2002 sustained substantial damage, and about 1 in 5 accident aircraft were destroyed. “Minor” and “no damage” classifications together comprised about 1% of accident aircraft.
30 Missing or unrecoverable aircraft are also considered “destroyed.”
Damage to Accident Aircraft, 2002
Minor0.3%
Destroyed18.6%
Substantial80.6% None
0.8%
Accidents and Fatal Accidents by LightingCondition, 2002
140
55
538
1,462263
TotalFatal
0 500 1,000 1,500 2,000
122
Number of Accidents
Night
Dusk
Day
Dawn
Percentage of Accidents Resulting in a Fatality by Lighting Condition, 2002
17% 18%
15%
39%
Dawn Day Dusk Night
Annual Review of Aircraft Accident Data21
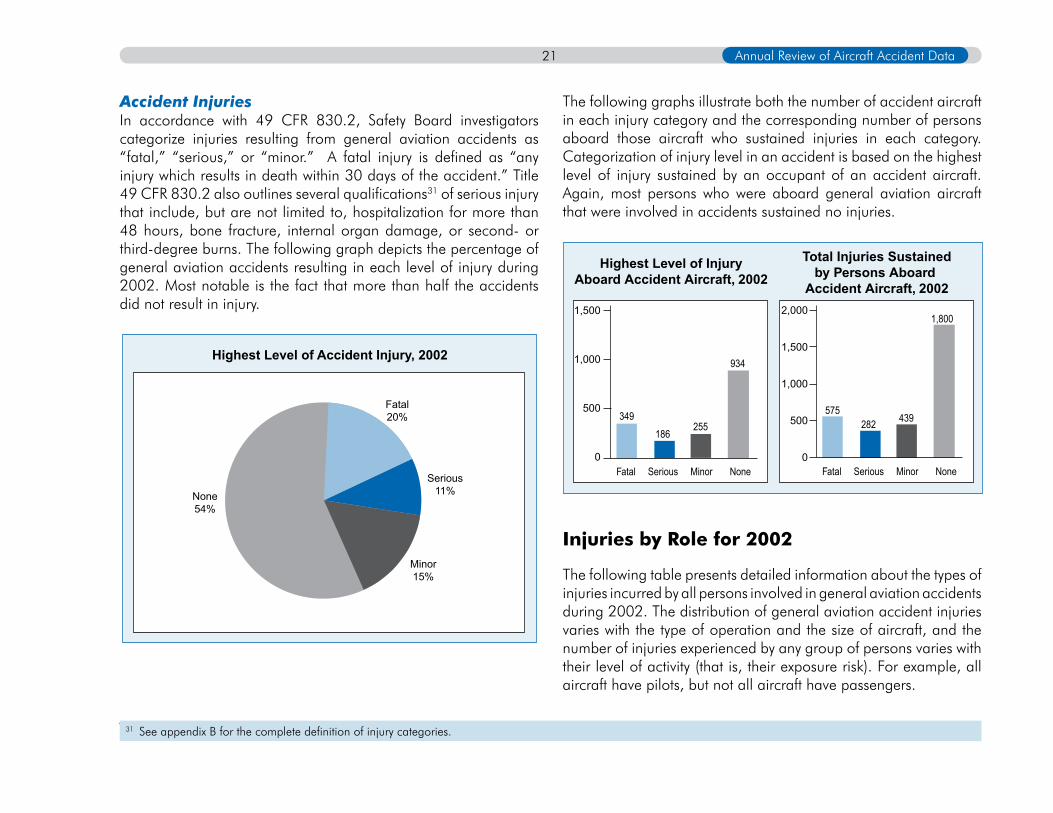
Accident InjuriesIn accordance with 49 CFR 830.2, Safety Board investigators categorize injuries resulting from general aviation accidents as “fatal,” “serious,” or “minor.” A fatal injury is defined as “any injury which results in death within 30 days of the accident.” Title 49 CFR 830.2 also outlines several qualifications31 of serious injury that include, but are not limited to, hospitalization for more than 48 hours, bone fracture, internal organ damage, or second- or third-degree burns. The following graph depicts the percentage of general aviation accidents resulting in each level of injury during 2002. Most notable is the fact that more than half the accidents did not result in injury.
The following graphs illustrate both the number of accident aircraft in each injury category and the corresponding number of persons aboard those aircraft who sustained injuries in each category. Categorization of injury level in an accident is based on the highest level of injury sustained by an occupant of an accident aircraft. Again, most persons who were aboard general aviation aircraft that were involved in accidents sustained no injuries.
Injuries by Role for 2002
The following table presents detailed information about the types of injuries incurred by all persons involved in general aviation accidents during 2002. The distribution of general aviation accident injuries varies with the type of operation and the size of aircraft, and the number of injuries experienced by any group of persons varies with their level of activity (that is, their exposure risk). For example, all aircraft have pilots, but not all aircraft have passengers.
Highest Level of InjuryAboard Accident Aircraft, 2002
1,500
1,000
500
0
349
186255
934
Fatal Serious Minor None
2,000
1,500
1,000
500
0
575282 439
1,800
Fatal Serious Minor None
Total Injuries Sustainedby Persons Aboard
Accident Aircraft, 2002
31 See appendix B for the complete definition of injury categories.
Highest Level of Accident Injury, 2002
Minor15%
None54%
Serious11%
Fatal20%
222002 in Depth
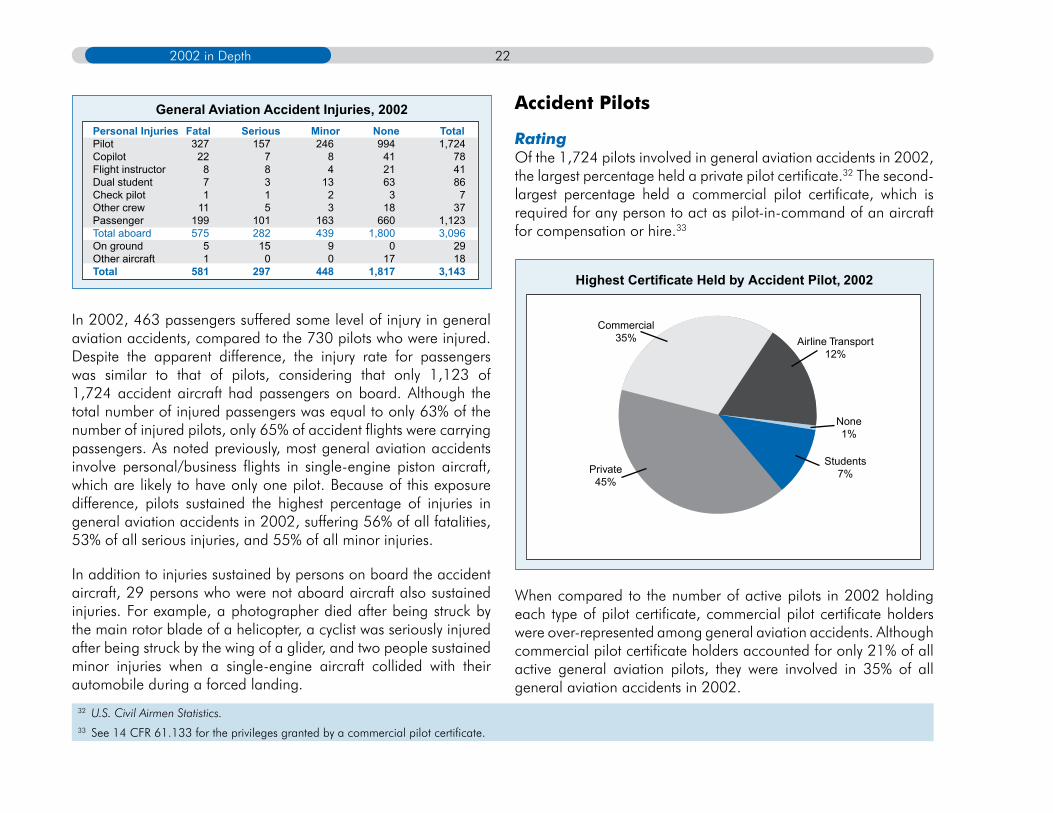
In 2002, 463 passengers suffered some level of injury in general aviation accidents, compared to the 730 pilots who were injured. Despite the apparent difference, the injury rate for passengers was similar to that of pilots, considering that only 1,123 of 1,724 accident aircraft had passengers on board. Although the total number of injured passengers was equal to only 63% of the number of injured pilots, only 65% of accident flights were carrying passengers. As noted previously, most general aviation accidents involve personal/business flights in single-engine piston aircraft, which are likely to have only one pilot. Because of this exposure difference, pilots sustained the highest percentage of injuries in general aviation accidents in 2002, suffering 56% of all fatalities, 53% of all serious injuries, and 55% of all minor injuries.
In addition to injuries sustained by persons on board the accident aircraft, 29 persons who were not aboard aircraft also sustained injuries. For example, a photographer died after being struck by the main rotor blade of a helicopter, a cyclist was seriously injured after being struck by the wing of a glider, and two people sustained minor injuries when a single-engine aircraft collided with their automobile during a forced landing.
Accident Pilots
RatingOf the 1,724 pilots involved in general aviation accidents in 2002, the largest percentage held a private pilot certificate.32 The second-largest percentage held a commercial pilot certificate, which is required for any person to act as pilot-in-command of an aircraft for compensation or hire.33
When compared to the number of active pilots in 2002 holding each type of pilot certificate, commercial pilot certificate holders were over-represented among general aviation accidents. Although commercial pilot certificate holders accounted for only 21% of all active general aviation pilots, they were involved in 35% of all general aviation accidents in 2002.
Highest Certificate Held by Accident Pilot, 2002
Students7%
Commercial35%
Private45%
None1%
Airline Transport12%
32 U.S. Civil Airmen Statistics.33 See 14 CFR 61.133 for the privileges granted by a commercial pilot certificate.
General Aviation Accident Injuries, 2002Personal Injuries Fatal Serious Minor None Total Pilot 327 157 246 994 1,724Copilot 22 7 8 41 78Flight instructor 8 8 4 21 41Dual student 7 3 13 63 86Check pilot 1 1 2 3 7Other crew 11 5 3 18 37Passenger 199 101 163 660 1,123Total aboard 575 282 439 1,800 3,096On ground 5 15 9 0 29Other aircraft 1 0 0 17 18Total 581 297 448 1,817 3,143

Annual Review of Aircraft Accident Data23
Similarly, the per-pilot accident rate was highest for commercial pilot certificate holders during 2002, with 4.36 accidents per 1,000 active pilots. One possible explanation for the higher numbers of accidents is that commercial certificate holders may be employed as pilots and would therefore be likely to fly more hours annually than student or private pilots.
However, the largest percentage of commercial pilots involved in accidents during 2002 (57%) were conducting personal flights and were not involved in commercial operations at the time of the accidents.
(1,695 of accident pilot records with data available, 2002)
Accident Rate per 1,000 Active Pilots by Certificate, 2002
1.29
2.93
4.36
1.38
5.00
4.00
3.00
2.00
1.00
0Student Private Commercial Airline
Transport
Type of Operation Conducted by AccidentPilot Certificate, 2002
Private Commercial Airline Transport
800
700
600
500
400
300
200
100
0
730
0 14 5
285
83 9339
112
4 33 23
Personal/Business Aerial ApplicationInstruction Ferry/Positioning
Number of Active Pilots by Highest Certificate, 2002
Students85,991
Commercial137,504
Private260,845
Recreational318
Airline Transport147,104
242002 in Depth
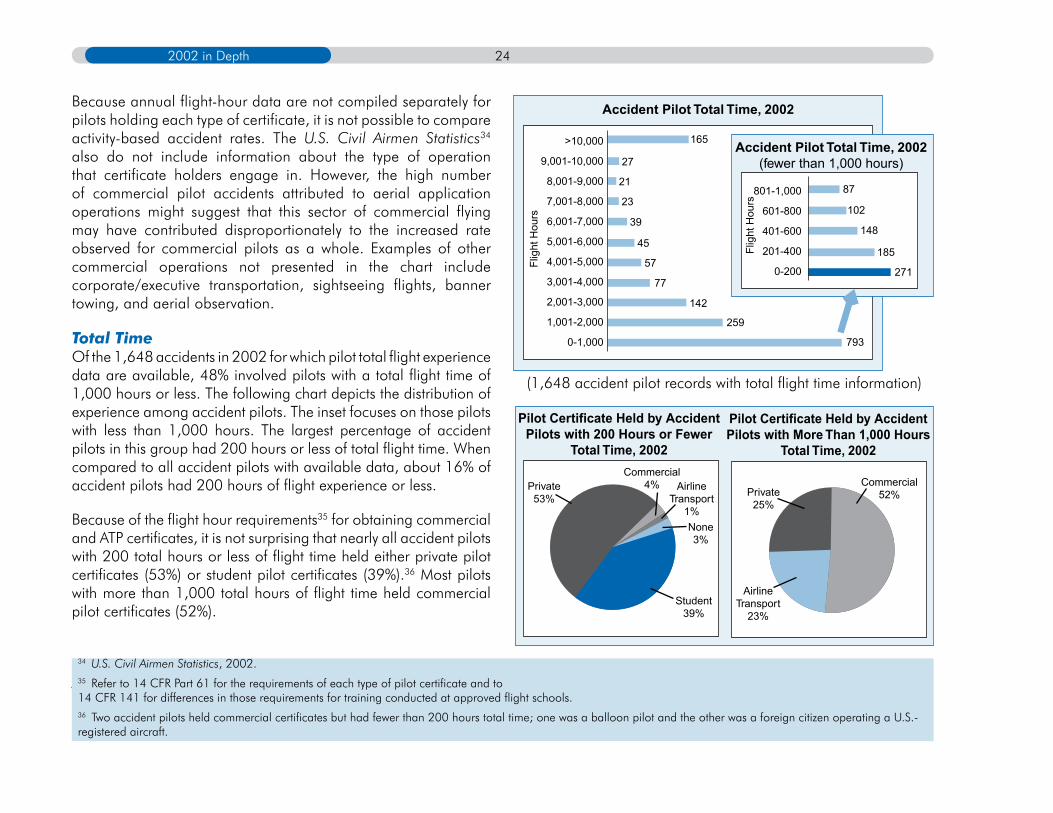
Because annual flight-hour data are not compiled separately for pilots holding each type of certificate, it is not possible to compare activity-based accident rates. The U.S. Civil Airmen Statistics34 also do not include information about the type of operation that certificate holders engage in. However, the high number of commercial pilot accidents attributed to aerial application operations might suggest that this sector of commercial flying may have contributed disproportionately to the increased rate observed for commercial pilots as a whole. Examples of other commercial operations not presented in the chart include corporate/executive transportation, sightseeing flights, banner towing, and aerial observation.
Total TimeOf the 1,648 accidents in 2002 for which pilot total flight experience data are available, 48% involved pilots with a total flight time of 1,000 hours or less. The following chart depicts the distribution of experience among accident pilots. The inset focuses on those pilots with less than 1,000 hours. The largest percentage of accident pilots in this group had 200 hours or less of total flight time. When compared to all accident pilots with available data, about 16% of accident pilots had 200 hours of flight experience or less.
Because of the flight hour requirements35 for obtaining commercial and ATP certificates, it is not surprising that nearly all accident pilots with 200 total hours or less of flight time held either private pilot certificates (53%) or student pilot certificates (39%).36 Most pilots with more than 1,000 total hours of flight time held commercial pilot certificates (52%).
(1,648 accident pilot records with total flight time information)
Accident Pilot Total Time, 2002
165>10,000
9,001-10,000
8,001-9,000
7,001-8,000
6,001-7,000
5,001-6,000
4,001-5,000
3,001-4,000
2,001-3,000
1,001-2,000
0-1,000
27
21
23
39
45
57
77
142
259
793
Flig
ht H
ours
Accident Pilot Total Time, 2002(fewer than 1,000 hours)
87801-1,000
601-800
401-600
201-400
0-200
102
148
185
271
Flig
ht H
ours
Pilot Certificate Held by AccidentPilots with 200 Hours or Fewer
Total Time, 2002Commercial
4%
Student39%
AirlineTransport
1%None3%
Private53%
Pilot Certificate Held by AccidentPilots with More Than 1,000 Hours
Total Time, 2002
Commercial52%Private
25%
AirlineTransport
23%
34 U.S. Civil Airmen Statistics, 2002. 35 Refer to 14 CFR Part 61 for the requirements of each type of pilot certificate and to 14 CFR 141 for differences in those requirements for training conducted at approved flight schools.36 Two accident pilots held commercial certificates but had fewer than 200 hours total time; one was a balloon pilot and the other was a foreign citizen operating a U.S.-registered aircraft.

Annual Review of Aircraft Accident Data25
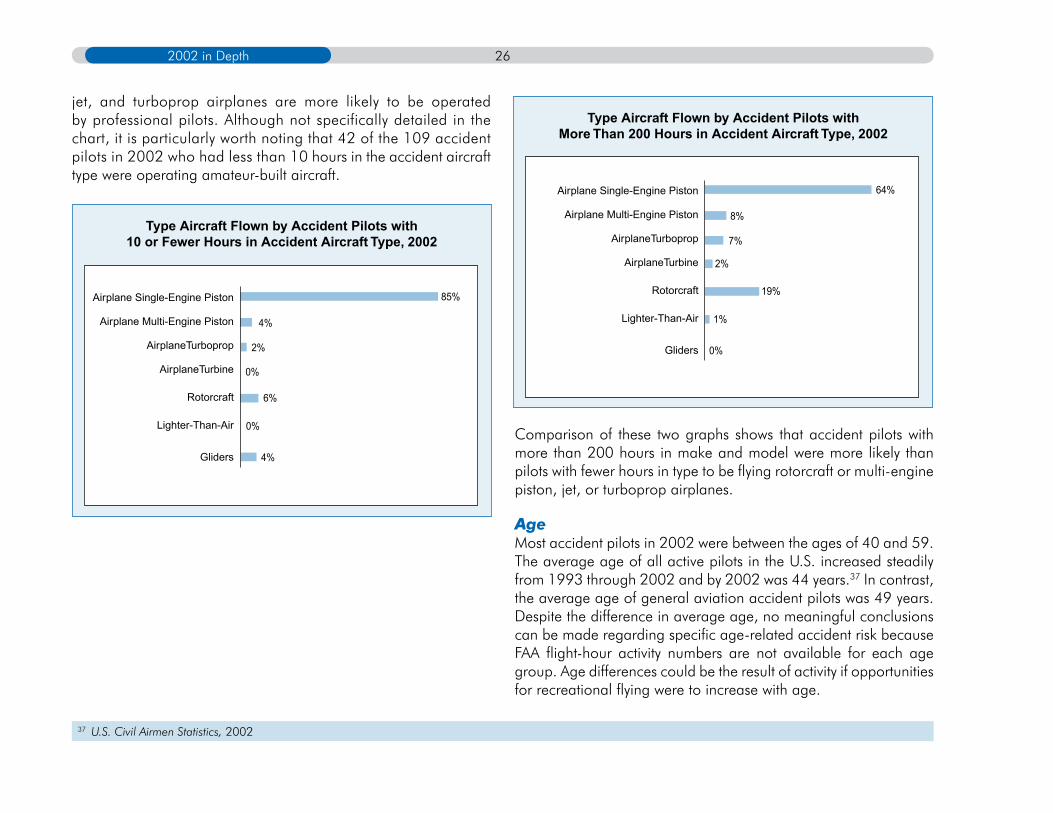
It is also not surprising that most accident pilots with 200 hours total flight time or less were flying single-engine piston airplanes when the accidents occurred. Accident pilots with more than 1,000 hours were flying a more diverse selection of aircraft, including significantly higher percentages who were flying multi-engine piston, turboprop, and turbine-powered airplanes, and about twice as many who were flying helicopters.
Time in Type of AircraftOf the 1,401 accidents in 2002 for which pertinent data are available, 87% involved pilots with 1,000 hours or less of time in the accident aircraft make and model. Most accident pilots in this group (64%) had less than 200 hours of total flight time in the accident aircraft type, and a total of 109 pilots (8% of all accident pilots for whom data are available) had less than 10 hours in type. Most accident pilots with less than 10 hours of flight time in make and model were flying single-engine piston aircraft.
(1,401 accident pilot records with time-in-aircraft-type information)
Pilots may have low time in type because they are new pilots with low total time or they are experienced pilots who are transitioning to a new aircraft. Two groups of pilots who might be expected to have accumulated significant time in make and model are those who own their own airplanes and fly them often and professional pilots who fly the same aircraft often. A large number of general aviation pilots who own aircraft have single-engine piston airplanes. Helicopters and multi-engine piston,
Type Aircraft Flown by Accident Pilots with200 or Fewer Hours Total Flight Time, 2002
Airplane Single-Engine Piston
Airplane Multi-Engine Piston
AirplaneTurboprop
AirplaneTurbine
Rotorcraft
Lighter-Than-Air
Gliders
90%
1%
5%
4%
0%
0%
0%
Type Aircraft Flown by Accident Pilots withMore Than 1,000 Hours Total Flight Time, 2002
Airplane Single-Engine Piston
Airplane Multi-Engine Piston
AirplaneTurboprop
AirplaneTurbine
Rotorcraft
Lighter-Than-Air
Gliders
63%
10%
16%
1%
7%
2%
0%
Accident Pilot Total Time in AircraftType, 2002
24>5,000
4,001-5,000
3,001-4,000
2,001-3,000
1,001-2,000
0-1,000
16
19
37
87
1,218
Flig
ht H
ours
Accident Pilot Total Timein Aircraft Type, 2002
(fewer than 1,000 hours)
Flig
ht H
ours
59801-1,000601-800401-600201-400
0-2000-10
67119
192781
109
262002 in Depth
jet, and turboprop airplanes are more likely to be operated by professional pilots. Although not specifically detailed in the chart, it is particularly worth noting that 42 of the 109 accident pilots in 2002 who had less than 10 hours in the accident aircraft type were operating amateur-built aircraft.
Comparison of these two graphs shows that accident pilots with more than 200 hours in make and model were more likely than pilots with fewer hours in type to be flying rotorcraft or multi-engine piston, jet, or turboprop airplanes.
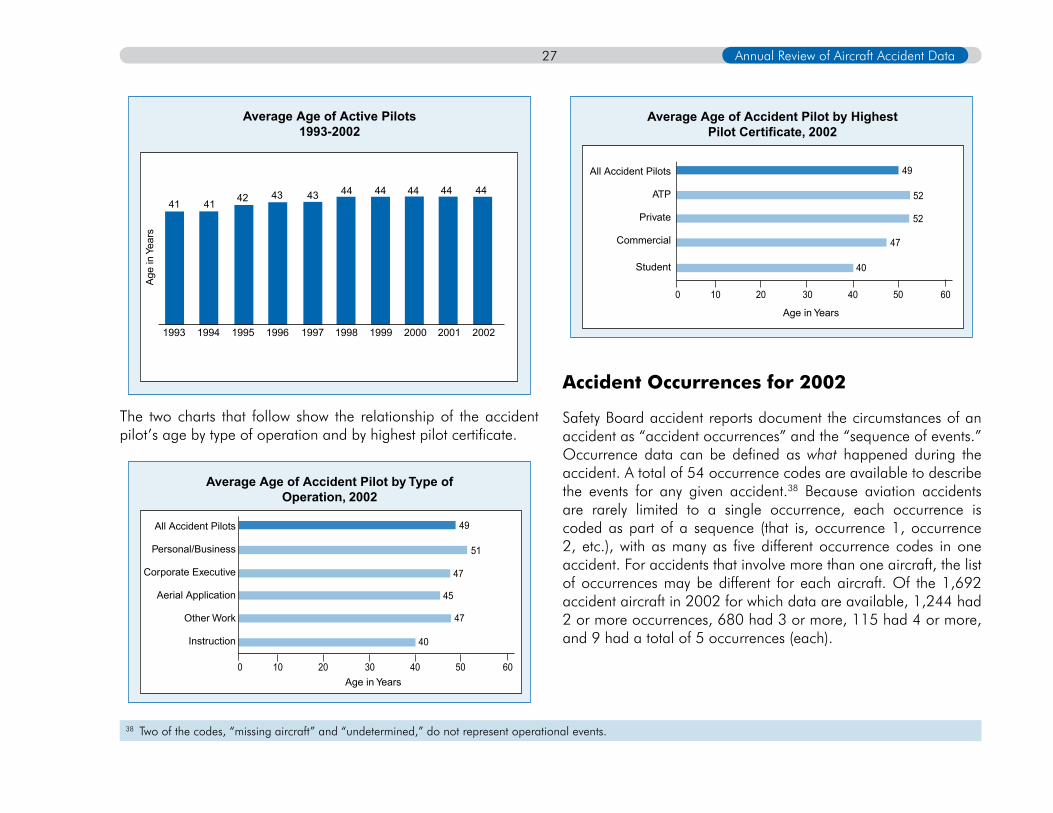
AgeMost accident pilots in 2002 were between the ages of 40 and 59. The average age of all active pilots in the U.S. increased steadily from 1993 through 2002 and by 2002 was 44 years.37 In contrast, the average age of general aviation accident pilots was 49 years. Despite the difference in average age, no meaningful conclusions can be made regarding specific age-related accident risk because FAA flight-hour activity numbers are not available for each age group. Age differences could be the result of activity if opportunities for recreational flying were to increase with age.
.
Type Aircraft Flown by Accident Pilots with10 or Fewer Hours in Accident Aircraft Type, 2002
Airplane Single-Engine Piston
Airplane Multi-Engine Piston
AirplaneTurboprop
AirplaneTurbine
Rotorcraft
Lighter-Than-Air
Gliders
85%
4%
6%
4%
2%
0%
0%
Type Aircraft Flown by Accident Pilots withMore Than 200 Hours in Accident Aircraft Type, 2002
Airplane Single-Engine Piston
Airplane Multi-Engine Piston
AirplaneTurboprop
AirplaneTurbine
Rotorcraft
Lighter-Than-Air
Gliders
64%
8%
19%
0%
7%
2%
1%
37 U.S. Civil Airmen Statistics, 2002
Annual Review of Aircraft Accident Data27
The two charts that follow show the relationship of the accident pilot’s age by type of operation and by highest pilot certificate.
Accident Occurrences for 2002
Safety Board accident reports document the circumstances of an accident as “accident occurrences” and the “sequence of events.” Occurrence data can be defined as what happened during the accident. A total of 54 occurrence codes are available to describe the events for any given accident.38 Because aviation accidents are rarely limited to a single occurrence, each occurrence is coded as part of a sequence (that is, occurrence 1, occurrence 2, etc.), with as many as five different occurrence codes in one accident. For accidents that involve more than one aircraft, the list of occurrences may be different for each aircraft. Of the 1,692 accident aircraft in 2002 for which data are available, 1,244 had 2 or more occurrences, 680 had 3 or more, 115 had 4 or more, and 9 had a total of 5 occurrences (each).
Average Age of Accident Pilot by Type ofOperation, 2002
All Accident Pilots
Personal/Business
Corporate Executive
Aerial Application
Other Work
Instruction
49
51
47
47
45
40
0 10 20 30 40 50 60Age in Years
Average Age of Accident Pilot by HighestPilot Certificate, 2002
All Accident Pilots
ATP
Private
Commercial
Student
49
52
40
52
47
0 10 20 30 40 50 60
Age in Years
38 Two of the codes, “missing aircraft” and “undetermined,” do not represent operational events.
Average Age of Active Pilots1993-2002
44
1993 1994 1995 1996 1997 1998 1999 2000 2001 2002
444444444343424141
Age
in Y
ears
282002 in Depth
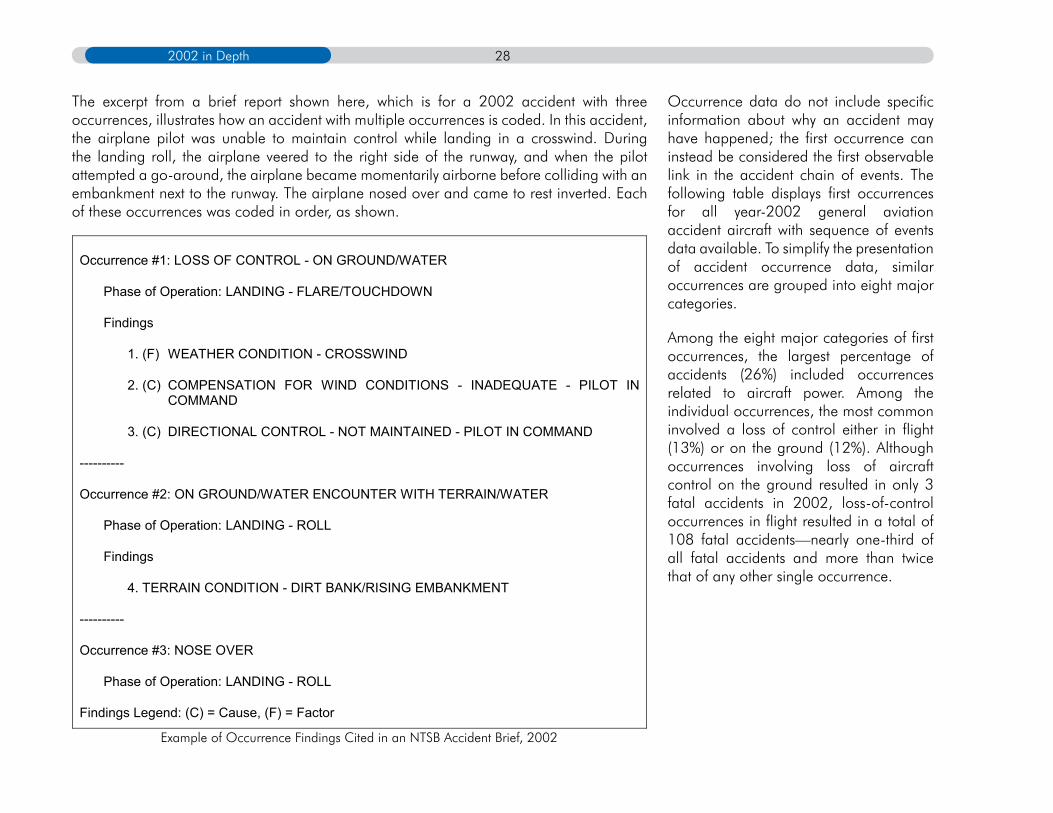
The excerpt from a brief report shown here, which is for a 2002 accident with three occurrences, illustrates how an accident with multiple occurrences is coded. In this accident, the airplane pilot was unable to maintain control while landing in a crosswind. During the landing roll, the airplane veered to the right side of the runway, and when the pilot attempted a go-around, the airplane became momentarily airborne before colliding with an embankment next to the runway. The airplane nosed over and came to rest inverted. Each of these occurrences was coded in order, as shown.
Occurrence data do not include specific information about why an accident may have happened; the first occurrence can instead be considered the first observable link in the accident chain of events. The following table displays first occurrences for all year-2002 general aviation accident aircraft with sequence of events data available. To simplify the presentation of accident occurrence data, similar occurrences are grouped into eight major categories.
Among the eight major categories of first occurrences, the largest percentage of accidents (26%) included occurrences related to aircraft power. Among the individual occurrences, the most common involved a loss of control either in flight (13%) or on the ground (12%). Although occurrences involving loss of aircraft control on the ground resulted in only 3 fatal accidents in 2002, loss-of-control occurrences in flight resulted in a total of 108 fatal accidents—nearly one-third of all fatal accidents and more than twice that of any other single occurrence.
Occurrence #1: LOSS OF CONTROL - ON GROUND/WATER
Phase of Operation: LANDING - FLARE/TOUCHDOWN
Findings
1. (F) WEATHER CONDITION - CROSSWIND
2. (C) COMPENSATION FOR WIND CONDITIONS - INADEQUATE - PILOT IN COMMAND
3. (C) DIRECTIONAL CONTROL - NOT MAINTAINED - PILOT IN COMMAND
----------
Occurrence #2: ON GROUND/WATER ENCOUNTER WITH TERRAIN/WATER
Phase of Operation: LANDING - ROLL
Findings
4. TERRAIN CONDITION - DIRT BANK/RISING EMBANKMENT
----------
Occurrence #3: NOSE OVER
Phase of Operation: LANDING - ROLL
Findings Legend: (C) = Cause, (F) = Factor
Example of Occurrence Findings Cited in an NTSB Accident Brief, 2002

Annual Review of Aircraft Accident Data29
Accident First Occurrences, 2002
Total FatalCollision - In-flight 252 85In-flight Collision with Object 130 37In-flight Collision with Terrain/Water 98 42Undershoot 12 0Midair Collision 10 6Near Collision Between Aircraft 2 0
Noncollision - In-flight 412 167Loss Of Control - In-flight 226 108Airframe/Component/System Failure/Malfunction 108 22In-flight Encounter with Weather 68 35Abrupt Maneuver 6 2Vortex Turbulence Encountered 4 0Altitude Deviation, Uncontrolled 0 0Forced Landing 0 0Decompression 0 0
Collision - On-ground or Water 105 2On Ground/Water Collision with Object 52 2On Ground/Water Encounter with Terrain/Water 41 0Dragged Wing, Rotor, Pod, Float or Tail/Skid 6 0Collision Between Aircraft (Other Than Midair) 6 0
Noncollision - On-ground or Water 400 7Loss of Control - On Ground/Water 195 3Hard Landing 122 1Overrun 40 2Nose Over 22 0On Ground/Water Encounter with Weather 9 0Roll Over 7 0Propeller Blast or Jet Exhaust/Suction 2 0Propeller/Rotor Contact to Person 2 1Nose Down 1 0Ditching 0 0
Total FatalPower Related 448 63Loss of Engine Power 212 31Loss of Engine Power(Total) - Nonmechanical 119 7Loss of Engine Power(Total) - Mech Failure/Malf 51 11Loss of Engine Power(Partial) - Mech Failure/Malf 32 6Loss of Engine Power(Partial) - Nonmechanical 28 7Rotor Failure/Malfunction 4 1Propeller Failure/Malfunction 2 0Engine Tear-away 0 0
Landing Gear 44 1Wheels-up Landing 14 0Gear Collapsed 12 0Main Gear Collapsed 7 0Gear Retraction on Ground 4 0Nose Gear Collapsed 4 0Wheels-down Landing in Water 2 1Complete Gear Collapsed 1 0Tail Gear Collapsed 0 0Other Gear Collapsed 0 0Gear Not Extended 0 0Gear Not Retracted 0 0
Miscellaneous 27 5Miscellaneous/Other 15 1Fire 11 4Hazardous Materials Leak/Spill 1 0Fire/Explosion 0 0Explosion 0 0Cargo Shift 0 0
Undetermined 4 4Missing Aircraft 3 3Undetermined 1 1
853742
060
167108
2235
20000
22000
73120000100
6331
71167100
100000100000
5140000
431
130
0

302002 in Depth
Phase of FlightThe following illustration displays the percentage of accident aircraft in each phase of flight at the time of the first occurrence. The phase of flight can be defined as when, during the operation of the aircraft, the first occurrence took place. Fifty distinct phases of flight are used to describe the operational chronology of occurrences. To simplify the presentation of this information, the detailed phases are grouped into the nine broad categories shown in this illustration. For example, the category “approach” includes any segment of an instrument approach or position in the airport traffic pattern and continues until the aircraft is landing on the runway. The upper set of numbers shows the distribution of accidents by each phase associated with each first occurrence, and the numbers in parentheses show the distribution of fatal accidents by each phase associated with each first occurrence.
As shown in the illustration, most initiating events for accidents (62%) occurred during takeoff, climb, approach, and landing, despite the relatively short duration of these phases compared to the entire profile of a normal flight. The high number of accidents that occurred during takeoff and landing reflects the increased workload placed on both the flight crew and the aircraft during these phases. During both takeoff and landing, the flight crew must control the aircraft, change altitude and speed, communicate
with air traffic control (ATC) and/or other aircraft, and maintain separation from obstacles and other aircraft. Aircraft systems are also stressed during takeoff and landing with changes to engine power settings, the possible operation of retractable landing gear, flaps, slats, and spoilers, and changes in cabin pressurization. While the aircraft is at low altitude during takeoff and landing, it is also most susceptible to hazards caused by wind and weather conditions.
Notably, landing accounted for the largest percentage of total accident first occurrences (29%) but only 3% of fatal accident first occurrences. The largest percentage of fatal accident first occurrences (29%) occurred during maneuvering, but only 14% of all accident first occurrences occurred during this phase. These differences reflect the relative severity of accidents that are likely to occur during each phase. Accidents during cruise and maneuvering are more likely to result in higher levels of injury and aircraft damage due to higher speeds and altitudes.
The likelihood of an aircraft accident first occurrence during each phase of flight varies by aircraft type and type of operation due to the unique hazards associated with each. For example, aircraft conducting aerial application flights fly at very low altitudes while spraying and therefore have an increased risk of colliding with
terrain or obstructions. As a result, about 62% of all first occurrences for 2002 accidents involving aerial application flights occurred during the maneuvering phase compared to less than 9% of personal/business flights and 12% for instructional flights.
Accident Aircraft Phase of Flight During First Occurrence, 2002
Standing Taxi/Other Takeoff Climb Cruise Descent Maneuver/Hover Approach Go-Around Landing 4.6% 19.1% 3.3% 15.0% 2.4% 13.7% 10.5% 2.1% 29.4% (2.7%) (17.1%) (7.2%) (20.1%) (4.5%) (29.3%) (15.0%) (1.2%) (3.0%)
1,692 accident aircraft with phase-of-flight data

Annual Review of Aircraft Accident Data31
Accident phase-of-flight differences among aircraft types are the result of the amount of time spent in each phase, aircraft-specific hazards associated with that phase, and the type of operations typically conducted with that aircraft. For example, the largest percentage of first occurrences for accidents involving helicopter flights, about 31%, occurred while maneuvering. The percentage of accidents during this phase reflects the hazards unique to helicopters while hovering and during operations that are unique to helicopters, such as carrying external loads. In contrast, the largest percentage of accidents involving single- and multi-engine piston aircraft occurred during landing.
Chain of Occurrences
An accident’s first occurrence and phase of flight during first occurrence indicate how and when an accident begins. However, the entire accident can also be viewed as a chain of all the accident occurrences cited in the order in which they happen. As previously discussed, accident events often include a combination of multiple occurrences, with many possible combinations. For example, of the 1,692 accidents that occurred during 2002 for which occurrence data are available, 417 unique combinations of accident occurrences were cited. The following tables, which list the top ten combinations of occurrences for all accidents and fatal accidents, illustrate the most common events.
Accident Aircraft Phase of Flight During AccidentFirst Occurrence by Type of Operation, 2002
0%
10%
20%
30%
40%
50%
60%
70%
Sta
ndin
g/Ta
xi/O
ther
Take
off
Clim
b
Cru
ise
Man
euve
ring
Des
cent
App
roac
h
Go-
Aro
und
Land
ing
Aerial Application Personal and Business Flight Instruction
Accident Aircraft Phase of Flight During Accident FirstOccurrence by Aircraft Type, 2002
0%
5%
10%
15%
20%
25%
30%
35%
Sta
ndin
g/Ta
xi/O
ther
Take
off
Clim
b
Cru
ise
Man
ueve
ring
Des
cent
App
roac
h
Go-
Aro
und
Land
ing
Single-Engine Piston Airplane Multi-Engine Piston AirplaneTurbine Airplane Helicopter

322002 in Depth
The top ten occurrence chains cited in fatal accidents are similar to those cited for all accidents. Loss of control followed by in-flight collision with terrain tops both lists, with more than half the accidents of this type being fatal. It is important to note that, although this was the most frequent chain of occurrences in 2002, it accounted for less than 9% of all accidents for the year.
A diverse range of events can, in combination, result in an accident. Fatal accidents, however, are often the result of a more predictable set of events. A comparison of the two lists provides insight as to why some accidents are fatal and others are not. Five of the top ten chains of accident occurrences for all accidents in 2002 involved ground events associated with taxi, takeoff, or landing. In contrast, all of the top ten chains of fatal accident occurrences included an in-flight collision with terrain or object, accident profiles that are more likely to result in the high impact forces likely to cause serious injury. As these differences show, most accidents in 2002 did not involve catastrophic events, and a large number of accidents involved aircraft on the ground.
Most Prevalent Causes/Factors for 2002
Probable Causes, Factors, Findings, and the Broad Cause/Factor ClassificationIn addition to coding accident occurrences, the Safety Board makes a determination of probable cause. The objective of the probable cause statement is to define the cause and effect relationships in the accident sequence. The probable cause could be described as why the accident happened. In determining probable cause, the Board considers the facts, conditions, and circumstances of the event. Within each accident occurrence, any information that helps explain why that event happened is identified as a “finding” and may be further designated as either a “cause” or “factor.” The term “factor” is used to describe situations or circumstances that contributed to the accident cause. The details of probable cause are coded as the combination of all causes, factors, and findings associated with the accident. Just as accidents often include a series of events, the reason why those events led to an accident reflects a combination of multiple causes and factors. For this reason, a single accident report can include multiple cause and factor codes, as shown in the following brief.
Chain of Occurrences - All GA Accidents, 2002
1 Loss of Control - In-flight → In-flight Collision with Terrain/Water 151 2 In-flight Collision with Terrain/Water 90 3 In-flight Collision with Object 78 4 Hard Landing 71 5 On ground/water Collision with Object 48 6 Loss of Engine Power → Forced Landing → 47 In-flight Collision with Terrain/Water 7 In-flight Collision with Object → In-flight Collision with Terrain/Water 46 8 Loss of Control - On ground/water → On ground/water Encounter 42 with Terrain/Water 9 Loss of Control - On ground/water → On ground/water 41 Collision with Object 10 Loss of Control - On ground/water 34
RankNumber ofAccidents
Chain of Occurrences - Fatal GA Accidents, 2002
Number ofRank Accidents 1 Loss of Control - In-flight → In-flight Collision with Terrain/Water 88 2 In-flight Collision with Terrain/Water 43 3 In-flight Collision with Object 22 4 In-flight Collision with Object → In-flight Collision with Terrain/Water 16 5 Airframe/Component/System Failure/Malfunction → 13 Loss of Control - In-flight → In-flight Collision with Terrain/Water 6 Loss of Control - In-flight → In-flight Collision with Object 11 7 In-flight Encounter with Weather → Loss of Control - In-flight → 10 In-flight Collision with Terrain/Water 8 Loss of Engine Power → Forced Landing → In-flight Collision 9 with Terrain/Water 9 In-flight Encounter with Weather → In-flight Collision 8 with Terrain/Water 10 Loss of Engine Power → Loss of Control - In-flight → 8 In-flight Collision with Terrain/Water
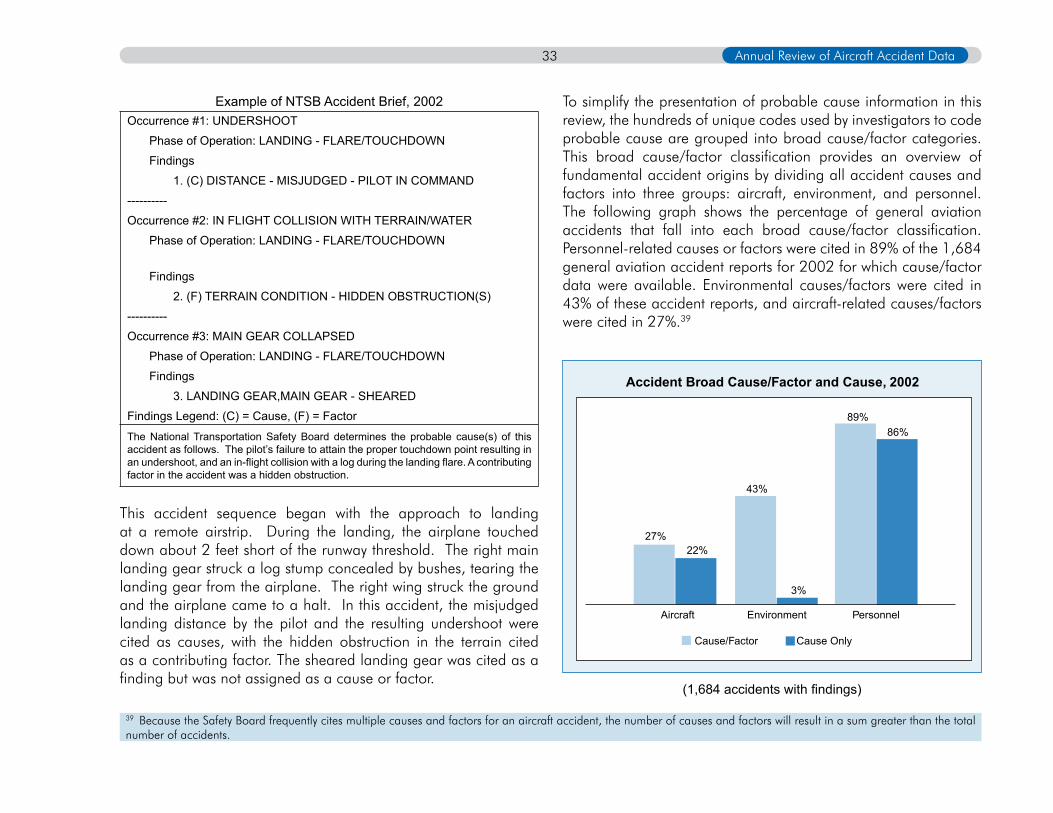
Annual Review of Aircraft Accident Data33
Example of NTSB Accident Brief, 2002Occurrence #1: UNDERSHOOT
Phase of Operation: LANDING - FLARE/TOUCHDOWN
Findings
1. (C) DISTANCE - MISJUDGED - PILOT IN COMMAND
----------
Occurrence #2: IN FLIGHT COLLISION WITH TERRAIN/WATER
Phase of Operation: LANDING - FLARE/TOUCHDOWN
Findings
2. (F) TERRAIN CONDITION - HIDDEN OBSTRUCTION(S)
----------
Occurrence #3: MAIN GEAR COLLAPSED
Phase of Operation: LANDING - FLARE/TOUCHDOWN
Findings
3. LANDING GEAR,MAIN GEAR - SHEARED
Findings Legend: (C) = Cause, (F) = Factor
The National Transportation Safety Board determines the probable cause(s) of this accident as follows. The pilot’s failure to attain the proper touchdown point resulting in an undershoot, and an in-flight collision with a log during the landing flare. A contributing factor in the accident was a hidden obstruction.
This accident sequence began with the approach to landing at a remote airstrip. During the landing, the airplane touched down about 2 feet short of the runway threshold. The right main landing gear struck a log stump concealed by bushes, tearing the landing gear from the airplane. The right wing struck the ground and the airplane came to a halt. In this accident, the misjudged landing distance by the pilot and the resulting undershoot were cited as causes, with the hidden obstruction in the terrain cited as a contributing factor. The sheared landing gear was cited as a finding but was not assigned as a cause or factor.
To simplify the presentation of probable cause information in this review, the hundreds of unique codes used by investigators to code probable cause are grouped into broad cause/factor categories. This broad cause/factor classification provides an overview of fundamental accident origins by dividing all accident causes and factors into three groups: aircraft, environment, and personnel. The following graph shows the percentage of general aviation accidents that fall into each broad cause/factor classification. Personnel-related causes or factors were cited in 89% of the 1,684 general aviation accident reports for 2002 for which cause/factor data were available. Environmental causes/factors were cited in 43% of these accident reports, and aircraft-related causes/factors were cited in 27%.39
(1,684 accidents with findings)
39 Because the Safety Board frequently cites multiple causes and factors for an aircraft accident, the number of causes and factors will result in a sum greater than the total number of accidents.
Accident Broad Cause/Factor and Cause, 2002
Aircraft Environment Personnel
27%22%
43%
3%
89%86%
Cause/Factor Cause Only
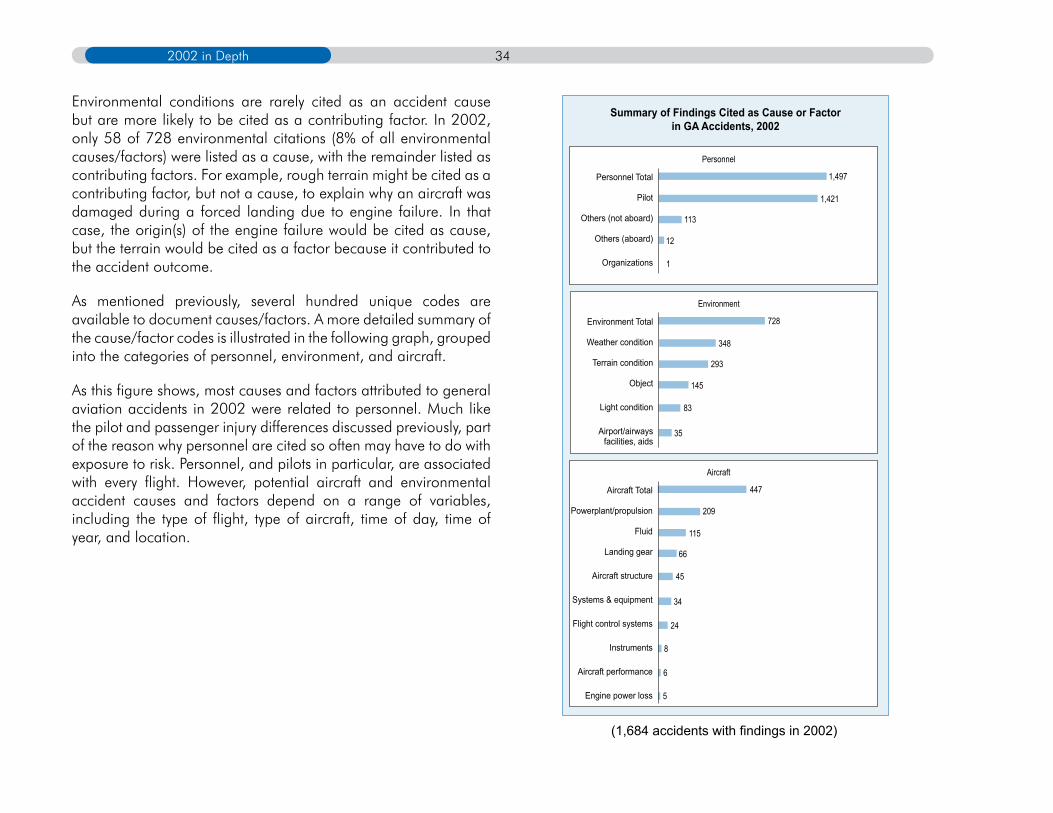
342002 in Depth
Environmental conditions are rarely cited as an accident cause but are more likely to be cited as a contributing factor. In 2002, only 58 of 728 environmental citations (8% of all environmental causes/factors) were listed as a cause, with the remainder listed as contributing factors. For example, rough terrain might be cited as a contributing factor, but not a cause, to explain why an aircraft was damaged during a forced landing due to engine failure. In that case, the origin(s) of the engine failure would be cited as cause, but the terrain would be cited as a factor because it contributed to the accident outcome.
As mentioned previously, several hundred unique codes are available to document causes/factors. A more detailed summary of the cause/factor codes is illustrated in the following graph, grouped into the categories of personnel, environment, and aircraft.
As this figure shows, most causes and factors attributed to general aviation accidents in 2002 were related to personnel. Much like the pilot and passenger injury differences discussed previously, part of the reason why personnel are cited so often may have to do with exposure to risk. Personnel, and pilots in particular, are associated with every flight. However, potential aircraft and environmental accident causes and factors depend on a range of variables, including the type of flight, type of aircraft, time of day, time of year, and location.
(1,684 accidents with findings in 2002)
Summary of Findings Cited as Cause or Factorin GA Accidents, 2002
Personnel Total
Pilot
Others (not aboard)
Others (aboard)
Organizations
1,497
1,421
113
12
Personnel
Environment Total
Weather condition
Terrain condition
Object
Light condition
Airport/airwaysfacilities, aids
728
348
293
145
Environment
83
35
Aircraft Total
Powerplant/propulsion
Fluid
Landing gear
Aircraft structure
Systems & equipment
Flight control systems
Instruments
Aircraft performance
Engine power loss
447
209
115
66
Aircraft
45
34
24
8
6
5
1
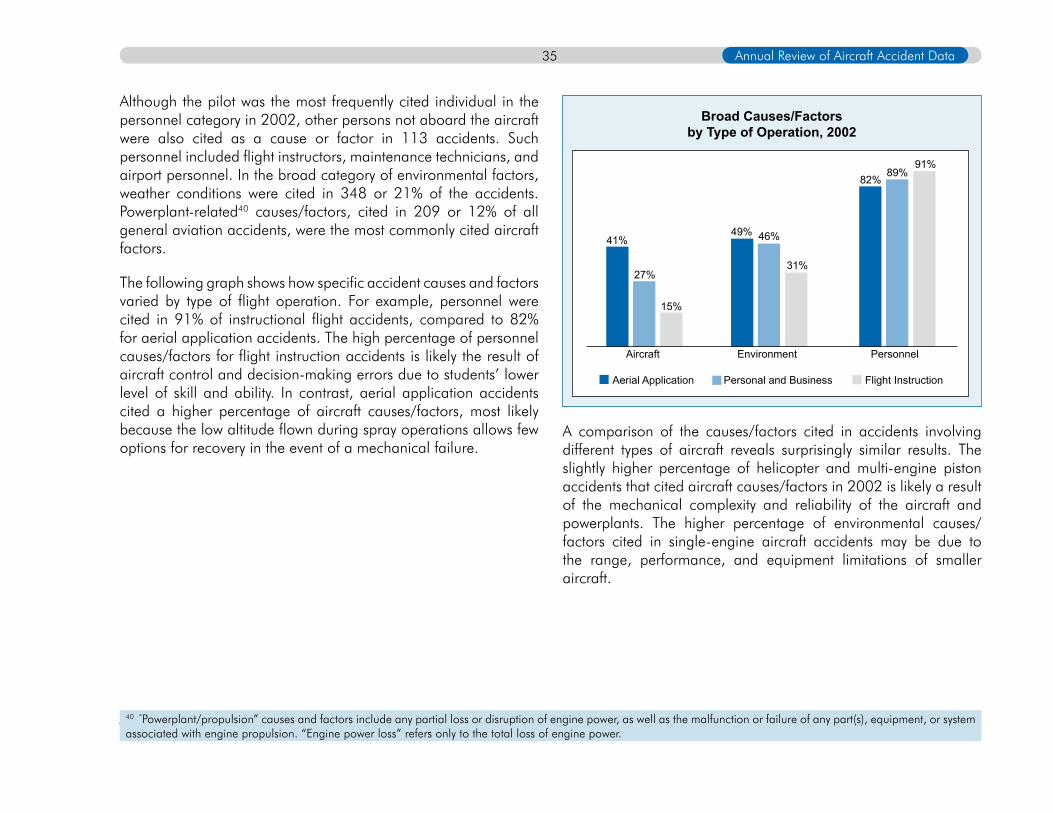
Annual Review of Aircraft Accident Data35
Although the pilot was the most frequently cited individual in the personnel category in 2002, other persons not aboard the aircraft were also cited as a cause or factor in 113 accidents. Such personnel included flight instructors, maintenance technicians, and airport personnel. In the broad category of environmental factors, weather conditions were cited in 348 or 21% of the accidents. Powerplant-related40 causes/factors, cited in 209 or 12% of all general aviation accidents, were the most commonly cited aircraft factors.
The following graph shows how specific accident causes and factors varied by type of flight operation. For example, personnel were cited in 91% of instructional flight accidents, compared to 82% for aerial application accidents. The high percentage of personnel causes/factors for flight instruction accidents is likely the result of aircraft control and decision-making errors due to students’ lower level of skill and ability. In contrast, aerial application accidents cited a higher percentage of aircraft causes/factors, most likely because the low altitude flown during spray operations allows few options for recovery in the event of a mechanical failure.
.
A comparison of the causes/factors cited in accidents involving different types of aircraft reveals surprisingly similar results. The slightly higher percentage of helicopter and multi-engine piston accidents that cited aircraft causes/factors in 2002 is likely a result of the mechanical complexity and reliability of the aircraft and powerplants. The higher percentage of environmental causes/factors cited in single-engine aircraft accidents may be due to the range, performance, and equipment limitations of smaller aircraft.
Broad Causes/Factorsby Type of Operation, 2002
41%
27%
15%
49% 46%
31%
82%89%
91%
Aircraft Environment Personnel
Aerial Application Personal and Business Flight Instruction
40 “Powerplant/propulsion” causes and factors include any partial loss or disruption of engine power, as well as the malfunction or failure of any part(s), equipment, or system associated with engine propulsion. “Engine power loss” refers only to the total loss of engine power.
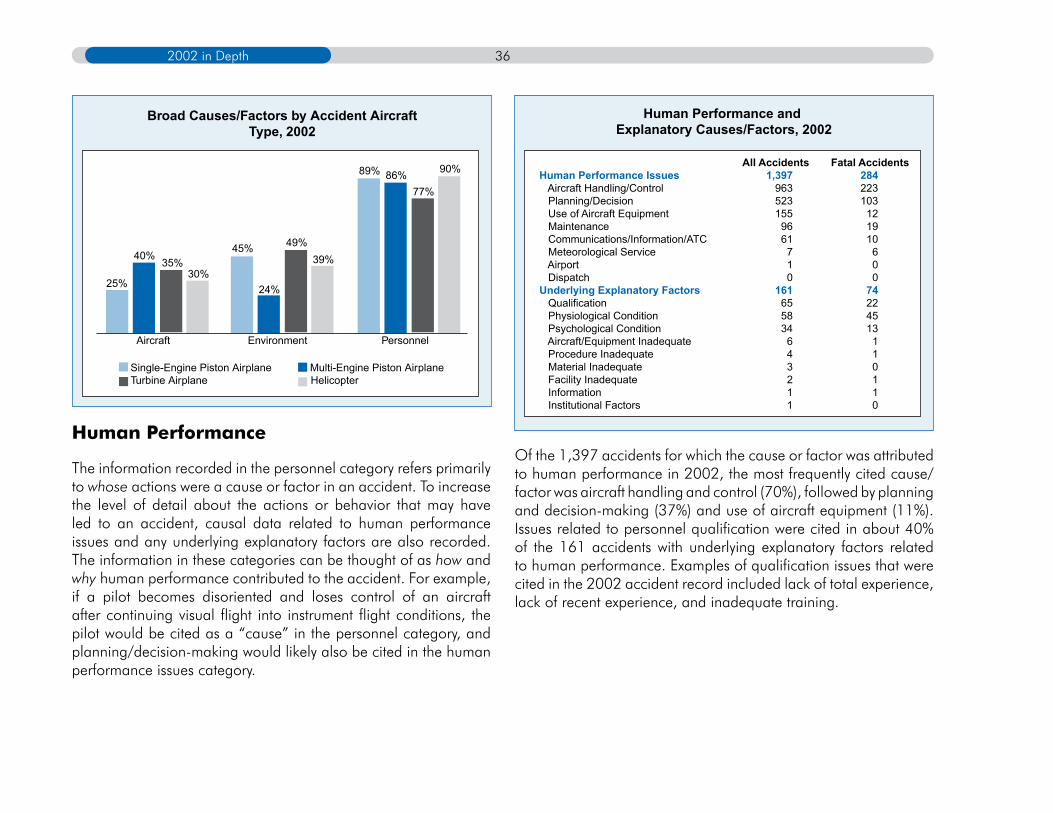
362002 in Depth
Human Performance
The information recorded in the personnel category refers primarily to whose actions were a cause or factor in an accident. To increase the level of detail about the actions or behavior that may have led to an accident, causal data related to human performance issues and any underlying explanatory factors are also recorded. The information in these categories can be thought of as how and why human performance contributed to the accident. For example, if a pilot becomes disoriented and loses control of an aircraft after continuing visual flight into instrument flight conditions, the pilot would be cited as a “cause” in the personnel category, and planning/decision-making would likely also be cited in the human performance issues category.
Of the 1,397 accidents for which the cause or factor was attributed to human performance in 2002, the most frequently cited cause/factor was aircraft handling and control (70%), followed by planning and decision-making (37%) and use of aircraft equipment (11%). Issues related to personnel qualification were cited in about 40% of the 161 accidents with underlying explanatory factors related to human performance. Examples of qualification issues that were cited in the 2002 accident record included lack of total experience, lack of recent experience, and inadequate training.
Broad Causes/Factors by Accident AircraftType, 2002
25%
40%35%
30%
45%
24%
49%39%
89% 86%77%
90%
Aircraft
Environment Personnel
Single-Engine Piston Airplane Multi-Engine Piston AirplaneTurbine Airplane Helicopter
Human Performance and Explanatory Causes/Factors, 2002
All Accidents Fatal Accidents Human Performance Issues 1,397 284 Aircraft Handling/Control 963 223 Planning/Decision 523 103 Use of Aircraft Equipment 155 12 Maintenance 96 19 Communications/Information/ATC 61 10 Meteorological Service 7 6 Airport 1 0 Dispatch 0 0 Underlying Explanatory Factors 161 74 Qualification 65 22 Physiological Condition 58 45 Psychological Condition 34 13 Aircraft/Equipment Inadequate 6 1 Procedure Inadequate 4 1 Material Inadequate 3 0 Facility Inadequate 2 1 Information 1 1 Institutional Factors 1 0

Annual Review of Aircraft Accident Data37
Weather as a Cause/Factor
Because general aviation aircraft are usually smaller, slower, and more limited in maximum altitude and range than transport-category aircraft, they can be more vulnerable to hazards posed by weather. Smaller aircraft are affected to a greater degree by adverse wind conditions; and precipitation, icing, and convective weather have a greater effect on aircraft that lack the speed, altitude, and/or range capabilities to avoid those conditions. Weather conditions cited most often as a cause or factor in general aviation accidents are related to winds, including “gusts,” “crosswind,” and “tailwind.”
Of the top five environmental causes/factors cited in general aviation accidents in 2002, three were related to wind. Because aircraft are most susceptible to the effects of wind during takeoffs and landings, the effect of adverse wind was reflected in a high percentage of general aviation accidents that occurred during those phases of flight.
As previously discussed, most landing accidents do not result in fatal injuries. Because of the strong association of wind with landing accidents, it is not surprising that most wind-related accidents in 2002 were not fatal. The wind-related weather factors “gusts,” “crosswind,” and “tailwind” were cited as a cause/factor in a total of 194 accidents, but only 14 of those accidents were fatal. Among fatal general aviation accidents, three of the five most frequently cited weather factors were related to conditions that resulted in reduced visibility, including “low ceiling,” “fog,” and “clouds.” Accidents under conditions of low visibility typically involve either loss of aircraft control and/or collision with obstacles or terrain, both of which are likely to result in severe injuries and aircraft damage.
Note: due to the possibility of multiple findings, the sum of causes/factors is greater than the total number of accidents.
Accidents by Weather Cause/Factor
All Accidents Fatal Accidents Weather Condition 348 80 Gusts 78 7 Crosswinds 71 2 Tailwind 45 5 High density altitude 34 11 Low ceiling 29 24 Downdraft 19 1 Carburetor icing conditions 18 1 Clouds 17 14 Fog 17 13 Icing conditions 15 9 High wind 12 3 Variable wind 9 0 Windshear 8 1 Turbulence 7 1 Snow 6 2 Unfavorable wind 6 0 Sudden windshift 5 0 Haze/smoke 5 0 Other 4 0 Rain 4 3 Dust devil/whirlwind 3 0 No thermal lift 3 0 Obscuration 3 3 Thunderstorm, outflow 3 2 Turbulence, terrain induced 3 1 Drizzle/mist 2 2 Mountain wave 2 1 Thunderstorm 2 2 Turbulence (thunderstorms) 2 2 Below approach/landing minimums 1 1 Freezing rain 1 1 Temperature, low 1 0 Turbulence, clear air 1 1 Updraft 1 0 Whiteout 1 1

38
FocuS on General aviation SaFety: Stall/Spin accidentS
In 1972, the Safety Board published a special study, General Aviation Stall/Spin Accidents,41 analyzing general aviation stall/spin accidents that occurred between 1967 and 1969. Based on the 991 stall/spin accidents and 427 fatal stall/spin accidents examined, the report stated the Board’s position that reduction of stall/spin accidents should be “a social, political, and economic” goal. A review of more recent data reveals that although the number of general aviation accidents and fatalities has decreased significantly42 in the 30 years since the Board’s special study, the percentage of accidents attributed to stall/spin events has changed little.
This section includes statistical data and discusses general aviation accidents involving stall/spin accidents. This section is not meant to be an exhaustive discussion of all the related safety concerns, but rather a discussion of the details of an issue important to general aviation.
What Is a Stall?
Airplanes fly because of the way air flows around a wing as it moves through the air. The wings of most general aviation aircraft are designed with an airfoil shape that is curved more on the top than the bottom. Because of this curvature, air flowing over the top of an aircraft wing speeds up, which results in a low pressure above the wing. At the same time, the air striking the underside of the airfoil and the air flowing off the back of the airfoil create high pressure under the wing. A lifting force is created by this pressure differential, and an airplane can fly if the lifting force is equal to or greater than the weight of the airplane. If the angle between
General Aviation Stall Accident Statistics, 2002
Fixed-Wing Stall Accidents Total Accidents 190 Accident Aircraft 190 Fixed-Wing Stall Accident Highest Injury Fatal 89 Serious 21 Minor 33 None 47 Fixed-Wing Stall Accident Injuries Fatal 147 Serious 44 Minor 54 Persons aboard with no injuries 124 Fixed-Wing Stall Accident Aircraft Damage Destroyed 75 Substantial 115 Minor 0 None 0
41 National Transportation Safety Board, Special Study—General Aviation Stall/Spin Accidents, NTSB-AAS-72-8 (Washington, DC: 1972).42 For example, a total of 4,256 general aviation accidents and 1,426 general aviation accident fatalities were reported in 1972 compared to 1,715 general aviation accidents and 581 fatalities reported in 2002.
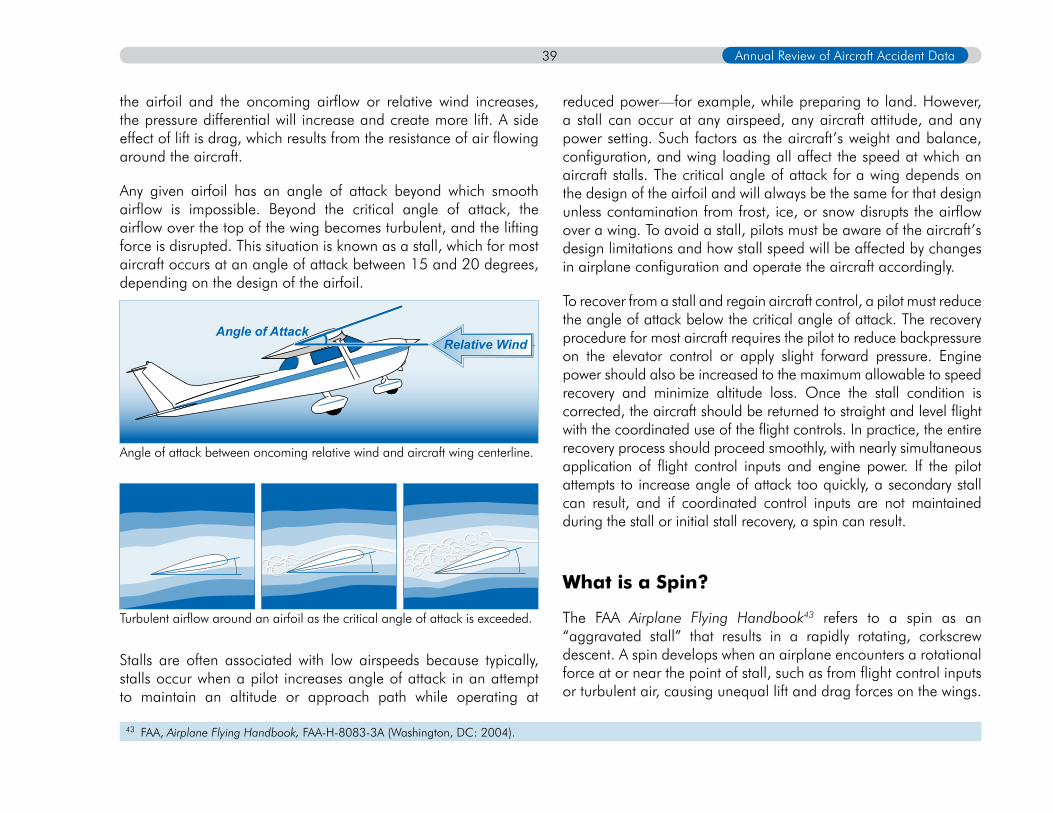
Annual Review of Aircraft Accident Data39
the airfoil and the oncoming airflow or relative wind increases, the pressure differential will increase and create more lift. A side effect of lift is drag, which results from the resistance of air flowing around the aircraft.
Any given airfoil has an angle of attack beyond which smooth airflow is impossible. Beyond the critical angle of attack, the airflow over the top of the wing becomes turbulent, and the lifting force is disrupted. This situation is known as a stall, which for most aircraft occurs at an angle of attack between 15 and 20 degrees, depending on the design of the airfoil.
Angle of attack between oncoming relative wind and aircraft wing centerline.
Turbulent airflow around an airfoil as the critical angle of attack is exceeded.
Stalls are often associated with low airspeeds because typically, stalls occur when a pilot increases angle of attack in an attempt to maintain an altitude or approach path while operating at
reduced power—for example, while preparing to land. However, a stall can occur at any airspeed, any aircraft attitude, and any power setting. Such factors as the aircraft’s weight and balance, configuration, and wing loading all affect the speed at which an aircraft stalls. The critical angle of attack for a wing depends on the design of the airfoil and will always be the same for that design unless contamination from frost, ice, or snow disrupts the airflow over a wing. To avoid a stall, pilots must be aware of the aircraft’s design limitations and how stall speed will be affected by changes in airplane configuration and operate the aircraft accordingly.
To recover from a stall and regain aircraft control, a pilot must reduce the angle of attack below the critical angle of attack. The recovery procedure for most aircraft requires the pilot to reduce backpressure on the elevator control or apply slight forward pressure. Engine power should also be increased to the maximum allowable to speed recovery and minimize altitude loss. Once the stall condition is corrected, the aircraft should be returned to straight and level flight with the coordinated use of the flight controls. In practice, the entire recovery process should proceed smoothly, with nearly simultaneous application of flight control inputs and engine power. If the pilot attempts to increase angle of attack too quickly, a secondary stall can result, and if coordinated control inputs are not maintained during the stall or initial stall recovery, a spin can result.
What is a Spin?
The FAA Airplane Flying Handbook43 refers to a spin as an “aggravated stall” that results in a rapidly rotating, corkscrew descent. A spin develops when an airplane encounters a rotational force at or near the point of stall, such as from flight control inputs or turbulent air, causing unequal lift and drag forces on the wings.
Relative WindAngle of Attack
43 FAA, Airplane Flying Handbook, FAA-H-8083-3A (Washington, DC: 2004).
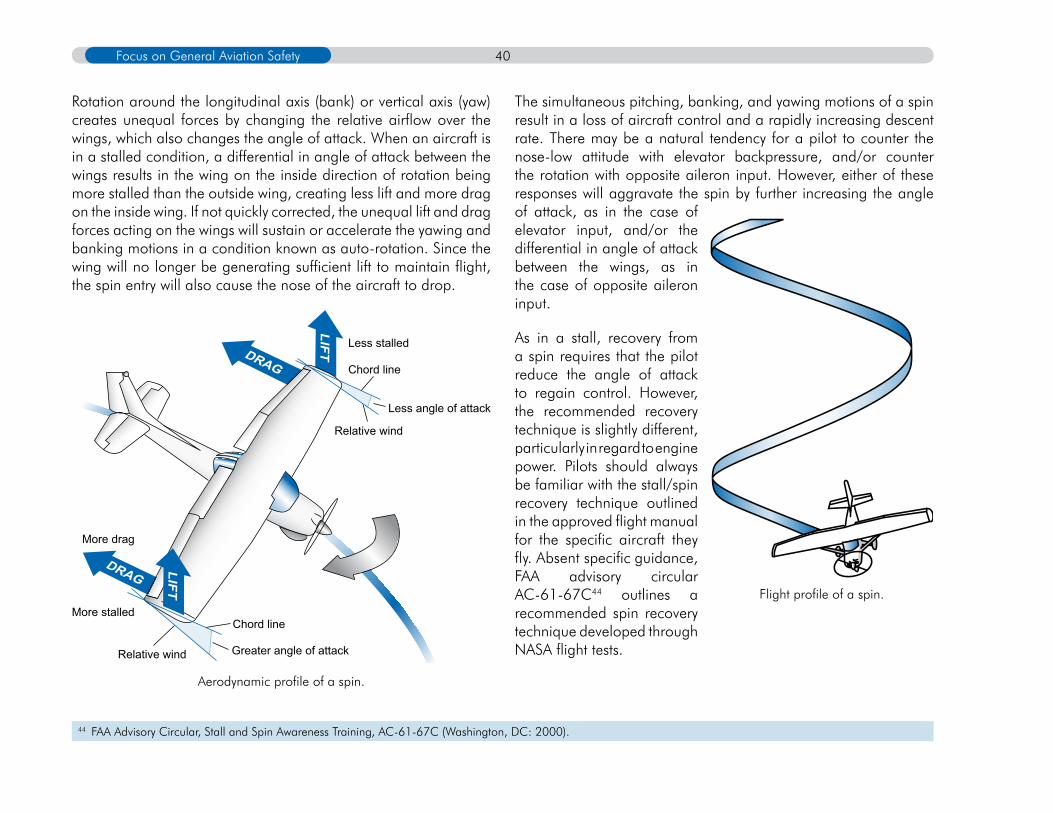
40Focus on General Aviation Safety
Rotation around the longitudinal axis (bank) or vertical axis (yaw) creates unequal forces by changing the relative airflow over the wings, which also changes the angle of attack. When an aircraft is in a stalled condition, a differential in angle of attack between the wings results in the wing on the inside direction of rotation being more stalled than the outside wing, creating less lift and more drag on the inside wing. If not quickly corrected, the unequal lift and drag forces acting on the wings will sustain or accelerate the yawing and banking motions in a condition known as auto-rotation. Since the wing will no longer be generating sufficient lift to maintain flight, the spin entry will also cause the nose of the aircraft to drop.
Aerodynamic profile of a spin.
The simultaneous pitching, banking, and yawing motions of a spin result in a loss of aircraft control and a rapidly increasing descent rate. There may be a natural tendency for a pilot to counter the nose-low attitude with elevator backpressure, and/or counter the rotation with opposite aileron input. However, either of these responses will aggravate the spin by further increasing the angle of attack, as in the case of elevator input, and/or the differential in angle of attack between the wings, as in the case of opposite aileron input.
As in a stall, recovery from a spin requires that the pilot reduce the angle of attack to regain control. However, the recommended recovery technique is slightly different, particularly in regard to engine power. Pilots should always be familiar with the stall/spin recovery technique outlined in the approved flight manual for the specific aircraft they fly. Absent specific guidance, FAA advisory circular AC-61-67C44 outlines a recommended spin recovery technique developed through NASA flight tests.
LIFTDRAG
DRAG
LIFT
More drag
More stalled
Relative wind
Chord line
Greater angle of attack
Less stalled
Chord line
Less angle of attack
Relative wind
Flight profile of a spin.
44 FAA Advisory Circular, Stall and Spin Awareness Training, AC-61-67C (Washington, DC: 2000).
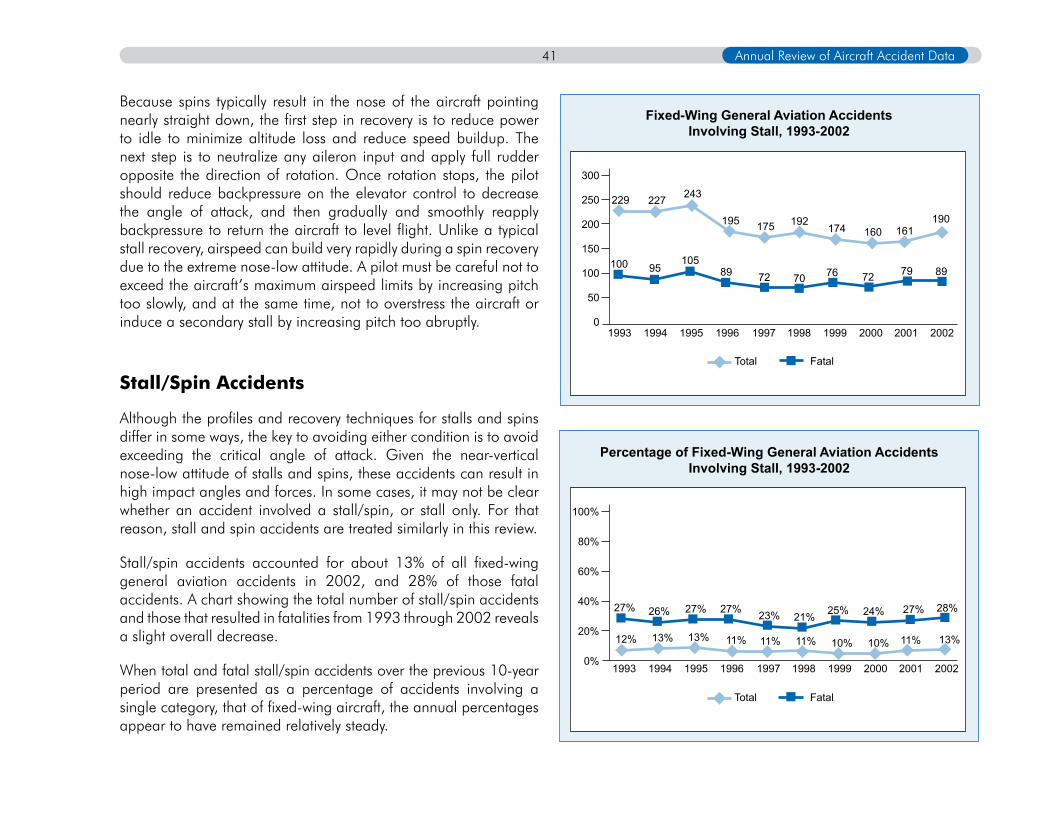
Annual Review of Aircraft Accident Data41
Because spins typically result in the nose of the aircraft pointing nearly straight down, the first step in recovery is to reduce power to idle to minimize altitude loss and reduce speed buildup. The next step is to neutralize any aileron input and apply full rudder opposite the direction of rotation. Once rotation stops, the pilot should reduce backpressure on the elevator control to decrease the angle of attack, and then gradually and smoothly reapply backpressure to return the aircraft to level flight. Unlike a typical stall recovery, airspeed can build very rapidly during a spin recovery due to the extreme nose-low attitude. A pilot must be careful not to exceed the aircraft’s maximum airspeed limits by increasing pitch too slowly, and at the same time, not to overstress the aircraft or induce a secondary stall by increasing pitch too abruptly.
Stall/Spin Accidents
Although the profiles and recovery techniques for stalls and spins differ in some ways, the key to avoiding either condition is to avoid exceeding the critical angle of attack. Given the near-vertical nose-low attitude of stalls and spins, these accidents can result in high impact angles and forces. In some cases, it may not be clear whether an accident involved a stall/spin, or stall only. For that reason, stall and spin accidents are treated similarly in this review.
Stall/spin accidents accounted for about 13% of all fixed-wing general aviation accidents in 2002, and 28% of those fatal accidents. A chart showing the total number of stall/spin accidents and those that resulted in fatalities from 1993 through 2002 reveals a slight overall decrease.
When total and fatal stall/spin accidents over the previous 10-year period are presented as a percentage of accidents involving a single category, that of fixed-wing aircraft, the annual percentages appear to have remained relatively steady.
300
250
200
150
100
50
0
Total Fatal
Fixed-Wing General Aviation AccidentsInvolving Stall, 1993-2002
100 10589 7995
72 70 76 72 89
229 227 243
195 175 192161174 160
190
1993 1994 1995 1996 1997 1998 1999 2000 2001 2002
Percentage of Fixed-Wing General Aviation AccidentsInvolving Stall, 1993-2002
27%
100%
80%
60%
40%
20%
0%
Total Fatal
1993 1994 1995 1996 1997 1998 1999 2000 2001 2002
27% 27% 27%26% 23% 21% 25% 24% 28%
12% 13% 13% 11% 11% 11% 11%10% 10% 13%

42Focus on General Aviation Safety
A comparison of these values with those reported in the Safety Board’s 1972 study also suggest that the relative contribution of stall/spin accidents to recent annual totals is slightly higher than it was 30 years ago.
Accident Severity
The high proportion of fatal accidents citing a stall/spin indicates the severity of these kinds of accidents. Almost half the stall/spin accidents in 2002 resulted in fatal injuries compared to the overall fatality rate of 20% for general aviation accidents. A total of 147 persons were killed, and 44 persons received serious injuries, in stall/spin accidents during 2002.
Percentage of GA Accidents Involving Stall
8%
22%28%
% of GA Accidents % of Fatal GA Accidents
100%
80%
60%
40%
20%
0%
1972 NTSB Study 2002
13%
Highest Level of Injury Sustained in StallAccidents, 2002
47%
11%17%
25%
Fatal Serious NoneMinor
100%
80%
60%
40%
20%
0%
Fatal Serious NoneMinor
200
180
160
140
120
100
80
60
40
20
0
Number of Injuries Resulting From StallAccidents, 2002
44
147
54
124
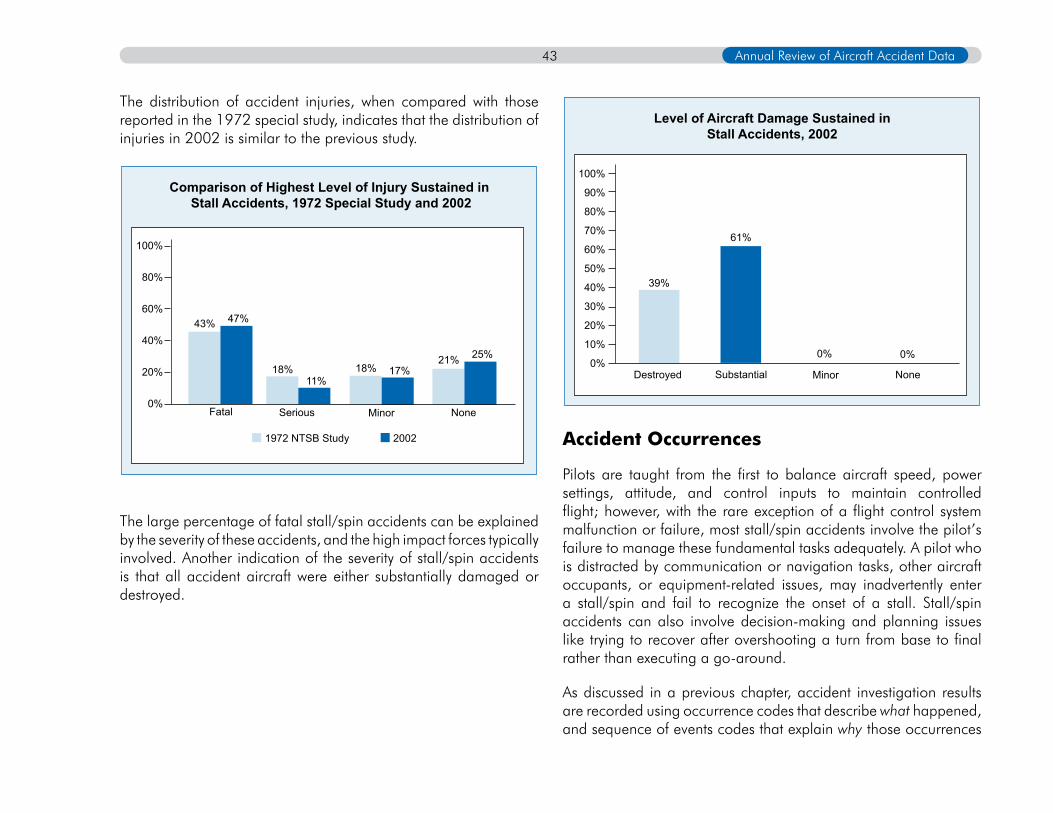
Annual Review of Aircraft Accident Data43
The distribution of accident injuries, when compared with those reported in the 1972 special study, indicates that the distribution of injuries in 2002 is similar to the previous study.
The large percentage of fatal stall/spin accidents can be explained by the severity of these accidents, and the high impact forces typically involved. Another indication of the severity of stall/spin accidents is that all accident aircraft were either substantially damaged or destroyed.
Accident Occurrences
Pilots are taught from the first to balance aircraft speed, power settings, attitude, and control inputs to maintain controlled flight; however, with the rare exception of a flight control system malfunction or failure, most stall/spin accidents involve the pilot’s failure to manage these fundamental tasks adequately. A pilot who is distracted by communication or navigation tasks, other aircraft occupants, or equipment-related issues, may inadvertently enter a stall/spin and fail to recognize the onset of a stall. Stall/spin accidents can also involve decision-making and planning issues like trying to recover after overshooting a turn from base to final rather than executing a go-around.
As discussed in a previous chapter, accident investigation results are recorded using occurrence codes that describe what happened, and sequence of events codes that explain why those occurrences
Comparison of Highest Level of Injury Sustained in Stall Accidents, 1972 Special Study and 2002
Fatal Serious NoneMinor
100%
80%
60%
40%
20%
0%
43% 47%
18%11%
18% 17%21% 25%
1972 NTSB Study 2002
100%
90%
80%
70%
60%
50%
40%
30%
20%
10%
0%
Level of Aircraft Damage Sustained inStall Accidents, 2002
61%
Destroyed Substantial NoneMinor
39%
0% 0%
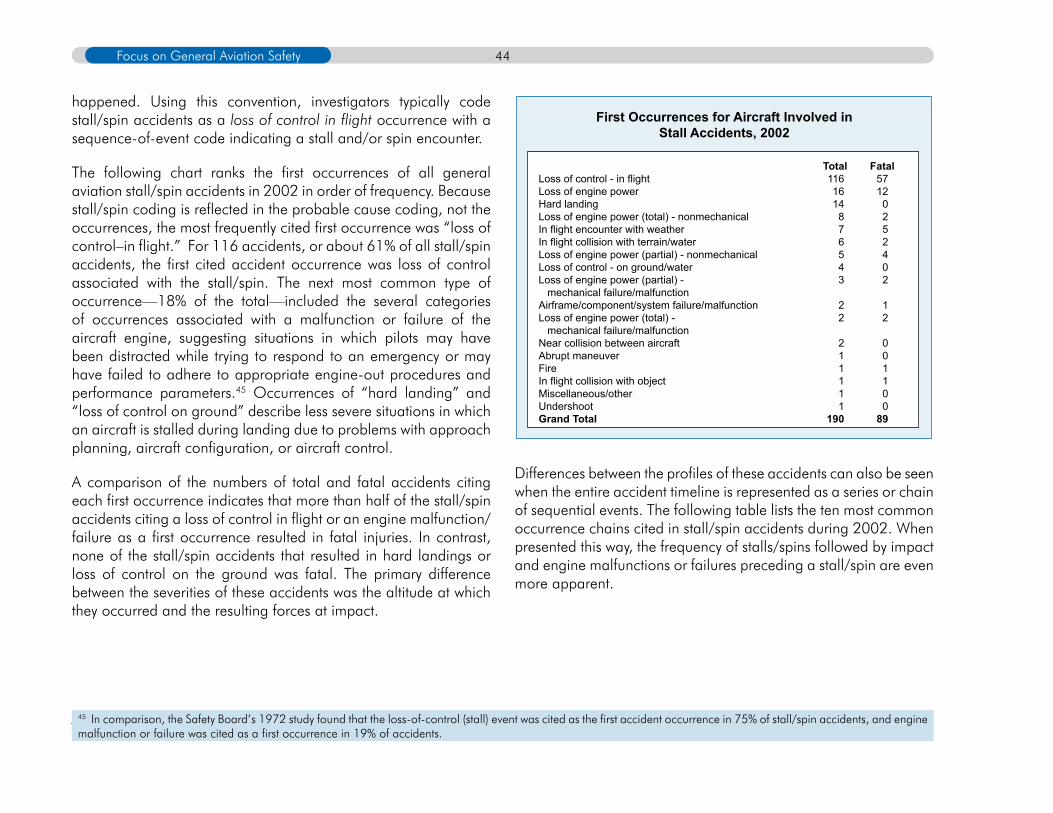
44Focus on General Aviation Safety
happened. Using this convention, investigators typically code stall/spin accidents as a loss of control in flight occurrence with a sequence-of-event code indicating a stall and/or spin encounter.
The following chart ranks the first occurrences of all general aviation stall/spin accidents in 2002 in order of frequency. Because stall/spin coding is reflected in the probable cause coding, not the occurrences, the most frequently cited first occurrence was “loss of control–in flight.” For 116 accidents, or about 61% of all stall/spin accidents, the first cited accident occurrence was loss of control associated with the stall/spin. The next most common type of occurrence—18% of the total—included the several categories of occurrences associated with a malfunction or failure of the aircraft engine, suggesting situations in which pilots may have been distracted while trying to respond to an emergency or may have failed to adhere to appropriate engine-out procedures and performance parameters.45 Occurrences of “hard landing” and “loss of control on ground” describe less severe situations in which an aircraft is stalled during landing due to problems with approach planning, aircraft configuration, or aircraft control.
A comparison of the numbers of total and fatal accidents citing each first occurrence indicates that more than half of the stall/spin accidents citing a loss of control in flight or an engine malfunction/failure as a first occurrence resulted in fatal injuries. In contrast, none of the stall/spin accidents that resulted in hard landings or loss of control on the ground was fatal. The primary difference between the severities of these accidents was the altitude at which they occurred and the resulting forces at impact.
Differences between the profiles of these accidents can also be seen when the entire accident timeline is represented as a series or chain of sequential events. The following table lists the ten most common occurrence chains cited in stall/spin accidents during 2002. When presented this way, the frequency of stalls/spins followed by impact and engine malfunctions or failures preceding a stall/spin are even more apparent.
45 In comparison, the Safety Board’s 1972 study found that the loss-of-control (stall) event was cited as the first accident occurrence in 75% of stall/spin accidents, and engine malfunction or failure was cited as a first occurrence in 19% of accidents.
First Occurrences for Aircraft Involved inStall Accidents, 2002
Total FatalLoss of control - in flight 116 57Loss of engine power 16 12Hard landing 14 0Loss of engine power (total) - nonmechanical 8 2In flight encounter with weather 7 5In flight collision with terrain/water 6 2Loss of engine power (partial) - nonmechanical 5 4Loss of control - on ground/water 4 0Loss of engine power (partial) - 3 2 mechanical failure/malfunction Airframe/component/system failure/malfunction 2 1Loss of engine power (total) - 2 2 mechanical failure/malfunction Near collision between aircraft 2 0Abrupt maneuver 1 0Fire 1 1In flight collision with object 1 1Miscellaneous/other 1 0Undershoot 1 0Grand Total 190 89
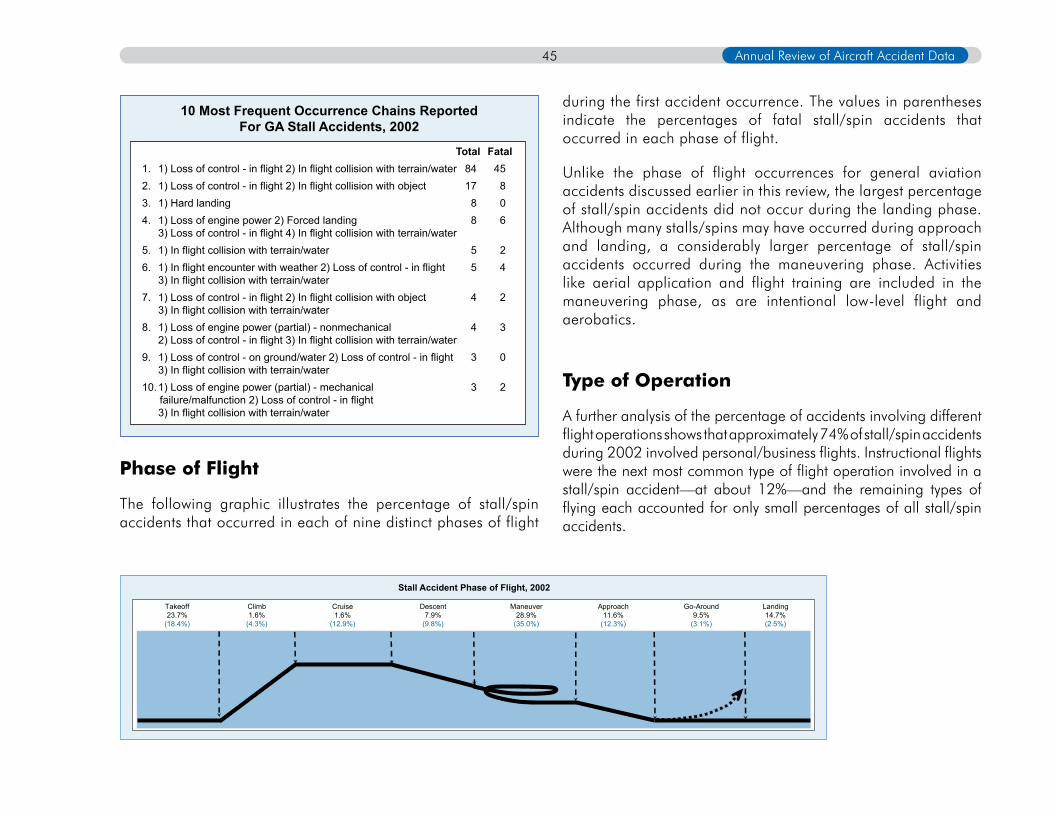
Annual Review of Aircraft Accident Data45
Phase of Flight
The following graphic illustrates the percentage of stall/spin accidents that occurred in each of nine distinct phases of flight
during the first accident occurrence. The values in parentheses indicate the percentages of fatal stall/spin accidents that occurred in each phase of flight.
Unlike the phase of flight occurrences for general aviation accidents discussed earlier in this review, the largest percentage of stall/spin accidents did not occur during the landing phase. Although many stalls/spins may have occurred during approach and landing, a considerably larger percentage of stall/spin accidents occurred during the maneuvering phase. Activities like aerial application and flight training are included in the maneuvering phase, as are intentional low-level flight and aerobatics.
Type of Operation
A further analysis of the percentage of accidents involving different flight operations shows that approximately 74% of stall/spin accidents during 2002 involved personal/business flights. Instructional flights were the next most common type of flight operation involved in a stall/spin accident—at about 12%—and the remaining types of flying each accounted for only small percentages of all stall/spin accidents.
10 Most Frequent Occurrence Chains ReportedFor GA Stall Accidents, 2002
Total Fatal1. 1) Loss of control - in flight 2) In flight collision with terrain/water 84 452. 1) Loss of control - in flight 2) In flight collision with object 17 83. 1) Hard landing 8 04. 1) Loss of engine power 2) Forced landing 8 6 3) Loss of control - in flight 4) In flight collision with terrain/water 5. 1) In flight collision with terrain/water 5 26. 1) In flight encounter with weather 2) Loss of control - in flight 5 4 3) In flight collision with terrain/water7. 1) Loss of control - in flight 2) In flight collision with object 4 2 3) In flight collision with terrain/water 8. 1) Loss of engine power (partial) - nonmechanical 4 3 2) Loss of control - in flight 3) In flight collision with terrain/water 9. 1) Loss of control - on ground/water 2) Loss of control - in flight 3 0 3) In flight collision with terrain/water10. 1) Loss of engine power (partial) - mechanical 3 2 failure/malfunction 2) Loss of control - in flight 3) In flight collision with terrain/water
Stall Accident Phase of Flight, 2002
Takeoff23.7%
(18.4%)
Climb1.6%
(4.3%)
Cruise1.6%
(12.9%)
Descent7.9%
(9.8%)
Maneuver28.9%
(35.0%)
Approach11.6%
(12.3%)
Go-Around9.5%
(3.1%)
Landing14.7%(2.5%)

46Focus on General Aviation Safety
Accident Pilot Experience
Because stalls and spins involve a breakdown in the basic tasks of aircraft control, one might assume that less-experienced pilots are more likely to be involved in stall/spin accidents than more experienced pilots. However, only 12% of the 175 stall/spin accident pilots in 2002 for whom flight time data were available had 200 hours or fewer total flight time, while 45% had more than 1,000 hours of flight time.
(175 stall accident pilots with data available)
A similar relationship between experience and stall/spin accidents can be observed in total flight time in accident aircraft type. Of the pilots involved in stall/spin with data available, 46% had more than 200 hours in the aircraft type compared to 36% who had 100 hours or fewer.
Stall Accident Pilot Total Time, 2002
>1000
901-
801-900
701-800
601-700
501-600
401-500
301-400
201-300
101-200
0-100
79
5
6
8
9
9
13
13
12
14
7
Flig
ht H
ours
Purpose of Flight for Stall Accident Aircraft, 2002
Corporate/Executive
Public Use
Aerial Application
Flight Instruction
Personal/Business
Other 8.9%
0.5%
2.1%
2.6%
11.6%
74.2%
100%80%60%40%20%0%

Annual Review of Aircraft Accident Data47
(128 stall accident pilots with data available)
The distribution of accident pilots by the highest level of pilot certificate held indicates that pilots holding private and commercial certificates accounted for the largest percentages. Both groups were over-represented in stall/spin accidents when compared to the active pilot population in which approximately 39% of pilots held a private certificate and 20% held a commercial certificate. It is also worth noting that in 31 of the 190 stall/spin accidents in 2002—about 16%—an FAA-certificated flight instructor was on board. The flight instructor certificate is currently the only FAA pilot certificate that requires flight training in spin recovery.
Stall/Spin Accident Causes/Factors
A comparison of the broad categories of accident probable cause and contributing factors for stall/spin accidents during 2002 shows that the aircraft and environment categories of causes/factors were less likely to be cited than in general aviation accidents overall, as presented earlier in this review. For stall/spin accidents, it is important to note that the Board’s probable cause coding conventions associate stall/spin encounters with a pilot action. Accordingly, this graph shows that 100% of accidents cited personnel. Because of this convention, no comparisons can be made between stalls/spins and other accidents regarding the relative number of probable cause findings attributed to personnel. Aircraft equipment and environmental conditions were rarely cited as causes of stall/spin accidents and were less likely to be cited as factors in stall/spin accidents than in general aviation accidents overall.
Highest Certificate Held by Stall/SpinAccident Pilots, 2002
Other/None1%
Student6%
ATP12%
Private55%
Commercial26%
Stall Accident Pilot Total Time inAircraft Type, 2002
>200
101-200
51-100
0-50
0-10
59
22
15
32
15
Flig
ht H
ours

48Focus on General Aviation Safety
Within the group of stall/spin accidents, the pilot-in-command was the most frequently cited individual and accounted for more than 97% of the individuals cited. Other personnel cited include a flight instructor who failed to supervise a student adequately and a maintenance technician who used incorrect materials in a repair, contributing to a gear collapse during a hard landing following a stall. The following chart includes a more detailed cause/factor summary that illustrates the distribution of cited personnel, as well as environmental and aircraft-related causes/factors.
General Aviation Stall Accident Causes/Factors, 2002
Personnel
Pilot
Others (not Aboard)
Others (aboard)
Organizations
Environment
Weather condition
Terrain condition
Object
Light condition
Airport/airwaysfacilities, aids
Aircraft
Powerplant/propulsion
Fluid
Aircraft structure
Aircraft performance
Engine power loss
Systems andequipment
Flight controlsystems
Instruments
Landing gear
79
0 50 100 150 200
190
189
7
3
0
49
38
9
6
3
2
23
11
6
3
2
1
1
0
0
0
Broad Causes/Factors Cited in StallAccidents, 2002
Aircraft Environment Personnel
12%4%
100% 99%
Cause or Factor Cause
26%
2%
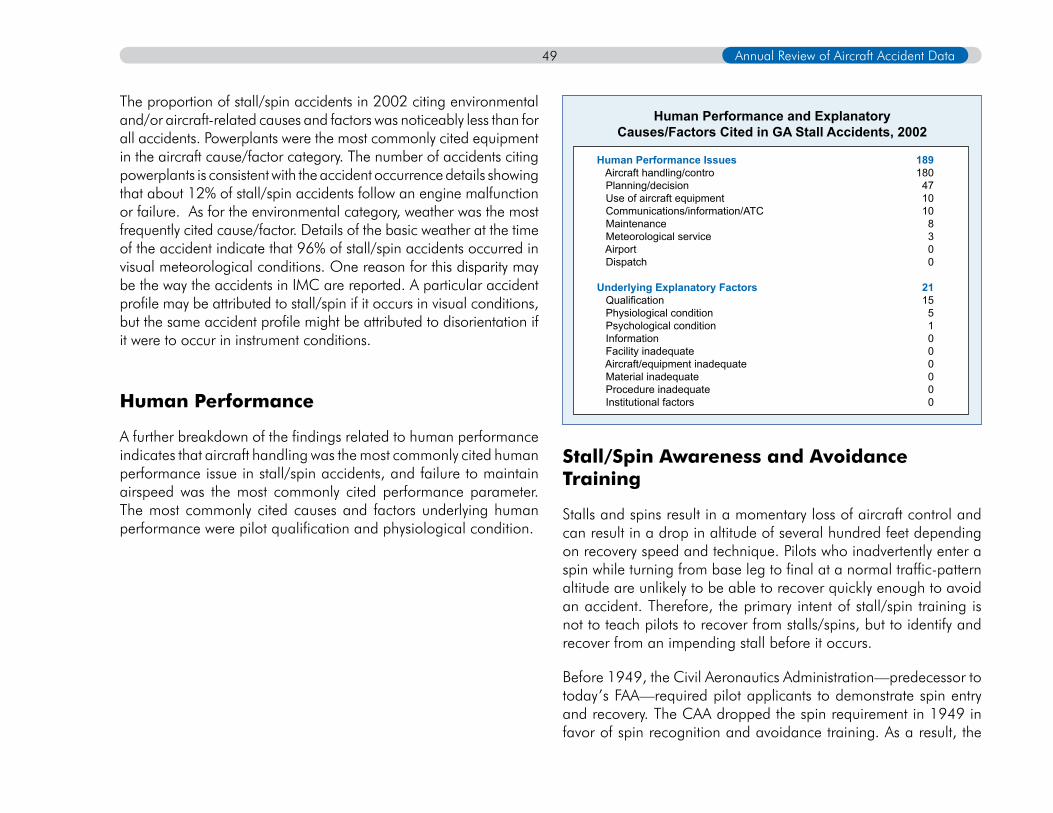
Annual Review of Aircraft Accident Data49
The proportion of stall/spin accidents in 2002 citing environmental and/or aircraft-related causes and factors was noticeably less than for all accidents. Powerplants were the most commonly cited equipment in the aircraft cause/factor category. The number of accidents citing powerplants is consistent with the accident occurrence details showing that about 12% of stall/spin accidents follow an engine malfunction or failure. As for the environmental category, weather was the most frequently cited cause/factor. Details of the basic weather at the time of the accident indicate that 96% of stall/spin accidents occurred in visual meteorological conditions. One reason for this disparity may be the way the accidents in IMC are reported. A particular accident profile may be attributed to stall/spin if it occurs in visual conditions, but the same accident profile might be attributed to disorientation if it were to occur in instrument conditions.
Human Performance
A further breakdown of the findings related to human performance indicates that aircraft handling was the most commonly cited human performance issue in stall/spin accidents, and failure to maintain airspeed was the most commonly cited performance parameter. The most commonly cited causes and factors underlying human performance were pilot qualification and physiological condition.
Stall/Spin Awareness and Avoidance Training
Stalls and spins result in a momentary loss of aircraft control and can result in a drop in altitude of several hundred feet depending on recovery speed and technique. Pilots who inadvertently enter a spin while turning from base leg to final at a normal traffic-pattern altitude are unlikely to be able to recover quickly enough to avoid an accident. Therefore, the primary intent of stall/spin training is not to teach pilots to recover from stalls/spins, but to identify and recover from an impending stall before it occurs.
Before 1949, the Civil Aeronautics Administration—predecessor to today’s FAA—required pilot applicants to demonstrate spin entry and recovery. The CAA dropped the spin requirement in 1949 in favor of spin recognition and avoidance training. As a result, the
Human Performance and ExplanatoryCauses/Factors Cited in GA Stall Accidents, 2002
Human Performance Issues 189 Aircraft handling/contro 180 Planning/decision 47 Use of aircraft equipment 10 Communications/information/ATC 10 Maintenance 8 Meteorological service 3 Airport 0 Dispatch 0
Underlying Explanatory Factors 21 Qualification 15 Physiological condition 5 Psychological condition 1 Information 0 Facility inadequate 0 Aircraft/equipment inadequate 0 Material inadequate 0 Procedure inadequate 0 Institutional factors 0
50Focus on General Aviation Safety
only pilots currently required to demonstrate proficiency in spins and spin recovery are flight instructor applicants46 in the airplane and glider categories. The most recent significant changes to stall training came in 1991 and 1997, with changes to the 14 CFR Part 61 requirements for stall training and certification. Coincidental with those changes, the FAA released updates to AC-61-67B in 1991 and AC-61-67C in 1997, providing guidance on stall and spin awareness training. In general, the emphasis in pilot training has continued to move from stall/spin recovery toward recognizing and avoiding stall/spin conditions and situations that could lead to inadvertent stalls and spins. The Safety Board’s 1972 special study noted that the increased emphasis on stall/spin recognition and avoidance after 1949 reduced the number of stall/spin accidents noticeably. However, a comparison of those results with the percentage of accidents attributed to stall/spin over the last decade suggests that the 1991 and 1997 changes have had little additional effect.
The 1972 special study pointed out that, in addition to the revised training procedures, the 1949 regulatory change was intended to spur the development of new spin-resistant aircraft designs, but those changes had not been realized. With the average age of aircraft operating in general aviation at more than 30 years, that situation continues to be true today for the bulk of the general aviation fleet. Analysis of more recent accidents indicates that the relative contribution of stalls/spins to general aviation accidents has changed little since the 1967-1969 timeframe covered in the Safety Board’s earlier report, suggesting that equipment and/or design changes may be necessary to further reduce stall/spin accidents.
Summary
A review of the historical data, and those from 2002, indicate that stalls/spins are among the most commonly cited causes of fatal general aviation accidents. Comparisons between stall/spin accidents and general aviation accidents overall indicate that stall/spin accidents result in higher-than-average levels of injury and aircraft damage, with more than 40% of all stall/spin accidents resulting in a fatality. A comparison of stall/spin accidents in 2002 with those cited in the Safety Board’s 1972 special study, General Aviation Stall/Spin Accidents, indicates that the total number of accidents each year has decreased noticeably. Despite the Safety Board’s call for action in that study, however, the relative contribution of stalls/spins to general aviation accidents has changed little in the intervening 30 years.
46 Title 14 CFR 61.183(i).
Annual Review of Aircraft Accident Data51
appendix a
The National Transportation Safety Board Aviation Accident/Incident Database
The National Transportation Safety Board is responsible for maintaining the government’s database on civil aviation accidents. The Safety Board’s Accident/Incident Database is the official repository of aviation accident data and causal factors. The database was established in 1962 and about 2,000 new event records are added each year.
The Accident/Incident Database is primarily composed of aircraft accidents. An “accident” is defined in 49 CFR 830.2 as “an occurrence associated with the operation of an aircraft which takes place between the time any person boards the aircraft with the intention of flight and all such persons have disembarked, and in which any person suffers death or serious injury, or in which the aircraft receives substantial damage.” The database also contains a select number of aviation “incidents,” defined in 49 CFR 830.2 as “occurrences other than accidents that are associated with the operation of an aircraft and that affect or could affect the safety of operations.”
Accident investigators use the Safety Board’s Accident Data Management System (ADMS) software to enter data into the Accident/Incident Database. Shortly after the event, a preliminary report containing a few data elements such as date, location, aircraft operator, and type of aircraft, becomes available. A factual report with additional information concerning the occurrence is available within a few months. A final report, which includes a statement of the probable cause and other contributing factors, may not be completed for months until the investigation is closed.
An accident-based relational database is currently available to the public at http://www.ntsb.gov/ntsb/query.asp#query_start. It contains records of about 40,000 accidents and incidents that occurred between 1982 and the present. Each record may contain more than 650 fields of data concerning the aircraft, event, engines, injuries, sequence of accident events, and other topics. Individual data files are also available for download at ftp://www.ntsb.gov/avdata, including one complete data set for each year beginning with 1982. The data files are in Microsoft Access (.mdb) format and are updated monthly. This download site also provides weekly “change” updates and complete documentation.
52
appendix B
Definitions
Definitions of Safety Board Severity Classifications
The severity of a general aviation accident or incident is classified as the combination of the highest level of injury sustained by the personnel involved (that is, fatal, serious, minor, or none) and level of damage to the aircraft involved (that is, destroyed, substantial, minor, or none). Accidents include those events in which any person suffers fatal or serious injury, or in which the aircraft receives substantial damage or is destroyed. An event that results in minor or no injuries and minor or no damage is not classified as an accident.
Definitions for Highest Level of Injury
Fatal—Any injury that results in death within 30 days of the accident.
Serious—Any injury that (1) requires the individual to be hospitalized for more than 48 hours, commencing within 7 days from the date the injury was received; (2) results in a fracture of any bone (except simple fractures of fingers, toes, or nose); (3) causes severe hemorrhages, nerve, muscle, or tendon damage; (4) involves any internal organ; or (5) involves second- or third-degree burns, or any burns affecting more than 5% of the body surface.
Minor—Any injury that is neither fatal nor serious.
None—No injury.
Definitions for Level of Aircraft Damage
Destroyed—Damage due to impact, fire, or in-flight failures to the extent that the aircraft cannot be repaired economically.1
Substantial Damage—Damage or failure that adversely affects the structural strength, performance, or flight characteristics of the aircraft, and that would normally require major repair or replacement of the affected component. Engine failure or damage limited to an engine if only one engine fails or is damaged, bent fairings or cowling, dented skin, small puncture holes in the skin or fabric, ground damage to rotor or propeller blades, and damage to landing gear, wheels, tires, flaps, engine accessories, brakes, or wingtips are not considered “substantial damage.”2
Minor Damage—Any damage that neither destroys the aircraft nor causes substantial damage (see definition of substantial damage for details).
None—No damage.
1 Title 49 Code of Federal Regulations (CFR) 830.2 does not define “destroyed.” This term is difficult to define because aircraft are sometimes rebuilt even when it is not economical to do so.2 See 49 CFR 830.2.
Annual Review of Aircraft Accident Data53
appendix c
The National Transportation Safety Board Investigative Process
The National Transportation Safety Board investigates every accident that occurs in the United States involving civil aviation and public aircraft flights that do not involve military or intelligence agencies. It also provides investigators to serve as U.S. Accredited Representatives as specified in international treaties for aviation accidents overseas involving U.S.-registered aircraft or involving aircraft or major components of U.S. manufacture. Investigations are conducted from Safety Board Headquarters in Washington, D.C. or from one of the 10 regional offices in the United States (see appendix D).1
In determining probable cause(s) of a domestic accident, investigators consider the facts, conditions, and circumstances of the event. The objective is to ascertain those cause and effect relationships in the accident sequence about which something can be done to prevent recurrence of the type of accident under consideration.
Note the distinction between the population of accidents investigated by the Safety Board and those that are included in the Annual Review of Aircraft Accident Data, U.S. General Aviation. Although the Safety Board is mandated by Congress to investigate all civil aviation accidents that occur on U.S. soil (including those involving both domestic and foreign operators), the Annual Review describes accidents that occurred among U.S.-registered aircraft in all parts of the world.
1 For more detailed information about the Safety Board’s investigation of aviation accidents or incidents, see 49 CFR 831.2
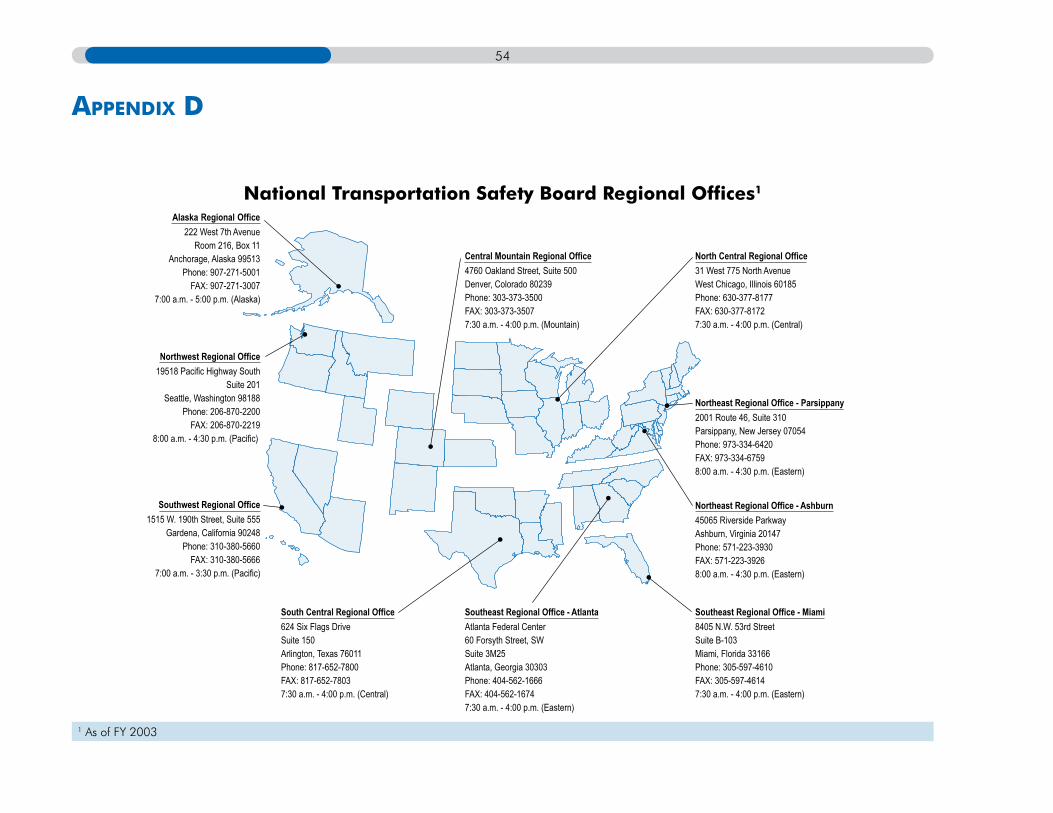
54
appendix d
National Transportation Safety Board Regional Offices1
Southwest Regional Office1515 W. 190th Street, Suite 555
Gardena, California 90248Phone: 310-380-5660
FAX: 310-380-56667:00 a.m. - 3:30 p.m. (Pacific)
Northwest Regional Office19518 Pacific Highway South
Suite 201Seattle, Washington 98188
Phone: 206-870-2200FAX: 206-870-2219
8:00 a.m. - 4:30 p.m. (Pacific)
Alaska Regional Office222 West 7th Avenue
Room 216, Box 11Anchorage, Alaska 99513
Phone: 907-271-5001FAX: 907-271-3007
7:00 a.m. - 5:00 p.m. (Alaska)
Central Mountain Regional Office4760 Oakland Street, Suite 500Denver, Colorado 80239Phone: 303-373-3500FAX: 303-373-35077:30 a.m. - 4:00 p.m. (Mountain)
South Central Regional Office624 Six Flags DriveSuite 150Arlington, Texas 76011Phone: 817-652-7800FAX: 817-652-78037:30 a.m. - 4:00 p.m. (Central)
Southeast Regional Office - Miami8405 N.W. 53rd StreetSuite B-103Miami, Florida 33166Phone: 305-597-4610FAX: 305-597-46147:30 a.m. - 4:00 p.m. (Eastern)
Southeast Regional Office - AtlantaAtlanta Federal Center 60 Forsyth Street, SWSuite 3M25Atlanta, Georgia 30303Phone: 404-562-1666FAX: 404-562-16747:30 a.m. - 4:00 p.m. (Eastern)
Northeast Regional Office - Ashburn45065 Riverside ParkwayAshburn, Virginia 20147 Phone: 571-223-3930FAX: 571-223-39268:00 a.m. - 4:30 p.m. (Eastern)
Northeast Regional Office - Parsippany2001 Route 46, Suite 310Parsippany, New Jersey 07054 Phone: 973-334-6420FAX: 973-334-67598:00 a.m. - 4:30 p.m. (Eastern)
North Central Regional Office31 West 775 North AvenueWest Chicago, Illinois 60185Phone: 630-377-8177FAX: 630-377-81727:30 a.m. - 4:00 p.m. (Central)
1 As of FY 2003