Embed Size (px)
Citation preview

Annual results 2000Annual results 2000
Randstad Holding nv
February/March 2001

TopicsTopics
Randstad: partner for flexibility and employability
The Randstad agenda
The year 2000
Key figures and financial report
Strategy
Outlook and prospects

Randstad: Partner for flexibility and employabilityRandstad: Partner for flexibility and employability
Mission: Randstad seeks to be among the world leaders in linking the supply of and demand for workers
Active in Europe and North America
Market leader in the Netherlands, Belgium, Germany and the U.S. Southeast
Ca. 245,000 staffing employees (daily avg.)
15,700 Corporate staff (year-end)
2,042 Branches and 426 in-house locations (year-end)

The Randstad agendaThe Randstad agenda
Internationalization
Segmentation
Information and communication technology
Cost control
Accountability

2000: Operations2000: Operations
Internationalization
212 total new branches 134 branches through acquisitions
Segmentation divisional structure

Randstad GroupRandstad Group
Randstad Holding
Shared Service Centers
Professionalsstaffing
Mass-customized staffing
Large scale
staffing
Europe & North America

2000: Operations2000: Operations
Information and communication technologyintegrated ICT approachnew business models Hedson and
newmonday.comwebsites in Europe and North America
Accountabilityvalue-based management
Cost controlfar-reaching measures

2000: Various market developments2000: Various market developments
Leveling off in regions important to Randstad
Disappointing and strongly changing ICT market
Rapid market growth in other regions
Investment program maintained
Results under pressure
Measures in November 2000

The NetherlandsGermanyBelgium *FranceSpainUnited KingdomSwitzerlandItalyDenmark
North America
* Belgium including Luxembourg** Autonomous growth in brackets*** Market share Spain, including FY Umano
Market growth
0%15%12%20%15%
9%6%
200%20%
5.5%
Revenue growth **
-2.6% (-2.5)%13.4%
7.1%40.3% (26.0%)
217.5% (44.5%)
17.2%5.4%
2,515.9%28.3%
2.1% (1.0%)
Market share***
+/-+/-
-+++-
++
-
Development Randstad in Europe and North America 2000
Development Randstad in Europe and North America 2000
Growth in local currency, revenues from temporary staffing and secondment only
Market position
***
11162-5
5-104
7

EUR mln
Net revenues
Operating result as % revenues
Income after tax
Net income
Earnings per ordinary share from operations
Earnings per ordinary share
2000
6,168.1
250.64.1%
151.8
207.2
1.24
1.72
10.8
-17.6
-26.7
0.1
-27.9
0.0
1999
5,565.5
304.35.5%
207.0
207.0
1.72
1.72
Key financial data 2000Key financial data 2000

EUR mln
Net revenues
Gross profitas % revenues
Operating result (EBIT) as % revenues
Financial income and expenses, net TaxesResult non-consolidated participations
Income from ordinary operations after tax
Extraordinary result after tax
Net income
Earnings per ordinary share from operations
Earnings per ordinary share
2000
6,168.1
1,482.824.0
250.64.1
-20.5-67.2-11.1
151.8
55.4
207.2
1.24
1.72
10.8
13.3
-17.6
-26.7
-27.9
0.0
1999
5,565.4
1,308.723.5
304.35.5
-10.6-86.7
207.0
207.0
1.72
1.72
Income statement dataIncome statement data

EUR mln
Net revenues
Gross profitas % revenues
Operating result (EBIT) as % revenues
2000
3,216.7
753.6
23.4
147.8
4.6
%
10.4
14.8
-1.4
1999
2,913.3
656.3
22.5
149.9
5.1
Key data Randstad EuropeKey data Randstad Europe

2000
1,590.0
383.1
24.1
49.0
3.1
%
18.1
18.1
-42.5
1999
1,346.6
324.5
24.1
85.2
6.3
Key data Randstad North AmericaKey data Randstad North America
EUR mln
Net revenues
Gross profitas % revenues
Operating result (EBIT) as % revenues

2000
282.4
82.6
29.2
-10.7
-3.8
%
-1.4
-13.8
-159.
4
1999
286.4
95.8
33.4
18.0
6.3
Key data YACHTKey data YACHT
EUR mln
Net revenues
Gross profitas % revenues
Operating result (EBIT) as % revenues
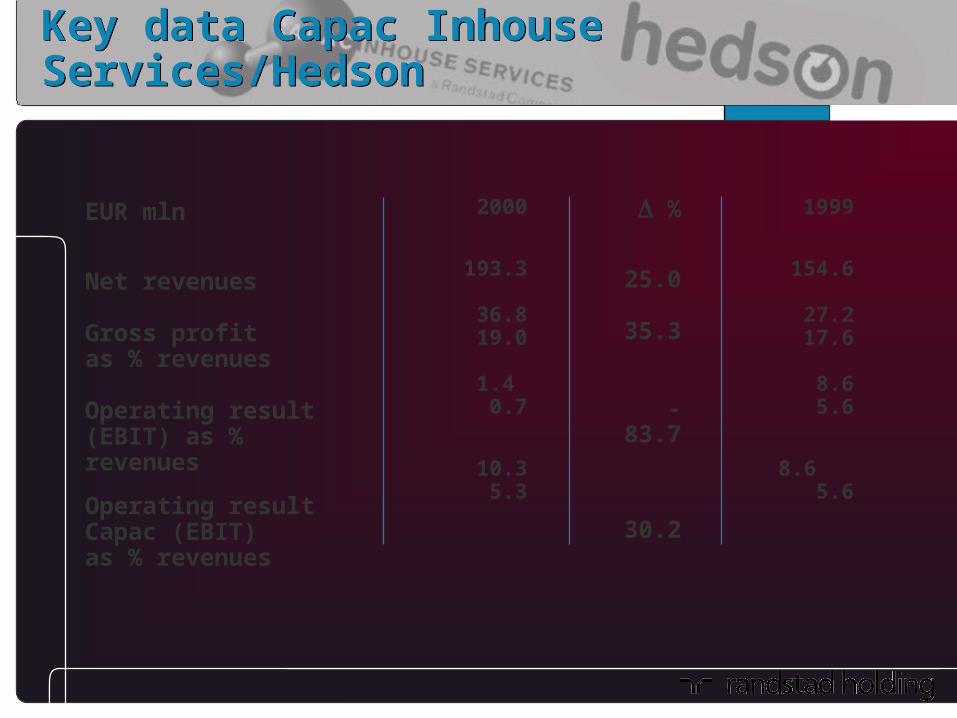
EUR mln
Net revenues
Gross profitas % revenues
Operating result (EBIT) as % revenues
Operating result Capac (EBIT)as % revenues
2000
193.3
36.819.0
1.4 0.7
10.35.3
%
25.0
35.3
-83.7
30.2
1999
154.6
27.2
17.6
8.6
5.6
8.65.6
Key data Capac Inhouse Services/HedsonKey data Capac Inhouse Services/Hedson

2000
627.8
176.0
28.0
61.3
9.8
%
-3.2
9.0
27.7
1999
648.8
161.5
24.9
48.0
7.4
Key data Tempo-Team/Otter-Westelaken GroupKey data Tempo-Team/Otter-Westelaken Group
EUR mln
Net revenues
Gross profitas % revenues
Operating result (EBIT) as % revenues
2000
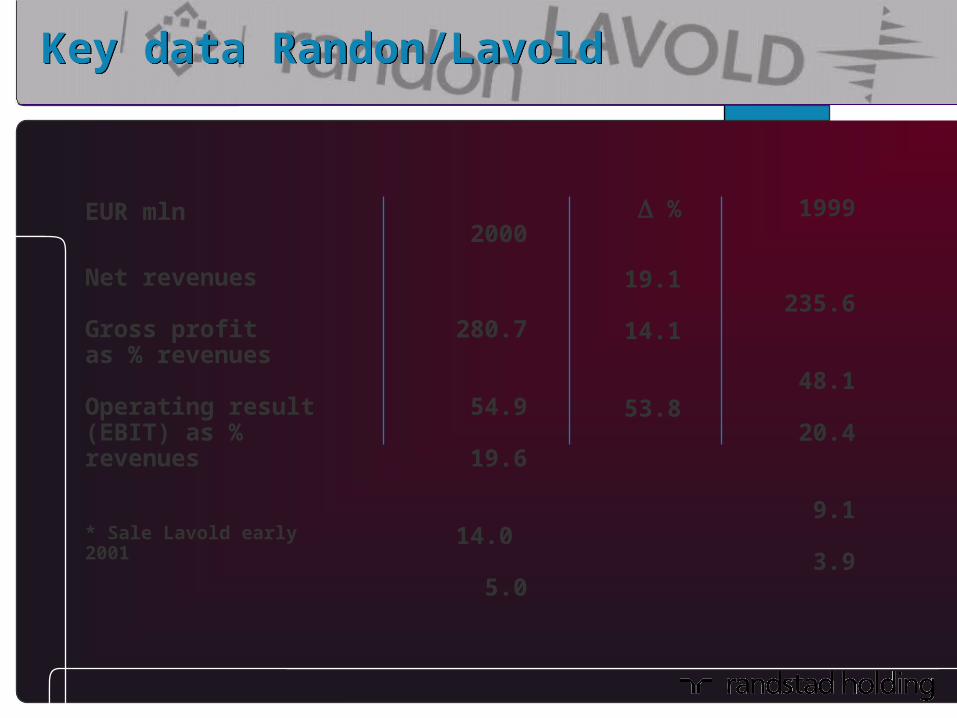
280.7
54.9
19.6
14.0
5.0
%
19.1
14.1
53.8
1999
235.6
48.1
20.4
9.1
3.9
Key data Randon/LavoldKey data Randon/Lavold
EUR mln
Net revenues
Gross profitas % revenues
Operating result (EBIT) as % revenues
* Sale Lavold early 2001

After profit appropriation,EUR mln
Tangible fixed assetsOperational working capitalOperational capital employed
Interest-bearing debtCashNet debt
Interest coverage
Shareholders’ equity
Key balance sheet data (year-end)Key balance sheet data (year-end)
2000
253.4
489.1
742.5
591.8
53.6
538.2
14.9
301.4
%
28.1113.
874.1
73.2-
70.5236.
8
1999
197.8
228.8426.6
341.7
181.9
159.8
33.0
331.0
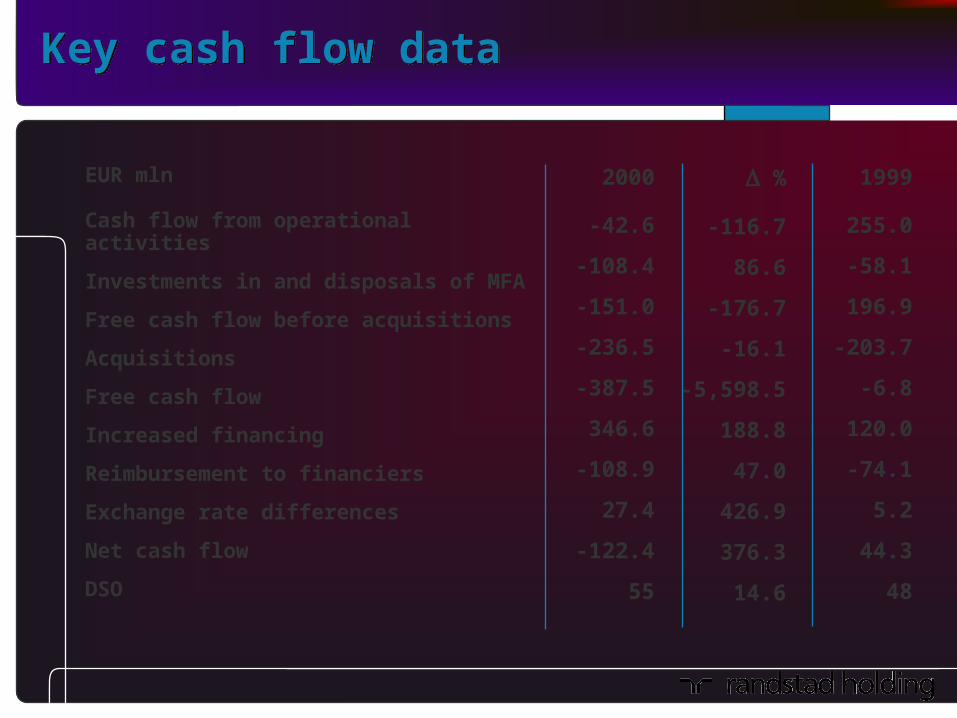
Key cash flow dataKey cash flow data
EUR mln
Cash flow from operational activities
Investments in and disposals of MFA
Free cash flow before acquisitions
Acquisitions
Free cash flow
Increased financing
Reimbursement to financiers
Exchange rate differences
Net cash flow
DSO
2000
-42.6
-108.4
-151.0
-236.5
-387.5
346.6
-108.9
27.4
-122.4
55
%
-116.7
86.6
-176.7
-16.1
-5,598.5
188.8
47.0
426.9
376.3
14.6
1999
255.0
-58.1
196.9
-203.7
-6.8
120.0
-74.1
5.2
44.3
48

StrategyStrategy
Goal:Creation of value for all stakeholders, through growth of revenues and profits, through which continuity over the long term is assured.
Autonomous growth and supplementary acquisitions
Geographic spread of revenues
Segmentation and focus
ICT
Multi-channel approach

Strategy: Growth plus supplementary acquisitionsStrategy: Growth plus supplementary acquisitions
Priority on rapid autonomous growth
Supplementary acquisitions to accelerate growth attaining more prominent market position

Strategy: Growth perspectiveStrategy: Growth perspective
The Netherlands
United Kingdom
France
Belgium
Spain
Germany
Italy
European Union
North America 5 - 7%
5-15%
35 - 43%
13 - 21%
15 - 19%
8 - 11%
4 - 7%
2 - 4%
3 - 5%
Average combined growth, 1998-2010
Source: CIETT Randstad estimates

Source: CIETT 2000
Strategy: Market enlargementStrategy: Market enlargement
Self-employed
Fixed term contracts
Private employment agencies
Spain
Italy
France
The Netherlands
Belgium
Germany
United Kingdom
52.4%
32.9%
25.0%
23.3%
22.7%
22.3%
18.5%
20.1
24.5
10.9
11.0
15.2
10.0
12.1
31.6
8.4
11.6
7.8
5.9
11.7
3.2
0.7
2.5
4.5
1.6
0.6
3.2
0.0

Strategy: Geographic spread of revenuesStrategy: Geographic spread of revenues
0%
20%
40%
60%
80%
100%
1996 1997 1998 1999 2000
The Netherlands
Europe, excl. theNetherlandsNorth America
2,701.4 3,209.5 4,223.8 5,565.4 6,168.1
7 6 1124 26
3027
272826
4449
626667
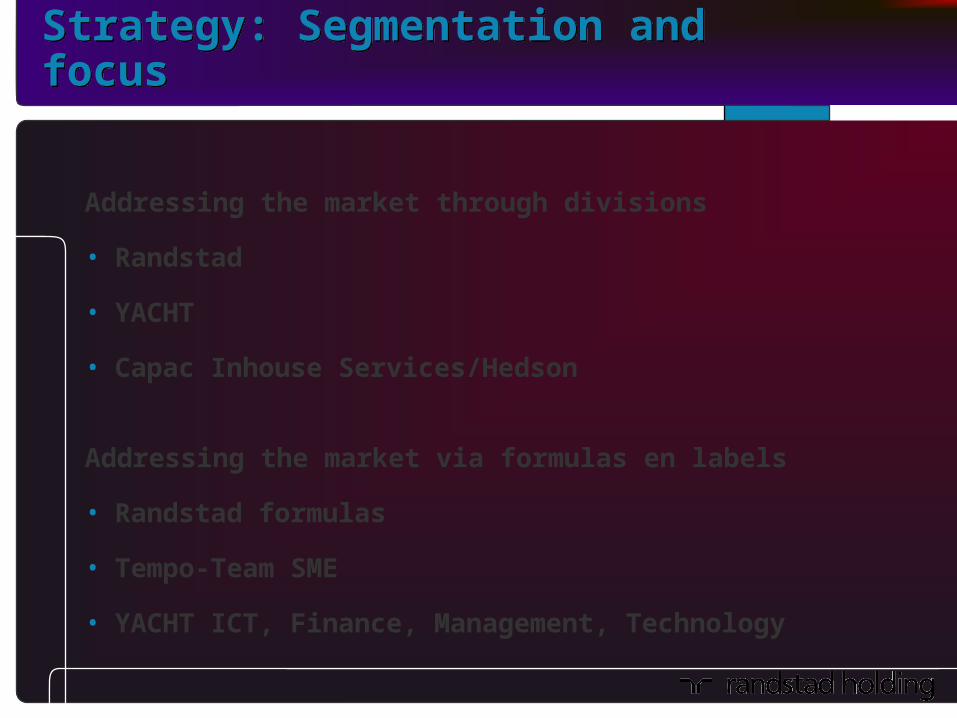
Strategy: Segmentation and focusStrategy: Segmentation and focus
Addressing the market through divisions
• Randstad
• YACHT
• Capac Inhouse Services/Hedson
Addressing the market via formulas en labels
• Randstad formulas
• Tempo-Team SME
• YACHT ICT, Finance, Management, Technology

Strategy: ICT objectivesStrategy: ICT objectives
Amplifying efficiency and raising productivity
Possibility to realize innovative service concepts
Increase scope for personalized services through staff

Strategy: ICT projectsStrategy: ICT projects
Infrastructure
Databases
Corporate data model & standards

Clients
Needs & Personalities
Attitude & behavior
Employees
Strategy: Multi-channelStrategy: Multi-channel
Serviceproviders
(Portal)
Temping
Secondment
Recruitment
Other services
Data

Outlook and forecastOutlook and forecast
• Estimated revenue growth: 5-10%
• Result H1 2001 < H1 2000
• Net effect measures clearly visible in H2 2001
• 2001: net income growth from ordinary operations > revenue growth

EUR
Earnings per ordinary share from operations
2000
1.22
%
-29
2001
1.35
Average analyst expectationsAverage analyst expectations
1999
1.72
%
11.2