Embed Size (px)
Citation preview

Annual Report PresentationAnnual Report Presentation
10 October 2007
Wawa Damane, CEO

Presentation OverviewPresentation Overview
1. Background/Introduction
2. seda’s National Footprint
3. Serving the SMME Sector
4. Partnerships
5. Major Events
6. Human Resources
7. Financial Issues
8. Future
BackgroundBackground
Consumer spending increasing significantly
• Small enterprises comprises 95% of all enterprises in SA• Contribution of SMMEs in various sectors in 2006
– Agriculture 40%– Manufacturing 40%– Construction (rapidly expanding)– Trade (micro enterprise sector largest) 55%– Transport and communication 43%– Financial and business services 41%– Community and Personal Services 62%

Strategic focus for 2006 /7Strategic focus for 2006 /7
from expanding the network to effective service delivery through the existing network
from central controlled organization to decentralized, flexible and customer-oriented
organization
from reliance on mono-funded approach to sustainable multi-sourcing of funds.
from expanding the network to effective service delivery through the existing network
from central controlled organization to decentralized, flexible and customer-oriented
organization
from reliance on mono-funded approach to sustainable multi-sourcing of funds.

Our Vision: Our Vision:
to be the centre of excellence for small enterprise development in South Africa
Our Mission: Our Mission:
to develop, support an promote small enterprises to ensure their growth and sustainability

Highlights for 2006 /7Highlights for 2006 /7
Significant growth by:• Assets grew from R95m to R209m
• Staff complement grew from 351 to 520
• Expenditure increased from R172m to R405m
• National footprint increased from 27 to 39 branches, from 87 to 102 Enterprise Information Centres, and 13 to 23 seda Technology Centres
• New seda Board of Directors appointed
• CFO appointed – 01/09/2006
• Incorporation of sTP (seda Technology Programme)

RollRoll--out Summaryout SummaryGeographic spread of seda offices
2006/2007
Province Branches EICs sTPCentres
Limpopo 3 11
12
24
4
9
9
24
1
8
102
1
Mpumalanga 5 5
Gauteng 1 6
North West 5 1
KZN 7 4
Free State 6 0
Eastern Cape 4 3
Northern Cape
5 0
Western Cape 3 3
Total 39 23

RollRoll--out Summaryout Summary
2006/2007
Target AchievedProvincial Offices 9 8
39
EICs 102 102
sTP Centres 23 23
Branches 39
Geographic spread of seda offices
SERVICE DELIVERY: URBAN vs RURALUrban29%
Rural71%

Serving the SMME sectorServing the SMME sector
1. A total of 140,779 small enterprises assisted through branches and EICs
2. 20,853 entrepreneurs benefited from training programmes
– 19,314 through branches and EIC’s
– 1,539 through National Programmes
3. 783 clients assisted through Sector specific programmes on tourism, agribusiness and cooperatives support

Serving the SMME SectorServing the SMME Sector
5. 15,117 clients assisted through the call centre
6. 349,406 unique visits recorded on the seda web-site
7. 98 new SMME’s established through seda Technology Programme

Examples of impact on enterprisesExamples of impact on enterprises
• Mthoko’s Internet Café
• Principle Plastics
• The Idea Factory

Sector ProgrammesSector Programmes
Export readiness:ABSA International Trade Bureau (OR Tambo)

Tourism :
Crafters Training
Programme
Sector ProgrammesSector Programmes

PartnershipsPartnerships
Number of international, national and regional partnerships formed in implementing joint projects.
• International Partnerships (Existing)– National Small Business Industries Council
(NSIC)– Brazilian Micro and Small Business Support
Services (SEBRAE)– Technonet Africa– Finnish Support Programme
• International Partnerships (New)– Belgium Unizo and Voka– Jica Japan– Israel Agriculture

• Local Partnerships
– Provincial, district and local government partners
– Public Institutions
• CIPRO, CSIR, NEF, NML, SBAB, NPI, SUNparks, various
SETA’s and Technoserve
– Financial Institutions
• FNB, ABSA, Standard Bank,
IDC, Khula
Partnerships (cont)Partnerships (cont)
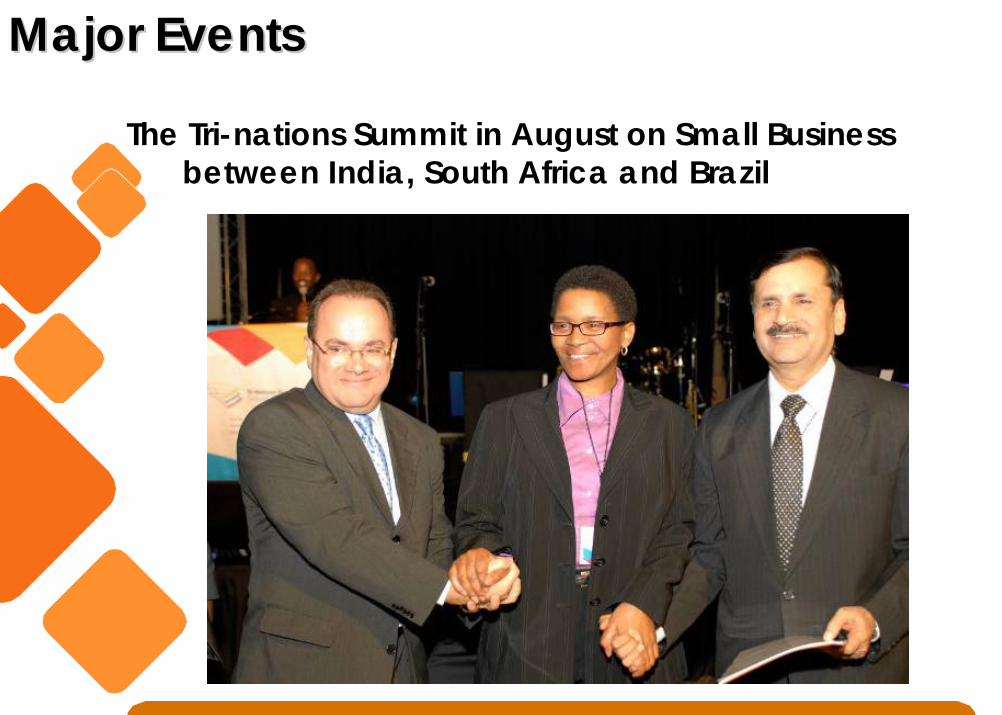
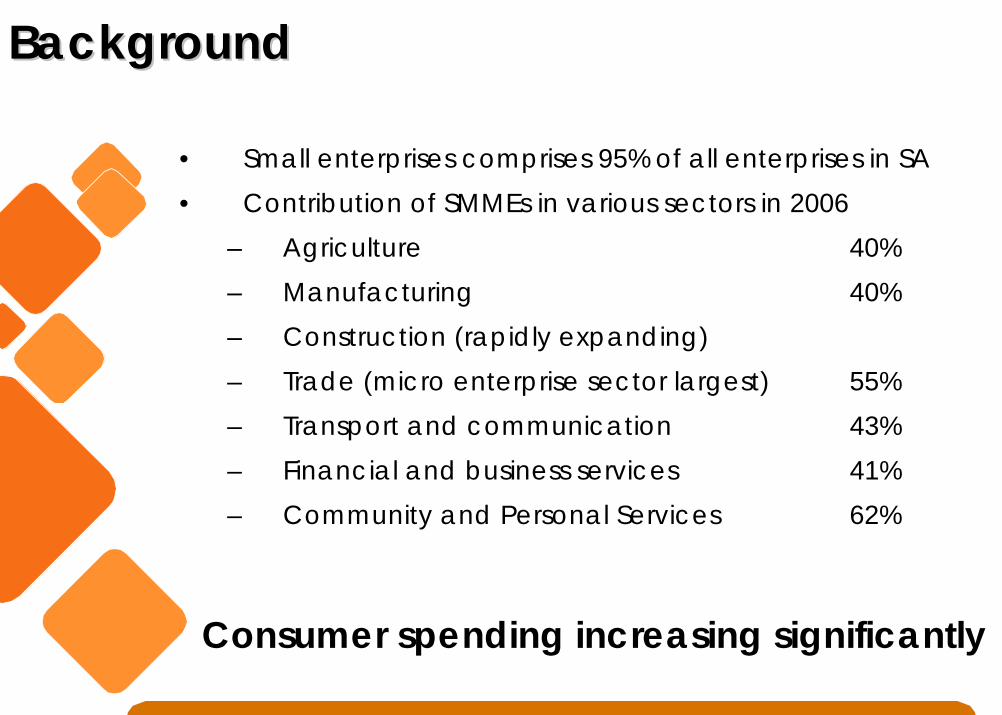
Major EventsMajor Events
The Tri-nations Summit in August on Small Business between India, South Africa and Brazil

Major EventsMajor Events
The International Trade Point Federation Annual General meeting

“Technology an Economic Driver !”
seda Technology Programmeseda Technology Programme
sTP = merger 1 April 2006
(Godisa Trust Sch 3A + National Technology Transfer Centre + Technology
Advisory Centre)

A new concept is generated.
The new concept is applied to a practical problem.
The application or technology is tested, refined & validated. It may be patented or licensed.
New tech is incorporated into a new or existing product, process or service.
Development CommercializationApplied ResearchBasic Research
Results
Source: R Goldsmith, San Antonio Technology Accelerator
The Technology PipelineThe Technology Pipeline

Low entry rates ofSMMEs into
manufacturingsector
Poor access tofacilities for
testing &promotion of
innovator's ideas
High failure ratesof start-up SMMEs
Poor technologysupport to SMMEs
Outdatedtechnologiesemployed by
SMMEs
Low rates ofeconomic
growth
Weakcompetitiveness
on globalmarkets
Insufficientlevels of value
added inindustry
Low levels ofproductivity
Insufficient rateof technological
innovation
High unemployment& poverty particularly amongst
previously disadvantagedgroups
Challenges to be addressedby centres
Challenges to be addressedby outcome of activities
Challenges to be addressed bylonger term impact of programme
Challenges for the Challenges for the sTPsTP

• Enhancing technological and technical innovation
• Replacing outdated technology used by many small enterprises
• Facilitating access to technology and technical support for
SMMEs
• Addressing the low entry rates of small enterprises into the
productive, value- added sectors of the economy
• Facilitating access to facilities for the testing and promotion of
innovative, ‘technological’ ideas
STP, through its STP, through its centrescentres, will therefore seek , will therefore seek to address the following issues:to address the following issues:

Incubation HighlightsIncubation Highlights
Centres Increase from 13 to 23
Turnover of SMMEs 162% higher to R 21.58 million
Survival rate of SMMEs up 90%
Team sTPIntegrated &
holistic support package for SMMEs from Government
Turning 8 in 10 Business Failures into 8 in 10 successes

Economic Impact : IncubationEconomic Impact : Incubation
• 708 Enterprises created (2002-2007)
2 300 Enterprises Supported
• 6 223 jobs created
• 86% Black owned businesses established

Economic Impact: Technology transferEconomic Impact: Technology transfer
• R13.5 million committed in 2006/7• 22 Technology transfer interventions
supported- 100% Black owned businesses supported- 66% Women owned businesses supported- 100% second economy businesses supported- 146 jobs created- All provinces supported

Narrow impact Narrow impact vsvs Broad focusBroad focus

Financial ReviewFinancial Review
2007 R’m 2006 R’m
Total Revenue 442 200Total Expenditure 411 172Total assets 209 95Total liabilities 121 53

Financial ReviewFinancial Review
• Second unqualified audit opinion
• Building and further enhancing robust systems of financial
management, internal control, policies and procedures
and risk management.
• A major systems re-engineering programme is currently
underway to address certain key risk areas, focused on
improved:
– Financial management
– Internal control
– Efficiency improvements
– Capacity Building

Human Resources reviewHuman Resources review
• A total of 248 positions filled during the year
• Total staff of seda at the end of the year reached 520.
– 60% female
– 78% African
• Training needs assessment done with the assistance from the Finnish Government’s support, training plan to be implemented over the coming years
• Performance management system developed

Staff complement in the provinces
Managers13%
Support staff47%
Technical Staff40%
Human Resources reviewHuman Resources review
Total staff complement - 520

Key challengesKey challenges
• Outreach
• Budgetary constraints
• Skill levels
• High expectations
• Coordination of effort

FutureFuture
• Enhance partnerships for better delivery
• Enhance the skills and knowledge of our
staff to effectively deliver the services
• Focus on productive capacity building for
small enterprises

Building entrepreneursBuilding entrepreneurs

ThankThank youyou