Embed Size (px)
Citation preview

2017ANNUAL REPORT

Now you can do all your banking on the phone anywhere, anytime.
Download the Orient Fastpay App today!
*Terms & Conditions Apply
@OrientBankUG
0800 144 551
ANNUALREPORT
2017
Now you can do all your banking on the phone anywhere, anytime.
Download the Orient Fastpay App today!
*Terms & Conditions Apply
@OrientBankUG
0800 144 551
Annual Report and Consolidated Financial Statements For the year ended 31 December 2017
04
Corporate information 6 – 18
Report of the Directors 20 – 21
Statement of directors’ responsibilities 22
Report of the independent auditors 23 – 25
FINANCIAL STATEMENTS
Consolidated and separate statements of profit or loss and other comprehensive income 26
Consolidated and separate statements of financial position 27
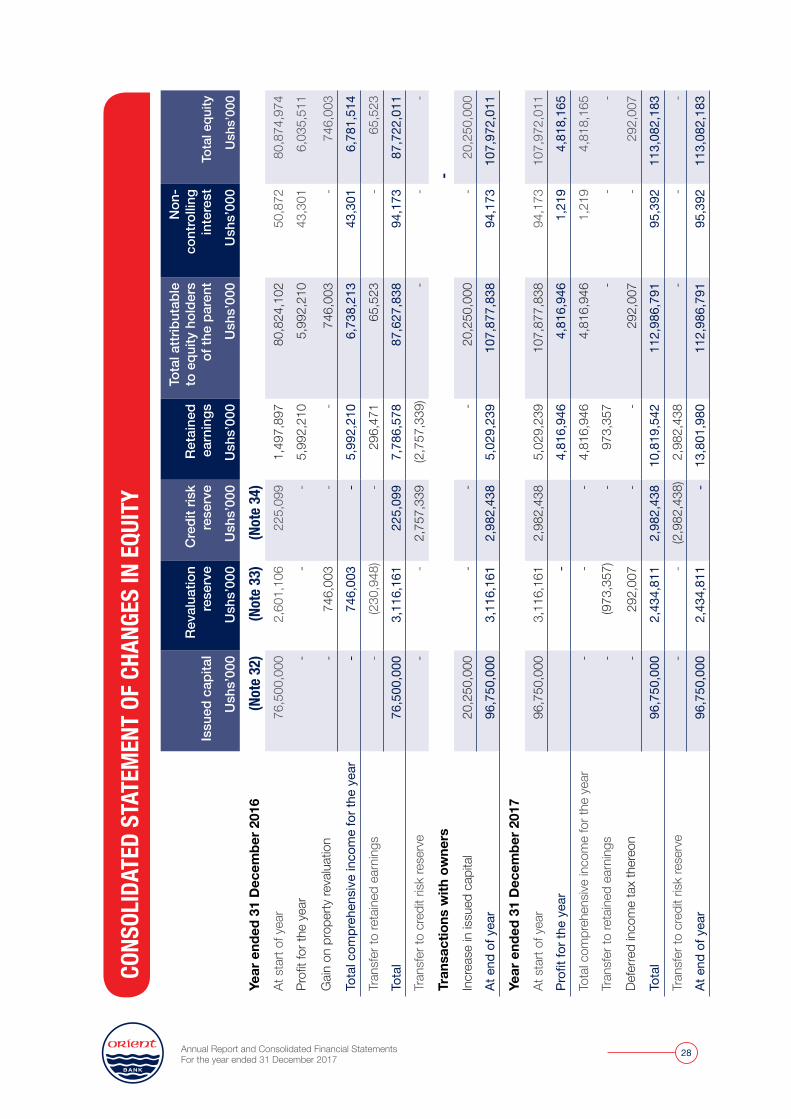
Consolidated statements of changes in equity 28
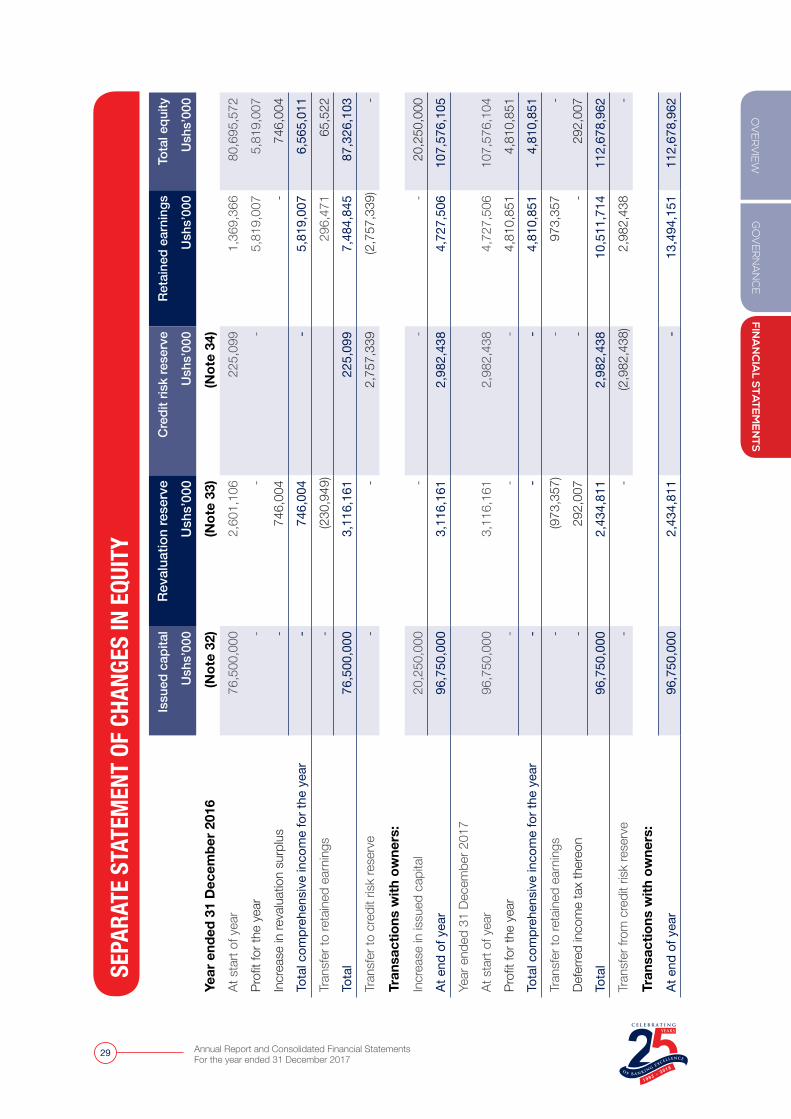
Separate statements of changes in equity 29
Consolidated and separate statements of cash flows 30
NOTES TO THE FINANCIAL STATEMENTS
Notes to the Financial Statements 31 – 94
APPENDIX I
Supplementary information to the annual report and consolidated and separate financial statements
95 – 99
CONTENTS

@OrientBankUG
0800 144 551
Visa Infinite.Get the recognition you deserve
Apply today for exclusive benefits!Terms and Conditions Apply
A multi-currency card (UGX, USD, GBP, EUR)
Multi-trip Travel Insurance of up to USD 1m
Airport Lounge access worldwide
24/7 Personal Concierge service
Up to 15% off global 5-star Hotels with VISA Hotel Club
Designed to give you more, whenever, wherever!

Annual Report and Consolidated Financial Statements For the year ended 31 December 2017
06
COMPANY SECRETARY
DIRECTORS
AUDITOR
REGISTERED OFFICE
COMPANY LAWYERS
Nicholas Ecimu c/o Sebalu & Lule AdvocatesCertified Public Secretaries (Uganda)P. O. Box 2255, Kampala
Shonubi Musoke & Company Advocates SM Chambers Plot 14, Hannington Road P. O. Box 3213, Kampala
Deloitte & Touche Certified Public Accountants3rd Floor, Rwenzori House, Plot 1, Lumumba Avenue P. O. Box 10314 Kampala
Orient PlazaPlot 6/6A Kampala Road P. O. Box 3072Kampala
Mr. Michael Cook Chairman British
Mr. Ketan Morjaria Vice-Chairman Ugandan
Mr. Hemen Shashikant Shah Non Executive Director American
Mr. Francis M. Byaruhanga Non Executive Director Ugandan
Mr. Joram Kahenano Non Executive Director Ugandan
Mr. Zhong Shuang Quan Non Executive Director Chinese
(Alternative: Mr. Jay Karia)
Mr. Julius Kakeeto Managing Director Ugandan
Ms. Darshana Bhatia Executive Director Indian
CORPORATE INFORMATION

Annual Report and Consolidated Financial Statements For the year ended 31 December 2017
07
GO
VER
NA
NC
EFIN
AN
CIA
L STATEM
EN
TSO
VE
RV
IEW
Head Office/ Main BranchOrient Plaza, Plot 6/6A Kampala RoadP.O. Box 3072, Kampala
Acacia BranchAcacia Mall - KisementiKampala
Arua BranchPlot 12 Avenue Road Arua Municipality
Ben Kiwanuka BranchHaider Plaza - Ben Kiwanuka StreetKampala
Bweyogerere BranchMamerito House, Jinja Road, Bweyogerere
Entebbe Town BranchPlot 29 Kampala Road Entebbe
Entebbe Airport BranchEntebbe International Airport Entebbe
Garden City BranchGarden City Mall - Yusuf Lule RoadKampala
Gulu BranchPlot 15 Awere RoadGulu
Jinja BranchScindia Road Jinja
Kabalagala BranchPlot 1900 Ggaba Road, Kampala
Branches
Katwe BranchMuganzirwazza Plaza - Katwe Kampala
Kawempe BranchPlot 78 Bombo RoadKampala
Kikuubo BranchGrand Corner HouseKampala
Kisekka BranchLohana Arcade, Nakivubo RoadKampala
Kololo BranchNyonyi Gardens, Wampewo AvenueKampala
Makerere BranchHam Shopping Mall, Makerere Hill RoadKampala
Mbale BranchPlot 23 Naboa Road Mbale Municipality
Mbarara BranchPlot 73 High Street Mbarara
Nkrumah Road BranchMirembe Arcade, Nasser RoadKampala
Ntinda BranchCapital Shoppers’ Mall NtindaKampala
William Street BranchWilliam StreetKampala
www.orient-bank.com
OUR BRANCH NETWORK

Annual Report and Consolidated Financial Statements For the year ended 31 December 2017
08
ABOUT US
OUR VALUES
ResilienceWe are strong, determined and adapt to the world around us
IntegrityWe are honest, open and straightforward with our colleagues, customers, investors, regulators and community
TeamworkWe are collaborative and combine our collective knowledge and skills to outperform our competitors
ServiceWe provide service that is timely, helpful, friendly and convenient
PassionWe are enthusiastic and self motivated to excel in all that we do
InnovationWe are open-minded and constantly striving to improve our processes, platforms and offerings
Orient Bank is a leading private sector commercial Bank in Uganda. We began operations in 1993 and have grown steadily due to our professional management and prudent lending and investment policies.
Our VisionTo be the pace setter and preferred financial partner for our stakeholders
Our MissionTo deliver service that provides superior value to our customers
We summarise our core values as SPIRIT

Annual Report and Consolidated Financial Statements For the year ended 31 December 2017
09
GO
VER
NA
NC
EFIN
AN
CIA
L STATEM
EN
TSO
VE
RV
IEW
OUR PRODUCT PORTFOLIO
� Foreign Currency Accounts � Telegraphic Transfer � Forex
� Current Account (Personal & Business) � SME Daily Account � Foreign Currency Account
(Personal & Business) � Kyakala Account (Personal & Business) � Premium Account � Sapphire Account
� Classic Saving Accounts � Dollar Savings Account (DOSA) � Future Children’s Savings Account � CHAMA Investment Club Account � Diaspora Account � Target Savings Account
� Commercial Loans � Overdrafts � Guarantees/Perfomance/Bid Bonds
We are a customer focused bank and have developed tailor-made products to efficiently and effectively meet our customers needs.
� SME Loans � Letters of Credit � Guarantees/Bid Bonds
CURRENT ACCOUNTS
RETAIL CREDIT TRADE FINANCE CORPORATE CREDIT
SAVINGS ACCOUNTS
INTERNATIONAL CURRENCY SERVICES
OTHER SERVICES
We have considerable experience in the provision of customer payments and cash management services for big organizations both local and foreign which includes;
� Salary Processing � Internal transfers � Safe custody � Collections - (Bill Payments (URA taxes, UMEME, NWSC bills, KCCA charges, NSSF )

Annual Report and Consolidated Financial Statements For the year ended 31 December 2017
10
The Bank has revamped it’s business strategy with a strong emphasis on five key pillars; Performance, Service, People, Controls and Technology. With this strategy we expect to achieve accelerated growth in the years ahead.
GO
VE
RN
AN
CE
FINA
NC
IAL S
TATEME
NTS
OV
ERV
IEW
Annual Report and Consolidated Financial Statements For the year ended 31 December 2017
11
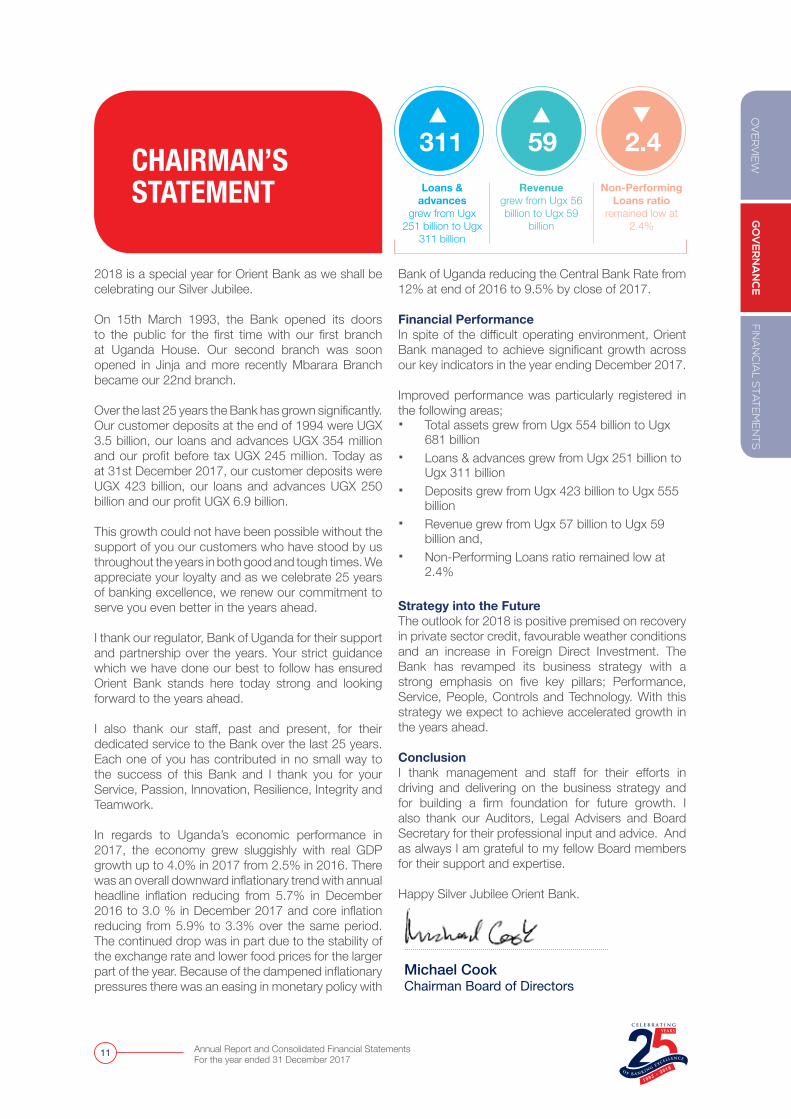
Bank of Uganda reducing the Central Bank Rate from 12% at end of 2016 to 9.5% by close of 2017.
Financial PerformanceIn spite of the difficult operating environment, Orient Bank managed to achieve significant growth across our key indicators in the year ending December 2017.
Improved performance was particularly registered in the following areas; � Total assets grew from Ugx 554 billion to Ugx
681 billion � Loans & advances grew from Ugx 251 billion to
Ugx 311 billion � Deposits grew from Ugx 423 billion to Ugx 555
billion � Revenue grew from Ugx 57 billion to Ugx 59
billion and, � Non-Performing Loans ratio remained low at
2.4%
Strategy into the FutureThe outlook for 2018 is positive premised on recovery in private sector credit, favourable weather conditions and an increase in Foreign Direct Investment. The Bank has revamped its business strategy with a strong emphasis on five key pillars; Performance, Service, People, Controls and Technology. With this strategy we expect to achieve accelerated growth in the years ahead.
ConclusionI thank management and staff for their efforts in driving and delivering on the business strategy and for building a firm foundation for future growth. I also thank our Auditors, Legal Advisers and Board Secretary for their professional input and advice. And as always I am grateful to my fellow Board members for their support and expertise.
Happy Silver Jubilee Orient Bank.
Michael Cook Chairman Board of Directors
CHAIRMAN’SSTATEMENT
2018 is a special year for Orient Bank as we shall be celebrating our Silver Jubilee.
On 15th March 1993, the Bank opened its doors to the public for the first time with our first branch at Uganda House. Our second branch was soon opened in Jinja and more recently Mbarara Branch became our 22nd branch.
Over the last 25 years the Bank has grown significantly. Our customer deposits at the end of 1994 were UGX 3.5 billion, our loans and advances UGX 354 million and our profit before tax UGX 245 million. Today as at 31st December 2017, our customer deposits were UGX 423 billion, our loans and advances UGX 250 billion and our profit UGX 6.9 billion.
This growth could not have been possible without the support of you our customers who have stood by us throughout the years in both good and tough times. We appreciate your loyalty and as we celebrate 25 years of banking excellence, we renew our commitment to serve you even better in the years ahead.
I thank our regulator, Bank of Uganda for their support and partnership over the years. Your strict guidance which we have done our best to follow has ensured Orient Bank stands here today strong and looking forward to the years ahead.
I also thank our staff, past and present, for their dedicated service to the Bank over the last 25 years. Each one of you has contributed in no small way to the success of this Bank and I thank you for your Service, Passion, Innovation, Resilience, Integrity and Teamwork.
In regards to Uganda’s economic performance in 2017, the economy grew sluggishly with real GDP growth up to 4.0% in 2017 from 2.5% in 2016. There was an overall downward inflationary trend with annual headline inflation reducing from 5.7% in December 2016 to 3.0 % in December 2017 and core inflation reducing from 5.9% to 3.3% over the same period. The continued drop was in part due to the stability of the exchange rate and lower food prices for the larger part of the year. Because of the dampened inflationary pressures there was an easing in monetary policy with
311 59 2.4Loans &
advances grew from Ugx
251 billion to Ugx 311 billion
Revenue grew from Ugx 56 billion to Ugx 59
billion
Non-Performing Loans ratio
remained low at 2.4%

Annual Report and Consolidated Financial Statements For the year ended 31 December 2017
12
We invested in revamping the ATM network with automatic cash depositors and US Dollar cash dispensing. This has allowed our customers the convenience of accessing and depositing cash on their accounts in both US Dollars and Uganda shillings
GO
VE
RN
AN
CE
FINA
NC
IAL S
TATEME
NTS
OV
ERV
IEW
Annual Report and Consolidated Financial Statements For the year ended 31 December 2017
13
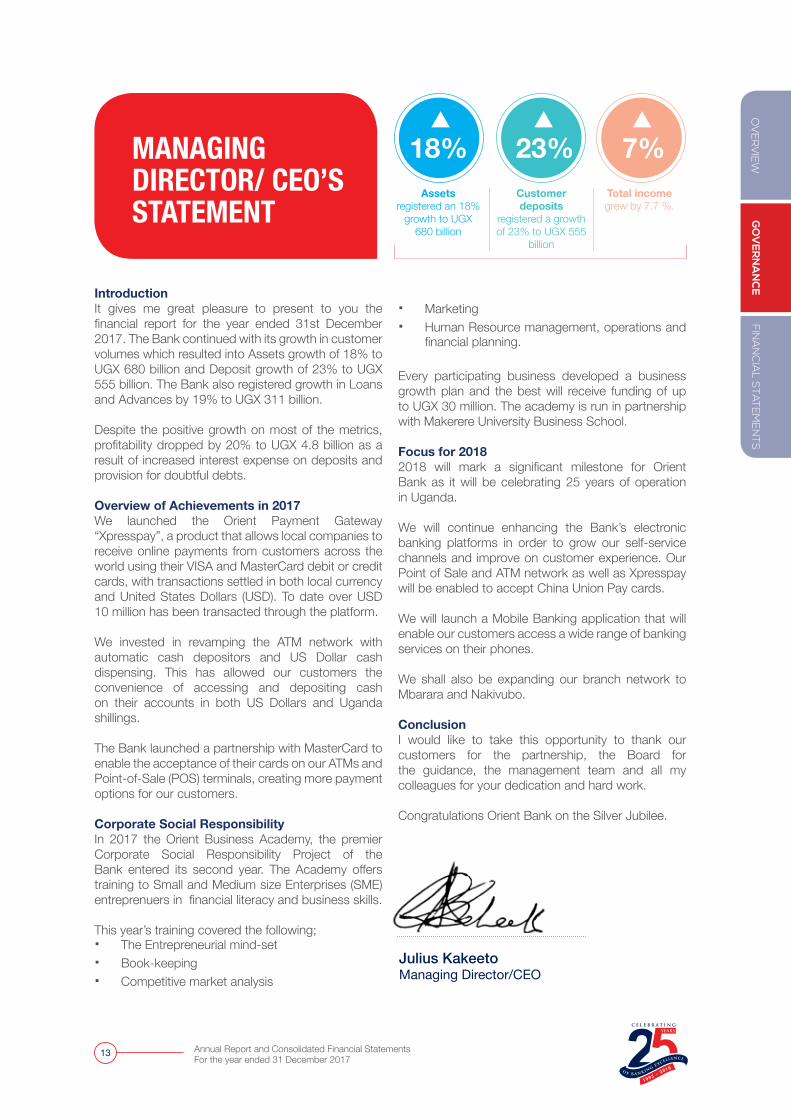
� Marketing � Human Resource management, operations and
financial planning.
Every participating business developed a business growth plan and the best will receive funding of up to UGX 30 million. The academy is run in partnership with Makerere University Business School.
Focus for 20182018 will mark a significant milestone for Orient Bank as it will be celebrating 25 years of operation in Uganda.
We will continue enhancing the Bank’s electronic banking platforms in order to grow our self-service channels and improve on customer experience. Our Point of Sale and ATM network as well as Xpresspay will be enabled to accept China Union Pay cards.
We will launch a Mobile Banking application that will enable our customers access a wide range of banking services on their phones.
We shall also be expanding our branch network to Mbarara and Nakivubo.
ConclusionI would like to take this opportunity to thank our customers for the partnership, the Board for the guidance, the management team and all my colleagues for your dedication and hard work.
Congratulations Orient Bank on the Silver Jubilee.
Julius KakeetoManaging Director/CEO
MANAGINGDIRECTOR/ CEO’S STATEMENT
Introduction It gives me great pleasure to present to you the financial report for the year ended 31st December 2017. The Bank continued with its growth in customer volumes which resulted into Assets growth of 18% to UGX 680 billion and Deposit growth of 23% to UGX 555 billion. The Bank also registered growth in Loans and Advances by 19% to UGX 311 billion. Despite the positive growth on most of the metrics, profitability dropped by 20% to UGX 4.8 billion as a result of increased interest expense on deposits and provision for doubtful debts.
Overview of Achievements in 2017We launched the Orient Payment Gateway “Xpresspay”, a product that allows local companies to receive online payments from customers across the world using their VISA and MasterCard debit or credit cards, with transactions settled in both local currency and United States Dollars (USD). To date over USD 10 million has been transacted through the platform.
We invested in revamping the ATM network with automatic cash depositors and US Dollar cash dispensing. This has allowed our customers the convenience of accessing and depositing cash on their accounts in both US Dollars and Uganda shillings.
The Bank launched a partnership with MasterCard to enable the acceptance of their cards on our ATMs and Point-of-Sale (POS) terminals, creating more payment options for our customers.
Corporate Social ResponsibilityIn 2017 the Orient Business Academy, the premier Corporate Social Responsibility Project of the Bank entered its second year. The Academy offers training to Small and Medium size Enterprises (SME) entreprenuers in financial literacy and business skills.
This year’s training covered the following; � The Entrepreneurial mind-set � Book-keeping � Competitive market analysis
18% 23% 7%Assets
registered an 18% growth to UGX
680 billion
Customer deposits
registered a growth of 23% to UGX 555
billion
Total income grew by 7.7 %.

Annual Report and Consolidated Financial Statements For the year ended 31 December 2017
14
SITTING (L -R) Julius Kakeeto - MD/CEO, Ketan Morjaria - Vice Chairman, Michael Cook - Chairman, Hemen Shashikant Shah - Non Executive Director
BOARD OF DIRECTORS

Annual Report and Consolidated Financial Statements For the year ended 31 December 2017
15
GO
VER
NA
NC
EFIN
AN
CIA
L STATEM
EN
TSO
VE
RV
IEW
STANDING (L - R) Zhong Shuang Quan - Non Executive Director, Joram Kahenano - Non Executive Director Darshana Bhatia - Executive Director Nicholas Ecimu - Secretary Francis M. Byaruhanga - Non Executive Director Jay Karia (not in photo) - Non Executive Director

Annual Report and Consolidated Financial Statements For the year ended 31 December 2017
16
MICHAEL COOK Chairman
Michael Cook was a senior career diplomat and a former British High Commissioner to Uganda, with a wide range of political and commercial experience in Scandinavia, the Caribbean, Turkey and Africa. After retiring from the Diplomatic Service he was a member of a commission established by David Cameron before he became British Prime Minister, to advise on future aid policy.
JULIUS KAKEETO Managing Director/CEO
Mr. Kakeeto is a Fellow of the Association of Chartered Certified Accountants (FCCA) and holds an MBA from Manchester Business School, United Kingdom. He has served in several management capacities, among others, in Citigroup London as a Vice President in Global Markets, in Citibank Uganda as Chief Financial Officer, and in Equity Bank Uganda as Finance Director. He started his career with Ernst & Young.
KETAN MORJARIA Vice Chairman
Mr. Morjaria is a founder and Board Member of both Orient Bank and Credit Bank in Kenya, and a strategic shareholder in both institutions. He has wide experience in commerce and property development in Africa, the United Kingdom, and the Middle East. He is a member of the Institute of Chartered Accountants of England and Wales and the Institute of Certified Public Accountants of Uganda.
HEMEN SHASHIKANT SHAH Non Executive Director
Mr. Hemen Shah is a graduate of Harvard University and a professional banker with over 23 years of cognitive experience. Mr. Shah has held several Board memberships including Directorships on the Boards of; SCB Sierra Leone, Gambia, Cameroon, Ghana and Chairman, Board of Directors for Standard Chartered Bank Cote d’Ivoire. Mr. Shah is a founding partner and Board member of 8 miles LLP.
JORAM KAHENANONon Executive Director
Mr. Kahenano is a Fellow of the Uganda Institute of Bankers and a Fellow of Chartered Institute of Bankers. He has held various director positions in Bank of Uganda where he worked for 36 years. He has in addition served on various Boards including Uganda Institute of Bankers, Makerere University, Mengo Hospital, Church of Uganda and Uganda Christian University. Joram is currently a trustee of Uganda Small Scale Industries.
RiCr Co Al
Cr Al Ri
Ri CrCoAl
RiAu
BOARD OF DIRECTORS
CrAl AuMember of Credit CommitteeMember of Asset and Liability Committee Member of Audit Committee

GO
VE
RN
AN
CE
FINA
NC
IAL S
TATEME
NTS
OV
ERV
IEW
Annual Report and Consolidated Financial Statements For the year ended 31 December 2017
17
FRANCIS MAGEMBE BYARUHANGA Non Executive Director
Mr. Byaruhanga holds a Masters Degree in Business Administration. He has over 25 years experience in the areas of Management, Finance, Accounting, Procurement and Logistics Management. He has worked with rural water and sanitation project on an executive level and was a Director Road Agency Formation Unit.
JAY KARIAAlternative - Non Executive Director
Mr. Karia is a business magnate with over 25 years diversified exposure in London, Kenya and Uganda. He has served in several managerial capacities as Manager Lloyds Exports UK, Manager Kabril Limited UK. He has also severed on several boards including Lloyds Exports and, Kabril Limited- in London UK, Orion FXB Ltd and Credit Bank in Nairobi Kenya.
ZHONG SHUANG QUANNon Executive Director
Mr. Zhong Shuang Quan holds a Bachelors of Arts in Business Management from the Sichuan Normal University. He is a prominent Businessman with diversified interests in East Africa, Asia and other parts of the world specializing in the fields of Manufacturing household plastics, Large Scale Rice farming, Import Trade in household goods and Road Transport. He has Managerial experience in Trade and Manufacturing Enterprise.
DARSHANA BHATIAExecutive Director
Ms. Bhatia is a member of the Institute of Chartered Accountants of India. She previously worked as Head of Finance at Exim Bank. Prior to that, Darshana worked as Head of Finance at Orient Bank from 2006 to 2013. She holds a Bachelor’s Degree in Commerce – Financial Accounting & Auditing from the University of Mumbai. She is also a member of the Institute of Cost & Works Accountants of India & the Institute of Certified Public Accountants of Uganda.
NICHOLAS ECIMUCompany Secretary
Mr. Ecimu practices law with Sebalu & Lule Advocates, a premier corporate and commercial law firm, where he is a Partner. He has previously served with the Privatisation & Utility Sector Reform Project (PUSRP) in Uganda’s Ministry of Finance, Planning and Economic Development and was attached to Edward Nathans Sonnenbergs, one of South Africa’s premier law firms, as visiting Attorney in 2006.
Al
Al
CrCo Au
Cr Al Ri
Ri CoMember of Risk/Compliance Committee Member of Compensation Committee Committee Chairman

Annual Report and Consolidated Financial Statements For the year ended 31 December 2017
18
ANDREW AGABAHead of Retail & SME
MILLIE NKAJAHead of Credit
DARSHANA BHATIAExecutive Director
JULIUS KAKEETOManaging Director/CEO
PANKAJ SHARMAHead of Operations
EXECUTIVE COMMITTEE
Annual Report and Consolidated Financial Statements For the year ended 31 December 2017
20
The Directors present their report together with the audited consolidated and separate financial statements of the Orient Bank Limited (the “Bank”) and its subsidiary, Equity Stock Brokers Limited (together ‘’the Consolidated’’) for the year ended 31 December 2017. ACTIVITIES The principal activities of the Bank are the provision of commercial banking and related financial services. The principal activity of the subsidiary is stock brokering. RESULTS AND DIVIDENDThe Consolidated and Bank profit for the year of Ushs 4,818 million (2016: profit of Ushs 6,036 million) and Ushs 4,810 million (2016: profit of Ushs 5,819 million) respectively has been transferred to retained earnings. The directors do not recommend payment of dividend for the year (2016: Nil). CORPORATE GOVERNANCEOrient Bank Limited has established a tradition of best practices in corporate governance. The corporate governance framework is based on an effective independent board, the separation of the board’s supervisory role from the executive management and the constitution of board committees generally comprising a majority of non-executive directors and chaired by a non-executive director to oversee critical areas. BOARD OF DIRECTORS Orient Bank Limited has a broad-based Board of Directors. The board functions either as a full board or through various committees constituted to oversee specific operational areas. The Board has constituted six committees. These are the Audit Committee, Risk Committee, Asset & Liability Committee, Remunerations and Nominations Committee, Credit Committee, Board IT Committee. All of these Board Committees are constituted and chaired by non-executive directors. As at 31 December 2017, the Board of Directors consisted of 8 members. a) Audit Committee This committee is chaired by an independent Non-Executive Director. The committee meets every quarter and also comprises:
i) Mr. Francis M. Byaruhangaii) Mr. Joram Kahenano
The Audit Committee informs the Bank and the Board of any risks, suspected frauds or irregularities, failures
of internal control or suspected infringements of laws, rules and regulations which come to its attention. b) Asset and Liability Committee ALCO is headed by a Non-Executive Director and meets quarterly. It also comprises the following:
i) Mr. Hemen Shashikant Shah ii) Mr. Ketan Morjaria iii) Mr. Zhong Shuang Quan (Alternative: Mr. Jay Karia) iv) Mr. Julius Kakeeto v) Ms. Darshana Bhatia
The overall objective of the Asset and Liability Committee is to maximize earning and return on capital with acceptable and controllable levels of the main treasury risks i.e. liquidity, interest rate, foreign exchange and concentration risks. The assets and liabilities of the Bank shall be managed to maximize shareholder value, to enhance profitability and increase capital, and to protect the Bank from any excessive financial risks arising from changes in interest rates. c) Remuneration and Nominations Committee This committee decides on recruitment at senior levels based on responsibilities and remuneration of management staff and directors. It meets quarterly. The committee is headed by a Non-Executive Director and comprises:
i) Mr. Francis M. Byaruhanga ii) Mr. Ketan Morjaria iii) Mr. Hemen Shashikant Shah
The Committee is responsible for ensuring that the Board remains balanced, both in terms of skills and experience, and between Executive and Non-Executive Directors. It is authorized to lead the process for appointments to the Board, and make recommendations to the Board, ensuring there is a formal, rigorous and transparent procedure.
d) Risk committee This committee is headed by a Non-Executive Director and meets quarterly. It is comprised of the following members:
i) Mr. Hemen Shashikant Shah ii) Mr. Joram Kahenano iii) Mr. Ketan Morjaria iv) Mr. Julius Kakeeto v) Ms. Darshana Bhatia
The committee is granted the authority for (i) oversight and advice to the board in relation to the current and potential risk exposures of OBL; (ii) oversight of the Bank’s Risk Management Framework; (iii) the future
REPORT OF THE DIRECTORS
GO
VE
RN
AN
CE
FINA
NC
IAL S
TATEME
NTS
OV
ERV
IEW
Annual Report and Consolidated Financial Statements For the year ended 31 December 2017
21
risk strategy of the bank, including strategy for capital and liquidity management and the determination of risk appetite and tolerance, and (iii) promoting a risk awareness culture in the bank, alongside established policies and procedures. e) Credit Committee The Board Credit Committee is chaired by a Non-Executive Director. It meets quarterly and comprises:
i) Mr. Ketan Morjaria ii) Mr. Hemen Shashikant Shah iii) Mr. Francis M. Byaruhanga iv) Mr. Julius Kakeeto v) Ms. Darshana Bhatia
The Credit Committee seeks to ensure that the quality of the Bank’s asset book remains within acceptable parameters and that the business has an effective credit policy, consistent with regulatory requirements and prudent risk management practices. f) IT Committee The Board IT Committee is chaired by a Non-Executive Director. It meets quarterly and comprises:
i) Mr. Ketan Morjaria ii) Mr. Hemen Shashikant Shah iii) Mr. Julius Kakeeto iv) Ms. Darshana Bhatia
The IT Committee is granted the authority for oversight and advice to the Board on IT strategy and initiatives, and to oversee the implementation and cost effectiveness of IT projects and IT security. In addition to the above committees, there are committees on a management level comprised of senior management whose frequency of meetings is daily, weekly, monthly and quarterly. Directors and their BenefitsDuring the financial year and up to the date of this report, other than as disclosed in Note 37 to the financial statements, no director has received or
become entitled to receive any benefit other than directors’ fees, and amounts receivable by executive directors under employment contracts and the senior staff incentive scheme. The aggregate amount of emoluments for directors for services rendered in the financial year is disclosed in Note 36 to the financial statements. Neither at the end of the financial year nor at any time during the year did there exist any arrangement to which the Bank is a party whereby directors might acquire benefits by means of acquisition of shares in or debentures of the Bank or any other body corporate. DIRECTORSThe directors who held office during the year and up to the date of this report are indicated on page 3. STATEMENT OF GOING CONCERN Nothing has come to the attention of the directors to indicate that the Consolidated will not remain a going concern for at least twelve months from the date of this statement. INDEPENDENT AUDITORS The auditors, Deloitte & Touche, were appointed during the year and have expressed their willingness to continue in office in accordance with section 167(2) of the Ugandan Companies Act, 2012. BY ORDER OF THE BOARD
Secretary Nicholas Ecimu C/O Sebalu & Lule Advocates Kampala
Annual Report and Consolidated Financial Statements For the year ended 31 December 2017
22
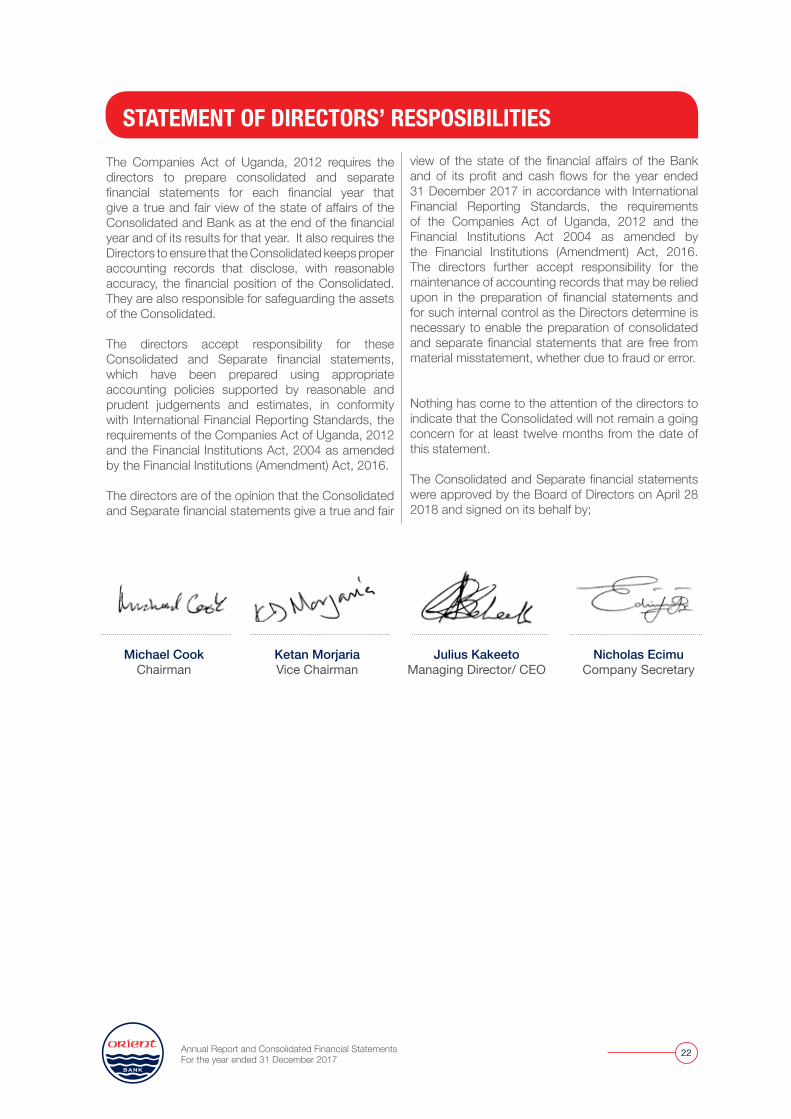
view of the state of the financial affairs of the Bank and of its profit and cash flows for the year ended 31 December 2017 in accordance with International Financial Reporting Standards, the requirements of the Companies Act of Uganda, 2012 and the Financial Institutions Act 2004 as amended by the Financial Institutions (Amendment) Act, 2016. The directors further accept responsibility for the maintenance of accounting records that may be relied upon in the preparation of financial statements and for such internal control as the Directors determine is necessary to enable the preparation of consolidated and separate financial statements that are free from material misstatement, whether due to fraud or error. Nothing has come to the attention of the directors to indicate that the Consolidated will not remain a going concern for at least twelve months from the date of this statement. The Consolidated and Separate financial statements were approved by the Board of Directors on April 28 2018 and signed on its behalf by;
The Companies Act of Uganda, 2012 requires the directors to prepare consolidated and separate financial statements for each financial year that give a true and fair view of the state of affairs of the Consolidated and Bank as at the end of the financial year and of its results for that year. It also requires the Directors to ensure that the Consolidated keeps proper accounting records that disclose, with reasonable accuracy, the financial position of the Consolidated. They are also responsible for safeguarding the assets of the Consolidated. The directors accept responsibility for these Consolidated and Separate financial statements, which have been prepared using appropriate accounting policies supported by reasonable and prudent judgements and estimates, in conformity with International Financial Reporting Standards, the requirements of the Companies Act of Uganda, 2012 and the Financial Institutions Act, 2004 as amended by the Financial Institutions (Amendment) Act, 2016.
The directors are of the opinion that the Consolidated and Separate financial statements give a true and fair
Michael CookChairman
Ketan MorjariaVice Chairman
Nicholas EcimuCompany Secretary
Julius KakeetoManaging Director/ CEO
STATEMENT OF DIRECTORS’ RESPOSIBILITIES
GO
VE
RN
AN
CE
FINA
NC
IAL S
TATEME
NTS
OV
ERV
IEW
Annual Report and Consolidated Financial Statements For the year ended 31 December 2017
23
REPORT ON THE CONSOLIDATED AND SEPARATE FINANCIAL STATEMENTS
Opinion We have audited the consolidated and separate financial statements of Orient Bank Limited and its subsidiary, as set out on pages 14 to 123. These Consolidated and Separate financial statements (“the financial statements”) comprise the Consolidated and Separate Statements of financial position as at 31 December 2017, and the Consolidated and Separate Statements of profit or loss and other comprehensive income, Consolidated and Separate Statements of changes in equity and Consolidated and Separate Statements of cash flows for the year then ended, and notes to the financial statements, including a summary of significant accounting policies. In our opinion, the Consolidated and separate financial statements present fairly the state of the financial affairs of the Consolidated and Bank as at 31 December 2017, and of their financial performance and cash flows for the year then ended in accordance with International Financial Reporting Standards
(IFRSs) and requirements of the Uganda Companies Act, 2012 as well as the Financial Institutions Act 2004 as amended by the Financial Institutions (Amendment) Act, 2016. Basis for Opinion We conducted our audit in accordance with International Standards on Auditing (ISAs). Our responsibilities under those standards are further described in the Auditor’s Responsibilities for the Audit of the Financial Statements section of our report.
We are independent of the Bank in accordance with the International Ethics Standards Board for Accountants’ Code of Ethics for Professional Accountants (IESBA Code) together with the ethical requirements that are relevant to our audit of the financial statements in Uganda. We have fulfilled our other ethical responsibilities in accordance with these requirements and the IESBA Code. We believe that the audit evidence we have obtained is sufficient and appropriate to provide a basis for our opinion.
INDEPENDENT AUDITORS REPORT TO THE MEMBERS OF ORIENT BANK LIMITED
Key audit mattersKey audit matters are those matters that, in our professional judgement, were of most significance in our audit of the consolidated and separate financial statements for the current period. These matters were addressed in the context of our audit of the consolidated and separate financial statements as a whole, and in forming our opinion thereon, and we do not provide a separate opinionon these matters.
Key Audit Matter How the matter was addressed in the audit
Allowance for impairment on loans and advances
The allowance for impairment of loans to customers is considered to be a matter of significance as it requires the application of significant judgement and use of subjective assumptions by the directors. The Bank records both individual and portfolio allowances of loans and advances to customers.
The Corporate banking cluster (collectively “corporate”) represent 79% (Ushs 253 Billion) of the group`s net loan exposure, whereas Retail clients represent 21% (Ushs 66 Billion). These exposures are different in nature and require specific considerations in regards to loan impairment.
All loans that show increased credit risks, based on management judgement and primarily based on days in arrears, are monitored individually (individual impairment assessment).
Our audit included identifying relevant controls that address the impairment risks identified and evaluating the design and implementation, and where possible the operating effectiveness, of these controls.
We focused on controls over the identification of impairment losses; the governance processes in place for credit models, inputs and assumptions; the credit forums where key judgements are considered; and how the Directors ensure they have appropriate oversight over loan provisions.
a) Our procedures in response to the risks specific to the individually assessed impairment (in the Corporate and retail clusters) included the following;
• We selected a sample of performing loans and advances and performed a detailed independent assessment of the credit losses identified, focusing on whether there is evidence of an incurred loss.
Ü
Annual Report and Consolidated Financial Statements For the year ended 31 December 2017
24
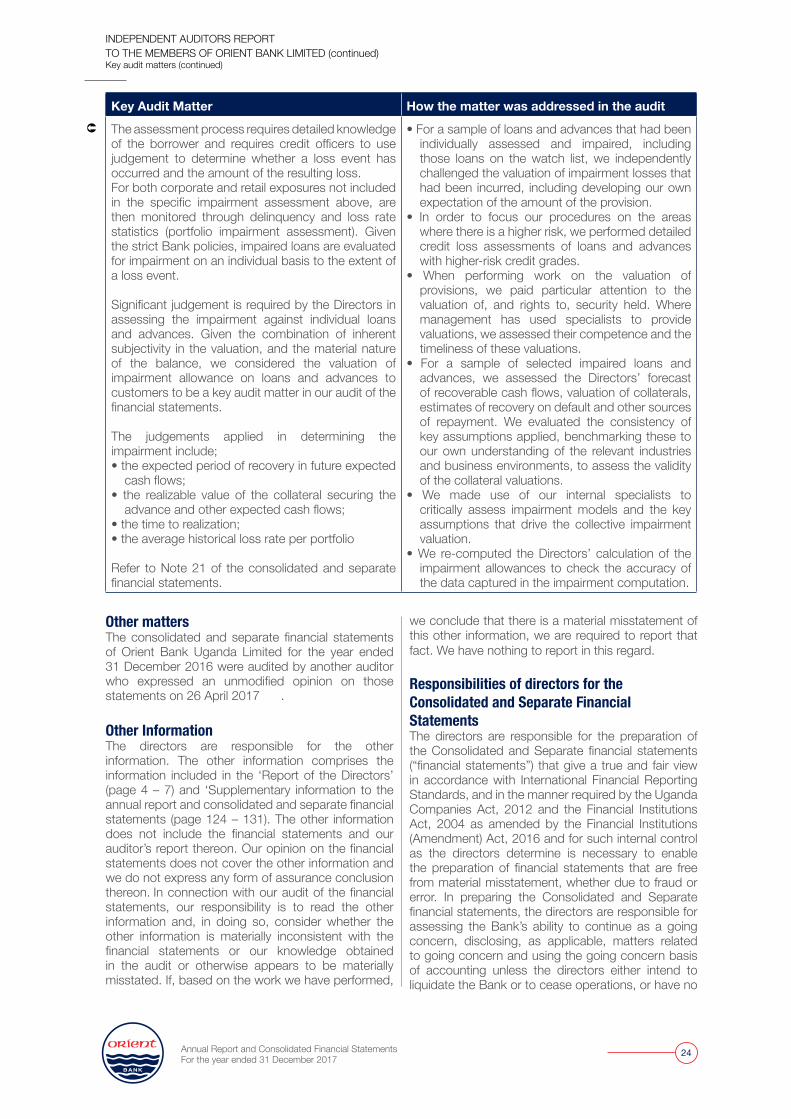
Key Audit Matter How the matter was addressed in the audit
The assessment process requires detailed knowledge of the borrower and requires credit officers to use judgement to determine whether a loss event has occurred and the amount of the resulting loss.For both corporate and retail exposures not included in the specific impairment assessment above, are then monitored through delinquency and loss rate statistics (portfolio impairment assessment). Given the strict Bank policies, impaired loans are evaluated for impairment on an individual basis to the extent of a loss event.
Significant judgement is required by the Directors in assessing the impairment against individual loans and advances. Given the combination of inherent subjectivity in the valuation, and the material nature of the balance, we considered the valuation of impairment allowance on loans and advances to customers to be a key audit matter in our audit of the financial statements.
The judgements applied in determining the impairment include; • the expected period of recovery in future expected
cash flows;• the realizable value of the collateral securing the
advance and other expected cash flows;• the time to realization;• the average historical loss rate per portfolio
Refer to Note 21 of the consolidated and separate financial statements.
• For a sample of loans and advances that had been individually assessed and impaired, including those loans on the watch list, we independently challenged the valuation of impairment losses that had been incurred, including developing our own expectation of the amount of the provision.
• In order to focus our procedures on the areas where there is a higher risk, we performed detailed credit loss assessments of loans and advances with higher-risk credit grades.
• When performing work on the valuation of provisions, we paid particular attention to the valuation of, and rights to, security held. Where management has used specialists to provide valuations, we assessed their competence and the timeliness of these valuations.
• For a sample of selected impaired loans and advances, we assessed the Directors’ forecast of recoverable cash flows, valuation of collaterals, estimates of recovery on default and other sources of repayment. We evaluated the consistency of key assumptions applied, benchmarking these to our own understanding of the relevant industries and business environments, to assess the validity of the collateral valuations.
• We made use of our internal specialists to critically assess impairment models and the key assumptions that drive the collective impairment valuation.
• We re-computed the Directors’ calculation of the impairment allowances to check the accuracy of the data captured in the impairment computation.
Other mattersThe consolidated and separate financial statements of Orient Bank Uganda Limited for the year ended 31 December 2016 were audited by another auditor who expressed an unmodified opinion on those statements on 26 April 2017 .
Other Information The directors are responsible for the other information. The other information comprises the information included in the ‘Report of the Directors’ (page 4 – 7) and ‘Supplementary information to the annual report and consolidated and separate financial statements (page 124 – 131). The other information does not include the financial statements and our auditor’s report thereon. Our opinion on the financial statements does not cover the other information and we do not express any form of assurance conclusion thereon. In connection with our audit of the financial statements, our responsibility is to read the other information and, in doing so, consider whether the other information is materially inconsistent with the financial statements or our knowledge obtained in the audit or otherwise appears to be materially misstated. If, based on the work we have performed,
we conclude that there is a material misstatement of this other information, we are required to report that fact. We have nothing to report in this regard.
Responsibilities of directors for the Consolidated and Separate Financial Statements The directors are responsible for the preparation of the Consolidated and Separate financial statements (“financial statements”) that give a true and fair view in accordance with International Financial Reporting Standards, and in the manner required by the Uganda Companies Act, 2012 and the Financial Institutions Act, 2004 as amended by the Financial Institutions (Amendment) Act, 2016 and for such internal control as the directors determine is necessary to enable the preparation of financial statements that are free from material misstatement, whether due to fraud or error. In preparing the Consolidated and Separate financial statements, the directors are responsible for assessing the Bank’s ability to continue as a going concern, disclosing, as applicable, matters related to going concern and using the going concern basis of accounting unless the directors either intend to liquidate the Bank or to cease operations, or have no
Û
INDEPENDENT AUDITORS REPORT TO THE MEMBERS OF ORIENT BANK LIMITED (continued)Key audit matters (continued)
GO
VE
RN
AN
CE
FINA
NC
IAL S
TATEME
NTS
OV
ERV
IEW
Annual Report and Consolidated Financial Statements For the year ended 31 December 2017
25
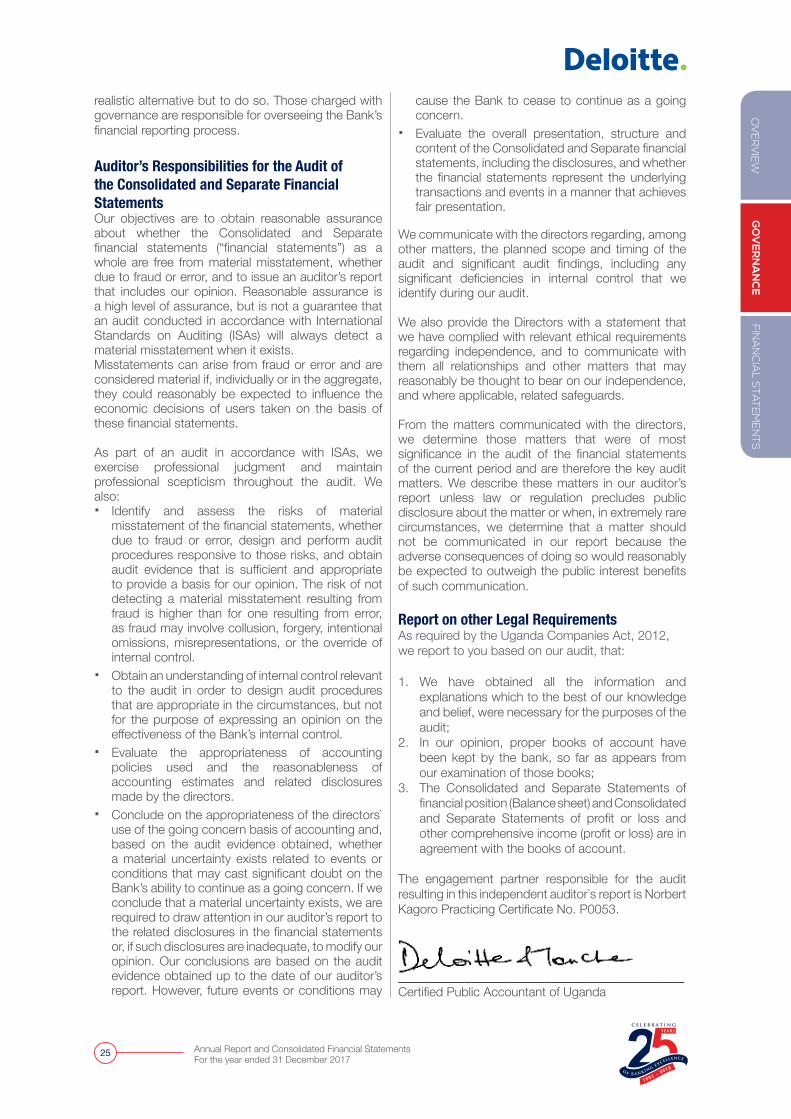
realistic alternative but to do so. Those charged with governance are responsible for overseeing the Bank’s financial reporting process.
Auditor’s Responsibilities for the Audit of the Consolidated and Separate Financial StatementsOur objectives are to obtain reasonable assurance about whether the Consolidated and Separate financial statements (“financial statements”) as a whole are free from material misstatement, whether due to fraud or error, and to issue an auditor’s report that includes our opinion. Reasonable assurance is a high level of assurance, but is not a guarantee that an audit conducted in accordance with International Standards on Auditing (ISAs) will always detect a material misstatement when it exists. Misstatements can arise from fraud or error and are considered material if, individually or in the aggregate, they could reasonably be expected to influence the economic decisions of users taken on the basis of these financial statements. As part of an audit in accordance with ISAs, we exercise professional judgment and maintain professional scepticism throughout the audit. We also: � Identify and assess the risks of material
misstatement of the financial statements, whether due to fraud or error, design and perform audit procedures responsive to those risks, and obtain audit evidence that is sufficient and appropriate to provide a basis for our opinion. The risk of not detecting a material misstatement resulting from fraud is higher than for one resulting from error, as fraud may involve collusion, forgery, intentional omissions, misrepresentations, or the override of internal control.
� Obtain an understanding of internal control relevant to the audit in order to design audit procedures that are appropriate in the circumstances, but not for the purpose of expressing an opinion on the effectiveness of the Bank’s internal control.
� Evaluate the appropriateness of accounting policies used and the reasonableness of accounting estimates and related disclosures made by the directors.
� Conclude on the appropriateness of the directors` use of the going concern basis of accounting and, based on the audit evidence obtained, whether a material uncertainty exists related to events or conditions that may cast significant doubt on the Bank’s ability to continue as a going concern. If we conclude that a material uncertainty exists, we are required to draw attention in our auditor’s report to the related disclosures in the financial statements or, if such disclosures are inadequate, to modify our opinion. Our conclusions are based on the audit evidence obtained up to the date of our auditor’s report. However, future events or conditions may
cause the Bank to cease to continue as a going concern.
� Evaluate the overall presentation, structure and content of the Consolidated and Separate financial statements, including the disclosures, and whether the financial statements represent the underlying transactions and events in a manner that achieves fair presentation.
We communicate with the directors regarding, among other matters, the planned scope and timing of the audit and significant audit findings, including any significant deficiencies in internal control that we identify during our audit.
We also provide the Directors with a statement that we have complied with relevant ethical requirements regarding independence, and to communicate with them all relationships and other matters that may reasonably be thought to bear on our independence, and where applicable, related safeguards. From the matters communicated with the directors, we determine those matters that were of most significance in the audit of the financial statements of the current period and are therefore the key audit matters. We describe these matters in our auditor’s report unless law or regulation precludes public disclosure about the matter or when, in extremely rare circumstances, we determine that a matter should not be communicated in our report because the adverse consequences of doing so would reasonably be expected to outweigh the public interest benefits of such communication.
Report on other Legal Requirements As required by the Uganda Companies Act, 2012, we report to you based on our audit, that: 1. We have obtained all the information and
explanations which to the best of our knowledge and belief, were necessary for the purposes of the audit;
2. In our opinion, proper books of account have been kept by the bank, so far as appears from our examination of those books;
3. The Consolidated and Separate Statements of financial position (Balance sheet) and Consolidated and Separate Statements of profit or loss and other comprehensive income (profit or loss) are in agreement with the books of account.
The engagement partner responsible for the audit resulting in this independent auditor`s report is Norbert Kagoro Practicing Certificate No. P0053.
___________________________________________Certified Public Accountant of Uganda
Annual Report and Consolidated Financial Statements For the year ended 31 December 2017
26
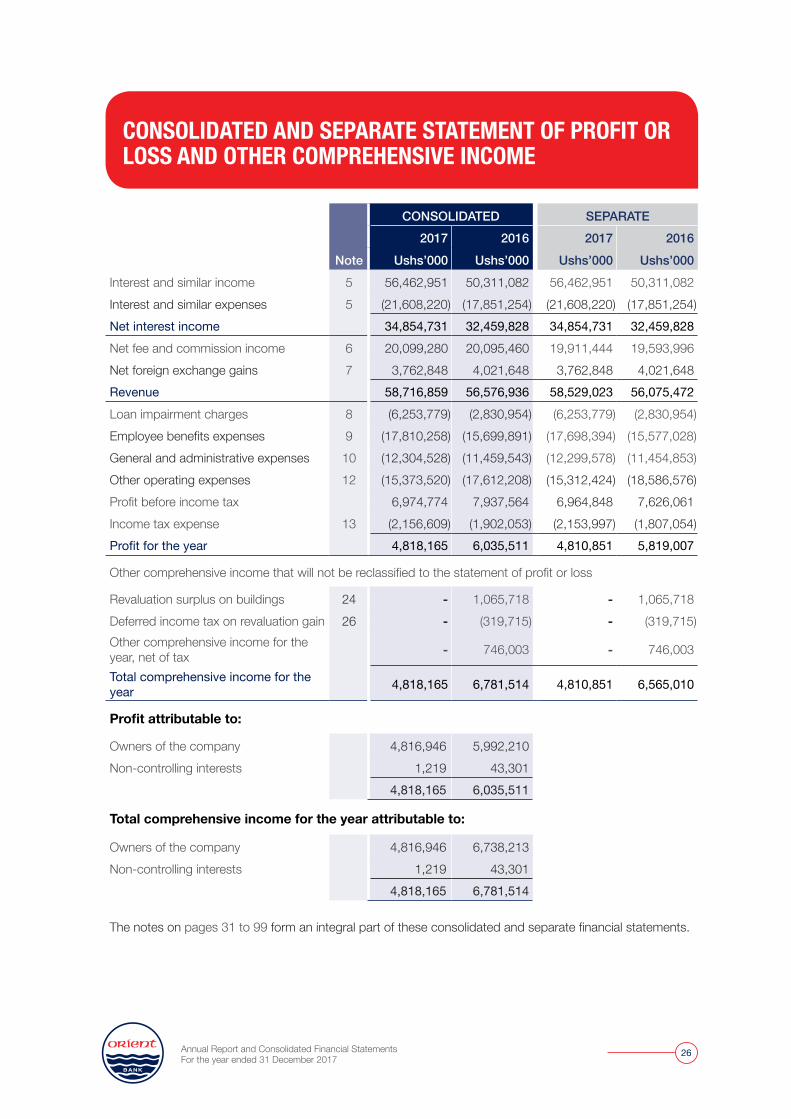
CONSOLIDATED SEPARATE2017 2016 2017 2016
Note Ushs’000 Ushs’000 Ushs’000 Ushs’000Interest and similar income 5 56,462,951 50,311,082 56,462,951 50,311,082 Interest and similar expenses 5 (21,608,220) (17,851,254) (21,608,220) (17,851,254)Net interest income 34,854,731 32,459,828 34,854,731 32,459,828 Net fee and commission income 6 20,099,280 20,095,460 19,911,444 19,593,996 Net foreign exchange gains 7 3,762,848 4,021,648 3,762,848 4,021,648 Revenue 58,716,859 56,576,936 58,529,023 56,075,472 Loan impairment charges 8 (6,253,779) (2,830,954) (6,253,779) (2,830,954)Employee benefits expenses 9 (17,810,258) (15,699,891) (17,698,394) (15,577,028)General and administrative expenses 10 (12,304,528) (11,459,543) (12,299,578) (11,454,853)Other operating expenses 12 (15,373,520) (17,612,208) (15,312,424) (18,586,576)Profit before income tax 6,974,774 7,937,564 6,964,848 7,626,061 Income tax expense 13 (2,156,609) (1,902,053) (2,153,997) (1,807,054)Profit for the year 4,818,165 6,035,511 4,810,851 5,819,007
Other comprehensive income that will not be reclassified to the statement of profit or loss
Revaluation surplus on buildings 24 - 1,065,718 - 1,065,718 Deferred income tax on revaluation gain 26 - (319,715) - (319,715)Other comprehensive income for the year, net of tax - 746,003 - 746,003
Total comprehensive income for the year 4,818,165 6,781,514 4,810,851 6,565,010
Profit attributable to:
Owners of the company 4,816,946 5,992,210 Non-controlling interests 1,219 43,301
4,818,165 6,035,511
Total comprehensive income for the year attributable to:
Owners of the company 4,816,946 6,738,213 Non-controlling interests 1,219 43,301
4,818,165 6,781,514
The notes on pages 31 to 99 form an integral part of these consolidated and separate financial statements.
CONSOLIDATED AND SEPARATE STATEMENT OF PROFIT OR LOSS AND OTHER COMPREHENSIVE INCOME
GO
VER
NA
NC
EFIN
AN
CIA
L STA
TEM
EN
TSO
VER
VIE
W
Annual Report and Consolidated Financial Statements For the year ended 31 December 2017
27
CONSOLIDATED AND SEPARATE STATEMENT OF FINANCIAL POSITION
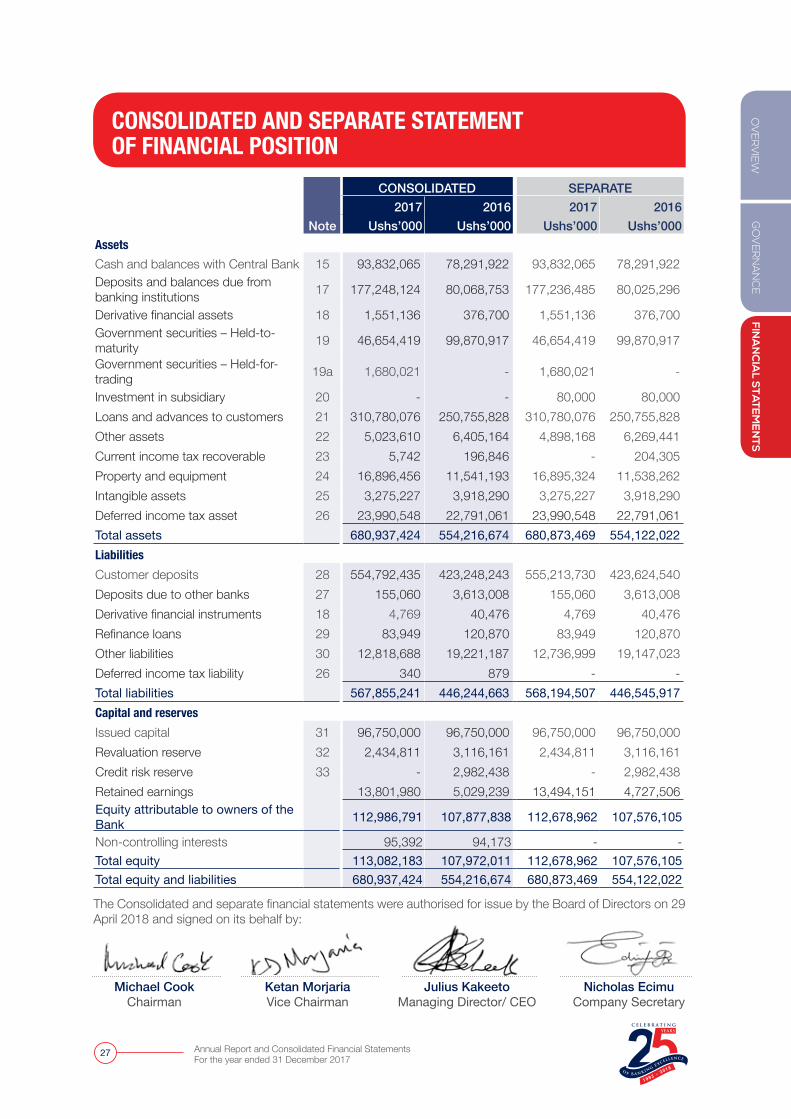
CONSOLIDATED SEPARATE2017 2016 2017 2016
Note Ushs’000 Ushs’000 Ushs’000 Ushs’000AssetsCash and balances with Central Bank 15 93,832,065 78,291,922 93,832,065 78,291,922 Deposits and balances due from banking institutions 17 177,248,124 80,068,753 177,236,485 80,025,296
Derivative financial assets 18 1,551,136 376,700 1,551,136 376,700 Government securities – Held-to-maturity 19 46,654,419 99,870,917 46,654,419 99,870,917
Government securities – Held-for-trading 19a 1,680,021 - 1,680,021 -
Investment in subsidiary 20 - - 80,000 80,000 Loans and advances to customers 21 310,780,076 250,755,828 310,780,076 250,755,828 Other assets 22 5,023,610 6,405,164 4,898,168 6,269,441 Current income tax recoverable 23 5,742 196,846 - 204,305 Property and equipment 24 16,896,456 11,541,193 16,895,324 11,538,262 Intangible assets 25 3,275,227 3,918,290 3,275,227 3,918,290 Deferred income tax asset 26 23,990,548 22,791,061 23,990,548 22,791,061 Total assets 680,937,424 554,216,674 680,873,469 554,122,022 Liabilities Customer deposits 28 554,792,435 423,248,243 555,213,730 423,624,540 Deposits due to other banks 27 155,060 3,613,008 155,060 3,613,008 Derivative financial instruments 18 4,769 40,476 4,769 40,476 Refinance loans 29 83,949 120,870 83,949 120,870 Other liabilities 30 12,818,688 19,221,187 12,736,999 19,147,023 Deferred income tax liability 26 340 879 - - Total liabilities 567,855,241 446,244,663 568,194,507 446,545,917 Capital and reservesIssued capital 31 96,750,000 96,750,000 96,750,000 96,750,000 Revaluation reserve 32 2,434,811 3,116,161 2,434,811 3,116,161 Credit risk reserve 33 - 2,982,438 - 2,982,438 Retained earnings 13,801,980 5,029,239 13,494,151 4,727,506 Equity attributable to owners of the Bank 112,986,791 107,877,838 112,678,962 107,576,105
Non-controlling interests 95,392 94,173 - - Total equity 113,082,183 107,972,011 112,678,962 107,576,105 Total equity and liabilities 680,937,424 554,216,674 680,873,469 554,122,022
The Consolidated and separate financial statements were authorised for issue by the Board of Directors on 29 April 2018 and signed on its behalf by:
Michael CookChairman
Ketan MorjariaVice Chairman
Nicholas EcimuCompany Secretary
Julius KakeetoManaging Director/ CEO
Annual Report and Consolidated Financial Statements For the year ended 31 December 2017
28
CONS
OLID
ATED
STA
TEM
ENT
OF C
HANG
ES IN
EQU
ITY
Issu
ed c
apita
lRe
valu
atio
n re
serv
eC
redi
t ris
k re
serv
eRe
tain
ed
earn
ings
Tota
l attr
ibut
able
to
equ
ity h
olde
rs
of th
e pa
rent
Non
-co
ntro
lling
in
tere
stTo
tal e
quity
Ush
s’00
0U
shs’
000
Ush
s’00
0U
shs’
000
Ush
s’00
0U
shs’
000
Ush
s’00
0
Year
end
ed 3
1 D
ecem
ber 2
016
(Not
e 32)
(Not
e 33)
(Not
e 34)
At s
tart
of y
ear
76,5
00,0
002,
601,
106
225,
099
1,49
7,89
780
,824
,102
50,8
7280
,874
,974
Profi
t for
the
year
--
-5,
992,
210
5,99
2,21
043
,301
6,03
5,51
1
Gain
on
prop
erty
reva
luat
ion
-74
6,00
3-
-74
6,00
3-
746,
003
Tota
l com
preh
ensi
ve in
com
e fo
r the
yea
r-
746,
003
-5,
992,
210
6,73
8,21
343
,301
6,78
1,51
4
Tran
sfer
to re
tain
ed e
arni
ngs
-(2
30,9
48)
-29
6,47
165
,523
-65
,523
Tota
l76
,500
,000
3,11
6,16
122
5,09
97,
786,
578
87,6
27,8
3894
,173
87,7
22,0
11
Tran
sfer
to c
redi
t risk
rese
rve
--
2,75
7,33
9(2
,757
,339
)-
--
Tran
sact
ions
with
ow
ners
-In
crea
se in
issu
ed c
apita
l20
,250
,000
--
-20
,250
,000
-20
,250
,000
At e
nd o
f yea
r96
,750
,000
3,11
6,16
12,
982,
438
5,02
9,23
910
7,87
7,83
894
,173
107,
972,
011
Year
end
ed 3
1 D
ecem
ber 2
017
At s
tart
of y
ear
96,7
50,0
003,
116,
161
2,98
2,43
85,
029,
239
107,
877,
838
94,1
7310
7,97
2,01
1
Profi
t for
the
year
-4,
816,
946
4,81
6,94
61,
219
4,81
8,16
5
Tota
l com
preh
ensiv
e in
com
e fo
r the
yea
r-
--
4,81
6,94
64,
816,
946
1,21
94,
818,
165
Tran
sfer
to re
tain
ed e
arni
ngs
-(9
73,3
57)
-97
3,35
7-
--
Defe
rred
inco
me
tax
ther
eon
-29
2,00
7-
-29
2,00
7-
292,
007
Tota
l96
,750
,000
2,43
4,81
12,
982,
438
10,8
19,5
4211
2,98
6,79
195
,392
113,
082,
183
Tran
sfer
to c
redi
t risk
rese
rve
--
(2,9
82,4
38)
2,98
2,43
8-
--
At e
nd o
f yea
r96
,750
,000
2,43
4,81
1-
13,8
01,9
8011
2,98
6,79
195
,392
113,
082,
183
GO
VER
NA
NC
EFIN
AN
CIA
L STA
TEM
EN
TSO
VER
VIE
W
Annual Report and Consolidated Financial Statements For the year ended 31 December 2017
29
SEPA
RATE
STA
TEM
ENT
OF C
HANG
ES IN
EQU
ITY
Issu
ed c
apita
lRe
valu
atio
n re
serv
eC
redi
t ris
k re
serv
eRe
tain
ed e
arni
ngs
Tota
l equ
ity
Ush
s’00
0U
shs’
000
Ush
s’00
0U
shs’
000
Ush
s’00
0
Year
end
ed 3
1 D
ecem
ber 2
016
(Not
e 32
)(N
ote
33)
(Not
e 34
)At
sta
rt of
yea
r76
,500
,000
2,60
1,10
622
5,09
91,
369,
366
80,6
95,5
72
Profi
t for
the
year
--
-5,
819,
007
5,81
9,00
7
Incr
ease
in re
valu
atio
n su
rplu
s-
746,
004
-74
6,00
4
Tota
l com
preh
ensi
ve in
com
e fo
r the
yea
r-
746,
004
-5,
819,
007
6,56
5,01
1
Tran
sfer
to re
tain
ed e
arni
ngs
-(2
30,9
49)
296,
471
65,5
22
Tota
l76
,500
,000
3,11
6,16
122
5,09
97,
484,
845
87,3
26,1
03
Tran
sfer
to c
redi
t risk
rese
rve
--
2,75
7,33
9(2
,757
,339
)-
Tran
sact
ions
with
ow
ners
:In
crea
se in
issu
ed c
apita
l20
,250
,000
--
-20
,250
,000
At e
nd o
f yea
r96
,750
,000
3,11
6,16
12,
982,
438
4,72
7,50
610
7,57
6,10
5
Year
end
ed 3
1 De
cem
ber 2
017
At s
tart
of y
ear
96,7
50,0
003,
116,
161
2,98
2,43
84,
727,
506
107,
576,
104
Profi
t for
the
year
--
-4,
810,
851
4,81
0,85
1
Tota
l com
preh
ensi
ve in
com
e fo
r the
yea
r-
--
4,81
0,85
14,
810,
851
Tran
sfer
to re
tain
ed e
arni
ngs
-(9
73,3
57)
-97
3,35
7-
Defe
rred
inco
me
tax
ther
eon
-29
2,00
7-
-29
2,00
7
Tota
l96
,750
,000
2,43
4,81
12,
982,
438
10,5
11,7
1411
2,67
8,96
2
Tran
sfer
from
cre
dit r
isk re
serv
e-
-(2
,982
,438
)2,
982,
438
-
Tran
sact
ions
with
ow
ners
:At
end
of y
ear
96,7
50,0
002,
434,
811
-13
,494
,151
112,
678,
962
Annual Report and Consolidated Financial Statements For the year ended 31 December 2017
30
CONSOLIDATED SEPARATE2017 2016 2017 2016
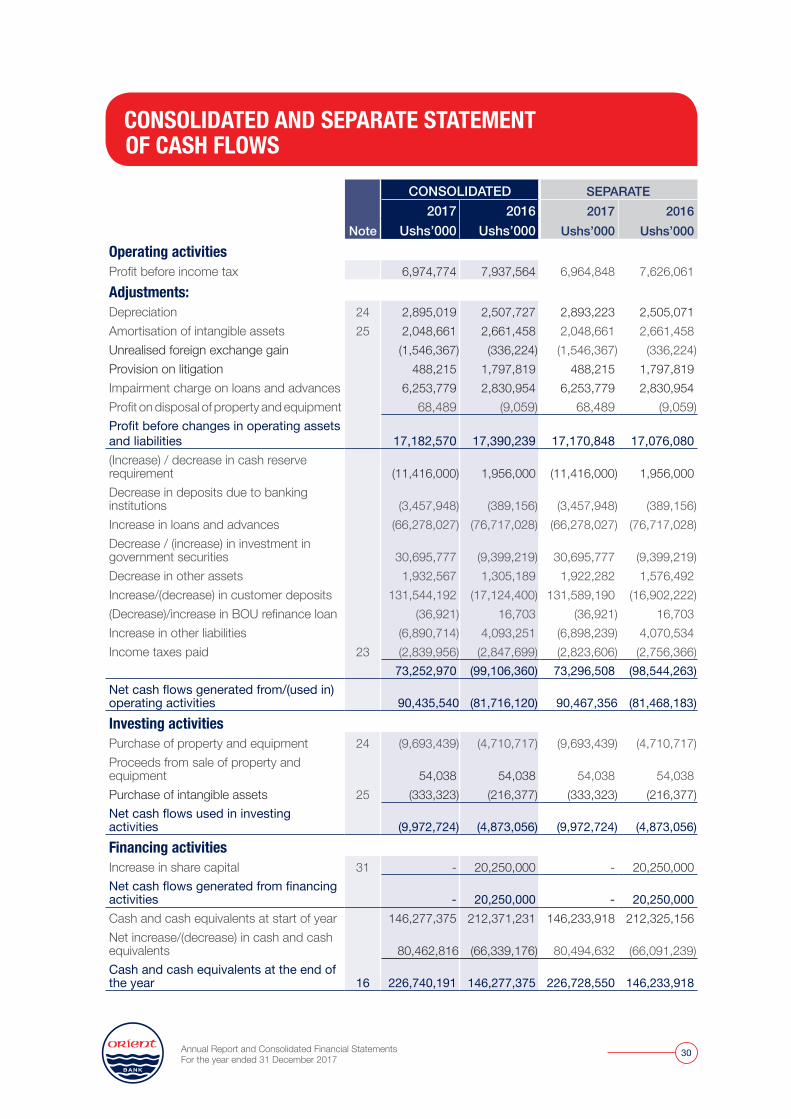
Note Ushs’000 Ushs’000 Ushs’000 Ushs’000Operating activitiesProfit before income tax 6,974,774 7,937,564 6,964,848 7,626,061Adjustments:Depreciation 24 2,895,019 2,507,727 2,893,223 2,505,071Amortisation of intangible assets 25 2,048,661 2,661,458 2,048,661 2,661,458Unrealised foreign exchange gain (1,546,367) (336,224) (1,546,367) (336,224)Provision on litigation 488,215 1,797,819 488,215 1,797,819Impairment charge on loans and advances 6,253,779 2,830,954 6,253,779 2,830,954Profit on disposal of property and equipment 68,489 (9,059) 68,489 (9,059)Profit before changes in operating assets and liabilities 17,182,570 17,390,239 17,170,848 17,076,080(Increase) / decrease in cash reserve requirement (11,416,000) 1,956,000 (11,416,000) 1,956,000Decrease in deposits due to banking institutions (3,457,948) (389,156) (3,457,948) (389,156)Increase in loans and advances (66,278,027) (76,717,028) (66,278,027) (76,717,028)Decrease / (increase) in investment in government securities 30,695,777 (9,399,219) 30,695,777 (9,399,219)Decrease in other assets 1,932,567 1,305,189 1,922,282 1,576,492Increase/(decrease) in customer deposits 131,544,192 (17,124,400) 131,589,190 (16,902,222)(Decrease)/increase in BOU refinance loan (36,921) 16,703 (36,921) 16,703Increase in other liabilities (6,890,714) 4,093,251 (6,898,239) 4,070,534Income taxes paid 23 (2,839,956) (2,847,699) (2,823,606) (2,756,366)
73,252,970 (99,106,360) 73,296,508 (98,544,263)Net cash flows generated from/(used in) operating activities 90,435,540 (81,716,120) 90,467,356 (81,468,183)Investing activitiesPurchase of property and equipment 24 (9,693,439) (4,710,717) (9,693,439) (4,710,717)Proceeds from sale of property and equipment 54,038 54,038 54,038 54,038Purchase of intangible assets 25 (333,323) (216,377) (333,323) (216,377)Net cash flows used in investing activities (9,972,724) (4,873,056) (9,972,724) (4,873,056)Financing activitiesIncrease in share capital 31 - 20,250,000 - 20,250,000Net cash flows generated from financing activities - 20,250,000 - 20,250,000Cash and cash equivalents at start of year 146,277,375 212,371,231 146,233,918 212,325,156Net increase/(decrease) in cash and cash equivalents 80,462,816 (66,339,176) 80,494,632 (66,091,239)Cash and cash equivalents at the end of the year 16 226,740,191 146,277,375 226,728,550 146,233,918
CONSOLIDATED AND SEPARATE STATEMENT OF CASH FLOWS
GO
VER
NA
NC
EFIN
AN
CIA
L STA
TEM
EN
TSO
VER
VIE
W
Annual Report and Consolidated Financial Statements For the year ended 31 December 2017
31
NOTES TO THE FINANCIAL STATEMENTS 1. GENERAL INFORMATIONOrient Bank Limited (the ‘Bank’) and its subsidiary Equity Stock Brokers Limited, (together the Consolidated) are incorporated in Uganda under the Companies Act as limited liability companies, and are domiciled in Uganda. The address of its registered office is:
Plot 6 & 6A, Kampala RoadP O Box 3072 Kampala
The Bank is licensed and regulated by Bank of Uganda under the FIA 2004 as amended by the FIA 2016. For the Companies Act of Uganda, 2012 reporting purposes, the balance sheet is represented by the consolidated and separate statement of financial position and the profit and loss account by the statement of comprehensive income in these consolidated and separate financial statements. The financial statements for the year ended 31 December 2017 have been approved for issue by the Board of Directors. 2. SUMMARY OF SIGNIFICANT
ACCOUNTING POLICIESThe principal accounting policies applied in the preparation of these consolidated and separate financial statements are set out below. These policies have been consistently applied to all the years presented, unless otherwise stated. 2.1 Statement of Compliance The consolidated and separate financial statements have been prepared in accordance with International Financial Reporting Standards. 2.2 Basis of preparationThe consolidated and separate financial statements have been prepared on a historical cost basis, except the following; � Derivative financial instruments are measured at
fair value � Financial instruments at fair value through profit
or loss are measured at fair value
The preparation of financial statements in conformity with IFRS requires the use of certain critical accounting estimates. It also requires the directors to exercise judgement in the process of applying the Bank’s accounting policies. Changes in assumptions may have a significant impact on the financial statements in the period the assumptions changed. The areas involving a higher degree of judgement or complexity, or areas where assumptions and estimates are
significant to the financial statements, are disclosed in Note 4.
2.3 Basis of consolidationThe consolidated and separate financial statements comprise the financial statements of Orient Bank Limited and its subsidiary, Equity Stock Brokers Limited, made up to 31 December 2017. Control is achieved when the Bank; � Has power over the investee; � Is exposed, or has rights, to variable returns from
its involvement with the investee; and � Has the ability to use its power to affect its
returns.
The Bank reassesses whether or not it controls an investee if facts and circumstances indicate that there are changes to one or more of the three elements of control listed above. Consolidation of a subsidiary begins when the Bank obtains control over the subsidiary and ceases when the Bank loses control of the subsidiary. Specifically, income and expenses of a subsidiary acquired or disposed of during the year are included in the consolidated statement of profit or loss and other comprehensive income from the date the Bank gains control until the date when the Bank ceases to control the subsidiary. Profit or loss and each component of other comprehensive income are attributed to the owners of the Bank and to the non-controlling interests. Total comprehensive income of subsidiary is attributed to the owners of the Bank and to the non-controlling interests even if this results in the non-controlling interests having a deficit balance. When necessary, adjustments are made to the financial statements of subsidiary to bring their accounting policies into line with the group’s accounting policies. All intragroup assets and liabilities, equity, income, expenses and cash flows relating to transactions between members of the Consolidated are eliminated in full on consolidation. A change in the ownership interest of a subsidiary, without loss of control, is accounted for as an equity transaction. If the Consolidated loses control over a subsidiary, it derecognises the related assets (including goodwill), liabilities, non-controlling interest (NCI) and other components of equity, while any resultant gain or loss is recognised in profit or loss. Any investment retained is recognised at fair value at the date of loss of control. Given the level of judgement required Ü
Annual Report and Consolidated Financial Statements For the year ended 31 December 2017
32
regarding consolidation of structured entities, these considerations are described further in the Critical accounting estimates and judgements in Note 4. Disclosures for investment in subsidiaries are provided in Note 20. Non-controlling interestsNon-controlling interests that are present ownership interests and entitle their holders to a proportionate share of the entity’s net assets in the event of liquidation may be initially measured either at fair value or at the non-controlling interests’ proportionate share of the recognised amounts of the acquiree’s identifiable net assets. The choice of measurement basis is made on a transaction-by-transaction basis. Other types of non-controlling interests are measured at fair value or, when applicable, on the basis specified in another IFRS.
2.4 Changes in accounting policy and disclosures
Amendments to IFRSs that are mandatorily effective for annual periods beginning on or after 1 January 2017The amendments generally require full retrospective application (i.e. comparative amounts have to be restated), with some amendments requiring retrospective application. � Amendments to IAS 7 disclosure initiative; � Amendments to IAS 12 Recognition of Deferred
Tax Assets for unrealised losses; and � Amendments to IFRS 12 included in Annual
Improvements to IFRS Standards 2014 – 2016 cycle.
Amendments to IAS 7 Disclosure Initiative (effective for annual periods beginning on or after 1 January 2017) The amendments require an entity to provide disclosures that enable users of financial statements to evaluate changes in liabilities arising from financing activities, including both cash and non-cash changes. The amendments apply prospectively.
Amendments to IAS 12 Recognition of deferred tax assets for unrealised losses (effective for annual periods beginning on or after 1 January 2017) The amendments clarify the following:
1. Unrealised losses on a debt instrument measured at fair value for which the tax base remains at cost given rise a deductible temporary difference, irrespective of whether the debt instrument’s holders expects to recover the carrying amount
of the debt instrument by sale or by use, or whether it is probable that the issuer will pay all the contractual cash flows;
2. When an entity assesses whether taxable profits will be available against which it can utilise a deductible temporary difference, and the tax law restricts the utilisation of losses to deduction against income of a specific type (e.g. capital losses can only be set off against capital gains), an entity assesses a deductible temporary difference in combination with other deductible temporary differences of that type, but separately from other types of deductible temporary differences;
3. The estimate of probable future taxable profit may include the recovery of some of an entity’s assets for more than their carrying amount if there is sufficient evidence that it is probable that the entity will achieve this; and
4. In evaluating whether sufficient future taxable profits are available, an entity should compare the deductible temporary differences with future taxable profits excluding tax deductions resulting from the reversal of those deductible temporary differences.
The amendments apply retrospectively. The directors consider that there has been no significant impact of the changes on the results for the year ended 31 December 2017.
NOTES TO THE FINANCIAL STATEMENTS (continued)2. Summary of significant accounting policies (continued)2.3 Basis of consolidation (continued)
Ü
Entities are not required to present comparative information for earlier periods when they first apply the amendments.
GO
VER
NA
NC
EFIN
AN
CIA
L STA
TEM
EN
TSO
VER
VIE
W
Annual Report and Consolidated Financial Statements For the year ended 31 December 2017
33
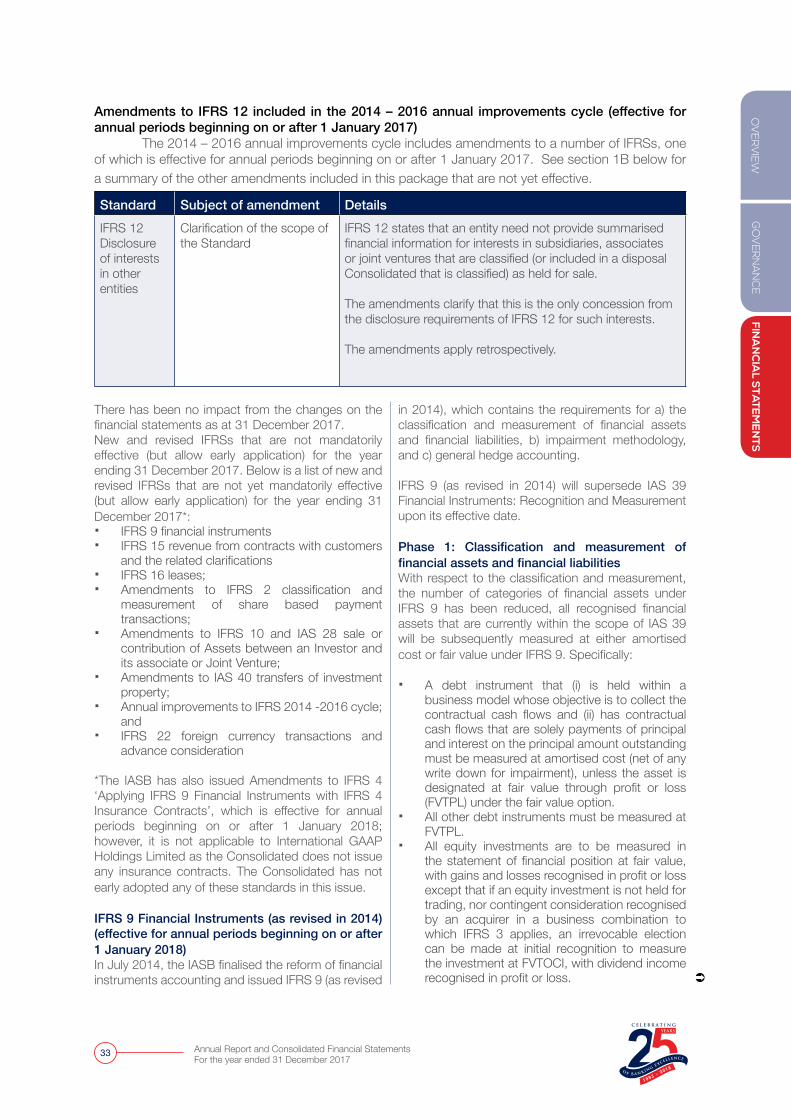
Amendments to IFRS 12 included in the 2014 – 2016 annual improvements cycle (effective for annual periods beginning on or after 1 January 2017) The 2014 – 2016 annual improvements cycle includes amendments to a number of IFRSs, one of which is effective for annual periods beginning on or after 1 January 2017. See section 1B below for a summary of the other amendments included in this package that are not yet effective.
Standard Subject of amendment DetailsIFRS 12Disclosure of interests in other entities
Clarification of the scope of the Standard
IFRS 12 states that an entity need not provide summarised financial information for interests in subsidiaries, associates or joint ventures that are classified (or included in a disposal Consolidated that is classified) as held for sale.
The amendments clarify that this is the only concession from the disclosure requirements of IFRS 12 for such interests. The amendments apply retrospectively.
in 2014), which contains the requirements for a) the classification and measurement of financial assets and financial liabilities, b) impairment methodology, and c) general hedge accounting.
IFRS 9 (as revised in 2014) will supersede IAS 39 Financial Instruments: Recognition and Measurement upon its effective date. Phase 1: Classification and measurement of financial assets and financial liabilitiesWith respect to the classification and measurement, the number of categories of financial assets under IFRS 9 has been reduced, all recognised financial assets that are currently within the scope of IAS 39 will be subsequently measured at either amortised cost or fair value under IFRS 9. Specifically:
� A debt instrument that (i) is held within a business model whose objective is to collect the contractual cash flows and (ii) has contractual cash flows that are solely payments of principal and interest on the principal amount outstanding must be measured at amortised cost (net of any write down for impairment), unless the asset is designated at fair value through profit or loss (FVTPL) under the fair value option.
� All other debt instruments must be measured at FVTPL.
� All equity investments are to be measured in the statement of financial position at fair value, with gains and losses recognised in profit or loss except that if an equity investment is not held for trading, nor contingent consideration recognised by an acquirer in a business combination to which IFRS 3 applies, an irrevocable election can be made at initial recognition to measure the investment at FVTOCI, with dividend income recognised in profit or loss.
There has been no impact from the changes on the financial statements as at 31 December 2017. New and revised IFRSs that are not mandatorily effective (but allow early application) for the year ending 31 December 2017. Below is a list of new and revised IFRSs that are not yet mandatorily effective (but allow early application) for the year ending 31 December 2017*: � IFRS 9 financial instruments � IFRS 15 revenue from contracts with customers
and the related clarifications � IFRS 16 leases; � Amendments to IFRS 2 classification and
measurement of share based payment transactions;
� Amendments to IFRS 10 and IAS 28 sale or contribution of Assets between an Investor and its associate or Joint Venture;
� Amendments to IAS 40 transfers of investment property;
� Annual improvements to IFRS 2014 -2016 cycle; and
� IFRS 22 foreign currency transactions and advance consideration
*The IASB has also issued Amendments to IFRS 4 ‘Applying IFRS 9 Financial Instruments with IFRS 4 Insurance Contracts’, which is effective for annual periods beginning on or after 1 January 2018; however, it is not applicable to International GAAP Holdings Limited as the Consolidated does not issue any insurance contracts. The Consolidated has not early adopted any of these standards in this issue. IFRS 9 Financial Instruments (as revised in 2014) (effective for annual periods beginning on or after 1 January 2018) In July 2014, the IASB finalised the reform of financial instruments accounting and issued IFRS 9 (as revised Ü
Annual Report and Consolidated Financial Statements For the year ended 31 December 2017
34
IFRS 9 also contains requirements for the classification and measurement of financial liabilities and derecognition requirements. One major change from IAS 39 relates to the presentation of changes in the fair value of a financial liability designated as at FVTPL attributable to changes in the credit risk or that liability. Under IFRS 9, such changes are presented in other comprehensive income, unless the presentation of the effect of the change in the liability’s credit risk in other comprehensive income would create or enlarge an accounting mismatch in profit or loss. Changes in fair value attributable to a financial liability’s credit risk are not subsequently reclassified to profit or loss. Under IAS 39, the entire amount of the change in the fair value of the financial liability designated as FVTPL is presented in profit or loss. Phase 2: Impairment of financial assetsThe impairment model under IFRS 9 reflects expected credit losses, as opposed to incurred credit losses under IAS 39. Under the impairment approach in IFRS 9, it is no longer necessary for a credit event to have occurred before credit losses are recognised. Instead, an entity always accounts for expected credit losses and changes in those expected credit losses. The amount of expected credit losses should be updated at each reporting date to reflect changes in credit risk since initial recognition.
Phase 3: Hedge accountingThe general hedge accounting requirements of IFRS 9 retain the three types of hedge accounting mechanisms in IAS 39. However, greater flexibility has been introduced to the types of transactions eligible for hedge accounting, specifically broadening the types of instruments that qualify as hedging instruments and the types of risk components of non-financial items that are eligible for hedge accounting. In addition, the effectiveness is no longer required. For more disclosure requirements about an entity’s risk management activities have been traduced.
The work on macro hedging by the IASB is still at a preliminary stage – a discussion paper was issued in April 2014 together preliminary views and direction from constituents with a comment period which ended in October 2014. The project is still under analysis at the time of writing. Transitional provisions IFRS 9 (as revised in 2014) is effective for annual periods beginning on or after 1 January 2018 with earlier application permitted. If an entity elects to apply IFRS 9 at the same time, except for those relating to: 1. The presentation of fair value gains and losses
attributable to changes in the credit risk of financial liabilities designated as at FVTPL, the requirements for which an entity may early apply
without applying the other requirements in IFRS 9; and
2. Hedge accounting, for which an entity may choose to continue to apply the hedge accounting requirements of IAS 39 instead of the requirements of IFRS 9.
IFRS 9 contains specific transitional provisions for i) classification and measurement of financial assets; ii) impairment of financial assets; and iii) hedge accounting. Please see IFRS 9 for details.
The Bank is currently in the process of completing its implementation of IFRS 9. Though the Bank has assessed the transitional impact of IFRS 9, the Bank is yet to complete the process of finalizing the transitional impact. The Bank is currently in the final stages and is currently testing for stability and adequate sophistication, and carrying out a parallel run. IFRS 15 Revenue from Contracts with Customers (effective for annual periods beginning on or after 1 January 2018) IFRS 15 establishes a single comprehensive model for entities to use in accounting for revenue arising from contracts with customers. It will supersede the following revenue Standards and Interpretations upon its effective date: � IAS 18 Revenue; � IAS 11 Construction Contracts; � IFRIC 13 Customer Loyalty Programmes; � IFRIC 15 Agreements for the Construction of
Real Estate; � IFRIC 18 Transfers of Assets from Customers;
and � SIC 13 Revenue-Barter Transactions involving
advertising services
As suggested by the title of the new Revenue Standard, IFRS 15 will only cover revenue arising from contracts with customers. Under IFRS 15, a customer of an entity is a party that has contracted with the entity to obtain goods or services that are an output of the entity’s activities in exchange for consideration. Unlike the scope of IAS 18, the recognition and measurement of interest income and dividend income from debt and equity investments are no longer within the scope of IFRS 15. Instead, they are within the scope of IAS 39 (or IFRS 9 if it is early adopted). As mentioned above, the new Revenue Standard has a single model to deal with revenue from contracts with customers. Its core principle is that an entity should recognise revenue to depict the transfer of promised goods or services to customers in an amount that reflects the consideration to which the entity expects to be entitled in exchange for those goods or services.
NOTES TO THE FINANCIAL STATEMENTS (continued)2. Summary of significant accounting policies (continued)2.4 Changes in accounting policy and disclosures (continued)
Ü
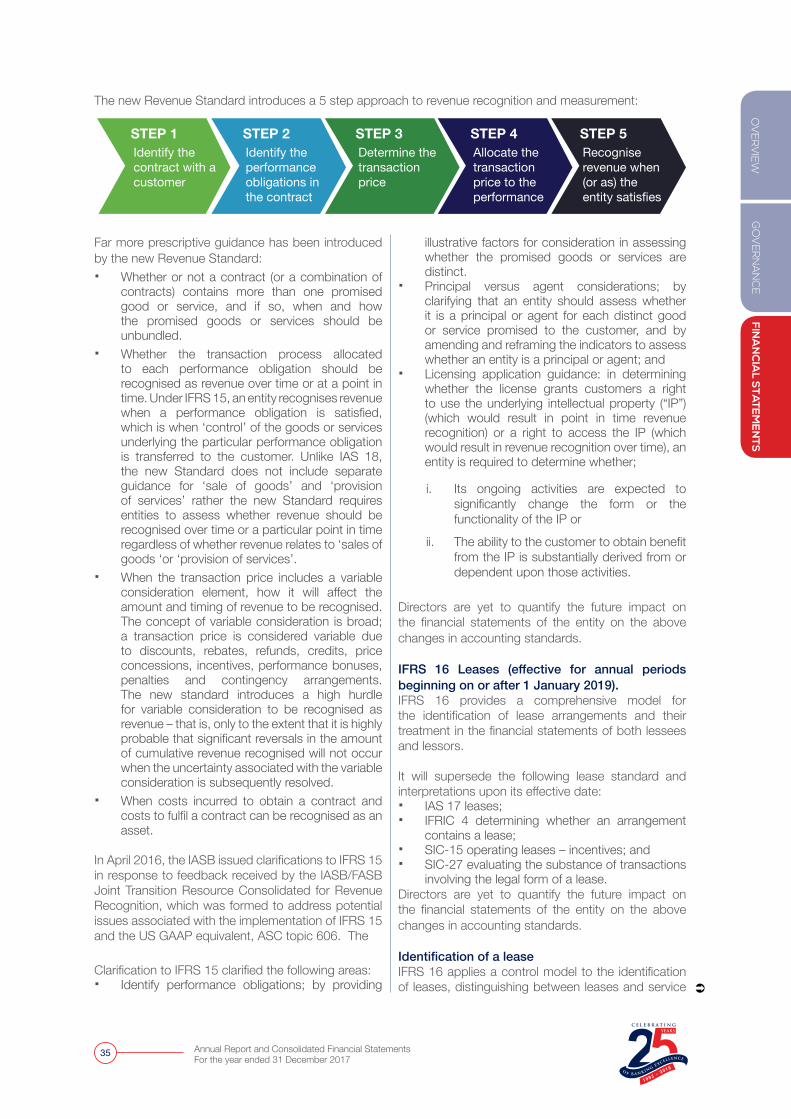
GO
VER
NA
NC
EFIN
AN
CIA
L STA
TEM
EN
TSO
VER
VIE
W
Annual Report and Consolidated Financial Statements For the year ended 31 December 2017
35
The new Revenue Standard introduces a 5 step approach to revenue recognition and measurement:
STEP 1Identify the contract with a customer
STEP 2Identify the performance obligations in the contract
STEP 3Determine the transaction price
STEP 4Allocate the transaction price to the performance
STEP 5Recognise revenue when (or as) the entity satisfies
Far more prescriptive guidance has been introduced by the new Revenue Standard: � Whether or not a contract (or a combination of
contracts) contains more than one promised good or service, and if so, when and how the promised goods or services should be unbundled.
� Whether the transaction process allocated to each performance obligation should be recognised as revenue over time or at a point in time. Under IFRS 15, an entity recognises revenue when a performance obligation is satisfied, which is when ‘control’ of the goods or services underlying the particular performance obligation is transferred to the customer. Unlike IAS 18, the new Standard does not include separate guidance for ‘sale of goods’ and ‘provision of services’ rather the new Standard requires entities to assess whether revenue should be recognised over time or a particular point in time regardless of whether revenue relates to ‘sales of goods ‘or ‘provision of services’.
� When the transaction price includes a variable consideration element, how it will affect the amount and timing of revenue to be recognised. The concept of variable consideration is broad; a transaction price is considered variable due to discounts, rebates, refunds, credits, price concessions, incentives, performance bonuses, penalties and contingency arrangements. The new standard introduces a high hurdle for variable consideration to be recognised as revenue – that is, only to the extent that it is highly probable that significant reversals in the amount of cumulative revenue recognised will not occur when the uncertainty associated with the variable consideration is subsequently resolved.
� When costs incurred to obtain a contract and costs to fulfil a contract can be recognised as an asset.
In April 2016, the IASB issued clarifications to IFRS 15 in response to feedback received by the IASB/FASB Joint Transition Resource Consolidated for Revenue Recognition, which was formed to address potential issues associated with the implementation of IFRS 15 and the US GAAP equivalent, ASC topic 606. The
Clarification to IFRS 15 clarified the following areas: � Identify performance obligations; by providing
illustrative factors for consideration in assessing whether the promised goods or services are distinct.
� Principal versus agent considerations; by clarifying that an entity should assess whether it is a principal or agent for each distinct good or service promised to the customer, and by amending and reframing the indicators to assess whether an entity is a principal or agent; and
� Licensing application guidance: in determining whether the license grants customers a right to use the underlying intellectual property (“IP”) (which would result in point in time revenue recognition) or a right to access the IP (which would result in revenue recognition over time), an entity is required to determine whether;
i. Its ongoing activities are expected to significantly change the form or the functionality of the IP or
ii. The ability to the customer to obtain benefit from the IP is substantially derived from or dependent upon those activities.
Directors are yet to quantify the future impact on the financial statements of the entity on the above changes in accounting standards.
IFRS 16 Leases (effective for annual periods beginning on or after 1 January 2019). IFRS 16 provides a comprehensive model for the identification of lease arrangements and their treatment in the financial statements of both lessees and lessors.
It will supersede the following lease standard and interpretations upon its effective date: � IAS 17 leases; � IFRIC 4 determining whether an arrangement
contains a lease; � SIC-15 operating leases – incentives; and � SIC-27 evaluating the substance of transactions
involving the legal form of a lease.Directors are yet to quantify the future impact on the financial statements of the entity on the above changes in accounting standards.
Identification of a leaseIFRS 16 applies a control model to the identification of leases, distinguishing between leases and service Ü
Annual Report and Consolidated Financial Statements For the year ended 31 December 2017
36
transactions on the basis of whether there is an identified asset controlled by the customer. Control is considered to exist if the customer has: a. The right to obtain substantially all of the
economic benefits from the use of an identified asset, and
b. The right to direct the use of that asset. The standard provides detailed guidance to determine whether those conditions are met, including instances where the supplier has substantive substitution rights, and where the relevant decisions about how and for what purpose the asset is used are predetermined.
Directors are yet to quantify the future impact on the financial statements of the entity on the above changes in accounting standards.
Lessee accountingIFRS 16 introduces significant changes to leases accounting: it removes the distinction between operating and finance leases under IAS 17 and requires a lessee to recognise a right – of – use asset and a lease liability at lease commencement for all leases, except for short-term leases and leases of low value assets. The right-of-use asset is initially measured at cost and subsequently measured at cost (subject to certain exceptions) less accumulated depreciation and impairment losses, adjusted for any remeasurement of the lease liability. The lease liability is initially measured at the present value of the lease payments that are not paid at that date. Subsequently, the lease liability is adjusted for interest and lease payments, as well as the impact of lease modifications, amongst others. If a lessee elects not to apply the general requirements of IFRS 16 to short-term leases (i.e. one that does not include a purchase option and had a lease term at commencement date of 12 months or less) and leases of low value assets, the lessee should recognise the lease payments associated with those leases as an expense on either a straight-line basis over the lease term or another systematic basis, similar to the current accounting for operating leases.
Lessor accountingIn contrast to lessee accounting, the IFRS 16 lessor accounting requirements remain largely unchanged from IAS 17, which continue to require a lessor to classify a lease either as an operating lease or a finance lease. In addition, IFRS 16 also provides guidance on the accounting for sale and leaseback transactions. Extensive disclosure are also required by the new Standard. IFRS 16 is effective for reporting periods beginning on or after 1 January 2019 with early application permitted for entities that apply
IFRS 15 at or before the date of initial application of IFRS 16. A lessee can apply IFRS 16 either by a full retrospective approach or a modified retrospective approach. If the latter approach is selected, an entity is not required to restate the comparative information and the cumulative effect of initially applying IFRS 16 must be presented to opening retained earnings (or other component of equity as appropriate)
Directors are yet to quantify the future impact on the financial statements of the entity on the above changes in accounting standards.
Amendments to IFRS 2 Classification and Management of Share-based Payment Transactions (Effective for manual periods beginning on after 1 January 2018)
The amendments clarify the following: 1. In estimating the fair value of cash-settled share-
based payment, the accounting for the effects of vesting and non-vesting conditions should follow the same approach as for equity-settled share-based payments.
2. Where tax law or regulations requires an entity to withhold a specified number of equity instruments equals to the monetary value of the employee’s tax obligation to meet the employee’s tax liability which is then remitted to the tax authority (typically in cash), i.e. the share-based payment arrangement has a net settlement feature such an arrangement should be classified as equity-settled in its entirely, provided that the share-based payment would have been classified as equity-settled had it not included the net settlement feature.
3. A modification of a share-based payment that changes the transaction from cash-settled to equity-settled should be accounted for as follows:
i. The original liability is derecognised
i. The equity-settled share-based payment is recognised at the modification date fair value of the equity instrument granted to the extent that services have been rendered up to the modification date; and
i. Any difference between the carrying amount of the liability at the modification date and the amount recognised in equity should be recognised in profit or loss immediately.
The changes are effective for annual reporting periods beginning on or after 1 January 2018 with earlier application permitted. Specific transition provisions apply. Directors are yet to quantify the future impact on the financial statements of the entity on the above changes in accounting standards.
NOTES TO THE FINANCIAL STATEMENTS (continued)2. Summary of significant accounting policies (continued)2.4 Changes in accounting policy and disclosures (continued)
Ü
GO
VER
NA
NC
EFIN
AN
CIA
L STA
TEM
EN
TSO
VER
VIE
W
Annual Report and Consolidated Financial Statements For the year ended 31 December 2017
37
Amendments of IFRS 10 and IAS 28 Sale or Contribution of Assets between an investor and its Associate or Joint Venture (Effective for annual periods beginning on or after a date to be determined)
The amendments deal with situations where there is a sale or contribution of assets between an investor and its associate or joint venture IAS 28 and IFRS 10 are amended, as follows: IAS 28 has been amended to reflect the following: � Gains and losses resulting from transactions
involving assets that do not constitute a business between an investor and its associate or joint venture are recognised to the extent of unrelated investors’ interest in the associate or joint venture.
� Gains and losses from downstream transactions involving assets that constitute a business between an investor and its associate or joint venture should be recognised in full in the investor’s financial statements.
Directors are yet to quantify the future impact on the financial statements of the entity on the above changes in accounting standards. IFRS 10 has been amended to reflect the following: Gains or losses resulting from the loss of control of a subsidiary that does not contain a business in a transaction with an associate or a joint venture that is accounted for using the equity method, are recognised in the parent’s profit or loss only to the extent of the unrelated investors’ interests in that associate or joint venture. Similarly, gains and losses resulting from the measurement or investments retained in any former subsidiary (that has become an associate or a joint venture that is accounted for using the equity method) to fair value are recognised in the former parent’s profit or loss only to the extent of the unrelated investors’ interests in the new associate or joint venture. In December 2015, the IASB postponed the effective date amendment indefinitely pending the outcome of its research project on the equity method of accounting. Earlier application of these amendments is still permitted. Directors are yet to quantify the future impact on the financial statements of the entity on the above changes in accounting standards. Amendments to IAS 40 Transfers to, or from Investment Property (Effective for annual periods beginning on or after 1 January 2018)The amendments clarify that a transfer to, or from, investment property necessitates an assessment of whether a property meets, or has ceased to meet
the definition of investment property supported by observable evidence that a change in use has occurred. The amendments further clarify that the situations listed in IAS 40 are not exhaustive and that a change in use is possible for properties under construction (i.e. a change in use is not limited to completed properties.)
The amendments are effective for annual periods beginning on or after 1 January 2018 with earlier application permitted. Entities can apply the amendments either retrospectively (if this is possible without the use of hindsight) or prospectively. Specific transition provisions apply.
Directors are yet to quantify the future impact on the financial statements of the entity on the above changes in accounting standards. Annual improvements to IFRS 2014-2016 Cycle (Effective for annual periods beginning on or after 1 January 2018) The Annual Improvements include amendments to a number of IFRSs, which have been summarised below. The package also includes amendments to IFRS 12 Disclosure of interests in Other Entities, which is effective for annual periods beginning on or after 1 January 2018. Ü
Annual Report and Consolidated Financial Statements For the year ended 31 December 2017
38
Standards Subject of amendment DetailsIFRS 1First-time Adoption of International Financial Reporting Standards
Deletion of short –term exemptions for first-time adopters
The amendments delete certain short-term exemptions in IFRS 1 because the reporting period to which the exemptions applied have already passed. As such, these exemptions are no longer applicable.
IAS 28Investments in Associates and Joint Ventures
Measuring an associate or joint venture at fair value
The amendments clarify that the option for a venture capital organisation and other similar entities to measure investments in associates and joint venture at FVTPL is available separately for each associate or joint venture, and that election should be made at initial recognition of the associate or joint venture.
In respect of the option for an entity that is not an investment entity (IE) to retain the fair value measurement applied by its associates and joint ventures that are IEs when applying the equity method, the amendments make a similar clarification that this choice is available for each IE associate or joint venture.
The amendments apply retrospectively with earlier application permitted.
Directors are yet to quantify the future impact on the financial statements of the entity on the below changes in accounting standards.
IFRIC 22 Foreign Currency Transactions and Advance Consideration (Effective for annual periods beginning on or after 1 January 2018)IFRIC 22 addresses how to determine the date of transaction for the purpose of determining the exchange rate to use on initial recognition of an asset, expense or income, when consideration for that item has been paid or received in advance in a foreign currency which resulted in the recognition of a non-monetary asset or non-monetary liability (for example, a non-refundable deposit or deferred revenue). The Interpretation specifies that the date of transaction is the date on which the entity initially recognises the non-monetary asset or non-monetary liability arising from the payment or receipt of advance consideration. If there are multiple payments or receipts in advance, the Interpretation requires an entity to determine the date of transaction for each payment or receipt of advance consideration. The Interpretation is effective for annual periods beginning on or after 1 January 2018 with earlier application permitted. Entities can apply the Interpretation either retrospectively or prospectively. Specific transition provisions apply to prospective application. Directors are yet to quantify the future impact on the financial statements of the entity on the below changes in accounting standards.
2.5 Foreign currency translation
a. Functional and presentation currency Items included in the consolidated and separate’s financial statements are items/transactions measured using the currency of the primary economic environment in which the entity operates (‘the functional currency’). The consolidated and separate financial statements are presented in Uganda shillings and figures are stated in thousands of Uganda shillings.
b. Transactions and balances Transactions in foreign currencies are initially
recorded at their respective functional currency spot rates at the date the transaction first qualifies for recognition.
Monetary assets and liabilities denominated in foreign currencies are translated at the functional currency spot rates of exchange at the reporting date. Differences arising on settlement or translation of monetary items are recognised in profit or loss.
Non-monetary items that are measured in terms of historical cost in a foreign currency are translated using the exchange rates at the dates of the recognition. Non-monetary items measured at fair value in a
Ü
NOTES TO THE FINANCIAL STATEMENTS (continued)2. Summary of significant accounting policies (continued)2.4 Changes in accounting policy and disclosures (continued)
GO
VER
NA
NC
EFIN
AN
CIA
L STA
TEM
EN
TSO
VER
VIE
W
Annual Report and Consolidated Financial Statements For the year ended 31 December 2017
39
foreign currency are translated using the exchange rates at the date when the fair value is measured. The gain or loss arising on translation of non-monetary items measured at fair value is treated in line with the recognition of the gain or loss on the change in fair value of the item (i.e., translation differences on items whose fair value gain or loss is recognised in OCI or profit or loss are also recognised in OCI or profit or loss, respectively). Non–monetary items that are measured at historical cost in a foreign currency are translated using the spot exchange rates as at the date of recognition. 2.6 Sale and repurchase agreementsSecurities sold subject to repurchase agreements (‘repos’) are reclassified in the financial statements as pledged assets when the transferee has the right by contract or custom to sell or repledge the collateral; the counterparty liability is included in deposits from banks or deposits from customers, as appropriate. Securities purchased under agreements to resell (‘reverse repos’) are recorded as loans and advances to other banks or customers, as appropriate.
The difference between sale and repurchase price is treated as interest and accrued over the life of the agreements using the effective interest method. Securities lent to counterparties are also retained in the financial statements. 2.7 Financial assetsThe Bank classifies its financial assets in the following categories: financial assets at fair value through profit or loss, loans and receivables, held-to-maturity and available-for-sale financial assets. The directors determine the classification of its financial assets at initial recognition. The Bank uses trade date accounting for regular way contracts when recording financial asset transactions. a. Financial assets at fair value through profit
or loss This category comprises two sub-categories: financial assets classified as held for trading, and financial assets designated by the Bank as at fair value through profit or loss upon initial recognition.
A financial asset is classified as held for trading if it is acquired or incurred principally for the purpose of selling it in the near term or if it is part of a portfolio of identified financial instruments that are managed together and for which there is evidence of a recent actual pattern of short-term profit-taking. Financial assets at fair value through profit or loss are carried in the statement of financial position at fair value with net changes in fair value presented as finance costs (negative net changes in fair value) or finance income (positive net changes in fair value) in the profit or loss.
b. Derivatives recorded at fair value through profit or loss
A derivative is a financial instrument or other contract with all three of the following characteristics: a. Its value changes in response to the
change in a specified interest rate, financial instrument price, commodity price, foreign exchange rate, index of prices or rates, credit rating or credit index, or other variable, provided in the case of a non-financial variable that the variable is not specific to a party to the contract (aka the ‘underlying’).
b. It requires no initial net investment or an initial net investment that is smaller than would be required for other types of contracts that would be expected to have a similar response to changes in market factors.
c. It is settled at a future date.
The Bank enters into derivative transactions with various counterparties. These include undelivered Spot and forward foreign exchange contracts. Derivatives are recorded at fair value and carried as assets when their fair value is positive and as liabilities when their fair value is negative. The Derivative instruments are held for non-hedging purposes and are principally executed for other counterparties thus the Consolidated has not applied Hedge accounting. c. Loans and receivables Loans and receivables are non-derivative financial
assets with fixed or determinable payments that are not quoted in an active market, other than:a. those that the Bank intends to sell
immediately or in the short term, which are classified as held for trading, and those that the Bank upon initial recognition designates as at fair value through profit or loss;
b. Those that the Bank upon initial recognition designates as available-for-sale; or
c. Those for which the holder may not recover substantially all of its initial investment, other than because of credit deterioration.
Loans and receivables are initially recognised at fair value – which is the cash consideration to originate or purchase the loan including any transaction costs – and measured subsequently at amortised cost using the effective interest method, less impairment. The effective interest rate (EIR) Ü
Annual Report and Consolidated Financial Statements For the year ended 31 December 2017
40
is the rate that exactly discounts estimated future cash payments or receipts through the expected life of the financial instrument or, when appropriate a shorter period, to the net carrying amount of the financial asset or financial liability.
The amortised cost of a financial asset or financial liability is the amount at which the financial asset or financial liability is measured at initial recognition minus principal repayments, plus or minus the cumulative amortisation using the effective interest method of any difference between that initial amount and the maturity amount, and minus any reduction (directly or through the use of an allowance account) for impairment or uncollectibility.
The financial assets under this category are loans and advances to customer
d. Held-to-maturity investments
Held-to-maturity investments are non-derivative financial assets with fixed or determinable payments and fixed maturities that the directors have the positive intention and ability to hold to maturity, other than: a. Those that the Bank upon initial recognition
designates as at fair value through profit or loss;
b. Those that the Bank designates as available-for-sale; and
c. Those that meet the definition of loans and receivables.
Held-to-maturity investments are initially recognised at fair value including direct and incremental transaction costs and measured subsequently at amortised cost, using the effective interest method. 2.8 Financial liabilities
Initial recognition and measurementFinancial liabilities are classified, at initial recognition, as loans and borrowings or as payables.
All financial liabilities are recognised initially at fair value and, in the case of loans and borrowings and payables, net of directly attributable transaction costs. The group’s financial liabilities include Deposits due to other banks, Customer deposits, Refinance loans, and other liabilities. Subsequent measurement The measurement of financial liabilities depends on their classification, as described below:
Loans and borrowings, and payables After initial recognition, deposits due to other banks, Customer deposits, Refinance loans, and other liabilities are subsequently measured at amortised cost. The interest bearing refinance loans use the EIR method to determine the amortised cost. Gains and losses are recognised in profit or loss when the liabilities are derecognised as well as through the EIR amortisation process. Effective Interest methodThe effective interest method is a method of calculating the amortised cost of a debt instrument and of allocating interest income over the relevant period. The effective interest rate is the rate that exactly discounts estimated future cash receipts (including all fees and points paid or received that form an integral part of the effective interest rate, transaction costs and other premium or discounts) through the expected life of the debt instrument, or, where appropriate, a shorter period, to the net carrying amount on initial recognition. Income is recognised on an effective interest basis for debt instruments other than those financials assets classified as at FVTPL Amortised cost is calculated by taking into account any discount or premium on acquisition and fees or costs that are an integral part of the EIR. The EIR amortisation is included as finance costs in the profit or loss.
In order to show how fair values have been derived, financial instruments are classified based on a hierarchy of valuation techniques, as summarised below: � Level 1 financial instruments − those where
the inputs used in the valuation are unadjusted quoted prices from active markets for identical assets or liabilities that the Bank has access to at the measurement date. The Bank considers markets as active only if there are sufficient trading activities with regards to the volume and liquidity of the identical assets or liabilities and when there are binding and exercisable price quotes available on the reporting date.
� Level 2 financial instruments− those where
the inputs that are used for valuation and are significant, are derived from directly or indirectly observable market data available over the entire period of the instrument’s life. Such inputs include quoted prices for similar assets or liabilities in active markets, quoted prices for identical instruments in inactive markets and observable inputs other than quoted prices such as interest rates and yield curves, implied volatilities, and credit spreads. In addition, adjustments may
Ü
NOTES TO THE FINANCIAL STATEMENTS (continued)2. Summary of significant accounting policies (continued)2.7 Financial Assets (continued)
GO
VER
NA
NC
EFIN
AN
CIA
L STA
TEM
EN
TSO
VER
VIE
W
Annual Report and Consolidated Financial Statements For the year ended 31 December 2017
41
be required for the condition or location of the asset or the extent to which it relates to items that are comparable to the valued instrument. However, if such adjustments are based on unobservable inputs which are significant to the entire measurement, the Bank will classify the instruments as Level 3.
� Level 3 financial instruments − those that include one or more unobservable input that is significant to the measurement as whole.
The Bank periodically reviews its valuation techniques including the adopted methodologies and model calibrations. However, the base models may not fully capture all factors relevant to the valuation of the Bank’s financial instruments such as credit risk (CVA), own credit (DVA) and/or funding costs (FVA).
Therefore, the Bank applies various techniques to estimate the credit risk associated with its financial instruments measured at fair value, which include a portfolio-based approach that estimates the expected net exposure per counterparty over the full lifetime of the individual assets, in order to reflect the credit risk of the individual counterparties for non-collateralised financial instruments. The Bank estimates the value of its own credit from market observable data, such as secondary prices for its traded debt and the credit spread on credit default swaps and traded debts on itself.
The Bank evaluates the levelling at each reporting period on an instrument-by-instrument basis and reclassifies instruments when necessary based on the facts at the end of the reporting period. 2.8.1 DerecognitionFinancial assets are derecognised when the contractual rights to receive the cash flows from these assets have ceased to exist or the assets have been transferred and substantially all the risks and rewards of ownership of the assets are also transferred (that is, if substantially all the risks and rewards have not been transferred, the Bank tests control to ensure that continuing involvement on the basis of any retained powers of control does not prevent derecognition). “A financial liability is derecognised when the obligation under the liability is discharged or cancelled or expires. When an existing financial liability is replaced by another from the same lender on substantially different terms, or the terms of an existing liability are substantially modified, such an exchange or modification is treated as the derecognition of the original liability and the recognition of a new liability. The difference in the respective carrying amounts is recognised in the profit or loss.”
2.8.2 Impairment of financial assetsAssets carried at amortised cost The Bank assesses at each reporting date whether there is objective evidence that a financial asset or Consolidated of financial assets is impaired. A financial asset or a Consolidated of financial assets is impaired and impairment losses are incurred only if there is objective evidence of impairment as a result of one or more events that occurred after the initial recognition of the asset (a ‘loss event’) and that loss event (or events) has an impact on the estimated future cash flows of the financial asset or Consolidated of financial assets that can be reliably estimated. The Bank first assesses whether objective evidence of impairment exists individually for financial assets that are individually significant, and individually or collectively for financial assets that are not individually significant. If the Bank determines that no objective evidence of impairment exists for an individually assessed financial asset, whether significant or not, it includes the asset in a Consolidated of financial assets with similar credit risk characteristics and collectively assesses them for impairment.
Assets that are individually assessed for impairment and for which an impairment loss is or continues to be recognised are not included in a collective assessment of impairment. The calculation of the present value of the estimated future cash flows of a collateralised financial asset reflects the cash flows that may result from foreclosure less costs for obtaining and selling the collateral, whether or not foreclosure is probable.
For the purposes of a collective evaluation of impairment, financial assets are grouped on the basis of similar credit risk characteristics (that is, on the basis of the Bank’s grading process that considers asset type, industry, geographical location, collateral type, past-due status and other relevant factors). Those characteristics are relevant to the estimation of future cash flows for groups of such assets by being indicative of the debtors’ ability to pay all amounts due according to the contractual terms of the assets being evaluated.
Future cash flows in a Consolidated of financial assets that are collectively evaluated for impairment are estimated on the basis of the contractual cash flows of the assets in the Consolidated and historical loss experience for assets with credit risk characteristics similar to those in the Consolidated. Historical loss experience is adjusted on the basis of current observable data to reflect the effects of current conditions that did not affect the period on which the historical loss experience is based and to remove the effects of conditions in the historical period that do not currently exist. Ü
Annual Report and Consolidated Financial Statements For the year ended 31 December 2017
42
Estimates of changes in future cash flows for groups of assets should reflect and be directionally consistent with changes in related observable data from period to period (for example, changes in unemployment rates, property prices, payment status, or other factors indicative of changes in the probability of losses in the Consolidated and their magnitude). The methodology and assumptions used for estimating future cash flows are reviewed regularly by the Consolidated to reduce any differences between loss estimates and actual loss experience. When a loan is uncollectible, it is written off against the related allowance for loan impairment. Such loans are written off after all the necessary procedures have been completed and the amount of the loss has been determined. Impairment charges relating to loans and advances to banks and customers are recognised in loan impairment charges in profit or loss.
If, in a subsequent period, the amount of the impairment loss decreases and the decrease can be related objectively to an event occurring after the impairment was recognised (such as an improvement in the debtor’s credit rating), the previously recognised impairment loss is reversed by adjusting the allowance account. The amount of the reversal is recognised in profit or loss. In addition to the measurement of impairment losses on loans and advances in accordance with International Financial Reporting Standards as set out above, the Bank is also required by the Ugandan Financial Institutions Act, 2004 to estimate losses on loans and advances as follows: A specific allowance for impairment for those loans and advances considered to be non-performing based on criteria and classification of such loans and advances established by the Financial Institutions (Credit Classification and Provisioning) Regulations, 2005, as follows: a. Substandard assets with arrears period between
90 and 179 days – 20%;b. Doubtful assets with arrears period between 181
days and 365 days – 50% andc. Loss assets with arrears period over 365 days –
100%.
The excess of provisions as per Financial Institutions (Credit Classification and Provisioning) Regulations, 2005 over IFRS is accounted for in the credit risk reserve in the statement of changes in equity. 2.9 Offsetting financial instrumentsFinancial assets and liabilities are offset and the net amount reported in the statement of financial position when there is a currently enforceable legal right to offset the recognised amounts and there is an
intention to settle on a net basis or realise the asset and settle the liability simultaneously. 2.10 Cash and cash equivalentsCash and cash equivalents include cash in hand, deposits held at call with banks and other short-term highly liquid investments with original maturities of three months or less. For the purposes of the statement of cash flows, cash and cash equivalents comprise balances with less than three months` maturity from the date of acquisition, including cash with central banks, treasury bills and other eligible bills, loans and advances to banks, amounts due from other banks and government securities. Cash and cash equivalent exclude the cash reserve requirement held with the Bank of Uganda. 2.11 Property and equipmentProperty and equipment comprise mainly office equipment, computer hardware, furniture & fittings and leasehold land. All equipment and land used by the Bank is stated at historical cost less depreciation. Historical cost includes expenditure that is directly attributable to the acquisition of the items.
Subsequent expenditures are included in the asset’s carrying amount or are recognised as a separate asset, as appropriate, only when it is probable that future economic benefits associated with the item will flow to the Bank and the cost of the item can be measured reliably. The carrying amount of the replaced part is derecognised. All other repair and maintenance costs are charged to profit or loss during the financial period in which they are incurred. Buildings are measured at fair value and in case for the building, less accumulated depreciation and impairment losses recognised at the date of revaluation. Valuations are performed with sufficient frequency to ensure that the carrying amount of a revalued asset does not differ materially from its fair value.
A revaluation surplus is recorded in OCI and credited to the asset revaluation surplus in equity. However, to the extent that it reverses a revaluation deficit of the same asset previously recognised in profit or loss, the increase is recognised in profit and loss. A revaluation deficit is recognised in the statement of profit or loss, except to the extent that it offsets an existing surplus on the same asset recognised in the asset revaluation surplus.
An annual transfer between retained earnings and revaluation reserves is made for the difference between depreciation based on the revalued carrying amount of the asset and depreciation based on
Ü
NOTES TO THE FINANCIAL STATEMENTS (continued)2. Summary of significant accounting policies (continued)2.7 Financial Liabilities (continued)
GO
VER
NA
NC
EFIN
AN
CIA
L STA
TEM
EN
TSO
VER
VIE
W
Annual Report and Consolidated Financial Statements For the year ended 31 December 2017
43
the asset’s original cost. Additionally, accumulated depreciation as at the revaluation date is eliminated against the gross carrying amount of the asset and the net amount is restated to the revalued amount of the asset. Upon disposal, any revaluation surplus relating to the particular asset being sold is transferred to retained earnings.
Depreciation of assets is calculated using the straight-line method to allocate their cost to their residual values over their estimated useful lives, as follows:
Buildings 7%
Leasehold improvements Shorter of useful lives and lease terms
Furniture, Fixtures, Strong room & Safes 12.5%
Office Equipment 20.0%Motor vehicles 25.0%
Computer Equipment, ATM, POS & SWIFT 33.3%
The assets’ residual values, depreciation methods and useful lives are reviewed, and adjusted if appropriate, at the end of each reporting period. Assets are reviewed for impairment whenever events or changes in circumstances indicate that the carrying amount may not be recoverable. “Property and equipment is derecognised on disposal or when no future economic benefits are expected from its use. Any gain or loss arising on derecognition of the asset (calculated as the difference between the net disposal proceeds and the carrying amount of the asset) is recognised in other operating income in the statement of profit or loss in the year the asset is derecognised. Detailed disclosures are provided in Note 25.
Gains and losses on disposals are determined by comparing proceeds with carrying amount. These are included in ‘other operating expenses’ in profit or loss.” The bank assesses the fair value of the buildings at the end of each reporting period to determine the frequency of revaluation. If the difference between the fair value of the buildings and their respective carrying amounts is insignificant, the buildings will be revalued every five years. 2.12 Intangible assetsCosts associated with maintaining computer software programmes are recognised as an expense as incurred. Development costs that are directly attributable to the design and testing of identifiable and unique software products controlled by the
Bank are recognised as intangible assets when the following criteria are met: � It is technically feasible to complete the software
product so that it will be available for use; � Management intends to complete the software
product and use or sell it; � There is an ability to use or sell the software
product; � It can be demonstrated how the software
product will generate probable future economic benefits;
� Adequate technical, financial and other resources to complete the development and to use or sell the software product are available; and
� The expenditure attributable to the software product during its development can be reliably measured.
Directly attributable costs that are capitalised as part of the software product include the software development employee costs and an appropriate portion of relevant overheads.
Other development expenditures that do not meet these criteria are recognised as an expense as incurred. Development costs previously recognised as an expense are not recognised as an asset in a subsequent period. Computer software development costs recognised as assets are amortised over their estimated useful lives, which does not exceed three years. Acquired computer software licences are capitalised on the basis of the costs incurred to acquire and bring to use the specific software. These costs are amortised over the expected useful lives. Software has a maximum expected useful life of 5 years. The useful lives of intangible assets are assessed as either finite or indefinite. Intangible assets with finite lives are amortised over the useful economic life and assessed for impairment whenever there is an indication that the intangible asset may be impaired. The amortisation period and the amortisation method for an intangible asset with a finite useful life are reviewed at least at the end of each reporting period. Changes in the expected useful life or the expected pattern of consumption of future economic benefits embodied in the asset are considered to modify the amortisation period or method, as appropriate, and are treated as changes in accounting estimates. The amortisation expense on intangible assets with finite lives is recognised in the statement of profit or loss in the expense category that is consistent with the function of the intangible assets.
Gains or losses arising from derecognition of an intangible asset are measured as the difference between the net disposal proceeds and the Ü
Annual Report and Consolidated Financial Statements For the year ended 31 December 2017
44
carrying amount of the asset and are recognised in the statement of profit or loss when the asset is derecognised. 2.13 Impairment of non-financial assetsThe Bank assesses, at each reporting date, whether there is an indication that an asset may be impaired. If any indication exists, or when annual impairment testing for an asset is required, the Bank estimates the asset’s recoverable amount. An asset’s recoverable amount is the higher of an asset’s or CGU’s fair value less costs of disposal and its value in use. The recoverable amount is determined for an individual asset, unless the asset does not generate cash inflows that are largely independent of those from other assets or group’s assets. When the carrying amount of an asset or CGU exceeds its recoverable amount, the asset is considered impaired and is written down to its recoverable amount. In assessing value in use, the estimated future cash flows are discounted to their present value using a pre-tax discount rate that reflects current market assessments of the time value of money and the risks specific to the asset. In determining fair value less costs of disposal, recent market transactions are taken into account. If no such transactions can be identified, an appropriate valuation model is used. These calculations are corroborated by valuation multiples, quoted share prices for publicly traded companies or other available fair value indicators. Impairment losses of continuing operations are recognised in the statement of profit or loss in expense categories consistent with the function of the impaired asset, except for properties previously revalued with the revaluation taken to OCI. For such properties, the impairment is recognised in OCI up to the amount of any previous revaluation. 2.14 Employee benefits
a. Pension obligations The Bank operates various pension schemes. The schemes are generally funded through payments to insurance companies or trustee-administered funds, determined by periodic actuarial calculations. The Bank has a defined contribution scheme. A defined contribution plan is a pension plan under which the Bank pays fixed contributions into a separate entity.
The Bank has no legal or constructive obligations to pay further contributions if the fund does not hold sufficient assets to pay all employees the benefits relating to employee service in the current and prior periods. For defined contribution plans, the Bank pays contributions to publicly or privately administered
pension insurance plans on a mandatory, contractual or voluntary basis. The contributions are recognised as employee benefit expense when they are due. Prepaid contributions are recognised as an asset to the extent that a cash refund or a reduction in the future payments is available. b. Retirement benefit obligationsThe Consolidated contributes to the statutory National Social Security Fund (NSSF) on behalf of its employees. This is a defined contribution scheme registered under the NSSF Act. The group’s obligations under the scheme are specific contributions legislated from time to time and are currently limited to 10% of the respective employees’ salaries. The group’s contributions are charged to the profit or loss in the year in which they relate. 2.15 ProvisionsProvisions for restructuring costs and legal claims are recognised when: the Bank has a present legal or constructive obligation as a result of past events; it is probable that an outflow of resources will be required to settle the obligation; and the amount has been reliably estimated. Provisions are not recognised for future operating losses.
Where there are a number of similar obligations, the likelihood that an outflow will be required in settlement is determined by considering the class of obligations as a whole. A provision is recognised even if the likelihood of an outflow with respect to any one item included in the same class of obligations may be small. Provisions are measured at the present value of the expenditures expected to be required to settle the obligation using a pre-tax rate that reflects current market assessments of the time value of money and the risks specific to the obligation. The increase in the provision due to passage of time is recognised as interest expense. Provisions are recognised when the Bank has a present legal or constructive obligation as a result of past events, where it is probable that an outflow of resources embodying economic benefits will be required to settle the obligation, and a reliable estimate of the amount of the obligation can be made. 2.16 Income tax
a. Current income tax Current tax assets and liabilities for the current and prior years are measured at the amount expected to be recovered from, or paid to, the taxation authorities. The tax rates and tax laws used to compute the amount are those that are enacted, or substantively enacted, by the reporting date in the countries where
NOTES TO THE FINANCIAL STATEMENTS (continued)2. Summary of significant accounting policies (continued)2.12 Intangible Assets (continued)
Ü
GO
VER
NA
NC
EFIN
AN
CIA
L STA
TEM
EN
TSO
VER
VIE
W
Annual Report and Consolidated Financial Statements For the year ended 31 December 2017
45
the Bank operates and generates taxable income. Current income tax relating to items recognised directly in equity is recognised in equity and not in the statement of profit or loss. Management periodically evaluates positions taken in the tax returns with respect to situations in which applicable tax regulations are subject to interpretation and establishes provisions where appropriate. b. Deferred income taxDeferred tax is provided on temporary differences at the reporting date between the tax bases of assets and liabilities and their carrying amounts for financial reporting purposes. Deferred tax liabilities are recognised for all taxable temporary differences, except: � Where the deferred tax liability arises from the
initial recognition of goodwill or of an asset or liability in a transaction that is not a business combination and, at the time of the transaction, affects neither the accounting profit nor taxable profit or loss
� In respect of taxable temporary differences
associated with investments in subsidiaries, where the timing of the reversal of the temporary differences can be controlled and it is probable that the temporary differences will not reverse in the foreseeable future
The carrying amount of deferred tax assets is reviewed at each reporting date and reduced to the extent that it is no longer probable that sufficient taxable profit will be available to allow all or part of the deferred tax asset to be utilised. Unrecognised deferred tax assets are reassessed at each reporting date and are recognised to the extent that it becomes probable that future taxable profit will allow the deferred tax asset to be recovered. Deferred tax assets and liabilities are measured at the tax rates that are expected to apply in the year when the asset is realised or the liability is settled, based on tax rates (and tax laws) that have been enacted or substantively enacted at the reporting date.
The measurement of deferred tax reflects the tax consequences that would follow from the manner in which the Consolidated expects at the end of the reporting period to recover to settle the carrying amounts of its assets and liabilities.
Current and deferred taxes are recognised as income tax benefits or expenses in the income statement except for tax related to the fair value remeasurement of available-for-sale assets, foreign exchange differences and the net movement on cash flow
hedges, which are charged or credited to OCI. These exceptions are subsequently reclassified from OCI to the income statement together with the respective deferred loss or gain. The Bank also recognises the tax consequences of payments and issuing costs, related to financial instruments that are classified as equity, directly in equity. The Bank only off-sets its deferred tax assets against liabilities when there is both a legal right to offset and it is the Bank’s intention to settle on a net basis. 2.17 Dividend payableDividends on ordinary shares are charged to equity in the period in which they are declared.
2.18 Share capitalOrdinary shares are classified as ‘share capital’ in equity. Any premium received over and above the par value of the shares is classified as ‘share premium’ in equity. 2.19 LeasesThe determination of whether an arrangement is a lease, or contains a lease, is based on the substance of the arrangement and requires an assessment of whether the fulfilment of the arrangement is dependent on the use of a specific asset or assets or whether the arrangement conveys a right to use the asset. Leases are divided into finance leases and operating leases. a. The Bank as the lessee
i. Operating lease
Leases in which a significant portion of the risks and rewards of ownership are retained by another party, the lessor, are classified as operating leases. Payments, including pre-payments, made under operating leases (net of any incentives received from the lessor) are charged to profit or loss on a straight-line basis over the period of the lease. Refer to note 25. The total payments made under operating leases are charged to ‘other operating expenses’ on a straight-line basis over the period of the lease. When an operating lease is terminated before the lease period has expired, any payment required to be made to the lessor by way of penalty is recognised as an expense in the period in which termination takes place.
The leases entered into by the Bank are primarily operating leases.
Annual Report and Consolidated Financial Statements For the year ended 31 December 2017
46
b. The Bank as the lessor When assets are leased out under a finance
lease, the present value of the lease payments is recognised as a receivable. The difference between the gross receivable and the present value of the receivable is recognised as unearned finance income. Lease income is recognised over the term of the lease using the net investment method (before income tax), which reflects a constant periodic rate of return.
2.20 Interest income and expenseInterest income and expense for all interest-bearing financial instruments are recognised in profit or loss using the effective interest method. The effective interest method is a method of calculating the amortised cost of a financial asset or a financial liability and of allocating the interest income or interest expense over the relevant period. The effective interest rate is the rate that exactly discounts estimated future cash payments or receipts through the expected life of the financial instrument or, when appropriate, a shorter period to the net carrying amount of the financial asset or financial liability. When calculating the effective interest rate, the Bank estimates cash flows considering all contractual terms of the financial instrument (for example, prepayment options) but does not consider future credit losses. The calculation includes all fees and points paid or received between parties to the contract that are an integral part of the effective interest rate, transaction costs and all other premiums or discounts. Once a financial asset or a Consolidated of similar financial assets has been written down as a result of an impairment loss, interest income is recognised using the rate of interest used to discount the future cash flows for the purpose of measuring the impairment loss. 2.21 Fee and commission incomeFees and commissions are generally recognised on an accrual basis when the service has been provided. Loan commitment fees for loans that are likely to be drawn down are deferred (together with related direct costs) and recognised as an adjustment to the effective interest rate on the loan. Loan syndication fees are recognised as revenue when the syndication has been completed and the Bank has retained no part of the loan package for itself or has retained a part at the same effective interest rate as the other participants.
Commission and fees arising from negotiating, or participating in the negotiation of, a transaction for a third party – such as the arrangement of the acquisition of shares or other securities, or the purchase or sale of businesses – are recognised on
completion of the underlying transaction. Portfolio and other management advisory and service fees are recognised based on the applicable service contracts, usually on a time-apportionate basis. Performance-linked fees or fee components are recognised when the performance criteria are fulfilled. 2.22 Dividend incomeDividends are recognised in profit or loss when the Bank’s right to receive payment is established. 2.23 Acceptances and letters of creditAcceptances and letters of credit are accounted for as off-balance sheet transactions and disclosed as contingent liabilities. 2.24 Financial guarantee contractsFinancial guarantee contracts are contracts that require the issuer to make specified payments to reimburse the holder for a loss it incurs because a specified debtor fails to make payment when due, in accordance with the terms of a debt instrument. Such financial guarantees are given to other Banks, financial institutions and other bodies on behalf of customers to secure loans, overdrafts and other facilities. Financial guarantees are initially recognised in the financial statements at fair value on the date the guarantee was given. Subsequent to initial recognition, the Bank’s liabilities under such guarantees are measured at the higher of the initial investment, less amortisation calculated to recognise in the income statement the fee income earned on a straight line basis over the life of the guarantee and the best estimate of the expenditure required to settle any financial obligation arising at the statement of financial position date.
The Bank’s business involves taking on risks in a targeted manner and managing them professionally. The core functions of the Bank’s risk management are to identify all key risks for the Bank, measure these risks, manage the risk positions and determine capital allocations. The Bank regularly reviews its risk management policies and systems to reflect changes in markets, products and best market practice.
NOTES TO THE FINANCIAL STATEMENTS (continued)2. Summary of significant accounting policies (continued)2.19 Leases (continued)
GO
VER
NA
NC
EFIN
AN
CIA
L STA
TEM
EN
TSO
VER
VIE
W
Annual Report and Consolidated Financial Statements For the year ended 31 December 2017
47
3. FINANCIAL RISK MANAGEMENTThe Bank’s aim is to achieve an appropriate balance between risk and return and minimise potential adverse effects on the Bank’s financial performance. The Bank defines risk as the possibility of losses or profits foregone, which may be caused by internal or external factors. Financial Risk Management is overseen by the Risk Department and carried out primarily by the Credit and Treasury Departments. Bank Treasury identifies, evaluates and hedges financial risks in close co-operation with the Bank’s operating units. The Board provides written principles for overall risk management, as well as written policies covering specific areas, such as foreign exchange risk, interest rate risk, credit risk, use of derivative financial instruments and non-derivative financial instruments. In addition, internal audit is responsible for the independent review of risk management and the control environment. The risks arising from financial instruments to which the Bank is exposed are financial risks, which includes credit risk, liquidity risk and market risk. 3.1 Credit risk Credit risk is the risk of suffering financial loss, should any of the Bank’s customers, clients or market counterparties fail to fulfil their contractual obligations to the Bank. Credit risk arises mainly from commercial and consumer loans and advances, credit cards, and loan commitments arising from such lending activities, but can also arise from credit enhancement provided, financial guarantees, letters of credit, endorsements and acceptances. The Bank is also exposed to other credit risks arising from investments in debt securities and other exposures arising from its trading activities (‘trading exposures’), including non-equity trading portfolio assets, derivatives and settlement balances with market counterparties and reverse repurchase loans.
Credit risk is the single largest risk for the Bank’s business; the directors therefore carefully manage the exposure to credit risk. The credit risk management and control are centralised in a credit risk management team, which provides reports to the Management and Board Credit Committees 3.1.1 Credit risk measurement Loans and advances (including loan commitments and guarantees) The estimation of credit exposure is complex and requires the use of models, as the value of a product varies with changes in market variables, expected cash flows and the passage of time. The assessment
of credit risk of a portfolio of assets entails further estimations as to the likelihood of defaults occurring, of the associated loss ratios and of default correlations between counterparties. The Bank has developed models to support the quantification of the credit risk. These rating and scoring models are in use for all key credit portfolios and form the basis for measuring default risks. In measuring credit risk of loan and advances at a counterparty level, the Bank considers three components: (i) the ‘probability of default’ (PD) by the client or counterparty on its contractual obligations; (ii) current exposures to the counterparty and its likely future development, from which the Bank derive the ‘exposure at default’ (EAD); and (iii) the likely recovery ratio on the defaulted obligations (the ‘loss given default’) (LGD). The models are reviewed regularly to monitor their robustness relative to actual performance and amended as necessary to optimise their effectiveness. These credit risk measurements, which reflect expected loss (the ‘expected loss model’), are required by the Basel Committee on Banking Regulations and the Supervisory Practices (the Basel Committee) and are embedded in the Bank’s daily operational management. The operational measurements can be contrasted with impairment allowances required under IAS 39, which are based on losses that have been incurred at the reporting date (the ‘incurred loss model’) rather than expected losses.
The Bank’s internal ratings scale and mapping of external ratings as supplemented by the Bank’s own assessment through the use of internal rating tools are as follows:
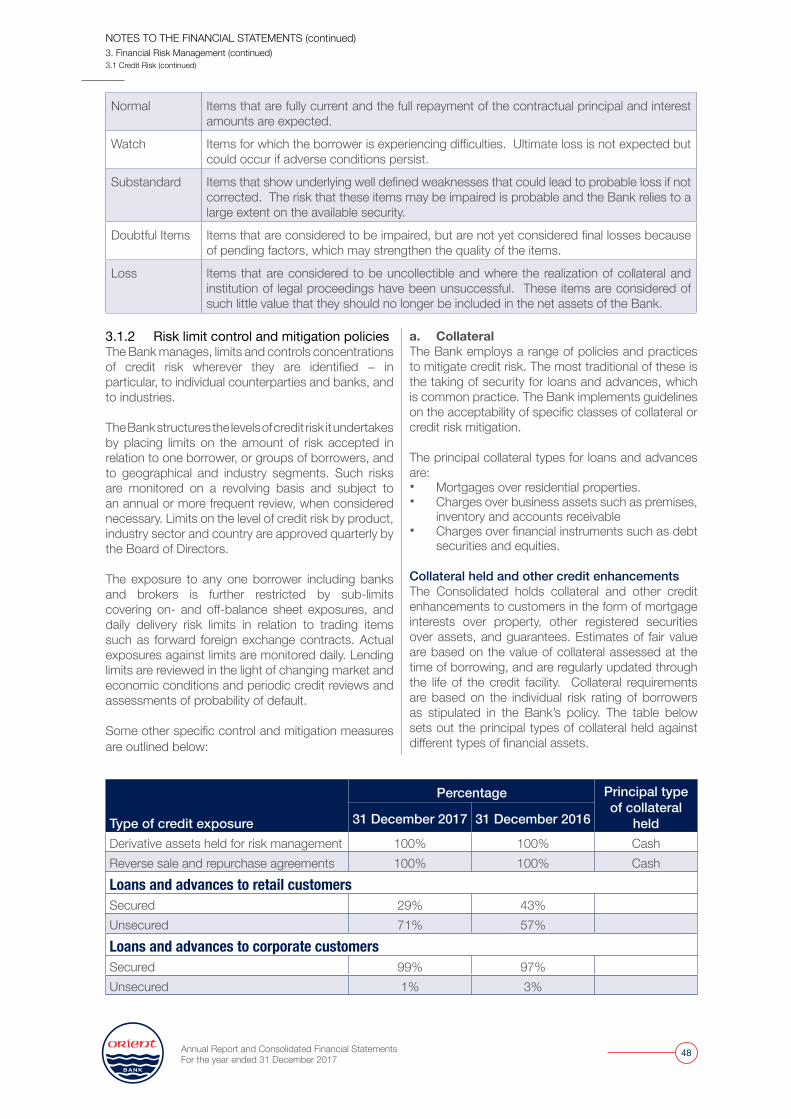
Annual Report and Consolidated Financial Statements For the year ended 31 December 2017
48
Normal Items that are fully current and the full repayment of the contractual principal and interest amounts are expected.
Watch Items for which the borrower is experiencing difficulties. Ultimate loss is not expected but could occur if adverse conditions persist.
Substandard Items that show underlying well defined weaknesses that could lead to probable loss if not corrected. The risk that these items may be impaired is probable and the Bank relies to a large extent on the available security.
Doubtful Items Items that are considered to be impaired, but are not yet considered final losses because of pending factors, which may strengthen the quality of the items.
Loss Items that are considered to be uncollectible and where the realization of collateral and institution of legal proceedings have been unsuccessful. These items are considered of such little value that they should no longer be included in the net assets of the Bank.
3.1.2 Risk limit control and mitigation policies The Bank manages, limits and controls concentrations of credit risk wherever they are identified − in particular, to individual counterparties and banks, and to industries.
The Bank structures the levels of credit risk it undertakes by placing limits on the amount of risk accepted in relation to one borrower, or groups of borrowers, and to geographical and industry segments. Such risks are monitored on a revolving basis and subject to an annual or more frequent review, when considered necessary. Limits on the level of credit risk by product, industry sector and country are approved quarterly by the Board of Directors. The exposure to any one borrower including banks and brokers is further restricted by sub-limits covering on- and off-balance sheet exposures, and daily delivery risk limits in relation to trading items such as forward foreign exchange contracts. Actual exposures against limits are monitored daily. Lending limits are reviewed in the light of changing market and economic conditions and periodic credit reviews and assessments of probability of default. Some other specific control and mitigation measures are outlined below:
a. Collateral The Bank employs a range of policies and practices to mitigate credit risk. The most traditional of these is the taking of security for loans and advances, which is common practice. The Bank implements guidelines on the acceptability of specific classes of collateral or credit risk mitigation.
The principal collateral types for loans and advances are: � Mortgages over residential properties. � Charges over business assets such as premises,
inventory and accounts receivable � Charges over financial instruments such as debt
securities and equities.
Collateral held and other credit enhancements The Consolidated holds collateral and other credit enhancements to customers in the form of mortgage interests over property, other registered securities over assets, and guarantees. Estimates of fair value are based on the value of collateral assessed at the time of borrowing, and are regularly updated through the life of the credit facility. Collateral requirements are based on the individual risk rating of borrowers as stipulated in the Bank’s policy. The table below sets out the principal types of collateral held against different types of financial assets.
Type of credit exposure
Percentage Principal type of collateral
held31 December 2017 31 December 2016
Derivative assets held for risk management 100% 100% CashReverse sale and repurchase agreements 100% 100% CashLoans and advances to retail customersSecured 29% 43%Unsecured 71% 57%Loans and advances to corporate customersSecured 99% 97%Unsecured 1% 3%
NOTES TO THE FINANCIAL STATEMENTS (continued)3. Financial Risk Management (continued)3.1 Credit Risk (continued)
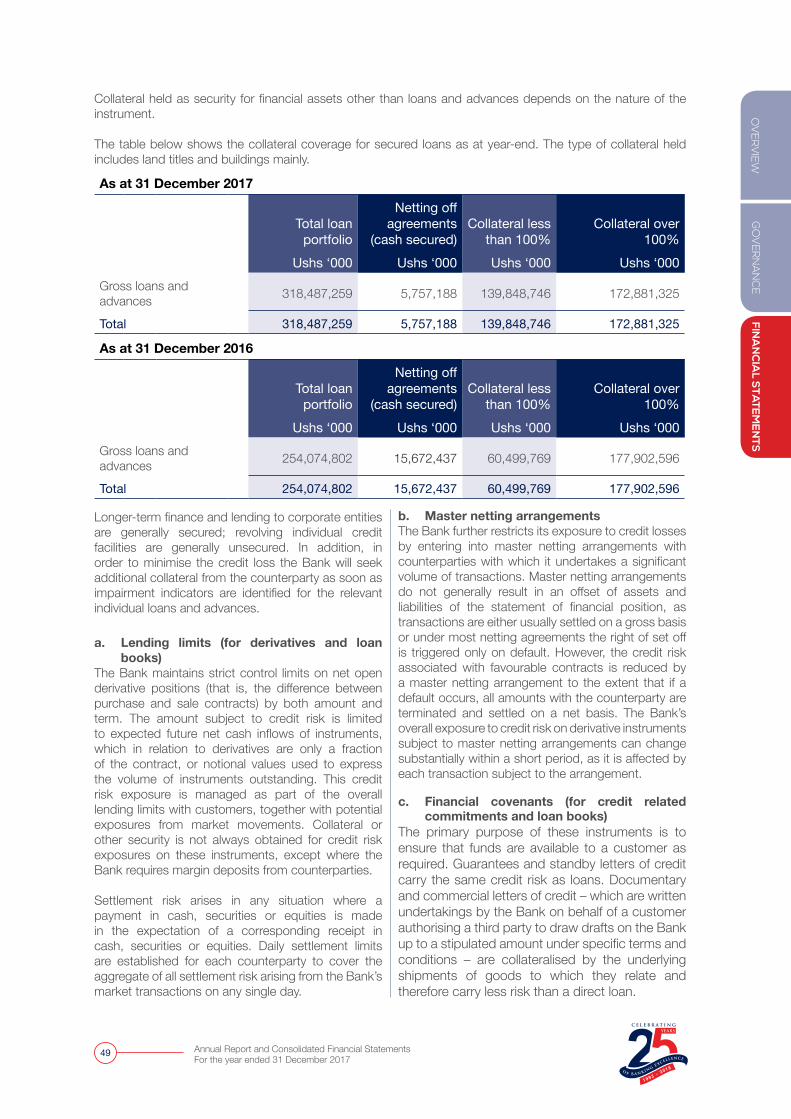
GO
VER
NA
NC
EFIN
AN
CIA
L STA
TEM
EN
TSO
VER
VIE
W
Annual Report and Consolidated Financial Statements For the year ended 31 December 2017
49
Collateral held as security for financial assets other than loans and advances depends on the nature of the instrument.
The table below shows the collateral coverage for secured loans as at year-end. The type of collateral held includes land titles and buildings mainly.
As at 31 December 2017
Total loan portfolio
Netting off agreements
(cash secured)Collateral less
than 100%Collateral over
100%Ushs ‘000 Ushs ‘000 Ushs ‘000 Ushs ‘000
Gross loans and advances 318,487,259 5,757,188 139,848,746 172,881,325
Total 318,487,259 5,757,188 139,848,746 172,881,325
As at 31 December 2016
Total loan portfolio
Netting off agreements
(cash secured)Collateral less
than 100%Collateral over
100%Ushs ‘000 Ushs ‘000 Ushs ‘000 Ushs ‘000
Gross loans and advances 254,074,802 15,672,437 60,499,769 177,902,596
Total 254,074,802 15,672,437 60,499,769 177,902,596
Longer-term finance and lending to corporate entities are generally secured; revolving individual credit facilities are generally unsecured. In addition, in order to minimise the credit loss the Bank will seek additional collateral from the counterparty as soon as impairment indicators are identified for the relevant individual loans and advances. a. Lending limits (for derivatives and loan
books) The Bank maintains strict control limits on net open derivative positions (that is, the difference between purchase and sale contracts) by both amount and term. The amount subject to credit risk is limited to expected future net cash inflows of instruments, which in relation to derivatives are only a fraction of the contract, or notional values used to express the volume of instruments outstanding. This credit risk exposure is managed as part of the overall lending limits with customers, together with potential exposures from market movements. Collateral or other security is not always obtained for credit risk exposures on these instruments, except where the Bank requires margin deposits from counterparties. Settlement risk arises in any situation where a payment in cash, securities or equities is made in the expectation of a corresponding receipt in cash, securities or equities. Daily settlement limits are established for each counterparty to cover the aggregate of all settlement risk arising from the Bank’s market transactions on any single day.
b. Master netting arrangementsThe Bank further restricts its exposure to credit losses by entering into master netting arrangements with counterparties with which it undertakes a significant volume of transactions. Master netting arrangements do not generally result in an offset of assets and liabilities of the statement of financial position, as transactions are either usually settled on a gross basis or under most netting agreements the right of set off is triggered only on default. However, the credit risk associated with favourable contracts is reduced by a master netting arrangement to the extent that if a default occurs, all amounts with the counterparty are terminated and settled on a net basis. The Bank’s overall exposure to credit risk on derivative instruments subject to master netting arrangements can change substantially within a short period, as it is affected by each transaction subject to the arrangement. c. Financial covenants (for credit related
commitments and loan books) The primary purpose of these instruments is to ensure that funds are available to a customer as required. Guarantees and standby letters of credit carry the same credit risk as loans. Documentary and commercial letters of credit – which are written undertakings by the Bank on behalf of a customer authorising a third party to draw drafts on the Bank up to a stipulated amount under specific terms and conditions – are collateralised by the underlying shipments of goods to which they relate and therefore carry less risk than a direct loan.
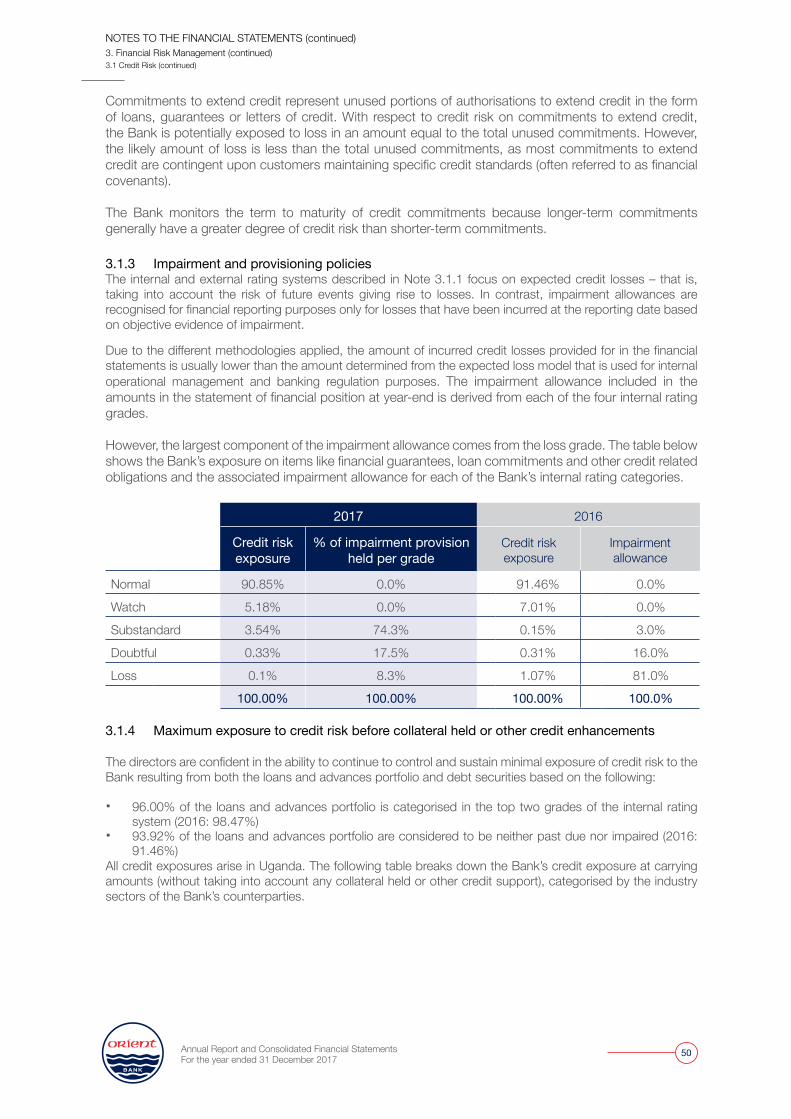
Annual Report and Consolidated Financial Statements For the year ended 31 December 2017
50
Commitments to extend credit represent unused portions of authorisations to extend credit in the form of loans, guarantees or letters of credit. With respect to credit risk on commitments to extend credit, the Bank is potentially exposed to loss in an amount equal to the total unused commitments. However, the likely amount of loss is less than the total unused commitments, as most commitments to extend credit are contingent upon customers maintaining specific credit standards (often referred to as financial covenants).
The Bank monitors the term to maturity of credit commitments because longer-term commitments generally have a greater degree of credit risk than shorter-term commitments. 3.1.3 Impairment and provisioning policies The internal and external rating systems described in Note 3.1.1 focus on expected credit losses – that is, taking into account the risk of future events giving rise to losses. In contrast, impairment allowances are recognised for financial reporting purposes only for losses that have been incurred at the reporting date based on objective evidence of impairment.
Due to the different methodologies applied, the amount of incurred credit losses provided for in the financial statements is usually lower than the amount determined from the expected loss model that is used for internal operational management and banking regulation purposes. The impairment allowance included in the amounts in the statement of financial position at year-end is derived from each of the four internal rating grades.
However, the largest component of the impairment allowance comes from the loss grade. The table below shows the Bank’s exposure on items like financial guarantees, loan commitments and other credit related obligations and the associated impairment allowance for each of the Bank’s internal rating categories.
2017 2016
Credit risk exposure
% of impairment provision held per grade
Credit risk exposure
Impairment allowance
Normal 90.85% 0.0% 91.46% 0.0%
Watch 5.18% 0.0% 7.01% 0.0%
Substandard 3.54% 74.3% 0.15% 3.0%
Doubtful 0.33% 17.5% 0.31% 16.0%
Loss 0.1% 8.3% 1.07% 81.0%
100.00% 100.00% 100.00% 100.0% 3.1.4 Maximum exposure to credit risk before collateral held or other credit enhancements
The directors are confident in the ability to continue to control and sustain minimal exposure of credit risk to the Bank resulting from both the loans and advances portfolio and debt securities based on the following: � 96.00% of the loans and advances portfolio is categorised in the top two grades of the internal rating
system (2016: 98.47%) � 93.92% of the loans and advances portfolio are considered to be neither past due nor impaired (2016:
91.46%) All credit exposures arise in Uganda. The following table breaks down the Bank’s credit exposure at carrying amounts (without taking into account any collateral held or other credit support), categorised by the industry sectors of the Bank’s counterparties.
NOTES TO THE FINANCIAL STATEMENTS (continued)3. Financial Risk Management (continued)3.1 Credit Risk (continued)
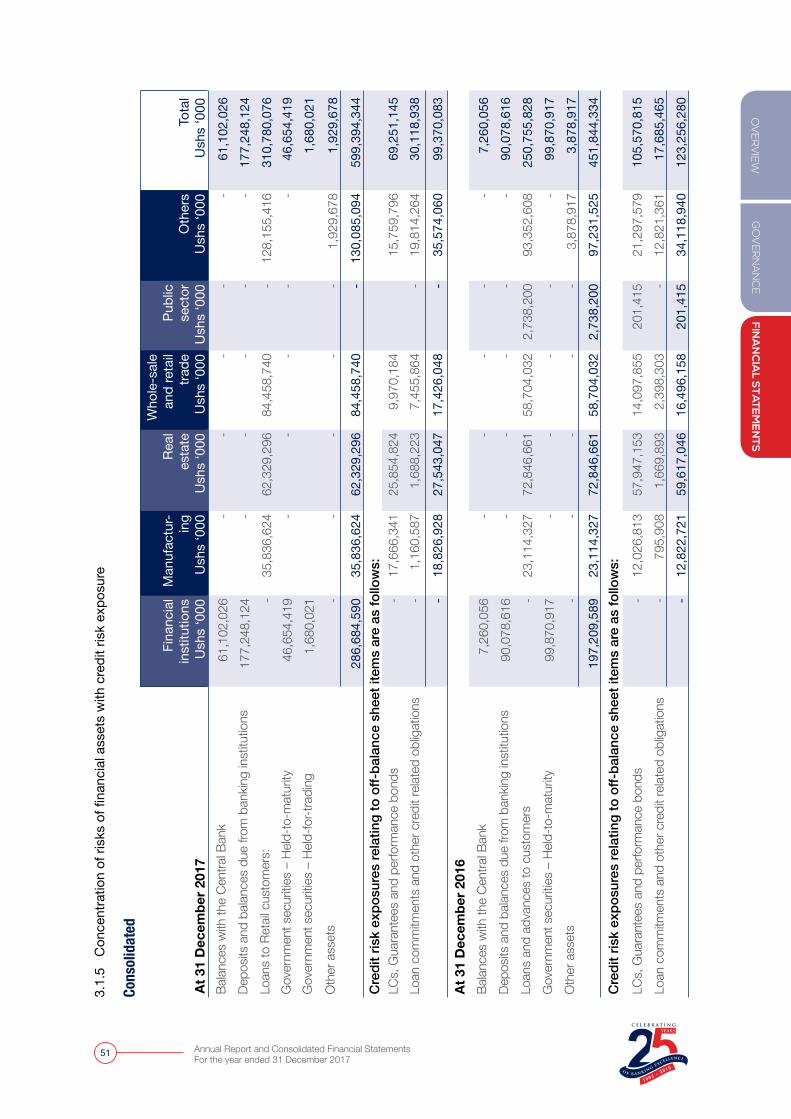
GO
VER
NA
NC
EFIN
AN
CIA
L STA
TEM
EN
TSO
VER
VIE
W
Annual Report and Consolidated Financial Statements For the year ended 31 December 2017
51
3.1.
5 C
once
ntra
tion
of ri
sks
of fi
nanc
ial a
sset
s w
ith c
redi
t ris
k ex
posu
re
Cons
olid
ated
At 3
1 D
ecem
ber 2
017
Fina
ncia
l in
stitu
tions
Ush
s ‘0
00
Man
ufac
tur- ing
Ush
s ‘0
00
Real
es
tate
Ush
s ‘0
00
Who
le-s
ale
and
reta
il tra
deU
shs
‘000
Publ
ic
sect
orU
shs
‘000
Oth
ers
Ush
s ‘0
00To
tal
Ush
s ‘0
00Ba
lance
s w
ith th
e Ce
ntra
l Ban
k61
,102
,026
-
-
-
-
-
61,
102,
026
Depo
sits
and
balan
ces
due
from
ban
king
inst
itutio
ns17
7,24
8,12
4
-
- -
- -
177
,248
,124
Lo
ans
to R
etail
cus
tom
ers:
-
35,8
36,6
24
62,3
29,2
96
84,4
58,7
40
-
128,
155,
416
310,
780,
076
Gov
ernm
ent s
ecur
ities
– He
ld-to
-mat
urity
46,6
54,4
19
-
-
- -
- 46
,654
,419
G
over
nmen
t sec
uritie
s –
Held
-for-t
radi
ng1,
680,
021
1,68
0,02
1 O
ther
ass
ets
- -
-
-
-
1,92
9,67
8 1,
929,
678
286,
684,
590
35,8
36,6
24
62,3
29,2
96
84,4
58,7
40
-
130,
085,
094
599
,394
,344
C
redi
t ris
k ex
posu
res
rela
ting
to o
ff-ba
lanc
e sh
eet i
tem
s ar
e as
follo
ws:
LCs,
Gua
rant
ees
and
perfo
rman
ce b
onds
- 17
,666
,341
25
,854
,824
9,
970,
184
15,7
59,7
96
69,2
51,1
45
Loan
com
mitm
ents
and
oth
er c
redi
t rela
ted
oblig
atio
ns
-
1,16
0,58
7 1,
688,
223
7,45
5,86
4 -
19,
814,
264
3
0,11
8,93
8
- 18
,826
,928
27
,543
,047
17
,426
,048
-
35,
574,
060
9
9,37
0,08
3 At
31
Dec
embe
r 201
6Ba
lance
s w
ith th
e Ce
ntra
l Ban
k7,
260,
056
-
-
-
-
-
7,
260,
056
Depo
sits
and
balan
ces
due
from
ban
king
inst
itutio
ns 9
0,07
8,61
6
-
-
-
-
- 90
,078
,616
Lo
ans
and
adva
nces
to c
usto
mer
s
-
23,1
14,3
27
72,8
46,6
61
58,7
04,0
32
2,73
8,20
0 93
,352
,608
2
50,7
55,8
28
Gov
ernm
ent s
ecur
ities
– He
ld-to
-mat
urity
99,8
70,9
17
-
-
-
-
-
99,8
70,9
17
Oth
er a
sset
s -
-
- -
- 3
,878
,917
3,
878,
917
197,
209,
589
23,1
14,3
27
72,8
46,6
61
58,7
04,0
32
2,73
8,20
0 97
,231
,525
4
51,8
44,3
34
Cre
dit r
isk
expo
sure
s re
latin
g to
off-
bala
nce
shee
t ite
ms
are
as fo
llow
s:LC
s, G
uara
ntee
s an
d pe
rform
ance
bon
ds -
12,0
26,8
13
57,9
47,1
53
14,0
97,8
55
201,
415
21,2
97,5
79
105,
570,
815
Loan
com
mitm
ents
and
oth
er c
redi
t rela
ted
oblig
atio
ns
-
795,
908
1,66
9,89
3 2,
398,
303
- 12
,821
,361
17
,685
,465
-
12,8
22,7
21
59,6
17,0
46
16,4
96,1
58
201,
415
3
4,11
8,94
0 1
23,2
56,2
80
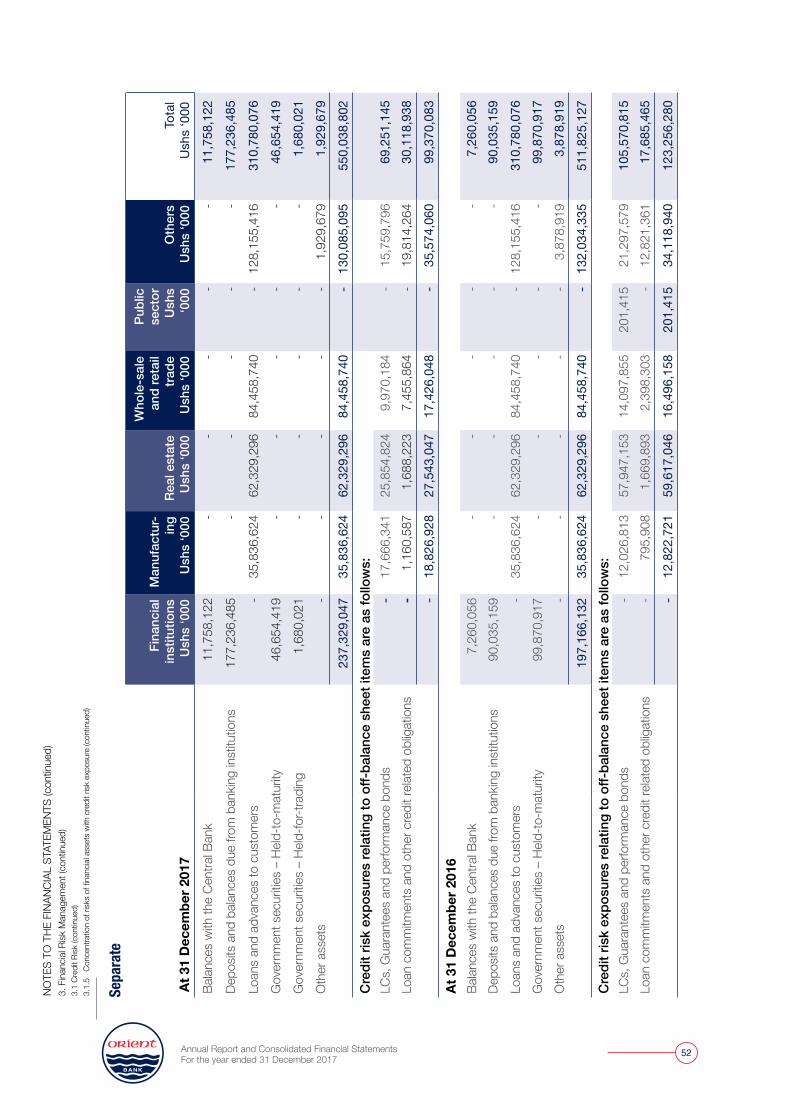
Annual Report and Consolidated Financial Statements For the year ended 31 December 2017
52
Sepa
rate
At 3
1 D
ecem
ber 2
017
Fina
ncia
l in
stitu
tions
Ush
s ‘0
00
Man
ufac
tur-
ing
Ush
s ‘0
00Re
al e
stat
eU
shs
‘000
Who
le-s
ale
and
reta
il tra
deU
shs
‘000
Publ
ic
sect
orU
shs
‘000
Oth
ers
Ush
s ‘0
00To
tal
Ush
s ‘0
00
Balan
ces
with
the
Cent
ral B
ank
11,7
58,1
22
-
-
-
-
-
1
1,75
8,12
2
Depo
sits
and
balan
ces
due
from
ban
king
inst
itutio
ns17
7,23
6,48
5
-
-
-
-
- 1
77,2
36,4
85
Loan
s an
d ad
vanc
es to
cus
tom
ers
-
35,8
36,6
24
62,3
29,2
96
84,4
58,7
40
- 12
8,15
5,41
6 3
10,7
80,0
76
Gov
ernm
ent s
ecur
ities
– He
ld-to
-mat
urity
4
6,65
4,41
9
-
-
-
-
-
4
6,65
4,41
9 G
over
nmen
t sec
uritie
s –
Held
-for-t
radi
ng
1,
680,
021
-
-
-
-
-
1,
680,
021
Oth
er a
sset
s
-
-
-
-
-
1,92
9,67
9
1,
929,
679
237
,329
,047
35
,836
,624
62
,329
,296
84
,458
,740
-
13
0,08
5,09
5 5
50,0
38,8
02
Cre
dit r
isk
expo
sure
s re
latin
g to
off-
bala
nce
shee
t ite
ms
are
as fo
llow
s:LC
s, G
uara
ntee
s an
d pe
rform
ance
bon
ds
- 17
,666
,341
25
,854
,824
9,
970,
184
-
15,7
59,7
96
6
9,25
1,14
5 Lo
an c
omm
itmen
ts a
nd o
ther
cre
dit r
elate
d ob
ligat
ions
-
1,16
0,58
7 1,
688,
223
7,45
5,86
4
-
19,8
14,2
64
3
0,11
8,93
8
- 18
,826
,928
27
,543
,047
17
,426
,048
-
35,5
74,0
60
9
9,37
0,08
3 At
31
Dec
embe
r 201
6Ba
lance
s w
ith th
e Ce
ntra
l Ban
k
7,
260,
056
-
-
-
-
-
7,26
0,05
6 De
posit
s an
d ba
lance
s du
e fro
m b
ankin
g in
stitu
tions
9
0,03
5,15
9
-
-
-
-
-
9
0,03
5,15
9 Lo
ans
and
adva
nces
to c
usto
mer
s
- 35
,836
,624
62
,329
,296
84
,458
,740
-
12
8,15
5,41
6 3
10,7
80,0
76
Gov
ernm
ent s
ecur
ities
– He
ld-to
-mat
urity
9
9,87
0,91
7 -
-
- -
- 99
,870
,917
O
ther
ass
ets
-
-
-
-
- 3,
878,
919
3,87
8,91
9 1
97,1
66,1
32
35,8
36,6
24
62,3
29,2
96
84,4
58,7
40
-
132,
034,
335
511
,825
,127
C
redi
t ris
k ex
posu
res
rela
ting
to o
ff-ba
lanc
e sh
eet i
tem
s ar
e as
follo
ws:
LCs,
Gua
rant
ees
and
perfo
rman
ce b
onds
-
12,0
26,8
13
57,9
47,1
53
14,0
97,8
55
201,
415
21,2
97,5
79
105
,570
,815
Lo
an c
omm
itmen
ts a
nd o
ther
cre
dit r
elate
d ob
ligat
ions
-
795,
908
1,66
9,89
3 2,
398,
303
-
12,8
21,3
61
1
7,68
5,46
5
-
12,8
22,7
21
59,6
17,0
46
16,4
96,1
58
201,
415
34,1
18,9
40
123
,256
,280
NOTE
S TO
THE
FIN
ANCI
AL S
TATE
MEN
TS (c
ontin
ued)
3. F
inan
cial R
isk M
anag
emen
t (co
ntin
ued)
3.1
Cred
it Ri
sk (c
ontin
ued)
3.1.
5 C
once
ntra
tion
of ri
sks
of fi
nanc
ial a
sset
s w
ith c
redi
t risk
exp
osur
e (c
ontin
ued)
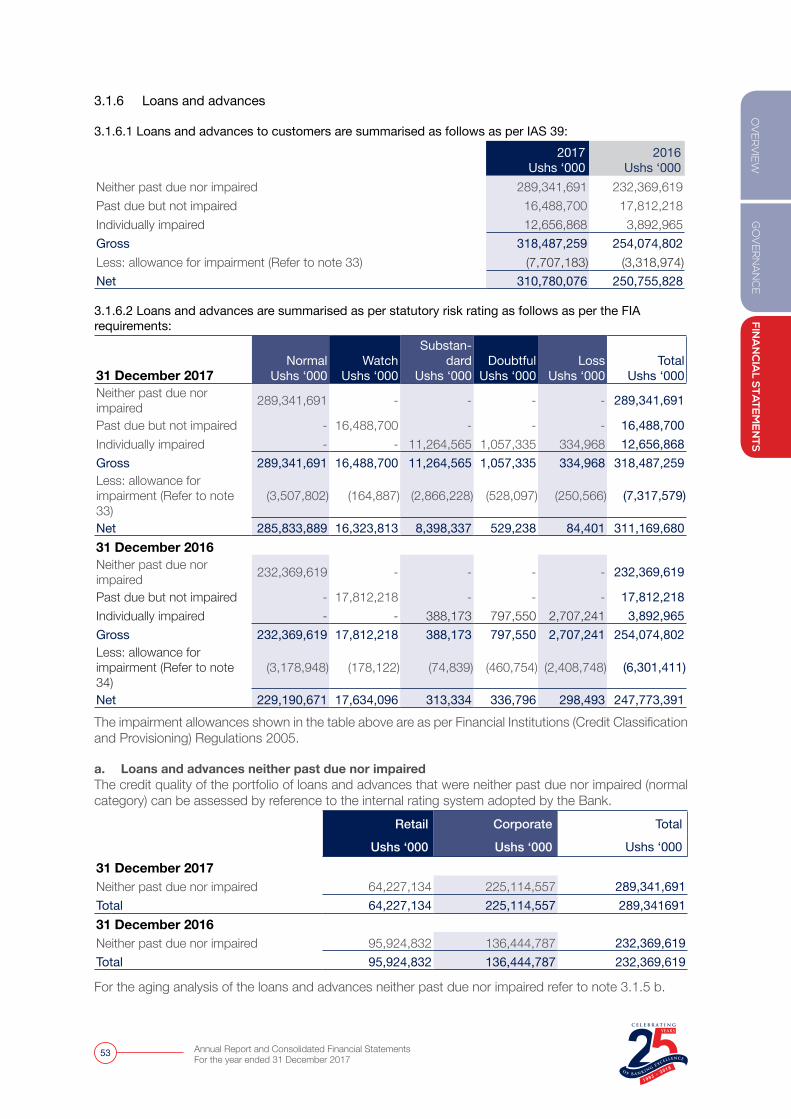
GO
VER
NA
NC
EFIN
AN
CIA
L STA
TEM
EN
TSO
VER
VIE
W
Annual Report and Consolidated Financial Statements For the year ended 31 December 2017
53
3.1.6 Loans and advances
3.1.6.1 Loans and advances to customers are summarised as follows as per IAS 39:2017
Ushs ‘0002016
Ushs ‘000Neither past due nor impaired 289,341,691 232,369,619 Past due but not impaired 16,488,700 17,812,218 Individually impaired 12,656,868 3,892,965 Gross 318,487,259 254,074,802 Less: allowance for impairment (Refer to note 33) (7,707,183) (3,318,974)Net 310,780,076 250,755,828
3.1.6.2 Loans and advances are summarised as per statutory risk rating as follows as per the FIA requirements:
31 December 2017Normal
Ushs ‘000Watch
Ushs ‘000
Substan-dard
Ushs ‘000Doubtful
Ushs ‘000Loss
Ushs ‘000Total
Ushs ‘000Neither past due nor impaired 289,341,691 - - - - 289,341,691
Past due but not impaired - 16,488,700 - - - 16,488,700 Individually impaired - - 11,264,565 1,057,335 334,968 12,656,868 Gross 289,341,691 16,488,700 11,264,565 1,057,335 334,968 318,487,259 Less: allowance for impairment (Refer to note 33)
(3,507,802) (164,887) (2,866,228) (528,097) (250,566) (7,317,579)
Net 285,833,889 16,323,813 8,398,337 529,238 84,401 311,169,680 31 December 2016Neither past due nor impaired 232,369,619 - - - - 232,369,619
Past due but not impaired - 17,812,218 - - - 17,812,218 Individually impaired - - 388,173 797,550 2,707,241 3,892,965 Gross 232,369,619 17,812,218 388,173 797,550 2,707,241 254,074,802 Less: allowance for impairment (Refer to note 34)
(3,178,948) (178,122) (74,839) (460,754) (2,408,748) (6,301,411)
Net 229,190,671 17,634,096 313,334 336,796 298,493 247,773,391 The impairment allowances shown in the table above are as per Financial Institutions (Credit Classification and Provisioning) Regulations 2005.
a. Loans and advances neither past due nor impaired The credit quality of the portfolio of loans and advances that were neither past due nor impaired (normal category) can be assessed by reference to the internal rating system adopted by the Bank.
Retail Corporate Total
Ushs ‘000 Ushs ‘000 Ushs ‘00031 December 2017Neither past due nor impaired 64,227,134 225,114,557 289,341,691 Total 64,227,134 225,114,557 289,341691 31 December 2016Neither past due nor impaired 95,924,832 136,444,787 232,369,619 Total 95,924,832 136,444,787 232,369,619
For the aging analysis of the loans and advances neither past due nor impaired refer to note 3.1.5 b.
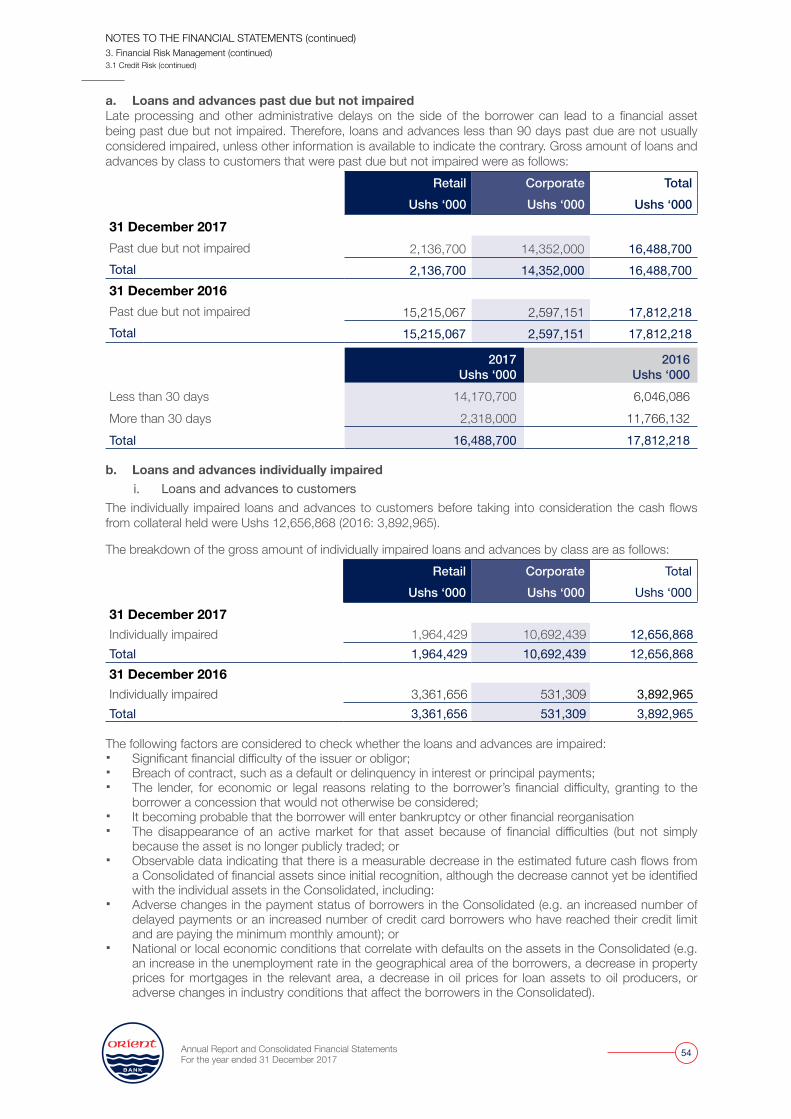
Annual Report and Consolidated Financial Statements For the year ended 31 December 2017
54
a. Loans and advances past due but not impairedLate processing and other administrative delays on the side of the borrower can lead to a financial asset being past due but not impaired. Therefore, loans and advances less than 90 days past due are not usually considered impaired, unless other information is available to indicate the contrary. Gross amount of loans and advances by class to customers that were past due but not impaired were as follows:
Retail Corporate TotalUshs ‘000 Ushs ‘000 Ushs ‘000
31 December 2017Past due but not impaired 2,136,700 14,352,000 16,488,700 Total 2,136,700 14,352,000 16,488,700 31 December 2016Past due but not impaired 15,215,067 2,597,151 17,812,218 Total 15,215,067 2,597,151 17,812,218
2017 Ushs ‘000
2016 Ushs ‘000
Less than 30 days 14,170,700 6,046,086 More than 30 days 2,318,000 11,766,132 Total 16,488,700 17,812,218
b. Loans and advances individually impairedi. Loans and advances to customers
The individually impaired loans and advances to customers before taking into consideration the cash flows from collateral held were Ushs 12,656,868 (2016: 3,892,965).
The breakdown of the gross amount of individually impaired loans and advances by class are as follows: Retail Corporate Total
Ushs ‘000 Ushs ‘000 Ushs ‘00031 December 2017Individually impaired 1,964,429 10,692,439 12,656,868 Total 1,964,429 10,692,439 12,656,868 31 December 2016Individually impaired 3,361,656 531,309 3,892,965 Total 3,361,656 531,309 3,892,965
The following factors are considered to check whether the loans and advances are impaired: � Significant financial difficulty of the issuer or obligor; � Breach of contract, such as a default or delinquency in interest or principal payments; � The lender, for economic or legal reasons relating to the borrower’s financial difficulty, granting to the
borrower a concession that would not otherwise be considered; � It becoming probable that the borrower will enter bankruptcy or other financial reorganisation � The disappearance of an active market for that asset because of financial difficulties (but not simply
because the asset is no longer publicly traded; or � Observable data indicating that there is a measurable decrease in the estimated future cash flows from
a Consolidated of financial assets since initial recognition, although the decrease cannot yet be identified with the individual assets in the Consolidated, including:
� Adverse changes in the payment status of borrowers in the Consolidated (e.g. an increased number of delayed payments or an increased number of credit card borrowers who have reached their credit limit and are paying the minimum monthly amount); or
� National or local economic conditions that correlate with defaults on the assets in the Consolidated (e.g. an increase in the unemployment rate in the geographical area of the borrowers, a decrease in property prices for mortgages in the relevant area, a decrease in oil prices for loan assets to oil producers, or adverse changes in industry conditions that affect the borrowers in the Consolidated).
NOTES TO THE FINANCIAL STATEMENTS (continued)3. Financial Risk Management (continued)3.1 Credit Risk (continued)
GO
VER
NA
NC
EFIN
AN
CIA
L STA
TEM
EN
TSO
VER
VIE
W
Annual Report and Consolidated Financial Statements For the year ended 31 December 2017
55
3.2 Market riskThe Bank takes on exposure to market risks, which is the risk that the fair value or future cash flows of a financial instrument will fluctuate because of changes in market prices. Market risks arise from open positions in interest rate, currency and equity products, all of which are exposed to general and specific market movements and changes in the level of volatility of market rates or prices such as interest rates, foreign exchange rates and equity prices. The Bank separates exposures to market risk into either trading or non-trading portfolios. The market risks arising from trading and non-trading activities are concentrated in Bank Treasury and monitored by two teams separately. Regular reports are submitted to the Management ALCO and Board ALCO Committees and the Board of Directors and heads of each business unit. Trading portfolios include those positions arising from market-making transactions where the Bank acts as principal with clients or with the market.
Non-trading portfolios primarily arise from the interest rate management of the entity’s retail and commercial banking assets and liabilities. Non-trading portfolios also consist of foreign exchange and equity risks arising from the Bank’s held-to-maturity and available-for-sale financial assets. 3.2.1 Market risk measurement techniques The objective of market risk measurement is to manage and control market risk exposures within acceptable limits while optimising the return on risk. The Bank Treasury is responsible for the development of detailed risk management policies and for day-to-day implementation of those policies. a. Value at riskThe Bank applies a ‘value at risk’ (VAR) methodology to its trading and non-trading portfolios to estimate the market risk of positions held and the maximum losses expected, based upon a number of assumptions for various changes in market conditions.
The Board sets limits on the value of risk that may be accepted for the Bank, which are monitored on a daily basis by Bank Treasury. Interest rate risk in the non-trading book is measured through the use of interest rate repricing gap analysis (Note 3.2.3). VAR is a statistically based estimate of the potential loss on the current portfolio from adverse market movements. It expresses the ‘maximum’ amount the Bank might lose, but only to a certain level of confidence (98%). There is therefore a specified statistical probability (2%) that actual loss could be
greater than the VAR estimate. The VAR model assumes a certain ‘holding period’ until positions can be closed (10 days). It also assumes that market moves occurring over this holding period will follow a similar pattern to those that have occurred over 10-day periods in the past.
The Bank’s assessment of past movements is based on data for the past five years. The Bank applies these historical changes in rates, prices, indices, etc. directly to its current positions − a method known as historical simulation. Actual outcomes are monitored regularly to test the validity of the assumptions and parameters/factors used in the VAR calculation. The use of this approach does not prevent losses outside of these limits in the event of more significant market movements. As VAR constitutes an integral part of the Bank’s market risk control regime, VAR limits are established by the Board annually for all trading portfolio operations and allocated to business units. Actual exposure against limits, together with a Bank-wide VAR, is reviewed daily by Bank Treasury. The quality of the VAR model is continuously monitored by back-testing the VAR results for trading books. All back-testing exceptions and any exceptional revenues on the profit side of the VAR distribution are investigated, and all back-testing results are reported to the Board of Directors.
b. Stress tests Stress tests provide an indication of the potential size of losses that could arise in extreme conditions. The stress tests carried out by Bank Treasury include: risk factor stress testing, where stress movements are applied to each risk category and ad hoc stress testing, which includes applying possible stress events to specific positions or sectors, or to the Bank’s top 5 borrowers. The results of the stress tests are reviewed by senior management in each business unit and by the Board of Directors. The stress testing is tailored to the business and typically uses scenario analysis.
3.2.2 Foreign exchange riskThe Bank takes on exposure to the effects of fluctuations in the prevailing foreign currency exchange rates on its financial position and cash flows. The Board sets limits on the level of exposure by currency and in aggregate for both overnight and intra-day positions, which are monitored daily. The table below summarises the Bank’s exposure to foreign exchange risk at 31 December 2017. Included in the table are the Bank’s financial instruments at carrying amounts, categorised by currency.
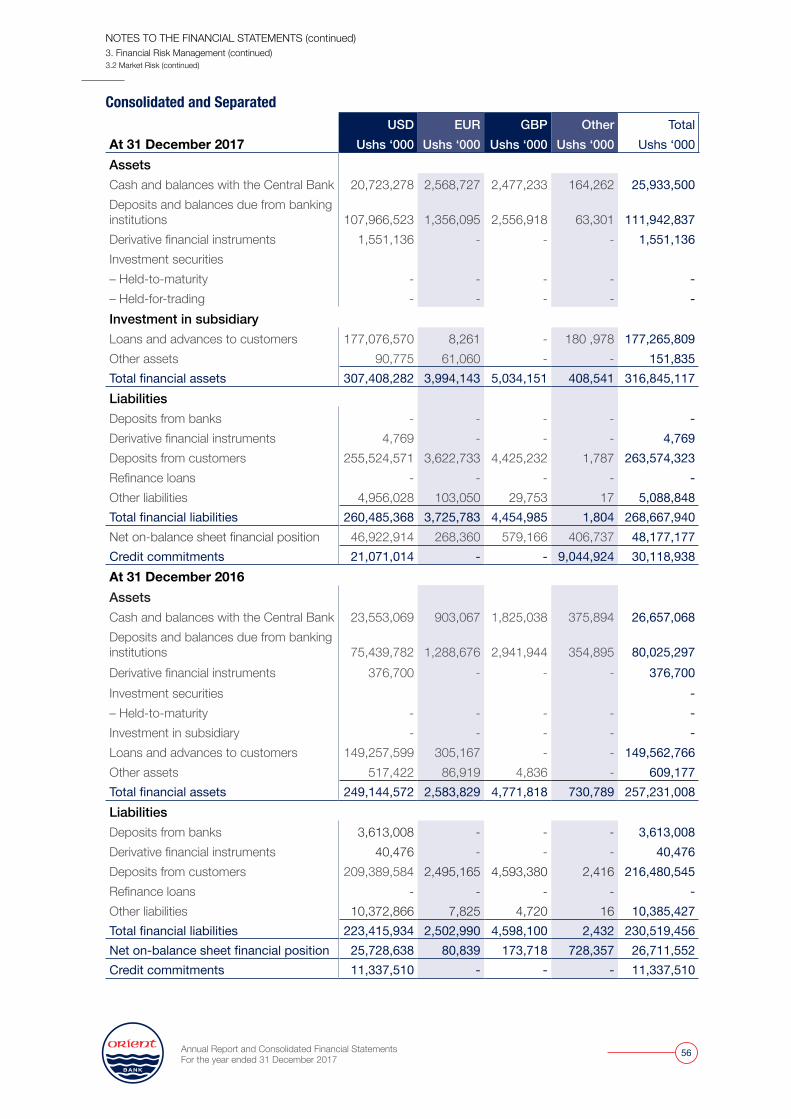
Annual Report and Consolidated Financial Statements For the year ended 31 December 2017
56
Consolidated and Separated
At 31 December 2017USD EUR GBP Other Total
Ushs ‘000 Ushs ‘000 Ushs ‘000 Ushs ‘000 Ushs ‘000AssetsCash and balances with the Central Bank 20,723,278 2,568,727 2,477,233 164,262 25,933,500 Deposits and balances due from banking institutions
107,966,523
1,356,095
2,556,918
63,301
111,942,837
Derivative financial instruments 1,551,136 - - - 1,551,136 Investment securities– Held-to-maturity - - - - -– Held-for-trading - - - - -Investment in subsidiaryLoans and advances to customers 177,076,570 8,261 - 180 ,978 177,265,809 Other assets 90,775 61,060 - - 151,835 Total financial assets 307,408,282 3,994,143 5,034,151 408,541 316,845,117 Liabilities Deposits from banks - - - - - Derivative financial instruments 4,769 - - - 4,769 Deposits from customers 255,524,571 3,622,733 4,425,232 1,787 263,574,323 Refinance loans - - - - - Other liabilities 4,956,028 103,050 29,753 17 5,088,848 Total financial liabilities 260,485,368 3,725,783 4,454,985 1,804 268,667,940 Net on-balance sheet financial position 46,922,914 268,360 579,166 406,737 48,177,177 Credit commitments 21,071,014 - - 9,044,924 30,118,938At 31 December 2016AssetsCash and balances with the Central Bank 23,553,069 903,067 1,825,038 375,894 26,657,068 Deposits and balances due from banking institutions 75,439,782 1,288,676 2,941,944 354,895 80,025,297 Derivative financial instruments 376,700 - - - 376,700 Investment securities - – Held-to-maturity - - - - - Investment in subsidiary - - - - - Loans and advances to customers 149,257,599 305,167 - - 149,562,766 Other assets 517,422 86,919 4,836 - 609,177 Total financial assets 249,144,572 2,583,829 4,771,818 730,789 257,231,008 LiabilitiesDeposits from banks 3,613,008 - - - 3,613,008 Derivative financial instruments 40,476 - - - 40,476 Deposits from customers 209,389,584 2,495,165 4,593,380 2,416 216,480,545 Refinance loans - - - - - Other liabilities 10,372,866 7,825 4,720 16 10,385,427 Total financial liabilities 223,415,934 2,502,990 4,598,100 2,432 230,519,456 Net on-balance sheet financial position 25,728,638 80,839 173,718 728,357 26,711,552 Credit commitments 11,337,510 - - - 11,337,510
NOTES TO THE FINANCIAL STATEMENTS (continued)3. Financial Risk Management (continued)3.2 Market Risk (continued)
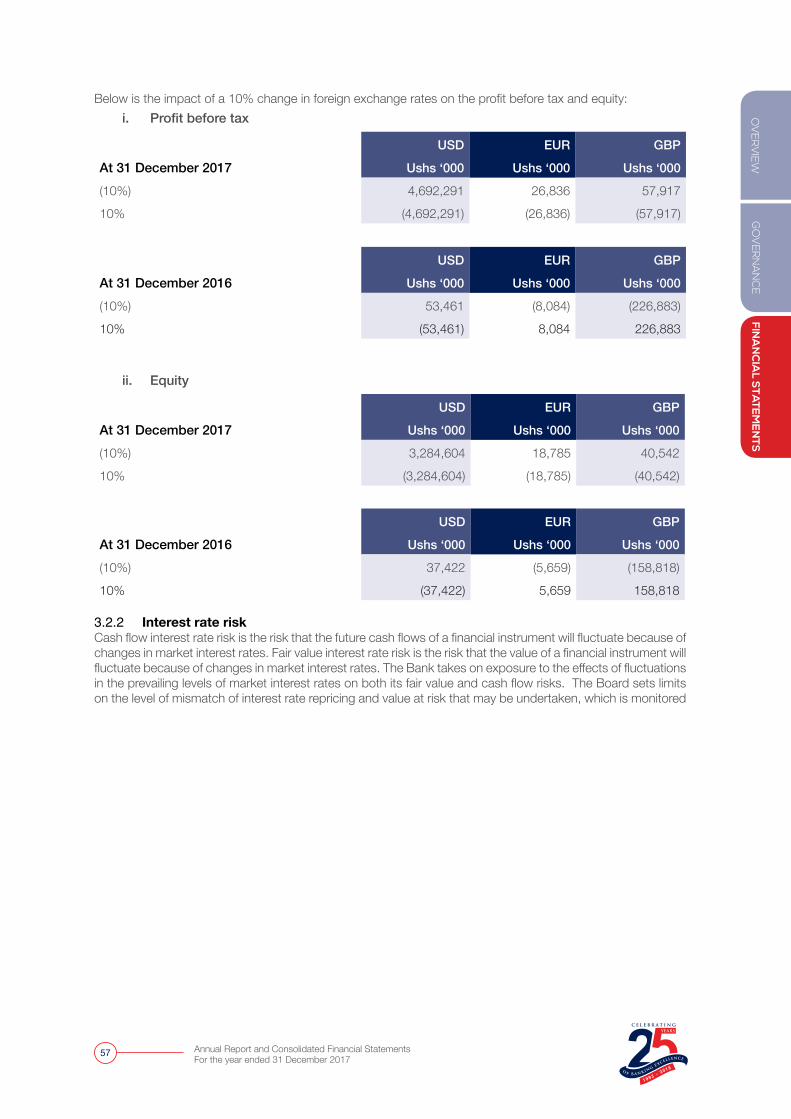
GO
VER
NA
NC
EFIN
AN
CIA
L STA
TEM
EN
TSO
VER
VIE
W
Annual Report and Consolidated Financial Statements For the year ended 31 December 2017
57
Below is the impact of a 10% change in foreign exchange rates on the profit before tax and equity:i. Profit before tax
At 31 December 2017USD EUR GBP
Ushs ‘000 Ushs ‘000 Ushs ‘000
(10%) 4,692,291 26,836 57,917
10% (4,692,291) (26,836) (57,917)
At 31 December 2016USD EUR GBP
Ushs ‘000 Ushs ‘000 Ushs ‘000
(10%) 53,461 (8,084) (226,883)
10% (53,461) 8,084 226,883
ii. Equity
At 31 December 2017USD EUR GBP
Ushs ‘000 Ushs ‘000 Ushs ‘000
(10%) 3,284,604 18,785 40,542
10% (3,284,604) (18,785) (40,542)
At 31 December 2016USD EUR GBP
Ushs ‘000 Ushs ‘000 Ushs ‘000
(10%) 37,422 (5,659) (158,818)
10% (37,422) 5,659 158,818 3.2.2 Interest rate risk Cash flow interest rate risk is the risk that the future cash flows of a financial instrument will fluctuate because of changes in market interest rates. Fair value interest rate risk is the risk that the value of a financial instrument will fluctuate because of changes in market interest rates. The Bank takes on exposure to the effects of fluctuations in the prevailing levels of market interest rates on both its fair value and cash flow risks. The Board sets limits on the level of mismatch of interest rate repricing and value at risk that may be undertaken, which is monitored
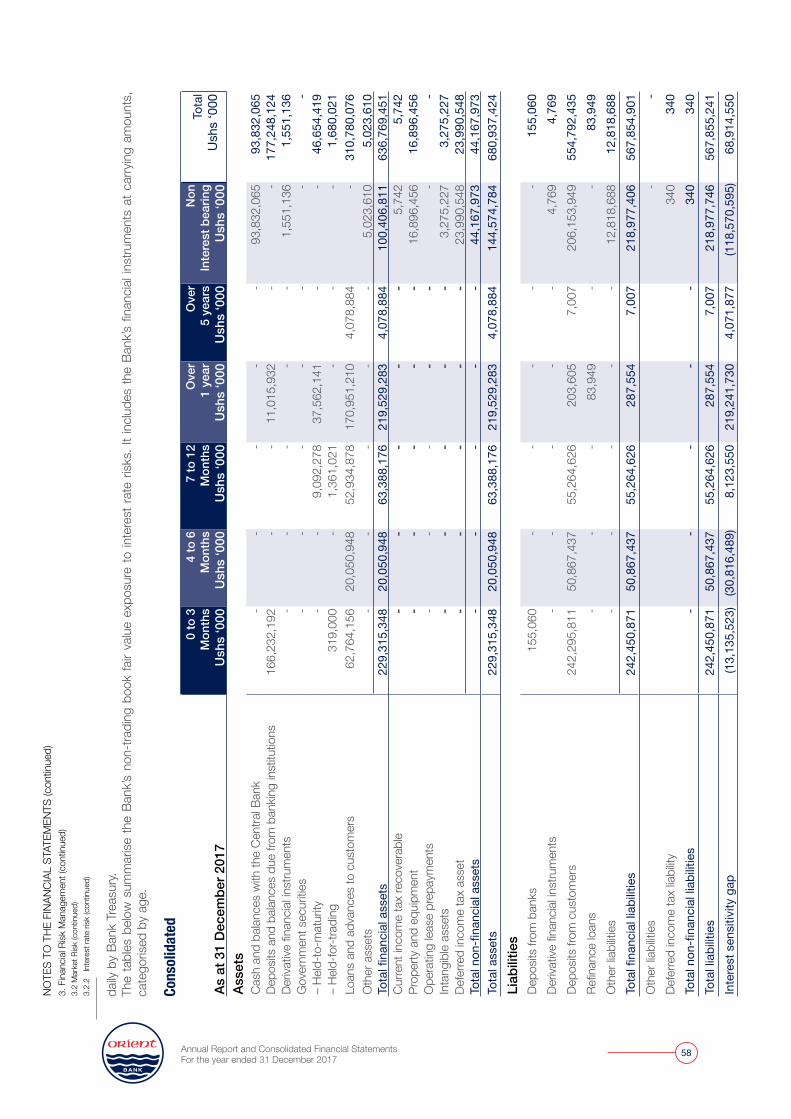
Annual Report and Consolidated Financial Statements For the year ended 31 December 2017
58
daily
by
Bank
Tre
asur
y.Th
e ta
bles
belo
w s
umm
arise
the
Bank
’s no
n-tra
ding
boo
k fa
ir va
lue
expo
sure
to in
tere
st ra
te ri
sks.
It in
clude
s th
e Ba
nk’s
finan
cial i
nstru
men
ts a
t car
ryin
g am
ount
s,
cate
goris
ed b
y ag
e.
Cons
olid
ated
As a
t 31
Dec
embe
r 201
7
0 to
3M
onth
sU
shs
‘000
4 to
6M
onth
sU
shs
‘000
7 to
12
Mon
ths
Ush
s ‘0
00
Ove
r1
year
Ush
s ‘0
00
Ove
r5
year
sU
shs
‘000
Non
Inte
rest
bea
ring
Ush
s ‘0
00To
tal
Ush
s ‘0
00
Asse
tsCa
sh a
nd b
alanc
es w
ith th
e Ce
ntra
l Ban
k
-
-
-
-
-
93,8
32,0
65
93,8
32,0
65
Depo
sits
and
balan
ces
due
from
ban
king
inst
itutio
ns16
6,23
2,19
2
-
-
11
,015
,932
-
- 17
7,24
8,12
4 De
rivat
ive fi
nanc
ial in
stru
men
ts
-
-
-
-
-
1,55
1,13
6 1,
551,
136
Gov
ernm
ent s
ecur
ities
-
-
-
-
-
-
-
– He
ld-to
-mat
urity
-
-
9,09
2,27
8 37
,562
,141
-
-
46,
654,
419
– He
ld-fo
r-tra
ding
319,
000
-
1,36
1,02
1 -
-
-
1,68
0,02
1 Lo
ans
and
adva
nces
to c
usto
mer
s 6
2,76
4,15
6 20
,050
,948
52
,934
,878
17
0,95
1,21
0 4,
078,
884
- 31
0,78
0,07
6 O
ther
ass
ets
-
-
-
-
- 5,
023,
610
5,02
3,61
0 To
tal fi
nanc
ial a
sset
s22
9,31
5,34
8 20
,050
,948
63
,388
,176
21
9,52
9,28
3 4,
078,
884
100,
406,
811
636,
769,
451
Curre
nt in
com
e ta
x re
cove
rabl
e
-
-
-
-
-
5
,742
5,
742
Prop
erty
and
equ
ipm
ent
- -
- -
- 16
,896
,456
16
,896
,456
O
pera
ting
lease
pre
paym
ents
-
-
-
-
-
-
-
Inta
ngib
le as
sets
-
-
-
-
- 3,
275,
227
3,27
5,22
7 De
ferre
d in
com
e ta
x as
set
- -
- -
- 23
,990
,548
23
,990
,548
To
tal n
on-fi
nanc
ial a
sset
s
-
-
-
-
-
44,1
67,9
73
44,1
67,9
73To
tal a
sset
s22
9,31
5,34
8 20
,050
,948
63
,388
,176
2
19,5
29,2
83
4,0
78,8
84
144,
574,
784
680
,937
,424
Liab
ilitie
s De
posit
s fro
m b
anks
15
5,06
0
-
-
-
-
-
155,
060
Deriv
ative
fina
ncial
inst
rum
ents
-
-
-
-
-
4
,769
4,7
69
Depo
sits
from
cus
tom
ers
242,
295,
811
50,8
67,4
37
55,
264,
626
203
,605
7
,007
2
06,1
53,9
49
5
54,7
92,4
35
Refin
ance
loan
s
-
-
-
83,
949
-
-
8
3,94
9 O
ther
liabi
lities
-
-
-
-
-
12,
818,
688
12,
818,
688
Tota
l fina
ncia
l lia
bilit
ies
242,
450,
871
50,8
67,4
37
55,
264,
626
287
,554
7,
007
218,
977,
406
567,
854,
901
Oth
er lia
biliti
es-
- De
ferre
d in
com
e ta
x lia
bility
340
3
40
Tota
l non
-fina
ncia
l lia
bilit
ies
-
-
-
-
-
340
3
40
Tota
l lia
bilit
ies
242,
450,
871
50,8
67,4
37
55,2
64,6
26
287,
554
7,0
07
218,
977,
746
567,
855,
241
Inte
rest
sen
sitiv
ity g
ap(1
3,13
5,52
3)(3
0,81
6,48
9)8,
123,
550
219,
241,
730
4,07
1,87
7 (1
18,5
70,5
95)
68,9
14,5
50
NOTE
S TO
THE
FIN
ANCI
AL S
TATE
MEN
TS (c
ontin
ued)
3. F
inan
cial R
isk M
anag
emen
t (co
ntin
ued)
3.2
Mar
ket R
isk (c
ontin
ued)
3.2.
2 I
nter
est r
ate
risk
(con
tinue
d)
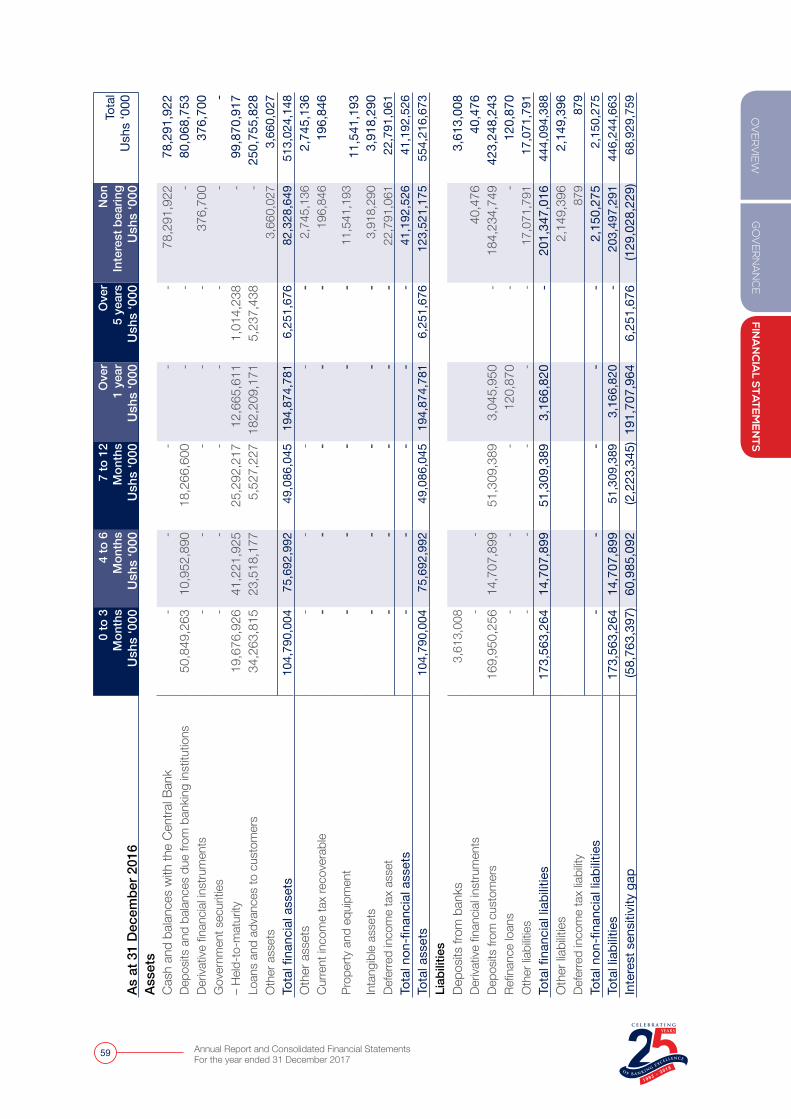
GO
VER
NA
NC
EFIN
AN
CIA
L STA
TEM
EN
TSO
VER
VIE
W
Annual Report and Consolidated Financial Statements For the year ended 31 December 2017
59
As a
t 31
Dec
embe
r 201
6
0 to
3M
onth
sU
shs
‘000
4 to
6M
onth
sU
shs
‘000
7 to
12
Mon
ths
Ush
s ‘0
00
Ove
r1
year
Ush
s ‘0
00
Ove
r5
year
sU
shs
‘000
Non
Inte
rest
bea
ring
Ush
s ‘0
00To
tal
Ush
s ‘0
00
Asse
tsCa
sh a
nd b
alanc
es w
ith th
e Ce
ntra
l Ban
k
-
-
-
-
-
78,2
91,9
22
78,2
91,9
22
Depo
sits
and
balan
ces
due
from
ban
king
inst
itutio
ns
50
,849
,263
10
,952
,890
18,
266,
600
-
-
-
80,0
68,7
53
Deriv
ative
fina
ncial
inst
rum
ents
-
-
-
-
-
37
6,70
0
376,
700
Gov
ernm
ent s
ecur
ities
-
-
-
-
-
-
-
– He
ld-to
-mat
urity
19,6
76,9
26
41,2
21,9
25
2
5,29
2,21
7 12
,665
,611
1,0
14,2
38
- 99
,870
,917
Lo
ans
and
adva
nces
to c
usto
mer
s
34
,263
,815
23
,518
,177
5,
527,
227
182,
209,
171
5
,237
,438
-
250,
755,
828
Oth
er a
sset
s
3
,660
,027
3
,660
,027
To
tal fi
nanc
ial a
sset
s
104
,790
,004
75
,692
,992
49,
086,
045
194,
874,
781
6
,251
,676
82,3
28,6
49
513,
024,
148
Oth
er a
sset
s
-
-
-
-
-
2
,745
,136
2
,745
,136
Cu
rrent
inco
me
tax
reco
vera
ble
-
-
-
-
-
19
6,84
6
196,
846
Prop
erty
and
equ
ipm
ent
-
-
-
-
-
11,
541,
193
11
,541
,193
In
tang
ible
asse
ts
-
-
-
-
-
3
,918
,290
3
,918
,290
De
ferre
d in
com
e ta
x as
set
-
-
-
-
-
22,
791,
061
22,
791,
061
Tota
l non
-fina
ncia
l ass
ets
-
-
-
-
-
41,
192,
526
41,
192,
526
Tota
l ass
ets
1
04,7
90,0
04
75,6
92,9
92
4
9,08
6,04
5 19
4,87
4,78
1
6,2
51,6
76
123,
521,
175
554,
216,
673
Liab
ilitie
s De
posit
s fro
m b
anks
3,6
13,0
08
3,6
13,0
08
Deriv
ative
fina
ncial
inst
rum
ents
-
-
40,
476
4
0,47
6 De
posit
s fro
m c
usto
mer
s16
9,95
0,25
6 14
,707
,899
51,
309,
389
3,04
5,95
0
-
184,
234,
749
423,
248,
243
Refin
ance
loan
s
-
-
-
12
0,87
0
-
-
120,
870
Oth
er lia
biliti
es
-
-
-
-
-
1
7,07
1,79
1
1
7,07
1,79
1 To
tal fi
nanc
ial l
iabi
litie
s17
3,56
3,26
4 14
,707
,899
51,
309,
389
3,16
6,82
0
-
201,
347,
016
444,
094,
388
Oth
er lia
biliti
es
2,1
49,3
96
2,1
49,3
96
Defe
rred
inco
me
tax
liabi
lity
879
8
79
Tota
l non
-fina
ncia
l lia
bilit
ies
-
-
-
-
-
2,1
50,2
75
2,1
50,2
75
Tota
l lia
bilit
ies
173,
563,
264
14,7
07,8
99
5
1,30
9,38
9 3,
166,
820
- 20
3,49
7,29
1 44
6,24
4,66
3 In
tere
st s
ensi
tivity
gap
(58,
763,
397)
60,9
85,0
92
(
2,22
3,34
5)19
1,70
7,96
4
6,2
51,6
76
(129
,028
,229
)
68
,929
,759
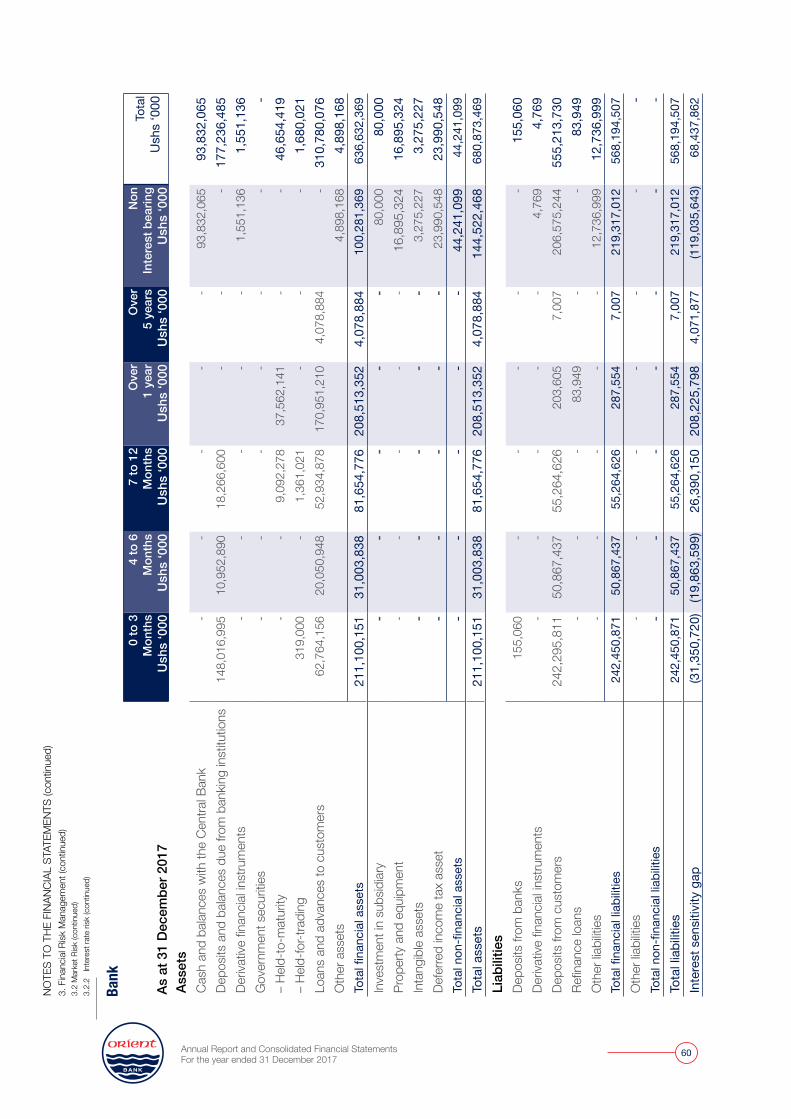
Annual Report and Consolidated Financial Statements For the year ended 31 December 2017
60
Bank
As a
t 31
Dec
embe
r 201
7
0 to
3M
onth
sU
shs
‘000
4 to
6M
onth
sU
shs
‘000
7 to
12
Mon
ths
Ush
s ‘0
00
Ove
r1
year
Ush
s ‘0
00
Ove
r5
year
sU
shs
‘000
Non
Inte
rest
bea
ring
Ush
s ‘0
00To
tal
Ush
s ‘0
00
Asse
tsCa
sh a
nd b
alanc
es w
ith th
e Ce
ntra
l Ban
k
-
-
-
-
-
9
3,83
2,06
5 93
,832
,065
De
posit
s an
d ba
lance
s du
e fro
m b
ankin
g in
stitu
tions
148,
016,
995
10,9
52,8
90
1
8,26
6,60
0
-
-
- 17
7,23
6,48
5 De
rivat
ive fi
nanc
ial in
stru
men
ts
-
-
-
-
-
1
,551
,136
1
,551
,136
G
over
nmen
t sec
uritie
s
-
-
-
-
-
-
- –
Held
-to-m
atur
ity
-
-
9,
092,
278
37,5
62,1
41
-
-
46,6
54,4
19
– He
ld-fo
r-tra
ding
31
9,00
0
-
1,
361,
021
-
-
-
1,6
80,0
21
Loan
s an
d ad
vanc
es to
cus
tom
ers
62,7
64,1
56
20,0
50,9
48
5
2,93
4,87
8 17
0,95
1,21
0
4,0
78,8
84
-31
0,78
0,07
6 O
ther
ass
ets
4,8
98,1
68
4,8
98,1
68To
tal fi
nanc
ial a
sset
s21
1,10
0,15
1 31
,003
,838
81
,654
,776
20
8,51
3,35
2 4,
078,
884
100,
281,
369
636,
632,
369
Inve
stm
ent i
n su
bsid
iary
-
-
-
-
-
8
0,00
0
80,
000
Prop
erty
and
equ
ipm
ent
-
-
-
-
- 16
,895
,324
16
,895
,324
In
tang
ible
asse
ts
-
-
-
-
-
3
,275
,227
3
,275
,227
De
ferre
d in
com
e ta
x as
set
-
-
-
-
-
23,
990,
548
23,9
90,5
48
Tota
l non
-fina
ncia
l ass
ets
-
-
-
-
-
44,2
41,0
99
44,2
41,0
99
Tota
l ass
ets
211,
100,
151
31,0
03,8
38
81
,654
,776
20
8,51
3,35
2
4,07
8,88
4 14
4,52
2,46
8 68
0,87
3,46
9 Li
abili
ties
Depo
sits
from
ban
ks
155,
060
-
-
-
-
-
15
5,06
0 De
rivat
ive fi
nanc
ial in
stru
men
ts
-
-
-
-
-
4,7
69
4
,769
De
posit
s fro
m c
usto
mer
s24
2,29
5,81
1 50
,867
,437
55
,264
,626
203,
605
7,0
07
206,
575,
244
555,
213,
730
Refin
ance
loan
s
-
-
-
83,
949
-
-
8
3,94
9 O
ther
liabi
lities
-
-
-
-
-
12,
736,
999
12,7
36,9
99To
tal fi
nanc
ial l
iabi
litie
s24
2,45
0,87
1 50
,867
,437
55,
264,
626
28
7,55
4
7
,007
21
9,31
7,01
2 56
8,19
4,50
7O
ther
liabi
lities
--
--
-
-
-
Tota
l non
-fina
ncia
l lia
bilit
ies
-
-
-
-
-
-
-
Tota
l lia
bilit
ies
242,
450,
871
50,8
67,4
37
5
5,26
4,62
6
287,
554
7,0
07
219,
317,
012
568,
194,
507
Inte
rest
sen
sitiv
ity g
ap(3
1,35
0,72
0)(1
9,86
3,59
9)26
,390
,150
20
8,22
5,79
8
4,0
71,8
77
(119
,035
,643
)
68
,437
,862
NOTE
S TO
THE
FIN
ANCI
AL S
TATE
MEN
TS (c
ontin
ued)
3. F
inan
cial R
isk M
anag
emen
t (co
ntin
ued)
3.2
Mar
ket R
isk (c
ontin
ued)
3.2.
2 I
nter
est r
ate
risk
(con
tinue
d)
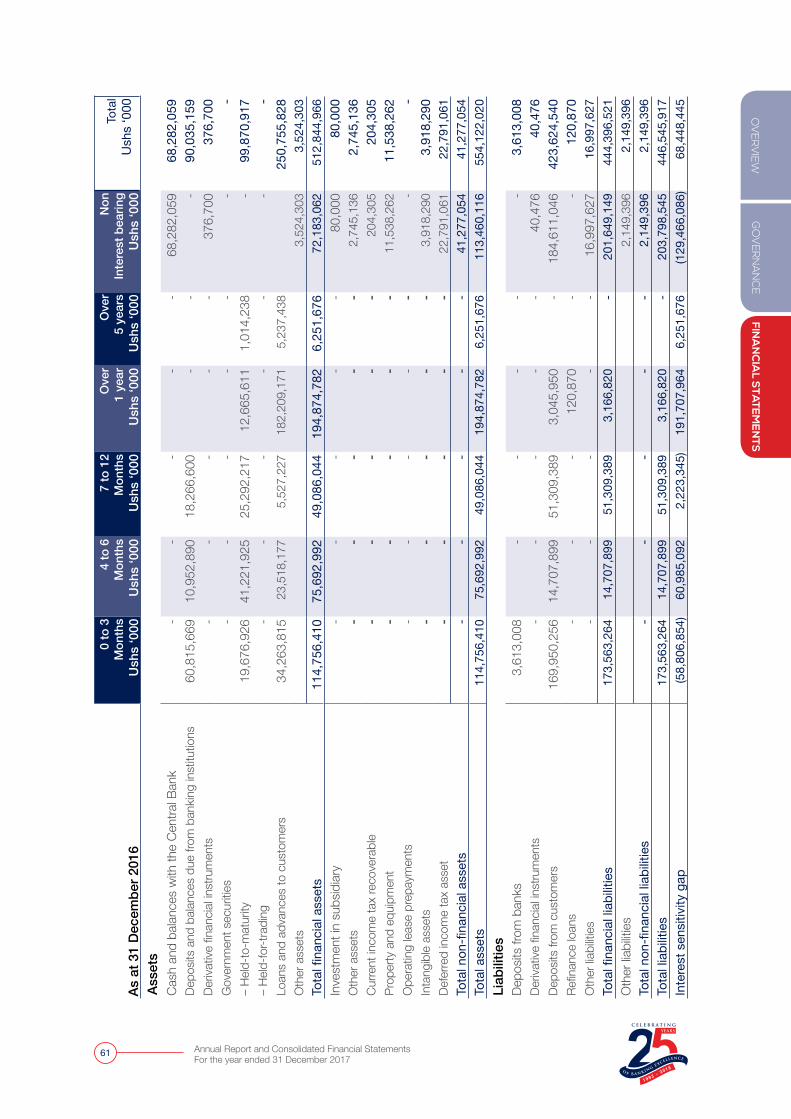
GO
VER
NA
NC
EFIN
AN
CIA
L STA
TEM
EN
TSO
VER
VIE
W
Annual Report and Consolidated Financial Statements For the year ended 31 December 2017
61
As a
t 31
Dec
embe
r 201
6
0 to
3M
onth
sU
shs
‘000
4 to
6M
onth
sU
shs
‘000
7 to
12
Mon
ths
Ush
s ‘0
00
Ove
r1
year
Ush
s ‘0
00
Ove
r5
year
sU
shs
‘000
Non
Inte
rest
bea
ring
Ush
s ‘0
00To
tal
Ush
s ‘0
00
Asse
tsCa
sh a
nd b
alanc
es w
ith th
e Ce
ntra
l Ban
k
-
-
-
-
-
68
,282
,059
68,
282,
059
Depo
sits
and
balan
ces
due
from
ban
king
inst
itutio
ns
60,
815,
669
10,
952,
890
1
8,26
6,60
0
-
-
-
90
,035
,159
De
rivat
ive fi
nanc
ial in
stru
men
ts
-
-
-
-
-
376,
700
37
6,70
0 G
over
nmen
t sec
uritie
s
-
-
-
-
-
-
- –
Held
-to-m
atur
ity
19,
676,
926
41,
221,
925
25
,292
,217
12,6
65,6
11
1,0
14,2
38
-
99,
870,
917
– He
ld-fo
r-tra
ding
-
-
-
-
-
-
-
Loan
s an
d ad
vanc
es to
cus
tom
ers
34,2
63,8
15
23,5
18,1
77
5,52
7,22
7 18
2,20
9,17
1
5,2
37,4
38
250,
755,
828
Oth
er a
sset
s
3
,524
,303
3
,524
,303
To
tal fi
nanc
ial a
sset
s11
4,75
6,41
0 75
,692
,992
49,0
86,0
44
194,
874,
782
6,25
1,67
6
72,
183,
062
512,
844,
966
Inve
stm
ent i
n su
bsid
iary
-
-
-
-
-
8
0,00
0
80,
000
Oth
er a
sset
s
-
-
-
-
-
2
,745
,136
2
,745
,136
Cu
rrent
inco
me
tax
reco
vera
ble
-
-
-
-
-
20
4,30
5
204,
305
Prop
erty
and
equ
ipm
ent
-
-
-
-
-
11,
538,
262
11,
538,
262
Ope
ratin
g lea
se p
repa
ymen
ts
-
-
-
-
-
-
- In
tang
ible
asse
ts
-
-
-
-
-
3
,918
,290
3
,918
,290
De
ferre
d in
com
e ta
x as
set
-
-
-
-
-
22,
791,
061
22,
791,
061
Tota
l non
-fina
ncia
l ass
ets
-
-
-
-
-
41,
277,
054
41,
277,
054
Tota
l ass
ets
114,
756,
410
75,6
92,9
92
4
9,08
6,04
4
194,
874,
782
6
,251
,676
1
13,4
60,1
16
5
54,1
22,0
20
Liab
ilitie
s De
posit
s fro
m b
anks
3,61
3,00
8
-
-
-
-
-
3
,613
,008
De
rivat
ive fi
nanc
ial in
stru
men
ts
-
-
-
-
-
40,
476
4
0,47
6 De
posit
s fro
m c
usto
mer
s16
9,95
0,25
6 14
,707
,899
51
,309
,389
3,
045,
950
- 18
4,61
1,04
6
423
,624
,540
Re
finan
ce lo
ans
-
-
-
120
,870
-
-
120,
870
Oth
er lia
biliti
es
-
-
-
-
-
16,
997,
627
16,
997,
627
Tota
l fina
ncia
l lia
bilit
ies
17
3,56
3,26
4
14,7
07,8
99
5
1,30
9,38
9
3
,166
,820
-
201
,649
,149
444
,396
,521
O
ther
liabi
lities
2
,149
,396
2
,149
,396
To
tal n
on-fi
nanc
ial l
iabi
litie
s
-
-
-
-
-
2
,149
,396
2
,149
,396
To
tal l
iabi
litie
s
173
,563
,264
14,7
07,8
99
5
1,30
9,38
9
3
,166
,820
-
203
,798
,545
446
,545
,917
In
tere
st s
ensi
tivity
gap
(5
8,80
6,85
4) 6
0,98
5,09
2
2,2
23,3
45)
19
1,70
7,96
4
6,2
51,6
76
(129
,466
,086
)
6
8,44
8,44
5
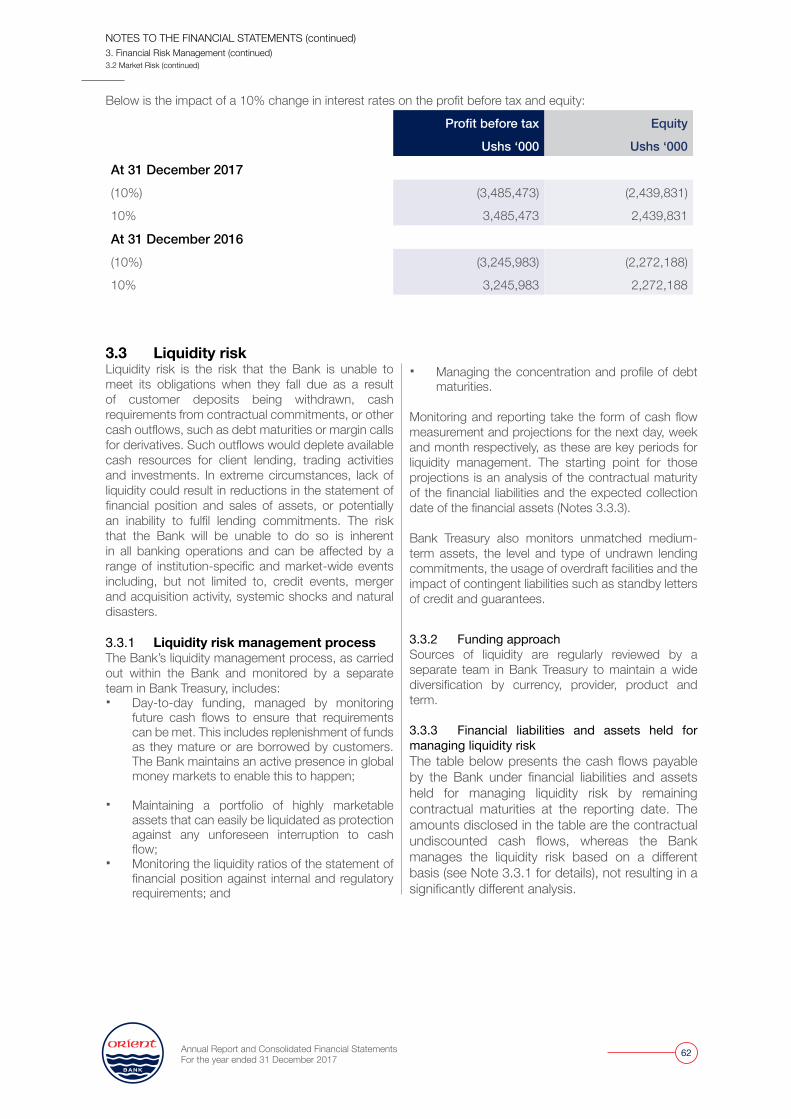
Annual Report and Consolidated Financial Statements For the year ended 31 December 2017
62
Below is the impact of a 10% change in interest rates on the profit before tax and equity:
Profit before tax Equity
Ushs ‘000 Ushs ‘000
At 31 December 2017(10%) (3,485,473) (2,439,831)
10% 3,485,473 2,439,831
At 31 December 2016(10%) (3,245,983) (2,272,188)
10% 3,245,983 2,272,188
NOTES TO THE FINANCIAL STATEMENTS (continued)3. Financial Risk Management (continued)3.2 Market Risk (continued)
3.3 Liquidity risk Liquidity risk is the risk that the Bank is unable to meet its obligations when they fall due as a result of customer deposits being withdrawn, cash requirements from contractual commitments, or other cash outflows, such as debt maturities or margin calls for derivatives. Such outflows would deplete available cash resources for client lending, trading activities and investments. In extreme circumstances, lack of liquidity could result in reductions in the statement of financial position and sales of assets, or potentially an inability to fulfil lending commitments. The risk that the Bank will be unable to do so is inherent in all banking operations and can be affected by a range of institution-specific and market-wide events including, but not limited to, credit events, merger and acquisition activity, systemic shocks and natural disasters. 3.3.1 Liquidity risk management processThe Bank’s liquidity management process, as carried out within the Bank and monitored by a separate team in Bank Treasury, includes: � Day-to-day funding, managed by monitoring
future cash flows to ensure that requirements can be met. This includes replenishment of funds as they mature or are borrowed by customers. The Bank maintains an active presence in global money markets to enable this to happen;
� Maintaining a portfolio of highly marketable assets that can easily be liquidated as protection against any unforeseen interruption to cash flow;
� Monitoring the liquidity ratios of the statement of financial position against internal and regulatory requirements; and
� Managing the concentration and profile of debt maturities.
Monitoring and reporting take the form of cash flow measurement and projections for the next day, week and month respectively, as these are key periods for liquidity management. The starting point for those projections is an analysis of the contractual maturity of the financial liabilities and the expected collection date of the financial assets (Notes 3.3.3). Bank Treasury also monitors unmatched medium-term assets, the level and type of undrawn lending commitments, the usage of overdraft facilities and the impact of contingent liabilities such as standby letters of credit and guarantees.
3.3.2 Funding approachSources of liquidity are regularly reviewed by a separate team in Bank Treasury to maintain a wide diversification by currency, provider, product and term. 3.3.3 Financial liabilities and assets held for managing liquidity riskThe table below presents the cash flows payable by the Bank under financial liabilities and assets held for managing liquidity risk by remaining contractual maturities at the reporting date. The amounts disclosed in the table are the contractual undiscounted cash flows, whereas the Bank manages the liquidity risk based on a different basis (see Note 3.3.1 for details), not resulting in a significantly different analysis.
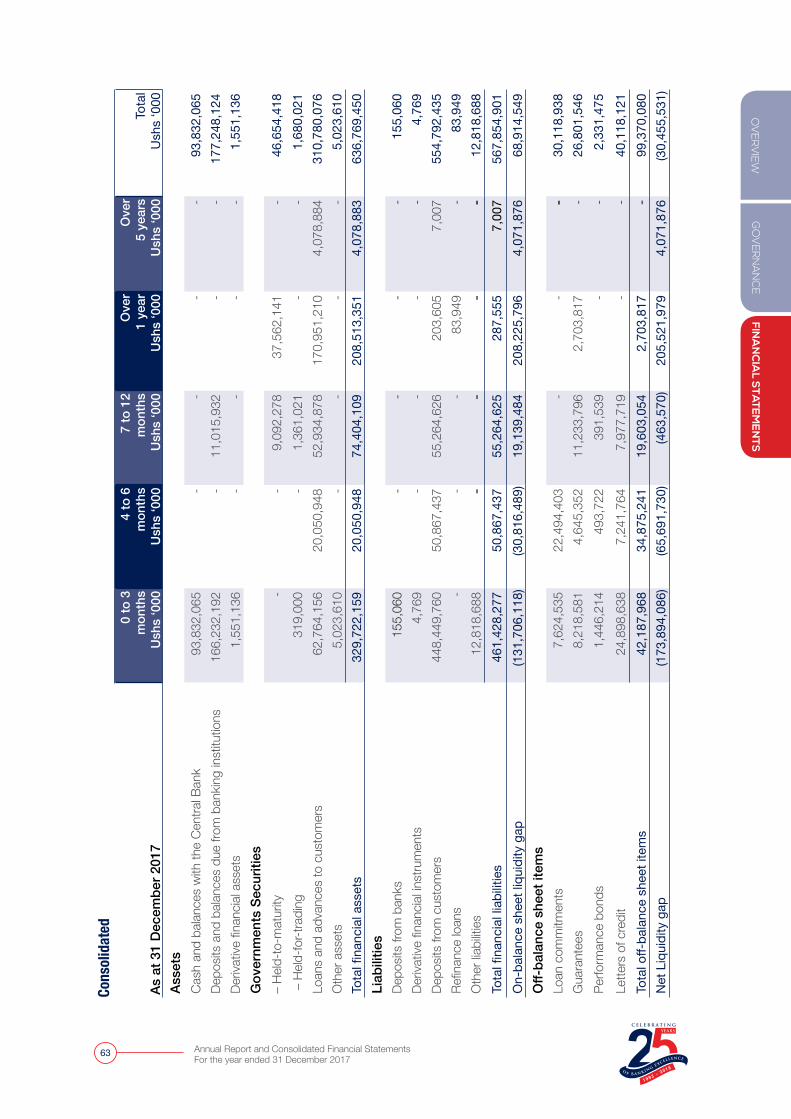
GO
VER
NA
NC
EFIN
AN
CIA
L STA
TEM
EN
TSO
VER
VIE
W
Annual Report and Consolidated Financial Statements For the year ended 31 December 2017
63
Cons
olid
ated
As a
t 31
Dec
embe
r 201
7
0 to
3m
onth
sU
shs
‘000
4 to
6m
onth
sU
shs
‘000
7 to
12
mon
ths
Ush
s ‘0
00
Ove
r1
year
Ush
s ‘0
00
Ove
r5
year
sU
shs
‘000
Tota
lU
shs
‘000
Asse
tsCa
sh a
nd b
alanc
es w
ith th
e Ce
ntra
l Ban
k
93,8
32,0
65
-
-
-
- 9
3,83
2,06
5 De
posit
s an
d ba
lance
s du
e fro
m b
ankin
g in
stitu
tions
166
,232
,192
-
11,0
15,9
32
-
- 17
7,24
8,12
4 De
rivat
ive fi
nanc
ial a
sset
s
1,5
51,1
36
-
-
-
-
1,5
51,1
36
Gov
ernm
ents
Sec
uriti
es–
Held
-to-m
atur
ity
-
- 9,
092,
278
37
,562
,141
- 4
6,65
4,41
8 –
Held
-for-t
radi
ng
31
9,00
0
-
1,36
1,02
1
-
-
1
,680
,021
Lo
ans
and
adva
nces
to c
usto
mer
s
62,7
64,1
56
20,0
50,9
48
52,9
34,8
78
170,
951,
210
4,07
8,88
4 31
0,78
0,07
6 O
ther
ass
ets
5
,023
,610
-
-
-
-
5
,023
,610
To
tal fi
nanc
ial a
sset
s 3
29,7
22,1
59
20,0
50,9
48
74,4
04,1
09
208,
513,
351
4,07
8,88
3 63
6,76
9,45
0 Li
abili
ties
Depo
sits
from
ban
ks
15
5,06
0
-
-
-
-
1
55,0
60
Deriv
ative
fina
ncial
inst
rum
ents
4,
769
-
-
-
-
4
,769
De
posit
s fro
m c
usto
mer
s 4
48,4
49,7
60
50,8
67,4
37
55,2
64,6
26
203,
605
7,00
7 55
4,79
2,43
5 Re
finan
ce lo
ans
-
-
-
8
3,94
9
-
83
,949
O
ther
liabi
lities
12
,818
,688
-
-
-
- 12
,818
,688
Tota
l fina
ncia
l lia
bilit
ies
461
,428
,277
50
,867
,437
55
,264
,625
28
7,55
5
7,
007
567,
854,
901
On-
bala
nce
shee
t liq
uidi
ty g
ap(1
31,7
06,1
18)
(30,
816,
489)
19,1
39,4
84
208,
225,
796
4,07
1,87
6 6
8,91
4,54
9 O
ff-ba
lanc
e sh
eet i
tem
sLo
an c
omm
itmen
ts
7,6
24,5
35
22,4
94,4
03
-
-
-
30,
118,
938
Gua
rant
ees
8
,218
,581
4,6
45,3
52
11,2
33,7
96
2
,703
,817
- 2
6,80
1,54
6 Pe
rform
ance
bon
ds
1,4
46,2
14
4
93,7
22
3
91,5
39
-
-
2,3
31,4
75
Lette
rs o
f cre
dit
24
,898
,638
7,2
41,7
64
7,97
7,71
9
-
-
40,
118,
121
Tota
l off-
bala
nce
shee
t ite
ms
42
,187
,968
34
,875
,241
19
,603
,054
2,7
03,8
17
-
99,
370,
080
Net
Liq
uidi
ty g
ap(1
73,8
94,0
86)
(65,
691,
730)
(463
,570
)20
5,52
1,97
9 4,
071,
876
(30,
455,
531)
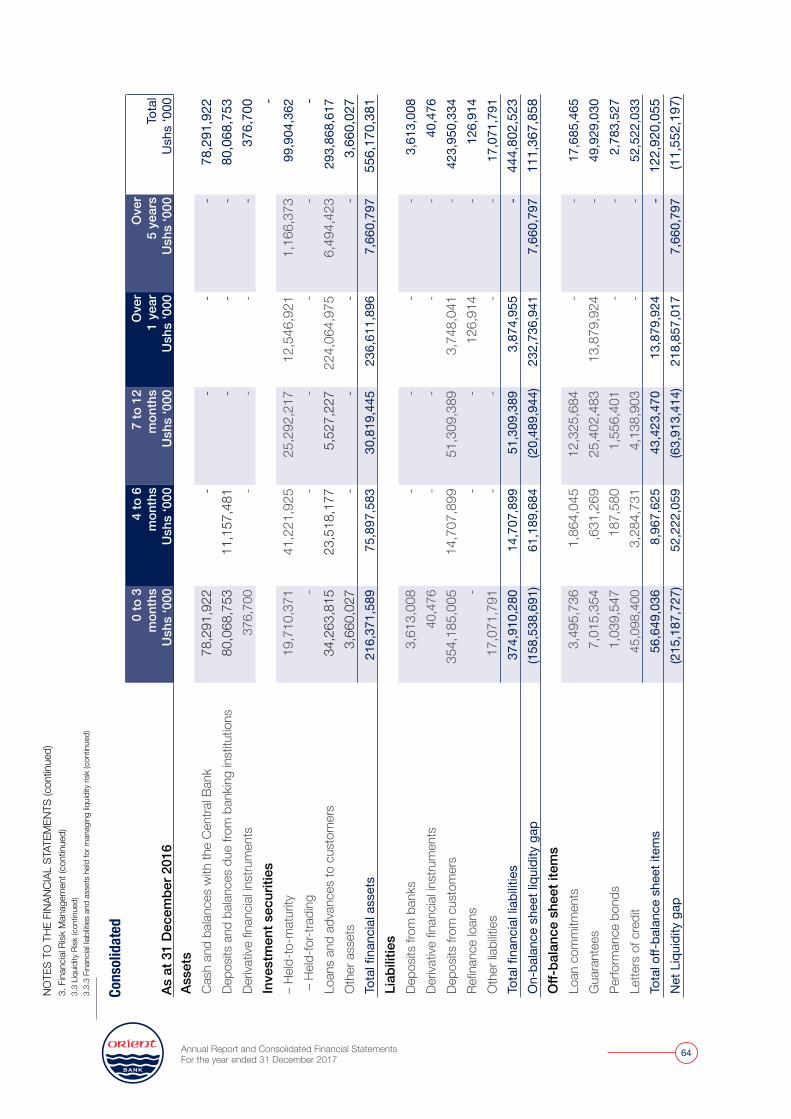
Annual Report and Consolidated Financial Statements For the year ended 31 December 2017
64
Cons
olid
ated
As a
t 31
Dec
embe
r 201
6
0 to
3m
onth
sU
shs
‘000
4 to
6m
onth
sU
shs
‘000
7 to
12
mon
ths
Ush
s ‘0
00
Ove
r1
year
Ush
s ‘0
00
Ove
r5
year
sU
shs
‘000
Tota
lU
shs
‘000
Asse
tsCa
sh a
nd b
alanc
es w
ith th
e Ce
ntra
l Ban
k
78,2
91,9
22
-
-
-
- 7
8,29
1,92
2 De
posit
s an
d ba
lance
s du
e fro
m b
ankin
g in
stitu
tions
80
,068
,753
11
,157
,481
-
-
- 8
0,06
8,75
3 De
rivat
ive fi
nanc
ial in
stru
men
ts
37
6,70
0
-
-
-
-
3
76,7
00
Inve
stm
ent s
ecur
ities
- –
Held
-to-m
atur
ity
19,7
10,3
71
41,2
21,9
25
25,
292,
217
12,5
46,9
21
1,16
6,37
3 9
9,90
4,36
2 –
Held
-for-t
radi
ng
-
-
-
-
-
-
Loan
s an
d ad
vanc
es to
cus
tom
ers
34
,263
,815
23,5
18,1
77
5,
527,
227
224
,064
,975
6
,494
,423
2
93,8
68,6
17
Oth
er a
sset
s
3,6
60,0
27
-
-
-
-
3,6
60,0
27
Tota
l fina
ncia
l ass
ets
216
,371
,589
75
,897
,583
3
0,81
9,44
5 23
6,61
1,89
6 7,
660,
797
556
,170
,381
Li
abili
ties
Depo
sits
from
ban
ks
3,6
13,0
08
-
-
-
-
3,6
13,0
08
Deriv
ative
fina
ncial
inst
rum
ents
40,
476
-
-
-
-
40
,476
De
posit
s fro
m c
usto
mer
s 3
54,1
85,0
05
14,7
07,8
99
51,
309,
389
3
,748
,041
- 4
23,9
50,3
34
Refin
ance
loan
s
-
-
-
126,
914
-
1
26,9
14
Oth
er lia
biliti
es
17,0
71,7
91
-
-
-
- 1
7,07
1,79
1 To
tal fi
nanc
ial l
iabi
litie
s 3
74,9
10,2
80
14,7
07,8
99
51,
309,
389
3
,874
,955
- 4
44,8
02,5
23
On-
bala
nce
shee
t liq
uidi
ty g
ap (1
58,5
38,6
91)
61
,189
,684
(2
0,48
9,94
4) 2
32,7
36,9
41
7,6
60,7
97
111
,367
,858
O
ff-ba
lanc
e sh
eet i
tem
sLo
an c
omm
itmen
ts
3,4
95,7
36
1,86
4,04
5 1
2,32
5,68
4
-
-
17,
685,
465
Gua
rant
ees
7
,015
,354
,6
31,2
69
25,
402,
483
13,8
79,9
24
-
49,
929,
030
Perfo
rman
ce b
onds
1
,039
,547
187
,580
1,55
6,40
1
-
-
2
,783
,527
Le
tters
of c
redi
t
45,0
98,4
00
3,28
4,73
1
4,13
8,90
3
-
-
52,
522,
033
Tota
l off-
bala
nce
shee
t ite
ms
56
,649
,036
8,9
67,6
25
43,
423,
470
13
,879
,924
- 1
22,9
20,0
55
Net
Liq
uidi
ty g
ap (2
15,1
87,7
27)
52,2
22,0
59
(63,
913,
414)
218,
857,
017
7,66
0,79
7 (
11,5
52,1
97)
NOTE
S TO
THE
FIN
ANCI
AL S
TATE
MEN
TS (c
ontin
ued)
3. F
inan
cial R
isk M
anag
emen
t (co
ntin
ued)
3.3
Liqu
idity
Risk
(con
tinue
d)3.
3.3
Fina
ncial
liabi
lities
and
ass
ets
held
for m
anag
ing
liqui
dity
risk
(con
tinue
d)
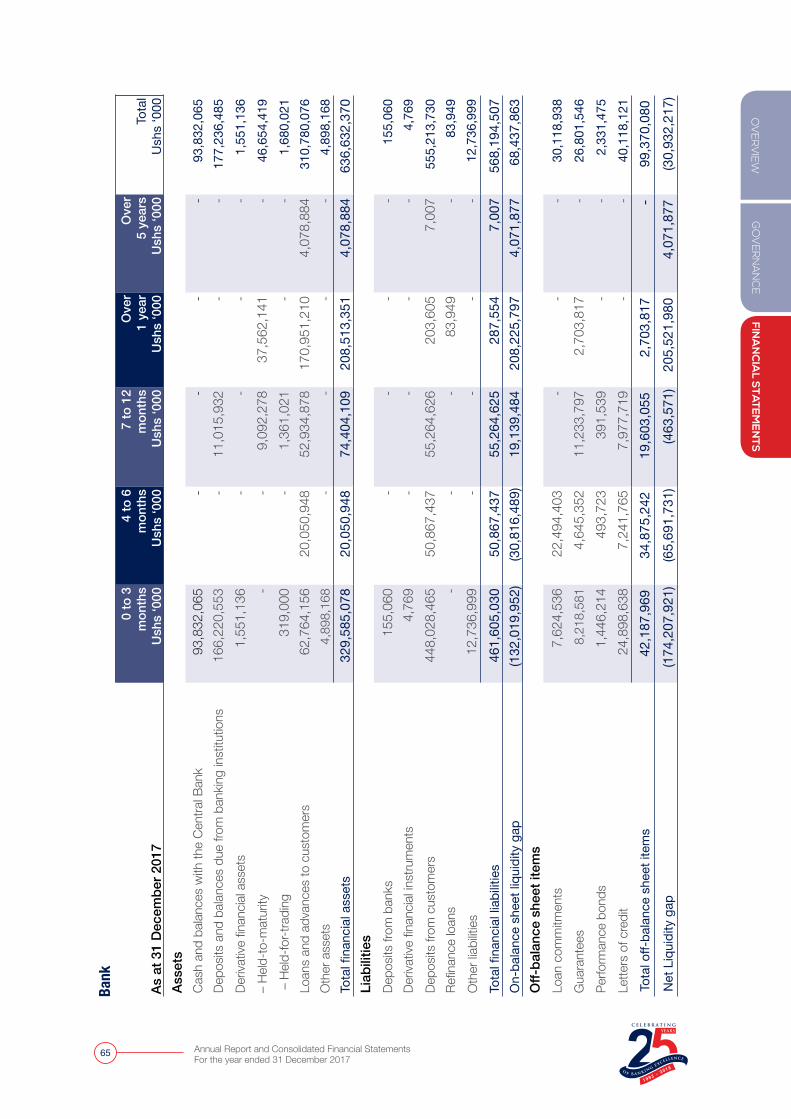
GO
VER
NA
NC
EFIN
AN
CIA
L STA
TEM
EN
TSO
VER
VIE
W
Annual Report and Consolidated Financial Statements For the year ended 31 December 2017
65
Bank
As a
t 31
Dec
embe
r 201
7
0 to
3m
onth
sU
shs
‘000
4 to
6m
onth
sU
shs
‘000
7 to
12
mon
ths
Ush
s ‘0
00
Ove
r1
year
Ush
s ‘0
00
Ove
r5
year
sU
shs
‘000
Tota
lU
shs
‘000
Asse
tsCa
sh a
nd b
alanc
es w
ith th
e Ce
ntra
l Ban
k
93,8
32,0
65
-
-
-
- 9
3,83
2,06
5 De
posit
s an
d ba
lance
s du
e fro
m b
ankin
g in
stitu
tions
166,
220,
553
-
1
1,01
5,93
2
-
-
177
,236
,485
De
rivat
ive fi
nanc
ial a
sset
s
1,5
51,1
36
-
-
-
-
1,5
51,1
36
– He
ld-to
-mat
urity
-
-
9,
092,
278
37
,562
,141
- 4
6,65
4,41
9 –
Held
-for-t
radi
ng
31
9,00
0
-
1,
361,
021
-
-
1,6
80,0
21
Loan
s an
d ad
vanc
es to
cus
tom
ers
62
,764
,156
20,0
50,9
48
52,
934,
878
170
,951
,210
4
,078
,884
3
10,7
80,0
76
Oth
er a
sset
s
4,8
98,1
68
-
-
-
-
4,8
98,1
68
Tota
l fina
ncia
l ass
ets
329,
585,
078
20
,050
,948
7
4,40
4,10
9 20
8,51
3,35
1 4
,078
,884
63
6,63
2,37
0 Li
abili
ties
Depo
sits
from
ban
ks
15
5,06
0
-
-
-
-
1
55,0
60
Deriv
ative
fina
ncial
inst
rum
ents
4,
769
-
-
-
-
4
,769
De
posit
s fro
m c
usto
mer
s 4
48,0
28,4
65
50
,867
,437
5
5,26
4,62
6
20
3,60
5
7,
007
555,
213,
730
Refin
ance
loan
s
-
-
-
83,
949
-
83,9
49
Oth
er lia
biliti
es12
,736
,999
-
-
- -
12
,736
,999
Tota
l fina
ncia
l lia
bilit
ies
461
,605
,030
50,8
67,4
37
55,
264,
625
287,
554
7,00
7 56
8,19
4,50
7 O
n-ba
lanc
e sh
eet l
iqui
dity
gap
(13
2,01
9,95
2)
(30,
816,
489)
1
9,13
9,48
4
208,
225,
797
4,
071,
877
6
8,43
7,86
3 O
ff-ba
lanc
e sh
eet i
tem
sLo
an c
omm
itmen
ts
7,6
24,5
36
22
,494
,403
-
-
- 3
0,11
8,93
8 G
uara
ntee
s
8,2
18,5
81
4
,645
,352
1
1,23
3,79
7
2,7
03,8
17
-
26,
801,
546
Perfo
rman
ce b
onds
1
,446
,214
493
,723
391
,539
-
-
2
,331
,475
Le
tters
of c
redi
t
24,8
98,6
38
7
,241
,765
7,97
7,71
9
-
-
40,
118,
121
Tota
l off-
bala
nce
shee
t ite
ms
42
,187
,969
34,8
75,2
42
19,
603,
055
2
,703
,817
- 9
9,37
0,08
0 N
et L
iqui
dity
gap
(174
,207
,921
)(6
5,69
1,73
1)(4
63,5
71)
205,
521,
980
4,07
1,87
7 (3
0,93
2,21
7)
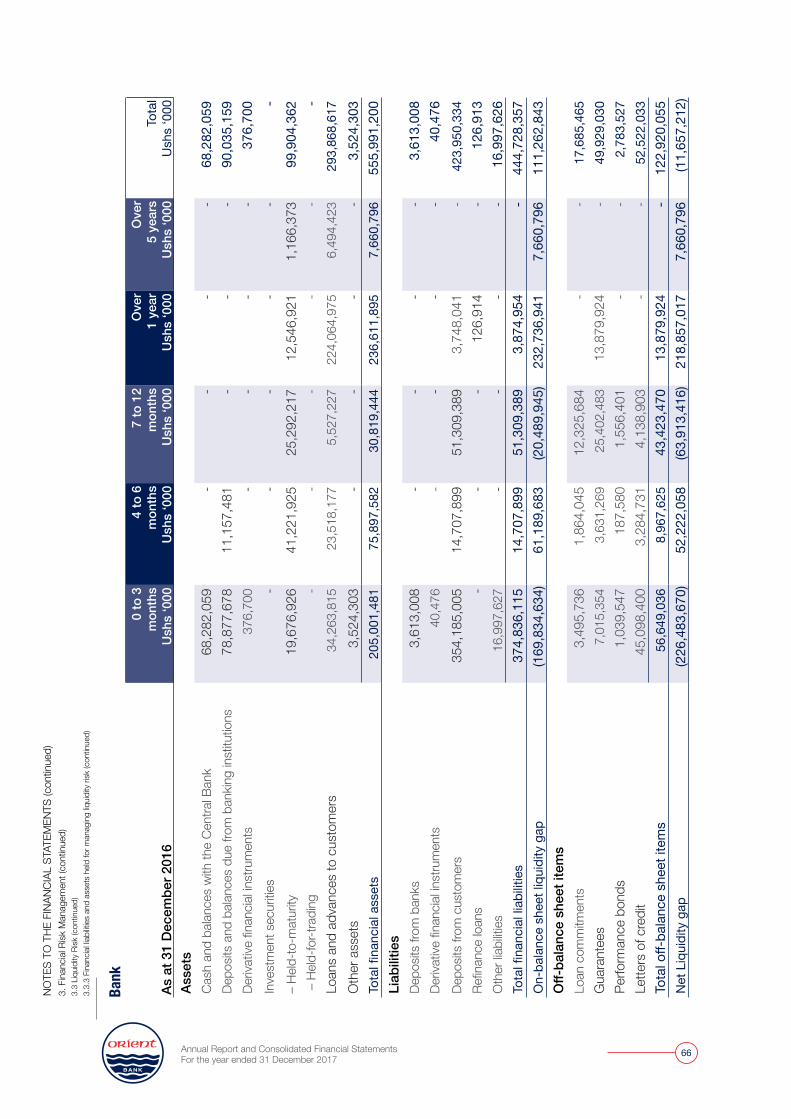
Annual Report and Consolidated Financial Statements For the year ended 31 December 2017
66
Bank
As a
t 31
Dec
embe
r 201
6
0 to
3m
onth
sU
shs
‘000
4 to
6m
onth
sU
shs
‘000
7 to
12
mon
ths
Ush
s ‘0
00
Ove
r1
year
Ush
s ‘0
00
Ove
r5
year
sU
shs
‘000
Tota
lU
shs
‘000
Asse
tsCa
sh a
nd b
alanc
es w
ith th
e Ce
ntra
l Ban
k 6
8,28
2,05
9
-
-
-
-
6
8,28
2,05
9 De
posit
s an
d ba
lance
s du
e fro
m b
ankin
g in
stitu
tions
78,
877,
678
11,
157,
481
-
-
-
9
0,03
5,15
9 De
rivat
ive fi
nanc
ial in
stru
men
ts
376,
700
-
-
-
-
37
6,70
0 In
vest
men
t sec
uritie
s
-
-
-
-
-
- –
Held
-to-m
atur
ity 1
9,67
6,92
6 4
1,22
1,92
5 2
5,29
2,21
7 1
2,54
6,92
1 1
,166
,373
9
9,90
4,36
2 –
Held
-for-t
radi
ng
-
-
-
-
-
- Lo
ans
and
adva
nces
to c
usto
mer
s 3
4,26
3,81
5 2
3,51
8,17
7 5
,527
,227
2
24,0
64,9
75
6,4
94,4
23
293
,868
,617
O
ther
ass
ets
3,
524,
303
-
-
-
-
3,5
24,3
03
Tota
l fina
ncia
l ass
ets
205
,001
,481
7
5,89
7,58
2 3
0,81
9,44
4 2
36,6
11,8
95
7,6
60,7
96
555,
991,
200
Liab
ilitie
s De
posit
s fro
m b
anks
3,
613,
008
-
-
-
-
3,6
13,0
08
Deriv
ative
fina
ncial
inst
rum
ents
4
0,47
6
-
-
-
-
40,4
76
Depo
sits
from
cus
tom
ers
354
,185
,005
1
4,70
7,89
9 5
1,30
9,38
9 3
,748
,041
-
423,
950,
334
Refin
ance
loan
s
-
-
-
12
6,91
4
-
12
6,91
3 O
ther
liabi
lities
16,
997,
627
-
-
-
-
16,
997,
626
Tota
l fina
ncia
l lia
bilit
ies
374
,836
,115
1
4,70
7,89
9 5
1,30
9,38
9 3
,874
,954
-
444,
728,
357
On-
bala
nce
shee
t liq
uidi
ty g
ap (1
69,8
34,6
34)
61,
189,
683
(20,
489,
945)
232
,736
,941
7
,660
,796
1
11,2
62,8
43
Off-
bala
nce
shee
t ite
ms
Loan
com
mitm
ents
3,
495,
736
1,8
64,0
45
12,
325,
684
-
-
17,
685,
465
Gua
rant
ees
7,
015,
354
3,6
31,2
69
25,
402,
483
13,
879,
924
-
4
9,92
9,03
0 Pe
rform
ance
bon
ds
1,03
9,54
7
187,
580
1,5
56,4
01
-
-
2,7
83,5
27
Lette
rs o
f cre
dit
45,
098,
400
3,2
84,7
31
4,1
38,9
03
-
-
52,
522,
033
Tota
l off-
bala
nce
shee
t ite
ms
56,
649,
036
8,9
67,6
25
43,
423,
470
13,
879,
924
-
12
2,92
0,05
5 N
et L
iqui
dity
gap
(226
,483
,670
)52
,222
,058
(6
3,91
3,41
6) 2
18,8
57,0
17
7,6
60,7
96
(11,
657,
212)
NOTE
S TO
THE
FIN
ANCI
AL S
TATE
MEN
TS (c
ontin
ued)
3. F
inan
cial R
isk M
anag
emen
t (co
ntin
ued)
3.3
Liqu
idity
Risk
(con
tinue
d)3.
3.3
Fina
ncial
liabi
lities
and
ass
ets
held
for m
anag
ing
liqui
dity
risk
(con
tinue
d)
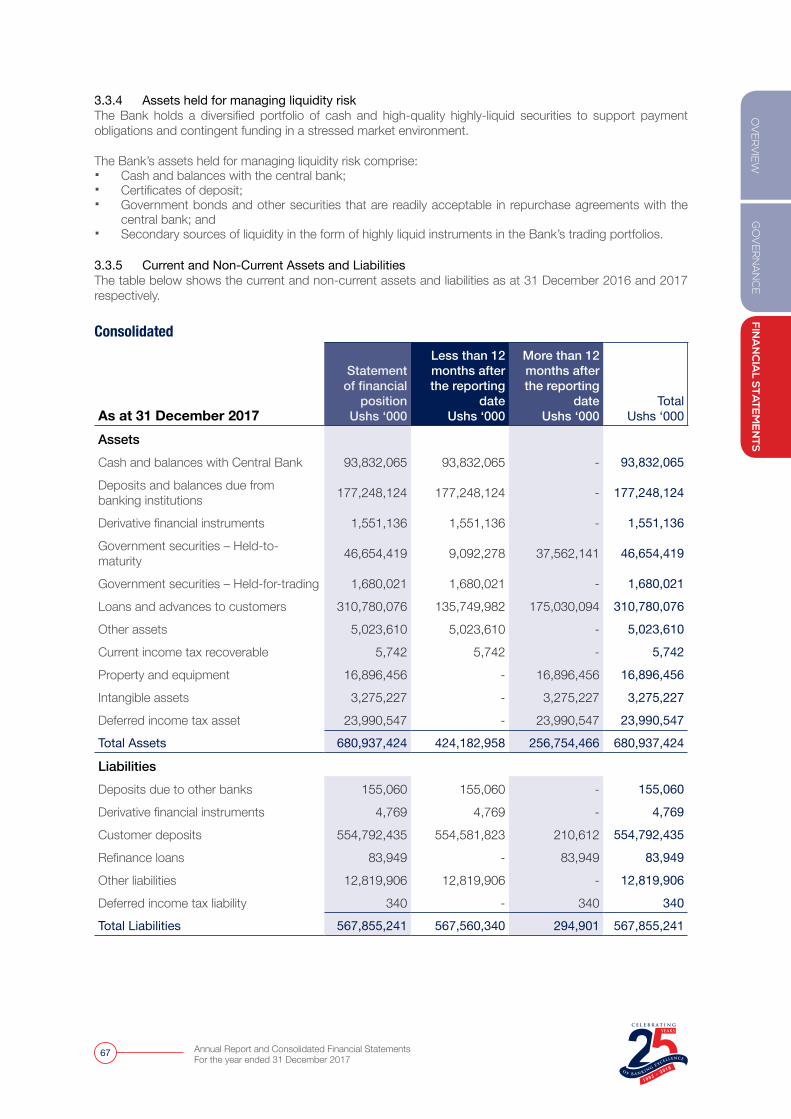
GO
VER
NA
NC
EFIN
AN
CIA
L STA
TEM
EN
TSO
VER
VIE
W
Annual Report and Consolidated Financial Statements For the year ended 31 December 2017
67
3.3.4 Assets held for managing liquidity risk The Bank holds a diversified portfolio of cash and high-quality highly-liquid securities to support payment obligations and contingent funding in a stressed market environment.
The Bank’s assets held for managing liquidity risk comprise: � Cash and balances with the central bank; � Certificates of deposit; � Government bonds and other securities that are readily acceptable in repurchase agreements with the
central bank; and � Secondary sources of liquidity in the form of highly liquid instruments in the Bank’s trading portfolios.
3.3.5 Current and Non-Current Assets and Liabilities The table below shows the current and non-current assets and liabilities as at 31 December 2016 and 2017 respectively.
Consolidated
As at 31 December 2017
Statement of financial
positionUshs ‘000
Less than 12 months after the reporting
dateUshs ‘000
More than 12 months after the reporting
dateUshs ‘000
TotalUshs ‘000
AssetsCash and balances with Central Bank 93,832,065 93,832,065 - 93,832,065
Deposits and balances due from banking institutions 177,248,124 177,248,124 - 177,248,124
Derivative financial instruments 1,551,136 1,551,136 - 1,551,136
Government securities – Held-to-maturity 46,654,419 9,092,278 37,562,141 46,654,419
Government securities – Held-for-trading 1,680,021 1,680,021 - 1,680,021
Loans and advances to customers 310,780,076 135,749,982 175,030,094 310,780,076
Other assets 5,023,610 5,023,610 - 5,023,610
Current income tax recoverable 5,742 5,742 - 5,742
Property and equipment 16,896,456 - 16,896,456 16,896,456
Intangible assets 3,275,227 - 3,275,227 3,275,227
Deferred income tax asset 23,990,547 - 23,990,547 23,990,547
Total Assets 680,937,424 424,182,958 256,754,466 680,937,424
LiabilitiesDeposits due to other banks 155,060 155,060 - 155,060
Derivative financial instruments 4,769 4,769 - 4,769
Customer deposits 554,792,435 554,581,823 210,612 554,792,435
Refinance loans 83,949 - 83,949 83,949
Other liabilities 12,819,906 12,819,906 - 12,819,906
Deferred income tax liability 340 - 340 340
Total Liabilities 567,855,241 567,560,340 294,901 567,855,241
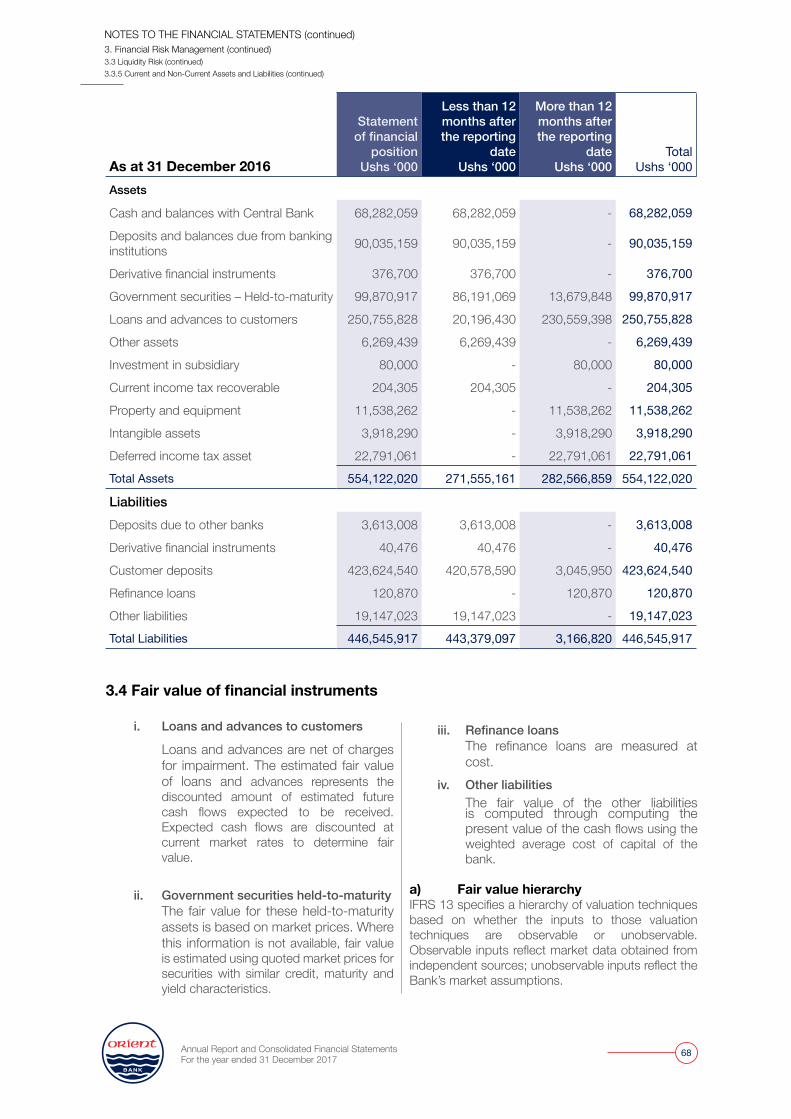
Annual Report and Consolidated Financial Statements For the year ended 31 December 2017
68
As at 31 December 2016
Statement of financial
positionUshs ‘000
Less than 12 months after the reporting
dateUshs ‘000
More than 12 months after the reporting
dateUshs ‘000
TotalUshs ‘000
Assets
Cash and balances with Central Bank 68,282,059 68,282,059 - 68,282,059
Deposits and balances due from banking institutions 90,035,159 90,035,159 - 90,035,159
Derivative financial instruments 376,700 376,700 - 376,700
Government securities – Held-to-maturity 99,870,917 86,191,069 13,679,848 99,870,917
Loans and advances to customers 250,755,828 20,196,430 230,559,398 250,755,828
Other assets 6,269,439 6,269,439 - 6,269,439
Investment in subsidiary 80,000 - 80,000 80,000
Current income tax recoverable 204,305 204,305 - 204,305
Property and equipment 11,538,262 - 11,538,262 11,538,262
Intangible assets 3,918,290 - 3,918,290 3,918,290
Deferred income tax asset 22,791,061 - 22,791,061 22,791,061Total Assets 554,122,020 271,555,161 282,566,859 554,122,020
LiabilitiesDeposits due to other banks 3,613,008 3,613,008 - 3,613,008
Derivative financial instruments 40,476 40,476 - 40,476
Customer deposits 423,624,540 420,578,590 3,045,950 423,624,540
Refinance loans 120,870 - 120,870 120,870
Other liabilities 19,147,023 19,147,023 - 19,147,023Total Liabilities 446,545,917 443,379,097 3,166,820 446,545,917
3.4 Fair value of financial instruments i. Loans and advances to customers
Loans and advances are net of charges for impairment. The estimated fair value of loans and advances represents the discounted amount of estimated future cash flows expected to be received. Expected cash flows are discounted at current market rates to determine fair value.
ii. Government securities held-to-maturity The fair value for these held-to-maturity assets is based on market prices. Where this information is not available, fair value is estimated using quoted market prices for securities with similar credit, maturity and yield characteristics.
iii. Refinance loans The refinance loans are measured at cost.
iv. Other liabilities The fair value of the other liabilities
is computed through computing the present value of the cash flows using the weighted average cost of capital of the bank.
a) Fair value hierarchyIFRS 13 specifies a hierarchy of valuation techniques based on whether the inputs to those valuation techniques are observable or unobservable. Observable inputs reflect market data obtained from independent sources; unobservable inputs reflect the Bank’s market assumptions.
NOTES TO THE FINANCIAL STATEMENTS (continued)3. Financial Risk Management (continued)3.3 Liquidity Risk (continued)3.3.5 Current and Non-Current Assets and Liabilities (continued)
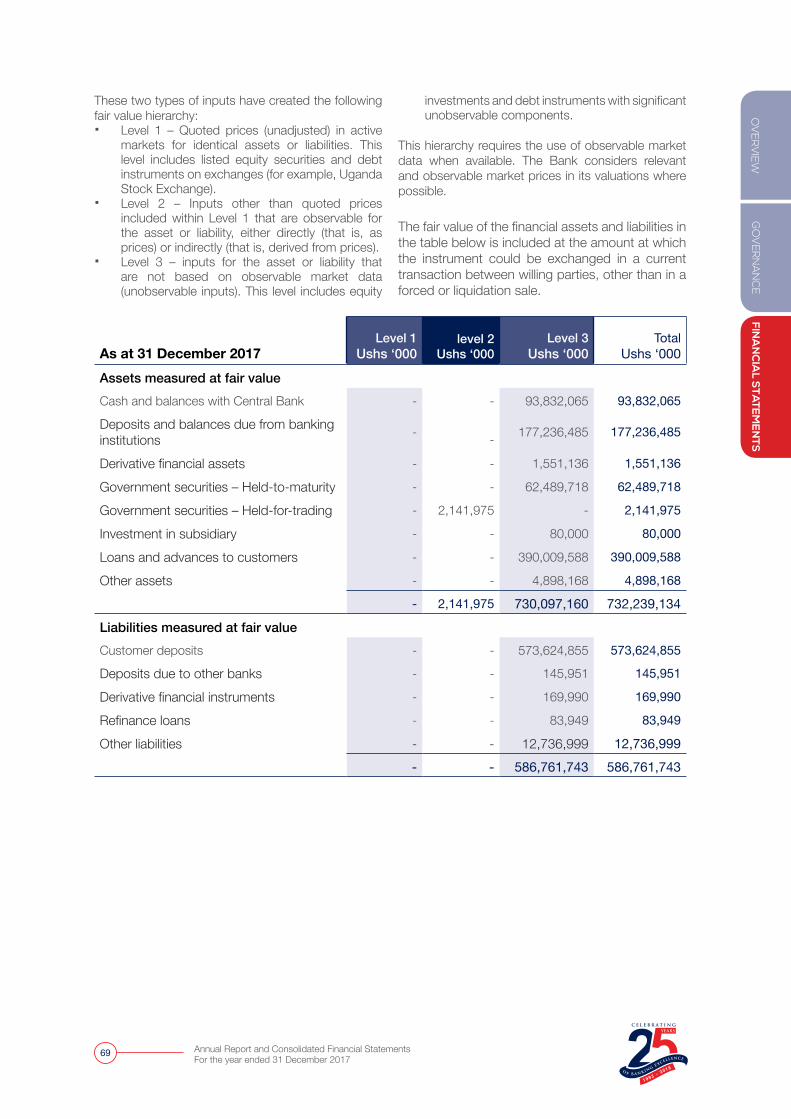
GO
VER
NA
NC
EFIN
AN
CIA
L STA
TEM
EN
TSO
VER
VIE
W
Annual Report and Consolidated Financial Statements For the year ended 31 December 2017
69
These two types of inputs have created the following fair value hierarchy: � Level 1 – Quoted prices (unadjusted) in active
markets for identical assets or liabilities. This level includes listed equity securities and debt instruments on exchanges (for example, Uganda Stock Exchange).
� Level 2 – Inputs other than quoted prices included within Level 1 that are observable for the asset or liability, either directly (that is, as prices) or indirectly (that is, derived from prices).
� Level 3 – inputs for the asset or liability that are not based on observable market data (unobservable inputs). This level includes equity
investments and debt instruments with significant unobservable components.
This hierarchy requires the use of observable market data when available. The Bank considers relevant and observable market prices in its valuations where possible.
The fair value of the financial assets and liabilities in the table below is included at the amount at which the instrument could be exchanged in a current transaction between willing parties, other than in a forced or liquidation sale.
As at 31 December 2017Level 1
Ushs ‘000level 2
Ushs ‘000Level 3
Ushs ‘000Total
Ushs ‘000
Assets measured at fair valueCash and balances with Central Bank - - 93,832,065 93,832,065
Deposits and balances due from banking institutions -
- 177,236,485 177,236,485
Derivative financial assets - - 1,551,136 1,551,136
Government securities – Held-to-maturity - - 62,489,718 62,489,718
Government securities – Held-for-trading - 2,141,975 - 2,141,975
Investment in subsidiary - - 80,000 80,000
Loans and advances to customers - - 390,009,588 390,009,588
Other assets - - 4,898,168 4,898,168
- 2,141,975 730,097,160 732,239,134 Liabilities measured at fair valueCustomer deposits - - 573,624,855 573,624,855
Deposits due to other banks - - 145,951 145,951
Derivative financial instruments - - 169,990 169,990
Refinance loans - - 83,949 83,949
Other liabilities - - 12,736,999 12,736,999 - - 586,761,743 586,761,743
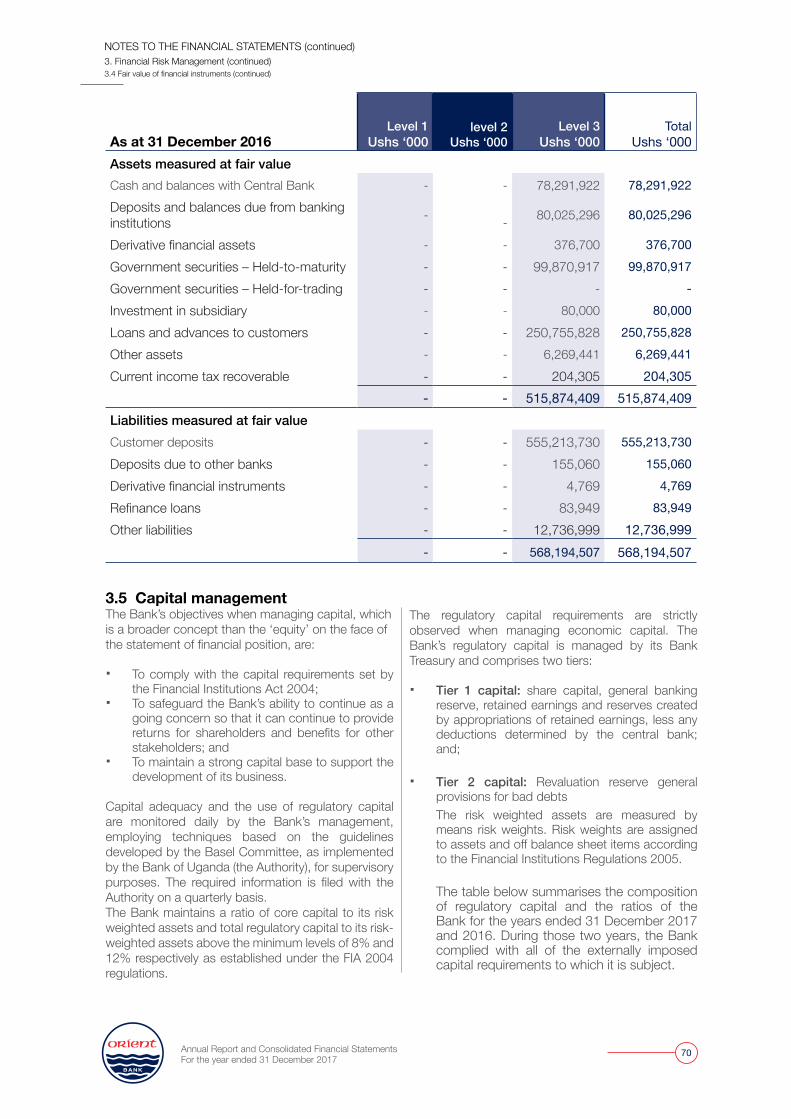
Annual Report and Consolidated Financial Statements For the year ended 31 December 2017
70
As at 31 December 2016Level 1
Ushs ‘000level 2
Ushs ‘000Level 3
Ushs ‘000Total
Ushs ‘000Assets measured at fair valueCash and balances with Central Bank - - 78,291,922 78,291,922 Deposits and balances due from banking institutions -
- 80,025,296 80,025,296
Derivative financial assets - - 376,700 376,700 Government securities – Held-to-maturity - - 99,870,917 99,870,917 Government securities – Held-for-trading - - - - Investment in subsidiary - - 80,000 80,000 Loans and advances to customers - - 250,755,828 250,755,828 Other assets - - 6,269,441 6,269,441Current income tax recoverable - - 204,305 204,305
- - 515,874,409 515,874,409Liabilities measured at fair valueCustomer deposits - - 555,213,730 555,213,730 Deposits due to other banks - - 155,060 155,060 Derivative financial instruments - - 4,769 4,769 Refinance loans - - 83,949 83,949 Other liabilities - - 12,736,999 12,736,999
- - 568,194,507 568,194,507
3.5 Capital management The Bank’s objectives when managing capital, which is a broader concept than the ‘equity’ on the face of the statement of financial position, are: � To comply with the capital requirements set by
the Financial Institutions Act 2004; � To safeguard the Bank’s ability to continue as a
going concern so that it can continue to provide returns for shareholders and benefits for other stakeholders; and
� To maintain a strong capital base to support the development of its business.
Capital adequacy and the use of regulatory capital are monitored daily by the Bank’s management, employing techniques based on the guidelines developed by the Basel Committee, as implemented by the Bank of Uganda (the Authority), for supervisory purposes. The required information is filed with the Authority on a quarterly basis. The Bank maintains a ratio of core capital to its risk weighted assets and total regulatory capital to its risk-weighted assets above the minimum levels of 8% and 12% respectively as established under the FIA 2004 regulations.
The regulatory capital requirements are strictly observed when managing economic capital. The Bank’s regulatory capital is managed by its Bank Treasury and comprises two tiers: � Tier 1 capital: share capital, general banking
reserve, retained earnings and reserves created by appropriations of retained earnings, less any deductions determined by the central bank; and;
� Tier 2 capital: Revaluation reserve general provisions for bad debts
The risk weighted assets are measured by means risk weights. Risk weights are assigned to assets and off balance sheet items according to the Financial Institutions Regulations 2005.
The table below summarises the composition of regulatory capital and the ratios of the Bank for the years ended 31 December 2017 and 2016. During those two years, the Bank complied with all of the externally imposed capital requirements to which it is subject.
NOTES TO THE FINANCIAL STATEMENTS (continued)3. Financial Risk Management (continued)3.4 Fair value of financial instruments (continued)
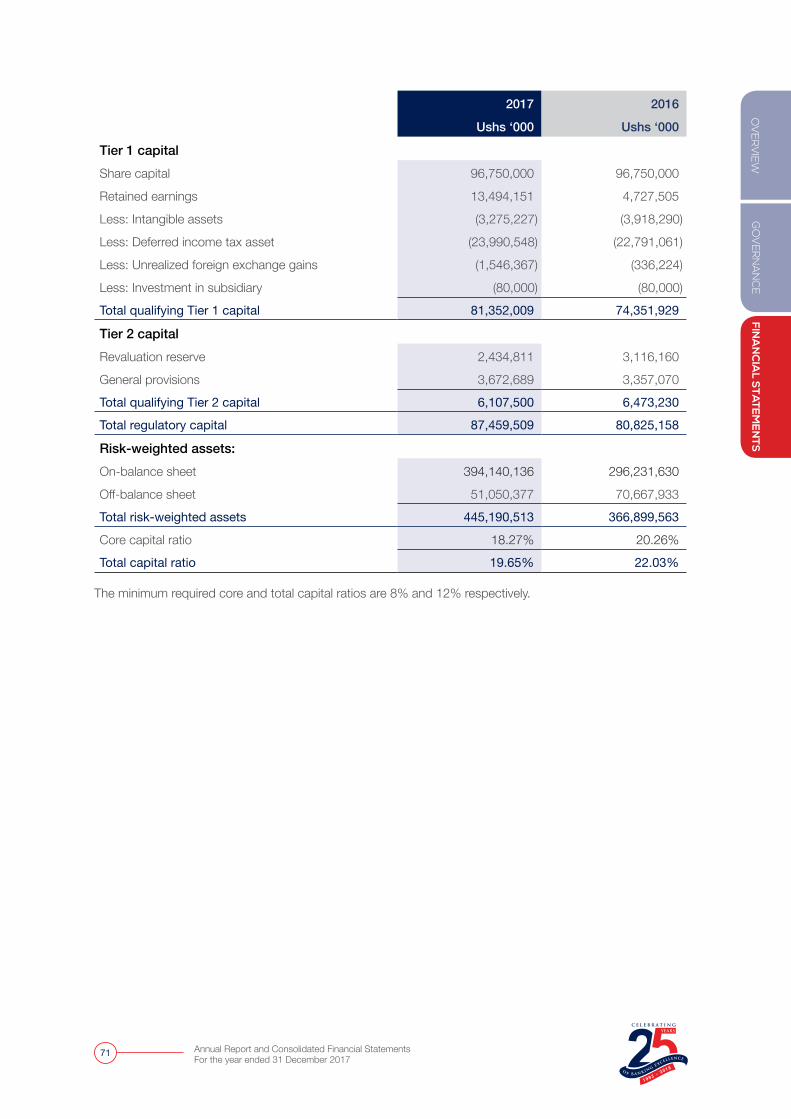
GO
VER
NA
NC
EFIN
AN
CIA
L STA
TEM
EN
TSO
VER
VIE
W
Annual Report and Consolidated Financial Statements For the year ended 31 December 2017
71
2017 2016
Ushs ‘000 Ushs ‘000
Tier 1 capitalShare capital 96,750,000 96,750,000
Retained earnings 13,494,151 4,727,505
Less: Intangible assets (3,275,227) (3,918,290)
Less: Deferred income tax asset (23,990,548) (22,791,061)
Less: Unrealized foreign exchange gains (1,546,367) (336,224)
Less: Investment in subsidiary (80,000) (80,000)
Total qualifying Tier 1 capital 81,352,009 74,351,929
Tier 2 capitalRevaluation reserve 2,434,811 3,116,160
General provisions 3,672,689 3,357,070
Total qualifying Tier 2 capital 6,107,500 6,473,230
Total regulatory capital 87,459,509 80,825,158
Risk-weighted assets:On-balance sheet 394,140,136 296,231,630
Off-balance sheet 51,050,377 70,667,933
Total risk-weighted assets 445,190,513 366,899,563
Core capital ratio 18.27% 20.26%
Total capital ratio 19.65% 22.03%
The minimum required core and total capital ratios are 8% and 12% respectively.
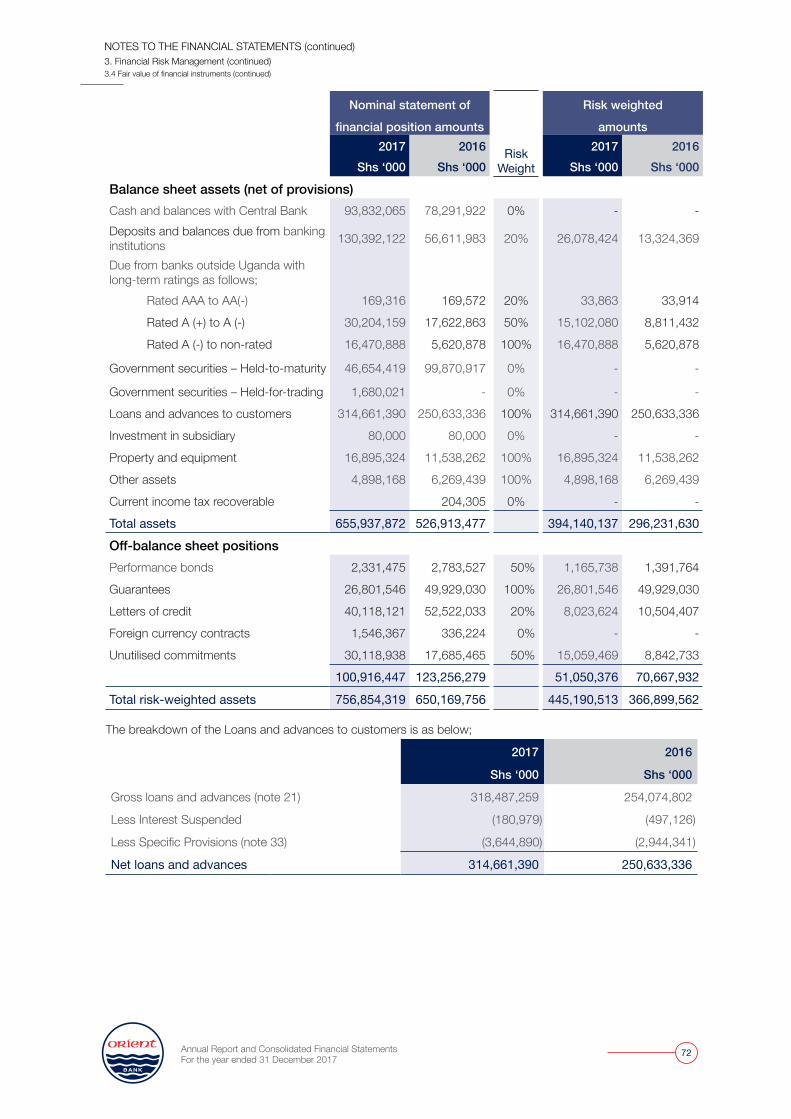
Annual Report and Consolidated Financial Statements For the year ended 31 December 2017
72
Nominal statement of
Risk Weight
Risk weighted
financial position amounts amounts2017 2016 2017 2016
Shs ‘000 Shs ‘000 Shs ‘000 Shs ‘000
Balance sheet assets (net of provisions)Cash and balances with Central Bank 93,832,065 78,291,922 0% - - Deposits and balances due from banking institutions 130,392,122 56,611,983 20% 26,078,424 13,324,369
Due from banks outside Uganda with long-term ratings as follows; Rated AAA to AA(-) 169,316 169,572 20% 33,863 33,914
Rated A (+) to A (-) 30,204,159 17,622,863 50% 15,102,080 8,811,432
Rated A (-) to non-rated 16,470,888 5,620,878 100% 16,470,888 5,620,878
Government securities – Held-to-maturity 46,654,419 99,870,917 0% - -
Government securities – Held-for-trading 1,680,021 - 0% - - Loans and advances to customers 314,661,390 250,633,336 100% 314,661,390 250,633,336
Investment in subsidiary 80,000 80,000 0% - -
Property and equipment 16,895,324 11,538,262 100% 16,895,324 11,538,262
Other assets 4,898,168 6,269,439 100% 4,898,168 6,269,439
Current income tax recoverable 204,305 0% - -
Total assets 655,937,872 526,913,477 394,140,137 296,231,630 Off-balance sheet positionsPerformance bonds 2,331,475 2,783,527 50% 1,165,738 1,391,764
Guarantees 26,801,546 49,929,030 100% 26,801,546 49,929,030
Letters of credit 40,118,121 52,522,033 20% 8,023,624 10,504,407
Foreign currency contracts 1,546,367 336,224 0% - -
Unutilised commitments 30,118,938 17,685,465 50% 15,059,469 8,842,733
100,916,447 123,256,279 51,050,376 70,667,932 Total risk-weighted assets 756,854,319 650,169,756 445,190,513 366,899,562
The breakdown of the Loans and advances to customers is as below;
2017 2016
Shs ‘000 Shs ‘000
Gross loans and advances (note 21) 318,487,259 254,074,802
Less Interest Suspended (180,979) (497,126)
Less Specific Provisions (note 33) (3,644,890) (2,944,341)
Net loans and advances 314,661,390 250,633,336
NOTES TO THE FINANCIAL STATEMENTS (continued)3. Financial Risk Management (continued)3.4 Fair value of financial instruments (continued)
GO
VER
NA
NC
EFIN
AN
CIA
L STA
TEM
EN
TSO
VER
VIE
W
Annual Report and Consolidated Financial Statements For the year ended 31 December 2017
73
4. CRITICAL ACCOUNTING ESTIMATES AND JUDGEMENTS
The Bank makes estimates and assumptions that affect the reported amounts of assets and liabilities within the next financial year. All estimates and assumptions required in conformity with IFRS are best estimates undertaken in accordance with the applicable standard. Estimates and judgements are evaluated on a continuous basis, and are based on past experience and other factors, including expectations with regard to future events. Accounting policies and directors’ judgements for certain items are especially critical to the Bank’s results and financial position due to their materiality. a. Impairment losses on loans and advancesThe Bank reviews its loan portfolios to assess impairment at least on a quarterly basis. In determining whether an impairment loss should be recorded in profit or loss, the Bank makes judgements as to whether there is any observable data indicating an impairment trigger followed by measurable decrease in the estimated future cash flows from a portfolio of loans before the decrease can be identified with that portfolio.
This evidence may include observable data indicating that there has been an adverse change in the payment status of borrowers in a Consolidated, or national or local economic conditions that correlate with defaults on assets in the Consolidated. The directors use estimates based on historical loss experience for assets with credit risk characteristics and objective evidence of impairment similar to those in the portfolio when scheduling future cash flows.
The methodology and assumptions used for estimating both the amount and timing of future cash flows are reviewed regularly to reduce any differences between loss estimates and actual loss experience. Refer to note 21. b. Fair value of financial instrumentsThe fair value of financial instruments where no active market exists or where quoted prices are not otherwise available are determined by using valuation techniques. In these cases, the fair values are estimated from observable data in respect of similar financial instruments or using models.
Where market observable inputs are not available, they are estimated based on appropriate assumptions. Where valuation techniques (for example, models) are used to determine fair values, they are validated and periodically reviewed by qualified personnel independent of those that sourced them.
All models are certified before they are used, and models are calibrated to ensure that outputs reflect actual data and comparative market prices. To the extent practical, models use only observable data; however, areas such as credit risk (both own credit risk and counterparty risk), volatilities and correlations require management to make estimates. Refer to note 3.4.
c. Held-to-maturity investmentsIn accordance with IAS 39 guidance, the Bank classifies some non-derivative financial assets with fixed or determinable payments and fixed maturity as held-to-maturity. This classification requires significant judgement. In making this judgement, the Bank evaluates its intention and ability to hold such investments to maturity. If the Bank were to fail to keep these investments to maturity other than under specific circumstances – for example, selling an insignificant amount close to maturity – the Bank is required to reclassify the entire category as available-for-sale. Accordingly, the investments would be measured at fair value instead of amortised cost. d. Property, plant and equipmentThe bank carries its buildings at revalued amounts, being its fair value at the date of the revaluation less any subsequent accumulated depreciation and subsequent accumulated impairment losses. Changes in fair value are recognised in other comprehensive income. Revaluations shall be made with sufficient regularity to ensure that the carrying amount does not differ materially from that which would be determined using fair value at the end of the reporting period. The Bank determined that as at 31 December 2017.
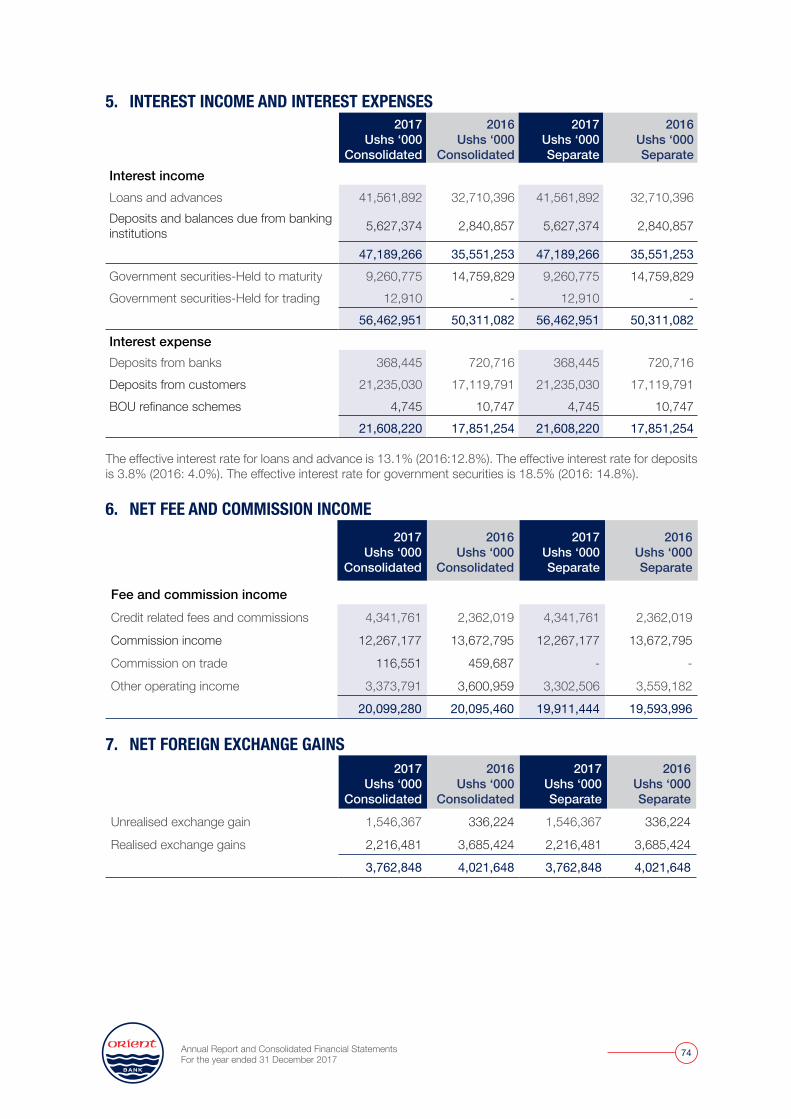
Annual Report and Consolidated Financial Statements For the year ended 31 December 2017
74
5. INTEREST INCOME AND INTEREST EXPENSES2017
Ushs ‘000Consolidated
2016Ushs ‘000
Consolidated
2017Ushs ‘000Separate
2016Ushs ‘000Separate
Interest incomeLoans and advances 41,561,892 32,710,396 41,561,892 32,710,396 Deposits and balances due from banking institutions 5,627,374 2,840,857 5,627,374 2,840,857
47,189,266 35,551,253 47,189,266 35,551,253 Government securities-Held to maturity 9,260,775 14,759,829 9,260,775 14,759,829 Government securities-Held for trading 12,910 - 12,910 -
56,462,951 50,311,082 56,462,951 50,311,082 Interest expenseDeposits from banks 368,445 720,716 368,445 720,716 Deposits from customers 21,235,030 17,119,791 21,235,030 17,119,791 BOU refinance schemes 4,745 10,747 4,745 10,747
21,608,220 17,851,254 21,608,220 17,851,254
The effective interest rate for loans and advance is 13.1% (2016:12.8%). The effective interest rate for deposits is 3.8% (2016: 4.0%). The effective interest rate for government securities is 18.5% (2016: 14.8%). 6. NET FEE AND COMMISSION INCOME
2017Ushs ‘000
Consolidated
2016Ushs ‘000
Consolidated
2017Ushs ‘000Separate
2016Ushs ‘000Separate
Fee and commission incomeCredit related fees and commissions 4,341,761 2,362,019 4,341,761 2,362,019
Commission income 12,267,177 13,672,795 12,267,177 13,672,795
Commission on trade 116,551 459,687 - -
Other operating income 3,373,791 3,600,959 3,302,506 3,559,182
20,099,280 20,095,460 19,911,444 19,593,996
7. NET FOREIGN EXCHANGE GAINS 2017
Ushs ‘000Consolidated
2016Ushs ‘000
Consolidated
2017Ushs ‘000Separate
2016Ushs ‘000Separate
Unrealised exchange gain 1,546,367 336,224 1,546,367 336,224
Realised exchange gains 2,216,481 3,685,424 2,216,481 3,685,424
3,762,848 4,021,648 3,762,848 4,021,648
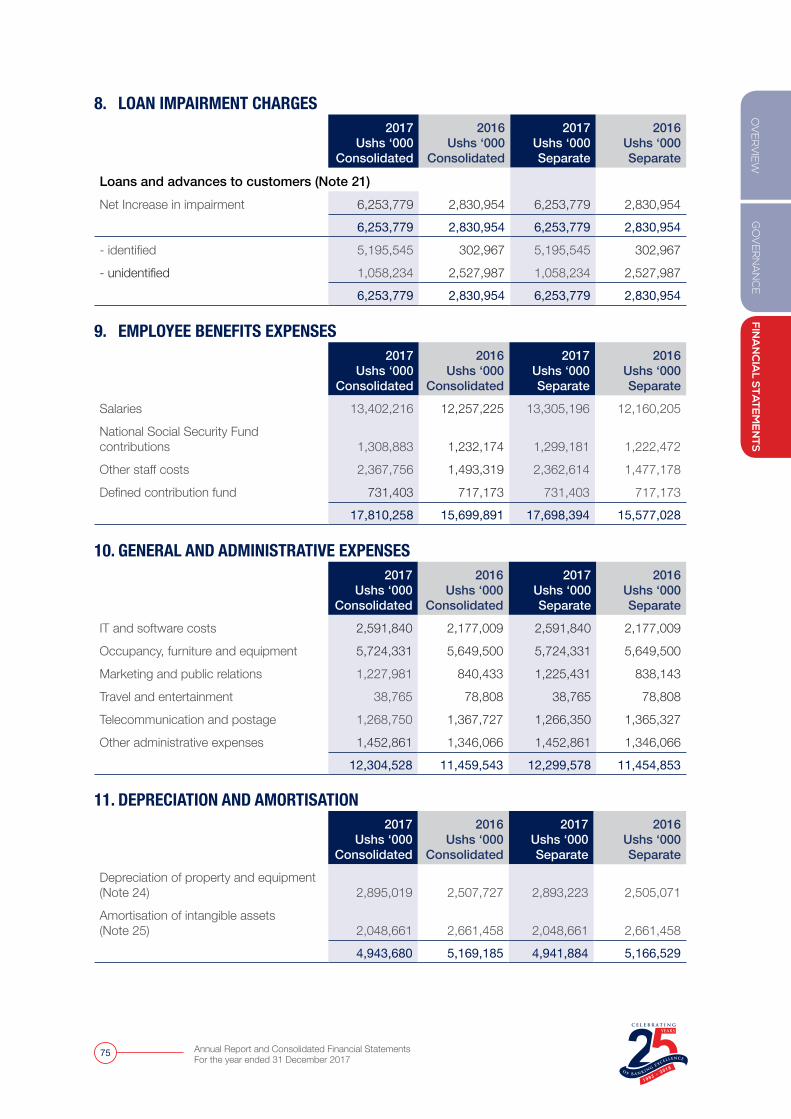
GO
VER
NA
NC
EFIN
AN
CIA
L STA
TEM
EN
TSO
VER
VIE
W
Annual Report and Consolidated Financial Statements For the year ended 31 December 2017
75
8. LOAN IMPAIRMENT CHARGES 2017
Ushs ‘000Consolidated
2016Ushs ‘000
Consolidated
2017Ushs ‘000Separate
2016Ushs ‘000Separate
Loans and advances to customers (Note 21)Net Increase in impairment 6,253,779 2,830,954 6,253,779 2,830,954
6,253,779 2,830,954 6,253,779 2,830,954
- identified 5,195,545 302,967 5,195,545 302,967
- unidentified 1,058,234 2,527,987 1,058,234 2,527,987
6,253,779 2,830,954 6,253,779 2,830,954
9. EMPLOYEE BENEFITS EXPENSES 2017
Ushs ‘000Consolidated
2016Ushs ‘000
Consolidated
2017Ushs ‘000Separate
2016Ushs ‘000Separate
Salaries 13,402,216 12,257,225 13,305,196 12,160,205
National Social Security Fund contributions 1,308,883 1,232,174
1,299,181 1,222,472
Other staff costs 2,367,756 1,493,319 2,362,614 1,477,178
Defined contribution fund 731,403 717,173 731,403 717,173
17,810,258 15,699,891 17,698,394 15,577,028
10. GENERAL AND ADMINISTRATIVE EXPENSES2017
Ushs ‘000Consolidated
2016Ushs ‘000
Consolidated
2017Ushs ‘000Separate
2016Ushs ‘000Separate
IT and software costs 2,591,840 2,177,009 2,591,840 2,177,009
Occupancy, furniture and equipment 5,724,331 5,649,500 5,724,331 5,649,500
Marketing and public relations 1,227,981 840,433 1,225,431 838,143
Travel and entertainment 38,765 78,808 38,765 78,808
Telecommunication and postage 1,268,750 1,367,727 1,266,350 1,365,327
Other administrative expenses 1,452,861 1,346,066 1,452,861 1,346,066
12,304,528 11,459,543 12,299,578 11,454,853
11. DEPRECIATION AND AMORTISATION 2017
Ushs ‘000Consolidated
2016Ushs ‘000
Consolidated
2017Ushs ‘000Separate
2016Ushs ‘000Separate
Depreciation of property and equipment (Note 24)
2,895,019 2,507,727 2,893,223 2,505,071
Amortisation of intangible assets (Note 25)
2,048,661 2,661,458 2,048,661 2,661,458
4,943,680 5,169,185 4,941,884 5,166,529
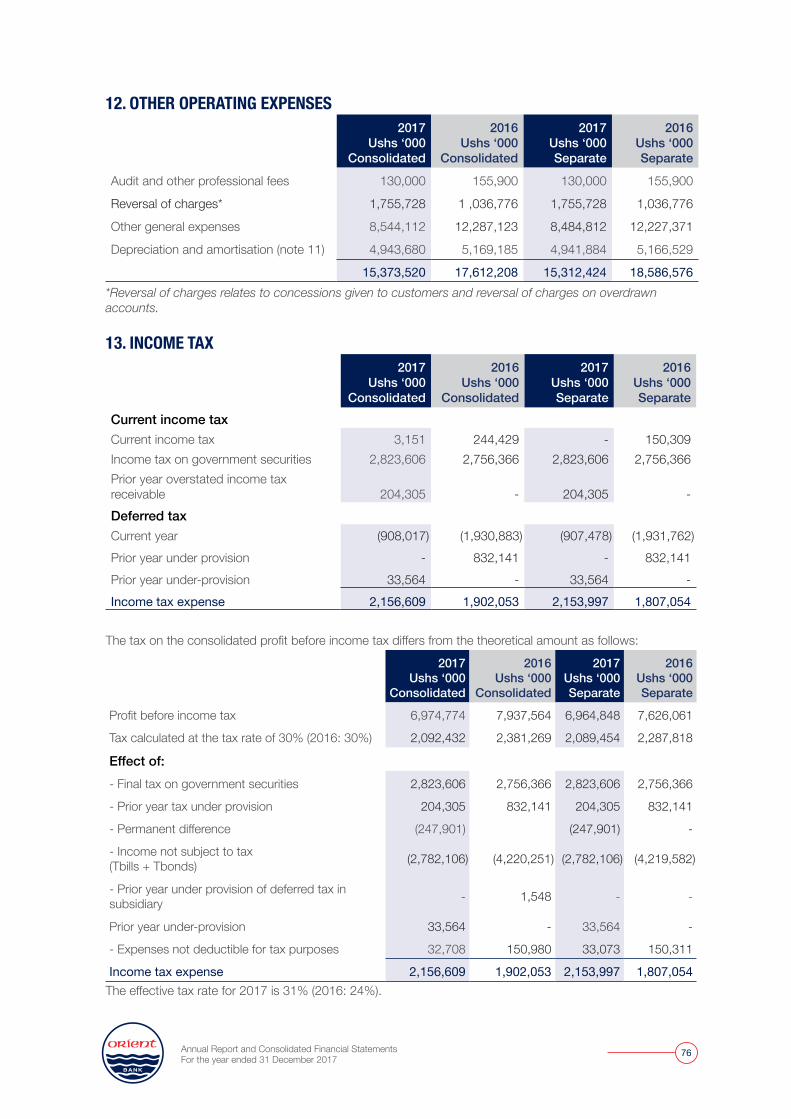
Annual Report and Consolidated Financial Statements For the year ended 31 December 2017
76
12. OTHER OPERATING EXPENSES2017
Ushs ‘000Consolidated
2016Ushs ‘000
Consolidated
2017Ushs ‘000Separate
2016Ushs ‘000Separate
Audit and other professional fees 130,000 155,900 130,000 155,900
Reversal of charges* 1,755,728 1 ,036,776 1,755,728 1,036,776
Other general expenses 8,544,112 12,287,123 8,484,812 12,227,371
Depreciation and amortisation (note 11) 4,943,680 5,169,185 4,941,884 5,166,529
15,373,520 17,612,208 15,312,424 18,586,576*Reversal of charges relates to concessions given to customers and reversal of charges on overdrawn accounts.
13. INCOME TAX2017
Ushs ‘000Consolidated
2016Ushs ‘000
Consolidated
2017Ushs ‘000Separate
2016Ushs ‘000Separate
Current income taxCurrent income tax 3,151 244,429 - 150,309Income tax on government securities 2,823,606 2,756,366 2,823,606 2,756,366Prior year overstated income tax receivable 204,305 - 204,305 -Deferred taxCurrent year (908,017) (1,930,883) (907,478) (1,931,762)Prior year under provision - 832,141 - 832,141Prior year under-provision 33,564 - 33,564 -Income tax expense 2,156,609 1,902,053 2,153,997 1,807,054
The tax on the consolidated profit before income tax differs from the theoretical amount as follows:
2017Ushs ‘000
Consolidated
2016Ushs ‘000
Consolidated
2017Ushs ‘000Separate
2016Ushs ‘000Separate
Profit before income tax 6,974,774 7,937,564 6,964,848 7,626,061
Tax calculated at the tax rate of 30% (2016: 30%) 2,092,432 2,381,269 2,089,454 2,287,818
Effect of:- Final tax on government securities 2,823,606 2,756,366 2,823,606 2,756,366
- Prior year tax under provision 204,305 832,141 204,305 832,141
- Permanent difference (247,901) (247,901) -
- Income not subject to tax (Tbills + Tbonds) (2,782,106) (4,220,251) (2,782,106) (4,219,582)
- Prior year under provision of deferred tax in subsidiary - 1,548 - -
Prior year under-provision 33,564 - 33,564 -
- Expenses not deductible for tax purposes 32,708 150,980 33,073 150,311
Income tax expense 2,156,609 1,902,053 2,153,997 1,807,054The effective tax rate for 2017 is 31% (2016: 24%).
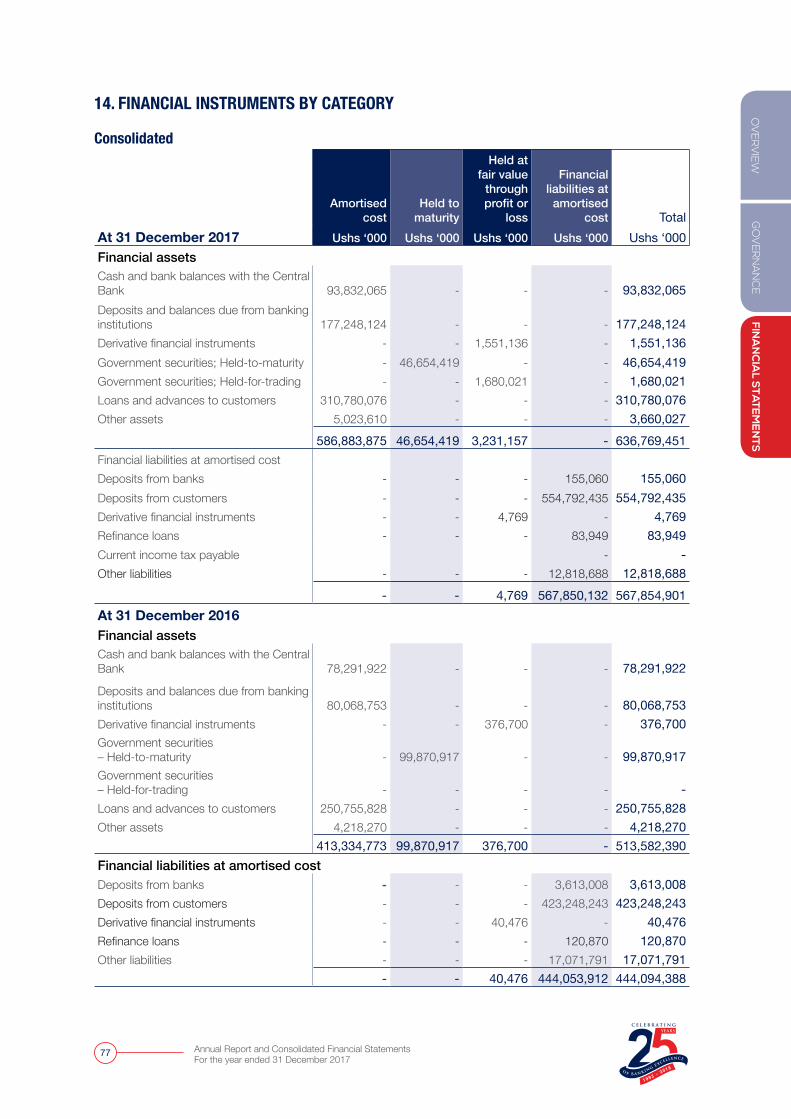
GO
VER
NA
NC
EFIN
AN
CIA
L STA
TEM
EN
TSO
VER
VIE
W
Annual Report and Consolidated Financial Statements For the year ended 31 December 2017
77
14. FINANCIAL INSTRUMENTS BY CATEGORY
Consolidated
Amortised cost
Held to maturity
Held at fair value
through profit or
loss
Financial liabilities at
amortised cost Total
At 31 December 2017 Ushs ‘000 Ushs ‘000 Ushs ‘000 Ushs ‘000 Ushs ‘000Financial assetsCash and bank balances with the Central Bank 93,832,065 - - - 93,832,065 Deposits and balances due from banking institutions 177,248,124 - - -
177,248,124
Derivative financial instruments - - 1,551,136 - 1,551,136 Government securities; Held-to-maturity - 46,654,419 - - 46,654,419 Government securities; Held-for-trading - - 1,680,021 - 1,680,021 Loans and advances to customers 310,780,076 - - - 310,780,076 Other assets 5,023,610 - - - 3,660,027
586,883,875 46,654,419 3,231,157 - 636,769,451 Financial liabilities at amortised costDeposits from banks - - - 155,060 155,060 Deposits from customers - - - 554,792,435 554,792,435 Derivative financial instruments - - 4,769 - 4,769 Refinance loans - - - 83,949 83,949 Current income tax payable - -Other liabilities - - - 12,818,688 12,818,688
- - 4,769 567,850,132 567,854,901 At 31 December 2016Financial assetsCash and bank balances with the Central Bank 78,291,922 - - - 78,291,922 Deposits and balances due from banking institutions 80,068,753 - - - 80,068,753 Derivative financial instruments - - 376,700 - 376,700 Government securities – Held-to-maturity - 99,870,917 - - 99,870,917 Government securities – Held-for-trading - - - - - Loans and advances to customers 250,755,828 - - - 250,755,828 Other assets 4,218,270 - - - 4,218,270
413,334,773 99,870,917 376,700 - 513,582,390 Financial liabilities at amortised costDeposits from banks - - - 3,613,008 3,613,008 Deposits from customers - - - 423,248,243 423,248,243 Derivative financial instruments - - 40,476 - 40,476 Refinance loans - - - 120,870 120,870 Other liabilities - - - 17,071,791 17,071,791
- - 40,476 444,053,912 444,094,388
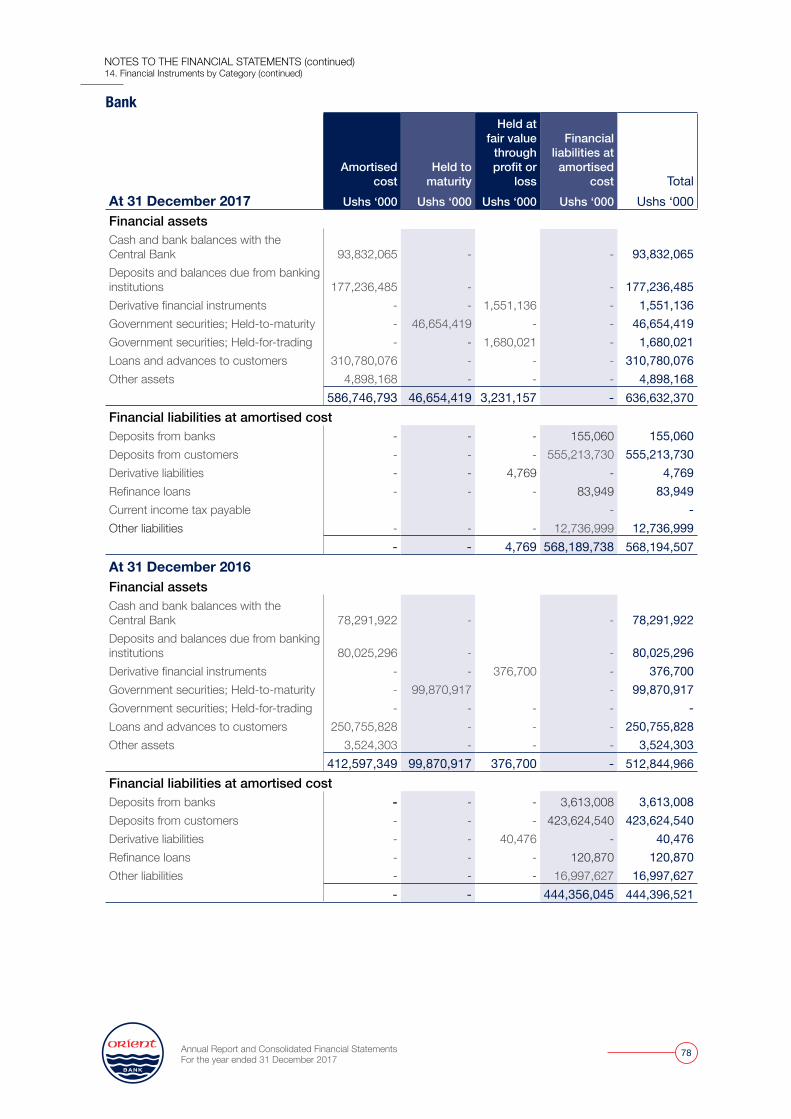
Annual Report and Consolidated Financial Statements For the year ended 31 December 2017
78
Bank
Amortised cost
Held to maturity
Held at fair value
through profit or
loss
Financial liabilities at
amortised cost Total
At 31 December 2017 Ushs ‘000 Ushs ‘000 Ushs ‘000 Ushs ‘000 Ushs ‘000Financial assetsCash and bank balances with the Central Bank 93,832,065 - - 93,832,065Deposits and balances due from banking institutions 177,236,485 - - 177,236,485Derivative financial instruments - - 1,551,136 - 1,551,136Government securities; Held-to-maturity - 46,654,419 - - 46,654,419Government securities; Held-for-trading - - 1,680,021 - 1,680,021Loans and advances to customers 310,780,076 - - - 310,780,076Other assets 4,898,168 - - - 4,898,168
586,746,793 46,654,419 3,231,157 - 636,632,370Financial liabilities at amortised costDeposits from banks - - - 155,060 155,060Deposits from customers - - - 555,213,730 555,213,730Derivative liabilities - - 4,769 - 4,769Refinance loans - - - 83,949 83,949Current income tax payable - -Other liabilities - - - 12,736,999 12,736,999
- - 4,769 568,189,738 568,194,507At 31 December 2016Financial assetsCash and bank balances with the Central Bank 78,291,922 - - 78,291,922Deposits and balances due from banking institutions 80,025,296 - - 80,025,296Derivative financial instruments - - 376,700 - 376,700Government securities; Held-to-maturity - 99,870,917 - 99,870,917Government securities; Held-for-trading - - - - -Loans and advances to customers 250,755,828 - - - 250,755,828Other assets 3,524,303 - - - 3,524,303
412,597,349 99,870,917 376,700 - 512,844,966Financial liabilities at amortised costDeposits from banks - - - 3,613,008 3,613,008Deposits from customers - - - 423,624,540 423,624,540Derivative liabilities - - 40,476 - 40,476Refinance loans - - - 120,870 120,870Other liabilities - - - 16,997,627 16,997,627
- - 444,356,045 444,396,521
NOTES TO THE FINANCIAL STATEMENTS (continued)14. Financial Instruments by Category (continued)
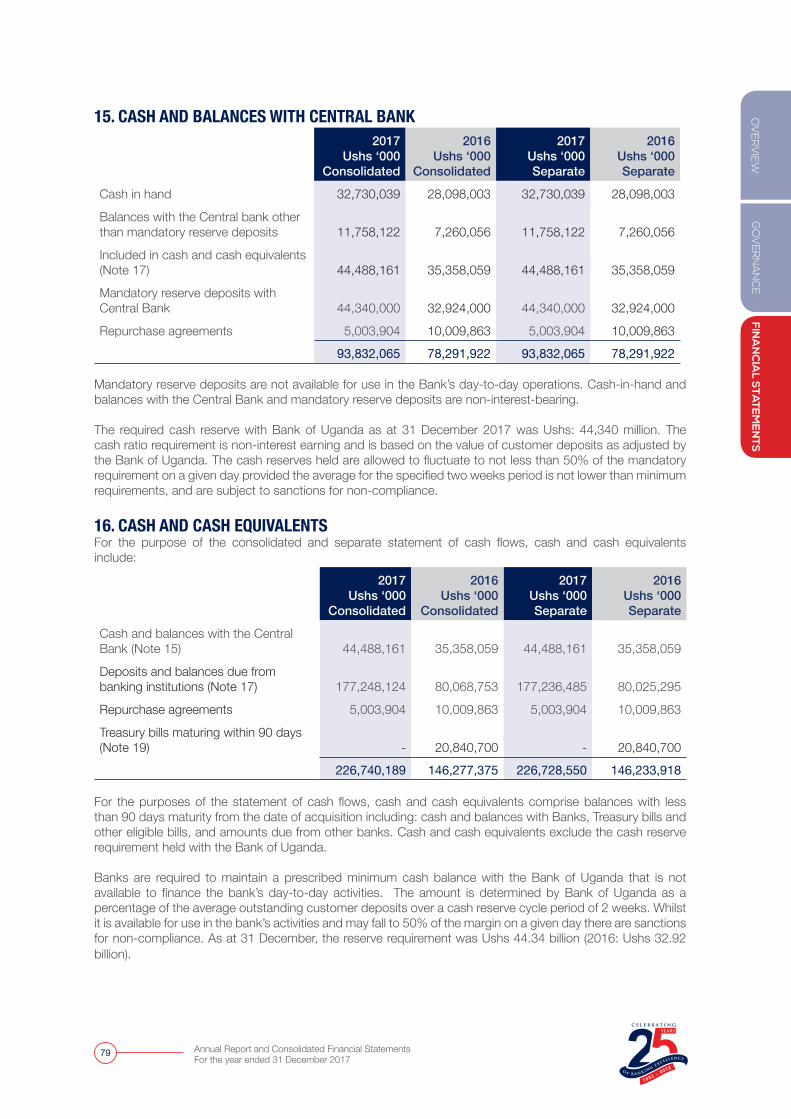
GO
VER
NA
NC
EFIN
AN
CIA
L STA
TEM
EN
TSO
VER
VIE
W
Annual Report and Consolidated Financial Statements For the year ended 31 December 2017
79
15. CASH AND BALANCES WITH CENTRAL BANK2017
Ushs ‘000Consolidated
2016Ushs ‘000
Consolidated
2017Ushs ‘000Separate
2016Ushs ‘000Separate
Cash in hand 32,730,039 28,098,003 32,730,039 28,098,003
Balances with the Central bank other than mandatory reserve deposits 11,758,122 7,260,056 11,758,122 7,260,056
Included in cash and cash equivalents (Note 17) 44,488,161 35,358,059 44,488,161 35,358,059
Mandatory reserve deposits with Central Bank 44,340,000 32,924,000 44,340,000 32,924,000
Repurchase agreements 5,003,904 10,009,863 5,003,904 10,009,863
93,832,065 78,291,922 93,832,065 78,291,922
Mandatory reserve deposits are not available for use in the Bank’s day-to-day operations. Cash-in-hand and balances with the Central Bank and mandatory reserve deposits are non-interest-bearing. The required cash reserve with Bank of Uganda as at 31 December 2017 was Ushs: 44,340 million. The cash ratio requirement is non-interest earning and is based on the value of customer deposits as adjusted by the Bank of Uganda. The cash reserves held are allowed to fluctuate to not less than 50% of the mandatory requirement on a given day provided the average for the specified two weeks period is not lower than minimum requirements, and are subject to sanctions for non-compliance. 16. CASH AND CASH EQUIVALENTS For the purpose of the consolidated and separate statement of cash flows, cash and cash equivalents include:
2017Ushs ‘000
Consolidated
2016Ushs ‘000
Consolidated
2017Ushs ‘000Separate
2016Ushs ‘000Separate
Cash and balances with the Central Bank (Note 15) 44,488,161 35,358,059
44,488,161
35,358,059
Deposits and balances due from banking institutions (Note 17) 177,248,124
80,068,753 177,236,485 80,025,295
Repurchase agreements 5,003,904 10,009,863 5,003,904 10,009,863
Treasury bills maturing within 90 days (Note 19)
-
20,840,700 - 20,840,700
226,740,189 146,277,375 226,728,550 146,233,918
For the purposes of the statement of cash flows, cash and cash equivalents comprise balances with less than 90 days maturity from the date of acquisition including: cash and balances with Banks, Treasury bills and other eligible bills, and amounts due from other banks. Cash and cash equivalents exclude the cash reserve requirement held with the Bank of Uganda.
Banks are required to maintain a prescribed minimum cash balance with the Bank of Uganda that is not available to finance the bank’s day-to-day activities. The amount is determined by Bank of Uganda as a percentage of the average outstanding customer deposits over a cash reserve cycle period of 2 weeks. Whilst it is available for use in the bank’s activities and may fall to 50% of the margin on a given day there are sanctions for non-compliance. As at 31 December, the reserve requirement was Ushs 44.34 billion (2016: Ushs 32.92 billion).
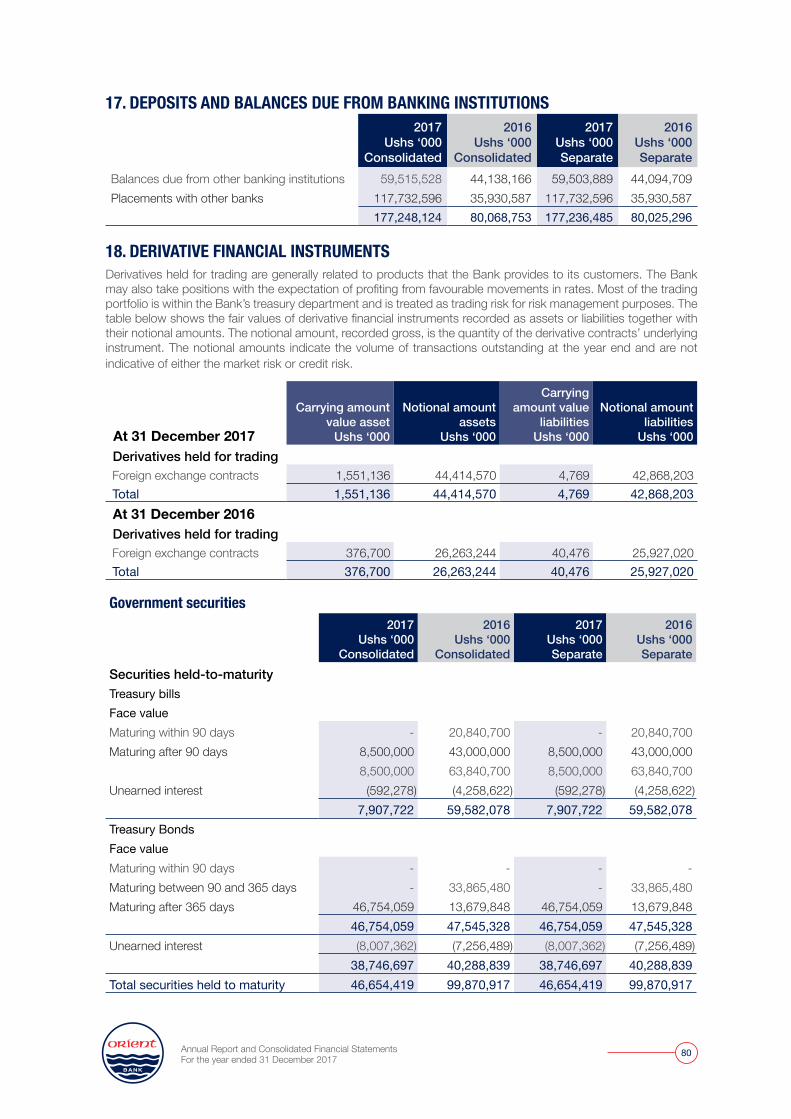
Annual Report and Consolidated Financial Statements For the year ended 31 December 2017
80
17. DEPOSITS AND BALANCES DUE FROM BANKING INSTITUTIONS2017
Ushs ‘000Consolidated
2016Ushs ‘000
Consolidated
2017Ushs ‘000Separate
2016Ushs ‘000Separate
Balances due from other banking institutions 59,515,528 44,138,166 59,503,889 44,094,709 Placements with other banks 117,732,596 35,930,587 117,732,596 35,930,587
177,248,124 80,068,753 177,236,485 80,025,296
18. DERIVATIVE FINANCIAL INSTRUMENTSDerivatives held for trading are generally related to products that the Bank provides to its customers. The Bank may also take positions with the expectation of profiting from favourable movements in rates. Most of the trading portfolio is within the Bank’s treasury department and is treated as trading risk for risk management purposes. The table below shows the fair values of derivative financial instruments recorded as assets or liabilities together with their notional amounts. The notional amount, recorded gross, is the quantity of the derivative contracts’ underlying instrument. The notional amounts indicate the volume of transactions outstanding at the year end and are not indicative of either the market risk or credit risk.
At 31 December 2017
Carrying amount value asset
Ushs ‘000
Notional amount assets
Ushs ‘000
Carrying amount value
liabilities Ushs ‘000
Notional amount liabilities
Ushs ‘000 Derivatives held for trading Foreign exchange contracts 1,551,136 44,414,570 4,769 42,868,203 Total 1,551,136 44,414,570 4,769 42,868,203 At 31 December 2016 Derivatives held for trading Foreign exchange contracts 376,700 26,263,244 40,476 25,927,020 Total 376,700 26,263,244 40,476 25,927,020
Government securities 2017
Ushs ‘000Consolidated
2016Ushs ‘000
Consolidated
2017Ushs ‘000Separate
2016Ushs ‘000Separate
Securities held-to-maturityTreasury billsFace valueMaturing within 90 days - 20,840,700 - 20,840,700 Maturing after 90 days 8,500,000 43,000,000 8,500,000 43,000,000
8,500,000 63,840,700 8,500,000 63,840,700 Unearned interest (592,278) (4,258,622) (592,278) (4,258,622)
7,907,722 59,582,078 7,907,722 59,582,078 Treasury BondsFace valueMaturing within 90 days - - - - Maturing between 90 and 365 days - 33,865,480 - 33,865,480 Maturing after 365 days 46,754,059 13,679,848 46,754,059 13,679,848
46,754,059 47,545,328 46,754,059 47,545,328 Unearned interest (8,007,362) (7,256,489) (8,007,362) (7,256,489)
38,746,697 40,288,839 38,746,697 40,288,839 Total securities held to maturity 46,654,419 99,870,917 46,654,419 99,870,917
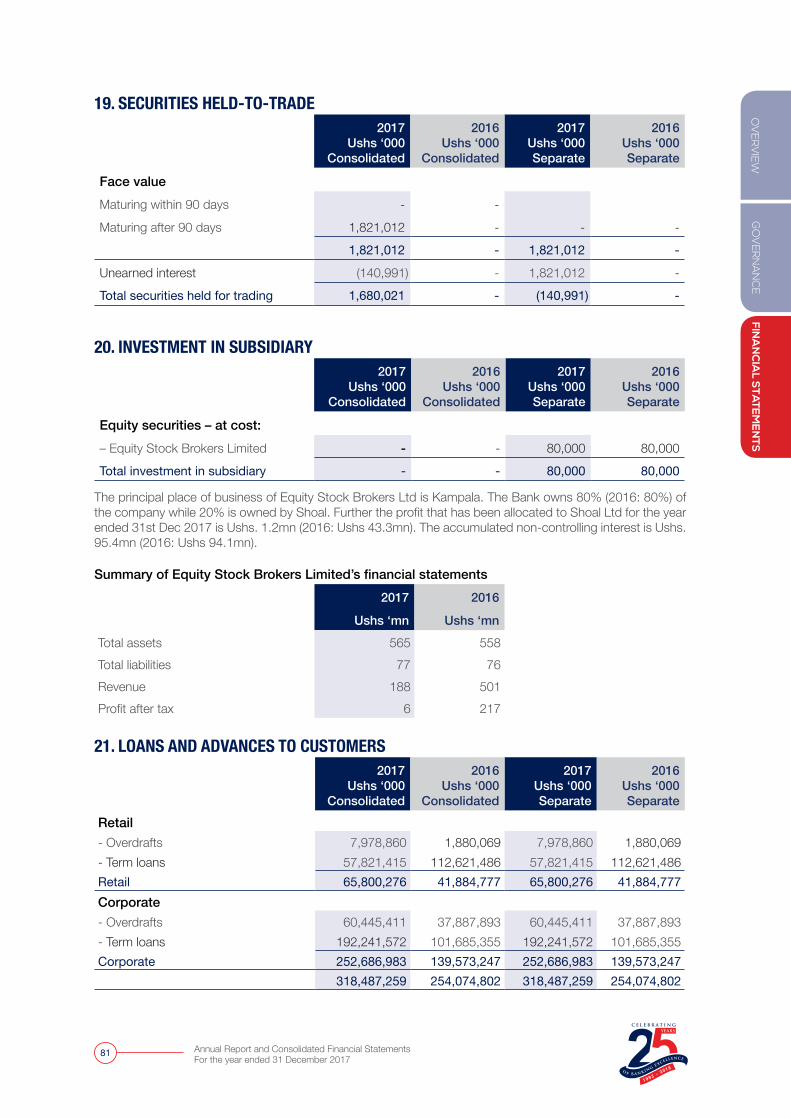
GO
VER
NA
NC
EFIN
AN
CIA
L STA
TEM
EN
TSO
VER
VIE
W
Annual Report and Consolidated Financial Statements For the year ended 31 December 2017
81
19. SECURITIES HELD-TO-TRADE 2017
Ushs ‘000Consolidated
2016Ushs ‘000
Consolidated
2017Ushs ‘000Separate
2016Ushs ‘000Separate
Face valueMaturing within 90 days - -
Maturing after 90 days 1,821,012 - - -
1,821,012 - 1,821,012 -
Unearned interest (140,991) - 1,821,012 -
Total securities held for trading 1,680,021 - (140,991) -
20. INVESTMENT IN SUBSIDIARY 2017
Ushs ‘000Consolidated
2016Ushs ‘000
Consolidated
2017Ushs ‘000Separate
2016Ushs ‘000Separate
Equity securities – at cost: – Equity Stock Brokers Limited - - 80,000 80,000
Total investment in subsidiary - - 80,000 80,000 The principal place of business of Equity Stock Brokers Ltd is Kampala. The Bank owns 80% (2016: 80%) of the company while 20% is owned by Shoal. Further the profit that has been allocated to Shoal Ltd for the year ended 31st Dec 2017 is Ushs. 1.2mn (2016: Ushs 43.3mn). The accumulated non-controlling interest is Ushs. 95.4mn (2016: Ushs 94.1mn). Summary of Equity Stock Brokers Limited’s financial statements
2017 2016
Ushs ‘mn Ushs ‘mnTotal assets 565 558 Total liabilities 77 76 Revenue 188 501 Profit after tax 6 217
21. LOANS AND ADVANCES TO CUSTOMERS2017
Ushs ‘000Consolidated
2016Ushs ‘000
Consolidated
2017Ushs ‘000Separate
2016Ushs ‘000Separate
Retail- Overdrafts 7,978,860 1,880,069 7,978,860 1,880,069 - Term loans 57,821,415 112,621,486 57,821,415 112,621,486 Retail 65,800,276 41,884,777 65,800,276 41,884,777 Corporate- Overdrafts 60,445,411 37,887,893 60,445,411 37,887,893 - Term loans 192,241,572 101,685,355 192,241,572 101,685,355 Corporate 252,686,983 139,573,247 252,686,983 139,573,247
318,487,259 254,074,802 318,487,259 254,074,802
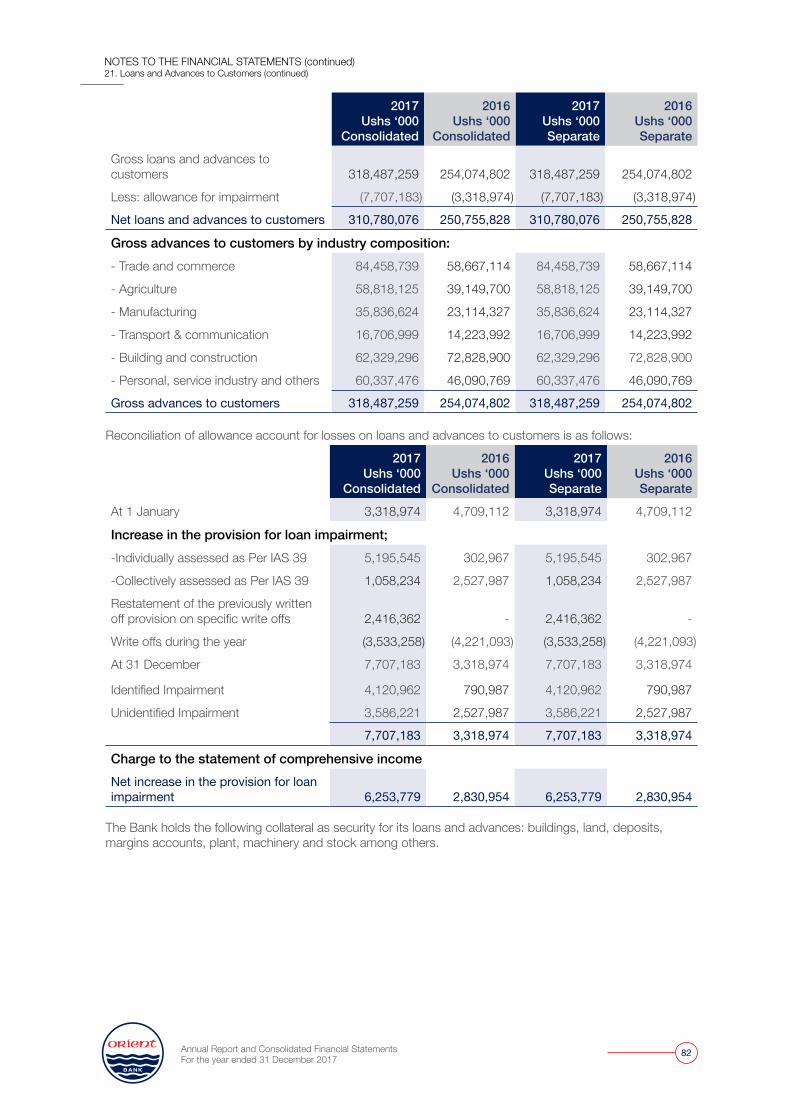
Annual Report and Consolidated Financial Statements For the year ended 31 December 2017
82
2017Ushs ‘000
Consolidated
2016Ushs ‘000
Consolidated
2017Ushs ‘000Separate
2016Ushs ‘000Separate
Gross loans and advances to customers 318,487,259 254,074,802 318,487,259 254,074,802
Less: allowance for impairment (7,707,183) (3,318,974) (7,707,183) (3,318,974)
Net loans and advances to customers 310,780,076 250,755,828 310,780,076 250,755,828
Gross advances to customers by industry composition:- Trade and commerce 84,458,739 58,667,114 84,458,739 58,667,114
- Agriculture 58,818,125 39,149,700 58,818,125 39,149,700
- Manufacturing 35,836,624 23,114,327 35,836,624 23,114,327
- Transport & communication 16,706,999 14,223,992 16,706,999 14,223,992
- Building and construction 62,329,296 72,828,900 62,329,296 72,828,900
- Personal, service industry and others 60,337,476 46,090,769 60,337,476 46,090,769
Gross advances to customers 318,487,259 254,074,802 318,487,259 254,074,802
Reconciliation of allowance account for losses on loans and advances to customers is as follows:
2017Ushs ‘000
Consolidated
2016Ushs ‘000
Consolidated
2017Ushs ‘000Separate
2016Ushs ‘000Separate
At 1 January 3,318,974 4,709,112 3,318,974 4,709,112
Increase in the provision for loan impairment;-Individually assessed as Per IAS 39 5,195,545 302,967 5,195,545 302,967
-Collectively assessed as Per IAS 39 1,058,234 2,527,987 1,058,234 2,527,987
Restatement of the previously written off provision on specific write offs 2,416,362 - 2,416,362 -
Write offs during the year (3,533,258) (4,221,093) (3,533,258) (4,221,093)
At 31 December 7,707,183 3,318,974 7,707,183 3,318,974
Identified Impairment 4,120,962 790,987 4,120,962 790,987
Unidentified Impairment 3,586,221 2,527,987 3,586,221 2,527,987
7,707,183 3,318,974 7,707,183 3,318,974
Charge to the statement of comprehensive incomeNet increase in the provision for loan impairment 6,253,779 2,830,954 6,253,779 2,830,954
The Bank holds the following collateral as security for its loans and advances: buildings, land, deposits, margins accounts, plant, machinery and stock among others.
NOTES TO THE FINANCIAL STATEMENTS (continued)21. Loans and Advances to Customers (continued)
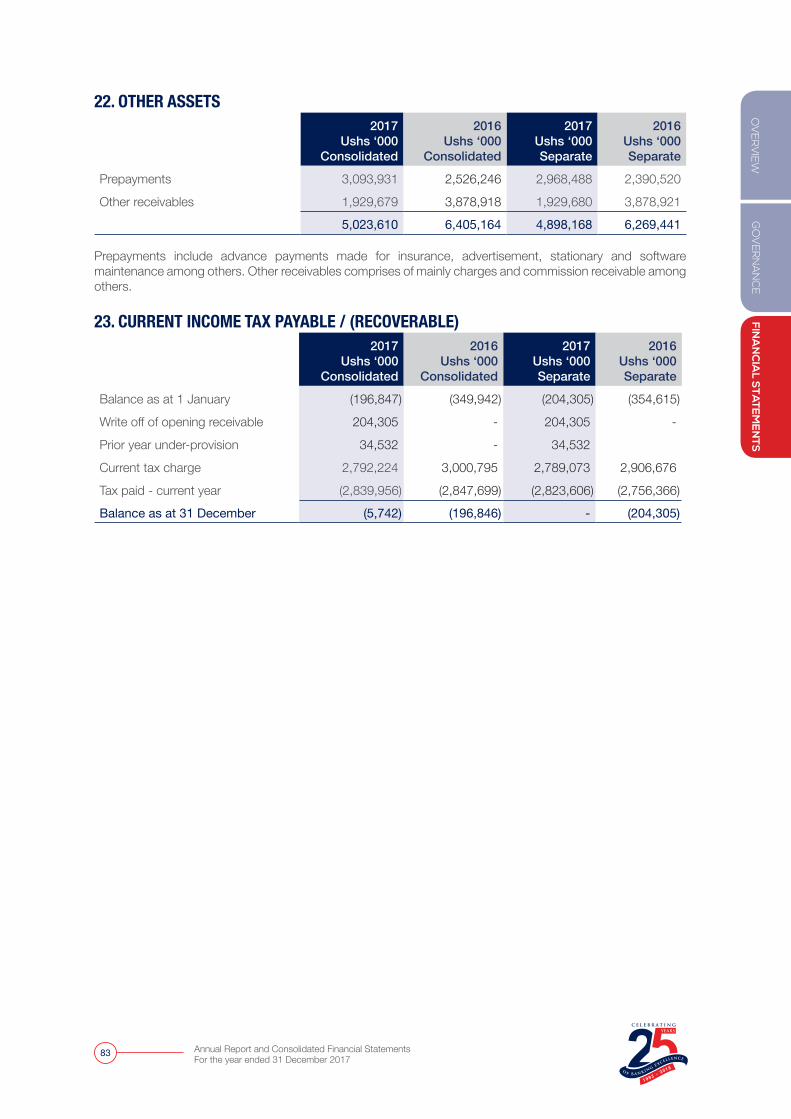
GO
VER
NA
NC
EFIN
AN
CIA
L STA
TEM
EN
TSO
VER
VIE
W
Annual Report and Consolidated Financial Statements For the year ended 31 December 2017
83
22. OTHER ASSETS2017
Ushs ‘000Consolidated
2016Ushs ‘000
Consolidated
2017Ushs ‘000Separate
2016Ushs ‘000Separate
Prepayments 3,093,931 2,526,246 2,968,488 2,390,520
Other receivables 1,929,679 3,878,918 1,929,680 3,878,921
5,023,610 6,405,164 4,898,168 6,269,441 Prepayments include advance payments made for insurance, advertisement, stationary and software maintenance among others. Other receivables comprises of mainly charges and commission receivable among others. 23. CURRENT INCOME TAX PAYABLE / (RECOVERABLE)
2017Ushs ‘000
Consolidated
2016Ushs ‘000
Consolidated
2017Ushs ‘000Separate
2016Ushs ‘000Separate
Balance as at 1 January (196,847) (349,942) (204,305) (354,615)
Write off of opening receivable 204,305 - 204,305 -
Prior year under-provision 34,532 - 34,532
Current tax charge 2,792,224 3,000,795 2,789,073 2,906,676
Tax paid - current year (2,839,956) (2,847,699) (2,823,606) (2,756,366)
Balance as at 31 December (5,742) (196,846) - (204,305)
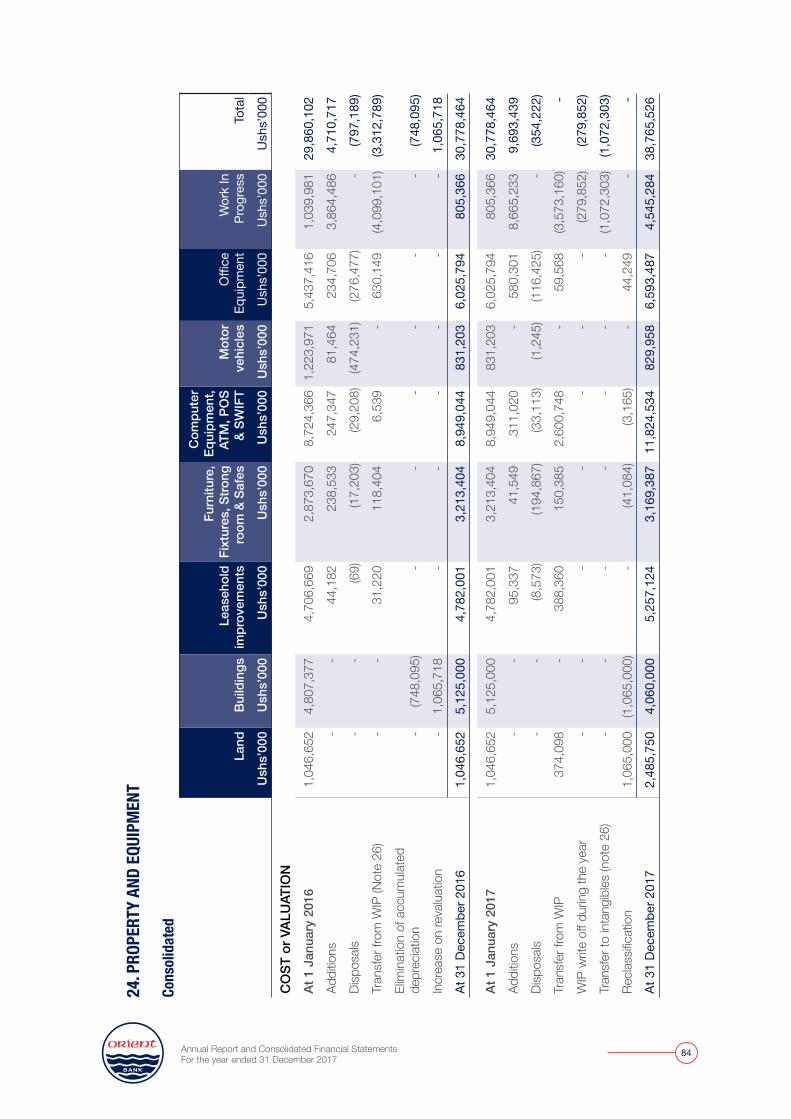
Annual Report and Consolidated Financial Statements For the year ended 31 December 2017
84
24. P
ROPE
RTY
AND
EQUI
PMEN
T
Cons
olid
ated
Land
Build
ings
Leas
ehol
d im
prov
emen
ts
Furn
iture
, Fi
xtur
es, S
trong
ro
om &
Saf
es
Com
pute
r Eq
uipm
ent,
ATM
, PO
S &
SWIF
TM
otor
ve
hicl
esO
ffice
Eq
uipm
ent
Wor
k In
Pr
ogre
ssTo
tal
Ush
s’00
0U
shs’
000
Ush
s’00
0U
shs’
000
Ush
s’00
0U
shs’
000
Ush
s’00
0U
shs’
000
Ush
s’00
0
CO
ST o
r VAL
UAT
ION
At 1
Jan
uary
201
6 1
,046
,652
4
,807
,377
4,
706,
669
2,87
3,67
0 8
,724
,366
1,
223,
971
5,43
7,41
6 1,
039,
981
29,8
60,1
02
Addi
tions
- -
44,1
82
238,
533
247,
347
81,4
64
234
,706
3,
864,
486
4,71
0,71
7
Disp
osals
- -
(69)
(17,
203)
(29,
208)
(474
,231
) (2
76,4
77)
- (7
97,1
89)
Tran
sfer
from
WIP
(Not
e 26
)-
- 31
,220
11
8,40
4 6
,539
-
630
,149
(4
,099
,101
) (3
,312
,789
)
Elim
inat
ion
of a
ccum
ulat
ed
depr
eciat
ion
- (7
48,0
95)
- -
- -
- -
(748
,095
)
Incr
ease
on
reva
luat
ion
- 1
,065
,718
-
- -
- -
- 1,
065,
718
At 3
1 De
cem
ber 2
016
1,0
46,6
52
5,1
25,0
00
4,78
2,00
1 3,
213,
404
8,9
49,0
44
831
,203
6,
025,
794
805
,366
30
,778
,464
At 1
Jan
uary
201
7 1
,046
,652
5
,125
,000
4,
782,
001
3,21
3,40
4 8
,949
,044
8
31,2
03
6,02
5,79
4 8
05,3
66
30,7
78,4
64
Addi
tions
- -
95,3
37
41,5
49
311,
020
- 5
80,3
01
8,66
5,23
3 9,
693,
439
Disp
osals
- -
(8,5
73)
(194
,867
) (3
3,11
3)(1
,245
) (1
16,4
25)
- (3
54,2
22)
Tran
sfer
from
WIP
37
4,09
8 -
388
,360
15
0,38
5 2
,600
,748
-
59,
568
(3,5
73,1
60)
-
WIP
writ
e off
dur
ing
the
year
- -
- -
- -
- (2
79,8
52)
(279
,852
)
Tran
sfer
to in
tang
ibles
(not
e 26
)-
- -
- -
- -
(1,0
72,3
03)
(1,0
72,3
03)
Recla
ssific
atio
n 1
,065
,000
(1
,065
,000
) -
(41,
084)
(3,1
65)
- 4
4,24
9 -
-
At 3
1 De
cem
ber 2
017
2,4
85,7
50
4,0
60,0
00
5,25
7,12
4 3,
169,
387
11,
824,
534
829
,958
6,
593,
487
4,54
5,28
4 38
,765
,526
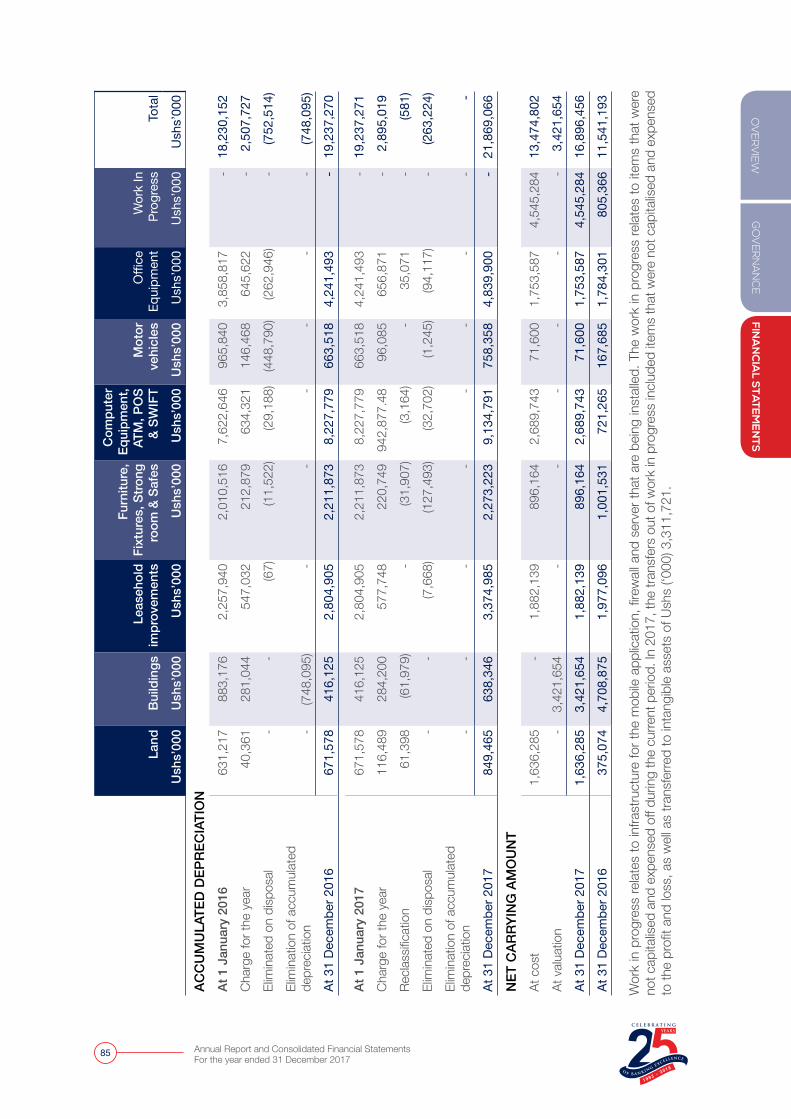
GO
VER
NA
NC
EFIN
AN
CIA
L STA
TEM
EN
TSO
VER
VIE
W
Annual Report and Consolidated Financial Statements For the year ended 31 December 2017
85
Land
Build
ings
Leas
ehol
d im
prov
emen
ts
Furn
iture
, Fi
xtur
es, S
trong
ro
om &
Saf
es
Com
pute
r Eq
uipm
ent,
ATM
, PO
S &
SWIF
TM
otor
ve
hicl
esO
ffice
Eq
uipm
ent
Wor
k In
Pr
ogre
ssTo
tal
Ush
s’00
0U
shs’
000
Ush
s’00
0U
shs’
000
Ush
s’00
0U
shs’
000
Ush
s’00
0U
shs’
000
Ush
s’00
0
ACC
UM
ULA
TED
DEP
REC
IATI
ON
At 1
Jan
uary
201
663
1,21
7 88
3,17
6 2,
257,
940
2,01
0,51
6 7
,622
,646
9
65,8
40
3,85
8,81
7 -
18,2
30,1
52
Char
ge fo
r the
yea
r40
,361
28
1,04
4 5
47,0
32
212,
879
634,
321
146
,468
6
45,6
22
- 2,
507,
727
Elim
inat
ed o
n di
spos
al-
- (6
7)(1
1,52
2) (2
9,18
8)(4
48,7
90)
(262
,946
) -
(752
,514
)
Elim
inat
ion
of a
ccum
ulat
ed
depr
eciat
ion
- (7
48,0
95)
- -
- -
- -
(748
,095
)
At 3
1 De
cem
ber 2
016
671,
578
416,
125
2,80
4,90
5 2,
211,
873
8,2
27,7
79
663
,518
4,
241,
493
- 19
,237
,270
At 1
Jan
uary
201
767
1,57
8 41
6,12
5 2,
804,
905
2,21
1,87
3 8
,227
,779
6
63,5
18
4,24
1,49
3 -
19,2
37,2
71
Char
ge fo
r the
yea
r11
6,48
9 28
4,20
0 5
77,7
48
220,
749
942
,877
.48
96,0
85
656
,871
-
2,89
5,01
9
Recla
ssific
atio
n61
,398
(6
1,97
9) -
(31,
907)
(3,1
64)
- 35
,071
-
(581
)
Elim
inat
ed o
n di
spos
al-
- (7
,668
)(1
27,4
93)
(32,
702)
(1,2
45)
(94,
117)
- (2
63,2
24)
Elim
inat
ion
of a
ccum
ulat
ed
depr
eciat
ion
- -
- -
- -
- -
-
At 3
1 De
cem
ber 2
017
849,
465
638,
346
3,37
4,98
5 2,
273,
223
9,1
34,7
91
758
,358
4,
839,
900
- 21
,869
,066
NET
CAR
RYIN
G A
MO
UN
TAt
cos
t 1
,636
,285
-
1,88
2,13
9 89
6,16
4 2
,689
,743
71
,600
1,
753,
587
4,54
5,28
4 13
,474
,802
At v
aluat
ion
- 3
,421
,654
-
- -
- -
- 3,
421,
654
At 3
1 De
cem
ber 2
017
1,6
36,2
85
3,4
21,6
54
1,88
2,13
9 89
6,16
4 2
,689
,743
71
,600
1,
753,
587
4,54
5,28
4 16
,896
,456
At 3
1 De
cem
ber 2
016
375,
074
4,7
08,8
75
1,97
7,09
6 1,
001,
531
721,
265
167
,685
1,
784,
301
805
,366
11
,541
,193
Wor
k in
pro
gres
s re
lates
to in
frast
ruct
ure
for t
he m
obile
app
licat
ion,
fire
wall
and
ser
ver t
hat a
re b
eing
inst
alled
. The
wor
k in
pro
gres
s re
lates
to it
ems
that
wer
e no
t cap
italis
ed a
nd e
xpen
sed
off d
urin
g th
e cu
rrent
per
iod.
In 2
017,
the
trans
fers
out
of w
ork
in p
rogr
ess
inclu
ded
item
s th
at w
ere
not c
apita
lised
and
exp
ense
d to
the
profi
t and
loss
, as
well
as
trans
ferre
d to
inta
ngib
le as
sets
of U
shs
(‘000
) 3,3
11,7
21.
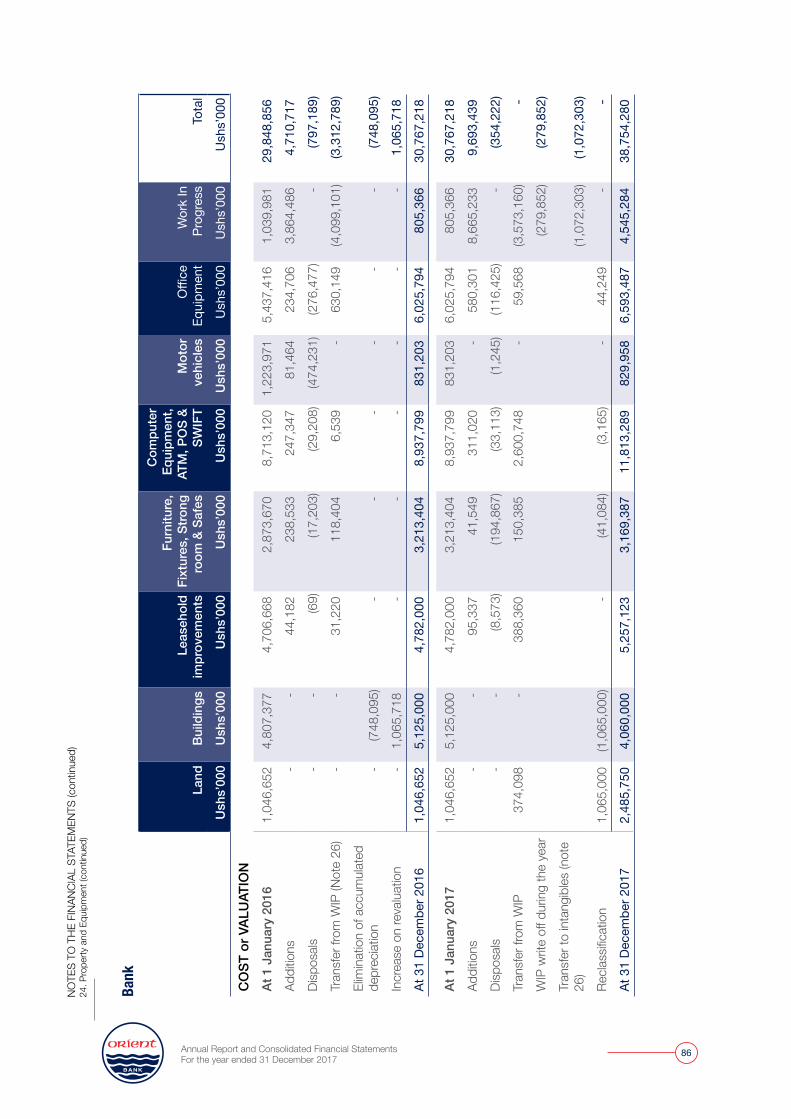
Annual Report and Consolidated Financial Statements For the year ended 31 December 2017
86
Bank
Land
Build
ings
Leas
ehol
d im
prov
emen
ts
Furn
iture
, Fi
xtur
es, S
trong
ro
om &
Saf
es
Com
pute
r Eq
uipm
ent,
ATM
, PO
S &
SWIF
TM
otor
ve
hicl
esO
ffice
Eq
uipm
ent
Wor
k In
Pr
ogre
ssTo
tal
Ush
s’00
0U
shs’
000
Ush
s’00
0U
shs’
000
Ush
s’00
0U
shs’
000
Ush
s’00
0U
shs’
000
Ush
s’00
0
CO
ST o
r VAL
UAT
ION
At 1
Jan
uary
201
6 1
,046
,652
4
,807
,377
4,
706,
668
2,87
3,67
0 8
,713
,120
1,
223,
971
5,43
7,41
6 1
,039
,981
29
,848
,856
Addi
tions
- -
44,
182
238
,533
2
47,3
47
81,4
64
234
,706
3
,864
,486
4,
710,
717
Disp
osals
- -
(69)
(17,
203)
(29,
208)
(474
,231
) (2
76,4
77)
- (7
97,1
89)
Tran
sfer
from
WIP
(Not
e 26
)-
- 3
1,22
0 1
18,4
04
6,5
39
- 6
30,1
49
(4,0
99,1
01)
(3,3
12,7
89)
Elim
inat
ion
of a
ccum
ulat
ed
depr
eciat
ion
- (7
48,0
95)
- -
- -
- -
(748
,095
)
Incr
ease
on
reva
luat
ion
- 1
,065
,718
-
- -
- -
- 1,
065,
718
At 3
1 De
cem
ber 2
016
1,0
46,6
52
5,1
25,0
00
4,78
2,00
0 3,
213,
404
8,9
37,7
99
831,
203
6,02
5,79
4 80
5,36
6 30
,767
,218
At 1
Jan
uary
201
7 1
,046
,652
5
,125
,000
4,
782,
000
3,21
3,40
4 8
,937
,799
83
1,20
3 6,
025,
794
805,
366
30,7
67,2
18
Addi
tions
- -
95,
337
41,
549
311
,020
-
580
,301
8
,665
,233
9,
693,
439
Disp
osals
- -
(8,5
73)
(194
,867
) (3
3,11
3) (1
,245
) (1
16,4
25)
- (3
54,2
22)
Tran
sfer
from
WIP
37
4,09
8 -
388
,360
1
50,3
85
2,6
00,7
48
- 5
9,56
8 (3
,573
,160
) -
WIP
writ
e off
dur
ing
the
year
(279
,852
)(2
79,8
52)
Tran
sfer
to in
tang
ibles
(not
e 26
) (1
,072
,303
)(1
,072
,303
)
Recla
ssific
atio
n 1
,065
,000
(1
,065
,000
) -
(41,
084)
(3,1
65)
- 4
4,24
9 -
-
At 3
1 De
cem
ber 2
017
2,4
85,7
50
4,0
60,0
00
5,25
7,12
3 3,
169,
387
11,
813,
289
829,
958
6,59
3,48
7 4
,545
,284
38
,754
,280
NOTE
S TO
THE
FIN
ANCI
AL S
TATE
MEN
TS (c
ontin
ued)
24. P
rope
rty a
nd E
quip
men
t (co
ntin
ued)
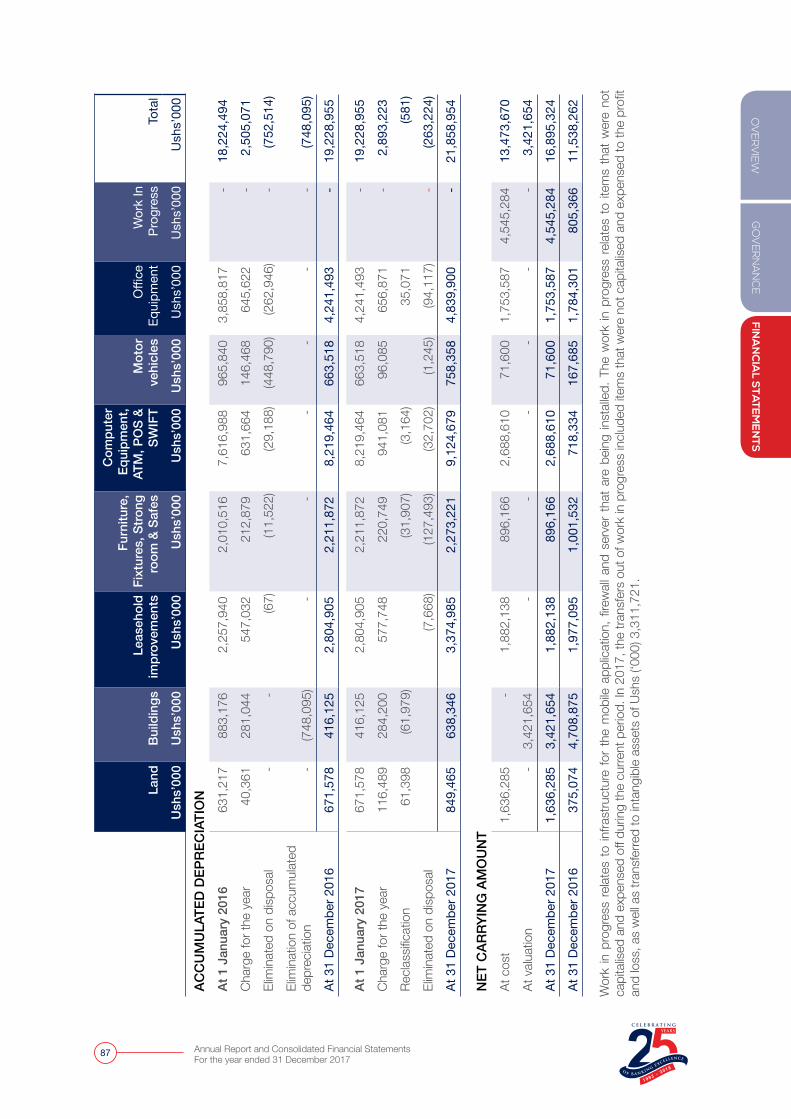
GO
VER
NA
NC
EFIN
AN
CIA
L STA
TEM
EN
TSO
VER
VIE
W
Annual Report and Consolidated Financial Statements For the year ended 31 December 2017
87
Land
Build
ings
Leas
ehol
d im
prov
emen
ts
Furn
iture
, Fi
xtur
es, S
trong
ro
om &
Saf
es
Com
pute
r Eq
uipm
ent,
ATM
, PO
S &
SWIF
TM
otor
ve
hicl
esO
ffice
Eq
uipm
ent
Wor
k In
Pr
ogre
ssTo
tal
Ush
s’00
0U
shs’
000
Ush
s’00
0U
shs’
000
Ush
s’00
0U
shs’
000
Ush
s’00
0U
shs’
000
Ush
s’00
0
ACC
UM
ULA
TED
DEP
REC
IATI
ON
At 1
Jan
uary
201
663
1,21
7 8
83,1
76
2,25
7,94
0 2,
010,
516
7,6
16,9
88
965,
840
3,85
8,81
7 -
18,2
24,4
94
Char
ge fo
r the
yea
r40
,361
2
81,0
44
547
,032
2
12,8
79
631
,664
14
6,46
8 6
45,6
22
- 2,
505,
071
Elim
inat
ed o
n di
spos
al-
- (6
7)(1
1,52
2) (2
9,18
8)(4
48,7
90)
(262
,946
)-
(752
,514
)
Elim
inat
ion
of a
ccum
ulat
ed
depr
eciat
ion
- (7
48,0
95)
- -
- -
- -
(748
,095
)
At 3
1 De
cem
ber 2
016
671,
578
416
,125
2,
804,
905
2,21
1,87
2 8
,219
,464
66
3,51
8 4,
241,
493
- 19
,228
,955
At 1
Jan
uary
201
767
1,57
8 4
16,1
25
2,80
4,90
5 2,
211,
872
8,2
19,4
64
663,
518
4,24
1,49
3 -
19,2
28,9
55
Char
ge fo
r the
yea
r11
6,48
9 2
84,2
00
577
,748
2
20,7
49
941
,081
96
,085
6
56,8
71
- 2,
893,
223
Recla
ssific
atio
n61
,398
(6
1,97
9)(3
1,90
7)(3
,164
) 3
5,07
1 (5
81)
Elim
inat
ed o
n di
spos
al(7
,668
) (1
27,4
93)
(32,
702)
(1,2
45)
(94,
117)
- (2
63,2
24)
At 3
1 De
cem
ber 2
017
849,
465
638
,346
3,
374,
985
2,27
3,22
1 9
,124
,679
75
8,35
8 4,
839,
900
- 21
,858
,954
NET
CAR
RYIN
G A
MO
UN
TAt
cos
t 1
,636
,285
-
1,88
2,13
8 8
96,1
66
2,6
88,6
10
71,6
00
1,75
3,58
7 4
,545
,284
13
,473
,670
At v
aluat
ion
- 3
,421
,654
-
- -
- -
- 3,
421,
654
At 3
1 De
cem
ber 2
017
1,6
36,2
85
3,4
21,6
54
1,88
2,13
8 8
96,1
66
2,6
88,6
10
71,6
00
1,75
3,58
7 4
,545
,284
16
,895
,324
At 3
1 De
cem
ber 2
016
375,
074
4,7
08,8
75
1,97
7,09
5 1,
001,
532
718
,334
16
7,68
5 1,
784,
301
805,
366
11,5
38,2
62
Wor
k in
pro
gres
s re
lates
to in
frast
ruct
ure
for t
he m
obile
app
licat
ion,
fire
wall
and
ser
ver t
hat a
re b
eing
inst
alled
. The
wor
k in
pro
gres
s re
lates
to it
ems
that
wer
e no
t ca
pita
lised
and
exp
ense
d off
dur
ing
the
curre
nt p
erio
d. In
201
7, th
e tra
nsfe
rs o
ut o
f wor
k in
pro
gres
s in
clude
d ite
ms
that
wer
e no
t cap
italis
ed a
nd e
xpen
sed
to th
e pr
ofit
and
loss
, as
well
as
trans
ferre
d to
inta
ngib
le as
sets
of U
shs
(‘000
) 3,3
11,7
21.
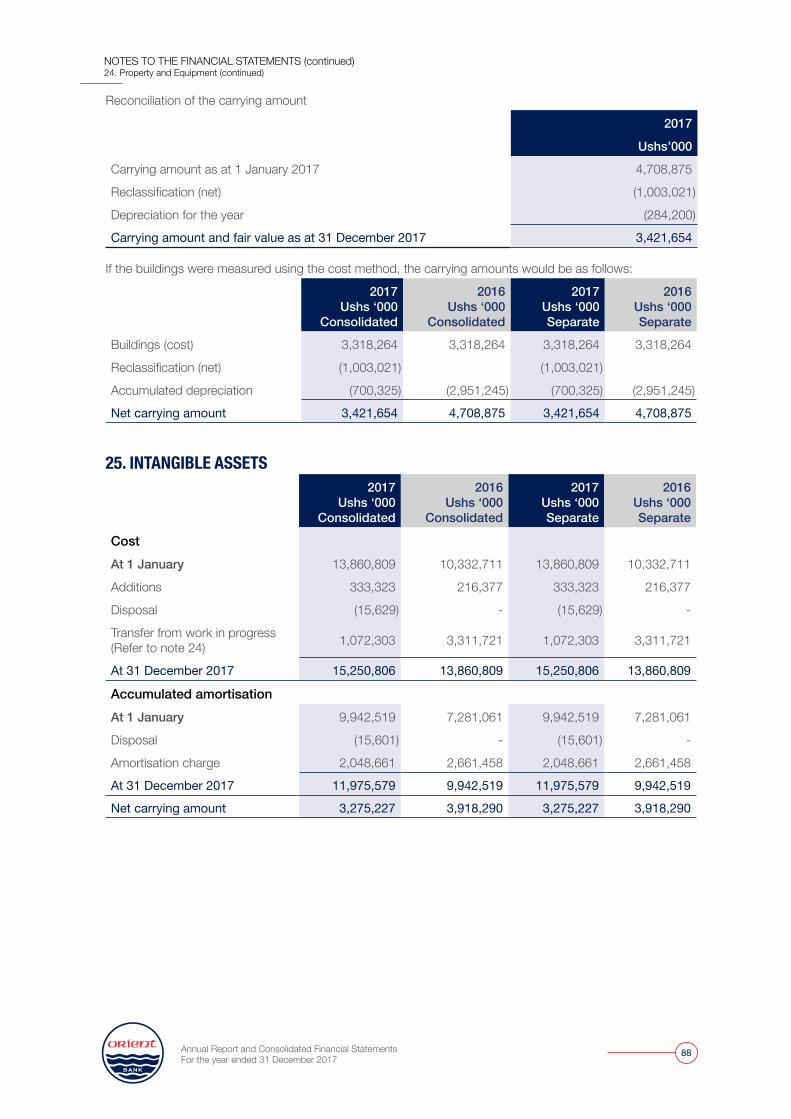
Annual Report and Consolidated Financial Statements For the year ended 31 December 2017
88
Reconciliation of the carrying amount
2017
Ushs’000
Carrying amount as at 1 January 2017 4,708,875
Reclassification (net) (1,003,021)
Depreciation for the year (284,200)
Carrying amount and fair value as at 31 December 2017 3,421,654
If the buildings were measured using the cost method, the carrying amounts would be as follows:
2017Ushs ‘000
Consolidated
2016Ushs ‘000
Consolidated
2017Ushs ‘000Separate
2016Ushs ‘000Separate
Buildings (cost) 3,318,264 3,318,264 3,318,264 3,318,264
Reclassification (net) (1,003,021) (1,003,021)
Accumulated depreciation (700,325) (2,951,245) (700,325) (2,951,245)
Net carrying amount 3,421,654 4,708,875 3,421,654 4,708,875
25. INTANGIBLE ASSETS 2017
Ushs ‘000Consolidated
2016Ushs ‘000
Consolidated
2017Ushs ‘000Separate
2016Ushs ‘000Separate
CostAt 1 January 13,860,809 10,332,711 13,860,809 10,332,711
Additions 333,323 216,377 333,323 216,377
Disposal (15,629) - (15,629) -
Transfer from work in progress (Refer to note 24) 1,072,303 3,311,721 1,072,303 3,311,721
At 31 December 2017 15,250,806 13,860,809 15,250,806 13,860,809
Accumulated amortisationAt 1 January 9,942,519 7,281,061 9,942,519 7,281,061
Disposal (15,601) - (15,601) -
Amortisation charge 2,048,661 2,661,458 2,048,661 2,661,458
At 31 December 2017 11,975,579 9,942,519 11,975,579 9,942,519
Net carrying amount 3,275,227 3,918,290 3,275,227 3,918,290
NOTES TO THE FINANCIAL STATEMENTS (continued)24. Property and Equipment (continued)
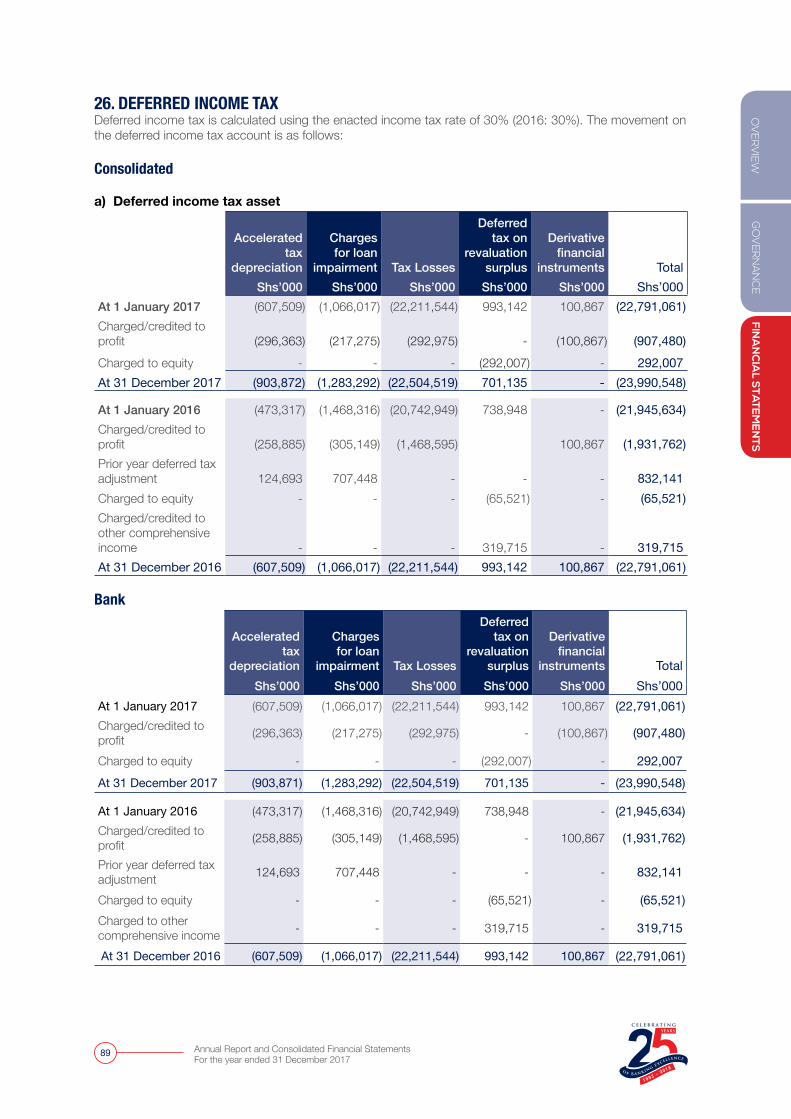
GO
VER
NA
NC
EFIN
AN
CIA
L STA
TEM
EN
TSO
VER
VIE
W
Annual Report and Consolidated Financial Statements For the year ended 31 December 2017
89
26. DEFERRED INCOME TAX Deferred income tax is calculated using the enacted income tax rate of 30% (2016: 30%). The movement on the deferred income tax account is as follows:
Consolidated
a) Deferred income tax asset
Accelerated tax
depreciation
Charges for loan
impairment Tax Losses
Deferred tax on
revaluation surplus
Derivative financial
instruments TotalShs’000 Shs’000 Shs’000 Shs’000 Shs’000 Shs’000
At 1 January 2017 (607,509) (1,066,017) (22,211,544) 993,142 100,867 (22,791,061)Charged/credited to profit (296,363) (217,275) (292,975) - (100,867) (907,480)Charged to equity - - - (292,007) - 292,007At 31 December 2017 (903,872) (1,283,292) (22,504,519) 701,135 - (23,990,548)
At 1 January 2016 (473,317) (1,468,316) (20,742,949) 738,948 - (21,945,634)Charged/credited to profit (258,885) (305,149) (1,468,595) 100,867 (1,931,762)Prior year deferred tax adjustment 124,693 707,448 - - - 832,141 Charged to equity - - - (65,521) - (65,521)Charged/credited to other comprehensive income - - - 319,715 - 319,715 At 31 December 2016 (607,509) (1,066,017) (22,211,544) 993,142 100,867 (22,791,061)
Bank
Accelerated tax
depreciation
Charges for loan
impairment Tax Losses
Deferred tax on
revaluation surplus
Derivative financial
instruments TotalShs’000 Shs’000 Shs’000 Shs’000 Shs’000 Shs’000
At 1 January 2017 (607,509) (1,066,017) (22,211,544) 993,142 100,867 (22,791,061)Charged/credited to profit (296,363) (217,275) (292,975) - (100,867) (907,480)
Charged to equity - - - (292,007) - 292,007At 31 December 2017 (903,871) (1,283,292) (22,504,519) 701,135 - (23,990,548)
At 1 January 2016 (473,317) (1,468,316) (20,742,949) 738,948 - (21,945,634)Charged/credited to profit (258,885) (305,149) (1,468,595) - 100,867 (1,931,762)
Prior year deferred tax adjustment 124,693 707,448 - - - 832,141
Charged to equity - - - (65,521) - (65,521)Charged to other comprehensive income - - - 319,715 - 319,715
At 31 December 2016 (607,509) (1,066,017) (22,211,544) 993,142 100,867 (22,791,061)
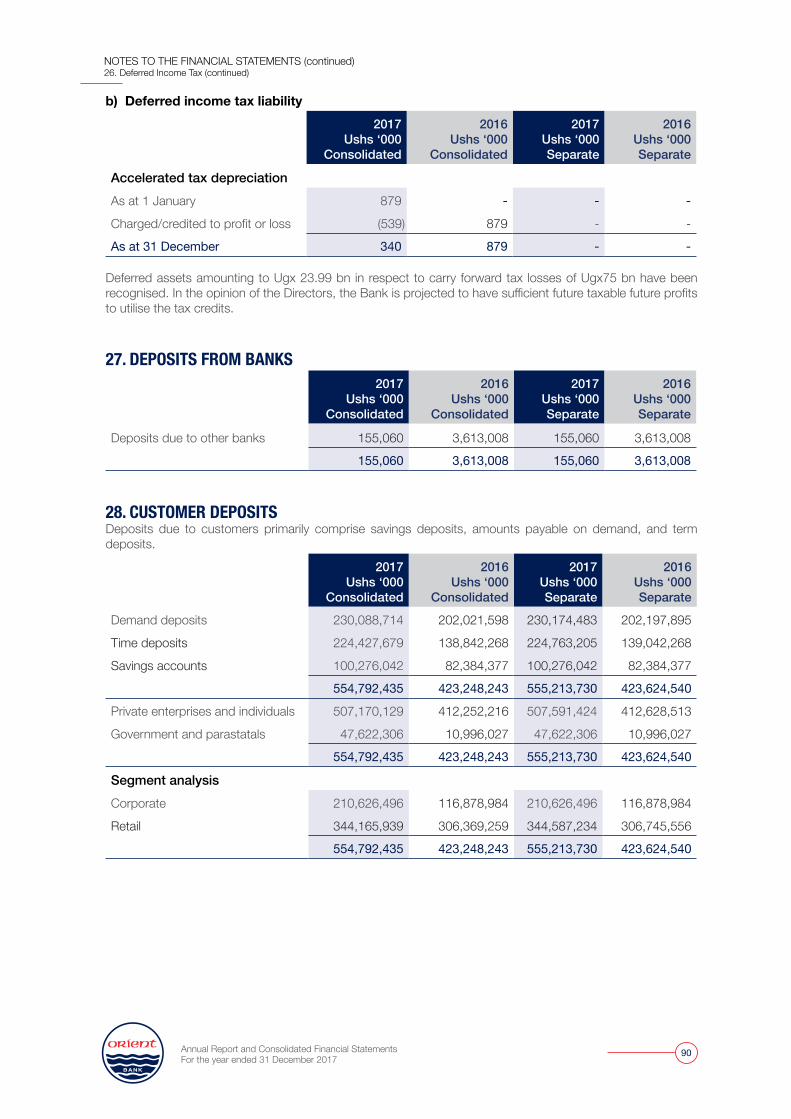
Annual Report and Consolidated Financial Statements For the year ended 31 December 2017
90
b) Deferred income tax liability 2017
Ushs ‘000Consolidated
2016Ushs ‘000
Consolidated
2017Ushs ‘000Separate
2016Ushs ‘000Separate
Accelerated tax depreciationAs at 1 January 879 - - -
Charged/credited to profit or loss (539) 879 - -
As at 31 December 340 879 - -
Deferred assets amounting to Ugx 23.99 bn in respect to carry forward tax losses of Ugx75 bn have been recognised. In the opinion of the Directors, the Bank is projected to have sufficient future taxable future profits to utilise the tax credits.
27. DEPOSITS FROM BANKS 2017
Ushs ‘000Consolidated
2016Ushs ‘000
Consolidated
2017Ushs ‘000Separate
2016Ushs ‘000Separate
Deposits due to other banks 155,060 3,613,008 155,060 3,613,008
155,060 3,613,008 155,060 3,613,008
28. CUSTOMER DEPOSITS Deposits due to customers primarily comprise savings deposits, amounts payable on demand, and term deposits.
2017Ushs ‘000
Consolidated
2016Ushs ‘000
Consolidated
2017Ushs ‘000Separate
2016Ushs ‘000Separate
Demand deposits 230,088,714 202,021,598 230,174,483 202,197,895
Time deposits 224,427,679 138,842,268 224,763,205 139,042,268
Savings accounts 100,276,042 82,384,377 100,276,042 82,384,377
554,792,435 423,248,243 555,213,730 423,624,540
Private enterprises and individuals 507,170,129 412,252,216 507,591,424 412,628,513
Government and parastatals 47,622,306 10,996,027 47,622,306 10,996,027
554,792,435 423,248,243 555,213,730 423,624,540
Segment analysisCorporate 210,626,496 116,878,984 210,626,496 116,878,984
Retail 344,165,939 306,369,259 344,587,234 306,745,556
554,792,435 423,248,243 555,213,730 423,624,540
NOTES TO THE FINANCIAL STATEMENTS (continued)26. Deferred Income Tax (continued)
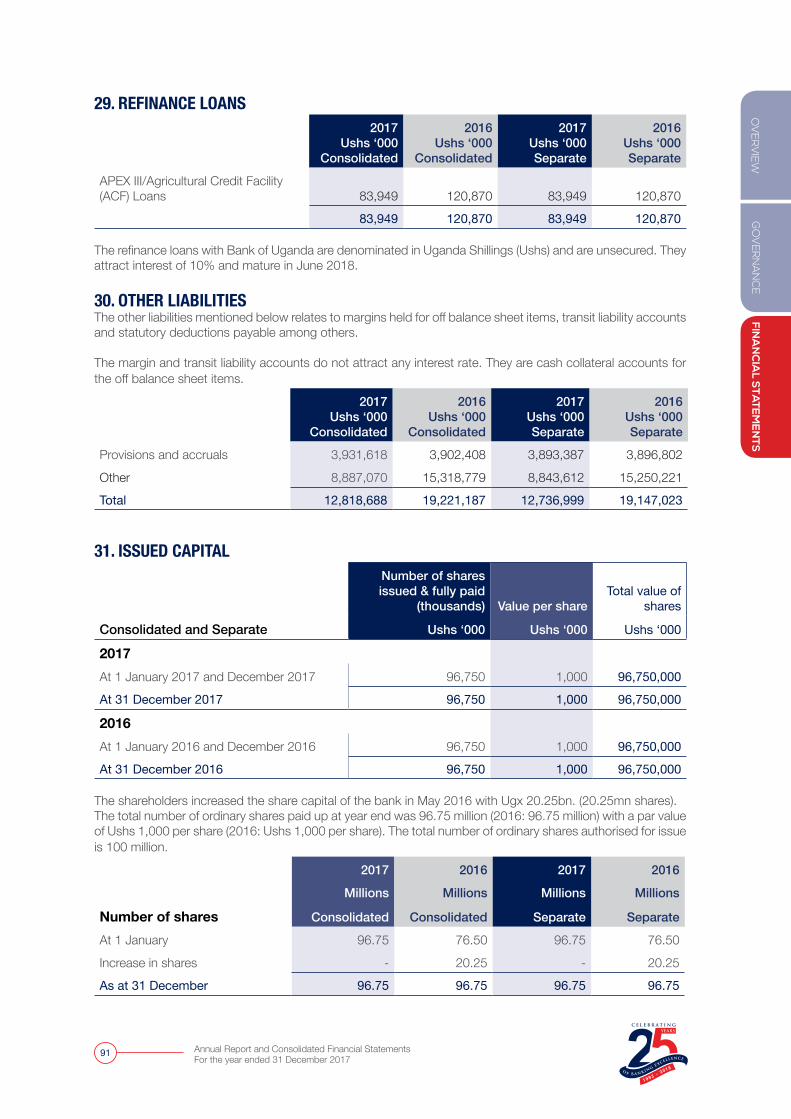
GO
VER
NA
NC
EFIN
AN
CIA
L STA
TEM
EN
TSO
VER
VIE
W
Annual Report and Consolidated Financial Statements For the year ended 31 December 2017
91
29. REFINANCE LOANS 2017
Ushs ‘000Consolidated
2016Ushs ‘000
Consolidated
2017Ushs ‘000Separate
2016Ushs ‘000Separate
APEX III/Agricultural Credit Facility (ACF) Loans 83,949 120,870 83,949 120,870
83,949 120,870 83,949 120,870
The refinance loans with Bank of Uganda are denominated in Uganda Shillings (Ushs) and are unsecured. They attract interest of 10% and mature in June 2018.
30. OTHER LIABILITIESThe other liabilities mentioned below relates to margins held for off balance sheet items, transit liability accounts and statutory deductions payable among others. The margin and transit liability accounts do not attract any interest rate. They are cash collateral accounts for the off balance sheet items.
2017Ushs ‘000
Consolidated
2016Ushs ‘000
Consolidated
2017Ushs ‘000Separate
2016Ushs ‘000Separate
Provisions and accruals 3,931,618 3,902,408 3,893,387 3,896,802
Other 8,887,070 15,318,779 8,843,612 15,250,221
Total 12,818,688 19,221,187 12,736,999 19,147,023
31. ISSUED CAPITAL
Number of shares issued & fully paid
(thousands) Value per shareTotal value of
shares
Consolidated and Separate Ushs ‘000 Ushs ‘000 Ushs ‘000
2017At 1 January 2017 and December 2017 96,750 1,000 96,750,000
At 31 December 2017 96,750 1,000 96,750,000
2016At 1 January 2016 and December 2016 96,750 1,000 96,750,000
At 31 December 2016 96,750 1,000 96,750,000 The shareholders increased the share capital of the bank in May 2016 with Ugx 20.25bn. (20.25mn shares).The total number of ordinary shares paid up at year end was 96.75 million (2016: 96.75 million) with a par value of Ushs 1,000 per share (2016: Ushs 1,000 per share). The total number of ordinary shares authorised for issue is 100 million.
2017 2016 2017 2016
Millions Millions Millions Millions
Number of shares Consolidated Consolidated Separate Separate
At 1 January 96.75 76.50 96.75 76.50
Increase in shares - 20.25 - 20.25
As at 31 December 96.75 96.75 96.75 96.75
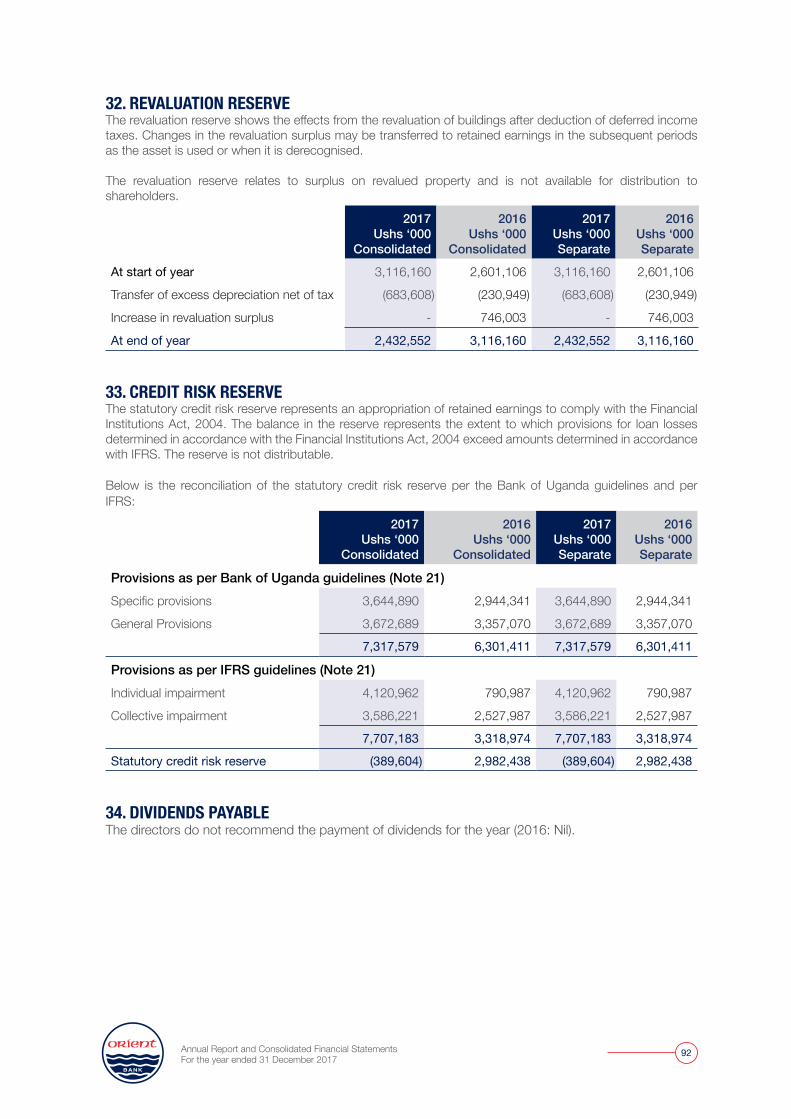
Annual Report and Consolidated Financial Statements For the year ended 31 December 2017
92
32. REVALUATION RESERVE The revaluation reserve shows the effects from the revaluation of buildings after deduction of deferred income taxes. Changes in the revaluation surplus may be transferred to retained earnings in the subsequent periods as the asset is used or when it is derecognised.
The revaluation reserve relates to surplus on revalued property and is not available for distribution to shareholders.
2017Ushs ‘000
Consolidated
2016Ushs ‘000
Consolidated
2017Ushs ‘000Separate
2016Ushs ‘000Separate
At start of year 3,116,160 2,601,106 3,116,160 2,601,106
Transfer of excess depreciation net of tax (683,608) (230,949) (683,608) (230,949)
Increase in revaluation surplus - 746,003 - 746,003
At end of year 2,432,552 3,116,160 2,432,552 3,116,160
33. CREDIT RISK RESERVE The statutory credit risk reserve represents an appropriation of retained earnings to comply with the Financial Institutions Act, 2004. The balance in the reserve represents the extent to which provisions for loan losses determined in accordance with the Financial Institutions Act, 2004 exceed amounts determined in accordance with IFRS. The reserve is not distributable.
Below is the reconciliation of the statutory credit risk reserve per the Bank of Uganda guidelines and per IFRS:
2017Ushs ‘000
Consolidated
2016Ushs ‘000
Consolidated
2017Ushs ‘000Separate
2016Ushs ‘000Separate
Provisions as per Bank of Uganda guidelines (Note 21)Specific provisions 3,644,890 2,944,341 3,644,890 2,944,341
General Provisions 3,672,689 3,357,070 3,672,689 3,357,070
7,317,579 6,301,411 7,317,579 6,301,411
Provisions as per IFRS guidelines (Note 21)Individual impairment 4,120,962 790,987 4,120,962 790,987
Collective impairment 3,586,221 2,527,987 3,586,221 2,527,987
7,707,183 3,318,974 7,707,183 3,318,974
Statutory credit risk reserve (389,604) 2,982,438 (389,604) 2,982,438
34. DIVIDENDS PAYABLE The directors do not recommend the payment of dividends for the year (2016: Nil).
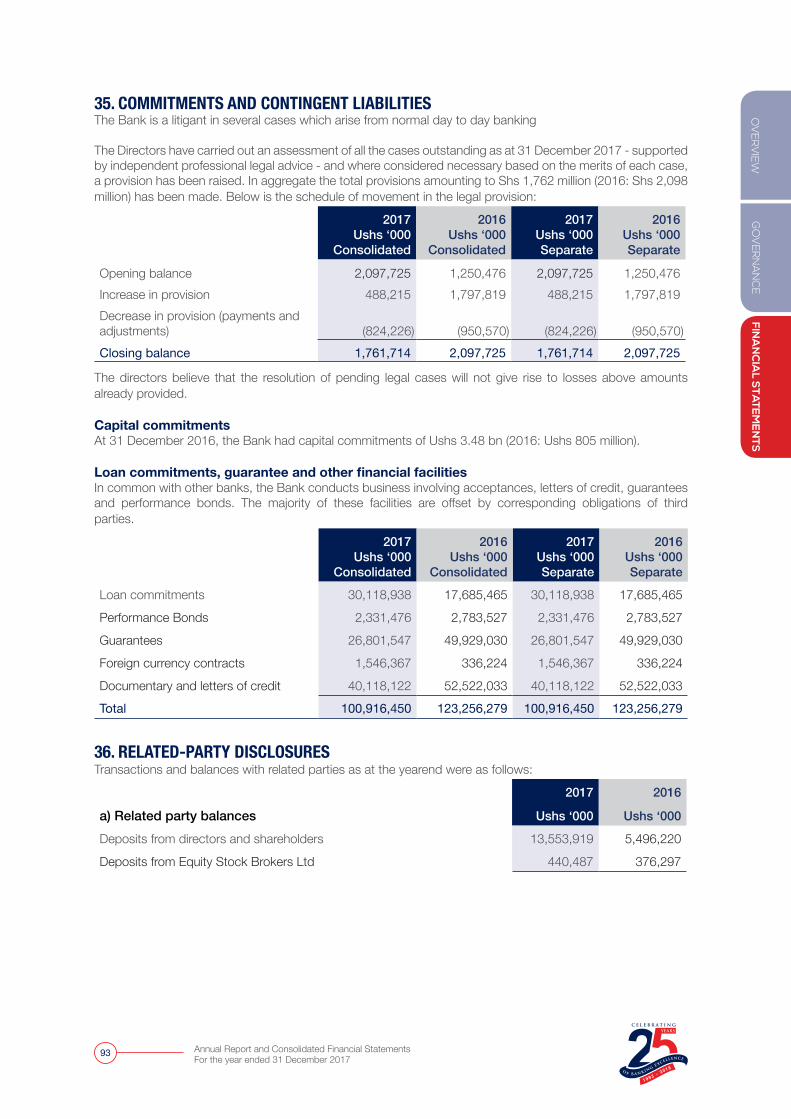
GO
VER
NA
NC
EFIN
AN
CIA
L STA
TEM
EN
TSO
VER
VIE
W
Annual Report and Consolidated Financial Statements For the year ended 31 December 2017
93
35. COMMITMENTS AND CONTINGENT LIABILITIES The Bank is a litigant in several cases which arise from normal day to day banking
The Directors have carried out an assessment of all the cases outstanding as at 31 December 2017 - supported by independent professional legal advice - and where considered necessary based on the merits of each case, a provision has been raised. In aggregate the total provisions amounting to Shs 1,762 million (2016: Shs 2,098 million) has been made. Below is the schedule of movement in the legal provision:
2017Ushs ‘000
Consolidated
2016Ushs ‘000
Consolidated
2017Ushs ‘000Separate
2016Ushs ‘000Separate
Opening balance 2,097,725 1,250,476 2,097,725 1,250,476Increase in provision 488,215 1,797,819 488,215 1,797,819Decrease in provision (payments and adjustments) (824,226) (950,570) (824,226) (950,570)Closing balance 1,761,714 2,097,725 1,761,714 2,097,725
The directors believe that the resolution of pending legal cases will not give rise to losses above amounts already provided.
Capital commitmentsAt 31 December 2016, the Bank had capital commitments of Ushs 3.48 bn (2016: Ushs 805 million).
Loan commitments, guarantee and other financial facilitiesIn common with other banks, the Bank conducts business involving acceptances, letters of credit, guarantees and performance bonds. The majority of these facilities are offset by corresponding obligations of third parties.
2017Ushs ‘000
Consolidated
2016Ushs ‘000
Consolidated
2017Ushs ‘000Separate
2016Ushs ‘000Separate
Loan commitments 30,118,938 17,685,465 30,118,938 17,685,465
Performance Bonds 2,331,476 2,783,527 2,331,476 2,783,527
Guarantees 26,801,547 49,929,030 26,801,547 49,929,030
Foreign currency contracts 1,546,367 336,224 1,546,367 336,224
Documentary and letters of credit 40,118,122 52,522,033 40,118,122 52,522,033
Total 100,916,450 123,256,279 100,916,450 123,256,279
36. RELATED-PARTY DISCLOSURES Transactions and balances with related parties as at the yearend were as follows:
2017 2016
a) Related party balances Ushs ‘000 Ushs ‘000
Deposits from directors and shareholders 13,553,919 5,496,220
Deposits from Equity Stock Brokers Ltd 440,487 376,297
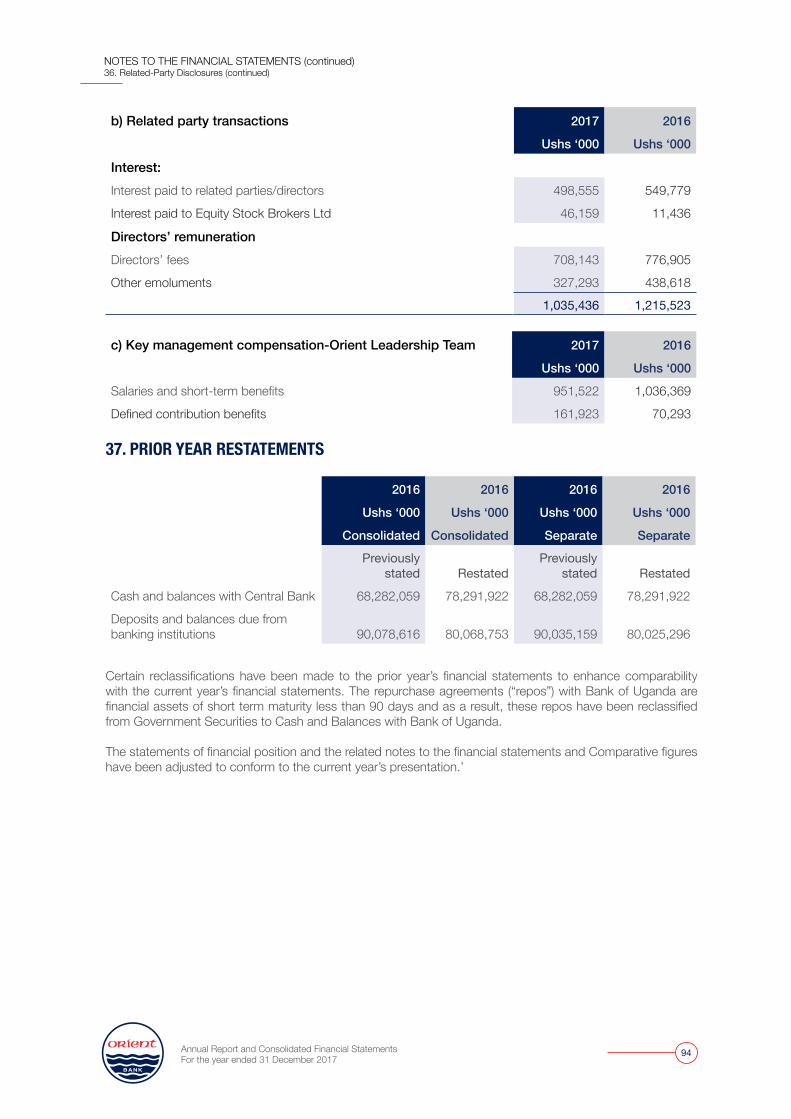
Annual Report and Consolidated Financial Statements For the year ended 31 December 2017
94
b) Related party transactions 2017 2016
Ushs ‘000 Ushs ‘000
Interest:Interest paid to related parties/directors 498,555 549,779
Interest paid to Equity Stock Brokers Ltd 46,159 11,436
Directors’ remunerationDirectors’ fees 708,143 776,905
Other emoluments 327,293 438,618
1,035,436 1,215,523
c) Key management compensation-Orient Leadership Team 2017 2016
Ushs ‘000 Ushs ‘000
Salaries and short-term benefits 951,522 1,036,369
Defined contribution benefits 161,923 70,293
37. PRIOR YEAR RESTATEMENTS
2016 2016 2016 2016
Ushs ‘000 Ushs ‘000 Ushs ‘000 Ushs ‘000
Consolidated Consolidated Separate Separate
Previously stated Restated
Previously stated Restated
Cash and balances with Central Bank 68,282,059 78,291,922 68,282,059 78,291,922
Deposits and balances due from banking institutions 90,078,616 80,068,753 90,035,159 80,025,296
Certain reclassifications have been made to the prior year’s financial statements to enhance comparability with the current year’s financial statements. The repurchase agreements (“repos”) with Bank of Uganda are financial assets of short term maturity less than 90 days and as a result, these repos have been reclassified from Government Securities to Cash and Balances with Bank of Uganda.
The statements of financial position and the related notes to the financial statements and Comparative figures have been adjusted to conform to the current year’s presentation.’
NOTES TO THE FINANCIAL STATEMENTS (continued)36. Related-Party Disclosures (continued)
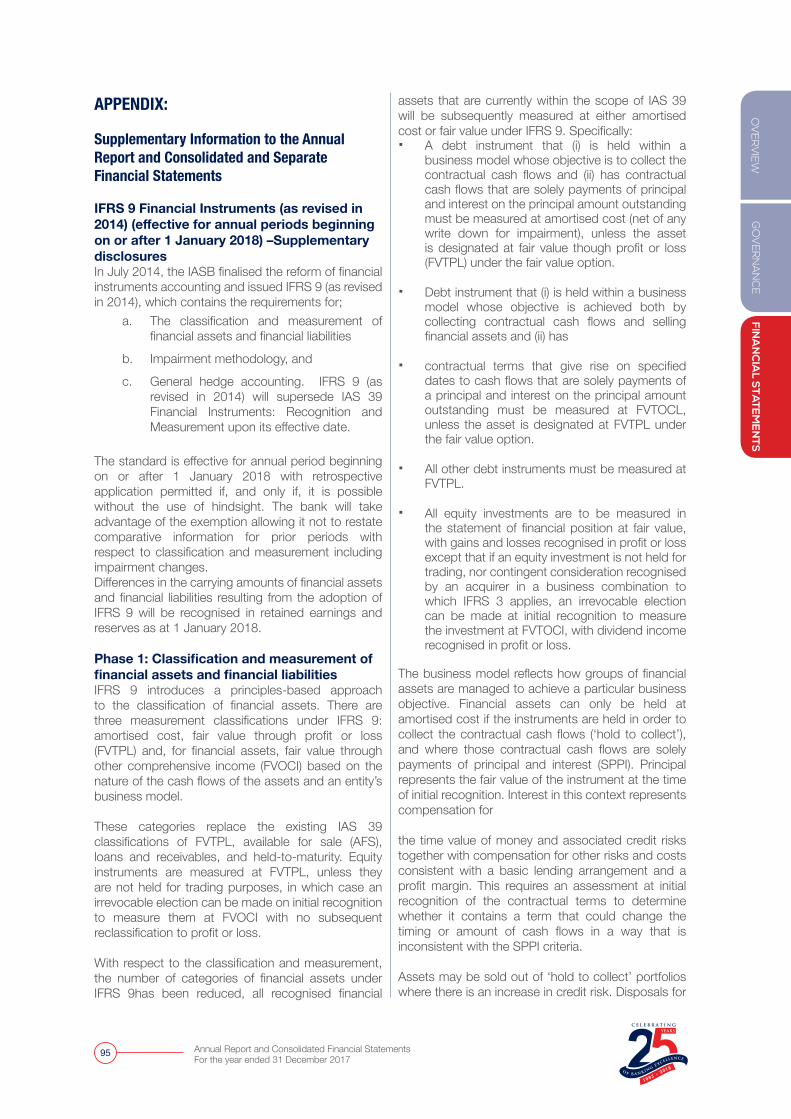
GO
VER
NA
NC
EFIN
AN
CIA
L STA
TEM
EN
TSO
VER
VIE
W
Annual Report and Consolidated Financial Statements For the year ended 31 December 2017
95
APPENDIX:
Supplementary Information to the Annual Report and Consolidated and Separate Financial Statements
IFRS 9 Financial Instruments (as revised in 2014) (effective for annual periods beginning on or after 1 January 2018) –Supplementary disclosuresIn July 2014, the IASB finalised the reform of financial instruments accounting and issued IFRS 9 (as revised in 2014), which contains the requirements for;
a. The classification and measurement of financial assets and financial liabilities
b. Impairment methodology, and
c. General hedge accounting. IFRS 9 (as revised in 2014) will supersede IAS 39 Financial Instruments: Recognition and Measurement upon its effective date.
The standard is effective for annual period beginning on or after 1 January 2018 with retrospective application permitted if, and only if, it is possible without the use of hindsight. The bank will take advantage of the exemption allowing it not to restate comparative information for prior periods with respect to classification and measurement including impairment changes. Differences in the carrying amounts of financial assets and financial liabilities resulting from the adoption of IFRS 9 will be recognised in retained earnings and reserves as at 1 January 2018. Phase 1: Classification and measurement of financial assets and financial liabilities IFRS 9 introduces a principles-based approach to the classification of financial assets. There are three measurement classifications under IFRS 9: amortised cost, fair value through profit or loss (FVTPL) and, for financial assets, fair value through other comprehensive income (FVOCI) based on the nature of the cash flows of the assets and an entity’s business model.
These categories replace the existing IAS 39 classifications of FVTPL, available for sale (AFS), loans and receivables, and held-to-maturity. Equity instruments are measured at FVTPL, unless they are not held for trading purposes, in which case an irrevocable election can be made on initial recognition to measure them at FVOCI with no subsequent reclassification to profit or loss.
With respect to the classification and measurement, the number of categories of financial assets under IFRS 9has been reduced, all recognised financial
assets that are currently within the scope of IAS 39 will be subsequently measured at either amortised cost or fair value under IFRS 9. Specifically: � A debt instrument that (i) is held within a
business model whose objective is to collect the contractual cash flows and (ii) has contractual cash flows that are solely payments of principal and interest on the principal amount outstanding must be measured at amortised cost (net of any write down for impairment), unless the asset is designated at fair value though profit or loss (FVTPL) under the fair value option.
� Debt instrument that (i) is held within a business model whose objective is achieved both by collecting contractual cash flows and selling financial assets and (ii) has
� contractual terms that give rise on specified dates to cash flows that are solely payments of a principal and interest on the principal amount outstanding must be measured at FVTOCL, unless the asset is designated at FVTPL under the fair value option.
� All other debt instruments must be measured at FVTPL.
� All equity investments are to be measured in the statement of financial position at fair value, with gains and losses recognised in profit or loss except that if an equity investment is not held for trading, nor contingent consideration recognised by an acquirer in a business combination to which IFRS 3 applies, an irrevocable election can be made at initial recognition to measure the investment at FVTOCI, with dividend income recognised in profit or loss.
The business model reflects how groups of financial assets are managed to achieve a particular business objective. Financial assets can only be held at amortised cost if the instruments are held in order to collect the contractual cash flows (‘hold to collect’), and where those contractual cash flows are solely payments of principal and interest (SPPI). Principal represents the fair value of the instrument at the time of initial recognition. Interest in this context represents compensation for
the time value of money and associated credit risks together with compensation for other risks and costs consistent with a basic lending arrangement and a profit margin. This requires an assessment at initial recognition of the contractual terms to determine whether it contains a term that could change the timing or amount of cash flows in a way that is inconsistent with the SPPI criteria.
Assets may be sold out of ‘hold to collect’ portfolios where there is an increase in credit risk. Disposals for
Annual Report and Consolidated Financial Statements For the year ended 31 December 2017
96
other reasons are permitted but such sales should be insignificant in value or infrequent in nature.
Financial asset debt instruments where the business model objectives are achieved by collecting the contractual cash flows and by selling the assets (‘hold to collect and sell’) and that have SPPI cash flows are held at FVOCI, with unrealised gains or losses deferred in reserves until the asset is derecognised. In certain circumstances, non-trading equity instruments can be irrevocably designated as FVOCI but both unrealised and realised gains or losses are recognised in reserves and no amounts other than dividends received are recognised in the Statement of profit or loss.
All other financial assets will mandatorily be held at FVTPL. Financial assets may be designated at FVTPL only if doing so eliminates or reduces an accounting mismatch.
For financial liabilities, most of the pre-existing requirements for classification and measurement previously included in IAS 39 were carried forward unchanged into IFRS 9 other than the provisions relating to the recognition of changes in own credit risk for financial liabilities designated at fair value through profit or loss, as permitted by IFRS 9.
Where the contractual terms of financial assets are modified, and that modification does not result in de-recognition, a modification gain or loss is recognised in the Statement of profit or loss and the gross carrying amount of the asset adjusted accordingly.
Transition impact of Phase 1 on the BankThe Directors have assessed the business models that it operates across the Bank. In its assessment, the Directors considered the objectives of the business model, how performance is measured and how staff are remunerated amongst other factors. Where the objective of a business is to manage financial assets on a fair value basis, the instruments within that business model are measured at FVTPL. This includes the Bank’s trading portfolios. The total impact of IFRS 9 in terms of provisions is Ugx 6.8bn.Most of the Bank’s loans to banks and customers are held within a ‘hold to collect’ business model.
Investment debt securities held with Treasury Markets are held within a ‘hold to trade and sell’ portfolio. The majority of the remaining investment debt securities are held within a ‘hold to sell’ business model.
Instruments (including hybrid financial assets) that do not meet the SPPI criteria are measured at FVTPL regardless of the business model in which they are held. Non-trading equity investments are measured at FVTPL except for a small portfolio of strategic
equity investments which are irrevocably designated at FVOCI.
Phase 2: Impairment of Financial AssetsThe impairment model under IFRS 9 reflects expected credit losses, as opposed to incurred credit losses under IAS 39. Under the impairment approach in IFRS 9, it is no longer necessary for a credit event to have occurred before credit losses are recognised. Instead, an entity always accounts for expected credit losses and changes in those expected credit losses. The amount of the expected credit losses should be updated at each reporting date to reflect changes in credit risk since initial recognition.
Under IFRS 9, the same impairment model is applied to all financial assets, except for financial assets classified or designated as at FVTPL and equity securities designated as at FVOCI, which are not subject to impairment assessment. The scope of the IFRS 9 expected credit loss impairment model includes amortized cost financial assets, debt securities classified as at FVOCI, and off balance sheet loan commitments and financial guarantees which were previously provided for under IAS 37 Provisions, Contingent Liabilities and Contingent Assets (IAS 37). The above-mentioned reclassifications into or out of these categories under IFRS 9 and items that previously fell under the IAS 37 framework were considered in determining the scope of our application of the new expected credit loss impairment model.
IFRS 9 also extends the measurement of impairment allowances on financial guarantees, letters of credit, and commitments (including undrawn lines of credit). The Bank uses the credit conversion factors as per the Basel II Accord to convert any off-balance sheet exposure to on-balance sheet and thereafter stage the exposure at default in determination of the expected credit loss.
Transition impact of Phase 2 on the BankThe Bank primarily uses models that utilise the probability of default (PD), loss given default (LGD) and exposure at default (EAD) metrics, discounted using the effective interest rate.
Expected credit losses are recognised for all financial debt instruments, loan commitments and financial guarantees that are classified as ‘hold to collect’/‘hold to collect and sell’ and have cash flows that are solely payments of principal and interest. Expected credit losses are not recognised for equity instruments designated at FVOCI.
Measurement of Expected Credit Losses ECLs are measured as the probability-weighted present value of expected cash shortfalls over the remaining expected life of the financial instrument.
GO
VER
NA
NC
EFIN
AN
CIA
L STA
TEM
EN
TSO
VER
VIE
W
Annual Report and Consolidated Financial Statements For the year ended 31 December 2017
97
The ECL model contains a three-stage approach that is based on the change in the credit quality of assets since initial recognition. � Stage 1 - If, at the reporting date, the credit risk
of non-impaired financial instruments has not increased significantly since initial recognition, these financial instruments are classified in Stage 1, and a loss allowance that is measured, at each reporting date, at an amount equal to 12-month expected credit losses is recorded;
� Stage 2 - When there is a significant increase in credit risk since initial recognition, these non-impaired financial instruments are migrated to Stage 2, and a loss allowance that is measured, at each reporting date, at an amount equal to lifetime expected credit losses is recorded. In subsequent reporting periods, if the credit risk of the financial instrument improves such that there is no longer a significant increase in credit risk since initial recognition, the ECL model requires reverting to recognition of 12-month expected credit losses based on the Bank`s policy on curing of loans; and
� When one or more events that have a detrimental impact on the estimated future cash flows of a financial asset have occurred, the financial asset is considered credit-impaired and is migrated to Stage 3, and an allowance equal to lifetime expected losses continues to be recorded or the financial asset is written off.
An ECL allowance is recognised at the time of initial recognition for all financial instruments that are in the scope of ECL in respect of default events that may occur over the next 12 months (so-called ‘stage 1 assets’ with allowances equivalent to 12-months expected credit losses).
ECL continues to be determined on this basis until there is either a significant increase in credit risk (“SICR”) or the asset becomes credit impaired. If a financial asset (or portfolio of financial assets) experiences an SICR since initial recognition, an ECL allowance is recognised for default events that may occur over the lifetime of the asset (so-called ‘stage 2 assets’ with loss allowances equivalent to lifetime expected credit losses). SICR is assessed in the context of an increase in the risk of a default occurring over the remaining life of the financial instrument when compared with that expected at the time of initial recognition for the same period. It is not assessed in the context of an increase in the expected credit loss.
The Bank uses a number of qualitative and quantitative measures in assessing SICR. Quantitative measures relate to the relative and absolute changes in the lifetime PD compared with those expected at initial recognition. Qualitative factors include placement of
loans on watch list, classification as higher credit risk or where principal and/or interest payments are 30 days or more past due.
An asset is only considered credit impaired, and lifetime expected credit losses recognised, if there is observed objective evidence of impairment. These factors are similar to the indicators of objective evidence of impairment under IAS 39. This includes, amongst other factors, assets in default, experiencing significant financial difficulty or subject to forbearance actions credit-impaired (so-called ‘stage 3 assets’).
The definition of default is aligned to the regulatory definition within Financial Instruments (Credit Classification and Provisioning) Regulations, 2005 and considered to occur when an asset is 90 days or more past due on contractual payments of principal and/or interest or is considered unlikely to pay without realisation of any collateral held.
To the extent that assets are credit-impaired at the point of initial recognition, they are classified as purchased or originated credit-impaired. An expected credit loss allowance is recognised at initial recognition. Any changes in lifetime expected losses after initial recognition are charged or credited to the Statement of profit or loss through ‘Impairment charges’.
The measurement of expected credit losses across all stages is required to reflect an unbiased and probability weighted amount that is determined by evaluating a range of reasonably possible outcomes using reasonable and supportable information about past events, current conditions and forecasts of future economic conditions.
To account for the potential non-linearity in credit losses, multiple forward-looking scenarios are incorporated into the range of reasonably possible outcomes for all material portfolios. The Bank uses a linear regression among other forecasting approaches to simulate a various scenarios around the central forecast to incorporate the potential non-linearity.
The period considered when measuring expected credit loss is the shorter of the expected life and the contractual term of the financial asset.
The expected life may be impacted by prepayments and the maximum contractual term by extension options. For certain revolving portfolios, the expected life is assessed over the period that the Group is exposed to credit risk (which is based on the length of time it takes for credit facilities to be withdrawn) rather than the contractual term.For stage 3, financial assets, the determination of lifetime expected credit losses will be similar to the
Annual Report and Consolidated Financial Statements For the year ended 31 December 2017
98
IAS 39 approach; for example, loan loss allowances on individually impaired loans and advances will be based on the present value of estimated future cash flows for those individual clients.
Modifications for other reasons are accounted for in a similar way, except the modification gain or loss will be reported as part of income. For assets measured at amortised cost, the balance sheet amount reflects the gross asset less the allowance for ECL.
For debt instruments held at FVOCI, the balance sheet amount reflects the instrument’s fair value, with the expected credit loss allowance held as a separate reserve within other comprehensive income.
ECL allowances on off-balance sheet instruments are held as liability provisions to the extent that the drawn and undrawn components of loan exposures can be separately identified. Otherwise they will be reported against the drawn component.
Recognition of Interest income Interest income is calculated on the gross carrying amount of the financial assets in Stages 1 and 2 and on the net carrying amount (net of provisions) for the financial assets in Stage 3.
Phase 3: Hedge accountingThe general hedge accounting requirements of IFRS 9 retain the three types of hedge accounting mechanisms in IAS 39.However, greater flexibility has been introduced to the types of transactions eligible for hedge accounting, specifically broadening the types of instruments that qualify as hedging instruments and the types of risk components of non-financial items that are eligible for hedge accounting. The IFRS 9 Hedge accounting requirements will not have any significant impact as the bank does not
apply hedge accounting.
The work on macro hedging by the IASB is still at a preliminary stage – a discussion paper was issued in April 2014 to gather preliminary views and direction from constituents with a comment period which ended in October 2014. The project is still under analysis at the IASB as at the time of writing this disclosure.
Other disclosures; i. Implementation costsThe Bank hired subject matter experts with the specific role of guiding and upskilling the finance function. The external costs of implementation, amount to Ushs 128mn. ii. Expected impairment (as an absolute amount
or percentage) The Bank is yet to complete its detailed quantitative impact assessment of the expected impairment amount. The un-audited quantitative impact assessment as at 31 December 2017 totalled to a decrease in the provision of approximately 12%. iii. If the Bank will adopt the restatement or no
restatementThe bank will take advantage of the exemption allowing it not to restate comparative information for prior periods with respect to classification and measurement including impairment changes. iv. Impact on the Core Capital as at January 1,
2018Based on the un-audited quantitative impact assessment as at 31 December 2017, the impact to the Core Capital is as follows;
GO
VER
NA
NC
EFIN
AN
CIA
L STA
TEM
EN
TSO
VER
VIE
W
Annual Report and Consolidated Financial Statements For the year ended 31 December 2017
99
Previous Anticipated % change
Tier I 18.22% 18.42% 0.20%
Tier II 19.59% 19.79% 0.20%
v. Assessment of core capital after taking into account both the transition and impairment effects of IFRS 9 and if it is sufficient to foster the growth articulated in the Strategic Plan.
Management are of the view that the Bank’s current buffers’ with respect to the Core Capital adequacy ratios as sufficient to cater for any deterioration caused by the implementation of the Standard.
vi. Comparison of IFRS 9 vis-à-vis IAS 39 and FIA 2004 loan loss provisions
As at 31 December 2017 IAS 39(Audited) FIA 2004
IFRS 9(Un-audited)
Specific 4,120,962 3,644,890
General 3,586,221 3,672,689
Stage 1 - 2,136,072
Stage 2 - 548,866
Stage 3 - 4,118,318
TOTAL 7,707,183 7,317,579 6,803,256
i. Challenges facedThe challenges faced include; � People
Increase in personnel /upskill current personnel with intricate understanding of the requirements of the Standard. � Processes
Review and revise of the current processes in place in order to be able to cater for the requirements of IFRS 9. Updating of the current processes in order to ensure that strong control environment is still maintained for a stable IFRS 9 model deployment.
� Data & systemsSignificant challenge in regard to the detailed and specific historical data requirements at a granular level.
� PoliciesUpdating current policies in order to capture the requirements of the Standard. � Models
Developing advanced and more sophisticated impairment model that is most relevant to the Bank. � MI & Reporting
Amendment of the Management Information and reporting based on the requirements of IFRS 9.

Annual Report and Consolidated Financial Statements For the year ended 31 December 2017
100

@OrientBankUG
0800 144 551
Affordable, simple and straightforward banking
BUSINESSCURRENT ACCOUNT

Orient Bank Limited
www.orient-bank.com