Embed Size (px)
Citation preview

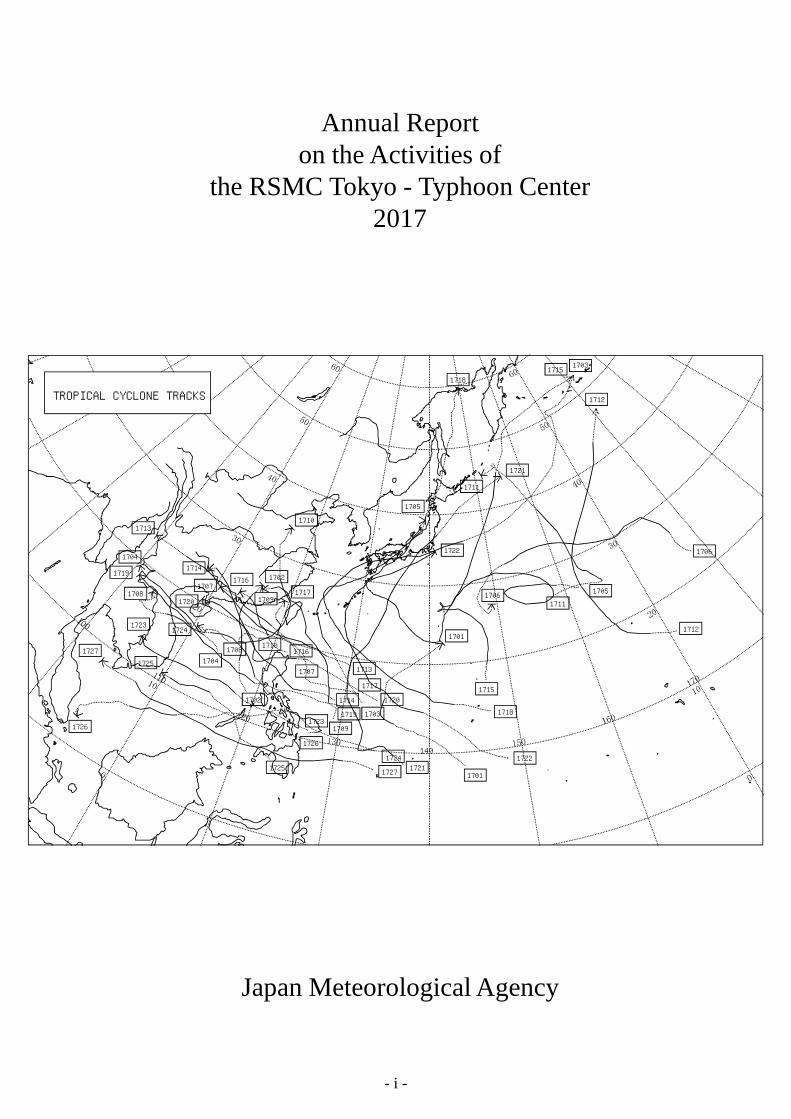
Annual Reporton the Activities of
the RSMC Tokyo - Typhoon Center2017
Japan Meteorological Agency
TY Lan01 UTC, 21 October 2017
- i -
Annual Reporton the Activities of
the RSMC Tokyo - Typhoon Center2017
Japan Meteorological Agency
140
TROPICAL CYCLONE TRACKS
1727
1727
1726
1726
1725
1725
1724
1724
1723
1723
1722
1722
1721
1721
1720
1720
1719
1719
1718
1718
1717
1717
1716
1716
1715
1715
1714
1714
1713
1713
1712
1712
1711
1711
1710
1710
1709
1709
1708
1708
1707
1707
1706
17061705
1705
1704
1704
1703
1703
1702
1702
1701
1701

- ii -
Copyright (c) 2018 by the Japan Meteorological Agency (JMA). All rights reserved.
1) This publication, including the DVD, shall not be reproduced or be provided to any third party.2) The source shall be properly acknowledged in any work connected to this publication, including the DVD.
JMA accepts no liability for any direct and/or indirect loss or damage to the user caused by the use of the software, data or documents in this publication, including the DVD.

Table of Contents
Page Introduction Chapter 1 Operations at the RSMC Tokyo - Typhoon Center in 2017 1.1 Analysis 1 1.2 Forecasts 1 1.3 Provision of RSMC Products 2 1.4 Graphical Tropical Cyclone Advisory for SIGMET 4 1.5 WIS Global Information System Center Tokyo Server 5 1.6 RSMC Tokyo - Typhoon Center Website 5 1.7 Numerical Typhoon Prediction Website 5 Chapter 2 Major Activities of the RSMC Tokyo - Typhoon Center in 2017 2.1 Provision of RSMC Products 6 2.2 Publications 6 2.3 Typhoon Committee Attachment Training 7 2.4 Monitoring of Observational Data Availability 7 2.5 Other Activities in 2017 7 2.5.1 Update of Numerical Typhoon Prediction Website 7 2.5.2 Update of Forecast Circle Radii based on GEPS 9 Chapter 3 Summary of the 2017 Typhoon Season 3.1 Atmospheric and Oceanographic Conditions in the Tropics 10 3.2 Tropical Cyclones in 2017 11 Chapter 4 Verification of Forecasts in 2017 4.1 Verification of Operational Forecasts 14 4.1.1 Center Position 14 4.1.2 Central Pressure and Maximum Wind Speed 17 4.2 Verification of Numerical Models (GSM, GEPS) 19 4.2.1 GSM Prediction 19 4.2.2 GEPS Prediction 22 4.3 Verification for Other Guidance Models 25 4.3.1 Center Position 25 4.3.2 Spread-Skill Relationship 26 4.3.3 Central Pressure and Maximum Wind Speed 27 4.4 Verification of Storm Surge Prediction 28 4.4.1 Deterministic Prediction 29 4.4.2 Multi-Scenario Prediction 30

Appendices 1 RSMC Tropical Cyclone Best Track Data in 2017 35 2 Monthly Tracks of Tropical Cyclones in 2017 41 3 Errors of Track and Intensity Forecasts for Each Tropical Cyclone in 2017 51 4 Monthly and Annual Frequencies of Tropical Cyclones 57 5 Code Forms of RSMC Products 59 6 Specifications of JMA’s NWP Models (GSM, GEPS) 67 7 Products on WIS GISC Tokyo Server 69 8 Products on NTP Website 73 9 User’s Guide to the DVD 75 Tropical Cyclones in 2017 (only PDF in DVD) DVD for Annual Report 2017

Introduction
The RSMC Tokyo - Typhoon Center (referred to here as the Center) is a Regional Specialized
Meteorological Centre (RSMC) that carries out specialized activities in analysis, tracking and forecasting of western North Pacific tropical cyclones (TCs) within the framework of the World Weather Watch (WWW) Programme of the World Meteorological Organization (WMO). The Center was established at the headquarters of the Japan Meteorological Agency (JMA) in July 1989 following a designation by the WMO Executive Council at its 40th session (Geneva, June 1988).
The Center conducts the following operations on a routine basis: (1) Preparation of information on the formation, movement and development of TCs and associated
meteorological phenomena (2) Preparation of information on synoptic-scale atmospheric situations that affect the behavior of
TCs (3) Provision of the above information to National Meteorological Services (NMSs), and in
particular to ESCAP/WMO Typhoon Committee Members, in appropriate formats for operational processing
In addition to the routine services outlined above, the Center distributes a series of reports entitled
Annual Report on the Activities of the RSMC Tokyo - Typhoon Center as operational references for the NMSs concerned. The reports summarize the activities of the Center and review the TCs of the preceding year.
In this issue covering 2017, Chapter 1 outlines routine operations performed at the Center and its
operational products, while Chapter 2 reports on its major activities in 2017. Chapter 3 describes atmospheric and oceanic conditions in the tropics and notes the highlights of TC activity in 2017. Chapter 4 presents verification statistics relating to operational forecasts, results from JMA’s numerical weather prediction (NWP) models and other guidance models, and storm surge prediction. Best track data for 2017 TCs are shown in table and chart form in the appendices. All relevant text, tables, charts and appendices are included on the DVD provided with this report.
The DVD contains hourly cloud images of all 2017 TCs of TS intensity or higher within the Center’s
area of responsibility. Also included is the necessary viewer software, which features various functions for analyzing satellite imagery (such as image animations) and facilitates efficient post-analysis of TCs and their environments. A setup program and a user manual for the software are included on the DVD. Appendix 9 gives an outline of the DVD and instructions on using the software.

1
Chapter 1
Operations at the RSMC Tokyo - Typhoon Center in 2017 The Center’s area of responsibility covers the western North Pacific and the South China Sea (0° –
60°N, 100° – 180°E) including marginal seas and adjacent land areas (Figure 1.1). The Center carries out analysis and forecasting in relation to tropical cyclones (TCs) in the area and also provides the relevant National Meteorological Services (NMSs) with RSMC products via the Global Telecommunication System (GTS), the Aeronautical Fixed Telecommunication Network (AFTN), the Internet and other media.
1.1 Analysis TC analysis is performed eight times a day at 00, 03, 06, 09, 12, 15, 18 and 21 UTC, and begins with
determination of the TC’s center position. Cloud images from the Himawari-8 are the principal source for this determination, especially for TCs migrating over data-sparse ocean areas. Information on the TC’s direction and speed of movement is extracted primarily from six-hourly displacement vectors of the center position.
The maximum sustained wind speed in the vicinity of the TC’s center is determined mainly from the
CI number, which is derived from satellite imagery using the Dvorak method. The central pressure of the TC is then determined from the maximum sustained wind speed with the assumption of a certain pressure profile around the TC. The radii of circles representing winds with speeds exceeding 30 and 50 knots are determined mainly from surface observation, ASCAT observation and Atmospheric Motion Vector (AMV) based Sea surface Wind (ASWind) data derived from satellite images in the vicinity of the TC. The size of the central dense overcast area of the TC as observed in satellite imagery is also referenced to determine the radius of 50-knot wind speed circles.
1.2 Forecasts
The Center issues TC track forecasts up to 120 hours ahead and intensity forecasts up to 72
hours ahead. As a primary basis for TC track forecasts, JMA implements NWP using the Global Spectral Model (GSM) and the Global Ensemble Prediction System (GEPS). The GSM (TL959L100; upgraded on 18 March, 2014) has a horizontal resolution of approximately 20 km and 100 vertical layers, while GEPS (TL479L100; operational as of 19 January 2017) has 27 members with a horizontal resolution of approximately 40 km and 100 vertical layers. Using mainly GEPS, JMA extended its TC track forecast up
Figure 1.1 Area of responsibility of the RSMC Tokyo - Typhoon Center

2
to five days ahead as of April 2009. Further details and recent model improvements are detailed in Appendix 6. Since 2015 the Center has mainly employed a consensus method for TC track forecasts. This approach involves taking the mean of predicted TC positions from multiple deterministic models, including the GSM and other centers’ models. In relation to TC intensity, central pressure and maximum sustained wind speeds are forecast mainly using a statistical intensity prediction scheme in an experimental phase in addition to results from NWP models, guidance models based on climatology and persistence, and the Dvorak method. The Center will extend the lead time of TC intensity forecasts up to 120 hours in March 2019 using the prediction scheme being developed by JMA based on the Statistical Hurricane Intensity Prediction Scheme (SHIPS). The new approach is known as TIFS (Typhoon Intensity Forecasting scheme based on SHIPS).
A probability circle shows the range into which the center of a TC is expected to move with 70%
probability at each validation time. The radius of the circle for all forecast times is statistically determined according to the direction and speed of TC movement based on the results of recent TC track forecast verification. In addition, those for 96- and 120-hour forecasts are statistically determined according to the confidence level based on the cumulative ensemble spread calculated using GEPS.
1.3 Provision of RSMC Products
The Center prepares and distributes the RSMC bulletins listed below via the GTS or the AFTN
when: - a TC of tropical storm (TS) intensity or higher exists in the Center’s area of responsibility - a TC is expected to reach or exceed TS intensity in the area within 24 hours RSMC products are continually issued while any TC of TS intensity or higher exists in the Center’s
area of responsibility. Appendix 5 denotes the code forms of the bulletins.
(1) RSMC Tropical Cyclone Advisory (WTPQ20-25 RJTD: via GTS) The RSMC Tropical Cyclone Advisory is issued eight times a day after observations made at 00, 03,
06, 09, 12, 15, 18 and 21 UTC, and reports the following elements in analysis, and in 24-, 48- and 72-hour forecasts for TCs:
Analysis Center position Accuracy of center position determination Direction and speed of movement Central pressure Maximum sustained wind speed (10-minute average) Maximum gust wind speed Radii of wind areas over 50 and 30 knots 24-, 48- and 72-hour Center position and radius of probability circle forecasts Direction and speed of movement Central pressure Maximum sustained wind speed (10-minute average) Maximum gust wind speed

3
(2) RSMC Tropical Cyclone Advisory for Five-day Track Forecast (WTPQ50-55 RJTD: via GTS) The RSMC Tropical Cyclone Advisory for Five-day Track Forecast is issued four times a day after
observations made at 00, 06, 12 and 18UTC, and reports the following elements in analysis and in 24-, 48-, 72-, 96- and 120-hour forecasts for TCs:
Analysis Center position Accuracy of center position determination Direction and speed of movement Central pressure Maximum sustained wind speed (10-minute average) Maximum gust wind speed Radii of wind areas over 50 and 30 knots 24-, 48- and 72-hour Center position and radius of probability circle forecasts Direction and speed of movement Central pressure Maximum sustained wind speed (10-minute average) Maximum gust wind speed 96- and 120-hour Center position and radius of probability circle forecasts Direction and speed of movement
(3) RSMC Guidance for Forecast (FXPQ20-25 RJTD: via GTS) The RSMC Guidance for Forecast reports the results of predictions made by the GSM; which is run
four times a day with initial analyses at 00, 06, 12 and 18 UTC. The guidance presents six-hourly GSM predictions for TCs up to 84 hours ahead and GEPS mean six-hourly predictions up to 132 hours ahead, and reports the following elements:
NWP prediction (T = 06 to 84 or 132) Center position Central pressure* Maximum sustained wind speed* * Predictions of these parameters are given as deviations from those at the initial time.
(4) SAREP (IUCC10 RJTD: via GTS) The SAREP in BUFR format reports on the results of TC analysis including intensity information
(i.e., the CI number) based on the Dvorak method. It is issued 30 minutes to an hour after observations made at 00, 03, 06, 09, 12, 15, 18 and 21 UTC, and reports the following elements:
Himawari-8 Center position imagery analysis Accuracy of center position determination Direction and speed of movement Mean diameter of overcast cloud Apparent past 24-hour change in intensity** Dvorak Intensity (CI, T, DT, MET, PT number) ** Cloud pattern type of the DT number** Trend of past 24-hour change**

4
Cloud pattern type of the PT number** Type of the final T-number** ** Reported only at 00, 06, 12 and 18 UTC BUFR/CREX templates for translation into table-driven code forms are provided on the WMO website at
http://www.wmo.int/pages/prog/www/WMOCodes.html. The SAREP is provided in text format on the Numerical Typhoon Prediction (NTP) website (https://tynwp-web.kishou.go.jp/Analysis/Satellite/Satellite_analysis/index.html; see 1.7).
(5) RSMC Prognostic Reasoning (WTPQ30-35 RJTD: via GTS)
The RSMC Prognostic Reasoning report provides brief reasoning for TC forecasts, and is issued at
00 and 06 UTC following the issuance of the RSMC Tropical Cyclone Advisory. In the bulletin, general comments on the forecasting method, the synoptic situation such as the subtropical ridge, the movement and intensity of the TC as well as relevant remarks are given in plain language.
(6) RSMC Tropical Cyclone Best Track (AXPQ20 RJTD: via GTS)
The RSMC Tropical Cyclone Best Track report provides post-analysis data on TCs of TS intensity or
higher. It reports the center position, the central pressure and the maximum sustained wind speed. The best track for each TC is usually finalized one and a half months after the termination of related issuance of the above RSMC bulletins.
(7) Tropical Cyclone Advisory for SIGMET (FKPQ30-35 RJTD: via AFTN)
As a Tropical Cyclone Advisory Centre (TCAC) within the framework of the International Civil
Aviation Organization (ICAO), the Center provides Tropical Cyclone Advisory (TCA) for SIGMET to Meteorological Watch Offices (MWOs) in order to support their preparations of SIGMET information on TCs. These advisories include the following elements in analysis and in 6-, 12-, 18- and 24-hour forecasts:
Analysis Center position Direction and speed of movement Central pressure Maximum sustained wind speed (10-minute average) Forecast Center position Maximum sustained wind speed (10-minute average)
1.4 Graphical Tropical Cyclone Advisory for SIGMET In August 2015, the Center started providing graphical Tropical Cyclone Advisory (TCA) in addition
to text-format TCA in its role as the ICAO TCAC. Graphical TCA shows not only the text-format TCA information but also the horizontal extent of cumulonimbus cloud and cloud top height associated with TCs potentially affecting aviation safety. It is provided through the website where the specifications and text-format TCA are also available (https://www.data.jma.go.jp/fcd/tca/data/index.html). This website is linked from the NTP website (see 1.7), and graphical TCA is also dispatched to World Area Forecast Centres (WAFCs).
5
1.5 WIS Global Information System Center Tokyo Server As designated at the Sixteenth WMO Congress in June 2011, the Center introduced Data Collection
or Production Center (DCPC) service under the Global Information System Center (GISC) Tokyo for the WMO Information System (WIS) in August 2011. It provides NWP products such as data on predicted fields in grid-point-value (GPV) form and observational values through WIS Data Discovery, Access and Retrieval (DAR) via a new GISC Tokyo server (https://www.wis-jma.go.jp/). GSM products with resolution of 0.5 and 0.25 degrees (surface layer) and JMA SATAID Service (https://www.wis-jma.go.jp/cms/sataid/) are also available from the server through WIS DAR. All products available via the new server are listed in Appendix 7.
1.6 RSMC Tokyo - Typhoon Center Website
The RSMC Tokyo - Typhoon Center Website provides TC advisories on a real-time basis and a wide
variety of products including TC analysis archives, technical reviews and annual reports on the Center’s activities at https://www.jma.go.jp/jma/jma-eng/jma-center/rsmc-hp-pub-eg/RSMC_HP.htm. Since 12 November 2012, the website has provided experimental TC advisory information in Common Alert Protocol (CAP) format.
1.7 Numerical Typhoon Prediction Website
Since 1 October 2004, the Center has operated the Numerical Typhoon Prediction (NTP) website
(https://tynwp-web.kishou.go.jp/) to assist the NMSs of Typhoon Committee Members in improving their TC forecasting and warning services. The site provides TC track predictions and weather maps of deterministic NWP models from nine centers (BoM (Australia), CMA (China), CMC (Canada), DWD (Germany), ECMWF, KMA (Republic of Korea), NCEP (USA), UKMO (UK) and JMA), ensemble TC track predictions of ensemble NWP models from four centers (ECMWF, NCEP, UKMO and JMA) and a wide variety of products including the results of the Center’s TC analysis, upper-air analysis, ocean analysis, storm surge and wave height forecasting. All products available on the website are listed in Appendix 8.
6
Chapter 2
Major Activities of the RSMC Tokyo - Typhoon Center in 2017 2.1 Provision of RSMC Products
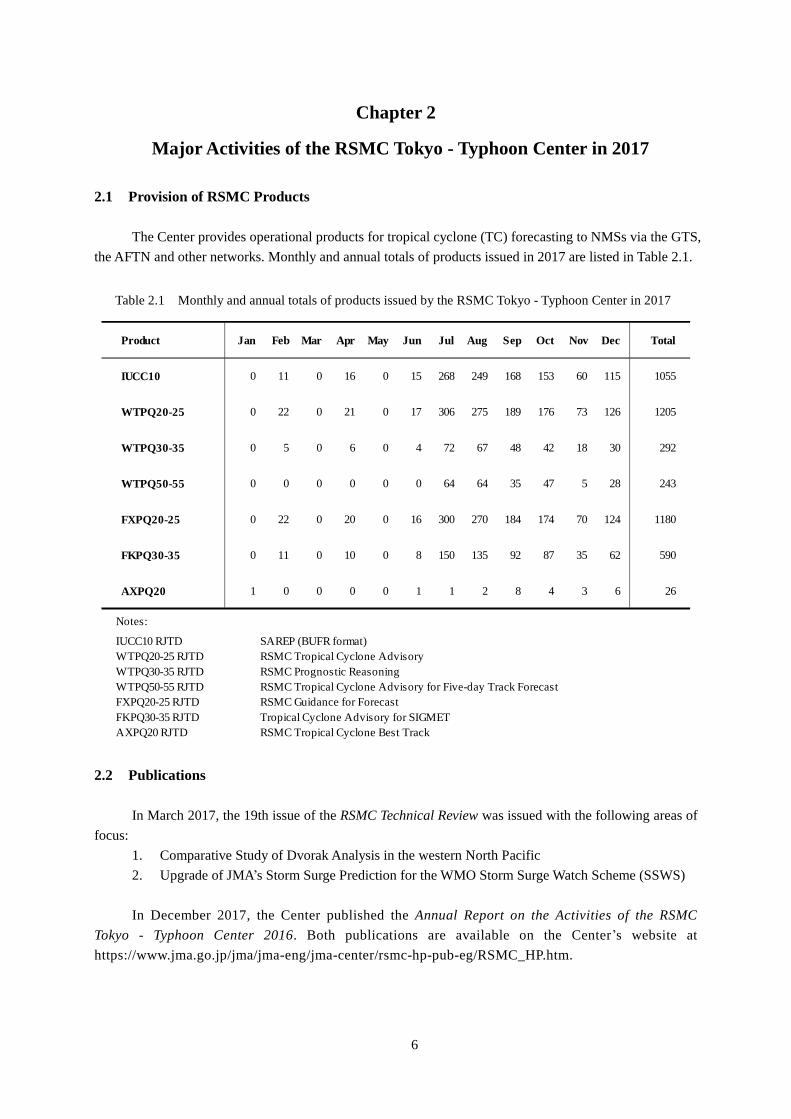
The Center provides operational products for tropical cyclone (TC) forecasting to NMSs via the GTS,
the AFTN and other networks. Monthly and annual totals of products issued in 2017 are listed in Table 2.1.
2.2 Publications In March 2017, the 19th issue of the RSMC Technical Review was issued with the following areas of
focus: 1. Comparative Study of Dvorak Analysis in the western North Pacific 2. Upgrade of JMA’s Storm Surge Prediction for the WMO Storm Surge Watch Scheme (SSWS) In December 2017, the Center published the Annual Report on the Activities of the RSMC
Tokyo - Typhoon Center 2016. Both publications are available on the Center’s website at https://www.jma.go.jp/jma/jma-eng/jma-center/rsmc-hp-pub-eg/RSMC_HP.htm.
Table 2.1 Monthly and annual totals of products issued by the RSMC Tokyo - Typhoon Center in 2017
Product Jan Feb Mar Apr May Jun Jul Aug Sep Oct Nov Dec Total
IUCC10 0 11 0 16 0 15 268 249 168 153 60 115 1055
WTPQ20-25 0 22 0 21 0 17 306 275 189 176 73 126 1205
WTPQ30-35 0 5 0 6 0 4 72 67 48 42 18 30 292
WTPQ50-55 0 0 0 0 0 0 64 64 35 47 5 28 243
FXPQ20-25 0 22 0 20 0 16 300 270 184 174 70 124 1180
FKPQ30-35 0 11 0 10 0 8 150 135 92 87 35 62 590
AXPQ20 1 0 0 0 0 1 1 2 8 4 3 6 26
Notes:
IUCC10 RJTD SAREP (BUFR format)WTPQ20-25 RJTD RSMC Tropical Cyclone AdvisoryWTPQ30-35 RJTD RSMC Prognostic ReasoningWTPQ50-55 RJTD RSMC Tropical Cyclone Advisory for Five-day Track Forecast FXPQ20-25 RJTD RSMC Guidance for ForecastFKPQ30-35 RJTD Tropical Cyclone Advisory for SIGMETAXPQ20 RJTD RSMC Tropical Cyclone Best Track

7
2.3 Typhoon Committee Attachment Training The 17th Typhoon Committee Attachment Training 2017 course was held at JMA Headquarters from
11 to 21 December 2017. The Center has organized ESCAP/WMO Typhoon Committee Attachment Training courses every
year since 2001 with the support of the WMO Tropical Cyclone Programme and the Typhoon Committee in order to advance the tropical cyclone forecasting capacity of Committee Members. Forecasters from the Member countries of the Panel on Tropical Cyclones have also been invited since 2015 to enhance training collaboration between the Panel and the Committee. The 2017 attendees were Ms. Sze-ning Chong from Hong Kong, Ms. Junjuda Pornsri from Thailand, Ms. Trang Quynh Tran from Viet Nam, Mr. Md Omar Faruq from Bangladesh, Mr. Abdulla Hafiz Abdul Sattar Ali from Maldives, and Dr. Tin Mar Htay from Myanmar.
The training focused on practical knowledge and skills related to operational tropical cyclone
analysis and forecasting via lectures and exercises using the Satellite Analysis and Viewer Program (SATAID). The course covered a range of subjects including Dvorak analysis, interpretation of microwave imagery, and storm surge forecasting. Presentations and exercises were also provided on public weather services, including the setting of warning criteria based on quantitative precipitation estimation and forecasting techniques, and forecast skill evaluation, to enhance capacity in the development and implementation of effective warning systems in collaboration with disaster risk reduction operators. All attendees gave presentations to help JMA staff understand the current status of their meteorological and hydrological services including tropical cyclone forecasting and warning services.
2.4 Monitoring of Observational Data Availability
The Center carried out regular monitoring of information exchanges for enhanced TC observation in
accordance with the standard procedures stipulated in Section 6.2, Chapter 6 of The Typhoon Committee Operational Manual (TOM) - Meteorological Component (WMO/TD-No. 196). Monitoring for the period from 1 November, 2016, to 31 October, 2017, was conducted for two tropical cyclones:
1. TY Hato (1713), from 21UTC 20 August to 15UTC 24 August 2017 2. TY Doksuri (1719), from 00UTC 11 September to 00UTC 16 September 2017 The results were distributed to all Typhoon Committee Members in March 2018, and are also
available on the WIS GISC Tokyo server at https://www.wis-jma.go.jp/monitoring/data/monitoring/.
2.5 Other Activities in 2017
2.5.1 Update of Numerical Typhoon Prediction Website In 2017, the changes outlined below were made to the NTP website.
(1) New Stations for Storm Surge Time Series Charts (30 March) The Center added ten stations for storm surge time series charts – four in Cambodia (Kampot, Keb,
Kohkong and Sihanoukvile) and six in Singapore (Pasirris, Sembawang, Tanjongchangi, Tanahmerah,

8
Tanjongpagar and Westcoast).
(2) Vorticity and Divergence of Wind Fields (30 March) The Center began to provide maps of vorticity at the 850-hPa level and wind field divergence at the
200-hPa level. These products are useful for identifying wind circulation in lower layers that could develop into tropical cyclones and identifying areas with divergence in upper layers.
(3) Expansion of Chart Areas (30 March)
Chart areas showing stream line content at 850 and 200 hPa, vertical wind shear, sea surface temperature (SST) and tropical cyclone heat potential (TCHP) were expanded to provide useful information over a larger area.
(4) Expansion of the Ensemble Ocean Wave Forecast Map Area (28 September)
The ensemble ocean wave forecast map area was expanded to cover more basins of the Pacific and Indian Oceans. This improvement made the product more relevant and useful for addressing maritime/coastal risks related to ocean waves caused by tropical cyclones.
(5) Radar Composite Imagery (25 October)
Malaysia, Thailand and Japan began to provide hourly radar composite imagery using data shared through an experimental exchange initiated in 2016. The imagery is produced as part of a Typhoon Committee Working Group on Meteorology project titled Development of Regional Radar Network.
Figure 2.1 Radar composite imagery provided by the NTP website (URL: https://tynwp-web.kishou.go.jp/Analysis/Radar/index.html)

9
2.5.2 Update of Forecast Circle Radii based on GEPS
In January 2017 JMA began to operate the Global Ensemble Prediction System (GEPS), which replaced the Typhoon Ensemble Prediction System (TEPS) along with the introduction of an upgraded forecast model, a revision of the initial perturbation production method and other updates. Verification results showed a consequent positive impact on TC track forecasts, including a reduction of track forecast errors for 24- to 120-hour forecasts and a mitigation of spread deficiencies for 96- to 120-hour forecasts.
Based on recent forecast results obtained using GEPS, the forecast circle radius for 96- to 120-hour forecasts was updated in June 2017, starting with STS Nanmadol (1703). Changes in the radius calculated using GEPS for forecast times were smoother than those of TEPS, reflecting changes in model characteristics. As a result, the issue of rapid radius expansion in 72- to 96-hour forecasts was mitigated as shown in Figure 2.2.
0
100
200
300
400
500
24 48 72 96 120
Radi
us o
f pro
babi
lity
circ
les (
nm)
FT
Radius for TEPS for direction Other
Other; ≤10kt; ABOther; >10kt; ABOther; ≤10kt; B'Other; <10kt; B'Other; ≤10kt; COther; <10kt; C
0
100
200
300
400
500
24 48 72 96 120
Radi
us o
f pro
babi
lity
circ
les(
nm)
FT
Radius for GEPS for direction Other
Other; ≤10kt; ABOther; >10kt; ABOther; ≤10kt; B'Other; <10kt; B'Other; ≤10kt; COther; <10kt; C
0
100
200
300
400
500
24 48 72 96 120
Radi
us o
f pro
babi
lity
circ
les (
nm)
FT
Radius for TEPS for direction NW
NW; ≤10k; ABNW; >10kt; ABNW; ≤10k; CNW; >10kt; C
0
100
200
300
400
500
24 48 72 96 120
Radi
us o
f pro
babi
lity
circ
les (
nm)
FT
Radius for GEPS for direction NW
NW; ≤10k; ABNW; >10kt; ABNW; ≤10k; B'NW; >10kt; B'NW; ≤10k; CNW; >10kt; C
Figure 2.2 Changes in radius for forecast times with TEPS (left) and GEPS (right) (top: NW; bottom: Other in the direction of TC movement)

10
Chapter 3
Summary of the 2017 Typhoon Season In 2017, 27 TCs of tropical storm (TS) intensity or higher formed over the western North Pacific and
the South China Sea. This is close to the climatological normal* frequency of 25.6. Among these 27 TCs, 11 reached typhoon (TY) intensity, 6 reached severe tropical storm (STS) intensity and 10 reached TS intensity (Table 3.1).
* Climatological normal is based on data for the period from 1981 to 2010.
3.1 Atmospheric and Oceanographic Conditions in the Tropics In the western equatorial Pacific, positive sea surface temperature (SST) anomalies continued in
areas other than near the date line in 2017. In association with these anomalies, tropical convective activity was enhanced around the Maritime Continent and suppressed over the central equatorial Pacific. Negative SST anomalies over the central equatorial Pacific were strengthened, indicating the occurrence of La Niña conditions from autumn onward.
Table 3.1 List of tropical cyclones reaching TS intensity or higher in 2017
(UTC) lat (N) long (E) (hPa) (kt)TS Muifa (1701) 251800 Apr - 270600 Apr 251800 13.1 136.0 1002 35STS Merbok (1702) 110000 Jun - 130000 Jun 121200 22.0 114.4 985 55STS Nanmadol (1703) 020000 Jul - 050000 Jul 030600 27.7 125.0 985 55STS Talas (1704) 150600 Jul - 171200 Jul 161800 18.5 105.6 985 50TY Noru (1705) 201200 Jul - 081200 Aug 310000 22.8 140.4 935 95TS Kulap (1706) 210600 Jul - 251800 Jul 230600 30.8 166.5 1002 40TS Roke (1707) 220600 Jul - 230600 Jul 221200 21.6 117.9 1002 35TS Sonca (1708) 230000 Jul - 251200 Jul 241800 16.9 109.5 994 35TY Nesat (1709) 251800 Jul - 301200 Jul 281800 21.7 123.5 960 80TS Haitang (1710) 281800 Jul - 310600 Jul 300600 21.9 120.3 985 45TS Nalgae (1711) 020000 Aug - 051800 Aug 050600 34.2 162.1 990 45TY Banyan (1712) 111200 Aug - 170600 Aug 130000 21.0 164.1 955 80TY Hato (1713) 201200 Aug - 241200 Aug 230000 21.6 114.4 965 75STS Pakhar (1714) 241800 Aug - 271800 Aug 270000 21.8 113.4 985 55TY Sanvu (1715) 280600 Aug - 031200 Sep 312100 27.5 141.8 955 80STS Mawar (1716) 311800 Aug - 040000 Sep 020000 21.0 117.4 990 50TS Guchol (1717) 051800 Sep - 061800 Sep 051800 20.3 121.1 1000 35TY Talim (1718) 091200 Sep - 171800 Sep 140000 26.6 124.6 935 95TY Doksuri (1719) 121200 Sep - 160000 Sep 141200 17.0 109.8 955 80TY Khanun (1720) 121200 Oct - 160000 Oct 150000 20.2 114.7 955 75TY Lan (1721) 151800 Oct - 230000 Oct 211800 25.6 133.3 915 100STS Saola (1722) 241200 Oct - 291200 Oct 271800 24.2 128.3 975 60TY Damrey (1723) 020000 Nov - 041800 Nov 030600 12.7 112.6 970 70TS Haikui (1724) 100000 Nov - 120600 Nov 110000 17.6 116.2 998 40TS Kirogi (1725) 180000 Nov - 190000 Nov 180000 11.5 115.2 1000 35TS Kai-tak (1726) 140000 Dec - 211200 Dec 150600 11.7 127.8 994 40TY Tembin (1727) 201800 Dec - 251200 Dec 240000 8.1 114.7 970 70
Tropical Cyclone Duration (UTC) Minimum Central Pressure Max Wind(TS or higher)

11
Corresponding to the positive SST anomalies and associated enhanced convective activity, lower-level cyclonic circulation anomalies were seen from the eastern Indian Ocean to the Maritime Continent in winter 2016/2017 and from autumn 2017. Suppression of convective activity and related lower-level anti-cyclonic circulation anomalies were observed from the southern part of the East China Sea to the seas east of the Philippines in June and August. Asian summer monsoon activity was enhanced and a deep monsoon trough was clearly observed from the South China Sea to the seas east of the Philippines in July. These conditions are considered to have been associated with an increased incidence of temporally coinciding TCs.
Figure 3.1 shows monthly mean streamlines and related anomalies at 850 hPa, Outgoing Longwave
Radiation (OLR) and related anomalies (with lower OLR values corresponding to stronger convective activity) in July 2017 and the tracks of TCs forming during the month, when convective activity was enhanced from the South China Sea to the seas east of the Philippines. It can be seen that six named TCs formed in the area of 100 – 130˚E in association with strong convective activity.
To highlight atmospheric and oceanographic conditions, charts showing monthly mean SST
anomalies for the western North Pacific and the South China Sea, monthly mean streamlines at 850 and 200 hPa and OLRs and related anomalies for the months from January to December are included on the DVD provided with this report.
3.2 Tropical Cyclones in 2017 A total of 27 named TCs formed over the western North Pacific and the South China Sea in 2017.
Monthly and the climatological normal numbers of TC formations are shown in Figure 3.2, and the tracks of the 27 TCs are shown in Figure 3.3. Figure 3.4 shows the genesis points of the 27 TCs (dots) and related frequency distribution for past years (1951 – 2016).
As many as eight named TCs formed in July, which was a joint-record high (along with July 1971)
since the Center began keeping TC statistics in 1951. Four of these formed over the South China Sea, two east of the Philippines and two east of Minamitorishima Island. During the month, SSTs were high in these areas and convection was active, partly because of the phase of the Madden-Julian Oscillation (MJO), to
Figure 3.1 Monthly mean streamlines (lines with arrows) and OLR (shading) (left) and related anomalies (right) at 850 hPa for July 2017. The tracks of the eight named TCs forming in July are superimposed in red onto both figures.

12
which the large number of TC formation could be attributed. The monthly and annual frequencies of named TCs forming since 1951 are detailed in Appendix 4.
The mean genesis point of the named TCs forming in summer (June to August) was at 19.7˚N and
134.5˚E, with almost no deviation from the 30-year summer average** (18.4˚N and 135.9˚E). That of named TCs forming in autumn (September to November) was 14.6˚N and 126.0˚E, representing a significant westward deviation from the 30-year autumn average** (15.9˚N and 137.8˚E), which contributed to a westward deviation of the annual average. The autumn deviation can be attributed to the incidence of higher sea surface temperatures east of the Philippines throughout autumn in association with the La Niña event that started in early autumn and active convection caused by warm seas. In contrast, convection was inactive in the middle of the Pacific Ocean, contributing to the lower number of TC formations in the area. As a result, more TCs formed around the Philippines and contributed to the westward deviation of the mean genesis point for named TCs forming in 2017.
The mean duration of TCs sustaining TS intensity or higher was 4.3 days, which was shorter than the
30-year average** (5.3 days). As TCs forming near and moving toward land are considered unlikely to maintain their intensity for a long time, the westward deviation of the mean genesis point for named TCs may have contributed to the short mean duration over the Center’s area of responsibility, which covers the continent in the western part of the area.
** The 30-year averaging period is from 1981 to 2010
Detailed descriptions of each TC forming in 2017 are included on the DVD provided with this
report.
Figure 3.2 Monthly number of TC formations for 2017 compared to the climatological normal
0
1
2
3
4
5
6
7
8
9
1 2 3 4 5 6 7 8 9 10 11 12
number
month
2017 Average (1981-2010)

13
Figure 3.3 Tracks of the 27 named TCs forming in 2017. TC tracks for those with an intensity of TS or higher are shown.
Figure 3.4 Genesis points of the 27 TCs forming in 2017 (dots) and related frequency distribution for 1951 – 2016 (lines). Red and blue crosses show the mean genesis points of TCs forming in 2017 and the 30-year average period (1981 – 2010), respectively.

14
Chapter 4
Verification of Forecasts in 2017
4.1 Verification of Operational Forecasts Operational forecasts for the 27 TCs of TS intensity or higher that formed in 2017 were verified
using RSMC TC best track data. The verified elements were forecasts of the center position (up to five days ahead), central pressure and maximum sustained wind (up to three days ahead). The position and intensity errors of operational forecasts for each TC forming in 2017 are indicated in Appendix 3.
4.1.1 Center Position
Figure 4.1 shows annual mean errors in TC track forecasts covering periods of 24 hours (since 1982),
48 hours (since 1989), 72 hours (since 1997), 96 hours and 120 hours (since 2009). It can be seen that operational TC track forecasts have steadily improved since 1982, although year-to-year fluctuations are seen due in part to differences in TC characteristics. The improvement observed since 2015 is partially attributed to the introduction of the consensus method for operational forecasts in that year. The errors in 2017 were 82, 151, 248, 335 and 420 km for 24-, 48-, 72-, 96- and 120-hour forecasts, respectively.
The details of errors for each TC forming in 2017 are summarized in Table 4.1. For TCs with mean
position errors up to 72 hours ahead, the 24-, 48- and 72-hour forecasts for Kulap (1706), which moved from west of the Midway Islands to east of Japan, and Banyan (1712), which moved from southeast of Wake Island to south of the Aleutian Islands, were characterized by large errors. Meanwhile, forecasts for Nalgae (1711) and Mawar (1716) showed relatively small errors. The 96- and/or 120-hour forecasts for Nesat (1709), which moved from east of the Philippines to southeastern China across Taiwan Island, and Talim (1718), which moved northwestward east of the Philippines and then northeastward, causing damage to Japan, showed large errors, while forecasts for Saola (1722) and Kai-tak (1726) exhibited relatively small errors.
Figure 4.1 Annual mean position errors in 24-, 48-, 72-, 96- and 120-hour operational track forecasts

15
The position errors were also compared with those determined using the persistency (PER) method*. The ratios of EO (i.e., the position errors of operational forecasts) to EP (the position errors of PER method forecasts) as percentages are also shown in Table 4.1. An EO/EP value smaller/greater than 100% indicates that the operational forecast was better/worse than the PER method forecast. The annual mean EO/EP ratios for 24-, 48-, 72-, 96- and 120-hour forecasts in 2017 were 30% (32% in 2016), 24% (26%), 22% (26%), 22% (23%) and 24% (24%), respectively. Figure 4.2 shows a histogram of 24-hour forecast position errors. About 91% (89% in 2016) of 24-hour forecasts, 92% (92%) of 48-hour forecasts, 91% (91%) of 72-hour forecasts, 80% (86%) of 96-hour forecasts and 81% (72%) of 120-hour forecasts had errors of less than 150, 300, 450, 500 and 600 km, respectively.
* The PER method is based on the assumption that a TC holds the same movement throughout the forecast period,
and linear extrapolation for the latest 12-hour track of the TC is applied to create TC track forecasts. Position errors
with the PER method are used to evaluate the relative performance of operational forecasts and model predictions. Table 4.2 presents the mean hitting ratios and radii of 70% probability circles** provided in
operational forecasts for each TC forming in 2017. The term hitting ratio here is used to describe the ratio of the number of 70% probability circles within which the actual TC center fell to the total number of circles. The annual mean radius of circles provided in 24-hour position forecasts was 112 km (112 km in 2016), and their hitting ratio was 78% (78%). The corresponding values for 48-hour forecasts were 206 km (207 km in 2016) and 79% (79%), those for 72-hour forecasts were 299 km (290 km in 2016) and 75% (79%), those for 96-hour forecasts were 418 km (409 km in 2016) and 68% (78%), and those for 120-hour forecasts were 552 km (510 km in 2016) and 75% (69%).
** Probability circle: a circular range in which a TC is expected to be located with a probability of 70% at each
forecast time
Table 4.1 Mean position errors of 24-, 48-, 72-, 96- and 120-hour operational forecasts for each TC forming in 2017. S.D., EO, EP, and EO/EP represent the standard deviation of operational forecast position error, the operational forecast position error, the position error with the PER method and the ratio of EO to EP, respectively.
Mean S.D. Num. EO/EP Mean S.D. Num. EO/EP Mean S.D. Num EO/EP Mean S.D. Num EO/EP Mean S.D. Num EO/EP(km) (km) (%) (km) (km) (%) (km) (km) (%) (km) (km) (%) (km) (km) (%)
TS Muifa (1701) 101 22 2 - - - 0 - - - 0 - - - 0 - - - 0 -STS Merbok (1702) 116 59 4 53 - - 0 - - - 0 - - - 0 - - - 0 -STS Nanmadol (1703) 109 17 8 16 470 153 4 28 - - 0 - - - 0 - - - 0 -STS Talas (1704) 66 30 5 38 182 0 1 - - - 0 - - - 0 - - - 0 -TY Noru (1705) 71 42 72 30 113 50 67 17 196 73 62 18 316 129 58 21 426 167 54 24TS Kulap (1706) 127 101 14 34 231 111 10 34 430 132 6 31 651 119 2 - - - 0 -TS Roke (1707) - - 0 - - - 0 - - - 0 - - - 0 - - - 0 -TS Sonca (1708) 107 17 6 53 145 23 2 - - - 0 - - - 0 - - - 0 -TY Nesat (1709) 90 54 15 49 173 69 10 53 367 96 5 63 1038 0 1 148 - - 0 -TS Haitang (1710) 183 79 4 41 - - 0 - - - 0 - - - 0 - - - 0 -TS Nalgae (1711) 38 22 11 23 104 81 7 41 128 44 3 17 - - 0 - - - 0 -TY Banyan (1712) 99 45 19 31 221 137 15 30 424 304 11 32 242 66 3 18 - - 0 -TY Hato (1713) 69 44 12 41 125 71 8 21 144 39 4 11 - - 0 - - - 0 -STS Pakhar (1714) 110 85 8 49 211 103 4 35 - - 0 - - - 0 - - - 0 -TY Sanvu (1715) 99 43 21 21 170 82 17 15 248 67 13 15 306 136 9 15 303 64 5 53STS Mawar (1716) 45 15 9 29 42 26 5 22 54 0 1 - - - 0 - - - 0 -TS Guchol (1717) - - 0 - - - 0 - - - 0 - - - 0 - - - 0 -TY Talim (1718) 73 25 29 35 152 72 25 32 305 140 21 34 464 205 17 33 610 284 13 31TY Doksuri (1719) 76 50 10 40 200 54 6 52 403 128 2 - - - 0 - - - 0 -TY Khanun (1720) 91 38 10 20 149 37 6 14 198 47 2 - - - 0 - - - 0 -TY Lan (1721) 85 32 25 27 121 58 21 20 193 112 17 21 276 237 13 23 285 258 9 16STS Saola (1722) 74 32 16 22 188 130 12 28 269 146 8 23 168 112 4 3 - - 0 -TY Damrey (1723) 40 23 7 33 105 44 3 15 - - 0 - - - 0 - - - 0 -TS Haikui (1724) 65 16 5 21 46 0 1 - - - 0 - - - 0 - - - 0 -TS Kirogi (1725) - - 0 - - - 0 - - - 0 - - - 0 - - - 0 -TS Kai-tak (1726) 67 51 8 23 67 11 2 - - - 0 - 186 17 2 19 254 44 6 15TY Tembin (1727) 94 30 15 59 148 50 11 53 236 78 7 35 287 92 3 22 - - 0 -
82 50 335 30 151 98 237 24 248 148 162 22 335 187 112 22 420 216 87 24
96-hour Forecast 120-hour Forecast
Annual Mean (Total)
Tropical Cyclone 24-hour Forecast 48-hour Forecast 72-hour Forecast

16
Table 4.2 Mean hitting ratios (%) and radii (km) of 70% probability circles provided in 24-, 48-, 72-, 96- and 120-hour operational forecasts for each TC forming in 2017
Figure 4.2 Histogram of 24-hour forecast position errors in 2017 (Histograms for 48-, 72-, 96- and 120-hour forecasts are included on the DVD provided with this report).
0 20 40 60 80 100 120 140
550- 600
500- 550
450- 500
400- 450
350- 400
300- 350
250- 300
200- 250
150- 200
100- 150
50- 100
0- 50
Error (km)
Number of Cases
Ratio Num. Radius Ratio Num. Radius Ratio Num. Radius Ratio Num. Radius Ratio Num. Radius(%) (km) (%) (km) (%) (km) (%) (km) (%) (km)
TS Muifa (1701) 100 2 148 - 0 - - 0 - - 0 - - 0 -STS Merbok (1702) 75 4 130 - 0 - - 0 - - 0 - - 0 -STS Nanmadol (1703) 100 8 162 25 4 315 - 0 - - 0 - - 0 -STS Talas (1704) 100 5 104 100 1 204 - 0 - - 0 - - 0 -TY Noru (1705) 88 72 111 94 67 196 90 62 288 71 58 404 78 54 551TS Kulap (1706) 57 14 105 30 10 176 17 6 241 0 2 296 - 0 -TS Roke (1707) - 0 - - 0 - - 0 - - 0 - - 0 -TS Sonca (1708) 50 6 111 100 2 264 - 0 - - 0 - - 0 -TY Nesat (1709) 73 15 114 60 10 194 0 5 241 0 1 444 - 0 -TS Haitang (1710) 25 4 148 - 0 - - 0 - - 0 - - 0 -TS Nalgae (1711) 100 11 101 86 7 188 100 3 247 - 0 - - 0 -TY Banyan (1712) 68 19 117 73 15 257 55 11 407 100 3 556 - 0 -TY Hato (1713) 83 12 108 88 8 204 100 4 259 - 0 - - 0 -STS Pakhar (1714) 50 8 111 50 4 204 - 0 - - 0 - - 0 -TY Sanvu (1715) 62 21 114 76 17 217 85 13 339 78 9 430 100 5 604STS Mawar (1716) 100 9 95 100 5 176 100 1 241 - 0 - - 0 -TS Guchol (1717) - 0 - - 0 - - 0 - - 0 - - 0 -TY Talim (1718) 90 29 115 72 25 214 52 21 300 41 17 411 38 13 554TY Doksuri (1719) 70 10 104 83 6 199 0 2 250 - 0 - - 0 -TY Khanun (1720) 60 10 100 83 6 185 50 2 241 - 0 - - 0 -TY Lan (1721) 80 25 113 90 21 205 94 17 305 77 13 412 78 9 537STS Saola (1722) 88 16 122 58 12 211 75 8 347 100 4 648 - 0 -TY Damrey (1723) 100 7 103 100 3 185 - 0 - - 0 - - 0 -TS Haikui (1724) 80 5 93 100 1 176 - 0 - - 0 - - 0 -TS Kirogi (1725) - 0 - - 0 - - 0 - - 0 - - 0 -TS Kai-tak (1726) 63 8 100 100 2 176 - 0 - 100 2 389 100 6 537TY Tembin (1727) 60 15 106 73 11 201 86 7 257 67 3 370 - 0 -
78 335 112 79 237 206 75 162 299 68 112 418 75 87 552
96-hour Forecast 120-hour Forecast
Annual Mean (Total)
Tropical Cyclone 24-hour Forecast 48-hour Forecast 72-hour Forecast

17
4.1.2 Central Pressure and Maximum Wind Speed Figure 4.3 shows annual means of root mean square errors (RMSEs) for TC central pressure
forecasts covering periods of 24 hours, 48 hours (since 2001) and 72 hours (since 2003). The values for maximum wind speed forecasts are included on the DVD provided with this report. They both show long-awaited improvements in operational TC intensity forecasts for 2017. This is partially attributed to the experimental use of the statistical intensity prediction scheme (TIFS).
Table 4.3 gives the RMSEs of 24-, 48- and 72-hour operational central pressure forecasts for each
TC forming in 2017. RMSE data for maximum wind speed forecasts are included on the DVD provided with this report. The annual mean RMSEs of central pressure and maximum wind speed for 24-hour forecasts were 10.1 hPa (14.6 hPa in 2016) and 5.0 m/s (6.5 m/s). For 48-hour forecasts, the corresponding values were 14.9 hPa (21.5 hPa in 2016) and 6.8 m/s (8.9 m/s), while those for 72-hour forecasts were 16.9 hPa (23.4 hPa in 2016) and 7.8 m/s (10.0 m/s).
Figure 4.4 shows a histogram of maximum wind speed errors for 24-hour forecasts. Approximately
56% (46% in 2016) of 24-hour forecasts had errors of less than ±3.75 m/s, with figures of ±6.25 m/s for 68% (51%) of 48-hour forecasts and ±6.25 m/s for 60% (52%) of 72-hour forecasts.
Figure 4.3 Annual RMSEs in 24-, 48- and 72-hour operational central pressure forecasts

18
Table 4.3 Mean intensity errors of 24-, 48- and 72-hour operational central pressure forecasts for each TC forming in 2017
Figure 4.4 Histogram of 24-hour forecast maximum wind speed errors in 2017 (Histograms for 48- and 72-hour forecasts are included on the DVD provided with this report).
Error RM SE Num. Error RM SE Num. Error RMSE Num.(hPa) (hPa) (hPa) (hPa) (hPa) (hPa)
TS Muifa (1701) -2.0 2.0 2 - - 0 - - 0STS Merbok (1702) 9.3 9.6 4 - - 0 - - 0STS Nanmadol (1703) 5.1 5.9 8 8.0 8.0 4 - - 0STS Talas (1704) 2.6 3.4 5 4.0 4.0 1 - - 0TY Noru (1705) -1.9 11.0 72 -4.1 16.2 67 -5.4 18.5 62TS Kulap (1706) -0.6 3.6 14 -0.4 3.5 10 -1.3 5.2 6TS Roke (1707) - - 0 - - 0 - - 0TS Sonca (1708) 3.0 3.2 6 6.0 6.0 2 - - 0TY Nesat (1709) 5.5 9.6 15 9.1 11.3 10 -2.0 11.4 5TS Haitang (1710) 6.8 7.0 4 - - 0 - - 0TS Nalgae (1711) 0.4 2.3 11 -2.1 4.1 7 2.0 2.6 3TY Banyan (1712) 6.5 15.8 19 5.1 17.8 15 6.6 22.0 11TY Hato (1713) 0.3 6.9 12 8.1 11.6 8 6.3 6.9 4STS Pakhar (1714) -3.6 6.6 8 -8.0 10.7 4 - - 0TY Sanvu (1715) -4.0 9.0 21 -5.3 9.5 17 -4.2 6.9 13STS Mawar (1716) -3.1 4.0 9 -6.4 6.7 5 -15.0 15.0 1TS Guchol (1717) - - 0 - - 0 - - 0TY Talim (1718) -3.1 11.9 29 -4.8 17.9 25 8.3 16.0 21TY Doksuri (1719) 12.1 16.5 10 16.7 20.4 6 -15.5 16.4 2TY Khanun (1720) 4.2 10.1 10 4.2 13.4 6 -12.5 14.6 2TY Lan (1721) -3.7 12.9 25 -8.3 22.5 21 -14.1 23.9 17STS Saola (1722) 1.9 7.9 16 1.8 9.2 12 -0.6 4.0 8TY Damrey (1723) 6.6 8.4 7 -1.0 6.6 3 - - 0TS Haikui (1724) -6.8 6.9 5 -17.0 17.0 1 - - 0TS Kirogi (1725) - - 0 - - 0 - - 0TS Kai-tak (1726) -0.5 2.6 8 -4.0 4.5 2 - - 0TY Tembin (1727) 5.3 9.8 15 8.2 12.1 11 8.9 15.7 7
0.5 10.1 335 -1.1 14.9 237 -2.4 16.9 162
Tropical Cyclone 24-hour Forecast 48-hour Forecast 72-hour Forecast
Annual Mean (Total)
0 10 20 30 40 50 60 70 80
18.75 - 21.2516.25 - 18.7513.75 - 16.2511.25 - 13.758.75 - 11.256.25 - 8.753.75 - 6.251.25 - 3.75-1.25 - 1.25-3.75 - -1.25-6.25 - -3.75-8.75 - -6.25-11.25 - -8.75-13.75 - -11.25-16.25 - -13.75-18.75 - -16.25-21.25 - -18.75
Number of Cases
Error (m/s)

19
4.2 Verification of Numerical Models (GSM, GEPS) The Global Spectral Model (GSM) and the Global Ensemble Prediction System (GEPS) provide
primary information for use by JMA forecasters in making operational TC track and intensity forecasts. The details of GSM and GEPS and information on recent related improvements are given in Appendix 6. GSM and GEPS predictions were verified with RSMC TC best track data and predictions using the persistency (PER) method. All TC forecast verifications were conducted for both systems.
4.2.1 GSM Prediction
1) Center Position
GSM annual mean position errors observed since 1997 are presented in Figure 4.5. In 2017, the
annual mean errors for 30-, 54- and 78-hour* predictions were 106 km (107 km in 2016), 182 km (190 km) and 300 km (301 km), respectively. The mean position errors of 18-, 30-, 42-, 54-, 66- and 78-hour predictions for each TC are given in Table 4.4.
* 30-, 54- and 78-hour GSM predictions are used as primary information by forecasters creating 24-, 48- and
72-hour operational forecasts, respectively.
Figure 4.5 GSM annual mean position errors since 1997

20
Table 4.5 shows relative GSM performance compared with results obtained using the PER method.
In this comparison, TCs were classified into the three life stages of before, during and after recurvature. The definition of the stages is based on the direction of movement of each TC at individual prediction times (Figure 4.6). The table indicates that GSM results outperformed those of the PER method throughout the forecast period beyond 18 hours from the initial time, and that the ratios of error reduction for the GSM compared to the PER method were about 58% (55% in 2016), 67% (64%), 72% (68%) and 70% (69%) for 18-, 30-, 54- and 78-hour predictions, respectively.
About 80% (78% in 2016) of 30-hour predictions had errors of less than 150 km, while 88% (83%) of 54-hour predictions had errors of less than 300 km, and 82% (85%) of 78-hour predictions had errors of less than 450 km. Histograms showing the position errors of 30-, 54- and 78-hour predictions are included on the DVD provided with this report.
Table 4.4 GSM mean position errors (km) for each TC forming in 2017. The number of samples is given in parentheses.
TS MUIFA (1701) 125.1 (11) 185.6 (9) 277.0 (7) 325.7 (5) 347.7 (3) 342.6 (1)
STS MERBOK (1702) 56.2 (5) 85.4 (3) - (-) - (-) - (-) - (-)
STS NANMADOL (1703) 78.6 (10) 137.9 (8) 238.0 (5) 367.1 (2) - (-) - (-)
STS TALAS (1704) 63.9 (9) 93.3 (7) 145.8 (5) 203.3 (2) 275.3 (1) - (-)
TY NORU (1705) 60.2 (78) 86.5 (76) 105.8 (74) 129.2 (72) 172.1 (70) 230.0 (68)
TS KULAP (1706) 82.6 (17) 87.5 (12) 118.7 (9) 207.4 (7) 299.7 (5) 427.3 (4)
TS ROKE (1707) - (-) - (-) - (-) - (-) - (-) - (-)
TS SONCA (1708) 69.0 (13) 116.2 (11) 193.2 (8) 243.6 (4) 213.6 (1) - (-)
TY NESAT (1709) 87.1 (18) 120.9 (16) 171.2 (14) 241.9 (12) 349.9 (10) 495.1 (8)
TS HAITANG (1710) 64.8 (4) - (-) - (-) - (-) - (-) - (-)
TS NALGAE (1711) 62.9 (20) 73.4 (18) 98.8 (16) 126.8 (14) 163.1 (12) 182.7 (10)
TY BANYAN (1712) 61.1 (21) 86.6 (19) 113.3 (17) 160.7 (15) 197.5 (11) 271.0 (9)
TY HATO (1713) 53.9 (15) 85.7 (13) 131.0 (11) 179.6 (9) 152.5 (5) 119.9 (2)
STS PAKHAR (1714) 133.7 (10) 214.6 (8) 317.6 (6) 433.3 (4) 615.3 (2) - (-)
TY SANVU (1715) 78.5 (26) 109.1 (24) 135.3 (22) 171.2 (20) 213.8 (18) 265.9 (16)
STS MAWAR (1716) 82.8 (13) 88.3 (11) 94.2 (9) 83.6 (7) 96.3 (5) 125.9 (3)
TS GUCHOL (1717) 89.6 (7) 115.7 (5) 147.8 (4) 94.5 (1) - (-) - (-)
TY TALIM (1718) 44.5 (34) 67.9 (33) 104.9 (31) 164.5 (29) 243.4 (27) 331.6 (25)
TY DOKSURI (1719) 105.2 (16) 108.1 (11) 172.9 (9) 270.4 (7) 381.2 (5) 574.8 (3)
TY KHANUN (1720) 95.1 (15) 109.9 (13) 116.5 (11) 143.3 (9) 204.5 (7) 256.7 (5)
TY LAN (1721) 74.1 (29) 116.6 (27) 152.4 (25) 179.1 (23) 187.2 (21) 235.8 (19)
STS SAOLA (1722) 111.1 (27) 187.2 (25) 275.8 (23) 411.3 (21) 558.8 (19) 768.8 (17)
TY DAMREY (1723) 51.5 (11) 83.5 (9) 116.0 (7) 182.6 (5) 253.3 (3) 323.1 (1)
TS HAIKUI (1724) 88.0 (9) 108.5 (7) 116.4 (5) 124.6 (3) 164.1 (1) - (-)
TS KIROGI (1725) 103.1 (2) - (-) - (-) - (-) - (-) - (-)
TS KAI-TAK (1726) 87.4 (30) 96.9 (28) 103.4 (26) 104.0 (24) 114.4 (22) 151.9 (20)
TY TEMBIN (1727) 101.4 (19) 128.9 (17) 143.3 (15) 184.9 (13) 241.3 (11) 333.5 (9)
77.1 (469) 106.3 (410) 140.5 (359) 181.6 (308) 230.1 (259) 300.0 (220)
T=54 T=66 T=78Tropical Cyclone
Annual Mean (Total)
T=18 T=30 T=42

21
2) Central Pressure and Maximum Wind Speed The mean errors of 30-, 54- and 78-hour GSM central pressure predictions in 2017 were +5.1 hPa
(+14.7 hPa in 2016), +5.0 hPa (+16.5 hPa) and +3.4 hPa (+16.5 hPa), respectively. Their root mean square errors (RMSEs) were 12.8 hPa (24.4 hPa in 2016) for 30-hour predictions, 16.4 hPa (27.6 hPa) for 54-hour predictions and 19.1 hPa (30.6 hPa) for 78-hour predictions. The biases for 30-, 54- and 78-hour maximum wind speed predictions were -5.5 m/s (-8.0 m/s in 2016) with a RMSE of 8.5 m/s (11.5 m/s), -5.8 m/s (-8.4 m/s) with a RMSE of 10.4 m/s (13.2 m/s) and -5.3 m/s (-8.1 m/s) with a RMSE of 11.4 m/s (14.4 m/s), respectively.
Figure 4.7 shows histograms of central pressure errors and maximum wind speed errors in 30-hour GSM predictions. It can be seen that the GSM has a small positive bias for central pressure prediction (left) and tends to underestimate the wind speed of TCs (right). This underestimation occurs because the model’s current horizontal resolution (about 20 km) is not fine enough to produce the TC core structure, especially
Table 4.5 Mean position errors (km) of GSM and PER method predictions for the 27 TCs forming in 2017 in the stages before, during and after recurvature. The number of samples is given in parentheses. IMPROV is the ratio of error reductions in GSM results to those observed using the PER method.
Figure 4.6 Definition of the stages before, during and after recurvature based on the direction of TC movement.
TIME MODEL
T=18 GSM 84.0 (280) 66.2 (96) 67.6 (93) 77.1 (469)PER 169.6 (280) 155.7 (96) 242.9 (93) 181.3 (469)IMPROV 50.5 % 57.5 % 72.2 % 57.5 %
T=30 GSM 109.5 (237) 96.9 (85) 106.7 (88) 106.3 (410)PER 290.2 (237) 290.8 (85) 433.9 (88) 321.2 (410)IMPROV 62.3 % 66.7 % 75.4 % 66.9 %
T=42 GSM 143.5 (202) 134.3 (75) 138.8 (82) 140.5 (359)PER 437.5 (202) 426.3 (75) 630.2 (82) 479.2 (359)IMPROV 67.2 % 68.5 % 78.0 % 70.7 %
T=54 GSM 183.9 (164) 177.8 (67) 180.1 (77) 181.6 (308)PER 610.0 (164) 526.8 (67) 806.1 (77) 640.9 (308)IMPROV 69.9 % 66.2 % 77.7 % 71.7 %
T=66 GSM 226.0 (131) 242.2 (54) 228.4 (74) 230.1 (259)PER 788.6 (131) 687.5 (54) 937.1 (74) 809.9 (259)IMPROV 71.3 % 64.8 % 75.6 % 71.6 %
T=78 GSM 278.0 (101) 349.4 (45) 300.0 (74) 300.0 (220)PER 920.7 (101) 959.6 (45) 1126.1 (74) 997.7 (220)IMPROV 69.8 % 63.6 % 73.4 % 69.9 %
Before During After All

22
when the TC is intense and small. In addition, relative frequencies of large positive central pressure errors and large negative wind speed errors decreased significantly in 2017 compared to those in previous years.
4.2.2 GEPS Prediction
1) Ensemble Mean Center Position GEPS took over the role of the Typhoon Ensemble Prediction System (TEPS), and has been
providing ensemble forecasts for TCs since January 2017. GEPS and TEPS annual mean position errors observed since 2008 are presented in Figure 4.8. In 2017, the mean position errors of GEPS ensemble mean forecasts for 30-, 54-, 78-, 102- and 126-hour predictions for each TC are given in Table 4.6. The annual means of ensemble mean position errors for 30-, 54-, 78-, 102- and 126-hour predictions were 114 km (106 km with the GSM), 193 km (182 km), 314 km (300 km), 436 km and 542 km, respectively.
Figure 4.7 Error distribution of GSM 30-hour intensity predictions in 2017. The figure on the left shows error distribution for central pressure, while the one on the right shows that for maximum wind speed (the error distributions of 54- and 78-hour predictions are included on the DVD provided with this report).
0 20 40 60 80 100 120
-40
-35
-30
-25
-20
-15
-10
-5
0
+5
+10
+15
+20
+25
+30
+35
+40
Number of Cases
Error(hPa)
30-hour GSM Predictions
for Central Pressure
0 20 40 60 80 100 120
-17.5
-15.0
-12.5
-10.0
-7.5
-5.0
-2.5
0
+2.5
+5.0
+7.5
+10.0
+12.5
+15.0
+17.5
Number of Cases
Error(m/s)
30-hour GSM Predictions
for Maximum Sustained Wind

23
2) Spread-Skill Relationship Although position errors of GEPS ensemble mean forecasts were larger than those of the GSM in
short-range forecasts, GEPS provides useful information on the reliability of TC track forecasts with its ensemble spread. Figure 4.9 shows the relationship between 6-hourly cumulative ensemble spreads in TC position forecasts and ensemble mean forecast position errors in 126-hour prediction. In an ideal EPS with a large number of samples, significant positional errors are observed when the ensemble spread is large. The figure shows that significant errors were seen in 2017 only when GEPS predicted large spreads.
Table 4.6 Mean position errors (km) of GEPS ensemble mean forecasts for each TC forming in 2017. The number of samples is given in parentheses.
Figure 4.8 GEPS and TEPS annual mean position errors since 2008
0
100
200
300
400
500
600
700
800
2008200920102011201220132014201520162017
Error (km) 126-hour
102-hour
78-hour
54-hour
30-hour
TS MUIFA (1701) 178.9 (7) 254.8 (3) - (-) - (-) - (-)STS MERBOK (1702) 59.6 (2) - (-) - (-) - (-) - (-)STS NANMADOL (1703) 192.5 (3) - (-) - (-) - (-) - (-)STS TALAS (1704) 95.0 (7) 249.2 (3) - (-) - (-) - (-)TY NORU (1705) 85.8 (76) 136.0 (72) 238.2 (68) 359.2 (64) 505.8 (59)TS KULAP (1706) 77.1 (12) 205.3 (7) 418.3 (4) 809.5 (1) - (-)TS ROKE (1707) - (-) - (-) - (-) - (-) - (-)TS SONCA (1708) 158.0 (9) - (-) - (-) - (-) - (-)TY NESAT (1709) 148.1 (16) 322.4 (12) 606.7 (8) 929.3 (4) - (-)TS HAITANG (1710) - (-) - (-) - (-) - (-) - (-)TS NALGAE (1711) 68.8 (18) 101.6 (14) 160.2 (10) 163.1 (6) 448.4 (2)TY BANYAN (1712) 113.8 (19) 183.5 (14) 371.3 (6) 695.8 (3) - (-)TY HATO (1713) 81.6 (13) 201.3 (9) 174.1 (1) - (-) - (-)STS PAKHAR (1714) 225.1 (8) 524.9 (4) - (-) - (-) - (-)TY SANVU (1715) 109.4 (24) 192.5 (20) 253.0 (16) 281.1 (12) 288.4 (8)STS MAWAR (1716) 114.8 (12) 98.2 (8) 140.0 (4) - (-) - (-)TS GUCHOL (1717) 134.2 (5) - (-) - (-) - (-) - (-)TY TALIM (1718) 71.1 (33) 165.2 (28) 326.8 (24) 472.0 (20) 550.0 (16)TY DOKSURI (1719) 120.9 (12) 291.7 (8) 605.8 (4) - (-) - (-)TY KHANUN (1720) 126.9 (13) 181.9 (9) 293.7 (5) 280.1 (1) - (-)TY LAN (1721) 128.9 (27) 211.4 (23) 305.7 (19) 443.4 (15) 560.0 (11)STS SAOLA (1722) 199.4 (25) 403.1 (21) 720.9 (17) 1044.5 (13) 1347.2 (9)TY DAMREY (1723) 78.3 (9) 171.5 (5) 315.2 (1) - (-) - (-)TS HAIKUI (1724) 129.5 (7) 179.9 (3) - (-) - (-) - (-)TS KIROGI (1725) - (-) - (-) - (-) - (-) - (-)TS KAI-TAK (1726) 98.7 (28) 117.0 (24) 175.5 (20) 258.9 (16) 277.2 (12)TY TEMBIN (1727) 150.8 (17) 195.0 (13) 324.5 (9) 347.8 (5) 454.0 (1)
113.5 (402) 192.7 (300) 314.2 (216) 436.2 (160) 541.6 (118)
T=102 T=126
All Mean (Total)
Tropical Cyclone T=30 T=54 T=78

24
To add reliability information to TC track forecasts, JMA has introduced a reliability index in which
the categories A, B and C represent the highest, middle and lowest levels of reliability, respectively. The index is based on the six-hourly cumulative ensemble spread at each forecast time. The category levels were set from the results of the pre-operational running of GEPS so that the category frequencies are 40%, 40% and 20%, respectively. Table 4.7 shows ensemble mean forecast errors classified with the reliability index. Theoretically, mean position errors with higher reliability should be smaller than those with lower reliability throughout forecast times with sufficient samples in an ideal EPS. The table shows that GEPS provides appropriate reliability information on 2017 TC track forecasts except for 78-hour predictions.
Figure 4.9 Relationship between six-hourly cumulative ensemble spread in TC position forecasts (km) and ensemble mean forecast position errors (km) in 126-hour predictions in 2017.
Table 4.7 Ensemble mean forecast position errors (km) in 2017 classified with six-hourly cumulative ensemble spread at each forecast time. The number of samples is given in parentheses.
0
500
1000
1500
2000
2500
3000
3500
4000
0 2000 4000 6000 8000
Position error (km)
Six-hourly cumulative ensemble spread (km)
T=30 88.3 (131) 112.1 (176) 129.9 (244)T=54 152.4 (127) 190.1 (99) 240.4 (96)T=78 272.6 (96) 271.0 (78) 402.6 (56)T=102 381.5 (71) 397.9 (68) 639.0 (27)T=126 471.1 (57) 525.6 (49) 916.1 (14)
A B CReliability Index
Time

25
4.3 Verification for Other Guidance Models The Center utilizes other guidance models in addition to JMA’s NWP models for operational TC
track and intensity forecasts, including global deterministic NWP models from eight other centers (BoM, CMA, CMC, DWD, ECMWF, KMA, NCEP and UKMO), global ensemble NWP models from three other centers (ECMWF, NCEP and UKMO) as provided via the NTP website, a regional deterministic model (HWRF) and various JMA intensity guidance models. Related predictions for center position (up to five days ahead), central pressure and maximum wind speed (up to three days ahead) were verified in consideration of availability time for RSMC TC best track data. Spread-skill relationships of ensemble model predictions were also verified.
4.3.1 Center Position
Table 4.8 shows mean center position errors of RSMC operational forecasts, nine global
deterministic model predictions, one regional deterministic model prediction and ensemble mean predictions from four global ensemble models. Examples from the consensus method are also shown, as the Center today mainly employs such a method involving the use of the mean of predicted TC positions from multiple global deterministic models. The effectiveness of this approach is seen in the tendency of related errors to be smaller than those of deterministic models, and errors in RSMC official forecasts based on the method were smaller than those of deterministic models for most forecast times. It can also be seen that the regional deterministic model produces smaller errors than global models for the first half of forecast times. Ensemble mean predictions from ECMWF, NCEP and UKMO ensemble models additionally exhibit smaller errors than the same centers’ deterministic models for most forecast times.
Mean Num. Mean Num. Mean Num. Mean Num. Mean Num.(km) (km) (km) (km) (km)
82 335 151 237 248 162 335 112 420 87JMA (GSM) 95 324 174 231 295 158 403 116 478 90BoM 142 293 218 210 349 147 476 106 541 84CMA 166 313 272 224 442 144 530 16 - 0CMC 139 315 223 218 320 152 452 111 622 82DWD 141 302 228 208 330 70 - 0 - 0ECMWF 89 268 172 183 279 127 366 94 393 75KMA 102 315 177 226 266 151 - 0 - 0NCEP 104 327 173 233 254 156 358 112 425 22UKMO 123 319 176 227 266 159 415 112 - 0EN 81 268 151 183 242 126 308 94 327 19JENU 85 328 149 234 230 161 317 115 400 78All 96 328 167 237 253 163 328 117 414 89
Regional deterministicmodel HWRF 92 318 142 224 227 152 379 108 451 85
JMA (GEPS) 105 329 187 232 316 164 425 120 496 91ECMWF 86 270 160 184 276 125 328 91 430 77NCEP 106 316 166 219 251 149 334 108 424 86UKMO 96 276 163 194 258 133 324 96 399 73
RSMC Operational
Global deterministicmodel
Consensus method withglobal deterministic
models
Ensemble mean of global ensemble
model
Prediction 48-hour 72-hour 96-hour 120-hour24-hour
Table 4.8 Mean position errors of various guidance models in 2017 As examples of the consensus method with global deterministic models, EN (ECMWF and NCEP), JENU (JMA, ECMWF, NCEP and UKMO) and All (all nine models) are shown.

26
4.3.2 Spread-Skill Relationship In addition to ensemble mean predictions from most ensemble models exhibiting smaller errors than
those of the same centers’ deterministic models, ensemble models (including multi- and single-ensemble types) provide useful information on the reliability of TC track forecasts with the related ensemble spread. Figure 4.10 shows relationships between the RMSE of the ensemble mean prediction and the spread for forecast times from each single-ensemble model and certain combinations of multi-ensemble models. It can be seen that the spread for all single ensembles is smaller than the RMSE, especially for longer forecast times, although the extent of the spread should be the same as the RMSE value. Meanwhile, the multi-ensemble RMSE is smaller than the single-ensemble value, and the multi-ensemble spread is closer to the RMSE value than that of single ensembles.
Figure 4.11 shows scatter diagrams indicating relationships between prediction errors and six-hourly
cumulative ensemble spreads for 96-hour forecasts with coloring based on reliability levels A, B and C, which are categorized for identical frequencies based on cumulative ensemble spreads at each forecast time, with lines showing the mean error for each level. Figure 4.12 shows relationships between mean errors and reliability levels for different forecast times. Although all single ensembles and multi-ensemble combinations exhibit a correlation between prediction errors and cumulative ensemble spreads, reverse correlations between mean errors and reliability levels are sometimes seen for the single-ensemble variety, while the same for the multi-ensemble variety is rarely seen. This indicates that multi-ensemble models provide more effective information on track forecast reliability.
Figure 4.10 Relationships between the RMSE (km) of ensemble mean prediction and spread (km) for forecast times for each single-ensemble model (top) and four combinations of multi-ensemble models (bottom) in 2017. The combinations are represented by the initials of the component models (e.g., JENU represents a multi-ensemble incorporating JMA, ECMWF, NCEP and UKMO).
JMA ECMWF NCEP
JENU
UKMO
JEN JEU ENU

27
4.3.3 Central Pressure and Maximum Wind Speed Table 4.9 shows mean central pressure errors in intensity guidance models; TIFS, LGEM (the
Logistic Growth Equation Model), SHIFOR (a guidance model based on climatology and persistence) and examples from the consensus method with intensity guidance models, in addition to the same predictions shown for TC track forecasts in Table 4.8. Values for maximum wind speed forecasts are included on the DVD provided with this report. The data show that global deterministic models, the consensus method and global ensemble models still need to improve in resolution for their direct use for TC intensity forecasts. Meanwhile, the regional deterministic model with higher resolution, intensity guidance model TIFS, RSMC
Figure 4.11 Relationships between prediction errors and cumulative ensemble spreads with coloring based on reliability levels A, B and C for 96-hour forecasts with each single-ensemble model (top) and four combinations (bottom) of multi-ensemble models in 2017. Lines show the mean error for each reliability level.
Figure 4.12 Relationships between mean errors and reliability levels for forecast times with each single-ensemble model and four combinations of multi-ensemble models in 2017.
JMA ECMWF NCEP UKMO
JENU JEN JEU ENU
JMA NCEP
JENU
ECMWF
JEU JEN
UKMO
ENU

28
operational forecasts based on TIFS data and the consensus method with intensity guidance models exhibit smaller errors and superior levels of skill than SHIFOR, which is used as the base for verification.
4.4 Verification of Storm Surge Prediction Storm surge predictions have been provided since 2011 via the Numerical Typhoon Prediction
website to Typhoon Committee Members within the framework of the Storm Surge Watch Scheme (SSWS) (for details of the storm surge model, refer to Hasegawa et al. (2012) on the RSMC Tokyo - Typhoon Center website). Verification of deterministic storm surge prediction was conducted on data from eight stations (Table 4.10) for which tide observation information is provided on the University of Hawaii Sea Level Center (UHSLC) database website (http://uhslc.soest.hawaii.edu/data/?fd) for all typhoons in 2017. Hourly hindcast data (from FT = -5 to FT = 0) and forecast data (from FT = 1 to FT = 72) were compared with observation data.
In addition, a multi-scenario prediction method was incorporated into the model in June 2016 to support the provision of more useful risk management information (Hasegawa et al., 2017). Verification of multi-scenario predictions was conducted on data from a station in Hong Kong for TY Hato (1713) and TY Khanun (1720).
Error RMSE Num. Error RMSE Num. Error RMSE Num.(hPa) (hPa) (hPa) (hPa) (hPa) (hPa)
0.5 10.1 335 -1.1 14.9 237 -2.4 16.9 162JMA (GSM) 6.2 14.1 324 5.4 17.8 231 2.9 20.9 158BoM 16.3 21.7 293 19.1 24.6 210 20.4 27.4 147CMA 7.4 14.8 313 6.8 17.8 224 5.8 19.9 144CMC 12.1 18.7 315 12.1 19.6 218 11.8 22.3 152DWD 9.4 16.0 302 9.3 18.4 208 9.2 21.9 70ECMWF -2.7 15.5 268 -5.5 19.6 183 -8.9 25.9 127KMA 5.0 13.8 315 3.5 15.8 226 2.6 20.2 151NCEP -3.1 16.4 327 -9.2 21.4 233 -15.8 27.8 156UKMO 4.6 14.0 319 4.3 15.9 227 2.3 19.2 159EN -3.3 15.4 268 -8.6 19.8 183 -13.7 25.2 126JENU 1.5 11.9 328 -0.4 15.0 234 -4.1 18.9 161All 6.5 13.0 328 5.7 14.9 237 3.3 17.3 163
Regional deterministicmodel HWRF -1.6 12.2 318 -3.0 15.6 224 -3.3 17.0 152
JMA (GEPS) 12.9 18.1 329 14.9 21.1 232 14.9 22.6 164ECMWF 5.0 13.4 270 6.5 16.2 184 9.0 19.0 124NCEP 15.9 21.0 316 17.3 22.2 219 17.1 22.6 149UKMO 5.3 13.3 276 4.0 15.0 194 2.5 18.9 133TIFS -0.5 10.4 324 -3.2 13.5 231 -5.4 16.2 158LGEM 0.7 11.7 324 -2.4 17.4 231 -5.0 20.2 157SHIFOR -0.9 12.0 333 -0.1 16.4 239 3.7 20.0 164JT 2.8 10.6 324 1.1 13.5 231 -1.2 16.0 158JHT 1.4 9.7 324 -0.2 12.4 231 -1.9 14.2 158JHTL 1.2 9.8 324 -0.8 12.9 231 -2.7 14.6 158HT -1.0 9.8 307 -3.0 12.9 216 -4.8 14.8 144
48-hour 72-hour
RSMC Operational
Intensity guidancemodel
Consensus method withintensity guidance
models
Ensemble mean of global ensemble
model
Prediction 24-hour
Global deterministicmodel
Consensus method withglobal deterministic
models
Table 4.9 Mean central pressure errors of various guidance models in 2017 Examples of the consensus method with intensity guidance models are represented by the initials of the components (JMA (GSM), HWRF, TIFS, LGEM).

29
Station Member 1 Quarry Bay QB Hong Kong 2 Langkawi LK Malaysia 3 Legaspi Port LG Philippines 4 Manila South Harbor ML Philippines 5 Subic Bay SB Philippines 6 Apra Harbor AP U.S.A. 7 Qui Nhon QN Viet Nam 8 Vung Tau VT Viet Nam
4.4.1 Deterministic Prediction
Storm surges of nearly a meter in height were observed in Quarry Bay (Hong Kong) in 2017 (Table
4.11). Figure 4.13 shows a scatter diagram of model storm surges (hindcast and forecast) against observation data. The root mean square errors (RMSEs; unit: m) were 0.081 (hindcast) and 0.082 (forecast), and the correlations were 0.35 and 0.34, respectively. Forecast data tended to overestimate storm surges because the typhoon bogus, which expresses wind and pressure fields based on parametric TC modeling, does not incorporate consideration of structural changes and wind reduction caused by land topography.
Table 4.10 Stations used for verification
T1701 T1702 T1703 T1704 T1705 T1706 T1707 T1708 T1709 T1710QB 0.07 0.21 0.24 0.16 0.13 0.16 0.24 0.24LK 0.10 0.07 -0.01 0.09 0.13 0.13 0.11 0.11 0.13 0.11LG 0.06 0.02 0.09 0.04 0.12 0.07 0.03 0.07 0.10 0.06ML 0.06 0.04 0.01 0.01 0.22 0.10 0.04 0.08 0.22 0.18SB 0.01 0.00 0.02 0.05 0.13 0.07 0.02 0.06 0.13 0.13AP 0.05 0.03 0.05 -0.03 0.15 0.07 0.06 0.07 0.12 0.14QN 0.03 0.10 0.05 0.15 0.21 0.21 0.19 0.21 0.21 0.17VT 0.07 0.01 0.13 0.12 0.20 0.19 0.12 0.14 0.20 0.09
T1711 T1712 T1713 T1714 T1715 T1716 T1717 T1718 T1719 T1720QB -0.01 -0.10 0.95 0.64 0.27 0.27 0.01 0.28 0.28 0.90LK 0.05 0.17 0.15 0.17 0.08 0.04 0.06 0.34 0.34 0.01LG 0.12 0.08 0.17 0.08 0.11 0.07 0.06 0.15 0.09 0.19ML 0.07 0.01 0.12 0.07 0.14 0.12 -0.02 0.19 0.12 0.31SB 0.07 0.06 0.07 0.06 0.10 0.07 0.21AP 0.12 0.17 0.13 0.12 0.15 0.15 0.10 0.10 0.10 0.14QN 0.02 -0.08 0.04 0.09 0.06 0.06 0.00 0.15 0.13 0.19VT 0.13 0.14 0.17 0.18 0.17 0.04 0.07 0.13 0.07 0.21
T1721 T1722 T1723 T1724 T1725 T1726 T1727QB 0.30 0.25 0.34 0.20 0.12 0.20 0.18LK 0.21 0.07 0.11 0.05 0.06 0.06 0.11LG 0.12 0.13 0.14 0.05 0.08 0.30 0.21ML 0.19 0.12 0.13 0.13 0.11 0.10 0.14SB 0.13 0.09 0.14 0.10 0.05 0.07 0.12AP 0.09 0.09 0.13 0.06 0.15 0.09QN 0.20 0.14 0.25 0.16 -0.01 0.12 0.12VT 0.23 0.26 0.31 0.08 -0.02 0.27 0.22
Table 4.11 Maximum storm surges observed at the eight stations for each TC forming in 2017 (unit: m). Slashes indicate missing observation data.

30
4.4.2 Multi-Scenario Prediction TY Hato (1713) hit the southern coast of China in August 2017 with a maximum wind speed of 40
m/s and a minimum pressure of 965 hPa. Storm surges are a concern along the wide, shallow sea area off the Chinese coast because the phenomenon is particularly intensified there. Figure 4.14 shows the analysis track and predicted tracks (the official one and five selected ones) for TY Hato covering the 30 hours before landfall. The official forecast track took the middle course, passing near Hong Kong. In reality, TY Hato passed several ten kilometers west of Hong Kong with a track similar to that of scenario 1, which was slightly different from the official forecast. The maximum storm tide and surge for Quarry Bay in Hong Kong in the official forecast were 3.42 and 1.08 m, respectively, and those of scenario 1 were 3.37 and 1.06 m, respectively (Figure 4.15). The values of scenario 1 correspond closely to the observation (3.38 and 0.95 m).
Figure 4.16 shows another example of multi-scenario prediction. TY Khanun (T1720) passed westward over the South China Sea in October 2017 with a maximum wind speed of 40 m/s and a minimum pressure of 955 hPa. The map of maximum storm surges among all scenarios during the 72-hour forecast period indicates probabilities of high storm surges along the southern coast of China.
Figure 4.13 Scatter diagram of model storm surges against observation data from the eight stations for all TCs forming in 2017 (left: hindcast; right: forecast)
Figure 4.14 Analysis track (left) and predicted tracks (right) for TY Hato. In the figure on the right, colored lines show the five selected tracks and the bold black line shows the official JMA forecast. The red arrow shows Quarry Bay.

31
[Reference] Hasegawa.H., N.Kohno, and H.Hayashibara, 2012: JMA’s Storm Surge Prediction for the WMO Storm
Surge Watch Scheme (SSWS). RSMC Tokyo-Typhoon Center Technical Review, 14, 13-24. Hasegawa.H, N.Kohno, M.Higaki, and M.Itoh, 2017: Upgrade of JMA’s Storm Surge Prediction for WMO
Storm Surge Watch Scheme (SSWS). RSMC Tokyo-Typhoon Center Technical Review, 19, 26-34.
Figure 4.15 Time-series representation of storm tide and astronomical tide (top), storm surge, sea level pressure and surface wind (bottom) for Quarry Bay (Hong Kong). Squares show hourly observation values.
Figure 4.16 Predicted tracks (black line: official forecast; colored lines: five selected tracks). The figure on the right shows storm surge distribution maxima for all scenarios during the forecast time for TY Khanun.

Appendices
Appendix 1 RSMC Tropical Cyclone Best Track Data in 2017 35
Appendix 2 Monthly Tracks of Tropical Cyclones in 2017 41
Appendix 3 Errors of Track and Intensity Forecasts for Each Tropical Cyclone in 2017 51
Appendix 4 Monthly and Annual Frequencies of Tropical Cyclones 57
Appendix 5 Code Forms of RSMC Products 59
Appendix 6 Specifications of JMA’s NWP Models (GSM, GEPS) 67
Appendix 7 Products on WIS GISC Tokyo Server 69
Appendix 8 Products on NTP Website 73
Appendix 9 User’s Guide to the DVD 75

Appendix 1RSMC Tropical Cyclone Best Track Data in 2017
Central Max CI Grade Central Max CI Grade Central Max CI Gradepressure wind num. pressure wind num. pressure wind num.
Lat (N) Lon (E) (hPa) (kt) Lat (N) Lon (E) (hPa) (kt) Lat (N) Lon (E) (hPa) (kt)
Apr. 22/18 8.6 143.9 1006 - 0.5 TD Jul. 01/06 15.0 132.2 1006 - 0.5 TD Jul. 19/06 26.1 162.1 1010 - 0.5 TD23/00 9.2 143.2 1006 - 0.5 TD 01/12 16.8 130.5 1006 - 1.0 TD 19/12 26.2 161.7 1010 - 1.0 TD23/06 9.9 142.4 1006 - 0.5 TD 01/18 18.8 128.9 1006 - 1.5 TD 19/18 26.4 161.2 1008 - 1.5 TD23/12 10.6 141.7 1006 - 1.0 TD 02/00 20.7 127.1 1002 35 2.0 TS 20/00 26.9 160.6 1008 - 1.5 TD23/18 11.2 140.8 1006 - 1.0 TD 02/06 21.9 125.7 1002 35 2.0 TS 20/06 27.2 159.9 1008 - 1.5 TD24/00 11.8 139.7 1006 - 1.0 TD 02/12 23.5 124.8 998 40 2.5 TS 20/12 27.4 159.0 1006 35 2.0 TS24/06 12.1 138.8 1004 - 1.0 TD 02/18 24.7 124.1 990 50 3.0 STS 20/18 27.6 158.4 1006 35 2.0 TS24/12 12.4 138.2 1004 - 1.0 TD 03/00 26.2 124.3 990 50 3.0 STS 21/00 28.0 157.5 1006 35 2.0 TS24/18 12.5 137.5 1004 - 1.5 TD 03/06 27.7 125.0 985 55 3.0 STS 21/06 28.2 156.6 1006 35 2.0 TS25/00 12.7 137.0 1004 - 1.5 TD 03/12 29.4 126.2 985 55 3.5 STS 21/12 28.3 155.5 1004 35 2.0 TS25/06 12.8 136.6 1004 - 2.0 TD 03/15 30.2 126.9 985 55 - STS 21/18 28.5 154.3 1000 40 2.5 TS25/12 12.9 136.4 1004 - 2.0 TD 03/18 31.3 127.7 985 55 3.5 STS 22/00 28.6 153.7 1000 40 2.5 TS25/18 13.1 136.0 1002 35 2.5 TS 03/21 32.1 128.9 985 55 - STS 22/06 28.7 153.2 998 40 2.5 TS26/00 13.2 135.7 1002 35 2.5 TS 03/23 32.7 130.0 985 55 - STS 22/12 28.7 152.5 994 45 3.0 TS26/06 13.6 134.8 1002 35 2.5 TS 04/00 32.8 130.5 990 50 3.5 STS 22/18 28.6 151.9 990 50 3.5 STS26/12 14.0 134.4 1002 35 2.5 TS 04/03 33.2 132.3 990 50 - STS 23/00 28.3 151.4 985 55 3.5 STS26/18 14.4 134.4 1002 35 2.5 TS 04/06 33.6 134.2 990 50 3.0 STS 23/06 28.1 151.2 980 60 4.0 STS27/00 14.8 134.4 1002 35 2.5 TS 04/07 33.7 134.8 990 50 - STS 23/12 28.0 151.4 975 65 4.5 TY27/06 15.9 134.7 1004 - 2.5 TD 04/09 34.1 136.5 990 50 - STS 23/18 27.6 151.6 975 65 4.5 TY27/12 17.0 134.7 1006 - 2.0 TD 04/12 34.1 138.3 990 50 3.0 STS 24/00 27.2 152.2 970 70 5.0 TY27/18 17.8 134.8 1006 - - TD 04/15 34.7 140.2 990 50 - STS 24/06 26.7 153.0 970 70 5.0 TY28/00 18.4 135.5 1008 - - TD 04/18 35.5 142.6 990 50 3.0 STS 24/12 26.2 154.1 970 70 5.0 TY28/06 19.0 136.3 1008 - - TD 05/00 36.1 146.0 994 - 3.0 L 24/18 25.9 155.5 970 70 5.0 TY28/12 19.9 137.7 1008 - - TD 05/06 36.9 150.7 994 - - L 25/00 25.7 156.7 970 70 5.0 TY28/18 20.8 139.0 1008 - - TD 05/12 38.2 154.8 994 - - L 25/06 25.9 157.6 970 70 5.0 TY29/00 21.5 140.2 1008 - - TD 05/18 40.3 160.2 994 - - L 25/12 26.2 158.2 975 65 4.5 TY29/06 22.7 141.8 1008 - - TD 06/00 43.0 166.1 992 - - L 25/18 27.0 158.4 975 65 4.5 TY29/12 Dissip. 06/06 46.4 169.9 988 - - L 26/00 28.0 157.9 975 65 4.5 TY
06/12 49.8 171.4 988 - - L 26/06 29.0 157.1 975 65 4.5 TY06/18 50.6 170.4 990 - - L 26/12 29.8 155.6 975 65 4.5 TY
Central Max CI Grade 07/00 51.0 170.6 990 - - L 26/18 30.4 154.1 975 65 4.5 TYpressure wind num. 07/06 51.0 171.3 988 - - L 27/00 30.7 152.1 975 65 4.5 TY
Lat (N) Lon (E) (hPa) (kt) 07/12 50.9 172.3 988 - - L 27/06 31.0 150.5 975 65 4.5 TY07/18 50.9 174.6 990 - - L 27/12 30.7 148.5 975 65 4.5 TY08/00 51.4 177.2 992 - - L 27/18 30.4 146.8 975 65 4.5 TY
Jun. 10/00 13.0 119.0 1006 - 1.0 TD 08/06 52.1 179.6 992 - - L 28/00 29.6 145.2 975 60 4.0 STS10/06 13.4 118.5 1006 - 0.5 TD 08/12 53.1 182.3 994 - - Out 28/06 28.9 144.5 975 60 4.0 STS10/12 14.0 117.8 1006 - 1.0 TD 28/09 28.6 144.0 975 60 - STS10/18 15.0 117.3 1004 - 1.5 TD 28/12 28.3 143.8 975 60 4.0 STS11/00 16.0 116.8 1002 35 2.0 TS Central Max CI Grade 28/15 28.0 143.6 975 60 - STS11/06 17.1 116.6 1002 35 2.5 TS pressure wind num. 28/18 27.7 143.5 975 60 4.0 STS11/12 18.1 116.2 1002 35 2.5 TS Lat (N) Lon (E) (hPa) (kt) 28/21 27.4 143.2 975 60 - STS11/18 19.3 115.6 998 40 2.5 TS 29/00 27.1 142.9 975 60 4.0 STS12/00 20.1 114.9 994 45 2.5 TS 29/03 26.6 142.5 975 60 - STS12/06 21.2 114.5 990 50 2.5 STS Jul. 14/00 16.0 114.1 1004 - 0.0 TD 29/06 26.2 142.2 975 60 4.0 STS12/12 22.0 114.4 985 55 2.5 STS 14/06 16.4 113.6 1004 - 0.5 TD 29/09 25.8 142.1 975 60 - STS12/18 22.9 114.6 994 45 2.5 TS 14/12 16.6 113.1 1002 - 0.5 TD 29/12 25.3 141.9 975 60 4.0 STS13/00 24.0 115.0 1002 - 2.0 TD 14/18 16.7 112.7 1002 - 1.0 TD 29/18 24.5 141.9 975 60 4.0 STS13/06 25.5 115.7 1004 - 1.5 TD 15/00 16.8 112.2 1000 - 1.5 TD 30/00 23.9 141.7 970 65 4.0 TY13/12 Dissip. 15/06 16.9 111.7 998 35 1.5 TS 30/06 23.4 141.5 965 70 4.5 TY
15/12 16.9 111.1 996 40 2.0 TS 30/12 22.9 141.4 955 75 5.0 TY15/18 17.4 110.1 996 40 2.5 TS 30/18 22.8 140.9 945 85 6.0 TY16/00 17.7 109.4 992 45 3.0 TS 31/00 22.8 140.4 935 95 6.0 TY16/06 18.0 108.5 990 50 3.5 STS 31/06 22.9 139.9 935 95 6.0 TY16/12 18.1 107.0 990 50 3.5 STS 31/12 23.0 139.3 935 95 6.0 TY16/18 18.5 105.6 985 50 3.5 STS 31/18 23.3 138.8 935 95 6.0 TY17/00 18.9 104.0 992 40 3.5 TS Aug. 01/00 23.7 138.2 935 95 6.0 TY17/06 18.9 102.2 996 35 3.0 TS 01/06 24.1 137.7 940 90 5.5 TY17/12 19.2 100.9 998 - - TD 01/12 24.4 137.3 940 90 5.0 TY17/18 19.5 100.4 1000 - - TD 01/18 25.0 136.7 940 90 5.0 TY18/00 Dissip. 02/00 25.4 136.4 940 90 5.0 TY
02/06 25.8 135.9 940 90 5.0 TY02/12 26.1 135.7 940 90 5.0 TY02/18 26.7 135.5 940 90 5.0 TY03/00 27.4 135.0 945 85 5.0 TY03/06 27.9 134.1 945 85 4.5 TY03/12 28.1 133.5 950 80 4.0 TY03/15 28.2 132.9 950 80 - TY03/18 28.3 132.5 955 75 4.0 TY03/21 28.4 132.0 955 75 - TY04/00 28.5 131.6 955 75 4.0 TY04/03 28.6 131.4 955 75 - TY04/06 28.7 131.2 960 70 4.0 TY04/09 28.8 131.1 960 70 - TY04/12 28.9 130.9 960 70 4.5 TY04/15 29.1 130.6 960 70 - TY04/18 29.2 130.5 960 70 4.5 TY04/21 29.3 130.4 960 70 - TY05/00 29.6 130.3 965 65 4.5 TY05/03 29.8 130.2 965 65 - TY05/06 29.9 130.1 965 65 4.5 TY05/09 30.0 130.1 965 65 - TY05/12 30.1 130.1 970 60 4.5 STS05/15 29.8 130.2 970 60 - STS05/17 30.3 130.4 970 60 - STS05/18 30.3 130.5 970 60 4.0 STS05/21 30.4 130.7 970 60 - STS06/00 30.7 130.9 970 60 4.0 STS06/03 30.9 131.2 970 60 - STS06/06 31.1 131.5 970 60 4.0 STS06/09 31.4 131.9 970 60 - STS06/12 31.8 132.3 970 60 4.0 STS06/15 32.2 132.5 970 60 - STS06/18 32.5 132.9 970 60 4.0 STS06/21 32.8 133.4 970 60 - STS07/00 33.1 134.0 970 60 4.0 STS07/01 33.3 134.2 970 60 - STS07/03 33.6 134.6 970 60 - STS07/06 34.0 135.1 975 55 4.0 STS07/09 34.5 135.7 975 55 - STS07/12 35.2 136.2 980 50 3.5 STS07/15 35.6 136.5 985 45 - TS07/18 36.2 136.8 985 40 3.0 TS07/21 37.1 137.4 985 40 - TS08/00 37.3 137.7 985 35 2.5 TS08/03 37.5 137.8 985 35 - TS08/06 37.7 138.1 988 35 2.0 TS08/09 38.4 138.3 990 35 - TS08/12 38.7 138.5 990 - 1.5 L08/18 39.0 139.0 992 - 1.0 L09/00 39.2 139.2 994 - - L09/06 39.2 139.3 996 - - L09/12 Dissip.
(UTC) position
Merbok (1702)
Muifa (1701) Nanmadol (1703) Noru (1705)
Date/Time Center
Date/Time Center(UTC) position
Talas (1704)
positionDate/Time Center Date/Time Center Date/Time Center
(UTC) position (UTC) position (UTC)

Central Max CI Grade Central Max CI Grade Central Max CI Gradepressure wind num. pressure wind num. pressure wind num.
Lat (N) Lon (E) (hPa) (kt) Lat (N) Lon (E) (hPa) (kt) Lat (N) Lon (E) (hPa) (kt)
Jul. 20/00 23.0 178.1 1012 - 1.0 TD Jul. 25/06 12.8 129.2 1002 - 0.5 TD Jul. 31/06 26.3 158.3 1006 - 0.0 TD20/06 23.4 177.7 1012 - 1.0 TD 25/12 14.0 129.3 1002 - 1.0 TD 31/12 26.5 159.5 1006 - 0.0 TD20/12 24.0 177.4 1012 - 1.5 TD 25/18 14.5 128.3 1000 35 1.5 TS 31/18 26.5 160.8 1006 - 0.0 TD20/18 24.6 177.2 1010 - 1.5 TD 26/00 15.5 128.1 996 40 1.5 TS Aug. 01/00 26.4 162.3 1006 - 0.0 TD21/00 25.2 177.1 1010 - 2.0 TD 26/06 16.1 128.0 996 40 2.0 TS 01/06 26.2 163.1 1004 - 0.5 TD21/06 26.4 177.3 1006 35 2.5 TS 26/12 16.6 127.8 996 40 2.0 TS 01/12 26.0 163.9 1004 - 0.5 TD21/12 28.2 176.8 1006 35 2.5 TS 26/18 17.1 127.7 994 45 2.5 TS 01/18 25.7 164.6 1000 - 1.0 TD21/18 30.3 175.1 1004 40 2.5 TS 27/00 17.5 127.6 990 50 3.0 STS 02/00 25.6 165.4 998 35 1.5 TS22/00 30.5 172.2 1004 40 2.5 TS 27/06 18.0 127.4 990 50 3.0 STS 02/06 25.8 165.4 996 40 2.0 TS22/06 30.0 170.6 1004 40 2.5 TS 27/12 18.6 127.2 990 50 3.0 STS 02/12 26.1 165.2 996 40 2.0 TS22/12 30.0 169.6 1004 40 2.5 TS 27/18 19.3 126.7 990 50 3.0 STS 02/18 26.4 165.0 992 40 2.5 TS22/18 30.4 168.3 1004 40 2.5 TS 28/00 20.0 125.8 985 55 3.5 STS 03/00 26.7 164.8 992 40 2.5 TS23/00 30.6 167.3 1004 40 2.5 TS 28/06 20.6 125.2 975 65 4.0 TY 03/06 27.3 164.3 992 40 2.5 TS23/06 30.8 166.5 1002 40 2.5 TS 28/12 21.1 124.4 970 70 4.5 TY 03/12 27.7 163.9 992 40 2.5 TS23/12 31.1 165.5 1002 40 2.5 TS 28/18 21.7 123.5 960 80 5.0 TY 03/18 28.0 163.4 992 40 2.5 TS23/18 31.4 164.3 1002 40 2.5 TS 29/00 22.5 123.3 960 80 5.0 TY 04/00 28.4 163.0 992 40 2.0 TS24/00 31.9 163.3 1002 40 2.5 TS 29/06 23.4 122.8 960 80 5.0 TY 04/06 29.0 162.9 992 40 2.0 TS24/06 32.6 161.7 1002 40 2.5 TS 29/09 23.9 122.4 960 80 - TY 04/12 29.7 162.8 992 40 2.0 TS24/12 33.0 160.1 1002 40 2.5 TS 29/12 24.6 121.9 960 80 5.0 TY 04/18 30.7 162.6 992 40 2.0 TS24/18 33.2 158.3 1002 35 2.5 TS 29/15 25.0 120.8 970 70 - TY 05/00 32.0 162.5 992 40 2.0 TS25/00 33.0 156.5 1002 35 2.0 TS 29/18 25.0 120.2 970 70 4.5 TY 05/06 34.2 162.1 990 45 2.0 TS25/06 32.8 155.0 1002 35 2.0 TS 30/00 25.8 119.3 985 50 4.0 STS 05/12 36.2 161.2 990 45 2.0 TS25/12 32.3 153.7 1002 35 1.5 TS 30/06 26.1 117.9 990 35 3.5 TS 05/18 38.1 160.2 990 - 1.5 L25/18 32.0 152.3 1004 - - TD 30/12 25.6 117.0 992 - 3.0 TD 06/00 40.0 159.0 990 - 1.5 L26/00 31.7 151.1 1004 - - TD 30/18 25.0 116.0 992 - 2.5 TD 06/06 41.6 158.3 990 - - L26/06 31.2 149.9 1002 - - TD 31/00 Dissip. 06/12 43.1 157.4 992 - - L26/12 30.2 148.8 1002 - - TD 06/18 44.5 156.1 994 - - L26/18 29.2 147.8 1002 - - TD 07/00 45.3 155.2 994 - - L27/00 28.1 147.1 1002 - - TD Central Max CI Grade 07/06 45.7 154.8 996 - - L27/06 26.9 147.5 1002 - - TD pressure wind num. 07/12 45.9 154.7 998 - - L27/12 25.9 148.5 1002 - - TD Lat (N) Lon (E) (hPa) (kt) 07/18 46.1 154.7 998 - - L27/18 26.3 149.0 1002 - - TD 08/00 46.6 154.6 998 - - L28/00 27.1 149.2 1002 - - TD 08/06 46.5 154.2 1000 - - L28/06 Dissip. Jul. 27/12 19.2 117.8 1000 - 0.0 TD 08/12 46.4 153.9 1000 - - L
27/18 19.4 117.2 1000 - 0.0 TD 08/18 46.0 154.6 1000 - - L28/00 19.3 116.6 1000 - 0.0 TD 09/00 45.6 153.0 1002 - - L
Central Max CI Grade 28/06 19.2 116.1 998 - 0.5 TD 09/06 45.2 151.3 1002 - - Lpressure wind num. 28/12 18.5 115.8 998 - 1.0 TD 09/12 Dissip.
Lat (N) Lon (E) (hPa) (kt) 28/18 18.0 115.8 996 35 1.0 TS29/00 18.1 116.2 994 35 1.0 TS29/06 18.2 116.6 990 40 1.5 TS Central Max CI Grade
Jul. 21/06 18.6 124.3 1008 - 1.0 TD 29/12 18.6 117.3 990 40 1.5 TS pressure wind num.21/12 19.3 123.0 1008 - 1.0 TD 29/18 19.0 118.2 990 40 1.5 TS Lat (N) Lon (E) (hPa) (kt)21/18 20.1 122.0 1006 - 1.0 TD 30/00 20.1 119.4 990 40 2.0 TS22/00 20.7 120.5 1006 - 1.5 TD 30/06 21.9 120.3 985 45 2.5 TS22/06 21.2 119.0 1004 35 1.5 TS 30/12 23.0 120.5 990 40 2.5 TS Aug. 10/18 16.0 170.9 1008 - 1.0 TD22/12 21.6 117.9 1002 35 2.0 TS 30/18 24.7 120.3 990 40 2.0 TS 11/00 16.4 169.9 1008 - 1.5 TD22/18 21.9 116.0 1002 35 2.0 TS 31/00 26.2 118.6 992 35 2.0 TS 11/06 16.9 168.9 1006 - 2.0 TD23/00 22.2 114.7 1002 35 2.0 TS 31/06 27.2 117.6 994 - 1.5 TD 11/12 17.3 168.0 1002 35 2.5 TS23/06 22.8 113.2 1004 - 1.5 TD 31/12 28.2 117.1 994 - 1.0 TD 11/18 17.8 166.9 996 45 3.0 TS23/12 22.9 110.5 1004 - 1.0 TD 31/18 29.2 116.6 996 - 0.5 TD 12/00 18.5 165.6 990 50 3.5 STS23/18 Dissip. Aug. 01/00 29.8 116.3 996 - 0.5 TD 12/06 19.3 164.9 980 60 4.0 STS
01/06 30.4 116.0 996 - 0.0 L 12/12 20.0 164.6 975 65 5.0 TY01/12 31.0 115.7 996 - - L 12/18 20.5 164.3 965 70 5.5 TY
Central Max CI Grade 01/18 31.4 115.5 996 - - L 13/00 21.0 164.1 955 80 5.5 TYpressure wind num. 02/00 31.8 115.8 996 - - L 13/06 21.4 163.9 955 80 5.5 TY
Lat (N) Lon (E) (hPa) (kt) 02/06 32.4 115.9 996 - - L 13/12 21.8 163.8 955 80 5.5 TY02/12 33.3 116.0 996 - - L 13/18 22.2 163.7 960 75 5.5 TY02/18 34.1 116.2 996 - - L 14/00 22.6 163.5 965 70 5.0 TY
Jul. 21/00 17.5 114.7 1006 - 1.0 TD 03/00 Dissip. 14/06 23.2 163.3 965 70 5.0 TY21/06 17.8 113.7 1006 - 1.0 TD 14/12 24.0 163.0 965 70 5.0 TY21/12 18.0 113.1 1006 - 1.5 TD 14/18 25.0 162.7 965 70 5.0 TY21/18 18.0 112.7 1004 - 1.5 TD 15/00 26.0 162.4 965 70 5.0 TY22/00 17.9 112.4 1004 - 2.0 TD 15/06 27.1 162.2 975 65 4.5 TY22/06 17.9 112.1 1002 - 2.0 TD 15/12 28.3 162.2 980 60 4.0 STS22/12 17.8 111.9 1002 - 2.0 TD 15/18 29.8 162.6 980 60 4.0 STS22/18 17.7 111.7 1002 - 2.0 TD 16/00 31.4 163.5 980 60 4.0 STS23/00 17.6 111.6 1000 35 2.0 TS 16/06 33.3 165.3 980 60 4.0 STS23/06 17.5 111.6 1000 35 2.5 TS 16/12 35.6 167.9 985 55 3.5 STS23/12 17.3 111.6 1000 35 2.5 TS 16/18 38.0 170.7 990 50 3.5 STS23/18 17.2 111.6 998 35 2.5 TS 17/00 40.5 173.8 994 45 3.0 TS24/00 17.1 111.2 998 35 2.5 TS 17/06 43.0 176.0 996 - 2.5 L24/06 17.0 110.8 996 35 2.5 TS 17/12 44.1 177.4 996 - - L24/12 16.9 110.3 996 35 2.5 TS 17/18 45.5 179.4 998 - - L24/18 16.9 109.5 994 35 2.5 TS 18/00 46.7 181.0 1000 - - Out25/00 17.1 108.7 994 35 2.5 TS25/06 17.1 107.5 994 35 2.5 TS25/12 16.8 106.5 998 - 2.5 TD25/18 16.2 105.2 998 - 2.0 TD26/00 16.0 104.1 998 - - TD26/06 16.1 103.7 998 - - TD26/12 16.2 103.3 998 - - TD26/18 16.2 103.0 998 - - TD27/00 16.4 103.2 998 - - TD27/06 16.6 103.5 998 - - TD27/12 16.9 103.7 1000 - - TD27/18 17.2 104.0 1000 - - TD28/00 17.4 104.1 1002 - - TD28/06 17.6 104.2 1002 - - TD28/12 17.6 103.8 1002 - - TD28/18 17.6 103.6 1004 - - TD29/00 17.7 103.6 1004 - - TD29/06 17.9 103.8 1002 - - TD29/12 18.0 103.6 1002 - - TD29/18 Dissip.
Date/Time Center(UTC) position
Roke (1707)
Date/Time Center(UTC) position
Sonca (1708)
(UTC) position
Nalgae (1711)
(UTC) position
Kulap (1706)
Date/Time Center(UTC) position
Nesat (1709)
Date/Time Center Date/Time Center
Date/Time Center(UTC) position
Haitang (1710)
Date/Time Center(UTC) position
Banyan (1712)

Central Max CI Grade Central Max CI Grade Central Max CI Gradepressure wind num. pressure wind num. pressure wind num.
Lat (N) Lon (E) (hPa) (kt) Lat (N) Lon (E) (hPa) (kt) Lat (N) Lon (E) (hPa) (kt)
Aug. 19/12 19.1 130.1 1006 - 0.5 TD Aug. 26/18 17.8 147.0 1004 - 0.0 TD Sep. 03/12 16.1 131.8 1010 - 1.0 TD19/18 19.4 129.1 1004 - 1.0 TD 27/00 18.2 147.0 1004 - 0.0 TD 03/18 16.3 129.8 1008 - 1.0 TD20/00 19.5 128.3 1004 - 1.5 TD 27/06 18.6 147.0 1004 - 0.5 TD 04/00 16.1 128.1 1006 - 1.5 TD20/06 19.6 127.6 1002 - 1.5 TD 27/12 18.9 147.1 1004 - 1.0 TD 04/06 16.4 127.4 1006 - 1.5 TD20/12 19.7 126.9 998 35 2.0 TS 27/18 19.1 147.2 1002 - 1.5 TD 04/12 16.3 125.7 1004 - 1.5 TD20/18 19.9 126.2 996 35 2.0 TS 28/00 19.4 147.2 1000 - 2.0 TD 04/18 16.6 125.0 1004 - 1.5 TD21/00 20.2 125.4 994 35 2.0 TS 28/06 19.7 147.3 994 35 2.0 TS 05/00 17.5 124.9 1004 - 1.5 TD21/06 20.3 124.3 994 35 2.0 TS 28/12 20.3 147.5 994 35 2.5 TS 05/06 19.0 124.2 1004 - 1.5 TD21/12 20.6 123.2 990 40 2.5 TS 28/18 20.9 147.6 992 40 2.5 TS 05/12 19.8 122.7 1004 - 1.5 TD21/18 20.5 121.5 990 40 3.0 TS 29/00 21.5 147.8 992 40 3.0 TS 05/18 20.3 121.1 1000 35 2.0 TS22/00 20.5 119.8 985 45 3.0 TS 29/06 22.7 147.9 992 40 3.0 TS 06/00 20.3 120.6 1000 35 2.0 TS22/06 20.5 118.8 975 60 3.5 STS 29/12 24.5 147.3 992 40 3.0 TS 06/06 20.7 120.0 1000 35 2.0 TS22/12 20.6 117.3 975 60 3.5 STS 29/18 26.0 145.9 985 45 3.0 TS 06/12 21.7 120.0 1004 35 2.0 TS22/18 21.1 116.0 970 65 4.0 TY 30/00 26.9 144.2 980 50 3.0 STS 06/18 22.2 119.1 1006 - 1.5 TD23/00 21.6 114.4 965 75 4.5 TY 30/03 26.9 143.5 975 55 - STS 07/00 22.8 118.9 1008 - 1.5 TD23/06 22.3 112.8 965 75 4.5 TY 30/06 26.9 142.7 970 55 3.0 STS 07/06 23.7 119.1 1008 - 1.0 TD23/12 22.7 111.0 985 50 4.0 STS 30/09 26.9 142.2 970 55 - STS 07/12 24.7 119.4 1008 - 0.5 TD23/18 23.5 109.1 994 40 3.5 TS 30/12 26.9 141.6 970 55 3.0 STS 07/18 Dissip.24/00 23.9 107.5 996 35 3.0 TS 30/15 26.8 141.4 970 55 - STS24/06 23.9 106.1 996 35 2.5 TS 30/18 26.7 141.2 970 55 3.5 STS24/12 23.8 104.5 998 - 2.0 TD 30/21 26.7 141.5 970 55 - STS24/18 23.8 101.9 1000 - 1.5 TD 31/00 26.8 141.7 970 55 3.5 STS25/00 23.6 99.5 1002 - - Out 31/03 27.0 141.9 970 55 - STS
31/06 27.2 142.0 965 60 4.5 STS31/09 27.4 142.1 965 60 - STS
Central Max CI Grade 31/12 27.7 141.9 965 65 4.5 TYpressure wind num. 31/15 27.9 141.6 965 65 - TY
Lat (N) Lon (E) (hPa) (kt) 31/18 27.7 141.6 960 70 4.5 TY31/21 27.5 141.8 955 75 - TY
Sep. 01/00 27.3 142.0 955 80 5.0 TYAug. 24/00 14.9 128.9 1010 - 1.0 TD 01/03 27.3 142.6 955 80 - TY
24/06 15.4 127.6 1008 - 1.0 TD 01/06 27.4 143.2 955 80 5.0 TY24/12 15.3 126.0 1006 - 1.5 TD 01/09 27.7 143.5 955 80 - TY24/18 15.1 124.9 1000 35 2.0 TS 01/12 28.0 143.7 955 80 5.0 TY25/00 15.0 123.9 996 40 2.5 TS 01/18 28.5 144.0 960 70 4.0 TY25/06 15.4 123.0 996 40 3.0 TS 02/00 29.3 144.7 965 65 4.0 TY25/12 16.0 122.2 994 45 3.0 TS 02/06 31.3 146.0 965 65 4.0 TY25/18 16.7 121.2 998 40 2.5 TS 02/12 33.1 146.9 965 65 4.0 TY26/00 17.2 119.5 996 40 3.0 TS 02/18 35.4 148.3 965 65 3.5 TY26/06 17.9 118.1 994 40 3.0 TS 03/00 38.2 150.3 965 65 3.5 TY26/12 19.0 116.8 992 45 3.0 TS 03/06 41.7 152.9 965 65 3.5 TY26/18 20.6 114.8 990 50 3.0 STS 03/12 45.2 154.6 964 - 3.5 L27/00 21.8 113.4 985 55 3.0 STS 03/18 48.1 157.3 964 - - L27/06 23.6 111.3 996 40 2.5 TS 04/00 49.6 157.8 960 - - L27/12 24.3 110.0 998 35 2.0 TS 04/06 50.7 158.4 960 - - L27/18 24.7 108.8 1002 - - TD 04/12 51.3 159.3 966 - - L28/00 24.1 108.0 1004 - - TD 04/18 51.9 161.0 972 - - L28/06 Dissip. 05/00 52.4 164.0 972 - - L
05/06 52.8 167.2 972 - - L05/12 53.2 170.0 974 - - L05/18 53.4 172.8 974 - - L06/00 53.4 175.8 976 - - L06/06 53.2 179.0 978 - - L06/12 53.0 181.7 982 - - Out
Central Max CI Gradepressure wind num.
Lat (N) Lon (E) (hPa) (kt)
Aug. 30/06 18.9 122.0 1002 - - TD30/12 18.9 120.9 1004 - 0.5 TD30/18 19.0 120.2 1002 - 0.5 TD31/00 19.3 119.6 1002 - 0.5 TD31/06 19.6 119.3 1002 - 1.0 TD31/12 19.8 119.1 1000 - 1.5 TD31/18 20.0 118.9 998 35 2.0 TS
Sep. 01/00 20.2 118.7 998 35 2.0 TS01/06 20.4 118.5 998 35 2.0 TS01/12 20.7 118.1 996 40 2.0 TS01/18 20.8 117.7 994 45 2.5 TS02/00 21.0 117.4 990 50 3.0 STS02/06 21.2 117.2 990 50 3.0 STS02/12 21.4 117.0 990 50 3.0 STS02/18 21.6 116.8 990 50 3.0 STS03/00 22.0 116.5 990 50 3.0 STS03/06 22.3 116.3 990 50 3.0 STS03/12 22.6 116.1 992 45 3.0 TS03/18 23.1 115.4 1000 35 2.5 TS04/00 23.5 114.6 1004 - 2.0 TD04/06 23.5 113.2 1004 - 1.5 TD04/12 Dissip.
Date/Time Center(UTC) position
Guchol (1717)
Date/Time Center(UTC) position
Sanvu (1715)
Date/Time Center(UTC) position
Hato (1713)
Mawar (1716)
Date/Time Center(UTC) position
Pakhar (1714)
Date/Time Center(UTC) position

Central Max CI Grade Central Max CI Grade Central Max CI Gradepressure wind num. pressure wind num. pressure wind num.
Lat (N) Lon (E) (hPa) (kt) Lat (N) Lon (E) (hPa) (kt) Lat (N) Lon (E) (hPa) (kt)
Sep. 08/12 14.3 147.1 1008 - 1.0 TD Sep. 10/00 14.3 130.0 1004 - 0.0 TD Oct. 15/06 8.8 137.3 1002 - 0.5 TD08/18 14.6 146.1 1006 - 1.5 TD 10/06 14.4 129.1 1004 - 0.0 TD 15/12 9.3 136.8 1002 - 1.0 TD09/00 14.9 145.2 1006 - 1.5 TD 10/12 14.4 128.0 1004 - 0.5 TD 15/18 9.7 136.2 1000 35 1.5 TS09/06 15.3 144.0 1004 - 1.5 TD 10/18 14.4 127.1 1004 - 0.5 TD 16/00 10.2 135.6 1000 35 2.0 TS09/12 15.4 142.9 1000 35 1.5 TS 11/00 14.7 126.2 1004 - 1.0 TD 16/06 10.6 135.1 996 40 2.0 TS09/18 15.6 141.5 996 40 2.0 TS 11/06 14.7 124.9 1002 - 1.5 TD 16/12 10.6 134.6 996 40 2.0 TS10/00 15.7 140.4 990 45 2.5 TS 11/12 14.7 123.9 1002 - 1.5 TD 16/18 10.3 133.9 992 45 2.0 TS10/06 16.6 139.6 990 45 2.5 TS 11/18 14.6 123.0 1002 - 1.5 TD 17/00 9.9 132.9 992 45 2.0 TS10/12 16.9 138.5 990 45 2.5 TS 12/00 14.4 122.1 1002 - 2.0 TD 17/06 9.9 132.4 985 50 2.5 STS10/18 17.3 137.3 985 50 3.0 STS 12/06 14.6 120.7 1000 - 1.5 TD 17/12 10.3 132.4 980 55 2.5 STS11/00 17.9 136.1 980 55 3.5 STS 12/12 14.3 119.5 998 35 2.0 TS 17/18 11.0 132.6 970 65 3.0 TY11/06 18.6 134.7 975 60 3.5 STS 12/18 14.7 118.1 998 40 2.5 TS 18/00 12.0 132.6 970 65 3.0 TY11/12 19.3 133.8 975 60 3.5 STS 13/00 14.7 117.2 996 40 2.5 TS 18/06 13.0 132.1 970 65 3.0 TY11/18 20.2 132.2 965 65 4.0 TY 13/06 15.3 116.0 996 40 2.5 TS 18/12 13.9 131.4 970 65 3.0 TY12/00 21.1 130.7 960 70 4.0 TY 13/12 15.5 114.6 996 40 2.5 TS 18/18 14.7 130.8 970 65 3.5 TY12/06 22.1 128.7 955 80 5.0 TY 13/18 15.9 113.6 990 50 3.0 STS 19/00 15.4 130.3 965 70 3.5 TY12/12 23.0 127.8 955 80 5.0 TY 14/00 16.1 112.2 980 55 3.5 STS 19/06 16.3 130.1 965 70 4.0 TY12/15 23.4 127.4 955 80 - TY 14/06 16.4 111.4 970 65 4.0 TY 19/12 17.0 130.1 965 70 4.0 TY12/18 23.7 127.0 955 80 5.0 TY 14/12 17.0 109.8 955 80 5.0 TY 19/18 17.9 130.0 965 70 4.0 TY12/21 24.0 126.6 955 80 - TY 14/18 17.4 108.7 955 80 5.0 TY 20/00 18.8 130.0 965 70 4.0 TY13/00 24.3 126.3 955 80 5.0 TY 15/00 17.8 107.4 955 80 5.0 TY 20/06 19.6 130.0 950 80 4.5 TY13/03 24.6 126.0 955 80 - TY 15/06 17.7 106.1 955 80 5.0 TY 20/12 20.1 130.2 945 85 5.5 TY13/06 24.9 125.8 955 80 5.0 TY 15/12 18.1 104.7 980 60 4.0 STS 20/18 20.7 130.7 935 90 6.0 TY13/09 25.3 125.6 950 80 - TY 15/18 18.3 102.7 996 40 3.5 TS 21/00 21.3 131.2 935 90 6.0 TY13/12 25.4 125.3 945 85 5.5 TY 16/00 18.6 101.0 1002 - 3.0 TD 21/03 21.7 131.6 935 90 - TY13/15 25.7 125.1 945 85 - TY 16/06 Dissip. 21/06 22.3 132.0 935 90 6.0 TY13/18 26.0 124.9 940 90 5.5 TY 21/09 23.2 132.3 935 90 - TY13/21 26.3 124.7 940 90 - TY 21/12 23.8 132.5 935 90 6.0 TY14/00 26.6 124.6 935 95 6.5 TY Central Max CI Grade 21/15 24.5 132.9 925 95 - TY14/06 27.0 124.3 935 95 6.5 TY pressure wind num. 21/18 25.6 133.3 915 100 7.0 TY14/12 27.3 124.4 935 95 6.5 TY Lat (N) Lon (E) (hPa) (kt) 21/21 26.7 133.7 915 100 - TY14/18 27.7 124.5 935 95 6.5 TY 22/00 27.8 133.9 915 100 7.0 TY15/00 28.1 124.8 940 85 5.5 TY 22/03 28.9 134.2 915 100 - TY15/06 28.3 125.0 950 80 5.0 TY Oct. 11/00 15.5 134.0 1002 - 0.5 TD 22/06 29.9 134.7 915 100 7.0 TY15/12 28.4 125.3 950 80 5.0 TY 11/06 16.2 132.1 1002 - 1.0 TD 22/09 30.9 135.4 925 95 - TY15/18 28.5 125.7 955 75 4.5 TY 11/12 17.0 130.1 1002 - 1.0 TD 22/12 32.2 136.3 935 90 6.0 TY16/00 28.6 126.3 960 70 4.0 TY 11/18 17.7 128.2 1000 - 1.0 TD 22/15 33.5 137.3 945 85 - TY16/03 28.8 126.6 965 65 - TY 12/00 18.3 126.1 1000 - 1.5 TD 22/18 34.7 138.1 950 80 6.0 TY16/06 29.0 127.0 965 65 4.0 TY 12/06 18.7 124.6 998 - 1.5 TD 22/21 36.1 140.1 965 65 - TY16/09 29.3 127.4 965 65 - TY 12/12 18.5 123.3 996 35 2.0 TS 23/00 37.2 141.5 970 - 5.0 L16/12 29.5 127.9 965 65 4.0 TY 12/18 18.2 121.9 994 35 2.0 TS 23/06 41.0 145.9 970 - 5.0 L16/15 29.8 128.4 965 65 - TY 13/00 17.6 120.3 992 35 2.5 TS 23/12 42.9 150.3 972 - - L16/18 30.0 128.9 965 65 4.0 TY 13/06 16.9 119.4 985 45 2.5 TS 23/18 44.4 155.4 978 - - L16/21 30.4 129.5 970 60 - STS 13/12 16.7 118.7 985 45 3.0 TS 24/00 Dissip.17/00 30.7 130.0 970 60 4.0 STS 13/18 16.7 118.3 980 50 3.5 STS17/02 31.0 130.3 975 55 - STS 14/00 17.3 118.1 980 50 4.0 STS17/03 31.4 130.7 975 55 - STS 14/06 18.0 118.0 975 55 4.5 STS Central Max CI Grade17/06 32.4 132.1 975 55 4.0 STS 14/12 18.7 117.5 970 60 4.5 STS pressure wind num.17/07 32.7 132.5 975 55 - STS 14/18 19.5 116.4 960 70 5.0 TY Lat (N) Lon (E) (hPa) (kt)17/09 33.3 133.3 975 55 - STS 15/00 20.2 114.7 955 75 5.0 TY17/12 34.4 134.6 975 55 4.0 STS 15/06 20.6 113.2 960 70 5.0 TY17/13 34.7 134.9 975 55 - STS 15/12 20.9 111.7 975 50 5.0 STS Oct. 22/06 9.1 148.3 1004 - 0.5 TD17/15 36.0 136.5 975 55 - STS 15/18 20.8 110.6 990 40 4.5 TS 22/12 9.0 148.3 1006 - 0.5 TD17/18 37.8 138.7 980 - 3.5 L 16/00 20.3 109.9 1004 - 4.0 TD 22/18 9.1 148.0 1004 - 0.0 TD18/00 41.3 139.9 976 - - L 16/06 20.5 109.3 1004 - 3.5 TD 23/00 9.2 147.7 1006 - 0.5 TD18/06 44.3 142.3 976 - - L 16/12 Dissip. 23/06 9.3 147.4 1004 - 0.5 TD18/12 46.6 143.1 976 - - L 23/12 9.5 147.0 1006 - 0.5 TD18/18 48.4 143.7 976 - - L 23/18 10.2 145.4 1002 - 1.0 TD19/00 49.8 144.3 980 - - L 24/00 11.7 144.0 1004 - 1.0 TD19/06 50.7 144.6 982 - - L 24/06 13.2 141.9 1002 - 1.5 TD19/12 51.3 145.0 982 - - L 24/12 14.5 139.3 1000 35 2.0 TS19/18 51.7 145.4 984 - - L 24/18 14.8 137.6 1000 35 2.0 TS20/00 52.0 145.9 988 - - L 25/00 15.1 136.6 998 40 2.5 TS20/06 52.6 146.1 988 - - L 25/06 15.7 135.7 998 40 2.5 TS20/12 53.3 146.2 992 - - L 25/12 16.7 134.6 998 40 2.5 TS20/18 53.8 146.2 994 - - L 25/18 17.1 133.4 996 40 2.5 TS21/00 54.6 146.4 994 - - L 26/00 17.6 132.6 992 45 3.0 TS21/06 55.3 146.5 996 - - L 26/06 18.4 132.1 992 45 3.0 TS21/12 55.9 146.6 998 - - L 26/12 19.6 131.2 992 45 3.0 TS21/18 56.3 147.3 1000 - - L 26/18 20.5 130.5 992 45 3.0 TS22/00 57.0 147.8 1000 - - L 27/00 21.3 129.8 990 50 3.0 STS22/06 58.0 147.8 1002 - - L 27/06 22.4 128.9 990 50 3.0 STS22/12 58.9 148.7 1006 - - L 27/12 23.5 128.5 985 55 3.5 STS22/18 59.5 149.8 1006 - - L 27/15 23.8 128.3 985 55 - STS23/00 Dissip. 27/18 24.2 128.3 975 60 3.5 STS
27/21 25.0 128.1 975 60 - STS28/00 25.6 128.0 975 60 3.5 STS28/03 26.3 128.2 975 60 - STS28/04 26.6 128.2 975 60 - STS28/06 27.1 128.4 975 60 3.5 STS28/09 27.9 128.7 975 60 - STS28/12 28.7 129.4 975 60 3.5 STS28/15 29.2 130.0 975 60 - STS28/18 29.9 130.4 975 60 3.5 STS28/21 30.7 131.5 975 60 - STS29/00 31.2 132.9 975 60 3.5 STS29/03 31.5 133.9 975 60 - STS29/06 32.4 135.8 975 60 3.5 STS29/09 33.3 138.0 975 60 - STS29/12 34.8 141.1 988 - 3.0 L29/18 Dissip.
Saola (1722)
Date/Time Center
Date/Time Center(UTC) position
Khanun (1720)
(UTC) position
position
Lan (1721)
Date/Time Center(UTC) position
Doksuri (1719)
Date/Time Center(UTC) position
Talim (1718)
Date/Time Center(UTC)

Central Max CI Grade Central Max CI Gradepressure wind num. pressure wind num.
Lat (N) Lon (E) (hPa) (kt) Lat (N) Lon (E) (hPa) (kt)
Oct. 31/00 11.0 126.8 1008 - 0.5 TD Dec. 13/18 10.8 126.8 1002 - 0.5 TD31/06 11.2 125.9 1006 - 0.5 TD 14/00 11.0 127.4 1000 35 1.0 TS31/12 11.4 124.7 1008 - 0.5 TD 14/06 11.1 127.8 1000 35 1.5 TS31/18 11.7 123.2 1006 - 0.5 TD 14/12 11.3 128.2 998 40 2.0 TS
Nov. 01/00 11.9 122.3 1008 - 0.5 TD 14/18 11.4 128.0 998 40 2.0 TS01/06 11.9 121.0 1006 - 1.0 TD 15/00 11.5 127.8 996 40 2.0 TS01/12 12.0 119.5 1004 - 1.5 TD 15/06 11.7 127.8 994 40 2.0 TS01/18 12.2 118.6 1002 - 1.5 TD 15/12 11.9 127.7 996 35 2.5 TS02/00 12.5 117.7 1000 35 2.0 TS 15/18 12.3 127.2 996 35 2.5 TS02/06 12.9 116.8 996 40 2.5 TS 16/00 12.4 126.6 998 35 2.5 TS02/12 13.1 115.6 994 40 3.0 TS 16/06 12.1 126.0 998 35 2.5 TS02/18 12.7 114.4 985 55 3.5 STS 16/12 12.2 125.6 1002 - 2.5 TD03/00 12.6 113.5 975 65 4.0 TY 16/18 12.4 125.2 1002 - 2.0 TD03/06 12.7 112.6 970 70 4.5 TY 17/00 12.5 124.2 1004 - 2.0 TD03/12 12.8 111.7 970 70 4.5 TY 17/06 12.2 122.7 1004 - 2.0 TD03/18 12.7 110.4 970 70 4.5 TY 17/12 11.4 121.7 1004 - 2.0 TD04/00 12.5 109.1 970 70 4.5 TY 17/18 10.8 120.4 1004 - 2.0 TD04/06 12.4 107.7 985 55 4.0 STS 18/00 10.6 119.7 1004 - 2.0 TD04/12 12.4 106.4 1000 35 3.5 TS 18/06 10.5 118.8 1004 - 2.0 TD04/18 13.2 105.6 1004 - - TD 18/12 10.2 117.7 1004 - 2.0 TD05/00 Dissip. 18/18 9.3 116.8 1004 - 2.0 TD
19/00 9.0 116.2 1004 - 2.0 TD19/06 8.8 115.2 1002 - 2.0 TD
Central Max CI Grade 19/12 8.5 114.4 1002 - 2.0 TDpressure wind num. 19/18 8.3 113.7 1002 - 2.0 TD
Lat (N) Lon (E) (hPa) (kt) 20/00 7.8 113.1 1000 35 2.0 TS20/06 7.6 112.6 1000 35 2.0 TS20/12 7.3 111.7 996 40 2.0 TS
Nov. 07/12 10.1 134.2 1008 - - TD 20/18 7.2 110.4 996 40 2.0 TS07/18 10.5 132.2 1006 - 0.0 TD 21/00 6.6 109.7 1000 35 2.0 TS08/00 10.7 130.6 1006 - 0.5 TD 21/06 6.5 109.1 1000 35 2.0 TS08/06 11.0 129.0 1004 - 0.5 TD 21/12 6.3 108.5 1002 - 1.5 TD08/12 11.3 127.1 1006 - 0.5 TD 21/18 6.1 107.3 1004 - 1.5 TD08/18 12.1 125.6 1004 - 1.0 TD 22/00 5.5 106.6 1004 - 1.0 TD09/00 12.7 124.3 1006 - 1.5 TD 22/06 5.2 106.1 1004 - 1.0 TD09/06 13.3 122.8 1004 - 2.0 TD 22/12 4.6 105.3 1004 - 1.0 TD09/12 13.8 121.5 1004 - 2.0 TD 22/18 4.0 104.8 1004 - 1.0 TD09/18 14.4 120.3 1004 - 2.0 TD 23/00 3.8 104.4 1004 - 1.0 TD10/00 15.0 119.2 1002 35 2.0 TS 23/06 3.0 104.5 1004 - 1.0 TD10/06 15.9 118.5 1002 35 2.0 TS 23/12 2.8 104.8 1004 - - TD10/12 16.9 117.6 1002 35 2.0 TS 23/18 2.7 104.8 1006 - - TD10/18 17.2 117.0 1000 35 2.0 TS 24/00 Dissip.11/00 17.6 116.2 998 40 2.5 TS11/06 18.1 115.0 998 40 2.5 TS11/12 18.1 114.3 998 40 2.5 TS Central Max CI Grade11/18 17.9 113.6 1000 35 2.5 TS pressure wind num.12/00 17.8 113.0 1002 35 2.0 TS Lat (N) Lon (E) (hPa) (kt)12/06 17.5 112.3 1006 - 2.0 TD12/12 17.3 111.8 1008 - 1.5 TD12/18 17.5 111.1 1008 - - TD Dec. 20/00 8.1 134.2 1006 - 0.5 TD13/00 17.5 110.5 1008 - - TD 20/06 8.5 133.0 1004 - 1.0 TD13/06 Dissip. 20/12 8.7 131.9 1002 - 1.5 TD
20/18 8.6 130.9 998 35 2.0 TS21/00 8.6 129.9 996 40 2.5 TS
Central Max CI Grade 21/06 8.4 129.0 994 45 3.0 TSpressure wind num. 21/12 8.1 128.0 992 45 3.0 TS
Lat (N) Lon (E) (hPa) (kt) 21/18 7.8 126.8 990 50 3.5 STS22/00 7.7 125.2 992 45 3.0 TS22/06 7.9 123.6 994 40 2.5 TS
Nov. 16/12 7.1 123.6 1006 - 0.0 TD 22/12 8.0 122.5 992 45 3.0 TS16/18 7.8 122.3 1006 - 0.5 TD 22/18 7.8 121.4 990 50 3.5 STS17/00 8.2 120.1 1006 - 1.0 TD 23/00 7.7 120.3 985 55 3.5 STS17/06 10.3 118.5 1004 - 1.0 TD 23/06 7.8 118.8 980 60 4.0 STS17/12 10.7 117.6 1004 - 1.5 TD 23/12 7.8 117.5 975 65 4.5 TY17/18 11.0 116.0 1002 - 2.0 TD 23/18 8.1 115.9 975 65 4.5 TY18/00 11.5 115.2 1000 35 2.5 TS 24/00 8.1 114.7 970 70 5.0 TY18/06 11.4 113.4 1000 35 2.5 TS 24/06 8.2 113.3 970 70 5.0 TY18/12 11.1 112.7 1000 35 2.5 TS 24/12 8.3 112.0 975 65 5.0 TY18/18 10.8 111.9 1000 35 2.5 TS 24/18 8.1 111.0 980 55 4.5 STS19/00 10.9 110.6 1002 - 2.5 TD 25/00 8.0 109.9 992 45 4.0 TS19/06 11.0 109.6 1004 - 2.5 TD 25/06 8.1 108.8 996 40 4.0 TS19/12 Dissip. 25/12 8.7 107.7 1004 - 3.5 TD
25/18 8.5 105.7 1006 - 3.0 TD26/00 8.4 104.4 1008 - 3.0 TD26/06 8.6 103.6 1008 - - TD26/12 Dissip.
(UTC) position
Kirogi (1725)
Date/Time Center(UTC) position
Tembin (1727)
(UTC) position
Haikui (1724)
Date/Time Center
Damrey (1723) Kai-tak (1726)
Date/Time Center
(UTC) position (UTC) positionDate/Time Center Date/Time Center

Appendix 2
Monthly Tracks of Tropical Cyclones in 2017


Appendix 3Errors of Track and Intensity Forecasts for Each Tropical Cyclone in 2017
T=00 =24 =48 =72 =96 =120 T=24 =48 =72 T=24 =48 =72 T=00 =24 =48 =72 =96 =120 T=24 =48 =72 T=24 =48 =72
Apr. 25/18 22 123 -2 0 Jul. 02/00 0 102 234 4 8 -5 -1026/00 40 78 -2 0 02/06 0 96 447 9 8 -10 -1026/06 65 02/12 0 147 555 9 8 -10 -1026/12 79 02/18 0 109 643 5 8 -5 -1526/18 66 03/00 0 113 0 027/00 31 03/06 0 107 2 -5
03/12 0 84 6 -10mean 50 101 -- -- -- -- -2 -- -- 0 -- -- 03/18 0 114 6 -10
sample 6 2 0 0 0 0 2 0 0 2 0 0 04/00 904/06 004/12 004/18 0
T=00 =24 =48 =72 =96 =120 T=24 =48 =72 T=24 =48 =72mean 1 109 470 -- -- -- 5 8 -- -7 -11 --
sample 12 8 4 0 0 0 8 4 0 8 4 0Jun. 11/00 0 194 6 -10
11/06 0 152 10 -1511/12 21 73 13 -1511/18 21 47 8 -10 T=00 =24 =48 =72 =96 =120 T=24 =48 =72 T=24 =48 =7212/00 012/06 012/12 0 Jul. 15/06 15 11 182 4 4 -10 -1012/18 0 15/12 11 77 0 -5
15/18 40 62 5 -5mean 5 116 -- -- -- -- 9 -- -- -12 -- -- 16/00 0 95 4 0
sample 8 4 0 0 0 0 4 0 0 4 0 0 16/06 31 85 0 016/12 4916/18 3417/00 1117/06 15
mean 23 66 182 -- -- -- 3 4 -- -4 -10 --sample 9 5 1 0 0 0 5 1 0 5 1 0
Date/Time Center Position (km) Central Pressure (hPa) Max. Wind (kt)
STS Talas (1704)(UTC)
Central Pressure (hPa) Max. Wind (kt)(UTC) (UTC)
TS Muifa (1701) STS Nanmadol (1703)
Date/Time Center Position (km) Central Pressure (hPa) Max. Wind (kt) Date/Time Center Position (km)
Date/Time Center Position (km) Central Pressure (hPa) Max. Wind (kt)(UTC)
STS Merbok (1702)

T=00 =24 =48 =72 =96 =120 T=24 =48 =72 T=24 =48 =72 T=00 =24 =48 =72 =96 =120 T=24 =48 =72 T=24 =48 =72
Jul. 20/12 89 76 163 2 2 0 5 06/00 0 93 168 5 0 0 1020/18 51 129 6 -5 06/06 11 73 38 5 -3 0 1021/00 126 157 236 194 502 508 4 7 20 0 -10 -20 06/12 0 35 5 021/06 59 185 245 167 522 419 2 12 20 0 -15 -20 06/18 0 35 0 521/12 79 200 149 232 473 343 6 17 20 5 -5 0 07/00 0 96 0 521/18 50 185 118 186 446 399 6 10 0 -5 -10 0 07/06 9 97 -3 022/00 60 137 86 182 230 645 9 10 -15 -5 -10 10 07/12 022/06 79 170 86 214 245 772 14 5 -15 -10 -5 10 07/18 022/12 89 157 122 160 241 710 15 0 -20 -10 0 15 08/00 022/18 29 132 49 170 164 623 10 0 -20 -5 0 15 08/06 023/00 11 69 104 176 194 494 10 -5 -20 -10 5 1523/06 0 70 80 131 123 318 5 -10 -20 0 10 20 mean 14 71 113 196 316 426 -2 -4 -5 4 6 723/12 11 30 59 109 208 256 0 -20 -20 5 20 20 sample 76 72 67 62 58 54 72 67 62 72 67 6223/18 0 20 134 124 209 164 -15 -25 -25 10 20 2024/00 0 51 109 112 165 30 -15 -25 -25 10 20 1524/06 10 70 76 97 116 170 -15 -25 -20 10 20 1524/12 0 100 68 150 176 284 -20 -25 -25 15 20 2024/18 10 52 11 178 209 386 -20 -25 -20 15 20 1525/00 10 76 44 182 157 400 -20 -20 -20 15 15 2025/06 10 85 73 175 260 424 -20 -15 -15 15 10 1525/12 10 31 77 190 356 555 -20 -15 -15 15 10 1525/18 0 0 129 212 403 510 -10 -5 -10 10 5 1026/00 10 40 161 200 397 457 -10 -10 -10 10 10 1026/06 0 22 150 268 496 490 -5 -5 -5 5 10 1026/12 10 53 166 295 489 403 -5 -5 -5 5 10 1026/18 0 68 112 284 381 275 -5 -5 -5 5 10 1027/00 0 80 126 303 345 227 -5 -5 0 10 10 527/06 0 45 153 313 304 212 -5 -5 5 10 10 027/12 11 46 145 259 210 254 -5 -5 15 10 10 -527/18 0 59 129 201 173 298 0 -5 20 5 10 -1028/00 0 41 98 147 236 387 0 0 30 5 5 -2028/06 35 11 80 123 244 404 -5 -10 20 5 0 -1528/12 11 44 113 128 230 376 0 10 20 5 0 -1528/18 0 63 78 107 251 457 -5 20 20 10 -10 -1529/00 0 56 35 23 105 337 5 35 30 0 -25 -2029/06 11 35 0 52 158 422 10 30 15 -5 -20 -1029/12 10 60 24 70 195 477 20 30 15 -10 -20 -1029/18 30 35 30 90 231 519 20 20 15 -10 -15 -1030/00 10 56 79 188 395 706 30 20 15 -20 -15 -1030/06 0 76 114 284 548 771 30 15 15 -20 -10 -1030/12 0 84 143 350 591 752 5 0 0 -5 0 030/18 0 56 132 318 568 589 5 0 10 -5 0 -531/00 0 81 164 345 577 579 5 10 5 -5 -5 -531/06 0 72 196 371 560 526 -5 0 0 5 0 031/12 0 38 143 279 398 397 -5 5 -5 5 -5 531/18 0 78 134 275 398 322 -5 -5 -10 0 0 10
Aug. 01/00 11 63 122 229 303 97 -5 -10 -10 0 5 1001/06 0 82 155 216 249 118 0 -5 -20 0 5 2001/12 0 56 133 174 295 504 0 -10 -20 0 10 2001/18 0 56 102 139 248 436 0 -15 -20 0 15 2002/00 15 74 87 162 327 526 -5 -15 -30 5 15 3002/06 11 56 70 220 386 525 0 -20 -30 0 20 3002/12 0 44 73 221 412 536 -10 -25 -35 10 25 3502/18 0 37 69 209 372 485 -15 -25 -35 15 25 3503/00 15 39 73 133 291 355 -10 -25 -30 10 25 3003/06 0 15 80 194 326 349 -15 -25 -30 15 25 3003/12 11 44 112 225 333 -15 -30 -30 15 30 3003/18 0 59 146 243 341 -10 -25 -20 10 25 2004/00 10 87 160 228 312 -15 -25 0 15 25 504/06 24 53 141 241 242 -15 -25 -5 15 25 1004/12 24 44 144 246 -10 -20 5 15 20 004/18 0 36 103 176 -10 15 5 15 -10 005/00 0 53 116 134 -10 15 5 15 -10 505/06 15 70 142 125 -5 10 2 10 -5 505/12 0 118 173 0 5 5 005/18 0 109 225 0 0 5 5
Central Pressure (hPa) Max. Wind (kt)(UTC) (UTC)
TY Noru (1705)
Date/Time Center Position (km) Central Pressure (hPa) Max. Wind (kt) Date/Time Center Position (km)

T=00 =24 =48 =72 =96 =120 T=24 =48 =72 T=24 =48 =72 T=00 =24 =48 =72 =96 =120 T=24 =48 =72 T=24 =48 =72
Jul. 21/06 30 73 44 172 533 -4 -10 -12 0 5 10 Jul. 25/18 60 164 4 -1021/12 0 347 340 531 770 -6 -2 -2 5 0 -5 26/00 11 130 242 8 11 -15 -1521/18 40 146 168 364 -6 0 0 5 -5 0 26/06 15 123 294 542 1038 0 5 10 0 -5 -1022/00 0 58 78 440 -6 0 2 5 0 0 26/12 11 39 209 354 0 10 10 0 -10 -1022/06 0 73 190 543 -4 0 2 5 0 0 26/18 11 44 109 271 -5 20 0 5 -20 022/12 0 56 208 529 0 0 2 0 0 0 27/00 25 38 54 287 0 20 -15 0 -20 2022/18 0 35 246 2 2 0 0 27/06 0 30 115 381 5 10 -15 -5 -10 3023/00 0 61 281 2 2 0 0 27/12 0 25 211 5 10 -5 -1023/06 0 48 338 2 2 -5 0 27/18 79 23 213 15 5 -15 -523/12 0 122 414 2 2 -5 0 28/00 0 68 157 15 0 -15 523/18 29 254 2 0 28/06 54 152 122 5 0 -5 1024/00 29 321 2 0 28/12 0 195 25 -3024/06 0 44 2 0 28/18 23 102 10 -1524/12 0 134 4 -10 29/00 0 104 -5 524/18 0 29/06 0 108 0 1025/00 0 29/12 025/06 0 29/18 025/12 44 30/00 0
30/06 35mean 10 127 231 430 651 -- -1 0 -1 0 0 1
sample 18 14 10 6 2 0 14 10 6 14 10 6 mean 17 90 173 367 1038 -- 5 9 -2 -6 -8 6sample 19 15 10 5 1 0 15 10 5 15 10 5
T=00 =24 =48 =72 =96 =120 T=24 =48 =72 T=24 =48 =72T=00 =24 =48 =72 =96 =120 T=24 =48 =72 T=24 =48 =72
Jul. 22/06 7022/12 10 Jul. 28/18 1522/18 126 29/00 2523/00 38 29/06 21 106 9 -10
29/12 34 149 6 -15mean 61 -- -- -- -- -- -- -- -- -- -- -- 29/18 79 163 8 -15
sample 4 0 0 0 0 0 0 0 0 0 0 0 30/00 15 315 4 -1030/06 030/12 1530/18 0
T=00 =24 =48 =72 =96 =120 T=24 =48 =72 T=24 =48 =72 31/00 23
mean 23 183 -- -- -- -- 7 -- -- -12 -- --Jul. 23/00 34 108 122 2 6 0 0 sample 10 4 0 0 0 0 4 0 0 4 0 0
23/06 54 94 168 4 6 0 023/12 39 135 2 023/18 32 123 4 024/00 15 91 4 0 T=00 =24 =48 =72 =96 =120 T=24 =48 =72 T=24 =48 =7224/06 34 89 2 024/12 2524/18 0 Aug. 02/00 37 23 31 67 6 4 0 -5 0 525/00 78 02/06 15 23 30 172 2 0 2 0 5 025/06 21 02/12 24 23 29 144 2 0 4 0 5 -5
02/18 33 15 63 0 -2 0 5mean 33 107 145 -- -- -- 3 6 -- 0 0 -- 03/00 24 46 147 -2 -7 5 10
sample 10 6 2 0 0 0 6 2 0 6 2 0 03/06 15 80 235 -2 -5 5 503/12 15 69 196 -2 -5 5 503/18 22 35 0 004/00 10 22 0 004/06 35 62 0 004/12 45 21 0 -504/18 2905/00 1905/06 2405/12 66
mean 28 38 104 128 -- -- 0 -2 2 0 5 0sample 15 11 7 3 0 0 11 7 3 11 7 3
(UTC)TS Roke (1707)
Date/Time Center Position (km) Central Pressure (hPa) Max. Wind (kt)(UTC)
TS Sonca (1708)
(UTC)TS Haitang (1710)
Date/Time Center Position (km) Central Pressure (hPa) Max. Wind (kt)(UTC)
TS Nalgae (1711)
Date/Time Center Position (km) Central Pressure (hPa) Max. Wind (kt)(UTC)
TS Kulap (1706)
Date/Time Center Position (km) Central Pressure (hPa) Max. Wind (kt)
Date/Time Center Position (km) Central Pressure (hPa) Max. Wind (kt)(UTC)
TY Nesat (1709)
Date/Time Center Position (km) Central Pressure (hPa) Max. Wind (kt)

T=00 =24 =48 =72 =96 =120 T=24 =48 =72 T=24 =48 =72 T=00 =24 =48 =72 =96 =120 T=24 =48 =72 T=24 =48 =72
Aug. 11/12 15 164 481 998 25 43 41 -25 -35 -45 Aug. 28/06 42 105 319 297 419 392 -12 5 5 10 0 011/18 35 172 479 893 33 38 41 -25 -30 -45 28/12 21 94 319 262 499 242 -12 0 -10 10 5 512/00 15 133 355 638 35 25 33 -20 -10 -25 28/18 15 182 289 276 363 258 -5 0 0 10 10 512/06 35 137 284 502 25 15 17 -15 -5 -15 29/00 11 167 179 272 323 368 0 -5 -5 5 15 012/12 21 56 80 142 175 25 5 -10 -15 5 15 29/06 31 134 82 191 111 254 10 0 -5 0 10 012/18 0 69 113 179 218 10 5 -5 0 5 10 29/12 30 97 59 174 122 5 0 -5 5 5 013/00 0 69 77 114 332 -5 5 -5 10 5 5 29/18 15 51 92 123 143 5 5 0 5 0 513/06 0 68 60 140 -5 -5 -5 10 10 5 30/00 10 15 160 281 350 0 5 -5 10 -5 1013/12 0 62 69 225 -5 -10 -10 10 15 10 30/06 11 56 178 256 422 -5 -5 -15 5 -5 1013/18 15 61 80 246 10 -5 -10 0 5 10 30/12 0 30 136 184 -10 -5 -10 5 -5 514/00 15 135 268 587 10 -5 -14 0 5 15 30/18 0 68 171 229 -5 -10 -5 0 5 014/06 0 74 259 0 -5 5 5 31/00 0 118 179 280 0 -10 -5 -10 5 014/12 32 54 241 -5 -5 5 5 31/06 15 128 111 403 0 -10 5 -10 5 -514/18 15 40 202 -5 -10 5 10 31/12 20 83 69 -5 -15 -5 1015/00 0 61 258 -5 -14 5 15 31/18 0 63 91 -20 -25 10 1515/06 0 99 0 0 Sep. 01/00 0 87 195 -20 -15 20 1515/12 0 192 -5 5 01/06 54 160 261 -10 -5 15 1015/18 0 140 -5 10 01/12 15 129 -10 1516/00 15 96 -9 15 01/18 29 97 0 516/06 14 02/00 56 91 5 016/12 70 02/06 77 122 5 016/18 97 02/12 3617/00 48 02/18 0
03/00 14mean 19 99 221 424 242 -- 7 5 7 -1 0 -5 03/06 20
sample 23 19 15 11 3 0 19 15 11 19 15 11mean 21 99 170 248 306 303 -4 -5 -4 5 6 3
sample 25 21 17 13 9 5 21 17 13 21 17 13
T=00 =24 =48 =72 =96 =120 T=24 =48 =72 T=24 =48 =72
T=00 =24 =48 =72 =96 =120 T=24 =48 =72 T=24 =48 =72Aug. 20/12 67 25 279 198 0 10 11 5 -10 -15
20/18 127 39 143 128 -5 10 6 10 -10 -1521/00 74 100 142 93 0 15 4 5 -20 -10 Aug. 31/18 103 57 15 54 -2 -5 -15 0 5 2021/06 0 160 166 159 10 25 4 -10 -30 -10 Sep. 01/00 69 35 23 0 -5 0 521/12 53 102 88 5 5 -10 -10 01/06 38 38 25 0 -5 0 521/18 0 112 56 10 0 -15 -5 01/12 35 43 80 0 -7 0 1022/00 0 25 63 10 -2 -20 0 01/18 30 35 67 -5 -10 5 1522/06 0 15 59 0 2 0 0 02/00 42 38 -5 522/12 0 30 -10 15 02/06 30 83 -5 522/18 0 73 -9 15 02/12 22 47 -7 1023/00 0 101 -6 15 02/18 21 31 -4 523/06 41 45 -2 5 03/00 2323/12 0 03/06 2223/18 0 03/12 2124/00 0 03/18 4224/06 15
mean 38 45 42 54 -- -- -3 -6 -15 3 8 20mean 24 69 125 144 -- -- 0 8 6 1 -11 -12 sample 13 9 5 1 0 0 9 5 1 9 5 1
sample 16 12 8 4 0 0 12 8 4 12 8 4
T=00 =24 =48 =72 =96 =120 T=24 =48 =72 T=24 =48 =72T=00 =24 =48 =72 =96 =120 T=24 =48 =72 T=24 =48 =72
Sep. 05/18 0Aug. 24/18 25 65 94 0 2 0 0 06/00 33
25/00 11 11 123 0 -5 0 0 06/06 025/06 0 15 299 -2 -16 5 20 06/12 2125/12 11 154 327 2 -13 0 2525/18 0 46 0 5 mean 13 -- -- -- -- -- -- -- -- -- -- --26/00 11 126 -5 5 sample 4 0 0 0 0 0 0 0 0 0 0 026/06 11 255 -16 2026/12 24 209 -8 1526/18 3827/00 027/06 10827/12 78
mean 26 110 211 -- -- -- -4 -8 -- 6 11 --sample 12 8 4 0 0 0 8 4 0 8 4 0
Central Pressure (hPa) Max. Wind (kt)(UTC)
TY Sanvu (1715)
Date/Time
(UTC)TY Banyan (1712)
Date/Time Center Position (km) Central Pressure (hPa) Max. Wind (kt)(UTC)
TY Hato (1713) Central Pressure (hPa) Max. Wind (kt)
Date/Time Center Position (km)
Center Position (km)(UTC)
STS Mawar (1716)
Date/Time Center Position (km) Central Pressure (hPa) Max. Wind (kt)(UTC)
TS Guchol (1717)
Date/Time Center Position (km) Central Pressure (hPa) Max. Wind (kt)
Date/Time Center Position (km) Central Pressure (hPa) Max. Wind (kt)(UTC)
STS Pakhar (1714)
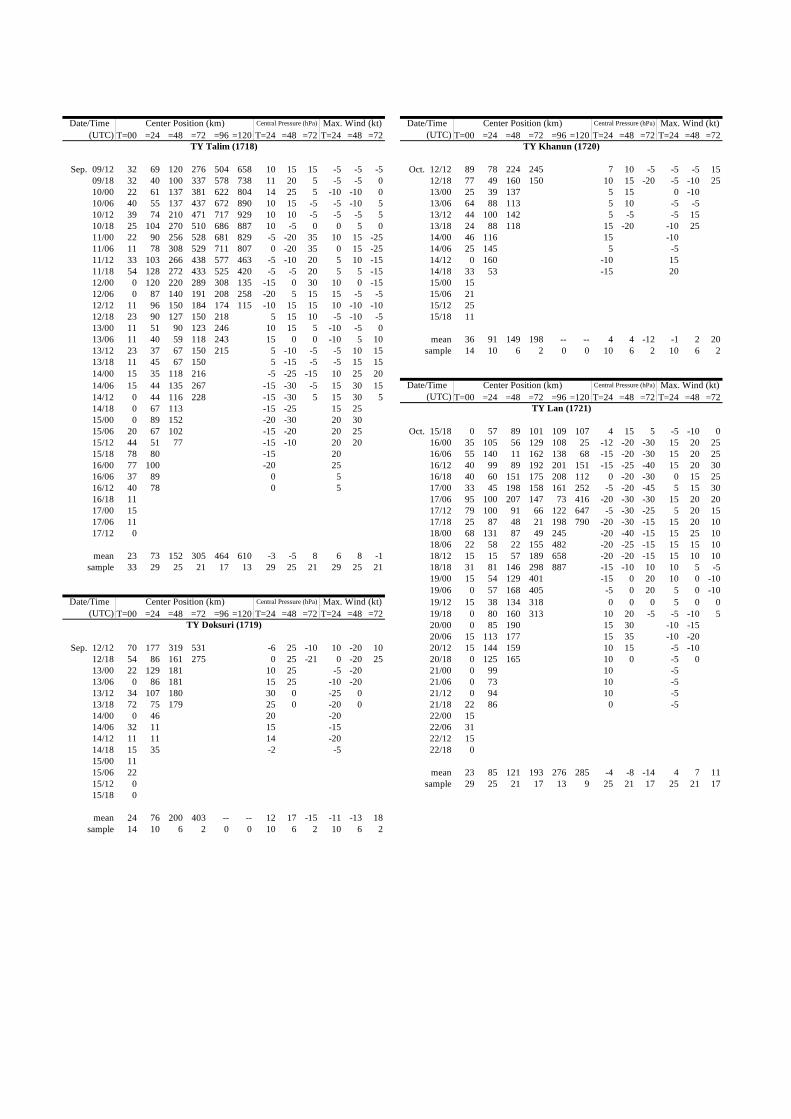
T=00 =24 =48 =72 =96 =120 T=24 =48 =72 T=24 =48 =72 T=00 =24 =48 =72 =96 =120 T=24 =48 =72 T=24 =48 =72
Sep. 09/12 32 69 120 276 504 658 10 15 15 -5 -5 -5 Oct. 12/12 89 78 224 245 7 10 -5 -5 -5 1509/18 32 40 100 337 578 738 11 20 5 -5 -5 0 12/18 77 49 160 150 10 15 -20 -5 -10 2510/00 22 61 137 381 622 804 14 25 5 -10 -10 0 13/00 25 39 137 5 15 0 -1010/06 40 55 137 437 672 890 10 15 -5 -5 -10 5 13/06 64 88 113 5 10 -5 -510/12 39 74 210 471 717 929 10 10 -5 -5 -5 5 13/12 44 100 142 5 -5 -5 1510/18 25 104 270 510 686 887 10 -5 0 0 5 0 13/18 24 88 118 15 -20 -10 2511/00 22 90 256 528 681 829 -5 -20 35 10 15 -25 14/00 46 116 15 -1011/06 11 78 308 529 711 807 0 -20 35 0 15 -25 14/06 25 145 5 -511/12 33 103 266 438 577 463 -5 -10 20 5 10 -15 14/12 0 160 -10 1511/18 54 128 272 433 525 420 -5 -5 20 5 5 -15 14/18 33 53 -15 2012/00 0 120 220 289 308 135 -15 0 30 10 0 -15 15/00 1512/06 0 87 140 191 208 258 -20 5 15 15 -5 -5 15/06 2112/12 11 96 150 184 174 115 -10 15 15 10 -10 -10 15/12 2512/18 23 90 127 150 218 5 15 10 -5 -10 -5 15/18 1113/00 11 51 90 123 246 10 15 5 -10 -5 013/06 11 40 59 118 243 15 0 0 -10 5 10 mean 36 91 149 198 -- -- 4 4 -12 -1 2 2013/12 23 37 67 150 215 5 -10 -5 -5 10 15 sample 14 10 6 2 0 0 10 6 2 10 6 213/18 11 45 67 150 5 -15 -5 -5 15 1514/00 15 35 118 216 -5 -25 -15 10 25 2014/06 15 44 135 267 -15 -30 -5 15 30 1514/12 0 44 116 228 -15 -30 5 15 30 5 T=00 =24 =48 =72 =96 =120 T=24 =48 =72 T=24 =48 =7214/18 0 67 113 -15 -25 15 2515/00 0 89 152 -20 -30 20 3015/06 20 67 102 -15 -20 20 25 Oct. 15/18 0 57 89 101 109 107 4 15 5 -5 -10 015/12 44 51 77 -15 -10 20 20 16/00 35 105 56 129 108 25 -12 -20 -30 15 20 2515/18 78 80 -15 20 16/06 55 140 11 162 138 68 -15 -20 -30 15 20 2516/00 77 100 -20 25 16/12 40 99 89 192 201 151 -15 -25 -40 15 20 3016/06 37 89 0 5 16/18 40 60 151 175 208 112 0 -20 -30 0 15 2516/12 40 78 0 5 17/00 33 45 198 158 161 252 -5 -20 -45 5 15 3016/18 11 17/06 95 100 207 147 73 416 -20 -30 -30 15 20 2017/00 15 17/12 79 100 91 66 122 647 -5 -30 -25 5 20 1517/06 11 17/18 25 87 48 21 198 790 -20 -30 -15 15 20 1017/12 0 18/00 68 131 87 49 245 -20 -40 -15 15 25 10
18/06 22 58 22 155 482 -20 -25 -15 15 15 10mean 23 73 152 305 464 610 -3 -5 8 6 8 -1 18/12 15 15 57 189 658 -20 -20 -15 15 10 10
sample 33 29 25 21 17 13 29 25 21 29 25 21 18/18 31 81 146 298 887 -15 -10 10 10 5 -519/00 15 54 129 401 -15 0 20 10 0 -1019/06 0 57 168 405 -5 0 20 5 0 -1019/12 15 38 134 318 0 0 0 5 0 0
T=00 =24 =48 =72 =96 =120 T=24 =48 =72 T=24 =48 =72 19/18 0 80 160 313 10 20 -5 -5 -10 520/00 0 85 190 15 30 -10 -1520/06 15 113 177 15 35 -10 -20
Sep. 12/12 70 177 319 531 -6 25 -10 10 -20 10 20/12 15 144 159 10 15 -5 -1012/18 54 86 161 275 0 25 -21 0 -20 25 20/18 0 125 165 10 0 -5 013/00 22 129 181 10 25 -5 -20 21/00 0 99 10 -513/06 0 86 181 15 25 -10 -20 21/06 0 73 10 -513/12 34 107 180 30 0 -25 0 21/12 0 94 10 -513/18 72 75 179 25 0 -20 0 21/18 22 86 0 -514/00 0 46 20 -20 22/00 1514/06 32 11 15 -15 22/06 3114/12 11 11 14 -20 22/12 1514/18 15 35 -2 -5 22/18 015/00 1115/06 22 mean 23 85 121 193 276 285 -4 -8 -14 4 7 1115/12 0 sample 29 25 21 17 13 9 25 21 17 25 21 1715/18 0
mean 24 76 200 403 -- -- 12 17 -15 -11 -13 18sample 14 10 6 2 0 0 10 6 2 10 6 2
TY Doksuri (1719)
Date/Time Center Position (km) Central Pressure (hPa) Max. Wind (kt)(UTC)
TY Khanun (1720)
(UTC)
(UTC)TY Talim (1718)
Date/Time Center Position (km) Central Pressure (hPa) Max. Wind (kt)
Date/Time
Date/Time Center Position (km) Central Pressure (hPa) Max. Wind (kt)(UTC)
TY Lan (1721)
Center Position (km) Central Pressure (hPa) Max. Wind (kt)

T=00 =24 =48 =72 =96 =120 T=24 =48 =72 T=24 =48 =72 T=00 =24 =48 =72 =96 =120 T=24 =48 =72 T=24 =48 =72
Oct. 24/12 112 149 239 364 352 0 -2 -10 0 5 10 Dec. 14/00 86 158 78 4 -2 -5 524/18 169 78 117 211 164 -6 -12 0 10 15 5 14/06 24 120 57 2 -6 0 1025/00 203 72 64 93 70 -2 -10 0 5 10 5 14/12 101 109 0 525/06 134 39 103 116 86 -7 -10 0 10 10 5 14/18 77 55 -2 1025/12 0 43 88 190 -7 -5 0 10 5 5 15/00 33 11 297 -4 1025/18 0 22 24 237 -7 5 0 10 0 5 15/06 16 33 219 -4 1026/00 0 46 78 381 -5 5 0 5 0 5 15/12 60 26126/06 0 49 112 558 -5 5 5 5 0 0 15/18 25 25426/12 0 90 335 0 5 0 0 16/00 47 203 31026/18 0 69 370 15 10 -10 -5 16/06 55 169 18027/00 0 93 359 10 15 -5 -10 16/1227/06 0 104 373 10 15 -5 -10 16/1827/12 0 125 10 -5 17/0027/18 0 59 10 -5 17/0628/00 0 66 10 -5 17/1228/06 0 75 5 -5 17/1828/12 0 18/0028/18 0 18/0629/00 0 18/1229/06 0 18/18
19/00mean 31 74 188 269 168 -- 2 2 -1 1 2 5 19/06
sample 20 16 12 8 4 0 16 12 8 16 12 8 19/1219/1820/00 46 40 0 020/06 11 11 0 0
T=00 =24 =48 =72 =96 =120 T=24 =48 =72 T=24 =48 =72 20/12 8120/18 4721/00 40
Nov. 02/00 24 60 110 17 5 -20 -10 21/06 1602/06 11 71 156 10 -10 -10 1002/12 31 57 49 5 2 -5 -10 mean 48 67 67 -- 186 254 0 -4 -- 4 8 --02/18 55 46 5 -5 sample 16 8 2 0 2 6 8 2 0 8 2 003/00 25 11 0 003/06 0 11 7 -1003/12 11 24 2 -1003/18 0 T=00 =24 =48 =72 =96 =120 T=24 =48 =72 T=24 =48 =7204/00 004/06 4304/12 80 Dec. 20/18 50 149 205 419 415 8 8 19 -10 -10 -20
21/00 66 123 102 237 242 6 13 24 -5 -15 -25mean 25 40 105 -- -- -- 7 -1 -- -9 -3 -- 21/06 47 118 86 212 203 0 12 22 5 -10 -20
sample 11 7 3 0 0 0 7 3 0 7 3 0 21/12 40 55 110 172 4 10 10 0 -10 -1021/18 0 78 220 227 4 15 5 -10 -15 022/00 44 74 206 205 9 20 -7 -10 -20 1022/06 22 105 198 181 12 15 -11 -15 -15 15
T=00 =24 =48 =72 =96 =120 T=24 =48 =72 T=24 =48 =72 22/12 11 133 174 17 10 -20 -1022/18 11 115 120 17 5 -15 523/00 11 86 113 15 -7 -10 15
Nov. 10/00 31 93 46 -6 -17 5 20 23/06 0 86 89 10 -11 -5 2010/06 15 70 -6 5 23/12 0 55 0 510/12 31 46 -6 5 23/18 22 40 -5 1510/18 15 57 -8 10 24/00 56 80 -7 1511/00 24 57 -8 10 24/06 0 110 -11 2011/06 86 24/12 1111/12 141 24/18 1111/18 42 25/00 2512/00 15 25/06 0
mean 45 65 46 -- -- -- -7 -17 -- 7 20 -- mean 22 94 148 236 287 -- 5 8 9 -3 -6 -7sample 9 5 1 0 0 0 5 1 0 5 1 0 sample 19 15 11 7 3 0 15 11 7 15 11 7
T=00 =24 =48 =72 =96 =120 T=24 =48 =72 T=24 =48 =72
Nov. 18/00 7018/06 10318/12 10318/18 25
mean 75 -- -- -- -- -- -- -- -- -- -- --sample 4 0 0 0 0 0 0 0 0 0 0 0
Central Pressure (hPa) Max. Wind (kt)(UTC)
STS Saola (1722)
Date/Time Center Position (km) Central Pressure (hPa) Max. Wind (kt)(UTC)
(UTC)TS Kai-tak (1726)
Date/Time Center Position (km) Central Pressure (hPa) Max. Wind (kt)(UTC)
TY Tembin (1727)
Date/Time Center Position (km) Central Pressure (hPa) Max. Wind (kt)
(UTC)TS Kirogi (1725)
Max. Wind (kt)Central Pressure (hPa)Center Position (km)
TY Damrey (1723)
Date/Time Center Position (km) Central Pressure (hPa) Max. Wind (kt)(UTC)
TS Haikui (1724)
Date/Time
Date/Time Center Position (km)

Monthly and annual frequencies of tropical cyclones that attained TS intensity or higherin the western North Pacific and the South China Sea for 1951 - 2017
Year Jan Feb Mar Apr May Jun Jul Aug Sep Oct Nov Dec Total19501951 1 1 2 1 1 3 3 2 4 1 2 211952 3 3 5 3 6 3 4 271953 1 1 2 1 6 3 5 3 1 231954 1 1 1 5 5 4 3 1 211955 1 1 1 1 2 7 6 4 3 1 1 281956 1 2 1 2 5 6 1 4 1 231957 2 1 1 1 1 4 5 4 3 221958 1 1 1 4 7 5 5 3 2 2 311959 1 1 1 2 5 5 4 2 2 231960 1 1 3 3 10 3 4 1 1 271961 1 1 2 3 4 6 6 4 1 1 291962 1 1 2 5 8 4 5 3 1 301963 1 4 4 3 5 4 3 241964 2 2 7 5 6 5 6 1 341965 2 1 1 1 2 3 5 6 7 2 2 321966 1 2 1 4 10 9 5 2 1 351967 1 2 1 1 1 7 9 9 4 3 1 391968 1 1 1 3 8 3 5 5 271969 1 1 1 3 4 3 3 2 1 191970 1 2 3 6 5 5 4 261971 1 1 3 4 2 8 5 6 4 2 361972 1 1 3 7 5 4 5 3 2 311973 7 5 2 4 3 211974 1 1 1 1 4 4 5 5 4 4 2 321975 1 2 4 5 5 3 1 211976 1 1 2 2 2 4 4 5 1 1 2 251977 1 1 3 3 5 5 1 2 211978 1 1 3 4 8 5 4 4 301979 1 1 1 2 4 2 6 3 2 2 241980 1 4 1 4 2 6 4 1 1 241981 1 2 3 4 8 4 2 3 2 291982 3 1 3 3 5 5 3 1 1 251983 1 3 5 2 5 5 2 231984 2 5 5 4 7 3 1 271985 2 1 3 1 8 5 4 1 2 271986 1 1 2 2 4 4 3 5 4 3 291987 1 1 2 4 4 6 2 2 1 231988 1 1 3 2 8 8 5 2 1 311989 1 1 2 2 7 5 6 4 3 1 321990 1 1 1 3 4 6 4 4 4 1 291991 2 1 1 1 4 5 6 3 6 291992 1 1 2 4 8 5 7 3 311993 1 1 4 7 6 4 2 3 281994 1 1 2 7 9 8 6 2 361995 1 1 2 6 5 6 1 1 231996 1 1 2 6 5 6 2 2 1 261997 2 3 3 4 6 4 3 2 1 281998 1 3 5 2 3 2 161999 2 1 4 6 6 2 1 222000 2 5 6 5 2 2 1 232001 1 2 5 6 5 3 1 3 262002 1 1 1 3 5 6 4 2 2 1 262003 1 1 2 2 2 5 3 3 2 212004 1 2 5 2 8 3 3 3 2 292005 1 1 1 1 5 5 5 2 2 232006 1 2 2 7 3 4 2 2 232007 1 1 3 4 5 6 4 242008 1 4 1 2 4 4 2 3 1 222009 2 2 2 5 7 3 1 222010 1 2 5 4 2 142011 2 3 4 3 7 1 1 212012 1 1 4 4 5 3 5 1 1 252013 1 1 4 3 6 8 6 2 312014 2 1 2 2 5 1 5 2 1 2 232015 1 1 2 1 2 2 3 4 5 4 1 1 272016 4 7 7 4 3 1 262017 1 1 8 6 3 3 3 2 27
Normal1981-2010 0.3 0.1 0.3 0.6 1.1 1.7 3.6 5.8 4.9 3.6 2.3 1.2 25.6
Appendix 4Monthly and Annual Frequencies of Tropical Cyclones

Appendix 5
Code Forms of RSMC Products (1) RSMC Tropical Cyclone Advisory (WTPQ20-25 RJTD) WTPQ i i RJTD YYGGgg RSMC TROPICAL CYCLONE ADVISORY NAME class ty-No. name (common-No.) ANALYSIS PSTN YYGGgg UTC LaLa.La N LoLoLo.Lo E (or W) confidence MOVE direction SpSpSp KT PRES PPPP HPA MXWD VmVmVm KT GUST VgVgVg KT 50KT RdRdRd NM (or 50KT RdRdRd NM octant RdRdRd NM octant) 30KT RdRdRd NM (or 30KT RdRdRd NM octant RdRdRd NM octant) FORECAST 24HF YYGGggF UTC LaLa.LaF N LoLoLo.LoF E (or W) FrFrFr NM 70% MOVE direction SpSpSp KT PRES PPPP HPA MXWD VmVmVm KT GUST VgVgVg KT Ft1Ft1HF YYGGggF UTC LaLa.LaF N LoLoLo.LoF E (or W) FrFrFr NM 70% MOVE direction SpSpSp KT PRES PPPP HPA GUST VgVgVg KT MXWD VmVmVm KT Ft2Ft2HF YYGGggF UTC LaLa.LaF N LoLoLo.LoF E (or W) FrFrFr NM 70% MOVE direction SpSpSp KT PRES PPPP HPA MXWD VmVmVm KT GUST VgVgVg KT = Notes: a. Underlined parts are fixed. b. Abbreviations PSTN : Position MOVE : Movement PRES : Pressure MXWD : Maximum wind HF : Hour forecast c. Symbolic letters i i : '20', '21', '22', '23', '24' or '25' YYGGgg : Time of observation submitting the data for analysis in UTC class : Intensity classification of the tropical cyclone 'TY', 'STS', 'TS' or 'TD' ty-No. : Domestic identification number of the tropical cyclone adopted in Japan given in four digits (same as the international identification number) name : Name assigned to the tropical cyclone from the name list prepared by the Typhoon Committee common-No. : International identification number of the tropical cyclones given in four digits LaLa.La : Latitude of the center position in "ANALYSIS" part LoLoLo.Lo : Longitude of the center position in "ANALYSIS" part confidence : Confidence of the center position. 'GOOD', 'FAIR' or 'POOR' direction : Direction of movement given in 16 azimuthal direction such as 'N', 'NNE', 'NE' and 'ENE' SpSpSp : Speed of movement PPPP : Central pressure VmVmVm : Maximum sustained wind

VgVgVg : Maximum gust wind RdRdRd : Radii of 30knots and 50knots wind octant : Eccentric distribution of wind given in 8 azimuthal direction such as 'NORTH', 'NORTHEAST' and 'EAST' Ft1Ft1 : 48 (00, 06, 12 and 18 UTC) or 45 (03, 09, 15 and 21 UTC) Ft2Ft2 : 72 (00, 06, 12 and 18 UTC) or 69 (03, 09, 15 and 21 UTC) YYGGggF : Time in UTC on which the forecast is valid LaLa.LaF : Latitude of the center of 70% probability circle in "FORECAST" part LoLoLo.LoF : Longitude of the center of 70% probability circle in "FORECAST" part FrFrFr : Radius of 70% probability circle d. MOVE is optionally described as 'ALMOST STATIONARY' or '(direction) SLOWLY', depending on the speed of movement. Example: WTPQ20 RJTD 150000 RSMC TROPICAL CYCLONE ADVISORY NAME STS 0320 NEPARTAK (0320) ANALYSIS PSTN 150000UTC 12.6N 117.8E FAIR MOVE WNW 13KT PRES 980HPA MXWD 055KT GUST 080KT 50KT 40NM 30KT 240NM NORTHEAST 160NM SOUTHWEST FORECAST 24HF 160000UTC 14.7N 113.7E 110NM 70% MOVE WNW 11KT PRES 965HPA MXWD 070KT GUST 100KT 48HF 170000UTC 16.0N 111.0E 170NM 70% MOVE WNW 07KT PRES 970HPA MXWD 065KT GUST 095KT 72HF 180000UTC 19.5N 110.0E 250NM 70% MOVE NNW 09KT PRES 985HPA MXWD 050KT GUST 070KT = (2) RSMC Tropical Cyclone Advisory for Five-day Track Forecast (WTPQ50-55 RJTD) WTPQ i i RJTD YYGGgg RSMC TROPICAL CYCLONE ADVISORY NAME class ty-No. name (common-No.) ANALYSIS PSTN YYGGgg UTC LaLa.La N LoLoLo.Lo E (or W) confidence MOVE direction SpSpSp KT PRES PPPP HPA MXWD VmVmVm KT GUST VgVgVg KT 50KT RdRdRd NM (or 50KT RdRdRd NM octant RdRdRd NM octant) 30KT RdRdRd NM (or 30KT RdRdRd NM octant RdRdRd NM octant) FORECAST 24HF YYGGggF UTC LaLa.LaF N LoLoLo.LoF E (or W) FrFrFr NM 70% MOVE direction SpSpSp KT PRES PPPP HPA MXWD VmVmVm KT GUST VgVgVg KT 48HF YYGGggF UTC LaLa.LaF N LoLoLo.LoF E (or W) FrFrFr NM 70% MOVE direction SpSpSp KT PRES PPPP HPA GUST VgVgVg KT MXWD VmVmVm KT 72HF YYGGggF UTC LaLa.LaF N LoLoLo.LoF E (or W) FrFrFr NM 70%

MOVE direction SpSpSp KT PRES PPPP HPA MXWD VmVmVm KT GUST VgVgVg KT 96HF YYGGggF UTC LaLa.LaF N LoLoLo.LoF E (or W) FrFrFr NM 70% MOVE direction SpSpSp KT 120HF YYGGggF UTC LaLa.LaF N LoLoLo.LoF E (or W) FrFrFr NM 70% MOVE direction SpSpSp KT= Notes: a. Underlined parts are fixed. b. Abbreviations and symbolic letters are the same as those used in RSMC Tropical Cyclone Advisory (WTPQ20-25 RJTD). Example: WTPQ50 RJTD 060000 RSMC TROPICAL CYCLONE ADVISORY NAME TY 0908 MORAKOT (0908) ANALYSIS PSTN 060000UTC 23.4N 128.3E FAIR MOVE WNW 09KT PRES 960HPA MXWD 075KT GUST 105KT 50KT 80NM 30KT 350NM SOUTH 300NM NORTH FORECAST 24HF 070000UTC 24.0N 123.9E 70NM 70% MOVE W 10KT PRES 925HPA MXWD 090KT GUST 130KT 48HF 080000UTC 25.3N 121.8E 110NM 70% MOVE WNW 06KT PRES 950HPA MXWD 080KT GUST 115KT 72HF 090000UTC 26.5N 119.7E 160NM 70% MOVE WNW 06KT PRES 970HPA MXWD 065KT GUST 095KT 96HF 100000UTC 28.0N 118.8E 240NM 70% MOVE NNW SLOWLY 120HF 110000UTC 29.6N 118.2E 375NM 70% MOVE NNW SLOWLY = (3) RSMC Guidance for Forecast (FXPQ20-25 RJTD) FXPQ i i RJTD YYGGgg RSMC GUIDANCE FOR FORECAST NAME class ty-No. name (common-No.) PSTN YYGGgg UTC LaLa.La N LoLoLo.Lo E (or W) PRES PPPP HPA MXWD WWW KT FORECAST BY GLOBAL MODEL TIME PSTN PRES MXWD (CHANGE FROM T=0) T=06 LaLa.La N LoLoLo.Lo E (or W) appp HPA awww KT T=12 LaLa.La N LoLoLo.Lo E (or W) appp HPA awww KT T=18 LaLa.La N LoLoLo.Lo E (or W) appp HPA awww KT : T=84 LaLa.La N LoLoLo.Lo E (or W) appp HPA awww KT=

Notes: a. Underlined parts are fixed. b. Symbolic letters i i : '20', '21', '22', '23', '24' or '25' YYGGgg : Initial time of the model in UTC class : Intensity classification of the tropical cyclone 'T', 'STS', 'TS' or 'TD' PPPP : Central pressure in hPa WWW : Maximum wind speed in knots a : Sign of ppp and www ( +, - or blank ) ppp : Absolute value of change in central pressure from T=0, in hPa www : Absolute value of change in maximum wind speed from T=0, in knots Example: FXPQ20 RJTD 180600 RSMC GUIDANCE FOR FORECAST NAME TY 0001DAMREY (0001) PSTN 180000UTC 15.2N 126.3E PRES 905HPA MXWD 105KT FORECAST BY GLOBAL MODEL TIME PSTN PRES MXWD (CHANGE FROM T=0) T=06 15.4N 125.8E +018HPA -008KT T=12 15.5N 125.6E +011HPA -011KT T=18 15.8N 125.7E +027HPA -028KT : : T=84 20.7N 128.8E +021HPA -022KT= (4) RSMC Prognostic Reasoning (WTPQ30-35 RJTD) Example: WTPQ30 RJTD 180000 RSMC TROPICAL CYCLONE PROGNOSTIC REASONING REASONING NO. 9 FOR TY 0001 DAMREY (0001) 1.GENERAL COMMENTS REASONING OF PROGNOSIS THIS TIME IS SIMILAR TO PREVIOUS ONE. POSITION FORECAST IS MAINLY BASED ON NWP AND PERSISTENCY. 2.SYNOPTIC SITUATION SUBTROPICAL RIDGE WILL NOT CHANGE ITS LOCATION AND STRENGTH FOR THE NEXT 24 HOURS. 3.MOTION FORECAST POSITION ACCURACY AT 180000 UTC IS GOOD. TY WILL DECELERATE FOR THE NEXT 12 HOURS. TY WILL RECURVE WITHIN 60 HOURS FROM 180000 UTC. TY WILL MOVE WEST FOR THE NEXT 12 HOURS THEN MOVE GRADUALLY TO WEST-NORTHWEST. 4.INTENSITY FORECAST TY WILL KEEP PRESENT INTENSITY FOR NEXT 24 HOURS. FI-NUMBER WILL BE 7.0 AFTER 24 HOURS.=

(5) RSMC Tropical Cyclone Best Track (AXPQ20 RJTD) AXPQ20 RJTD YYGGgg RSMC TROPICAL CYCLONE BEST TRACK NAME ty-No. name (common-No.) PERIOD FROM MMMDDTTUTC TO MMMDDTTUTC DDTT LaLa.LaN LoLoLo.LoE PPPHPA WWWKT DDTT LaLa.LaN LoLoLo.LoE PPPHPA WWWKT DDTT LaLa.LaN LoLoLo.LoE PPPHPA WWWKT DDTT LaLa.LaN LoLoLo.LoE PPPHPA WWWKT : : DDTT LaLa.LaN LoLoLo.LoE PPPHPA WWWKT DDTT LaLa.LaN LoLoLo.LoE PPPHPA WWWKT REMARKS1) TD FORMATION AT MMMDDTTUTC FROM TD TO TS AT MMMDDTTUTC : : DISSIPATION AT MMMDDTTUTC= Notes: a. Underlined parts are fixed. b. 1) REMARKS is given optionally. c. Symbolic letters MMM : Month in UTC given such as 'JAN' and 'FEB' DD : Date in UTC TT : Hour in UTC PPP : Central pressure WWW : Maximum wind speed Example: AXPQ20 RJTD 020600 RSMC TROPICAL CYCLONE BEST TRACK NAME 0001 DAMREY (0001) PERIOD FROM OCT1300UTC TO OCT2618UTC 1300 10.8N 155.5E 1008HPA //KT 1306 10.9N 153.6E 1006HPA //KT 1312 11.1N 151.5E 1004HPA //KT 1318 11.5N 149.8E 1002HPA //KT 1400 11.9N 148.5E 1000HPA //KT 1406 12.0N 146.8E 998HPA 35KT : : 1712 14.6N 129.5E 905HPA 105KT 1718 14.7N 128.3E 905HPA 105KT : : 2612 32.6N 154.0E 1000HPA //KT 2618 33.8N 157.4E 1010HPA //KT REMARKS TD FORMATION AT OCT1300UTC FROM TD TO TS AT OCT1406UTC FROM TS TO STS AT OCT1512UTC FROM STS TO TY AT OCT1600UTC FROM TY TO STS AT OCT2100UTC FROM STS TO TS AT OCT2112UTC FROM TS TO L AT OCT2506UTC DISSIPATION AT OCT2700UTC= (6) Tropical Cyclone Advisory for SIGMET (FKPQ30-35 RJTD) FKPQ i i RJTD YYGGgg TC ADVISORY DTG: yyyymmdd/time Z TCAC: TOKYO TC: name NR: number PSN: N LaLa.LaLa E LoLoLo.LoLo

MOV: direction SpSpSp KT C: PPPP HPA MAX WIND: WWW KT FCST PSN +6HR: YY/GGgg Z NLaLa.LaLa ELoLoLo.LoLo* FCST MAX WIND +6HR: WWW KT* FCST PSN +12HR: YY/GGgg Z NLaLa.LaLa ELoLoLo.LoLo FCST MAX WIND +12HR: WWW KT FCST PSN +18HR: YY/GGgg Z NLaLa.LaLa ELoLoLo.LoLo* FCST MAX WIND +18HR: YY/GGgg Z NLaLa.LaLa ELoLoLo.LoLo* FCST PSN +24HR: YY/GGgg Z N LaLa.LaLa E LoLoLo.LoLo FCST MAX WIND +24HR: WWW KT RMK: NIL = NXT MSG: yyyymmdd/time Z * 6 hour and 18 hour forecasts are added from 22 May 2008. Notes: a. Underlined parts are fixed. b. Abbreviations DTG : Date and time TCAC : Tropical Cyclone Advisory Centre TC : Tropical Cyclone NR : Number PSN : Position MOV : Movement C : Central pressure MAX WIND : Maximum wind FCST : Forecast RMK : Remarks NXT MSG : Next message c. Symbolic letters i i : '30', '31', '32', '33', '34' or '35' YYGGgg : Date(YY), hour(GG) and minute(gg) in UTC (Using “Z”) yyyymmdd/time : Year(yyyy), month(mm), date(dd), hour and minute (time) in UTC (Using “Z”) name : Name assigned to the tropical cyclone by RSMC Tokyo-Typhoon Center Number : Advisory number (starting with “01” for each cyclone) LaLa.LaLa : Latitude of the center position LoLoLo.LoLo : Longitude of the center position direction : Direction of movement given in 16 azimuthal direction such as 'N', 'NNE', 'NE' and 'ENE' SpSpSp : Speed of movement. “SLW” for less than 3 kt “STNR” for less than 1 kt. PPPP : Central pressure WWW : Maximum sustained wind Example: FKPQ30 RJTD 271200 TC ADVISORY DTG: 20080927/1200Z TCAC: TOKYO TC: JANGMI NR: 15 PSN: N2120 E12425 MOV: NW 13KT C: 910HPA MAX WIND: 115KT FCST PSN +6HR: 27/1800Z N2200 E12330 FCST MAX WIND +6HR: 115KT FCST PSN +12HR: 28/0000Z N2240 E12250 FCST MAX WIND +12HR: 115KT FCST PSN +18HR: 28/0600Z N2340 E12205 FCST MAX WIND +18HR: 95KT

FCST PSN +24HR: 28/1200Z N2440 E12105 FCST MAX WIND +24HR: 80KT RMK: NIL NXT MSG: 20080927/1800Z = (7) Graphical Tropical Cyclone Advisory for SIGMET Example:

Appendix 6
Specifications of JMA’s NWP Models (GSM, GEPS)
The Global Spectral Model (GSM) and the Global Ensemble Prediction System (GEPS) are used in JMA as a primary basis for TC forecasts. The general specifications of GSM and GEPS are summarized in Table 6.1.
Table 6.1 Specifications of GSM and GEPS
NWP Models GSM (Global Spectral Model), TL959L100
GEPS (Global Ensemble Prediction System), TL479L100
Resolution 20 km, 100 layers (Top: 0.01hPa) 40 km, 100 layers (Top: 0.01hPa) Area Global Global Method for initial value
Global Data Assimilation System (4DVAR) Outer resolution: TL959L100 Inner resolution: TL319L100 Window: Init-3h to Init + 3h
Unperturbed condition: Truncated GSM initial condition Initial perturbation: LETKF-based perturbation and SV-based perturbation Ensemble size: 27 (26 perturbed members and 1 control member) SV target areas: Northern Hemisphere (30 – 90°N), Tropics (30°S – 30°N), Southern Hemisphere (90 – 30°S)
Forecast length (initial times)
84h (00, 06, 18 UTC) 264h (12 UTC)
264 hours (00, 12 UTC) 132 hours (06, 18 UTC)
Operational as from
18 March 2014 19 January 2017
The GSM (TL959L100) has a horizontal resolution of approximately 20 km and 100 vertical
layers. Details of the model can be found in Yonehara et al. (2014). GEPS (TL479L100) is an ensemble prediction system used for TC track forecasts up to five
days ahead, one-week forecasts, early warning information on extreme weather, and one-month forecasts. It has 27 members and a horizontal resolution of approximately 40 km along with 100 vertical layers for the first 11 days of forecasts. Details of the system can be found in Tokuhiro (2018). A combination of a Local Ensemble Transform Kalman Filter (LETKF; Hunt et al. 2007) and a singular vector (SV) method (Buizza and Palmer 1995) is employed for the initial perturbation setup. In addition, a stochastically perturbed physics tendency scheme (Buizza et al. 1999) is incorporated in consideration of model uncertainties associated with physical parameterizations, and a perturbation technique for sea surface temperature (SST) is incorporated to represent uncertainty in the prescribed SST. Forecasts from initial times at 06 and 18 UTC are produced when any of the following conditions is satisfied at the initial times:

- A TC of tropical storm (TS) intensity or higher is present in the RSMC Tokyo - Typhoon Center’s area of responsibility (0 – 60°N, 100°E – 180°),
- A TC is expected to reach or exceed TS intensity in the area within the next 24 hours. [Recent upgrades to the GSM and the Global Data Assimilation System and GEPS] GSM:
- Parameterization schemes including deep convection, cloud, radiation, land surface and sea surface were revised (May 2017).
- A stratospheric methane oxidation parameterization scheme was implemented (May 2017).
- Discretization in calculation of pressure gradient force terms was revised (May 2017). Global Data Assimilation System:
- Usage of GNSS radio occultation data was revised. (July 2017). - Background error statistics in the data assimilation system were revised (May 2017). - Assimilation of Suomi-NPP/ATMS, Suomi-NPP/CrIS and DMSP-F17 and 18/SSMIS
(183 GHz) was commenced (March 2017). - Transition of AMV and CSR from Meteosat-7 to Meteosat-8 was completed (March
2017). GEPS:
- GEPS was put into operation (January 2017), replacing the Typhoon Ensemble Prediction System (TEPS).
[References] Buizza, R., M. Miller, and T. N. Palmer, 1999: Stochastic representation of model uncertainties in
the ECMWF Ensemble Prediction System. Quart. J. Roy. Meteor. Soc., 125, 2887–2908. Buizza, R. and Palmer, T. N., 1995: The singular-vector structure of the atmospheric global
circulation. J. Atmos. Sci., 52, 1434 – 1456. Hunt, B. R., E. J. Kostelich and I. Szunyogh, 2007: Efficient data assimilation for spatiotemporal
chaos: a local ensemble transform Kalman filter. Physica. D., 230, 112 – 126. Tokuhiro, T., 2018: Introduction to JMA’s new Global Ensemble Prediction System. RSMC Tokyo –
Typhoon Center Technical Review, 20. http://www.jma.go.jp/jma/jma-eng/jma-center/rsmc-hp-pub-eg/techrev/text17-1.pdf
Yonehara, H., M. Ujiie, T. Kanehama, R. Sekiguchi and Y. Hayashi, 2014: Upgrade of JMA's Operational NWP Global Model, CAS/JSC WGNE Res. Activ. Atmos. Oceanic Modell., 44, 06.19-06.20.

Appendix 7
Products on WIS GISC Tokyo Server (Available at https://www.wis-jma.go.jp/cms/)
NWP products (GSM and EPS)
Model GSM GSM GSM
Area and resolution Whole globe, 1.25°×1.25° 20°S–60°N, 60°E–160°W
1.25°×1.25° Whole globe, 2.5°×2.5°
Levels and elements
10 hPa: Z, U, V, T 20 hPa: Z, U, V, T 30 hPa: Z, U, V, T 50 hPa: Z, U, V, T 70 hPa: Z, U, V, T
100 hPa: Z, U, V, T 150 hPa: Z, U, V, T 200 hPa: Z, U, V, T, ψ, χ 250 hPa: Z, U, V, T 300 hPa: Z, U, V, T, H, ω 400 hPa: Z, U, V, T, H, ω 500 hPa: Z, U, V, T, H, ω, ζ 600 hPa: Z, U, V, T, H, ω 700 hPa: Z, U, V, T, H, ω 850 hPa: Z, U, V, T, H, ω, ψ, χ 925 hPa: Z, U, V, T, H, ω
1000 hPa: Z, U, V, T, H, ω Surface: P, U, V, T, H, R†
10 hPa: Z, U, V, T 20 hPa: Z, U, V, T 30 hPa: Z, U, V, T 50 hPa: Z, U, V, T 70 hPa: Z, U, V, T
100 hPa: Z, U, V, T 150 hPa: Z, U, V, T 200 hPa: Z§, U§, V§, T§, ψ, χ 250 hPa: Z, U, V, T 300 hPa: Z, U, V, T, D 400 hPa: Z, U, V, T, D 500 hPa: Z§, U§, V§, T§, D§, ζ 700 hPa: Z§, U§, V§, T§, D§, ω 850 hPa: Z§, U§, V§, T§, D§, ω, ψ, χ 925 hPa: Z, U, V, T, D, ω
1000 hPa: Z, U, V, T, D Surface: P¶, U¶, V¶, T¶, D¶, R¶
10 hPa: Z*, U*, V*, T* 20 hPa: Z*, U*, V*, T* 30 hPa: Z°, U°, V°, T° 50 hPa: Z°, U°, V°, T° 70 hPa: Z°, U°, V°, T°
100 hPa: Z°, U°, V°, T° 150 hPa: Z*, U*, V*, T* 200 hPa: Z, U, V, T 250 hPa: Z°, U°, V°, T° 300 hPa: Z, U, V, T, D*‡ 400 hPa: Z*, U*, V*, T*, D*‡ 500 hPa: Z, U, V, T, D*‡ 700 hPa: Z, U, V, T, D 850 hPa: Z, U, V, T, D
1000 hPa: Z, U*, V*, T*, D*‡ Surface: P, U, V, T, D*‡, R†
Forecast hours
0–84 every 6 hours and 96–192 every 12 hours † Except analysis
0–84 (every 6 hours) § 96–192 (every 24 hours) for 12UTC initial ¶ 90–192 (every 6 hours) for 12UTC initial
0–72 every 24 hours and 96–192 every 24 hours for 12UTC ° 0–120 for 12UTC † Except analysis * Analysis only
Initial times 00, 06, 12, 18UTC 00, 06, 12, 18UTC 00UTC and 12UTC
‡ 00UTC only
Model Global EPS Area and resolution Whole globe, 2.5°×2.5°
Levels and elements
250 hPa: µU, σU, µV, σV 500 hPa: µZ, σZ 850 hPa: µU, σU, µV, σV, µT, σT
1000 hPa: µZ, σZ Surface: µP, σP
Forecast hours 0–192 every 12 hours Initial times 00, 12UTC
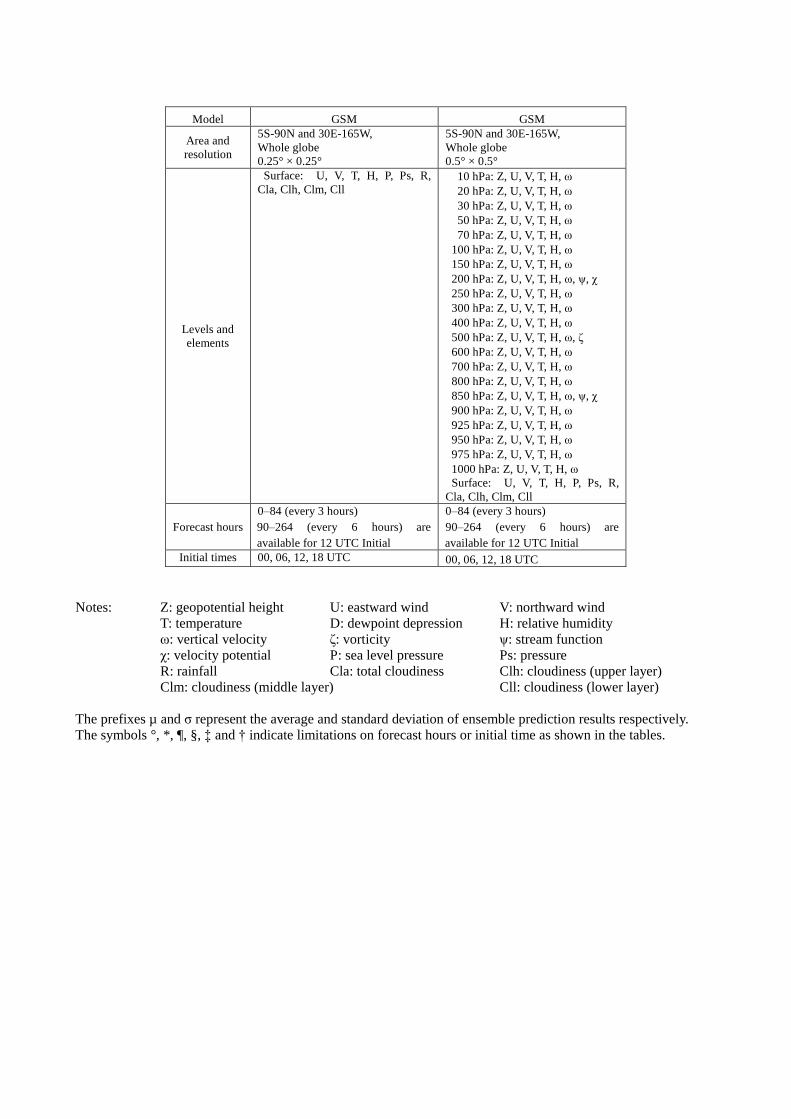
Model GSM GSM
Area and resolution
5S-90N and 30E-165W, Whole globe 0.25° × 0.25°
5S-90N and 30E-165W, Whole globe 0.5° × 0.5°
Levels and elements
Surface: U, V, T, H, P, Ps, R, Cla, Clh, Clm, Cll
10 hPa: Z, U, V, T, H, ω 20 hPa: Z, U, V, T, H, ω 30 hPa: Z, U, V, T, H, ω 50 hPa: Z, U, V, T, H, ω 70 hPa: Z, U, V, T, H, ω
100 hPa: Z, U, V, T, H, ω 150 hPa: Z, U, V, T, H, ω 200 hPa: Z, U, V, T, H, ω, ψ, χ 250 hPa: Z, U, V, T, H, ω 300 hPa: Z, U, V, T, H, ω 400 hPa: Z, U, V, T, H, ω 500 hPa: Z, U, V, T, H, ω, ζ 600 hPa: Z, U, V, T, H, ω 700 hPa: Z, U, V, T, H, ω 800 hPa: Z, U, V, T, H, ω 850 hPa: Z, U, V, T, H, ω, ψ, χ 900 hPa: Z, U, V, T, H, ω 925 hPa: Z, U, V, T, H, ω 950 hPa: Z, U, V, T, H, ω 975 hPa: Z, U, V, T, H, ω 1000 hPa: Z, U, V, T, H, ω Surface: U, V, T, H, P, Ps, R,
Cla, Clh, Clm, Cll
Forecast hours 0–84 (every 3 hours) 90–264 (every 6 hours) are available for 12 UTC Initial
0–84 (every 3 hours) 90–264 (every 6 hours) are available for 12 UTC Initial
Initial times 00, 06, 12, 18 UTC 00, 06, 12, 18 UTC Notes: Z: geopotential height U: eastward wind V: northward wind T: temperature D: dewpoint depression H: relative humidity ω: vertical velocity ζ: vorticity ψ: stream function χ: velocity potential P: sea level pressure Ps: pressure R: rainfall Cla: total cloudiness Clh: cloudiness (upper layer) Clm: cloudiness (middle layer) Cll: cloudiness (lower layer) The prefixes µ and σ represent the average and standard deviation of ensemble prediction results respectively. The symbols °, *, ¶, §, ‡ and † indicate limitations on forecast hours or initial time as shown in the tables.

Other products Data Contents / frequency (initial time)
Satellite products
High density atmospheric motion vectors (BUFR) Himawari-8 (VIS, IR, WVx3: every hour), 60S-60N, 90E-170W Clear Sky Radiance (CSR) data (BUFR)
Himawari-8 radiances and brightness temperatures averaged over cloud-free pixels: every hour
Tropical cyclone Information
Tropical cyclone related information (BUFR) • tropical cyclone analysis data (00, 06, 12 and 18 UTC)
Wave data
Global Wave Model (GRIB2) • significant wave height • prevailing wave period • wave direction Forecast hours: 0–84 every 6 hours (00, 06 and 18UTC) 0–84 every 6 hours and 96-192 every 12 hours (12 UTC)
Observational data
(a) Surface data (TAC/TDCF) SYNOP, SHIP, BUOY: Mostly 4 times a day (b) Upper-air data (TAC/TDCF) TEMP (parts A-D), PILOT (parts A-D): Mostly twice a day
SATAID service
(a) Satellite imagery (SATAID) Himawari-8 (b) Observation data (SATAID)
SYNOP, SHIP, METAR, TEMP (A, B) and ASCAT sea-surface wind (c) NWP products (SATAID)
GSM (Available at https://www.wis-jma.go.jp/cms/sataid/)

Appendix 8
Products on NTP Website List of products provided on the Numerical Typhoon Prediction (NTP) website:
https://tynwp-web.kishou.go.jp/
Products Frequency Details
Observation/Analysis
TC Analysis At least 4 times/day
Results and historical logs of the Center’s TC analysis conducted using satellite images (Conventional Dvorak analysis and Early-stage Dvorak analysis)
Satellite Microwave Products
TC snapshot images Warm-core-based TC intensity estimates Weighted consensus TC intensity estimates made using Dvorak
analysis and satellite microwave warm-core-based intensity estimates
Radar Every hour Radar composite imagery from the Typhoon Committee Regional Radar Network
Upper-Air Analysis 4 times/day
Upper-air analysis based on GSM initial field data - Streamlines at 850 and 200 hPa - Vertical wind shear between 200 and 850 hPa - Divergence at 200 hPa - Vorticity at 850 hPa
Ocean Analysis Once/day Sea surface temperature and difference from 24 hours ago Tropical cyclone heat potential and difference from 24 hours ago
Forecasting/NWP
TC Track Prediction 4 times/day
TC track prediction of deterministic NWP models from nine centers (BoM, CMA, CMC, DWD, ECMWF, KMA, NCEP, UKMO and JMA) and a related consensus
TC track prediction of ensemble NWP models from four centers (ECMWF, NCEP, UKMO and JMA)
NWP Weather Maps Twice/day
Mean sea level pressure and 500 hPa Geopotential height (up to 72 hours at 00 UTC, up to 168 hours at 12 UTC) of deterministic NWP models from nine centers (BoM, CMA, CMC, DWD, ECMWF, KMA, NCEP, UKMO and JMA)
TC Activity Prediction Twice/day
Two- and five-day TC activity prediction maps based on ensemble NWP models from two centers (ECMWF and UKMO) and a related consensus
Storm Surge/Waves
Storm Surge Forecasts 4 times/day
Distribution maps of storm surges for the Center’s TC track forecast and each of five TC track forecasts selected from GEPS ensemble members, and the maximum storm surge among these six TC track forecasts (up to 72 hours ahead)
Time-series storm surge forecast charts for the Center’s TC track forecast and each of five TC track forecasts selected from GEPS ensemble members (up to 72 hours ahead)
Wave Height Forecasts Twice/day
Distribution maps of ensemble mean wave height, maximum wave height, probability of exceeding various wave heights and ensemble spread based on Wave Ensemble System (WENS) (up to 264 hours ahead)
Time-series charts of ensemble mean wave height with ensemble spread information and probability of exceeding various wave heights based on Wave Ensemble System (WENS) (up to 264 hours ahead)

Appendix 9
User’s Guide to the DVD
Preface This DVD contains all the texts, tables and charts of the RSMC Annual Report 2017 along with satellite images of the tropical cyclones that attained TS intensity or higher in the western North Pacific and the South China Sea in 2017. This document is a brief user's guide on how to use the DVD, which was mastered in ISO-9660 format. Directory and File layout [Root] |------TopMenu.html (start menu html page) |------Readme.txt (brief explanation of the DVD) |------SATAIDmanual.pdf (user manual for the satellite image viewer) |------Annual_Report |---Text (text of Annual Report 2017 in PDF) |---Figure (figures in PDF) |---Table (tables in PDF) |---Appendix (appendices for MS Word, Excel and PDF) |------Best_Track |---E_BST_2017.txt (best track data for 2017) |---E_BST_201704.txt (best track data for TCs generated in April 2017)
: |---E_BST_201712.txt (best track data for TCs generated in December 2017) |------SATAID |---Gmslpd.exe (viewer; tropical cyclone version in English for 32-bit OS) |---Gsetup.exe (setup program for 32-bit OS) |---Gmslpd64.exe (viewer; tropical cyclone version in English for 64-bit OS) |---Gsetup64.exe (setup program for 64-bit OS) |------Satellite_Images |---T1701 (hourly satellite image data for T1701) |---T1702 (hourly satellite image data for T1702)
: |---T1727 (hourly satellite image data for T1727)

How to use the DVD The start menu shown when the DVD is inserted or the TopMenu.html file is clicked contains links titled Annual Report 2017, SATAID Installation for 32-bit OS/64-bit OS, Satellite Images and About this DVD. Click the link or the file name of the content you wish to see and follow the instructions on the display. Hardware/OS requirements for using the DVD: Hardware : PC/AT compatible OS : Microsoft Windows XP or later < Annual Report 2017> Annual Report 2017 is provided in two formats as PDF files and MS Word/Excel files. - PDF files: Click Annual Report 2017 to open the text in PDF. If you cannot open it, download Adobe Reader from Adobe’s website (http://www.adobe.com/). Adobe Reader (or Adobe Acrobat) is required to view PDF files. - MS Word/Excel files: The original figures and tables prepared with Microsoft Word or Excel are contained in the Annual Report folder of the DVD. < SATAID Installation > - Installation of the program for displaying satellite images Click SATAID Installation for 32-bit OS/64-bit OS to run the setup program (Gsetup.exe for 32-bit OS/Gsetup64.exe for 64-bit OS) for the satellite image viewer (SATAID). Follow the instructions to install SATAID (Gmslpd.exe for 32-bit OS/Gmslpd64.exe for 64-bit OS). < Satellite Images > - Displaying satellite images After installing SATAID, click Satellite Images in Internet Explorer or Firefox to launch SATAID and display a list of tropical cyclones occurring in 2017 in the selection window. Choose and click a tropical cyclone from the list to see hourly satellite images of it. You can also display the track of the tropical cyclone superimposed onto the satellite image and measure its intensity using the Dvorak method. - User manual for the viewer Besides the above features, the viewer has many other useful functions. See the User Manual (SATAIDmanual.pdf) for further details on its use.

- Explanation of satellite image data Satellite : Himawari-8
Period : From the TD formation to the time of dissipation Images : Infrared images (00 to 23 UTC) Visible images (00 to 12 and 17 to 23 UTC) Range : 40 degrees in both latitude and longitude (The image window moves to follow the track of the tropical cyclone so that its center remains in the middle of the window.) Time interval : Hourly Resolution : 0.05 degrees in both latitude and longitude Compression of file : Compressed using the compress.exe command of Microsoft Windows < About this DVD > Click About this DVD to open the Readme.txt file.

Microsoft Windows is a registered trademark of Microsoft Corporation in the United States and other countries. Adobe and Acrobat Reader are trademarks of Adobe Systems Incorporated.
For further information, please contact:
RSMC Tokyo - Typhoon Center Forecast Division Forecast Department Japan Meteorological Agency 1-3-4 Otemachi, Chiyoda-ku, Tokyo 100-8122, Japan FAX: +81-3-3211-8303 E-mail: [email protected]

Tropical Cyclones in 2017

MUIFA (1701)
MUIFA formed as a tropical depression (TD) around the Caroline Islands at 18 UTC on 22 April 2017 and
moved west-northwestward. It was upgraded to tropical storm (TS) intensity and reached its peak
intensity with maximum sustained winds of 35 kt and a central pressure of 1002 hPa around the sea east of
the Philippines at 18 UTC on 25 April. After turning northward, MUIFA weakened to TD intensity over
the same waters at 06 UTC on 27 April. It turned northeastward and dissipated south of the Ogasawara
Islands at 12 UTC on 29 April.
[Circle] 6 hourly position [Circle with number] Position at 00UTC Number: Day [TC grade] TY STS TS TD or L

MERBOK (1702)
MERBOK formed as a tropical depression (TD) over the South China Sea at 00 UTC on 10 June 2017.
After moving north-northwestward, it was upgraded to tropical storm (TS) intensity over the same waters at
00 UTC on the next day. Keeping its north-northwestward track, MERBOK reached its peak intensity with
maximum sustained winds of 55 kt and a central pressure of 985 hPa southeast of Hong Kong at 12 UTC
on 12 June. After turning north-northeastward and crossing the coast line of the southern part of China with
STS intensity, it downgraded to TS intensity on 18 UTC the same day and weakened to TD intensity in the
same area 6 hours later. MERBOK dissipated there at 12 UTC on 13 June.
[Circle] 6 hourly position
[Circle with number] Position at 00UTC Number: Day
[TC grade] TY STS TS TD or L

NANMADOL (1703)
NANMADOL formed as a tropical depression (TD) around the sea east of the Philippines at 06 UTC on 1
July 2017. Moving northwestward, it was upgraded to tropical storm (TS) intensity around the sea south of
Okinawa Island at 00 UTC on 02 July. NANMADOL gradually turned northeastward and reached its peak
intensity with maximum sustained winds of 55 kt and a central pressure of 985 hPa over the East China Sea
at 06 UTC on 03 July. NANMADOL made a landfall on Nagasaki City, Nagasaki Prefecture around 2300
UTC on 3 July and made landfall on Uwajima City, Ehime Prefecture after 0300 UTC the next day. After
making landfall on Tanabe City, Wakayama Prefecture before 0800 UTC on 4 July, NANMADOL
transformed into an extratropical cyclone around the sea east of Japan at 00 UTC on 5 July. It moved
northeastward and crossed longitude 180 degrees east at 12 UTC on 8 July.
[Circle] 6 hourly position
[Circle with number] Position at 00UTC Number: Day
[TC grade] TY STS TS TD or L
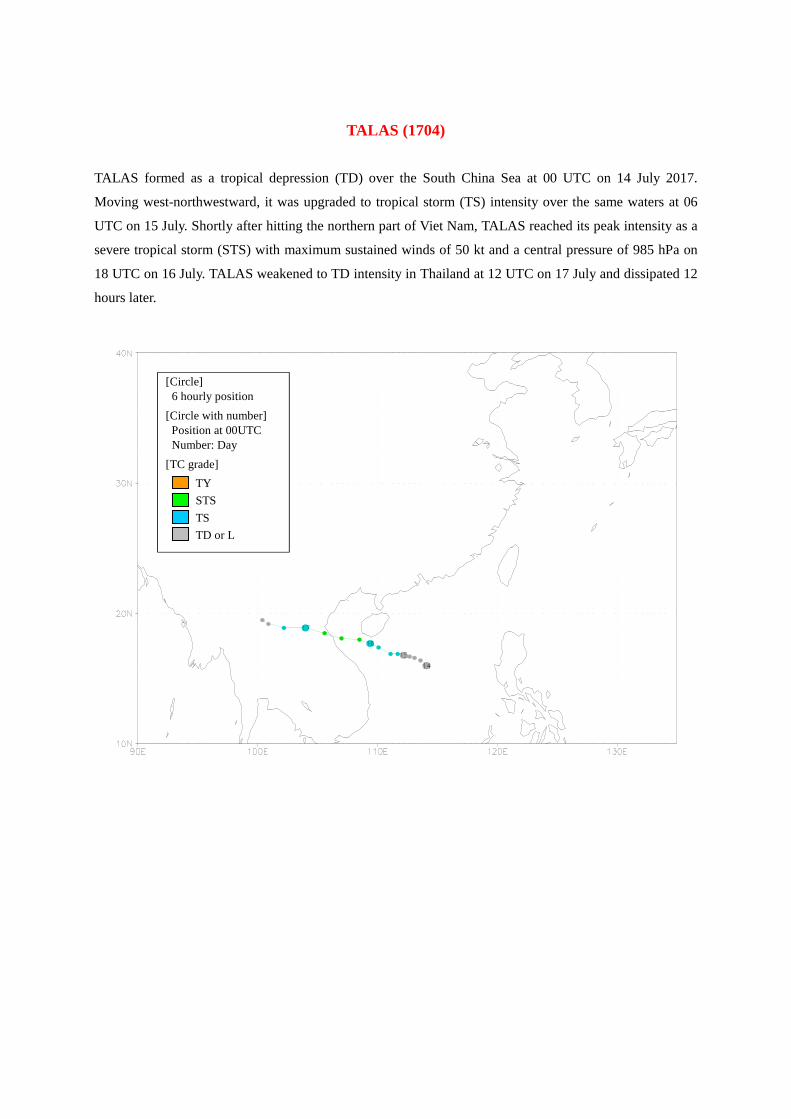
TALAS (1704)
TALAS formed as a tropical depression (TD) over the South China Sea at 00 UTC on 14 July 2017.
Moving west-northwestward, it was upgraded to tropical storm (TS) intensity over the same waters at 06
UTC on 15 July. Shortly after hitting the northern part of Viet Nam, TALAS reached its peak intensity as a
severe tropical storm (STS) with maximum sustained winds of 50 kt and a central pressure of 985 hPa on
18 UTC on 16 July. TALAS weakened to TD intensity in Thailand at 12 UTC on 17 July and dissipated 12
hours later.
[Circle] 6 hourly position [Circle with number] Position at 00UTC Number: Day [TC grade] TY STS TS TD or L

NORU (1705)
NORU formed as a tropical depression (TD) over the sea east of Minamitorishima Island at 06 UTC on 19
July 2017. Moving westward, it was upgraded to tropical storm (TS) intensity northeast of the same
island at 12 UTC on the next day. Shortly after turning in a counterclockwise direction, NORU was
upgraded to typhoon (TY) intensity northwest of Minamitorishima Island at 12 UTC on 23 July. Gradually
turning southwestward, it weakened to severe tropical storm (STS) intensity northeast of Chichijima
Island.at 00 UTC on 28 July. Keeping its southwestward track, NORU gradually developed and was
upgraded to TY intensity again at 00 UTC on 30 July. Gradually turning northwestward, it reached its peak
intensity with maximum sustained winds of 95 kt and a central pressure of 935 hPa south-southwest of
Chichijima Island at 00 UTC on 31 July. After that NORU remained almost stationary over the sea west of
Yakushima Island on 5 August and weakened to STS intensity at 12 UTC on the same day. After moving
northeastward, it passed over Yakushima Island with STS intensity after 17 UTC on 5 August, and passed
over Tanegashima Island with STS intensity around 0030 UTC on the next day. After passing around Cape
Muroto before 01 UTC on 7 August, Noru made landfall in the northern part of Wakayama Prefecture with
STS intensity after 06 UTC on the same day. Keeping its northeastward track, NORU crossed the central
Honshu Island and entered the Sea of Japan on 8 August. It transformed into an extratropical cyclone over
the same waters at 12 UTC on the same day. Noru dissipated over the Sea of Japan at 12 UTC on 9 August.
[Circle] 6 hourly position
[Circle with number] Position at 00UTC Number: Day
[TC grade] TY STS TS TD or L

KULAP (1706)
KULAP formed as a tropical depression (TD) over the sea southwest of the Midway Islands at 00 UTC on
20 July 2017. Moving northward, it was upgraded to tropical storm (TS) intensity over the sea west of the
Midway Islands at 06 UTC the next day. Turning westward, KULAP reached its peak intensity with
maximum sustained winds of 40 kt and a central pressure of 1002 hPa far east of Japan at 18 UTC on 06
UTC on 23 July. Keeping its westward track, KULAP was downgraded to TD intensity over the sea east
of Japan at 18 UTC on 25 July. It dissipated over the sea east of the Ogasawara Islands at 06UTC on 28
July.
[Circle] 6 hourly position
[Circle with number] Position at 00UTC Number: Day
[TC grade] TY STS TS TD or L

ROKE (1707) ROKE formed as a tropical depression (TD) around the sea south-southwest of Okinawa Island at 06 UTC
on 21 July 2017. After moving west-northwestward, it was upgraded to tropical storm (TS) intensity around
the Luzon Strait at 06 UTC on 22 July and reached its peak intensity with maximum sustained winds of 35
kt and a central pressure of 1002 hPa over the South China Sea six hours later. Keeping its
west-northwestward track, ROKE crossed the coast line of the southern part of China with TS intensity
early on 23 July. It weakened to TD intensity there at 06 UTC on 23 July and dissipated 12 hours later.
[Circle] 6 hourly position
[Circle with number] Position at 00UTC Number: Day
[TC grade] TY STS TS TD or L
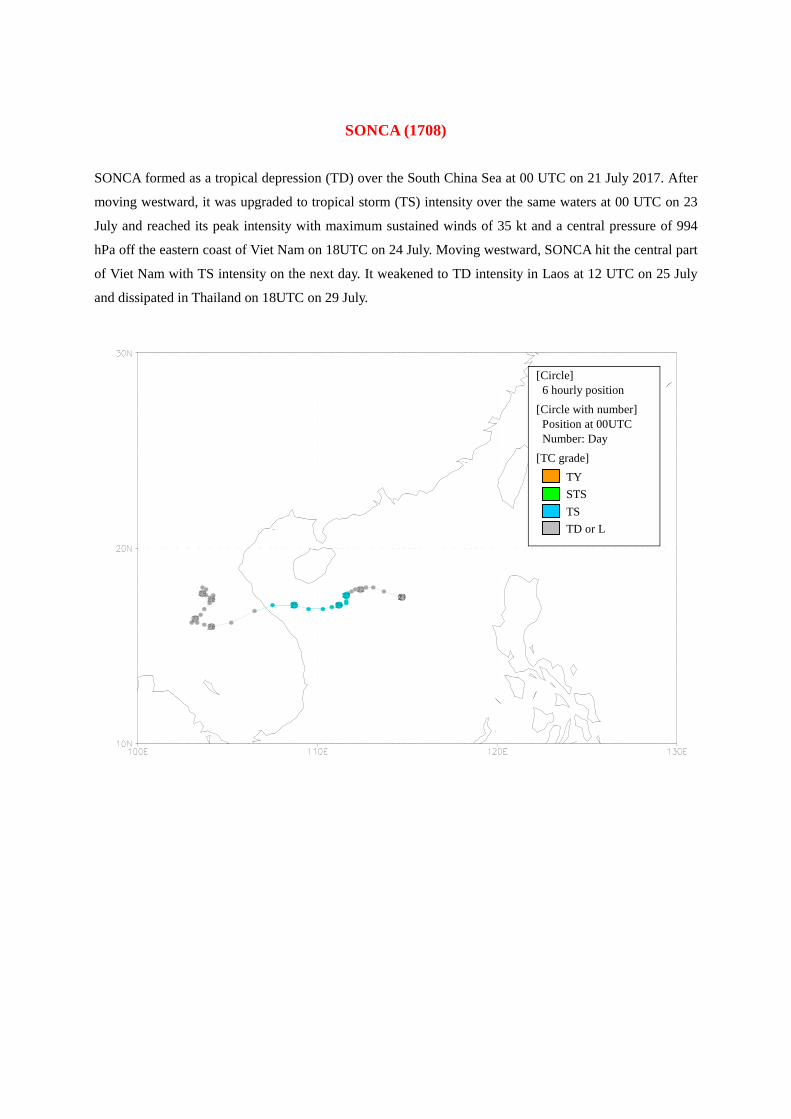
SONCA (1708)
SONCA formed as a tropical depression (TD) over the South China Sea at 00 UTC on 21 July 2017. After
moving westward, it was upgraded to tropical storm (TS) intensity over the same waters at 00 UTC on 23
July and reached its peak intensity with maximum sustained winds of 35 kt and a central pressure of 994
hPa off the eastern coast of Viet Nam on 18UTC on 24 July. Moving westward, SONCA hit the central part
of Viet Nam with TS intensity on the next day. It weakened to TD intensity in Laos at 12 UTC on 25 July
and dissipated in Thailand on 18UTC on 29 July.
[Circle] 6 hourly position [Circle with number] Position at 00UTC Number: Day [TC grade] TY STS TS TD or L

NESAT (1709)
NESAT formed as a tropical depression (TD) over the sea east of the Philippines at 06 UTC on 25 July
2017 and moved north-northwestward. NESAT was upgraded to tropical storm (TS) intensity at 18 UTC
on the same day over the same waters and was upgraded to typhoon (TY) intensity at 06 UTC on 28 July
over the sea southeast of Taiwan Island. It reached its peak intensity with maximum sustained winds of
80 kt and a central pressure of 960 hPa southeast of Taiwan Island at 18 UTC on 28 July. NESAT crossed
Taiwan Island on 29 July and then turned west-northwestward. After entering the Taiwan Strait, it hit the
coast of southeastern China at 00 UTC on 30 July and weakened to a TD at 12 UTC on the same day.
NESAT dissipated on southeastern China at 00 UTC on 31 July.
[Circle] 6 hourly position
[Circle with number] Position at 00UTC Number: Day
[TC grade] TY STS TS TD or L

HAITANG (1710)
HAITANG formed as a tropical depression (TD) over the South China Sea at 12 UTC on 27 July 2017.
Turning in a counterclockwise direction to circle, it was upgraded to tropical storm (TS) intensity over the
same waters at 18 UTC on 28 July. HAITANG reached its peak intensity with maximum sustained winds
of 45 kt and a central pressure of 985 hPa south of Taiwan Island at 06 UTC on 30 July. After crossing
Taiwan Island, it hit southeast of China late on the same day. HAITANG weakened to TD intensity in the
same area at 06 UTC on 31 July. It transformed into an extratropical cyclone around the lower Yangtze
River at 06 UTC on 1 August and moved northward. It dissipated around the lower Yellow River at 00 UTC
on 3 August.
[Circle] 6 hourly position
[Circle with number] Position at 00UTC Number: Day
[TC grade] TY STS TS TD or L

NALGAE (1711)
NALGAE formed as a tropical depression (TD) northeast of Minamitorishima Island at 06 UTC on 31 July
2017 and moved eastward. It was upgraded to tropical storm (TS) intensity north of Wake Island at 00 UTC
on 2 August. NALGAE turned sharply north-northwestward and reached its peak intensity with maximum
sustained winds of 45 kt and a central pressure of 990 hPa far east of Japan at 06 UTC on 5 August. It
transformed into an extratropical cyclone over the same waters 12 hours later. After drawing a
counterclockwise loop east of the Chishima Islands, NALGAE turned west-southwestward and dissipated
around the same waters at 12 UTC on 9 August.
[Circle] 6 hourly position
[Circle with number] Position at 00UTC Number: Day
[TC grade] TY STS TS TD or L
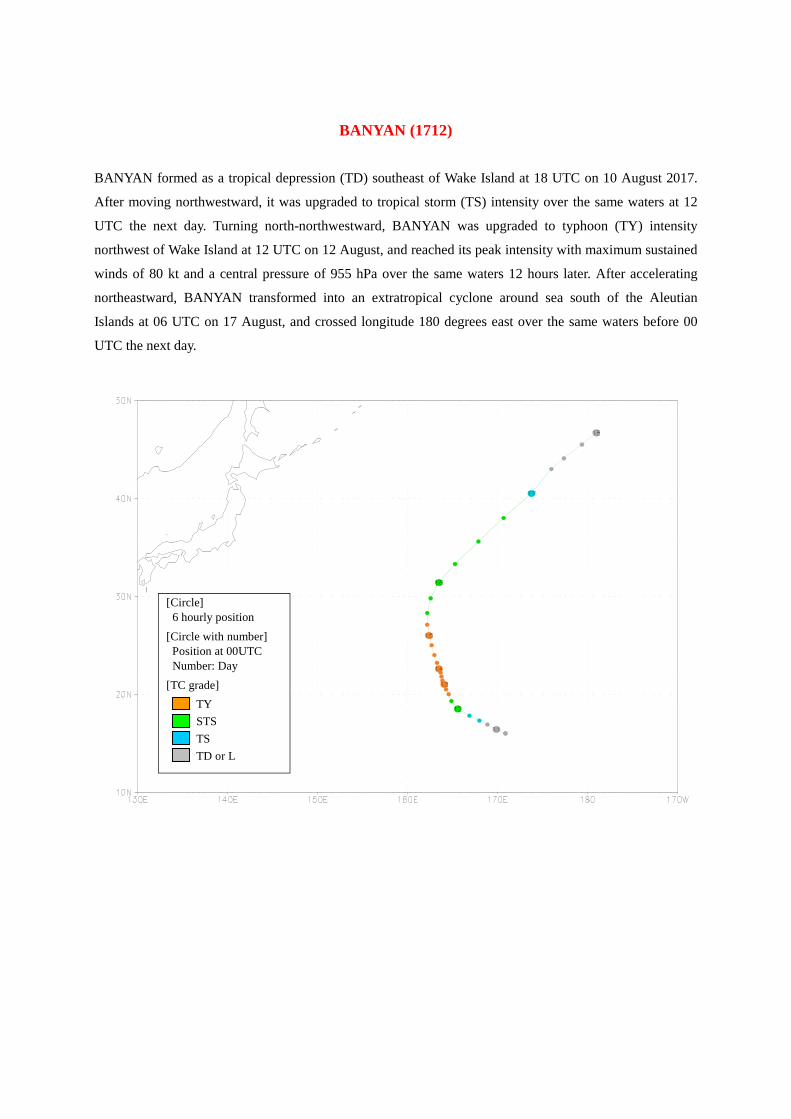
BANYAN (1712)
BANYAN formed as a tropical depression (TD) southeast of Wake Island at 18 UTC on 10 August 2017.
After moving northwestward, it was upgraded to tropical storm (TS) intensity over the same waters at 12
UTC the next day. Turning north-northwestward, BANYAN was upgraded to typhoon (TY) intensity
northwest of Wake Island at 12 UTC on 12 August, and reached its peak intensity with maximum sustained
winds of 80 kt and a central pressure of 955 hPa over the same waters 12 hours later. After accelerating
northeastward, BANYAN transformed into an extratropical cyclone around sea south of the Aleutian
Islands at 06 UTC on 17 August, and crossed longitude 180 degrees east over the same waters before 00
UTC the next day.
[Circle] 6 hourly position [Circle with number] Position at 00UTC Number: Day [TC grade] TY STS TS TD or L

HATO (1713)
HATO formed as a tropical depression (TD) over the sea east of the Philippines at 12 UTC on 19 August
2017 and moved westward. It was upgraded to tropical storm (TS) intensity over the same waters at 12
UTC on 20 August. After passing the Luzon Strait, HATO was upgraded to typhoon (TY) intensity over the
northern part of the South China Sea at 18 UTC on 22 August. It reached its peak intensity with maximum
sustained winds of 75 kt and a central pressure of 965 hPa over the same waters 6 hours later. After hitting
the southern part of China with TY intensity early on 23 August, HATO rapidly weakened to TD intensity
there at 12 UTC on 24 August and crossed longitude 100 degrees east at 00 UTC on the next day.
[Circle] 6 hourly position
[Circle with number] Position at 00UTC Number: Day
[TC grade] TY STS TS TD or L

PAKHAR (1714)
PAKHAR formed as a tropical depression (TD) around sea east of the Philippines at 00 UTC on 24 August
2017. Moving westward, it was upgraded to tropical storm (TS) intensity east of Luzon Island at 18 UTC
on the same day. Turning northwestward, it crossed the island late on 25 August and entered the South
China Sea. PAKHAR was upgraded to severe tropical storm (STS) intensity at 18 UTC on 26 August, and
reached its peak intensity with maximum sustained winds of 55 kt and a central pressure of 985 hPa over
the same waters 6 hours later. After hitting the southern part of China, it weakened to TD intensity there
at 18 UTC on 27 August and dissipated at 06 UTC on the next day.
[Circle] 6 hourly position
[Circle with number] Position at 00UTC Number: Day
[TC grade] TY STS TS TD or L

SANVU (1715)
SANVU formed as a tropical depression (TD) around the sea east of the Northern Mariana Islands at 18
UTC on 26 August 2017. After moving northward, it was upgraded to tropical storm (TS) intensity over the
same waters at 06 UTC on 28 August. After gradually turned westward, SANVU was upgraded to typhoon
(TY) intensity at 12 UTC on 31 August during its turning in a counterclockwise direction to circle twice
around the Ogasawara Islands. SANVU reached its peak intensity with maximum sustained winds of 80 kt
and a central pressure of 955 hPa over the same waters at 00 UTC on 1 September. SANVU turned
north-eastward and transformed into an extratropical cyclone over the sea east of the Chishima Islands at
12 UTC on 3 September. It crossed longitude 180 degrees east over the sea around the Aleutian Islands
before 12 UTC on 6 September.
[Circle] 6 hourly position [Circle with number] Position at 00UTC Number: Day [TC grade] TY STS TS TD or L

MAWAR (1716)
MAWAR formed as a tropical depression (TD) over the Balintang Channel at 06 UTC on 30 August 2017.
Moving northwestward, it was upgraded to tropical storm (TS) intensity over the South China Sea at 18
UTC on 31 August. MAWAR was upgraded to severe tropical storm (STS) intensity and reached its peak
intensity with maximum sustained winds of 50 kt and a central pressure of 990 hPa over the same waters at
00 UTC on 2 September. MAWAR hit the coast of southern China late on 3 September before weakening to
TD intensity at 00 UTC on 4 September, and dissipated over southern China at 12 UTC on the same day.
[Circle] 6 hourly position [Circle with number] Position at 00UTC Number: Day [TC grade] TY STS TS TD or L

GUCHOL (1717)
GUCHOL formed as a tropical depression (TD) around the sea east of the Philippines at 12 UTC on 3
September 2017, and moved westward. After turning northwestward, it was upgraded to tropical storm (TS)
intensity around the Luzon Strait and reached its peak intensity with maximum sustained winds of 35 kt
and a central pressure of 1000 hPa at 18 UTC on 5 September. After turning north-northwestward,
GUCHOL was downgraded to TD intensity around the Taiwan Strait at 18 UTC on 6 September. Moving
northward, it dissipated at 18 UTC the next day.
[Circle] 6 hourly position [Circle with number] Position at 00UTC Number: Day [TC grade] TY STS TS TD or L
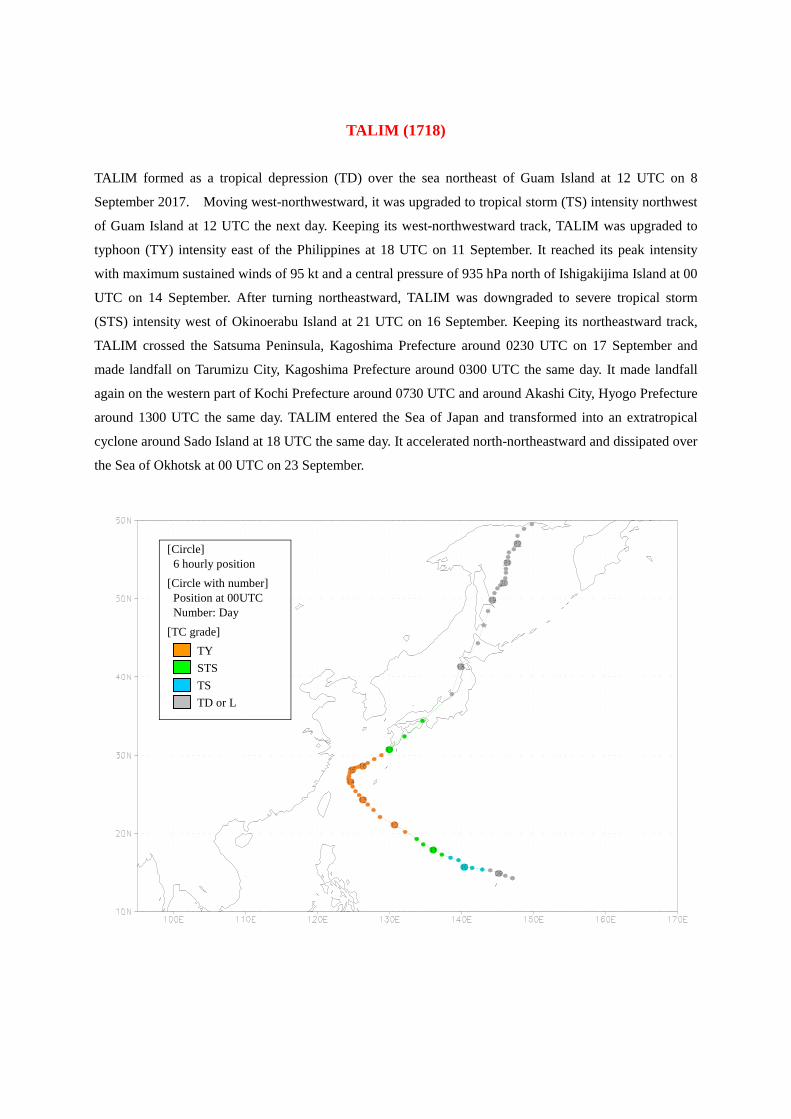
TALIM (1718)
TALIM formed as a tropical depression (TD) over the sea northeast of Guam Island at 12 UTC on 8
September 2017. Moving west-northwestward, it was upgraded to tropical storm (TS) intensity northwest
of Guam Island at 12 UTC the next day. Keeping its west-northwestward track, TALIM was upgraded to
typhoon (TY) intensity east of the Philippines at 18 UTC on 11 September. It reached its peak intensity
with maximum sustained winds of 95 kt and a central pressure of 935 hPa north of Ishigakijima Island at 00
UTC on 14 September. After turning northeastward, TALIM was downgraded to severe tropical storm
(STS) intensity west of Okinoerabu Island at 21 UTC on 16 September. Keeping its northeastward track,
TALIM crossed the Satsuma Peninsula, Kagoshima Prefecture around 0230 UTC on 17 September and
made landfall on Tarumizu City, Kagoshima Prefecture around 0300 UTC the same day. It made landfall
again on the western part of Kochi Prefecture around 0730 UTC and around Akashi City, Hyogo Prefecture
around 1300 UTC the same day. TALIM entered the Sea of Japan and transformed into an extratropical
cyclone around Sado Island at 18 UTC the same day. It accelerated north-northeastward and dissipated over
the Sea of Okhotsk at 00 UTC on 23 September.
[Circle] 6 hourly position [Circle with number] Position at 00UTC Number: Day [TC grade] TY STS TS TD or L
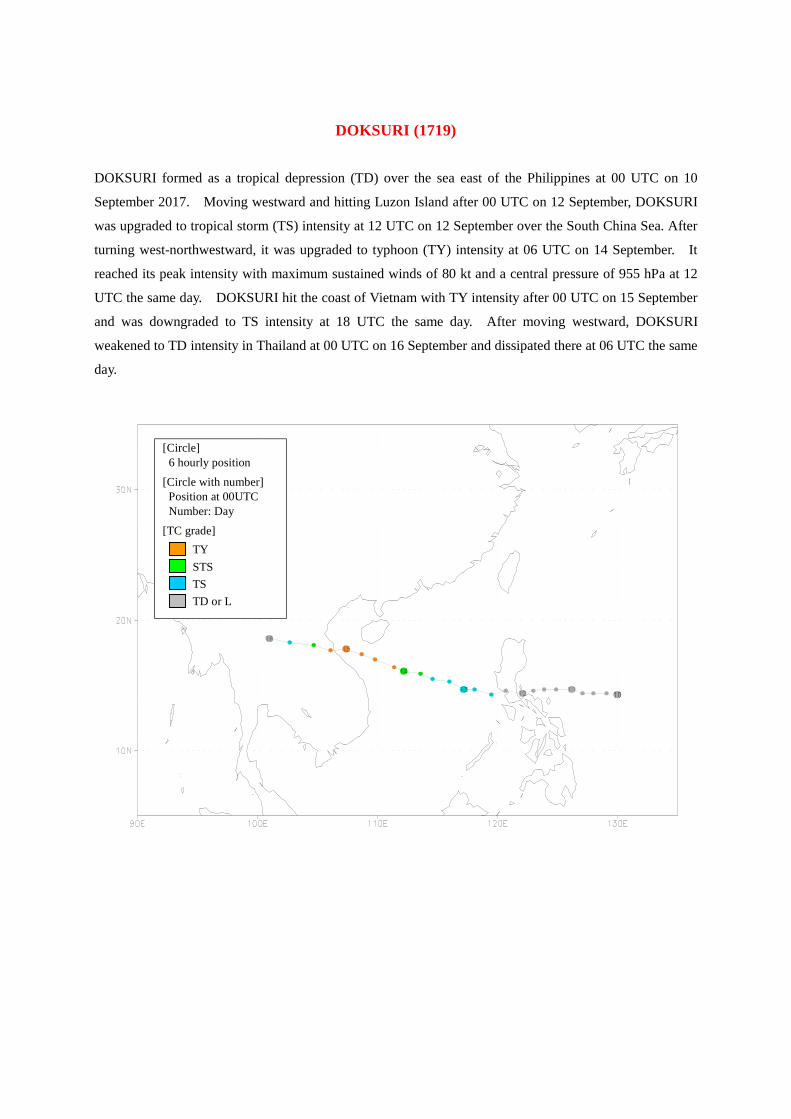
DOKSURI (1719)
DOKSURI formed as a tropical depression (TD) over the sea east of the Philippines at 00 UTC on 10
September 2017. Moving westward and hitting Luzon Island after 00 UTC on 12 September, DOKSURI
was upgraded to tropical storm (TS) intensity at 12 UTC on 12 September over the South China Sea. After
turning west-northwestward, it was upgraded to typhoon (TY) intensity at 06 UTC on 14 September. It
reached its peak intensity with maximum sustained winds of 80 kt and a central pressure of 955 hPa at 12
UTC the same day. DOKSURI hit the coast of Vietnam with TY intensity after 00 UTC on 15 September
and was downgraded to TS intensity at 18 UTC the same day. After moving westward, DOKSURI
weakened to TD intensity in Thailand at 00 UTC on 16 September and dissipated there at 06 UTC the same
day.
[Circle] 6 hourly position
[Circle with number] Position at 00UTC Number: Day
[TC grade] TY STS TS TD or L

KHANUN (1720)
KHANUN formed as a tropical depression (TD) around the sea east of the Philippines at 00 UTC on 11
October 2017 and moved west-northwestward. After turning west-southwestward, it was upgraded to
tropical storm (TS) intensity northeast of Luzon Island at 12 UTC on 12 October. KHANUN hit Luzon
Island with TS intensity late on 12 October and entered the South China Sea. After turning northwestward,
it was upgraded to typhoon (TY) intensity over the South China Sea at 18 UTC on 14 October. KHANUN
reached its peak intensity with maximum sustained winds of 75 kt and a central pressure of 955 hPa over
the same waters 6 hours later. It moved westward and weakened to TD intensity around the Gulf of Tonkin
at 00 UTC on 16 October. KHANUN dissipated there 12 hours later.
[Circle] 6 hourly position [Circle with number] Position at 00UTC Number: Day [TC grade] TY STS TS TD or L

LAN (1721)
LAN formed as a tropical depression (TD) over the sea around the Yap Islands at 06 UTC on 15 October
2017 and moved northwestward. It was upgraded to tropical storm (TS) intensity over the same waters 12
hours later and turned west-southwestward. After turning northward sharply, LAN was upgraded to
typhoon (TY) intensity around the sea east of the Philippines at 18 UTC on 17 October and turned
northwestward. After turning northeastward, it accelerated gradually and reached its peak intensity with
maximum sustained winds of 100 kt and a central pressure of 915 hPa east of Minamidaitojima Island at 18
UTC on 21 October. LAN made landfall on around Kakegawa City in Shizuoka Prefecture around 18 UTC
on 22 October with TY intensity. After crossing the Kanto region, it transformed into an extratropical
cyclone around the sea east of Japan at 00 UTC on 23 October and dissipated around the Kuril Islands 24
hours later.
[Circle] 6 hourly position [Circle with number] Position at 00UTC Number: Day [TC grade] TY STS TS TD or L

SAOLA (1722) SAOLA formed as a tropical depression (TD) over the sea west of the Chuuk Islands at 06 UTC on 22
October 2017 and moved northwestward. It was upgraded to tropical storm (TS) intensity west of the
Mariana Islands at 12 UTC on 24 October. Keeping the northwestward track, SAOLA was upgraded to
severe tropical storm (STS) intensity south of Okinawa Island at 00 UTC on 27 October. After turning
northward, it reached its peak intensity with maximum sustained winds of 60 kt and a central pressure of
975 hPa south of Okinawa Island at 18 UTC on the same day. SAOLA turned northeastward and passed
over Okinawa Island before 05 UTC on 28 October. It transformed into an extratropical cyclone off the
southeastern coast of Chiba Prefecture at 12 UTC on 29 October and dissipated 6 hours later.
[Circle] 6 hourly position
[Circle with number] Position at 00UTC Number: Day
[TC grade] TY STS TS TD or L
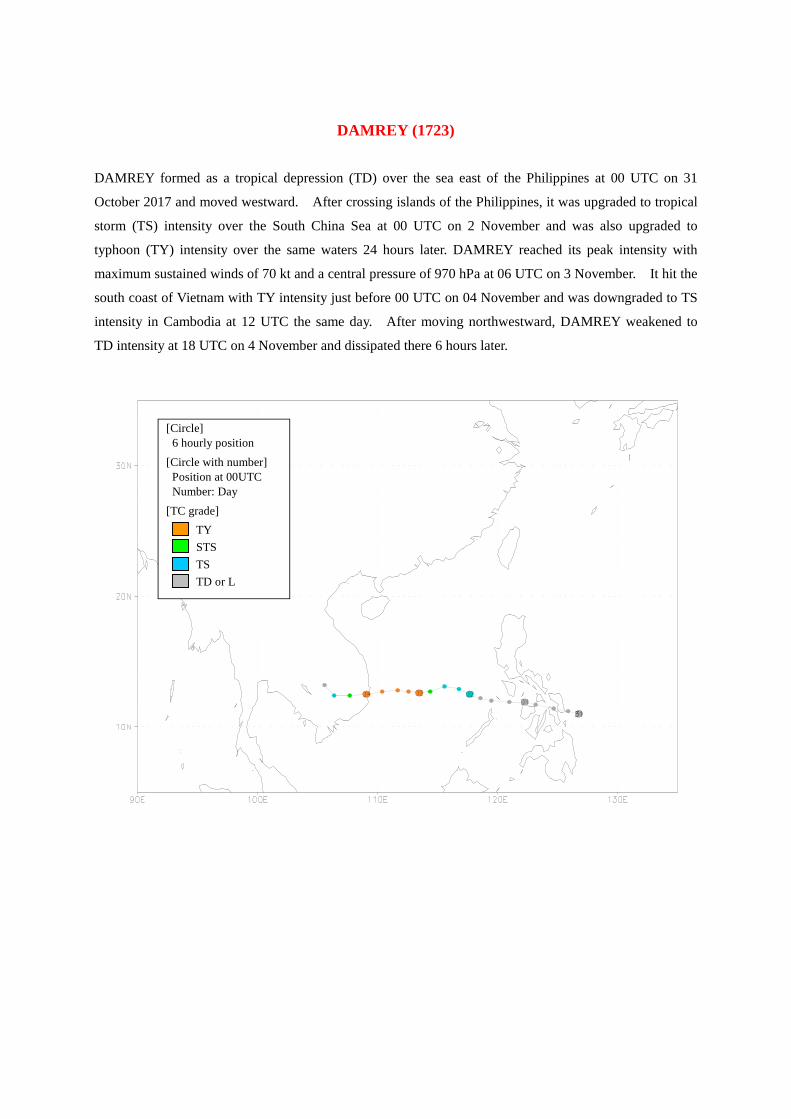
DAMREY (1723)
DAMREY formed as a tropical depression (TD) over the sea east of the Philippines at 00 UTC on 31
October 2017 and moved westward. After crossing islands of the Philippines, it was upgraded to tropical
storm (TS) intensity over the South China Sea at 00 UTC on 2 November and was also upgraded to
typhoon (TY) intensity over the same waters 24 hours later. DAMREY reached its peak intensity with
maximum sustained winds of 70 kt and a central pressure of 970 hPa at 06 UTC on 3 November. It hit the
south coast of Vietnam with TY intensity just before 00 UTC on 04 November and was downgraded to TS
intensity in Cambodia at 12 UTC the same day. After moving northwestward, DAMREY weakened to
TD intensity at 18 UTC on 4 November and dissipated there 6 hours later.
[Circle] 6 hourly position [Circle with number] Position at 00UTC Number: Day [TC grade] TY STS TS TD or L

HAIKUI (1724)
HAIKUI formed as a tropical depression (TD) around the sea east of the Philippines at 12 UTC on 7
November 2017, and moved west-northwestward. After crossing Samar Island and Luzon Island with TD
intensity, it entered the South China Sea late on 9 November. HAIKUI was upgraded to tropical storm
(TS) intensity over the same waters at 00 UTC on 10 November and reached its peak intensity with
maximum sustained winds of 40 kt and a central pressure of 998 hPa at 00 UTC the next day. After
turning westward, HAIKUI was weakened to TD intensity southeast of Hainan Island at 06 UTC on 12
November and dissipated south of the island at 06 UTC the next day.
[Circle] 6 hourly position
[Circle with number] Position at 00UTC Number: Day
[TC grade] TY STS TS TD or L

KIROGI (1725)
KIROGI formed as a tropical depression (TD) over the sea to the immediate south of Mindanao Island at
12 UTC on 16 November 2017 and moved west-northwestward. It was upgraded to tropical storm (TS)
intensity and also reached its peak intensity with maximum sustained winds of 35 kt and a central pressure
of 1000 hPa over the South China Sea at 00 UTC on 18 November. Having moved westward over the same
waters, KIROGI weakened to tropical depression (TD) intensity over the sea east of Viet Nam at 00 UTC
on 19 November and dissipated there 12 hours later.
[Circle] 6 hourly position
[Circle with number] Position at 00UTC Number: Day
[TC grade] TY STS TS TD or L

KAI-TAK (1726)
KAI-TAK formed as a tropical depression (TD) around the sea east of the Philippines at 18 UTC on 13
December 2017 and moved east-northeastward. It was upgraded to tropical storm (TS) intensity over the
same waters six hours later. Remaining almost stationary there, it reached its first peak intensity with
maximum sustained winds of 40 kt and a central pressure of 994 hPa at 06 UTC on 15 December. After
moving westward, KAI-TAK weakened to TD intensity off the eastern coast of Samar Island at 12 UTC on
16 December. Keeping its TD intensity and west-southwestward track, KAI-TAK crossed several islands
of the Philippines and entered the South China Sea. Moving west-southwestward in the South China Sea,
it was re-upgraded to TS intensity at 00 UTC on 20 December and reached its second peak intensity with
maximum sustained winds of 40 kt and a central pressure of 996 hPa 12 hours later. KAI-TAK
downgraded to TD intensity over the South China Sea at 12 UTC on 21 December. After holding its TD
intensity more than 2 days, KAI-TAK dissipated off the eastern coast of the Malay Peninsula at 00 UTC on
24 December.
[Circle] 6 hourly position
[Circle with number] Position at 00UTC Number: Day
[TC grade] TY STS TS TD or L

TEMBIN (1727)
TEMBIN formed as a tropical depression (TD) north of the Palau Islands at 00 UTC on 20 December 2017.
Moving westward, it was upgraded to tropical storm (TS) intensity east of Mindanao Island 18 hours later.
After crossing Mindanao Island, TEMBIN gradually developed and was upgraded to typhoon (TY)
intensity over the Sulu Sea at 12 UTC on 23 December It reached its peak intensity with maximum
sustained winds of 70 kt and a central pressure of 970 hPa over the South China Sea 12 hours later.
TEMBIN weakened to TD intensity south of Viet Nam at 12 UTC on 25 December and dissipated south of
Cambodia 24 hours later.
[Circle] 6 hourly position [Circle with number] Position at 00UTC Number: Day [TC grade] TY STS TS TD or L