Embed Size (px)
Citation preview
Annual ReportSeptember 30, 2015
2Annual Report
Trustee’s Message to Participants 4Performance: The Bottom Line 5Fund Talk: The Managers’ Overview 52FA 529 College Portfolio 54 Investment Summary
55 Investments56 Financial Statements
FA 529 Portfolio 2016 60 Investment Summary61 Investments62 Financial Statements
FA 529 Portfolio 2019 66 Investment Summary67 Investments68 Financial Statements
FA 529 Portfolio 2022 72 Investment Summary73 Investments74 Financial Statements
FA 529 Portfolio 2025 78 Investment Summary79 Investments80 Financial Statements
FA 529 Portfolio 2028 83 Investment Summary84 Investments85 Financial Statements
FA 529 Portfolio 2031 88 Investment Summary89 Investments90 Financial Statements
FA 529 Portfolio 2034 93 Investment Summary94 Investments95 Financial Statements
FA 529 Aggressive Growth Portfolio 98 Investment Summary99 Investments100 Financial Statements
FA 529 Moderate Growth Portfolio 104 Investment Summary105 Investments106 Financial Statements
FA 529 Diversified International Portfolio 110 Financial StatementsFA 529 Dividend Growth Portfolio 113 Financial StatementsFA 529 Equity Growth Portfolio 116 Financial StatementsFA 529 Equity Income Portfolio 119 Financial StatementsFA 529 Global Strategies Portfolio 122 Financial StatementsFA 529 Growth Opportunities Portfolio 125 Financial StatementsFA 529 High Income Portfolio 128 Financial StatementsFA 529 Inflation-Protected Bond Portfolio 131 Financial StatementsFA 529 Limited Term Bond Portfolio 134 Financial StatementsFA 529 Money Market Portfolio 137 Financial StatementsFA 529 New Insights Portfolio 141 Financial Statements
Contents
3 Annual Report
FA 529 Small Cap Portfolio 144 Financial StatementsFA 529 Stock Selector Mid Cap Portfolio 147 Financial StatementsFA 529 Strategic Dividend & Income Portfolio 150 Financial StatementsFA 529 Strategic Income Portfolio 153 Financial StatementsFA 529 Total Bond Portfolio 156 Financial StatementsFA 529 Value Strategies Portfolio 159 Financial StatementsNotes to Financial Statements 162Independent Auditor’s Report 178
Standard & Poor’s, S&P and S&P 500 are registered service marks of The McGraw-Hill Companies, Inc. and have been licensed for use by Fidelity Distributors Corporation.
Other third-party marks appearing herein are the property of their respective owners.
All other marks appearing herein are registered or unregistered trademarks or service marks of the State of New Hampshire or of FMR LLC or an affiliated company. © 2015 FMR LLC. All rights reserved.
This report and the financial statements contained herein are submitted for the general information of the holders of units of the Portfolios. This report is not authorized for distribution to prospective participants in the Portfolios unless preceded or accompanied by a current Offering Statement.
Mutual fund shares and Portfolio units are not deposits or obligations of, or guaranteed by, any depository institution. Shares and units are not insured by the FDIC, Federal Reserve Board or any other agency, and are subject to investment risks, including possible loss of principal amount invested.
Neither the Portfolios, the mutual funds in which they invest, nor Fidelity Distributors Corporation is a bank.
For more information on any Fidelity Advisor fund, including charges and expenses, contact your investment professional for a free prospectus. For more information on the Fidelity Advisor 529 Plan, call 1-877-208-0098. Read it carefully before you invest or send money.
4Annual Report
Trustee’s Message to Participants
Dear Participant:
On behalf of the State of New Hampshire and the College Tuition Savings Plan Advisory Commission (the “Commission”), I am pleased to provide you with the Fidelity Advisor 529 Plan (the “Plan”) Annual Report for the one-year period from October 1, 2014, through September 30, 2015.
The Annual Report is designed to provide participants with an opportunity to review the Plan in depth, including the performance of the Portfolios, along with expense, holdings and asset allocation information. Additionally, the Managers’ Overview, a discussion with Co-Portfolio Managers Andrew Dierdorf and Brett Sumsion, provides insight into Portfolio and market performance over the past year, as well as an outlook for the months ahead.
Since our last report, we have enhanced the Plan’s glide path, which is the path each Portfolio takes over time – from more aggressive to more conservative – as it approaches its target date. A thorough discussion of this important change can be found in the Manager’s Overview within the Annual Report.
U.S. stocks lost ground this past year, largely on concern over slowing economic growth in China. Uncertainty as to when the U.S. Federal Reserve might raise interest rates added to the volatility. The large-cap S&P 500® Index returned -0.61% for the period, with value stocks significantly lagging their growth counterparts. Many non-U.S. equity indexes, particularly in emerging markets, suffered double-digit losses driven lower by a collapse in commodity prices that hurt resources-related sectors and geographies. Meanwhile, U.S. fixed-income markets saw modest gains, aided by the performance of higher-quality and longer-duration securities.
During these challenging times, we understand that our participants are concerned about how to save and pay for a college education, and we know that every dollar saved is important. You can take comfort in knowing that any growth of your investments will be tax deferred and withdrawals for qualified higher education expenses will be free from federal income tax. Lastly, we encourage you to call your advisor to review your Plan account to help determine whether your investments are appropriately allocated based on your college savings goals.
Thank you for choosing the Fidelity Advisor 529 Plan. We look forward to serving your needs for years to come.
Sincerely,
William F. Dwyer
State Treasurer
State of New Hampshire
5 Annual Report
FA 529 College Portfolio
Performance: The Bottom Line
Understanding PerformanceHow a portfolio did yesterday is no guarantee of how it will do tomorrow. The stock market, for example, has a history of long-term growth and short-term volatility. In turn, the unit price and return of a portfolio that invests in stocks will vary. That means if you sell your units during a market downturn, you might lose money. But if you can ride out the market’s ups and downs, you may have a gain.
PerformanceThere are several ways to evaluate a portfolio’s historical perfor-mance. You can look at the total percentage change in value, the average annual percentage change or the growth of a hypothetical $10,000 investment. Total return reflects the change in the value of an investment.
Cumulative Total ReturnsPeriods ended September 30, 2015 Past 1
yearPast 5 years
Past 10 years
FA 529 College Portfolio – CL A -0.95% 14.84% 36.85%FA 529 College Portfolio – CL A
(incl. 5.75% sales charge) -6.64% 8.24% 28.98%FA 529 College Portfolio – Old
CL A A -1.01% 14.84% 36.73%FA 529 College Portfolio – Old
CL A (incl. 3.50% sales charge) A -4.47% 10.82% 31.94%
FA 529 College Portfolio – CL B -1.68% 10.63% 29.72%FA 529 College Portfolio – CL B
(incl. contingent deferred sales charge) -6.60% 8.63% 29.72%
FA 529 College Portfolio – Old CL B A -1.43% 12.07% 32.58%
FA 529 College Portfolio – Old CL B (incl. contingent deferred sales charge) A -3.89% 11.07% 32.58%
FA 529 College Portfolio – CL C -1.68% 10.65% 26.85%FA 529 College Portfolio – CL C
(incl. contingent deferred sales charge) -2.67% 10.65% 26.85%
FA 529 College Portfolio – CL D A -1.17% 13.49% 33.51%FA 529 College Portfolio – CL P -1.42% 12.03% 29.84%FA 529 College Portfolio
Composite 0.46% 16.56% 41.65%Dow Jones U.S. Total Stock
Market IndexSM -0.55% 86.37% 97.78%Barclays® U.S. Aggregate Bond
Index 2.94% 16.47% 57.34%Barclays® U.S. 3 Month Treasury
Bellwether Index 0.05% 0.46% 14.65%MSCI ACWI (All Country World
Index) ex USA Index -12.04% 10.12% 36.72%
A Available only to accounts established before June 25, 2003.
Cumulative total returns show the Portfolio’s performance in per-centage terms over the periods shown. For example, if you invested $1,000 in a portfolio that had a 5% return over the past year, the value of your investment would be $1,050.
You can compare the Portfolio’s return to the performance of the FA 529 College Portfolio Composite, an approximate weighted combination of the following unmanaged indices: Dow Jones U.S. Total Stock Market IndexSM, Barclays® U.S. Aggregate Bond Index, Barclays® U.S. 3 Month Treasury Bellwether Index, and MSCI ACWI (All Country World Index) ex USA Index. These benchmarks include reinvested dividends and capital gains, if any. The index weightings
may be adjusted periodically to reflect the Portfolio’s changing asset allocation.
Average Annual Total ReturnsPeriods ended September 30, 2015 Past 1
yearPast 5 years
Past 10 years
FA 529 College Portfolio – CL A -0.95% 2.81% 3.19%FA 529 College Portfolio – CL A
(incl. 5.75% sales charge) -6.64% 1.6% 2.58%FA 529 College Portfolio – Old
CL A A -1.01% 2.81% 3.18%FA 529 College Portfolio – Old CL
A (incl. 3.50% sales charge) A -4.47% 2.08% 2.81%FA 529 College Portfolio – CL B -1.68% 2.04% 2.64%FA 529 College Portfolio – CL B
(incl. contingent deferred sales charge) -6.60% 1.67% 2.64%
FA 529 College Portfolio – Old CL B A -1.43% 2.31% 2.86%
FA 529 College Portfolio – Old CL B (incl. contingent deferred sales charge) A -3.89% 2.12% 2.86%
FA 529 College Portfolio – CL C -1.68% 2.04% 2.41%FA 529 College Portfolio – CL C
(incl. contingent deferred sales charge) -2.67% 2.04% 2.41%
FA 529 College Portfolio – CL D A -1.17% 2.56% 2.93%FA 529 College Portfolio – CL P -1.42% 2.30% 2.65%FA 529 College Portfolio
Composite 0.46% 3.11% 3.54%Dow Jones U.S. Total Stock
Market IndexSM -0.55% 13.26% 7.06%Barclays® U.S. Aggregate Bond
Index 2.94% 3.10% 4.64%Barclays® U.S. 3 Month Treasury
Bellwether Index 0.05% 0.09% 1.38%MSCI ACWI (All Country World
Index) ex USA Index -12.04% 1.95% 3.18%
A Available only to accounts established before June 25, 2003.
Average annual total returns take the Portfolio’s cumulative return and show you what would have happened if the Portfolio had performed at a constant rate each year.
6Annual Report
FA 529 College PortfolioPerformance: The Bottom Line – continued
$10,000 Over 10 Years
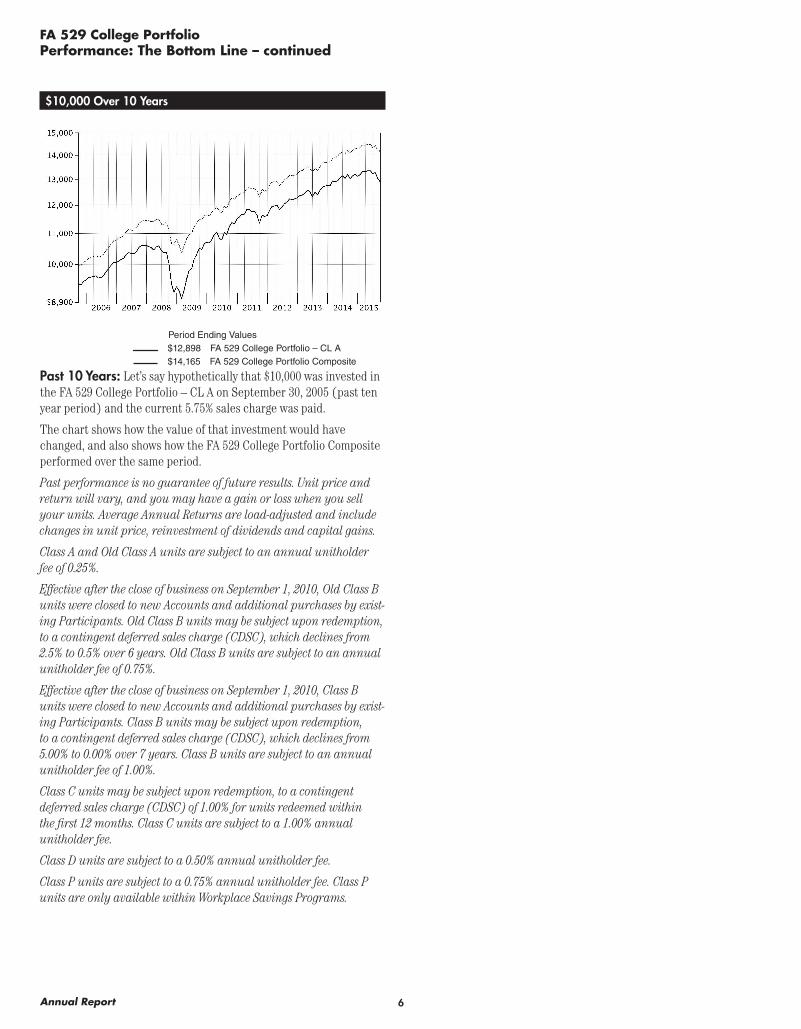
Period Ending Values $12,898 FA 529 College Portfolio – CL A $14,165 FA 529 College Portfolio Composite
Past 10 Years: Let’s say hypothetically that $10,000 was invested in the FA 529 College Portfolio – CL A on September 30, 2005 (past ten year period) and the current 5.75% sales charge was paid.
The chart shows how the value of that investment would have changed, and also shows how the FA 529 College Portfolio Composite performed over the same period.
Past performance is no guarantee of future results. Unit price and return will vary, and you may have a gain or loss when you sell your units. Average Annual Returns are load-adjusted and include changes in unit price, reinvestment of dividends and capital gains.
Class A and Old Class A units are subject to an annual unitholder fee of 0.25%.
Effective after the close of business on September 1, 2010, Old Class B units were closed to new Accounts and additional purchases by exist-ing Participants. Old Class B units may be subject upon redemption, to a contingent deferred sales charge (CDSC), which declines from 2.5% to 0.5% over 6 years. Old Class B units are subject to an annual unitholder fee of 0.75%.
Effective after the close of business on September 1, 2010, Class B units were closed to new Accounts and additional purchases by exist-ing Participants. Class B units may be subject upon redemption, to a contingent deferred sales charge (CDSC), which declines from 5.00% to 0.00% over 7 years. Class B units are subject to an annual unitholder fee of 1.00%.
Class C units may be subject upon redemption, to a contingent deferred sales charge (CDSC) of 1.00% for units redeemed within the first 12 months. Class C units are subject to a 1.00% annual unitholder fee.
Class D units are subject to a 0.50% annual unitholder fee.
Class P units are subject to a 0.75% annual unitholder fee. Class P units are only available within Workplace Savings Programs.
7 Annual Report
FA 529 Portfolio 2016
Performance: The Bottom Line
Understanding PerformanceHow a portfolio did yesterday is no guarantee of how it will do tomorrow. The stock market, for example, has a history of long-term growth and short-term volatility. In turn, the unit price and return of a portfolio that invests in stocks will vary. That means if you sell your units during a market downturn, you might lose money. But if you can ride out the market’s ups and downs, you may have a gain.
PerformanceThere are several ways to evaluate a portfolio’s historical perfor-mance. You can look at the total percentage change in value, the average annual percentage change or the growth of a hypothetical $10,000 investment. Total return reflects the change in the value of an investment.
Cumulative Total ReturnsPeriods ended September 30, 2015 Past 1
yearPast 5 years
Past 10 years
FA 529 Portfolio 2016 – CL A -0.88% 25.93% 45.49%FA 529 Portfolio 2016 – CL A
(incl. 5.75% sales charge) -6.58% 18.69% 37.13%FA 529 Portfolio 2016 – Old
CL A A -0.88% 25.87% 45.50%FA 529 Portfolio 2016 – Old CL
A (incl. 3.50% sales charge) A -4.35% 21.47% 40.41%FA 529 Portfolio 2016 – CL B -1.59% 21.21% 37.95%FA 529 Portfolio 2016 – CL B
(incl. contingent deferred sales charge) -6.51% 19.21% 37.95%
FA 529 Portfolio 2016 – Old CL B A -1.36% 22.78% 41.01%
FA 529 Portfolio 2016 – Old CL B (incl. contingent deferred sales charge) A -3.83% 21.78% 41.01%
FA 529 Portfolio 2016 – CL C -1.59% 21.29% 34.97%FA 529 Portfolio 2016 – CL C
(incl. contingent deferred sales charge) -2.58% 21.29% 34.97%
FA 529 Portfolio 2016 – CL D A -1.08% 24.32% 41.83%FA 529 Portfolio 2016 – CL P -1.37% 22.76% 38.39%FA 529 Portfolio 2016
Composite Index 0.51% 27.95% 53.34%Dow Jones U.S. Total Stock
Market IndexSM -0.55% 86.37% 97.78%MSCI ACWI (All Country World
Index) ex USA Index -12.04% 10.12% 36.72%Barclays® U.S. Aggregate Bond
Index 2.94% 16.47% 57.34%Barclays® U.S. 3 Month Treasury
Bellwether Index 0.05% 0.46% 14.65%
A Available only to accounts established before June 25, 2003.
Cumulative total returns show the Portfolio’s performance in per-centage terms over the periods shown. For example, if you invested $1,000 in a portfolio that had a 5% return over the past year, the value of your investment would be $1,050.
You can compare the Portfolio’s return to the performance of the FA 529 Portfolio 2016 Composite Index, an approximate weighted combination of the following unmanaged indices: Dow Jones U.S. Total Stock Market IndexSM, MSCI ACWI (All Country World Index) ex USA Index, Barclays® U.S. Aggregate Bond Index, and Barclays® U.S. 3 Month Treasury Bellwether Index. These benchmarks include reinvested dividends and capital gains, if any. The index weightings may be adjusted periodically to reflect the Portfolio’s changing asset allocation.
Average Annual Total ReturnsPeriods ended September 30, 2015 Past 1
yearPast 5 years
Past 10 years
FA 529 Portfolio 2016 – CL A -0.88% 4.72% 3.82%FA 529 Portfolio 2016 – CL A
(incl. 5.75% sales charge) -6.58% 3.49% 3.21%FA 529 Portfolio 2016 – Old CL
A A -0.88% 4.71% 3.82%FA 529 Portfolio 2016 – Old CL
A (incl. 3.50% sales charge) A -4.35% 3.97% 3.45%FA 529 Portfolio 2016 – CL B -1.59% 3.92% 3.27%FA 529 Portfolio 2016 – CL B
(incl. contingent deferred sales charge) -6.51% 3.58% 3.27%
FA 529 Portfolio 2016 – Old CL B A -1.36% 4.19% 3.50%
FA 529 Portfolio 2016 – Old CL B (incl. contingent deferred sales charge) A -3.83% 4.02% 3.50%
FA 529 Portfolio 2016 – CL C -1.59% 3.94% 3.04%FA 529 Portfolio 2016 – CL C
(incl. contingent deferred sales charge) -2.58% 3.94% 3.04%
FA 529 Portfolio 2016 – CL D A -1.08% 4.45% 3.56%FA 529 Portfolio 2016 – CL P -1.37% 4.19% 3.30%FA 529 Portfolio 2016 Composite
Index 0.51% 5.05% 4.37%Dow Jones U.S. Total Stock
Market IndexSM -0.55% 13.26% 7.06%MSCI ACWI (All Country World
Index) ex USA Index -12.04% 1.95% 3.18%Barclays® U.S. Aggregate Bond
Index 2.94% 3.10% 4.64%Barclays® U.S. 3 Month Treasury
Bellwether Index 0.05% 0.09% 1.38%
A Available only to accounts established before June 25, 2003.
Average annual total returns take the Portfolio’s cumulative return and show you what would have happened if the Portfolio had performed at a constant rate each year.
8Annual Report
FA 529 Portfolio 2016Performance: The Bottom Line – continued
$10,000 Over 10 Years
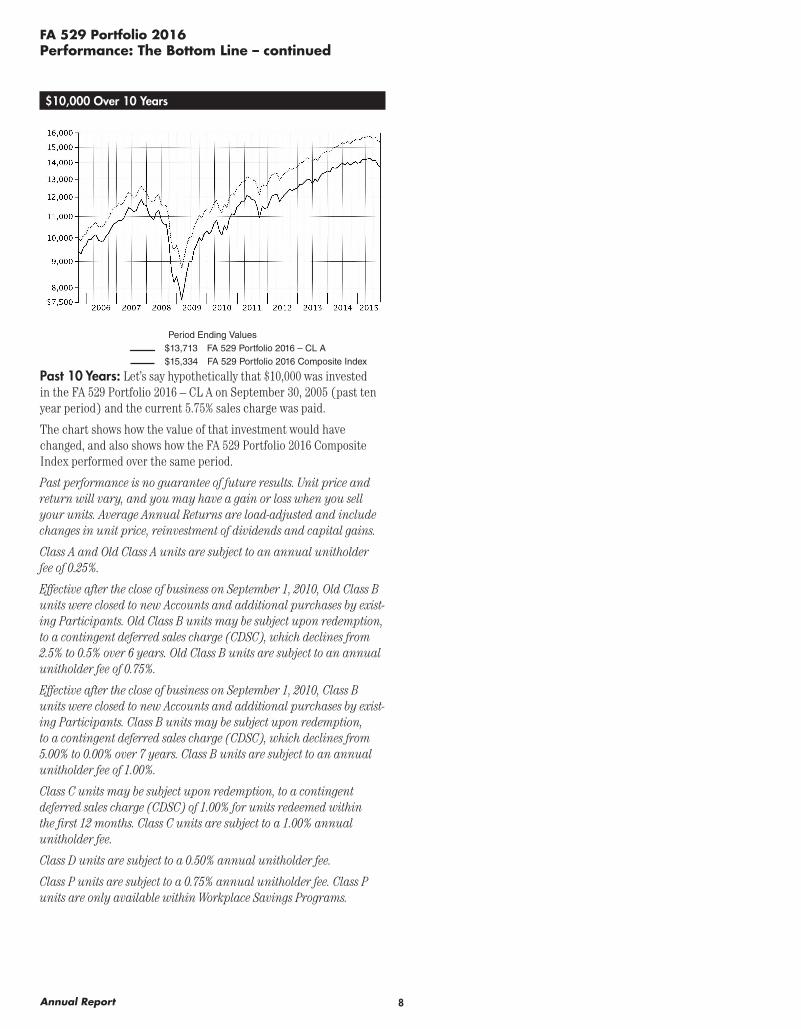
Period Ending Values $13,713 FA 529 Portfolio 2016 – CL A $15,334 FA 529 Portfolio 2016 Composite Index
Past 10 Years: Let’s say hypothetically that $10,000 was invested in the FA 529 Portfolio 2016 – CL A on September 30, 2005 (past ten year period) and the current 5.75% sales charge was paid.
The chart shows how the value of that investment would have changed, and also shows how the FA 529 Portfolio 2016 Composite Index performed over the same period.
Past performance is no guarantee of future results. Unit price and return will vary, and you may have a gain or loss when you sell your units. Average Annual Returns are load-adjusted and include changes in unit price, reinvestment of dividends and capital gains.
Class A and Old Class A units are subject to an annual unitholder fee of 0.25%.
Effective after the close of business on September 1, 2010, Old Class B units were closed to new Accounts and additional purchases by exist-ing Participants. Old Class B units may be subject upon redemption, to a contingent deferred sales charge (CDSC), which declines from 2.5% to 0.5% over 6 years. Old Class B units are subject to an annual unitholder fee of 0.75%.
Effective after the close of business on September 1, 2010, Class B units were closed to new Accounts and additional purchases by exist-ing Participants. Class B units may be subject upon redemption, to a contingent deferred sales charge (CDSC), which declines from 5.00% to 0.00% over 7 years. Class B units are subject to an annual unitholder fee of 1.00%.
Class C units may be subject upon redemption, to a contingent deferred sales charge (CDSC) of 1.00% for units redeemed within the first 12 months. Class C units are subject to a 1.00% annual unitholder fee.
Class D units are subject to a 0.50% annual unitholder fee.
Class P units are subject to a 0.75% annual unitholder fee. Class P units are only available within Workplace Savings Programs.

9 Annual Report
FA 529 Portfolio 2019
Performance: The Bottom Line
Understanding PerformanceHow a portfolio did yesterday is no guarantee of how it will do tomorrow. The stock market, for example, has a history of long-term growth and short-term volatility. In turn, the unit price and return of a portfolio that invests in stocks will vary. That means if you sell your units during a market downturn, you might lose money. But if you can ride out the market’s ups and downs, you may have a gain.
PerformanceThere are several ways to evaluate a portfolio’s historical perfor-mance. You can look at the total percentage change in value, the average annual percentage change or the growth of a hypothetical $10,000 investment. Total return reflects the change in the value of an investment.
Cumulative Total ReturnsPeriods ended September 30, 2015 Past 1
yearPast 5 years
Past 10 years
FA 529 Portfolio 2019 – CL A -1.23% 33.94% 50.64%FA 529 Portfolio 2019 – CL A
(incl. 5.75% sales charge) -6.91% 26.24% 41.98%FA 529 Portfolio 2019 – Old
CL A A -1.29% 33.92% 50.60%FA 529 Portfolio 2019 – Old CL
A (incl. 3.50% sales charge) A -4.74% 29.23% 45.33%FA 529 Portfolio 2019 – CL B -2.02% 29.01% 42.90%FA 529 Portfolio 2019 – CL B
(incl. contingent deferred sales charge) -6.92% 27.01% 42.90%
FA 529 Portfolio 2019 – Old CL B A -1.73% 30.62% 46.19%
FA 529 Portfolio 2019 – Old CL B (incl. contingent deferred sales charge) A -4.18% 29.62% 46.19%
FA 529 Portfolio 2019 – CL C -2.02% 28.99% 39.79%FA 529 Portfolio 2019 – CL C
(incl. contingent deferred sales charge) -3.00% 28.99% 39.79%
FA 529 Portfolio 2019 – CL D A -1.51% 32.27% 47.02%FA 529 Portfolio 2019 – CL P -1.73% 30.61% 43.34%FA 529 Portfolio 2019
Composite Index 0.04% 36.73% 60.49%Dow Jones U.S. Total Stock
Market IndexSM -0.55% 86.37% 97.78%MSCI ACWI (All Country World
Index) ex USA Index -12.04% 10.12% 36.72%Barclays® U.S. Aggregate Bond
Index 2.94% 16.47% 57.34%Barclays® U.S. 3 Month Treasury
Bellwether Index 0.05% 0.46% 14.65%
A Available only to accounts established before June 25, 2003.
Cumulative total returns show the Portfolio’s performance in per-centage terms over the periods shown. For example, if you invested $1,000 in a portfolio that had a 5% return over the past year, the value of your investment would be $1,050.
You can compare the Portfolio’s return to the performance of the FA 529 Portfolio 2019 Composite Index, an approximate weighted combination of the following unmanaged indices: Dow Jones U.S. Total Stock Market IndexSM, MSCI ACWI (All Country World Index) ex USA Index, Barclays® U.S. Aggregate Bond Index, and Barclays® U.S. 3 Month Treasury Bellwether Index. These benchmarks include reinvested dividends and capital gains, if any. The index weightings may be adjusted periodically to reflect the Portfolio’s changing asset allocation.
Average Annual Total ReturnsPeriods ended September 30, 2015 Past 1
yearPast 5 years
Past 10 years
FA 529 Portfolio 2019 – CL A -1.23% 6.02% 4.18%FA 529 Portfolio 2019 – CL A
(incl. 5.75% sales charge) -6.91% 4.77% 3.57%FA 529 Portfolio 2019 – Old CL
A A -1.29% 6.01% 4.18%FA 529 Portfolio 2019 – Old CL
A (incl. 3.50% sales charge) A -4.74% 5.26% 3.81%FA 529 Portfolio 2019 – CL B -2.02% 5.23% 3.63%FA 529 Portfolio 2019 – CL B
(incl. contingent deferred sales charge) -6.92% 4.90% 3.63%
FA 529 Portfolio 2019 – Old CL B A -1.73% 5.49% 3.87%
FA 529 Portfolio 2019 – Old CL B (incl. contingent deferred sales charge) A -4.18% 5.33% 3.87%
FA 529 Portfolio 2019 – CL C -2.02% 5.22% 3.41%FA 529 Portfolio 2019 – CL C
(incl. contingent deferred sales charge) -3.00% 5.22% 3.41%
FA 529 Portfolio 2019 – CL D A -1.51% 5.75% 3.93%FA 529 Portfolio 2019 – CL P -1.73% 5.49% 3.67%FA 529 Portfolio 2019 Composite
Index 0.04% 6.46% 4.84%Dow Jones U.S. Total Stock
Market IndexSM -0.55% 13.26% 7.06%MSCI ACWI (All Country World
Index) ex USA Index -12.04% 1.95% 3.18%Barclays® U.S. Aggregate Bond
Index 2.94% 3.10% 4.64%Barclays® U.S. 3 Month Treasury
Bellwether Index 0.05% 0.09% 1.38%
A Available only to accounts established before June 25, 2003.
Average annual total returns take the Portfolio’s cumulative return and show you what would have happened if the Portfolio had performed at a constant rate each year.
10Annual Report
FA 529 Portfolio 2019Performance: The Bottom Line – continued
$10,000 Over 10 Years
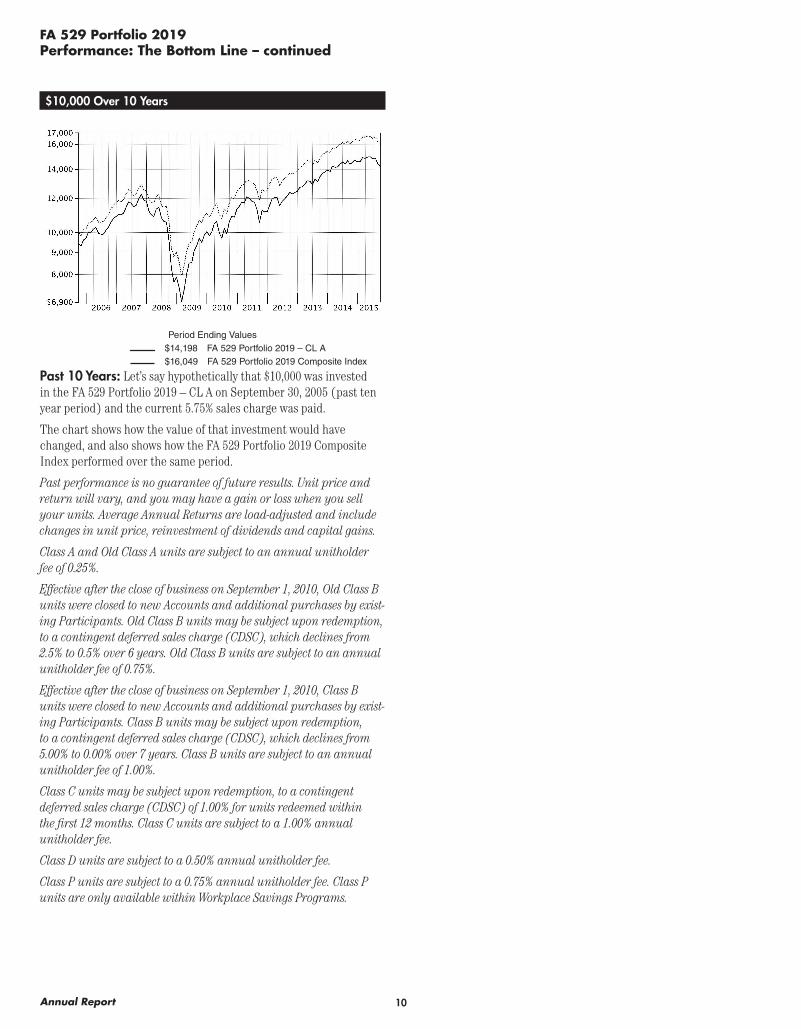
Period Ending Values $14,198 FA 529 Portfolio 2019 – CL A $16,049 FA 529 Portfolio 2019 Composite Index
Past 10 Years: Let’s say hypothetically that $10,000 was invested in the FA 529 Portfolio 2019 – CL A on September 30, 2005 (past ten year period) and the current 5.75% sales charge was paid.
The chart shows how the value of that investment would have changed, and also shows how the FA 529 Portfolio 2019 Composite Index performed over the same period.
Past performance is no guarantee of future results. Unit price and return will vary, and you may have a gain or loss when you sell your units. Average Annual Returns are load-adjusted and include changes in unit price, reinvestment of dividends and capital gains.
Class A and Old Class A units are subject to an annual unitholder fee of 0.25%.
Effective after the close of business on September 1, 2010, Old Class B units were closed to new Accounts and additional purchases by exist-ing Participants. Old Class B units may be subject upon redemption, to a contingent deferred sales charge (CDSC), which declines from 2.5% to 0.5% over 6 years. Old Class B units are subject to an annual unitholder fee of 0.75%.
Effective after the close of business on September 1, 2010, Class B units were closed to new Accounts and additional purchases by exist-ing Participants. Class B units may be subject upon redemption, to a contingent deferred sales charge (CDSC), which declines from 5.00% to 0.00% over 7 years. Class B units are subject to an annual unitholder fee of 1.00%.
Class C units may be subject upon redemption, to a contingent deferred sales charge (CDSC) of 1.00% for units redeemed within the first 12 months. Class C units are subject to a 1.00% annual unitholder fee.
Class D units are subject to a 0.50% annual unitholder fee.
Class P units are subject to a 0.75% annual unitholder fee. Class P units are only available within Workplace Savings Programs.

11 Annual Report
FA 529 Portfolio 2022
Performance: The Bottom Line
Understanding PerformanceHow a portfolio did yesterday is no guarantee of how it will do tomorrow. The stock market, for example, has a history of long-term growth and short-term volatility. In turn, the unit price and return of a portfolio that invests in stocks will vary. That means if you sell your units during a market downturn, you might lose money. But if you can ride out the market’s ups and downs, you may have a gain.
PerformanceThere are several ways to evaluate a portfolio’s historical perfor-mance. You can look at the total percentage change in value, the average annual percentage change or the growth of a hypothetical $10,000 investment. Total return reflects the change in the value of an investment.
Cumulative Total ReturnsPeriods ended September 30, 2015 Past 1
yearPast 5 years
Past 10 years
FA 529 Portfolio 2022 – CL A -1.77% 40.79% 53.14%FA 529 Portfolio 2022 – CL A
(incl. 5.75% sales charge) -7.42% 32.69% 44.34%FA 529 Portfolio 2022 – Old
CL A A -1.73% 40.80% 53.14%FA 529 Portfolio 2022 – Old CL
A (incl. 3.50% sales charge) A -5.17% 35.87% 47.78%FA 529 Portfolio 2022 – CL B -2.46% 35.73% 45.29%FA 529 Portfolio 2022 – CL B
(incl. contingent deferred sales charge) -7.34% 33.73% 45.29%
FA 529 Portfolio 2022 – Old CL B A -2.21% 37.34% 48.56%
FA 529 Portfolio 2022 – Old CL B (incl. contingent deferred sales charge) A -4.65% 36.34% 48.56%
FA 529 Portfolio 2022 – CL C -2.51% 35.70% 42.09%FA 529 Portfolio 2022 – CL C
(incl. contingent deferred sales charge) -3.48% 35.70% 42.09%
FA 529 Portfolio 2022 – CL D A -2.01% 39.07% 49.31%FA 529 Portfolio 2022 – CL P -2.20% 37.42% 45.77%FA 529 Portfolio 2022
Composite Index -0.58% 44.70% 65.47%Barclays® U.S. Aggregate Bond
Index 2.94% 16.47% 57.34%Barclays® U.S. 3 Month Treasury
Bellwether Index 0.05% 0.46% 14.65%MSCI ACWI (All Country World
Index) ex USA Index -12.04% 10.12% 36.72%Dow Jones U.S. Total Stock
Market IndexSM -0.55% 86.37% 97.78%
A Available only to accounts established before June 25, 2003.
Cumulative total returns show the Portfolio’s performance in per-centage terms over the periods shown. For example, if you invested $1,000 in a portfolio that had a 5% return over the past year, the value of your investment would be $1,050.
You can compare the Portfolio’s return to the performance of the FA 529 Portfolio 2022 Composite Index, an approximate weighted combination of the following unmanaged indices: Dow Jones U.S. Total Stock Market IndexSM, MSCI ACWI (All Country World Index) ex USA Index, Barclays® U.S. Aggregate Bond Index, and Barclays® U.S. 3 Month Treasury Bellwether Index. These benchmarks include reinvested dividends and capital gains, if any. The index weightings may be adjusted periodically to reflect the Portfolio’s changing asset allocation.
Average Annual Total ReturnsPeriods ended September 30, 2015 Past 1
yearPast 5 years
Past 10 years
FA 529 Portfolio 2022 – CL A -1.77% 7.08% 4.35%FA 529 Portfolio 2022 – CL A
(incl. 5.75% sales charge) -7.42% 5.82% 3.74%FA 529 Portfolio 2022 – Old CL
A A -1.73% 7.08% 4.35%FA 529 Portfolio 2022 – Old CL
A (incl. 3.50% sales charge) A -5.17% 6.32% 3.98%FA 529 Portfolio 2022 – CL B -2.46% 6.30% 3.81%FA 529 Portfolio 2022 – CL B
(incl. contingent deferred sales charge) -7.34% 5.99% 3.81%
FA 529 Portfolio 2022 – Old CL B A -2.21% 6.55% 4.04%
FA 529 Portfolio 2022 – Old CL B (incl. contingent deferred sales charge) A -4.65% 6.40% 4.04%
FA 529 Portfolio 2022 – CL C -2.51% 6.30% 3.58%FA 529 Portfolio 2022 – CL C
(incl. contingent deferred sales charge) -3.48% 6.30% 3.58%
FA 529 Portfolio 2022 – CL D A -2.01% 6.82% 4.09%FA 529 Portfolio 2022 – CL P -2.20% 6.56% 3.84%FA 529 Portfolio 2022 Composite
Index -0.58% 7.67% 5.17%Barclays® U.S. Aggregate Bond
Index 2.94% 3.10% 4.64%Barclays® U.S. 3 Month Treasury
Bellwether Index 0.05% 0.09% 1.38%MSCI ACWI (All Country World
Index) ex USA Index -12.04% 1.95% 3.18%Dow Jones U.S. Total Stock
Market IndexSM -0.55% 13.26% 7.06%
A Available only to accounts established before June 25, 2003.
Average annual total returns take the Portfolio’s cumulative return and show you what would have happened if the Portfolio had performed at a constant rate each year.

12Annual Report
FA 529 Portfolio 2022Performance: The Bottom Line – continued
$10,000 Over 10 Years
Period Ending Values $14,434 FA 529 Portfolio 2022 – CL A $16,547 FA 529 Portfolio 2022 Composite Index
Past 10 Years: Let’s say hypothetically that $10,000 was invested in the FA 529 Portfolio 2022 – CL A on September 30, 2005 (past ten year period) and the current 5.75% sales charge was paid.
The chart shows how the value of that investment would have changed, and also shows how the FA 529 Portfolio 2022 Composite Index performed over the same period.
Past performance is no guarantee of future results. Unit price and return will vary, and you may have a gain or loss when you sell your units. Average Annual Returns are load-adjusted and include changes in unit price, reinvestment of dividends and capital gains.
Class A and Old Class A units are subject to an annual unitholder fee of 0.25%.
Effective after the close of business on September 1, 2010, Old Class B units were closed to new Accounts and additional purchases by exist-ing Participants. Old Class B units may be subject upon redemption, to a contingent deferred sales charge (CDSC), which declines from 2.5% to 0.5% over 6 years. Old Class B units are subject to an annual unitholder fee of 0.75%.
Effective after the close of business on September 1, 2010, Class B units were closed to new Accounts and additional purchases by exist-ing Participants. Class B units may be subject upon redemption, to a contingent deferred sales charge (CDSC), which declines from 5.00% to 0.00% over 7 years. Class B units are subject to an annual unitholder fee of 1.00%.
Class C units may be subject upon redemption, to a contingent deferred sales charge (CDSC) of 1.00% for units redeemed within the first 12 months. Class C units are subject to a 1.00% annual unitholder fee.
Class D units are subject to a 0.50% annual unitholder fee.
Class P units are subject to a 0.75% annual unitholder fee. Class P units are only available within Workplace Savings Programs.
13 Annual Report
FA 529 Portfolio 2025
Performance: The Bottom Line
Understanding PerformanceHow a portfolio did yesterday is no guarantee of how it will do tomorrow. The stock market, for example, has a history of long-term growth and short-term volatility. In turn, the unit price and return of a portfolio that invests in stocks will vary. That means if you sell your units during a market downturn, you might lose money. But if you can ride out the market’s ups and downs, you may have a gain.
PerformanceThere are several ways to evaluate a portfolio’s historical perfor-mance. You can look at the total percentage change in value, the average annual percentage change or the growth of a hypothetical $10,000 investment. Total return reflects the change in the value of an investment.
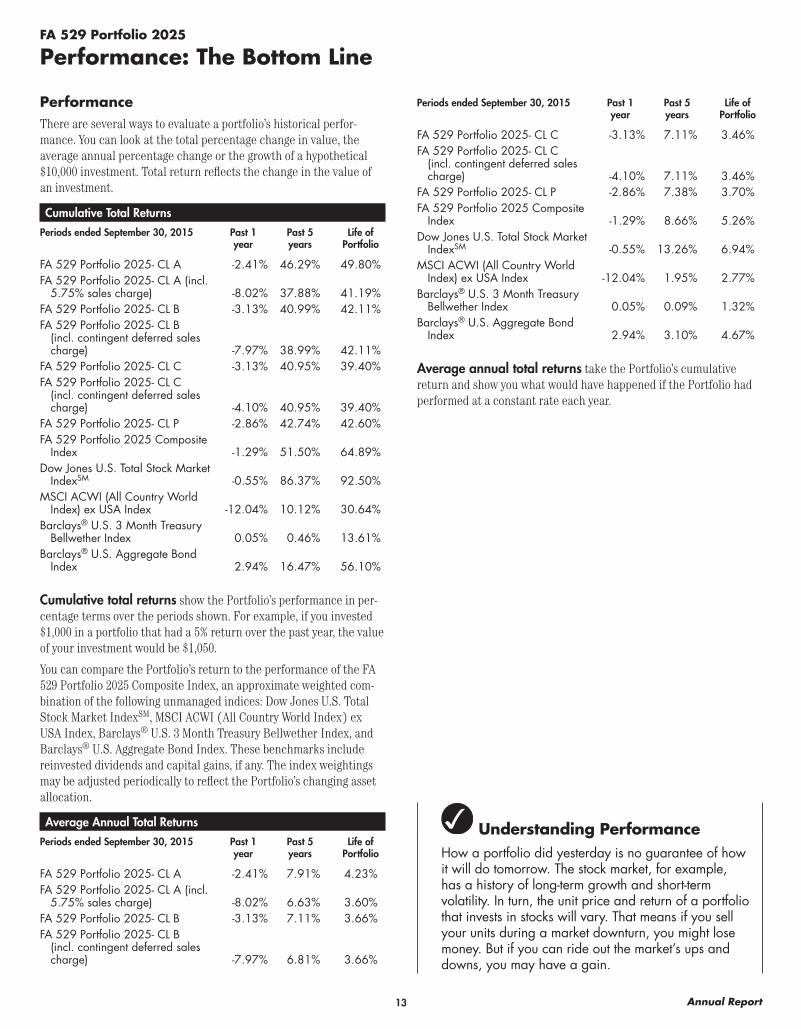
Cumulative Total ReturnsPeriods ended September 30, 2015 Past 1
yearPast 5 years
Life of Portfolio
FA 529 Portfolio 2025- CL A -2.41% 46.29% 49.80%FA 529 Portfolio 2025- CL A (incl.
5.75% sales charge) -8.02% 37.88% 41.19%FA 529 Portfolio 2025- CL B -3.13% 40.99% 42.11%FA 529 Portfolio 2025- CL B
(incl. contingent deferred sales charge) -7.97% 38.99% 42.11%
FA 529 Portfolio 2025- CL C -3.13% 40.95% 39.40%FA 529 Portfolio 2025- CL C
(incl. contingent deferred sales charge) -4.10% 40.95% 39.40%
FA 529 Portfolio 2025- CL P -2.86% 42.74% 42.60%FA 529 Portfolio 2025 Composite
Index -1.29% 51.50% 64.89%Dow Jones U.S. Total Stock Market
IndexSM -0.55% 86.37% 92.50%MSCI ACWI (All Country World
Index) ex USA Index -12.04% 10.12% 30.64%Barclays® U.S. 3 Month Treasury
Bellwether Index 0.05% 0.46% 13.61%Barclays® U.S. Aggregate Bond
Index 2.94% 16.47% 56.10%
Cumulative total returns show the Portfolio’s performance in per-centage terms over the periods shown. For example, if you invested $1,000 in a portfolio that had a 5% return over the past year, the value of your investment would be $1,050.
You can compare the Portfolio’s return to the performance of the FA 529 Portfolio 2025 Composite Index, an approximate weighted com-bination of the following unmanaged indices: Dow Jones U.S. Total Stock Market IndexSM, MSCI ACWI (All Country World Index) ex USA Index, Barclays® U.S. 3 Month Treasury Bellwether Index, and Barclays® U.S. Aggregate Bond Index. These benchmarks include reinvested dividends and capital gains, if any. The index weightings may be adjusted periodically to reflect the Portfolio’s changing asset allocation.
Average Annual Total ReturnsPeriods ended September 30, 2015 Past 1
yearPast 5 years
Life of Portfolio
FA 529 Portfolio 2025- CL A -2.41% 7.91% 4.23%FA 529 Portfolio 2025- CL A (incl.
5.75% sales charge) -8.02% 6.63% 3.60%FA 529 Portfolio 2025- CL B -3.13% 7.11% 3.66%FA 529 Portfolio 2025- CL B
(incl. contingent deferred sales charge) -7.97% 6.81% 3.66%
Periods ended September 30, 2015 Past 1 year
Past 5 years
Life of Portfolio
FA 529 Portfolio 2025- CL C -3.13% 7.11% 3.46%FA 529 Portfolio 2025- CL C
(incl. contingent deferred sales charge) -4.10% 7.11% 3.46%
FA 529 Portfolio 2025- CL P -2.86% 7.38% 3.70%FA 529 Portfolio 2025 Composite
Index -1.29% 8.66% 5.26%Dow Jones U.S. Total Stock Market
IndexSM -0.55% 13.26% 6.94%MSCI ACWI (All Country World
Index) ex USA Index -12.04% 1.95% 2.77%Barclays® U.S. 3 Month Treasury
Bellwether Index 0.05% 0.09% 1.32%Barclays® U.S. Aggregate Bond
Index 2.94% 3.10% 4.67%
Average annual total returns take the Portfolio’s cumulative return and show you what would have happened if the Portfolio had performed at a constant rate each year.
14Annual Report
FA 529 Portfolio 2025Performance: The Bottom Line – continued
$10,000 Over Life of Portfolio
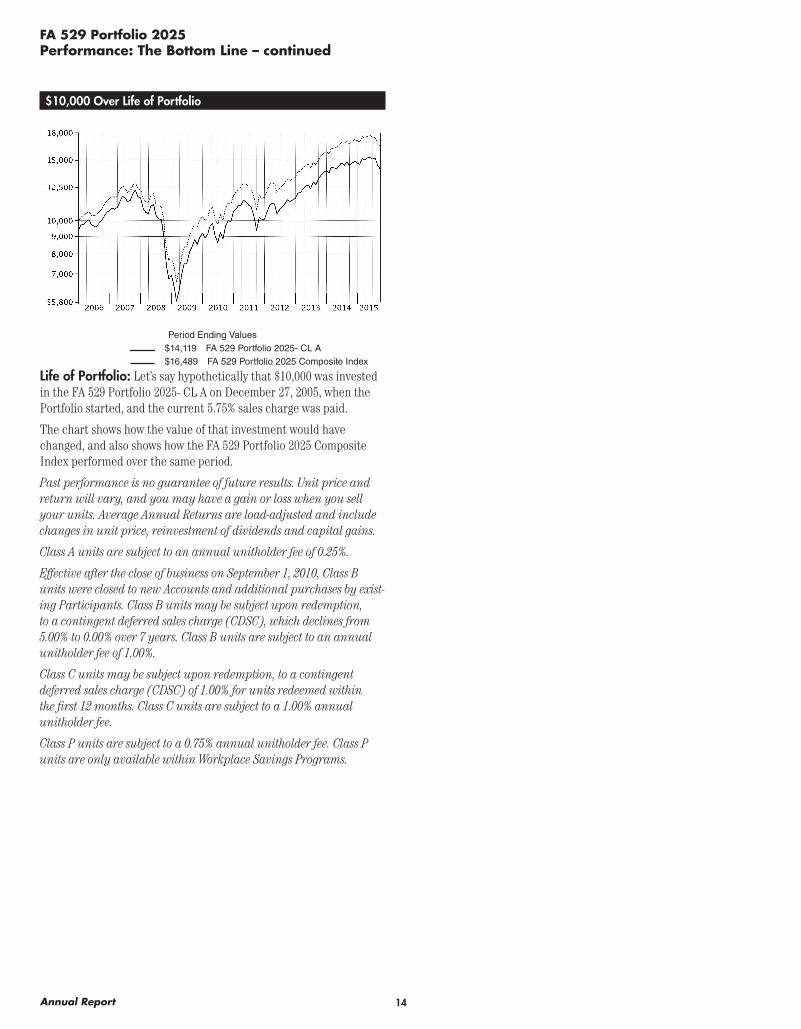
Period Ending Values $14,119 FA 529 Portfolio 2025- CL A $16,489 FA 529 Portfolio 2025 Composite Index
Life of Portfolio: Let’s say hypothetically that $10,000 was invested in the FA 529 Portfolio 2025- CL A on December 27, 2005, when the Portfolio started, and the current 5.75% sales charge was paid.
The chart shows how the value of that investment would have changed, and also shows how the FA 529 Portfolio 2025 Composite Index performed over the same period.
Past performance is no guarantee of future results. Unit price and return will vary, and you may have a gain or loss when you sell your units. Average Annual Returns are load-adjusted and include changes in unit price, reinvestment of dividends and capital gains.
Class A units are subject to an annual unitholder fee of 0.25%.
Effective after the close of business on September 1, 2010, Class B units were closed to new Accounts and additional purchases by exist-ing Participants. Class B units may be subject upon redemption, to a contingent deferred sales charge (CDSC), which declines from 5.00% to 0.00% over 7 years. Class B units are subject to an annual unitholder fee of 1.00%.
Class C units may be subject upon redemption, to a contingent deferred sales charge (CDSC) of 1.00% for units redeemed within the first 12 months. Class C units are subject to a 1.00% annual unitholder fee.
Class P units are subject to a 0.75% annual unitholder fee. Class P units are only available within Workplace Savings Programs.
15 Annual Report
FA 529 Portfolio 2028
Performance: The Bottom Line
Understanding PerformanceHow a portfolio did yesterday is no guarantee of how it will do tomorrow. The stock market, for example, has a history of long-term growth and short-term volatility. In turn, the unit price and return of a portfolio that invests in stocks will vary. That means if you sell your units during a market downturn, you might lose money. But if you can ride out the market’s ups and downs, you may have a gain.
PerformanceThere are several ways to evaluate a portfolio’s historical perfor-mance. You can look at the total percentage change in value, the average annual percentage change or the growth of a hypothetical $10,000 investment. Total return reflects the change in the value of an investment.
Cumulative Total ReturnsPeriods ended September 30, 2015 Past 1
yearPast 5 years
Life of Portfolio
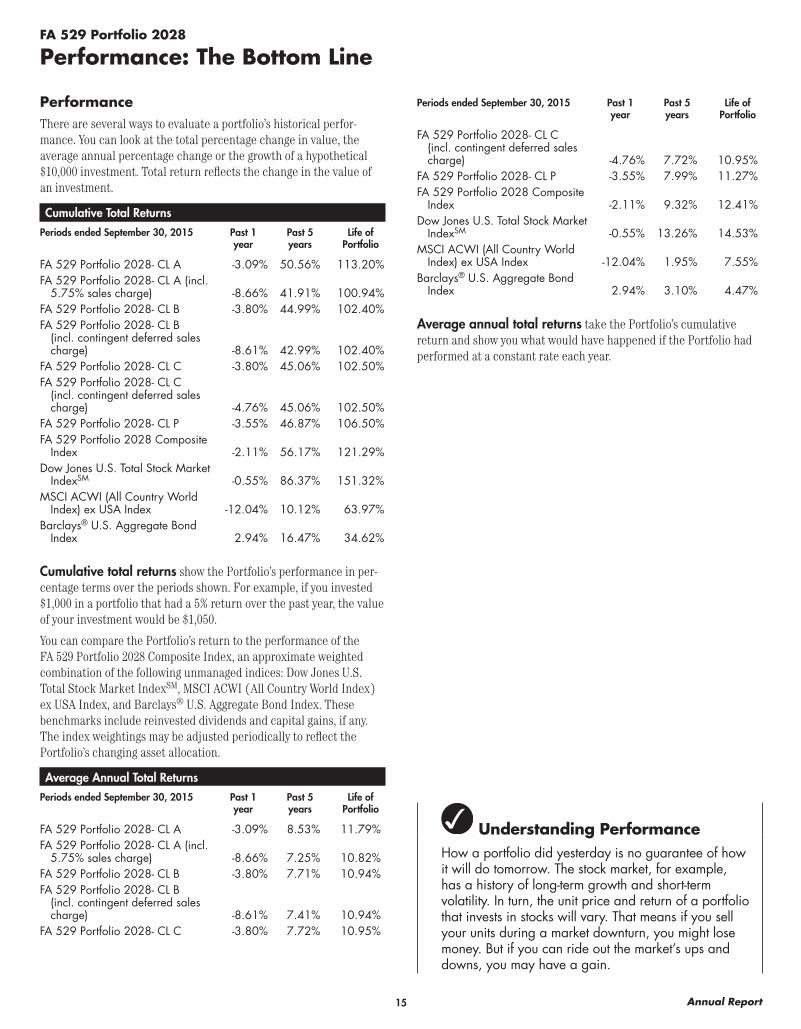
FA 529 Portfolio 2028- CL A -3.09% 50.56% 113.20%FA 529 Portfolio 2028- CL A (incl.
5.75% sales charge) -8.66% 41.91% 100.94%FA 529 Portfolio 2028- CL B -3.80% 44.99% 102.40%FA 529 Portfolio 2028- CL B
(incl. contingent deferred sales charge) -8.61% 42.99% 102.40%
FA 529 Portfolio 2028- CL C -3.80% 45.06% 102.50%FA 529 Portfolio 2028- CL C
(incl. contingent deferred sales charge) -4.76% 45.06% 102.50%
FA 529 Portfolio 2028- CL P -3.55% 46.87% 106.50%FA 529 Portfolio 2028 Composite
Index -2.11% 56.17% 121.29%Dow Jones U.S. Total Stock Market
IndexSM -0.55% 86.37% 151.32%MSCI ACWI (All Country World
Index) ex USA Index -12.04% 10.12% 63.97%Barclays® U.S. Aggregate Bond
Index 2.94% 16.47% 34.62%
Cumulative total returns show the Portfolio’s performance in per-centage terms over the periods shown. For example, if you invested $1,000 in a portfolio that had a 5% return over the past year, the value of your investment would be $1,050.
You can compare the Portfolio’s return to the performance of the FA 529 Portfolio 2028 Composite Index, an approximate weighted combination of the following unmanaged indices: Dow Jones U.S. Total Stock Market IndexSM, MSCI ACWI (All Country World Index) ex USA Index, and Barclays® U.S. Aggregate Bond Index. These benchmarks include reinvested dividends and capital gains, if any. The index weightings may be adjusted periodically to reflect the Portfolio’s changing asset allocation.
Average Annual Total ReturnsPeriods ended September 30, 2015 Past 1
yearPast 5 years
Life of Portfolio
FA 529 Portfolio 2028- CL A -3.09% 8.53% 11.79%FA 529 Portfolio 2028- CL A (incl.
5.75% sales charge) -8.66% 7.25% 10.82%FA 529 Portfolio 2028- CL B -3.80% 7.71% 10.94%FA 529 Portfolio 2028- CL B
(incl. contingent deferred sales charge) -8.61% 7.41% 10.94%
FA 529 Portfolio 2028- CL C -3.80% 7.72% 10.95%
Periods ended September 30, 2015 Past 1 year
Past 5 years
Life of Portfolio
FA 529 Portfolio 2028- CL C (incl. contingent deferred sales charge) -4.76% 7.72% 10.95%
FA 529 Portfolio 2028- CL P -3.55% 7.99% 11.27%FA 529 Portfolio 2028 Composite
Index -2.11% 9.32% 12.41%Dow Jones U.S. Total Stock Market
IndexSM -0.55% 13.26% 14.53%MSCI ACWI (All Country World
Index) ex USA Index -12.04% 1.95% 7.55%Barclays® U.S. Aggregate Bond
Index 2.94% 3.10% 4.47%
Average annual total returns take the Portfolio’s cumulative return and show you what would have happened if the Portfolio had performed at a constant rate each year.
16Annual Report
FA 529 Portfolio 2028Performance: The Bottom Line – continued
$10,000 Over Life of Portfolio
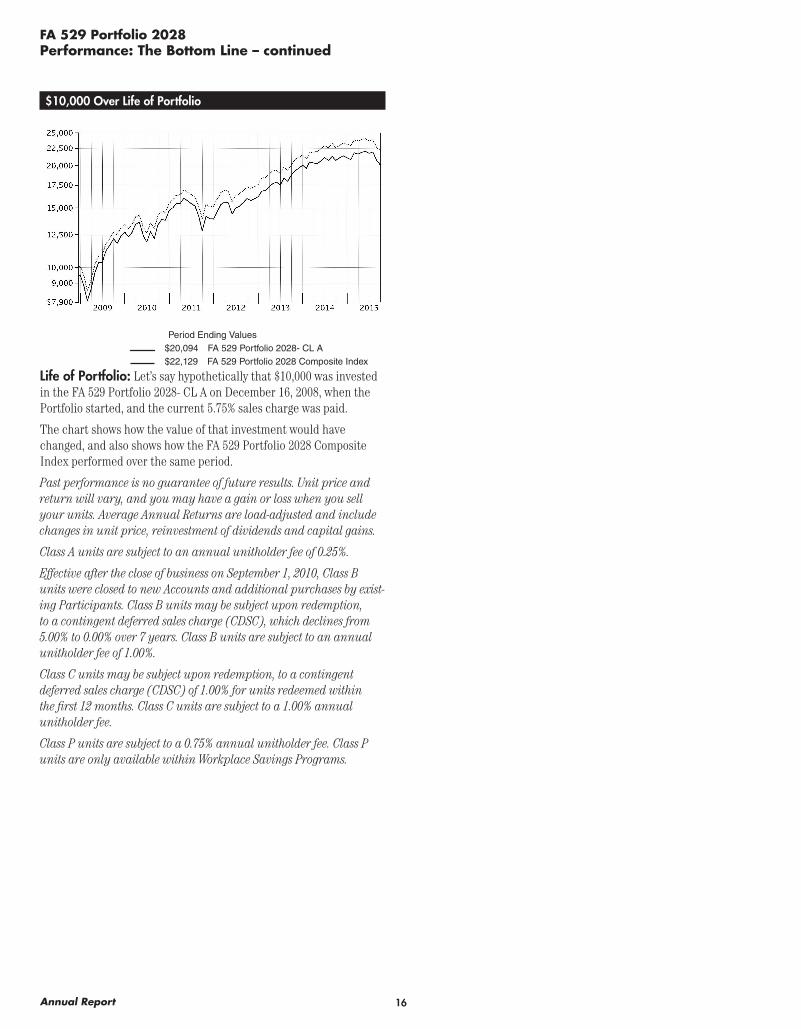
Period Ending Values $20,094 FA 529 Portfolio 2028- CL A $22,129 FA 529 Portfolio 2028 Composite Index
Life of Portfolio: Let’s say hypothetically that $10,000 was invested in the FA 529 Portfolio 2028- CL A on December 16, 2008, when the Portfolio started, and the current 5.75% sales charge was paid.
The chart shows how the value of that investment would have changed, and also shows how the FA 529 Portfolio 2028 Composite Index performed over the same period.
Past performance is no guarantee of future results. Unit price and return will vary, and you may have a gain or loss when you sell your units. Average Annual Returns are load-adjusted and include changes in unit price, reinvestment of dividends and capital gains.
Class A units are subject to an annual unitholder fee of 0.25%.
Effective after the close of business on September 1, 2010, Class B units were closed to new Accounts and additional purchases by exist-ing Participants. Class B units may be subject upon redemption, to a contingent deferred sales charge (CDSC), which declines from 5.00% to 0.00% over 7 years. Class B units are subject to an annual unitholder fee of 1.00%.
Class C units may be subject upon redemption, to a contingent deferred sales charge (CDSC) of 1.00% for units redeemed within the first 12 months. Class C units are subject to a 1.00% annual unitholder fee.
Class P units are subject to a 0.75% annual unitholder fee. Class P units are only available within Workplace Savings Programs.

17 Annual Report
FA 529 Portfolio 2031
Performance: The Bottom Line
Understanding PerformanceHow a portfolio did yesterday is no guarantee of how it will do tomorrow. The stock market, for example, has a history of long-term growth and short-term volatility. In turn, the unit price and return of a portfolio that invests in stocks will vary. That means if you sell your units during a market downturn, you might lose money. But if you can ride out the market’s ups and downs, you may have a gain.
PerformanceThere are several ways to evaluate a portfolio’s historical perfor-mance. You can look at the total percentage change in value, the average annual percentage change or the growth of a hypothetical $10,000 investment. Total return reflects the change in the value of an investment.
Cumulative Total ReturnsPeriods ended September 30, 2015 Past 1
yearLife of
Portfolio
FA 529 Portfolio 2031- CL A -3.81% 49.00%FA 529 Portfolio 2031- CL A (incl. 5.75%
sales charge) -9.34% 40.43%FA 529 Portfolio 2031- CL C -4.48% 45.10%FA 529 Portfolio 2031- CL C (incl. contingent
deferred sales charge) -5.43% 45.10%FA 529 Portfolio 2031- CL P -4.31% 46.60%FA 529 Portfolio 2031 Composite Index -3.01% 50.63%MSCI ACWI (All Country World Index) ex
USA Index -12.04% 22.27%Dow Jones U.S. Total Stock Market IndexSM -0.55% 70.26%Barclays® U.S. Aggregate Bond Index 2.94% 9.54%
Cumulative total returns show the Portfolio’s performance in per-centage terms over the periods shown. For example, if you invested $1,000 in a portfolio that had a 5% return over the past year, the value of your investment would be $1,050.
You can compare the Portfolio’s return to the performance of the FA 529 Portfolio 2031 Composite Index, an approximate weighted combination of the following unmanaged indices: MSCI ACWI (All Country World Index) ex USA Index, Dow Jones U.S. Total Stock Market IndexSM, and Barclays® U.S. Aggregate Bond Index. These benchmarks include reinvested dividends and capital gains, if any. The index weightings may be adjusted periodically to reflect the Portfolio’s changing asset allocation.
Average Annual Total ReturnsPeriods ended September 30, 2015 Past 1
yearLife of
Portfolio
FA 529 Portfolio 2031- CL A -3.81% 11.09%FA 529 Portfolio 2031- CL A (incl. 5.75%
sales charge) -9.34% 9.37%FA 529 Portfolio 2031- CL C -4.48% 10.32%FA 529 Portfolio 2031- CL C (incl. contingent
deferred sales charge) -5.43% 10.32%FA 529 Portfolio 2031- CL P -4.31% 10.62%FA 529 Portfolio 2031 Composite Index -3.01% 11.41%MSCI ACWI (All Country World Index) ex
USA Index -12.04% 5.45%Dow Jones U.S. Total Stock Market IndexSM -0.55% 15.07%Barclays® U.S. Aggregate Bond Index 2.94% 2.43%
Average annual total returns take the Portfolio’s cumulative return and show you what would have happened if the Portfolio had performed at a constant rate each year.
$10,000 Over Life of Portfolio
Period Ending Values $14,043 FA 529 Portfolio 2031- CL A $15,063 FA 529 Portfolio 2031 Composite Index
Life of Portfolio: Let’s say hypothetically that $10,000 was invested in the FA 529 Portfolio 2031- CL A on December 16, 2011, when the Portfolio started, and the current 5.75% sales charge was paid.
The chart shows how the value of that investment would have changed, and also shows how the FA 529 Portfolio 2031 Composite Index performed over the same period.
Past performance is no guarantee of future results. Unit price and return will vary, and you may have a gain or loss when you sell your units. Average Annual Returns are load-adjusted and include changes in unit price, reinvestment of dividends and capital gains.
Class A units are subject to an annual unitholder fee of 0.25%.
Class C units may be subject upon redemption, to a contingent deferred sales charge (CDSC) of 1.00% for units redeemed within the first 12 months. Class C units are subject to a 1.00% annual unitholder fee.
Class P units are subject to a 0.75% annual unitholder fee. Class P units are only available within Workplace Savings Programs.
18Annual Report
FA 529 Portfolio 2034
Performance: The Bottom Line
Understanding PerformanceHow a portfolio did yesterday is no guarantee of how it will do tomorrow. The stock market, for example, has a history of long-term growth and short-term volatility. In turn, the unit price and return of a portfolio that invests in stocks will vary. That means if you sell your units during a market downturn, you might lose money. But if you can ride out the market’s ups and downs, you may have a gain.
PerformanceThere are several ways to evaluate a portfolio’s historical perfor-mance. You can look at the total percentage change in value, the average annual percentage change or the growth of a hypothetical $10,000 investment. Total return reflects the change in the value of an investment.
Cumulative Total ReturnsPeriods ended September 30, 2015 Life of
Portfolio
FA 529 Portfolio 2034 – CL A -5.80%FA 529 Portfolio 2034- CL A (incl. 5.75% sales charge) -11.22%FA 529 Portfolio 2034 – CL C -6.30%FA 529 Portfolio 2034- CL C (incl. contingent deferred
sales charge) -7.24%FA 529 Portfolio 2034 – CL P -6.00%FA 529 Portfolio 2034 Composite Index -5.55%MSCI ACWI (All Country World Index) ex USA Index -7.57%Dow Jones U.S. Total Stock Market IndexSM -5.35%Barclays® U.S. Aggregate Bond Index 1.44%
Cumulative total returns show the Portfolio’s performance in per-centage terms over the periods shown. For example, if you invested $1,000 in a portfolio that had a 5% return over the past year, the value of your investment would be $1,050.
You can compare the Portfolio’s return to the performance of the FA 529 Portfolio 2034 Composite Index, an approximate weighted combination of the following unmanaged indices: MSCI ACWI (All Country World Index) ex USA Index, Dow Jones U.S. Total Stock Market IndexSM, and Barclays® U.S. Aggregate Bond Index. These benchmarks include reinvested dividends and capital gains, if any. The index weightings may be adjusted periodically to reflect the Portfolio’s changing asset allocation.
Average annual total returns take the Portfolio’s cumulative return and show you what would have happened if the Portfolio had performed at a constant rate each year. These numbers will be reported once the Portfolio is a year old.
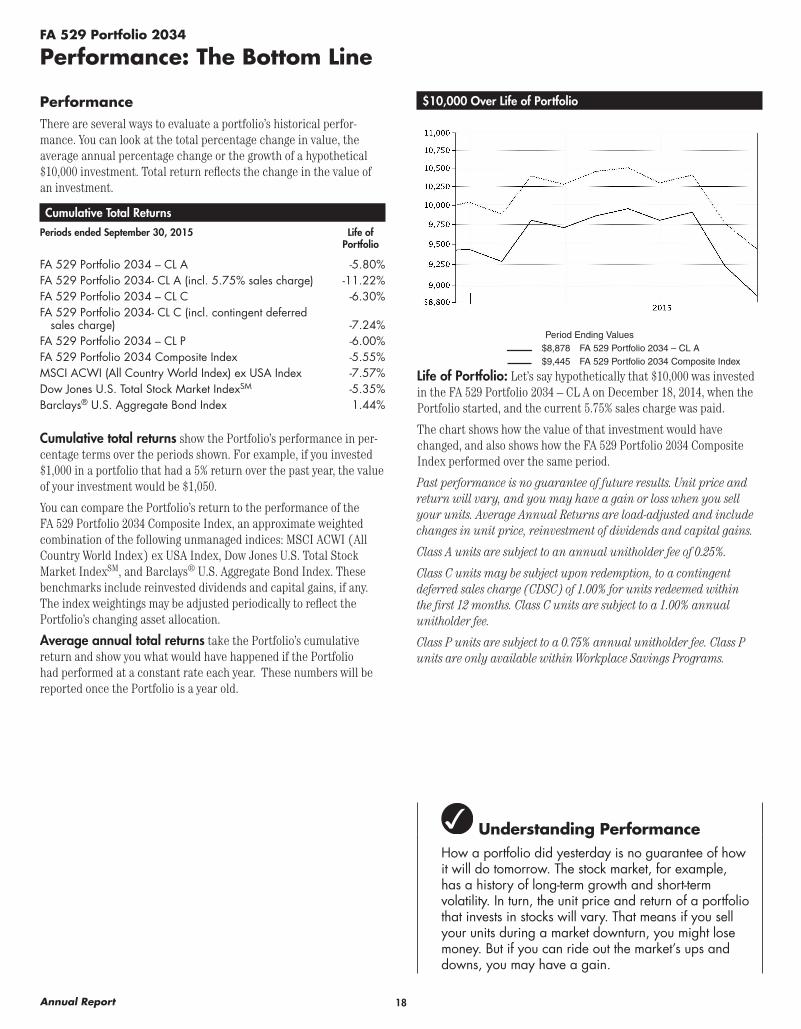
$10,000 Over Life of Portfolio
Period Ending Values $8,878 FA 529 Portfolio 2034 – CL A $9,445 FA 529 Portfolio 2034 Composite Index
Life of Portfolio: Let’s say hypothetically that $10,000 was invested in the FA 529 Portfolio 2034 – CL A on December 18, 2014, when the Portfolio started, and the current 5.75% sales charge was paid.
The chart shows how the value of that investment would have changed, and also shows how the FA 529 Portfolio 2034 Composite Index performed over the same period.
Past performance is no guarantee of future results. Unit price and return will vary, and you may have a gain or loss when you sell your units. Average Annual Returns are load-adjusted and include changes in unit price, reinvestment of dividends and capital gains.
Class A units are subject to an annual unitholder fee of 0.25%.
Class C units may be subject upon redemption, to a contingent deferred sales charge (CDSC) of 1.00% for units redeemed within the first 12 months. Class C units are subject to a 1.00% annual unitholder fee.
Class P units are subject to a 0.75% annual unitholder fee. Class P units are only available within Workplace Savings Programs.
19 Annual Report
FA 529 Aggressive Growth Portfolio
Performance: The Bottom Line
Understanding PerformanceHow a portfolio did yesterday is no guarantee of how it will do tomorrow. The stock market, for example, has a history of long-term growth and short-term volatility. In turn, the unit price and return of a portfolio that invests in stocks will vary. That means if you sell your units during a market downturn, you might lose money. But if you can ride out the market’s ups and downs, you may have a gain.
PerformanceThere are several ways to evaluate a portfolio’s historical perfor-mance. You can look at the total percentage change in value, the average annual percentage change or the growth of a hypothetical $10,000 investment. Total return reflects the change in the value of an investment.
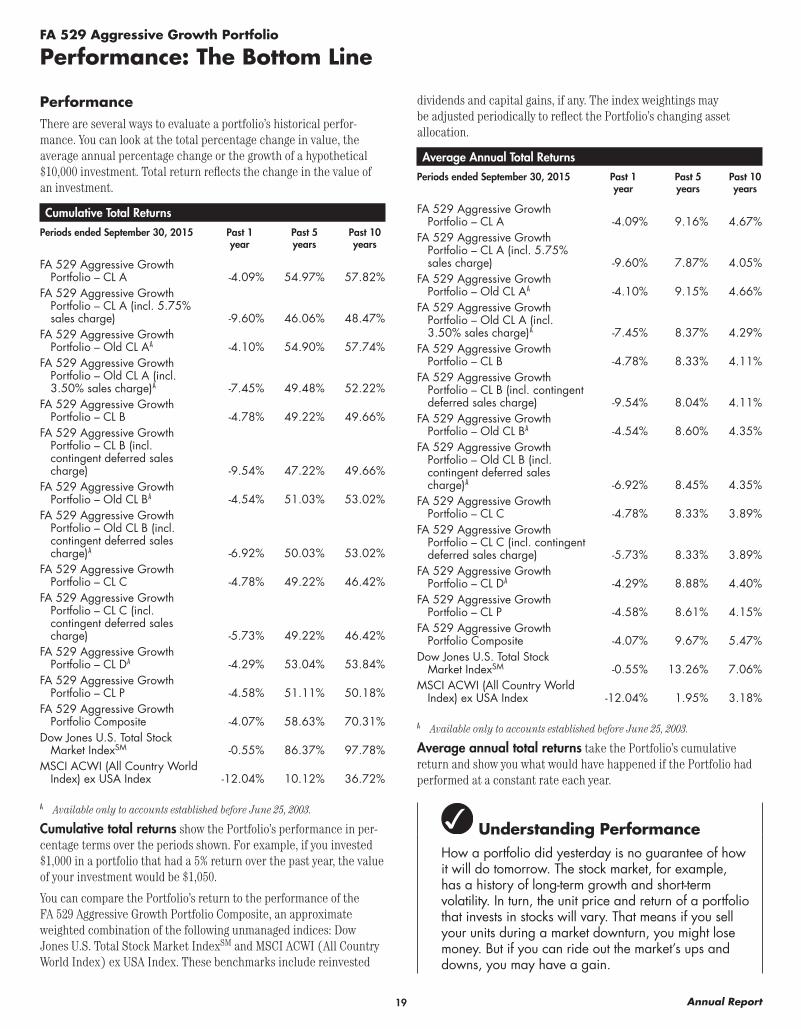
Cumulative Total ReturnsPeriods ended September 30, 2015 Past 1
yearPast 5 years
Past 10 years
FA 529 Aggressive Growth Portfolio – CL A -4.09% 54.97% 57.82%
FA 529 Aggressive Growth Portfolio – CL A (incl. 5.75% sales charge) -9.60% 46.06% 48.47%
FA 529 Aggressive Growth Portfolio – Old CL A A -4.10% 54.90% 57.74%
FA 529 Aggressive Growth Portfolio – Old CL A (incl. 3.50% sales charge) A -7.45% 49.48% 52.22%
FA 529 Aggressive Growth Portfolio – CL B -4.78% 49.22% 49.66%
FA 529 Aggressive Growth Portfolio – CL B (incl. contingent deferred sales charge) -9.54% 47.22% 49.66%
FA 529 Aggressive Growth Portfolio – Old CL B A -4.54% 51.03% 53.02%
FA 529 Aggressive Growth Portfolio – Old CL B (incl. contingent deferred sales charge) A -6.92% 50.03% 53.02%
FA 529 Aggressive Growth Portfolio – CL C -4.78% 49.22% 46.42%
FA 529 Aggressive Growth Portfolio – CL C (incl. contingent deferred sales charge) -5.73% 49.22% 46.42%
FA 529 Aggressive Growth Portfolio – CL D A -4.29% 53.04% 53.84%
FA 529 Aggressive Growth Portfolio – CL P -4.58% 51.11% 50.18%
FA 529 Aggressive Growth Portfolio Composite -4.07% 58.63% 70.31%
Dow Jones U.S. Total Stock Market IndexSM -0.55% 86.37% 97.78%
MSCI ACWI (All Country World Index) ex USA Index -12.04% 10.12% 36.72%
A Available only to accounts established before June 25, 2003.
Cumulative total returns show the Portfolio’s performance in per-centage terms over the periods shown. For example, if you invested $1,000 in a portfolio that had a 5% return over the past year, the value of your investment would be $1,050.
You can compare the Portfolio’s return to the performance of the FA 529 Aggressive Growth Portfolio Composite, an approximate weighted combination of the following unmanaged indices: Dow Jones U.S. Total Stock Market IndexSM and MSCI ACWI (All Country World Index) ex USA Index. These benchmarks include reinvested
dividends and capital gains, if any. The index weightings may be adjusted periodically to reflect the Portfolio’s changing asset allocation.
Average Annual Total ReturnsPeriods ended September 30, 2015 Past 1
yearPast 5 years
Past 10 years
FA 529 Aggressive Growth Portfolio – CL A -4.09% 9.16% 4.67%
FA 529 Aggressive Growth Portfolio – CL A (incl. 5.75% sales charge) -9.60% 7.87% 4.05%
FA 529 Aggressive Growth Portfolio – Old CL A A -4.10% 9.15% 4.66%
FA 529 Aggressive Growth Portfolio – Old CL A (incl. 3.50% sales charge) A -7.45% 8.37% 4.29%
FA 529 Aggressive Growth Portfolio – CL B -4.78% 8.33% 4.11%
FA 529 Aggressive Growth Portfolio – CL B (incl. contingent deferred sales charge) -9.54% 8.04% 4.11%
FA 529 Aggressive Growth Portfolio – Old CL B A -4.54% 8.60% 4.35%
FA 529 Aggressive Growth Portfolio – Old CL B (incl. contingent deferred sales charge) A -6.92% 8.45% 4.35%
FA 529 Aggressive Growth Portfolio – CL C -4.78% 8.33% 3.89%
FA 529 Aggressive Growth Portfolio – CL C (incl. contingent deferred sales charge) -5.73% 8.33% 3.89%
FA 529 Aggressive Growth Portfolio – CL D A -4.29% 8.88% 4.40%
FA 529 Aggressive Growth Portfolio – CL P -4.58% 8.61% 4.15%
FA 529 Aggressive Growth Portfolio Composite -4.07% 9.67% 5.47%
Dow Jones U.S. Total Stock Market IndexSM -0.55% 13.26% 7.06%
MSCI ACWI (All Country World Index) ex USA Index -12.04% 1.95% 3.18%
A Available only to accounts established before June 25, 2003.
Average annual total returns take the Portfolio’s cumulative return and show you what would have happened if the Portfolio had performed at a constant rate each year.
20Annual Report
FA 529 Aggressive Growth PortfolioPerformance: The Bottom Line – continued
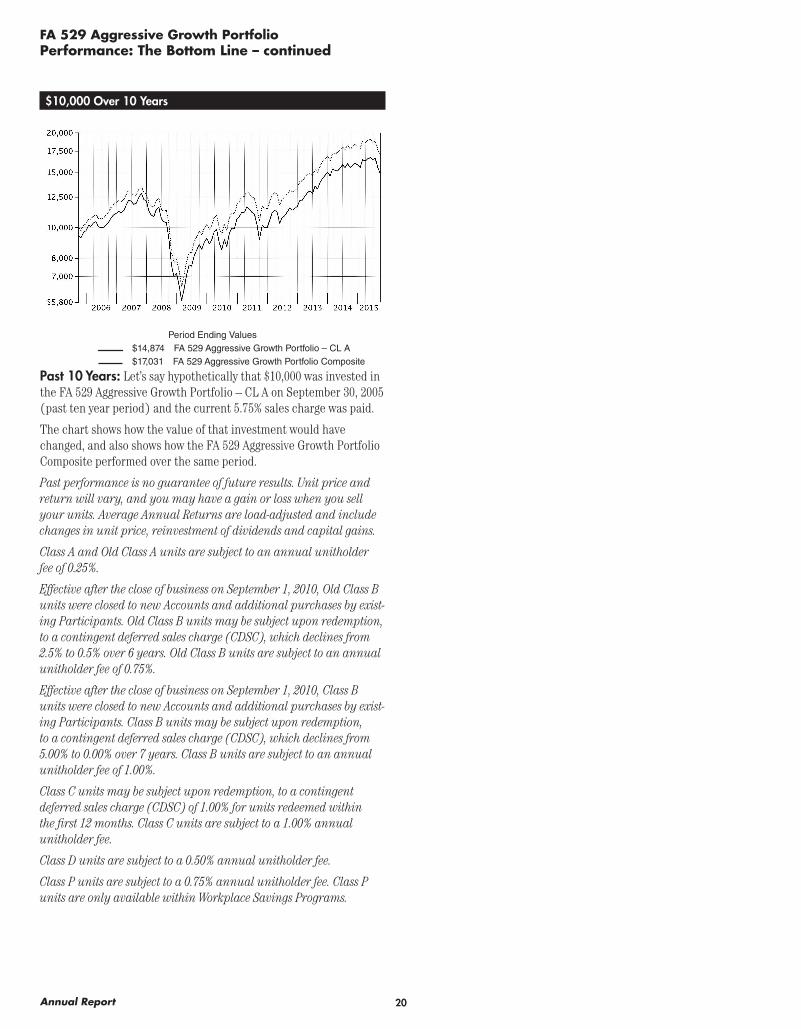
$10,000 Over 10 Years
Period Ending Values $14,874 FA 529 Aggressive Growth Portfolio – CL A $17,031 FA 529 Aggressive Growth Portfolio Composite
Past 10 Years: Let’s say hypothetically that $10,000 was invested in the FA 529 Aggressive Growth Portfolio – CL A on September 30, 2005 (past ten year period) and the current 5.75% sales charge was paid.
The chart shows how the value of that investment would have changed, and also shows how the FA 529 Aggressive Growth Portfolio Composite performed over the same period.
Past performance is no guarantee of future results. Unit price and return will vary, and you may have a gain or loss when you sell your units. Average Annual Returns are load-adjusted and include changes in unit price, reinvestment of dividends and capital gains.
Class A and Old Class A units are subject to an annual unitholder fee of 0.25%.
Effective after the close of business on September 1, 2010, Old Class B units were closed to new Accounts and additional purchases by exist-ing Participants. Old Class B units may be subject upon redemption, to a contingent deferred sales charge (CDSC), which declines from 2.5% to 0.5% over 6 years. Old Class B units are subject to an annual unitholder fee of 0.75%.
Effective after the close of business on September 1, 2010, Class B units were closed to new Accounts and additional purchases by exist-ing Participants. Class B units may be subject upon redemption, to a contingent deferred sales charge (CDSC), which declines from 5.00% to 0.00% over 7 years. Class B units are subject to an annual unitholder fee of 1.00%.
Class C units may be subject upon redemption, to a contingent deferred sales charge (CDSC) of 1.00% for units redeemed within the first 12 months. Class C units are subject to a 1.00% annual unitholder fee.
Class D units are subject to a 0.50% annual unitholder fee.
Class P units are subject to a 0.75% annual unitholder fee. Class P units are only available within Workplace Savings Programs.
21 Annual Report
FA 529 Moderate Growth Portfolio
Performance: The Bottom Line
Understanding PerformanceHow a portfolio did yesterday is no guarantee of how it will do tomorrow. The stock market, for example, has a history of long-term growth and short-term volatility. In turn, the unit price and return of a portfolio that invests in stocks will vary. That means if you sell your units during a market downturn, you might lose money. But if you can ride out the market’s ups and downs, you may have a gain.
PerformanceThere are several ways to evaluate a portfolio’s historical perfor-mance. You can look at the total percentage change in value, the average annual percentage change or the growth of a hypothetical $10,000 investment. Total return reflects the change in the value of an investment.
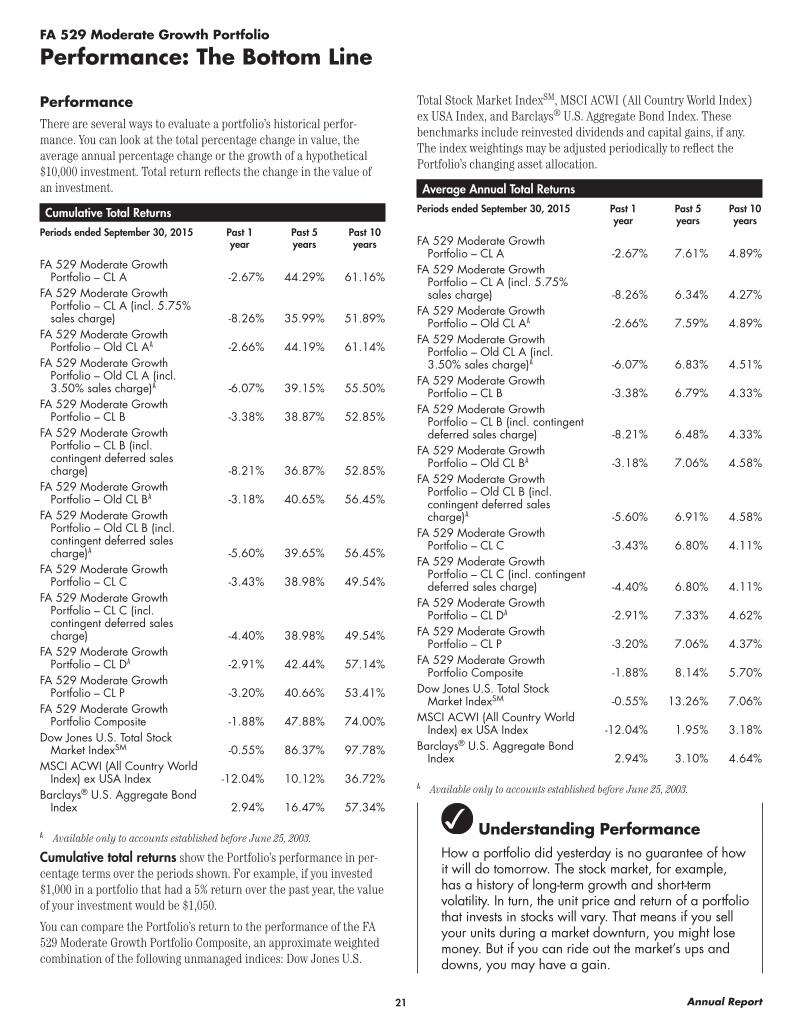
Cumulative Total ReturnsPeriods ended September 30, 2015 Past 1
yearPast 5 years
Past 10 years
FA 529 Moderate Growth Portfolio – CL A -2.67% 44.29% 61.16%
FA 529 Moderate Growth Portfolio – CL A (incl. 5.75% sales charge) -8.26% 35.99% 51.89%
FA 529 Moderate Growth Portfolio – Old CL A A -2.66% 44.19% 61.14%
FA 529 Moderate Growth Portfolio – Old CL A (incl. 3.50% sales charge) A -6.07% 39.15% 55.50%
FA 529 Moderate Growth Portfolio – CL B -3.38% 38.87% 52.85%
FA 529 Moderate Growth Portfolio – CL B (incl. contingent deferred sales charge) -8.21% 36.87% 52.85%
FA 529 Moderate Growth Portfolio – Old CL B A -3.18% 40.65% 56.45%
FA 529 Moderate Growth Portfolio – Old CL B (incl. contingent deferred sales charge) A -5.60% 39.65% 56.45%
FA 529 Moderate Growth Portfolio – CL C -3.43% 38.98% 49.54%
FA 529 Moderate Growth Portfolio – CL C (incl. contingent deferred sales charge) -4.40% 38.98% 49.54%
FA 529 Moderate Growth Portfolio – CL D A -2.91% 42.44% 57.14%
FA 529 Moderate Growth Portfolio – CL P -3.20% 40.66% 53.41%
FA 529 Moderate Growth Portfolio Composite -1.88% 47.88% 74.00%
Dow Jones U.S. Total Stock Market IndexSM -0.55% 86.37% 97.78%
MSCI ACWI (All Country World Index) ex USA Index -12.04% 10.12% 36.72%
Barclays® U.S. Aggregate Bond Index 2.94% 16.47% 57.34%
A Available only to accounts established before June 25, 2003.
Cumulative total returns show the Portfolio’s performance in per-centage terms over the periods shown. For example, if you invested $1,000 in a portfolio that had a 5% return over the past year, the value of your investment would be $1,050.
You can compare the Portfolio’s return to the performance of the FA 529 Moderate Growth Portfolio Composite, an approximate weighted combination of the following unmanaged indices: Dow Jones U.S.
Total Stock Market IndexSM, MSCI ACWI (All Country World Index) ex USA Index, and Barclays® U.S. Aggregate Bond Index. These benchmarks include reinvested dividends and capital gains, if any. The index weightings may be adjusted periodically to reflect the Portfolio’s changing asset allocation.
Average Annual Total ReturnsPeriods ended September 30, 2015 Past 1
yearPast 5 years
Past 10 years
FA 529 Moderate Growth Portfolio – CL A -2.67% 7.61% 4.89%
FA 529 Moderate Growth Portfolio – CL A (incl. 5.75% sales charge) -8.26% 6.34% 4.27%
FA 529 Moderate Growth Portfolio – Old CL A A -2.66% 7.59% 4.89%
FA 529 Moderate Growth Portfolio – Old CL A (incl. 3.50% sales charge) A -6.07% 6.83% 4.51%
FA 529 Moderate Growth Portfolio – CL B -3.38% 6.79% 4.33%
FA 529 Moderate Growth Portfolio – CL B (incl. contingent deferred sales charge) -8.21% 6.48% 4.33%
FA 529 Moderate Growth Portfolio – Old CL B A -3.18% 7.06% 4.58%
FA 529 Moderate Growth Portfolio – Old CL B (incl. contingent deferred sales charge) A -5.60% 6.91% 4.58%
FA 529 Moderate Growth Portfolio – CL C -3.43% 6.80% 4.11%
FA 529 Moderate Growth Portfolio – CL C (incl. contingent deferred sales charge) -4.40% 6.80% 4.11%
FA 529 Moderate Growth Portfolio – CL D A -2.91% 7.33% 4.62%
FA 529 Moderate Growth Portfolio – CL P -3.20% 7.06% 4.37%
FA 529 Moderate Growth Portfolio Composite -1.88% 8.14% 5.70%
Dow Jones U.S. Total Stock Market IndexSM -0.55% 13.26% 7.06%
MSCI ACWI (All Country World Index) ex USA Index -12.04% 1.95% 3.18%
Barclays® U.S. Aggregate Bond Index 2.94% 3.10% 4.64%
A Available only to accounts established before June 25, 2003.
22Annual Report
FA 529 Moderate Growth PortfolioPerformance: The Bottom Line – continued
Average annual total returns take the Portfolio’s cumulative return and show you what would have happened if the Portfolio had performed at a constant rate each year.
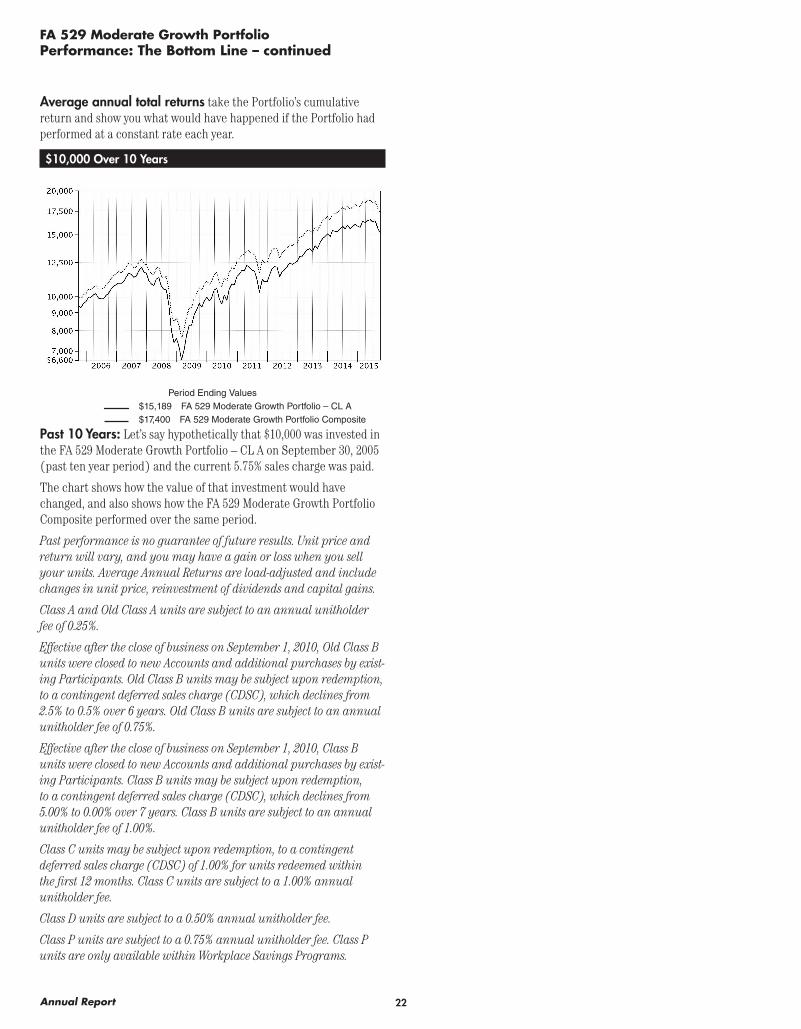
$10,000 Over 10 Years
Period Ending Values $15,189 FA 529 Moderate Growth Portfolio – CL A $17,400 FA 529 Moderate Growth Portfolio Composite
Past 10 Years: Let’s say hypothetically that $10,000 was invested in the FA 529 Moderate Growth Portfolio – CL A on September 30, 2005 (past ten year period) and the current 5.75% sales charge was paid.
The chart shows how the value of that investment would have changed, and also shows how the FA 529 Moderate Growth Portfolio Composite performed over the same period.
Past performance is no guarantee of future results. Unit price and return will vary, and you may have a gain or loss when you sell your units. Average Annual Returns are load-adjusted and include changes in unit price, reinvestment of dividends and capital gains.
Class A and Old Class A units are subject to an annual unitholder fee of 0.25%.
Effective after the close of business on September 1, 2010, Old Class B units were closed to new Accounts and additional purchases by exist-ing Participants. Old Class B units may be subject upon redemption, to a contingent deferred sales charge (CDSC), which declines from 2.5% to 0.5% over 6 years. Old Class B units are subject to an annual unitholder fee of 0.75%.
Effective after the close of business on September 1, 2010, Class B units were closed to new Accounts and additional purchases by exist-ing Participants. Class B units may be subject upon redemption, to a contingent deferred sales charge (CDSC), which declines from 5.00% to 0.00% over 7 years. Class B units are subject to an annual unitholder fee of 1.00%.
Class C units may be subject upon redemption, to a contingent deferred sales charge (CDSC) of 1.00% for units redeemed within the first 12 months. Class C units are subject to a 1.00% annual unitholder fee.
Class D units are subject to a 0.50% annual unitholder fee.
Class P units are subject to a 0.75% annual unitholder fee. Class P units are only available within Workplace Savings Programs.
23 Annual Report
FA 529 Diversified International Portfolio
Performance: The Bottom Line
Understanding PerformanceHow a portfolio did yesterday is no guarantee of how it will do tomorrow. The stock market, for example, has a history of long-term growth and short-term volatility. In turn, the unit price and return of a portfolio that invests in stocks will vary. That means if you sell your units during a market downturn, you might lose money. But if you can ride out the market’s ups and downs, you may have a gain.
PerformanceThere are several ways to evaluate a portfolio’s historical perfor-mance. You can look at the total percentage change in value, the average annual percentage change or the growth of a hypothetical $10,000 investment. Total return reflects the change in the value of an investment.
Cumulative Total ReturnsPeriods ended September 30, 2015 Past 1
yearPast 5 years
Past 10 years
FA 529 Diversified International Portfolio – CL A -2.10% 34.78% 31.23%
FA 529 Diversified International Portfolio – CL A (incl. 5.75% sales charge) -7.73% 27.03% 23.69%
FA 529 Diversified International Portfolio – CL B -2.80% 29.84% 24.37%
FA 529 Diversified International Portfolio – CL B (incl. contingent deferred sales charge) -7.66% 27.84% 24.37%
FA 529 Diversified International Portfolio – CL C -2.80% 29.82% 21.78%
FA 529 Diversified International Portfolio – CL C (incl. contingent deferred sales charge) -3.77% 29.82% 21.78%
FA 529 Diversified International Portfolio – CL D A -2.31% 33.18% 28.09%
FA 529 Diversified International Portfolio – CL P -2.57% 31.48% 24.94%
MSCI EAFE Index -8.53% 22.30% 35.98%
A Available only to accounts established before June 25, 2003.
Cumulative total returns show the Portfolio’s performance in per-centage terms over the periods shown. For example, if you invested $1,000 in a portfolio that had a 5% return over the past year, the value of your investment would be $1,050.
You can compare the Portfolio’s return to the performance of the MSCI EAFE Index. The benchmark includes reinvested dividends and capital gains, if any.
Average Annual Total ReturnsPeriods ended September 30, 2015 Past 1
yearPast 5 years
Past 10 years
FA 529 Diversified International Portfolio – CL A -2.10% 6.15% 2.76%
FA 529 Diversified International Portfolio – CL A (incl. 5.75% sales charge) -7.73% 4.90% 2.15%
FA 529 Diversified International Portfolio – CL B -2.80% 5.36% 2.20%
FA 529 Diversified International Portfolio – CL B (incl. contingent deferred sales charge) -7.66% 5.03% 2.20%
FA 529 Diversified International Portfolio – CL C -2.80% 5.36% 1.99%
FA 529 Diversified International Portfolio – CL C (incl. contingent deferred sales charge) -3.77% 5.36% 1.99%
Periods ended September 30, 2015 Past 1 year
Past 5 years
Past 10 years
FA 529 Diversified International Portfolio – CL D A -2.31% 5.90% 2.51%
FA 529 Diversified International Portfolio – CL P -2.57% 5.63% 2.25%
MSCI EAFE Index -8.53% 4.11% 3.12%
A Available only to accounts established before June 25, 2003.
Average annual total returns take the Portfolio’s cumulative return and show you what would have happened if the Portfolio had performed at a constant rate each year.
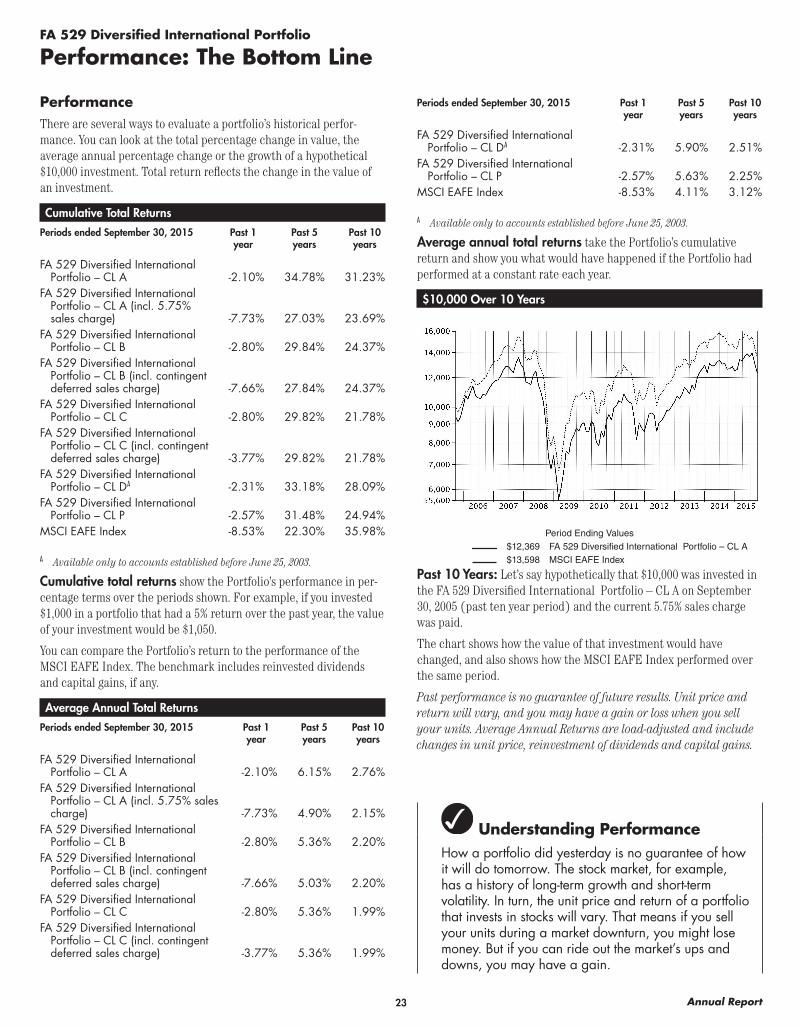
$10,000 Over 10 Years
Period Ending Values $12,369 FA 529 Diversified International Portfolio – CL A $13,598 MSCI EAFE Index
Past 10 Years: Let’s say hypothetically that $10,000 was invested in the FA 529 Diversified International Portfolio – CL A on September 30, 2005 (past ten year period) and the current 5.75% sales charge was paid.
The chart shows how the value of that investment would have changed, and also shows how the MSCI EAFE Index performed over the same period.
Past performance is no guarantee of future results. Unit price and return will vary, and you may have a gain or loss when you sell your units. Average Annual Returns are load-adjusted and include changes in unit price, reinvestment of dividends and capital gains.
24Annual Report
FA 529 Diversified International PortfolioPerformance: The Bottom Line – continued
Class A units are subject to an annual unitholder fee of 0.25%.
Effective after the close of business on September 1, 2010, Class B units were closed to new Accounts and additional purchases by exist-ing Participants. Class B units may be subject upon redemption, to a contingent deferred sales charge (CDSC), which declines from 5.00% to 0.00% over 7 years. Class B units are subject to an annual unitholder fee of 1.00%.
Class C units may be subject upon redemption, to a contingent deferred sales charge (CDSC) of 1.00% for units redeemed within the first 12 months. Class C units are subject to a 1.00% annual unitholder fee.
Class D units are subject to a 0.50% annual unitholder fee.
Class P units are subject to a 0.75% annual unitholder fee. Class P units are only available within Workplace Savings Programs.

25 Annual Report
FA 529 Dividend Growth Portfolio
Performance: The Bottom Line
Understanding PerformanceHow a portfolio did yesterday is no guarantee of how it will do tomorrow. The stock market, for example, has a history of long-term growth and short-term volatility. In turn, the unit price and return of a portfolio that invests in stocks will vary. That means if you sell your units during a market downturn, you might lose money. But if you can ride out the market’s ups and downs, you may have a gain.
PerformanceThere are several ways to evaluate a portfolio’s historical perfor-mance. You can look at the total percentage change in value, the average annual percentage change or the growth of a hypothetical $10,000 investment. Total return reflects the change in the value of an investment.
Cumulative Total ReturnsPeriods ended September 30, 2015 Past 1
yearPast 5 years
Past 10 years
FA 529 Dividend Growth Portfolio – CL A -3.38% 67.73% 77.87%
FA 529 Dividend Growth Portfolio – CL A (incl. 5.75% sales charge) -8.94% 58.08% 67.64%
FA 529 Dividend Growth Portfolio – CL B -4.07% 61.57% 68.84%
FA 529 Dividend Growth Portfolio – CL B (incl. contingent deferred sales charge) -8.86% 59.57% 68.84%
FA 529 Dividend Growth Portfolio – CL C -4.12% 61.51% 65.03%
FA 529 Dividend Growth Portfolio – CL C (incl. contingent deferred sales charge) -5.07% 61.51% 65.03%
FA 529 Dividend Growth Portfolio – CL D A -3.63% 65.56% 73.57%
FA 529 Dividend Growth Portfolio – CL P -3.85% 63.76% 69.38%
S&P 500® Index -0.61% 87.02% 93.05%
A Available only to accounts established before June 25, 2003.
Cumulative total returns show the Portfolio’s performance in per-centage terms over the periods shown. For example, if you invested $1,000 in a portfolio that had a 5% return over the past year, the value of your investment would be $1,050.
You can compare the Portfolio’s return to the performance of the S&P 500® Index. The benchmark includes reinvested dividends and capital gains, if any.
Average Annual Total ReturnsPeriods ended September 30, 2015 Past 1
yearPast 5 years
Past 10 years
FA 529 Dividend Growth Portfolio – CL A -3.38% 10.90% 5.93%
FA 529 Dividend Growth Portfolio – CL A (incl. 5.75% sales charge) -8.94% 9.59% 5.30%
FA 529 Dividend Growth Portfolio – CL B -4.07% 10.07% 5.38%
FA 529 Dividend Growth Portfolio – CL B (incl. contingent deferred sales charge) -8.86% 9.80% 5.38%
FA 529 Dividend Growth Portfolio – CL C -4.12% 10.06% 5.14%
FA 529 Dividend Growth Portfolio – CL C (incl. contingent deferred sales charge) -5.07% 10.06% 5.14%
Periods ended September 30, 2015 Past 1 year
Past 5 years
Past 10 years
FA 529 Dividend Growth Portfolio – CL D A -3.63% 10.61% 5.67%
FA 529 Dividend Growth Portfolio – CL P -3.85% 10.37% 5.41%
S&P 500® Index -0.61% 13.34% 6.80%
A Available only to accounts established before June 25, 2003.
Average annual total returns take the Portfolio’s cumulative return and show you what would have happened if the Portfolio had performed at a constant rate each year.
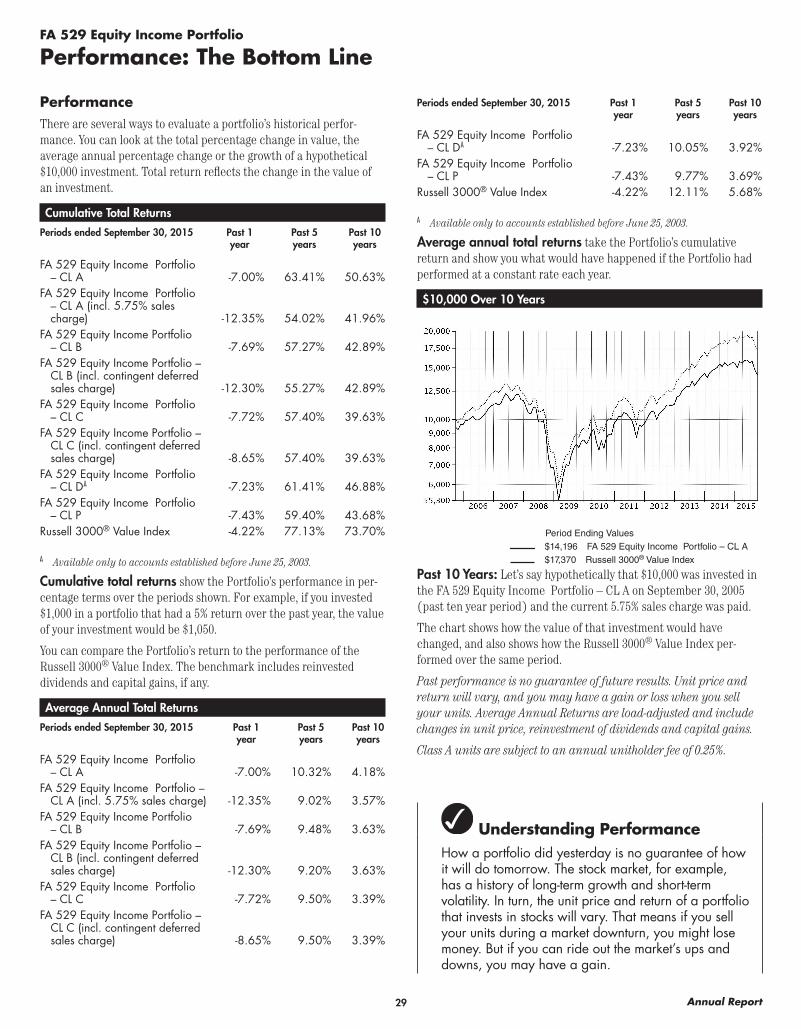
$10,000 Over 10 Years
Period Ending Values $16,764 FA 529 Dividend Growth Portfolio – CL A $19,305 S&P 500® Index
Past 10 Years: Let’s say hypothetically that $10,000 was invested in the FA 529 Dividend Growth Portfolio – CL A on September 30, 2005 (past ten year period) and the current 5.75% sales charge was paid.
The chart shows how the value of that investment would have changed, and also shows how the S&P 500® Index performed over the same period.
Past performance is no guarantee of future results. Unit price and return will vary, and you may have a gain or loss when you sell your units. Average Annual Returns are load-adjusted and include changes in unit price, reinvestment of dividends and capital gains.
Class A units are subject to an annual unitholder fee of 0.25%.

26Annual Report
FA 529 Dividend Growth PortfolioPerformance: The Bottom Line – continued
Effective after the close of business on September 1, 2010, Class B units were closed to new Accounts and additional purchases by exist-ing Participants. Class B units may be subject upon redemption, to a contingent deferred sales charge (CDSC), which declines from 5.00% to 0.00% over 7 years. Class B units are subject to an annual unitholder fee of 1.00%.
Class C units may be subject upon redemption, to a contingent deferred sales charge (CDSC) of 1.00% for units redeemed within the first 12 months. Class C units are subject to a 1.00% annual unitholder fee.
Class D units are subject to a 0.50% annual unitholder fee.
Class P units are subject to a 0.75% annual unitholder fee. Class P units are only available within Workplace Savings Programs.

27 Annual Report
FA 529 Equity Growth Portfolio
Performance: The Bottom Line
Understanding PerformanceHow a portfolio did yesterday is no guarantee of how it will do tomorrow. The stock market, for example, has a history of long-term growth and short-term volatility. In turn, the unit price and return of a portfolio that invests in stocks will vary. That means if you sell your units during a market downturn, you might lose money. But if you can ride out the market’s ups and downs, you may have a gain.
PerformanceThere are several ways to evaluate a portfolio’s historical perfor-mance. You can look at the total percentage change in value, the average annual percentage change or the growth of a hypothetical $10,000 investment. Total return reflects the change in the value of an investment.
Cumulative Total ReturnsPeriods ended September 30, 2015 Past 1
yearPast 5 years
Past 10 years
FA 529 Equity Growth Portfolio – CL A -0.32% 91.02% 93.72%
FA 529 Equity Growth Portfolio – CL A (incl. 5.75% sales charge) -6.05% 80.04% 82.58%
FA 529 Equity Growth Portfolio – CL B -1.11% 83.93% 83.54%
FA 529 Equity Growth Portfolio – CL B (incl. contingent deferred sales charge) -6.05% 81.93% 83.54%
FA 529 Equity Growth Portfolio – CL C -1.10% 84.09% 79.58%
FA 529 Equity Growth Portfolio – CL C (incl. contingent deferred sales charge) -2.09% 84.09% 79.58%
FA 529 Equity Growth Portfolio – CL D A -0.56% 88.84% 89.01%
FA 529 Equity Growth Portfolio – CL P -0.82% 86.35% 84.34%
Russell 3000® Growth Index 3.21% 95.73% 116.96%
A Available only to accounts established before June 25, 2003.
Cumulative total returns show the Portfolio’s performance in per-centage terms over the periods shown. For example, if you invested $1,000 in a portfolio that had a 5% return over the past year, the value of your investment would be $1,050.
You can compare the Portfolio’s return to the performance of the Russell 3000® Growth Index. The benchmark includes reinvested dividends and capital gains, if any.
Average Annual Total ReturnsPeriods ended September 30, 2015 Past 1
yearPast 5 years
Past 10 years
FA 529 Equity Growth Portfolio – CL A -0.32% 13.82% 6.84%
FA 529 Equity Growth Portfolio – CL A (incl. 5.75% sales charge) -6.05% 12.48% 6.21%
FA 529 Equity Growth Portfolio – CL B -1.11% 12.96% 6.26%
FA 529 Equity Growth Portfolio – CL B (incl. contingent deferred sales charge) -6.05% 12.71% 6.26%
FA 529 Equity Growth Portfolio – CL C -1.10% 12.98% 6.03%
FA 529 Equity Growth Portfolio – CL C (incl. contingent deferred sales charge) -2.09% 12.98% 6.03%
Periods ended September 30, 2015 Past 1 year
Past 5 years
Past 10 years
FA 529 Equity Growth Portfolio – CL D A -0.56% 13.56% 6.57%
FA 529 Equity Growth Portfolio – CL P -0.82% 13.26% 6.31%
Russell 3000® Growth Index 3.21% 14.38% 8.05%
A Available only to accounts established before June 25, 2003.
Average annual total returns take the Portfolio’s cumulative return and show you what would have happened if the Portfolio had performed at a constant rate each year.
$10,000 Over 10 Years
Period Ending Values $18,258 FA 529 Equity Growth Portfolio – CL A $21,696 Russell 3000® Growth Index
Past 10 Years: Let’s say hypothetically that $10,000 was invested in the FA 529 Equity Growth Portfolio – CL A on September 30, 2005 (past ten year period) and the current 5.75% sales charge was paid.
The chart shows how the value of that investment would have changed, and also shows how the Russell 3000® Growth Index per-formed over the same period.
Past performance is no guarantee of future results. Unit price and return will vary, and you may have a gain or loss when you sell your units. Average Annual Returns are load-adjusted and include changes in unit price, reinvestment of dividends and capital gains.
Class A units are subject to an annual unitholder fee of 0.25%.

28Annual Report
FA 529 Equity Growth PortfolioPerformance: The Bottom Line – continued
Effective after the close of business on September 1, 2010, Class B units were closed to new Accounts and additional purchases by exist-ing Participants. Class B units may be subject upon redemption, to a contingent deferred sales charge (CDSC), which declines from 5.00% to 0.00% over 7 years. Class B units are subject to an annual unitholder fee of 1.00%.
Class C units may be subject upon redemption, to a contingent deferred sales charge (CDSC) of 1.00% for units redeemed within the first 12 months. Class C units are subject to a 1.00% annual unitholder fee.
Class D units are subject to a 0.50% annual unitholder fee.
Class P units are subject to a 0.75% annual unitholder fee. Class P units are only available within Workplace Savings Programs.
29 Annual Report
FA 529 Equity Income Portfolio
Performance: The Bottom Line
Understanding PerformanceHow a portfolio did yesterday is no guarantee of how it will do tomorrow. The stock market, for example, has a history of long-term growth and short-term volatility. In turn, the unit price and return of a portfolio that invests in stocks will vary. That means if you sell your units during a market downturn, you might lose money. But if you can ride out the market’s ups and downs, you may have a gain.
PerformanceThere are several ways to evaluate a portfolio’s historical perfor-mance. You can look at the total percentage change in value, the average annual percentage change or the growth of a hypothetical $10,000 investment. Total return reflects the change in the value of an investment.
Cumulative Total ReturnsPeriods ended September 30, 2015 Past 1
yearPast 5 years
Past 10 years
FA 529 Equity Income Portfolio – CL A -7.00% 63.41% 50.63%
FA 529 Equity Income Portfolio – CL A (incl. 5.75% sales charge) -12.35% 54.02% 41.96%
FA 529 Equity Income Portfolio – CL B -7.69% 57.27% 42.89%
FA 529 Equity Income Portfolio – CL B (incl. contingent deferred sales charge) -12.30% 55.27% 42.89%
FA 529 Equity Income Portfolio – CL C -7.72% 57.40% 39.63%
FA 529 Equity Income Portfolio – CL C (incl. contingent deferred sales charge) -8.65% 57.40% 39.63%
FA 529 Equity Income Portfolio – CL D A -7.23% 61.41% 46.88%
FA 529 Equity Income Portfolio – CL P -7.43% 59.40% 43.68%
Russell 3000® Value Index -4.22% 77.13% 73.70%
A Available only to accounts established before June 25, 2003.
Cumulative total returns show the Portfolio’s performance in per-centage terms over the periods shown. For example, if you invested $1,000 in a portfolio that had a 5% return over the past year, the value of your investment would be $1,050.
You can compare the Portfolio’s return to the performance of the Russell 3000® Value Index. The benchmark includes reinvested dividends and capital gains, if any.
Average Annual Total ReturnsPeriods ended September 30, 2015 Past 1
yearPast 5 years
Past 10 years
FA 529 Equity Income Portfolio – CL A -7.00% 10.32% 4.18%
FA 529 Equity Income Portfolio – CL A (incl. 5.75% sales charge) -12.35% 9.02% 3.57%
FA 529 Equity Income Portfolio – CL B -7.69% 9.48% 3.63%
FA 529 Equity Income Portfolio – CL B (incl. contingent deferred sales charge) -12.30% 9.20% 3.63%
FA 529 Equity Income Portfolio – CL C -7.72% 9.50% 3.39%
FA 529 Equity Income Portfolio – CL C (incl. contingent deferred sales charge) -8.65% 9.50% 3.39%
Periods ended September 30, 2015 Past 1 year
Past 5 years
Past 10 years
FA 529 Equity Income Portfolio – CL D A -7.23% 10.05% 3.92%
FA 529 Equity Income Portfolio – CL P -7.43% 9.77% 3.69%
Russell 3000® Value Index -4.22% 12.11% 5.68%
A Available only to accounts established before June 25, 2003.
Average annual total returns take the Portfolio’s cumulative return and show you what would have happened if the Portfolio had performed at a constant rate each year.
$10,000 Over 10 Years
Period Ending Values $14,196 FA 529 Equity Income Portfolio – CL A $17,370 Russell 3000® Value Index
Past 10 Years: Let’s say hypothetically that $10,000 was invested in the FA 529 Equity Income Portfolio – CL A on September 30, 2005 (past ten year period) and the current 5.75% sales charge was paid.
The chart shows how the value of that investment would have changed, and also shows how the Russell 3000® Value Index per-formed over the same period.
Past performance is no guarantee of future results. Unit price and return will vary, and you may have a gain or loss when you sell your units. Average Annual Returns are load-adjusted and include changes in unit price, reinvestment of dividends and capital gains.
Class A units are subject to an annual unitholder fee of 0.25%.

30Annual Report
FA 529 Equity Income PortfolioPerformance: The Bottom Line – continued
Effective after the close of business on September 1, 2010, Class B units were closed to new Accounts and additional purchases by exist-ing Participants. Class B units may be subject upon redemption, to a contingent deferred sales charge (CDSC), which declines from 5.00% to 0.00% over 7 years. Class B units are subject to an annual unitholder fee of 1.00%.
Class C units may be subject upon redemption, to a contingent deferred sales charge (CDSC) of 1.00% for units redeemed within the first 12 months. Class C units are subject to a 1.00% annual unitholder fee.
Class D units are subject to a 0.50% annual unitholder fee.
Class P units are subject to a 0.75% annual unitholder fee. Class P units are only available within Workplace Savings Programs.
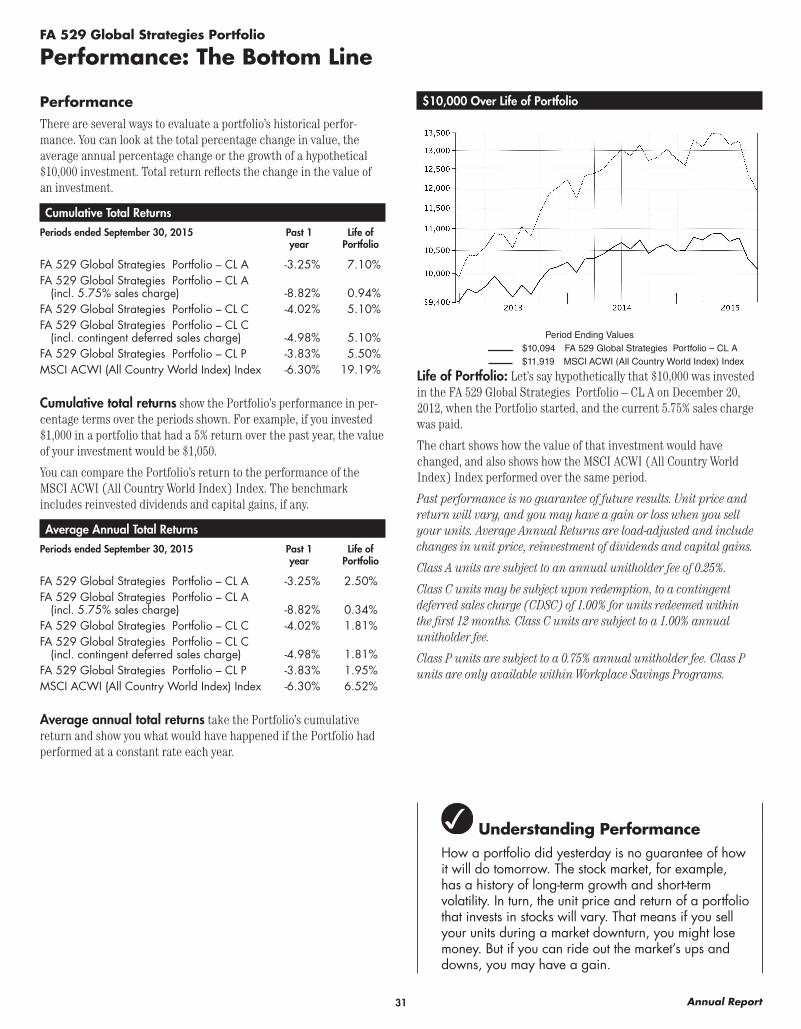
31 Annual Report
FA 529 Global Strategies Portfolio
Performance: The Bottom Line
Understanding PerformanceHow a portfolio did yesterday is no guarantee of how it will do tomorrow. The stock market, for example, has a history of long-term growth and short-term volatility. In turn, the unit price and return of a portfolio that invests in stocks will vary. That means if you sell your units during a market downturn, you might lose money. But if you can ride out the market’s ups and downs, you may have a gain.
PerformanceThere are several ways to evaluate a portfolio’s historical perfor-mance. You can look at the total percentage change in value, the average annual percentage change or the growth of a hypothetical $10,000 investment. Total return reflects the change in the value of an investment.
Cumulative Total ReturnsPeriods ended September 30, 2015 Past 1
yearLife of
Portfolio
FA 529 Global Strategies Portfolio – CL A -3.25% 7.10%FA 529 Global Strategies Portfolio – CL A
(incl. 5.75% sales charge) -8.82% 0.94%FA 529 Global Strategies Portfolio – CL C -4.02% 5.10%FA 529 Global Strategies Portfolio – CL C
(incl. contingent deferred sales charge) -4.98% 5.10%FA 529 Global Strategies Portfolio – CL P -3.83% 5.50%MSCI ACWI (All Country World Index) Index -6.30% 19.19%
Cumulative total returns show the Portfolio’s performance in per-centage terms over the periods shown. For example, if you invested $1,000 in a portfolio that had a 5% return over the past year, the value of your investment would be $1,050.
You can compare the Portfolio’s return to the performance of the MSCI ACWI (All Country World Index) Index. The benchmark includes reinvested dividends and capital gains, if any.
Average Annual Total ReturnsPeriods ended September 30, 2015 Past 1
yearLife of
Portfolio
FA 529 Global Strategies Portfolio – CL A -3.25% 2.50%FA 529 Global Strategies Portfolio – CL A
(incl. 5.75% sales charge) -8.82% 0.34%FA 529 Global Strategies Portfolio – CL C -4.02% 1.81%FA 529 Global Strategies Portfolio – CL C
(incl. contingent deferred sales charge) -4.98% 1.81%FA 529 Global Strategies Portfolio – CL P -3.83% 1.95%MSCI ACWI (All Country World Index) Index -6.30% 6.52%
Average annual total returns take the Portfolio’s cumulative return and show you what would have happened if the Portfolio had performed at a constant rate each year.
$10,000 Over Life of Portfolio
Period Ending Values $10,094 FA 529 Global Strategies Portfolio – CL A $11,919 MSCI ACWI (All Country World Index) Index
Life of Portfolio: Let’s say hypothetically that $10,000 was invested in the FA 529 Global Strategies Portfolio – CL A on December 20, 2012, when the Portfolio started, and the current 5.75% sales charge was paid.
The chart shows how the value of that investment would have changed, and also shows how the MSCI ACWI (All Country World Index) Index performed over the same period.
Past performance is no guarantee of future results. Unit price and return will vary, and you may have a gain or loss when you sell your units. Average Annual Returns are load-adjusted and include changes in unit price, reinvestment of dividends and capital gains.
Class A units are subject to an annual unitholder fee of 0.25%.
Class C units may be subject upon redemption, to a contingent deferred sales charge (CDSC) of 1.00% for units redeemed within the first 12 months. Class C units are subject to a 1.00% annual unitholder fee.
Class P units are subject to a 0.75% annual unitholder fee. Class P units are only available within Workplace Savings Programs.
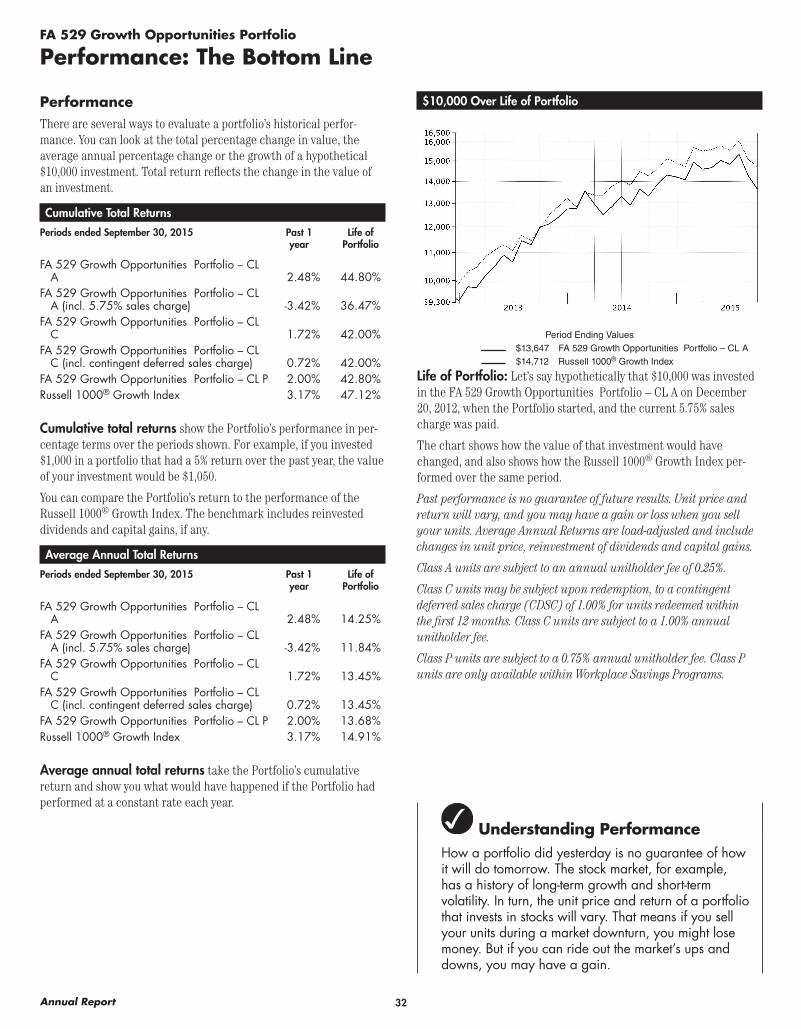
32Annual Report
FA 529 Growth Opportunities Portfolio
Performance: The Bottom Line
Understanding PerformanceHow a portfolio did yesterday is no guarantee of how it will do tomorrow. The stock market, for example, has a history of long-term growth and short-term volatility. In turn, the unit price and return of a portfolio that invests in stocks will vary. That means if you sell your units during a market downturn, you might lose money. But if you can ride out the market’s ups and downs, you may have a gain.
PerformanceThere are several ways to evaluate a portfolio’s historical perfor-mance. You can look at the total percentage change in value, the average annual percentage change or the growth of a hypothetical $10,000 investment. Total return reflects the change in the value of an investment.
Cumulative Total ReturnsPeriods ended September 30, 2015 Past 1
yearLife of
Portfolio
FA 529 Growth Opportunities Portfolio – CL A 2.48% 44.80%
FA 529 Growth Opportunities Portfolio – CL A (incl. 5.75% sales charge) -3.42% 36.47%
FA 529 Growth Opportunities Portfolio – CL C 1.72% 42.00%
FA 529 Growth Opportunities Portfolio – CL C (incl. contingent deferred sales charge) 0.72% 42.00%
FA 529 Growth Opportunities Portfolio – CL P 2.00% 42.80%Russell 1000® Growth Index 3.17% 47.12%
Cumulative total returns show the Portfolio’s performance in per-centage terms over the periods shown. For example, if you invested $1,000 in a portfolio that had a 5% return over the past year, the value of your investment would be $1,050.
You can compare the Portfolio’s return to the performance of the Russell 1000® Growth Index. The benchmark includes reinvested dividends and capital gains, if any.
Average Annual Total ReturnsPeriods ended September 30, 2015 Past 1
yearLife of
Portfolio
FA 529 Growth Opportunities Portfolio – CL A 2.48% 14.25%
FA 529 Growth Opportunities Portfolio – CL A (incl. 5.75% sales charge) -3.42% 11.84%
FA 529 Growth Opportunities Portfolio – CL C 1.72% 13.45%
FA 529 Growth Opportunities Portfolio – CL C (incl. contingent deferred sales charge) 0.72% 13.45%
FA 529 Growth Opportunities Portfolio – CL P 2.00% 13.68%Russell 1000® Growth Index 3.17% 14.91%
Average annual total returns take the Portfolio’s cumulative return and show you what would have happened if the Portfolio had performed at a constant rate each year.
$10,000 Over Life of Portfolio
Period Ending Values $13,647 FA 529 Growth Opportunities Portfolio – CL A $14,712 Russell 1000® Growth Index
Life of Portfolio: Let’s say hypothetically that $10,000 was invested in the FA 529 Growth Opportunities Portfolio – CL A on December 20, 2012, when the Portfolio started, and the current 5.75% sales charge was paid.
The chart shows how the value of that investment would have changed, and also shows how the Russell 1000® Growth Index per-formed over the same period.
Past performance is no guarantee of future results. Unit price and return will vary, and you may have a gain or loss when you sell your units. Average Annual Returns are load-adjusted and include changes in unit price, reinvestment of dividends and capital gains.
Class A units are subject to an annual unitholder fee of 0.25%.
Class C units may be subject upon redemption, to a contingent deferred sales charge (CDSC) of 1.00% for units redeemed within the first 12 months. Class C units are subject to a 1.00% annual unitholder fee.
Class P units are subject to a 0.75% annual unitholder fee. Class P units are only available within Workplace Savings Programs.
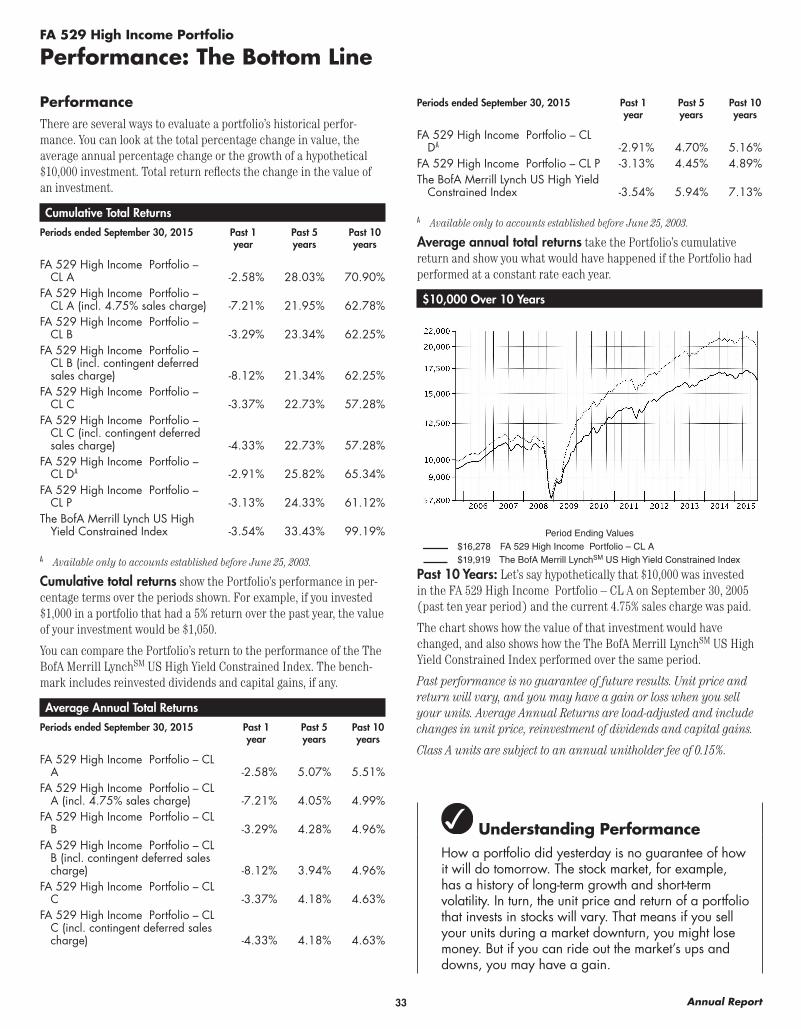
33 Annual Report
FA 529 High Income Portfolio
Performance: The Bottom Line
Understanding PerformanceHow a portfolio did yesterday is no guarantee of how it will do tomorrow. The stock market, for example, has a history of long-term growth and short-term volatility. In turn, the unit price and return of a portfolio that invests in stocks will vary. That means if you sell your units during a market downturn, you might lose money. But if you can ride out the market’s ups and downs, you may have a gain.
PerformanceThere are several ways to evaluate a portfolio’s historical perfor-mance. You can look at the total percentage change in value, the average annual percentage change or the growth of a hypothetical $10,000 investment. Total return reflects the change in the value of an investment.
Cumulative Total ReturnsPeriods ended September 30, 2015 Past 1
yearPast 5 years
Past 10 years
FA 529 High Income Portfolio – CL A -2.58% 28.03% 70.90%
FA 529 High Income Portfolio – CL A (incl. 4.75% sales charge) -7.21% 21.95% 62.78%
FA 529 High Income Portfolio – CL B -3.29% 23.34% 62.25%
FA 529 High Income Portfolio – CL B (incl. contingent deferred sales charge) -8.12% 21.34% 62.25%
FA 529 High Income Portfolio – CL C -3.37% 22.73% 57.28%
FA 529 High Income Portfolio – CL C (incl. contingent deferred sales charge) -4.33% 22.73% 57.28%
FA 529 High Income Portfolio – CL D A -2.91% 25.82% 65.34%
FA 529 High Income Portfolio – CL P -3.13% 24.33% 61.12%
The BofA Merrill Lynch US High Yield Constrained Index -3.54% 33.43% 99.19%
A Available only to accounts established before June 25, 2003.
Cumulative total returns show the Portfolio’s performance in per-centage terms over the periods shown. For example, if you invested $1,000 in a portfolio that had a 5% return over the past year, the value of your investment would be $1,050.
You can compare the Portfolio’s return to the performance of the The BofA Merrill LynchSM US High Yield Constrained Index. The bench-mark includes reinvested dividends and capital gains, if any.
Average Annual Total ReturnsPeriods ended September 30, 2015 Past 1
yearPast 5 years
Past 10 years
FA 529 High Income Portfolio – CL A -2.58% 5.07% 5.51%
FA 529 High Income Portfolio – CL A (incl. 4.75% sales charge) -7.21% 4.05% 4.99%
FA 529 High Income Portfolio – CL B -3.29% 4.28% 4.96%
FA 529 High Income Portfolio – CL B (incl. contingent deferred sales charge) -8.12% 3.94% 4.96%
FA 529 High Income Portfolio – CL C -3.37% 4.18% 4.63%
FA 529 High Income Portfolio – CL C (incl. contingent deferred sales charge) -4.33% 4.18% 4.63%
Periods ended September 30, 2015 Past 1 year
Past 5 years
Past 10 years
FA 529 High Income Portfolio – CL D A -2.91% 4.70% 5.16%
FA 529 High Income Portfolio – CL P -3.13% 4.45% 4.89%The BofA Merrill Lynch US High Yield
Constrained Index -3.54% 5.94% 7.13%
A Available only to accounts established before June 25, 2003.
Average annual total returns take the Portfolio’s cumulative return and show you what would have happened if the Portfolio had performed at a constant rate each year.
$10,000 Over 10 Years
Period Ending Values $16,278 FA 529 High Income Portfolio – CL A $19,919 The BofA Merrill LynchSM US High Yield Constrained Index
Past 10 Years: Let’s say hypothetically that $10,000 was invested in the FA 529 High Income Portfolio – CL A on September 30, 2005 (past ten year period) and the current 4.75% sales charge was paid.
The chart shows how the value of that investment would have changed, and also shows how the The BofA Merrill LynchSM US High Yield Constrained Index performed over the same period.
Past performance is no guarantee of future results. Unit price and return will vary, and you may have a gain or loss when you sell your units. Average Annual Returns are load-adjusted and include changes in unit price, reinvestment of dividends and capital gains.
Class A units are subject to an annual unitholder fee of 0.15%.
34Annual Report
FA 529 High Income PortfolioPerformance: The Bottom Line – continued
Effective after the close of business on September 1, 2010, Class B units were closed to new Accounts and additional purchases by exist-ing Participants. Class B units may be subject upon redemption, to a contingent deferred sales charge (CDSC), which declines from 5.00% to 0.00% over 7 years. Class B units are subject to an annual unitholder fee of 0.90%.
Class C units may be subject upon redemption, to a contingent deferred sales charge (CDSC) of 1.00% for units redeemed within the first 12 months. Class C units are subject to a 1.00% annual unitholder fee.
Class D units are subject to a 0.50% annual unitholder fee.
Class P units are subject to a 0.75% annual unitholder fee. Class P units are only available within Workplace Savings Programs.
35 Annual Report
FA 529 Inflation-Protected Bond Portfolio
Performance: The Bottom Line
Understanding PerformanceHow a portfolio did yesterday is no guarantee of how it will do tomorrow. The stock market, for example, has a history of long-term growth and short-term volatility. In turn, the unit price and return of a portfolio that invests in stocks will vary. That means if you sell your units during a market downturn, you might lose money. But if you can ride out the market’s ups and downs, you may have a gain.
PerformanceThere are several ways to evaluate a portfolio’s historical perfor-mance. You can look at the total percentage change in value, the average annual percentage change or the growth of a hypothetical $10,000 investment. Total return reflects the change in the value of an investment.
Cumulative Total ReturnsPeriods ended September 30, 2015 Past 1
yearPast 5 years
Past 10 years
FA 529 Inflation-Protected Bond Portfolio – CL A -1.72% 8.63% 32.50%
FA 529 Inflation-Protected Bond Portfolio – CL A (incl. 4.75% sales charge) -6.39% 3.47% 26.21%
FA 529 Inflation-Protected Bond Portfolio – CL B -2.42% 4.69% 25.73%
FA 529 Inflation-Protected Bond Portfolio – CL B (incl. contingent deferred sales charge) -7.30% 2.69% 25.73%
FA 529 Inflation-Protected Bond Portfolio – CL C -2.52% 4.15% 21.77%
FA 529 Inflation-Protected Bond Portfolio – CL C (incl. contingent deferred sales charge) -3.49% 4.15% 21.77%
FA 529 Inflation-Protected Bond Portfolio – CL D A -2.06% 6.72% 27.83%
FA 529 Inflation-Protected Bond Portfolio – CL P -2.31% 5.41% 24.77%
Barclays® U.S. Treasury Inflation-Protected Securities (TIPS) Index (Series-L) -0.83% 13.41% 48.14%
A Available only to accounts established before June 25, 2003.
Cumulative total returns show the Portfolio’s performance in per-centage terms over the periods shown. For example, if you invested $1,000 in a portfolio that had a 5% return over the past year, the value of your investment would be $1,050.
You can compare the Portfolio’s return to the performance of the Barclays® U.S. Treasury Inflation-Protected Securities (TIPS) Index (Series-L). The benchmark includes reinvested dividends and capital gains, if any.
Average Annual Total ReturnsPeriods ended September 30, 2015 Past 1
yearPast 5 years
Past 10 years
FA 529 Inflation-Protected Bond Portfolio – CL A -1.72% 1.67% 2.85%
FA 529 Inflation-Protected Bond Portfolio – CL A (incl. 4.75% sales charge) -6.39% 0.69% 2.36%
FA 529 Inflation-Protected Bond Portfolio – CL B -2.42% 0.92% 2.32%
FA 529 Inflation-Protected Bond Portfolio – CL B (incl. contingent deferred sales charge) -7.30% 0.53% 2.32%
FA 529 Inflation-Protected Bond Portfolio – CL C -2.52% 0.82% 1.99%
Periods ended September 30, 2015 Past 1 year
Past 5 years
Past 10 years
FA 529 Inflation-Protected Bond Portfolio – CL C (incl. contingent deferred sales charge) -3.49% 0.82% 1.99%
FA 529 Inflation-Protected Bond Portfolio – CL D A -2.06% 1.31% 2.49%
FA 529 Inflation-Protected Bond Portfolio – CL P -2.31% 1.06% 2.24%
Barclays® U.S. Treasury Inflation-Protected Securities (TIPS) Index (Series-L) -0.83% 2.55% 4.01%
A Available only to accounts established before June 25, 2003.
Average annual total returns take the Portfolio’s cumulative return and show you what would have happened if the Portfolio had performed at a constant rate each year.
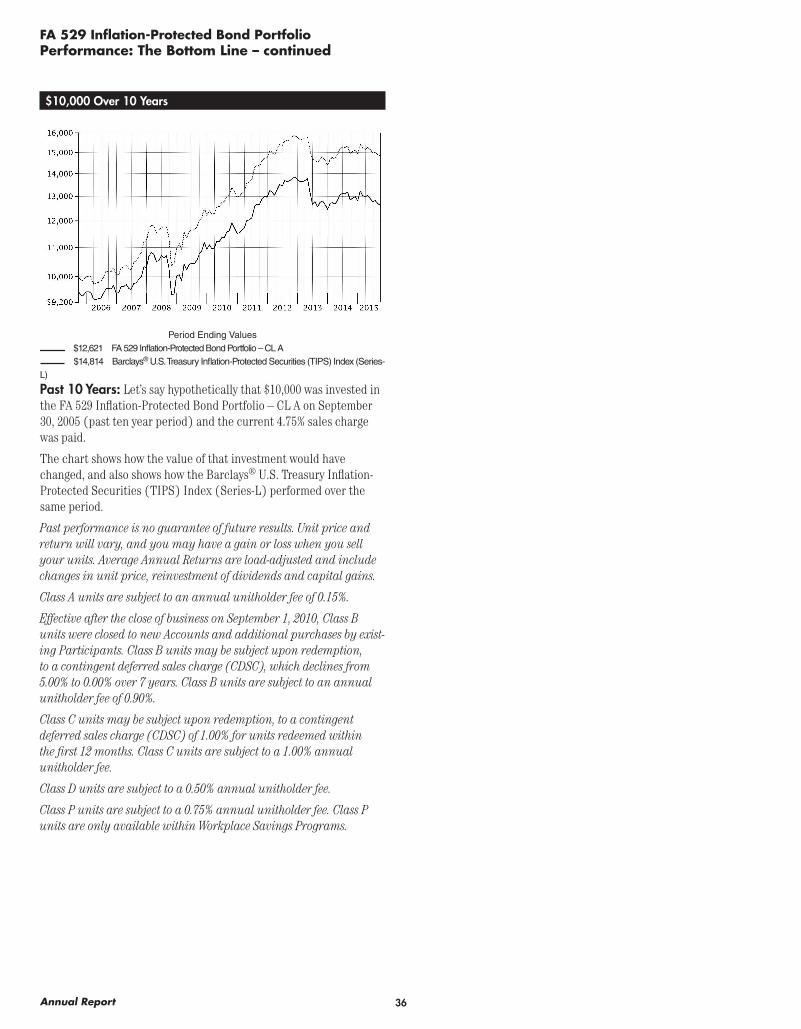
36Annual Report
FA 529 Inflation-Protected Bond PortfolioPerformance: The Bottom Line – continued
$10,000 Over 10 Years
Period Ending Values $12,621 FA 529 Inflation-Protected Bond Portfolio – CL A $14,814 Barclays® U.S. Treasury Inflation-Protected Securities (TIPS) Index (Series-
L)
Past 10 Years: Let’s say hypothetically that $10,000 was invested in the FA 529 Inflation-Protected Bond Portfolio – CL A on September 30, 2005 (past ten year period) and the current 4.75% sales charge was paid.
The chart shows how the value of that investment would have changed, and also shows how the Barclays® U.S. Treasury Inflation-Protected Securities (TIPS) Index (Series-L) performed over the same period.
Past performance is no guarantee of future results. Unit price and return will vary, and you may have a gain or loss when you sell your units. Average Annual Returns are load-adjusted and include changes in unit price, reinvestment of dividends and capital gains.
Class A units are subject to an annual unitholder fee of 0.15%.
Effective after the close of business on September 1, 2010, Class B units were closed to new Accounts and additional purchases by exist-ing Participants. Class B units may be subject upon redemption, to a contingent deferred sales charge (CDSC), which declines from 5.00% to 0.00% over 7 years. Class B units are subject to an annual unitholder fee of 0.90%.
Class C units may be subject upon redemption, to a contingent deferred sales charge (CDSC) of 1.00% for units redeemed within the first 12 months. Class C units are subject to a 1.00% annual unitholder fee.
Class D units are subject to a 0.50% annual unitholder fee.
Class P units are subject to a 0.75% annual unitholder fee. Class P units are only available within Workplace Savings Programs.
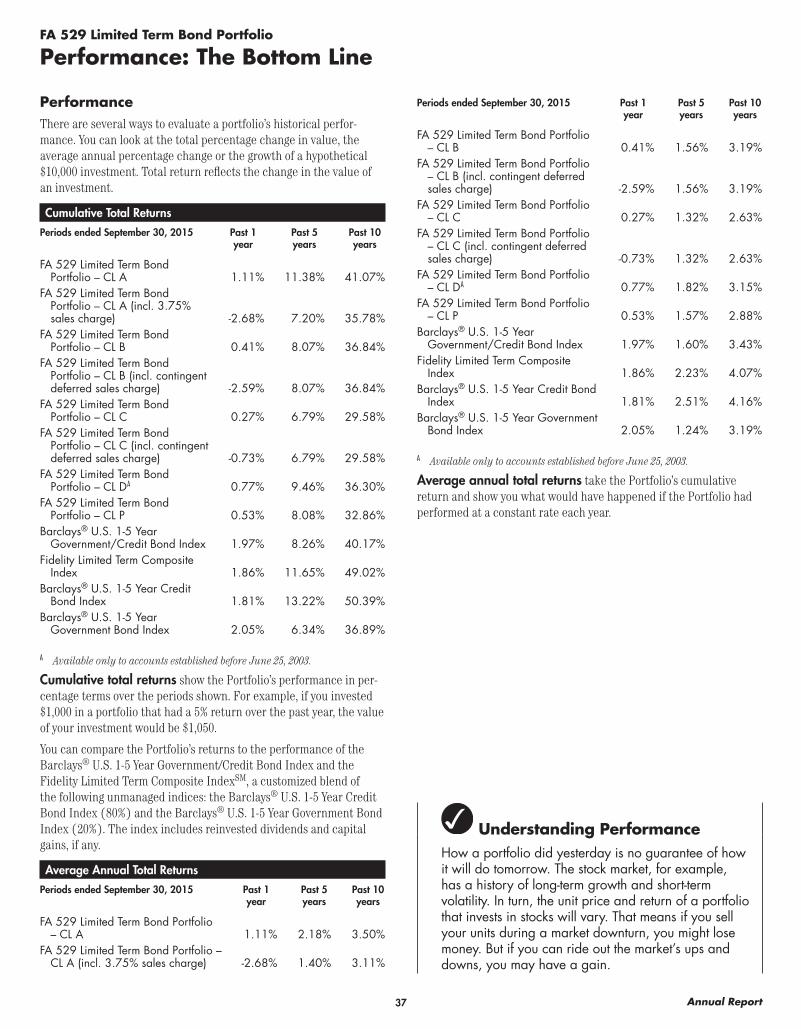
37 Annual Report
FA 529 Limited Term Bond Portfolio
Performance: The Bottom Line
Understanding PerformanceHow a portfolio did yesterday is no guarantee of how it will do tomorrow. The stock market, for example, has a history of long-term growth and short-term volatility. In turn, the unit price and return of a portfolio that invests in stocks will vary. That means if you sell your units during a market downturn, you might lose money. But if you can ride out the market’s ups and downs, you may have a gain.
PerformanceThere are several ways to evaluate a portfolio’s historical perfor-mance. You can look at the total percentage change in value, the average annual percentage change or the growth of a hypothetical $10,000 investment. Total return reflects the change in the value of an investment.
Cumulative Total ReturnsPeriods ended September 30, 2015 Past 1
yearPast 5 years
Past 10 years
FA 529 Limited Term Bond Portfolio – CL A 1.11% 11.38% 41.07%
FA 529 Limited Term Bond Portfolio – CL A (incl. 3.75% sales charge) -2.68% 7.20% 35.78%
FA 529 Limited Term Bond Portfolio – CL B 0.41% 8.07% 36.84%
FA 529 Limited Term Bond Portfolio – CL B (incl. contingent deferred sales charge) -2.59% 8.07% 36.84%
FA 529 Limited Term Bond Portfolio – CL C 0.27% 6.79% 29.58%
FA 529 Limited Term Bond Portfolio – CL C (incl. contingent deferred sales charge) -0.73% 6.79% 29.58%
FA 529 Limited Term Bond Portfolio – CL D A 0.77% 9.46% 36.30%
FA 529 Limited Term Bond Portfolio – CL P 0.53% 8.08% 32.86%
Barclays® U.S. 1-5 Year Government/Credit Bond Index 1.97% 8.26% 40.17%
Fidelity Limited Term Composite Index 1.86% 11.65% 49.02%
Barclays® U.S. 1-5 Year Credit Bond Index 1.81% 13.22% 50.39%
Barclays® U.S. 1-5 Year Government Bond Index 2.05% 6.34% 36.89%
A Available only to accounts established before June 25, 2003.
Cumulative total returns show the Portfolio’s performance in per-centage terms over the periods shown. For example, if you invested $1,000 in a portfolio that had a 5% return over the past year, the value of your investment would be $1,050.
You can compare the Portfolio’s returns to the performance of the Barclays® U.S. 1-5 Year Government/Credit Bond Index and the Fidelity Limited Term Composite IndexSM, a customized blend of the following unmanaged indices: the Barclays® U.S. 1-5 Year Credit Bond Index (80%) and the Barclays® U.S. 1-5 Year Government Bond Index (20%). The index includes reinvested dividends and capital gains, if any.
Average Annual Total ReturnsPeriods ended September 30, 2015 Past 1
yearPast 5 years
Past 10 years
FA 529 Limited Term Bond Portfolio – CL A 1.11% 2.18% 3.50%
FA 529 Limited Term Bond Portfolio – CL A (incl. 3.75% sales charge) -2.68% 1.40% 3.11%
Periods ended September 30, 2015 Past 1 year
Past 5 years
Past 10 years
FA 529 Limited Term Bond Portfolio – CL B 0.41% 1.56% 3.19%
FA 529 Limited Term Bond Portfolio – CL B (incl. contingent deferred sales charge) -2.59% 1.56% 3.19%
FA 529 Limited Term Bond Portfolio – CL C 0.27% 1.32% 2.63%
FA 529 Limited Term Bond Portfolio – CL C (incl. contingent deferred sales charge) -0.73% 1.32% 2.63%
FA 529 Limited Term Bond Portfolio – CL D A 0.77% 1.82% 3.15%
FA 529 Limited Term Bond Portfolio – CL P 0.53% 1.57% 2.88%
Barclays® U.S. 1-5 Year Government/Credit Bond Index 1.97% 1.60% 3.43%
Fidelity Limited Term Composite Index 1.86% 2.23% 4.07%
Barclays® U.S. 1-5 Year Credit Bond Index 1.81% 2.51% 4.16%
Barclays® U.S. 1-5 Year Government Bond Index 2.05% 1.24% 3.19%
A Available only to accounts established before June 25, 2003.
Average annual total returns take the Portfolio’s cumulative return and show you what would have happened if the Portfolio had performed at a constant rate each year.

38Annual Report
FA 529 Limited Term Bond PortfolioPerformance: The Bottom Line – continued
$10,000 Over 10 Years
Period Ending Values $13,578 FA 529 Limited Term Bond Portfolio – CL A $14,017 Barclays® U.S. 1-5 Year Government/Credit Bond Index
Past 10 Years: Let’s say hypothetically that $10,000 was invested in the FA 529 Limited Term Bond Portfolio – CL A on September 30, 2005 (past ten year period) and the current 3.75% sales charge was paid.
The chart shows how the value of that investment would have changed, and also shows how the Barclays® U.S. 1-5 Year Government/Credit Bond Index performed over the same period.
Past performance is no guarantee of future results. Unit price and return will vary, and you may have a gain or loss when you sell your units. Average Annual Returns are load-adjusted and include changes in unit price, reinvestment of dividends and capital gains.
Class A units are subject to an annual unitholder fee of 0.15%.
Effective after the close of business on September 1, 2010, Class B units were closed to new Accounts and additional purchases by exist-ing Participants. Class B units may be subject upon redemption, to a contingent deferred sales charge (CDSC), which declines from 3.00% to 0.00% over 4 years. Class B units are subject to an annual unitholder fee of 0.90%.
Class C units may be subject upon redemption, to a contingent deferred sales charge (CDSC) of 1.00% for units redeemed within the first 12 months. Class C units are subject to a 1.00% annual unitholder fee.
Class D units are subject to a 0.50% annual unitholder fee.
Class P units are subject to a 0.75% annual unitholder fee. Class P units are only available within Workplace Savings Programs.
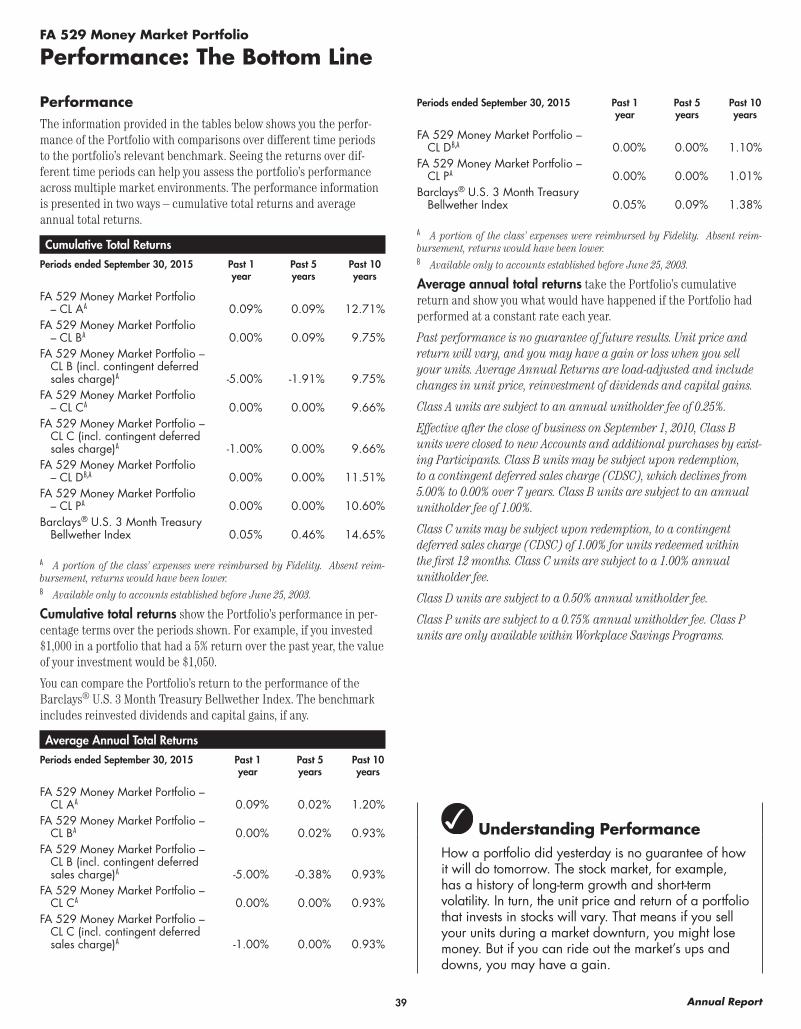
39 Annual Report
FA 529 Money Market Portfolio
Performance: The Bottom Line
Understanding PerformanceHow a portfolio did yesterday is no guarantee of how it will do tomorrow. The stock market, for example, has a history of long-term growth and short-term volatility. In turn, the unit price and return of a portfolio that invests in stocks will vary. That means if you sell your units during a market downturn, you might lose money. But if you can ride out the market’s ups and downs, you may have a gain.
PerformanceThe information provided in the tables below shows you the perfor-mance of the Portfolio with comparisons over different time periods to the portfolio’s relevant benchmark. Seeing the returns over dif-ferent time periods can help you assess the portfolio’s performance across multiple market environments. The performance information is presented in two ways – cumulative total returns and average annual total returns.
Cumulative Total ReturnsPeriods ended September 30, 2015 Past 1
yearPast 5 years
Past 10 years
FA 529 Money Market Portfolio – CL A A 0.09% 0.09% 12.71%
FA 529 Money Market Portfolio – CL B A 0.00% 0.09% 9.75%
FA 529 Money Market Portfolio – CL B (incl. contingent deferred sales charge) A -5.00% -1.91% 9.75%
FA 529 Money Market Portfolio – CL C A 0.00% 0.00% 9.66%
FA 529 Money Market Portfolio – CL C (incl. contingent deferred sales charge) A -1.00% 0.00% 9.66%
FA 529 Money Market Portfolio – CL D B,A 0.00% 0.00% 11.51%
FA 529 Money Market Portfolio – CL P A 0.00% 0.00% 10.60%
Barclays® U.S. 3 Month Treasury Bellwether Index 0.05% 0.46% 14.65%
A A portion of the class’ expenses were reimbursed by Fidelity. Absent reim-bursement, returns would have been lower.B Available only to accounts established before June 25, 2003.
Cumulative total returns show the Portfolio’s performance in per-centage terms over the periods shown. For example, if you invested $1,000 in a portfolio that had a 5% return over the past year, the value of your investment would be $1,050.
You can compare the Portfolio’s return to the performance of the Barclays® U.S. 3 Month Treasury Bellwether Index. The benchmark includes reinvested dividends and capital gains, if any.
Average Annual Total ReturnsPeriods ended September 30, 2015 Past 1
yearPast 5 years
Past 10 years
FA 529 Money Market Portfolio – CL A A 0.09% 0.02% 1.20%
FA 529 Money Market Portfolio – CL B A 0.00% 0.02% 0.93%
FA 529 Money Market Portfolio – CL B (incl. contingent deferred sales charge) A -5.00% -0.38% 0.93%
FA 529 Money Market Portfolio – CL C A 0.00% 0.00% 0.93%
FA 529 Money Market Portfolio – CL C (incl. contingent deferred sales charge) A -1.00% 0.00% 0.93%
Periods ended September 30, 2015 Past 1 year
Past 5 years
Past 10 years
FA 529 Money Market Portfolio – CL D B,A 0.00% 0.00% 1.10%
FA 529 Money Market Portfolio – CL P A 0.00% 0.00% 1.01%
Barclays® U.S. 3 Month Treasury Bellwether Index 0.05% 0.09% 1.38%
A A portion of the class’ expenses were reimbursed by Fidelity. Absent reim-bursement, returns would have been lower.B Available only to accounts established before June 25, 2003.
Average annual total returns take the Portfolio’s cumulative return and show you what would have happened if the Portfolio had performed at a constant rate each year.
Past performance is no guarantee of future results. Unit price and return will vary, and you may have a gain or loss when you sell your units. Average Annual Returns are load-adjusted and include changes in unit price, reinvestment of dividends and capital gains.
Class A units are subject to an annual unitholder fee of 0.25%.
Effective after the close of business on September 1, 2010, Class B units were closed to new Accounts and additional purchases by exist-ing Participants. Class B units may be subject upon redemption, to a contingent deferred sales charge (CDSC), which declines from 5.00% to 0.00% over 7 years. Class B units are subject to an annual unitholder fee of 1.00%.
Class C units may be subject upon redemption, to a contingent deferred sales charge (CDSC) of 1.00% for units redeemed within the first 12 months. Class C units are subject to a 1.00% annual unitholder fee.
Class D units are subject to a 0.50% annual unitholder fee.
Class P units are subject to a 0.75% annual unitholder fee. Class P units are only available within Workplace Savings Programs.
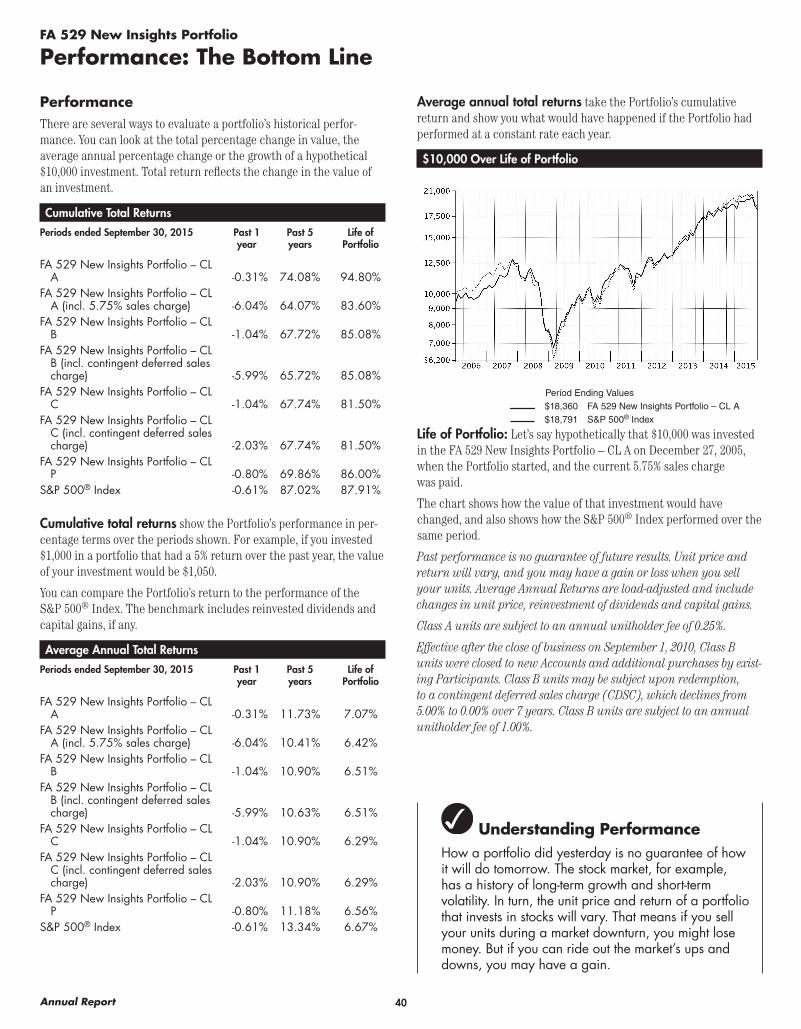
40Annual Report
FA 529 New Insights Portfolio
Performance: The Bottom Line
Understanding PerformanceHow a portfolio did yesterday is no guarantee of how it will do tomorrow. The stock market, for example, has a history of long-term growth and short-term volatility. In turn, the unit price and return of a portfolio that invests in stocks will vary. That means if you sell your units during a market downturn, you might lose money. But if you can ride out the market’s ups and downs, you may have a gain.
PerformanceThere are several ways to evaluate a portfolio’s historical perfor-mance. You can look at the total percentage change in value, the average annual percentage change or the growth of a hypothetical $10,000 investment. Total return reflects the change in the value of an investment.
Cumulative Total ReturnsPeriods ended September 30, 2015 Past 1
yearPast 5 years
Life of Portfolio
FA 529 New Insights Portfolio – CL A -0.31% 74.08% 94.80%
FA 529 New Insights Portfolio – CL A (incl. 5.75% sales charge) -6.04% 64.07% 83.60%
FA 529 New Insights Portfolio – CL B -1.04% 67.72% 85.08%
FA 529 New Insights Portfolio – CL B (incl. contingent deferred sales charge) -5.99% 65.72% 85.08%
FA 529 New Insights Portfolio – CL C -1.04% 67.74% 81.50%
FA 529 New Insights Portfolio – CL C (incl. contingent deferred sales charge) -2.03% 67.74% 81.50%
FA 529 New Insights Portfolio – CL P -0.80% 69.86% 86.00%
S&P 500® Index -0.61% 87.02% 87.91%
Cumulative total returns show the Portfolio’s performance in per-centage terms over the periods shown. For example, if you invested $1,000 in a portfolio that had a 5% return over the past year, the value of your investment would be $1,050.
You can compare the Portfolio’s return to the performance of the S&P 500® Index. The benchmark includes reinvested dividends and capital gains, if any.
Average Annual Total ReturnsPeriods ended September 30, 2015 Past 1
yearPast 5 years
Life of Portfolio
FA 529 New Insights Portfolio – CL A -0.31% 11.73% 7.07%
FA 529 New Insights Portfolio – CL A (incl. 5.75% sales charge) -6.04% 10.41% 6.42%
FA 529 New Insights Portfolio – CL B -1.04% 10.90% 6.51%
FA 529 New Insights Portfolio – CL B (incl. contingent deferred sales charge) -5.99% 10.63% 6.51%
FA 529 New Insights Portfolio – CL C -1.04% 10.90% 6.29%
FA 529 New Insights Portfolio – CL C (incl. contingent deferred sales charge) -2.03% 10.90% 6.29%
FA 529 New Insights Portfolio – CL P -0.80% 11.18% 6.56%
S&P 500® Index -0.61% 13.34% 6.67%
Average annual total returns take the Portfolio’s cumulative return and show you what would have happened if the Portfolio had performed at a constant rate each year.
$10,000 Over Life of Portfolio
Period Ending Values $18,360 FA 529 New Insights Portfolio – CL A $18,791 S&P 500® Index
Life of Portfolio: Let’s say hypothetically that $10,000 was invested in the FA 529 New Insights Portfolio – CL A on December 27, 2005, when the Portfolio started, and the current 5.75% sales charge was paid.
The chart shows how the value of that investment would have changed, and also shows how the S&P 500® Index performed over the same period.
Past performance is no guarantee of future results. Unit price and return will vary, and you may have a gain or loss when you sell your units. Average Annual Returns are load-adjusted and include changes in unit price, reinvestment of dividends and capital gains.
Class A units are subject to an annual unitholder fee of 0.25%.
Effective after the close of business on September 1, 2010, Class B units were closed to new Accounts and additional purchases by exist-ing Participants. Class B units may be subject upon redemption, to a contingent deferred sales charge (CDSC), which declines from 5.00% to 0.00% over 7 years. Class B units are subject to an annual unitholder fee of 1.00%.

41 Annual Report
FA 529 New Insights PortfolioPerformance: The Bottom Line – continued
Class C units may be subject upon redemption, to a contingent deferred sales charge (CDSC) of 1.00% for units redeemed within the first 12 months. Class C units are subject to a 1.00% annual unitholder fee.
Class P units are subject to a 0.75% annual unitholder fee. Class P units are only available within Workplace Savings Programs.
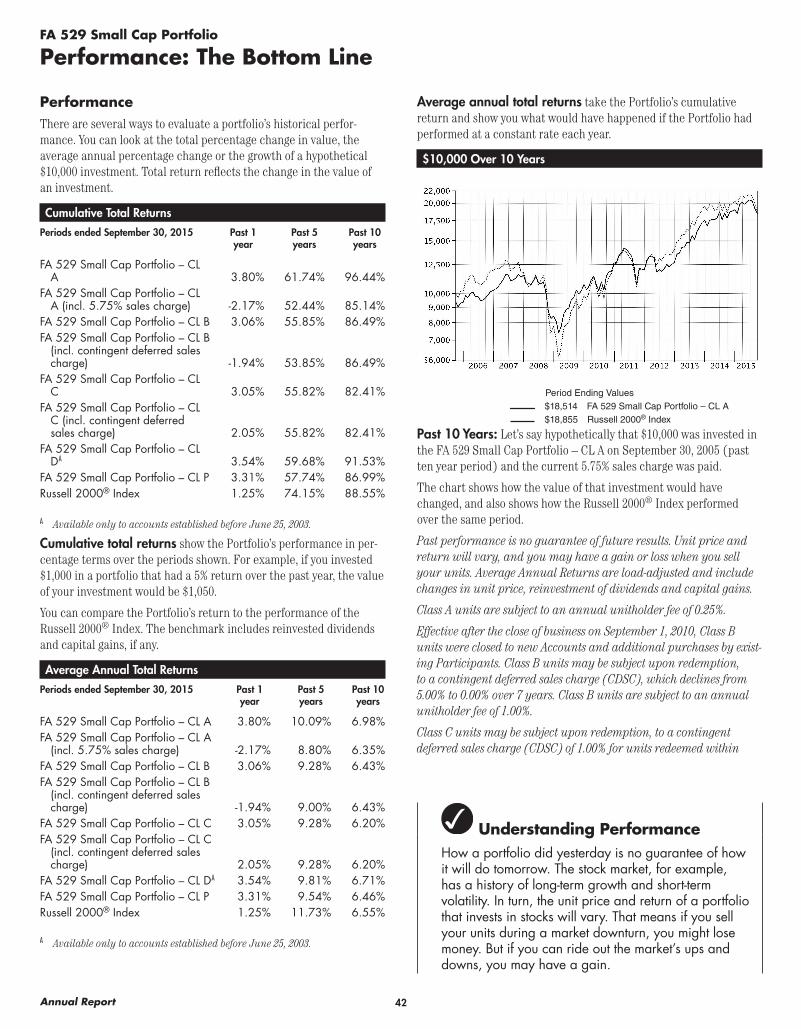
42Annual Report
FA 529 Small Cap Portfolio
Performance: The Bottom Line
Understanding PerformanceHow a portfolio did yesterday is no guarantee of how it will do tomorrow. The stock market, for example, has a history of long-term growth and short-term volatility. In turn, the unit price and return of a portfolio that invests in stocks will vary. That means if you sell your units during a market downturn, you might lose money. But if you can ride out the market’s ups and downs, you may have a gain.
PerformanceThere are several ways to evaluate a portfolio’s historical perfor-mance. You can look at the total percentage change in value, the average annual percentage change or the growth of a hypothetical $10,000 investment. Total return reflects the change in the value of an investment.
Cumulative Total ReturnsPeriods ended September 30, 2015 Past 1
yearPast 5 years
Past 10 years
FA 529 Small Cap Portfolio – CL A 3.80% 61.74% 96.44%
FA 529 Small Cap Portfolio – CL A (incl. 5.75% sales charge) -2.17% 52.44% 85.14%
FA 529 Small Cap Portfolio – CL B 3.06% 55.85% 86.49%FA 529 Small Cap Portfolio – CL B
(incl. contingent deferred sales charge) -1.94% 53.85% 86.49%
FA 529 Small Cap Portfolio – CL C 3.05% 55.82% 82.41%
FA 529 Small Cap Portfolio – CL C (incl. contingent deferred sales charge) 2.05% 55.82% 82.41%
FA 529 Small Cap Portfolio – CL D A 3.54% 59.68% 91.53%
FA 529 Small Cap Portfolio – CL P 3.31% 57.74% 86.99%Russell 2000® Index 1.25% 74.15% 88.55%
A Available only to accounts established before June 25, 2003.
Cumulative total returns show the Portfolio’s performance in per-centage terms over the periods shown. For example, if you invested $1,000 in a portfolio that had a 5% return over the past year, the value of your investment would be $1,050.
You can compare the Portfolio’s return to the performance of the Russell 2000® Index. The benchmark includes reinvested dividends and capital gains, if any.
Average Annual Total ReturnsPeriods ended September 30, 2015 Past 1
yearPast 5 years
Past 10 years
FA 529 Small Cap Portfolio – CL A 3.80% 10.09% 6.98%FA 529 Small Cap Portfolio – CL A
(incl. 5.75% sales charge) -2.17% 8.80% 6.35%FA 529 Small Cap Portfolio – CL B 3.06% 9.28% 6.43%FA 529 Small Cap Portfolio – CL B
(incl. contingent deferred sales charge) -1.94% 9.00% 6.43%
FA 529 Small Cap Portfolio – CL C 3.05% 9.28% 6.20%FA 529 Small Cap Portfolio – CL C
(incl. contingent deferred sales charge) 2.05% 9.28% 6.20%
FA 529 Small Cap Portfolio – CL D A 3.54% 9.81% 6.71%FA 529 Small Cap Portfolio – CL P 3.31% 9.54% 6.46%Russell 2000® Index 1.25% 11.73% 6.55%
A Available only to accounts established before June 25, 2003.
Average annual total returns take the Portfolio’s cumulative return and show you what would have happened if the Portfolio had performed at a constant rate each year.
$10,000 Over 10 Years
Period Ending Values $18,514 FA 529 Small Cap Portfolio – CL A $18,855 Russell 2000® Index
Past 10 Years: Let’s say hypothetically that $10,000 was invested in the FA 529 Small Cap Portfolio – CL A on September 30, 2005 (past ten year period) and the current 5.75% sales charge was paid.
The chart shows how the value of that investment would have changed, and also shows how the Russell 2000® Index performed over the same period.
Past performance is no guarantee of future results. Unit price and return will vary, and you may have a gain or loss when you sell your units. Average Annual Returns are load-adjusted and include changes in unit price, reinvestment of dividends and capital gains.
Class A units are subject to an annual unitholder fee of 0.25%.
Effective after the close of business on September 1, 2010, Class B units were closed to new Accounts and additional purchases by exist-ing Participants. Class B units may be subject upon redemption, to a contingent deferred sales charge (CDSC), which declines from 5.00% to 0.00% over 7 years. Class B units are subject to an annual unitholder fee of 1.00%.
Class C units may be subject upon redemption, to a contingent deferred sales charge (CDSC) of 1.00% for units redeemed within

43 Annual Report
FA 529 Small Cap PortfolioPerformance: The Bottom Line – continued
the first 12 months. Class C units are subject to a 1.00% annual unitholder fee.
Class D units are subject to a 0.50% annual unitholder fee.
Class P units are subject to a 0.75% annual unitholder fee. Class P units are only available within Workplace Savings Programs.
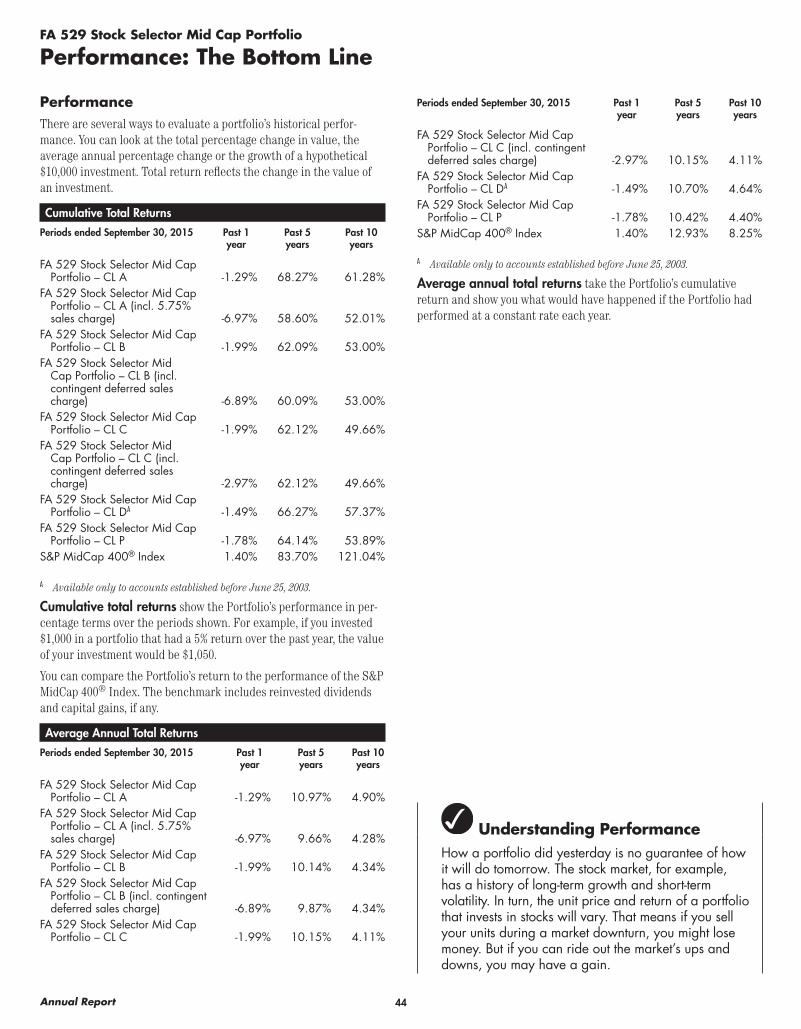
44Annual Report
FA 529 Stock Selector Mid Cap Portfolio
Performance: The Bottom Line
Understanding PerformanceHow a portfolio did yesterday is no guarantee of how it will do tomorrow. The stock market, for example, has a history of long-term growth and short-term volatility. In turn, the unit price and return of a portfolio that invests in stocks will vary. That means if you sell your units during a market downturn, you might lose money. But if you can ride out the market’s ups and downs, you may have a gain.
PerformanceThere are several ways to evaluate a portfolio’s historical perfor-mance. You can look at the total percentage change in value, the average annual percentage change or the growth of a hypothetical $10,000 investment. Total return reflects the change in the value of an investment.
Cumulative Total ReturnsPeriods ended September 30, 2015 Past 1
yearPast 5 years
Past 10 years
FA 529 Stock Selector Mid Cap Portfolio – CL A -1.29% 68.27% 61.28%
FA 529 Stock Selector Mid Cap Portfolio – CL A (incl. 5.75% sales charge) -6.97% 58.60% 52.01%
FA 529 Stock Selector Mid Cap Portfolio – CL B -1.99% 62.09% 53.00%
FA 529 Stock Selector Mid Cap Portfolio – CL B (incl. contingent deferred sales charge) -6.89% 60.09% 53.00%
FA 529 Stock Selector Mid Cap Portfolio – CL C -1.99% 62.12% 49.66%
FA 529 Stock Selector Mid Cap Portfolio – CL C (incl. contingent deferred sales charge) -2.97% 62.12% 49.66%
FA 529 Stock Selector Mid Cap Portfolio – CL D A -1.49% 66.27% 57.37%
FA 529 Stock Selector Mid Cap Portfolio – CL P -1.78% 64.14% 53.89%
S&P MidCap 400® Index 1.40% 83.70% 121.04%
A Available only to accounts established before June 25, 2003.
Cumulative total returns show the Portfolio’s performance in per-centage terms over the periods shown. For example, if you invested $1,000 in a portfolio that had a 5% return over the past year, the value of your investment would be $1,050.
You can compare the Portfolio’s return to the performance of the S&P MidCap 400® Index. The benchmark includes reinvested dividends and capital gains, if any.
Average Annual Total ReturnsPeriods ended September 30, 2015 Past 1
yearPast 5 years
Past 10 years
FA 529 Stock Selector Mid Cap Portfolio – CL A -1.29% 10.97% 4.90%
FA 529 Stock Selector Mid Cap Portfolio – CL A (incl. 5.75% sales charge) -6.97% 9.66% 4.28%
FA 529 Stock Selector Mid Cap Portfolio – CL B -1.99% 10.14% 4.34%
FA 529 Stock Selector Mid Cap Portfolio – CL B (incl. contingent deferred sales charge) -6.89% 9.87% 4.34%
FA 529 Stock Selector Mid Cap Portfolio – CL C -1.99% 10.15% 4.11%
Periods ended September 30, 2015 Past 1 year
Past 5 years
Past 10 years
FA 529 Stock Selector Mid Cap Portfolio – CL C (incl. contingent deferred sales charge) -2.97% 10.15% 4.11%
FA 529 Stock Selector Mid Cap Portfolio – CL D A -1.49% 10.70% 4.64%
FA 529 Stock Selector Mid Cap Portfolio – CL P -1.78% 10.42% 4.40%
S&P MidCap 400® Index 1.40% 12.93% 8.25%
A Available only to accounts established before June 25, 2003.
Average annual total returns take the Portfolio’s cumulative return and show you what would have happened if the Portfolio had performed at a constant rate each year.
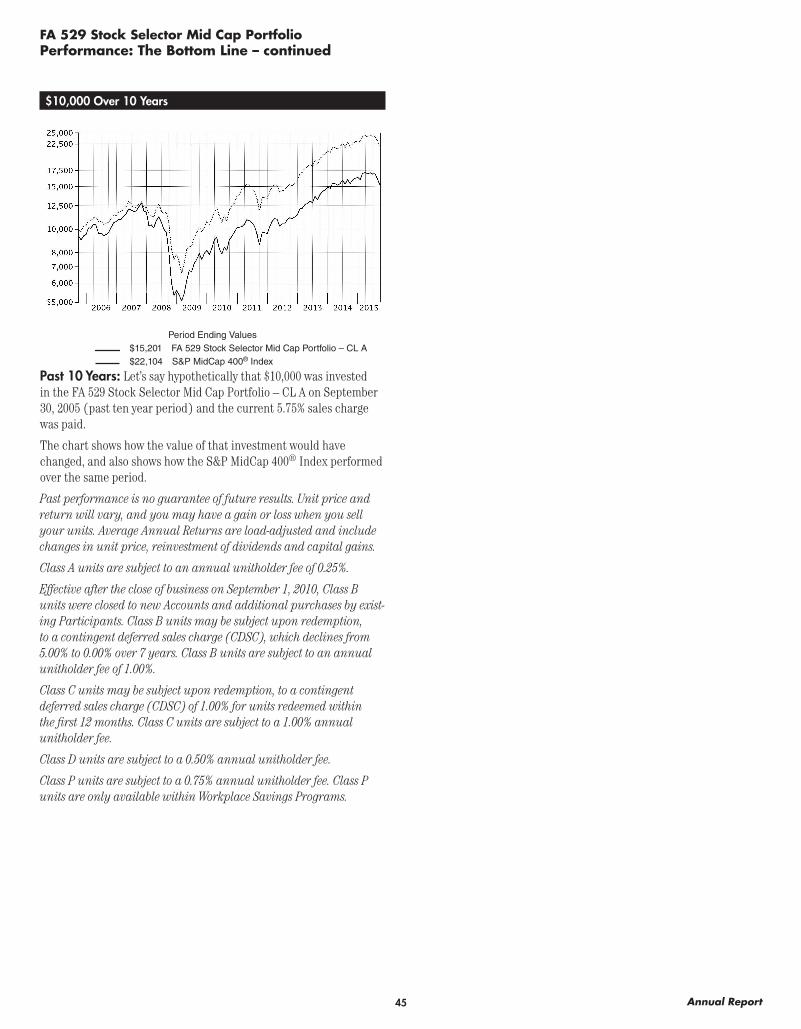
45 Annual Report
FA 529 Stock Selector Mid Cap PortfolioPerformance: The Bottom Line – continued
$10,000 Over 10 Years
Period Ending Values $15,201 FA 529 Stock Selector Mid Cap Portfolio – CL A $22,104 S&P MidCap 400® Index
Past 10 Years: Let’s say hypothetically that $10,000 was invested in the FA 529 Stock Selector Mid Cap Portfolio – CL A on September 30, 2005 (past ten year period) and the current 5.75% sales charge was paid.
The chart shows how the value of that investment would have changed, and also shows how the S&P MidCap 400® Index performed over the same period.
Past performance is no guarantee of future results. Unit price and return will vary, and you may have a gain or loss when you sell your units. Average Annual Returns are load-adjusted and include changes in unit price, reinvestment of dividends and capital gains.
Class A units are subject to an annual unitholder fee of 0.25%.
Effective after the close of business on September 1, 2010, Class B units were closed to new Accounts and additional purchases by exist-ing Participants. Class B units may be subject upon redemption, to a contingent deferred sales charge (CDSC), which declines from 5.00% to 0.00% over 7 years. Class B units are subject to an annual unitholder fee of 1.00%.
Class C units may be subject upon redemption, to a contingent deferred sales charge (CDSC) of 1.00% for units redeemed within the first 12 months. Class C units are subject to a 1.00% annual unitholder fee.
Class D units are subject to a 0.50% annual unitholder fee.
Class P units are subject to a 0.75% annual unitholder fee. Class P units are only available within Workplace Savings Programs.
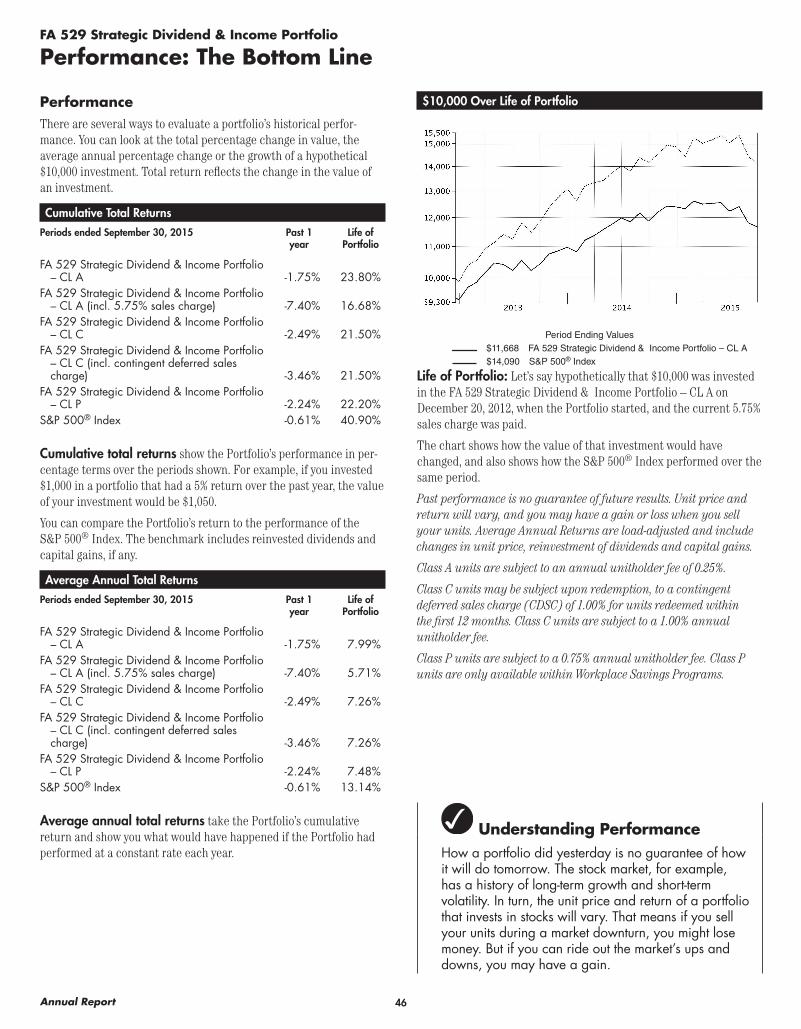
46Annual Report
FA 529 Strategic Dividend & Income Portfolio
Performance: The Bottom Line
Understanding PerformanceHow a portfolio did yesterday is no guarantee of how it will do tomorrow. The stock market, for example, has a history of long-term growth and short-term volatility. In turn, the unit price and return of a portfolio that invests in stocks will vary. That means if you sell your units during a market downturn, you might lose money. But if you can ride out the market’s ups and downs, you may have a gain.
PerformanceThere are several ways to evaluate a portfolio’s historical perfor-mance. You can look at the total percentage change in value, the average annual percentage change or the growth of a hypothetical $10,000 investment. Total return reflects the change in the value of an investment.
Cumulative Total ReturnsPeriods ended September 30, 2015 Past 1
yearLife of
Portfolio
FA 529 Strategic Dividend & Income Portfolio – CL A -1.75% 23.80%
FA 529 Strategic Dividend & Income Portfolio – CL A (incl. 5.75% sales charge) -7.40% 16.68%
FA 529 Strategic Dividend & Income Portfolio – CL C -2.49% 21.50%
FA 529 Strategic Dividend & Income Portfolio – CL C (incl. contingent deferred sales charge) -3.46% 21.50%
FA 529 Strategic Dividend & Income Portfolio – CL P -2.24% 22.20%
S&P 500® Index -0.61% 40.90%
Cumulative total returns show the Portfolio’s performance in per-centage terms over the periods shown. For example, if you invested $1,000 in a portfolio that had a 5% return over the past year, the value of your investment would be $1,050.
You can compare the Portfolio’s return to the performance of the S&P 500® Index. The benchmark includes reinvested dividends and capital gains, if any.
Average Annual Total ReturnsPeriods ended September 30, 2015 Past 1
yearLife of
Portfolio
FA 529 Strategic Dividend & Income Portfolio – CL A -1.75% 7.99%
FA 529 Strategic Dividend & Income Portfolio – CL A (incl. 5.75% sales charge) -7.40% 5.71%
FA 529 Strategic Dividend & Income Portfolio – CL C -2.49% 7.26%
FA 529 Strategic Dividend & Income Portfolio – CL C (incl. contingent deferred sales charge) -3.46% 7.26%
FA 529 Strategic Dividend & Income Portfolio – CL P -2.24% 7.48%
S&P 500® Index -0.61% 13.14%
Average annual total returns take the Portfolio’s cumulative return and show you what would have happened if the Portfolio had performed at a constant rate each year.
$10,000 Over Life of Portfolio
Period Ending Values $11,668 FA 529 Strategic Dividend & Income Portfolio – CL A $14,090 S&P 500® Index
Life of Portfolio: Let’s say hypothetically that $10,000 was invested in the FA 529 Strategic Dividend & Income Portfolio – CL A on December 20, 2012, when the Portfolio started, and the current 5.75% sales charge was paid.
The chart shows how the value of that investment would have changed, and also shows how the S&P 500® Index performed over the same period.
Past performance is no guarantee of future results. Unit price and return will vary, and you may have a gain or loss when you sell your units. Average Annual Returns are load-adjusted and include changes in unit price, reinvestment of dividends and capital gains.
Class A units are subject to an annual unitholder fee of 0.25%.
Class C units may be subject upon redemption, to a contingent deferred sales charge (CDSC) of 1.00% for units redeemed within the first 12 months. Class C units are subject to a 1.00% annual unitholder fee.
Class P units are subject to a 0.75% annual unitholder fee. Class P units are only available within Workplace Savings Programs.
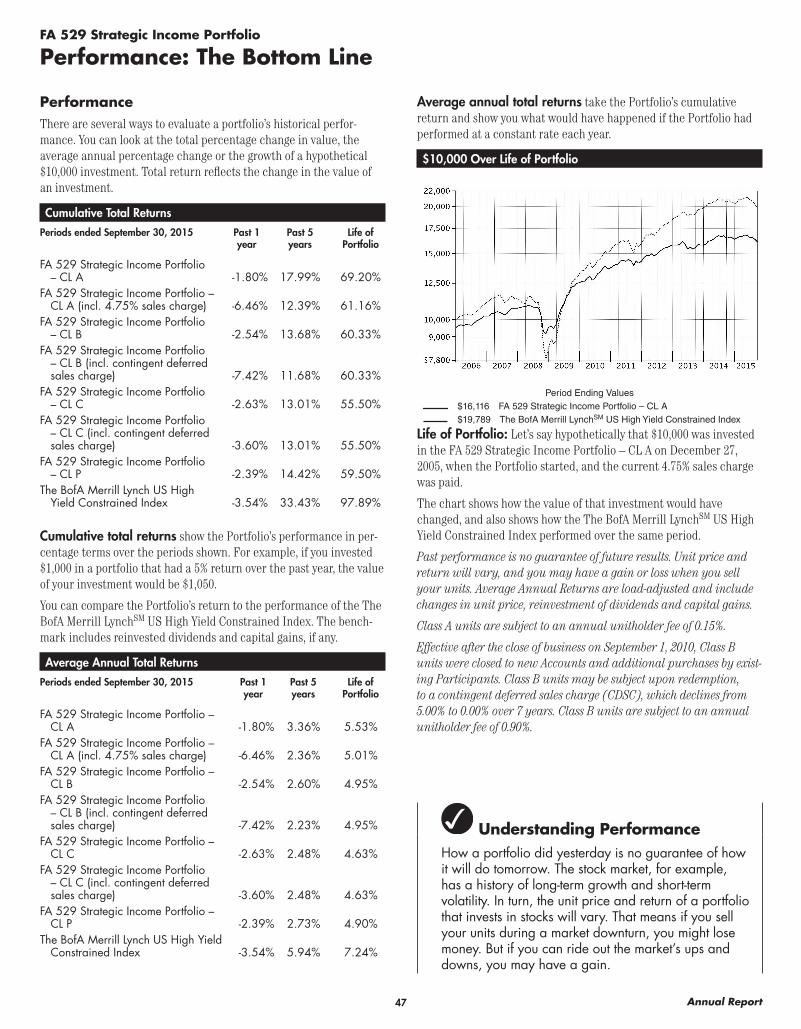
47 Annual Report
FA 529 Strategic Income Portfolio
Performance: The Bottom Line
Understanding PerformanceHow a portfolio did yesterday is no guarantee of how it will do tomorrow. The stock market, for example, has a history of long-term growth and short-term volatility. In turn, the unit price and return of a portfolio that invests in stocks will vary. That means if you sell your units during a market downturn, you might lose money. But if you can ride out the market’s ups and downs, you may have a gain.
PerformanceThere are several ways to evaluate a portfolio’s historical perfor-mance. You can look at the total percentage change in value, the average annual percentage change or the growth of a hypothetical $10,000 investment. Total return reflects the change in the value of an investment.
Cumulative Total ReturnsPeriods ended September 30, 2015 Past 1
yearPast 5 years
Life of Portfolio
FA 529 Strategic Income Portfolio – CL A -1.80% 17.99% 69.20%
FA 529 Strategic Income Portfolio – CL A (incl. 4.75% sales charge) -6.46% 12.39% 61.16%
FA 529 Strategic Income Portfolio – CL B -2.54% 13.68% 60.33%
FA 529 Strategic Income Portfolio – CL B (incl. contingent deferred sales charge) -7.42% 11.68% 60.33%
FA 529 Strategic Income Portfolio – CL C -2.63% 13.01% 55.50%
FA 529 Strategic Income Portfolio – CL C (incl. contingent deferred sales charge) -3.60% 13.01% 55.50%
FA 529 Strategic Income Portfolio – CL P -2.39% 14.42% 59.50%
The BofA Merrill Lynch US High Yield Constrained Index -3.54% 33.43% 97.89%
Cumulative total returns show the Portfolio’s performance in per-centage terms over the periods shown. For example, if you invested $1,000 in a portfolio that had a 5% return over the past year, the value of your investment would be $1,050.
You can compare the Portfolio’s return to the performance of the The BofA Merrill LynchSM US High Yield Constrained Index. The bench-mark includes reinvested dividends and capital gains, if any.
Average Annual Total ReturnsPeriods ended September 30, 2015 Past 1
yearPast 5 years
Life of Portfolio
FA 529 Strategic Income Portfolio – CL A -1.80% 3.36% 5.53%
FA 529 Strategic Income Portfolio – CL A (incl. 4.75% sales charge) -6.46% 2.36% 5.01%
FA 529 Strategic Income Portfolio – CL B -2.54% 2.60% 4.95%
FA 529 Strategic Income Portfolio – CL B (incl. contingent deferred sales charge) -7.42% 2.23% 4.95%
FA 529 Strategic Income Portfolio – CL C -2.63% 2.48% 4.63%
FA 529 Strategic Income Portfolio – CL C (incl. contingent deferred sales charge) -3.60% 2.48% 4.63%
FA 529 Strategic Income Portfolio – CL P -2.39% 2.73% 4.90%
The BofA Merrill Lynch US High Yield Constrained Index -3.54% 5.94% 7.24%
Average annual total returns take the Portfolio’s cumulative return and show you what would have happened if the Portfolio had performed at a constant rate each year.
$10,000 Over Life of Portfolio
Period Ending Values $16,116 FA 529 Strategic Income Portfolio – CL A $19,789 The BofA Merrill LynchSM US High Yield Constrained Index
Life of Portfolio: Let’s say hypothetically that $10,000 was invested in the FA 529 Strategic Income Portfolio – CL A on December 27, 2005, when the Portfolio started, and the current 4.75% sales charge was paid.
The chart shows how the value of that investment would have changed, and also shows how the The BofA Merrill LynchSM US High Yield Constrained Index performed over the same period.
Past performance is no guarantee of future results. Unit price and return will vary, and you may have a gain or loss when you sell your units. Average Annual Returns are load-adjusted and include changes in unit price, reinvestment of dividends and capital gains.
Class A units are subject to an annual unitholder fee of 0.15%.
Effective after the close of business on September 1, 2010, Class B units were closed to new Accounts and additional purchases by exist-ing Participants. Class B units may be subject upon redemption, to a contingent deferred sales charge (CDSC), which declines from 5.00% to 0.00% over 7 years. Class B units are subject to an annual unitholder fee of 0.90%.

48Annual Report
FA 529 Strategic Income PortfolioPerformance: The Bottom Line – continued
Class C units may be subject upon redemption, to a contingent deferred sales charge (CDSC) of 1.00% for units redeemed within the first 12 months. Class C units are subject to a 1.00% annual unitholder fee.
Class P units are subject to a 0.75% annual unitholder fee. Class P units are only available within Workplace Savings Programs.

49 Annual Report
FA 529 Total Bond Portfolio
Performance: The Bottom Line
Understanding PerformanceHow a portfolio did yesterday is no guarantee of how it will do tomorrow. The stock market, for example, has a history of long-term growth and short-term volatility. In turn, the unit price and return of a portfolio that invests in stocks will vary. That means if you sell your units during a market downturn, you might lose money. But if you can ride out the market’s ups and downs, you may have a gain.
PerformanceThere are several ways to evaluate a portfolio’s historical perfor-mance. You can look at the total percentage change in value, the average annual percentage change or the growth of a hypothetical $10,000 investment. Total return reflects the change in the value of an investment.
Cumulative Total ReturnsPeriods ended September 30, 2015 Past 1
yearLife of
Portfolio
FA 529 Total Bond Portfolio – CL A 1.26% 4.10%FA 529 Total Bond Portfolio – CL A (incl.
4.75% sales charge) -3.55% -0.84%FA 529 Total Bond Portfolio – CL C 0.39% 1.80%FA 529 Total Bond Portfolio – CL C (incl.
contingent deferred sales charge) -0.61% 1.80%FA 529 Total Bond Portfolio – CL P 0.69% 2.80%Barclays® U.S. Aggregate Bond Index 2.94% 5.25%
Cumulative total returns show the Portfolio’s performance in per-centage terms over the periods shown. For example, if you invested $1,000 in a portfolio that had a 5% return over the past year, the value of your investment would be $1,050.
You can compare the Portfolio’s return to the performance of the Barclays® U.S. Aggregate Bond Index. The benchmark includes reinvested dividends and capital gains, if any.
Average Annual Total ReturnsPeriods ended September 30, 2015 Past 1
yearLife of
Portfolio
FA 529 Total Bond Portfolio – CL A 1.26% 1.46%FA 529 Total Bond Portfolio – CL A (incl.
4.75% sales charge) -3.55% -0.30%FA 529 Total Bond Portfolio – CL C 0.39% 0.64%FA 529 Total Bond Portfolio – CL C (incl.
contingent deferred sales charge) -0.61% 0.64%FA 529 Total Bond Portfolio – CL P 0.69% 1.00%Barclays® U.S. Aggregate Bond Index 2.94% 1.86%
Average annual total returns take the Portfolio’s cumulative return and show you what would have happened if the Portfolio had performed at a constant rate each year.
$10,000 Over Life of Portfolio
Period Ending Values $9,916 FA 529 Total Bond Portfolio – CL A $10,525 Barclays® U.S. Aggregate Bond Index
Life of Portfolio: Let’s say hypothetically that $10,000 was invested in the FA 529 Total Bond Portfolio – CL A on December 20, 2012, when the Portfolio started, and the current 4.75% sales charge was paid.
The chart shows how the value of that investment would have changed, and also shows how the Barclays® U.S. Aggregate Bond Index performed over the same period.
Past performance is no guarantee of future results. Unit price and return will vary, and you may have a gain or loss when you sell your units. Average Annual Returns are load-adjusted and include changes in unit price, reinvestment of dividends and capital gains.
Class A units are subject to an annual unitholder fee of 0.15%.
Class C units may be subject upon redemption, to a contingent deferred sales charge (CDSC) of 1.00% for units redeemed within the first 12 months. Class C units are subject to a 1.00% annual unitholder fee.
Class P units are subject to a 0.75% annual unitholder fee. Class P units are only available within Workplace Savings Programs.
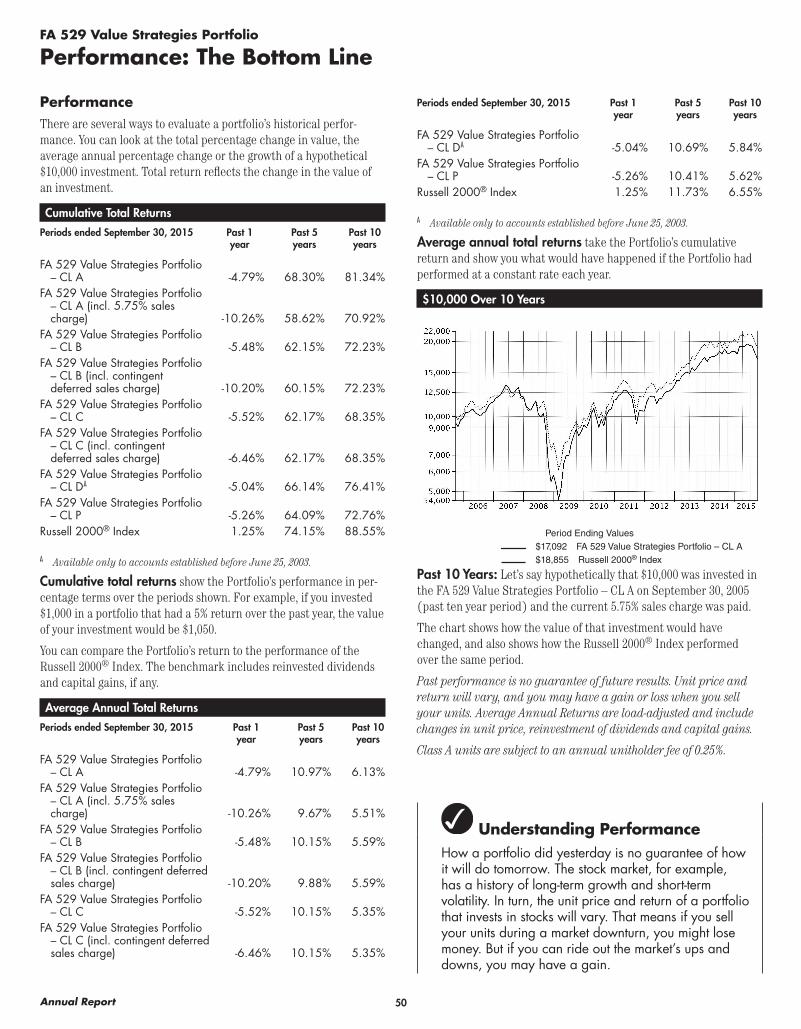
50Annual Report
FA 529 Value Strategies Portfolio
Performance: The Bottom Line
Understanding PerformanceHow a portfolio did yesterday is no guarantee of how it will do tomorrow. The stock market, for example, has a history of long-term growth and short-term volatility. In turn, the unit price and return of a portfolio that invests in stocks will vary. That means if you sell your units during a market downturn, you might lose money. But if you can ride out the market’s ups and downs, you may have a gain.
PerformanceThere are several ways to evaluate a portfolio’s historical perfor-mance. You can look at the total percentage change in value, the average annual percentage change or the growth of a hypothetical $10,000 investment. Total return reflects the change in the value of an investment.
Cumulative Total ReturnsPeriods ended September 30, 2015 Past 1
yearPast 5 years
Past 10 years
FA 529 Value Strategies Portfolio – CL A -4.79% 68.30% 81.34%
FA 529 Value Strategies Portfolio – CL A (incl. 5.75% sales charge) -10.26% 58.62% 70.92%
FA 529 Value Strategies Portfolio – CL B -5.48% 62.15% 72.23%
FA 529 Value Strategies Portfolio – CL B (incl. contingent deferred sales charge) -10.20% 60.15% 72.23%
FA 529 Value Strategies Portfolio – CL C -5.52% 62.17% 68.35%
FA 529 Value Strategies Portfolio – CL C (incl. contingent deferred sales charge) -6.46% 62.17% 68.35%
FA 529 Value Strategies Portfolio – CL D A -5.04% 66.14% 76.41%
FA 529 Value Strategies Portfolio – CL P -5.26% 64.09% 72.76%
Russell 2000® Index 1.25% 74.15% 88.55%
A Available only to accounts established before June 25, 2003.
Cumulative total returns show the Portfolio’s performance in per-centage terms over the periods shown. For example, if you invested $1,000 in a portfolio that had a 5% return over the past year, the value of your investment would be $1,050.
You can compare the Portfolio’s return to the performance of the Russell 2000® Index. The benchmark includes reinvested dividends and capital gains, if any.
Average Annual Total ReturnsPeriods ended September 30, 2015 Past 1
yearPast 5 years
Past 10 years
FA 529 Value Strategies Portfolio – CL A -4.79% 10.97% 6.13%
FA 529 Value Strategies Portfolio – CL A (incl. 5.75% sales charge) -10.26% 9.67% 5.51%
FA 529 Value Strategies Portfolio – CL B -5.48% 10.15% 5.59%
FA 529 Value Strategies Portfolio – CL B (incl. contingent deferred sales charge) -10.20% 9.88% 5.59%
FA 529 Value Strategies Portfolio – CL C -5.52% 10.15% 5.35%
FA 529 Value Strategies Portfolio – CL C (incl. contingent deferred sales charge) -6.46% 10.15% 5.35%
Periods ended September 30, 2015 Past 1 year
Past 5 years
Past 10 years
FA 529 Value Strategies Portfolio – CL D A -5.04% 10.69% 5.84%
FA 529 Value Strategies Portfolio – CL P -5.26% 10.41% 5.62%
Russell 2000® Index 1.25% 11.73% 6.55%
A Available only to accounts established before June 25, 2003.
Average annual total returns take the Portfolio’s cumulative return and show you what would have happened if the Portfolio had performed at a constant rate each year.
$10,000 Over 10 Years
Period Ending Values $17,092 FA 529 Value Strategies Portfolio – CL A $18,855 Russell 2000® Index
Past 10 Years: Let’s say hypothetically that $10,000 was invested in the FA 529 Value Strategies Portfolio – CL A on September 30, 2005 (past ten year period) and the current 5.75% sales charge was paid.
The chart shows how the value of that investment would have changed, and also shows how the Russell 2000® Index performed over the same period.
Past performance is no guarantee of future results. Unit price and return will vary, and you may have a gain or loss when you sell your units. Average Annual Returns are load-adjusted and include changes in unit price, reinvestment of dividends and capital gains.
Class A units are subject to an annual unitholder fee of 0.25%.
51 Annual Report
FA 529 Value Strategies PortfolioPerformance: The Bottom Line – continued
Effective after the close of business on September 1, 2010, Class B units were closed to new Accounts and additional purchases by exist-ing Participants. Class B units may be subject upon redemption, to a contingent deferred sales charge (CDSC), which declines from 5.00% to 0.00% over 7 years. Class B units are subject to an annual unitholder fee of 1.00%.
Class C units may be subject upon redemption, to a contingent deferred sales charge (CDSC) of 1.00% for units redeemed within the first 12 months. Class C units are subject to a 1.00% annual unitholder fee.
Class D units are subject to a 0.50% annual unitholder fee.
Class P units are subject to a 0.75% annual unitholder fee. Class P units are only available within Workplace Savings Programs.
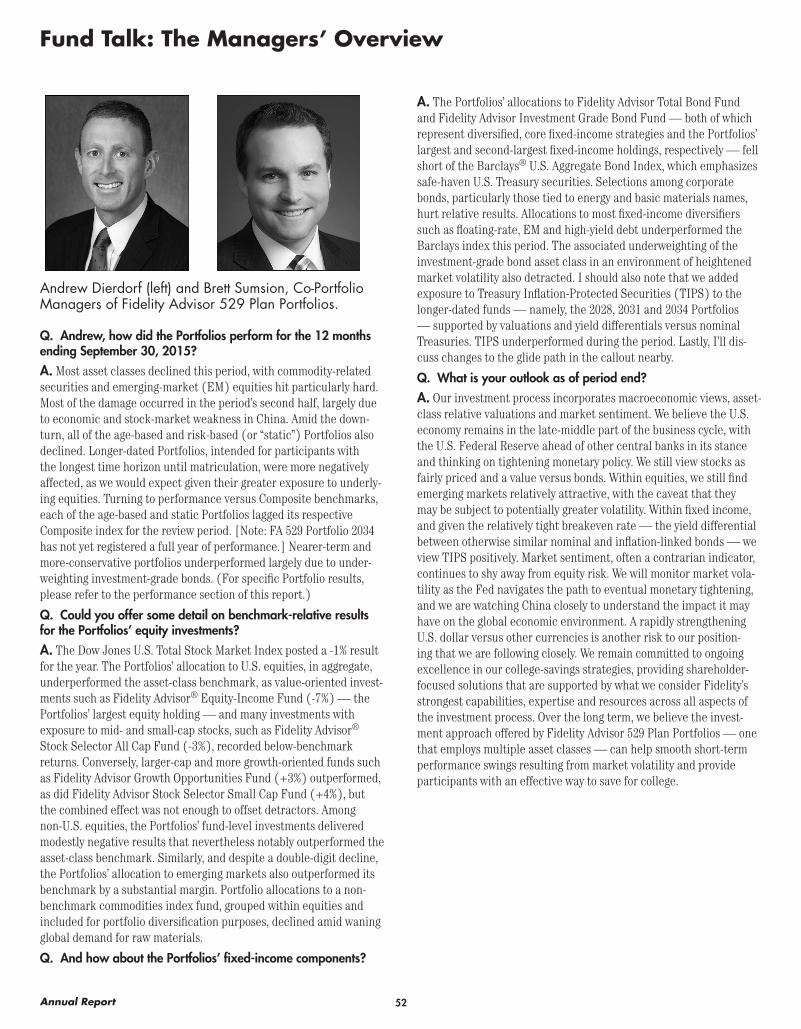
52Annual Report
Fund Talk: The Managers’ Overview
Andrew Dierdorf (left) and Brett Sumsion, Co-Portfolio Managers of Fidelity Advisor 529 Plan Portfolios.
Q. Andrew, how did the Portfolios perform for the 12 months ending September 30, 2015?A. Most asset classes declined this period, with commodity-related securities and emerging-market (EM) equities hit particularly hard. Most of the damage occurred in the period’s second half, largely due to economic and stock-market weakness in China. Amid the down-turn, all of the age-based and risk-based (or “static”) Portfolios also declined. Longer-dated Portfolios, intended for participants with the longest time horizon until matriculation, were more negatively affected, as we would expect given their greater exposure to underly-ing equities. Turning to performance versus Composite benchmarks, each of the age-based and static Portfolios lagged its respective Composite index for the review period. [Note: FA 529 Portfolio 2034 has not yet registered a full year of performance.] Nearer-term and more-conservative portfolios underperformed largely due to under-weighting investment-grade bonds. (For specific Portfolio results, please refer to the performance section of this report.)
Q. Could you offer some detail on benchmark-relative results for the Portfolios’ equity investments?A. The Dow Jones U.S. Total Stock Market Index posted a -1% result for the year. The Portfolios’ allocation to U.S. equities, in aggregate, underperformed the asset-class benchmark, as value-oriented invest-ments such as Fidelity Advisor® Equity-Income Fund (-7%) — the Portfolios’ largest equity holding — and many investments with exposure to mid- and small-cap stocks, such as Fidelity Advisor® Stock Selector All Cap Fund (-3%), recorded below-benchmark returns. Conversely, larger-cap and more growth-oriented funds such as Fidelity Advisor Growth Opportunities Fund (+3%) outperformed, as did Fidelity Advisor Stock Selector Small Cap Fund (+4%), but the combined effect was not enough to offset detractors. Among non-U.S. equities, the Portfolios’ fund-level investments delivered modestly negative results that nevertheless notably outperformed the asset-class benchmark. Similarly, and despite a double-digit decline, the Portfolios’ allocation to emerging markets also outperformed its benchmark by a substantial margin. Portfolio allocations to a non-benchmark commodities index fund, grouped within equities and included for portfolio diversification purposes, declined amid waning global demand for raw materials.
Q. And how about the Portfolios’ fixed-income components?
A. The Portfolios’ allocations to Fidelity Advisor Total Bond Fund and Fidelity Advisor Investment Grade Bond Fund — both of which represent diversified, core fixed-income strategies and the Portfolios’ largest and second-largest fixed-income holdings, respectively — fell short of the Barclays® U.S. Aggregate Bond Index, which emphasizes safe-haven U.S. Treasury securities. Selections among corporate bonds, particularly those tied to energy and basic materials names, hurt relative results. Allocations to most fixed-income diversifiers such as floating-rate, EM and high-yield debt underperformed the Barclays index this period. The associated underweighting of the investment-grade bond asset class in an environment of heightened market volatility also detracted. I should also note that we added exposure to Treasury Inflation-Protected Securities (TIPS) to the longer-dated funds — namely, the 2028, 2031 and 2034 Portfolios — supported by valuations and yield differentials versus nominal Treasuries. TIPS underperformed during the period. Lastly, I’ll dis-cuss changes to the glide path in the callout nearby.
Q. What is your outlook as of period end?A. Our investment process incorporates macroeconomic views, asset-class relative valuations and market sentiment. We believe the U.S. economy remains in the late-middle part of the business cycle, with the U.S. Federal Reserve ahead of other central banks in its stance and thinking on tightening monetary policy. We still view stocks as fairly priced and a value versus bonds. Within equities, we still find emerging markets relatively attractive, with the caveat that they may be subject to potentially greater volatility. Within fixed income, and given the relatively tight breakeven rate — the yield differential between otherwise similar nominal and inflation-linked bonds — we view TIPS positively. Market sentiment, often a contrarian indicator, continues to shy away from equity risk. We will monitor market vola-tility as the Fed navigates the path to eventual monetary tightening, and we are watching China closely to understand the impact it may have on the global economic environment. A rapidly strengthening U.S. dollar versus other currencies is another risk to our position-ing that we are following closely. We remain committed to ongoing excellence in our college-savings strategies, providing shareholder-focused solutions that are supported by what we consider Fidelity’s strongest capabilities, expertise and resources across all aspects of the investment process. Over the long term, we believe the invest-ment approach offered by Fidelity Advisor 529 Plan Portfolios — one that employs multiple asset classes — can help smooth short-term performance swings resulting from market volatility and provide participants with an effective way to save for college.
53 Annual Report
Portfolio Facts
Goals: All of the age-based Portfolios seek capital appre-ciation with reasonable safety of principal, consistent with the ages of the beneficiaries for whom they are designed. There are two static allocation Portfolios. The investment objective of FA 529 Moderate Growth Portfolio is to maximize total return over the long term by allocating assets among stock and bond mutual funds. The investment objective of FA 529 Aggressive Growth Portfolio is growth of capital over the long term. There are 17 individual fund Portfolios. The investment objectives of the individual fund Portfolios are those of the underlying mutual funds in which each FA 529 Portfolio invests.
Start dates: July 25, 2001; except FA 529 Diversified International Portfolio, FA 529 Dividend Growth Portfolio, FA 529 Equity Growth Portfolio, FA 529 Equity Income Portfolio, FA 529 Stock Selector Mid Cap Portfolio, FA 529 Small Cap Portfolio, FA 529 Value Strategies Portfolio, FA 529 High Income Portfolio, FA 529 Limited Term Bond Portfolio and FA 529 Money Market Portfolio, all of which started on June 10, 2002; FA 529 Portfolio 2022 and FA 529 Inflation-Protected Bond Portfolio, which both started November 20, 2002; FA 529 Portfolio 2025, FA 529 New Insights Portfolio and FA 529 Strategic Income Portfolio, which started December 27, 2005; FA 529 Portfolio 2028, December 16, 2008; FA 529 Portfolio 2031, December 16, 2011; FA 529 Global Strategies Portfolio, FA 529 Growth Opportunities Portfolio, FA 529 Strategic Dividend & Income Portfolio and FA 529 Total Bond Portfolio, which all started December 20, 2012; and FA 529 Portfolio 2034, which started on December 18, 2014.
Co-Managers: Andrew Dierdorf, since 2007; joined Fidelity in 2004; Brett Sumsion, since 2014; joined Fidelity in 2014
Andrew Dierdorf on changes to the Portfolios’ Glide Path:The Portfolios are designed as a comprehensive strategy based on a disciplined investment process that evolves over time, seeking to help investors achieve their college-savings goals. The glide path, a critical component of the age-based Portfolios, represents the strategic allocation to stocks, bonds and cash in a target-date fund — and how that mix adjusts over time.
Drawing upon our experience in managing multi-asset-class portfolios, changes made to the glide path early in 2015 reflect updates to our research in three primary areas: investor behavior, risk capacity and capital-markets assumptions (CMAs).
Evaluation of investor behavior considers initial and on-going contributions as well as withdrawal behaviors, including both point-in-time snapshots and trends over time. These observations influence the demographic and risk assumptions that inform the glide path analysis.
Risk capacity expresses investors’ ability and tolerance for withstanding portfolio volatility or losses. Our refined assessment of risk capacity considers both risk-preference and loss-recovery analysis to develop a “risk boundary” throughout the savings period. This boundary considers investor behavior and market conditions to help manage the Portfolios’ risk in the context of college-savings goals.
Secular-based CMAs, developed by Fidelity’s Asset Allocation Research Team, incorporate both a long-term historical perspec-tive and importantly, a forward-looking perspective that provides a baseline for estimated return, risk and correlations over a 20-year period. These assumptions are a starting point for glide path analysis that is developed and evaluated by the investment team, including stress testing and additional quantitative analysis to evaluate outcomes that may not be represented by the baseline secular CMAs.
All three of these primary areas of research go into our target-date analysis. The glide path is intended to provide an appropri-ate risk/reward balance, with the goals of helping to accumulate assets for college savings, to limit the risk of early asset deple-tion and to reflect investor risk capacity over time. Our most recent research indicated equity allocations should increase in early-dated Portfolios and decrease in mid-dated Portfolio; these changes were implemented early in 2015.
Fidelity is committed to delivering excellence in its target-date strategies. We believe these changes offer the investment man-agement team greater flexibility to deliver incremental value to the age-based Portfolios and improve outcomes for participants.

54Annual Report
FA 529 College Portfolio
Investment Summary
Portfolio Holdings as of September 30, 2015% of Portfolio’s net
assetsU.S. Equity FundsFidelity Advisor Equity Growth Fund Class I 1.5Fidelity Advisor Equity Income Fund Class I 3.1Fidelity Advisor Growth Opportunities Class I 1.1Fidelity Advisor Large Cap Fund Class I 1.9Fidelity Advisor Mega Cap Stock Fund Class I 1.7Fidelity Advisor New Insights Fund Class I 1.6Fidelity Advisor Real Estate Fund Class I 0.2Fidelity Advisor Stock Selector Small Cap Fund Class I 0.6Fidelity Series Commodity Strategy Fund 0.7Fidelity Stock Selector All Cap Fund Class I 3.9
16.3Non – U.S. Equity FundsFidelity Advisor Diversified International Fund Class I 1.6Fidelity Advisor Emerging Markets Fund Class I 3.0Fidelity Advisor Emerging Markets Income Class I 0.6Fidelity Advisor Overseas Fund Class I 1.6
6.8Bond FundsFidelity Advisor Corporate Bond Fund Class I 2.6Fidelity Advisor Floating Rate High Income Fund Class I 0.3Fidelity Advisor Government Income Fund Class I 9.9Fidelity Advisor High Income Fund Class I 3.1Fidelity Advisor Inflation-Protected Bond Fund Class I 3.5Fidelity Advisor Investment Grade Bond Fund Class I 14.6Fidelity Advisor Mortgage Securities Class I 2.3Fidelity Advisor Real Estate Income Fund Class I 0.8Fidelity Advisor Total Bond Fund Class I 15.5
52.6Short-Term FundsFidelity Advisor Short Fixed-Income Fund Class I 7.3Fidelity Institutional Money Market Portfolio Institutional Class 17.1
24.4Net Other Assets (Liabilities) (0.1)
100.0
Asset Allocation (% of Portfolio’s net assets)
Bond Funds 52.6%
U.S. Equity Funds 16.3%
Non – U.S. Equity Funds 6.8%
Short-Term Funds 24.4%
Net Other Assets (Liabilities) (0.1)%*
* Net Other Assets (Liabilities) are not included in the pie chart

55 Annual Report
See accompanying notes which are an integral part of the financial statements.
U.S. Equity Funds – 16.3%Shares Value
Fidelity Advisor Equity Growth Fund Class I 60,598 $ 5,919,776
Fidelity Advisor Equity Income Fund Class I 409,466 12,505,098
Fidelity Advisor Growth Opportunities Class I 68,830 4,373,480
Fidelity Advisor Large Cap Fund Class I 277,630 7,512,669Fidelity Advisor Mega Cap Stock Fund
Class I 457,091 6,833,513Fidelity Advisor New Insights Fund
Class I 249,692 6,556,900Fidelity Advisor Real Estate Fund Class I 32,045 689,296Fidelity Advisor Stock Selector Small
Cap Fund Class I 104,901 2,484,063Fidelity Series Commodity Strategy
Fund 545,285 2,982,711Fidelity Stock Selector All Cap Fund
Class I 474,007 15,637,499
TOTAL U.S. EQUITY FUNDS(Cost $64,730,651) 65,495,005
Non – U.S. Equity Funds – 6.8%
Fidelity Advisor Diversified International Fund Class I 330,715 6,362,952
Fidelity Advisor Emerging Markets Fund Class I 630,591 12,208,242
Fidelity Advisor Emerging Markets Income Class I 189,922 2,383,516
Fidelity Advisor Overseas Fund Class I 306,645 6,356,751
TOTAL NON – U.S. EQUITY FUNDS(Cost $27,948,801) 27,311,461
Bond Funds – 52.6%
Fidelity Advisor Corporate Bond Fund Class I 947,770 10,520,242
Fidelity Advisor Floating Rate High Income Fund Class I 106,740 1,005,487
Fidelity Advisor Government Income Fund Class I 3,754,833 39,651,032
Fidelity Advisor High Income Fund Class I 1,681,520 12,560,954
Fidelity Advisor Inflation-Protected Bond Fund Class I 1,198,992 14,100,141
Fidelity Advisor Investment Grade Bond Fund Class I 7,597,055 58,725,236
Fidelity Advisor Mortgage Securities Class I 809,513 9,171,777
Fidelity Advisor Real Estate Income Fund Class I 269,354 3,030,233
Fidelity Advisor Total Bond Fund Class I 5,944,810 62,301,604
TOTAL BOND FUNDS(Cost $216,221,984) 211,066,706
FA 529 College Portfolio
Investments September 30, 2015Showing Percentage of Net Assets
Short-Term Funds – 24.4%Shares Value
Fidelity Advisor Short Fixed-Income Fund Class I 3,142,962 $ 29,418,125
Fidelity Institutional Money Market Portfolio Institutional Class 0.17% (a) 68,526,102 68,526,103
TOTAL SHORT-TERM FUNDS(Cost $97,760,206) 97,944,228
TOTAL INVESTMENT PORTFOLIO – 100.1%(Cost $406,661,642) $401,817,400
NET OTHER ASSETS (LIABILITIES) – (0.1)% (244,911)
NET ASSETS – 100% $401,572,489
Legend(a) The rate quoted is the annualized seven-day yield of the fund at
period end.
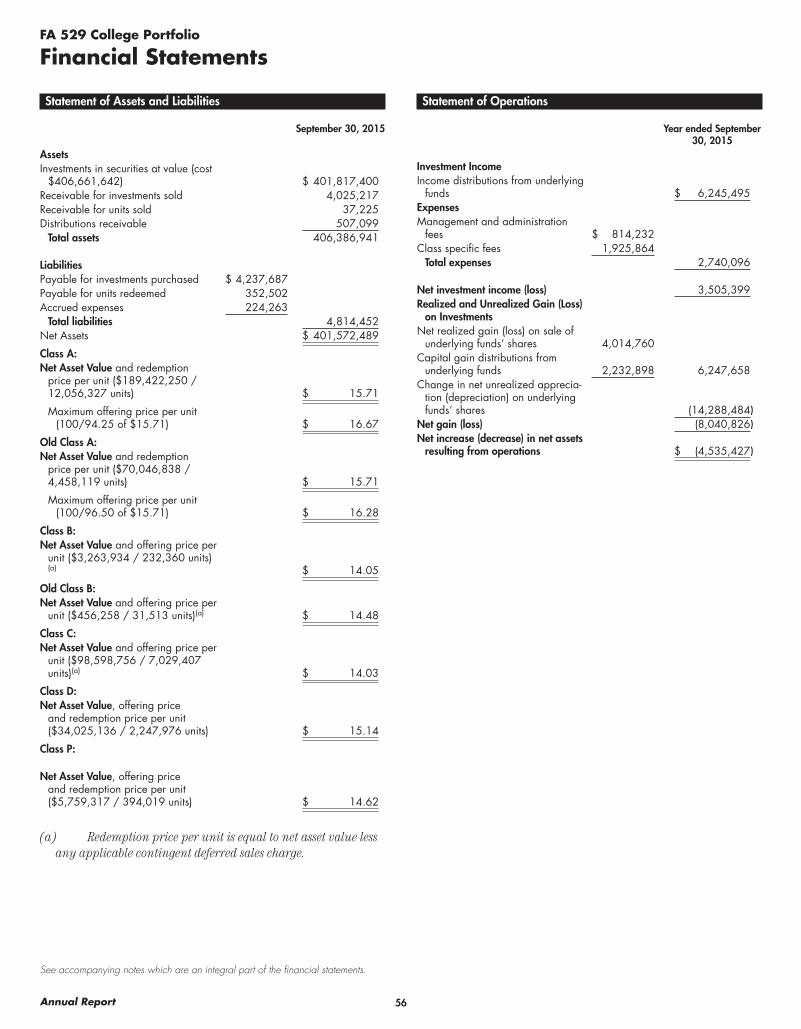
56Annual Report
See accompanying notes which are an integral part of the financial statements.
FA 529 College Portfolio
Financial Statements
Statement of Assets and Liabilities
September 30, 2015
AssetsInvestments in securities at value (cost
$406,661,642) $ 401,817,400Receivable for investments sold 4,025,217Receivable for units sold 37,225Distributions receivable 507,099
Total assets 406,386,941
LiabilitiesPayable for investments purchased $ 4,237,687Payable for units redeemed 352,502Accrued expenses 224,263
Total liabilities 4,814,452Net Assets $ 401,572,489
Class A:Net Asset Value and redemption
price per unit ($189,422,250 / 12,056,327 units) $ 15.71
Maximum offering price per unit (100/94.25 of $15.71) $ 16.67
Old Class A:Net Asset Value and redemption
price per unit ($70,046,838 / 4,458,119 units) $ 15.71
Maximum offering price per unit (100/96.50 of $15.71) $ 16.28
Class B:Net Asset Value and offering price per
unit ($3,263,934 / 232,360 units)(a) $ 14.05
Old Class B:Net Asset Value and offering price per
unit ($456,258 / 31,513 units)(a) $ 14.48
Class C:Net Asset Value and offering price per
unit ($98,598,756 / 7,029,407 units)(a) $ 14.03
Class D:Net Asset Value, offering price
and redemption price per unit ($34,025,136 / 2,247,976 units) $ 15.14
Class P:
Net Asset Value, offering price and redemption price per unit ($5,759,317 / 394,019 units) $ 14.62
(a) Redemption price per unit is equal to net asset value less any applicable contingent deferred sales charge.
Statement of Operations
Year ended September 30, 2015
Investment IncomeIncome distributions from underlying
funds $ 6,245,495ExpensesManagement and administration
fees $ 814,232Class specific fees 1,925,864
Total expenses 2,740,096
Net investment income (loss) 3,505,399Realized and Unrealized Gain (Loss)
on InvestmentsNet realized gain (loss) on sale of
underlying funds’ shares 4,014,760Capital gain distributions from
underlying funds 2,232,898 6,247,658Change in net unrealized apprecia-
tion (depreciation) on underlying funds’ shares (14,288,484)
Net gain (loss) (8,040,826)Net increase (decrease) in net assets
resulting from operations $ (4,535,427)
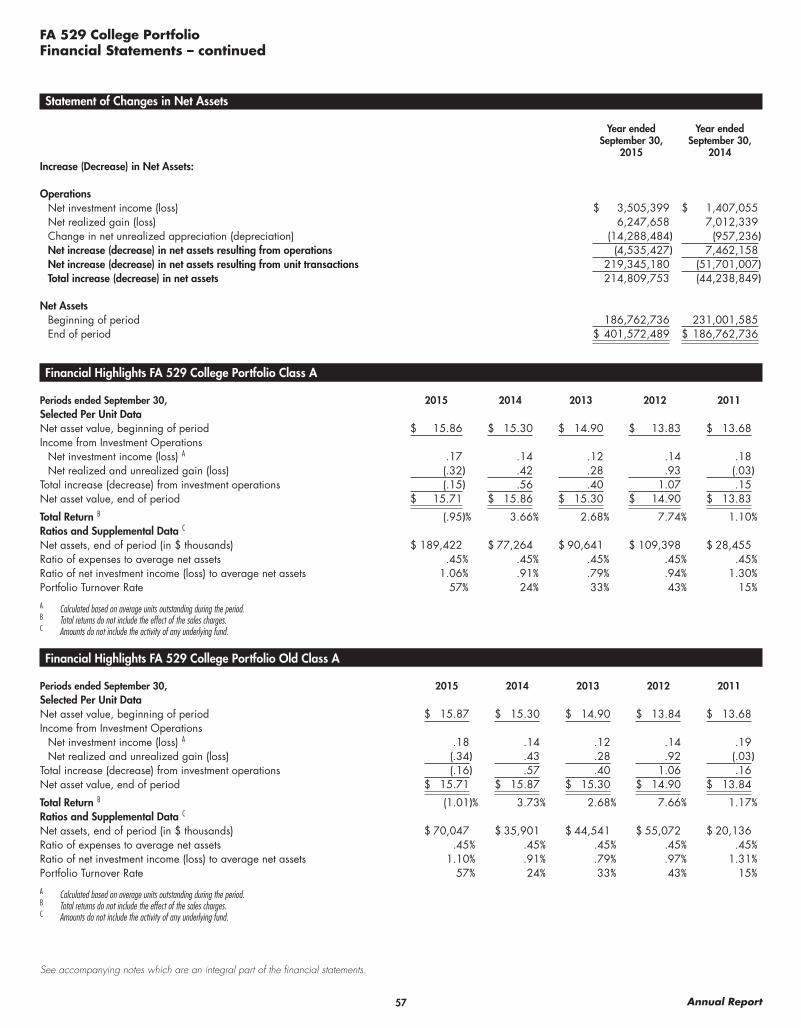
57 Annual Report
See accompanying notes which are an integral part of the financial statements.
FA 529 College PortfolioFinancial Statements – continued
Statement of Changes in Net Assets
Year ended September 30,
2015
Year ended September 30,
2014Increase (Decrease) in Net Assets:
OperationsNet investment income (loss) $ 3,505,399 $ 1,407,055Net realized gain (loss) 6,247,658 7,012,339Change in net unrealized appreciation (depreciation) (14,288,484) (957,236)Net increase (decrease) in net assets resulting from operations (4,535,427) 7,462,158Net increase (decrease) in net assets resulting from unit transactions 219,345,180 (51,701,007)Total increase (decrease) in net assets 214,809,753 (44,238,849)
Net AssetsBeginning of period 186,762,736 231,001,585End of period $ 401,572,489 $ 186,762,736
Financial Highlights FA 529 College Portfolio Class A
Periods ended September 30, 2015 2014 2013 2012 2011Selected Per Unit Data Net asset value, beginning of period $ 15.86 $ 15.30 $ 14.90 $ 13.83 $ 13.68Income from Investment Operations
Net investment income (loss) A .17 .14 .12 .14 .18Net realized and unrealized gain (loss) (.32) .42 .28 .93 (.03)
Total increase (decrease) from investment operations (.15) .56 .40 1.07 .15Net asset value, end of period $ 15.71 $ 15.86 $ 15.30 $ 14.90 $ 13.83
Total Return B (.95)% 3.66% 2.68% 7.74% 1.10%Ratios and Supplemental Data C Net assets, end of period (in $ thousands) $ 189,422 $ 77,264 $ 90,641 $ 109,398 $ 28,455Ratio of expenses to average net assets .45% .45% .45% .45% .45%Ratio of net investment income (loss) to average net assets 1.06% .91% .79% .94% 1.30%Portfolio Turnover Rate 57% 24% 33% 43% 15%
A Calculated based on average units outstanding during the period.B Total returns do not include the effect of the sales charges.C Amounts do not include the activity of any underlying fund.
Financial Highlights FA 529 College Portfolio Old Class A
Periods ended September 30, 2015 2014 2013 2012 2011Selected Per Unit Data Net asset value, beginning of period $ 15.87 $ 15.30 $ 14.90 $ 13.84 $ 13.68Income from Investment Operations
Net investment income (loss) A .18 .14 .12 .14 .19Net realized and unrealized gain (loss) (.34) .43 .28 .92 (.03)
Total increase (decrease) from investment operations (.16) .57 .40 1.06 .16Net asset value, end of period $ 15.71 $ 15.87 $ 15.30 $ 14.90 $ 13.84
Total Return B (1.01)% 3.73% 2.68% 7.66% 1.17%Ratios and Supplemental Data C Net assets, end of period (in $ thousands) $ 70,047 $ 35,901 $ 44,541 $ 55,072 $ 20,136Ratio of expenses to average net assets .45% .45% .45% .45% .45%Ratio of net investment income (loss) to average net assets 1.10% .91% .79% .97% 1.31%Portfolio Turnover Rate 57% 24% 33% 43% 15%
A Calculated based on average units outstanding during the period.B Total returns do not include the effect of the sales charges.C Amounts do not include the activity of any underlying fund.

58Annual Report
See accompanying notes which are an integral part of the financial statements.
FA 529 College PortfolioFinancial Statements – continued
Financial Highlights FA 529 College Portfolio Class B
Periods ended September 30, 2015 2014 2013 2012 2011Selected Per Unit Data Net asset value, beginning of period $ 14.29 $ 13.89 $ 13.62 $ 12.74 $ 12.70Income from Investment Operations
Net investment income (loss) A .04 .02 .01 .03 .08Net realized and unrealized gain (loss) (.28) .38 .26 .85 (.04)
Total increase (decrease) from investment operations (.24) .40 .27 .88 .04Net asset value, end of period $ 14.05 $ 14.29 $ 13.89 $ 13.62 $ 12.74
Total Return B (1.68)% 2.88% 1.98% 6.91% .31%Ratios and Supplemental Data C Net assets, end of period (in $ thousands) $ 3,264 $ 1,625 $ 3,266 $ 6,620 $ 3,152Ratio of expenses to average net assets 1.20% 1.20% 1.20% 1.20% 1.20%Ratio of net investment income (loss) to average net assets .29% .17% .07% .22% .60%Portfolio Turnover Rate 57% 24% 33% 43% 15%
A Calculated based on average units outstanding during the period.B Total returns do not include the effect of the contingent deferred sales charge.C Amounts do not include the activity of any underlying fund.
Financial Highlights FA 529 College Portfolio Old Class B
Periods ended September 30, 2015 2014 2013 2012 2011Selected Per Unit Data Net asset value, beginning of period $ 14.69 $ 14.24 $ 13.93 $ 13.00 $ 12.92Income from Investment Operations
Net investment income (loss) A .08 .06 .05 .06 .11Net realized and unrealized gain (loss) (.29) .39 .26 .87 (.03)
Total increase (decrease) from investment operations (.21) .45 .31 .93 .08Net asset value, end of period $ 14.48 $ 14.69 $ 14.24 $ 13.93 $ 13.00
Total Return B (1.43)% 3.16% 2.23% 7.15% .62%Ratios and Supplemental Data C Net assets, end of period (in $ thousands) $ 456 $ 238 $ 618 $ 1,676 $ 868Ratio of expenses to average net assets .95% .95% .95% .95% .95%Ratio of net investment income (loss) to average net assets .54% .42% .33% .48% .85%Portfolio Turnover Rate 57% 24% 33% 43% 15%
A Calculated based on average units outstanding during the period.B Total returns do not include the effect of the contingent deferred sales charge.C Amounts do not include the activity of any underlying fund.
Financial Highlights FA 529 College Portfolio Class C
Periods ended September 30, 2015 2014 2013 2012 2011Selected Per Unit Data Net asset value, beginning of period $ 14.27 $ 13.87 $ 13.60 $ 12.72 $ 12.68Income from Investment Operations
Net investment income (loss) A .05 .02 .01 .03 .07Net realized and unrealized gain (loss) (.29) .38 .26 .85 (.03)
Total increase (decrease) from investment operations (.24) .40 .27 .88 .04Net asset value, end of period $ 14.03 $ 14.27 $ 13.87 $ 13.60 $ 12.72
Total Return B (1.68)% 2.88% 1.99% 6.92% .32%Ratios and Supplemental Data C Net assets, end of period (in $ thousands) $ 98,599 $ 47,463 $ 60,733 $ 76,729 $ 26,586Ratio of expenses to average net assets 1.20% 1.20% 1.20% 1.20% 1.20%Ratio of net investment income (loss) to average net assets .34% .16% .04% .21% .56%Portfolio Turnover Rate 57% 24% 33% 43% 15%
A Calculated based on average units outstanding during the period.B Total returns do not include the effect of the contingent deferred sales charge.C Amounts do not include the activity of any underlying fund.

59 Annual Report
See accompanying notes which are an integral part of the financial statements.
FA 529 College PortfolioFinancial Statements – continued
Financial Highlights FA 529 College Portfolio Class D
Periods ended September 30, 2015 2014 2013 2012 2011Selected Per Unit Data Net asset value, beginning of period $ 15.32 $ 14.81 $ 14.46 $ 13.46 $ 13.34Income from Investment Operations
Net investment income (loss) A .14 .10 .08 .11 .15Net realized and unrealized gain (loss) (.32) .41 .27 .89 (.03)
Total increase (decrease) from investment operations (.18) .51 .35 1.00 .12Net asset value, end of period $ 15.14 $ 15.32 $ 14.81 $ 14.46 $ 13.46
Total Return (1.17)% 3.44% 2.42% 7.43% .90%Ratios and Supplemental Data B Net assets, end of period (in $ thousands) $ 34,025 $ 21,732 $ 28,182 $ 36,043 $ 18,290Ratio of expenses to average net assets .70% .70% .70% .70% .70%Ratio of net investment income (loss) to average net assets .92% .66% .54% .76% 1.07%Portfolio Turnover Rate 57% 24% 33% 43% 15%
A Calculated based on average units outstanding during the period.B Amounts do not include the activity of any underlying fund.
Financial Highlights FA 529 College Portfolio Class P
Periods ended September 30, 2015 2014 2013 2012 2011Selected Per Unit Data Net asset value, beginning of period $ 14.83 $ 14.38 $ 14.07 $ 13.13 $ 13.05Income from Investment Operations
Net investment income (loss) A .09 .06 .04 .07 .11Net realized and unrealized gain (loss) (.30) .39 .27 .87 (.03)
Total increase (decrease) from investment operations (.21) .45 .31 .94 .08Net asset value, end of period $ 14.62 $ 14.83 $ 14.38 $ 14.07 $ 13.13
Total Return (1.42)% 3.13% 2.20% 7.16% .61%Ratios and Supplemental Data B Net assets, end of period (in $ thousands) $ 5,759 $ 2,540 $ 3,021 $ 3,772 $ 1,459Ratio of expenses to average net assets .95% .95% .95% .95% .95%Ratio of net investment income (loss) to average net assets .58% .41% .29% .47% .82%Portfolio Turnover Rate 57% 24% 33% 43% 15%
A Calculated based on average units outstanding during the period.B Amounts do not include the activity of any underlying fund.
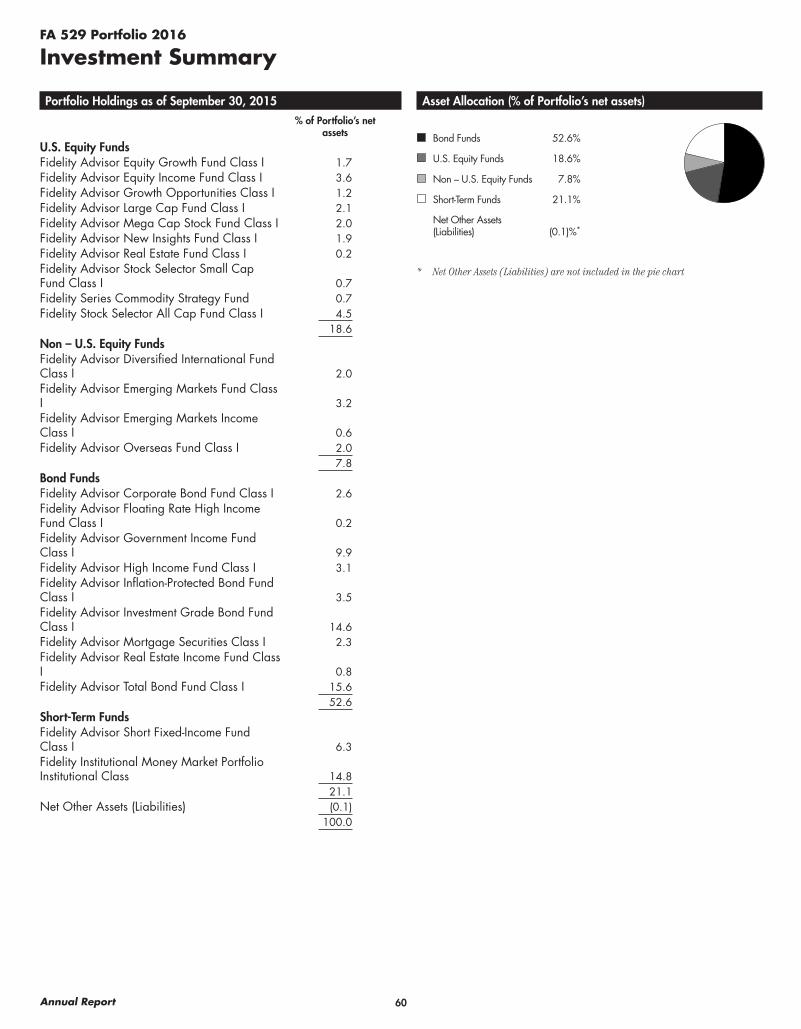
60Annual Report
FA 529 Portfolio 2016
Investment Summary
Portfolio Holdings as of September 30, 2015% of Portfolio’s net
assetsU.S. Equity FundsFidelity Advisor Equity Growth Fund Class I 1.7Fidelity Advisor Equity Income Fund Class I 3.6Fidelity Advisor Growth Opportunities Class I 1.2Fidelity Advisor Large Cap Fund Class I 2.1Fidelity Advisor Mega Cap Stock Fund Class I 2.0Fidelity Advisor New Insights Fund Class I 1.9Fidelity Advisor Real Estate Fund Class I 0.2Fidelity Advisor Stock Selector Small Cap Fund Class I 0.7Fidelity Series Commodity Strategy Fund 0.7Fidelity Stock Selector All Cap Fund Class I 4.5
18.6Non – U.S. Equity FundsFidelity Advisor Diversified International Fund Class I 2.0Fidelity Advisor Emerging Markets Fund Class I 3.2Fidelity Advisor Emerging Markets Income Class I 0.6Fidelity Advisor Overseas Fund Class I 2.0
7.8Bond FundsFidelity Advisor Corporate Bond Fund Class I 2.6Fidelity Advisor Floating Rate High Income Fund Class I 0.2Fidelity Advisor Government Income Fund Class I 9.9Fidelity Advisor High Income Fund Class I 3.1Fidelity Advisor Inflation-Protected Bond Fund Class I 3.5Fidelity Advisor Investment Grade Bond Fund Class I 14.6Fidelity Advisor Mortgage Securities Class I 2.3Fidelity Advisor Real Estate Income Fund Class I 0.8Fidelity Advisor Total Bond Fund Class I 15.6
52.6Short-Term FundsFidelity Advisor Short Fixed-Income Fund Class I 6.3Fidelity Institutional Money Market Portfolio Institutional Class 14.8
21.1Net Other Assets (Liabilities) (0.1)
100.0
Asset Allocation (% of Portfolio’s net assets)
Bond Funds 52.6%
U.S. Equity Funds 18.6%
Non – U.S. Equity Funds 7.8%
Short-Term Funds 21.1%
Net Other Assets (Liabilities) (0.1)%*
* Net Other Assets (Liabilities) are not included in the pie chart
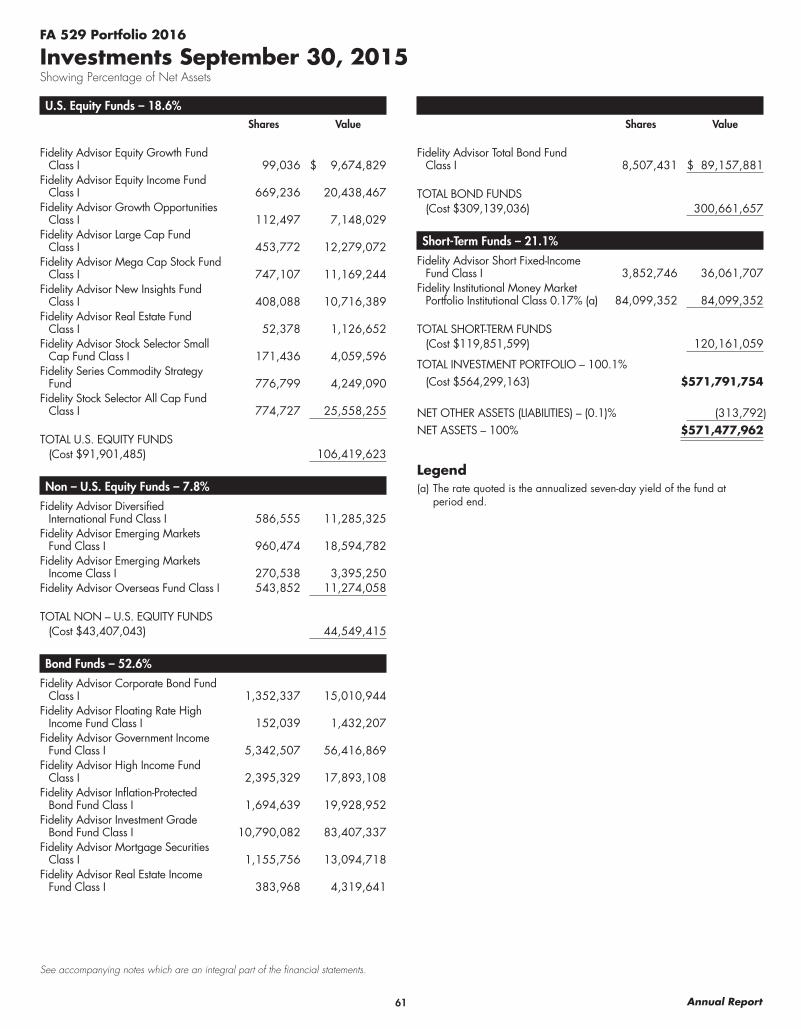
61 Annual Report
See accompanying notes which are an integral part of the financial statements.
U.S. Equity Funds – 18.6%Shares Value
Fidelity Advisor Equity Growth Fund Class I 99,036 $ 9,674,829
Fidelity Advisor Equity Income Fund Class I 669,236 20,438,467
Fidelity Advisor Growth Opportunities Class I 112,497 7,148,029
Fidelity Advisor Large Cap Fund Class I 453,772 12,279,072
Fidelity Advisor Mega Cap Stock Fund Class I 747,107 11,169,244
Fidelity Advisor New Insights Fund Class I 408,088 10,716,389
Fidelity Advisor Real Estate Fund Class I 52,378 1,126,652
Fidelity Advisor Stock Selector Small Cap Fund Class I 171,436 4,059,596
Fidelity Series Commodity Strategy Fund 776,799 4,249,090
Fidelity Stock Selector All Cap Fund Class I 774,727 25,558,255
TOTAL U.S. EQUITY FUNDS(Cost $91,901,485) 106,419,623
Non – U.S. Equity Funds – 7.8%
Fidelity Advisor Diversified International Fund Class I 586,555 11,285,325
Fidelity Advisor Emerging Markets Fund Class I 960,474 18,594,782
Fidelity Advisor Emerging Markets Income Class I 270,538 3,395,250
Fidelity Advisor Overseas Fund Class I 543,852 11,274,058
TOTAL NON – U.S. EQUITY FUNDS(Cost $43,407,043) 44,549,415
Bond Funds – 52.6%
Fidelity Advisor Corporate Bond Fund Class I 1,352,337 15,010,944
Fidelity Advisor Floating Rate High Income Fund Class I 152,039 1,432,207
Fidelity Advisor Government Income Fund Class I 5,342,507 56,416,869
Fidelity Advisor High Income Fund Class I 2,395,329 17,893,108
Fidelity Advisor Inflation-Protected Bond Fund Class I 1,694,639 19,928,952
Fidelity Advisor Investment Grade Bond Fund Class I 10,790,082 83,407,337
Fidelity Advisor Mortgage Securities Class I 1,155,756 13,094,718
Fidelity Advisor Real Estate Income Fund Class I 383,968 4,319,641
FA 529 Portfolio 2016
Investments September 30, 2015Showing Percentage of Net Assets
Shares Value
Fidelity Advisor Total Bond Fund Class I 8,507,431 $ 89,157,881
TOTAL BOND FUNDS(Cost $309,139,036) 300,661,657
Short-Term Funds – 21.1%
Fidelity Advisor Short Fixed-Income Fund Class I 3,852,746 36,061,707
Fidelity Institutional Money Market Portfolio Institutional Class 0.17% (a) 84,099,352 84,099,352
TOTAL SHORT-TERM FUNDS(Cost $119,851,599) 120,161,059
TOTAL INVESTMENT PORTFOLIO – 100.1%(Cost $564,299,163) $571,791,754
NET OTHER ASSETS (LIABILITIES) – (0.1)% (313,792)
NET ASSETS – 100% $571,477,962
Legend(a) The rate quoted is the annualized seven-day yield of the fund at
period end.
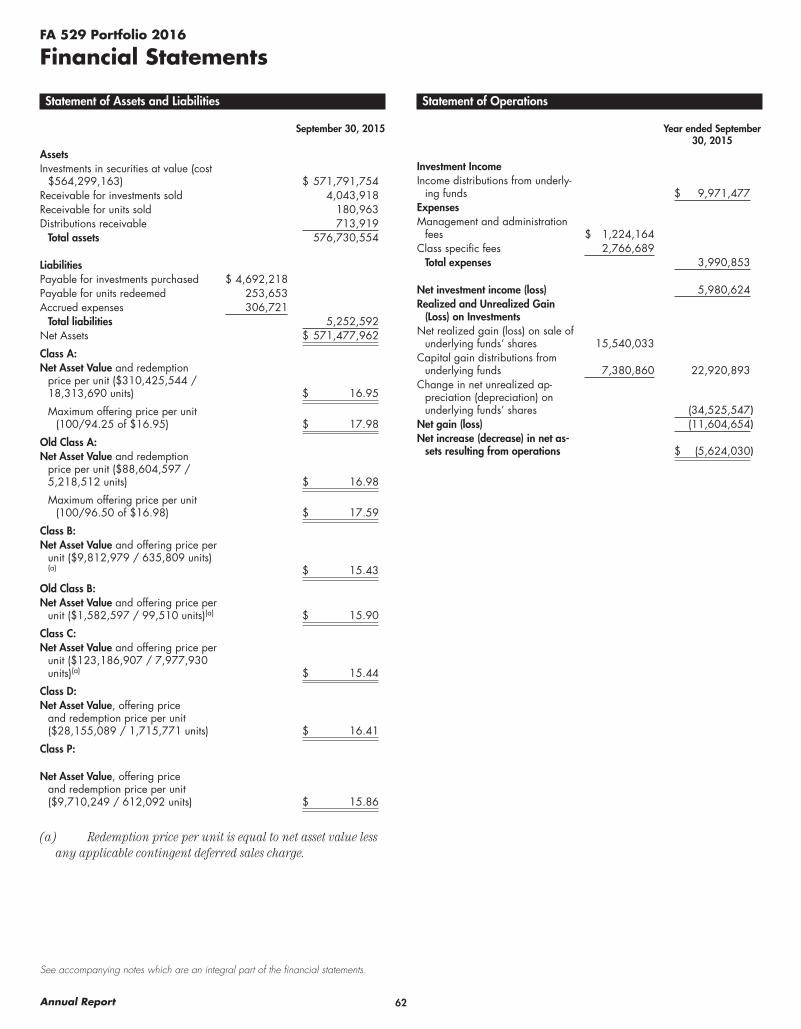
62Annual Report
See accompanying notes which are an integral part of the financial statements.
FA 529 Portfolio 2016
Financial Statements
Statement of Assets and Liabilities
September 30, 2015
AssetsInvestments in securities at value (cost
$564,299,163) $ 571,791,754Receivable for investments sold 4,043,918Receivable for units sold 180,963Distributions receivable 713,919
Total assets 576,730,554
LiabilitiesPayable for investments purchased $ 4,692,218Payable for units redeemed 253,653Accrued expenses 306,721
Total liabilities 5,252,592Net Assets $ 571,477,962
Class A:Net Asset Value and redemption
price per unit ($310,425,544 / 18,313,690 units) $ 16.95
Maximum offering price per unit (100/94.25 of $16.95) $ 17.98
Old Class A:Net Asset Value and redemption
price per unit ($88,604,597 / 5,218,512 units) $ 16.98
Maximum offering price per unit (100/96.50 of $16.98) $ 17.59
Class B:Net Asset Value and offering price per
unit ($9,812,979 / 635,809 units)(a) $ 15.43
Old Class B:Net Asset Value and offering price per
unit ($1,582,597 / 99,510 units)(a) $ 15.90
Class C:Net Asset Value and offering price per
unit ($123,186,907 / 7,977,930 units)(a) $ 15.44
Class D:Net Asset Value, offering price
and redemption price per unit ($28,155,089 / 1,715,771 units) $ 16.41
Class P:
Net Asset Value, offering price and redemption price per unit ($9,710,249 / 612,092 units) $ 15.86
(a) Redemption price per unit is equal to net asset value less any applicable contingent deferred sales charge.
Statement of Operations
Year ended September 30, 2015
Investment IncomeIncome distributions from underly-
ing funds $ 9,971,477ExpensesManagement and administration
fees $ 1,224,164Class specific fees 2,766,689
Total expenses 3,990,853
Net investment income (loss) 5,980,624Realized and Unrealized Gain
(Loss) on InvestmentsNet realized gain (loss) on sale of
underlying funds’ shares 15,540,033Capital gain distributions from
underlying funds 7,380,860 22,920,893Change in net unrealized ap-
preciation (depreciation) on underlying funds’ shares (34,525,547)
Net gain (loss) (11,604,654)Net increase (decrease) in net as-
sets resulting from operations $ (5,624,030)
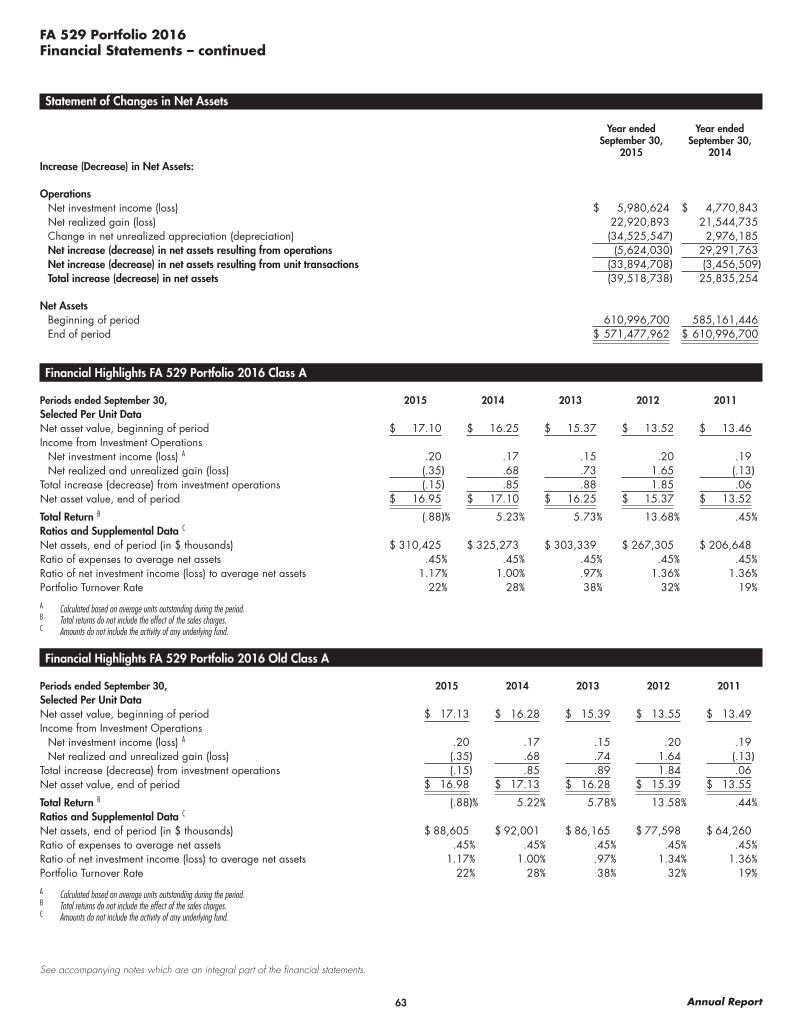
63 Annual Report
See accompanying notes which are an integral part of the financial statements.
FA 529 Portfolio 2016Financial Statements – continued
Statement of Changes in Net Assets
Year ended September 30,
2015
Year ended September 30,
2014Increase (Decrease) in Net Assets:
OperationsNet investment income (loss) $ 5,980,624 $ 4,770,843Net realized gain (loss) 22,920,893 21,544,735Change in net unrealized appreciation (depreciation) (34,525,547) 2,976,185Net increase (decrease) in net assets resulting from operations (5,624,030) 29,291,763Net increase (decrease) in net assets resulting from unit transactions (33,894,708) (3,456,509)Total increase (decrease) in net assets (39,518,738) 25,835,254
Net AssetsBeginning of period 610,996,700 585,161,446End of period $ 571,477,962 $ 610,996,700
Financial Highlights FA 529 Portfolio 2016 Class A
Periods ended September 30, 2015 2014 2013 2012 2011Selected Per Unit Data Net asset value, beginning of period $ 17.10 $ 16.25 $ 15.37 $ 13.52 $ 13.46Income from Investment Operations
Net investment income (loss) A .20 .17 .15 .20 .19Net realized and unrealized gain (loss) (.35) .68 .73 1.65 (.13)
Total increase (decrease) from investment operations (.15) .85 .88 1.85 .06Net asset value, end of period $ 16.95 $ 17.10 $ 16.25 $ 15.37 $ 13.52
Total Return B (.88)% 5.23% 5.73% 13.68% .45%Ratios and Supplemental Data C Net assets, end of period (in $ thousands) $ 310,425 $ 325,273 $ 303,339 $ 267,305 $ 206,648Ratio of expenses to average net assets .45% .45% .45% .45% .45%Ratio of net investment income (loss) to average net assets 1.17% 1.00% .97% 1.36% 1.36%Portfolio Turnover Rate 22% 28% 38% 32% 19%
A Calculated based on average units outstanding during the period.B Total returns do not include the effect of the sales charges.C Amounts do not include the activity of any underlying fund.
Financial Highlights FA 529 Portfolio 2016 Old Class A
Periods ended September 30, 2015 2014 2013 2012 2011Selected Per Unit Data Net asset value, beginning of period $ 17.13 $ 16.28 $ 15.39 $ 13.55 $ 13.49Income from Investment Operations
Net investment income (loss) A .20 .17 .15 .20 .19Net realized and unrealized gain (loss) (.35) .68 .74 1.64 (.13)
Total increase (decrease) from investment operations (.15) .85 .89 1.84 .06Net asset value, end of period $ 16.98 $ 17.13 $ 16.28 $ 15.39 $ 13.55
Total Return B (.88)% 5.22% 5.78% 13.58% .44%Ratios and Supplemental Data C Net assets, end of period (in $ thousands) $ 88,605 $ 92,001 $ 86,165 $ 77,598 $ 64,260Ratio of expenses to average net assets .45% .45% .45% .45% .45%Ratio of net investment income (loss) to average net assets 1.17% 1.00% .97% 1.34% 1.36%Portfolio Turnover Rate 22% 28% 38% 32% 19%
A Calculated based on average units outstanding during the period.B Total returns do not include the effect of the sales charges.C Amounts do not include the activity of any underlying fund.

64Annual Report
See accompanying notes which are an integral part of the financial statements.
FA 529 Portfolio 2016Financial Statements – continued
Financial Highlights FA 529 Portfolio 2016 Class B
Periods ended September 30, 2015 2014 2013 2012 2011Selected Per Unit Data Net asset value, beginning of period $ 15.68 $ 15.02 $ 14.31 $ 12.69 $ 12.73Income from Investment Operations
Net investment income (loss) A .09 .04 .04 .09 .08Net realized and unrealized gain (loss) (.34) .62 .67 1.53 (.12)
Total increase (decrease) from investment operations (.25) .66 .71 1.62 (.04)Net asset value, end of period $ 15.43 $ 15.68 $ 15.02 $ 14.31 $ 12.69
Total Return B (1.59)% 4.39% 4.96% 12.77% (.31)%Ratios and Supplemental Data C Net assets, end of period (in $ thousands) $ 9,813 $ 18,388 $ 27,097 $ 36,707 $ 43,606Ratio of expenses to average net assets 1.20% 1.20% 1.20% 1.20% 1.20%Ratio of net investment income (loss) to average net assets .55% .27% .26% .68% .61%Portfolio Turnover Rate 22% 28% 38% 32% 19%
A Calculated based on average units outstanding during the period.B Total returns do not include the effect of the contingent deferred sales charge.C Amounts do not include the activity of any underlying fund.
Financial Highlights FA 529 Portfolio 2016 Old Class B
Periods ended September 30, 2015 2014 2013 2012 2011Selected Per Unit Data Net asset value, beginning of period $ 16.12 $ 15.40 $ 14.64 $ 12.94 $ 12.95Income from Investment Operations
Net investment income (loss) A .14 .08 .08 .05 .12Net realized and unrealized gain (loss) (.36) .64 .68 1.65 (.13)
Total increase (decrease) from investment operations (.22) .72 .76 1.70 (.01)Net asset value, end of period $ 15.90 $ 16.12 $ 15.40 $ 14.64 $ 12.94
Total Return B (1.36)% 4.68% 5.19% 13.14% (.08)%Ratios and Supplemental Data C Net assets, end of period (in $ thousands) $ 1,583 $ 4,043 $ 6,686 $ 9,447 $ 11,679Ratio of expenses to average net assets .95% .95% .95% .95% .95%Ratio of net investment income (loss) to average net assets .86% .52% .52% .33% .86%Portfolio Turnover Rate 22% 28% 38% 32% 19%
A Calculated based on average units outstanding during the period.B Total returns do not include the effect of the contingent deferred sales charge.C Amounts do not include the activity of any underlying fund.
Financial Highlights FA 529 Portfolio 2016 Class C
Periods ended September 30, 2015 2014 2013 2012 2011Selected Per Unit Data Net asset value, beginning of period $ 15.69 $ 15.03 $ 14.32 $ 12.69 $ 12.73Income from Investment Operations
Net investment income (loss) A .07 .04 .03 .08 .08Net realized and unrealized gain (loss) (.32) .62 .68 1.55 (.12)
Total increase (decrease) from investment operations (.25) .66 .71 1.63 (.04)Net asset value, end of period $ 15.44 $ 15.69 $ 15.03 $ 14.32 $ 12.69
Total Return B (1.59)% 4.39% 4.96% 12.84% (.31)%Ratios and Supplemental Data C Net assets, end of period (in $ thousands) $ 123,187 $ 130,764 $ 122,234 $ 104,271 $ 75,667Ratio of expenses to average net assets 1.20% 1.20% 1.20% 1.20% 1.20%Ratio of net investment income (loss) to average net assets .43% .25% .22% .60% .61%Portfolio Turnover Rate 22% 28% 38% 32% 19%
A Calculated based on average units outstanding during the period.B Total returns do not include the effect of the contingent deferred sales charge.C Amounts do not include the activity of any underlying fund.
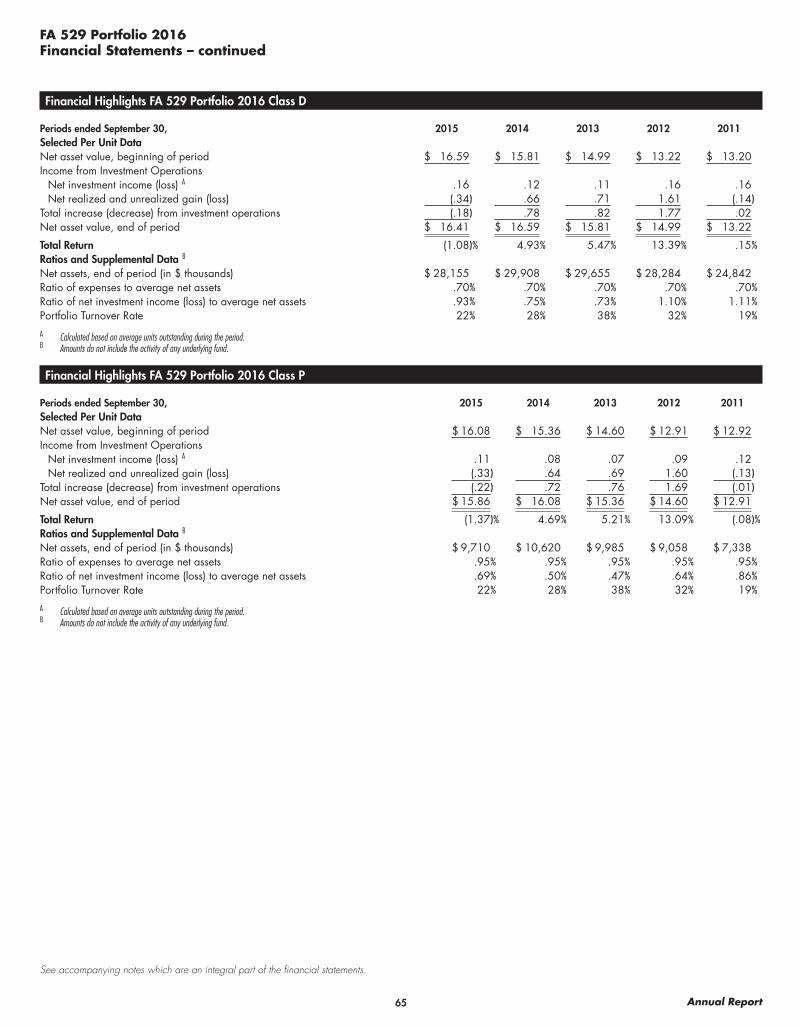
65 Annual Report
See accompanying notes which are an integral part of the financial statements.
FA 529 Portfolio 2016Financial Statements – continued
Financial Highlights FA 529 Portfolio 2016 Class D
Periods ended September 30, 2015 2014 2013 2012 2011Selected Per Unit Data Net asset value, beginning of period $ 16.59 $ 15.81 $ 14.99 $ 13.22 $ 13.20Income from Investment Operations
Net investment income (loss) A .16 .12 .11 .16 .16Net realized and unrealized gain (loss) (.34) .66 .71 1.61 (.14)
Total increase (decrease) from investment operations (.18) .78 .82 1.77 .02Net asset value, end of period $ 16.41 $ 16.59 $ 15.81 $ 14.99 $ 13.22
Total Return (1.08)% 4.93% 5.47% 13.39% .15%Ratios and Supplemental Data B Net assets, end of period (in $ thousands) $ 28,155 $ 29,908 $ 29,655 $ 28,284 $ 24,842Ratio of expenses to average net assets .70% .70% .70% .70% .70%Ratio of net investment income (loss) to average net assets .93% .75% .73% 1.10% 1.11%Portfolio Turnover Rate 22% 28% 38% 32% 19%
A Calculated based on average units outstanding during the period.B Amounts do not include the activity of any underlying fund.
Financial Highlights FA 529 Portfolio 2016 Class P
Periods ended September 30, 2015 2014 2013 2012 2011Selected Per Unit Data Net asset value, beginning of period $ 16.08 $ 15.36 $ 14.60 $ 12.91 $ 12.92Income from Investment Operations
Net investment income (loss) A .11 .08 .07 .09 .12Net realized and unrealized gain (loss) (.33) .64 .69 1.60 (.13)
Total increase (decrease) from investment operations (.22) .72 .76 1.69 (.01)Net asset value, end of period $ 15.86 $ 16.08 $ 15.36 $ 14.60 $ 12.91
Total Return (1.37)% 4.69% 5.21% 13.09% (.08)%Ratios and Supplemental Data B Net assets, end of period (in $ thousands) $ 9,710 $ 10,620 $ 9,985 $ 9,058 $ 7,338Ratio of expenses to average net assets .95% .95% .95% .95% .95%Ratio of net investment income (loss) to average net assets .69% .50% .47% .64% .86%Portfolio Turnover Rate 22% 28% 38% 32% 19%
A Calculated based on average units outstanding during the period.B Amounts do not include the activity of any underlying fund.

66Annual Report
FA 529 Portfolio 2019
Investment Summary
Portfolio Holdings as of September 30, 2015% of Portfolio’s net
assetsU.S. Equity FundsFidelity Advisor Equity Growth Fund Class I 2.6Fidelity Advisor Equity Income Fund Class I 5.4Fidelity Advisor Growth Opportunities Class I 1.9Fidelity Advisor Large Cap Fund Class I 3.2Fidelity Advisor Mega Cap Stock Fund Class I 3.0Fidelity Advisor New Insights Fund Class I 2.8Fidelity Advisor Real Estate Fund Class I 0.3Fidelity Advisor Stock Selector Small Cap Fund Class I 1.1Fidelity Series Commodity Strategy Fund 0.7Fidelity Stock Selector All Cap Fund Class I 6.8
27.8Non – U.S. Equity FundsFidelity Advisor Diversified International Fund Class I 3.6Fidelity Advisor Emerging Markets Fund Class I 4.3Fidelity Advisor Emerging Markets Income Class I 0.6Fidelity Advisor Overseas Fund Class I 3.5
12.0Bond FundsFidelity Advisor Corporate Bond Fund Class I 2.4Fidelity Advisor Floating Rate High Income Fund Class I 0.2Fidelity Advisor Government Income Fund Class I 9.2Fidelity Advisor High Income Fund Class I 3.1Fidelity Advisor Inflation-Protected Bond Fund Class I 3.1Fidelity Advisor Investment Grade Bond Fund Class I 13.6Fidelity Advisor Mortgage Securities Class I 2.1Fidelity Advisor Real Estate Income Fund Class I 0.8Fidelity Advisor Total Bond Fund Class I 14.6
49.1Short-Term FundsFidelity Advisor Short Fixed-Income Fund Class I 3.4Fidelity Institutional Money Market Portfolio Institutional Class 7.8
11.2Net Other Assets (Liabilities) (0.1)
100.0
Asset Allocation (% of Portfolio’s net assets)
Bond Funds 49.1%
U.S. Equity Funds 27.8%
Non – U.S. Equity Funds 12.0%
Short-Term Funds 11.2%
Net Other Assets (Liabilities) (0.1)%*
* Net Other Assets (Liabilities) are not included in the pie chart

67 Annual Report
See accompanying notes which are an integral part of the financial statements.
U.S. Equity Funds – 27.8%Shares Value
Fidelity Advisor Equity Growth Fund Class I 189,270 $ 18,489,814
Fidelity Advisor Equity Income Fund Class I 1,279,042 39,061,954
Fidelity Advisor Growth Opportunities Class I 214,992 13,660,561
Fidelity Advisor Large Cap Fund Class I 867,234 23,467,347
Fidelity Advisor Mega Cap Stock Fund Class I 1,427,841 21,346,228
Fidelity Advisor New Insights Fund Class I 779,915 20,480,571
Fidelity Advisor Real Estate Fund Class I 100,113 2,153,422
Fidelity Advisor Stock Selector Small Cap Fund Class I 327,606 7,757,720
Fidelity Series Commodity Strategy Fund 983,460 5,379,527
Fidelity Stock Selector All Cap Fund Class I 1,480,668 48,847,227
TOTAL U.S. EQUITY FUNDS(Cost $172,769,981) 200,644,371
Non – U.S. Equity Funds – 12.0%
Fidelity Advisor Diversified International Fund Class I 1,323,225 25,458,846
Fidelity Advisor Emerging Markets Fund Class I 1,600,802 30,991,527
Fidelity Advisor Emerging Markets Income Class I 342,509 4,298,490
Fidelity Advisor Overseas Fund Class I 1,226,887 25,433,374
TOTAL NON – U.S. EQUITY FUNDS(Cost $82,818,430) 86,182,237
Bond Funds – 49.1%
Fidelity Advisor Corporate Bond Fund Class I 1,570,266 17,429,948
Fidelity Advisor Floating Rate High Income Fund Class I 192,480 1,813,162
Fidelity Advisor Government Income Fund Class I 6,258,052 66,085,026
Fidelity Advisor High Income Fund Class I 3,032,556 22,653,190
Fidelity Advisor Inflation-Protected Bond Fund Class I 1,881,846 22,130,511
Fidelity Advisor Investment Grade Bond Fund Class I 12,669,352 97,934,092
Fidelity Advisor Mortgage Securities Class I 1,339,373 15,175,094
Fidelity Advisor Real Estate Income Fund Class I 487,410 5,483,367
FA 529 Portfolio 2019
Investments September 30, 2015Showing Percentage of Net Assets
Shares Value
Fidelity Advisor Total Bond Fund Class I 10,027,465 $ 105,087,832
TOTAL BOND FUNDS(Cost $363,228,284) 353,792,222
Short-Term Funds – 11.2%
Fidelity Advisor Short Fixed-Income Fund Class I 2,589,789 24,240,422
Fidelity Institutional Money Market Portfolio Institutional Class 0.17% (a) 56,532,991 56,532,991
TOTAL SHORT-TERM FUNDS(Cost $80,647,544) 80,773,413
TOTAL INVESTMENT PORTFOLIO – 100.1%(Cost $699,464,239) $721,392,243
NET OTHER ASSETS (LIABILITIES) – (0.1)% (379,641)
NET ASSETS – 100% $721,012,602
Legend(a) The rate quoted is the annualized seven-day yield of the fund at
period end.
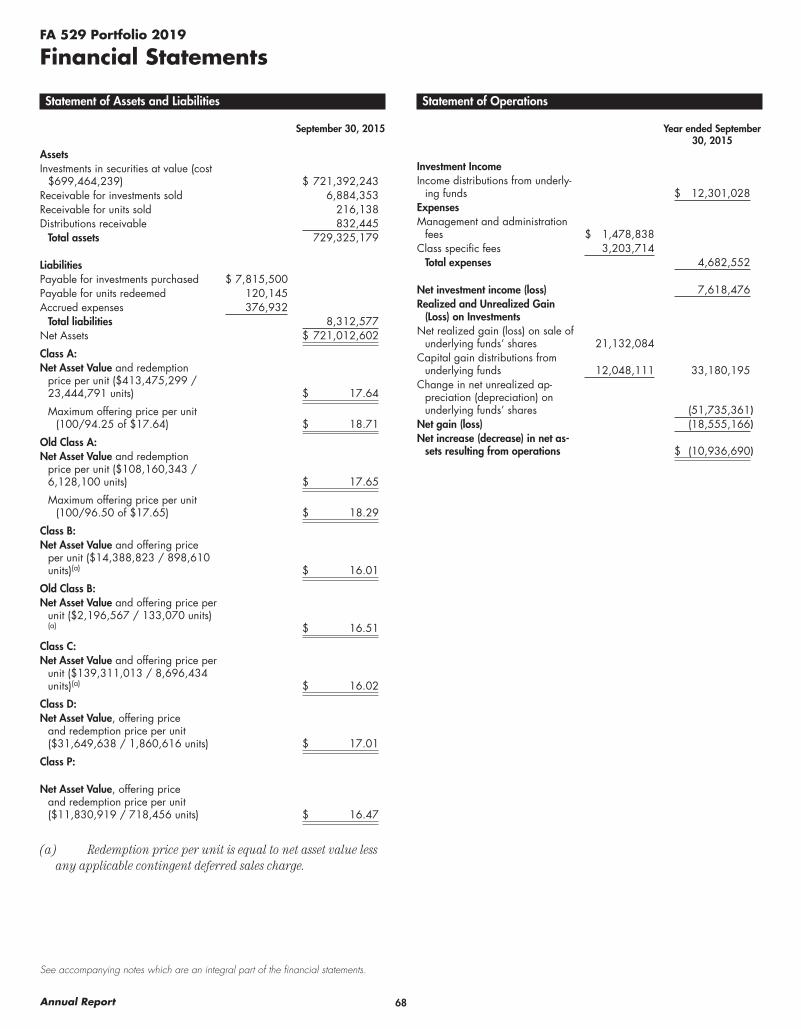
68Annual Report
See accompanying notes which are an integral part of the financial statements.
FA 529 Portfolio 2019
Financial Statements
Statement of Assets and Liabilities
September 30, 2015
AssetsInvestments in securities at value (cost
$699,464,239) $ 721,392,243Receivable for investments sold 6,884,353Receivable for units sold 216,138Distributions receivable 832,445
Total assets 729,325,179
LiabilitiesPayable for investments purchased $ 7,815,500Payable for units redeemed 120,145Accrued expenses 376,932
Total liabilities 8,312,577Net Assets $ 721,012,602
Class A:Net Asset Value and redemption
price per unit ($413,475,299 / 23,444,791 units) $ 17.64
Maximum offering price per unit (100/94.25 of $17.64) $ 18.71
Old Class A:Net Asset Value and redemption
price per unit ($108,160,343 / 6,128,100 units) $ 17.65
Maximum offering price per unit (100/96.50 of $17.65) $ 18.29
Class B:Net Asset Value and offering price
per unit ($14,388,823 / 898,610 units)(a) $ 16.01
Old Class B:Net Asset Value and offering price per
unit ($2,196,567 / 133,070 units)(a) $ 16.51
Class C:Net Asset Value and offering price per
unit ($139,311,013 / 8,696,434 units)(a) $ 16.02
Class D:Net Asset Value, offering price
and redemption price per unit ($31,649,638 / 1,860,616 units) $ 17.01
Class P:
Net Asset Value, offering price and redemption price per unit ($11,830,919 / 718,456 units) $ 16.47
(a) Redemption price per unit is equal to net asset value less any applicable contingent deferred sales charge.
Statement of Operations
Year ended September 30, 2015
Investment IncomeIncome distributions from underly-
ing funds $ 12,301,028ExpensesManagement and administration
fees $ 1,478,838Class specific fees 3,203,714
Total expenses 4,682,552
Net investment income (loss) 7,618,476Realized and Unrealized Gain
(Loss) on InvestmentsNet realized gain (loss) on sale of
underlying funds’ shares 21,132,084Capital gain distributions from
underlying funds 12,048,111 33,180,195Change in net unrealized ap-
preciation (depreciation) on underlying funds’ shares (51,735,361)
Net gain (loss) (18,555,166)Net increase (decrease) in net as-
sets resulting from operations $ (10,936,690)

69 Annual Report
See accompanying notes which are an integral part of the financial statements.
FA 529 Portfolio 2019Financial Statements – continued
Statement of Changes in Net Assets
Year ended September 30,
2015
Year ended September 30,
2014Increase (Decrease) in Net Assets:
OperationsNet investment income (loss) $ 7,618,476 $ 5,986,173Net realized gain (loss) 33,180,195 24,869,815Change in net unrealized appreciation (depreciation) (51,735,361) 12,108,743Net increase (decrease) in net assets resulting from operations (10,936,690) 42,964,731Net increase (decrease) in net assets resulting from unit transactions 19,549,009 31,431,538Total increase (decrease) in net assets 8,612,319 74,396,269
Net AssetsBeginning of period 712,400,283 638,004,014End of period $ 721,012,602 $ 712,400,283
Financial Highlights FA 529 Portfolio 2019 Class A
Periods ended September 30, 2015 2014 2013 2012 2011Selected Per Unit Data Net asset value, beginning of period $ 17.86 $ 16.72 $ 15.36 $ 13.09 $ 13.17Income from Investment Operations
Net investment income (loss) A .22 .19 .16 .19 .20Net realized and unrealized gain (loss) (.44) .95 1.20 2.08 (.28)
Total increase (decrease) from investment operations (.22) 1.14 1.36 2.27 (.08)Net asset value, end of period $ 17.64 $ 17.86 $ 16.72 $ 15.36 $ 13.09
Total Return B (1.23)% 6.82% 8.85% 17.34% (.61)%Ratios and Supplemental Data C Net assets, end of period (in $ thousands) $ 413,475 $ 402,721 $ 352,667 $ 292,116 $ 214,000Ratio of expenses to average net assets .45% .45% .45% .45% .45%Ratio of net investment income (loss) to average net assets 1.21% 1.06% 1.02% 1.33% 1.41%Portfolio Turnover Rate 18% 25% 35% 33% 21%
A Calculated based on average units outstanding during the period.B Total returns do not include the effect of the sales charges.C Amounts do not include the activity of any underlying fund.
Financial Highlights FA 529 Portfolio 2019 Old Class A
Periods ended September 30, 2015 2014 2013 2012 2011Selected Per Unit Data Net asset value, beginning of period $ 17.88 $ 16.73 $ 15.37 $ 13.10 $ 13.18Income from Investment Operations
Net investment income (loss) A .22 .19 .17 .20 .20Net realized and unrealized gain (loss) (.45) .96 1.19 2.07 (.28)
Total increase (decrease) from investment operations (.23) 1.15 1.36 2.27 (.08)Net asset value, end of period $ 17.65 $ 17.88 $ 16.73 $ 15.37 $ 13.10
Total Return B (1.29)% 6.87% 8.85% 17.33% (.61)%Ratios and Supplemental Data C Net assets, end of period (in $ thousands) $ 108,160 $ 105,514 $ 94,335 $ 83,246 $ 66,243Ratio of expenses to average net assets .45% .45% .45% .45% .45%Ratio of net investment income (loss) to average net assets 1.21% 1.06% 1.03% 1.35% 1.43%Portfolio Turnover Rate 18% 25% 35% 33% 21%
A Calculated based on average units outstanding during the period.B Total returns do not include the effect of the sales charges.C Amounts do not include the activity of any underlying fund.
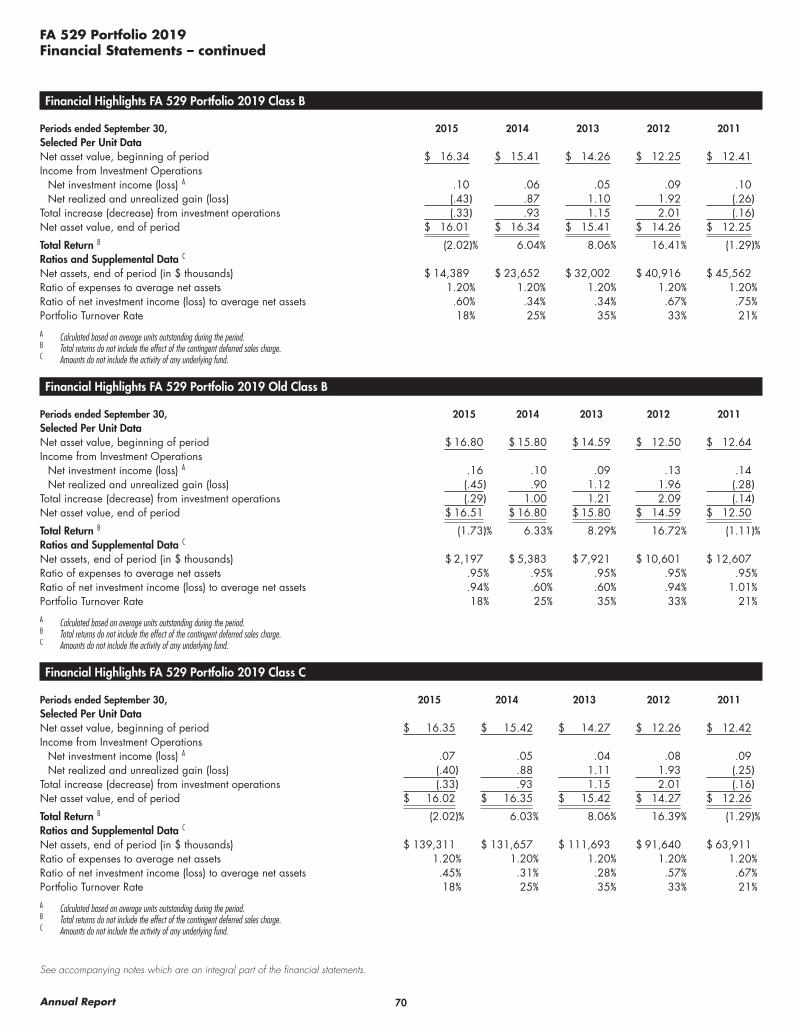
70Annual Report
See accompanying notes which are an integral part of the financial statements.
FA 529 Portfolio 2019Financial Statements – continued
Financial Highlights FA 529 Portfolio 2019 Class B
Periods ended September 30, 2015 2014 2013 2012 2011Selected Per Unit Data Net asset value, beginning of period $ 16.34 $ 15.41 $ 14.26 $ 12.25 $ 12.41Income from Investment Operations
Net investment income (loss) A .10 .06 .05 .09 .10Net realized and unrealized gain (loss) (.43) .87 1.10 1.92 (.26)
Total increase (decrease) from investment operations (.33) .93 1.15 2.01 (.16)Net asset value, end of period $ 16.01 $ 16.34 $ 15.41 $ 14.26 $ 12.25
Total Return B (2.02)% 6.04% 8.06% 16.41% (1.29)%Ratios and Supplemental Data C Net assets, end of period (in $ thousands) $ 14,389 $ 23,652 $ 32,002 $ 40,916 $ 45,562Ratio of expenses to average net assets 1.20% 1.20% 1.20% 1.20% 1.20%Ratio of net investment income (loss) to average net assets .60% .34% .34% .67% .75%Portfolio Turnover Rate 18% 25% 35% 33% 21%
A Calculated based on average units outstanding during the period.B Total returns do not include the effect of the contingent deferred sales charge.C Amounts do not include the activity of any underlying fund.
Financial Highlights FA 529 Portfolio 2019 Old Class B
Periods ended September 30, 2015 2014 2013 2012 2011Selected Per Unit Data Net asset value, beginning of period $ 16.80 $ 15.80 $ 14.59 $ 12.50 $ 12.64Income from Investment Operations
Net investment income (loss) A .16 .10 .09 .13 .14Net realized and unrealized gain (loss) (.45) .90 1.12 1.96 (.28)
Total increase (decrease) from investment operations (.29) 1.00 1.21 2.09 (.14)Net asset value, end of period $ 16.51 $ 16.80 $ 15.80 $ 14.59 $ 12.50
Total Return B (1.73)% 6.33% 8.29% 16.72% (1.11)%Ratios and Supplemental Data C Net assets, end of period (in $ thousands) $ 2,197 $ 5,383 $ 7,921 $ 10,601 $ 12,607Ratio of expenses to average net assets .95% .95% .95% .95% .95%Ratio of net investment income (loss) to average net assets .94% .60% .60% .94% 1.01%Portfolio Turnover Rate 18% 25% 35% 33% 21%
A Calculated based on average units outstanding during the period.B Total returns do not include the effect of the contingent deferred sales charge.C Amounts do not include the activity of any underlying fund.
Financial Highlights FA 529 Portfolio 2019 Class C
Periods ended September 30, 2015 2014 2013 2012 2011Selected Per Unit Data Net asset value, beginning of period $ 16.35 $ 15.42 $ 14.27 $ 12.26 $ 12.42Income from Investment Operations
Net investment income (loss) A .07 .05 .04 .08 .09Net realized and unrealized gain (loss) (.40) .88 1.11 1.93 (.25)
Total increase (decrease) from investment operations (.33) .93 1.15 2.01 (.16)Net asset value, end of period $ 16.02 $ 16.35 $ 15.42 $ 14.27 $ 12.26
Total Return B (2.02)% 6.03% 8.06% 16.39% (1.29)%Ratios and Supplemental Data C Net assets, end of period (in $ thousands) $ 139,311 $ 131,657 $ 111,693 $ 91,640 $ 63,911Ratio of expenses to average net assets 1.20% 1.20% 1.20% 1.20% 1.20%Ratio of net investment income (loss) to average net assets .45% .31% .28% .57% .67%Portfolio Turnover Rate 18% 25% 35% 33% 21%
A Calculated based on average units outstanding during the period.B Total returns do not include the effect of the contingent deferred sales charge.C Amounts do not include the activity of any underlying fund.

71 Annual Report
See accompanying notes which are an integral part of the financial statements.
FA 529 Portfolio 2019Financial Statements – continued
Financial Highlights FA 529 Portfolio 2019 Class D
Periods ended September 30, 2015 2014 2013 2012 2011Selected Per Unit Data Net asset value, beginning of period $ 17.27 $ 16.21 $ 14.92 $ 12.76 $ 12.86Income from Investment Operations
Net investment income (loss) A .17 .14 .12 .16 .17Net realized and unrealized gain (loss) (.43) .92 1.17 2.00 (.27)
Total increase (decrease) from investment operations (.26) 1.06 1.29 2.16 (.10)Net asset value, end of period $ 17.01 $ 17.27 $ 16.21 $ 14.92 $ 12.76
Total Return (1.51)% 6.54% 8.65% 16.93% (.78)%Ratios and Supplemental Data B Net assets, end of period (in $ thousands) $ 31,650 $ 32,035 $ 29,243 $ 26,567 $ 22,363Ratio of expenses to average net assets .70% .70% .70% .70% .70%Ratio of net investment income (loss) to average net assets .98% .81% .78% 1.11% 1.20%Portfolio Turnover Rate 18% 25% 35% 33% 21%
A Calculated based on average units outstanding during the period.B Amounts do not include the activity of any underlying fund.
Financial Highlights FA 529 Portfolio 2019 Class P
Periods ended September 30, 2015 2014 2013 2012 2011Selected Per Unit Data Net asset value, beginning of period $ 16.76 $ 15.77 $ 14.56 $ 12.47 $ 12.61Income from Investment Operations
Net investment income (loss) A .12 .09 .08 .12 .13Net realized and unrealized gain (loss) (.41) .90 1.13 1.97 (.27)
Total increase (decrease) from investment operations (.29) .99 1.21 2.09 (.14)Net asset value, end of period $ 16.47 $ 16.76 $ 15.77 $ 14.56 $ 12.47
Total Return (1.73)% 6.28% 8.31% 16.76% (1.11)%Ratios and Supplemental Data B Net assets, end of period (in $ thousands) $ 11,831 $ 11,440 $ 10,143 $ 8,747 $ 6,822Ratio of expenses to average net assets .95% .95% .95% .95% .95%Ratio of net investment income (loss) to average net assets .71% .56% .53% .85% .93%Portfolio Turnover Rate 18% 25% 35% 33% 21%
A Calculated based on average units outstanding during the period.B Amounts do not include the activity of any underlying fund.

72Annual Report
FA 529 Portfolio 2022
Investment Summary
Portfolio Holdings as of September 30, 2015% of Portfolio’s net
assetsU.S. Equity FundsFidelity Advisor Equity Growth Fund Class I 3.4Fidelity Advisor Equity Income Fund Class I 7.2Fidelity Advisor Growth Opportunities Class I 2.5Fidelity Advisor Large Cap Fund Class I 4.3Fidelity Advisor Mega Cap Stock Fund Class I 3.9Fidelity Advisor New Insights Fund Class I 3.8Fidelity Advisor Real Estate Fund Class I 0.4Fidelity Advisor Stock Selector Small Cap Fund Class I 1.4Fidelity Series Commodity Strategy Fund 0.8Fidelity Stock Selector All Cap Fund Class I 9.0
36.7Non – U.S. Equity FundsFidelity Advisor Diversified International Fund Class I 5.0Fidelity Advisor Emerging Markets Fund Class I 5.4Fidelity Advisor Emerging Markets Income Class I 0.6Fidelity Advisor Overseas Fund Class I 5.0
16.0Bond FundsFidelity Advisor Corporate Bond Fund Class I 2.1Fidelity Advisor Floating Rate High Income Fund Class I 0.3Fidelity Advisor Government Income Fund Class I 8.0Fidelity Advisor High Income Fund Class I 3.1Fidelity Advisor Inflation-Protected Bond Fund Class I 2.1Fidelity Advisor Investment Grade Bond Fund Class I 11.8Fidelity Advisor Mortgage Securities Class I 1.8Fidelity Advisor Real Estate Income Fund Class I 0.8Fidelity Advisor Total Bond Fund Class I 12.4
42.4Short-Term FundsFidelity Advisor Short Fixed-Income Fund Class I 1.5Fidelity Institutional Money Market Portfolio Institutional Class 3.5
5.0Net Other Assets (Liabilities) (0.1)
100.0
Asset Allocation (% of Portfolio’s net assets)
Bond Funds 42.4%
U.S. Equity Funds 36.7%
Non – U.S. Equity Funds 16.0%
Short-Term Funds 5.0%
Net Other Assets (Liabilities) (0.1)%*
* Net Other Assets (Liabilities) are not included in the pie chart

73 Annual Report
See accompanying notes which are an integral part of the financial statements.
U.S. Equity Funds – 36.7%Shares Value
Fidelity Advisor Equity Growth Fund Class I 227,263 $ 22,201,330
Fidelity Advisor Equity Income Fund Class I 1,536,104 46,912,613
Fidelity Advisor Growth Opportunities Class I 258,118 16,400,836
Fidelity Advisor Large Cap Fund Class I 1,041,420 28,180,814
Fidelity Advisor Mega Cap Stock Fund Class I 1,714,590 25,633,128
Fidelity Advisor New Insights Fund Class I 936,512 24,592,812
Fidelity Advisor Real Estate Fund Class I 120,270 2,587,010
Fidelity Advisor Stock Selector Small Cap Fund Class I 393,163 9,310,094
Fidelity Series Commodity Strategy Fund 893,222 4,885,925
Fidelity Stock Selector All Cap Fund Class I 1,778,606 58,676,223
TOTAL U.S. EQUITY FUNDS(Cost $206,558,142) 239,380,785
Non – U.S. Equity Funds – 16.0%
Fidelity Advisor Diversified International Fund Class I 1,705,728 32,818,210
Fidelity Advisor Emerging Markets Fund Class I 1,797,656 34,802,613
Fidelity Advisor Emerging Markets Income Class I 311,091 3,904,195
Fidelity Advisor Overseas Fund Class I 1,581,535 32,785,217
TOTAL NON – U.S. EQUITY FUNDS(Cost $100,800,394) 104,310,235
Bond Funds – 42.4%
Fidelity Advisor Corporate Bond Fund Class I 1,236,757 13,728,001
Fidelity Advisor Floating Rate High Income Fund Class I 174,823 1,646,828
Fidelity Advisor Government Income Fund Class I 4,926,196 52,020,626
Fidelity Advisor High Income Fund Class I 2,754,358 20,575,053
Fidelity Advisor Inflation-Protected Bond Fund Class I 1,175,082 13,818,966
Fidelity Advisor Investment Grade Bond Fund Class I 9,976,268 77,116,551
Fidelity Advisor Mortgage Securities Class I 1,055,331 11,956,899
Fidelity Advisor Real Estate Income Fund Class I 443,396 4,988,200
FA 529 Portfolio 2022
Investments September 30, 2015Showing Percentage of Net Assets
Shares Value
Fidelity Advisor Total Bond Fund Class I 7,732,045 $ 81,031,835
TOTAL BOND FUNDS(Cost $284,010,494) 276,882,959
Short-Term Funds – 5.0%
Fidelity Advisor Short Fixed-Income Fund Class I 1,041,274 9,746,328
Fidelity Institutional Money Market Portfolio Institutional Class 0.17% (a) 22,733,740 22,733,740
TOTAL SHORT-TERM FUNDS(Cost $32,486,326) 32,480,068
TOTAL INVESTMENT PORTFOLIO – 100.1%(Cost $623,855,356) $653,054,047
NET OTHER ASSETS (LIABILITIES) – (0.1)% (343,879)
NET ASSETS – 100% $652,710,168
Legend(a) The rate quoted is the annualized seven-day yield of the fund at
period end.

74Annual Report
See accompanying notes which are an integral part of the financial statements.
FA 529 Portfolio 2022
Financial Statements
Statement of Assets and Liabilities
September 30, 2015
AssetsInvestments in securities at value (cost
$623,855,356) $ 653,054,047Receivable for investments sold 6,664,567Receivable for units sold 131,779Distributions receivable 661,031
Total assets 660,511,424
LiabilitiesPayable for investments purchased $ 7,433,091Payable for units redeemed 23,995Accrued expenses 344,170
Total liabilities 7,801,256Net Assets $ 652,710,168
Class A:Net Asset Value and redemption
price per unit ($475,369,498 / 21,448,056 units) $ 22.16
Maximum offering price per unit (100/94.25 of $22.16) $ 23.52
Old Class A:Net Asset Value and redemption price
per unit ($11,988,628 / 540,339 units) $ 22.19
Maximum offering price per unit (100/96.50 of $22.19) $ 22.99
Class B:Net Asset Value and offering price
per unit ($18,196,310 / 900,568 units)(a) $ 20.21
Old Class B:Net Asset Value and offering price per
unit ($181,439 / 8,714 units)(a) $ 20.82
Class C:Net Asset Value and offering price per
unit ($135,329,871 / 6,692,260 units)(a) $ 20.22
Class D:Net Asset Value, offering price
and redemption price per unit ($3,074,189 / 142,972 units) $ 21.50
Class P:
Net Asset Value, offering price and redemption price per unit ($8,570,233 / 410,841 units) $ 20.86
(a) Redemption price per unit is equal to net asset value less any applicable contingent deferred sales charge.
Statement of Operations
Year ended September 30, 2015
Investment IncomeIncome distributions from underly-
ing funds $ 10,939,585ExpensesManagement and administration
fees $ 1,336,544Class specific fees 2,941,643
Total expenses 4,278,187
Net investment income (loss) 6,661,398Realized and Unrealized Gain
(Loss) on InvestmentsNet realized gain (loss) on sale of
underlying funds’ shares 21,652,790Capital gain distributions from
underlying funds 13,491,736 35,144,526Change in net unrealized ap-
preciation (depreciation) on underlying funds’ shares (55,347,068)
Net gain (loss) (20,202,542)Net increase (decrease) in net as-
sets resulting from operations $ (13,541,144)
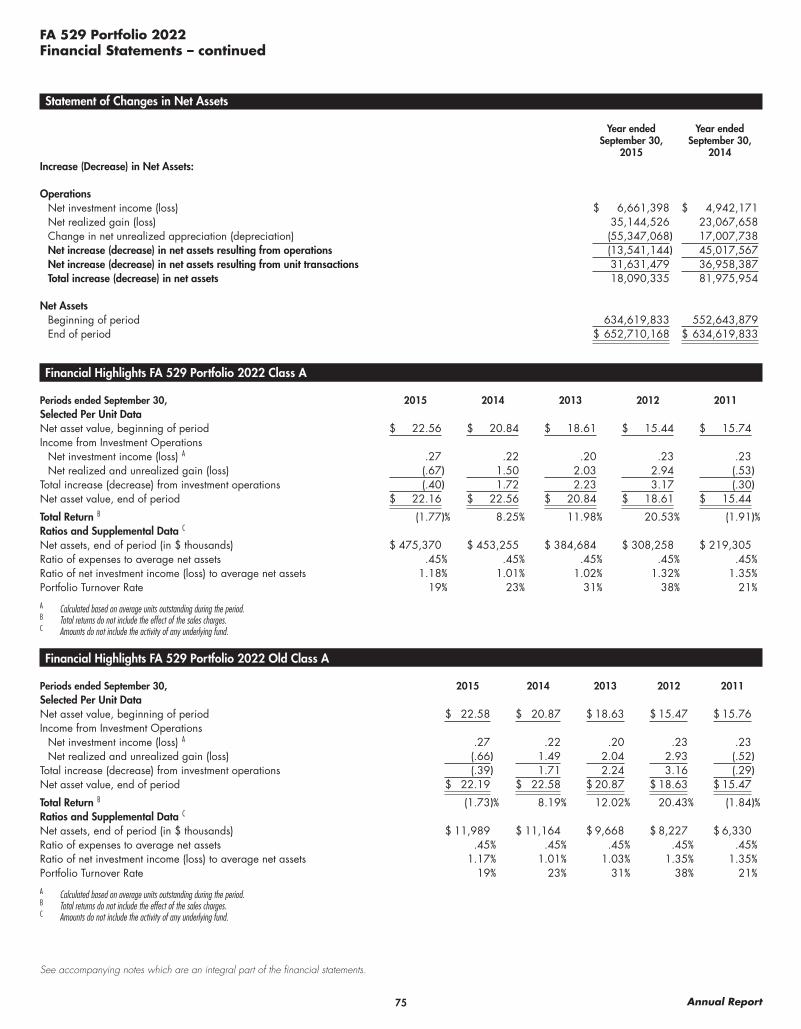
75 Annual Report
See accompanying notes which are an integral part of the financial statements.
FA 529 Portfolio 2022Financial Statements – continued
Statement of Changes in Net Assets
Year ended September 30,
2015
Year ended September 30,
2014Increase (Decrease) in Net Assets:
OperationsNet investment income (loss) $ 6,661,398 $ 4,942,171Net realized gain (loss) 35,144,526 23,067,658Change in net unrealized appreciation (depreciation) (55,347,068) 17,007,738Net increase (decrease) in net assets resulting from operations (13,541,144) 45,017,567Net increase (decrease) in net assets resulting from unit transactions 31,631,479 36,958,387Total increase (decrease) in net assets 18,090,335 81,975,954
Net AssetsBeginning of period 634,619,833 552,643,879End of period $ 652,710,168 $ 634,619,833
Financial Highlights FA 529 Portfolio 2022 Class A
Periods ended September 30, 2015 2014 2013 2012 2011Selected Per Unit Data Net asset value, beginning of period $ 22.56 $ 20.84 $ 18.61 $ 15.44 $ 15.74Income from Investment Operations
Net investment income (loss) A .27 .22 .20 .23 .23Net realized and unrealized gain (loss) (.67) 1.50 2.03 2.94 (.53)
Total increase (decrease) from investment operations (.40) 1.72 2.23 3.17 (.30)Net asset value, end of period $ 22.16 $ 22.56 $ 20.84 $ 18.61 $ 15.44
Total Return B (1.77)% 8.25% 11.98% 20.53% (1.91)%Ratios and Supplemental Data C Net assets, end of period (in $ thousands) $ 475,370 $ 453,255 $ 384,684 $ 308,258 $ 219,305Ratio of expenses to average net assets .45% .45% .45% .45% .45%Ratio of net investment income (loss) to average net assets 1.18% 1.01% 1.02% 1.32% 1.35%Portfolio Turnover Rate 19% 23% 31% 38% 21%
A Calculated based on average units outstanding during the period.B Total returns do not include the effect of the sales charges.C Amounts do not include the activity of any underlying fund.
Financial Highlights FA 529 Portfolio 2022 Old Class A
Periods ended September 30, 2015 2014 2013 2012 2011Selected Per Unit Data Net asset value, beginning of period $ 22.58 $ 20.87 $ 18.63 $ 15.47 $ 15.76Income from Investment Operations
Net investment income (loss) A .27 .22 .20 .23 .23Net realized and unrealized gain (loss) (.66) 1.49 2.04 2.93 (.52)
Total increase (decrease) from investment operations (.39) 1.71 2.24 3.16 (.29)Net asset value, end of period $ 22.19 $ 22.58 $ 20.87 $ 18.63 $ 15.47
Total Return B (1.73)% 8.19% 12.02% 20.43% (1.84)%Ratios and Supplemental Data C Net assets, end of period (in $ thousands) $ 11,989 $ 11,164 $ 9,668 $ 8,227 $ 6,330Ratio of expenses to average net assets .45% .45% .45% .45% .45%Ratio of net investment income (loss) to average net assets 1.17% 1.01% 1.03% 1.35% 1.35%Portfolio Turnover Rate 19% 23% 31% 38% 21%
A Calculated based on average units outstanding during the period.B Total returns do not include the effect of the sales charges.C Amounts do not include the activity of any underlying fund.

76Annual Report
See accompanying notes which are an integral part of the financial statements.
FA 529 Portfolio 2022Financial Statements – continued
Financial Highlights FA 529 Portfolio 2022 Class B
Periods ended September 30, 2015 2014 2013 2012 2011Selected Per Unit Data Net asset value, beginning of period $ 20.72 $ 19.29 $ 17.35 $ 14.51 $ 14.89Income from Investment Operations
Net investment income (loss) A .13 .06 .06 .11 .11Net realized and unrealized gain (loss) (.64) 1.37 1.88 2.73 (.49)
Total increase (decrease) from investment operations (.51) 1.43 1.94 2.84 (.38)Net asset value, end of period $ 20.21 $ 20.72 $ 19.29 $ 17.35 $ 14.51
Total Return B (2.46)% 7.41% 11.18% 19.57% (2.55)%Ratios and Supplemental Data C Net assets, end of period (in $ thousands) $ 18,196 $ 29,424 $ 39,314 $ 48,650 $ 52,406Ratio of expenses to average net assets 1.20% 1.20% 1.20% 1.20% 1.20%Ratio of net investment income (loss) to average net assets .60% .31% .35% .69% .68%Portfolio Turnover Rate 19% 23% 31% 38% 21%
A Calculated based on average units outstanding during the period.B Total returns do not include the effect of the contingent deferred sales charge.C Amounts do not include the activity of any underlying fund.
Financial Highlights FA 529 Portfolio 2022 Old Class B
Periods ended September 30, 2015 2014 2013 2012 2011Selected Per Unit Data Net asset value, beginning of period $ 21.29 $ 19.78 $ 17.75 $ 14.80 $ 15.16Income from Investment Operations
Net investment income (loss) A .21 .12 .12 .16 .16Net realized and unrealized gain (loss) (.68) 1.39 1.91 2.79 (.52)
Total increase (decrease) from investment operations (.47) 1.51 2.03 2.95 (.36)Net asset value, end of period $ 20.82 $ 21.29 $ 19.78 $ 17.75 $ 14.80
Total Return B (2.21)% 7.63% 11.44% 19.93% (2.37)%Ratios and Supplemental Data C Net assets, end of period (in $ thousands) $ 181 $ 446 $ 661 $ 876 $ 1,022Ratio of expenses to average net assets .95% .95% .95% .95% .95%Ratio of net investment income (loss) to average net assets .95% .57% .64% .96% .96%Portfolio Turnover Rate 19% 23% 31% 38% 21%
A Calculated based on average units outstanding during the period.B Total returns do not include the effect of the contingent deferred sales charge.C Amounts do not include the activity of any underlying fund.
Financial Highlights FA 529 Portfolio 2022 Class C
Periods ended September 30, 2015 2014 2013 2012 2011Selected Per Unit Data Net asset value, beginning of period $ 20.74 $ 19.30 $ 17.37 $ 14.52 $ 14.90Income from Investment Operations
Net investment income (loss) A .09 .05 .05 .09 .10Net realized and unrealized gain (loss) (.61) 1.39 1.88 2.76 (.48)
Total increase (decrease) from investment operations (.52) 1.44 1.93 2.85 (.38)Net asset value, end of period $ 20.22 $ 20.74 $ 19.30 $ 17.37 $ 14.52
Total Return B (2.51)% 7.46% 11.11% 19.63% (2.55)%Ratios and Supplemental Data C Net assets, end of period (in $ thousands) $ 135,330 $ 128,996 $ 108,762 $ 87,031 $ 62,942Ratio of expenses to average net assets 1.20% 1.20% 1.20% 1.20% 1.20%Ratio of net investment income (loss) to average net assets .43% .26% .27% .58% .62%Portfolio Turnover Rate 19% 23% 31% 38% 21%
A Calculated based on average units outstanding during the period.B Total returns do not include the effect of the contingent deferred sales charge.C Amounts do not include the activity of any underlying fund.
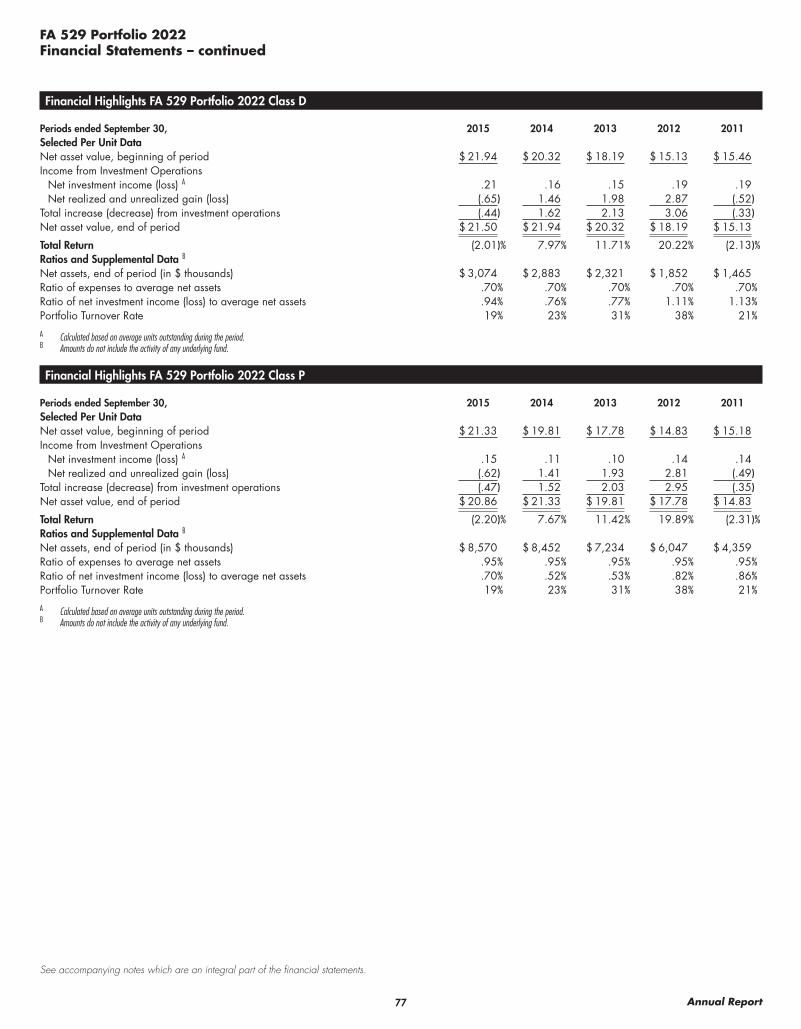
77 Annual Report
See accompanying notes which are an integral part of the financial statements.
FA 529 Portfolio 2022Financial Statements – continued
Financial Highlights FA 529 Portfolio 2022 Class D
Periods ended September 30, 2015 2014 2013 2012 2011Selected Per Unit Data Net asset value, beginning of period $ 21.94 $ 20.32 $ 18.19 $ 15.13 $ 15.46Income from Investment Operations
Net investment income (loss) A .21 .16 .15 .19 .19Net realized and unrealized gain (loss) (.65) 1.46 1.98 2.87 (.52)
Total increase (decrease) from investment operations (.44) 1.62 2.13 3.06 (.33)Net asset value, end of period $ 21.50 $ 21.94 $ 20.32 $ 18.19 $ 15.13
Total Return (2.01)% 7.97% 11.71% 20.22% (2.13)%Ratios and Supplemental Data B Net assets, end of period (in $ thousands) $ 3,074 $ 2,883 $ 2,321 $ 1,852 $ 1,465Ratio of expenses to average net assets .70% .70% .70% .70% .70%Ratio of net investment income (loss) to average net assets .94% .76% .77% 1.11% 1.13%Portfolio Turnover Rate 19% 23% 31% 38% 21%
A Calculated based on average units outstanding during the period.B Amounts do not include the activity of any underlying fund.
Financial Highlights FA 529 Portfolio 2022 Class P
Periods ended September 30, 2015 2014 2013 2012 2011Selected Per Unit Data Net asset value, beginning of period $ 21.33 $ 19.81 $ 17.78 $ 14.83 $ 15.18Income from Investment Operations
Net investment income (loss) A .15 .11 .10 .14 .14Net realized and unrealized gain (loss) (.62) 1.41 1.93 2.81 (.49)
Total increase (decrease) from investment operations (.47) 1.52 2.03 2.95 (.35)Net asset value, end of period $ 20.86 $ 21.33 $ 19.81 $ 17.78 $ 14.83
Total Return (2.20)% 7.67% 11.42% 19.89% (2.31)%Ratios and Supplemental Data B Net assets, end of period (in $ thousands) $ 8,570 $ 8,452 $ 7,234 $ 6,047 $ 4,359Ratio of expenses to average net assets .95% .95% .95% .95% .95%Ratio of net investment income (loss) to average net assets .70% .52% .53% .82% .86%Portfolio Turnover Rate 19% 23% 31% 38% 21%
A Calculated based on average units outstanding during the period.B Amounts do not include the activity of any underlying fund.
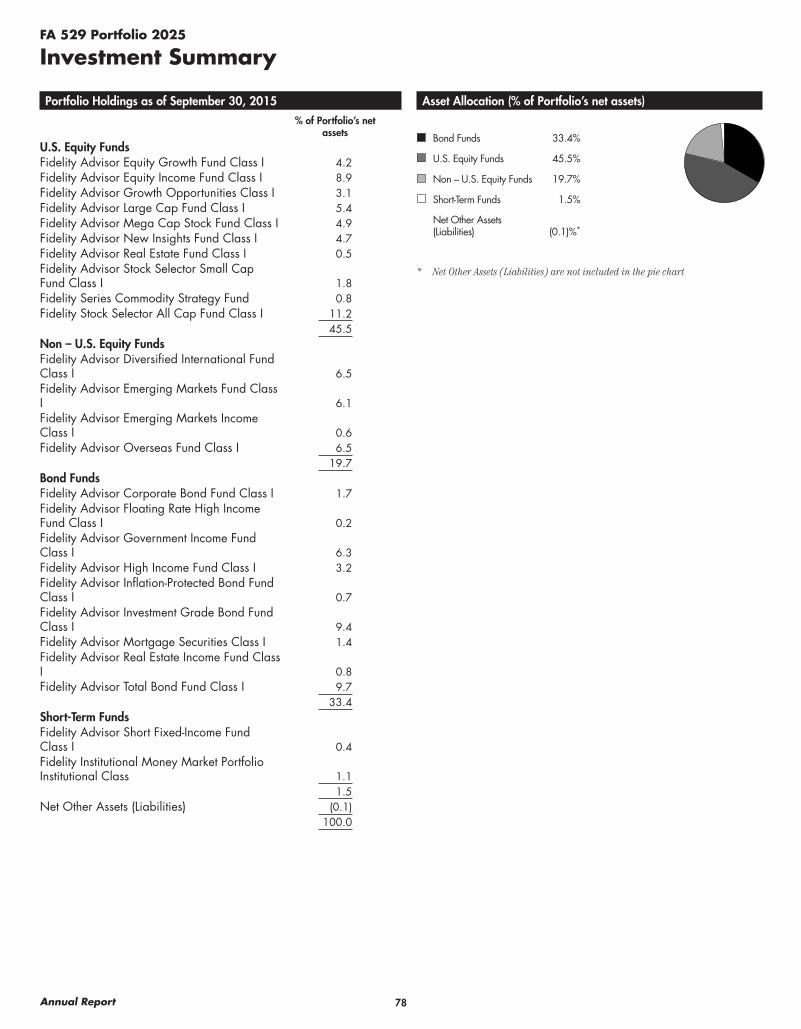
78Annual Report
FA 529 Portfolio 2025
Investment Summary
Portfolio Holdings as of September 30, 2015% of Portfolio’s net
assetsU.S. Equity FundsFidelity Advisor Equity Growth Fund Class I 4.2Fidelity Advisor Equity Income Fund Class I 8.9Fidelity Advisor Growth Opportunities Class I 3.1Fidelity Advisor Large Cap Fund Class I 5.4Fidelity Advisor Mega Cap Stock Fund Class I 4.9Fidelity Advisor New Insights Fund Class I 4.7Fidelity Advisor Real Estate Fund Class I 0.5Fidelity Advisor Stock Selector Small Cap Fund Class I 1.8Fidelity Series Commodity Strategy Fund 0.8Fidelity Stock Selector All Cap Fund Class I 11.2
45.5Non – U.S. Equity FundsFidelity Advisor Diversified International Fund Class I 6.5Fidelity Advisor Emerging Markets Fund Class I 6.1Fidelity Advisor Emerging Markets Income Class I 0.6Fidelity Advisor Overseas Fund Class I 6.5
19.7Bond FundsFidelity Advisor Corporate Bond Fund Class I 1.7Fidelity Advisor Floating Rate High Income Fund Class I 0.2Fidelity Advisor Government Income Fund Class I 6.3Fidelity Advisor High Income Fund Class I 3.2Fidelity Advisor Inflation-Protected Bond Fund Class I 0.7Fidelity Advisor Investment Grade Bond Fund Class I 9.4Fidelity Advisor Mortgage Securities Class I 1.4Fidelity Advisor Real Estate Income Fund Class I 0.8Fidelity Advisor Total Bond Fund Class I 9.7
33.4Short-Term FundsFidelity Advisor Short Fixed-Income Fund Class I 0.4Fidelity Institutional Money Market Portfolio Institutional Class 1.1
1.5Net Other Assets (Liabilities) (0.1)
100.0
Asset Allocation (% of Portfolio’s net assets)
Bond Funds 33.4%
U.S. Equity Funds 45.5%
Non – U.S. Equity Funds 19.7%
Short-Term Funds 1.5%
Net Other Assets (Liabilities) (0.1)%*
* Net Other Assets (Liabilities) are not included in the pie chart
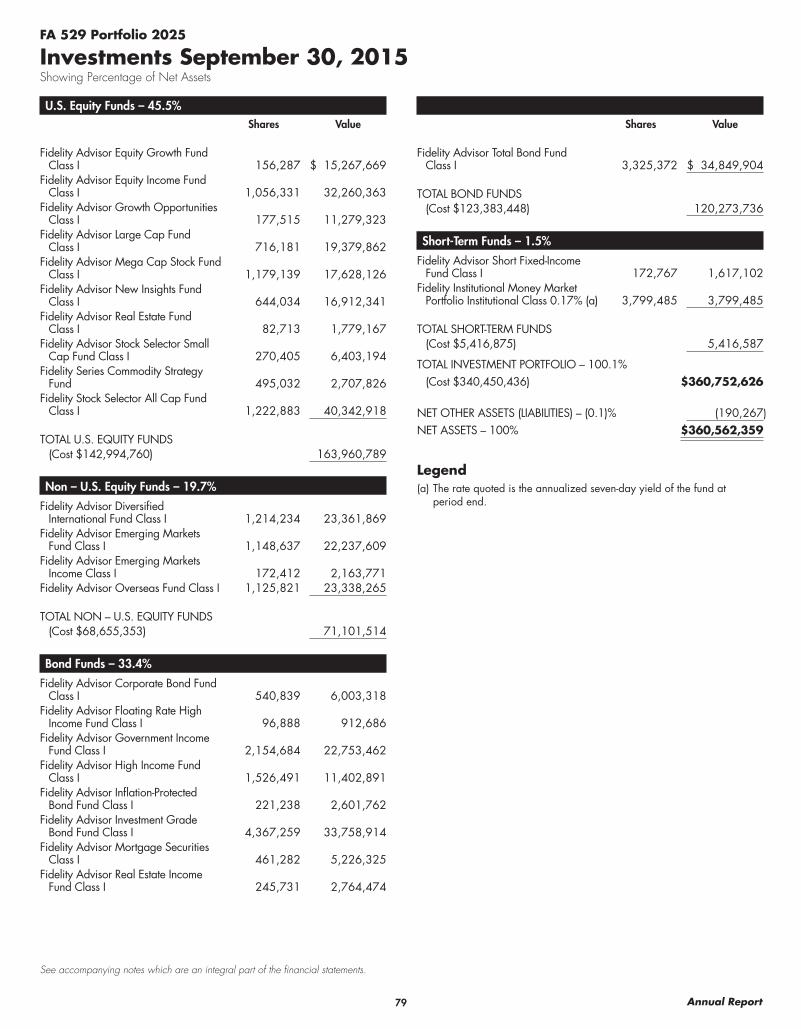
79 Annual Report
See accompanying notes which are an integral part of the financial statements.
U.S. Equity Funds – 45.5%Shares Value
Fidelity Advisor Equity Growth Fund Class I 156,287 $ 15,267,669
Fidelity Advisor Equity Income Fund Class I 1,056,331 32,260,363
Fidelity Advisor Growth Opportunities Class I 177,515 11,279,323
Fidelity Advisor Large Cap Fund Class I 716,181 19,379,862
Fidelity Advisor Mega Cap Stock Fund Class I 1,179,139 17,628,126
Fidelity Advisor New Insights Fund Class I 644,034 16,912,341
Fidelity Advisor Real Estate Fund Class I 82,713 1,779,167
Fidelity Advisor Stock Selector Small Cap Fund Class I 270,405 6,403,194
Fidelity Series Commodity Strategy Fund 495,032 2,707,826
Fidelity Stock Selector All Cap Fund Class I 1,222,883 40,342,918
TOTAL U.S. EQUITY FUNDS(Cost $142,994,760) 163,960,789
Non – U.S. Equity Funds – 19.7%
Fidelity Advisor Diversified International Fund Class I 1,214,234 23,361,869
Fidelity Advisor Emerging Markets Fund Class I 1,148,637 22,237,609
Fidelity Advisor Emerging Markets Income Class I 172,412 2,163,771
Fidelity Advisor Overseas Fund Class I 1,125,821 23,338,265
TOTAL NON – U.S. EQUITY FUNDS(Cost $68,655,353) 71,101,514
Bond Funds – 33.4%
Fidelity Advisor Corporate Bond Fund Class I 540,839 6,003,318
Fidelity Advisor Floating Rate High Income Fund Class I 96,888 912,686
Fidelity Advisor Government Income Fund Class I 2,154,684 22,753,462
Fidelity Advisor High Income Fund Class I 1,526,491 11,402,891
Fidelity Advisor Inflation-Protected Bond Fund Class I 221,238 2,601,762
Fidelity Advisor Investment Grade Bond Fund Class I 4,367,259 33,758,914
Fidelity Advisor Mortgage Securities Class I 461,282 5,226,325
Fidelity Advisor Real Estate Income Fund Class I 245,731 2,764,474
FA 529 Portfolio 2025
Investments September 30, 2015Showing Percentage of Net Assets
Shares Value
Fidelity Advisor Total Bond Fund Class I 3,325,372 $ 34,849,904
TOTAL BOND FUNDS(Cost $123,383,448) 120,273,736
Short-Term Funds – 1.5%
Fidelity Advisor Short Fixed-Income Fund Class I 172,767 1,617,102
Fidelity Institutional Money Market Portfolio Institutional Class 0.17% (a) 3,799,485 3,799,485
TOTAL SHORT-TERM FUNDS(Cost $5,416,875) 5,416,587
TOTAL INVESTMENT PORTFOLIO – 100.1%(Cost $340,450,436) $360,752,626
NET OTHER ASSETS (LIABILITIES) – (0.1)% (190,267)
NET ASSETS – 100% $360,562,359
Legend(a) The rate quoted is the annualized seven-day yield of the fund at
period end.
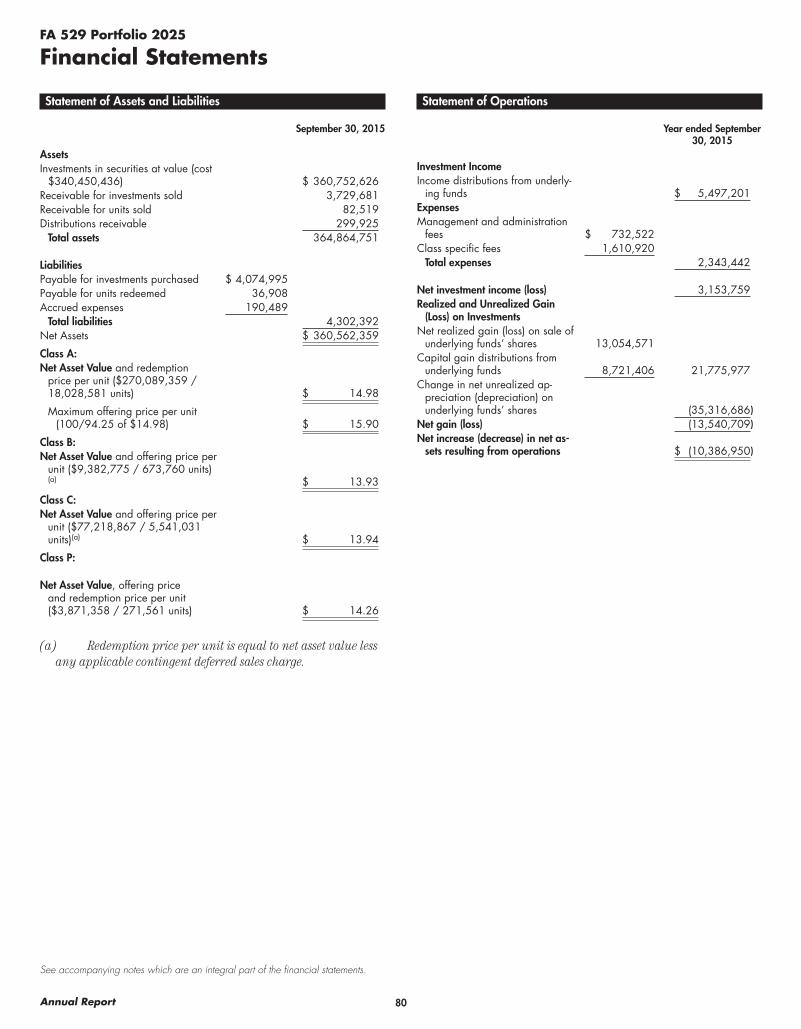
80Annual Report
See accompanying notes which are an integral part of the financial statements.
FA 529 Portfolio 2025
Financial Statements
Statement of Assets and Liabilities
September 30, 2015
AssetsInvestments in securities at value (cost
$340,450,436) $ 360,752,626Receivable for investments sold 3,729,681Receivable for units sold 82,519Distributions receivable 299,925
Total assets 364,864,751
LiabilitiesPayable for investments purchased $ 4,074,995Payable for units redeemed 36,908Accrued expenses 190,489
Total liabilities 4,302,392Net Assets $ 360,562,359
Class A:Net Asset Value and redemption
price per unit ($270,089,359 / 18,028,581 units) $ 14.98
Maximum offering price per unit (100/94.25 of $14.98) $ 15.90
Class B:Net Asset Value and offering price per
unit ($9,382,775 / 673,760 units)(a) $ 13.93
Class C:Net Asset Value and offering price per
unit ($77,218,867 / 5,541,031 units)(a) $ 13.94
Class P:
Net Asset Value, offering price and redemption price per unit ($3,871,358 / 271,561 units) $ 14.26
(a) Redemption price per unit is equal to net asset value less any applicable contingent deferred sales charge.
Statement of Operations
Year ended September 30, 2015
Investment IncomeIncome distributions from underly-
ing funds $ 5,497,201ExpensesManagement and administration
fees $ 732,522Class specific fees 1,610,920
Total expenses 2,343,442
Net investment income (loss) 3,153,759Realized and Unrealized Gain
(Loss) on InvestmentsNet realized gain (loss) on sale of
underlying funds’ shares 13,054,571Capital gain distributions from
underlying funds 8,721,406 21,775,977Change in net unrealized ap-
preciation (depreciation) on underlying funds’ shares (35,316,686)
Net gain (loss) (13,540,709)Net increase (decrease) in net as-
sets resulting from operations $ (10,386,950)

81 Annual Report
See accompanying notes which are an integral part of the financial statements.
FA 529 Portfolio 2025Financial Statements – continued
Statement of Changes in Net Assets
Year ended September 30,
2015
Year ended September 30,
2014Increase (Decrease) in Net Assets:
OperationsNet investment income (loss) $ 3,153,759 $ 2,084,287Net realized gain (loss) 21,775,977 11,897,709Change in net unrealized appreciation (depreciation) (35,316,686) 12,628,484Net increase (decrease) in net assets resulting from operations (10,386,950) 26,610,480Net increase (decrease) in net assets resulting from unit transactions 30,900,063 33,034,341Total increase (decrease) in net assets 20,513,113 59,644,821
Net AssetsBeginning of period 340,049,246 280,404,425End of period $ 360,562,359 $ 340,049,246
Financial Highlights FA 529 Portfolio 2025 Class A
Periods ended September 30, 2015 2014 2013 2012 2011Selected Per Unit Data Net asset value, beginning of period $ 15.35 $ 14.03 $ 12.20 $ 9.92 $ 10.24Income from Investment Operations
Net investment income (loss) A .17 .13 .13 .14 .14Net realized and unrealized gain (loss) (.54) 1.19 1.70 2.14 (.46)
Total increase (decrease) from investment operations (.37) 1.32 1.83 2.28 (.32)Net asset value, end of period $ 14.98 $ 15.35 $ 14.03 $ 12.20 $ 9.92
Total Return B (2.41)% 9.41% 15.00% 22.98% (3.13)%Ratios and Supplemental Data C Net assets, end of period (in $ thousands) $ 270,089 $ 251,228 $ 203,049 $ 152,649 $ 94,799Ratio of expenses to average net assets .45% .45% .45% .45% .45%Ratio of net investment income (loss) to average net assets 1.05% .84% .99% 1.23% 1.24%Portfolio Turnover Rate 22% 19% 25% 39% 22%
A Calculated based on average units outstanding during the period.B Total returns do not include the effect of the sales charges.C Amounts do not include the activity of any underlying fund.
Financial Highlights FA 529 Portfolio 2025 Class B
Periods ended September 30, 2015 2014 2013 2012 2011Selected Per Unit Data Net asset value, beginning of period $ 14.38 $ 13.24 $ 11.60 $ 9.50 $ 9.88Income from Investment Operations
Net investment income (loss) A .07 .05 .04 .06 .06Net realized and unrealized gain (loss) (.52) 1.09 1.60 2.04 (.44)
Total increase (decrease) from investment operations (.45) 1.14 1.64 2.10 (.38)Net asset value, end of period $ 13.93 $ 14.38 $ 13.24 $ 11.60 $ 9.50
Total Return B (3.13)% 8.61% 14.14% 22.11% (3.85)%Ratios and Supplemental Data C Net assets, end of period (in $ thousands) $ 9,383 $ 14,731 $ 17,098 $ 16,464 $ 14,097Ratio of expenses to average net assets 1.20% 1.20% 1.20% 1.20% 1.20%Ratio of net investment income (loss) to average net assets .46% .35% .29% .60% .55%Portfolio Turnover Rate 22% 19% 25% 39% 22%
A Calculated based on average units outstanding during the period.B Total returns do not include the effect of the contingent deferred sales charge.C Amounts do not include the activity of any underlying fund.
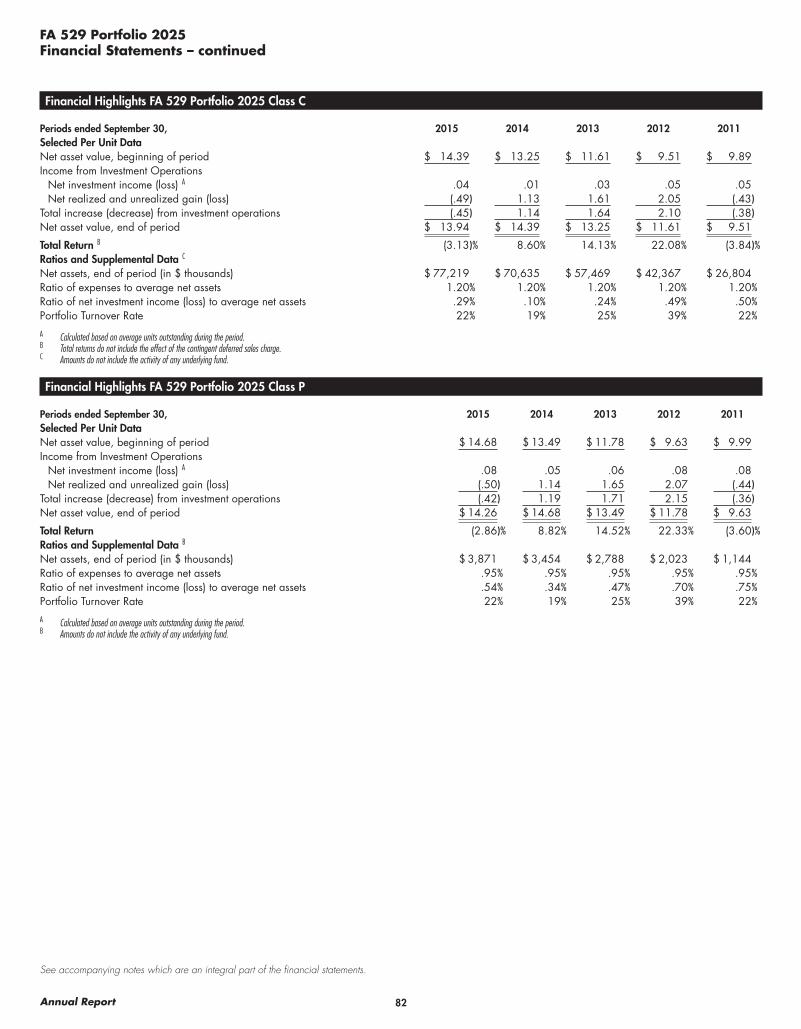
82Annual Report
See accompanying notes which are an integral part of the financial statements.
FA 529 Portfolio 2025Financial Statements – continued
Financial Highlights FA 529 Portfolio 2025 Class C
Periods ended September 30, 2015 2014 2013 2012 2011Selected Per Unit Data Net asset value, beginning of period $ 14.39 $ 13.25 $ 11.61 $ 9.51 $ 9.89Income from Investment Operations
Net investment income (loss) A .04 .01 .03 .05 .05Net realized and unrealized gain (loss) (.49) 1.13 1.61 2.05 (.43)
Total increase (decrease) from investment operations (.45) 1.14 1.64 2.10 (.38)Net asset value, end of period $ 13.94 $ 14.39 $ 13.25 $ 11.61 $ 9.51
Total Return B (3.13)% 8.60% 14.13% 22.08% (3.84)%Ratios and Supplemental Data C Net assets, end of period (in $ thousands) $ 77,219 $ 70,635 $ 57,469 $ 42,367 $ 26,804Ratio of expenses to average net assets 1.20% 1.20% 1.20% 1.20% 1.20%Ratio of net investment income (loss) to average net assets .29% .10% .24% .49% .50%Portfolio Turnover Rate 22% 19% 25% 39% 22%
A Calculated based on average units outstanding during the period.B Total returns do not include the effect of the contingent deferred sales charge.C Amounts do not include the activity of any underlying fund.
Financial Highlights FA 529 Portfolio 2025 Class P
Periods ended September 30, 2015 2014 2013 2012 2011Selected Per Unit Data Net asset value, beginning of period $ 14.68 $ 13.49 $ 11.78 $ 9.63 $ 9.99Income from Investment Operations
Net investment income (loss) A .08 .05 .06 .08 .08Net realized and unrealized gain (loss) (.50) 1.14 1.65 2.07 (.44)
Total increase (decrease) from investment operations (.42) 1.19 1.71 2.15 (.36)Net asset value, end of period $ 14.26 $ 14.68 $ 13.49 $ 11.78 $ 9.63
Total Return (2.86)% 8.82% 14.52% 22.33% (3.60)%Ratios and Supplemental Data B Net assets, end of period (in $ thousands) $ 3,871 $ 3,454 $ 2,788 $ 2,023 $ 1,144Ratio of expenses to average net assets .95% .95% .95% .95% .95%Ratio of net investment income (loss) to average net assets .54% .34% .47% .70% .75%Portfolio Turnover Rate 22% 19% 25% 39% 22%
A Calculated based on average units outstanding during the period.B Amounts do not include the activity of any underlying fund.

83 Annual Report
FA 529 Portfolio 2028
Investment Summary
Portfolio Holdings as of September 30, 2015% of Portfolio’s net
assetsU.S. Equity FundsFidelity Advisor Equity Growth Fund Class I 5.1Fidelity Advisor Equity Income Fund Class I 10.7Fidelity Advisor Growth Opportunities Class I 3.7Fidelity Advisor Large Cap Fund Class I 6.4Fidelity Advisor Mega Cap Stock Fund Class I 5.8Fidelity Advisor New Insights Fund Class I 5.6Fidelity Advisor Real Estate Fund Class I 0.6Fidelity Advisor Stock Selector Small Cap Fund Class I 2.1Fidelity Series Commodity Strategy Fund 0.7Fidelity Stock Selector All Cap Fund Class I 13.4
54.1Non – U.S. Equity FundsFidelity Advisor Diversified International Fund Class I 7.9Fidelity Advisor Emerging Markets Fund Class I 7.0Fidelity Advisor Emerging Markets Income Class I 0.6Fidelity Advisor Overseas Fund Class I 7.9
23.4Bond FundsFidelity Advisor Corporate Bond Fund Class I 1.0Fidelity Advisor Floating Rate High Income Fund Class I 0.2Fidelity Advisor Government Income Fund Class I 3.8Fidelity Advisor High Income Fund Class I 3.2Fidelity Advisor Inflation-Protected Bond Fund Class I 0.2Fidelity Advisor Investment Grade Bond Fund Class I 5.6Fidelity Advisor Mortgage Securities Class I 0.9Fidelity Advisor Real Estate Income Fund Class I 0.8Fidelity Advisor Total Bond Fund Class I 6.0
21.7Short-Term FundsFidelity Advisor Short Fixed-Income Fund Class I 0.3Fidelity Institutional Money Market Portfolio Institutional Class 0.6
0.9Net Other Assets (Liabilities) (0.1)
100.0
Asset Allocation (% of Portfolio’s net assets)
Bond Funds 21.7%
U.S. Equity Funds 54.1%
Non – U.S. Equity Funds 23.4%
Short-Term Funds 0.9%
Net Other Assets (Liabilities) (0.1)%*
* Net Other Assets (Liabilities) are not included in the pie chart
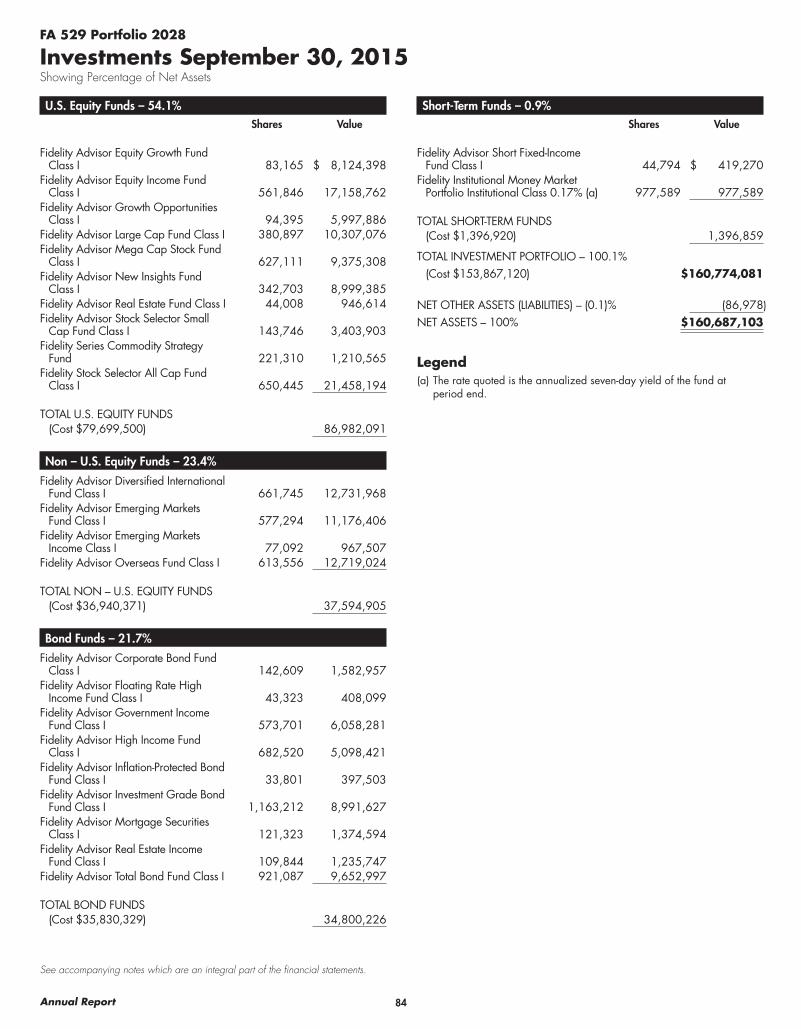
84Annual Report
See accompanying notes which are an integral part of the financial statements.
U.S. Equity Funds – 54.1%Shares Value
Fidelity Advisor Equity Growth Fund Class I 83,165 $ 8,124,398
Fidelity Advisor Equity Income Fund Class I 561,846 17,158,762
Fidelity Advisor Growth Opportunities Class I 94,395 5,997,886
Fidelity Advisor Large Cap Fund Class I 380,897 10,307,076Fidelity Advisor Mega Cap Stock Fund
Class I 627,111 9,375,308Fidelity Advisor New Insights Fund
Class I 342,703 8,999,385Fidelity Advisor Real Estate Fund Class I 44,008 946,614Fidelity Advisor Stock Selector Small
Cap Fund Class I 143,746 3,403,903Fidelity Series Commodity Strategy
Fund 221,310 1,210,565Fidelity Stock Selector All Cap Fund
Class I 650,445 21,458,194
TOTAL U.S. EQUITY FUNDS(Cost $79,699,500) 86,982,091
Non – U.S. Equity Funds – 23.4%
Fidelity Advisor Diversified International Fund Class I 661,745 12,731,968
Fidelity Advisor Emerging Markets Fund Class I 577,294 11,176,406
Fidelity Advisor Emerging Markets Income Class I 77,092 967,507
Fidelity Advisor Overseas Fund Class I 613,556 12,719,024
TOTAL NON – U.S. EQUITY FUNDS(Cost $36,940,371) 37,594,905
Bond Funds – 21.7%
Fidelity Advisor Corporate Bond Fund Class I 142,609 1,582,957
Fidelity Advisor Floating Rate High Income Fund Class I 43,323 408,099
Fidelity Advisor Government Income Fund Class I 573,701 6,058,281
Fidelity Advisor High Income Fund Class I 682,520 5,098,421
Fidelity Advisor Inflation-Protected Bond Fund Class I 33,801 397,503
Fidelity Advisor Investment Grade Bond Fund Class I 1,163,212 8,991,627
Fidelity Advisor Mortgage Securities Class I 121,323 1,374,594
Fidelity Advisor Real Estate Income Fund Class I 109,844 1,235,747
Fidelity Advisor Total Bond Fund Class I 921,087 9,652,997
TOTAL BOND FUNDS(Cost $35,830,329) 34,800,226
FA 529 Portfolio 2028
Investments September 30, 2015Showing Percentage of Net Assets
Short-Term Funds – 0.9%Shares Value
Fidelity Advisor Short Fixed-Income Fund Class I 44,794 $ 419,270
Fidelity Institutional Money Market Portfolio Institutional Class 0.17% (a) 977,589 977,589
TOTAL SHORT-TERM FUNDS(Cost $1,396,920) 1,396,859
TOTAL INVESTMENT PORTFOLIO – 100.1%(Cost $153,867,120) $160,774,081
NET OTHER ASSETS (LIABILITIES) – (0.1)% (86,978)
NET ASSETS – 100% $160,687,103
Legend(a) The rate quoted is the annualized seven-day yield of the fund at
period end.
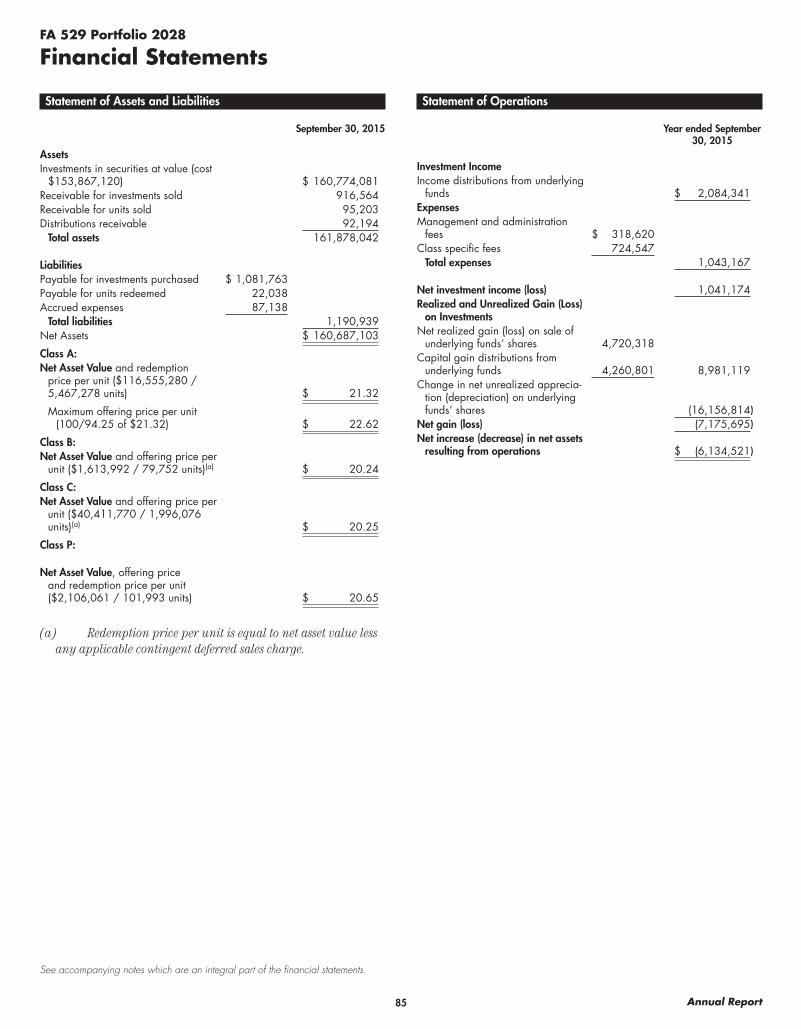
85 Annual Report
See accompanying notes which are an integral part of the financial statements.
FA 529 Portfolio 2028
Financial Statements
Statement of Assets and Liabilities
September 30, 2015
AssetsInvestments in securities at value (cost
$153,867,120) $ 160,774,081Receivable for investments sold 916,564Receivable for units sold 95,203Distributions receivable 92,194
Total assets 161,878,042
LiabilitiesPayable for investments purchased $ 1,081,763Payable for units redeemed 22,038Accrued expenses 87,138
Total liabilities 1,190,939Net Assets $ 160,687,103
Class A:Net Asset Value and redemption
price per unit ($116,555,280 / 5,467,278 units) $ 21.32
Maximum offering price per unit (100/94.25 of $21.32) $ 22.62
Class B:Net Asset Value and offering price per
unit ($1,613,992 / 79,752 units)(a) $ 20.24
Class C:Net Asset Value and offering price per
unit ($40,411,770 / 1,996,076 units)(a) $ 20.25
Class P:
Net Asset Value, offering price and redemption price per unit ($2,106,061 / 101,993 units) $ 20.65
(a) Redemption price per unit is equal to net asset value less any applicable contingent deferred sales charge.
Statement of Operations
Year ended September 30, 2015
Investment IncomeIncome distributions from underlying
funds $ 2,084,341ExpensesManagement and administration
fees $ 318,620Class specific fees 724,547
Total expenses 1,043,167
Net investment income (loss) 1,041,174Realized and Unrealized Gain (Loss)
on InvestmentsNet realized gain (loss) on sale of
underlying funds’ shares 4,720,318Capital gain distributions from
underlying funds 4,260,801 8,981,119Change in net unrealized apprecia-
tion (depreciation) on underlying funds’ shares (16,156,814)
Net gain (loss) (7,175,695)Net increase (decrease) in net assets
resulting from operations $ (6,134,521)
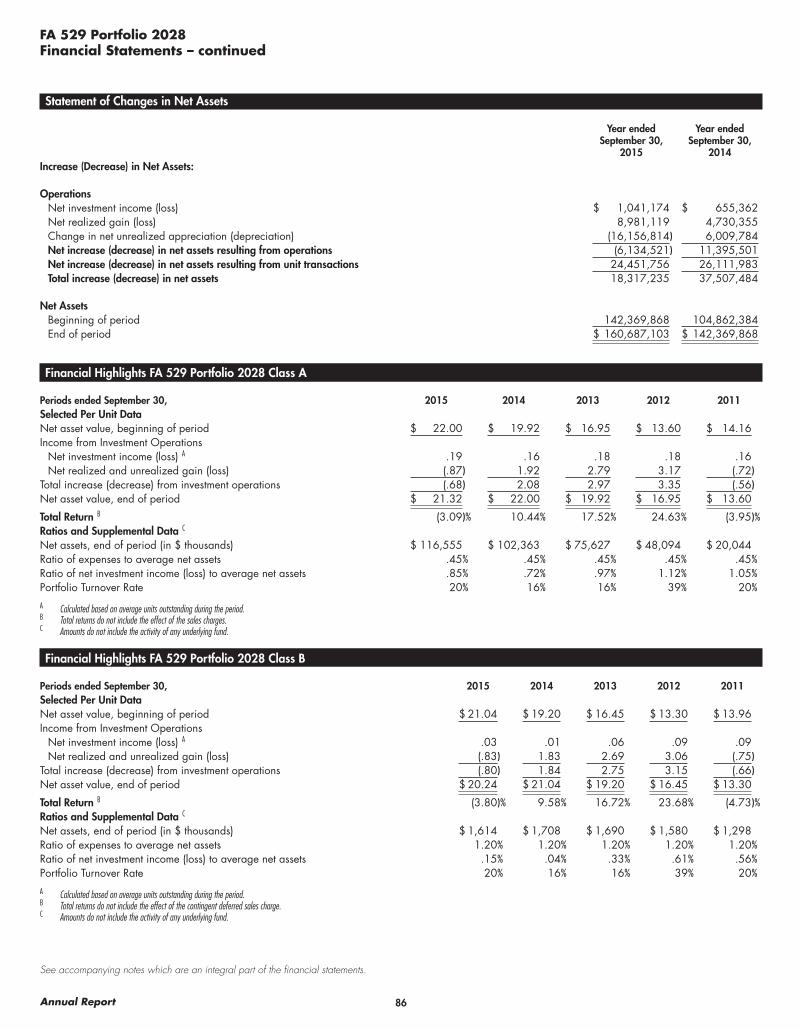
86Annual Report
See accompanying notes which are an integral part of the financial statements.
FA 529 Portfolio 2028Financial Statements – continued
Statement of Changes in Net Assets
Year ended September 30,
2015
Year ended September 30,
2014Increase (Decrease) in Net Assets:
OperationsNet investment income (loss) $ 1,041,174 $ 655,362Net realized gain (loss) 8,981,119 4,730,355Change in net unrealized appreciation (depreciation) (16,156,814) 6,009,784Net increase (decrease) in net assets resulting from operations (6,134,521) 11,395,501Net increase (decrease) in net assets resulting from unit transactions 24,451,756 26,111,983Total increase (decrease) in net assets 18,317,235 37,507,484
Net AssetsBeginning of period 142,369,868 104,862,384End of period $ 160,687,103 $ 142,369,868
Financial Highlights FA 529 Portfolio 2028 Class A
Periods ended September 30, 2015 2014 2013 2012 2011Selected Per Unit Data Net asset value, beginning of period $ 22.00 $ 19.92 $ 16.95 $ 13.60 $ 14.16Income from Investment Operations
Net investment income (loss) A .19 .16 .18 .18 .16Net realized and unrealized gain (loss) (.87) 1.92 2.79 3.17 (.72)
Total increase (decrease) from investment operations (.68) 2.08 2.97 3.35 (.56)Net asset value, end of period $ 21.32 $ 22.00 $ 19.92 $ 16.95 $ 13.60
Total Return B (3.09)% 10.44% 17.52% 24.63% (3.95)%Ratios and Supplemental Data C Net assets, end of period (in $ thousands) $ 116,555 $ 102,363 $ 75,627 $ 48,094 $ 20,044Ratio of expenses to average net assets .45% .45% .45% .45% .45%Ratio of net investment income (loss) to average net assets .85% .72% .97% 1.12% 1.05%Portfolio Turnover Rate 20% 16% 16% 39% 20%
A Calculated based on average units outstanding during the period.B Total returns do not include the effect of the sales charges.C Amounts do not include the activity of any underlying fund.
Financial Highlights FA 529 Portfolio 2028 Class B
Periods ended September 30, 2015 2014 2013 2012 2011Selected Per Unit Data Net asset value, beginning of period $ 21.04 $ 19.20 $ 16.45 $ 13.30 $ 13.96Income from Investment Operations
Net investment income (loss) A .03 .01 .06 .09 .09Net realized and unrealized gain (loss) (.83) 1.83 2.69 3.06 (.75)
Total increase (decrease) from investment operations (.80) 1.84 2.75 3.15 (.66)Net asset value, end of period $ 20.24 $ 21.04 $ 19.20 $ 16.45 $ 13.30
Total Return B (3.80)% 9.58% 16.72% 23.68% (4.73)%Ratios and Supplemental Data C Net assets, end of period (in $ thousands) $ 1,614 $ 1,708 $ 1,690 $ 1,580 $ 1,298Ratio of expenses to average net assets 1.20% 1.20% 1.20% 1.20% 1.20%Ratio of net investment income (loss) to average net assets .15% .04% .33% .61% .56%Portfolio Turnover Rate 20% 16% 16% 39% 20%
A Calculated based on average units outstanding during the period.B Total returns do not include the effect of the contingent deferred sales charge.C Amounts do not include the activity of any underlying fund.
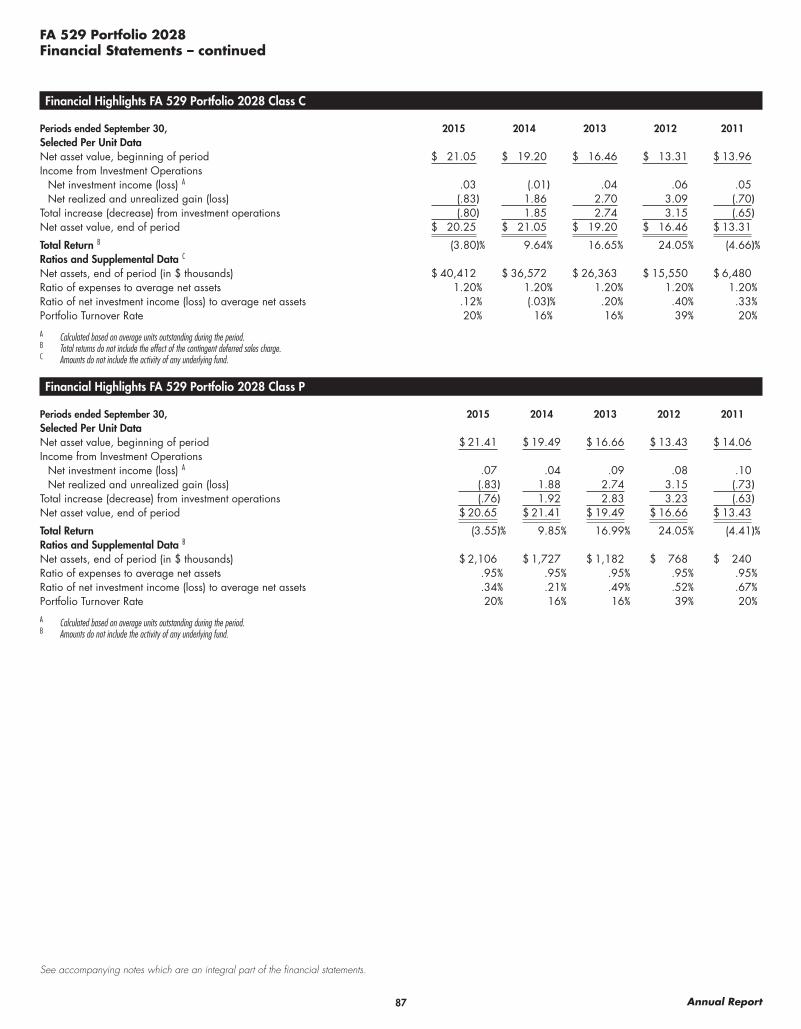
87 Annual Report
See accompanying notes which are an integral part of the financial statements.
FA 529 Portfolio 2028Financial Statements – continued
Financial Highlights FA 529 Portfolio 2028 Class C
Periods ended September 30, 2015 2014 2013 2012 2011Selected Per Unit Data Net asset value, beginning of period $ 21.05 $ 19.20 $ 16.46 $ 13.31 $ 13.96Income from Investment Operations
Net investment income (loss) A .03 (.01) .04 .06 .05Net realized and unrealized gain (loss) (.83) 1.86 2.70 3.09 (.70)
Total increase (decrease) from investment operations (.80) 1.85 2.74 3.15 (.65)Net asset value, end of period $ 20.25 $ 21.05 $ 19.20 $ 16.46 $ 13.31
Total Return B (3.80)% 9.64% 16.65% 24.05% (4.66)%Ratios and Supplemental Data C Net assets, end of period (in $ thousands) $ 40,412 $ 36,572 $ 26,363 $ 15,550 $ 6,480Ratio of expenses to average net assets 1.20% 1.20% 1.20% 1.20% 1.20%Ratio of net investment income (loss) to average net assets .12% (.03)% .20% .40% .33%Portfolio Turnover Rate 20% 16% 16% 39% 20%
A Calculated based on average units outstanding during the period.B Total returns do not include the effect of the contingent deferred sales charge.C Amounts do not include the activity of any underlying fund.
Financial Highlights FA 529 Portfolio 2028 Class P
Periods ended September 30, 2015 2014 2013 2012 2011Selected Per Unit Data Net asset value, beginning of period $ 21.41 $ 19.49 $ 16.66 $ 13.43 $ 14.06Income from Investment Operations
Net investment income (loss) A .07 .04 .09 .08 .10Net realized and unrealized gain (loss) (.83) 1.88 2.74 3.15 (.73)
Total increase (decrease) from investment operations (.76) 1.92 2.83 3.23 (.63)Net asset value, end of period $ 20.65 $ 21.41 $ 19.49 $ 16.66 $ 13.43
Total Return (3.55)% 9.85% 16.99% 24.05% (4.41)%Ratios and Supplemental Data B Net assets, end of period (in $ thousands) $ 2,106 $ 1,727 $ 1,182 $ 768 $ 240Ratio of expenses to average net assets .95% .95% .95% .95% .95%Ratio of net investment income (loss) to average net assets .34% .21% .49% .52% .67%Portfolio Turnover Rate 20% 16% 16% 39% 20%
A Calculated based on average units outstanding during the period.B Amounts do not include the activity of any underlying fund.

88Annual Report
FA 529 Portfolio 2031
Investment Summary
Portfolio Holdings as of September 30, 2015% of Portfolio’s net
assetsU.S. Equity FundsFidelity Advisor Equity Growth Fund Class I 5.9Fidelity Advisor Equity Income Fund Class I 12.4Fidelity Advisor Growth Opportunities Class I 4.3Fidelity Advisor Large Cap Fund Class I 7.4Fidelity Advisor Mega Cap Stock Fund Class I 6.8Fidelity Advisor New Insights Fund Class I 6.5Fidelity Advisor Real Estate Fund Class I 0.7Fidelity Advisor Stock Selector Small Cap Fund Class I 2.5Fidelity Series Commodity Strategy Fund 0.8Fidelity Stock Selector All Cap Fund Class I 15.5
62.8Non – U.S. Equity FundsFidelity Advisor Diversified International Fund Class I 9.4Fidelity Advisor Emerging Markets Fund Class I 7.7Fidelity Advisor Emerging Markets Income Class I 0.6Fidelity Advisor Overseas Fund Class I 9.4
27.1Bond FundsFidelity Advisor Corporate Bond Fund Class I 0.2Fidelity Advisor Floating Rate High Income Fund Class I 0.3Fidelity Advisor Government Income Fund Class I 1.0Fidelity Advisor High Income Fund Class I 3.2Fidelity Advisor Inflation-Protected Bond Fund Class I 0.2Fidelity Advisor Investment Grade Bond Fund Class I 1.4Fidelity Advisor Mortgage Securities Class I 0.2Fidelity Advisor Real Estate Income Fund Class I 0.8Fidelity Advisor Total Bond Fund Class I 1.8
9.1Short-Term FundsFidelity Advisor Short Fixed-Income Fund Class I 0.3Fidelity Institutional Money Market Portfolio Institutional Class 0.8
1.1Net Other Assets (Liabilities) (0.1)
100.0
Asset Allocation (% of Portfolio’s net assets)
Bond Funds 9.1%
U.S. Equity Funds 62.8%
Non – U.S. Equity Funds 27.1%
Short-Term Funds 1.1%
Net Other Assets (Liabilities) (0.1)%*
* Net Other Assets (Liabilities) are not included in the pie chart
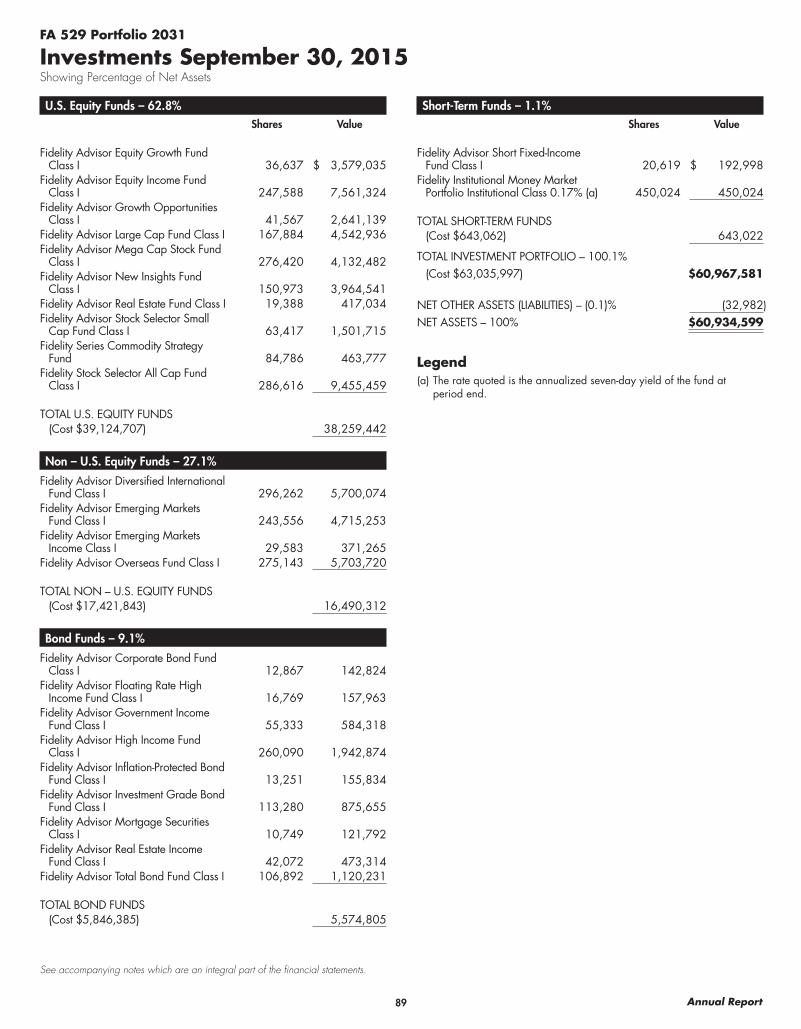
89 Annual Report
See accompanying notes which are an integral part of the financial statements.
U.S. Equity Funds – 62.8%Shares Value
Fidelity Advisor Equity Growth Fund Class I 36,637 $ 3,579,035
Fidelity Advisor Equity Income Fund Class I 247,588 7,561,324
Fidelity Advisor Growth Opportunities Class I 41,567 2,641,139
Fidelity Advisor Large Cap Fund Class I 167,884 4,542,936Fidelity Advisor Mega Cap Stock Fund
Class I 276,420 4,132,482Fidelity Advisor New Insights Fund
Class I 150,973 3,964,541Fidelity Advisor Real Estate Fund Class I 19,388 417,034Fidelity Advisor Stock Selector Small
Cap Fund Class I 63,417 1,501,715Fidelity Series Commodity Strategy
Fund 84,786 463,777Fidelity Stock Selector All Cap Fund
Class I 286,616 9,455,459
TOTAL U.S. EQUITY FUNDS(Cost $39,124,707) 38,259,442
Non – U.S. Equity Funds – 27.1%
Fidelity Advisor Diversified International Fund Class I 296,262 5,700,074
Fidelity Advisor Emerging Markets Fund Class I 243,556 4,715,253
Fidelity Advisor Emerging Markets Income Class I 29,583 371,265
Fidelity Advisor Overseas Fund Class I 275,143 5,703,720
TOTAL NON – U.S. EQUITY FUNDS(Cost $17,421,843) 16,490,312
Bond Funds – 9.1%
Fidelity Advisor Corporate Bond Fund Class I 12,867 142,824
Fidelity Advisor Floating Rate High Income Fund Class I 16,769 157,963
Fidelity Advisor Government Income Fund Class I 55,333 584,318
Fidelity Advisor High Income Fund Class I 260,090 1,942,874
Fidelity Advisor Inflation-Protected Bond Fund Class I 13,251 155,834
Fidelity Advisor Investment Grade Bond Fund Class I 113,280 875,655
Fidelity Advisor Mortgage Securities Class I 10,749 121,792
Fidelity Advisor Real Estate Income Fund Class I 42,072 473,314
Fidelity Advisor Total Bond Fund Class I 106,892 1,120,231
TOTAL BOND FUNDS(Cost $5,846,385) 5,574,805
FA 529 Portfolio 2031
Investments September 30, 2015Showing Percentage of Net Assets
Short-Term Funds – 1.1%Shares Value
Fidelity Advisor Short Fixed-Income Fund Class I 20,619 $ 192,998
Fidelity Institutional Money Market Portfolio Institutional Class 0.17% (a) 450,024 450,024
TOTAL SHORT-TERM FUNDS(Cost $643,062) 643,022
TOTAL INVESTMENT PORTFOLIO – 100.1%(Cost $63,035,997) $60,967,581
NET OTHER ASSETS (LIABILITIES) – (0.1)% (32,982)
NET ASSETS – 100% $60,934,599
Legend(a) The rate quoted is the annualized seven-day yield of the fund at
period end.
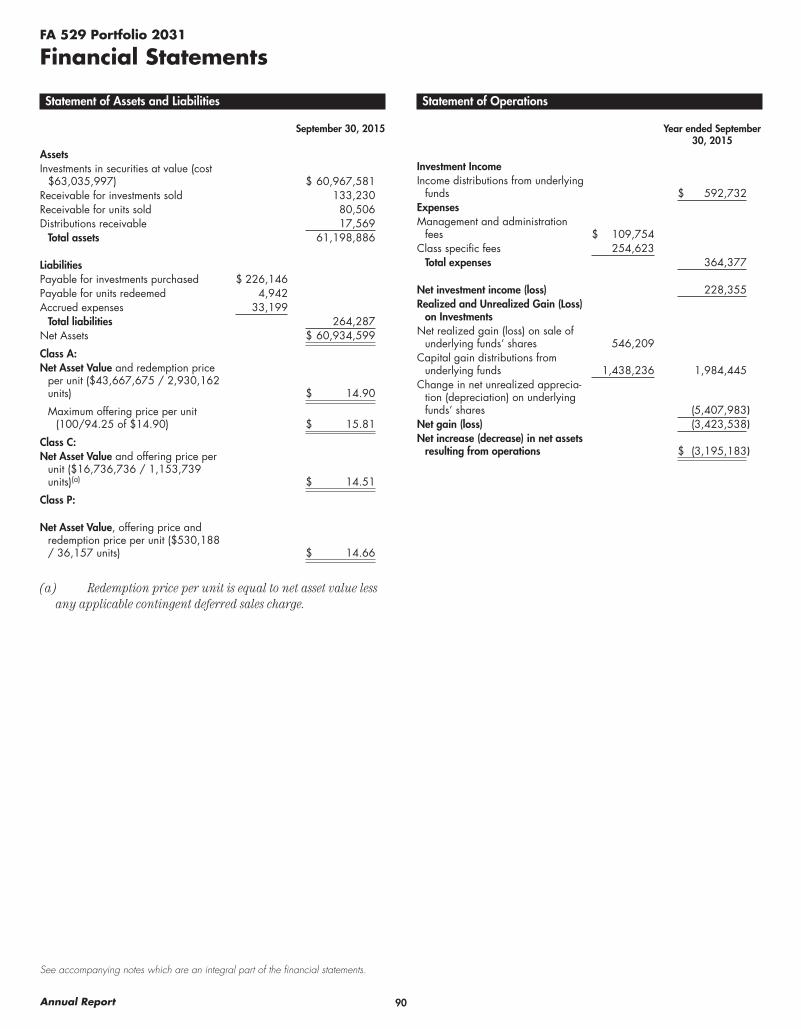
90Annual Report
See accompanying notes which are an integral part of the financial statements.
FA 529 Portfolio 2031
Financial Statements
Statement of Assets and Liabilities
September 30, 2015
AssetsInvestments in securities at value (cost
$63,035,997) $ 60,967,581Receivable for investments sold 133,230Receivable for units sold 80,506Distributions receivable 17,569
Total assets 61,198,886
LiabilitiesPayable for investments purchased $ 226,146Payable for units redeemed 4,942Accrued expenses 33,199
Total liabilities 264,287Net Assets $ 60,934,599
Class A:Net Asset Value and redemption price
per unit ($43,667,675 / 2,930,162 units) $ 14.90
Maximum offering price per unit (100/94.25 of $14.90) $ 15.81
Class C:Net Asset Value and offering price per
unit ($16,736,736 / 1,153,739 units)(a) $ 14.51
Class P:
Net Asset Value, offering price and redemption price per unit ($530,188 / 36,157 units) $ 14.66
(a) Redemption price per unit is equal to net asset value less any applicable contingent deferred sales charge.
Statement of Operations
Year ended September 30, 2015
Investment IncomeIncome distributions from underlying
funds $ 592,732ExpensesManagement and administration
fees $ 109,754Class specific fees 254,623
Total expenses 364,377
Net investment income (loss) 228,355Realized and Unrealized Gain (Loss)
on InvestmentsNet realized gain (loss) on sale of
underlying funds’ shares 546,209Capital gain distributions from
underlying funds 1,438,236 1,984,445Change in net unrealized apprecia-
tion (depreciation) on underlying funds’ shares (5,407,983)
Net gain (loss) (3,423,538)Net increase (decrease) in net assets
resulting from operations $ (3,195,183)
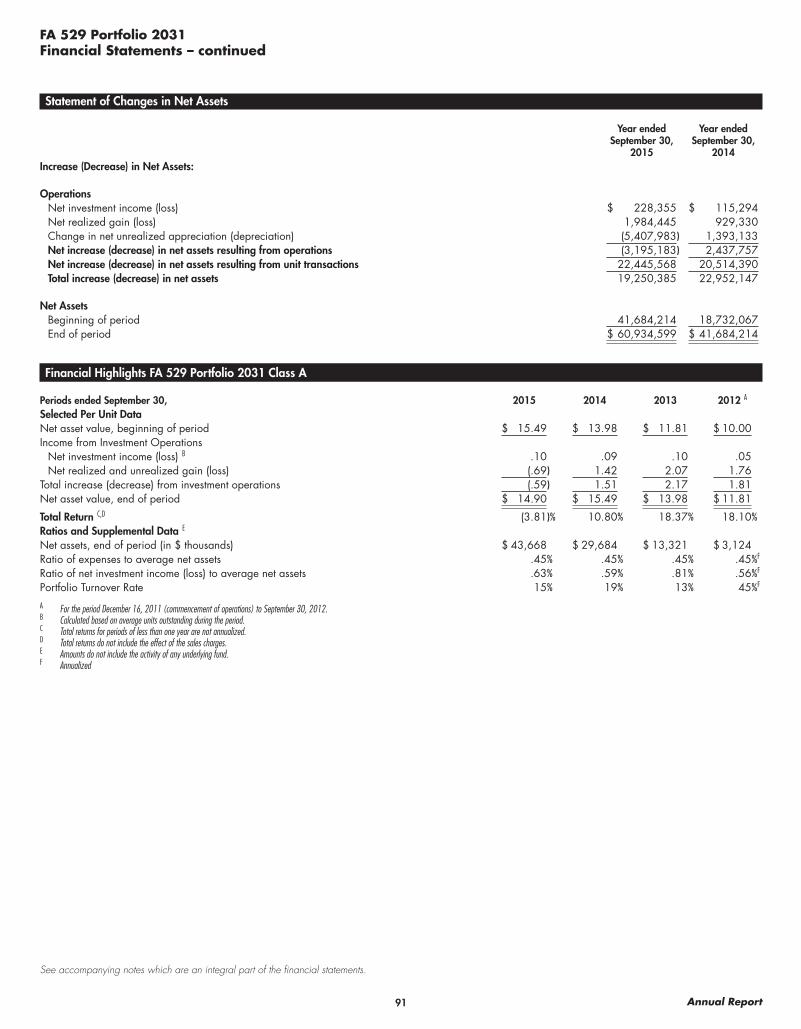
91 Annual Report
See accompanying notes which are an integral part of the financial statements.
FA 529 Portfolio 2031Financial Statements – continued
Statement of Changes in Net Assets
Year ended September 30,
2015
Year ended September 30,
2014Increase (Decrease) in Net Assets:
OperationsNet investment income (loss) $ 228,355 $ 115,294Net realized gain (loss) 1,984,445 929,330Change in net unrealized appreciation (depreciation) (5,407,983) 1,393,133Net increase (decrease) in net assets resulting from operations (3,195,183) 2,437,757Net increase (decrease) in net assets resulting from unit transactions 22,445,568 20,514,390Total increase (decrease) in net assets 19,250,385 22,952,147
Net AssetsBeginning of period 41,684,214 18,732,067End of period $ 60,934,599 $ 41,684,214
Financial Highlights FA 529 Portfolio 2031 Class A
Periods ended September 30, 2015 2014 2013 2012 A
Selected Per Unit Data Net asset value, beginning of period $ 15.49 $ 13.98 $ 11.81 $ 10.00Income from Investment Operations
Net investment income (loss) B .10 .09 .10 .05Net realized and unrealized gain (loss) (.69) 1.42 2.07 1.76
Total increase (decrease) from investment operations (.59) 1.51 2.17 1.81Net asset value, end of period $ 14.90 $ 15.49 $ 13.98 $ 11.81
Total Return C,D (3.81)% 10.80% 18.37% 18.10%Ratios and Supplemental Data E Net assets, end of period (in $ thousands) $ 43,668 $ 29,684 $ 13,321 $ 3,124Ratio of expenses to average net assets .45% .45% .45% .45%F
Ratio of net investment income (loss) to average net assets .63% .59% .81% .56%F
Portfolio Turnover Rate 15% 19% 13% 45%F
A For the period December 16, 2011 (commencement of operations) to September 30, 2012.B Calculated based on average units outstanding during the period.C Total returns for periods of less than one year are not annualized.D Total returns do not include the effect of the sales charges.E Amounts do not include the activity of any underlying fund.F Annualized
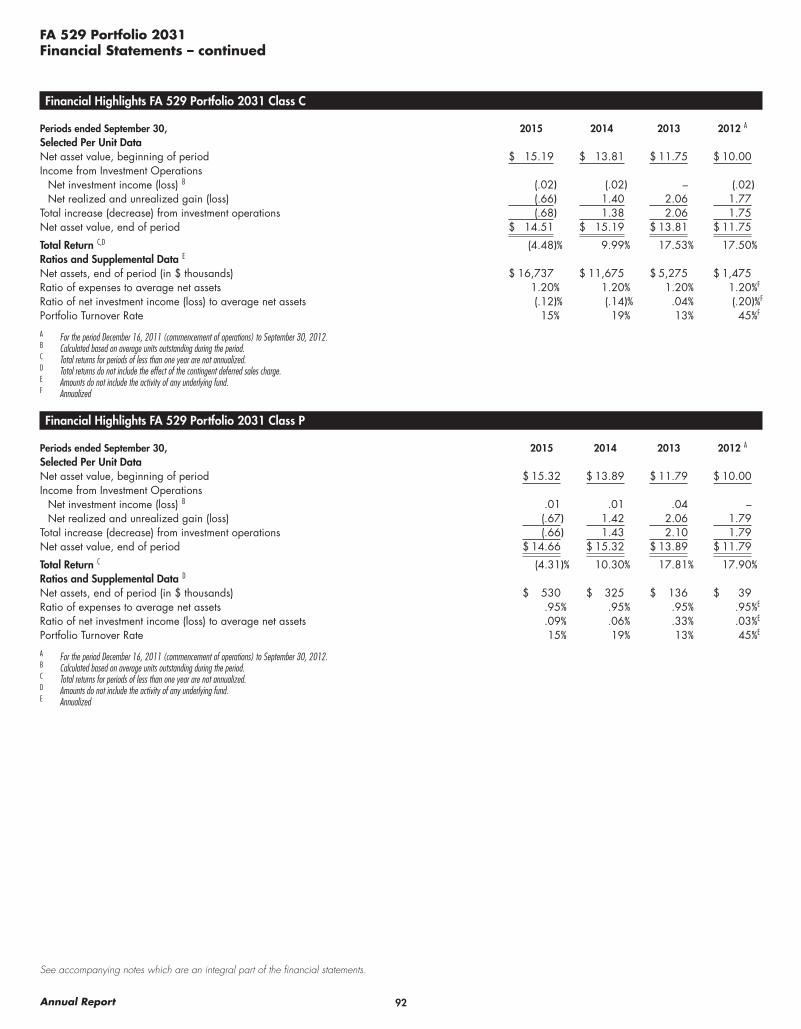
92Annual Report
See accompanying notes which are an integral part of the financial statements.
FA 529 Portfolio 2031Financial Statements – continued
Financial Highlights FA 529 Portfolio 2031 Class C
Periods ended September 30, 2015 2014 2013 2012 A
Selected Per Unit Data Net asset value, beginning of period $ 15.19 $ 13.81 $ 11.75 $ 10.00Income from Investment Operations
Net investment income (loss) B (.02) (.02) – (.02)Net realized and unrealized gain (loss) (.66) 1.40 2.06 1.77
Total increase (decrease) from investment operations (.68) 1.38 2.06 1.75Net asset value, end of period $ 14.51 $ 15.19 $ 13.81 $ 11.75
Total Return C,D (4.48)% 9.99% 17.53% 17.50%Ratios and Supplemental Data E Net assets, end of period (in $ thousands) $ 16,737 $ 11,675 $ 5,275 $ 1,475Ratio of expenses to average net assets 1.20% 1.20% 1.20% 1.20%F
Ratio of net investment income (loss) to average net assets (.12)% (.14)% .04% (.20)%F
Portfolio Turnover Rate 15% 19% 13% 45%F
A For the period December 16, 2011 (commencement of operations) to September 30, 2012.B Calculated based on average units outstanding during the period.C Total returns for periods of less than one year are not annualized.D Total returns do not include the effect of the contingent deferred sales charge.E Amounts do not include the activity of any underlying fund.F Annualized
Financial Highlights FA 529 Portfolio 2031 Class P
Periods ended September 30, 2015 2014 2013 2012 A
Selected Per Unit Data Net asset value, beginning of period $ 15.32 $ 13.89 $ 11.79 $ 10.00Income from Investment Operations
Net investment income (loss) B .01 .01 .04 –Net realized and unrealized gain (loss) (.67) 1.42 2.06 1.79
Total increase (decrease) from investment operations (.66) 1.43 2.10 1.79Net asset value, end of period $ 14.66 $ 15.32 $ 13.89 $ 11.79
Total Return C (4.31)% 10.30% 17.81% 17.90%Ratios and Supplemental Data D Net assets, end of period (in $ thousands) $ 530 $ 325 $ 136 $ 39Ratio of expenses to average net assets .95% .95% .95% .95%E
Ratio of net investment income (loss) to average net assets .09% .06% .33% .03%E
Portfolio Turnover Rate 15% 19% 13% 45%E
A For the period December 16, 2011 (commencement of operations) to September 30, 2012.B Calculated based on average units outstanding during the period.C Total returns for periods of less than one year are not annualized.D Amounts do not include the activity of any underlying fund.E Annualized

93 Annual Report
FA 529 Portfolio 2034
Investment Summary
Portfolio Holdings as of September 30, 2015% of Portfolio’s net
assetsU.S. Equity FundsFidelity Advisor Equity Growth Fund Class I 6.5Fidelity Advisor Equity Income Fund Class I 13.7Fidelity Advisor Growth Opportunities Class I 4.7Fidelity Advisor Large Cap Fund Class I 8.2Fidelity Advisor Mega Cap Stock Fund Class I 7.5Fidelity Advisor New Insights Fund Class I 7.2Fidelity Advisor Real Estate Fund Class I 0.8Fidelity Advisor Stock Selector Small Cap Fund Class I 2.7Fidelity Series Commodity Strategy Fund 0.3Fidelity Stock Selector All Cap Fund Class I 17.1
68.7Non – U.S. Equity FundsFidelity Advisor Diversified International Fund Class I 10.4Fidelity Advisor Emerging Markets Fund Class I 8.3Fidelity Advisor Emerging Markets Income Class I 0.3Fidelity Advisor Overseas Fund Class I 10.4
29.4Bond FundsFidelity Advisor Floating Rate High Income Fund Class I 0.1Fidelity Advisor High Income Fund Class I 1.4Fidelity Advisor Inflation-Protected Bond Fund Class I 0.1Fidelity Advisor Real Estate Income Fund Class I 0.3Fidelity Advisor Total Bond Fund Class I 0.0
1.9Net Other Assets (Liabilities) 0.0
100.0
Asset Allocation (% of Portfolio’s net assets)
Bond Funds 1.9%
U.S. Equity Funds 68.7%
Non – U.S. Equity Funds 29.4%
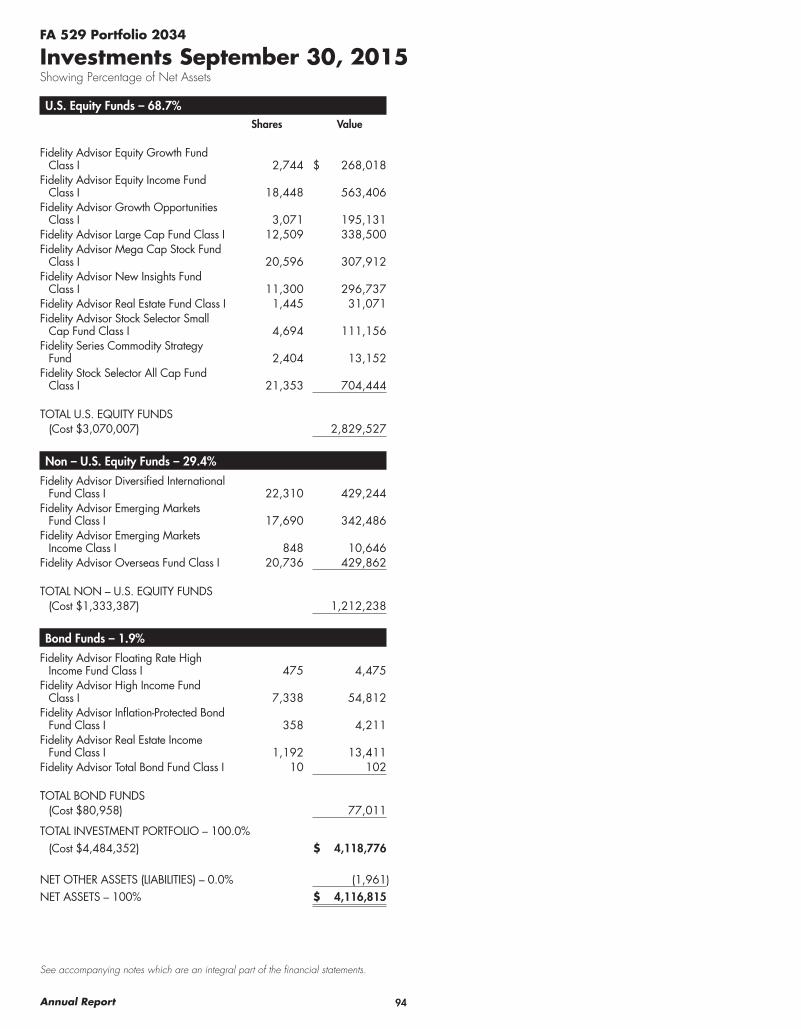
94Annual Report
See accompanying notes which are an integral part of the financial statements.
U.S. Equity Funds – 68.7%Shares Value
Fidelity Advisor Equity Growth Fund Class I 2,744 $ 268,018
Fidelity Advisor Equity Income Fund Class I 18,448 563,406
Fidelity Advisor Growth Opportunities Class I 3,071 195,131
Fidelity Advisor Large Cap Fund Class I 12,509 338,500Fidelity Advisor Mega Cap Stock Fund
Class I 20,596 307,912Fidelity Advisor New Insights Fund
Class I 11,300 296,737Fidelity Advisor Real Estate Fund Class I 1,445 31,071Fidelity Advisor Stock Selector Small
Cap Fund Class I 4,694 111,156Fidelity Series Commodity Strategy
Fund 2,404 13,152Fidelity Stock Selector All Cap Fund
Class I 21,353 704,444
TOTAL U.S. EQUITY FUNDS(Cost $3,070,007) 2,829,527
Non – U.S. Equity Funds – 29.4%
Fidelity Advisor Diversified International Fund Class I 22,310 429,244
Fidelity Advisor Emerging Markets Fund Class I 17,690 342,486
Fidelity Advisor Emerging Markets Income Class I 848 10,646
Fidelity Advisor Overseas Fund Class I 20,736 429,862
TOTAL NON – U.S. EQUITY FUNDS(Cost $1,333,387) 1,212,238
Bond Funds – 1.9%
Fidelity Advisor Floating Rate High Income Fund Class I 475 4,475
Fidelity Advisor High Income Fund Class I 7,338 54,812
Fidelity Advisor Inflation-Protected Bond Fund Class I 358 4,211
Fidelity Advisor Real Estate Income Fund Class I 1,192 13,411
Fidelity Advisor Total Bond Fund Class I 10 102
TOTAL BOND FUNDS(Cost $80,958) 77,011
TOTAL INVESTMENT PORTFOLIO – 100.0%(Cost $4,484,352) $ 4,118,776
NET OTHER ASSETS (LIABILITIES) – 0.0% (1,961)
NET ASSETS – 100% $ 4,116,815
FA 529 Portfolio 2034
Investments September 30, 2015Showing Percentage of Net Assets
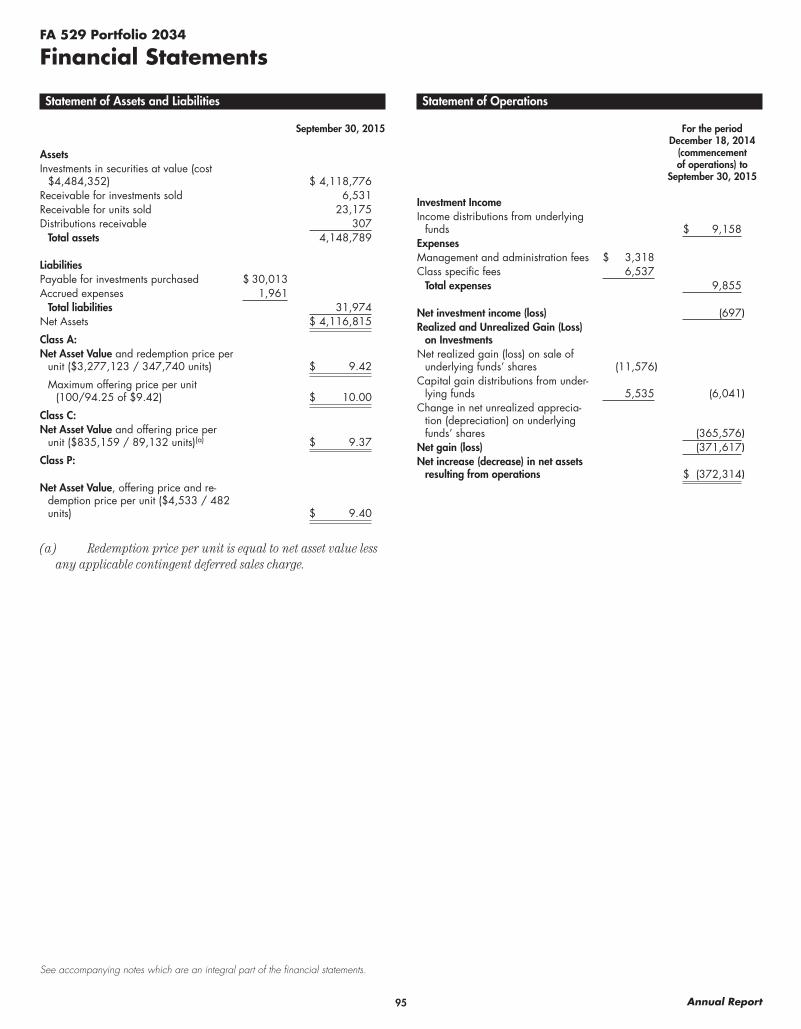
95 Annual Report
See accompanying notes which are an integral part of the financial statements.
FA 529 Portfolio 2034
Financial Statements
Statement of Assets and Liabilities
September 30, 2015
AssetsInvestments in securities at value (cost
$4,484,352) $ 4,118,776Receivable for investments sold 6,531Receivable for units sold 23,175Distributions receivable 307
Total assets 4,148,789
LiabilitiesPayable for investments purchased $ 30,013Accrued expenses 1,961
Total liabilities 31,974Net Assets $ 4,116,815
Class A:Net Asset Value and redemption price per
unit ($3,277,123 / 347,740 units) $ 9.42
Maximum offering price per unit (100/94.25 of $9.42) $ 10.00
Class C:Net Asset Value and offering price per
unit ($835,159 / 89,132 units)(a) $ 9.37
Class P:
Net Asset Value, offering price and re-demption price per unit ($4,533 / 482 units) $ 9.40
(a) Redemption price per unit is equal to net asset value less any applicable contingent deferred sales charge.
Statement of Operations
For the period December 18, 2014
(commencement of operations) to
September 30, 2015
Investment IncomeIncome distributions from underlying
funds $ 9,158ExpensesManagement and administration fees $ 3,318Class specific fees 6,537
Total expenses 9,855
Net investment income (loss) (697)Realized and Unrealized Gain (Loss)
on InvestmentsNet realized gain (loss) on sale of
underlying funds’ shares (11,576)Capital gain distributions from under-
lying funds 5,535 (6,041)Change in net unrealized apprecia-
tion (depreciation) on underlying funds’ shares (365,576)
Net gain (loss) (371,617)Net increase (decrease) in net assets
resulting from operations $ (372,314)
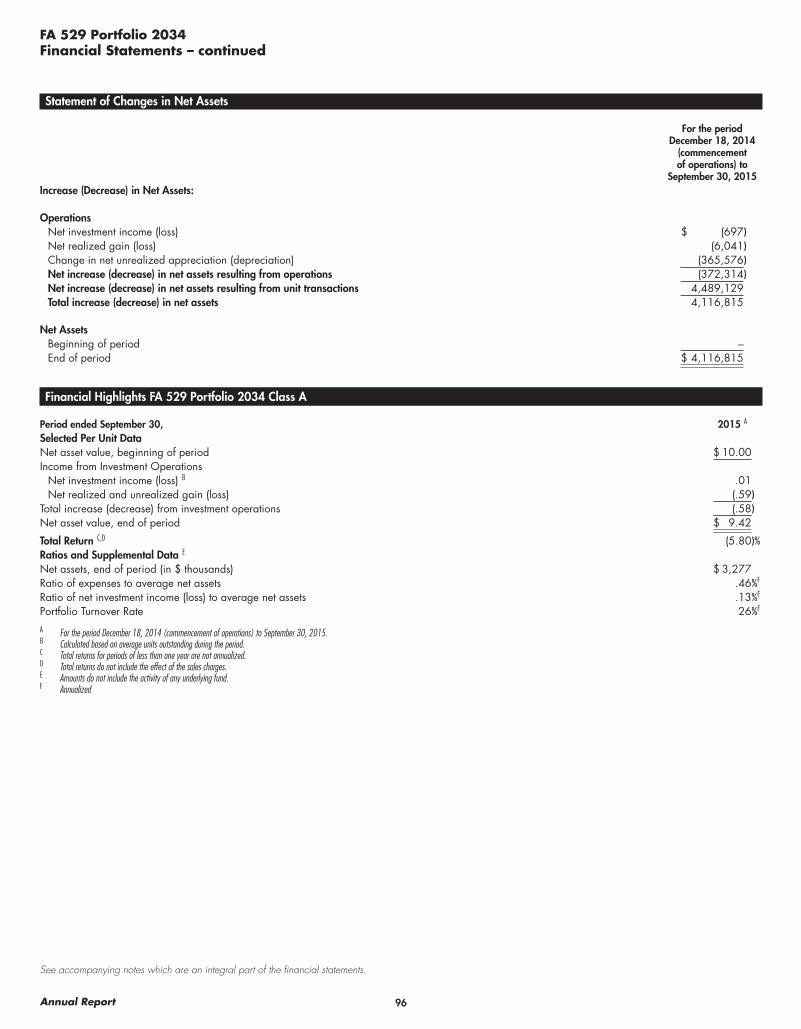
96Annual Report
See accompanying notes which are an integral part of the financial statements.
FA 529 Portfolio 2034Financial Statements – continued
Statement of Changes in Net Assets
For the period December 18, 2014
(commencement of operations) to
September 30, 2015Increase (Decrease) in Net Assets:
OperationsNet investment income (loss) $ (697)Net realized gain (loss) (6,041)Change in net unrealized appreciation (depreciation) (365,576)Net increase (decrease) in net assets resulting from operations (372,314)Net increase (decrease) in net assets resulting from unit transactions 4,489,129Total increase (decrease) in net assets 4,116,815
Net AssetsBeginning of period –End of period $ 4,116,815
Financial Highlights FA 529 Portfolio 2034 Class A
Period ended September 30, 2015 A
Selected Per Unit DataNet asset value, beginning of period $ 10.00Income from Investment Operations
Net investment income (loss) B .01Net realized and unrealized gain (loss) (.59)
Total increase (decrease) from investment operations (.58)Net asset value, end of period $ 9.42
Total Return C,D (5.80)%Ratios and Supplemental Data E
Net assets, end of period (in $ thousands) $ 3,277Ratio of expenses to average net assets .46%F
Ratio of net investment income (loss) to average net assets .13%F
Portfolio Turnover Rate 26%F
A For the period December 18, 2014 (commencement of operations) to September 30, 2015.B Calculated based on average units outstanding during the period.C Total returns for periods of less than one year are not annualized.D Total returns do not include the effect of the sales charges.E Amounts do not include the activity of any underlying fund.F Annualized
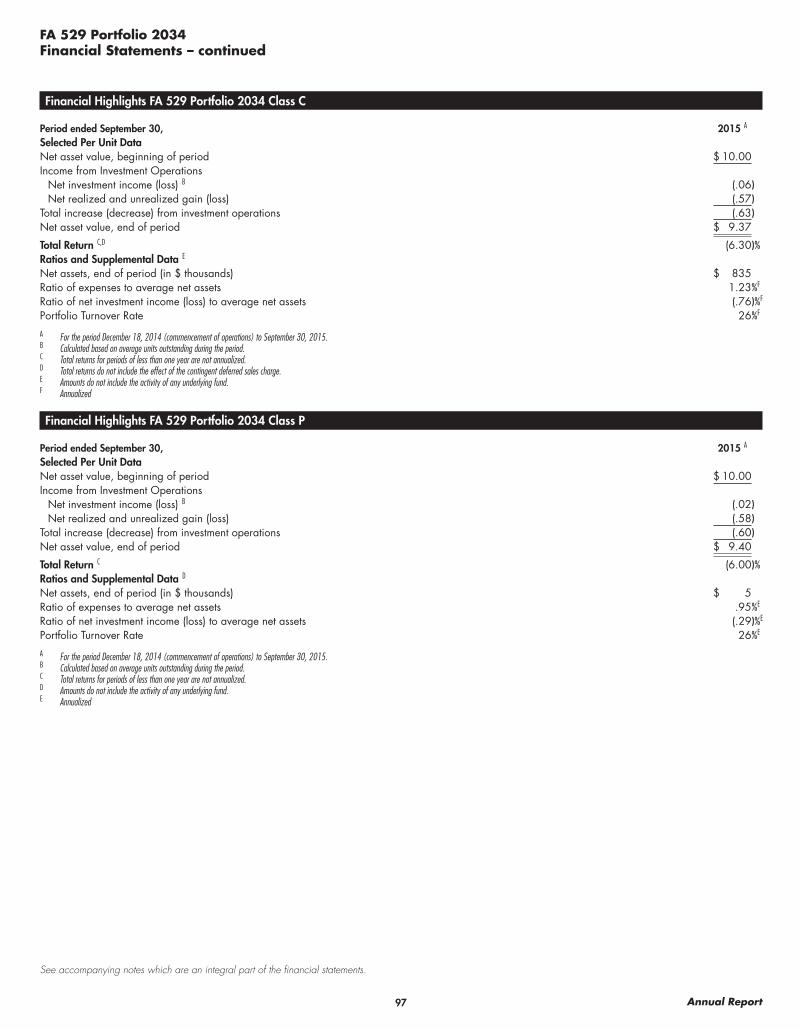
97 Annual Report
See accompanying notes which are an integral part of the financial statements.
FA 529 Portfolio 2034Financial Statements – continued
Financial Highlights FA 529 Portfolio 2034 Class C
Period ended September 30, 2015 A
Selected Per Unit DataNet asset value, beginning of period $ 10.00Income from Investment Operations
Net investment income (loss) B (.06)Net realized and unrealized gain (loss) (.57)
Total increase (decrease) from investment operations (.63)Net asset value, end of period $ 9.37
Total Return C,D (6.30)%Ratios and Supplemental Data E
Net assets, end of period (in $ thousands) $ 835Ratio of expenses to average net assets 1.23%F
Ratio of net investment income (loss) to average net assets (.76)%F
Portfolio Turnover Rate 26%F
A For the period December 18, 2014 (commencement of operations) to September 30, 2015.B Calculated based on average units outstanding during the period.C Total returns for periods of less than one year are not annualized.D Total returns do not include the effect of the contingent deferred sales charge.E Amounts do not include the activity of any underlying fund.F Annualized
Financial Highlights FA 529 Portfolio 2034 Class P
Period ended September 30, 2015 A
Selected Per Unit DataNet asset value, beginning of period $ 10.00Income from Investment Operations
Net investment income (loss) B (.02)Net realized and unrealized gain (loss) (.58)
Total increase (decrease) from investment operations (.60)Net asset value, end of period $ 9.40
Total Return C (6.00)%Ratios and Supplemental Data D
Net assets, end of period (in $ thousands) $ 5Ratio of expenses to average net assets .95%E
Ratio of net investment income (loss) to average net assets (.29)%E
Portfolio Turnover Rate 26%E
A For the period December 18, 2014 (commencement of operations) to September 30, 2015.B Calculated based on average units outstanding during the period.C Total returns for periods of less than one year are not annualized.D Amounts do not include the activity of any underlying fund.E Annualized
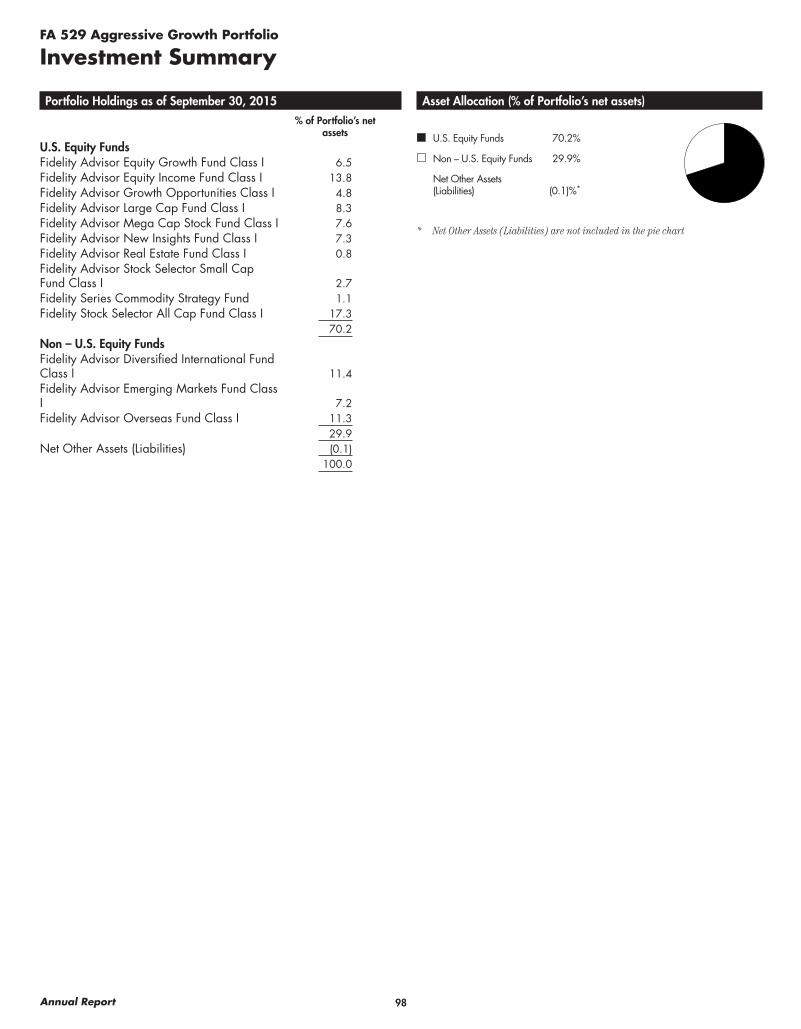
98Annual Report
FA 529 Aggressive Growth Portfolio
Investment Summary
Portfolio Holdings as of September 30, 2015% of Portfolio’s net
assetsU.S. Equity FundsFidelity Advisor Equity Growth Fund Class I 6.5Fidelity Advisor Equity Income Fund Class I 13.8Fidelity Advisor Growth Opportunities Class I 4.8Fidelity Advisor Large Cap Fund Class I 8.3Fidelity Advisor Mega Cap Stock Fund Class I 7.6Fidelity Advisor New Insights Fund Class I 7.3Fidelity Advisor Real Estate Fund Class I 0.8Fidelity Advisor Stock Selector Small Cap Fund Class I 2.7Fidelity Series Commodity Strategy Fund 1.1Fidelity Stock Selector All Cap Fund Class I 17.3
70.2Non – U.S. Equity FundsFidelity Advisor Diversified International Fund Class I 11.4Fidelity Advisor Emerging Markets Fund Class I 7.2Fidelity Advisor Overseas Fund Class I 11.3
29.9Net Other Assets (Liabilities) (0.1)
100.0
Asset Allocation (% of Portfolio’s net assets)
U.S. Equity Funds 70.2%
Non – U.S. Equity Funds 29.9%
Net Other Assets (Liabilities) (0.1)%*
* Net Other Assets (Liabilities) are not included in the pie chart
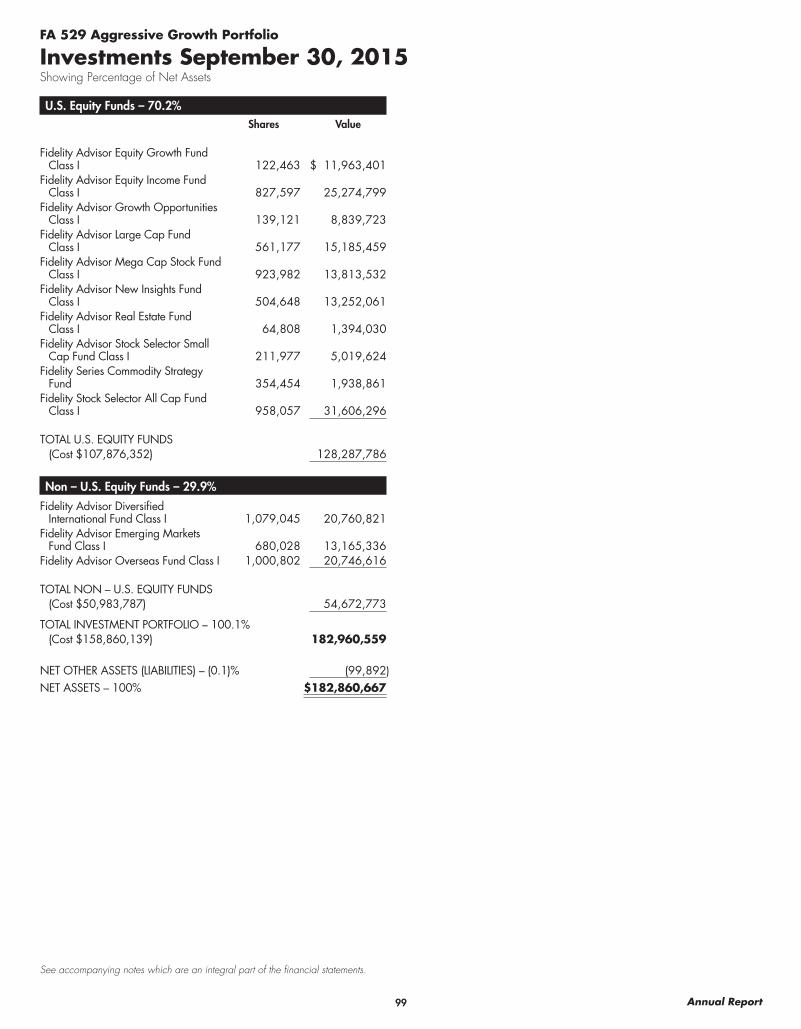
99 Annual Report
See accompanying notes which are an integral part of the financial statements.
U.S. Equity Funds – 70.2%Shares Value
Fidelity Advisor Equity Growth Fund Class I 122,463 $ 11,963,401
Fidelity Advisor Equity Income Fund Class I 827,597 25,274,799
Fidelity Advisor Growth Opportunities Class I 139,121 8,839,723
Fidelity Advisor Large Cap Fund Class I 561,177 15,185,459
Fidelity Advisor Mega Cap Stock Fund Class I 923,982 13,813,532
Fidelity Advisor New Insights Fund Class I 504,648 13,252,061
Fidelity Advisor Real Estate Fund Class I 64,808 1,394,030
Fidelity Advisor Stock Selector Small Cap Fund Class I 211,977 5,019,624
Fidelity Series Commodity Strategy Fund 354,454 1,938,861
Fidelity Stock Selector All Cap Fund Class I 958,057 31,606,296
TOTAL U.S. EQUITY FUNDS(Cost $107,876,352) 128,287,786
Non – U.S. Equity Funds – 29.9%
Fidelity Advisor Diversified International Fund Class I 1,079,045 20,760,821
Fidelity Advisor Emerging Markets Fund Class I 680,028 13,165,336
Fidelity Advisor Overseas Fund Class I 1,000,802 20,746,616
TOTAL NON – U.S. EQUITY FUNDS(Cost $50,983,787) 54,672,773
TOTAL INVESTMENT PORTFOLIO – 100.1%(Cost $158,860,139) 182,960,559
NET OTHER ASSETS (LIABILITIES) – (0.1)% (99,892)
NET ASSETS – 100% $182,860,667
FA 529 Aggressive Growth Portfolio
Investments September 30, 2015Showing Percentage of Net Assets
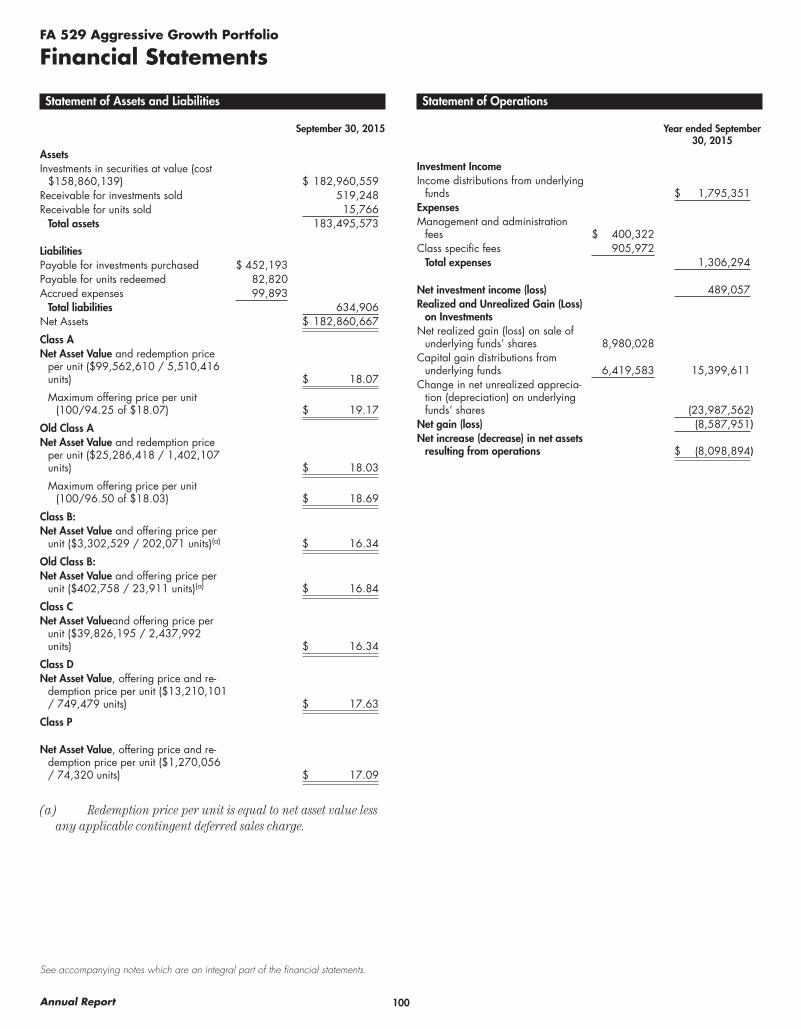
100Annual Report
See accompanying notes which are an integral part of the financial statements.
FA 529 Aggressive Growth Portfolio
Financial Statements
Statement of Assets and Liabilities
September 30, 2015
AssetsInvestments in securities at value (cost
$158,860,139) $ 182,960,559Receivable for investments sold 519,248Receivable for units sold 15,766
Total assets 183,495,573
LiabilitiesPayable for investments purchased $ 452,193Payable for units redeemed 82,820Accrued expenses 99,893
Total liabilities 634,906Net Assets $ 182,860,667
Class ANet Asset Value and redemption price
per unit ($99,562,610 / 5,510,416 units) $ 18.07
Maximum offering price per unit (100/94.25 of $18.07) $ 19.17
Old Class ANet Asset Value and redemption price
per unit ($25,286,418 / 1,402,107 units) $ 18.03
Maximum offering price per unit (100/96.50 of $18.03) $ 18.69
Class B:Net Asset Value and offering price per
unit ($3,302,529 / 202,071 units)(a) $ 16.34
Old Class B:Net Asset Value and offering price per
unit ($402,758 / 23,911 units)(a) $ 16.84
Class CNet Asset Valueand offering price per
unit ($39,826,195 / 2,437,992 units) $ 16.34
Class DNet Asset Value, offering price and re-
demption price per unit ($13,210,101 / 749,479 units) $ 17.63
Class P
Net Asset Value, offering price and re-demption price per unit ($1,270,056 / 74,320 units) $ 17.09
(a) Redemption price per unit is equal to net asset value less any applicable contingent deferred sales charge.
Statement of Operations
Year ended September 30, 2015
Investment IncomeIncome distributions from underlying
funds $ 1,795,351ExpensesManagement and administration
fees $ 400,322Class specific fees 905,972
Total expenses 1,306,294
Net investment income (loss) 489,057Realized and Unrealized Gain (Loss)
on InvestmentsNet realized gain (loss) on sale of
underlying funds’ shares 8,980,028Capital gain distributions from
underlying funds 6,419,583 15,399,611Change in net unrealized apprecia-
tion (depreciation) on underlying funds’ shares (23,987,562)
Net gain (loss) (8,587,951)Net increase (decrease) in net assets
resulting from operations $ (8,098,894)

101 Annual Report
See accompanying notes which are an integral part of the financial statements.
FA 529 Aggressive Growth PortfolioFinancial Statements – continued
Statement of Changes in Net Assets
Year ended September 30,
2015
Year ended September 30,
2014Increase (Decrease) in Net Assets:
OperationsNet investment income (loss) $ 489,057 $ 332,631Net realized gain (loss) 15,399,611 9,946,315Change in net unrealized appreciation (depreciation) (23,987,562) 9,732,942Net increase (decrease) in net assets resulting from operations (8,098,894) 20,011,888Net increase (decrease) in net assets resulting from unit transactions (5,026,622) (1,708,053)Total increase (decrease) in net assets (13,125,516) 18,303,835
Net AssetsBeginning of period 195,986,183 177,682,348End of period $ 182,860,667 $ 195,986,183
Financial Highlights FA 529 Aggressive Growth Portfolio Class A
Periods ended September 30, 2015 2014 2013 2012 2011Selected Per Unit Data Net asset value, beginning of period $ 18.84 $ 16.90 $ 14.02 $ 11.11 $ 11.66Income from Investment Operations
Net investment income (loss) A .08 .07 .10 .09 .07Net realized and unrealized gain (loss) (.85) 1.87 2.78 2.82 (.62)
Total increase (decrease) from investment operations (.77) 1.94 2.88 2.91 (.55)Net asset value, end of period $ 18.07 $ 18.84 $ 16.90 $ 14.02 $ 11.11
Total Return B (4.09)% 11.48% 20.54% 26.19% (4.72)%Ratios and Supplemental Data C Net assets, end of period (in $ thousands) $ 99,563 $ 101,185 $ 86,495 $ 70,079 $ 51,318Ratio of expenses to average net assets .45% .45% .45% .45% .45%Ratio of net investment income (loss) to average net assets .43% .37% .63% .73% .54%Portfolio Turnover Rate 17% 12% 15% 45% 26%
A Calculated based on average units outstanding during the period.B Total returns do not include the effect of the sales charges.C Amounts do not include the activity of any underlying fund.
Financial Highlights FA 529 Aggressive Growth Portfolio Old Class A
Periods ended September 30, 2015 2014 2013 2012 2011Selected Per Unit Data Net asset value, beginning of period $ 18.80 $ 16.86 $ 13.99 $ 11.09 $ 11.64Income from Investment Operations
Net investment income (loss) A .09 .07 .10 .10 .07Net realized and unrealized gain (loss) (.86) 1.87 2.77 2.80 (.62)
Total increase (decrease) from investment operations (.77) 1.94 2.87 2.90 (.55)Net asset value, end of period $ 18.03 $ 18.80 $ 16.86 $ 13.99 $ 11.09
Total Return B (4.10)% 11.51% 20.51% 26.15% (4.73)%Ratios and Supplemental Data C Net assets, end of period (in $ thousands) $ 25,286 $ 29,295 $ 28,272 $ 25,719 $ 21,171Ratio of expenses to average net assets .45% .45% .45% .45% .45%Ratio of net investment income (loss) to average net assets .46% .40% .66% .77% .56%Portfolio Turnover Rate 17% 12% 15% 45% 26%
A Calculated based on average units outstanding during the period.B Total returns do not include the effect of the sales charges.C Amounts do not include the activity of any underlying fund.
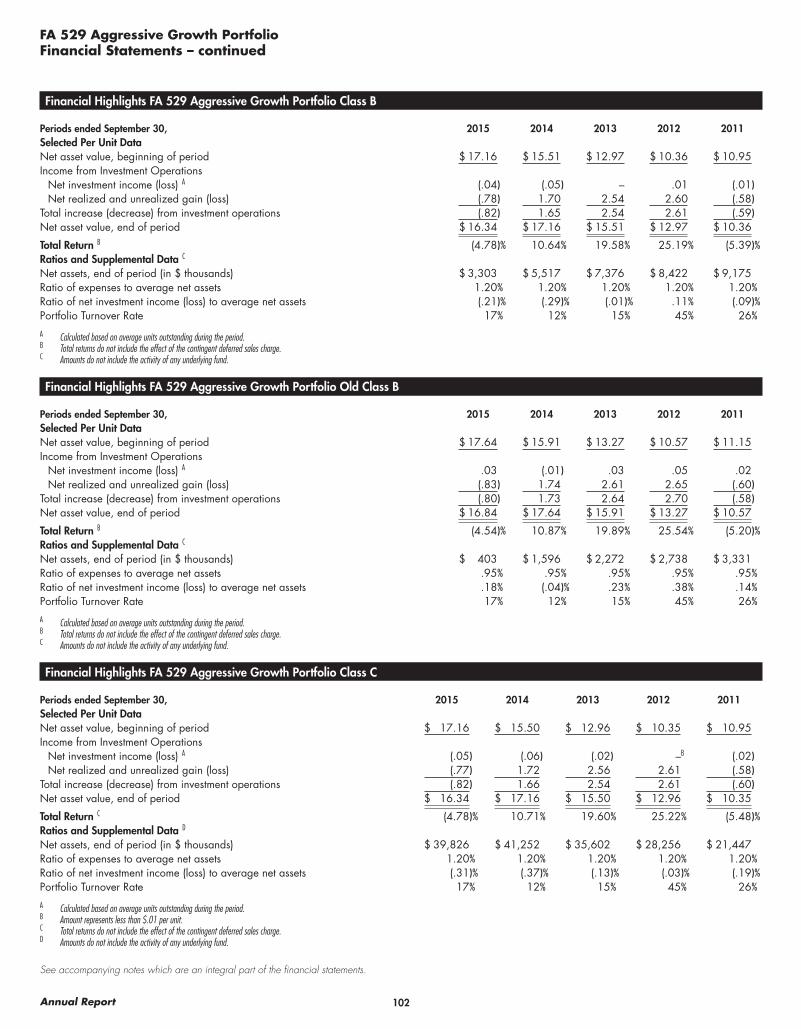
102Annual Report
See accompanying notes which are an integral part of the financial statements.
FA 529 Aggressive Growth PortfolioFinancial Statements – continued
Financial Highlights FA 529 Aggressive Growth Portfolio Class B
Periods ended September 30, 2015 2014 2013 2012 2011Selected Per Unit Data Net asset value, beginning of period $ 17.16 $ 15.51 $ 12.97 $ 10.36 $ 10.95Income from Investment Operations
Net investment income (loss) A (.04) (.05) – .01 (.01)Net realized and unrealized gain (loss) (.78) 1.70 2.54 2.60 (.58)
Total increase (decrease) from investment operations (.82) 1.65 2.54 2.61 (.59)Net asset value, end of period $ 16.34 $ 17.16 $ 15.51 $ 12.97 $ 10.36
Total Return B (4.78)% 10.64% 19.58% 25.19% (5.39)%Ratios and Supplemental Data C Net assets, end of period (in $ thousands) $ 3,303 $ 5,517 $ 7,376 $ 8,422 $ 9,175Ratio of expenses to average net assets 1.20% 1.20% 1.20% 1.20% 1.20%Ratio of net investment income (loss) to average net assets (.21)% (.29)% (.01)% .11% (.09)%Portfolio Turnover Rate 17% 12% 15% 45% 26%
A Calculated based on average units outstanding during the period.B Total returns do not include the effect of the contingent deferred sales charge.C Amounts do not include the activity of any underlying fund.
Financial Highlights FA 529 Aggressive Growth Portfolio Old Class B
Periods ended September 30, 2015 2014 2013 2012 2011Selected Per Unit Data Net asset value, beginning of period $ 17.64 $ 15.91 $ 13.27 $ 10.57 $ 11.15Income from Investment Operations
Net investment income (loss) A .03 (.01) .03 .05 .02Net realized and unrealized gain (loss) (.83) 1.74 2.61 2.65 (.60)
Total increase (decrease) from investment operations (.80) 1.73 2.64 2.70 (.58)Net asset value, end of period $ 16.84 $ 17.64 $ 15.91 $ 13.27 $ 10.57
Total Return B (4.54)% 10.87% 19.89% 25.54% (5.20)%Ratios and Supplemental Data C Net assets, end of period (in $ thousands) $ 403 $ 1,596 $ 2,272 $ 2,738 $ 3,331Ratio of expenses to average net assets .95% .95% .95% .95% .95%Ratio of net investment income (loss) to average net assets .18% (.04)% .23% .38% .14%Portfolio Turnover Rate 17% 12% 15% 45% 26%
A Calculated based on average units outstanding during the period.B Total returns do not include the effect of the contingent deferred sales charge.C Amounts do not include the activity of any underlying fund.
Financial Highlights FA 529 Aggressive Growth Portfolio Class C
Periods ended September 30, 2015 2014 2013 2012 2011Selected Per Unit Data Net asset value, beginning of period $ 17.16 $ 15.50 $ 12.96 $ 10.35 $ 10.95Income from Investment Operations
Net investment income (loss) A (.05) (.06) (.02) –B (.02)Net realized and unrealized gain (loss) (.77) 1.72 2.56 2.61 (.58)
Total increase (decrease) from investment operations (.82) 1.66 2.54 2.61 (.60)Net asset value, end of period $ 16.34 $ 17.16 $ 15.50 $ 12.96 $ 10.35
Total Return C (4.78)% 10.71% 19.60% 25.22% (5.48)%Ratios and Supplemental Data D Net assets, end of period (in $ thousands) $ 39,826 $ 41,252 $ 35,602 $ 28,256 $ 21,447Ratio of expenses to average net assets 1.20% 1.20% 1.20% 1.20% 1.20%Ratio of net investment income (loss) to average net assets (.31)% (.37)% (.13)% (.03)% (.19)%Portfolio Turnover Rate 17% 12% 15% 45% 26%
A Calculated based on average units outstanding during the period.B Amount represents less than $.01 per unit.C Total returns do not include the effect of the contingent deferred sales charge.D Amounts do not include the activity of any underlying fund.

103 Annual Report
See accompanying notes which are an integral part of the financial statements.
FA 529 Aggressive Growth PortfolioFinancial Statements – continued
Financial Highlights FA 529 Aggressive Growth Portfolio Class D
Periods ended September 30, 2015 2014 2013 2012 2011Selected Per Unit Data Net asset value, beginning of period $ 18.42 $ 16.56 $ 13.78 $ 10.95 $ 11.52Income from Investment Operations
Net investment income (loss) A .05 .03 .06 .07 .04Net realized and unrealized gain (loss) (.84) 1.83 2.72 2.76 (.61)
Total increase (decrease) from investment operations (.79) 1.86 2.78 2.83 (.57)Net asset value, end of period $ 17.63 $ 18.42 $ 16.56 $ 13.78 $ 10.95
Total Return (4.29)% 11.23% 20.17% 25.84% (4.95)%Ratios and Supplemental Data B Net assets, end of period (in $ thousands) $ 13,210 $ 15,817 $ 16,575 $ 14,966 $ 13,565Ratio of expenses to average net assets .70% .70% .70% .70% .70%Ratio of net investment income (loss) to average net assets .24% .15% .39% .55% .33%Portfolio Turnover Rate 17% 12% 15% 45% 26%
A Calculated based on average units outstanding during the period.B Amounts do not include the activity of any underlying fund.
Financial Highlights FA 529 Aggressive Growth Portfolio Class P
Periods ended September 30, 2015 2014 2013 2012 2011Selected Per Unit Data Net asset value, beginning of period $ 17.91 $ 16.14 $ 13.46 $ 10.72 $ 11.31Income from Investment Operations
Net investment income (loss) A (.01) (.02) .02 .03 .01Net realized and unrealized gain (loss) (.81) 1.79 2.66 2.71 (.60)
Total increase (decrease) from investment operations (.82) 1.77 2.68 2.74 (.59)Net asset value, end of period $ 17.09 $ 17.91 $ 16.14 $ 13.46 $ 10.72
Total Return (4.58)% 10.97% 19.91% 25.56% (5.22)%Ratios and Supplemental Data B Net assets, end of period (in $ thousands) $ 1,270 $ 1,325 $ 1,090 $ 870 $ 721Ratio of expenses to average net assets .95% .95% .95% .95% .95%Ratio of net investment income (loss) to average net assets (.05)% (.13)% .11% .28% .11%Portfolio Turnover Rate 17% 12% 15% 45% 26%
A Calculated based on average units outstanding during the period.B Amounts do not include the activity of any underlying fund.
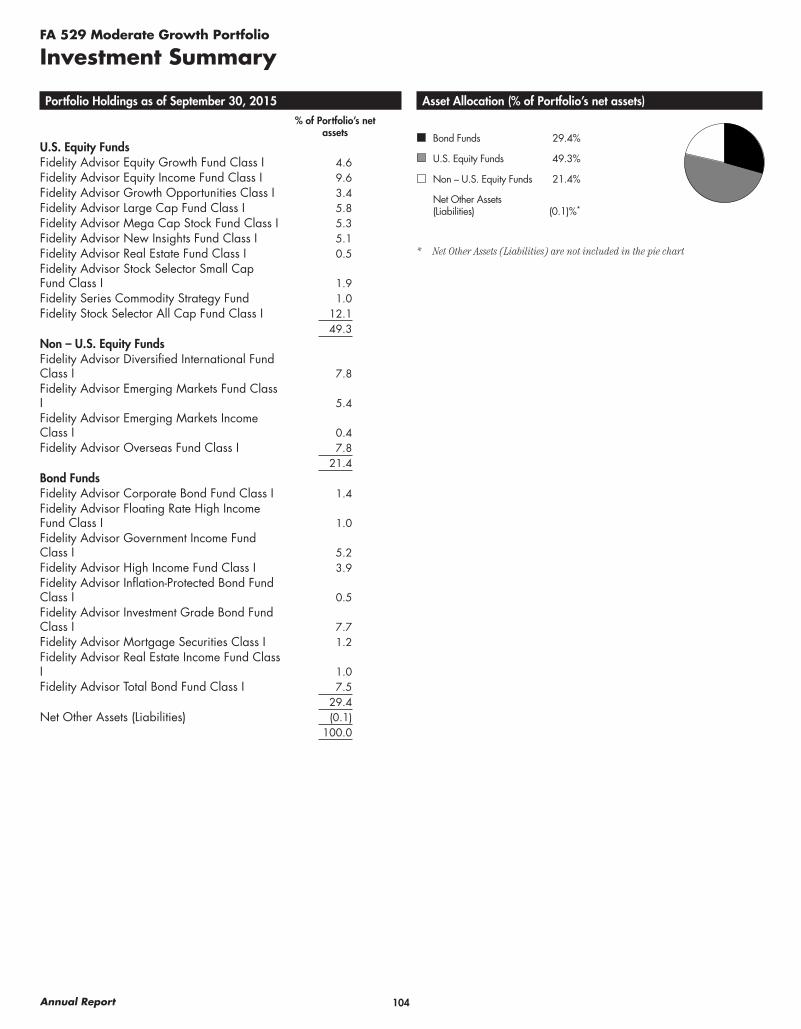
104Annual Report
FA 529 Moderate Growth Portfolio
Investment Summary
Portfolio Holdings as of September 30, 2015% of Portfolio’s net
assetsU.S. Equity FundsFidelity Advisor Equity Growth Fund Class I 4.6Fidelity Advisor Equity Income Fund Class I 9.6Fidelity Advisor Growth Opportunities Class I 3.4Fidelity Advisor Large Cap Fund Class I 5.8Fidelity Advisor Mega Cap Stock Fund Class I 5.3Fidelity Advisor New Insights Fund Class I 5.1Fidelity Advisor Real Estate Fund Class I 0.5Fidelity Advisor Stock Selector Small Cap Fund Class I 1.9Fidelity Series Commodity Strategy Fund 1.0Fidelity Stock Selector All Cap Fund Class I 12.1
49.3Non – U.S. Equity FundsFidelity Advisor Diversified International Fund Class I 7.8Fidelity Advisor Emerging Markets Fund Class I 5.4Fidelity Advisor Emerging Markets Income Class I 0.4Fidelity Advisor Overseas Fund Class I 7.8
21.4Bond FundsFidelity Advisor Corporate Bond Fund Class I 1.4Fidelity Advisor Floating Rate High Income Fund Class I 1.0Fidelity Advisor Government Income Fund Class I 5.2Fidelity Advisor High Income Fund Class I 3.9Fidelity Advisor Inflation-Protected Bond Fund Class I 0.5Fidelity Advisor Investment Grade Bond Fund Class I 7.7Fidelity Advisor Mortgage Securities Class I 1.2Fidelity Advisor Real Estate Income Fund Class I 1.0Fidelity Advisor Total Bond Fund Class I 7.5
29.4Net Other Assets (Liabilities) (0.1)
100.0
Asset Allocation (% of Portfolio’s net assets)
Bond Funds 29.4%
U.S. Equity Funds 49.3%
Non – U.S. Equity Funds 21.4%
Net Other Assets (Liabilities) (0.1)%*
* Net Other Assets (Liabilities) are not included in the pie chart
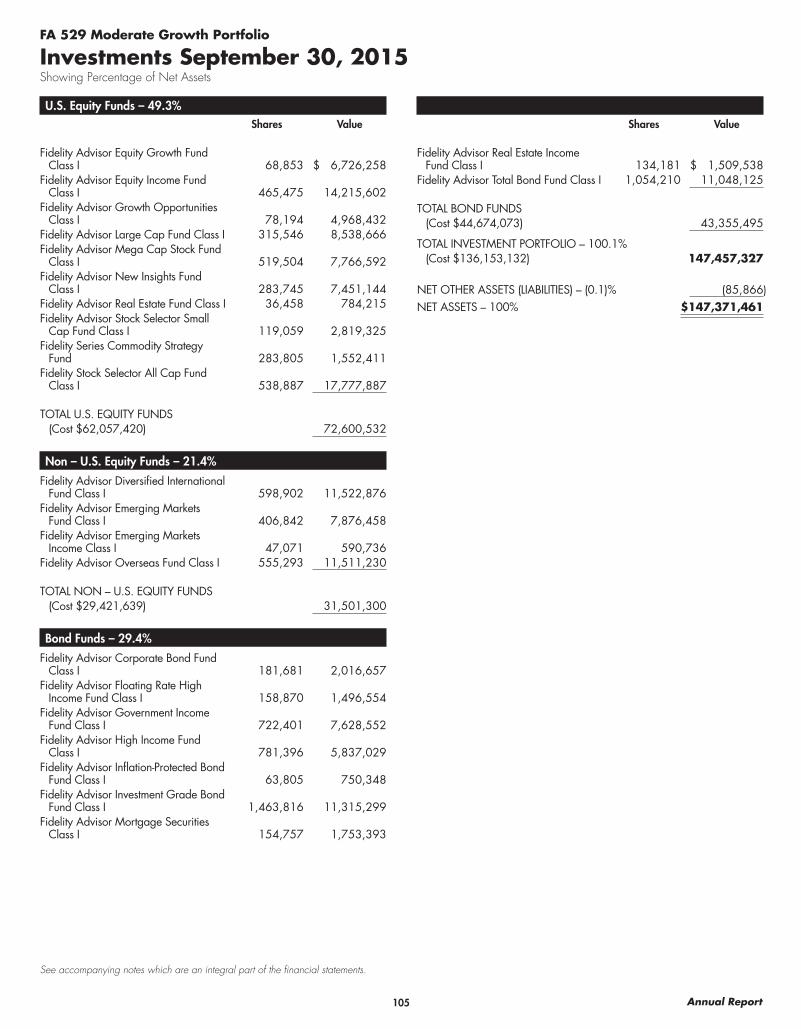
105 Annual Report
See accompanying notes which are an integral part of the financial statements.
U.S. Equity Funds – 49.3%Shares Value
Fidelity Advisor Equity Growth Fund Class I 68,853 $ 6,726,258
Fidelity Advisor Equity Income Fund Class I 465,475 14,215,602
Fidelity Advisor Growth Opportunities Class I 78,194 4,968,432
Fidelity Advisor Large Cap Fund Class I 315,546 8,538,666Fidelity Advisor Mega Cap Stock Fund
Class I 519,504 7,766,592Fidelity Advisor New Insights Fund
Class I 283,745 7,451,144Fidelity Advisor Real Estate Fund Class I 36,458 784,215Fidelity Advisor Stock Selector Small
Cap Fund Class I 119,059 2,819,325Fidelity Series Commodity Strategy
Fund 283,805 1,552,411Fidelity Stock Selector All Cap Fund
Class I 538,887 17,777,887
TOTAL U.S. EQUITY FUNDS(Cost $62,057,420) 72,600,532
Non – U.S. Equity Funds – 21.4%
Fidelity Advisor Diversified International Fund Class I 598,902 11,522,876
Fidelity Advisor Emerging Markets Fund Class I 406,842 7,876,458
Fidelity Advisor Emerging Markets Income Class I 47,071 590,736
Fidelity Advisor Overseas Fund Class I 555,293 11,511,230
TOTAL NON – U.S. EQUITY FUNDS(Cost $29,421,639) 31,501,300
Bond Funds – 29.4%
Fidelity Advisor Corporate Bond Fund Class I 181,681 2,016,657
Fidelity Advisor Floating Rate High Income Fund Class I 158,870 1,496,554
Fidelity Advisor Government Income Fund Class I 722,401 7,628,552
Fidelity Advisor High Income Fund Class I 781,396 5,837,029
Fidelity Advisor Inflation-Protected Bond Fund Class I 63,805 750,348
Fidelity Advisor Investment Grade Bond Fund Class I 1,463,816 11,315,299
Fidelity Advisor Mortgage Securities Class I 154,757 1,753,393
FA 529 Moderate Growth Portfolio
Investments September 30, 2015Showing Percentage of Net Assets
Shares Value
Fidelity Advisor Real Estate Income Fund Class I 134,181 $ 1,509,538
Fidelity Advisor Total Bond Fund Class I 1,054,210 11,048,125
TOTAL BOND FUNDS(Cost $44,674,073) 43,355,495
TOTAL INVESTMENT PORTFOLIO – 100.1%(Cost $136,153,132) 147,457,327
NET OTHER ASSETS (LIABILITIES) – (0.1)% (85,866)
NET ASSETS – 100% $147,371,461
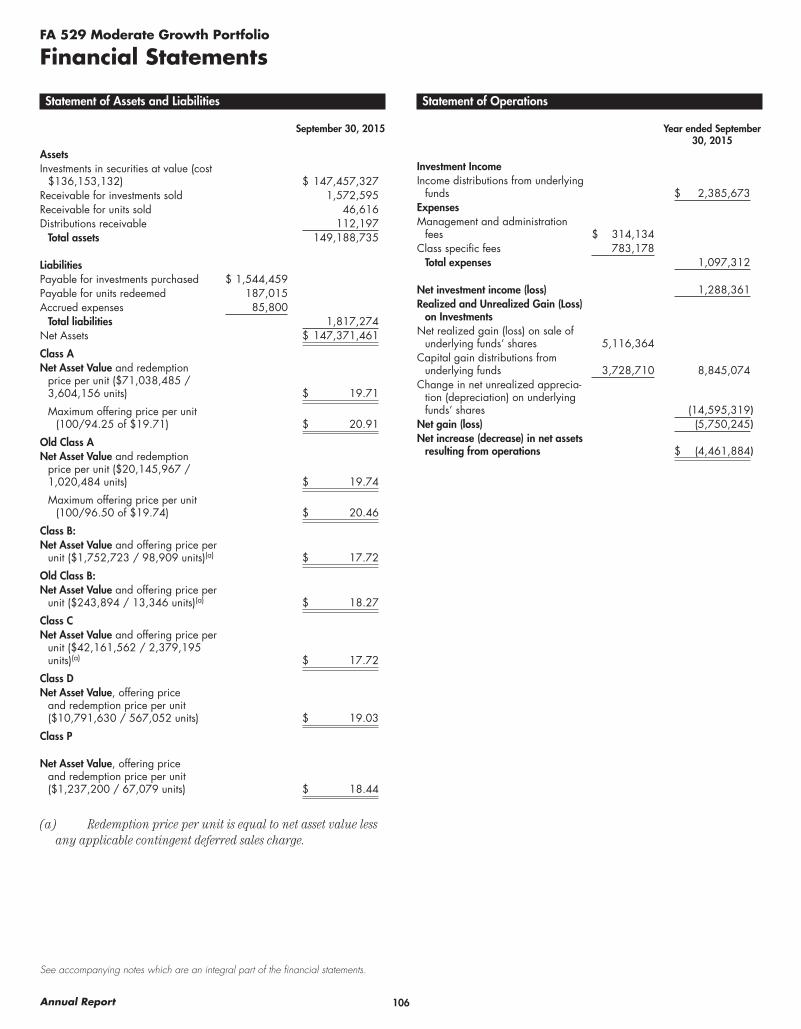
106Annual Report
See accompanying notes which are an integral part of the financial statements.
FA 529 Moderate Growth Portfolio
Financial Statements
Statement of Assets and Liabilities
September 30, 2015
AssetsInvestments in securities at value (cost
$136,153,132) $ 147,457,327Receivable for investments sold 1,572,595Receivable for units sold 46,616Distributions receivable 112,197
Total assets 149,188,735
LiabilitiesPayable for investments purchased $ 1,544,459Payable for units redeemed 187,015Accrued expenses 85,800
Total liabilities 1,817,274Net Assets $ 147,371,461
Class ANet Asset Value and redemption
price per unit ($71,038,485 / 3,604,156 units) $ 19.71
Maximum offering price per unit (100/94.25 of $19.71) $ 20.91
Old Class ANet Asset Value and redemption
price per unit ($20,145,967 / 1,020,484 units) $ 19.74
Maximum offering price per unit (100/96.50 of $19.74) $ 20.46
Class B:Net Asset Value and offering price per
unit ($1,752,723 / 98,909 units)(a) $ 17.72
Old Class B:Net Asset Value and offering price per
unit ($243,894 / 13,346 units)(a) $ 18.27
Class CNet Asset Value and offering price per
unit ($42,161,562 / 2,379,195 units)(a) $ 17.72
Class DNet Asset Value, offering price
and redemption price per unit ($10,791,630 / 567,052 units) $ 19.03
Class P
Net Asset Value, offering price and redemption price per unit ($1,237,200 / 67,079 units) $ 18.44
(a) Redemption price per unit is equal to net asset value less any applicable contingent deferred sales charge.
Statement of Operations
Year ended September 30, 2015
Investment IncomeIncome distributions from underlying
funds $ 2,385,673ExpensesManagement and administration
fees $ 314,134Class specific fees 783,178
Total expenses 1,097,312
Net investment income (loss) 1,288,361Realized and Unrealized Gain (Loss)
on InvestmentsNet realized gain (loss) on sale of
underlying funds’ shares 5,116,364Capital gain distributions from
underlying funds 3,728,710 8,845,074Change in net unrealized apprecia-
tion (depreciation) on underlying funds’ shares (14,595,319)
Net gain (loss) (5,750,245)Net increase (decrease) in net assets
resulting from operations $ (4,461,884)
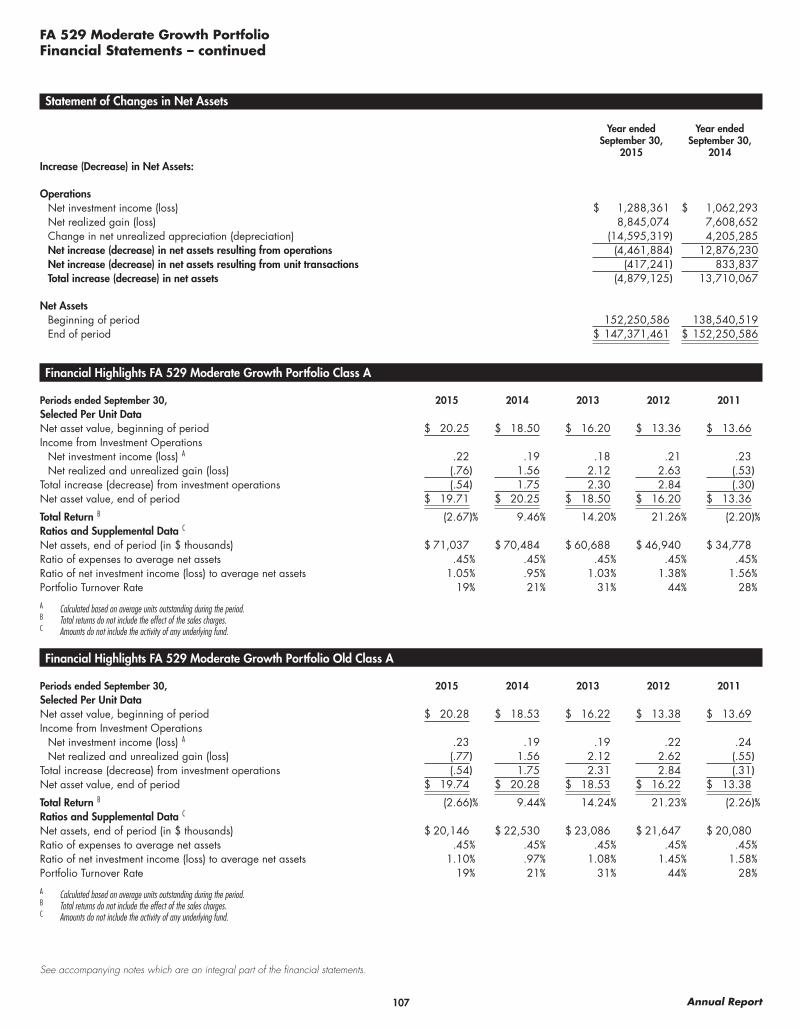
107 Annual Report
See accompanying notes which are an integral part of the financial statements.
FA 529 Moderate Growth PortfolioFinancial Statements – continued
Statement of Changes in Net Assets
Year ended September 30,
2015
Year ended September 30,
2014Increase (Decrease) in Net Assets:
OperationsNet investment income (loss) $ 1,288,361 $ 1,062,293Net realized gain (loss) 8,845,074 7,608,652Change in net unrealized appreciation (depreciation) (14,595,319) 4,205,285Net increase (decrease) in net assets resulting from operations (4,461,884) 12,876,230Net increase (decrease) in net assets resulting from unit transactions (417,241) 833,837Total increase (decrease) in net assets (4,879,125) 13,710,067
Net AssetsBeginning of period 152,250,586 138,540,519End of period $ 147,371,461 $ 152,250,586
Financial Highlights FA 529 Moderate Growth Portfolio Class A
Periods ended September 30, 2015 2014 2013 2012 2011Selected Per Unit Data Net asset value, beginning of period $ 20.25 $ 18.50 $ 16.20 $ 13.36 $ 13.66Income from Investment Operations
Net investment income (loss) A .22 .19 .18 .21 .23Net realized and unrealized gain (loss) (.76) 1.56 2.12 2.63 (.53)
Total increase (decrease) from investment operations (.54) 1.75 2.30 2.84 (.30)Net asset value, end of period $ 19.71 $ 20.25 $ 18.50 $ 16.20 $ 13.36
Total Return B (2.67)% 9.46% 14.20% 21.26% (2.20)%Ratios and Supplemental Data C Net assets, end of period (in $ thousands) $ 71,037 $ 70,484 $ 60,688 $ 46,940 $ 34,778Ratio of expenses to average net assets .45% .45% .45% .45% .45%Ratio of net investment income (loss) to average net assets 1.05% .95% 1.03% 1.38% 1.56%Portfolio Turnover Rate 19% 21% 31% 44% 28%
A Calculated based on average units outstanding during the period.B Total returns do not include the effect of the sales charges.C Amounts do not include the activity of any underlying fund.
Financial Highlights FA 529 Moderate Growth Portfolio Old Class A
Periods ended September 30, 2015 2014 2013 2012 2011Selected Per Unit Data Net asset value, beginning of period $ 20.28 $ 18.53 $ 16.22 $ 13.38 $ 13.69Income from Investment Operations
Net investment income (loss) A .23 .19 .19 .22 .24Net realized and unrealized gain (loss) (.77) 1.56 2.12 2.62 (.55)
Total increase (decrease) from investment operations (.54) 1.75 2.31 2.84 (.31)Net asset value, end of period $ 19.74 $ 20.28 $ 18.53 $ 16.22 $ 13.38
Total Return B (2.66)% 9.44% 14.24% 21.23% (2.26)%Ratios and Supplemental Data C Net assets, end of period (in $ thousands) $ 20,146 $ 22,530 $ 23,086 $ 21,647 $ 20,080Ratio of expenses to average net assets .45% .45% .45% .45% .45%Ratio of net investment income (loss) to average net assets 1.10% .97% 1.08% 1.45% 1.58%Portfolio Turnover Rate 19% 21% 31% 44% 28%
A Calculated based on average units outstanding during the period.B Total returns do not include the effect of the sales charges.C Amounts do not include the activity of any underlying fund.
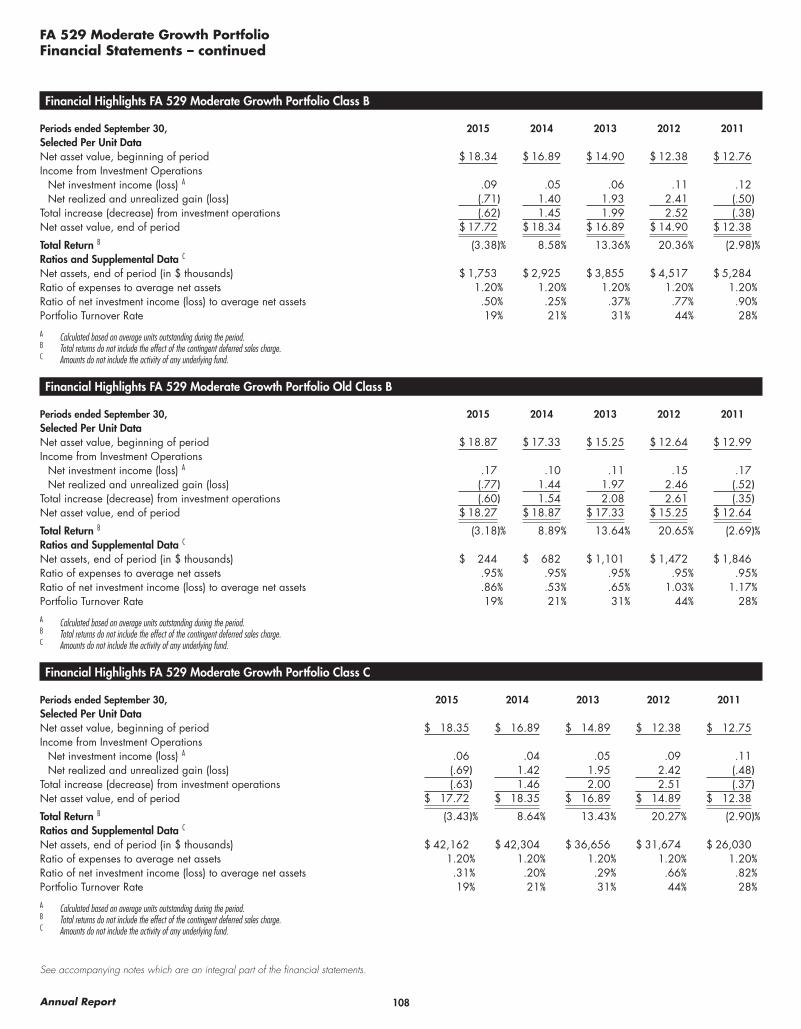
108Annual Report
See accompanying notes which are an integral part of the financial statements.
FA 529 Moderate Growth PortfolioFinancial Statements – continued
Financial Highlights FA 529 Moderate Growth Portfolio Class B
Periods ended September 30, 2015 2014 2013 2012 2011Selected Per Unit Data Net asset value, beginning of period $ 18.34 $ 16.89 $ 14.90 $ 12.38 $ 12.76Income from Investment Operations
Net investment income (loss) A .09 .05 .06 .11 .12Net realized and unrealized gain (loss) (.71) 1.40 1.93 2.41 (.50)
Total increase (decrease) from investment operations (.62) 1.45 1.99 2.52 (.38)Net asset value, end of period $ 17.72 $ 18.34 $ 16.89 $ 14.90 $ 12.38
Total Return B (3.38)% 8.58% 13.36% 20.36% (2.98)%Ratios and Supplemental Data C Net assets, end of period (in $ thousands) $ 1,753 $ 2,925 $ 3,855 $ 4,517 $ 5,284Ratio of expenses to average net assets 1.20% 1.20% 1.20% 1.20% 1.20%Ratio of net investment income (loss) to average net assets .50% .25% .37% .77% .90%Portfolio Turnover Rate 19% 21% 31% 44% 28%
A Calculated based on average units outstanding during the period.B Total returns do not include the effect of the contingent deferred sales charge.C Amounts do not include the activity of any underlying fund.
Financial Highlights FA 529 Moderate Growth Portfolio Old Class B
Periods ended September 30, 2015 2014 2013 2012 2011Selected Per Unit Data Net asset value, beginning of period $ 18.87 $ 17.33 $ 15.25 $ 12.64 $ 12.99Income from Investment Operations
Net investment income (loss) A .17 .10 .11 .15 .17Net realized and unrealized gain (loss) (.77) 1.44 1.97 2.46 (.52)
Total increase (decrease) from investment operations (.60) 1.54 2.08 2.61 (.35)Net asset value, end of period $ 18.27 $ 18.87 $ 17.33 $ 15.25 $ 12.64
Total Return B (3.18)% 8.89% 13.64% 20.65% (2.69)%Ratios and Supplemental Data C Net assets, end of period (in $ thousands) $ 244 $ 682 $ 1,101 $ 1,472 $ 1,846Ratio of expenses to average net assets .95% .95% .95% .95% .95%Ratio of net investment income (loss) to average net assets .86% .53% .65% 1.03% 1.17%Portfolio Turnover Rate 19% 21% 31% 44% 28%
A Calculated based on average units outstanding during the period.B Total returns do not include the effect of the contingent deferred sales charge.C Amounts do not include the activity of any underlying fund.
Financial Highlights FA 529 Moderate Growth Portfolio Class C
Periods ended September 30, 2015 2014 2013 2012 2011Selected Per Unit Data Net asset value, beginning of period $ 18.35 $ 16.89 $ 14.89 $ 12.38 $ 12.75Income from Investment Operations
Net investment income (loss) A .06 .04 .05 .09 .11Net realized and unrealized gain (loss) (.69) 1.42 1.95 2.42 (.48)
Total increase (decrease) from investment operations (.63) 1.46 2.00 2.51 (.37)Net asset value, end of period $ 17.72 $ 18.35 $ 16.89 $ 14.89 $ 12.38
Total Return B (3.43)% 8.64% 13.43% 20.27% (2.90)%Ratios and Supplemental Data C Net assets, end of period (in $ thousands) $ 42,162 $ 42,304 $ 36,656 $ 31,674 $ 26,030Ratio of expenses to average net assets 1.20% 1.20% 1.20% 1.20% 1.20%Ratio of net investment income (loss) to average net assets .31% .20% .29% .66% .82%Portfolio Turnover Rate 19% 21% 31% 44% 28%
A Calculated based on average units outstanding during the period.B Total returns do not include the effect of the contingent deferred sales charge.C Amounts do not include the activity of any underlying fund.
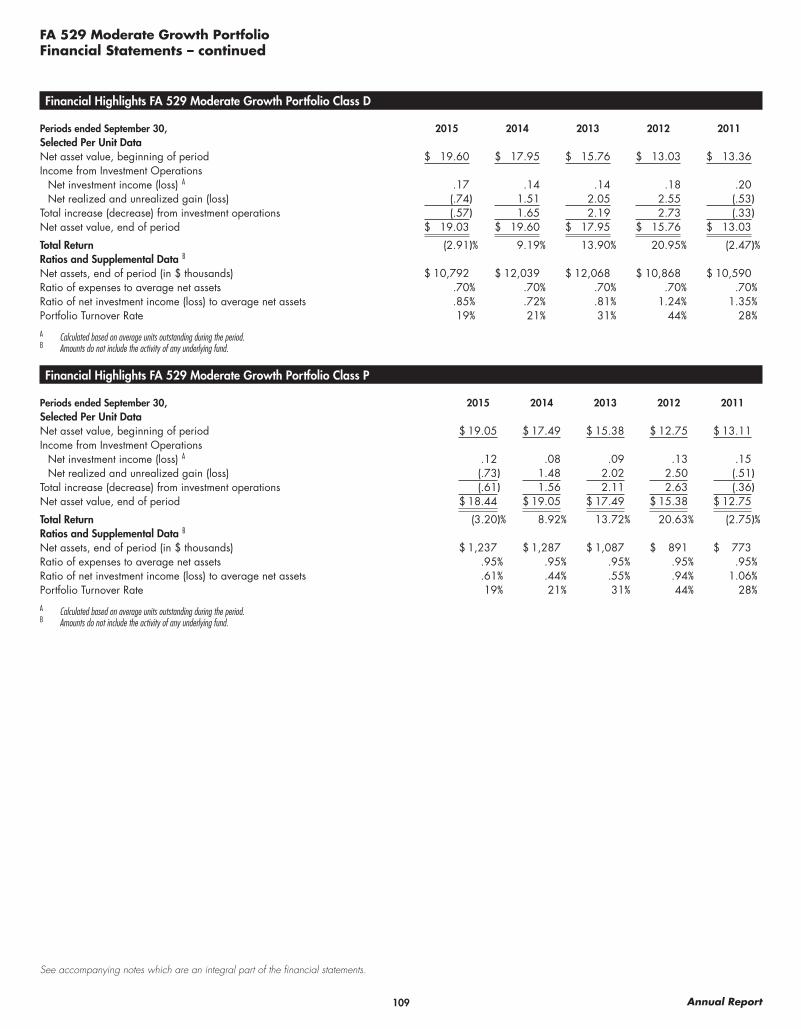
109 Annual Report
See accompanying notes which are an integral part of the financial statements.
FA 529 Moderate Growth PortfolioFinancial Statements – continued
Financial Highlights FA 529 Moderate Growth Portfolio Class D
Periods ended September 30, 2015 2014 2013 2012 2011Selected Per Unit Data Net asset value, beginning of period $ 19.60 $ 17.95 $ 15.76 $ 13.03 $ 13.36Income from Investment Operations
Net investment income (loss) A .17 .14 .14 .18 .20Net realized and unrealized gain (loss) (.74) 1.51 2.05 2.55 (.53)
Total increase (decrease) from investment operations (.57) 1.65 2.19 2.73 (.33)Net asset value, end of period $ 19.03 $ 19.60 $ 17.95 $ 15.76 $ 13.03
Total Return (2.91)% 9.19% 13.90% 20.95% (2.47)%Ratios and Supplemental Data B Net assets, end of period (in $ thousands) $ 10,792 $ 12,039 $ 12,068 $ 10,868 $ 10,590Ratio of expenses to average net assets .70% .70% .70% .70% .70%Ratio of net investment income (loss) to average net assets .85% .72% .81% 1.24% 1.35%Portfolio Turnover Rate 19% 21% 31% 44% 28%
A Calculated based on average units outstanding during the period.B Amounts do not include the activity of any underlying fund.
Financial Highlights FA 529 Moderate Growth Portfolio Class P
Periods ended September 30, 2015 2014 2013 2012 2011Selected Per Unit Data Net asset value, beginning of period $ 19.05 $ 17.49 $ 15.38 $ 12.75 $ 13.11Income from Investment Operations
Net investment income (loss) A .12 .08 .09 .13 .15Net realized and unrealized gain (loss) (.73) 1.48 2.02 2.50 (.51)
Total increase (decrease) from investment operations (.61) 1.56 2.11 2.63 (.36)Net asset value, end of period $ 18.44 $ 19.05 $ 17.49 $ 15.38 $ 12.75
Total Return (3.20)% 8.92% 13.72% 20.63% (2.75)%Ratios and Supplemental Data B Net assets, end of period (in $ thousands) $ 1,237 $ 1,287 $ 1,087 $ 891 $ 773Ratio of expenses to average net assets .95% .95% .95% .95% .95%Ratio of net investment income (loss) to average net assets .61% .44% .55% .94% 1.06%Portfolio Turnover Rate 19% 21% 31% 44% 28%
A Calculated based on average units outstanding during the period.B Amounts do not include the activity of any underlying fund.

110Annual Report
See accompanying notes which are an integral part of the financial statements.
FA 529 Diversified International Portfolio
Financial Statements
Statement of Assets and Liabilities
September 30, 2015
AssetsInvestments in securities, at value
(4,606,910 shares of Fidelity Advisor Diversified International Fund, Class I; cost $88,148,778) $ 88,636,941
Receivable for investments sold 3,050Receivable for units sold 94,940
Total assets 88,734,931
LiabilitiesPayable for investments purchased $ 80,419Payable for units redeemed 32,936Accrued expenses 50,053
Total liabilities 163,408Net Assets $ 88,571,523
Class ANet Asset Value and redemption price per
unit ($61,663,040 / 2,877,333 units) $ 21.43
Maximum offering price per unit (100/94.25 of $21.43) $ 22.74
Class BNet Asset Value and offering price per
unit ($1,849,569 / 95,103 units)(a) $ 19.45
Class C:Net Asset Value and offering price per
unit ($23,631,153 / 1,214,195 units)(a) $ 19.46
Class DNet Asset Value, offering price and
redemption price per unit ($852,119 / 41,063 units) $ 20.75
Class P
Net Asset Value, offering price and redemption price per unit ($575,642 / 28,654 units) $ 20.09
(a) Redemption price per unit is equal to net asset value less any applicable contingent deferred sales charge.
Statement of Operations
Year ended September 30, 2015
Investment IncomeIncome distributions from underlying
funds $ 1,179,911ExpensesManagement and administration fees $ 186,886Class specific fees 446,863
Total expenses 633,749
Net investment income (loss) 546,162Realized and Unrealized Gain (Loss)
on InvestmentsNet realized gain (loss) on sale of
underlying funds’ shares 283,798Capital gain distributions from under-
lying funds 99,557 383,355Change in net unrealized apprecia-
tion (depreciation) on underlying funds’ shares (3,251,836)
Net gain (loss) (2,868,481)Net increase (decrease) in net assets
resulting from operations $ (2,322,319)

111 Annual Report
See accompanying notes which are an integral part of the financial statements.
FA 529 Diversified International PortfolioFinancial Statements – continued
Statement of Changes in Net Assets
Year ended September 30,
2015
Year ended September 30,
2014Increase (Decrease) in Net Assets:
OperationsNet investment income (loss) $ 546,162 $ 373,436Net realized gain (loss) 383,355 1,070,730Change in net unrealized appreciation (depreciation) (3,251,836) 3,208,811Net increase (decrease) in net assets resulting from operations (2,322,319) 4,652,977Net increase (decrease) in net assets resulting from unit transactions 618,923 1,459,486Total increase (decrease) in net assets (1,703,396) 6,112,463
Net AssetsBeginning of period 90,274,919 84,162,456End of period $ 88,571,523 $ 90,274,919
Financial Highlights FA 529 Diversified International Portfolio Class A
Periods ended September 30, 2015 2014 2013 2012 2011Selected Per Unit Data Net asset value, beginning of period $ 21.89 $ 20.70 $ 16.94 $ 14.13 $ 15.90Income from Investment Operations
Net investment income (loss) A .18 .14 .19 .19 .18Net realized and unrealized gain (loss) (.64) 1.05 3.57 2.62 (1.95)
Total increase (decrease) from investment operations (.46) 1.19 3.76 2.81 (1.77)Net asset value, end of period $ 21.43 $ 21.89 $ 20.70 $ 16.94 $ 14.13
Total Return B (2.10)% 5.75% 22.20% 19.89% (11.13)%Ratios and Supplemental Data C Net assets, end of period (in $ thousands) $ 61,663 $ 61,236 $ 55,159 $ 44,899 $ 36,125Ratio of expenses to average net assets .45% .45% .45% .45% .45%Ratio of net investment income (loss) to average net assets .80% .63% 1.03% 1.19% 1.02%
A Calculated based on average units outstanding during the period.B Total returns do not include the effect of the sales charges.C Amounts do not include the activity of any underlying fund.
Financial Highlights FA 529 Diversified International Portfolio Class B
Periods ended September 30, 2015 2014 2013 2012 2011Selected Per Unit Data Net asset value, beginning of period $ 20.01 $ 19.07 $ 15.72 $ 13.21 $ 14.98Income from Investment Operations
Net investment income (loss) A .06 .01 .08 .10 .07Net realized and unrealized gain (loss) (.62) .93 3.27 2.41 (1.84)
Total increase (decrease) from investment operations (.56) .94 3.35 2.51 (1.77)Net asset value, end of period $ 19.45 $ 20.01 $ 19.07 $ 15.72 $ 13.21
Total Return B (2.80)% 4.93% 21.31% 19.00% (11.82)%Ratios and Supplemental Data C Net assets, end of period (in $ thousands) $ 1,850 $ 3,393 $ 4,862 $ 5,323 $ 5,912Ratio of expenses to average net assets 1.20% 1.20% 1.20% 1.20% 1.20%Ratio of net investment income (loss) to average net assets .27% .07% .44% .68% .42%
A Calculated based on average units outstanding during the period.B Total returns do not include the effect of the contingent deferred sales charge.C Amounts do not include the activity of any underlying fund.

112Annual Report
See accompanying notes which are an integral part of the financial statements.
FA 529 Diversified International PortfolioFinancial Statements – continued
Financial Highlights FA 529 Diversified International Portfolio Class C
Periods ended September 30, 2015 2014 2013 2012 2011Selected Per Unit Data Net asset value, beginning of period $ 20.02 $ 19.08 $ 15.73 $ 13.22 $ 14.99Income from Investment Operations
Net investment income (loss) A .01 (.02) .05 .07 .05Net realized and unrealized gain (loss) (.57) .96 3.30 2.44 (1.82)
Total increase (decrease) from investment operations (.56) .94 3.35 2.51 (1.77)Net asset value, end of period $ 19.46 $ 20.02 $ 19.08 $ 15.73 $ 13.22
Total Return B (2.80)% 4.93% 21.30% 18.99% (11.81)%Ratios and Supplemental Data C Net assets, end of period (in $ thousands) $ 23,631 $ 24,209 $ 22,744 $ 18,594 $ 15,892Ratio of expenses to average net assets 1.20% 1.20% 1.20% 1.20% 1.20%Ratio of net investment income (loss) to average net assets .07% (.09)% .27% .48% .28%
A Calculated based on average units outstanding during the period.B Total returns do not include the effect of the contingent deferred sales charge.C Amounts do not include the activity of any underlying fund.
Financial Highlights FA 529 Diversified International Portfolio Class D
Periods ended September 30, 2015 2014 2013 2012 2011Selected Per Unit Data Net asset value, beginning of period $ 21.24 $ 20.14 $ 16.52 $ 13.82 $ 15.58Income from Investment Operations
Net investment income (loss) A .12 .08 .15 .17 .14Net realized and unrealized gain (loss) (.61) 1.02 3.47 2.53 (1.90)
Total increase (decrease) from investment operations (.49) 1.10 3.62 2.70 (1.76)Net asset value, end of period $ 20.75 $ 21.24 $ 20.14 $ 16.52 $ 13.82
Total Return (2.31)% 5.46% 21.91% 19.54% (11.30)%Ratios and Supplemental Data B Net assets, end of period (in $ thousands) $ 852 $ 860 $ 799 $ 634 $ 573Ratio of expenses to average net assets .70% .70% .70% .70% .70%Ratio of net investment income (loss) to average net assets .53% .38% .82% 1.10% .81%
A Calculated based on average units outstanding during the period.B Amounts do not include the activity of any underlying fund.
Financial Highlights FA 529 Diversified International Portfolio Class P
Periods ended September 30, 2015 2014 2013 2012 2011Selected Per Unit Data Net asset value, beginning of period $ 20.62 $ 19.60 $ 16.12 $ 13.51 $ 15.28Income from Investment Operations
Net investment income (loss) A .07 .04 .09 .12 .09Net realized and unrealized gain (loss) (.60) .98 3.39 2.49 (1.86)
Total increase (decrease) from investment operations (.53) 1.02 3.48 2.61 (1.77)Net asset value, end of period $ 20.09 $ 20.62 $ 19.60 $ 16.12 $ 13.51
Total Return (2.57)% 5.20% 21.59% 19.32% (11.58)%Ratios and Supplemental Data B Net assets, end of period (in $ thousands) $ 576 $ 577 $ 598 $ 470 $ 420Ratio of expenses to average net assets .95% .95% .95% .95% .95%Ratio of net investment income (loss) to average net assets .31% .17% .52% .79% .55%
A Calculated based on average units outstanding during the period.B Amounts do not include the activity of any underlying fund.

113 Annual Report
See accompanying notes which are an integral part of the financial statements.
FA 529 Dividend Growth Portfolio
Financial Statements
Statement of Assets and Liabilities
September 30, 2015
AssetsInvestments in securities, at value
(3,532,924 shares of Fidelity Advisor Dividend Growth Fund, Class I; cost $47,511,439) $ 59,423,783
Receivable for investments sold 21,703Receivable for units sold 17,225
Total assets 59,462,711
LiabilitiesPayable for investments purchased $ 873Payable for units redeemed 56,456Accrued expenses 33,773
Total liabilities 91,102Net Assets $ 59,371,609
Class A:Net Asset Value and redemption price per
unit ($40,447,023 / 2,021,419 units) $ 20.01
Maximum offering price per unit (100/94.25 of $20.01) $ 21.23
Class B:Net Asset Value and offering price per
unit ($1,288,782 / 70,980 units)(a) $ 18.16
Class C:Net Asset Value and offering price per
unit ($16,276,261 / 895,622 units)(a) $ 18.17
Class D:Net Asset Value, offering price and
redemption price per unit ($873,260 / 45,092 units) $ 19.37
Class P:
Net Asset Value, offering price and redemption price per unit ($486,283 / 25,938 units) $ 18.75
(a) Redemption price per unit is equal to net asset value less any applicable contingent deferred sales charge.
Statement of Operations
Year ended September 30, 2015
Investment IncomeIncome distributions from underlying
funds $ 742,759ExpensesManagement and administration
fees $ 127,534Class specific fees 311,121
Total expenses 438,655
Net investment income (loss) 304,104Realized and Unrealized Gain (Loss)
on InvestmentsNet realized gain (loss) on sale of
underlying funds’ shares 1,110,273Capital gain distributions from
underlying funds 6,142,010 7,252,283Change in net unrealized apprecia-
tion (depreciation) on underlying funds’ shares (9,766,670)
Net gain (loss) (2,514,387)Net increase (decrease) in net assets
resulting from operations $ (2,210,283)

114Annual Report
See accompanying notes which are an integral part of the financial statements.
FA 529 Dividend Growth PortfolioFinancial Statements – continued
Statement of Changes in Net Assets
Year ended September 30,
2015
Year ended September 30,
2014Increase (Decrease) in Net Assets:
OperationsNet investment income (loss) $ 304,104 $ 32,265Net realized gain (loss) 7,252,283 1,181,791Change in net unrealized appreciation (depreciation) (9,766,670) 7,535,416Net increase (decrease) in net assets resulting from operations (2,210,283) 8,749,472Net increase (decrease) in net assets resulting from unit transactions 984,986 1,148,538Total increase (decrease) in net assets (1,225,297) 9,898,010
Net AssetsBeginning of period 60,596,906 50,698,896End of period $ 59,371,609 $ 60,596,906
Financial Highlights FA 529 Dividend Growth Portfolio Class A
Periods ended September 30, 2015 2014 2013 2012 2011Selected Per Unit Data Net asset value, beginning of period $ 20.71 $ 17.66 $ 14.62 $ 11.25 $ 11.93Income from Investment Operations
Net investment income (loss) A .15 .06 .08 (.06) (.04)Net realized and unrealized gain (loss) (.85) 2.99 2.96 3.43 (.64)
Total increase (decrease) from investment operations (.70) 3.05 3.04 3.37 (.68)Net asset value, end of period $ 20.01 $ 20.71 $ 17.66 $ 14.62 $ 11.25
Total Return B (3.38)% 17.27% 20.79% 29.96% (5.70)%Ratios and Supplemental Data C Net assets, end of period (in $ thousands) $ 40,448 $ 39,844 $ 32,652 $ 25,300 $ 16,186Ratio of expenses to average net assets .45% .45% .45% .45% .45%Ratio of net investment income (loss) to average net assets .70% .30% .50% (.45)% (.32)%
A Calculated based on average units outstanding during the period.B Total returns do not include the effect of the sales charges.C Amounts do not include the activity of any underlying fund.
Financial Highlights FA 529 Dividend Growth Portfolio Class B
Periods ended September 30, 2015 2014 2013 2012 2011Selected Per Unit Data Net asset value, beginning of period $ 18.93 $ 16.27 $ 13.57 $ 10.52 $ 11.24Income from Investment Operations
Net investment income (loss) A .03 (.06) (.02) (.15) (.13)Net realized and unrealized gain (loss) (.80) 2.72 2.72 3.20 (.59)
Total increase (decrease) from investment operations (.77) 2.66 2.70 3.05 (.72)Net asset value, end of period $ 18.16 $ 18.93 $ 16.27 $ 13.57 $ 10.52
Total Return B (4.07)% 16.35% 19.90% 28.99% (6.41)%Ratios and Supplemental Data C Net assets, end of period (in $ thousands) $ 1,289 $ 2,193 $ 2,785 $ 2,955 $ 3,055Ratio of expenses to average net assets 1.20% 1.20% 1.20% 1.20% 1.20%Ratio of net investment income (loss) to average net assets .18% (.33)% (.13)% (1.20)% (1.05)%
A Calculated based on average units outstanding during the period.B Total returns do not include the effect of the contingent deferred sales charge.C Amounts do not include the activity of any underlying fund.
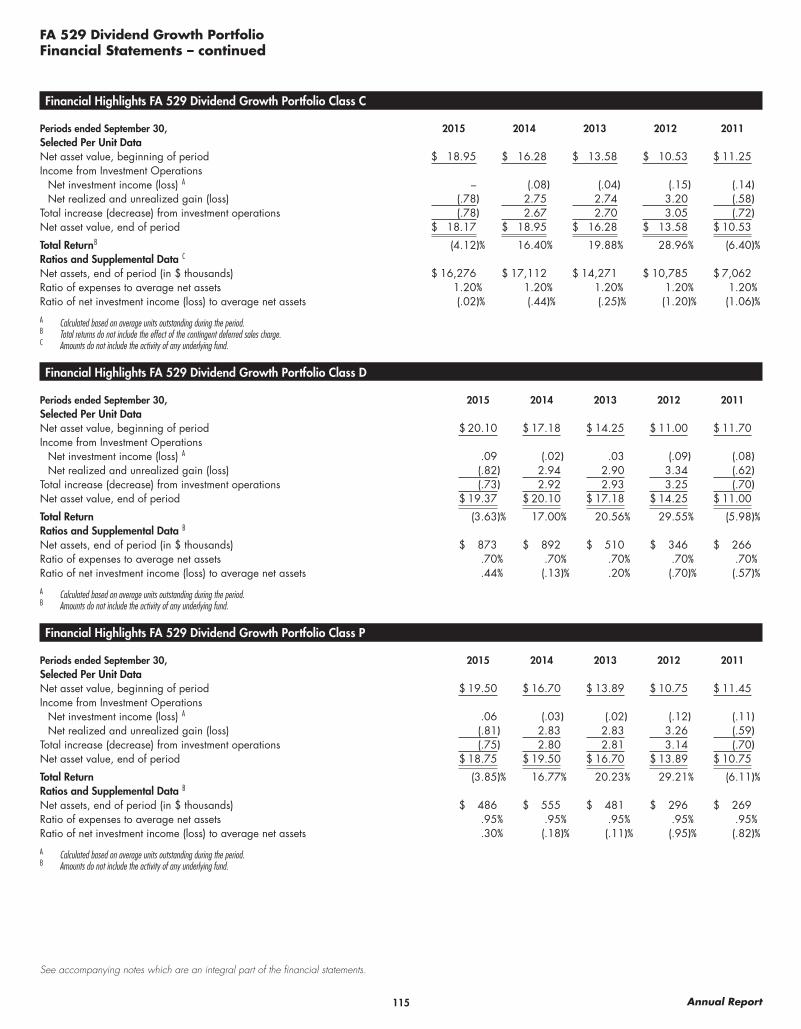
115 Annual Report
See accompanying notes which are an integral part of the financial statements.
FA 529 Dividend Growth PortfolioFinancial Statements – continued
Financial Highlights FA 529 Dividend Growth Portfolio Class C
Periods ended September 30, 2015 2014 2013 2012 2011Selected Per Unit Data Net asset value, beginning of period $ 18.95 $ 16.28 $ 13.58 $ 10.53 $ 11.25Income from Investment Operations
Net investment income (loss) A – (.08) (.04) (.15) (.14)Net realized and unrealized gain (loss) (.78) 2.75 2.74 3.20 (.58)
Total increase (decrease) from investment operations (.78) 2.67 2.70 3.05 (.72)Net asset value, end of period $ 18.17 $ 18.95 $ 16.28 $ 13.58 $ 10.53
Total Return B (4.12)% 16.40% 19.88% 28.96% (6.40)%Ratios and Supplemental Data C Net assets, end of period (in $ thousands) $ 16,276 $ 17,112 $ 14,271 $ 10,785 $ 7,062Ratio of expenses to average net assets 1.20% 1.20% 1.20% 1.20% 1.20%Ratio of net investment income (loss) to average net assets (.02)% (.44)% (.25)% (1.20)% (1.06)%
A Calculated based on average units outstanding during the period.B Total returns do not include the effect of the contingent deferred sales charge.C Amounts do not include the activity of any underlying fund.
Financial Highlights FA 529 Dividend Growth Portfolio Class D
Periods ended September 30, 2015 2014 2013 2012 2011Selected Per Unit Data Net asset value, beginning of period $ 20.10 $ 17.18 $ 14.25 $ 11.00 $ 11.70Income from Investment Operations
Net investment income (loss) A .09 (.02) .03 (.09) (.08)Net realized and unrealized gain (loss) (.82) 2.94 2.90 3.34 (.62)
Total increase (decrease) from investment operations (.73) 2.92 2.93 3.25 (.70)Net asset value, end of period $ 19.37 $ 20.10 $ 17.18 $ 14.25 $ 11.00
Total Return (3.63)% 17.00% 20.56% 29.55% (5.98)%Ratios and Supplemental Data B Net assets, end of period (in $ thousands) $ 873 $ 892 $ 510 $ 346 $ 266Ratio of expenses to average net assets .70% .70% .70% .70% .70%Ratio of net investment income (loss) to average net assets .44% (.13)% .20% (.70)% (.57)%
A Calculated based on average units outstanding during the period.B Amounts do not include the activity of any underlying fund.
Financial Highlights FA 529 Dividend Growth Portfolio Class P
Periods ended September 30, 2015 2014 2013 2012 2011Selected Per Unit Data Net asset value, beginning of period $ 19.50 $ 16.70 $ 13.89 $ 10.75 $ 11.45Income from Investment Operations
Net investment income (loss) A .06 (.03) (.02) (.12) (.11)Net realized and unrealized gain (loss) (.81) 2.83 2.83 3.26 (.59)
Total increase (decrease) from investment operations (.75) 2.80 2.81 3.14 (.70)Net asset value, end of period $ 18.75 $ 19.50 $ 16.70 $ 13.89 $ 10.75
Total Return (3.85)% 16.77% 20.23% 29.21% (6.11)%Ratios and Supplemental Data B Net assets, end of period (in $ thousands) $ 486 $ 555 $ 481 $ 296 $ 269Ratio of expenses to average net assets .95% .95% .95% .95% .95%Ratio of net investment income (loss) to average net assets .30% (.18)% (.11)% (.95)% (.82)%
A Calculated based on average units outstanding during the period.B Amounts do not include the activity of any underlying fund.
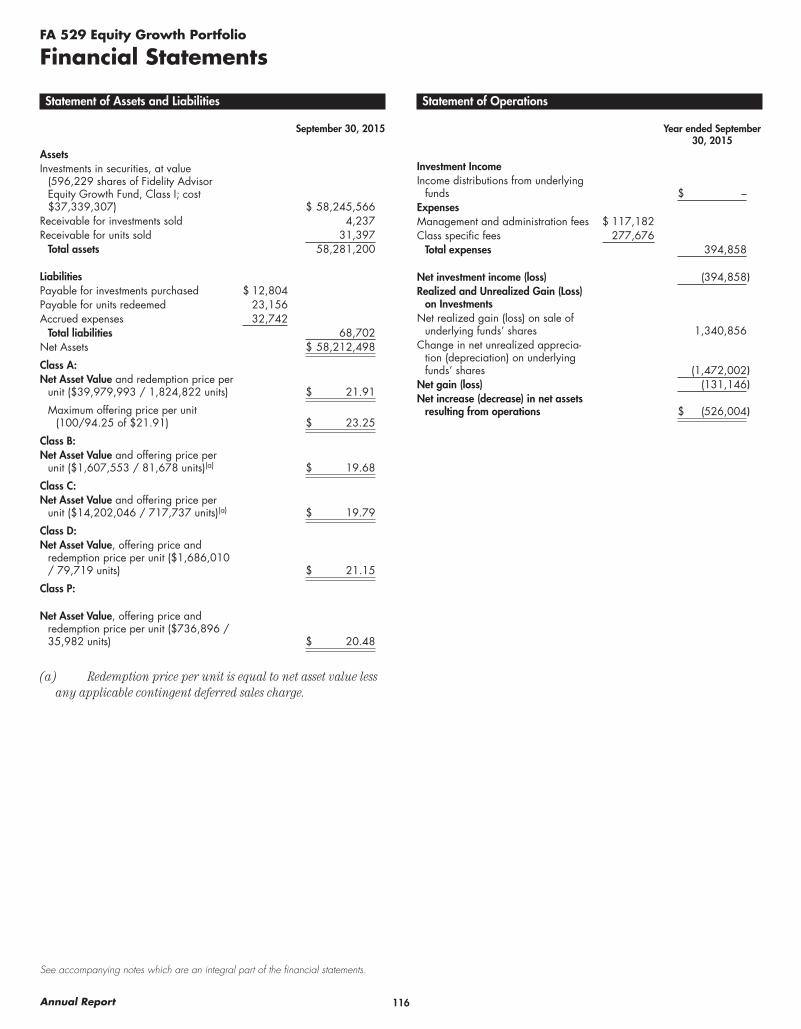
116Annual Report
See accompanying notes which are an integral part of the financial statements.
FA 529 Equity Growth Portfolio
Financial Statements
Statement of Assets and Liabilities
September 30, 2015
AssetsInvestments in securities, at value
(596,229 shares of Fidelity Advisor Equity Growth Fund, Class I; cost $37,339,307) $ 58,245,566
Receivable for investments sold 4,237Receivable for units sold 31,397
Total assets 58,281,200
LiabilitiesPayable for investments purchased $ 12,804Payable for units redeemed 23,156Accrued expenses 32,742
Total liabilities 68,702Net Assets $ 58,212,498
Class A:Net Asset Value and redemption price per
unit ($39,979,993 / 1,824,822 units) $ 21.91
Maximum offering price per unit (100/94.25 of $21.91) $ 23.25
Class B:Net Asset Value and offering price per
unit ($1,607,553 / 81,678 units)(a) $ 19.68
Class C:Net Asset Value and offering price per
unit ($14,202,046 / 717,737 units)(a) $ 19.79
Class D:Net Asset Value, offering price and
redemption price per unit ($1,686,010 / 79,719 units) $ 21.15
Class P:
Net Asset Value, offering price and redemption price per unit ($736,896 / 35,982 units) $ 20.48
(a) Redemption price per unit is equal to net asset value less any applicable contingent deferred sales charge.
Statement of Operations
Year ended September 30, 2015
Investment IncomeIncome distributions from underlying
funds $ –ExpensesManagement and administration fees $ 117,182Class specific fees 277,676
Total expenses 394,858
Net investment income (loss) (394,858)Realized and Unrealized Gain (Loss)
on InvestmentsNet realized gain (loss) on sale of
underlying funds’ shares 1,340,856Change in net unrealized apprecia-
tion (depreciation) on underlying funds’ shares (1,472,002)
Net gain (loss) (131,146)Net increase (decrease) in net assets
resulting from operations $ (526,004)
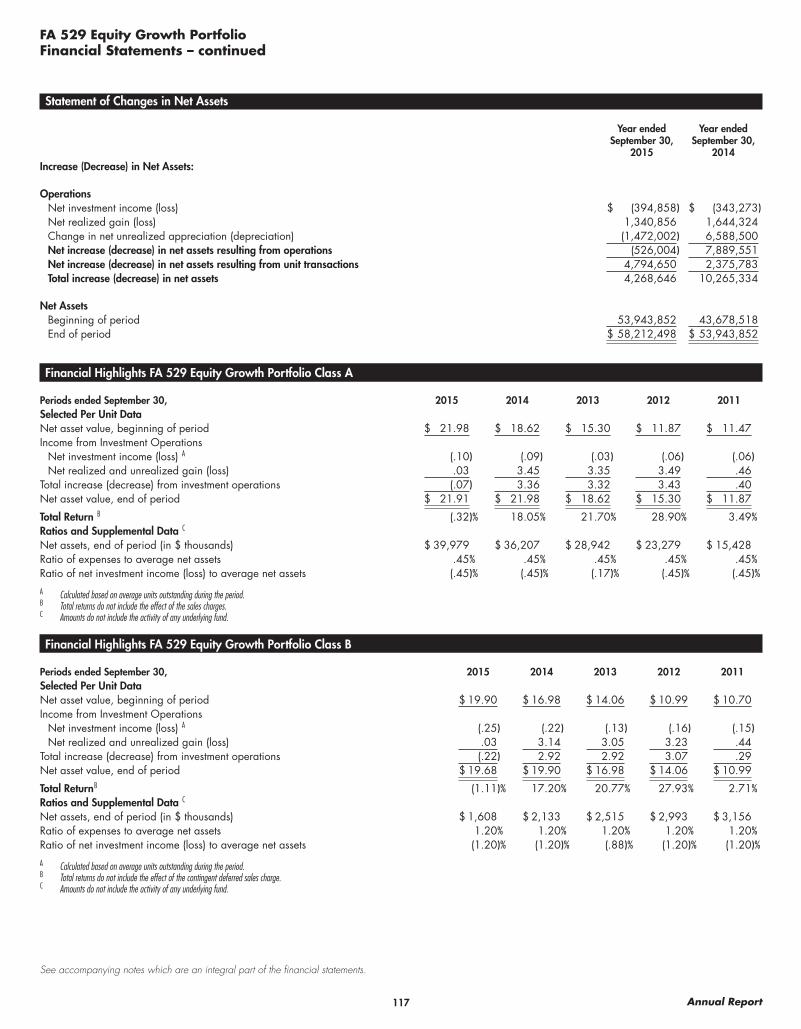
117 Annual Report
See accompanying notes which are an integral part of the financial statements.
FA 529 Equity Growth PortfolioFinancial Statements – continued
Statement of Changes in Net Assets
Year ended September 30,
2015
Year ended September 30,
2014Increase (Decrease) in Net Assets:
OperationsNet investment income (loss) $ (394,858) $ (343,273)Net realized gain (loss) 1,340,856 1,644,324Change in net unrealized appreciation (depreciation) (1,472,002) 6,588,500Net increase (decrease) in net assets resulting from operations (526,004) 7,889,551Net increase (decrease) in net assets resulting from unit transactions 4,794,650 2,375,783Total increase (decrease) in net assets 4,268,646 10,265,334
Net AssetsBeginning of period 53,943,852 43,678,518End of period $ 58,212,498 $ 53,943,852
Financial Highlights FA 529 Equity Growth Portfolio Class A
Periods ended September 30, 2015 2014 2013 2012 2011Selected Per Unit Data Net asset value, beginning of period $ 21.98 $ 18.62 $ 15.30 $ 11.87 $ 11.47Income from Investment Operations
Net investment income (loss) A (.10) (.09) (.03) (.06) (.06)Net realized and unrealized gain (loss) .03 3.45 3.35 3.49 .46
Total increase (decrease) from investment operations (.07) 3.36 3.32 3.43 .40Net asset value, end of period $ 21.91 $ 21.98 $ 18.62 $ 15.30 $ 11.87
Total Return B (.32)% 18.05% 21.70% 28.90% 3.49%Ratios and Supplemental Data C Net assets, end of period (in $ thousands) $ 39,979 $ 36,207 $ 28,942 $ 23,279 $ 15,428Ratio of expenses to average net assets .45% .45% .45% .45% .45%Ratio of net investment income (loss) to average net assets (.45)% (.45)% (.17)% (.45)% (.45)%
A Calculated based on average units outstanding during the period.B Total returns do not include the effect of the sales charges.C Amounts do not include the activity of any underlying fund.
Financial Highlights FA 529 Equity Growth Portfolio Class B
Periods ended September 30, 2015 2014 2013 2012 2011Selected Per Unit Data Net asset value, beginning of period $ 19.90 $ 16.98 $ 14.06 $ 10.99 $ 10.70Income from Investment Operations
Net investment income (loss) A (.25) (.22) (.13) (.16) (.15)Net realized and unrealized gain (loss) .03 3.14 3.05 3.23 .44
Total increase (decrease) from investment operations (.22) 2.92 2.92 3.07 .29Net asset value, end of period $ 19.68 $ 19.90 $ 16.98 $ 14.06 $ 10.99
Total Return B (1.11)% 17.20% 20.77% 27.93% 2.71%Ratios and Supplemental Data C Net assets, end of period (in $ thousands) $ 1,608 $ 2,133 $ 2,515 $ 2,993 $ 3,156Ratio of expenses to average net assets 1.20% 1.20% 1.20% 1.20% 1.20%Ratio of net investment income (loss) to average net assets (1.20)% (1.20)% (.88)% (1.20)% (1.20)%
A Calculated based on average units outstanding during the period.B Total returns do not include the effect of the contingent deferred sales charge.C Amounts do not include the activity of any underlying fund.

118Annual Report
See accompanying notes which are an integral part of the financial statements.
FA 529 Equity Growth PortfolioFinancial Statements – continued
Financial Highlights FA 529 Equity Growth Portfolio Class C
Periods ended September 30, 2015 2014 2013 2012 2011Selected Per Unit Data Net asset value, beginning of period $ 20.01 $ 17.07 $ 14.14 $ 11.05 $ 10.75Income from Investment Operations
Net investment income (loss) A (.25) (.23) (.14) (.16) (.15)Net realized and unrealized gain (loss) .03 3.17 3.07 3.25 .45
Total increase (decrease) from investment operations (.22) 2.94 2.93 3.09 .30Net asset value, end of period $ 19.79 $ 20.01 $ 17.07 $ 14.14 $ 11.05
Total Return B (1.10)% 17.22% 20.72% 27.96% 2.79%Ratios and Supplemental Data C Net assets, end of period (in $ thousands) $ 14,202 $ 13,257 $ 11,153 $ 9,046 $ 6,775Ratio of expenses to average net assets 1.20% 1.20% 1.20% 1.20% 1.20%Ratio of net investment income (loss) to average net assets (1.20)% (1.20)% (.92)% (1.20)% (1.20)%
A Calculated based on average units outstanding during the period.B Total returns do not include the effect of the contingent deferred sales charge.C Amounts do not include the activity of any underlying fund.
Financial Highlights FA 529 Equity Growth Portfolio Class D
Periods ended September 30, 2015 2014 2013 2012 2011Selected Per Unit Data Net asset value, beginning of period $ 21.27 $ 18.06 $ 14.88 $ 11.56 $ 11.20Income from Investment Operations
Net investment income (loss) A (.16) (.14) (.07) (.10) (.09)Net realized and unrealized gain (loss) .04 3.35 3.25 3.42 .45
Total increase (decrease) from investment operations (.12) 3.21 3.18 3.32 .36Net asset value, end of period $ 21.15 $ 21.27 $ 18.06 $ 14.88 $ 11.56
Total Return (.56)% 17.77% 21.37% 28.72% 3.21%Ratios and Supplemental Data B Net assets, end of period (in $ thousands) $ 1,686 $ 1,620 $ 532 $ 356 $ 283Ratio of expenses to average net assets .70% .70% .70% .70% .70%Ratio of net investment income (loss) to average net assets (.70)% (.70)% (.42)% (.70)% (.70)%
A Calculated based on average units outstanding during the period.B Amounts do not include the activity of any underlying fund.
Financial Highlights FA 529 Equity Growth Portfolio Class P
Periods ended September 30, 2015 2014 2013 2012 2011Selected Per Unit Data Net asset value, beginning of period $ 20.65 $ 17.58 $ 14.52 $ 11.32 $ 10.99Income from Investment Operations
Net investment income (loss) A (.20) (.19) (.10) (.13) (.12)Net realized and unrealized gain (loss) .03 3.26 3.16 3.33 .45
Total increase (decrease) from investment operations (.17) 3.07 3.06 3.20 .33Net asset value, end of period $ 20.48 $ 20.65 $ 17.58 $ 14.52 $ 11.32
Total Return (.82)% 17.46% 21.07% 28.27% 3.00%Ratios and Supplemental Data B Net assets, end of period (in $ thousands) $ 737 $ 727 $ 537 $ 466 $ 420Ratio of expenses to average net assets .95% .95% .95% .95% .95%Ratio of net investment income (loss) to average net assets (.95)% (.95)% (.66)% (.95)% (.95)%
A Calculated based on average units outstanding during the period.B Amounts do not include the activity of any underlying fund.

119 Annual Report
See accompanying notes which are an integral part of the financial statements.
FA 529 Equity Income Portfolio
Financial Statements
Statement of Assets and Liabilities
September 30, 2015
AssetsInvestments in securities, at value
(1,802,809 shares of Fidelity Advi-sor Equity Income Fund, Class I; cost $50,331,771) $ 55,057,775
Receivable for investments sold 14,446Receivable for units sold 35,394
Total assets 55,107,615
LiabilitiesPayable for investments purchased $ 11,974Payable for units redeemed 37,867Accrued expenses 31,699
Total liabilities 81,540Net Assets $ 55,026,075
Class A:Net Asset Value and redemption price per
unit ($36,915,407 / 1,918,081 units) $ 19.25
Maximum offering price per unit (100/94.25 of $19.25) $ 20.42
Class B:Net Asset Value and offering price per
unit ($1,137,346 / 65,328 units)(a) $ 17.41
Class C:Net Asset Value and offering price per
unit ($15,872,945 / 910,056 units)(a) $ 17.44
Class D:Net Asset Value, offering price and
redemption price per unit ($587,545 / 31,577 units) $ 18.61
Class P:
Net Asset Value, offering price and redemption price per unit ($512,832 / 28,400 units) $ 18.06
(a) Redemption price per unit is equal to net asset value less any applicable contingent deferred sales charge.
Statement of Operations
Year ended September 30, 2015
Investment IncomeIncome distributions from underlying
funds $ 1,717,047ExpensesManagement and administration
fees $ 123,112Class specific fees 306,109
Total expenses 429,221
Net investment income (loss) 1,287,826Realized and Unrealized Gain (Loss)
on InvestmentsNet realized gain (loss) on sale of
underlying funds’ shares 1,053,877Capital gain distributions from
underlying funds 2,100,561 3,154,438Change in net unrealized apprecia-
tion (depreciation) on underlying funds’ shares (8,687,123)
Net gain (loss) (5,532,685)Net increase (decrease) in net assets
resulting from operations $ (4,244,859)

120Annual Report
See accompanying notes which are an integral part of the financial statements.
FA 529 Equity Income PortfolioFinancial Statements – continued
Statement of Changes in Net Assets
Year ended September 30,
2015
Year ended September 30,
2014Increase (Decrease) in Net Assets:
OperationsNet investment income (loss) $ 1,287,826 $ 961,419Net realized gain (loss) 3,154,438 826,823Change in net unrealized appreciation (depreciation) (8,687,123) 5,630,193Net increase (decrease) in net assets resulting from operations (4,244,859) 7,418,435Net increase (decrease) in net assets resulting from unit transactions (2,330,589) 266,100Total increase (decrease) in net assets (6,575,448) 7,684,535
Net AssetsBeginning of period 61,601,523 53,916,988End of period $ 55,026,075 $ 61,601,523
Financial Highlights FA 529 Equity Income Portfolio Class A
Periods ended September 30, 2015 2014 2013 2012 2011Selected Per Unit Data Net asset value, beginning of period $ 20.70 $ 18.18 $ 15.19 $ 11.76 $ 11.78Income from Investment Operations
Net investment income (loss) A .49 .37 .30 .28 .16Net realized and unrealized gain (loss) (1.94) 2.15 2.69 3.15 (.18)
Total increase (decrease) from investment operations (1.45) 2.52 2.99 3.43 (.02)Net asset value, end of period $ 19.25 $ 20.70 $ 18.18 $ 15.19 $ 11.76
Total Return B (7.00)% 13.86% 19.68% 29.17% (.17)%Ratios and Supplemental Data C Net assets, end of period (in $ thousands) $ 36,915 $ 39,864 $ 33,760 $ 25,720 $ 17,852Ratio of expenses to average net assets .45% .45% .45% .45% .45%Ratio of net investment income (loss) to average net assets 2.32% 1.87% 1.81% 2.04% 1.25%
A Calculated based on average units outstanding during the period.B Total returns do not include the effect of the sales charges.C Amounts do not include the activity of any underlying fund.
Financial Highlights FA 529 Equity Income Portfolio Class B
Periods ended September 30, 2015 2014 2013 2012 2011Selected Per Unit Data Net asset value, beginning of period $ 18.86 $ 16.69 $ 14.06 $ 10.96 $ 11.07Income from Investment Operations
Net investment income (loss) A .34 .23 .18 .18 .07Net realized and unrealized gain (loss) (1.79) 1.94 2.45 2.92 (.18)
Total increase (decrease) from investment operations (1.45) 2.17 2.63 3.10 (.11)Net asset value, end of period $ 17.41 $ 18.86 $ 16.69 $ 14.06 $ 10.96
Total Return B (7.69)% 13.00% 18.71% 28.28% (.99)%Ratios and Supplemental Data C Net assets, end of period (in $ thousands) $ 1,137 $ 1,964 $ 2,636 $ 2,744 $ 2,973Ratio of expenses to average net assets 1.20% 1.20% 1.20% 1.20% 1.20%Ratio of net investment income (loss) to average net assets 1.77% 1.28% 1.19% 1.44% .53%
A Calculated based on average units outstanding during the period.B Total returns do not include the effect of the contingent deferred sales charge.C Amounts do not include the activity of any underlying fund.
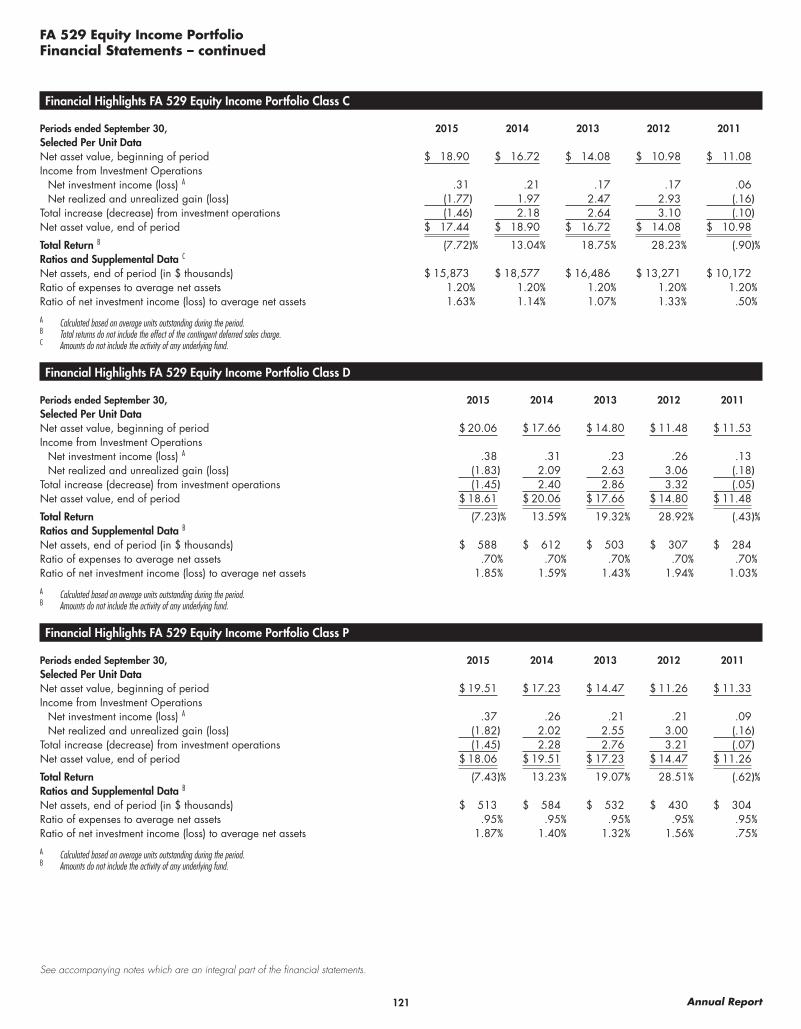
121 Annual Report
See accompanying notes which are an integral part of the financial statements.
FA 529 Equity Income PortfolioFinancial Statements – continued
Financial Highlights FA 529 Equity Income Portfolio Class C
Periods ended September 30, 2015 2014 2013 2012 2011Selected Per Unit Data Net asset value, beginning of period $ 18.90 $ 16.72 $ 14.08 $ 10.98 $ 11.08Income from Investment Operations
Net investment income (loss) A .31 .21 .17 .17 .06Net realized and unrealized gain (loss) (1.77) 1.97 2.47 2.93 (.16)
Total increase (decrease) from investment operations (1.46) 2.18 2.64 3.10 (.10)Net asset value, end of period $ 17.44 $ 18.90 $ 16.72 $ 14.08 $ 10.98
Total Return B (7.72)% 13.04% 18.75% 28.23% (.90)%Ratios and Supplemental Data C Net assets, end of period (in $ thousands) $ 15,873 $ 18,577 $ 16,486 $ 13,271 $ 10,172Ratio of expenses to average net assets 1.20% 1.20% 1.20% 1.20% 1.20%Ratio of net investment income (loss) to average net assets 1.63% 1.14% 1.07% 1.33% .50%
A Calculated based on average units outstanding during the period.B Total returns do not include the effect of the contingent deferred sales charge.C Amounts do not include the activity of any underlying fund.
Financial Highlights FA 529 Equity Income Portfolio Class D
Periods ended September 30, 2015 2014 2013 2012 2011Selected Per Unit Data Net asset value, beginning of period $ 20.06 $ 17.66 $ 14.80 $ 11.48 $ 11.53Income from Investment Operations
Net investment income (loss) A .38 .31 .23 .26 .13Net realized and unrealized gain (loss) (1.83) 2.09 2.63 3.06 (.18)
Total increase (decrease) from investment operations (1.45) 2.40 2.86 3.32 (.05)Net asset value, end of period $ 18.61 $ 20.06 $ 17.66 $ 14.80 $ 11.48
Total Return (7.23)% 13.59% 19.32% 28.92% (.43)%Ratios and Supplemental Data B Net assets, end of period (in $ thousands) $ 588 $ 612 $ 503 $ 307 $ 284Ratio of expenses to average net assets .70% .70% .70% .70% .70%Ratio of net investment income (loss) to average net assets 1.85% 1.59% 1.43% 1.94% 1.03%
A Calculated based on average units outstanding during the period.B Amounts do not include the activity of any underlying fund.
Financial Highlights FA 529 Equity Income Portfolio Class P
Periods ended September 30, 2015 2014 2013 2012 2011Selected Per Unit Data Net asset value, beginning of period $ 19.51 $ 17.23 $ 14.47 $ 11.26 $ 11.33Income from Investment Operations
Net investment income (loss) A .37 .26 .21 .21 .09Net realized and unrealized gain (loss) (1.82) 2.02 2.55 3.00 (.16)
Total increase (decrease) from investment operations (1.45) 2.28 2.76 3.21 (.07)Net asset value, end of period $ 18.06 $ 19.51 $ 17.23 $ 14.47 $ 11.26
Total Return (7.43)% 13.23% 19.07% 28.51% (.62)%Ratios and Supplemental Data B Net assets, end of period (in $ thousands) $ 513 $ 584 $ 532 $ 430 $ 304Ratio of expenses to average net assets .95% .95% .95% .95% .95%Ratio of net investment income (loss) to average net assets 1.87% 1.40% 1.32% 1.56% .75%
A Calculated based on average units outstanding during the period.B Amounts do not include the activity of any underlying fund.
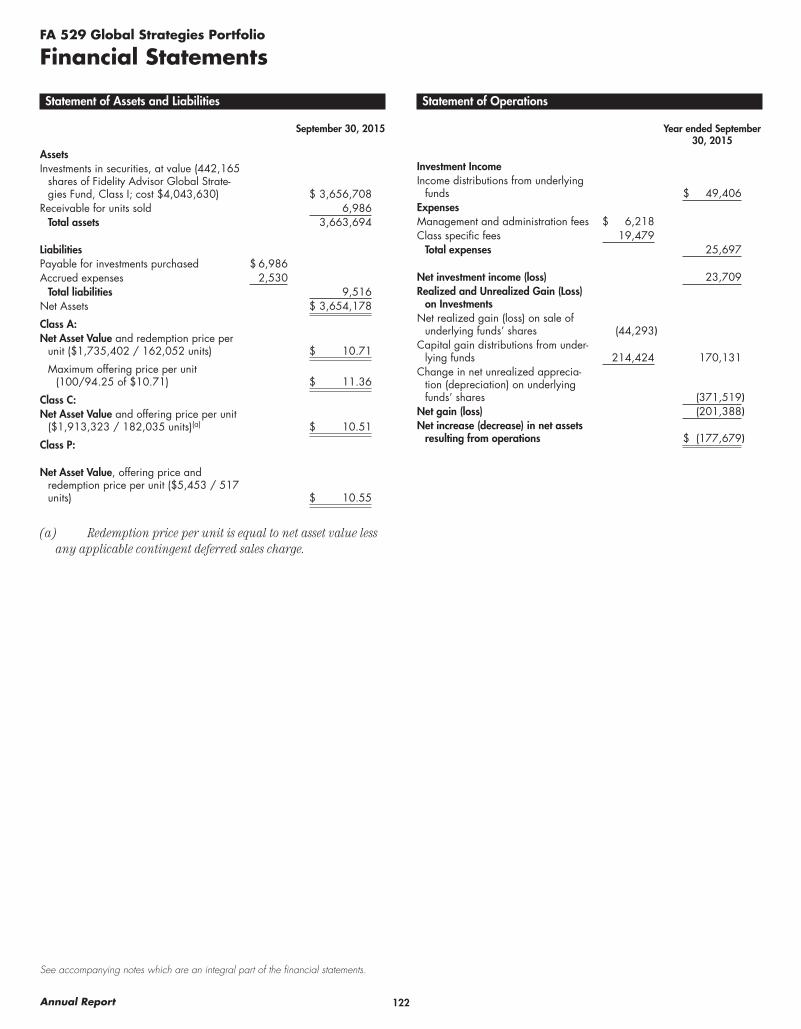
122Annual Report
See accompanying notes which are an integral part of the financial statements.
FA 529 Global Strategies Portfolio
Financial Statements
Statement of Assets and Liabilities
September 30, 2015
AssetsInvestments in securities, at value (442,165
shares of Fidelity Advisor Global Strate-gies Fund, Class I; cost $4,043,630) $ 3,656,708
Receivable for units sold 6,986Total assets 3,663,694
LiabilitiesPayable for investments purchased $ 6,986Accrued expenses 2,530
Total liabilities 9,516Net Assets $ 3,654,178
Class A:Net Asset Value and redemption price per
unit ($1,735,402 / 162,052 units) $ 10.71
Maximum offering price per unit (100/94.25 of $10.71) $ 11.36
Class C:Net Asset Value and offering price per unit
($1,913,323 / 182,035 units)(a) $ 10.51
Class P:
Net Asset Value, offering price and redemption price per unit ($5,453 / 517 units) $ 10.55
(a) Redemption price per unit is equal to net asset value less any applicable contingent deferred sales charge.
Statement of Operations
Year ended September 30, 2015
Investment IncomeIncome distributions from underlying
funds $ 49,406ExpensesManagement and administration fees $ 6,218Class specific fees 19,479
Total expenses 25,697
Net investment income (loss) 23,709Realized and Unrealized Gain (Loss)
on InvestmentsNet realized gain (loss) on sale of
underlying funds’ shares (44,293)Capital gain distributions from under-
lying funds 214,424 170,131Change in net unrealized apprecia-
tion (depreciation) on underlying funds’ shares (371,519)
Net gain (loss) (201,388)Net increase (decrease) in net assets
resulting from operations $ (177,679)
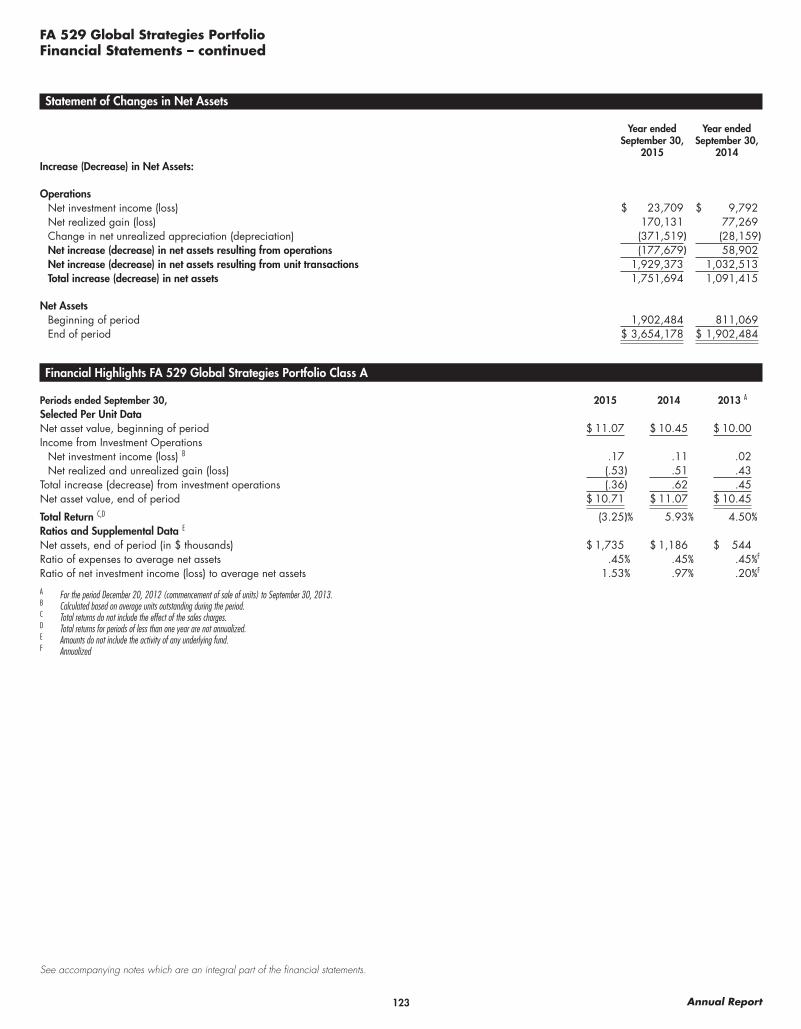
123 Annual Report
See accompanying notes which are an integral part of the financial statements.
FA 529 Global Strategies PortfolioFinancial Statements – continued
Statement of Changes in Net Assets
Year ended September 30,
2015
Year ended September 30,
2014Increase (Decrease) in Net Assets:
OperationsNet investment income (loss) $ 23,709 $ 9,792Net realized gain (loss) 170,131 77,269Change in net unrealized appreciation (depreciation) (371,519) (28,159)Net increase (decrease) in net assets resulting from operations (177,679) 58,902Net increase (decrease) in net assets resulting from unit transactions 1,929,373 1,032,513Total increase (decrease) in net assets 1,751,694 1,091,415
Net AssetsBeginning of period 1,902,484 811,069End of period $ 3,654,178 $ 1,902,484
Financial Highlights FA 529 Global Strategies Portfolio Class A
Periods ended September 30, 2015 2014 2013 A
Selected Per Unit Data Net asset value, beginning of period $ 11.07 $ 10.45 $ 10.00Income from Investment Operations
Net investment income (loss) B .17 .11 .02Net realized and unrealized gain (loss) (.53) .51 .43
Total increase (decrease) from investment operations (.36) .62 .45Net asset value, end of period $ 10.71 $ 11.07 $ 10.45
Total Return C,D (3.25)% 5.93% 4.50%Ratios and Supplemental Data E Net assets, end of period (in $ thousands) $ 1,735 $ 1,186 $ 544Ratio of expenses to average net assets .45% .45% .45%F
Ratio of net investment income (loss) to average net assets 1.53% .97% .20%F
A For the period December 20, 2012 (commencement of sale of units) to September 30, 2013.B Calculated based on average units outstanding during the period.C Total returns do not include the effect of the sales charges.D Total returns for periods of less than one year are not annualized.E Amounts do not include the activity of any underlying fund.F Annualized

124Annual Report
See accompanying notes which are an integral part of the financial statements.
FA 529 Global Strategies PortfolioFinancial Statements – continued
Financial Highlights FA 529 Global Strategies Portfolio Class C
Periods ended September 30, 2015 2014 2013 A
Selected Per Unit Data Net asset value, beginning of period $ 10.95 $ 10.41 $ 10.00Income from Investment Operations
Net investment income (loss) B –C .01 (.02)Net realized and unrealized gain (loss) (.44) .53 .43
Total increase (decrease) from investment operations (.44) .54 .41Net asset value, end of period $ 10.51 $ 10.95 $ 10.41
Total Return D,E (4.02)% 5.19% 4.10%Ratios and Supplemental Data F Net assets, end of period (in $ thousands) $ 1,914 $ 711 $ 266Ratio of expenses to average net assets 1.20% 1.20% 1.20%G
Ratio of net investment income (loss) to average net assets (.01)% .12% (.20)%G
A For the period December 20, 2012 (commencement of sale of units) to September 30, 2013.B Calculated based on average units outstanding during the period.C Amount represents less than $.01 per unit.D Total returns do not include the effect of the contingent deferred sales charge.E Total returns for periods of less than one year are not annualized.F Amounts do not include the activity of any underlying fund.G Annualized
Financial Highlights FA 529 Global Strategies Portfolio Class P
Periods ended September 30, 2015 2014 2013 A
Selected Per Unit Data Net asset value, beginning of period $ 10.97 $ 10.40 $ 10.00Income from Investment Operations
Net investment income (loss) B .19 .05 .11Net realized and unrealized gain (loss) (.61) .52 .29
Total increase (decrease) from investment operations (.42) .57 .40Net asset value, end of period $ 10.55 $ 10.97 $ 10.40
Total Return C (3.83)% 5.48% 4.00%Ratios and Supplemental Data D Net assets, end of period (in $ thousands) $ 5 $ 5 $ 1Ratio of expenses to average net assets .94% .95% .95%E
Ratio of net investment income (loss) to average net assets 1.69% .46% 1.35%E
A For the period December 20, 2012 (commencement of sale of units) to September 30, 2013.B Calculated based on average units outstanding during the period.C Total returns for periods of less than one year are not annualized.D Amounts do not include the activity of any underlying fund.E Annualized
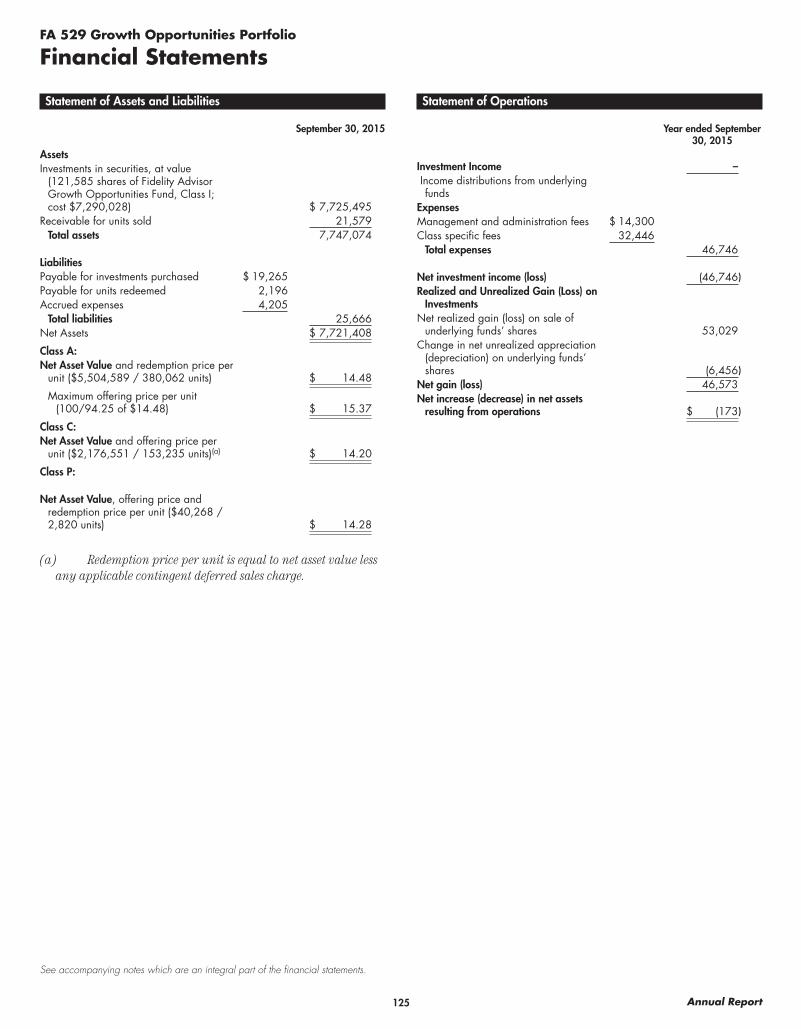
125 Annual Report
See accompanying notes which are an integral part of the financial statements.
FA 529 Growth Opportunities Portfolio
Financial Statements
Statement of Assets and Liabilities
September 30, 2015
AssetsInvestments in securities, at value
(121,585 shares of Fidelity Advisor Growth Opportunities Fund, Class I; cost $7,290,028) $ 7,725,495
Receivable for units sold 21,579Total assets 7,747,074
LiabilitiesPayable for investments purchased $ 19,265Payable for units redeemed 2,196Accrued expenses 4,205
Total liabilities 25,666Net Assets $ 7,721,408
Class A:Net Asset Value and redemption price per
unit ($5,504,589 / 380,062 units) $ 14.48
Maximum offering price per unit (100/94.25 of $14.48) $ 15.37
Class C:Net Asset Value and offering price per
unit ($2,176,551 / 153,235 units)(a) $ 14.20
Class P:
Net Asset Value, offering price and redemption price per unit ($40,268 / 2,820 units) $ 14.28
(a) Redemption price per unit is equal to net asset value less any applicable contingent deferred sales charge.
Statement of Operations
Year ended September 30, 2015
Investment Income – Income distributions from underlying
funds ExpensesManagement and administration fees $ 14,300Class specific fees 32,446
Total expenses 46,746
Net investment income (loss) (46,746)Realized and Unrealized Gain (Loss) on
InvestmentsNet realized gain (loss) on sale of
underlying funds’ shares 53,029Change in net unrealized appreciation
(depreciation) on underlying funds’ shares (6,456)
Net gain (loss) 46,573Net increase (decrease) in net assets
resulting from operations $ (173)
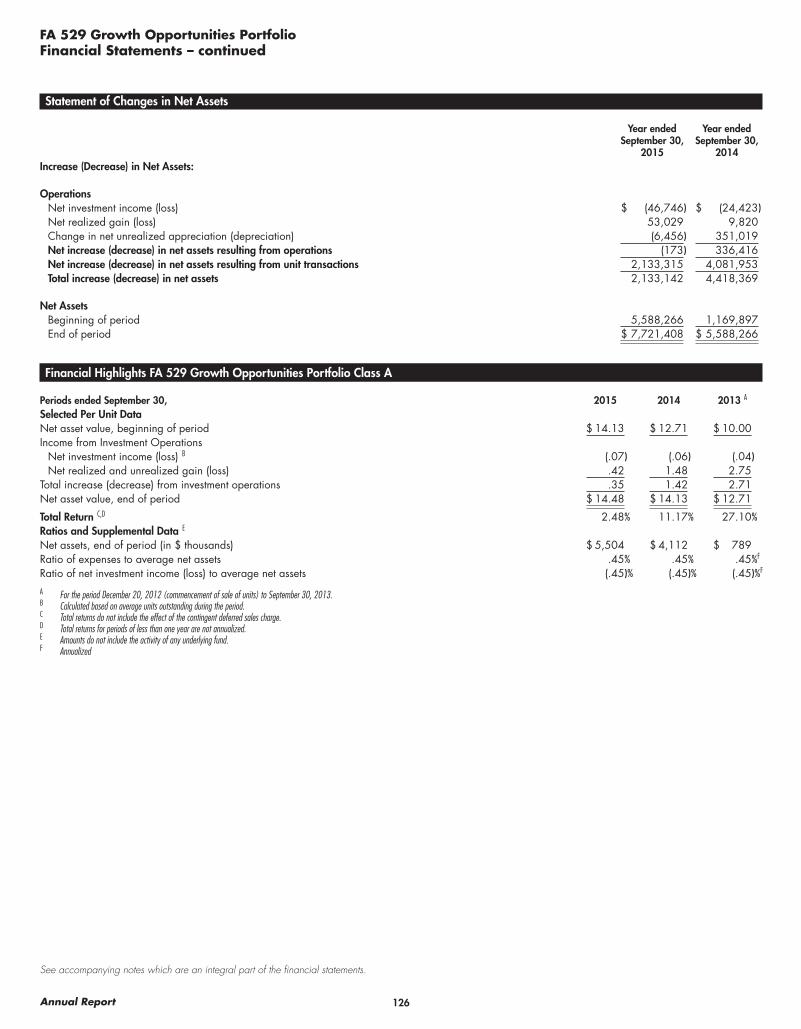
126Annual Report
See accompanying notes which are an integral part of the financial statements.
FA 529 Growth Opportunities PortfolioFinancial Statements – continued
Statement of Changes in Net Assets
Year ended September 30,
2015
Year ended September 30,
2014Increase (Decrease) in Net Assets:
OperationsNet investment income (loss) $ (46,746) $ (24,423)Net realized gain (loss) 53,029 9,820Change in net unrealized appreciation (depreciation) (6,456) 351,019Net increase (decrease) in net assets resulting from operations (173) 336,416Net increase (decrease) in net assets resulting from unit transactions 2,133,315 4,081,953Total increase (decrease) in net assets 2,133,142 4,418,369
Net AssetsBeginning of period 5,588,266 1,169,897End of period $ 7,721,408 $ 5,588,266
Financial Highlights FA 529 Growth Opportunities Portfolio Class A
Periods ended September 30, 2015 2014 2013 A
Selected Per Unit Data Net asset value, beginning of period $ 14.13 $ 12.71 $ 10.00Income from Investment Operations
Net investment income (loss) B (.07) (.06) (.04)Net realized and unrealized gain (loss) .42 1.48 2.75
Total increase (decrease) from investment operations .35 1.42 2.71Net asset value, end of period $ 14.48 $ 14.13 $ 12.71
Total Return C,D 2.48% 11.17% 27.10%Ratios and Supplemental Data E Net assets, end of period (in $ thousands) $ 5,504 $ 4,112 $ 789Ratio of expenses to average net assets .45% .45% .45%F
Ratio of net investment income (loss) to average net assets (.45)% (.45)% (.45)%F
A For the period December 20, 2012 (commencement of sale of units) to September 30, 2013.B Calculated based on average units outstanding during the period.C Total returns do not include the effect of the contingent deferred sales charge.D Total returns for periods of less than one year are not annualized.E Amounts do not include the activity of any underlying fund.F Annualized
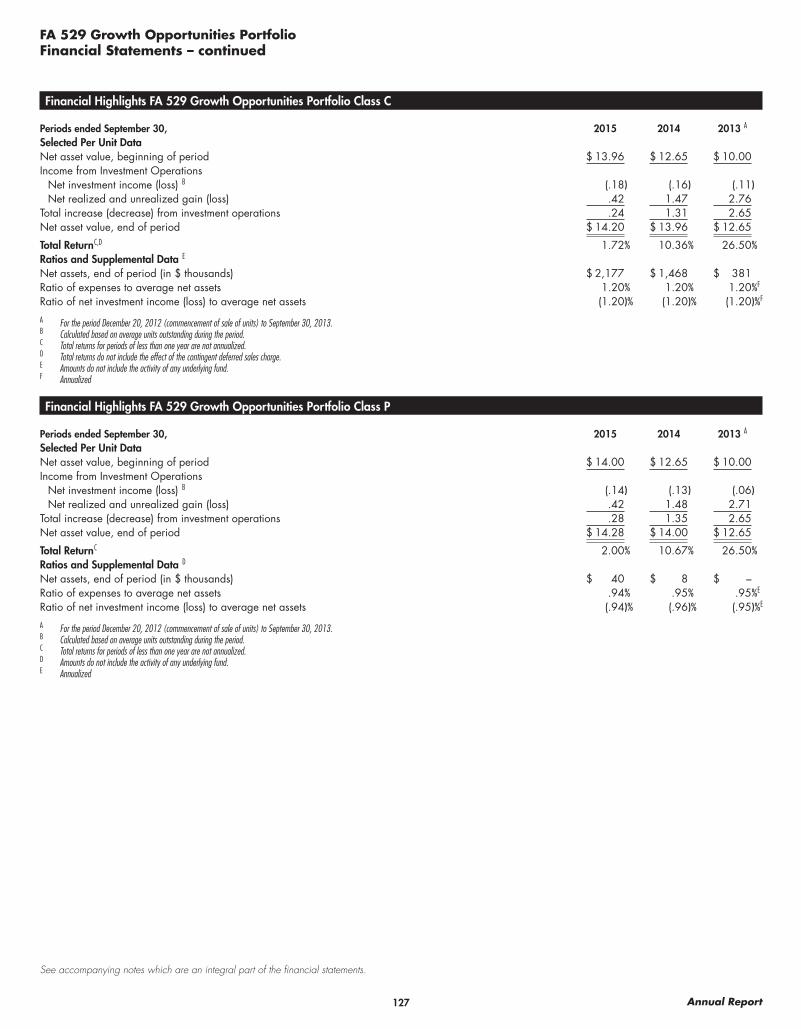
127 Annual Report
See accompanying notes which are an integral part of the financial statements.
FA 529 Growth Opportunities PortfolioFinancial Statements – continued
Financial Highlights FA 529 Growth Opportunities Portfolio Class C
Periods ended September 30, 2015 2014 2013 A
Selected Per Unit Data Net asset value, beginning of period $ 13.96 $ 12.65 $ 10.00Income from Investment Operations
Net investment income (loss) B (.18) (.16) (.11)Net realized and unrealized gain (loss) .42 1.47 2.76
Total increase (decrease) from investment operations .24 1.31 2.65Net asset value, end of period $ 14.20 $ 13.96 $ 12.65
Total Return C,D 1.72% 10.36% 26.50%Ratios and Supplemental Data E Net assets, end of period (in $ thousands) $ 2,177 $ 1,468 $ 381Ratio of expenses to average net assets 1.20% 1.20% 1.20%F
Ratio of net investment income (loss) to average net assets (1.20)% (1.20)% (1.20)%F
A For the period December 20, 2012 (commencement of sale of units) to September 30, 2013.B Calculated based on average units outstanding during the period.C Total returns for periods of less than one year are not annualized.D Total returns do not include the effect of the contingent deferred sales charge.E Amounts do not include the activity of any underlying fund.F Annualized
Financial Highlights FA 529 Growth Opportunities Portfolio Class P
Periods ended September 30, 2015 2014 2013 A
Selected Per Unit Data Net asset value, beginning of period $ 14.00 $ 12.65 $ 10.00Income from Investment Operations
Net investment income (loss) B (.14) (.13) (.06)Net realized and unrealized gain (loss) .42 1.48 2.71
Total increase (decrease) from investment operations .28 1.35 2.65Net asset value, end of period $ 14.28 $ 14.00 $ 12.65
Total Return C 2.00% 10.67% 26.50%Ratios and Supplemental Data D Net assets, end of period (in $ thousands) $ 40 $ 8 $ –Ratio of expenses to average net assets .94% .95% .95%E
Ratio of net investment income (loss) to average net assets (.94)% (.96)% (.95)%E
A For the period December 20, 2012 (commencement of sale of units) to September 30, 2013.B Calculated based on average units outstanding during the period.C Total returns for periods of less than one year are not annualized.D Amounts do not include the activity of any underlying fund.E Annualized

128Annual Report
See accompanying notes which are an integral part of the financial statements.
FA 529 High Income Portfolio
Financial Statements
Statement of Assets and Liabilities
September 30, 2015
AssetsInvestments in securities, at value
(2,771,639 shares of Fidelity Advi-sor High Income Fund, Class I; cost $23,288,437) $ 20,704,140
Receivable for investments sold 42,606Receivable for units sold 5,722Distributions receivable 97,730
Total assets 20,850,198
LiabilitiesPayable for investments purchased $ 101,026Payable for units redeemed 34,996Accrued expenses 10,744
Total liabilities 146,766Net Assets $ 20,703,432
Class A:Net Asset Value and redemption price
per unit ($13,919,655 / 593,993 units) $ 23.43
Maximum offering price per unit (100/95.25 of $23.43) $ 24.60
Class B:Net Asset Value and offering price per
unit ($287,329 / 13,561 units)(a) $ 21.19
Class C:Net Asset Value and offering price per
unit ($5,903,609 / 281,819 units)(a) $ 20.95
Class D:Net Asset Value, offering price and
redemption price per unit ($496,330 / 22,183 units) $ 22.37
Class P:
Net Asset Value, offering price and redemption price per unit ($96,509 / 4,454 units) $ 21.67
(a) Redemption price per unit is equal to net asset value less any applicable contingent deferred sales charge.
Statement of Operations
Year ended September 30, 2015
Investment IncomeIncome distributions from underlying
funds $ 1,228,422ExpensesManagement and administration
fees $ 44,702Class specific fees 94,805
Total expenses 139,507
Net investment income (loss) 1,088,915Realized and Unrealized Gain (Loss)
on InvestmentsNet realized gain (loss) on sale of
underlying funds’ shares (196,398)Capital gain distributions from
underlying funds 570,112 373,714Change in net unrealized apprecia-
tion (depreciation) on underlying funds’ shares (2,071,866)
Net gain (loss) (1,698,152)Net increase (decrease) in net assets
resulting from operations $ (609,237)

129 Annual Report
See accompanying notes which are an integral part of the financial statements.
FA 529 High Income PortfolioFinancial Statements – continued
Statement of Changes in Net Assets
Year ended September 30,
2015
Year ended September 30,
2014Increase (Decrease) in Net Assets:
OperationsNet investment income (loss) $ 1,088,915 $ 1,084,172Net realized gain (loss) 373,714 1,022,696Change in net unrealized appreciation (depreciation) (2,071,866) (933,766)Net increase (decrease) in net assets resulting from operations (609,237) 1,173,102Net increase (decrease) in net assets resulting from unit transactions (1,969,281) (246,526)Total increase (decrease) in net assets (2,578,518) 926,576
Net AssetsBeginning of period 23,281,950 22,355,374End of period $ 20,703,432 $ 23,281,950
Financial Highlights FA 529 High Income Portfolio Class A
Periods ended September 30, 2015 2014 2013 2012 2011Selected Per Unit Data Net asset value, beginning of period $ 24.05 $ 22.80 $ 21.72 $ 18.49 $ 18.30Income from Investment Operations
Net investment income (loss) A 1.24 1.17 1.14 1.29 1.29Net realized and unrealized gain (loss) (1.86) .08 (.06) 1.94 (1.10)
Total increase (decrease) from investment operations (.62) 1.25 1.08 3.23 .19Net asset value, end of period $ 23.43 $ 24.05 $ 22.80 $ 21.72 $ 18.49
Total Return B (2.58)% 5.48% 4.97% 17.47% 1.04%Ratios and Supplemental Data C Net assets, end of period (in $ thousands) $ 13,919 $ 15,133 $ 14,615 $ 13,893 $ 9,676Ratio of expenses to average net assets .35% .35% .35% .35% .35%Ratio of net investment income (loss) to average net assets 5.12% 4.88% 5.04% 6.30% 6.68%
A Calculated based on average units outstanding during the period.B Total returns do not include the effect of the sales charges.C Amounts do not include the activity of any underlying fund.
Financial Highlights FA 529 High Income Portfolio Class B
Periods ended September 30, 2015 2014 2013 2012 2011Selected Per Unit Data Net asset value, beginning of period $ 21.91 $ 20.93 $ 20.08 $ 17.22 $ 17.18Income from Investment Operations
Net investment income (loss) A 1.04 .91 .89 1.08 1.09Net realized and unrealized gain (loss) (1.76) .07 (.04) 1.78 (1.05)
Total increase (decrease) from investment operations (.72) .98 .85 2.86 .04Net asset value, end of period $ 21.19 $ 21.91 $ 20.93 $ 20.08 $ 17.22
Total Return B (3.29)% 4.68% 4.23% 16.61% .23%Ratios and Supplemental Data C Net assets, end of period (in $ thousands) $ 287 $ 597 $ 865 $ 1,007 $ 1,134Ratio of expenses to average net assets 1.10% 1.10% 1.10% 1.10% 1.10%Ratio of net investment income (loss) to average net assets 4.71% 4.15% 4.29% 5.70% 6.07%
A Calculated based on average units outstanding during the period.B Total returns do not include the effect of the contingent deferred sales charge.C Amounts do not include the activity of any underlying fund.
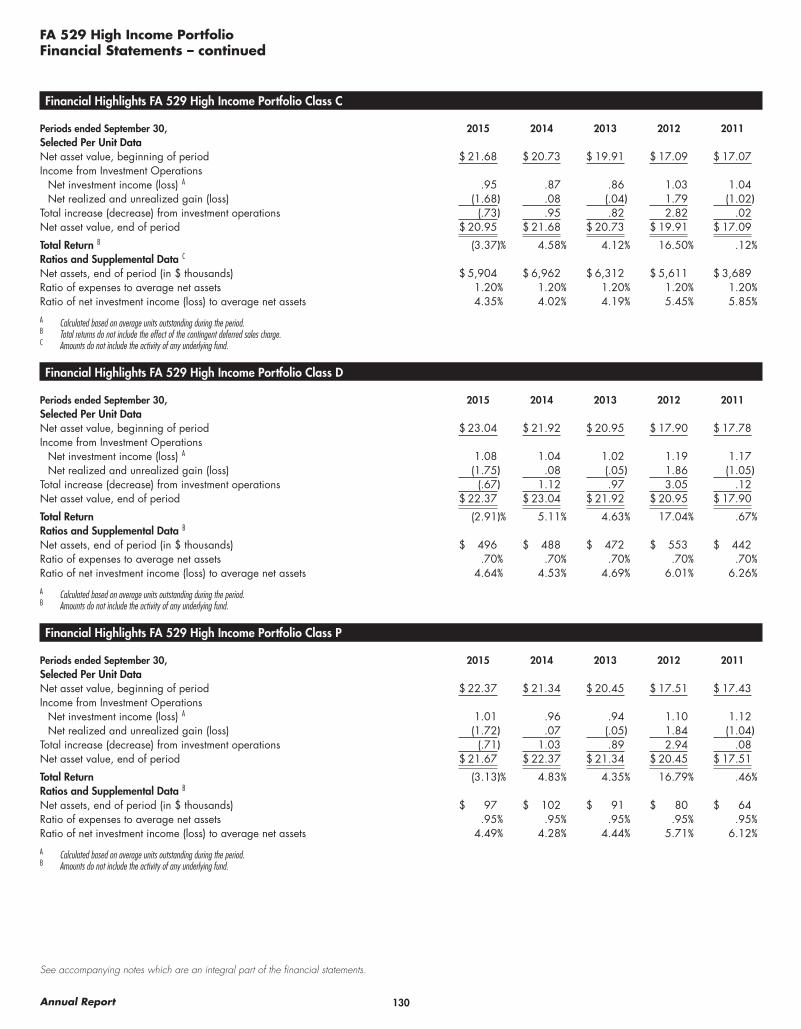
130Annual Report
See accompanying notes which are an integral part of the financial statements.
FA 529 High Income PortfolioFinancial Statements – continued
Financial Highlights FA 529 High Income Portfolio Class C
Periods ended September 30, 2015 2014 2013 2012 2011Selected Per Unit Data Net asset value, beginning of period $ 21.68 $ 20.73 $ 19.91 $ 17.09 $ 17.07Income from Investment Operations
Net investment income (loss) A .95 .87 .86 1.03 1.04Net realized and unrealized gain (loss) (1.68) .08 (.04) 1.79 (1.02)
Total increase (decrease) from investment operations (.73) .95 .82 2.82 .02Net asset value, end of period $ 20.95 $ 21.68 $ 20.73 $ 19.91 $ 17.09
Total Return B (3.37)% 4.58% 4.12% 16.50% .12%Ratios and Supplemental Data C Net assets, end of period (in $ thousands) $ 5,904 $ 6,962 $ 6,312 $ 5,611 $ 3,689Ratio of expenses to average net assets 1.20% 1.20% 1.20% 1.20% 1.20%Ratio of net investment income (loss) to average net assets 4.35% 4.02% 4.19% 5.45% 5.85%
A Calculated based on average units outstanding during the period.B Total returns do not include the effect of the contingent deferred sales charge.C Amounts do not include the activity of any underlying fund.
Financial Highlights FA 529 High Income Portfolio Class D
Periods ended September 30, 2015 2014 2013 2012 2011Selected Per Unit Data Net asset value, beginning of period $ 23.04 $ 21.92 $ 20.95 $ 17.90 $ 17.78Income from Investment Operations
Net investment income (loss) A 1.08 1.04 1.02 1.19 1.17Net realized and unrealized gain (loss) (1.75) .08 (.05) 1.86 (1.05)
Total increase (decrease) from investment operations (.67) 1.12 .97 3.05 .12Net asset value, end of period $ 22.37 $ 23.04 $ 21.92 $ 20.95 $ 17.90
Total Return (2.91)% 5.11% 4.63% 17.04% .67%Ratios and Supplemental Data B Net assets, end of period (in $ thousands) $ 496 $ 488 $ 472 $ 553 $ 442Ratio of expenses to average net assets .70% .70% .70% .70% .70%Ratio of net investment income (loss) to average net assets 4.64% 4.53% 4.69% 6.01% 6.26%
A Calculated based on average units outstanding during the period.B Amounts do not include the activity of any underlying fund.
Financial Highlights FA 529 High Income Portfolio Class P
Periods ended September 30, 2015 2014 2013 2012 2011Selected Per Unit Data Net asset value, beginning of period $ 22.37 $ 21.34 $ 20.45 $ 17.51 $ 17.43Income from Investment Operations
Net investment income (loss) A 1.01 .96 .94 1.10 1.12Net realized and unrealized gain (loss) (1.72) .07 (.05) 1.84 (1.04)
Total increase (decrease) from investment operations (.71) 1.03 .89 2.94 .08Net asset value, end of period $ 21.67 $ 22.37 $ 21.34 $ 20.45 $ 17.51
Total Return (3.13)% 4.83% 4.35% 16.79% .46%Ratios and Supplemental Data B Net assets, end of period (in $ thousands) $ 97 $ 102 $ 91 $ 80 $ 64Ratio of expenses to average net assets .95% .95% .95% .95% .95%Ratio of net investment income (loss) to average net assets 4.49% 4.28% 4.44% 5.71% 6.12%
A Calculated based on average units outstanding during the period.B Amounts do not include the activity of any underlying fund.

131 Annual Report
See accompanying notes which are an integral part of the financial statements.
FA 529 Inflation-Protected Bond Portfolio
Financial Statements
Statement of Assets and Liabilities
September 30, 2015
AssetsInvestments in securities, at value
(1,725,189 shares of Fidelity Advisor Inflation-Protected Bond Fund, Class I; cost $20,322,761) $ 20,288,217
Receivable for investments sold 10,310Receivable for units sold 1,716Distributions receivable 3,041
Total assets 20,303,284
LiabilitiesPayable for investments purchased $ 3,242Payable for units redeemed 7,382Accrued expenses 10,951
Total liabilities 21,575Net Assets $ 20,281,709
Class A:Net Asset Value and redemption price per
unit ($12,893,548 / 806,674 units) $ 15.98
Maximum offering price per unit (100/95.25 of $15.98) $ 16.78
Class B:Net Asset Value and offering price per
unit ($454,840 / 31,329 units)(a) $ 14.52
Class C:Net Asset Value and offering price per
unit ($6,485,381 / 452,996 units)(a) $ 14.32
Class D:Net Asset Value, offering price and
redemption price per unit ($231,258 / 15,162 units) $ 15.25
Class P:
Net Asset Value, offering price and redemption price per unit ($216,682 / 14,627 units) $ 14.81
(a) Redemption price per unit is equal to net asset value less any applicable contingent deferred sales charge.
Statement of Operations
Year ended September 30, 2015
Investment IncomeIncome distributions from underlying
funds $ 39,130ExpensesManagement and administration fees $ 45,532Class specific fees 104,728
Total expenses 150,260
Net investment income (loss) (111,130)Realized and Unrealized Gain (Loss)
on InvestmentsNet realized gain (loss) on sale of
underlying funds’ shares 91,425Capital gain distributions from under-
lying funds 464,125 555,550Change in net unrealized apprecia-
tion (depreciation) on underlying funds’ shares (866,012)
Net gain (loss) (310,462)Net increase (decrease) in net assets
resulting from operations $ (421,592)

132Annual Report
See accompanying notes which are an integral part of the financial statements.
FA 529 Inflation-Protected Bond PortfolioFinancial Statements – continued
Statement of Changes in Net Assets
Year ended September 30,
2015
Year ended September 30,
2014Increase (Decrease) in Net Assets:
OperationsNet investment income (loss) $ (111,130) $ (153,577)Net realized gain (loss) 555,550 1,096,160Change in net unrealized appreciation (depreciation) (866,012) (850,629)Net increase (decrease) in net assets resulting from operations (421,592) 91,954Net increase (decrease) in net assets resulting from unit transactions (3,627,994) (7,898,073)Total increase (decrease) in net assets (4,049,586) (7,806,119)
Net AssetsBeginning of period 24,331,295 32,137,414End of period $ 20,281,709 $ 24,331,295
Financial Highlights FA 529 Inflation-Protected Bond Portfolio Class A
Periods ended September 30, 2015 2014 2013 2012 2011Selected Per Unit Data Net asset value, beginning of period $ 16.26 $ 16.14 $ 17.33 $ 16.02 $ 14.71Income from Investment Operations
Net investment income (loss) A (.03) (.03) (.05) (.02) .07Net realized and unrealized gain (loss) (.25) .15 (1.14) 1.33 1.24
Total increase (decrease) from investment operations (.28) .12 (1.19) 1.31 1.31Net asset value, end of period $ 15.98 $ 16.26 $ 16.14 $ 17.33 $ 16.02
Total Return B (1.72)% .74% (6.87)% 8.18% 8.91%Ratios and Supplemental Data C Net assets, end of period (in $ thousands) $ 12,894 $ 14,901 $ 17,844 $ 22,391 $ 17,398Ratio of expenses to average net assets .35% .35% .35% .35% .35%Ratio of net investment income (loss) to average net assets (.18)% (.21)% (.32)% (.11)% .48%
A Calculated based on average units outstanding during the period.B Total returns do not include the effect of the sales charges.C Amounts do not include the activity of any underlying fund.
Financial Highlights FA 529 Inflation-Protected Bond Portfolio Class B
Periods ended September 30, 2015 2014 2013 2012 2011Selected Per Unit Data Net asset value, beginning of period $ 14.88 $ 14.88 $ 16.09 $ 14.99 $ 13.87Income from Investment Operations
Net investment income (loss) A (.14) (.14) (.17) (.13) (.04)Net realized and unrealized gain (loss) (.22) .14 (1.04) 1.23 1.16
Total increase (decrease) from investment operations (.36) – (1.21) 1.10 1.12Net asset value, end of period $ 14.52 $ 14.88 $ 14.88 $ 16.09 $ 14.99
Total Return B (2.42)% –% (7.52)% 7.34% 8.07%Ratios and Supplemental Data C Net assets, end of period (in $ thousands) $ 455 $ 952 $ 1,558 $ 2,738 $ 3,400Ratio of expenses to average net assets 1.10% 1.10% 1.10% 1.10% 1.10%Ratio of net investment income (loss) to average net assets (.91)% (.97)% (1.07)% (.85)% (.25)%
A Calculated based on average units outstanding during the period.B Total returns do not include the effect of the contingent deferred sales charge.C Amounts do not include the activity of any underlying fund.
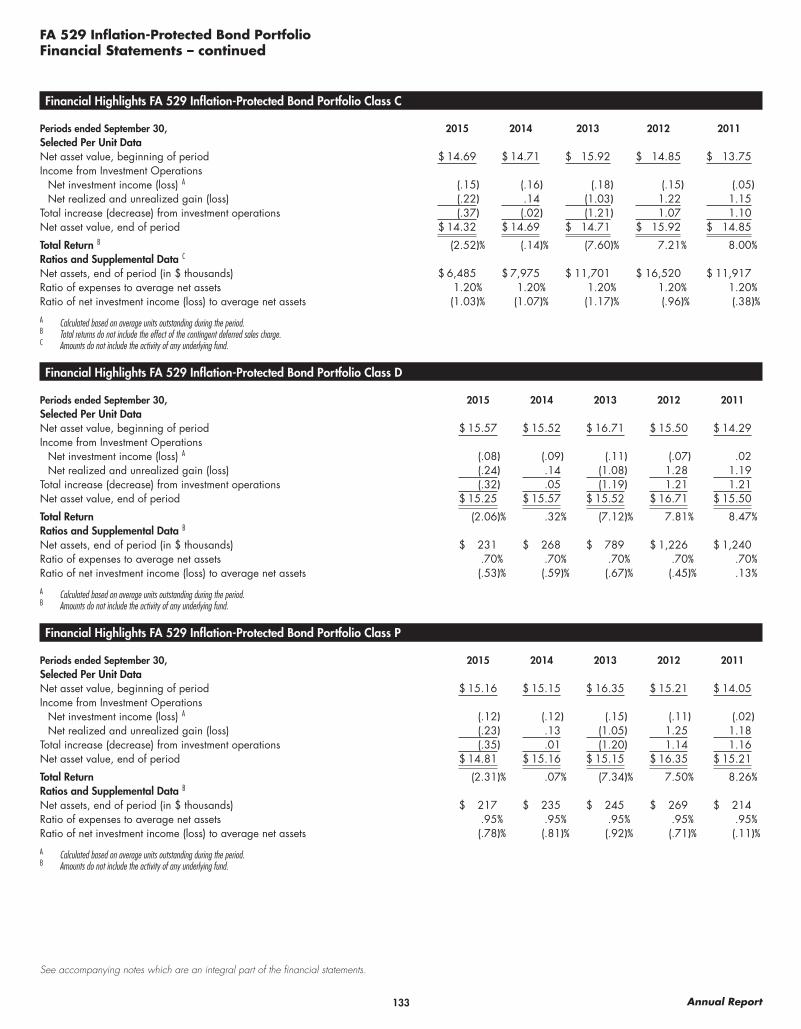
133 Annual Report
See accompanying notes which are an integral part of the financial statements.
FA 529 Inflation-Protected Bond PortfolioFinancial Statements – continued
Financial Highlights FA 529 Inflation-Protected Bond Portfolio Class C
Periods ended September 30, 2015 2014 2013 2012 2011Selected Per Unit Data Net asset value, beginning of period $ 14.69 $ 14.71 $ 15.92 $ 14.85 $ 13.75Income from Investment Operations
Net investment income (loss) A (.15) (.16) (.18) (.15) (.05)Net realized and unrealized gain (loss) (.22) .14 (1.03) 1.22 1.15
Total increase (decrease) from investment operations (.37) (.02) (1.21) 1.07 1.10Net asset value, end of period $ 14.32 $ 14.69 $ 14.71 $ 15.92 $ 14.85
Total Return B (2.52)% (.14)% (7.60)% 7.21% 8.00%Ratios and Supplemental Data C Net assets, end of period (in $ thousands) $ 6,485 $ 7,975 $ 11,701 $ 16,520 $ 11,917Ratio of expenses to average net assets 1.20% 1.20% 1.20% 1.20% 1.20%Ratio of net investment income (loss) to average net assets (1.03)% (1.07)% (1.17)% (.96)% (.38)%
A Calculated based on average units outstanding during the period.B Total returns do not include the effect of the contingent deferred sales charge.C Amounts do not include the activity of any underlying fund.
Financial Highlights FA 529 Inflation-Protected Bond Portfolio Class D
Periods ended September 30, 2015 2014 2013 2012 2011Selected Per Unit Data Net asset value, beginning of period $ 15.57 $ 15.52 $ 16.71 $ 15.50 $ 14.29Income from Investment Operations
Net investment income (loss) A (.08) (.09) (.11) (.07) .02Net realized and unrealized gain (loss) (.24) .14 (1.08) 1.28 1.19
Total increase (decrease) from investment operations (.32) .05 (1.19) 1.21 1.21Net asset value, end of period $ 15.25 $ 15.57 $ 15.52 $ 16.71 $ 15.50
Total Return (2.06)% .32% (7.12)% 7.81% 8.47%Ratios and Supplemental Data B Net assets, end of period (in $ thousands) $ 231 $ 268 $ 789 $ 1,226 $ 1,240Ratio of expenses to average net assets .70% .70% .70% .70% .70%Ratio of net investment income (loss) to average net assets (.53)% (.59)% (.67)% (.45)% .13%
A Calculated based on average units outstanding during the period.B Amounts do not include the activity of any underlying fund.
Financial Highlights FA 529 Inflation-Protected Bond Portfolio Class P
Periods ended September 30, 2015 2014 2013 2012 2011Selected Per Unit Data Net asset value, beginning of period $ 15.16 $ 15.15 $ 16.35 $ 15.21 $ 14.05Income from Investment Operations
Net investment income (loss) A (.12) (.12) (.15) (.11) (.02)Net realized and unrealized gain (loss) (.23) .13 (1.05) 1.25 1.18
Total increase (decrease) from investment operations (.35) .01 (1.20) 1.14 1.16Net asset value, end of period $ 14.81 $ 15.16 $ 15.15 $ 16.35 $ 15.21
Total Return (2.31)% .07% (7.34)% 7.50% 8.26%Ratios and Supplemental Data B Net assets, end of period (in $ thousands) $ 217 $ 235 $ 245 $ 269 $ 214Ratio of expenses to average net assets .95% .95% .95% .95% .95%Ratio of net investment income (loss) to average net assets (.78)% (.81)% (.92)% (.71)% (.11)%
A Calculated based on average units outstanding during the period.B Amounts do not include the activity of any underlying fund.

134Annual Report
See accompanying notes which are an integral part of the financial statements.
FA 529 Limited Term Bond Portfolio
Financial Statements
Statement of Assets and Liabilities
September 30, 2015
AssetsInvestments in securities, at value
(2,807,014 shares of Fidelity Advisor Limited Term Bond Fund, Class I; cost $31,191,066) $ 32,196,452
Receivable for investments sold 10,693Receivable for units sold 127,588Distributions receivable 42,945
Total assets 32,377,678
LiabilitiesPayable for investments purchased $ 156,594Payable for units redeemed 24,682Accrued expenses 16,960
Total liabilities 198,236Net Assets $ 32,179,442
Class A:Net Asset Value and redemption price
per unit ($20,003,736 / 1,223,323 units) $ 16.35
Maximum offering price per unit (100/96.25 of $16.35) $ 16.99
Class B:Net Asset Value and offering price per
unit ($220,128 / 14,857 units)(a) $ 14.82
Class C:Net Asset Value and offering price per
unit ($10,213,269 / 698,180 units)(a) $ 14.63
Class D:Net Asset Value, offering price and re-
demption price per unit ($1,567,646 / 100,368 units) $ 15.62
Class P:
Net Asset Value, offering price and redemption price per unit ($174,663 / 11,553 units) $ 15.12
(a) Redemption price per unit is equal to net asset value less any applicable contingent deferred sales charge.
Statement of Operations
Year ended September 30, 2015
Investment IncomeIncome distributions from underlying
funds $ 526,321ExpensesManagement and administration fees $ 64,152Class specific fees 143,499
Total expenses 207,651
Net investment income (loss) 318,670Realized and Unrealized Gain (Loss)
on InvestmentsNet realized gain (loss) on sale of
underlying funds’ shares 179,059Change in net unrealized apprecia-
tion (depreciation) on underlying funds’ shares (239,111)
Net gain (loss) (60,052)Net increase (decrease) in net assets
resulting from operations $ 258,618

135 Annual Report
See accompanying notes which are an integral part of the financial statements.
FA 529 Limited Term Bond PortfolioFinancial Statements – continued
Statement of Changes in Net Assets
Year ended September 30,
2015
Year ended September 30,
2014Increase (Decrease) in Net Assets:
OperationsNet investment income (loss) $ 318,670 $ 449,082Net realized gain (loss) 179,059 325,951Change in net unrealized appreciation (depreciation) (239,111) (190,076)Net increase (decrease) in net assets resulting from operations 258,618 584,957Net increase (decrease) in net assets resulting from unit transactions (16,367) (4,959,561)Total increase (decrease) in net assets 242,251 (4,374,604)
Net AssetsBeginning of period 31,937,191 36,311,795End of period $ 32,179,442 $ 31,937,191
Financial Highlights FA 529 Limited Term Bond Portfolio Class A
Periods ended September 30, 2015 2014 2013 2012 2011Selected Per Unit Data Net asset value, beginning of period $ 16.17 $ 15.85 $ 15.97 $ 15.22 $ 14.68Income from Investment Operations
Net investment income (loss) A .21 .26 .28 .33 .40Net realized and unrealized gain (loss) (.03) .06 (.40) .42 .14
Total increase (decrease) from investment operations .18 .32 (.12) .75 .54Net asset value, end of period $ 16.35 $ 16.17 $ 15.85 $ 15.97 $ 15.22
Total Return B 1.11% 2.02% (.75)% 4.93% 3.68%Ratios and Supplemental Data C Net assets, end of period (in $ thousands) $ 20,003 $ 19,648 $ 21,897 $ 25,163 $ 20,064Ratio of expenses to average net assets .35% .35% .35% .35% .35%Ratio of net investment income (loss) to average net assets 1.29% 1.63% 1.77% 2.10% 2.70%
A Calculated based on average units outstanding during the period.B Total returns do not include the effect of the sales charges.C Amounts do not include the activity of any underlying fund.
Financial Highlights FA 529 Limited Term Bond Portfolio Class B
Periods ended September 30, 2015 2014 2013 2012 2011Selected Per Unit Data Net asset value, beginning of period $ 14.76 $ 14.58 $ 14.80 $ 14.21 $ 13.81Income from Investment Operations
Net investment income (loss) A .08 .13 .15 .20 .27Net realized and unrealized gain (loss) (.02) .05 (.37) .39 .13
Total increase (decrease) from investment operations .06 .18 (.22) .59 .40Net asset value, end of period $ 14.82 $ 14.76 $ 14.58 $ 14.80 $ 14.21
Total Return B .41% 1.23% (1.49)% 4.15% 2.90%Ratios and Supplemental Data C Net assets, end of period (in $ thousands) $ 220 $ 320 $ 650 $ 1,390 $ 1,875Ratio of expenses to average net assets 1.10% 1.10% 1.10% 1.10% 1.10%Ratio of net investment income (loss) to average net assets .54% .89% 1.04% 1.37% 1.96%
A Calculated based on average units outstanding during the period.B Total returns do not include the effect of the contingent deferred sales charge.C Amounts do not include the activity of any underlying fund.
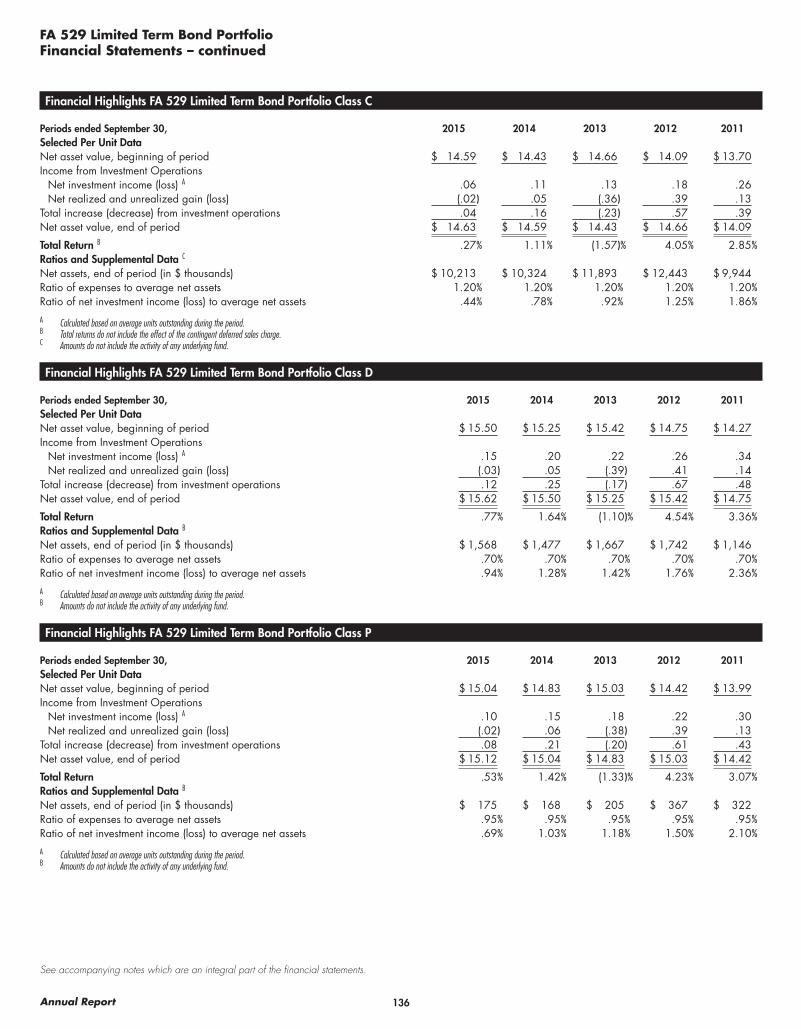
136Annual Report
See accompanying notes which are an integral part of the financial statements.
FA 529 Limited Term Bond PortfolioFinancial Statements – continued
Financial Highlights FA 529 Limited Term Bond Portfolio Class C
Periods ended September 30, 2015 2014 2013 2012 2011Selected Per Unit Data Net asset value, beginning of period $ 14.59 $ 14.43 $ 14.66 $ 14.09 $ 13.70Income from Investment Operations
Net investment income (loss) A .06 .11 .13 .18 .26Net realized and unrealized gain (loss) (.02) .05 (.36) .39 .13
Total increase (decrease) from investment operations .04 .16 (.23) .57 .39Net asset value, end of period $ 14.63 $ 14.59 $ 14.43 $ 14.66 $ 14.09
Total Return B .27% 1.11% (1.57)% 4.05% 2.85%Ratios and Supplemental Data C Net assets, end of period (in $ thousands) $ 10,213 $ 10,324 $ 11,893 $ 12,443 $ 9,944Ratio of expenses to average net assets 1.20% 1.20% 1.20% 1.20% 1.20%Ratio of net investment income (loss) to average net assets .44% .78% .92% 1.25% 1.86%
A Calculated based on average units outstanding during the period.B Total returns do not include the effect of the contingent deferred sales charge.C Amounts do not include the activity of any underlying fund.
Financial Highlights FA 529 Limited Term Bond Portfolio Class D
Periods ended September 30, 2015 2014 2013 2012 2011Selected Per Unit Data Net asset value, beginning of period $ 15.50 $ 15.25 $ 15.42 $ 14.75 $ 14.27Income from Investment Operations
Net investment income (loss) A .15 .20 .22 .26 .34Net realized and unrealized gain (loss) (.03) .05 (.39) .41 .14
Total increase (decrease) from investment operations .12 .25 (.17) .67 .48Net asset value, end of period $ 15.62 $ 15.50 $ 15.25 $ 15.42 $ 14.75
Total Return .77% 1.64% (1.10)% 4.54% 3.36%Ratios and Supplemental Data B Net assets, end of period (in $ thousands) $ 1,568 $ 1,477 $ 1,667 $ 1,742 $ 1,146Ratio of expenses to average net assets .70% .70% .70% .70% .70%Ratio of net investment income (loss) to average net assets .94% 1.28% 1.42% 1.76% 2.36%
A Calculated based on average units outstanding during the period.B Amounts do not include the activity of any underlying fund.
Financial Highlights FA 529 Limited Term Bond Portfolio Class P
Periods ended September 30, 2015 2014 2013 2012 2011Selected Per Unit Data Net asset value, beginning of period $ 15.04 $ 14.83 $ 15.03 $ 14.42 $ 13.99Income from Investment Operations
Net investment income (loss) A .10 .15 .18 .22 .30Net realized and unrealized gain (loss) (.02) .06 (.38) .39 .13
Total increase (decrease) from investment operations .08 .21 (.20) .61 .43Net asset value, end of period $ 15.12 $ 15.04 $ 14.83 $ 15.03 $ 14.42
Total Return .53% 1.42% (1.33)% 4.23% 3.07%Ratios and Supplemental Data B Net assets, end of period (in $ thousands) $ 175 $ 168 $ 205 $ 367 $ 322Ratio of expenses to average net assets .95% .95% .95% .95% .95%Ratio of net investment income (loss) to average net assets .69% 1.03% 1.18% 1.50% 2.10%
A Calculated based on average units outstanding during the period.B Amounts do not include the activity of any underlying fund.
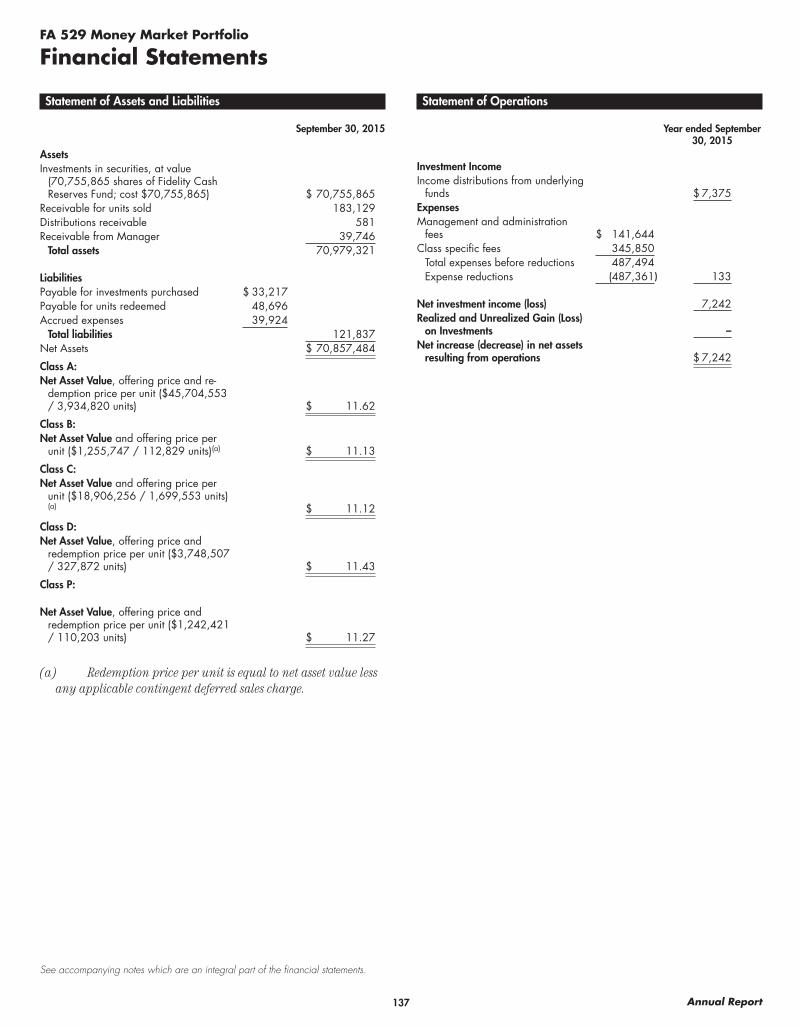
137 Annual Report
See accompanying notes which are an integral part of the financial statements.
FA 529 Money Market Portfolio
Financial Statements
Statement of Assets and Liabilities
September 30, 2015
AssetsInvestments in securities, at value
(70,755,865 shares of Fidelity Cash Reserves Fund; cost $70,755,865) $ 70,755,865
Receivable for units sold 183,129Distributions receivable 581Receivable from Manager 39,746
Total assets 70,979,321
LiabilitiesPayable for investments purchased $ 33,217Payable for units redeemed 48,696Accrued expenses 39,924
Total liabilities 121,837Net Assets $ 70,857,484
Class A:Net Asset Value, offering price and re-
demption price per unit ($45,704,553 / 3,934,820 units) $ 11.62
Class B:Net Asset Value and offering price per
unit ($1,255,747 / 112,829 units)(a) $ 11.13
Class C:Net Asset Value and offering price per
unit ($18,906,256 / 1,699,553 units)(a) $ 11.12
Class D:Net Asset Value, offering price and
redemption price per unit ($3,748,507 / 327,872 units) $ 11.43
Class P:
Net Asset Value, offering price and redemption price per unit ($1,242,421 / 110,203 units) $ 11.27
(a) Redemption price per unit is equal to net asset value less any applicable contingent deferred sales charge.
Statement of Operations
Year ended September 30, 2015
Investment IncomeIncome distributions from underlying
funds $ 7,375ExpensesManagement and administration
fees $ 141,644Class specific fees 345,850
Total expenses before reductions 487,494Expense reductions (487,361) 133
Net investment income (loss) 7,242Realized and Unrealized Gain (Loss)
on Investments –Net increase (decrease) in net assets
resulting from operations $ 7,242
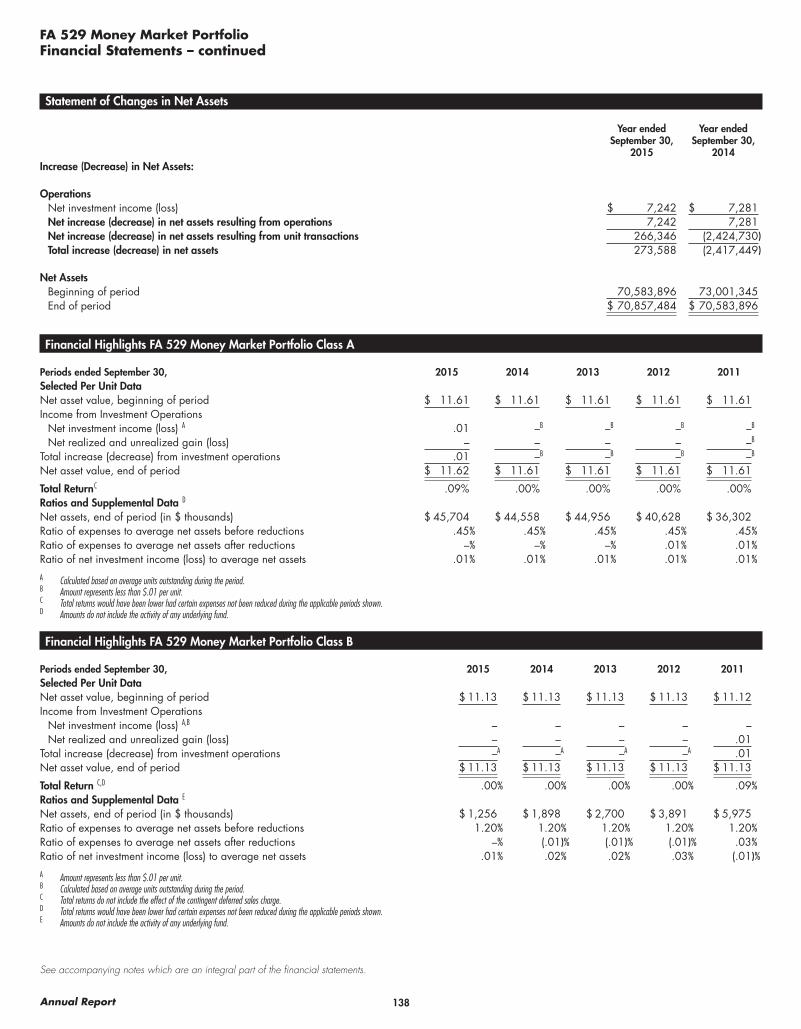
138Annual Report
See accompanying notes which are an integral part of the financial statements.
FA 529 Money Market PortfolioFinancial Statements – continued
Statement of Changes in Net Assets
Year ended September 30,
2015
Year ended September 30,
2014Increase (Decrease) in Net Assets:
OperationsNet investment income (loss) $ 7,242 $ 7,281Net increase (decrease) in net assets resulting from operations 7,242 7,281Net increase (decrease) in net assets resulting from unit transactions 266,346 (2,424,730)Total increase (decrease) in net assets 273,588 (2,417,449)
Net AssetsBeginning of period 70,583,896 73,001,345End of period $ 70,857,484 $ 70,583,896
Financial Highlights FA 529 Money Market Portfolio Class A
Periods ended September 30, 2015 2014 2013 2012 2011Selected Per Unit Data Net asset value, beginning of period $ 11.61 $ 11.61 $ 11.61 $ 11.61 $ 11.61Income from Investment Operations
Net investment income (loss) A .01 –B –B –B –B
Net realized and unrealized gain (loss) – – – – –B
Total increase (decrease) from investment operations .01 –B –B –B –B
Net asset value, end of period $ 11.62 $ 11.61 $ 11.61 $ 11.61 $ 11.61
Total Return C .09% .00% .00% .00% .00%Ratios and Supplemental Data D Net assets, end of period (in $ thousands) $ 45,704 $ 44,558 $ 44,956 $ 40,628 $ 36,302Ratio of expenses to average net assets before reductions .45% .45% .45% .45% .45%Ratio of expenses to average net assets after reductions –% –% –% .01% .01%Ratio of net investment income (loss) to average net assets .01% .01% .01% .01% .01%
A Calculated based on average units outstanding during the period.B Amount represents less than $.01 per unit.C Total returns would have been lower had certain expenses not been reduced during the applicable periods shown.D Amounts do not include the activity of any underlying fund.
Financial Highlights FA 529 Money Market Portfolio Class B
Periods ended September 30, 2015 2014 2013 2012 2011Selected Per Unit Data Net asset value, beginning of period $ 11.13 $ 11.13 $ 11.13 $ 11.13 $ 11.12Income from Investment Operations
Net investment income (loss) A,B – – – – –Net realized and unrealized gain (loss) – – – – .01
Total increase (decrease) from investment operations –A –A –A –A .01Net asset value, end of period $ 11.13 $ 11.13 $ 11.13 $ 11.13 $ 11.13
Total Return C,D .00% .00% .00% .00% .09%Ratios and Supplemental Data E Net assets, end of period (in $ thousands) $ 1,256 $ 1,898 $ 2,700 $ 3,891 $ 5,975Ratio of expenses to average net assets before reductions 1.20% 1.20% 1.20% 1.20% 1.20%Ratio of expenses to average net assets after reductions –% (.01)% (.01)% (.01)% .03%Ratio of net investment income (loss) to average net assets .01% .02% .02% .03% (.01)%
A Amount represents less than $.01 per unit.B Calculated based on average units outstanding during the period.C Total returns do not include the effect of the contingent deferred sales charge.D Total returns would have been lower had certain expenses not been reduced during the applicable periods shown.E Amounts do not include the activity of any underlying fund.
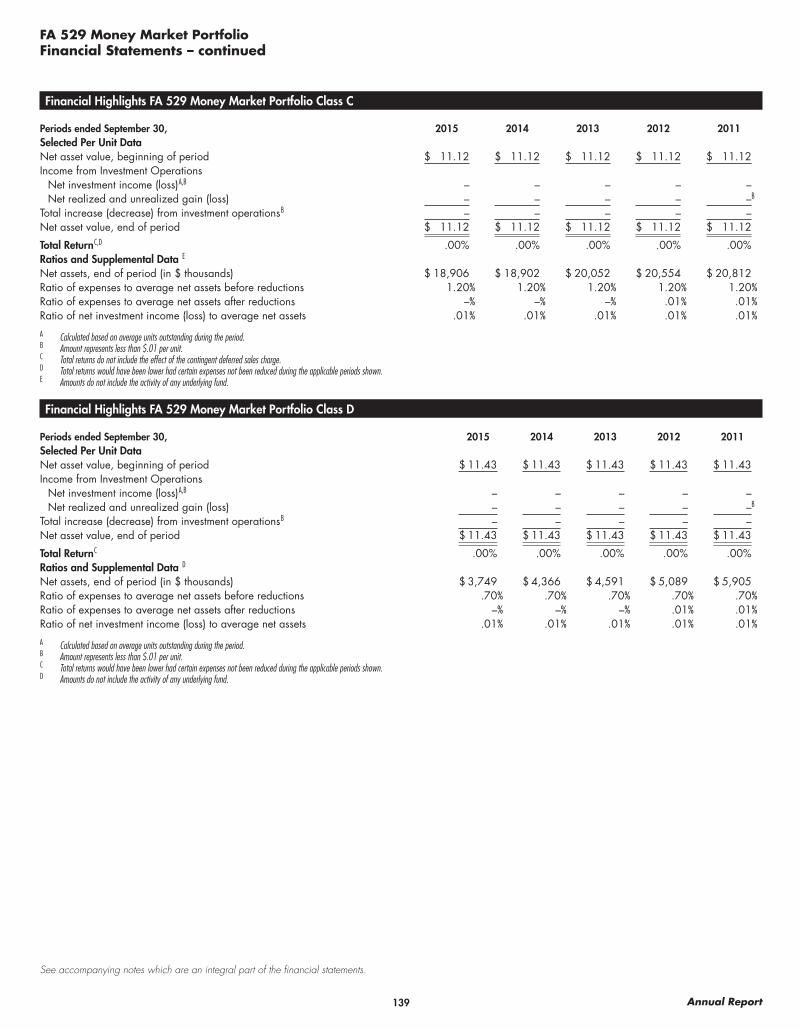
139 Annual Report
See accompanying notes which are an integral part of the financial statements.
FA 529 Money Market PortfolioFinancial Statements – continued
Financial Highlights FA 529 Money Market Portfolio Class C
Periods ended September 30, 2015 2014 2013 2012 2011Selected Per Unit Data Net asset value, beginning of period $ 11.12 $ 11.12 $ 11.12 $ 11.12 $ 11.12Income from Investment Operations
Net investment income (loss) A,B – – – – –Net realized and unrealized gain (loss) – – – – –B
Total increase (decrease) from investment operations B – – – – –Net asset value, end of period $ 11.12 $ 11.12 $ 11.12 $ 11.12 $ 11.12
Total Return C,D .00% .00% .00% .00% .00%Ratios and Supplemental Data E Net assets, end of period (in $ thousands) $ 18,906 $ 18,902 $ 20,052 $ 20,554 $ 20,812Ratio of expenses to average net assets before reductions 1.20% 1.20% 1.20% 1.20% 1.20%Ratio of expenses to average net assets after reductions –% –% –% .01% .01%Ratio of net investment income (loss) to average net assets .01% .01% .01% .01% .01%
A Calculated based on average units outstanding during the period.B Amount represents less than $.01 per unit.C Total returns do not include the effect of the contingent deferred sales charge.D Total returns would have been lower had certain expenses not been reduced during the applicable periods shown.E Amounts do not include the activity of any underlying fund.
Financial Highlights FA 529 Money Market Portfolio Class D
Periods ended September 30, 2015 2014 2013 2012 2011Selected Per Unit Data Net asset value, beginning of period $ 11.43 $ 11.43 $ 11.43 $ 11.43 $ 11.43Income from Investment Operations
Net investment income (loss) A,B – – – – –Net realized and unrealized gain (loss) – – – – –B
Total increase (decrease) from investment operations B – – – – –Net asset value, end of period $ 11.43 $ 11.43 $ 11.43 $ 11.43 $ 11.43
Total Return C .00% .00% .00% .00% .00%Ratios and Supplemental Data D Net assets, end of period (in $ thousands) $ 3,749 $ 4,366 $ 4,591 $ 5,089 $ 5,905Ratio of expenses to average net assets before reductions .70% .70% .70% .70% .70%Ratio of expenses to average net assets after reductions –% –% –% .01% .01%Ratio of net investment income (loss) to average net assets .01% .01% .01% .01% .01%
A Calculated based on average units outstanding during the period.B Amount represents less than $.01 per unit.C Total returns would have been lower had certain expenses not been reduced during the applicable periods shown.D Amounts do not include the activity of any underlying fund.
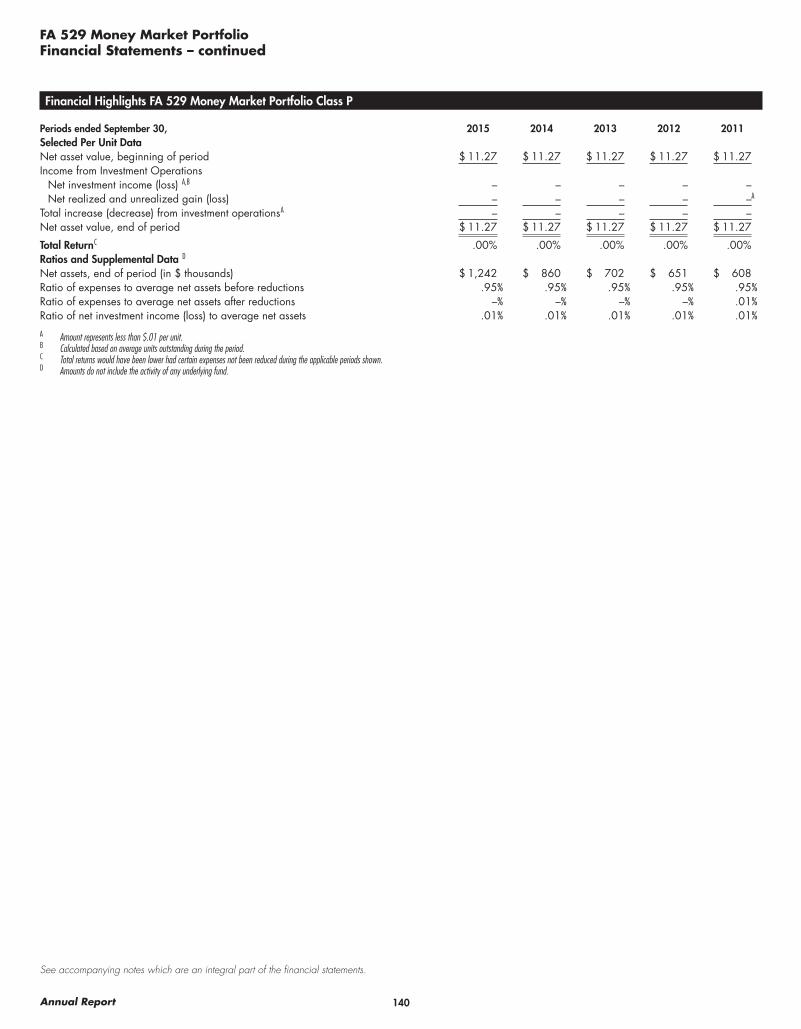
140Annual Report
See accompanying notes which are an integral part of the financial statements.
FA 529 Money Market PortfolioFinancial Statements – continued
Financial Highlights FA 529 Money Market Portfolio Class P
Periods ended September 30, 2015 2014 2013 2012 2011Selected Per Unit Data Net asset value, beginning of period $ 11.27 $ 11.27 $ 11.27 $ 11.27 $ 11.27Income from Investment Operations
Net investment income (loss) A,B – – – – –Net realized and unrealized gain (loss) – – – – –A
Total increase (decrease) from investment operations A – – – – –Net asset value, end of period $ 11.27 $ 11.27 $ 11.27 $ 11.27 $ 11.27
Total Return C .00% .00% .00% .00% .00%Ratios and Supplemental Data D Net assets, end of period (in $ thousands) $ 1,242 $ 860 $ 702 $ 651 $ 608Ratio of expenses to average net assets before reductions .95% .95% .95% .95% .95%Ratio of expenses to average net assets after reductions –% –% –% –% .01%Ratio of net investment income (loss) to average net assets .01% .01% .01% .01% .01%
A Amount represents less than $.01 per unit.B Calculated based on average units outstanding during the period.C Total returns would have been lower had certain expenses not been reduced during the applicable periods shown.D Amounts do not include the activity of any underlying fund.
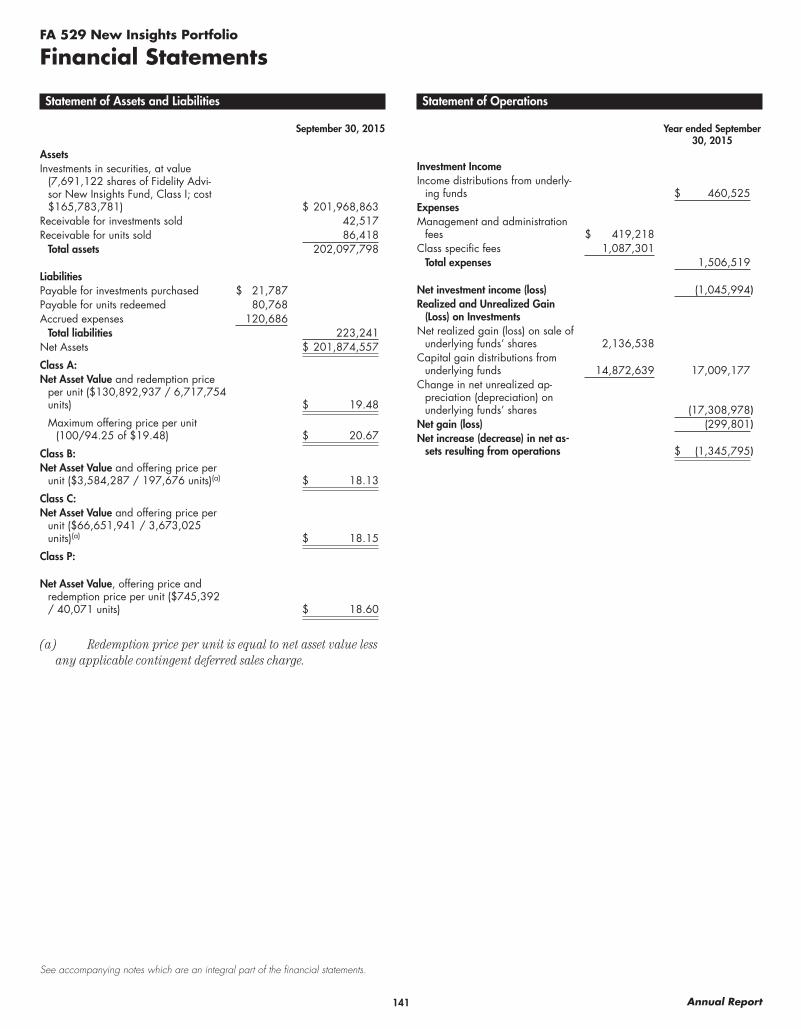
141 Annual Report
See accompanying notes which are an integral part of the financial statements.
FA 529 New Insights Portfolio
Financial Statements
Statement of Assets and Liabilities
September 30, 2015
AssetsInvestments in securities, at value
(7,691,122 shares of Fidelity Advi-sor New Insights Fund, Class I; cost $165,783,781) $ 201,968,863
Receivable for investments sold 42,517Receivable for units sold 86,418
Total assets 202,097,798
LiabilitiesPayable for investments purchased $ 21,787Payable for units redeemed 80,768Accrued expenses 120,686
Total liabilities 223,241Net Assets $ 201,874,557
Class A:Net Asset Value and redemption price
per unit ($130,892,937 / 6,717,754 units) $ 19.48
Maximum offering price per unit (100/94.25 of $19.48) $ 20.67
Class B:Net Asset Value and offering price per
unit ($3,584,287 / 197,676 units)(a) $ 18.13
Class C:Net Asset Value and offering price per
unit ($66,651,941 / 3,673,025 units)(a) $ 18.15
Class P:
Net Asset Value, offering price and redemption price per unit ($745,392 / 40,071 units) $ 18.60
(a) Redemption price per unit is equal to net asset value less any applicable contingent deferred sales charge.
Statement of Operations
Year ended September 30, 2015
Investment IncomeIncome distributions from underly-
ing funds $ 460,525ExpensesManagement and administration
fees $ 419,218Class specific fees 1,087,301
Total expenses 1,506,519
Net investment income (loss) (1,045,994)Realized and Unrealized Gain
(Loss) on InvestmentsNet realized gain (loss) on sale of
underlying funds’ shares 2,136,538Capital gain distributions from
underlying funds 14,872,639 17,009,177Change in net unrealized ap-
preciation (depreciation) on underlying funds’ shares (17,308,978)
Net gain (loss) (299,801)Net increase (decrease) in net as-
sets resulting from operations $ (1,345,795)

142Annual Report
See accompanying notes which are an integral part of the financial statements.
FA 529 New Insights PortfolioFinancial Statements – continued
Statement of Changes in Net Assets
Year ended September 30,
2015
Year ended September 30,
2014Increase (Decrease) in Net Assets:
OperationsNet investment income (loss) $ (1,045,994) $ (1,344,028)Net realized gain (loss) 17,009,177 23,406,541Change in net unrealized appreciation (depreciation) (17,308,978) 2,655,169Net increase (decrease) in net assets resulting from operations (1,345,795) 24,717,682Net increase (decrease) in net assets resulting from unit transactions 5,867,790 10,950,399Total increase (decrease) in net assets 4,521,995 35,668,081
Net AssetsBeginning of period 197,352,562 161,684,481End of period $ 201,874,557 $ 197,352,562
Financial Highlights FA 529 New Insights Portfolio Class A
Periods ended September 30, 2015 2014 2013 2012 2011Selected Per Unit Data Net asset value, beginning of period $ 19.54 $ 16.96 $ 14.19 $ 11.21 $ 11.19Income from Investment Operations
Net investment income (loss) A (.05) (.08) (.06) (.06) (.06)Net realized and unrealized gain (loss) (.01) 2.66 2.83 3.04 .08
Total increase (decrease) from investment operations (.06) 2.58 2.77 2.98 .02Net asset value, end of period $ 19.48 $ 19.54 $ 16.96 $ 14.19 $ 11.21
Total Return B (.31)% 15.21% 19.52% 26.58% .18%Ratios and Supplemental Data C Net assets, end of period (in $ thousands) $ 130,894 $ 125,232 $ 101,513 $ 77,181 $ 50,972Ratio of expenses to average net assets .45% .45% .45% .45% .45%Ratio of net investment income (loss) to average net assets (.23)% (.45)% (.37)% (.45)% (.45)%
A Calculated based on average units outstanding during the period.B Total returns do not include the effect of the sales charges.C Amounts do not include the activity of any underlying fund.
Financial Highlights FA 529 New Insights Portfolio Class B
Periods ended September 30, 2015 2014 2013 2012 2011Selected Per Unit Data Net asset value, beginning of period $ 18.32 $ 16.02 $ 13.50 $ 10.74 $ 10.81Income from Investment Operations
Net investment income (loss) A (.18) (.21) (.16) (.15) (.14)Net realized and unrealized gain (loss) (.01) 2.51 2.68 2.91 .07
Total increase (decrease) from investment operations (.19) 2.30 2.52 2.76 (.07)Net asset value, end of period $ 18.13 $ 18.32 $ 16.02 $ 13.50 $ 10.74
Total Return B (1.04)% 14.36% 18.67% 25.70% (.65)%Ratios and Supplemental Data C Net assets, end of period (in $ thousands) $ 3,584 $ 5,771 $ 6,686 $ 6,835 $ 6,094Ratio of expenses to average net assets 1.20% 1.20% 1.20% 1.20% 1.20%Ratio of net investment income (loss) to average net assets (.95)% (1.20)% (1.11)% (1.20)% (1.20)%
A Calculated based on average units outstanding during the period.B Total returns do not include the effect of the contingent deferred sales charge.C Amounts do not include the activity of any underlying fund.
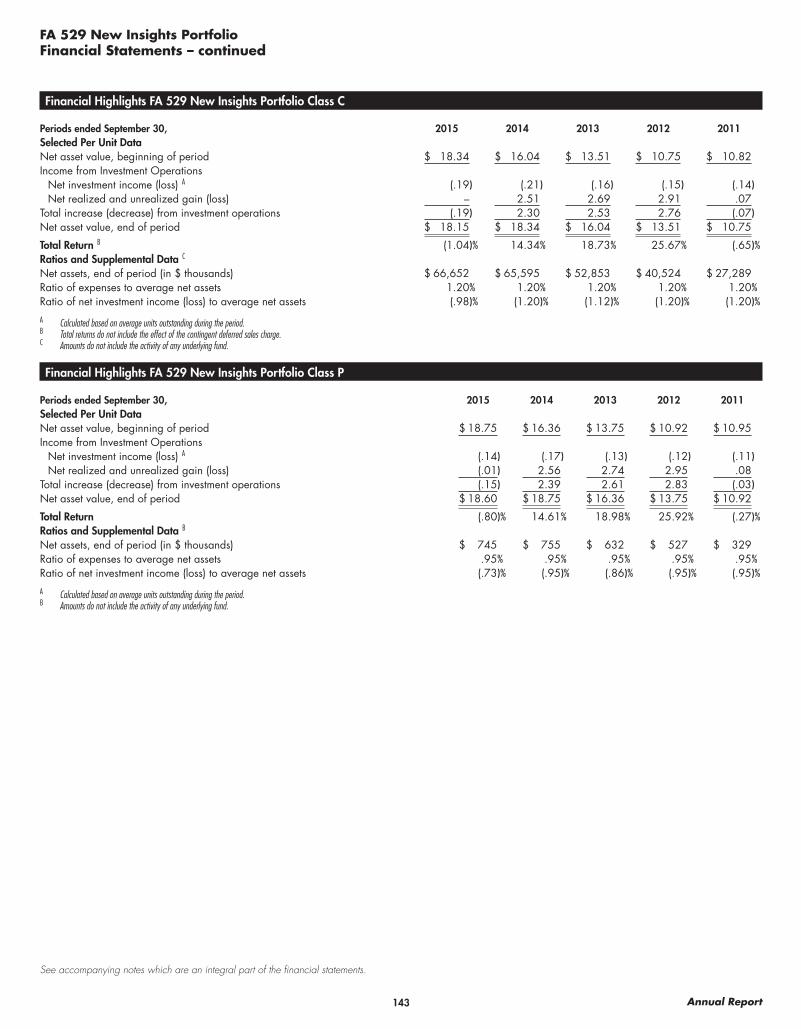
143 Annual Report
See accompanying notes which are an integral part of the financial statements.
FA 529 New Insights PortfolioFinancial Statements – continued
Financial Highlights FA 529 New Insights Portfolio Class C
Periods ended September 30, 2015 2014 2013 2012 2011Selected Per Unit Data Net asset value, beginning of period $ 18.34 $ 16.04 $ 13.51 $ 10.75 $ 10.82Income from Investment Operations
Net investment income (loss) A (.19) (.21) (.16) (.15) (.14)Net realized and unrealized gain (loss) – 2.51 2.69 2.91 .07
Total increase (decrease) from investment operations (.19) 2.30 2.53 2.76 (.07)Net asset value, end of period $ 18.15 $ 18.34 $ 16.04 $ 13.51 $ 10.75
Total Return B (1.04)% 14.34% 18.73% 25.67% (.65)%Ratios and Supplemental Data C Net assets, end of period (in $ thousands) $ 66,652 $ 65,595 $ 52,853 $ 40,524 $ 27,289Ratio of expenses to average net assets 1.20% 1.20% 1.20% 1.20% 1.20%Ratio of net investment income (loss) to average net assets (.98)% (1.20)% (1.12)% (1.20)% (1.20)%
A Calculated based on average units outstanding during the period.B Total returns do not include the effect of the contingent deferred sales charge.C Amounts do not include the activity of any underlying fund.
Financial Highlights FA 529 New Insights Portfolio Class P
Periods ended September 30, 2015 2014 2013 2012 2011Selected Per Unit Data Net asset value, beginning of period $ 18.75 $ 16.36 $ 13.75 $ 10.92 $ 10.95Income from Investment Operations
Net investment income (loss) A (.14) (.17) (.13) (.12) (.11)Net realized and unrealized gain (loss) (.01) 2.56 2.74 2.95 .08
Total increase (decrease) from investment operations (.15) 2.39 2.61 2.83 (.03)Net asset value, end of period $ 18.60 $ 18.75 $ 16.36 $ 13.75 $ 10.92
Total Return (.80)% 14.61% 18.98% 25.92% (.27)%Ratios and Supplemental Data B Net assets, end of period (in $ thousands) $ 745 $ 755 $ 632 $ 527 $ 329Ratio of expenses to average net assets .95% .95% .95% .95% .95%Ratio of net investment income (loss) to average net assets (.73)% (.95)% (.86)% (.95)% (.95)%
A Calculated based on average units outstanding during the period.B Amounts do not include the activity of any underlying fund.
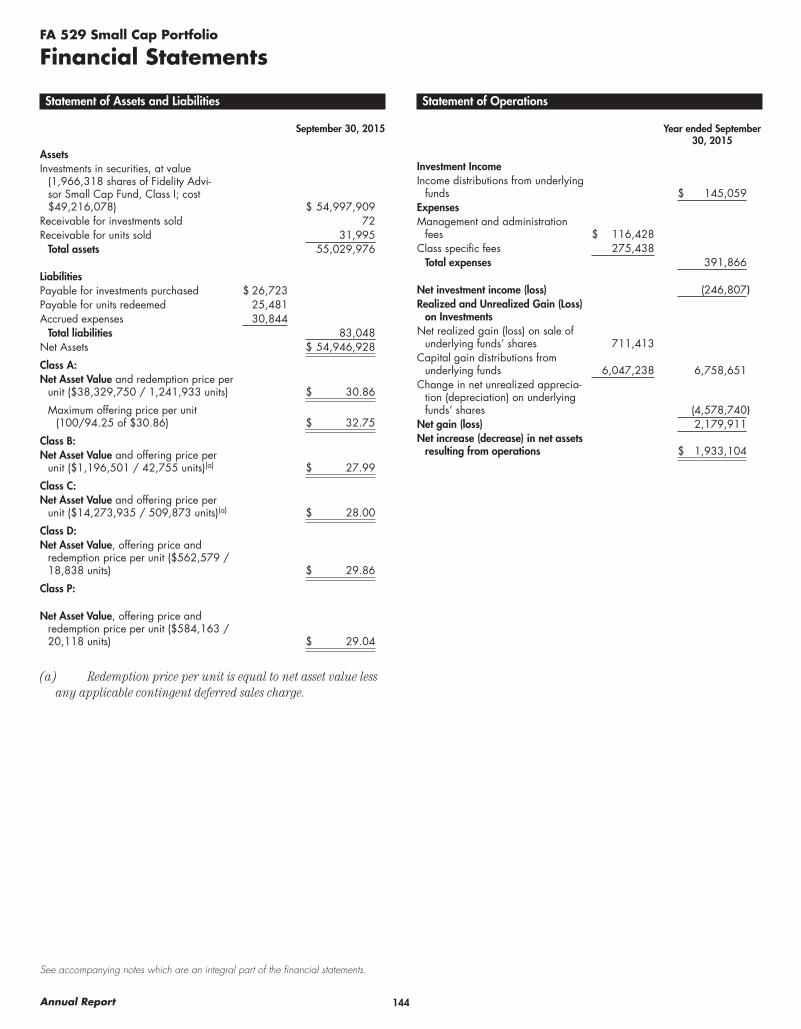
144Annual Report
See accompanying notes which are an integral part of the financial statements.
FA 529 Small Cap Portfolio
Financial Statements
Statement of Assets and Liabilities
September 30, 2015
AssetsInvestments in securities, at value
(1,966,318 shares of Fidelity Advi-sor Small Cap Fund, Class I; cost $49,216,078) $ 54,997,909
Receivable for investments sold 72Receivable for units sold 31,995
Total assets 55,029,976
LiabilitiesPayable for investments purchased $ 26,723Payable for units redeemed 25,481Accrued expenses 30,844
Total liabilities 83,048Net Assets $ 54,946,928
Class A:Net Asset Value and redemption price per
unit ($38,329,750 / 1,241,933 units) $ 30.86
Maximum offering price per unit (100/94.25 of $30.86) $ 32.75
Class B:Net Asset Value and offering price per
unit ($1,196,501 / 42,755 units)(a) $ 27.99
Class C:Net Asset Value and offering price per
unit ($14,273,935 / 509,873 units)(a) $ 28.00
Class D:Net Asset Value, offering price and
redemption price per unit ($562,579 / 18,838 units) $ 29.86
Class P:
Net Asset Value, offering price and redemption price per unit ($584,163 / 20,118 units) $ 29.04
(a) Redemption price per unit is equal to net asset value less any applicable contingent deferred sales charge.
Statement of Operations
Year ended September 30, 2015
Investment IncomeIncome distributions from underlying
funds $ 145,059ExpensesManagement and administration
fees $ 116,428Class specific fees 275,438
Total expenses 391,866
Net investment income (loss) (246,807)Realized and Unrealized Gain (Loss)
on InvestmentsNet realized gain (loss) on sale of
underlying funds’ shares 711,413Capital gain distributions from
underlying funds 6,047,238 6,758,651Change in net unrealized apprecia-
tion (depreciation) on underlying funds’ shares (4,578,740)
Net gain (loss) 2,179,911Net increase (decrease) in net assets
resulting from operations $ 1,933,104

145 Annual Report
See accompanying notes which are an integral part of the financial statements.
FA 529 Small Cap PortfolioFinancial Statements – continued
Statement of Changes in Net Assets
Year ended September 30,
2015
Year ended September 30,
2014Increase (Decrease) in Net Assets:
OperationsNet investment income (loss) $ (246,807) $ (270,975)Net realized gain (loss) 6,758,651 6,570,350Change in net unrealized appreciation (depreciation) (4,578,740) (1,070,127)Net increase (decrease) in net assets resulting from operations 1,933,104 5,229,248Net increase (decrease) in net assets resulting from unit transactions (1,015,265) (702,580)Total increase (decrease) in net assets 917,839 4,526,668
Net AssetsBeginning of period 54,029,089 49,502,421End of period $ 54,946,928 $ 54,029,089
Financial Highlights FA 529 Small Cap Portfolio Class A
Periods ended September 30, 2015 2014 2013 2012 2011Selected Per Unit Data Net asset value, beginning of period $ 29.73 $ 26.86 $ 20.86 $ 17.91 $ 19.08Income from Investment Operations
Net investment income (loss) A (.07) (.08) .01 (.09) (.10)Net realized and unrealized gain (loss) 1.20 2.95 5.99 3.04 (1.07)
Total increase (decrease) from investment operations 1.13 2.87 6.00 2.95 (1.17)Net asset value, end of period $ 30.86 $ 29.73 $ 26.86 $ 20.86 $ 17.91
Total Return B 3.80% 10.69% 28.76% 16.47% (6.13)%Ratios and Supplemental Data C Net assets, end of period (in $ thousands) $ 38,329 $ 36,999 $ 33,241 $ 24,772 $ 20,414Ratio of expenses to average net assets .45% .45% .45% .45% .45%Ratio of net investment income (loss) to average net assets (.20)% (.27)% .04% (.45)% (.45)%
A Calculated based on average units outstanding during the period.B Total returns do not include the effect of the sales charges.C Amounts do not include the activity of any underlying fund.
Financial Highlights FA 529 Small Cap Portfolio Class B
Periods ended September 30, 2015 2014 2013 2012 2011Selected Per Unit Data Net asset value, beginning of period $ 27.16 $ 24.73 $ 19.35 $ 16.74 $ 17.96Income from Investment Operations
Net investment income (loss) A (.27) (.26) (.14) (.23) (.24)Net realized and unrealized gain (loss) 1.10 2.69 5.52 2.84 (.98)
Total increase (decrease) from investment operations .83 2.43 5.38 2.61 (1.22)Net asset value, end of period $ 27.99 $ 27.16 $ 24.73 $ 19.35 $ 16.74
Total Return B 3.06% 9.83% 27.80% 15.59% (6.79)%Ratios and Supplemental Data C Net assets, end of period (in $ thousands) $ 1,197 $ 1,884 $ 2,583 $ 2,751 $ 3,391Ratio of expenses to average net assets 1.20% 1.20% 1.20% 1.20% 1.20%Ratio of net investment income (loss) to average net assets (.92)% (.99)% (.65)% (1.20)% (1.20)%
A Calculated based on average units outstanding during the period.B Total returns do not include the effect of the contingent deferred sales charge.C Amounts do not include the activity of any underlying fund.
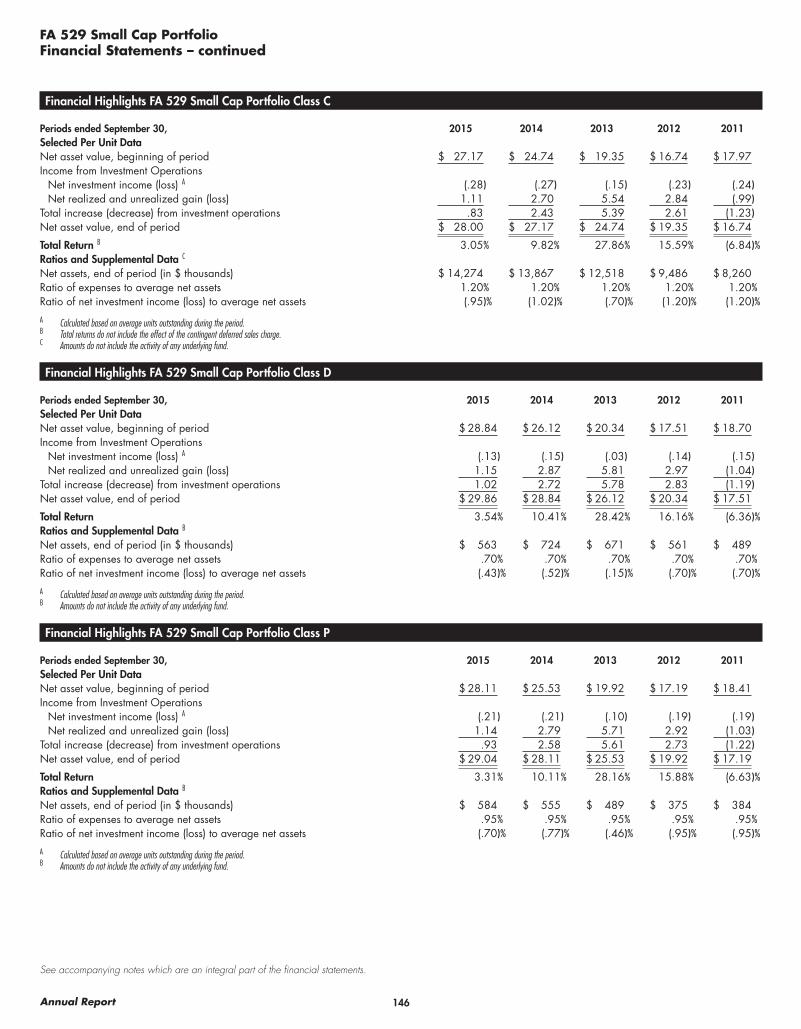
146Annual Report
See accompanying notes which are an integral part of the financial statements.
FA 529 Small Cap PortfolioFinancial Statements – continued
Financial Highlights FA 529 Small Cap Portfolio Class C
Periods ended September 30, 2015 2014 2013 2012 2011Selected Per Unit Data Net asset value, beginning of period $ 27.17 $ 24.74 $ 19.35 $ 16.74 $ 17.97Income from Investment Operations
Net investment income (loss) A (.28) (.27) (.15) (.23) (.24)Net realized and unrealized gain (loss) 1.11 2.70 5.54 2.84 (.99)
Total increase (decrease) from investment operations .83 2.43 5.39 2.61 (1.23)Net asset value, end of period $ 28.00 $ 27.17 $ 24.74 $ 19.35 $ 16.74
Total Return B 3.05% 9.82% 27.86% 15.59% (6.84)%Ratios and Supplemental Data C Net assets, end of period (in $ thousands) $ 14,274 $ 13,867 $ 12,518 $ 9,486 $ 8,260Ratio of expenses to average net assets 1.20% 1.20% 1.20% 1.20% 1.20%Ratio of net investment income (loss) to average net assets (.95)% (1.02)% (.70)% (1.20)% (1.20)%
A Calculated based on average units outstanding during the period.B Total returns do not include the effect of the contingent deferred sales charge.C Amounts do not include the activity of any underlying fund.
Financial Highlights FA 529 Small Cap Portfolio Class D
Periods ended September 30, 2015 2014 2013 2012 2011Selected Per Unit Data Net asset value, beginning of period $ 28.84 $ 26.12 $ 20.34 $ 17.51 $ 18.70Income from Investment Operations
Net investment income (loss) A (.13) (.15) (.03) (.14) (.15)Net realized and unrealized gain (loss) 1.15 2.87 5.81 2.97 (1.04)
Total increase (decrease) from investment operations 1.02 2.72 5.78 2.83 (1.19)Net asset value, end of period $ 29.86 $ 28.84 $ 26.12 $ 20.34 $ 17.51
Total Return 3.54% 10.41% 28.42% 16.16% (6.36)%Ratios and Supplemental Data B Net assets, end of period (in $ thousands) $ 563 $ 724 $ 671 $ 561 $ 489Ratio of expenses to average net assets .70% .70% .70% .70% .70%Ratio of net investment income (loss) to average net assets (.43)% (.52)% (.15)% (.70)% (.70)%
A Calculated based on average units outstanding during the period.B Amounts do not include the activity of any underlying fund.
Financial Highlights FA 529 Small Cap Portfolio Class P
Periods ended September 30, 2015 2014 2013 2012 2011Selected Per Unit Data Net asset value, beginning of period $ 28.11 $ 25.53 $ 19.92 $ 17.19 $ 18.41Income from Investment Operations
Net investment income (loss) A (.21) (.21) (.10) (.19) (.19)Net realized and unrealized gain (loss) 1.14 2.79 5.71 2.92 (1.03)
Total increase (decrease) from investment operations .93 2.58 5.61 2.73 (1.22)Net asset value, end of period $ 29.04 $ 28.11 $ 25.53 $ 19.92 $ 17.19
Total Return 3.31% 10.11% 28.16% 15.88% (6.63)%Ratios and Supplemental Data B Net assets, end of period (in $ thousands) $ 584 $ 555 $ 489 $ 375 $ 384Ratio of expenses to average net assets .95% .95% .95% .95% .95%Ratio of net investment income (loss) to average net assets (.70)% (.77)% (.46)% (.95)% (.95)%
A Calculated based on average units outstanding during the period.B Amounts do not include the activity of any underlying fund.
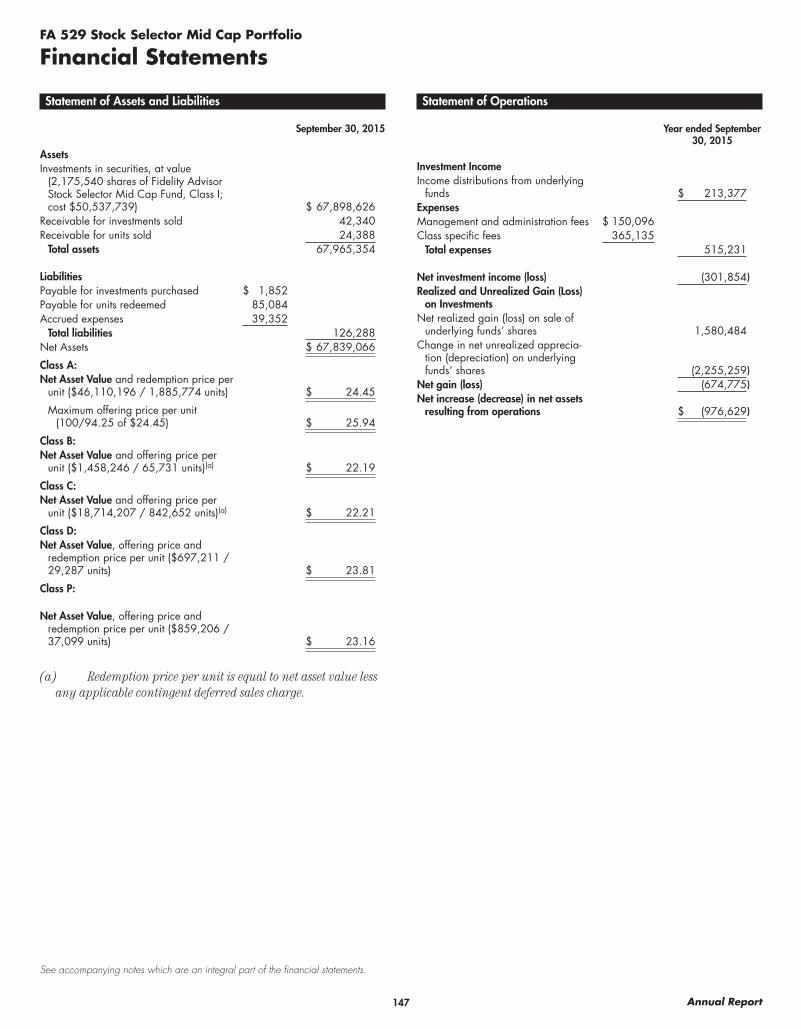
147 Annual Report
See accompanying notes which are an integral part of the financial statements.
FA 529 Stock Selector Mid Cap Portfolio
Financial Statements
Statement of Assets and Liabilities
September 30, 2015
AssetsInvestments in securities, at value
(2,175,540 shares of Fidelity Advisor Stock Selector Mid Cap Fund, Class I; cost $50,537,739) $ 67,898,626
Receivable for investments sold 42,340Receivable for units sold 24,388
Total assets 67,965,354
LiabilitiesPayable for investments purchased $ 1,852Payable for units redeemed 85,084Accrued expenses 39,352
Total liabilities 126,288Net Assets $ 67,839,066
Class A:Net Asset Value and redemption price per
unit ($46,110,196 / 1,885,774 units) $ 24.45
Maximum offering price per unit (100/94.25 of $24.45) $ 25.94
Class B:Net Asset Value and offering price per
unit ($1,458,246 / 65,731 units)(a) $ 22.19
Class C:Net Asset Value and offering price per
unit ($18,714,207 / 842,652 units)(a) $ 22.21
Class D:Net Asset Value, offering price and
redemption price per unit ($697,211 / 29,287 units) $ 23.81
Class P:
Net Asset Value, offering price and redemption price per unit ($859,206 / 37,099 units) $ 23.16
(a) Redemption price per unit is equal to net asset value less any applicable contingent deferred sales charge.
Statement of Operations
Year ended September 30, 2015
Investment IncomeIncome distributions from underlying
funds $ 213,377ExpensesManagement and administration fees $ 150,096Class specific fees 365,135
Total expenses 515,231
Net investment income (loss) (301,854)Realized and Unrealized Gain (Loss)
on InvestmentsNet realized gain (loss) on sale of
underlying funds’ shares 1,580,484Change in net unrealized apprecia-
tion (depreciation) on underlying funds’ shares (2,255,259)
Net gain (loss) (674,775)Net increase (decrease) in net assets
resulting from operations $ (976,629)
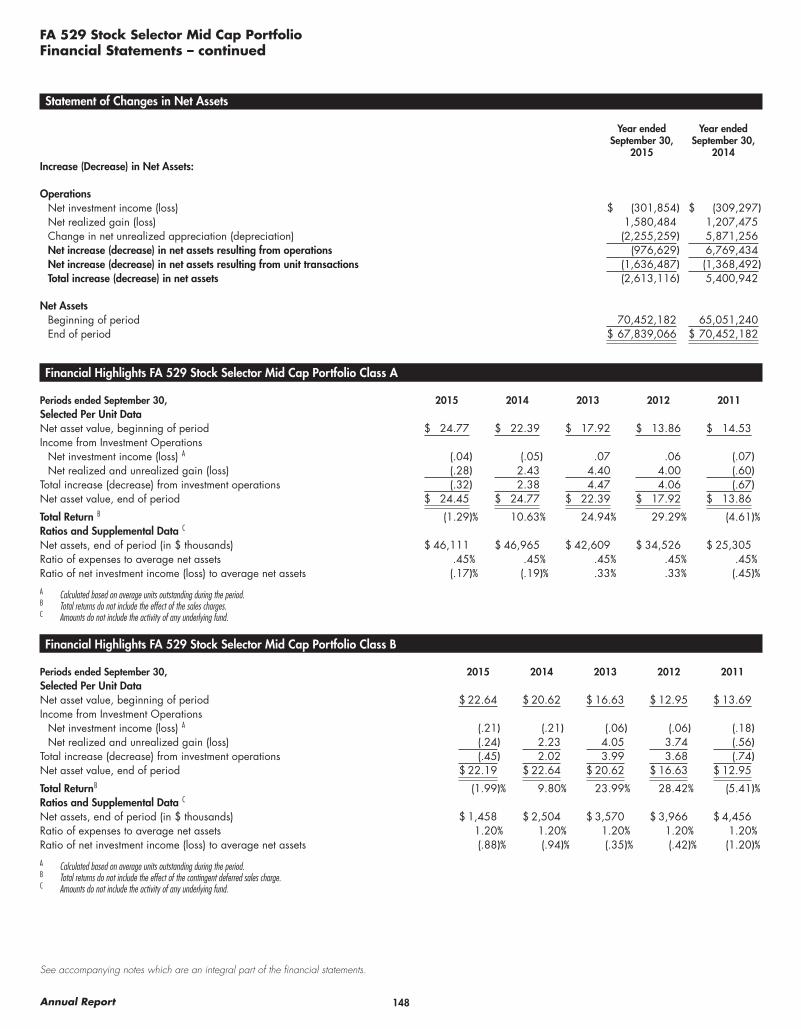
148Annual Report
See accompanying notes which are an integral part of the financial statements.
FA 529 Stock Selector Mid Cap PortfolioFinancial Statements – continued
Statement of Changes in Net Assets
Year ended September 30,
2015
Year ended September 30,
2014Increase (Decrease) in Net Assets:
OperationsNet investment income (loss) $ (301,854) $ (309,297)Net realized gain (loss) 1,580,484 1,207,475Change in net unrealized appreciation (depreciation) (2,255,259) 5,871,256Net increase (decrease) in net assets resulting from operations (976,629) 6,769,434Net increase (decrease) in net assets resulting from unit transactions (1,636,487) (1,368,492)Total increase (decrease) in net assets (2,613,116) 5,400,942
Net AssetsBeginning of period 70,452,182 65,051,240End of period $ 67,839,066 $ 70,452,182
Financial Highlights FA 529 Stock Selector Mid Cap Portfolio Class A
Periods ended September 30, 2015 2014 2013 2012 2011Selected Per Unit Data Net asset value, beginning of period $ 24.77 $ 22.39 $ 17.92 $ 13.86 $ 14.53Income from Investment Operations
Net investment income (loss) A (.04) (.05) .07 .06 (.07)Net realized and unrealized gain (loss) (.28) 2.43 4.40 4.00 (.60)
Total increase (decrease) from investment operations (.32) 2.38 4.47 4.06 (.67)Net asset value, end of period $ 24.45 $ 24.77 $ 22.39 $ 17.92 $ 13.86
Total Return B (1.29)% 10.63% 24.94% 29.29% (4.61)%Ratios and Supplemental Data C Net assets, end of period (in $ thousands) $ 46,111 $ 46,965 $ 42,609 $ 34,526 $ 25,305Ratio of expenses to average net assets .45% .45% .45% .45% .45%Ratio of net investment income (loss) to average net assets (.17)% (.19)% .33% .33% (.45)%
A Calculated based on average units outstanding during the period.B Total returns do not include the effect of the sales charges.C Amounts do not include the activity of any underlying fund.
Financial Highlights FA 529 Stock Selector Mid Cap Portfolio Class B
Periods ended September 30, 2015 2014 2013 2012 2011Selected Per Unit Data Net asset value, beginning of period $ 22.64 $ 20.62 $ 16.63 $ 12.95 $ 13.69Income from Investment Operations
Net investment income (loss) A (.21) (.21) (.06) (.06) (.18)Net realized and unrealized gain (loss) (.24) 2.23 4.05 3.74 (.56)
Total increase (decrease) from investment operations (.45) 2.02 3.99 3.68 (.74)Net asset value, end of period $ 22.19 $ 22.64 $ 20.62 $ 16.63 $ 12.95
Total Return B (1.99)% 9.80% 23.99% 28.42% (5.41)%Ratios and Supplemental Data C Net assets, end of period (in $ thousands) $ 1,458 $ 2,504 $ 3,570 $ 3,966 $ 4,456Ratio of expenses to average net assets 1.20% 1.20% 1.20% 1.20% 1.20%Ratio of net investment income (loss) to average net assets (.88)% (.94)% (.35)% (.42)% (1.20)%
A Calculated based on average units outstanding during the period.B Total returns do not include the effect of the contingent deferred sales charge.C Amounts do not include the activity of any underlying fund.
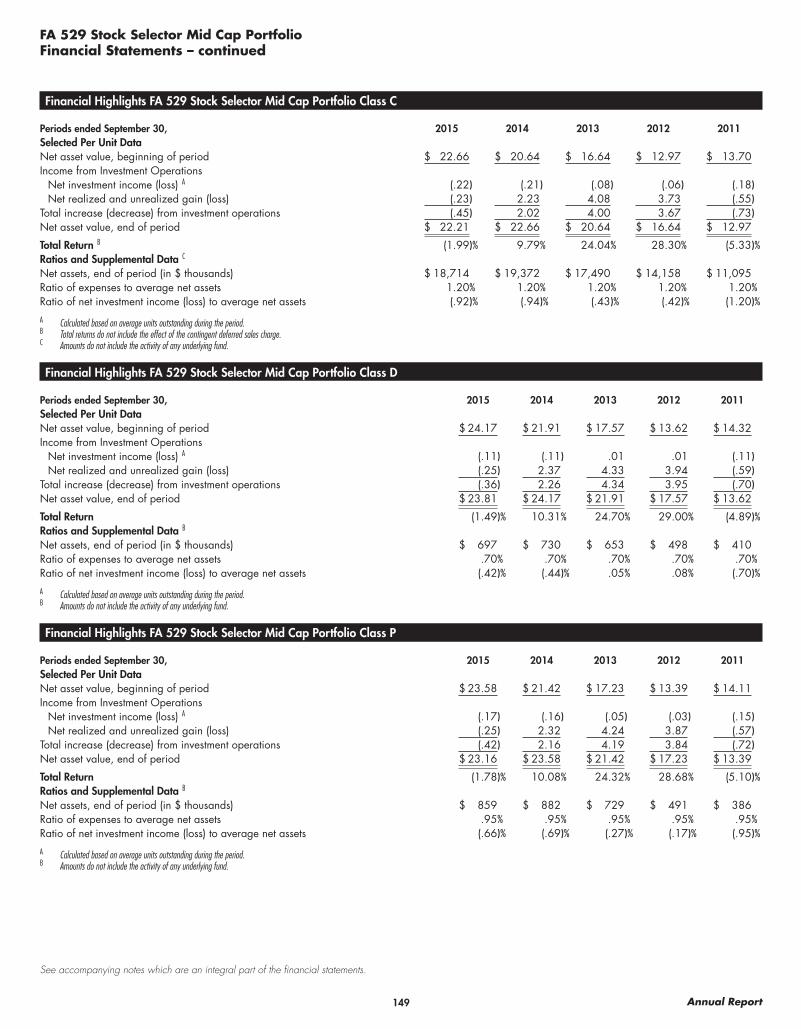
149 Annual Report
See accompanying notes which are an integral part of the financial statements.
FA 529 Stock Selector Mid Cap PortfolioFinancial Statements – continued
Financial Highlights FA 529 Stock Selector Mid Cap Portfolio Class C
Periods ended September 30, 2015 2014 2013 2012 2011Selected Per Unit Data Net asset value, beginning of period $ 22.66 $ 20.64 $ 16.64 $ 12.97 $ 13.70Income from Investment Operations
Net investment income (loss) A (.22) (.21) (.08) (.06) (.18)Net realized and unrealized gain (loss) (.23) 2.23 4.08 3.73 (.55)
Total increase (decrease) from investment operations (.45) 2.02 4.00 3.67 (.73)Net asset value, end of period $ 22.21 $ 22.66 $ 20.64 $ 16.64 $ 12.97
Total Return B (1.99)% 9.79% 24.04% 28.30% (5.33)%Ratios and Supplemental Data C Net assets, end of period (in $ thousands) $ 18,714 $ 19,372 $ 17,490 $ 14,158 $ 11,095Ratio of expenses to average net assets 1.20% 1.20% 1.20% 1.20% 1.20%Ratio of net investment income (loss) to average net assets (.92)% (.94)% (.43)% (.42)% (1.20)%
A Calculated based on average units outstanding during the period.B Total returns do not include the effect of the contingent deferred sales charge.C Amounts do not include the activity of any underlying fund.
Financial Highlights FA 529 Stock Selector Mid Cap Portfolio Class D
Periods ended September 30, 2015 2014 2013 2012 2011Selected Per Unit Data Net asset value, beginning of period $ 24.17 $ 21.91 $ 17.57 $ 13.62 $ 14.32Income from Investment Operations
Net investment income (loss) A (.11) (.11) .01 .01 (.11)Net realized and unrealized gain (loss) (.25) 2.37 4.33 3.94 (.59)
Total increase (decrease) from investment operations (.36) 2.26 4.34 3.95 (.70)Net asset value, end of period $ 23.81 $ 24.17 $ 21.91 $ 17.57 $ 13.62
Total Return (1.49)% 10.31% 24.70% 29.00% (4.89)%Ratios and Supplemental Data B Net assets, end of period (in $ thousands) $ 697 $ 730 $ 653 $ 498 $ 410Ratio of expenses to average net assets .70% .70% .70% .70% .70%Ratio of net investment income (loss) to average net assets (.42)% (.44)% .05% .08% (.70)%
A Calculated based on average units outstanding during the period.B Amounts do not include the activity of any underlying fund.
Financial Highlights FA 529 Stock Selector Mid Cap Portfolio Class P
Periods ended September 30, 2015 2014 2013 2012 2011Selected Per Unit Data Net asset value, beginning of period $ 23.58 $ 21.42 $ 17.23 $ 13.39 $ 14.11Income from Investment Operations
Net investment income (loss) A (.17) (.16) (.05) (.03) (.15)Net realized and unrealized gain (loss) (.25) 2.32 4.24 3.87 (.57)
Total increase (decrease) from investment operations (.42) 2.16 4.19 3.84 (.72)Net asset value, end of period $ 23.16 $ 23.58 $ 21.42 $ 17.23 $ 13.39
Total Return (1.78)% 10.08% 24.32% 28.68% (5.10)%Ratios and Supplemental Data B Net assets, end of period (in $ thousands) $ 859 $ 882 $ 729 $ 491 $ 386Ratio of expenses to average net assets .95% .95% .95% .95% .95%Ratio of net investment income (loss) to average net assets (.66)% (.69)% (.27)% (.17)% (.95)%
A Calculated based on average units outstanding during the period.B Amounts do not include the activity of any underlying fund.
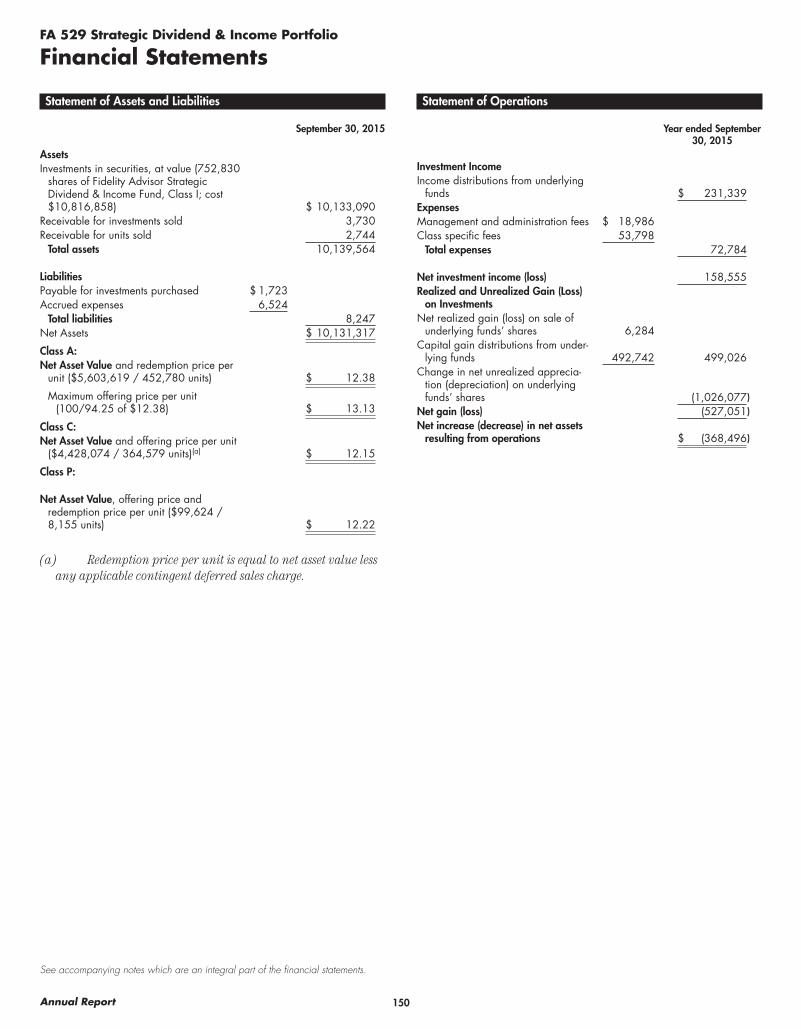
150Annual Report
See accompanying notes which are an integral part of the financial statements.
FA 529 Strategic Dividend & Income Portfolio
Financial Statements
Statement of Assets and Liabilities
September 30, 2015
AssetsInvestments in securities, at value (752,830
shares of Fidelity Advisor Strategic Dividend & Income Fund, Class I; cost $10,816,858) $ 10,133,090
Receivable for investments sold 3,730Receivable for units sold 2,744
Total assets 10,139,564
LiabilitiesPayable for investments purchased $ 1,723Accrued expenses 6,524
Total liabilities 8,247Net Assets $ 10,131,317
Class A:Net Asset Value and redemption price per
unit ($5,603,619 / 452,780 units) $ 12.38
Maximum offering price per unit (100/94.25 of $12.38) $ 13.13
Class C:Net Asset Value and offering price per unit
($4,428,074 / 364,579 units)(a) $ 12.15
Class P:
Net Asset Value, offering price and redemption price per unit ($99,624 / 8,155 units) $ 12.22
(a) Redemption price per unit is equal to net asset value less any applicable contingent deferred sales charge.
Statement of Operations
Year ended September 30, 2015
Investment IncomeIncome distributions from underlying
funds $ 231,339ExpensesManagement and administration fees $ 18,986Class specific fees 53,798
Total expenses 72,784
Net investment income (loss) 158,555Realized and Unrealized Gain (Loss)
on InvestmentsNet realized gain (loss) on sale of
underlying funds’ shares 6,284Capital gain distributions from under-
lying funds 492,742 499,026Change in net unrealized apprecia-
tion (depreciation) on underlying funds’ shares (1,026,077)
Net gain (loss) (527,051)Net increase (decrease) in net assets
resulting from operations $ (368,496)
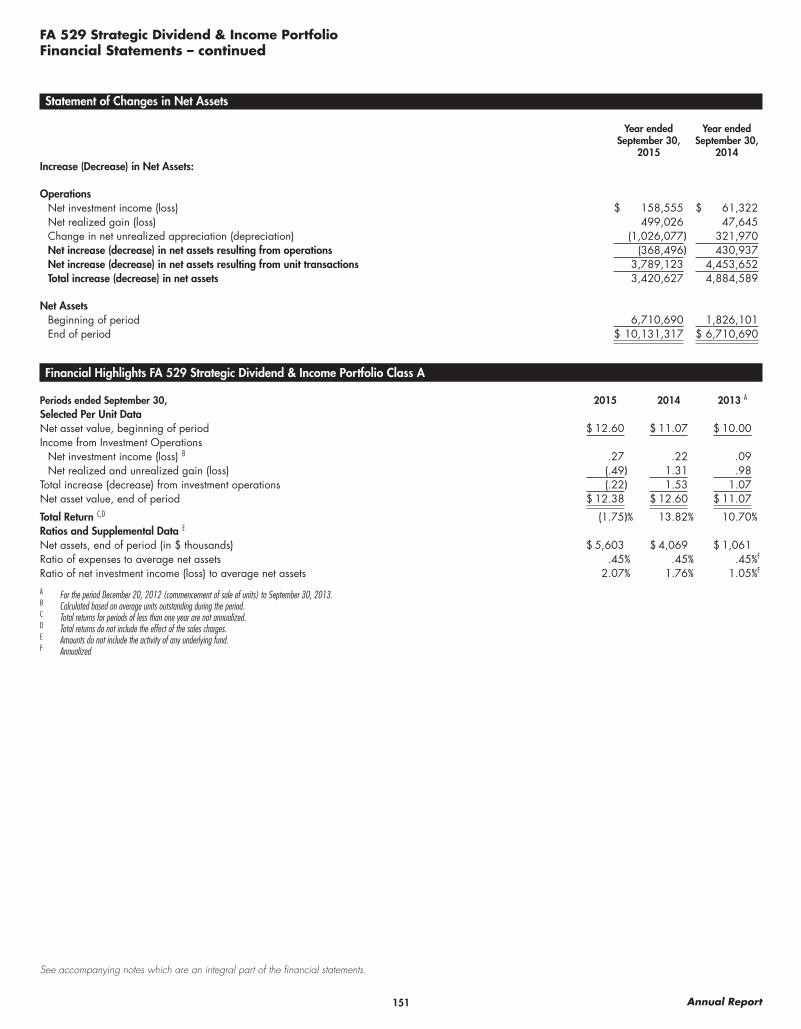
151 Annual Report
See accompanying notes which are an integral part of the financial statements.
FA 529 Strategic Dividend & Income PortfolioFinancial Statements – continued
Statement of Changes in Net Assets
Year ended September 30,
2015
Year ended September 30,
2014Increase (Decrease) in Net Assets:
OperationsNet investment income (loss) $ 158,555 $ 61,322Net realized gain (loss) 499,026 47,645Change in net unrealized appreciation (depreciation) (1,026,077) 321,970Net increase (decrease) in net assets resulting from operations (368,496) 430,937Net increase (decrease) in net assets resulting from unit transactions 3,789,123 4,453,652Total increase (decrease) in net assets 3,420,627 4,884,589
Net AssetsBeginning of period 6,710,690 1,826,101End of period $ 10,131,317 $ 6,710,690
Financial Highlights FA 529 Strategic Dividend & Income Portfolio Class A
Periods ended September 30, 2015 2014 2013 A
Selected Per Unit Data Net asset value, beginning of period $ 12.60 $ 11.07 $ 10.00Income from Investment Operations
Net investment income (loss) B .27 .22 .09Net realized and unrealized gain (loss) (.49) 1.31 .98
Total increase (decrease) from investment operations (.22) 1.53 1.07Net asset value, end of period $ 12.38 $ 12.60 $ 11.07
Total Return C,D (1.75)% 13.82% 10.70%Ratios and Supplemental Data E Net assets, end of period (in $ thousands) $ 5,603 $ 4,069 $ 1,061Ratio of expenses to average net assets .45% .45% .45%F
Ratio of net investment income (loss) to average net assets 2.07% 1.76% 1.05%F
A For the period December 20, 2012 (commencement of sale of units) to September 30, 2013.B Calculated based on average units outstanding during the period.C Total returns for periods of less than one year are not annualized.D Total returns do not include the effect of the sales charges.E Amounts do not include the activity of any underlying fund.F Annualized

152Annual Report
See accompanying notes which are an integral part of the financial statements.
FA 529 Strategic Dividend & Income PortfolioFinancial Statements – continued
Financial Highlights FA 529 Strategic Dividend & Income Portfolio Class C
Periods ended September 30, 2015 2014 2013 A
Selected Per Unit Data Net asset value, beginning of period $ 12.46 $ 11.02 $ 10.00Income from Investment Operations
Net investment income (loss) B .14 .13 .02Net realized and unrealized gain (loss) (.45) 1.31 1.00
Total increase (decrease) from investment operations (.31) 1.44 1.02Net asset value, end of period $ 12.15 $ 12.46 $ 11.02
Total Return C,D (2.49)% 13.07% 10.20%Ratios and Supplemental Data E Net assets, end of period (in $ thousands) $ 4,428 $ 2,546 $ 730Ratio of expenses to average net assets 1.20% 1.20% 1.20%F
Ratio of net investment income (loss) to average net assets 1.12% 1.08% .27%F
A For the period December 20, 2012 (commencement of sale of units) to September 30, 2013.B Calculated based on average units outstanding during the period.C Total returns for periods of less than one year are not annualized.D Total returns do not include the effect of the contingent deferred sales charge.E Amounts do not include the activity of any underlying fund.F Annualized
Financial Highlights FA 529 Strategic Dividend & Income Portfolio Class P
Periods ended September 30, 2015 2014 2013 A
Selected Per Unit Data Net asset value, beginning of period $ 12.50 $ 11.03 $ 10.00Income from Investment Operations
Net investment income (loss) B .22 .17 .08Net realized and unrealized gain (loss) (.50) 1.30 .95
Total increase (decrease) from investment operations (.28) 1.47 1.03Net asset value, end of period $ 12.22 $ 12.50 $ 11.03
Total Return C (2.24)% 13.33% 10.30%Ratios and Supplemental Data D Net assets, end of period (in $ thousands) $ 100 $ 96 $ 35Ratio of expenses to average net assets .95% .95% .95%E
Ratio of net investment income (loss) to average net assets 1.73% 1.39% .89%E
A For the period December 20, 2012 (commencement of sale of units) to September 30, 2013.B Calculated based on average units outstanding during the period.C Total returns for periods of less than one year are not annualized.D Amounts do not include the activity of any underlying fund.E Annualized
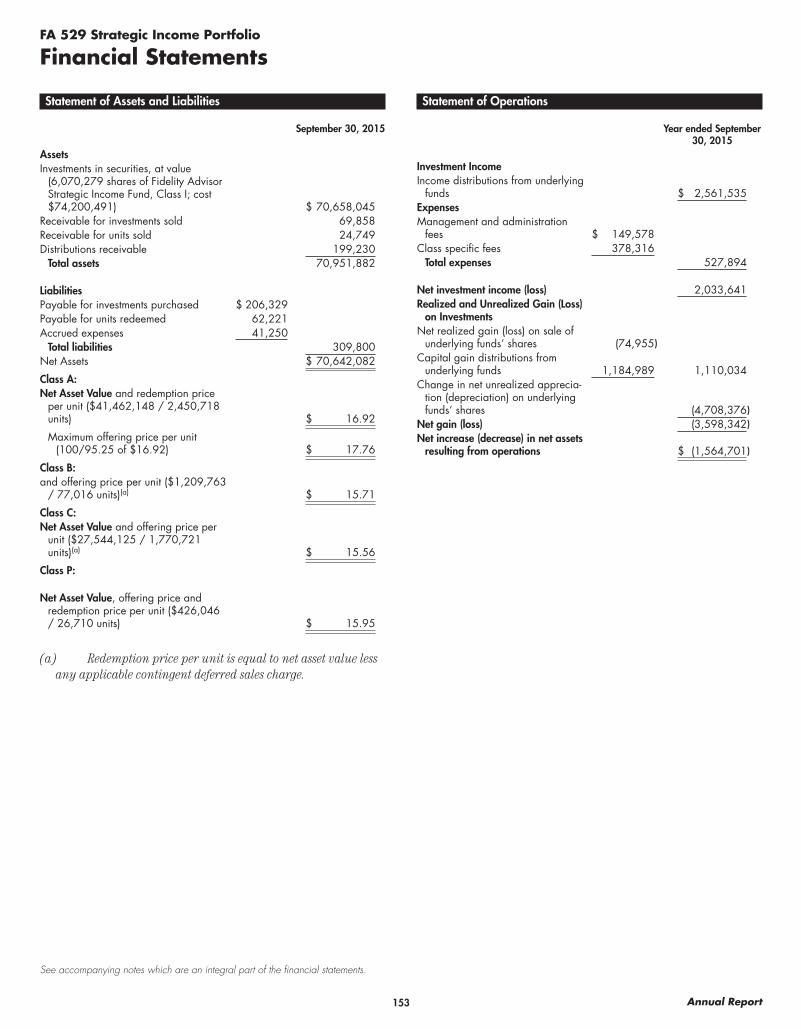
153 Annual Report
See accompanying notes which are an integral part of the financial statements.
FA 529 Strategic Income Portfolio
Financial Statements
Statement of Assets and Liabilities
September 30, 2015
AssetsInvestments in securities, at value
(6,070,279 shares of Fidelity Advisor Strategic Income Fund, Class I; cost $74,200,491) $ 70,658,045
Receivable for investments sold 69,858Receivable for units sold 24,749Distributions receivable 199,230
Total assets 70,951,882
LiabilitiesPayable for investments purchased $ 206,329Payable for units redeemed 62,221Accrued expenses 41,250
Total liabilities 309,800Net Assets $ 70,642,082
Class A:Net Asset Value and redemption price
per unit ($41,462,148 / 2,450,718 units) $ 16.92
Maximum offering price per unit (100/95.25 of $16.92) $ 17.76
Class B:and offering price per unit ($1,209,763
/ 77,016 units)(a) $ 15.71
Class C:Net Asset Value and offering price per
unit ($27,544,125 / 1,770,721 units)(a) $ 15.56
Class P:
Net Asset Value, offering price and redemption price per unit ($426,046 / 26,710 units) $ 15.95
(a) Redemption price per unit is equal to net asset value less any applicable contingent deferred sales charge.
Statement of Operations
Year ended September 30, 2015
Investment IncomeIncome distributions from underlying
funds $ 2,561,535ExpensesManagement and administration
fees $ 149,578Class specific fees 378,316
Total expenses 527,894
Net investment income (loss) 2,033,641Realized and Unrealized Gain (Loss)
on InvestmentsNet realized gain (loss) on sale of
underlying funds’ shares (74,955)Capital gain distributions from
underlying funds 1,184,989 1,110,034Change in net unrealized apprecia-
tion (depreciation) on underlying funds’ shares (4,708,376)
Net gain (loss) (3,598,342)Net increase (decrease) in net assets
resulting from operations $ (1,564,701)

154Annual Report
See accompanying notes which are an integral part of the financial statements.
FA 529 Strategic Income PortfolioFinancial Statements – continued
Statement of Changes in Net Assets
Year ended September 30,
2015
Year ended September 30,
2014Increase (Decrease) in Net Assets:
OperationsNet investment income (loss) $ 2,033,641 $ 2,344,389Net realized gain (loss) 1,110,034 1,284,464Change in net unrealized appreciation (depreciation) (4,708,376) 208,276Net increase (decrease) in net assets resulting from operations (1,564,701) 3,837,129Net increase (decrease) in net assets resulting from unit transactions (3,471,845) (8,058,565)Total increase (decrease) in net assets (5,036,546) (4,221,436)
Net AssetsBeginning of period 75,678,628 79,900,064End of period $ 70,642,082 $ 75,678,628
Financial Highlights FA 529 Strategic Income Portfolio Class A
Periods ended September 30, 2015 2014 2013 2012 2011Selected Per Unit Data Net asset value, beginning of period $ 17.23 $ 16.34 $ 16.27 $ 14.63 $ 14.34Income from Investment Operations
Net investment income (loss) A .53 .57 .53 .64 .62Net realized and unrealized gain (loss) (.84) .32 (.46) 1.00 (.33)
Total increase (decrease) from investment operations (.31) .89 .07 1.64 .29Net asset value, end of period $ 16.92 $ 17.23 $ 16.34 $ 16.27 $ 14.63
Total Return B (1.80)% 5.45% .43% 11.21% 2.02%Ratios and Supplemental Data C Net assets, end of period (in $ thousands) $ 41,462 $ 43,121 $ 43,884 $ 42,577 $ 26,341Ratio of expenses to average net assets .35% .35% .35% .35% .35%Ratio of net investment income (loss) to average net assets 3.07% 3.37% 3.22% 4.11% 4.23%
A Calculated based on average units outstanding during the period.B Total returns do not include the effect of the sales charges.C Amounts do not include the activity of any underlying fund.
Financial Highlights FA 529 Strategic Income Portfolio Class B
Periods ended September 30, 2015 2014 2013 2012 2011Selected Per Unit Data Net asset value, beginning of period $ 16.12 $ 15.40 $ 15.45 $ 13.99 $ 13.82Income from Investment Operations
Net investment income (loss) A .40 .42 .38 .51 .50Net realized and unrealized gain (loss) (.81) .30 (.43) .95 (.33)
Total increase (decrease) from investment operations (.41) .72 (.05) 1.46 .17Net asset value, end of period $ 15.71 $ 16.12 $ 15.40 $ 15.45 $ 13.99
Total Return B (2.54)% 4.68% (.32)% 10.44% 1.23%Ratios and Supplemental Data C Net assets, end of period (in $ thousands) $ 1,210 $ 1,758 $ 2,231 $ 3,077 $ 2,718Ratio of expenses to average net assets 1.10% 1.10% 1.10% 1.10% 1.10%Ratio of net investment income (loss) to average net assets 2.48% 2.63% 2.46% 3.43% 3.54%
A Calculated based on average units outstanding during the period.B Total returns do not include the effect of the contingent deferred sales charge.C Amounts do not include the activity of any underlying fund.
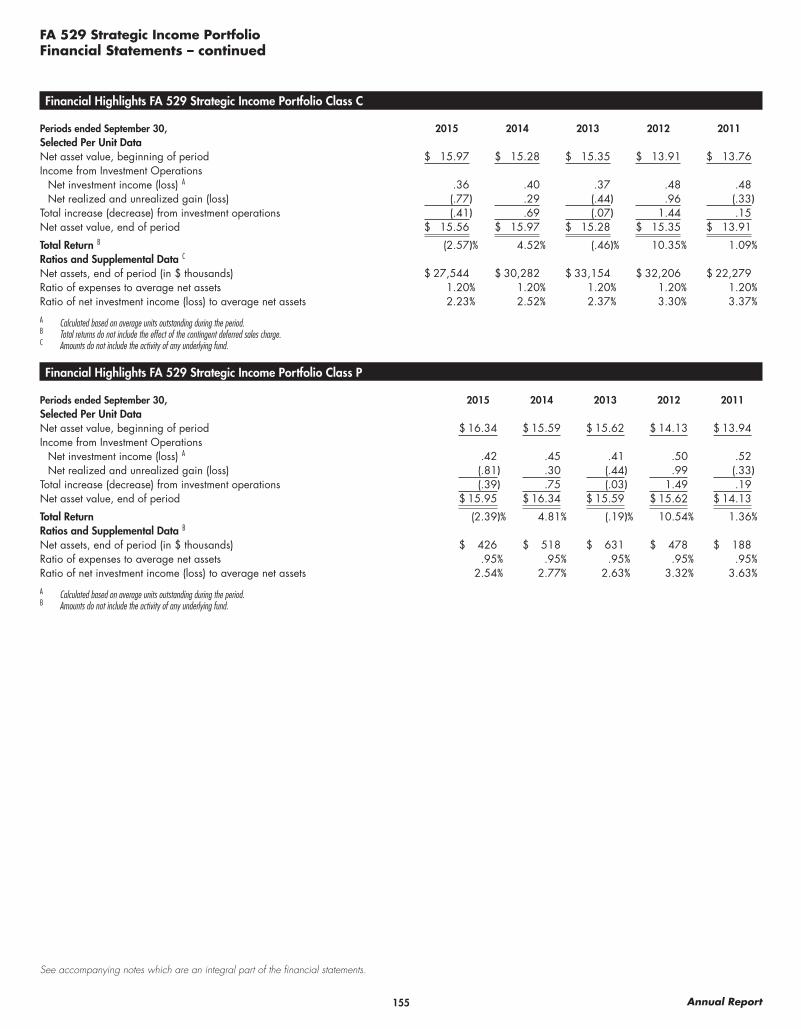
155 Annual Report
See accompanying notes which are an integral part of the financial statements.
FA 529 Strategic Income PortfolioFinancial Statements – continued
Financial Highlights FA 529 Strategic Income Portfolio Class C
Periods ended September 30, 2015 2014 2013 2012 2011Selected Per Unit Data Net asset value, beginning of period $ 15.97 $ 15.28 $ 15.35 $ 13.91 $ 13.76Income from Investment Operations
Net investment income (loss) A .36 .40 .37 .48 .48Net realized and unrealized gain (loss) (.77) .29 (.44) .96 (.33)
Total increase (decrease) from investment operations (.41) .69 (.07) 1.44 .15Net asset value, end of period $ 15.56 $ 15.97 $ 15.28 $ 15.35 $ 13.91
Total Return B (2.57)% 4.52% (.46)% 10.35% 1.09%Ratios and Supplemental Data C Net assets, end of period (in $ thousands) $ 27,544 $ 30,282 $ 33,154 $ 32,206 $ 22,279Ratio of expenses to average net assets 1.20% 1.20% 1.20% 1.20% 1.20%Ratio of net investment income (loss) to average net assets 2.23% 2.52% 2.37% 3.30% 3.37%
A Calculated based on average units outstanding during the period.B Total returns do not include the effect of the contingent deferred sales charge.C Amounts do not include the activity of any underlying fund.
Financial Highlights FA 529 Strategic Income Portfolio Class P
Periods ended September 30, 2015 2014 2013 2012 2011Selected Per Unit Data Net asset value, beginning of period $ 16.34 $ 15.59 $ 15.62 $ 14.13 $ 13.94Income from Investment Operations
Net investment income (loss) A .42 .45 .41 .50 .52Net realized and unrealized gain (loss) (.81) .30 (.44) .99 (.33)
Total increase (decrease) from investment operations (.39) .75 (.03) 1.49 .19Net asset value, end of period $ 15.95 $ 16.34 $ 15.59 $ 15.62 $ 14.13
Total Return (2.39)% 4.81% (.19)% 10.54% 1.36%Ratios and Supplemental Data B Net assets, end of period (in $ thousands) $ 426 $ 518 $ 631 $ 478 $ 188Ratio of expenses to average net assets .95% .95% .95% .95% .95%Ratio of net investment income (loss) to average net assets 2.54% 2.77% 2.63% 3.32% 3.63%
A Calculated based on average units outstanding during the period.B Amounts do not include the activity of any underlying fund.
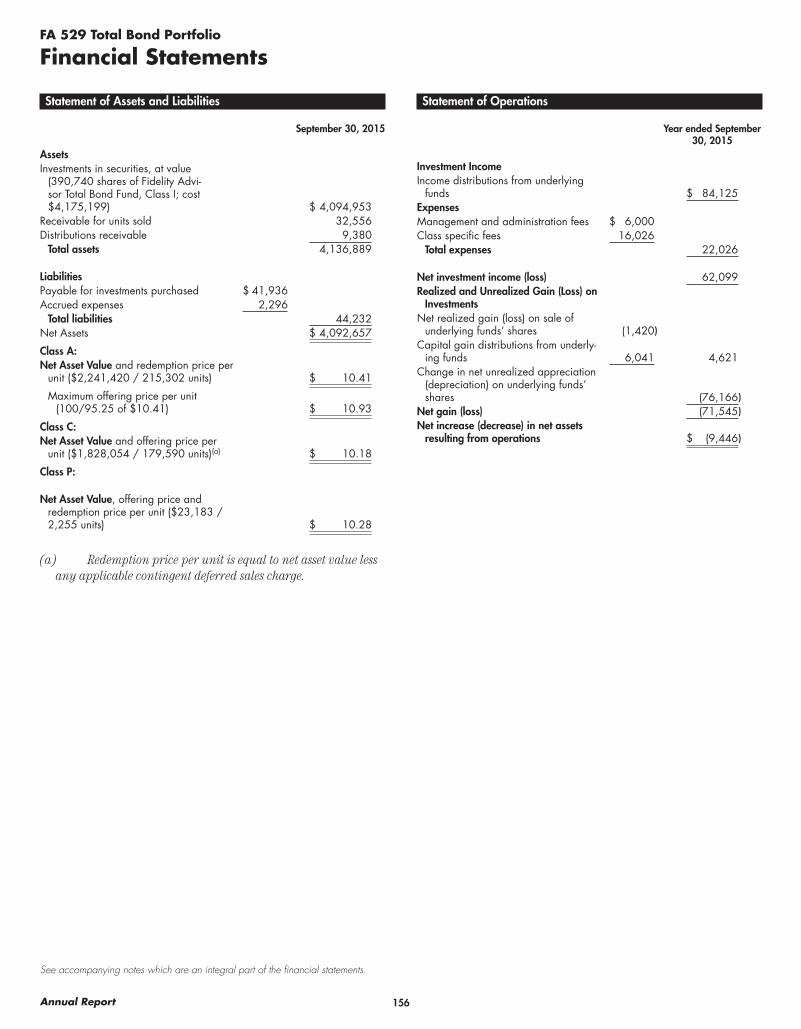
156Annual Report
See accompanying notes which are an integral part of the financial statements.
FA 529 Total Bond Portfolio
Financial Statements
Statement of Assets and Liabilities
September 30, 2015
AssetsInvestments in securities, at value
(390,740 shares of Fidelity Advi-sor Total Bond Fund, Class I; cost $4,175,199) $ 4,094,953
Receivable for units sold 32,556Distributions receivable 9,380
Total assets 4,136,889
LiabilitiesPayable for investments purchased $ 41,936Accrued expenses 2,296
Total liabilities 44,232Net Assets $ 4,092,657
Class A:Net Asset Value and redemption price per
unit ($2,241,420 / 215,302 units) $ 10.41
Maximum offering price per unit (100/95.25 of $10.41) $ 10.93
Class C:Net Asset Value and offering price per
unit ($1,828,054 / 179,590 units)(a) $ 10.18
Class P:
Net Asset Value, offering price and redemption price per unit ($23,183 / 2,255 units) $ 10.28
(a) Redemption price per unit is equal to net asset value less any applicable contingent deferred sales charge.
Statement of Operations
Year ended September 30, 2015
Investment IncomeIncome distributions from underlying
funds $ 84,125ExpensesManagement and administration fees $ 6,000Class specific fees 16,026
Total expenses 22,026
Net investment income (loss) 62,099Realized and Unrealized Gain (Loss) on
InvestmentsNet realized gain (loss) on sale of
underlying funds’ shares (1,420)Capital gain distributions from underly-
ing funds 6,041 4,621Change in net unrealized appreciation
(depreciation) on underlying funds’ shares (76,166)
Net gain (loss) (71,545)Net increase (decrease) in net assets
resulting from operations $ (9,446)
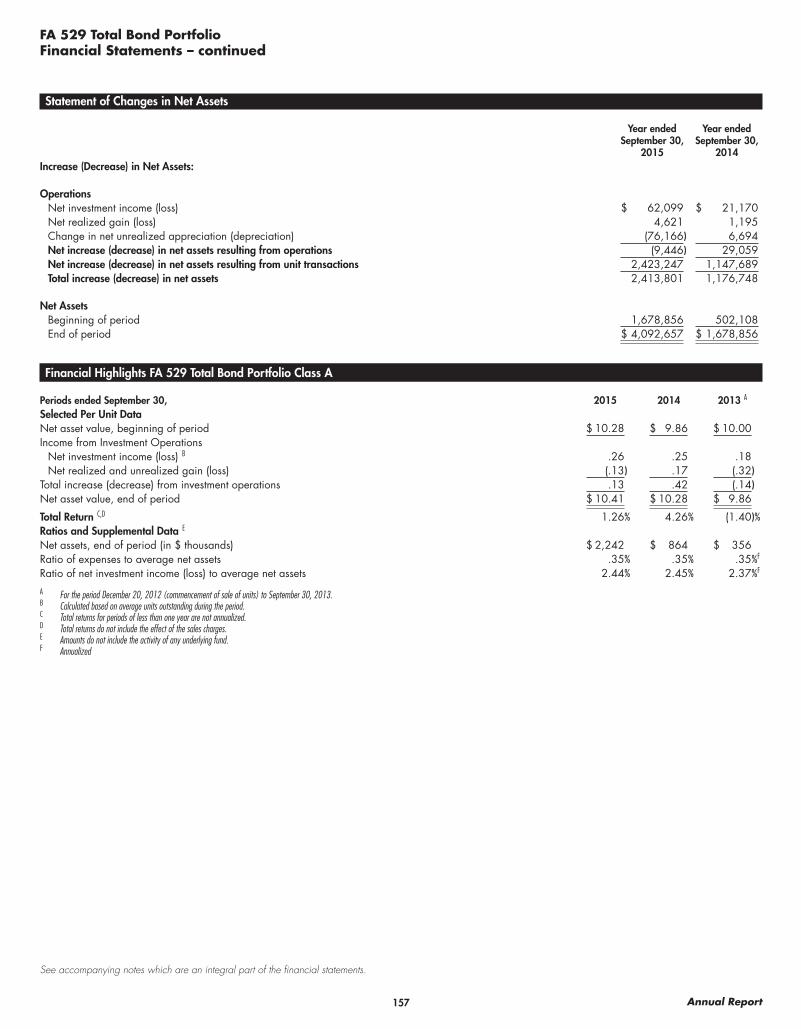
157 Annual Report
See accompanying notes which are an integral part of the financial statements.
FA 529 Total Bond PortfolioFinancial Statements – continued
Statement of Changes in Net Assets
Year ended September 30,
2015
Year ended September 30,
2014Increase (Decrease) in Net Assets:
OperationsNet investment income (loss) $ 62,099 $ 21,170Net realized gain (loss) 4,621 1,195Change in net unrealized appreciation (depreciation) (76,166) 6,694Net increase (decrease) in net assets resulting from operations (9,446) 29,059Net increase (decrease) in net assets resulting from unit transactions 2,423,247 1,147,689Total increase (decrease) in net assets 2,413,801 1,176,748
Net AssetsBeginning of period 1,678,856 502,108End of period $ 4,092,657 $ 1,678,856
Financial Highlights FA 529 Total Bond Portfolio Class A
Periods ended September 30, 2015 2014 2013 A
Selected Per Unit Data Net asset value, beginning of period $ 10.28 $ 9.86 $ 10.00Income from Investment Operations
Net investment income (loss) B .26 .25 .18Net realized and unrealized gain (loss) (.13) .17 (.32)
Total increase (decrease) from investment operations .13 .42 (.14)Net asset value, end of period $ 10.41 $ 10.28 $ 9.86
Total Return C,D 1.26% 4.26% (1.40)%Ratios and Supplemental Data E Net assets, end of period (in $ thousands) $ 2,242 $ 864 $ 356Ratio of expenses to average net assets .35% .35% .35%F
Ratio of net investment income (loss) to average net assets 2.44% 2.45% 2.37%F
A For the period December 20, 2012 (commencement of sale of units) to September 30, 2013.B Calculated based on average units outstanding during the period.C Total returns for periods of less than one year are not annualized.D Total returns do not include the effect of the sales charges.E Amounts do not include the activity of any underlying fund.F Annualized
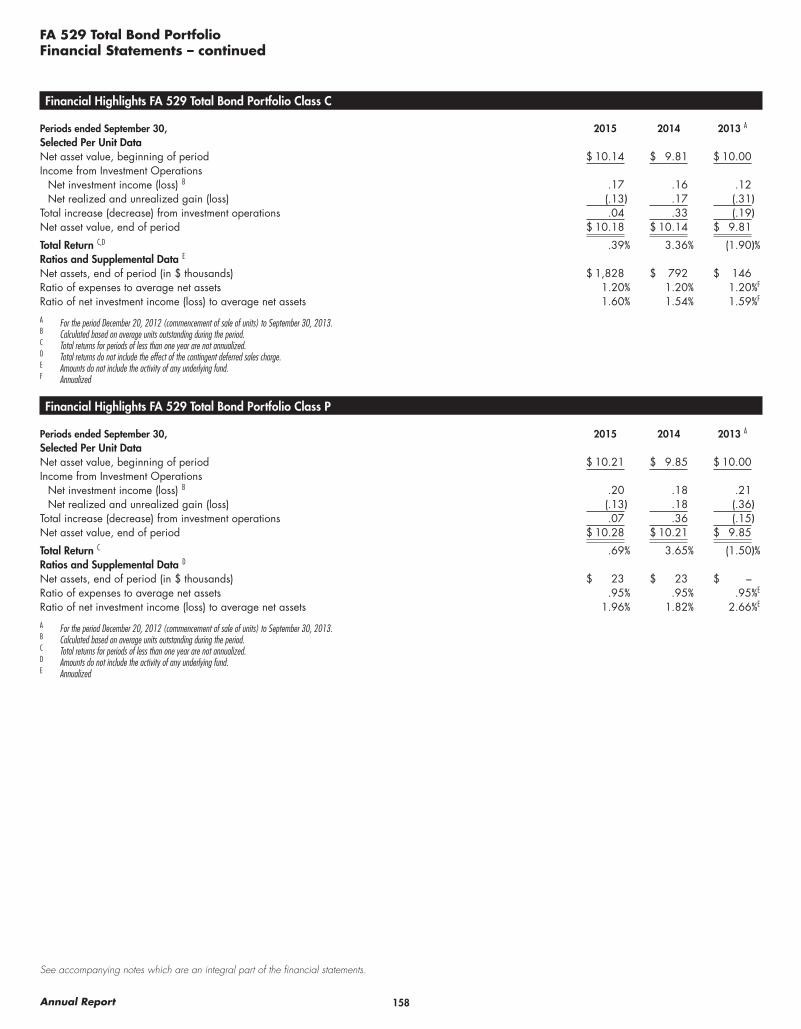
158Annual Report
See accompanying notes which are an integral part of the financial statements.
FA 529 Total Bond PortfolioFinancial Statements – continued
Financial Highlights FA 529 Total Bond Portfolio Class C
Periods ended September 30, 2015 2014 2013 A
Selected Per Unit Data Net asset value, beginning of period $ 10.14 $ 9.81 $ 10.00Income from Investment Operations
Net investment income (loss) B .17 .16 .12Net realized and unrealized gain (loss) (.13) .17 (.31)
Total increase (decrease) from investment operations .04 .33 (.19)Net asset value, end of period $ 10.18 $ 10.14 $ 9.81
Total Return C,D .39% 3.36% (1.90)%Ratios and Supplemental Data E Net assets, end of period (in $ thousands) $ 1,828 $ 792 $ 146Ratio of expenses to average net assets 1.20% 1.20% 1.20%F
Ratio of net investment income (loss) to average net assets 1.60% 1.54% 1.59%F
A For the period December 20, 2012 (commencement of sale of units) to September 30, 2013.B Calculated based on average units outstanding during the period.C Total returns for periods of less than one year are not annualized.D Total returns do not include the effect of the contingent deferred sales charge.E Amounts do not include the activity of any underlying fund.F Annualized
Financial Highlights FA 529 Total Bond Portfolio Class P
Periods ended September 30, 2015 2014 2013 A
Selected Per Unit Data Net asset value, beginning of period $ 10.21 $ 9.85 $ 10.00Income from Investment Operations
Net investment income (loss) B .20 .18 .21Net realized and unrealized gain (loss) (.13) .18 (.36)
Total increase (decrease) from investment operations .07 .36 (.15)Net asset value, end of period $ 10.28 $ 10.21 $ 9.85
Total Return C .69% 3.65% (1.50)%Ratios and Supplemental Data D Net assets, end of period (in $ thousands) $ 23 $ 23 $ –Ratio of expenses to average net assets .95% .95% .95%E
Ratio of net investment income (loss) to average net assets 1.96% 1.82% 2.66%E
A For the period December 20, 2012 (commencement of sale of units) to September 30, 2013.B Calculated based on average units outstanding during the period.C Total returns for periods of less than one year are not annualized.D Amounts do not include the activity of any underlying fund.E Annualized

159 Annual Report
See accompanying notes which are an integral part of the financial statements.
FA 529 Value Strategies Portfolio
Financial Statements
Statement of Assets and Liabilities
September 30, 2015
AssetsInvestments in securities, at value
(774,078 shares of Fidelity Advisor Value Strategies Fund, Class I; cost $22,896,217) $ 29,972,293
Receivable for investments sold 22,922Receivable for units sold 1,205
Total assets 29,996,420
LiabilitiesPayable for investments purchased $ 150Payable for units redeemed 28,322Accrued expenses 16,816
Total liabilities 45,288Net Assets $ 29,951,132
Class A:Net Asset Value and redemption price per
unit ($21,128,329 / 799,142 units) $ 26.44
Maximum offering price per unit (100/94.25 of $26.44) $ 28.05
Class B:Net Asset Value and offering price per
unit ($726,207 / 30,060 units)(a) $ 24.16
Class C:Net Asset Value and offering price per
unit ($7,131,772 / 293,406 units)(a) $ 24.31
Class D:Net Asset Value, offering price and
redemption price per unit ($307,639 / 12,102 units) $ 25.42
Class P:
Net Asset Value, offering price and redemption price per unit ($657,185 / 26,437 units) $ 24.86
(a) Redemption price per unit is equal to net asset value less any applicable contingent deferred sales charge.
Statement of Operations
Year ended September 30, 2015
Investment IncomeIncome distributions from underlying
funds $ 324,089ExpensesManagement and administration fees $ 66,494Class specific fees 153,179
Total expenses 219,673
Net investment income (loss) 104,416Realized and Unrealized Gain (Loss)
on InvestmentsNet realized gain (loss) on sale of
underlying funds’ shares 829,532Capital gain distributions from under-
lying funds 6,308 835,840Change in net unrealized apprecia-
tion (depreciation) on underlying funds’ shares (2,514,376)
Net gain (loss) (1,678,536)Net increase (decrease) in net assets
resulting from operations $ (1,574,120)

160Annual Report
See accompanying notes which are an integral part of the financial statements.
FA 529 Value Strategies PortfolioFinancial Statements – continued
Statement of Changes in Net Assets
Year ended September 30,
2015
Year ended September 30,
2014Increase (Decrease) in Net Assets:
OperationsNet investment income (loss) $ 104,416 $ 41,791Net realized gain (loss) 835,840 651,429Change in net unrealized appreciation (depreciation) (2,514,376) 3,264,404Net increase (decrease) in net assets resulting from operations (1,574,120) 3,957,624Net increase (decrease) in net assets resulting from unit transactions (760,045) (160,708)Total increase (decrease) in net assets (2,334,165) 3,796,916
Net AssetsBeginning of period 32,285,297 28,488,381End of period $ 29,951,132 $ 32,285,297
Financial Highlights FA 529 Value Strategies Portfolio Class A
Periods ended September 30, 2015 2014 2013 2012 2011Selected Per Unit Data Net asset value, beginning of period $ 27.77 $ 24.36 $ 19.46 $ 14.43 $ 15.71Income from Investment Operations
Net investment income (loss) A .15 .09 .02 .05 (.02)Net realized and unrealized gain (loss) (1.48) 3.32 4.88 4.98 (1.26)
Total increase (decrease) from investment operations (1.33) 3.41 4.90 5.03 (1.28)Net asset value, end of period $ 26.44 $ 27.77 $ 24.36 $ 19.46 $ 14.43
Total Return B (4.79)% 14.00% 25.18% 34.86% (8.15)%Ratios and Supplemental Data C Net assets, end of period (in $ thousands) $ 21,128 $ 22,644 $ 19,491 $ 14,909 $ 10,634Ratio of expenses to average net assets .45% .45% .45% .45% .45%Ratio of net investment income (loss) to average net assets .53% .35% .08% .28% (.13)%
A Calculated based on average units outstanding during the period.B Total returns do not include the effect of the sales charges.C Amounts do not include the activity of any underlying fund.
Financial Highlights FA 529 Value Strategies Portfolio Class B
Periods ended September 30, 2015 2014 2013 2012 2011Selected Per Unit Data Net asset value, beginning of period $ 25.56 $ 22.60 $ 18.19 $ 13.58 $ 14.90Income from Investment Operations
Net investment income (loss) A (.03) (.07) (.12) (.06) (.14)Net realized and unrealized gain (loss) (1.37) 3.03 4.53 4.67 (1.18)
Total increase (decrease) from investment operations (1.40) 2.96 4.41 4.61 (1.32)Net asset value, end of period $ 24.16 $ 25.56 $ 22.60 $ 18.19 $ 13.58
Total Return B (5.48)% 13.10% 24.24% 33.95% (8.86)%Ratios and Supplemental Data C Net assets, end of period (in $ thousands) $ 726 $ 1,153 $ 1,562 $ 1,778 $ 2,051Ratio of expenses to average net assets 1.20% 1.20% 1.20% 1.20% 1.20%Ratio of net investment income (loss) to average net assets (.11)% (.29)% (.61)% (.34)% (.84)%
A Calculated based on average units outstanding during the period.B Total returns do not include the effect of the contingent deferred sales charge.C Amounts do not include the activity of any underlying fund.
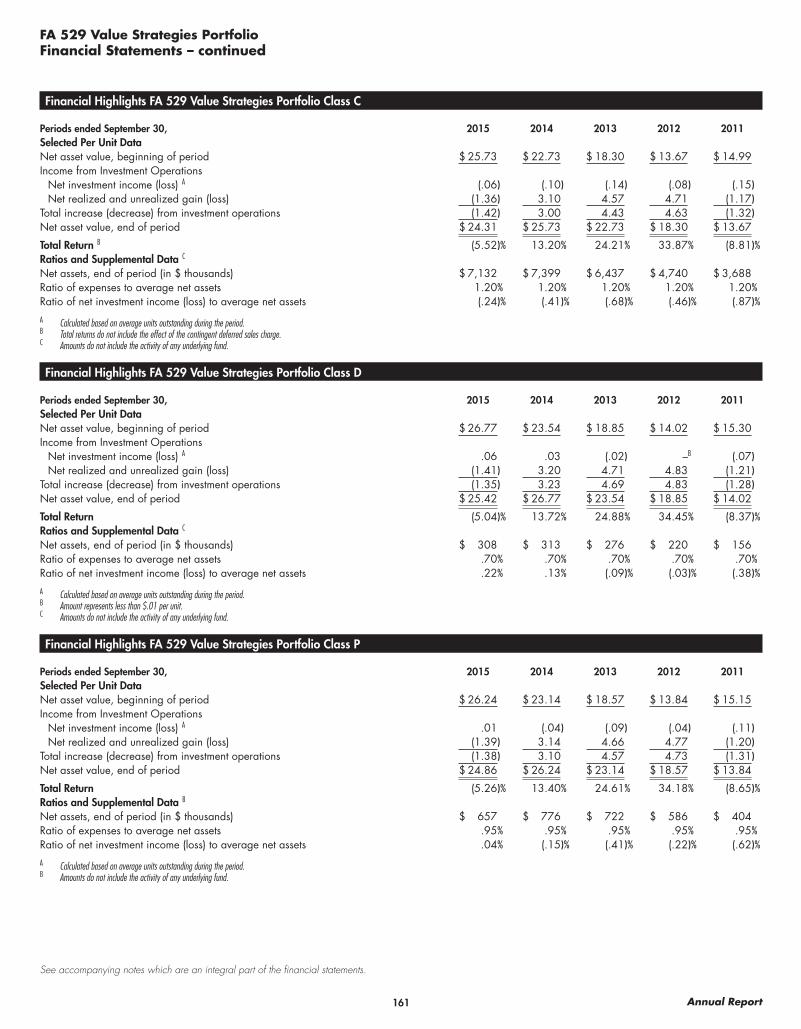
161 Annual Report
See accompanying notes which are an integral part of the financial statements.
FA 529 Value Strategies PortfolioFinancial Statements – continued
Financial Highlights FA 529 Value Strategies Portfolio Class C
Periods ended September 30, 2015 2014 2013 2012 2011Selected Per Unit Data Net asset value, beginning of period $ 25.73 $ 22.73 $ 18.30 $ 13.67 $ 14.99Income from Investment Operations
Net investment income (loss) A (.06) (.10) (.14) (.08) (.15)Net realized and unrealized gain (loss) (1.36) 3.10 4.57 4.71 (1.17)
Total increase (decrease) from investment operations (1.42) 3.00 4.43 4.63 (1.32)Net asset value, end of period $ 24.31 $ 25.73 $ 22.73 $ 18.30 $ 13.67
Total Return B (5.52)% 13.20% 24.21% 33.87% (8.81)%Ratios and Supplemental Data C Net assets, end of period (in $ thousands) $ 7,132 $ 7,399 $ 6,437 $ 4,740 $ 3,688Ratio of expenses to average net assets 1.20% 1.20% 1.20% 1.20% 1.20%Ratio of net investment income (loss) to average net assets (.24)% (.41)% (.68)% (.46)% (.87)%
A Calculated based on average units outstanding during the period.B Total returns do not include the effect of the contingent deferred sales charge.C Amounts do not include the activity of any underlying fund.
Financial Highlights FA 529 Value Strategies Portfolio Class D
Periods ended September 30, 2015 2014 2013 2012 2011Selected Per Unit Data Net asset value, beginning of period $ 26.77 $ 23.54 $ 18.85 $ 14.02 $ 15.30Income from Investment Operations
Net investment income (loss) A .06 .03 (.02) –B (.07)Net realized and unrealized gain (loss) (1.41) 3.20 4.71 4.83 (1.21)
Total increase (decrease) from investment operations (1.35) 3.23 4.69 4.83 (1.28)Net asset value, end of period $ 25.42 $ 26.77 $ 23.54 $ 18.85 $ 14.02
Total Return (5.04)% 13.72% 24.88% 34.45% (8.37)%Ratios and Supplemental Data C Net assets, end of period (in $ thousands) $ 308 $ 313 $ 276 $ 220 $ 156Ratio of expenses to average net assets .70% .70% .70% .70% .70%Ratio of net investment income (loss) to average net assets .22% .13% (.09)% (.03)% (.38)%
A Calculated based on average units outstanding during the period.B Amount represents less than $.01 per unit.C Amounts do not include the activity of any underlying fund.
Financial Highlights FA 529 Value Strategies Portfolio Class P
Periods ended September 30, 2015 2014 2013 2012 2011Selected Per Unit Data Net asset value, beginning of period $ 26.24 $ 23.14 $ 18.57 $ 13.84 $ 15.15Income from Investment Operations
Net investment income (loss) A .01 (.04) (.09) (.04) (.11)Net realized and unrealized gain (loss) (1.39) 3.14 4.66 4.77 (1.20)
Total increase (decrease) from investment operations (1.38) 3.10 4.57 4.73 (1.31)Net asset value, end of period $ 24.86 $ 26.24 $ 23.14 $ 18.57 $ 13.84
Total Return (5.26)% 13.40% 24.61% 34.18% (8.65)%Ratios and Supplemental Data B Net assets, end of period (in $ thousands) $ 657 $ 776 $ 722 $ 586 $ 404Ratio of expenses to average net assets .95% .95% .95% .95% .95%Ratio of net investment income (loss) to average net assets .04% (.15)% (.41)% (.22)% (.62)%
A Calculated based on average units outstanding during the period.B Amounts do not include the activity of any underlying fund.
162Annual Report
Notes to Financial StatementsFor the period ended September 30, 2015
1. Organization:
The New Hampshire Higher Education Savings Plan Trust (Trust) was formed to establish and maintain a qualified tuition program under section 529 of the Internal Revenue Code of 1986, as amended. The Treasurer of the State of New Hampshire (State of New Hampshire) is the Trustee of the Trust.
These financials report on the following Portfolios (Portfolios):
FA 529 College Portfolio FA 529 Global Strategies PortfolioFA 529 Portfolio 2016 FA 529 Growth Opportunities PortfolioFA 529 Portfolio 2019 FA 529 High Income PortfolioFA 529 Portfolio 2022 FA 529 Inflation-Protected Bond PortfolioFA 529 Portfolio 2025 FA 529 Limited Term Bond PortfolioFA 529 Portfolio 2028 FA 529 Money Market PortfolioFA 529 Portfolio 2031 FA 529 New Insights PortfolioFA 529 Portfolio 2034 FA 529 Small Cap PortfolioFA 529 Aggressive Growth Portfolio FA 529 Stock Selector Mid Cap PortfolioFA 529 Moderate Growth Portfolio FA 529 Strategic Dividend & Income PortfolioFA 529 Diversified International Portfolio FA 529 Strategic Income PortfolioFA 529 Dividend Growth Portfolio FA 529 Total Bond PortfolioFA 529 Equity Growth Portfolio FA 529 Value Strategies PortfolioFA 529 Equity Income Portfolio
The Portfolios invest primarily in a combination of other Fidelity equity, fixed-income, and short-term funds, collectively referred to as the Underlying Funds, managed by Fidelity Management & Research Company (FMR). There are individual Fund Portfolios which invest in a single equity, fixed-income, or money market fund, also managed by FMR.
Each Portfolio may offer up to seven classes of units: Class A, Old Class A, Class B, Old Class B, Class C, Class D and Class P Units.
Class P Units are only available through employer sponsored payroll deduction arrangements. Class B Units automatically convert to Class A Units between four and seven years from the date of purchase depending on the Portfolio. Old Class B Units automatically convert to Old Class A Units at the end of six years from the date of purchase. Class B Units may not be purchased in an account once the beneficiary is age 14 or older. Old Class A, Old Class B and Class D Units of the Portfolios are available only for accounts established before June 25, 2003. Investment income, realized and unrealized capital gains and losses and the Portfolio level expenses are allocated on a pro rata basis to each class based on relative net assets of each Class to the total net assets of each Portfolio. Each Class is also subject to Class specific fees. Certain expenses and sales loads differ by class.
FA 529 Portfolio 2034 commenced operations on December 18, 2014.
2. Significant Accounting Policies:
The financial statements have been prepared in conformity with accounting principles generally accepted in the United States of America (GAAP), which require management to make certain estimates and assumptions at the date of the financial statements. Actual results could differ from those estimates. Subsequent events, if any, through the date that the financial statements were issued, December 28, 2015, have been evaluated in the preparation of the financial statements. The Portfolios qualify as investment companies under FASB ASC 946 Financial Services -Investment Companies and follow the accounting and reporting guidance for investment companies. The Portfolios’ Schedules of Investments or Statements of Assets and Liabilities lists each of the Underlying Funds as an investment of each Portfolio but do not include the underlying hold-ings of each Underlying Fund. The following summarizes the significant accounting policies of the Portfolios:
Investment Valuation. Investments are valued as of 4:00 p.m. Eastern time on the last calendar day of the period. Each Portfolio categorizes the inputs to valuation techniques used to value its investments into a disclosure hierarchy consisting of three levels as shown below:
Level 1 – quoted prices in active markets for identical investments
Level 2 – other significant observable inputs
Level 3 – unobservable inputs (including each Portfolio’s own assumptions based on the best information available)
Valuation techniques used to value each Portfolio’s investments by major category are as follows: Investments in the Underlying Funds are valued at their closing net asset value (NAV) each business day and are categorized as Level 1 in the hierarchy. As of September 30, 2015, all investments held by the Portfolios are categorized as Level 1 under the Fair Value Hierarchy.
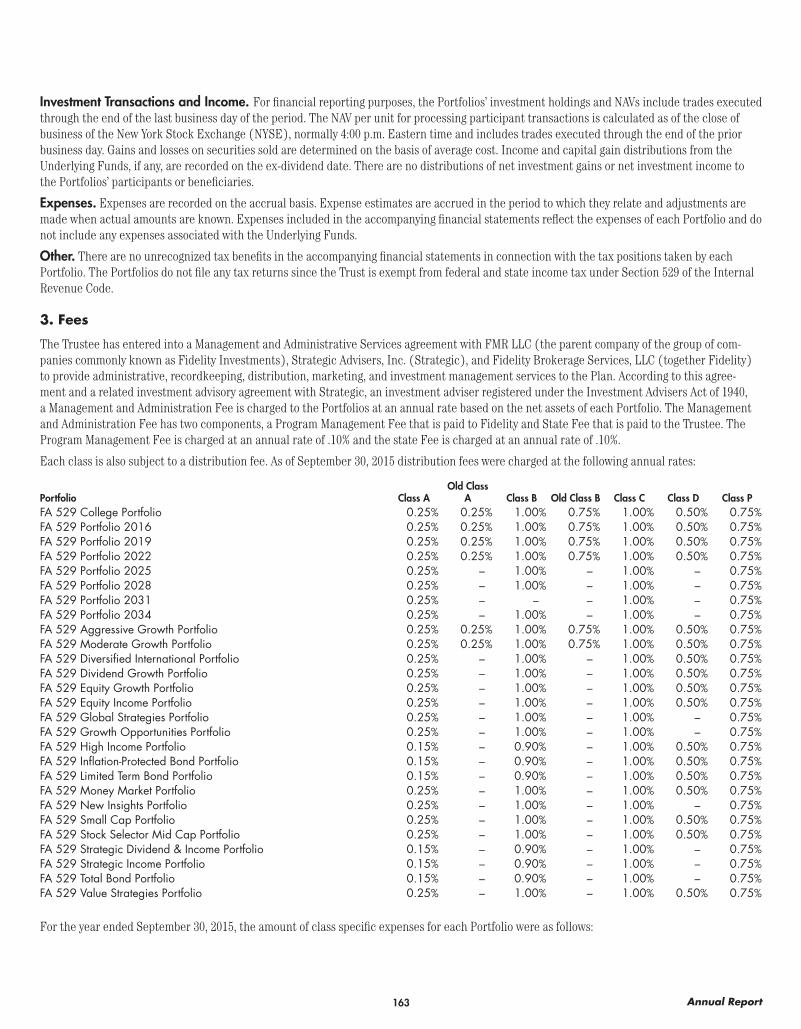
163 Annual Report
Investment Transactions and Income. For financial reporting purposes, the Portfolios’ investment holdings and NAVs include trades executed through the end of the last business day of the period. The NAV per unit for processing participant transactions is calculated as of the close of business of the New York Stock Exchange (NYSE), normally 4:00 p.m. Eastern time and includes trades executed through the end of the prior business day. Gains and losses on securities sold are determined on the basis of average cost. Income and capital gain distributions from the Underlying Funds, if any, are recorded on the ex-dividend date. There are no distributions of net investment gains or net investment income to the Portfolios’ participants or beneficiaries.
Expenses. Expenses are recorded on the accrual basis. Expense estimates are accrued in the period to which they relate and adjustments are made when actual amounts are known. Expenses included in the accompanying financial statements reflect the expenses of each Portfolio and do not include any expenses associated with the Underlying Funds.
Other. There are no unrecognized tax benefits in the accompanying financial statements in connection with the tax positions taken by each Portfolio. The Portfolios do not file any tax returns since the Trust is exempt from federal and state income tax under Section 529 of the Internal Revenue Code.
3. Fees
The Trustee has entered into a Management and Administrative Services agreement with FMR LLC (the parent company of the group of com-panies commonly known as Fidelity Investments), Strategic Advisers, Inc. (Strategic), and Fidelity Brokerage Services, LLC (together Fidelity) to provide administrative, recordkeeping, distribution, marketing, and investment management services to the Plan. According to this agree-ment and a related investment advisory agreement with Strategic, an investment adviser registered under the Investment Advisers Act of 1940, a Management and Administration Fee is charged to the Portfolios at an annual rate based on the net assets of each Portfolio. The Management and Administration Fee has two components, a Program Management Fee that is paid to Fidelity and State Fee that is paid to the Trustee. The Program Management Fee is charged at an annual rate of .10% and the state Fee is charged at an annual rate of .10%.
Each class is also subject to a distribution fee. As of September 30, 2015 distribution fees were charged at the following annual rates:
Portfolio Class AOld Class
A Class B Old Class B Class C Class D Class PFA 529 College Portfolio 0.25% 0.25% 1.00% 0.75% 1.00% 0.50% 0.75%FA 529 Portfolio 2016 0.25% 0.25% 1.00% 0.75% 1.00% 0.50% 0.75%FA 529 Portfolio 2019 0.25% 0.25% 1.00% 0.75% 1.00% 0.50% 0.75%FA 529 Portfolio 2022 0.25% 0.25% 1.00% 0.75% 1.00% 0.50% 0.75%FA 529 Portfolio 2025 0.25% – 1.00% – 1.00% – 0.75%FA 529 Portfolio 2028 0.25% – 1.00% – 1.00% – 0.75%FA 529 Portfolio 2031 0.25% – – – 1.00% – 0.75%FA 529 Portfolio 2034 0.25% – 1.00% – 1.00% – 0.75%FA 529 Aggressive Growth Portfolio 0.25% 0.25% 1.00% 0.75% 1.00% 0.50% 0.75%FA 529 Moderate Growth Portfolio 0.25% 0.25% 1.00% 0.75% 1.00% 0.50% 0.75%FA 529 Diversified International Portfolio 0.25% – 1.00% – 1.00% 0.50% 0.75%FA 529 Dividend Growth Portfolio 0.25% – 1.00% – 1.00% 0.50% 0.75%FA 529 Equity Growth Portfolio 0.25% – 1.00% – 1.00% 0.50% 0.75%FA 529 Equity Income Portfolio 0.25% – 1.00% – 1.00% 0.50% 0.75%FA 529 Global Strategies Portfolio 0.25% – 1.00% – 1.00% – 0.75%FA 529 Growth Opportunities Portfolio 0.25% – 1.00% – 1.00% – 0.75%FA 529 High Income Portfolio 0.15% – 0.90% – 1.00% 0.50% 0.75%FA 529 Inflation-Protected Bond Portfolio 0.15% – 0.90% – 1.00% 0.50% 0.75%FA 529 Limited Term Bond Portfolio 0.15% – 0.90% – 1.00% 0.50% 0.75%FA 529 Money Market Portfolio 0.25% – 1.00% – 1.00% 0.50% 0.75%FA 529 New Insights Portfolio 0.25% – 1.00% – 1.00% – 0.75%FA 529 Small Cap Portfolio 0.25% – 1.00% – 1.00% 0.50% 0.75%FA 529 Stock Selector Mid Cap Portfolio 0.25% – 1.00% – 1.00% 0.50% 0.75%FA 529 Strategic Dividend & Income Portfolio 0.15% – 0.90% – 1.00% – 0.75%FA 529 Strategic Income Portfolio 0.15% – 0.90% – 1.00% – 0.75%FA 529 Total Bond Portfolio 0.15% – 0.90% – 1.00% – 0.75%FA 529 Value Strategies Portfolio 0.25% – 1.00% – 1.00% 0.50% 0.75%
For the year ended September 30, 2015, the amount of class specific expenses for each Portfolio were as follows:
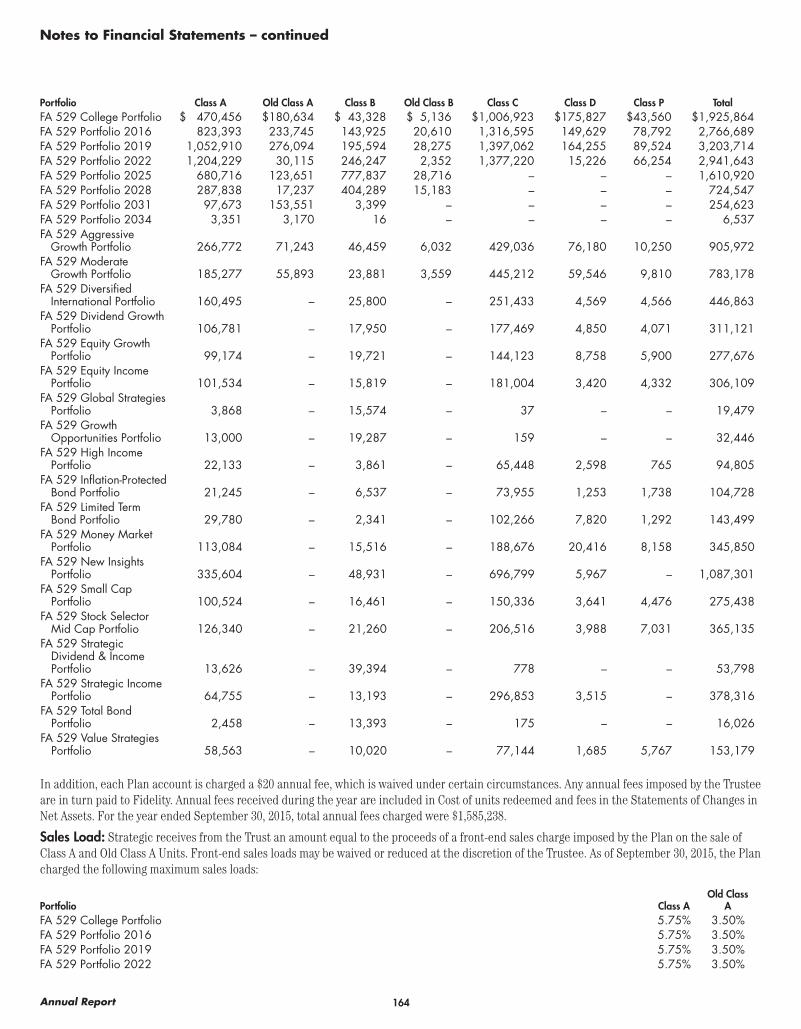
164Annual Report
Notes to Financial Statements – continued
Portfolio Class A Old Class A Class B Old Class B Class C Class D Class P TotalFA 529 College Portfolio $ 470,456 $ 180,634 $ 43,328 $ 5,136 $ 1,006,923 $ 175,827 $ 43,560 $ 1,925,864FA 529 Portfolio 2016 823,393 233,745 143,925 20,610 1,316,595 149,629 78,792 2,766,689FA 529 Portfolio 2019 1,052,910 276,094 195,594 28,275 1,397,062 164,255 89,524 3,203,714FA 529 Portfolio 2022 1,204,229 30,115 246,247 2,352 1,377,220 15,226 66,254 2,941,643FA 529 Portfolio 2025 680,716 123,651 777,837 28,716 – – – 1,610,920FA 529 Portfolio 2028 287,838 17,237 404,289 15,183 – – – 724,547FA 529 Portfolio 2031 97,673 153,551 3,399 – – – – 254,623FA 529 Portfolio 2034 3,351 3,170 16 – – – – 6,537FA 529 Aggressive
Growth Portfolio 266,772 71,243 46,459 6,032 429,036 76,180 10,250 905,972FA 529 Moderate
Growth Portfolio 185,277 55,893 23,881 3,559 445,212 59,546 9,810 783,178FA 529 Diversified
International Portfolio 160,495 – 25,800 – 251,433 4,569 4,566 446,863FA 529 Dividend Growth
Portfolio 106,781 – 17,950 – 177,469 4,850 4,071 311,121FA 529 Equity Growth
Portfolio 99,174 – 19,721 – 144,123 8,758 5,900 277,676FA 529 Equity Income
Portfolio 101,534 – 15,819 – 181,004 3,420 4,332 306,109FA 529 Global Strategies
Portfolio 3,868 – 15,574 – 37 – – 19,479FA 529 Growth
Opportunities Portfolio 13,000 – 19,287 – 159 – – 32,446FA 529 High Income
Portfolio 22,133 – 3,861 – 65,448 2,598 765 94,805FA 529 Inflation-Protected
Bond Portfolio 21,245 – 6,537 – 73,955 1,253 1,738 104,728FA 529 Limited Term
Bond Portfolio 29,780 – 2,341 – 102,266 7,820 1,292 143,499FA 529 Money Market
Portfolio 113,084 – 15,516 – 188,676 20,416 8,158 345,850FA 529 New Insights
Portfolio 335,604 – 48,931 – 696,799 5,967 – 1,087,301FA 529 Small Cap
Portfolio 100,524 – 16,461 – 150,336 3,641 4,476 275,438FA 529 Stock Selector
Mid Cap Portfolio 126,340 – 21,260 – 206,516 3,988 7,031 365,135FA 529 Strategic
Dividend & Income Portfolio 13,626 – 39,394 – 778 – – 53,798
FA 529 Strategic Income Portfolio 64,755 – 13,193 – 296,853 3,515 – 378,316
FA 529 Total Bond Portfolio 2,458 – 13,393 – 175 – – 16,026
FA 529 Value Strategies Portfolio 58,563 – 10,020 – 77,144 1,685 5,767 153,179
In addition, each Plan account is charged a $20 annual fee, which is waived under certain circumstances. Any annual fees imposed by the Trustee are in turn paid to Fidelity. Annual fees received during the year are included in Cost of units redeemed and fees in the Statements of Changes in Net Assets. For the year ended September 30, 2015, total annual fees charged were $1,585,238.
Sales Load: Strategic receives from the Trust an amount equal to the proceeds of a front-end sales charge imposed by the Plan on the sale of Class A and Old Class A Units. Front-end sales loads may be waived or reduced at the discretion of the Trustee. As of September 30, 2015, the Plan charged the following maximum sales loads:
Portfolio Class AOld Class
AFA 529 College Portfolio 5.75% 3.50%FA 529 Portfolio 2016 5.75% 3.50%FA 529 Portfolio 2019 5.75% 3.50%FA 529 Portfolio 2022 5.75% 3.50%
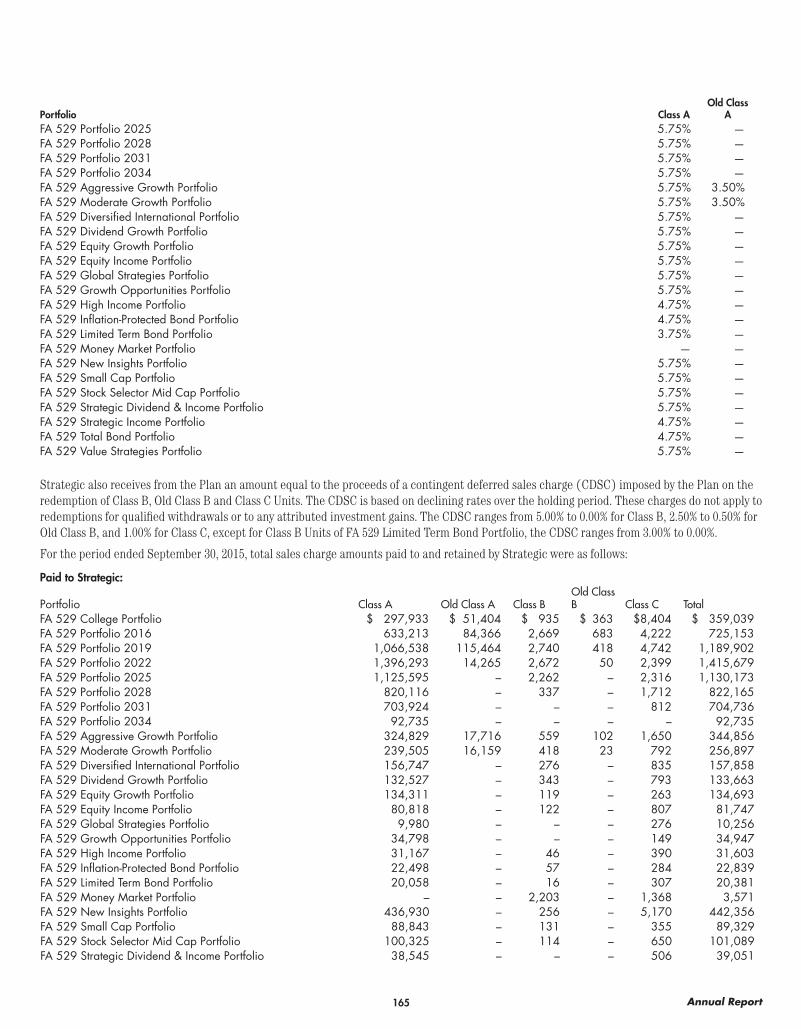
165 Annual Report
Portfolio Class AOld Class
AFA 529 Portfolio 2025 5.75% —FA 529 Portfolio 2028 5.75% —FA 529 Portfolio 2031 5.75% —FA 529 Portfolio 2034 5.75% —FA 529 Aggressive Growth Portfolio 5.75% 3.50%FA 529 Moderate Growth Portfolio 5.75% 3.50%FA 529 Diversified International Portfolio 5.75% —FA 529 Dividend Growth Portfolio 5.75% —FA 529 Equity Growth Portfolio 5.75% —FA 529 Equity Income Portfolio 5.75% —FA 529 Global Strategies Portfolio 5.75% —FA 529 Growth Opportunities Portfolio 5.75% —FA 529 High Income Portfolio 4.75% —FA 529 Inflation-Protected Bond Portfolio 4.75% —FA 529 Limited Term Bond Portfolio 3.75% —FA 529 Money Market Portfolio — —FA 529 New Insights Portfolio 5.75% —FA 529 Small Cap Portfolio 5.75% —FA 529 Stock Selector Mid Cap Portfolio 5.75% —FA 529 Strategic Dividend & Income Portfolio 5.75% —FA 529 Strategic Income Portfolio 4.75% —FA 529 Total Bond Portfolio 4.75% —FA 529 Value Strategies Portfolio 5.75% —
Strategic also receives from the Plan an amount equal to the proceeds of a contingent deferred sales charge (CDSC) imposed by the Plan on the redemption of Class B, Old Class B and Class C Units. The CDSC is based on declining rates over the holding period. These charges do not apply to redemptions for qualified withdrawals or to any attributed investment gains. The CDSC ranges from 5.00% to 0.00% for Class B, 2.50% to 0.50% for Old Class B, and 1.00% for Class C, except for Class B Units of FA 529 Limited Term Bond Portfolio, the CDSC ranges from 3.00% to 0.00%.
For the period ended September 30, 2015, total sales charge amounts paid to and retained by Strategic were as follows:
Paid to Strategic:
Portfolio Class A Old Class A Class BOld Class B Class C Total
FA 529 College Portfolio $ 297,933 $ 51,404 $ 935 $ 363 $ 8,404 $ 359,039FA 529 Portfolio 2016 633,213 84,366 2,669 683 4,222 725,153FA 529 Portfolio 2019 1,066,538 115,464 2,740 418 4,742 1,189,902FA 529 Portfolio 2022 1,396,293 14,265 2,672 50 2,399 1,415,679FA 529 Portfolio 2025 1,125,595 – 2,262 – 2,316 1,130,173FA 529 Portfolio 2028 820,116 – 337 – 1,712 822,165FA 529 Portfolio 2031 703,924 – – – 812 704,736FA 529 Portfolio 2034 92,735 – – – – 92,735FA 529 Aggressive Growth Portfolio 324,829 17,716 559 102 1,650 344,856FA 529 Moderate Growth Portfolio 239,505 16,159 418 23 792 256,897FA 529 Diversified International Portfolio 156,747 – 276 – 835 157,858FA 529 Dividend Growth Portfolio 132,527 – 343 – 793 133,663FA 529 Equity Growth Portfolio 134,311 – 119 – 263 134,693FA 529 Equity Income Portfolio 80,818 – 122 – 807 81,747FA 529 Global Strategies Portfolio 9,980 – – – 276 10,256FA 529 Growth Opportunities Portfolio 34,798 – – – 149 34,947FA 529 High Income Portfolio 31,167 – 46 – 390 31,603FA 529 Inflation-Protected Bond Portfolio 22,498 – 57 – 284 22,839FA 529 Limited Term Bond Portfolio 20,058 – 16 – 307 20,381FA 529 Money Market Portfolio – – 2,203 – 1,368 3,571FA 529 New Insights Portfolio 436,930 – 256 – 5,170 442,356FA 529 Small Cap Portfolio 88,843 – 131 – 355 89,329FA 529 Stock Selector Mid Cap Portfolio 100,325 – 114 – 650 101,089FA 529 Strategic Dividend & Income Portfolio 38,545 – – – 506 39,051
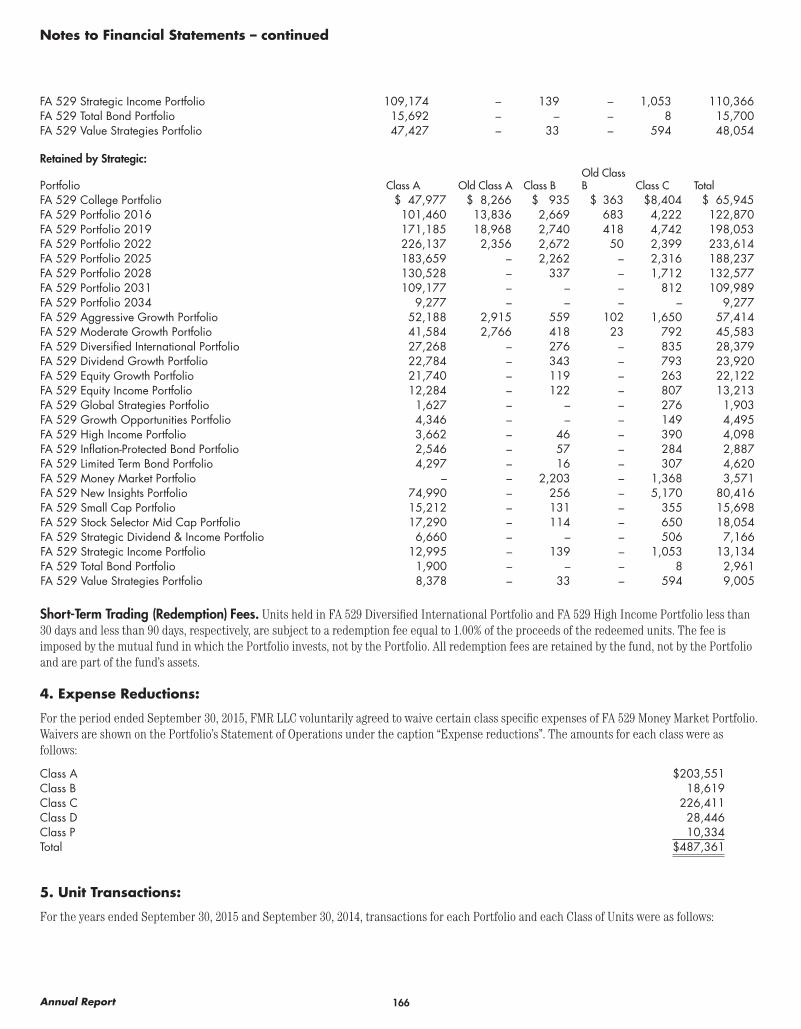
166Annual Report
Notes to Financial Statements – continued
FA 529 Strategic Income Portfolio 109,174 – 139 – 1,053 110,366FA 529 Total Bond Portfolio 15,692 – – – 8 15,700FA 529 Value Strategies Portfolio 47,427 – 33 – 594 48,054
Retained by Strategic:
Portfolio Class A Old Class A Class BOld Class B Class C Total
FA 529 College Portfolio $ 47,977 $ 8,266 $ 935 $ 363 $ 8,404 $ 65,945FA 529 Portfolio 2016 101,460 13,836 2,669 683 4,222 122,870FA 529 Portfolio 2019 171,185 18,968 2,740 418 4,742 198,053FA 529 Portfolio 2022 226,137 2,356 2,672 50 2,399 233,614FA 529 Portfolio 2025 183,659 – 2,262 – 2,316 188,237FA 529 Portfolio 2028 130,528 – 337 – 1,712 132,577FA 529 Portfolio 2031 109,177 – – – 812 109,989FA 529 Portfolio 2034 9,277 – – – – 9,277FA 529 Aggressive Growth Portfolio 52,188 2,915 559 102 1,650 57,414FA 529 Moderate Growth Portfolio 41,584 2,766 418 23 792 45,583FA 529 Diversified International Portfolio 27,268 – 276 – 835 28,379FA 529 Dividend Growth Portfolio 22,784 – 343 – 793 23,920FA 529 Equity Growth Portfolio 21,740 – 119 – 263 22,122FA 529 Equity Income Portfolio 12,284 – 122 – 807 13,213FA 529 Global Strategies Portfolio 1,627 – – – 276 1,903FA 529 Growth Opportunities Portfolio 4,346 – – – 149 4,495FA 529 High Income Portfolio 3,662 – 46 – 390 4,098FA 529 Inflation-Protected Bond Portfolio 2,546 – 57 – 284 2,887FA 529 Limited Term Bond Portfolio 4,297 – 16 – 307 4,620FA 529 Money Market Portfolio – – 2,203 – 1,368 3,571FA 529 New Insights Portfolio 74,990 – 256 – 5,170 80,416FA 529 Small Cap Portfolio 15,212 – 131 – 355 15,698FA 529 Stock Selector Mid Cap Portfolio 17,290 – 114 – 650 18,054FA 529 Strategic Dividend & Income Portfolio 6,660 – – – 506 7,166FA 529 Strategic Income Portfolio 12,995 – 139 – 1,053 13,134FA 529 Total Bond Portfolio 1,900 – – – 8 2,961FA 529 Value Strategies Portfolio 8,378 – 33 – 594 9,005
Short-Term Trading (Redemption) Fees. Units held in FA 529 Diversified International Portfolio and FA 529 High Income Portfolio less than 30 days and less than 90 days, respectively, are subject to a redemption fee equal to 1.00% of the proceeds of the redeemed units. The fee is imposed by the mutual fund in which the Portfolio invests, not by the Portfolio. All redemption fees are retained by the fund, not by the Portfolio and are part of the fund’s assets.
4. Expense Reductions:
For the period ended September 30, 2015, FMR LLC voluntarily agreed to waive certain class specific expenses of FA 529 Money Market Portfolio. Waivers are shown on the Portfolio’s Statement of Operations under the caption “Expense reductions”. The amounts for each class were as follows:
Class A $ 203,551Class B 18,619Class C 226,411Class D 28,446Class P 10,334Total $ 487,361
5. Unit Transactions:
For the years ended September 30, 2015 and September 30, 2014, transactions for each Portfolio and each Class of Units were as follows:
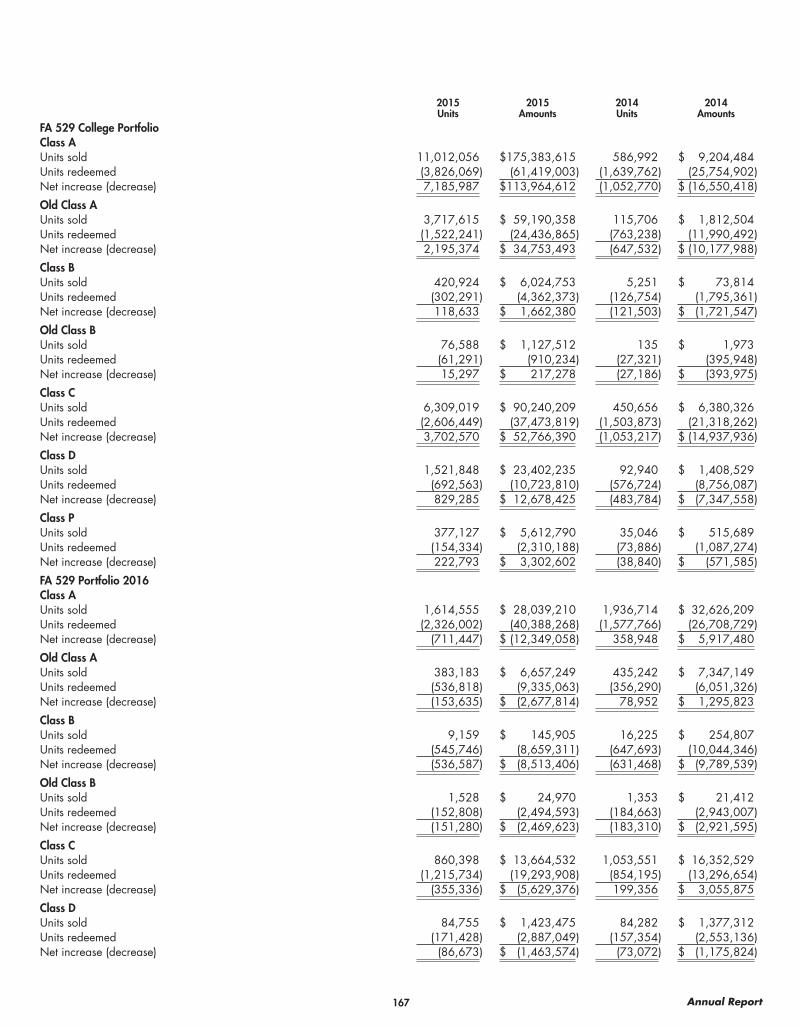
167 Annual Report
2015 2015 2014 2014Units Amounts Units Amounts
FA 529 College PortfolioClass AUnits sold 11,012,056 $ 175,383,615 586,992 $ 9,204,484Units redeemed (3,826,069) (61,419,003) (1,639,762) (25,754,902)Net increase (decrease) 7,185,987 $ 113,964,612 (1,052,770) $ (16,550,418)
Old Class AUnits sold 3,717,615 $ 59,190,358 115,706 $ 1,812,504Units redeemed (1,522,241) (24,436,865) (763,238) (11,990,492)Net increase (decrease) 2,195,374 $ 34,753,493 (647,532) $ (10,177,988)
Class BUnits sold 420,924 $ 6,024,753 5,251 $ 73,814Units redeemed (302,291) (4,362,373) (126,754) (1,795,361)Net increase (decrease) 118,633 $ 1,662,380 (121,503) $ (1,721,547)
Old Class BUnits sold 76,588 $ 1,127,512 135 $ 1,973Units redeemed (61,291) (910,234) (27,321) (395,948)Net increase (decrease) 15,297 $ 217,278 (27,186) $ (393,975)
Class CUnits sold 6,309,019 $ 90,240,209 450,656 $ 6,380,326Units redeemed (2,606,449) (37,473,819) (1,503,873) (21,318,262)Net increase (decrease) 3,702,570 $ 52,766,390 (1,053,217) $ (14,937,936)
Class DUnits sold 1,521,848 $ 23,402,235 92,940 $ 1,408,529Units redeemed (692,563) (10,723,810) (576,724) (8,756,087)Net increase (decrease) 829,285 $ 12,678,425 (483,784) $ (7,347,558)
Class PUnits sold 377,127 $ 5,612,790 35,046 $ 515,689Units redeemed (154,334) (2,310,188) (73,886) (1,087,274)Net increase (decrease) 222,793 $ 3,302,602 (38,840) $ (571,585)
FA 529 Portfolio 2016Class AUnits sold 1,614,555 $ 28,039,210 1,936,714 $ 32,626,209Units redeemed (2,326,002) (40,388,268) (1,577,766) (26,708,729)Net increase (decrease) (711,447) $ (12,349,058) 358,948 $ 5,917,480
Old Class AUnits sold 383,183 $ 6,657,249 435,242 $ 7,347,149Units redeemed (536,818) (9,335,063) (356,290) (6,051,326)Net increase (decrease) (153,635) $ (2,677,814) 78,952 $ 1,295,823
Class BUnits sold 9,159 $ 145,905 16,225 $ 254,807Units redeemed (545,746) (8,659,311) (647,693) (10,044,346)Net increase (decrease) (536,587) $ (8,513,406) (631,468) $ (9,789,539)
Old Class BUnits sold 1,528 $ 24,970 1,353 $ 21,412Units redeemed (152,808) (2,494,593) (184,663) (2,943,007)Net increase (decrease) (151,280) $ (2,469,623) (183,310) $ (2,921,595)
Class CUnits sold 860,398 $ 13,664,532 1,053,551 $ 16,352,529Units redeemed (1,215,734) (19,293,908) (854,195) (13,296,654)Net increase (decrease) (355,336) $ (5,629,376) 199,356 $ 3,055,875
Class DUnits sold 84,755 $ 1,423,475 84,282 $ 1,377,312Units redeemed (171,428) (2,887,049) (157,354) (2,553,136)Net increase (decrease) (86,673) $ (1,463,574) (73,072) $ (1,175,824)
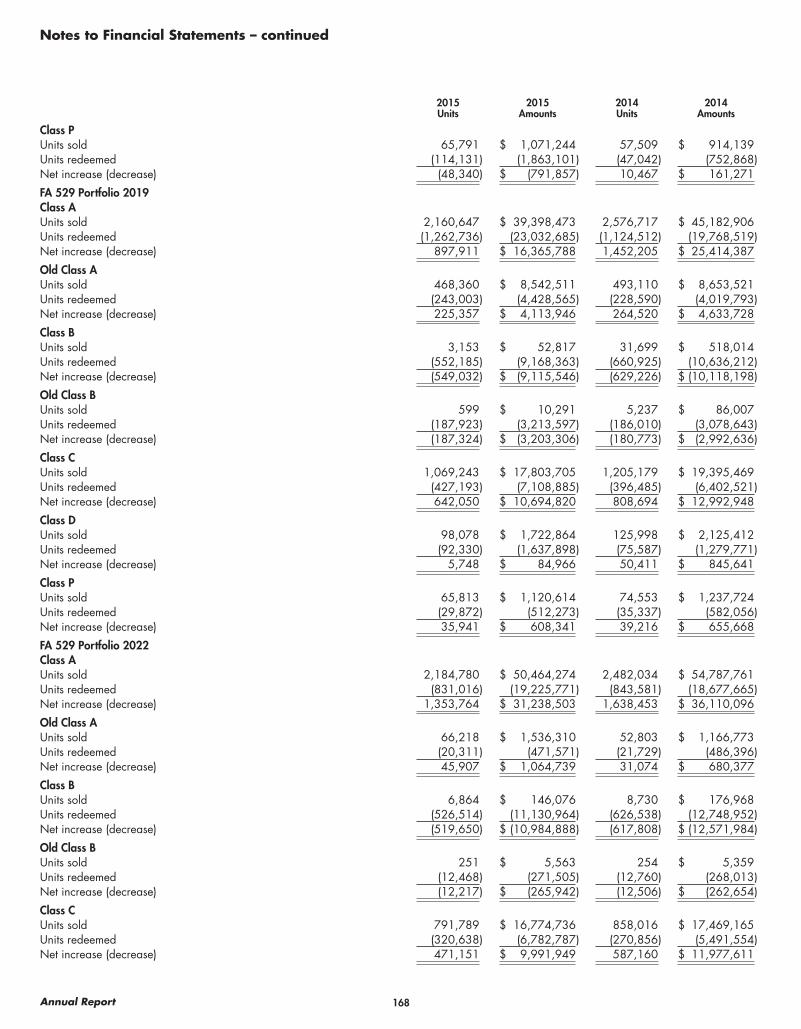
168Annual Report
Notes to Financial Statements – continued
2015 2015 2014 2014Units Amounts Units Amounts
Class PUnits sold 65,791 $ 1,071,244 57,509 $ 914,139Units redeemed (114,131) (1,863,101) (47,042) (752,868)Net increase (decrease) (48,340) $ (791,857) 10,467 $ 161,271
FA 529 Portfolio 2019Class AUnits sold 2,160,647 $ 39,398,473 2,576,717 $ 45,182,906Units redeemed (1,262,736) (23,032,685) (1,124,512) (19,768,519)Net increase (decrease) 897,911 $ 16,365,788 1,452,205 $ 25,414,387
Old Class AUnits sold 468,360 $ 8,542,511 493,110 $ 8,653,521Units redeemed (243,003) (4,428,565) (228,590) (4,019,793)Net increase (decrease) 225,357 $ 4,113,946 264,520 $ 4,633,728
Class BUnits sold 3,153 $ 52,817 31,699 $ 518,014Units redeemed (552,185) (9,168,363) (660,925) (10,636,212)Net increase (decrease) (549,032) $ (9,115,546) (629,226) $ (10,118,198)
Old Class BUnits sold 599 $ 10,291 5,237 $ 86,007Units redeemed (187,923) (3,213,597) (186,010) (3,078,643)Net increase (decrease) (187,324) $ (3,203,306) (180,773) $ (2,992,636)
Class CUnits sold 1,069,243 $ 17,803,705 1,205,179 $ 19,395,469Units redeemed (427,193) (7,108,885) (396,485) (6,402,521)Net increase (decrease) 642,050 $ 10,694,820 808,694 $ 12,992,948
Class DUnits sold 98,078 $ 1,722,864 125,998 $ 2,125,412Units redeemed (92,330) (1,637,898) (75,587) (1,279,771)Net increase (decrease) 5,748 $ 84,966 50,411 $ 845,641
Class PUnits sold 65,813 $ 1,120,614 74,553 $ 1,237,724Units redeemed (29,872) (512,273) (35,337) (582,056)Net increase (decrease) 35,941 $ 608,341 39,216 $ 655,668
FA 529 Portfolio 2022Class AUnits sold 2,184,780 $ 50,464,274 2,482,034 $ 54,787,761Units redeemed (831,016) (19,225,771) (843,581) (18,677,665)Net increase (decrease) 1,353,764 $ 31,238,503 1,638,453 $ 36,110,096
Old Class AUnits sold 66,218 $ 1,536,310 52,803 $ 1,166,773Units redeemed (20,311) (471,571) (21,729) (486,396)Net increase (decrease) 45,907 $ 1,064,739 31,074 $ 680,377
Class BUnits sold 6,864 $ 146,076 8,730 $ 176,968Units redeemed (526,514) (11,130,964) (626,538) (12,748,952)Net increase (decrease) (519,650) $ (10,984,888) (617,808) $ (12,571,984)
Old Class BUnits sold 251 $ 5,563 254 $ 5,359Units redeemed (12,468) (271,505) (12,760) (268,013)Net increase (decrease) (12,217) $ (265,942) (12,506) $ (262,654)
Class CUnits sold 791,789 $ 16,774,736 858,016 $ 17,469,165Units redeemed (320,638) (6,782,787) (270,856) (5,491,554)Net increase (decrease) 471,151 $ 9,991,949 587,160 $ 11,977,611
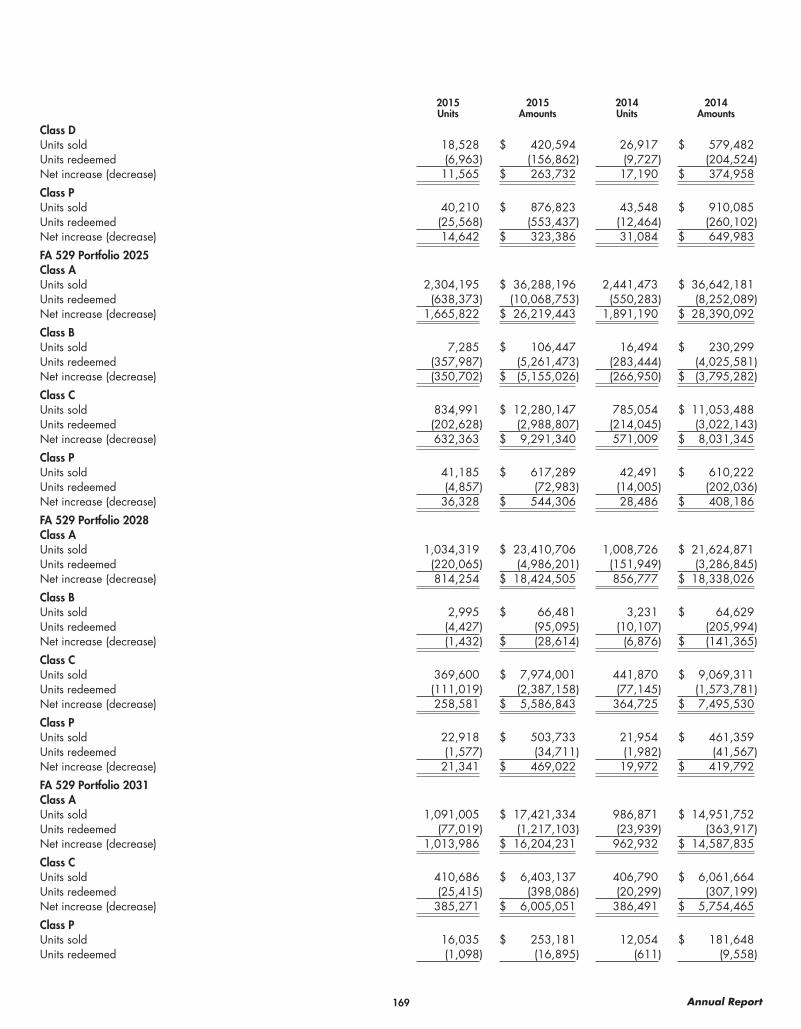
169 Annual Report
2015 2015 2014 2014Units Amounts Units Amounts
Class DUnits sold 18,528 $ 420,594 26,917 $ 579,482Units redeemed (6,963) (156,862) (9,727) (204,524)Net increase (decrease) 11,565 $ 263,732 17,190 $ 374,958
Class PUnits sold 40,210 $ 876,823 43,548 $ 910,085Units redeemed (25,568) (553,437) (12,464) (260,102)Net increase (decrease) 14,642 $ 323,386 31,084 $ 649,983
FA 529 Portfolio 2025Class AUnits sold 2,304,195 $ 36,288,196 2,441,473 $ 36,642,181Units redeemed (638,373) (10,068,753) (550,283) (8,252,089)Net increase (decrease) 1,665,822 $ 26,219,443 1,891,190 $ 28,390,092
Class BUnits sold 7,285 $ 106,447 16,494 $ 230,299Units redeemed (357,987) (5,261,473) (283,444) (4,025,581)Net increase (decrease) (350,702) $ (5,155,026) (266,950) $ (3,795,282)
Class CUnits sold 834,991 $ 12,280,147 785,054 $ 11,053,488Units redeemed (202,628) (2,988,807) (214,045) (3,022,143)Net increase (decrease) 632,363 $ 9,291,340 571,009 $ 8,031,345
Class PUnits sold 41,185 $ 617,289 42,491 $ 610,222Units redeemed (4,857) (72,983) (14,005) (202,036)Net increase (decrease) 36,328 $ 544,306 28,486 $ 408,186
FA 529 Portfolio 2028Class AUnits sold 1,034,319 $ 23,410,706 1,008,726 $ 21,624,871Units redeemed (220,065) (4,986,201) (151,949) (3,286,845)Net increase (decrease) 814,254 $ 18,424,505 856,777 $ 18,338,026
Class BUnits sold 2,995 $ 66,481 3,231 $ 64,629Units redeemed (4,427) (95,095) (10,107) (205,994)Net increase (decrease) (1,432) $ (28,614) (6,876) $ (141,365)
Class CUnits sold 369,600 $ 7,974,001 441,870 $ 9,069,311Units redeemed (111,019) (2,387,158) (77,145) (1,573,781)Net increase (decrease) 258,581 $ 5,586,843 364,725 $ 7,495,530
Class PUnits sold 22,918 $ 503,733 21,954 $ 461,359Units redeemed (1,577) (34,711) (1,982) (41,567)Net increase (decrease) 21,341 $ 469,022 19,972 $ 419,792
FA 529 Portfolio 2031Class AUnits sold 1,091,005 $ 17,421,334 986,871 $ 14,951,752Units redeemed (77,019) (1,217,103) (23,939) (363,917)Net increase (decrease) 1,013,986 $ 16,204,231 962,932 $ 14,587,835
Class CUnits sold 410,686 $ 6,403,137 406,790 $ 6,061,664Units redeemed (25,415) (398,086) (20,299) (307,199)Net increase (decrease) 385,271 $ 6,005,051 386,491 $ 5,754,465
Class PUnits sold 16,035 $ 253,181 12,054 $ 181,648Units redeemed (1,098) (16,895) (611) (9,558)
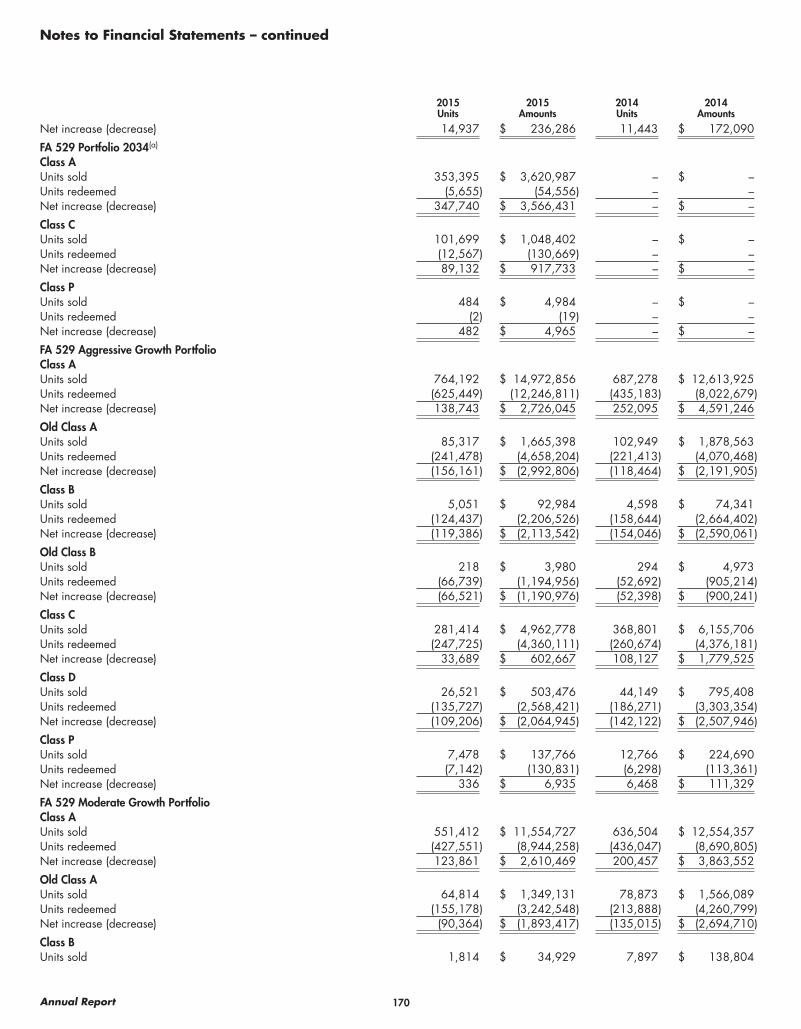
170Annual Report
Notes to Financial Statements – continued
2015 2015 2014 2014Units Amounts Units Amounts
Net increase (decrease) 14,937 $ 236,286 11,443 $ 172,090
FA 529 Portfolio 2034(a)
Class AUnits sold 353,395 $ 3,620,987 – $ –Units redeemed (5,655) (54,556) – –Net increase (decrease) 347,740 $ 3,566,431 – $ –
Class CUnits sold 101,699 $ 1,048,402 – $ –Units redeemed (12,567) (130,669) – –Net increase (decrease) 89,132 $ 917,733 – $ –
Class PUnits sold 484 $ 4,984 – $ –Units redeemed (2) (19) – –Net increase (decrease) 482 $ 4,965 – $ –
FA 529 Aggressive Growth PortfolioClass AUnits sold 764,192 $ 14,972,856 687,278 $ 12,613,925Units redeemed (625,449) (12,246,811) (435,183) (8,022,679)Net increase (decrease) 138,743 $ 2,726,045 252,095 $ 4,591,246
Old Class AUnits sold 85,317 $ 1,665,398 102,949 $ 1,878,563Units redeemed (241,478) (4,658,204) (221,413) (4,070,468)Net increase (decrease) (156,161) $ (2,992,806) (118,464) $ (2,191,905)
Class BUnits sold 5,051 $ 92,984 4,598 $ 74,341Units redeemed (124,437) (2,206,526) (158,644) (2,664,402)Net increase (decrease) (119,386) $ (2,113,542) (154,046) $ (2,590,061)
Old Class BUnits sold 218 $ 3,980 294 $ 4,973Units redeemed (66,739) (1,194,956) (52,692) (905,214)Net increase (decrease) (66,521) $ (1,190,976) (52,398) $ (900,241)
Class CUnits sold 281,414 $ 4,962,778 368,801 $ 6,155,706Units redeemed (247,725) (4,360,111) (260,674) (4,376,181)Net increase (decrease) 33,689 $ 602,667 108,127 $ 1,779,525
Class DUnits sold 26,521 $ 503,476 44,149 $ 795,408Units redeemed (135,727) (2,568,421) (186,271) (3,303,354)Net increase (decrease) (109,206) $ (2,064,945) (142,122) $ (2,507,946)
Class PUnits sold 7,478 $ 137,766 12,766 $ 224,690Units redeemed (7,142) (130,831) (6,298) (113,361)Net increase (decrease) 336 $ 6,935 6,468 $ 111,329
FA 529 Moderate Growth PortfolioClass AUnits sold 551,412 $ 11,554,727 636,504 $ 12,554,357Units redeemed (427,551) (8,944,258) (436,047) (8,690,805)Net increase (decrease) 123,861 $ 2,610,469 200,457 $ 3,863,552
Old Class AUnits sold 64,814 $ 1,349,131 78,873 $ 1,566,089Units redeemed (155,178) (3,242,548) (213,888) (4,260,799)Net increase (decrease) (90,364) $ (1,893,417) (135,015) $ (2,694,710)
Class BUnits sold 1,814 $ 34,929 7,897 $ 138,804
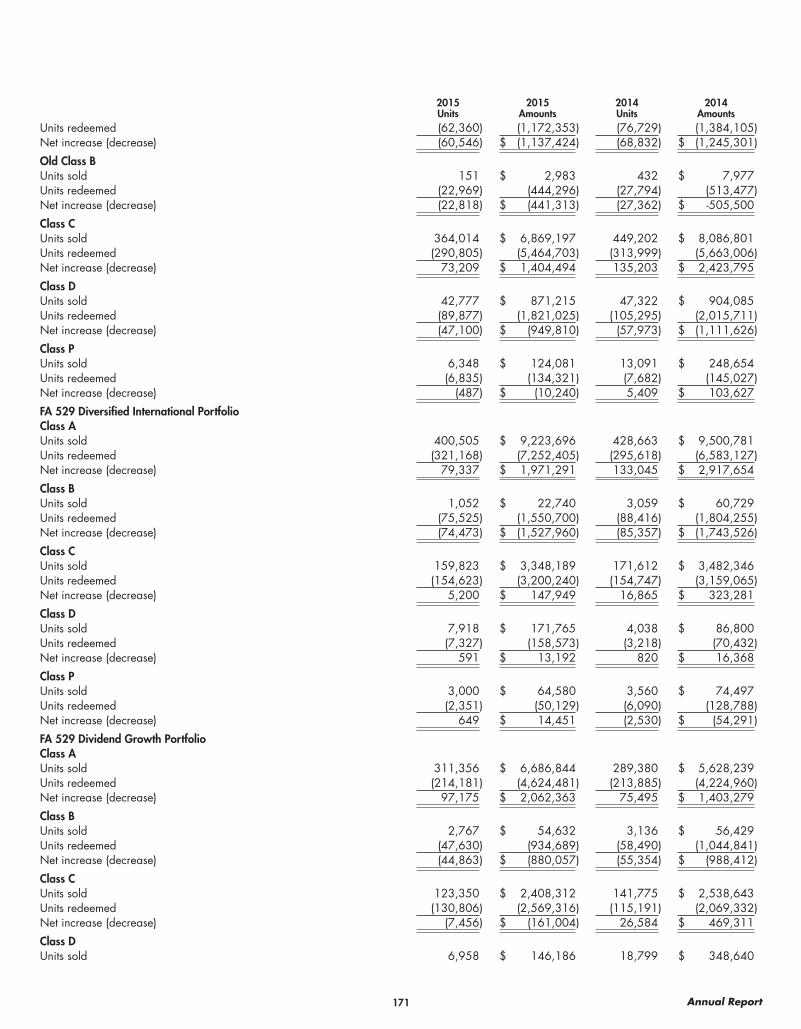
171 Annual Report
2015 2015 2014 2014Units Amounts Units Amounts
Units redeemed (62,360) (1,172,353) (76,729) (1,384,105)Net increase (decrease) (60,546) $ (1,137,424) (68,832) $ (1,245,301)
Old Class BUnits sold 151 $ 2,983 432 $ 7,977Units redeemed (22,969) (444,296) (27,794) (513,477)Net increase (decrease) (22,818) $ (441,313) (27,362) $ -505,500
Class CUnits sold 364,014 $ 6,869,197 449,202 $ 8,086,801Units redeemed (290,805) (5,464,703) (313,999) (5,663,006)Net increase (decrease) 73,209 $ 1,404,494 135,203 $ 2,423,795
Class DUnits sold 42,777 $ 871,215 47,322 $ 904,085Units redeemed (89,877) (1,821,025) (105,295) (2,015,711)Net increase (decrease) (47,100) $ (949,810) (57,973) $ (1,111,626)
Class PUnits sold 6,348 $ 124,081 13,091 $ 248,654Units redeemed (6,835) (134,321) (7,682) (145,027)Net increase (decrease) (487) $ (10,240) 5,409 $ 103,627
FA 529 Diversified International PortfolioClass AUnits sold 400,505 $ 9,223,696 428,663 $ 9,500,781Units redeemed (321,168) (7,252,405) (295,618) (6,583,127)Net increase (decrease) 79,337 $ 1,971,291 133,045 $ 2,917,654
Class BUnits sold 1,052 $ 22,740 3,059 $ 60,729Units redeemed (75,525) (1,550,700) (88,416) (1,804,255)Net increase (decrease) (74,473) $ (1,527,960) (85,357) $ (1,743,526)
Class CUnits sold 159,823 $ 3,348,189 171,612 $ 3,482,346Units redeemed (154,623) (3,200,240) (154,747) (3,159,065)Net increase (decrease) 5,200 $ 147,949 16,865 $ 323,281
Class DUnits sold 7,918 $ 171,765 4,038 $ 86,800Units redeemed (7,327) (158,573) (3,218) (70,432)Net increase (decrease) 591 $ 13,192 820 $ 16,368
Class PUnits sold 3,000 $ 64,580 3,560 $ 74,497Units redeemed (2,351) (50,129) (6,090) (128,788)Net increase (decrease) 649 $ 14,451 (2,530) $ (54,291)
FA 529 Dividend Growth PortfolioClass AUnits sold 311,356 $ 6,686,844 289,380 $ 5,628,239Units redeemed (214,181) (4,624,481) (213,885) (4,224,960)Net increase (decrease) 97,175 $ 2,062,363 75,495 $ 1,403,279
Class BUnits sold 2,767 $ 54,632 3,136 $ 56,429Units redeemed (47,630) (934,689) (58,490) (1,044,841)Net increase (decrease) (44,863) $ (880,057) (55,354) $ (988,412)
Class CUnits sold 123,350 $ 2,408,312 141,775 $ 2,538,643Units redeemed (130,806) (2,569,316) (115,191) (2,069,332)Net increase (decrease) (7,456) $ (161,004) 26,584 $ 469,311
Class DUnits sold 6,958 $ 146,186 18,799 $ 348,640
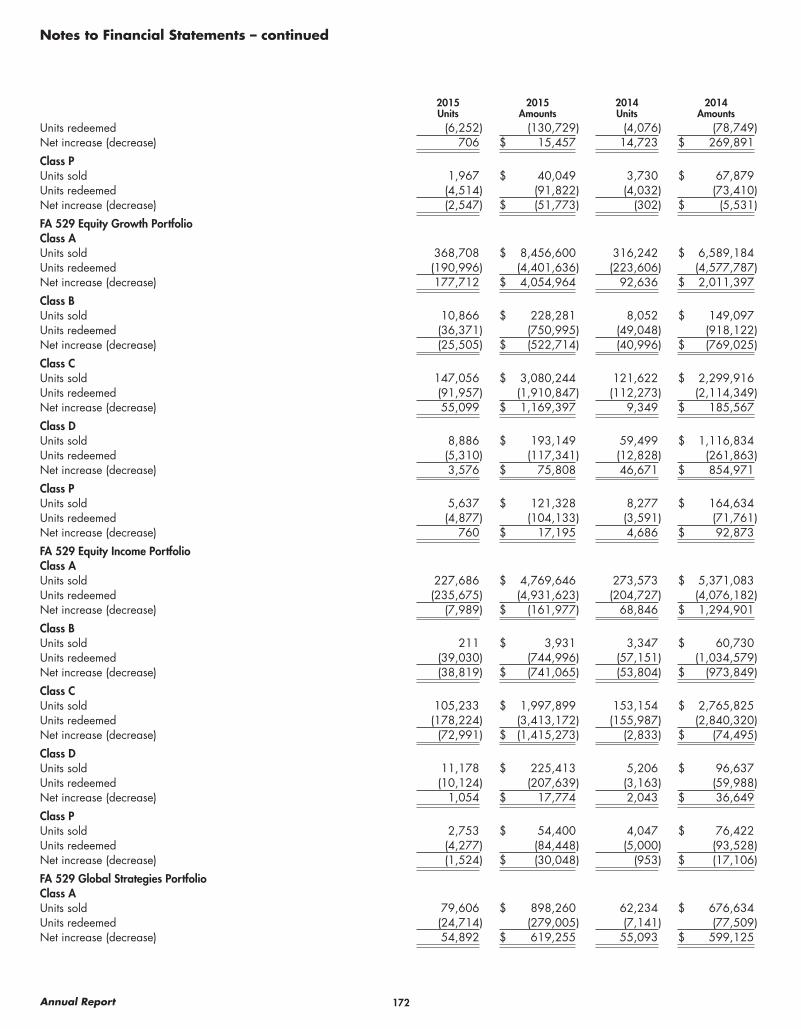
172Annual Report
Notes to Financial Statements – continued
2015 2015 2014 2014Units Amounts Units Amounts
Units redeemed (6,252) (130,729) (4,076) (78,749)Net increase (decrease) 706 $ 15,457 14,723 $ 269,891
Class PUnits sold 1,967 $ 40,049 3,730 $ 67,879Units redeemed (4,514) (91,822) (4,032) (73,410)Net increase (decrease) (2,547) $ (51,773) (302) $ (5,531)
FA 529 Equity Growth PortfolioClass AUnits sold 368,708 $ 8,456,600 316,242 $ 6,589,184Units redeemed (190,996) (4,401,636) (223,606) (4,577,787)Net increase (decrease) 177,712 $ 4,054,964 92,636 $ 2,011,397
Class BUnits sold 10,866 $ 228,281 8,052 $ 149,097Units redeemed (36,371) (750,995) (49,048) (918,122)Net increase (decrease) (25,505) $ (522,714) (40,996) $ (769,025)
Class CUnits sold 147,056 $ 3,080,244 121,622 $ 2,299,916Units redeemed (91,957) (1,910,847) (112,273) (2,114,349)Net increase (decrease) 55,099 $ 1,169,397 9,349 $ 185,567
Class DUnits sold 8,886 $ 193,149 59,499 $ 1,116,834Units redeemed (5,310) (117,341) (12,828) (261,863)Net increase (decrease) 3,576 $ 75,808 46,671 $ 854,971
Class PUnits sold 5,637 $ 121,328 8,277 $ 164,634Units redeemed (4,877) (104,133) (3,591) (71,761)Net increase (decrease) 760 $ 17,195 4,686 $ 92,873
FA 529 Equity Income PortfolioClass AUnits sold 227,686 $ 4,769,646 273,573 $ 5,371,083Units redeemed (235,675) (4,931,623) (204,727) (4,076,182)Net increase (decrease) (7,989) $ (161,977) 68,846 $ 1,294,901
Class BUnits sold 211 $ 3,931 3,347 $ 60,730Units redeemed (39,030) (744,996) (57,151) (1,034,579)Net increase (decrease) (38,819) $ (741,065) (53,804) $ (973,849)
Class CUnits sold 105,233 $ 1,997,899 153,154 $ 2,765,825Units redeemed (178,224) (3,413,172) (155,987) (2,840,320)Net increase (decrease) (72,991) $ (1,415,273) (2,833) $ (74,495)
Class DUnits sold 11,178 $ 225,413 5,206 $ 96,637Units redeemed (10,124) (207,639) (3,163) (59,988)Net increase (decrease) 1,054 $ 17,774 2,043 $ 36,649
Class PUnits sold 2,753 $ 54,400 4,047 $ 76,422Units redeemed (4,277) (84,448) (5,000) (93,528)Net increase (decrease) (1,524) $ (30,048) (953) $ (17,106)
FA 529 Global Strategies PortfolioClass AUnits sold 79,606 $ 898,260 62,234 $ 676,634Units redeemed (24,714) (279,005) (7,141) (77,509)Net increase (decrease) 54,892 $ 619,255 55,093 $ 599,125
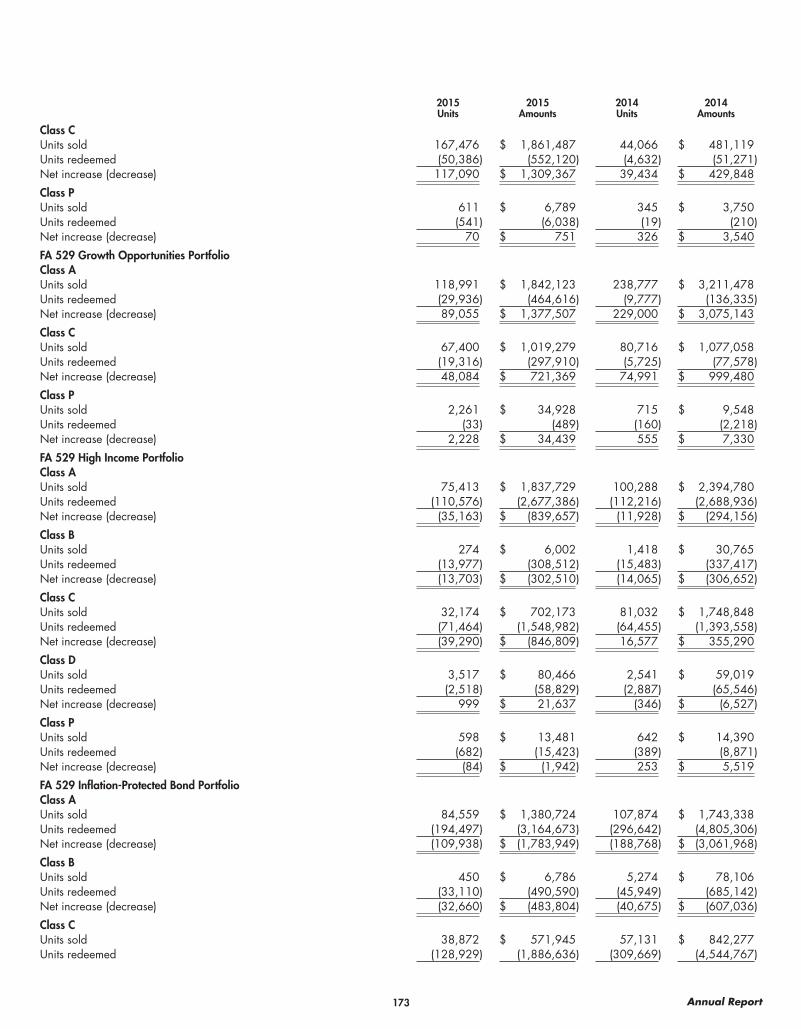
173 Annual Report
2015 2015 2014 2014Units Amounts Units Amounts
Class CUnits sold 167,476 $ 1,861,487 44,066 $ 481,119Units redeemed (50,386) (552,120) (4,632) (51,271)Net increase (decrease) 117,090 $ 1,309,367 39,434 $ 429,848
Class PUnits sold 611 $ 6,789 345 $ 3,750Units redeemed (541) (6,038) (19) (210)Net increase (decrease) 70 $ 751 326 $ 3,540
FA 529 Growth Opportunities PortfolioClass AUnits sold 118,991 $ 1,842,123 238,777 $ 3,211,478Units redeemed (29,936) (464,616) (9,777) (136,335)Net increase (decrease) 89,055 $ 1,377,507 229,000 $ 3,075,143
Class CUnits sold 67,400 $ 1,019,279 80,716 $ 1,077,058Units redeemed (19,316) (297,910) (5,725) (77,578)Net increase (decrease) 48,084 $ 721,369 74,991 $ 999,480
Class PUnits sold 2,261 $ 34,928 715 $ 9,548Units redeemed (33) (489) (160) (2,218)Net increase (decrease) 2,228 $ 34,439 555 $ 7,330
FA 529 High Income PortfolioClass AUnits sold 75,413 $ 1,837,729 100,288 $ 2,394,780Units redeemed (110,576) (2,677,386) (112,216) (2,688,936)Net increase (decrease) (35,163) $ (839,657) (11,928) $ (294,156)
Class BUnits sold 274 $ 6,002 1,418 $ 30,765Units redeemed (13,977) (308,512) (15,483) (337,417)Net increase (decrease) (13,703) $ (302,510) (14,065) $ (306,652)
Class CUnits sold 32,174 $ 702,173 81,032 $ 1,748,848Units redeemed (71,464) (1,548,982) (64,455) (1,393,558)Net increase (decrease) (39,290) $ (846,809) 16,577 $ 355,290
Class DUnits sold 3,517 $ 80,466 2,541 $ 59,019Units redeemed (2,518) (58,829) (2,887) (65,546)Net increase (decrease) 999 $ 21,637 (346) $ (6,527)
Class PUnits sold 598 $ 13,481 642 $ 14,390Units redeemed (682) (15,423) (389) (8,871)Net increase (decrease) (84) $ (1,942) 253 $ 5,519
FA 529 Inflation-Protected Bond PortfolioClass AUnits sold 84,559 $ 1,380,724 107,874 $ 1,743,338Units redeemed (194,497) (3,164,673) (296,642) (4,805,306)Net increase (decrease) (109,938) $ (1,783,949) (188,768) $ (3,061,968)
Class BUnits sold 450 $ 6,786 5,274 $ 78,106Units redeemed (33,110) (490,590) (45,949) (685,142)Net increase (decrease) (32,660) $ (483,804) (40,675) $ (607,036)
Class CUnits sold 38,872 $ 571,945 57,131 $ 842,277Units redeemed (128,929) (1,886,636) (309,669) (4,544,767)
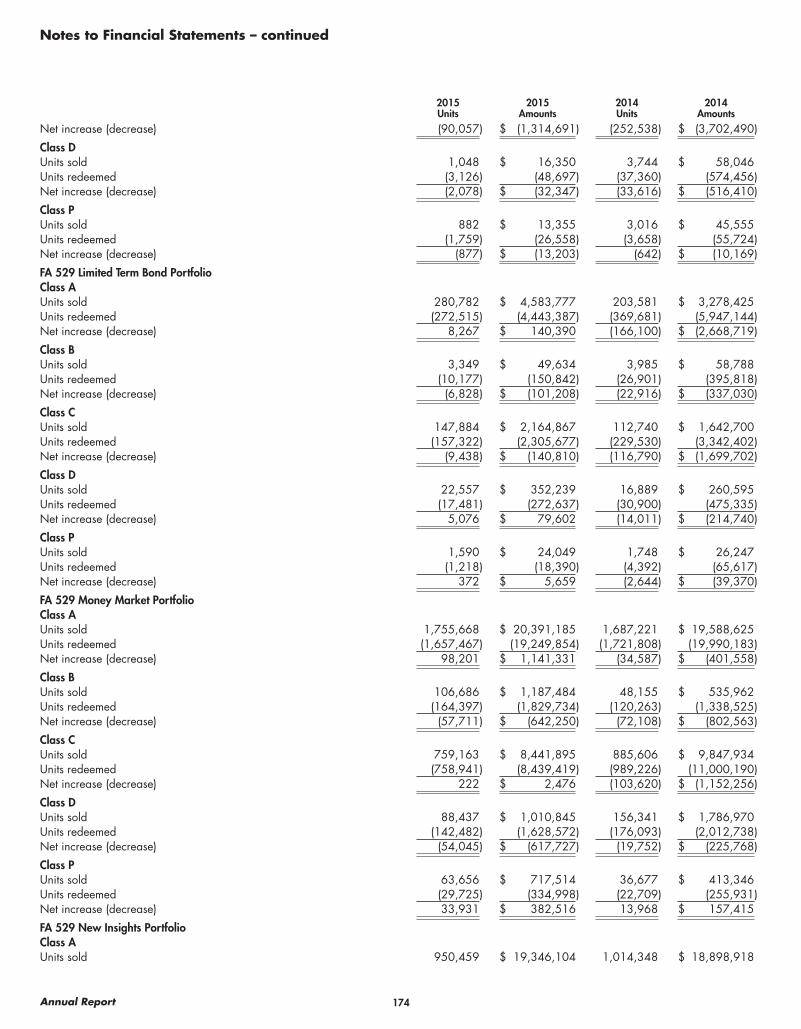
174Annual Report
Notes to Financial Statements – continued
2015 2015 2014 2014Units Amounts Units Amounts
Net increase (decrease) (90,057) $ (1,314,691) (252,538) $ (3,702,490)
Class DUnits sold 1,048 $ 16,350 3,744 $ 58,046Units redeemed (3,126) (48,697) (37,360) (574,456)Net increase (decrease) (2,078) $ (32,347) (33,616) $ (516,410)
Class PUnits sold 882 $ 13,355 3,016 $ 45,555Units redeemed (1,759) (26,558) (3,658) (55,724)Net increase (decrease) (877) $ (13,203) (642) $ (10,169)
FA 529 Limited Term Bond PortfolioClass AUnits sold 280,782 $ 4,583,777 203,581 $ 3,278,425Units redeemed (272,515) (4,443,387) (369,681) (5,947,144)Net increase (decrease) 8,267 $ 140,390 (166,100) $ (2,668,719)
Class BUnits sold 3,349 $ 49,634 3,985 $ 58,788Units redeemed (10,177) (150,842) (26,901) (395,818)Net increase (decrease) (6,828) $ (101,208) (22,916) $ (337,030)
Class CUnits sold 147,884 $ 2,164,867 112,740 $ 1,642,700Units redeemed (157,322) (2,305,677) (229,530) (3,342,402)Net increase (decrease) (9,438) $ (140,810) (116,790) $ (1,699,702)
Class DUnits sold 22,557 $ 352,239 16,889 $ 260,595Units redeemed (17,481) (272,637) (30,900) (475,335)Net increase (decrease) 5,076 $ 79,602 (14,011) $ (214,740)
Class PUnits sold 1,590 $ 24,049 1,748 $ 26,247Units redeemed (1,218) (18,390) (4,392) (65,617)Net increase (decrease) 372 $ 5,659 (2,644) $ (39,370)
FA 529 Money Market PortfolioClass AUnits sold 1,755,668 $ 20,391,185 1,687,221 $ 19,588,625Units redeemed (1,657,467) (19,249,854) (1,721,808) (19,990,183)Net increase (decrease) 98,201 $ 1,141,331 (34,587) $ (401,558)
Class BUnits sold 106,686 $ 1,187,484 48,155 $ 535,962Units redeemed (164,397) (1,829,734) (120,263) (1,338,525)Net increase (decrease) (57,711) $ (642,250) (72,108) $ (802,563)
Class CUnits sold 759,163 $ 8,441,895 885,606 $ 9,847,934Units redeemed (758,941) (8,439,419) (989,226) (11,000,190)Net increase (decrease) 222 $ 2,476 (103,620) $ (1,152,256)
Class DUnits sold 88,437 $ 1,010,845 156,341 $ 1,786,970Units redeemed (142,482) (1,628,572) (176,093) (2,012,738)Net increase (decrease) (54,045) $ (617,727) (19,752) $ (225,768)
Class PUnits sold 63,656 $ 717,514 36,677 $ 413,346Units redeemed (29,725) (334,998) (22,709) (255,931)Net increase (decrease) 33,931 $ 382,516 13,968 $ 157,415
FA 529 New Insights PortfolioClass AUnits sold 950,459 $ 19,346,104 1,014,348 $ 18,898,918
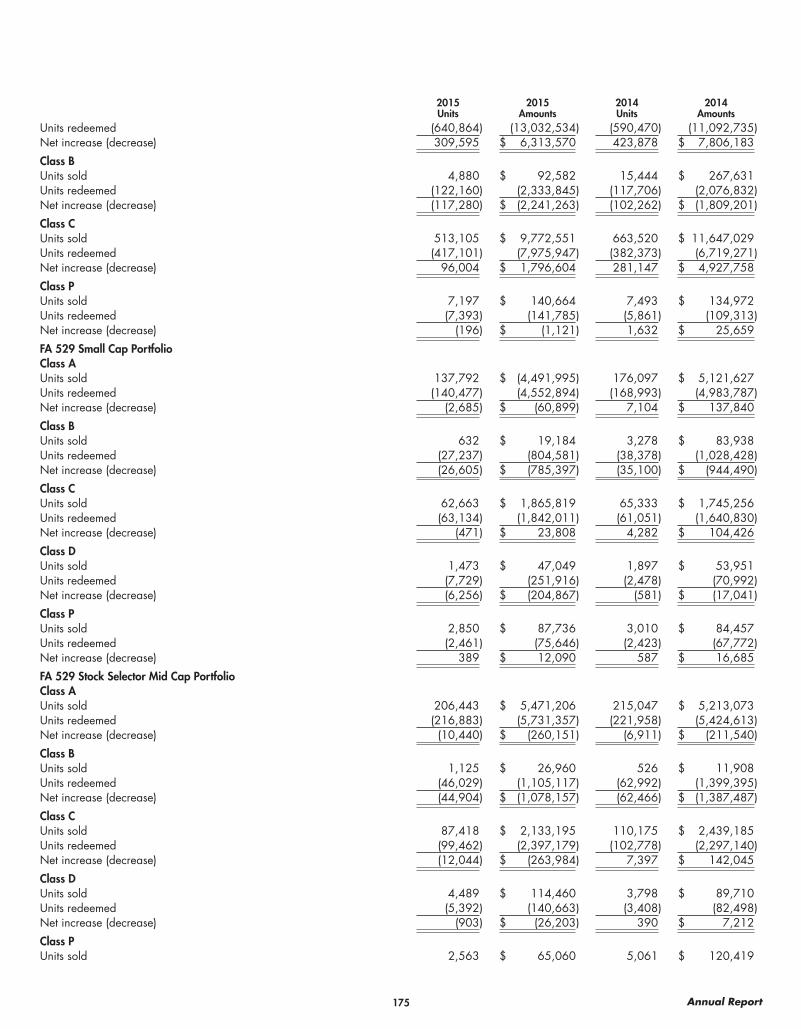
175 Annual Report
2015 2015 2014 2014Units Amounts Units Amounts
Units redeemed (640,864) (13,032,534) (590,470) (11,092,735)Net increase (decrease) 309,595 $ 6,313,570 423,878 $ 7,806,183
Class BUnits sold 4,880 $ 92,582 15,444 $ 267,631Units redeemed (122,160) (2,333,845) (117,706) (2,076,832)Net increase (decrease) (117,280) $ (2,241,263) (102,262) $ (1,809,201)
Class CUnits sold 513,105 $ 9,772,551 663,520 $ 11,647,029Units redeemed (417,101) (7,975,947) (382,373) (6,719,271)Net increase (decrease) 96,004 $ 1,796,604 281,147 $ 4,927,758
Class PUnits sold 7,197 $ 140,664 7,493 $ 134,972Units redeemed (7,393) (141,785) (5,861) (109,313)Net increase (decrease) (196) $ (1,121) 1,632 $ 25,659
FA 529 Small Cap PortfolioClass AUnits sold 137,792 $ (4,491,995) 176,097 $ 5,121,627Units redeemed (140,477) (4,552,894) (168,993) (4,983,787)Net increase (decrease) (2,685) $ (60,899) 7,104 $ 137,840
Class BUnits sold 632 $ 19,184 3,278 $ 83,938Units redeemed (27,237) (804,581) (38,378) (1,028,428)Net increase (decrease) (26,605) $ (785,397) (35,100) $ (944,490)
Class CUnits sold 62,663 $ 1,865,819 65,333 $ 1,745,256Units redeemed (63,134) (1,842,011) (61,051) (1,640,830)Net increase (decrease) (471) $ 23,808 4,282 $ 104,426
Class DUnits sold 1,473 $ 47,049 1,897 $ 53,951Units redeemed (7,729) (251,916) (2,478) (70,992)Net increase (decrease) (6,256) $ (204,867) (581) $ (17,041)
Class PUnits sold 2,850 $ 87,736 3,010 $ 84,457Units redeemed (2,461) (75,646) (2,423) (67,772)Net increase (decrease) 389 $ 12,090 587 $ 16,685
FA 529 Stock Selector Mid Cap PortfolioClass AUnits sold 206,443 $ 5,471,206 215,047 $ 5,213,073Units redeemed (216,883) (5,731,357) (221,958) (5,424,613)Net increase (decrease) (10,440) $ (260,151) (6,911) $ (211,540)
Class BUnits sold 1,125 $ 26,960 526 $ 11,908Units redeemed (46,029) (1,105,117) (62,992) (1,399,395)Net increase (decrease) (44,904) $ (1,078,157) (62,466) $ (1,387,487)
Class CUnits sold 87,418 $ 2,133,195 110,175 $ 2,439,185Units redeemed (99,462) (2,397,179) (102,778) (2,297,140)Net increase (decrease) (12,044) $ (263,984) 7,397 $ 142,045
Class DUnits sold 4,489 $ 114,460 3,798 $ 89,710Units redeemed (5,392) (140,663) (3,408) (82,498)Net increase (decrease) (903) $ (26,203) 390 $ 7,212
Class PUnits sold 2,563 $ 65,060 5,061 $ 120,419
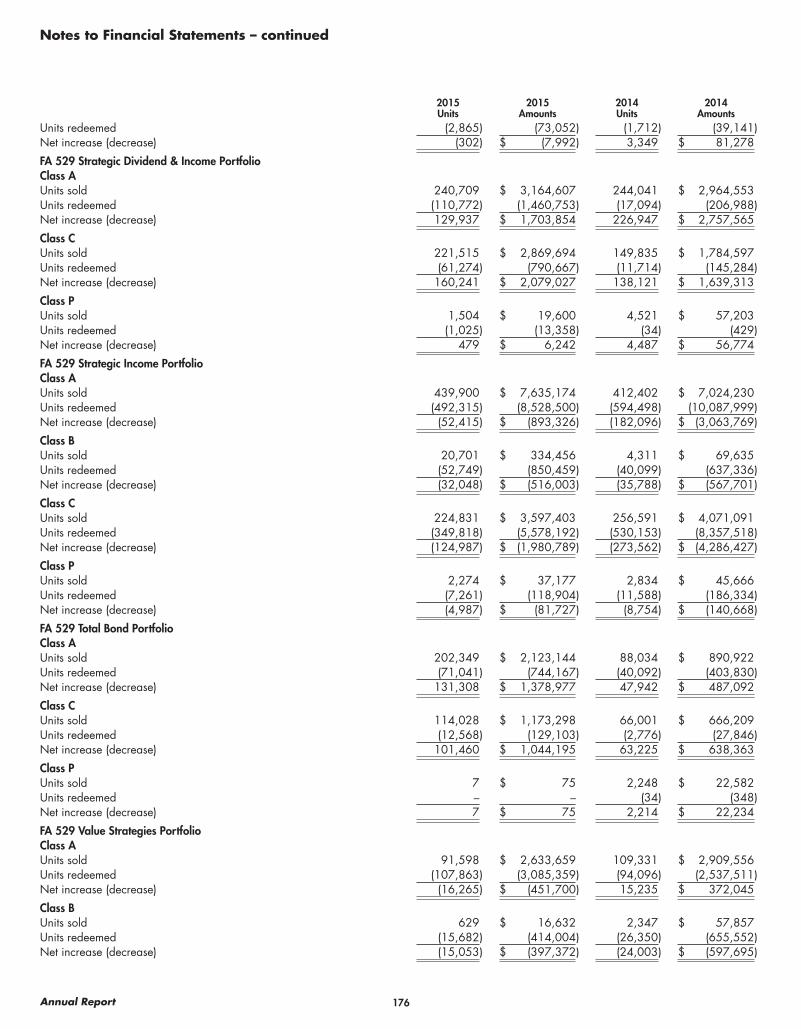
176Annual Report
Notes to Financial Statements – continued
2015 2015 2014 2014Units Amounts Units Amounts
Units redeemed (2,865) (73,052) (1,712) (39,141)Net increase (decrease) (302) $ (7,992) 3,349 $ 81,278
FA 529 Strategic Dividend & Income PortfolioClass AUnits sold 240,709 $ 3,164,607 244,041 $ 2,964,553Units redeemed (110,772) (1,460,753) (17,094) (206,988)Net increase (decrease) 129,937 $ 1,703,854 226,947 $ 2,757,565
Class CUnits sold 221,515 $ 2,869,694 149,835 $ 1,784,597Units redeemed (61,274) (790,667) (11,714) (145,284)Net increase (decrease) 160,241 $ 2,079,027 138,121 $ 1,639,313
Class PUnits sold 1,504 $ 19,600 4,521 $ 57,203Units redeemed (1,025) (13,358) (34) (429)Net increase (decrease) 479 $ 6,242 4,487 $ 56,774
FA 529 Strategic Income PortfolioClass AUnits sold 439,900 $ 7,635,174 412,402 $ 7,024,230Units redeemed (492,315) (8,528,500) (594,498) (10,087,999)Net increase (decrease) (52,415) $ (893,326) (182,096) $ (3,063,769)
Class BUnits sold 20,701 $ 334,456 4,311 $ 69,635Units redeemed (52,749) (850,459) (40,099) (637,336)Net increase (decrease) (32,048) $ (516,003) (35,788) $ (567,701)
Class CUnits sold 224,831 $ 3,597,403 256,591 $ 4,071,091Units redeemed (349,818) (5,578,192) (530,153) (8,357,518)Net increase (decrease) (124,987) $ (1,980,789) (273,562) $ (4,286,427)
Class PUnits sold 2,274 $ 37,177 2,834 $ 45,666Units redeemed (7,261) (118,904) (11,588) (186,334)Net increase (decrease) (4,987) $ (81,727) (8,754) $ (140,668)
FA 529 Total Bond PortfolioClass AUnits sold 202,349 $ 2,123,144 88,034 $ 890,922Units redeemed (71,041) (744,167) (40,092) (403,830)Net increase (decrease) 131,308 $ 1,378,977 47,942 $ 487,092
Class CUnits sold 114,028 $ 1,173,298 66,001 $ 666,209Units redeemed (12,568) (129,103) (2,776) (27,846)Net increase (decrease) 101,460 $ 1,044,195 63,225 $ 638,363
Class PUnits sold 7 $ 75 2,248 $ 22,582Units redeemed – – (34) (348)Net increase (decrease) 7 $ 75 2,214 $ 22,234
FA 529 Value Strategies PortfolioClass AUnits sold 91,598 $ 2,633,659 109,331 $ 2,909,556Units redeemed (107,863) (3,085,359) (94,096) (2,537,511)Net increase (decrease) (16,265) $ (451,700) 15,235 $ 372,045
Class BUnits sold 629 $ 16,632 2,347 $ 57,857Units redeemed (15,682) (414,004) (26,350) (655,552)Net increase (decrease) (15,053) $ (397,372) (24,003) $ (597,695)
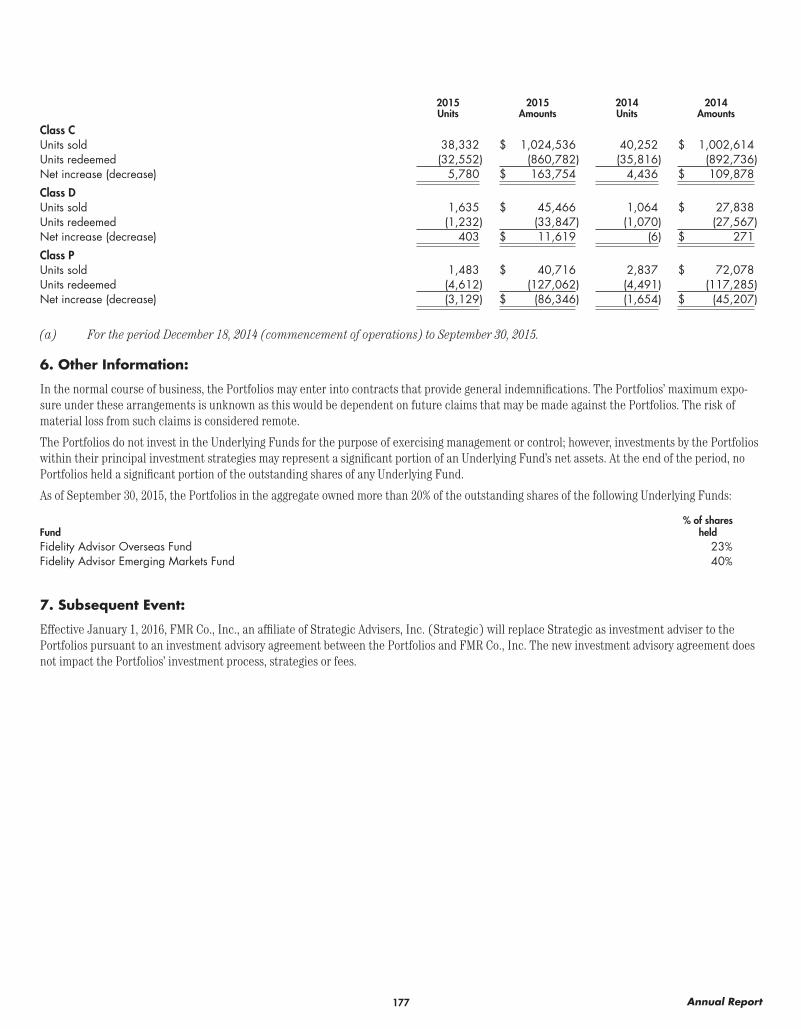
177 Annual Report
2015 2015 2014 2014Units Amounts Units Amounts
Class CUnits sold 38,332 $ 1,024,536 40,252 $ 1,002,614Units redeemed (32,552) (860,782) (35,816) (892,736)Net increase (decrease) 5,780 $ 163,754 4,436 $ 109,878
Class DUnits sold 1,635 $ 45,466 1,064 $ 27,838Units redeemed (1,232) (33,847) (1,070) (27,567)Net increase (decrease) 403 $ 11,619 (6) $ 271
Class PUnits sold 1,483 $ 40,716 2,837 $ 72,078Units redeemed (4,612) (127,062) (4,491) (117,285)Net increase (decrease) (3,129) $ (86,346) (1,654) $ (45,207)
(a) For the period December 18, 2014 (commencement of operations) to September 30, 2015.
6. Other Information:
In the normal course of business, the Portfolios may enter into contracts that provide general indemnifications. The Portfolios’ maximum expo-sure under these arrangements is unknown as this would be dependent on future claims that may be made against the Portfolios. The risk of material loss from such claims is considered remote.
The Portfolios do not invest in the Underlying Funds for the purpose of exercising management or control; however, investments by the Portfolios within their principal investment strategies may represent a significant portion of an Underlying Fund’s net assets. At the end of the period, no Portfolios held a significant portion of the outstanding shares of any Underlying Fund.
As of September 30, 2015, the Portfolios in the aggregate owned more than 20% of the outstanding shares of the following Underlying Funds:
Fund% of shares
heldFidelity Advisor Overseas Fund 23%Fidelity Advisor Emerging Markets Fund 40%
7. Subsequent Event:
Effective January 1, 2016, FMR Co., Inc., an affiliate of Strategic Advisers, Inc. (Strategic) will replace Strategic as investment adviser to the Portfolios pursuant to an investment advisory agreement between the Portfolios and FMR Co., Inc. The new investment advisory agreement does not impact the Portfolios’ investment process, strategies or fees.
178Annual Report
Independent Auditor’s Report
To the Fiscal Committee of the General Court of the State of New Hampshire, the Trustee of the New Hampshire Higher Education Savings Plan Trust and the Participants of the Fidelity Advisor 529 Plan:
We have audited the accompanying financial statements of the Fidelity Advisor 529 Plan (“the Plan”), which comprise the statements of assets and liabilities, including the schedules of investments as of September 30, 2015, and the related statements of operations, of changes in net assets, and the financial highlights for the periods indicated for the following Portfolios (“the Portfolios”):
FA 529 College Portfolio FA 529 Global Strategies PortfolioFA 529 Portfolio 2016 FA 529 Growth Opportunities PortfolioFA 529 Portfolio 2019 FA 529 High Income PortfolioFA 529 Portfolio 2022 FA 529 Inflation-Protected Bond PortfolioFA 529 Portfolio 2025 FA 529 Limited Term Bond PortfolioFA 529 Portfolio 2028 FA 529 Mid Cap PortfolioFA 529 Portfolio 2031 FA 529 Money Market PortfolioFA 529 Portfolio 2034 FA 529 New Insights PortfolioFA 529 Aggressive Growth Portfolio FA 529 Small Cap PortfolioFA 529 Moderate Growth Portfolio FA 529 Strategic Dividend & Income PortfolioFA 529 Diversified International Portfolio FA 529 Strategic Income PortfolioFA 529 Dividend Growth Portfolio FA 529 Total Bond PortfolioFA 529 Equity Growth Portfolio FA 529 Value Strategies PortfolioFA 529 Equity Income Portfolio
These financial statements and financial highlights are hereafter collectively referred to as “financial statements”.
Management’s Responsibility for the Financial StatementsManagement is responsible for the preparation and fair presentation of the financial statements in accordance with accounting principles gener-ally accepted in the United States of America; this includes the design, implementation and maintenance of internal control relevant to the preparation and fair presentation of financial statements that are free from material misstatement, whether due to fraud or error.
Auditor’s ResponsibilityOur responsibility is to express an opinion on the financial statements based on our audits. We conducted our audits in accordance with auditing standards generally accepted in the United States of America. Those standards require that we plan and perform the audit to obtain reasonable assurance about whether the financial statements are free from material misstatement.
An audit involves performing procedures to obtain audit evidence about the amounts and disclosures in the financial statements. The proce-dures selected depend on our judgment, including the assessment of the risks of material misstatement of the financial statements, whether due to fraud or error. In making those risk assessments, we consider internal control relevant to the Plan’s preparation and fair presentation of the financial statements in order to design audit procedures that are appropriate in the circumstances, but not for the purpose of expressing an opinion on the effectiveness of the Plan’s internal control. Accordingly, we express no such opinion. An audit also includes evaluating the appro-priateness of accounting policies used and the reasonableness of significant accounting estimates made by management, as well as evaluating the overall presentation of the financial statements. We believe that the audit evidence we have obtained is sufficient and appropriate to provide a basis for our audit opinion.
OpinionIn our opinion, the financial statements referred to above present fairly, in all material respects, the financial position at September 30, 2015, and the results of their operations, changes in their net assets, and the financial highlights for the periods indicated, in accordance with accounting principles generally accepted in the United States of America.
PricewaterhouseCoopers LLP Boston, Massachusetts December 28, 2015

179 Annual Report

brought to you by the State of New Hampshire managed by Fidelity Investments
The Fidelity Advisor 529 Plan is offered by the State of New Hampshire and managed by Fidelity Investments. Fidelity, Fidelity Investments, the pyramid designs, are registered trademarks of FMR LLC. Strategic Advisers is a service mark of FMR LLC. The third-party marks appearing in this document are the marks of their respective owners.
Brokerage services provided by Fidelity Brokerage Services LLC, Member NYSE, SIPC.
1.778388.113 508343.8.0 ACIP-ANN-1215