Embed Size (px)
Citation preview
CITY OF KEENE, NEW HAMPSHIRE
Comprehensive Annual Financial Report
For the Fiscal Year Ended June 30, 2017

(This page intentionally left blank.)
CITY OF KEENE NEW HAMPSHIRE
Comprehensive Annual Financial Report
For The Fiscal Year Ended
June 30, 2017
Prepared by: The Finance Department
Steve Thornton
Finance Director
CITY OF KEENE, NEW HAMPSHIRE
TABLE OF CONTENTS
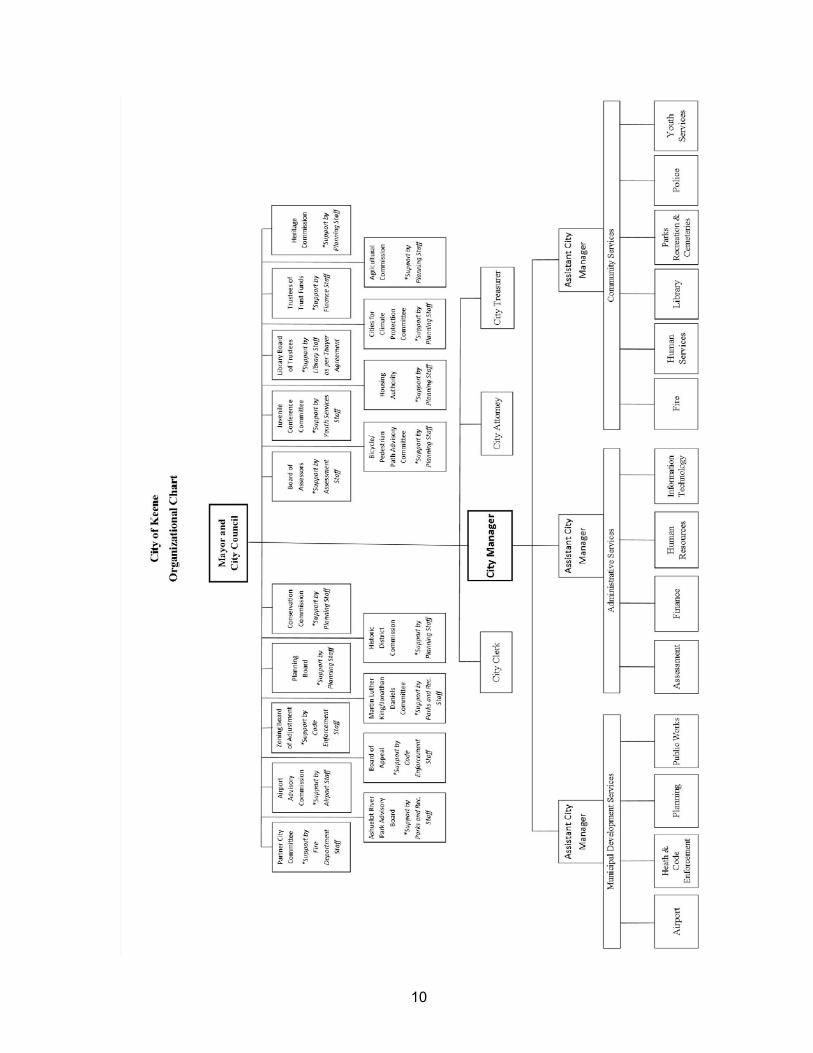
PAGE INTRODUCTORY SECTION: Transmittal Letter 1 Organizational Chart 10 FINANCIAL SECTION: Independent Auditors’ Report 13 Management’s Discussion and Analysis 16 Basic Financial Statements: Government-wide Financial Statements: Statement of Net Position 29 Statement of Activities 30 Fund Financial Statements: Governmental Funds: Balance Sheet 31 Reconciliation of Total Governmental Fund Balances to Net Position of Governmental Activities in the Statement of Net Position 32 Statement of Revenues, Expenditures, and Changes in Fund Balances 33 Reconciliation of the Statement of Revenues, Expenditures, and Changes in Fund Balances of Governmental Funds to the Statement of Activities 34 Statement of Revenues and Other Sources, and Expenditures and Other Uses - Budget and Actual - General Fund 35 Proprietary Funds: Statement of Net Position 36 Statement of Revenues, Expenses, and Changes in Fund Net Position 37
Statement of Cash Flows 38 Fiduciary Funds:
Statement of Fiduciary Net Position 39 Statement of Changes in Fiduciary Net Position 40 Notes to Financial Statements 41 Required Supplementary Information: Pension: Schedule of Proportionate Share of the Net Pension Liability (GASB 68) 79 Schedule of Pension Contributions (GASB 68) 80 OPEB: Schedule of OPEB Funding Progress (GASB 45) 81 Combining and Individual Fund Financial Statements and Schedules: Combining Balance Sheet - Nonmajor Governmental Funds 85 Combining Statement of Revenues, Expenditures, and Changes in Fund Balances - Nonmajor Governmental Funds 86 Detail Schedule of Revenues, Expenditures and Other Financing Sources and Uses
Budget and Actual - Solid Waste Fund 88
Detail Schedule of Revenues, Expenditures and Other Financing Sources and Uses Budget and Actual - Parking Fund 89
Combining Statement of Net Position - Internal Service Funds 92 Combining Statement of Revenues, Expenses and Changes in Fund Net Position - Internal Service Funds 93 Combining Statement of Cash Flows - Internal Service Funds 94 Schedule of Revenues, Expenses, and Other Financing Sources and Uses - Budget and Actual - Internal Service Funds 95

STATISTICAL SECTION: Financial Trends Net Position by Component - Last Ten Fiscal Years 99 Changes in Net Position - Last Ten Fiscal Years 100 Fund Balances, Governmental Funds - Last Ten Fiscal Years 101 Changes in Fund Balances, Governmental Funds - Last Ten Fiscal Years 102 Revenue Capacity General Government Tax Revenues by Source - Last Ten Fiscal Years 103 Assessed and Estimated Full Value of Real Property - Last Ten Fiscal Years 104 Property Tax Rates per $1,000 of Assessed Value - Direct and Overlapping Governments - Last Ten Fiscal Years 105 Principal Taxpayers - Current Year and Nine Years Ago 106 Property Tax Levies and Collections - Last Ten Fiscal Years 107 Debt Capacity Ratios of Outstanding Debt by Debt Type - Last Ten Fiscal Years 108 Computation of Overlapping Debt by Debt Type - Last Ten Fiscal Years 109 Ratios of Long Term Debt Outstanding and Legal Debt Limits - Last Ten Fiscal Years 110 Demographic and Economic Information Demographic Statistics - Last Ten Fiscal Years 111 Principal Employers - Current Year and Nine Years Ago 112 Operating Information City Government Employees by Function - Full Time Equivalents - Last Ten Fiscal Years 113 Operating Indicators by Function - Last Ten Fiscal Years 114 Capital Asset Statistics by Function - Last Ten Fiscal Years 115

INTRODUCTORY SECTION

(This page intentionally left blank.)
1
City of Keene New Hampshire
December 28, 2017 To the Honorable Mayor, Members of the City Council, and Citizens of the City of Keene: The Keene Finance Department is pleased to present the Comprehensive Annual Financial Report (CAFR) for the City of Keene, New Hampshire for the Fiscal Year ending June 30, 2017. This report is published to provide citizens, City Council, investors and other interested parties with detailed information regarding the finan-cial position of the City. Responsibility for the accuracy of the data, and the com-pleteness and fairness of this report, including all disclosures and schedules, rests with management. To the best of our knowledge and belief, the following data is accurate in all material respects and is reported in a manner designed to fairly present the City's financial position and changes in financial position of the various funds of the City. The accompanying disclosures are necessary to enable the reader to gain an under-standing of the City's financial activities. The City’s financial statements and CAFR do not report on the funds of the Keene School District or the County of Cheshire. These governmental units are independ-ent of the City and do not meet established reporting entity criteria for inclusion in this report. The Report - The CAFR is presented in three main sections: Introductory, Financial, and Statistical. The Introductory Section, which is unaudited, includes the letter of transmittal, and the City organizational chart. The Financial Section includes the independent auditors’ report, management’s dis-cussion and analysis (MD&A), the basic financial statements, required supplemen-tary information, and the combining and individual financial statements, and schedules. The Statistical Section, which is unaudited, includes financial and demographic information on a ten-year historical basis indicating trends for comparative basis by fiscal year.

2
General - Incorporated as a City in 1874, Keene, New Hampshire is located in southwestern New Hampshire in Cheshire County, 85 miles northwest of Boston, Massachusetts, 97 miles north of Hartford, Connecticut, and 100 miles northeast of Albany, New York. According to the 2015 Census, the population in the 37.1 square miles of land known as the City of Keene was 23,406. Four major highways, Routes 101, 12, 10 and 9, intersect at Keene, making it the hub of the region and also giving access to Interstates 91, 89, and 93. The City provides governmental services including police, fire, ambulance, road and sidewalk maintenance, public health and welfare, code compliance, public library, and water and sewer. In addition, the City maintains 16 parks, 2 municipal pools, 8 tennis courts, cemeteries, and an airport. Government - The City of Keene is governed by a mayor and 15-member council, five of whom are elected at large, with the Mayor presiding at all council meetings. The Mayor has no veto power over Council actions. Through the power defined in the City Charter, the City Council appoints the Manager to serve as the chief execu-tive officer of the City. Keene's City Charter defines the powers the citizens agree to give their City government, how the government is structured, and specifies the responsibilities of the City Manager. Under the Mayor/Council/Manager form of gov-ernment adopted by Keene, the Mayor and Council establish policies for operations within the City, and it is the Manager's responsibility to ensure these policies are carried out. In general, the Manager supervises all property and business affairs of the City and oversees expenditure of all funds appropriated for City purposes.
Principal City Officials
Office Name Term
Expires* 2017 Standing Committee Assignment Mayor Kendall W. Lane 2017 N/A Ward One Janis O. Manwaring 2017 Municipal Services, Facilities & Infrastructure (Chair) Councilors Stephen L. Hooper 2019 Municipal Services, Facilities & Infrastructure
Ward Two Mitchell H. Greenwald 2017 Finance, Organization & Personnel (Chair) Councilors Carl B. Jacobs 2019 Finance, Organization & Personnel
Ward Three David C. Richards 2019 Planning, Licenses & Development (Chair) Councilors Terry M. Clark 2017 Finance, Organization & Personnel Ward Four Robert J. O'Connor 2017 Municipal Services, Facilities & Infrastructure Councilors Robert B. Sutherland 2019 Planning, Licenses, and Development Ward Five Thomas F. Powers 2019 Finance, Organization & Personnel Councilors Philip Jones 2017 Planning, Licenses and Development (Vice-Chair)
At Large Gary P. Lamoureux 2017 Municipal Services, Facilities and Infrastructure Councilors George S. Hansel 2017 Planning, Licenses and Development Bart K. Sapeta 2017 Planning, Licenses and Development Bettina A. Chadbourne 2017 Finance, Organization and Personnel Randy L. Filiault 2017
Municipal Services, Facilities and Infrastructure (Vice-Chair)
*Term expires on December 31 in year noted.
3
Appointed Administration Title Name City Manager Elizabeth A. Dragon City Attorney Thomas P. Mullins City Clerk Patricia A. Little Finance Director/Treasurer Steve Thornton Asst. Finance Director/Treasurer Merri Howe Local Economy - The City of Keene continues to report lower than federal and state unemployment rates. As reported by the New Hampshire Department of Employ-ment Security, Keene’s unemployment rate was 2.8%; similar to the state rate and lower than the federal rate. Another indicator of local economic conditions is building permits. The number of permits issued during fiscal 2017 increased by 49 and the dollar amount increased by $5.39 million, showing growth in the local real estate market, and strengthening of the local economy. Tax collections continue to trend high with 98.48% of the 2016 tax warrant collected. The total lien amount increased to $1,162,354 for 2016 from $930,149 for 2015. Analysis of the properties comprising the top ten lien amounts indicate an increase of $137,596, or 61.61%, moving from $223,342 for 2015 to $360,938. Of the $137,596, $132,357 is elderly tax deferral going to tax lien, representing 96.19% of the 2016 increase. Economic Development In 1988, the City purchased land owned by the Boston & Maine Railroad, com-prised of approximately seven acres of land that stretches across Main Street, and is encompassed within the downtown area. The intent of this purchase was for redevelopment from vacant land and derelict buildings to tax paying entities that would complement the historic character of the Main Street/downtown area. In 2005, the City and Monadnock Economic Development Corporation (MEDC), a private not-for-profit development corporation headquartered in Keene, entered into a development agreement with the City of Keene that outlined the timing, nature and magnitude of property-tax paying development that MEDC would cause to occur, and the public infrastructure improvements that would be undertaken by the City if the necessary assessed values were realized. Subsequently, the City sold land to MEDC, and since that time, much of the property has been developed, as planned. The site work for the development started in the summer of 2008, building construction started in 2009, and occupancy permits were issued in the second half of 2010. In summary, to date, there has been approximately $42.5 million of new investment in 181,677 square feet and infra-structure on those 7 acres. There are approximately 215 people working within the site, and there are 32 housing units, as detailed below:
4
51 Railroad Street has a total of 34,400 square feet on four floors. Two bottom floors of commercial space in 17,600 square feet (the first floor is a bit bigger than the upper floors) and the residential space on the top two floors has eight condominiums totaling 16,800 square feet. There are about 50 people working in the commercial space between Nicola's, Cheshire Medical, FastRoads, and MEDC. This development represents investment of approximately $7 million.
The Courtyard by Marriott has 100 guest rooms and related meeting
rooms/ballroom, pool, gym, etc., in a five story 71,000 square foot building. There are at least 35 people working there. This development represents investment of approximately $15 million. It is also a LEEDS certified building.
Keene Senior Housing is three floors totaling 25,650 square feet. There
are 22 one-bedroom and 2 two-bedroom apartments for seniors, represent-ing investment of approximately $5 million.
Southwestern Community Services purchased 33,000 square feet of
the former Wright Silver Polish plant from Railroad Land Development LLC and converted the condominium unit into offices and Head Start class-rooms. There are about 125 people working there and the project repre-sents investments of approximately $5.5 million.
Monadnock Developmental Services purchased the remainder of the
space in the former Wright Silver Polish building (4,500 square feet) and converted the former warehouse space into a food production facility. Total investment was approximately $2 million. There are about 6 people working there.
Railroad Land Development also has invested over $4 million in infrastruc-
ture to support the redevelopment of the 7-acre site. Monadnock Food Co-Op is a 13,177 square foot $4 million food co-op
facility that opened in 2014. Prior to opening, the Food Co-op had more than 1,000 member families. The Food Co-op added approximately 60 employees, with more than 45 being full time equivalent positions.
Remaining within the Railroad Land area is one additional site currently subject to purchase agreements. Those agreements provide for the following development:
A five-story mixed use building with the first floor dedicated to commercial uses and 35 upscale residential units on the upper floors.
Adjacent to the Railroad Property at the end of Railroad Street,
construction is underway on a 24-unit senior housing development. Developments in other areas of the City include a new courthouse, new fiber optic network and other initiatives as detailed below:
5
In Downtown Keene, the former Keene Middle School is currently being redeveloped. The project includes an adaptive re-use of the 1912 building as a performing arts center. The center will include new office, business and residential units, as well as a restaurant, bistro and night club. At the rear of the site, a 132-unit condominium development began construction in 2016.
A Continuing Care Retirement Community of approximately 140 units is on track for construction in 2017. This important asset, for the region’s senior citizens has an estimated construction value of approximately $60 million.
MEDC, in partnership with the City, the County and private developers,
completed construction of a new $10.4 million courthouse in Downtown Keene to house both the Superior and District Courts through a lease of this facility to the State.
The former EF Lane Hotel on Main Street was renovated and its developers
since its re-opening as a Fairfield Inn with a restaurant, Fireworks, on the first floor of the hotel. The total investment in this hotel development is approximately $6 million.
FastRoads (a solely owned subsidiary of MEDC) continues its work building
out a $7.5 million fiber optic network in the region that will initially benefit community anchor institutions (hospitals, libraries, government offices, etc.) and eventually small business and residences by providing ubiquitous, high-speed broadband. The launch of this new network running through Keene was completed in 2014 with the goal to help ensure that the busi-nesses, institutions and residents of the region have the right infrastructure to support jobs and sustainable economic development. The availability of affordable broadband infrastructure has become an essential component of a viable economic development strategy in rural areas, such as Keene. A developing initiative is Gigabit Keene, which will analyze the feasibility of municipal broadband to ensure adequate access to high speed internet throughout the City.
Renovations providing for existing retail and new retail uses including
renovation of existing occupied space by Target, as well as renovation of other space, in the former Sear Plaza, for new tenants, including Kohl’s, Aldi’s, and Urgent Care.
Downtown retail and occupancy rates remain high.
The City has also been successful in competing for grants that have leveraged other investment, totaling $11 million, to provide for the reconstruction of 75 units of existing multi-family housing stock and providing for expansion of local business incubator space and micro-enterprise support services provided by the Hannah
6
Grimes Center. The former project, the redevelopment of the Brook Bend Apartments, was completed in 2014, and the latter in 2015. Further development activity includes the sale of City owned land to Public Service of New Hampshire for the construction of a new electric service substation, and the construction of two apartment buildings on Ralston Street providing housing for a total of 460 students. Keene State College has completed the construction of new dormitories on campus. In addition, The Cheshire Medical Center completed a major renovation and expansion of its emergency room facilities in 2015, to better serve the community and region. Development and renovations supporting education and community institutional organizations expanding the community’s resources and enhancing quality of life over the past year have been noteworthy. At the end of 2011, a new 65,000 square foot YMCA with childcare center, aquatic center and lap pool, fitness and wellness facilities, sports courts and a climbing wall opened. This facility represents an investment of almost $10 million and provides the community with expanded wellness and fitness programming. Other institu-tional improvements include an addition valued at almost $2 million to a religious institution, construction of a new central fire station investing almost $6 million and completion and dedication of a new Technology, Design and Safety Center at Keene State College providing 53,000 square feet of educational space represent-ing an investment of $16 million dollars. These opportunities have provided con-tinuing stimulus to the local economy, as well as continuing contributions that will sustain a vibrant community. A local group, Keene Ice, in partnership with the City, completed construction of an all-season ice rink at the municipal facility at 350 Marlboro Street in November 2015. The rink serves local figure skating and ice hockey organizations, as well as provides recreational skating opportunities to residents. This new ice rink also allows tournaments and ice shows to be held within the City. Also in downtown, MOCO Arts, a homegrown, nonprofit arts education organization for children, has begun construction of a new 17,000 square foot performing arts center on the former YMCA property. The existing building has been removed to build a two-story, multi-use performing arts facility containing a 200-seat black box theatre, three studios and administrative offices. Financial Information – The City of Keene is responsible for the development of an accounting and internal control structure to ensure the safeguarding of City assets from loss, theft, and misuse and that adequate accounting information is maintained and reported in conformity with generally accepted accounting principles. The inter-nal control structure is designed to provide reasonable assurances that these objec-tives are attained. In providing these reasonable assurances, it is recognized that the cost of control should not exceed the benefits and the valuation of costs and benefits requires management's judgment. Testing of the internal control procedures
7
are part of the annual audit, though an audit opinion is not expressed; any deficien-cies and material weaknesses are brought forward by the auditors to management. The City has also developed budgetary controls through the adoption of its fiscal policy to ensure compliance with legal provisions. The policy also mandates the budgets be presented balanced, adopted annually, and lapse at the end of the fiscal year. The fiscal policy adopted annually by the Council establishes and articulates the financial blueprint of the City. Long-term Financial Planning - The City Manager and City staff prepare and pre-sent a Capital Improvement Program (CIP) spanning a period of six years to the City Council for consideration, amendment, and adoption. The focus of the CIP process is planning for our City’s future. The foundation of that planning effort seeks to advance Comprehensive Master Plan (CMP) vision through its focus areas includ-ing; a quality built environment, unique natural environment, a vibrant economy, strong citizenship and proactive leadership, a creative and learning culture, and healthy community. Guided by fiscal policy, each year anticipated capital expenditures are identified in the six-year CIP, which forecasts projects anticipated within that time period with an estimated cost in excess of $20,000, and anticipated useful life of at least five years. Individual project requests are consolidated into a capital program combined with revenue and operating cost projections to provide estimated rate impacts. This capital planning process allows projects in its first year to be fully considered in context of the community’s vision, values, and goals, along with impact on property taxes, water rates, and sewer rates. Following a review and public hearing process, the adopted program’s first year is included in the next operating budget proposal as the capital budget. The Capital Improvement Program is fluid and changes from time to time upon action of the City Council and is considered a planning document that does not serve to preclude advancement of a viable project not timely in the program sched-ule or identified within it. It does not bind any public body to undertaking any project, but provides the City with a tool to identify and schedule needed improvements, and is used to forecast and plan for the impact of those improvements. Debt - Bonds and serial notes are authorized by a minimum of two-thirds vote of all City Council members. The sale of bonds is a significant part of each CIP. Long term borrowing is used to finance projects that have a significant cost and are of a lasting nature. While projects are often bundled together into one annual sale in order to minimize bond issuance costs, the time over which the bonds are repaid (the term) varies based on the financed improvement’s expected useful life. The City’s fiscal health was reaffirmed by Standard and Poor’s assignment of a AA/Stable long-term rating when the City went to market with debt in the fall of 2016. While recognizing the chal-lenging revenue environment, the City’s fiscal practices including incorporation of
8
operating budget projection, annual re-prioritization of capital projects and debt and reserve policies are factors viewed favorably by rating agencies. This assessment attracts investors to our bonds and helps keep interest rates favorable. The 2016 bonds were issued with a true interest cost of approximately 1.849%, ranging from five to twenty years in length. The general debt limit of the City of Keene is 3% of “base valuation” determined annually by the State Department of Revenue Administration Board of Taxation. The School District’s debt limit is 7% of the City’s “base valuation,” which is not counted in the computation of the City’s 3% general limitation. Water and sewer projects under-taken by order of the Water Supply and Pollution Control, Division of the State Department of Environmental Service, are excluded from the measure of indebt-edness as the debt is supported by grant and user fees. Non-compulsory water projects are subject to a debt limit of 10% of the “base valuation”. Parking meters and facilities may have debt to an amount not exceeding ½ of one percent of the base valuation excluded from the general debt limit. The base valuation for computing the debt limit consists of the City’s equalized assessed valuation plus property formerly taxed by the City prior to enactment of the State Business Profits Tax Law all as determined annually by the State of New Hampshire Department of Revenue Administration. For Keene, the base valuation for computing the debt limit is $1,792,296,603 (2016). Long- term debt outstanding from general obligation bonds as of June 30, 2017 totaled $43,864,814 and the amount authorized and unissued totaled $135,000. Fund Balance – Fund balance represents the difference between current assets and liabilities and comprises non-spendable, restricted, committed, assigned, and assigned amounts as specified in GASB 54. In the general fund, unassigned fund balance is a key indicator of the City’s ability to withstand and respond to fiscal challenges and opportunities. City fiscal policy establishes a target range of 7% to 10% of the total of the City’s General Fund budget, local, and state education taxes, and the county tax. The unassigned fund balance can be used to offset emergency expenditures, a downturn in collection of significate revenues, or other unforeseen events. Retirement - Provision for the retirement of teachers and other municipal employees is handled via the New Hampshire Retirement System. The City of Keene currently has approximately 256 active and 55 retired members of the System and its prede-cessor programs. In addition to pension benefits, cities and towns may provide retired employees with health care and life insurance benefits, referred to as Other Post-Employment Benefits. The portion of the cost of such benefits paid by cities and towns is gener-ally provided on a pay-as-you-go basis.
9
The Government Accounting Standards Board (GASB) promulgates its Statements Nos. 43 and 45, requiring for public entities report the future costs of these non-pension, post-employment benefits in their financial statements. These accounting standards for measurement of costs and liabilities for these benefits is conservative if they continue to be funded on a pay-as-you-go basis and will result in larger annual cost and liability accruals than if such benefits were pre-funded in a trust fund in the same manner as traditional pension benefits. The City indirectly provides post-employment health care for retired employees through an implicit rate covered by current year employees. Retirees of the City pay to participate in the City’s medical, prescription drug, mental health/substance abuse programs. Retirees contribute 100% of the cost of the health plan, as determined by the City. The City contributes its implicit rate subsidy of the health plan costs on a pay-as-you-go basis. The benefits, benefit levels, employee contributions and employer contributions are governed by RSA 100-A:50. As of June 30, 2017, the City has completed an actuarial valuation of its Post-Employment Benefits other than Pensions liability in accordance with GASB State-ment 45. According to this report, the Unfunded Actuarial Accrued Liability was $5,017,794 or 30.1% of covered payroll. The Annual Required Contribution for this liability is $420,569, of which the City contributed $209,207 on a pay-as-you-go basis. Audits - The City employs an outside independent accounting firm, Melanson Heath, Certified Public Accountants, Manchester, New Hampshire to audit their operations annually. The audit is in accordance with generally accepted auditing standards. Thank you to the finance staff and all City departments for their cooperation and assistance in gathering the information contained in this report. Respectfully submitted,
Steve Thornton Finance Director
10

FINANCIAL SECTION

12
(This page intentionally left blank.)
121 River Front DriveManchester, NH 03102(603)669-6130melansonheath.com
Additional Offices:Nashua, NHAndover, MAGreenfield, MAEllsworth, ME
13
INDEPENDENT AUDITORS’ REPORT To the Honorable Mayor and City Council City of Keene, New Hampshire Report on the Financial Statements We have audited the accompanying financial statements of the governmental activi-ties, the business-type activities, each major fund, and the aggregate remaining fund information of the City of Keene, New Hampshire as of and for the year ended June 30, 2017, and the related notes to the financial statements, which collectively comprise the City’s basic financial statements as listed in the Table of Contents. Management’s Responsibility for the Financial Statements The City’s management is responsible for the preparation and fair presentation of these financial statements in accordance with accounting principles generally accepted in the United States of America; this includes the design, implementation, and main-tenance of internal control relevant to the preparation and fair presentation of finan-cial statements that are free from material misstatement, whether due to fraud or error. Auditors’ Responsibility Our responsibility is to express opinions on these financial statements based on our audit. We conducted our audit in accordance with auditing standards generally accepted in the United States of America and the standards applicable to financial audits contained in Government Auditing Standards, issued by the Comptroller General of the United States. Those standards require that we plan and perform the audit to obtain reasonable assurance about whether the financial statements are free from material misstatement. An audit involves performing procedures to obtain audit evidence about the amounts and disclosures in the financial statements. The procedures selected depend on the auditors’ judgment, including the assessment of the risks of material misstatement of the financial statements, whether due to fraud or error. In making those risk assess-ments, the auditor considers internal control relevant to the entity’s preparation and fair presentation of the financial statements in order to design audit procedures that are appropriate in the circumstances, but not for the purpose of expressing an opinion on the effectiveness of the entity’s internal control. Accordingly, we express no such opinion. An audit also includes evaluating the appropriateness of accounting policies
14
used and the reasonableness of significant accounting estimates made by manage-ment, as well as evaluating the overall presentation of the financial statements. We believe that the audit evidence we have obtained is sufficient and appropriate to provide a basis for our audit opinions. Opinions In our opinion, the financial statements referred to above present fairly, in all material respects, the respective financial position of the governmental activities, the business-type activities, each major fund, and the aggregate remaining fund information of the City of Keene, New Hampshire, as of June 30, 2017, and the respective changes in financial position and, where applicable, cash flows thereof and the respective budget-ary comparison for the general fund for the year then ended in accordance with account-ing principles generally accepted in the United States of America. Other Matters Required Supplementary Information Accounting principles generally accepted in the United States of America require that Management’s Discussion and Analysis, and the Pension and OPEB schedules appear-ing on pages 79 to 81 be presented to supplement the basic financial statements. Such information, although not a part of the basic financial statements, is required by the Governmental Accounting Standards Board, who considers it to be an essential part of financial reporting for placing the basic financial statements in an appropriate operational, economic, or historical context. We have applied certain limited proce-dures to the required supplementary information in accordance with auditing stand-ards generally accepted in the United States of America, which consisted of inquiries of management about the methods of preparing the information and comparing the information for consistency with management’s responses to our inquiries, the basic financial statements, and other knowledge we obtained during our audit of the basic financial statements. We do not express an opinion or provide any assurance on the information because the limited procedures do not provide us with evidence sufficient to express an opinion or provide any assurance. Other Information Our audit was conducted for the purpose of forming opinions on the financial statements that collectively comprise the City’s basic financial statements. The introductory section, combining and individual fund financial statements and schedules, and statistical section are presented for purposes of additional analysis and are not a required part of the basic financial statements. The combining and individual fund financial statements and schedules appearing on pages 85 through 95 are the responsibility of management and were derived from and relate directly to the underlying accounting and other records used to prepare the basic financial statements. Such information has been subjected to the auditing
15
procedures applied in the audit of the basic financial statements and certain addi-tional procedures, including comparing and reconciling such information directly to the underlying accounting and other records used to prepare the basic financial statements or to the basic financial statements themselves, and other additional procedures in accordance with auditing standards generally accepted in the United States of America. In our opinion, the combining and individual fund financial state-ments and schedules are fairly stated, in all material respects, in relation to the basic financial statements as a whole.
The introductory and statistical sections appearing on pages 1 through 10, and 99 through 115 have not been subjected to the auditing procedures applied in the audit of the basic financial statements and, accordingly, we do not express an opinion or provide any assurance on it.
Other Reporting Required by Government Auditing Standards
In accordance with Government Auditing Standards, we have also issued our report dated December 28, 2017 on our consideration of the City’s internal control over financial reporting and on our tests of its compliance with certain provisions of laws, regulations, contracts, and grant agreements and other matters. The purpose of that report is to describe the scope of our testing of internal control over financial report-ing and compliance and the results of that testing, and not to provide an opinion on internal control over financial reporting or on compliance. That report is an integral part of an audit performed in accordance with Government Auditing Standards in considering City’s internal control over financial reporting and compliance.
December 28, 2017
16
MANAGEMENT’S DISCUSSION AND ANALYSIS As management of the City, we offer readers this narrative overview and analysis of the financial activities of the City for the fiscal year ended June 30, 2017.
A. OVERVIEW OF THE FINANCIAL STATEMENTS
This discussion and analysis is intended to serve as an introduction to the basic financial statements. The basic financial statements comprise three components: (1) government-wide financial statements, (2) fund financial statements, and (3) notes to financial statements. This report also contains other supplementary information in addition to the basic financial statements themselves. Government-wide financial statements. The government-wide financial state-ments are designed to provide readers with a broad overview of our finances in a manner similar to a private-sector business. The Statement of Net Position presents information on all assets, liabilities, and deferred outflows/inflows of resources with the difference reported as net posi-tion. Over time, increases or decreases in net position may serve as a useful indicator of whether the financial position is improving or deteriorating. The Statement of Activities presents information showing how the City’s net posi-tion changed during the most recent fiscal year. All changes in net position are reported as soon as the underlying event giving rise to the change occurs, regard-less of the timing of related cash flows. Thus, revenues and expenses are reported in this statement for some items that will only result in cash flows in future fiscal periods (e.g., uncollected taxes and earned but unused vacation leave). Both of the government-wide financial statements distinguish functions that are principally supported by taxes and intergovernmental revenues (governmental activities) from other functions that are intended to recover all or a significant portion of their costs through user fees and charges (business-type activities). The governmental activities include general government, public safety, public works, welfare and human services, airport, library, planning, and parks and facilities. The business-type activities include water and sewer activities. Fund financial statements. A fund is a grouping of related accounts that is used to maintain control over resources that have been segregated for specific activi-ties or objectives. Fund accounting is used to ensure and demonstrate compli-ance with finance-related legal requirements. All of the funds can be divided into three categories: governmental funds, proprietary funds and fiduciary funds. Governmental funds. Governmental funds are used to account for essentially the same functions reported as governmental activities in the government-wide financial statements. However, unlike the government-wide financial statements,
17
governmental fund financial statements focus on near-term inflows and outflows of spendable resources, as well as on balances of spendable resources available at the end of the fiscal year. Such information may be useful in evaluating a gov-ernment’s near-term financing requirements. Because the focus of governmental funds is narrower than that of the government-wide financial statements, it is useful to compare the information presented for gov-ernmental funds with similar information presented for governmental activities in the government-wide financial statements. By doing so, readers may better under-stand the long-term impact of the government’s near-term financing decisions. Both the governmental fund balance sheet and the governmental fund statement of rev-enues, expenditures and changes in fund balances provide a reconciliation to facil-itate this comparison between governmental funds and governmental activities. An annual appropriated budget is adopted for the general fund. A budgetary comparison statement has been provided for the general fund to demonstrate compliance with this budget. Proprietary funds. Proprietary fund reporting focuses on the determination of operating income, changes in net position, financial position, and cash flows. The proprietary fund category includes enterprise and internal service funds. Enterprise funds are used to report activity for which a fee is charged to external users, and must be used when one of the following criteria are met: (1) activity is financed with debt that is secured solely by a pledge of the net revenues from fees and charges, (2) laws or regulations require the activity’s costs of providing services be recovered with fees and charges, and (3) the pricing policies of the activity establish fees and charges designed to recover its costs, including capital costs such as depreciation or debt service. The primary focus on these criteria is on fees charged to external users. Enterprise funds are used to report the same functions presented as business-type activities in the government-wide financial statements, only in more detail. Specifically, enterprise funds are used to account for water and sewer operations, which are considered to be major funds. Internal service funds are an accounting device used to accumulate and allocate costs internally among various functions. Specifically, internal service funds are used to account for the maintenance of certain City equipment. Because these services predominantly benefit governmental rather than business-type functions, they have been included within governmental activities in the government-wide financial statements. Fiduciary funds. Fiduciary funds are used to account for resources held for the benefit of parties outside the government. Fiduciary funds are not reflected in the government-wide financial statements because the resources of those funds are not available to support the City’s own programs. The accounting used for fiduci-ary funds is much like that used for proprietary funds.
18
Notes to financial statements. The notes provide additional information that is essential to a full understanding of the data provided in the government-wide and fund financial statements. Other information. In addition to the basic financial statements and accom-panying notes, this report also presents certain required supplementary infor-mation which is required to be disclosed by accounting principles generally accepted in the United States of America.
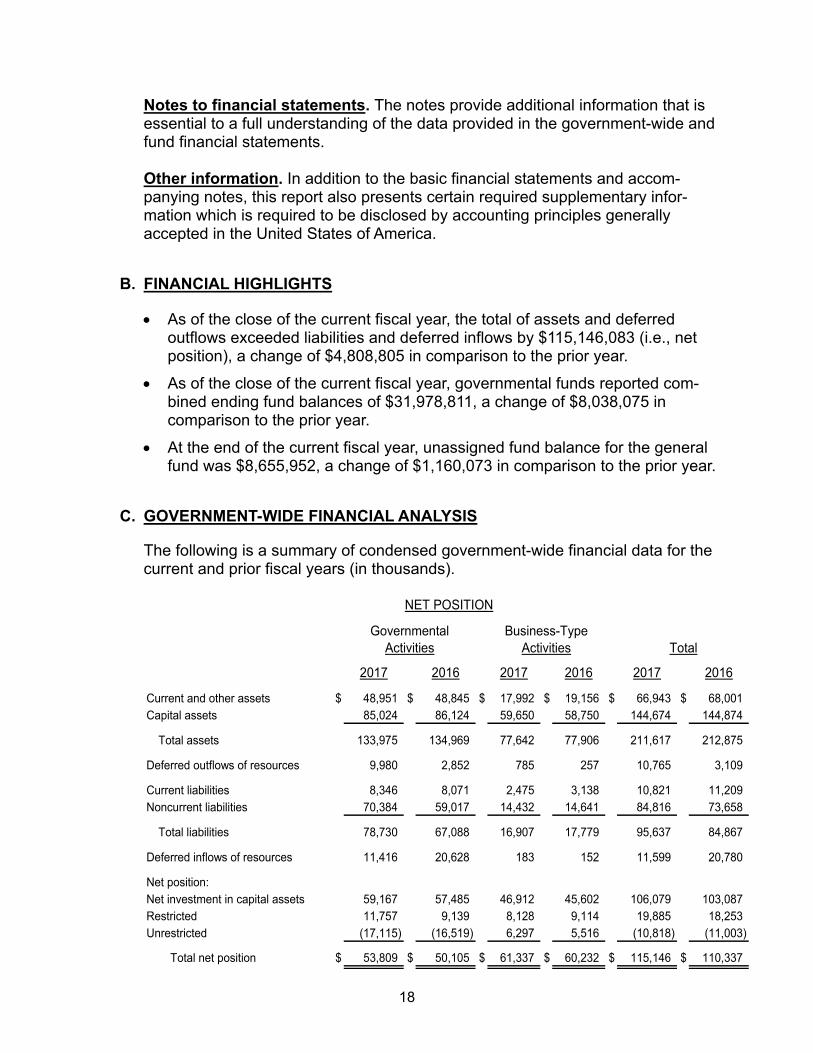
B. FINANCIAL HIGHLIGHTS
As of the close of the current fiscal year, the total of assets and deferred outflows exceeded liabilities and deferred inflows by $115,146,083 (i.e., net position), a change of $4,808,805 in comparison to the prior year.
As of the close of the current fiscal year, governmental funds reported com-bined ending fund balances of $31,978,811, a change of $8,038,075 in comparison to the prior year.
At the end of the current fiscal year, unassigned fund balance for the general fund was $8,655,952, a change of $1,160,073 in comparison to the prior year.
C. GOVERNMENT-WIDE FINANCIAL ANALYSIS
The following is a summary of condensed government-wide financial data for the current and prior fiscal years (in thousands).
2017 2016 2017 2016 2017 2016
Current and other assets $ 48,951 $ 48,845 $ 17,992 $ 19,156 $ 66,943 $ 68,001 Capital assets 85,024 86,124 59,650 58,750 144,674 144,874
Total assets 133,975 134,969 77,642 77,906 211,617 212,875
Deferred outflows of resources 9,980 2,852 785 257 10,765 3,109
Current liabilities 8,346 8,071 2,475 3,138 10,821 11,209 Noncurrent liabilities 70,384 59,017 14,432 14,641 84,816 73,658
Total liabilities 78,730 67,088 16,907 17,779 95,637 84,867
Deferred inflows of resources 11,416 20,628 183 152 11,599 20,780
Net position:Net investment in capital assets 59,167 57,485 46,912 45,602 106,079 103,087 Restricted 11,757 9,139 8,128 9,114 19,885 18,253 Unrestricted (17,115) (16,519) 6,297 5,516 (10,818) (11,003)
Total net position $ 53,809 $ 50,105 $ 61,337 $ 60,232 $ 115,146 $ 110,337
NET POSITION
Governmental Activities
Business-TypeActivities Total
19
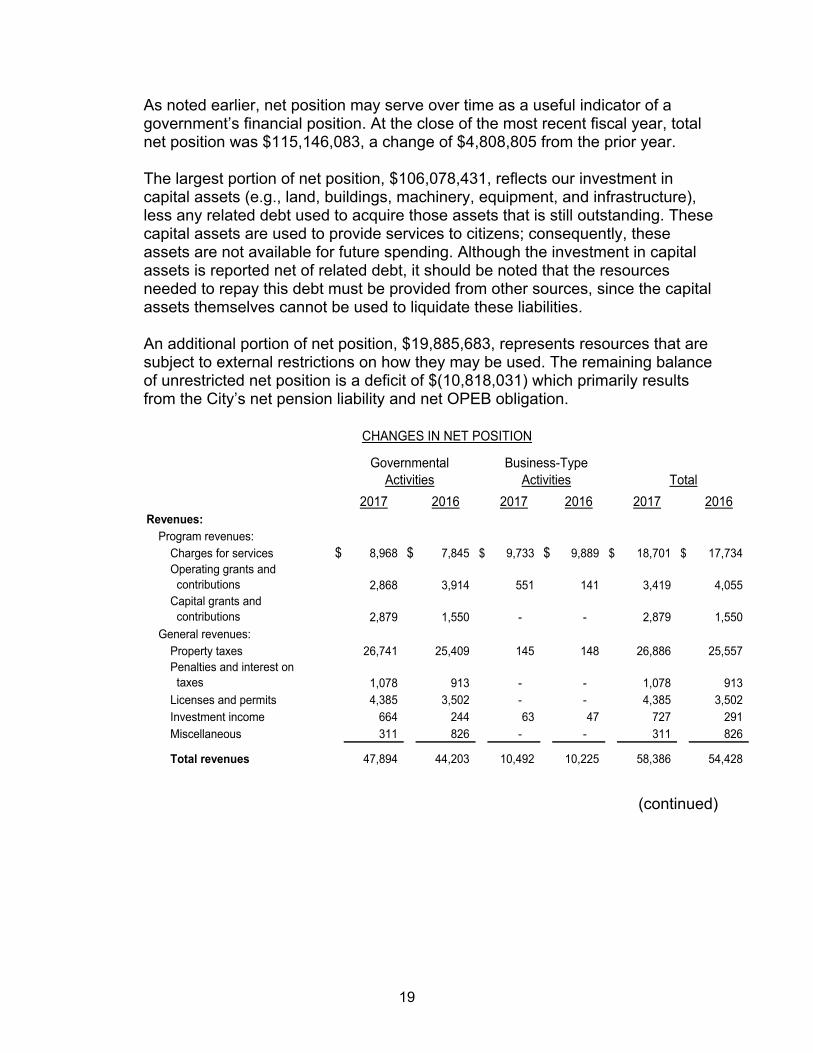
As noted earlier, net position may serve over time as a useful indicator of a government’s financial position. At the close of the most recent fiscal year, total net position was $115,146,083, a change of $4,808,805 from the prior year. The largest portion of net position, $106,078,431, reflects our investment in capital assets (e.g., land, buildings, machinery, equipment, and infrastructure), less any related debt used to acquire those assets that is still outstanding. These capital assets are used to provide services to citizens; consequently, these assets are not available for future spending. Although the investment in capital assets is reported net of related debt, it should be noted that the resources needed to repay this debt must be provided from other sources, since the capital assets themselves cannot be used to liquidate these liabilities. An additional portion of net position, $19,885,683, represents resources that are subject to external restrictions on how they may be used. The remaining balance of unrestricted net position is a deficit of $(10,818,031) which primarily results from the City’s net pension liability and net OPEB obligation.
2017 2016 2017 2016 2017 2016Revenues:
Program revenues:Charges for services $ 8,968 $ 7,845 $ 9,733 $ 9,889 $ 18,701 $ 17,734 Operating grants and contributions 2,868 3,914 551 141 3,419 4,055 Capital grants and contributions 2,879 1,550 - - 2,879 1,550
General revenues:Property taxes 26,741 25,409 145 148 26,886 25,557 Penalties and interest on taxes 1,078 913 - - 1,078 913 Licenses and permits 4,385 3,502 - - 4,385 3,502 Investment income 664 244 63 47 727 291 Miscellaneous 311 826 - - 311 826
Total revenues 47,894 44,203 10,492 10,225 58,386 54,428
CHANGES IN NET POSITION
Governmental Activities
Business-TypeActivities Total
(continued)
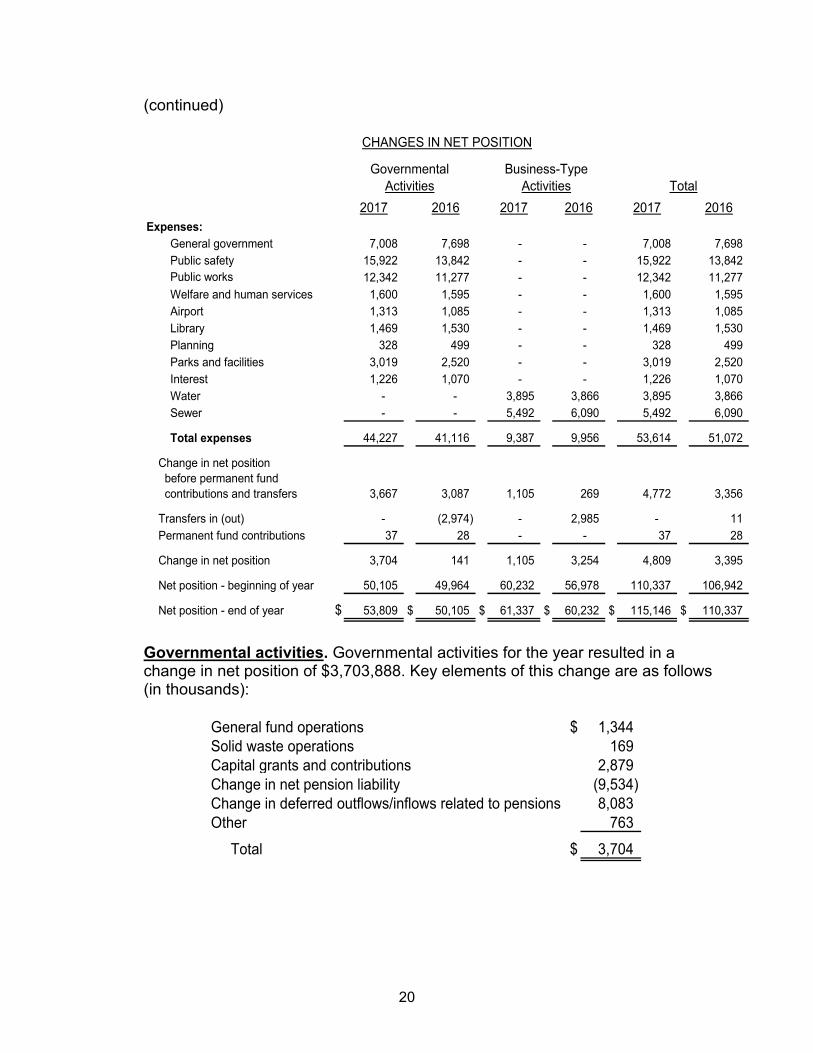
20
(continued)
2017 2016 2017 2016 2017 2016
CHANGES IN NET POSITION
Governmental Activities
Business-TypeActivities Total
Expenses:
General government 7,008 7,698 - - 7,008 7,698 Public safety 15,922 13,842 - - 15,922 13,842 Public works 12,342 11,277 - - 12,342 11,277 Welfare and human services 1,600 1,595 - - 1,600 1,595 Airport 1,313 1,085 - - 1,313 1,085 Library 1,469 1,530 - - 1,469 1,530 Planning 328 499 - - 328 499 Parks and facilities 3,019 2,520 - - 3,019 2,520 Interest 1,226 1,070 - - 1,226 1,070 Water - - 3,895 3,866 3,895 3,866 Sewer - - 5,492 6,090 5,492 6,090
Total expenses 44,227 41,116 9,387 9,956 53,614 51,072
3,667 3,087 1,105 269 4,772 3,356
- (2,974) - 2,985 - 11 37 28 - - 37 28
3,704 141 1,105 3,254 4,809 3,395
50,105 49,964 60,232 56,978 110,337 106,942
$ 53,809 $ 50,105 $ 61,337 $ 60,232 $ 115,146 $ 110,337
Permanent fund contributions
Change in net position
Net position - beginning of year
Net position - end of year
Change in net position before permanent fund contributions and transfers
Transfers in (out)
Governmental activities. Governmental activities for the year resulted in a change in net position of $3,703,888. Key elements of this change are as follows (in thousands):
General fund operations $ 1,344 Solid waste operations 169 Capital grants and contributions 2,879 Change in net pension liability (9,534) Change in deferred outflows/inflows related to pensions 8,083 Other 763
Total $ 3,704
21
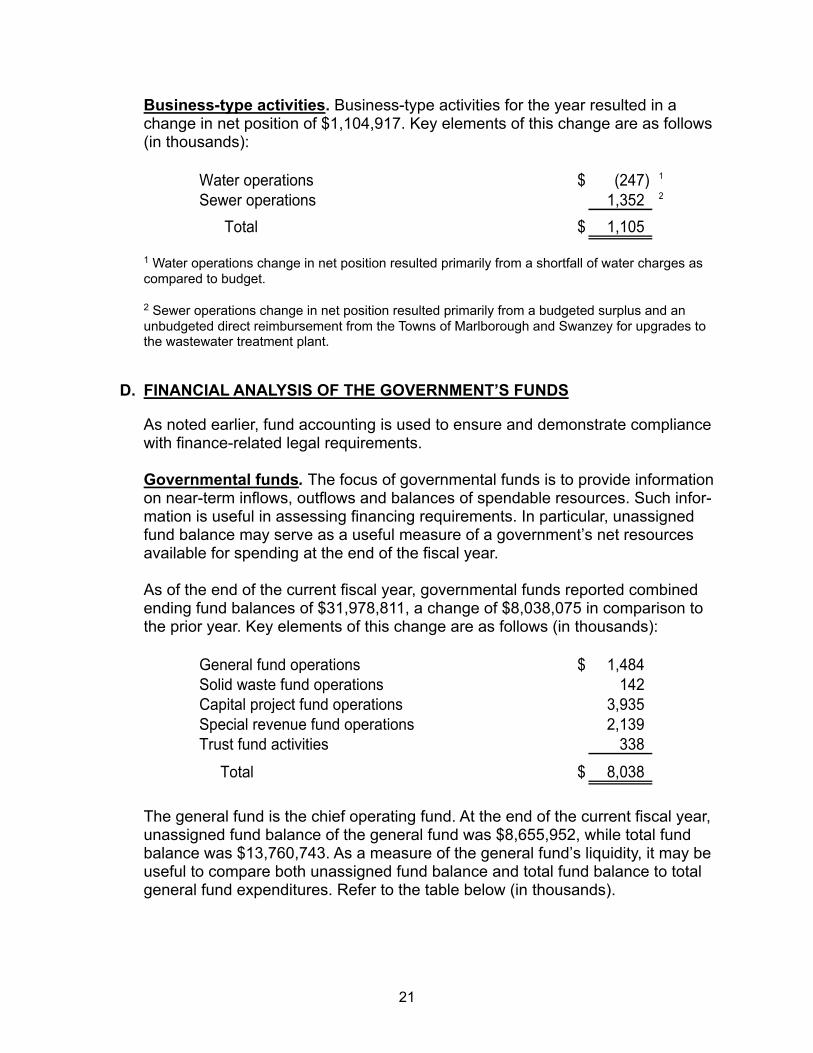
Business-type activities. Business-type activities for the year resulted in a change in net position of $1,104,917. Key elements of this change are as follows (in thousands):
Water operations $ (247) 1
Sewer operations 1,352 2
Total $ 1,105
1 Water operations change in net position resulted primarily from a shortfall of water charges as compared to budget. 2 Sewer operations change in net position resulted primarily from a budgeted surplus and an unbudgeted direct reimbursement from the Towns of Marlborough and Swanzey for upgrades to the wastewater treatment plant.
D. FINANCIAL ANALYSIS OF THE GOVERNMENT’S FUNDS
As noted earlier, fund accounting is used to ensure and demonstrate compliance with finance-related legal requirements. Governmental funds. The focus of governmental funds is to provide information on near-term inflows, outflows and balances of spendable resources. Such infor-mation is useful in assessing financing requirements. In particular, unassigned fund balance may serve as a useful measure of a government’s net resources available for spending at the end of the fiscal year. As of the end of the current fiscal year, governmental funds reported combined ending fund balances of $31,978,811, a change of $8,038,075 in comparison to the prior year. Key elements of this change are as follows (in thousands):
General fund operations $ 1,484 Solid waste fund operations 142 Capital project fund operations 3,935 Special revenue fund operations 2,139 Trust fund activities 338
Total $ 8,038
The general fund is the chief operating fund. At the end of the current fiscal year, unassigned fund balance of the general fund was $8,655,952, while total fund balance was $13,760,743. As a measure of the general fund’s liquidity, it may be useful to compare both unassigned fund balance and total fund balance to total general fund expenditures. Refer to the table below (in thousands).
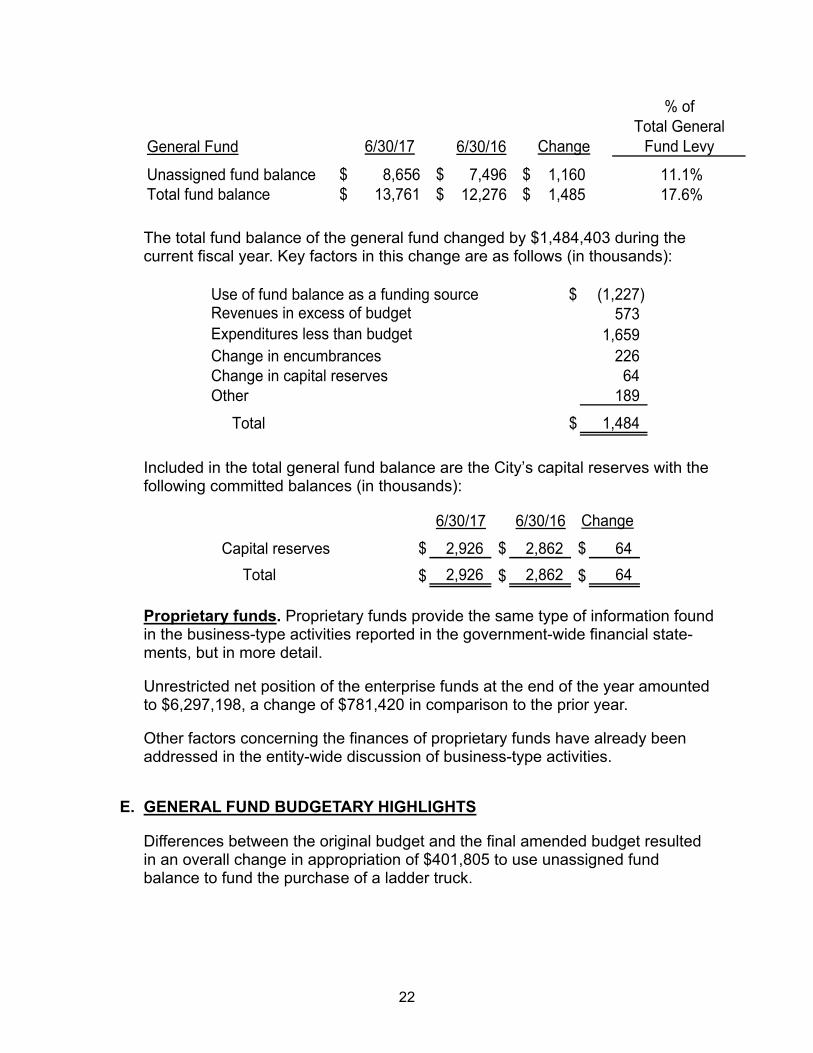
22
General Fund 6/30/16
Unassigned fund balance $ 8,656 $ 7,496 $ 1,160 11.1%Total fund balance $ 13,761 $ 12,276 $ 1,485 17.6%
Fund Levy
% ofTotal General
Change6/30/17
The total fund balance of the general fund changed by $1,484,403 during the current fiscal year. Key factors in this change are as follows (in thousands):
Use of fund balance as a funding source $ (1,227) Revenues in excess of budget 573 Expenditures less than budget 1,659 Change in encumbrances 226 Change in capital reserves 64 Other 189
Total $ 1,484
Included in the total general fund balance are the City’s capital reserves with the following committed balances (in thousands):
6/30/17 6/30/16
Capital reserves $ 2,926 $ 2,862 $ 64
Total $ 2,926 $ 2,862 $ 64
Change
Proprietary funds. Proprietary funds provide the same type of information found in the business-type activities reported in the government-wide financial state-ments, but in more detail. Unrestricted net position of the enterprise funds at the end of the year amounted to $6,297,198, a change of $781,420 in comparison to the prior year. Other factors concerning the finances of proprietary funds have already been addressed in the entity-wide discussion of business-type activities.
E. GENERAL FUND BUDGETARY HIGHLIGHTS
Differences between the original budget and the final amended budget resulted in an overall change in appropriation of $401,805 to use unassigned fund balance to fund the purchase of a ladder truck.
23
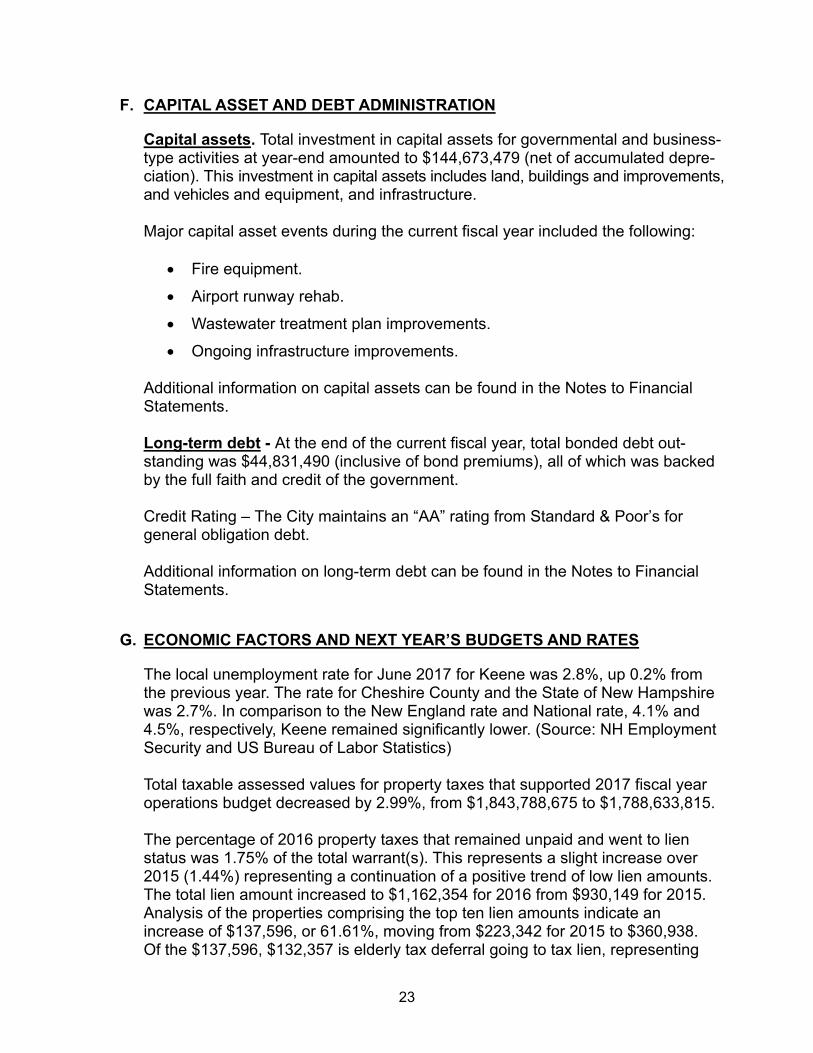
F. CAPITAL ASSET AND DEBT ADMINISTRATION
Capital assets. Total investment in capital assets for governmental and business-type activities at year-end amounted to $144,673,479 (net of accumulated depre-ciation). This investment in capital assets includes land, buildings and improvements, and vehicles and equipment, and infrastructure. Major capital asset events during the current fiscal year included the following:
Fire equipment.
Airport runway rehab.
Wastewater treatment plan improvements.
Ongoing infrastructure improvements. Additional information on capital assets can be found in the Notes to Financial Statements. Long-term debt - At the end of the current fiscal year, total bonded debt out-standing was $44,831,490 (inclusive of bond premiums), all of which was backed by the full faith and credit of the government. Credit Rating – The City maintains an “AA” rating from Standard & Poor’s for general obligation debt. Additional information on long-term debt can be found in the Notes to Financial Statements.
G. ECONOMIC FACTORS AND NEXT YEAR’S BUDGETS AND RATES
The local unemployment rate for June 2017 for Keene was 2.8%, up 0.2% from the previous year. The rate for Cheshire County and the State of New Hampshire was 2.7%. In comparison to the New England rate and National rate, 4.1% and 4.5%, respectively, Keene remained significantly lower. (Source: NH Employment Security and US Bureau of Labor Statistics) Total taxable assessed values for property taxes that supported 2017 fiscal year operations budget decreased by 2.99%, from $1,843,788,675 to $1,788,633,815. The percentage of 2016 property taxes that remained unpaid and went to lien status was 1.75% of the total warrant(s). This represents a slight increase over 2015 (1.44%) representing a continuation of a positive trend of low lien amounts. The total lien amount increased to $1,162,354 for 2016 from $930,149 for 2015. Analysis of the properties comprising the top ten lien amounts indicate an increase of $137,596, or 61.61%, moving from $223,342 for 2015 to $360,938. Of the $137,596, $132,357 is elderly tax deferral going to tax lien, representing
24
96.19% of the 2016 increase. The total number of properties liened was 232, down 14 from 2015. Out of the top ten parcels liened, four were commercial, which is down three from the previous year. By fiscal year end, 98.48% of the entire 2016 tax warrant had been collected; continuing a trend of higher collection rates. When developing a budget for the ensuing year, many factors are taken into consideration by City officials: property tax burden, water and sewer utility rate burden, continuation of municipal services and service levels, compliance with statutory and other legal requirements (e.g., adequate welfare budget, budget for debt service costs, funding cost items contained within collective bargaining agreements, contributions required by the NH Retirement System), and the fair and adequate compensation of its employees, to name a few. Rooms and Meals Tax, shared by the State with local entities according to a formula that provides for limited sharing of additional revenue, are projected to remain stable. Reflective of legislative changes, the distribution of the highway funds derived from the Gas Tax are projected to increase slightly, while interest earnings continue to remain at historic lows. The City, in accordance with its own fiscal policies, has continued to make preservation of principal the highest prior-ity. With longer term multi-year instruments maturing, interest earning declines will continue until market investment rates rise. Motor vehicle registration fees, a significant source of General Fund Revenue, continue to trend higher, exceeding projections for FY17 and expected to exceed projections for FY18. Water and sewer utility rates are reviewed every year, and are adjusted accord-ingly by the City Council. The rates have been adjusted each year since 2006, after a decade of no rate changes. The City is beginning to implement rate increases in the sewer rates to provide the resources necessary for a substantial upgrade of the Wastewater Treatment Plant to accommodate the EPA-ordered removal of phosphorus and other metals. Although rate adjustments required for this project are less than prior estimates, the costs of replacing original equip-ment and technology installed in the early 1980s will require financial resources. The City continues to see the value in investing in its infrastructure. Planning is underway for the reconstruction of Winchester Street from Route 101 to the Winchester Street bridge. This project is largely funded by the State of New Hampshire, and includes the construction of a pedestrian bridge over Route 101. In FY17, the City continues the replacement of four bridges and resurface roads, update drainage systems, improve sidewalks, and fund capital reserves for the scheduled replacement of fire apparatus, ambulances and other fleet compo-nents. The Comprehensive Master Plan will guide the City as it prepares for the next budget cycle and will continue to focus on sustainability and core community values. As the City prepares for the FY19 budget cycle, it will continue to focus on efforts to streamline the organization and directing attention to services that are integral to the quality of life enjoyed by residents and visitors alike. The Comprehensive
25
Master Plan will guide this effort. In addition, a thorough review of the regulatory process, rules and regulations, and a greater emphasis on collaboration and/or contracted services, offer potential opportunities to realize additional efficiencies in the future. The City Council conducted its annual review of the City’s Fiscal Policies in August 2016. The policies incorporate best practices, as outlined by the National Advisory Council on State and Local Budgeting (NACSLB). This review serves to focus elected officials and staff on principals and best practices that advance the organization’s fiscal security. The policies provide guidance on fund structure, revenues, fees and charges, capital improvement program, debt, capital assets, investment of temporarily idle funds, and stabilization funds. As part of those policies, the practice of projecting operating and capital budgets, as well as revenues over a three-year horizon advancing ability to anticipate and respond strategically to community needs continues.
REQUESTS FOR INFORMATION This financial report is designed to provide a general overview of the City of Keene’s finances for all those with an interest in the government’s finances. Questions concerning any of the information provided in this report or requests for additional financial information should be addressed to:
Office of the Finance Director
City Hall
3 Washington Street
Keene, New Hampshire 03431

26
(This page intentionally left blank.)
27
BASIC FINANCIAL STATEMENTS

28
(This page intentionally left blank.)
29
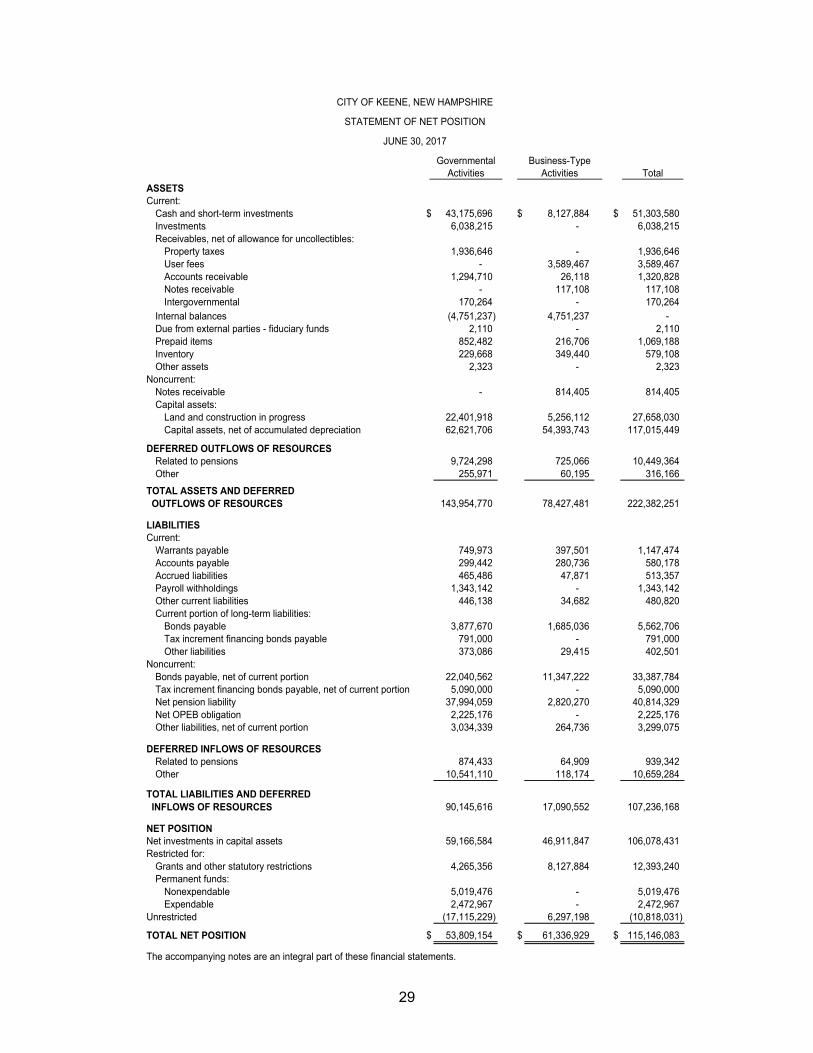
Total
ASSETSCurrent:
Cash and short-term investments $ 43,175,696 $ 8,127,884 $ 51,303,580 Investments 6,038,215 - 6,038,215 Receivables, net of allowance for uncollectibles:
Property taxes 1,936,646 - 1,936,646 User fees - 3,589,467 3,589,467 Accounts receivable 1,294,710 26,118 1,320,828 Notes receivable - 117,108 117,108 Intergovernmental 170,264 - 170,264
Internal balances (4,751,237) 4,751,237 - Due from external parties - fiduciary funds 2,110 - 2,110 Prepaid items 852,482 216,706 1,069,188 Inventory 229,668 349,440 579,108 Other assets 2,323 - 2,323
Noncurrent:Notes receivable - 814,405 814,405 Capital assets:
Land and construction in progress 22,401,918 5,256,112 27,658,030 Capital assets, net of accumulated depreciation 62,621,706 54,393,743 117,015,449
DEFERRED OUTFLOWS OF RESOURCESRelated to pensions 9,724,298 725,066 10,449,364 Other 255,971 60,195 316,166
143,954,770 78,427,481 222,382,251
LIABILITIESCurrent:
Warrants payable 749,973 397,501 1,147,474 Accounts payable 299,442 280,736 580,178 Accrued liabilities 465,486 47,871 513,357 Payroll withholdings 1,343,142 - 1,343,142 Other current liabilities 446,138 34,682 480,820 Current portion of long-term liabilities:
Bonds payable 3,877,670 1,685,036 5,562,706 Tax increment financing bonds payable 791,000 - 791,000 Other liabilities 373,086 29,415 402,501
Noncurrent:Bonds payable, net of current portion 22,040,562 11,347,222 33,387,784 Tax increment financing bonds payable, net of current portion 5,090,000 - 5,090,000 Net pension liability 37,994,059 2,820,270 40,814,329 Net OPEB obligation 2,225,176 - 2,225,176 Other liabilities, net of current portion 3,034,339 264,736 3,299,075
DEFERRED INFLOWS OF RESOURCESRelated to pensions 874,433 64,909 939,342 Other 10,541,110 118,174 10,659,284
90,145,616 17,090,552 107,236,168
NET POSITIONNet investments in capital assets 59,166,584 46,911,847 106,078,431 Restricted for:
Grants and other statutory restrictions 4,265,356 8,127,884 12,393,240 Permanent funds:
Nonexpendable 5,019,476 - 5,019,476 Expendable 2,472,967 - 2,472,967
Unrestricted (17,115,229) 6,297,198 (10,818,031)
TOTAL NET POSITION $ 53,809,154 $ 61,336,929 $ 115,146,083
The accompanying notes are an integral part of these financial statements.
TOTAL ASSETS AND DEFERRED OUTFLOWS OF RESOURCES
TOTAL LIABILITIES AND DEFERRED INFLOWS OF RESOURCES
ActivitiesBusiness-Type
Activities
CITY OF KEENE, NEW HAMPSHIRE
STATEMENT OF NET POSITION
JUNE 30, 2017
Governmental
30
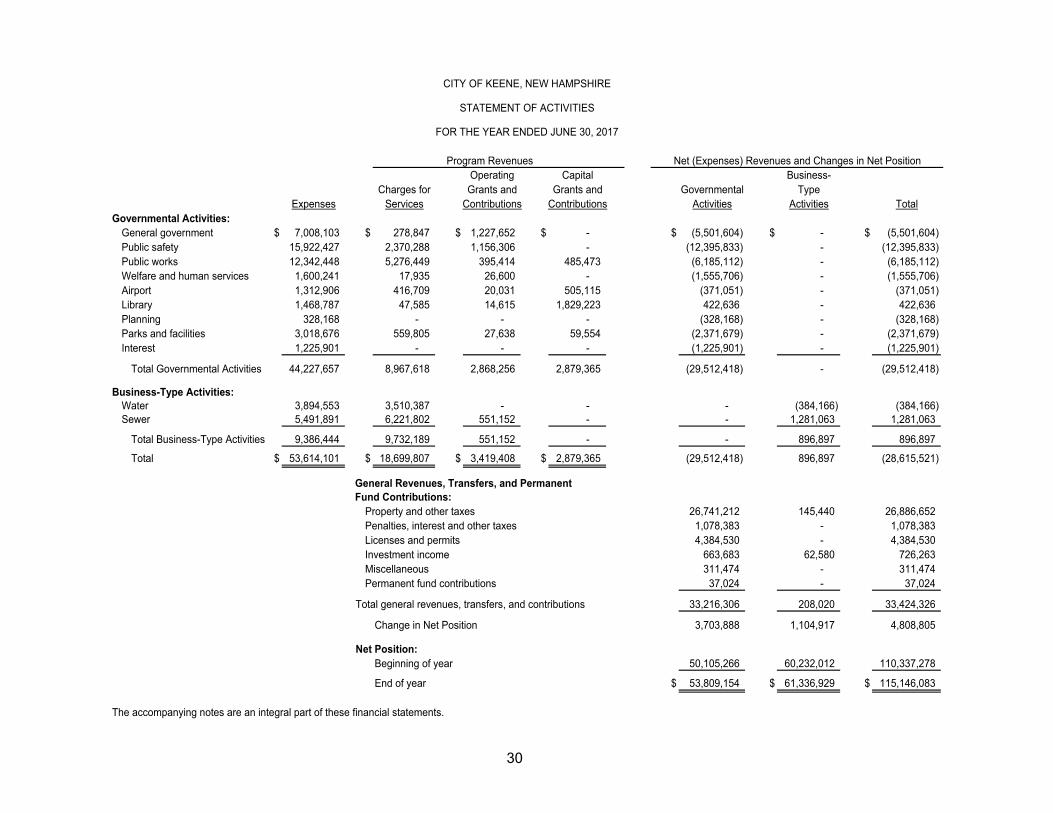
Operating Capital Business-Charges for Grants and Grants and Governmental Type
Expenses Services Contributions Contributions Activities Activities TotalGovernmental Activities:
General government $ 7,008,103 $ 278,847 $ 1,227,652 $ - $ (5,501,604) $ - $ (5,501,604) Public safety 15,922,427 2,370,288 1,156,306 - (12,395,833) - (12,395,833) Public works 12,342,448 5,276,449 395,414 485,473 (6,185,112) - (6,185,112) Welfare and human services 1,600,241 17,935 26,600 - (1,555,706) - (1,555,706) Airport 1,312,906 416,709 20,031 505,115 (371,051) - (371,051) Library 1,468,787 47,585 14,615 1,829,223 422,636 - 422,636 Planning 328,168 - - - (328,168) - (328,168) Parks and facilities 3,018,676 559,805 27,638 59,554 (2,371,679) - (2,371,679) Interest 1,225,901 - - - (1,225,901) - (1,225,901)
Total Governmental Activities 44,227,657 8,967,618 2,868,256 2,879,365 (29,512,418) - (29,512,418)
Business-Type Activities:Water 3,894,553 3,510,387 - - - (384,166) (384,166) Sewer 5,491,891 6,221,802 551,152 - - 1,281,063 1,281,063
Total Business-Type Activities 9,386,444 9,732,189 551,152 - - 896,897 896,897
Total $ 53,614,101 $ 18,699,807 $ 3,419,408 $ 2,879,365 (29,512,418) 896,897 (28,615,521)
Property and other taxes 26,741,212 145,440 26,886,652 Penalties, interest and other taxes 1,078,383 - 1,078,383 Licenses and permits 4,384,530 - 4,384,530 Investment income 663,683 62,580 726,263 Miscellaneous 311,474 - 311,474 Permanent fund contributions 37,024 - 37,024
Total general revenues, transfers, and contributions 33,216,306 208,020 33,424,326
Change in Net Position 3,703,888 1,104,917 4,808,805
Net Position:Beginning of year 50,105,266 60,232,012 110,337,278
End of year $ 53,809,154 $ 61,336,929 $ 115,146,083
The accompanying notes are an integral part of these financial statements.
General Revenues, Transfers, and Permanent Fund Contributions:
CITY OF KEENE, NEW HAMPSHIRE
FOR THE YEAR ENDED JUNE 30, 2017
STATEMENT OF ACTIVITIES
Net (Expenses) Revenues and Changes in Net PositionProgram Revenues
31
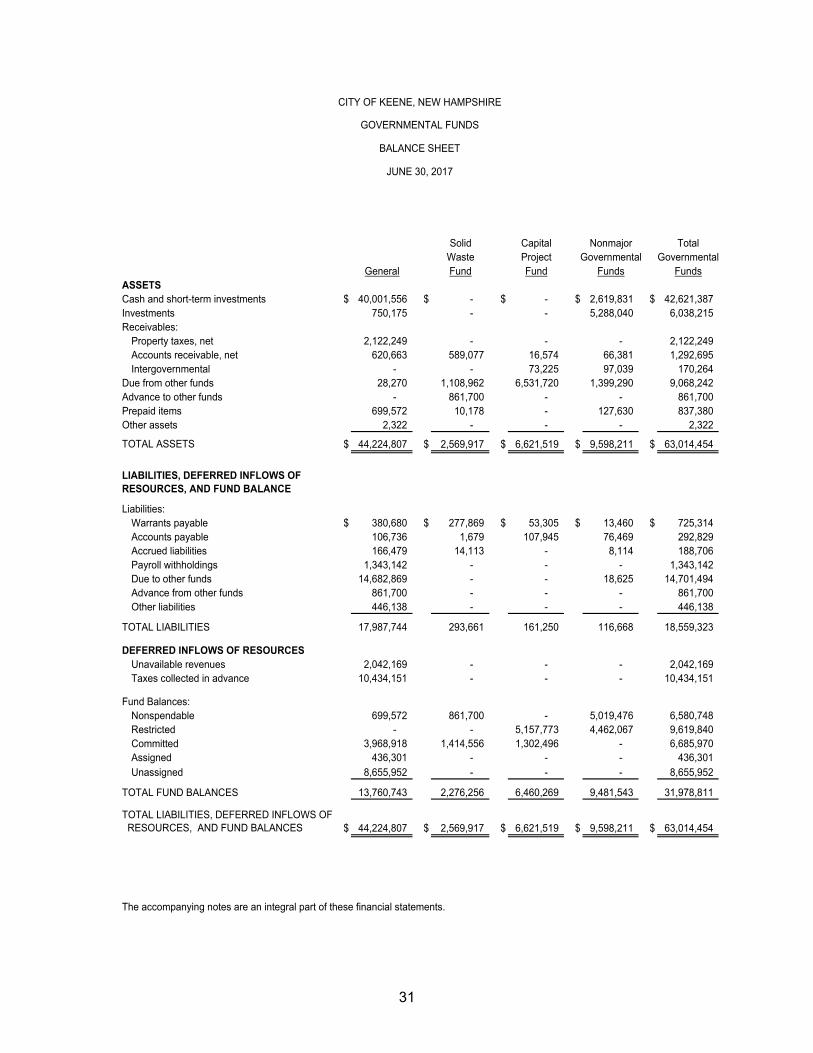
Solid Capital Nonmajor TotalWaste Project Governmental Governmental
General Fund Fund Funds Funds
Cash and short-term investments $ 40,001,556 $ - $ - $ 2,619,831 $ 42,621,387 Investments 750,175 - - 5,288,040 6,038,215 Receivables:
Property taxes, net 2,122,249 - - - 2,122,249 Accounts receivable, net 620,663 589,077 16,574 66,381 1,292,695 Intergovernmental - - 73,225 97,039 170,264
Due from other funds 28,270 1,108,962 6,531,720 1,399,290 9,068,242 Advance to other funds - 861,700 - - 861,700 Prepaid items 699,572 10,178 - 127,630 837,380 Other assets 2,322 - - - 2,322
$ 44,224,807 $ 2,569,917 $ 6,621,519 $ 9,598,211 $ 63,014,454
Liabilities:Warrants payable $ 380,680 $ 277,869 $ 53,305 $ 13,460 $ 725,314 Accounts payable 106,736 1,679 107,945 76,469 292,829 Accrued liabilities 166,479 14,113 - 8,114 188,706 Payroll withholdings 1,343,142 - - - 1,343,142 Due to other funds 14,682,869 - - 18,625 14,701,494 Advance from other funds 861,700 - - - 861,700 Other liabilities 446,138 - - - 446,138
TOTAL LIABILITIES 17,987,744 293,661 161,250 116,668 18,559,323
DEFERRED INFLOWS OF RESOURCESUnavailable revenues 2,042,169 - - - 2,042,169 Taxes collected in advance 10,434,151 - - - 10,434,151
Fund Balances:Nonspendable 699,572 861,700 - 5,019,476 6,580,748 Restricted - - 5,157,773 4,462,067 9,619,840 Committed 3,968,918 1,414,556 1,302,496 - 6,685,970 Assigned 436,301 - - - 436,301 Unassigned 8,655,952 - - - 8,655,952
TOTAL FUND BALANCES 13,760,743 2,276,256 6,460,269 9,481,543 31,978,811
$ 44,224,807 $ 2,569,917 $ 6,621,519 $ 9,598,211 $ 63,014,454
The accompanying notes are an integral part of these financial statements.
TOTAL LIABILITIES, DEFERRED INFLOWS OF RESOURCES, AND FUND BALANCES
LIABILITIES, DEFERRED INFLOWS OF RESOURCES, AND FUND BALANCE
ASSETS
CITY OF KEENE, NEW HAMPSHIRE
BALANCE SHEET
JUNE 30, 2017
GOVERNMENTAL FUNDS
TOTAL ASSETS

32
Total governmental fund balances $ 31,978,811
Capital assets used in governmental activities are not financialresources and, therefore, are not reported in governmental funds. 82,709,610
Deferred outflows of resources related to losses on refunding bonds are notfinancial resources, and therefore, are not reported in governmental funds 255,971
Revenues are reported on the accrual basis of accountingand are not deferred until collection. 1,856,566
Internal service funds are used to account for the financing ofservices provided by one department to other departments of theCity. The assets and liabilities of the internal service funds areincluded in governmental activities in the statement of net position. 3,725,717
In the Statement of Activities, interest is accrued on outstandinglong-term debt, whereas in governmental funds interest is not reported until due. (266,433)
Long-term liabilities, and related deferred outflows/inflows of resources, are not due and payable in the current period and,therefore, are not reported in the governmental funds.
Bonds payable (25,918,232)
Tax increment financing bonds payable (5,881,000)
Net pension liability (37,994,059)
Pension related deferred outflows of resources 9,724,298
Pension related deferred inflows of resources (874,433)
Net OPEB obligation (2,225,176)
Other long-term liabilities (3,175,528)
Deferred inflows of resources related to gains on refunding bonds are notfinancial resources, and therefore, are not reported in governmental funds (106,958)
Net position of governmental activities $ 53,809,154
The accompanying notes are an integral part of these financial statements.
JUNE 30, 2017
CITY OF KEENE, NEW HAMPSHIRE
RECONCILIATION OF TOTAL GOVERNMENTAL FUNDBALANCES TO NET POSITION OF GOVERNMENTALACTIVITIES IN THE STATEMENT OF NET POSITION
33
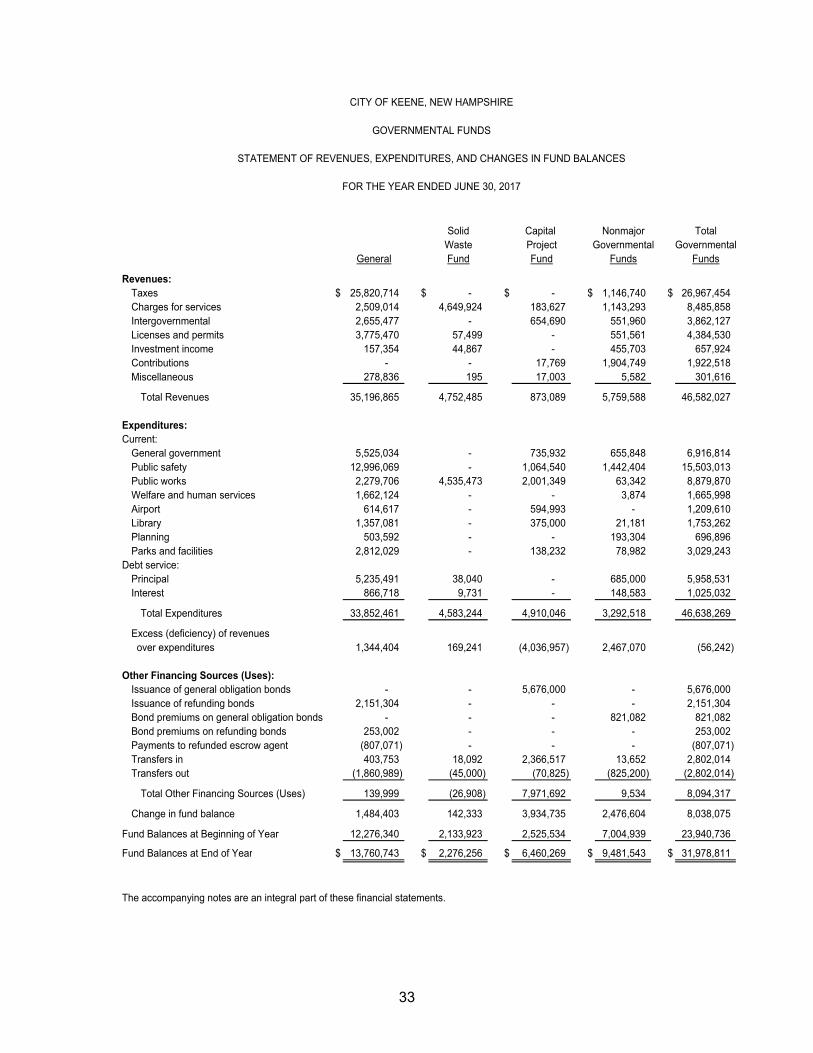
Solid Capital Nonmajor TotalWaste Project Governmental Governmental
General Fund Fund Funds Funds
Revenues:Taxes $ 25,820,714 $ - $ - $ 1,146,740 $ 26,967,454 Charges for services 2,509,014 4,649,924 183,627 1,143,293 8,485,858 Intergovernmental 2,655,477 - 654,690 551,960 3,862,127 Licenses and permits 3,775,470 57,499 - 551,561 4,384,530 Investment income 157,354 44,867 - 455,703 657,924 Contributions - - 17,769 1,904,749 1,922,518 Miscellaneous 278,836 195 17,003 5,582 301,616
Total Revenues 35,196,865 4,752,485 873,089 5,759,588 46,582,027
Expenditures:Current:
General government 5,525,034 - 735,932 655,848 6,916,814 Public safety 12,996,069 - 1,064,540 1,442,404 15,503,013 Public works 2,279,706 4,535,473 2,001,349 63,342 8,879,870 Welfare and human services 1,662,124 - - 3,874 1,665,998 Airport 614,617 - 594,993 - 1,209,610 Library 1,357,081 - 375,000 21,181 1,753,262 Planning 503,592 - - 193,304 696,896 Parks and facilities 2,812,029 - 138,232 78,982 3,029,243
Debt service:Principal 5,235,491 38,040 - 685,000 5,958,531 Interest 866,718 9,731 - 148,583 1,025,032
Total Expenditures 33,852,461 4,583,244 4,910,046 3,292,518 46,638,269
Excess (deficiency) of revenues over expenditures 1,344,404 169,241 (4,036,957) 2,467,070 (56,242)
Other Financing Sources (Uses):Issuance of general obligation bonds - - 5,676,000 - 5,676,000 Issuance of refunding bonds 2,151,304 - - - 2,151,304 Bond premiums on general obligation bonds - - - 821,082 821,082 Bond premiums on refunding bonds 253,002 - - - 253,002 Payments to refunded escrow agent (807,071) - - - (807,071) Transfers in 403,753 18,092 2,366,517 13,652 2,802,014 Transfers out (1,860,989) (45,000) (70,825) (825,200) (2,802,014)
Total Other Financing Sources (Uses) 139,999 (26,908) 7,971,692 9,534 8,094,317
Change in fund balance 1,484,403 142,333 3,934,735 2,476,604 8,038,075
Fund Balances at Beginning of Year 12,276,340 2,133,923 2,525,534 7,004,939 23,940,736
Fund Balances at End of Year $ 13,760,743 $ 2,276,256 $ 6,460,269 $ 9,481,543 $ 31,978,811
The accompanying notes are an integral part of these financial statements.
CITY OF KEENE, NEW HAMPSHIRE
GOVERNMENTAL FUNDS
STATEMENT OF REVENUES, EXPENDITURES, AND CHANGES IN FUND BALANCES
FOR THE YEAR ENDED JUNE 30, 2017
34
$ 8,038,075
Governmental funds report capital outlays as expenditures. However,in the Statement of Activities the cost of those assets is allocatedover their estimated useful lives and reported as depreciation expense:
Capital outlay, net of disposals 2,732,386
Depreciation (4,190,715)
Revenues in the Statement of Activities that do not provide currentfinancial resources are fully deferred in the Statement of Revenues,Expenditures, and Changes in Fund Balances. Therefore, therecognition of revenue for various types of accounts receivable (e.g., property taxes) differ between the two statements. This amount represents the net change in deferred revenue. 852,141
The issuance of long-term debt (e.g., bonds) providescurrent financial resources to governmental funds, while the repaymentof the principal of long-term debt consumes the financial resources ofgovernmental funds. Neither transaction, however, has any effect on net position:
Issuance of debt (7,827,304)
Repayments of debt 6,631,467
Premiums from issuance of debt (1,074,084)
Bond premium amortization 107,408
Gain on bond refunding (118,867)
Amortize gain on refunding bonds 11,908
Amortize loss on prior years refunding bonds (37,203)
In the Statement of Activities, interest is accrued on outstandinglong-term debt, whereas in governmental funds interest is not reported until due. (23,515)
Some expenses reported in the Statement of Activities, do not require the useof current financial resources and therefore, are not reported as expendituresin the governmental funds.
Change in net pension liability (9,533,805)
Change in pension related deferred outflows 7,165,103
Change in pension related deferred inflows 918,146
Change in net OPEB obligation (218,638)
Change in other liabilities 6,480
Internal service funds are used by management to charge the costof certain activities to individual funds. The net activity ofinternal service funds is reported with Governmental Activities. 264,905
$ 3,703,888
The accompanying notes are an integral part of these financial statements.
Change in net position of governmental activities
Net changes in fund balances - Total governmental funds
FOR THE YEAR ENDED JUNE 30, 2017
CITY OF KEENE, NEW HAMPSHIRE
RECONCILIATION OF THE STATEMENT OF REVENUES,EXPENDITURES, AND CHANGES IN FUND BALANCES OF
GOVERNMENTAL FUNDS TO THE STATEMENT OF ACTIVITIES

35
Actual Variance withAmounts Final Budget
Original Final (Budgetary PositiveBudget Budget Basis) (Negative)
Revenues and other sources:Property taxes $ 24,552,112 24,552,112 24,552,112 $ - Interest, penalties, and other taxes 491,509 491,509 520,756 29,247 Licenses and permits 3,423,280 3,423,280 3,775,470 352,190 Intergovernmental 2,699,243 2,699,243 2,655,477 (43,766) Charges for services 1,813,131 1,813,131 1,940,290 127,159 Other revenues 1,376,118 1,376,119 1,656,160 280,041 Other financing sources:
Transfers in 2,371,741 2,371,741 2,199,999 (171,742) Use of fund balance 825,000 1,226,804 - (1,226,804)
Total Revenues and other sources 37,552,134 37,953,939 37,300,264 (653,675)
Expenditures and other uses:Unclassified:
Mayor & city council 181,468 182,614 175,142 7,472 City manager 270,472 293,371 289,975 3,396 City attorney 334,697 342,104 305,711 36,393 City clerk 568,370 572,038 558,934 13,104 Outside agencies & unclassified 321,608 321,608 319,833 1,775 Non-departmental (employee benefits) 669,854 389,380 165,077 224,303 Operating transfers out 1,644,683 2,056,487 1,704,124 352,363
Administrative Services:Assessment 438,347 444,963 441,365 3,598 Finance 1,535,364 1,562,591 1,519,609 42,982 Human resources 316,837 321,738 321,887 (149) Information technology 1,220,405 1,224,365 1,205,234 19,131 Debt service 4,634,196 4,634,196 4,504,974 129,222 Risk management 295,471 295,471 295,399 72
Community Services:Fire 6,513,326 6,590,962 6,430,144 160,818 Human services 712,971 716,642 702,669 13,973 Library 1,359,267 1,380,274 1,357,081 23,193 Parks, Rec & Facilities 2,906,798 2,925,966 2,835,990 89,976 Police 7,215,213 7,236,579 6,828,270 408,309 Youth services 121,164 122,948 114,903 8,045
Municipal Development Services:Airport 600,687 610,982 611,301 (319) Health & Code Enforcement 967,807 979,280 886,152 93,128 Planning 494,502 502,697 497,924 4,773 Public works 4,228,627 4,246,683 4,223,735 22,948
Total Expenditures and other uses 37,552,134 37,953,939 36,295,433 1,658,506
Excess of revenues and other sourcesover expenditures and other uses $ - $ - $ 1,004,831 $ 1,004,831
The accompanying notes are an integral part of these financial statements.
FOR THE YEAR ENDED JUNE 30, 2017
CITY OF KEENE, NEW HAMPSHIRE
GENERAL FUND
STATEMENT OF REVENUES AND OTHER SOURCES,AND EXPENDITURES AND OTHER USES - BUDGET AND ACTUAL
36
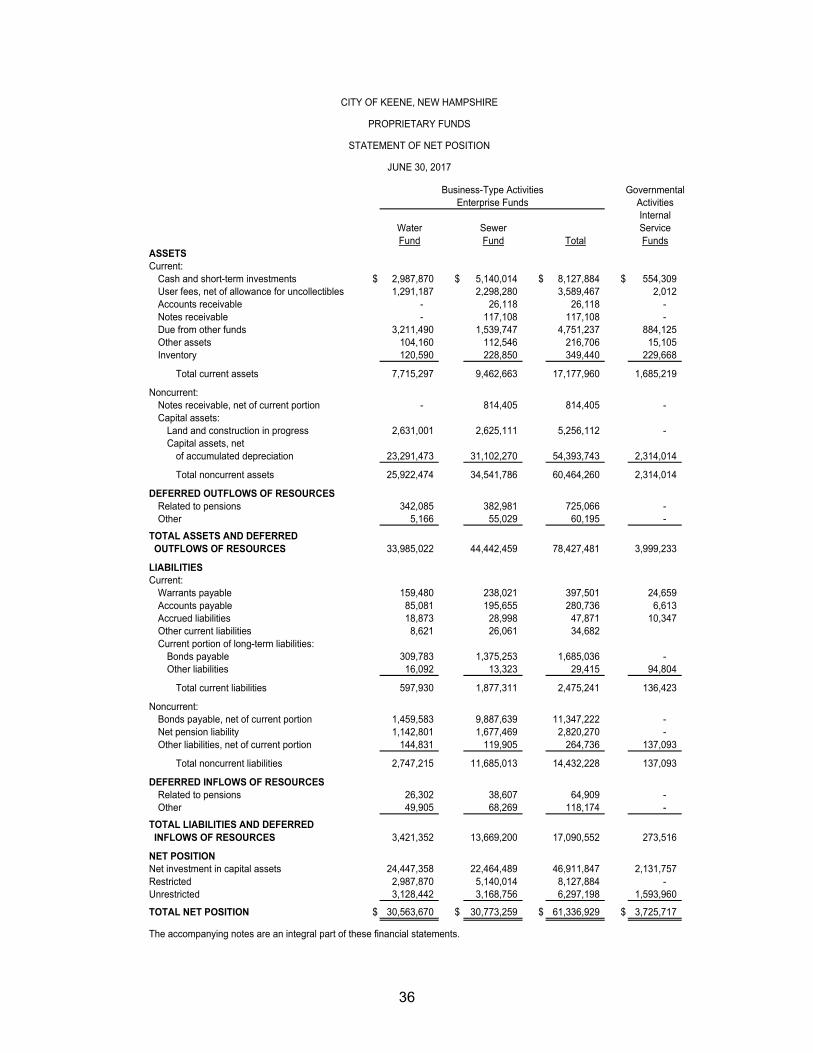
InternalWater Sewer ServiceFund Fund Total Funds
Current:Cash and short-term investments $ 2,987,870 $ 5,140,014 $ 8,127,884 $ 554,309 User fees, net of allowance for uncollectibles 1,291,187 2,298,280 3,589,467 2,012 Accounts receivable - 26,118 26,118 - Notes receivable - 117,108 117,108 - Due from other funds 3,211,490 1,539,747 4,751,237 884,125 Other assets 104,160 112,546 216,706 15,105 Inventory 120,590 228,850 349,440 229,668
Total current assets 7,715,297 9,462,663 17,177,960 1,685,219
Noncurrent:Notes receivable, net of current portion - 814,405 814,405 - Capital assets:
Land and construction in progress 2,631,001 2,625,111 5,256,112 - Capital assets, net
of accumulated depreciation 23,291,473 31,102,270 54,393,743 2,314,014
Total noncurrent assets 25,922,474 34,541,786 60,464,260 2,314,014
DEFERRED OUTFLOWS OF RESOURCESRelated to pensions 342,085 382,981 725,066 - Other 5,166 55,029 60,195 -
33,985,022 44,442,459 78,427,481 3,999,233
Current:Warrants payable 159,480 238,021 397,501 24,659 Accounts payable 85,081 195,655 280,736 6,613 Accrued liabilities 18,873 28,998 47,871 10,347 Other current liabilities 8,621 26,061 34,682 Current portion of long-term liabilities:
Bonds payable 309,783 1,375,253 1,685,036 - Other liabilities 16,092 13,323 29,415 94,804
Total current liabilities 597,930 1,877,311 2,475,241 136,423
Noncurrent:Bonds payable, net of current portion 1,459,583 9,887,639 11,347,222 - Net pension liability 1,142,801 1,677,469 2,820,270 - Other liabilities, net of current portion 144,831 119,905 264,736 137,093
Total noncurrent liabilities 2,747,215 11,685,013 14,432,228 137,093
DEFERRED INFLOWS OF RESOURCESRelated to pensions 26,302 38,607 64,909 - Other 49,905 68,269 118,174 -
3,421,352 13,669,200 17,090,552 273,516
Net investment in capital assets 24,447,358 22,464,489 46,911,847 2,131,757 Restricted 2,987,870 5,140,014 8,127,884 - Unrestricted 3,128,442 3,168,756 6,297,198 1,593,960
TOTAL NET POSITION $ 30,563,670 $ 30,773,259 $ 61,336,929 $ 3,725,717
The accompanying notes are an integral part of these financial statements.
NET POSITION
CITY OF KEENE, NEW HAMPSHIRE
PROPRIETARY FUNDS
STATEMENT OF NET POSITION
ASSETS
LIABILITIES
JUNE 30, 2017
Business-Type Activities
TOTAL ASSETS AND DEFERRED OUTFLOWS OF RESOURCES
TOTAL LIABILITIES AND DEFERRED INFLOWS OF RESOURCES
Enterprise FundsGovernmental
Activities
37
ActivitiesInternal
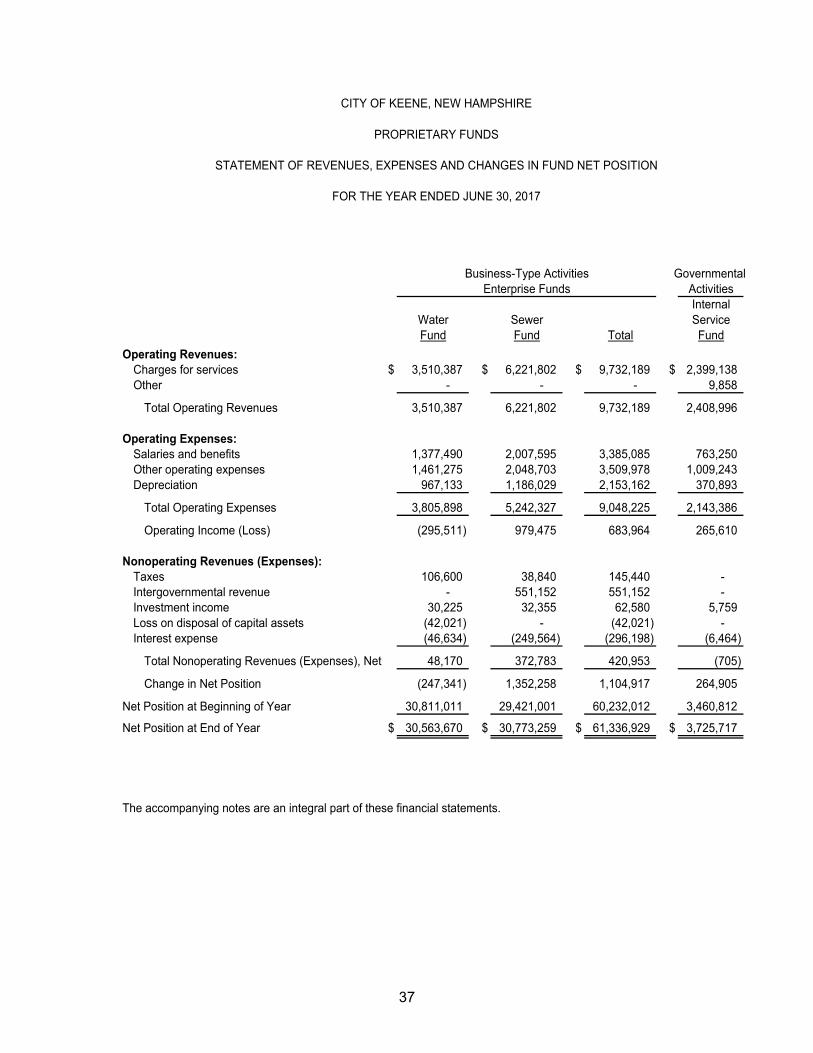
Water Sewer ServiceFund Fund Total Fund
Operating Revenues:Charges for services $ 3,510,387 $ 6,221,802 $ 9,732,189 $ 2,399,138 Other - - - 9,858
Total Operating Revenues 3,510,387 6,221,802 9,732,189 2,408,996
Operating Expenses:Salaries and benefits 1,377,490 2,007,595 3,385,085 763,250 Other operating expenses 1,461,275 2,048,703 3,509,978 1,009,243 Depreciation 967,133 1,186,029 2,153,162 370,893
Total Operating Expenses 3,805,898 5,242,327 9,048,225 2,143,386
Operating Income (Loss) (295,511) 979,475 683,964 265,610
Nonoperating Revenues (Expenses):Taxes 106,600 38,840 145,440 - Intergovernmental revenue - 551,152 551,152 - Investment income 30,225 32,355 62,580 5,759 Loss on disposal of capital assets (42,021) - (42,021) - Interest expense (46,634) (249,564) (296,198) (6,464)
Total Nonoperating Revenues (Expenses), Net 48,170 372,783 420,953 (705)
Change in Net Position (247,341) 1,352,258 1,104,917 264,905
Net Position at Beginning of Year 30,811,011 29,421,001 60,232,012 3,460,812
Net Position at End of Year $ 30,563,670 $ 30,773,259 $ 61,336,929 $ 3,725,717
The accompanying notes are an integral part of these financial statements.
Business-Type ActivitiesEnterprise Funds
CITY OF KEENE, NEW HAMPSHIRE
PROPRIETARY FUNDS
STATEMENT OF REVENUES, EXPENSES AND CHANGES IN FUND NET POSITION
FOR THE YEAR ENDED JUNE 30, 2017
Governmental
38
GovernmentalActivities
InternalWater Sewer ServiceFund Fund Total Fund
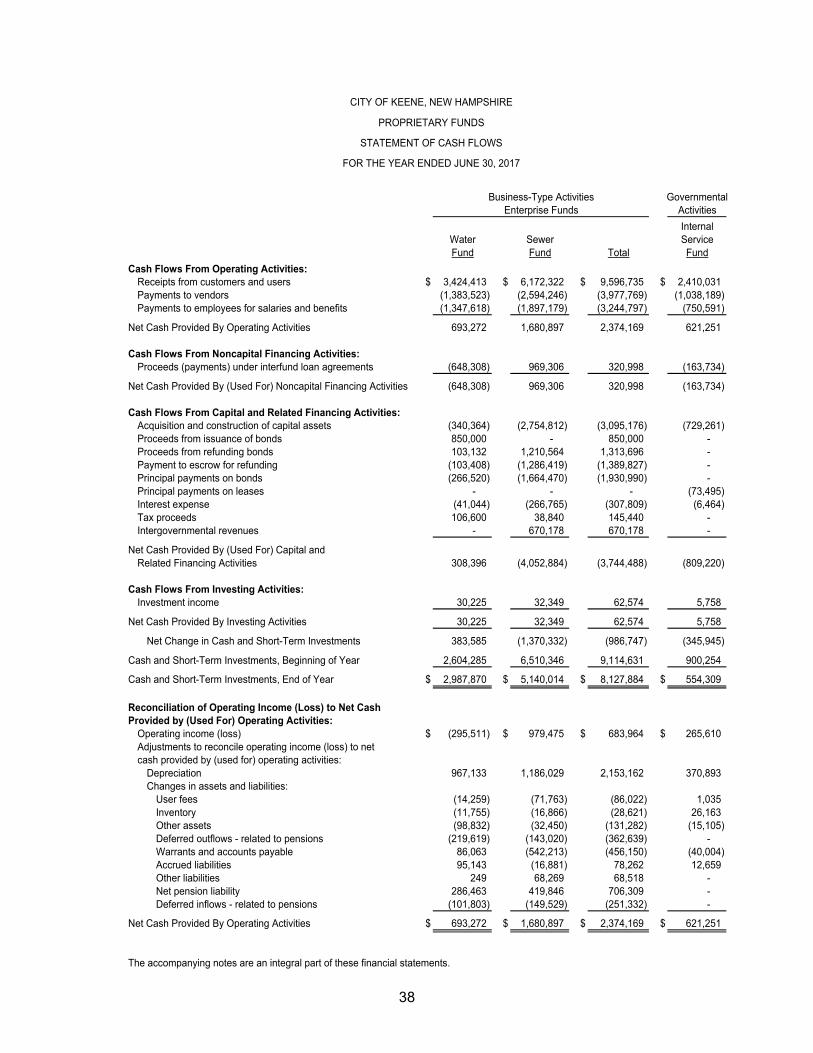
Cash Flows From Operating Activities:Receipts from customers and users $ 3,424,413 $ 6,172,322 $ 9,596,735 $ 2,410,031 Payments to vendors (1,383,523) (2,594,246) (3,977,769) (1,038,189) Payments to employees for salaries and benefits (1,347,618) (1,897,179) (3,244,797) (750,591)
Net Cash Provided By Operating Activities 693,272 1,680,897 2,374,169 621,251
Cash Flows From Noncapital Financing Activities:Proceeds (payments) under interfund loan agreements (648,308) 969,306 320,998 (163,734)
Net Cash Provided By (Used For) Noncapital Financing Activities (648,308) 969,306 320,998 (163,734)
Cash Flows From Capital and Related Financing Activities:Acquisition and construction of capital assets (340,364) (2,754,812) (3,095,176) (729,261) Proceeds from issuance of bonds 850,000 - 850,000 - Proceeds from refunding bonds 103,132 1,210,564 1,313,696 - Payment to escrow for refunding (103,408) (1,286,419) (1,389,827) - Principal payments on bonds (266,520) (1,664,470) (1,930,990) - Principal payments on leases - - - (73,495) Interest expense (41,044) (266,765) (307,809) (6,464) Tax proceeds 106,600 38,840 145,440 - Intergovernmental revenues - 670,178 670,178 -
Net Cash Provided By (Used For) Capital and Related Financing Activities 308,396 (4,052,884) (3,744,488) (809,220)
Cash Flows From Investing Activities:Investment income 30,225 32,349 62,574 5,758
Net Cash Provided By Investing Activities 30,225 32,349 62,574 5,758
Net Change in Cash and Short-Term Investments 383,585 (1,370,332) (986,747) (345,945)
Cash and Short-Term Investments, Beginning of Year 2,604,285 6,510,346 9,114,631 900,254
Cash and Short-Term Investments, End of Year $ 2,987,870 $ 5,140,014 $ 8,127,884 $ 554,309
Reconciliation of Operating Income (Loss) to Net CashProvided by (Used For) Operating Activities:
Operating income (loss) $ (295,511) $ 979,475 $ 683,964 $ 265,610 Adjustments to reconcile operating income (loss) to netcash provided by (used for) operating activities:
Depreciation 967,133 1,186,029 2,153,162 370,893 Changes in assets and liabilities:
User fees (14,259) (71,763) (86,022) 1,035 Inventory (11,755) (16,866) (28,621) 26,163 Other assets (98,832) (32,450) (131,282) (15,105) Deferred outflows - related to pensions (219,619) (143,020) (362,639) - Warrants and accounts payable 86,063 (542,213) (456,150) (40,004) Accrued liabilities 95,143 (16,881) 78,262 12,659 Other liabilities 249 68,269 68,518 - Net pension liability 286,463 419,846 706,309 - Deferred inflows - related to pensions (101,803) (149,529) (251,332) -
Net Cash Provided By Operating Activities $ 693,272 $ 1,680,897 $ 2,374,169 $ 621,251
The accompanying notes are an integral part of these financial statements.
Business-Type ActivitiesEnterprise Funds
CITY OF KEENE, NEW HAMPSHIRE
PROPRIETARY FUNDS
STATEMENT OF CASH FLOWS
FOR THE YEAR ENDED JUNE 30, 2017
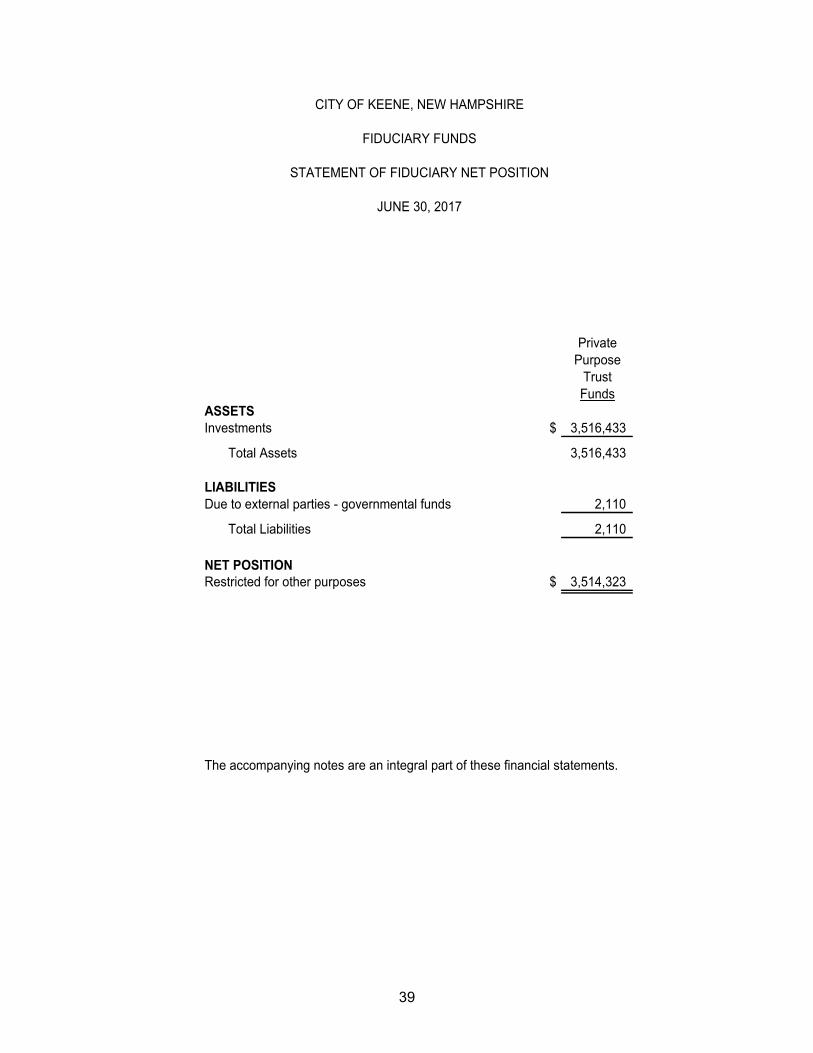
39
PrivatePurpose
TrustFunds
Investments $ 3,516,433
Total Assets 3,516,433
Due to external parties - governmental funds 2,110
Total Liabilities 2,110
NET POSITIONRestricted for other purposes $ 3,514,323
The accompanying notes are an integral part of these financial statements.
JUNE 30, 2017
ASSETS
LIABILITIES
CITY OF KEENE, NEW HAMPSHIRE
FIDUCIARY FUNDS
STATEMENT OF FIDUCIARY NET POSITION
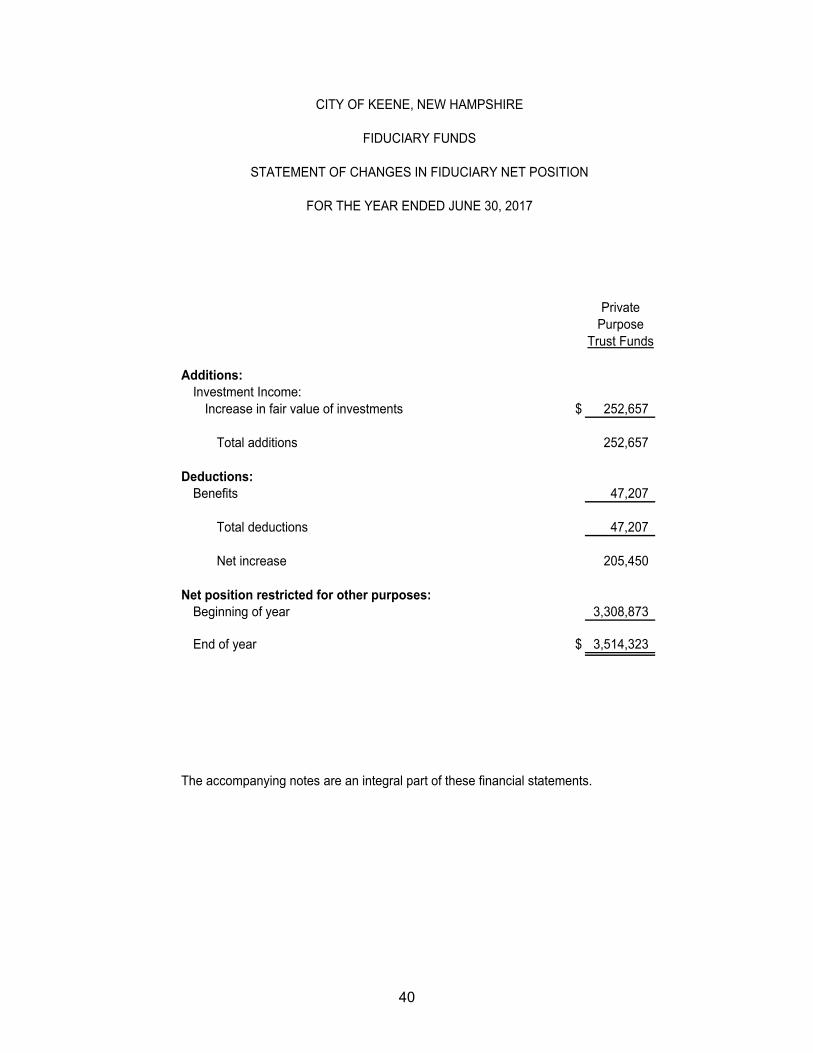
40
PrivatePurpose
Trust Funds
Additions:Investment Income:
Increase in fair value of investments $ 252,657
Total additions 252,657
Deductions:Benefits 47,207
Total deductions 47,207
Net increase 205,450
Net position restricted for other purposes:Beginning of year 3,308,873
End of year $ 3,514,323
The accompanying notes are an integral part of these financial statements.
CITY OF KEENE, NEW HAMPSHIRE
FIDUCIARY FUNDS
STATEMENT OF CHANGES IN FIDUCIARY NET POSITION
FOR THE YEAR ENDED JUNE 30, 2017
41
CITY OF KEENE, NEW HAMPSHIRE
Notes to Financial Statements
1. Summary of Significant Accounting Policies
The accounting policies of the City conform to generally accepted accounting principles (GAAP) as applicable to governmental units. The following is a summary of the more significant policies:
A. Reporting Entity
The City is a municipal corporation governed by a Mayor/City Council/Man-ager form of government. As required by generally accepted accounting principles, these financial statements present the City and applicable com-ponent units for which the government is considered to be financially accountable. In fiscal year 2017, it was determined that no entities met the required GASB 14 (as amended) criteria of component units.
B. Government-wide and Fund Financial Statements
Government-wide Financial Statements The government-wide financial statements (i.e., the Statement of Net Position and the Statement of Activities) report information on all of the nonfiduciary activities of the primary government. For the most part, the effect of interfund activity has been removed from these statements. Governmental activities, which normally are supported by taxes and intergovernmental revenues, are reported separately from business-type activities, which rely to a significant extent on fees and charges for support. The statement of activities demonstrates the degree to which the direct expenses of a given function or segment are offset by program revenues. Direct expenses are those that are clearly identifiable with a specific func-tion or segment. Program revenues include (1) charges to customers or applicants who purchase, use, or directly benefit from goods, services, or privileges provided by a given function or segment and (2) grants and con-tributions that are restricted to meeting the operational or capital require-ments of a particular function or segment. Taxes and other items not properly included among program revenues are reported instead as general revenues. Fund Financial Statements Separate financial statements are provided for governmental funds, pro-prietary funds and fiduciary funds, even though the latter are excluded from the government-wide financial statements. Major individual governmental
42
funds and major individual enterprise funds are reported as separate columns in the fund financial statements.
C. Measurement Focus, Basis of Accounting, and Financial Statement Presentation
Government-wide Financial Statements The government-wide financial statements are reported using the eco-nomic resources measurement focus and the accrual basis of accounting. Revenues are recorded when earned and expenses are recorded when a liability is incurred, regardless of the timing of related cash flows. Property taxes are recognized as revenues in the year for which they are levied. Grants and similar items are recognized as revenue as soon as all elig-ibility requirements imposed by the provider have been met. As a general rule, the effect of interfund activity has been eliminated from the govern-ment-wide financial statements. Amounts reported as program revenues include (1) charges to customers or applicants for goods, services, or privileges provided, (2) operating grants and contributions, and (3) capital grants and contributions, includ-ing special assessments. Internally dedicated resources are reported as general revenues rather than as program revenues. Likewise, general revenues include all taxes. Fund Financial Statements Governmental fund financial statements are reported using the current financial resources measurement focus and the modified accrual basis of accounting. Revenues are recognized as soon as they are both measur-able and available. Revenues are considered to be available when they are collectible within the current period or soon enough thereafter to pay liabilities of the current period. For this purpose, the government considers property tax revenues to be available if they are collected within 60 days of the end of the current fiscal period. All other revenue items are consid-ered to be measurable and available only when cash is received by the government. Expenditures generally are recorded when a liability is incurred, as under accrual accounting. However, debt service expendi-tures, as well as expenditures related to compensated absences and claims and judgments, are recorded only when payment is due. The government reports the following major governmental funds:
The general fund is the City’s primary operating fund. It accounts for all financial resources of the general government, except those required to be accounted for in another fund.
The solid waste fund accounts for the activities of the transfer and recycling operations and for post-closure costs associated with the landfill.
43
The capital project fund accounts for the activity pertaining to various construction/renovation projects and the purchase of vehicles and equipment of the City.
The proprietary fund financial statements are reported using the economic resources measurement focus and the accrual basis of accounting. Under this method, revenues are recognized when earned and expenses are recorded when liabilities are incurred. Proprietary funds distinguish operating revenues and expenses from non-operating items. Operating revenues and expenses generally result from providing services and producing and delivering goods in connection with a proprietary fund’s principal ongoing operations. The principal operating revenues of the enterprise fund are charges to customers for sales and services. Operating expenses for enterprise funds include the cost of sales and services, administrative expenses and depreciation on capital assets. All revenues and expenses not meeting this definition are reported as nonoperating revenues and expenses.
The City reports the following major proprietary funds:
The water fund accounts for the operations, maintenance, and capital outlay needs of the water treatment and distribution systems.
The sewer fund accounts for the operations, maintenance, and capital outlay needs of the sewer collection and treatment systems.
The internal service funds are used to account for the financing of services provided by one department to other departments of the City on a cost-reimbursement basis. The fiduciary fund financial statements are reported using the economic resources measurement focus and the accrual basis of accounting. Under this method, revenues are recognized when earned and expenses are recorded when liabilities are incurred. The City reports the following fiduciary funds:
The private-purpose trust fund is used to account for trust arrange-ments, other than those properly reported in the pension trust fund or permanent fund, under which principal and investment income exclusively benefit individuals, private organizations, or other governments.
44
D. Cash and Short-Term Investments
Cash balances from all funds, except those required to be segregated by law, are combined to form a consolidation of cash. Cash balances are invested to the extent available, and interest earnings are recognized in the general fund. Certain special revenue, proprietary, and fiduciary funds segregate cash, and investment earnings become a part of those funds. Deposits with financial institutions consist primarily of demand deposits, certificates of deposits, and savings accounts. A cash and investment pool is maintained that is available for use by all funds. Each fund’s portion of this pool is reflected on the combined financial statements under the caption “cash and short-term investments”. The interest earnings attributable to each fund type are included under investment income. For purpose of the statement of cash flows, the proprietary funds consider investments with original maturities of three months or less to be short-term investments.
E. Investments
State and local statutes place certain limitations on the nature of deposits and investments available. Deposits in any financial institution may not exceed certain levels within the financial institution. Non-fiduciary fund investments can be made in securities issued by or unconditionally guar-anteed by the U.S. Government or agencies that have a maturity of one year or less from the date of purchase and repurchase agreements guar-anteed by such securities with maturity dates of no more than 90 days from the date of purchase. Investments for the trust funds consist of marketable securities, bonds and short-term money market investments. Investments are carried at fair value.
F. Interfund Receivables and Payables
Transactions between funds that are representative of lending/borrowing arrangements outstanding at the end of the fiscal year are referred to as “due from/to other funds” (i.e., the current portion of interfund loans) or “advances to/from other funds” (i.e., the noncurrent portion of interfund loans). Advances between funds are offset by a fund balance reserve account in applicable governmental funds to indicate the portion not available for appropriation and not available as expendable financial resources. Any residual balances outstanding between governmental activities and business-type activities are reported in the government-wide financial statements as “internal balances.”
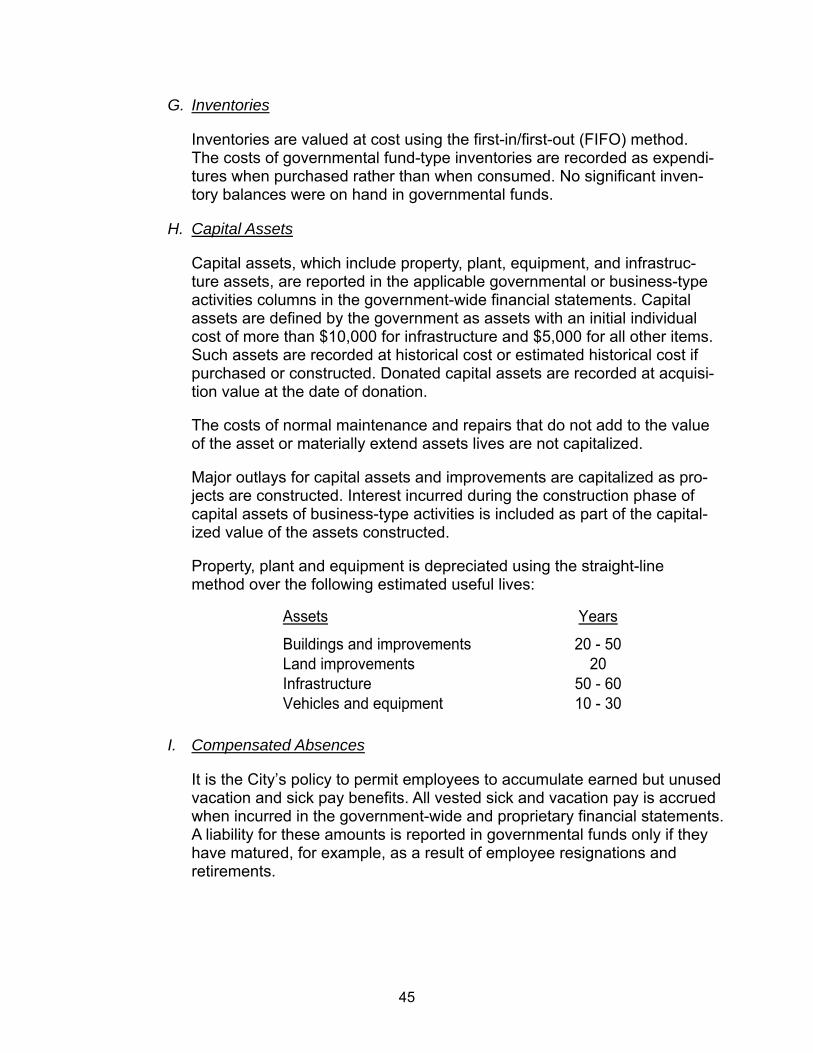
45
G. Inventories
Inventories are valued at cost using the first-in/first-out (FIFO) method. The costs of governmental fund-type inventories are recorded as expendi-tures when purchased rather than when consumed. No significant inven-tory balances were on hand in governmental funds.
H. Capital Assets
Capital assets, which include property, plant, equipment, and infrastruc-ture assets, are reported in the applicable governmental or business-type activities columns in the government-wide financial statements. Capital assets are defined by the government as assets with an initial individual cost of more than $10,000 for infrastructure and $5,000 for all other items. Such assets are recorded at historical cost or estimated historical cost if purchased or constructed. Donated capital assets are recorded at acquisi-tion value at the date of donation. The costs of normal maintenance and repairs that do not add to the value of the asset or materially extend assets lives are not capitalized. Major outlays for capital assets and improvements are capitalized as pro-jects are constructed. Interest incurred during the construction phase of capital assets of business-type activities is included as part of the capital-ized value of the assets constructed. Property, plant and equipment is depreciated using the straight-line method over the following estimated useful lives:
Assets Years
Buildings and improvements 20 - 50Land improvements 20Infrastructure 50 - 60Vehicles and equipment 10 - 30
I. Compensated Absences
It is the City’s policy to permit employees to accumulate earned but unused vacation and sick pay benefits. All vested sick and vacation pay is accrued when incurred in the government-wide and proprietary financial statements. A liability for these amounts is reported in governmental funds only if they have matured, for example, as a result of employee resignations and retirements.

46
J. Long-Term Obligations
In the government-wide financial statements, and proprietary fund types in the fund financial statements, long-term debt, and other long-term obliga-tions are reported as liabilities in the applicable governmental activities, business-type activities, or proprietary fund type Statement of Net Position.
K. Fund Equity
Fund equity at the governmental fund financial reporting level is classified as “fund balance”. Fund equity for all other reporting is classified as “Net Position”. Fund Balance - Generally, fund balance represents the difference between the current assets/deferred outflows and current liabilities/deferred inflows. The City reserves those portions of fund balance that are legally segregated for a specific future use or which do not represent available, spendable resources and, therefore, are not available for appropriation or expenditure. Unassigned fund balance indicates that portion of fund balance that is available for appropriation in future periods. When an expenditure is incurred that would qualify for payment from multiple fund balance types, the City uses the following order to liquidate liabilities: restricted, committed, assigned and unassigned. Net Position - Net position represents the difference between assets/deferred outflows and liabilities/deferred inflows. Net position invested in capital assets, net of related debt, consist of capital assets, net of accumulated depreciation, reduced by the outstanding balances of any borrowing used for the acquisition, construction or improvement of those assets. Net posi-tion is reported as restricted when there are limitations imposed on their use either through the enabling legislation adopted by the City or through external restrictions imposed by creditors, grantors, or laws or regulations of other governments. All other net position is reported as unrestricted.
L. Use of Estimates
The preparation of basic financial statements in conformity with generally accepted accounting principles requires management to make estimates and assumptions that affect the reported amounts of assets and liabilities and disclosures for contingent assets and liabilities at the date of the basic financial statements, and the reported amounts of the revenues and expenditures/expenses during the fiscal year. Actual results could vary from estimates that were used.
47
2. Stewardship, Compliance, and Accountability
A. Budgetary Information
The City Manager presents an operating and capital budget for the pro-posed expenditures of the fiscal year commencing the following July 1. The budget, as enacted by the City Council, establishes the legal level of control and specifies that certain appropriations are to be funded by partic-ular revenues. The original budget is amended during the fiscal year at City Council meetings as required by changing conditions. Departments are limited to their voted budgets. However, City Council authorization is needed to use salary and wage appropriations for other operating expenditures, and vice versa. Formal budgetary integration is employed as a management control device during the year for the general fund and proprietary funds. At year-end, appropriation balances lapse, except for certain unexpended capital items and encumbrances which will be honored during the subse-quent year.
B. Budgetary Basis
The general fund final appropriation appearing on the “Budget and Actual” page of the fund financial statements represents the final amended budget after all reserve fund transfers and supplemental appropriations.
C. Budget/GAAP Reconciliation
The budgetary data for the general fund is based upon accounting principles that differ from generally accepted accounting principles (GAAP). Therefore, in addition to the GAAP basis financial statements, the results of operations of the general fund are presented in accordance with budgetary accounting principles to provide a meaningful comparison to budgetary data. The following is a summary of adjustments made to the actual revenues and other sources, and expenditures and other uses, to conform to the budgetary basis of accounting.
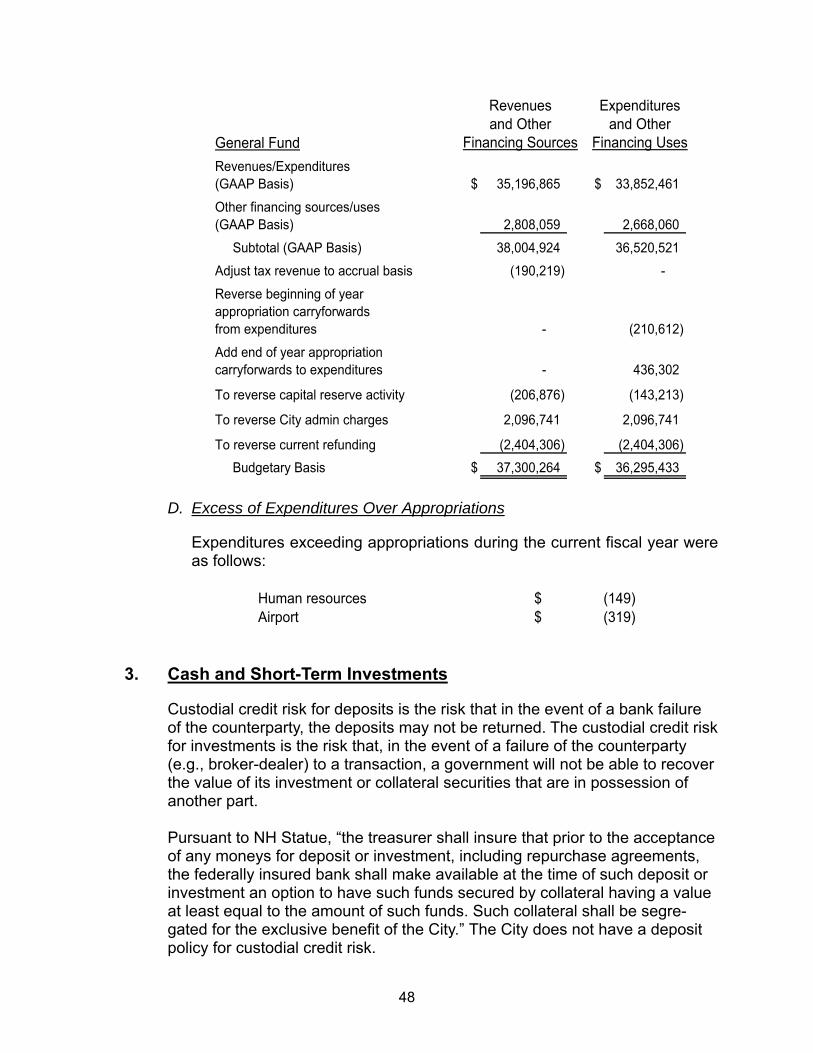
48
General Fund
Revenues/Expenditures(GAAP Basis) $ 35,196,865 $ 33,852,461
Other financing sources/uses(GAAP Basis) 2,808,059 2,668,060
Subtotal (GAAP Basis) 38,004,924 36,520,521
Adjust tax revenue to accrual basis (190,219) -
Reverse beginning of yearappropriation carryforwardsfrom expenditures - (210,612)
Add end of year appropriationcarryforwards to expenditures - 436,302
To reverse capital reserve activity (206,876) (143,213)
To reverse City admin charges 2,096,741 2,096,741
To reverse current refunding (2,404,306) (2,404,306)
Budgetary Basis $ 37,300,264 $ 36,295,433
Revenues Expendituresand Other and Other
Financing Sources Financing Uses
D. Excess of Expenditures Over Appropriations
Expenditures exceeding appropriations during the current fiscal year were as follows:
Human resources $ (149) Airport $ (319)
3. Cash and Short-Term Investments
Custodial credit risk for deposits is the risk that in the event of a bank failure of the counterparty, the deposits may not be returned. The custodial credit risk for investments is the risk that, in the event of a failure of the counterparty (e.g., broker-dealer) to a transaction, a government will not be able to recover the value of its investment or collateral securities that are in possession of another part. Pursuant to NH Statue, “the treasurer shall insure that prior to the acceptance of any moneys for deposit or investment, including repurchase agreements, the federally insured bank shall make available at the time of such deposit or investment an option to have such funds secured by collateral having a value at least equal to the amount of such funds. Such collateral shall be segre-gated for the exclusive benefit of the City.” The City does not have a deposit policy for custodial credit risk.
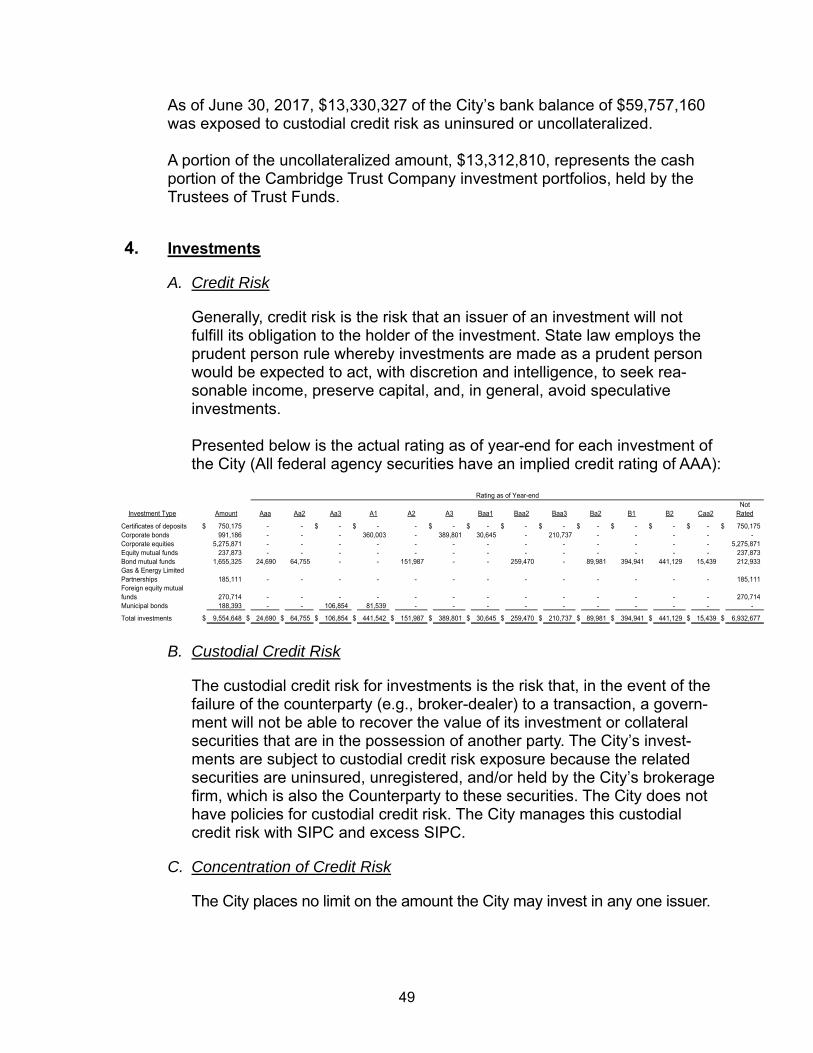
49
As of June 30, 2017, $13,330,327 of the City’s bank balance of $59,757,160 was exposed to custodial credit risk as uninsured or uncollateralized. A portion of the uncollateralized amount, $13,312,810, represents the cash portion of the Cambridge Trust Company investment portfolios, held by the Trustees of Trust Funds.
4. Investments
A. Credit Risk
Generally, credit risk is the risk that an issuer of an investment will not fulfill its obligation to the holder of the investment. State law employs the prudent person rule whereby investments are made as a prudent person would be expected to act, with discretion and intelligence, to seek rea-sonable income, preserve capital, and, in general, avoid speculative investments. Presented below is the actual rating as of year-end for each investment of the City (All federal agency securities have an implied credit rating of AAA):
Not Investment Type Amount Aaa Aa2 Aa3 A1 A2 A3 Baa1 Baa2 Baa3 Ba2 B1 B2 Caa2 Rated
Certificates of deposits $ 750,175 - - $ - $ - - $ - $ - $ - $ - $ - $ - $ - $ - $ 750,175 Corporate bonds 991,186 - - - 360,003 - 389,801 30,645 - 210,737 - - - - - Corporate equities 5,275,871 - - - - - - - - - - - - - 5,275,871 Equity mutual funds 237,873 - - - - - - - - - - - - - 237,873 Bond mutual funds 1,655,325 24,690 64,755 - - 151,987 - - 259,470 - 89,981 394,941 441,129 15,439 212,933 Gas & Energy LimitedPartnerships 185,111 - - - - - - - - - - - - - 185,111 Foreign equity mutualfunds 270,714 - - - - - - - - - - - - - 270,714 Municipal bonds 188,393 - - 106,854 81,539 - - - - - - - - - -
Total investments $ 9,554,648 $ 24,690 $ 64,755 $ 106,854 $ 441,542 $ 151,987 $ 389,801 $ 30,645 $ 259,470 $ 210,737 $ 89,981 $ 394,941 $ 441,129 $ 15,439 $ 6,932,677
Rating as of Year-end
B. Custodial Credit Risk
The custodial credit risk for investments is the risk that, in the event of the failure of the counterparty (e.g., broker-dealer) to a transaction, a govern-ment will not be able to recover the value of its investment or collateral securities that are in the possession of another party. The City’s invest-ments are subject to custodial credit risk exposure because the related securities are uninsured, unregistered, and/or held by the City’s brokerage firm, which is also the Counterparty to these securities. The City does not have policies for custodial credit risk. The City manages this custodial credit risk with SIPC and excess SIPC.
C. Concentration of Credit Risk
The City places no limit on the amount the City may invest in any one issuer.
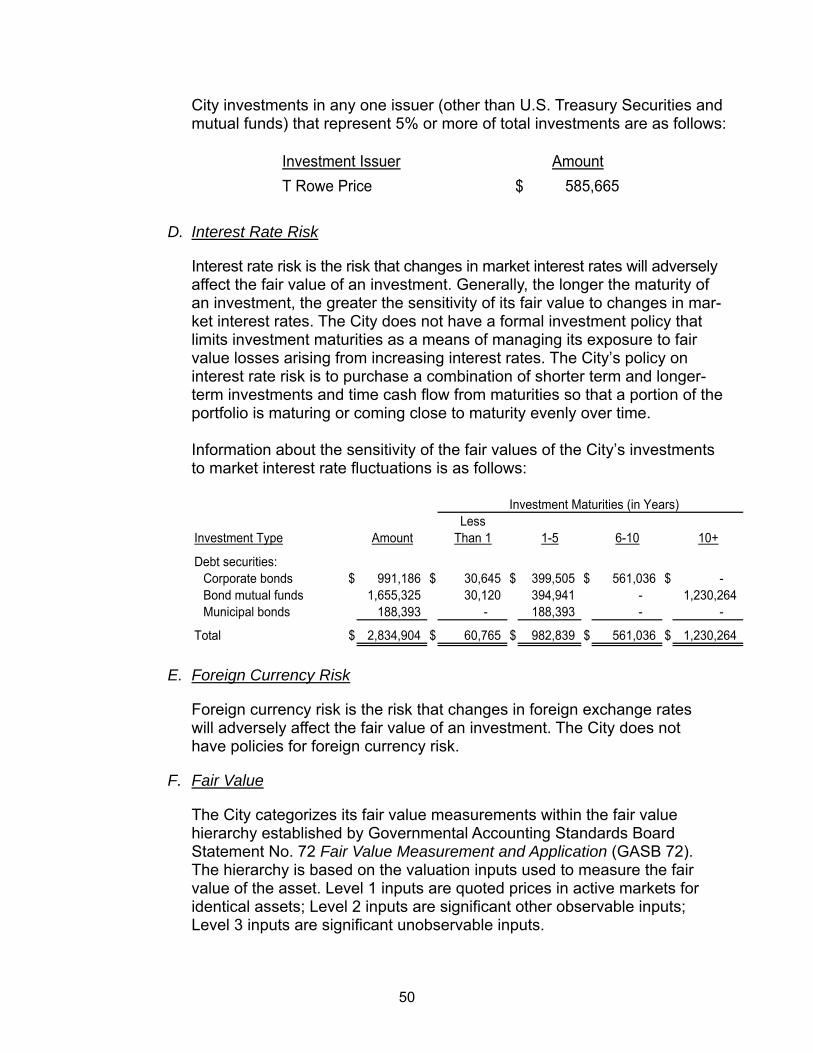
50
City investments in any one issuer (other than U.S. Treasury Securities and mutual funds) that represent 5% or more of total investments are as follows:
Investment Issuer Amount
T Rowe Price $ 585,665
D. Interest Rate Risk
Interest rate risk is the risk that changes in market interest rates will adversely affect the fair value of an investment. Generally, the longer the maturity of an investment, the greater the sensitivity of its fair value to changes in mar-ket interest rates. The City does not have a formal investment policy that limits investment maturities as a means of managing its exposure to fair value losses arising from increasing interest rates. The City’s policy on interest rate risk is to purchase a combination of shorter term and longer-term investments and time cash flow from maturities so that a portion of the portfolio is maturing or coming close to maturity evenly over time. Information about the sensitivity of the fair values of the City’s investments to market interest rate fluctuations is as follows:
LessInvestment Type Amount Than 1 1-5 6-10 10+
Debt securities:Corporate bonds $ 991,186 $ 30,645 $ 399,505 $ 561,036 $ - Bond mutual funds 1,655,325 30,120 394,941 - 1,230,264 Municipal bonds 188,393 - 188,393 - -
Total $ 2,834,904 $ 60,765 $ 982,839 $ 561,036 $ 1,230,264
Investment Maturities (in Years)
E. Foreign Currency Risk
Foreign currency risk is the risk that changes in foreign exchange rates will adversely affect the fair value of an investment. The City does not have policies for foreign currency risk.
F. Fair Value
The City categorizes its fair value measurements within the fair value hierarchy established by Governmental Accounting Standards Board Statement No. 72 Fair Value Measurement and Application (GASB 72). The hierarchy is based on the valuation inputs used to measure the fair value of the asset. Level 1 inputs are quoted prices in active markets for identical assets; Level 2 inputs are significant other observable inputs; Level 3 inputs are significant unobservable inputs.
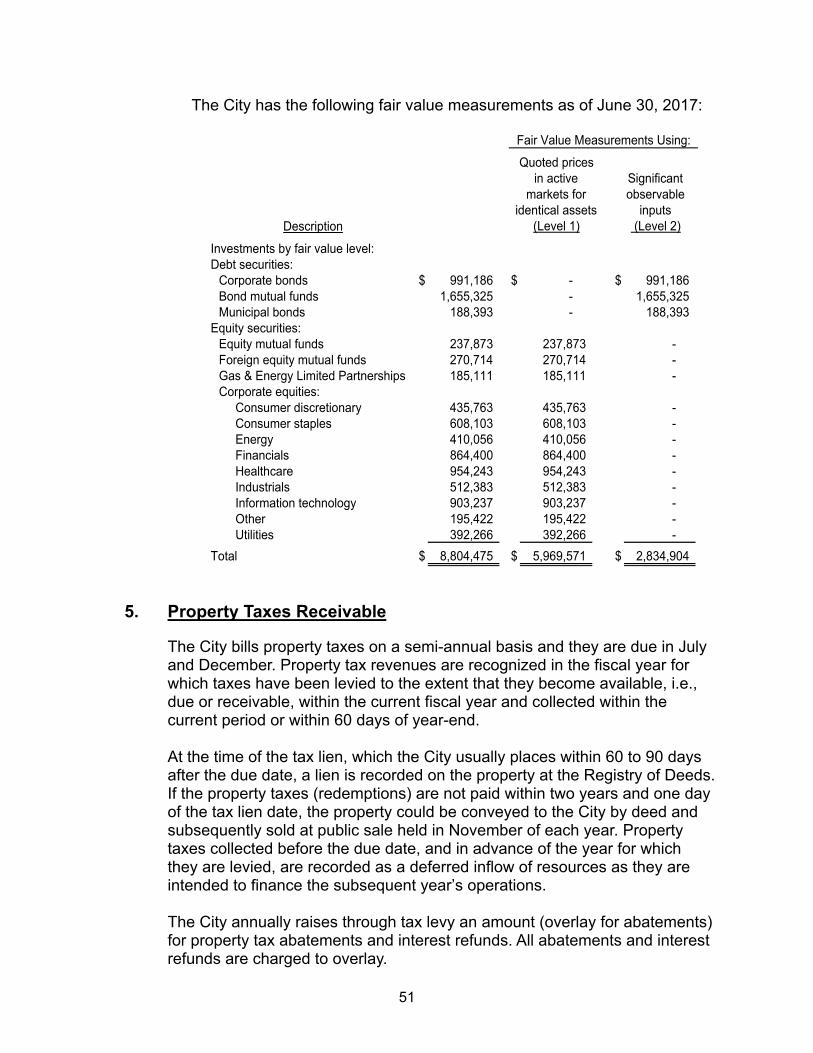
51
The City has the following fair value measurements as of June 30, 2017:
Description
Investments by fair value level:Debt securities:
Corporate bonds $ 991,186 $ - $ 991,186 Bond mutual funds 1,655,325 - 1,655,325 Municipal bonds 188,393 - 188,393
Equity securities:Equity mutual funds 237,873 237,873 - Foreign equity mutual funds 270,714 270,714 - Gas & Energy Limited Partnerships 185,111 185,111 - Corporate equities:
Consumer discretionary 435,763 435,763 - Consumer staples 608,103 608,103 - Energy 410,056 410,056 - Financials 864,400 864,400 - Healthcare 954,243 954,243 - Industrials 512,383 512,383 - Information technology 903,237 903,237 - Other 195,422 195,422 - Utilities 392,266 392,266 -
Total $ 8,804,475 $ 5,969,571 $ 2,834,904
markets for observable
Fair Value Measurements Using:
Quoted pricesin active Significant
identical assets inputs (Level 1) (Level 2)
5. Property Taxes Receivable
The City bills property taxes on a semi-annual basis and they are due in July and December. Property tax revenues are recognized in the fiscal year for which taxes have been levied to the extent that they become available, i.e., due or receivable, within the current fiscal year and collected within the current period or within 60 days of year-end.
At the time of the tax lien, which the City usually places within 60 to 90 days after the due date, a lien is recorded on the property at the Registry of Deeds. If the property taxes (redemptions) are not paid within two years and one day of the tax lien date, the property could be conveyed to the City by deed and subsequently sold at public sale held in November of each year. Property taxes collected before the due date, and in advance of the year for which they are levied, are recorded as a deferred inflow of resources as they are intended to finance the subsequent year’s operations. The City annually raises through tax levy an amount (overlay for abatements) for property tax abatements and interest refunds. All abatements and interest refunds are charged to overlay.
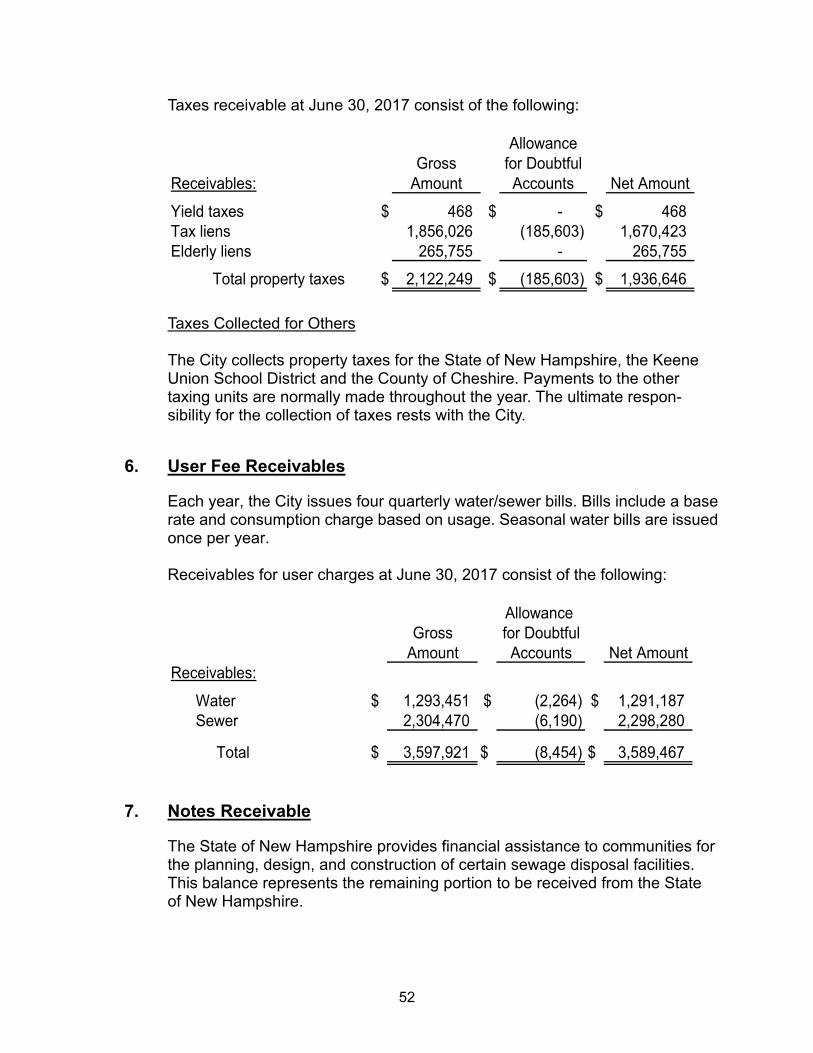
52
Taxes receivable at June 30, 2017 consist of the following:
Receivables:Gross
Amount
Allowance for Doubtful Accounts Net Amount
Yield taxes $ 468 $ - $ 468 Tax liens 1,856,026 (185,603) 1,670,423 Elderly liens 265,755 - 265,755
Total property taxes $ 2,122,249 $ (185,603) $ 1,936,646
Taxes Collected for Others The City collects property taxes for the State of New Hampshire, the Keene Union School District and the County of Cheshire. Payments to the other taxing units are normally made throughout the year. The ultimate respon-sibility for the collection of taxes rests with the City.
6. User Fee Receivables
Each year, the City issues four quarterly water/sewer bills. Bills include a base rate and consumption charge based on usage. Seasonal water bills are issued once per year. Receivables for user charges at June 30, 2017 consist of the following:
Allowance Gross for Doubtful
Amount Accounts Net AmountReceivables:
Water $ 1,293,451 $ (2,264) $ 1,291,187 Sewer 2,304,470 (6,190) 2,298,280
Total $ 3,597,921 $ (8,454) $ 3,589,467
7. Notes Receivable
The State of New Hampshire provides financial assistance to communities for the planning, design, and construction of certain sewage disposal facilities. This balance represents the remaining portion to be received from the State of New Hampshire.
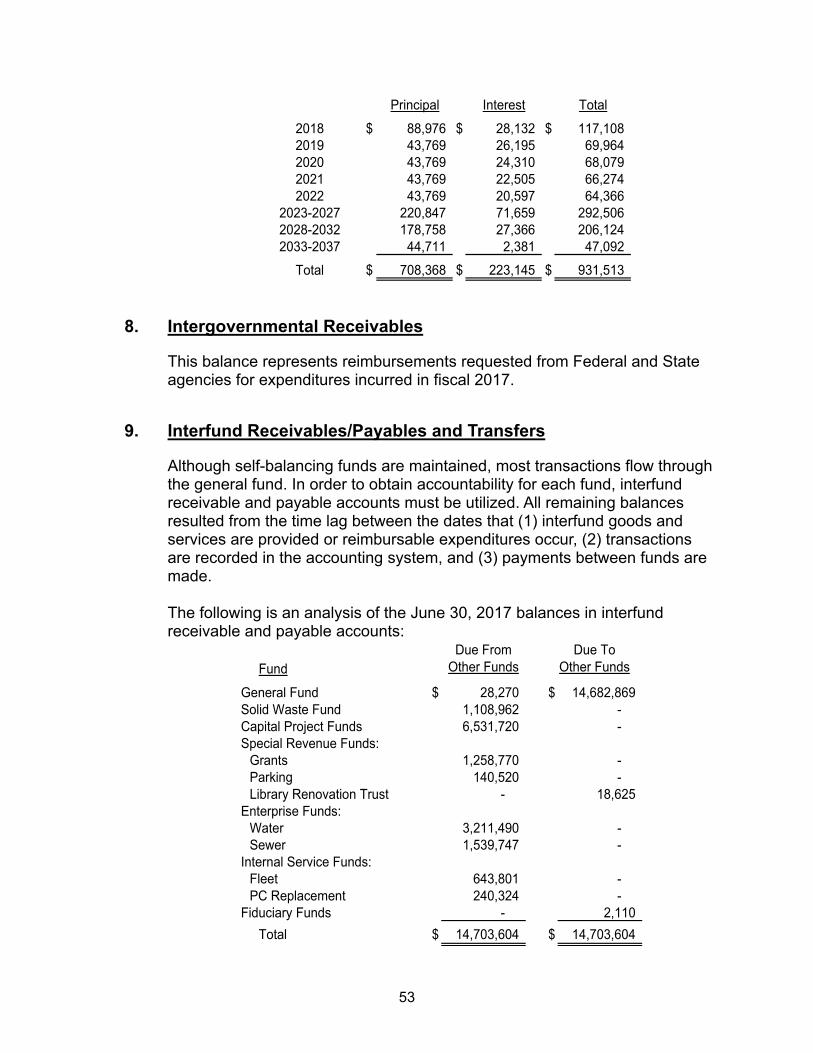
53
Principal Interest Total
2018 $ 88,976 $ 28,132 $ 117,108 2019 43,769 26,195 69,964 2020 43,769 24,310 68,079 2021 43,769 22,505 66,274 2022 43,769 20,597 64,366
2023-2027 220,847 71,659 292,506 2028-2032 178,758 27,366 206,124 2033-2037 44,711 2,381 47,092
Total $ 708,368 $ 223,145 $ 931,513
8. Intergovernmental Receivables
This balance represents reimbursements requested from Federal and State agencies for expenditures incurred in fiscal 2017.
9. Interfund Receivables/Payables and Transfers
Although self-balancing funds are maintained, most transactions flow through the general fund. In order to obtain accountability for each fund, interfund receivable and payable accounts must be utilized. All remaining balances resulted from the time lag between the dates that (1) interfund goods and services are provided or reimbursable expenditures occur, (2) transactions are recorded in the accounting system, and (3) payments between funds are made. The following is an analysis of the June 30, 2017 balances in interfund receivable and payable accounts:
Fund
General Fund $ 28,270 $ 14,682,869 Solid Waste Fund 1,108,962 - Capital Project Funds 6,531,720 - Special Revenue Funds:
Grants 1,258,770 - Parking 140,520 - Library Renovation Trust - 18,625
Enterprise Funds:Water 3,211,490 - Sewer 1,539,747 -
Internal Service Funds:Fleet 643,801 - PC Replacement 240,324 -
Fiduciary Funds - 2,110
Total $ 14,703,604 $ 14,703,604
Due FromOther Funds
Due ToOther Funds
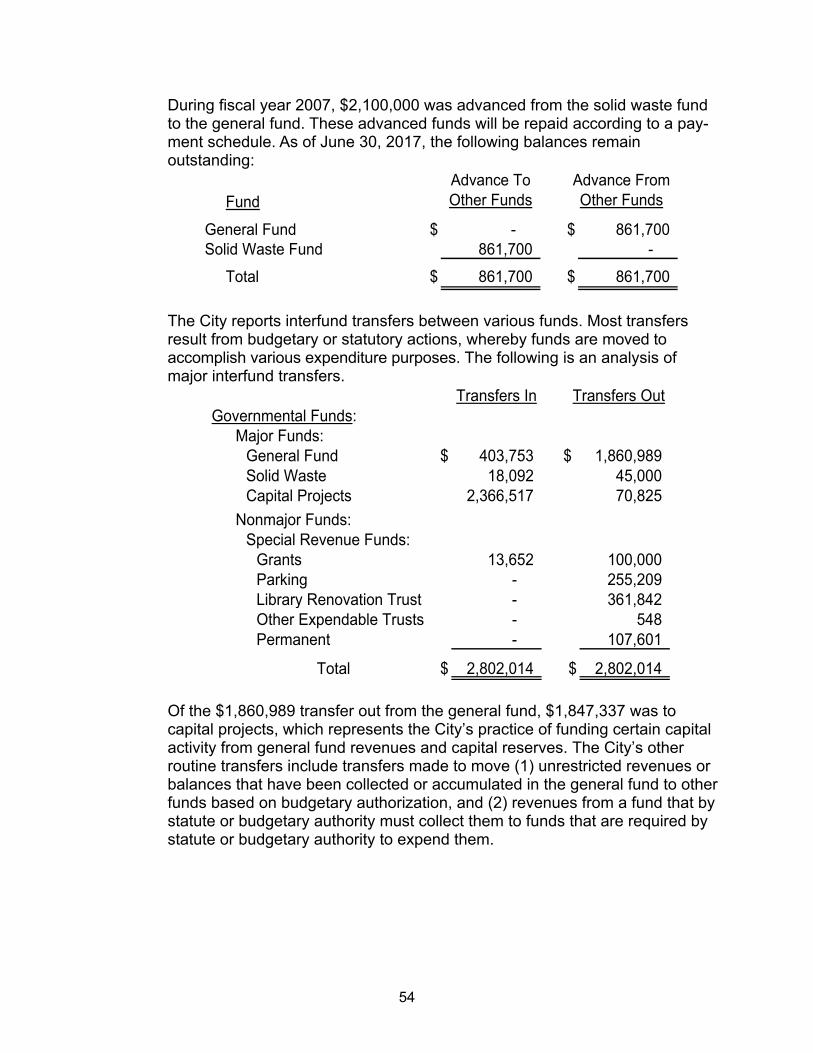
54
During fiscal year 2007, $2,100,000 was advanced from the solid waste fund to the general fund. These advanced funds will be repaid according to a pay-ment schedule. As of June 30, 2017, the following balances remain outstanding:
Fund
General Fund $ - $ 861,700 Solid Waste Fund 861,700 -
Total $ 861,700 $ 861,700
Advance ToOther Funds
Advance FromOther Funds
The City reports interfund transfers between various funds. Most transfers result from budgetary or statutory actions, whereby funds are moved to accomplish various expenditure purposes. The following is an analysis of major interfund transfers.
Governmental Funds:Major Funds:
General Fund $ 403,753 $ 1,860,989 Solid Waste 18,092 45,000 Capital Projects 2,366,517 70,825
Nonmajor Funds:Special Revenue Funds:
Grants 13,652 100,000 Parking - 255,209 Library Renovation Trust - 361,842 Other Expendable Trusts - 548 Permanent - 107,601
Total $ 2,802,014 $ 2,802,014
Transfers OutTransfers In
Of the $1,860,989 transfer out from the general fund, $1,847,337 was to capital projects, which represents the City’s practice of funding certain capital activity from general fund revenues and capital reserves. The City’s other routine transfers include transfers made to move (1) unrestricted revenues or balances that have been collected or accumulated in the general fund to other funds based on budgetary authorization, and (2) revenues from a fund that by statute or budgetary authority must collect them to funds that are required by statute or budgetary authority to expend them.
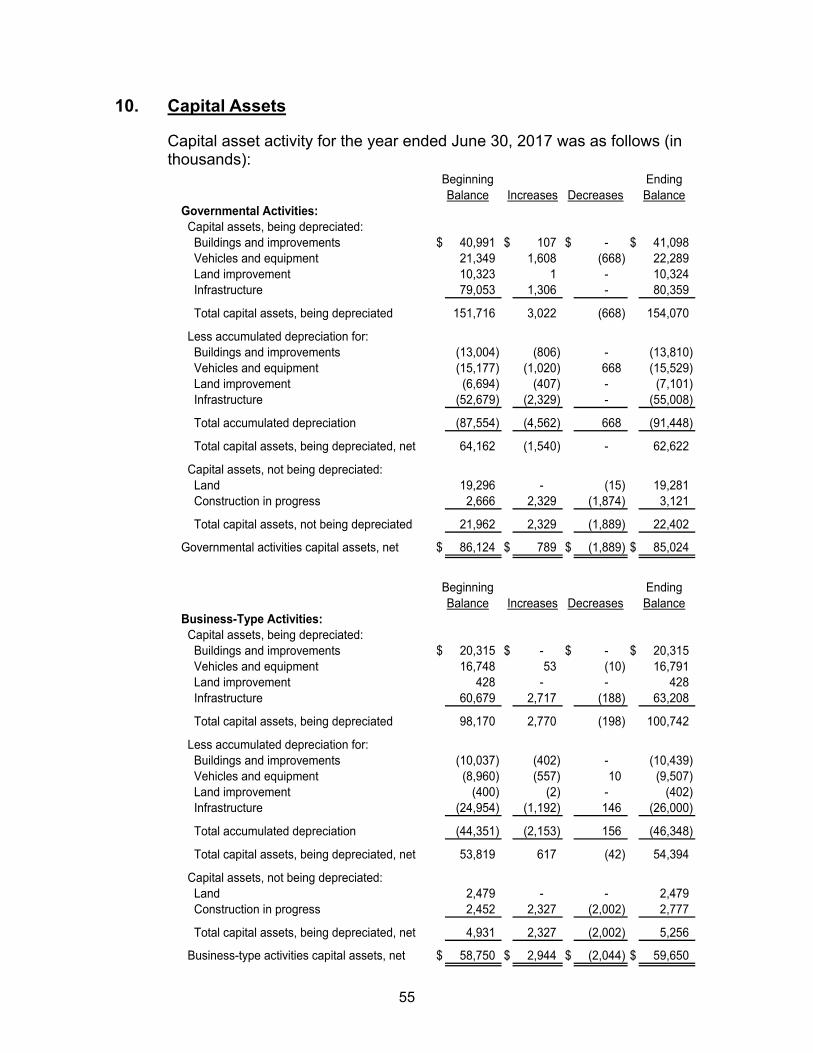
55
10. Capital Assets
Capital asset activity for the year ended June 30, 2017 was as follows (in thousands):
Governmental Activities: Capital assets, being depreciated: Buildings and improvements $ 40,991 $ 107 $ - $ 41,098 Vehicles and equipment 21,349 1,608 (668) 22,289 Land improvement 10,323 1 - 10,324 Infrastructure 79,053 1,306 - 80,359
Total capital assets, being depreciated 151,716 3,022 (668) 154,070
Less accumulated depreciation for: Buildings and improvements (13,004) (806) - (13,810) Vehicles and equipment (15,177) (1,020) 668 (15,529) Land improvement (6,694) (407) - (7,101) Infrastructure (52,679) (2,329) - (55,008)
Total accumulated depreciation (87,554) (4,562) 668 (91,448)
Total capital assets, being depreciated, net 64,162 (1,540) - 62,622
Capital assets, not being depreciated: Land 19,296 - (15) 19,281 Construction in progress 2,666 2,329 (1,874) 3,121
Total capital assets, not being depreciated 21,962 2,329 (1,889) 22,402
Governmental activities capital assets, net $ 86,124 $ 789 $ (1,889) $ 85,024
Beginning Balance Increases Decreases
Ending Balance
Business-Type Activities: Capital assets, being depreciated: Buildings and improvements $ 20,315 $ - $ - $ 20,315 Vehicles and equipment 16,748 53 (10) 16,791 Land improvement 428 - - 428 Infrastructure 60,679 2,717 (188) 63,208
Total capital assets, being depreciated 98,170 2,770 (198) 100,742
Less accumulated depreciation for: Buildings and improvements (10,037) (402) - (10,439) Vehicles and equipment (8,960) (557) 10 (9,507) Land improvement (400) (2) - (402) Infrastructure (24,954) (1,192) 146 (26,000)
Total accumulated depreciation (44,351) (2,153) 156 (46,348)
Total capital assets, being depreciated, net 53,819 617 (42) 54,394
Capital assets, not being depreciated: Land 2,479 - - 2,479 Construction in progress 2,452 2,327 (2,002) 2,777
Total capital assets, being depreciated, net 4,931 2,327 (2,002) 5,256
Business-type activities capital assets, net $ 58,750 $ 2,944 $ (2,044) $ 59,650
Beginning Balance Increases Decreases
Ending Balance
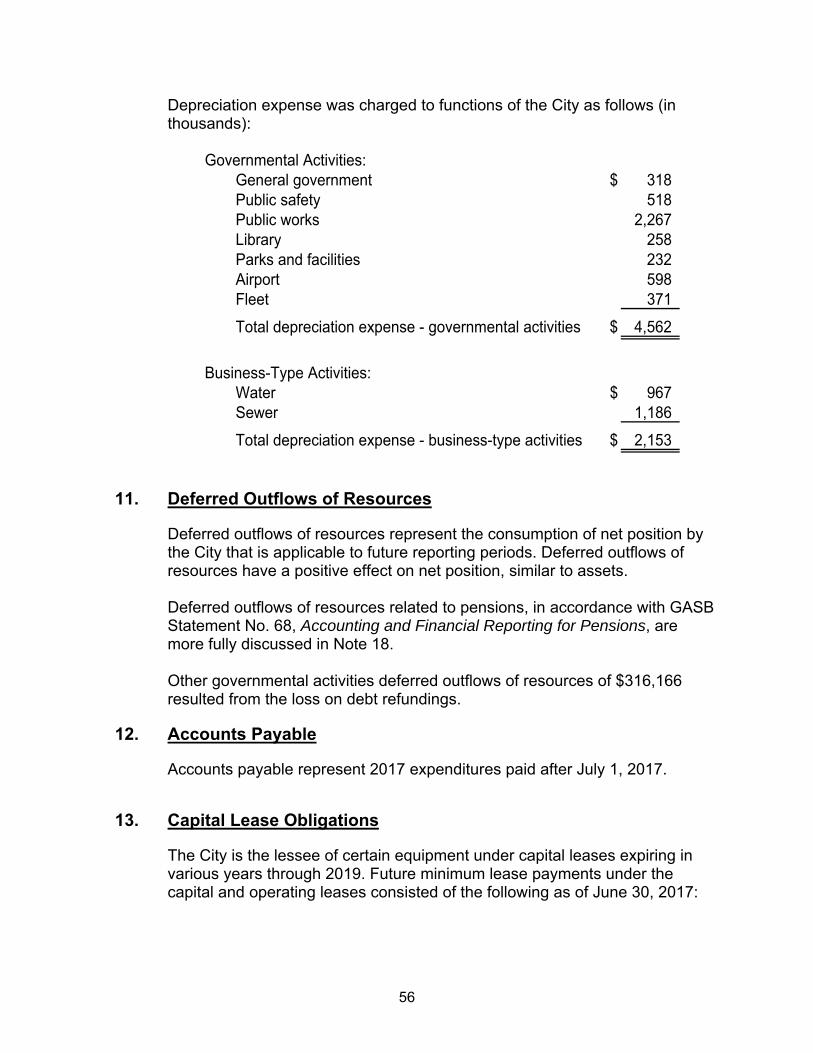
56
Depreciation expense was charged to functions of the City as follows (in thousands):
Governmental Activities:General government $ 318 Public safety 518 Public works 2,267 Library 258 Parks and facilities 232 Airport 598 Fleet 371
Total depreciation expense - governmental activities $ 4,562
Business-Type Activities:
Water $ 967 Sewer 1,186
Total depreciation expense - business-type activities $ 2,153
11. Deferred Outflows of Resources
Deferred outflows of resources represent the consumption of net position by the City that is applicable to future reporting periods. Deferred outflows of resources have a positive effect on net position, similar to assets. Deferred outflows of resources related to pensions, in accordance with GASB Statement No. 68, Accounting and Financial Reporting for Pensions, are more fully discussed in Note 18. Other governmental activities deferred outflows of resources of $316,166 resulted from the loss on debt refundings.
12. Accounts Payable
Accounts payable represent 2017 expenditures paid after July 1, 2017.
13. Capital Lease Obligations
The City is the lessee of certain equipment under capital leases expiring in various years through 2019. Future minimum lease payments under the capital and operating leases consisted of the following as of June 30, 2017:
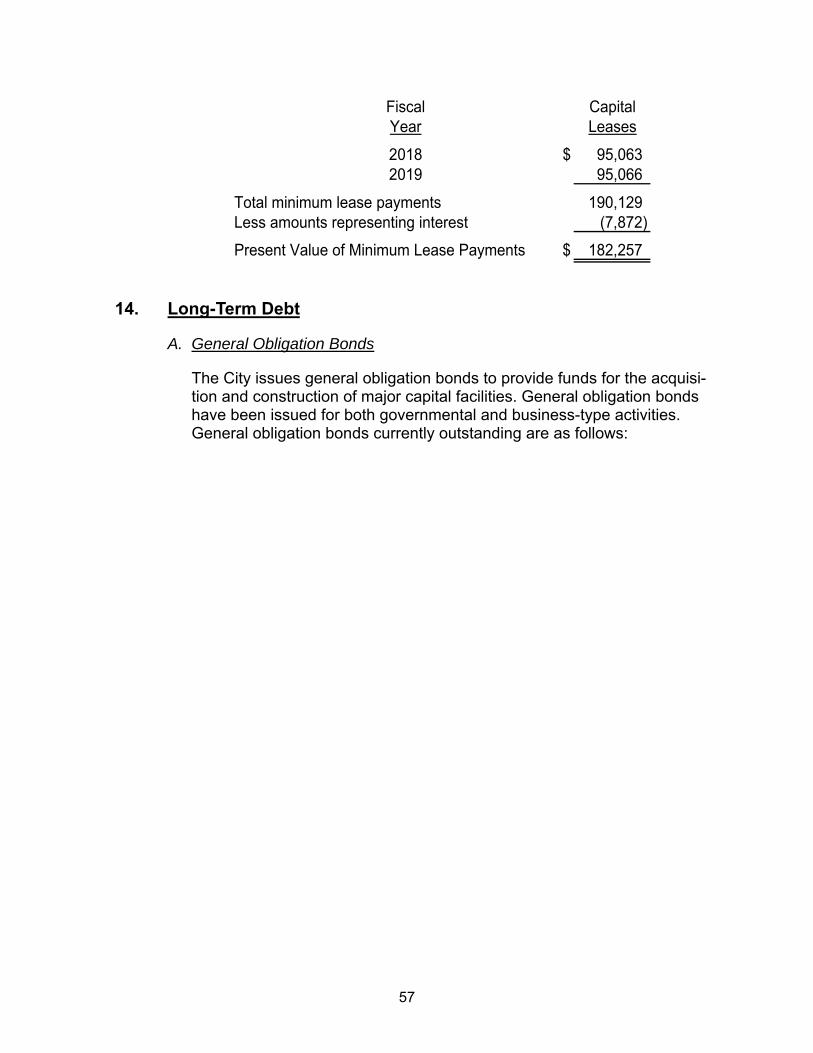
57
Fiscal CapitalYear Leases
2018 $ 95,063 2019 95,066
Total minimum lease payments 190,129 Less amounts representing interest (7,872)
Present Value of Minimum Lease Payments $ 182,257
14. Long-Term Debt
A. General Obligation Bonds
The City issues general obligation bonds to provide funds for the acquisi-tion and construction of major capital facilities. General obligation bonds have been issued for both governmental and business-type activities. General obligation bonds currently outstanding are as follows:
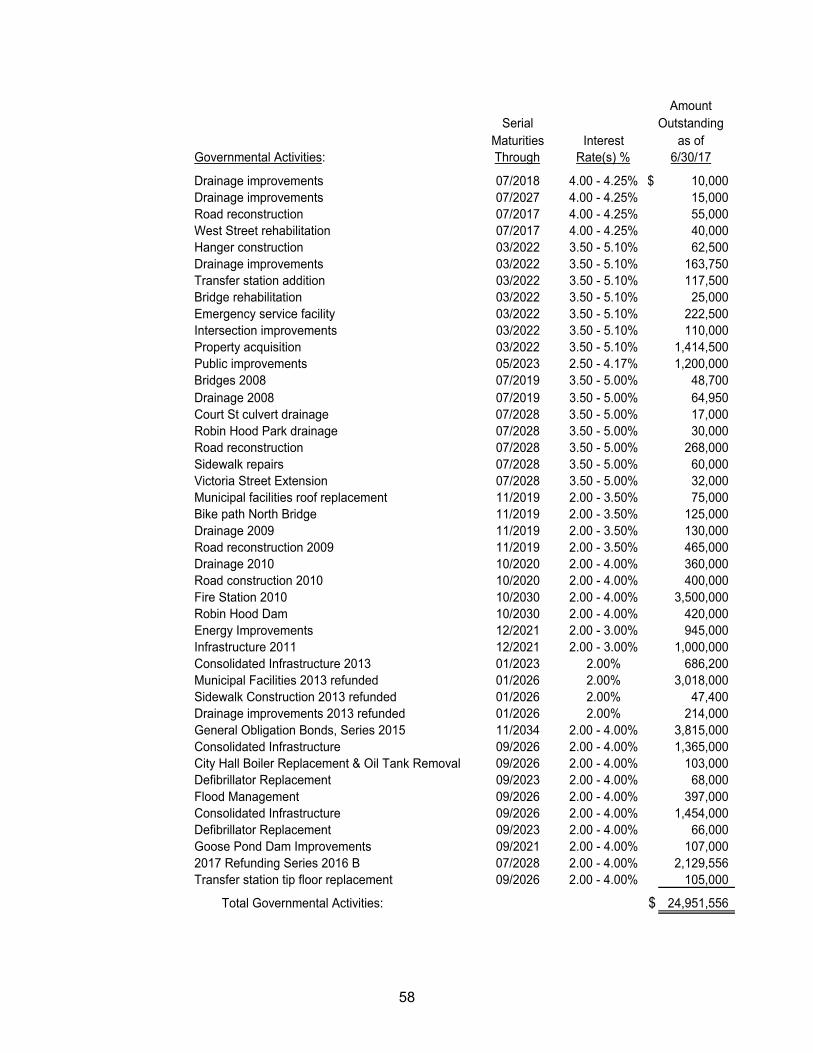
58
SerialMaturities Interest
Governmental Activities: Through Rate(s) %
Drainage improvements 07/2018 4.00 - 4.25% $ 10,000 Drainage improvements 07/2027 4.00 - 4.25% 15,000 Road reconstruction 07/2017 4.00 - 4.25% 55,000 West Street rehabilitation 07/2017 4.00 - 4.25% 40,000 Hanger construction 03/2022 3.50 - 5.10% 62,500 Drainage improvements 03/2022 3.50 - 5.10% 163,750 Transfer station addition 03/2022 3.50 - 5.10% 117,500 Bridge rehabilitation 03/2022 3.50 - 5.10% 25,000 Emergency service facility 03/2022 3.50 - 5.10% 222,500 Intersection improvements 03/2022 3.50 - 5.10% 110,000 Property acquisition 03/2022 3.50 - 5.10% 1,414,500 Public improvements 05/2023 2.50 - 4.17% 1,200,000 Bridges 2008 07/2019 3.50 - 5.00% 48,700 Drainage 2008 07/2019 3.50 - 5.00% 64,950 Court St culvert drainage 07/2028 3.50 - 5.00% 17,000 Robin Hood Park drainage 07/2028 3.50 - 5.00% 30,000 Road reconstruction 07/2028 3.50 - 5.00% 268,000 Sidewalk repairs 07/2028 3.50 - 5.00% 60,000 Victoria Street Extension 07/2028 3.50 - 5.00% 32,000 Municipal facilities roof replacement 11/2019 2.00 - 3.50% 75,000 Bike path North Bridge 11/2019 2.00 - 3.50% 125,000 Drainage 2009 11/2019 2.00 - 3.50% 130,000 Road reconstruction 2009 11/2019 2.00 - 3.50% 465,000 Drainage 2010 10/2020 2.00 - 4.00% 360,000 Road construction 2010 10/2020 2.00 - 4.00% 400,000 Fire Station 2010 10/2030 2.00 - 4.00% 3,500,000 Robin Hood Dam 10/2030 2.00 - 4.00% 420,000 Energy Improvements 12/2021 2.00 - 3.00% 945,000 Infrastructure 2011 12/2021 2.00 - 3.00% 1,000,000 Consolidated Infrastructure 2013 01/2023 2.00% 686,200 Municipal Facilities 2013 refunded 01/2026 2.00% 3,018,000 Sidewalk Construction 2013 refunded 01/2026 2.00% 47,400 Drainage improvements 2013 refunded 01/2026 2.00% 214,000 General Obligation Bonds, Series 2015 11/2034 2.00 - 4.00% 3,815,000 Consolidated Infrastructure 09/2026 2.00 - 4.00% 1,365,000 City Hall Boiler Replacement & Oil Tank Removal 09/2026 2.00 - 4.00% 103,000 Defibrillator Replacement 09/2023 2.00 - 4.00% 68,000 Flood Management 09/2026 2.00 - 4.00% 397,000 Consolidated Infrastructure 09/2026 2.00 - 4.00% 1,454,000 Defibrillator Replacement 09/2023 2.00 - 4.00% 66,000 Goose Pond Dam Improvements 09/2021 2.00 - 4.00% 107,000 2017 Refunding Series 2016 B 07/2028 2.00 - 4.00% 2,129,556 Transfer station tip floor replacement 09/2026 2.00 - 4.00% 105,000
Total Governmental Activities: $ 24,951,556
AmountOutstanding
6/30/17as of
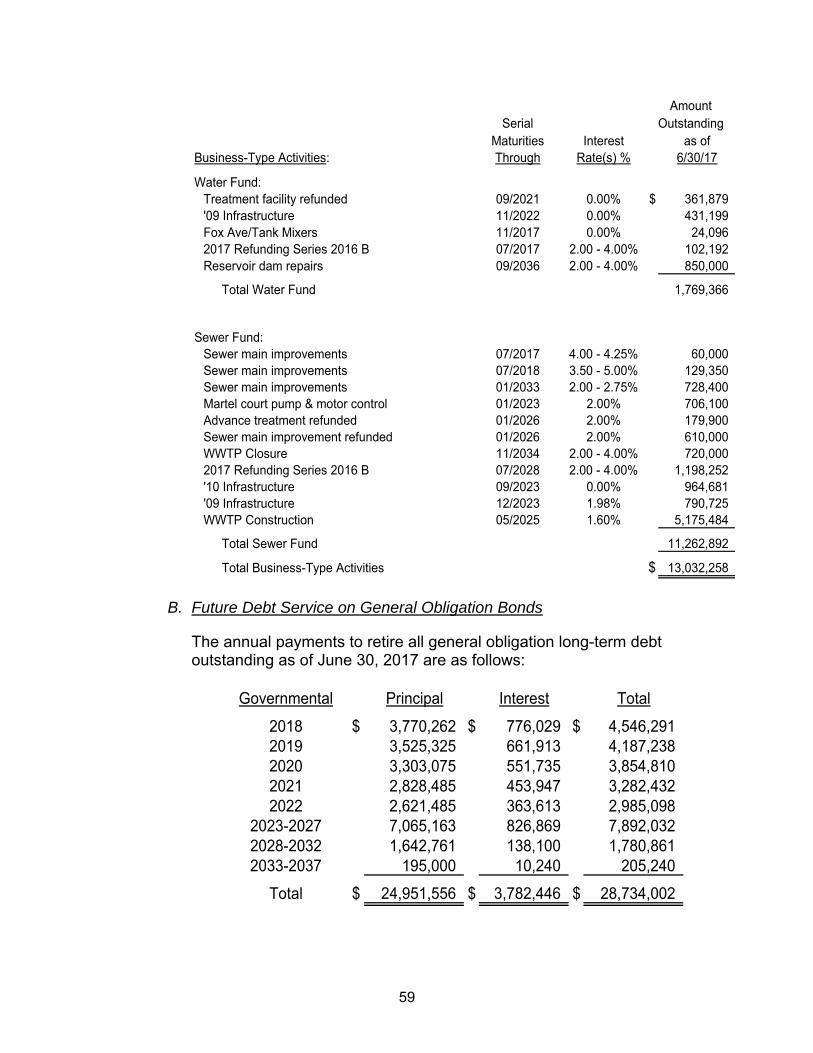
59
SerialMaturities Interest as of
Business-Type Activities: Through Rate(s) % 6/30/17
Water Fund:Treatment facility refunded 09/2021 0.00% $ 361,879 '09 Infrastructure 11/2022 0.00% 431,199 Fox Ave/Tank Mixers 11/2017 0.00% 24,096 2017 Refunding Series 2016 B 07/2017 2.00 - 4.00% 102,192 Reservoir dam repairs 09/2036 2.00 - 4.00% 850,000
Total Water Fund 1,769,366
OutstandingAmount
Sewer Fund:Sewer main improvements 07/2017 4.00 - 4.25% 60,000 Sewer main improvements 07/2018 3.50 - 5.00% 129,350 Sewer main improvements 01/2033 2.00 - 2.75% 728,400 Martel court pump & motor control 01/2023 2.00% 706,100 Advance treatment refunded 01/2026 2.00% 179,900 Sewer main improvement refunded 01/2026 2.00% 610,000 WWTP Closure 11/2034 2.00 - 4.00% 720,000 2017 Refunding Series 2016 B 07/2028 2.00 - 4.00% 1,198,252 '10 Infrastructure 09/2023 0.00% 964,681 '09 Infrastructure 12/2023 1.98% 790,725 WWTP Construction 05/2025 1.60% 5,175,484
Total Sewer Fund 11,262,892
Total Business-Type Activities $ 13,032,258
B. Future Debt Service on General Obligation Bonds
The annual payments to retire all general obligation long-term debt outstanding as of June 30, 2017 are as follows:
Governmental Principal Interest Total
2018 $ 3,770,262 $ 776,029 $ 4,546,291 2019 3,525,325 661,913 4,187,238 2020 3,303,075 551,735 3,854,810 2021 2,828,485 453,947 3,282,432 2022 2,621,485 363,613 2,985,098
2023-2027 7,065,163 826,869 7,892,032 2028-2032 1,642,761 138,100 1,780,861 2033-2037 195,000 10,240 205,240
Total $ 24,951,556 $ 3,782,446 $ 28,734,002
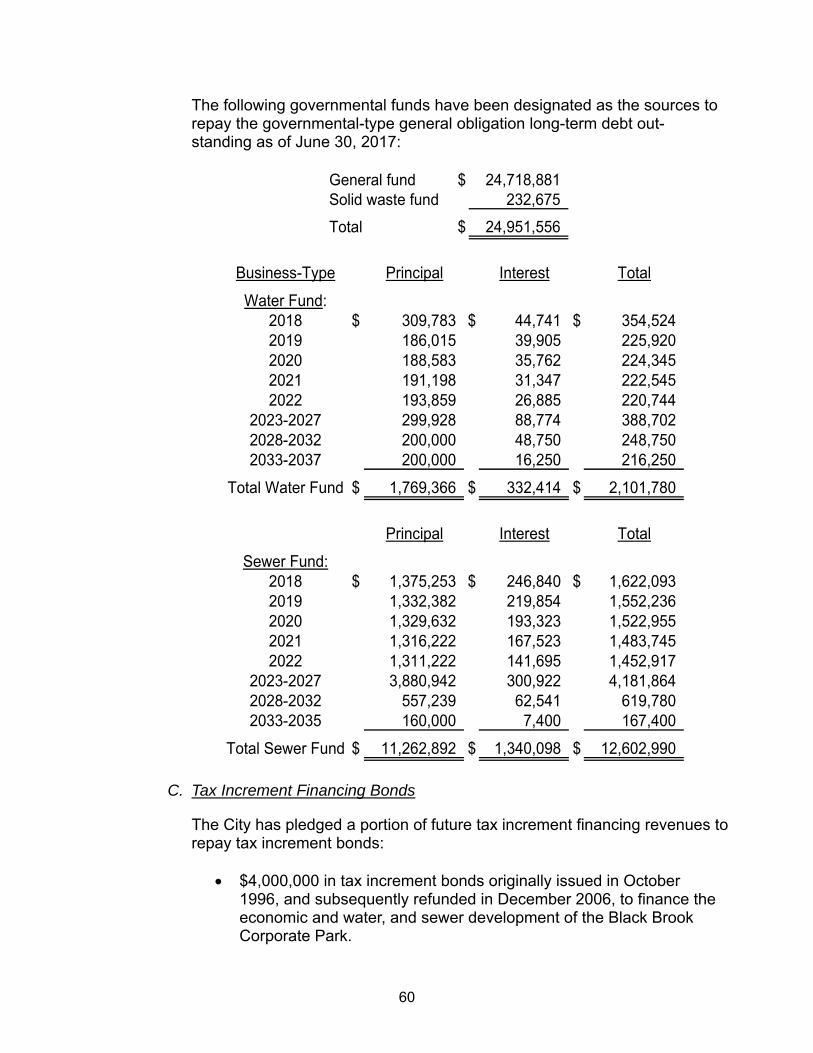
60
The following governmental funds have been designated as the sources to repay the governmental-type general obligation long-term debt out-standing as of June 30, 2017:
General fund $ 24,718,881 Solid waste fund 232,675
Total $ 24,951,556
Business-Type Principal Interest Total
Water Fund:2018 $ 309,783 $ 44,741 $ 354,524 2019 186,015 39,905 225,920 2020 188,583 35,762 224,345 2021 191,198 31,347 222,545 2022 193,859 26,885 220,744
2023-2027 299,928 88,774 388,702 2028-2032 200,000 48,750 248,750 2033-2037 200,000 16,250 216,250
Total Water Fund $ 1,769,366 $ 332,414 $ 2,101,780
Principal Interest Total
Sewer Fund:2018 $ 1,375,253 $ 246,840 $ 1,622,093 2019 1,332,382 219,854 1,552,236 2020 1,329,632 193,323 1,522,955 2021 1,316,222 167,523 1,483,745 2022 1,311,222 141,695 1,452,917
2023-2027 3,880,942 300,922 4,181,864 2028-2032 557,239 62,541 619,780 2033-2035 160,000 7,400 167,400
Total Sewer Fund $ 11,262,892 $ 1,340,098 $ 12,602,990
C. Tax Increment Financing Bonds
The City has pledged a portion of future tax increment financing revenues to repay tax increment bonds:
$4,000,000 in tax increment bonds originally issued in October 1996, and subsequently refunded in December 2006, to finance the economic and water, and sewer development of the Black Brook Corporate Park.
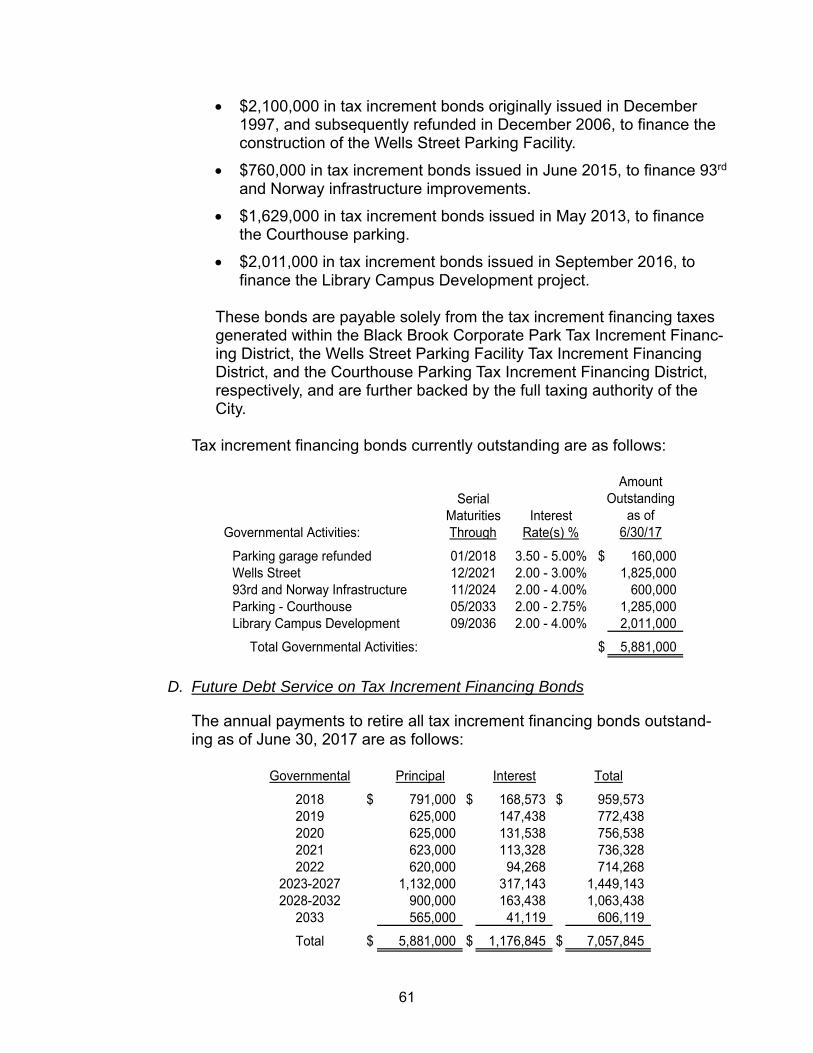
61
$2,100,000 in tax increment bonds originally issued in December 1997, and subsequently refunded in December 2006, to finance the construction of the Wells Street Parking Facility.
$760,000 in tax increment bonds issued in June 2015, to finance 93rd and Norway infrastructure improvements.
$1,629,000 in tax increment bonds issued in May 2013, to finance the Courthouse parking.
$2,011,000 in tax increment bonds issued in September 2016, to finance the Library Campus Development project.
These bonds are payable solely from the tax increment financing taxes generated within the Black Brook Corporate Park Tax Increment Financ-ing District, the Wells Street Parking Facility Tax Increment Financing District, and the Courthouse Parking Tax Increment Financing District, respectively, and are further backed by the full taxing authority of the City.
Tax increment financing bonds currently outstanding are as follows:
SerialMaturities Interest
Governmental Activities: Through Rate(s) %
Parking garage refunded 01/2018 3.50 - 5.00% $ 160,000 Wells Street 12/2021 2.00 - 3.00% 1,825,000 93rd and Norway Infrastructure 11/2024 2.00 - 4.00% 600,000 Parking - Courthouse 05/2033 2.00 - 2.75% 1,285,000 Library Campus Development 09/2036 2.00 - 4.00% 2,011,000
Total Governmental Activities: $ 5,881,000
6/30/17
AmountOutstanding
as of
D. Future Debt Service on Tax Increment Financing Bonds
The annual payments to retire all tax increment financing bonds outstand-ing as of June 30, 2017 are as follows:
Governmental Principal Interest Total
2018 $ 791,000 $ 168,573 $ 959,573 2019 625,000 147,438 772,438 2020 625,000 131,538 756,538 2021 623,000 113,328 736,328 2022 620,000 94,268 714,268
2023-2027 1,132,000 317,143 1,449,143 2028-2032 900,000 163,438 1,063,438
2033 565,000 41,119 606,119
Total $ 5,881,000 $ 1,176,845 $ 7,057,845
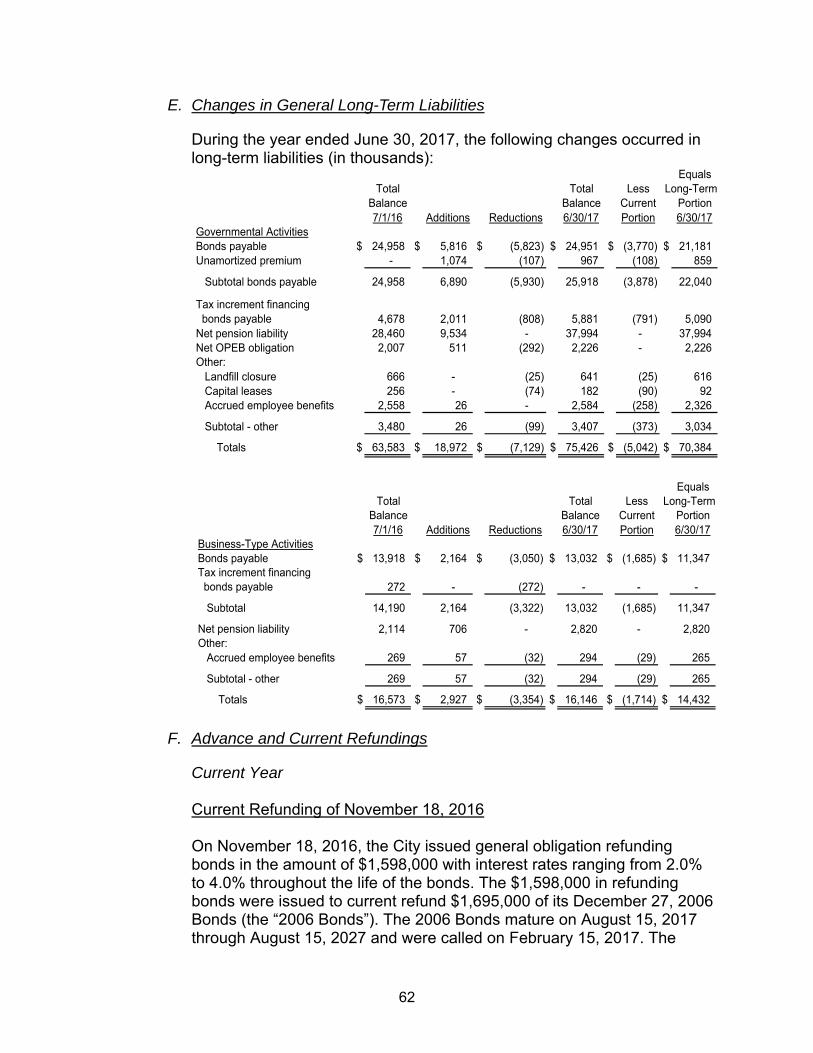
62
E. Changes in General Long-Term Liabilities
During the year ended June 30, 2017, the following changes occurred in long-term liabilities (in thousands):
EqualsTotal Total Less
Balance Balance Current Portion7/1/16 Additions Reductions 6/30/17 Portion 6/30/17
Governmental ActivitiesBonds payable $ 24,958 $ 5,816 $ (5,823) $ 24,951 $ (3,770) $ 21,181 Unamortized premium - 1,074 (107) 967 (108) 859
Subtotal bonds payable 24,958 6,890 (5,930) 25,918 (3,878) 22,040
Tax increment financing bonds payable 4,678 2,011 (808) 5,881 (791) 5,090 Net pension liability 28,460 9,534 - 37,994 - 37,994 Net OPEB obligation 2,007 511 (292) 2,226 - 2,226 Other:
Landfill closure 666 - (25) 641 (25) 616 Capital leases 256 - (74) 182 (90) 92 Accrued employee benefits 2,558 26 - 2,584 (258) 2,326
Subtotal - other 3,480 26 (99) 3,407 (373) 3,034
Totals $ 63,583 $ 18,972 $ (7,129) $ 75,426 $ (5,042) $ 70,384
Long-Term
EqualsTotal Total Less
Balance Balance Current Portion7/1/16 Additions Reductions 6/30/17 Portion 6/30/17
Business-Type ActivitiesBonds payable $ 13,918 $ 2,164 $ (3,050) $ 13,032 $ (1,685) $ 11,347 Tax increment financing bonds payable 272 - (272) - - -
Subtotal 14,190 2,164 (3,322) 13,032 (1,685) 11,347
Net pension liability 2,114 706 - 2,820 - 2,820 Other:
Accrued employee benefits 269 57 (32) 294 (29) 265
Subtotal - other 269 57 (32) 294 (29) 265
Totals $ 16,573 $ 2,927 $ (3,354) $ 16,146 $ (1,714) $ 14,432
Long-Term
F. Advance and Current Refundings
Current Year Current Refunding of November 18, 2016
On November 18, 2016, the City issued general obligation refunding bonds in the amount of $1,598,000 with interest rates ranging from 2.0% to 4.0% throughout the life of the bonds. The $1,598,000 in refunding bonds were issued to current refund $1,695,000 of its December 27, 2006 Bonds (the “2006 Bonds”). The 2006 Bonds mature on August 15, 2017 through August 15, 2027 and were called on February 15, 2017. The
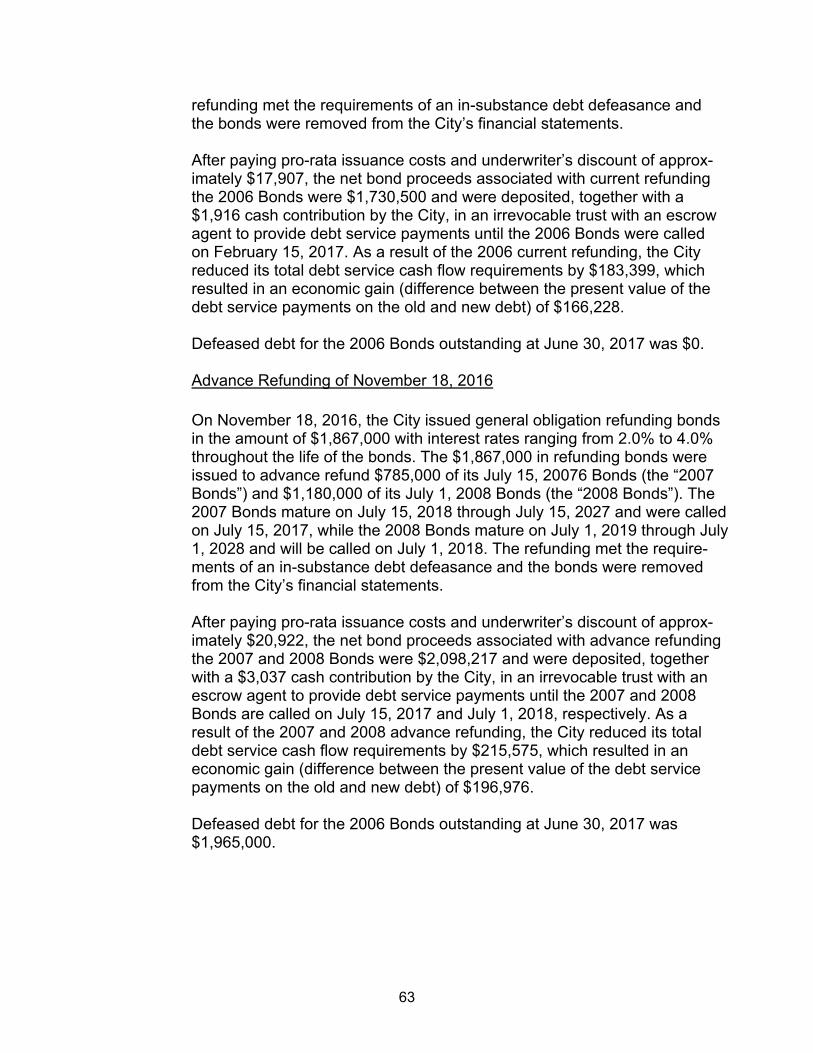
63
refunding met the requirements of an in-substance debt defeasance and the bonds were removed from the City’s financial statements.
After paying pro-rata issuance costs and underwriter’s discount of approx-imately $17,907, the net bond proceeds associated with current refunding the 2006 Bonds were $1,730,500 and were deposited, together with a $1,916 cash contribution by the City, in an irrevocable trust with an escrow agent to provide debt service payments until the 2006 Bonds were called on February 15, 2017. As a result of the 2006 current refunding, the City reduced its total debt service cash flow requirements by $183,399, which resulted in an economic gain (difference between the present value of the debt service payments on the old and new debt) of $166,228. Defeased debt for the 2006 Bonds outstanding at June 30, 2017 was $0. Advance Refunding of November 18, 2016
On November 18, 2016, the City issued general obligation refunding bonds in the amount of $1,867,000 with interest rates ranging from 2.0% to 4.0% throughout the life of the bonds. The $1,867,000 in refunding bonds were issued to advance refund $785,000 of its July 15, 20076 Bonds (the “2007 Bonds”) and $1,180,000 of its July 1, 2008 Bonds (the “2008 Bonds”). The 2007 Bonds mature on July 15, 2018 through July 15, 2027 and were called on July 15, 2017, while the 2008 Bonds mature on July 1, 2019 through July 1, 2028 and will be called on July 1, 2018. The refunding met the require-ments of an in-substance debt defeasance and the bonds were removed from the City’s financial statements. After paying pro-rata issuance costs and underwriter’s discount of approx-imately $20,922, the net bond proceeds associated with advance refunding the 2007 and 2008 Bonds were $2,098,217 and were deposited, together with a $3,037 cash contribution by the City, in an irrevocable trust with an escrow agent to provide debt service payments until the 2007 and 2008 Bonds are called on July 15, 2017 and July 1, 2018, respectively. As a result of the 2007 and 2008 advance refunding, the City reduced its total debt service cash flow requirements by $215,575, which resulted in an economic gain (difference between the present value of the debt service payments on the old and new debt) of $196,976. Defeased debt for the 2006 Bonds outstanding at June 30, 2017 was $1,965,000.
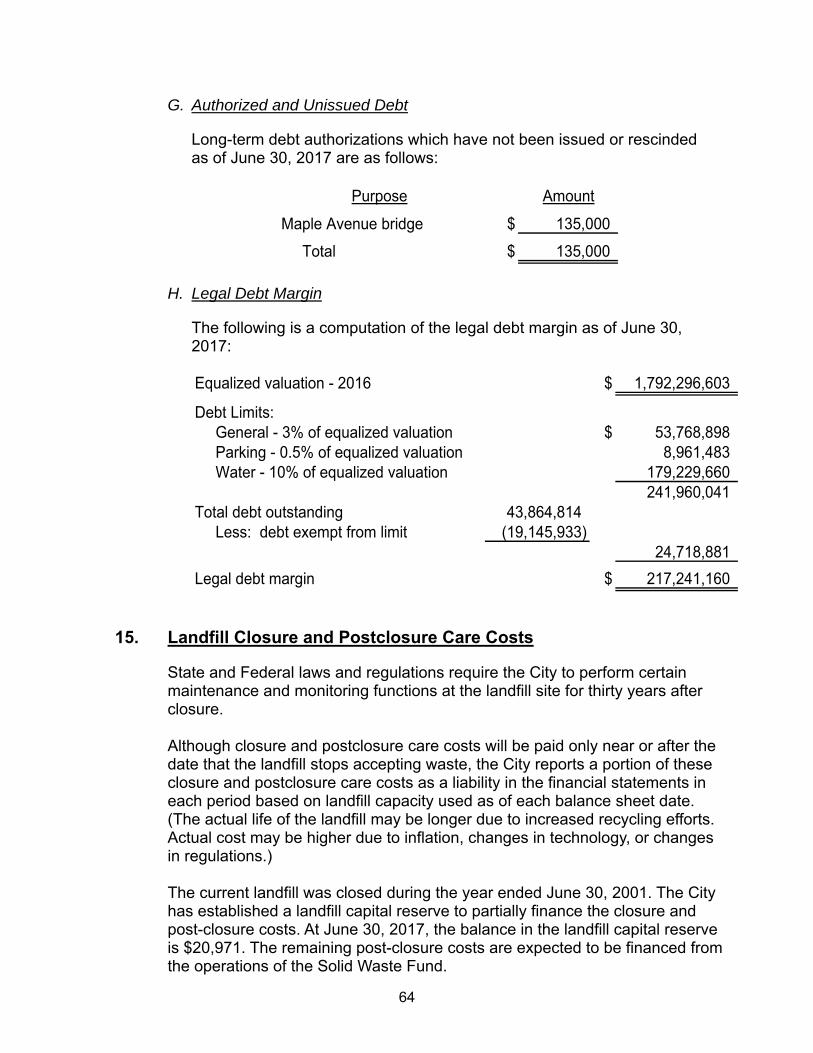
64
G. Authorized and Unissued Debt
Long-term debt authorizations which have not been issued or rescinded as of June 30, 2017 are as follows:
Purpose Amount
Maple Avenue bridge $ 135,000
Total $ 135,000
H. Legal Debt Margin
The following is a computation of the legal debt margin as of June 30, 2017: Equalized valuation - 2016 $ 1,792,296,603
Debt Limits:General - 3% of equalized valuation $ 53,768,898 Parking - 0.5% of equalized valuation 8,961,483 Water - 10% of equalized valuation 179,229,660
241,960,041 Total debt outstanding 43,864,814
Less: debt exempt from limit (19,145,933) 24,718,881
Legal debt margin $ 217,241,160
15. Landfill Closure and Postclosure Care Costs
State and Federal laws and regulations require the City to perform certain maintenance and monitoring functions at the landfill site for thirty years after closure. Although closure and postclosure care costs will be paid only near or after the date that the landfill stops accepting waste, the City reports a portion of these closure and postclosure care costs as a liability in the financial statements in each period based on landfill capacity used as of each balance sheet date. (The actual life of the landfill may be longer due to increased recycling efforts. Actual cost may be higher due to inflation, changes in technology, or changes in regulations.) The current landfill was closed during the year ended June 30, 2001. The City has established a landfill capital reserve to partially finance the closure and post-closure costs. At June 30, 2017, the balance in the landfill capital reserve is $20,971. The remaining post-closure costs are expected to be financed from the operations of the Solid Waste Fund.
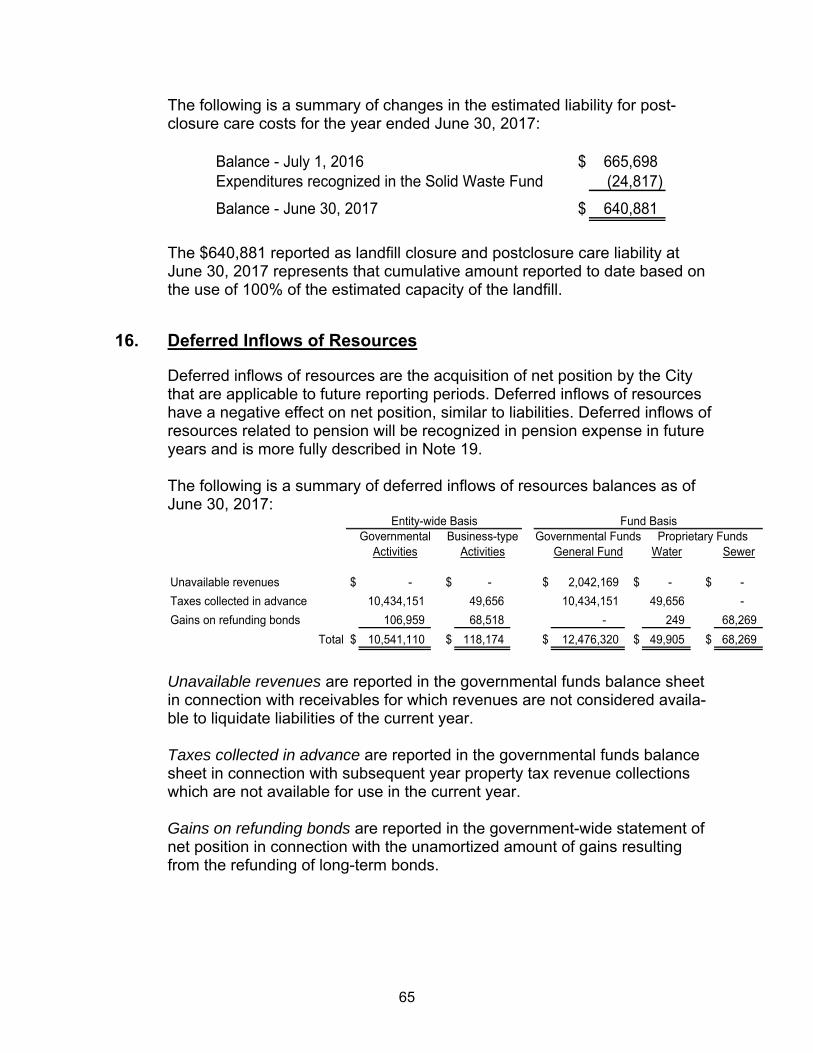
65
The following is a summary of changes in the estimated liability for post-closure care costs for the year ended June 30, 2017:
Balance - July 1, 2016 $ 665,698 Expenditures recognized in the Solid Waste Fund (24,817)
Balance - June 30, 2017 $ 640,881
The $640,881 reported as landfill closure and postclosure care liability at June 30, 2017 represents that cumulative amount reported to date based on the use of 100% of the estimated capacity of the landfill.
16. Deferred Inflows of Resources
Deferred inflows of resources are the acquisition of net position by the City that are applicable to future reporting periods. Deferred inflows of resources have a negative effect on net position, similar to liabilities. Deferred inflows of resources related to pension will be recognized in pension expense in future years and is more fully described in Note 19. The following is a summary of deferred inflows of resources balances as of June 30, 2017:
Governmental Business-typeActivities Activities General Fund Water Sewer
Unavailable revenues $ - $ - $ 2,042,169 $ - $ -
Taxes collected in advance 10,434,151 49,656 10,434,151 49,656 -
Gains on refunding bonds 106,959 68,518 - 249 68,269
Total $ 10,541,110 $ 118,174 $ 12,476,320 $ 49,905 $ 68,269
Entity-wide Basis Fund BasisGovernmental Funds Proprietary Funds
Unavailable revenues are reported in the governmental funds balance sheet in connection with receivables for which revenues are not considered availa-ble to liquidate liabilities of the current year. Taxes collected in advance are reported in the governmental funds balance sheet in connection with subsequent year property tax revenue collections which are not available for use in the current year. Gains on refunding bonds are reported in the government-wide statement of net position in connection with the unamortized amount of gains resulting from the refunding of long-term bonds.
66
17. Governmental Funds - Balances
Fund balances are segregated to account for resources that are either not available for expenditure in the future or are legally set aside for a specific future use. The City implemented GASB Statement No. 54 (GASB 54), Fund Balance Reporting and Governmental Fund Type Definitions, which enhances the usefulness of fund balance information by providing clearer fund balance classifications that can be more consistently applied and by clarifying existing governmental fund type definitions. The following types of fund balances are reported at June 30, 2017: Nonspendable - Represents amounts that cannot be spent because they are either (a) not in spendable form or (b) legally or contractually required to be maintained intact. This fund balance classification includes general fund reserves for prepaid expenditures, nonmajor governmental fund reserves for the principal portion of permanent trust funds, and long-term interfund advances.
Restricted - Represents amounts that are restricted to specific purposes by constraints imposed by creditors, grantors, contributors, or laws or regulations of other governments, or constraints imposed by law through constitutional provisions or enabling legislation. This fund balance classification various special revenue funds, capital projects, and the income portion of permanent trust funds.
Committed - Represents amounts that can only be used for specific purposes pursuant to constraints imposed by resolution of the City Council. This fund balance classification includes capital reserve funds set aside by City Council resolution for future capital acquisitions and improvements and capital project funds. A similar action is needed to modify or rescind a commitment.
Assigned - Represents amounts that are constrained by the City’s intent to use these resources for a specific purpose. This fund balance classification includes general fund encumbrances that have been established by various City departments for the expenditure of current year budgetary financial resources upon vendor performance in the subsequent budgetary period.
Unassigned - Represents amounts that are available to be spent in future periods and deficit funds.
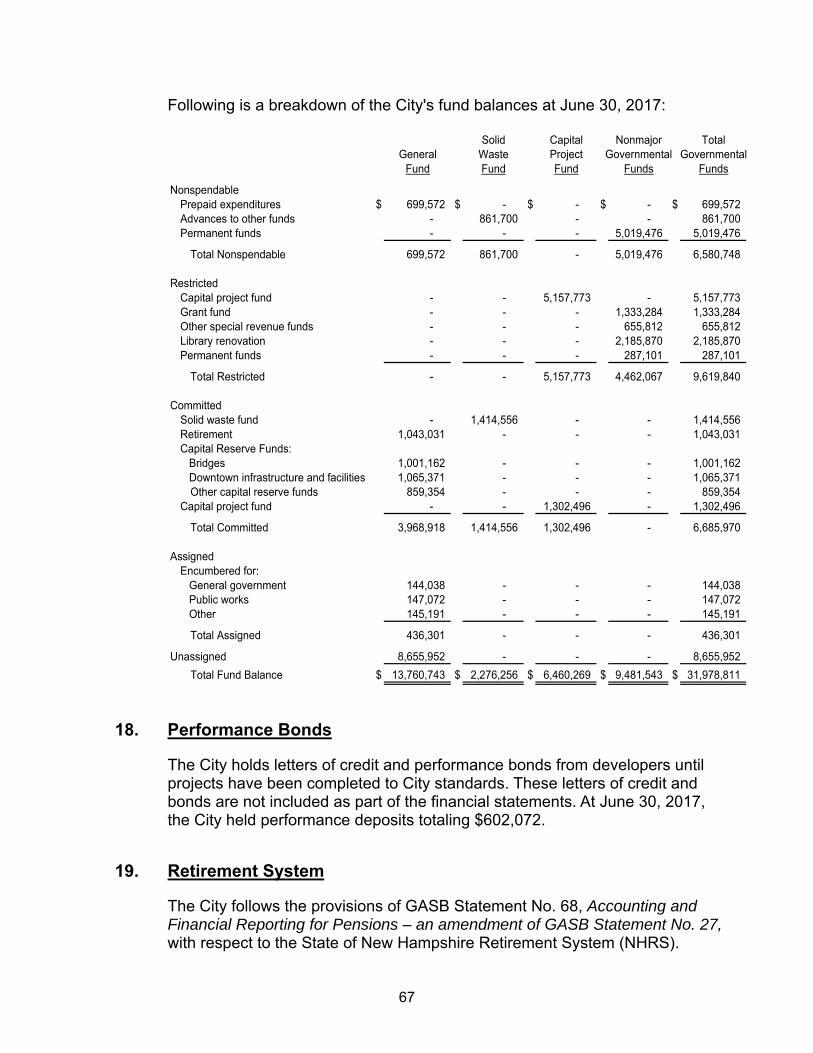
67
Following is a breakdown of the City's fund balances at June 30, 2017:
Solid Capital Nonmajor TotalGeneral Waste Project Governmental Governmental
Fund Fund Fund Funds Funds
NonspendablePrepaid expenditures $ 699,572 $ - $ - $ - $ 699,572 Advances to other funds - 861,700 - - 861,700 Permanent funds - - - 5,019,476 5,019,476
Total Nonspendable 699,572 861,700 - 5,019,476 6,580,748
RestrictedCapital project fund - - 5,157,773 - 5,157,773 Grant fund - - - 1,333,284 1,333,284 Other special revenue funds - - - 655,812 655,812 Library renovation - - - 2,185,870 2,185,870 Permanent funds - - - 287,101 287,101
Total Restricted - - 5,157,773 4,462,067 9,619,840
CommittedSolid waste fund - 1,414,556 - - 1,414,556 Retirement 1,043,031 - - - 1,043,031 Capital Reserve Funds:
Bridges 1,001,162 - - - 1,001,162 Downtown infrastructure and facilities 1,065,371 - - - 1,065,371 Other capital reserve funds 859,354 - - - 859,354
Capital project fund - - 1,302,496 - 1,302,496
Total Committed 3,968,918 1,414,556 1,302,496 - 6,685,970
AssignedEncumbered for:
General government 144,038 - - - 144,038 Public works 147,072 - - - 147,072 Other 145,191 - - - 145,191
Total Assigned 436,301 - - - 436,301
Unassigned 8,655,952 - - - 8,655,952
Total Fund Balance $ 13,760,743 $ 2,276,256 $ 6,460,269 $ 9,481,543 $ 31,978,811
18. Performance Bonds
The City holds letters of credit and performance bonds from developers until projects have been completed to City standards. These letters of credit and bonds are not included as part of the financial statements. At June 30, 2017, the City held performance deposits totaling $602,072.
19. Retirement System
The City follows the provisions of GASB Statement No. 68, Accounting and Financial Reporting for Pensions – an amendment of GASB Statement No. 27, with respect to the State of New Hampshire Retirement System (NHRS).
68
A. Plan Description
Full-time employees participate in the State of New Hampshire Retirement System (the System), a cost-sharing, multiple-employer contributory pen-sion plan and trust established in 1967 by RSA 100-A:2 and is qualified as a tax-exempt organization under Sections 401(a) and 501(a) of the Internal Revenue Code. The plan is a contributory, defined benefit plan providing service, disability, death and vested retirement benefits to members and their beneficiaries. Substantially all full-time state employees, public school teachers and administrators, permanent firefighters and permanent police officers within the State of New Hampshire are eligible and required to participate in the system. Full-time employees of political subdivisions, including counties, municipalities and school districts, are also eligible to participate as a group if the governing body of the political subdivision has elected participation. The New Hampshire Retirement System, a Public Employees Retirement System (PERS), is divided into two membership groups. State or local employees and teachers belong to Group I. Police officers and firefighters belong to Group II. All assets are held in a single trust and are available to each group. Additional information is disclosed in the System’s annual report publicly available from the New Hampshire Retirement System located at 54 Regional Drive, Concord, New Hampshire 03301-8507.
B. Benefits Provided
Group I members at age 60 or 65 (for members who commence service after July 1, 2011) qualify for a normal service retirement allowance based on years of creditable service and average final salary for the highest of either three or five years, depending on when their service commenced. The yearly pension amount is 1/60 or 1.667% of average final compensa-tion (AFC), multiplied by years of creditable service. At age 65, the yearly pension amount is recalculated at 1/66 or 1.515% of AFC multiplied by years of creditable service. Group II members who are age 60, or members who are at least age 45 with at least 20 years of creditable service, can receive a retirement allow-ance at a rate of 2.5% of AFC for each year of creditable service, not to exceed 40 years. Members commencing service on or after July 1, 2011 or members who have a nonvested status as of January 1, 2012 can receive a retirement allowance at age 52.5 with 25 years of service or age 60. The benefit shall be equal to 2% of AFC times creditable service up to 42.5 years. However, a member who commenced service on or after July 1, 2011 shall not receive a retirement allowance until attaining the age of 52.5, but may receive a reduced allowance after age 50 if the member has at least 25 years of creditable service where the allowance shall be reduced, for each month by which the benefit commencement date
69
precedes the month after which the member attains 52.5 years of age by ¼ of 1% or age 60. Members of both groups may qualify for vested deferred allowances, disability allowances and death benefit allowances subject to meeting various eligibility requirements. Benefits are based on AFC or earned compensation and/or service.
C. Contributions
Plan members are required to contribute a percentage of their gross earnings to the pension plan, for which the contribution rates are 7% for employees and teachers 11.55% for police and 11.80% for fire. The City makes annual contributions to the pension plan equal to the amount required by Revised Statutes Annotated 100-A:16, and range from 11.17% to 29.16% of covered compensation. The City’s contributions to the System for the year ended June 30, 2017 was $2,759,440, which was equal to its annual required contribution.
D. Summary of Significant Accounting Policies
For purposes of measuring the net pension liability, deferred outflows of resources and deferred inflows of resources related to pensions, and pension expense, information about the fiduciary net position of the NHRS and additions to/deductions from NHRS’s fiduciary net position have been determined on the same basis as they are reported by NHRS. For this purpose, benefit payments (including refunds of employee contributions) are recognized when due and payable in accordance with benefit terms. Investments are reported at fair value.
E. Pension Liabilities, Pension Expense, and Deferred Outflows of Resources and Deferred Inflows of Resources Related to Pensions
At June 30, 2017, the City reported a liability of $40,814,329 for its pro-portionate share of the net pension liability. The net pension liability was measured as of June 30, 2016, and the total pension liability used to calcu-late the net pension liability was determined by an actuarial valuation as of June 30, 2015. The City’s proportion of the net pension liability was based on a projection of the City’s long-term share of contributions to the pension plan relative to the projected contributions of all participating employers, actuarially determined. At June 30, 2015, City’s proportion was .7718%. At the most recent measurement date of June 30, 2016, the City’s propor-tion was .7670%, which was a decrease of .0048% from its previous year proportion.
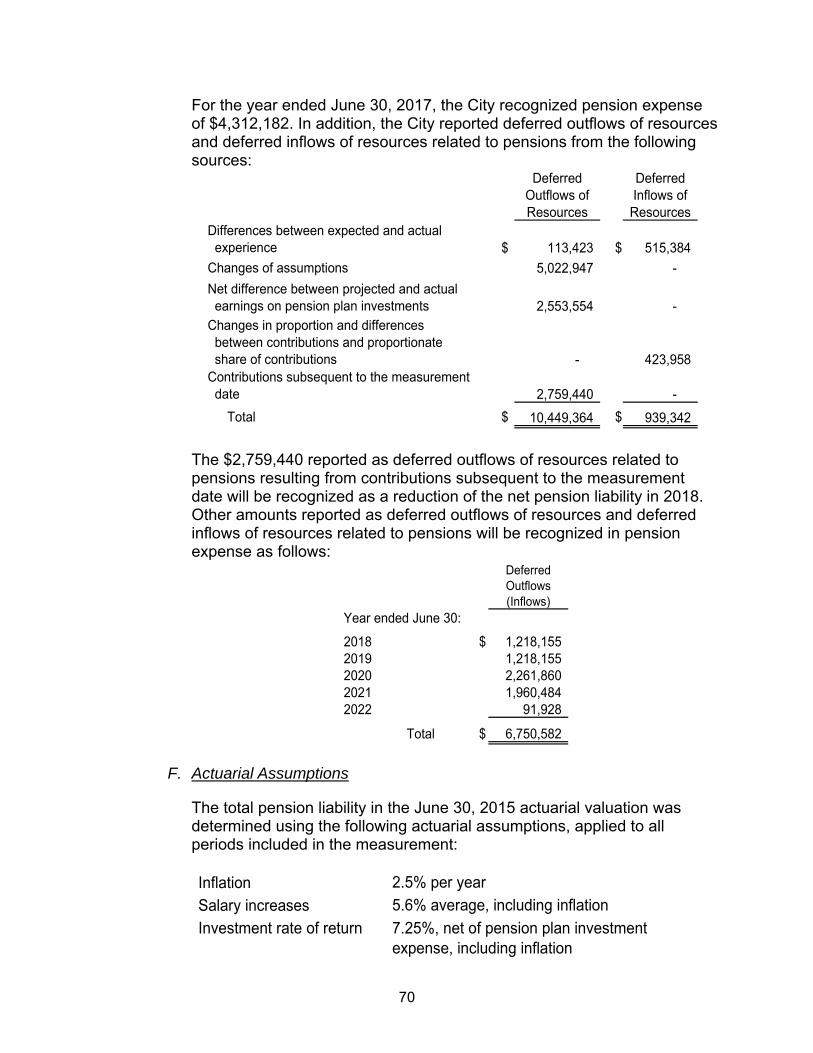
70
For the year ended June 30, 2017, the City recognized pension expense of $4,312,182. In addition, the City reported deferred outflows of resources and deferred inflows of resources related to pensions from the following sources:
Deferred Outflows of Resources
Deferred Inflows of Resources
$ 113,423 $ 515,384
5,022,947 -
2,553,554 -
- 423,958
2,759,440 -
Total $ 10,449,364 $ 939,342
Differences between expected and actual experience
Changes of assumptions
Net difference between projected and actual earnings on pension plan investments
Contributions subsequent to the measurement date
Changes in proportion and differences between contributions and proportionate share of contributions
The $2,759,440 reported as deferred outflows of resources related to pensions resulting from contributions subsequent to the measurement date will be recognized as a reduction of the net pension liability in 2018. Other amounts reported as deferred outflows of resources and deferred inflows of resources related to pensions will be recognized in pension expense as follows:
Deferred Outflows (Inflows)
Year ended June 30:
2018 $ 1,218,155 2019 1,218,155 2020 2,261,860 2021 1,960,484 2022 91,928
Total $ 6,750,582
F. Actuarial Assumptions
The total pension liability in the June 30, 2015 actuarial valuation was determined using the following actuarial assumptions, applied to all periods included in the measurement:
Inflation
Salary increasesInvestment rate of return
5.6% average, including inflation
7.25%, net of pension plan investment expense, including inflation
2.5% per year
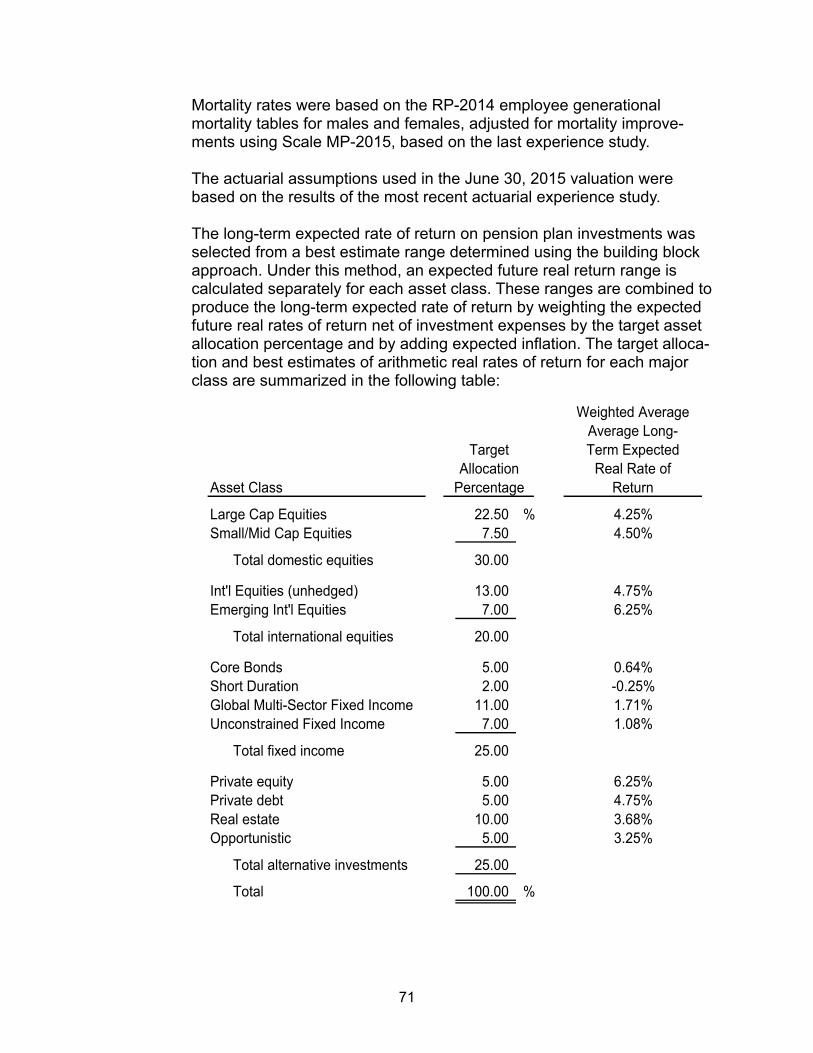
71
Mortality rates were based on the RP-2014 employee generational mortality tables for males and females, adjusted for mortality improve-ments using Scale MP-2015, based on the last experience study. The actuarial assumptions used in the June 30, 2015 valuation were based on the results of the most recent actuarial experience study. The long-term expected rate of return on pension plan investments was selected from a best estimate range determined using the building block approach. Under this method, an expected future real return range is calculated separately for each asset class. These ranges are combined to produce the long-term expected rate of return by weighting the expected future real rates of return net of investment expenses by the target asset allocation percentage and by adding expected inflation. The target alloca-tion and best estimates of arithmetic real rates of return for each major class are summarized in the following table:
Weighted AverageAverage Long-Term Expected
Real Rate ofReturn
22.50 % 4.25%Small/Mid Cap Equities 7.50 4.50%
Total domestic equities 30.00
Int'l Equities (unhedged) 13.00 4.75%Emerging Int'l Equities 7.00 6.25%
Total international equities 20.00
Core Bonds 5.00 0.64%Short Duration 2.00 -0.25%Global Multi-Sector Fixed Income 11.00 1.71%Unconstrained Fixed Income 7.00 1.08%
Total fixed income 25.00
Private equity 5.00 6.25%Private debt 5.00 4.75%Real estate 10.00 3.68%Opportunistic 5.00 3.25%
Total alternative investments 25.00
Total 100.00 %
Large Cap Equities
TargetAllocation
Asset Class Percentage
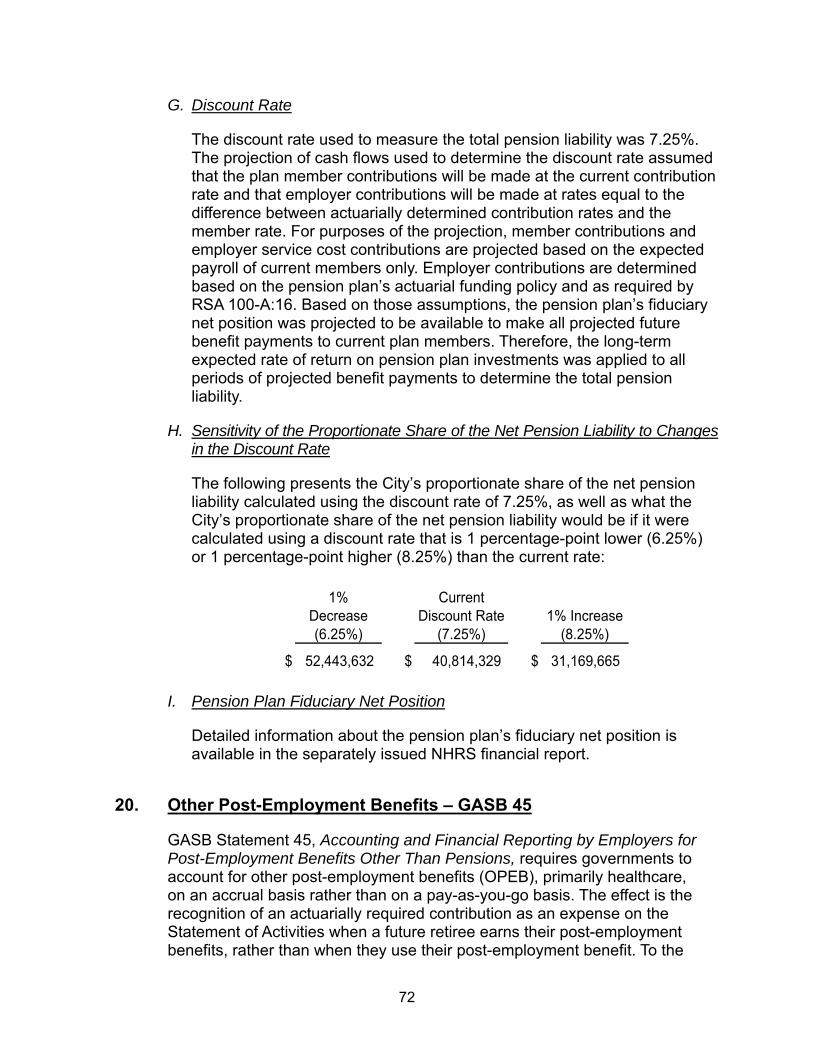
72
G. Discount Rate
The discount rate used to measure the total pension liability was 7.25%. The projection of cash flows used to determine the discount rate assumed that the plan member contributions will be made at the current contribution rate and that employer contributions will be made at rates equal to the difference between actuarially determined contribution rates and the member rate. For purposes of the projection, member contributions and employer service cost contributions are projected based on the expected payroll of current members only. Employer contributions are determined based on the pension plan’s actuarial funding policy and as required by RSA 100-A:16. Based on those assumptions, the pension plan’s fiduciary net position was projected to be available to make all projected future benefit payments to current plan members. Therefore, the long-term expected rate of return on pension plan investments was applied to all periods of projected benefit payments to determine the total pension liability.
H. Sensitivity of the Proportionate Share of the Net Pension Liability to Changes in the Discount Rate
The following presents the City’s proportionate share of the net pension liability calculated using the discount rate of 7.25%, as well as what the City’s proportionate share of the net pension liability would be if it were calculated using a discount rate that is 1 percentage-point lower (6.25%) or 1 percentage-point higher (8.25%) than the current rate:
1% Decrease (6.25%)
Current Discount Rate
(7.25%)1% Increase
(8.25%)
$ 52,443,632 $ 40,814,329 $ 31,169,665
I. Pension Plan Fiduciary Net Position
Detailed information about the pension plan’s fiduciary net position is available in the separately issued NHRS financial report.
20. Other Post-Employment Benefits – GASB 45
GASB Statement 45, Accounting and Financial Reporting by Employers for Post-Employment Benefits Other Than Pensions, requires governments to account for other post-employment benefits (OPEB), primarily healthcare, on an accrual basis rather than on a pay-as-you-go basis. The effect is the recognition of an actuarially required contribution as an expense on the Statement of Activities when a future retiree earns their post-employment benefits, rather than when they use their post-employment benefit. To the
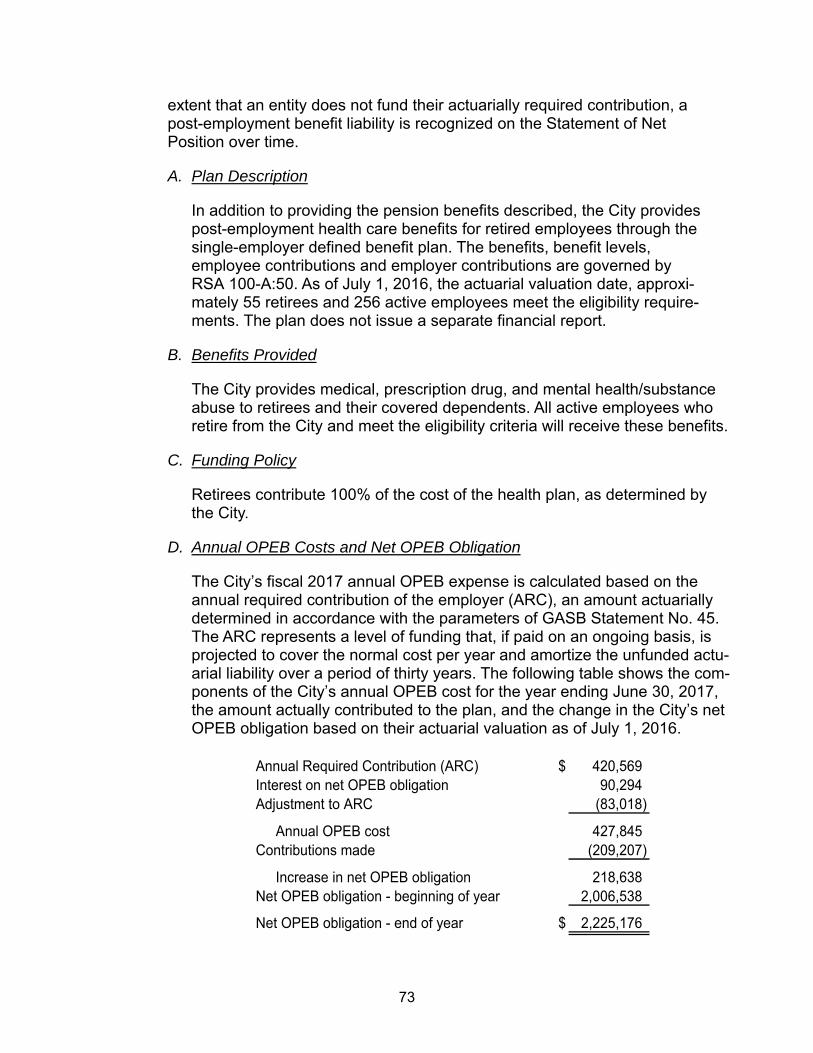
73
extent that an entity does not fund their actuarially required contribution, a post-employment benefit liability is recognized on the Statement of Net Position over time.
A. Plan Description
In addition to providing the pension benefits described, the City provides post-employment health care benefits for retired employees through the single-employer defined benefit plan. The benefits, benefit levels, employee contributions and employer contributions are governed by RSA 100-A:50. As of July 1, 2016, the actuarial valuation date, approxi-mately 55 retirees and 256 active employees meet the eligibility require-ments. The plan does not issue a separate financial report.
B. Benefits Provided
The City provides medical, prescription drug, and mental health/substance abuse to retirees and their covered dependents. All active employees who retire from the City and meet the eligibility criteria will receive these benefits.
C. Funding Policy
Retirees contribute 100% of the cost of the health plan, as determined by the City.
D. Annual OPEB Costs and Net OPEB Obligation
The City’s fiscal 2017 annual OPEB expense is calculated based on the annual required contribution of the employer (ARC), an amount actuarially determined in accordance with the parameters of GASB Statement No. 45. The ARC represents a level of funding that, if paid on an ongoing basis, is projected to cover the normal cost per year and amortize the unfunded actu-arial liability over a period of thirty years. The following table shows the com-ponents of the City’s annual OPEB cost for the year ending June 30, 2017, the amount actually contributed to the plan, and the change in the City’s net OPEB obligation based on their actuarial valuation as of July 1, 2016.
Annual Required Contribution (ARC) $ 420,569 Interest on net OPEB obligation 90,294 Adjustment to ARC (83,018)
Annual OPEB cost 427,845 Contributions made (209,207)
Increase in net OPEB obligation 218,638 Net OPEB obligation - beginning of year 2,006,538
Net OPEB obligation - end of year $ 2,225,176
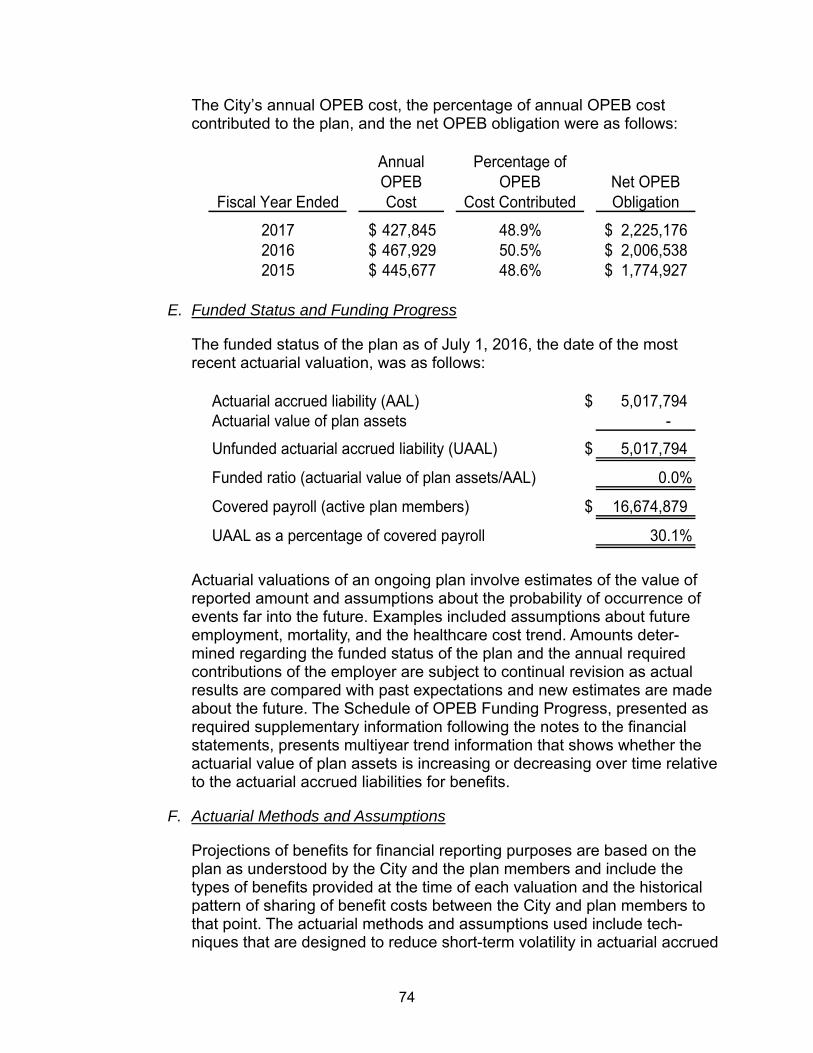
74
The City’s annual OPEB cost, the percentage of annual OPEB cost contributed to the plan, and the net OPEB obligation were as follows:
Fiscal Year Ended
Annual OPEBCost
Percentage of OPEB
Cost ContributedNet OPEBObligation
2017 427,845$ 48.9% 2,225,176$ 2016 467,929$ 50.5% 2,006,538$ 2015 445,677$ 48.6% 1,774,927$
E. Funded Status and Funding Progress
The funded status of the plan as of July 1, 2016, the date of the most recent actuarial valuation, was as follows:
Actuarial accrued liability (AAL) $ 5,017,794 Actuarial value of plan assets -
Unfunded actuarial accrued liability (UAAL) $ 5,017,794
Funded ratio (actuarial value of plan assets/AAL) 0.0%
Covered payroll (active plan members) $ 16,674,879
UAAL as a percentage of covered payroll 30.1%
Actuarial valuations of an ongoing plan involve estimates of the value of reported amount and assumptions about the probability of occurrence of events far into the future. Examples included assumptions about future employment, mortality, and the healthcare cost trend. Amounts deter-mined regarding the funded status of the plan and the annual required contributions of the employer are subject to continual revision as actual results are compared with past expectations and new estimates are made about the future. The Schedule of OPEB Funding Progress, presented as required supplementary information following the notes to the financial statements, presents multiyear trend information that shows whether the actuarial value of plan assets is increasing or decreasing over time relative to the actuarial accrued liabilities for benefits.
F. Actuarial Methods and Assumptions
Projections of benefits for financial reporting purposes are based on the plan as understood by the City and the plan members and include the types of benefits provided at the time of each valuation and the historical pattern of sharing of benefit costs between the City and plan members to that point. The actuarial methods and assumptions used include tech-niques that are designed to reduce short-term volatility in actuarial accrued
75
liabilities and the actuarial value of assets, consistent with the long-term perspective of the calculations. In the July 1, 2016 actuarial valuation, the projected unit credit cost method was used. The actuarial value of assets was not determined, as the City has not advance funded its obligation. The actuarial assumptions included a 4% investment rate of return and an initial annual healthcare cost trend rate of 8% which decreases to a 5% long-term rate for all healthcare bene-fits after four years. The amortization costs for the initial UAAL is a level percentage of payroll for a period of 30 years, on an open group basis. This has been calculated assuming the amortization payment increases at a rate of approximately 3%.
21. Commitments and Contingencies
Outstanding Legal Issues - On an ongoing basis, there are typically pending legal issues in which the City is involved. The City’s management is of the opinion that the potential future settlement of these issues would not materi-ally affect its financial statements taken as a whole. Abatements - There are several cases pending before the New Hampshire Board of Tax and Land Appeals in regard to alleged discrepancies in property assessments. According to the City’s counsel, the probable outcome of these cases at the present time is indeterminable, although the City expects such amounts, if any, to be immaterial. Grants - Amounts received or receivable from grantor agencies are subject to audit and adjustment by grantor agencies, principally the federal government. Any disallowed claims, including amounts already collected, may constitute a liability of the applicable funds. The amount of expenditures which may be disallowed by the grantor cannot be determined at this time, although the City expects such amounts, if any, to be immaterial.
22. Implementation of New GASB Standard
The Governmental Accounting Standards Board (GASB) has issued Statement No. 75, Accounting and Financial Reporting for Postemployment Benefits Other than Pensions, replacing requirements of Statements No. 45 and 57, effective for the City beginning with its year ending June 30, 2018. This Statement estab-lishes standards for recognizing and measuring liabilities, deferred outflows of resources, deferred inflows of resources, and expense/expenditures. In addition, this Statement details the recognition and disclosure requirements for employers with payables to defined benefit OPEB plans that are administered through trusts that meet the specific criteria and for employers whose employees are provided with defined contribution OPEB.

76
(This page intentionally left blank.)
77
REQUIRED SUPPLEMENTARY INFORMATION

78
(This page intentionally left blank.)
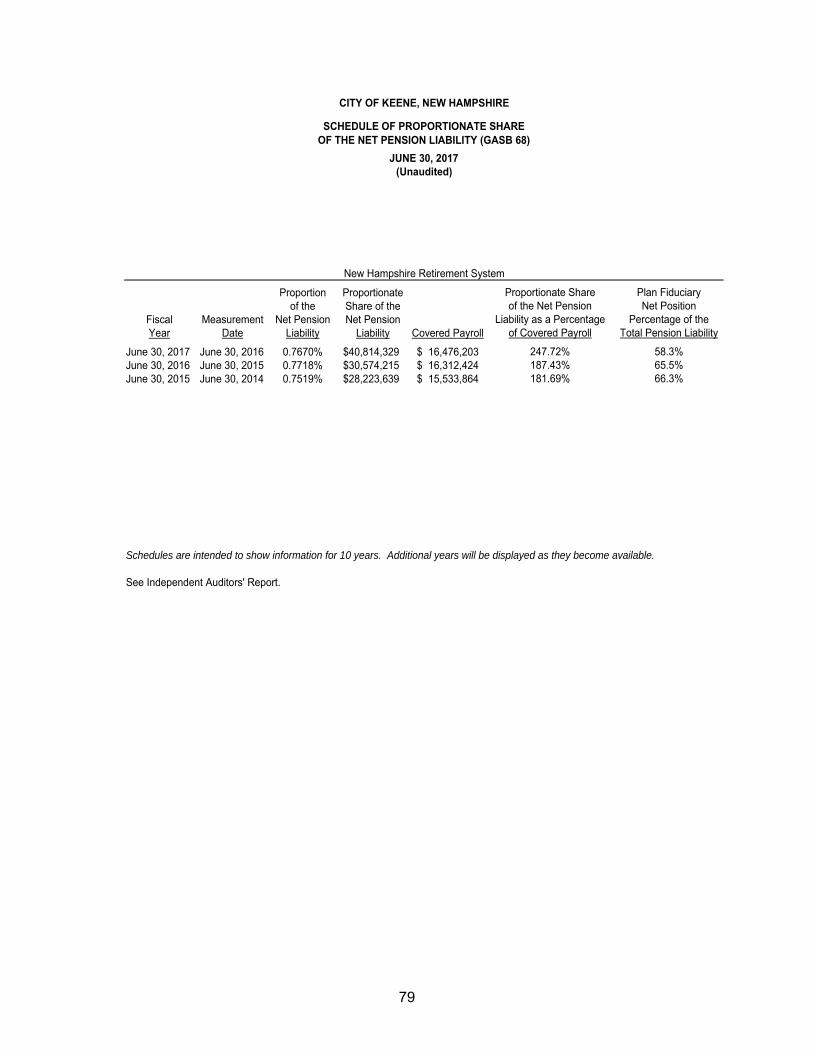
79
Proportion Proportionateof the Share of the
Fiscal Measurement Net Pension Net PensionYear Date Liability Liability Covered Payroll
June 30, 2017 June 30, 2016 0.7670% $40,814,329 16,476,203$ June 30, 2016 June 30, 2015 0.7718% $30,574,215 16,312,424$ June 30, 2015 June 30, 2014 0.7519% $28,223,639 15,533,864$
See Independent Auditors' Report.
New Hampshire Retirement System
CITY OF KEENE, NEW HAMPSHIRE
SCHEDULE OF PROPORTIONATE SHAREOF THE NET PENSION LIABILITY (GASB 68)
JUNE 30, 2017(Unaudited)
Proportionate Share Plan Fiduciaryof the Net Pension Net Position
Liability as a Percentage Percentage of the
Schedules are intended to show information for 10 years. Additional years will be displayed as they become available.
of Covered Payroll Total Pension Liability
187.43% 65.5%181.69% 66.3%
247.72% 58.3%
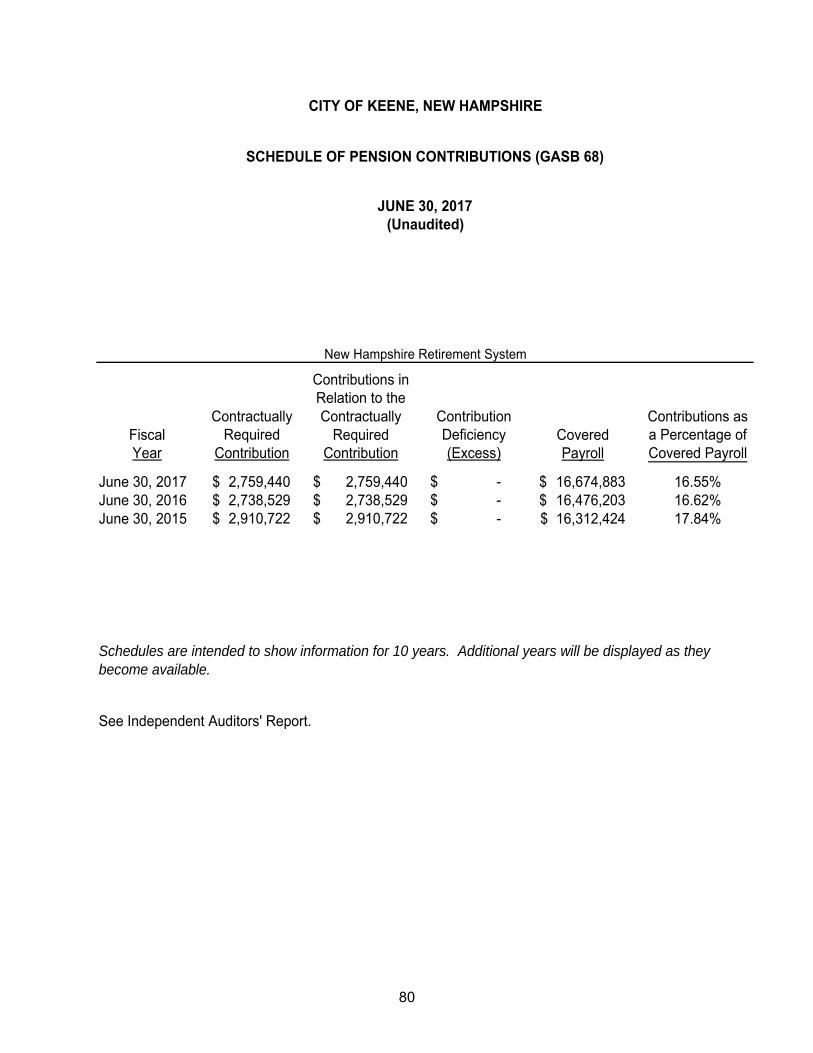
80
Contributions inRelation to the
Contractually Contractually Contribution Contributions asFiscal Required Required Deficiency Covered a Percentage ofYear Contribution Contribution (Excess) Payroll Covered Payroll
June 30, 2017 2,759,440$ 2,759,440$ -$ 16,674,883$ 16.55%June 30, 2016 2,738,529$ 2,738,529$ -$ 16,476,203$ 16.62%June 30, 2015 2,910,722$ 2,910,722$ -$ 16,312,424$ 17.84%
Schedules are intended to show information for 10 years. Additional years will be displayed as they become available.
See Independent Auditors' Report.
CITY OF KEENE, NEW HAMPSHIRE
SCHEDULE OF PENSION CONTRIBUTIONS (GASB 68)
JUNE 30, 2017(Unaudited)
New Hampshire Retirement System

81
Actuarial UAAL asAccrued a Percent-
Actuarial Liability Unfunded age ofActuarial Value of (AAL) - AAL Funded Covered CoveredValuation Assets Entry Age (UAAL) Ratio Payroll Payroll
Date (a) (b) (b-a) (a/b) (c) [(b-a)/c]
07/01/16 -$ 5,017,794$ 5,017,794$ 0.0% 16,674,879$ 30.1%07/01/14 -$ 4,820,878$ 4,820,878$ 0.0% 15,049,531$ 32.0%07/01/12 -$ 4,527,296$ 4,527,296$ 0.0% 13,728,500$ 33.0%
See Independent Auditors' Report.
CITY OF KEENE, NEW HAMPSHIRE
SCHEDULE OF OPEB FUNDING PROGRESS (GASB 45)
June 30, 2017(Unaudited)
Other Post-Employment Benefits

82
(This page intentionally left blank.)
83
Combining and Individual Fund Financial Statements and Schedules
84
NONMAJOR GOVERNMENTAL FUNDS
SPECIAL REVENUE FUNDS
Special Revenue Funds are established to account for resources obtained and expended for specified purposes and restricted by law or local action. Special Revenue Funds are established for the following purposes: Grants Fund: to account for those activities that are funded in part or in whole by
contributions from other entities.
Parking Fund: to account for the operations, maintenance, and capital outlay needs of the municipal parking areas.
Library Fund: to account for the revenues and expenditures incurred with the operation of the Public Library.
Library Renovation Expendable Trust: to account for assets and activities specifically restricted for the library renovation project.
Other Expendable Trusts: to account for various assets and activities restricted for specific purposes. Both the principal and earnings may be used.
PERMANENT FUNDS Permanent Funds are used to report resources that are legally restricted to the extent that only earnings, and not principal, may be used for purposes that support the City’s programs – that is, for the benefit of the City or its citizenry.
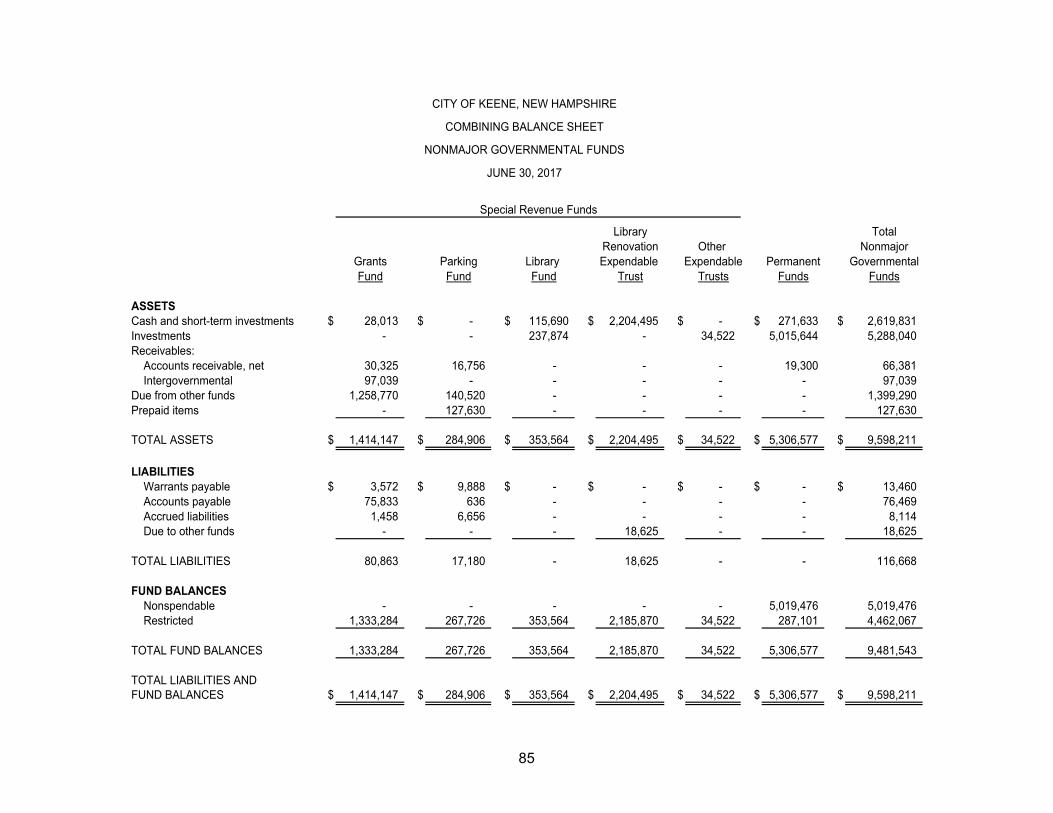
85
Library TotalRenovation Other Nonmajor
Grants Parking Library Expendable Expendable Permanent GovernmentalFund Fund Fund Trust Trusts Funds Funds
ASSETSCash and short-term investments $ 28,013 $ - $ 115,690 $ 2,204,495 $ - $ 271,633 $ 2,619,831 Investments - - 237,874 - 34,522 5,015,644 5,288,040 Receivables:
Accounts receivable, net 30,325 16,756 - - - 19,300 66,381 Intergovernmental 97,039 - - - - - 97,039
Due from other funds 1,258,770 140,520 - - - - 1,399,290 Prepaid items - 127,630 - - - - 127,630
TOTAL ASSETS $ 1,414,147 $ 284,906 $ 353,564 $ 2,204,495 $ 34,522 $ 5,306,577 $ 9,598,211
LIABILITIESWarrants payable $ 3,572 $ 9,888 $ - $ - $ - $ - $ 13,460 Accounts payable 75,833 636 - - - - 76,469 Accrued liabilities 1,458 6,656 - - - - 8,114 Due to other funds - - - 18,625 - - 18,625
TOTAL LIABILITIES 80,863 17,180 - 18,625 - - 116,668
FUND BALANCESNonspendable - - - - - 5,019,476 5,019,476 Restricted 1,333,284 267,726 353,564 2,185,870 34,522 287,101 4,462,067
TOTAL FUND BALANCES 1,333,284 267,726 353,564 2,185,870 34,522 5,306,577 9,481,543
TOTAL LIABILITIES ANDFUND BALANCES $ 1,414,147 $ 284,906 $ 353,564 $ 2,204,495 $ 34,522 $ 5,306,577 $ 9,598,211
Special Revenue Funds
CITY OF KEENE, NEW HAMPSHIRE
COMBINING BALANCE SHEET
NONMAJOR GOVERNMENTAL FUNDS
JUNE 30, 2017
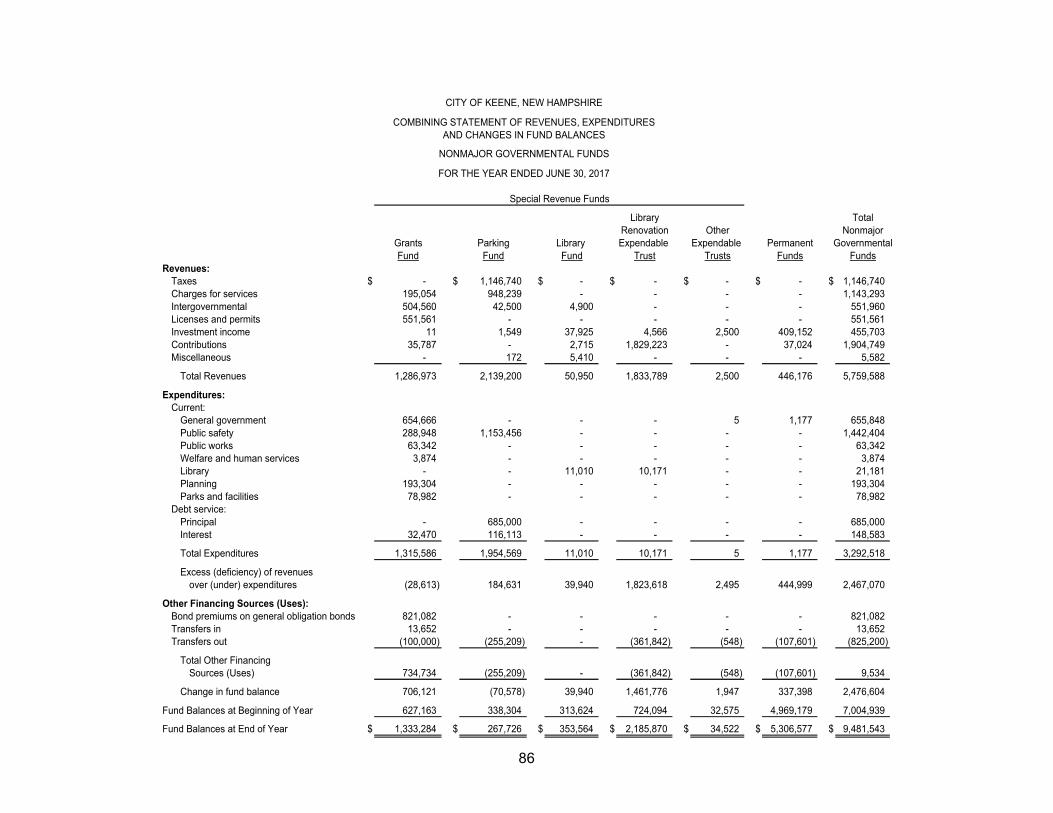
86
Library TotalRenovation Other Nonmajor
Grants Parking Library Expendable Expendable Permanent GovernmentalFund Fund Fund Trust Trusts Funds Funds
Revenues:Taxes $ - $ 1,146,740 $ - $ - $ - $ - $ 1,146,740 Charges for services 195,054 948,239 - - - - 1,143,293 Intergovernmental 504,560 42,500 4,900 - - - 551,960 Licenses and permits 551,561 - - - - - 551,561 Investment income 11 1,549 37,925 4,566 2,500 409,152 455,703 Contributions 35,787 - 2,715 1,829,223 - 37,024 1,904,749 Miscellaneous - 172 5,410 - - - 5,582
Total Revenues 1,286,973 2,139,200 50,950 1,833,789 2,500 446,176 5,759,588
Expenditures:Current:
General government 654,666 - - - 5 1,177 655,848 Public safety 288,948 1,153,456 - - - - 1,442,404 Public works 63,342 - - - - - 63,342 Welfare and human services 3,874 - - - - - 3,874 Library - - 11,010 10,171 - - 21,181 Planning 193,304 - - - - - 193,304 Parks and facilities 78,982 - - - - - 78,982
Debt service:Principal - 685,000 - - - - 685,000 Interest 32,470 116,113 - - - - 148,583
Total Expenditures 1,315,586 1,954,569 11,010 10,171 5 1,177 3,292,518
Excess (deficiency) of revenuesover (under) expenditures (28,613) 184,631 39,940 1,823,618 2,495 444,999 2,467,070
Other Financing Sources (Uses):Bond premiums on general obligation bonds 821,082 - - - - - 821,082 Transfers in 13,652 - - - - - 13,652 Transfers out (100,000) (255,209) - (361,842) (548) (107,601) (825,200)
Total Other FinancingSources (Uses) 734,734 (255,209) - (361,842) (548) (107,601) 9,534
Change in fund balance 706,121 (70,578) 39,940 1,461,776 1,947 337,398 2,476,604
Fund Balances at Beginning of Year 627,163 338,304 313,624 724,094 32,575 4,969,179 7,004,939
Fund Balances at End of Year $ 1,333,284 $ 267,726 $ 353,564 $ 2,185,870 $ 34,522 $ 5,306,577 $ 9,481,543
Special Revenue Funds
CITY OF KEENE, NEW HAMPSHIRE
COMBINING STATEMENT OF REVENUES, EXPENDITURESAND CHANGES IN FUND BALANCES
NONMAJOR GOVERNMENTAL FUNDS
FOR THE YEAR ENDED JUNE 30, 2017
87
SOLID WASTE FUND
The solid waste fund is established to account for the activities of the transfer and recycling operations and for post-closure costs associated with the landfill.
The solid waste fund has an annually adopted budget.
PARKING FUND
The Parking Fund has an annually adopted budget.
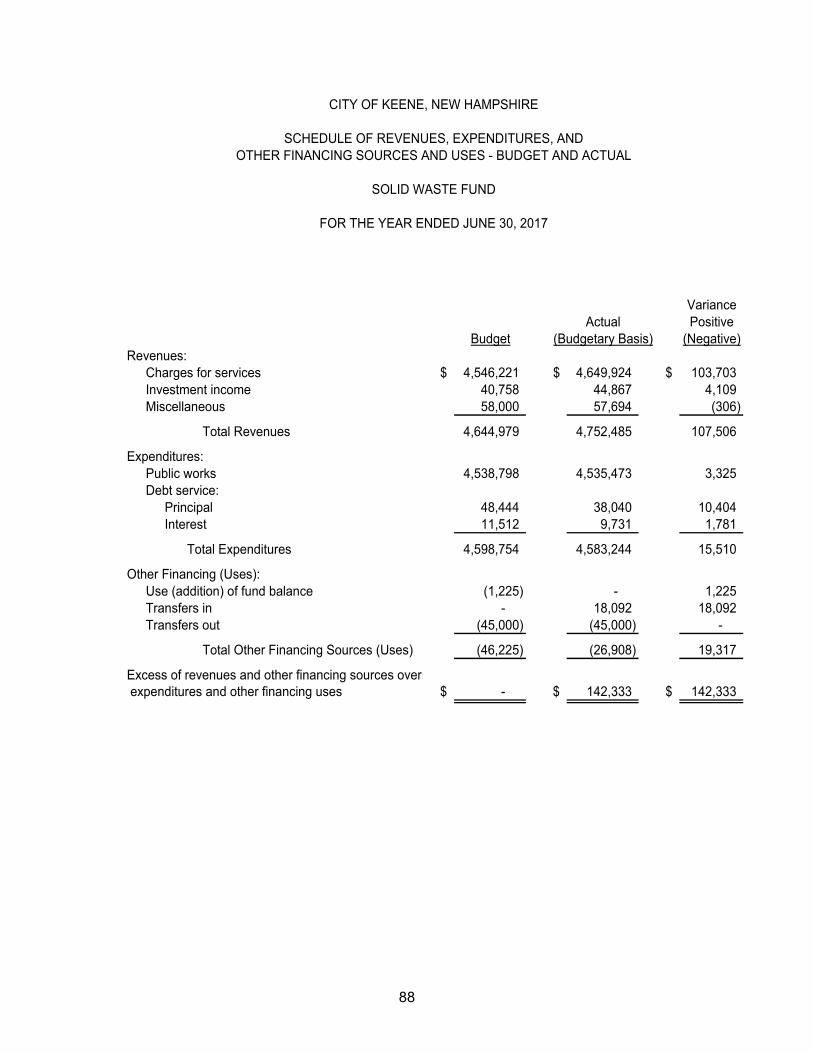
88
VarianceActual Positive
Budget (Budgetary Basis) (Negative)Revenues:
Charges for services $ 4,546,221 $ 4,649,924 $ 103,703 Investment income 40,758 44,867 4,109 Miscellaneous 58,000 57,694 (306)
Total Revenues 4,644,979 4,752,485 107,506
Expenditures:Public works 4,538,798 4,535,473 3,325 Debt service:
Principal 48,444 38,040 10,404 Interest 11,512 9,731 1,781
Total Expenditures 4,598,754 4,583,244 15,510
Other Financing (Uses):Use (addition) of fund balance (1,225) - 1,225 Transfers in - 18,092 18,092 Transfers out (45,000) (45,000) -
Total Other Financing Sources (Uses) (46,225) (26,908) 19,317
Excess of revenues and other financing sources over expenditures and other financing uses $ - $ 142,333 $ 142,333
CITY OF KEENE, NEW HAMPSHIRE
SCHEDULE OF REVENUES, EXPENDITURES, ANDOTHER FINANCING SOURCES AND USES - BUDGET AND ACTUAL
SOLID WASTE FUND
FOR THE YEAR ENDED JUNE 30, 2017
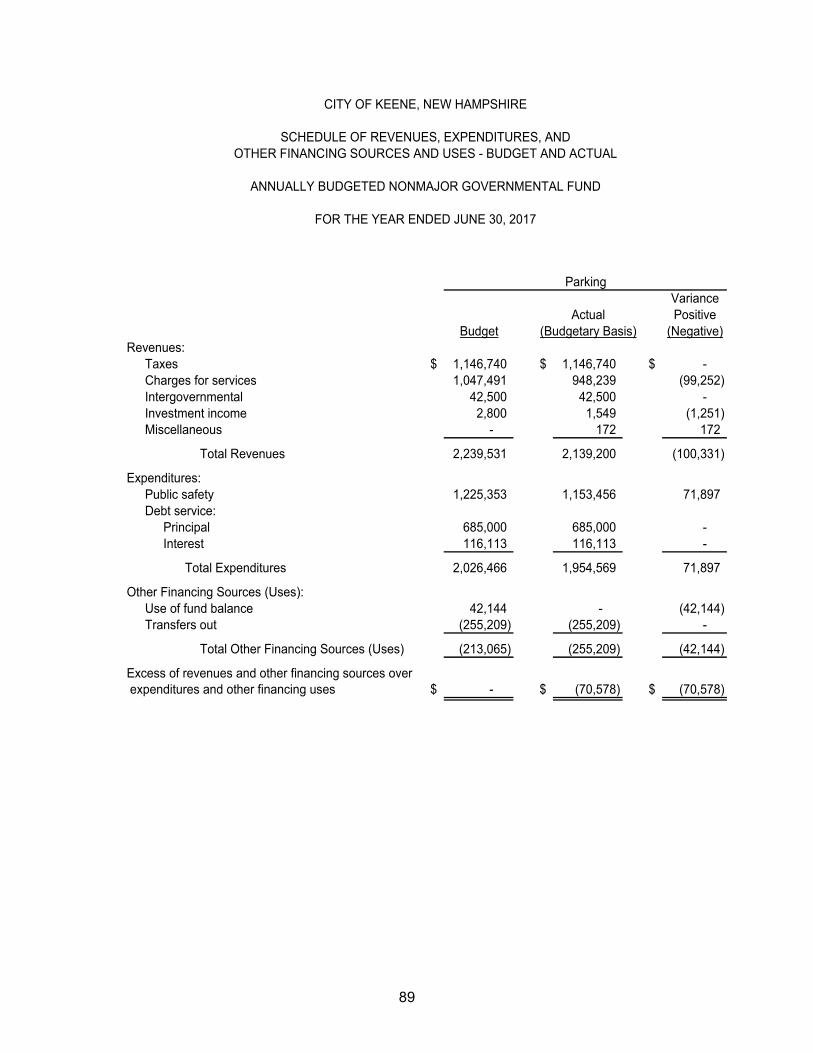
89
VarianceActual Positive
Budget (Budgetary Basis) (Negative)Revenues:
Taxes $ 1,146,740 $ 1,146,740 $ - Charges for services 1,047,491 948,239 (99,252) Intergovernmental 42,500 42,500 - Investment income 2,800 1,549 (1,251) Miscellaneous - 172 172
Total Revenues 2,239,531 2,139,200 (100,331)
Expenditures:Public safety 1,225,353 1,153,456 71,897 Debt service:
Principal 685,000 685,000 - Interest 116,113 116,113 -
Total Expenditures 2,026,466 1,954,569 71,897
Other Financing Sources (Uses):Use of fund balance 42,144 - (42,144) Transfers out (255,209) (255,209) -
Total Other Financing Sources (Uses) (213,065) (255,209) (42,144)
Excess of revenues and other financing sources over expenditures and other financing uses $ - $ (70,578) $ (70,578)
Parking
CITY OF KEENE, NEW HAMPSHIRE
ANNUALLY BUDGETED NONMAJOR GOVERNMENTAL FUND
SCHEDULE OF REVENUES, EXPENDITURES, ANDOTHER FINANCING SOURCES AND USES - BUDGET AND ACTUAL
FOR THE YEAR ENDED JUNE 30, 2017

90
(This page intentionally left blank.)
91
INTERNAL SERVICE FUNDS Internal service funds are used to account for central source activities that provide goods and services to other funds, departments, or agencies. The City of Keene has the following Internal Service Funds: Fleet Fund: to account for the operations, maintenance, and capital outlay needs
of fleet services.
PC Replacement Fund: to account for the on-going replacement of PCs, certain peripherals, and desktop software utilized by all City departments.
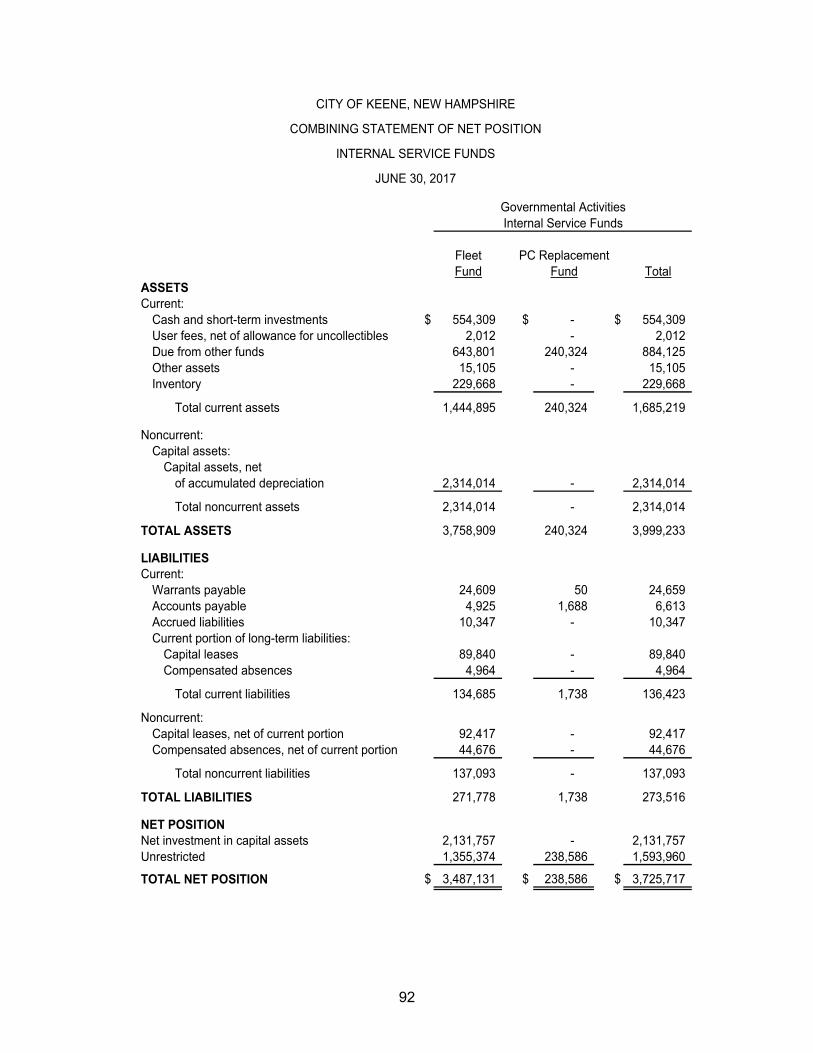
92
Fleet PC ReplacementFund Fund Total
Current:Cash and short-term investments $ 554,309 $ - $ 554,309 User fees, net of allowance for uncollectibles 2,012 - 2,012 Due from other funds 643,801 240,324 884,125 Other assets 15,105 - 15,105 Inventory 229,668 - 229,668
Total current assets 1,444,895 240,324 1,685,219
Noncurrent:Capital assets:
Capital assets, netof accumulated depreciation 2,314,014 - 2,314,014
Total noncurrent assets 2,314,014 - 2,314,014
3,758,909 240,324 3,999,233
Current:Warrants payable 24,609 50 24,659 Accounts payable 4,925 1,688 6,613 Accrued liabilities 10,347 - 10,347 Current portion of long-term liabilities:
Capital leases 89,840 - 89,840 Compensated absences 4,964 - 4,964
Total current liabilities 134,685 1,738 136,423
Noncurrent:Capital leases, net of current portion 92,417 - 92,417 Compensated absences, net of current portion 44,676 - 44,676
Total noncurrent liabilities 137,093 - 137,093
271,778 1,738 273,516
Net investment in capital assets 2,131,757 - 2,131,757 Unrestricted 1,355,374 238,586 1,593,960
TOTAL NET POSITION $ 3,487,131 $ 238,586 $ 3,725,717
CITY OF KEENE, NEW HAMPSHIRE
COMBINING STATEMENT OF NET POSITION
INTERNAL SERVICE FUNDS
JUNE 30, 2017
Governmental Activities
NET POSITION
Internal Service Funds
ASSETS
TOTAL ASSETS
LIABILITIES
TOTAL LIABILITIES
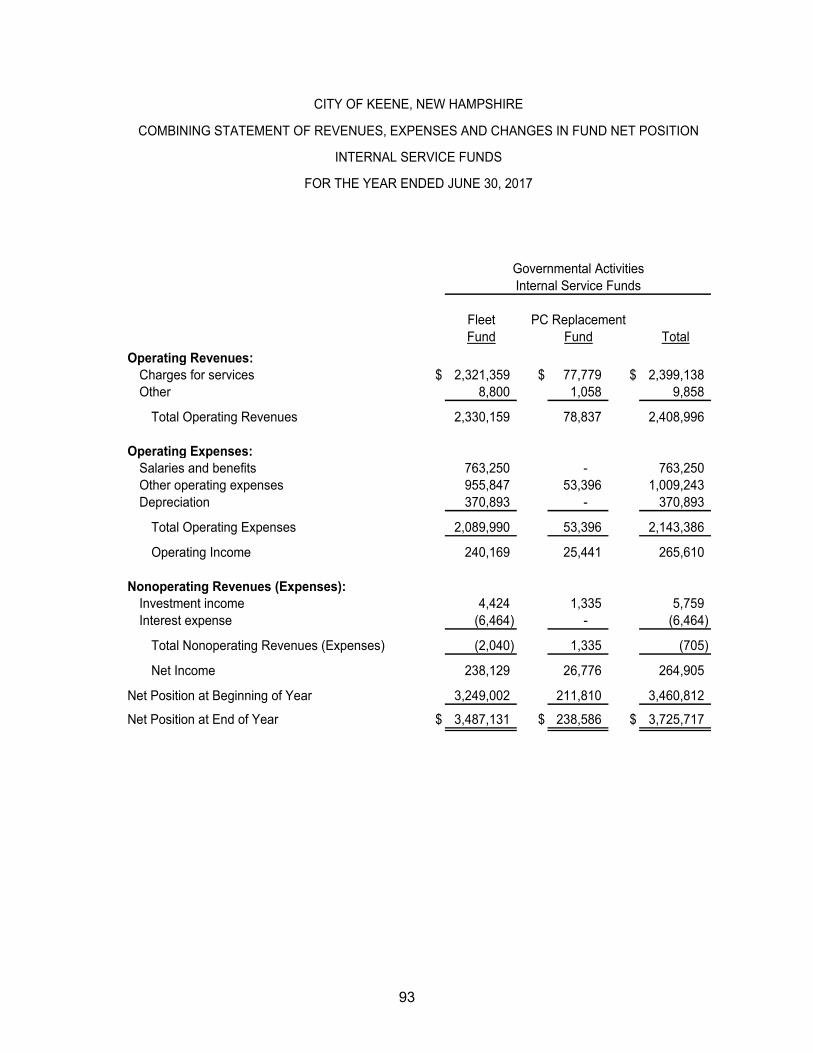
93
Fleet PC ReplacementFund Fund Total
Operating Revenues:Charges for services $ 2,321,359 $ 77,779 $ 2,399,138 Other 8,800 1,058 9,858
Total Operating Revenues 2,330,159 78,837 2,408,996
Operating Expenses:Salaries and benefits 763,250 - 763,250 Other operating expenses 955,847 53,396 1,009,243 Depreciation 370,893 - 370,893
Total Operating Expenses 2,089,990 53,396 2,143,386
Operating Income 240,169 25,441 265,610
Nonoperating Revenues (Expenses):Investment income 4,424 1,335 5,759 Interest expense (6,464) - (6,464)
Total Nonoperating Revenues (Expenses) (2,040) 1,335 (705)
Net Income 238,129 26,776 264,905
Net Position at Beginning of Year 3,249,002 211,810 3,460,812
Net Position at End of Year $ 3,487,131 $ 238,586 $ 3,725,717
Internal Service Funds
CITY OF KEENE, NEW HAMPSHIRE
COMBINING STATEMENT OF REVENUES, EXPENSES AND CHANGES IN FUND NET POSITION
INTERNAL SERVICE FUNDS
FOR THE YEAR ENDED JUNE 30, 2017
Governmental Activities
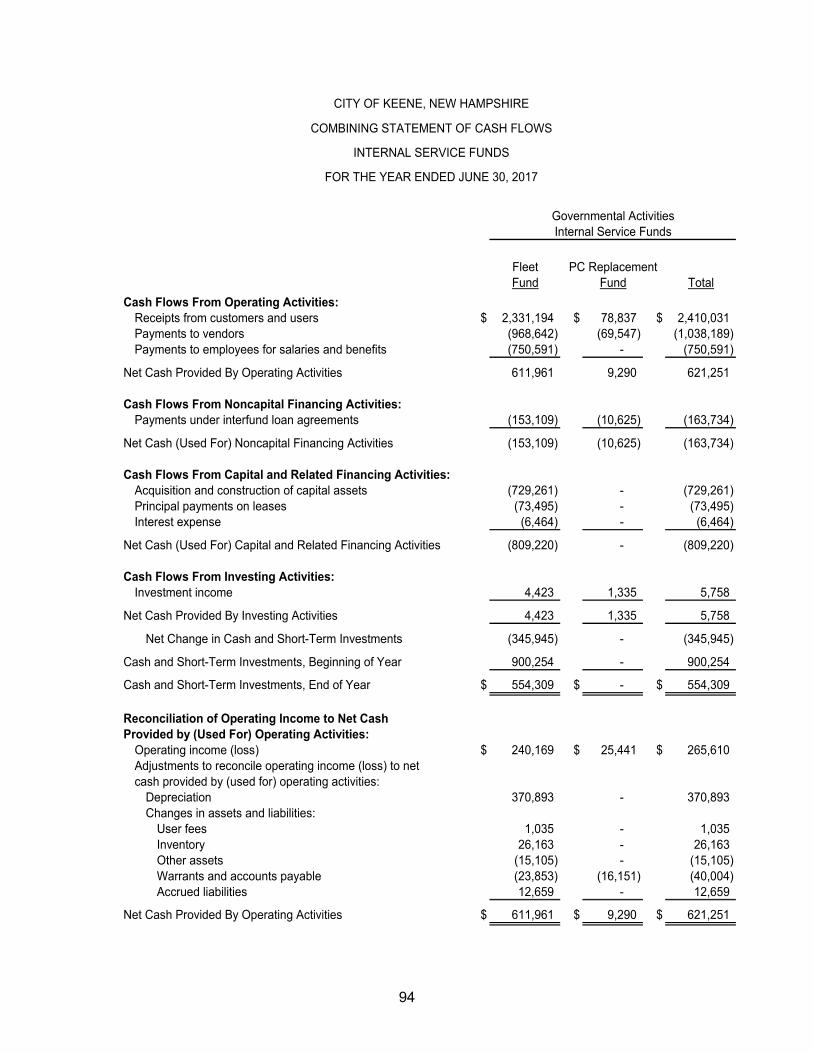
94
Fleet PC ReplacementFund Fund Total
Cash Flows From Operating Activities:Receipts from customers and users $ 2,331,194 $ 78,837 $ 2,410,031 Payments to vendors (968,642) (69,547) (1,038,189) Payments to employees for salaries and benefits (750,591) - (750,591)
Net Cash Provided By Operating Activities 611,961 9,290 621,251
Cash Flows From Noncapital Financing Activities:Payments under interfund loan agreements (153,109) (10,625) (163,734)
Net Cash (Used For) Noncapital Financing Activities (153,109) (10,625) (163,734)
Cash Flows From Capital and Related Financing Activities:Acquisition and construction of capital assets (729,261) - (729,261) Principal payments on leases (73,495) - (73,495) Interest expense (6,464) - (6,464)
Net Cash (Used For) Capital and Related Financing Activities (809,220) - (809,220)
Cash Flows From Investing Activities:Investment income 4,423 1,335 5,758
Net Cash Provided By Investing Activities 4,423 1,335 5,758
Net Change in Cash and Short-Term Investments (345,945) - (345,945)
Cash and Short-Term Investments, Beginning of Year 900,254 - 900,254
Cash and Short-Term Investments, End of Year $ 554,309 $ - $ 554,309
Reconciliation of Operating Income to Net CashProvided by (Used For) Operating Activities:
Operating income (loss) $ 240,169 $ 25,441 $ 265,610 Adjustments to reconcile operating income (loss) to netcash provided by (used for) operating activities:
Depreciation 370,893 - 370,893 Changes in assets and liabilities:
User fees 1,035 - 1,035 Inventory 26,163 - 26,163 Other assets (15,105) - (15,105) Warrants and accounts payable (23,853) (16,151) (40,004) Accrued liabilities 12,659 - 12,659
Net Cash Provided By Operating Activities $ 611,961 $ 9,290 $ 621,251
Internal Service Funds
CITY OF KEENE, NEW HAMPSHIRE
COMBINING STATEMENT OF CASH FLOWS
INTERNAL SERVICE FUNDS
FOR THE YEAR ENDED JUNE 30, 2017
Governmental Activities
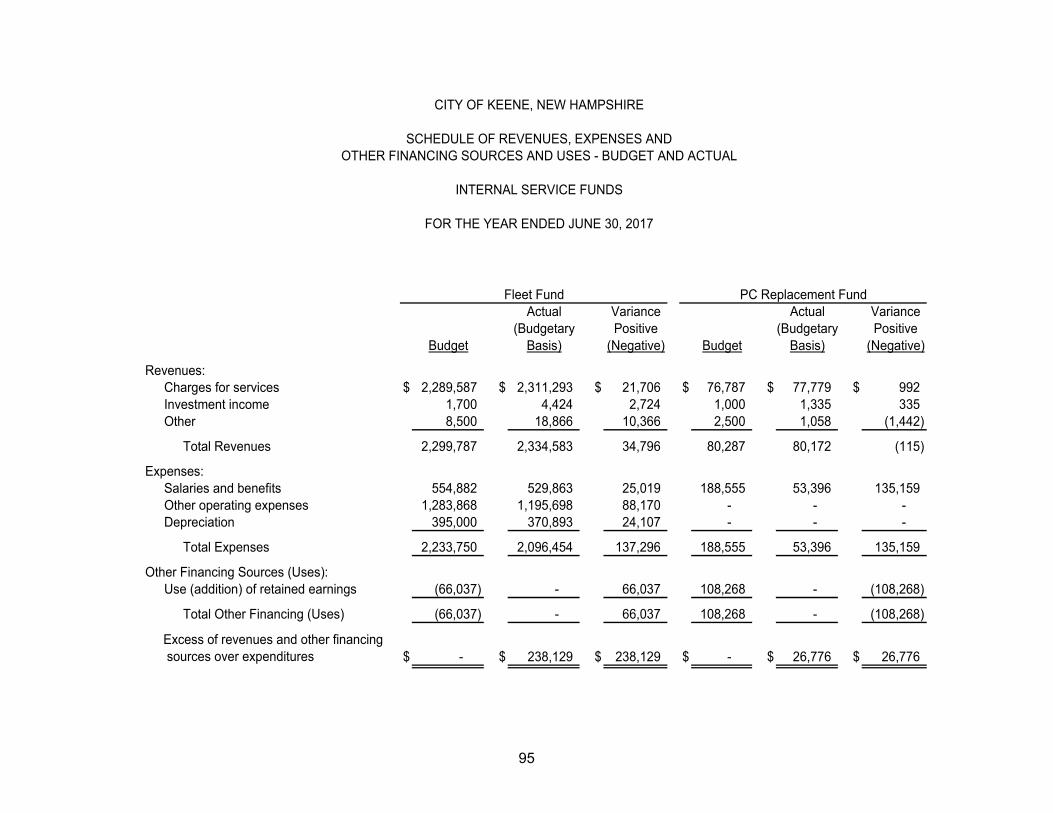
95
Actual Variance Actual Variance(Budgetary Positive (Budgetary Positive
Budget Basis) (Negative) Budget Basis) (Negative)
Revenues:Charges for services $ 2,289,587 $ 2,311,293 $ 21,706 $ 76,787 $ 77,779 $ 992 Investment income 1,700 4,424 2,724 1,000 1,335 335 Other 8,500 18,866 10,366 2,500 1,058 (1,442)
Total Revenues 2,299,787 2,334,583 34,796 80,287 80,172 (115)
Expenses:Salaries and benefits 554,882 529,863 25,019 188,555 53,396 135,159 Other operating expenses 1,283,868 1,195,698 88,170 - - - Depreciation 395,000 370,893 24,107 - - -
Total Expenses 2,233,750 2,096,454 137,296 188,555 53,396 135,159
Other Financing Sources (Uses):Use (addition) of retained earnings (66,037) - 66,037 108,268 - (108,268)
Total Other Financing (Uses) (66,037) - 66,037 108,268 - (108,268)
$ - $ 238,129 $ 238,129 $ - $ 26,776 $ 26,776 Excess of revenues and other financing sources over expenditures
PC Replacement Fund
CITY OF KEENE, NEW HAMPSHIRE
SCHEDULE OF REVENUES, EXPENSES ANDOTHER FINANCING SOURCES AND USES - BUDGET AND ACTUAL
INTERNAL SERVICE FUNDS
FOR THE YEAR ENDED JUNE 30, 2017
Fleet Fund

STATISTICAL SECTION
97
CITY OF KEENE, NEW HAMPSHIRE
STATISTICAL SECTION
The City of Keene, New Hampshire comprehensive annual financial report presents detailed information as a context for understanding what the information in the finan-cial statements, note disclosures, and required supplementary information says about the government’s overall financial health.
Page Financial Trends
These schedules contain trend information to help the reader understand how the government’s financial performance and well- being have changed over time. 99
Revenue Capacity These schedules contain information to help the reader assess the government’s most significant local revenue source, the property tax. 103
Debt Capacity These schedules present information to help the reader assess the affordability of the government’s current levels of outstanding debt and the government’s ability to issue additional debt in the future. 108
Demographic and Economic Information These schedules offer demographic and economic indicators to help the reader understand the environment within which the government’s financial activities take place. 111
Operating Information These schedules contain service and infrastructure data to help the reader understand how the information in the government’s financial report relates to the service the government provides and the activities it performs. 113

98
(This page intentionally left blank.)
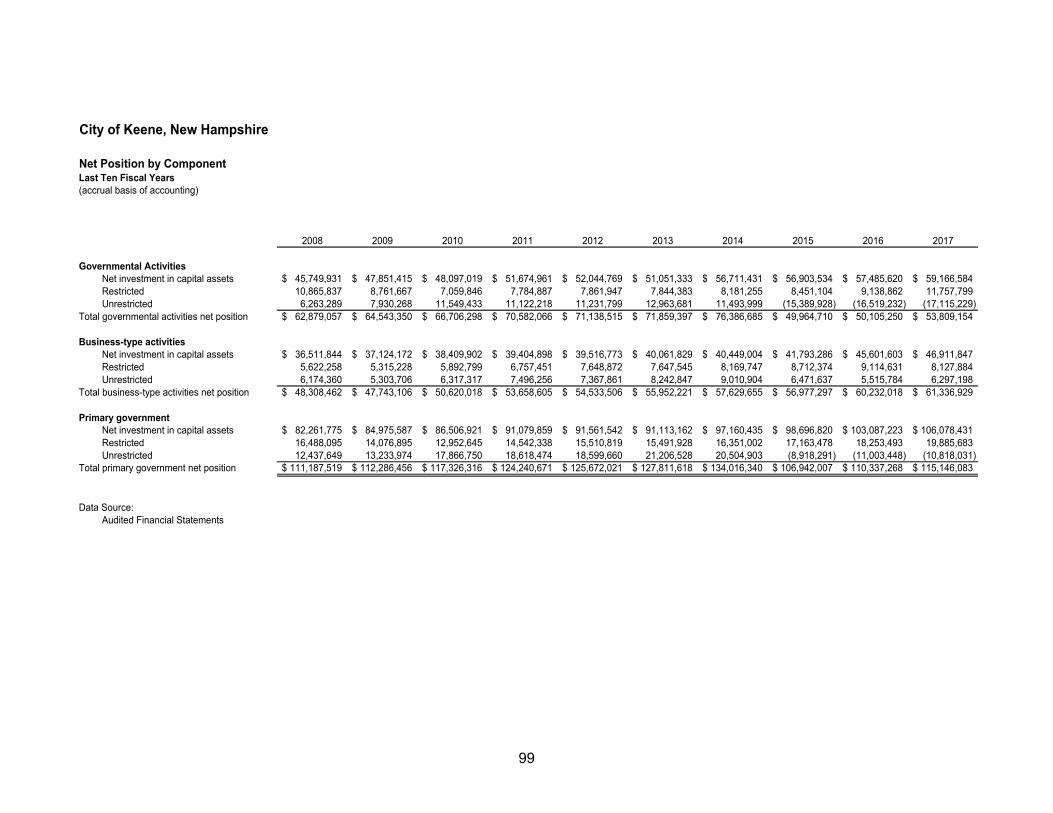
99
City of Keene, New Hampshire
Net Position by ComponentLast Ten Fiscal Years(accrual basis of accounting)
2008 2009 2010 2011 2012 2013 2014 2015 2016 2017
Governmental ActivitiesNet investment in capital assets 45,749,931$ 47,851,415$ 48,097,019$ 51,674,961$ 52,044,769$ 51,051,333$ 56,711,431$ 56,903,534$ 57,485,620$ 59,166,584$ Restricted 10,865,837 8,761,667 7,059,846 7,784,887 7,861,947 7,844,383 8,181,255 8,451,104 9,138,862 11,757,799 Unrestricted 6,263,289 7,930,268 11,549,433 11,122,218 11,231,799 12,963,681 11,493,999 (15,389,928) (16,519,232) (17,115,229)
Total governmental activities net position 62,879,057$ 64,543,350$ 66,706,298$ 70,582,066$ 71,138,515$ 71,859,397$ 76,386,685$ 49,964,710$ 50,105,250$ 53,809,154$
Business-type activitiesNet investment in capital assets 36,511,844$ 37,124,172$ 38,409,902$ 39,404,898$ 39,516,773$ 40,061,829$ 40,449,004$ 41,793,286$ 45,601,603$ 46,911,847$ Restricted 5,622,258 5,315,228 5,892,799 6,757,451 7,648,872 7,647,545 8,169,747 8,712,374 9,114,631 8,127,884 Unrestricted 6,174,360 5,303,706 6,317,317 7,496,256 7,367,861 8,242,847 9,010,904 6,471,637 5,515,784 6,297,198
Total business-type activities net position 48,308,462$ 47,743,106$ 50,620,018$ 53,658,605$ 54,533,506$ 55,952,221$ 57,629,655$ 56,977,297$ 60,232,018$ 61,336,929$
Primary governmentNet investment in capital assets 82,261,775$ 84,975,587$ 86,506,921$ 91,079,859$ 91,561,542$ 91,113,162$ 97,160,435$ 98,696,820$ 103,087,223$ 106,078,431$ Restricted 16,488,095 14,076,895 12,952,645 14,542,338 15,510,819 15,491,928 16,351,002 17,163,478 18,253,493 19,885,683 Unrestricted 12,437,649 13,233,974 17,866,750 18,618,474 18,599,660 21,206,528 20,504,903 (8,918,291) (11,003,448) (10,818,031)
Total primary government net position 111,187,519$ 112,286,456$ 117,326,316$ 124,240,671$ 125,672,021$ 127,811,618$ 134,016,340$ 106,942,007$ 110,337,268$ 115,146,083$
Data Source:Audited Financial Statements
100
City of Keene, New Hampshire
Change in Net PositionLast Ten Fiscal Years (accrual basis of accounting)
2008 2009 2010 2011 2012 2013 2014 2015 2016 2017ExpensesGovernmental activities:
General government 6,662,781$ 4,990,180$ 5,330,926$ 5,610,728$ 5,822,868$ 6,053,842$ 6,163,749$ 6,192,633$ 7,698,162$ 7,008,103$ Public safety 11,370,321 12,354,157 11,892,430 12,193,171 12,656,227 13,366,663 12,861,971 11,522,512 13,841,925 15,922,427 Public works 5,041,539 9,027,623 12,013,014 10,877,207 12,302,282 13,905,776 11,505,399 12,030,608 14,272,374 12,342,448 Welfare and human services 794,849 1,779,285 1,741,733 1,737,574 1,601,369 1,626,264 1,584,798 1,678,845 1,594,633 1,600,241 Airport - 2,203,344 727,933 734,289 744,772 618,376 569,217 854,783 1,084,668 1,312,906 Library - 1,268,411 1,287,321 1,350,597 1,598,121 1,380,133 1,399,236 1,383,430 1,529,730 1,468,787 Planning - 859,635 985,672 1,452,390 1,530,547 1,046,842 642,702 1,468,668 498,721 328,168 Sanitation 4,311,112 - - - - - - - - - Parks and facilities 3,051,340 2,821,788 2,939,012 2,917,866 2,771,982 2,813,250 3,938,106 2,910,530 2,519,671 3,018,676 Economic development 3,253,654 - - - - - - - - - Cemetery 341,630 - - - - - - - - - Interest 1,222,655 1,275,337 1,238,853 1,377,650 1,409,256 1,307,235 1,217,767 1,105,316 1,070,477 1,225,901
Total governmental activities expenses 36,049,881 36,579,760 38,156,894 38,251,472 40,437,424 42,118,381 39,882,945 39,147,325 44,110,361 44,227,657
Business-type activities:Water services 3,136,907 2,938,702 3,017,282 2,831,527 3,168,404 2,938,752 3,656,619 3,167,831 3,866,375 3,894,553 Sewer services 4,416,712 5,205,734 4,482,410 4,515,891 4,597,936 4,425,423 4,814,906 4,462,398 6,089,976 5,491,891
Total business-type activities expenses 7,553,619 8,144,436 7,499,692 7,347,418 7,766,340 7,364,175 8,471,525 7,630,229 9,956,351 9,386,444 Total primary government expenses 43,603,500$ 44,724,196$ 45,656,586$ 45,598,890$ 48,203,764$ 49,482,556$ 48,354,470$ 46,777,554$ 54,066,712$ 53,614,101$
Program RevenuesGovernmental activities:
Charges for services 5,971,762 6,592,070 7,312,865 7,735,136 7,905,994 7,529,669 7,767,554 7,870,307 7,845,237 8,967,618 Operating grants and contributions 2,576,175 4,281,304 2,675,787 3,116,118 2,807,994 2,688,371 2,629,292 2,815,646 3,914,405 2,868,256 Capital grants and contributions 941,624 843,869 2,984,455 3,503,169 2,301,745 2,906,463 3,727,365 2,124,908 1,549,538 2,879,365
Total governmental activities program revenu 9,489,561 11,717,243 12,973,107 14,354,423 13,015,733 13,124,503 14,124,211 12,810,861 13,309,180 14,715,239
Business-type activities:Charges for services 7,903,520 8,415,386 9,316,838 9,859,549 8,814,525 9,116,917 9,534,445 10,050,780 9,888,922 9,732,189 Operating grants and contributions 26,698 431,428 181,777 173,355 118,810 117,674 1,401,132 176,929 141,079 551,152 Capital grants and contributions - - 1,766,010 1,173,267 566,710 398,056 109,881 - 2,995,426 -
Total business-type activities program revenu 7,930,218 8,846,814 11,264,625 11,206,171 9,500,045 9,632,647 11,045,458 10,227,709 13,025,427 10,283,341 Total primary government program revenues 17,419,779$ 20,564,057$ 24,237,732$ 25,560,594$ 22,515,778$ 22,757,150$ 25,169,669$ 23,038,570$ 26,334,607$ 24,998,580$
Net (Expenses)RevenueGovernmental activities (26,560,320)$ (24,862,517)$ (25,183,787)$ (23,897,049)$ (27,421,691)$ (28,993,878)$ (25,758,734)$ (26,336,464)$ (30,801,181)$ (29,512,418)$ Business-type activities 376,599 702,378 3,764,933 3,858,753 1,733,705 2,268,472 2,573,933 2,597,480 3,069,076 896,897
Total Primary government net expense (26,183,721)$ (24,160,139)$ (21,418,854)$ (20,038,296)$ (25,687,986)$ (26,725,406)$ (23,184,801)$ (23,738,984)$ (27,732,105)$ (28,615,521)$
General Revenues and Other Changes in Net PositionGovernmental activities:
Property tax 19,650,893$ 20,196,104$ 20,604,593$ 20,979,065$ 21,760,281$ 22,864,243$ 23,225,219$ 24,168,766$ 25,409,198$ 26,741,212$ Penalties, interest and other taxes - 454,409 548,100 694,488 581,123 589,785 1,048,960 888,171 913,408 1,078,383 Licenses and permits 3,080,021 2,884,607 2,964,138 2,842,530 2,808,529 2,992,017 3,071,633 3,294,505 3,501,521 4,384,530 Grants and contributions not restricted to 1,953,599 - - - - - - - - - Investment income 1,187,306 496,384 1,028,537 1,438,974 747,548 754,289 977,974 574,119 243,658 663,683 Miscellaneous 1,692,123 713,712 916,337 674,857 923,534 1,360,322 790,562 1,568,073 825,354 311,474 Transfers, net - 947,366 1,147,442 1,116,623 1,138,320 1,133,130 1,158,798 1,145,574 21,242 - Permanent fund contributions 30,053 38,974 137,588 26,280 18,805 20,975 12,876 23,165 27,933 37,024 Special item - loss on disposal of capital (866,200) - - - - - - - - -
Total governmental activities 26,727,795 25,731,556 27,346,735 27,772,817 27,978,140 29,714,761 30,286,022 31,662,373 30,942,314 33,216,306
Business-type activities:Property tax 214,913 217,288 205,951 188,688 182,907 172,141 166,646 160,144 147,897 145,440 Investment income 428,073 256,720 46,880 44,182 73,723 102,262 42,667 46,625 47,112 62,580 Miscellaneous 7,329 60,240 19,082 - - - 635 - Transfers, net - (946,488) (1,140,852) (1,113,276) (1,134,516) (1,124,160) (1,105,812) (1,098,454) (10,000) -
Total business-type activities 650,315 (472,480) (888,021) (820,166) (858,804) (849,757) (896,499) (891,685) 185,644 208,020 Total primary government 27,378,110$ 25,259,076$ 26,458,714$ 26,952,651$ 27,119,336$ 28,865,004$ 29,389,523$ 30,770,688$ 31,127,958$ 33,424,326$
Change in Net PositionGovernmental activities 167,475$ 869,039$ 2,162,948$ 3,875,768$ 556,449$ 720,883$ 4,527,288$ 5,325,909$ 141,133$ 3,703,888$ Business-type activities 1,026,914 229,898 2,876,912 3,038,587 874,901 1,418,715 1,677,434 1,705,795 3,254,720 1,104,917
Total primary government 1,194,389$ 1,098,937$ 5,039,860$ 6,914,355$ 1,431,350$ 2,139,598$ 6,204,722$ 7,031,704$ 3,395,853$ 4,808,805$
Data SourceAudited Financial Statements
101
City of Keene, New Hampshire
Fund Balances, Governmental FundsLast Ten Fiscal Years(modified accrual basis of accounting)
2008 2009 2010 2011 (1) 2012 2013 2014 2015 2016 2017General Fund
Reserved 188,629$ 904,997$ 698,446$ -$ -$ -$ -$ -$ -$ -$ Unreserved 6,992,530 6,279,935 6,986,075 - - - - - - - Nonspendable - - - 424,072 425,964 381,611 363,483 341,018 362,095 699,572 Restricted - - - - - - - - - - Committed - - - 2,417,136 2,700,437 3,074,928 3,423,762 3,517,742 3,380,255 3,968,918 Assigned - - - 1,099,218 1,281,293 1,175,686 1,258,208 1,378,786 1,038,111 436,301 Unassigned - - - 6,771,406 6,801,027 6,050,735 6,498,576 6,763,152 7,495,863 8,655,952
Total General Fund 7,181,159$ 7,184,932$ 7,684,521$ 10,711,832$ 11,208,721$ 10,682,960$ 11,544,029$ 12,000,698$ 12,276,324$ 13,760,743$
Other Governmental FundsReserved 4,038,794$ 7,802,252$ 9,222,109$ -$ -$ -$ -$ -$ -$ -$ Unreserved: Special Revenue Funds 7,133,282 3,587,171 2,985,194 - - - - - - - Capital Projects - 684,388 1,420,476 - - - - - - - Permanent Trust Funds 126,341 326,749 398,926 - - - - - - - Nonspendable - - - 5,559,717 5,460,867 5,629,927 6,104,692 5,659,081 5,585,419 5,881,176 Restricted - - - 10,680,705 9,257,416 6,009,770 3,723,770 6,857,313 3,405,551 9,619,840 Committed - - - 3,823,670 3,161,878 2,998,753 2,428,004 4,064,769 2,673,426 2,717,052 Assigned - - - - - - - - - - Unassigned - - - (1,277,123) (142,719) - (68,306) (2,890) - -
Total Other Funds 11,298,417$ 12,400,560$ 14,026,705$ 18,786,969$ 17,737,442$ 14,638,450$ 12,188,160$ 16,578,273$ 11,664,396$ 18,218,068$
Data Source Audited Financial Statements
(1) Beginning with FY11, the presentation of Fund Balance conforms with Government Accounting Standards Board Statement No. 54
102
City of Keene, New Hampshire
Change in Fund Balances, Governmental FundsLast Ten Fiscal Years(modified accrual basis of accounting)
2008 2009 2010 2011 2012 2013 2014 2015 2016 2017Revenues
Taxes 19,466,227$ 20,451,595$ 20,703,737$ 21,751,017$ 22,676,964$ 23,133,820$ 24,210,554$ 25,288,836$ 26,432,668$ 26,967,454$ Charges for services 5,342,199 6,380,685 7,160,429 7,522,029 7,658,470 7,291,378 7,369,188 7,533,948 7,629,481 8,485,858 Intergovernmental 5,471,398 4,829,320 5,489,463 6,136,097 4,959,426 5,493,486 6,140,731 4,484,310 4,652,406 3,862,127 Licenses and permits 3,080,021 2,884,607 2,964,138 2,842,526 2,808,529 2,992,017 3,071,633 3,294,504 3,501,521 4,384,530 Investment income 1,145,516 470,777 1,016,948 1,432,108 743,734 947,051 972,289 593,061 237,109 657,924 Contributions - 334,826 308,367 509,470 169,117 122,326 228,801 479,409 839,470 1,922,518 Miscellaneous 2,978,170 705,274 900,828 665,610 907,199 1,345,792 785,568 1,564,627 819,207 301,616
Total revenues 37,483,531 36,057,084 38,543,910 40,858,857 39,923,439 41,325,870 42,778,764 43,238,695 44,111,862 46,582,027
Expenditures by Function
General government 6,310,089 4,945,106 5,045,246 5,415,262 5,587,652 5,468,373 5,469,804 5,719,168 7,089,882 6,916,814 Public safety 10,942,505 12,197,224 12,460,460 12,981,022 17,291,383 14,087,522 13,513,465 14,398,801 15,008,670 15,503,013 Public works 3,531,436 10,679,367 11,249,353 12,933,004 12,009,098 15,503,210 9,958,887 10,678,166 11,069,870 8,879,870 Welfare and human services 795,096 1,807,693 1,756,534 1,774,941 1,595,458 1,666,794 1,628,021 1,752,376 1,671,547 1,665,998 Airport - 2,163,468 1,935,047 906,708 607,014 964,802 3,709,384 1,177,027 1,384,971 1,209,610 Library - 1,184,227 1,170,427 1,253,341 1,490,138 1,286,249 1,326,260 1,473,703 1,501,992 1,753,262 Planning - 834,487 961,076 1,441,564 1,515,779 1,029,380 726,662 1,506,517 477,782 696,896 Parks and facilities - 2,698,063 3,069,448 2,940,017 4,606,368 3,246,208 3,931,313 3,196,997 4,602,423 3,029,243 Sanitation 4,309,465 - - - - - - - - - Culture and recreation 2,667,131 - - - - - - - - - Economic development 2,898,499 - - - - - - - - - Cemetery 272,067 - - - - - - - - - Capital outlay 5,406,726 - - - - - - - - - Debt service 3,595,386 3,590,616 3,878,515 4,126,516 5,042,061 5,743,892 5,474,561 5,336,759 5,993,627 6,983,563 Operating expenses - 11,207 21,709 23,683 21,166 12,610 50,074 92,264 - -
Total expenditures 40,728,400 40,111,458 41,547,815 43,796,058 49,766,117 49,009,040 45,788,431 45,331,778 48,800,764 46,638,269
Excess (deficiency) of revenuesOver(under) expenditures (3,244,869) (4,054,374) (3,003,905) (2,937,201) (9,842,678) (7,683,170) (3,009,667) (2,093,083) (4,688,902) (56,242)
Other Financing Sources (Uses)Issuance of general obligation bonds 1,455,000 3,155,000 3,680,000 9,295,000 7,856,700 2,775,200 - 5,530,000 - 5,676,000 Issuance of refunding bonds - - - - - 3,850,900 - - - 2,151,304 Bond premiums on generalobligation bonds - - - - - - - - - 821,082 Bond premiums on refunding bonds - - - - - - - - - 253,002 Payment to escrow agent - - - - - (3,961,406) - - - (807,071) Gain on refunding - - - - - (25,739) - - - Transfers in 3,417,313 3,869,312 4,060,917 3,998,021 3,519,678 5,015,021 3,808,287 3,481,201 2,340,391 2,802,014 Transfers out (3,417,313) (2,669,022) (2,611,278) (2,568,245) (2,086,338) (3,595,560) (2,387,841) (2,071,336) (2,289,149) (2,802,014)
Total other financing sources (uses) 1,455,000 4,355,290 5,129,639 10,724,776 9,290,040 4,058,416 1,420,446 6,939,865 51,242 8,094,317
Net Change in fund balances (1,789,869)$ 300,916$ 2,125,734$ 7,787,575$ (552,638)$ (3,624,754)$ (1,589,221)$ 4,846,782$ (4,637,660)$ 8,038,075$
Debt Service as a percentage of non-capital outlay expenditures 11.33% 9.83% 10.30% 10.41% 11.28% 13.28% 13.60% 13.37% 14.00% 17.61%
Data SourceAudited Financial Statements
103
City of Keene, New Hampshire
General Government Tax Revenues by SourceLast Ten Fiscal Years
Fiscal Property Timber Year Taxes Tax Tax Total
2017 24,742,331$ 20,875$ -$ 3,128,771$ 433,772$ 28,325,750$ 2016 24,352,010 14,696 - 3,005,853 412,492 27,785,051 2015 23,352,375 20,160 - 2,792,019 390,688 26,555,242 2014 22,470,718 22,326 72 2,668,587 379,467 25,541,170 2013 21,639,386 17,024 - 2,505,780 97,248 24,259,438 2012 21,614,949 8,151 35 2,384,164 64,183 24,071,482 2011 20,785,361 8,656 336 2,313,616 67,891 23,175,860 2010 19,872,115 5,041 - 2,342,736 61,973 22,281,865 2009 19,714,129 2,635 220 2,468,446 75,154 22,260,584 2008 18,856,395 2,597 - 2,683,293 76,918 21,619,203
Data SourceAudited Financial Statements
Excavation Motor Vehicle Payment inRegistrations Lieu of Taxes
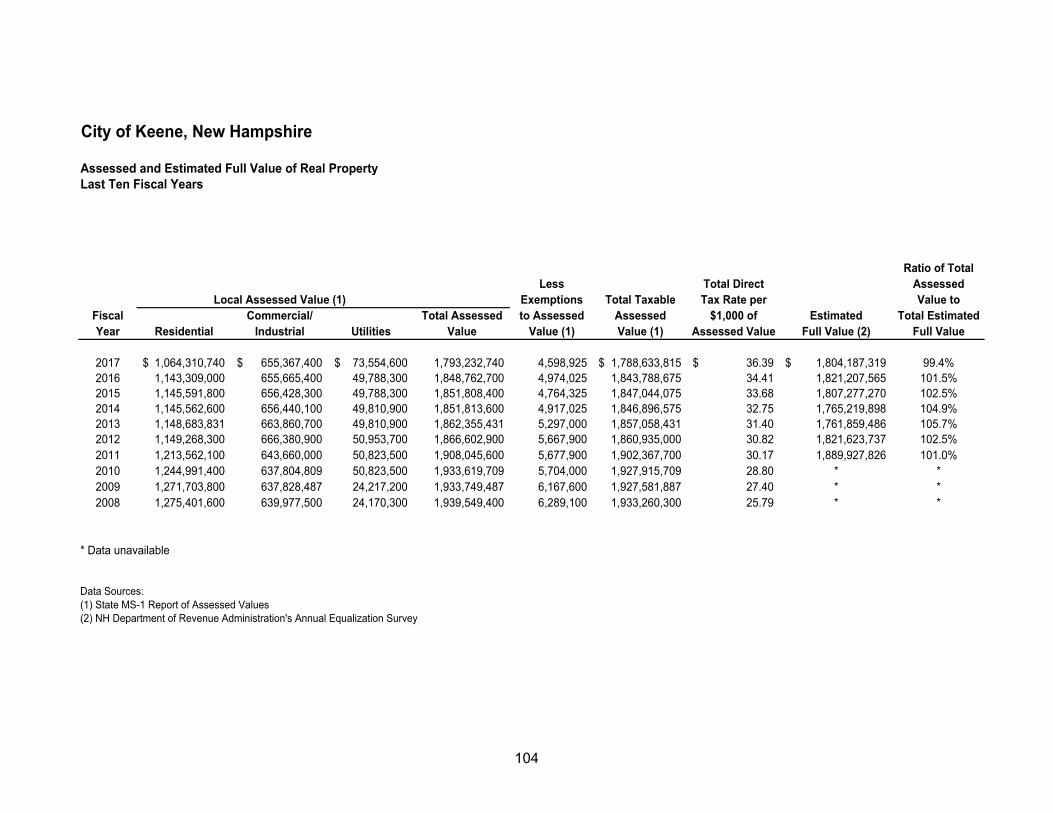
104
City of Keene, New Hampshire
Assessed and Estimated Full Value of Real PropertyLast Ten Fiscal Years
Ratio of TotalLess Total Direct Assessed
Local Assessed Value (1) Exemptions Total Taxable Tax Rate per Value toFiscal Commercial/ Total Assessed to Assessed Assessed $1,000 of Estimated Total EstimatedYear Residential Industrial Utilities Value Value (1) Value (1) Assessed Value Full Value (2) Full Value
2017 1,064,310,740$ 655,367,400$ 73,554,600$ 1,793,232,740 4,598,925 1,788,633,815$ 36.39$ 1,804,187,319$ 99.4%2016 1,143,309,000 655,665,400 49,788,300 1,848,762,700 4,974,025 1,843,788,675 34.41 1,821,207,565 101.5%2015 1,145,591,800 656,428,300 49,788,300 1,851,808,400 4,764,325 1,847,044,075 33.68 1,807,277,270 102.5%2014 1,145,562,600 656,440,100 49,810,900 1,851,813,600 4,917,025 1,846,896,575 32.75 1,765,219,898 104.9%2013 1,148,683,831 663,860,700 49,810,900 1,862,355,431 5,297,000 1,857,058,431 31.40 1,761,859,486 105.7%2012 1,149,268,300 666,380,900 50,953,700 1,866,602,900 5,667,900 1,860,935,000 30.82 1,821,623,737 102.5%2011 1,213,562,100 643,660,000 50,823,500 1,908,045,600 5,677,900 1,902,367,700 30.17 1,889,927,826 101.0%2010 1,244,991,400 637,804,809 50,823,500 1,933,619,709 5,704,000 1,927,915,709 28.80 * *2009 1,271,703,800 637,828,487 24,217,200 1,933,749,487 6,167,600 1,927,581,887 27.40 * *2008 1,275,401,600 639,977,500 24,170,300 1,939,549,400 6,289,100 1,933,260,300 25.79 * *
* Data unavailable
Data Sources:(1) State MS-1 Report of Assessed Values(2) NH Department of Revenue Administration's Annual Equalization Survey
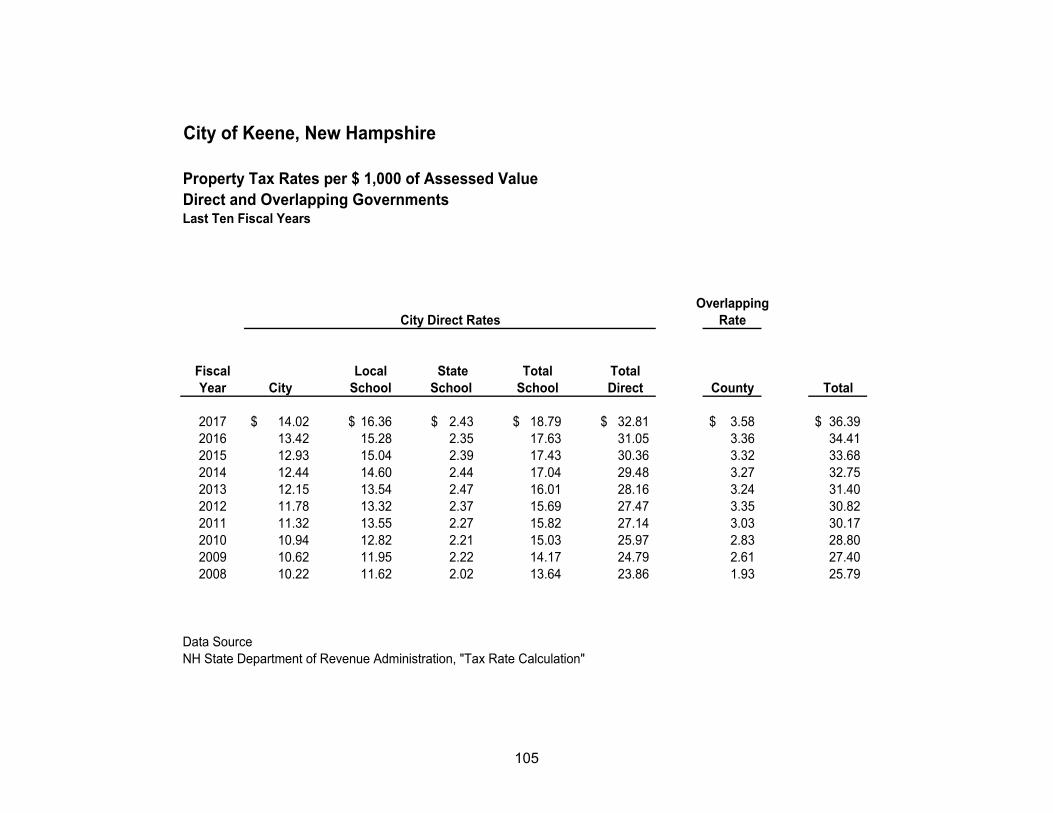
105
City of Keene, New Hampshire
Property Tax Rates per $ 1,000 of Assessed ValueDirect and Overlapping GovernmentsLast Ten Fiscal Years
OverlappingRate
Fiscal Local State Total TotalYear City School School School Direct County Total
2017 14.02$ 16.36$ 2.43$ 18.79$ 32.81$ 3.58$ 36.39$ 2016 13.42 15.28 2.35 17.63 31.05 3.36 34.41 2015 12.93 15.04 2.39 17.43 30.36 3.32 33.68 2014 12.44 14.60 2.44 17.04 29.48 3.27 32.75 2013 12.15 13.54 2.47 16.01 28.16 3.24 31.40 2012 11.78 13.32 2.37 15.69 27.47 3.35 30.82 2011 11.32 13.55 2.27 15.82 27.14 3.03 30.17 2010 10.94 12.82 2.21 15.03 25.97 2.83 28.80 2009 10.62 11.95 2.22 14.17 24.79 2.61 27.40 2008 10.22 11.62 2.02 13.64 23.86 1.93 25.79
Data SourceNH State Department of Revenue Administration, "Tax Rate Calculation"
City Direct Rates
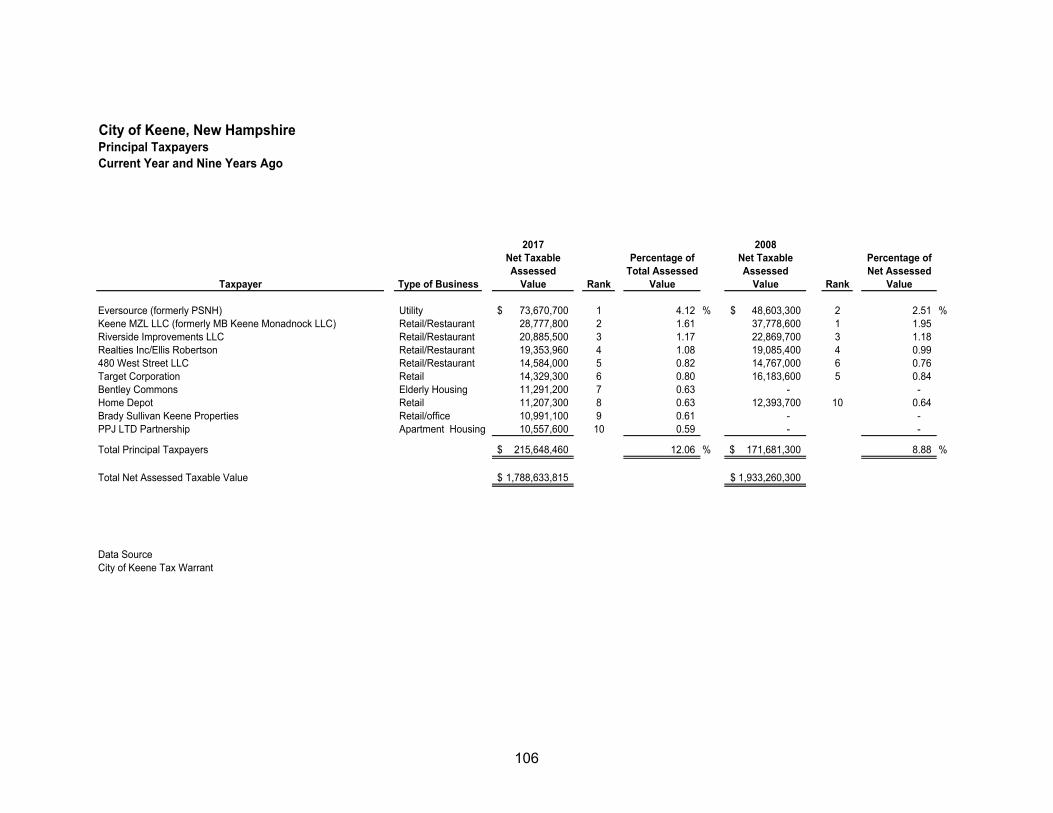
106
City of Keene, New HampshirePrincipal TaxpayersCurrent Year and Nine Years Ago
2017 2008Net Taxable Percentage of Net Taxable Percentage ofAssessed Total Assessed Assessed Net Assessed
Taxpayer Type of Business Value Rank Value Value Rank Value
Eversource (formerly PSNH) Utility 73,670,700$ 1 4.12 % 48,603,300$ 2 2.51 %Keene MZL LLC (formerly MB Keene Monadnock LLC) Retail/Restaurant 28,777,800 2 1.61 37,778,600 1 1.95 Riverside Improvements LLC Retail/Restaurant 20,885,500 3 1.17 22,869,700 3 1.18 Realties Inc/Ellis Robertson Retail/Restaurant 19,353,960 4 1.08 19,085,400 4 0.99 480 West Street LLC Retail/Restaurant 14,584,000 5 0.82 14,767,000 6 0.76 Target Corporation Retail 14,329,300 6 0.80 16,183,600 5 0.84 Bentley Commons Elderly Housing 11,291,200 7 0.63 - - Home Depot Retail 11,207,300 8 0.63 12,393,700 10 0.64 Brady Sullivan Keene Properties Retail/office 10,991,100 9 0.61 - - PPJ LTD Partnership Apartment Housing 10,557,600 10 0.59 - -
Total Principal Taxpayers 215,648,460$ 12.06 % 171,681,300$ 8.88 %
Total Net Assessed Taxable Value 1,788,633,815$ 1,933,260,300$
Data SourceCity of Keene Tax Warrant
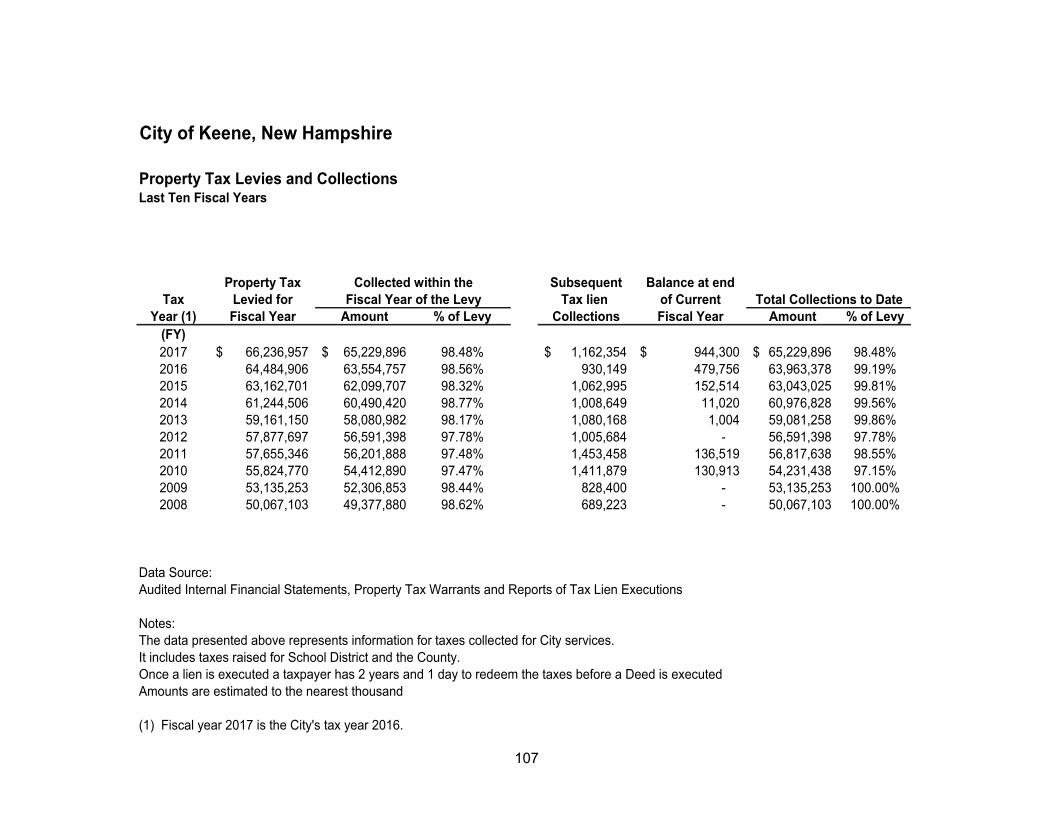
107
City of Keene, New Hampshire
Property Tax Levies and CollectionsLast Ten Fiscal Years
Property Tax Subsequent Balance at end
Tax Levied for Tax lien of CurrentYear (1) Fiscal Year Amount % of Levy Collections Fiscal Year Amount % of Levy
(FY)2017 66,236,957$ 65,229,896$ 98.48% 1,162,354$ 944,300$ 65,229,896$ 98.48%2016 64,484,906 63,554,757 98.56% 930,149 479,756 63,963,378 99.19%2015 63,162,701 62,099,707 98.32% 1,062,995 152,514 63,043,025 99.81%2014 61,244,506 60,490,420 98.77% 1,008,649 11,020 60,976,828 99.56%2013 59,161,150 58,080,982 98.17% 1,080,168 1,004 59,081,258 99.86%2012 57,877,697 56,591,398 97.78% 1,005,684 - 56,591,398 97.78%2011 57,655,346 56,201,888 97.48% 1,453,458 136,519 56,817,638 98.55%2010 55,824,770 54,412,890 97.47% 1,411,879 130,913 54,231,438 97.15%2009 53,135,253 52,306,853 98.44% 828,400 - 53,135,253 100.00%2008 50,067,103 49,377,880 98.62% 689,223 - 50,067,103 100.00%
Data Source:Audited Internal Financial Statements, Property Tax Warrants and Reports of Tax Lien Executions
Notes:The data presented above represents information for taxes collected for City services.It includes taxes raised for School District and the County. Once a lien is executed a taxpayer has 2 years and 1 day to redeem the taxes before a Deed is executedAmounts are estimated to the nearest thousand
(1) Fiscal year 2017 is the City's tax year 2016.
Total Collections to DateCollected within the
Fiscal Year of the Levy
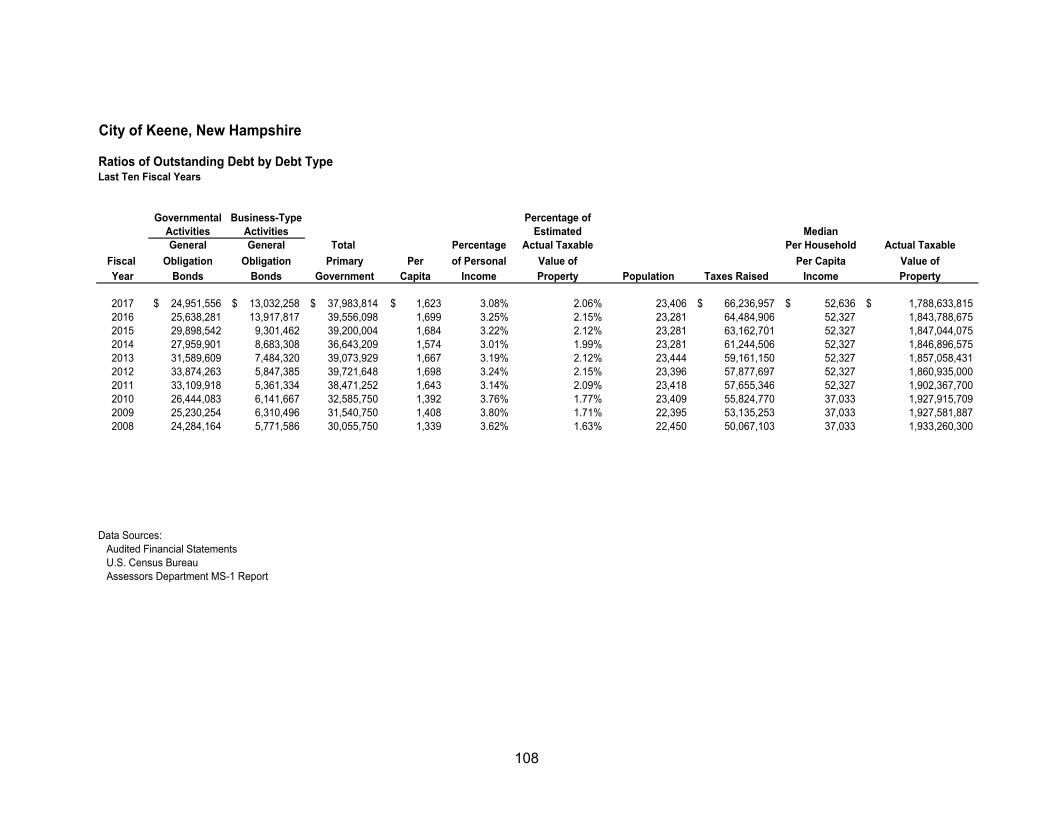
108
City of Keene, New Hampshire
Ratios of Outstanding Debt by Debt TypeLast Ten Fiscal Years
Governmental Business-Type Percentage ofActivities Activities Estimated MedianGeneral General Total Percentage Actual Taxable Per Household Actual Taxable
Fiscal Obligation Obligation Primary Per of Personal Value of Per Capita Value ofYear Bonds Bonds Government Capita Income Property Population Taxes Raised Income Property
2017 24,951,556$ 13,032,258$ 37,983,814$ 1,623$ 3.08% 2.06% 23,406 66,236,957$ 52,636$ 1,788,633,815$ 2016 25,638,281 13,917,817 39,556,098 1,699 3.25% 2.15% 23,281 64,484,906 52,327 1,843,788,675 2015 29,898,542 9,301,462 39,200,004 1,684 3.22% 2.12% 23,281 63,162,701 52,327 1,847,044,075 2014 27,959,901 8,683,308 36,643,209 1,574 3.01% 1.99% 23,281 61,244,506 52,327 1,846,896,575 2013 31,589,609 7,484,320 39,073,929 1,667 3.19% 2.12% 23,444 59,161,150 52,327 1,857,058,431 2012 33,874,263 5,847,385 39,721,648 1,698 3.24% 2.15% 23,396 57,877,697 52,327 1,860,935,000 2011 33,109,918 5,361,334 38,471,252 1,643 3.14% 2.09% 23,418 57,655,346 52,327 1,902,367,700 2010 26,444,083 6,141,667 32,585,750 1,392 3.76% 1.77% 23,409 55,824,770 37,033 1,927,915,709 2009 25,230,254 6,310,496 31,540,750 1,408 3.80% 1.71% 22,395 53,135,253 37,033 1,927,581,887 2008 24,284,164 5,771,586 30,055,750 1,339 3.62% 1.63% 22,450 50,067,103 37,033 1,933,260,300
Data Sources: Audited Financial Statements U.S. Census Bureau Assessors Department MS-1 Report
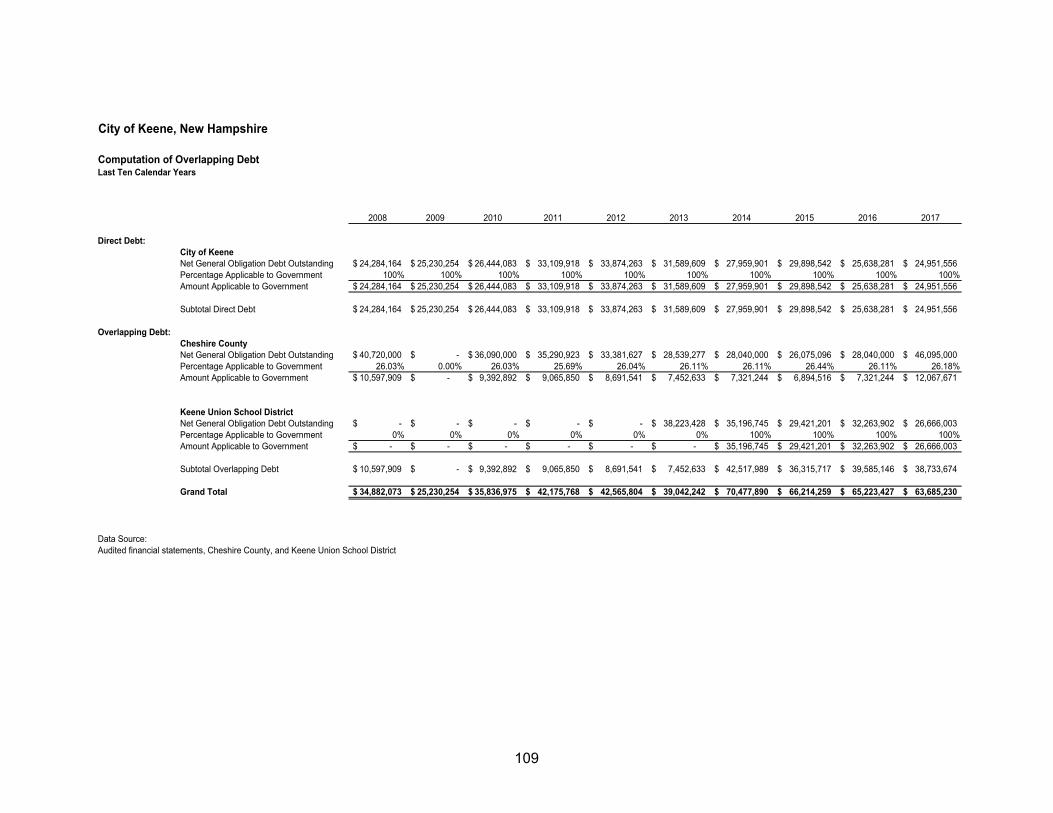
109
City of Keene, New Hampshire
Computation of Overlapping DebtLast Ten Calendar Years
2008 2009 2010 2011 2012 2013 2014 2015 2016 2017
Direct Debt:City of KeeneNet General Obligation Debt Outstanding 24,284,164$ 25,230,254$ 26,444,083$ 33,109,918$ 33,874,263$ 31,589,609$ 27,959,901$ 29,898,542$ 25,638,281$ 24,951,556$ Percentage Applicable to Government 100% 100% 100% 100% 100% 100% 100% 100% 100% 100%Amount Applicable to Government 24,284,164$ 25,230,254$ 26,444,083$ 33,109,918$ 33,874,263$ 31,589,609$ 27,959,901$ 29,898,542$ 25,638,281$ 24,951,556$
Subtotal Direct Debt 24,284,164$ 25,230,254$ 26,444,083$ 33,109,918$ 33,874,263$ 31,589,609$ 27,959,901$ 29,898,542$ 25,638,281$ 24,951,556$
Overlapping Debt:Cheshire CountyNet General Obligation Debt Outstanding 40,720,000$ -$ 36,090,000$ 35,290,923$ 33,381,627$ 28,539,277$ 28,040,000$ 26,075,096$ 28,040,000$ 46,095,000$ Percentage Applicable to Government 26.03% 0.00% 26.03% 25.69% 26.04% 26.11% 26.11% 26.44% 26.11% 26.18%Amount Applicable to Government 10,597,909$ -$ 9,392,892$ 9,065,850$ 8,691,541$ 7,452,633$ 7,321,244$ 6,894,516$ 7,321,244$ 12,067,671$
Keene Union School DistrictNet General Obligation Debt Outstanding -$ -$ -$ -$ -$ 38,223,428$ 35,196,745$ 29,421,201$ 32,263,902$ 26,666,003$ Percentage Applicable to Government 0% 0% 0% 0% 0% 0% 100% 100% 100% 100%Amount Applicable to Government -$ -$ -$ -$ -$ -$ 35,196,745$ 29,421,201$ 32,263,902$ 26,666,003$
Subtotal Overlapping Debt 10,597,909$ -$ 9,392,892$ 9,065,850$ 8,691,541$ 7,452,633$ 42,517,989$ 36,315,717$ 39,585,146$ 38,733,674$
Grand Total 34,882,073$ 25,230,254$ 35,836,975$ 42,175,768$ 42,565,804$ 39,042,242$ 70,477,890$ 66,214,259$ 65,223,427$ 63,685,230$
Data Source:Audited financial statements, Cheshire County, and Keene Union School District
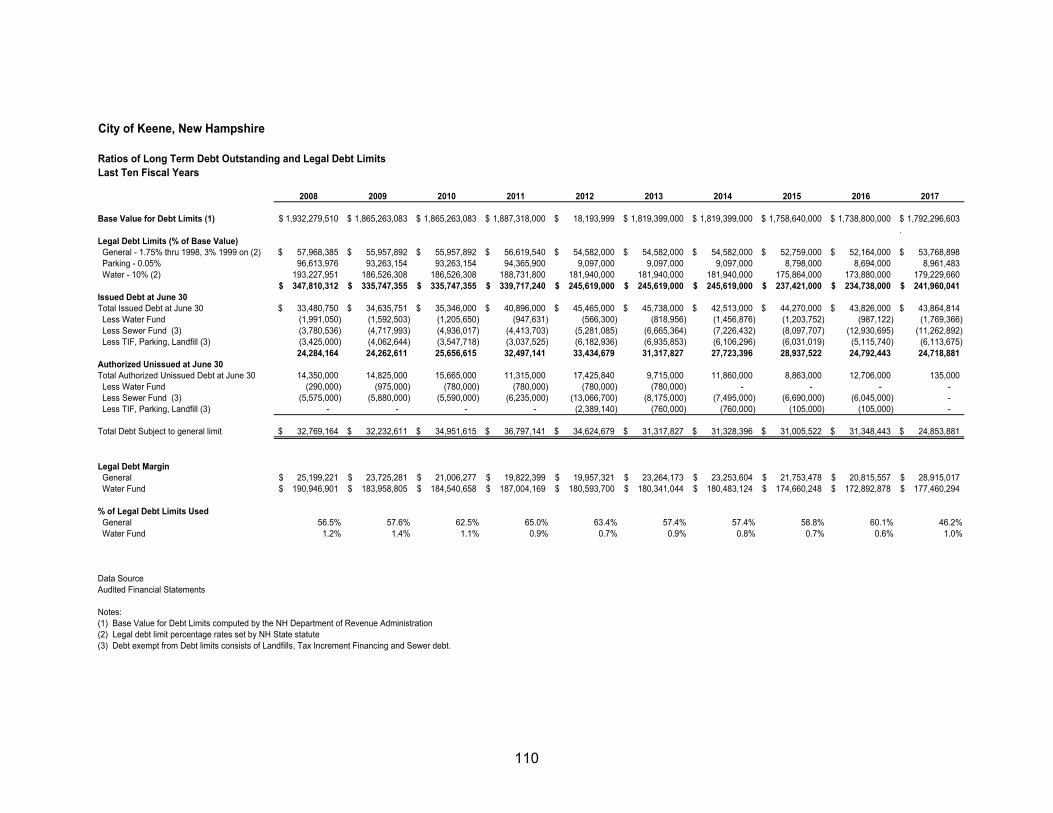
110
City of Keene, New Hampshire
Ratios of Long Term Debt Outstanding and Legal Debt LimitsLast Ten Fiscal Years
2008 2009 2010 2011 2012 2013 2014 2015 2016 2017
Base Value for Debt Limits (1) 1,932,279,510$ 1,865,263,083$ 1,865,263,083$ 1,887,318,000$ 18,193,999$ 1,819,399,000$ 1,819,399,000$ 1,758,640,000$ 1,738,800,000$ 1,792,296,603$ .
Legal Debt Limits (% of Base Value) General - 1.75% thru 1998, 3% 1999 on (2) 57,968,385$ 55,957,892$ 55,957,892$ 56,619,540$ 54,582,000$ 54,582,000$ 54,582,000$ 52,759,000$ 52,164,000$ 53,768,898$ Parking - 0.05% 96,613,976 93,263,154 93,263,154 94,365,900 9,097,000 9,097,000 9,097,000 8,798,000 8,694,000 8,961,483 Water - 10% (2) 193,227,951 186,526,308 186,526,308 188,731,800 181,940,000 181,940,000 181,940,000 175,864,000 173,880,000 179,229,660
347,810,312$ 335,747,355$ 335,747,355$ 339,717,240$ 245,619,000$ 245,619,000$ 245,619,000$ 237,421,000$ 234,738,000$ 241,960,041$ Issued Debt at June 30 Total Issued Debt at June 30 33,480,750$ 34,635,751$ 35,346,000$ 40,896,000$ 45,465,000$ 45,738,000$ 42,513,000$ 44,270,000$ 43,826,000$ 43,864,814$ Less Water Fund (1,991,050) (1,592,503) (1,205,650) (947,631) (566,300) (818,956) (1,456,876) (1,203,752) (987,122) (1,769,366) Less Sewer Fund (3) (3,780,536) (4,717,993) (4,936,017) (4,413,703) (5,281,085) (6,665,364) (7,226,432) (8,097,707) (12,930,695) (11,262,892) Less TIF, Parking, Landfill (3) (3,425,000) (4,062,644) (3,547,718) (3,037,525) (6,182,936) (6,935,853) (6,106,296) (6,031,019) (5,115,740) (6,113,675)
24,284,164 24,262,611 25,656,615 32,497,141 33,434,679 31,317,827 27,723,396 28,937,522 24,792,443 24,718,881Authorized Unissued at June 30Total Authorized Unissued Debt at June 30 14,350,000 14,825,000 15,665,000 11,315,000 17,425,840 9,715,000 11,860,000 8,863,000 12,706,000 135,000 Less Water Fund (290,000) (975,000) (780,000) (780,000) (780,000) (780,000) - - - - Less Sewer Fund (3) (5,575,000) (5,880,000) (5,590,000) (6,235,000) (13,066,700) (8,175,000) (7,495,000) (6,690,000) (6,045,000) - Less TIF, Parking, Landfill (3) - - - - (2,389,140) (760,000) (760,000) (105,000) (105,000) -
Total Debt Subject to general limit 32,769,164$ 32,232,611$ 34,951,615$ 36,797,141$ 34,624,679$ 31,317,827$ 31,328,396$ 31,005,522$ 31,348,443$ 24,853,881$
Legal Debt Margin General 25,199,221$ 23,725,281$ 21,006,277$ 19,822,399$ 19,957,321$ 23,264,173$ 23,253,604$ 21,753,478$ 20,815,557$ 28,915,017$ Water Fund 190,946,901$ 183,958,805$ 184,540,658$ 187,004,169$ 180,593,700$ 180,341,044$ 180,483,124$ 174,660,248$ 172,892,878$ 177,460,294$
% of Legal Debt Limits Used General 56.5% 57.6% 62.5% 65.0% 63.4% 57.4% 57.4% 58.8% 60.1% 46.2% Water Fund 1.2% 1.4% 1.1% 0.9% 0.7% 0.9% 0.8% 0.7% 0.6% 1.0%
Data SourceAudited Financial Statements
Notes:(1) Base Value for Debt Limits computed by the NH Department of Revenue Administration(2) Legal debt limit percentage rates set by NH State statute(3) Debt exempt from Debt limits consists of Landfills, Tax Increment Financing and Sewer debt.
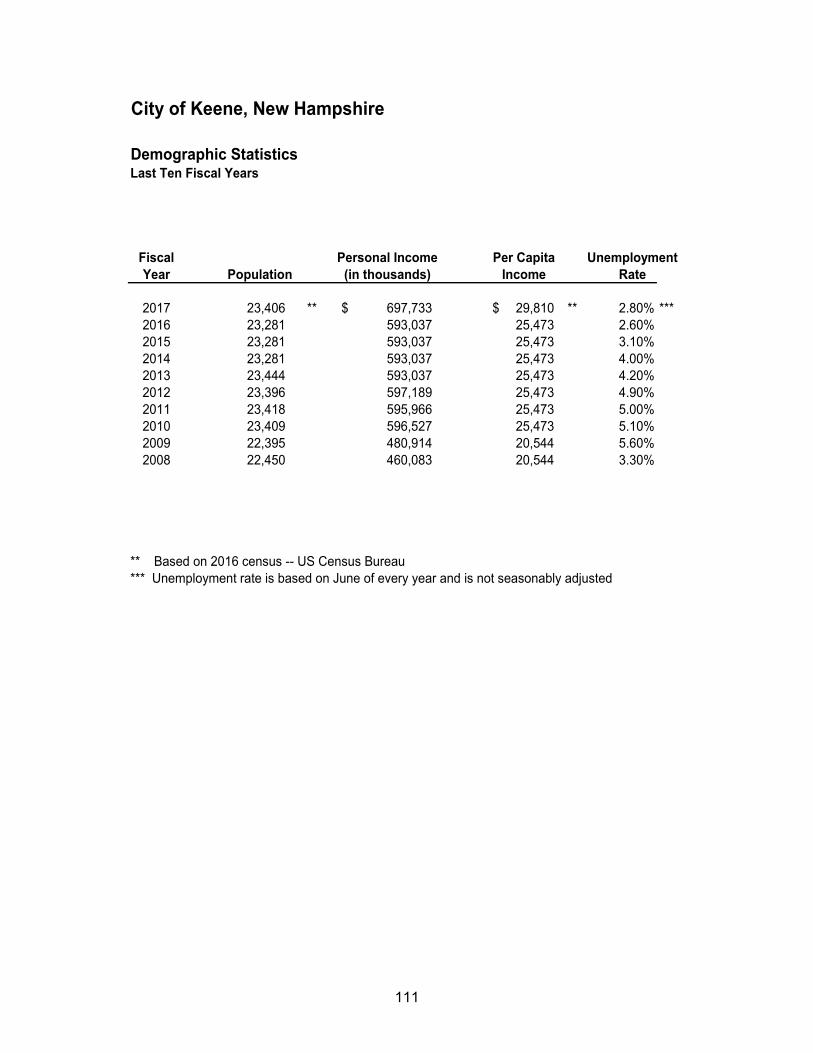
111
City of Keene, New Hampshire
Demographic StatisticsLast Ten Fiscal Years
Fiscal Personal Income Per Capita UnemploymentYear Population (in thousands) Income Rate
2017 23,406 ** 697,733$ 29,810$ ** 2.80% ***2016 23,281 593,037 25,473 2.60%2015 23,281 593,037 25,473 3.10%2014 23,281 593,037 25,473 4.00%2013 23,444 593,037 25,473 4.20%2012 23,396 597,189 25,473 4.90%2011 23,418 595,966 25,473 5.00%2010 23,409 596,527 25,473 5.10%2009 22,395 480,914 20,544 5.60%2008 22,450 460,083 20,544 3.30%
** Based on 2016 census -- US Census Bureau*** Unemployment rate is based on June of every year and is not seasonably adjusted
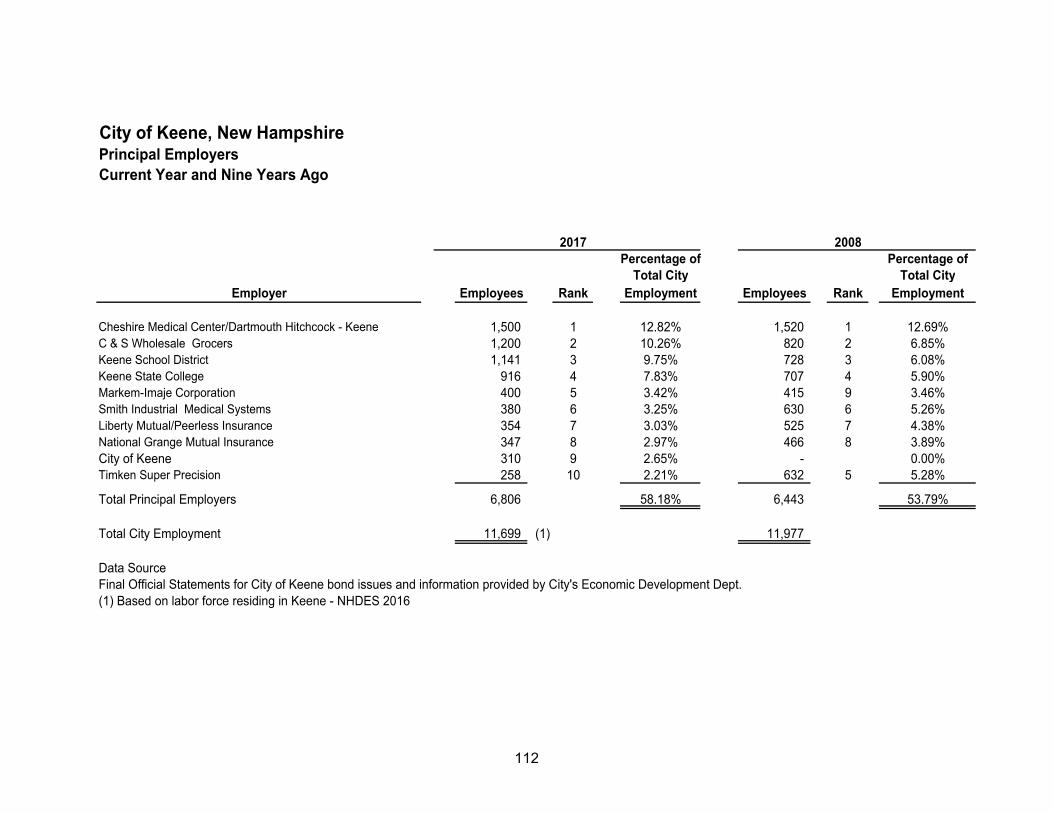
112
City of Keene, New HampshirePrincipal EmployersCurrent Year and Nine Years Ago
2017 2008Percentage of Percentage of
Total City Total CityEmployer Employees Rank Employment Employees Rank Employment
Cheshire Medical Center/Dartmouth Hitchcock - Keene 1,500 1 12.82% 1,520 1 12.69%C & S Wholesale Grocers 1,200 2 10.26% 820 2 6.85%Keene School District 1,141 3 9.75% 728 3 6.08%Keene State College 916 4 7.83% 707 4 5.90%Markem-Imaje Corporation 400 5 3.42% 415 9 3.46%Smith Industrial Medical Systems 380 6 3.25% 630 6 5.26%Liberty Mutual/Peerless Insurance 354 7 3.03% 525 7 4.38%National Grange Mutual Insurance 347 8 2.97% 466 8 3.89%City of Keene 310 9 2.65% - 0.00%Timken Super Precision 258 10 2.21% 632 5 5.28%
Total Principal Employers 6,806 58.18% 6,443 53.79%
Total City Employment 11,699 (1) 11,977
Data SourceFinal Official Statements for City of Keene bond issues and information provided by City's Economic Development Dept.(1) Based on labor force residing in Keene - NHDES 2016
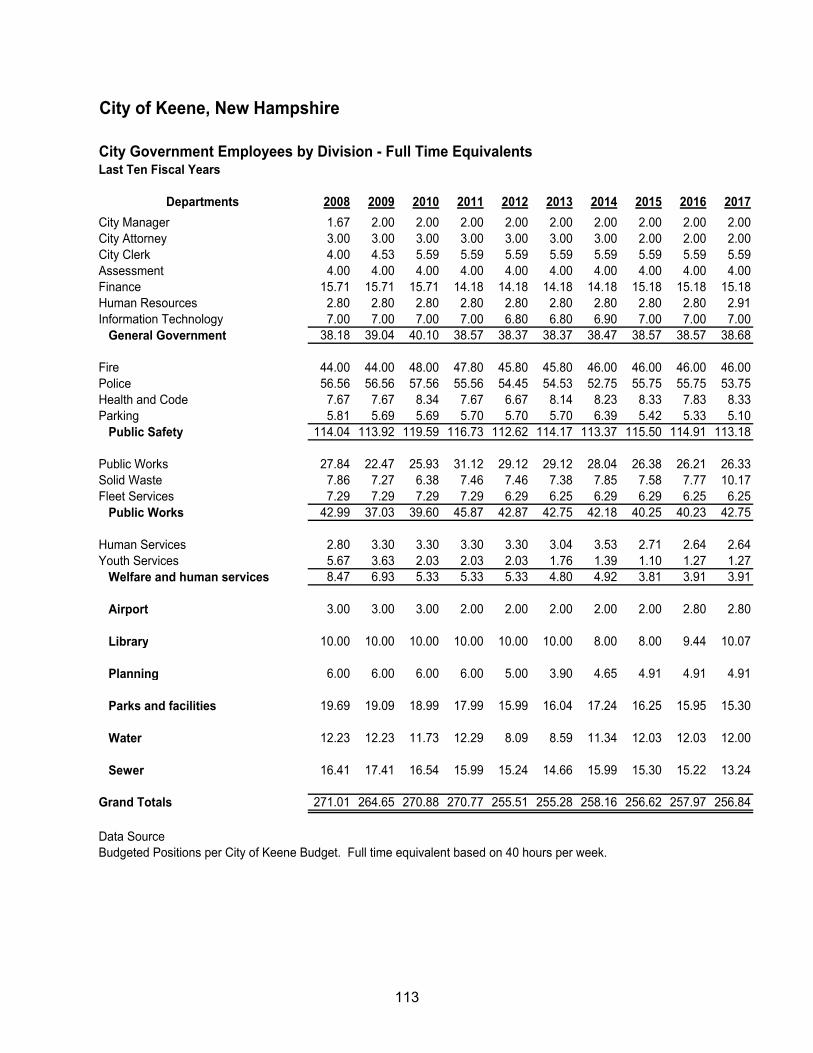
113
City of Keene, New Hampshire
City Government Employees by Division - Full Time EquivalentsLast Ten Fiscal Years
Departments 2008 2009 2010 2011 2012 2013 2014 2015 2016 2017
City Manager 1.67 2.00 2.00 2.00 2.00 2.00 2.00 2.00 2.00 2.00City Attorney 3.00 3.00 3.00 3.00 3.00 3.00 3.00 2.00 2.00 2.00City Clerk 4.00 4.53 5.59 5.59 5.59 5.59 5.59 5.59 5.59 5.59Assessment 4.00 4.00 4.00 4.00 4.00 4.00 4.00 4.00 4.00 4.00Finance 15.71 15.71 15.71 14.18 14.18 14.18 14.18 15.18 15.18 15.18Human Resources 2.80 2.80 2.80 2.80 2.80 2.80 2.80 2.80 2.80 2.91Information Technology 7.00 7.00 7.00 7.00 6.80 6.80 6.90 7.00 7.00 7.00 General Government 38.18 39.04 40.10 38.57 38.37 38.37 38.47 38.57 38.57 38.68
Fire 44.00 44.00 48.00 47.80 45.80 45.80 46.00 46.00 46.00 46.00Police 56.56 56.56 57.56 55.56 54.45 54.53 52.75 55.75 55.75 53.75Health and Code 7.67 7.67 8.34 7.67 6.67 8.14 8.23 8.33 7.83 8.33Parking 5.81 5.69 5.69 5.70 5.70 5.70 6.39 5.42 5.33 5.10 Public Safety 114.04 113.92 119.59 116.73 112.62 114.17 113.37 115.50 114.91 113.18
Public Works 27.84 22.47 25.93 31.12 29.12 29.12 28.04 26.38 26.21 26.33Solid Waste 7.86 7.27 6.38 7.46 7.46 7.38 7.85 7.58 7.77 10.17Fleet Services 7.29 7.29 7.29 7.29 6.29 6.25 6.29 6.29 6.25 6.25 Public Works 42.99 37.03 39.60 45.87 42.87 42.75 42.18 40.25 40.23 42.75
Human Services 2.80 3.30 3.30 3.30 3.30 3.04 3.53 2.71 2.64 2.64Youth Services 5.67 3.63 2.03 2.03 2.03 1.76 1.39 1.10 1.27 1.27 Welfare and human services 8.47 6.93 5.33 5.33 5.33 4.80 4.92 3.81 3.91 3.91
Airport 3.00 3.00 3.00 2.00 2.00 2.00 2.00 2.00 2.80 2.80
Library 10.00 10.00 10.00 10.00 10.00 10.00 8.00 8.00 9.44 10.07
Planning 6.00 6.00 6.00 6.00 5.00 3.90 4.65 4.91 4.91 4.91
Parks and facilities 19.69 19.09 18.99 17.99 15.99 16.04 17.24 16.25 15.95 15.30
Water 12.23 12.23 11.73 12.29 8.09 8.59 11.34 12.03 12.03 12.00
Sewer 16.41 17.41 16.54 15.99 15.24 14.66 15.99 15.30 15.22 13.24
Grand Totals 271.01 264.65 270.88 270.77 255.51 255.28 258.16 256.62 257.97 256.84
Data SourceBudgeted Positions per City of Keene Budget. Full time equivalent based on 40 hours per week.
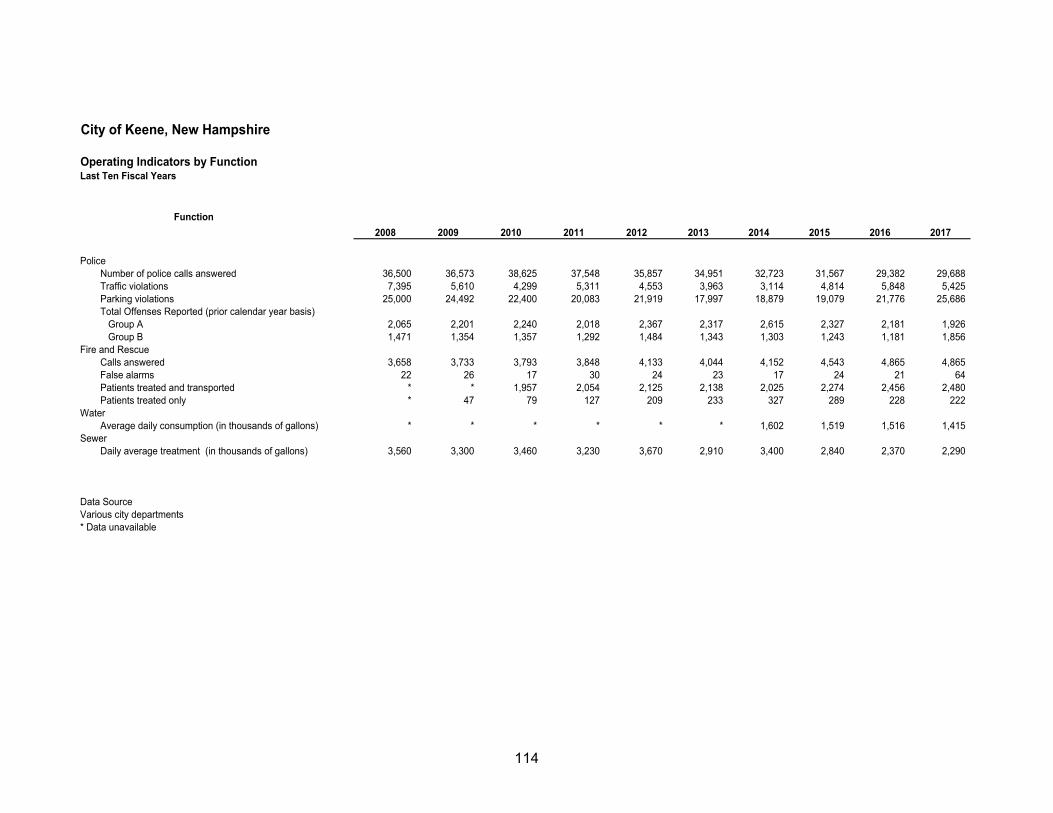
114
City of Keene, New Hampshire
Operating Indicators by FunctionLast Ten Fiscal Years
Function
2008 2009 2010 2011 2012 2013 2014 2015 2016 2017
PoliceNumber of police calls answered 36,500 36,573 38,625 37,548 35,857 34,951 32,723 31,567 29,382 29,688 Traffic violations 7,395 5,610 4,299 5,311 4,553 3,963 3,114 4,814 5,848 5,425 Parking violations 25,000 24,492 22,400 20,083 21,919 17,997 18,879 19,079 21,776 25,686 Total Offenses Reported (prior calendar year basis)
Group A 2,065 2,201 2,240 2,018 2,367 2,317 2,615 2,327 2,181 1,926 Group B 1,471 1,354 1,357 1,292 1,484 1,343 1,303 1,243 1,181 1,856
Fire and RescueCalls answered 3,658 3,733 3,793 3,848 4,133 4,044 4,152 4,543 4,865 4,865 False alarms 22 26 17 30 24 23 17 24 21 64 Patients treated and transported * * 1,957 2,054 2,125 2,138 2,025 2,274 2,456 2,480 Patients treated only * 47 79 127 209 233 327 289 228 222
WaterAverage daily consumption (in thousands of gallons) * * * * * * 1,602 1,519 1,516 1,415
SewerDaily average treatment (in thousands of gallons) 3,560 3,300 3,460 3,230 3,670 2,910 3,400 2,840 2,370 2,290
Data SourceVarious city departments* Data unavailable
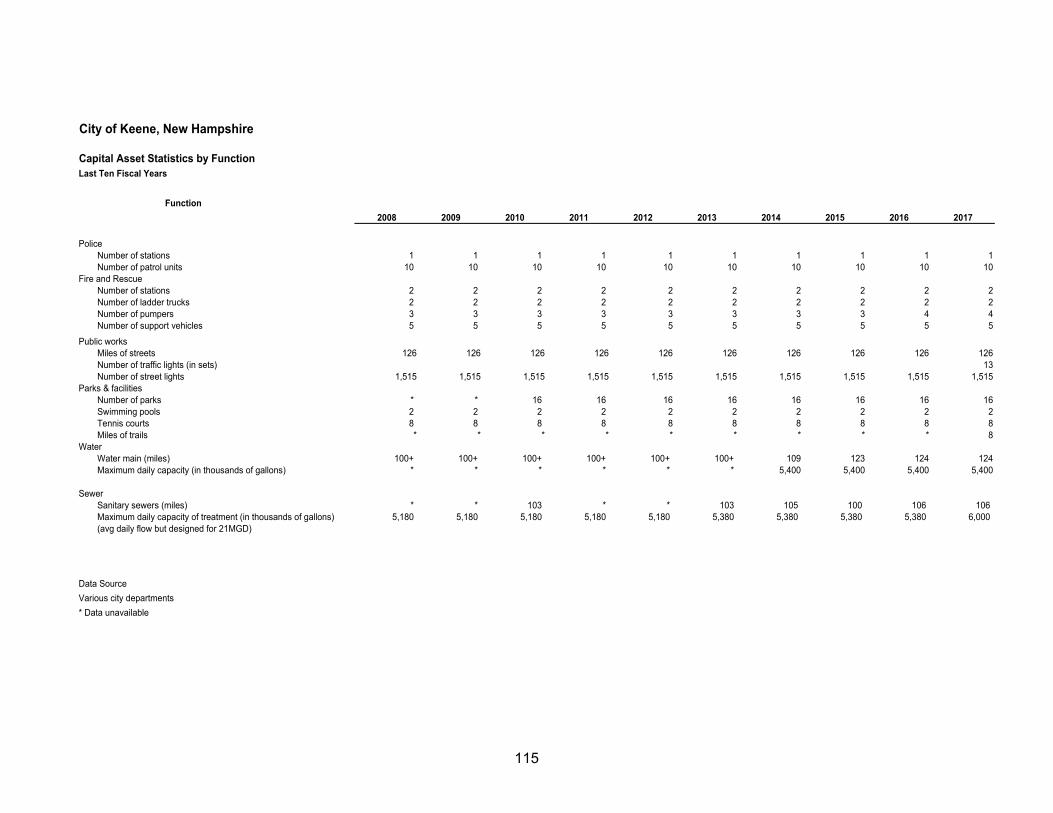
115
City of Keene, New Hampshire
Capital Asset Statistics by FunctionLast Ten Fiscal Years
Function
2008 2009 2010 2011 2012 2013 2014 2015 2016 2017
Police Number of stations 1 1 1 1 1 1 1 1 1 1Number of patrol units 10 10 10 10 10 10 10 10 10 10
Fire and RescueNumber of stations 2 2 2 2 2 2 2 2 2 2Number of ladder trucks 2 2 2 2 2 2 2 2 2 2Number of pumpers 3 3 3 3 3 3 3 3 4 4Number of support vehicles 5 5 5 5 5 5 5 5 5 5
Public worksMiles of streets 126 126 126 126 126 126 126 126 126 126Number of traffic lights (in sets) 13Number of street lights 1,515 1,515 1,515 1,515 1,515 1,515 1,515 1,515 1,515 1,515
Parks & facilitiesNumber of parks * * 16 16 16 16 16 16 16 16Swimming pools 2 2 2 2 2 2 2 2 2 2Tennis courts 8 8 8 8 8 8 8 8 8 8Miles of trails * * * * * * * * * 8
WaterWater main (miles) 100+ 100+ 100+ 100+ 100+ 100+ 109 123 124 124Maximum daily capacity (in thousands of gallons) * * * * * * 5,400 5,400 5,400 5,400
SewerSanitary sewers (miles) * * 103 * * 103 105 100 106 106 Maximum daily capacity of treatment (in thousands of gallons) 5,180 5,180 5,180 5,180 5,180 5,380 5,380 5,380 5,380 6,000 (avg daily flow but designed for 21MGD)
Data Source
Various city departments
* Data unavailable


![A History of the Town of Keene [New Hampshire] from 1732](https://img.pdfslide.us/doc/110x75/61a2e8e551cc920e06397450/a-history-of-the-town-of-keene-new-hampshire-from-1732-.jpg)