Embed Size (px)
Citation preview
ANNUALREPORT on Migration and International
Protection Statistics

Annual Report 2009 on Migration
and International Protection Statistics
in the Netherlands
Date October 2011
Status Final

INDIAC- NL EMN NCP | Annual Report 2009 | August 2011
Page 3 of 66
Colophon
Title Annual Report 2009 on Migration and International
Protection Statistics in The Netherlands
Subtitle October 2011
Status Final
Author mrs. M.H. Belevska
Policy Officer
Ministry of the Interior and Kingdom Relations
Immigration and Naturalisation Service (IND)
Implementation Policy Department
IND Information and Analysis Centre (INDIAC)
Dutch national contact point for the European Migration
Network (EMN)
Dr. H. Colijnlaan 341 | 2283 XL Rijswijk | The Netherlands
P.O. Box 5800 | 2280 HV Rijswijk | The Netherlands

INDIAC- NL EMN NCP | Annual Report 2009 | August 2011
Page 5 of 66
Executive Summary
This Annual Statistical Report contains the most important statistics on migration,
international protection, and the prevention of illegal entry and illegal stay in the
Netherlands in 2009. It provides information on recent trends and important
differences with previous years.
Since 2008, the Member States have been obliged to provide statistics to Eurostat,
the Statistical Office of the European Union, in accordance with Regulation (EC) No
862/2007 of the European Parliament and of the Council of 11 July 2007 on
Community statistics on migration and international protection.
Statistics Netherlands provides Eurostat with all data with regard to legal
immigration, emigration, population and the acquisition of Dutch citizenship, illegal
immigration, return, border control, and international protection.
Immigration
According to national statistics, nearly 144,000 persons immigrated in 2008. In
2009, this number was over 146,000 according to national statistics. Measured
according to national criteria, there was consequently an increase compared to
2008. According to European statistics, however, this number was over 128,000.
The difference is due to the fact that different definitions were used. Approximately
17,000 immigrants left again within the year and consequently do not comply with
the definition of the Regulation.
Emigration
With regard to emigration, it is noteworthy that the declining trend was also visible
in 2009. In 2008, the number concerned was over 90,000 persons. In 2009, this
number dropped to over 85,000.
Legal migration
Just as in 2008, family reasons formed the most important purpose for third-country
nationals to come to the Netherlands in 2009. In total, 23,078 residence permits
were granted for this reason for stay. Compared to 2008, there was a slight
decrease of 3%. Just as in 2008, the largest groups were formed by third-country
nationals with Turkish nationality (14%) and Moroccan nationality (9%).
Labour migration formed the second important reason for third-country nationals to
come to the Netherlands. In 2009, Indians formed the largest group of third-country
nationals who obtained residence permits for reasons of labour. The Chinese ranked
second.
Study was the third important reason for third-country nationals to come to the
Netherlands. Migration for study purposes showed an upward trend. In 2008, the
largest group of third-country nationals that obtained residence permits for study
purposes was formed by Chinese students.
Illegal immigration and return
In total, 7,565 persons were placed in detention. This number remained
approximately the same as in 2008 (7,505). The three largest groups were formed
Page 6 of 66
by Somalis (850), Iraqis (535), and Moroccans (520) respectively.1 What is
noteworthy is the decrease in the number of Chinese that were placed in detention
from 605 in 2008 to 255 in 2009, as well as the increase in the number of Somalis
from 295 in 2008 to 850 in 2009. This decrease in the number of Chinese is, in all
likelihood, caused by a decision of the Administrative Jurisdiction Division of the
Council of State in 2008. This Division judged that - in respect of Chinese without
travel documents - there was no longer a prospect of expulsion. In 2009, 8,980
third-country nationals left the Netherlands demonstrably. This is slightly less than
the year before (9,350). In this context it should be pointed out as well that –
according to national definitions – the number of third-country nationals that left
demonstrably is higher (10,400).2
Applications for international protection asylum
In 2009, more asylum applications were submitted than in 2008. In total, 14,880
new asylum applications were submitted. Just as in previous years, more than half
the number of asylum seekers came from Somalia and Iraq. In particular the
number of applications submitted by Somalis increased in 2009. The policy of
protection for asylum seekers from Central- en South-Somalia was abolished on 19
May 2009. However the number of asylum seekers from Somalia did not decrease
until the last quarter of 2009.
The number of asylum applications submitted by unaccompanied minors also
increased compared to the year before. In total, 1,040 applications were submitted;
this is 314 more than in 2008. In the majority of cases, the applications were
submitted by boys (83%) and most of them originated from Somalia (355) and
Afghanistan (320).
1Third-country nationals are persons who are not nationals of the Union within the meaning of
Article 17(1) of Regulation (EC) No 862/2007 on Community statistics on migration and
international protection. 2 Rapportage Vreemdelingenketen: periode juli-december 2009 (Report of the organisations
cooperating in the immigration process: period July-December 2009), to be consulted on
www.rijksoverheid.nl
INDIAC- NL EMN NCP | Annual Report 2009 | August 2011
Page 7 of 66
Contents
EXECUTIVE SUMMARY—5
Contents—7
List of Abbreviations—9
1 Introduction—11
2 Methodology—13
3 Legal Immigration and Integration—17 3.1 International Migration, Usually Resident Population, and Acquisition of
Citizenship—17 3.1.1 International Migration Flows—17 3.1.2 Usual Residence—18 3.1.3 Acquisition of Citizenship—19
3.2 Residence Permits and Residence of Third-Country Nationals—20
4 Illegal Immigration and Return—25 4.1 Prevention of Illegal Entry and Stay -Apprehensions—26 4.2 Returns—27
5 Border Control—31 5.1 Prevention of Illegal Entry and l Stay: Refusals—31 5.2 Relationship between refusals, apprehensions and returns—32
6 Asylum: International Protection—33 6.1 Applications for International Protection—33 6.2 Decisions on International Protection—34 6.2.1 General Developments—35 6.2.2 Refugee Status—37 6.2.3 Subsidiary Protection Status (Article 3 ECHR)—38 6.2.4 Humanitarian Status—39
6.3 Dublin Transfers—39 6.4 Unaccompanied Minors—40
ANNEX - TABLES—43
BIBLIOGRAPHY—65

INDIAC- NL EMN NCP | Annual Report 2009 | August 2011
Page 9 of 66
List of Abbreviations
COA Central Agency for the Reception of Asylum Seekers
DJI Custodial Institutions Agency
DT&V Repatriation and Departure Service
EFTA European Free Trade Association
EC European Community
EMN European Migration Network
EU European Union
Eurostat Statistical Office of the European Union
ECHR European Convention for the Protection of Human Rights and
Fundamental Freedoms
GBA Municipal Personal Records Database
IND Immigration and Naturalisation Service
INDIAC IND, Information and Analysis Centre
IOM International Organisation for Migration
KMar Royal Netherlands Marechaussee
NCP National Contact Point

Page 10 of 66
INDIAC- NL EMN NCP | Annual Report 2009 | August 2011
Page 11 of 66
1 Introduction
This Annual Report on Migration and International Protection Statistics 2009
contains the most important statistics on migration, international protection, and the
prevention of illegal entry and illegal stay in the Netherlands in 2009. This Annual
Statistical Report presents developments and differences with previous years and
explains them where possible. This report is a product of the Dutch National Contact
Point (NCP) for the European Migration Network (EMN), which is located under the
Information and Analysis Centre (INDIAC) of the Immigration and Naturalisation
Service (IND).
The EMN is an initiative of the European Commission and finds its legal basis in the
Council Decision 2008/381/EC of 14 May 2008. The objective of the EMN is to meet
the information needs in the area of migration and asylum. In order to support
policymaking in the European Union in these areas, the EMN provides up-to-date,
objective, reliable, and comparable information. The EMN also has the task to
provide information on these subjects to the general public.
The EMN National Contact Points contribute to achieving this objective, among other
things, by drawing up Annual Statistical Reports. The present report is the seventh
edition of the Annual Report on Migration and International Protection Statistics
(formerly called Annual Statistical Report on Asylum and Migration). The European
Commission compiles the results of the various country analyses into a comparative
European report.
Just like the report for 2008, the report for 2009 has been drawn up in accordance
with the Migration Statistics Regulation3 (hereinafter referred to as the ‘Regulation’).
This report presents the statistics for 2009. The reason that it was not issued until
2011 is that the statistics on international migration, population, and the acquisition
of the Dutch citizenship are only available after 12 months.
Since 2008, all Member States of the European Union are obliged to provide
statistics on migration and international protection to Eurostat in accordance with
the Regulation. This ensures that each Member State provides data in a uniform
manner in accordance with a predefined format.
Also in 2009, the countries of origin (countries outside the EU27, EFTA4 and the
prospective Member States) were classified on the basis of their levels of
development. This classification is made on the basis of the Human Development
Index developed by the United Nations. Countries are classified as high, medium or
low human development countries. Criteria that affect this classification are life
expectancy, literacy, access to education and gross national product per capita.5
The structure of this report is derived from the specifications that have been
developed jointly by the European Commission and the NCPs. All countries describe
their national situation in the same manner. This facilitates comparison among the
reports of the different countries.
3 This is Regulation (EC) No 862/2007 on Community statistics on migration and international
protection. 4 EFTA stands for European Free Trade Association of which Norway, Iceland, Liechtenstein, and
Switzerland are members. 5 http://hdr.undp.org/en/statistics/hdi/
Page 12 of 66
Chapter 2 explains the methodology followed in the present report.
Chapter 3 focuses on legal migration and integration. This chapter provides, among
other things, information on how many people in total immigrated into the
Netherlands in 2009. In addition, this chapter provides a description of how many
regular residence permits were issued to third-country nationals. Where possible, a
comparison with statistics from 2008 is made in this context. Closer examination has
revealed that some statistics included in the report for 2008 have changed. In this
chapter, the corrected statistics for 2008 are compared with figures for 2009.
Chapter 4 provides a description on the developments with regard to illegal
immigration to the Netherlands in 2009. In addition, data on the return of third-
country nationals are discussed.
Chapter 5 deals with border control. In this chapter, information is given on how
many third-country nationals were apprehended and how many third-country
nationals were refused entry to Dutch territory.
Chapter 6, in conclusion, provides a description of all developments in the area of
international protection: the number of asylum applications and the number of
decisions, relevant trends and policy developments and so forth.
The report contains a large number of tables, which can be found in the Annex.
Page 13 of 66
2 Methodology
The data for this report were collected by the European Migration Network of the
European Commission. All data originate from the database of Eurostat, located in
Luxembourg, and were collected in the period from February up to and including June
2011. The data in this report are primarily about third-country nationals.6 Just as in
last year’s report, the data on EU nationals can be found in Chapter 3, which
discusses the developments in the area of total immigration and emigration,
composition of the population, and the acquisition of Dutch citizenship.
In addition, information from various relevant Dutch public publications was used for
the purpose of this report. Information was also collected through the Internet. The
tables used were selected in accordance with the specifications developed by the
European Commission and the various NCPs, as already set out in the Introduction.
In the Netherlands, several actors serve as suppliers of data on international
protection, migration, and return. The most important are the following:
• Immigration and Naturalisation Service (IND);
• Statistics Netherlands;
• Municipal Personal Records Database (GBA);
• Repatriation and Departure Service (DT&V);
• Royal Netherlands Marechaussee (KMar); and
• International Organisation for Migration (IOM).
The figures collected for the purpose of this report were provided to Eurostat by
Statistics Netherlands.
Statistics from Statistics Netherlands
Statistics Netherlands compiles statistics on population growth on the basis of
information from the GBAs of all Dutch municipalities. The figures on immigration and
emigration relate to persons who are registered in or have been deregistered from
the GBA. The registration criterion is fulfilled if the expected period of residence in
the Netherlands in the six months following the settlement is at least four months.
Asylum seekers are classified as immigrants as soon as they have been granted a
residence permit or after six months of legal residence in the Netherlands. With
regard to emigration it applies that the expected period of residence abroad in the
year following the departure is at least eight months.7
The period of four months applied by Statistics Netherlands deviates from the
definition of the Regulation. Article 2(b) of the Regulation defines ‘immigration’ as
“the action by which a person establishes his or her usual residence in the territory of
a Member State for a period that is, or is expected to be, of at least 12 months,
having previously been usually resident in another Member State of a third country.”
In accordance with Article 2 of the Regulation, persons are considered immigrants if
they have been registered in the GBA for a year or more. This differs from the way in
6 Third-country nationals are persons who are not nationals of the Union within the meaning of Article 17(1) of
Regulation (EC) No 862/2007 on Community statistics on migration and international protection. 7 Press release from Statistics Netherlands (POLITIEBUREAU 10-2006), Crisis remt migratie en verhuizingen (Crisis
acts as a brake on migration and relocations). Derived from www.cbs.nl on 8 July 2011.
Page 14 of 66
which Statistics Netherlands maintains the national statistics. As stated above in this
chapter, Statistics Netherlands classifies asylum seekers as immigrants as soon as
they have been granted a residence permit or after six months of legal residence in
the Netherlands.
This means that – due to the use of different definitions – the national data of
Statistics Netherlands on the total immigration to the Netherlands in 2009 deviate
from the statistics as provided to Eurostat. It is difficult to make a comparison with
previous years, because this method of counting in accordance with Article 2 of the
Regulation was not used for the first time until 2009. As an approximation for the
definition used in the Regulation, Statistics Netherlands calculated on an ex-post
basis for 2009 how many immigrants stayed in the Netherlands for at least 12
months. This appears to be approximately 90% of the immigrants. As a result of this,
the figure provided to Eurostat is approximately 10% lower than the figure published
by Statistics Netherlands in accordance with national definitions.
The emigration figures included in Eurostat are exclusive of the balance of
administrative corrections.
In the Netherlands, a case of unreported migration is registered as an administrative
correction, in the form of a registration or a deregistration. A deregistration occurs
when a municipality has established that a person is no longer included in its
population because the address is unknown or the person cannot be reached
anymore and has probably left the country. Once a person has been removed
administratively, he or she can, in principle, only be registered in the population
register again by administrative registration (entry with unknown country of origin)
or immigration (entry with known country of origin). If, at a person’s request, a
municipality decides to register him or her in the register without the fact that it
concerns a birth, immigration, or settlement from another Dutch municipality, this
will be an administrative registration. In the Netherlands, the balance of the
administrative corrections (registrations minus deregistrations) consequently relates
to persons who have been deregistered administratively without having been
registered administratively again. In migration statistics, this balance is regarded as
unreported emigration and as such added to registered emigration.
Statistics from the IND
The IND collects data in the area of international protection and residence permits for
regular purposes. Just as last year, it is not possible to provide all figures with regard
to decisions on asylum applications in accordance with the specifications set. The
number of residence permits that have been withdrawn cannot be broken down into
the status of the residence permits withdrawn. Specifications requesting the
distinction between first instance asylum decisions and final decisions have also been
introduced this year. The term ‘first instance decision’ is taken to mean the decision
that is made by the IND. The term ‘final decision’ is taken to mean the decision made
on an objection and/or an appeal.
The KMar and the Seaport Police collect data with regard to persons who have been
refused entry to the Netherlands. They fulfil an important role in the area of border
control.
Figures on persons illegally resident in the Netherlands are collected, among others,
by the IND, but also by the Aliens Police. The following caveat applies in this context.
The IND does not register these persons until they have been placed in detention and
have appealed this decision.
Page 15 of 66
Until 1 January 2007, the data on persons who departed voluntarily or who were
removed forcibly from the Netherlands were collected by the IND. Since 1 January
2007, many duties associated with the return of persons illegally resident in the
Netherlands have been transferred to DT&V. Since the aforementioned date, the data
have been collected by the central government by means of a database called
‘Management Information Across the Cooperating Organisations’ (Ketenbrede
Management Informatie, KMI), in which data from DT&V, KMar, and the IOM are
gathered. It is important to note that – in the present report – the data on persons
illegally resident in the Netherlands and the data on the return of persons illegally
resident in the Netherlands deviate from the national data. As stated above, this is
due to the application of different definitions. In accordance with national criteria, for
instance, approximately 10,400 third-country nationals departed demonstrably from
the Netherlands in 20098, whereas in accordance with European criteria, 8,980 third-
country nationals departed demonstrably. This difference is, among other things, due
to the fact that third-country nationals who have been transferred to another EU
Member State do not fall under this category according to the European definition.
With regard to Dublin transfers as well, the national figures deviate from the
European figures. At the European level, for instance, only one claim per claimant is
counted. A request for a review of a claim does consequently not result in a new
claim, whereas this is the case at the national level.
Where the items in an enumeration have been put in round figures, for instance in a
table, it may occur that the round figures do not add up to the sum, which may also
have been rounded off. In order to stay as closely to the original figures as possible,
the enumeration has not been corrected. For the same reasons, the percentages
were calculated using the relevant original figures.
8 Rapportage Vreemdelingenketen 2009 (Report of the organisations cooperating in the immigration process 2009),
press release, derived from www.rijksoverheid.nl.

Page 16 of 66
Page 17 of 66
3 Legal Immigration and Integration
This chapter provides an overview of a number of demographic developments that
are directly related to international migration. Sub-section 3.1.1. describes the
developments in the area of immigration and emigration. In sub-section 3.1.2.,
attention is paid to the third-country nationals residing in the Netherlands. Sub-
section 3.1.3., in conclusion, provides an overview of the developments and trends
with regard to the acquisition of Dutch citizenship by third-country nationals.
3.1 International Migration, Usually Resident Population, and
Acquisition of Citizenship
An explanation about the method used to maintain statistics on immigration at the
national and European level is already given in the previous chapter. With regard to
emigration it applies that the expected period of residence abroad in the year
following the departure is at least eight months.9
3.1.1 International Migration Flows
In the first decade of this century, the Dutch population increased faster than that of
the European Union as a whole. The number of residents in the Netherlands
increased from 15.9 million to 16.6 million residents in the past ten years, an
increase of 4.5% The population growth in the Netherlands is primarily the result of a
natural increase: in ten years, more than half a million more people were born than
died.10
As last year’s report showed, immigration nearly reached a record level in 2008 with
143,516 persons. This calculation was, however, not based on the definition of the
Regulation. This means that this number was the sum of all immigrants that had
come to the Netherlands in 2008, including those who were registered in the GBA for
less than a year. In accordance with the national definition, even more people
immigrated in 2009, namely 146,378. The number of immigrants in accordance with
Article 2 of the Regulation is, however, lower, namely 128,813.
As explained in the Introduction, as an approximation for the definition used in the
Regulation, Statistics Netherlands calculated on an ex-post basis for 2009 how many
immigrants stayed in the Netherlands for at least 12 months. This appears to be
approximately 90% of the immigrants. As a result of this, the figure provided to
Eurostat is approximately 10% lower than the figure published by Statistics
Netherlands in accordance with national definitions.
Despite the differences in the definitions applied, the following developments have
been observed. With regard to immigration by country of citizenship, the Chinese
formed the largest group of third-country nationals who came to the Netherlands in
2009, just as in 2008. Turkey and the United States of America ranked second and
third, respectively (see Table 3).
9 Press release from Statistics Netherlands (POLITIEBUREAU 10-2006), Crisis remt migratie en verhuizingen (Crisis
acts as a brake on migration and relocations). Derived from www.cbs.nl on 8 July 2011. 10 Garssen, J., Wobma, E., (CBS) (Web Magazine, 6 July 2011). Bijdrage migratie aan bevolkingsgroei relatief gering
(Contribution of migration to population growth relatively small). Derived from www.cbs.nl on 8 July 2011.
Page 18 of 66
National sources show that the economic crisis that began in 2008 and continued in
2009 had an influence on the immigration flow from countries where primarily labour
migrants originate from. Compared to 2008, fewer immigrants originated, for
instance, from the United States of America, India, and Japan.11
In 2009, emigration showed a downward trend. In 2008, 90,067 emigrated from the
Netherlands. In 2009, the number was 85,357; an absolute decrease of 4,710
people. The emigration figures Eurostat recorded for the Netherlands are exclusive of
the balance of administrative corrections, whereas Statistics Netherlands usually
publishes the emigration figures inclusive of the corrections.
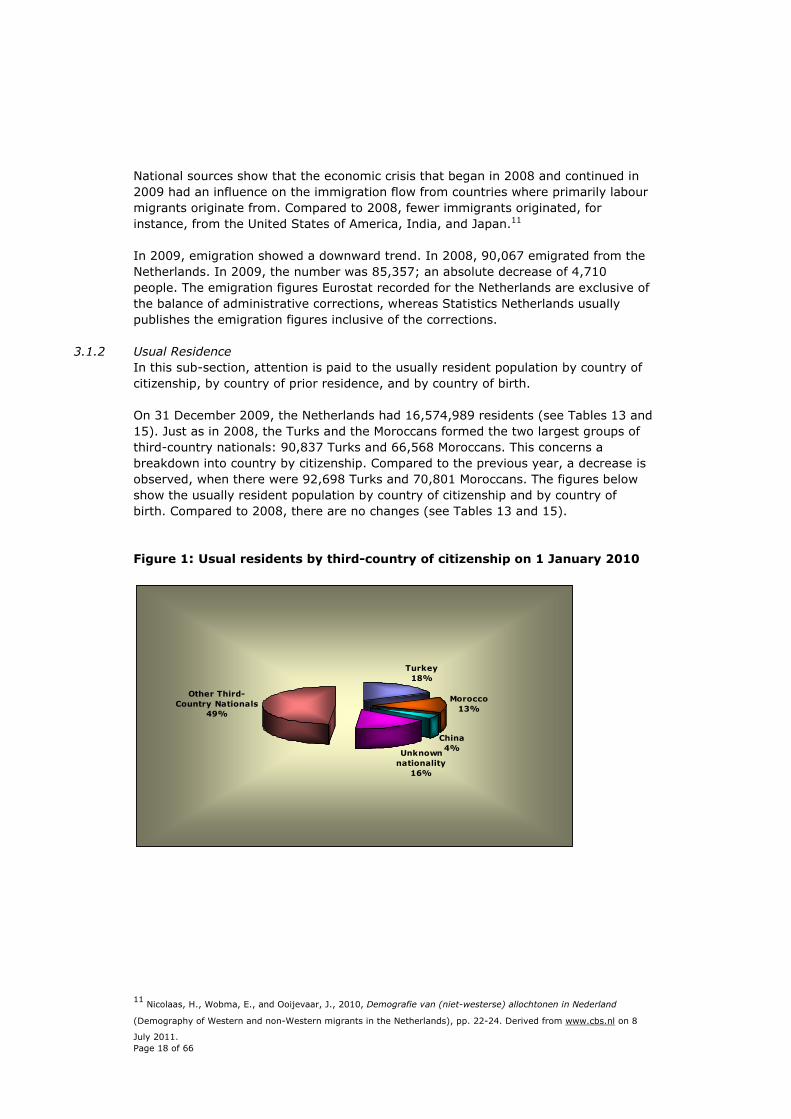
3.1.2 Usual Residence
In this sub-section, attention is paid to the usually resident population by country of
citizenship, by country of prior residence, and by country of birth.
On 31 December 2009, the Netherlands had 16,574,989 residents (see Tables 13 and
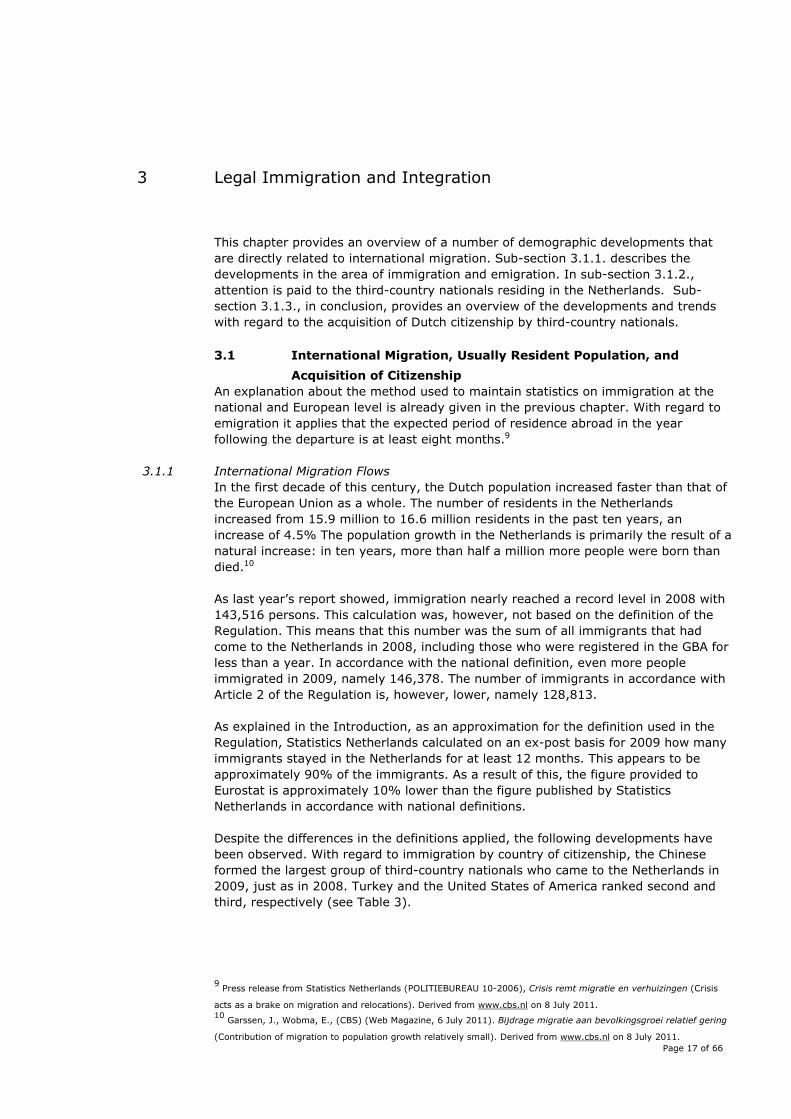
15). Just as in 2008, the Turks and the Moroccans formed the two largest groups of
third-country nationals: 90,837 Turks and 66,568 Moroccans. This concerns a
breakdown into country by citizenship. Compared to the previous year, a decrease is
observed, when there were 92,698 Turks and 70,801 Moroccans. The figures below
show the usually resident population by country of citizenship and by country of
birth. Compared to 2008, there are no changes (see Tables 13 and 15).
Figure 1: Usual residents by third-country of citizenship on 1 January 2010
Morocco
13%
Turkey
18%
Other Third-
Country Nationals
49%
China
4%Unknown
nationality
16%
11 Nicolaas, H., Wobma, E., and Ooijevaar, J., 2010, Demografie van (niet-westerse) allochtonen in Nederland
(Demography of Western and non-Western migrants in the Netherlands), pp. 22-24. Derived from www.cbs.nl on 8
July 2011.
Page 19 of 66
Figure 2: Usual residents by non-EU country of birth and other countries of
birth on 1 January 2010
Other Third Country-Nationals
44%
Turkey14%
Surinam14%
Morocco12%
Indonesia10%
Dutch Antilles6%
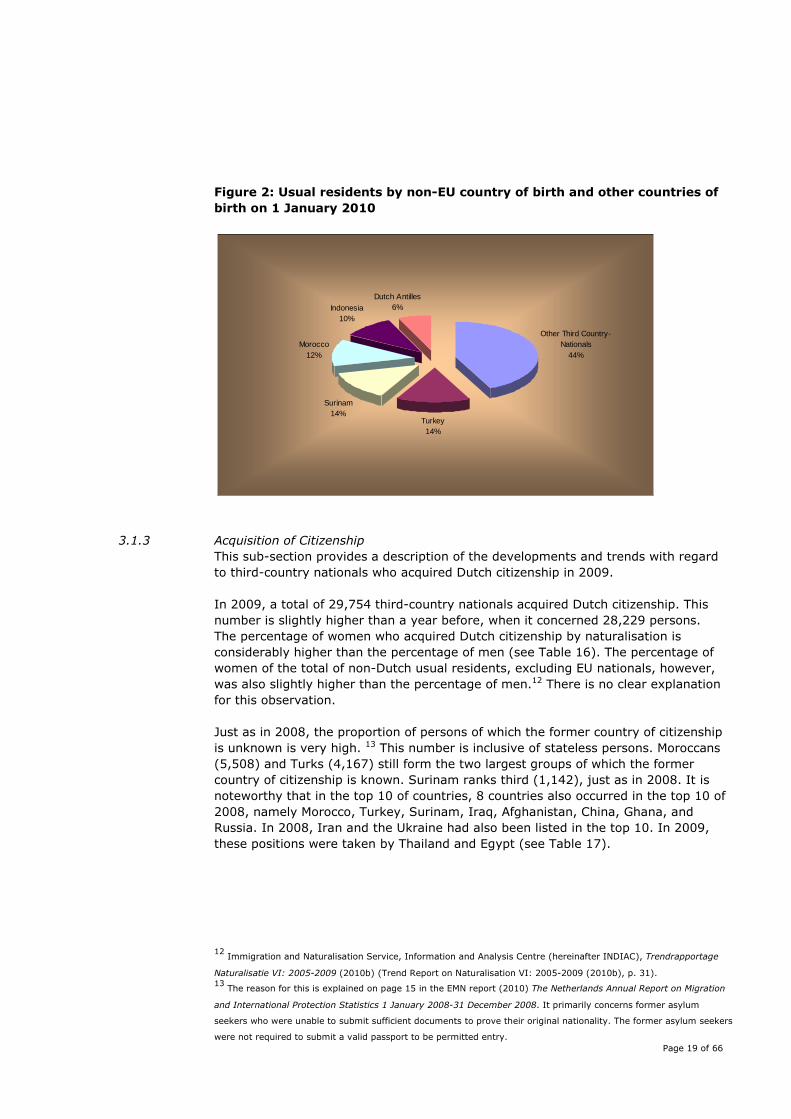
3.1.3 Acquisition of Citizenship
This sub-section provides a description of the developments and trends with regard
to third-country nationals who acquired Dutch citizenship in 2009.
In 2009, a total of 29,754 third-country nationals acquired Dutch citizenship. This
number is slightly higher than a year before, when it concerned 28,229 persons.
The percentage of women who acquired Dutch citizenship by naturalisation is
considerably higher than the percentage of men (see Table 16). The percentage of
women of the total of non-Dutch usual residents, excluding EU nationals, however,
was also slightly higher than the percentage of men.12 There is no clear explanation
for this observation.
Just as in 2008, the proportion of persons of which the former country of citizenship
is unknown is very high. 13 This number is inclusive of stateless persons. Moroccans
(5,508) and Turks (4,167) still form the two largest groups of which the former
country of citizenship is known. Surinam ranks third (1,142), just as in 2008. It is
noteworthy that in the top 10 of countries, 8 countries also occurred in the top 10 of
2008, namely Morocco, Turkey, Surinam, Iraq, Afghanistan, China, Ghana, and
Russia. In 2008, Iran and the Ukraine had also been listed in the top 10. In 2009,
these positions were taken by Thailand and Egypt (see Table 17).
12 Immigration and Naturalisation Service, Information and Analysis Centre (hereinafter INDIAC), Trendrapportage
Naturalisatie VI: 2005-2009 (2010b) (Trend Report on Naturalisation VI: 2005-2009 (2010b), p. 31). 13 The reason for this is explained on page 15 in the EMN report (2010) The Netherlands Annual Report on Migration
and International Protection Statistics 1 January 2008-31 December 2008. It primarily concerns former asylum
seekers who were unable to submit sufficient documents to prove their original nationality. The former asylum seekers
were not required to submit a valid passport to be permitted entry.
Page 20 of 66
Figure 3: Acquisition of Dutch citizenship by third-country nationals
Morocco
20%
Other Third
Country-Nationals
32%
Surinam
4%Turkey
15%
Unknown
nationality
25%
Iraq
2%
Afghanistan
2%
3.2 Residence Permits and Residence of Third-Country Nationals
The Netherlands has two types of applications for residence permits. The first type of
application concerns applications for admission to the Netherlands in the context of
international protection, referred to as asylum applications. The second type of
application concerns applications for regular purposes of stay, such as family
formation, family reunification, labour, and study. Applications are submitted to and
processed by the IND. In this chapter, the emphasis will be on applications for
regular purposes of stay. It is important to note in advance that some figures stated
in the report for 2008 have been corrected after its publication. Where comparisons
are made with the figures for 2008, the changed figures will be used and not the
figures mentioned in last year’s report.
Figure 4: Residence permits issued in 2009, by reason for stay
Labour
18%
Other
23%
Study
18%
Family Reasons
41%
Page 21 of 66
Family reasons
Just as in 2008, family reasons were the most important reason to issue regular
residence permits in 2009. In the entire year, a total of 23,078 residence permits
were issued for that reason for stay (see Table 18). In 2008, a total of 24,092
residence permits were granted. That is 1,014 fewer permits than the previous year,
or 4%.
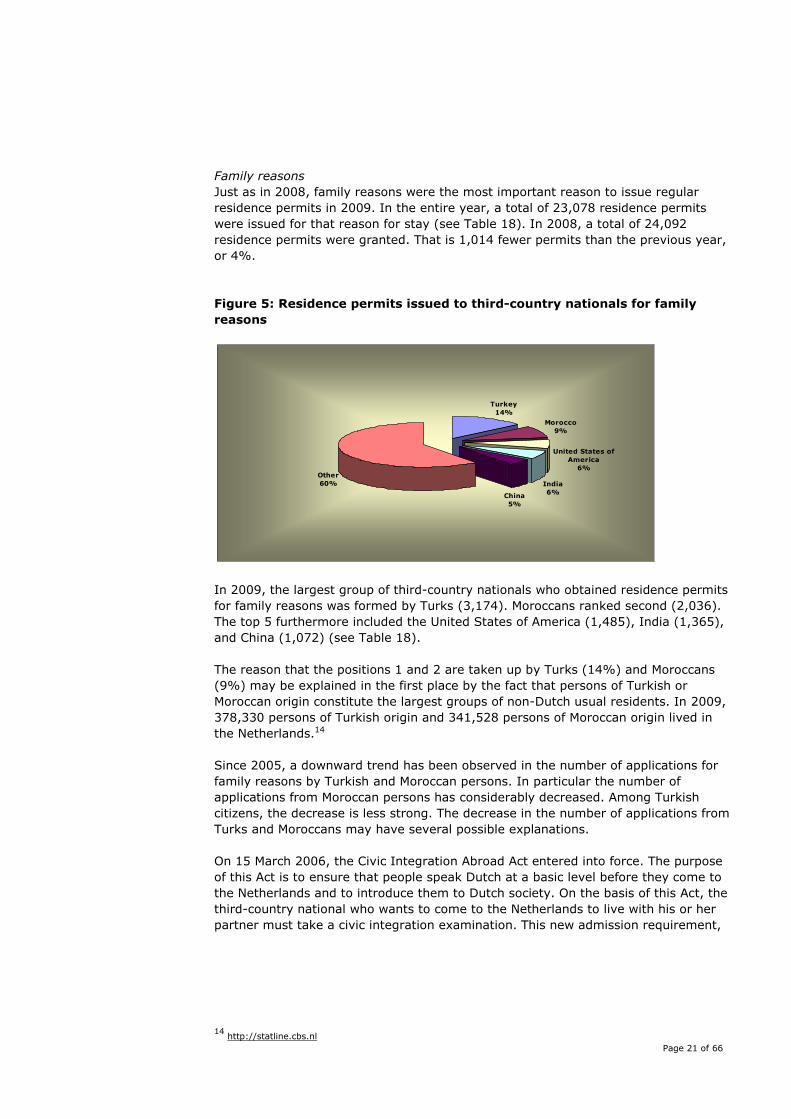
Figure 5: Residence permits issued to third-country nationals for family
reasons
Turkey
14%
Other
60%
United States of
America
6%
India
6%China
5%
Morocco
9%
In 2009, the largest group of third-country nationals who obtained residence permits
for family reasons was formed by Turks (3,174). Moroccans ranked second (2,036).
The top 5 furthermore included the United States of America (1,485), India (1,365),
and China (1,072) (see Table 18).
The reason that the positions 1 and 2 are taken up by Turks (14%) and Moroccans
(9%) may be explained in the first place by the fact that persons of Turkish or
Moroccan origin constitute the largest groups of non-Dutch usual residents. In 2009,
378,330 persons of Turkish origin and 341,528 persons of Moroccan origin lived in
the Netherlands.14
Since 2005, a downward trend has been observed in the number of applications for
family reasons by Turkish and Moroccan persons. In particular the number of
applications from Moroccan persons has considerably decreased. Among Turkish
citizens, the decrease is less strong. The decrease in the number of applications from
Turks and Moroccans may have several possible explanations.
On 15 March 2006, the Civic Integration Abroad Act entered into force. The purpose
of this Act is to ensure that people speak Dutch at a basic level before they come to
the Netherlands and to introduce them to Dutch society. On the basis of this Act, the
third-country national who wants to come to the Netherlands to live with his or her
partner must take a civic integration examination. This new admission requirement,
14 http://statline.cbs.nl
Page 22 of 66
together with the income requirement, may deter people from submitting an
application.15
Another possible reason may be the increase in the fee to be paid for an application.
Since 2005, the amount of the fee has been linked to the processing costs. Since
2005, an amount of EUR 830 must be paid for an application for family reasons.
In comparison, in 2002, this amount had been set at EUR 258.16
Another development that may have contributed to the decrease in the number of
family applications is the increased use of Community Law for family life by Turks
and Moroccans. With regard to admission requirements, Community Law is more
flexible than national aliens policy.17
In the top 3 of countries, the group of Indians who want to come to the Netherlands
for family reasons is clearly present. This is a group of persons who are family
members of highly skilled migrants who reside in the Netherlands on the basis of the
Highly Skilled Migrants Scheme that was introduced in 2004. But with regard to this
group as well, a slight decrease in the number of applications has been observed.
This is possibly due to the economic crisis that began in 2008. If fewer highly skilled
migrants come to the Netherlands, this also affects the number of family members
who want to come to the Netherlands to live with the highly skilled migrant.18
Labour Migration
Labour migration comes second after immigration for family reasons as an important
reason to come to the Netherlands. In 2009, 10,433 applications were granted for
this reason. This is a decrease of 10% compared to 2008, when the number was
11,613. In 2009, the largest group of third-country nationals who obtained residence
permits for reasons of labour was formed by Indians. It concerned 1,791 persons.
Compared to 2008, this is a decrease of 468 applications, or 21%. Most Indians
made use of the Highly Skilled Migrants Scheme. An increase in the number of
applications for reasons of labour granted was seen among the Chinese (1,727). In
2008, the Chinese had submitted 387 fewer applications, or an increase of 29%.
This increase in the number of Chinese immigrants who came to the Netherlands for
reasons of labour may have several possible causes. An increasing number of
enterprises in the Chinese hotel and catering industry are looking for cheap labour
from China. In addition, this increase may be ascribed to the fact that increasingly
more enterprises are coming to the Netherlands. Together with these enterprises,
Chinese employees come to the Netherlands as well.19 In 2008, the United States of
15 Internationale gezinsvorming begrensd? (International family formation subject to restrictions?) An evaluation of
the raised income and age requirements with regard to the migration of foreign partners to the Netherlands, p. 138,
Research and Documentation Centre (WODC), IND (INDIAC), 2009. 16 Source: IND.
17 Schreijenberg, A., Klaver, J.F.I., Soethout, J. E., Lodder, G.G., and Vleugel, M.J. (2009) Gemeenschapsrecht en
gezinsmigratie – Het gebruik van gemeenschapsrecht door gezinsmigranten uit derde landen (Community Law and
Family Migration – The use of Community Law by family migrants from third countries). Amsterdam/The Hague:
Research and Documentation Centre (WODC); Regioplan Policy Research; Institute for Immigration Law; Leiden
University; INDIAC 18 INDIAC, 2010, Trendrapportage regulier 2010, Reguliere migratie naar Nederland in beeld (Trend Report on
Regular Residence 2010, An Overview of Regular Migration to the Netherlands), (2010a) p. 31. 19 INDIAC (2010a), p. 41
Page 23 of 66
America ranked second on this list, with a total of 1,387 migrants. In 2009, there
were 267 fewer migrants, a decrease of 19%.
Study Migration
Since 2007, there has been an upward trend in migration to the Netherlands for
reasons of study. This trend continued in 2009. A total of 9,944 applications were
granted, 1,094 more than in 2008, an increase of 12%. Just as in 2008, the Chinese
students formed the largest group of migrants with a total of 2,264, an increase of
414 migrants, or 22%. The fact that so many Chinese come to the Netherlands to
study has several causes. The Chinese government encourages young people to
study abroad, so that they may return to China with the knowledge gained. In
addition, the Dutch Ministry of Education, Culture and Science is actively promoting
the Netherlands in China as a destination to undertake one’s study. The Netherlands
is a popular destination for Chinese students due to the English-language study
programmes and the high level of education. In addition, the Netherlands may also
be attractive to this group of migrants because they are given the opportunity to try
and find a suitable job in the Netherlands in the year following graduation.20
In 2009 as well, the American students ranked second with regard to the number of
migrants for reasons of study. With regard to this group as well, an increase was
observed compared to 2008. In 2008, 1,086 applications were granted and in 2009,
this number was 1,285, an increase of 18%. This increase is difficult to explain. It is
clear, however, that an increasing number of Americans go abroad to undertake a
study.21
20 INDIAC (2010a), p. 52
21 INDIAC (2010a), p. 54

Page 24 of 66
Page 25 of 66
4 Illegal Immigration and Return
The Netherlands has a restrictive admission policy. The Dutch Aliens Act sets out who
is legally present in the Netherlands and who is not. In addition to persons with
Dutch citizenship, persons with a residence permit or a visa may also stay in the
Netherlands. Citizens of a number of countries furthermore have the right to stay in
the Netherlands for a specific period of time without a visa. This also applies to
persons who wish to rely on a residence permit for international protection. As stated
above in section 3.2, persons may submit an application for a residence permit to the
IND. A person who is not or is no longer a legal resident in the Netherlands is obliged
to leave the Netherlands. If this does not happen, he or she may be forced to return.
The Netherlands performs border controls on the Schengen external borders 22 to
check whether the persons concerned, their means of transport, and the items in
their possession may either enter or leave the Netherlands.
These border controls are performed by the Royal Netherlands Marechaussee (KMar).
The Seaport Police of the Rotterdam-Rijnmond Regional Police Force performs these
border controls in the Rotterdam port area.
Anyone who is refused entry to the Netherlands or anyone who no longer has the
right to residence is obliged to leave the Netherlands. The illegally resident third-
country national is personally responsible for his or her own departure. The
government encourages third-country nationals who are not permitted to stay in the
Netherlands to leave the country independently and provides assistance if necessary.
Illegally resident third-country nationals who do not leave the Netherlands may be
removed. For this purpose, it is, for instance, possible to request the court to order
detention.
The cooperation of the country of origin is sometimes also required. This is the case if
the third-country national does not have valid travel documents and the country
where he or she states to come from must provide a travel document or a
replacement travel document.
In the Netherlands, the Repatriation and Departure Service (DT&V) is responsible for
the independent and forced departure of third-country nationals who are not
permitted to stay in the Netherlands. The DT&V is an implementing body of the
Ministry of the Interior and Kingdom Relations.23
The International Organisation for Migration (IOM) may also provide assistance if
third-country nationals wish to return. The Dutch government supports the activities
of the IOM.
The DT&V targets two groups:
22 This concerns sea borders and airport borders.
23 http://www.rijksoverheid.nl/documenten-en-publicaties/vragen-en-antwoorden/hoe-is-het-terugkeerbeleid-voor-
vreemdelingen-in-nederland-geregeld.html, see also: www.dienstterugkeerenvertrek.nl.
Page 26 of 66
• Illegally resident third-country nationals who have been apprehended in the
context of aliens supervision, mobile or otherwise, and third-country
nationals who have been refused entry in the context of border control; and
• Asylum seekers who have exhausted all legal remedies and who must leave
the Netherlands.
The DT&V adopts a personalised multi-disciplinary approach to the departure
process. The DT&V cooperates with other government organisations that have a duty
in the departure process, including the IND, the KMar, the Aliens Police, the Central
Agency for the Reception of Asylum Seekers, the DJI, and other organisations such
as the IOM.
4.1 Prevention of Illegal Entry and Stay -Apprehensions
The statistics used for this report as a measure for illegally resident third-country
nationals relate to the number of third-country nationals placed in detention. Dutch
law provides that a third-country national who is not or no longer legally present in
the Netherlands may be placed in detention.24
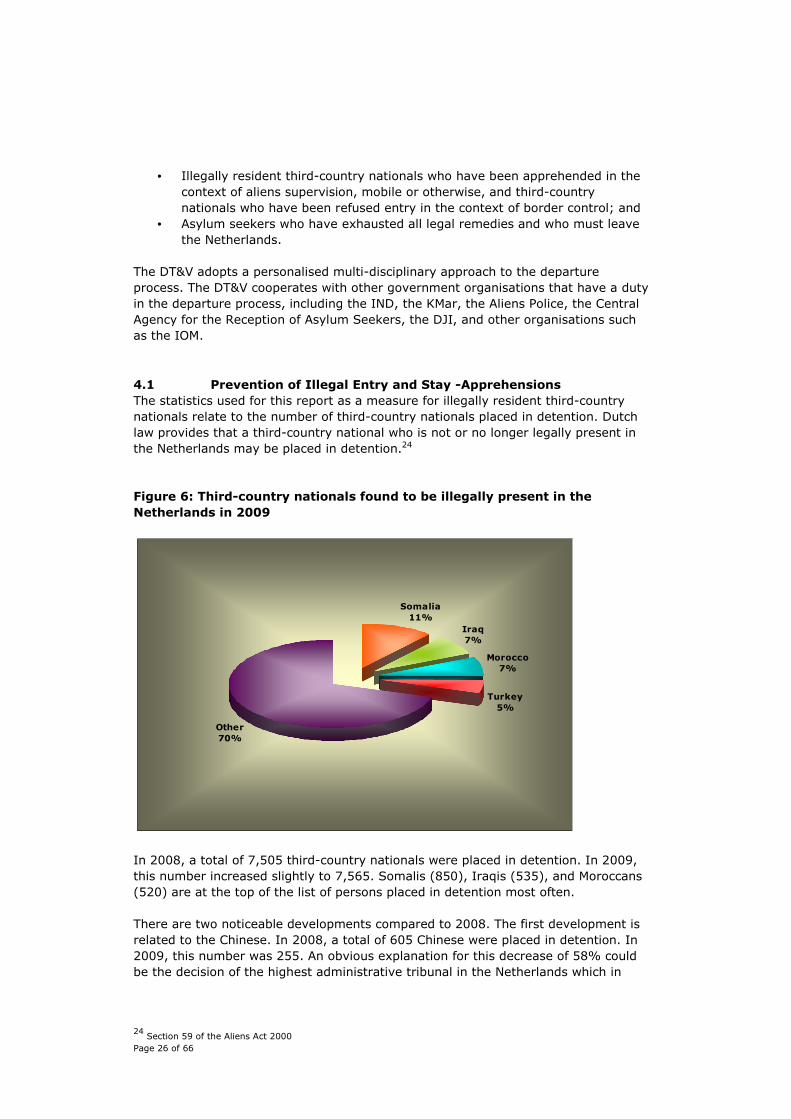
Figure 6: Third-country nationals found to be illegally present in the
Netherlands in 2009
Somalia
11%
Iraq
7%
Morocco
7%
Turkey
5%
Other
70%
In 2008, a total of 7,505 third-country nationals were placed in detention. In 2009,
this number increased slightly to 7,565. Somalis (850), Iraqis (535), and Moroccans
(520) are at the top of the list of persons placed in detention most often.
There are two noticeable developments compared to 2008. The first development is
related to the Chinese. In 2008, a total of 605 Chinese were placed in detention. In
2009, this number was 255. An obvious explanation for this decrease of 58% could
be the decision of the highest administrative tribunal in the Netherlands which in
24 Section 59 of the Aliens Act 2000
Page 27 of 66
September 2008 held that Chinese without documents could not be kept in detention
because forced removal for this group of Chinese appeared to be impossible.25 The
possibility of removing an illegally resident third-country national to his or her
country of origin is a condition for keeping illegally resident third-country nationals in
detention. In other words: there must be a prospect of removal. This decision could
explain the smaller number of Chinese in detention.
A second development is the larger number of Somalis (850) that were placed in
detention. The previous year, it concerned 295 persons. The reason for this increase
could be the abolition of the policy of protection for certain categories of asylum
seekers on 19 May 2009.26 The large number may also be related to the fact that
Somalia is the country of origin that occurs most among the persons who come to
the Netherlands for international protection.
4.2 Returns
Return has high priority within Dutch aliens policy. Everything possible is being done
to realise the actual departure of persons who are not permitted or no longer
permitted to stay in the Netherlands. The government committed itself in 2009 to
improve the possibilities to ensure the return of third-country nationals and it made
commitments to this end in the following five areas:27
• To cooperate in the area of return with countries of origin;
• To cooperate with local authorities and civil society organisations in the area
of return;
• To adopt a more effective approach to the individual third-country national to
induce him or her to departure;
• To create possibilities for the cooperating organisations concerned to
effectively work on the return of the third-country nationals;
• To take measures against criminal third-country nationals.
The Dutch government encourages independent departure. The Dutch government is
cooperating with other national and international organisations in various projects.28
The obligation for a person to leave the Netherlands ensues directly from the law. In
2009, the Netherlands did not have a separate return decision or expulsion order.29
In the Netherlands, the decision made on the applications for residence permits has
multiple consequences. The decision rejecting a residence permit also includes the
obligation for the third-country nationals to leave the Netherlands. The figures
relating to applications for residence permits that have been rejected are provided by
the IND. Where reference is made to third-country nationals who have received a
notice ordering them to leave the Netherlands in this report, this refers to third-
25 Administrative Jurisdiction Division of the Council of State, 5 September 2008, no 200805982/1. The prosepct of
removing Chinese to China again has arisen anew, also for Chinese who do not have any travel documents. 26 Decision of the State Secretary for Justice of 2 July 2009, no 2009/16 amending the Aliens Act Implementation
Guidelines 2000, Government Gazette no 11449. 27 Parliamentary Papers II 2008/09, 19 637, no 1263 (Letter).
28 The EMN Report (2009b) Gefaciliteerde terugkeer- en herintegratieprogramma’s in Nederland (Facilitated Return
and Reintegration Programmes) includes a list of various facilities for return. 29 This could change in the future as a result of the Directive 2008/115/EC (Return Directive) of the European
Parliament and the Council of 16 December 2008 on common standards and procedures in Member States for
returning illegally staying third-country nationals. This Directive has not yet been implemented in the Netherlands.
Page 28 of 66
country nationals who have received a decision rejecting their application for a
residence permit. 30
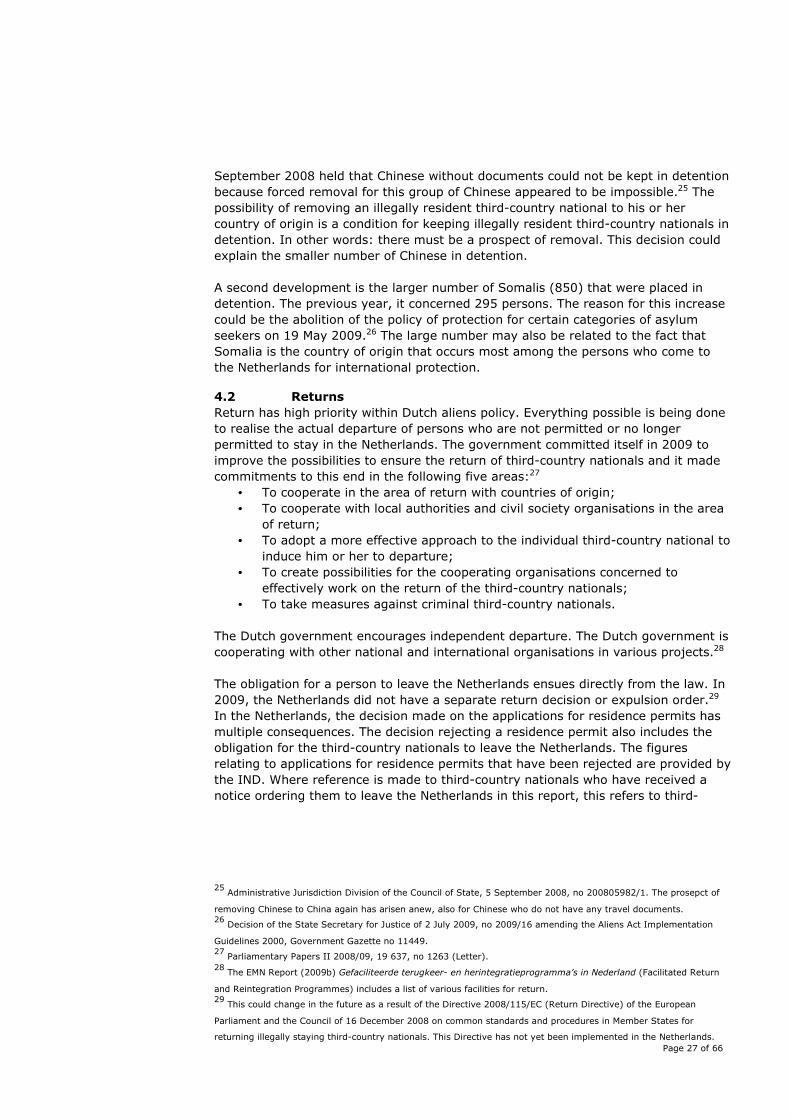
Figure 7: Total number of notices to leave the Netherlands in 2009
Total
49%
Morocco
4%
Other
29%
Turkey
6%
Iraq
6%
Somalia
4%
Afghanistan
2%
In 2009, 8,980 third-country nationals left the Netherlands demonstrably. That is
slightly less than the year before (9,350). In this context it should be pointed out as
well that – according to national definitions – the number of third-country nationals
that left demonstrably is higher (10,400).31
A total of 35,574 third-country nationals received a notice to leave the Netherlands.
Just as in 2008, the largest group of third-country nationals who received a notice to
leave the Netherlands was formed by Turks (4,095). The Turks were also the largest
group of third-country nationals who returned demonstrably (935). Iraqis ranked
second. A total of 3 915 Iraqis received a notice to leave the Netherlands; 685 Iraqis
left demonstrably. Somalia ranked third in the list of third-country nationals who
received a notice to leave the Netherlands (2,730); 395 Somalis left demonstrably.
Other countries that occurred in both lists, the list of notices and the list of
demonstrable return, were Morocco (2,570 notices vs 380 departures), China (1,350
notices vs 475 departures), Surinam (1,180 notices vs 410 departures), and Nigeria
(1,130 notices vs 435 departures). Afghanistan, Ghana, and Iran were in the top 10
of countries of third-country nationals who received notices, but not in the top 10 of
countries who actually returned. The opposite is true for Brazil, the Ukraine, and
Indonesia. These countries occurred in the top 10 of countries to which third-country
30 Dienst Terugkeer en Vertrek hanteert een andere definitie voor de term aanzegging. De Vreemdelingenpolitie geeft
bijvoorbeeld ook aanzeggingen aan vreemdelingen die niet rechtmatig in Nederland verblijven. Te denken valt aan
vreemdelingen die zich nooit tot de IND hebben gewend en dus nooit een procedure hebben gevoerd. Maar ook
vreemdelingen die met een visum naar Nederland zijn gekomen maar niet (tijdig) teruggekeerd zijn, de zogenaamde
“overstayers”, kunnen een aanzegging van de Vreemdelingenpolitie krijgen. 31 Rapportage Vreemdelingenketen: periode juli-december 2009 (Report of the organisations cooperating in the
immigration process: period July-December 2009), to be consulted on www.rijksoverheid.nl.
Page 29 of 66
nationals actually returned, but they do not occur in the top 10 of countries of third-
country nationals who received a notice to leave the Netherlands.

Page 30 of 66
Page 31 of 66
5 Border Control
Persons who wish to come to the Netherlands from a country outside the Schengen
territory must do so via a personal security check at a border crossing point. This
border control is performed by the Royal Netherlands Marechaussee (KMar) or – in
the Rotterdam port area – by the Seaport Police of the Rotterdam-Rijnmond Regional
Police Force. If a person is refused entry, he or she is obliged to return immediately
to the country where he or she departed from, to the country of origin, or to another
country where his or her admission is granted.
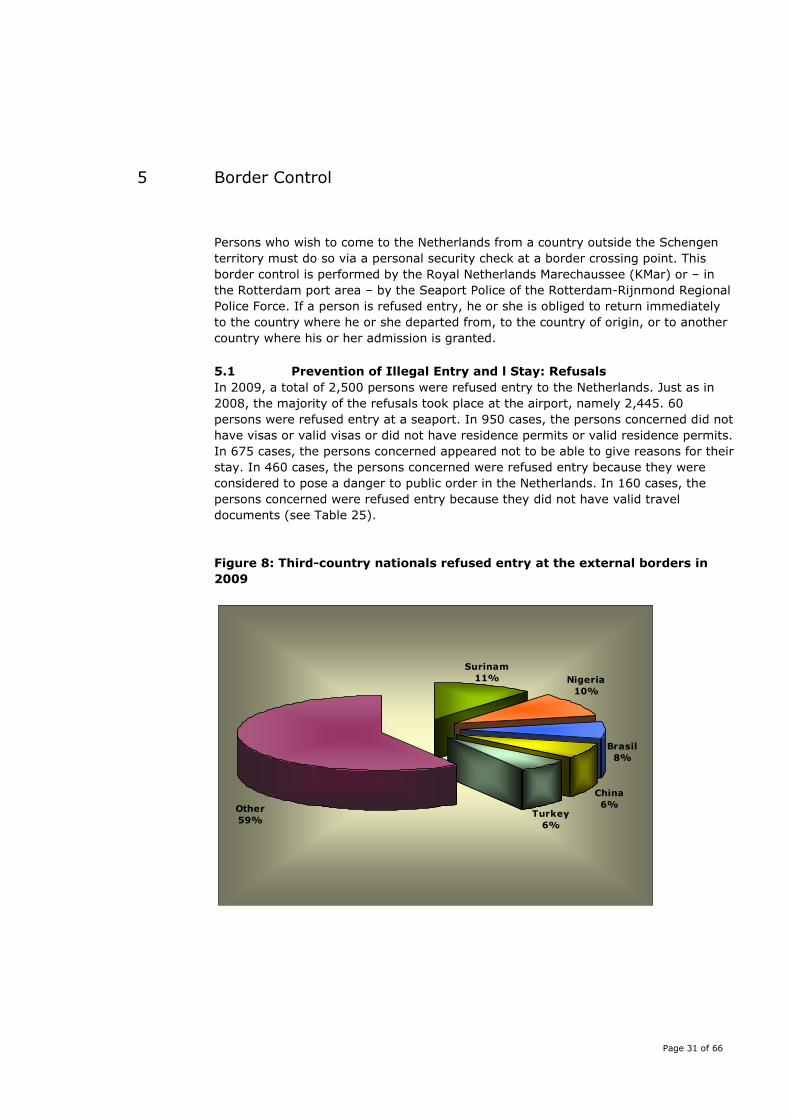
5.1 Prevention of Illegal Entry and l Stay: Refusals
In 2009, a total of 2,500 persons were refused entry to the Netherlands. Just as in
2008, the majority of the refusals took place at the airport, namely 2,445. 60
persons were refused entry at a seaport. In 950 cases, the persons concerned did not
have visas or valid visas or did not have residence permits or valid residence permits.
In 675 cases, the persons concerned appeared not to be able to give reasons for their
stay. In 460 cases, the persons concerned were refused entry because they were
considered to pose a danger to public order in the Netherlands. In 160 cases, the
persons concerned were refused entry because they did not have valid travel
documents (see Table 25).
Figure 8: Third-country nationals refused entry at the external borders in
2009
China
6%
Brasil
8%
Nigeria
10%
Surinam
11%
Other
59%Turkey
6%
Page 32 of 66
5.2 Relationship between refusals, apprehensions and returns
In theory, a relationship could be assumed between the number of third-country
nationals that were refused entry, the number of third-country nationals found to be
illegally present, and the number of third-country nationals that returned.
What is noteworthy is the fact that the number of third-country nationals that
actually returned is lower than the number of notices to leave the Netherlands. It
may be concluded from this that most third-country nationals fail to comply with their
legal obligation to leave the Netherlands after having received a decision rejecting
their application. This complicates the task of the Dutch authorities to supervise and
combat illegality.
In general, it is difficult to find an explanation for this conclusion. Different
explanations are conceivable. It cannot be concluded from the figures on the number
of third-country nationals that actually returned whether each of them received a
notice in 2009. It could be the case that some third-country nationals received a
notice to leave the Netherlands years ago.
Some third-country nationals may have left independently without their departures
having been registered, either to unknown destinations or to their countries of origin
or to other countries. Other third-country nationals may have chosen to initiate
proceedings against the rejection of their application. In some cases, they are
allowed to await the outcome of these proceedings in the Netherlands. Another group
of third-country nationals may prefer to submit a new application for a residence
permit. In that case, they are legally present in the Netherlands awaiting the decision
of the IND.
Somalia is the most important country with regard to the number of apprehensions of
illegally resident third-country nationals in the Netherlands (see Table 22). This
ranking is, however, not recognised in the category of third-country nationals who
actually returned (see Table 24). Somalia ranks seven in that category. The return of
third-country nationals, whether forced or voluntarily, to the country of origin, mainly
occurs among Turks. In general, it may be argued that the return to some countries
is more difficult than to other countries. Many persons are undocumented and this
complicates and delays the return.
Page 33 of 66
6 Asylum: International Protection
This chapter focuses on the most important developments in the area of international
protection in the Netherlands in 2009.
A comparison will be made with the figures for 2008. Where possible, noteworthy
statistical shifts will be related to policy developments.
6.1 Applications for International Protection
In 2009, more asylum applications were submitted than in the previous year. In
2009, the number increased by 11% to 14,880 new asylum applications (see Table
32). Compared to 2008, the number of applications increased less strongly. In that
year, the increase was 88%.32
Just as in previous years, more than half the number of asylum seekers came from
Somalia (5890) and Iraq (1990) (see Table 33). Both in 2007 and in 2008, Iraq
ranked first on the list of countries where most asylum seekers came from, while
Somalia ranked second. In 2009, it was the other way around. The large decrease in
the number of applications submitted by persons originating from Iraq is probably
related to the abolition of the policy of categorical protection for persons from Central
Iraq on 12 September 2008.33 It concerns a decrease of 60%.
But on the other hand, the number of first asylum applications submitted by Somalis
increased for the third subsequent year. In 2009, the number increased by 53%,
from 3,840 in 2008 to 5,890 in 2009. The security situation in Somalia has been poor
for years. For this reason, the policy of categorical protection for persons applied to
Central and South Somalia. 34 The increase may be ascribed to this policy, which was
abolished on 19 May 2009.35 The abolition of this policy did not immediately result in
a decrease in the number of applications. The number of asylum seekers from
Somalia did not start to decrease until the last quarter of 2009.36
An increase in the number of asylum applications is also observed for persons who
originate from Afghanistan. For the second subsequent year, the number increased.
Compared to 2008, the increase is substantial. In 2008, 396 applications were
submitted, but in 2009, this number had increased to 1,280. In the absolute sense,
there was an increase of 885 applications. This increase may be caused by the
deteriorating security situation in Afghanistan. The number of asylum applications
submitted by Afghan persons increased in nearly all European countries.37
32 EMN (2010) The Netherlands Annual Report on Migration and International Protection Statistics 1 January 2008-31
December 2008, p. 17. 33 Parliamentary Papers II 2008/09, 19 637, no 1220 (Letter).
34 For more information, see Chapter 6, section 6.2.
35 Decision of the State Secretary for Justice of 2 July 2009, no. 2009/16 amending the Aliens Act Implementation
Guidelines 2000, Government Gazette no. 11449. 36 Sprangers, A. and Nicolaas, H., 2010, Stijging aantal asielzoekers in Nederland iets groter dan in EU (Increase in
number of asylum seekers in the Netherlands larger than in EU), pp. 25-27. Derived from www.cbs.nl on 9 March
2011. 37 Parliamentary Papers II 2009/2010, 19 637, no 1346.
Page 34 of 66
Noteworthy in this top 10 of countries is the presence of Georgia ranking sixth. In
total, 410 applications were submitted by persons originating from Georgia. The
reason for this is unclear. The Dutch government received signals that it might be
connected with the possibility of a financial contribution upon return to one’s country
of origin.38
Since August 2006, it has been possible to distinguish new applications from
repeated applications. As stated above, a total of 14,880 new applications were
submitted. In addition, 1,260 subsequent asylum applications were submitted.
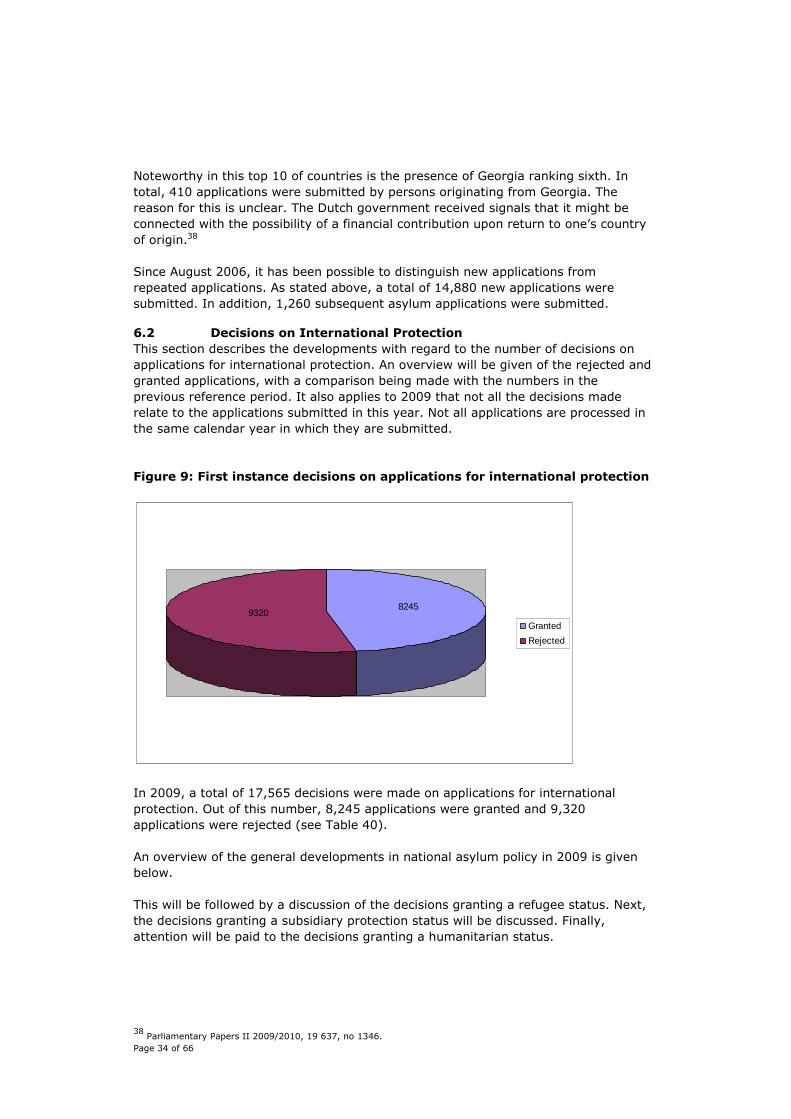
6.2 Decisions on International Protection
This section describes the developments with regard to the number of decisions on
applications for international protection. An overview will be given of the rejected and
granted applications, with a comparison being made with the numbers in the
previous reference period. It also applies to 2009 that not all the decisions made
relate to the applications submitted in this year. Not all applications are processed in
the same calendar year in which they are submitted.
Figure 9: First instance decisions on applications for international protection
82459320
Granted
Rejected
In 2009, a total of 17,565 decisions were made on applications for international
protection. Out of this number, 8,245 applications were granted and 9,320
applications were rejected (see Table 40).
An overview of the general developments in national asylum policy in 2009 is given
below.
This will be followed by a discussion of the decisions granting a refugee status. Next,
the decisions granting a subsidiary protection status will be discussed. Finally,
attention will be paid to the decisions granting a humanitarian status.
38 Parliamentary Papers II 2009/2010, 19 637, no 1346.
Page 35 of 66
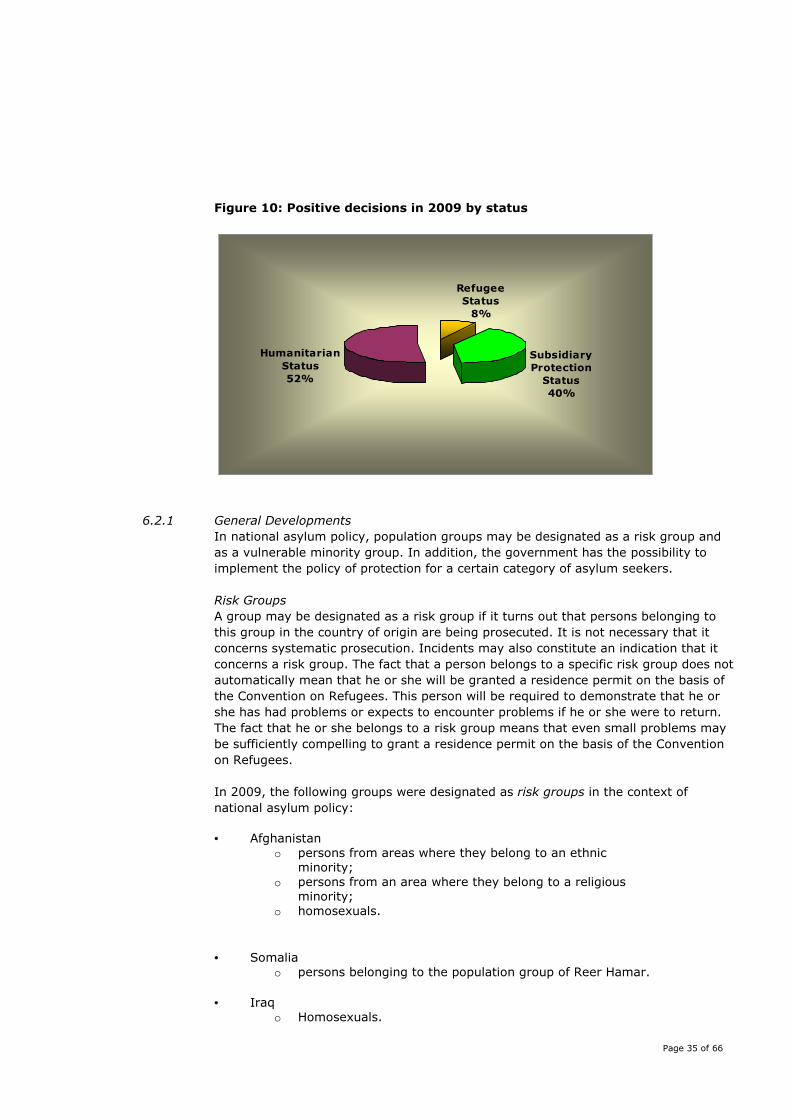
Figure 10: Positive decisions in 2009 by status
Refugee
Status
8%
Subsidiary
Protection
Status
40%
Humanitarian
Status
52%
6.2.1 General Developments
In national asylum policy, population groups may be designated as a risk group and
as a vulnerable minority group. In addition, the government has the possibility to
implement the policy of protection for a certain category of asylum seekers.
Risk Groups
A group may be designated as a risk group if it turns out that persons belonging to
this group in the country of origin are being prosecuted. It is not necessary that it
concerns systematic prosecution. Incidents may also constitute an indication that it
concerns a risk group. The fact that a person belongs to a specific risk group does not
automatically mean that he or she will be granted a residence permit on the basis of
the Convention on Refugees. This person will be required to demonstrate that he or
she has had problems or expects to encounter problems if he or she were to return.
The fact that he or she belongs to a risk group means that even small problems may
be sufficiently compelling to grant a residence permit on the basis of the Convention
on Refugees.
In 2009, the following groups were designated as risk groups in the context of
national asylum policy:
• Afghanistan
o persons from areas where they belong to an ethnic
minority;
o persons from an area where they belong to a religious
minority;
o homosexuals.
• Somalia
o persons belonging to the population group of Reer Hamar.
• Iraq
o Homosexuals.
Page 36 of 66
Vulnerable Minority Groups
If a person does not qualify for a residence permit on the basis of the Convention on
Refugees, he or she may qualify for a residence permit on the basis of subsidiary
protection. This form of protection has been harmonised with the EU. What is
precisely meant by this protection is defined in the Qualification directive.39 This form
of protection corresponds largely with the protection envisaged by Article 3 ECHR.
If a group is systematically exposed to inhuman treatment in a country of origin, this
group may be designated as a vulnerable minority group. For a population group to
be designated as a vulnerable minority group, the following aspects are important:
• To what extent it is a matter of arbitrary violence or arbitrary violation of human rights;
• The position of the population group in the country of origin; and • The degree in which the persons of this group can rely on effective protection against threatening violence or violation of human rights or the degree in which
these persons are in the position to withdraw from this by taking up residence
elsewhere. 40
Unlike persons who belong to a risk group, persons who belong to a vulnerable
minority group are not required to adduce personal facts and circumstances on the
basis of which it may be concluded that they may be subjected to inhuman treatment
upon return. The mere fact of belonging to such a group is sufficient to be granted a
subsidiary protection status.
The following groups were designated as vulnerable minority groups in 2009:
• Afghanistan:
o ethnic minorities
o religious minorities
o single women
• Democratic Republic of the Congo:
o Tutsi
• Iraq:
o Christians
o Mandaeans
o Yezidi
o Palestinians
o Jews
o Shabak and Kaka’i
• Sudan:
o Non-Arab population groups from Darfur
• Somalia:
o Reer Hamar
39 Directive No 2004/83/EC of the Council of 29 April 2004 on the minimum standards for the qualification and status
of third country nationals or stateless persons as refugees or as persons who otherwise need international protection
and the content of the protection granted. 40 Parliamentary Papers II 2009/10, 29,344, no 72 (Letter).
Page 37 of 66
Policy of Protection for Certain Categories of Asylum Seekers
In exceptional circumstances, the government may implement a policy of protection
for certain categories of asylum seekers from a specific country, a specific region, or
a specific population group. Reasons for such a policy of categorical protection may
be that the security and human rights situation in a specific area or for a specific
group is a matter of great concern and return is not justifiable. In order to determine
if such protection must be provided, the government also includes the policies
adopted in this context by other European countries in its considerations.
In 2009, the policy of categorical protection applied to persons originating from Ivory
Coast. Until 19 May 2009, this policy also applied to persons originating from
Somalia, with the exception of the regions of Puntland, Somaliland, Sool, and
Sanaag.41
6.2.2 Refugee Status
For the second subsequent year, there was an increase in the number of applications
granted on the basis of the Convention on Refugees. In 2007, there were 485
positive decisions, in 2008, this number rose to 515, and in 2009, there were 695
positive decisions (see Table 41). This increase of 180 more positive decisions, or
35% more than in 2008, may be ascribed to the higher number of applications
submitted in 2009.
Iraq is again the country with the highest number of Convention refugees; 200
persons were admitted on the basis of the Convention on Refugees (see Table 40).
The group of persons originating from Iraq constitutes 29% of the total number of
refugees admitted in 2009. Somalia ranked second, an increase from 35 in 2008 to
95 in 2009. Just as is the case in Iraq, the security situation in Somalia has also been
a matter of concern for years. Another increase was observed among Iranian persons
who qualified for a residence permit on the basis of the Convention on Refugees. In
2008, 45 persons had qualified, but in 2009, this number doubled to 90. China was
also listed in the top 10 of countries and ranked fourth with 55 applications granted,
5 more than in 2008. Afghanistan ranked fifth with 20 acknowledged refugees, 15
more than in 2008 (see Table 40).
41 For the reasons for ending the policy of protection for Somalia, see the EMN report (2009a): Annual Policy Report
2009, Ontwikkelingen in het Nederlandse migratie- en asielbeleid 1 januari 2009-31 december 2009 (Annual Policy
Report 2009, Developments in Dutch Migration and Asylum Policy 1 January 2009-31 December 2009), p. 23
Page 38 of 66
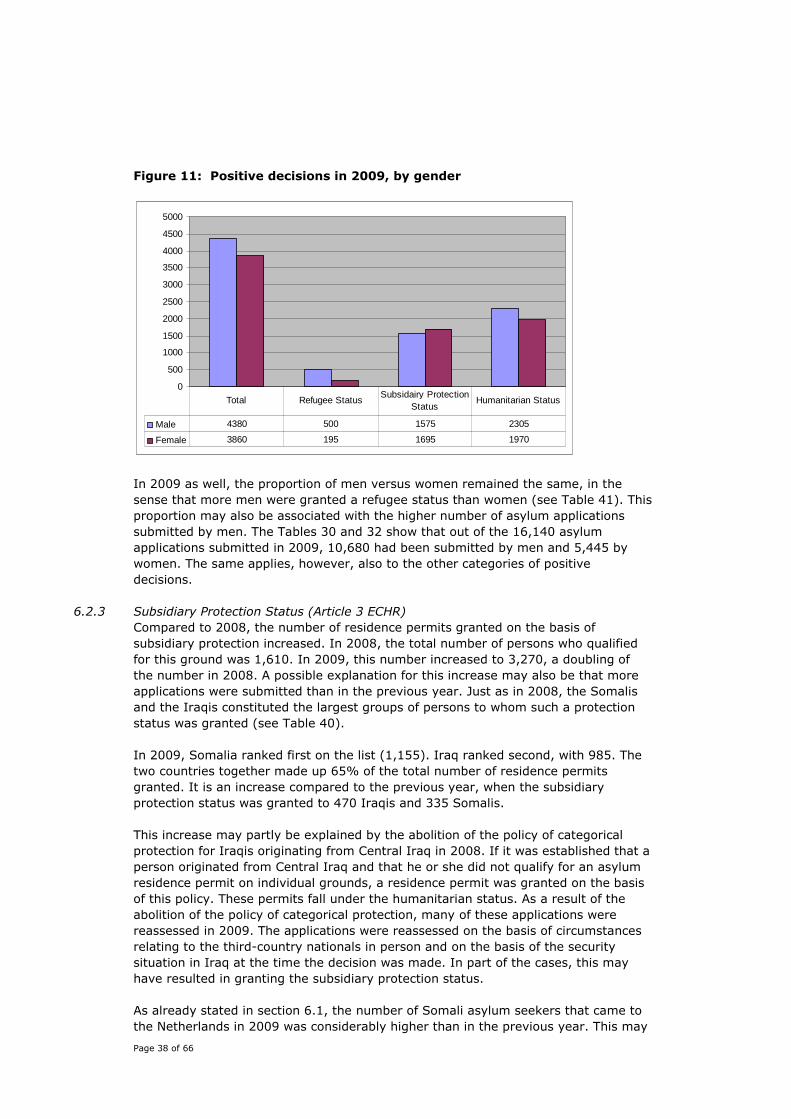
Figure 11: Positive decisions in 2009, by gender
0
500
1000
1500
2000
2500
3000
3500
4000
4500
5000
Male 4380 500 1575 2305
Female 3860 195 1695 1970
Total Refugee StatusSubsidairy Protection
Status Humanitarian Status
In 2009 as well, the proportion of men versus women remained the same, in the
sense that more men were granted a refugee status than women (see Table 41). This
proportion may also be associated with the higher number of asylum applications
submitted by men. The Tables 30 and 32 show that out of the 16,140 asylum
applications submitted in 2009, 10,680 had been submitted by men and 5,445 by
women. The same applies, however, also to the other categories of positive
decisions.
6.2.3 Subsidiary Protection Status (Article 3 ECHR)
Compared to 2008, the number of residence permits granted on the basis of
subsidiary protection increased. In 2008, the total number of persons who qualified
for this ground was 1,610. In 2009, this number increased to 3,270, a doubling of
the number in 2008. A possible explanation for this increase may also be that more
applications were submitted than in the previous year. Just as in 2008, the Somalis
and the Iraqis constituted the largest groups of persons to whom such a protection
status was granted (see Table 40).
In 2009, Somalia ranked first on the list (1,155). Iraq ranked second, with 985. The
two countries together made up 65% of the total number of residence permits
granted. It is an increase compared to the previous year, when the subsidiary
protection status was granted to 470 Iraqis and 335 Somalis.
This increase may partly be explained by the abolition of the policy of categorical
protection for Iraqis originating from Central Iraq in 2008. If it was established that a
person originated from Central Iraq and that he or she did not qualify for an asylum
residence permit on individual grounds, a residence permit was granted on the basis
of this policy. These permits fall under the humanitarian status. As a result of the
abolition of the policy of categorical protection, many of these applications were
reassessed in 2009. The applications were reassessed on the basis of circumstances
relating to the third-country nationals in person and on the basis of the security
situation in Iraq at the time the decision was made. In part of the cases, this may
have resulted in granting the subsidiary protection status.
As already stated in section 6.1, the number of Somali asylum seekers that came to
the Netherlands in 2009 was considerably higher than in the previous year. This may
Page 39 of 66
partially be the explanation for the higher number of residence permits granted on
the basis of subsidiary protection. It also applies to Somali asylum seekers that in
mid 2009, the policy of categorical protection for Somalis was abolished. This means
that applications submitted after the abolition were assessed on individual grounds.
6.2.4 Humanitarian Status
Humanitarian residence permits also cover the residence permits granted on the
basis of categorical protection.
With regard to this type of permit as well, an increase in the number of permits could
be observed compared to 2008. In total, 4,280 persons were granted a humanitarian
status in 2009, compared to 3,550 in 2008. This number relates to the total number
of humanitarian residence permits, consequently including the permits granted on
the basis of categorical protection. Also in 2009, the major part of this group was
formed by Somali asylum seekers (2,595, or 58% of the total number of permits
granted on this ground). In 2008, this number was still 1,115. This doubling of the
number may be explained again by a large number of Somali asylum seekers that
came to the Netherlands in 2008 (see Table 40).
6.3 Dublin Transfers
The Dublin Regulation42 regulates which Member State in the EU is responsible for
the substantive examination of an asylum application. Another purpose of the Dublin
Regulation is that the asylum application of a person is processed by one EU country
only. This is to prevent people from submitting subsequent applications within the
EU. The Member State where the asylum application is submitted must examine
whether another Member State is possibly responsible for processing the application
submitted.
If another EU country is responsible for the asylum application on the basis of the
provisions in the Dublin Regulation, this Member State may submit a request for
transfer to this other country (the ‘Dublin claim’). If this request is honoured, the
responsibility of that other country to examine the substance of an asylum
application is hereby confirmed. This means that the person concerned will be
transferred to the responsible Member State.
The Dublin Regulation distinguishes between taking charge of and taking back the
asylum seeker concerned. It is a matter of ‘taking charge’ if the asylum application
has submitted an asylum application in a Member State for the first time, but this
Member State is of the opinion that another Member State is responsible for
processing this application. In that case, a request to take charge of the applicant is
submitted. It is a matter of ‘taking back’ if an asylum seeker has withdrawn the
application during the processing procedure and subsequently submits an asylum
application again in another Member State. In that case, the second Member State
will submit a request for the applicant to be taken back. The request to take back the
applicant may also be submitted if the asylum seeker whose asylum application has
been rejected subsequently leaves for another Member State and submits an asylum
application again there. The second Member State may subsequently request the first
Member State to take back the applicant.
42 The official name of this Regulation is: Council Regulation (EC) No 343/2003 of 18 February 2003 establishing the
criteria and mechanisms for determining the Member State responsible for examining an asylum application lodged in
one of the Member States by a third-country national.
Page 40 of 66
In general, it may be concluded that the Netherlands submits more requests to other
Member States than it receives. In 2009, the Netherlands submitted 3,730 requests
to other Member States and it received 942 requests. What is furthermore
noteworthy is the fact that the percentage of outgoing requests that were granted is
fairly high. In 2009, a total of 3,402 requests were granted. The total number of
incoming requests that were granted was 501 in 2009.
The following caveat applies to these figures. With regard to both the incoming and
outgoing requests that were granted, the requests were not necessarily always
submitted in 2009. It is, for instance, possible that a request that had been
submitted at the end of 2008 was not granted until 2009. Most requests to take
charge of an applicant were submitted by Sweden (49), Germany (36), Belgium (30),
Norway (28), and France (15). Most requests to take an applicant back were
submitted by Germany (143), Belgium (131), France (125), Norway (79), and the
United Kingdom (65). Most requests to take charge of an applicant submitted by the
Netherlands were directed to Greece (799) and Italy (296). Most requests to take an
applicant back submitted by the Netherlands were directed to Italy (752), France
(239), Belgium (269), and Greece (130), (see Tables 26 up to and including 29).
6.4 Unaccompanied Minors
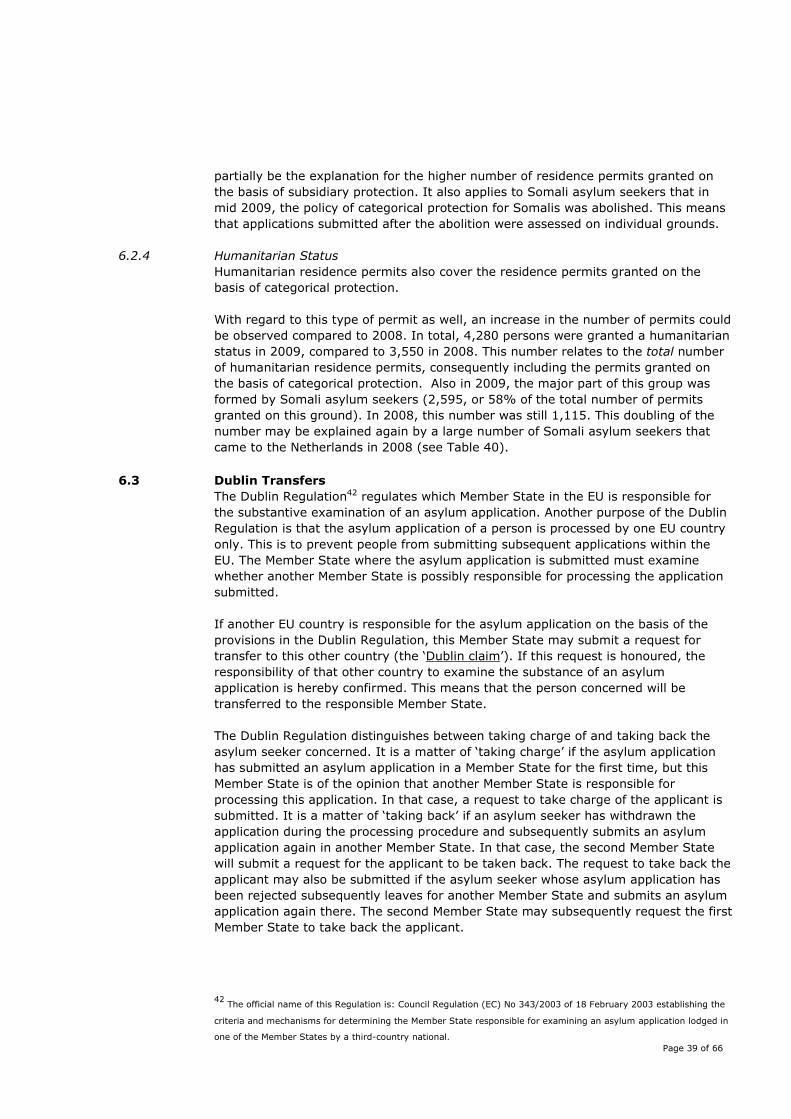
Also the number of unaccompanied minors increased compared to the previous year.
In 2008, 725 applications were submitted by unaccompanied minors. In 2009, this
number increased slightly to 1,040. The proportion of boys versus girls remained the
same, though. Also in 2009, the largest group was formed by the boys (83%). With
355 applications, Somalia was again the most important country of origin in 2009. In
2008, there were fewer applications, namely 200. Another noteworthy trend is the
increase in the number of Afghan unaccompanied minors that came to the
Netherlands. In 2008, 95 applications were submitted by unaccompanied minors. In
2009, this number increased to 320, an increase of 225 applications. This increase is
difficult to explain. An obvious explanation is the poor security situation and the
position of young men in Afghanistan. Child trafficking occurs on a large scale in
Afghanistan.43 Another noteworthy development is the decrease in the number of
applications submitted by Iraqi unaccompanied minors. In 2009, 65 applications were
submitted, 120 applications less than in the previous year. This may also have been
caused by the abolition of the policy of categorical protection for Central Iraq (see
Tables 34 and 35).
43 Ministry of Foreign Affairs, Country Report on Afghanistan, July 2010, pp. 87-88
Page 41 of 66
Figure 12: Asylum applications from unaccompanied minors
Somalia Afghanistan Iraq Guinea Eritrea Others
355 320
65 45 40
215
Totaal 1040

Page 42 of 66
Page 43 of 66
Annex - Tables
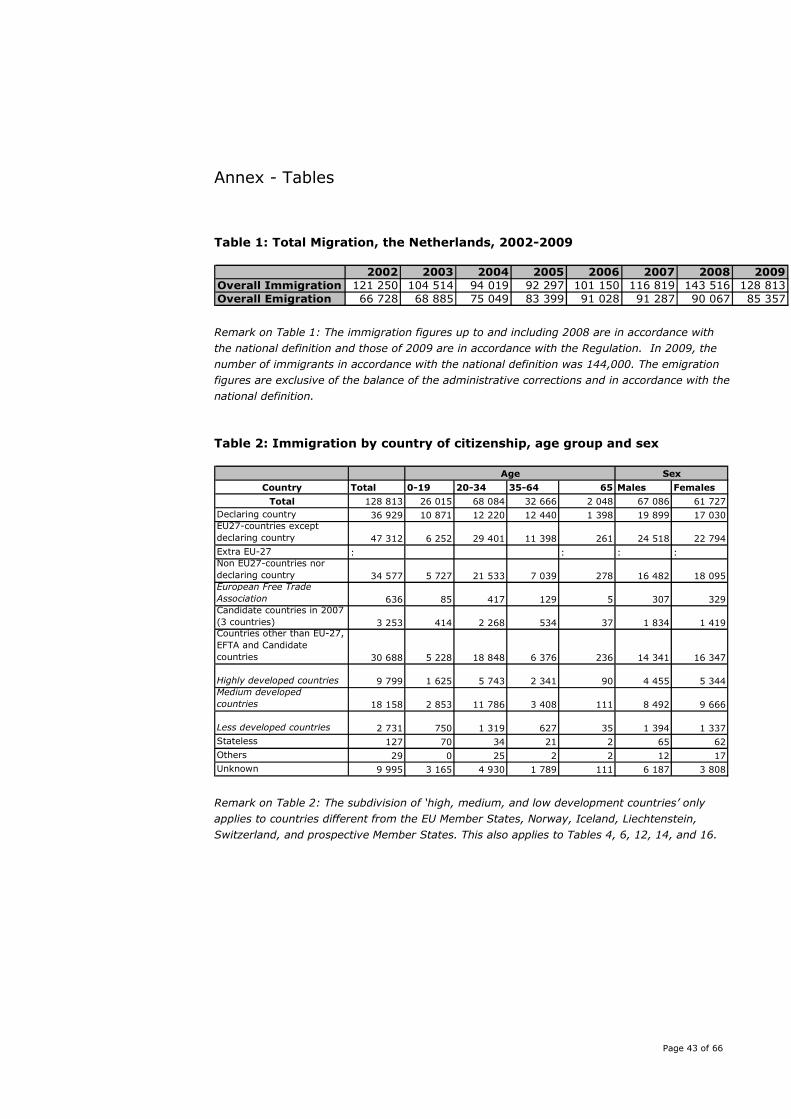
Table 1: Total Migration, the Netherlands, 2002-2009
2002 2003 2004 2005 2006 2007 2008 2009
Overall Immigration 121 250 104 514 94 019 92 297 101 150 116 819 143 516 128 813
Overall Emigration 66 728 68 885 75 049 83 399 91 028 91 287 90 067 85 357
Remark on Table 1: The immigration figures up to and including 2008 are in accordance with
the national definition and those of 2009 are in accordance with the Regulation. In 2009, the
number of immigrants in accordance with the national definition was 144,000. The emigration
figures are exclusive of the balance of the administrative corrections and in accordance with the
national definition.
Table 2: Immigration by country of citizenship, age group and sex
Country Total 0-19 20-34 35-64 65 Males Females
Total 128 813 26 015 68 084 32 666 2 048 67 086 61 727
Declaring country 36 929 10 871 12 220 12 440 1 398 19 899 17 030EU27-countries except
declaring country 47 312 6 252 29 401 11 398 261 24 518 22 794
Extra EU-27 : : : :Non EU27-countries nor
declaring country 34 577 5 727 21 533 7 039 278 16 482 18 095European Free Trade
Association 636 85 417 129 5 307 329Candidate countries in 2007
(3 countries) 3 253 414 2 268 534 37 1 834 1 419Countries other than EU-27,
EFTA and Candidate
countries 30 688 5 228 18 848 6 376 236 14 341 16 347
Highly developed countries 9 799 1 625 5 743 2 341 90 4 455 5 344Medium developed
countries 18 158 2 853 11 786 3 408 111 8 492 9 666
Less developed countries 2 731 750 1 319 627 35 1 394 1 337
Stateless 127 70 34 21 2 65 62
Others 29 0 25 2 2 12 17
Unknown 9 995 3 165 4 930 1 789 111 6 187 3 808
Age Sex
Remark on Table 2: The subdivision of ‘high, medium, and low development countries’ only
applies to countries different from the EU Member States, Norway, Iceland, Liechtenstein,
Switzerland, and prospective Member States. This also applies to Tables 4, 6, 12, 14, and 16.
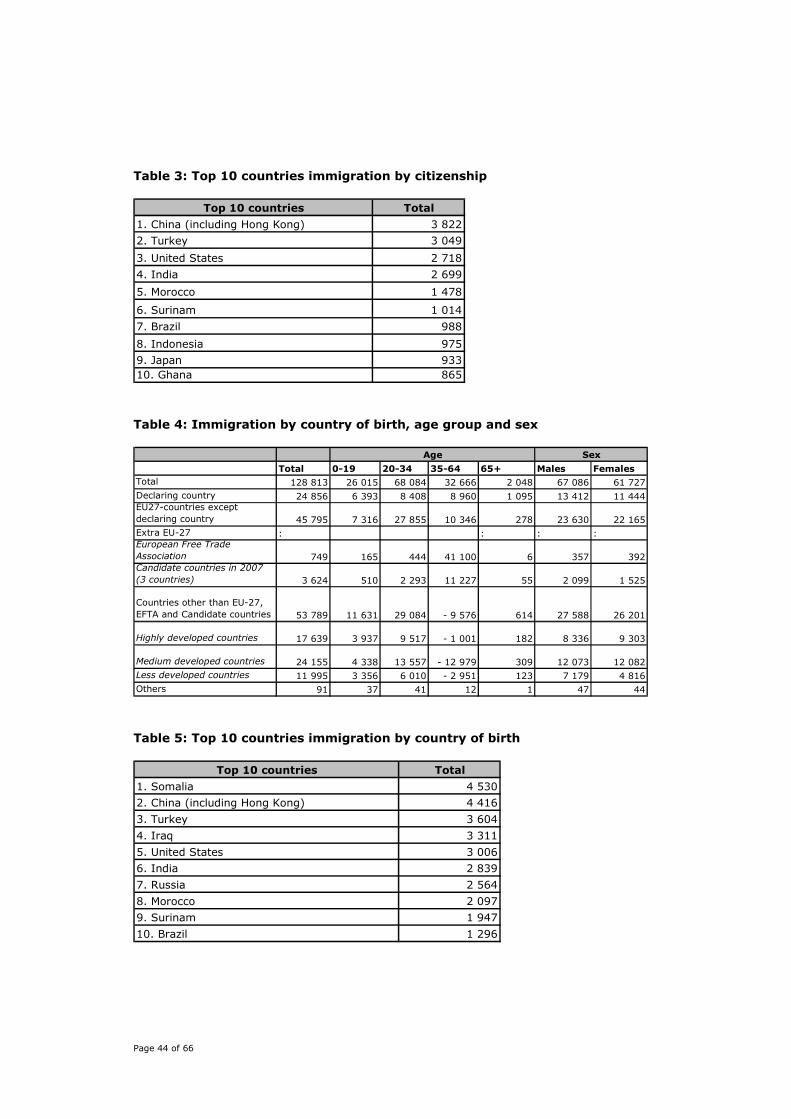
Page 44 of 66
Table 3: Top 10 countries immigration by citizenship
Top 10 countries Total
1. China (including Hong Kong) 3 822
2. Turkey 3 049
3. United States 2 718
4. India 2 699
5. Morocco 1 478
6. Surinam 1 014
7. Brazil 988
8. Indonesia 975
9. Japan 933
10. Ghana 865
Table 4: Immigration by country of birth, age group and sex
Total 0-19 20-34 35-64 65+ Males Females
Total 128 813 26 015 68 084 32 666 2 048 67 086 61 727
Declaring country 24 856 6 393 8 408 8 960 1 095 13 412 11 444EU27-countries except
declaring country 45 795 7 316 27 855 10 346 278 23 630 22 165
Extra EU-27 : : : :European Free Trade
Association 749 165 444 41 100 6 357 392Candidate countries in 2007
(3 countries) 3 624 510 2 293 11 227 55 2 099 1 525
Countries other than EU-27,
EFTA and Candidate countries 53 789 11 631 29 084 - 9 576 614 27 588 26 201
Highly developed countries 17 639 3 937 9 517 - 1 001 182 8 336 9 303
Medium developed countries 24 155 4 338 13 557 - 12 979 309 12 073 12 082
Less developed countries 11 995 3 356 6 010 - 2 951 123 7 179 4 816
Others 91 37 41 12 1 47 44
Age Sex
Table 5: Top 10 countries immigration by country of birth
Top 10 countries Total
1. Somalia 4 530
2. China (including Hong Kong) 4 416
3. Turkey 3 604
4. Iraq 3 311
5. United States 3 006
6. India 2 839
7. Russia 2 564
8. Morocco 2 097
9. Surinam 1 947
10. Brazil 1 296
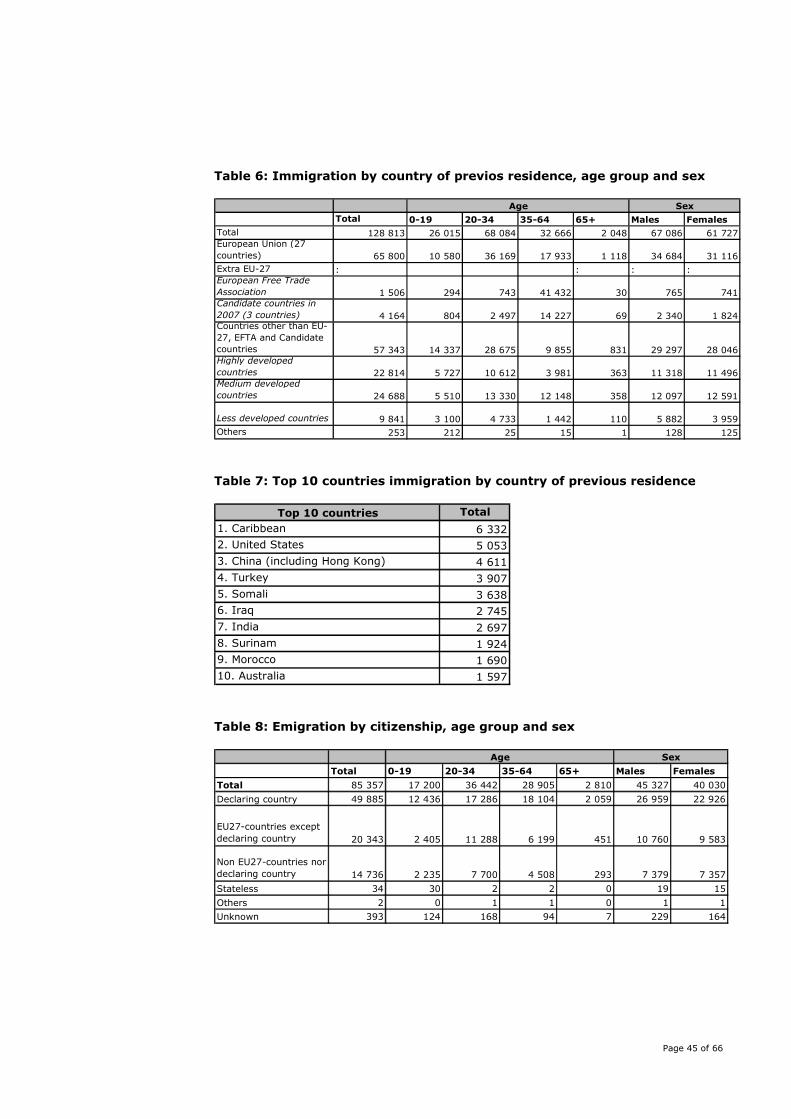
Page 45 of 66
Table 6: Immigration by country of previos residence, age group and sex
Total 0-19 20-34 35-64 65+ Males Females
Total 128 813 26 015 68 084 32 666 2 048 67 086 61 727European Union (27
countries) 65 800 10 580 36 169 17 933 1 118 34 684 31 116
Extra EU-27 : : : :European Free Trade
Association 1 506 294 743 41 432 30 765 741Candidate countries in
2007 (3 countries) 4 164 804 2 497 14 227 69 2 340 1 824Countries other than EU-
27, EFTA and Candidate
countries 57 343 14 337 28 675 9 855 831 29 297 28 046Highly developed
countries 22 814 5 727 10 612 3 981 363 11 318 11 496Medium developed
countries 24 688 5 510 13 330 12 148 358 12 097 12 591
Less developed countries 9 841 3 100 4 733 1 442 110 5 882 3 959
Others 253 212 25 15 1 128 125
Age Sex
Table 7: Top 10 countries immigration by country of previous residence
Top 10 countries Total
1. Caribbean 6 332
2. United States 5 053
3. China (including Hong Kong) 4 611
4. Turkey 3 907
5. Somali 3 638
6. Iraq 2 745
7. India 2 697
8. Surinam 1 924
9. Morocco 1 690
10. Australia 1 597
Table 8: Emigration by citizenship, age group and sex
Total 0-19 20-34 35-64 65+ Males Females
Total 85 357 17 200 36 442 28 905 2 810 45 327 40 030
Declaring country 49 885 12 436 17 286 18 104 2 059 26 959 22 926
EU27-countries except
declaring country 20 343 2 405 11 288 6 199 451 10 760 9 583
Non EU27-countries nor
declaring country 14 736 2 235 7 700 4 508 293 7 379 7 357
Stateless 34 30 2 2 0 19 15
Others 2 0 1 1 0 1 1
Unknown 393 124 168 94 7 229 164
Age Sex
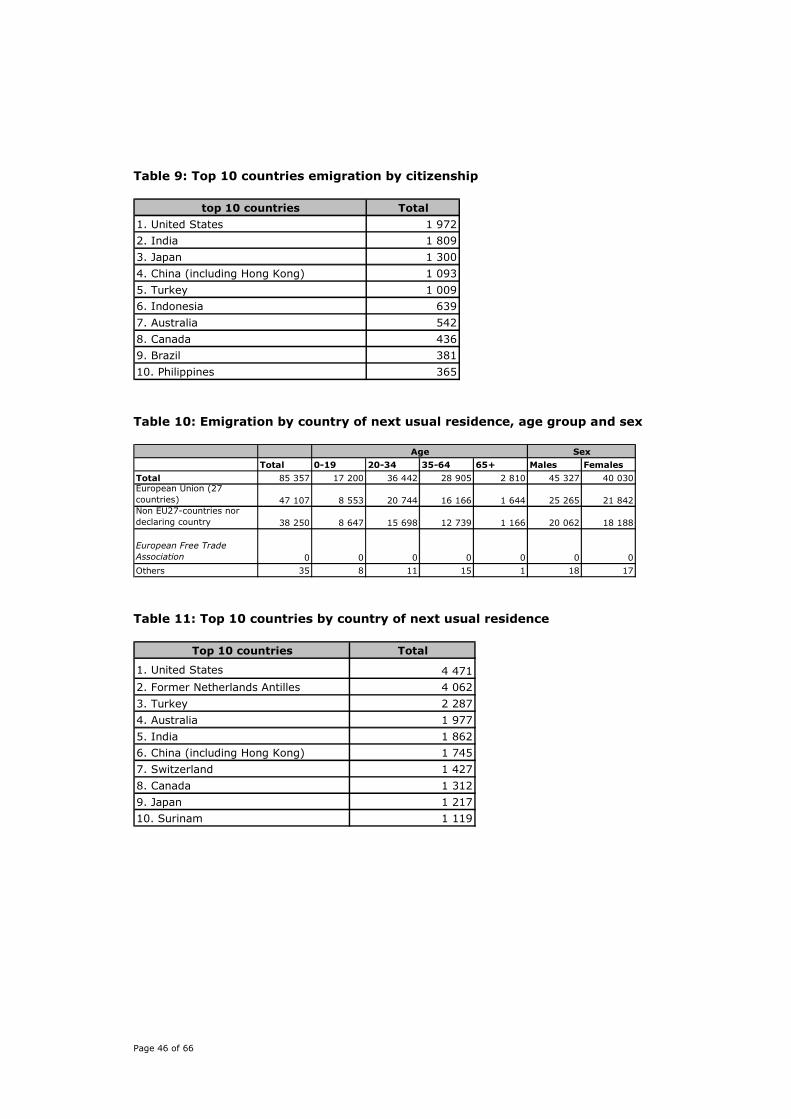
Page 46 of 66
Table 9: Top 10 countries emigration by citizenship
top 10 countries Total
1. United States 1 972
2. India 1 809
3. Japan 1 300
4. China (including Hong Kong) 1 093
5. Turkey 1 009
6. Indonesia 639
7. Australia 542
8. Canada 436
9. Brazil 381
10. Philippines 365
Table 10: Emigration by country of next usual residence, age group and sex
Total 0-19 20-34 35-64 65+ Males Females
Total 85 357 17 200 36 442 28 905 2 810 45 327 40 030European Union (27
countries) 47 107 8 553 20 744 16 166 1 644 25 265 21 842Non EU27-countries nor
declaring country 38 250 8 647 15 698 12 739 1 166 20 062 18 188
European Free Trade
Association 0 0 0 0 0 0 0
Others 35 8 11 15 1 18 17
Age Sex
Table 11: Top 10 countries by country of next usual residence
Top 10 countries Total
1. United States 4 471
2. Former Netherlands Antilles 4 062
3. Turkey 2 287
4. Australia 1 977
5. India 1 862
6. China (including Hong Kong) 1 745
7. Switzerland 1 427
8. Canada 1 312
9. Japan 1 217
10. Surinam 1 119
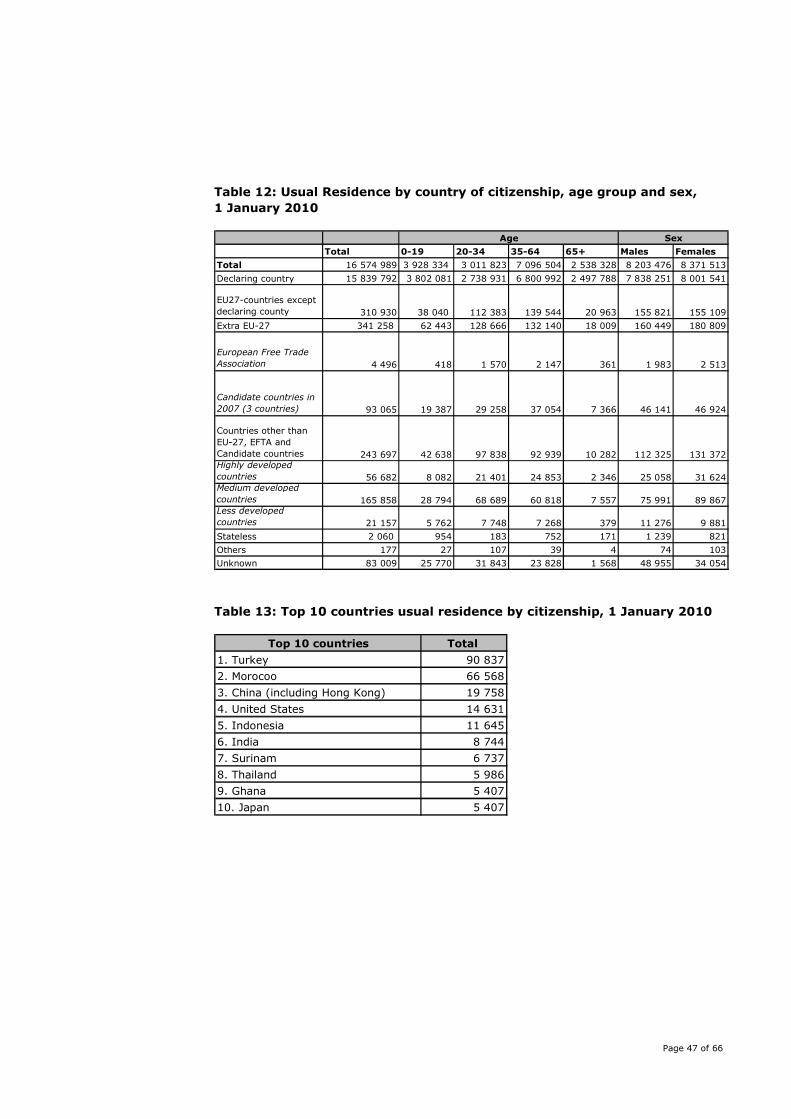
Page 47 of 66
Table 12: Usual Residence by country of citizenship, age group and sex,
1 January 2010
Total 0-19 20-34 35-64 65+ Males Females
Total 16 574 989 3 928 334 3 011 823 7 096 504 2 538 328 8 203 476 8 371 513
Declaring country 15 839 792 3 802 081 2 738 931 6 800 992 2 497 788 7 838 251 8 001 541
EU27-countries except
declaring county 310 930 38 040 112 383 139 544 20 963 155 821 155 109
Extra EU-27 341 258 62 443 128 666 132 140 18 009 160 449 180 809
European Free Trade
Association 4 496 418 1 570 2 147 361 1 983 2 513
Candidate countries in
2007 (3 countries) 93 065 19 387 29 258 37 054 7 366 46 141 46 924
Countries other than
EU-27, EFTA and
Candidate countries 243 697 42 638 97 838 92 939 10 282 112 325 131 372Highly developed
countries 56 682 8 082 21 401 24 853 2 346 25 058 31 624Medium developed
countries 165 858 28 794 68 689 60 818 7 557 75 991 89 867Less developed
countries 21 157 5 762 7 748 7 268 379 11 276 9 881
Stateless 2 060 954 183 752 171 1 239 821
Others 177 27 107 39 4 74 103
Unknown 83 009 25 770 31 843 23 828 1 568 48 955 34 054
Age Sex
Table 13: Top 10 countries usual residence by citizenship, 1 January 2010
Top 10 countries Total
1. Turkey 90 837
2. Morocoo 66 568
3. China (including Hong Kong) 19 758
4. United States 14 631
5. Indonesia 11 645
6. India 8 744
7. Surinam 6 737
8. Thailand 5 986
9. Ghana 5 407
10. Japan 5 407
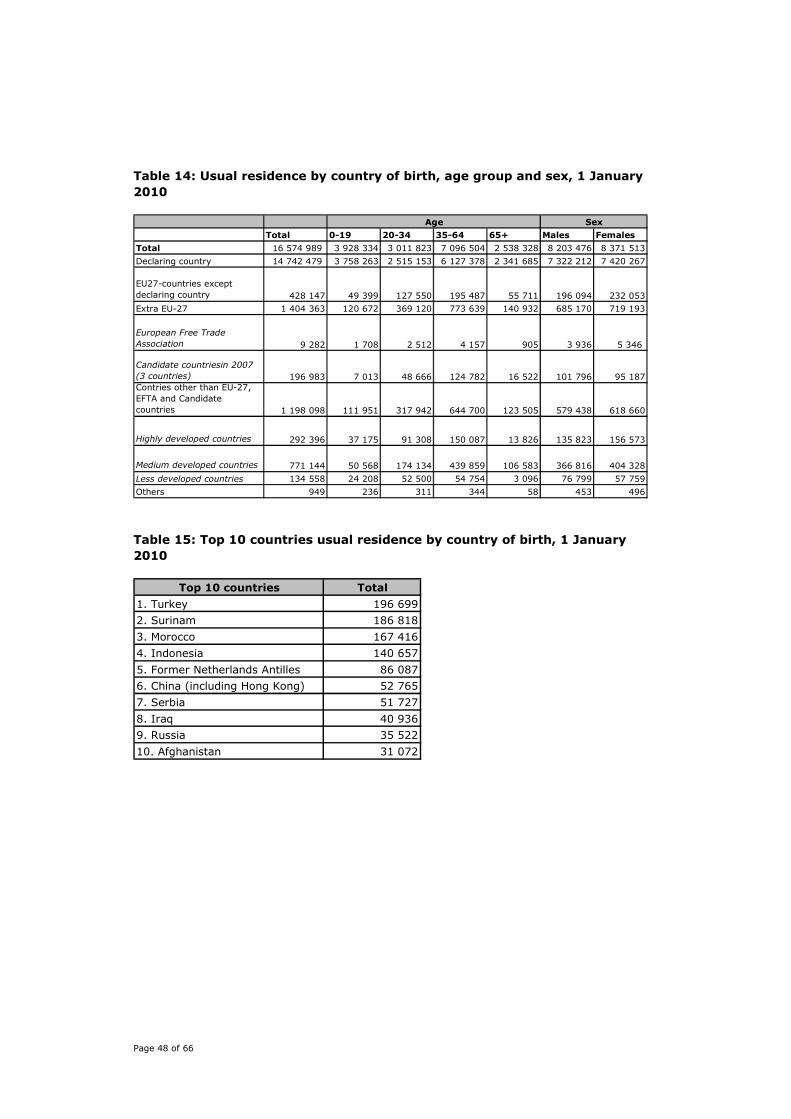
Page 48 of 66
Table 14: Usual residence by country of birth, age group and sex, 1 January
2010
Total 0-19 20-34 35-64 65+ Males Females
Total 16 574 989 3 928 334 3 011 823 7 096 504 2 538 328 8 203 476 8 371 513
Declaring country 14 742 479 3 758 263 2 515 153 6 127 378 2 341 685 7 322 212 7 420 267
EU27-countries except
declaring country 428 147 49 399 127 550 195 487 55 711 196 094 232 053
Extra EU-27 1 404 363 120 672 369 120 773 639 140 932 685 170 719 193
European Free Trade
Association 9 282 1 708 2 512 4 157 905 3 936 5 346
Candidate countriesin 2007
(3 countries) 196 983 7 013 48 666 124 782 16 522 101 796 95 187
Contries other than EU-27,
EFTA and Candidate
countries 1 198 098 111 951 317 942 644 700 123 505 579 438 618 660
Highly developed countries 292 396 37 175 91 308 150 087 13 826 135 823 156 573
Medium developed countries 771 144 50 568 174 134 439 859 106 583 366 816 404 328
Less developed countries 134 558 24 208 52 500 54 754 3 096 76 799 57 759
Others 949 236 311 344 58 453 496
Age Sex
Table 15: Top 10 countries usual residence by country of birth, 1 January
2010
Top 10 countries Total
1. Turkey 196 699
2. Surinam 186 818
3. Morocco 167 416
4. Indonesia 140 657
5. Former Netherlands Antilles 86 087
6. China (including Hong Kong) 52 765
7. Serbia 51 727
8. Iraq 40 936
9. Russia 35 522
10. Afghanistan 31 072
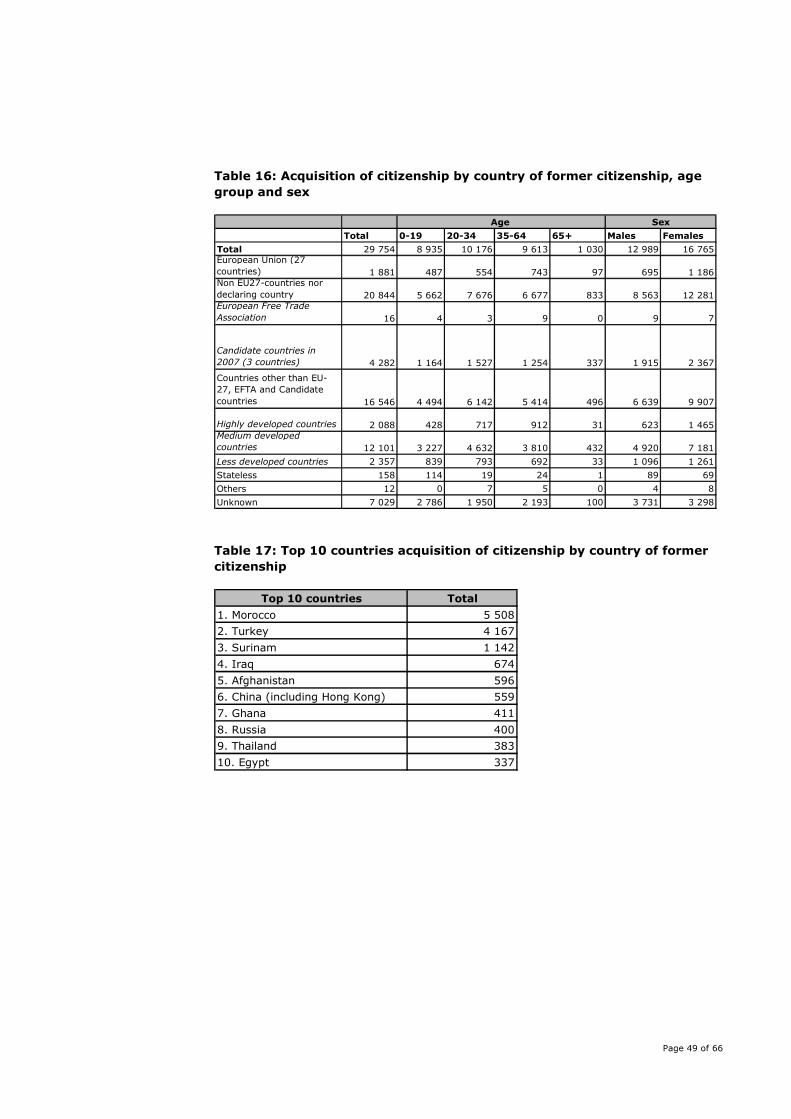
Page 49 of 66
Table 16: Acquisition of citizenship by country of former citizenship, age
group and sex
Total 0-19 20-34 35-64 65+ Males Females
Total 29 754 8 935 10 176 9 613 1 030 12 989 16 765European Union (27
countries) 1 881 487 554 743 97 695 1 186Non EU27-countries nor
declaring country 20 844 5 662 7 676 6 677 833 8 563 12 281European Free Trade
Association 16 4 3 9 0 9 7
Candidate countries in
2007 (3 countries) 4 282 1 164 1 527 1 254 337 1 915 2 367
Countries other than EU-
27, EFTA and Candidate
countries 16 546 4 494 6 142 5 414 496 6 639 9 907
Highly developed countries 2 088 428 717 912 31 623 1 465Medium developed
countries 12 101 3 227 4 632 3 810 432 4 920 7 181
Less developed countries 2 357 839 793 692 33 1 096 1 261
Stateless 158 114 19 24 1 89 69
Others 12 0 7 5 0 4 8
Unknown 7 029 2 786 1 950 2 193 100 3 731 3 298
Age Sex
Table 17: Top 10 countries acquisition of citizenship by country of former
citizenship
Top 10 countries Total
1. Morocco 5 508
2. Turkey 4 167
3. Surinam 1 142
4. Iraq 674
5. Afghanistan 596
6. China (including Hong Kong) 559
7. Ghana 411
8. Russia 400
9. Thailand 383
10. Egypt 337
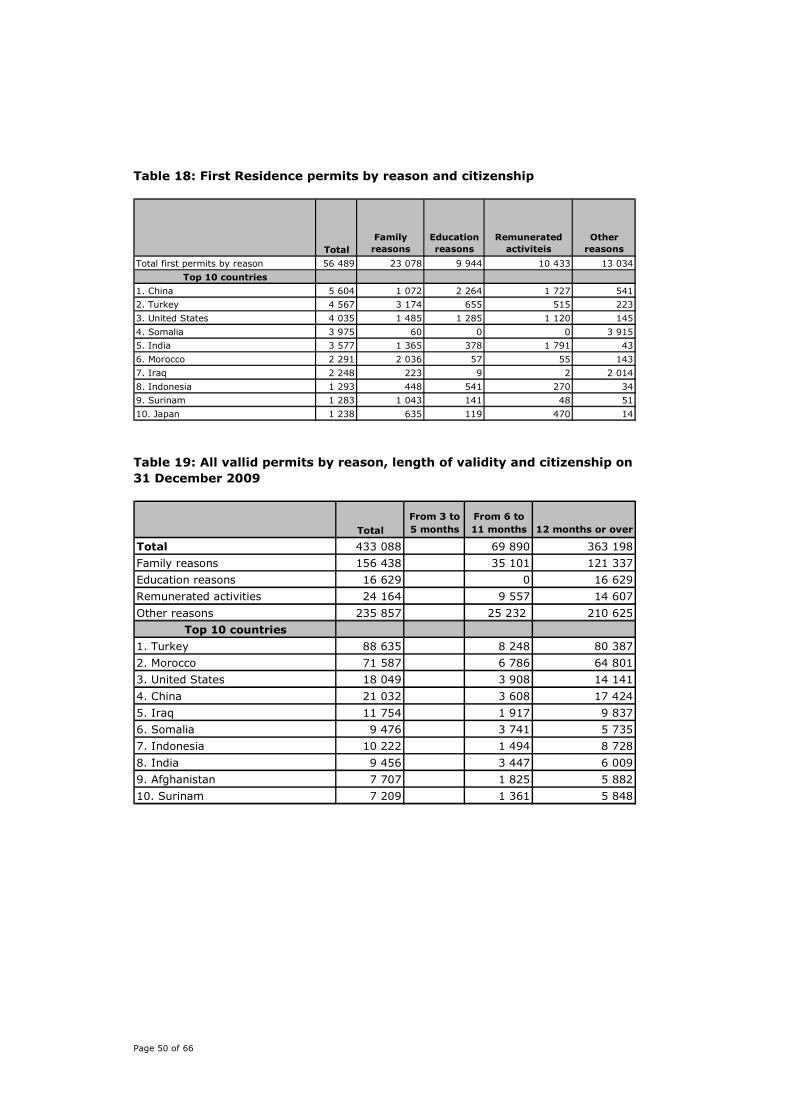
Page 50 of 66
Table 18: First Residence permits by reason and citizenship
Total
Family
reasons
Education
reasons
Remunerated
activiteis
Other
reasons
Total first permits by reason 56 489 23 078 9 944 10 433 13 034
Top 10 countries
1. China 5 604 1 072 2 264 1 727 541
2. Turkey 4 567 3 174 655 515 223
3. United States 4 035 1 485 1 285 1 120 145
4. Somalia 3 975 60 0 0 3 915
5. India 3 577 1 365 378 1 791 43
6. Morocco 2 291 2 036 57 55 143
7. Iraq 2 248 223 9 2 2 014
8. Indonesia 1 293 448 541 270 34
9. Surinam 1 283 1 043 141 48 51
10. Japan 1 238 635 119 470 14
Table 19: All vallid permits by reason, length of validity and citizenship on
31 December 2009
Total
From 3 to
5 months
From 6 to
11 months 12 months or over
Total 433 088 69 890 363 198
Family reasons 156 438 35 101 121 337
Education reasons 16 629 0 16 629
Remunerated activities 24 164 9 557 14 607
Other reasons 235 857 25 232 210 625
Top 10 countries
1. Turkey 88 635 8 248 80 387
2. Morocco 71 587 6 786 64 801
3. United States 18 049 3 908 14 141
4. China 21 032 3 608 17 424
5. Iraq 11 754 1 917 9 837
6. Somalia 9 476 3 741 5 735
7. Indonesia 10 222 1 494 8 728
8. India 9 456 3 447 6 009
9. Afghanistan 7 707 1 825 5 882
10. Surinam 7 209 1 361 5 848
Page 51 of 66
Table 20: Long-term residents by citizenship on 31.December 2009
Total 19 351
Stateless 3
Unknown 255
Top 10 countries
1. Turkey 8 069
2. Morocco 2 459
3. Indonesia 1 073
4. China 901
5. Thailand 800
6. United States 684
7. Russia 348
8. India 320
9. Ghana 309
10. Japan 275
Table 21: Third country nationals found to be illegaly present, by age group
and sex
Total 0-13 14-17 18-34 35+ Males Females
Total 7 565 25 325 4 875 2 340 6 590 975
Stateless 55 0 0 25 30 45 5
Unknown 410 5 20 250 135 365 50
SexAge
Table 22: Top 10 countries of citizenship of third country nationals found to
be illegaly present
Top 10 countries Total
1. Somalia 850
2. Iraq 535
3. Morocco 520
4. Turkey 360
5. Afghanistan 350
6. Nigeria 2757. China (including
Hong Kong) 255
8. Algeria 250
9. India 225
10. Surinam 210
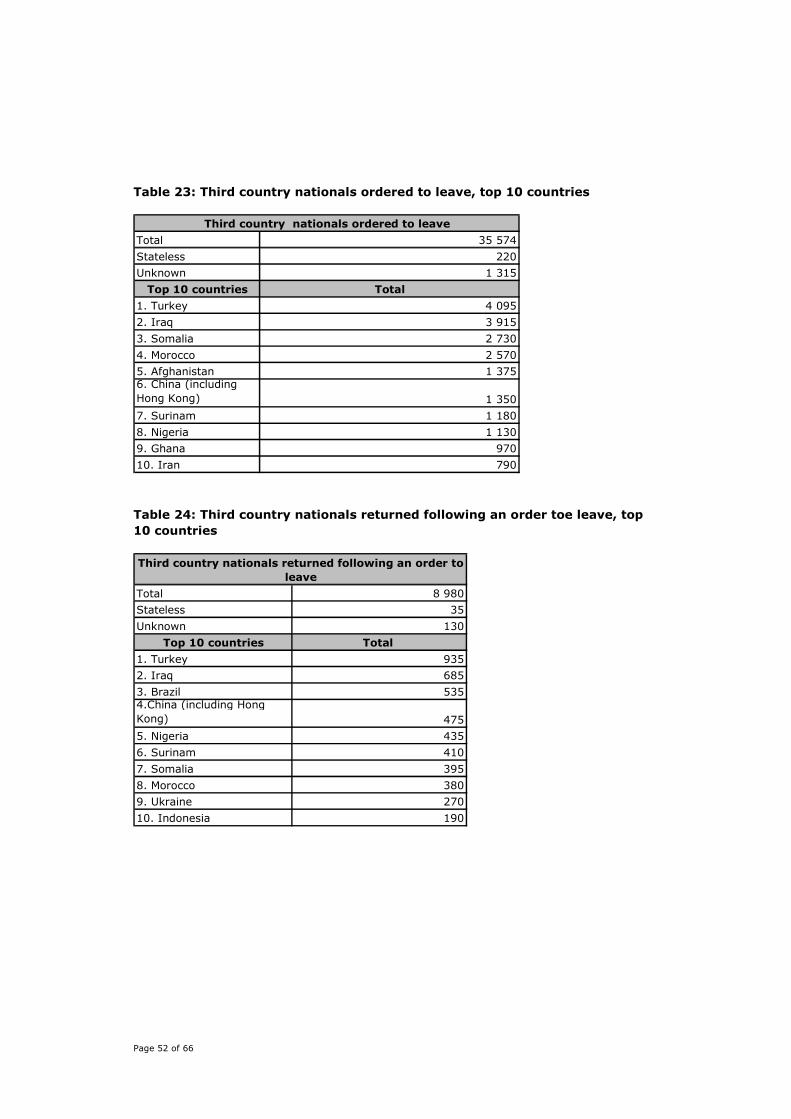
Page 52 of 66
Table 23: Third country nationals ordered to leave, top 10 countries
Total 35 574
Stateless 220
Unknown 1 315
Top 10 countries Total
1. Turkey 4 095
2. Iraq 3 915
3. Somalia 2 730
4. Morocco 2 570
5. Afghanistan 1 3756. China (including
Hong Kong) 1 350
7. Surinam 1 180
8. Nigeria 1 130
9. Ghana 970
10. Iran 790
Third country nationals ordered to leave
Table 24: Third country nationals returned following an order toe leave, top
10 countries
Total 8 980
Stateless 35
Unknown 130
Top 10 countries Total
1. Turkey 935
2. Iraq 685
3. Brazil 5354.China (including Hong
Kong) 475
5. Nigeria 435
6. Surinam 410
7. Somalia 395
8. Morocco 380
9. Ukraine 270
10. Indonesia 190
Third country nationals returned following an order to
leave
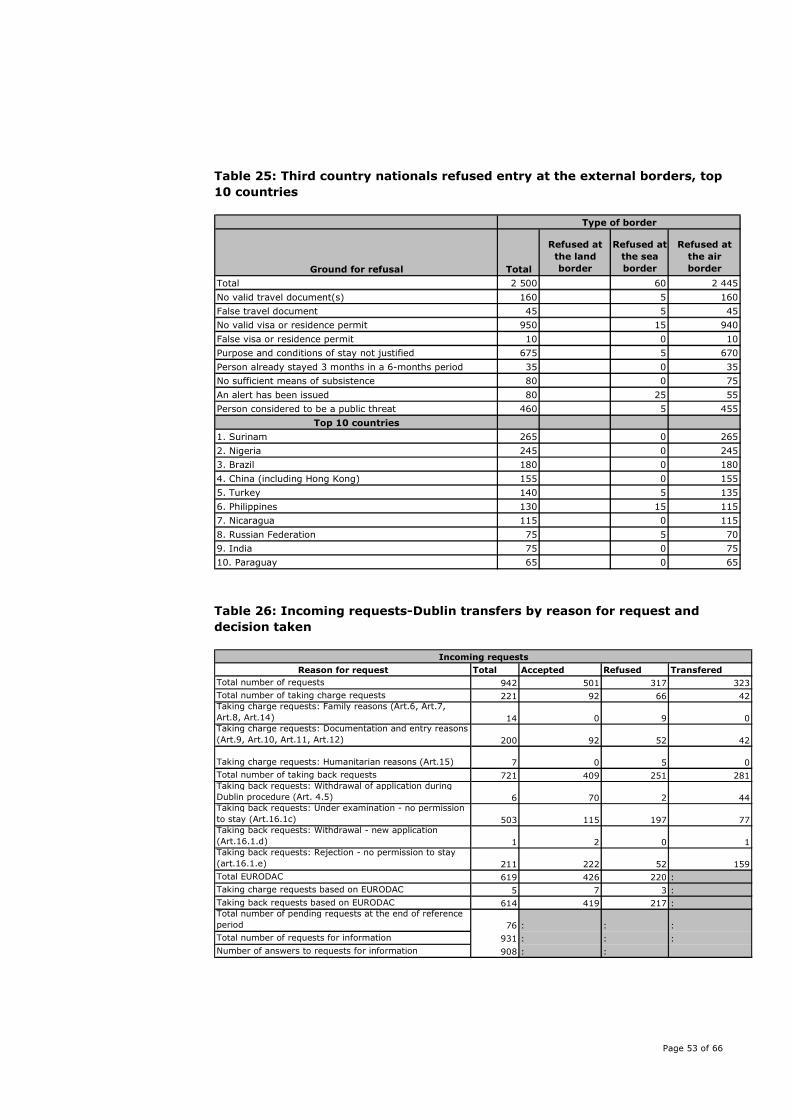
Page 53 of 66
Table 25: Third country nationals refused entry at the external borders, top
10 countries
Ground for refusal Total
Refused at
the land
border
Refused at
the sea
border
Refused at
the air
border
Total 2 500 60 2 445
No valid travel document(s) 160 5 160
False travel document 45 5 45
No valid visa or residence permit 950 15 940
False visa or residence permit 10 0 10
Purpose and conditions of stay not justified 675 5 670
Person already stayed 3 months in a 6-months period 35 0 35
No sufficient means of subsistence 80 0 75
An alert has been issued 80 25 55
Person considered to be a public threat 460 5 455
Top 10 countries
1. Surinam 265 0 265
2. Nigeria 245 0 245
3. Brazil 180 0 180
4. China (including Hong Kong) 155 0 155
5. Turkey 140 5 135
6. Philippines 130 15 115
7. Nicaragua 115 0 115
8. Russian Federation 75 5 70
9. India 75 0 75
10. Paraguay 65 0 65
Type of border
Table 26: Incoming requests-Dublin transfers by reason for request and
decision taken
Reason for request Total Accepted Refused Transfered
Total number of requests 942 501 317 323
Total number of taking charge requests 221 92 66 42Taking charge requests: Family reasons (Art.6, Art.7,
Art.8, Art.14) 14 0 9 0Taking charge requests: Documentation and entry reasons
(Art.9, Art.10, Art.11, Art.12) 200 92 52 42
Taking charge requests: Humanitarian reasons (Art.15) 7 0 5 0
Total number of taking back requests 721 409 251 281Taking back requests: Withdrawal of application during
Dublin procedure (Art. 4.5) 6 70 2 44Taking back requests: Under examination - no permission
to stay (Art.16.1c) 503 115 197 77Taking back requests: Withdrawal - new application
(Art.16.1.d) 1 2 0 1Taking back requests: Rejection - no permission to stay
(art.16.1.e) 211 222 52 159
Total EURODAC 619 426 220 :
Taking charge requests based on EURODAC 5 7 3 :
Taking back requests based on EURODAC 614 419 217 :Total number of pending requests at the end of reference
period 76 : : :
Total number of requests for information 931 : : :
Number of answers to requests for information 908 : :
Incoming requests
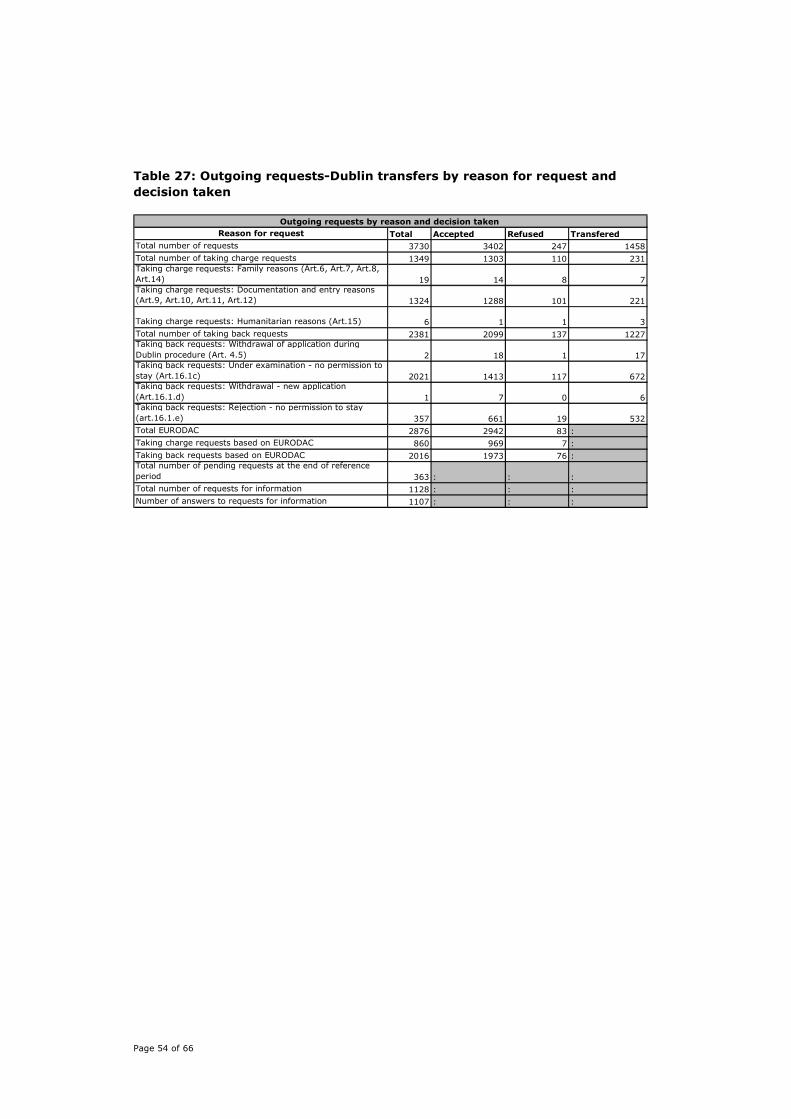
Page 54 of 66
Table 27: Outgoing requests-Dublin transfers by reason for request and
decision taken
Reason for request Total Accepted Refused Transfered
Total number of requests 3730 3402 247 1458
Total number of taking charge requests 1349 1303 110 231Taking charge requests: Family reasons (Art.6, Art.7, Art.8,
Art.14) 19 14 8 7Taking charge requests: Documentation and entry reasons
(Art.9, Art.10, Art.11, Art.12) 1324 1288 101 221
Taking charge requests: Humanitarian reasons (Art.15) 6 1 1 3
Total number of taking back requests 2381 2099 137 1227Taking back requests: Withdrawal of application during
Dublin procedure (Art. 4.5) 2 18 1 17Taking back requests: Under examination - no permission to
stay (Art.16.1c) 2021 1413 117 672Taking back requests: Withdrawal - new application
(Art.16.1.d) 1 7 0 6Taking back requests: Rejection - no permission to stay
(art.16.1.e) 357 661 19 532
Total EURODAC 2876 2942 83 :
Taking charge requests based on EURODAC 860 969 7 :
Taking back requests based on EURODAC 2016 1973 76 :Total number of pending requests at the end of reference
period 363 : : :
Total number of requests for information 1128 : : :
Number of answers to requests for information 1107 : : :
Outgoing requests by reason and decision taken
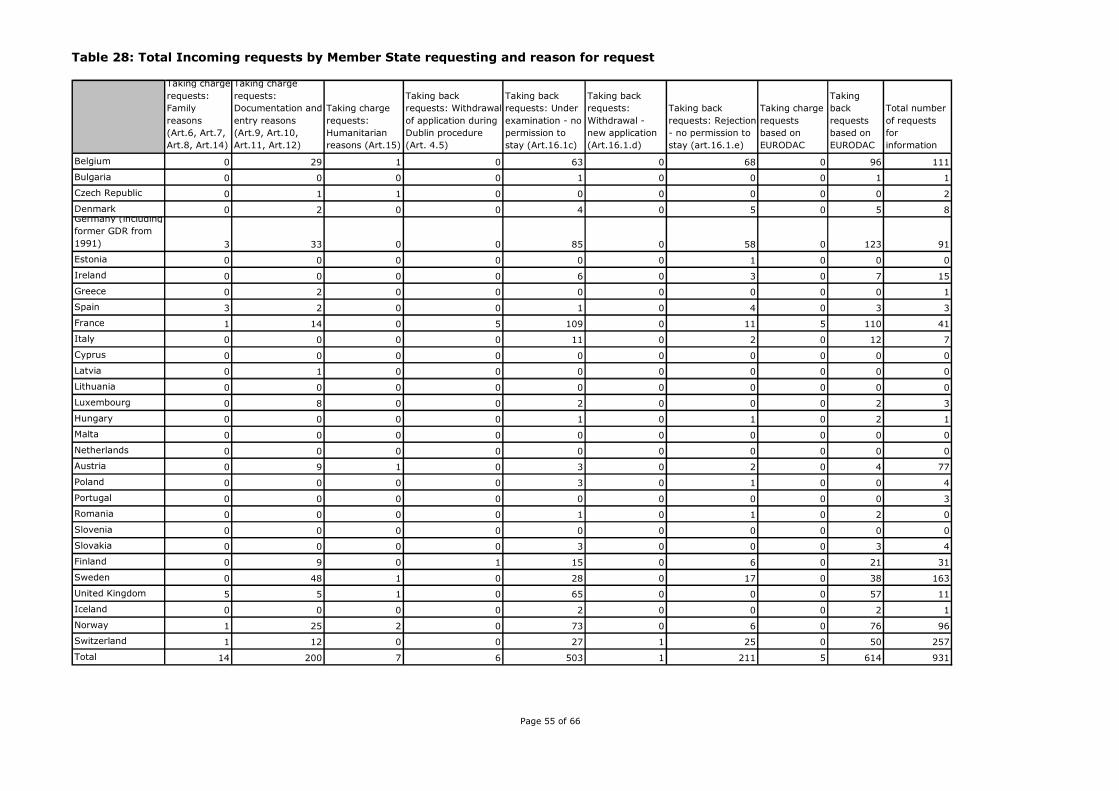
Page 55 of 66
Table 28: Total Incoming requests by Member State requesting and reason for request
Taking charge
requests:
Family
reasons
(Art.6, Art.7,
Art.8, Art.14)
Taking charge
requests:
Documentation and
entry reasons
(Art.9, Art.10,
Art.11, Art.12)
Taking charge
requests:
Humanitarian
reasons (Art.15)
Taking back
requests: Withdrawal
of application during
Dublin procedure
(Art. 4.5)
Taking back
requests: Under
examination - no
permission to
stay (Art.16.1c)
Taking back
requests:
Withdrawal -
new application
(Art.16.1.d)
Taking back
requests: Rejection
- no permission to
stay (art.16.1.e)
Taking charge
requests
based on
EURODAC
Taking
back
requests
based on
EURODAC
Total number
of requests
for
information
Belgium 0 29 1 0 63 0 68 0 96 111
Bulgaria 0 0 0 0 1 0 0 0 1 1
Czech Republic 0 1 1 0 0 0 0 0 0 2
Denmark 0 2 0 0 4 0 5 0 5 8Germany (including
former GDR from
1991) 3 33 0 0 85 0 58 0 123 91
Estonia 0 0 0 0 0 0 1 0 0 0
Ireland 0 0 0 0 6 0 3 0 7 15
Greece 0 2 0 0 0 0 0 0 0 1
Spain 3 2 0 0 1 0 4 0 3 3
France 1 14 0 5 109 0 11 5 110 41
Italy 0 0 0 0 11 0 2 0 12 7
Cyprus 0 0 0 0 0 0 0 0 0 0
Latvia 0 1 0 0 0 0 0 0 0 0
Lithuania 0 0 0 0 0 0 0 0 0 0
Luxembourg 0 8 0 0 2 0 0 0 2 3
Hungary 0 0 0 0 1 0 1 0 2 1
Malta 0 0 0 0 0 0 0 0 0 0
Netherlands 0 0 0 0 0 0 0 0 0 0
Austria 0 9 1 0 3 0 2 0 4 77
Poland 0 0 0 0 3 0 1 0 0 4
Portugal 0 0 0 0 0 0 0 0 0 3
Romania 0 0 0 0 1 0 1 0 2 0
Slovenia 0 0 0 0 0 0 0 0 0 0
Slovakia 0 0 0 0 3 0 0 0 3 4
Finland 0 9 0 1 15 0 6 0 21 31
Sweden 0 48 1 0 28 0 17 0 38 163
United Kingdom 5 5 1 0 65 0 0 0 57 11
Iceland 0 0 0 0 2 0 0 0 2 1
Norway 1 25 2 0 73 0 6 0 76 96
Switzerland 1 12 0 0 27 1 25 0 50 257
Total 14 200 7 6 503 1 211 5 614 931
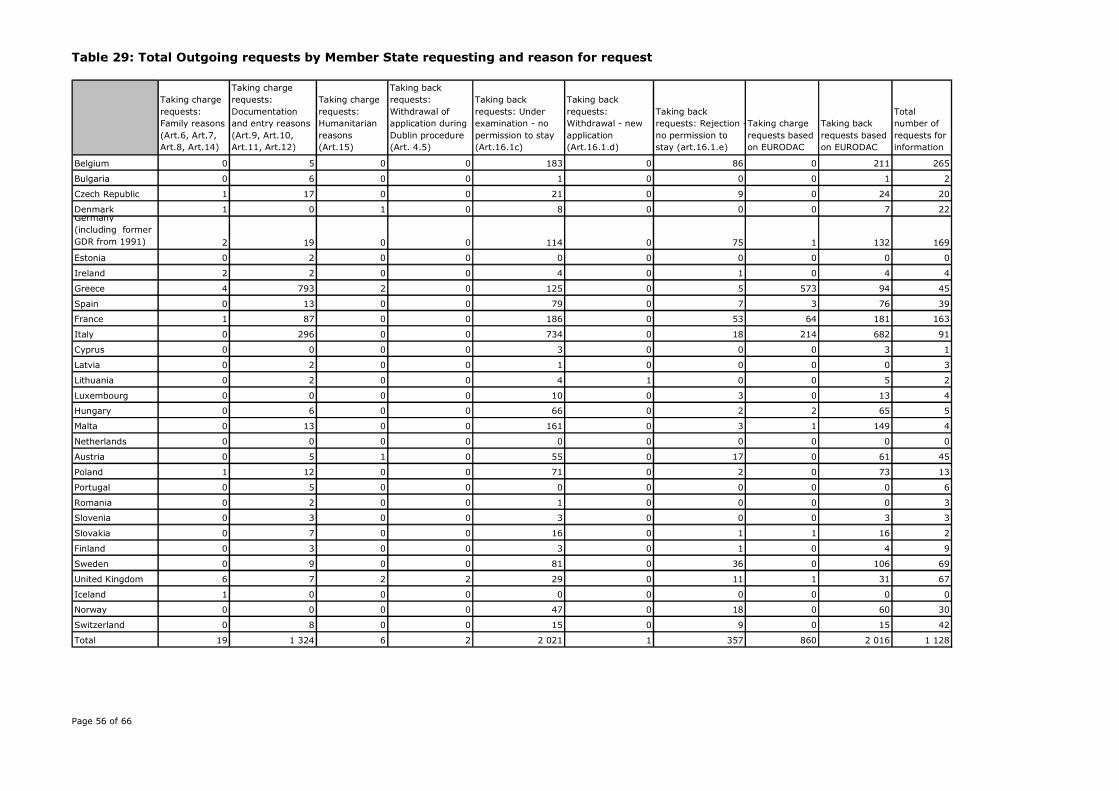
Page 56 of 66
Table 29: Total Outgoing requests by Member State requesting and reason for request
Taking charge
requests:
Family reasons
(Art.6, Art.7,
Art.8, Art.14)
Taking charge
requests:
Documentation
and entry reasons
(Art.9, Art.10,
Art.11, Art.12)
Taking charge
requests:
Humanitarian
reasons
(Art.15)
Taking back
requests:
Withdrawal of
application during
Dublin procedure
(Art. 4.5)
Taking back
requests: Under
examination - no
permission to stay
(Art.16.1c)
Taking back
requests:
Withdrawal - new
application
(Art.16.1.d)
Taking back
requests: Rejection -
no permission to
stay (art.16.1.e)
Taking charge
requests based
on EURODAC
Taking back
requests based
on EURODAC
Total
number of
requests for
information
Belgium 0 5 0 0 183 0 86 0 211 265
Bulgaria 0 6 0 0 1 0 0 0 1 2
Czech Republic 1 17 0 0 21 0 9 0 24 20
Denmark 1 0 1 0 8 0 0 0 7 22Germany
(including former
GDR from 1991) 2 19 0 0 114 0 75 1 132 169
Estonia 0 2 0 0 0 0 0 0 0 0
Ireland 2 2 0 0 4 0 1 0 4 4
Greece 4 793 2 0 125 0 5 573 94 45
Spain 0 13 0 0 79 0 7 3 76 39
France 1 87 0 0 186 0 53 64 181 163
Italy 0 296 0 0 734 0 18 214 682 91
Cyprus 0 0 0 0 3 0 0 0 3 1
Latvia 0 2 0 0 1 0 0 0 0 3
Lithuania 0 2 0 0 4 1 0 0 5 2
Luxembourg 0 0 0 0 10 0 3 0 13 4
Hungary 0 6 0 0 66 0 2 2 65 5
Malta 0 13 0 0 161 0 3 1 149 4
Netherlands 0 0 0 0 0 0 0 0 0 0
Austria 0 5 1 0 55 0 17 0 61 45
Poland 1 12 0 0 71 0 2 0 73 13
Portugal 0 5 0 0 0 0 0 0 0 6
Romania 0 2 0 0 1 0 0 0 0 3
Slovenia 0 3 0 0 3 0 0 0 3 3
Slovakia 0 7 0 0 16 0 1 1 16 2
Finland 0 3 0 0 3 0 1 0 4 9
Sweden 0 9 0 0 81 0 36 0 106 69
United Kingdom 6 7 2 2 29 0 11 1 31 67
Iceland 1 0 0 0 0 0 0 0 0 0
Norway 0 0 0 0 47 0 18 0 60 30
Switzerland 0 8 0 0 15 0 9 0 15 42
Total 19 1 324 6 2 2 021 1 357 860 2 016 1 128
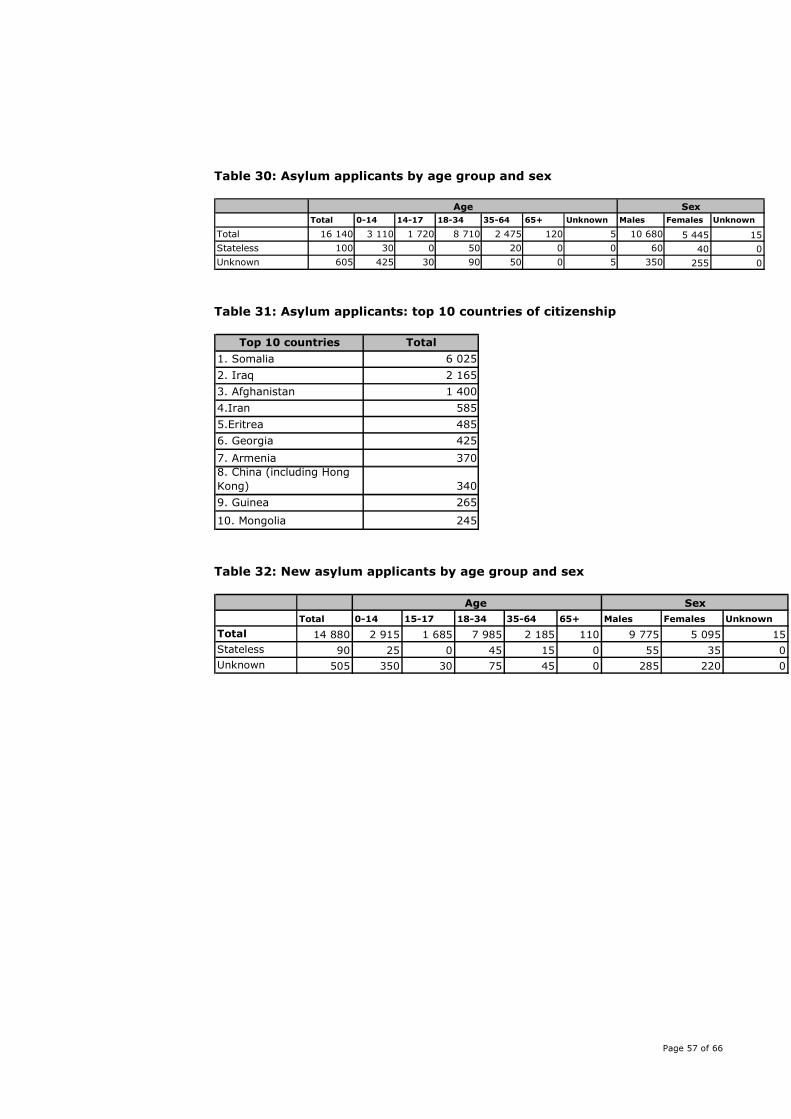
Page 57 of 66
Table 30: Asylum applicants by age group and sex
Total 0-14 14-17 18-34 35-64 65+ Unknown Males Females Unknown
Total 16 140 3 110 1 720 8 710 2 475 120 5 10 680 5 445 15
Stateless 100 30 0 50 20 0 0 60 40 0
Unknown 605 425 30 90 50 0 5 350 255 0
Age Sex
Table 31: Asylum applicants: top 10 countries of citizenship
Top 10 countries Total
1. Somalia 6 025
2. Iraq 2 165
3. Afghanistan 1 400
4.Iran 585
5.Eritrea 485
6. Georgia 425
7. Armenia 370
8. China (including Hong
Kong) 340
9. Guinea 265
10. Mongolia 245
Table 32: New asylum applicants by age group and sex
Total 0-14 15-17 18-34 35-64 65+ Males Females Unknown
Total 14 880 2 915 1 685 7 985 2 185 110 9 775 5 095 15
Stateless 90 25 0 45 15 0 55 35 0
Unknown 505 350 30 75 45 0 285 220 0
Age Sex
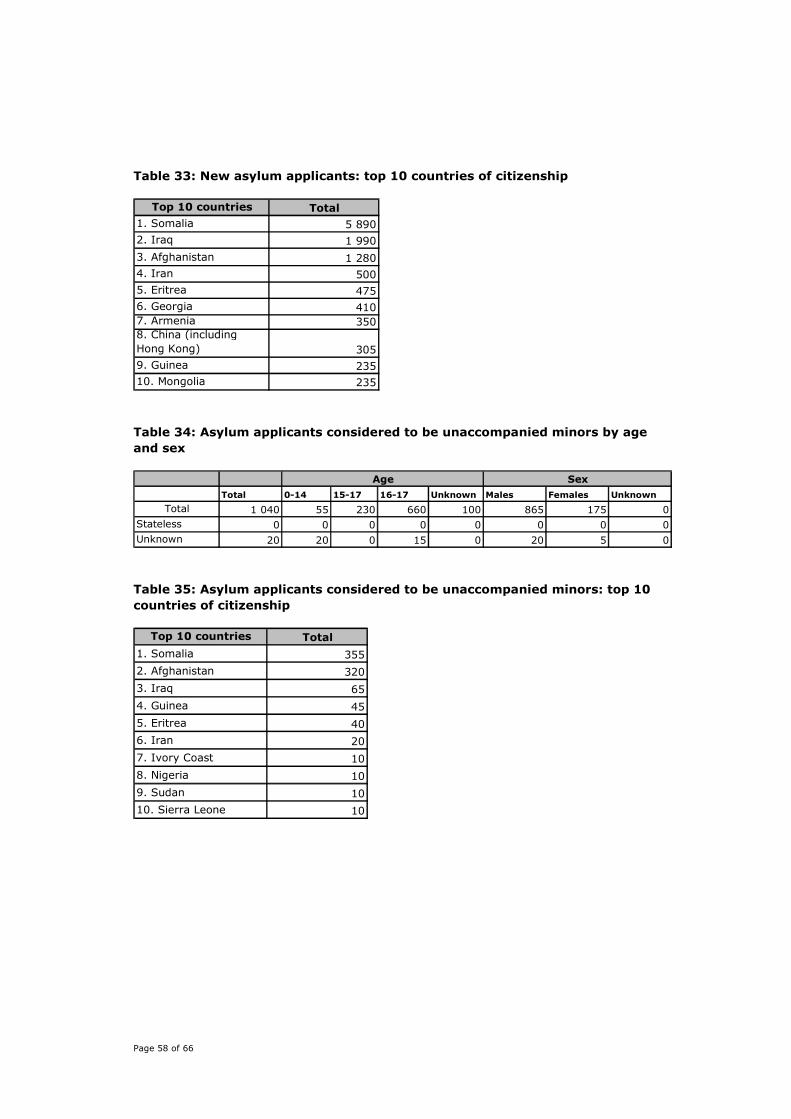
Page 58 of 66
Table 33: New asylum applicants: top 10 countries of citizenship
Top 10 countries Total
1. Somalia 5 890
2. Iraq 1 990
3. Afghanistan 1 280
4. Iran 500
5. Eritrea 475
6. Georgia 410
7. Armenia 3508. China (including
Hong Kong) 305
9. Guinea 235
10. Mongolia 235
Table 34: Asylum applicants considered to be unaccompanied minors by age
and sex
Total 0-14 15-17 16-17 Unknown Males Females Unknown
Total 1 040 55 230 660 100 865 175 0
Stateless 0 0 0 0 0 0 0 0
Unknown 20 20 0 15 0 20 5 0
Age Sex
Table 35: Asylum applicants considered to be unaccompanied minors: top 10
countries of citizenship
Top 10 countries Total
1. Somalia 355
2. Afghanistan 320
3. Iraq 65
4. Guinea 45
5. Eritrea 40
6. Iran 20
7. Ivory Coast 10
8. Nigeria 10
9. Sudan 10
10. Sierra Leone 10
Page 59 of 66
Table 36: Persons subject of asylum applications pending at the end of the
month by age and sex
Total 0-14 14-17 18-34 35-64 65+ Unknown Mals Females Unknown
Total 16 245 1 580 1 255 9 660 3 565 185 0 11 350 4 895 0
Stateless 95 20 5 45 25 0 0 65 30 0
Unknown 360 165 25 100 60 10 0 220 140 0
SexAge
Table 37: Persons subject of asylum applications pending at the end of the
month by age and sex: top 10 countries by citizenship
Top 10 countries Total
1. Iraq 4 895
2. Somalia 3 765
3. Afghanistan 1 605
4. Iran 560
5. Burundi 430
6. Armenia 405
7. Georgia 370
8. Eritrea 335
9. Sri Lanka 275
10. Guinea 265
Table 38: Asylum applications withdrawn by age and sex
Total 0-14 15-17 18-34 35-64 65+ Unknown Males Females Unknown
Total 635 55 15 375 180 5 0 505 130 0
Stateless 5 0 0 0 0 0 0 5 0 0
Unknown 35 15 0 10 5 0 0 25 10 0
SexAge
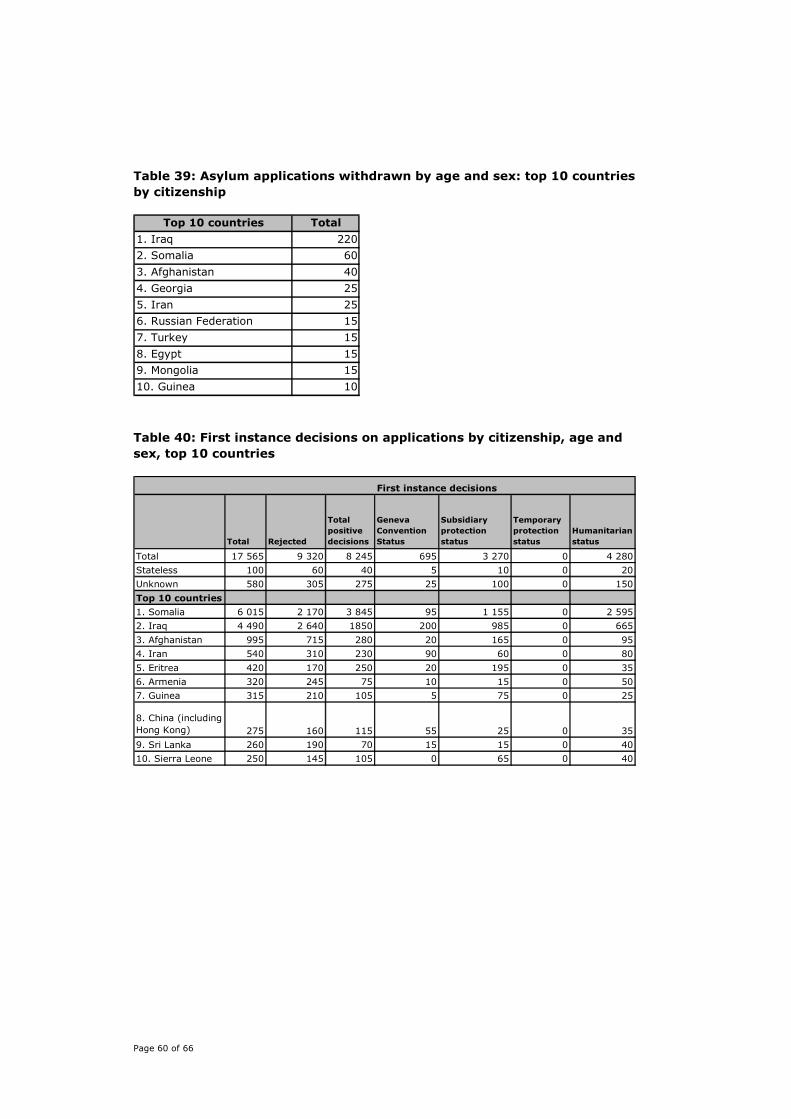
Page 60 of 66
Table 39: Asylum applications withdrawn by age and sex: top 10 countries
by citizenship
Top 10 countries Total
1. Iraq 220
2. Somalia 60
3. Afghanistan 40
4. Georgia 25
5. Iran 25
6. Russian Federation 15
7. Turkey 15
8. Egypt 15
9. Mongolia 15
10. Guinea 10
Table 40: First instance decisions on applications by citizenship, age and
sex, top 10 countries
First instance decisions
Total Rejected
Total
positive
decisions
Geneva
Convention
Status
Subsidiary
protection
status
Temporary
protection
status
Humanitarian
status
Total 17 565 9 320 8 245 695 3 270 0 4 280
Stateless 100 60 40 5 10 0 20
Unknown 580 305 275 25 100 0 150
Top 10 countries
1. Somalia 6 015 2 170 3 845 95 1 155 0 2 595
2. Iraq 4 490 2 640 1850 200 985 0 665
3. Afghanistan 995 715 280 20 165 0 95
4. Iran 540 310 230 90 60 0 80
5. Eritrea 420 170 250 20 195 0 35
6. Armenia 320 245 75 10 15 0 50
7. Guinea 315 210 105 5 75 0 25
8. China (including
Hong Kong) 275 160 115 55 25 0 35
9. Sri Lanka 260 190 70 15 15 0 40
10. Sierra Leone 250 145 105 0 65 0 40
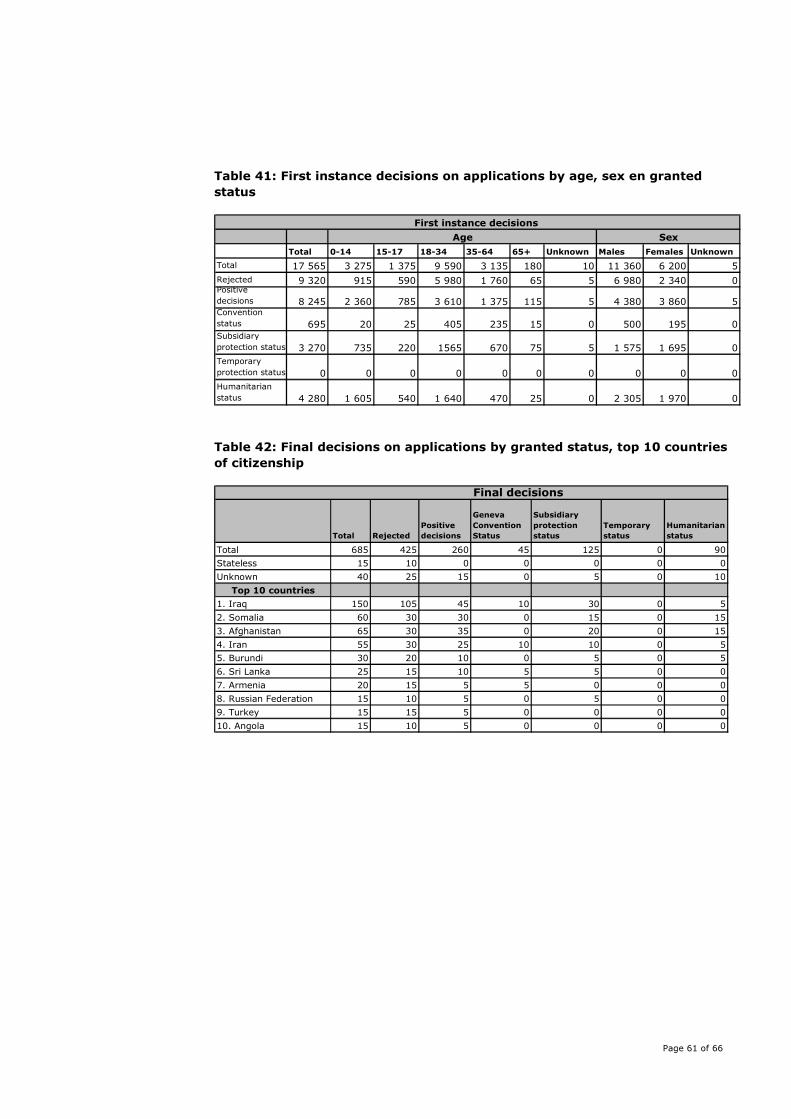
Page 61 of 66
Table 41: First instance decisions on applications by age, sex en granted
status
Total 0-14 15-17 18-34 35-64 65+ Unknown Males Females Unknown
Total 17 565 3 275 1 375 9 590 3 135 180 10 11 360 6 200 5
Rejected 9 320 915 590 5 980 1 760 65 5 6 980 2 340 0Positive
decisions 8 245 2 360 785 3 610 1 375 115 5 4 380 3 860 5Convention
status 695 20 25 405 235 15 0 500 195 0Subsidiary
protection status 3 270 735 220 1565 670 75 5 1 575 1 695 0
Temporary
protection status 0 0 0 0 0 0 0 0 0 0
Humanitarian
status 4 280 1 605 540 1 640 470 25 0 2 305 1 970 0
Sex
First instance decisions
Age
Table 42: Final decisions on applications by granted status, top 10 countries
of citizenship
Final decisions
Total Rejected
Positive
decisions
Geneva
Convention
Status
Subsidiary
protection
status
Temporary
status
Humanitarian
status
Total 685 425 260 45 125 0 90
Stateless 15 10 0 0 0 0 0
Unknown 40 25 15 0 5 0 10
Top 10 countries
1. Iraq 150 105 45 10 30 0 5
2. Somalia 60 30 30 0 15 0 15
3. Afghanistan 65 30 35 0 20 0 15
4. Iran 55 30 25 10 10 0 5
5. Burundi 30 20 10 0 5 0 5
6. Sri Lanka 25 15 10 5 5 0 0
7. Armenia 20 15 5 5 0 0 0
8. Russian Federation 15 10 5 0 5 0 0
9. Turkey 15 15 5 0 0 0 0
10. Angola 15 10 5 0 0 0 0
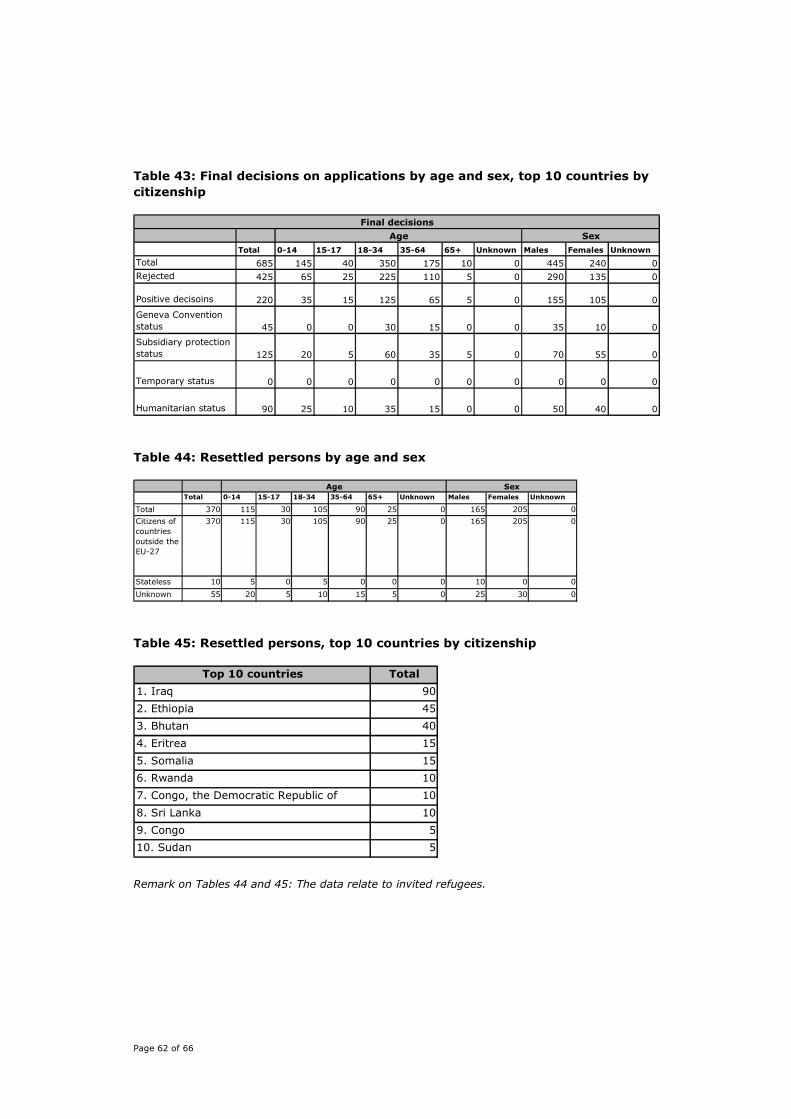
Page 62 of 66
Table 43: Final decisions on applications by age and sex, top 10 countries by
citizenship
Total 0-14 15-17 18-34 35-64 65+ Unknown Males Females Unknown
Total 685 145 40 350 175 10 0 445 240 0
Rejected 425 65 25 225 110 5 0 290 135 0
Positive decisoins 220 35 15 125 65 5 0 155 105 0
Geneva Convention
status 45 0 0 30 15 0 0 35 10 0
Subsidiary protection
status 125 20 5 60 35 5 0 70 55 0
Temporary status 0 0 0 0 0 0 0 0 0 0
Humanitarian status 90 25 10 35 15 0 0 50 40 0
Sex
Final decisions
Age
Table 44: Resettled persons by age and sex
Total 0-14 15-17 18-34 35-64 65+ Unknown Males Females Unknown
Total 370 115 30 105 90 25 0 165 205 0
Citizens of
countries
outside the
EU-27
115 30 105 90 25 0
Stateless 10 5 0 5 0 0 0 10 0 0
Unknown 55 20 5 10 15 5 0 25 30 0
370
Age Sex
165 205 0
Table 45: Resettled persons, top 10 countries by citizenship
Top 10 countries Total
1. Iraq 90
2. Ethiopia 45
3. Bhutan 40
4. Eritrea 15
5. Somalia 15
6. Rwanda 10
7. Congo, the Democratic Republic of 10
8. Sri Lanka 10
9. Congo 5
10. Sudan 5
Remark on Tables 44 and 45: The data relate to invited refugees.
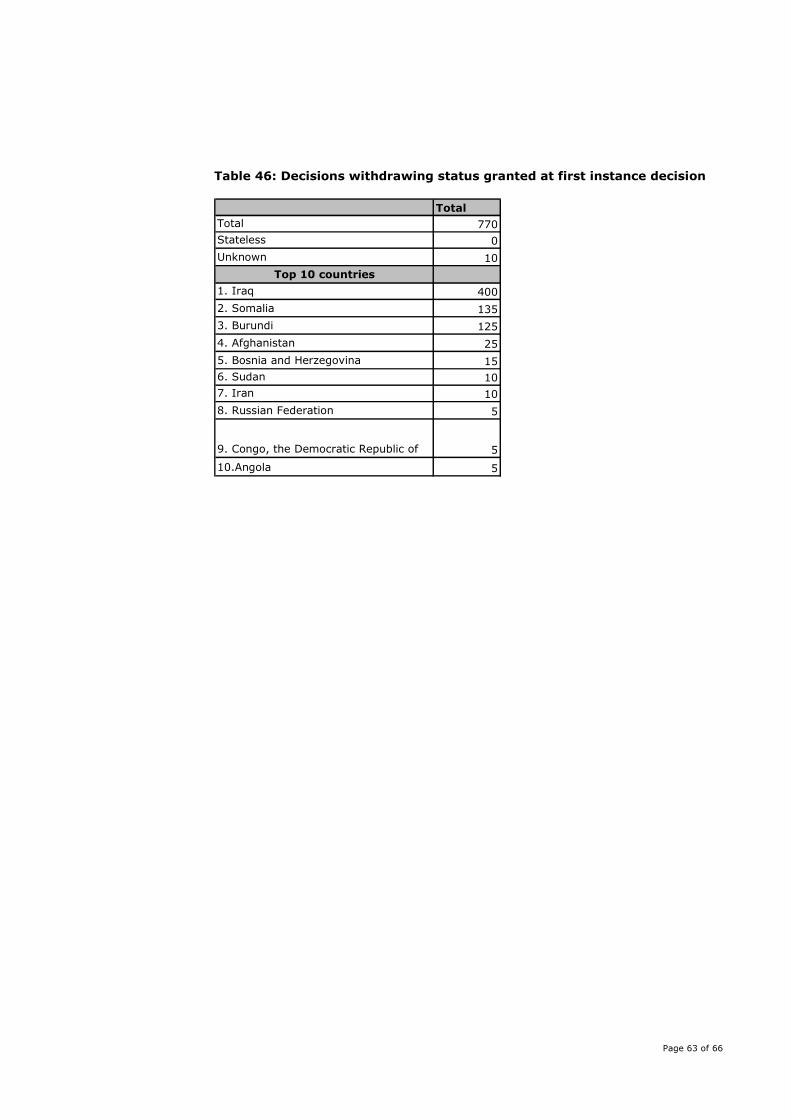
Page 63 of 66
Table 46: Decisions withdrawing status granted at first instance decision
Total
Total 770
Stateless 0
Unknown 10
Top 10 countries
1. Iraq 400
2. Somalia 135
3. Burundi 125
4. Afghanistan 25
5. Bosnia and Herzegovina 15
6. Sudan 10
7. Iran 10
8. Russian Federation 5
9. Congo, the Democratic Republic of 5
10.Angola 5

Page 64 of 66
Page 65 of 66
Bibliography
Press release from Statistics Netherlands, Press release10-006 (2010), Crisis remt
migratie en verhuizingen (Crisis acts as a brake on migration and relocations).
Extracted from http://www.cbs.nl/nl on 8 July 2011.
European Migration Network (EMN) (2009a) Annual Policy Report 2009,
Ontwikkelingen in het Nederlandse migratie- en asielbeleid 1 januari 2009-31
december 2009 (Annual Policy Report 2009, Developments in Dutch Migration and
Asylum Policy 1 January 2009-31 December 2009). Rijswijk: Immigration and
Naturalisation Service (IND), National Contact Point for the European Migration
Network
EMN (2009b) Gefaciliteerde terugkeer- en herintegratieprogramma’ s in Nederland
(Facilitated Return and Reintegration Programmes in the Netherlands). Rijswijk:
(IND), National Contact Point for the European Migration Network.
EMN (2010) T
he Netherlands Annual Report on Migration and International Protection
Statistics 1 January 2008-31 December 2008. Rijswijk: (IND), National Contact Point
for the European Migration Network.
Garssen, J., Wobma, E., (CBS) 6 juli 2011, Bijdrage migratie aan bevolkingsgroei
relatief gering (Contribution of migration to population growth relatively small)
Immigration and Naturalisation Service (IND) (2010a), Trendrapportage Regulier:
Reguliere migratie naar Nederland in beeld. (Trend Report on Regular Residence
2010, An Overview of Regular Migration to the Netherlands) Rijswijk: Information
and Analysis Centre (INDIAC)
IND (2010b), Trendrapportage Naturalisatie VI: Aanvragen en verkrijgen van het
Nederlanderschap door naturalisatie en optie (Trend Report on Naturalisation VI:
Application and Acquisition of Dutch Citizenship by Naturalisation and Option)
Rijswijk: Information and Analysis Centre (INDIAC)
Ministry of Foreign Affairs (July 2010), Country Report on Afghanistan
Nicolaas, H., Wobma, E., and Ooijevaar, J., 2010, Demografie van (niet-westerse) allochtonen
in Nederland (Demography of Western and non-Western migrants in the Netherlands)
Schreijenberg, A., Klaver, J.F.I., Soethout, J. E., Lodder, G.G., and Vleugel, M.J.
(2009) Community Law and Family Migration – The use of Community Law by family
migrants from third countries (Gemeenschapsrecht en gezinsmigratie – Het gebruik
van gemeenschapsrecht door gezinsmigranten uit derde landen). Amsterdam/The
Hague: WODC; Regional Plan Policy Research; Institute of Immigration, Leiden
University; IND Information and Analysis Centre (INDIAC).
Sprangers, A. and Nicolaas, H., 2010, Stijging aantal asielzoekers in Nederland iets
groter dan in EU (Increase in number of asylum seekers in the Netherlands larger
than in EU)
Page 66 of 66
United Nations, International Human Development Indicators, derived from
http://hdr.undp.org/en/statistics/
Research and Documentation Centre (WODC) and Immigration and Naturalisation
Service (IND), Information and Analysis Centre (INDIAC), (2009), Internationale
gezinsvorming begrensd? Een evaluatie van de verhoging van de inkomens- en
leeftijdseis bij migratie van buitenlandse partners naar Nederland (International
family formation restricted? An evalutaion of the raised income and age requirement
with regard to the migration of foreign partners to the Netherlands)

The European Migration Network (EMN) has been set up by the
Council of the European Union. The EMN collects up-to-date,
objective, reliable and where possible comparable information
on migration and asylum. The EMN publishes reports on a variety
of subjects in the fi eld of asylum and migration.
The establishment of the EMN is consistent with the aim of the
EU to establish an effective asylum and migration policy.
www.emnnetherlands.nl
The EMN was established via Council Decision
2008/381/EC of 14 May 2008 and is fi nancially sup-
ported by the European Commission.