Embed Size (px)
Citation preview

RP No: 104/2014 ISBN: 978-0-621-42626-7
14th COMMISSION FOR EMPLOYMENT EQUITY
2013
- 20
14
ANNUAL REPORT
TURNING OVER A NEW LEAF AGAINST ALL ODDS
EMPLOYMENT EQUITY

TURNING OVER A NEW LEAF AGAINST ALL ODDS
iii
14th COMMISSION FOR EMPLOYMENT EQUITY
2013
- 20
14
ANNUAL REPORT
Publisher
Department of LabourChief Directorate of Communication
Private Bag X117Pretoria
0001
Text
Commission for Employment Equity
Editing, layout and design, photography and distributionSubdirectorate of Media Production, Design Studio,
Chief Directorate of Communication, Department of Labour
PrinterGovernment Printers
RP No:104/2014
ISBN No:978-0-621-42626-7
Website
www.labour.gov.za
Stay in touch with the Department on Facebook (Department of Labour) and
Twitter (@deptoflabour)

iv
Table of ConTenTs
1 Introduction 9
2 Highlights for the period 9
2.1 Amendments to the Act 9
2.2 Regulations 11
2.3 Labour court cases on employment equity (2009 – 2013) 12
2.3.1 Director-General of Department of Labour vs. Comair Limited (Case no. J2326/07) 12
2.3.2 Solidarity vs. Department of Correctional Services (Case no. C368/2012) 12
2.3.3 Solidarity vs. South African Police Service (Case no. 165/13) 13
2.4 Employment Equity and Transformation Indaba 13
2.5 Director-General Reviews 14
2.5.1 NETCARE (in the health sector) 15
2.5.2 MASSDICOUNTERS (wholesale and retail sector) 16
2.6 Broad-Based Black Economic Empowerment 17
3 Workforce distribution 18
4 Trends analysis from 2003 to 2013 by population group and gender 20
4.1 Population distribution trends for the Top Management level 20
4.2 Population distribution trends for the Senior Management level 21
4.3 Population distribution trends for the Professionally Qualified level 23
4.4 Population distribution trends for the Skilled Technical level 24
5 Analysis of employment equity reports received in 2013 27
5.1 Extent of reporting 27
5.2 Workforce profile, workforce movement and skills development in terms of population group, gender and disability - (all percentages are rounded to one decimal point) 27
5.2.1 Population distribution trends for the Top Management level 27
5.2.2 Population distribution trends for the Senior Management level 34
5.2.3 Population distribution trends for the Professionally Qualified level 41
5.2.4 Population distribution trends for the Skilled Technical level 47
6 Summary and conclusion 53
7 References 56
8 Appendix A 57
8.1 TABLES FOR WORKFORCE PROFILE FOR ALL LARGE EMPLOYERS 57
8.2 WORKFORCE MOVEMENT 58
8.3 SKILLS DEVELOPMENT 59
8.4 TABLES FOR EACH PROVINCE IN TERMS OF POPULATION GROUP AND GENDER 60
8.4.1 EASTERN CAPE 60
8.4.2 FREE STATE 61
8.4.3 GAUTENG 62
8.4.4 KWAZULU-NATAL 63

v
8.4.5 LIMPOPO 63 8.4.6 MPUMALANGA 64 8.4.7 NORTH WEST 65 8.4.8 NORTHERN CAPE 66 8.4.9 WESTERN CAPE 67
8.5 TABLES FOR EACH SECTOR IN TERMS OF POPULATION GROUP AND GENDER 68
8.5.1 AGRICULTURE 68
8.5.2 CATERING/ACCOMODATION/OTHER 69 8.5.3 COMMUNITY/SOCIAL/PERSONAL SERVICES 70 8.5.4 CONSTRUCTION 71
8.5.5 ELECTRICITY, GAS AND WATER 71
8.5.6 FINANCE/BUSINESS SERVICES 72
8.5.7 MANUFACTURING 72 8.5.8 MINING AND QUARRYING 73
8.5.9 RETAIL AND MOTOR TRADE/REPAIR SERVICES 73
8.5.10 TRANSPORT/STORAGE/COMMUNICATION 74
8.5.11 WHOLESALES TRADE/COMMERCIAL AGENT/ALLIED SERVICES 75
8.6 TABLES FOR EACH BUSINESS TYPE IN TERMS OF POPULATION GROUP AND GENDER 76
8.6.1 ALL EMPLOYERS 76
8.6.2 ALL GOVERNMENT 77
8.6.3 NATIONAL GOVERNMENT 78
8.6.4 PROVINCIAL GOVERNMENT 79
8.6.5 LOCAL GOVERNMENT 80
8.6.6 PRIVATE SECTOR 80
8.6.7 NON-PROFIT ORGANISATIONS 81
8.6.8 STATE OWNED ENTERPRISES 82
8.6.9 EDUCATIONAL INSTITUTIONS 83
TURNING OVER A NEW
LEAF A
GAINST ALL ODDS

vi

vii
GLOSSARY
Commission Means the Commission for Employment Equity (CEE)
Department Means the Department of Labour
DG Means the Director-General of the Department of Labour
Designated groups Means black people, women and people with disabilities who:(a) are citizens of the Republic of South Africa by birth or de-
scent; or(b) became citizens of the Republic of South Africa by naturali-
sation–(i) before 27 April 1994; (ii) after 26 April 1994 and who would have been entitled
to acquire citizenship by naturalisation prior to that date but who were precluded by apartheid policies
Small employers Mean those designated employers who employ fewer than 150 employees
Large employers Mean those designated employers who employ 150 or more employees
EAP Means the Economically Active Population which includes people from 15 to 64 years of age who are either employed or unem-ployed and seeking employment
NEDLAC Means National Economic Development Labour Council
Workforce profile Means a snapshot of an employer’s workforce population distri-bution, including race, gender and disability
Workforce movement Pertains to any movement in the workforce, including recruit-ment, promotion and terminations
SOEs State Owned Enterprises formerly known as Parastatals

viii
ISBN No: 978-0-621-41728-9
ix
ISBN No: 978-0-621-41728-9
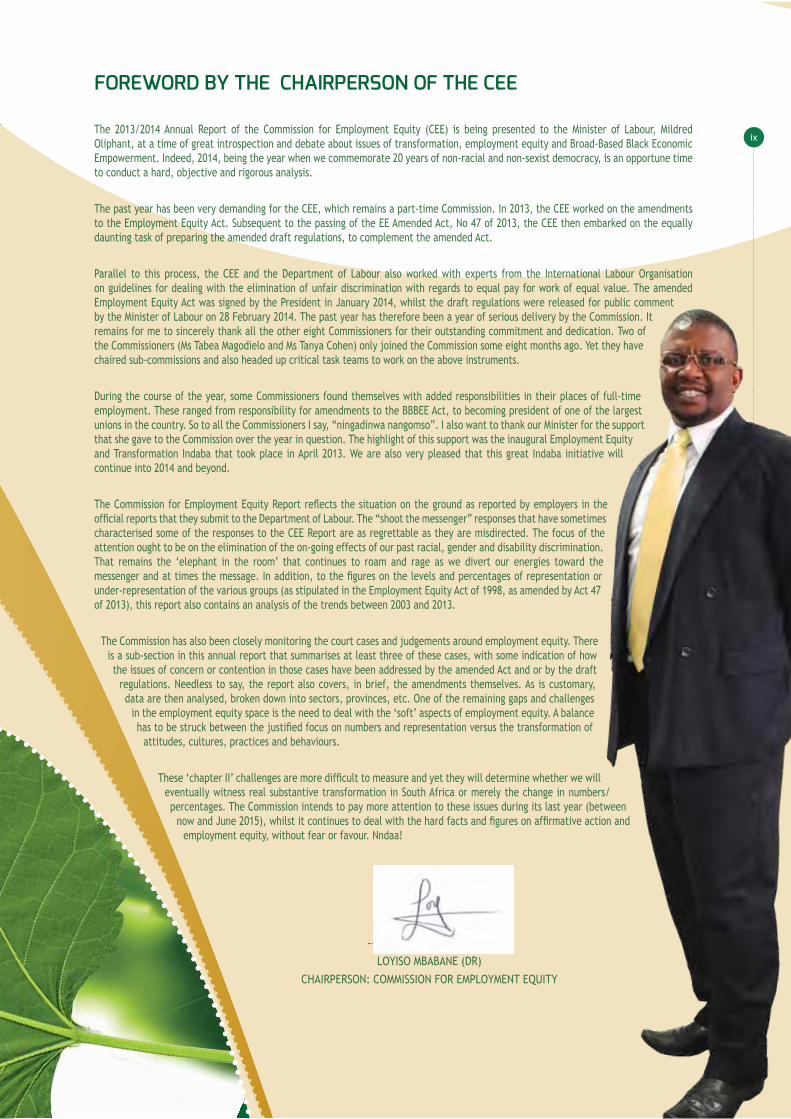
FOREwORd bY ThE ChAIRPERSON OF ThE CEE
The 2013/2014 Annual Report of the Commission for Employment Equity (CEE) is being presented to the Minister of Labour, Mildred Oliphant, at a time of great introspection and debate about issues of transformation, employment equity and Broad-Based Black Economic Empowerment. Indeed, 2014, being the year when we commemorate 20 years of non-racial and non-sexist democracy, is an opportune time to conduct a hard, objective and rigorous analysis.
The past year has been very demanding for the CEE, which remains a part-time Commission. In 2013, the CEE worked on the amendments to the Employment Equity Act. Subsequent to the passing of the EE Amended Act, No 47 of 2013, the CEE then embarked on the equally daunting task of preparing the amended draft regulations, to complement the amended Act.
Parallel to this process, the CEE and the Department of Labour also worked with experts from the International Labour Organisation on guidelines for dealing with the elimination of unfair discrimination with regards to equal pay for work of equal value. The amended Employment Equity Act was signed by the President in January 2014, whilst the draft regulations were released for public comment by the Minister of Labour on 28 February 2014. The past year has therefore been a year of serious delivery by the Commission. It remains for me to sincerely thank all the other eight Commissioners for their outstanding commitment and dedication. Two of the Commissioners (Ms Tabea Magodielo and Ms Tanya Cohen) only joined the Commission some eight months ago. Yet they have chaired sub-commissions and also headed up critical task teams to work on the above instruments.
During the course of the year, some Commissioners found themselves with added responsibilities in their places of full-time employment. These ranged from responsibility for amendments to the BBBEE Act, to becoming president of one of the largest unions in the country. So to all the Commissioners I say, “ningadinwa nangomso”. I also want to thank our Minister for the support that she gave to the Commission over the year in question. The highlight of this support was the inaugural Employment Equity and Transformation Indaba that took place in April 2013. We are also very pleased that this great Indaba initiative will continue into 2014 and beyond.
The Commission for Employment Equity Report reflects the situation on the ground as reported by employers in the official reports that they submit to the Department of Labour. The “shoot the messenger” responses that have sometimes characterised some of the responses to the CEE Report are as regrettable as they are misdirected. The focus of the attention ought to be on the elimination of the on-going effects of our past racial, gender and disability discrimination. That remains the ‘elephant in the room’ that continues to roam and rage as we divert our energies toward the messenger and at times the message. In addition, to the figures on the levels and percentages of representation or under-representation of the various groups (as stipulated in the Employment Equity Act of 1998, as amended by Act 47 of 2013), this report also contains an analysis of the trends between 2003 and 2013.
The Commission has also been closely monitoring the court cases and judgements around employment equity. There is a sub-section in this annual report that summarises at least three of these cases, with some indication of how the issues of concern or contention in those cases have been addressed by the amended Act and or by the draft
regulations. Needless to say, the report also covers, in brief, the amendments themselves. As is customary, data are then analysed, broken down into sectors, provinces, etc. One of the remaining gaps and challenges
in the employment equity space is the need to deal with the ‘soft’ aspects of employment equity. A balance has to be struck between the justified focus on numbers and representation versus the transformation of
attitudes, cultures, practices and behaviours.
These ‘chapter II’ challenges are more difficult to measure and yet they will determine whether we will eventually witness real substantive transformation in South Africa or merely the change in numbers/percentages. The Commission intends to pay more attention to these issues during its last year (between
now and June 2015), whilst it continues to deal with the hard facts and figures on affirmative action and employment equity, without fear or favour. Nndaa!
--------------------------------
LOYISO MBABANE (DR)
CHAIRPERSON: COMMISSION FOR EMPLOYMENT EQUITY
ix

x
Members of the Commission for Employment Equity are appointed according to section 29 (1) of the Act, which includes the appointment of a Chairperson and eight members nominated by NEDLAC, i.e. two representatives of each from the State, Organised Busi-ness, Organised Labour and Community.
MEMbERS OF ThE COMMISSION FOR EMPLOYMENT EQUITY
Malesela Maleka Community representative
Community Constituency
Mr Malesela Maleka is presently the Head of Policy at the SACP. A sports activist, he has held various leadership positions in the sporting fraternity, the student movement (SASCO) and is currently a member of the YCL SA National Committee. He also serves on BANKSETA Council and the Quality Council for Trades and Occupations.
Chairperson
Dr Loyiso Mbabane was the Director of Equal Opportunities in the Department of Labour at the time of the promulgation of the EE Act in 1998. He has been the Executive Director for both the Black Economic Empowerment Commission and the Black Business Council. He is an academic and currently the acting Deputy Vice Chancellor (Academic Affairs and Research) of the Walter Sisulu University. He holds a PhD in Business Administration from the University of Cape Town (Graduate School of Business).
Tanya CohenBusiness Representative
Ms Tanya Cohen is an attorney and holds a BA, LLB, LLM (Laws) from the University of Witwatersrand. Tanya is the di-rector of the Retail Association and also serves on the Boards of BUSA NPC and Starfish Greathearts NPC. She is an active participant in the labour market and led the BUSA delegation in negotiations in NEDLAC on the labour law amendments, including those on the Employment Equity Bill. She is the former Chairperson of the CCMA Governing Body and has on a number of occasions represented BUSA internationally at the International Labour Organisation.
Tabea MagodieloBusiness Representative
Business Constituency
Ms Tabea Magodielo, is the Joint Managing Director of TPG Consulting. She qualified as a Social Worker and later as a Clinical Psychologist. Tabea has held a number of leadership positions, including sitting on a number of Boards for Private Companies and NGOs. Currently she sits on the Board of G4S (PTY) LTD. She is also the President and Director for APSO (Federation of African Professional Staffing Organisations) and serves as the Chairperson of the Job Club Fund.

xi
Andrew MadellaCommunity representative
Mr Andrew Madella is also a community representative and has occupied leadership positions in various community based
organisations, trade unions, the SACP and the ANC. He also served as Municipal Councillor and later as Member of Parlia-
ment for the African National Congress. He is currently the Secretary-General of Disabled People South Africa and serves
on the board of the National Development Agency, the Council of the Cape Peninsula University of Technology and at NEDLAC.
Nomvula HadiLabour Representative
Labour Constituency
Ms Nomvula Hadi has held many leadership positions in the ANC, Youth League and the Women’s League before joining a trade union. Her highest position was as the President of the South African Municipal Workers’ Union (SAMWU) until 2012.
Ms Nomonde MesatywaGovernment Representative
Government Constituency
Ms Nomonde Mesatywa is employed at the Department of Trade and Industry as the Chief Director for Broad Based Black Economic Empowerment. Her area of expertise is
rights based policy formulation and development. She is an admitted attorney and Heads the Secretariat for the Presi-
dential Advisory Council on BBBEE.
Barbara WatsonGovernment Representative
Ms Barbara Watson is currently the Chief Director: Transformation Policies and Programmes at the Department
of Public Service and Administration. She is a social worker by Profession and has extensive experience in
fields such as childcare, mental health, education and community development. Her interests are human rights and transformation, with a special focus on the rights of people with disabilities and women. Prior to joining the public service, Commissioner Watson worked in the civil
society sector and also served at the Truth and Reconciliation Commission.
Andrew ChirwaLabour Representative
Mr Andrew Chirwa is currently the President of NUMSA, a mem-ber of the Central Executive Committee of COSATU and sits on
NEDLAC exco representing Labour. He intends as his new role on the CEE to champion real and meaningful transformation in
the interest of our country.

INTROdUCTION
ONE

1
1. INTROdUCTION
The Commission for Employment Equity (CEE), is a statutory body established in terms of section 28 of the EE Act to advise the Minister, the CEE is required to submit an annual report to the Minister of Labour on the implementation of employment equity in terms of Section 33 of the Act. This is the 14th annual report submitted to the Minister by the CEE since the first report of 2000.
Workforce distribution provides information on the Economically Active Population (EAP) of the country’s four major population groupings in terms of their race and gender, which is crucial for the setting of EE numerical goals. The trends analysis provides a snapshot of changes in the top four occupational levels for the years 2003, 2005, 2007, 2009, 2011 and 2013. Focus is placed on these specific reporting periods because this is when only large employers submitted reports to the Department.
Employers with 150 or more employees (i.e. large employers) are required by the Act to report annually to the Department of Labour. Employers with fewer than 150 employees (i.e. small employers) are required to report every two years. A further requirement is for employers with fewer than 50 employees but who have a turnover exceeding that of a small business (as stipulated in Schedule 4 of the Act) to report. Employers who are not designated to report in terms of the aforementioned requirements have the option to voluntarily comply with the reporting requirements. From the 2014 reporting period, due to the amendments to the Act, all employers, both large and small, will be required to report annually.
MEMbERS OF ThE COMMISSION FOR EMPLOYMENT EQUITY

hIGhLIGhTSFOR ThE PERIOd
TWO

3
2. hIGhLIGhTS FOR ThE PERIOd
Highlights for the period cover key activities of the CEE in the execution of its mandate. Key highlights for the period included the amended Employment Equity Act no.47 of 2013, amended regulations for public comment, the Transformation and Employment Equity Indaba held in April 2013 and a reflection on some best practices identified during the DG Review process.
2.2 AMENdMENTS TO ThE ACT
The Employment Equity Act of 1998 has not been amended since its inception. This has provided some time to assess the effectiveness of the Act and to identify and consider any unintended consequences, gaps and administrative improvements that are required with the legislation.
Under the auspices of the Commission for Employment Equity, a formal process began towards the end of 2010 to identify areas for review and amendment in the Employment Equity Act. This culminated in a Bill being tabled for consideration in NEDLAC. Following a rigorous social dialogue process, substantial consensus was obtained on proposed amendments. The high degree of consensus is notable, particularly in relation to the extent to which representatives from Government, Organised Labour and Organised Business jointly supported the imperative of the employment equity legislation in transforming the workplace into a one where there is equal opportunity for all.
The following are some of the key proposals that are contained in the amended Employment Equity Act, no. 47 of 2013 (‘the Act’) which was assented to by the President on (14 January 2014) for promulgation at a future date:
The definition of “designated groups” has been revised to ensure that black people, women and people with disabilities who became citizens of South Africa prior to 27 April 1994 or who would have obtained citizenship but for apartheid policies, will now benefit from affirmative action. Local spheres of Government are now subject to the Act.
Throughout the Act, the requirement to monitor and report on categories within the workforce has been removed. Only the requirement to monitor and report on levels in the workplace remains. The experience gained since the inception of the Act demonstrated that categories of work were too varied across different sectors and different workplaces to provide a meaningful basis of comparison. As such this amendment was made in order to simplify administrative requirements for employers as far as possible.
The concept of equal pay for work of equal value has been explicitly incorporated into the unfair discrimination provisions. This stipulates that it is unfair for an employer, based on a prohibited ground, or analogous arbitrary ground, to have different terms and conditions of employment for employees doing the same work, similar work or work of equal value. The law is now explicitly aligned with the International Labour Organisation prescripts on equal pay for work of equal value. Provision is now made in the Act for the Minister, after consultation with the Commission, to issue regulations to prescribe the criteria and methodology for assessing work of equal value.
Discrimination on the basis of arbitrary grounds has been added to the list of unfair discriminatory grounds. The onus provision in relation to unfair discrimination has been updated in the Act in order to create clarity and to align with emerging case law on employment equity (Mangena and Others v Fila South Africa (Pty) Ltd and Others [2009] ZALC 81; (2010) 31 ILJ 662 (LC); [2009] 12 BLLR 1224 (LC). The onus provisions differ for listed grounds and arbitrary grounds. For listed grounds, once alleged, the employer must prove that either the discrimination did not take place, or it is rational and not unfair or otherwise justifiable. In the instance of arbitrary grounds, the complainant must prove that the conduct complained of is not rational, amounts to discrimination and is unfair.
Access is enhanced in relation to unfair discrimination cases as employees earning under the BCEA threshold or employees that allege unfair discrimination on the basis of sexual harassment may now have their cases conciliated and arbitrated by the CCMA. Previously these cases would have been adjudicated upon by the Labour Court – a much longer and more expensive process. In order to ensure fairness and in light of the legal importance of such cases, a full right of appeal is available for discrimination matters that are adjudicated upon by the CCMA.
The Act provides that psychometric assessments must now be certified by the Health Professionals Council of SA or other body authorised by law to certify such assessments.
Smaller businesses are now required to report annually in order for improved data capturing. The CEE is cognisant of the increased frequency of reporting adding to the regulatory burden, but has already provided for more simplified reporting and continuous monitoring on the impact on small businesses.
4
Assessment of compliance has been simplified and made more relevant. It is no longer mandatory to refer to: (1) the pool of suitably qualified people from designated groups; (2) the economic and financial factors relevant to the sector, (3) the present and anticipated economic and financial circumstances of the employer or (4) the present and planned vacancies that exist. An employer may, however, refer to reasonable grounds in its defence in order to justify its failure to comply. There is also an enabling provision empowering the Minister, after consultation with NEDLAC, to issue regulations in this regard as well as on the specification of circumstances under which an employer’s compliance may be assessed with respect to national and regional economically active population.
The enforcement provisions of the EE Act are simplified to eliminate excessive mandatory enforcement steps as well as the mandatory criteria that must be taken into account in assessing compliance. This is intended to promote effective enforcement and will also prevent the delaying tactics of some employers that have abused the previous enforcement process. The new provisions should not prevent employers who are legitimately aggrieved by decisions from challenging these decisions at an appropriate juncture.
In terms of the Act, failure to consult, conduct an analysis, assign a senior manager, publish a report, keep records and comply with a DG request in 90 days can result in a voluntary undertaking or compliance order. On the other hand, failing to act on a compliance order may result in application to the Labour Court to impose a fine. Fines of between R1.5 and R2.7 million can be imposed.
For more serious transgressions, such as failure to report, a complaint about an EE plan or a successive EE plan, or failure to comply with a DG recommendation within 180 days can be referred directly to Court by the DG. A fine of between 2% - 10% of turnover can be imposed.
In terms of the Act, failure to consult, conduct an analysis, assign a senior manager, publish a report, keep records and comply with a DG request in 90 days can result in a undertaking or compliance order, and failing compliance the matter can be referred to Court. Fines of between R1.5 and R2.7 million can be imposed.
For more serious transgressions, such as failure to report, a complaint about an EE plan or a successive EE plan, or failure to comply with a DG recommendation within 180 days can be referred directly to Court by the DG. A fine of between 2% - 10% of turnover can be imposed.
The fines for breach of confidentiality, undue influence, obstruction and fraud in relation to the Act have been increased from R10 000 to R30 000 in order to reflect the seriousness with which these offences are regarded.
After 20 years of our newly found democracy, sufficient time has passed in order to assess the effectiveness of the Act and to identify and consider any unintended consequences, gaps and administrative improvements that are required with the legislation.
2.2 REGULATIONS
Regulations are being amended mainly to bring them in line with the provisions of the amended Employment Equity Act of 2013, with the Minister publishing a gazetted version for public comment on 28 February 2014 for 30 days. Additional changes are also proposed in order to simplify reporting requirements by employers to the Department of Labour. Some of the key proposed changes include:
Reporting requirements: An employer, who becomes designated on or after the first working day of April, but before the first working day of October of the same year, must only submit its first report on the first working day of October in the following year or on such other date as may be prescribed to enable a full annual cycle of reporting. Regulations of 2009 required designated employers employing 150 or more employees to report within six months of being designated and thereafter annually on the first working day of October; and designated employers employing fewer than 150 employees to report within twelve months of being designated and thereafter every year that ends with an even number. The new regulations now require all employers regardless of the number of employees to report each and every year.
Reporting forms (EEA2 and EEA4): Reporting forms are now simplified even further in order to make reporting to the Department by designated employers even easier and more conducive for online reporting.
Equal pay for work of equal value: The amended Employment Equity Act of 2013 is very explicit about equal pay for work of equal value. Consequently, pay equity provisions have been included in the regulations outlining the criteria and methodology for eliminating unfair discrimination in pay in terms of race, gender, disability or any other prohibited or arbitrary ground.

5
The previous regulations of 2009 did not have criteria and methodologies for assessing equal pay for work of equal value. The Commission has, with the support of the International Labour Organisation, advised the Minister on the ‘Equal Pay for Work of Equal Value’ contained in the regulations for public comment.
National and provincial Economically Active Population (EAP): Employers will be provided with guidance in the regulations for the setting of numerical goals and numerical targets by taking the national and provincial EAP into account when developing and implementing their employment equity plans.
Employment equity analysis and plan: A designated employer is still required to consult with its employees, conduct an analysis of its workforce, workforce environment, including policies, procedures and practices, prepare and implement an employment equity plan and submit a report to the Department of Labour on the first working day of October as prescribed. As with reporting, where forms are provided in terms of the EEA2 Form and the EEA4 Form, Amendments to the regulations now have included templates for the conducting of an analysis and for the development of an employment equity plan. Designated employers will still be expected to submit their reports to the Department, and they will still be expected to keep their analysis reports and employment equity plans and submit them only on request.
The regulations that were published for public comment were also tabled at NEDLAC for deliberation, commencing on 10 March 2014. The Commission for Employment Equity (CEE) will advise the Minister after considering all inputs and ensuring that amendments are finalised and made effective for reporting for the first working day of October or as prescribed.
A big thank you goes to the public, NEDLAC, the ILO and various stakeholders for their submissions as a response to pleas for public comments. The South African Rewards Association (SARA) is acknowledged for their assistance and professionalism in contributing towards the updating of Annexure EEA 9 and establishing the various occupational levels using different job evaluation and grading systems.
2.3 LAbOUR COURT CASES ON EMPLOYMENT EQUITY (2009 – 2013)
The following Labour Court Judgements on employment equity are highlighted in this report as they have direct policy implications that have been addressed through the amendments to the Employment Equity Act and its regulations:
2.3.1 director-General of department of Labour vs. Comair Limited (Case no. J2326/07)
Comair was referred to the Labour Court for failure to comply with the Director-General’s recommendations pertaining to the preparation of the Employment Equity Plan (EE Plan). However, the decision of the DG to refer Comair to Court for non-compliance was reviewed and set aside in terms of Section 50(h) of the Employment Equity Act, 1998 (the Act).
The reasons for the review was due to the fact that the DG failed to take into account during the assessment process, all factors listed under Section 42 before referring non-compliance to Court. These factors included: (1) no consideration was made to the pool of suitably qualified people from designated groups from which the employer may reasonably be expected to promote or appoint employees, (2) economic and financial factors relevant to the sector in which the employer operates, and (3) present and anticipated economic and financial circumstances of the employer; etc. The gaps in these sections highlighted by the judgement have now been amended in the Act and further guidance will be provided in the regulations in order to strengthen the implementation and enforcement mechanisms of the Act to improve compliance.
2.3.2 Solidarity vs. department of Correctional Services (Case no. C368/2012)
In this case, Solidarity sought relief on behalf of the Western Cape Correctional Services’ officials that were denied promotion, despite having acted in those positions for a long time and also having been recommended for promotion after interviews. These officials lodged an unfair discrimination case in relation to the Department’s employment equity (EE) targets reflected in the EE Plan, which were geared towards Africans and not Coloureds for those particular positions. The Department’s EE targets were formulated utilising only the demographics of the national economically active population and not taking into account both the national and regional demographics as required by Section 42 (a)(i) of the Act.
The Court ruled that the Department of Correctional Services is required to take immediate steps to ensure that both national and regional demographics are taken into account in respect of members of the designated groups, i.e. black people, women and people with disabilities when setting targets at all occupational levels of its workforce.

6
In order to provide guidance as to how designated employers should take into account both national and regional EAP, new provisions have been inserted under section 42(2) and 42(3) of the Act to empower the Minister to issue regulations that provide implementation guidelines on this matter. The draft EE regulations that are inclusive of proposed guidelines on this matter have been published for public comment.
2.3.3 Solidarity vs. South African Police Service (Case no. 165/13)
In this case, Solidarity on behalf of a white female police captain who was not appointed as Superintendent despite having been evaluated as the best candidate, lodged an unfair discrimination case against the South African Police Service (SAPS). The white woman captain was not promoted because her appointment would have affected representivity and militates against employment equity as per the EE targets in the SAPS EE Plan.
It is explained in the ruling that the Employment Equity Act, section 15, is very clear that ‘no absolute barriers’ should be established by any employment policy or practice to the prospective or continued employment or advancement of people who are not from designated groups. Therefore, it does not follow that where the only suitable person is from non-designated group in relation to representivity, that person should not be appointed.
To provide implementation tools for designated employers to be able to prepare and implement EE Plans that are fully compliant with the requirements of section 20, an EE Plan template has been developed and included in the EE regulations published for public comment.
2.4 EMPLOYMENT EQUITY ANd TRANSFORMATION INdAbA
As part of their activities, the CEE together with the Minister of Labour hosted the first Employment Equity and Transformation Indaba since the inception of the Employment Equity Act 15 years ago. The indaba was held in Boksburg over two days on 18 and 19 April 2013. The objectives of the Indaba included, but were not limited to:
• Reflection on achievements and challenges relating to employment equity and transformation of our country, particularly at the workplace, since the inception of our democracy in 1994
• Placement of employment equity and transformation back onto the public arena
• Establishment of strategic partnerships with other Ministries and Departments, Commissions and Councils to ensure synergy, alignment and effectiveness in government transformation initiatives moving forward
• Creation of social dialogue in order to develop appropriate interventions on transformation to address challenges at the workplace level.
Minister Mildred Oliphant delivering a keynote address at the 2013 EE and Transformation Indaba.

7
The distinguished guests that attended this event included, amongst others, the Minister of Labour as a key note speaker; Minister of Higher Education and Minister of Women, Children and People with Disabilities, Members of the Parliamentary Portfolio Committee on Labour, Executives of Organised Business and Organised Labour, the Director-General of the Department of Labour, the Commission for Employment Equity, Commission for Gender Equality; International Labour Organisation (ILO); Director of the CCMA, including stakeholders from Community Constituencies who participated in constituency-based commissions. In addition, formal presentations by the Minister for Public Service and Administration and Minister for Trade and Industry were delivered on their behalf as well.
Minister of Labour, Minister Oliphant, launched the 13th CEE Annual Report on the first day of the Indaba. It was clear from the details of this report that workers still face unfair discrimination in the workplace on a day-to-day basis in terms of race, gender and disability. It was evident from the report that the country is still found wanting in relation to equitable representation of the designated groups, in particular women and people with disabilities in the middle-to-upper occupational levels.
In his presentation of the key highlights of the report, the CEE Chairperson alluded to worrying phenomena demonstrated by statistics submitted by designated employers, especially in the four upper occupational levels. He referred to the following phenomena:
• Deep-Hole Syndrome: (This refers to the population group profile of employees in an organisational structure. The demographic profile of employee representation that gets darker as one goes lower in the organisational structure)
• Random Walk Phenomenon: (There is no consistency in the up or downward trend in statistics. The gains made in the representation of designated groups in one period are reversed by an increase in the representation of whites particularly males in the next period and as such the performance of the country on 10 years resembles a” “drunkards walk” from the bar)
• Missing Women Phenomenon: Women representation is always lower than male representation at middle to senior levels, contrary to the gender demographics of the country or even to the woman EAP
• Some groups being more designated than others: With reference to the over-representation of Indians amongst “designated groups” at middle to senior management levels as well as the pattern whereby white females are usually over-represented in relation to other designated groups at the most significant levels
• Packing order in the representation of people with disabilities. The same pattern that is found with population group is also prevalent in terms of disability, where the representation of Black people with disabilities is much less than those of the White group, particularly at the middle-to-upper levels. This shows that population group raises its ugly head, even in the employment of people with disabilities.
In its endeavours to encourage compliance, the CEE also took the opportunity to show-case some designated employers for the progress that they have made in implementing their Employment Equity Plans that were approved by the Director-General during the review process. Some key areas of improvement that were identified and showcased involved the employment of people with disabilities, graduate development programmes, accelerated management training interventions, coaching and mentoring programmes, including talent management programmes of people from designated groups. Of those designated employers invited, Woolworths, Nedbank, Old Mutual, Truworths, Pick n Pay, South African Breweries, Tongaat-Hulett, Bid Air, Kolok, MTN, Tiger Consumer Brands and Rennies Ships fully participated in the Indaba, which included showcasing their efforts via video clips.
Participants were divided into commissions on the second day and were required to deliberate on best practices and challenges, including making recommendations on the way forward. The focus areas together with key points for each of the Commissions are listed below:
• Management of disputes in relation to the elimination of unfair discrimination and the implementation of affirmative action measures
• Pay equity – Equal Pay for Work of Equal Value
• Increasing the pool of suitably qualified individuals
• Increasing the representation of the designated groups in crucial occupational levels in the workplace, particularly Africans and Coloureds, Black women and People with Disabilities
• Strengthening compliance and enforcement mechanisms.
Participants at the Indaba reiterated the need for employers to take employment equity seriously and address inequality in order to transform workplaces.
8
2.5 dIRECTOR-GENERAL REvIEwS
The process of conducting Director-General Reviews has been on-going for seven years since 2006. The process commenced with identification of JSE listed companies, including multinational companies operating in the country in different sectors. During this process, the Department found employers wanting in complying with the requirements stipulated by the Employment Equity Act.
ChALLENGESThe Department observed among others, the following challenges during reviews:• There was no buy-in from senior and top leadership to embrace employment equity as part of business imperatives
• EE Managers assigned were mostly junior staff with no authority and the necessary resources to execute their mandate
• Consultative Forums were not existing or if existing they were not properly constituted
• Lack of consultation on the preparation and development of EE Plans, including preparation of annual EE reports before submission to the Department
• In matters referred to the Labour Court, companies were reluctant to submit requested information in the DG Reviews and Companies failing to comply with recommendations made by the Director-General.
However, employers were issued with DG Recommendations and given reasonable time to implement those recommendations. Follow-ups were conducted to monitor progress made by companies after their EE Plans were approved by the DG for implementation going forward. It came as no surprise when companies came with positive strategies and practices that yielded positive spin-offs ensuring that employment equity and transformation happen in their workplaces.
SPIN-OFFS• The Chief Executive Officers (CEOs) of the employers concerned became hands-on in implementing and monitoring
programmes to develop their employees
• Improvement in recruitment by engaging in methods involving career fairs and open-days
• Some companies surpassed their EE targets as projected in their approved EE Plan, including an increase on employment of People with Disabilities from a zero-base
• Development of programmes within the IT Systems to track employee movements and align it with the projected targets.
In lieu of the positive strategies and best practices implemented by some companies, the Commission for Employment Equity (CEE) show-cased some 15 companies in the Commission for Employment Equity Annual Report (2011/2012) as recognition of efforts to embrace transformation and to encourage other companies to follow suit.
The Department has again this financial year, conducted follow-ups with 17 companies, and found only two companies that were reviewed in 2009 (i.e. Netcare Holdings Group and Massdiscounters) showing satisfactory progress of transformation.
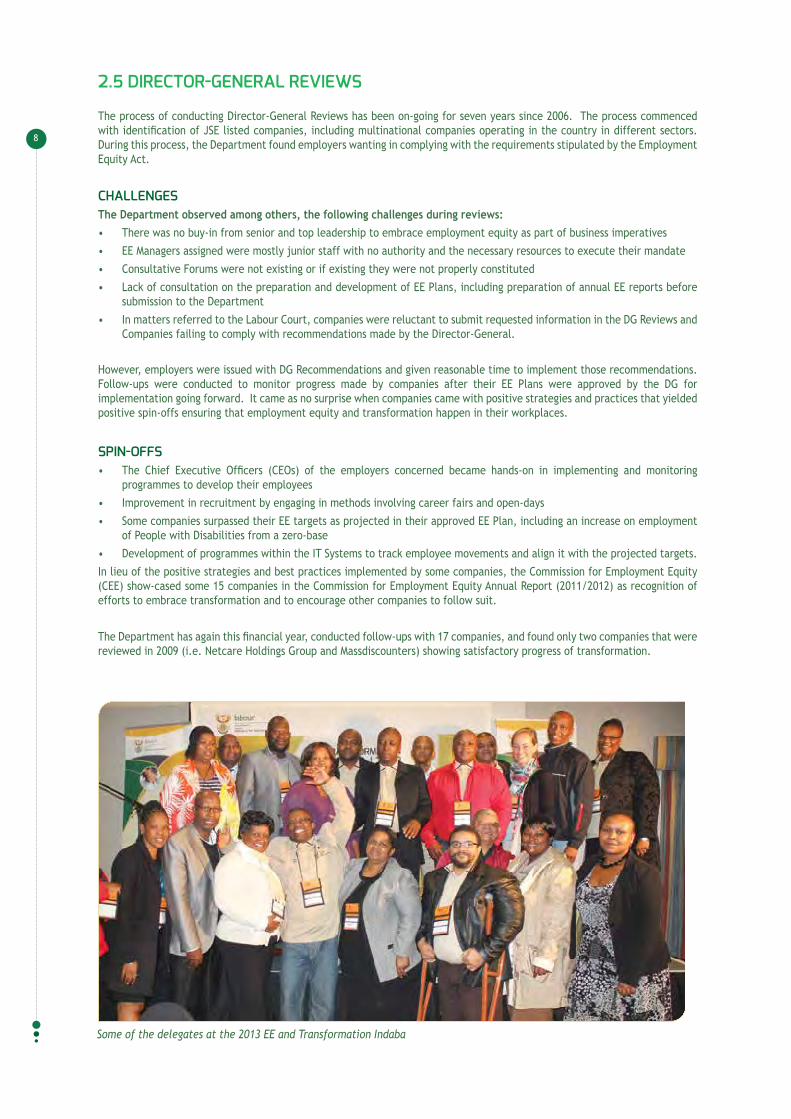
Some of the delegates at the 2013 EE and Transformation Indaba

9
2.5.1 NETCARE (IN ThE hEALTh SECTOR)
ChALLENGESDuring the review process, the Netcare Holdings Group was found wanting and operating without an Employment Equity Plan (EE Plan) in terms section 20(2). DG recommendations were issued requesting the company to prepare and develop an EE Plan for the DG’s approval.
INTERvENTIONS
Subsequent to the approval of the EE Plan by the DG, the CEO of the company demonstrated full involvement and a “hands-on” approach in implementing and monitoring a Plan that included strategies aimed at training and employing People with Disabilities. The strategies/interventions included the following:
• Introduction of the Sinako Project in 2012 to assist individuals with disabilities who had not completed Grade 12, or did not have a post-Grade 12 qualification to be more employable
• Adopted an approach of “One Hospital-One employee with a disability per year”
• Introduced “External Recruitment Drive” of using referral and financial incentive for staff
• Built relations with Disability Organisations (NGOs) and recruitment companies
• Partnered with Masingita Project to exchange learners for permanent placement
• Set targets for a workplace Skills Plan, pharmacy internships/learnerships and netcare education
• The company is extending learnerships programme under the Sinako Project to include internships for students with a disability who may have a degree or diploma in human resources, financial management, accounting, economics, administration, pharmacy and nursing.
OUTCOME/RESULTSIn 2013, the Department conducted a follow-up as part of monitoring progress made by the company in implementing the approved EE Plan. It was found that the company implemented the above interventions that yielded the following positive results:
• Of the 50 learners who enrolled for the first time in learnership programmes under the Sinako Project in 2012, 35 were unemployed youth and most of them have already been offered permanent employment by Netcare
• In 2009, Netcare employed 0.5% People with Disabilities
• In May 2013, the company reached 2.3% employment of People with Disabilities.
2.5.2 MASSdICOUNTERS (whOLESALE ANd RETAIL SECTOR)
ChALLENGESDuring the DG review process, the company was operating with an EE Plan that did not meet the requirements of section 20(2). The company lacked strategies to create and accelerate a pool of suitably qualified designated groups in corporate and junior management levels, women leaders with a sound understanding of retail, including in positions of buyers and Planners. The company also had challenges in accountability for transformation.
INTERvENTIONSMassdiscounters implemented the following interventions in response to the challenges it faced above:
• The company created a Merchandise Academy which accelerates the development of merchandise competencies
• Recruitment agencies with a level 3-4 recognition Level are incentivised to ensure the suitable placement of designated groups
• The company participated in the WRSETA NQF Level 5 Buying and Planning Learnerships
• The MDD female consumer panel was created with the intention of gauging key insights from women on various areas of business and consumer patterns
• An Internal Management bridging programme was developed
• A recruitment tracker was created to provide the company with a more powerful approach to managing placements of designated groups
• A unique E-based learning program was developed and it is supported by Walmart International.

10
OUTCOME/RESULTSThe Department did a follow-up in 2013 to monitor the progress made by Massdiscounters in achieving numerical goals through the implementation of interventions as reflected in the EE Plan approved by the DG. The above interventions by Massdiscounters returned the following results:
• The company was found to have surpassed numerical goals in Senior Management and Professionally Qualified levels in its last 2013 reporting cycle of the approved EE Plan
• 68% of designated groups placed in the Merchandising Team are providing exceptional results, and the company has now several African male and female Buyers at strategic level
• Although the forum of MDD female consumer panel started in 2013, it had already contributed to the placement of the first Black female who is heading a regional distribution centre
• There are 41 women who make up the panel, and the panel has started to add value to the company by providing feedback on the expectations of female consumers
• Internal management bridging programme MDD developed and launched the first Admin Manager Supervisory Programme (NQF4). 91 Deputy Admin Managers completed a 12 month accredited programme aimed at bridging the gap between supervisory and management
• Developed a unique E-based learning programme that is supported by Walmart International, with 29 students, of which 60% are Black and equipped with critical management skills, empowering them to transform the business themselves.
2.6 bROAd-bASEd bLACk ECONOMIC EMPOwERMENT
The Commission has been involved in activities to align the Broad-Based Black Economic Empowerment Act and their Codes to critical provisions of the Employment Equity Act as amended, including their regulations. Key areas that have already been considered for alignment include the following:
• Beneficiaries of Broad-Based Black Economic Employment are very similar to that of the beneficiaries of employment equity, with the focus of the former pertaining only Black people. The definition of “designated groups” has been revised to ensure that Black people, including women, youth, people with disabilities and people living in rural areas who became citizens of South Africa prior to 27 April 1994 or who would have obtained citizenship but for apartheid policies did not, will now benefit from affirmative action. Local spheres of Government are now subjected to the Act.
• Occupational levels defined in the EEA9 Annexure in the Employment Equity Regulations will be exactly the same as those contained in the BBBEE Codes
• The BBBEE Codes used to have seven elements for assessment previously, which have now been consolidated and reduced to five, with employment equity subsumed under the Management and Control element in Code 200. Assessment of this element focuses on disability and the following three occupational levels: Senior Management, Professionally Qualified and Skilled and Lower Management levels. The Top Management level has been subsumed under the Ownership element in Code 100
• Penalties in terms of fines are now linked to the turnover of companies.

11

wORkFORCEdISTRIbUTION
THREE

13
3. wORkFORCE dISTRIbUTION
The workforce population distribution is based on the Quarterly Labour Force Survey (QLFS) published by Statistics South Africa on the Economically Active Population (EAP). The EAP includes people from 15 to 64 years of age who are either employed or unemployed and who are seeking employment. The EAP is meant to assist employers during the analysis of their workforce to determine the degree of under-representation of the designated groups. Further, it guides employers by assisting them in the setting of their numerical goals and targets in order to achieve an equitable and representative workforce.
The national and provincial demographics of the Economically Active Population (EAP) are illustrated in Tables 1 and 2 by population group and gender respectively. In addition, the EAP data indicates that special efforts are also required to increase the pool of women who are economically active, especially when they are the majority and are able to make more of a contribution towards the development of the South African economy.
Table 1: Profile of the national EAP distribution by population group and gender
NATIONAL EAP BY POPULATION GROUP AND GENDERRace Male Female Total
African 40.3% 34.9 75.2
Coloured 5.6% 5.0% 10.6
Indian 1.9% 1.2% 3.1
White 6.2% 4.6% 10.8
Total 54.0% 46.0% 100%
Source: Statistics South Africa, (QLFS 3 2013) (all percentages are rounded to one decimal point)
Table 2: Profile of the EAP distribution by population group and gender per province
PROVINCEPOPULATION GROUP AND GENDER
GENDER A C I W Total
Western Cape
Male 16.2% 27.4% 0.2% 8.7% 52.5%
Female 15.0% 25.0% 0.1% 7.3% 47.4%
TOTAL 31.2% 52.4% 0.3% 16.0% 100%
Eastern Cape
Male 39.6% 7.3% 0.4% 5.1% 52.4%
Female 37.3% 6.2% 0.1% 4.0% 47.6%
TOTAL 76.9% 13.5% 0.5% 9.1% 100%
Northern Cape
Male 30.6% 19.1% 0.2% 5.3% 55.2%
Female 24.8% 15.8% 0.1% 4.1% 44.8%
TOTAL 55.4% 34.9% 0.3% 9.4% 100%
Free State
Male 47.8% 1.1% 0.2% 5.3% 54.4%
Female 24.8% 15.8% 0.1% 4.1% 44.8%
TOTAL 72.6% 16.9% 0.3% 9.4% 100%
KwaZulu-Natal
Male 42.6% 1.1% 6.4% 2.7% 52.8%
Female 39.9% 1.0% 4.2% 2.1% 47.2%
TOTAL 82.5% 2.1% 10.6% 4.8% 100%
North West
Male 54.9% 0.7% 0.2% 3.5% 59.3
Female 36.9% 0.7% 0.1% 3.0% 40.7%
TOTAL 91.8% 1.4% 0.3% 6.5% 100%
Gauteng
Male 41.2% 1.8% 1.7% 9.9% 54.6%
Female 35.0% 1.5% 1.1% 7.8% 45.4%
TOTAL 76.2% 3.3% 2.8% 17.7% 100%
Mpumalanga
Male 49.9% 0.4% 0.9% 4.6% 55.8
Female 40.9% 0.4% 0.3% 2.5% 44.1
TOTAL 90.8% 0.8% 1.2% 7.1% 100%
Limpopo
Male 50.3% 0.4% 0.5% 1.8% 53.0%
Female 45.1% 0.4% 0.3% 1.3% 47.1%
TOTAL 95.4% 0.8% 0.8% 3.1% 100%Source: Statistics South Africa, (QLFS 3 2013) (all percentages are rounded to one decimal point)
Table 2 shows the EAP distribution per province and in terms of population group and gender. All employee statistics in graphs and tables that follow should be viewed in relation to the national and provincial EAP both in terms of race and gender.

TRENdS ANALYSIS
FOUR

15
4. TRENdS ANALYSIS
The graphs and tables in this section provide the population group and gender workforce profile distribution from 2003 to 2013. A trends analysis of the first four occupational levels, i.e. Top Management, Senior Management, Professionally Qualified and Skilled levels, are provided below in terms of population group and gender. Please note that the Department only started collecting data for foreign nationals from 2006 onwards.
4.1 POPULATION dISTRIbUTION TRENdS FOR ThE TOP MANAGEMENT LEvEL FROM 2003 TO 2013 bY POPULATION GROUP ANd GENdER
Figure 1: Population distribution trends for the Top Management level from 2003 to 2013 by population group
Figure 1 shows fluctuations in the employment distribution of African, Coloured and White population groups in terms of their representation at the Top Management level. The representation of Indians and Foreign nationals has been gradually increasing over the same period. White representation decreased by 13.6% from 76.3% in 2003 to 62.7% in 2013 and African representation increased slightly by 4.9% over the same period from 14.9% to 19.8%. Coloureds representation increased over the same by 1.1% from 4.0% in 2003 to 5.1% in 2013.
Figure 2 : Population distribution trends for the Top Management level from 2003 to 2013 by gender
Figure 2 shows that males continue to be over-represented at the Top Management level, although their representation at this level dropped by 6.6% from 86.0% in 2003 to 79.4% in 2013. Female representation increased steadily by 6.6% from 14% in 2003 to 20.6% in 2013 at this level. More still needs to be done in order to bring the representation of females anywhere near close to their EAP.
0.0%
20.0%
40.0%
60.0%
80.0%
100.0%
2003 2005 2007 2009 2011 2013Male 86.0% 83.0% 79.5% 81.5% 80.9% 79.4%
Female 14.0% 17.0% 20.6% 18.4% 19.0% 20.6%
Top management - Gender
0.0%
50.0%
100.0%
2003 2005 2007 2009 2011 2013
African 14.9% 17.9% 18.8% 20.3% 18.5% 19.8%
Coloured 4.0% 3.7% 3.9% 5.0% 4.8% 5.1%
Indian 4.9% 5.6% 6.1% 6.9% 7.5% 8.4%
White 76.3% 72.6% 68.2% 63.8% 65.4% 62.7%
Foreign national 0.0% 0.0% 3.1% 3.9% 3.9% 4.1%
Top management - population group

16
4.2 POPULATION dISTRIbUTION TRENdS FOR ThE SENIOR MANAGEMENT LEvEL FROM 2003 TO 2013 bY POPULATION GROUP ANd GENdER
Figure 3: Population distribution trends for the Senior Management level from 2003 to 2013 by population groupFigure 3 shows an increase of the Black Groups (i.e. Africans, Coloureds and Indians) and a decrease of Whites at this level.
African representation has been consistently increasing from 14.2% in 2003 to 23.0% in 2013, representing 8.8% increase. Indians increased at this level by 3.3% from 6.8% in 2003 to 10.1% in 2013, while Coloureds representation increased by 0.7% from 6.3% in 2003 to 7% in 2013, which is a clear indication that the increase in representation is not benefiting all within the Black group equally or on an equitable basis. White representation decreased from 72.7% in 2003 to 57% in 2013. The representation of Foreign Nationals increased by 0.7% from 2.3% in 2007 to 3.0% in 2013.
Figure 4: Population distribution trends for the Senior Management level from 2003 to 2013 by gender
0.0%
20.0%
40.0%
60.0%
80.0%
100.0%
2003 2005 2007 2009 2011 2013
African 14.2% 14.5% 18.1% 20.0% 12.8% 23.0%
Coloured 6.3% 6.0% 6.1% 6.4% 7.0% 7.0%
Indian 6.8% 7.0% 8.2% 9.1% 9.6% 10.1%
White 72.7% 72.4% 65.0% 61.9% 59.1% 57.0%
Foreign national 0.0% 0.0% 2.3% 2.0% 2.5% 3.0%
Senior management - population group
Changes at the Top Management Level from 2003 to 2013 using actual values and percentages
At the Top Management Level, the total workforce increased by 7 056 (45.5%) from15 515 in 2003 to 2 2571 in 2013, which had the following impact in terms of population group and gender distribution:
• White representation increased by 2 318 (19.6%) at this level from 1 1831 employees in 2003 to 14 149 employees in 2013
• Indian representation increased by 1 113 (145.3%) at this level from 766 employees in 2003 to 1 879 employees in 2013
• Coloured representation increased by 537 (88.2%) at this level from 609 employees in 2003 to 1 146 employees in 2013
• African representation increased by 2 155 (93.3%) at this level from 2 309 employees in 2003 to 4 464 employees in 2013
• Female representation increased by 2 468 (113.4%) at this level from 2 177 employees in 2003 to 4 646 employees in 2013
• Male representation increased by 4 587 (34.4%) at this level from 13 338 employees in 2003 to 17 925 employees in 2013
• Disability representation increased by 100 (40.5%) at this level from 247 employees in 2003 to 347 employees in 2013.
0.0%
20.0%
40.0%
60.0%
80.0%
100.0%
2003 2005 2007 2009 2011 2013
Male 77.7% 76.3% 74.6% 72.8% 71.8% 70.1%
Female 22.3% 23.7% 25.3% 27.2% 28.2% 29.9%
Senior management - Gender

17
as shown in Figure 4, males occupy more than double the positions occupied by females at this level. Male representation decreased 7.6% from 77.7% in 2003 to 70.1% in 2013 and female representation increased by the same amount from 22.3% to 29.9% over the same period. The representation of females has been increasing at a snail’s pace, illustrating some blockages for women to reach the upper echelons of the organisational structure.
4.3 POPULATION dISTRIbUTION TRENdS FOR ThE PROFESSIONALLY QUALIFIEd LEvEL FROM 2003 TO 2013 bY POPULATION GROUP ANd GENdER
Figure 5: Population distribution trends for the Professionally Qualified level from 2003 to 2013 by population group
Figure 5 shows fluctuations in the representation of Blacks at the Professionally Qualified level over the ten year period albeit at varying degrees. Africans representation decreased by 0.6% from 39.0% in 2003 to 38.4% in 2013, although the decrease they experienced between 2003 and 2005 by 17.5% was the worst. Coloured representation increased by 3.5% from 6.1% to 9.6% over the same period and has been gradually declining from 2009. Indian representation increased by 3.9 from 5.5% in 2003 to 9.4% in 2013, with a slight decline of 0.6% between 2007 and 2009 before increasing again from 2011. While the representation of Whites increased by 12.1% between 2003 and 2005, it has been gradually from 2007 with a decrease of 8.6% between from 49.2% to 40.6%. The representation of foreign nationals has been on a steady increase from 2007.
Indians have benefited the most from the opportunities that arose and African representation actually decreased over the period in this significant occupational level that serves as a stepping stone to the Senior Management and Top Management levels.
0.0%
20.0%
40.0%
60.0%
80.0%
100.0%
2003 2005 2007 2009 2011 2013
African 39.0% 38.8% 24.1% 32.8% 36.3% 38.4%
Coloured 6.1% 9.3% 8.5% 13.5% 10.2% 9.6%
Indian 5.5% 7.9% 8.7% 8.1% 9.1% 9.4%
White 49.2% 61.3% 57.2% 43.7% 42.3% 40.6%
Foreign Na�onal 0.0% 0.0% 1.4% 1.8% 2.1% 2.4%
Professionally qualified - population group
Changes at the Senior Management Level from 2003 to 2013 using actual values and percentages
At the Senior Management Level, the total workforce increased by 37 094 (78.2%) from 47 433 in 2003 to 84 527 in 2013, which had the following impact in terms of population group and gender distribution:
• White representation increased by 13 656 (19.6%) at this level from 34 485 employees in 2003 to 48 141 employees in 2013
• Indian representation increased by 5 285 (165.2%) at this level from 3 200 employees in 2003 to 8 485 employees in 2013
• Coloured representation increased by 2 864 (94.8%) at this level from 3 020 employees in 2003 to 5 884 employees in 2013
• African representation increased by 12 764 (189.7%) at this level from 6 728 employees in 2003 to 19 492 employees in 2013
• Female representation increased by 14 716 (138.7%) at this level from 10607 employees in 2003 to 25 323 employees in 2013
• Male representation increased by 22.379 (60.8%) at this level from 36 826 employees in 2003 to 59 204 employees in 2013
• Disability representation increased by 456 (74.3%) at this level from 614 employees in 2003 to 1 070 employees in 2013.

18
Figure 6: Population distribution trends for the Professionally Qualified level from 2003 to 2013 by gender
According to Figure 6, male representation is still slightly more than females at the Professionally Qualified level. Although male representation increased between 2003 and 2005, it has been decreasing over the years.
The 43% representation of females at this level is very encouraging as they are gaining ground and are closer to their EAP.
4.4 POPULATION dISTRIbUTION TRENdS FOR ThE SkILLEd TEChNICAL LEvEL FROM 2003 TO 2013 bY POPULATION GROUP ANd GENdER
Figure 7: Population distribution trends for the Skilled Level from 2003 to 2013 by population group group
Figure 7 shows fluctuations in terms of representation of the various population groups at the skilled level, while the representation of whites, while has been on a constant decline over the period. African representation at this level increased by 17.1% from 42.1% in 2003 to 59.2% in 2013 as well as the representation of Foreign Nationals by 0.6% for the same period. The representation of Coloureds people decreased by 1.6% from 12.9% to 11.3%, Indians people decreased by 0.9% from 6.8% to 5.9% and Whites representation decreased by 16.2% from 38.2% to 22% from 2003 to 2013.
0.0%
20.0%
40.0%
60.0%
2003 2005 2007 2009 2011 2013
African 42.1% 38.8% 44.1% 57.0% 57.0% 59.2%
Coloured 12.9% 17.0% 12.8% 11.5% 11.5% 11.3%
Indian 6.8% 6.2% 6.7% 6.2% 6.2% 5.9%
White 38.2% 37.9% 35.6% 24.0% 24.0% 22.0%
Foreign Na�onal 0.0% 0.0% 1.2% 1.3% 1.3% 1.5%
Skilled Technical - population group
2003 2005 2007 2009 2011 2013
Male 64.0% 67.3% 66.1% 56.8% 57.5% 57.0%
Female 36.0% 32.7% 33.8% 43.1% 42.5% 43.0%
0.0%
10.0%
20.0%
30.0%
40.0%
50.0%
60.0%
70.0%
80.0%
Professionally qualified - Gender
Changes at the Professionally Qualified Level from 2003 to 2013 using actual values and percentages
• At the Professionally Qualified Level, the total workforce increased by 7 056 (45.5%) from15 515 in 2003 to 22 571 in 2013, which had the following impact in terms of population group and gender distribution:
• White representation increased by 40 701 (32.0%) at this level from 127 181 employees in 2003 to 167 882 employees in 2013
• Indian representation increased by 24 992 (174.5%) at this level from 14 323 employees in 2003 to 39 315 employees in 2013
• Coloured representation increased by 24 336 (154.1%) at this level from 15 796 employees in 2003 to 40 132 employees in 2013
• African representation increased by 59 605 (59.2%) at this level from 100 798 employees in 2003 to 160 401 employees in 2013
• Female representation increased by 85 910 (91.2%) at this level from 94 223 employees in 2003 to 180 133 employees in 2013
• Male representation increased by 73 964 (45.1%) at this level from 163 899 employees in 2003 to 237 863 employees in 2013
• Disability representation increased by 2 500 (123.7%) at this level from 2 021 employees in 2003 to 4 521 employees in 2013.
19
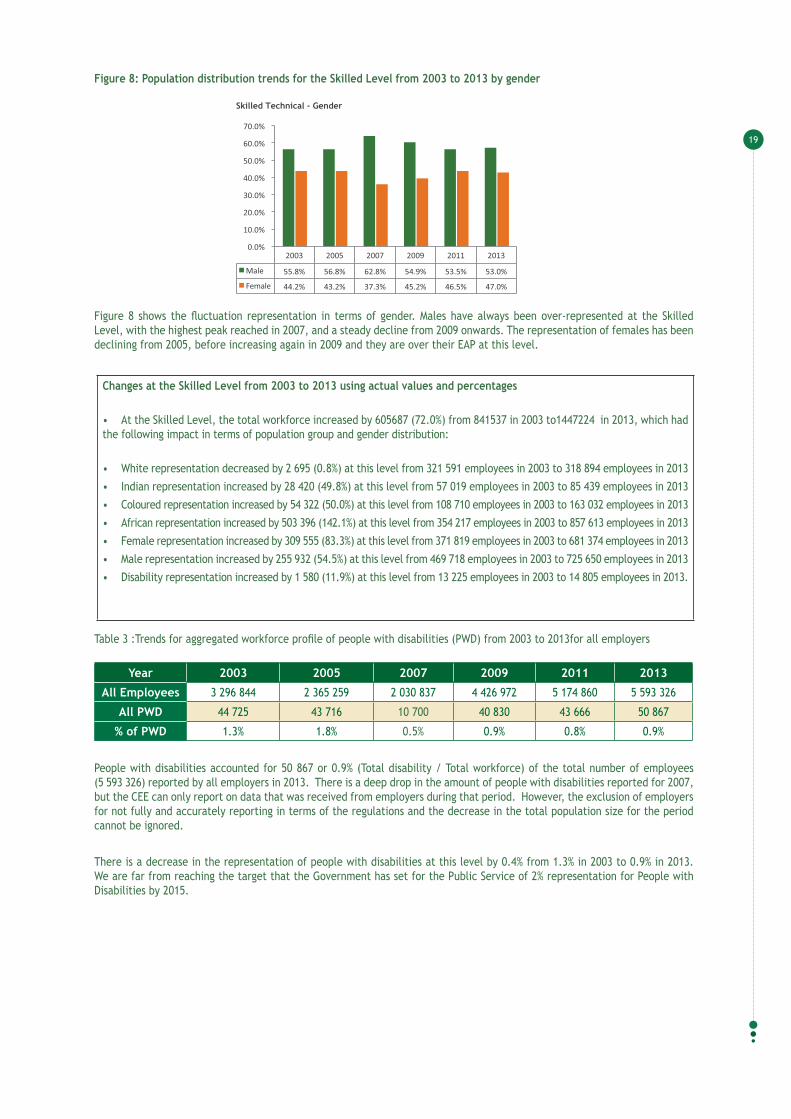
Figure 8: Population distribution trends for the Skilled Level from 2003 to 2013 by gender
Figure 8 shows the fluctuation representation in terms of gender. Males have always been over-represented at the Skilled Level, with the highest peak reached in 2007, and a steady decline from 2009 onwards. The representation of females has been declining from 2005, before increasing again in 2009 and they are over their EAP at this level.
Table 3 :Trends for aggregated workforce profile of people with disabilities (PWD) from 2003 to 2013for all employers
Year 2003 2005 2007 2009 2011 2013
All Employees 3 296 844 2 365 259 2 030 837 4 426 972 5 174 860 5 593 326
All PWD 44 725 43 716 10 700 40 830 43 666 50 867
% of PWD 1.3% 1.8% 0.5% 0.9% 0.8% 0.9%
People with disabilities accounted for 50 867 or 0.9% (Total disability / Total workforce) of the total number of employees (5 593 326) reported by all employers in 2013. There is a deep drop in the amount of people with disabilities reported for 2007, but the CEE can only report on data that was received from employers during that period. However, the exclusion of employers for not fully and accurately reporting in terms of the regulations and the decrease in the total population size for the period cannot be ignored.
There is a decrease in the representation of people with disabilities at this level by 0.4% from 1.3% in 2003 to 0.9% in 2013. We are far from reaching the target that the Government has set for the Public Service of 2% representation for People with Disabilities by 2015.
Changes at the Skilled Level from 2003 to 2013 using actual values and percentages
• At the Skilled Level, the total workforce increased by 605687 (72.0%) from 841537 in 2003 to1447224 in 2013, which had the following impact in terms of population group and gender distribution:
• White representation decreased by 2 695 (0.8%) at this level from 321 591 employees in 2003 to 318 894 employees in 2013
• Indian representation increased by 28 420 (49.8%) at this level from 57 019 employees in 2003 to 85 439 employees in 2013
• Coloured representation increased by 54 322 (50.0%) at this level from 108 710 employees in 2003 to 163 032 employees in 2013
• African representation increased by 503 396 (142.1%) at this level from 354 217 employees in 2003 to 857 613 employees in 2013
• Female representation increased by 309 555 (83.3%) at this level from 371 819 employees in 2003 to 681 374 employees in 2013
• Male representation increased by 255 932 (54.5%) at this level from 469 718 employees in 2003 to 725 650 employees in 2013
• Disability representation increased by 1 580 (11.9%) at this level from 13 225 employees in 2003 to 14 805 employees in 2013.
2003 2005 2007 2009 2011 2013
Male 55.8% 56.8% 62.8% 54.9% 53.5% 53.0%
Female 44.2% 43.2% 37.3% 45.2% 46.5% 47.0%
0.0%
10.0%
20.0%
30.0%
40.0%
50.0%
60.0%
70.0%
Skilled Technical - Gender

ANALYSIS OF EMPLOYMENT EQUITY REPORTS RECEIvEd IN 2013
FIVE
21
5. ANALYSIS OF EMPLOYMENT EQUITY REPORTS RECEIvEd IN 2013
This section of the report reflects on the extent of reporting by employers for 2013 in relation to workforce profiles, workforce movement by province, sector and business type of the population distribution in terms of population groups, gender and disability. Focus is only placed on the first four occupational levels, i.e. Top Management, Senior Management, Professionally Qualified and Skilled levels, because this is where people from designated groups are most under-represented.
The main tables supporting the information reflected in this report are contained in Appendix A. An increase or decrease in the percentage in the report refers mainly, in most cases, to the percentage point difference for interpretation purposes.
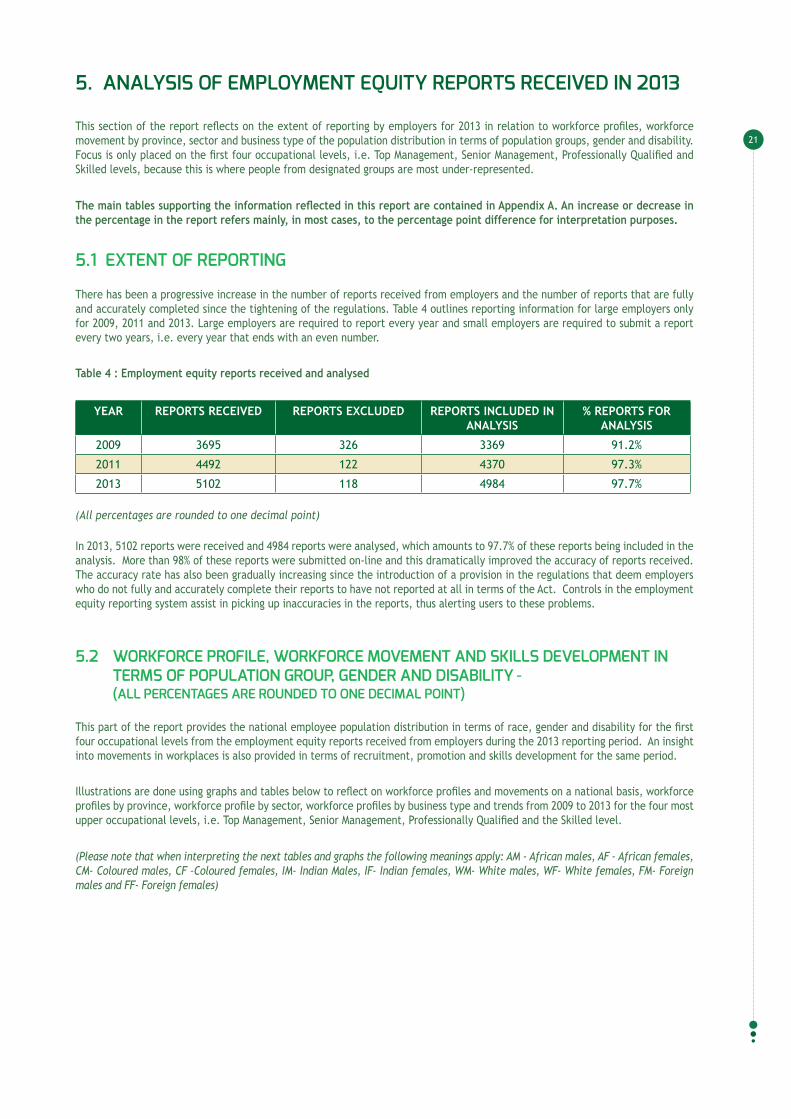
5.1 ExTENT OF REPORTING
There has been a progressive increase in the number of reports received from employers and the number of reports that are fully and accurately completed since the tightening of the regulations. Table 4 outlines reporting information for large employers only for 2009, 2011 and 2013. Large employers are required to report every year and small employers are required to submit a report every two years, i.e. every year that ends with an even number.
Table 4 : Employment equity reports received and analysed
YEAR REPORTS RECEIVED REPORTS EXCLUDED REPORTS INCLUDED IN ANALYSIS
% REPORTS FOR ANALYSIS
2009 3695 326 3369 91.2%
2011 4492 122 4370 97.3%
2013 5102 118 4984 97.7%
(All percentages are rounded to one decimal point)
In 2013, 5102 reports were received and 4984 reports were analysed, which amounts to 97.7% of these reports being included in the analysis. More than 98% of these reports were submitted on-line and this dramatically improved the accuracy of reports received. The accuracy rate has also been gradually increasing since the introduction of a provision in the regulations that deem employers who do not fully and accurately complete their reports to have not reported at all in terms of the Act. Controls in the employment equity reporting system assist in picking up inaccuracies in the reports, thus alerting users to these problems.
5.2 wORkFORCE PROFILE, wORkFORCE MOvEMENT ANd SkILLS dEvELOPMENT IN TERMS OF POPULATION GROUP, GENdER ANd dISAbILITY - (ALL PERCENTAGES ARE ROUNdEd TO ONE dECIMAL POINT)
This part of the report provides the national employee population distribution in terms of race, gender and disability for the first four occupational levels from the employment equity reports received from employers during the 2013 reporting period. An insight into movements in workplaces is also provided in terms of recruitment, promotion and skills development for the same period.
Illustrations are done using graphs and tables below to reflect on workforce profiles and movements on a national basis, workforce profiles by province, workforce profile by sector, workforce profiles by business type and trends from 2009 to 2013 for the four most upper occupational levels, i.e. Top Management, Senior Management, Professionally Qualified and the Skilled level.
(Please note that when interpreting the next tables and graphs the following meanings apply: AM - African males, AF - African females, CM- Coloured males, CF –Coloured females, IM- Indian Males, IF- Indian females, WM- White males, WF- White females, FM- Foreign males and FF- Foreign females)

22
5.2.1 TOP MANAGEMENT POPULATION dISTRIbUTION IN TERMS OF POPULATION GROUP, GENdER ANd dISAbILITY
Figure 9: Workforce profile at the Top Management level by population group, gender and disability
According to Figure 9, there is an over-representation of Whites with 62.7% more than, which is nearly five times their EAP and nearly double the sum of all Blacks at this level combined. This is followed by Africans with 19.8% representation, while Indians make up 8.3%, which is more than double their EAP when compared to Africans and Coloured within the Black Group. Coloureds make up 5.1% of the representation at the Top Management level.
Male representation at 79.4% is almost four times that of females at this level. People with Disabilities are lurking behind with 1.5% of the representation at this level.
Top Management - population group
Top Management - Gender
Top Management
19.8%5.1%
8.3%
62.7%
4.1%African
Coloured
Indian
White
Foreign Na�onal
79.4%
20.6%
MaleFemale
1.5%
98.5%
DisabilityOther

23
Table 5 : Workforce profile at the Top Management level by province and by population group and gender
PROVINCE
Male Female Foreign Na-tional TOTAL
African Coloured Indian White African Coloured Indian White Male Female
Western Cape 3.9% 8.3% 3.4% 62.0% 1.5% 4.4% 1.2% 12.7% 2.2% 0.4% 100.0%
Eastern Cape 16.6% 5.5% 2.8% 55.7% 7.0% 1.2% 0.1% 8.1% 2.9% 0.0% 100.0%
Northern Cape 19.2% 11.4% 2.2% 45.4% 13.1% 2.6% 0.0% 6.1% 0.0% 0.0% 100.0%
Free State 25.7% 2.9% 1.3% 41.1% 15.4% 0.0% 0.2% 11.8% 1.1% 0.6% 100.0%
KwaZulu-Natal 16.5% 2.5% 13.6% 45.9% 7.1% 1.1% 3.8% 7.1% 2.2% 0.1% 100.0%
North West 42.5% 0.6% 1.7% 35.8% 10.7% 0.4% 0.8% 6.1% 1.5% 0.0% 100.0%
Gauteng 12.3% 2.4% 6.8% 52.2% 6.5% 1.1% 2.0% 11.0% 4.9% 0.8% 100.0%
Mpumala-nga 24.8% 2.4% 2.3% 52.6% 7.6% 0.3% 0.5% 7.8% 1.7% 0.0% 100.0%
Limpopo 28.5% 1.3% 3.9% 43.2% 12.3% 0.5% 0.5% 8.9% 0.8% 0.0% 100.0%
Table 5 shows the White group as over-represented at the Top management level in eight provinces, except the North West province where African Male representation is performing well in Top Management. The Western Cape Province has the most representation of the White group at the Top management level for both the male and female groups. White male representation occupies almost two thirds of Top management positions in the Western Cape and just more than half of the positions in the North West.
African female representation appears to be the least preferred group in the Western Cape. Male Foreign National representation in the Western Cape is more than the African female representation at this level.
Table 6: Workforce profile at the Top Management level by province for disability
PROVINCEMale Female Foreign
National TOTALAfrican Coloured Indian White African Coloured Indian White Male Female
Western Cape 0.0% 11.1% 4.4% 55.6% 0.0% 6.7% 4.4% 15.6% 2.2% 0.0% 100.0%
Eastern Cape 26.7% 6.7% 6.7% 40.0% 0.0% 0.0% 0.0% 20.0% 0.0% 0.0% 100.0%
Northern Cape 0.0% 0.0% 0.0% 100.0% 0.0% 0.0% 0.0% 0.0% 0.0% 0.0% 100.0%
Free State 0.0% 0.0% 0.0% 50.0% 50.0% 0.0% 0.0% 0.0% 0.0% 0.0% 100.0%
KwaZulu-Natal 31.1% 2.7% 8.1% 23.0% 23.0% 2.7% 1.4% 6.8% 1.4% 0.0% 100.0%
North West 40.0% 0.0% 0.0% 60.0% 0.0% 0.0% 0.0% 0.0% 0.0% 0.0% 100.0%
Gauteng 11.9% 3.0% 10.1% 49.4% 4.8% 3.0% 2.4% 11.3% 4.2% 0.0% 100.0%
Mpumala-nga 29.6% 0.0% 0.0% 63.0% 3.7% 0.0% 0.0% 3.7% 0.0% 0.0% 100.0%
Limpopo 71.4% 0.0% 0.0% 28.6% 0.0% 0.0% 0.0% 0.0% 0.0% 0.0% 100.0%
Table 6: shows that White representation is the highest among people with disabilities at the Top Management level in almost all provinces. African males with disabilities are the least represented in the Northern Cape, Free State and the Western Cape provinces. African females with disabilities are least represented in the Eastern Cape, Western Cape, Northern Cape and North West Province.

24
Representation of African females with disabilities are strong in Free State and Kwa-Zulu-Natal and White female representation is stronger than all the other groups in all the other provinces when compared to the representation of Black female representation.
Table 7: Sector workforce profile at the Top Management Level by population group and gender
According to Table 7, White representation is stronger than other groups almost in all the business sectors at the Top Management level. This is very evident in the agricultural sector and seem to feature less in the community, social and personal services sector, which has a large representation of government employers in the sector.
There is a growing trend towards the employment of Foreign Nationals at this level. A case in point is in mining; manufacturing; electricity, gas and water supply; wholesale and trade; catering; transport and finance sectors where foreign national representation surpasses that of Indian and Coloureds females at the top management level.
SECTORSMale Female Foreign
National TOTALAfrican Coloured Indian White African Coloured Indian White Male Female
Agriculture 6.7% 2.2% 1.3% 72.7% 3.4% 0.6% 0.2% 11.1% 1.7% 0.1% 100.0%
Mining and Quarrying 17.4% 2.0% 2.2% 60.8% 4.9% 0.6% 1.2% 6.3% 4.2% 0.5% 100.0%
Manufacturing 6.0% 2.9% 8.4% 61.5% 2.7% 1.3% 1.5% 8.1% 7.1% 0.6% 100.0%
Electricity, Gas and Water 36.8% 3.9% 4.7% 26.2% 17.1% 1.4% 1.4% 3.6% 4.5% 0.4% 100.0%
Construction 13.4% 5.1% 5.2% 60.8% 4.4% 1.2% 1.8% 5.1% 2.8% 0.3% 100.0%
Retail and Motor Trade/Repair Service
3.5% 4.0% 5.6% 68.7% 1.2% 1.5% 1.4% 12.0% 1.8% 0.3% 100.0%
Wholesale Trade/ Com-mercial Agents/Allied Services
5.4% 2.5% 9.9% 59.7% 3.3% 1.4% 2.9% 10.3% 3.7% 0.8% 100.0%
Catering/Accom-modation/other trade
11.5% 2.9% 4.1% 51.4% 6.3% 1.5% 1.3% 17.9% 2.8% 0.4% 100.0%
Transport/ Stor-age/ Communi-cations
13.5% 3.5% 9.4% 48.9% 6.4% 1.4% 2.2% 10.2% 3.6% 0.7% 100.0%
Finance/Business Services 11.3% 2.9% 6.9% 48.7% 6.2% 2.3% 2.5% 14.7% 3.9% 0.8% 100.0%
Community/Social/Personal Services
32.5% 5.2% 5.2% 26.7% 15.1% 2.1% 2.1% 9.8% 1.1% 0.3% 100.0%

25
Table 8: Sector workforce profile at the Top Management Level for people with disabilities
Table 8 depicts that even with disability, White people are more represented than any other group in all the sectors at the Top Management level, particularly Agriculture where their representation stands at more than 80%. An impressive feature is that of African people with disabilities featuring significantly with one third of them in Electricity, gas and water supply sector.
SECTORMale Female Foreign
National TOTALAfrican Coloured Indian White African Coloured Indian White Male Female
Agriculture 12.5% 0.0% 0.0% 87.5% 0.0% 0.0% 0.0% 0.0% 0.0% 0.0% 100.0%
Mining and Quar-rying 21.1% 0.0% 0.0% 68.4% 0.0% 0.0% 0.0% 10.5% 0.0% 0.0% 100.0%
Manufacturing 4.8% 11.1% 4.8% 54.0% 3.2% 1.6% 3.2% 11.1% 6.3% 0.0% 100.0%
Electricity, Gas and Water 0.0% 0.0% 16.7% 33.3% 33.3% 16.7% 0.0% 0.0% 0.0% 0.0% 100.0%
Construction 27.6% 0.0% 13.8% 31.0% 6.9% 3.4% 0.0% 13.8% 3.4% 0.0% 100.0%
Retail and Motor Trade/Repair Service
0.0% 11.8% 29.4% 47.1% 0.0% 5.9% 0.0% 5.9% 0.0% 0.0% 100.0%
Wholesale Trade/ Commercial Agents/Allied Services
8.7% 0.0% 4.3% 52.2% 0.0% 4.3% 4.3% 8.7% 17.4% 0.0% 100.0%
Catering/Accom-modation/other trade
27.3% 0.0% 0.0% 72.7% 0.0% 0.0% 0.0% 0.0% 0.0% 0.0% 100.0%
Transport/ Stor-age/ Communica-tions
25.6% 5.1% 10.3% 38.5% 0.0% 0.0% 2.6% 17.9% 0.0% 0.0% 100.0%
Finance/Busi-ness Services 2.9% 0.0% 5.9% 52.9% 2.9% 5.9% 8.8% 20.6% 0.0% 0.0% 100.0%
Community/Social/Personal Services
32.2% 2.2% 6.7% 26.7% 23.3% 3.3% 0.0% 5.6% 0.0% 0.0% 100.0%
26
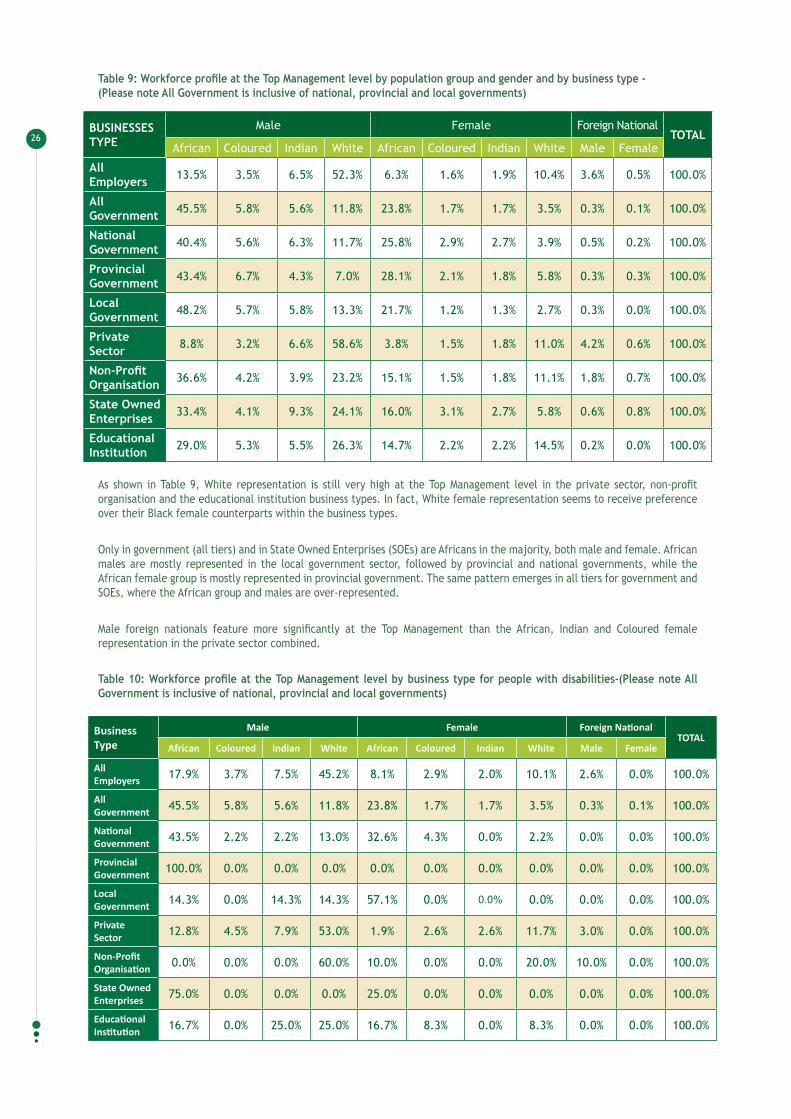
Table 9: Workforce profile at the Top Management level by population group and gender and by business type - (Please note All Government is inclusive of national, provincial and local governments)
As shown in Table 9, White representation is still very high at the Top Management level in the private sector, non-profit organisation and the educational institution business types. In fact, White female representation seems to receive preference over their Black female counterparts within the business types.
Only in government (all tiers) and in State Owned Enterprises (SOEs) are Africans in the majority, both male and female. African males are mostly represented in the local government sector, followed by provincial and national governments, while the African female group is mostly represented in provincial government. The same pattern emerges in all tiers for government and SOEs, where the African group and males are over-represented.
Male foreign nationals feature more significantly at the Top Management than the African, Indian and Coloured female representation in the private sector combined.
Table 10: Workforce profile at the Top Management level by business type for people with disabilities-(Please note All Government is inclusive of national, provincial and local governments)
BUSINESSES TYPE
Male Female Foreign NationalTOTAL
African Coloured Indian White African Coloured Indian White Male Female
All Employers 13.5% 3.5% 6.5% 52.3% 6.3% 1.6% 1.9% 10.4% 3.6% 0.5% 100.0%
All Government 45.5% 5.8% 5.6% 11.8% 23.8% 1.7% 1.7% 3.5% 0.3% 0.1% 100.0%
National Government 40.4% 5.6% 6.3% 11.7% 25.8% 2.9% 2.7% 3.9% 0.5% 0.2% 100.0%
Provincial Government 43.4% 6.7% 4.3% 7.0% 28.1% 2.1% 1.8% 5.8% 0.3% 0.3% 100.0%
Local Government 48.2% 5.7% 5.8% 13.3% 21.7% 1.2% 1.3% 2.7% 0.3% 0.0% 100.0%
Private Sector 8.8% 3.2% 6.6% 58.6% 3.8% 1.5% 1.8% 11.0% 4.2% 0.6% 100.0%
Non-Profit Organisation 36.6% 4.2% 3.9% 23.2% 15.1% 1.5% 1.8% 11.1% 1.8% 0.7% 100.0%
State Owned Enterprises 33.4% 4.1% 9.3% 24.1% 16.0% 3.1% 2.7% 5.8% 0.6% 0.8% 100.0%
Educational Institution 29.0% 5.3% 5.5% 26.3% 14.7% 2.2% 2.2% 14.5% 0.2% 0.0% 100.0%
Business Type
Male Female Foreign NationalTOTAL
African Coloured Indian White African Coloured Indian White Male Female
All Employers 17.9% 3.7% 7.5% 45.2% 8.1% 2.9% 2.0% 10.1% 2.6% 0.0% 100.0%
All Government 45.5% 5.8% 5.6% 11.8% 23.8% 1.7% 1.7% 3.5% 0.3% 0.1% 100.0%
National Government 43.5% 2.2% 2.2% 13.0% 32.6% 4.3% 0.0% 2.2% 0.0% 0.0% 100.0%
Provincial Government 100.0% 0.0% 0.0% 0.0% 0.0% 0.0% 0.0% 0.0% 0.0% 0.0% 100.0%
Local Government 14.3% 0.0% 14.3% 14.3% 57.1% 0.0% 0.0% 0.0% 0.0% 0.0% 100.0%
Private Sector 12.8% 4.5% 7.9% 53.0% 1.9% 2.6% 2.6% 11.7% 3.0% 0.0% 100.0%
Non-Profit Organisation 0.0% 0.0% 0.0% 60.0% 10.0% 0.0% 0.0% 20.0% 10.0% 0.0% 100.0%
State Owned Enterprises 75.0% 0.0% 0.0% 0.0% 25.0% 0.0% 0.0% 0.0% 0.0% 0.0% 100.0%
Educational Institution 16.7% 0.0% 25.0% 25.0% 16.7% 8.3% 0.0% 8.3% 0.0% 0.0% 100.0%

27
In Table 10, White representation still has a hold at the Top Management level with regard to the people with disabilities in the private sector. African people with disabilities feature more prominently in government, especially in provincial government. They are also fairly represented in non-profit organisations and in SOE’s, while disabled Indians are mostly represented in institutions of learning.
National Government appears to be doing fairly well with regards to the representation of females at the Top Management level.
Figure 10: Workforce population distribution for Top Management for all employers
As depicted in Figure 10, the representation of Africans and Coloured is higher in government, while Indians, Whites and Foreign Nationals are mostly represented in the private sector.
Figure 11: Workforce population distribution for Top Management for government employers only
According to Figure 11 this is the sector where designated groups are doing well in Top Management level compared to their EAP and Whites are few in this sector. Africans appear to be significantly represented than the other designated groups in all spheres of government. Almost half (48.2%) of the employees reported to be in local government were African males. There is a fair amount of representation of white males especially in national and local government spheres.
0.0%
10.0%
20.0%
30.0%
40.0%
50.0%
60.0%
AM CM IM WM AF CF
National Govt 40.4% 5.6% 6.3% 11.7% 25.8% 2.9%
Provincial Govt 43.4% 6.7% 4.3% 7.0% 28.1% 2.1%
IF
2.7%
1.8%
WF
3.9%
5.8%
FM
0.5%
0.3%
FF
0.2%
0.3%
Local Govt 48.2% 5.7% 5.8% 13.3% 21.7% 1.2% 1.3% 2.7% 0.3% 0.0%
Top management
0.0%
10.0%
20.0%
30.0%
40.0%
50.0%
60.0%
AM CM IM WM AF CF
All employer 13.5% 3.5% 6.5% 52.3% 6.3% 1.6%
All government 45.5% 5.8% 5.6% 11.8% 23.8% 1.7%
IF
1.9%
1.7%
WF
10.4%
3.5%
FM
3.6%
0.3%
FF
0.5%
0.1%
All private 10.8% 3.3% 6.5% 55.8% 4.8% 1.6% 1.9% 10.9% 3.9% 0.6%
Top management

28
Figure 12: Workforce population distribution for Top Management for private sector employers
Figure 12 depicts that the White group (69.6% ) especially males (58.6%) are over-represented in the Top Management level in the private sector compared to the designated groups, while African male representation (33.4%) and Indian male representation (9.3%) are more represented within State Owned Enterprisess. The White group and African group are mostly represented within educational institutions.
Table 11: Workforce profiles and movements population distribution at the Top Management level in terms of population group, gender and disability – (Please note that there is no separate workforce movement data on disability)
Table 11 above shows that at the Top Management level, White representation at 62.7% and males in particular still continue to enjoy preference over other race groups in terms of representation, recruitment, promotion and skills development at this level. Accounting for 47.1% of all recruitments and 55.7% of all promotions, the status quo of inequity is bound to remain for at least a century at this level if workforce movements are to continue along the same path. More than 53.8% of the White group was exposed to skills development as opposed to other racial groups. This situation puts them in a better position for available opportunities in the workplace.
Males, particularly the White male group, seem to still enjoy the same preference when comparing their representation status and recruitment and promotion trajectory to that of females at this level. Accounting for only 20.7% of the representation, and noting the low recruitment and promotion drive, female representation is likely to remain under-represented at this level for centuries to come. White female representation at 12.8% representation was nevertheless more than twice their EAP at this level.
The population group and gender distribution of people with disabilities represented at this level is very similar to that of the total workforce at this level, with a huge margin of white and male representation.
0.0%
10.0%
20.0%
30.0%
40.0%
50.0%
60.0%
AM CM IM WM AF CF
Private entities 8.8% 3.2% 6.6% 58.6% 3.8% 1.5%
Educational inst 29.0% 5.3% 5.5% 26.3% 14.7% 2.2%
IF
1.8%
2.2%
WF
11.0%
14.5%
FM
4.2%
0.2%
FF
0.6%
0.0%
State Owned Enterprises 33.4% 4.1% 9.3% 24.1% 16.0% 3.1% 2.7% 5.8% 0.6% 0.8%
Top management
WORKFORCE MOVEMENTS
Male Female Foreign National TOTAL
African Coloured Indian White African Coloured Indian White Male Female
Workforce profile for all employees
13.5% 3.5% 6.5% 52.3% 6.3% 1.6% 1.9% 10.4% 3.6% 0.5% 100.0%
Workforce profile for people with disabilities only
17.9% 3.7% 7.5% 45.2% 8.1% 2.9% 2.0% 10.1% 2.6% 0.0% 100.0%
Recruitment for all employers
18.8% 4.2% 5.7% 37.1% 12.6% 2.5% 2.5% 10.0% 6.2% 0.4% 100.0%
Promotion for all employers 13.2% 4.2% 9.5% 42.3% 8.6% 3.2% 3.7% 13.4% 1.6% 0.4% 100.0%
Skills development for all employers
18.8% 4.5% 7.1% 41.2% 10.8% 2.3% 2.7% 12.6% 0% 0% 100%

29
5.2.2 SENIOR MANAGEMENT IN TERMS OF POPULATION GROUP, GENdER ANd dISAbILITY
Figure 13: Workforce profile at the Senior Management level by population group, gender and disability
Figure 13 shows that the representation of the White group at 57.0% is more than the EAP and almost doubles when compared to the Black group. The representation of the Indian group at 10% is the most over-represented in the Black group as their representation is around three times their EAP at this level.
Male representation at 70% are almost double the representation of women and nearly one-and-a-half-times their EAP at this level. Their over-representation at this level seems to be entrenched, and unless drastic action is taken the status quo will remain in both the upper occupational levels. People with Disabilities accounted for 1.2% of the workforce at this level.
Dissability
Other
1.2%
98.8%
Senior Management
Male
Female70%
30%
Senior Management - Gender
African
Coloured
Indian
White
Foreign Na�onal10.0%
7.0%
23.1%
57.0%
3.0%
Senior Management - population group

30
Table 12: Workforce profile at the Senior Management level by province and by population group and gender
Table 12 shows a similar picture at this level where the White group is generally over-represented in most provinces especially the Western Cape Province where they occupy 64.1% of the positions in Senior Management. The Black group is over-represented in Senior Management in Limpopo (71%) and has a slight majority in North West (52.1%) and KwaZulu-Natal Provinces (51.7%).
A common pattern that emerges from the data is the exceptionally good representation of Indians at this level when compared to their EAP in nearly every province. The Coloured group may appear to be performing well in the Western Cape and Northern Cape, but if one had to zoom in on their EAP even at the provincial level, much more needs to be done in order to increase their representation at this level. Generally, with the exception of the Western Cape and Kwa-Zulu Natal, the African group has the second largest representation in all the other provinces at this level.
Table 13: Workforce profile at the Senior Management level by province for disability
According to Table 13, except in Northern Cape and Limpopo, White people with disabilities are well represented at the Senior Management level in most of the provinces. African people with disabilities are the least represented in the Western Cape and Indian people with disabilities are fairly represented in KwaZulu-Natal.
From reports received, it appears as though there are more male people with disabilities than females with disabilities in almost all the provinces.
PROVINCEMale Female Foreign
National TOTALAfrican Coloured Indian White African Coloured Indian White Male Female
Western Cape 5.6% 11.7% 3.8% 45.1% 3.3% 7.0% 1.9% 19.0% 2.0% 0.5% 100.0%
Eastern Cape 21.2% 5.5% 2.3% 43.1% 11.4% 2.1% 0.7% 11.6% 1.6% 0.4% 100.0%
Northern Cape 18.6% 13.3% 1.4% 44.1% 6.9% 4.7% 0.2% 8.8% 2.0% 0.0% 100.0%
Free State 31.6% 3.1% 1.4% 35.5% 11.9% 0.9% 0.2% 15.2% 0.2% 0.0% 100.0%
KwaZulu-Natal 15.2% 2.9% 17.5% 34.8% 6.9% 1.9% 7.3% 11.4% 1.8% 0.3% 100.0%
North West 32.0% 1.7% 1.4% 36.7% 15.1% 1.3% 0.6% 10.4% 0.6% 0.0% 100.0%
Gauteng 14.2% 3.5% 6.8% 42.0% 8.2% 1.9% 3.3% 16.6% 2.8% 0.7% 100.0%
Mpumalanga 33.0% 1.3% 1.7% 41.3% 11.1% 0.4% 0.4% 9.1% 1.5% 0.1% 100.0%
Limpopo 44.2% 0.4% 1.6% 21.7% 24.1% 0.1% 0.6% 5.8% 1.4% 0.1% 100.0%
PROVINCEMale Female Foreign
National TOTAL
African Coloured Indian White African Coloured Indian White Male Female
Western Cape 3.2% 18.3% 6.3% 38.1% 1.6% 8.7% 1.6% 19.8% 2.4% 0.0% 100.0%
Eastern Cape 35.7% 2.4% 0.0% 42.9% 11.9% 2.4% 0.0% 4.8% 0.0% 0.0% 100.0%
Northern Cape 100.0% 0.0% 0.0% 0.0% 0.0% 0.0% 0.0% 0.0% 0.0% 0.0% 100.0%
Free State 42.9% 0.0% 0.0% 57.1% 0.0% 0.0% 0.0% 0.0% 0.0% 0.0% 100.0%
KwaZulu-Natal 13.6% 0.0% 13.6% 40.9% 9.1% 1.1% 5.7% 15.9% 0.0% 0.0% 100.0%
North West 30.8% 15.4% 0.0% 30.8% 7.7% 0.0% 0.0% 15.4% 0.0% 0.0% 100.0%
Gauteng 14.1% 4.0% 6.0% 44.8% 7.5% 1.5% 3.5% 16.9% 1.1% 0.6% 100.0%
Mpumalanga 26.8% 0.0% 0.0% 51.2% 9.8% 2.4% 0.0% 9.8% 0.0% 0.0% 100.0%
Limpopo 47.1% 0.0% 2.9% 44.1% 2.9% 0.0% 0.0% 2.9% 0.0% 0.0% 100.0%

31
Table 14: Sector workforce profile at the Senior Management Level by population group and gender
As depicted in Table 14, the White group, particularly White males, are over-repressented at the Senior Management level. An exception can be found in the community, social and personal services, which have more African male representation and the electricity, gas and water supply industries, with slightly more African female representation than White female representation.
Africans as a group are the second largest group across most sectors, except for the manufacturing industry where Indians have the second largest representation after the White group. Coloured female representation is slightly more in retail and the motor trade sector as compared to their African and Indians female counterparts.
Male foreign national representation at the senior management level feature prominently in mining and quarrying, even ahead of the Coloured and Indian groups.
SECTORSMale Female Foreign
National TOTALAfrican Coloured Indian White African Coloured Indian White Male Female
Agriculture 12.6% 3.8% 1.9% 60.8% 4.6% 1.4% 0.7% 12.7% 1.2% 0.2% 100.0%
Mining and Quarrying 15.7% 2.4% 3.5% 61.0% 3.5% 0.6% 1.1% 8.0% 3.7% 0.4% 100.0%
Manufacturing 8.4% 4.8% 8.5% 52.6% 3.7% 2.2% 3.0% 12.7% 3.8% 0.4% 100.0%
Electricity, Gas and Water 31.0% 3.3% 5.6% 29.5% 16.3% 1.5% 2.2% 8.1% 2.0% 0.5% 100.0%
Construction 16.1% 5.1% 4.4% 56.3% 6.4% 1.1% 1.2% 6.2% 3.1% 0.2% 100.0%
Retail and Motor Trade/Repair Service
9.1% 6.2% 7.8% 44.0% 4.3% 4.1% 3.7% 19.2% 1.2% 0.4% 100.0%
Wholesale Trade/ Commercial Agents/Allied Services
10.8% 4.3% 10.3% 43.6% 4.5% 2.7% 2.9% 18.0% 2.2% 0.6% 100.0%
Catering/Accom-modation/other trade
12.5% 4.0% 4.8% 32.5% 9.9% 4.3% 2.6% 26.5% 2.4% 0.5% 100.0%
Transport/ Stor-age/ Communica-tions
15.6% 4.6% 11.0% 39.7% 7.9% 2.2% 3.1% 13.7% 1.8% 0.4% 100.0%
Finance/Business Services 10.2% 3.8% 7.4% 39.6% 6.8% 2.6% 4.5% 21.2% 2.9% 1.1% 100.0%
Community/Social/Personal Services
32.2% 5.4% 4.2% 18.8% 19.0% 2.9% 3.2% 12.8% 1.0% 0.3% 100.0%

32
Table 15: Sector workforce profile at the Senior Management Level for disability
Table 15 shows that White representation is still very strong at the Senior Management for people with disabilities in most sectors. The only exception is seen in the transport, storage and communication sector, which is overshadowed by Indian people with disabilities at 55.6% in this sector.
Table 16: Workforce profile at the Senior Management level by population group and gender and by business type (Please note All Government is inclusive of national, provincial and local governments)
SECTORMale Female Foreign
National TOTALAfrican Coloured Indian White African Coloured Indian White Male Female
Agriculture 11.4% 5.7% 2.9% 65.7% 0.0% 2.9% 2.9% 8.6% 0.0% 0.0% 100.0%
Mining and Quarrying 14.8% 3.7% 0.0% 63.0% 1.9% 0.0% 0.0% 14.8% 1.9% 0.0% 100.0%
Manufacturing 7.9% 6.1% 12.2% 57.3% 1.8% 4.3% 0.6% 9.1% 0.6% 0.0% 100.0%
Electricity, Gas and Water 20.7% 0.0% 3.4% 48.3% 10.3% 0.0% 0.0% 17.2% 0.0% 0.0% 100.0%
Construction 9.8% 5.9% 3.9% 72.5% 5.9% 0.0% 0.0% 2.0% 0.0% 0.0% 100.0%
Retail and Motor Trade/Repair Service
5.3% 8.8% 7.0% 52.6% 1.8% 0.0% 3.5% 21.1% 0.0% 0.0% 100.0%
Wholesale Trade/ Com-mercial Agents/Allied Services
2.2% 4.3% 6.5% 60.9% 0.0% 2.2% 0.0% 21.7% 0.0% 2.2% 100.0%
Catering/Accom-modation/other trade
30.2% 1.9% 0.0% 17.0% 20.8% 5.7% 1.9% 18.9% 3.8% 0.0% 100.0%
Transport/ Storage/ Communications
7.9% 4.0% 11.9% 43.6% 5.0% 3.0% 4.0% 19.8% 0.0% 1.0% 100.0%
Finance/Busi-ness Services 10.4% 5.8% 5.0% 42.3% 4.6% 1.9% 4.6% 21.9% 2.7% 0.8% 100.0%
Community/Social/Personal Services
34.5% 5.0% 3.6% 20.5% 16.4% 2.3% 5.0% 12.7% 0.0% 0.0% 100.0%
BUSINESSES TYPE
Male Female Foreign National TOTAL
African Coloured Indian White African Coloured Indian White Male Female
All Employers 15.0% 4.5% 6.9% 41.3% 8.0% 2.5% 3.2% 15.7% 2.4% 0.6% 100.0%
AllGovernment 39.0% 5.4% 4.4% 13.4% 23.8% 2.6% 2.9% 7.7% 0.5% 0.3% 100.0%
National Government 34.3% 4.6% 4.8% 13.8% 24.0% 2.6% 4.1% 10.5% 0.7% 0.5% 100.0%
Provincial Government 45.1% 5.6% 3.1% 7.4% 28.5% 3.4% 2.0% 4.5% 0.4% 0.0% 100.0%
Local Government 41.7% 6.5% 4.7% 18.3% 19.4% 1.9% 1.4% 5.7% 0.3% 0.1% 100.0%
Private Sector 10.2% 4.3% 7.4% 47.5% 4.8% 2.4% 3.2% 16.9% 2.8% 0.6% 100.0%
Non-Profit Organisation 27.9% 5.3% 3.2% 21.6% 16.6% 4.4% 3.2% 15.9% 1.3% 0.6% 100.0%
SOE 26.8% 4.4% 6.4% 24.7% 18.3% 2.8% 3.0% 10.6% 2.0% 0.9% 100.0%
Educational Institution 23.0% 4.5% 5.4% 21.8% 13.8% 3.1% 3.7% 22.1% 2.0% 0.4% 100.0%

33
The picture depicted in Table 16 is very similar to that of Top Management with slightly reduced representation of the African group in all tiers of government. African representation, both males and females, is strongest at provincial government for both the genders. Africans as a group are also significantly represented at the senior management level in SOEs, which is bigger than the White group.
More people from the White group, especially White females, are found in non-profit organisations and educational institutions, while the status quo of White male representation is still very prominent in the private sector, non-profit organisations as well as educational institutions.
Table 17: Workforce profile at the Senior Management level by Business Type for disability (Please note All Government is inclusive of national, provincial and local Governments)
According to Table 17, White people with disabilities are mostly represented in the private sector, non-profit organisations, parastatals and National Government at this level. Although the numbers are small, the Indian group, especially males, seems to be over-represented in educational institution. African people with disabilities are mostly represented in the provincial and local government spheres at the Senior Management.
Business Type
Male Female Foreign National TOTAL
African Coloured Indian White African Coloured Indian White Male Female
All Employers 15.6% 5.1% 6.0% 43.7% 7.0% 2.3% 3.0% 15.8% 1.0% 0.4% 100.0%
All Government 41.8% 1.8% 3.6% 12.7% 34.5% 3.6% 0.0% 1.8% 0.0% 0.0% 100.0%
National Government 22.1% 5.2% 2.6% 31.2% 15.6% 0.0% 5.2% 18.2% 0.0% 0.0% 100.0%
Provincial Govern-ment
53.8% 5.1% 5.1% 15.4% 15.4% 2.6% 2.6% 0.0% 0.0% 0.0% 100.0%
Local Government 38.9% 5.6% 0.0% 44.4% 5.6% 5.6% 0.0% 0.0% 0.0% 0.0% 100.0%
Private Sector 9.8% 5.2% 7.0% 50.8% 3.5% 2.3% 2.5% 17.2% 1.3% 0.5% 100.0%
Non-Profit Organisa-tion
16.2% 5.4% 2.7% 21.6% 27.0% 2.7% 2.7% 21.6% 0.0% 0.0% 100.0%
SOE 17.6% 5.9% 2.9% 47.1% 2.9% 2.9% 2.9% 17.6% 0.0% 0.0% 100.0%
Educational Institution 37.4% 4.4% 4.4% 14.3% 19.8% 3.3% 6.6% 8.8% 1.1% 0.0% 100.0%
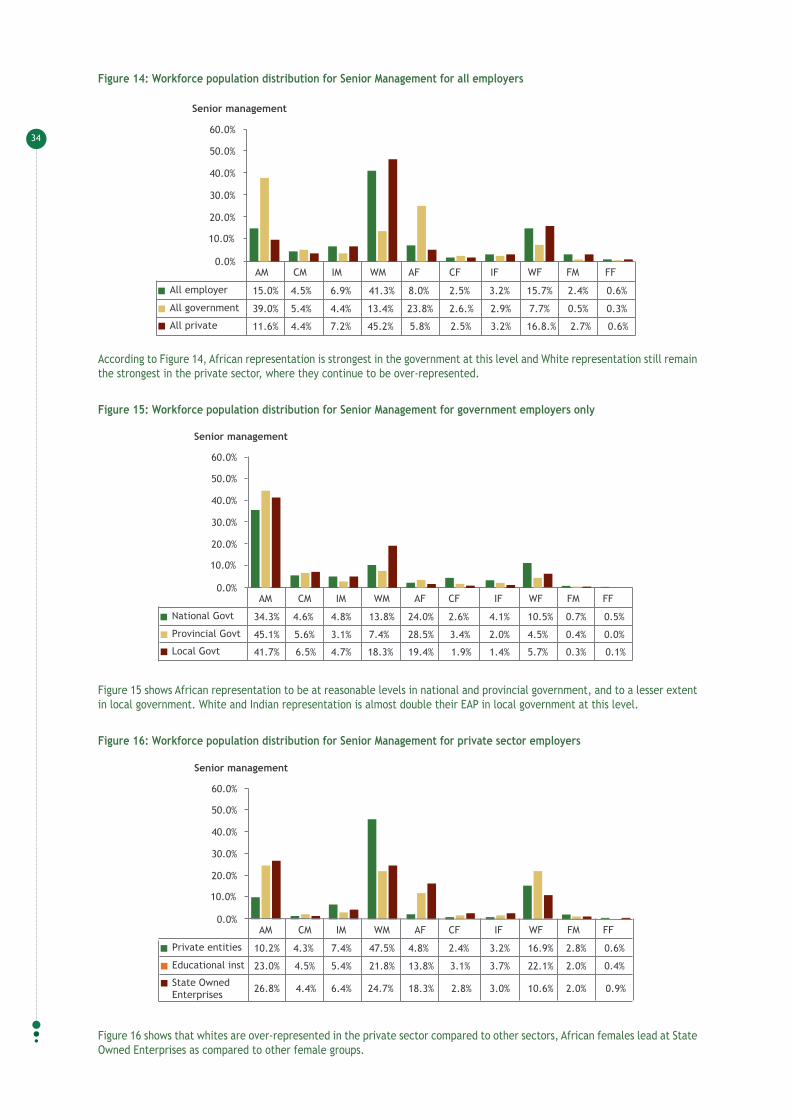
34
Figure 14: Workforce population distribution for Senior Management for all employers
According to Figure 14, African representation is strongest in the government at this level and White representation still remain the strongest in the private sector, where they continue to be over-represented.
Figure 15: Workforce population distribution for Senior Management for government employers only
Figure 15 shows African representation to be at reasonable levels in national and provincial government, and to a lesser extent in local government. White and Indian representation is almost double their EAP in local government at this level.
Figure 16: Workforce population distribution for Senior Management for private sector employers
Figure 16 shows that whites are over-represented in the private sector compared to other sectors, African females lead at State Owned Enterprises as compared to other female groups.
0.0%
10.0%
20.0%
30.0%
40.0%
50.0%
60.0%
AM CM IM WM AF CF
National Govt 34.3% 4.6% 4.8% 13.8% 24.0% 2.6%
Provincial Govt 45.1% 5.6% 3.1% 7.4% 28.5% 3.4%
IF
4.1%
2.0%
WF
10.5%
4.5%
FM
0.7%
0.4%
FF
0.5%
0.0%
Local Govt 41.7% 6.5% 4.7% 18.3% 19.4% 1.9% 1.4% 5.7% 0.3% 0.1%
Senior management
0.0%
10.0%
20.0%
30.0%
40.0%
50.0%
60.0%
AM CM IM WM AF CF
All employer 15.0% 4.5% 6.9% 41.3% 8.0% 2.5%
All government 39.0% 5.4% 4.4% 13.4% 23.8% 2.6.%
IF
3.2%
2.9%
WF
15.7%
7.7%
FM
2.4%
0.5%
FF
0.6%
0.3%
All private 11.6% 4.4% 7.2% 45.2% 5.8% 2.5% 3.2% 16.8.% 2.7% 0.6%
Senior management
0.0%
10.0%
20.0%
30.0%
40.0%
50.0%
60.0%
AM CM IM WM AF CF
Private entities 10.2% 4.3% 7.4% 47.5% 4.8% 2.4%
Educational inst 23.0% 4.5% 5.4% 21.8% 13.8% 3.1%
IF
3.2%
3.7%
WF
16.9%
22.1%
FM
2.8%
2.0%
FF
0.6%
0.4%
State Owned Enterprises 26.8% 4.4% 6.4% 24.7% 18.3% 2.8% 3.0% 10.6% 2.0% 0.9%
Senior management

35
Table 18: Workforce profile and movements at the Senior Management level in terms of population group, gender and disability - (Please note that there is no separate workforce movement data for disability)
As shown in Table 18, the over-representation of Whites at this level almost mirrors their representation and the recruitment and promotion opportunities offered to them at the Top Management level. Whites and Indians are more likely to be appointed, promoted or exposed to training at the Senior Management level, particularly when their EAP is taken into account.
Only 44.1% work opportunities went to the Black group collectively at the Senior Management level compared to 50.1% for the White group. The same pattern prevailed with the White group exposed to more training opportunities (50.2%) than the Black group (49.6%). With regards to promotion the Black group had a slight advantage (52.9%) that the White group (44.2%).
Once again, just as with the representation at the Top Management level, the race and gender population distribution of people with disabilities represented at this level is very similar to that of the total workforce at this level, with White and male representation are leading by a huge margin.
The existing patterns only indicate that inequities in the representation in terms of race, gender and disability at this level will remain for a number of decades to come.
WORKFORCE MOVEMENTS
Male Female Foreign National TOTAL
African Coloured Indian White African Coloured Indian White Male Female
Workforce profile for all employees
15.0% 4.5% 6.9% 41.3% 8.0% 2.5% 3.2% 15.7% 2.4% 0.6% 100.0%
Workforce profile for people with disabilities only
15.6% 5.1% 6.0% 43.7% 7.0% 2.3% 3.0% 15.8% 1.0% 0.4% 100.0%
Recruitment for all employers
18.3% 4.2% 6.3% 36.2% 10.7% 2.1% 3.3% 13.9% 3.9% 1.1% 100.0%
Promotion for all employers
20.0% 4.7% 8.4% 28.9% 11.7% 2.9% 5.2% 15.3% 2.1% 0.7% 100.0%
Skills development for all employers
17.7% 4.9% 7.8% 32.7% 11.9% 3.1% 4.2% 17.5% 0% 0% 100%

36
5.2.3 PROFESSIONALLY QUALIFIEd IN TERMS OF POPULATION GROUP, GENdER ANd dISAbILITY
Figure 17: Workforce profile at the Professionally Qualified level by population group, gender and disability
Figure 17 reflects that at 40.2% whites are still over-represented at this level three-and-a-half times in comparison with their EAP. Blacks, particularly Africans and Coloureds are gradually making ground at this level both in terms of males and females. Although this is still low in comparison to the EAP, this is pleasing as it is the level which is a feeder to the upper echelons indicating the availability of a pool of suitably qualified designated people. The representation of Indians is still very high as it is nearly three times their EAP at this level.
It is clear from the above chart that males still make up the majority of employees at this level, but the gap is narrowing as female representation at this level is only about 2.9% below their EAP. Much still needs to be done in terms of the representation of people with disabilities as they accounted for a mere 1.8% of the workforce at this level, although it is an improvement from the upper two levels.
Male
Female56.9%
43.1%
Professionally Qualified - Gender
African
Coloured
Indian
White
Foreign Na�onal
9.4% 9.6%
38.4% 40.2%
2.5%
Professionally Qualified - population group
Dissability
Other
1.8%
98.2%
Professionally Qualified

37
Table 19: Workforce profile at the Professional Qualified level by province and by population group and gender
According to Table 19, the representation of Whites is more than double their EAP in most of the provinces.
African people are mostly over-represented in Limpopo. Whites are mostly represented at the professionally qualified level in six of the nine provinces, while White female representation is also more than double their EAP in most provinces and they appear to be doing particularly well in the Western Cape.
Table 20: Workforce profile at the Professionally Qualified level by province for disability
Table 20 shows that except for the Limpopo and North West Provinces where Africans are over-represented, the White group continue to be the most represented in other provinces at the Professionally Qualified level. White people with disabilities are most represented in Mpumalanga, where they make up more than 64.1% of the people with disabilities employed. African people with disabilities are the least represented in the Western Cape Province and Indian people with disabilities are well represented in Kwazulu-Natal. Males with disabilities are more than females with disabilities at this level.
Males with disabilities are more than females with disabilities at this level.
PROVINCEMale Female Foreign
National TOTALAfrican Coloured Indian White African Coloured Indian White Male Female
Western Cape 8.1% 14.8% 3.2% 25.9% 7.3% 15.1% 2.4% 21.0% 1.5% 0.7% 100.0%
Eastern Cape 27.4% 6.1% 0.9% 13.0% 37.8% 4.2% 0.6% 8.6% 1.0% 0.4% 100.0%
Northern Cape 18.7% 13.7% 0.5% 35.3% 9.7% 8.6% 0.2% 12.3% 0.8% 0.3% 100.0%
Free State 26.2% 1.5% 0.3% 22.1% 27.1% 1.7% 0.4% 17.4% 2.2% 1.1% 100.0%
KwaZulu-Natal 22.6% 2.3% 13.9% 14.8% 23.0% 2.0% 10.3% 8.5% 1.8% 0.6% 100.0%
North West 28.9% 1.3% 1.3% 23.3% 27.6% 1.1% 0.8% 14.3% 1.3% 0.2% 100.0%
Gauteng 18.6% 4.0% 5.8% 28.3% 16.2% 3.4% 4.4% 16.7% 2.0% 0.7% 100.0%
Mpumalanga 35.7% 1.2% 1.3% 32.5% 14.9% 0.5% 0.3% 11.0% 2.4% 0.3% 100.0%
Limpopo 42.0% 0.2% 0.3% 4.6% 48.0% 0.2% 0.2% 3.0% 1.3% 0.3% 100.0%
PROVINCE
Male Female Foreign National TOTAL
African Coloured Indian White African Coloured Indian White Male Female
Western Cape 4.7% 15.3% 2.8% 38.6% 1.7% 10.6% 1.7% 22.5% 1.3% 0.8% 100.0%
Eastern Cape 23.1% 11.3% 2.3% 28.5% 20.4% 3.6% 0.0% 10.4% 0.5% 0.0% 100.0%
Northern Cape 16.7% 8.3% 0.0% 41.7% 8.3% 8.3% 0.0% 16.7% 0.0% 0.0% 100.0%
Free State 32.1% 3.6% 0.0% 46.4% 7.1% 0.0% 0.0% 7.1% 0.0% 3.6% 100.0%
KwaZulu-Natal 15.4% 2.5% 16.5% 29.1% 11.2% 1.8% 4.9% 17.5% 0.7% 0.4% 100.0%
North West 34.8% 0.0% 0.0% 34.8% 18.0% 0.0% 2.2% 10.1% 0.0% 0.0% 100.0%
Gauteng 16.6% 3.3% 5.6% 37.6% 11.0% 2.3% 3.2% 19.5% 0.5% 0.4% 100.0%
Mpumalanga 28.2% 0.8% 1.5% 51.1% 4.6% 0.0% 0.0% 13.0% 0.8% 0.0% 100.0%
Limpopo 58.8% 0.0% 0.0% 10.9% 26.1% 0.0% 0.0% 4.2% 0.0% 0.0% 100.0%

38
Table 21: Sector workforce profile at the Professionally Qualified Level by population group and gender
According to Table 21, Africans are mostly represented within the community, social and personal services industry, which is mainly composed of government departments, while Whites still dominate in many of the other sectors. Most notable is the significant representation of females, which surprisingly even surpasses their male counterparts in this sector.
Africans are more represented at the professionally qualified level within the electricity, gas and water supply sector. African females feature prominently in the catering sector, more than even their male counterparts
SECTORSMale Female Foreign National
TOTALAfrican Coloured Indian White African Co-
loured Indian White Male Female
Agriculture 24.5% 4.8% 1.8% 37.3% 12.0% 2.6% 1.0% 14.3% 1.4% 0.3% 100.0%
Mining and Quarrying 24.5% 2.9% 2.6% 45.3% 8.7% 1.1% 1.4% 10.4% 2.6% 0.5% 100.0%
Manufacturing 13.2% 6.6% 8.8% 41.9% 5.6% 3.0% 3.8% 14.9% 1.9% 0.4% 100.0%
Electricity, Gas and Water 27.8% 4.7% 5.8% 25.2% 20.9% 2.2% 2.4% 8.3% 2.3% 0.4% 100.0%
Construction 22.4% 6.1% 4.3% 43.4% 8.1% 1.2% 1.5% 8.7% 4.0% 0.4% 100.0%
Retail and Mo-tor Trade/Re-pair Service
16.6% 7.4% 7.1% 25.3% 11.6% 7.5% 4.6% 18.9% 0.7% 0.3% 100.0%
Wholesale Trade/ Commercial Agents/Allied Services
16.4% 5.6% 7.7% 29.8% 10.2% 4.6% 3.9% 20.1% 1.2% 0.3% 100.0%
Catering/Ac-commodation/other trade
16.4% 4.3% 3.8% 19.1% 19.8% 6.0% 4.1% 22.3% 3.0% 1.3% 100.0%
Transport/ Storage/ Com-munications
19.7% 6.1% 7.7% 33.0% 10.8% 2.9% 3.3% 13.4% 2.6% 0.5% 100.0%
Finance/Busi-ness Services 13.8% 5.0% 7.0% 25.8% 12.4% 5.6% 6.6% 21.3% 1.5% 0.9% 100.0%
Community/Social/Personal Services
25.4% 4.1% 2.8% 10.2% 34.4% 5.2% 3.4% 12.0% 1.7% 0.7% 100.0%

39
Table 22 : Sector workforce profile at the Professionally Qualified Level for disability
The continued dominance of White disabled people in the Professionally Qualified level is observed, in Table 22, in most of the sectors. An exception can be seen in the Community, Social & Personal Services, where Africans have a slight edge over other race groups.
There is an over representation of male people with disabilities in all the sectors at this level.
SECTORMale Female Foreign
National TOTALAfrican Coloured Indian White African Coloured Indian White Male Female
Agriculture 15.9% 6.2% 2.1% 40.7% 11.7% 3.4% 2.1% 17.9% 0.0% 0.0% 100.0%
Mining and Quarrying 23.5% 1.9% 0.9% 58.2% 1.4% 1.4% 0.5% 10.8% 1.4% 0.0% 100.0%
Manufacturing 9.4% 8.3% 9.1% 52.2% 2.4% 4.5% 1.4% 12.0% 0.5% 0.2% 100.0%
Electricity, Gas and Water 13.5% 8.6% 3.7% 44.8% 11.7% 1.8% 3.1% 11.7% 0.0% 1.2% 100.0%
Construction 21.5% 4.0% 4.7% 50.3% 6.0% 0.0% 1.3% 10.7% 0.0% 1.3% 100.0%
Retail and Mo-tor Trade/Re-pair Service
5.4% 4.9% 14.1% 41.3% 2.7% 3.3% 4.3% 22.8% 0.5% 0.5% 100.0%
Wholesale Trade/ Com-mercial Agents/Allied Services
4.9% 4.2% 9.9% 50.0% 1.4% 3.5% 2.8% 22.5% 0.0% 0.7% 100.0%
Catering/Accom-modation/other trade
8.3% 1.2% 2.4% 31.5% 13.1% 4.8% 0.0% 31.5% 3.6% 3.6% 100.0%
Transport/ Stor-age/ Communi-cations
17.6% 7.3% 7.6% 43.3% 6.4% 0.9% 2.7% 13.0% 1.2% 0.0% 100.0%
Finance/Busi-ness Services 11.3% 3.7% 5.2% 34.6% 7.3% 4.8% 4.9% 27.3% 0.4% 0.4% 100.0%
Community/Social/Personal Services
28.9% 4.2% 3.5% 21.8% 21.5% 2.2% 2.2% 15.2% 0.4% 0.1% 100.0%

40
Table 23: Workforce profile at the Professional Qualified level by population group and gender and by business type -(Please note All Government is inclusive of national, provincial and local governments)
As far as the Professionally Qualified level is concerned, Whites still have an edge over other population groups in the private sector and the educational institutions, while White females continue to have an advantage over other Black females in non-profit organisations as shown in Table 23.
The African group is mostly employed in government and State Owned Enterprises with African females dominating the provincial government. The representation of foreign nationals (mostly male) is visible only in educational institutions and non-profit organisations..
Table 24: Workforce profile at the Professional Qualified level by business type for disability - (Please note All Government is inclusive of national, provincial and local governments)
Table 24, above shows that White people with disabilities are over-represented in the Private Sector, educational institutions, State Owned Enterprises and the National Government at this level. Disabled Africans however feature mostly in Provincial and Local Government spheres an in non-profit organisations.
Female people with disabilities are mostly represented in non-profit organisations at the Professionally Qualified level.
BUSINESSES TYPE
Male Female Foreign National TOTAL
African Coloured Indian White African Coloured Indian White Male Female
All Employers 19.8% 5.1% 5.4% 24.9% 18.6% 4.5% 4.0% 15.3% 1.8% 0.6% 100.0%
All Govern-ment 30.1% 4.2% 2.3% 8.5% 36.6% 5.7% 2.8% 8.3% 1.0% 0.5% 100.0%
National Gov-ernment 36.7% 3.5% 2.2% 11.4% 30.1% 3.0% 2.6% 9.9% 0.4% 0.2% 100.0%
Provincial Government 28.5% 3.5% 2.1% 6.2% 40.2% 6.5% 3.0% 8.0% 1.3% 0.6% 100.0%
Local Govern-ment 28.7% 10.2% 3.6% 19.4% 23.2% 5.3% 1.6% 7.6% 0.3% 0.1% 100.0%
Private Sec-tor 15.3% 5.7% 6.9% 32.8% 9.8% 4.5% 4.6% 18.0% 1.8% 0.6% 100.0%
Non-Profit Organisation 25.9% 4.4% 2.8% 16.6% 23.4% 5.0% 2.7% 16.4% 2.0% 0.8% 100.0%
SOE 26.7% 4.2% 5.3% 26.1% 19.6% 3.0% 3.2% 9.3% 1.9% 0.6% 100.0%
Educational Institution 19.8% 3.4% 3.8% 14.4% 30.6% 2.8% 3.8% 16.7% 3.4% 1.3% 100.0%
Business TypeMale Female Foreign
National TOTALAfrican Coloured Indian White African Coloured Indian White Male Female
All Employers 17.4% 4.8% 5.4% 36.4% 10.7% 3.1% 2.7% 18.4% 0.6% 0.4% 100.0%
All Govern-ment 30.5% 6.1% 2.6% 23.3% 20.1% 2.6% 1.7% 12.9% 0.2% 0.0% 100.0%
National Gov-ernment 29.6% 3.8% 3.5% 25.4% 16.5% 1.2% 2.7% 16.9% 0.4% 0.0% 100.0%
Provincial Government 32.3% 6.8% 2.1% 17.3% 25.6% 3.2% 1.3% 11.1% 0.2% 0.0% 100.0%
Local Govern-ment 24.8% 8.3% 2.8% 44.0% 4.6% 3.7% 0.9% 11.0% 0.0% 0.0% 100.0%
Private Sec-tor 11.1% 5.3% 6.7% 44.0% 4.8% 3.7% 3.3% 20.2% 0.5% 0.4% 100.0%
Non-Profit Organisation 14.6% 1.0% 1.0% 34.4% 13.5% 3.1% 1.0% 30.2% 0.0% 1.0% 100.0%
SOE 24.8% 3.7% 4.1% 35.3% 13.3% 0.9% 2.8% 13.8% 0.0% 1.4% 100.0%
Educational Institution 24.4% 2.1% 4.4% 22.6% 22.0% 2.1% 2.0% 18.0% 1.7% 0.8% 100.0%

41
Figure 18: Workforce population distribution for Professionally Qualified for all employers
Figure 18 shows that the government is doing very well in terms of representation of the African group (66.7%) and females in particular (53.4%). In contrast the White group especially males are still over represented by almost half (46.9%) in the private sector and by more than a third (40.2%) in all establishments who reported overall.
Figure 19: Workforce population distribution for Professionally Qualified for government employers only
Figure 19 depicts the workforce distribution within government only. As can be seen in this level there is an overwhelming majority representation of Blacks in provincial government (83.8%) followed by national government (78.1%) and local government (72.6%). There appears to be a clear preference for the appointment of males in most spheres with the exception of the provincial government sector which places an emphasis in the appointment of females.
Figure 20: Workforce population distribution for Professionally Qualified for private sector employers
AM CM IM WM AF CF
National Govt 36.7% 3.5% 2.2% 11.4% 30.1% 3.0%
Provincial Govt 28.5% 3.5% 2.1% 6.2% 40.2% 6.5%
IF
2.6%
3.0%
WF
9.9%
8.0%
FM
0.4%
1.3%
FF
0.2%
0.6%
Local Govt 28.7% 10.2% 3.6% 19.4% 23.2% 5.3% 1.6% 7.6% 0.3% 0.1%
Professionally Qualified
0.0%
10.0%
20.0%
30.0%
40.0%
AM CM IM WM AF CF
Private entities 15.3% 5.7% 6.9% 32.8% 9.8% 4.5%
Educational inst 19.8% 3.4% 3.8% 14.4% 30.6% 2.8%
IF
4.6%
3.8%
WF
18.0%
16.7%
FM
1.8%
3.4%
FF
0.6%
1.3%
State Owned Enterprises
26.7% 4.2% 5.3% 26.1% 19.6% 3.0% 3.2% 9.3% 1.9% 0.6%
Professionally Qualified
0.0%
10.0%
20.0%
30.0%
40.0%
0.0%
10.0%
20.0%
30.0%
40.0%
AM CM IM WM AF CF
All employers 19.8% 5.1% 5.4% 24.9% 18.6% 4.5%
All government 30.1% 4.2% 2.3% 8.5% 36.6% 5.7%
IF
4.0%
2.8%
WF
15.3%
8.3%
FM
1.8%
1.0%
FF
0.6%
0.5%
All private 16.8% 5.3% 6.3% 29.6% 13.4% 4.2% 4.4% 17.3% 2.1% 0.7%
Professionally Qualified

42
Figure 20 above shows the representation of the workforce in the private sector. Just over half of the workforce (50.8%) within private entities in the professional occupational level consists of the White group. This is followed by 25.1% Africans, 11.5% Indians and 10.2% Coloureds. This representation is imbalanced in comparison with the EAP of the various population groups.
With regards to the educational institutions, just more than half (50.4%) of the Africans are represented at this level, followed by whites (31.1%), Indians (7.6%) and Coloureds (6.2%). Of significance is the encouraging representation of females in the educational institution sector at 53.9% in relation to their EAP.
There is an almost equitable representation of African and white males within State Owned Enterprises at this level.
Table 25: Workforce profile and movements at the Professionally Qualified level in terms of population group, gender and disability - (Please note that there is no separate workforce movement data for disability)
As can be seen in Table 25, the African group has made significant gains with regards to recruitment (45.1%), promotions (50%) and skills development opportunities (41.3%). Females were afforded more recruitment and training opportunities than males, which is a significant change in practice as there has been more emphasis on males than females. Despite the White group already making up 40.2% of the representation at this level, a third of all recruitments (33.2%) of all recruitments, promotions (30.3%) and training (34.4%) opportunities were afforded to them. Coloureds were also afforded more promotion and training opportunities than Indians but the situation with regards to recruitment is still following traditional patterns.
5.2.4 SkILLEd IN TERMS OF POPULATION GROUP, GENdER ANd dISAbILITY
African
Coloured
Indian
White
Foreign Na�onal
59.3%
1.5%
22.0%
5.9%
11.3%
Skilled Technical - Population group
WORKFORCE MOVEMENTS
Male Female Foreign National TOTAL
African Coloured Indian White African Coloured Indian White Male Female
Workforce profile for all employees
19.8% 5.1% 5.4% 24.9% 18.6% 4.5% 4.0% 15.3% 1.8% 0.6% 100.0%
Workforce profile for people with disabilities only
17.4% 4.8% 5.4% 36.4% 10.7% 3.1% 2.7% 18.4% 0.6% 0.4% 100.0%
Recruit-ment for all employers
18.9% 3.9% 5.2% 19.8% 26.2% 3.5% 4.5% 13.4% 3.3% 1.2% 100.0%
Promotion for all em-ployers
26.3% 5.0% 4.4% 16.4% 23.7% 4.5% 4.2% 13.9% 1.0% 0.4% 100.0%
Skills devel-opment for all employ-ers
19.2% 6.0% 5.8% 18.3% 22.1% 7.8% 4.6% 16.1% 0% 0% 100%
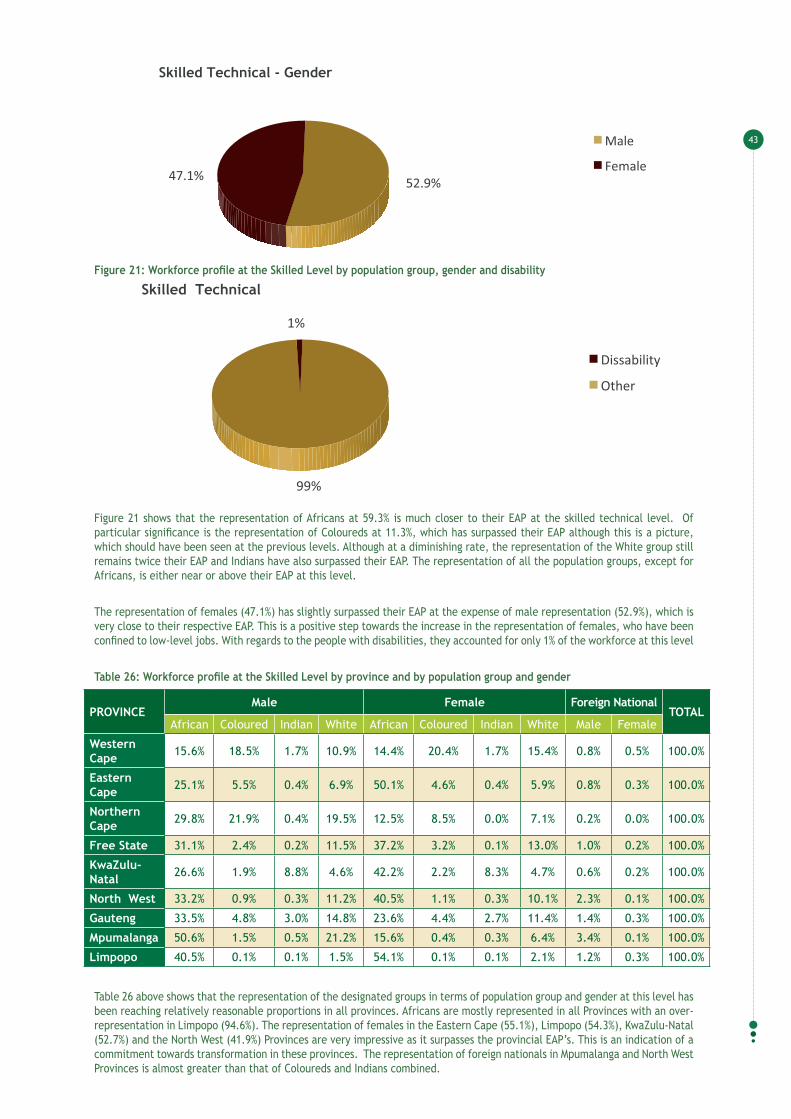
43
Figure 21: Workforce profile at the Skilled Level by population group, gender and disability
Figure 21 shows that the representation of Africans at 59.3% is much closer to their EAP at the skilled technical level. Of particular significance is the representation of Coloureds at 11.3%, which has surpassed their EAP although this is a picture, which should have been seen at the previous levels. Although at a diminishing rate, the representation of the White group still remains twice their EAP and Indians have also surpassed their EAP. The representation of all the population groups, except for Africans, is either near or above their EAP at this level.
The representation of females (47.1%) has slightly surpassed their EAP at the expense of male representation (52.9%), which is very close to their respective EAP. This is a positive step towards the increase in the representation of females, who have been confined to low-level jobs. With regards to the people with disabilities, they accounted for only 1% of the workforce at this level
Table 26: Workforce profile at the Skilled Level by province and by population group and gender
Table 26 above shows that the representation of the designated groups in terms of population group and gender at this level has been reaching relatively reasonable proportions in all provinces. Africans are mostly represented in all Provinces with an over-representation in Limpopo (94.6%). The representation of females in the Eastern Cape (55.1%), Limpopo (54.3%), KwaZulu-Natal (52.7%) and the North West (41.9%) Provinces are very impressive as it surpasses the provincial EAP’s. This is an indication of a commitment towards transformation in these provinces. The representation of foreign nationals in Mpumalanga and North West Provinces is almost greater than that of Coloureds and Indians combined.
Dissability
Other
1%
99%
Skilled Technical
Male
Female52.9% 47.1%
Skilled Technical - Gender
PROVINCEMale Female Foreign National
TOTALAfrican Coloured Indian White African Coloured Indian White Male Female
Western Cape 15.6% 18.5% 1.7% 10.9% 14.4% 20.4% 1.7% 15.4% 0.8% 0.5% 100.0%
Eastern Cape 25.1% 5.5% 0.4% 6.9% 50.1% 4.6% 0.4% 5.9% 0.8% 0.3% 100.0%
Northern Cape 29.8% 21.9% 0.4% 19.5% 12.5% 8.5% 0.0% 7.1% 0.2% 0.0% 100.0%
Free State 31.1% 2.4% 0.2% 11.5% 37.2% 3.2% 0.1% 13.0% 1.0% 0.2% 100.0%
KwaZulu-Natal 26.6% 1.9% 8.8% 4.6% 42.2% 2.2% 8.3% 4.7% 0.6% 0.2% 100.0%
North West 33.2% 0.9% 0.3% 11.2% 40.5% 1.1% 0.3% 10.1% 2.3% 0.1% 100.0%
Gauteng 33.5% 4.8% 3.0% 14.8% 23.6% 4.4% 2.7% 11.4% 1.4% 0.3% 100.0%
Mpumalanga 50.6% 1.5% 0.5% 21.2% 15.6% 0.4% 0.3% 6.4% 3.4% 0.1% 100.0%
Limpopo 40.5% 0.1% 0.1% 1.5% 54.1% 0.1% 0.1% 2.1% 1.2% 0.3% 100.0%

44
Table 27: Workforce profile at the Skilled Level by province for disability
According to Table 27 above, there is an over-representation of African people with disabilities in Limpopo (97.5%), whilst whites are mostly represented in the Northern Cape at 52.9%, Free State (45.7%) and the Western Cape (40%). The representation of disabled females is disappointing in comparison to their able-bodied counterparts.
Table 28: Sector workforce profile at the Skilled Level by population group and genderTable 28 shows that the most of the industries within the skilled level is highly represented by Africans, notably African males.
This is the case especially in the mining (50.9%), construction (44.2%), electricity & gas (38.9%) and the transport, storage and communications industries (33%). Whites are mostly represented in mining (29.9%) and the manufacturing industries (23.6%). Most of the industries are male
SECTORSMale Female Foreign National
TOTALAfrican Coloured Indian White African Coloured Indian White Male Female
Agriculture 35.7% 9.5% 1.9% 16.3% 16.6% 5.7% 1.0% 12.3% 0.8% 0.1% 100.0%
Mining and Quar-rying 44.2% 3.9% 0.8% 29.9% 8.7% 1.0% 0.4% 6.1% 5.0% 0.1% 100.0%
Manufacturing 31.6% 9.6% 6.7% 23.6% 8.9% 4.6% 2.7% 10.1% 1.9% 0.2% 100.0%
Electricity, Gas and Water 38.9% 4.8% 2.5% 15.0% 27.1% 2.7% 1.5% 6.4% 0.8% 0.2% 100.0%
Construction 50.9% 7.2% 2.4% 17.1% 9.8% 1.7% 1.1% 6.0% 3.7% 0.2% 100.0%
Retail and Motor Trade/Repair Service
24.2% 7.1% 5.0% 13.2% 22.8% 10.7% 4.3% 12.2% 0.4% 0.2% 100.0%
Wholesale Trade/ Commercial Agents/Allied Services
27.8% 6.7% 5.3% 16.9% 16.3% 6.5% 4.2% 15.5% 0.7% 0.3% 100.0%
Catering/Accom-modation/other trade
26.0% 5.0% 2.5% 8.2% 30.2% 9.5% 3.0% 12.4% 1.8% 1.3% 100.0%
Transport/ Stor-age/ Communi-cations
33.0% 8.1% 5.0% 19.6% 17.2% 4.4% 2.6% 8.9% 0.9% 0.2% 100.0%
Finance/Business Services 21.0% 5.6% 3.7% 10.0% 26.8% 9.6% 5.0% 17.3% 0.6% 0.4% 100.0%
Community/Social/Personal Services
30.5% 3.8% 1.5% 3.5% 44.8% 4.8% 2.5% 7.6% 0.7% 0.4% 100.0%
PROVINCEMale Female Foreign National
TOTALAfrican Coloured Indian White African Coloured Indian White Male Female
Western Cape 8.0% 21.3% 3.1% 20.1% 6.3% 18.6% 2.3% 19.9% 0.3% 0.0% 100.0%
Eastern Cape 31.9% 10.7% 0.5% 15.9% 28.1% 4.9% 0.2% 7.4% 0.4% 0.0% 100.0%
Northern Cape 13.2% 22.6% 1.9% 47.2% 3.8% 5.7% 0.0% 5.7% 0.0% 0.0% 100.0%
Free State 27.2% 4.3% 1.1% 25.0% 20.7% 0.0% 1.1% 20.7% 0.0% 0.0% 100.0%
KwaZulu-Natal 31.5% 3.8% 17.8% 12.1% 15.1% 1.9% 8.4% 8.6% 0.6% 0.2% 100.0%
North West 37.3% 1.5% 0.7% 18.3% 30.6% 1.5% 0.4% 8.6% 1.1% 0.0% 100.0%
Gauteng 26.2% 4.6% 3.4% 22.0% 19.8% 4.3% 2.5% 16.3% 0.8% 0.2% 100.0%
Mpumalanga 48.7% 0.9% 0.0% 26.3% 13.7% 0.6% 0.0% 9.6% 0.3% 0.0% 100.0%
Limpopo 83.7% 0.1% 0.0% 1.4% 13.8% 0.1% 0.0% 0.7% 0.1% 0.1% 100.0%

45
dominated, with females mostly represented in the community, social & personal services industry (59.7%), followed by finance & business services industry (58.7%) and catering/accommodation industry (55.1%).
The representation of African females within the electricity, gas & water supply is encouraging as it is an indication that females are beginning to make inroads into the industries, which were traditionally male dominated although more could be done with regards to the representation of females in all industries in general.
Table 29: Sector workforce profile at the Skilled Level for disabilityAs expected Table 29, indicates that males are also over-represented in people with disabilities in most industries at the Skilled
Technical level, with the exception of the catering/accommodation sector (58.4%) and community, social & personal services (50.2%). African males with disabilities feature prominently in construction (46.7%), mining (46.5%), and finance & business services (39%) industries, which are traditionally male dominated. White females with disabilities also feature prominently in the wholesale & retail trade industry (19.7%).
Table 30 : Workforce profile at the Skilled level by population group and gender and by business type -
SECTORSMale Female Foreign National
TOTALAfrican Coloured Indian White African Coloured Indian White Male Female
Agriculture 35.6% 11.0% 3.3% 17.5% 10.4% 6.8% 1.8% 13.4% 0.3% 0.0% 100.0%
Mining and Quarrying 46.5% 2.9% 0.7% 34.6% 4.2% 0.6% 0.1% 5.02% 5.2% 0.0% 100.0%
Manufacturing 22.7% 11.2% 7.9% 34.6% 6.7% 4.8% 1.5% 10.2% 0.5% 0.0% 100.0%
Electricity, Gas and Water 33.2% 3.5% 2.9% 33.2% 14.2% 1.4% 0.9% 9.6% 0.8% 0.1% 100.0%
Construction 46.7% 5.6% 2.8% 23.6% 7.9% 1.9% 0.5% 10.0% 0.5% 0.5% 100.0%
Retail and Motor Trade/Repair Service
18.2% 6.0% 8.4% 19.3% 17.0% 10.1% 5.5% 15.4% 0.0% 0.2% 100.0%
Wholesale Trade/ Commercial Agents/Allied Services
20.0% 7.7% 7.4% 20.4% 14.6% 5.6% 4.2% 19.7% 0.2% 0.2% 100.0%
Catering/Accom-modation/other trade
20.3% 6.4% 1.9% 11.4% 28.7% 11.1% 3.3% 15.3% 0.8% 0.6% 100.0%
Transport/ Storage/ Communications
21.7% 5.2% 4.8% 31.9% 16.9% 3.8% 2.1% 13.3% 0.3% 0.0% 100.0%
Finance/Business Services 39.0% 4.7% 2.8% 8.7% 18.6% 6.1% 3.1% 16.7% 0.1% 0.1% 100.0%
Community/Social/Personal Services
32.0% 4.6% 2.9% 9.7% 429.4% 3.8% 2.8% 14.2% 0.4% 0.2% 100.0%

46
(Please note All Government is inclusive of national, provincial and local governments)
Table 30 shows that at the skilled technical level, Blacks (89.5%) are mostly represented in government especially females (60%). The
provincial tier of government deserved commendation with its achievements of representation of females (67.8%) and Black females in particular (62%). The educational institutions are also doing well in the representation of females (68.1%) and Blacks in particular (57%). The over-representation of males (60.5%) in the private sector has been a common thread throughout the occupational levels. African males are mostly represented in most business types except in provincial government (56.9%) and educational institutions (45.9%).
Table 31: Workforce profile at the Skilled Level by business type for people with disabilities- (Please note All Government is inclusive of national, provincial and local governments)As shown in Table 31, the situation is the same with disabled people where males are over-represented in most of the business types
especially African males, although white males are the most in state owned enterprises (32%). Their presence is felt within the local government tier (67.6%), private sector (65.2%) and in state owned enterprises (64.9%.
In the skilled technical level, females are mostly represented within the provincial government tier (55.8%) and educational institutions (54.1%).
Figure 22: Workforce population distribution for Skilled Technical for all employers
Business Type
Male Female Foreign National TOTAL
African Coloured Indian White African Coloured Indian White Male Female
All Employers 32.0% 5.7% 3.9% 18.8% 17.9% 4.8% 2.5% 13.7% 0.6% 0.1% 100.0%
All Government 31.3% 5.6% 2.1% 11.2% 30.6% 3.2% 1.5% 14.2% 0.2% 0.0% 100.0%
National Government 35.5% 4.3% 2.1% 11.1% 25.8% 3.2% 1.4% 16.6% 0.0% 0.0% 100.0%
Provincial Government 30.4% 3.8% 1.8% 8.2% 37.7% 2.6% 1.8% 13.7% 0.1% 0.0% 100.0%
Local Government 25.1% 16.0% 3.2% 23.3% 14.4% 5.6% 0.8% 10.4% 1.1% 0.0% 100.0%
Private Sector 33.6% 5.8% 4.6% 21.2% 12.7% 5.3% 2.5% 13.5% 0.7% 0.1% 100.0%
Non-Profit Organisation 25.2% 5.4% 1.2% 17.8% 19.8% 5.4% 3.9% 21.3% 0.0% 0.0% 100.0%
SOE 27.7% 2.5% 2.5% 32.2% 20.3% 2.3% 1.3% 10.4% 0.9% 0.0% 100.0%
Educational Institution 25.0% 7.4% 4.3% 7.9% 29.0% 5.9% 5.1% 14.1% 0.7% 0.5% 100.0%
BUSINESSES TYPE
Male Female Foreign National TOTAL
African Coloured Indian White African Coloured Indian White Male Female
All Employ-ers 30.9% 5.7% 3.1% 12.0% 28.3% 5.6% 2.8% 10.0% 1.2% 0.3% 100.0%
All Govern-ment 30.5% 3.9% 1.2% 3.7% 48.4% 4.2% 1.3% 6.1% 0.5% 0.2% 100.0%
National Government 39.6% 6.5% 1.1% 7.2% 33.0% 4.2% 1.2% 7.2% 0.0% 0.0% 100.0%
Provincial Government 27.2% 1.6% 0.6% 1.6% 56.9% 3.9% 1.2% 5.8% 0.8% 0.3% 100.0%
Local Gov-ernment 33.6% 13.5% 5.0% 9.9% 23.8% 6.4% 2.1% 5.4% 0.1% 0.0% 100.0%
Private Sec-tor 32.7% 6.9% 4.1% 16.8% 16.6% 6.1% 3.2% 11.7% 1.6% 0.3% 100.0%
Non-Profit Organisation 36.2% 4.1% 1.6% 7.5% 33.3% 5.5% 1.7% 9.4% 0.5% 0.2% 100.0%
SOE 34.7% 5.0% 2.4% 15.9% 28.7% 3.7% 2.1% 6.8% 0.5% 0.2% 100.0%
Educational Institution 19.6% 3.9% 2.2% 4.5% 45.9% 6.1% 5.0% 11.1% 1.1% 0.6% 100.0%
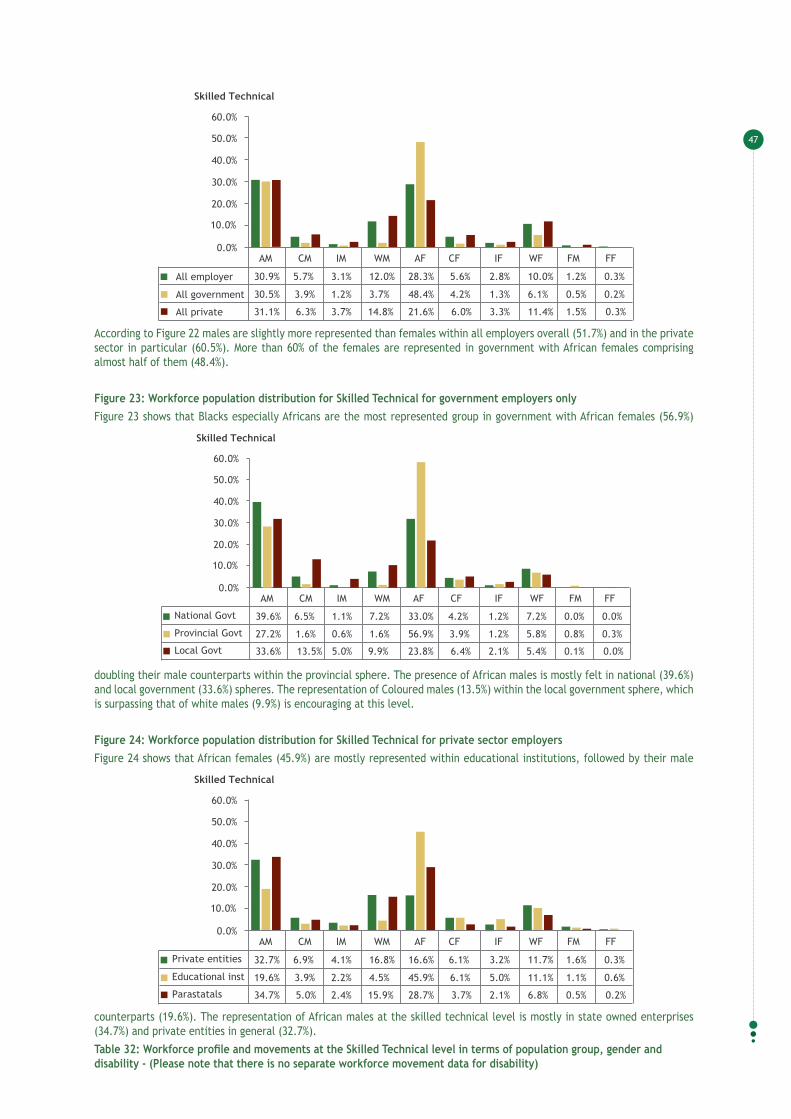
47
According to Figure 22 males are slightly more represented than females within all employers overall (51.7%) and in the private sector in particular (60.5%). More than 60% of the females are represented in government with African females comprising almost half of them (48.4%).
Figure 23: Workforce population distribution for Skilled Technical for government employers onlyFigure 23 shows that Blacks especially Africans are the most represented group in government with African females (56.9%)
doubling their male counterparts within the provincial sphere. The presence of African males is mostly felt in national (39.6%) and local government (33.6%) spheres. The representation of Coloured males (13.5%) within the local government sphere, which is surpassing that of white males (9.9%) is encouraging at this level.
Figure 24: Workforce population distribution for Skilled Technical for private sector employersFigure 24 shows that African females (45.9%) are mostly represented within educational institutions, followed by their male
counterparts (19.6%). The representation of African males at the skilled technical level is mostly in state owned enterprises (34.7%) and private entities in general (32.7%).
Table 32: Workforce profile and movements at the Skilled Technical level in terms of population group, gender and disability - (Please note that there is no separate workforce movement data for disability)
0.0%
10.0%
20.0%
30.0%
40.0%
50.0%
60.0%
AM CM IM WM AF CF
30.9% 5.7% 3.1% 12.0% 28.3% 5.6%
30.5% 3.9% 1.2% 3.7% 48.4% 4.2%
IF
2.8%
1.3%
WF
10.0%
6.1%
FM
1.2%
0.5%
FF
0.3%
0.2%
31.1% 6.3% 3.7% 14.8% 21.6% 6.0% 3.3% 11.4% 1.5% 0.3%
Skilled Technical
All employer
All government
All private
0.0%
10.0%
20.0%
30.0%
40.0%
50.0%
60.0%
AM CM IM WM AF CF
National Govt 39.6% 6.5% 1.1% 7.2% 33.0% 4.2%
Provincial Govt 27.2% 1.6% 0.6% 1.6% 56.9% 3.9%
IF
1.2%
1.2%
WF
7.2%
5.8%
FM
0.0%
0.8%
FF
0.0%
0.3%
Local Govt 33.6% 13.5% 5.0% 9.9% 23.8% 6.4% 2.1% 5.4% 0.1% 0.0%
Skilled Technical
0.0%
10.0%
20.0%
30.0%
40.0%
50.0%
60.0%
AM CM IM WM AF CF
Private entities 6.9% 4.1% 16.8% 16.6% 6.1%
Educational inst 19.6%
32.7%
3.9% 2.2% 4.5% 45.9% 6.1%
IF
3.2%
5.0%
WF
11.7%
11.1%
FM
1.6%
1.1%
FF
0.3%
0.6%
Parastatals 34.7% 5.0% 2.4% 15.9% 28.7% 3.7% 2.1% 6.8% 0.5% 0.2%
Skilled Technical

48
Table 32 above shows that Blacks and Africans in particular have benefitted significantly from recruitment, promotion and training opportunities at this level, with females benefitting the most in terms of promotion opportunities (54.7%) compared to
their male counterparts (44%). Males continue to receive preference in terms of all recruitment (55.3%) and skills development (55.6%) opportunities.
WORKFORCE MOVEMENTS
Male Female Foreign National TOTAL
African Coloured Indian White African Coloured Indian White Male Female
Workforce profile for all employees
30.9% 5.7% 3.1% 12.0% 28.3% 5.6% 2.8% 10.0% 1.2% 0.3% 100.0%
Workforce profile for people with disabilities only
32.0% 5.7% 3.9% 18.8% 17.9% 4.8% 2.5% 13.7% 0.6% 0.1% 100.0%
Recruitment for all em-ployers
34.3% 5.4% 2.9% 12.7% 25.6% 4.5% 2.5% 9.5% 2.0% 0.6% 100.0%
Promotion for all employers 31.4% 4.3% 2.2% 6.1% 39.9% 5.1% 2.2% 7.5% 0.9% 0.3% 100.0%
Skills devel-opment for all employers
32.8% 7.1% 3.9% 11.8% 22.4% 7.5% 3.6% 10.8% 0% 0% 100%

49

SUMMARY ANd CONCLUSION
SIX

51
6. SUMMARY ANd CONCLUSION
The 2013/2014 CEE Annual Report (the 14th Report) contains more than the usual statistics, demographics and percentages, because 2013/2014 heralded major amendments to the Employment Equity Act. The amended Employment Equity Act, No. 47 of 2013 is also accompanied by draft regulations, which were released by the Minister of Labour for public comment on 28 February 2014. The regulations also include guidelines on dealing with issues of equal pay for work of equal value. Over and above these developments, which are all covered in this 14th Report, there is also a summary of the three major court cases on affirmative action/ employment equity, with a brief overview of the implications of the judgements and how these are addressed in the amendments. On the statistical front, the 14th Report contains a long-run analysis of patterns from 2003 to 2013. An important addition this year is the actual numbers are provided over and above the percentages. One gets to see the base from which the various groups are either declining or increasing. This changes the effect of the percentages drastically.
AMENdMENTS TO ThE EE ACT
The following changes were introduced in the EE Amendment Act, 2013:
a) The EE Amendment Act, No 47 of 2013, inter alia, extends the definition of “designated group” to include people who were denied their South African citizenship by apartheid laws
b) Reporting is streamlined to focus only on levels and no longer on categories
c) Discrimination on the grounds of pay/ remuneration/ benefits is prohibited for people who are doing equal work or work of equal value (which are defined in the draft regulations)
d) Discrimination on ‘arbitrary grounds’ is added to the prohibited grounds for discriminating. The burden of proof is however reversed so that the onus rests on the party who is alleging the discrimination
e) Lower-paid employees (covered by BCEA) can use the CCMA to deal with cases of unfair discrimination (rather than the Labour Court)
f) Cases of unfair discrimination on the basis of sexual harassment can now be handled via the CCMA (for conciliation and arbitration), with a full right of appeal for such matters. Items ‘e’ and ‘f’ seek to increase access to justice for poorer and/ or sexually abused employees
g) All employers will now report annually, rather than only those with 150 or more employees
h) Section 42 of the Act has been repealed so that the DG no longer has to consider all the factors that were listed in the previous section 42 in assessing compliance with the EE Act. The draft regulations contain proposals on how employers can approach the vexing issue of balancing national and regional demographics of the Economically Active Population i) Linked to the ‘h’ above is the streamlining of the processes for assessing compliance on the part of the Department of Labour, resulting in the shortening of the path to the Labour Court
j) More robust fines are introduced for non-compliance (R1.5 million – R2.7 million). For more serious violations the turnover threshold applies (2% - 10%)
k) Failure to comply after 180 days can now result in a direct appeal to the Labour Court by the DG.
l) Trebling of fines for breach of confidentiality, undue influence, obstruction, fraud are increased to R30 000.
dRAFT EMPLOYMENT EQUITY REGULATIONS
The following proposals are included in the Draft EE Regulations 2014:
a) All employers must now report every year, so smaller employers no longer report every second year. An employer who becomes designated during the reporting period, should submit their first report only on the first working day of October of the following reporting year (not in November, February, etc.)
b) The regulations unpack the concept of ‘pay’ as well as the meaning of ‘equal value’ to guide employers in dealing with any possible discrimination on the grounds of equal pay for equal work or for work of equal value
c) In terms of the Solidarity versus Department of Correctional Services case, the court insisted that employers should consider both the national as well as the regional demographics of the Economically Active Population (EAP) in their application and enforcement of targets. It ought to be noted that the EAP demographics are not the same as the general population demographics, because they exclude people below the ages of 16 and above 65. EAP also excludes people who are no longer looking for work (discouraged potential employees); it excludes students; people in prisons and others who are not eligible for employment. EAP is therefore very sensitive to the historical patterns of employment in the country and in any province (e..g. the previously all-male employment patterns of mining provinces such as the North West and Free State). Over the past few centuries, the EAP’s of such provinces would have been strongly biased in favour of the males who were the preferred group for employment. The apartheid laws also played a very serious role in creating preferences for one particular group over others. So some balance ought to be struck between taking cognizance of these historical patterns of employment and their distortionary effect on the labour market and the EAP’s in various parts of South Africa, versus the globalisation imperative which requires the recruitment of skills from across the nation and even globally. The draft regulations seek to accommodate the need by larger employers (using numberof employees as proxy) to widen their net when they seek prospective employees, particularly at the senior levels

52
The assumption is that the senior levels tend to scarcity of supply, particularly at the local or regional level and hence would require recruitment nationally (and even globally), whereas at the lower levels, the skills that are required are not always that scarce and supply is normally available locally and/or regionally. On the other hand, using the EAP of Rustenburg or the North West province when planning the targets for a platinum mine, will invariable lead to the continued under-representation of women, who were historically not employed at any level in the mines (including lower levels). Consequently, the female EAP of North West (as just one case in point) currently stands at only 40% versus that of males (60%).
LAbOUR COURT CASES
Director-General of Labour versus Comair (2007)
The Labour Court ruled against the Department of Labour for not considering all the factors that were listed in section 42, of the Act when reviewing if an employer has complied. The Employment Equity Act (47 of 2013) has now repealed section 42. The onus is no longer on the DG to conduct research into all the socio-economic factors that could possible influence whether a particular employer can comply with the Act.
Solidarity vs Department of Correctional Services (2012)
The judgement in this case also turned on the interpretation of section 42, particularly the need to consider both the national EAP as well as the regional EAP (rather than one or the other). The amended regulations seek to deal with this balancing act by proposing two ways of accommodating both, one is via the levels, where some are national and other regional, the other is via averaging of the two.
Solidarity vs South African Police Services (2013)
The court rejected the refusal by the SAPS to employ a white female as Superintendent merely on the basis that her category (white females) was already over-represented. This case reinforces the need for long-term planning with respect to employment equity, as part of the key strategic plan of any institution or employer. Employers should develop the required capacity and skills and not expect to get them via advertisement. So human resources policies and practices, including skills development, ought to be aligned to employment equity, otherwise the SAPS and other employers will never get enough candidates that are eligible to be Superintendents from the ranks of designated groups.
Key observations from 2003-2013 data
Top Managementa) Africans constitute less than 20% of Top Management in 2013, whereas they are 75% of the national EAP of the country. Whites constitute 62% of Top Management in 2013, in stark contrast with their EAP nationally of 10.8%
b) The movement of various designated groups into Top Management, over the past ten years, has been staggered and inconsistent. For instance, in 2009, African representation at the Top Management level reached the highest percentage point of 20.3%, before declining to the current 19.8%. In fact the ‘movement’ has been more like static, if not retrogressive, over the past five years, at this most crucial level of decision-making and influence
c) The above-noted pattern is also reflected in the trends of the Coloured category of designated group members. This category first declines in 2005, when it is expected to increase, then it increases to 5% in 2009, before declining to 4.8% in 2011. So there is regression, not progress
d) The only solid and consistent progress in the percentages of representation at Top Management level, between 2003 and 2013, takes place in the Indian sub-category of designated group members. This group virtually doubles its representation during that period
e) The actual figures (raw data) of all employees in Top Management reveal another story. The total number of employees in Top Management from the statistics that were given by employers in their EE reports, were 15 515 in 2003 and it rose to 22 571 in 2013. Of the 22 571 Top Managers in 2013, a staggering 14 149 are white employees. This is ‘followed’ by Africans who are a mere 4 464; then Indians (1 879); Coloureds (1 146). The total number of People with Disabilities in the reporting population at Top Management is 347 people in 2013
f) Females constitute 20.6% of Top Management. Their actual figure is 4 646 employees. So, in real terms, there are more females in Top Management (4 646) than all the Africans in Top Management (4 464). This ought to be interpreted in the backdrop of the respective EAP’s of the various designated group members (Female EAP: 46%; Africans: 75%; Indians; 3.1%; Coloureds : 10.6% ). In actual terms, there are more Indians in Top Management (1 879) than Coloured people (1 146), when the actual EAP’s are the complete opposite.
g) What the real numbers reveal is that the ‘cake’ has been expanding/ increasing over the past ten years, but it has not transformed at the same rate as it has been increasing. We then have the biblical situation of even more being added to
53
those to whom more representation had been given, whereas from those whose representation was less, lesser still will be added. To continue the cake analogy, the black raisins on the cake remain scattered here and there even as the cake continues to enlarge.
h) People with disabilities constituted 1.6% (247) of Top Management in 2003, ten years later they are 1.8% (347 employees). The actual number went up by only 100 people in ten years!
Senior Managementa) The pattern for Top Management is reflected in Senior Management, albeit with some slight variation of between 2% and 5%. For instance white senior managers (at 57%) are only 5% points below their representation of 62.7 in Top Management. Similarly, Africans constitute 23% of Senior Management (versus 19.8% of Top Management); Coloureds are 7% (versus 5.1%); Indians are 10% of Senior Management (versus 8.4% of Top Management).
b) Females constitute 29.9% of Senior Management in 2013, versus 20.6% in Top Management. So in 2013, 70% of Senior Management remains male employees
c) The percentage representation of People with Disabilities in Senior Management has not changed in the last ten years; it is stuck at 1.3%. The actual figures are 614 employees with disabilities in Senior Management by 2003 and 1070 in 2013. But then the total number of employees at Senior Management level grew from 47,433 in 2003 to 84,527. A staggering 37,095 additional employees were added to the category of which only 456 were People with Disabilities (or 1.23 %).
Professionally Qualifieda) The proportion of Africans in this category actually declined between 2003 and 2013. In 2003 Africans constituted 39% of Professionally Qualified employees, but in 2013 they were 38.4%. The total pool of employees in this category, in actual numbers was 15 515 in 2003, and 22 571 in 2013. Of this total in 2003, Whites were 49.2%, Africans were 39%, Coloureds 6.1%, Indians 5.5% and females 36%. In 2013, on the other hand, the real number of whites at the Professionally Qualified level grew to 167 882; versus those of Africans 160 401, Coloureds 40 132, Indians 39 315 and People with Disabilities 4 521
b) The actual proportion of women at the Professionally Qualified level has been static at some 43% for the past five years or so. The actual number of females at this level was 94 223 in 2003 and it grew to 180 133 in 2013. This compares with the actual number of males which was at 163 889 in 2003 and which actually grew to 237 863 by 2013.
Skilled Levela) In percentage representation terms, the various groups seem to be doing well at the skilled level. Whites would appear to have declined from 38.2% in 2003 to 22% in 2013; whilst Africans seem to have increased from 42% in 2003 to 59% in 2013. Contrarily, Coloureds in percentage terms actually decreased from 12.9% in 2003 to 11.3% in 2013; whilst Indians declined from 6.8% to 5.9% during the same period. However this has to be interpreted in the backdrop of the real increases in opportunities between 2003 and 2013.
c) The total pool of employees in this category, in actual numbers was 841 537 in 2003, and 1 447 224 in 2013. Of this total in 2003, Whites were 38.2%, Africans were 42.1%, Coloureds 12.9%, Indians 6.8% and Females 44.2%. In 2013, on the other hand, the real number of whites at the Professionally Qualified level grew to 167 882, versus those of Africans 160 401, Coloureds 40 132, Indians 39 315 and People with Disabilities 4 521
d) The actual proportion of women at the Skilled Level was 47% in 2013 versus 44.2% in 2003. The actual number of females at this level was 371,819 in 2003 and it grew to 681 374 in 2013. This compares with the actual number of males which was at 469 718 in 2003 and which actually grew to 725 650 by 2013.
e) At this level, the proportion of People with Disabilities declined from 1.6% in 2003 to 1% in 2013.
The 14th Annual CEE Report also produces data for 2013 on the representation of the various categories by sector, business type and by province. Efforts will be made in future to also do some long-term trends’ analyses of these data, based on the actual reports that were submitted by employers over the past ten years or more. The sum-total will still be the same because the total figures are extracted from all the reports, representing all the provinces as well as all sectors and business types. The addition of actual figures in this year’s annual report show, in actual fact, opportunities continue to be skewed along the old racial, gender and disability lines. Whilst the percentages seem to be increasing for some designated groups, even these increases are inconsistent and staggered. Yet beyond the staggered and erratic movement of designated group, lies another picture of very low bases from which the percentages are calculated, so that the actual numbers are increasing at a far slower rate. Where there were 10 000 members of non-designated groups in a particular level and only 1 000 members of designated groups, if the designated groups double in actual numbers, the move from 1 000 to 2 000 changes the representation in percentage terms from 10% to 20%, which looks very good. But in the meantime the 10 000 actually grows to some 13 000, so that the additional 1 000 members of designated groups becomes 15.4% of the new numbers. Whilst a 15.4% level of representation is better than 10%, the reality is that another 2 000 extra members of non-designated groups were also added in the process. This calls for a far more nuanced approach to the interpretation of the percentages of representation than has been the case hitherto, so that the reality can be understood. So many challenges still lie ahead and we still have a very long way to go.

REFERENCES
SEVEN

55
7 REFERENCES
Department of Labour (2004). Commission for Employment Equity Annual Report 2003/2004, Pretoria
Department of Labour (2006). Commission for Employment Equity Annual Report 2005/2006, Pretoria
Department of Labour (2008). Commission for Employment Equity Annual Report 2007/2008, Pretoria
Department of Labour (2010). Commission for Employment Equity Annual Report 2009/2010, Pretoria
Department of Labour (2012). Commission for Employment Equity Annual Report 2011/2012, Pretoria
South Africa (2013). Employment Equity Amendment Act, No. 47, Government Printers, Pretoria.
Statistics South Africa (2013). Quarterly Labour Force Survey, Quarter 3.Pretoria

APPENdIx A
EIGHT

57
8 APPENdIx A
8.1 TABLES FOR WORKFORCE PROFILE FOR ALL LARGE EMPLOYERS
8.1.1 Please report the total number of employees (including employees with disabilities) in each of the following
occupational levels (for all large employers)
OCCUPATIONAL LEVELS
Male Female Foreign National Total
AM CM IM WM AF CF IF WF FM FF
Top Management3 048 790 1460 11 811 1 416 356 419 2 338 816 117 22 571
13.5% 3.5% 6.5% 52.3% 6.3% 1.6% 1.9% 10.4% 3.6% 0.5% 100.0%
Senior Management
12 701 3 786 5 793 34 888 6 791 2 098 2 692 13 253 2 036 489 84 527
15.0% 4.5% 6.9% 41.3% 8.0% 2.5% 3.2% 15.7% 2.4% 0.6% 100.0%
Professionally qualified and experienced specialists and mid-management
82 596 21 139 22 526 103 951 77 805 18 933 16 789 63 931 7 651 2 675 417 996
19.8% 5.1% 5.4% 24.9% 18.6% 4.5% 4.0% 15.3% 1.8% 0.6% 100.0%
Skilled technical and academically qualified workers, junior management, supervisors, foremen, and superintendents
447 378 82 463 44 660 173 627 410 235 80 569 40 779 145 269 17 722 4 522 1 447 224
30.9% 5.7% 3.1% 12.0% 28.3% 5.6% 2.8% 10.0% 1.2% 0.3% 100.0%
Semi-skilled and discretionary decision making
872 001 102 223 30 464 49 345 578 643 120 122 30 855 78 962 48 048 3 766 1 914 429
45.5% 5.3% 1.6% 2.6% 30.2% 6.3% 1.6% 4.1% 2.5% 0.2% 100.0%
Unskilled and defined decision making
521 315 49 203 5 482 6 691 300 977 45 298 3 272 2 691 27 072 3 695 965 696
54.0% 5.1% 0.6% 0.7% 31.2% 4.7% 0.3% 0.3% 2.8% 0.4% 100.0%
TOTAL PERMANENT
1 939 039 259 604 110 385 380 313 1 375 867 267 376 94 806 306 444 103 345 15 264 4 852 443
40.0% 5.3% 2.3% 7.8% 28.4% 5.5% 2.0% 6.3% 2.1% 0.3% 100.0%
Temporary employees
310 216 40 170 7 341 23 170 272 809 40 383 7 708 23 154 11 413 4 519 740 883
41.9% 5.4% 1.0% 3.1% 36.8% 5.5% 1.0% 3.1% 1.5% 0.6% 100.0%
GRAND TOTAL 2 249 255 299 774 117 726 403 483 1 648 676 307 759 102 514 329 598 114 758 19 783 5 593 326

58Occupational Levels
Male Female Foreign National Total
A C I W A C I W Male Female
Top Management62 13 26 157 28 10 7 35 9 0 347
17.9% 3.7% 7.5% 45.2% 8.1% 2.9% 2.0% 10.1% 2.6% 0.0% 100.0%
Senior Management167 55 64 468 75 25 32 169 11 4 1070
15.6% 5.1% 6.0% 43.7% 7.0% 2.3% 3.0% 15.8% 1.0% 0.4% 100.0%
Professionally qualified and experienced special-ists and mid-manage-ment
785 218 243 1646 483 142 124 834 27 19 4521
17.4% 4.8% 5.4% 36.4% 10.7% 3.1% 2.7% 18.4% 0.6% 0.4% 100.0%
Skilled technical and academically qualified workers, junior man-agement, supervisors, foremen, and superin-tendents
4 743 850 580 2 777 2 646 709 366 2 025 89 20 14 805
32.0% 5.7% 3.9% 18.8% 17.9% 4.8% 2.5% 13.7% 0.6% 0.1% 100.0%
Semi-skilled and discre-tionary decision making
6 889 1 193 421 1 518 4 278 1 370 372 1 508 350 23 17 922
38.4% 6.7% 2.3% 8.5% 23.9% 7.6% 2.1% 8.4% 2.0% 0.1% 100.0%
Unskilled and defined decision making
4 856 446 89 210 3 023 395 29 117 434 28 9 627
50.4% 4.6% 0.9% 2.2% 31.4% 4.1% 0.3% 1.2% 4.5% 0.3% 100.0%
TOTAL PERMANENT17 502 2 775 1 423 6 776 10 533 2 651 930 4 688 920 94 48 292
36.2% 5.7% 2.9% 14.0% 21.8% 5.5% 1.9% 9.7% 1.9% 0.2% 100.0%
Temporary employees939 108 21 91 1 041 209 23 58 57 28 2 575
36.5% 4.2% 0.8% 3.5% 40.4% 8.1% 0.9% 2.3% 2.2% 1.1% 100.0%
GRAND TOTAL 1 8441 2 883 1 444 6 867 11 574 2 860 953 4 746 977 122 50 867
8.1.2 Please report the total number of employees with disabilities only in each of the following occupational levels (for all large employers)

59
8.2 wORkFORCE MOvEMENT
8.2.1 Please report the total number of new recruits, including people with disabilities (for all large employers)
OCCUPATIONAL LEVELS
Male Female Foreign National Total
A C I W A C I W Male Female
Top Management345 78 104 681 231 46 46 184 113 8 1 836
18.8% 4.2% 5.7% 37.1% 12.6% 2.5% 2.5% 10.0% 6.2% 0.4% 100.0%
Senior Management1 697 385 580 3 361 992 195 310 1 290 360 103 9 273
18.3% 4.2% 6.3% 36.2% 10.7% 2.1% 3.3% 13.9% 3.9% 1.1% 100.0%
Professionally quali-fied and experienced specialists and mid-management
10 992 2 273 3 039 11 533 15 274 2 048 2 617 7 809 1 897 709 58 191
18.9% 3.9% 5.2% 19.8% 26.2% 3.5% 4.5% 13.4% 3.3% 1.2% 100.0%
Skilled technical and academically qualified workers, junior man-agement, supervisors, foremen, and superin-tendents
70 584 11 087 5 966 26 191 52 769 9 251 5 175 19 494 4 151 1 132 205 800
34.3% 5.4% 2.9% 12.7% 25.6% 4.5% 2.5% 9.5% 2.0% 0.6% 100.0%
Semi-skilled and discretionary decision making
182 011 23 893 8 066 12 787 137 260 26 851 7 763 14 797 4 493 2 100 420 021
43.3% 5.7% 1.9% 3.0% 32.7% 6.4% 1.8% 3.5% 1.1% 0.5% 100.0%
Unskilled and defined decision making
154 948 17 011 1 749 2 844 96 670 13 564 1 002 1 296 4 008 1 067 294 159
52.7% 5.8% 0.6% 1.0% 32.9% 4.6% 0.3% 0.4% 1.4% 0.4% 100.0%
TOTAL PERMANENT420 577 54 727 19 504 57 397 303 196 51 955 16 913 44 870 15 022 5 119 989 280
42.5% 5.5% 2.0% 5.8% 30.6% 5.3% 1.7% 4.5% 1.5% 0.5% 100.0%
Temporary employees265 644 42 440 6 975 16 783 223 941 48 036 6 212 19 503 9 222 3 780 642 536
41.3% 6.6% 1.1% 2.6% 34.9% 7.5% 1.0% 3.0% 1.4% 0.6% 100.0%
GRAND TOTAL 686 221 97 167 26 479 74 180 527 137 99 991 23 125 64 373 24 244 8 899 1 631 816

60
8.2.2 Please report the total number of promotions into each occupational level, including people with disabilities (for all large employers)
Occupational Levels
Male Female Foreign National Total
A C I W A C I W Male Female
Top Management183 58 132 586 119 44 51 185 22 5 1 385
13.2% 4.2% 9.5% 42.3% 8.6% 3.2% 3.7% 13.4% 1.6% 0.4% 100.0%
Senior Management1 782 417 746 2 571 1 042 258 465 1 360 185 65 8 891
20.0% 4.7% 8.4% 28.9% 11.7% 2.9% 5.2% 15.3% 2.1% 0.7% 100.0%
Professionally quali-fied and experi-enced specialists and mid-manage-ment
12 695 2 402 2 124 7 922 11 441 2 187 2 037 6 694 491 210 48 203
26.3% 5.0% 4.4% 16.4% 23.7% 4.5% 4.2% 13.9% 1.0% 0.4% 100.0%
Skilled technical and academically qualified workers, junior management, supervisors, fore-men, and superin-tendents
43 180 5 969 2 959 8 400 54 853 7 050 3 087 10 263 1 175 372 137 308
31.4% 4.3% 2.2% 6.1% 39.9% 5.1% 2.2% 7.5% 0.9% 0.3% 100.0%
Semi-skilled and dis-cretionary decision making
36 782 3 905 1 023 1 645 29 657 4 308 1 048 1 624 1 250 110 81 352
45.2% 4.8% 1.3% 2.0% 36.5% 5.3% 1.3% 2.0% 1.5% 0.1% 100.0%
Unskilled and defined decision making
6705 1079 149 167 5668 817 115 101 132 27 14 960
44.8% 7.2% 1.0% 1.1% 37.9% 5.5% 0.8% 0.7% 0.9% 0.2% 100.0%
TOTAL PERMANENT101 327 13 830 7 133 21 291 102 780 14 664 6 803 20 227 3 255 789 292 099
34.7% 4.7% 2.4% 7.3% 35.2% 5.0% 2.3% 6.9% 1.1% 0.3% 100.0%
Temporary employees7136 1 339 266 622 5 106 807 169 528 218 33 16224
44.0% 8.3% 1.6% 3.8% 31.5% 5.0% 1.0% 3.3% 1.3% 0.2% 100.0%
GRAND TOTAL 108 463 15 169 7 399 21 913 107 886 15 471 6 972 20 755 3 473 822 308 323

61
8.3 SkILLS dEvELOPMENT
8.3.1 Please report the total number of people from the designated groups, including people with disabilities, who received training solely for the purpose of achieving the numerical goals, and not the number of training courses attended by individuals (for all large employers)
OCCUPATIONAL LEVELS
Male FemaleTotal
A C I W A C I W
Top Management
1 154 275 438 2 531 664 144 164 772 6 142
18.8% 4.5% 7.1% 41.2% 10.8% 2.3% 2.7% 12.6% 100.0%
Senior Management
6 555 1 822 2 880 12 090 4 410 1 150 1 544 6 480 36931
17.7% 4.9% 7.8% 32.7% 11.9% 3.1% 4.2% 17.5% 100.0%
Professionally qualified and experienced specialists and mid-manage-ment
38 951 12 185 11 700 37 228 44 949 15 926 9 390 32 791 203 120
19.2% 6.0% 5.8% 18.3% 22.1% 7.8% 4.6% 16.1% 100.0%
Skilled technical and academi-cally qualified workers, junior management, supervisors, foremen, and superintendents
161 985 34 874 19 279 58 486 110 725 37 097 17 845 53 289 493 580
32.8% 7.1% 3.9% 11.8% 22.4% 7.5% 3.6% 10.8% 100.0%
Semi-skilled and discretionary decision making
290 387 33 782 12 282 16 110 205 854 43 882 15 072 29 034 646 403
44.9% 5.2% 1.9% 2.5% 31.8% 6.8% 2.3% 4.5% 100.0%
Unskilled and defined decision making
142 266 12 035 1 942 2 444 70 200 11 287 1 362 1 047 242 583
58.6% 5.0% 0.8% 1.0% 28.9% 4.7% 0.6% 0.4% 100.0%
TOTAL PERMANENT
641 298 94 973 48 521 128 889 436 802 109 486 45 377 123 413 1 628 759
39.4% 5.8% 3.0% 7.9% 26.8% 6.7% 2.8% 7.6% 100.0%
Temporary employees
51 097 4 322 1 234 3 431 31 591 4 908 857 2 669 100109
51.0% 4.3% 1.2% 3.4% 31.6% 4.9% 0.9% 2.7% 100.0%
GRAND TOTAL 692 395 99 295 49 755 132 320 468 393 114 394 46 234 126 082 1 728 868

62
8.3.1 Please report the total number of people with disabilities only who received training solely for the purpose of achieving the numerical goals, and not the number of training courses attended by individuals
(for all large employers)
OCCUPATIONAL LEVELS
Male FemaleTotal
A C I W A C I W
Top Management17 1 6 34 6 2 3 12 81
21.0% 1.2% 7.4% 42.0% 7.4% 2.5% 3.7% 14.8% 100.0%
Senior Management83 30 48 214 34 21 26 79 535
15.5% 5.6% 9.0% 40.0% 6.4% 3.9% 4.9% 14.8% 100.0%
Professionally quali-fied and experienced specialists and mid-management
371 96 123 719 173 83 85 389 2 039
18.2% 4.7% 6.0% 35.3% 8.5% 4.1% 4.2% 19.1% 100.0%
Skilled technical and academically quali-fied workers, junior management, super-visors, foremen, and superintendents
8 666 624 249 1 163 2 051 417 189 900 14 259
60.8% 4.4% 1.7% 8.2% 14.4% 2.9% 1.3% 6.3% 100.0%
Semi-skilled and discretionary decision making
3950 345 136 359 2 041 368 175 507 7 881
50.1% 4.4% 1.7% 4.6% 25.9% 4.7% 2.2% 6.4% 100.0%
Unskilled and defined decision making
3889 265 37 193 1 634 163 10 48 6 239
62.3% 4.2% 0.6% 3.1% 26.2% 2.6% 0.2% 0.8% 100.0%
TOTAL PERMANENT16 976 1 361 599 2 682 5 939 1 054 488 1 935 31 034
54.7% 4.4% 1.9% 8.6% 19.1% 3.4% 1.6% 6.2% 100.0%
Temporary employees644 105 25 31 454 64 12 19 1 354
47.6% 7.8% 1.8% 2.3% 33.5% 4.7% 0.9% 1.4% 100.0%
GRAND TOTAL 6 245 1 329 693 2 619 4 451 973 509 1 794 18 613
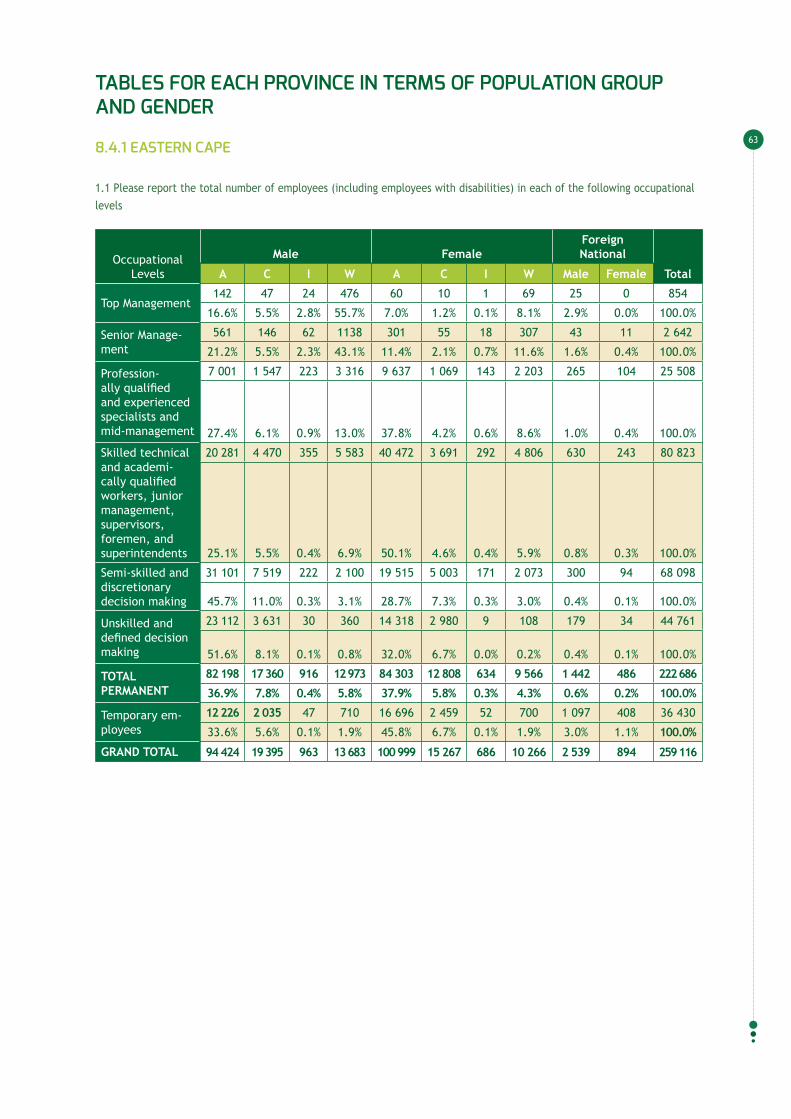
63
TAbLES FOR EACh PROvINCE IN TERMS OF POPULATION GROUP ANd GENdER
8.4.1 EASTERN CAPE
1.1 Please report the total number of employees (including employees with disabilities) in each of the following occupational levels
Occupational Levels
Male FemaleForeign National
TotalA C I W A C I W Male Female
Top Management142 47 24 476 60 10 1 69 25 0 854
16.6% 5.5% 2.8% 55.7% 7.0% 1.2% 0.1% 8.1% 2.9% 0.0% 100.0%
Senior Manage-ment
561 146 62 1138 301 55 18 307 43 11 2 642
21.2% 5.5% 2.3% 43.1% 11.4% 2.1% 0.7% 11.6% 1.6% 0.4% 100.0%
Profession-ally qualified and experienced specialists and mid-management
7 001 1 547 223 3 316 9 637 1 069 143 2 203 265 104 25 508
27.4% 6.1% 0.9% 13.0% 37.8% 4.2% 0.6% 8.6% 1.0% 0.4% 100.0%
Skilled technical and academi-cally qualified workers, junior management, supervisors, foremen, and superintendents
20 281 4 470 355 5 583 40 472 3 691 292 4 806 630 243 80 823
25.1% 5.5% 0.4% 6.9% 50.1% 4.6% 0.4% 5.9% 0.8% 0.3% 100.0%
Semi-skilled and discretionary decision making
31 101 7 519 222 2 100 19 515 5 003 171 2 073 300 94 68 098
45.7% 11.0% 0.3% 3.1% 28.7% 7.3% 0.3% 3.0% 0.4% 0.1% 100.0%
Unskilled and defined decision making
23 112 3 631 30 360 14 318 2 980 9 108 179 34 44 761
51.6% 8.1% 0.1% 0.8% 32.0% 6.7% 0.0% 0.2% 0.4% 0.1% 100.0%
TOTAL PERMANENT
82 198 17 360 916 12 973 84 303 12 808 634 9 566 1 442 486 222 686
36.9% 7.8% 0.4% 5.8% 37.9% 5.8% 0.3% 4.3% 0.6% 0.2% 100.0%
Temporary em-ployees
12 226 2 035 47 710 16 696 2 459 52 700 1 097 408 36 430
33.6% 5.6% 0.1% 1.9% 45.8% 6.7% 0.1% 1.9% 3.0% 1.1% 100.0%
GRAND TOTAL 94 424 19 395 963 13 683 100 999 15 267 686 10 266 2 539 894 259 116

64
8.4.2 FREE STATE
Please report the total number of employees (including People with Disabilities) in each of the following occupational levels
Occupational LevelsMale Female Foreign
National Total
A C I W A C I W Male Female
Top Management 122 14 6 195 73 0 1 56 5 3 475
25.7% 2.9% 1.3% 41.1% 15.4% 0.0% 0.2% 11.8% 1.1% 0.6% 100.0%
Senior Management 274 27 12 308 103 8 2 132 2 0 868
31.6% 3.1% 1.4% 35.5% 11.9% 0.9% 0.2% 15.2% 0.2% 0.0% 100.0%
Professionally qualified and experienced specialists and mid-management
1856 103 21 1564 1917 121 25 1230 156 79 7072
26.2% 1.5% 0.3% 22.1% 27.1% 1.7% 0.4% 17.4% 2.2% 1.1% 100.0%
Skilled technical and aca-demically qualified work-ers, junior management, supervisors, foremen, and superintendents
6 172 471 35 2 288 7 378 637 23 2 575 197 46 19 822
31.1% 2.4% 0.2% 11.5% 37.2% 3.2% 0.1% 13.0% 1.0% 0.2% 100.0%
Semi-skilled and discretion-ary decision making
19 425 770 14 1 594 20 876 783 21 4 237 1 855 62 49 637
39.1% 1.6% 0.0% 3.2% 42.1% 1.6% 0.0% 8.5% 3.7% 0.1% 100.0%
Unskilled and defined deci-sion making
15 252 489 9 150 7 604 301 3 93 1 571 64 25 536
59.7% 1.9% 0.0% 0.6% 29.8% 1.2% 0.0% 0.4% 6.2% 0.3% 100.0%
TOTAL PERMANENT 43 101 1 874 97 6 099 37 951 1 850 75 8 323 3 786 254 103 410
41.7% 1.8% 0.1% 5.9% 36.7% 1.8% 0.1% 8.0% 3.7% 0.2% 100.0%
Temporary employees 4 510 292 16 703 5 555 183 5 870 284 311 12729
35.4% 2.3% 0.1% 5.5% 43.6% 1.4% 0.0% 6.8% 2.2% 2.4% 100.0%
GRAND TOTAL 47 611 2 166 113 6 802 43 506 2 033 80 9 193 4 070 565 116 139
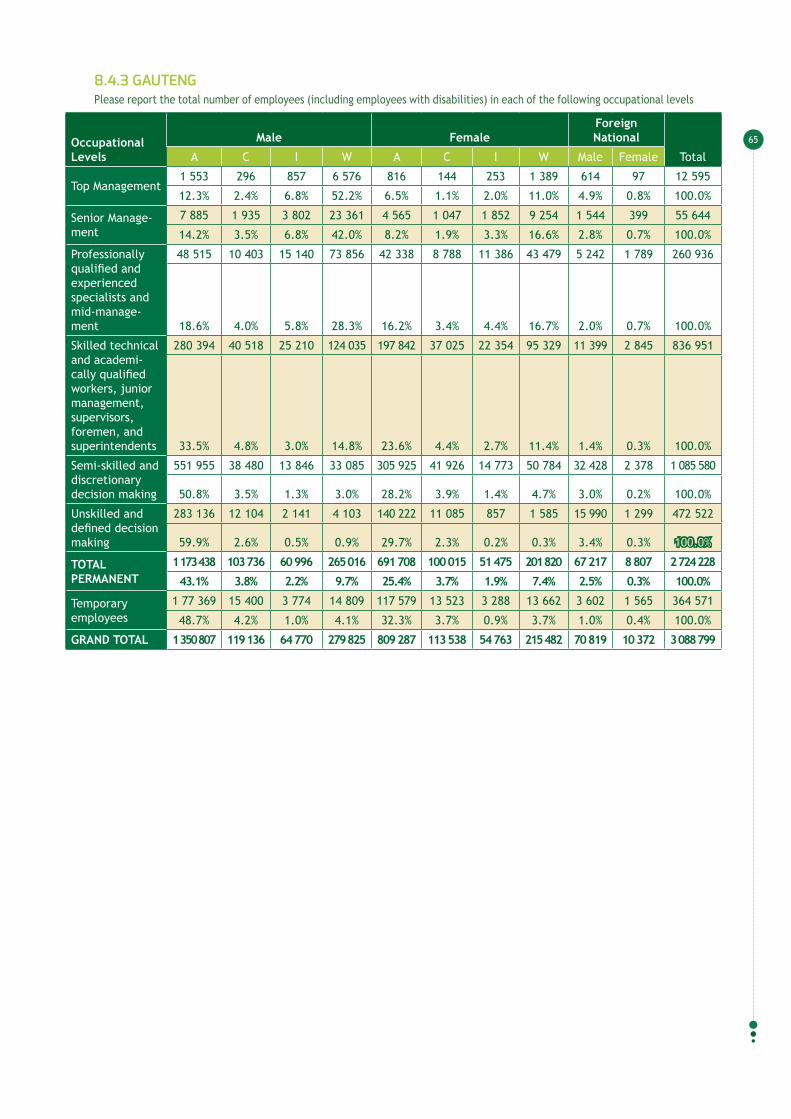
65
8.4.3 GAUTENGPlease report the total number of employees (including employees with disabilities) in each of the following occupational levels
Occupational Levels
Male FemaleForeign National
TotalA C I W A C I W Male Female
Top Management1 553 296 857 6 576 816 144 253 1 389 614 97 12 595
12.3% 2.4% 6.8% 52.2% 6.5% 1.1% 2.0% 11.0% 4.9% 0.8% 100.0%
Senior Manage-ment
7 885 1 935 3 802 23 361 4 565 1 047 1 852 9 254 1 544 399 55 644
14.2% 3.5% 6.8% 42.0% 8.2% 1.9% 3.3% 16.6% 2.8% 0.7% 100.0%
Professionally qualified and experienced specialists and mid-manage-ment
48 515 10 403 15 140 73 856 42 338 8 788 11 386 43 479 5 242 1 789 260 936
18.6% 4.0% 5.8% 28.3% 16.2% 3.4% 4.4% 16.7% 2.0% 0.7% 100.0%
Skilled technical and academi-cally qualified workers, junior management, supervisors, foremen, and superintendents
280 394 40 518 25 210 124 035 197 842 37 025 22 354 95 329 11 399 2 845 836 951
33.5% 4.8% 3.0% 14.8% 23.6% 4.4% 2.7% 11.4% 1.4% 0.3% 100.0%
Semi-skilled and discretionary decision making
551 955 38 480 13 846 33 085 305 925 41 926 14 773 50 784 32 428 2 378 1 085 580
50.8% 3.5% 1.3% 3.0% 28.2% 3.9% 1.4% 4.7% 3.0% 0.2% 100.0%
Unskilled and defined decision making
283 136 12 104 2 141 4 103 140 222 11 085 857 1 585 15 990 1 299 472 522
59.9% 2.6% 0.5% 0.9% 29.7% 2.3% 0.2% 0.3% 3.4% 0.3% 100.0%
TOTAL PERMANENT
1 173 438 103 736 60 996 265 016 691 708 100 015 51 475 201 820 67 217 8 807 2 724 228
43.1% 3.8% 2.2% 9.7% 25.4% 3.7% 1.9% 7.4% 2.5% 0.3% 100.0%
Temporary employees
1 77 369 15 400 3 774 14 809 117 579 13 523 3 288 13 662 3 602 1 565 364 571
48.7% 4.2% 1.0% 4.1% 32.3% 3.7% 0.9% 3.7% 1.0% 0.4% 100.0%
GRAND TOTAL 1 350 807 119 136 64 770 279 825 809 287 113 538 54 763 215 482 70 819 10 372 3 088 799

66
8.4.4 kwAZULU NATAL
Please report the total number of employees (including People with Disabilities) in each of the following occupational levels
Occupational Levels
Male FemaleForeign National
TotalA C I W A C I W Male Female
Top Management480 73 396 1 333 205 31 110 207 63 4 2 902
16.5% 2.5% 13.6% 45.9% 7.1% 1.1% 3.8% 7.1% 2.2% 0.1% 100.0%
Senior Management1 211 233 1 399 2 778 548 155 580 910 143 21 7978
15.2% 2.9% 17.5% 34.8% 6.9% 1.9% 7.3% 11.4% 1.8% 0.3% 100.0%
Professionally quali-fied and experienced specialists and mid-management
8431 844 5 196 5 536 8 583 758 3 858 3 181 661 240 37 288
22.6% 2.3% 13.9% 14.8% 23.0% 2.0% 10.3% 8.5% 1.8% 0.6% 100.0%
Skilled technical and academically quali-fied workers, junior management, super-visors, foremen, and superintendents
47 993 3 489 15 876 8 326 76 236 3 937 14 917 8 463 998 291 180 526
26.6% 1.9% 8.8% 4.6% 42.2% 2.2% 8.3% 4.7% 0.6% 0.2% 100.0%
Semi-skilled and dis-cretionary decision making
101 425 4 683 14 002 2 483 79 769 5 219 12 391 3 848 1 164 221 225 205
45.0% 2.1% 6.2% 1.1% 35.4% 2.3% 5.5% 1.7% 0.5% 0.1% 100.0%
Unskilled and defined decision making
66 059 2 123 2 790 349 49 120 1 508 1 936 157 376 58 124476
53.1% 1.7% 2.2% 0.3% 39.5% 1.2% 1.6% 0.1% 0.3% 0.0% 100.0%
TOTAL PERMANENT
225 599 11 445 39 659 20 805 214 461 11 608 33 792 16 766 3 405 835 578 375
39.0% 2.0% 6.9% 3.6% 37.1% 2.0% 5.8% 2.9% 0.6% 0.1% 100.0%
Temporary employees
49 449 3 301 2 883 1 915 57 825 2 845 3 833 2 458 516 60 125 085
39.5% 2.6% 2.3% 1.5% 46.2% 2.3% 3.1% 2.0% 0.4% 0.0% 100.0%
GRAND TOTAL 275 048 14 746 42 542 22 720 272 286 14 453 37 625 19 224 3921 895 703 460

67
8.4.5 LIMPOPO
Please report the total number of employees (including employees with disabilities) in each of the following occupational levels
Occupational Levels
Male Female Foreign National
TotalA C I W A C I W Male Female
Top Management109 5 15 165 47 2 2 34 3 0 382
28.5% 1.3% 3.9% 43.2% 12.3% 0.5% 0.5% 8.9% 0.8% 0.0% 100.0%
Senior Management589 6 21 289 321 1 8 78 19 2 1334
44.2% 0.4% 1.6% 21.7% 24.1% 0.1% 0.6% 5.8% 1.4% 0.1% 100.0%
Professionally qualified and experienced specialists and mid-management
6 741 30 45 739 7 702 28 38 481 201 50 16 055
42.0% 0.2% 0.3% 4.6% 48.0% 0.2% 0.2% 3.0% 1.3% 0.3% 100.0%
Skilled technical and aca-demically qualified workers, junior management, supervi-sors, foremen, and superin-tendents
31 996 74 50 1 200 42 691 74 67 1632 926 215 78 925
40.5% 0.1% 0.1% 1.5% 54.1% 0.1% 0.1% 2.1% 1.2% 0.3% 100.0%
Semi-skilled and discretion-ary decision making
23 054 109 23 189 23 506 87 16 305 214 51 47 554
48.5% 0.2% 0.0% 0.4% 49.4% 0.2% 0.0% 0.6% 0.5% 0.1% 100.0%
Unskilled and defined deci-sion making
12 009 49 4 39 10 011 43 0 10 2 869 1 160 26 194
45.8% 0.2% 0.0% 0.1% 38.2% 0.2% 0.0% 0.0% 11.0% 4.4% 100.0%
TOTAL PERMANENT74 498 273 158 2 621 84 278 235 131 2 540 4 232 1 478 170 444
43.7% 0.2% 0.1% 1.5% 49.4% 0.1% 0.1% 1.5% 2.5% 0.9% 100.0%
Temporary employees8 021 498 5 51 15 218 1 031 0 38 1 896 242 27 000
29.7% 1.8% 0.0% 0.2% 56.4% 3.8% 0.0% 0.1% 7.0% 0.9% 100.0%
GRAND TOTAL 82 519 771 163 2 672 99 496 1 266 131 2 578 6 128 1 720 197 444

68
8.4.6 MPUMALANGA
Please report the total number of employees (including People with Disabilities) in each of the following occupational levels
Occupational Levels
Male FemaleForeign National
TotalA C I W A C I W Male Female
Top Management255 25 24 542 78 3 5 80 18 0 1 030
24.8% 2.4% 2.3% 52.6% 7.6% 0.3% 0.5% 7.8% 1.7% 0.0% 100.0%
Senior Management1 048 41 53 1 309 353 14 13 290 49 2 3 172
33.0% 1.3% 1.7% 41.3% 11.1% 0.4% 0.4% 9.1% 1.5% 0.1% 100.0%
Professionally quali-fied and experienced specialists and mid-management
3 036 100 110 2 771 1 268 41 24 938 203 23 8 514
35.7% 1.2% 1.3% 32.5% 14.9% 0.5% 0.3% 11.0% 2.4% 0.3% 100.0%
Skilled technical and academically quali-fied workers, junior management, super-visors, foremen, and superintendents
20 723 616 201 8 680 6 373 180 128 2 602 1 404 30 40 937
50.6% 1.5% 0.5% 21.2% 15.6% 0.4% 0.3% 6.4% 3.4% 0.1% 100.0%
Semi-skilled and dis-cretionary decision making
53 313 511 56 1 872 12 625 216 81 1 513 5 301 52 75 540
70.6% 0.7% 0.1% 2.5% 16.7% 0.3% 0.1% 2.0% 7.0% 0.1% 100.0%
Unskilled and defined decision making
41 900 556 15 515 18 792 390 1 66 2 248 365 64 848
64.6% 0.9% 0.0% 0.8% 29.0% 0.6% 0.0% 0.1% 3.5% 0.6% 100.0%
TOTAL PERMANENT120 275 1 849 459 15 689 39 489 844 252 5 489 9 223 472 194 041
62.0% 1.0% 0.2% 8.1% 20.4% 0.4% 0.1% 2.8% 4.8% 0.2% 100.0%
Temporary employees16 466 378 111 1 075 14 771 86 39 595 1 038 524 35 083
46.9% 1.1% 0.3% 3.1% 42.1% 0.2% 0.1% 1.7% 3.0% 1.5% 100.0%
GRAND TOTAL 136 741 2 227 570 16 764 54 260 930 291 6 084 10 261 996 229 124

69
8.4.7 NORTh wEST
Please report the total number of employees (including People with Disabilities) in each of the following occupational levels
Occupational LevelsMale Female
Foreign National
TotalA C I W A C I W Male Female
Top Management203 3 8 171 51 2 4 29 7 0 478
42.5% 0.6% 1.7% 35.8% 10.7% 0.4% 0.8% 6.1% 1.5% 0.0% 100.0%
Senior Management400 21 18 459 189 16 8 130 8 0 1 249
32.0% 1.7% 1.4% 36.7% 15.1% 1.3% 0.6% 10.4% 0.6% 0.0% 100.0%
Professionally qualified and experienced specialists and mid-management
2 455 109 111 1 981 2 351 93 68 1 216 108 17 8 509
28.9% 1.3% 1.3% 23.3% 27.6% 1.1% 0.8% 14.3% 1.3% 0.2% 100.0%
Skilled technical and aca-demically qualified workers, junior management, supervi-sors, foremen, and superin-tendents
11 687 331 115 3 956 14 248 370 91 3 569 799 37 35 203
33.2% 0.9% 0.3% 11.2% 40.5% 1.1% 0.3% 10.1% 2.3% 0.1% 100.0%
Semi-skilled and discretion-ary decision making
23 754 313 16 1 012 20 746 519 44 2 129 4 958 43 53 534
44.4% 0.6% 0.0% 1.9% 38.8% 1.0% 0.1% 4.0% 9.3% 0.1% 100.0%
Unskilled and defined deci-sion making
18 828 170 7 163 8 801 158 4 92 2 097 107 30 427
61.9% 0.6% 0.0% 0.5% 28.9% 0.5% 0.0% 0.3% 6.9% 0.4% 100.0%
TOTAL PERMANENT57 327 947 275 7 742 46 386 1 158 219 7 165 7 977 204 129 40044.3% 0.7% 0.2% 6.0% 35.8% 0.9% 0.2% 5.5% 6.2% 0.2% 100.0%
Temporary employees9602 94 24 815 17740 111 37 1294 516 180 30413
31.6% 0.3% 0.1% 2.7% 58.3% 0.4% 0.1% 4.3% 1.7% 0.6% 100.0%
GRAND TOTAL 66 929 1 041 299 8 557 64 126 1 269 256 8 459 8 493 384 159 813
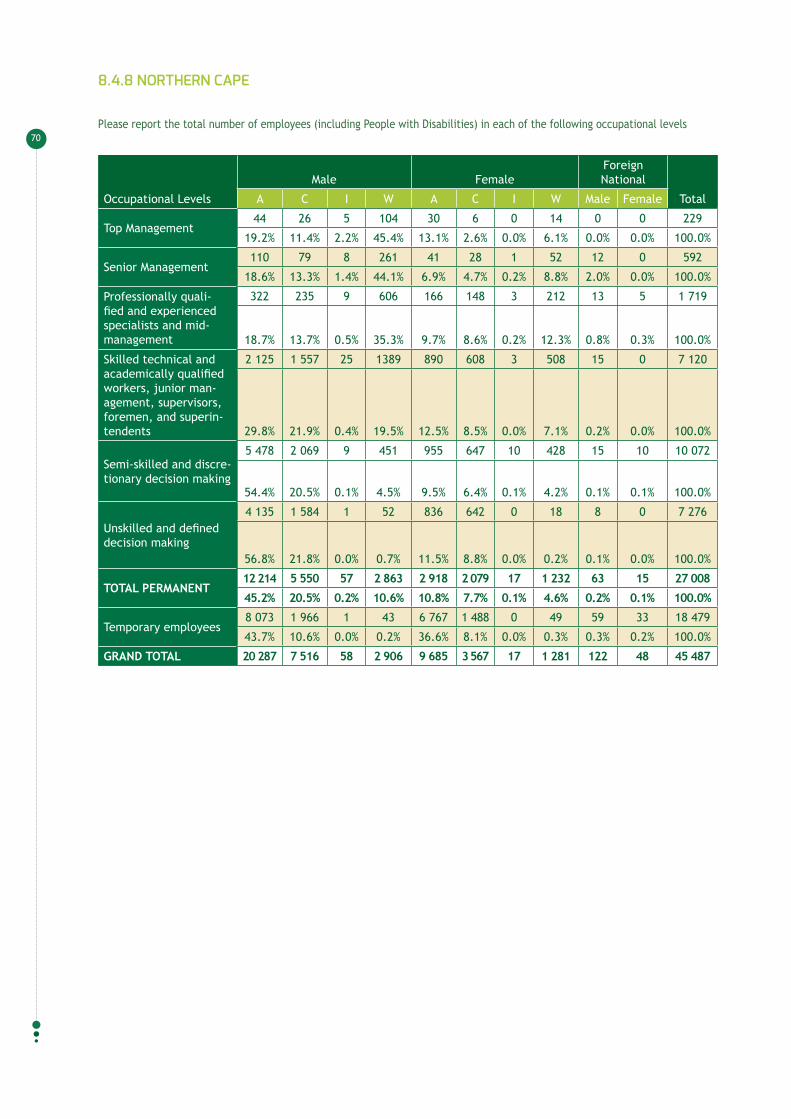
70
8.4.8 NORThERN CAPE
Please report the total number of employees (including People with Disabilities) in each of the following occupational levels
Occupational Levels
Male FemaleForeign National
TotalA C I W A C I W Male Female
Top Management44 26 5 104 30 6 0 14 0 0 229
19.2% 11.4% 2.2% 45.4% 13.1% 2.6% 0.0% 6.1% 0.0% 0.0% 100.0%
Senior Management110 79 8 261 41 28 1 52 12 0 592
18.6% 13.3% 1.4% 44.1% 6.9% 4.7% 0.2% 8.8% 2.0% 0.0% 100.0%
Professionally quali-fied and experienced specialists and mid-management
322 235 9 606 166 148 3 212 13 5 1 719
18.7% 13.7% 0.5% 35.3% 9.7% 8.6% 0.2% 12.3% 0.8% 0.3% 100.0%
Skilled technical and academically qualified workers, junior man-agement, supervisors, foremen, and superin-tendents
2 125 1 557 25 1389 890 608 3 508 15 0 7 120
29.8% 21.9% 0.4% 19.5% 12.5% 8.5% 0.0% 7.1% 0.2% 0.0% 100.0%
Semi-skilled and discre-tionary decision making
5 478 2 069 9 451 955 647 10 428 15 10 10 072
54.4% 20.5% 0.1% 4.5% 9.5% 6.4% 0.1% 4.2% 0.1% 0.1% 100.0%
Unskilled and defined decision making
4 135 1 584 1 52 836 642 0 18 8 0 7 276
56.8% 21.8% 0.0% 0.7% 11.5% 8.8% 0.0% 0.2% 0.1% 0.0% 100.0%
TOTAL PERMANENT12 214 5 550 57 2 863 2 918 2 079 17 1 232 63 15 27 008
45.2% 20.5% 0.2% 10.6% 10.8% 7.7% 0.1% 4.6% 0.2% 0.1% 100.0%
Temporary employees8 073 1 966 1 43 6 767 1 488 0 49 59 33 18 479
43.7% 10.6% 0.0% 0.2% 36.6% 8.1% 0.0% 0.3% 0.3% 0.2% 100.0%
GRAND TOTAL 20 287 7 516 58 2 906 9 685 3 567 17 1 281 122 48 45 487

71
8.4.9 wESTERN CAPE
Please report the total number of employees (including employees with disabilities) in each of the following occupational levels
Occupational Levels
Male FemaleForeign National
TotalA C I W A C I W Male Female
Top Management140 301 125 2249 56 158 43 460 81 13 3 626
3.9% 8.3% 3.4% 62.0% 1.5% 4.4% 1.2% 12.7% 2.2% 0.4% 100.0%
Senior Management623 1 298 418 4985 370 774 210 2100 216 54 11 048
5.6% 11.7% 3.8% 45.1% 3.3% 7.0% 1.9% 19.0% 2.0% 0.5% 100.0%
Professionally qualified and expe-rienced specialists and mid-manage-ment
4 239 7 768 1 671 13 582 3 843 7 887 1 244 10 991 802 368 52 395
8.1% 14.8% 3.2% 25.9% 7.3% 15.1% 2.4% 21.0% 1.5% 0.7% 100.0%
Skilled technical and academically quali-fied workers, junior management, super-visors, foremen, and superintendents
26 007 30 937 2 793 18 170 24 105 34 047 2 904 25 785 1 354 815 166 917
15.6% 18.5% 1.7% 10.9% 14.4% 20.4% 1.7% 15.4% 0.8% 0.5% 100.0%
Semi-skilled and dis-cretionary decision making
62 496 47 769 2 276 6 559 94 726 65 722 3 348 13 645 1 813 855 299 209
20.9% 16.0% 0.8% 2.2% 31.7% 22.0% 1.1% 4.6% 0.6% 0.3% 100.0%
Unskilled and defined decision making
56 884 28 497 485 960 51 273 28 191 462 562 1 734 608 169 656
33.5% 16.8% 0.3% 0.6% 30.2% 16.6% 0.3% 0.3% 1.0% 0.4% 100.0%
TOTAL PERMANENT150 389 116 570 7 768 46 505 174 373 136 779 8 211 53 543 6 000 2 713 702 851
21.4% 16.6% 1.1% 6.6% 24.8% 19.5% 1.2% 7.6% 0.9% 0.4% 100.0%
Temporary employ-ees
24 500 16 206 480 3 049 20 658 18 657 454 3 488 2 405 1 196 91 093
26.9% 17.8% 0.5% 3.3% 22.7% 20.5% 0.5% 3.8% 2.6% 1.3% 100.0%
GRAND TOTAL 174 889 132 776 8 248 49 554 195 031 155 436 8 665 57 031 8 405 3 909 793 944

TAbLES FOR EACh SECTOR IN TERMS OF POPULATION GROUP ANd GENdER
NINE

73
9 TAbLES FOR EACh SECTOR IN TERMS OF POPULATION GROUP ANd GENdER
9.1 AGRICULTURE
Please report the total number of employees (including employees with disabilities) in each of the following occupational levels
Occupational Levels
Male FemaleForeign National
TotalA C I W A C I W Male Female
Top Management81 26 16 877 41 7 2 134 21 1 1206
6.7% 2.2% 1.3% 72.7% 3.4% 0.6% 0.2% 11.1% 1.7% 0.1% 100.0%
Senior Management386 116 58 1 859 142 43 21 388 37 6 3 056
12.6% 3.8% 1.9% 60.8% 4.6% 1.4% 0.7% 12.7% 1.2% 0.2% 100.0%
Professionally quali-fied and experienced specialists and mid-management
2 687 524 198 4 093 1 317 287 109 1 575 155 36 10 981
24.5% 4.8% 1.8% 37.3% 12.0% 2.6% 1.0% 14.3% 1.4% 0.3% 100.0%
Skilled technical and academically quali-fied workers, junior management, super-visors, foremen, and superintendents
11 898 3 167 650 5 452 5 530 1 899 324 4 117 273 38 33 348
35.7% 9.5% 1.9% 16.3% 16.6% 5.7% 1.0% 12.3% 0.8% 0.1% 100.0%
Semi-skilled and dis-cretionary decision making
35 057 7 999 448 1 570 14 605 4 749 286 2 665 695 194 68 268
51.4% 11.7% 0.7% 2.3% 21.4% 7.0% 0.4% 3.9% 1.0% 0.3% 100.0%
Unskilled and defined decision making
56 004 7 307 64 253 44 365 8 371 11 70 5 284 1 855123 584
45.3% 5.9% 0.1% 0.2% 35.9% 6.8% 0.0% 0.1% 4.3% 1.5% 100.0%
TOTAL PERMANENT106 113 19 139 1 434 14 104 66 000 15 356 753 8 949 6 465 2 130 240 443
44.1% 8.0% 0.6% 5.9% 27.4% 6.4% 0.3% 3.7% 2.7% 0.9% 100.0%
Temporary employees36 629 7 379 80 352 41 640 10 818 47 245 3 608 1 808 102 606
35.7% 7.2% 0.1% 0.3% 40.6% 10.5% 0.0% 0.2% 3.5% 1.8% 100.0%
GRAND TOTAL 142 742 26 518 1 514 14 456 107 640 26 174 800 9 194 10 073 3 938 343 049

74
9.2 CATERING/ACCOMOdATION/OThER
Please report the total number of employees (including employees with disabilities) in each of the following occupational levels
Occupational Levels
Male FemaleForeign National
TotalA C I W A C I W Male Female
Top Management90 23 32 403 49 12 10 140 22 3 784
11.5% 2.9% 4.1% 51.4% 6.3% 1.5% 1.3% 17.9% 2.8% 0.4% 100.0%
Senior Management327 106 125 850 259 113 68 694 62 14 2 618
12.5% 4.0% 4.8% 32.5% 9.9% 4.3% 2.6% 26.5% 2.4% 0.5% 100.0%
Professionally quali-fied and experienced specialists and mid-management
1 847 487 428 2161 2 236 674 459 2 514 337 145 11 288
16.4% 4.3% 3.8% 19.1% 19.8% 6.0% 4.1% 22.3% 3.0% 1.3% 100.0%
Skilled technical and academically qualified workers, junior man-agement, supervisors, foremen, and superin-tendents
7 920 1 517 775 2 506 9 176 2 886 916 3 759 561 390 30 406
26.0% 5.0% 2.5% 8.2% 30.2% 9.5% 3.0% 12.4% 1.8% 1.3% 100.0%
Semi-skilled and discretionary decision making
24 045 2 687 671 1 146 33 716 4 949 963 2 162 919 741 71 999
33.4% 3.7% 0.9% 1.6% 46.8% 6.9% 1.3% 3.0% 1.3% 1.0% 100.0%
Unskilled and defined decision making
13 501 1 311 34 159 23 736 2 753 68 181 456 246 42 445
31.8% 3.1% 0.1% 0.4% 55.9% 6.5% 0.2% 0.4% 1.1% 0.6% 100.0%
TOTAL PERMANENT47 730 6 131 2 065 7 225 69 172 11 387 2 484 9 450 2 357 1 539 159 540
29.9% 3.8% 1.3% 4.5% 43.4% 7.1% 1.6% 5.9% 1.5% 1.0% 100.0%
Temporary employees3764 712 83 531 5814 1223 113 610 248 163 13261
28.4% 5.4% 0.6% 4.0% 43.8% 9.2% 0.9% 4.6% 1.9% 1.2% 100.0%
GRAND TOTAL 51 494 6 843 2 148 7 756 74 986 12 610 2 597 10 060 2 605 1 702 172 801
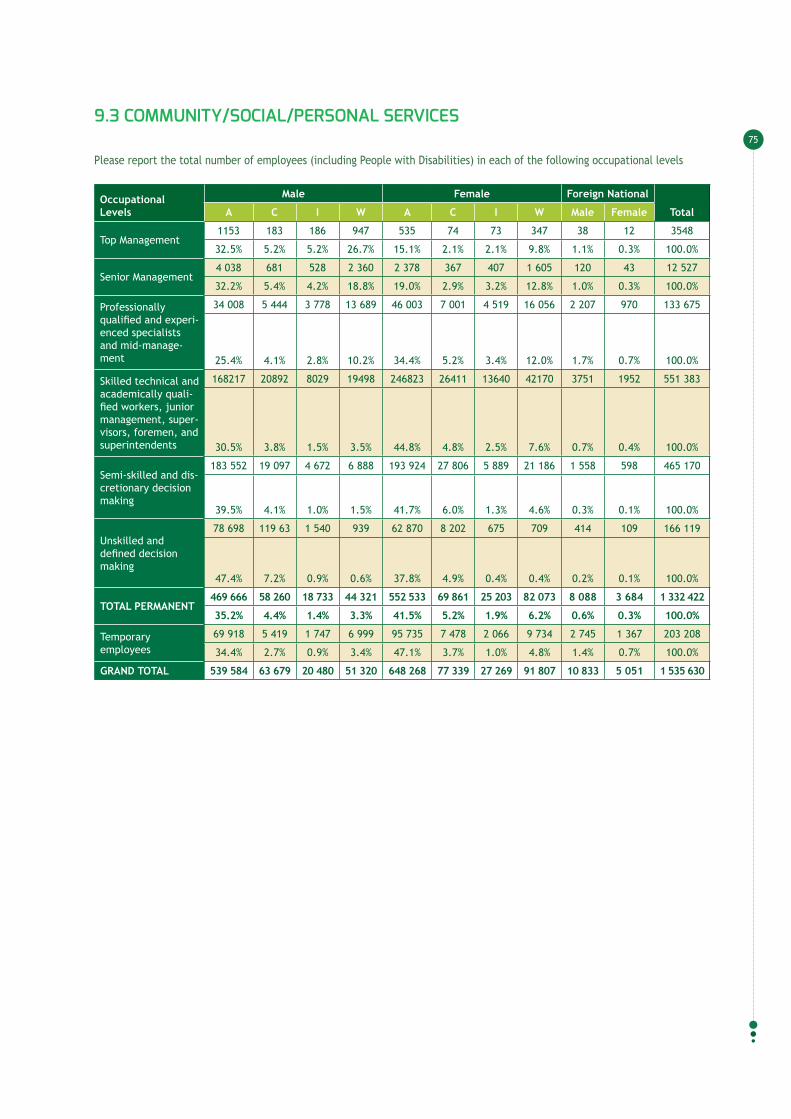
75
9.3 COMMUNITY/SOCIAL/PERSONAL SERvICES
Please report the total number of employees (including People with Disabilities) in each of the following occupational levels
Occupational Levels
Male Female Foreign National
TotalA C I W A C I W Male Female
Top Management1153 183 186 947 535 74 73 347 38 12 3548
32.5% 5.2% 5.2% 26.7% 15.1% 2.1% 2.1% 9.8% 1.1% 0.3% 100.0%
Senior Management4 038 681 528 2 360 2 378 367 407 1 605 120 43 12 527
32.2% 5.4% 4.2% 18.8% 19.0% 2.9% 3.2% 12.8% 1.0% 0.3% 100.0%
Professionally qualified and experi-enced specialists and mid-manage-ment
34 008 5 444 3 778 13 689 46 003 7 001 4 519 16 056 2 207 970 133 675
25.4% 4.1% 2.8% 10.2% 34.4% 5.2% 3.4% 12.0% 1.7% 0.7% 100.0%
Skilled technical and academically quali-fied workers, junior management, super-visors, foremen, and superintendents
168217 20892 8029 19498 246823 26411 13640 42170 3751 1952 551 383
30.5% 3.8% 1.5% 3.5% 44.8% 4.8% 2.5% 7.6% 0.7% 0.4% 100.0%
Semi-skilled and dis-cretionary decision making
183 552 19 097 4 672 6 888 193 924 27 806 5 889 21 186 1 558 598 465 170
39.5% 4.1% 1.0% 1.5% 41.7% 6.0% 1.3% 4.6% 0.3% 0.1% 100.0%
Unskilled and defined decision making
78 698 119 63 1 540 939 62 870 8 202 675 709 414 109 166 119
47.4% 7.2% 0.9% 0.6% 37.8% 4.9% 0.4% 0.4% 0.2% 0.1% 100.0%
TOTAL PERMANENT469 666 58 260 18 733 44 321 552 533 69 861 25 203 82 073 8 088 3 684 1 332 422
35.2% 4.4% 1.4% 3.3% 41.5% 5.2% 1.9% 6.2% 0.6% 0.3% 100.0%
Temporary employees
69 918 5 419 1 747 6 999 95 735 7 478 2 066 9 734 2 745 1 367 203 208
34.4% 2.7% 0.9% 3.4% 47.1% 3.7% 1.0% 4.8% 1.4% 0.7% 100.0%
GRAND TOTAL 539 584 63 679 20 480 51 320 648 268 77 339 27 269 91 807 10 833 5 051 1 535 630

76
9.4 CONSTRUCTION
Please report the total number of employees (including People with Disabilities) in each of the following occupational levels
Occupational Levels
Male FemaleForeign National
TotalA C I W A C I W Male Female
Top Management243 93 94 1105 80 21 33 92 51 5 1817
13.4% 5.1% 5.2% 60.8% 4.4% 1.2% 1.8% 5.1% 2.8% 0.3% 100.0%
Senior Management823 259 226 2883 327 54 62 316 159 12 5 121
16.1% 5.1% 4.4% 56.3% 6.4% 1.1% 1.2% 6.2% 3.1% 0.2% 100.0%
Professionally quali-fied and experienced specialists and mid-management
3 791 1 025 727 7 332 1 369 199 251 1 466 672 69 16 901
22.4% 6.1% 4.3% 43.4% 8.1% 1.2% 1.5% 8.7% 4.0% 0.4% 100.0%
Skilled technical and academically quali-fied workers, junior management, super-visors, foremen, and superintendents
32 285 4 565 1 513 10 825 6 211 1 073 670 3 801 2 353 135 63 431
50.9% 7.2% 2.4% 17.1% 9.8% 1.7% 1.1% 6.0% 3.7% 0.2% 100.0%
Semi-skilled and discretionary decision making
52 931 3 194 587 2 467 8 303 960 355 2 178 1 186 71 72 232
73.3% 4.4% 0.8% 3.4% 11.5% 1.3% 0.5% 3.0% 1.6% 0.1% 100.0%
Unskilled and defined decision making
56 227 3 206 90 595 10 942 1 114 22 205 768 212 73 381
76.6% 4.4% 0.1% 0.8% 14.9% 1.5% 0.0% 0.3% 1.0% 0.3% 100.0%
TOTAL PERMANENT146 300 12 342 3 237 25 207 27 232 3421 1393 8 058 5 189 504 232 883
62.8% 5.3% 1.4% 10.8% 11.7% 1.5% 0.6% 3.5% 2.2% 0.2% 100.0%
Temporary employees 32 446 2 974 195 1 55211 360 827 69 459 422 52 50 356
64.4% 5.9% 0.4% 3.1% 22.6% 1.6% 0.1% 0.9% 0.8% 0.1% 100.0%
GRAND TOTAL 178 746 15 316 3 432 26 759 38 592 4 248 1 462 8 517 5 611 556 283 239
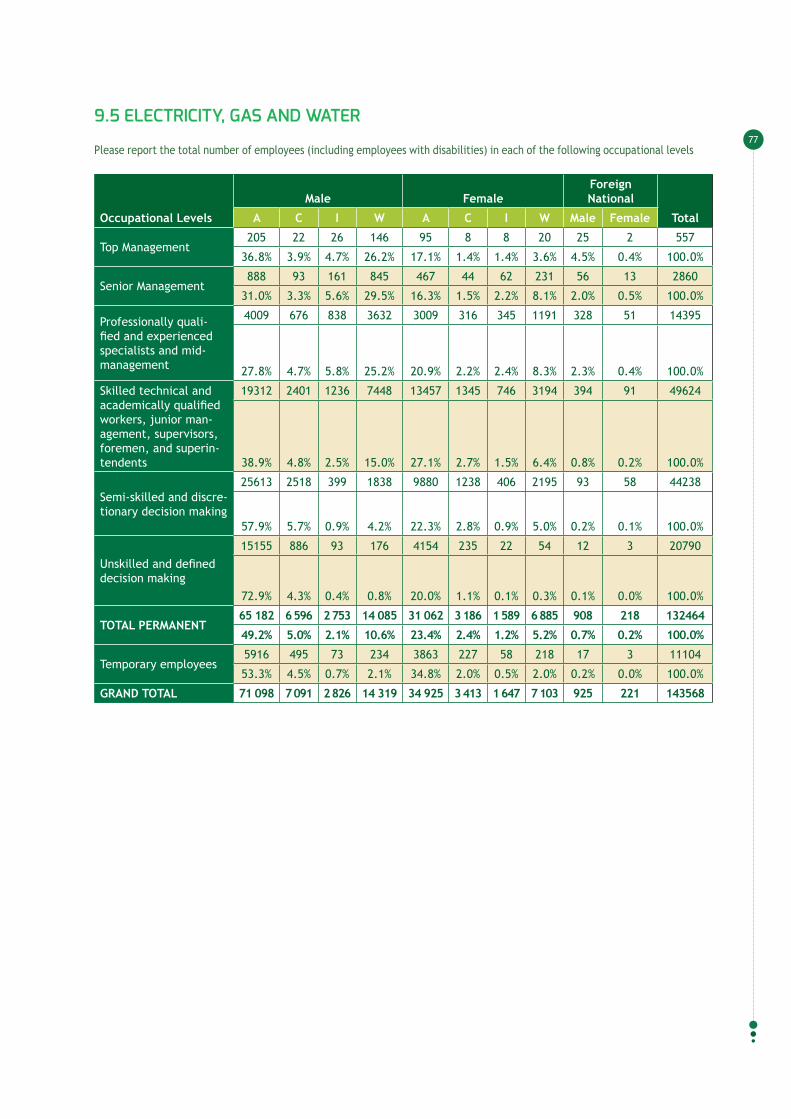
77
9.5 ELECTRICITY, GAS ANd wATER
Please report the total number of employees (including employees with disabilities) in each of the following occupational levels
Occupational Levels
Male FemaleForeign National
TotalA C I W A C I W Male Female
Top Management205 22 26 146 95 8 8 20 25 2 557
36.8% 3.9% 4.7% 26.2% 17.1% 1.4% 1.4% 3.6% 4.5% 0.4% 100.0%
Senior Management888 93 161 845 467 44 62 231 56 13 2860
31.0% 3.3% 5.6% 29.5% 16.3% 1.5% 2.2% 8.1% 2.0% 0.5% 100.0%
Professionally quali-fied and experienced specialists and mid-management
4009 676 838 3632 3009 316 345 1191 328 51 14395
27.8% 4.7% 5.8% 25.2% 20.9% 2.2% 2.4% 8.3% 2.3% 0.4% 100.0%
Skilled technical and academically qualified workers, junior man-agement, supervisors, foremen, and superin-tendents
19312 2401 1236 7448 13457 1345 746 3194 394 91 49624
38.9% 4.8% 2.5% 15.0% 27.1% 2.7% 1.5% 6.4% 0.8% 0.2% 100.0%
Semi-skilled and discre-tionary decision making
25613 2518 399 1838 9880 1238 406 2195 93 58 44238
57.9% 5.7% 0.9% 4.2% 22.3% 2.8% 0.9% 5.0% 0.2% 0.1% 100.0%
Unskilled and defined decision making
15155 886 93 176 4154 235 22 54 12 3 20790
72.9% 4.3% 0.4% 0.8% 20.0% 1.1% 0.1% 0.3% 0.1% 0.0% 100.0%
TOTAL PERMANENT65 182 6 596 2 753 14 085 31 062 3 186 1 589 6 885 908 218 132464
49.2% 5.0% 2.1% 10.6% 23.4% 2.4% 1.2% 5.2% 0.7% 0.2% 100.0%
Temporary employees5916 495 73 234 3863 227 58 218 17 3 11104
53.3% 4.5% 0.7% 2.1% 34.8% 2.0% 0.5% 2.0% 0.2% 0.0% 100.0%
GRAND TOTAL 71 098 7 091 2 826 14 319 34 925 3 413 1 647 7 103 925 221 143568

78
9.6 FINANCE/bUSINESS SERvICES
Please report the total number of employees (including People with Disabilities) in each of the following occupational levels
Occupational Levels
Male FemaleForeign National
TotalA C I W A C I W Male Female
Top Management490 126 298 2 112 271 98 107 636 169 34 4 341
11.3% 2.9% 6.9% 48.7% 6.2% 2.3% 2.5% 14.7% 3.9% 0.8% 100.0%
Senior Management2 394 892 1 746 9 326 1 591 606 1059 4 980 688 253 23 535
10.2% 3.8% 7.4% 39.6% 6.8% 2.6% 4.5% 21.2% 2.9% 1.1% 100.0%
Professionally quali-fied and experienced specialists and mid-management
13 270 4 858 6 752 24 862 12 003 5 400 6 358 20 566 1 491 856 96 416
13.8% 5.0% 7.0% 25.8% 12.4% 5.6% 6.6% 21.3% 1.5% 0.9% 100.0%
Skilled technical and academically quali-fied workers, junior management, super-visors, foremen, and superintendents
48 096 12 778 8 582 22 856 61 399 21 902 11 553 39 688 1 315 1 015 229 184
21.0% 5.6% 3.7% 10.0% 26.8% 9.6% 5.0% 17.3% 0.6% 0.4% 100.0%
Semi-skilled and dis-cretionary decision making
103 464 12 063 4 943 7 475 98 864 20 556 8 109 19 857 865 667 276 863
37.4% 4.4% 1.8% 2.7% 35.7% 7.4% 2.9% 7.2% 0.3% 0.2% 100.0%
Unskilled and defined decision making
43 365 2 879 269 547 35 282 2 602 98 311 476 109 85 938
50.5% 3.4% 0.3% 0.6% 41.1% 3.0% 0.1% 0.4% 0.6% 0.1% 100.0%
TOTAL PERMANENT211 079 33 596 22 590 67 178 209 410 51 164 27 284 86 038 5 004 2 934 716 277
29.5% 4.7% 3.2% 9.4% 29.2% 7.1% 3.8% 12.0% 0.7% 0.4% 100.0%
Temporary employees
83 693 11 460 2 814 6 244 62 638 9 444 2074 7214 2 997 844 189 422
44.2% 6.0% 1.5% 3.3% 33.1% 5.0% 1.1% 3.8% 1.6% 0.4% 100.0%
GRAND TOTAL 294 772 45 056 25 404 73 422 272 048 60 608 29 358 93 252 8 001 3 778 905 699
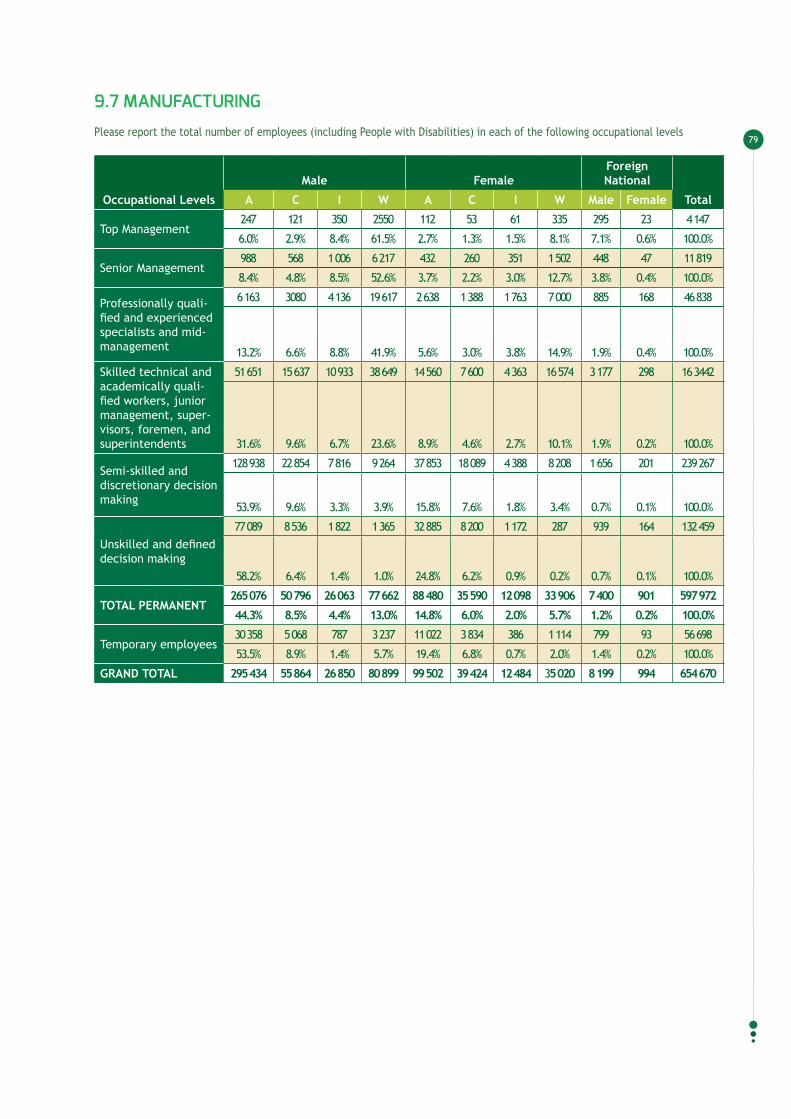
79
9.7 MANUFACTURING
Please report the total number of employees (including People with Disabilities) in each of the following occupational levels
Occupational Levels
Male FemaleForeign National
TotalA C I W A C I W Male Female
Top Management247 121 350 2550 112 53 61 335 295 23 4 147
6.0% 2.9% 8.4% 61.5% 2.7% 1.3% 1.5% 8.1% 7.1% 0.6% 100.0%
Senior Management988 568 1 006 6 217 432 260 351 1 502 448 47 11 819
8.4% 4.8% 8.5% 52.6% 3.7% 2.2% 3.0% 12.7% 3.8% 0.4% 100.0%
Professionally quali-fied and experienced specialists and mid-management
6 163 3080 4 136 19 617 2 638 1 388 1 763 7 000 885 168 46 838
13.2% 6.6% 8.8% 41.9% 5.6% 3.0% 3.8% 14.9% 1.9% 0.4% 100.0%
Skilled technical and academically quali-fied workers, junior management, super-visors, foremen, and superintendents
51 651 15 637 10 933 38 649 14 560 7 600 4 363 16 574 3 177 298 16 3442
31.6% 9.6% 6.7% 23.6% 8.9% 4.6% 2.7% 10.1% 1.9% 0.2% 100.0%
Semi-skilled and discretionary decision making
128 938 22 854 7 816 9 264 37 853 18 089 4 388 8 208 1 656 201 239 267
53.9% 9.6% 3.3% 3.9% 15.8% 7.6% 1.8% 3.4% 0.7% 0.1% 100.0%
Unskilled and defined decision making
77 089 8 536 1 822 1 365 32 885 8 200 1 172 287 939 164 132 459
58.2% 6.4% 1.4% 1.0% 24.8% 6.2% 0.9% 0.2% 0.7% 0.1% 100.0%
TOTAL PERMANENT265 076 50 796 26 063 77 662 88 480 35 590 12 098 33 906 7 400 901 597 972
44.3% 8.5% 4.4% 13.0% 14.8% 6.0% 2.0% 5.7% 1.2% 0.2% 100.0%
Temporary employees30 358 5 068 787 3 237 11 022 3 834 386 1 114 799 93 56 698
53.5% 8.9% 1.4% 5.7% 19.4% 6.8% 0.7% 2.0% 1.4% 0.2% 100.0%
GRAND TOTAL 295 434 55 864 26 850 80 899 99 502 39 424 12 484 35 020 8 199 994 654 670

80
9.8 MINING ANd QUARRYING
Please report the total number of employees (including People with Disabilitiess) in each of the following occupational levels
Occupational LevelsMale Female Foreign National
TotalA C I W A C I W Male Female
Top Management142 16 18 496 40 5 10 51 34 4 816
17.4% 2.0% 2.2% 60.8% 4.9% 0.6% 1.2% 6.3% 4.2% 0.5% 100.0%
Senior Management660 102 149 2 563 149 26 45 335 156 18 4 203
15.7% 2.4% 3.5% 61.0% 3.5% 0.6% 1.1% 8.0% 3.7% 0.4% 100.0%
Professionally quali-fied and experienced specialists and mid-management
4 306 501 449 7 956 1 526 201 242 1832 465 89 17 567
24.5% 2.9% 2.6% 45.3% 8.7% 1.1% 1.4% 10.4% 2.6% 0.5% 100.0%
Skilled technical and academically qualified workers, junior manage-ment, supervisors, foremen, and superin-tendents
37 456 3 280 712 25 312 7 333 851 330 5 136 4 227 108 84 745
44.2% 3.9% 0.8% 29.9% 8.7% 1.0% 0.4% 6.1% 5.0% 0.1% 100.0%
Semi-skilled and discre-tionary decision making
139 368 3 414 222 3 575 15 126 835 146 2 138 38 502 397 203 723
68.4% 1.7% 0.1% 1.8% 7.4% 0.4% 0.1% 1.0% 18.9% 0.2% 100.0%
Unskilled and defined decision making
87 155 782 57 816 14 435 161 9 63 17 633 632 121 743
71.6% 0.6% 0.0% 0.7% 11.9% 0.1% 0.0% 0.1% 14.5% 0.5% 100.0%
TOTAL PERMANENT269 087 8 095 1 607 40 718 38 609 2 079 782 9 555 61 017 1 248 432 797
62.2% 1.9% 0.4% 9.4% 8.9% 0.5% 0.2% 2.2% 14.1% 0.3% 100.0%
Temporary employees3 846 409 43 737 848 146 25 225 102 5 6 386
60.2% 6.4% 0.7% 11.5% 13.3% 2.3% 0.4% 3.5% 1.6% 0.1% 100.0%
GRAND TOTAL 272 933 8 504 1 650 41 455 39 457 2 225 807 9 780 61 119 1 253 439 183

81
9.9 RETAIL ANd MOTOR TRAdE/REPAIR SERvICES
Please report the total number of employees (including People with Disabilities) in each of the following occupational levels
Occupational LevelsMale Female Foreign National
TotalA C I W A C I W Male Female
Top Management66 76 106 1 305 22 29 27 228 34 6 1 899
3.5% 4.0% 5.6% 68.7% 1.2% 1.5% 1.4% 12.0% 1.8% 0.3% 100.0%
Senior Management671 461 576 3 255 320 305 270 1419 88 27 7 392
9.1% 6.2% 7.8% 44.0% 4.3% 4.1% 3.7% 19.2% 1.2% 0.4% 100.0%
Professionally quali-fied and experienced specialists and mid-management
4 369 1 958 1 866 6 662 3 069 1 987 1 209 4 985 173 92 26 370
16.6% 7.4% 7.1% 25.3% 11.6% 7.5% 4.6% 18.9% 0.7% 0.3% 100.0%
Skilled technical and academically qualified workers, junior manage-ment, supervisors, foremen, and superin-tendents
19 630 5 787 4 029 10 746 18 488 8 682 3 472 9 946 323 153 81 256
24.2% 7.1% 5.0% 13.2% 22.8% 10.7% 4.3% 12.2% 0.4% 0.2% 100.0%
Semi-skilled and discre-tionary decision making
61 982 11 793 3 752 5 205 118 088 29 820 5 259 7 148 456 275 243 778
25.4% 4.8% 1.5% 2.1% 48.4% 12.2% 2.2% 2.9% 0.2% 0.1% 100.0%
Unskilled and defined decision making
34 915 5 647 701 715 37 180 8 968 687 388 207 83 89 491
39.0% 6.3% 0.8% 0.8% 41.5% 10.0% 0.8% 0.4% 0.2% 0.1% 100.0%
TOTAL PERMANENT121 633 25 722 11 030 27 888 177 167 49 791 10 924 24 114 1 281 636 450 186
27.0% 5.7% 2.5% 6.2% 39.4% 11.1% 2.4% 5.4% 0.3% 0.1% 100.0%
Temporary employees10 447 2 390 508 1 125 17 966 4 279 695 1 367 95 47 38 919
26.8% 6.1% 1.3% 2.9% 46.2% 11.0% 1.8% 3.5% 0.2% 0.1% 100.0%
GRAND TOTAL 132 080 28 112 11 538 29 013 195 133 54 070 11 619 25 481 1 376 683 489 105

82
9.10 TRANSPORT/STORAGE/COMMUNICATION
Please report the total number of employees (including employees with disabilities) in each of the following occupational levels
Occupational LevelsMale Female
Foreign National
TotalA C I W A C I W Male Female
Top Management241 63 168 872 115 25 40 182 65 13 1784
13.5% 3.5% 9.4% 48.9% 6.4% 1.4% 2.2% 10.2% 3.6% 0.7% 100.0%
Senior Management957 282 676 2443 488 138 193 841 109 22 6149
15.6% 4.6% 11.0% 39.7% 7.9% 2.2% 3.1% 13.7% 1.8% 0.4% 100.0%
Professionally quali-fied and experienced specialists and mid-management
5967 1842 2335 9994 3283 865 1012 4076 782 155 30311
19.7% 6.1% 7.7% 33.0% 10.8% 2.9% 3.3% 13.4% 2.6% 0.5% 100.0%
Skilled technical and academically qualified workers, junior manage-ment, supervisors, foremen, and superin-tendents
39888 9794 6088 23623 20805 5356 3116 10756 1079 238 120743
33.0% 8.1% 5.0% 19.6% 17.2% 4.4% 2.6% 8.9% 0.9% 0.2% 100.0%
Semi-skilled and discre-tionary decision making
72317 10470 4383 6219 23317 5231 2783 6005 1376 196 132297
54.7% 7.9% 3.3% 4.7% 17.6% 4.0% 2.1% 4.5% 1.0% 0.1% 100.0%
Unskilled and defined decision making
25378 3182 299 599 6698 883 72 184 197 34 37526
67.6% 8.5% 0.8% 1.6% 17.8% 2.4% 0.2% 0.5% 0.5% 0.1% 100.0%
TOTAL PERMANENT144 748 25 633 13 949 43 750 54 706 12 498 7 216 22 044 3 608 658 328 810
44.0% 7.8% 4.2% 13.3% 16.6% 3.8% 2.2% 6.7% 1.1% 0.2% 100.0%
Temporary employees21 057 2 682 525 1 361 7 975 863 257 698 216 38 35 672
59.0% 7.5% 1.5% 3.8% 22.4% 2.4% 0.7% 2.0% 0.6% 0.1% 100.0%
GRAND TOTAL 165 805 28 315 14 474 45 111 62 681 13 361 7 473 22 742 3 824 696 364 482

83
9.11 whOLESALES TRAdE/COMMERCIAL AGENT/ALLIEd SERvICES
Please report the total number of employees (including People with Disabilities) in each of the following occupational levels
Occupational LevelsMale Female
Foreign Na-tional
TotalA C I W A C I W Male Female
Top Management90 41 166 998 56 24 48 173 62 14 1 672
5.4% 2.5% 9.9% 59.7% 3.3% 1.4% 2.9% 10.3% 3.7% 0.8% 100.0%
Senior Management569 226 542 2287 238 142 154 942 113 34 5247
10.8% 4.3% 10.3% 43.6% 4.5% 2.7% 2.9% 18.0% 2.2% 0.6% 100.0%
Professionally quali-fied and experienced specialists and mid-management
2 179 744 1 019 3 953 1 352 615 522 2 670 156 44 13 254
16.4% 5.6% 7.7% 29.8% 10.2% 4.6% 3.9% 20.1% 1.2% 0.3% 100.0%
Skilled technical and academically qualified workers, junior manage-ment, supervisors, foremen, and superin-tendents
11 025 2 645 2 113 6 712 6 453 2 564 1 649 6 128 269 104 39 662
27.8% 6.7% 5.3% 16.9% 16.3% 6.5% 4.2% 15.5% 0.7% 0.3% 100.0%
Semi-skilled and discre-tionary decision making
44 734 6 134 2 571 3 698 24 967 5 889 2 271 5 220 742 368 96 594
46.3% 6.4% 2.7% 3.8% 25.8% 6.1% 2.4% 5.4% 0.8% 0.4% 100.0%
Unskilled and defined decision making
33 828 3 504 513 527 28 430 3 809 436 239 686 248 72 220
46.8% 4.9% 0.7% 0.7% 39.4% 5.3% 0.6% 0.3% 0.9% 0.3% 100.0%
TOTAL PERMANENT92 425 13 294 6 924 18 175 61 496 13 043 5 080 15 372 2 028 812 228 649
40.4% 5.8% 3.0% 7.9% 26.9% 5.7% 2.2% 6.7% 0.9% 0.4% 100.0%
Temporary employees12 142 1 182 486 798 13 948 1244 1 918 1 270 164 99 33 251
36.5% 3.6% 1.5% 2.4% 41.9% 3.7% 5.8% 3.8% 0.5% 0.3% 100.0%
GRAND TOTAL 104 567 14 476 7 410 18 973 75 444 14 287 6 998 16 642 2 192 911 261 900
TAbLES FOR EACh bUSINESS TYPE IN TERMS OF POPULATION GROUP ANd GENdER
TEN
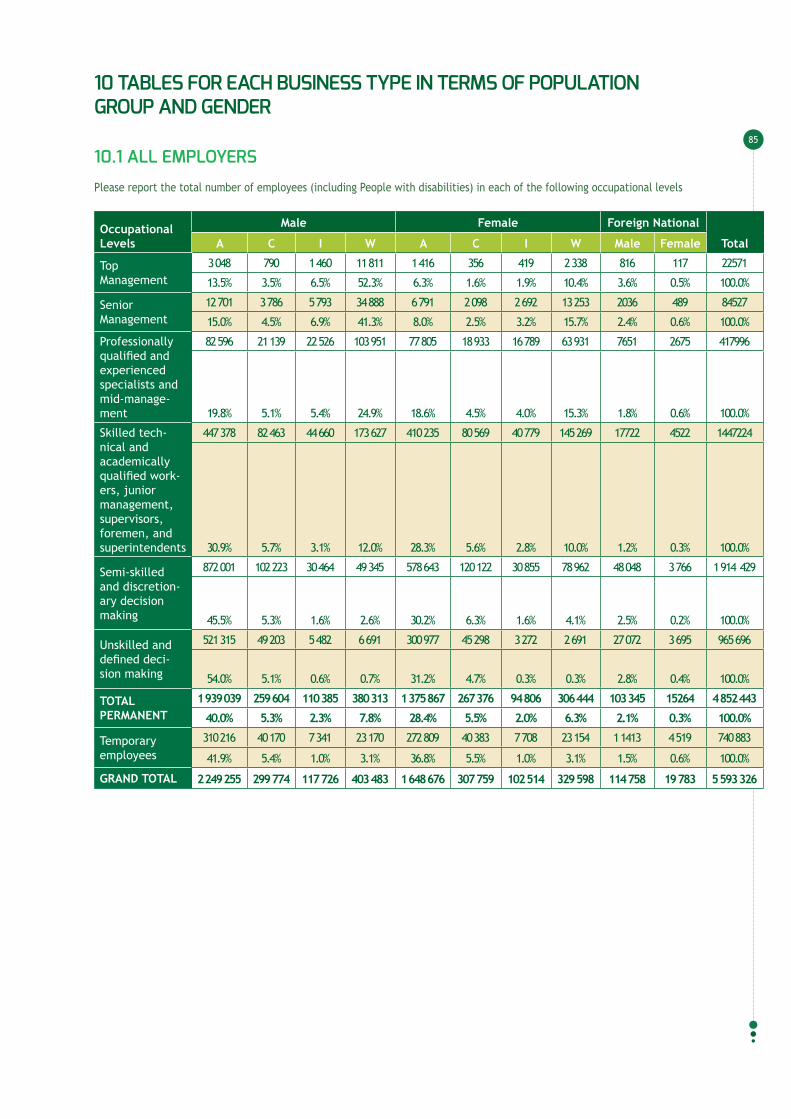
85
10 TAbLES FOR EACh bUSINESS TYPE IN TERMS OF POPULATION GROUP ANd GENdER
10.1 ALL EMPLOYERS
Please report the total number of employees (including People with disabilities) in each of the following occupational levels
Occupational Levels
Male Female Foreign National
TotalA C I W A C I W Male Female
Top Management
3 048 790 1 460 11 811 1 416 356 419 2 338 816 117 22571
13.5% 3.5% 6.5% 52.3% 6.3% 1.6% 1.9% 10.4% 3.6% 0.5% 100.0%
Senior Management
12 701 3 786 5 793 34 888 6 791 2 098 2 692 13 253 2036 489 84527
15.0% 4.5% 6.9% 41.3% 8.0% 2.5% 3.2% 15.7% 2.4% 0.6% 100.0%
Professionally qualified and experienced specialists and mid-manage-ment
82 596 21 139 22 526 103 951 77 805 18 933 16 789 63 931 7651 2675 417996
19.8% 5.1% 5.4% 24.9% 18.6% 4.5% 4.0% 15.3% 1.8% 0.6% 100.0%
Skilled tech-nical and academically qualified work-ers, junior management, supervisors, foremen, and superintendents
447 378 82 463 44 660 173 627 410 235 80 569 40 779 145 269 17722 4522 1447224
30.9% 5.7% 3.1% 12.0% 28.3% 5.6% 2.8% 10.0% 1.2% 0.3% 100.0%
Semi-skilled and discretion-ary decision making
872 001 102 223 30 464 49 345 578 643 120 122 30 855 78 962 48 048 3 766 1 914 429
45.5% 5.3% 1.6% 2.6% 30.2% 6.3% 1.6% 4.1% 2.5% 0.2% 100.0%
Unskilled and defined deci-sion making
521 315 49 203 5 482 6 691 300 977 45 298 3 272 2 691 27 072 3 695 965 696
54.0% 5.1% 0.6% 0.7% 31.2% 4.7% 0.3% 0.3% 2.8% 0.4% 100.0%
TOTAL PERMANENT
1 939 039 259 604 110 385 380 313 1 375 867 267 376 94 806 306 444 103 345 15264 4 852 443
40.0% 5.3% 2.3% 7.8% 28.4% 5.5% 2.0% 6.3% 2.1% 0.3% 100.0%
Temporary employees
310 216 40 170 7 341 23 170 272 809 40 383 7 708 23 154 1 1413 4 519 740 883
41.9% 5.4% 1.0% 3.1% 36.8% 5.5% 1.0% 3.1% 1.5% 0.6% 100.0%
GRAND TOTAL 2 249 255 299 774 117 726 403 483 1 648 676 307 759 102 514 329 598 114 758 19 783 5 593 326

86
10.2 ALL GOvERNMENT
Please report the total number of employees (including People with disabilities) in each of the following occupational levels
Occupational LevelsMale Female
Foreign National
TotalA C I W A C I W Male Female
Top Management809 104 100 209 424 31 30 63 6 2 1 778
45.5% 5.8% 5.6% 11.8% 23.8% 1.7% 1.7% 3.5% 0.3% 0.1% 100.0%
Senior Management4 084 561 458 1 407 2 499 274 302 811 55 27 10 478
39.0% 5.4% 4.4% 13.4% 23.8% 2.6% 2.9% 7.7% 0.5% 0.3% 100.0%
Professionally quali-fied and experienced specialists and mid-management
28 138 3 971 2 135 8 000 34 232 5 345 2 598 7 803 965 442 93 629
30.1% 4.2% 2.3% 8.5% 36.6% 5.7% 2.8% 8.3% 1.0% 0.5% 100.0%
Skilled technical and academically quali-fied workers, junior management, super-visors, foremen, and superintendents
111 138 14 141 4 224 13 404 176 563 15 431 4 603 22 212 2 001 791 364 508
30.5% 3.9% 1.2% 3.7% 48.4% 4.2% 1.3% 6.1% 0.5% 0.2% 100.0%
Semi-skilled and discretionary decision making
81 774 12 309 2 788 3 371 123 633 13 121 3 087 11 080 343 226 251 732
32.5% 4.9% 1.1% 1.3% 49.1% 5.2% 1.2% 4.4% 0.1% 0.1% 100.0%
Unskilled and defined decision making
44 352 8 187 717 467 32 862 3 159 250 326 40 11 90 371
49.1% 9.1% 0.8% 0.5% 36.4% 3.5% 0.3% 0.4% 0.0% 0.0% 100.0%
TOTAL PERMANENT
270 295 39 273 10 422 26 858 370 213 37 361 10 870 42 295 3 410 1 499 812 496
33.3% 4.8% 1.3% 3.3% 45.6% 4.6% 1.3% 5.2% 0.4% 0.2% 100.0%
Temporary employees
24 784 1 862 613 1 511 59 564 2 233 627 3 042 1 471 607 96 314
25.7% 1.9% 0.6% 1.6% 61.8% 2.3% 0.7% 3.2% 1.5% 0.6% 100.0%
GRAND TOTAL 295 079 41 135 11 035 28 369 429 777 39 594 11 497 45 337 4 881 2106 908 810
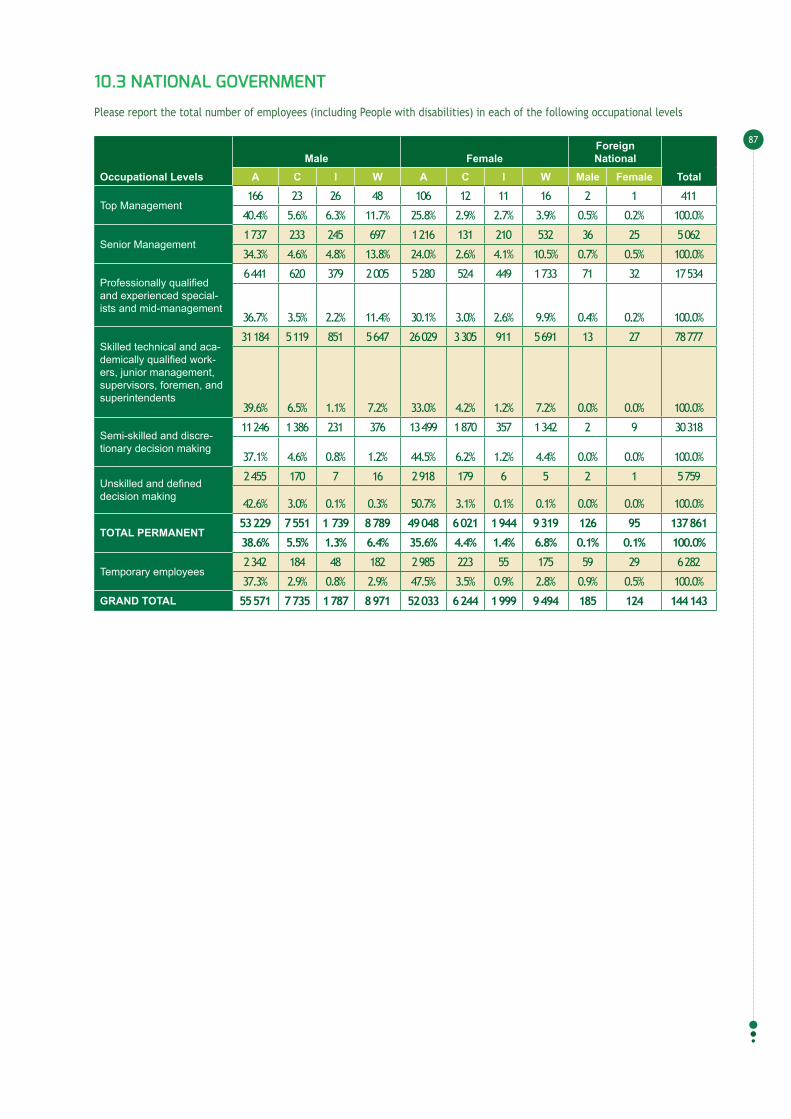
87
10.3 NATIONAL GOvERNMENT
Please report the total number of employees (including People with disabilities) in each of the following occupational levels
Occupational LevelsMale Female
Foreign National
TotalA C I W A C I W Male Female
Top Management166 23 26 48 106 12 11 16 2 1 411
40.4% 5.6% 6.3% 11.7% 25.8% 2.9% 2.7% 3.9% 0.5% 0.2% 100.0%
Senior Management1 737 233 245 697 1 216 131 210 532 36 25 5 062
34.3% 4.6% 4.8% 13.8% 24.0% 2.6% 4.1% 10.5% 0.7% 0.5% 100.0%
Professionally qualified and experienced special-ists and mid-management
6 441 620 379 2 005 5 280 524 449 1 733 71 32 17 534
36.7% 3.5% 2.2% 11.4% 30.1% 3.0% 2.6% 9.9% 0.4% 0.2% 100.0%
Skilled technical and aca-demically qualified work-ers, junior management, supervisors, foremen, and superintendents
31 184 5 119 851 5 647 26 029 3 305 911 5 691 13 27 78 777
39.6% 6.5% 1.1% 7.2% 33.0% 4.2% 1.2% 7.2% 0.0% 0.0% 100.0%
Semi-skilled and discre-tionary decision making
11 246 1 386 231 376 13 499 1 870 357 1 342 2 9 30 318
37.1% 4.6% 0.8% 1.2% 44.5% 6.2% 1.2% 4.4% 0.0% 0.0% 100.0%
Unskilled and defined decision making
2 455 170 7 16 2 918 179 6 5 2 1 5 759
42.6% 3.0% 0.1% 0.3% 50.7% 3.1% 0.1% 0.1% 0.0% 0.0% 100.0%
TOTAL PERMANENT53 229 7 551 1 739 8 789 49 048 6 021 1 944 9 319 126 95 137 861
38.6% 5.5% 1.3% 6.4% 35.6% 4.4% 1.4% 6.8% 0.1% 0.1% 100.0%
Temporary employees2 342 184 48 182 2 985 223 55 175 59 29 6 282
37.3% 2.9% 0.8% 2.9% 47.5% 3.5% 0.9% 2.8% 0.9% 0.5% 100.0%
GRAND TOTAL 55 571 7 735 1 787 8 971 52 033 6 244 1 999 9 494 185 124 144 143

88
10.4 PROvINCIAL GOvERNMENT
Please report the total number of employees (including People with disabilities) in each of the following occupational levels
Occupational Levels
Male FemaleForeign National
TotalA C I W A C I W Male Female
Top Management142 22 14 23 92 7 6 19 1 1 327
43.4% 6.7% 4.3% 7.0% 28.1% 2.1% 1.8% 5.8% 0.3% 0.3% 100.0%
Senior Management1 163 144 81 191 734 88 51 116 11 0 2 579
45.1% 5.6% 3.1% 7.4% 28.5% 3.4% 2.0% 4.5% 0.4% 0.0% 100.0%
Professionally quali-fied and experienced specialists and mid-management
18 885 2 352 1 402 4 098 26 679 4 300 1 994 5 322 868 399 66 299
28.5% 3.5% 2.1% 6.2% 40.2% 6.5% 3.0% 8.0% 1.3% 0.6% 100.0%
Skilled technical and academically qualified workers, junior man-agement, supervisors, foremen, and superin-tendents
67 599 4 047 1 518 4 105 141 778 9 780 2 932 14 526 1 934 748 248 967
27.2% 1.6% 0.6% 1.6% 56.9% 3.9% 1.2% 5.8% 0.8% 0.3% 100.0%
Semi-skilled and discre-tionary decision making
48 474 3 878 853 1 789 98 742 7 564 1 814 7 970 331 206 171 621
28.2% 2.3% 0.5% 1.0% 57.5% 4.4% 1.1% 4.6% 0.2% 0.1% 100.0%
Unskilled and defined decision making
18 272 1 162 153 177 19 897 1 145 126 233 21 8 41 194
44.4% 2.8% 0.4% 0.4% 48.3% 2.8% 0.3% 0.6% 0.1% 0.0% 100.0%
TOTAL PERMANENT154 535 11 605 4 021 10 383 287 922 22 884 6 923 28 186 3 166 1 362 530 987
29.1% 2.2% 0.8% 2.0% 54.2% 4.3% 1.3% 5.3% 0.6% 0.3% 100.0%
Temporary employees15 144 592 364 1 155 50 803 1 350 438 2 741 1 408 577 74 572
20.3% 0.8% 0.5% 1.5% 68.1% 1.8% 0.6% 3.7% 1.9% 0.8% 100.0%
GRAND TOTAL 169 679 12 197 4 385 11 538 338 725 24 234 7 361 30 927 4 574 1 939 605 559

89
10.5 LOCAL GOvERNMENT
Please report the total number of employees (including People with disabilities) in each of the following occupational levels
Occupational LevelsMale Female
Foreign National
TotalA C I W A C I W Male Female
Top Management501 59 60 138 226 12 13 28 3 0 1 040
48.2% 5.7% 5.8% 13.3% 21.7% 1.2% 1.3% 2.7% 0.3% 0.0% 100.0%
Senior Management1 184 184 132 519 549 55 41 163 8 2 2 837
41.7% 6.5% 4.7% 18.3% 19.4% 1.9% 1.4% 5.7% 0.3% 0.1% 100.0%
Professionally qualified and experienced special-ists and mid-management
2 812 999 354 1 897 2 273 521 155 748 26 11 9 796
28.7% 10.2% 3.6% 19.4% 23.2% 5.3% 1.6% 7.6% 0.3% 0.1% 100.0%
Skilled technical and aca-demically qualified work-ers, junior management, supervisors, foremen, and superintendents
12 355 4 975 1 855 3 652 8 756 2 346 760 1 995 54 16 36 764
33.6% 13.5% 5.0% 9.9% 23.8% 6.4% 2.1% 5.4% 0.1% 0.0% 100.0%
Semi-skilled and discre-tionary decision making
22 054 7 045 1 704 1 206 11 392 3 687 916 1 768 10 11 49 793
44.3% 14.1% 3.4% 2.4% 22.9% 7.4% 1.8% 3.6% 0.0% 0.0% 100.0%
Unskilled and defined deci-sion making
23 625 6 855 557 274 10 047 1 835 118 88 17 2 43 418
54.4% 15.8% 1.3% 0.6% 23.1% 4.2% 0.3% 0.2% 0.0% 0.0% 100.0%
TOTAL PERMANENT62 531 20 117 4 662 7 686 33 243 8 456 2 003 4 790 118 42 143 648
43.5% 14.0% 3.2% 5.4% 23.1% 5.9% 1.4% 3.3% 0.1% 0.0% 100.0%
Temporary employees7298 1086 201 174 5776 660 134 126 4 1 15460
47.2% 7.0% 1.3% 1.1% 37.4% 4.3% 0.9% 0.8% 0.0% 0.0% 100.0%
GRAND TOTAL 69 829 21 203 4 863 7 860 39 019 9 116 2 137 4 916 122 43 159108
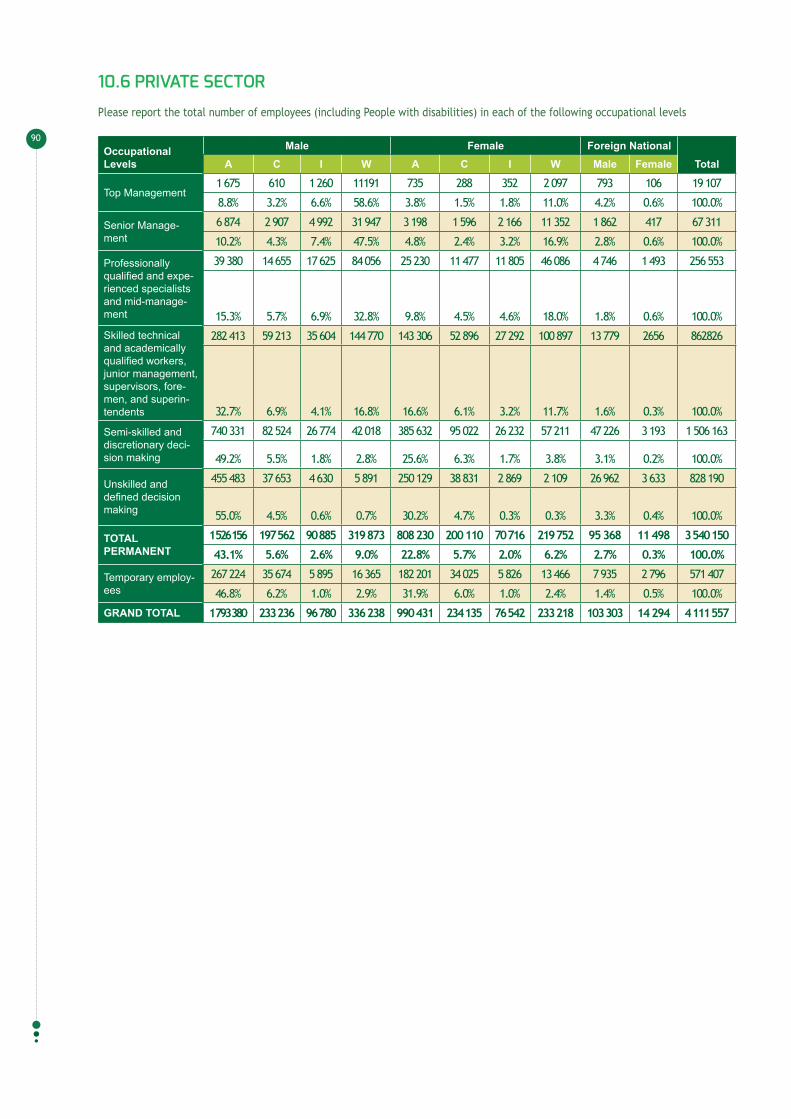
90
10.6 PRIvATE SECTOR
Please report the total number of employees (including People with disabilities) in each of the following occupational levels
Occupational Levels
Male Female Foreign NationalTotalA C I W A C I W Male Female
Top Management1 675 610 1 260 11191 735 288 352 2 097 793 106 19 107
8.8% 3.2% 6.6% 58.6% 3.8% 1.5% 1.8% 11.0% 4.2% 0.6% 100.0%
Senior Manage-ment
6 874 2 907 4 992 31 947 3 198 1 596 2 166 11 352 1 862 417 67 311
10.2% 4.3% 7.4% 47.5% 4.8% 2.4% 3.2% 16.9% 2.8% 0.6% 100.0%
Professionally qualified and expe-rienced specialists and mid-manage-ment
39 380 14 655 17 625 84 056 25 230 11 477 11 805 46 086 4 746 1 493 256 553
15.3% 5.7% 6.9% 32.8% 9.8% 4.5% 4.6% 18.0% 1.8% 0.6% 100.0%
Skilled technical and academically qualified workers, junior management, supervisors, fore-men, and superin-tendents
282 413 59 213 35 604 144 770 143 306 52 896 27 292 100 897 13 779 2656 862826
32.7% 6.9% 4.1% 16.8% 16.6% 6.1% 3.2% 11.7% 1.6% 0.3% 100.0%
Semi-skilled and discretionary deci-sion making
740 331 82 524 26 774 42 018 385 632 95 022 26 232 57 211 47 226 3 193 1 506 163
49.2% 5.5% 1.8% 2.8% 25.6% 6.3% 1.7% 3.8% 3.1% 0.2% 100.0%
Unskilled and defined decision making
455 483 37 653 4 630 5 891 250 129 38 831 2 869 2 109 26 962 3 633 828 190
55.0% 4.5% 0.6% 0.7% 30.2% 4.7% 0.3% 0.3% 3.3% 0.4% 100.0%
TOTAL PERMANENT
1 526 156 197 562 90 885 319 873 808 230 200 110 70 716 219 752 95 368 11 498 3 540 150
43.1% 5.6% 2.6% 9.0% 22.8% 5.7% 2.0% 6.2% 2.7% 0.3% 100.0%
Temporary employ-ees
267 224 35 674 5 895 16 365 182 201 34 025 5 826 13 466 7 935 2 796 571 407
46.8% 6.2% 1.0% 2.9% 31.9% 6.0% 1.0% 2.4% 1.4% 0.5% 100.0%
GRAND TOTAL 1 793 380 233 236 96 780 336 238 990 431 234 135 76 542 233 218 103 303 14 294 4 111 557

91
10.7 NON-PROFIT ORGANISATIONS
Please report the total number of employees (including People with disabilities) in each of the following occupational levels
Occupational LevelsMale Female
Foreign National
TotalA C I W A C I W Male Female
Top Management261 30 28 166 108 11 13 79 13 5 714
36.6% 4.2% 3.9% 23.2% 15.1% 1.5% 1.8% 11.1% 1.8% 0.7% 100.0%
Senior Management582 111 66 450 345 91 67 331 27 13 2083
27.9% 5.3% 3.2% 21.6% 16.6% 4.4% 3.2% 15.9% 1.3% 0.6% 100.0%
Professionally qualified and experienced specialists and mid-management
2 101 353 223 1 342 1897 407 221 1 328 158 68 8 098
25.9% 4.4% 2.8% 16.6% 23.4% 5.0% 2.7% 16.4% 2.0% 0.8% 100.0%
Skilled technical and aca-demically qualified work-ers, junior management, supervisors, foremen, and superintendents
9 602 1 084 418 1 986 8 831 1 472 463 2 485 120 62 26 523
36.2% 4.1% 1.6% 7.5% 33.3% 5.5% 1.7% 9.4% 0.5% 0.2% 100.0%
Semi-skilled and discretion-ary decision making
7 825 1 713 226 901 8 607 1 731 282 1 299 42 53 22 679
34.5% 7.6% 1.0% 4.0% 38.0% 7.6% 1.2% 5.7% 0.2% 0.2% 100.0%
Unskilled and defined deci-sion making
7 006 1 220 33 80 5 828 1 265 29 65 14 19 15 559
45.0% 7.8% 0.2% 0.5% 37.5% 8.1% 0.2% 0.4% 0.1% 0.1% 100.0%
TOTAL PERMANENT27 377 4 511 994 4 925 25 616 4 977 1 075 5 587 374 220 75 656
36.2% 6.0% 1.3% 6.5% 33.9% 6.6% 1.4% 7.4% 0.5% 0.3% 100.0%
Temporary employees4364 283 50 353 5401 517 34 252 25 20 11299
38.6% 2.5% 0.4% 3.1% 47.8% 4.6% 0.3% 2.2% 0.2% 0.2% 100.0%
GRAND TOTAL 31 741 4 794 1 044 5 278 31 017 5 494 1 109 5 839 399 240 86 955
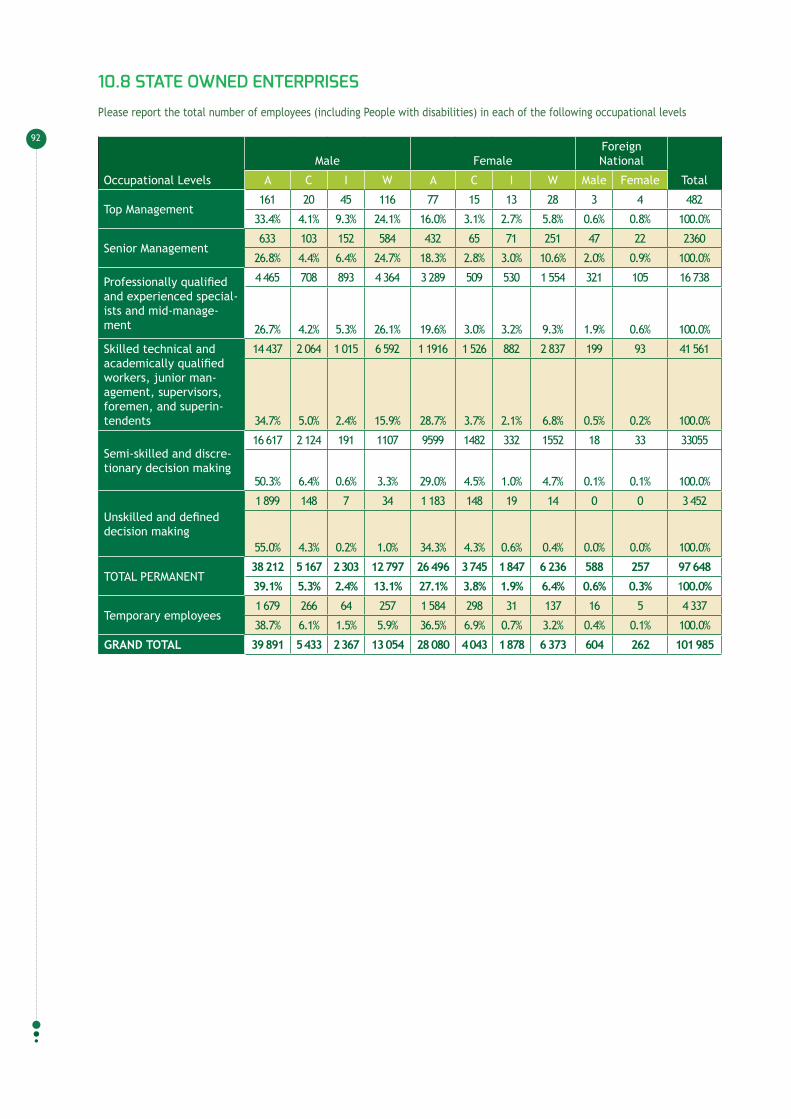
92
10.8 STATE OwNEd ENTERPRISES
Please report the total number of employees (including People with disabilities) in each of the following occupational levels
Occupational Levels
Male FemaleForeign National
TotalA C I W A C I W Male Female
Top Management161 20 45 116 77 15 13 28 3 4 482
33.4% 4.1% 9.3% 24.1% 16.0% 3.1% 2.7% 5.8% 0.6% 0.8% 100.0%
Senior Management633 103 152 584 432 65 71 251 47 22 2360
26.8% 4.4% 6.4% 24.7% 18.3% 2.8% 3.0% 10.6% 2.0% 0.9% 100.0%
Professionally qualified and experienced special-ists and mid-manage-ment
4 465 708 893 4 364 3 289 509 530 1 554 321 105 16 738
26.7% 4.2% 5.3% 26.1% 19.6% 3.0% 3.2% 9.3% 1.9% 0.6% 100.0%
Skilled technical and academically qualified workers, junior man-agement, supervisors, foremen, and superin-tendents
14 437 2 064 1 015 6 592 1 1916 1 526 882 2 837 199 93 41 561
34.7% 5.0% 2.4% 15.9% 28.7% 3.7% 2.1% 6.8% 0.5% 0.2% 100.0%
Semi-skilled and discre-tionary decision making
16 617 2 124 191 1107 9599 1482 332 1552 18 33 33055
50.3% 6.4% 0.6% 3.3% 29.0% 4.5% 1.0% 4.7% 0.1% 0.1% 100.0%
Unskilled and defined decision making
1 899 148 7 34 1 183 148 19 14 0 0 3 452
55.0% 4.3% 0.2% 1.0% 34.3% 4.3% 0.6% 0.4% 0.0% 0.0% 100.0%
TOTAL PERMANENT38 212 5 167 2 303 12 797 26 496 3 745 1 847 6 236 588 257 97 648
39.1% 5.3% 2.4% 13.1% 27.1% 3.8% 1.9% 6.4% 0.6% 0.3% 100.0%
Temporary employees1 679 266 64 257 1 584 298 31 137 16 5 4 337
38.7% 6.1% 1.5% 5.9% 36.5% 6.9% 0.7% 3.2% 0.4% 0.1% 100.0%
GRAND TOTAL 39 891 5 433 2 367 13 054 28 080 4 043 1 878 6 373 604 262 101 985

93
10.9 EdUCATIONAL INSTITUTIONS
Please report the total number of employees (including People with disabilities) in each of the following occupational levels
Occupational Levels
Male FemaleForeign National
TotalA C I W A C I W Male Female
Top Management142 26 27 129 72 11 11 71 1 0 490
29.0% 5.3% 5.5% 26.3% 14.7% 2.2% 2.2% 14.5% 0.2% 0.0% 100.0%
Senior Management528 104 125 500 317 72 86 508 45 10 2 295
23.0% 4.5% 5.4% 21.8% 13.8% 3.1% 3.7% 22.1% 2.0% 0.4% 100.0%
Professionally quali-fied and experienced specialists and mid-management
8 512 1 452 1 650 6 189 13 157 1 195 1 635 7 160 1 461 567 42 978
19.8% 3.4% 3.8% 14.4% 30.6% 2.8% 3.8% 16.7% 3.4% 1.3% 100.0%
Skilled technical and academically qualified workers, junior man-agement, supervisors, foremen, and superin-tendents
29 788 5 961 3 399 6 875 69 619 9 244 7 539 16 838 1 623 920 151 806
19.6% 3.9% 2.2% 4.5% 45.9% 6.1% 5.0% 11.1% 1.1% 0.6% 100.0%
Semi-skilled and discretionary decision making
25 454 3 553 485 1 948 51 172 8 766 922 7 820 419 261 100 800
25.3% 3.5% 0.5% 1.9% 50.8% 8.7% 0.9% 7.8% 0.4% 0.3% 100.0%
Unskilled and defined decision making
12 575 1 995 95 219 10 975 1 895 105 177 56 32 28124
44.7% 7.1% 0.3% 0.8% 39.0% 6.7% 0.4% 0.6% 0.2% 0.1% 100.0%
TOTAL PERMANENT 76 999 13 091 5 781 15 860 14 5312 21 183 10 29832 574 3 605 1790 32 6493
23.6% 4.0% 1.8% 4.9% 44.5% 6.5% 3.2% 10.0% 1.1% 0.5% 100.0%
Temporary employees12 165 2 085 719 4 684 24 059 3 310 1 190 6 257 1 966 1 091 57 526
21.1% 3.6% 1.2% 8.1% 41.8% 5.8% 2.1% 10.9% 3.4% 1.9% 100.0%
GRAND TOTAL 89 164 15 176 6 500 20 544 169 371 24 493 11 488 38 831 5 571 2 881 384 019

94

95

96

97

RP No: 104/2014 ISBN: 978-0-621-42626-7