Embed Size (px)
Citation preview

REPORT2017A N N U A L

Northview Apartment Real Estate Investment Trust (“Northview”) is one of Canada’s largest
publicly traded multi-family REITs with a portfolio of approximately 25,000 quality residential
suites and 1.2 million square feet of commercial space in more than 60 markets across
eight provinces and two territories. Northview’s well-diversified portfolio includes markets
characterized by expanding populations and growing economies, which provides Northview the
means to deliver stable and growing profitability and distributions to Unitholders of Northview
over time.
Northview’s residential portfolio is comprised of a multi-family segment: apartments, town
homes, and single family rental units. The commercial and execusuites business segment is
comprised of office, industrial, and retail properties primarily in areas where Northview has
residential operations.
CORPORATE PROFILE
Northern
Canada
30%
25% 27% 5%
13%Western
CanadaOntario
Quebec
Atlantic
Canada
The map above highlights how Northview derives net
operating income from across Canada.

GEO
GRA
PHIC
ALLY
DIV
ERSI
FIED Northview operates in eight Canadian provinces and
two territories. The geographical segments include Ontario, Western Canada, Atlantic Canada, Northern Canada, and Quebec. The Ontario and Quebec regions include only the operations of properties located in those respective provinces. The Western Canada segment includes the operations of properties located in Alberta, British Columbia, and Saskatchewan. The Northern Canada segment includes the operations of properties located in the Northwest Territories and Nunavut. The Atlantic Canada segment includes the operations of properties located in New Brunswick, Newfoundland and Labrador, and Nova Scotia.
While our roots are in Canada’s north, we are also located in some of Canada’s largest urban areas and
key secondary markets across the country. In many of our regions, we are the leading residential landlord, including in key centers for commodity-based industries. These communities represent Northview’s roots and remain an important part of its strategy, which has been expanded to include higher growth markets.
Northview’s portfolio is diversified, reducing exposure to occasionally volatile resource prices. Northview’s
markets in eastern and central Canada provide opportunities for both internal and external growth, from growing populations and increasing demand for rental apartments.
Multi-FamilyResidential Units
25,188

We are a passionate, community-focused team dedicated to making our properties the best they can be. We are proud to live, work and play in the neighbourhoods we serve, next to our residents, hotel guests and commercial tenants. At Northview, we will:
• Treat our customers respectfully and promptly, with thoughtfulness and consideration
• Create neighbourhoods that have a safe and friendly environment for the people we serve
• Provide our team with a supportive environment in which their unique talents and skills are appreciated and valued
• Pursue growth where opportunities allow us to create value for our Unitholders
• Invest in the communities we serveVISI
ON
Across Canada,Northview’s passion
is providing ourcustomers with a
place to call homeMIS
SIO
N
STAT
EMEN
T
CORE
VAL
UES

CORE
VAL
UES Customer Satisfaction
Service Excellence
Integrity
Social Responsibility
People

2017 RESULTS$331 MILLION $189 MILLION
$1.63 $2.08 78.3%
$3.6 BILLIONTotal Revenue
Distributions per Trust Unit FFO per Trust Unit - Diluted FFO Payout Ratio - Diluted
Net Operating Income Total Assets
2016: $327 Million
2016: $1.63
2016: $182 Million 2016: $3.2 Billion
2016: $2.14 2016: 76.7%
Northview’s strategy is based on the following:
Portfolio diversification: Northview has a well-diversified multi-family portfolio across Canada. This
portfolio allows for stable returns, and distributions, with flexibility for growth opportunities.
Organic growth: Northview’s high quality portfolio includes properties in stable markets characterized
by expanding populations and growing economies. Northview will seek to increase same door net
operating income by improving occupancy and average monthly rents combined with operating
efficiencies to reduce expenses.
Growth through acquisitions: Northview invests in strong markets across the country where it has an
established operations platform and market knowledge. Northview has a strategic relationship with
Starlight Group Property Holdings Inc. and affiliates that may generate future acquisition opportunities.
Growth through development: In-house development expertise enables Northview to focus in areas
with high values for existing properties and execute developments with returns 100 to 200 basis points
higher than market capitalization rates contributing to higher net asset values upon completion.
STRATEGY

TABLE OF CONTENTS89
404142468787
Letter to Unitholders
Management’s Discussion and Analysis
Management’s Report
Independent Auditor’s Report
Consolidated Financial Statements
Notes to the Consolidated Financial Statements
Trustees and Officers
Corporate Information

LETTER TO UNITHOLDERS
Dear Fellow Unitholders:
It is my pleasure to provide you with a summary on Northview’s activities over the past year.
Our primary focus was delivering on our 2017 strategic priorities of generating organic growth in the existing portfolio, managing leverage, and strategic capital deployment in support of external growth. The successful execution of these priorities was the cornerstone for our successful year.
From an operational perspective; we saw positive trends in all regions and business lines across the country including a reversal of the negative trend in Western Canada, generating positive same door NOI growth for the first time since 2014. Our Northern Canada and Atlantic Canada portfolios remain stable, and are steady contributors once again to our financial performance. The portfolios acquired in 2015 continued to perform well. Apartment fundamentals in Ontario continued to strengthen, leading to strong performance, including the successful execution of value creation initiatives, an increase of $141 million in the value of our multi-family portfolio, and the resulting continued improvement in our leverage ratios.
The improvement in operating results in 2017 offset the dilution in earnings from the sale of non-core assets, and the 2016 equity issuance, both of which were primarily directed at improving Northview’s leverage.
We continued with strategic capital deployment through the acquisition and development of high quality rental assets. During 2017, Northview successfully executed on the year’s largest Canadian multi-family acquisition of 1,250 apartment units located primarily in Ontario and Quebec; completed the development and successful lease up of 261 units in northeast Calgary, AB; and started over $56 million in new developments in Regina, SK, Canmore, AB, and Iqaluit, NU, which will come online in 2018.
In early 2018, we acquired our first land for development in Kitchener, ON, where we anticipate starting construction in late 2018. We are excited for this opportunity to bring our successful development program to Ontario, and continue to create Unitholder value through our proven development track record.
Our strategy for 2018 remains focused on creating value for our Unitholders. We will continue to deliver value through delivery of organic growth across our diversified portfolio, and our focus on strategic growth through acquisitions and development of high quality, well located assets, in our strong and growing markets.
Thank you for your support of Northview Apartment REIT over the past year. Our experienced, committed management team looks forward to delivering continued value to our Unitholders in the years to come.
Respectfully submitted,
Todd R. Cook, President and Chief Executive Officer
Northview Apartment REIT 2017 Annual Report | Page 8

Management’s Discussion and Analysis
ADVISORIES
The following Management’s Discussion and Analysis of Financial Results (“MD&A”), dated February 27, 2018, should
be read in conjunction with the cautionary statement regarding forward-looking information below, as well as the
Northview Apartment Real Estate Investment Trust (“Northview”) audited consolidated financial statements and notes
thereto for the years ended December 31, 2017, and 2016. The consolidated financial statements have been prepared
in accordance with International Financial Reporting Standards (“IFRS”). This MD&A is intended to provide readers with
management’s assessment of the performance of Northview, as well as its financial position and future prospects. All
amounts in the following MD&A are in Canadian Dollars unless otherwise stated. Additional information relating to
Northview, including periodic quarterly and annual reports and Annual Information Forms, filed with the Canadian
securities regulatory authorities, is available on SEDAR at www.sedar.com.
CAUTIONARY STATEMENT REGARDING FORWARD-LOOKING INFORMATION
Certain information contained in this MD&A may constitute forward-looking statements within the meaning of securities
laws relating to the business and financial outlook of Northview. Statements which reflect Northview’s current objectives,
plans, goals, and strategies are subject to risks, uncertainties, and other factors which could cause actual results to differ
materially from future results expressed, projected, or implied by such forward-looking statements. In some instances,
forward-looking information can be identified by the use of terms such as “may”, “should”, “expect”, “will”, “anticipate”,
“believe”, “intend”, “estimate”, “predict”, “potentially”, “starting”, “beginning”, “begun”, “moving”, “continue”, or other similar
expressions concerning matters that are not historical facts. Forward-looking statements in this MD&A include, but are
not limited to, statements related to acquisitions or dispositions, development activities, future maintenance expenditures,
financing and the availability of financing, tenant incentives, and occupancy levels. Such statements involve significant
risks and uncertainties and are not meant to provide guarantees of future performance or results. These cautionary
statements qualify all of the statements and information contained in this MD&A incorporating forward-looking information.
Forward-looking statements are made as of February 27, 2018, and are based on information available to management
as of that date. Management believes that the expectations reflected in forward-looking statements are based upon
information and reasonable assumptions available at the time they are made; however, management can give no
assurance that the actual results will be consistent with these forward-looking statements. Factors that could cause actual
results, performance, or achievements to differ materially from those expressed or implied by forward-looking statements
include, but are not limited to, general economic conditions, the availability of a new competitive supply of real estate
which may become available through construction, Northview’s ability to maintain occupancy and the timely lease or re-
lease of multi-family, execusuite units, and commercial space at current market rates, tenant defaults, changes in interest
rates, changes in operating costs, governmental regulations and taxation, fluctuations in commodity prices, and the
availability of financing. Additional risks and uncertainties not presently known to Northview, or those risks and
uncertainties that Northview currently believes to be not material, may also adversely affect Northview. Northview
cautions readers that this list of factors is not exhaustive and that should certain risks or uncertainties materialize, or
should underlying estimates or assumptions prove incorrect, actual events, performance, and results may vary materially
from those expected. This statement also qualifies any predictions made regarding Northview’s future funds from
operations (“FFO”), adjusted funds from operations (“AFFO”), FFO and AFFO payout ratio, debt to gross book value, and
coverage ratios.
Except as specifically required by applicable Canadian law, Northview assumes no obligation to update or revise publicly
any forward-looking statements to reflect new events or circumstances that may arise after February 27, 2018.
NON-GAAP AND ADDITIONAL GAAP MEASURES
Certain measures in this MD&A do not have any standardized meaning as prescribed by generally accepted accounting
principles (“GAAP”) and are, therefore, considered non-GAAP measures. These measures are provided to enhance the
reader’s understanding of Northview’s current financial condition. They are included to provide investors and management
with an alternative method for assessing Northview’s operating results in a manner that is focused on the performance of
Northview’s ongoing operations and to provide a more consistent basis for comparison between periods. These measures
include widely accepted measures of performance for Canadian real estate investment trusts; however, the measures
are not defined by IFRS. In addition, the definitions of these measures are subject to interpretation by the preparers and
may not be applied consistently.
Northview Apartment REIT 2017 Annual Report | Page 9

The following MD&A is for the financial results of Northview for the years ended December 31, 2017, and 2016. Units in
the MD&A refer to the publicly traded Northview Trust Units (“Trust Units”) and the Limited Partnership Class B units
(“Class B LP Units”). Unitholders in the MD&A refer to the Northview unitholders (“Trust Unitholders”) and the Class B LP
unitholders (“Class B LP Unitholders”).
This MD&A uses certain non-GAAP, additional GAAP and other measures that exclude Non-recurring Items on a
consistently applied basis to enhance GAAP measures. Please see page 32 for definition and cautionary language for
these measures.
BUSINESS OVERVIEW
Northview is one of Canada's largest publicly traded multi-family real estate investment trusts (“REITs”) with a portfolio
of approximately 25,000 residential units, and 1.2 million square feet of commercial space in more than 60 markets across
eight provinces and two territories. Northview currently trades on the Toronto Stock Exchange (“TSX”) under the symbol:
NVU.UN.
Northview’s strategy and objectives for 2018 are based on the following:
• Portfolio diversification: Northview has a well-diversified multi-family portfolio across Canada. This portfolio
allows for stable returns, and distributions, with flexibility for growth opportunities.
• Organic growth: Northview’s high quality portfolio includes properties in stable markets characterized by
expanding populations and growing economies. Northview will seek to increase same door NOI by improving
occupancy and average monthly rents combined with operating efficiencies to reduce expenses.
• Growth through acquisitions: Northview invests in strong markets across the country where it has an established
operations platform and market knowledge. Northview has a strategic relationship with Starlight Group Property
Holdings Inc. and affiliates (“Starlight”) that may generate future acquisition opportunities.
• Growth through development: In-house development expertise enables Northview to focus in areas with high
values for existing properties and execute developments with returns 100 to 200 basis points higher than market
capitalization rates (“Cap Rate”) contributing to higher net asset values upon completion.
HIGHLIGHTS
• Diluted FFO per unit of $2.08 for the year ended December 31, 2017, compared to $2.14 for the same period of 2016,
excluding Non-recurring Items.
• Multi-family portfolio occupancy of 93.3% in the fourth quarter of 2017, consistent with the third quarter of 2017 and
an improvement of 2.9% from the same period of 2016.
• Same door NOI increase of 6.4% and 4.3% for the three months and year ended December 31, 2017, respectively,
excluding Non-recurring Items.
• Annualized NOI increase from Value Creation Initiatives was $4.1 million for 2017, bringing the cumulative progress
to $6.8 million since November 1, 2015.
• Net fair value increase on investment properties of $56 million and $141 million, respectively, for the three months
and year ended December 31, 2017.
• Debt to gross book value was 56.4% as at December 31, 2017, a reduction of 1.1% from December 31, 2016 as a
result of organic growth and increased property values.
PROGRESS MADE AGAINST 2017 STRATEGIC PRIORITIES
1. ORGANIC GROWTH
Northview continues to focus on improving occupancy, monthly rents, operating expense management and completing
Value Creation Initiatives (“VCIs”) to increase same door NOI.
During the year ended December 31, 2017, Northview generated organic growth which resulted in total same door NOI
increase of 4.3%, excluding Non-recurring Items. This included multi-family same door NOI increases of 7.1% in Ontario
and 5.0% in Western Canada. All other multi-family regions also achieved positive same door NOI growth of 2.0% to
5.0%.
Northview Apartment REIT 2017 Annual Report | Page 10

Progress continues on VCIs with annualized increase in NOI of $4.1 million for the year ended December 31, 2017.
The high-end renovation program achieved an average rate of return of 23% in 2017, exceeding the target rate of return
of 15% to 20%. The cumulative progress on VCIs is $6.8 million since November 1, 2015. In addition, property
management internalization will generate an estimated $2.9 million of cumulative annualized savings once completed
by the end of the first quarter in 2018.
Revenue increased 1.2% for year ended December 31, 2017, compared to the prior year, excluding Non-recurring
Items. The increase in revenue was due to an increase in average monthly rent (“AMR”) and higher occupancy
throughout most of the portfolio, contributions from newly developed properties and acquisitions completed during 2017;
partially offset by non-core asset sales and lower commercial revenue.
Operating expenses decreased by $3.6 million or 2.5% for the year ended December 31, 2017, compared to the prior
year, excluding Non-recurring Items. Northview’s ongoing focus on reducing costs resulted in lower salaries and
benefits, lower general operating expenses, and expense reduction associated with non-core asset sales. These cost
savings were achieved through negotiating new contracts and process improvements. The internalization of property
management has and will create additional opportunities for operating efficiencies.
Improvements in revenue and operating expense management resulted in the NOI margin increasing to 57.2% for the
year ended December 31, 2017, up from 55.5% in 2016, excluding Non-recurring Items.
2. MANAGING LEVERAGE
Northview’s long-term target for debt to gross book value is 50% to 55%. Leverage reduction will be achieved through
asset value increases driven by same door NOI growth, successful execution of the VCIs, and fair value increases upon
the completion of developments.
Debt to gross book value was 56.4% as at December 31, 2017, which is a reduction of 1.1% from December 31, 2016,
and 3.8% from June 30, 2016. In 2017, improvements to this ratio were the result of organic growth and increases in
investment property values, particularly in Ontario. Interest and debt service coverage ratios were 3.05 and 1.63,
respectively, for the year ended December 31, 2017, which are comparable to the prior year.
3. STRATEGIC CAPITAL DEPLOYMENT IN SUPPORT OF EXTERNAL GROWTH
Management is focused on creating unitholder value through organic growth, capital redeployment, and external
growth opportunities. Northview continues to utilize its existing land investments and intends to expand the in-house
development program to Ontario.
On August 1, 2017, Northview completed the acquisition of a portfolio consisting of 327 units in Moncton, NB, for
$31.4 million. On December 7, 2017, Northview completed the acquisition of a portfolio consisting of 1,250 units for
$196.8 million in British Columbia, Nova Scotia, Ontario, and Quebec, and the disposition of a non-core asset located
in Kitchener, ON, for $37.7 million. This strategic capital redeployment has improved the geographic diversification
and quality of the portfolio through investment in stronger and stable markets. During the fourth quarter of 2017, FFO
included a one-time increase in financing costs of $0.7 million related to the disposition of a non-core asset located
in Kitchener, ON.
Since announcing an intention to sell approximately $150 million of non-core properties in the portfolio, $130.6 million
have been sold which is the completion of this non-core property sale program. Any future non-core asset sales are
expected to support capital redeployment and external growth opportunities through acquisitions and developments.
2018 OUTLOOK
Northview expects positive same door NOI growth to continue in 2018 although growth is expected to moderate from
2017. The portfolio will be fully internalized by the end of the first quarter in 2018, which is expected to increase portfolio
performance and reduce costs. Northview’s strongest markets, Ontario and Northern Canada, are expected to continue
to generate organic growth driven by tight supply conditions, high occupancy, and the benefits of the VCIs in Ontario.
Northern Canada is supported by long-term leases and primarily government based tenants. The Atlantic Canada and
Quebec markets are expected to generate stable growth in NOI.
Northview Apartment REIT 2017 Annual Report | Page 11

Occupancy levels in Western Canada have recently stabilized at levels expected for 2018. Although select markets
started to recover in 2017, an uncertain outlook for the resource sector, gross domestic product, and employment rate
leads to continued uncertainty for the performance in northern regions of Alberta and British Columbia. The southern
regions of Alberta and British Columbia are expected to remain strong.
Developments underway in Regina, SK, Iqaluit, NU, and Canmore, AB, will contribute to Northview’s growth in 2018 after
the projects are completed. Strategic capital deployment, including the recently completed acquisitions, will improve the
overall quality of the portfolio and the potential for growth in 2018. Northview will continue to pursue growth by acquisition
and development in its strong markets in 2018.
Growth will be focused in areas with long-term potential for stable and growing returns. This targeted growth will enhance
diversification by increasing Northview’s exposure to Ontario and southern British Columbia.
GROWTH
CURRENT DEVELOPMENT ACTIVITY
Northview has development projects in progress in Regina, SK, Iqaluit, NU, and Canmore, AB, with total estimated
development costs of $57 million. At the end of the fourth quarter, $33 million has been incurred in respect of these
projects.
PROJECTS UNDER DEVELOPMENT at December 31, 2017 (thousands of dollars except units and sq. ft. amounts)
Location Units
Expected
Occupancy
Estimated
Total Costs
Expected
Stabilized Cap Rate Property Type Sq. Ft.
Multi-family Regina, SK 132 - Q1 2018 22,300 7.0% to 7.5%
Multi-family/Commercial Iqaluit, NU 30 11,400 Q1 2018 9,400 9.0% to 9.5%
Multi-family Canmore, AB 140 - Q3 2018 25,000 7.0% to 7.5%
Total 302 11,400 56,700
RECENTLY COMPLETED DEVELOPMENTS
Northview completed the development of 36 units in Cambridge Bay, NU, on May 1, 2017, with 100% of the units being
leased in the first quarter of 2018. Total development costs were consistent with budget at $10.5 million with an expected
stabilized Cap Rate of 10.0% to 10.5%. Northview has recorded a cumulative fair value increase of $2.0 million or 19%
relative to total development costs at completion of the development.
Northview’s Calgary, AB, development reached stabilized occupancy in the third quarter of 2017. Total development
costs were consistent with budget at $46.3 million with an expected stabilized Cap Rate of 7.0% to 7.5%. Northview has
recorded a cumulative fair value increase of $8.8 million or 19% relative to total development costs at completion of the
development.
2018 DEVELOPMENTS
Northview’s planned 2018 development program includes a development on land recently acquired in Kitchener, ON, for
$5.3 million. This supports Northview’s strategic goal of bringing in-house development expertise to the Ontario market.
ACQUISITION ACTIVITY
RECENTLY COMPLETED ACQUISITIONS (thousands of dollars except units and sq. ft. amounts)
Location Units Date Cost Property Type Sq. Ft.
Multi-family/Commercial Atlantic Canada 399 14,000 Q3, Q4 2017 41,842
Multi-family/Commercial Ontario 851 20,000 Q4 2017 144,690
Multi-family Quebec 201 - Q4 2017 24,383
Multi-family/Land Western Canada 126 - Q4 2017 28,286
Total 1,577 34,000 239,201
Northview Apartment REIT 2017 Annual Report | Page 12

SELECTED ANNUAL INFORMATION
(i) The calculation of weighted average number of units outstanding for diluted FFO per unit and diluted AFFO per unit includes the
convertible debentures for the year ended December 31, 2017, 2016, and 2015 because convertible debentures are dilutive.
(ii) FFO payout ratio – diluted, trailing 12 month is calculated as total distribution declared to Unitholders – diluted, divided by total
diluted FFO, for the 12 months ended December 31, 2017, 2016, and 2015.
(iii) AFFO is a disclosure implemented by Northview in the third quarter of 2017. AFFO payout ratio – diluted, trailing 12 month is
calculated as total distribution declared to Unitholders – diluted, divided by total diluted AFFO, for the 12 months ended December
31, 2017. For the purpose of this calculation, maintenance capital expenditures are calculated using maintenance capital
expenditures reserve amounts in the “Adjusted Funds from Operations” section of this MD&A.
(thousands of dollars, except units, sq. ft. and per unit
amounts) 2017 2016 2015
Financial measurement:
(measurements excluding Non-recurring Items)
Total revenue 330,999 326,939 217,578
Total NOI 189,264 181,583 126,699
NOI margin 57.2% 55.5% 58.2%
Net and comprehensive income 211,451 73,529 31,852
FFO – diluted 118,597 115,331 83,054
FFO per unit – diluted(i) $2.08 $2.14 $2.34
FFO payout ratio – diluted, trailing 12 month(ii) 78.3% 76.7% 69.0%
AFFO – diluted 96,481 n/a n/a
AFFO per unit – diluted(i) $1.69 n/a n/a
AFFO payout ratio – diluted, trailing 12 month(iii) 96.1% n/a n/a
Total assets 3,573,416 3,185,672 3,132,617
Total non-current financial liabilities 1,815,672 1,708,411 1,390,392
Weighted average mortgage interest rate 3.20% 3.23% 3.33%
Weighted average term to maturity (years) 4.6 5.0 5.0
Weighted average capitalization rate 6.24% 6.67% 6.83%
Weighted average number of units outstanding – diluted
(000’s) 57,131 53,962 35,458
Distributions declared to Trust and Class B LP
Unitholders – diluted 92,838 88,403 57,312
Distributions declared per Trust Unit $1.63 $1.63 $1.63
Operational measurement:
(measurements excluding Non-recurring Items)
Same door NOI increase (decrease) 4.3% (5.9%) (1.6%)
Occupancy 92.4% 90.7% 90.3%
Number of multi-family units 25,188 24,094 24,202
Number of execusuites units 344 419 419
Commercial square feet 1,172,000 1,135,000 1,143,000
Leverage measurement:
(measurements including Non-recurring Items)
Debt to gross book value (excluding convertible
debentures) 56.4% 57.5% 59.2%
Interest coverage ratio (times) 3.05 2.98 3.31
Debt service coverage ratio (times) 1.63 1.70 1.86
Northview Apartment REIT 2017 Annual Report | Page 13

2017 OPERATING RESULTS
The following section provides a comparison of the operating results for the three months and year ended December 31,
2017, with the same periods of 2016. Operations include multi-family, and commercial & execusuites business segments.
Management presents geographical segment reporting for Ontario, Western Canada, Atlantic Canada, Northern Canada,
and Quebec. The Ontario and Quebec regions include only the operations of properties located in those respective
provinces. The Western Canada segment includes the operations of properties located in Alberta, British Columbia, and
Saskatchewan. The Atlantic Canada segment includes the operations of properties located in Newfoundland and
Labrador, New Brunswick, and Nova Scotia. The Northern Canada segment includes the operations of properties located
in the Northwest Territories, and Nunavut.
REVENUE BY BUSINESS SEGMENT
Three months ended December 31 Year ended December 31
(thousands of dollars) 2017 2016 Change 2017 2016 Change
Multi-family(i) 74,296 69,609 6.7% 287,387 280,982 2.3%
Commercial and execusuites 10,396 11,543 (9.9%) 43,612 45,957 (5.1%)
Total 84,692 81,152 4.4% 330,999 326,939 1.2%
(i) Non-recurring Items are excluded from revenue for the multi-family business segment for the three months and year ended December
31, 2017, and 2016.
Revenue in the multi-family business segment for the three months and year ended December 31, 2017, was $74.3
million and $287.4 million, respectively. The increase in revenue for the three months and year ended December 31,
2017, compared to the same periods of 2016 was due to an increase in AMR and higher occupancy throughout most of
the portfolio, contributions from newly developed properties completed in 2017, and acquisitions that occurred during
2017, partially offset by non-core asset sales.
Revenue in the commercial and execusuites business segment for the three months and year ended December 31, 2017,
were $10.4 million and $43.6 million, respectively. The decrease in revenue for the three months and year ended
December 31, 2017, compared to the same periods of 2016 was due to the disposition of an execusuite property in Iqaluit,
NU, during the third quarter of 2017, and lower commercial occupancy throughout the year.
OPERATING EXPENSES
Three months ended December 31 Year ended December 31
(thousands of dollars) 2017 2016 Change 2017 2016 Change
Operating expenses
Utilities 10,220 10,156 0.6% 38,708 38,981 (0.7%)
Property taxes 8,290 7,999 3.6% 32,241 32,645 (1.2%)
Salaries and benefits 4,387 4,959 (11.5%) 19,122 20,529 (6.9%)
Maintenance 7,639 7,781 (1.8%) 26,364 27,270 (3.3%)
Cleaning 1,733 1,847 (6.2%) 6,864 6,939 (1.1%)
General(i) 5,066 4,784 5.9% 18,436 18,992 (2.9%)
Total 37,335 37,526 (0.5%) 141,735 145,356 (2.5%)
(i) Non-recurring Item is excluded from general expenses for the year ended December 31, 2016.
Northview revised the account groupings of operating expenses to provide increased transparency with respect to
operational results. The comparative amounts have been restated accordingly to be consistent with the current year
presentation. These changes had no impact on the total operating expenses.
Total operating expenses for the three months ended December 31, 2017, were consistent with the same period of 2016,
and decreased 2.5% for the year ended December 31, 2017, compared to the same period in the prior year. Higher
operating expenses from acquisitions and newly developed properties were offset by decreases in expenses from non-
core asset dispositions.
Northview Apartment REIT 2017 Annual Report | Page 14

Utilities for the three months and year ended December 31, 2017, were consistent with the same periods of 2016. For
the three months ended December 31, 2017, the lower electricity costs from the Ontario Fair Hydro Plan were offset by
higher water costs across most regions due to increased rates. For the year ended December 31, 2017, the lower
electricity costs in Ontario were offset by higher gas costs in Ontario, Quebec, and Western Canada, and higher water
costs in Ontario due to increased rates, partially offset by lower utilities in Northern Canada and Atlantic Canada.
Salaries and benefits decreased 11.5% and 6.9% for the three months and year ended December 31, 2017, respectively,
compared to the same periods of 2016. The decrease in salaries and benefits was related to an improved staffing model
in Western Canada.
Cleaning costs decreased 6.2% for the three months ended December 31, 2017, compared to the same period of 2016.
The decrease is due to the sale of an execusuite property in the third quarter of 2017. Cleaning costs for the year ended
December 31, 2017, were consistent with the prior year.
General expenses for the three months ended December 31, 2017, increased 5.9% compared to the same period of 2016
due to higher insurance costs and professional fees. For the year ended December 31, 2017, general expenses
decreased 2.9% compared to the prior year, excluding Non-recurring Items. Northview’s ongoing focus on reducing costs
contributed to the decrease in general operating expenses, such as management of bad debts and recoveries, telephone,
and travel costs. These cost savings were achieved through negotiating new contracts and process improvements.
NET OPERATING INCOME
Northview uses NOI and same door NOI as key indicators to measure the financial performance of a region and business
segment. Same door NOI is a key measurement of Northview’s ability to generate NOI based on the same properties,
excluding the impact of acquisitions, dispositions, and developments.
NOI by business segment
Three months ended December 31 Year ended December 31
(thousands of dollars) 2017 2016 Change 2017 2016 Change
Multi-family(i) 41,272 37,467 10.2% 163,745 155,304 5.4%
Commercial & execusuites 6,085 6,159 (1.2%) 25,519 26,279 (2.9%)
Total 47,357 43,626 8.6% 189,264 181,583 4.2%
(i) Non-recurring Items are excluded from NOI for the multi-family business segment for the three months and year ended December 31,
2017, and 2016.
Same door NOI by business segment
Three months ended December 31 Year ended December 31
(thousands of dollars) 2017 2016 Change 2017 2016 Change
Multi-family(i) 38,853 36,365 6.8% 157,121 149,741 4.9%
Commercial & execusuites 6,025 5,807 3.8% 24,237 24,212 0.1%
Total 44,878 42,172 6.4% 181,358 173,953 4.3%
(i) Non-recurring Items are excluded from same door NOI for the multi-family business segment for the three months and year ended
December 31, 2017, and 2016.
Northview Apartment REIT 2017 Annual Report | Page 15

NOI by region
Three months ended December 31 Year ended December 31
(thousands of dollars) 2017 2016 Change 2017 2016 Change
Ontario 12,723 12,068 5.4% 50,462 48,856 3.3%
Western Canada(i) 11,670 10,331 13.0% 46,299 43,295 6.9%
Atlantic Canada 6,396 5,695 12.3% 24,918 23,592 5.6%
Northern Canada(i) 13,957 13,247 5.4% 57,518 56,255 2.2%
Quebec 2,611 2,285 14.3% 10,067 9,585 5.0%
Total 47,357 43,626 8.6% 189,264 181,583 4.2%
(i) Non-recurring Items are excluded from NOI for Western Canada for the three months and year ended December 31, 2017, and 2016.
Non-recurring Item is excluded from NOI for Northern Canada for the year ended December 31, 2016.
Portfolio summary – December 31, 2017
Regions Multi-family units Execusuites units
Commercial
(sq. ft.)
Ontario 8,335 - 20,000
Western Canada 7,426 - 139,000
Atlantic Canada 4,517 145 239,000
Northern Canada 2,427 199 771,000
Quebec 2,483 - 3,000
Total 25,188 344 1,172,000
Portfolio change – December 31, 2017
Multi-family units Execusuites units
Commercial
(sq. ft.)
December 31, 2016 24,094 419 1,135,000
Dispositions (484) (75) -
Additions and conversions 1,578 - 37,000
December 31, 2017 25,188 344 1,172,000
Northview Apartment REIT 2017 Annual Report | Page 16

MULTI-FAMILY OPERATIONS
Same door NOI, AMR, and occupancy by region
AMR is the average monthly rent of occupied units on December 31, 2017, and 2016. AMR is calculated as gross rent,
less incentives, divided by the number of occupied units as at the period end date. Occupancy is a measure used by
management to evaluate the performance of its properties on a comparable basis, and the occupancy presented
in this MD&A is financial occupancy for each period.
Same Door NOI % Change
2017 Q4 2017 Q3 2017 Q2 2017 Q1 2017
Ontario 7.1% 4.3% 13.0% 7.5% 2.4%
Western Canada(i) 5.0% 11.1% 9.6% 3.3% (3.9%)
Atlantic Canada 2.2% 4.2% 0.8% (5.4%) 11.1%
Northern Canada 3.7% 5.6% 3.4% 6.1% (0.8%)
Quebec 4.3% 11.4% 5.5% 1.7% (1.5%)
Overall 4.9% 6.8% 7.7% 4.1% 0.5%
(i) Non-recurring Items are excluded from same door NOI for Western Canada in 2017.
82.0%
84.0%
86.0%
88.0%
90.0%
92.0%
94.0%
96.0%
-15.0%
-10.0%
-5.0%
0.0%
5.0%
10.0%
Q1'15 Q2'15 Q3'15 Q4'15 Q1'16 Q2'16 Q3'16 Q4'16 Q1'17 Q2'17 Q3'17 Q4'17
Occu
pa
ncy (
%)
Mu
lti-
Fa
mily S
D N
OI G
row
th (
%)
Multi-Family Same Door NOI and Occupancy
SD NOI Growth Occupancy Rate
Northview Apartment REIT 2017 Annual Report | Page 17

Multi-family units, AMR, and occupancy by region
Multi-family Units AMR Occupancy
Q4 2017 Q4 2016 Change Q4 2017 Q4 2016 Change
Southwestern 4,636 938 907 3.4% 96.2% 95.6% 0.6%
Eastern 1,773 1,060 991 7.0% 98.2% 96.4% 1.8%
Toronto and area 1,926 1,160 1,120 3.6% 97.9% 96.8% 1.1%
Ontario 8,335 1,018 975 4.4% 97.1% 96.1% 1.0%
Alberta 4,282 1,055 1,006 4.9% 85.7% 77.8% 7.9%
British Columbia 2,715 895 841 6.4% 86.8% 86.2% 0.6%
Saskatchewan 429 1,006 1,064 (5.5%) 92.8% 90.6% 2.2%
Western Canada 7,426 998 955 4.5% 86.5% 81.3% 5.2%
Newfoundland and Labrador
1,728 827 830 (0.4%) 91.1% 88.1% 3.0%
Nova Scotia 1,358 689 683 0.9% 96.2% 94.9% 1.3%
New Brunswick 1,431 759 731 3.8% 97.9% 95.9% 2.0%
Atlantic Canada 4,517 764 755 1.2% 94.6% 92.0% 2.6%
Northwest Territories 1,309 1,653 1,614 2.4% 93.5% 91.2% 2.3%
Nunavut 1,118 2,572 2,527 1.8% 98.0% 95.9% 2.1%
Northern Canada 2,427 2,089 2,040 2.4% 96.1% 93.9% 2.2%
Quebec 2,483 741 724 2.3% 94.2% 92.5% 1.7%
Total 25,188 1,049 1,016 3.2% 93.3% 90.4% 2.9%
Occupancy
2017 Q4 2017 Q3 2017 Q2 2017 Q1 2017 2016 Q4 2016
Ontario 96.6% 97.1% 96.8% 96.8% 95.7% 96.0% 96.1%
Western Canada 85.3% 86.5% 87.6% 85.4% 81.7% 81.6% 81.3%
Atlantic Canada 93.5% 94.6% 94.4% 93.0% 92.1% 92.8% 92.0%
Northern Canada 95.0% 96.1% 95.4% 94.5% 94.1% 94.7% 93.9%
Quebec 94.3% 94.2% 94.0% 94.7% 94.2% 91.4% 92.5%
Overall 92.4% 93.3% 93.3% 92.3% 90.6% 90.7% 90.4%
AMR
Q4 2017 Q3 2017 Q2 2017 Q1 2017 Q4 2016
Ontario 1,018 1,011 1,000 1,000 975
Western Canada 998 990 979 971 955
Atlantic Canada 764 758 754 752 755
Northern Canada 2,089 2,088 2,059 2,049 2,040
Quebec 741 737 728 725 724
Overall 1,049 1,041 1,033 1,029 1,016
Northview Apartment REIT 2017 Annual Report | Page 18

VCIs PROGRAM DESCRIPTION
In addition to portfolio diversification, a key driver of the Transaction completed in 2015 was Northview’s enhanced ability
to organically grow FFO in strong markets. In 2015, management identified several areas that would drive FFO growth
over the following three to five years:
(i) High-end renovation program: Management identified properties suitable for substantive renovations to
increase rental rates. These renovations involve upgrades to the properties’ common areas including high-
end suite improvements with complete bathroom and kitchen renovations. The target for post renovation
increase in rents is approximately $200 to $300 per month and a return of 15% to 20% on the additional
capital invested.
(ii) Address below market rents: At the time of the Transaction, average monthly rents in the portfolios
acquired were on average $32 below market rents. Management is converting these rents to market levels
on turnover, with the completion of standard renovations.
(iii) Sub-metering program: The sub-metering program in Ontario provides individual electricity meters for
each suite, which allows tenants to pay their electricity bill directly. On tenant turnover, this reduces the
utility costs to the landlord, which was estimated in 2015 as an average monthly savings of $40 per suite.
The current estimate for monthly savings is $55 per suite which is reflected in progress since Q2 2017.
Northview has not incurred costs related to the sub-metering program as the installation cost of sub-
metering is incurred by the third-party energy providers.
(iv) Above guideline increases: The significant capital that was invested in the assets prior to the Transaction
in 2015 has enabled management to submit applications to the Ontario Landlord and Tenant Board to
increase rents by more than the regulated annual increase.
(v) Property management internalization: Northview has a history of successfully managing its own properties
directly. After the property management internalization of Atlantic Canada in late 2017 and Quebec effective
February 1, 2018, the portfolio will be fully internalized by the end of the first quarter in 2018.
VCI PROGRESS
Program Annualized NOI Increase
(thousands of dollars)
Initial
5-year Target Q4 2017 2017
Cumulative
Progress Since
Inception
High-end renovation 5,800 448 1,535 2,149
Below market rents 5,200 1,200 2,096 3,740
Sub-metering 2,500 111 236 417
Above guideline increases 800 - 194 506
Total 14,300 1,759 4,061 6,812
2015 capitalization rate 5.5% 5.5% 5.5% 5.5%
Estimated value creation 260,000 32,000 74,000 124,000
Overall progress on the VCIs in 2017 exceeded management’s expectations based on 2017 annualized incremental NOI
of $4.1 million being achieved. Estimated value creation is based on the 5.5% Cap Rate in place at the time of the
Transaction. The Cap Rate in Ontario has decreased to approximately 4.5%, which has increased the initial estimated
value creation projections.
Under the high-end renovation program, 169 units were completed during the fourth quarter of 2017, of which 143 units
have been leased with an AMR increase of approximately $261 per unit. For the year ended December 31, 2017, 500
units have been completed, of which 466 units have been leased with an AMR increase of approximately $253 per unit.
Capital expenditures on the program for the three months and year ended December 31, 2017, were $2.8 million and
$8.3 million, respectively. The program has achieved a rate of return of 23% year to date in 2017, which exceeded the
target rate of return of 15% to 20%, as a result of control of the renovation costs and higher rents achieved on the
renovated units. In addition to the initial target, management has identified an additional 875 units suitable for the high-
end renovation program as part of the acquisition completed in December 2017.
Northview Apartment REIT 2017 Annual Report | Page 19

Progress on below market rents and above guideline increases is in line with expectations. Sub-metering is progressing
slower than anticipated as a result of lower than expected suite turnover.
In addition to the VCI progress, Northview internalized the property management of approximately 7,600 units in 2016 in
Ontario with an annualized NOI increase of $2.1 million. The internalization of Nova Scotia and New Brunswick on October
1, 2017, and Quebec on February 1, 2018, is expected to result in an annualized NOI increase of approximately $0.8
million, which will bring the estimated cumulative annualized savings from internalization of property management to $2.9
million.
ONTARIO OPERATIONS
AMR was $1,018 as at December 31, 2017, compared to $975 as at December 31, 2016. The increase in AMR was due
to the successful execution of the VCIs and strong market conditions. For the fourth quarter of 2017, occupancy in the
Kitchener-Waterloo market increased to 96.5% compared to 95.3% for the third quarter of 2017.
Overall, Ontario continues to experience high occupancy of 97.1% for the fourth quarter of 2017, compared to 96.1% in
the fourth quarter of 2016.
Ontario Three months ended December 31 Year ended December 31
(thousands of dollars) 2017 2016 Change 2017 2016 Change
Revenue 24,659 23,369 5.5% 94,994 95,076 (0.1%)
Operating expenses (11,963) (11,301) 5.9% (44,559) (46,220) (3.6%)
NOI 12,696 12,068 5.2% 50,435 48,856 3.2%
NOI margin % 51.5% 51.6% (0.1%) 53.1% 51.4% 1.7%
Same door NOI 12,090 11,587 4.3% 48,431 45,234 7.1%
NOI increased 5.2% and 3.2% for the three months and year ended December 31, 2017, respectively, compared to the
same periods of 2016. The increases were due to higher AMR, occupancy increase, electricity costs savings, and
contributions from new acquisitions that occurred in the fourth quarter of 2017, partially offset by non-core asset sales
that occurred in 2017.
Same door NOI increased 4.3% and 7.1% for the three months and year ended December 31, 2017, respectively. Same
door NOI for the three months and year ended December 31, 2016, includes $0.2 million and $0.9 million, of revenue
related to one-time head lease income, respectively. Excluding this revenue, same door NOI growth is 6.4% and 9.3%
for the three months and year ended December 31, 2017, respectively. The increases were due to higher AMR,
occupancy increase, and electricity costs savings, partially offset by higher expenses related to higher rates for water and
gas, higher salaries, an increase in property taxes due to higher assessments, and higher insurance costs.
90.0%
92.0%
94.0%
96.0%
98.0%
100.0%
Q1 2016 Q2 2016 Q3 2016 Q4 2016 Q1 2017 Q2 2017 Q3 2017 Q4 2017
940
960
980
1,000
1,020
1,040
AM
R (
$)
Ontario Occupancy and AMR
AMR Occupancy
Northview Apartment REIT 2017 Annual Report | Page 20

WESTERN CANADA OPERATIONS
AMR was $998 as at December 31, 2017, compared to $955 as at December 31, 2016. In Alberta, the increase in AMR
from the prior year was due to higher occupancy and contributions from newly developed properties that were completed
near the end of 2016. In British Columbia, the increase in AMR from the prior year was due to increased market rents in
southern British Columbia, higher occupancy in northeastern British Columbia, partially offset by non-core asset
dispositions that occurred in 2017. In Saskatchewan, the decrease in AMR from the prior year was due to reduced market
rents in Saskatoon, where new supply and a weakened local economy have impacted occupancy levels.
The Q4 2017 increase in occupancy for the Western Canada region compared to the same period in 2016 was attributable
to Alberta, which experienced improved economic conditions compared to the prior year, and contributions from newly
developed properties. Most of the resource based markets in northern Alberta and northeastern British Columbia showed
improvements, compared to the same period of 2016. Compared to the third quarter of 2017, overall occupancy in Alberta,
British Columbia, and Saskatchewan decreased slightly, particularly in the resource based markets where the completion
of energy and infrastructure projects impacted occupancy levels during the fourth quarter.
Western Canada Three months ended December 31 Year ended December 31
(thousands of dollars) 2017 2016 Change 2017 2016 Change
Revenue(i) 19,860 18,533 7.2% 77,818 74,670 4.2%
Operating expenses(i) (8,153) (8,414) (3.1%) (31,612) (32,257) (2.0%)
NOI(i) 11,707 10,119 15.7% 46,206 42,413 8.9%
NOI margin % 58.9% 54.6% 4.3% 59.4% 56.8% 2.6%
Same door NOI(i) 10,653 9,588 11.1% 42,925 40,871 5.0%
(i) Non-recurring Items are excluded from revenue, operating expenses, NOI, and same door NOI for Western Canada for the three
months and year ended December 31, 2017, and 2016.
For the three months and year ended December 31, 2017, NOI increased by 15.7% and 8.9%, respectively, compared to
the same periods of 2016, excluding Non-recurring Items. The increase in NOI was due to improved occupancy, NOI
contribution from the newly developed properties in Alberta, and from the new acquisition that closed in the fourth quarter
of 2017, management of controllable costs, and lower property taxes. These increases were partially offset by higher
utilities, higher insurance costs, and the impact of a non-core asset disposition that occurred in 2017.
Same door NOI for the three months ended December 31, 2017, was $10.7 million, an increase of 11.1%, compared to
$9.6 million for the same period in 2016, excluding Non-recurring Items. The increase in same door NOI was due to higher
revenue from occupancy increase, management of controllable costs, and lower property taxes.
80.0%
82.0%
84.0%
86.0%
88.0%
90.0%
Q1 2016 Q2 2016 Q3 2016 Q4 2016 Q1 2017 Q2 2017 Q3 2017 Q4 2017
900
920
940
960
980
1,000
AM
R (
$)
Western Canada Occupancy and AMR
AMR Occupancy
Northview Apartment REIT 2017 Annual Report | Page 21

Same door NOI for the year ended December 31, 2017, increased 5.0% to $42.9 million from $40.9 million for the same
period of 2016. The increase in same door NOI was due to both higher revenue and lower expenses. Revenue was higher
compared to the prior year due to increased occupancy, partially offset by reduced market rents and lease incentives to
manage occupancy levels. The lower expenses compared to the prior year were due to management of controllable costs
and lower property taxes, partially offset by higher utilities and insurance costs.
ATLANTIC CANADA OPERATIONS
AMR was $764 as at December 31, 2017, compared to $755 as at December 31, 2016. AMR in New Brunswick increased
3.8% from the prior year, due to the acquisition of a portfolio in Moncton, NB, on August 1, 2017, consisting of 327 units
with an AMR of $880. AMR in Nova Scotia increased 0.8% from the prior year due to an improved economy. In
Newfoundland and Labrador, AMR decreased from the prior year due to reduced market rents to maintain occupancy
levels in a weak economic environment; however, fewer incentives in the fourth quarter have resulted in increased AMR
of $827 compared to $813 as at September 30, 2017.
Occupancy for the Atlantic Canada region was 94.6% for the fourth quarter of 2017, compared to 92.0% in the same period
of 2016. Occupancy in the fourth quarter of 2017 increased throughout the region, compared to the same period of 2016,
including the St. John’s, NL, market where recent new supply and a weak local economy had impacted occupancy levels
in the first half of 2017. Northview has been actively managing occupancy levels through lease incentives and a proactive
lease renewal program. These programs are showing positive results with occupancy increasing in St. John’s, NL, to
94.0% in the fourth quarter of 2017, compared to 91.5% in the same period of 2016.
Atlantic Canada Three months ended December 31 Year ended December 31
(thousands of dollars) 2017 2016 Change 2017 2016 Change
Revenue 10,028 8,932 12.3% 37,323 36,055 3.5%
Operating expenses (4,908) (4,440) 10.5% (18,048) (17,666) 2.2%
NOI 5,120 4,492 14.0% 19,275 18,389 4.8%
NOI margin % 51.1% 50.3% 0.8% 51.6% 51.0% 0.6%
Same door NOI 4,619 4,434 4.2% 18,481 18,087 2.2%
For the three months and year ended December 31, 2017, NOI increased 14.0% and 4.8%, respectively, compared to the
same periods of 2016 due to an increase in AMR in Nova Scotia and New Brunswick, higher occupancy, and the acquisition
of the portfolio in Moncton, NB. These increases were partially offset by a non-core asset disposition that occurred in 2017.
Same door NOI for the three months ended December 31, 2017, was $4.6 million, an increase of 4.2%, compared to $4.4
million for the same period in the prior year. The increase in same door NOI was due to higher AMR in Nova Scotia and
New Brunswick, occupancy increase, lower property taxes as a result of successful tax appeals, and cost savings from
internalization, partially offset by higher maintenance.
90.0%
92.0%
94.0%
96.0%
98.0%
100.0%
Q1 2016 Q2 2016 Q3 2016 Q4 2016 Q1 2017 Q2 2017 Q3 2017 Q4 2017
700
720
740
760
780
800
AM
R (
$)
Atlantic Canada Occupancy and AMR
AMR Occupancy
Northview Apartment REIT 2017 Annual Report | Page 22

Same door NOI for the year ended December 31, 2017, was $18.5 million, an increase of 2.2%, compared to $18.1 million
for the prior year. The increase in same door NOI was due to higher AMR in Nova Scotia and New Brunswick, occupancy
increase, lower electricity expenses in Newfoundland and Labrador, and lower gas expenses in Nova Scotia due to a
decrease in rates. These positive factors were partially offset by higher maintenance and insurance costs.
NORTHERN CANADA OPERATIONS
AMR was $2,089 as at December 31, 2017, compared to $2,040 as at December 31, 2016. The increase in AMR was due
to rent increases upon renewal of leases in Nunavut and Yellowknife, NT, partially offset by market rent reductions in
Inuvik, NT, to maintain occupancy levels in a weak economic environment.
Occupancy for the three months ended December 31, 2017, and 2016, were 96.1% and 93.9%, respectively. In Nunavut,
occupancy increased to 98.0% for the fourth quarter of 2017, compared to 95.9% for the same period 2016. The increase
in Nunavut occupancy was attributable to Iqaluit, NU, with 99.6% occupancy for the fourth quarter of 2017, as a result of
a favorable economy and increased demand for rental units, compared to 96.3% for the same period of 2016. In the
Northwest Territories, occupancy increased to 93.5% for the fourth quarter of 2017, compared to 91.2% for the same
period of 2016. The increase in occupancy was attributable to Yellowknife, NT, where higher market rents, combined with
an increase in corporate and construction leases in the current period, improved occupancy to 92.9%, compared to 90.3%
for the same period of 2016.
Northern Canada Three months ended December 31 Year ended December 31
(thousands of dollars) 2017 2016 Change 2017 2016 Change
Revenue(i) 14,709 14,057 4.6% 57,630 56,487 2.0%
Operating expenses (5,571) (5,554) 0.3% (19,868) (20,426) (2.7%)
NOI(i) 9,138 8,503 7.5% 37,762 36,061 4.7%
NOI margin % 62.1% 60.5% 1.6% 65.5% 63.8% 1.7%
Same door NOI(i) 8,946 8,471 5.6% 37,283 35,964 3.7%
(i) Non-recurring Item is excluded from revenue, NOI, and same door NOI for Northern Canada for the year ended December 31, 2016.
NOI for the three months and year ended December 31, 2017, were $9.1 million and $37.8 million, respectively, compared
to $8.5 million and $36.1 million for the same periods in the prior year, excluding Non-recurring Items. Revenue for the
three months and year ended December 31, 2017, increased by 4.6% and 2.0%, respectively, compared to the same
periods of 2016, excluding Non-recurring Items. The increases were due to higher market rent, occupancy increase, and
NOI contribution from the new development completed in 2017 at Cambridge Bay, NU. Overall operating expenses for
the fourth quarter of 2017 slightly increased due to the new development, compared to the same period of 2016. For the
year ended December 31, 2017, operating expenses decreased 2.7% compared to the prior year, due to lower utilities
and maintenance costs.
Same door NOI for the three months and year ended December 31, 2017, increased 5.6% and 3.7%, excluding Non-
recurring Items, respectively, compared to the same periods in 2016. The increase was attributable to the same factors
previously discussed.
90.0%
92.0%
94.0%
96.0%
98.0%
100.0%
Q1 2016 Q2 2016 Q3 2016 Q4 2016 Q1 2017 Q2 2017 Q3 2017 Q4 2017
2,000
2,020
2,040
2,060
2,080
2,100
AM
R (
$)
Northern Canada Occupancy and AMR
AMR Occupancy
Northview Apartment REIT 2017 Annual Report | Page 23

QUEBEC OPERATIONS
AMR as at December 31, 2017, was $741 compared to $724 as at December 31, 2016. The increase in AMR was due
to higher market rent at the Norgate and Renaissance properties in Montreal, QC. Northview has enhanced the profile of
these properties through recently completed unit renovations, focused marketing, improved tenant retention, general
operations, and lease incentives. Successful execution of these strategies has resulted in higher market rent on unit
turnover in the fourth quarter of 2017.
Occupancy for the three months ended December 31, 2017, and 2016, was 94.2% and 92.5%, respectively. The increase
was attributable to the Norgate and Renaissance properties in Montreal, QC, where occupancy increased to 94.0% in the
fourth quarter of 2017 through successful profile enhancement for the properties, from 91.9% in the same period of 2016.
Sept-Iles, QC, continues to be a consistent and strong performing market for Northview with occupancy at 98.2% during
the fourth quarter of 2017.
Quebec Three months ended December 31 Year ended December 31
(thousands of dollars) Q4 2017 Q4 2016 Change Q4 2017 Q4 2016 Change
Revenue 5,040 4,718 6.8% 19,622 18,694 5.0%
Operating expenses (2,429) (2,433) (0.2%) (9,555) (9,109) 4.9%
NOI 2,611 2,285 14.3% 10,067 9,585 5.0%
NOI margin % 51.8% 48.4% 3.4% 51.3% 51.3% -
Same door NOI 2,545 2,285 11.4% 10,001 9,585 4.3%
NOI increased 14.3% and 5.0% for the three months and year ended December 31, 2017, respectively, compared to the
same periods of 2016. The increase in NOI was attributable to higher revenue in Montreal, QC, due to higher AMR and
occupancy increase, and contributions from acquisitions completed in the fourth quarter of 2017. Operating expenses for
the three months ended December 31, 2017, were consistent with the same period in 2016. Increased operating expenses
from the new acquisitions were offset by lower utility costs from the expiration of fixed gas contracts at the beginning of
the fourth quarter of 2017. For the year ended December 31, 2017, operating expenses increased 4.9% compared to the
prior year due to higher utility expenses incurred through the first nine months of 2017.
Same door NOI for the three months and year ended December 31, 2017, increased 11.4% and 4.3%, respectively,
compared to the same periods in 2016, and were attributable to the same factors previously discussed.
COMMERCIAL AND EXECUSUITE OPERATIONS
Northview’s commercial properties are located primarily in regions where Northview also has multi-family operations. The
commercial portfolio consists of office, warehouse, and mixed-use buildings, which are largely leased to federal or
territorial governments and other quality commercial tenants under long-term leases. In addition, Northview operates four
execusuite properties: one in Yellowknife, NT; one in Iqaluit, NU; one in St. John’s, NL; and a 50% joint venture in Inuvik,
NT. The execusuite properties offer apartment-style accommodation and are rented for both short and long-term stays.
90.0%
92.0%
94.0%
96.0%
98.0%
100.0%
Q1 2016 Q2 2016 Q3 2016 Q4 2016 Q1 2017 Q2 2017 Q3 2017 Q4 2017
680
700
720
740
760
780
AM
R (
$)
Quebec Occupancy and AMR
AMR Occupancy
Northview Apartment REIT 2017 Annual Report | Page 24

Three months ended December 31 Year ended December 31
(thousands of dollars) 2017 2016 Change 2017 2016 Change
Revenue 10,396 11,543 (9.9%) 43,612 45,957 (5.1%)
Operating expenses (4,311) (5,384) (19.9%) (18,093) (19,678) (8.1%)
NOI 6,085 6,159 (1.2%) 25,519 26,279 (2.9%)
NOI margin % 58.5% 53.4% 5.1% 58.5% 57.2% 1.3%
Same door NOI 6,025 5,807 3.8% 24,237 24,212 0.1%
For the three months and year ended December 31, 2017, both revenue and operating expenses decreased from the
same periods of 2016 due to the sale of a non-core asset that occurred during the third quarter of 2017, partially offset
by new commercial acquisitions that closed in the fourth quarter of 2017.
Overall, for the three months ended December 31, 2017, same door NOI increased 3.8% compared to the same period
of 2016. The increase was attributable to the execusuite operations, as the commercial operations were consistent with
the fourth quarter of 2016. For the year ended December 31, 2017, same door NOI was consistent with the prior year.
Positive gains realized from the execusuite operations were offset by the commercial operations.
For the execusuite operations, same door NOI for the three months ended December 31, 2017, was $1.0 million
compared to $0.8 million for the same period of 2016. The increase in same door NOI was attributable to occupancy
increase. On a same door basis, execusuites operated at an average occupancy of 52.7% for the fourth quarter of 2017,
compared to 47.8% for the same period of 2016. The increase in occupancy was attributable to the execusuite in Iqaluit,
NU, as a result of less supply in that market since the fourth quarter of 2016. For the year ended December 31, 2017,
same door NOI was $4.4 million compared to $3.7 million for the prior year. The increase was due to the occupancy
increase in Iqaluit, NU, as previously mentioned, as well as a short-term contract that commenced in the second quarter
of 2017 at the execusuite property in St. John’s, NL. The lease contract expired during the third quarter of 2017.
For the commercial operations, same door NOI for the three months ended December 31, 2017, was $5.0 million, in line
with the same period of 2016. For the year ended December 31, 2017, same door NOI was $19.8 million compared to
$20.5 million for the prior year. The decrease was due to lower occupancy throughout the year.
Commercial portfolio summary (including joint ventures at 100%)
Region $ Average Rent/Sq.Ft. Occupancy
Q4 2017 Q4 2016 Q4 2017 Q4 2016
Atlantic Canada 18.34 18.87 94.2% 95.5%
Northern Canada 24.36 23.96 93.1% 95.3%
Ontario 16.69 - 100.0% -
Quebec 21.95 21.95 100.0% 100.0%
Western Canada 12.87 12.20 72.7% 80.7%
Total / Average 22.81 22.97 91.0% 93.6%
For the three months ended December 31, 2017, the average rent per square foot was $22.81 compared to $22.97 for
the same period of 2016. The decrease in the average rent per square foot was due to a new acquisition in Ontario in the
fourth quarter of 2017 that had existing leases at a lower average rent per square foot. Excluding the acquisition, the
average rent per square foot increased to $23.31 in the fourth quarter of 2017, as a result of rent increases upon renewal
of leases in Northern Canada and Western Canada.
Commercial occupancy was 91.0% for the three months ended December 31, 2017, compared to 93.6% for the same
period of 2016. There was approximately 149,000 square feet of commercial space with leases renewing in 2017, of
which approximately 84,000 square feet has been renewed as of December 31, 2017. The decrease in occupancy was
mainly due to the warehouse vacancy in Ft. Nelson, BC.
Northview has 83,000 commercial square feet maturing in 2018.
Northview Apartment REIT 2017 Annual Report | Page 25

FFO CALCULATION
Three months ended
December 31
Year ended
December 31
(thousands of dollars, except per unit amounts) 2017 2016 2017 2016
Net and comprehensive income 64,943 43,968 212,367 77,475
Adjustments:
Depreciation of property, plant and
equipment 1,226 1,051 4,560 4,179
Loss on sale of properties 777 164 1,668 722
Fair value (gain) loss (40,304) (20,630) (110,824) 10,268
Business combination transaction costs - 43 - 14,579
Class B LP Unit distributions recorded as
interest 2,487 2,368 9,594 9,822
Other(i) 178 94 826 907
FFO basic 29,307 27,058 118,191 117,952
Interest on 2019 Debentures 330 313 1,322 1,324
FFO diluted 29,637 27,371 119,513 119,276
Non-recurring Items:
Insurance proceeds received (500) (377) (916) (7,125)
Loss of revenue - - - 1,609
Incremental operating costs - - - 1,570
Measurement excluding Non-recurring
Items:
FFO diluted 29,137 26,994 118,597 115,331
FFO per unit – diluted $0.51 $0.48 $2.08 $2.14
FFO payout ratio – diluted, trailing 12 month 78.3% 76.7% 78.3% 76.7%
Weighted average number of units
outstanding:
Basic (000’s) 56,325 54,565 55,905 52,810
Diluted (000’s) 57,572 55,730 57,131 53,962
(i) “Other” is comprised of non-controlling interests, amortization of other long-term assets, amortization of tenant inducements, and fair
value adjustments for non-controlling interest and equity investments.
Northview measures its financial performance by using industry accepted non-GAAP performance metrics such as FFO,
which is calculated in accordance with the White Paper on FFO for IFRS, issued by Real Property Association of Canada
(“REALpac”) in February 2017. The IFRS measurement most comparable to FFO is net and comprehensive income for
which a reconciliation is provided in this MD&A.
Diluted FFO was $29.1 million for the three months ended December 31, 2017, compared to $27.0 million for the same
period in 2016; diluted FFO was $118.6 million for the year ended December 31, 2017, compared to $115.3 million for
the same period in 2016; diluted FFO per unit was $0.51 for the three months ended December 31, 2017, compared to
$0.48 for the same period in 2016, all excluding Non-recurring Items.
The increase in FFO for the three months and year ended December 31, 2017, compared to the same periods of 2016,
and the increase in FFO per unit for the three months ended December 31, 2017, compared to the same period of 2016,
were due to same door NOI growth, NOI contributions from newly developed properties completed in 2017, and
acquisitions that occurred during 2017, partially offset by non-core asset sales. During the fourth quarter of 2017, FFO
included a one-time increase in financing costs of $0.7 million related to the disposition of a non-core asset located in
Kitchener, ON.
Diluted FFO per unit was $2.08 for the year ended December 31, 2017, compared to $2.14 for the same period in 2016,
excluding Non-recurring Items. The decrease in FFO for the year ended December 31, 2017, compared to the same
period of 2016, on a per unit basis was primarily driven by the dilution from the equity offering completed in October 2016,
and the units issued to the vendors for the acquisitions completed in the fourth quarter of 2017, largely offset by the
increase in total FFO as noted.
Northview Apartment REIT 2017 Annual Report | Page 26
ADJUSTED FUNDS FROM OPERATIONS
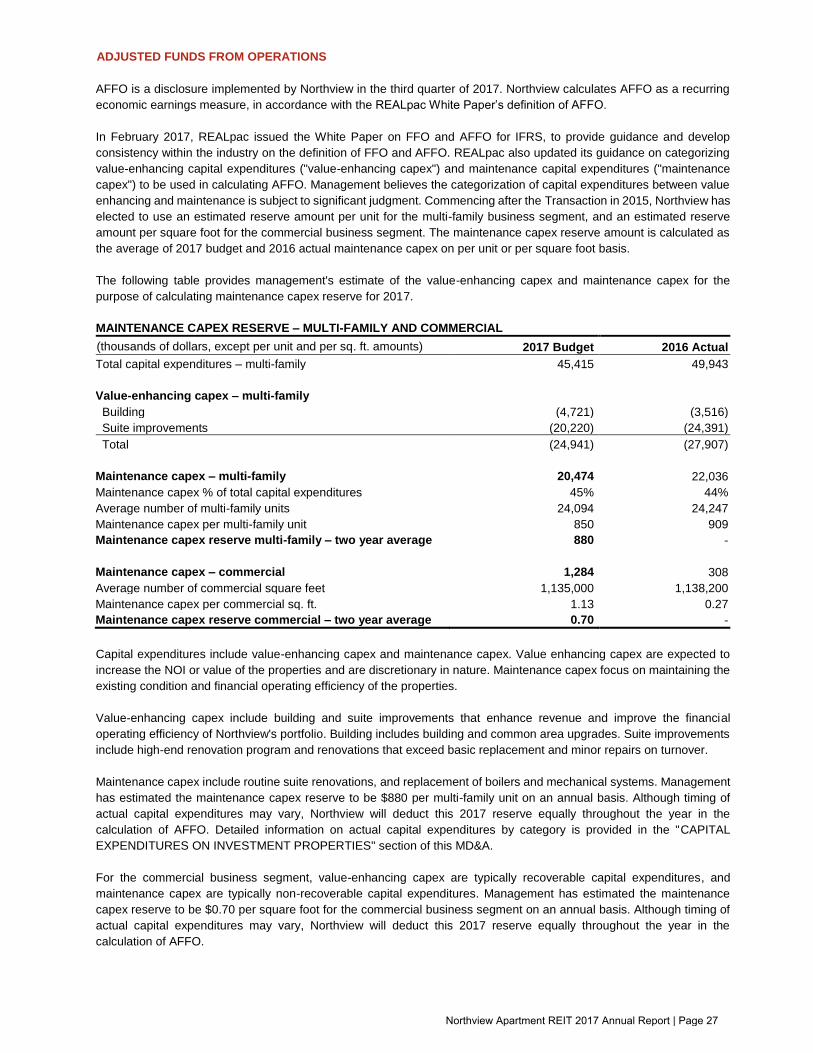
AFFO is a disclosure implemented by Northview in the third quarter of 2017. Northview calculates AFFO as a recurring
economic earnings measure, in accordance with the REALpac White Paper’s definition of AFFO.
In February 2017, REALpac issued the White Paper on FFO and AFFO for IFRS, to provide guidance and develop
consistency within the industry on the definition of FFO and AFFO. REALpac also updated its guidance on categorizing
value-enhancing capital expenditures ("value-enhancing capex") and maintenance capital expenditures ("maintenance
capex") to be used in calculating AFFO. Management believes the categorization of capital expenditures between value
enhancing and maintenance is subject to significant judgment. Commencing after the Transaction in 2015, Northview has
elected to use an estimated reserve amount per unit for the multi-family business segment, and an estimated reserve
amount per square foot for the commercial business segment. The maintenance capex reserve amount is calculated as
the average of 2017 budget and 2016 actual maintenance capex on per unit or per square foot basis.
The following table provides management's estimate of the value-enhancing capex and maintenance capex for the
purpose of calculating maintenance capex reserve for 2017.
MAINTENANCE CAPEX RESERVE – MULTI-FAMILY AND COMMERCIAL
(thousands of dollars, except per unit and per sq. ft. amounts)
amounts)
2017 Budget 2016 Actual
Total capital expenditures – multi-family 45,415 49,943
Value-enhancing capex – multi-family
Building (4,721) (3,516)
Suite improvements (20,220) (24,391)
Total (24,941) (27,907)
Maintenance capex – multi-family 20,474 22,036
Maintenance capex % of total capital expenditures 45% 44%
Average number of multi-family units 24,094 24,247
Maintenance capex per multi-family unit 850 909
Maintenance capex reserve multi-family – two year average 880 -
Maintenance capex – commercial 1,284 308
Average number of commercial square feet 1,135,000 1,138,200
Maintenance capex per commercial sq. ft. 1.13 0.27
Maintenance capex reserve commercial – two year average 0.70 -
Capital expenditures include value-enhancing capex and maintenance capex. Value enhancing capex are expected to
increase the NOI or value of the properties and are discretionary in nature. Maintenance capex focus on maintaining the
existing condition and financial operating efficiency of the properties.
Value-enhancing capex include building and suite improvements that enhance revenue and improve the financial
operating efficiency of Northview's portfolio. Building includes building and common area upgrades. Suite improvements
include high-end renovation program and renovations that exceed basic replacement and minor repairs on turnover.
Maintenance capex include routine suite renovations, and replacement of boilers and mechanical systems. Management
has estimated the maintenance capex reserve to be $880 per multi-family unit on an annual basis. Although timing of
actual capital expenditures may vary, Northview will deduct this 2017 reserve equally throughout the year in the
calculation of AFFO. Detailed information on actual capital expenditures by category is provided in the "CAPITAL
EXPENDITURES ON INVESTMENT PROPERTIES" section of this MD&A.
For the commercial business segment, value-enhancing capex are typically recoverable capital expenditures, and
maintenance capex are typically non-recoverable capital expenditures. Management has estimated the maintenance
capex reserve to be $0.70 per square foot for the commercial business segment on an annual basis. Although timing of
actual capital expenditures may vary, Northview will deduct this 2017 reserve equally throughout the year in the
calculation of AFFO.
Northview Apartment REIT 2017 Annual Report | Page 27

RECONCILIATION OF FFO TO AFFO
(thousands of dollars, except per unit amounts)
Three months ended
December 31, 2017
Year ended
December 31, 2017
FFO basic 29,307 118,191
FFO diluted 29,637 119,513
Maintenance capex reserve – multi-family(i) (5,428) (21,316)
Maintenance capex reserve – commercial(ii) (202) (800)
AFFO – basic 23,677 96,075
AFFO – diluted 24,007 97,397
Measurement excluding Non-recurring Items:
FFO diluted 29,137 118,597
AFFO – diluted 23,507 96,481
AFFO per unit – diluted $0.41 $1.69
AFFO payout ratio – diluted, trailing 12 month 96.1% 96.1%
(i) Maintenance capex for multi-family for the three months ended December 31, 2017, is calculated as $220 (25% of $880) times the
average number of multi-family units of 24,673. Maintenance capex for multi-family for the year ended December 31, 2017, is calculated
as $880 (100% of $880) times the average number of multi-family units of 24,222.
(ii) Maintenance capex for commercial for the three months ended December 31, 2017, is calculated as $0.175 (25% of $0.70) times the
average number of square feet of 1,153,500. Maintenance capex for commercial for the year ended December 31, 2017, is calculated
as $0.70 (100% of $0.70) times the average number of square feet of 1,142,400.
CAPITAL EXPENDITURES ON INVESTMENT PROPERTIES
Three months ended December 31 Year ended December 31
(thousands of dollars, except per unit
amounts) 2017 2016 Change 2017 2016 Change
Building and common areas 2,098 3,512 (40%) 7,306 9,995 (27%)
Suite renovations 5,277 8,353 (37%) 26,222 26,623 (2%)
High-end renovation program 2,813 455 n/a 8,330 5,178 61%
Appliances 943 10 n/a 2,234 1,378 62%
Boilers and mechanical 1,026 400 157% 3,506 2,936 19%
Other 1,180 711 66% 3,533 3,658 (3%)
Total capex – multi-family 13,337 13,441 (1%) 51,131 49,768 3%
Average number of multi-family units 24,673 24,189 2% 24,222 24,247 -
Capex per multi-family unit 541 556 (3%) 2,111 2,053 3%
Total capex – commercial (146) 64 (328%) 650 483 35%
Total capex 13,191 13,505 (2%) 51,781 50,251 3%
For the year ended December 31, 2017, $26.2 million and $8.3 million were invested in suite renovations and the high-
end renovation program, compared to $26.6 million and $5.2 million for the same period of 2016. Northview continues to
focus on enhancing revenue and improving the operating efficiency of the portfolio to maximize occupancy and NOI.
Northview Apartment REIT 2017 Annual Report | Page 28

OTHER EXPENSE (INCOME)
Three months ended December 31 Year ended December 31
(thousands of dollars) 2017 2016 Change 2017 2016 Change
Financing costs 17,671 16,961 4% 68,053 68,552 (1%)
Administration 3,739 2,533 48% 14,738 9,830 50%
Depreciation and amortization 1,333 1,180 13% 5,025 4,967 1%
Loss on sale of properties 777 164 374% 1,668 722 131%
Equity income from joint ventures (293) (216) 36% (847) (864) (2%)
Business combination transaction costs - 43 (100%) - 14,579 (100%)
Fair value (gain) loss (40,304) (20,630) 95% (110,824) 10,268 n/a
Total (17,077) 35 n/a (22,187) 108,054 (121%)
Financing costs consist of mortgage interest, amortization of deferred financing costs and fair value of debt, interest
expense on credit facilities, interest expense on Class B LP Units, and other interest expense. Financing costs for the
three months ended December 31, 2017, increased 4% from the same period of 2016 mainly due to loss on
extinguishment of debt related to a non-core asset disposition in the current quarter.
For the three months and year ended December 31, 2017, administration expense increased 48% and 50%, respectively,
compared to the same periods of 2016. The increase was due to salary and incentive compensation expense,
professional fees, and bank charges. Salary expense increase in 2017 was related to general corporate salary increases
and a portion of administration costs previously included in NOI related to third party property management. Incentive
compensation expense increase in 2017 was due to improved operating results and Northview Trust Unit price.
FAIR VALUE (GAIN) LOSS
Three months ended December 31 Year ended December 31
(thousands of dollars) 2017 2016 Change 2017 2016 Change
Investment properties (55,535) (8,861) n/a (140,709) (3,228) n/a
Interest rate swap - (904) (100%) (239) (16) n/a
2019 Debentures 462 (253) (283%) 1,380 575 140%
Unit based payments 202 (87) (332%) 396 302 31%
Class B LP Units 14,567 (10,525) (238%) 28,348 12,635 124%
Total (40,304) (20,630) 95% (110,824) 10,268 n/a
Northview reports fair value change of investment properties on a net basis after deducting capital expenditures.
The fair value gain for the three months and year ended December 31, 2017, was mainly related to the net fair value
increase of investment properties in Ontario, partially offset by the fair value loss on Class B LP Units, 2019 Debentures,
and unit based payments. In 2017, investment property values in Ontario increased due to a 0.6% decline in the weighted
average Cap Rate to 4.5% and higher NOI, compared to 2016.
Class B LP Units are marked to market each reporting period, which is equal to the trading price of Trust Units, with the
change in value being recorded to fair value gain or loss. For the three months ended December 31, 2017, the $14.6
million fair value loss resulted from an increase in Northview unit price from $22.44 to $24.99. For the year ended
December 31, 2017, the $28.3 million fair value loss resulted from an increase in Northview Trust Unit price from $20.07
to $24.99.
TAX STATUS
Northview is a mutual fund trust for Canadian income tax purposes. In accordance with the Declaration of Trust (“DOT”),
distributions to Unitholders are declared at the discretion of the Board of Trustees (“Trustees”). Pursuant to the DOT, the
Trustees may, at their sole discretion, determine distributions or designate that all taxable income earned, including the
taxable part of net realized capital gains, be distributed to Trust Unitholders. Northview will deduct such distributions and
designations for income tax purposes.
Northview Apartment REIT 2017 Annual Report | Page 29

The Canadian Income Tax Act (“Tax Act”) contains rules (the “SIFT Rules”) that impose tax on certain mutual fund trusts
and their trust unitholders at rates that approximate corporate and dividend income tax rates. The SIFT Rules do not
apply to any mutual fund trust that qualifies as a “real estate investment trust” (a “Tax REIT”) as defined in the Tax Act
(the “Tax REIT Exemption”). A REIT must hold less than 10% of non-qualifying assets and earn less than 10% of non-
qualifying revenue to keep its status as a Tax REIT. As of December 31, 2017, Northview met all the requirements to be
qualified as a Tax REIT.
The Tax REIT Exemption does not apply to incorporated subsidiaries of Northview, which are therefore subject to
Canadian income taxes. Northview does not currently hold any income producing property or operation in taxable
incorporated subsidiaries. As such, there is currently no provision for current or deferred income tax expense required in
the current reporting period.
SUMMARY OF QUARTERLY RESULTS
The table below summarizes Northview’s financial results for the last eight fiscal quarters:
(thousands of dollars, except
per unit amounts) 2017 2016
Q4 (i) Q3 Q2 (i) Q1 Q4 (i) Q3 (i) Q2 (i) Q1 (i)
Total revenue 84,692 83,345 82,013 80,949 81,151 81,467 82,029 82,292
NOI 47,357 51,316 48,253 42,338 43,629 48,173 46,817 42,964
Net and comprehensive
income (loss) 64,444 23,757 123,321 (71) 43,591 31,265 (1,792) 466
FFO – diluted 29,137 33,608 30,816 25,036 26,994 32,189 29,822 26,322
FFO per unit – diluted $0.51 $0.59 $0.54 $0.44 $0.48 $0.60 $0.56 $0.49
FFO payout ratio – diluted 79.7% 69.1% 75.4% 92.6% 85.9% 67.6% 72.9% 82.6%
(i) Non-recurring Items are excluded from Q4 2017, Q2 2017, and 2016 results.
Northview’s quarterly financial results have a seasonal component resulting from higher utility costs in the first and fourth
quarters of each year.
Diluted FFO was $29.1 million for the three months ended December 31, 2017, compared to $27.0 million for the same
period in 2016, excluding Non-recurring Items. The increase in FFO was due to same door NOI growth, NOI contributions
from newly developed properties completed in 2017, and acquisitions that occurred during 2017, partially offset by non-
core asset sales.
LIQUIDITY AND CAPITAL RESOURCES
Northview’s objective for managing liquidity and capital resources is to ensure adequate liquidity for operating, capital,
and investment activities as well as distributions to Unitholders. Northview is able to fund its obligations with cash flow
from operations, operating facilities, construction financing, mortgage debt secured by investment properties, and equity
issuances.
As at December 31, 2017, Northview had a working capital deficiency of $397.6 million. In the normal course of business,
a certain portion of Northview’s borrowings under mortgages and credit facilities with a maturity date less than one year
will be considered current liabilities prior to being replaced with longer-term financing. Of the total deficiency, $274.7
million relating to the current portion of mortgages payable is expected to be refinanced with long-term mortgages. Current
portion of mortgages payable as at December 31, 2017, is affected by the timing of mortgage maturities. The majority of
the current portion of credit facilities of $89.5 million is expected to be replaced by long-term mortgages upon the
completion of the construction projects, or extension of the maturity date of credit facilities.
Northview Apartment REIT 2017 Annual Report | Page 30

Liquidity risk is the risk that Northview is not able to meet its financial obligations as they become due or can only do so
at excessive cost. Northview manages liquidity risk by balancing the maturity profile of mortgages and credit facilities.
Mortgage maturities normally enable replacement financing with funds available for other purposes. Changes in property
NOI impact the borrowing base calculation which determines the availability under the operating facility. Adverse
economic conditions may result in a decrease of NOI and therefore the borrowing base which would reduce the amount
of liquidity available to Northview. Cash flow projections are updated on a regular basis to ensure there will be adequate
liquidity to maintain operating, capital, investment activities, and distributions to Unitholders.
Diluted FFO payout ratio is 78.3% for the year ended December 31, 2017, excluding Non-recurring Items, which is higher
than the long-term target for FFO payout ratio of 70%. This target allows Northview the ability to maintain distributions
long term at current levels of FFO. Northview’s current diluted trailing twelve months FFO payout ratio is temporarily
higher than target due to reduced operating results in resource based markets. The long-term target for debt to gross
book value ratio is 50% to 55%. Leverage reduction in the near to mid-term will be achieved through asset value increases
driven by the same door NOI growth and successful execution of the VCIs.
The total net proceeds of the equity offering completed on October 31, 2016, was approximately $71.1 million. Northview
stated that it planned to use the net proceeds of the equity offering prior to the over-allotment option for the following
purposes: (i) $54 million for leverage reduction, including the repayment of credit facilities, (ii) $5 million for VCIs, (iii) $3
million for ongoing development and acquisition opportunities, and (iv) if any, the remainder for working capital
requirements. Northview used the net proceeds of the equity offering to repay credit facilities in 2016. During the year
ended December 31, 2017, Northview used a portion of the net proceeds for VCIs, acquisition, and development
opportunities.
MORTGAGES
During the three months ended December 31, 2017, Northview completed $164.9 million in mortgage financing with a
weighted average interest rate of 2.77% and an average term to maturity of 5.4 years. For the year ended December 31,
2017, Northview completed $338.2 million in mortgage financing with a weighted average interest rate of 3.10% and an
average term to maturity of 5.7 years. Northview utilizes Canada Mortgage and Housing Corporation (“CMHC”) insured
mortgage lender financing to obtain loans up to 75% of CMHC’s assessed value of a multi-family property. Northview
incurs lower borrowing costs on properties financed using insured mortgage lender financing, including the cost of the
insurance, when compared to conventional financing.
The following table outlines Northview’s mortgage maturity schedule and weighted average interest rate as at December
31, 2017, for the next five years, and thereafter:
0.00%
1.00%
2.00%
3.00%
4.00%
5.00%
0
100,000
200,000
300,000
400,000
500,000
600,000
700,000
2018 2019 2020 2021 2022 Thereafter
Mortgages Payable Maturity Schedule
Principal on Maturity Principal Repayments Weighted Average Interest Rate
Northview Apartment REIT 2017 Annual Report | Page 31

CREDIT FACILITIES
Borrowings under credit facilities 2017 2016
Operating facilities(i) 143,700 73,200
Construction financing(ii) 51,715 50,013
Land financing(iii) 5,828 10,629
Total 201,243 133,842
Current 89,543 68,013
Non-current 111,700 65,829
Total 201,243 133,842
(i) At December 31, 2017, Northview had three operating facilities with total credit limits of $203.0 million (December
31, 2016 – $203.0 million). The maximum borrowing capacity at December 31, 2017, is $172.2 million (December
31, 2016 – $153.1 million). Specific investment properties with total fair value of $421.5 million (December 31, 2016
- $362.5 million) have been pledged as collateral security for the operating facility. Northview also has $5.3 million
(December 31, 2016 – $4.1 million) in Letters of Credit (“LOC”) outstanding as security for construction projects and
mortgage holdbacks. The LOC reduces the amount available under the $150.0 million operating facility.
OPERATING FACILITIES
(thousands of dollars) Maturity Date Credit Limit
Maximum
borrowing
capacity
2017
Amounts
Drawn
2016
Amounts
Drawn
$150 million operating facility
(interest at prime plus 0.75% or banker’s
acceptance plus 2.00%: May 12, 2019 150,000 129,800 111,700 55,200
$23 million operating facility
(interest at prime plus 0.75% or banker’s
acceptance plus 2.00%: May 22, 2018 23,000 23,000 23,000 18,000
$30 million operating facility
(interest at prime plus 1.15% or banker’s
acceptance plus 2.40%: May 31, 2018 30,000 19,400 9,000 -
Total 203,000 172,200 143,700 73,200
(ii) At December 31, 2017, Northview had three construction financing loans outstanding relating to the developments
in Calgary, AB; Cambridge Bay, NU; and Regina, SK. Interest rates range from prime plus 0.50% to 1.00% or
Banker’s Acceptance plus 2.00% to 2.20%. Maturity dates range from January 1, 2018, to March 31, 2019.
(iii) The land financing relates to land held for development and bears interest at prime plus 0.50% or Bankers’
Acceptance plus 2.00% with a maturity date of December 31, 2018. Financing is secured by three parcels of land
held for development.
Northview’s credit facilities contain certain financial covenants. The principal financial covenants are debt to gross book
value, debt service coverage, and interest coverage. The debt to gross book value ratio covenant maximum threshold is
70%. The interest coverage ratio and debt service coverage ratio covenant minimum thresholds are at least 1.90 and
1.50, respectively. As at and during the year ended December 31, 2017, Northview was in compliance with all financial
covenants.
CAPITAL MANAGEMENT
Management monitors Northview’s capital structure on an ongoing basis to determine the appropriate level of mortgages
and credit facilities. Consistent with others in the industry, Northview monitors capital on the basis of debt to gross book
value ratio, interest, and debt service coverage ratios. The DOT provides for a maximum debt to gross book value ratio
of 70%.
Northview Apartment REIT 2017 Annual Report | Page 32

Debt to gross book value was 56.4% as at December 31, 2017, which is a reduction of 1.1% from December 31, 2016.
In the fourth quarter of 2017, improvements in leverage ratios are the result of organic growth reflected in total same door
NOI growth of 6.4% excluding Non-recurring Items, and improvement in investment property values in Ontario. Interest
and debt service coverage ratios were 3.05 and 1.63, respectively, for the year ended December 31, 2017, which are stable
compared to the prior year.
EQUITY
Northview’s issued and outstanding Units, along with Trust Units potentially issuable, are as follows:
(number of units) December 31, 2017 December 31, 2016
Units issued and outstanding
Trust Units 51,141,771 49,942,379
Class B LP Units 6,684,614 5,814,664
Total Units issued and outstanding 57,826,385 55,757,043
Trust Units potentially issuable
Long-term incentive and deferred units 284,538 180,392
2019 Debentures 966,344 966,386
Total Trust Units potentially issuable 1,250,882 1,146,778
Total Units issued and outstanding and Trust Units potentially
issuable
59,077,267 56,903,821
During the year ended December 31, 2017, 50,261 potentially issuable long-term incentive (“LTI”) performance units
were granted, and 2,399 LTI performance units were cancelled; 41,540 LTI restricted units were granted, and 778 LTI
restricted units were cancelled; 25,341 deferred units (“DUs”) were granted; 7,449 DUs and 2,370 LTIP units were
converted into an equivalent number of Trust Units. 2019 Debentures with $1,000 (actual dollars) face value were
converted to 42 Trust Units at a conversion price of $23.80 per Trust Unit.
CONTRACTUAL OBLIGATIONS
CONTRACTUAL OBLIGATIONS AT DECEMBER 31, 2017
(thousands of dollars)
Carrying
Amount
Contractual
Cash Flows
Up to
1 year
1 – 5
years
Over 5
years
Mortgages payable 1,786,156 2,030,176 319,618 1,018,907 691,651
Credit facilities 201,243 201,243 89,543 111,700 -
Trade and other payables 69,027 69,027 69,027 - -
Distributions and Class B LP interest payable 7,853 7,853 7,853 - -
Convertible debentures 24,839 24,839 - 24,839 -
Unit based payments 3,250 3,250 2,586 664 -
Total 2,092,368 2,336,388 488,627 1,156,110 691,651
CONTRACTUAL OBLIGATIONS AT DECEMBER 31, 2016
(thousands of dollars)
Carrying
Amount
Contractual
Cash Flows
Up to
1 year
1 – 5
years
Over 5
years
Mortgages payable 1,661,532 1,918,758 213,537 1,084,217 621,004
Credit facilities 133,842 133,842 68,013 65,829 -
Trade and other payables 68,106 68,106 68,106 - -
Distributions and Class B LP interest payable 7,571 7,571 7,571 - -
Liabilities related to assets held for sale 18,008 18,008 18,008 - -
Convertible debentures 23,460 23,460 - 23,460 -
Derivative instruments 1,499 1,499 1,499 - -
Unit based payments 1,733 1,733 - 1,733 -
Total 1,915,751 2,172,977 376,734 1,175,239 621,004
Northview Apartment REIT 2017 Annual Report | Page 33

NORMAL COURSE ISSUER BID (“NCIB”)
On May 27, 2016, the TSX approved Northview’s notice of intention to renew the NCIB for its Trust Units. Northview’s
NCIB was made in accordance with the policies of the TSX. Northview could purchase Trust Units during the period from
June 1, 2016 to May 31, 2017. Northview paid the market price at the time of acquisition for any Trust Units in accordance
with the rules and policies of the TSX and applicable securities laws. Purchases under the NCIB were funded out of
Northview’s working capital. Northview was not obligated to make any purchases pursuant to the NCIB. Northview was
authorized to purchase, in a 12 month period, up to 3,852,249 Trust Units, representing 10% of its public float as at May
26, 2016, through the facilities of the TSX and other Canadian trading platforms. On any trading day, Northview could not
purchase more than 32,646 Trust Units, which equaled 25% of Northview’s average daily trading volume on the TSX for
the most recently completed six calendar months preceding May 27, 2016, the date of acceptance of the NCIB by the
TSX, except where such purchases were made in accordance with the block purchase exemptions under the TSX rules.
On May 31, 2017, Northview’s NCIB expired. During the period from June 1, 2016, to May 31, 2017, Northview did not
purchase any Trust Units under its NCIB.
DISTRIBUTIONS TO TRUST AND CLASS B LP UNITHOLDERS
Pursuant to the DOT, Unitholders are entitled to receive distributions made on each distribution date as approved by the
Trustees. During the year ended December 31, 2017, Northview declared monthly cash distributions of $0.1358 per Unit,
totaling $91.2 million (December 31, 2016 – $88.4 million). The 2017 increase in distributions relates to the equity offering
completed in October 2016. The Class B LP Units are treated as a financial liability for accounting purposes, and
distributions on the Class B LP Units are recorded as a financing cost.
For the three months ended December 31, 2017, $23.0 million in distributions were paid to Unitholders from $31.3 million
of cash flow from operations. For the year ended December 31, 2017, $91.2 million in distributions were paid to
Unitholders from $91.4 million of cash flow from operations. In any given financial period, total distributions may be greater
than cash flow from operations, primarily due to the short-term fluctuations in non-cash working capital and the temporary
fluctuations in cash flows. Temporary deficiencies in operating cash flow may be funded by revolving operating facilities,
construction financing, mortgage debt secured by investment properties, equity issuances, and asset sales. If Northview
were unable to raise additional funds or renew existing maturing debt on acceptable terms, then capital expenditures and
acquisition or development activities may be reduced, or asset sales increased. Management expects cash flow from
operations to exceed distributions paid in future years.
RELATED PARTY TRANSACTIONS
Related party transactions are conducted in the normal course of operations and are made on terms equivalent to arm’s
length transactions.
Starlight is a related party as it is controlled by a Trustee and significant Unitholder of Northview. Pursuant to the
transitional services agreement dated October 30, 2015, Starlight is to provide Northview transitional services of an asset
management nature. For the year ended December 31, 2017, the costs of these services aggregated to $1.8 million
(December 31, 2016 − $1.9 million). Of this amount, $1.4 million (December 31, 2016 − $1.5 million) has been capitalized,
while the remaining $0.4 million (December 31, 2016 − $0.4 million) has been recognized as administration expenses in
the consolidated statements of net and comprehensive income. Balance outstanding and payable to Northview from
Starlight as at December 31, 2017, is $0.2 million (December 31, 2016 − $0.4 million) and is included in accounts
receivable in the consolidated statements of financial position. The balance outstanding and payable to Starlight from
Northview as at December 31, 2017, is $0.2 million (December 31, 2016 − $0.2 million) and is included in trade and other
payables in the consolidated statements of financial position. On October 30, 2017, Northview provided notice to Starlight
terminating the transitional service agreement, effective October 30, 2018.
During the fourth quarter of 2017, Northview purchased two properties from Starlight for a total purchase price of $58.2
million. The properties were purchased at a value consistent with an independent third-party assessment of the fair value
of the properties. Fair value was calculated using expected net operating income of that property divided by the market
capitalization rate at the time of the valuation. In addition, Northview issued 555,114 Class B LP Units and Special Voting
Units, subject to conversion in accordance with their terms, to Starlight with a fair value of $14.0 million. In conjunction
with the transactions, a fee of $1.6 million is payable to Starlight from Northview in accordance with the Transitional
Service Agreement. The transactions were unanimously approved by the independent Trustees of Northview.
Northview Apartment REIT 2017 Annual Report | Page 34
Inuvik Commercial Properties Zheh Gwizu’ Limited Partnership (“ICP”) and Inuvik Capital Suites Zheh Gwizuh Limited
Partnership (“ICS”) are related parties as Northview has a 50% interest in ICP and a 50% interest in ICS. For the three
months ended December 31, 2017, revenue from ICP and ICS related to management fees was $0.1 million (December
31, 2016 − $0.1 million). For the year ended December 31, 2017, revenue from ICP and ICS related to management fees
was $0.4 million (December 31, 2016 − $0.4 million). The balance outstanding and payable to Northview from ICP and
ICS related to management fees is $0.1 million (December 31, 2016 − $0.1 million) and is included in accounts receivable
in the consolidated statements of financial position. The balance outstanding and payable to ICP and ICS from Northview
as at December 31, 2017, is nil (December 31, 2016 – $0.1 million) and is included in trade and other payables in the
consolidated statements of financial position.
During the year ended December 31, 2017, nil Class B LP Units and Special Voting Units were exchanged for Trust Units
by a related party. During the year ended December 31, 2016, 1,910,853 Class B LP Units and Special Voting Units,
subject to conversion in accordance with their terms, were exchanged for Trust Units with a fair value of $31.3 million by
a Trustee, a related party. Exchange of Class B LP Units and Special Voting Units to Trust Units does not affect the
Trustee’s total ownership.
CRITICAL ACCOUNTING POLICIES, ESTIMATES AND JUDGMENTS
The preparation of the consolidated financial statements in accordance with International Financial Reporting Standards
(“IFRS”) as issued by the International Accounting Standards Board (“IASB”) requires management to make estimates
and judgments that affect the reported amounts of assets, liabilities, income, and expenses. Estimates and judgments
are evaluated each reporting period and based on historical experience and other factors, including expectations of future
events that are believed to be reasonable under the circumstances. Accounting estimates will, by definition, differ from
the actual results. The following discussion sets forth management’s most critical estimates and assumptions in
determining the value of assets and liabilities and management’s most critical judgments in applying accounting policies.
Actual results may differ from these estimates. The following discussion sets forth management’s most critical estimates
and assumptions in determining the value of assets and liabilities and management’s most critical judgments in applying
accounting policies. Actual results may differ from these estimates.
Estimates
(i) Fair value of investment properties
Northview carries its investment properties at fair value. Significant estimates used in determining the fair value of
Northview’s investment properties include Cap Rates and NOI. A change to either of these inputs could significantly
alter the fair value of an investment property.
(ii) Depreciation and amortization
Depreciation and amortization are calculated to write off the cost, less estimated residual value, of assets on a
systematic and rational basis over their expected useful lives. Estimates of useful lives are based on data and
information from various sources including industry practice and company-specific history. Expected useful lives and
residual values are reviewed periodically for any change to estimates and assumptions.
(iii) Accrued liabilities
Northview estimates accrued liabilities when work has been completed but invoices have not been received. If actual
costs differ from estimates, future income would be affected. Accrued liabilities, including an estimate of any
applicable taxes, are included in Trade and other payables.
(iv) Capital adequacy
Northview prepares estimated cash flow projections on a regular basis to ensure there will be adequate liquidity to
maintain operating, capital and investment activities and uses these estimates to assess capital adequacy.
Management reviews the current financial results and the annual business plan in determining appropriate capital
adequacy and uses this to determine distribution levels. Changes in these estimates affect distributions to the
Unitholders and Northview’s cost of capital.
(v) Income taxes and other tax liabilities
Under current tax legislation, a real estate investment trust is not liable to pay Canadian income taxes provided that
its taxable income is fully distributed to Unitholders during the year. Northview is a real estate investment trust if it
meets prescribed conditions under the Tax Act relating to the nature of its assets and revenue (the "REIT
Conditions"). Northview has reviewed the REIT Conditions and has assessed their interpretation and application to
Northview's assets and revenue, and it has determined that it qualifies as a real estate investment trust.
Northview Apartment REIT 2017 Annual Report | Page 35

Northview expects to qualify as a real estate investment trust under the Tax Act. Should it no longer qualify, it would
not be able to flow-through its taxable income to Unitholders and would be subject to tax.
Judgments
(i) Purchase of investment properties
Northview reviews its purchases of investment property to determine whether or not the purchase is part of a business
combination, as IFRS requires differing treatment of property acquisitions depending on whether or not the purchase
is part of a business combination. Judgment is involved in determining whether or not a purchase forms part of a
business combination or an asset acquisition. Should the purchase form part of a business combination, closing
costs, such as appraisal and legal fees, are expensed immediately and earnings are affected. If the purchase is an
asset acquisition, these costs form part of the purchase price, and earnings are not immediately affected.
(ii) Financial instrument
Northview’s accounting policies and risk management relating to financial instruments are described in note 2 (j) and
note 17 to the consolidated financial statements for the years ended December 31, 2017, and 2016. Critical
judgments are inherent in these policies related to applying the criteria set out in IAS 39, to designate financial
instruments into categories, and determine the identification of embedded derivatives, if any.
(iii) Componentization
The componentization of Northview’s property, plant and equipment, namely buildings, are based on management’s
judgment of what components constitute a significant cost in relation to the total cost of an asset and whether these
components have similar or dissimilar patterns of consumption and useful lives for purposes of calculating
depreciation and amortization.
(iv) Impairment
Assessment of impairment is based on management’s judgment of whether there are sufficient internal and external
factors that would indicate that an asset or Cash Generating Unit (“CGU”) is impaired. The determination of CGUs is
also based on management’s judgment, and is an assessment of the smallest group of assets that generate cash
inflows independently of other assets. Factors considered include whether an active market exists for the output
produced by the asset or group of assets, as well as how management monitors and makes decisions about
Northview’s operations.
(v) Classification of ICP and ICS as joint ventures
The ownership of ICS is for the purpose of investing in an income producing execusuite property in Inuvik, NT, and
the ownership of ICP is for the purpose of investing in a portfolio of commercial and mixed-use income producing
properties in Inuvik, NT. Furthermore, there is no contractual arrangement or any other facts and circumstances that
indicate that the parties to the joint arrangement have rights to the assets and obligations for the liabilities of the joint
arrangement. Accordingly, ICP and ICS are classified as joint ventures.
ACCOUNTING STANDARDS AND INTERPRETATIONS
Northview has applied a revised IFRS issued by the International Accounting Standards Board (“IASB”) that is mandatorily
effective for an accounting period that begins on January 1, 2017.
Revised Standard Description Previous Standard
Impact of
Application
Amendments to IAS 7 –
Statement of Cash
Flows
The amendments to IAS 7 require
entities to provide disclosures that
enable users of financial statements to
evaluate changes in liabilities arising
from financing activities.
No direct replacement. Additional disclosure
for mortgages payable
is provided in the
notes to the
consolidated financial
statements.
Northview Apartment REIT 2017 Annual Report | Page 36

RECENT ACCOUNTING PRONOUNCEMENTS
The IASB has issued the following standards that have not been applied in preparing the audited consolidated financial
statements as their effective dates fall within annual periods subsequent to the current reporting period.
Proposed Standard Description Possible Impact
IFRS 15 – Revenue from Contracts with Customers
Introduces a principle to report information about the
nature, timing, and uncertainty of revenue from contracts
with customers in a single, comprehensive revenue
recognition model. The standard is effective for annual
periods beginning on or after January 1, 2018.
Northview has completed its assessment of the impact of
IFRS 15 on its consolidated financial statements.
Northview has assessed all lease contracts for the
presence of non-lease components that would be in scope
of IFRS 15. Northview has further concluded that no
changes to the pattern of recognition are required for this
revenue stream; however, additional disclosures will be
required. Northview adopted the provisions of IFRS 15 on
January 1, 2018 and will provide the additional disclosures
in 2018 as required by IFRS 15 and other applicable
standards.
IFRS 9 – Financial Instruments
The IASB has undertaken a three-phase project to
replace IAS 39 with IFRS 9. The new standard replaces
the current multiple classification and measurement
models for financial assets and liabilities with a single
model that has only two classification categories:
Amortized cost and fair value; and introduces a new
hedge accounting model. The standard was finalized in
July 2014. The standard is effective for annual periods
beginning on or after January 1, 2018.
Northview has completed its assessment of the impact of
IFRS 9 on its consolidated financial statements and
concluded that an adjustment to the allowance for doubtful
accounts will be required. The adjustment will impact
current year opening retained earnings and does not
impact prior years. This adjustment is not expected to be
material to the consolidated financial statements.
IAS 40 – Investment Properties
During December 2016, the IASB issued an amendment
to IAS 40 to state that an entity shall transfer a property
to, or from, investment property when, and only when,
there is evidence of a change in use. A change in use
occurs if property meets, or ceases to meet, the
definition of investment property. A change in
management’s intentions for the use of a property by
itself does not constitute evidence of a change in use.
The amendment is effective for annual periods beginning
on or after January 1, 2018.
Northview has completed its assessment of the impact of
the amendment to IAS 40 on its consolidated financial
statements and concluded that there is no significant
impact on the consolidated financial statements.
IFRS 2 – Share Based Compensation
The IASB issued an amendment to IFRS 2 to clarify the
classification and measurement of cash settled share
based payment transactions that include performance
condition, classification of share based payment
transactions with net settlement features and accounting
for modifications of share based payment transactions
from cash-settled to equity settled. The amendment is
effective for annual periods beginning on or after January
1, 2018.
Northview has completed its assessment of the impact of
the amendment to IFRS 2 on its consolidated financial
statements and has concluded that there is no material
impact.
Northview Apartment REIT 2017 Annual Report | Page 37

IFRS 16 – Leases
The IASB issued IFRS 16 – Leases, which provides a
single lessee accounting model, requiring lessees to
recognize assets and liabilities for all leases unless the
lease term is 12 months or less or the underlying asset
has a low value. The standard is effective for annual
periods beginning on or after January 1, 2019.
Northview is in the process of assessing the impact that
IFRS 16 may have on the consolidated financial
statements and plans to adopt the new standard on the
effective date.
Management continues to evaluate the potential qualitative and quantitative impact of these new standards on
Northview’s financial statement measurements and disclosures. Northview is not early adopting these standards.
CONTROLS AND PROCEDURES
DISCLOSURE CONTROLS AND PROCEDURES
As at December 31, 2017, the Chief Executive Officer ("CEO") and Chief Financial Officer ("CFO") have designed, or
caused it to be designed under their supervision, disclosure controls and procedures (“DC&P”), as defined in National
Instrument 52-109 Certification of Disclosure in Issuers’ Annual and Interim Filings (“NI 52-109”), to provide reasonable
assurance that (i) material information relating to Northview is made known to the CEO and the CFO by others, particularly
during the period in which the annual filings are being prepared; and (ii) information required to be disclosed by Northview
in its annual filings, interim filings, or other reports filed or submitted by Northview under securities legislation is recorded,
processed, summarized, and reported within the time periods specified in securities legislation.
As at December 31, 2017, management conducted an evaluation of the design and operating effectiveness of Northview’s
DC&P under the supervision of the CEO and the CFO. Based on the evaluation, the CEO and the CFO concluded that
Northview’s DC&P were effective as at December 31, 2017.
INTERNAL CONTROL OVER FINANCIAL REPORTING
As at December 31, 2017, the CEO and the CFO have designed, or caused it to be designed under their supervision,
internal control over financial reporting (“ICFR”), as defined in NI 52-109, to provide reasonable assurance regarding the
reliability of Northview’s financial reporting and the preparation of financial statements for external purposes in accordance
with IFRS.
The control framework used to design Northview’s ICFR is the framework set forth in Internal Control – Integrated
Framework issued by the Committee of Sponsoring Organizations of the Treadway Commission in 2013.
As at December 31, 2017, management conducted an evaluation of the design and operating effectiveness of Northview’s
ICFR under the supervision of the CEO and the CFO. Based on the evaluation, the CEO and the CFO concluded that
Northview’s ICFR was effective as at December 31, 2017. It should be noted that a control system, no matter how well
designed and operated, can provide only reasonable, not absolute, assurance that the objectives of the control system
will be met and it should not be expected that the control system will prevent all errors and fraud.
During the fourth quarter of 2017, there were no changes in Northview's ICFR that have materially affected, or are
reasonably likely to materially affect, Northview's ICFR.
SUBSEQUENT EVENTS
Between January 1, 2018, and February 27, 2018, Northview acquired one piece of land in Ontario, for $5.3 million.
TRANSACTION
On October 30, 2015, Northern Property Real Estate Investment Trust (“NPR”) acquired all of the assets and properties
of True North Apartment Real Estate Investment Trust (“True North”). In addition, NPR acquired apartment properties
held by Starlight and a joint venture between affiliates of Starlight and affiliates of the Public Sector Pension Investment
Board (“PSP”), collectively the “Transaction”.
Northview Apartment REIT 2017 Annual Report | Page 38

NON-RECURRING ITEMS
During the three months ended December 31, 2017, Northview received insurance proceeds of $0.5 million relating to a
fire in Lethbridge, AB. During the year ended December 31, 2017, Northview received total insurance proceeds of $0.9
million relating to the wildfires in Fort McMurray, AB, and the fire in Lethbridge, AB. During the three months ended
December 31, 2016, Northview received insurance proceeds of $0.4 million relating to the wildfires in Fort McMurray, AB.
During the year ended December 31, 2016, Northview received total insurance proceeds of $7.1 million for the wildfires
in Fort McMurray, AB, the 2015 fire in Yellowknife, NT, and a property in Fort McMurray, AB. In addition, Northview had
$1.6 million of lost revenue and $1.6 million of incremental costs relating to the wildfires in Fort McMurray, AB. These
items have been defined as “Non-recurring Items”, as they are not considered normal operating conditions, and
management has presented revenue, operating expenses, net operating income (“NOI”), same door NOI, and NOI margin
for the multi-family business segment and other specific performance metrics adjusting for Non-recurring Items where
appropriate in this MD&A.
NON-GAAP AND ADDITIONAL GAAP MEASURES
The following non-GAAP and additional GAAP measures are used to monitor Northview’s financial performance. All non-
GAAP measures do not have any standardized meaning prescribed by GAAP and are therefore unlikely to be comparable
to similar measures presented by other issuers.
Funds from operations: FFO is calculated in accordance with Realpac’s White Paper definition. FFO measures
operating performance by adjusting net and comprehensive income (loss) for depreciation of property, plant and
equipment, gain or loss on sale of properties, fair value gain or loss, business combination transaction costs, Class B LP
Unit distributions recorded as interest, and other applicable items.
Adjusted funds from operations: AFFO is defined as a recurring economic earnings measure and calculated in
accordance with Realpac’s White Paper definition as FFO less maintenance capex.
Net operating income: NOI is calculated by deducting the direct operating costs of maintaining and operating investment
properties from the revenue which they generate. Refer to the consolidated statements of net and comprehensive income
for the detailed calculation.
Same door NOI: measured as NOI from properties owned by Northview for both the current reporting period and on or
before the first day of the previous annual reporting period. For the purpose of calculating same door NOI in this MD&A,
properties owned and in operation by Northview for both the current reporting period and on or before January 1, 2016,
are included in the calculation.
Average monthly rent: AMR is calculated as gross rent less lease incentives and then divided by the number of occupied
units as at the period end date.
Debt: the sum of credit facilities and mortgages payable, including liabilities related to assets held for sale, less cash.
Gross book value: the sum of investment properties, property, plant and equipment before accumulated depreciation,
and assets held for sale before accumulated depreciation.
Debt to gross book value: calculated as debt as a percentage of gross book value. Refer to the consolidated financial
statements for the calculation.
Debt service coverage: calculated as net income before tax, interest, depreciation and amortization, business
combination transaction costs, and fair value gain or loss, divided by the sum of total interest expense and principal
mortgage repayments. Refer to the consolidated financial statements for the calculation.
Interest coverage: calculated as net income before tax, interest, depreciation and amortization, business combination
transaction costs, and fair value gain or loss, divided by total interest expense. Refer to the consolidated financial
statements for the calculation.
Portfolio summary and unit count: these non-GAAP measures include joint ventures at 100%. The joint venture portion
owned by third parties of multi-family, execusuites, and commercial business segments is 10 units, 82 units, and 92,000
square feet, respectively.
Northview Apartment REIT 2017 Annual Report | Page 39
MANAGEMENT’S REPORT
To the Unitholders of Northview Apartment Real Estate Investment Trust:
The accompanying consolidated financial statements of Northview Apartment Real Estate Investment Trust (“Northview”)
(formerly Northern Property Real Estate Investment Trust) were prepared by management in accordance with the
accounting policies in the notes to the consolidated financial statements. The management of Northview is responsible
for the integrity and objectivity of the information presented in the consolidated financial statements including the amounts
based on estimates and judgments. The consolidated financial statements have been prepared by management in
accordance with International Financial Reporting Standards (“IFRS”) appropriate in the circumstances. Financial
information contained in Management’s Discussion and Analysis is consistent with these consolidated financial
statements.
To fulfill its responsibility, Northview maintains appropriate systems of internal control, policies, and procedures to ensure
that its’ reporting practices and accounting and administrative procedures are of high quality. Northview’s internal controls
are designed to provide reasonable assurance that transactions are authorized, assets are safeguarded, and proper
records are maintained.
The Board of Trustees oversees management’s responsibility for financial reporting through an Audit and Risk
Management Committee which is comprised of four independent trustees. The Audit and Risk Management Committee
reviews the consolidated financial statements and recommends them for approval to the Board of Trustees. The
consolidated financial statements have been further reviewed by the Board of Trustees of Northview prior to their
approval.
Deloitte LLP, the auditors appointed by the Northview unitholders and Class B LP limited partnership unitholders
(collectively, ”Unitholders”), have audited the consolidated financial statements in accordance with Canadian generally
accepted auditing standards to enable them to express to the Unitholders their opinion on the consolidated financial
statements. Their report as auditors is set forth herein. The auditors have direct and full access to the Audit and Risk
Management Committee to discuss their audit and related findings.
“Signed” “Signed”
Todd R. Cook Travis Beatty
Chief Executive Officer Chief Financial Officer
Northview Apartment REIT 2017 Annual Report | Page 40

INDEPENDENT AUDITOR’S REPORT
To the Unitholders of Northview Apartment Real Estate Investment Trust:
We have audited the accompanying consolidated financial statements of Northview Apartment Real Estate Investment Trust, which comprise the consolidated statements of financial position as at December 31, 2017 and 2016, and the consolidated statements of net and comprehensive income, changes in unitholders’ equity, and cash flows for the years then ended, and a summary of significant accounting policies and other explanatory information.
Management's Responsibility for the consolidated financial statements Management is responsible for the preparation and fair presentation of these consolidated financial statements in accordance with International Financial Reporting Standards, as issued by the International Accounting Standards Board, and for such internal control as management determines is necessary to enable the preparation of consolidated financial statements that are free from material misstatement, whether due to fraud or error.
Auditor's Responsibility Our responsibility is to express an opinion on these consolidated financial statements based on our audits. We conducted our audits in accordance with Canadian generally accepted auditing standards. Those standards require that we comply with ethical requirements and plan and perform the audit to obtain reasonable assurance about whether the consolidated financial statements are free from material misstatement.
An audit involves performing procedures to obtain audit evidence about the amounts and disclosures in the consolidated financial statements. The procedures selected depend on the auditor's judgment, including the assessment of the risks of material misstatement of the consolidated financial statements, whether due to fraud or error. In making those risk assessments, the auditor considers internal control relevant to the entity's preparation and fair presentation of the consolidated financial statements in order to design audit procedures that are appropriate in the circumstances, but not for the purpose of expressing an opinion on the effectiveness of the entity's internal control. An audit also includes evaluating the appropriateness of accounting policies used and the reasonableness of accounting estimates made by management, as well as evaluating the overall presentation of the consolidated financial statements.
We believe that the audit evidence we have obtained in our audits is sufficient and appropriate to provide a basis for our audit opinion.
Opinion In our opinion, the consolidated financial statements present fairly, in all material respects, the financial position of Northview Apartment Real Estate Investment Trust as at December 31, 2017 and 2016, and its financial performance and its cash flows for the years then ended in accordance with International Financial Reporting Standards, as issued by the International Accounting Standards Board.
Chartered Professional Accountants February 27, 2018 Calgary, Alberta
Northview Apartment REIT 2017 Annual Report | Page 41
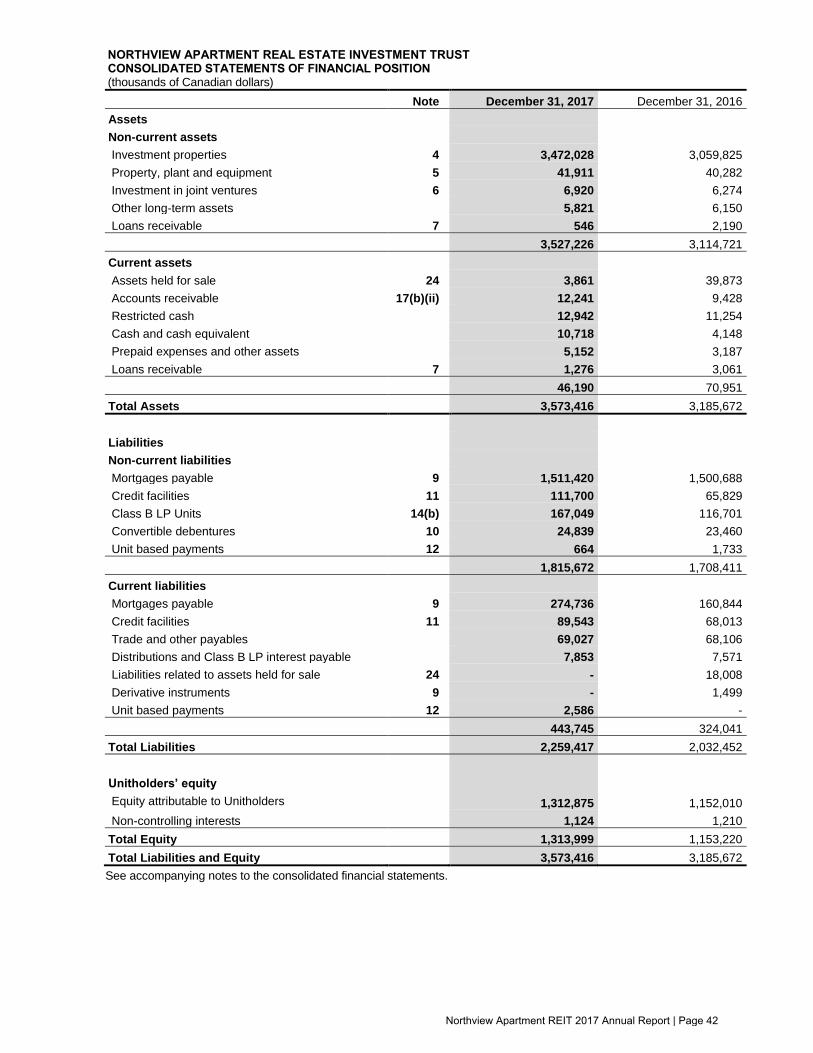
NORTHVIEW APARTMENT REAL ESTATE INVESTMENT TRUST CONSOLIDATED STATEMENTS OF FINANCIAL POSITION (thousands of Canadian dollars)
Note December 31, 2017 December 31, 2016
Assets
Non-current assets
Investment properties 4 3,472,028 3,059,825
Property, plant and equipment 5 41,911 40,282
Investment in joint ventures 6 6,920 6,274
Other long-term assets 5,821 6,150
Loans receivable 7 546 2,190
3,527,226 3,114,721
Current assets
Assets held for sale 24 3,861 39,873
Accounts receivable 17(b)(ii) 12,241 9,428
Restricted cash 12,942 11,254
Cash and cash equivalent 10,718 4,148
Prepaid expenses and other assets 5,152 3,187
Loans receivable 7 1,276 3,061
46,190 70,951
Total Assets 3,573,416 3,185,672
Liabilities
Non-current liabilities
Mortgages payable 9 1,511,420 1,500,688
Credit facilities 11 111,700 65,829
Class B LP Units 14(b) 167,049 116,701
Convertible debentures 10 24,839 23,460
Unit based payments 12 664 1,733
1,815,672 1,708,411
Current liabilities
Mortgages payable 9 274,736 160,844
Credit facilities 11 89,543 68,013
Trade and other payables 69,027 68,106
Distributions and Class B LP interest payable 7,853 7,571
Liabilities related to assets held for sale 24 - 18,008
Derivative instruments 9 - 1,499
Unit based payments 12 2,586 -
443,745 324,041
Total Liabilities 2,259,417 2,032,452
Unitholders’ equity
Equity attributable to Unitholders 1,312,875 1,152,010
Non-controlling interests 1,124 1,210
Total Equity 1,313,999 1,153,220
Total Liabilities and Equity 3,573,416 3,185,672
See accompanying notes to the consolidated financial statements.
Northview Apartment REIT 2017 Annual Report | Page 42

NORTHVIEW APARTMENT REAL ESTATE INVESTMENT TRUST CONSOLIDATED STATEMENTS OF NET AND COMPREHENSIVE INCOME Years ended December 31 (thousands of Canadian dollars)
Note 2017 2016
Revenue
Rental revenue 319,453 313,667
Other revenue 12,462 18,788
331,915 332,455
Operating expenses 141,735 146,926
Net operating income 190,180 185,529
Other expense (income)
Financing costs 20 68,053 68,552
Administration 14,738 9,830
Depreciation and amortization 5,025 4,967
Loss on sale of properties 1,668 722
Equity income from joint ventures 6 (847) (864)
Business combination transaction costs - 14,579
Fair value (gain) loss 21 (110,824) 10,268
(22,187) 108,054
Net and comprehensive income 212,367 77,475
Net and comprehensive income attributable to:
Unitholders 212,221 77,285
Non-controlling interests 146 190
Net and comprehensive income 212,367 77,475
See accompanying notes to the consolidated financial statements.
Northview Apartment REIT 2017 Annual Report | Page 43

NORTHVIEW APARTMENT REAL ESTATE INVESTMENT TRUST CONSOLIDATED STATEMENTS OF CHANGES IN UNITHOLDERS’ EQUITY
Years ended December 31 (thousands of Canadian dollars)
Note 2017 2016
Units
Balance, January 1 1,157,774 1,053,626
Units issued, net of issuance cost 14 30,206 104,148
Balance, December 31 1,187,980 1,157,774
Retained earnings
Cumulative net income
Balance, January 1 360,089 282,804
Net and comprehensive income attributable to Unitholders 212,221 77,285
Balance, December 31 572,310 360,089
Cumulative distributions to Unitholders
Balance, January 1 (365,853) (289,134)
Distributions declared to Unitholders (81,562) (76,719)
Balance, December 31 (447,415) (365,853)
Cumulative retained earnings (deficit), December 31 124,895 (5,764)
Equity attributable to Unitholders 1,312,875 1,152,010
Non-controlling interests
Balance, January 1 1,210 1,810
Net and comprehensive income attributable to NCI 146 190
Distributions to non-controlling interests (232) (790)
Balance, December 31 1,124 1,210
Total Unitholders’ equity 1,313,999 1,153,220
See accompanying notes to the consolidated financial statements.
Northview Apartment REIT 2017 Annual Report | Page 44

NORTHVIEW APARTMENT REAL ESTATE INVESTMENT TRUST CONSOLIDATED STATEMENTS OF CASH FLOWS Years ended December 31 (thousands of Canadian dollars)
Note 2017 2016
Operating activities:
Net and comprehensive income 212,367 77,475
Adjustments:
Fair value (gain) loss 21 (110,824) 10,268
Mortgage and credit facilities interest expense 20 56,584 59,047
Mortgage and credit facilities interest paid (56,591) (59,302)
Interest expense to Class B LP Unitholders 20 9,594 9,822
Distribution interest paid to Class B LP Unitholders 14(c) (9,594) (10,093)
Depreciation and amortization 5,025 4,967
Interest expense on convertible debentures 20 1,322 1,324
Interest paid on convertible debentures (1,322) (1,328)
Loss on sale of properties 1,668 722
Equity income from joint ventures 6 (847) (864)
Long-term incentive plan compensation 1,326 654
Changes in non-cash working capital 22 (17,297) 5,018
Cash provided by operating activities 91,411 97,710
Financing activities:
Proceeds from mortgages 240,703 461,412
Repayment of mortgages (160,962) (141,507)
Borrowing (repayment) of credit facilities, net 11 67,401 (349,902)
Distributions paid to Unitholders 14(c) (81,562) (75,965)
Settlement of interest rate swap 9 (1,260) -
Proceeds from unit issuance, net - 71,066
Distributions to non-controlling interests (232) (790)
Cash provided by (used in) financing activities 64,088 (35,686)
Investing activities:
Acquisition of investment properties and land 4 (147,510) (5,630)
Capital expenditures on investment properties under development 4 (28,206) (48,965)
Capital expenditures on investment properties 4 (51,781) (50,251)
Proceeds from sale of assets and investment properties, net 81,978 47,241
Acquisition of property, plant and equipment 5 (5,050) (4,218)
Distributions received from equity investees 201 800
Changes in non-cash working capital 1,439 (1,340)
Cash used in investing activities (148,929) (62,363)
Net increase (decrease) in cash 6,570 (339)
Cash, beginning of year 4,148 4,487
Cash, end of year 10,718 4,148
See accompanying notes to the consolidated financial statements.
Northview Apartment REIT 2017 Annual Report | Page 45

NORTHVIEW APARTMENT REAL ESTATE INVESTMENT TRUST NOTES TO THE CONSOLIDATED FINANCIAL STATEMENTS Years ended December 31, 2017 and 2016 (Tabular amounts expressed in thousands of Canadian dollars except where indicated)
1. DESCRIPTION OF THE CONSOLIDATED ENTITIES
Northview Apartment Real Estate Investment Trust (“Northview”) is an unincorporated, open-ended real estate
investment trust created pursuant to a declaration of trust (“DOT” or the “Trust”) dated January 2, 2002, and last
amended May 5, 2016, under the laws of the Province of Alberta (and the federal laws of Canada applicable therein).
Northview is primarily a multi-family residential real estate investor and operator, providing rental accommodations
with a portfolio of approximately 25,000 residential suites in more than 60 markets across eight provinces and two
territories. Northview’s registered office is located at 200, 6131 6th Street SE, Calgary, Alberta.
Northview is listed on the Toronto Stock Exchange (“TSX”) under the symbol “NVU.UN”. Northview continues to
qualify as a real estate investment trust for tax purposes.
2. SIGNIFICANT ACCOUNTING POLICIES
A. BASIS OF PREPARATION AND STATEMENT OF COMPLIANCE
The consolidated financial statements have been prepared in accordance with International Financial Reporting
Standards (“IFRS”) as issued by the International Accounting Standards Board (“IASB”) and approved by the
Canadian Accounting Standards Board (“AcSB”).
These consolidated financial statements have been prepared on a going concern basis and are presented in
Canadian dollars rounded to the nearest thousand except where indicated. The accounting policies set out below
have been applied consistently to all periods presented in these consolidated financial statements. These
consolidated financial statements reflect all normal and recurring adjustments which are, in the opinion of
management, necessary for a fair presentation of the respective years presented.
The consolidated financial statements were approved by the Trustees of Northview (the “Trustees”) on February
27, 2018.
B. PRINCIPLES OF CONSOLIDATION
These consolidated financial statements include the accounts of Northview, wholly-owned subsidiaries, partially
owned partnerships, and joint arrangements. Subsidiaries are entities controlled by Northview. The financial
transactions of subsidiaries are included in the consolidated financial statements to the date that control ceases.
The accounting policies of subsidiaries, partially owned partnerships, and joint arrangements are the same as
those of the Trust. Northview has no controlling entity.
C. INVESTMENT PROPERTIES
Northview’s investment properties include residential and commercial properties held to earn rental income, held
for capital appreciation, and properties that are being constructed, developed, or redeveloped for future use as
investment properties.
Investment properties are measured initially at cost, including transaction costs, unless the acquisition is part of
a business combination. Subsequent to initial recognition, investment properties are measured at fair value, in
accordance with International Accounting Standard 40 – Investment Property (“IAS 40”).
The fair value is the price that would be received to sell an asset or paid to transfer a liability in an orderly
transaction between market participants at the measurement date. In estimating the fair value of the investment
properties, the highest and best use of the investment properties is their current use. Northview reviews the fair
value of its investment property each reporting period and revises the carrying value when market circumstances
change the underlying variables used to fair value investment properties.
Northview Apartment REIT 2017 Annual Report | Page 46
NORTHVIEW APARTMENT REAL ESTATE INVESTMENT TRUST NOTES TO THE CONSOLIDATED FINANCIAL STATEMENTS Years ended December 31, 2017 and 2016 (Tabular amounts expressed in thousands of Canadian dollars except where indicated)
The fair value of investment property is based on valuations by a combination of management estimates and
independent appraisers, who hold a recognized and relevant professional qualification and have recent
experience in the location and category of the investment property being valued. External appraisals of
investment property are performed throughout each year and continue to be used to verify certain variables used
in the internal calculation of investment property values. Management uses the external investment property
appraisals to verify its assessment of regional vacancy, management overhead and Capitalization Rate (“Cap
Rate”) information which is then applied to the stabilized net operating income, which is projected annual net
operating income that an investment property is likely to experience over the holding period, to calculate the fair
value of the remainder of Northview’s investment properties within the region. Where increases or decreases
are warranted, Northview adjusts the fair value of its investment properties. Fair value gains and losses arising
from changes in the fair value of investment properties are included in the consolidated statements of net and
comprehensive income in the period in which they arise. There has been no change to the valuation technique
during the year.
In accordance with IFRS 5 – Non-current Assets Held for Sale and Discontinued Operations (“IFRS 5”),
investment properties are reclassified to “Assets held for sale” when certain criteria are met. An investment
property is derecognized upon disposal or when the investment property is permanently withdrawn from use and
no future economic benefits are expected from the disposal. Any gain or loss arising on derecognition of the
property (calculated as the difference between the net disposal proceeds and the carrying amount of the asset)
is included in the consolidated statements of net and comprehensive income in the period in which the property
is sold.
Investment properties are segregated into two categories: (i) residential (apartments, townhouses, duplexes,
single family, and mixed use) and (ii) commercial (office, industrial, and retail).
Investment property consists of several separate components which are included in the estimation of fair value
for each property. Residential investment property includes prepaid land equity leases ranging in terms from 15
to 30 years, asset acquisition costs, furniture and fixtures, and capital expenditures. In addition, commercial
investment property includes above and below market leases, in-place leases, prepaid tenant improvements,
and direct leasing costs.
Land held for development is measured initially at cost, including transaction costs and subsequently measured
at fair value.
Capital expenditures include value enhancing and maintenance capex. Value enhancing capex are expected to
increase the NOI or value of the properties and are discretionary in nature. Maintenance capex focus on
maintaining the existing condition and financial operating efficiency of the properties.
Tenant inducements include cash payments made to tenants where no specific obligation exists on how the
payment is utilized by the tenant. Tenant inducements are considered in the cash inflows modeled to measure
the fair value of a commercial investment property.
D. ASSET ACQUISITION / BUSINESS COMBINATION
In accordance with IFRS 3 – Business Combination (“IFRS 3”), a transaction is recorded as a business
combination if the significant assets, liabilities, or activities in addition to property and related mortgage debt
assumed constitute a business. A business is defined as an integrated set of activities and assets, capable of
being conducted and managed for the purpose of providing a return, lower costs, or other economic benefits.
Where there are no such integrated activities, the transaction is treated as an asset acquisition.
Residential and commercial properties, developments and redevelopments are measured initially at cost,
including transaction costs (except transaction costs related to a business combination) and improvement of the
properties.
Northview Apartment REIT 2017 Annual Report | Page 47
NORTHVIEW APARTMENT REAL ESTATE INVESTMENT TRUST NOTES TO THE CONSOLIDATED FINANCIAL STATEMENTS Years ended December 31, 2017 and 2016 (Tabular amounts expressed in thousands of Canadian dollars except where indicated)
Costs that are directly attributable to investment properties under development or redevelopment are capitalized.
These costs include direct development costs, realty taxes, borrowing costs directly attributable to the
development, and upgrading and extending the economic life of the existing facilities, other than ordinary repairs
and maintenance.
E. BORROWING COSTS
Borrowing costs associated with direct expenditures on investment properties under development are
capitalized. Borrowing costs are also capitalized on the purchase cost of a site or property acquired specifically
for redevelopment in the short-term but only where activities necessary to prepare the asset for development or
redevelopment are in progress. The amount of borrowing costs capitalized is determined first by reference to
borrowings specific to the project, where relevant, and otherwise by applying a weighted average cost of
borrowings to eligible expenditures after adjusting for borrowings associated with other specific developments.
Where borrowings are associated with specific developments, the amount capitalized is the gross cost incurred
on those borrowings less any investment income arising on their temporary investment. Borrowing costs are
capitalized from the commencement of the development until the date of substantial completion, normally the
receipt of an occupancy permit. The capitalization of borrowing costs is suspended if there are prolonged periods
when development activity is interrupted.
F. PROPERTY, PLANT AND EQUIPMENT
Land and buildings used by Northview as administrative offices and warehouse properties, as well as the
execusuites and hotels, are classified as property, plant and equipment (“PP&E”) in accordance with IAS 16 –
Property, Plant and Equipment (“IAS 16”). PP&E is initially measured using the cost model. PP&E is measured
and carried at cost less accumulated depreciation and any accumulated impairment losses.
PP&E is recorded at cost and depreciated using the following annual rates and methods:
Buildings
Maximum
50 years straight-line basis
Parking lot 20 years straight-line basis
Roof 15 years straight-line basis
HVAC 15 years straight-line basis
CAPEX 5 years straight-line basis
Furniture, fixtures and equipment 5 years straight-line basis
Automotive 5 years straight-line basis
Computer 4 years straight-line basis
Cost includes expenditures that are directly attributable to the acquisition of the asset. The cost initially
recognized with respect to a building is further allocated amongst its significant component parts with each part
being depreciated separately. Northview has identified the significant components of a building to be the parking
lot, roof, HVAC, and CAPEX which is defined as interior finishing including wallpaper, paint, flooring or carpeting,
cabinets, and bathroom fixtures. The method of depreciation, estimated economic lives of tangible assets, and
PP&E are evaluated annually by management and any changes in these estimates are accounted for on a
prospective basis in accordance with IAS 8 – Accounting Policies, Changes in Accounting Estimates and Errors
(“IAS 8”).
Gains and losses on disposal of an item of PP&E are determined by comparing the proceeds from disposal with
the carrying amount of PP&E, and are recognized net within expenses and other income.
Northview Apartment REIT 2017 Annual Report | Page 48

NORTHVIEW APARTMENT REAL ESTATE INVESTMENT TRUST NOTES TO THE CONSOLIDATED FINANCIAL STATEMENTS Years ended December 31, 2017 and 2016 (Tabular amounts expressed in thousands of Canadian dollars except where indicated)
G. TRANSFERS BETWEEN INVESTMENT PROPERTY AND PP&E
Transfers between investment property and PP&E are based on change in use from earning passive income to
serving an administrative purpose and vice versa. The change in use is tracked only for units which actively
serve an administrative purpose. Northview reviews this allocation on an annual basis. Northview does not revise
these allocations unless a significant change in the number of units or square footage occupied occurs.
Property transfers from investment property to PP&E are transferred at the fair value of the asset at the time of
transfer. Differences in the fair value are recorded in net income.
Property transfers from PP&E to investment property are transferred at the fair value of the asset at the time of
transfer. Differences in the fair value are recorded in other comprehensive income for fair value increases.
Differences in the fair value are recorded in net income for fair value decreases.
H. IMPAIRMENT
Assumptions are used in assessing PP&E for impairment including estimates of future operating cash flows, the
time period over which they will occur, a discount rate and growth rates.
The carrying amounts of Northview’s assets, other than investment property, are reviewed at each reporting
date to determine whether there is any indication of impairment. If any such indication exists, then the asset’s
recoverable amount is estimated. The recoverable amount is the higher of an asset’s fair value less cost to sell
or its value in use. Northview estimates fair value based upon current prices for similar assets. In assessing
value-in-use, the estimated future cash flows are discounted to their present value using the asset’s current
effective interest rate.
An impairment loss is recognized in the consolidated statement of net and comprehensive income in the amount
by which the carrying amount of the asset exceeds the recoverable amount determined. When a subsequent
event causes the amount of impairment loss to decrease, the decrease in impairment loss is reversed through
income.
Impairment losses are evaluated for potential reversals when events or changes in circumstances warrant such
consideration.
I. ASSETS HELD FOR SALE AND DISCONTINUED OPERATIONS
Non-current assets (or disposal groups) are classified as held for sale if their carrying amount will be recovered
principally through a sale transaction rather than through continuing use. Amounts related to the disposal of
non-current assets are classified as “Assets held for sale”, and the results of operations and cash flows
associated with the assets held for sale are reported separately as being related to assets held for sale or
discontinued operations, less applicable income taxes. A non-current asset is classified as an “Asset held for
sale” at the point in time when it is available for immediate sale, management has committed to a plan to sell
the asset and is actively seeking a buyer for the asset at a sales price that is reasonable in relation to the current
fair value of the asset, and the sale is probable and is expected to be completed within a one-year period. For
unsolicited interest in a non-current asset, the asset is classified as held for sale only if all the conditions of the
purchase and sale agreement have been met, a sufficient purchaser deposit has been received and the sale is
probable and expected to be completed shortly after the end of the current period.
Northview Apartment REIT 2017 Annual Report | Page 49

NORTHVIEW APARTMENT REAL ESTATE INVESTMENT TRUST NOTES TO THE CONSOLIDATED FINANCIAL STATEMENTS Years ended December 31, 2017 and 2016 (Tabular amounts expressed in thousands of Canadian dollars except where indicated)
A discontinued operation is a component of an entity that either has been disposed of, or is classified as held
for sale, and
i) represents a separate major line of business or geographical area of operations;
ii) is part of a single coordinated plan to dispose of a separate major line of business or geographical area
of operations; or
iii) is a subsidiary acquired exclusively with a view to resale.
The component will have been a cash-generating unit (“CGU”) or group of CGUs while being held for use. Profits
and gains or losses related to the disposal of discontinued operations are measured based on fair value less
cost to sell, except for investment property which is valued at fair value and presented in the consolidated
financial statements on an after tax basis in accordance with IFRS 5. Comparative figures are restated to reflect
retrospective application of discontinued operations.
J. FINANCIAL INSTRUMENTS
Financial assets and financial liabilities are recognized when Northview becomes a party to the contractual
provisions of the instrument. Financial assets and financial liabilities are initially recognized at fair value and are
subsequently accounted for based on their classification as described below:
i) Financial assets at fair value through profit or loss (“FVTPL”)
Financial assets are classified as FVTPL when acquired principally for the purpose of trading, if so
designated by management (fair value option), or if they are derivative assets. Financial assets classified
as FVTPL are measured at fair value, with changes recognized in the consolidated statement of net and
comprehensive income.
ii) Loans and receivables
Loans and receivables are non-derivative financial assets that have fixed or determinable payments and
are not quoted in an active market. Subsequent to initial recognition, loans and receivables are carried at
amortized cost, using the effective interest method, less a provision for impairment. A provision for
impairment is established when there is objective evidence that collection will not be possible under the
original terms of the contract. Indicators of impairment include delinquency of payment and significant
financial difficulty of the holder. The carrying amount of the financial asset is reduced through an allowance
account and the amount of loss is recognized in the consolidated statement of net and comprehensive
income. Financial instruments that are subsequently measured at amortized cost are subject to testing for
impairment each reporting period. Any subsequent reversal of an impairment loss is recognized in profit or
loss.
iii) Financial liabilities at FVTPL
Financial liabilities are classified as FVTPL if they are designated as such by management, or they are
derivative liabilities. Financial liabilities classified as FVTPL are measured at fair value, with changes
recognized in the consolidated statement of net and comprehensive income.
iv) Other financial liabilities
Other financial liabilities are financial liabilities that are not classified as FVTPL. Subsequent to initial
recognition, other financial liabilities are measured at amortized cost using the effective interest method.
The effective interest method is a method of calculating the amortized cost of an instrument and of allocating
interest income over the relevant period. The effective interest rate is the rate that exactly discounts
Northview Apartment REIT 2017 Annual Report | Page 50

NORTHVIEW APARTMENT REAL ESTATE INVESTMENT TRUST NOTES TO THE CONSOLIDATED FINANCIAL STATEMENTS Years ended December 31, 2017 and 2016 (Tabular amounts expressed in thousands of Canadian dollars except where indicated)
estimated future cash receipts (including all transaction costs and other premiums or discounts) through the
expected life of the debt instrument to the net carrying amount on initial recognition.
Fair value measurements recognized in the consolidated statement of financial position are categorized
using a fair value hierarchy that reflects the significance of inputs used in determining the fair value:
a) Level 1: Quoted prices in active markets for identical assets or liabilities.
b) Level 2: Quoted prices in active markets for similar assets or liabilities or valuation techniques
where significant inputs are based on observable market data.
c) Level 3: Valuation techniques for which any significant input is not based on observable market
data.
Each type of fair value is categorized based on the lowest level input that is significant to the fair value
measurement in its entirety.
Classification and measurement of financial assets and liabilities:
Cash and cash equivalent is comprised of cash balances and all deposits used in operations. Restricted
cash is comprised of cash balances not available for immediate and general use by Northview related to
security deposits paid by residential tenants. Security deposits are returned to the tenant upon move out
net of any additional charges. Bank indebtedness, repayable on demand and forming an integral part of
Northview’s cash management, is included as a component of cash and cash equivalent for the purpose of
the statement of cash flows. Distributions or dividends payable declared on units with a record date of or
prior to Northview’s reporting date are recorded as a financial liability.
Transaction costs that are directly attributable to the acquisition or issuance of financial assets or liabilities,
other than financial assets and liabilities measured at FVTPL, are accounted for as part of the carrying
amount of the respective asset or liability at inception. Transaction costs on financial assets and liabilities
measured at FVTPL are expensed in the period incurred. Transaction costs related to financial instruments
measured at amortized cost are amortized using the effective interest rate over the anticipated life of the
related instrument.
Financial asset or financial liability Classification Measurement
Financial assets
Non-current financial assets
Other long-term assets Loans and receivables Amortized cost
Loans receivable Loans and receivables Amortized cost
Installment notes receivable Loans and receivables Amortized cost
Current financial assets
Accounts receivable Loans and receivables Amortized cost
Restricted cash FVTPL Fair value
Cash and cash equivalent FVTPL Fair value
Financial liabilities
Non-current financial liabilities
Mortgages payable Other financial liabilities Amortized cost
Convertible debentures FVTPL Fair value
Derivative instruments FVTPL Fair value
Class B LP Units FVTPL Fair value
Current financial liabilities
Distributions payable Other financial liabilities Amortized cost
Trade and other payables Other financial liabilities Amortized cost
Unit based payments FVTPL Fair value
Bank indebtedness FVTPL Fair value
Credit facilities Other financial liabilities Amortized cost
Northview Apartment REIT 2017 Annual Report | Page 51

NORTHVIEW APARTMENT REAL ESTATE INVESTMENT TRUST NOTES TO THE CONSOLIDATED FINANCIAL STATEMENTS Years ended December 31, 2017 and 2016 (Tabular amounts expressed in thousands of Canadian dollars except where indicated)
Derivative instruments are recorded in the consolidated statement of financial position at fair value, including
those derivatives that are embedded in financial or non‐financial contracts and which are not closely related
to the host contract.
K. INCOME TAXES
Northview is a mutual fund trust for Canadian income tax purposes. In accordance with the DOT,
distributions to Unitholders are declared at the discretion of the Trustees. Pursuant to the DOT, the Trustees
may, at their sole discretion, determine distributions or designate that all taxable income earned, including
the taxable part of net realized capital gains, be distributed to Unitholders and will deduct such distributions
and designations for income tax purposes.
Northview follows the liability method for determining deferred income taxes. Under this method, deferred
taxes are recognized on temporary differences between the carrying values of assets and liabilities in the
consolidated financial statements and the corresponding tax carrying values for the same assets and
liabilities. Deferred tax assets are recognized for all deductible temporary differences to the extent it is
probable that taxable income will be available against which the deductible temporary differences can be
utilized. Deferred tax liabilities are recognized for all taxable temporary differences. Deferred tax liabilities
are not recognized for the temporary differences from investments in all subsidiaries and joint arrangements
to the extent that:
a) Northview is able to control the timing of the reversal of the temporary differences; and
b) the temporary difference will not reverse in the foreseeable future.
Deferred tax assets and liabilities are measured based on enacted or substantively enacted tax rates and
laws at the date of the financial statements for the years in which these temporary differences are expected
to reverse, and adjustments are recognized in earnings as they occur.
L. UNIT BASED PAYMENTS
i) Unit award plan
Northview issues units to executives and key personnel under a unit award plan. The unit award plan is
comprised of a Long-term Incentive (“LTI”) plan, whereby performance units (“Performance Units”) and
restricted units (“Restricted Units”) are issued to executives and key personnel of Northview. Under these
plans, the fair value of the units granted to executives and key personnel is recognized as compensation
expense with an offsetting amount to unit based payments based on the market price at the time of vesting.
Northview records compensation expense and unit based payments based on the fair values of the units
over the vesting period, less an estimated forfeiture rate. The estimated forfeiture rate is based on the
historical forfeiture rate. As units are forfeited or issued, this estimate is adjusted to actual over the vesting
period. The impact of the revision of the original estimates, if any, is recognized in the consolidated
statements of net and comprehensive income prospectively such that the cumulative expense reflects the
revised estimate. Upon issue, the market value of the units is credited to capital with a corresponding
reduction to unit based payments. In accordance with IAS 32 – Financial Instruments: Presentation (“IAS
32”), the units are presented as a liability on the consolidated statement of financial position as the Trust is
obliged to provide the holder with trust units (“Trust Units”) once the units vest. Under IAS 39 – Financial
Instruments: Recognition and Measurement (“IAS 39”), the units are classified as ‘fair value through profit
or loss’ and are measured at each reporting period at fair value with changes in fair value recognized in the
consolidated statements of net and comprehensive income. Fair value of the units is calculated based on
the observable market price of Trust Units.
Northview Apartment REIT 2017 Annual Report | Page 52

NORTHVIEW APARTMENT REAL ESTATE INVESTMENT TRUST NOTES TO THE CONSOLIDATED FINANCIAL STATEMENTS Years ended December 31, 2017 and 2016 (Tabular amounts expressed in thousands of Canadian dollars except where indicated)
ii) Deferred unit plan ("DUP")
Northview has a DUP whereby the Trustees receive a portion of their annual retainer in the form of deferred
units ("Deferred Units") that vest immediately when granted. Deferred Units are redeemable upon the
Trustee’s retirement from Northview. The Deferred Units are equivalent in value to Trust Units and
accumulate additional Deferred Units at the same rate that distributions are paid on Trust Units. Northview
measures Deferred Units as a liability at their fair value which is equivalent to the fair value of Trust Units
with changes in fair value being recognized in the consolidated statements of net and comprehensive
income.
M. INVESTMENT IN JOINT VENTURES
Under IFRS 11 – Joint Arrangements (“IFRS 11”), there are two types of joint arrangements – joint operations
and joint ventures. Joint arrangements are determined based on the rights and obligations of parties to the joint
arrangements by considering the structure, the legal form of the arrangements, the contractual terms agreed by
the parties to the arrangement, and, when relevant, other facts and circumstances. A joint operation is a joint
arrangement whereby the parties that have joint control of the arrangement (i.e. joint operators) have rights to
the assets, and obligations for the liabilities, relating to the arrangement. A joint venture is a joint arrangement
whereby the parties that have joint control of the arrangement (i.e. joint venturers) have rights to the net assets
of the arrangement.
Northview classifies its joint arrangements as joint ventures and accounts for them using the equity method.
Under the equity method, investments in joint ventures are carried in the consolidated statement of financial
position at cost as adjusted for Northview’s proportionate share of post-acquisition changes in the net assets of
the joint ventures, or for post-acquisition changes in any excess of Northview’s carrying amount over the net
assets of the joint ventures, less any identified impairment loss. When Northview’s share of losses of a joint
venture equals or exceeds its interest in that joint venture, Northview discontinues recognizing its share of further
losses. An additional share of losses is provided for and a liability is recognized only to the extent that Northview
has incurred legal or constructive obligations to fund the entity or made payments on behalf of that entity.
Where a group entity transacts with a joint venture of Northview, profits and losses are eliminated to the extent
of the Trust’s interest in the relevant joint venture. Balances outstanding between Northview and jointly controlled
entities are not eliminated in the consolidated statement of financial position.
N. SUBSIDIARIES AND ASSOCIATES
Subsidiaries and associates are consolidated when Northview has the power to govern the financial and
operating policies of the entity so as to obtain benefits from its activities. Subsidiary accounting policies are
consistent with those of Northview and reporting dates are the same as Northview. The subsidiary financial
statements are consolidated line by line, adding assets, liabilities, equity, revenue and expenses of similar types.
Intercompany balances, transactions, income, and expense are eliminated and gains or losses on intercompany
transactions are eliminated. Where Northview does not own 100% of the subsidiary or associate, non-controlling
interest is classified as a component of equity.
O. INTANGIBLE ASSETS
Intangible assets with finite useful lives that are acquired separately are carried at cost less accumulated
amortization and accumulated impairment losses. Amortization is recognized on a straight-line basis over the
intangible assets’ estimated useful lives. The estimated useful life and amortization method are reviewed at the
end of each reporting period, with the effect of any changes in estimate being accounted for on a prospective
basis.
Northview Apartment REIT 2017 Annual Report | Page 53

NORTHVIEW APARTMENT REAL ESTATE INVESTMENT TRUST NOTES TO THE CONSOLIDATED FINANCIAL STATEMENTS Years ended December 31, 2017 and 2016 (Tabular amounts expressed in thousands of Canadian dollars except where indicated)
P. REVENUE RECOGNITION
Revenue from an income producing property is recognized when a tenant commences occupancy of a property
and rent is due. Northview retains all benefits and risks of ownership of its investment properties and, therefore,
accounts for leases with its tenants as operating leases. Rental revenue includes rent and other sundry revenue
recoveries. Rental revenue to be received from leases with rental rates varying over the term of the lease is
recorded on a straight-line basis over the term of the associated lease. Accordingly, the difference between the
rental revenue recorded on a straight line basis and the rent that is contractually due from the tenant has been
recorded as deferred rent receivable for accounting purposes.
Operational cost recoveries (“OCR”) for commercial tenants and on selected residential leases are accrued
monthly on a leased square footage based on budgeted operating costs. Operating costs are verified annually,
usually within 90 days after year end, tenant accounts are reconciled and additional amounts are either invoiced
or rebated. Deferred recoverable costs are recorded as other long-term assets and charged against expenses.
Tenant inducements for commercial tenants are recorded as other long-term assets and charged against
revenue on a straight-line basis over the lease term.
Q. CLASS B LP UNITS
The Class B LP units (“Class B LP Units”) are exchangeable into Trust Units at the option of the holder. The
Trust Units are puttable and, therefore, the Class B LP Units meet the definition of a financial liability under IAS
32. Further, the Class B LP Units are designated as FVTPL financial liabilities and are measured at fair value
at each reporting period with any changes in fair value recorded in the consolidated statements of net and
comprehensive income. The distributions paid on the Class B LP Units are accounted for as financing costs.
R. UNIT CAPITAL
The Trust Units are redeemable at the option of the holder and, therefore, are considered puttable instruments
in accordance with IAS 32. Puttable instruments are required to be accounted for as financial liabilities, except
where certain conditions are met in accordance with IAS 32, in which case, the puttable instruments may be
presented as Unitholders' equity. The Trust Units meet the conditions of IAS 32 and are, therefore, presented
as Unitholders' equity.
As a result of the redemption feature of Trust Units, these units are considered financial liabilities under IAS 33
– Earnings Per Share, and they may not be considered as equity for the purposes of calculating net and
comprehensive income on a per unit basis. Consequently, Northview has elected not to report an Earnings Per
Unit calculation, as permitted under IFRS.
S. UNIT REPURCHASES
If Northview repurchases its own Trust Units, those Trust Units are deducted from Unitholders' equity and the
associated Trust Units are cancelled. No gain or loss is recognized and the consideration paid, including any
directly attributable incremental costs, is recognized in Unitholders' equity.
T. DISTRIBUTIONS TO UNITHOLDERS AND CLASS B LP UNITHOLDERS
Unitholders at the close of business on each distribution record date (the last day of the month) are entitled to
receive distributions from Northview as declared by the Trustees for such month. The distributions are accrued
and will be paid on the distribution date (usually the 15th of the following month). Where the Trustees determine
that Northview does not have sufficient cash to pay distributions, the payment may, at the Trustees’ discretion,
include the issuance of additional units.
Northview Apartment REIT 2017 Annual Report | Page 54
NORTHVIEW APARTMENT REAL ESTATE INVESTMENT TRUST NOTES TO THE CONSOLIDATED FINANCIAL STATEMENTS Years ended December 31, 2017 and 2016 (Tabular amounts expressed in thousands of Canadian dollars except where indicated)
Distributions declared to Class B LP Unitholders are classified as financing costs for reporting purposes because
the units are treated as financial liabilities.
U. CONVERTIBLE DEBENTURES
The convertible debentures are convertible into Trust Units. As the Trust Units are redeemable at the option of
the holder and are considered puttable instruments in accordance with IAS 32, the convertible debentures are
considered a financial liability containing liability-classified embedded derivatives. Northview has elected to
reflect the full outstanding amount of each convertible debenture at its fair value and are designated as FVTPL
with the changes in fair value being recognized in the consolidated statements of net and comprehensive
income. The interests paid on the convertible debentures are accounted for as financing costs.
V. FINANCE COST AND FINANCE INCOME
Interest earned from financial assets is recognized by applying the effective interest rate to the principal
outstanding when it is probable that economic benefits will flow to Northview. Mortgage interest and interest on
credit facilities is recognized by applying the effective interest rate to the principal outstanding.
W. CRITICAL ACCOUNTING ESTIMATES AND JUDGMENTS
The preparation of financial statements requires management to make estimates and judgments about the
future. Estimates and judgments are continually evaluated and are based on historical experience and other
factors, including expectations of future events that are believed to be reasonable under the circumstances.
Accounting estimates will, by definition, differ from the actual results. The following discussion sets forth
management’s most critical estimates and assumptions in determining the value of assets and liabilities and
management’s most critical judgments in applying accounting policies. Actual results may differ from these
estimates.
i) ESTIMATES
a) Fair value of investment properties
Northview carries its investment properties at fair value. Significant estimates used in determining the
fair value of Northview’s investment properties include capitalization rates and net operating income
(which is influenced by inflation rates and vacancy rates). A change to any one of these inputs could
significantly alter the fair value of an investment property.
b) Depreciation and amortization
Depreciation and amortization are calculated to write off the cost, less estimated residual value, of
assets on a systematic and rational basis over their expected useful lives. Estimates of useful lives are
based on data and information from various sources including industry practice and company-specific
history. Expected useful lives and residual values are reviewed annually for any change to estimates
and assumptions.
c) Allowance for doubtful accounts
Northview must make an assessment of whether accounts receivable are collectible from tenants.
Accordingly, management establishes an allowance for estimated losses arising from non-payment,
taking into consideration customer creditworthiness, current economic trends, and past experience. If
future collections differ from estimates, future income would be affected.
Northview Apartment REIT 2017 Annual Report | Page 55

NORTHVIEW APARTMENT REAL ESTATE INVESTMENT TRUST NOTES TO THE CONSOLIDATED FINANCIAL STATEMENTS Years ended December 31, 2017 and 2016 (Tabular amounts expressed in thousands of Canadian dollars except where indicated)
d) Accrued liabilities
Northview must estimate accrued liabilities when invoices have not been received in order to ensure
all expenditures have been recognized. If future expenditures differ from estimates, future income
would be affected. Accrued liabilities are included in trade and other payables.
e) Capital adequacy
Northview prepares estimated cash flow projections on a regular basis to ensure there will be adequate
liquidity to maintain operating, capital and investment activities and uses these estimates to assess
capital adequacy. Management reviews the current financial results and the annual business plan in
determining appropriate capital adequacy and uses this to determine distribution levels. Changes in
these estimates affect distributions to the Unitholders and Northview’s cost of capital, which in turn
affects income.
f) Income taxes and other tax liability
Under current tax legislation, a real estate investment trust is not liable to pay Canadian income taxes
provided that its taxable income is fully distributed to Unitholders during the year. Northview is a real
estate investment trust if it meets prescribed conditions under the Income Tax Act (Canada) relating to
the nature of its assets and revenue (the "REIT Conditions"). Northview has reviewed the REIT
Conditions and has assessed their interpretation and application to Northview's assets and revenue,
and it has determined that it qualifies as a real estate investment trust.
Northview qualifies as a real estate investment trust under the Income Tax Act (Canada); however,
should it no longer qualify, it would not be able to flow-through its taxable income to Unitholders and
Northview would, therefore, be subject to tax.
ii. JUDGMENTS
a) Purchase of investment properties
Northview reviews its purchases of investment property to determine whether or not the purchase is part of
a business combination as IFRS requires differing treatment of property acquisitions depending on whether
or not the purchase is part of a business combination. Judgment is involved in determining whether or not
a purchase forms part of a business combination or an asset acquisition. Should the purchase form part of
a business combination, closing costs, such as appraisal and legal fees, are expensed immediately and
earnings are affected. If the purchase is an asset acquisition, these costs form part of the purchase price
and earnings are not immediately affected.
b) Fair value of investment properties
While investment properties are recorded at fair value on a quarterly basis, not every property is
independently appraised every year. Significant judgment is applied in arriving at these fair values,
particularly as the properties are in smaller communities with limited trading activity. Changes in the value
of the investment properties affect income.
c) Componentization
The componentization of Northview’s PP&E, namely buildings, is based on management’s judgment of what
components constitute a significant cost in relation to the total cost of an asset and whether these
components have similar or dissimilar patterns of consumption and useful lives for purposes of calculating
depreciation and amortization.
Northview Apartment REIT 2017 Annual Report | Page 56

NORTHVIEW APARTMENT REAL ESTATE INVESTMENT TRUST NOTES TO THE CONSOLIDATED FINANCIAL STATEMENTS Years ended December 31, 2017 and 2016 (Tabular amounts expressed in thousands of Canadian dollars except where indicated)
d) Impairment
Assessment of impairment is based on management’s judgment of whether there are sufficient internal and
external factors that would indicate that an asset or cash generating unit (“CGU”) is impaired. The
determination of CGUs is also based on management’s judgment and is an assessment of the smallest
group of assets that generate cash inflows independently of other assets. Factors considered include
whether an active market exists for the output produced by the asset or group of assets as well as how
management monitors and makes decisions about Northview’s operations.
e) Classification of Inuvik Commercial Properties Zheh Gwizu’ Limited Partnership (“ICP”) and
Inuvik Capital Suites Zheh Gwizuh Limited Partnership (“ICS”) as joint ventures
Note 6 describes that the ownership of ICS is for the purpose of investing in an income producing execusuite
property in the Northwest Territories and the ownership of ICP is for the purpose of investing in a portfolio
of commercial and mixed-use income producing properties in the Northwest Territories. Furthermore, there
is no contractual arrangement or any other facts and circumstances that indicate that the parties to the joint
arrangement have rights to the assets and obligations for the liabilities of the joint arrangement. Accordingly,
ICP and ICS are classified as joint ventures for Northview.
3. APPLICATION OF NEW AND REVISED IFRSs
A. NEW ACCOUNTING STANDARDS AND INTERPRETATIONS
Northview has applied a revised IFRS issued by IASB that is mandatorily effective for an accounting period that
begins on or after January 1, 2017.
Revised Standard Description Impact of Application
Amendments to IAS 7 – Statement of Cash Flows
The amendments to IAS 7 require entities to provide
disclosures that enable users of the financial statements
to evaluate changes in liabilities arising from financing
activities
Additional disclosure for mortgages payable is provided
in the notes to the consolidated financial statements.
Refer to Note 9.
Northview Apartment REIT 2017 Annual Report | Page 57

NORTHVIEW APARTMENT REAL ESTATE INVESTMENT TRUST NOTES TO THE CONSOLIDATED FINANCIAL STATEMENTS Years ended December 31, 2017 and 2016 (Tabular amounts expressed in thousands of Canadian dollars except where indicated)
B. RECENT ACCOUNTING PRONOUNCEMENTS
The IASB has issued the following standards that have not been applied in preparing these consolidated financial
statements as their effective dates fall within annual periods subsequent to the current reporting period.
Proposed Standard Description Possible Impact
IFRS 15 – Revenue from Contracts with Customers
Introduces a principle to report information about the
nature, timing, and uncertainty of revenue from contracts
with customers in a single, comprehensive revenue
recognition model. The standard is effective for annual
periods beginning on or after January 1, 2018.
Northview has completed its assessment of the impact of
IFRS 15 on its consolidated financial statements.
Northview has assessed all lease contracts for the
presence of non-lease components that would be in the
scope of IFRS 15. Northview has further concluded that
no changes to the pattern of recognition are required for
this revenue stream; however, additional disclosures
would be required. Northview adopted the provisions of
IFRS 15 on January 1, 2018 and will provide the additional
disclosures in 2018 as required by IFRS 15 and other
applicable standards.
IFRS 9 – Financial Instruments
The IASB has undertaken a three-phase project to replace
IAS 39 with IFRS 9. The new standard replaces the
current multiple classification and measurement models
for financial assets and liabilities with a single model that
has only two classification categories: amortized cost and
fair value; and introduces a new hedge accounting model.
The standard was finalized in July 2014. The standard is
effective for annual periods beginning on or after January
1, 2018.
Northview has completed its assessment of the impact of
IFRS 9 on its consolidated financial statements and
concluded that an adjustment to the allowance for doubtful
accounts would be required. The adjustment will impact
current year opening retained earnings and does not
impact prior years. This adjustment is not expected to be
material to the consolidated financial statements.
IAS 40 – Investment Properties
During December 2016, the IASB issued an amendment
to IAS 40 to state that an entity shall transfer a property
to, or from, investment property when, and only when,
there is evidence of a change in use. A change in use
occurs if property meets, or ceases to meet, the definition
of investment property. A change in management’s
intentions for the use of a property by itself does not
constitute evidence of a change in use. The amendment
is effective for annual periods beginning on or after
January 1, 2018.
Northview has completed its assessment of the impact of
the amendment to IAS 40 on its consolidated financial
statements and concluded that there is no material impact
on the consolidated financial statements.
Northview Apartment REIT 2017 Annual Report | Page 58

NORTHVIEW APARTMENT REAL ESTATE INVESTMENT TRUST NOTES TO THE CONSOLIDATED FINANCIAL STATEMENTS Years ended December 31, 2017 and 2016 (Tabular amounts expressed in thousands of Canadian dollars except where indicated)
IFRS 2 – Share Based Compensation
IASB issued an amendment to IFRS 2 to clarify the
classification and measurement of cash settled share
based payment transactions that include performance
condition, classification of share based payment
transactions with net settlement features and accounting
for modifications of share based payment transactions
from cash-settled to equity settled. The amendment is
effective for annual periods beginning on or after January
1, 2018.
Northview has completed its assessment of the impact of
the amendment to IFRS 2 on its consolidated financial
statements and concluded that there is no material impact
on the consolidated financial statements.
IFRS 16 – Leases
The IASB issued IFRS 16 – Leases, which provides a
single lessee accounting model, requiring lessees to
recognize assets and liabilities for all leases unless the
lease term is 12 months or less or the underlying asset
has a low value. The standard is effective for annual
periods beginning on or after January 1, 2019.
Northview is in the process of assessing the impact that
IFRS 16 may have on the consolidated financial
statements and plans to adopt the new standard on the
effective date.
Management continues to evaluate the potential qualitative and quantitative impact of these new standards on
Northview’s financial statement measurements and disclosures. Northview is not early adopting these standards.
Northview Apartment REIT 2017 Annual Report | Page 59

NORTHVIEW APARTMENT REAL ESTATE INVESTMENT TRUST NOTES TO THE CONSOLIDATED FINANCIAL STATEMENTS Years ended December 31, 2017 and 2016 (Tabular amounts expressed in thousands of Canadian dollars except where indicated)
4. INVESTMENT PROPERTIES
2017 2016
Investment properties 3,410,609 3,010,817
Investment properties under development 38,791 14,471
Land held for development 22,628 34,537
Balance, end of year 3,472,028 3,059,825
Changes to investment properties:
2017 2016
Balance, January 1 3,059,825 3,025,468
Acquisitions of investment properties 236,471 -
Acquisitions of land 2,730 5,630
Disposals (37,690) -
Transfers to property, plant and equipment (1,592) (303)
Transfers to assets held for sale (8,412) (73,414)
Capital expenditures on investment properties under development 28,206 48,965
Capital expenditures on investment properties 51,781 50,251
Fair value gain 140,709 3,228
Balance, end of year 3,472,028 3,059,825
During the year ended December 31, 2017, Northview transferred $9.8 million (December 31, 2016 – $73.0 million) from
investment properties under development to investment properties.
During the year ended December 31, 2017, Northview capitalized borrowing costs of $0.4 million (as at December 31,
2016 – $0.8 million) to investment properties under development.
During the year ended December 31, 2017, Northview disposed of properties with total fair value of $82.0 million
(December 31, 2016 – $48.6 million).
Acquisitions for the year ended December 31, 2017 were as follows:
Property Type Location Date Cost
Multi-family/Commercial Atlantic Canada Q3, Q4 2017 41,842
Multi-family/Commercial Ontario Q4 2017 144,690
Multi-family Quebec Q4 2017 24,383
Multi-family/Land Western Canada Q4 2017 28,286
Total 239,201
For the year ended December 31, 2016, Northview did not acquire any properties.
Northview uses the capitalization rate (“Cap Rate”) method to value investment properties. As at December 31, 2017,
Cap Rates ranging from 3.25% to 13.00% (December 31, 2016 – 4.25% to 13.00%) were applied to a projected stabilized
net operating income (“NOI”). The weighted average Cap Rate applied to fair value Northview’s investment properties as
at December 31, 2017, is 6.24% (December 31, 2016 – 6.67%).
Northview Apartment REIT 2017 Annual Report | Page 60

NORTHVIEW APARTMENT REAL ESTATE INVESTMENT TRUST NOTES TO THE CONSOLIDATED FINANCIAL STATEMENTS Years ended December 31, 2017 and 2016 (Tabular amounts expressed in thousands of Canadian dollars except where indicated)
A summary of the Cap Rates used for valuations is as follows:
2017 2016
Regions Minimum Maximum
Weighted
Average Minimum Maximum
Weighted
Average
Atlantic Canada 5.50% 9.50% 6.74% 5.50% 9.50% 6.82%
Northern Canada 6.86% 13.00% 9.14% 6.86% 13.00% 9.13%
Ontario 3.25% 6.00% 4.52% 4.25% 6.00% 5.12%
Quebec 4.50% 7.55% 5.74% 5.85% 7.55% 6.06%
Western Canada 4.25% 11.00% 6.59% 4.75% 11.00% 6.92%
Overall 3.25% 13.00% 6.24% 4.25% 13.00% 6.67%
The impact of a 10 basis point change in Cap rates used to value the investment properties would affect the fair value as
follows:
2017 2016
Regions
Weighted
Average Increase Decrease
Weighted
Average Increase Decrease
Atlantic Canada 6.74% (6,305) 6,495 6.82% (5,644) 5,812
Northern Canada 9.14% (6,693) 6,841 9.13% (6,446) 6,588
Ontario 4.52% (27,157) 28,387 5.12% (18,710) 19,457
Quebec 5.74% (3,597) 3,724 6.06% (2,960) 3,060
Western Canada 6.59% (14,519) 14,966 6.92% (13,469) 13,864
Overall 6.24% (58,271) 60,413 6.67% (47,229) 48,781
The impact of a 1% change in stabilized NOI used to value the investment properties would affect fair value as follows:
Regions 2017 2016
Atlantic Canada 4,309 3,905
Northern Canada 6,186 5,949
Ontario 12,537 9,758
Quebec 2,099 1,823
Western Canada 9,709 9,459
Overall 34,840 30,894
Northview Apartment REIT 2017 Annual Report | Page 61
NORTHVIEW APARTMENT REAL ESTATE INVESTMENT TRUST NOTES TO THE CONSOLIDATED FINANCIAL STATEMENTS Years ended December 31, 2017 and 2016 (Tabular amounts expressed in thousands of Canadian dollars except where indicated)
5. PROPERTY, PLANT AND EQUIPMENT
Land Buildings Other Assets Total
Cost or deemed cost
Balance at January 1, 2016 2,185 66,383 9,098 77,666
Additions for the year - 3,753 465 4,218
Transfers from investment property 6 295 2 303
Transfers to assets held for sale (57) (18,532) (561) (19,150)
Disposals for the year - (33) (228) (261)
Balance at December 31, 2016 2,134 51,866 8,776 62,776
Additions for the year - 4,069 981 5,050
Transfers from investment property 33 1,559 - 1,592
Disposals for the year - (32) (232) (264)
Balance at December 31, 2017 2,167 57,462 9,525 69,154
Accumulated depreciation
Balance at January 1, 2016 - 15,896 6,260 22,156
Depreciation for the year - 3,483 1,176 4,659
Transfers to assets held for sale - (3,600) (474) (4,074)
Disposals for the year - (33) (214) (247)
Balance at December 31, 2016 - 15,746 6,748 22,494
Depreciation for the year - 4,153 831 4,984
Disposals for the year - (32) (203) (235)
Balance at December 31, 2017 - 19,867 7,376 27,243
Carrying amounts
December 31, 2016 2,134 36,120 2,028 40,282
December 31, 2017 2,167 37,595 2,149 41,911
Northview Apartment REIT 2017 Annual Report | Page 62

NORTHVIEW APARTMENT REAL ESTATE INVESTMENT TRUST NOTES TO THE CONSOLIDATED FINANCIAL STATEMENTS Years ended December 31, 2017 and 2016 (Tabular amounts expressed in thousands of Canadian dollars except where indicated)
6. INVESTMENT IN JOINT VENTURES
Northview has a 50% interest in ICS and a 50% interest in ICP. The ownership of ICS is between the Zheh Gwizu’ Limited
Partnership and NPR Limited Partnership (“NPRLP”) for the purpose of investing in an income producing execusuite
property in the Northwest Territories. The ownership of ICP is between the Zheh Gwizu’ Limited Partnership and NPRLP
for the purposes of investing in a portfolio of commercial and mixed-use income producing properties in the Northwest
Territories.
The table below summarizes key financial position balances, revenue and expenses as well as Northview’s share for the
periods reported.
Current
assets
Non-
current
assets
Total
assets
Current
liabilities
Non-
current
liabilities
Total
liabilities Net assets
Northview
share of
net assets
December 31, 2017
ICP 2,654 15,483 18,137 4,205 3,145 7,350 10,787 5,393
ICS 884 5,261 6,145 551 2,540 3,091 3,054 1,527
Total 3,538 20,744 24,282 4,756 5,685 10,441 13,841 6,920
December 31, 2016
ICP 2,162 15,213 17,375 1,538 6,213 7,751 9,624 4,812
ICS 831 5,407 6,238 375 2,940 3,315 2,923 1,462
Total 2,993 20,620 23,613 1,913 9,153 11,066 12,547 6,274
Year ended December 31
Revenue Expenses Net Income
Northview share
of net income
2017
ICP 3,514 2,353 1,161 581
ICS 1,996 1,464 532 266
Total 5,510 3,817 1,693 847
2016
ICP 3,716 2,741 975 487
ICS 2,167 1,414 753 377
Total 5,883 4,155 1,728 864
There has been no change in Northview’s 50% ownership and voting interests in these joint ventures for the reported
periods.
Northview Apartment REIT 2017 Annual Report | Page 63
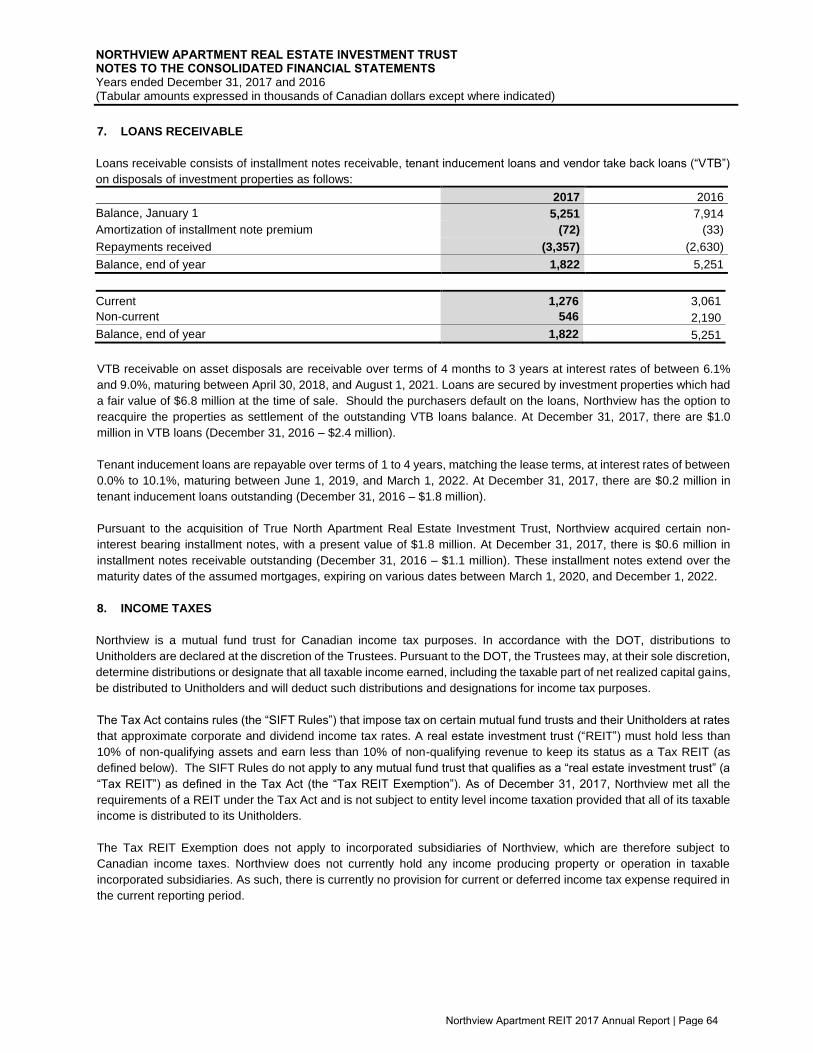
NORTHVIEW APARTMENT REAL ESTATE INVESTMENT TRUST NOTES TO THE CONSOLIDATED FINANCIAL STATEMENTS Years ended December 31, 2017 and 2016 (Tabular amounts expressed in thousands of Canadian dollars except where indicated)
7. LOANS RECEIVABLE
Loans receivable consists of installment notes receivable, tenant inducement loans and vendor take back loans (“VTB”)
on disposals of investment properties as follows:
2017 2016
Balance, January 1 5,251 7,914
Amortization of installment note premium (72) (33)
Repayments received (3,357) (2,630)
Balance, end of year 1,822 5,251
Current 1,276 3,061
Non-current 546 2,190
Balance, end of year 1,822 5,251
VTB receivable on asset disposals are receivable over terms of 4 months to 3 years at interest rates of between 6.1%
and 9.0%, maturing between April 30, 2018, and August 1, 2021. Loans are secured by investment properties which had
a fair value of $6.8 million at the time of sale. Should the purchasers default on the loans, Northview has the option to
reacquire the properties as settlement of the outstanding VTB loans balance. At December 31, 2017, there are $1.0
million in VTB loans (December 31, 2016 – $2.4 million).
Tenant inducement loans are repayable over terms of 1 to 4 years, matching the lease terms, at interest rates of between
0.0% to 10.1%, maturing between June 1, 2019, and March 1, 2022. At December 31, 2017, there are $0.2 million in
tenant inducement loans outstanding (December 31, 2016 – $1.8 million).
Pursuant to the acquisition of True North Apartment Real Estate Investment Trust, Northview acquired certain non-
interest bearing installment notes, with a present value of $1.8 million. At December 31, 2017, there is $0.6 million in
installment notes receivable outstanding (December 31, 2016 – $1.1 million). These installment notes extend over the
maturity dates of the assumed mortgages, expiring on various dates between March 1, 2020, and December 1, 2022.
8. INCOME TAXES
Northview is a mutual fund trust for Canadian income tax purposes. In accordance with the DOT, distributions to
Unitholders are declared at the discretion of the Trustees. Pursuant to the DOT, the Trustees may, at their sole discretion,
determine distributions or designate that all taxable income earned, including the taxable part of net realized capital gains,
be distributed to Unitholders and will deduct such distributions and designations for income tax purposes.
The Tax Act contains rules (the “SIFT Rules”) that impose tax on certain mutual fund trusts and their Unitholders at rates
that approximate corporate and dividend income tax rates. A real estate investment trust (“REIT”) must hold less than
10% of non-qualifying assets and earn less than 10% of non-qualifying revenue to keep its status as a Tax REIT (as
defined below). The SIFT Rules do not apply to any mutual fund trust that qualifies as a “real estate investment trust” (a
“Tax REIT”) as defined in the Tax Act (the “Tax REIT Exemption”). As of December 31, 2017, Northview met all the
requirements of a REIT under the Tax Act and is not subject to entity level income taxation provided that all of its taxable
income is distributed to its Unitholders.
The Tax REIT Exemption does not apply to incorporated subsidiaries of Northview, which are therefore subject to
Canadian income taxes. Northview does not currently hold any income producing property or operation in taxable
incorporated subsidiaries. As such, there is currently no provision for current or deferred income tax expense required in
the current reporting period.
Northview Apartment REIT 2017 Annual Report | Page 64

NORTHVIEW APARTMENT REAL ESTATE INVESTMENT TRUST NOTES TO THE CONSOLIDATED FINANCIAL STATEMENTS Years ended December 31, 2017 and 2016 (Tabular amounts expressed in thousands of Canadian dollars except where indicated)
9. MORTGAGES PAYABLE
2017 2016
Mortgages payable 1,810,154 1,692,255
Fair value adjustment upon assumption 9,377 14,685
Deferred financing costs (33,375) (27,400)
1,786,156 1,679,540
Mortgages related to assets held for sale - (18,008)
Total 1,786,156 1,661,532
Current 274,736 160,844
Non-current 1,511,420 1,500,688
Total 1,786,156 1,661,532
Mortgages payable bear interest at rates ranging from 1.41% to 6.48% (December 31, 2016 – 1.41% to 6.48%) and have
a weighted average rate of 3.20% as at December 31, 2017 (December 31, 2016 – 3.23%). Mortgages are payable in
monthly installments of blended principal and interest of approximately $8.7 million (December 31, 2016 – $8.6 million).
The mortgages mature between 2018 and 2027 (December 31, 2016 – 2017 and 2031) and are secured by charges
against specific properties. Land and buildings with a carrying value of $2.9 billion (December 31, 2016 – $2.8 billion)
have been pledged to secure the mortgages payable of Northview.
The fair value of mortgages payable at December 31, 2017, is approximately $1.8 billion (December 31, 2016 – $1.7
billion). The fair value is determined by discounting the future cash payments by the current market borrowing rate. Most
of the mortgages on Northview’s investment properties are insured by Canada Mortgage and Housing Corporation
(“CMHC”). Pursuant to standard mortgage terms, each mortgagee has a first position security interest in the specified
property funded with mortgage proceeds. As well, there are some mortgagees with a second position security interest.
In addition, certain investment properties are cross-securitized providing the lender with preferential security rights to
those properties.
The following table summarizes Northview’s mortgages as at December 31, 2017:
Northview held one cash settled interest rate swap contract for $35.0 million which was repaid upon maturity in July
2017. Hedge accounting was not being applied to this swap contract. During the year ended December 31, 2017, the
fair value adjustment of the interest rate swap was $0.2 million (December 31, 2016 - $0.1 million) and has been
recognized as fair value gain (Note 21) in the consolidated statements of net and comprehensive income.
(thousands of dollars)
Principal
Amount
Principal on
Maturity Total % of Total
Weighted Average
Interest Rate
2018 51,528 218,989 270,517 14.9% 4.12%
2019 46,794 185,535 232,329 12.8% 3.30%
2020 41,895 185,945 227,840 12.6% 2.70%
2021 33,059 267,997 301,056 16.6% 3.53%
2022 27,681 102,185 129,866 7.2% 2.77%
Thereafter 64,952 583,594 648,546 35.8% 2.87%
Total 265,909 1,544,245 1,810,154 100.0% 3.20%
Northview Apartment REIT 2017 Annual Report | Page 65

NORTHVIEW APARTMENT REAL ESTATE INVESTMENT TRUST NOTES TO THE CONSOLIDATED FINANCIAL STATEMENTS Years ended December 31, 2017 and 2016 (Tabular amounts expressed in thousands of Canadian dollars except where indicated)
The following table summarizes the change in the mortgages payable during the year ended December 31, 2017:
December 31, 2017
Mortgages payable, January 1, 2017 (i) 1,679,540
Proceeds from new mortgages 240,703
Prepaid mortgage fees (12,809)
Mortgage assumption 39,691
Repayment of mortgages (160,962)
Mortgage interest expense 51,970
Mortgage interest paid (51,977)
Mortgages payable, December 31, 2017 (i) 1,786,156
(i) Mortgages payable as at January 1, 2017 includes the liabilities related to assets held for sale.
10. CONVERTIBLE DEBENTURES
Northview has a $23.0 million principal amount of convertible unsecured subordinated debentures at par (the “2019
Debentures”). The 2019 Debentures bear interest at 5.75% per annum, are payable semi-annually in arrears, and mature
on June 30, 2019 (the "Maturity Date"). The 2019 Debentures are convertible with each $1,000 (actual dollars) of face
value and a conversion price of $23.80 per Trust Unit, for a total of 966,386 Trust Units.
On and after June 30, 2017, but prior to June 30, 2018, the 2019 Debentures will be redeemable, in whole or in part, at
par plus accrued and unpaid interest at the sole option of Northview, on not more than 60-days and less than 30-days
prior notice, provided that the market price of a Unit, calculated with reference to the date on which notice of redemption
is given, is not less than 125% of the conversion price.
On and after June 30, 2018, but prior to the Maturity Date, the 2019 Debentures are redeemable, in whole or in part, at
par plus accrued and unpaid interest, at the sole option of Northview, on not more than 60-days and not less than 30-
days prior notice.
Northview may, at its sole option, subject to certain restrictions, elect to satisfy its obligation to pay all or any portion of
the principal amount on the 2019 Debentures by delivering to debenture holders on the redemption date that number of
Trust Units obtained by dividing the principal amount redeemed by 95% of the current market price of the Trust Units on
the redemption date.
The following table summarizes the changes in the 2019 Debentures during the year ended December 31, 2017:
Convertible Debentures
Principal Amount
Outstanding, January 1, 2016 23,000 22,885
Fair value adjustment - 575
Outstanding, December 31, 2016 23,000 23,460
Redemption (1) (1)
Fair value adjustment - 1,380
Outstanding, December 31, 2017 22,999 24,839
The following table reconciles the face value of the 2019 Debentures to their fair value:
2017 2016
Face value 22,999 23,000
Fair value adjustment 1,840 460
Fair value 24,839 23,460
Northview Apartment REIT 2017 Annual Report | Page 66

NORTHVIEW APARTMENT REAL ESTATE INVESTMENT TRUST NOTES TO THE CONSOLIDATED FINANCIAL STATEMENTS Years ended December 31, 2017 and 2016 (Tabular amounts expressed in thousands of Canadian dollars except where indicated)
11. CREDIT FACILITIES
Borrowings under credit facilities 2017 2016
Operating facilities(i) 143,700 73,200
Construction financing(ii) 51,715 50,013
Land financing(iii) 5,828 10,629
Total 201,243 133,842
Current 89,543 68,013
Non-current 111,700 65,829
Total 201,243 133,842
(i) At December 31, 2017, Northview had three operating facilities with total credit limits of $203.0 million (December
31, 2016 – $203.0 million). The maximum borrowing capacity at December 31, 2017, is $172.2 million (December
31, 2016 – $153.1 million). Specific investment properties with total fair value of $421.5 million (December 31, 2016
- $362.5 million) have been pledged as collateral security for the operating facility. Northview also has $5.3 million
(December 31, 2016 – $4.1 million) in Letters of Credit (“LOC”) outstanding as security for construction projects and
mortgage holdbacks. The LOC reduces the amount available under the $150.0 million operating facility.
OPERATING FACILITIES
(thousands of dollars) Maturity Date Credit Limit
Maximum
borrowing
capacity
2017
Amounts
Drawn
2016
Amounts
Drawn
$150 million operating facility
(interest at prime plus 0.75% or banker’s
acceptance plus 2.00%: May 12, 2019 150,000 129,800 111,700 55,200
$23 million operating facility
(interest at prime plus 0.75% or banker’s
acceptance plus 2.00%: May 22, 2018 23,000 23,000 23,000 18,000
$30 million operating facility
(interest at prime plus 1.15% or banker’s
acceptance plus 2.40%: May 31, 2018 30,000 19,400 9,000 -
Total 203,000 172,200 143,700 73,200
(ii) At December 31, 2017, Northview had three construction financing loans outstanding relating to the developments
in Calgary, AB; Cambridge Bay, NU; and Regina, SK. Interest rates range from prime plus 0.50% to 1.00% or
Banker’s Acceptance plus 2.00% to 2.20%. Maturity dates range from January 1, 2018, to March 31, 2019.
(iii) The land financing relates to land held for development and bears interest at prime plus 0.50% or Bankers’
Acceptance plus 2.00% with a maturity date of December 31, 2018. Financing is secured by three parcels of land
held for development.
Northview’s credit facilities contain certain financial covenants. The principal financial covenants are debt to gross book
value, debt service coverage, and interest coverage. The debt to gross book value ratio covenant maximum threshold is
70%. The interest coverage ratio and debt service coverage ratio covenant minimum thresholds are at least 1.90 and
1.50, respectively. As at and during the year ended December 31, 2017, Northview was in compliance with all financial
covenants.
Northview Apartment REIT 2017 Annual Report | Page 67
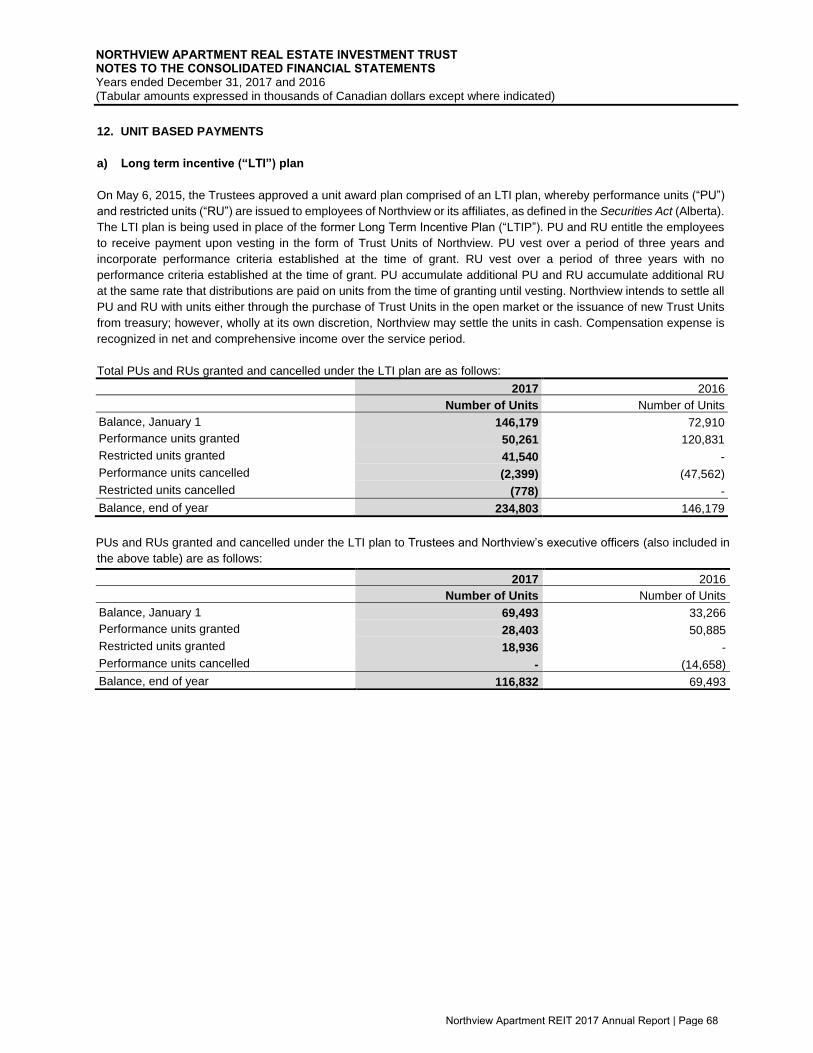
NORTHVIEW APARTMENT REAL ESTATE INVESTMENT TRUST NOTES TO THE CONSOLIDATED FINANCIAL STATEMENTS Years ended December 31, 2017 and 2016 (Tabular amounts expressed in thousands of Canadian dollars except where indicated)
12. UNIT BASED PAYMENTS
a) Long term incentive (“LTI”) plan
On May 6, 2015, the Trustees approved a unit award plan comprised of an LTI plan, whereby performance units (“PU”)
and restricted units (“RU”) are issued to employees of Northview or its affiliates, as defined in the Securities Act (Alberta).
The LTI plan is being used in place of the former Long Term Incentive Plan (“LTIP”). PU and RU entitle the employees
to receive payment upon vesting in the form of Trust Units of Northview. PU vest over a period of three years and
incorporate performance criteria established at the time of grant. RU vest over a period of three years with no
performance criteria established at the time of grant. PU accumulate additional PU and RU accumulate additional RU
at the same rate that distributions are paid on units from the time of granting until vesting. Northview intends to settle all
PU and RU with units either through the purchase of Trust Units in the open market or the issuance of new Trust Units
from treasury; however, wholly at its own discretion, Northview may settle the units in cash. Compensation expense is
recognized in net and comprehensive income over the service period.
Total PUs and RUs granted and cancelled under the LTI plan are as follows:
2017 2016
Number of Units Number of Units
Balance, January 1 146,179 72,910
Performance units granted 50,261 120,831
Restricted units granted 41,540 -
Performance units cancelled (2,399) (47,562)
Restricted units cancelled (778) -
Balance, end of year 234,803 146,179
PUs and RUs granted and cancelled under the LTI plan to Trustees and Northview’s executive officers (also included in
the above table) are as follows:
2017 2016
Number of Units Number of Units
Balance, January 1 69,493 33,266
Performance units granted 28,403 50,885
Restricted units granted 18,936 -
Performance units cancelled - (14,658)
Balance, end of year 116,832 69,493
Northview Apartment REIT 2017 Annual Report | Page 68

NORTHVIEW APARTMENT REAL ESTATE INVESTMENT TRUST NOTES TO THE CONSOLIDATED FINANCIAL STATEMENTS Years ended December 31, 2017 and 2016 (Tabular amounts expressed in thousands of Canadian dollars except where indicated)
b) Long-term incentive plan (“LTIP”)
Prior to 2015, Northview had an LTIP for individuals who provide management services to Northview or any corporation,
trust, or other entity directly or indirectly owned or controlled by Northview (a “Managed Entity”), based on the results of
each fiscal year. This plan was replaced with the LTI plan described in Note 12(a). As such, Northview does not intend to
grant any additional securities under the LTIP. The total amount of LTIP awards are determined at the end of each fiscal
year by the Trustees based on an assessment of the performance of Northview and the individual performance of the
individuals who provide management services to Northview or a Managed Entity. The number of Trust Units granted is
based on the weighted average trading price on December 31 of each year. Pursuant to the policy, rights to Trust Units
generally vest over a period of three years.
Total Trust Units issued under the LTIP are as follows:
2017 2016
Number of
Units Price per unit
Number of
Units Price per unit
Balance, January 1 2,370 - 2,980 -
Units issued (2,370) $19.86 (610) $19.96
Balance, end of year - - 2,370 -
Trust Units issued under the LTIP to Trustee’s and Northview’s executive officers (also included in the above table) are
as follows:
2017 2016
Number of
Units Price per unit
Number of
Units Price per unit
Balance, January 1 645 - 1,293 -
Units issued (645) $19.86 (325) $18.46
Change in key management personnel - - (323) -
Balance, end of year - - 645 -
c) Deferred Unit (“DU”) award plan
On May 6, 2015, the Unitholders approved a DU award plan, whereby DUs are issued to non-executive Trustees as a
form of compensation. Total compensation expense is recognized at the time of grant. DUs accumulate additional DUs
at the same rate that distributions are paid on Trust Units from the time of granting until issued. Fluctuations in the market
value are recognized in fair value in the consolidated statements of net and comprehensive income in the period in which
the fluctuations occur. DUs are redeemable upon the Trustee’s retirement from Northview. The carrying amount of the
liability, included in unit based payments, relating to the cash-settled DUs at December 31, 2017 is $1.2 million (December
31, 2016 - $0.6 million).
Total DUs granted under the DU award plan are as follows:
2017 2016
Number of Units Number of Units
Balance, January 1 31,843 10,026
Units granted 25,341 21,817
Units redeemed (7,449) -
Balance, end of year 49,735 31,843
Northview Apartment REIT 2017 Annual Report | Page 69

NORTHVIEW APARTMENT REAL ESTATE INVESTMENT TRUST NOTES TO THE CONSOLIDATED FINANCIAL STATEMENTS Years ended December 31, 2017 and 2016 (Tabular amounts expressed in thousands of Canadian dollars except where indicated)
13. EMPLOYEE UNIT PURCHASE PLAN
Changes to the Employee Unit Purchase Plan (the “EUPP”) were approved by the Board and made effective January 1,
2016. Under the terms of the EUPP, employees may invest a maximum of 5% of their salary excluding bonuses, deferred
compensation, overtime pay, statutory holiday pay, severance payment and any special incentive compensation
payments, in Trust Units and Northview will contribute an amount equal to 25% of the employee’s contribution during that
pay period. The units are purchased on the TSX at market prices. During the year ended December 31, 2017, employees
invested a total of $0.4 million (December 31, 2016 – $0.3 million) and Northview contributed $0.1 million (December 31,
2016 – $0.1 million). During the year ended December 31, 2017, 25,601 units (December 31, 2016 – 25,007 units) were
purchased at an average cost of $22.22 per unit (December 31, 2016 – $19.60).
14. UNITHOLDERS’ EQUITY
a) Trust Units
The aggregate number of Trust Units and special voting units of Northview (“Special Voting Units”) which are authorized
and may be issued is unlimited.
Each Trust Unit represents an equal undivided beneficial interest in any distributions from Northview, and in any of the
net assets of Northview in the event of termination or winding up of Northview. All Trust Units are of the same class with
equal rights and privileges and are not subject to future calls or assessments. Each Trust Unit entitles the holder of
record thereof to one vote for each whole Trust Unit held at all meetings of Trust Unitholders. Except as set out under
“Redemption Rights” below, the Trust Units have no conversion, retraction, redemption or pre-emptive rights.
The Trust Units should not be viewed by potential investors as shares in Northview. A Unitholder has substantially all of
the same protections, rights and remedies as a shareholder would have under the Canada Business Corporations Act
(“CBCA”), except that Unitholders will not have the statutory rights normally associated with ownership of shares of a
CBCA corporation including, for example, “dissent rights” in respect of certain corporate transactions and fundamental
changes, rights to submit shareholder proposals at shareholder meetings, or the right to bring “derivative” or “oppression”
actions. The Trustees have powers, responsibilities and duties analogous to those of a board of directors of a corporation
governed by the CBCA. The protections, rights and remedies available to a Unitholder are contained in the DOT.
Transfer of Trust Units
Pursuant to the DOT, the Trust Units are freely transferable.
Repurchase of Trust Units
Northview shall be entitled to purchase for cancellation at any time the whole or from time to time any part of the
outstanding Trust Units, at a price per Trust Unit and on a basis to be determined by the Trustees in compliance with all
applicable securities regulatory laws, regulations or policies or the policies of any applicable stock exchange.
Redemption Rights
Trust Units are redeemable at any time on demand by the Unitholders. A Unitholder not otherwise holding a fully
registered Trust Unit certificate who wishes to exercise the redemption right is required to obtain a written redemption
notice (the “Redemption Notice”) from his or her investment dealer who is then required to deliver the completed
Redemption Notice to Northview. Upon receipt by Northview of the Redemption Notice, the Unitholder shall thereafter
cease to have any rights with respect to the Trust Units tendered for redemption (other than to receive the redemption
payment thereof) including the right to receive any distributions thereon which are declared payable to the Unitholders of
record on a date which is subsequent to the day of receipt by Northview of such notice. Trust Units shall be considered
to be tendered for redemption on the date that Northview has, to the satisfaction of the Trustees, received the Redemption
Notice and all other required documents or evidence.
Upon receipt of the Redemption Notice by Northview, the holder of the Trust Units tendered for redemption shall be
entitled to receive a price per Trust Unit (the “Redemption Price”) equal to the lesser of:
Northview Apartment REIT 2017 Annual Report | Page 70
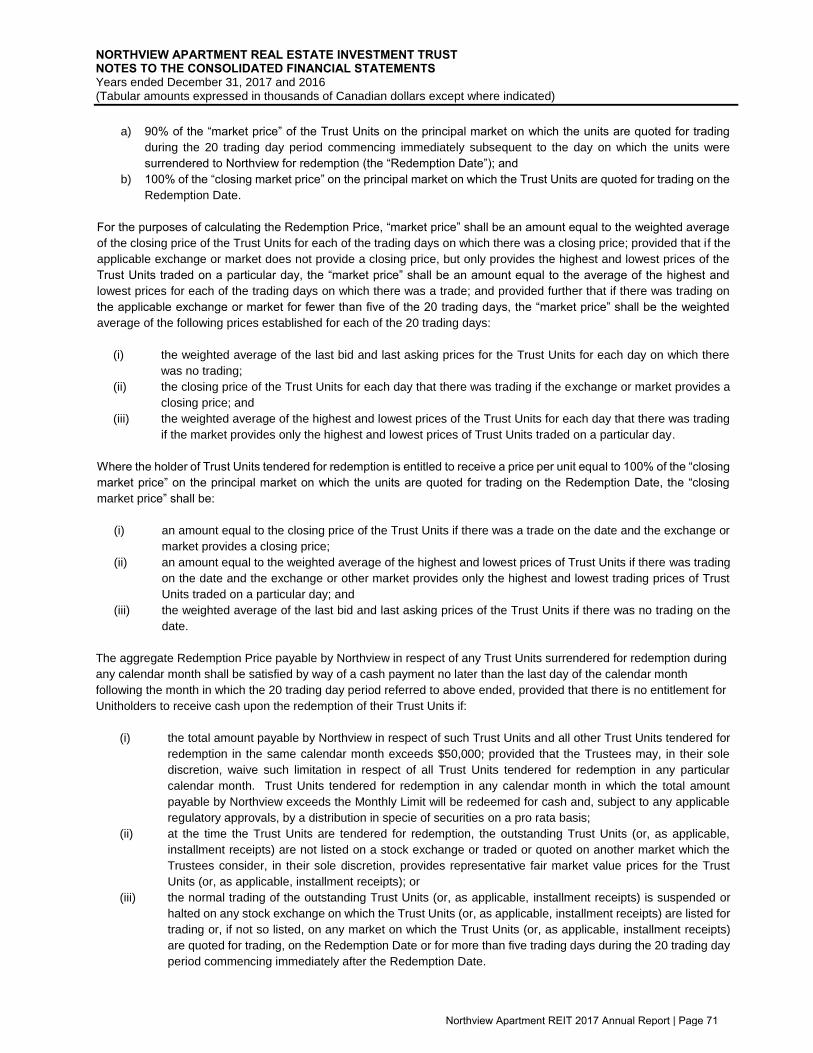
NORTHVIEW APARTMENT REAL ESTATE INVESTMENT TRUST NOTES TO THE CONSOLIDATED FINANCIAL STATEMENTS Years ended December 31, 2017 and 2016 (Tabular amounts expressed in thousands of Canadian dollars except where indicated)
a) 90% of the “market price” of the Trust Units on the principal market on which the units are quoted for trading
during the 20 trading day period commencing immediately subsequent to the day on which the units were
surrendered to Northview for redemption (the “Redemption Date”); and
b) 100% of the “closing market price” on the principal market on which the Trust Units are quoted for trading on the
Redemption Date.
For the purposes of calculating the Redemption Price, “market price” shall be an amount equal to the weighted average
of the closing price of the Trust Units for each of the trading days on which there was a closing price; provided that if the
applicable exchange or market does not provide a closing price, but only provides the highest and lowest prices of the
Trust Units traded on a particular day, the “market price” shall be an amount equal to the average of the highest and
lowest prices for each of the trading days on which there was a trade; and provided further that if there was trading on
the applicable exchange or market for fewer than five of the 20 trading days, the “market price” shall be the weighted
average of the following prices established for each of the 20 trading days:
(i) the weighted average of the last bid and last asking prices for the Trust Units for each day on which there
was no trading;
(ii) the closing price of the Trust Units for each day that there was trading if the exchange or market provides a
closing price; and
(iii) the weighted average of the highest and lowest prices of the Trust Units for each day that there was trading
if the market provides only the highest and lowest prices of Trust Units traded on a particular day.
Where the holder of Trust Units tendered for redemption is entitled to receive a price per unit equal to 100% of the “closing
market price” on the principal market on which the units are quoted for trading on the Redemption Date, the “closing
market price” shall be:
(i) an amount equal to the closing price of the Trust Units if there was a trade on the date and the exchange or
market provides a closing price;
(ii) an amount equal to the weighted average of the highest and lowest prices of Trust Units if there was trading
on the date and the exchange or other market provides only the highest and lowest trading prices of Trust
Units traded on a particular day; and
(iii) the weighted average of the last bid and last asking prices of the Trust Units if there was no trading on the
date.
The aggregate Redemption Price payable by Northview in respect of any Trust Units surrendered for redemption during
any calendar month shall be satisfied by way of a cash payment no later than the last day of the calendar month
following the month in which the 20 trading day period referred to above ended, provided that there is no entitlement for
Unitholders to receive cash upon the redemption of their Trust Units if:
(i) the total amount payable by Northview in respect of such Trust Units and all other Trust Units tendered for
redemption in the same calendar month exceeds $50,000; provided that the Trustees may, in their sole
discretion, waive such limitation in respect of all Trust Units tendered for redemption in any particular
calendar month. Trust Units tendered for redemption in any calendar month in which the total amount
payable by Northview exceeds the Monthly Limit will be redeemed for cash and, subject to any applicable
regulatory approvals, by a distribution in specie of securities on a pro rata basis;
(ii) at the time the Trust Units are tendered for redemption, the outstanding Trust Units (or, as applicable,
installment receipts) are not listed on a stock exchange or traded or quoted on another market which the
Trustees consider, in their sole discretion, provides representative fair market value prices for the Trust
Units (or, as applicable, installment receipts); or
(iii) the normal trading of the outstanding Trust Units (or, as applicable, installment receipts) is suspended or
halted on any stock exchange on which the Trust Units (or, as applicable, installment receipts) are listed for
trading or, if not so listed, on any market on which the Trust Units (or, as applicable, installment receipts)
are quoted for trading, on the Redemption Date or for more than five trading days during the 20 trading day
period commencing immediately after the Redemption Date.
Northview Apartment REIT 2017 Annual Report | Page 71

NORTHVIEW APARTMENT REAL ESTATE INVESTMENT TRUST NOTES TO THE CONSOLIDATED FINANCIAL STATEMENTS Years ended December 31, 2017 and 2016 (Tabular amounts expressed in thousands of Canadian dollars except where indicated)
If a Unitholder is not entitled to receive cash upon the redemption of Trust Units as a result of any one of the foregoing
limitations, then the Redemption Price per Trust Unit to which the Unitholder is entitled shall be the fair market value
thereof as determined by the Trustees and, subject to any applicable regulatory approvals, shall be paid out and satisfied
by way of a distribution in specie consisting of such assets of Northview as the Trustees determine.
Based on historic information over the past year, redemption levels are expected to be nil. However, the actual level of
redemptions may differ significantly from historic experience.
Special Voting Units
The DOT provides for the issuance of the Special Voting Units which have no economic entitlement in Northview or in
the distribution of assets of Northview, but are used to provide voting rights proportionate to the votes of the Trust Units
to holders of securities exchangeable into Trust Units, including the Class B LP Units. Each Special Voting Unit is not
transferable separately from the Class B LP Unit to which it is attached and will be automatically redeemed and cancelled
upon exchange of the attached Class B LP Unit into a Trust Unit. Each Special Voting Unit will entitle the holder to one
vote, either in person or by proxy, at the meeting of Unitholders as if he or she was a Unitholder.
The number of Trust Units issued and outstanding at December 31, 2017, and December 31, 2016, is as follows:
2017 2016
Number of Units Amount Number of Units Amount
Balance, January 1 49,942,379 1,157,774 44,410,640 1,053,626
Trust Units issued 1,199,392 30,206 5,531,739 104,148
Balance, end of year 51,141,771 1,187,980 49,942,379 1,157,774
b) Class B LP Units and Special Voting Units
The Class B LP Units are units issued by subsidiaries of Northview and can be issued in conjunction with property
acquisitions. The Class B LP Units can be exchanged for Trust Units at any time at the option of the holder. Each Class
B LP Unit will have a Special Voting Unit attached to it, which will entitle the holder to one vote, either in person or by
proxy, at the meeting of Unitholders as if he or she was a Unitholder.
Subsidiaries of Northview are authorized to issue Class B LP Units and Northview issues the related Special Voting Units.
The ability to exchange Class B LP Units for Trust Units implies a liability element exists because it imposes an
unavoidable obligation to deliver Trust Units (i.e., a financial instrument of another entity). Therefore, Class B LP Units
are classified as financial liabilities on the consolidated statements of financial position.
The total number of Class B LP Units and Special Voting Units outstanding as at December 31, 2017 is 6,684,614
(December 31, 2016 – 5,814,664), subject to conversion in accordance with their terms, with a corresponding liability of
$167.0 million (December 31, 2016 – $116.7 million). During 2017, nil Class B LP Units and Special Voting Units
(December 31, 2016 – 1,994,875), subject to conversion in accordance with their terms, were exchanged for Trust Units.
Northview issued 869,950 Class B LP and Special Voting Units, subject to conversion in accordance with their terms,
with a fair value of $22.0 million (December 31, 2016 – nil) for the year ended December 31, 2017.
Northview Apartment REIT 2017 Annual Report | Page 72

NORTHVIEW APARTMENT REAL ESTATE INVESTMENT TRUST NOTES TO THE CONSOLIDATED FINANCIAL STATEMENTS Years ended December 31, 2017 and 2016 (Tabular amounts expressed in thousands of Canadian dollars except where indicated)
The continuity schedule for the Class B LP Units and Special Voting Units classified as liabilities is as follows:
c) Distributions to Unitholders
Pursuant to the DOT, holders of Trust Units and Class B LP Units, are entitled to receive distributions made on each
distribution date as approved by the Trustees. During the year ended December 31, 2017, Northview declared monthly
cash distributions of $0.1358 per Unit (December 31, 2016 - $0.1358 per unit). For the year ended December 31, 2017,
Northview declared distributions totaling $91.2 million (December 31, 2016 – $88.4 million).
d) Normal course issuer bid (“NCIB”)
On May 27, 2016, the TSX approved Northview’s notice of intention to renew the NCIB for its Trust Units. Northview’s
NCIB was made in accordance with the policies of the TSX. Northview could purchase Trust Units during the period from
June 1, 2016 to May 31, 2017. Northview paid the market price at the time of acquisition for any Trust Units in accordance
with the rules and policies of the TSX and applicable securities laws. Purchases under the NCIB were funded out of
Northview’s working capital. Northview was not obligated to make any purchases pursuant to the NCIB. Northview was
authorized to purchase, in a 12 month period, up to 3,852,249 Trust Units, representing 10% of its public float as at May
26, 2016, through the facilities of the TSX and other Canadian trading platforms. On any trading day, Northview could not
purchase more than 32,646 Trust Units, which equaled 25% of Northview’s average daily trading volume on the TSX for
the most recently completed six calendar months preceding May 27, 2016, the date of acceptance of the NCIB by the
TSX, except where such purchases were made in accordance with the block purchase exemptions under the TSX rules.
On May 31, 2017, Northview’s NCIB expired. During the period from June 1, 2016 to May 31, 2017, Northview did not
purchase any Trust Units under its NCIB.
15. NON-CONTROLLING INTERESTS
Northview holds investments in a joint operation. Northview owns 55% of GoGa Cho Building Limited Partnership and,
accordingly, consolidates the operations and records a 45% non-controlling interest. Northview manages all aspects of
the joint operation, prepares budgets in compliance with Northview’s operating policies and determines whether
distributions should be paid to the joint venture partners. Due to the inherent control over the joint operation, Northview
consolidates the operations and records non-controlling interests.
Date Description
Issue Price/
Call Price
Number of
Units Amount
Balance at January 1, 2016 $17.56 7,809,539 137,135
February 11 Exchange of Class B LP Units and Special Voting Units $16.38 (1,910,853) (31,300)
August 29 Exchange of Class B LP Units and Special Voting Units $20.48 (25,402) (520)
September 26 Exchange of Class B LP Units and Special Voting Units $21.33 (58,620) (1,250)
December 31 Fair value adjustment $20.07 - 12,636
Balance at December 31, 2016 $20.07 5,814,664 116,701
December 1 Issuance of Class B LP Units and Special Voting Units $25.41 314,836 8,000
December 7 Issuance of Class B LP Units and Special Voting Units $25.22 555,114 14,000
December 31 Fair value adjustment $24.99 - 28,348
Balance at December 31, 2017 $24.99 6,684,614 167,049
Northview Apartment REIT 2017 Annual Report | Page 73

NORTHVIEW APARTMENT REAL ESTATE INVESTMENT TRUST NOTES TO THE CONSOLIDATED FINANCIAL STATEMENTS Years ended December 31, 2017 and 2016 (Tabular amounts expressed in thousands of Canadian dollars except where indicated)
16. GUARANTEES, COMMITMENTS AND CONTINGENCIES
In the normal course of operations, Northview may provide indemnification commitments to counterparties in transactions
such as credit facilities, leasing transactions, service arrangements, director and officer indemnification agreements, and
sales of assets. These indemnification agreements may require Northview to compensate the counterparties for costs
incurred as a result of changes in laws and regulations (including tax legislation) or as a result of litigation claims or
statutory sanctions that may be suffered by counterparties as a consequence of the transaction. The terms of these
indemnification agreements vary based on the contract and do not provide any limit on the maximum potential liability.
To date, Northview has not made any payments under such indemnifications and no amount has been accrued in the
consolidated financial statements with respect to these indemnification commitments.
In the normal course of operations, from time to time, Northview becomes subject to various legal and other claims.
Management and its legal counsel evaluate these claims and, where required, accrue the best estimate of costs relating
to these claims. Management believes the outcome of claims of this nature at December 31, 2017 will not have a material
impact on Northview’s consolidated financial statements.
In the normal course of operations, Northview provides guarantees for mortgages payable relating to investments in
corporations and joint ventures where Northview owns less than 100%. The mortgages payable are secured by specific
charges against the properties owned by the corporations and joint ventures. In the event of a default of the corporation
or joint venture, Northview may be liable for up to 100% of the outstanding balances of these mortgages payable.
At December 31, 2017, Northview has provided guarantees on mortgages secured by investment properties totaling $9.8
million (December 31, 2016 – $10.6 million) of its equity accounted joint ventures, ICP and ICS. These mortgages bear
interest at rates ranging from 3.01% to 5.50% (December 31, 2016 – 3.01% to 5.50%) and mature between May 2018
and July 2022 (December 31, 2016 – July 2017 and December 2020). As at December 31, 2017, land and buildings with
a carrying value of $23.5 million have been pledged to secure these mortgages payable (December 31, 2016 – $23.4
million). Due to the equity accounting of ICP and ICS, the mortgage balances have not been recorded in Northview’s
consolidated financial statements. Management believes no default will occur and, accordingly, no amount has been
recorded by Northview in the consolidated financial statements.
Northview Apartment REIT 2017 Annual Report | Page 74

NORTHVIEW APARTMENT REAL ESTATE INVESTMENT TRUST NOTES TO THE CONSOLIDATED FINANCIAL STATEMENTS Years ended December 31, 2017 and 2016 (Tabular amounts expressed in thousands of Canadian dollars except where indicated)
17. FINANCIAL INSTRUMENTS AND RISK MANAGEMENT
a) Fair value of financial assets and financial liabilities
Northview’s financial assets and financial liabilities are carried at amortized cost, which approximates fair value, or at fair
value through profit or loss as applicable. Such fair value estimates are not necessarily indicative of the amounts
Northview might pay or receive in actual market transactions.
The tables below present the fair value of Northview's assets and liabilities, as at December 31, 2017 and December 31,
2016:
2017 2016
Level 1 Level 2 Level 3 Level 1 Level 2 Level 3
Assets
Investment properties - - 3,472,028 - - 3,059,825
Cash and cash equivalent 10,718 - - 4,148 - -
Restricted cash 12,942 - - 11,254 - -
Assets held for sale - - 3,861 - - 24,797
Liabilities
Mortgages payable - 1,773,226 - - 1,692,821 -
Convertible debentures 24,839 - - 23,460 - -
Class B LP Units - 167,049 - - 116,701 -
Derivative instruments - - - - 1,499 -
Unit based payments - 3,250 - - 1,733 -
Liabilities related to asset held for sale - - - - - 18,008
Northview had no embedded derivatives requiring separate recognition as at December 31, 2017, or December 31, 2016.
Transfers between levels in the fair value hierarchy are recognized on the date of the event or change in circumstances
that caused the transfer. During the years ended December 31, 2017, and December 31, 2016, there were no transfers
between Level 1, Level 2 and Level 3 assets and liabilities. Northview had no credit derivatives over financial assets at
December 31, 2017, or December 31, 2016, and throughout the intervening periods.
The following summarizes the significant methods and assumptions used in estimating fair values of Northview's assets
and liabilities measured at fair value and other financial instruments:
(i) Investment properties
Northview determined the fair value of each investment property using the valuation methodology and key
assumptions described in Note 4.
(ii) Mortgages payable
The fair value of mortgages payable is estimated based on the present value of future payments, discounted at
the yield on a Government of Canada bond with the nearest maturity date to the underlying mortgage, plus an
estimated credit spread at the reporting date for a comparable mortgage or the yield of a comparable mortgage.
The spread rates used at December 31, 2017, ranged from 0.77% to 2.25% (December 31, 2016 - 1.01% to
2.59%), depending on the nature and terms of the respective mortgages.
Northview Apartment REIT 2017 Annual Report | Page 75

NORTHVIEW APARTMENT REAL ESTATE INVESTMENT TRUST NOTES TO THE CONSOLIDATED FINANCIAL STATEMENTS Years ended December 31, 2017 and 2016 (Tabular amounts expressed in thousands of Canadian dollars except where indicated)
(iii) Convertible debentures
The fair value of the convertible debentures is determined based on the market trading prices of the convertible
debentures as at the valuation date. As allowed under IFRS 13, Fair Value Measurement ("IFRS 13"), if an
asset or liability measured at fair value has a bid and an ask price, the price within the bid-ask spread that is
most representative of fair value in the circumstances shall be used to determine fair value. Northview uses the
closing price at the end of the period of the convertible debentures as the fair value for the convertible
debentures.
(iv) Class B LP Units
The fair value of the Class B LP Units is estimated based on the market trading prices of the Trust Units at the
valuation date. As allowed under IFRS 13, if an asset or liability measured at fair value has a bid price and an
ask price, the price within the bid-ask spread that is most representative of fair value in the circumstances shall
be used to determine fair value. Northview has chosen to use the closing price on the period end date of its
Trust Units for fair value measurement for its Class B LP Units.
(v) Derivative instruments
The fair value of the interest rate swap was determined using widely accepted valuation techniques including
discounted cash flow analysis on the expected cash flows of the derivatives. The fair value was determined
using the market standard methodology of netting the discounted future fixed cash payments and the discounted
expected variable cash receipts. The variable cash receipts were based on expectation of future interest rates
(forward curves) derived from observable market rate curves. The interest rate swap contract was repaid upon
maturity in July 2017.
(vi) Unit based payments
Northview determines the fair value of unit based payments and deferred units using the valuation methodology
and key assumptions described in Note 2(l) of the consolidated financial statements for the year ended
December 31, 2017 and 2016.
(vii) Other financial assets and financial liabilities
The fair values of Northview's other financial assets, which include cash and cash equivalent, restricted cash
and accounts receivable, as well as Northview's other financial liabilities, which include credit facilities, trade and
other payables, and distributions and Class B LP interest payable, approximate their recorded values due to
their short-term nature.
b) Risk management related to financial instruments
Northview is exposed to utility, credit, interest rate, and liquidity risks associated with its financial assets and liabilities.
The Trustees have responsibility for the establishment and approval of Northview’s overall risk management policies,
including those related to financial instruments. Management performs continuous assessments so that all significant
risks related to financial instruments are reviewed and addressed in light of changes to market conditions and
Northview’s operating activities.
(i) Utility cost risk
Utility cost risk is the potential financial loss Northview may experience as a result of higher resource prices
or lack of supply. Northview is exposed to utility cost risk from the fluctuation in retail prices for fuel oil,
natural gas, and electricity, the primary utilities used to heat its properties. The exposure to utility cost risk
is restricted primarily to the multi-family rental and execusuites and hotel portfolios. The leases in the
Northview Apartment REIT 2017 Annual Report | Page 76

NORTHVIEW APARTMENT REAL ESTATE INVESTMENT TRUST NOTES TO THE CONSOLIDATED FINANCIAL STATEMENTS Years ended December 31, 2017 and 2016 (Tabular amounts expressed in thousands of Canadian dollars except where indicated)
commercial portfolio generally provide for recovery of operating costs from tenants, including utilities. Due
to the northern locations of a significant portion of Northview’s portfolio, the exposure to utility price
fluctuations is more pronounced in the first and last fiscal quarters of the year. Northview manages its
exposure to utility risk through a number of preventative measures, including retrofitting properties with
energy efficient appliances, fixtures, and windows. Northview may utilize hedges or forward contracts to
manage exposure to utility cost risk.
Northview continues to implement a sub-metering program in properties located in Ontario. Sub-metering
provides individual electric meters for each multi-family rental unit, allowing tenants to pay their electricity
bills directly. This reduces utility costs to the landlord. As a result, Northview’s exposure to utility price
fluctuations is minimized in Ontario.
Heating oil is the primary source of fuel for heating properties located in Nunavut and Yellowknife, NT.
Natural gas is the main source of fuel for heating properties located in Alberta, parts of British Columbia,
New Brunswick, Nova Scotia, Ontario, Quebec, Saskatchewan, and Inuvik, NT. Natural gas prices in
Alberta, British Columbia, and Ontario are not subject to regulated price control. Northview does not use
financial instruments to manage the exposure to the utility cost risk.
Management prepared a sensitivity analysis of the impact of price changes in the cost of heating oil and
natural gas. A 10% change in the combined average price of heating oil and natural gas would impact
Northview’s net income by approximately $1.1 million for the year ended December 31, 2017 (December
31, 2016 – $1.0 million).
Electricity is the primary source for heating properties located in Newfoundland and Labrador, as well as
parts of British Columbia. In Newfoundland and Labrador and British Columbia, electricity is purchased from
the provincially regulated utilities and is directly paid by the residents for a significant portion of Northview’s
multi-family rental units. As a result, there is no significant risk to Northview regarding the price of electricity
in Newfoundland and Labrador and British Columbia.
(ii) Credit risk
Credit risk is the risk that one party to a financial instrument will cause a financial loss for the other party by
failing to discharge an obligation. Northview’s credit risk primarily arises from the possibility that residents may
not be able to fulfill their lease commitments. Loan receivables consist mainly of amounts due from commercial
tenants. Given Northview’s collection history and the nature of these tenants, credit risk is assessed as low.
Accounts receivable consists mainly of resident receivables. Resident receivables are comprised of a large
number of residents spread across the geographic areas in which Northview operates. There are no significant
exposures to single residents with the exception of the Governments of Canada, Nunavut and the Northwest
Territories, which lease a large number of residential units and commercial space in the Northwest Territories
and Nunavut.
Northview mitigates credit risk through conducting thorough credit checks on prospective residents, requiring
rental payments on the first of the month, obtaining security deposits approximating one month’s rent from
residents where legislation permits, and geographic diversification in its portfolio. Northview records a specific
bad debt provision on balances owed from past residents and provides an allowance for receivables, net of
security deposits, from current residents where the expected amount to be collected is less than the actual
accounts receivable. The aging of current residents and resident receivables is net of allowance for doubtful
accounts from current and past residents.
Northview classifies residents as past residents on the date of their move out from a residential unit. Any
subsequent recovery of balances owed from past residents is recorded as a reduction in the bad debt provision
for the period. The amounts disclosed on the consolidated statements of financial position are net of allowances
Northview Apartment REIT 2017 Annual Report | Page 77

NORTHVIEW APARTMENT REAL ESTATE INVESTMENT TRUST NOTES TO THE CONSOLIDATED FINANCIAL STATEMENTS Years ended December 31, 2017 and 2016 (Tabular amounts expressed in thousands of Canadian dollars except where indicated)
for uncollectible accounts from current and past residents and other receivables, estimated by management
based on prior experience and current economic conditions.
The following is an aging of current residents and other receivables:
2017 2016
0-30 days 1,946 1,866
31-60 days 572 441
61-90 days 122 144
Over 90 days 2,420 1,979
Resident receivables 5,060 4,430
Other receivables 7,181 4,998
12,241 9,428
Other receivables consist of goods and services tax rebates, mortgage holdbacks, insurance claims, miscellaneous
receivables and proceeds from the non-core asset disposition.
(iii) Interest rate risk
Interest rate risk is the risk that the value of future cash flows of a financial instrument will fluctuate as a result
of changes in market interest rates. Northview is exposed to interest rate risk on mortgages payable and its
credit facilities and does not hold any financial instruments to mitigate that risk. Northview may not be able to
continue to renew mortgage loans with interest rates that are lower than those currently in place. Northview
utilizes both fixed and floating rate debt. Interest rate risk related to floating interest rates is limited primarily to
the utilization of credit facilities. Management mitigates interest rate risk by utilizing fixed rate mortgages,
ensuring access to a number of sources of funding, and staggering mortgage maturities. To the extent possible,
Northview maximizes the amount of mortgages on residential rental properties where it is possible to lower
interest rates through CMHC mortgage insurance.
A sensitivity analysis on floating rate debt has been completed based on the exposure to interest rates at the
statement of financial position date. Floating rate debt includes all mortgages payable which are not subject to
fixed interest rates and the credit facilities. A 0.50% change in interest rates, keeping all other variables constant,
would change Northview’s net income for the year ended December 31, 2017, by approximately $0.5 million
(December 31, 2016 – $0.7 million). For the year ended December 31, 2017, the average floating rate debt was
$11.3 million and the average credit facilities balance was $123.2 million (December 31, 2016 – average floating
rate debt was $10.2 million and the average credit facilities balance was $82.2 million).
(iv) Liquidity risk
Liquidity risk is the risk that Northview is not able to meet its financial obligations as they fall due or can do so
only at excessive cost. Northview manages liquidity risk by managing mortgage and loan maturities . Cash flow
projections are completed on a regular basis to ensure there will be adequate liquidity to maintain operating,
capital, and investment activities in addition to making monthly distributions to Unitholders. The Trustees review
the current financial results and the annual business plan in determining appropriate distribution levels.
Contractual maturity for non-derivative financial liabilities at December 31, 2017:
Carrying Amount
Contractual Cash Flows
Up to 1 year
1 – 5 years
Over 5 years
Mortgages payable 1,786,156 2,030,176 319,618 1,018,907 691,651
Credit facilities 201,243 201,243 89,543 111,700 -
Trade and other payables (i) 69,027 69,027 69,027 - -
Distributions and Class B LP interest payable 7,853 7,853 7,853 - -
Liabilities related to assets held for sale - - - - - (i) Security deposits payable are included in trade and other payables.
Northview Apartment REIT 2017 Annual Report | Page 78
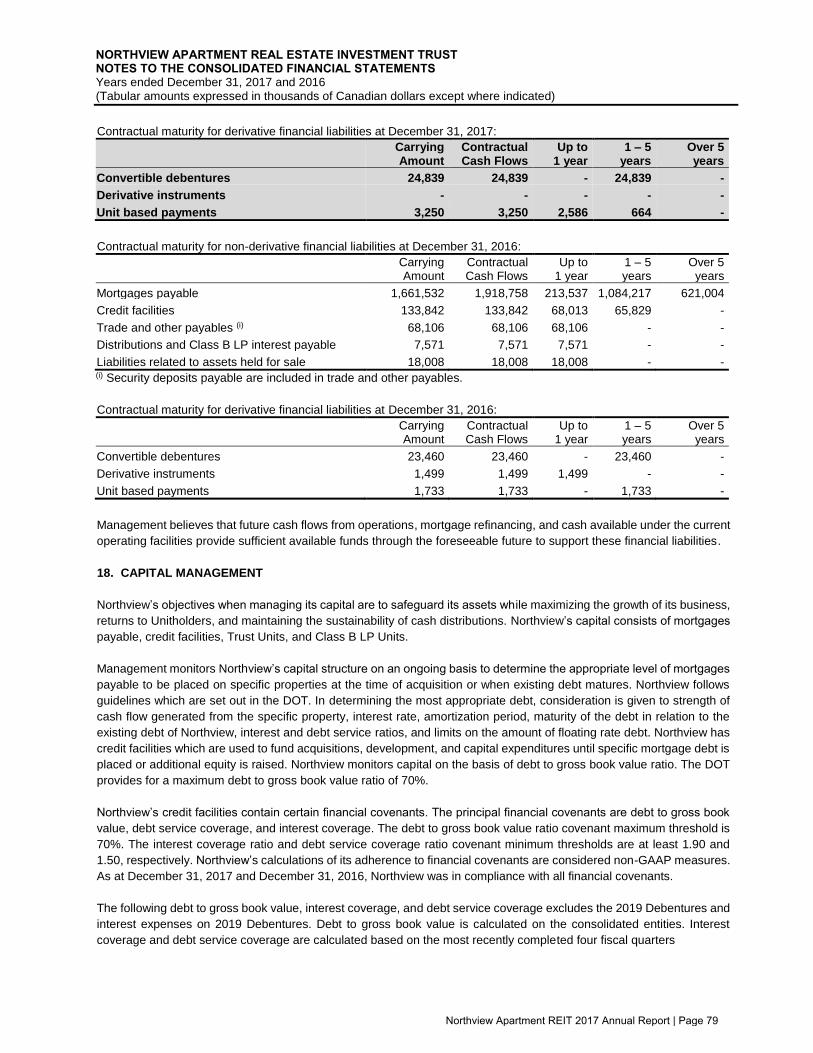
NORTHVIEW APARTMENT REAL ESTATE INVESTMENT TRUST NOTES TO THE CONSOLIDATED FINANCIAL STATEMENTS Years ended December 31, 2017 and 2016 (Tabular amounts expressed in thousands of Canadian dollars except where indicated)
Contractual maturity for derivative financial liabilities at December 31, 2017:
Carrying Amount
Contractual Cash Flows
Up to 1 year
1 – 5 years
Over 5 years
Convertible debentures 24,839 24,839 - 24,839 -
Derivative instruments - - - - -
Unit based payments 3,250 3,250 2,586 664 -
Contractual maturity for non-derivative financial liabilities at December 31, 2016:
Carrying Amount
Contractual Cash Flows
Up to 1 year
1 – 5 years
Over 5 years
Mortgages payable 1,661,532 1,918,758 213,537 1,084,217 621,004
Credit facilities 133,842 133,842 68,013 65,829 -
Trade and other payables (i) 68,106 68,106 68,106 - -
Distributions and Class B LP interest payable 7,571 7,571 7,571 - -
Liabilities related to assets held for sale 18,008 18,008 18,008 - - (i) Security deposits payable are included in trade and other payables.
Contractual maturity for derivative financial liabilities at December 31, 2016:
Carrying Amount
Contractual Cash Flows
Up to 1 year
1 – 5 years
Over 5 years
Convertible debentures 23,460 23,460 - 23,460 -
Derivative instruments 1,499 1,499 1,499 - -
Unit based payments 1,733 1,733 - 1,733 -
Management believes that future cash flows from operations, mortgage refinancing, and cash available under the current
operating facilities provide sufficient available funds through the foreseeable future to support these financial liabilities.
18. CAPITAL MANAGEMENT
Northview’s objectives when managing its capital are to safeguard its assets while maximizing the growth of its business,
returns to Unitholders, and maintaining the sustainability of cash distributions. Northview’s capital consists of mortgages
payable, credit facilities, Trust Units, and Class B LP Units.
Management monitors Northview’s capital structure on an ongoing basis to determine the appropriate level of mortgages
payable to be placed on specific properties at the time of acquisition or when existing debt matures. Northview follows
guidelines which are set out in the DOT. In determining the most appropriate debt, consideration is given to strength of
cash flow generated from the specific property, interest rate, amortization period, maturity of the debt in relation to the
existing debt of Northview, interest and debt service ratios, and limits on the amount of floating rate debt. Northview has
credit facilities which are used to fund acquisitions, development, and capital expenditures until specific mortgage debt is
placed or additional equity is raised. Northview monitors capital on the basis of debt to gross book value ratio. The DOT
provides for a maximum debt to gross book value ratio of 70%.
Northview’s credit facilities contain certain financial covenants. The principal financial covenants are debt to gross book
value, debt service coverage, and interest coverage. The debt to gross book value ratio covenant maximum threshold is
70%. The interest coverage ratio and debt service coverage ratio covenant minimum thresholds are at least 1.90 and
1.50, respectively. Northview’s calculations of its adherence to financial covenants are considered non-GAAP measures.
As at December 31, 2017 and December 31, 2016, Northview was in compliance with all financial covenants.
The following debt to gross book value, interest coverage, and debt service coverage excludes the 2019 Debentures and
interest expenses on 2019 Debentures. Debt to gross book value is calculated on the consolidated entities. Interest
coverage and debt service coverage are calculated based on the most recently completed four fiscal quarters
Northview Apartment REIT 2017 Annual Report | Page 79

NORTHVIEW APARTMENT REAL ESTATE INVESTMENT TRUST NOTES TO THE CONSOLIDATED FINANCIAL STATEMENTS Years ended December 31, 2017 and 2016 (Tabular amounts expressed in thousands of Canadian dollars except where indicated)
2017 2016
Debt to gross book value
Cash and cash equivalent (10,718) (4,148)
Credit facilities 201,243 133,842
Mortgages payable (Note 9) 1,810,154 1,692,255
Debt 2,000,679 1,821,949
Investment properties 3,472,028 3,059,825
Property, plant and equipment 41,911 40,282
Assets held for sale 3,861 39,873
Accumulated depreciation 27,243 22,493
Accumulated depreciation for assets held for sale - 4,074
Gross book value 3,545,043 3,166,547
Debt to gross book value 56.4% 57.5%
2017 2016
Interest coverage and debt service coverage
Net income before income taxes 212,367 77,475
Depreciation and amortization 5,025 4,967
Mortgage interest and deferred financing costs 51,970 53,004
Interest expense on credit facilities 4,614 6,043
Interest expense to Class B LP Unitholders 9,594 9,822
Business combination transaction costs - 14,579
Fair value (gain) loss (110,824) 10,268
Adjusted earnings 172,746 176,158
Mortgage interest and deferred financing costs 51,970 53,004
Interest expense on credit facilities 4,614 6,043
Total interest expense 56,584 59,047
Principal repayment 49,444 44,590
Debt service payments 106,028 103,637
Interest coverage 3.05 2.98
Debt service coverage 1.63 1.70
Debt to gross book value, interest coverage, and debt service coverage including the 2019 Debentures and interest
expenses on 2019 Debentures are 57.1%, 3.01, and 1.62, respectively (December 31, 2016 – 58.3%, 2.94, and 1.69,
respectively).
19. PERSONNEL COSTS
2017 2016
Salaries, wages and benefits 45,405 45,988
Equity settled unit based compensation 47 103
45,452 46,091
Personnel costs capitalized to investment properties (8,393) (8,406)
37,059 37,685
Northview Apartment REIT 2017 Annual Report | Page 80

NORTHVIEW APARTMENT REAL ESTATE INVESTMENT TRUST NOTES TO THE CONSOLIDATED FINANCIAL STATEMENTS Years ended December 31, 2017 and 2016 (Tabular amounts expressed in thousands of Canadian dollars except where indicated)
20. FINANCING COSTS
2017 2016
Mortgage interest 50,131 48,928
Deferred financing costs 1,839 4,076
Interest expense on 2019 debentures 1,322 1,324
Interest expense on credit facilities 4,614 6,043
Interest expense to Class B LP Unitholders 9,594 9,822
Interest and other income (1,286) (886)
(Gain) loss on extinguishment of debt 1,839 (755)
Total 68,053 68,552
21. FAIR VALUE (GAIN) LOSS
2017 2016
Investment properties (140,709) (3,228)
Interest rate swap (239) (16)
2019 debentures 1,380 575
Unit based payments 396 302
Class B LP Units 28,348 12,635
Total (110,824) 10,268
22. CHANGES IN NON-CASH WORKING CAPITAL
2017 2016
Restricted cash (1,688) 281
Accounts receivable (2,813) 3,333
Prepaid expenses and other assets (1,965) 1,219
Loans receivable 3,429 2,629
Other long term assets 324 (345)
Trade and other payables (14,584) (2,099)
Changes in non-cash working capital from operating activities (17,297) 5,018
The changes in non-cash working capital from investing activities for the year ended December 31, 2017, of $1.4 million
cash inflow (December 31, 2016 – $1.3 million cash outflow) is due to the change in trade and other payables related to
work in progress with respect to investment property improvements and land held for development.
23. OPERATING LEASES
As lessor, Northview leases commercial investment property held under operating leases. Commercial property operating
leases have lease terms of between 1 to 20 years, with an option to extend for a further period. All commercial operating
lease contracts contain market review clauses in the event that the lessee exercises its option to renew.
The future minimum lease payments receivable on commercial investment properties are as follows:
2017 2016
Less than 1 year 19,563 20,063
Between 1 and 5 years 52,733 60,299
More than 5 years 14,360 22,228
86,656 102,590
Northview Apartment REIT 2017 Annual Report | Page 81

NORTHVIEW APARTMENT REAL ESTATE INVESTMENT TRUST NOTES TO THE CONSOLIDATED FINANCIAL STATEMENTS Years ended December 31, 2017 and 2016 (Tabular amounts expressed in thousands of Canadian dollars except where indicated)
24. ASSETS HELD FOR SALE
As at December 31, 2017, there is one non-core property across the portfolio classified as ‘Assets held for sale’ with a fair value
of $3.9 million which is expected to be disposed of within twelve (12) months.
Dispositions of non-core properties for the year ended December 31, 2017, were as follows:
Property Type Location Units Gross Proceeds
Multi-family Atlantic Canada 36 4,000
Multi-family/Land Western Canada 179 20,283
Multi-family Ontario 269 42,820
Hotel Northern Canada 75 14,875
Total 559 81,978
Dispositions of non-core properties for the year ended December 31, 2016, were as follows:
Property Type Location Units Gross Proceeds
Multi-family Atlantic Canada 28 1,770
Multi-family Northern Canada 2 300
Multi-family Ontario 489 46,500
Total 519 48,570
The assets held for sale included in the consolidated statements of financial position are:
2017 2016
Assets
Investment properties 3,861 24,797
Property, plant and equipment - 15,076
3,861 39,873
Liabilities
Mortgages payable - 18,008
- 18,008
Net assets held for sale 3,861 21,865
25. RELATED PARTIES
a) Key management personnel
Key management personnel are comprised of Trustees and the Trust’s executive officers. The remuneration of
Northview’s key management personnel is as follows:
2017 2016
Salaries, wages and benefits 1,700 1,805
Equity settled unit based compensation - 429
1,700 2,234
Northview Apartment REIT 2017 Annual Report | Page 82

NORTHVIEW APARTMENT REAL ESTATE INVESTMENT TRUST NOTES TO THE CONSOLIDATED FINANCIAL STATEMENTS Years ended December 31, 2017 and 2016 (Tabular amounts expressed in thousands of Canadian dollars except where indicated)
b) Related party transactions
Related party transactions are conducted in the normal course of operations and are made on terms equivalent to arm’s
length transactions.
Pursuant to the Transitional Services Agreement dated October 30, 2015, Starlight Group Property Holdings Inc. and
affiliates (“Starlight”) is to provide transitional services of an asset management nature for a monthly fee equal to 0.125%
of the sum of: (i) the agreed upon allocated values of the properties acquired from True North and its affiliates in
connection with the Transaction; (ii) the third party appraised values of the private portfolio acquired by Northview in
connection with the Transaction; (iii) the purchase price of new sourced properties; (iv) the third party appraised values
of added properties; and (v) the cost of any capital expenditures incurred by Northview or any of its affiliates in respect of
the properties since the closing date of the Transaction. This agreement is for a term of three years ending October 30,
2018, with Northview having the option to exclude the New Brunswick and Nova Scotia properties from the agreement
after October 30, 2017. At Northview’s option, the term may be renewed for two additional one year terms. On October
30, 2017, Northview provided notice to Starlight terminating the transitional service agreement, effective October 30,
2018.
For the year ended December 31, 2017, the costs of these services aggregated to $1.8 million (December 31, 2016 -
$1.9 million). Of this amount, $1.4 million (December 31, 2016 - $1.5 million) has been capitalized, while the remaining
$0.4 million (December 31, 2016 - $0.4 million) has been recognized as administration expenses in the consolidated
statements of net and comprehensive income.
Balance outstanding and payable to Northview from Starlight as at December 31, 2017, is $0.2 million (December 31,
2016 - $0.4 million) and is included in accounts receivable in the consolidated statements of financial position. The
balance outstanding and payable to Starlight from Northview as at December 31, 2017, is $0.2 million (December 31,
2016 - $0.2 million) and is included in trade and other payables in the consolidated statements of financial position.
During the fourth quarter of 2017, Northview purchased two properties from Starlight for a total purchase price of $58.2
million. The properties were purchased at a value consistent with an independent third-party assessment of the fair
value of the properties. Fair value was calculated using expected net operating income of that property divided by the
market capitalization rate at the time of the valuation. In addition, Northview issued 555,114 Class B LP Units and
Special Voting Units, subject to conversion in accordance with their terms, to Starlight with a fair value of $14.0 million.
In conjunction with the transactions, a fee of $1.6 million is payable to Starlight from Northview in accordance with the
Transitional Service Agreement. The transactions were unanimously approved by the independent Trustees of
Northview.
ICP and ICS are related parties as Northview has a 50% interest in ICP and a 50% interest in ICS. For the three months
ended December 31, 2017, revenue from ICP and ICS related to management fees was $0.1 million (December 31, 2016
- $0.1 million). For the year ended December 31, 2017, revenue from ICP and ICS related to management fees was $0.4
million (December 31, 2016- $0.4 million). Balance outstanding and payable to Northview from ICP and ICS related to
management fees is $0.1 million (December 31, 2016 - $0.1 million) and is included in accounts receivable in the
consolidated statements of financial position. The balance outstanding and payable to ICP and ICS from Northview as at
December 31, 2017, is nil (December 31, 2016 – $0.1 million) and is included in trade and other payables in the
consolidated statements of financial position.
During the year ended December 31, 2017, nil Class B LP Units and Special Voting Units were exchanged for Trust Units
by a related party. During the year ended December 31, 2016, 1,910,853 Class B LP Units and Special Voting Units,
subject to conversion in accordance with their terms, were exchanged for Trust Units with a fair value of $31.3 million by
a Trustee, a related party. Exchange of Class B LP Units and Special Voting Units to Trust Units does not affect the
Trustee’s total ownership.
Northview Apartment REIT 2017 Annual Report | Page 83

NORTHVIEW APARTMENT REAL ESTATE INVESTMENT TRUST NOTES TO THE CONSOLIDATED FINANCIAL STATEMENTS Years ended December 31, 2017 and 2016 (Tabular amounts expressed in thousands of Canadian dollars except where indicated)
26. SEGMENTED INFORMATION
Management uses geographic segments (i.e. groups of provinces and territories) to manage the properties. The
geographic segments consist of Atlantic Canada (Newfoundland and Labrador, Nova Scotia, and New Brunswick),
Northern Canada (Northwest Territories and Nunavut), Ontario, Quebec, and Western Canada (Alberta, British Columbia,
and Saskatchewan). In addition, due to the differences between the commercial & execusuites and the residential
markets, management also reviews operations by market segment.
Northview’s residential portfolio is comprised of a multi-family segment: apartments, town homes, and single family rental
units; where the rental period ranges from a few days to several months. The commercial and execusuites business
segment is comprised of office, industrial, and retail properties primarily in areas where Northview has residential
operations. On July 28, 2017, Northview completed the disposition of a non-core hotel asset for $14.9 million. After the
non-core hotel asset disposition, execusuites and hotel business segment does not meet the quantitative thresholds as
a separate reportable segment; therefore it is combined with commercial business segment. The prior year market
segments have been recast to reflect the current year presentation.
a) Geographic Segments
Atlantic
Canada
Northern
Canada Ontario Quebec
Western
Canada Total
Year ended
December 31, 2017
Rental revenue 46,282 87,801 90,463 19,072 75,835 319,453
Other revenue 1,127 2,030 4,570 550 4,185 12,462
Operating expense (22,491) (32,313) (44,571) (9,555) (32,805) (141,735)
Net operating income 24,918 57,518 50,462 10,067 47,215 190,180
As at December 31, 2017
Total assets 446,442 647,560 1,253,956 208,541 982,138 3,538,637
Investment properties 429,683 618,196 1,253,108 207,288 963,753 3,472,028
Total liabilities 200,728 303,355 703,130 150,672 480,606 1,838,491
Atlantic
Canada
Northern
Canada Ontario Quebec
Western
Canada Total
Year ended
December 31, 2016
Rental revenue 45,061 88,255 89,725 18,401 72,225 313,667
Other revenue 955 5,644 5,351 293 6,545 18,788
Operating expense (22,424) (34,042) (46,220) (9,109) (35,131) (146,926)
Net operating income 23,592 59,857 48,856 9,585 43,639 185,529
As at December 31, 2016
Total assets 408,728 626,385 986,206 184,192 949,714 3,155,225
Investment properties 383,722 594,599 970,131 181,856 929,517 3,059,825
Total liabilities 230,359 302,467 602,885 135,371 443,300 1,714,382
Northview Apartment REIT 2017 Annual Report | Page 84

NORTHVIEW APARTMENT REAL ESTATE INVESTMENT TRUST NOTES TO THE CONSOLIDATED FINANCIAL STATEMENTS Years ended December 31, 2017 and 2016 (Tabular amounts expressed in thousands of Canadian dollars except where indicated)
b) Market Segments
Multi-family
Commercial and
Execusuites Total
Year ended December 31, 2017
Rental revenue 276,864 42,589 319,453
Other revenue 11,439 1,023 12,462
Operating expense (123,642) (18,093) (141,735)
Net operating income 164,661 25,519 190,180
As at December 31, 2017
Total assets 3,252,103 286,534 3,538,637
Investment properties 3,229,026 243,002 3,472,028
Total liabilities 1,697,152 141,339 1,838,491
Multi-family
Commercial and
Execusuites Total
Year ended December 31, 2016
Rental revenue 268,668 44,999 313,667
Other revenue 17,830 958 18,788
Operating expense (127,249) (19,677) (146,926)
Net operating income 159,249 26,280 185,529
As at December 31, 2016
Total assets 2,875,882 279,343 3,155,225
Investment properties 2,821,454 238,371 3,059,825
Total liabilities 1,569,525 144,857 1,714,382
c) Reconciliation of reportable segment net income
2017 2016
Total net operating income for reportable segments 190,180 185,529
Financing costs (68,053) (68,552)
Administration (14,738) (9,830)
Depreciation and amortization (5,025) (4,967)
Loss on sale of properties (1,668) (722)
Equity income from joint ventures 847 864
Business combination transaction costs - (14,579)
Fair value gain (loss) 110,824 (10,268)
Net and comprehensive income 212,367 77,475
d) Reconciliation of reportable segment assets
2017 2016
Total assets for reportable segments 3,538,637 3,155,225
Investment in joint ventures 6,920 6,274
Other assets 4,199 2,376
Restricted cash and cash 23,660 6,721
Assets held for sale - 15,076
Total assets 3,573,416 3,185,672
Northview Apartment REIT 2017 Annual Report | Page 85

NORTHVIEW APARTMENT REAL ESTATE INVESTMENT TRUST NOTES TO THE CONSOLIDATED FINANCIAL STATEMENTS Years ended December 31, 2017 and 2016 (Tabular amounts expressed in thousands of Canadian dollars except where indicated)
e) Reconciliation of reportable segment liabilities
2017 2016
Total liabilities for reportable segments 1,838,491 1,714,382
Class B LP Units 166,147 115,971
Convertible debentures 24,839 23,460
Derivative instruments - 1,499
Credit facilities 201,243 133,842
Trade and other payables 17,594 15,986
Distributions and Class B LP interest payable 7,853 7,571
Unit based payments 3,250 1,733
Liabilities related to assets held for sale - 18,008
Total liabilities 2,259,417 2,032,452
27. SUBSEQUENT EVENTS
Between January 1, 2018, and February 27, 2018, Northview acquired one piece of land in Ontario, for $5.3 million.
Northview Apartment REIT 2017 Annual Report | Page 86

TRUSTEES OFFICERS
Scott Thon, P.Eng., ICD.D
Trustee and Chairman of the Board
Todd R. Cook, CPA, CA President and Chief Executive Officer
Todd R. Cook, CPA, CA President, Chief Executive Officer, and Trustee
Travis Beatty, CPA, CA, CFA Chief Financial Officer
Daniel Drimmer
Trustee Leslie Veiner, CPA, CA
Chief Operating Officer Kevin E. Grayston, CPA, CA, ICD.D Trustee
Richard Anda
Vice President, Business Development Dennis J. Hoffman, FCPA, FCA, ICD.D Trustee
Louise Elsey
Corporate Secretary Christine McGinley, CPA, CA, ICD.D Trustee
Bo Rasmussen
Vice President, Property Development Terrance L. McKibbon, ICD.D Trustee
Lizaine Wheeler
Vice President, Residential Operations Graham Rosenberg, CPA, CA Trustee
CORPORATE INFORMATION
ANNUAL GENERAL MEETING
Thursday, May 10, 2018
3:00 p.m. MT, 5:00 p.m. ET
Calgary Marriott Downtown Hotel
110 9th Avenue SE
Calgary, AB
STOCK EXCHANGE
Toronto Stock Exchange (TSX)
Trading Symbol: NVU.UN
LEGAL COUNSEL
Borden Ladner Gervais LLP
AUDITORS
Deloitte LLP
REGISTRAR AND TRANSFER AGENT
Computershare Trust Company of Canada
CORPORATE OFFICE
200, 6131 – 6th Street SE
Calgary, AB T2H 1L9
Telephone: 403-531-0720
Fax: 403-531-0727
Email: [email protected]
Website: www.northviewreit.com
Northview Apartment REIT 2017 Annual Report | Page 87