Embed Size (px)
Citation preview
ANNUAL REPORT

ii
INDEX
OUR BUSINESS .......................................................................................................................................................... 1
MANAGEMENT ......................................................................................................................................................... 2
MANAGEMENT'S DISCUSSION AND ANALYSIS OF FINANCIAL CONDITION AND RESULTS OF OPERATIONS ............................................................................................................................................................. 6
SELECTED FINANCIAL DATA AND SUPPLEMENTARY DATA ................................................................. 28
MARKET FOR OUR COMMON EQUITY AND RELATED STOCKHOLDER MATTERS ........................ 30
FINANCIAL STATEMENTS .................................................................................................................................. 31

1
OUR BUSINESS
Altair Nanotechnologies Inc. (the “Company”, “we” or “us”) is a Delaware corporation whose primary business
is developing, manufacturing and selling nano lithium titanate batteries and battery systems. We target applications that effectively utilize the key attributes of our technology, including safety, long cycle life, a wide temperature operating range, high power density, and very fast charge and discharge capabilities.
We are focusing our product development, marketing and sales and manufacturing operations in three market segments: electric grid, transportation (commercial vehicles), and industrial, as a result of market research concluding these segments offered the best fit for our technology and the most promising path for revenue growth.
In July 2011, Canon Investment Holdings, Ltd (“Canon”), through its subsidiary Energy Storage Technology
(China) Group Limited (“Energy Storage China”), acquired a majority interest in our Company. During 2012, we formed Altair Nanotechnologies (China) Co., Ltd, a wholly foreign owned entity in China (“Altair China”), and its subsidiary in Wu’an, China named Northern Altair Nanotechnologies Co. Ltd. (“Altair Northern”). Our intention is to launch manufacturing and sales operations in China through Altair Northern with the goal of supplying the Chinese market with cost-effective advanced energy solutions for the electric grid, transportation and industrial market segments. Initially, the operation will focus on the manufacture of lithium titanate materials and energy storage systems for large residential complexes as well as for the electric grid. Consistent with this goal, Altair Northern has signed agreements with local governmental agencies related to Altair Northern’s acquisition of land and the sale of products to such governmental agencies. Our business plan currently provides that we will transfer our nano lithium titanate manufacturing capability to China in 2013 and consolidate our U.S. operations for greater efficiency and cost reductions.
2
MANAGEMENT
Set forth below is certain information with respect to each of the directors of the Company.
Yincang Wei :Age: 53 Director Since: July 2011 Committees: Compensation, Governance and Nominating Committee Principal Occupation: Chairman, Canon Investment Holdings Limited, Zhuhai Yintong Energy Company Ltd.
and Guangdong Yintong Investment Holdings Group Co., Ltd. Experience: Mr. Yincang Wei has served as the chairman of Canon Investment Holdings Limited,
Zhuhai Yintong Energy Company Ltd. and Guangdong Yingtong Investment Holdings Group Co., Ltd. from 2004 until the present time. Prior to that, Mr. Wei served as the chairman of Nan-Ming-He Iron Ore Limited, a company engaged in the business of iron mine operations. Mr. Wei also previously served in various senior management positions at Hebei Yinda Transportation Industrial Group, Hong Kong Dalong Investment Holdings Limited, Transportation Industrial Group Corporation, and Transportation Safety Equipment Factory. Mr. Wei graduated from Xi’an Highway University with a degree in engineering. Mr. Wei has also pursued further education in Transportation Management and Vehicle Inspection and Testing at Xi’an Highway University.
Alexander Lee Age: 46 Director Since: December 2009 Committees: Audit Committee until the Meeting Principal Occupation: Chief Executive Officer of the Company. Mr. Lee is also Managing Director of Al
Yousuf, LLC and CEO of Phoenix Cars LLC. Experience: Mr. Lee was named as Interim Chief Executive Officer of the Company in April 2012,
and was named as Chief Executive Officer of the Company in August 2012. Prior to joining the Company, Mr. Lee served as managing director of Al Yousuf, LLC, a Dubai-based company that operates a range of businesses in the electronics, information technology, transportation and real estate sectors. Mr. Lee joined Al Yousuf, LLC as a managing director in December 2009. From August 2010 to the present, Mr. Lee also served as CEO of Phoenix Cars LLC (“Phoenix Motorcars”), an electric vehicle developer. Phoenix Cars LLC is a wholly-owned subsidiary of Al Yousuf LLC, which acquired the operating assets of Phoenix MC Inc. in August 2009. Mr. Lee also held executive level positions at Phoenix MC, Inc. from December 2007 to October 2009. Prior to Phoenix MC, Inc., Mr. Lee worked at Rapiscan Systems (Nasdaq: OSIS), a developer, manufacturer and distributor of x-ray, gamma-ray and computed tomography products. Mr. Lee was vice president of strategic planning at Rapiscan from February 2006 to December 2007. Mr. Lee joined Rapiscan as the head of its contracts and proposals group in October 2003. Mr. Lee earned a bachelor of arts degree from Brown University and a juris doctorate degree from the King Hall School of Law at University of California Davis.
Liming (Albert) Zou Age: 49 Director Since: July 2011 Committees: None Principal Occupation:
President of the Company
3
Experience: Mr. Zou was appointed as President of the Company in April 2012. Mr. Zou
previously served as Chief Executive Officer of YuView Holdings Ltd. and President of the Company; from 2009 to 2012. Mr. Zou previously served as Vice President for Asian Coast Development Ltd. from 2007 to 2008. In this position Mr. Zou had primary responsibility for marketing and business development in China. Mr. Zou served as Executive Director of SI-TECH Information Technology Ltd. from 2005 to 2007, where he was responsible for corporate financing and mergers & acquisitions. From 2004 to 2005, Mr. Zou served as a Director of Confederal Finance Corp.
Mr. Zou earned his bachelor’s degree in science from Beijing University of Post and Telecommunications and earned his master’s degree in science from the Graduate School of China Academy of Posts & Telecommunications. He also earned a master’s degree in business administration from the Richard Ivey School of Business at the University of Western Ontario, Canada.
Guohua Sun Age: 36 Director Since: July 2011 Committees: Compensation, Governance and Nominating Committee Principal Occupation: General Manager, Canon Investment Holdings Limited and Guangdong Yintong
Investment Holdings Group Co., Ltd; Director, Zhuhai Yintong Energy Company Ltd. Experience: Mr. Sun has served as the General Manager of Canon Investment Holdings Limited
and Guangdong Yintong Investment Holdings Group Co., Ltd. from April 2005 to the present and also currently serves as a director of Zhuhai Yintong Energy Company Ltd. Prior to that, Mr. Sun served as General Manager of Beijing Yinda Transportation Investment Limited from 2003 to 2005, prior to that time, as Vice General Manager from 2001 to 2003. Mr. Sun also served as Vice General Manager of Nan-Ming-He Iron Ore Limited from 2001 to 2003. Mr. Sun graduated with a degree in business administration from Handan University and with a master’s degree in business administration from the University of Wales.
Jun (Eddie) Liu :Age: 57 Director Since: July 2011 Committees: Compensation, Governance and Nominating Committee Principal Occupation: Experience:
General Manager of Vantech Enviro Plastics Corp. Canada Mr. Liu currently serves as the General Manager of Vantech Enviro Plastics Corp. Canada, a company focused on the development and production of plastic film products. Mr. Liu previously served as Marketing and Sales Director for Morgan Grandview Group (Canada) from November 2008 to October 2009. In this position Mr. Liu had primary responsibility for marketing development, business management and product sales in Canada and the United States. Mr. Liu served as Account Manager and then as Authorized Supervisor at JNE (Canada) from September 2004 to December 2007. Mr. Liu earned his bachelor’s degree in chemistry from Beijing University and a certificate of executive in marketing strategy from the State University of New York at Buffalo.
Zhigang (Frank) Zhao Age: 52 Director Since: July 2011 Committees: Audit Committee Principal Occupation: Chief Financial Officer, Borqs International Holding Corporation Experience: Mr. Zhao works for Borqs International Holding Corporation, a technology company
that provides Android software and end-to-end service platform solutions from September 2012. Mr. Zhao previously served as chief financial officer for KingMed Diagnostics, an independent medical testing service company through May 2012. Prior
4
to joining KingMed in January 2011, Mr. Zhao served as chief financial officer for Simcere Pharmaceutical Group (NYSE: SCR) from October 2006 to January 2011. Mr. Zhao served as chief financial officer for Sun New Media/Hurray in China from September 2005 to October 2006, as controller for Faro Technology (Nasdaq: FARO) in the United States from September 2003 to August 2005, and as vice president of finance for 800 Travel (USA), an Introwest Company from June 1997 to August 2003. Prior to that, Mr. Zhao worked at Price Waterhouse Coopers in the United States as a senior auditor from September 1993 to May 1997. Mr. Zhao earned his bachelor’s degree in economics from Beijing University and his master of business administration from the University of Hartford. Mr. Zhao is a member of the American Institute of Certified Public Accountants.
Other Directorships Zuoan Fashion (NYSE: ZA), a clothing and design company. Hong Guo :Age: 46 Director Since: October 2011 Committees: Audit Committee Principal Occupation: Attorney at Guo Law Corporation in Richmond, BC, British Columbia Experience: Ms. Guo has worked as an attorney in private practice at Guo Law Corporation in
Richmond, BC, British Columbia since May 2009. From November 2005 to April 2009, and from June 1999 to February 2002, Ms. Guo was an associate with the Merchant Law Group. From February 2002 to October 2005, Ms. Guo was a partner at the Derun Law Firm and in house counsel for XinDe Holdings Limited, a joint venture between Citic Group and Siemens. Ms. Guo earned a B.A. in History from Beijing University, an M.A. in Sociology from University of Regina in Saskatchewan and an L.L.B. from the University of Windsor College of Law in Ontario.
Executive Officers
The executive officers of the Company are Alexander Lee, Liming (Albert) Zou, Stephen B. Huang, Bruce J. Sabacky and Tom Kieffer. Information regarding Mr. Lee and Mr. Zou is presented in “Directors” immediately above. Certain information regarding Messrs. Huang, Sabacky, and Kieffer follows. Stephen B. Huang :Age: 39 Principal Occupation: Vice President, Chief Financial Officer and Secretary of the Company Experience: Mr. Huang was appointed as Vice President and Chief Financial Officer of the
Company in September 2011. Prior to joining the Company, Mr. Huang served as Chief Financial Officer Consultant to Robert Half International, Inc. where he provided interim and consulting CFO, project leadership, and advisory services to a variety of clients from September 2010 through his appointment with the Company. From February 2010 through September 2010, Mr. Huang served as Chief Financial Officer of Unigen Corporation. From December 2005 through January 2010, Mr. Huang served as Chief Financial Officer, Corporate Secretary and Vice President of Penguin Computing, Inc. Mr. Huang also worked for Candescent Technologies Corporation (1999–2005) as a Corporate Officer, Vice President Finance, and Corporate Controller, for Intel Corporation (1998–1999) as a Manager, Corporate Finance, for Innovative Interfaces, Inc. (1995–1998) as Assistant Corporate Controller, and for Great Western Financial Corporation (1992–1995) as a Banker, Analyst. Mr. Huang received his bachelor’s degree in Business Administration (Finance and Accounting) from San Francisco State University, College of Business.
Bruce J. Sabacky :Age: 62 Principal Occupation: Chief Technology Officer of the Company Experience: Dr. Sabacky was appointed Chief Technology Officer of the Company in June
5
2006. Dr. Sabacky was appointed Vice President of Research and Engineering for Altairnano, Inc., the operating subsidiary through which the Company conducts its nanotechnology business, in October 2003. Dr. Sabacky joined Altairnano, Inc. in January 2001 as Director of Research and Engineering. Prior to that, he was the manager of process development at BHP Minerals Inc.’s Center for Minerals Technology from 1996 to 2001, where he was instrumental in developing the nanostructured materials technology. Dr. Sabacky was the technical superintendent for Minera Escondida Ltda. from 1993 to 1996 and was a principal process engineer with BHP from 1991 to 1993. Prior to that, he held senior engineering positions in the minerals and metallurgical industries. Dr. Sabacky obtained a bachelor of science and a master of science degree in metallurgical engineering from the South Dakota School of Mines and Technology and a doctor of philosophy degree in materials science & mineral engineering with minors in chemical engineering and mechanical engineering from the University of California, Berkeley.
Tom Kieffer :Age: 53 Principal Occupation: Vice President of Marketing and Sales for the Company Experience: Prior to joining the Company in March 2010, Mr. Kieffer served as the executive
director of customer support excellence and brand from 2005 through March 2009 for Cummins Inc. From 2001 through the end of 2005, Mr. Kieffer was executive director of engine business marketing for Cummins Inc., and from 1999 through 2000, Mr. Kieffer was executive director of engine business automotive marketing for Cummins Inc. From 1996 to 1998, Mr. Kieffer was general manager responsible for Cummins Inc’s $250 million global commercial relationship with PACCAR, a major truck manufacturer. From 1993 through 1995, Mr. Kieffer was director of industrial markets with responsibility for Cummins Inc.’s Original Equipment Manufacturer (OEM) and North American field sales organizations servicing construction, mining, and agriculture markets.
Mr. Kieffer obtained a bachelor of science in industrial engineering from Purdue University, West Lafayette, Indiana and a master of business administration from Indiana University, Bloomington, Indiana.
6
MANAGEMENT'S DISCUSSION AND ANALYSIS OF FINANCIAL CONDITION AND RESULTS OF OPERATIONS
This Annual Report and Supplementary Financial Disclosures (this “Report”) contains various forward-looking
statements. Such statements can be identified by the use of the forward-looking words “anticipate,” “estimate,” “project,” “likely,” “believe,” “intend,” “expect,” or similar words. These statements discuss future expectations, contain projections regarding future developments, operations, or financial conditions, or state other forward-looking information. When considering such forward-looking statements, you should keep in mind the risk factors noted in under “Risk Factors” below and other cautionary statements throughout this Report and our other filings with the SEC. You should also keep in mind that all forward-looking statements are based on management’s existing beliefs about present and future events outside of management’s control and on assumptions that may prove to be incorrect. If one or more risks identified in this Report or any other applicable filings materializes, or any other underlying assumptions prove incorrect, our actual results may vary materially from those anticipated, estimated, projected, or intended.
Overview
Our primary focus is marketing advanced energy storage solutions for the electric grid, transportation, and industrial markets. In 2010, we expanded our sales focus to include original equipment manufacturers in the commercial vehicle and industrial markets targeting applications that leveraged the key attributes of our technology. These markets include medium and heavy-duty trucks, rail, stationary industrial applications and micro-grid systems. We believe that in the aggregate, our target markets are multi-billion dollar emerging markets with room for a number of successful suppliers. We believe the markets for advanced energy storage are maturing and as a result of our differentiated product attributes and the growing recognition we are receiving in the marketplace, that we will be successful in expanding orders. Customers are now telling us that unique attributes of our nano lithium titanate chemistry create real value for their businesses by allowing them to use energy storage in ways previously unachievable. Customers are most interested in the safety of our batteries, the long calendar and cycle life and the very fast charging capabilities over the widest temperature operating range in the industry.
Our historical revenues have been generated by license fees, product sales, commercial collaborations, and
government contracts and grants. We expect future revenues to consist primarily of product sales. Our current customer backlog includes purchase orders to (1) supply a 1 MW ALTI-ESS energy storage system for a test of wind energy integration in Hawaii, (2) supply a 1 MW ALTI-ESS energy storage system for a test of solar energy integration in Hawaii, (3) supply a 1.8 MW ALTI-ESS energy storage system to an electric utility in New Jersey, (4) supply a 1.2 MW ALTI-ESS energy storage system to a wind turbine manufacturer for integration into their wind energy systems for testing in Europe, (5) supply a 2 MW ALTI-ESS energy storage system for integration with a solar energy system in Puerto Rico, (7) supply battery modules to an electric bus manufacturer, (8) supply Altair Power Rack systems to numerous integration firms, and (9) supply application kits to various OEMs for testing.
During the three months ending March 31, 2012 we formed Altair China. Our intention is to launch
manufacturing and sales operations in China with the goal of supplying the Chinese government with advanced energy solutions for the electric grid, transportation and industrial market segments. Initially, the operation will focus on powering electric buses, taxis, and assembling energy storage systems for large residential complexes as well as for the electric grid. Consistent with this goal, in April 2012, Altair Northern signed an Agreement (the “Wu’an Agreement") with Wu'an Municipal People's Government ("Wu'an") and Handan Municipal People's Government ("Handan"). This Wu’an Agreement anticipates a number of transactions between Altair Northern and Wu'an or Handan, the first of which is the agreement of Wu’an to make approximately 330 acres of commercial land available to Altair China free of rent or land transfer fees for a 50 year commercial term to facilitate Altair China's construction of a manufacturing facility in an industrial park being promoted by Wu'an. The Wu’an agreement also anticipates purchases of electric buses and other products over time.
General Outlook
Our current focus is on the development of battery systems that we anticipate will eventually bring a substantial amount of revenue volume and gross profit from product sales into the electric grid, transportation, and industrial markets. As we attempt to significantly expand our revenues from licensing, manufacturing and other sources, some of the key near-term events that will affect our long-term success prospects include the following:
7
• Based on the success of the 2008 AES 2 MW frequency regulation trial, as validated in the KEMA, Inc.
analysis and report, we have experienced a substantial amount of interest in our large scale battery systems from other entities and are in active sales development discussions with a number of them. In 2011, we accepted purchase orders to supply the University of Hawaii - Hawaii Natural Energy Institute (“HNEI”) with two 1 MW energy storage systems for a test of wind and solar energy integration. We shipped the wind system in the third quarter of 2012, and are in the final stages of the installation. We are currently scheduled to install the solar system in the first quarter of 2013.
• On February 9, 2011, we signed an $18 million contract with Inversiones Energéticas, S.A. de C.V. (“INE”) for the supply and installation of a 10 MW ALTI-ESS advanced battery system in El Salvador. Total revenue under the Contract shall be recognized over an expected 14-month period following Altair’s receipt of the notice to proceed. This project has been delayed as a result of obtaining necessary regulatory approvals to enable battery-based energy storage on the El Salvador electric grid. We believe the necessary regulatory approvals will eventually be received.
• We have supplied battery modules to Proterra, LLC, a Golden, Colorado based leading designer and manufacturer of heavy-duty drive systems, energy storage systems, vehicle control systems and transit buses for their all-electric and hybrid-electric buses. In 2011 we sold $2.1 million of battery modules to Proterra. In May 2012, we signed a contract to supply battery modules to Proterra. On June 19, 2012, Proterra released its first purchase order under the agreement for deliveries in the first quarter of 2013.
• Based on the demonstrated success of our battery modules in the Proterra bus application, we have also entered into discussions with a number of other bus manufacturers or systems integrators regarding joint development products or purchases of our battery products for transportation applications in the U.S., Europe and China. These customers are now testing and prototyping our products.
• We have shipped a 1 MW energy storage system to a leading renewable energy company for integration into a wind farm. We are currently in the final stages of the installation and commissioning for that system.
• We are in discussions with a number of industrial manufacturers of forklifts, elevators, mining, rail and other electric equipment whose use requires the long-life, rapid recharge, extreme operating temperature range or other differentiating attributes of our battery technology. We have supplied application kits to several of these companies for testing and evaluation.
• We are targeting China as a primary source of revenue for our battery systems targeted at the electric bus and electric grid markets. We recently formed Altair China, which signed the Wu’an Agreement related to a number of transactions between Altair China and Wu'an or Handan. Consistent with the Wu’an Agreement, we recently acquired rights to use approximately 65 acres of commercial land in Wu’an under an arrangement in benefits received directly to offset the purchase price. This is to facilitate Altair China's construction of a manufacturing facility in an industrial park being promoted by Wu'an. We are still in the process of documenting the transfer. Under the Wu’an agreement, the city also agreed to place orders for electrical buses and energy storage systems for large residential complexes. Wu’an placed an initial deposit for its initial electric bus order.
• In September 2012, we entered into an agreement with TSK in Puerto Rico to deliver a 2 MW ALTI ESS system. Under the agreement, we received an initial down payment on the system. This system is scheduled to be delivered, installed and commissioned by the end of 2012.
Although it is not essential that all of these markets become successful for our battery technology in order to permit substantial long-term revenue growth, we believe that full commercialization of several of our battery applications will be necessary in order to expand our revenues enough to create a likelihood of our becoming profitable in the long-term. We remain optimistic with respect to our current key projects, as well as others we are pursuing, but recognize that, with respect to each, there are development, marketing, partnering and other risks to be overcome.
Current and Expected Liquidity
Altair’s cash and cash equivalents decreased by $11.2 million, from $46.5 million at December 31, 2011 to $35.3
million at June 30, 2012. The decrease in cash was primarily due to the $10.8 million of cash used in operating activities during the six months ending June 30, 2012. The bulk of the cash used in operations went to cover our net loss of $9.7 million, along with $2.5 million build-up of work in process inventory related to the fulfillment of customer sales backlog. During the six months ending June 30, 2011 we issued shares of common stock and warrants to purchase shares of common stock for net proceeds of $5.7 million. We recorded a $1.9 million warrant liability related to this capital raise. We also paid off $206,000 of debt.
8
As of June 30, 2012, we had cash totaling $35.3 million. Of this amount, $32 million was transferred to Altair
China in April 2012 to be used towards our China operations. The Board of Directors has developed a funding process for both our U. S. operations and our China operations moving forward. For China, assuming our completion of the land transfer, development of suitable manufacturing plans and finalization of orders, we believe that project financing or indebtedness may be available to facilitate operations. In the U.S., our operations may be supported in the near term by selling inventory, equipment and services to Altair China, and receiving fees associated with intellectual property licensing; however, in the longer term, we may need to raise equity capital for the U.S. and China operation, particularly to build out inventory if orders from China, Central America or other areas increase.
We evaluate our capital needs and the availability of capital on an ongoing basis and, consistent with past practice, expect to seek capital when and on such terms as we deem appropriate based upon our assessment of our current liquidity, capital needs and the availability of capital. Given that we are not yet in a positive cash flow or earnings position, the options available to us are fewer than to a positive cash flow company. Specifically, we would not generally qualify for long-term institutional debt financing. Consistent with past practice, we expect to raise additional capital through loans, the sale of shares of common stock, convertible notes, stock options, and warrants. We do not expect the current economic environment to preclude our ability to raise capital, but the overall cost of doing so may be high. The company expects to have adequate cash based on current levels and planned capital raises to operate for at least twelve months from June 30, 2012.
Over the long-term, we anticipate substantially increasing revenues by entering into new contracts and increasing product sales in the stationary power, electric bus and selected other industrial markets.
Capital Commitments and Expenditures The following table discloses aggregate information about our contractual obligations and the periods in which payments are due as of June 30, 2012: In thousands of dollars
Contractual Obligations Total < 1 yr 1-3 yrs 3-5 yrs > 5 yrsNotes payable -$ -$ -$ -$ -$ Contractual service agreements 666 599 67 Capital leases 21 14 7 Operating leasesPurchase obligations 1,084 1,084 Total 1,771$ 1,697$ 74$ -$ -$
Off-Balance Sheet Arrangements The company did not have any off-balance sheet transactions during the six months ending June 30, 2012. Results of Operations (Year-To-Date) Three and Six Months Ended June 30, 2012 Compared to Three and Six Months Ended June 30, 2011 In thousands of dollars
9
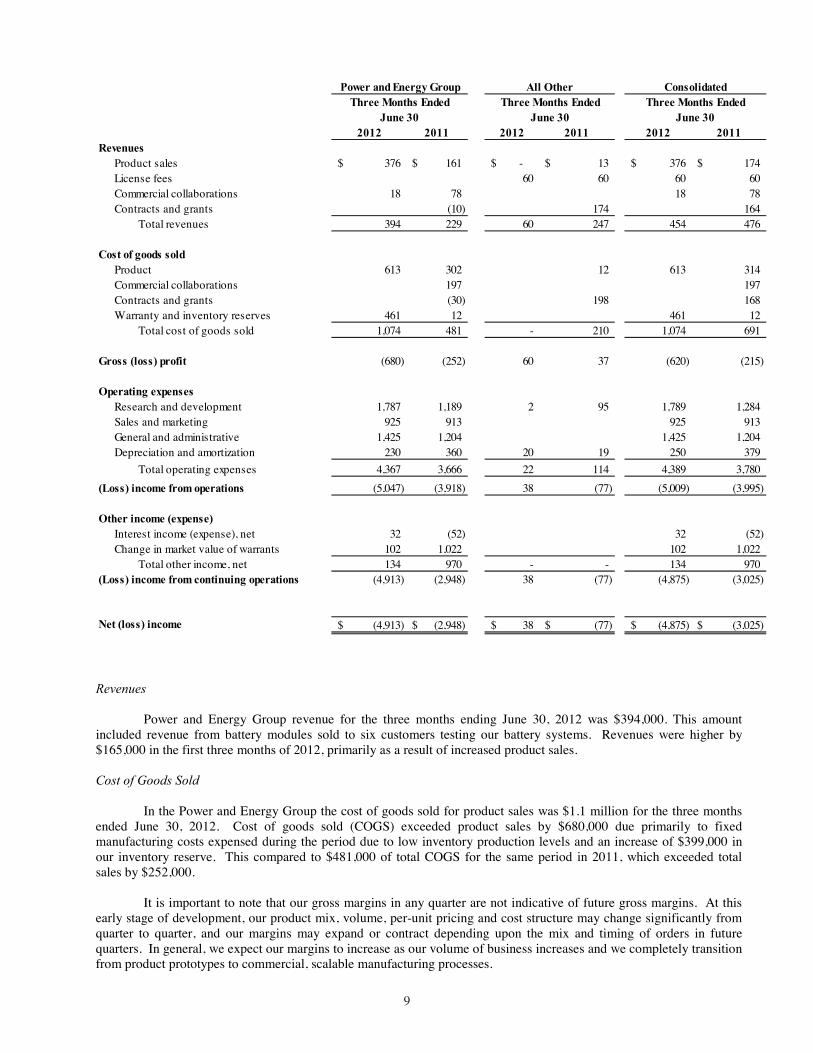
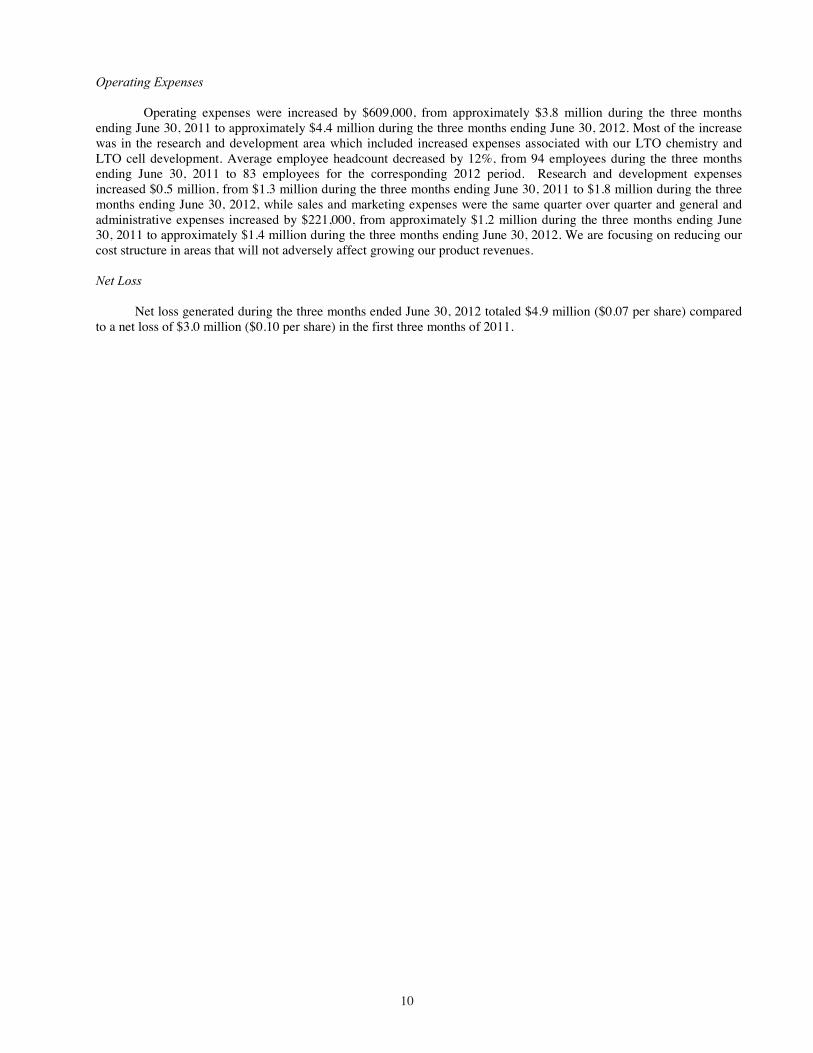
2012 2011 2012 2011 2012 2011Revenues
Product sales 376$ 161$ -$ 13$ 376$ 174$ License fees 60 60 60 60 Commercial collaborations 18 78 18 78 Contracts and grants (10) 174 164
Total revenues 394 229 60 247 454 476
Cost of goods soldProduct 613 302 12 613 314 Commercial collaborations 197 197 Contracts and grants (30) 198 168 Warranty and inventory reserves 461 12 461 12
Total cost of goods sold 1,074 481 - 210 1,074 691
Gross (loss) profit (680) (252) 60 37 (620) (215)
Operating expensesResearch and development 1,787 1,189 2 95 1,789 1,284 Sales and marketing 925 913 925 913 General and administrative 1,425 1,204 1,425 1,204 Depreciation and amortization 230 360 20 19 250 379
Total operating expenses 4,367 3,666 22 114 4,389 3,780 (Loss) income from operations (5,047) (3,918) 38 (77) (5,009) (3,995)
Other income (expense)Interest income (expense), net 32 (52) 32 (52) Change in market value of warrants 102 1,022 102 1,022
Total other income, net 134 970 - - 134 970 (Loss) income from continuing operations (4,913) (2,948) 38 (77) (4,875) (3,025)
Net (loss) income (4,913)$ (2,948)$ 38$ (77)$ (4,875)$ (3,025)$
June 30 June 30 June 30
Power and Energy Group All Other ConsolidatedThree Months Ended Three Months Ended Three Months Ended
Revenues
Power and Energy Group revenue for the three months ending June 30, 2012 was $394,000. This amount included revenue from battery modules sold to six customers testing our battery systems. Revenues were higher by $165,000 in the first three months of 2012, primarily as a result of increased product sales.
Cost of Goods Sold
In the Power and Energy Group the cost of goods sold for product sales was $1.1 million for the three months ended June 30, 2012. Cost of goods sold (COGS) exceeded product sales by $680,000 due primarily to fixed manufacturing costs expensed during the period due to low inventory production levels and an increase of $399,000 in our inventory reserve. This compared to $481,000 of total COGS for the same period in 2011, which exceeded total sales by $252,000.
It is important to note that our gross margins in any quarter are not indicative of future gross margins. At this early stage of development, our product mix, volume, per-unit pricing and cost structure may change significantly from quarter to quarter, and our margins may expand or contract depending upon the mix and timing of orders in future quarters. In general, we expect our margins to increase as our volume of business increases and we completely transition from product prototypes to commercial, scalable manufacturing processes.
10
Operating Expenses
Operating expenses were increased by $609,000, from approximately $3.8 million during the three months ending June 30, 2011 to approximately $4.4 million during the three months ending June 30, 2012. Most of the increase was in the research and development area which included increased expenses associated with our LTO chemistry and LTO cell development. Average employee headcount decreased by 12%, from 94 employees during the three months ending June 30, 2011 to 83 employees for the corresponding 2012 period. Research and development expenses increased $0.5 million, from $1.3 million during the three months ending June 30, 2011 to $1.8 million during the three months ending June 30, 2012, while sales and marketing expenses were the same quarter over quarter and general and administrative expenses increased by $221,000, from approximately $1.2 million during the three months ending June 30, 2011 to approximately $1.4 million during the three months ending June 30, 2012. We are focusing on reducing our cost structure in areas that will not adversely affect growing our product revenues. Net Loss
Net loss generated during the three months ended June 30, 2012 totaled $4.9 million ($0.07 per share) compared
to a net loss of $3.0 million ($0.10 per share) in the first three months of 2011.
11
ALTAIR NANOTECHNOLOGIES INC. AND SUBSIDIARIES
CONSOLIDATED STATEMENTS OF OPERATIONS (Expressed in thousands of United States Dollars)
(Unaudited)
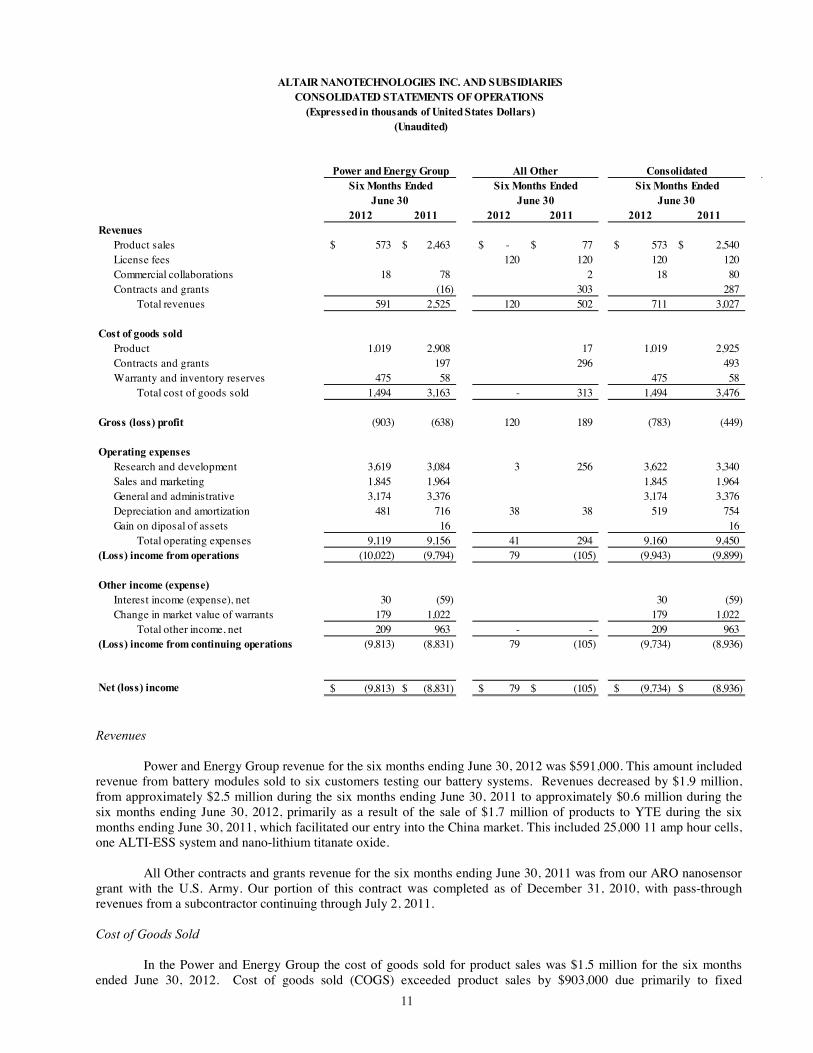
2012 2011 2012 2011 2012 2011Revenues
Product sales 573$ 2,463$ -$ 77$ 573$ 2,540$ License fees 120 120 120 120 Commercial collaborations 18 78 2 18 80 Contracts and grants (16) 303 287
Total revenues 591 2,525 120 502 711 3,027
Cost of goods soldProduct 1,019 2,908 17 1,019 2,925 Contracts and grants 197 296 493 Warranty and inventory reserves 475 58 475 58
Total cost of goods sold 1,494 3,163 - 313 1,494 3,476
Gross (loss) profit (903) (638) 120 189 (783) (449)
Operating expensesResearch and development 3,619 3,084 3 256 3,622 3,340 Sales and marketing 1,845 1,964 1,845 1,964 General and administrative 3,174 3,376 3,174 3,376 Depreciation and amortization 481 716 38 38 519 754 Gain on diposal of assets 16 16
Total operating expenses 9,119 9,156 41 294 9,160 9,450 (Loss) income from operations (10,022) (9,794) 79 (105) (9,943) (9,899)
Other income (expense)Interest income (expense), net 30 (59) 30 (59) Change in market value of warrants 179 1,022 179 1,022
Total other income, net 209 963 - - 209 963 (Loss) income from continuing operations (9,813) (8,831) 79 (105) (9,734) (8,936)
Net (loss) income (9,813)$ (8,831)$ 79$ (105)$ (9,734)$ (8,936)$
Six Months Ended Six Months Ended Six Months EndedJune 30 June 30 June 30
Power and Energy Group All Other Consolidated
Revenues
Power and Energy Group revenue for the six months ending June 30, 2012 was $591,000. This amount included revenue from battery modules sold to six customers testing our battery systems. Revenues decreased by $1.9 million, from approximately $2.5 million during the six months ending June 30, 2011 to approximately $0.6 million during the six months ending June 30, 2012, primarily as a result of the sale of $1.7 million of products to YTE during the six months ending June 30, 2011, which facilitated our entry into the China market. This included 25,000 11 amp hour cells, one ALTI-ESS system and nano-lithium titanate oxide.
All Other contracts and grants revenue for the six months ending June 30, 2011 was from our ARO nanosensor grant with the U.S. Army. Our portion of this contract was completed as of December 31, 2010, with pass-through revenues from a subcontractor continuing through July 2, 2011. Cost of Goods Sold
In the Power and Energy Group the cost of goods sold for product sales was $1.5 million for the six months ended June 30, 2012. Cost of goods sold (COGS) exceeded product sales by $903,000 due primarily to fixed
12
manufacturing costs expensed during the period due to low inventory production levels and an increase in our inventory reserve. This compared to $3.2 million of total COGS for the same period in 2011, due primarily to the YTE and Proterra revenue generated during 2011. The COGS associated with the YTE product sales during the first six months of 2011 was higher than the revenue generated by those product sales, leading to a gross loss of $638,000 in the first six months of 2011 for the Power and Energy Group. We sold this product to YTE at less than our cost in order to expose our products to the potentially large China economic market.
It is important to note that our gross margins in any quarter are not indicative of future gross margins. At this early stage of development, our product mix, volume, per-unit pricing and cost structure may change significantly from quarter to quarter, and our margins may expand or contract depending upon the mix and timing of orders in future quarters. In general, we expect our margins to increase as our volume of business increases and we completely transition from product prototypes to commercial, scalable manufacturing processes. Operating Expenses
Operating expenses were down $0.3 million during the six months ending June 30, 2012, from $9.5 million during the six months ending June 30, 2011 to $9.2 million during the six months ending June 30, 2012. This reduction is the result of constrained spending in almost all areas of the company. Average employee headcount decreased by 14%, from 97 employees during the six months ending June 30, 2011 to 83 employees for the corresponding 2012 period. Research and development expenses increased $0.3 million from $3.3 million during the six months ending June 30, 2011 to $3.6 million during the six months ending June 30, 2012. Sales and marketing expenses decreased by $0.2 million, or 6%, from $2.0 million during the six months ending June 30, 2011 to $1.8 million during the six months ending June 30, 2012. General and administrative expenses decreased by $0.2 million, or 6%, from $3.4 million during the six months ending June 30, 2011 to $3.2 million during the six months ending June 30, 2012. We continue to focus on reducing our cost structure in areas that will not adversely affect growing our product revenues. Net Loss
Net loss generated during the six months ended June 30, 2012 totaled $9.7 million ($0.14 per share) compared
to a net loss of $8.9 million ($0.31 per share) in the first six months of 2011.
13
Results of Operations (Annual Periods)
The following table sets forth certain selected, unaudited, condensed consolidated financial data for the periods indicated.
ALTAIR NANOTECHNOLOGIES INC. AND SUBSIDIARIES
CONSOLIDATED STATEMENTS OF OPERATIONS (Expressed in thousands of United States Dollars)
(Unaudited)
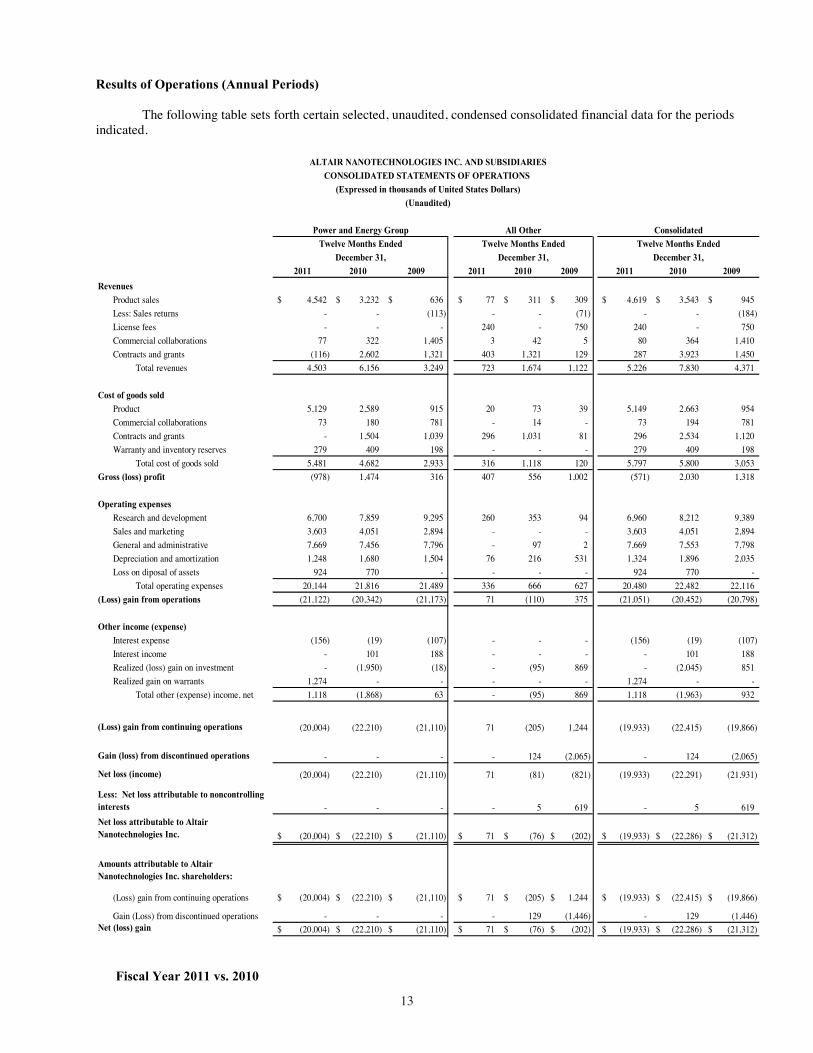
2011 2010 2009 2011 2010 2009 2011 2010 2009
RevenuesProduct sales 4,542$ 3,232$ 636$ 77$ 311$ 309$ 4,619$ 3,543$ 945$ Less: Sales returns - - (113) - - (71) - - (184) License fees - - - 240 - 750 240 - 750 Commercial collaborations 77 322 1,405 3 42 5 80 364 1,410 Contracts and grants (116) 2,602 1,321 403 1,321 129 287 3,923 1,450
Total revenues 4,503 6,156 3,249 723 1,674 1,122 5,226 7,830 4,371
Cost of goods soldProduct 5,129 2,589 915 20 73 39 5,149 2,663 954 Commercial collaborations 73 180 781 - 14 - 73 194 781 Contracts and grants - 1,504 1,039 296 1,031 81 296 2,534 1,120 Warranty and inventory reserves 279 409 198 - - - 279 409 198
Total cost of goods sold 5,481 4,682 2,933 316 1,118 120 5,797 5,800 3,053 Gross (loss) profit (978) 1,474 316 407 556 1,002 (571) 2,030 1,318
Operating expensesResearch and development 6,700 7,859 9,295 260 353 94 6,960 8,212 9,389 Sales and marketing 3,603 4,051 2,894 - - - 3,603 4,051 2,894 General and administrative 7,669 7,456 7,796 - 97 2 7,669 7,553 7,798 Depreciation and amortization 1,248 1,680 1,504 76 216 531 1,324 1,896 2,035 Loss on diposal of assets 924 770 - - - - 924 770 -
Total operating expenses 20,144 21,816 21,489 336 666 627 20,480 22,482 22,116 (Loss) gain from operations (21,122) (20,342) (21,173) 71 (110) 375 (21,051) (20,452) (20,798)
Other income (expense)Interest expense (156) (19) (107) - - - (156) (19) (107) Interest income - 101 188 - - - - 101 188 Realized (loss) gain on investment - (1,950) (18) - (95) 869 - (2,045) 851 Realized gain on warrants 1,274 - - - - - 1,274 - -
Total other (expense) income, net 1,118 (1,868) 63 - (95) 869 1,118 (1,963) 932
(Loss) gain from continuing operations (20,004) (22,210) (21,110) 71 (205) 1,244 (19,933) (22,415) (19,866)
Gain (loss) from discontinued operations - - - - 124 (2,065) - 124 (2,065)
Net loss (income) (20,004) (22,210) (21,110) 71 (81) (821) (19,933) (22,291) (21,931)
Less: Net loss attributable to noncontrolling interests - - - - 5 619 - 5 619 Net loss attributable to Altair Nanotechnologies Inc. (20,004)$ (22,210)$ (21,110)$ 71$ (76)$ (202)$ (19,933)$ (22,286)$ (21,312)$
Amounts attributable to Altair Nanotechnologies Inc. shareholders:
(Loss) gain from continuing operations (20,004)$ (22,210)$ (21,110)$ 71$ (205)$ 1,244$ (19,933)$ (22,415)$ (19,866)$
Gain (Loss) from discontinued operations - - - - 129 (1,446) - 129 (1,446) Net (loss) gain (20,004)$ (22,210)$ (21,110)$ 71$ (76)$ (202)$ (19,933)$ (22,286)$ (21,312)$
Power and Energy Group All Other ConsolidatedTwelve Months Ended Twelve Months Ended Twelve Months Ended
December 31, December 31, December 31,
Fiscal Year 2011 vs. 2010
14
Revenues Power and Energy Group product sales increased $1.3 million from $3.2 million in 2010 to $4.5 million in 2011. This was due primarily to the $1.8 million sale of LTO, battery cells and a 1 MW battery system to a Chinese company in early 2011. Power and Energy Group contracts and grants revenue decreased $2.7 million from $2.6 million in 2010 to ($.1) million in 2011, as we completed our contract with the U.S. Office of Naval Research in 2010. All Other contracts and grants revenue decreased by $918,000 from 1.3 million in 2010 to $403,000 in 2011. This decrease resulted primarily from the completion of our U.S. Army nanosensor contract in mid-2011. All Other License fees increased $240,000 from zero in 2010 to $240,000 in 2011, from license revenue associated with technology licensed to AlSher Titania, LLC. Power and Energy Commercial Collaborations decreased $245,000 from $322,000 in 2010 to $77,000 in 2011, primarily due to Proterra moving from a commercial collaboration contract to a product revenue contract in 2011.
Cost of Goods Sold (“COGS”)
Product COGS in the Power and Energy Group product COGS increased from 80% of revenue in 2010 to 113% of revenue in 2011. This increase was due primarily from the sale of product at a reduced price to a Chinese company to enable us to secure our initial order from China. In addition we recorded a $264,000 inventory reserve as of December 31, 2011 for battery cell quality issues.
Our product gross margins have been, and are expected to be low during 2012. As we expand our production
volume along with customer demand, and assuming that we shift certain aspects of our manufacturing to China, where we expect to experience lower costs, we expect our production costs to come down, which should result in higher product gross margins.
Operating Expenses
Power and Energy Group research and development expenses decreased $1.2 million or 15% from $7.9 million in 2010 to $6.7 million in 2011 due to cost reductions in the business. We performed less research in our battery business as our products mature and focused more on product development from our existing technology.
Consolidated sales and marketing costs decreased $448,000 or 11% from 2010 to 2011 as we emphasized cost
reduction throughout our business during 2011.
Total general and administrative costs were up $116,000 or 2% from 2010 to 2011 primarily from employee severance costs associated with our departed CEO and CFO and due to the expense related to stock option accelerated vesting for officers and directors resulting from the change in control equity financing in July 2011.
Power and Energy Group loss on disposal of assets of $924,000 in 2011 related to the impairment of specified equipment in our Reno, Nevada corporate headquarters that will no longer be used due to our planned shift of LTO manufacturing to China. Other Income and Expense
Other income realized gain on warrants increased $1.3 million from zero in 2010 to $1.3 million in 2011, due to the change in fair value of the warrant liabilities issued during 2011.
Net Loss
Overall net loss decreased $2.4 million from $22.3 million in 2010 to $19.9 million in 2011 primarily due to a decrease in overall operating expenses of $2 million, a $2 million realized loss on the sale of auction rate securities in 2010, a $1.3 million realized gain on warrants during 2011, all offset by a reduction of $2.6 million in gross profit from 2010 to 2011.
Fiscal Year 2010 vs. 2009 Revenues
Total revenues for the year ended December 31, 2010 were $7.8 million, up 79% from $4.4 million for 2009. Power and Energy Group revenue increased $3.0 million from $3.2 million in 2009 to 6.2 million in 2010. This was due
15
primarily to $2.0 million of increased battery module sales to Proterra and a $1.4 million increase in revenue from our Office of Naval Research (ONR) contract, offset by $744,000 in non-recurring revenues in 2009 with BAE Systems. The ONR contract was completed as of December 31, 2010.
All Other contracts and grants revenue increased $1.2 million from $129,000 in 2009 to $1.3 million in 2010
due to our U.S. Army nanosensor contract. Cost of Goods Sold (“COGS”)
Product COGS in the Power and Energy Group increased from $915,000 in 2009 to $2.6 million in 2010 primarily from increased battery module sales to Proterra. Commercial collaborations COGS in the Power and Energy Group dropped from $781,000 in 2009 to $180,000 in 2010 due primarily to the nonrecurring contract with BAE Systems during 2009. Contract and grants COGS in the Power and Energy Group increased from $1 million in 2009 to $1.5 million in 2010 related primarily to the $1.4 million increase in revenue from our Office of Naval Research contract.
All Other contracts and grants COGS increased from $81,000 in 2009 to $1 million in 2010 due to our U.S. Army nanosensor contract. Operating Expenses
Total research and development expenses decreased $1.2 million or 13% from $9.4 million in 2009 to $8.2 million in 2010. Power and Energy Group research and development expenses decreased $1.1 million from $9.3 million in 2009 to $7.9 million in 2010. Both trends were due to the transfer of more costs to cost of goods sold that directly related to our Office of Naval Research and U.S. Army nanosensor contracts.
Total sales and marketing expenses increased $1.2 million or 40% from 2009 to 2010 as the result of our effort
to enhance our sales penetration into our target markets of electricity generation and distribution and electric buses. Total general and administrative costs were down $244,000 or 3% from 2009 to 2010 as the result of our focus on company-wide cost controls.
Loss on disposal of assets of $770,000 during 2010 resulted from the early retirement of various production and research and development-related assets no longer used in our Power and Energy Group. Other Income and Expense
The $2 million realized loss on investments during 2010 resulted primarily from the sale of our auction rate securities ($1.95 million). Net Loss
Overall net loss of $22.3 million in 2010 versus the overall net loss of $21.3 million during 2009 was the result of our transitions in 2010 described above. Overall this transition consisted of eliminating our defense and performance materials businesses as we focused on growing our Power and Energy Group business.
16
Risk Factors
Investing in our shares of common stock involves a high degree of risk. You should carefully consider the risks
described below, and all of the other information set forth in this Report before deciding to invest in shares of our common stock. In addition to historical information, the information in this Report contains forward-looking statements about our future business and performance. Our actual operating results and financial performance may be different from what we expect as of the date of this Report. The risks described in this Report represent the risks that management has identified and determined to be material to our company. Additional risks and uncertainties not currently known to us, or that we currently deem to be immaterial, may also materially harm our business operations and financial condition.
We may continue to experience significant losses from operations.
We have experienced a net loss in every fiscal year since our inception. Our loss from operations was $19.9 million for the twelve months ended December 31, 2011. We may never be profitable in the future. Even if we are profitable in one or more future years, subsequent developments in the economy, our industry, customer base, business or cost structure, or an event such as significant litigation or a significant transaction, may cause us to again experience losses. We may not be able to raise sufficient capital to finance our operations due to our operating results, market conditions and similar factors.
As of June 30, 2012, we had approximately $35.3 million in cash and cash equivalents; however, $32 million of
this amount was transferred to our China operations to fund expansion of operations into China. Although it may be possible for the Company to repatriate capital for various intercompany transactions, these transactions will be governed by Chinese law. From time to time, administrative and legal issues may delay the timing of such transfers.
We expect that in the future we will again need to raise capital. With respect to any such capital raise, we may
be unable to raise the amount of capital needed and may be forced to pay an extremely high price for capital. Factors affecting the availability and price of capital may include the following:
• market factors affecting the availability and cost of capital generally, including increases or decreases in
major stock market indexes, the stability of the banking and investment banking systems and general economic stability or instability;
• the price, volatility and trading volume of our shares of common stock; • our financial results, particularly the amount of revenue we are generating from product sales; • the market's perception of our ability to execute our business plan and any specific projects identified as
uses of proceeds; • our ownership structure and recent or anticipated dilution; • the amount of our capital needs; • the market's perception of our company and companies in our line of business; and • the economics of projects being pursued.
If we are unable to raise required capital or generate sufficient revenue to fund our operations, we may be forced
to discontinue our operations. We have entered into contractual provisions that may significantly limit our ability to raise capital in the near term.
In conjunction with the March 2011 “registered direct” offering, we entered a Securities Purchase Agreement pursuant to which we agreed that we would not sell securities at a price below $2.23 per share for a two-year period ending March 2013, unless the March 2011 transaction is approved by our shareholders. Such approval will eliminate the floor on an exercise price adjustment in the warrants issued as part of the March 2011 offering. If we do not either obtain shareholder approval or cause the parties to the Securities Purchase Agreement to waive or amend this restriction, our ability to raise capital prior to March 2013 will be significantly impaired. This may affect our ability to obtain cash necessary to continue operations. In addition, in conjunction with the closing of purchase by an affiliate of Canon Investment Holdings Ltd. of
17
shares representing over 50% of our outstanding shares in 2011, we granted certain rights to Canon, including the right to proportional representation on our Board of Directors, certain registration rights, and an option to purchase a sufficient number of our equity securities at market price to maintain their percentage of ownership should we offer, sell or issue new securities. These rights may dissuade potential investors from purchasing our capital or may require us to accept less than favorable terms in future financings. Laws governing repatriation of investments in a China WFOE may contribute to a need to obtain capital to finance our non-China operations in the near future.
Any business that we conduct in China will likely be through Altair China, or its manufacturing subsidiary. We have designated registered capital of the equivalent of $32 million for Altair China and have transferred that much to its accounts. Although Chinese law permits intercompany transactions and certain intercompany transfers, it will strictly limit the ability of Altair China to repatriate money to its non-Chinese parent. In addition, distributions to the non-Chinese parent must derive from profits, as determined in accordance with Chinese accounting standards and regulations. Altair China will also be required to set aside at least 10% of its after-tax profit based on Chinese accounting standards each year to a statutory surplus reserve fund until the accumulative amount of such reserve reaches 50% of registered capital. These reserves are not distributable as dividends.
In addition, Altair China may be required to allocate a portion of its after-tax profit to a staff welfare and bonus
fund. Moreover, if Altair China incurs debt on its own behalf in the future, the instruments governing the debt may restrict Altair China's ability to pay dividends or make other distributions to us. Any limitation on the ability of Altair China to distribute dividends and other distributions to us could materially and adversely limit our ability to make investments or enter into joint ventures that could be beneficial to our business, pay dividends, or otherwise fund and conduct our business. We may become subject to international economic and political risks over which we have little or no control and may be unable to alter our business practice in time to avoid the possibility of reduced revenues.
We conduct a portion of our business outside the United States and plan to significantly increase our presence in China. Doing business outside the United States subjects us to various risks, including changing economic and political conditions, major work stoppages, exchange controls, currency fluctuations, armed conflicts and unexpected changes in United States and foreign laws relating to tariffs, trade restrictions, transportation regulations, foreign investments and taxation. We have no control over most of these risks and may be unable to anticipate or adapt to changes in international economic and political conditions. This may lead to sudden and unexpected revenue reductions or expense increases.
China’s economic policies, laws and regulations could affect our business.
Our business plan currently anticipates that a substantial portion of our assets will be located in China and a portion of our revenue will be derived from Chinese operations. Accordingly, our results of operations and prospects will become subject, to a significant extent, to the economic, political and legal developments in China.
While China’s economy has experienced significant growth in the past twenty years, such growth has been uneven, both geographically and among various sectors of the economy. The PRC government has implemented various measures to encourage economic growth and guide the allocation of resources. Some of these measures benefit the overall economy of China, but they may also have a negative effect on us. For example, our operating results and financial condition may be adversely affected by the government control over capital investments or changes in tax regulations. The economy of China has been transitioning from a planned economy to a more market-oriented economy. In recent years, the PRC government has implemented measures emphasizing the utilization of market forces for economic reform and the reduction of state ownership of productive assets, and the establishment of corporate governance in business enterprises; however, a substantial portion of productive assets in China are still owned by the PRC government. In addition, the PRC government continues to play a significant role in regulating industry development by imposing industrial policies. It also exercises significant control over China’s economic growth through the allocation of resources, the control of payment of foreign currency-denominated obligations, the setting of monetary policy and the provision of preferential treatment to particular industries or companies. Any adverse change in the economic conditions or government policies in China could directly harm our business or harm overall economic growth in China, which in either case could increase our expenses and decrease expected revenues. We may have difficulty establishing adequate management, legal and financial controls internationally.
As a result of difference in management, accounting, legal, language and cultural norms, we may experience
18
difficulty in establishing management, legal and financial controls, collecting financial data and preparing financial statements, books of account and corporate records and instituting standard business practices for our international projects as well as in our China-based operations. Moreover, our international efforts may divert management attention and consume a significant amount of capital without anticipated results. If relations between the United States and China worsen, investors may be unwilling to hold or buy our stock and our stock price may decrease.
At various times during recent years, the United States and China have had significant disagreements over political and economic issues. Controversies may arise in the future between these two countries. Any political or trade controversies between the United States and China, whether or not directly related to our business, could harm our results of operations and the price of our common stock. The nature and application of many laws of China create an uncertain environment for business operations and they could have a negative effect on us.
The legal system in China is a civil law system. Unlike the common law system, the civil law system is based
on written statutes in which decided legal cases have little value as precedents. The promulgation of new laws, changes of existing laws and the abrogation of local regulations by national laws could cause a decline in the price of our common stock. In addition, as these laws, regulations and legal requirements are relatively recent, their interpretation and enforcement involve significant uncertainty.
Furthermore, the political, governmental and judicial systems in China are sometimes impacted by corruption. There is no assurance that we will be able to obtain recourse in any legal disputes with suppliers, customers or other parties with whom we conduct business. Following the acquisition of a majority interest in the company by an affiliate of Canon, we face risks associated with having a majority shareholder.
In July 2011, an affiliate of Canon acquired a majority of our outstanding shares of common stock which
presents certain risks to us, including the following: • The majority shareholder controls the appointments on the Board of Directors and may appoint persons less
qualified, or more loyal to the majority shareholder, than would be appointed absent a controlling shareholder;
• The majority shareholder may be able to influence our Board of Directors to enter into transactions with related or third parties that are more favorable to such parties than would be negotiated by an independent Board of Directors;
• The majority shareholders controls all matters requiring approval by the shareholders, including any determination with respect to the acquisition or disposition of assets, future issuances of a material number of securities and other major transactions; and
• This concentration of ownership may also delay, defer or prevent a change in control and otherwise prevent shareholders other than our affiliates from influencing our direction and future.
If one or more of these risks, or other risks, materializes, our business will be harmed, and it may be harmed materially. Our majority shareholder is based in China.
Because of the physical distance, cultural differences and language difference between the United States and
China, we may experience conflicts or inefficiencies in Board-management communication, management-employee communication, strategy formation and other parts of our business; this risk may be exacerbated by the fact that some of the directors nominated by Canon do not speak English as a first language, or at all. We may not realize anticipated benefits from our agreement with Inversiones Energeticas. In February 2011, we entered into a purchase contract with Inversiones Energeticas, S.A. de C.V., or INE, related to the purchase of a turn-key 10 MW ALTI-ESS advanced battery system for $18 million. Projected revenue under this agreement represented a substantial portion of our expected revenue in 2011 and represents a substantial
19
portion of our projected revenue for 2012. On April 15, 2011, as a result of unexpected regulatory issues, INE notified us that they needed to cancel the contract in accordance with its terms. INE subsequently stated that such letter was not intended to effect a termination of the contract, but merely to provide notice of its initial failure to obtain regulatory approval, which would automatically effect a termination of the contract if the issue was not resolved within 120 days, subject to extension by the parties. We have entered into several extensions in order to allow the various parties additional time to resolve these regulatory issues. However, we may be unable to resolve the regulatory issues with the existing agreement or may otherwise be unable to enter into a new agreement with INE. If not, we will lose anticipated revenue and lose the expected marketing benefits we expected following the completion of the installation of the ALTI-ESS system. This will harm our short-term revenue projections and possibly our long-term revenue potential. Our nano lithium titanate battery materials and battery business is currently dependent upon a few customers and potential customers, which presents various risks.
Our nano lithium titanate battery materials and battery business is dependent upon a few current or potential customers, including a small number of power producers, smaller companies developing electric or hybrid electric buses and Chinese government agencies. In addition, many of these customers are, or are expected to be, development partners who are subsidizing the research and development of products for which they may be the sole, or one of a few, potential purchasers. As a result of the small number of potential customers and partners, our existing or potential customers and partners may have significant leverage on pricing terms, exclusivity terms and other economic and noneconomic terms. This may harm our attempts to sell products at prices that reflect desired gross margins. In addition, the decision by a single or potential customer to chose not to purchase or abandon the use or development of a product may significantly harm both our financial results and the development track of one or more products.
We depend upon several sole-source and limited-source third-party suppliers.
We rely on certain suppliers as the sole-source, or as a primary source, of certain services, raw materials and other components of our products. We do not yet have long-term supply or service agreements engaged with any such suppliers. As a result, the providers of such services and components could terminate or alter the terms of service or supply with little or no advance notice. If our arrangements with any sole-source supplier were terminated, or if such a supplier failed to provide essential services or deliver essential components on a timely basis, failed to meet our product specifications and/or quality standards, or introduced unacceptable price increases, our production schedule would be delayed, possibly by as long as six months. Any such delay in our production schedule would result in delayed product delivery and may also result in additional production costs, customer losses and litigation.
An area in which our dependence upon a limited number of sources creates significant vulnerability is the
manufacturing of our nano lithium titanate cells. As of the date hereof, we have two contract manufacturing sources for our nano lithium titanate cells. We have had quality issues with both contract manufacturers. Our nano lithium titanate battery cells are the building blocks of all of our products (other than our nano lithium titanate powder). If we continue to experience quality issues with our suppliers, we may be unable to meet our deadlines, or quality specifications, with respect to existing or future orders. This would harm our reputation and our ability to grow our business. Our operating results have fluctuated significantly in the past and will continue to fluctuate in the future, which could cause our stock price to decline.
Our operating results have fluctuated significantly in the past, and we believe that they will continue to fluctuate
in the future, due to a number of factors, many of which are beyond our control. If in future periods our operating results do not meet the expectations of investors or analysts who choose to follow our company, the price of our shares of common stock may fall. Factors that may affect our operating results include the following:
• fluctuations in the size, quantity and timing of customer orders; • timing of delivery of our services and products; • additions of new customers or losses of existing customers; • positive or negative business or financial developments announced by us or our key customers; • our ability to commercialize and obtain orders for products we are developing; • costs associated with developing our manufacturing capabilities; • the retention of our key employees; • new product announcements by our competitors or potential competitors;
20
• the effect of variations in the market price of our shares of common stock on our equity-based
compensation expenses; • disruptions in the supply of raw materials or components used in the manufacture of our products; • the pace of adoption of regulation facilitating our ability to sell our products in our target markets; • technology and intellectual property issues associated with our products; and • general political, social, geopolitical and economic trends and events.
Our patents and other protective measures may not adequately protect our proprietary intellectual property.
We regard our intellectual property, particularly our proprietary rights in our nano lithium titanate technology,
as critical to our success. We have received various patents, and filed other patent applications, for various applications and aspects of our nano lithium titanate technology and other intellectual property. Such patents and agreements and various other measures we take to protect our intellectual property from use by others may not be effective for various reasons, including the following:
• Our pending patent applications may not be granted for various reasons, including the existence of
conflicting patents or defects in our applications, if there was in existence relevant prior art or the invention was deemed by the examiner to be obvious to a person skilled in the art whether or not there were other existing patents. Risks associated with patent applications are enhanced because patent applications of others remain confidential for a period of approximately 18 months after filing; as a result, our belief that we are the first creator of an invention or the first to patent it may prove incorrect, as information related to conflicting patents is first published or first brought to our attention;
• The patents we have been granted may be challenged, invalidated, narrowed or circumvented because of the pre-existence of similar patented or unpatented intellectual property rights or for other reasons;
• The costs associated with enforcing patents, confidentiality and invention agreements or other intellectual property rights may make aggressive enforcement cost prohibitive;
• We have not filed for complete patent protection in many countries, including China, in which we are currently selling product or seeking to sell product; as a result, we may be unable to prevent competitors in such markets from selling infringing products;
• Even if we enforce our rights aggressively, injunctions, fines and other penalties may be insufficient to deter violations of our intellectual property rights; and
• Other persons may independently develop proprietary information and techniques that, although functionally equivalent or superior to our intellectual proprietary information and techniques, do not breach our proprietary rights.
Our inability to protect our proprietary intellectual property rights or gain a competitive advantage from such
rights could harm our ability to generate revenues and, as a result, our business and operations.
We may be involved in lawsuits to protect or enforce our patents, which could be expensive, time consuming and involve adverse publicity and adverse results.
Competitors or others may infringe our patents. To counter infringement or unauthorized use, we may be
required to file patent infringement claims, which can be expensive and time-consuming. Interference proceedings brought by the United States Patent and Trademark Office may be necessary to determine the priority of inventions with respect to our patent applications. Litigation or interference proceedings may result in substantial costs and be a distraction to our management.
Because of the substantial amount of discovery required in connection with intellectual property litigation, there
is a risk that some of our confidential information could be compromised by disclosure. In addition, during the course of this litigation (even if ultimately successful), there could be public announcements of the results of hearings, motions or other interim proceedings or developments. If securities analysts or investors perceive these results to be negative, it could have a substantial adverse effect on the price of our shares of common stock.
In addition, in an infringement proceeding, a court may decide that a patent of ours is not valid or is
unenforceable, or may refuse to stop the other party from using the technology at issue on the grounds that our patents do not cover that technology. An adverse determination of any litigation or defense proceedings could put one or more of
21
our patents at risk of being invalidated or interpreted narrowly and could put our patent applications at risk of not issuing.
We may not prevail in any litigation or interference proceeding in which we are involved. Even if we do
prevail, these proceedings can be expensive, result in adverse publicity and distract our management.
Other parties may bring intellectual property infringement claims against us, which would be time-consuming and expensive to defend, and if any of our products or processes is found to be infringing, we may not be able to procure licenses to use patents necessary to our business on reasonable terms, if at all.
Our success depends in part on avoiding the infringement of other parties’ patents and proprietary rights. We
may inadvertently infringe existing third-party patents or third-party patents issued on existing patent applications. Third party holders of such patents or patent applications could bring claims against us that, even if resolved in our favor, could cause us to incur substantial expenses and, if resolved against us, could cause us to pay substantial damages. Under some circumstances in the United States, these damages could be triple the actual damages the patent holder incurs.
If we have supplied infringing products to third parties for marketing or licensed third parties to manufacture,
use or market infringing products, we may be obligated to indemnify these third parties for any damages they may be required to pay to the patent holder and for any losses the third parties may sustain themselves as the result of lost sales or damages paid to the patent holder. In addition, we have, and may be required to, make representations as to our right to supply and/or license intellectual property and to our compliance with laws. Such representations are usually supported by indemnification provisions requiring us to defend our customers and otherwise make them whole if we license or supply products that infringe on third party technologies or violate government regulations. Further, if a patent infringement suit were brought against us, we and our customers, development partners and licensees could be forced to stop or delay research, development, manufacturing or sales of products based on our technologies in the country or countries covered by the patent we infringe, unless we can obtain a license from the patent holder. Such a license may not be available on acceptable terms, or at all, particularly if the third party is developing or marketing a product competitive with products based on our technologies. Even if we were able to obtain a license, the rights may be nonexclusive, which would give our competitors access to the same intellectual property.
Any successful infringement action brought against us may also adversely affect marketing of products based
on our technologies in other markets not covered by the infringement action. Furthermore, we may suffer adverse consequences from a successful infringement action against us even if the action is subsequently reversed on appeal, nullified through another action or resolved by settlement with the patent holder. As a result, any infringement action against us would likely harm our competitive position, be costly and require significant time and attention of our key management and technical personnel. We may be unable to adequately prevent disclosure of trade secrets and other proprietary information.
We rely on trade secrets to protect our proprietary technologies, especially where we do not believe patent
protection is appropriate or obtainable. Trade secrets are difficult to protect. We rely in part on confidentiality agreements with our employees, contractors, consultants, outside scientific collaborators and other advisors to protect our trade secrets and other proprietary information. Parties to the confidentiality agreements may have such agreements declared unenforceable or, even if the agreements are enforceable, may breach such agreements. Remedies available in connection with the breach of such agreements may not be adequate, or enforcing such agreements may be cost prohibitive. Courts outside the United States may be less willing to protect trade secrets. In addition, others may independently discover our trade secrets or independently develop processes or products that are similar or identical to our trade secrets. Costly and time-consuming litigation could be necessary to enforce and determine the scope of our proprietary rights, and failure to obtain or maintain trade secret protection would harm our competitive business position. If we are sued on a product liability claim, our insurance policies may not be sufficient.
Our insurance may not cover all potential types of product liability claims to which manufacturers are exposed or may not be adequate to indemnify us for all liability that may be imposed. Any imposition of liability that is not covered by insurance or is in excess of our insurance coverage could harm our business, including our relationships with current customers and our ability to attract and retain new customers. In addition, if the liability were substantial relative to the size of our business, any uncovered liability could harm our liquidity and ability to continue as a going concern. Laws regulating the manufacture or transportation of batteries may be enacted which could result in a delay in the production of our batteries or the imposition of additional costs that could harm our ability to be profitable.
22
At the present time, international, federal, state and local laws do not directly regulate the storage, use and disposal of the component parts of our batteries. However, laws and regulations may be enacted in the future which could impose environmental, health and safety controls on the storage, use and disposal of certain chemicals and metals used in the manufacture of lithium and lithium-ion batteries. Satisfying any future laws or regulations could require significant time and resources from our technical staff, including those related to possible redesign which may result in substantial expenditures and delays in the production of our product, all of which could harm our business and reduce our future profitability.
The transportation of lithium and lithium-ion batteries is regulated both domestically and internationally. Under recently revised United Nations recommendations and as adopted by the International Air Transport Association, our batteries and battery systems currently fall within the level such that they are not exempt and require a Class 9 designation for transportation. The revised United Nations recommendations and other recommendations are not U.S. law until such time as they are incorporated into the Hazardous Material Regulations of the U.S. Department of Transportation, or DOT. However, DOT has proposed new regulations harmonizing with the U.N. guidelines and is reviewing other proposed changes under consideration for inclusion. At present it is not known if or when the proposed regulations would be adopted by the United States. Although we fall under the equivalency levels for the United States and comply with all safety packaging requirements worldwide, future DOT or IATA approval processes could require significant time and resources from our technical staff and, if redesign were necessary, could delay the introduction of new products. If our warranty expense estimates differ materially from our actual claims, or if we are unable to estimate future warranty expense for new products, our business and financial results could be harmed.
Our warranty for our products ranges from one to three years from the date of sale, depending on the type of product and its application. We expect that in the future some of our warranties may extend for longer periods. Because our supply arrangements are negotiated, the scope of our product warranties differ substantially depending upon the product, the purchaser and the intended use; however, we have granted and may grant broad warranties, addressing such issues as leakage, cycle life and decline in power. We have a limited product history on which to base our warranty estimates. Because of the limited operating history of our batteries and battery systems, our management is required to make assumptions and to apply judgment regarding a number of factors, including anticipated rate of warranty claims, the durability and reliability of our products, and service delivery costs. Our assumptions could prove to be materially different from the actual performance of our batteries and battery systems, which could cause us to incur substantial expense to repair or replace defective products in the future and may exceed expected levels against which we have reserved. If our estimates prove incorrect, we could be required to accrue additional expenses from the time we realize our estimates are incorrect and also face a significant unplanned cash burden at the time our customers make a warranty claim, which could harm our operating results.
In addition, with our new products and products that remain under development, we will be required to base our
warranty estimates on historical experience of similar products, testing of our batteries under laboratory conditions and limited performance information learned during our development activities with the customer. As a result, actual warranty claims may be significantly different from our estimates and our financial results could vary significantly from period-to-period. Product liability or other claims could cause us to incur losses or damage our reputation.
The risk of product liability claims and associated adverse publicity is inherent in the development, manufacturing and sale of batteries and battery systems. Certain materials we use in our batteries, as well as our battery systems, could, if used improperly, cause injuries to others. Improperly charging or discharging our batteries could cause fires. Any accident involving our batteries or other products could decrease or even eliminate demand for our products. Because some of our batteries are designed to be used in electric and hybrid electric buses, and because vehicle accidents can cause injury to persons and damage to property, we are subject to a risk of claims for such injuries and damages. In addition, we could be harmed by adverse publicity resulting from problems or accidents caused by third party products that incorporate our batteries. We could even be harmed by problems or accidents involving competing battery systems, if the market viewed our batteries as being vulnerable to similar problems. Any such claims, loss of customers or reputation harm would harm our financial results and ability to continue as a going concern. Continuing adverse economic conditions could reduce, or delay demand for our products.
Although improving compared to recent years, the financial markets and general economic conditions are still
23
relatively weak in certain geographic markets worldwide. Our products are targeted primarily at large power producers, worldwide bus manufacturers and other industrial parties. Due to economic factors, companies and government agencies in some of our target markets have reduced, delayed or eliminated many research and development initiatives, including those related to energy storage. This reduction or delay in development spending by targeted key customers is hindering our development and production efforts and will continue to do so until development spending increases from current depressed levels.
The commercialization of many of our products is dependent upon the efforts of commercial partners and other third parties over which we have no or little control.
The commercialization of our principal products requires the cooperation and efforts of commercial partners
and customers. For example, because completion and testing of our large-scale stationary batteries for power suppliers requires input from utilities and connection to a power network, commercialization of such batteries can only be done in conjunction with a power or utility company. The commercialization of transportation and other applications of our technology are also dependent, in part, upon the expertise, resources and efforts of our commercial partners. This presents certain risks, including the following:
• we may not be able to enter into development, licensing, supply and other agreements with commercial
partners with appropriate resources, technology and expertise on reasonable terms or at all; • our commercial partners may not place the same priority on a project as we do, may fail to honor
contractual commitments, may not have the level of resources, expertise, market strength or other characteristics necessary for the success of the project, may dedicate only limited resources to, and/or may abandon, a development project for reasons, including reasons such as a shift in corporate focus, unrelated to its merits;
• our commercial partners may be in the early stages of development and may not have sufficient liquidity to invest in joint development projects, expand their businesses and purchase our products as expected or honor contractual commitments;
• our commercial partners may terminate joint testing, development or marketing projects on the merits of the projects for various reasons, including determinations that a project is not feasible, cost-effective or likely to lead to a marketable end product;
• our commercial partners may not protect our intellectual property adequately or they may infringe our intellectual property rights;
• at various stages in the testing, development, marketing or production process, we may have disputes with our commercial partners, which may inhibit development, lead to an abandonment of the project or have other negative consequences; and
• even if the commercialization and marketing of jointly developed products is successful, our revenue share may be limited and may not exceed our associated development and operating costs.
As a result of the actions or omissions of our commercial partners, or our inability to identify and enter into
suitable arrangements with qualified commercial partners, we may be unable to commercialize apparently viable products on a timely and cost-effective basis, or at all. Interest in our nano lithium titanate batteries is affected by energy supply and pricing, political events, popular consciousness and other factors over which we have no control.
Currently, our marketing and development efforts for our batteries and battery materials are focused primarily
on the electric grid, industrial and transportation applications. In the transportation and industrial markets, batteries containing our nano lithium titanate materials are designed to replace or supplement gasoline and diesel engines. In the stationary power applications, our batteries are designed to conserve and regulate the stable supply of electricity, including from renewable sources. The interest of our potential customers and business partners in our products and services is affected by a number of factors beyond our control, including:
• economic conditions and capital financing and liquidity constraints; • short-term and long-term trends in the supply and price of natural gas, gasoline, diesel, coal and other fuels; • the anticipated or actual granting or elimination by governments of tax and other financial incentives
favoring electric or hybrid electric vehicles and renewable energy production;
24
• the ability of the various regulatory bodies to define the rules and procedures under which this new
technology can be deployed into the electric grid; • the anticipated or actual funding, or elimination of funding, for programs that support renewable energy
programs and electric grid improvements; • changes in public and investor interest for financial and/or environmental reasons, in supporting or
adopting alternatives to gasoline and diesel for transportation and other purposes; • the overall economic environment and the availability of credit to assist customers in purchasing our large
battery systems; • the expansion or contraction of private and public research and development budgets as a result of global
and U.S. economic trends; and • the speed of incorporation of renewable energy generating sources into the electric grid.
Adverse trends in one or more of these factors may inhibit our ability to commercialize our products and expand
revenues from our battery materials and batteries. If we combine with other companies, we may be unable to successfully integrate our business, technology, management or other aspects of our business with the other party to the transaction.
As evidenced by our signing the Share Subscription Agreement with Canon and related agreements with YTE,
we routinely consider entering into acquisition, strategic or combination transactions with other companies for strategic and/or financial reasons. We do not have extensive experience in conducting diligence on, evaluating, purchasing, merging with, selling to or integrating new businesses or technologies with other entities. If we do succeed in closing a combination with another company, we will be exposed to a number of risks, including:
• we may have difficulty integrating our assets, technologies, operations and personnel in connection with a
business combination; • our ongoing business and management's attention may be disrupted or diverted by transition or integration
issues and the complexity of managing, or being a part of, a geographically or culturally diverse enterprises;
• we may find that the transaction does not further our business strategy or that the economic and strategic assumptions underlying the transaction have proved inaccurate;
• we may encounter difficulty entering and competing in new product or geographic markets; • we may face business, product, structural or other limitations or prohibitions as our business becomes
subject to the laws or customs of other jurisdictions; and • we may experience significant problems or liabilities associated with product quality, technology and legal
contingencies relating to the integrated business or technology, such as intellectual property or employment matters.
In addition, from time to time we may enter into negotiations for acquisitions, dispositions, mergers or other
transactions that are not ultimately consummated. These negotiations could result in significant diversion of management time, substantial out-of-pocket costs and, while such transactions are pending, limitations on the operation of our business (including negotiation of alternative business combinations and capital raising transactions). To the extent we issue shares of capital stock or other rights to purchase capital stock in any such transactions, including options and warrants, existing stockholders would be diluted. Any of these issues will harm our business and financial condition.
Our competitors have more resources than we do, and may be supported by more prominent partners, which may give them a competitive advantage.
We have limited financial, personnel and other resources and, because of our early stage of development, have
limited access to capital. We compete or may compete against entities that are much larger than we are, have more extensive resources than we do and have an established reputation and operating history. In addition, certain of our early stage competitors are partnered with, associated with or supported by larger business or financial partners. This may increase their ability to raise capital, attract media attention, develop products and attract customers. Because of their size, resources, reputation and history (or that of their business and financial partners), certain of our competitors may be able to exploit acquisition, development and joint venture opportunities more rapidly, easily or thoroughly than we can. In addition, potential customers may choose to do business with our more established competitors, without regard to the
25
comparative quality of our products, because of their perception that our competitors are more stable, are more likely to complete various projects, are more likely to continue as a going concern and lend greater credibility to any joint venture.
As manufacturing becomes a larger part of our operations, we will become exposed to accompanying risks and liabilities.
In-house and outsourced manufacturing is becoming an increasingly significant part of our business. As a result,
we expect to become increasingly subject to various risks associated with the manufacturing and supply of products, including the following:
• If we fail to supply products in accordance with contractual terms, including terms related to time of
delivery and performance specifications, we may be required to repair or replace defective products and may become liable for direct, special, consequential and other damages, even if manufacturing or delivery was outsourced;
• Raw materials used in the manufacturing process, labor and other key inputs may become scarce and expensive, causing our actual costs to exceed cost projections and associated revenues;
• Manufacturing processes typically involve large machinery, fuels and chemicals, any or all of which may lead to accidents involving bodily harm, destruction of facilities and environmental contamination and associated liabilities;
• As our manufacturing operations expand, we expect that a significant portion of our manufacturing will be done overseas, either by third-party contractors or in a plant owned by the company. Any manufacturing done overseas presents risks associated with quality control, currency exchange rates, foreign laws and customs, timing and loss risks associated with overseas transportation and potential adverse changes in the political, legal and social environment in the host county; and
• We have made, and may be required to make, representations as to our right to supply and/or license intellectual property and to our compliance with laws. Such representations are usually supported by indemnification provisions requiring us to defend our customers and otherwise make them whole if we license or supply products that infringe on third-party technologies or violate government regulations.
Any failure to adequately manage risks associated with the manufacture and supply of materials and products
could lead to losses (or smaller than anticipated gross profits) from that segment of our business and/or significant liabilities, which would harm our business, operations and financial condition. Our past and future operations may lead to substantial environmental liability.
Virtually any prior or future production of our nanomaterials and titanium dioxide pigment technology is
subject to federal, state and local environmental laws. Under such laws, we may be jointly and severally liable with prior property owners for the treatment, cleanup, remediation and/or removal of any hazardous substances discovered at any property we use. In addition, courts or government agencies may impose liability for, among other things, the improper release, discharge, storage, use, disposal or transportation of hazardous substances. If we incur any significant environmental liabilities, our ability to execute our business plan and our financial condition would be harmed. Certain of our experts and directors reside in Canada or China and may be able to avoid civil liability.
We are a US corporation, and a majority of our directors reside outside the United States in Canada or China.
As a result, investors may be unable to effect service of process upon such persons within the United States and may be unable to enforce court judgments against such persons predicated upon civil liability provisions of the U.S. securities laws. It is uncertain whether Canadian or Chinese courts would enforce judgments of U.S. courts obtained against us or such directors, officers or experts predicated upon the civil liability provisions of U.S. securities laws or impose liability in original actions against us or our directors, officers or experts predicated upon U.S. securities laws. We are dependent on key personnel.
We have experienced, and may continue to experience, turnover in key positions, which could result in the loss
of company-specific knowledge, experience and expertise. Our continued success will depend, to a significant extent, on the services of our executive management team and certain key scientists and engineers. We do not have key man insurance on any of these individuals. Nor do we have agreements requiring any of our key personnel to remain with our
26
company. The loss or unavailability of any or all of these individuals could harm our ability to execute our business plan, maintain important business relationships and complete certain product development initiatives, which would harm our business.
We may issue substantial amounts of additional shares without stockholder approval.
Our articles of incorporation authorize the issuance of 200 million shares of common stock that may be issued
without any action or approval by our stockholders. In addition, we have various stock option plans that have potential for diluting the ownership interests of our stockholders. The issuance of any additional shares of common stock would further dilute the percentage ownership of our company held by existing stockholders.
The market price of our shares of common stock is highly volatile and may increase or decrease dramatically at any time.
The market price of our shares of common stock is highly volatile. Our stock price may change dramatically as
the result of announcements of product developments, new products or innovations by us or our competitors, uncertainty regarding the viability of our technology or our product initiatives, significant customer contracts, significant litigation, our liquidity situation, revenues or losses, or other factors or events that would be expected to affect our business, financial condition, results of operations and future prospects.
The market price for our shares of common stock may be affected by various factors not directly related to our business or future prospects, including the following:
• intentional manipulation of our stock price by existing or future shareholders or a reaction by investors to
trends in our stock rather than the fundamentals of our business; • a single acquisition or disposition, or several related acquisitions or dispositions, of a large number of our
shares, including by short sellers covering their position; • the interest of the market in our business sector, without regard to our financial condition, results of
operations or business prospects; • positive or negative statements or projections about our company or our industry, by analysts, stock gurus
and other persons; • the adoption of governmental regulations or government grant programs and similar developments in the
United States or abroad that may enhance or detract from our ability to offer our products and services or affect our cost structure; and
• economic and other external market factors, such as a general decline in market prices due to poor economic conditions, investor distrust or a financial crisis.
We have never declared a cash dividend and do not intend to declare a cash dividend in the foreseeable future.
We have never declared or paid cash dividends on our common stock. We currently intend to retain any future
earnings, if any, for use in our business and, therefore, do not anticipate paying dividends on our common stock in the foreseeable future.
We are subject to various regulatory regimes, and may be adversely affected by inquiries, investigations and allegations that we have not complied with governing rules and laws.
In light of our status as a public company and our lines of business, we are subject to a variety of laws and
regulatory regimes in addition to those applicable to all businesses generally. For example, we are subject to the reporting requirements applicable to the United States and Canadian reporting issuers, such as the Sarbanes-Oxley Act of 2002, the rules of the NASDAQ Capital Market and certain state and provincial securities laws. We are also subject to state and federal environmental, health and safety laws. Such laws and rules change frequently and are often complex. In connection with such laws, we are subject to periodic audits, inquiries and investigations. Any such audits, inquiries and investigations may divert considerable financial and human resources and adversely affect the execution of our business plan.
Through such audits, inquiries and investigations, we or a regulator may determine that we are out of
compliance with one or more governing rules or laws. Remedying such non-compliance diverts additional financial and human resources. In addition, in the future, we may be subject to a formal charge or determination that we have

27
materially violated a governing law, rule or regulation. We may also be subject to lawsuits as a result of alleged violation of the securities laws or governing corporate laws. Any charge or allegation, and particularly any determination, that we had materially violated a governing law would harm our ability to enter into business relationships, recruit qualified officers and employees and raise capital.
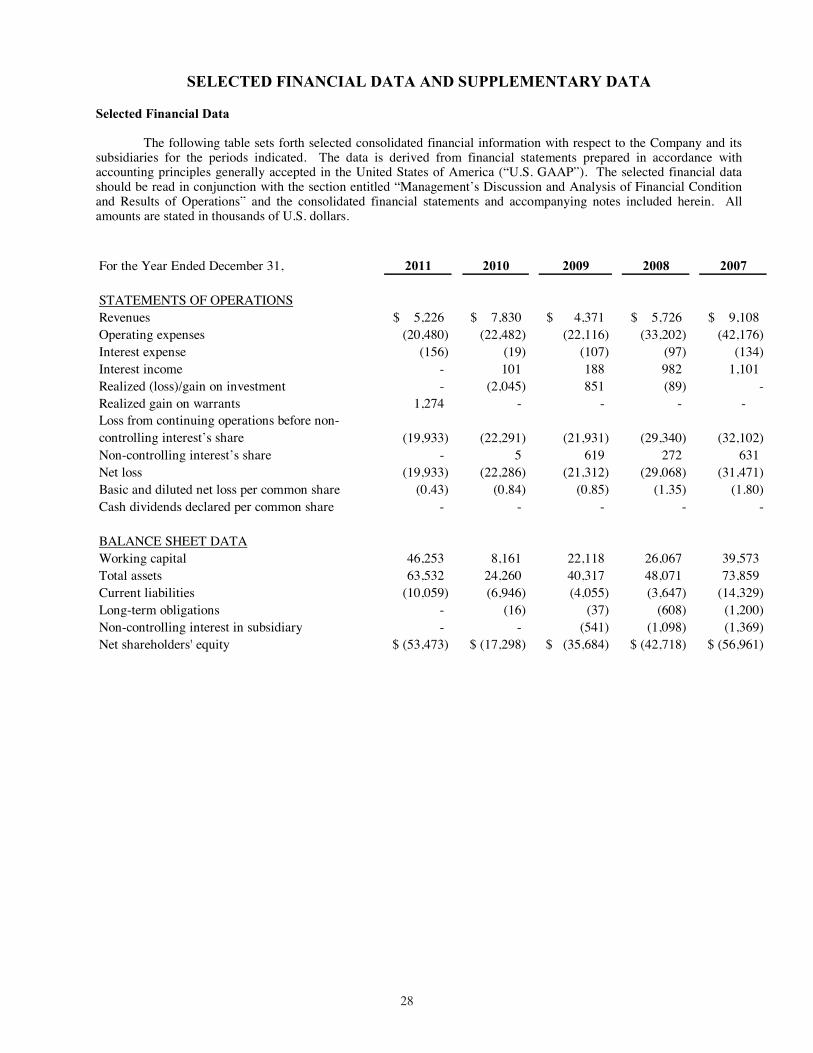
28
SELECTED FINANCIAL DATA AND SUPPLEMENTARY DATA Selected Financial Data The following table sets forth selected consolidated financial information with respect to the Company and its subsidiaries for the periods indicated. The data is derived from financial statements prepared in accordance with accounting principles generally accepted in the United States of America (“U.S. GAAP”). The selected financial data should be read in conjunction with the section entitled “Management’s Discussion and Analysis of Financial Condition and Results of Operations” and the consolidated financial statements and accompanying notes included herein. All amounts are stated in thousands of U.S. dollars.
For the Year Ended December 31, 2011 2010 2009 2008 2007 STATEMENTS OF OPERATIONSRevenues 5,226$ 7,830$ 4,371$ 5,726$ 9,108$ Operating expenses (20,480) (22,482) (22,116) (33,202) (42,176)Interest expense (156) (19) (107) (97) (134)Interest income - 101 188 982 1,101Realized (loss)/gain on investment - (2,045) 851 (89) -Realized gain on warrants 1,274 - - - - Loss from continuing operations before non-controlling interest’s share (19,933) (22,291) (21,931) (29,340) (32,102)Non-controlling interest’s share - 5 619 272 631Net loss (19,933) (22,286) (21,312) (29,068) (31,471)Basic and diluted net loss per common share (0.43) (0.84) (0.85) (1.35) (1.80)Cash dividends declared per common share - - - - - BALANCE SHEET DATAWorking capital 46,253 8,161 22,118 26,067 39,573Total assets 63,532 24,260 40,317 48,071 73,859Current liabilities (10,059) (6,946) (4,055) (3,647) (14,329)Long-term obligations - (16) (37) (608) (1,200)Non-controlling interest in subsidiary - - (541) (1,098) (1,369)Net shareholders' equity (53,473)$ (17,298)$ (35,684)$ (42,718)$ (56,961)$
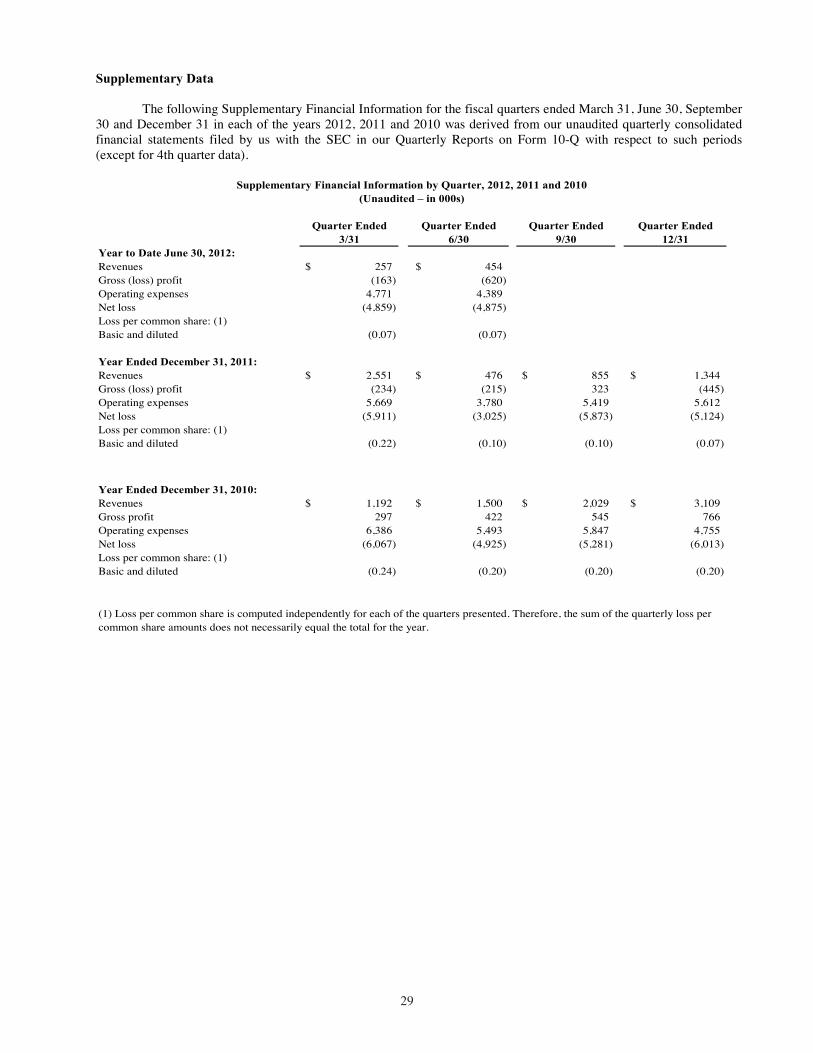
29
Supplementary Data
The following Supplementary Financial Information for the fiscal quarters ended March 31, June 30, September
30 and December 31 in each of the years 2012, 2011 and 2010 was derived from our unaudited quarterly consolidated financial statements filed by us with the SEC in our Quarterly Reports on Form 10-Q with respect to such periods (except for 4th quarter data).
Quarter Ended Quarter Ended Quarter Ended Quarter Ended 3/31 6/30 9/30 12/31Year to Date June 30, 2012:Revenues 257$ 454$ Gross (loss) profit (163) (620)Operating expenses 4,771 4,389Net loss (4,859) (4,875)Loss per common share: (1)Basic and diluted (0.07) (0.07)
Year Ended December 31, 2011:Revenues 2,551$ 476$ 855$ 1,344$ Gross (loss) profit (234) (215) 323 (445)Operating expenses 5,669 3,780 5,419 5,612Net loss (5,911) (3,025) (5,873) (5,124)Loss per common share: (1)Basic and diluted (0.22) (0.10) (0.10) (0.07)
Year Ended December 31, 2010:Revenues 1,192$ 1,500$ 2,029$ 3,109$ Gross profit 297 422 545 766Operating expenses 6,386 5,493 5,847 4,755Net loss (6,067) (4,925) (5,281) (6,013)Loss per common share: (1)Basic and diluted (0.24) (0.20) (0.20) (0.20)
Supplementary Financial Information by Quarter, 2012, 2011 and 2010(Unaudited – in 000s)
(1) Loss per common share is computed independently for each of the quarters presented. Therefore, the sum of the quarterly loss per common share amounts does not necessarily equal the total for the year.
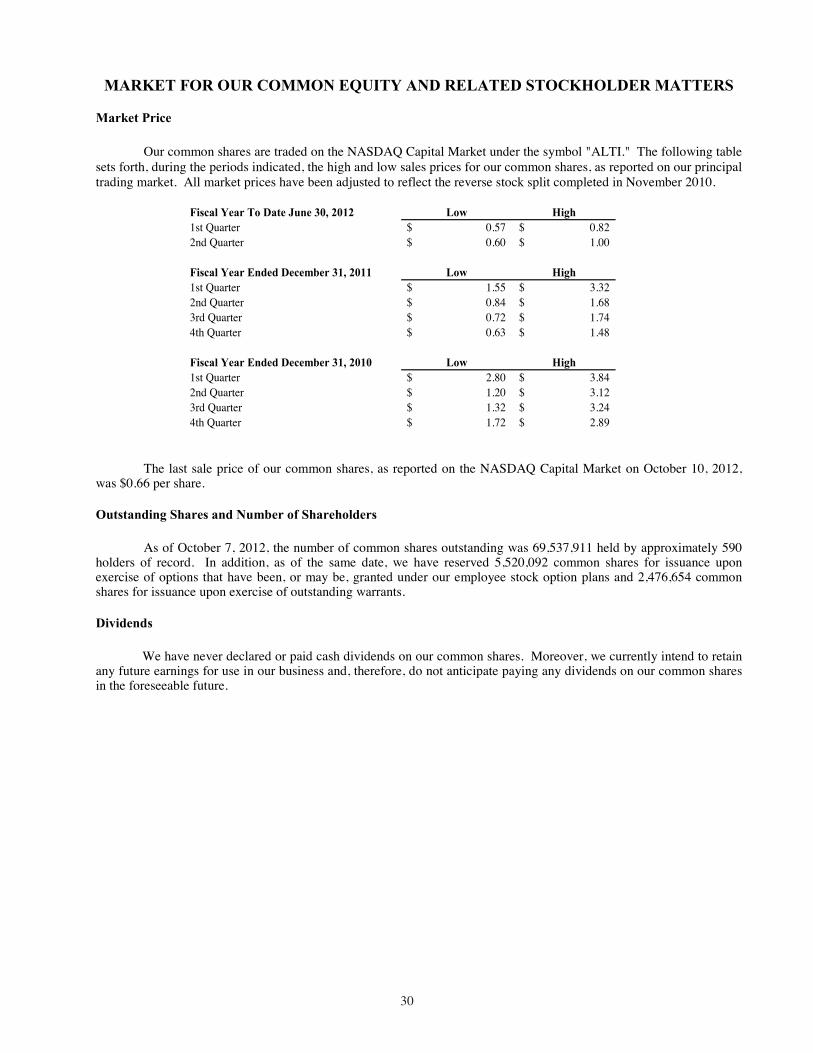
30
MARKET FOR OUR COMMON EQUITY AND RELATED STOCKHOLDER MATTERS
Market Price
Our common shares are traded on the NASDAQ Capital Market under the symbol "ALTI." The following table sets forth, during the periods indicated, the high and low sales prices for our common shares, as reported on our principal trading market. All market prices have been adjusted to reflect the reverse stock split completed in November 2010.
Fiscal Year To Date June 30, 2012 Low High1st Quarter 0.57$ 0.82$ 2nd Quarter 0.60$ 1.00$
Fiscal Year Ended December 31, 2011 Low High1st Quarter 1.55$ 3.32$ 2nd Quarter 0.84$ 1.68$ 3rd Quarter 0.72$ 1.74$ 4th Quarter 0.63$ 1.48$ Fiscal Year Ended December 31, 2010 Low High1st Quarter 2.80$ 3.84$ 2nd Quarter 1.20$ 3.12$ 3rd Quarter 1.32$ 3.24$ 4th Quarter 1.72$ 2.89$
The last sale price of our common shares, as reported on the NASDAQ Capital Market on October 10, 2012,
was $0.66 per share.
Outstanding Shares and Number of Shareholders
As of October 7, 2012, the number of common shares outstanding was 69,537,911 held by approximately 590 holders of record. In addition, as of the same date, we have reserved 5,520,092 common shares for issuance upon exercise of options that have been, or may be, granted under our employee stock option plans and 2,476,654 common shares for issuance upon exercise of outstanding warrants.
Dividends
We have never declared or paid cash dividends on our common shares. Moreover, we currently intend to retain any future earnings for use in our business and, therefore, do not anticipate paying any dividends on our common shares in the foreseeable future.
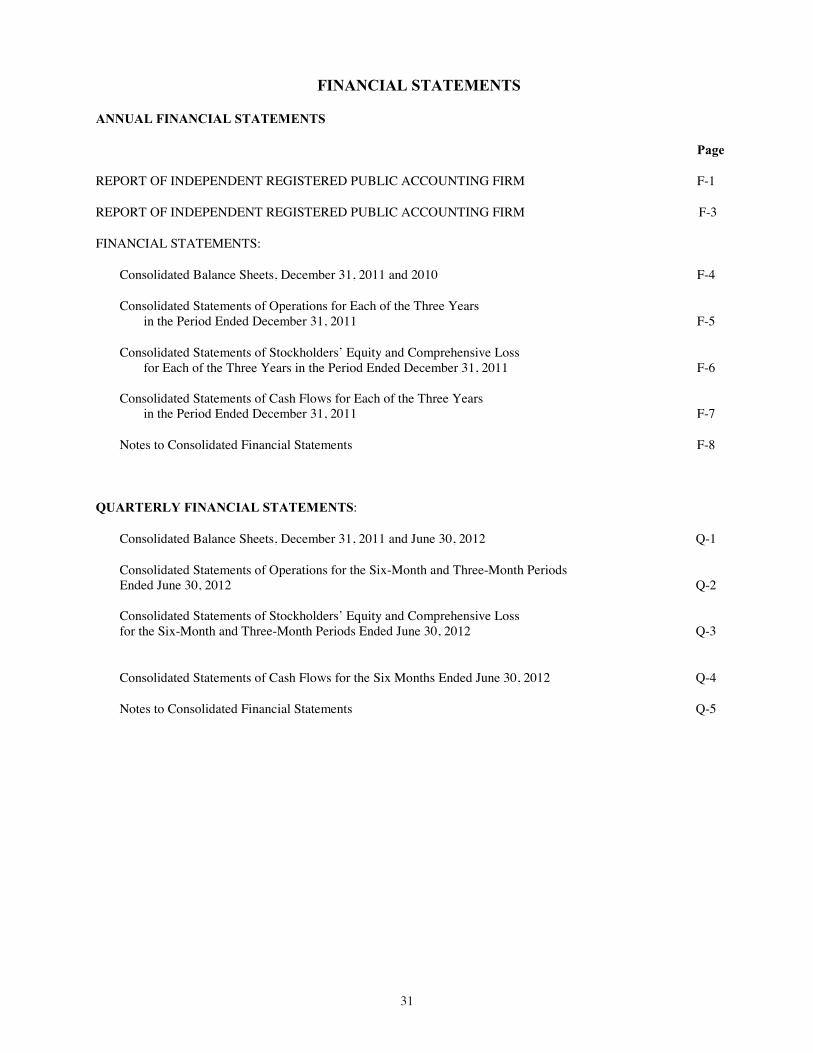
31
FINANCIAL STATEMENTS
ANNUAL FINANCIAL STATEMENTS
Page
REPORT OF INDEPENDENT REGISTERED PUBLIC ACCOUNTING FIRM F-1
REPORT OF INDEPENDENT REGISTERED PUBLIC ACCOUNTING FIRM F-3
FINANCIAL STATEMENTS:
Consolidated Balance Sheets, December 31, 2011 and 2010 F-4
Consolidated Statements of Operations for Each of the Three Years in the Period Ended December 31, 2011 F-5
Consolidated Statements of Stockholders’ Equity and Comprehensive Loss for Each of the Three Years in the Period Ended December 31, 2011 F-6 Consolidated Statements of Cash Flows for Each of the Three Years
in the Period Ended December 31, 2011 F-7
Notes to Consolidated Financial Statements F-8
QUARTERLY FINANCIAL STATEMENTS:
Consolidated Balance Sheets, December 31, 2011 and June 30, 2012 Q-1
Consolidated Statements of Operations for the Six-Month and Three-Month Periods Ended June 30, 2012 Q-2 Consolidated Statements of Stockholders’ Equity and Comprehensive Loss for the Six-Month and Three-Month Periods Ended June 30, 2012 Q-3
Consolidated Statements of Cash Flows for the Six Months Ended June 30, 2012 Q-4
Notes to Consolidated Financial Statements Q-5
Altair Nanotechnologies Inc.and Subsidiaries
Consolidated Financial Statements as of December 31, 2011 and2010 and for Each of the Three Years in the Period Ended December 31, 2011 and Reports of the Independent Registered Public Accounting Firms
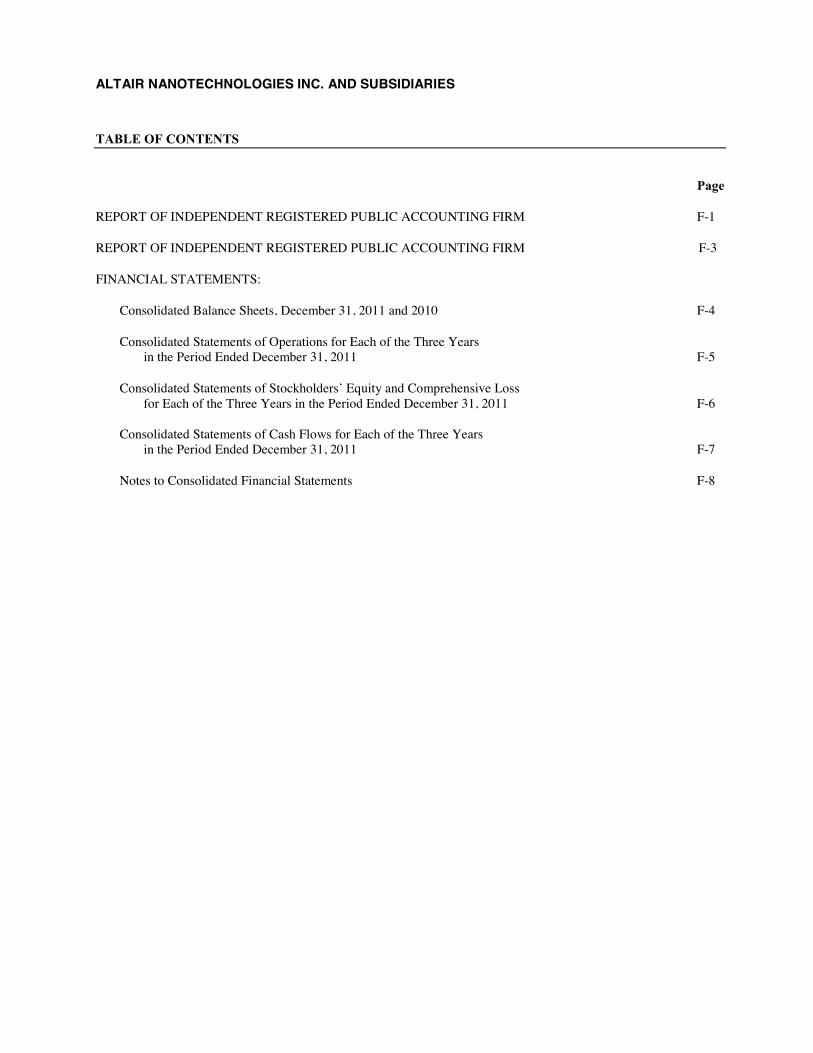
ALTAIR NANOTECHNOLOGIES INC. AND SUBSIDIARIES
TABLE OF CONTENTS
Page
REPORT OF INDEPENDENT REGISTERED PUBLIC ACCOUNTING FIRM F-1
REPORT OF INDEPENDENT REGISTERED PUBLIC ACCOUNTING FIRM F-3
FINANCIAL STATEMENTS:
Consolidated Balance Sheets, December 31, 2011 and 2010 F-4
Consolidated Statements of Operations for Each of the Three Yearsin the Period Ended December 31, 2011 F-5
Consolidated Statements of Stockholders’ Equity and Comprehensive Lossfor Each of the Three Years in the Period Ended December 31, 2011 F-6
Consolidated Statements of Cash Flows for Each of the Three Yearsin the Period Ended December 31, 2011 F-7
Notes to Consolidated Financial Statements F-8
F-1
REPORT OF INDEPENDENT REGISTERED PUBLIC ACCOUNTING FIRM
To the Board of Directors and Stockholders Altair Nanotechnologies Inc. Reno, Nevada
We have audited the accompanying balance sheet of Altair Nanotechnologies Inc. and subsidiaries (the
"Company") as of December 31, 2011, and the related consolidated statements of operations, stockholders' equity and comprehensive loss, and cash flows for the year then ended. We also have audited the Company's internal control over financial reporting as of December 31, 2011, based on criteria established in Internal Control — Integrated Framework issued by the Committee of Sponsoring Organizations of the Treadway Commission (COSO). The Company's management is responsible for these financial statements, for maintaining effective internal control over financial reporting, and for its assessment of the effectiveness of internal control over financial reporting, included in the accompanying Management Report on Internal Control Over Financial Reporting. Our responsibility is to express an opinion on these financial statements and an opinion on the Company's internal control over financial reporting based on our audits.
We conducted our audits in accordance with the standards of the Public Company Accounting Oversight Board (United States). Those standards require that we plan and perform the audits to obtain reasonable assurance about whether the financial statements are free of material misstatement and whether effective internal control over financial reporting was maintained in all material respects. Our audit of the financial statements included examining, on a test basis, evidence supporting the amounts and disclosures in the financial statements, assessing the accounting principles used and significant estimates made by management, and evaluating the overall financial statement presentation. Our audit of internal control over financial reporting included obtaining an understanding of internal control over financial reporting, assessing the risk that a material weakness exists, and testing and evaluating the design and operating effectiveness of internal control based on the assessed risk. Our audits also included performing such other procedures as we considered necessary in the circumstances. We believe that our audits provide a reasonable basis for our opinions.
A company's internal control over financial reporting is a process designed to provide reasonable assurance regarding the reliability of financial reporting and the preparation of financial statements for external purposes in accordance with generally accepted accounting principles. A company's internal control over financial reporting includes those policies and procedures that (1) pertain to the maintenance of records that, in reasonable detail, accurately and fairly reflect the transactions and dispositions of the assets of the company; (2) provide reasonable assurance that transactions are recorded as necessary to permit preparation of financial statements in accordance with generally accepted accounting principles, and that receipts and expenditures of the company are being made only in accordance with authorizations of management and directors of the company; and (3) provide reasonable assurance regarding prevention or timely detection of unauthorized acquisition, use, or disposition of the company's assets that could have a material effect on the financial statements.
Because of its inherent limitations, internal control over financial reporting may not prevent or detect misstatements. Also, projections of any evaluation of effectiveness to future periods are subject to the risk that controls may become inadequate because of changes in conditions, or that the degree of compliance with the policies or procedures may deteriorate.
F-2
REPORT OF INDEPENDENT REGISTERED PUBLIC ACCOUNTING FIRM
(continued) In our opinion, the financial statements referred to above present fairly, in all material respects, the financial
position of the Company as of December 31, 2011, and the results of its operations and its cash flows for the year then ended in conformity with accounting principles generally accepted in the United States of America. Also in our opinion, the Company maintained, in all material respects, effective internal control over financial reporting as of December 31, 2011, based on criteria established in Internal Control – Integrated Framework issued by the Committee of Sponsoring Organizations of the Treadway Commission (COSO). /s/ Crowe Horwath LLP Sacramento, California March 30, 2012
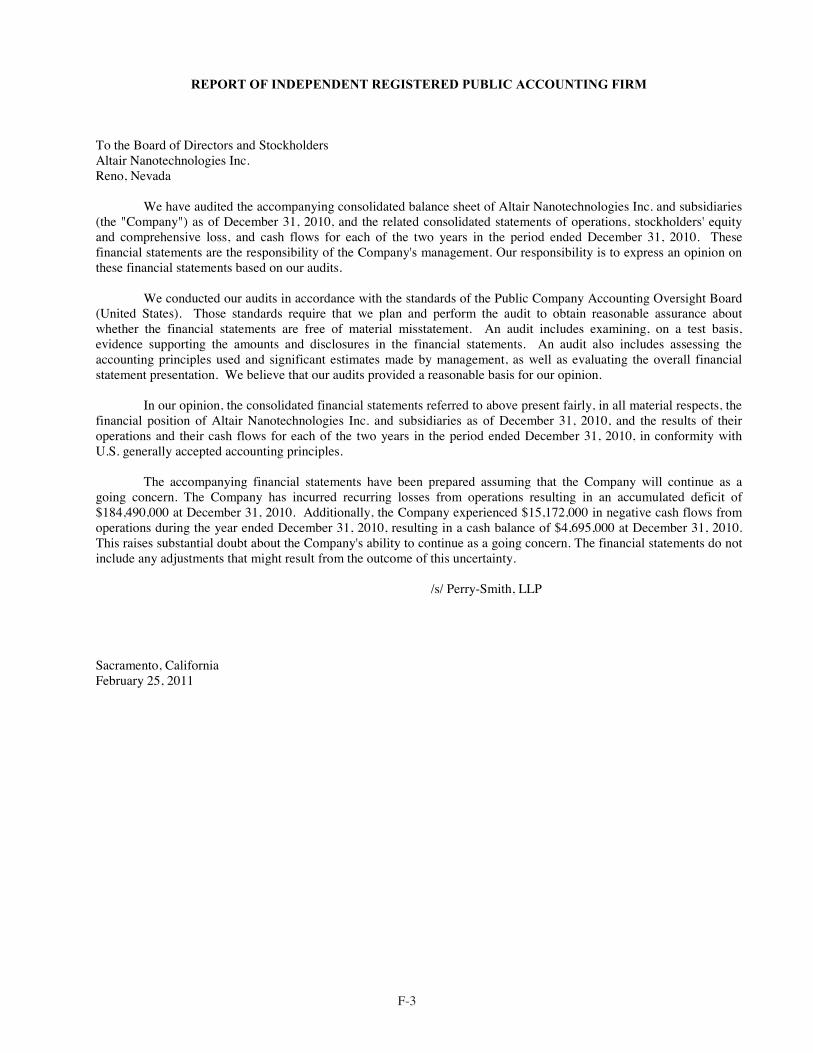
F-3
REPORT OF INDEPENDENT REGISTERED PUBLIC ACCOUNTING FIRM
To the Board of Directors and Stockholders Altair Nanotechnologies Inc. Reno, Nevada
We have audited the accompanying consolidated balance sheet of Altair Nanotechnologies Inc. and subsidiaries (the "Company") as of December 31, 2010, and the related consolidated statements of operations, stockholders' equity and comprehensive loss, and cash flows for each of the two years in the period ended December 31, 2010. These financial statements are the responsibility of the Company's management. Our responsibility is to express an opinion on these financial statements based on our audits.
We conducted our audits in accordance with the standards of the Public Company Accounting Oversight Board (United States). Those standards require that we plan and perform the audit to obtain reasonable assurance about whether the financial statements are free of material misstatement. An audit includes examining, on a test basis, evidence supporting the amounts and disclosures in the financial statements. An audit also includes assessing the accounting principles used and significant estimates made by management, as well as evaluating the overall financial statement presentation. We believe that our audits provided a reasonable basis for our opinion.
In our opinion, the consolidated financial statements referred to above present fairly, in all material respects, the financial position of Altair Nanotechnologies Inc. and subsidiaries as of December 31, 2010, and the results of their operations and their cash flows for each of the two years in the period ended December 31, 2010, in conformity with U.S. generally accepted accounting principles. The accompanying financial statements have been prepared assuming that the Company will continue as a going concern. The Company has incurred recurring losses from operations resulting in an accumulated deficit of $184,490,000 at December 31, 2010. Additionally, the Company experienced $15,172,000 in negative cash flows from operations during the year ended December 31, 2010, resulting in a cash balance of $4,695,000 at December 31, 2010. This raises substantial doubt about the Company's ability to continue as a going concern. The financial statements do not include any adjustments that might result from the outcome of this uncertainty.
/s/ Perry-Smith, LLP
Sacramento, California February 25, 2011
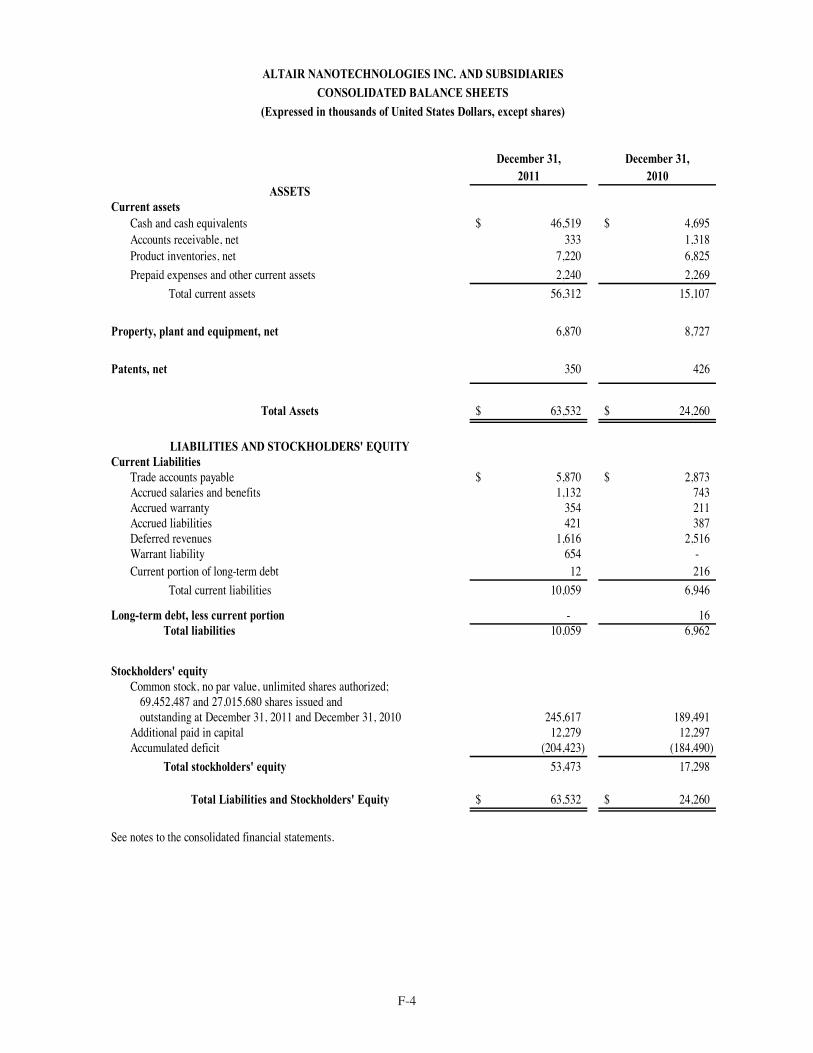
F-4
December 31, December 31,2011 2010
ASSETSCurrent assets
Cash and cash equivalents 46,519$ 4,695$ Accounts receivable, net 333 1,318 Product inventories, net 7,220 6,825 Prepaid expenses and other current assets 2,240 2,269
Total current assets 56,312 15,107
Property, plant and equipment, net 6,870 8,727
Patents, net 350 426
Total Assets 63,532$ 24,260$
LIABILITIES AND STOCKHOLDERS' EQUITYCurrent Liabilities
Trade accounts payable 5,870$ 2,873$ Accrued salaries and benefits 1,132 743 Accrued warranty 354 211 Accrued liabilities 421 387 Deferred revenues 1,616 2,516 Warrant liability 654 - Current portion of long-term debt 12 216
Total current liabilities 10,059 6,946
Long-term debt, less current portion - 16 Total liabilities 10,059 6,962
Stockholders' equity
Common stock, no par value, unlimited shares authorized;69,452,487 and 27,015,680 shares issued and outstanding at December 31, 2011 and December 31, 2010 245,617 189,491
Additional paid in capital 12,279 12,297 Accumulated deficit (204,423) (184,490)
Total stockholders' equity 53,473 17,298
Total Liabilities and Stockholders' Equity 63,532$ 24,260$
See notes to the consolidated financial statements.
ALTAIR NANOTECHNOLOGIES INC. AND SUBSIDIARIESCONSOLIDATED BALANCE SHEETS
(Expressed in thousands of United States Dollars, except shares)
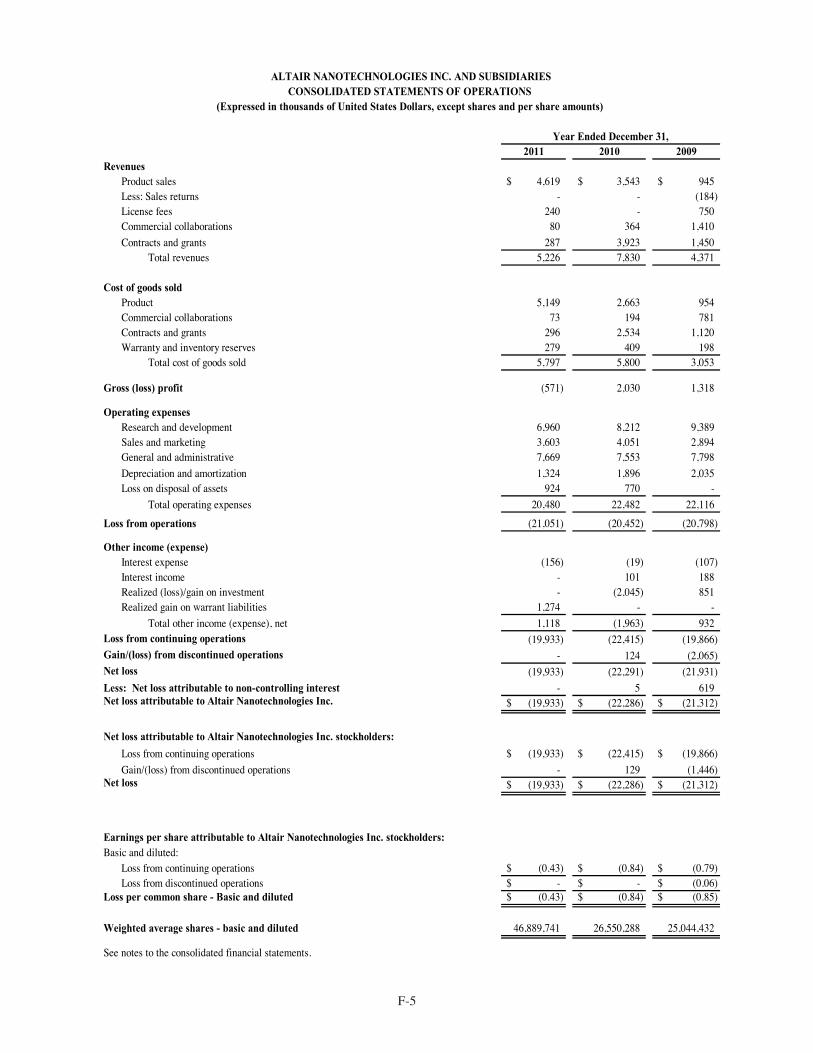
F-5
2011 2010 2009Revenues
Product sales 4,619$ 3,543$ 945$ Less: Sales returns - - (184) License fees 240 - 750 Commercial collaborations 80 364 1,410 Contracts and grants 287 3,923 1,450
Total revenues 5,226 7,830 4,371
Cost of goods soldProduct 5,149 2,663 954 Commercial collaborations 73 194 781 Contracts and grants 296 2,534 1,120 Warranty and inventory reserves 279 409 198
Total cost of goods sold 5,797 5,800 3,053
Gross (loss) profit (571) 2,030 1,318
Operating expensesResearch and development 6,960 8,212 9,389 Sales and marketing 3,603 4,051 2,894 General and administrative 7,669 7,553 7,798 Depreciation and amortization 1,324 1,896 2,035 Loss on disposal of assets 924 770 -
Total operating expenses 20,480 22,482 22,116
Loss from operations (21,051) (20,452) (20,798)
Other income (expense)Interest expense (156) (19) (107) Interest income - 101 188 Realized (loss)/gain on investment - (2,045) 851 Realized gain on warrant liabilities 1,274 - -
Total other income (expense), net 1,118 (1,963) 932 Loss from continuing operations (19,933) (22,415) (19,866) Gain/(loss) from discontinued operations - 124 (2,065) Net loss (19,933) (22,291) (21,931) Less: Net loss attributable to non-controlling interest - 5 619 Net loss attributable to Altair Nanotechnologies Inc. (19,933)$ (22,286)$ (21,312)$
Net loss attributable to Altair Nanotechnologies Inc. stockholders:
Loss from continuing operations (19,933)$ (22,415)$ (19,866)$ Gain/(loss) from discontinued operations - 129 (1,446)
Net loss (19,933)$ (22,286)$ (21,312)$
Earnings per share attributable to Altair Nanotechnologies Inc. stockholders:Basic and diluted:
Loss from continuing operations (0.43)$ (0.84)$ (0.79)$ Loss from discontinued operations -$ -$ (0.06)$
Loss per common share - Basic and diluted (0.43)$ (0.84)$ (0.85)$
Weighted average shares - basic and diluted 46,889,741 26,550,288 25,044,432
See notes to the consolidated financial statements.
ALTAIR NANOTECHNOLOGIES INC. AND SUBSIDIARIESCONSOLIDATED STATEMENTS OF OPERATIONS
(Expressed in thousands of United States Dollars, except shares and per share amounts)
Year Ended December 31,
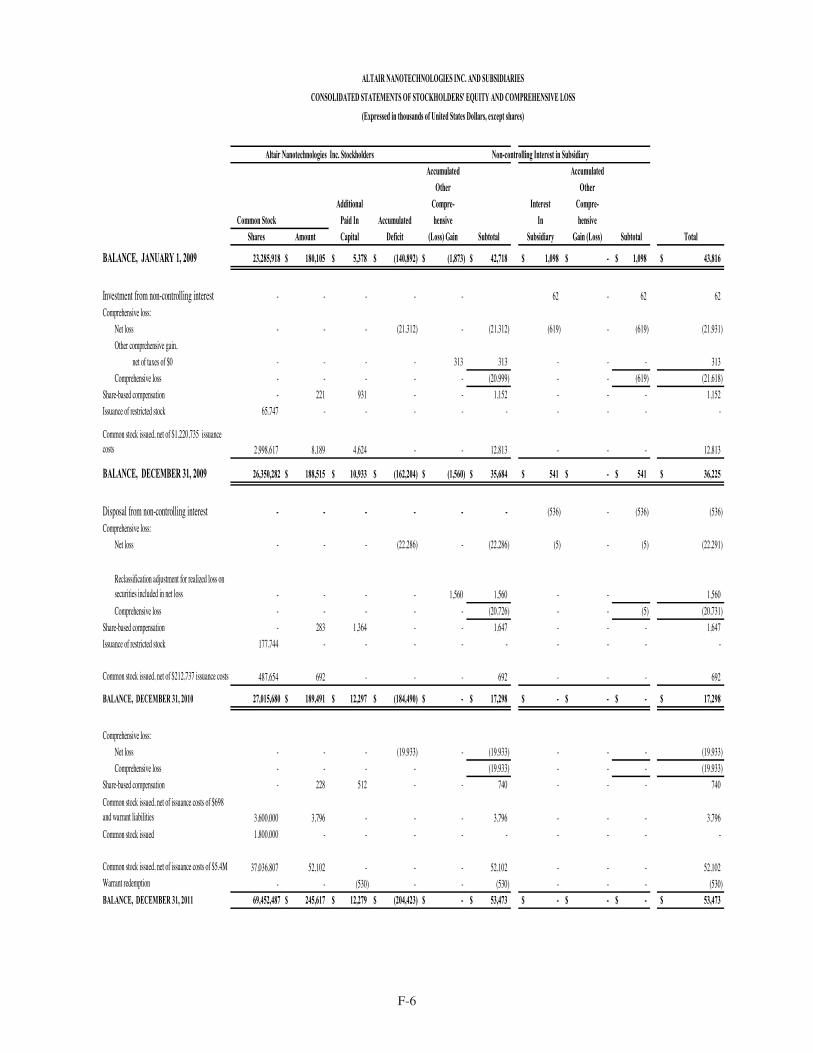
F-6
ALTAIR NANOTECHNOLOGIES INC. AND SUBSIDIARIES
CONSOLIDATED STATEMENTS OF STOCKHOLDERS' EQUITY AND COMPREHENSIVE LOSS
(Expressed in thousands of United States Dollars, except shares)
Altair Nanotechnologies Inc. Stockholders Non-controlling Interest in Subsidiary
Accumulated Accumulated
Other Other
Additional Compre- Interest Compre-
Common Stock Paid In Accumulated hensive In hensive
Shares Amount Capital Deficit (Loss) Gain Subtotal Subsidiary Gain (Loss) Subtotal Total
BALANCE, JANUARY 1, 2009 23,285,918 180,105$ 5,378$ (140,892)$ (1,873)$ 42,718$ 1,098$ -$ 1,098$ 43,816$
Investment from non-controlling interest - - - - - 62 - 62 62 Comprehensive loss:
Net loss - - - (21,312) - (21,312) (619) - (619) (21,931) Other comprehensive gain,
net of taxes of $0 - - - - 313 313 - - - 313 Comprehensive loss - - - - - (20,999) - - (619) (21,618)
Share-based compensation - 221 931 - - 1,152 - - - 1,152 Issuance of restricted stock 65,747 - - - - - - - - -
Common stock issued, net of $1,220,735 issuance costs 2,998,617 8,189 4,624 - - 12,813 - - - 12,813
BALANCE, DECEMBER 31, 2009 26,350,282 188,515$ 10,933$ (162,204)$ (1,560)$ 35,684$ 541$ -$ 541$ 36,225$
Disposal from non-controlling interest - - - - - - (536) - (536) (536) Comprehensive loss:
Net loss - - - (22,286) - (22,286) (5) - (5) (22,291)
Reclassification adjustment for realized loss on securities included in net loss - - - - 1,560 1,560 - - 1,560 Comprehensive loss - - - - - (20,726) - - (5) (20,731)
Share-based compensation - 283 1,364 - - 1,647 - - - 1,647 Issuance of restricted stock 177,744 - - - - - - - - -
Common stock issued, net of $212,737 issuance costs 487,654 692 - - - 692 - - - 692
BALANCE, DECEMBER 31, 2010 27,015,680 189,491$ 12,297$ (184,490)$ -$ 17,298$ -$ -$ -$ 17,298$
Comprehensive loss:Net loss - - - (19,933) - (19,933) - - - (19,933) Comprehensive loss - - - - (19,933) - - - (19,933)
Share-based compensation - 228 512 - - 740 - - - 740 Common stock issued, net of issuance costs of $698 and warrant liabilities 3,600,000 3,796 - - - 3,796 - - - 3,796 Common stock issued 1,800,000 - - - - - - - - -
Common stock issued, net of issuance costs of $5.4M 37,036,807 52,102 - - - 52,102 - - - 52,102 Warrant redemption - - (530) - - (530) - - - (530) BALANCE, DECEMBER 31, 2011 69,452,487 245,617$ 12,279$ (204,423)$ -$ 53,473$ -$ -$ -$ 53,473$
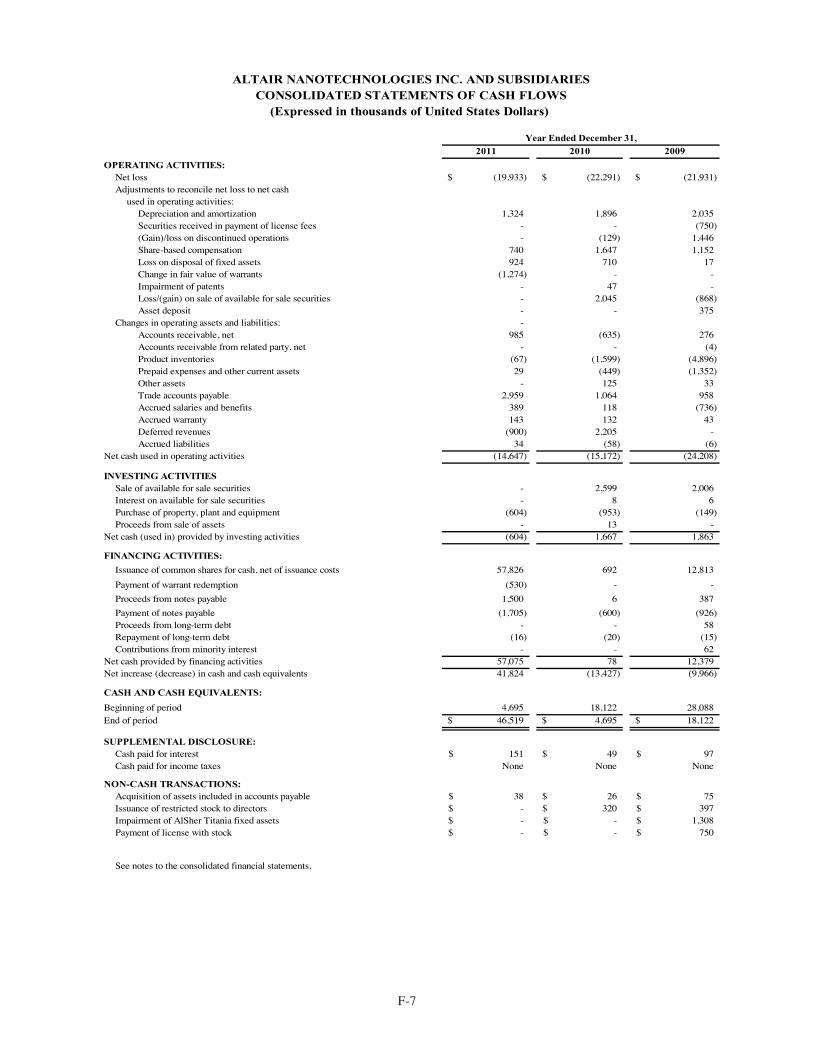
F-7
2011 2010 2009
OPERATING ACTIVITIES:Net loss (19,933)$ (22,291)$ (21,931)$ Adjustments to reconcile net loss to net cash
used in operating activities:Depreciation and amortization 1,324 1,896 2,035 Securities received in payment of license fees - - (750) (Gain)/loss on discontinued operations - (129) 1,446 Share-based compensation 740 1,647 1,152 Loss on disposal of fixed assets 924 710 17 Change in fair value of warrants (1,274) - - Impairment of patents - 47 - Loss/(gain) on sale of available for sale securities - 2,045 (868) Asset deposit - - 375
Changes in operating assets and liabilities: - Accounts receivable, net 985 (635) 276 Accounts receivable from related party, net - - (4) Product inventories (67) (1,599) (4,896) Prepaid expenses and other current assets 29 (449) (1,352) Other assets - 125 33 Trade accounts payable 2,959 1,064 958 Accrued salaries and benefits 389 118 (736) Accrued warranty 143 132 43 Deferred revenues (900) 2,205 - Accrued liabilities 34 (58) (6)
Net cash used in operating activities (14,647) (15,172) (24,208)
INVESTING ACTIVITIESSale of available for sale securities - 2,599 2,006 Interest on available for sale securities - 8 6 Purchase of property, plant and equipment (604) (953) (149) Proceeds from sale of assets - 13 -
Net cash (used in) provided by investing activities (604) 1,667 1,863
FINANCING ACTIVITIES:
Issuance of common shares for cash, net of issuance costs 57,826 692 12,813 Payment of warrant redemption (530) - - Proceeds from notes payable 1,500 6 387 Payment of notes payable (1,705) (600) (926) Proceeds from long-term debt - - 58 Repayment of long-term debt (16) (20) (15) Contributions from minority interest - - 62
Net cash provided by financing activities 57,075 78 12,379 Net increase (decrease) in cash and cash equivalents 41,824 (13,427) (9,966)
CASH AND CASH EQUIVALENTS:
Beginning of period 4,695 18,122 28,088 End of period 46,519$ 4,695$ 18,122$
SUPPLEMENTAL DISCLOSURE:Cash paid for interest 151$ 49$ 97$ Cash paid for income taxes None None None
NON-CASH TRANSACTIONS:Acquisition of assets included in accounts payable 38$ 26$ 75$ Issuance of restricted stock to directors -$ 320$ 397$ Impairment of AlSher Titania fixed assets -$ -$ 1,308$ Payment of license with stock -$ -$ 750$
See notes to the consolidated financial statements.
Year Ended December 31,
ALTAIR NANOTECHNOLOGIES INC. AND SUBSIDIARIESCONSOLIDATED STATEMENTS OF CASH FLOWS
(Expressed in thousands of United States Dollars)
F-8
ALTAIR NANOTECHNOLOGIES INC. AND SUBSIDIARIES NOTES TO THE CONSOLIDATED FINANCIAL STATEMENTS FOR THE YEARS ENDED DECEMBER 31, 2011, 2010, AND 2009 (Expressed in United States Dollars)
1. DESCRIPTION OF BUSINESS AND BASIS OF PRESENTATION
Description of Business — We are a Canadian corporation, with principal assets and operations in the United States, whose primary business is developing, manufacturing and selling our nano lithium titanate battery products. Our primary focus is marketing our large-scale energy storage solutions to power companies and electric grid operators throughout the world. In addition, we market our battery products to electric and hybrid-electric mass-transit vehicle manufacturers. During 2010 we also started to expand our market focus to include use of our battery technology in additional industrial markets with applications requiring batteries that can provide high power quickly, a fast recharge, have a long cycle life, operate at a wide temperature range and are extremely safe.
We also provide contract research services on select projects where we can utilize our resources to develop intellectual property and/or new products and technology. Although contract services revenue comprised a significant portion of our total revenues through 2010 accounting for 5%, 50%, and 33%, in 2011, 2010 and 2009, respectively, there has been a major decline in this percentage as our battery product sales increased in 2011.
In July 2011, Canon Investment Holdings, Ltd, (“Canon”) acquired a majority of common shares of the Company. As a result of this investment, the Company initiated activities to enter the China market including the sales of batteries and systems, and to develop a manufacturing and supply chain strategy to reduce costs.
Principles of Consolidation — The consolidated financial statements include the accounts of Altair Nanotechnologies Inc. and our subsidiaries which include (1) Altairnano, Inc. (“ANI”), (collectively referred to as the “Company”), which are 100% owned and (2) AlSher Titania LLC, which was 70% owned by ANI but was sold April 30, 2010. Both of the subsidiaries are incorporated in the United States of America. Inter-company transactions and balances have been eliminated in consolidation.
Basis of Presentation — The accompanying consolidated financial statements have been prepared on a going
concern basis which contemplates the realization of assets and the satisfaction of liabilities in the normal course of business. As shown in the consolidated financial statements for the years ended December 31, 2011, 2010 and 2009, we incurred net losses of $19.9 million, $22.3 million, and $21.3 million, respectively. At December 31, 2011 and 2010, we had stockholders’ equity of $53.5 million and $17.3 million, respectively.
The consolidated financial statements do not include any adjustments relating to the recoverability and classification of recorded asset amounts or the amounts and classification of liabilities that might be necessary should we be unable to continue as a going concern. Our continuation as a going concern is dependent upon our ability to generate sufficient cash flow to meet our obligations on a timely basis, to obtain additional financing or refinancing as may be required, including expansion into China, to develop commercially viable products and processes, and ultimately to establish profitable operations. We have financed operations through operating revenues and through the issuance of equity securities (common shares, convertible debentures, stock options and warrants), and debt (term notes). Until we are able to generate positive operating cash flows, additional funds will be required to support operations. We believe that current working capital, cash receipts from anticipated sales and funding through additional financing or raising additional capital in 2012 to fund our China expansion as well as sustain our U.S. operations will be sufficient to enable us to continue as a going concern through 2012.
On October 21, 2010, the Board of Directors of the Company authorized a reverse split of the Company’s
common stock at a ratio of one-for-four, effective close of business on November 15, 2010. The Company’s stockholders previously approved the reverse split in May 2010. As a result of the reverse split, every four shares of common stock outstanding were combined into one share of common stock. The reverse split did not affect the amount of equity the Company has nor did it affect the Company’s market capitalization. All previously reported share and per share amounts have been restated in the accompanying consolidated financial statements and related notes to reflect the reverse stock split.
F-9
2. SUMMARY OF SIGNIFICANT ACCOUNTING POLICIES
Use of Estimates — The preparation of the consolidated financial statements in conformity with accounting principles generally accepted in the United States of America requires that we make estimates and assumptions that affect the reported amounts of assets and liabilities, and disclosure of contingent assets and liabilities at the date of the consolidated financial statements and the reported amounts of revenues and expenses during the reporting period. Actual results could differ from those estimates.
Cash and Cash Equivalents — Cash and cash equivalents consist principally of bank deposits and institutional
money market funds. Short-term investments that are highly liquid have insignificant interest rate risk and original maturities of 90 days or less are classified as cash and cash equivalents. Investments that do not meet the definition of cash equivalents are classified as held-to-maturity or available-for-sale.
Our cash balances are maintained in bank accounts that are fully insured by the Federal Deposit Insurance
Corporation (“FDIC”) and Canada Deposit Insurance Corporation (“CDIC”). The FDIC adopted a final rule amending its deposit insurance regulations on November 15, 2010 to implement Section 343 of the Dodd-Frank Wall Street Reform and Consumer Protection Act providing for unlimited deposit insurance for non-interest bearing transaction accounts for two years starting December 31, 2010. Our Canadian deposits were insured up to CN $100,000 and the US deposits were in a non-interest bearing account with unlimited deposit insurance. At December 31, 2011 and December 31, 2010 we had $46.3 million and $2.2 million, respectively, and the bank balances were fully insured by the FDIC or CDIC.
Investment in Available for Sale Securities — The Company did not have any investments in Available for
Sale securities at December 31, 2011. Accounts Receivable — Accounts receivable consists of amounts due from customers for services and product
sales, net of an allowance for doubtful accounts. We determine the allowance for doubtful accounts by reviewing each customer account and specifically identifying any potential for loss.
Inventory – We value our inventories generally at the lower of cost (first-in, first-out method) or market. We
employ a full absorption procedure using standard cost techniques. The standards are customarily reviewed and adjusted every three months. Overhead rates are recorded to inventory based on normal capacity. Any idle facility costs or excessive spoilage are recorded as current period charges. As of December 31, 2011 we recorded a $264,000 inventory valuation allowance due to quality issues with one of our cell suppliers. As of December 31, 2010, we recorded a $623,000 inventory valuation allowance due to quality issues with our cell supplier, of which $541,000 was recorded as a receivable from our vendor covered under their product warranty. At December 31, 2010, we had a corresponding account payable to our supplier for these cells. We reached an agreement with our supplier in 2011 and the receivable was offset against the supplier account payable.
Research and Development Expenditures — The costs of materials, equipment, or facilities that are acquired
or constructed for a particular research and development project and that have no alternative future uses (in other research and development projects or otherwise) are expensed as research and development costs at the time the costs are incurred. Research and development expenditures related to materials and equipment or facilities that are acquired or constructed for research and development activities and that have alternative future uses (in research and development projects or otherwise) are capitalized when acquired or constructed. Research and development expenditures, which include the cost of materials consumed in research and development activities, salaries, wages and other costs of personnel engaged in research and development, costs of services performed by others for research and development on our behalf and indirect costs are expensed as research and development costs when incurred.
Stock-Based Compensation — We measure the cost of services received in exchange for an award of equity
instruments based on the grant-date fair value of the award. That cost is recognized over the period during which services are provided in exchange for the award, known as the requisite vesting period.
Long-Lived Assets — We evaluate the carrying value of long-lived assets whenever events or changes in
business circumstances indicate that the carrying value of the assets may not be recoverable. The carrying value of a long-lived asset is considered impaired when the total projected undiscounted cash flows expected to be generated by the asset are less than the carrying value. Our estimate of the cash flows is based on the information available at the time including the following: internal budgets; sales forecasts; customer trends; anticipated production volumes; and market conditions over an estimate of the remaining useful life of the asset which may range from 3 to 10 years for most equipment and up to 22 years for our building and related building improvements. If an impairment is indicated, the
F-10
asset value is written down to its fair value. Events or circumstances that could indicate the existence of a possible impairment include obsolescence of the technology, an absence of market demand for the product or the assets used to produce it, a history of operating or cash flow losses and/or the partial or complete lapse of technology rights protection.
As of December 31, 2011, we estimate that our future cash flows, on an undiscounted basis, are greater than our $7.2 million investment in long-lived assets. Our estimated future cash flows include anticipated product margins and commercial collaborations, since our long-lived asset base, which is primarily composed of production, laboratory and testing equipment is utilized to fulfill customer contracts in all revenue categories. Management evaluates the carrying value and useful lives of its long-lived assets annually. In 2011, the long-lived assets on hand were evaluated for their future use. Assets with a net book value of $924,000 were impaired as of December 31, 2011.
In the first quarter of 2010, we reviewed our four capitalized patents and determined that three of these patents had value in excess of their net book value of $483,000 at that time. In the first quarter, we determined that the fourth patent no longer had value. The fourth patent had an original cost of $152,000, accumulated depreciation of $105,000 and a net value of $47,000. Accordingly, an impairment charge of $47,000 was recorded, and is reflected for the twelve months ended December 31, 2010.
We reviewed the remaining three capitalized patents and show a net weighted average value of $350,000 and $426,000, at December 31, 2011 and 2010, respectively. AlSher currently has an exclusive license to use this technology from Altair.
Property, plant and equipment held and used are stated at cost less accumulated depreciation. Depreciation is
recorded using the straight-line method over the following useful lives: Furniture and office equipmentVehiclesNanoparticle production equipmentBuilding and improvements
5 years 5–10 years 30 years
3–7 years
Patents related to the nanoparticle production technology are carried at cost and amortized on a straight-line basis over their estimated useful lives, for a weighted average amortization period of 16.7 years.
Revenue Recognition — We recognize revenue when persuasive evidence of an arrangement exists, delivery
has occurred or service has been performed, the fee is fixed and determinable, and collectability is reasonably assured. Our revenues were derived from product sales, commercial collaborations and contracts and grants. Revenue from product sales is recognized upon delivery of the product, unless specific contractual terms dictate otherwise. Based on the specific terms and conditions of each contract/grant, revenues are recognized on a time and materials basis, a percentage of completion basis and/or a completed contract basis. Revenue under contracts based on time and materials is recognized at contractually billable rates as labor hours and expenses are incurred. Revenue under contracts based on a fixed fee arrangement is recognized based on various performance measures, such as stipulated milestones. As these milestones are achieved, revenue is recognized. From time to time, facts develop that may require us to revise our estimated total costs or revenues expected. The cumulative effect of revised estimates is recorded in the period in which the facts requiring revisions become known. The full amount of anticipated losses on any type of contract is recognized in the period in which it becomes known. Payments received in advance relating to the future performance of services or deliveries of products are deferred until the performance of the service is complete or the product is shipped. Upfront payments received in connection with certain rights granted in contractual arrangements are deferred and revenue is recognized over the related time period which the benefits are received.
Accrued Warranty — We provide a limited warranty for battery packs and energy storage systems. A liability is recorded for estimated warranty obligations at the date products are sold. Since these are new products, the estimated cost of warranty coverage is based on cell and module life cycle testing and compared for reasonableness to warranty rates on competing battery products. As sufficient actual historical data is collected on the new product, the estimated cost of warranty coverage will be adjusted accordingly. The liability for estimated warranty obligations may also be adjusted based on specific warranty issues identified.
Non-controlling Interest — In April 2007, The Sherwin-Williams Company (“Sherwin”) entered into an agreement with us to form AlSher Titania LLC (“AlSher”), a Delaware limited liability company. AlSher is a joint venture combining certain technologies of ours and Sherwin in order to develop and produce titanium dioxide pigment
F-11
for use in paint and coatings and nano titanium dioxide materials for use in a variety of applications, including those related to removing contaminants from air and water. Pursuant to a Contribution Agreement dated April 24, 2007 among Sherwin, AlSher, and us, we contributed to AlSher an exclusive license to use our technology (including our hydrochloride pigment process) for the production of titanium dioxide pigment and other titanium containing materials (other than battery or nanoelectrode materials) and certain pilot plant assets with a net book value of $3,110,000. We received no consideration for the license granted to AlSher other than our ownership interest in AlSher. Sherwin agreed to contribute to AlSher cash and a license agreement related to a technology for the manufacture of titanium dioxide using the digestion of ilmenite in hydrochloric acid. As a condition to enter into the second phase of the joint venture, we agreed to complete the pigment pilot processing plant and related development activities by January 2008. The 100 ton pigment pilot processing plant was commissioned in February 2008 and the costs associated with this effort were partially reimbursed by AlSher. We contributed any work in process and fixed assets associated with completion of the pigment pilot processing plant to the AlSher joint venture. For each reporting period, AlSher is consolidated with our subsidiaries because we have a controlling interest in AlSher and any inter-company transactions are eliminated (refer to Note 1 – Basis of Preparation of Consolidated Financial Statements). The non-controlling shareholder’s interest in the net assets and net income or loss of AlSher are reported as non-controlling interest in subsidiary on the condensed consolidated balance sheet and as non-controlling interest share in the condensed consolidated statement of operations, respectively.
Asset impairment of $1.3 million in 2009 relates to the expense of adjusting AlSher Titania, LLC assets to fair
market value as of December 31, 2009. These assets were temporarily idled throughout 2009 as we searched for an interested party to acquire our interests in AlSher Titania. On April 30, 2010, we sold our 70% share in the AlSher Titania Joint Venture to Sherwin-Williams. We recorded a gain of $124,000 on discontinued operations that was comprised of $400,000 loss on disposal of fixed assets and $524,000 remaining equity in noncontrolling interest.
Overhead Allocation — Facilities overhead and production employees fringe benefit costs are initially
recorded in general and administrative expenses and then allocated to research and development and product inventories based on relative labor costs. Production equipment depreciation expense is recorded to cost of goods sold as the equipment is used to produce product sold to customers and production equipment depreciation is attached to, and transferred to product in ending inventory until such product is used to satisfy customer orders.
Net Loss per Common Share — Basic loss per share is computed using the weighted average number of
common shares outstanding during the period. Diluted loss per share is computed using the weighted average number of common and potentially dilutive shares outstanding during the period. Potentially dilutive shares consist of the incremental common shares issuable upon the exercise of stock options and warrants. Potentially dilutive shares are excluded from the computation if their effect is anti-dilutive. We had a net loss for all periods presented herein; therefore, none of the stock options and warrants outstanding during each of the periods presented were included in the computation of diluted loss per share as they were anti-dilutive. Stock options and warrants to purchase a total of 4,041,478 as of December 31, 2011, 3,271,138 shares as of December 31, 2010, and 2,987,162 shares as of December 31, 2009 were excluded from the calculations of diluted loss per share for the years ended December 31, 2011, 2010 and 2009, respectively.
Accumulated Other Comprehensive Loss — Accumulated other comprehensive loss is a separate component
of stockholders` equity and consists entirely of unrealized loss on the investment in available for sale securities.
Income Taxes — The provision for income taxes is determined using the asset and liability approach of accounting for income taxes. Under this approach, the provision for income taxes represents income taxes paid or payable (or received or receivable) for the current year plus the change in deferred taxes during the year. Deferred taxes represent the future tax consequences expected to occur when the reported amounts of assets and liabilities are recovered or paid, and result from differences between the financial and tax bases of the Company’s assets and liabilities and are adjusted for changes in tax rates and tax laws when enacted.
Valuation allowances are recorded to reduce deferred tax assets when it is more likely than not that a tax benefit will not be realized. In evaluating the need for a valuation allowance, management considers all potential sources of taxable income, including income available in carryback periods, future reversals of taxable temporary differences, projections of taxable income, and income from tax planning strategies, as well as all available positive and negative evidence. Positive evidence includes factors such as a history of profitable operations, projections of future profitability within the carryforward period, including from tax planning strategies, and the Company’s experience with similar operations. Existing favorable contracts and the ability to sell products into established markets are additional positive evidence. Negative evidence includes items such as cumulative losses, projections of future losses, or carryforward periods that are not long enough to allow for the utilization of a deferred tax asset based on existing projections of
F-12
income. Deferred tax assets for which no valuation allowance is recorded may not be realized upon changes in facts and circumstances, resulting in a future charge to establish a valuation allowance.
Tax benefits related to uncertain tax positions taken or expected to be taken on a tax return are recorded when such benefits meet a more likely than not threshold. Otherwise, these tax benefits are recorded when a tax position has been effectively settled, which means that the statute of limitation has expired or the appropriate taxing authority has completed their examination even though the statute of limitations remains open. Interest and penalties related to uncertain tax positions are recognized as part of the provision for income taxes and are accrued beginning in the period that such interest and penalties would be applicable under relevant tax law until such time that the related tax benefits are recognized. The company is no longer subject to income tax examinations by tax authorities for years prior to 2004.
Fair Value of Financial Instruments — Our financial instruments such as cash and cash equivalents and long-
term debt, when valued using market interest rates, would not be materially different from the amounts presented in the consolidated financial statements.
Recently Issued Accounting Guidance
In May 2011, the FASB issued changes to conform existing guidance regarding fair value measurement and disclosure between GAAP and International Financial Reporting Standards. These changes both clarify the FASB’s intent about the application of existing fair value measurement and disclosure requirements and amend certain principles or requirements for measuring fair value or for disclosing information about fair value measurements. The clarifying changes relate to the application of the highest and best use and valuation premise concepts, measuring the fair value of an instrument classified in a reporting entity’s shareholders’ equity, and disclosure of quantitative information about unobservable inputs used for Level 3 fair value measurements. The amendments relate to measuring the fair value of financial instruments that are managed within a portfolio; application of premiums and discounts in a fair value measurement; and additional disclosures concerning the valuation processes used and sensitivity of the fair value measurement to changes in unobservable inputs for those items categorized as Level 3, a reporting entity’s use of a nonfinancial asset in a way that differs from the asset’s highest and best use, and the categorization by level in the fair value hierarchy for items required to be measured at fair value for disclosure purposes only. These changes become effective for the Company on January 1, 2012. Other than the additional disclosure requirements, management has determined that the adoption of these changes will not have an impact on the consolidated financial statements.
In June 2011, the FASB issued changes to the presentation of comprehensive income. These changes give an
entity the option to present the total of comprehensive income, the components of net income, and the components of other comprehensive income either in a single continuous statement of comprehensive income or in two separate but consecutive statements; the option to present components of other comprehensive income as part of the statement of changes in stockholders’ equity was eliminated. The items that must be reported in other comprehensive income or when an item of other comprehensive income must be reclassified to net income were not changed. Additionally, no changes were made to the calculation and presentation of earnings per share. These changes become effective for Altair on January 1, 2012. Management is currently evaluating these changes to determine which option will be chosen for the presentation of comprehensive income. Other than the change in presentation, management has determined these changes will not have an impact on the Consolidated Financial Statements.
In December 2011, the FASB issued changes to the disclosure of offsetting assets and liabilities. These changes require an entity to disclose both gross information and net information about both instruments and transactions eligible for offset in the statement of financial position and instruments and transactions subject to an agreement similar to a master netting arrangement. The enhanced disclosures will enable users of an entity’s financial statements to understand and evaluate the effect or potential effect of master netting arrangements on an entity’s financial position, including the effect or potential effect of rights of setoff associated with certain financial instruments and derivative instruments. These changes become effective for the Company on January 1, 2013. Management has determined that the adoption of these changes will not have an impact on the consolidated financial statements.
Reclassifications — Certain reclassifications have been made to prior period amounts to conform to classifications adopted in the current year.
3. FAIR VALUE MEASUREMENTS
The following are the methods and assumptions we use to estimate the fair value of our financial instruments. Cash and cash equivalents
F-13
Due to their short term nature, carrying amount approximates fair value. Accounts receivable Due to their short term nature, carrying amount approximates fair value. Trade accounts payable Due to their short term nature, carrying amount approximates fair value. Warrant liabilities Fair values are determined using the Black-Scholes-Merton option-pricing model, a Level 3 input. Long-term debt Due to the short term nature of the current portion of long-term debt, the carrying amount approximates fair value. The non current portion of long-term debt is not material and the carrying amount approximates fair value.
Our financial instruments are accounted for at fair value on a recurring basis. We have no financial instruments accounted for on a non-recurring basis as of December 31, 2011 or 2010. Fair value is determined based on the exchange price that would be received for an asset or paid to transfer a liability (an exit price) in the principal or most advantageous market for the asset or liability in an orderly transaction between market participants. A market or observable inputs is the preferred source of values, followed by assumptions based on hypothetical transactions in the absence of market inputs.
The valuation techniques are based upon observable and unobservable inputs. Observable inputs reflect market
data obtained from independent sources, while unobservable inputs reflect our market assumptions. These two types of inputs create the following fair value hierarchy: Level 1 Unadjusted quoted prices in active markets that are accessible at the measurement date
for identical, unrestricted assets or liabilities. Level 2 Inputs other than quoted prices included within Level 1 that are observable for the
asset or liability, either directly or indirectly, including quoted prices for similar assets or liabilities in active markets; quoted prices for identical or similar assets or liabilities in markets that are not active; inputs other than quoted prices that are observable for the asset or liability (e.g., interest rates); and inputs that are derived principally from or corroborated by observable market data by correlation or other means.
Level 3 Inputs that are both significant to the fair value measurement and unobservable.
No assets were recorded at fair value on a recurring basis at December 31, 2011. In arriving at fair-value estimates, we utilize the most observable inputs available for the valuation technique
employed. If a fair-value measurement reflects inputs at multiple levels within the hierarchy, the fair-value measurement characterized based upon the lowest level of input that is significant to the fair-value measurement. For us, recurring fair-value measurements are performed for warrant liabilities.
All warrant liability financial instruments are recognized in the balance sheet at their fair value. Changes in the fair values of warrant liability financial instruments are reported in earnings. We do not hold any derivative liability financial instruments that reduce risk associated with hedging exposure and we have not designated any of our warrant liability financial instruments as hedge instruments.
The Company has no items valued using Level 1 and Level 2 inputs. The following table sets forth the fair value hierarchy of the Company’s financial liabilities that were accounted for at fair value, on a recurring bases, as of December 31, 2011.
There were no financial liabilities outstanding at December 31, 2010. The following table summarizes the valuation of our financial liabilities by the fair value hierarchy at December 31, 2011.
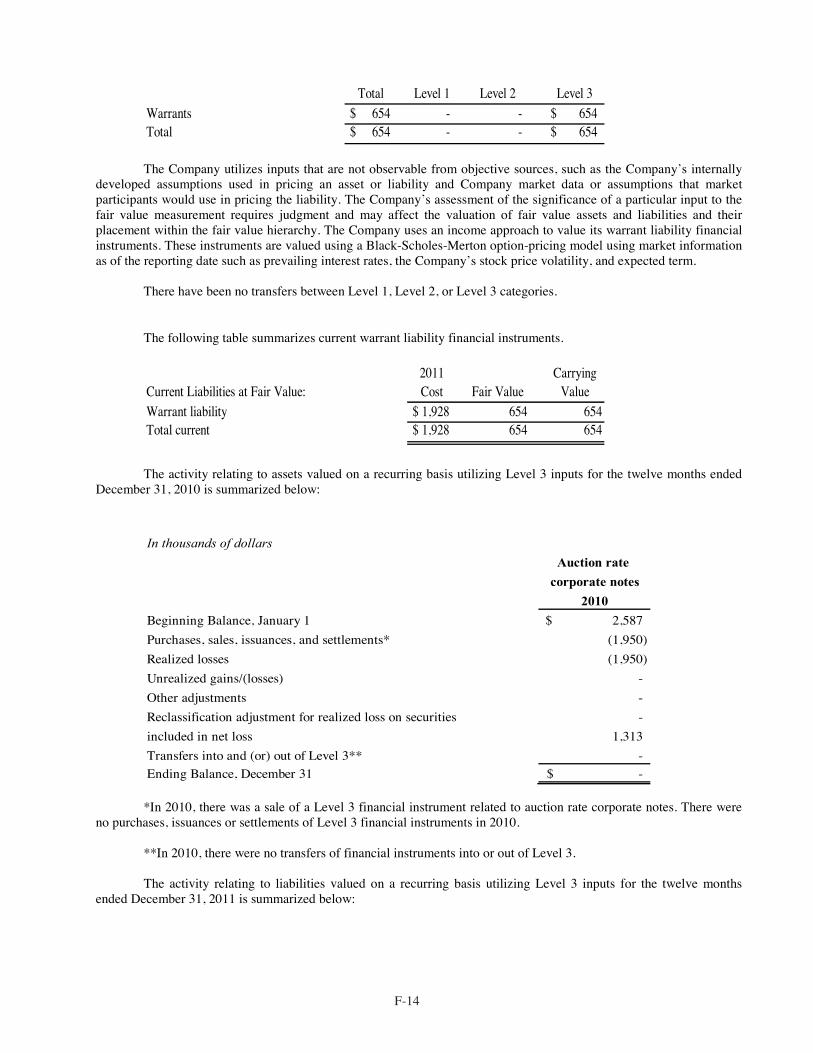
F-14
Total Level 1 Level 2 Level 3
Warrants $ 654 - - $ 654 Total $ 654 - - $ 654
The Company utilizes inputs that are not observable from objective sources, such as the Company’s internally developed assumptions used in pricing an asset or liability and Company market data or assumptions that market participants would use in pricing the liability. The Company’s assessment of the significance of a particular input to the fair value measurement requires judgment and may affect the valuation of fair value assets and liabilities and their placement within the fair value hierarchy. The Company uses an income approach to value its warrant liability financial instruments. These instruments are valued using a Black-Scholes-Merton option-pricing model using market information as of the reporting date such as prevailing interest rates, the Company’s stock price volatility, and expected term.
There have been no transfers between Level 1, Level 2, or Level 3 categories.
The following table summarizes current warrant liability financial instruments.
Current Liabilities at Fair Value: 2011 Cost Fair Value
Carrying Value
Warrant liability $ 1,928 654 654 Total current $ 1,928 654 654
The activity relating to assets valued on a recurring basis utilizing Level 3 inputs for the twelve months ended December 31, 2010 is summarized below:
In thousands of dollars
Auction rate
corporate notes
2010
Beginning Balance, January 1 2,587$ Purchases, sales, issuances, and settlements* (1,950) Realized losses (1,950) Unrealized gains/(losses) - Other adjustments - Reclassification adjustment for realized loss on securities - included in net loss 1,313 Transfers into and (or) out of Level 3** - Ending Balance, December 31 -$
*In 2010, there was a sale of a Level 3 financial instrument related to auction rate corporate notes. There were
no purchases, issuances or settlements of Level 3 financial instruments in 2010. **In 2010, there were no transfers of financial instruments into or out of Level 3.
The activity relating to liabilities valued on a recurring basis utilizing Level 3 inputs for the twelve months
ended December 31, 2011 is summarized below:
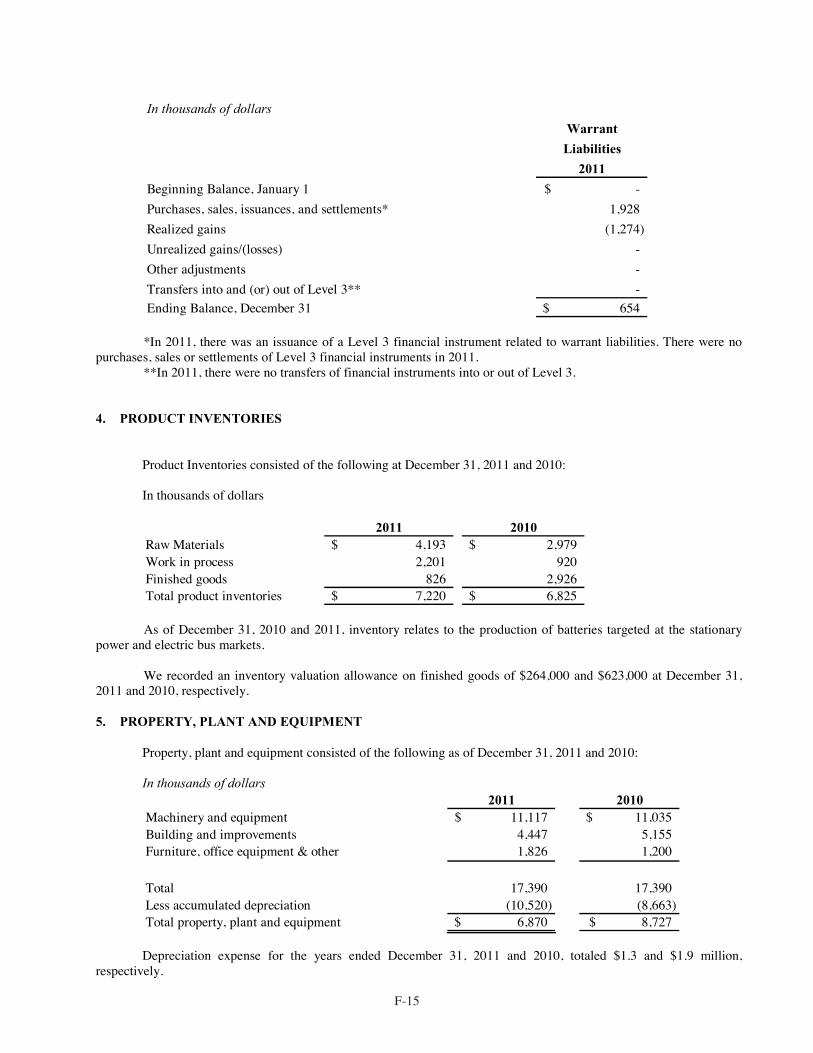
F-15
In thousands of dollars
Warrant
Liabilities
2011
Beginning Balance, January 1 -$ Purchases, sales, issuances, and settlements* 1,928 Realized gains (1,274) Unrealized gains/(losses) - Other adjustments - Transfers into and (or) out of Level 3** - Ending Balance, December 31 654$
*In 2011, there was an issuance of a Level 3 financial instrument related to warrant liabilities. There were no
purchases, sales or settlements of Level 3 financial instruments in 2011. **In 2011, there were no transfers of financial instruments into or out of Level 3.
4. PRODUCT INVENTORIES
Product Inventories consisted of the following at December 31, 2011 and 2010: In thousands of dollars
2011 2010Raw Materials 4,193$ 2,979$ Work in process 2,201 920Finished goods 826 2,926Total product inventories 7,220$ 6,825$ As of December 31, 2010 and 2011, inventory relates to the production of batteries targeted at the stationary
power and electric bus markets. We recorded an inventory valuation allowance on finished goods of $264,000 and $623,000 at December 31,
2011 and 2010, respectively.
5. PROPERTY, PLANT AND EQUIPMENT
Property, plant and equipment consisted of the following as of December 31, 2011 and 2010:
In thousands of dollars 2011 2010Machinery and equipment 11,117$ 11,035$ Building and improvements 4,447 5,155 Furniture, office equipment & other 1,826 1,200 Total 17,390 17,390 Less accumulated depreciation (10,520) (8,663) Total property, plant and equipment 6,870$ 8,727$
Depreciation expense for the years ended December 31, 2011 and 2010, totaled $1.3 and $1.9 million,
respectively.
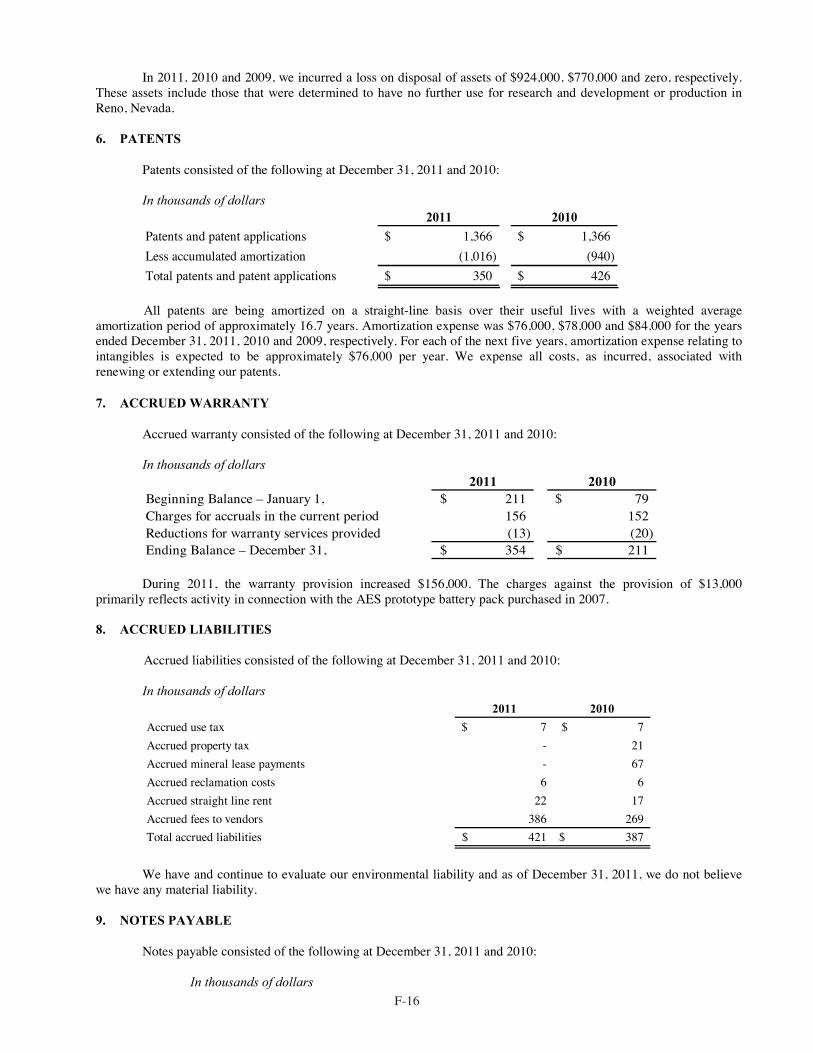
F-16
In 2011, 2010 and 2009, we incurred a loss on disposal of assets of $924,000, $770,000 and zero, respectively.
These assets include those that were determined to have no further use for research and development or production in Reno, Nevada.
6. PATENTS
Patents consisted of the following at December 31, 2011 and 2010: In thousands of dollars
2011 2010
Patents and patent applications 1,366$ 1,366$ Less accumulated amortization (1,016) (940) Total patents and patent applications 350$ 426$ All patents are being amortized on a straight-line basis over their useful lives with a weighted average
amortization period of approximately 16.7 years. Amortization expense was $76,000, $78,000 and $84,000 for the years ended December 31, 2011, 2010 and 2009, respectively. For each of the next five years, amortization expense relating to intangibles is expected to be approximately $76,000 per year. We expense all costs, as incurred, associated with renewing or extending our patents.
7. ACCRUED WARRANTY
Accrued warranty consisted of the following at December 31, 2011 and 2010: In thousands of dollars 2011 2010Beginning Balance – January 1, 211$ 79$ Charges for accruals in the current period 156 152 Reductions for warranty services provided (13) (20) Ending Balance – December 31, 354$ 211$
During 2011, the warranty provision increased $156,000. The charges against the provision of $13,000
primarily reflects activity in connection with the AES prototype battery pack purchased in 2007. 8. ACCRUED LIABILITIES
Accrued liabilities consisted of the following at December 31, 2011 and 2010:
In thousands of dollars
2011 2010
Accrued use tax 7$ 7$ Accrued property tax - 21 Accrued mineral lease payments - 67 Accrued reclamation costs 6 6 Accrued straight line rent 22 17 Accrued fees to vendors 386 269 Total accrued liabilities 421$ 387$
We have and continue to evaluate our environmental liability and as of December 31, 2011, we do not believe
we have any material liability.
9. NOTES PAYABLE
Notes payable consisted of the following at December 31, 2011 and 2010:
In thousands of dollars
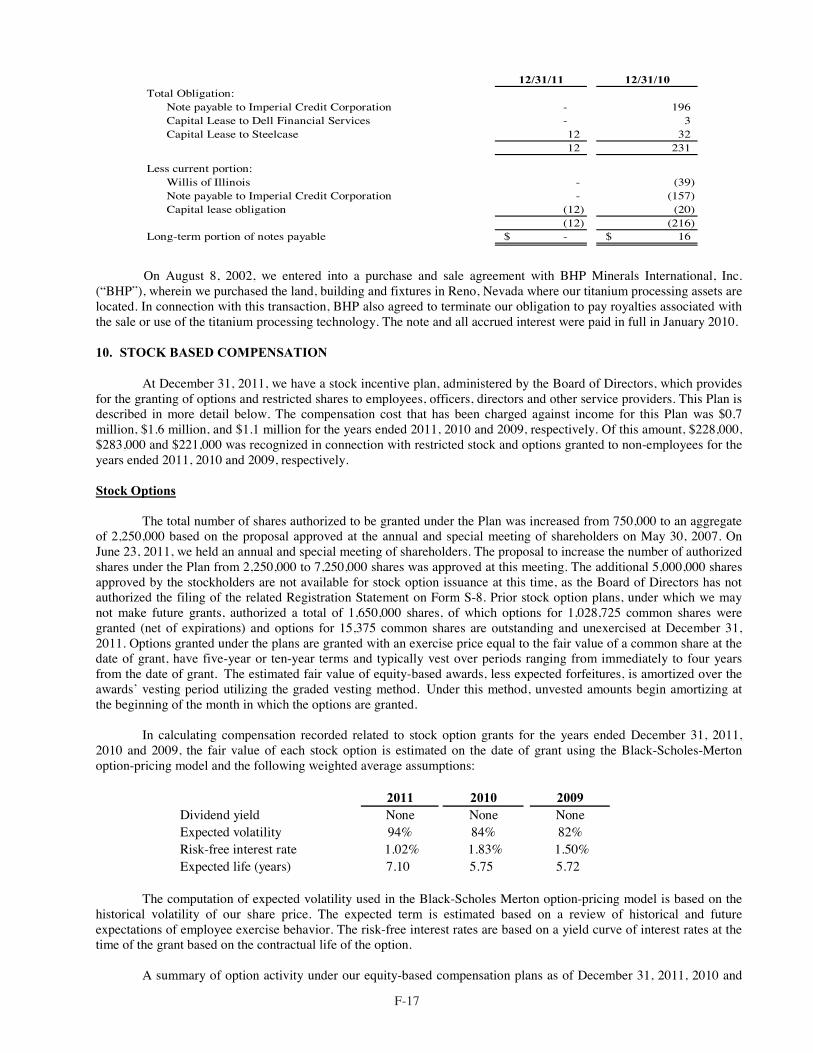
F-17
12/31/11 12/31/10
Total Obligation:Note payable to Imperial Credit Corporation - 196 Capital Lease to Dell Financial Services - 3 Capital Lease to Steelcase 12 32
12 231
Less current portion:Willis of Illinois - (39) Note payable to Imperial Credit Corporation - (157) Capital lease obligation (12) (20)
(12) (216) Long-term portion of notes payable -$ 16$
On August 8, 2002, we entered into a purchase and sale agreement with BHP Minerals International, Inc.
(“BHP”), wherein we purchased the land, building and fixtures in Reno, Nevada where our titanium processing assets are located. In connection with this transaction, BHP also agreed to terminate our obligation to pay royalties associated with the sale or use of the titanium processing technology. The note and all accrued interest were paid in full in January 2010.
10. STOCK BASED COMPENSATION
At December 31, 2011, we have a stock incentive plan, administered by the Board of Directors, which provides for the granting of options and restricted shares to employees, officers, directors and other service providers. This Plan is described in more detail below. The compensation cost that has been charged against income for this Plan was $0.7 million, $1.6 million, and $1.1 million for the years ended 2011, 2010 and 2009, respectively. Of this amount, $228,000, $283,000 and $221,000 was recognized in connection with restricted stock and options granted to non-employees for the years ended 2011, 2010 and 2009, respectively.
Stock Options
The total number of shares authorized to be granted under the Plan was increased from 750,000 to an aggregate
of 2,250,000 based on the proposal approved at the annual and special meeting of shareholders on May 30, 2007. On June 23, 2011, we held an annual and special meeting of shareholders. The proposal to increase the number of authorized shares under the Plan from 2,250,000 to 7,250,000 shares was approved at this meeting. The additional 5,000,000 shares approved by the stockholders are not available for stock option issuance at this time, as the Board of Directors has not authorized the filing of the related Registration Statement on Form S-8. Prior stock option plans, under which we may not make future grants, authorized a total of 1,650,000 shares, of which options for 1,028,725 common shares were granted (net of expirations) and options for 15,375 common shares are outstanding and unexercised at December 31, 2011. Options granted under the plans are granted with an exercise price equal to the fair value of a common share at the date of grant, have five-year or ten-year terms and typically vest over periods ranging from immediately to four years from the date of grant. The estimated fair value of equity-based awards, less expected forfeitures, is amortized over the awards’ vesting period utilizing the graded vesting method. Under this method, unvested amounts begin amortizing at the beginning of the month in which the options are granted.
In calculating compensation recorded related to stock option grants for the years ended December 31, 2011,
2010 and 2009, the fair value of each stock option is estimated on the date of grant using the Black-Scholes-Merton option-pricing model and the following weighted average assumptions:
2011 2010 2009Dividend yield None None NoneExpected volatility 94% 84% 82%Risk-free interest rate 1.02% 1.83% 1.50%Expected life (years) 7.10 5.75 5.72
The computation of expected volatility used in the Black-Scholes Merton option-pricing model is based on the
historical volatility of our share price. The expected term is estimated based on a review of historical and future expectations of employee exercise behavior. The risk-free interest rates are based on a yield curve of interest rates at the time of the grant based on the contractual life of the option.
A summary of option activity under our equity-based compensation plans as of December 31, 2011, 2010 and
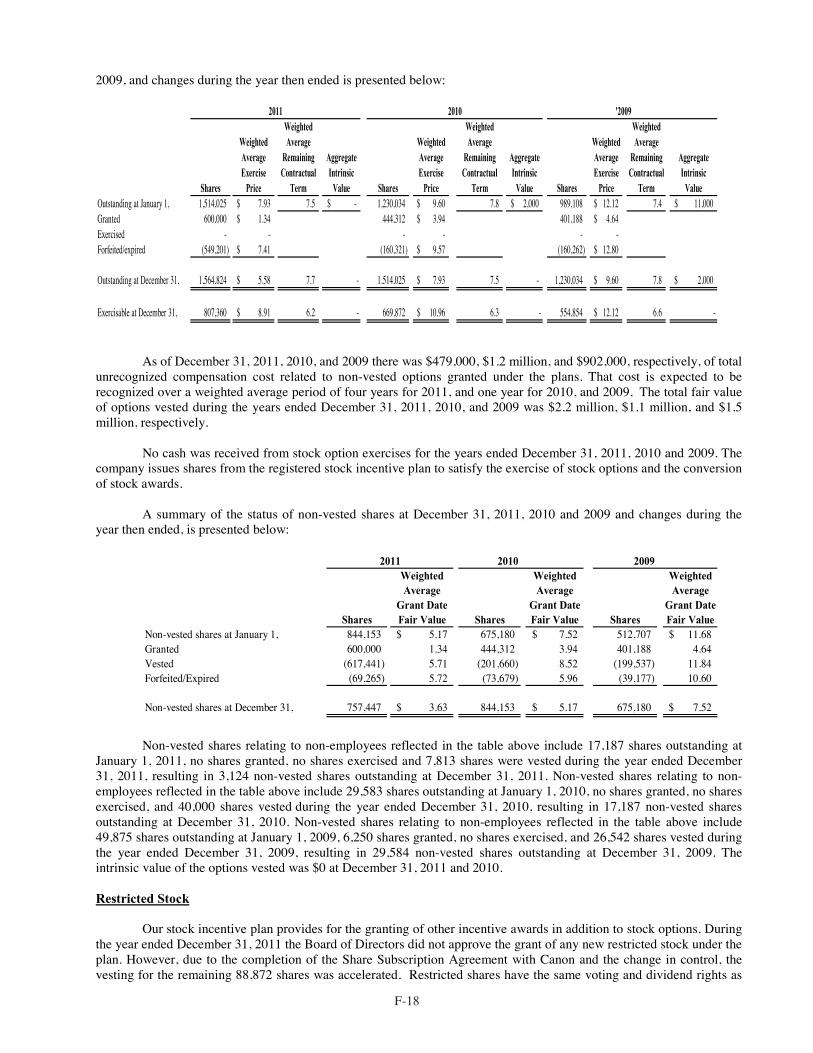
F-18
2009, and changes during the year then ended is presented below:
'2009
Weighted Weighted WeightedWeighted Average Weighted Average Weighted AverageAverage Remaining Aggregate Average Remaining Aggregate Average Remaining AggregateExercise Contractual Intrinsic Exercise Contractual Intrinsic Exercise Contractual Intrinsic
Shares Price Term Value Shares Price Term Value Shares Price Term ValueOutstanding at January 1, 1,514,025 7.93$ 7.5 -$ 1,230,034 9.60$ 7.8 2,000$ 989,108 12.12$ 7.4 11,000$ Granted 600,000 1.34$ 444,312 3.94$ 401,188 4.64$ Exercised - - - - - -Forfeited/expired (549,201) 7.41$ (160,321) 9.57$ (160,262) 12.80$ Outstanding at December 31, 1,564,824 5.58$ 7.7 - 1,514,025 7.93$ 7.5 - 1,230,034 9.60$ 7.8 2,000$ Exercisable at December 31, 807,360 8.91$ 6.2 - 669,872 10.96$ 6.3 - 554,854 12.12$ 6.6 -
2011 2010
As of December 31, 2011, 2010, and 2009 there was $479,000, $1.2 million, and $902,000, respectively, of total unrecognized compensation cost related to non-vested options granted under the plans. That cost is expected to be recognized over a weighted average period of four years for 2011, and one year for 2010, and 2009. The total fair value of options vested during the years ended December 31, 2011, 2010, and 2009 was $2.2 million, $1.1 million, and $1.5 million, respectively.
No cash was received from stock option exercises for the years ended December 31, 2011, 2010 and 2009. The
company issues shares from the registered stock incentive plan to satisfy the exercise of stock options and the conversion of stock awards.
A summary of the status of non-vested shares at December 31, 2011, 2010 and 2009 and changes during the
year then ended, is presented below:
2010 2009Weighted Weighted WeightedAverage Average Average
Grant Date Grant Date Grant Date Shares Fair Value Shares Fair Value Shares Fair ValueNon-vested shares at January 1, 844,153 5.17$ 675,180 7.52$ 512,707 11.68$ Granted 600,000 1.34 444,312 3.94 401,188 4.64Vested (617,441) 5.71 (201,660) 8.52 (199,537) 11.84Forfeited/Expired (69,265) 5.72 (73,679) 5.96 (39,177) 10.60 Non-vested shares at December 31, 757,447 3.63$ 844,153 5.17$ 675,180 7.52$
2011
Non-vested shares relating to non-employees reflected in the table above include 17,187 shares outstanding at
January 1, 2011, no shares granted, no shares exercised and 7,813 shares were vested during the year ended December 31, 2011, resulting in 3,124 non-vested shares outstanding at December 31, 2011. Non-vested shares relating to non-employees reflected in the table above include 29,583 shares outstanding at January 1, 2010, no shares granted, no shares exercised, and 40,000 shares vested during the year ended December 31, 2010, resulting in 17,187 non-vested shares outstanding at December 31, 2010. Non-vested shares relating to non-employees reflected in the table above include 49,875 shares outstanding at January 1, 2009, 6,250 shares granted, no shares exercised, and 26,542 shares vested during the year ended December 31, 2009, resulting in 29,584 non-vested shares outstanding at December 31, 2009. The intrinsic value of the options vested was $0 at December 31, 2011 and 2010.
Restricted Stock
Our stock incentive plan provides for the granting of other incentive awards in addition to stock options. During the year ended December 31, 2011 the Board of Directors did not approve the grant of any new restricted stock under the plan. However, due to the completion of the Share Subscription Agreement with Canon and the change in control, the vesting for the remaining 88,872 shares was accelerated. Restricted shares have the same voting and dividend rights as
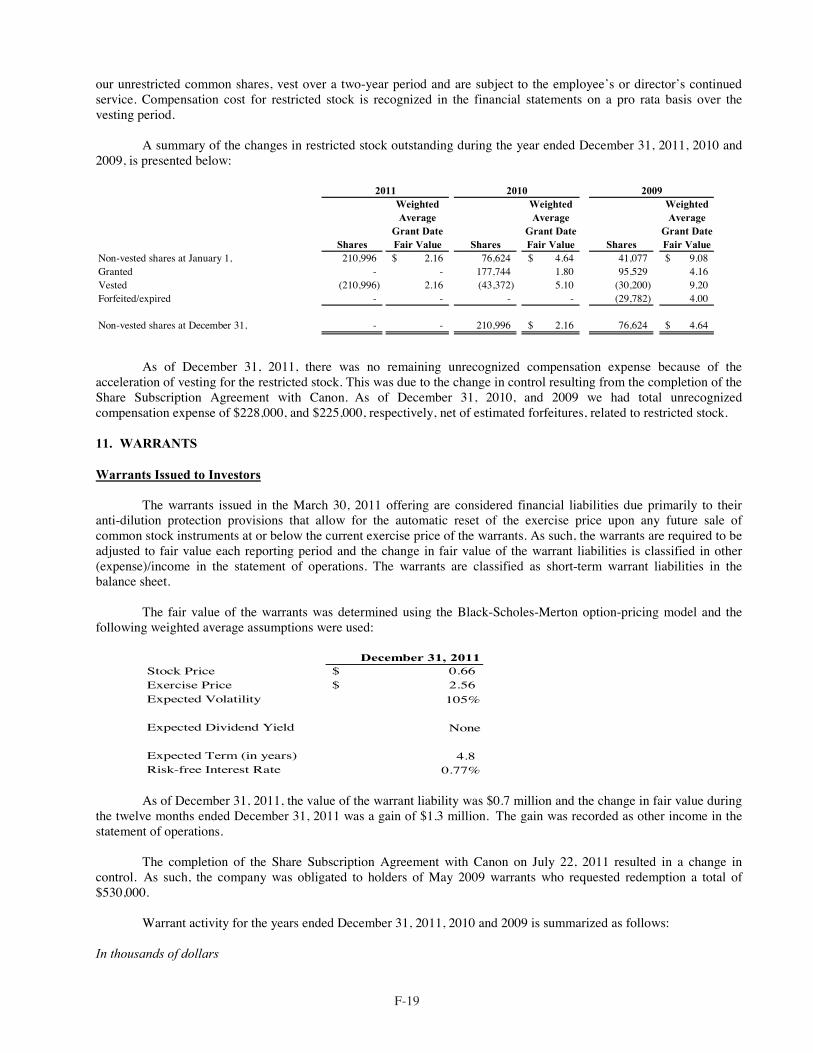
F-19
our unrestricted common shares, vest over a two-year period and are subject to the employee’s or director’s continued service. Compensation cost for restricted stock is recognized in the financial statements on a pro rata basis over the vesting period.
A summary of the changes in restricted stock outstanding during the year ended December 31, 2011, 2010 and
2009, is presented below:
Weighted Weighted WeightedAverage Average Average
Grant Date Grant Date Grant Date Shares Fair Value Shares Fair Value Shares Fair ValueNon-vested shares at January 1, 210,996 2.16$ 76,624 4.64$ 41,077 9.08$ Granted - - 177,744 1.80 95,529 4.16Vested (210,996) 2.16 (43,372) 5.10 (30,200) 9.20Forfeited/expired - - - - (29,782) 4.00 Non-vested shares at December 31, - - 210,996 2.16$ 76,624 4.64$
2011 2010 2009
As of December 31, 2011, there was no remaining unrecognized compensation expense because of the acceleration of vesting for the restricted stock. This was due to the change in control resulting from the completion of the Share Subscription Agreement with Canon. As of December 31, 2010, and 2009 we had total unrecognized compensation expense of $228,000, and $225,000, respectively, net of estimated forfeitures, related to restricted stock.
11. WARRANTS
Warrants Issued to Investors The warrants issued in the March 30, 2011 offering are considered financial liabilities due primarily to their
anti-dilution protection provisions that allow for the automatic reset of the exercise price upon any future sale of common stock instruments at or below the current exercise price of the warrants. As such, the warrants are required to be adjusted to fair value each reporting period and the change in fair value of the warrant liabilities is classified in other (expense)/income in the statement of operations. The warrants are classified as short-term warrant liabilities in the balance sheet.
The fair value of the warrants was determined using the Black-Scholes-Merton option-pricing model and the
following weighted average assumptions were used:
December 31, 2011Stock Price $ 0.66 Exercise Price $ 2.56 Expected Volatility 105%
Expected Dividend Yield None
Expected Term (in years) 4.8Risk-free Interest Rate 0.77%
As of December 31, 2011, the value of the warrant liability was $0.7 million and the change in fair value during
the twelve months ended December 31, 2011 was a gain of $1.3 million. The gain was recorded as other income in the statement of operations.
The completion of the Share Subscription Agreement with Canon on July 22, 2011 resulted in a change in control. As such, the company was obligated to holders of May 2009 warrants who requested redemption a total of $530,000.
Warrant activity for the years ended December 31, 2011, 2010 and 2009 is summarized as follows:
In thousands of dollars
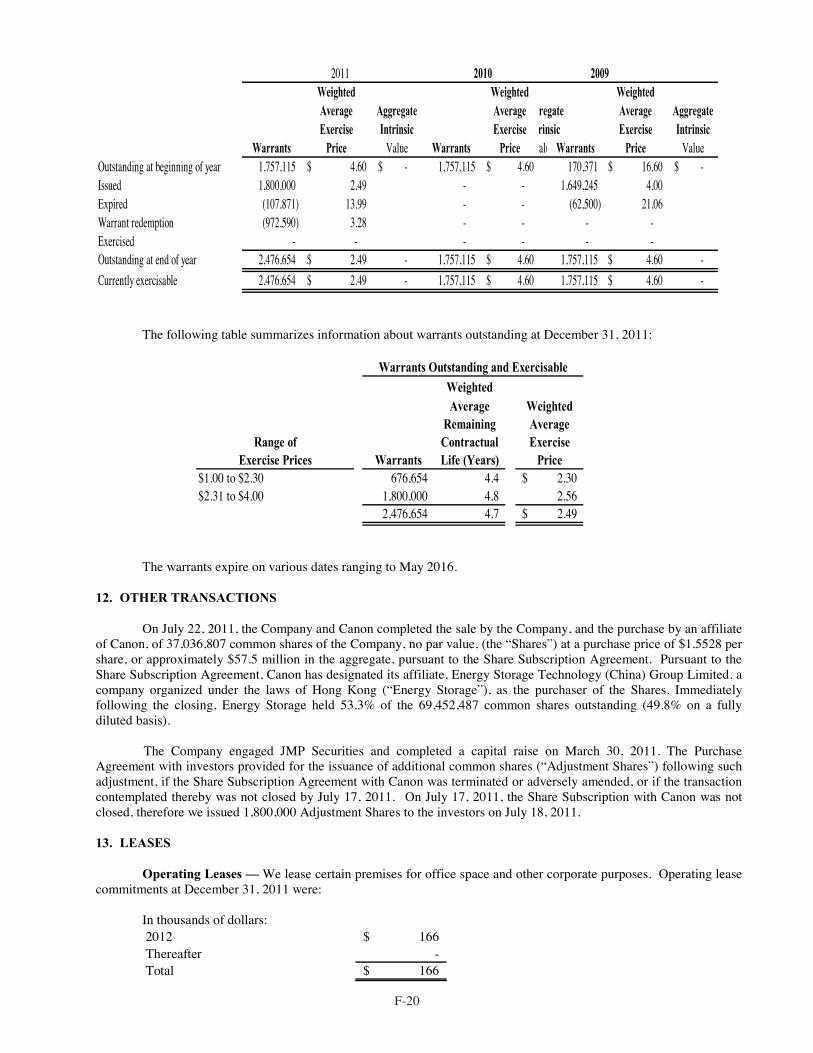
F-20
2011 2010 2009
Weighted Weighted WeightedAverage Aggregate Average regate Average AggregateExercise Intrinsic Exercise rinsic Exercise Intrinsic
Warrants Price Value Warrants Price alu Warrants Price ValueOutstanding at beginning of year 1,757,115 4.60$ -$ 1,757,115 4.60$ 170,371 16.60$ -$ Issued 1,800,000 2.49 - - 1,649,245 4.00 Expired (107,871) 13.99 - - (62,500) 21.06 Warrant redemption (972,590) 3.28 - - - - Exercised - - - - - - Outstanding at end of year 2,476,654 2.49$ - 1,757,115 4.60$ 1,757,115 4.60$ - Currently exercisable 2,476,654 2.49$ - 1,757,115 4.60$ 1,757,115 4.60$ -
The following table summarizes information about warrants outstanding at December 31, 2011:
WeightedAverage Weighted
Remaining AverageContractual Exercise
Warrants Life (Years) Price$1.00 to $2.30 676,654 4.4 2.30$ $2.31 to $4.00 1,800,000 4.8 2.56
2,476,654 4.7 2.49$
Range ofExercise Prices
Warrants Outstanding and Exercisable
The warrants expire on various dates ranging to May 2016.
12. OTHER TRANSACTIONS
On July 22, 2011, the Company and Canon completed the sale by the Company, and the purchase by an affiliate of Canon, of 37,036,807 common shares of the Company, no par value, (the “Shares”) at a purchase price of $1.5528 per share, or approximately $57.5 million in the aggregate, pursuant to the Share Subscription Agreement. Pursuant to the Share Subscription Agreement, Canon has designated its affiliate, Energy Storage Technology (China) Group Limited, a company organized under the laws of Hong Kong (“Energy Storage”), as the purchaser of the Shares. Immediately following the closing, Energy Storage held 53.3% of the 69,452,487 common shares outstanding (49.8% on a fully diluted basis).
The Company engaged JMP Securities and completed a capital raise on March 30, 2011. The Purchase Agreement with investors provided for the issuance of additional common shares (“Adjustment Shares”) following such adjustment, if the Share Subscription Agreement with Canon was terminated or adversely amended, or if the transaction contemplated thereby was not closed by July 17, 2011. On July 17, 2011, the Share Subscription with Canon was not closed, therefore we issued 1,800,000 Adjustment Shares to the investors on July 18, 2011. 13. LEASES
Operating Leases — We lease certain premises for office space and other corporate purposes. Operating lease commitments at December 31, 2011 were:
In thousands of dollars: 2012 166$ Thereafter -Total 166$
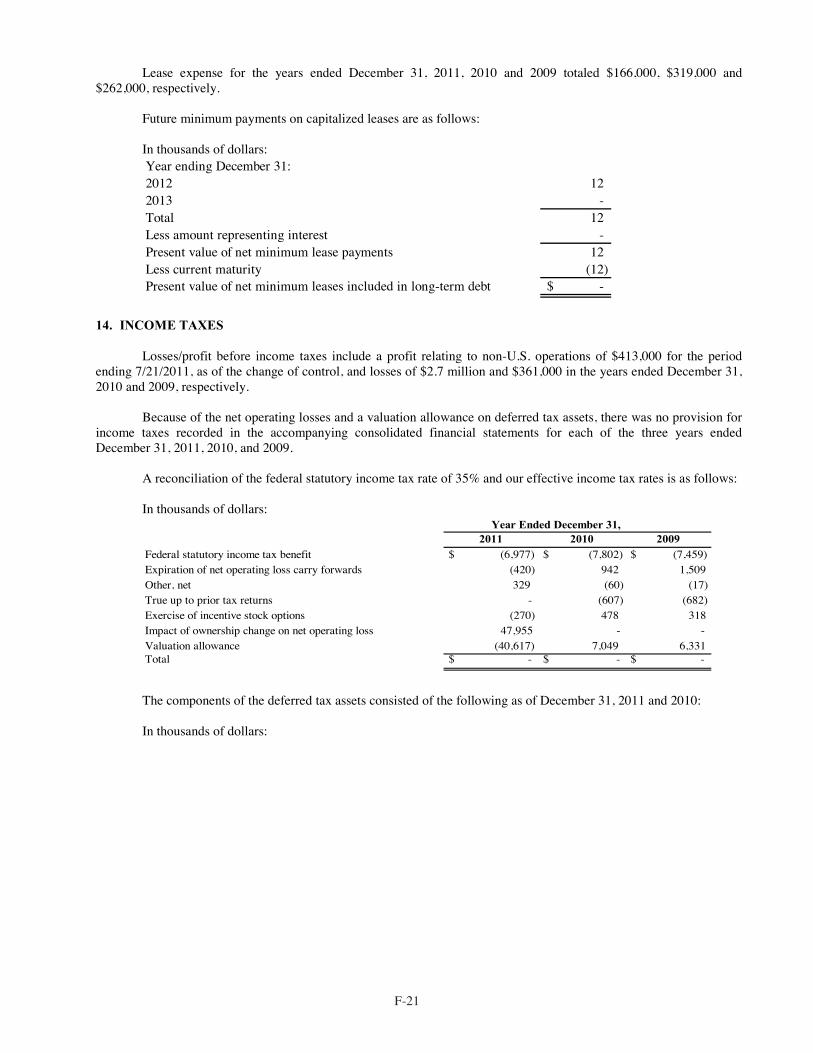
F-21
Lease expense for the years ended December 31, 2011, 2010 and 2009 totaled $166,000, $319,000 and
$262,000, respectively. Future minimum payments on capitalized leases are as follows: In thousands of dollars: Year ending December 31:2012 12 2013 - Total 12 Less amount representing interest - Present value of net minimum lease payments 12 Less current maturity (12) Present value of net minimum leases included in long-term debt -$
14. INCOME TAXES
Losses/profit before income taxes include a profit relating to non-U.S. operations of $413,000 for the period ending 7/21/2011, as of the change of control, and losses of $2.7 million and $361,000 in the years ended December 31, 2010 and 2009, respectively.
Because of the net operating losses and a valuation allowance on deferred tax assets, there was no provision for
income taxes recorded in the accompanying consolidated financial statements for each of the three years ended December 31, 2011, 2010, and 2009.
A reconciliation of the federal statutory income tax rate of 35% and our effective income tax rates is as follows: In thousands of dollars:
Year Ended December 31,2011 2010 2009
Federal statutory income tax benefit $ (6,977) $ (7,802) $ (7,459)Expiration of net operating loss carry forwards (420) 942 1,509 Other, net 329 (60) (17)True up to prior tax returns - (607) (682)Exercise of incentive stock options (270) 478 318 Impact of ownership change on net operating loss 47,955 - - Valuation allowance (40,617) 7,049 6,331 Total $ - $ - $ -
The components of the deferred tax assets consisted of the following as of December 31, 2011 and 2010: In thousands of dollars:
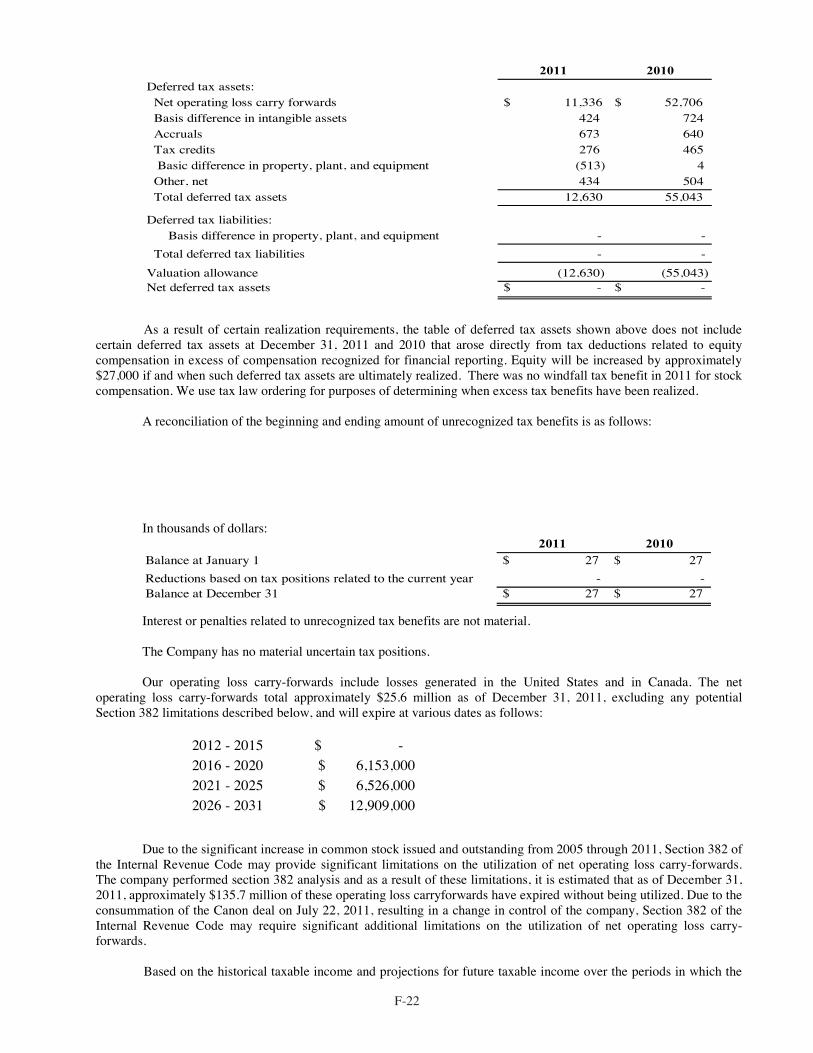
F-22
2011 2010
Deferred tax assets: Net operating loss carry forwards $ 11,336 $ 52,706 Basis difference in intangible assets 424 724 Accruals 673 640 Tax credits 276 465 Basic difference in property, plant, and equipment (513) 4 Other, net 434 504 Total deferred tax assets 12,630 55,043
Deferred tax liabilities: Basis difference in property, plant, and equipment - - Total deferred tax liabilities - - Valuation allowance (12,630) (55,043)Net deferred tax assets $ - $ -
As a result of certain realization requirements, the table of deferred tax assets shown above does not include
certain deferred tax assets at December 31, 2011 and 2010 that arose directly from tax deductions related to equity compensation in excess of compensation recognized for financial reporting. Equity will be increased by approximately $27,000 if and when such deferred tax assets are ultimately realized. There was no windfall tax benefit in 2011 for stock compensation. We use tax law ordering for purposes of determining when excess tax benefits have been realized.
A reconciliation of the beginning and ending amount of unrecognized tax benefits is as follows: In thousands of dollars:
2011 2010Balance at January 1 $ 27 $ 27 Reductions based on tax positions related to the current year - - Balance at December 31 $ 27 $ 27
Interest or penalties related to unrecognized tax benefits are not material. The Company has no material uncertain tax positions. Our operating loss carry-forwards include losses generated in the United States and in Canada. The net
operating loss carry-forwards total approximately $25.6 million as of December 31, 2011, excluding any potential Section 382 limitations described below, and will expire at various dates as follows:
2012 - 2015 $ - 2016 - 2020 $ 6,153,000 2021 - 2025 $ 6,526,000 2026 - 2031 $ 12,909,000
Due to the significant increase in common stock issued and outstanding from 2005 through 2011, Section 382 of
the Internal Revenue Code may provide significant limitations on the utilization of net operating loss carry-forwards. The company performed section 382 analysis and as a result of these limitations, it is estimated that as of December 31, 2011, approximately $135.7 million of these operating loss carryforwards have expired without being utilized. Due to the consummation of the Canon deal on July 22, 2011, resulting in a change in control of the company, Section 382 of the Internal Revenue Code may require significant additional limitations on the utilization of net operating loss carry-forwards.
Based on the historical taxable income and projections for future taxable income over the periods in which the
F-23
deferred income tax assets become deductible, management believes it more likely than not that the Company will not realize benefits of these deductible differences as of December 31, 2011. Management has, therefore, established a full valuation allowance against its net deferred income tax assets as of December 31, 2011.
We are subject to taxation in the U.S., Canada and various states. We record liabilities for income tax
contingencies based on our best estimate of the underlying exposures. We have not been audited by any jurisdiction since our inception in 1998. We are open for audit by the U.S. Internal Revenue Service, the Canada Revenue Agency and U.S. state tax jurisdictions from our inception in 1998 to 2011.
15. COMMITMENTS AND CONTINGENCIES
Contingencies — We are subject to claims in the normal course of business. Management, after consultation with legal counsel, believes that liabilities, if any, resulting from such claims will not materially affect our financial position or results of operations.
Litigation — JMP Dispute. On or about September 9, 2011, JMP Securities LLC ("JMP") filed a complaint
against the Company in the United States District Court in the Northern District of California. JMP alleges breach of contract, promissory estoppel, fraud and negligence misrepresentation and seeks damages and punitive damages in an unspecified amount. This dispute arises from JMP's engagement as the Company's financial advisor in July 2010, and the key issue in this dispute is the amount of the fee JMP is entitled to receive as a result of the closing of the common share issuance to an affiliate of Canon. Under governing agreements, the amount of JMP's fee differs depending upon whether the common share issuance is a "Sale or Merger" (defined to include an acquisition of a majority of voting securities of the Company) or whether it is a "Strategic Investment", and whether certain gross up provisions apply. The Company asserts that the correct fee amount is approximately $.8 million, while JMP asserts that the correct fee amount is approximately $2.3 million. The Company filed an answer to JMP's complaint and a motion to dismiss certain, but not all, claims in JMP's complaint, of which a motion is pending.
Charles Cheng Fee Dispute. On or about October 12, 2011, Altairnano filed a complaint against Zhiyuan (Charles) Cheng in the United States District Court in the Northern District of Nevada. Altairnano seeks a declaratory judgment that it owes Mr. Cheng no fee and seeks damages for breach of contract in an unspecified amount. The dispute arises from Mr. Cheng's engagement as a consultant to seek customers and strategic partners for Altairnano in China. Mr. Cheng has asserted in various communications that his efforts were significant in the arranging of the common share issuance with Canon and that, as a result, he is entitled to a $1.7 million fee in consideration of the closing of such transaction. Altairnano claims that Mr. Cheng is entitled to no fee, and that Altairnano is entitled to damages, as a result of Mr. Cheng's numerous breaches of material provisions of the agreement. Altairnano has filed the complaint, and Mr. Cheng has filed an answer denying key allegations of the complaint and a counterclaim seeking payment of the fee, and damages, under various theories. Mr. Cheng has joined Zhuhai Yintong Energy Company Ltd. (“YTE”) and Wei Yincang into the action by means of a complaint against them alleging a breach of an agreement between them and Mr. Cheng.
These disputed amounts are directly related to the Share Subscription Agreement with Canon. Management
recorded a $4 million charge for these disputed amounts included in stock issuance costs within Equity.
Concentrations – We rely on certain suppliers as the sole-source, or as a primary source, of certain services, raw materials and other components of our products. We do not yet have long-term supply or service agreements engaged with any such suppliers. As a result, the providers of such services and components could terminate or alter the terms of service or supply with little or no advance notice. If our arrangements with any sole-source supplier were terminated, or if such a supplier failed to provide essential services or deliver essential components on a timely basis, failed to meet our product specifications and/or quality standards, or introduced unacceptable price increases, our production schedule would be delayed, possibly by as long as six months. Any such delay in our production schedule would result in delayed product delivery and may also result in additional production costs, customer losses and litigation.
An area in which our dependence upon a limited number of sources creates significant vulnerability is the
manufacturing of our nano lithium titanate cells. As of the date hereof, we have two contract manufacturing sources for our nano lithium titanate cells. We have had quality issues with both contract manufacturers. Our nano lithium titanate battery cells are the building blocks of all of our products (other than our nano lithium titanate powder). If we continue to experience quality issues with our suppliers, we may be unable to meet our deadlines, or quality specifications, with respect to existing or future orders. This would harm our reputation and our ability to grow our business.
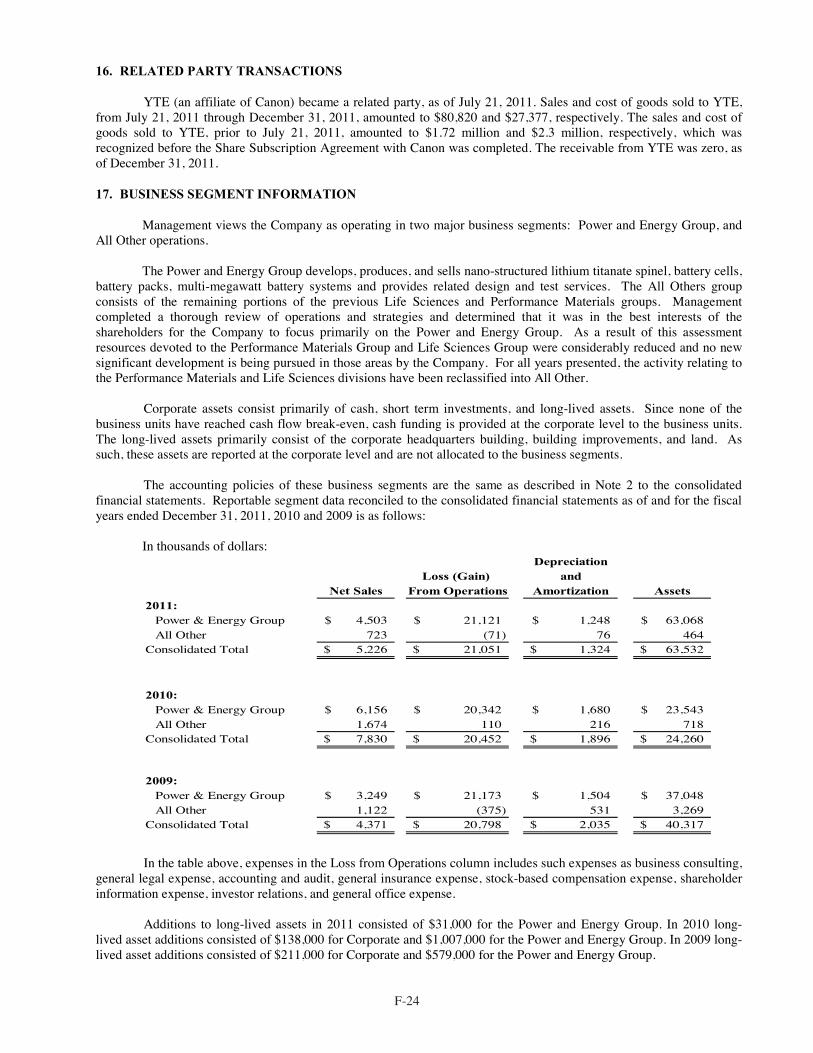
F-24
16. RELATED PARTY TRANSACTIONS
YTE (an affiliate of Canon) became a related party, as of July 21, 2011. Sales and cost of goods sold to YTE, from July 21, 2011 through December 31, 2011, amounted to $80,820 and $27,377, respectively. The sales and cost of goods sold to YTE, prior to July 21, 2011, amounted to $1.72 million and $2.3 million, respectively, which was recognized before the Share Subscription Agreement with Canon was completed. The receivable from YTE was zero, as of December 31, 2011.
17. BUSINESS SEGMENT INFORMATION
Management views the Company as operating in two major business segments: Power and Energy Group, and All Other operations.
The Power and Energy Group develops, produces, and sells nano-structured lithium titanate spinel, battery cells,
battery packs, multi-megawatt battery systems and provides related design and test services. The All Others group consists of the remaining portions of the previous Life Sciences and Performance Materials groups. Management completed a thorough review of operations and strategies and determined that it was in the best interests of the shareholders for the Company to focus primarily on the Power and Energy Group. As a result of this assessment resources devoted to the Performance Materials Group and Life Sciences Group were considerably reduced and no new significant development is being pursued in those areas by the Company. For all years presented, the activity relating to the Performance Materials and Life Sciences divisions have been reclassified into All Other.
Corporate assets consist primarily of cash, short term investments, and long-lived assets. Since none of the
business units have reached cash flow break-even, cash funding is provided at the corporate level to the business units. The long-lived assets primarily consist of the corporate headquarters building, building improvements, and land. As such, these assets are reported at the corporate level and are not allocated to the business segments.
The accounting policies of these business segments are the same as described in Note 2 to the consolidated
financial statements. Reportable segment data reconciled to the consolidated financial statements as of and for the fiscal years ended December 31, 2011, 2010 and 2009 is as follows:
In thousands of dollars:
DepreciationLoss (Gain) and
Net Sales From Operations Amortization Assets2011:
Power & Energy Group 4,503$ 21,121$ 1,248$ 63,068$ All Other 723 (71) 76 464
Consolidated Total 5,226$ 21,051$ 1,324$ 63,532$
2010:Power & Energy Group 6,156$ 20,342$ 1,680$ 23,543$ All Other 1,674 110 216 718
Consolidated Total 7,830$ 20,452$ 1,896$ 24,260$
2009:Power & Energy Group 3,249$ 21,173$ 1,504$ 37,048$ All Other 1,122 (375) 531 3,269
Consolidated Total 4,371$ 20,798$ 2,035$ 40,317$
In the table above, expenses in the Loss from Operations column includes such expenses as business consulting,
general legal expense, accounting and audit, general insurance expense, stock-based compensation expense, shareholder information expense, investor relations, and general office expense.
Additions to long-lived assets in 2011 consisted of $31,000 for the Power and Energy Group. In 2010 long-
lived asset additions consisted of $138,000 for Corporate and $1,007,000 for the Power and Energy Group. In 2009 long-lived asset additions consisted of $211,000 for Corporate and $579,000 for the Power and Energy Group.
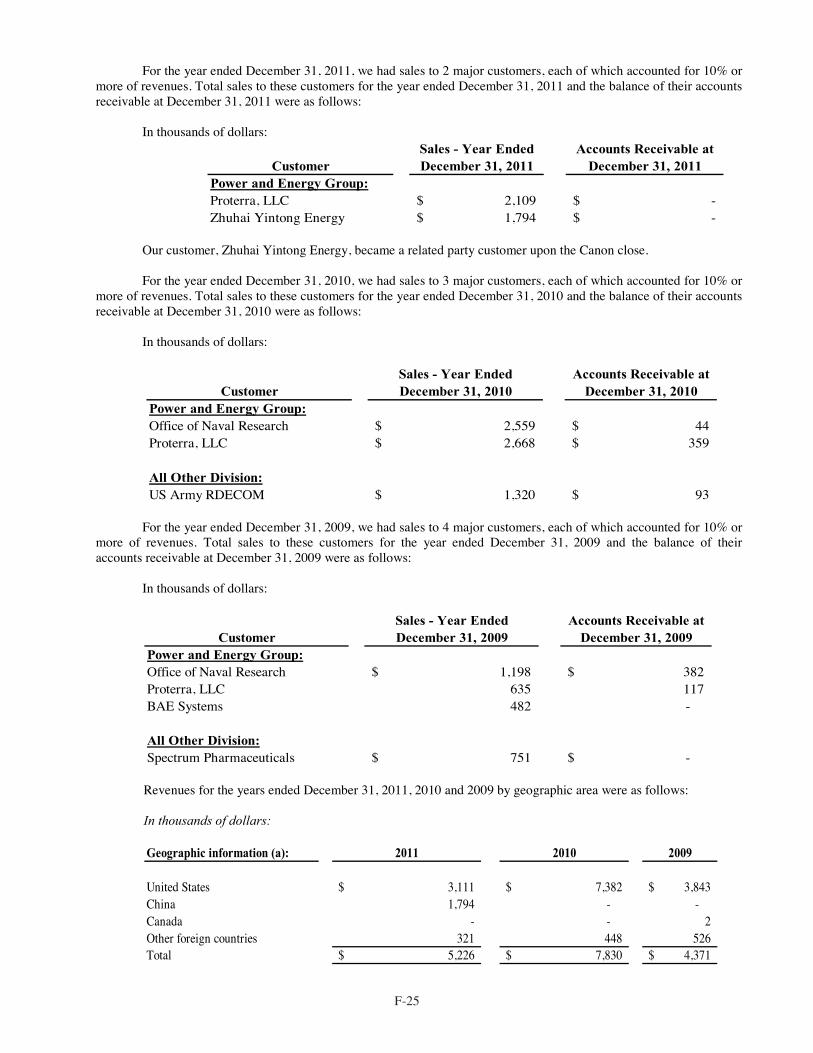
F-25
For the year ended December 31, 2011, we had sales to 2 major customers, each of which accounted for 10% or
more of revenues. Total sales to these customers for the year ended December 31, 2011 and the balance of their accounts receivable at December 31, 2011 were as follows:
In thousands of dollars:
Sales - Year Ended Accounts Receivable atCustomer December 31, 2011 December 31, 2011
Power and Energy Group:Proterra, LLC 2,109$ -$ Zhuhai Yintong Energy 1,794$ -$
Our customer, Zhuhai Yintong Energy, became a related party customer upon the Canon close. For the year ended December 31, 2010, we had sales to 3 major customers, each of which accounted for 10% or
more of revenues. Total sales to these customers for the year ended December 31, 2010 and the balance of their accounts receivable at December 31, 2010 were as follows:
In thousands of dollars:
Sales - Year Ended Accounts Receivable atCustomer December 31, 2010 December 31, 2010
Power and Energy Group:Office of Naval Research 2,559$ 44$ Proterra, LLC 2,668$ 359$
All Other Division:US Army RDECOM 1,320$ 93$
For the year ended December 31, 2009, we had sales to 4 major customers, each of which accounted for 10% or
more of revenues. Total sales to these customers for the year ended December 31, 2009 and the balance of their accounts receivable at December 31, 2009 were as follows:
In thousands of dollars:
Sales - Year Ended Accounts Receivable at
Customer December 31, 2009 December 31, 2009Power and Energy Group:Office of Naval Research 1,198$ 382$ Proterra, LLC 635 117BAE Systems 482 -
All Other Division:Spectrum Pharmaceuticals 751$ -$
Revenues for the years ended December 31, 2011, 2010 and 2009 by geographic area were as follows: In thousands of dollars: Geographic information (a): 2011 2010 2009
United States 3,111$ 7,382$ 3,843$ China 1,794 - - Canada - - 2Other foreign countries 321 448 526Total 5,226$ 7,830$ 4,371$
F-26
All assets are held within the United States at December 31, 2011 with the exception of a Canadian cash
account having a balance of $13,000 and $32,000 in raw material inventory located in South Korea at our cell contract manufacturer. All assets are held within the United States at December 31, 2010 with the exception of a Canadian cash account having a balance of $21,000 and $39,000 in raw material inventory located in South Korea at our cell contract manufacturers. 18. SUBSEQUENT EVENTS
On April 19, 2012, our subsidiary Altair Nanotechnologies (China) Co., Ltd. ("Altair China") entered into an Agreement (the “Agreement") with Wu'an Municipal People's Government ("Wu'an") and Handan Municipal People's Government ("Handan") regarding the establishment by Altair China of a manufacturing facility in the City of Wu'an, in Hebei Province in China. The Agreement provides the framework for Altair China's location of an up to 3,000 ton per annum lithium titanate oxide (LTO) manufacturing facility in a newly formed technology park in Wu'an, anticipates the future expansion of such facility based on market demand and the establishment of an energy storage system production line. To provide incentives for Altair China to locate in Wu'an, the government of Wu'an has agreed, subject to tender, auction and listing procedures that may be required by law, to make approximately 330 acres of commercial land available to Altair China free of rent or land transfer fees for a 50 year commercial term and, subject to certain limitations and procedures, to provide tax incentives to Altair China. The Agreement anticipates that Altair China will establish a presence in Wu'an immediately, the land use rights being granted in summer of 2012 and the first phase of Altair China's manufacturing facility being completed in late 2013. The Agreement contemplates the purchase by Wu'an and Handan of electric buses beginning in late 2012 and continuing over a period of years, and the future purchase of electric taxis and energy storage systems. The Agreement also contemplates the adoption of laws and policies regulations facilitating or supporting the use of battery energy storage systems to support wind power projects, multi-tenant residential constructions and other initiatives, as well as various tax and loan-related incentives. The Agreement contemplates the negotiation of additional terms and conditions related to the land use grant, the product purchases and the other support initiatives, including purchase price with respect to many of the electric vehicles, the energy storage systems and related matters. In addition, the purchases and support initiatives are generally subject to procedural and substantive limitations imposed by federal Chinese law that may limit the ability the respective governmental entity to implement such purchases and initiatives.
On August 1, 2012, Wu’an paid Northern Altair Nanotechnologies Co., Ltd., $1.9 million (12 million RMB), as a down payment for its first electric bus order under the Agreement (the “Wu’an Agreement") among Altair China and the Wu'an Municipal People's Government ("Wu'an") and Handan Municipal People's Government ("Handan"). This payment shall be applied by Altair China to purchase and deliver 50 electric buses from a third party manufacturer to Wu’an by the end of 2012.
On August 8, 2012, we entered into a Note Secured by Deed of Trust, a Deed of Trust, Guaranty and Hazardous Materials Indemnity Agreement (collectively, the “Loan Documents”) for the provision of a $1 million loan (the “Loan”) secured by the Company’s Reno, Nevada Facility. Under the terms of the Loan Documents, interest accrues on the outstanding principal balance at the rate of 11% per annum. We are obligated to pay five months of prepaid interest to the lender upon closing and make interest-only payments on a monthly basis during the remaining term of the Loan and to repay all principal and any outstanding interest on or before August 1, 2013. Although we may prepay the Loan, we are obligated to pay a minimum of five months’ interest. Proceeds of the Loan will be used for general working capital requirements.
Quarterly Financial Reports
ALTAIR NANOTECHNOLOGIES INC. AND SUBSIDIARIES
TABLE OF CONTENTS
Page
QUARTERLY FINANCIAL STATEMENTS:
Consolidated Balance Sheets, December 31, 2011 and June 30, 2012 Q-1
Consolidated Statements of Operations for the Six-Month and Three-Month Periods Ended June 30, 2012 Q-2
Consolidated Statements of Stockholders’ Equity and Comprehensive Lossfor the Six-Month and Three-Month Periods Ended June 30, 2012 Q-3
Consolidated Statements of Cash Flows for the Six Months Ended June 30, 2012 Q-4
Notes to Consolidated Financial Statements Q-5
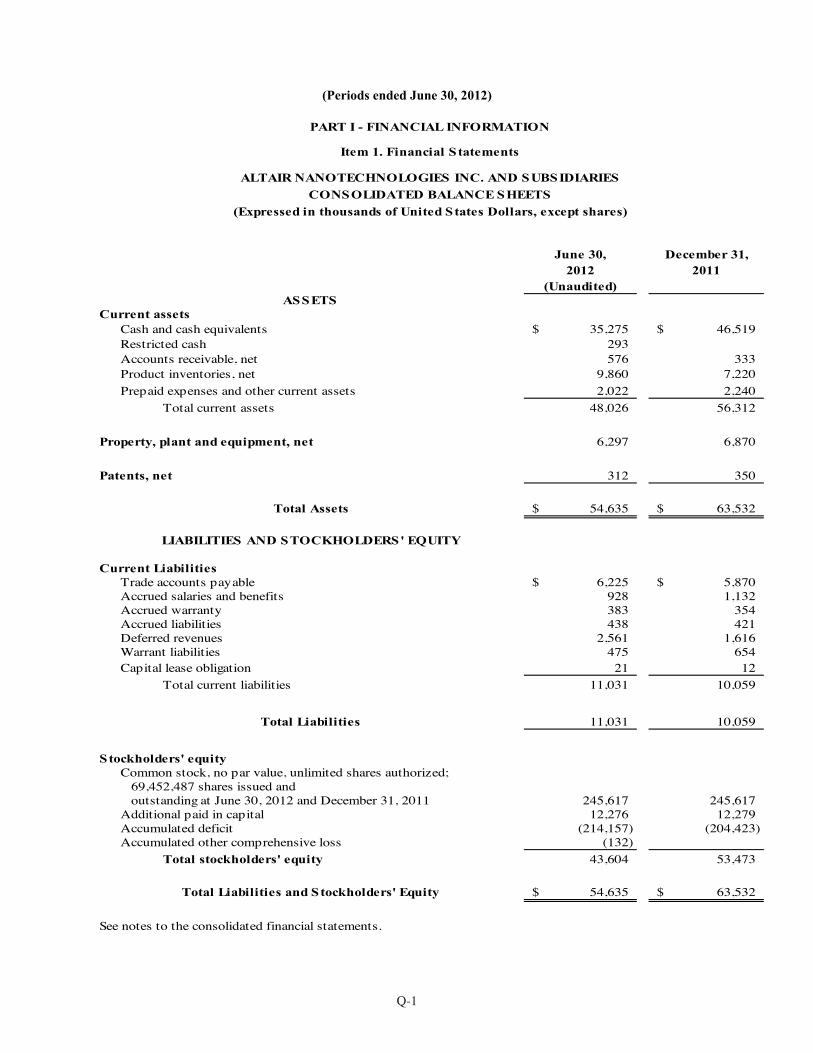
Q-1
(Periods ended June 30, 2012)
June 30, December 31,2012 2011
(Unaudited)ASSETS
Current assetsCash and cash equivalents 35,275$ 46,519$ Restricted cash 293 Accounts receivable, net 576 333 Product inventories, net 9,860 7,220 Prepaid expenses and other current assets 2,022 2,240
Total current assets 48,026 56,312
Property, plant and equipment, net 6,297 6,870
Patents, net 312 350
Total Assets 54,635$ 63,532$
LIABILITIES AND STOCKHOLDERS' EQUITY
Current LiabilitiesTrade accounts payable 6,225$ 5,870$ Accrued salaries and benefits 928 1,132 Accrued warranty 383 354 Accrued liabilities 438 421 Deferred revenues 2,561 1,616 Warrant liabilities 475 654 Capital lease obligation 21 12
Total current liabilities 11,031 10,059
Total Liabilities 11,031 10,059
S tockholders' equity
Common stock, no par value, unlimited shares authorized;69,452,487 shares issued and outstanding at June 30, 2012 and December 31, 2011 245,617 245,617
Additional paid in capital 12,276 12,279 Accumulated deficit (214,157) (204,423) Accumulated other comprehensive loss (132)
Total stockholders' equity 43,604 53,473
Total Liabilities and Stockholders' Equity 54,635$ 63,532$
See notes to the consolidated financial statements.
PART I - FINANCIAL INFORMATION
ALTAIR NANOTECHNOLOGIES INC. AND SUBSIDIARIESCONSOLIDATED BALANCE SHEETS
(Expressed in thousands of United States Dollars, except shares)
Item 1. Financial Statements
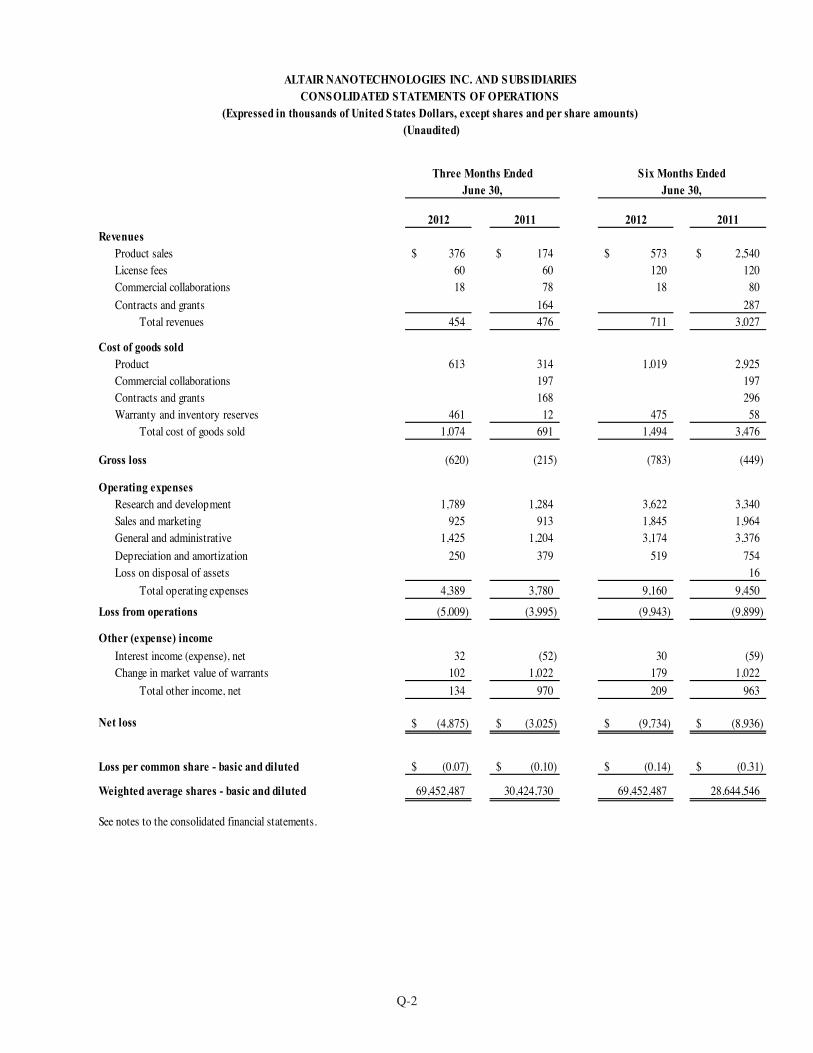
Q-2
2012 2011 2012 2011Revenues
Product sales 376$ 174$ 573$ 2,540$ License fees 60 60 120 120 Commercial collaborations 18 78 18 80 Contracts and grants 164 287
Total revenues 454 476 711 3,027
Cost of goods soldProduct 613 314 1,019 2,925 Commercial collaborations 197 197 Contracts and grants 168 296 Warranty and inventory reserves 461 12 475 58
Total cost of goods sold 1,074 691 1,494 3,476
Gross loss (620) (215) (783) (449)
Operating expensesResearch and development 1,789 1,284 3,622 3,340 Sales and marketing 925 913 1,845 1,964 General and administrative 1,425 1,204 3,174 3,376 Depreciation and amortization 250 379 519 754 Loss on disposal of assets 16
Total operating expenses 4,389 3,780 9,160 9,450
Loss from operations (5,009) (3,995) (9,943) (9,899)
Other (expense) incomeInterest income (expense), net 32 (52) 30 (59) Change in market value of warrants 102 1,022 179 1,022
Total other income, net 134 970 209 963
Net loss (4,875)$ (3,025)$ (9,734)$ (8,936)$
Loss per common share - basic and diluted (0.07)$ (0.10)$ (0.14)$ (0.31)$
Weighted average shares - basic and diluted 69,452,487 30,424,730 69,452,487 28,644,546
Three Months Ended June 30,
S ix Months Ended June 30,
See notes to the consolidated financial statements.
(Expressed in thousands of United States Dollars, except shares and per share amounts) CONSOLIDATED STATEMENTS OF OPERATIONS
ALTAIR NANOTECHNOLOGIES INC. AND SUBSIDIARIES
(Unaudited)
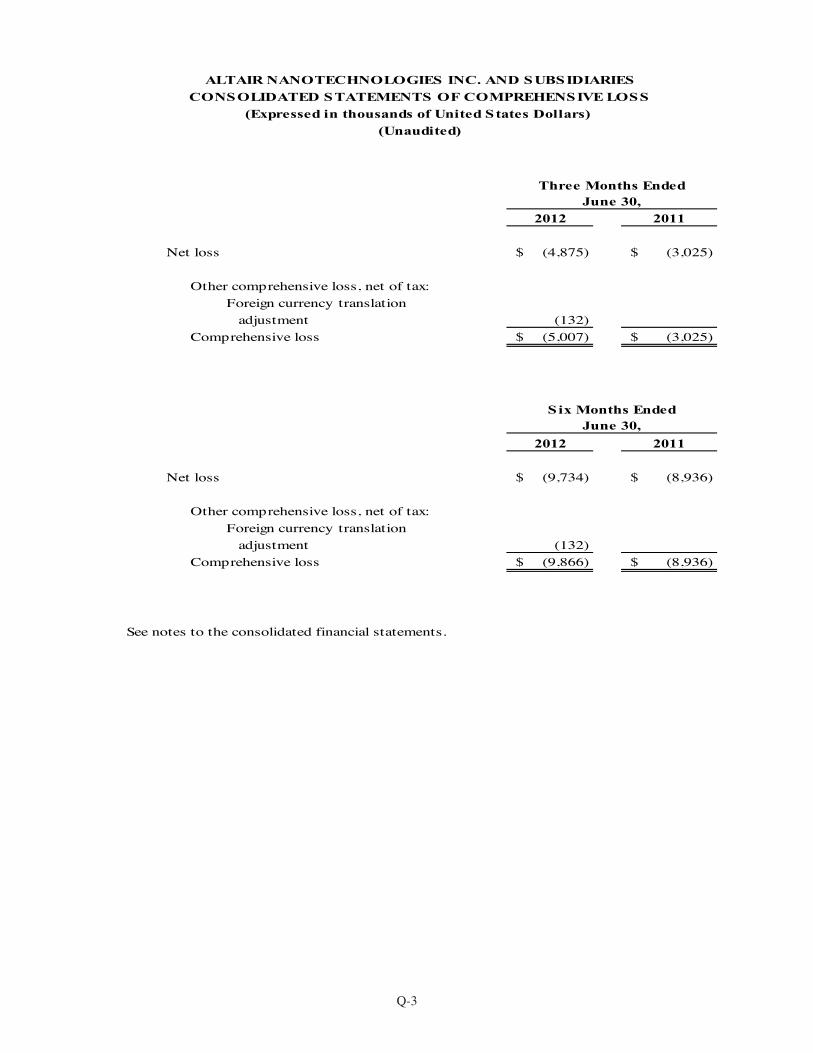
Q-3
2012 2011
Net loss (4,875)$ (3,025)$
Other comprehensive loss, net of tax: Foreign currency translation adjustment (132)
Comprehensive loss (5,007)$ (3,025)$
2012 2011
Net loss (9,734)$ (8,936)$
Other comprehensive loss, net of tax: Foreign currency translation adjustment (132)
Comprehensive loss (9,866)$ (8,936)$
ALTAIR NANOTECHNOLOGIES INC. AND SUBSIDIARIESCONSOLIDATED STATEMENTS OF COMPREHENSIVE LOSS
(Expressed in thousands of United States Dollars) (Unaudited)
Three Months Ended June 30,
See notes to the consolidated financial statements.
Six Months Ended June 30,
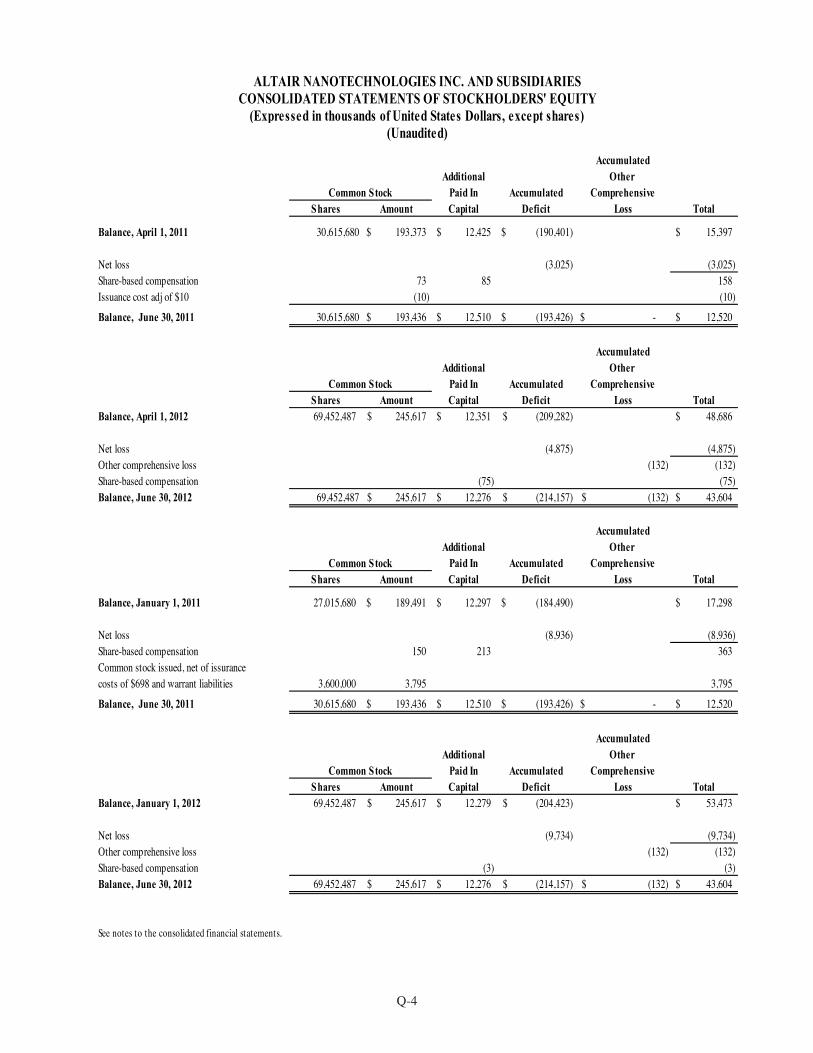
Q-4
AccumulatedAdditional Other
Paid In Accumulated ComprehensiveShares Amount Capital Deficit Loss Total
Balance, April 1, 2011 30,615,680 193,373$ 12,425$ (190,401)$ 15,397$
Net loss (3,025) (3,025) Share-based compensation 73 85 158 Issuance cost adj of $10 (10) (10)
Balance, June 30, 2011 30,615,680 193,436$ 12,510$ (193,426)$ -$ 12,520$
AccumulatedAdditional Other
Paid In Accumulated ComprehensiveShares Amount Capital Deficit Loss Total
Balance, April 1, 2012 69,452,487 245,617$ 12,351$ (209,282)$ 48,686$
Net loss (4,875) (4,875) Other comprehensive loss (132) (132) Share-based compensation (75) (75) Balance, June 30, 2012 69,452,487 245,617$ 12,276$ (214,157)$ (132)$ 43,604$
AccumulatedAdditional Other
Paid In Accumulated ComprehensiveShares Amount Capital Deficit Loss Total
Balance, January 1, 2011 27,015,680 189,491$ 12,297$ (184,490)$ 17,298$
Net loss (8,936) (8,936) Share-based compensation 150 213 363 Common stock issued, net of issurancecosts of $698 and warrant liabilities 3,600,000 3,795 3,795
Balance, June 30, 2011 30,615,680 193,436$ 12,510$ (193,426)$ -$ 12,520$
AccumulatedAdditional Other
Paid In Accumulated ComprehensiveShares Amount Capital Deficit Loss Total
Balance, January 1, 2012 69,452,487 245,617$ 12,279$ (204,423)$ 53,473$
Net loss (9,734) (9,734) Other comprehensive loss (132) (132) Share-based compensation (3) (3) Balance, June 30, 2012 69,452,487 245,617$ 12,276$ (214,157)$ (132)$ 43,604$
See notes to the consolidated financial statements.
Common Stock
Common Stock
ALTAIR NANOTECHNOLOGIES INC. AND SUBSIDIARIESCONSOLIDATED STATEMENTS OF STOCKHOLDERS' EQUITY
(Expressed in thousands of United States Dollars, except shares)(Unaudited)
Common Stock
Common Stock
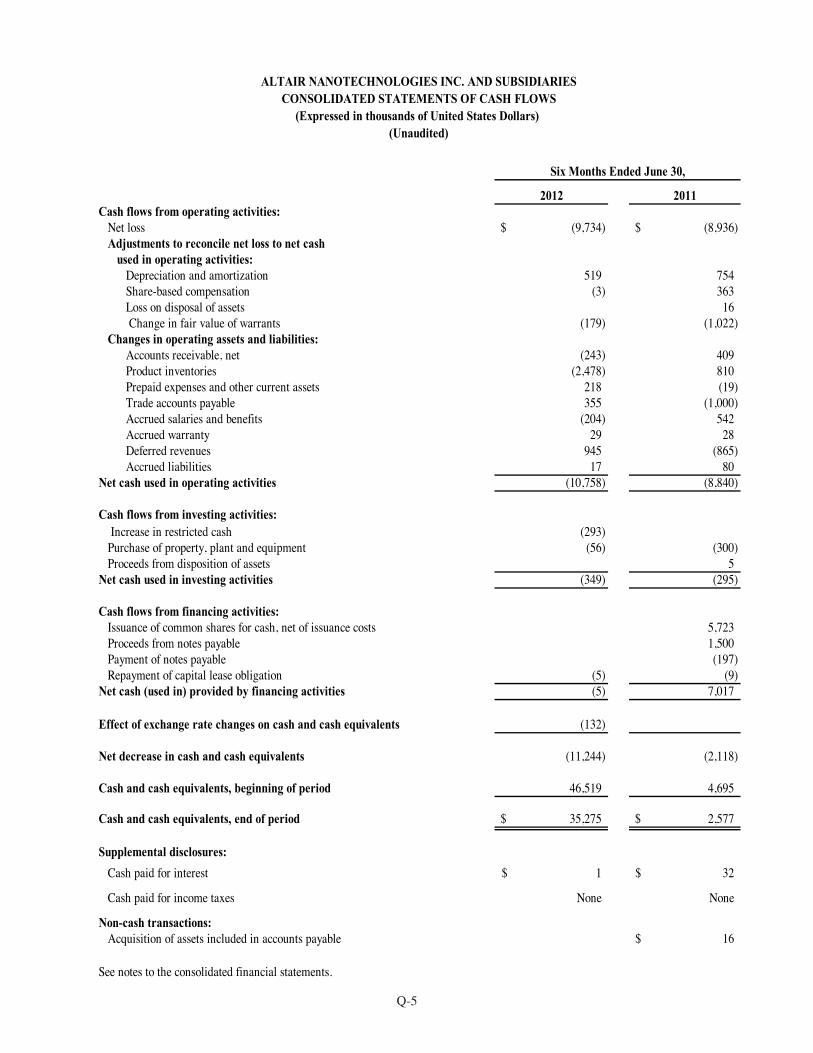
Q-5
2012 2011Cash flows from operating activities:
Net loss (9,734)$ (8,936)$ Adjustments to reconcile net loss to net cash
used in operating activities:Depreciation and amortization 519 754 Share-based compensation (3) 363 Loss on disposal of assets 16 Change in fair value of warrants (179) (1,022)
Changes in operating assets and liabilities:Accounts receivable, net (243) 409 Product inventories (2,478) 810 Prepaid expenses and other current assets 218 (19) Trade accounts payable 355 (1,000) Accrued salaries and benefits (204) 542 Accrued warranty 29 28 Deferred revenues 945 (865) Accrued liabilities 17 80
Net cash used in operating activities (10,758) (8,840)
Cash flows from investing activities: Increase in restricted cash (293)
Purchase of property, plant and equipment (56) (300) Proceeds from disposition of assets 5
Net cash used in investing activities (349) (295)
Cash flows from financing activities:Issuance of common shares for cash, net of issuance costs 5,723 Proceeds from notes payable 1,500 Payment of notes payable (197) Repayment of capital lease obligation (5) (9)
Net cash (used in) provided by financing activities (5) 7,017
Effect of exchange rate changes on cash and cash equivalents (132)
Net decrease in cash and cash equivalents (11,244) (2,118)
Cash and cash equivalents, beginning of period 46,519 4,695
Cash and cash equivalents, end of period 35,275$ 2,577$
Supplemental disclosures:
Cash paid for interest 1$ 32$
Cash paid for income taxes None None
Non-cash transactions:Acquisition of assets included in accounts payable 16$
See notes to the consolidated financial statements.
Six Months Ended June 30,
(Unaudited)
ALTAIR NANOTECHNOLOGIES INC. AND SUBSIDIARIESCONSOLIDATED STATEMENTS OF CASH FLOWS
(Expressed in thousands of United States Dollars)
Q-6
ALTAIR NANOTECHNOLOGIES INC. AND SUBSIDIARIES NOTES TO CONSOLIDATED FINANCIAL STATEMENTS
(UNAUDITED) Note 1. Basis of Presentation and Going Concern
The interim consolidated financial statements of Altair Nanotechnologies Inc. and its subsidiaries (the
“Company”) are unaudited. These consolidated financial statements include all adjustments, consisting of normal recurring adjustments, considered necessary by management to fairly state the Company’s results of operations, financial position, and cash flows. The results reported in these consolidated financial statements are not necessarily indicative of the results that may be expected for the entire year. The 2011 year-end balance sheet data was derived from audited financial statements but does not include all disclosures required by accounting principles generally accepted in the United States of America (GAAP). This Form 10-Q (this “Report”) should be read in conjunction with the Company’s Annual Report on Form 10-K for the year ended December 31, 2011, which includes all disclosures required by GAAP.
The interim consolidated financial statements do not include any adjustments relating to the recoverability
and classification of recorded asset amounts or the amounts and classification of liabilities that might be necessary should we be unable to continue as a going concern. Our continuation as a going concern is dependent upon our ability to generate sufficient cash flow to meet our obligations on a timely basis, to obtain additional financing or refinancing as may be required, including our expansion into China, to develop commercially viable products and processes, and ultimately to establish profitable operations. We have financed operations through operating revenues and through the issuance of equity securities (shares of common stock, stock options and warrants), and debt (term notes). Until we are able to generate positive operating cash flows, additional funds will be required to support operations. We believe that current working capital, cash receipts from anticipated sales and funding through additional financing or raising additional capital in 2012 to fund our China expansion as well as sustain our U.S. operations will be sufficient to enable us to continue as a going concern through June 30, 2013.
The interim consolidated financial statements include Altair Nanotechnologies (China) Co., Ltd. (“Altair
China”), established in the first quarter of 2012. The interim consolidated financial statements include a new Wu’an China subsidiary of Altair China, called
Northern Altair Nanotechnologies Co., Ltd., established in the second quarter of 2012. On May 15, 2012, Altair Nanotechnologies Inc., domesticated from Canada to the United States of
America and is now a Delaware Corporation.
Note 2. Recently Adopted and Recently Issued Accounting Guidance Adopted
In May, 2011, the FASB issued an amendment to achieve common fair value measurement and disclosure requirements between U.S. and International accounting principles. Overall, the guidance is consistent with existing U.S. accounting principles; however, there are some amendments that change a particular principle or requirement for measuring fair value or for disclosing information about fair value measurements. Other than the additional disclosure requirements (see Note 3.) the adoption of this guidance had no impact on the financial statements.
In June 2011, the FASB amended existing guidance and eliminated the option to present the components of
other comprehensive income as part of the statement of changes in shareholder’s equity. The amendment requires that comprehensive income be presented in either a single continuous statement or in two separate consecutive statements. Management elected to present the two-statement option. Other than the change in presentation, the adoption of these changes had no impact on the financial statements.
Foreign Currency
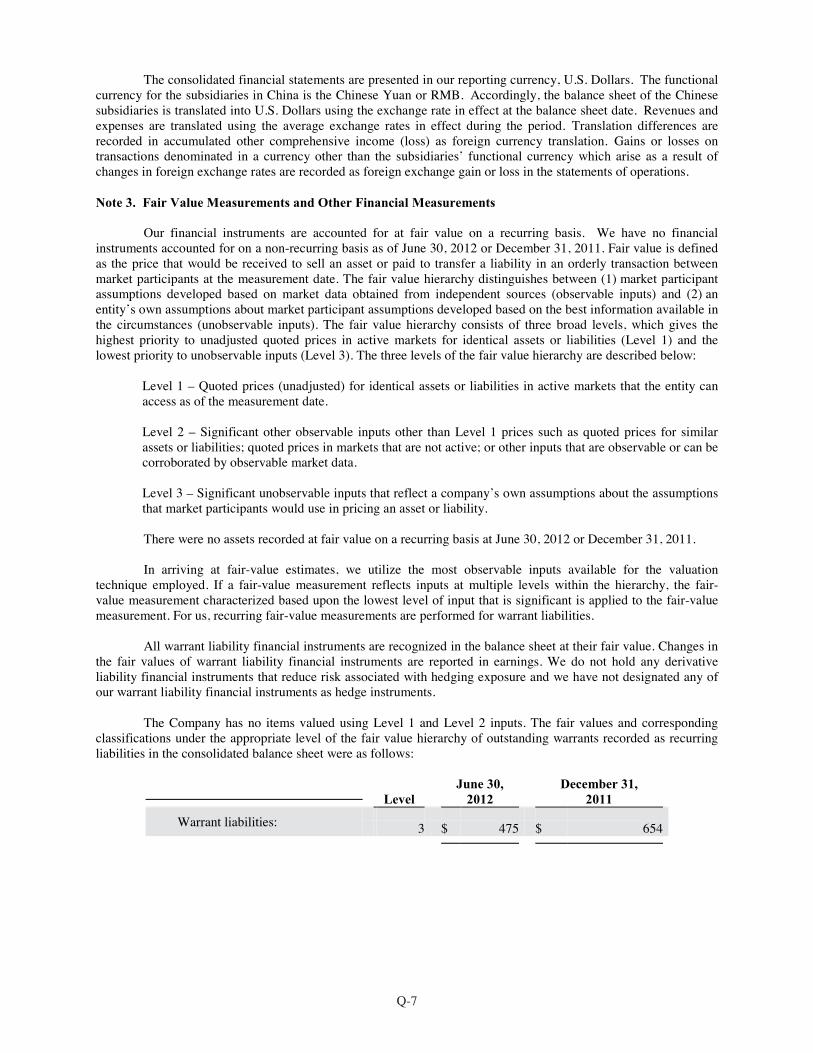
Q-7
The consolidated financial statements are presented in our reporting currency, U.S. Dollars. The functional currency for the subsidiaries in China is the Chinese Yuan or RMB. Accordingly, the balance sheet of the Chinese subsidiaries is translated into U.S. Dollars using the exchange rate in effect at the balance sheet date. Revenues and expenses are translated using the average exchange rates in effect during the period. Translation differences are recorded in accumulated other comprehensive income (loss) as foreign currency translation. Gains or losses on transactions denominated in a currency other than the subsidiaries’ functional currency which arise as a result of changes in foreign exchange rates are recorded as foreign exchange gain or loss in the statements of operations.
Note 3. Fair Value Measurements and Other Financial Measurements
Our financial instruments are accounted for at fair value on a recurring basis. We have no financial instruments accounted for on a non-recurring basis as of June 30, 2012 or December 31, 2011. Fair value is defined as the price that would be received to sell an asset or paid to transfer a liability in an orderly transaction between market participants at the measurement date. The fair value hierarchy distinguishes between (1) market participant assumptions developed based on market data obtained from independent sources (observable inputs) and (2) an entity’s own assumptions about market participant assumptions developed based on the best information available in the circumstances (unobservable inputs). The fair value hierarchy consists of three broad levels, which gives the highest priority to unadjusted quoted prices in active markets for identical assets or liabilities (Level 1) and the lowest priority to unobservable inputs (Level 3). The three levels of the fair value hierarchy are described below:
Level 1 – Quoted prices (unadjusted) for identical assets or liabilities in active markets that the entity can access as of the measurement date. Level 2 – Significant other observable inputs other than Level 1 prices such as quoted prices for similar assets or liabilities; quoted prices in markets that are not active; or other inputs that are observable or can be corroborated by observable market data. Level 3 – Significant unobservable inputs that reflect a company’s own assumptions about the assumptions that market participants would use in pricing an asset or liability.
There were no assets recorded at fair value on a recurring basis at June 30, 2012 or December 31, 2011. In arriving at fair-value estimates, we utilize the most observable inputs available for the valuation
technique employed. If a fair-value measurement reflects inputs at multiple levels within the hierarchy, the fair-value measurement characterized based upon the lowest level of input that is significant is applied to the fair-value measurement. For us, recurring fair-value measurements are performed for warrant liabilities.
All warrant liability financial instruments are recognized in the balance sheet at their fair value. Changes in the fair values of warrant liability financial instruments are reported in earnings. We do not hold any derivative liability financial instruments that reduce risk associated with hedging exposure and we have not designated any of our warrant liability financial instruments as hedge instruments.
The Company has no items valued using Level 1 and Level 2 inputs. The fair values and corresponding classifications under the appropriate level of the fair value hierarchy of outstanding warrants recorded as recurring liabilities in the consolidated balance sheet were as follows:
Level June 30,
2012 December 31,
2011
Warrant liabilities: 3 $ 475 $ 654
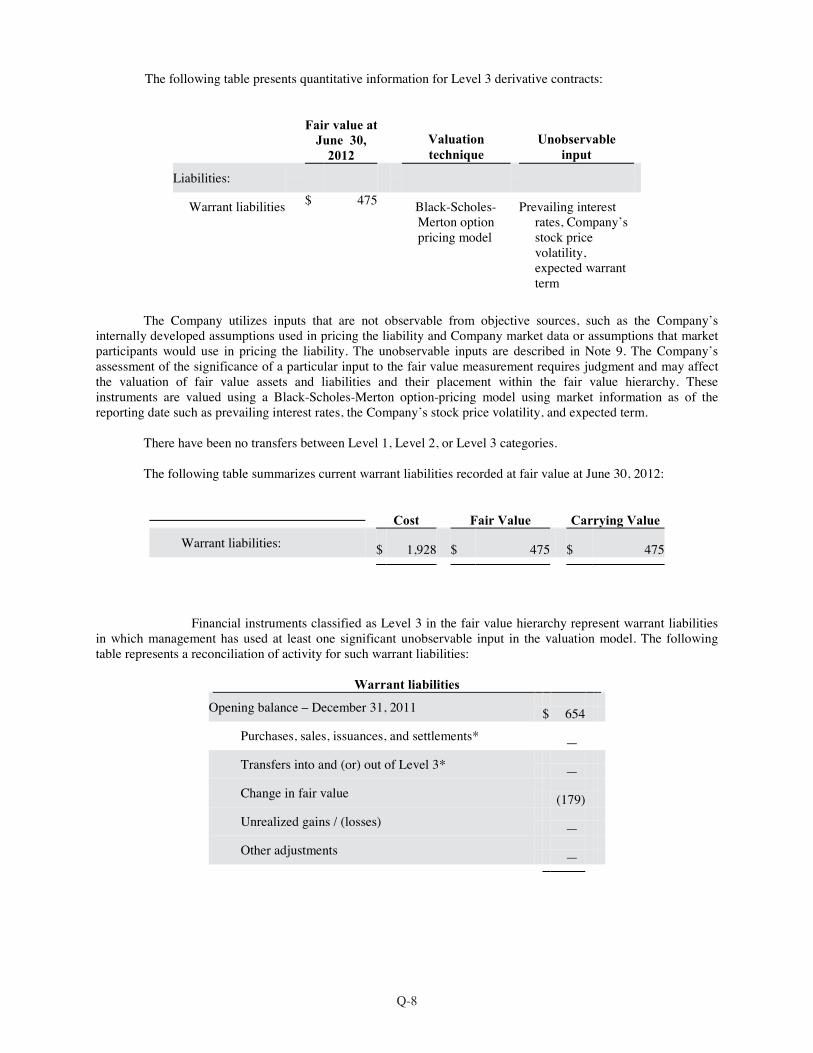
Q-8
The following table presents quantitative information for Level 3 derivative contracts:
Fair value at June 30,
2012 Valuation technique
Unobservable input
Liabilities:
Warrant liabilities
$ 475
Black-Scholes-Merton option pricing model
Prevailing interest rates, Company’s stock price volatility, expected warrant term
The Company utilizes inputs that are not observable from objective sources, such as the Company’s
internally developed assumptions used in pricing the liability and Company market data or assumptions that market participants would use in pricing the liability. The unobservable inputs are described in Note 9. The Company’s assessment of the significance of a particular input to the fair value measurement requires judgment and may affect the valuation of fair value assets and liabilities and their placement within the fair value hierarchy. These instruments are valued using a Black-Scholes-Merton option-pricing model using market information as of the reporting date such as prevailing interest rates, the Company’s stock price volatility, and expected term.
There have been no transfers between Level 1, Level 2, or Level 3 categories. The following table summarizes current warrant liabilities recorded at fair value at June 30, 2012:
Cost
Fair Value
Carrying Value
Warrant liabilities: $ 1,928 $ 475 $ 475
Financial instruments classified as Level 3 in the fair value hierarchy represent warrant liabilities
in which management has used at least one significant unobservable input in the valuation model. The following table represents a reconciliation of activity for such warrant liabilities:
Warrant liabilities
Opening balance – December 31, 2011 $ 654
Purchases, sales, issuances, and settlements* —
Transfers into and (or) out of Level 3* —
Change in fair value (179)
Unrealized gains / (losses) — Other adjustments —
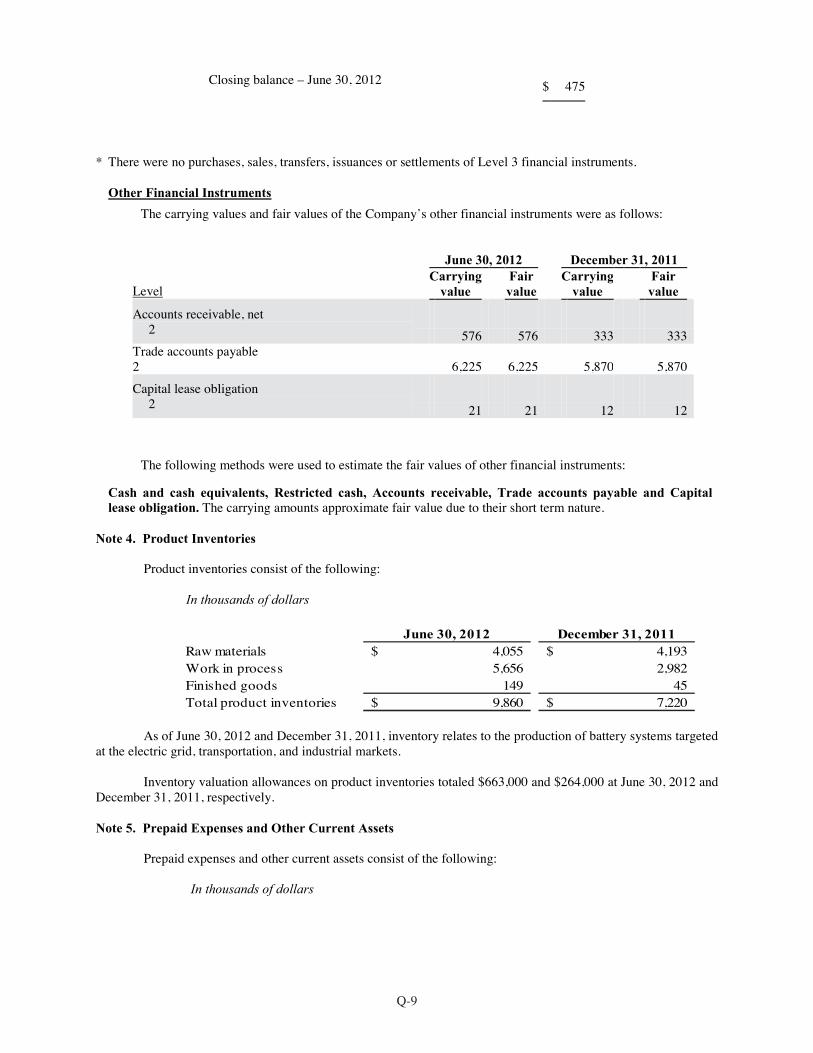
Q-9
Closing balance – June 30, 2012 $ 475
* There were no purchases, sales, transfers, issuances or settlements of Level 3 financial instruments.
Other Financial Instruments
The carrying values and fair values of the Company’s other financial instruments were as follows:
June 30, 2012 December 31, 2011 Level
Carrying value
Fair value
Carrying value
Fair value
Accounts receivable, net 2 576 576 333 333
Trade accounts payable 2 6,225 6,225 5,870 5,870
Capital lease obligation 2 21 21 12 12
The following methods were used to estimate the fair values of other financial instruments:
Cash and cash equivalents, Restricted cash, Accounts receivable, Trade accounts payable and Capital lease obligation. The carrying amounts approximate fair value due to their short term nature.
Note 4. Product Inventories
Product inventories consist of the following: In thousands of dollars
June 30, 2012 December 31, 2011Raw materials 4,055$ 4,193$ Work in process 5,656 2,982Finished goods 149 45Total product inventories 9,860$ 7,220$
As of June 30, 2012 and December 31, 2011, inventory relates to the production of battery systems targeted
at the electric grid, transportation, and industrial markets.
Inventory valuation allowances on product inventories totaled $663,000 and $264,000 at June 30, 2012 and December 31, 2011, respectively.
Note 5. Prepaid Expenses and Other Current Assets
Prepaid expenses and other current assets consist of the following: In thousands of dollars
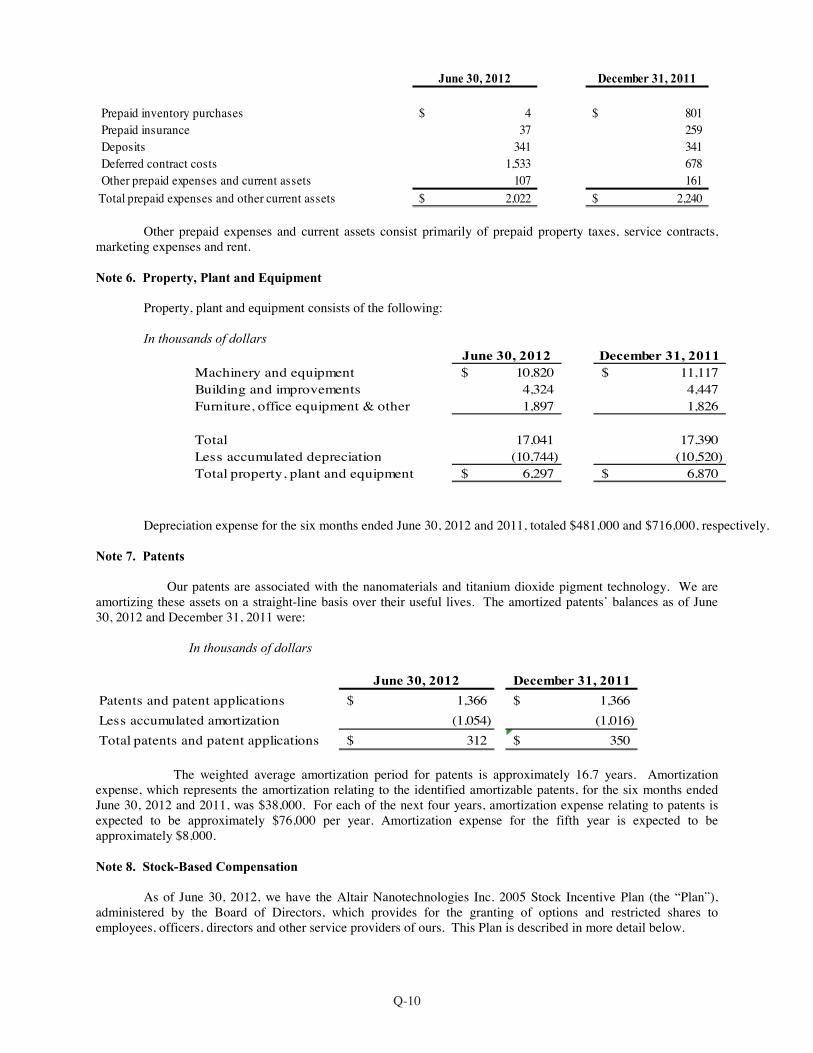
Q-10
June 30, 2012 December 31, 2011
Prepaid inventory purchases 4$ 801$ Prepaid insurance 37 259 Deposits 341 341 Deferred contract costs 1,533 678 Other prepaid expenses and current assets 107 161Total prepaid expenses and other current assets 2,022$ 2,240$
Other prepaid expenses and current assets consist primarily of prepaid property taxes, service contracts, marketing expenses and rent. Note 6. Property, Plant and Equipment
Property, plant and equipment consists of the following: In thousands of dollars
June 30, 2012 December 31, 2011Machinery and equipment 10,820$ 11,117$ Building and improvements 4,324 4,447 Furniture, office equipment & other 1,897 1,826 Total 17,041 17,390 Less accumulated depreciation (10,744) (10,520) Total property, plant and equipment 6,297$ 6,870$
Depreciation expense for the six months ended June 30, 2012 and 2011, totaled $481,000 and $716,000, respectively. Note 7. Patents
Our patents are associated with the nanomaterials and titanium dioxide pigment technology. We are amortizing these assets on a straight-line basis over their useful lives. The amortized patents’ balances as of June 30, 2012 and December 31, 2011 were:
In thousands of dollars
June 30, 2012 December 31, 2011
Patents and patent applications 1,366$ 1,366$ Less accumulated amortization (1,054) (1,016) Total patents and patent applications 312$ 350$
The weighted average amortization period for patents is approximately 16.7 years. Amortization
expense, which represents the amortization relating to the identified amortizable patents, for the six months ended June 30, 2012 and 2011, was $38,000. For each of the next four years, amortization expense relating to patents is expected to be approximately $76,000 per year. Amortization expense for the fifth year is expected to be approximately $8,000. Note 8. Stock-Based Compensation
As of June 30, 2012, we have the Altair Nanotechnologies Inc. 2005 Stock Incentive Plan (the “Plan”),
administered by the Board of Directors, which provides for the granting of options and restricted shares to employees, officers, directors and other service providers of ours. This Plan is described in more detail below.
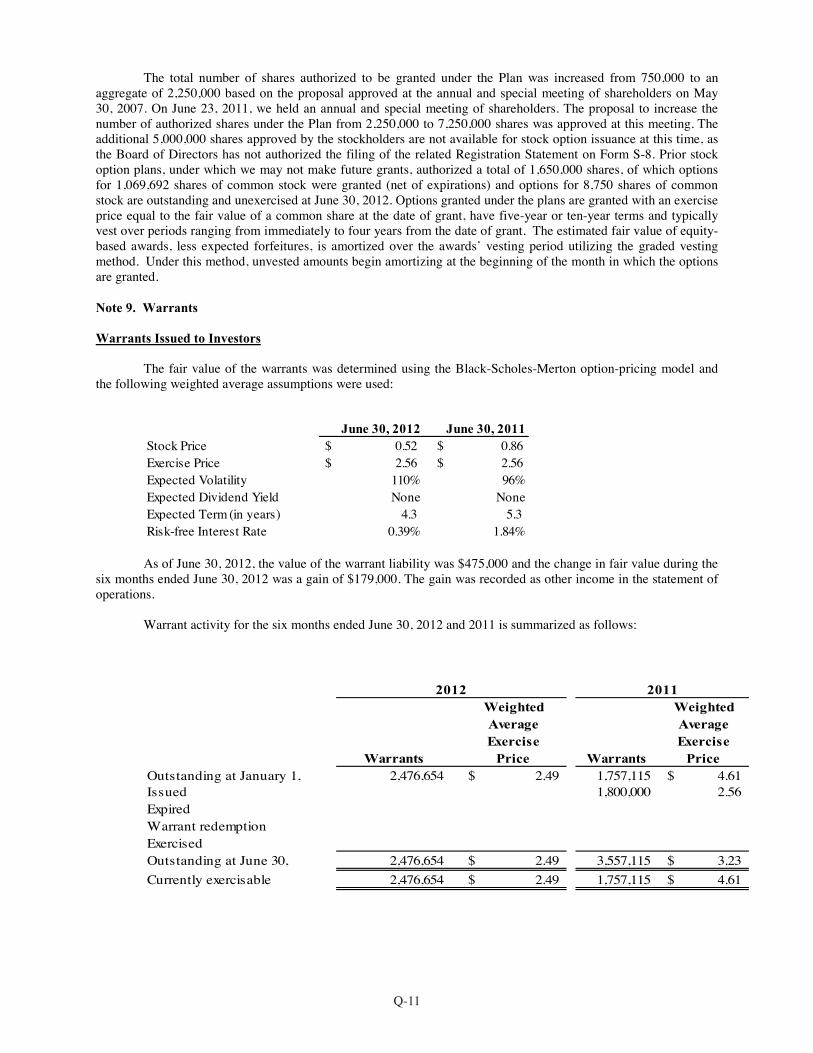
Q-11
The total number of shares authorized to be granted under the Plan was increased from 750,000 to an
aggregate of 2,250,000 based on the proposal approved at the annual and special meeting of shareholders on May 30, 2007. On June 23, 2011, we held an annual and special meeting of shareholders. The proposal to increase the number of authorized shares under the Plan from 2,250,000 to 7,250,000 shares was approved at this meeting. The additional 5,000,000 shares approved by the stockholders are not available for stock option issuance at this time, as the Board of Directors has not authorized the filing of the related Registration Statement on Form S-8. Prior stock option plans, under which we may not make future grants, authorized a total of 1,650,000 shares, of which options for 1,069,692 shares of common stock were granted (net of expirations) and options for 8,750 shares of common stock are outstanding and unexercised at June 30, 2012. Options granted under the plans are granted with an exercise price equal to the fair value of a common share at the date of grant, have five-year or ten-year terms and typically vest over periods ranging from immediately to four years from the date of grant. The estimated fair value of equity-based awards, less expected forfeitures, is amortized over the awards’ vesting period utilizing the graded vesting method. Under this method, unvested amounts begin amortizing at the beginning of the month in which the options are granted.
Note 9. Warrants Warrants Issued to Investors
The fair value of the warrants was determined using the Black-Scholes-Merton option-pricing model and
the following weighted average assumptions were used:
June 30, 2012 June 30, 2011Stock Price $ 0.52 $ 0.86 Exercise Price $ 2.56 $ 2.56 Expected Volatility 110% 96%Expected Dividend Yield None NoneExpected Term (in years) 4.3 5.3Risk-free Interest Rate 0.39% 1.84%
As of June 30, 2012, the value of the warrant liability was $475,000 and the change in fair value during the
six months ended June 30, 2012 was a gain of $179,000. The gain was recorded as other income in the statement of operations.
Warrant activity for the six months ended June 30, 2012 and 2011 is summarized as follows:
Weighted WeightedAverage AverageExercise Exercise
Warrants Price Warrants PriceOutstanding at January 1, 2,476,654 2.49$ 1,757,115 4.61$ Issued 1,800,000 2.56 Expired Warrant redemptionExercised Outstanding at June 30, 2,476,654 2.49$ 3,557,115 3.23$ Currently exercisable 2,476,654 2.49$ 1,757,115 4.61$
2012 2011
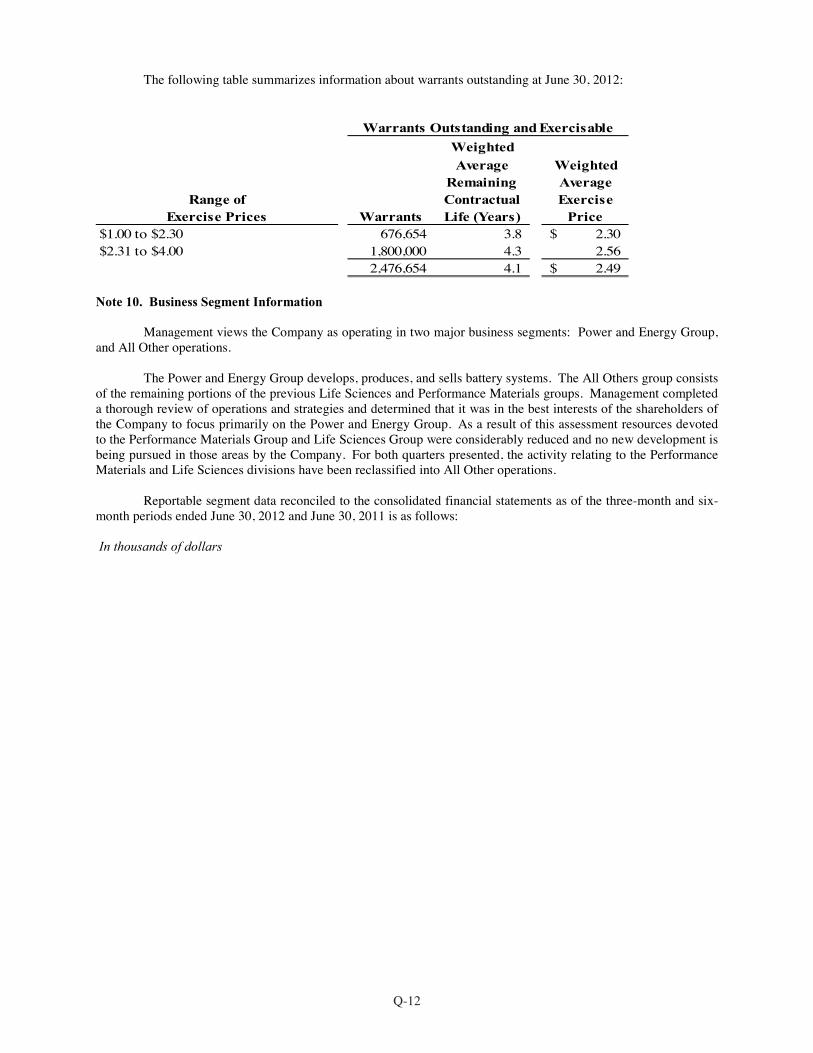
Q-12
The following table summarizes information about warrants outstanding at June 30, 2012:
WeightedAverage Weighted
Remaining AverageContractual Exercise
Warrants Life (Years) Price$1.00 to $2.30 676,654 3.8 2.30$ $2.31 to $4.00 1,800,000 4.3 2.56
2,476,654 4.1 2.49$
Warrants Outstanding and Exercisable
Range ofExercise Prices
Note 10. Business Segment Information
Management views the Company as operating in two major business segments: Power and Energy Group, and All Other operations.
The Power and Energy Group develops, produces, and sells battery systems. The All Others group consists
of the remaining portions of the previous Life Sciences and Performance Materials groups. Management completed a thorough review of operations and strategies and determined that it was in the best interests of the shareholders of the Company to focus primarily on the Power and Energy Group. As a result of this assessment resources devoted to the Performance Materials Group and Life Sciences Group were considerably reduced and no new development is being pursued in those areas by the Company. For both quarters presented, the activity relating to the Performance Materials and Life Sciences divisions have been reclassified into All Other operations.
Reportable segment data reconciled to the consolidated financial statements as of the three-month and six-
month periods ended June 30, 2012 and June 30, 2011 is as follows: In thousands of dollars
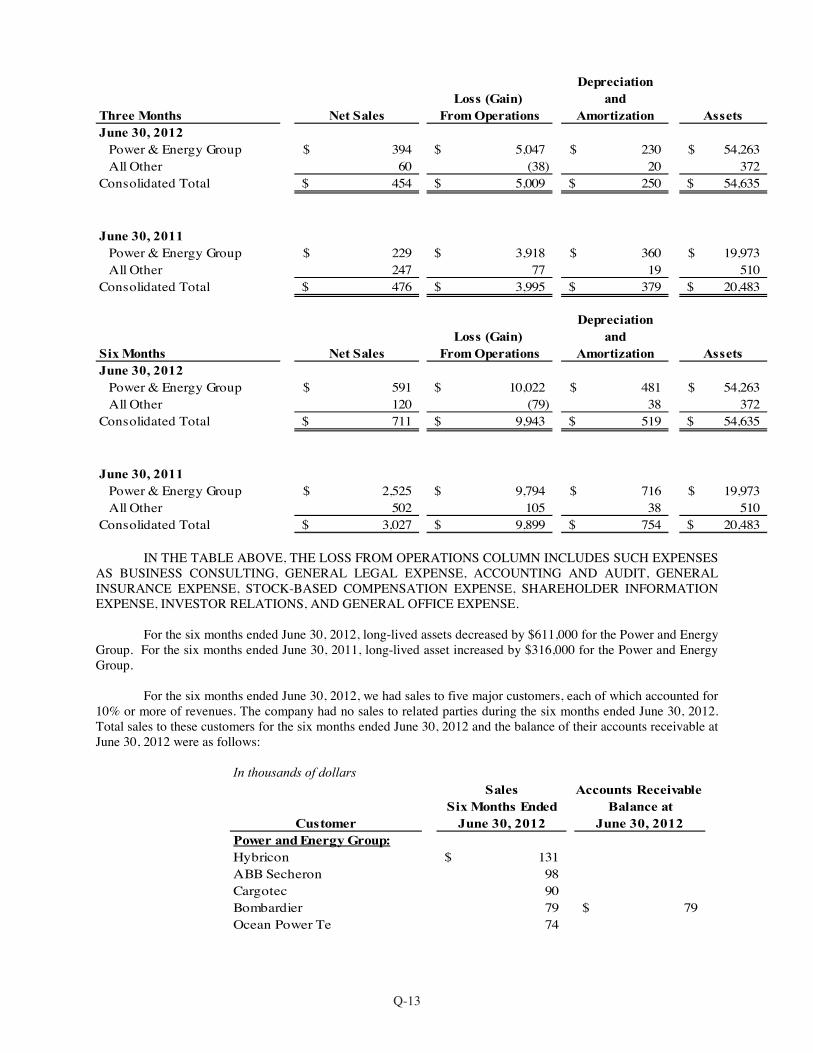
Q-13
DepreciationLoss (Gain) and
Three Months Net Sales From Operations Amortization AssetsJune 30, 2012
Power & Energy Group 394$ 5,047$ 230$ 54,263$ All Other 60 (38) 20 372
Consolidated Total 454$ 5,009$ 250$ 54,635$
June 30, 2011Power & Energy Group 229$ 3,918$ 360$ 19,973$ All Other 247 77 19 510
Consolidated Total 476$ 3,995$ 379$ 20,483$
DepreciationLoss (Gain) and
Six Months Net Sales From Operations Amortization AssetsJune 30, 2012
Power & Energy Group 591$ 10,022$ 481$ 54,263$ All Other 120 (79) 38 372
Consolidated Total 711$ 9,943$ 519$ 54,635$
June 30, 2011Power & Energy Group 2,525$ 9,794$ 716$ 19,973$ All Other 502 105 38 510
Consolidated Total 3,027$ 9,899$ 754$ 20,483$
IN THE TABLE ABOVE, THE LOSS FROM OPERATIONS COLUMN INCLUDES SUCH EXPENSES AS BUSINESS CONSULTING, GENERAL LEGAL EXPENSE, ACCOUNTING AND AUDIT, GENERAL INSURANCE EXPENSE, STOCK-BASED COMPENSATION EXPENSE, SHAREHOLDER INFORMATION EXPENSE, INVESTOR RELATIONS, AND GENERAL OFFICE EXPENSE.
For the six months ended June 30, 2012, long-lived assets decreased by $611,000 for the Power and Energy Group. For the six months ended June 30, 2011, long-lived asset increased by $316,000 for the Power and Energy Group.
For the six months ended June 30, 2012, we had sales to five major customers, each of which accounted for
10% or more of revenues. The company had no sales to related parties during the six months ended June 30, 2012. Total sales to these customers for the six months ended June 30, 2012 and the balance of their accounts receivable at June 30, 2012 were as follows:
In thousands of dollars
Sales Accounts Receivable Six Months Ended Balance at
Customer June 30, 2012 June 30, 2012Power and Energy Group:Hybricon 131$ ABB Secheron 98 Cargotec 90 Bombardier 79 79$ Ocean Power Te 74
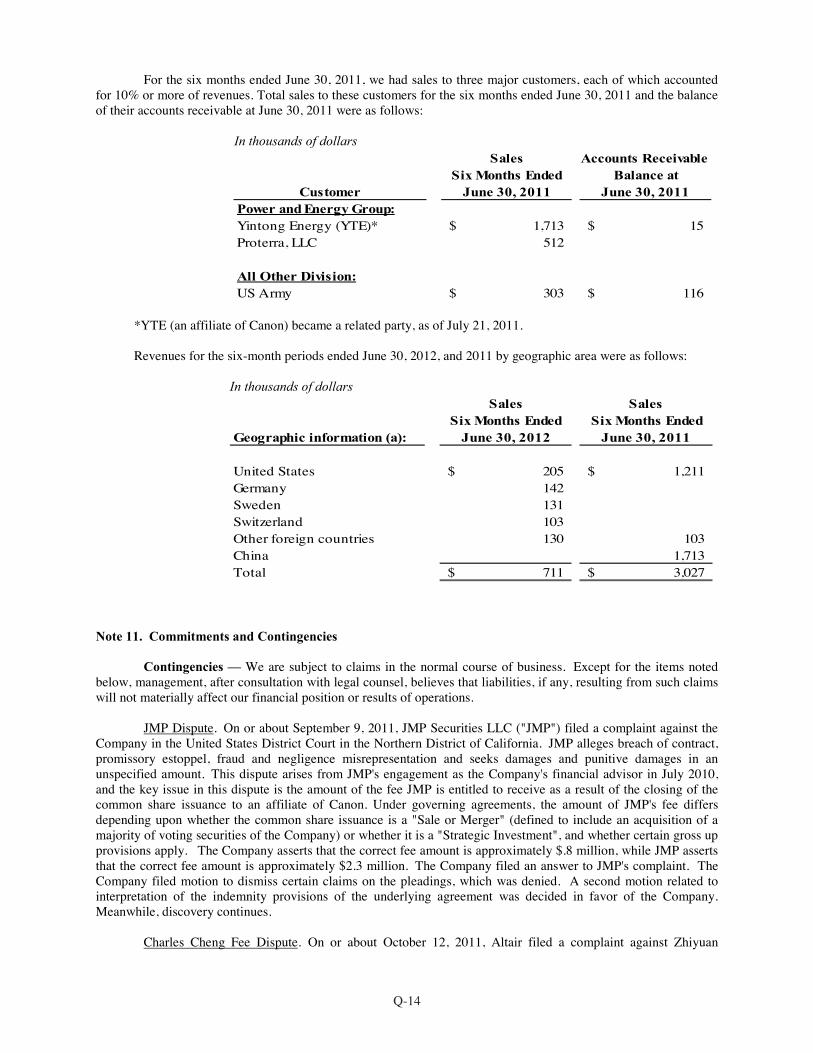
Q-14
For the six months ended June 30, 2011, we had sales to three major customers, each of which accounted for 10% or more of revenues. Total sales to these customers for the six months ended June 30, 2011 and the balance of their accounts receivable at June 30, 2011 were as follows:
In thousands of dollars
Sales Accounts Receivable Six Months Ended Balance at
Customer June 30, 2011 June 30, 2011Power and Energy Group:Yintong Energy (YTE)* 1,713$ 15$ Proterra, LLC 512
All Other Division:US Army 303$ 116$
*YTE (an affiliate of Canon) became a related party, as of July 21, 2011. Revenues for the six-month periods ended June 30, 2012, and 2011 by geographic area were as follows:
In thousands of dollars
Sales SalesSix Months Ended Six Months Ended
Geographic information (a): June 30, 2012 June 30, 2011
United States 205$ 1,211$ Germany 142 Sweden 131 Switzerland 103 Other foreign countries 130 103 China 1,713 Total 711$ 3,027$
Note 11. Commitments and Contingencies
Contingencies — We are subject to claims in the normal course of business. Except for the items noted below, management, after consultation with legal counsel, believes that liabilities, if any, resulting from such claims will not materially affect our financial position or results of operations.
JMP Dispute. On or about September 9, 2011, JMP Securities LLC ("JMP") filed a complaint against the
Company in the United States District Court in the Northern District of California. JMP alleges breach of contract, promissory estoppel, fraud and negligence misrepresentation and seeks damages and punitive damages in an unspecified amount. This dispute arises from JMP's engagement as the Company's financial advisor in July 2010, and the key issue in this dispute is the amount of the fee JMP is entitled to receive as a result of the closing of the common share issuance to an affiliate of Canon. Under governing agreements, the amount of JMP's fee differs depending upon whether the common share issuance is a "Sale or Merger" (defined to include an acquisition of a majority of voting securities of the Company) or whether it is a "Strategic Investment", and whether certain gross up provisions apply. The Company asserts that the correct fee amount is approximately $.8 million, while JMP asserts that the correct fee amount is approximately $2.3 million. The Company filed an answer to JMP's complaint. The Company filed motion to dismiss certain claims on the pleadings, which was denied. A second motion related to interpretation of the indemnity provisions of the underlying agreement was decided in favor of the Company. Meanwhile, discovery continues.
Charles Cheng Fee Dispute. On or about October 12, 2011, Altair filed a complaint against Zhiyuan
Q-15
(Charles) Cheng in the United States District Court in the Northern District of Nevada. Altair seeks a declaratory judgment that it owes Mr. Cheng no fee and seeks damages for breach of contract in an unspecified amount. The dispute arises from Mr. Cheng's engagement as a consultant to seek customers and strategic partners for Altair in China. Mr. Cheng has asserted in various communications that his efforts were significant in the arranging of the common share issuance with Canon and that, as a result, he is entitled to a $1.7 million fee in consideration of the closing of such transaction. Altair claims that Mr. Cheng is entitled to no fee, and that Altair is entitled to damages, as a result of Mr. Cheng's numerous breaches of material provisions of the agreement. Altair has filed the complaint, and Mr. Cheng has filed an answer denying key allegations of the complaint and a counterclaim seeking payment of the fee, and damages, under various theories. Mr. Cheng has joined Zhuhai Yintong Energy Company Ltd. (“YTE”) and Wei Yincang into the action by means of a complaint against them alleging a breach of an agreement between them and Mr. Cheng. The parties have engaged in settlement discussions and, the case is not actively proceeding while settlement discussions are pending.

NEVEDA | 204 Edison Way, Reno, Neveda 89502
INDIANA | 3019 Enterprise Drive, Anderson, Indiana 46013
NASDAQ: ALTI