Embed Size (px)
Citation preview
ANNUAL REPORT
2021
FAR
ME
RS
OF
OC
EA
N &
LA
ND

Annual Report 2021 | Tassal Group Limited and Controlled Entities
Directors
Allan McCallum AO, Dip.Ag Science, FAICD (Chairman)
James Fazzino, B.Ec (Hons), CPA
Richard Haire, B.Ec, FAICD
Trevor Gerber, B.Acc CA (SA) (Resigned 28 October 2020)
Mark Ryan, B.Com, CA, MAICD, FAIM (Managing Director)
John Watson, AM
Jackie McArthur, B.Eng (Aero)
Georgina Lynch, BA.LLB
Chief Executive Officer
Mark Ryan, B.Com, CA, MAICD, FAIM
Company Secretary
Monika Maedler, B.Ec, LLB, FCIS
Registered Office*
Level 91 Franklin WharfHobartTasmania 7000Telephone (03) 6244 9099Facsimile (03) 6244 9002E-mail [email protected] www.tassalgroup.com.auABN 15 106 067 270(*Also principal administration office)
Auditors
Deloitte Touche TohmatsuLevel 822 Elizabeth StreetHobartTasmania 7000
Bankers
Westpac Banking CorporationLevel 7150 Collins StreetMelbourneVictoria 3000
Commonwealth Bank of AustraliaLevel 20, Tower 1727 Collins StreetDocklandsVictoria 3008
Coöperatieve Rabobank U.A.Level 91 Collins StreetMelbourneVictoria 3000
Stock Exchange Listing
Tassal Group Limited is listed on the Australian Securities Exchange.
The Home Exchange is Melbourne, Victoria.
ASX Code: TGR
Share Registry
Register of Securities is held at the following address:
Computershare Investor Services Pty LimitedYarra Falls452 Johnston StreetAbbotsfordVictoria 3067
Enquiries (within Australia) 1300 850 505Enquiries (outside Australia) 61 3 9415 4000Investor Enquiries Facsimile 61 3 9473 2555Website www.computershare.com
Executive Directory
Mark Ryan Managing Director and Chief Executive Officer
Mark Asman Head of Aquaculture
Andrew Creswell Chief Financial Officer
Ben Daley Head of Supply Chain and Commercial Services
Kaylene Little Head of People and Communities
Matthew Vince Head of Sales (From 1 February 2021)
Dale Williams Head of Sales (Until 31 January 2021)
Company Directory

Tassal Group Limited and Controlled Entities | Annual Report 2021 1
Company Directory Inside front
Chairman’s and Chief Executive Officer’s Report 2 - 10
Directors’ Report 11 - 27
Auditor’s Independence Declaration 28
Finanical Report Table of Contents 29
Income Statement 30
Statement of Comprehensive Income 31
Statement of Financial Position 32
Statement of Changes In Equity 33
Statement of Cashflows 34
Notes to the Financial Statements 35 - 73
Directors’ Declaration 74
Independent Auditor’s Report 75 - 77
Additional Securities Exchange Information 78 - 79
Contents

Annual Report 2021 | Tassal Group Limited and Controlled Entities2
Chairman’s and Chief Executive Officer’s Report
1. REVIEW OF OPERATIONS
Tassal’s Directors are pleased to present the Company’s Appendix 4E: Full Year Report to 30 June 2021 (FY21) that saw the Company continue to grow operationally and deliver strong execution across all controllable factors.
Tassal’s diversification strategy, focus on driving operating efficiencies and lowering costs, risk management systems and business continuity planning, cashflows and strong balance sheet, supported the Company navigating through a volatile COVID-19 operating environment.
The Company’s long-term growth strategy is underpinned by 5 pillars:
1. Being the market leader on all operational, financial, environmental and societal value metrics
2. Ensuring geographic and species diversification
3. Driving domestic per capita consumption growth
4. Maintaining an Eastern Seaboard supply chain: ensuring Tassal is freshest to market on a national basis
5. Maintaining best practice aquaculture: being regarded as global leaders in aquaculture production and environmental stewardship.
Tassal has the right strategy in place to drive long-term growth in sustainable earnings and returns; and has planned, executed and delivered on all factors under its control.
FY21 saw Tassal focus on factors in its control:
• Salmon retail “Tassal” branded volume growth - MAP up 27.7% and smoked up 19.5%, reflecting a focussed marketing campaign that delivered increased brand strength and trust, and successful levering of the megatrends that underpin salmon growth
• Growing salmon production – 40,018 hog tonnes achieved in FY21 (up 16.3%), 3 years ahead of strategic plan, underpinned by improved survival and food conversion rates
• Australia’s largest prawn harvest – 3,915 tonnes achieved in FY21 (up 59.1%) underpinned by significant improvements in farming yield and harvest biomass
• Strong efficiency gains – cost of growing and production savings of $0.33/kg and $1.45/kg across both salmon and prawns, respectively through infrastructure upgrades and operation optimisation
• Sustainability – Responsible Business platform to cement Tassal’s ESG and sustainability industry leadership.
Like other global and domestic seafood companies, Tassal experienced significant pricing volatility in FY21 due to COVID-19 and resulting restrictions and market fractures, particularly in global/export markets:
• After growing at 9% pa (2005-20), global salmon demand fell by -11% in CY20 as a result of global lockdowns and restrictions on foodservice, with the market impact compounded by a 6% increase in global supply. Current market forecasts see global demand growing at between 10% to 15% in CY21, with only a 2% increase in global supply forecast1
• Asian export markets, the key export region for Australian salmon producers, were impacted with foodservice shutdowns from resulting lockdowns and high logistics costs associated with shortages in air freight capacity (particularly in 1H21)
• Global pricing experienced significant price deflation over CY20 for both salmon and prawns, and recovered from March 2021
• Significant dislocation in global markets in CY20 (particularly from July 2020) impacted salmon domestic wholesale pricing in 1H21 (currently recovering) and retail deli contracts for supply from 4Q21 (Tassal reduced supply into fresh deli).
Tassal successfully navigated a year of COVID-19:
• Over FY21, Tassal’s focus and actions were on the controllables:
o Managing supply to meet domestic demand
o Growing the Tassal and Tropico brands
o Maintaining share within existing customers
o Accelerating growth with new partners
1 Rabobank 2021
0
10,000
20,000
30,000
40,000
50,000
FY17 FY18 FY19 FY20 FY21
25,432
30,883 33,036 34,395
40,018
HOG Tonnes
Salmon harvest up 16.3% to 40,018 tonnes
FY17 FY18 FY19 FY20 FY21
560.8 562.5594.0
484.5
A$m
Revenue up 5.6% to $594.0 million
0
100
200
300
400
500
600
450.5
Operational cash�ow up 22.4% to $61.0 million
FY17 FY18 FY19 FY20 FY21
51.4 43.9
89.9
49.9 61.0
A$m
0
20
40
60
80
100

Tassal Group Limited and Controlled Entities | Annual Report 2021 3
• Initiatives implemented to mitigate the impact of COVID-19 on business performance included:
o Focusing on Operational Excellence – lowering growing and processing costs, and improving survival and optimising fish size
o Working closely with Government and freight partners to secure ongoing International airfreight capacity
o Leveraging Tassal’s strong brand recognition in retail to mitigate softer domestic wholesale market
• Tassal did not receive, nor sought to receive, any JobKeeper payments.
Operational & financial highlights
Sustained salmon growth supported by operational and marketing initiatives that continue to position Tassal as Australia’s no.1 salmon brand
• Salmon production has outperformed with salmon biomass well ahead of Strategic Plan:
• Smolt input has been materially the same over the past 3 years, so growth reflects improved survival and SmartFarming application
• Survival improvements given POMV vaccine and successful investment in Ocean Sanctuary Pens decreasing seal impacts, lead to survival rate of 94% for the current harvest year class
• Fish size maintained supported by Well Boat, automated Feed Centre, improved diets and a more tolerant fish to summer water temperatures
• Cost of growing $/kg improvements delivered $0.33/kg in savings from fish survival and “cost-out” focus
• Processing $/kg improvements were generated given fish size and condition underpinned increased yield and throughput
• Strategic increase in frozen hog volumes mitigated lower global pricing in 1H21, which is now being efficiently and effectively used for smoked salmon production in CY21, which in turn allows fish to be kept in the water longer to enable maintaining / bigger size fish.
• Salmon biomass growth underpinned strong growth in salmon volumes. Tassal’s focus in retail and fresh hog wholesale business during FY21 provides a platform for growth in FY22, particularly as export prices recover0
10,000
20,000
30,000
40,000
50,000
FY17 FY18 FY19 FY20 FY21
25,432
30,883 33,036 34,395
40,018
HOG Tonnes
Harvested tonnes up 16.3% to 40,018 tonnes
FY17 FY18 FY19 FY20 FY21
Tonnes
Salmon live biomass maintained at 26,896 tonnes
21,77822,978
18,978
27,384 26,896
0
5,000
10,000
15,000
20,000
25,000
30,000
FY17 FY18 FY19 FY20 FY21
Kg
Salmon harvest size largest ever at 4.55kg
3.91
4.45 4.39 4.53 4.55
0
1
2
3
4
5
Domestic Salmon Market - Key Products (Hog equiv tonnes) FY21 FY20 Change
Wholesale - Fresh Hog 7,009 6,445 8.8%
Retail - Tassal Brand MAP 1,921 1,503 27.7%
Retail - Private Label MAP 4,881 4,841 0.8%
Retail - Tassal Brand Smoked 2,326 1,947 19.5%
Retail - BTC / Deli 5,789 6,175 (6.2%)
Salmon Sales Volume (Hog equiv tonnes) FY21 FY20 Change
Domestic Salmon Market 28,620 28,259 1.3%
Export Salmon Market 8,889 6,051 46.9%
Total Salmon Market 37.509 34,310 9.3%
Domestic Retail Market 20,228 20,306 (0.4%)
Domestic Wholesale Market 8,392 7,954 5.5%
Total Domestic Salmon Market 28,620 28,259 1.3%

Annual Report 2021 | Tassal Group Limited and Controlled Entities4
Chairman’s and Chief Executive Officer’s Report (continued)
• T assal effectively refocused sales and marketing efforts in 1H21 (including Tassal branded TV commercials) into more profitable categories over FY21, while growing fresh hog wholesale business during 2H21
• Salmon: Operating EBITDA decreased to $3.20/kg due to reduced export pricing, partially offset by efficiency benefits
• Strong growth in salmon sales volume, up 9.3% to 37,509 hog tonnes
• Salmon efficiency benefits delivered lower cost of growing and production - $0.33/kg
• Negative pricing in domestic wholesale and export markets was materially negative
o Export was down 19% given lower global pricing and an appreciating AUD/USD rate
o Domestic was also impacted by reduced wholesale pricing and the costs of marketing and promotional efforts
FY17
Domestic Retail Domestic Wholesale Export
FY18 FY19 FY20 FY21
Domestic wholesale and export price volatility - particularly in 1H21
$14.9 $14.9
$12.5 $12.2
$14.9
$11.2
$13.5
$16.2 $16.1
$12.2 $12.4 $12.4$13.1
$13.8
$10.0
$18
16
14
12
10
8
6
4
2
0
Total Salmon Sales (A$m) FY21 FY20 Change
Salmon Volume (Hog equiv tonnes) 37,509 34,310 9.3%
Salmon Average Price ($/Hog kg equivalent) $12.54 $13.28 (5.5%)
Salmon Revenue ($m) 470.54 455.55 3.3%
EBITDA 120.03 123.42 (2.7%)
EBITDA ($/kg) $3.20 $3.60 (11.0%)
Domestic Salmon Market FY21 FY20 Change
Salmon Volume (Hog equiv tonnes) 28,620 28,259 1.3%
Salmon Average Price ($/Hog kg equivalent) $13.35 $13.47 (0.9%)
Salmon Revenue ($m) 381.95 380.65 0.3%
EBITDA 109.63 108.88 0.7%
EBITDA ($/kg) $3.83 $3.85 (0.6%)
Export Salmon Market FY21 FY20 Change
Salmon Volume (Hog equiv tonnes) 8,889 6,051 46.9%
Salmon Average Price ($/Hog kg equivalent) $9.97 $12.38 (19.5%)
Salmon Revenue ($m) 88.59 74.90 18.3%
EBITDA 10.40 14.54 (28.5%)
EBITDA ($/kg) $1.17 $2.40 (51.3%)
Total salmon value and revenue grew
Slight growth in domestic salmon market
Export salmon market impacted by COVID pricing

Tassal Group Limited and Controlled Entities | Annual Report 2021 5
Australia’s largest prawn harvest
• Prawn harvest tonnage underpinned strong growth in sales
• Operations – Consolidation of innovation and expertise from salmon to Tassal’s prawn farming model were evident, with data capture and insights continuing to drive yield gains and improved utilisation of assets
• Harvesting uplift – The Company’s planned earlier stocking program in 2020 facilitated a significant uplift in harvest volumes
• Yield and growth improvement – combination of SmartFarm, improved feed diets and fish husbandry, leading to improved sizes, survival and live biomass.
Total Prawn Sales (A$m) FY21 FY20 Change
Prawn Volume (tonnes) 3,350 2,011 66.6%
Prawn Average Price ($/kg) $17.85 $20.59 (13.3%)
Prawn Revenue ($m) 59.81 41.42 44.4%
EBITDA 17.18 12.91 33.1%
EBITDA ($/kg) $5.13 $6.42 (20.1%)
Safety & wellbeing
Tassal’s operations have been and are running close to normal despite COVID-19 restrictions − maintaining strict measures, and securing the health and safety of our employees and quality of our seafood products.
Tassal’s Board has endorsed a health and safety strategy, with a Can-do Safely culture at its core – Zero Harm for Everyone, Everywhere. Tassal’s commitment to safety is consistent with the Company’s focus on maximising shareholder value. Ultimately, no job is so important that it cannot be done safely.
Tassal’s focus and relentless pursuit is to achieve the core value of “Zero Harm”. Tassal’s goal from a Total Recordable Injury Frequency Rate (TRIFR) perspective is < 10. This goal was not achieved with a result of 14.1 (FY20: 8.0). Regrettably, twenty team members were temporarily affected by carbon monoxide fumes at the Company’s Dover processing factory and admitted to hospital as a precautionary measure for further medical examinations and treatment, resulting in 20 lost time injuries. We were determined to learn from this incident to prevent a reoccurrence and following an investigation, undertook immediate corrective action as well as reaffirming our safety values and culture of responsibility with our staff and authorities.
Tassal’s training and focus is to instil a philosophy and culture of zero tolerance to medical treatment incidents. The reduction of manual tasks through automation and operational advancements, such as our Wellboat the “Aqua Spa” and Centralised Feed Centre, will continue to support Tassal’s priority goal of achieving Zero Harm.
Operating EBITDA was down to $5.13/kg due to negative export pricing and sales mix into domestic market, partially offset by efficiency benefits:
• Strong growth, with prawn sales up 66.6% and revenue up 44.4%
• Average pricing reduction due to sales mix change into domestic retail market, and net pricing impact due to COVID-19 market dislocation for export market
• Wholesale market pricing remained stable despite significant volume growth
• Efficiency benefits from auto-feeders and state-of-the-art hatchery processing facilities delivered $1.45/kg lower cost of growing and production.
Tonnes
FY19 FY20 FY21
Harvested tonnes up 59.1% to 3,915 tonnes
453
2,460
3,915
0
1,000
2,000
3,000
4,000
5,000

Annual Report 2021 | Tassal Group Limited and Controlled Entities6
Chairman’s and Chief Executive Officer’s Report (continued)
Financial results
Statutory, Underlying and Operating financial performance
EBITDA, EBIT and NPAT excluding significant items are financial measures not prescribed by Australian Accounting Standards (AIFRS) and represent the profit under AIFRS adjusted for specific significant items. The Directors consider these measures to reflect the core earnings of the Company, and are described in this report as either ‘underlying’ profit (when considered after the impact of AASB 141) and ‘operational’ profit (when considered before the impact of AASB 141).
Tassal has followed the guidance for underlying profit as issued by the Australian Institute of Company Directors and Financial Services Institute of Australasia in March 2009, and ASIC Regulatory Guide RG 230 ‘Disclosing non-IFRS financial information’.
The key financial results for FY21 were:
Full Year ended 30 June 2021Statutory
Profit $'000Significant
Items $'000Underlying Profit $'000
AASB 141 Impact $'000
Operational Profit $'000
Revenue (from all sources) $594,035 $0 $594,035 $0 $594,035
EBITDA $119,814 $16,431 $136,245 $3,106 $139,351
EBIT $61,359 $16,431 $77,790 $3,106 $80,896
Profit before income tax expense $48,061 $16,431 $64,492 $3,106 $67,598
Income tax expense ($13,441) ($4,929) ($18,370) ($932) ($19,302)
Net profit after income tax expense $34,620 $11,502 $46,122 $2,174 $48,296
Full Year ended 30 June 2020Statutory
Profit $'000Significant
Items $'000Underlying Profit $'000
AASB 141 Impact $'000
Operational Profit $'000
Revenue (from all sources) $562,540 $0 $562,540 $0 $562,540
EBITDA $145,605 $5,116 $150,721 ($12,170) $138,551
EBIT $106,874 $5,116 $111,990 ($12,170) $99,820
Profit before income tax expense $96,563 $5,116 $101,679 ($12,170) $89,509
Income tax expense ($27,452) ($1,535) ($28,987) $3,651 ($25,336)
Net profit after income tax expense $69,111 $3,581 $72,692 ($8,519) $64,173
Statutory results
Biological assets (being salmon at sea and prawns in ponds) are accounted for in accordance with Accounting Standard AASB 141 ’Agriculture’. The biological assets are accounted for at the fair value of the salmon and prawns at an estimated harvest tonnage and at an estimated future net market value.
Further, finished goods (being harvested salmon and prawns on hand at reporting date) are accounted for in accordance with AASB 102 ‘Inventories’. The finished goods are accounted for at the fair value of the raw materials (i.e. salmon and prawns) at the point of harvest (not including processing costs) at an estimated future net market value.
The combination of the above calculations, are, in aggregate compared to the values at the previous reporting period (i.e. 30 June 2020) with any difference in value then applied to the income statement as an increment (SGARA uplift) or decrement (SGARA reduction).
The Company’s pre-tax adjustment for FY21 was a decrement of $(3.1) million (FY20: increase of $12.2 million), of which salmon SGARA decrement was $(6.7) million and prawn SGARA increment was $3.6 million.
The key FY21 statutory financial results were:
• EBITDA2 down 17.7% to $119.8 million (FY20: $145.6 million)
• EBIT down 42.6% to $61.4 million (FY20: $106.9 million)
• NPAT down 49.9% to $34.6 million (FY20: $69.1 million).
Underlying results
Underlying results adjust Tassal’s statutory profit to reflect the ongoing business activities of the Company.
Over FY21 Tassal was able to increase salmon and prawn live and harvest biomass, continue to drive domestic consumption growth, further optimise margins via sales mix, generate operating efficiencies/cost out opportunities, and deliver a strong, diversified operating platform, to position Tassal to navigate as best as possible through COVID-19, and importantly to deliver long-term growing earnings and returns in a “post COVID-19 world”.
Costs relating to the additional costs of the export supply chain due to COVID-19 supply chain fractures and the acquisition costs of Billy Creek and Mid-Farm properties were accounted for as significant items.
2 Operating EBITDA was up 0.6% to $139.4 million (FY20: $138.5 million). Operating EBITDA (pre AASB 16) was down 12.2% to $111.7 million (FY20: $127.2 million)

Tassal Group Limited and Controlled Entities | Annual Report 2021 7
Operating results
Reflecting the underlying performance of the business and excluding the impact of SGARA, the key FY21 operating results were:
• Revenue up 5.6% to $594.04 million (FY20: $562.5 million)
• EBITDA2 up 0.6% to $139.4 million (FY20: $138.5 million)
• EBIT down 19.0% to $80.9 million (FY20: $99.8 million)
• NPAT down 24.7% to $48.3 million (FY20: $64.2 million).
Despite the strong growth in sales volumes and salmon efficiency benefits, operating results were materially negatively impacted by the short-term export salmon pricing impacts from negative global pricing and the appreciating AUD/USD.
Operating cashflow
Operating cashflow is expected to move closer towards the Company’s Operating EBITDA. Despite the COVID-19 impacts on FY21, operating cashflow was up 22.4% to $61.0 million. The difference to Operating EBITDA reflecting in the main:
• Growth in finished goods of $43.4 million, which was 1H21 driven due to the lack of capacity in airfreight in the early stages of COVID-19 and has now been resolved to a large extent. Record export sales in July and August 2021 supports this position. Accordingly, this growth in finished goods should not replicate in FY22
• Biological assets growth of $21.0 million was driven by the excellent growth performance on the salmon year class for sale in late FY22 and early stocking of prawns. This is not planned to be replicated in FY22
• Significant Items of $16.4 million largely reflected elevated export freight costs. Given the cost of export supply chains is still elevated, this cost is expected to occur again in FY22.
Tassal will continue to responsibly utilise its cashflows and debt facilities to consolidate salmon operations, optimise prawn operations and maintain a strong balance sheet.
Financial returns
Tassal’s FY21 results clearly demonstrated that the Company outperformed on its salmon growth operational strategy and delivered on its prawn growth operational strategy. The Company has the right strategies in place to drive long-term growth in sustainable earnings and returns; and has planned, executed and delivered on all controllable factors over FY21.
Tassal’s strategic investments in salmon and prawns should deliver strong earnings and returns in a “post-COVID-19 world”. However, Tassal’s FY21 return performance was impacted by COVID-19 factors. Like other global and domestic seafood companies, Tassal has experienced pricing volatility due to COVID-19 and resulting restrictions and market fractures, particularly in global/export markets.
Dividends
The Directors of Tassal have declared an unfranked FY21 final dividend of 7.0 cps (2H20: 9.0 cps, 25% franked), bringing the total dividend for FY21 to 14.0 cps unfranked (FY20: 18.0 cps). The dividend reflects the dividend payout policy of at least 50% of Operating NPAT.
2 Operating EBITDA was up 0.6% to $139.4 million (FY20: $138.5 million). Operating EBITDA (pre AASB 16) was down 12.2% to $111.7 million (FY20: $127.2 million)
The record and payment dates for this dividend are 15 and 29 September 2021, respectively.
The Company’s Dividend Reinvestment Plan (DRP) will apply to the FY21 final dividend, and shareholders electing to participate in the non-underwritten DRP will receive a 2% discount.
Business performance
The Directors are mindful of Tassal’s social licence to operate, and responsibly balance the Company’s initiatives and outcomes against scorecard objectives covering people, planet, product, performance and principles of governance.
In line with the United Nations’ Sustainable Development Goals, and supported by world-class partnerships and certification programs, long-term financial, operational, social, biosecurity and environmental ambitions have been established by Tassal that are centred on collaboration, shared value and responsible growth.
Tassal is proud of the role it plays in the global production of responsibly farmed salmon and prawns, that in turn provides nutritious and healthy food to a growing population in Australia and globally.
Our sustainability journey began in earnest 10 years ago. FY21 has been used to reframe our ESG and sustainability outlook and operations resulting in the inclusions of an additional ‘P’ – ‘Principles of governance’ and transition from ‘Performance’ to ‘Prosperity’.
We use the framework of 5Ps – People, Planet, Product, Prosperity and Principles of governance – which is a united platform to drive long-term value and make a lasting positive contribution to our shareholders and the broader global community. This considers global challenges, demand and trends and incorporates what matters to our consumers, customers shareholders, people, and the communities within which we operate.
Our new Beyond Sustainability, Responsible Business Roadmap sets out commitments and an accelerated program of inclusive action in seven areas of transformation – waste, people and communities, climate and circularity, freshwater, responsible sourcing, governance and animal welfare. It involves more transparency on progress, including visual transparency into our operations and farms.
Further information on Tassal’s ESG initiatives and performance metrics can be found in the Company’s FY21 results presentation and the Sustainability Report that will be lodged alongside the Company’s 2021 Annual Report.
“ The essence of sustainable development is that today’s generations meet their needs without prejudicing future generations’ ability to meet theirs”
Business fundamentals and risks
Tassal has a robust risk management system in place with an overall “conservative” risk appetite. A comprehensive risk management system and business continuity planning process manages risks in the short-term (including COVID-19) and also for the long-term (including climate change).
Tassal actively engages with experts to continue lowering its environmental impact, and the Company prides itself on

Annual Report 2021 | Tassal Group Limited and Controlled Entities8
Chairman’s and Chief Executive Officer’s Report (continued)
being a leader in sustainability within the global aquaculture industry. Utilising the latest technology and data to monitor environmental impacts, Tassal has continuously innovated to reduce environmental impacts and provide high quality Australian grown sustainable products for consumers.
Like all farming operations across Australia, Tassal is at the will of nature – storms, droughts and warmer waters. All of these events can create challenges for understanding the effects of climate change on an operation like ours. However, the Company is confident it can navigate these challenges and continue on its responsible growth pathway.
The release of the book, Toxic, has been challenging for our industry and the communities in which we operate. Many of the criticisms in the book are inaccurate, baseless, or not supported by independent experts or scientific facts. Nevertheless they are unsettling for our people and our communities, and as a Board we take them very seriously. We acknowledge that we have an opportunity to provide greater visual transparency under the waterways in which we operate to showcase the fact that we farm in a healthy marine environment.
We see an opportunity to work proactively with the industry to highlight integrity, accuracy, and transparency as well as the credibility of the independent science that underpins the collective operations of Tasmanian salmon. For us, our people and our reputation will always be our most valuable assets, so this has been a catalyst to continue our pursuit to respond to what matters to our stakeholders – our people, communities, customers, consumers and investors.
Risk mitigation, particularly around operational risk in the marine environment, is a continuous focus at Tassal. The key and associated mitigation strategies Tassal has put in place include:
• Managing Climate Risk – a comprehensive risk management system is used to manage long-term risks, issues and opportunities presented by climate change and respond accordingly
o Understanding the environment and the effects of climate change is crucial to Tassal’s ongoing operations, particularly in summer where water temperatures affect the growth of salmon – managing stock in a sustainable and responsible way
- The Aqua Spa provides improved farming practices and has been in operation for 2 years now
- Automated feeding and improved diets, a focus on net hygiene, appropriate level of harvest for frozen hog – i.e. inventory - (for later and further value adding) and isolating larger fish to cooler sites, are all factors to help decrease mortality rates and improve overall health of our salmon
- Summer water temperatures on average were around 1.0 degrees warmer than the previous year – we will continue to monitor summer water temperatures closely and manage our live biomass prudently
o Tassal has developed considerable options for adapting to climate change:
- Species diversification with prawns – prawns are a ‘warmer’ climate species
- Selective Breeding Program (SBP) for salmon, focusing on families/lines that can withstand temperature increases and volatility
- Improved feed diets for both salmon and prawns
- Modified farming technologies and practices
- Geographic diversification
o Listening to the science: Tassal supplements the work of its environmental team with external scientists to identify emerging climate trends, system responses and to undertake comprehensive broadscale monitoring.
• COVID-19 - Tassal is classed as an “Essential Service” and the Company’s operations have, due to the risk mitigation measures employed, effectively continued as “normal” over the past 18 months. Tassal has worked hard to ensure the continued safety and wellbeing of its employees and customers – strategies were developed and implemented from both a physical and mental wellbeing perspective. In addition, the Company’s supply chain has been resilient to date.
However, the current environment impacted by COVID-19 is volatile, sometimes unpredictable and always challenging, particularly in terms of the Government’s preparedness and responses for risk and risk management. Tassal is as best prepared as it can be. While the Company is not immune to global and local forces outside of its control, the key strengths that should assist mitigating this environment – Tassal’s diversification strategies across customers and consumers, growing and processing areas, and species and products – combined with a focus on sustainability and more efficient operations, position the Company to continue its growth trajectory.
• Summer and Autumn water temperatures and the impact on the rate of salmon growth and survival – Tassal has continued to develop its advanced SBP for salmon. The current focus of the program is breeding from fish more resilient to higher water temperatures. Summer and Autumn water temperatures are challenging.
• Amoebic Gill Disease (AGD) remains a significant issue – To ensure Tassal’s fish remain healthy and active, they are bathed in fresh water. This bathing process cleans the amoeba from the gills of the fish and allows the fish to intake oxygen and release carbon dioxide more efficiently and effectively. To bathe the fish, fish are transferred from saltwater to fresh water. Tassal has mitigated this risk through the introduction of the harvest strategy for the South East, together with fish grown in Macquarie Harbour (where there is no AGD) and with all fish now from the SBP.
Tassal has successfully integrated its Aqua Spa into the operations and it has been fundamental in allowing the Company to grow its current salmon biomass volumes ahead of Strategic Plan targets. The Aqua Spa is under a 10-year lease (with Tassal holding a 5-year option). The Well Boat has a 3,500m3 water capacity – enough to completely bathe one of Tassal’s largest pens around three (3) times quicker than current methods – and is able to both re-use freshwater and through its desalination plant use seawater to make freshwater. The Aqua Spa also enables higher fish survival rates, improved biosecurity and fish health and welfare.

Tassal Group Limited and Controlled Entities | Annual Report 2021 9
• Seals remain a significant challenge – Seals are attracted to salmon farms. The risk of seal interactions is a continual challenge. Our roll out of Ocean Sanctuary Pens has considerably reduced the use of government approved deterrents when our peoples’ safety is directly threatened. At a cost of $500,000 per pen, this circa $90 million investment in world leading exclusion driven infrastructure is our commitment to keeping our fish and our people safe while keeping wildlife in its natural habitat.
• Community activism is an increasing risk – This is not unique to aquaculture nor Tassal, and is part of doing business in many industries. A proactive engagement strategy, centred around shared value principles, has been implemented by Tassal across operating communities and more broadly. This focuses on a range of partnerships and initiatives aligned to the Company’s Community Charter.
• Ability to grow salmon based on current technologies, methodologies, and production sites (including new prospects) is becoming more difficult – The industry is starting to test the ‘natural capacity’ and growth limits for fish farming in current lease areas using today’s technologies and methodologies. Adaptive management and innovation have always been at the core of Tassal’s business and growth; in fact it is a strong competitive advantage for Tassal. We believe we need to continue to learn, adapt and innovate as we move forward.
To mitigate this risk, Tassal has and continues to use technology to optimise operations. The Company is considered a global seafood leader in digital technology – a key competitive advantage that should be further enhanced in FY22.
Strategic update & outlook
• Strategic Proserpine footprint expansion – and disposal of surplus land – supports the strategic goal of 20,000 tonnes prawns production
o Existing Proserpine farm optimised – approval has been received for 455ha of ponds, vs original target of 400 hectares. For FY21, 270 hectares of ponds were fully stocked, and in FY22, 289 hectares of ponds are excepted to be fully stocked
o Strategic Proserpine farming footprint expansion – The Billy Creek property was acquired on 9 November 2020. Billy Creek is a c1,300 hectare property neighbouring the Company’s existing Proserpine farm, enabling the creation of an enlarged Proserpine “farming precinct”:
- Subject to the receipt of regulatory approvals and development, the combination provides an opportunity for an additional c350 hectares of ponds (i.e. 805 hectares of ponds across the wider precinct)
- Proximity to the Bruce Highway provides ready power availability as well as existing road infrastructure
In addition, Mid Farm, an 800 hectare property neighbouring the Proserpine prawn farm and Billy Creek property was acquired in May 2021, allowing the Group
to integrate its farm holdings in its Proserpine farming precinct, and creating the potential to substantially improve operational aspects for the whole Proserpine farming precinct.
• Exmoor Station divestment of surplus land – With the expansion of the Proserpine farming footprint with Billy Creek and Mid Farm, and the general increase in land value for cattle grazing, surplus land (i.e. land not suitable for prawn farming) was sold at Exmoor Station
A net $1.4 million cash benefit was realised from this land sale and the acquisitions of Billy Creek and Mid Farm.
Once fully authorised and developed, the Proserpine farming footprint expansion plus the remaining 1,000ha at Exmoor Station, provides an optimal path to 20,000 tonnes of prawn production by 2030.
• Technology – Tassal’s global leadership in digital technology was a key competitive advantage in FY21, and will be further enhanced in FY22
o Tassal’s salmon farming was further enhanced in FY21
- Completion of Ocean Sanctuary Pen roll-out to enhance the safety and welfare of our people and fish while decreasing wildlife impacts and interactions
- Improved survival and welfare through successful implementation of POMV vaccine
- Pico oxygenation trial which saw an enhanced in-pen environment for salmon during summer
- Implementation of Tassal’s diverless retrieval system allowing improved product for our rendering facility
o At the same time, Tassal’s SmartFarming technology and ways of working were rolled out across our prawn farms, underpinning improved harvest yields
- Biggest leap in innovation to prawn farming globally through combination of auto-feeders and diets
- Enabled real time monitoring of the welfare of our prawns
- Construction of state-of-the-art hatchery and processing facilities
o A blueprint to substitute all marine based compressors on our salmon farms to electric compressors to further reduce GHG emissions and noise in sensitive areas was set in motion
o We are actively exploring partnerships and initiatives to unlock Blue Carbon opportunities through seaweed and support food systems adaption
o Going forward, Tassal will leverage the large amount of data it is now capturing with an increasingly advanced data analytics capability. This will allow the Company to continue to drive improvements in both salmon and prawn farming through growth optimisation, survival and feed conversion rates

Annual Report 2021 | Tassal Group Limited and Controlled Entities10
Improved market fundamentals and operational initiatives underpin positive outlook
While Tassal does not provide earnings guidance, the Company provides the following outlook commentary.
• Global salmon market and pricing is recovering
o Following 7% growth in CY20, global supply has tightened, with negligible supply growth of c2% forecast for CY21, with supply declines expected in H2 CY21. For CY21, most market commentary suggests that the salmon industry is expected to deliver 10-15% demand growth with only a 2% increase in global supply3
o Larger European Union, United Kingdom and United States’ retail customer bases and a strong recovery in “other markets” (due to restricted supply) is expected to underpin this growth. In addition, the foodservice industry is returning as lockdowns ease and vaccines are rolled out
o CY21 has seen the start of the recovery in global pricing. Prices look promising in Q3 and Q4 CY21 based on FishPool Futures Pricing, which is the optimum supply period for Australian producers
o The supply chain from Australia is still likely to be the greatest risk going forward – both from a capacity and cost perspective. The number of Australian outbound flights is circa 80% below pre COVID-19 levels (with Australian Government’s International Freight Assistance Mechanism continuing to be extended for FY22).
• Salmon outlook
o Global market beginning to recover, albeit not yet to pre-COVID-19 levels. Current forward export pricing is promising. Unit economics will remain dependent on exchange rates and the cost and availability of airfreight. In addition, political risk surrounding China exports remain, though volume was stable in FY21 and Tassal maintains strong relationships in the region
o From a domestic market perspective, domestic pricing (particularly in the wholesale market) is recovering in line with the global pricing recovery. However, it will take a little longer for some retail contracts – e.g. BTC/deli support - to recover due to 3-5 year agreements in place
o Tassal’s focus will remain on the controllable factors:
- Driving cost-out $/kg efficiencies and fish performance in FY22
- Circa 40,000 hog tonnes of salmon production is expected in FY22 (which remains ahead of strategic plan)
- Expected to reach 41,000 hog tonnes of salmon production in FY23, keeping this level until more favourable domestic conditions return
- Maintaining replacement and upgrade capital expenditure of circa $50m pa will enable the ‘housing’ of 41,000 hog tonnes
- Continued brand investment will continue to support Tassal’s no. 1 brand status and top of mind awareness – the marketing plan will build on FY21’s success to continue to drive long term demand for “Tassal” branded products
3 Rabobank
Chairman’s and Chief Executive Officer’s Report (continued)
• Prawns outlook –“Tropic Co”
o The Group is committed to its strategic goal of 20,000 tonnes of prawn production by 2030 – once fully authorised and land developed - which can be brought forward if considered appropriate in a ‘post COVID-19’ world
o Production growth is expected from improving yield (survival and growth) via a similar path to salmon – fish husbandry (health), domestification (i.e. selective breeding), automated feeding systems, improving fish diets and diet cost. Given the shorter working capital cycle (6 months) and capital cycle (12 months) in prawns, the growth program can be flexed as market conditions evolve
o Similar to salmon, branding will become central. Our vision is for Topic Co to be Australia’s no. 1 farmed Tiger Prawn brand, recognised and trusted by customers and consumers
o We remain on track for circa 5,000 tonnes of prawn production in FY22, with sales volumes supported by the Coles contract that commenced in December 2020. The Company’s current 369 hectares of ponds and associated infrastructure at Proserpine, Mission Beach and Yamba is sufficient to achieve FY22 production targets, with limited growth capex required in FY22.
• Funding in place supports Tassal’s growth
o The Company’s diversity of funding sources – bank debt, leasing and receivable purchase facility (RPF) – is appropriate
o The Group’s bank debt has an appropriate tenor, with a weighted average currently 2.3 years
o Prudent credit metrics at 30 June 2021 – significant headroom to banking covenants
o Tassal had substantial headroom available in its debt facilities with $118.6 million in undrawn debt facilities, in addition to $30.6 million cash at 30 June 2021
o FY22 operating cashflow is expected to grow, as FY20’s and FY21’s working capital build, coupled with the increase in prawn biomass in FY21 and FY22 is converted into cash
o Plan to reduce both salmon and prawn capital spend from $105.9 million to $80.0 - $90.0 million in FY22 as the Company’s major investment program rolls off
o The Board is maintaining its dividend payout policy of circa 50% of Operating NPAT.
On behalf of the Directors,
A. D. McCallum, AO M. A. Ryan
Chairman Managing Director & Chief Executive Officer
Hobart, this 17th day of August 2021

Tassal Group Limited and Controlled Entities | Annual Report 2021 11
The Directors present their report together with the Annual Financial Report of Tassal Group Limited (the Company) and the consolidated Annual Financial Report of the consolidated entity, being the Company and its controlled entities (the Group), for the year ended 30 June 2021.
1. DIRECTORS
At the date of this report, the Directors of the Company who held office at any time during or since the end of the financial year are:
Name:
Mr Allan McCallum AO (Director since 7 October 2003) (Chairman since 27 June 2005)
Mr Mark Ryan – Chief Executive Officer (Director since 21 December 2005)
Mr James Fazzino (Director since 29 May 2020)
Mr Trevor Gerber (Resigned 28 October 2020)
Mr Richard Haire (Director since 5 March 2020)
Mr John Watson (Director since 19 March 2018)
Ms Georgina Lynch (Director since 27 November 2018)
Ms Jackie McArthur (Director since 27 November 2018)
2. PRINCIPAL ACTIVITIES
During the year the principal activities of the consolidated entity were the farming of Atlantic Salmon and Tiger Prawns and the processing and marketing of salmon, prawns and other seafood.
3. DIVIDENDS
Since the end of the 2020 financial year the following dividends have been paid or declared:
a. On 19 August 2020, the Directors declared a 25% franked dividend of 9.00 cents per ordinary share amounting to $18.836 million in respect of the financial year ended 30 June 2020. The record date for determining entitlements to this dividend was 15 September 2020. The final dividend was paid on 29 September 2020.
b. On 16 February 2021 the Directors declared an interim unfranked dividend of 7.00 cents per ordinary share amounting to $14.794 million in respect of the half year ended 31 December 2020. The record date for determining entitlements to this dividend was 15 March 2021 with a payment date of 30 March 2021.
On 17 August 2021, the Directors declared a final unfranked dividend of 7.00 cents per ordinary share amounting to $14.864 million in respect of the financial year ended 30 June 2021. The record date for determining entitlements to this dividend is 15 September 2021. The final dividend will be paid on 29 September 2021.
The final dividend for the year ended 30 June 2021 has not been recognised in this Annual Financial Report because it was declared subsequent to 30 June 2021.
4. REVIEW OF OPERATIONS
The consolidated net profit after tax for the financial year was $34.620 million. (For the financial year ended 30 June 2020: $69.111 million).
The consolidated entity’s revenue was $583.860 million compared with $552.706 million for the financial year to 30 June 2020.
Earnings before interest and tax (EBIT) was $61.359 million compared with $106.874 million for the financial year to 30 June 2020.
Cashflow from operating activities was significantly utilised to underpin the growth of livestock inventory and infrastructure investment which, in turn, will underpin future profitability.
Earnings per share (EPS) on a weighted average basis was 16.40 cents per share compared with 34.03 cents per share for the financial year to 30 June 2020.
Further details on review of operations and likely future developments are outlined in the Chairman’s and CEO’s Report on pages 2 – 10 of this Annual Report.
5. CHANGES IN STATE OF AFFAIRS
In the opinion of the Directors, there were no significant changes in the state of affairs of the consolidated entity that occurred during the financial year under review not otherwise disclosed in this Directors’ Report or the Annual Report.
6. FUTURE DEVELOPMENTS
Likely developments in the consolidated entity’s operations have been commented on in a general nature in the Annual Financial Report. In particular, reference should be made to the joint Chairman’s and CEO’s Report.
7. DIRECTORS, DIRECTORS’ MEETINGS AND DIRECTORS’ SHAREHOLDINGS
The names of the Directors who held office during the financial year and details of current Directors’ qualifications, Directors’ interests in the Company, experience and special responsibilities and directorships of other listed entities are set out in sections 16 and 17 of this Directors’ Report.
Details of Directors’ meetings and meetings of Committees of Directors including attendances are set out in section 18 of this Directors’ Report.
8. EVENTS SUBSEQUENT TO BALANCE DATE
Dividend declared after year end (refer to section 3 of Directors Report and also to note 2 to the financial statement)
9. INDEMNIFICATION OF OFFICERS AND AUDITORS
During the financial year, the Company paid a premium in respect of a contract insuring the Directors of the Company (as named above), the Company Secretary, and all officers of the Company against a liability incurred as such a Director, Secretary or officer to the extent permitted by the Corporations Act 2001. The contract of insurance prohibits disclosure of the nature of the liability and the amount of the premium.
Directors’ Report

Annual Report 2021 | Tassal Group Limited and Controlled Entities12
The Company has not otherwise, during or since the financial year, indemnified or agreed to indemnify an officer or auditor of the Company or of any related body corporate against a liability incurred as such an officer or auditor.
10. ENVIRONMENTAL REGULATION
The consolidated entity’s operations are subject to Commonwealth and State regulations governing marine and hatchery operations, processing, land tenure and use, environmental requirements, including site specific environmental licences, permits, and statutory authorisations, workplace health and safety and trade and export.
The consolidated entity’s management regularly and routinely monitor compliance with the relevant environmental regulations and compliance is regularly reported to the Board.
The consolidated entity has well established procedures to monitor and manage compliance with existing environmental regulations and new regulations as they come into force.
The consolidated entity employs a Head of Sustainability whose role is to ensure compliance with the regulatory framework and implement processes of continuous improvement with respect to environmental management.
Further details with respect to the consolidated entity’s sustainability credentials and environmental management policies are outlined in the Chairman’s and CEO’s Report on pages 2 - 10 of the Annual Report.
The Directors believe that all regulations have been materially met during the period covered by this Annual Report and are not aware of any significant environmental incidents arising from the operations of the consolidated entity during the financial year.
11. CORPORATE GOVERNANCE
In recognising the need for the highest standards of corporate behaviour and accountability, the Directors support the principles of good corporate governance.
The consolidated entity’s statement on the main corporate governance practices in place during the year is set out on the Company’s website at http://www.tassalgroup.com.au/governance-policies/
The Chief Executive Officer and Chief Financial Officer have declared, in writing to the Board, that the Company’s Annual Report is founded on a sound system of risk management and internal compliance and control which implements the policies adopted by the Board.
The Company’s Head of Risk has also provided a letter of assurance confirming that:
• the Company’s risk management system is supported by a well-structured framework and policy, which is established based on the guidelines from AS/NZS ISO 31000:2009 Risk Management and ASX Corporate Governance Principles and Recommendations;
• appropriate and adequate risk management and control monitoring and reporting mechanisms are in place; and
• the Company’s risk management and internal compliance and risk related control systems are operating efficiently and effectively in all material respects.
12. AUDITOR’S INDEPENDENCE DECLARATION
There were no former partners or directors of Deloitte Touche Tohmatsu, the Company’s auditor, who are or were at any time during the financial year an officer of the Company.
The auditor’s independence declaration made under section 307C of the Corporations Act 2001 is set out on page 28 and forms part of this Directors’ Report.
13. NON-AUDIT SERVICES
During the year Deloitte Touche Tohmatsu, the Company’s auditor, has performed certain “non-audit services” for the consolidated entity in addition to their statutory duties.
The Board has considered the non-audit services provided during the year by the auditor and in accordance with written advice endorsed by unanimous resolution of the Audit and Risk Committee, is satisfied that the provision of those non-audit services during the year by the auditor is compatible with, and did not compromise, the auditor independence requirements of the Corporations Act 2001 for the following reasons:
a. Non-audit services were subject to the corporate governance procedures adopted by the Company and have been reviewed to ensure they do not impact the integrity and objectivity of the auditor; and
b. The non-audit services provided do not undermine the general principles relating to auditor independence as set out in Code of Conduct APES 110 Code of Ethics for Professional Accountants issued by the Accounting Professional and Ethical Standards Board, including reviewing or auditing the auditor’s own work, acting in a management or decision making capacity for the Company, acting as an advocate for the Company or jointly sharing economic risks and rewards.
Details of the amounts paid to Deloitte Touche Tohmatsu for audit and non-audit services provided during the year are set out in note 6 to the financial statements.
14. PROCEEDINGS ON BEHALF OF THE COMPANY
There were no proceedings brought or intervened in on behalf of the Company with leave under section 237 of the Corporations Act 2001.
15. SHARE OPTIONS AND PERFORMANCE RIGHTS
There were no options granted to Directors or any of the Senior Executives during or since the end of the financial year.
No options were exercised during or since the end of the financial year.
During the year 754,495 (2020: 366,390) performance rights were granted to the Chief Executive Officer and other members of the Company’s Executive Group pursuant to the Company’s Long-term Incentive Plan.
Nil (2020: 173,751) performance rights vested on 30 June 2021.
Refer to section 20 (g) (ii) of the Directors’ Report for further details.
Directors’ Report (continued)

Tassal Group Limited and Controlled Entities | Annual Report 2021 13
16. INFORMATION ON DIRECTORS
Director Qualifications and experienceSpecial responsibilities
Particulars of Directors’ interests in ordinary shares, options and performance rights over ordinary shares in the Company
ALLAN McCALLUM AO
(Chairman) Dip. Ag Science, FAICD
Allan is Chairman of Cann Group Limited.
Allan is a member of the Rabobank Advisory Board.
Allan is a former Chairman of Vicgrain Limited and CRF Group Ltd and Deputy Chairman of Graincorp Limited. He was also a Non-Executive Director of Incitec Pivot Limited and Medical Developments International Limited.
Allan has extensive experience in the agribusiness sector across production, processing, logistics and marketing.
Chairman of the Board of Directors
Independent Non-executive Director
Chairman of the Nominations Committee
398,996 Ordinary Shares
TREVOR GERBER
B.Acc, CA(SA)
(resigned 28 October 2020)
Trevor has extensive board experience spanning property, funds management, tourism, infrastructure and aquaculture.
He is Chairman of Sydney Airport Holdings and Vicinity Shopping Centres. Trevor is also a former director of the CIMIC Group.
Prior to becoming a professional director in 2000, Trevor was an executive at Westfield Holdings Limited for 14 years during which time he held senior executive positions including Group Treasurer and Director of Funds Management responsible for the Westfield Trust and Westfield America Trust
Independent Non-executive Director
Member of the Audit and Risk Committee
Chair of the Remuneration Committee (until 01/04/20)
50,000 Ordinary Shares
MARK RYAN
(Managing Director and Chief Executive Officer)
B.Com, CA, MAICD, FAIM
Mark is the Managing Director and Chief Executive Officer of Tassal Group Limited, a position that he has held since November 2003. Mark holds a Bachelor of Commerce from the University of Tasmania, is a Chartered Accountant, a fellow of Australia Institute of Management and a Member of Australian Institute of Company Directors. Mark holds Board positions with Salmon Enterprises of Tasmania Pty Ltd (Industry hatchery), Seafood Industry Australia and Tasmanian Bakeries.
Mark has extensive experience in the finance and turnaround management sector, with experience gained through PricewaterhouseCoopers, Arthur Andersen and KordaMentha. Mark was previously a partner with KordaMentha.
Managing Director and Chief Executive Officer
234,512 Ordinary Shares
257,233 Performance Rights
JOHN WATSON AM John has returned to the Tassal Board as from March 2018 having previously served as a non- executive director from October 2003 to October 2015 John has had extensive experience in the food production and processing industries as a producer and Non-executive Director. In his time as a Non-executive Director, John has been on many boards of listed and unlisted companies in Australia and New Zealand and has served on numerous advisory boards to State and Commonwealth governments. John was a Non-executive Director and Chairman of Incitec Pivot Limited from December 1997 to 30 June 2012. John was also Governor of the Van Dieman’s Land Company (now VDL Farms) from 2008 to 2011 and was on the Board of the Numurkah District Health Service from 2015 to 2018.
Independent Non-executive Director
Chair of the Audit and Risk Committee
Member of the Nominations Committee
220,841 Ordinary Shares

Annual Report 2021 | Tassal Group Limited and Controlled Entities14
Director Qualifications and experienceSpecial responsibilities
Particulars of Directors’ interests in ordinary shares, options and performance rights over ordinary shares in the Company
JACKIE MCARTHUR
BEng (Aero)
Ms McArthur has more than 20 years’ experience at executive level roles in supply chain and logistics, as well as in operations, transport, food and packaging manufacturing, emerging brand issues and crisis management, risk management, corporate social responsibility, compliance, governance and information technology. Most recently she was Managing Director, Australia and New Zealand, of Martin-Brower ANZ, the exclusive distributor to McDonald’s restaurants across Australia and New Zealand. Previously, for more than thirteen years, she held various senior executive positions with McDonalds, both in Australia and overseas, including Vice President of Supply Chain for Asia, Pacific, Middle East and Africa and, in McDonalds Australia, as Senior Vice President Chief Restaurant Support Officer and Vice President Supply Chain Director.
Ms McArthur was the 2016 Telstra NSW Business Woman of the Year and overall 2016 Telstra Business Women’s Awards - Corporate and Private National Winner. She has completed the INSEAD International Executive Program, has a Bachelor of Engineering from the University of Sydney and is a member of the Australian Institute of Company Directors. Ms McArthur is also a Non-Executive Director of Ingham’s and Qube Holdings Ltd. She has also been a non- executive director of Invocare and Blackmores Limited.
Independent Non-executive Director
Member of the Audit and Risk Committee
Member of the Nominations Committee (until 01/04/20)
Member of the Remuneration Committee (as from 01/04/20)
54,549 Ordinary Shares
GEORGINA LYNCH
BA Llb
Georgina has over 25 years’ experience in the financial services and property industry. In her executive career she held senior roles at AMP Capital Investors, Galileo Funds Management and Stockland. In addition to her role on the Tassal board Georgina is the Independent non -executive Chairman of Cbus Property and Independent non-executive director of ASX-listed Waypoint REIT (formerly Viva Energy REIT) and ASX and JSE listed Irongate Group (formerly Investec Property Group).
Georgina brings significant global experience in corporate transactions, capital raisings, initial public offerings, funds management, corporate strategy and acquisitions and divestments to the board.
Independent Non-executive Director
Member of the Remuneration Committee
Member of the Nominations Committee
25,000 Ordinary Shares
RICHARD HAIRE
BEc FAICD
Mr Haire has more than 29 years’ experience in the international cotton and agribusiness industry, including 27 years in agricultural commodity trading and banking.
Mr. Haire is also the Chair of the Cotton Research and Development Corporation and Endeavour Foundation and former Chair of Reef Corporate Services Limited. He also serves as a Non-Executive Director of BEC Stockfeed Solutions Pty Ltd. Mr Haire is a former Director of Bank of Queensland Limited, Open Country Dairy (NZ) and New Zealand Farming Systems Uruguay.
Richard holds a Bachelor of Economics from the University of New England, a Diploma in Corporate Management from the University of Sydney and holds a Company Directors Diploma.
Independent Non-executive Director
Member of the Audit and Risk Committee
Chair of the Remuneration Committee
17,000 Ordinary Shares
JAMES FAZZINO
BEc (Honours)
Mr. Fazzino has extensive national and international business experience in industrial chemicals, fertilisers, explosives and manufacturing sectors.
Mr Fazzino held senior executive roles with Incitec Pivot Limited in the period 2003 to 2017 including being its Managing Director and Chief Executive Officer from 2009 to 2017.
James is currently a director of APA group and Rabobank Australia Limited. He is also the Chair of Implant Solutions Pty Limited (Osteon Medical) and Manufacturing Australia.
James holds a Bachelor of Economics (Honours) and is a fellow of CPA Australia.
Independent Non-executive Director
Member of the Audit and Risk Committee
57,413 Ordinary Shares
The particulars of Directors’ interests in ordinary shares, options and performance rights over ordinary shares disclosed above are as at the date of this Directors’ Report and as notified by Directors to Australian Stock Exchange Limited in accordance with the S205G(1) of the Corporations Act 2001.
Directors’ Report (continued)

Tassal Group Limited and Controlled Entities | Annual Report 2021 15
17. DIRECTORSHIPS OF OTHER LISTED COMPANIES
Directorships of other listed companies held by the Directors in the three years immediately before the end of the financial year are as follows:
Director Company Period of Directorship (last 3 years)
A. McCallum AO Medical Developments International Limited Until 17 December 2018
Cann Group Limited Throughout
T. Gerber (resigned 28 October 2020)
Sydney Airport Holdings Limited Vicinity Shopping Centres CIMIC Group Regis Healthcare
Throughout Throughout Until December 2019 Until November 2017
M. Ryan - None held
J. Watson AM - None Held
J. McArthur Inghams Group Limited Blackmores Limited Invocare Limited Qube Holdings Ltd
As from September 2017 Until August 2019 Until May 2021 As from August 2020
G. LynchWaypoint REIT Ltd (formerly Viva Energy REIT) Irongate Group (formerly Investec Property Group)
Throughout As from 1 July 2019
R. Haire Reef Casino Trust Bank of Queensland
Until May 2021 Until April 2020
J. Fazzino APA Group Throughout
18. DIRECTORS’ MEETINGS
The following table sets out the number of Directors’ meetings (including meetings of Committees of Directors) held during the financial year and the number of meetings attended by each Director (while they were a Director or Committee Member). During the financial year, 11 Board meetings, 5 Audit and Risk Committee meetings, 1 Remuneration Committee Meeting and 1 Nominations Committee Meetings were held.
Board of Directors meetings
Audit and Risk Committee meetings
Remuneration Committee meetings
Nominations Committee meetings
DirectorNumber
heldNumber attended
Number held
Number attended
Number held
Number attended
Number held
Number attended
A. McCallum AO 11 11 * * * * 1 1
T. Gerber (resigned 28/10/20)
4 4 2 2 * * * *
M. Ryan 11 11 * * * * * *
J. Watson AM 11 11 5 5 * * 1 1
J. McArthur 11 11 5 5 1 1 * *
G. Lynch 11 11 * * 1 1 1 1
R. Haire 11 11 5 5 1 1 * *
J. Fazzino 11 11 3 3 * * * *
(*not a committee member)

Annual Report 2021 | Tassal Group Limited and Controlled Entities16
19. COMPANY SECRETARY
Monika Sylvia Maedler BEc, LLB, FCIS. Ms Maedler is a senior legal executive with experience across a number of organisations including Kodak (Australasia) Pty Ltd, Philip Morris Ltd, SPC Ardmona Ltd and Adecco Group Australia and New Zealand.
20. REMUNERATION REPORT - AUDITED
(a) Introduction
This Remuneration Report outlines the Company’s overall reward strategy for the year ended 30 June 2021 and provides detailed information on the remuneration arrangements in this period for the Directors of the Company including the Managing Director and Chief Executive Officer and other Key Management Personnel. Key Management Personnel have the authority and responsibility for planning, directing and controlling the activities of the Company for the year ended 30 June 2021.
The Remuneration Report forms part of the Directors’ Report and has been prepared in accordance with the requirements of the Corporations Act 2001 and its Regulations.
Tassal’s Remuneration Policy may be amended from time to time and is reviewed at least once a year. This may result in changes being made to the Policy for the year ending 30 June 2022.
(b) Remuneration Philosophy
The Remuneration Committee is responsible for making recommendations to the Board on remuneration policies and packages applicable to Directors, the Managing Director and Chief Executive Officer and the Senior Executives.
The primary objectives of the Remuneration Policy are to provide a competitive, flexible and benchmarked structure that reflects market best practice, is tailored to the specific circumstances of the Company and which reflects the person’s duties and responsibilities so as to attract, motivate and retain people of the appropriate quality.
Remuneration levels are competitively set to attract appropriately qualified and experienced Directors and executives. The Remuneration Committee obtains market data on remuneration quantum. The remuneration packages of the Managing Director and Chief Executive Officer and Senior Executives may include a short-term incentive component that is linked to the overall financial and operational performance of the Company and based on the achievement of specific Company and individual / team goals. The Managing Director and Chief Executive Officer and the Senior Executives may also be invited to participate in the Company’s Long-term Incentive Plan (LTI Plan). The long-term benefits of the LTI Plan are conditional upon the Company achieving certain performance criteria, details of which are outlined below.
(c) Remuneration Structure
In accordance with best practice corporate governance, the structure of non-executive Director remuneration is separate and distinct from executive remuneration.
(d) Relationship Between the Remuneration Policy and Company Performance
The Consolidated entity’s key operations performance indicators in the financial year ended 30 June 2021 and the previous four financial years are summarised below.
Directors’ Report (continued)
30-June 2021
30-June 2020
30-June 2019
30-June 2018
30-June 2017
$'000 $'000 $'000 $'000 $'000
Revenue (from all sources) $594,035 $562,540 $560,788 $484,535 $450,453
Net proft before tax $48,061 $96,563 $81,989 $79,316 $85,556
Net profit after tax $34,620 $69,111 $58,439 $57,293 $58,083
30-June 2021
30-June 2020
30-June 2019
30-June 2018
30-June 2017
Share price:
Share price at the start of the year $3.45 $4.90 $4.13 $3.81 $3.98
Share price at the end of the year $3.58 $3.45 $4.90 $4.13 $3.81
Dividend per share:
Interim dividend $0.0700 $0.0900 $0.0900 $0.0800 $0.0750
Final dividend $0.0700 $0.0900 $0.0900 $0.0800 $0.0750
$0.1400 $0.1800 $0.1800 $0.1600 $0.1500
Earnings per share:
Basic $0.1640 $0.3403 $0.3301 $0.3313 $0.3718
Diluted $0.1635 $0.3393 $0.3288 $0.3301 $0.3714

Tassal Group Limited and Controlled Entities | Annual Report 2021 17
The consolidated entity ultimately assesses its performance from increases in earnings and shareholder value. The performance measures for both the Company’s Short-term Incentive Plan (STI Plan) and LTI Plan have been tailored to align at-risk remuneration and performance hurdle thresholds to the delivery of financial and operational objectives and sustained shareholder value growth.
Over the past 5 years the consolidated entity has achieved the following compound annual growth rates:
• Revenue (from all sources) - 6.63%
• Net profit after tax - (6.52)%
• Basic earnings per share - (13.02)%
(e) Components of Compensation – Non-executive Directors
The Board seeks to set aggregate remuneration at a level which provides the Company with the ability to attract and retain Directors of the highest calibre, whilst incurring a cost which is acceptable to shareholders.
The Constitution and the ASX Listing Rules specify that the aggregate remuneration of non-executive Directors shall be determined from time to time by a general meeting. Currently, the aggregate remuneration threshold is set at $1,200,000 per annum as approved by shareholders at the AGM on 31 October 2018. Legislated superannuation contributions made in respect of non-executive Directors are included in determining this shareholder approved maximum aggregate annual pool limit.
The amount of aggregate remuneration sought to be approved by shareholders and the manner in which it is apportioned amongst Directors is reviewed annually. The Board reviews its fees to ensure the Company’s non-executive Directors are fairly remunerated for their services, recognising the level of skill and experience required to fulfil the role, and to have in place a fee scale which enables the Company to attract and retain talented non-executive Directors. In conducting a review, the Board may take advice from an external independent remuneration consultant. The process involves benchmarking against a group of peer companies.
Non-executive Directors receive a cash fee for service and have no entitlement to any performance-based remuneration or participation in any share-based incentive schemes. This policy reflects the differences in the role of the non-executive Directors, which is to provide oversight and guide strategy, and the role of management, which is to operate the business and execute the Company’s strategy. Non-executive Directors are not subject to a minimum shareholding requirement, but are encouraged to acquire a number of shares whose value is at least equal to their annual fees as a Director of the Company.
Each non-executive Director receives a fee for being a Director of the Company. An additional fee is also paid for being a member of the Board’s Remuneration Committee, Nominations Committee and Audit and Risk Committee. The payment of an additional fee recognises the additional time commitment required by Directors who serve on those committees.
Fees payable to the non-executive Directors of the Company for the 2021 financial year (inclusive of legislated superannuation contributions) were as follows:
Per annum Base
Remuneration Committee
Nominations Committee
Audit and Risk
Committee
Chairman of the Board
$247,612 N/A N/A N/A
Each other non-executive Director
$118,178 $10,609 $10,609 $10,609
The Chair of the Audit and Risk Committee received an additional $10,609 for chairing that Committee
The Chair of the Remuneration Committee received an additional $5,305 for chairing that Committee
There is no separate fee for the Chair of the Nominations Committee as the chair of that committee is Chair of the Board
(f) Components of Compensation – Chief Executive Officer and Other Senior Executives
(i) Structure
The Company aims to reward the Chief Executive Officer and Senior Executives with a level and mix of remuneration commensurate with their position and responsibilities within the Group, so as to:
• reward them for Company, business unit and individual performance against targets set by reference to appropriate benchmarks and key performance indicators;
• align their interests with those of shareholders; and
• ensure total remuneration is competitive by market standards.
Remuneration consists of both fixed and variable remuneration components. The variable remuneration component consists of the STI Plan and the LTI Plan.
The proportion of fixed remuneration and variable remuneration (potential short-term and long-term incentives) is established for the Chief Executive Officer by the Board and for each Senior Executive by the Board following recommendations from the Chief Executive Officer and the Remuneration Committee.
The Chief Executive Officer’s and Senior Executives’ remuneration packages are all respectively subject to Board approval.
(ii) Fixed annual remuneration
Remuneration levels are reviewed annually to ensure that they are appropriate for the responsibility, qualifications and experience of the Chief Executive Officer and each Senior Executive and are competitive with the market.
The Chief Executive Officer and Senior Executives have the option to receive their fixed annual remuneration in cash and a limited range of prescribed fringe benefits such as a motor vehicle and car parking. The total employment cost
Annual Report 2021 | Tassal Group Limited and Controlled Entities18
of any remuneration package, including fringe benefits tax, is taken into account in determining an employee’s fixed annual remuneration.
(iii) Variable remuneration – STI Plan
The objective of the STI Plan is to link the achievement of the annual operational targets with the remuneration received by the executives charged with meeting those targets. The total potential STI available is set at a level so as to provide sufficient incentive to the executive to achieve the operational targets such that the cost to the Company is reasonable in the circumstances.
Actual STI payments granted to the Chief Executive Officer and each Senior Executive depend on the extent to which specific operational targets, set at the beginning of the year, are met. The operational targets may include a weighted combination of:
• meeting a pre-determined growth target in consolidated entity net profit after tax over the prior year;
• meeting strategic objectives; and
• assessed personal effort and contribution.
The Remuneration Committee considers the performance against targets, and determines the amount, if any, to be allocated to the Chief Executive Officer and each Senior Executive. STI payments are delivered as a cash bonus.
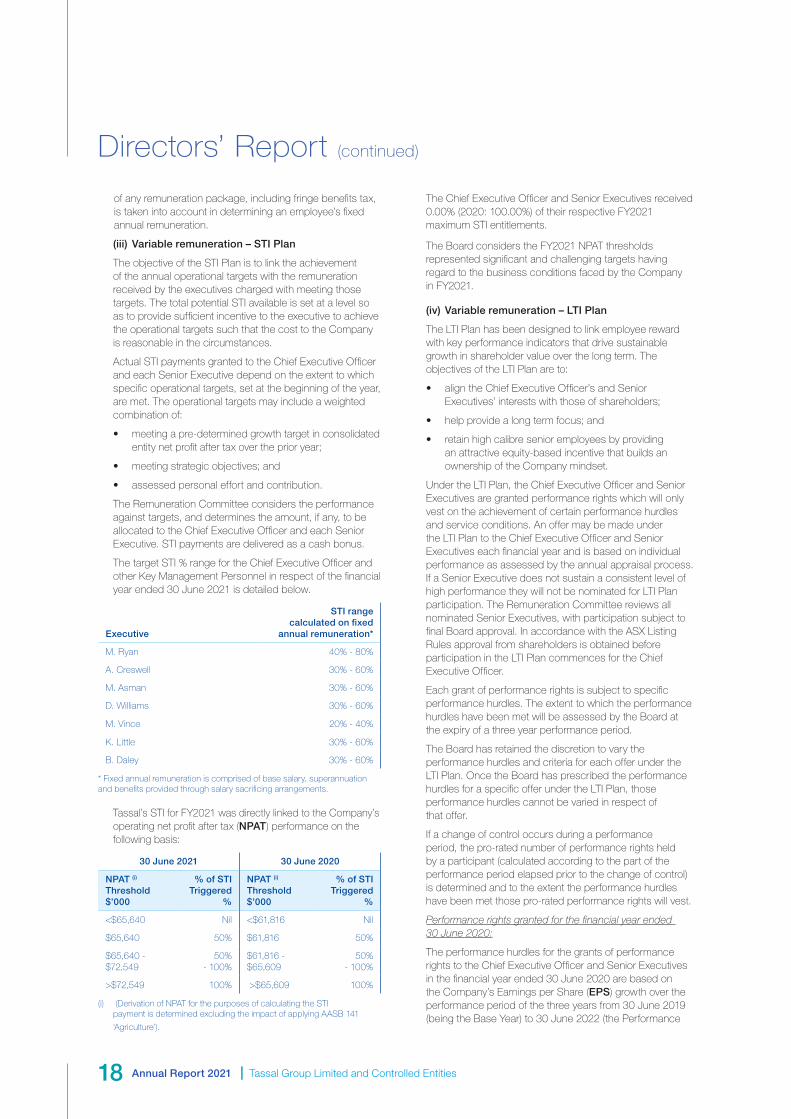
The target STI % range for the Chief Executive Officer and other Key Management Personnel in respect of the financial year ended 30 June 2021 is detailed below.
Executive
STI range calculated on fixed
annual remuneration*
M. Ryan 40% - 80%
A. Creswell 30% - 60%
M. Asman 30% - 60%
D. Williams 30% - 60%
M. Vince 20% - 40%
K. Little 30% - 60%
B. Daley 30% - 60%
* Fixed annual remuneration is comprised of base salary, superannuation and benefits provided through salary sacrificing arrangements.
Tassal’s STI for FY2021 was directly linked to the Company’s operating net profit after tax (NPAT) performance on the following basis:
30 June 2021 30 June 2020
NPAT (i)
Threshold $’000
% of STI Triggered
%
NPAT (i)
Threshold $’000
% of STI Triggered
%
<$65,640 Nil <$61,816 Nil
$65,640 50% $61,816 50%
$65,640 - $72,549
50% - 100%
$61,816 - $65,609
50% - 100%
>$72,549 100% >$65,609 100%
(i) (Derivation of NPAT for the purposes of calculating the STI payment is determined excluding the impact of applying AASB 141
‘Agriculture’).
The Chief Executive Officer and Senior Executives received 0.00% (2020: 100.00%) of their respective FY2021 maximum STI entitlements.
The Board considers the FY2021 NPAT thresholds represented significant and challenging targets having regard to the business conditions faced by the Company in FY2021.
(iv) Variable remuneration – LTI Plan
The LTI Plan has been designed to link employee reward with key performance indicators that drive sustainable growth in shareholder value over the long term. The objectives of the LTI Plan are to:
• align the Chief Executive Officer’s and Senior Executives’ interests with those of shareholders;
• help provide a long term focus; and
• retain high calibre senior employees by providing an attractive equity-based incentive that builds an ownership of the Company mindset.
Under the LTI Plan, the Chief Executive Officer and Senior Executives are granted performance rights which will only vest on the achievement of certain performance hurdles and service conditions. An offer may be made under the LTI Plan to the Chief Executive Officer and Senior Executives each financial year and is based on individual performance as assessed by the annual appraisal process. If a Senior Executive does not sustain a consistent level of high performance they will not be nominated for LTI Plan participation. The Remuneration Committee reviews all nominated Senior Executives, with participation subject to final Board approval. In accordance with the ASX Listing Rules approval from shareholders is obtained before participation in the LTI Plan commences for the Chief Executive Officer.
Each grant of performance rights is subject to specific performance hurdles. The extent to which the performance hurdles have been met will be assessed by the Board at the expiry of a three year performance period.
The Board has retained the discretion to vary the performance hurdles and criteria for each offer under the LTI Plan. Once the Board has prescribed the performance hurdles for a specific offer under the LTI Plan, those performance hurdles cannot be varied in respect of that offer.
If a change of control occurs during a performance period, the pro-rated number of performance rights held by a participant (calculated according to the part of the performance period elapsed prior to the change of control) is determined and to the extent the performance hurdles have been met those pro-rated performance rights will vest.
Performance rights granted for the financial year ended 30 June 2020:
The performance hurdles for the grants of performance rights to the Chief Executive Officer and Senior Executives in the financial year ended 30 June 2020 are based on the Company’s Earnings per Share (EPS) growth over the performance period of the three years from 30 June 2019 (being the Base Year) to 30 June 2022 (the Performance
Directors’ Report (continued)

Tassal Group Limited and Controlled Entities | Annual Report 2021 19
Period), and on the Company’s Return on Assets (ROA) performance for the financial year ended 30 June 2022. Each performance condition is summarised as follows:
Earnings Per Share Hurdle (EPS) (Applies to 50% of performance rights granted in the financial year ended 30 June 2020).
“EPS” means earnings per share for a financial year which is calculated as operating reported net profit after tax divided by the weighted average number of Shares on issue in the Company in respect of that financial year.
The EPS hurdle requires that the Company’s EPS growth over the Performance Period must be greater than the target set by the Board. The EPS target growth rate is linked to the Company’s Strategic Plan. The EPS hurdle was chosen as it provides evidence of the Company’s growth in earnings. The hurdle is as follows:
• if the compound average annual EPS growth rate over the Performance Period compared to the Base Year is less than 7.5% no performance rights will vest;
• if the compound average annual EPS growth rate over the Performance Period compared to the Base Year is equal to 7.5% but less than 12.5%, the portion of performance rights vesting will be increased on a pro-rata basis between 50% and 100%; or
• if the compound average annual EPS growth over the Performance Period compared to the Base Year is equal to or greater than 12.5%, all of the performance rights granted (and attached to this hurdle) will vest.
Return on Assets (ROA) (Applies to 50% of performance rights granted in the financial year ended 30 June 2020).
“ROA” means Return on Assets for a financial year which is calculated as operating earnings before interest and tax (EBIT) divided by average total assets in respect of that financial year.
The ROA hurdle requires that the Company’s ROA for the financial year ending 30 June 2022 must be greater than the target set by the Board. The ROA target is linked to the Company’s Strategic Plan. The ROA hurdle was chosen as it provides evidence of the Company’s ability to deliver growth in earnings through efficient use of the available asset base. The hurdle is as follows:
• if the Company’s ROA for the financial year ending 30 June 2022 is less than 9% no performance rights will vest;
• if the Company’s ROA for the financial year ending 30 June 2022 is equal to or greater than 9% but less than 11%, the proportion of performance rights vesting will be increased on a pro-rata basis between 50% and 100%; or
• if the Company’s ROA for the financial year ending 30 June 2022 is equal to or greater than 11%, all of the performance rights (and attached to this hurdle) will vest.
The Board considers that the selection and structuring of both EPS and ROA performance hurdles provides a suitably balanced approach to creating long term
shareholder value whilst ensuring that rewards reflect sustainable performance results.
The performance hurdles have been aligned with the performance expectations underlying the delivery of the Company’s Strategic Plan.
The minimum and maximum percentage of the Chief Executive Officer and other Key Management Personnel’s fixed annual remuneration applicable to performance rights granted during the financial year ending 30 June 2020 is detailed below.
Executive
LTI range calculated on fixed
annual remuneration*
M. Ryan 25% - 50%
A. Creswell 15% - 30%
M. Asman 15% - 30%
D. Williams 15% - 30%
K. Little 15% - 30%
B. Daley 15% - 30%
* Fixed annual remuneration is comprised of base salary, superannuation and benefits provided through salary sacrificing arrangements.
Performance rights granted during the financial year ended 30 June 2021:
The performance hurdle for the grants of performance rights to the Chief Executive Officer and Senior Executives in the financial year ended 30 June 2021 is based on the Company’s EPS and ROA growth over the performance period of the three years from 30 June 2020 (being the Base Year) to 30 June 2023 (the Performance Period) and are summarised as follows.
Earnings Per Share Hurdle (EPS) (Applies to 50% of performance rights granted in the financial year ended 30 June 2021).
“EPS” means earnings per share for a financial year which is calculated as operating reported net profit after tax divided by the weighted average number of Shares on issue in the Company in respect of that financial year.
The EPS hurdle requires that the Company’s EPS growth over the Performance Period must be greater than the target set by the Board. The EPS target growth rate is linked to the Company’s Strategic Plan. The EPS hurdle was chosen as it provides evidence of the Company’s growth in earnings. The hurdle is as follows:
• if the compound average annual EPS growth rate over the Performance Period compared to the Base Year is less than 4% no performance rights will vest;
• if the compound average annual EPS growth rate over the Performance Period compared to the Base Year is equal to 4% but less than 10%, the portion of performance rights vesting will be increased on a pro-rata basis between 50% and 100%; or
• if the compound average annual EPS growth over the Performance Period compared to the Base Year is equal to or greater than 10%, all of the performance rights granted (and attached to this hurdle) will vest.

Annual Report 2021 | Tassal Group Limited and Controlled Entities20
Return on Assets (ROA) (Applies to 50% of performance rights granted in the financial year ended 30 June 2021).
“ROA” means Return on Assets for a financial year which is calculated as operating earnings before interest and tax (EBIT) divided by average total assets in respect of that financial year.
The ROA hurdle requires that the Company’s ROA for the financial year ending 30 June 2023 must be greater than the target set by the Board. The ROA target is linked to the Company’s Strategic Plan. The ROA hurdle was chosen as it provides evidence of the Company’s ability to deliver growth in earnings through efficient use of the available asset base. The hurdle is as follows:
• if the Company’s ROA for the financial year ending 30 June 2023 is less than 8% no performance rights will vest;
• if the Company’s ROA for the financial year ending 30 June 2023 is equal to or greater than 8% but less than 10%, the proportion of performance rights vesting will be increased on a pro-rata basis between 50% and 100%; or
• if the Company’s ROA for the financial year ending 30 June 2023 is equal to or greater than 10%, all of the performance rights (and attached to this hurdle) will vest.
The Board considers that the selection and structuring of both EPS and ROA performance hurdles provides a suitably balanced approach to creating long term shareholder value whilst ensuring that rewards reflect sustainable performance results.
The performance hurdles have been aligned with the performance expectations underlying the delivery of the Company’s Strategic Plan.
The minimum and maximum percentage of the Chief Executive Officer and other Key Management Personnel’s fixed annual remuneration applicable to performance rights granted during the financial year ending 30 June 2021 is detailed below.
Executive
LTI range calculated on fixed
annual remuneration*
M. Ryan 40% - 80%
A. Creswell 30% - 60%
M. Asman 30% - 60%
D. Williams 30% - 60%
K. Little 30% - 60%
B. Daley 30% - 60%
* Fixed annual remuneration is comprised of base salary, superannuation
and benefits provided through salary sacrificing arrangements.
Performance rights to be granted for the financial year ending 30 June 2022:
Since the end of the financial year, the Board has approved the following LTI Plan dual performance hurdle structure for performance rights to be granted during the financial year ending 30 June 2022.
The performance hurdles for the grants of performance rights to the Chief Executive Officer and Senior Executives in the financial year ending 30 June 2022 will be based on the Company’s EPS (Earnings per Share) growth over the performance period of the three years from 30 June 2021 (being the Base Year) to 30 June 2024 (the Performance Period), and on the Company’s ROA (Return on Assets) performance for the financial year ending 30 June 2024. Each performance condition is summarised as follows:
Earnings Per Share Hurdle (EPS) (Applies to 50% of performance rights granted in the financial year ending 30 June 2022).
“EPS” means earnings per share for a financial year which is calculated as operating net profit after tax divided by the weighted average number of Shares on issue in the Company in respect of that financial year.
The EPS hurdle requires that the Company’s EPS growth over the Performance Period must be greater than the target set by the Board. The EPS target growth rate is linked to the Company’s Strategic Plan. The EPS hurdle was chosen as it provides evidence of the Company’s growth in earnings. The hurdle is as follows:
• if the compound average annual EPS growth rate over the Performance Period compared to the Base Year is less than 5% no performance rights will vest;
• if the compound average annual EPS growth rate over the Performance Period compared to the Base Year is equal to 5% but less than 10%, the portion of performance rights vesting will be increased on a pro-rata basis between 50% and 100%; or
• if the compound average annual EPS growth over the Performance Period compared to the Base Year is equal or greater than 10%, all of the performance rights granted (and attached to this hurdle) will vest.
Return on Assets (ROA) (Applies to 50% of performance rights granted in the financial year ending 30 June 2022).
“ROA” means Return on Assets for a financial year which is calculated as operating earnings before interest and tax (EBIT) divided by average total assets in respect of that financial year.
The ROA hurdle requires that the Company’s ROA for the financial year ending 30 June 2024 must be greater than the target set by the Board. The ROA target is linked to the Company’s Strategic Plan. The ROA hurdle was chosen as it provides evidence of the Company’s ability to deliver growth in earnings through efficient use of the available asset base. The hurdle is as follows:
• if the Company’s ROA for the financial year ending 30 June 2024 is less than 7% no performance rights will vest;
Directors’ Report (continued)

Tassal Group Limited and Controlled Entities | Annual Report 2021 21
• if the Company’s ROA for the financial year ending 30 June 2024 is equal to 7% but less than 9%, the proportion of performance rights vesting will be increased on a pro-rata basis between 50% and 100%; or
• if the Company’s ROA for the financial year ending 30 June 2024 is equal to or greater than 9%, all of the performance rights (and attached to this hurdle) will vest.
The Board considers that the selection and structuring of both EPS and ROA performance hurdles provides a suitably balanced approach to creating long term shareholder value whilst ensuring that rewards reflect sustainable performance results.
The performance hurdles have been aligned with the performance expectations underlying the delivery of the Company’s Strategic Plan.
The minimum and maximum percentage of the Chief Executive Officer and other Key Management Personnel’s fixed annual remuneration applicable to performance rights to be granted during the financial year ending 30 June 2022 is detailed below.
Executive
LTI range calculated on fixed
annual remuneration*
M. Ryan 40% - 80%
M. Asman 30% - 60%
A. Creswell 30% - 60%
M. Vince 20% - 40%
K. Little 30% - 60%
* Fixed annual remuneration is comprised of base salary, superannuation and benefits provided through salary sacrificing arrangements.
(v) Contract for services – Chief Executive Officer
The structure of the Chief Executive Officer’s compensation is in accordance with his employment agreement. The Chief Executive Officer’s employment agreement is for an indefinite term. The Company may terminate the agreement by providing twelve months’ notice and the Chief Executive Officer may terminate the agreement by providing twelve months’ notice to the Company. There are no termination benefits beyond statutory leave and superannuation obligations associated with the Chief Executive Officer’s termination in accordance with these notice requirements or in circumstances where notice is not required pursuant to his employment agreement.
(vi) Contract for services – Senior Executives
The terms on which the majority of Senior Executives are engaged provide for termination by either the Executive or the Company on six months’ notice. There are no termination benefits beyond statutory leave and superannuation obligations associated with these notice requirements.
(g) Key Management Personnel Compensation
(i) Identity of Key Management Personnel
The following were Key Management Personnel of the consolidated entity at any time during the financial year and unless otherwise indicated were Key Management Personnel for the entire period.
Directors:
Name Title
A. McCallum Chairman, Non-executive Director
M. Ryan Chief Executive Officer and Managing Director
J. Fazzino Non-executive Director
T. Gerber Non-executive Director (resigned 28 October 2020)
R. Haire Non-executive Director
G. Lynch Non-executive Director
J. McArthur Non-executive Director
J. Watson Non-executive Director
Other Key Management Personnel:
Name Title
A. Creswell Chief Financial Officer
M. Asman Head of Aquaculture
D. Williams Head of Sales (until 31 January 2021)
M. Vince Head of Sales (from 1 February 2021)
K. Little Head of People and Communities
B. Daley Head of Supply Chain and Commercial Services
(ii) Compensation of Key Management Personnel
Details of the nature and amount of each major element of the remuneration of each Key Management Personnel of the Company and the consolidated entity are set out below. The remuneration tables are calculated on an accrual basis.
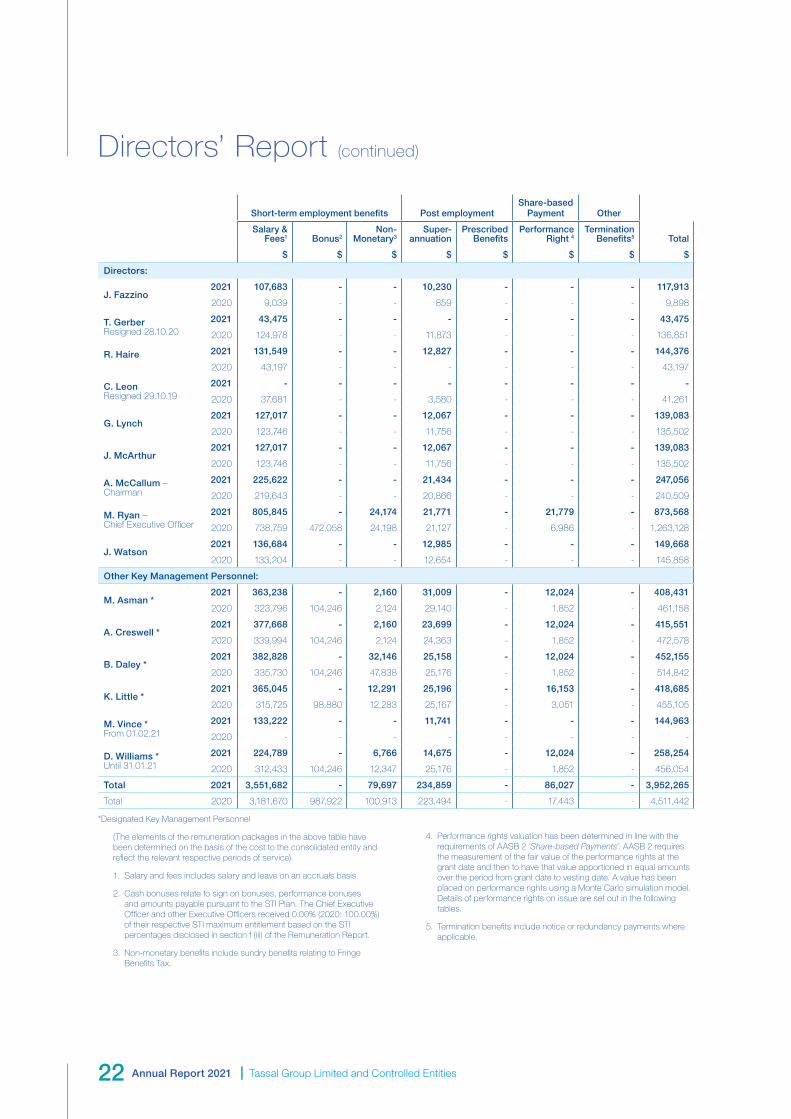
Annual Report 2021 | Tassal Group Limited and Controlled Entities22
Short-term employment benefits Post employmentShare-based
Payment Other
Salary & Fees1 Bonus2
Non-Monetary3
Super-annuation
Prescribed Benefits
Performance Right 4
Termination Benefits5 Total
$ $ $ $ $ $ $ $
Directors:
J. Fazzino2021 107,683 - - 10,230 - - - 117,913
2020 9,039 - - 859 - - - 9,898
T. Gerber Resigned 28.10.20
2021 43,475 - - - - - - 43,475
2020 124,978 - - 11,873 - - - 136,851
R. Haire 2021 131,549 - - 12,827 - - - 144,376
2020 43,197 - - - - - - 43,197
C. Leon Resigned 29.10.19
2021 - - - - - - - -
2020 37,681 - - 3,580 - - - 41,261
G. Lynch2021 127,017 - - 12,067 - - - 139,083
2020 123,746 - - 11,756 - - - 135,502
J. McArthur2021 127,017 - - 12,067 - - - 139,083
2020 123,746 - - 11,756 - - - 135,502
A. McCallum – Chairman
2021 225,622 - - 21,434 - - - 247,056
2020 219,643 - - 20,866 - - - 240,509
M. Ryan – Chief Executive Officer
2021 805,845 - 24,174 21,771 - 21,779 - 873,568
2020 738,759 472,058 24,198 21,127 - 6,986 - 1,263,128
J. Watson2021 136,684 - - 12,985 - - - 149,668
2020 133,204 - - 12,654 - - - 145,858
Other Key Management Personnel:
M. Asman *2021 363,238 - 2,160 31,009 - 12,024 - 408,431
2020 323,796 104,246 2,124 29,140 - 1,852 - 461,158
A. Creswell *2021 377,668 - 2,160 23,699 - 12,024 - 415,551
2020 339,994 104,246 2,124 24,363 - 1,852 - 472,578
B. Daley * 2021 382,828 - 32,146 25,158 - 12,024 - 452,155
2020 335,730 104,246 47,838 25,176 - 1,852 - 514,842
K. Little *2021 365,045 - 12,291 25,196 - 16,153 - 418,685
2020 315,725 98,880 12,283 25,167 - 3,051 - 455,105
M. Vince * From 01.02.21
2021 133,222 - - 11,741 - - - 144,963
2020 - - - - - - - -
D. Williams * Until 31.01.21
2021 224,789 - 6,766 14,675 - 12,024 - 258,254
2020 312,433 104,246 12,347 25,176 - 1,852 - 456,054
Total 2021 3,551,682 - 79,697 234,859 - 86,027 - 3,952,265
Total 2020 3,181,670 987,922 100,913 223,494 - 17,443 - 4,511,442
*Designated Key Management Personnel
(The elements of the remuneration packages in the above table have been determined on the basis of the cost to the consolidated entity and reflect the relevant respective periods of service).
1. Salary and fees includes salary and leave on an accruals basis.
2. Cash bonuses relate to sign on bonuses, performance bonuses and amounts payable pursuant to the STI Plan. The Chief Executive Officer and other Executive Officers received 0.00% (2020: 100.00%) of their respective STI maximum entitlement based on the STI percentages disclosed in section f (iii) of the Remuneration Report.
3. Non-monetary benefits include sundry benefits relating to Fringe Benefits Tax.
4. Performance rights valuation has been determined in line with the requirements of AASB 2 ‘Share-based Payments’. AASB 2 requires the measurement of the fair value of the performance rights at the grant date and then to have that value apportioned in equal amounts over the period from grant date to vesting date. A value has been placed on performance rights using a Monte Carlo simulation model. Details of performance rights on issue are set out in the following tables.
5. Termination benefits include notice or redundancy payments where applicable.
Directors’ Report (continued)
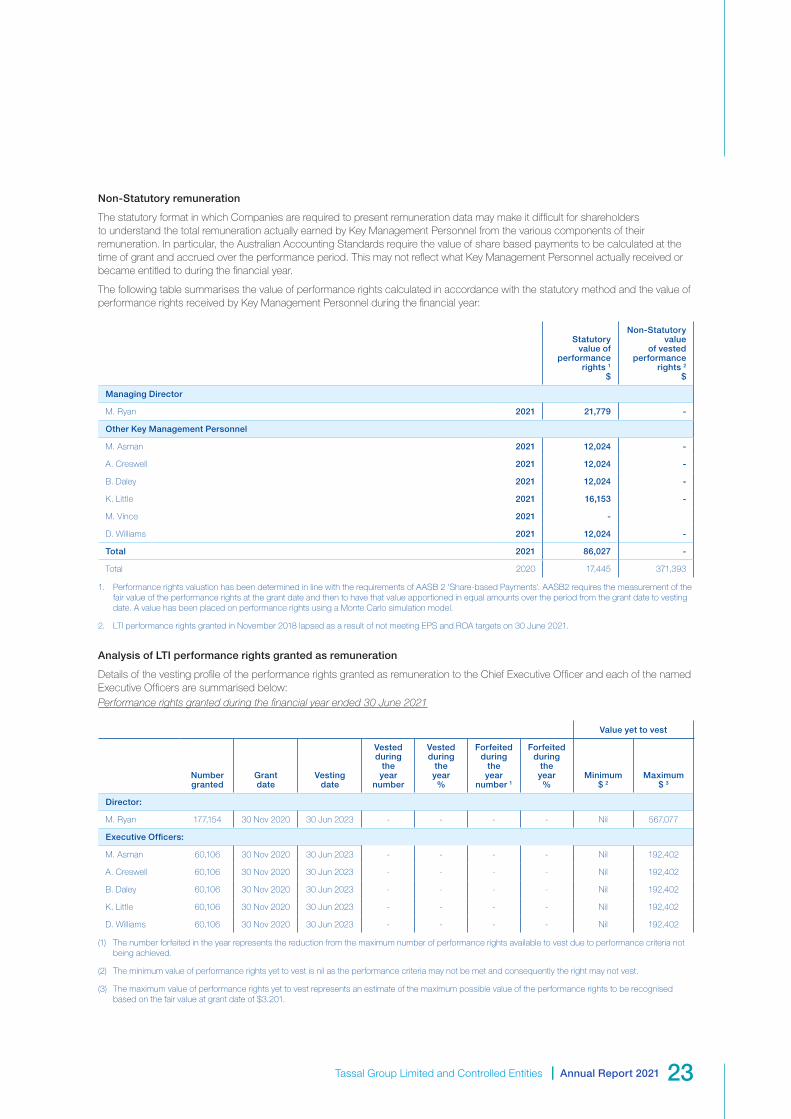
Tassal Group Limited and Controlled Entities | Annual Report 2021 23
Non-Statutory remuneration
The statutory format in which Companies are required to present remuneration data may make it difficult for shareholders to understand the total remuneration actually earned by Key Management Personnel from the various components of their remuneration. In particular, the Australian Accounting Standards require the value of share based payments to be calculated at the time of grant and accrued over the performance period. This may not reflect what Key Management Personnel actually received or became entitled to during the financial year.
The following table summarises the value of performance rights calculated in accordance with the statutory method and the value of performance rights received by Key Management Personnel during the financial year:
Statutory value of
performance rights 1
$
Non-Statutory value
of vested performance
rights 2
$
Managing Director
M. Ryan 2021 21,779 -
Other Key Management Personnel
M. Asman 2021 12,024 -
A. Creswell 2021 12,024 -
B. Daley 2021 12,024 -
K. Little 2021 16,153 -
M. Vince 2021 -
D. Williams 2021 12,024 -
Total 2021 86,027 -
Total 2020 17,445 371,393
1. Performance rights valuation has been determined in line with the requirements of AASB 2 'Share-based Payments'. AASB2 requires the measurement of the fair value of the performance rights at the grant date and then to have that value apportioned in equal amounts over the period from the grant date to vesting date. A value has been placed on performance rights using a Monte Carlo simulation model.
2. LTI performance rights granted in November 2018 lapsed as a result of not meeting EPS and ROA targets on 30 June 2021.
Analysis of LTI performance rights granted as remuneration
Details of the vesting profile of the performance rights granted as remuneration to the Chief Executive Officer and each of the named Executive Officers are summarised below:Performance rights granted during the financial year ended 30 June 2021
Value yet to vest
Number granted
Grant date
Vesting date
Vested during
the year
number
Vested during
the year %
Forfeited during
the year
number 1
Forfeited during
the year %
Minimum $ 2
Maximum $ 3
Director:
M. Ryan 177,154 30 Nov 2020 30 Jun 2023 - - - - Nil 567,077
Executive Officers:
M. Asman 60,106 30 Nov 2020 30 Jun 2023 - - - - Nil 192,402
A. Creswell 60,106 30 Nov 2020 30 Jun 2023 - - - - Nil 192,402
B. Daley 60,106 30 Nov 2020 30 Jun 2023 - - - - Nil 192,402
K. Little 60,106 30 Nov 2020 30 Jun 2023 - - - - Nil 192,402
D. Williams 60,106 30 Nov 2020 30 Jun 2023 - - - - Nil 192,402
(1) The number forfeited in the year represents the reduction from the maximum number of performance rights available to vest due to performance criteria not being achieved.
(2) The minimum value of performance rights yet to vest is nil as the performance criteria may not be met and consequently the right may not vest.
(3) The maximum value of performance rights yet to vest represents an estimate of the maximum possible value of the performance rights to be recognised based on the fair value at grant date of $3.201.

Annual Report 2021 | Tassal Group Limited and Controlled Entities24
Performance rights granted during the financial year ended 30 June 2020
Value yet to vest
Number granted
Grant date
Vesting date
Vested during
the year
number
Vested during
the year %
Forfeited during
the year
number 1
Forfeited during
the year %
Minimum $ 2
Maximum $ 3
Director:
M. Ryan 80,079 30 Nov 2019 30 Jun 2022 - - - - Nil 314,149
Executive Officers:
M. Asman 21,221 30 Nov 2019 30 Jun 2022 - - - - Nil 83,250
A. Creswell 21,221 30 Nov 2019 30 Jun 2022 - - - - Nil 83,250
B. Daley 21,221 30 Nov 2019 30 Jun 2022 - - - - Nil 83,250
K. Little 20,129 30 Nov 2019 30 Jun 2022 - - - - Nil 78,966
D. Williams 21,221 30 Nov 2019 30 Jun 2022 - - - - Nil 83,250
(1) The number forfeited in the year represents the reduction from the maximum number of performance rights available to vest due to performance criteria not being achieved.
(2) The minimum value of performance rights yet to vest is nil as the performance criteria may not be met and consequently the right may not vest.
(3) The maximum value of performance rights yet to vest represents an estimate of the maximum possible value of the performance rights to be recognised based on the fair value at grant date of $3.923.
Performance rights granted during the financial year ended 30 June 2019
Number granted
Grant date
Vesting date
Vested during
the year
number 1,5
Vested during
the year %
Forfeited during
the year
number 2
Forfeited during
the year %
Value vested
during the year $ 3
Value forfeited
during the year $ 4
Director:
M. Ryan 95,819 30 Nov 2018 30 Jun 2021 - 0.00% 95,819 100.00% - 370,599
Executive Officers:
M. Asman 25,392 30 Nov 2018 30 Jun 2021 - 0.00% 25,392 100.00% - 98,209
A. Creswell 25,392 30 Nov 2018 30 Jun 2021 - 0.00% 25,392 100.00% - 98,209
B. Daley 25,392 30 Nov 2018 30 Jun 2021 - 0.00% 25,392 100.00% - 98,209
K. Little 19,962 30 Nov 2018 30 Jun 2021 - 0.00% 19,962 100.00% - 77,207
D. Williams 25,392 30 Nov 2018 30 Jun 2021 - 0.00% 25,392 100.00% - 98,209
(1) The number vested in the year represents the allotment from the maximum number of performance rights available to vest due to performance criteria being achieved.
(2) The number forfeited in the year represents the reduction from the maximum number of performance rights available to vest due to performance criteria not being achieved.
(3) The value of performance rights vested based on the fair value at grant date of $3.868.
(4) The value of performance rights forfeited as the performance criteria were not met and consequently the right did not vest, based on the fair value at grant date of $3.868.
(5) An equivalent number of fully paid ordinary shares in respect of the performance rights granted during the year ended 30 June 2019 and which vested on 30 June 2021 will be issued pursuant to the Company’s Long-term incentive plan.
Directors’ Report (continued)
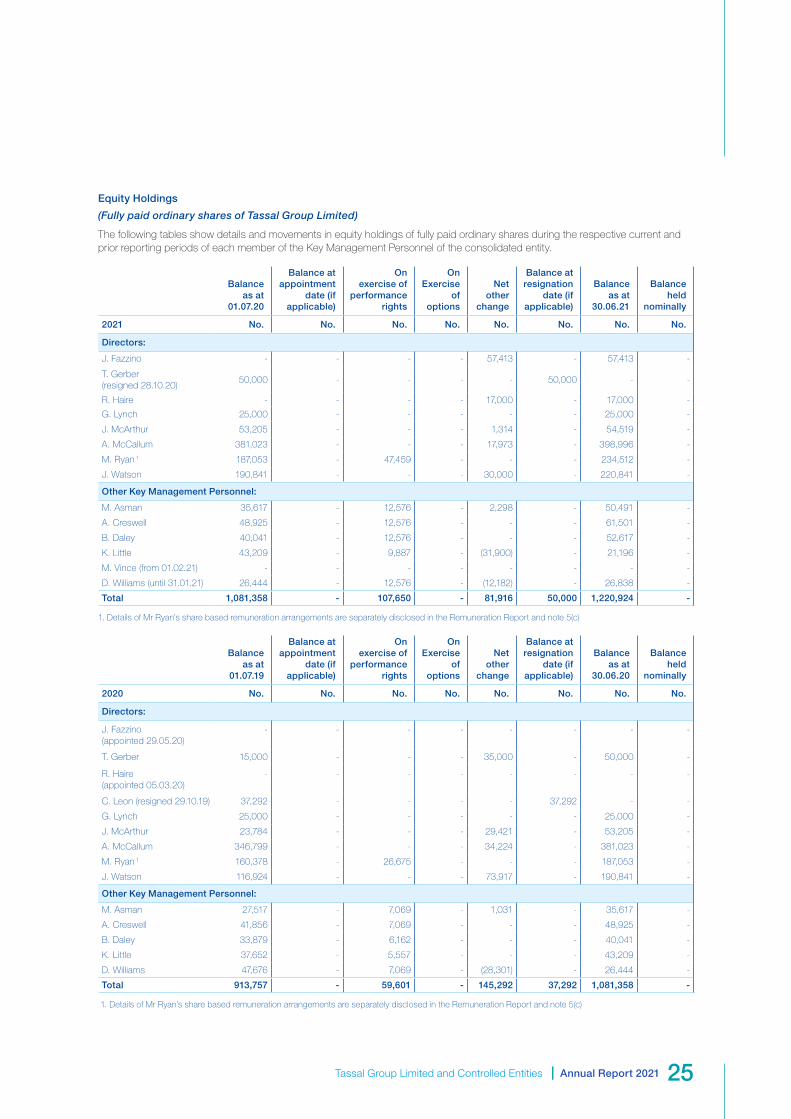
Tassal Group Limited and Controlled Entities | Annual Report 2021 25
Equity Holdings
(Fully paid ordinary shares of Tassal Group Limited)
The following tables show details and movements in equity holdings of fully paid ordinary shares during the respective current and prior reporting periods of each member of the Key Management Personnel of the consolidated entity.
Balance as at
01.07.20
Balance at appointment
date (if applicable)
On exercise of
performance rights
On Exercise
of options
Net other
change
Balance at resignation
date (if applicable)
Balance as at
30.06.21
Balance held
nominally
2021 No. No. No. No. No. No. No. No.
Directors:
J. Fazzino - - - - 57,413 - 57,413 -
T. Gerber (resigned 28.10.20)
50,000 - - - - 50,000 - -
R. Haire - - - - 17,000 - 17,000 -
G. Lynch 25,000 - - - - - 25,000 -
J. McArthur 53,205 - - - 1,314 - 54,519 -
A. McCallum 381,023 - - - 17,973 - 398,996 -
M. Ryan 1 187,053 - 47,459 - - - 234,512 -
J. Watson 190,841 - - - 30,000 - 220,841 -
Other Key Management Personnel:
M. Asman 35,617 - 12,576 - 2,298 - 50,491 -
A. Creswell 48,925 - 12,576 - - - 61,501 -
B. Daley 40,041 - 12,576 - - - 52,617 -
K. Little 43,209 - 9,887 - (31,900) - 21,196 -
M. Vince (from 01.02.21) - - - - - - - -
D. Williams (until 31.01.21) 26,444 - 12,576 - (12,182) - 26,838 -
Total 1,081,358 - 107,650 - 81,916 50,000 1,220,924 -
1. Details of Mr Ryan’s share based remuneration arrangements are separately disclosed in the Remuneration Report and note 5(c)
Balance as at
01.07.19
Balance at appointment
date (if applicable)
On exercise of
performance rights
On Exercise
of options
Net other
change
Balance at resignation
date (if applicable)
Balance as at
30.06.20
Balance held
nominally
2020 No. No. No. No. No. No. No. No.
Directors:
J. Fazzino (appointed 29.05.20)
- - - - - - - -
T. Gerber 15,000 - - - 35,000 - 50,000 -
R. Haire (appointed 05.03.20)
- - - - - - - -
C. Leon (resigned 29.10.19) 37,292 - - - - 37,292 - -
G. Lynch 25,000 - - - - - 25,000 -
J. McArthur 23,784 - - - 29,421 - 53,205 -
A. McCallum 346,799 - - - 34,224 - 381,023 -
M. Ryan 1 160,378 - 26,675 - - - 187,053 -
J. Watson 116,924 - - - 73,917 - 190,841 -
Other Key Management Personnel:
M. Asman 27,517 - 7,069 - 1,031 - 35,617 -
A. Creswell 41,856 - 7,069 - - - 48,925 -
B. Daley 33,879 - 6,162 - - - 40,041 -
K. Little 37,652 - 5,557 - - - 43,209 -
D. Williams 47,676 - 7,069 - (28,301) - 26,444 -
Total 913,757 - 59,601 - 145,292 37,292 1,081,358 -
1. Details of Mr Ryan’s share based remuneration arrangements are separately disclosed in the Remuneration Report and note 5(c)

Annual Report 2021 | Tassal Group Limited and Controlled Entities26
Long-term incentive plan - performance rights
The following table shows details and movements in equity holdings of performance rights granted pursuant to the Company’s Long-term incentive plan during the current reporting period of each member of the Key Management Personnel of the consolidated entity:
Balance as at
01.07.20
Balance at appointment
date (if applicable)
On exercise of
performance rights
On Exercise
of options
Net other
change
Balance at resignation
date (if applicable)
Balance as at
30.06.21
Balance held
nominally
2021 No. No. No. No. No. No. No. No.
Directors:
J. Fazzino - - - - - - - -
T. Gerber (resigned 28.10.20)
- - - - - - - -
R. Haire - - - - - - - -
G. Lynch
J. McArthur - - - - - - - -
A. McCallum - - - - - - - -
M. Ryan 1 175,898 - 177,154 - (95,819) - 257,233 -
J. Watson - - - - - - - -
Other Key Management Personnel:
M. Asman 46,613 - 60,106 - (25,392) - 81,327 -
A. Creswell 46,613 - 60,106 - (25,392) - 81,327 -
B. Daley 46,613 - 60,106 - (25,392) - 81,327 -
K. Little 40,091 - 60,106 - (19,962) - 80,235 -
M. Vince (from 01.02.21) - - - - - - - -
D. Williams (until 31.01.21) 46,613 - 60,106 - (25,392) - 81,327 -
Total 402,441 - 477,684 - (217,349) - 662,776 -
1. Details of Mr Ryan’s share based remuneration arrangements are separately disclosed in the Remuneration Report and note 5(c)
Balance as at
01.07.19
Balance at appointment
date (if applicable)
On exercise of
performance rights
On Exercise
of options
Net other
change
Balance at resignation
date (if applicable)
Balance as at
30.06.20
Balance held
nominally
2020 No. No. No. No. No. No. No. No.
Directors:
J. Fazzino (appointed 29.05.20)
- - - - - - - -
T. Gerber - - - - - - - -
R. Haire (appointed 05.03.20)
- - - - - - - -
C. Leon (resigned 29.10.19) - - - - - - - -
G. Lynch
J. McArthur - - - - - - - -
A. McCallum - - - - - - - -
M. Ryan 1 183,665 - 80,079 (47,459) (40,387) - 175,898 -
J. Watson - - - - - - - -
Other Key Management Personnel:
M. Asman 48,671 - 21,221 (12,576) (10,703) - 46,613 -
A. Creswell 48,671 - 21,221 (12,576) (10,703) - 46,613 -
B. Daley 48,671 - 21,221 (12,576) (10,703) - 46,613 -
K. Little 38,263 - 20,129 (9,887) (8,414) - 40,091 -
D. Williams 48,671 - 21,221 (12,576) (10,703) - 46,613 -
Total 416,612 - 185,092 (107,650) (91,613) - 402,441 -
1. Details of Mr Ryan’s share based remuneration arrangements are separately disclosed in the Remuneration Report and note 5(c)
All performance rights granted to Key Management Personnel were granted in accordance with the provisions of the Company’s Long-term Incentive Plan. Refer to the Remuneration Report and note 5 to the financial statements, for further details.
Directors’ Report (continued)

Tassal Group Limited and Controlled Entities | Annual Report 2021 27
21. ROUNDING OFF OF AMOUNTS
The Company is of a kind referred to in ASIC Corporations (Rounding in Financial / Directors’ Reports) Instrument 2016/191 and in accordance with that legislative instrument, amounts in the Annual Financial Report and the Directors’ Report have been rounded off to the nearest thousand dollars, unless otherwise indicated.
Signed in accordance with a resolution of Directors made pursuant to section 298(2) of the Corporations Act 2001.
On behalf of the Directors,
A. D. McCallum Chairman
Hobart this 17th day of August 2021

Annual Report 2021 | Tassal Group Limited and Controlled Entities28
Auditor’s Independence Declaration
The Board of Directors Tassal Group Limited Level 9, 1 Franklin Wharf Hobart TAS 7000
17 August 2021
Dear Board Members
Tassal Group Limited
In accordance with section 307C of the Corporations Act 2001, I am pleased to provide the following declaration of independence to the directors of Tassal Group Limited.
As lead audit partner for the audit of the financial statements of Tassal Group Limited for the financial year ended 30 June 2021, I declare that to the best of my knowledge and belief, there have been no contraventions of:
(i) the auditor independence requirements of the Corporations Act 2001 in relation to the audit; and
(ii) any applicable code of professional conduct in relation to the audit.
Yours sincerely
DELOITTE TOUCHE TOHMATSU
Chris BiermannPartner Chartered Accountant
Liability limited by a scheme approved under Professional Standards Legislation Member of Deloitte Asia Pacific Limited and the Deloitte Network
Deloitte Touche Tohmatsu ABN 74 490 121 060
Level 8 22 Elizabeth Street Hobart TAS 7000 Australia
Tel: +61 3 6237 7000 www.deloitte.com.au

Tassal Group Limited and Controlled Entities | Annual Report 2021 29
Financial Report Table of Contents
Income Statement 30
Statement of Comprehensive Income 31
Statement of Financial Position 32
Statement of Changes In Equity 33
Statement of Cashflows 34
Notes to the Financial Statements 35 - 73
Directors’ Declaration 74
Independent Auditor’s Report 75 - 77
Additional Securities Exchange Information 78 - 79

Annual Report 2021 | Tassal Group Limited and Controlled Entities30
Income Statementfor the year ended 30 June 2021
Note
Consolidated 2021
$’000
Consolidated 2020
$’000
Revenue 3(a) 583,860 552,706
Other income 3(b) 10,175 9,834
Fair value adjustment of biological assets (17,918) 6,109
Fair value adjustment of biological assets at point of harvest 14,812 6,061
Share of profits / (losses) of associates accounted for using the equity method 12 975 816
Changes in inventories of finished goods and work in progress 43,422 18,771
Raw materials and consumables used (335,454) (294,104)
Significant item – export supply chain expense (14,832) (2,863)
Employee benefits expense 3(c) (139,786) (125,791)
Depreciation and amortisation expense 3(c) (58,455) (38,731)
Finance costs 3(c) (13,297) (10,311)
Property transaction costs (1,599) (2,253)
Other expenses (23,842) (23,681)
Profit before income tax expense 48,061 96,563
Income tax expense 4 (13,441) (27,452)
Net profit for the period attributable to members of the Company 34,620 69,111
Note
Cents per share 2021
Cents per share 2020
Earnings per ordinary share:
Basic (cents per share) 28 16.40 34.03
Diluted (cents per share) 28 16.35 33.93
Notes to the financial statements are included on pages 35 to 73.

Tassal Group Limited and Controlled Entities | Annual Report 2021 31
Statement of Comprehensive Incomefor the year ended 30 June 2021
Note
Consolidated 2021
$’000
Consolidated 2020
$’000
Profit for the period 34,620 69,111
Other comprehensive income
Items that will not be reclassified subsequently to profit or loss:
Gain / (loss) on revaluation of property 14 - -
Income tax relating to items that will not be reclassified subsequently - -
Items that may be reclassified subsequently to profit or loss:
Gain / (loss) on cashflow hedges 26(a) - 263
Income tax relating to items that may be reclassified subsequently 26(a) - (79)
Other comprehensive income for the period (net of tax) - 184
Total comprehensive income for the period attributed to owners of the parent 34,620 69,295
Notes to the financial statements are included on pages 35 to 73.
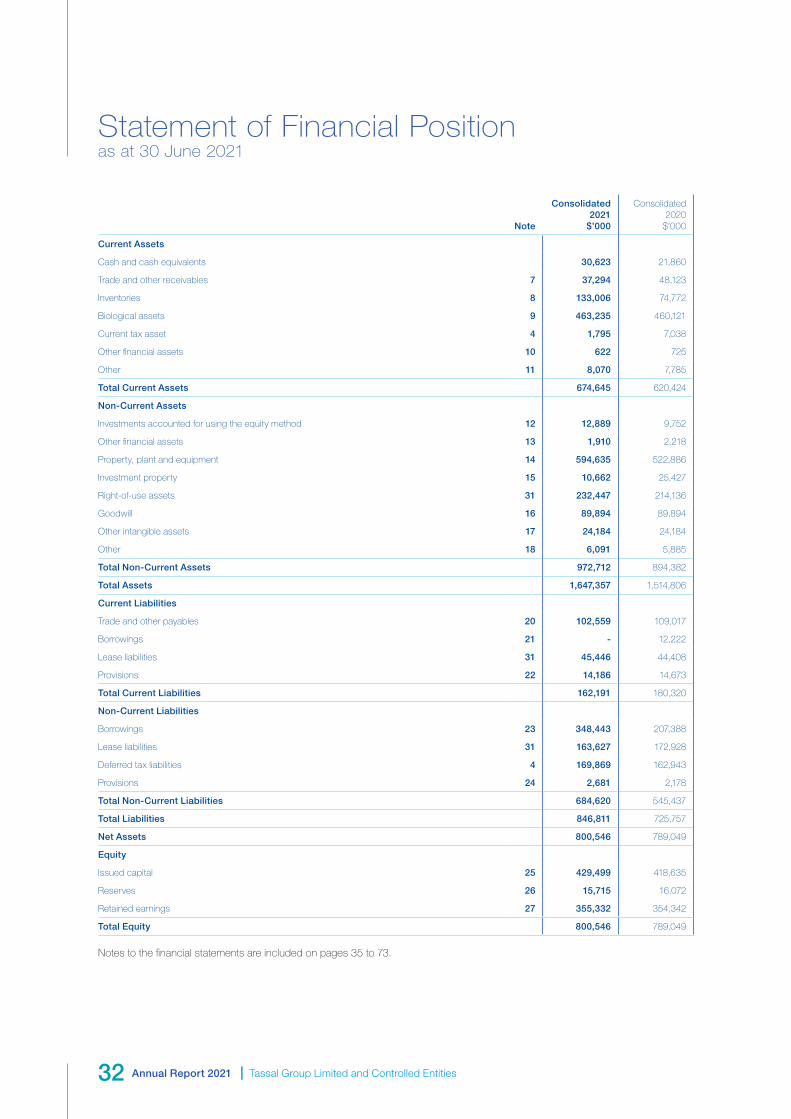
Annual Report 2021 | Tassal Group Limited and Controlled Entities32
Statement of Financial Positionas at 30 June 2021
Note
Consolidated 2021
$’000
Consolidated 2020
$’000
Current Assets
Cash and cash equivalents 30,623 21,860
Trade and other receivables 7 37,294 48,123
Inventories 8 133,006 74,772
Biological assets 9 463,235 460,121
Current tax asset 4 1,795 7,038
Other financial assets 10 622 725
Other 11 8,070 7,785
Total Current Assets 674,645 620,424
Non-Current Assets
Investments accounted for using the equity method 12 12,889 9,752
Other financial assets 13 1,910 2,218
Property, plant and equipment 14 594,635 522,886
Investment property 15 10,662 25,427
Right-of-use assets 31 232,447 214,136
Goodwill 16 89,894 89,894
Other intangible assets 17 24,184 24,184
Other 18 6,091 5,885
Total Non-Current Assets 972,712 894,382
Total Assets 1,647,357 1,514,806
Current Liabilities
Trade and other payables 20 102,559 109,017
Borrowings 21 - 12,222
Lease liabilities 31 45,446 44,408
Provisions 22 14,186 14,673
Total Current Liabilities 162,191 180,320
Non-Current Liabilities
Borrowings 23 348,443 207,388
Lease liabilities 31 163,627 172,928
Deferred tax liabilities 4 169,869 162,943
Provisions 24 2,681 2,178
Total Non-Current Liabilities 684,620 545,437
Total Liabilities 846,811 725,757
Net Assets 800,546 789,049
Equity
Issued capital 25 429,499 418,635
Reserves 26 15,715 16,072
Retained earnings 27 355,332 354,342
Total Equity 800,546 789,049
Notes to the financial statements are included on pages 35 to 73.

Tassal Group Limited and Controlled Entities | Annual Report 2021 33
Statement of Changes in Equityfor the year ended 30 June 2021
Consolidated
Issued capital
$’000
Asset revaluation
reserve $’000
Hedging reserve
$’000
Equity-settled
employee benefits reserve
$’000
Retained earnings
$’000
Total attributable
to equity holders of the entity
$’000
Balance as at 1 July 2019 288,814 14,090 (184) 2,097 322,181 626,998
Profit for the period - - - - 69,111 69,111
Gain / (loss) on revaluation of property (net of any related tax)
- - - - - -
Gain / (loss) on cashflow hedges (net of any related tax)
- - 184 - - 184
Total comprehensive income for the period - - 184 - 69,111 69,295
Payment of dividends - - - - (36,950) (36,950)
Issue of shares pursuant to dividend reinvestment plan
5,266 - - - - 5,266
Issue of shares pursuant to share placement 108,416 - - - - 108,416
Share placement costs (3,060) - - - - (3,060)
Related income tax 1,557 - - - - 1,557
Issue of shares pursuant to share purchase plan
17,431 - - - - 17,431
Issue of shares pursuant to executive long term incentive plan
211 - - (211) - -
Recognition of share-based payments - - - 96 - 96
Balance as at 30 June 2020 418,635 14,090 - 1,982 354,342 789,049
Balance as at 1 July 2020 418,635 14,090 - 1,982 354,342 789,049
Profit for the period - - - - 34,620 34,620
Gain / (loss) on revaluation of property (net of any related tax)
- - - - - -
Gain / (loss) on cashflow hedges (net of any related tax)
- - - - - -
Total comprehensive income for the period - - - - 34,620 34,620
Payment of dividends - - - - (33,630) (33,630)
Issue of shares pursuant to dividend reinvestment plan
10,432 - - - - 10,432
Issue of shares pursuant to executive long term incentive plan
432 - - (432) - -
Recognition of share-based payments - - - 75 - 75
Balance as at 30 June 2021 429,499 14,090 - 1,625 355,332 800,546
Notes to the financial statements are included on pages 35 to 73.
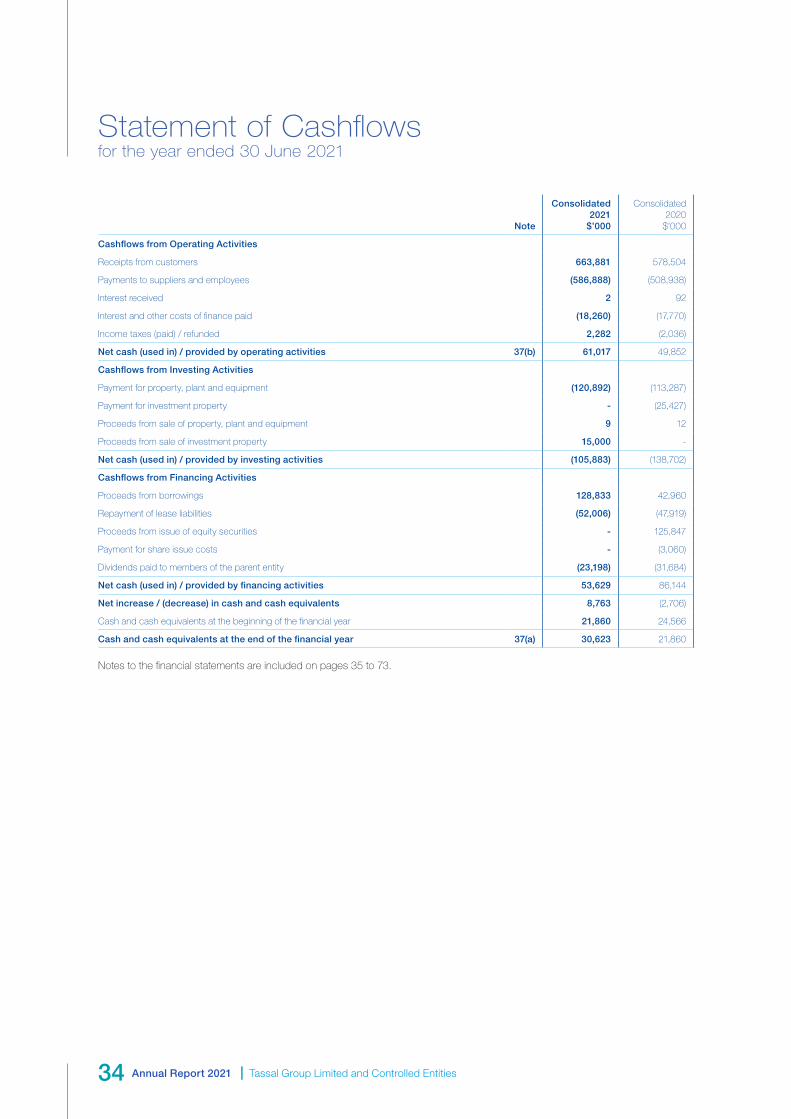
Annual Report 2021 | Tassal Group Limited and Controlled Entities34
Statement of Cashflowsfor the year ended 30 June 2021
Note
Consolidated 2021
$’000
Consolidated 2020
$’000
Cashflows from Operating Activities
Receipts from customers 663,881 578,504
Payments to suppliers and employees (586,888) (508,938)
Interest received 2 92
Interest and other costs of finance paid (18,260) (17,770)
Income taxes (paid) / refunded 2,282 (2,036)
Net cash (used in) / provided by operating activities 37(b) 61,017 49,852
Cashflows from Investing Activities
Payment for property, plant and equipment (120,892) (113,287)
Payment for investment property - (25,427)
Proceeds from sale of property, plant and equipment 9 12
Proceeds from sale of investment property 15,000 -
Net cash (used in) / provided by investing activities (105,883) (138,702)
Cashflows from Financing Activities
Proceeds from borrowings 128,833 42,960
Repayment of lease liabilities (52,006) (47,919)
Proceeds from issue of equity securities - 125,847
Payment for share issue costs - (3,060)
Dividends paid to members of the parent entity (23,198) (31,684)
Net cash (used in) / provided by financing activities 53,629 86,144
Net increase / (decrease) in cash and cash equivalents 8,763 (2,706)
Cash and cash equivalents at the beginning of the financial year 21,860 24,566
Cash and cash equivalents at the end of the financial year 37(a) 30,623 21,860
Notes to the financial statements are included on pages 35 to 73.

Tassal Group Limited and Controlled Entities | Annual Report 2021 35
Notes to the Financial Statements for the year ended 30 June 2021
Contents
1. Summary of Accounting Policies
2. Subsequent Events
3. Profit for the Year Before Tax
4. Income Taxes
5. Key Management Personnel Compensation
6. Remuneration of Auditors
7. Current Trade and Other Receivables
8. Current Inventories
9. Biological Assets
10. Other Current Financial Assets
11. Other Current Assets
12. Investments Accounted for Using the Equity Method
13. Other Non-current Financial Assets
14. Property, Plant and Equipment
15. Investment Property
16. Goodwill
17. Other Intangible Assets
18. Other Non-current Assets
19. Assets Pledged as Security
20. Current Trade and Other Payables
21. Current Borrowings
22. Current Provisions
23. Non-current Borrowings
24. Non-current Provisions
25. Issued Capital
26. Reserves
27. Retained Earnings
28. Earnings Per Share (EPS)
29. Dividends
30. Commitments for Expenditure
31. Right-of-use Assets and Lease Liabilities
32. Contingent Liabilities and Contingent Assets
33. Investments in Controlled Entities
34. Segment Information
35. Seasonality
36. Related Party Disclosures
37. Notes to the Statement of Cashflows
38. Financial Instruments
39. Parent Entity Information

Annual Report 2021 | Tassal Group Limited and Controlled Entities36
Notes to the Financial Statements for the year ended 30 June 2021
1. SUMMARY OF ACCOUNTING POLICIES
Statement of Compliance
The Annual Financial Report is a general purpose financial report and has been prepared in accordance with the Corporations Act 2001, Accounting Standards and Interpretations, and complies with other requirements of the law. For the purposes of preparing the consolidated financial statements, the consolidated entity is a for-profit entity. Accounting Standards include Australian Accounting Standards. Compliance with Australian Accounting Standards ensures that the financial statements and notes of the consolidated entity comply with International Financial Reporting Standards (IFRS).
The Annual Financial Report was authorised for issue by the Directors on 17 August 2021.
Basis of Preparation
The Annual Financial Report has been prepared on the basis of historic cost except for biological assets which are measured at net market value, and, if relevant for the revaluation of certain non-current assets and financial instruments, and except where stated, does not take into account changing money values or current valuations of non-current assets. Cost is based on the fair values of the consideration given in exchange for assets.
All amounts are presented in Australian Dollars, unless otherwise noted.
Fair value is the price that would be received to sell an asset or paid to transfer a liability in an orderly transaction between market participants at the measurement date, regardless of whether that price is directly observable or estimated using another valuation technique. In estimating the fair value of an asset or a liability, the Group takes into account the characteristics of the asset or liability if market participants would take those characteristics into account when pricing the asset or liability at the measurement date. Fair value for measurement and/or disclosure purposes in these consolidated financial statements is determined on such a basis, except for share-based payment transactions that are within the scope of AASB 2, leasing transactions that are within the scope of AASB 16, and measurements that have some similarities to fair value but are not fair value, such as net realisable value in AASB 102 or value in use in AASB 136.
In addition, for financial reporting purposes, fair value measurements are categorised into Level 1, 2 or 3 based on the degree to which the inputs to the fair value measurements are observable and the significance of the inputs to the fair value measurement in its entirety, which are described as follows:
• Level 1 inputs are quoted prices (unadjusted) in active markets for identical assets or liabilities that the entity can access at the measurement date;
• Level 2 inputs are inputs, other than quoted prices included within Level 1, that are observable for the asset or liability, either directly or indirectly; and
• Level 3 inputs are unobservable inputs for the asset or liability.
The Company is a company of the kind referred to in ASIC Corporations Instrument 2016/191 and in accordance with that Instrument amounts in the Annual Financial Report are rounded to the nearest thousand dollars, unless otherwise indicated.
Critical Accounting Judgements and Key Sources of Estimation Uncertainty
In the application of the consolidated entity’s accounting policies, management is required to make judgments, estimates and assumptions about carrying values of assets and liabilities that are not readily apparent from other sources.
The estimates and associated assumptions are based on historical experience and various other factors, including expectations of future events, that are believed to be reasonable under the circumstances, the results of which form the basis of making the judgments. Actual results may differ from these estimates.
The estimates and underlying assumptions are reviewed on an ongoing basis. Revisions to accounting estimates are recognised in the period in which the estimate is revised if the revision affects only that period, or in the period of the revision and future periods if the revision affects both current and future periods.
Judgments made by management in the application of consolidated entity’s accounting policies that have significant effects on the Annual Financial Report and estimates with a significant risk of material adjustments in the next year are disclosed, where applicable, in the relevant notes to the financial statements. They include the following significant judgements and estimates:
• Biological assets (refer to notes 1(w) and (9)) – including forecast harvest weights, forecast sale prices, forecast feed costs, labour and overheads, as well as discount rate.
• Impairment testing (refer to notes 1(g) and 1(k)), including assessment of future cash flows against carrying amounts.
Impact of Covid-19
As noted in the Review of Operations in the Directors’ Report, the Board and management have considered the impact of Covid-19 on the consolidated entity’s operations and financial performance and have noted that as an “Essential Service”, Tassal’s operations have, due to the risk mitigation measures employed, effectively continued as “normal”. In particular, Tassal’s supply chain has been resilient to date. The consolidated entity’s main financial impact from Covid-19 has been the incurring of additional export supply chain expenses due to the lower than normal airfreight capacity.
In preparing the consolidated financial report, management has considered the impact of Covid-19 on the various balances in the financial report, including the carrying value of trade receivables and inventories, as well as balances and accounting estimates for which cash flow forecasts are required to be prepared, such as the fair value of biological assets, impairment assessments of goodwill and brand names and forecast compliance with borrowing financial covenants. Management determined that there was no significant impact of Covid-19 on the abovementioned balances and accounting estimates.
Accounting policies are selected and applied in a manner which ensures that the resulting financial information satisfies the concepts of relevance and reliability, thereby ensuring that the substance of the underlying transactions or other events is reported.
The accounting policies set out below have been applied in preparing the financial statements for the year ended 30 June 2021, and the comparative information presented in these financial statements.
Tassal Group Limited and Controlled Entities | Annual Report 2021 37
Application of New and Revised Accounting Standards
(i) Amendments to AASBs and the new Interpretations that are mandatorily effective for the current year
The adoption of the following new and amended standards have not had any material impact on the disclosures or on the amounts reported in these financial statements. These amendments applicable to the Group include:
• Amendments to AASB 3 - Definition of Business
• Amendments to AASB 101 and AASB 108 - Definition of Material
• Amendments to AASB 9, AASB 139 - Interest Rate Benchmark Reform
(ii) Standards and Interpretations in issue not yet adopted
The following standards, amendments to standards and interpretations have been identified as those which may impact the Group in the period of initial application. The Group is required to disclose known or reasonably estimable information relevant to assessing the possible impact that the application of the new accounting standard will have on the Group’s financial statements. The Group’s preliminary assessment, of the impact of new standards and interpretations, is that the adoption of the following standards will not have a material impact on the financial statements of the Group in future periods.
• Amendments to AASB 9, AASB 139, AASB 7, and AASB 16 - Interest Rate Benchmark Reform Phase 2
At the date of authorisation of the financial statements, the Group has not applied the following new and revised Australian Accounting Standards, Interpretations and amendments that have been issued but are not yet effective:
Standard / Interpretation
Effective for financial years commencing on or after
Expected to be initially applied in the financial year ending
AASB 17 Insurance Contracts
1 January 2021 30 June 2022
AASB 2014-10 Amendments to Australian Accounting Standards – Sale or Contribution of Assets between an Investor and its Associate or of Amendments to AASB 10 and AASB 128 and Editorial Corrections
1 January 2022 30 June 2023
Significant Accounting Policies
The following significant accounting policies have been adopted in the preparation and presentation of the Annual Financial Report:
(a) Basis of Consolidation
The consolidated financial statements are prepared by combining the financial statements of all the entities that comprise the consolidated entity, being the Company (the parent entity) and its subsidiaries as defined in Accounting Standard AASB 10 ‘Consolidated Financial Statements’ (the Group). Control is achieved when the company:
• has power over the investee;
• i s exposed, or has rights, to variable returns from its involvement with the investee; and
• has the ability to use its power to affect its returns.
Consistent accounting policies are employed in the preparation and presentation of the consolidated financial statements.
On acquisition, the assets, liabilities and contingent liabilities of a subsidiary are measured at their fair values at the date of acquisition. Any excess of the cost of acquisition over the fair values of the identifiable net assets acquired is recognised as goodwill. If, after reassessment, the fair values of the identifiable net assets acquired exceeds the cost of acquisition, the difference is credited to profit or loss in the period of acquisition.
The interest of minority shareholders is stated at the minority’s proportion of the fair values of the assets and liabilities recognised.
The consolidated financial statements include the information and results of each subsidiary from the date on which the Company obtains control and until such time as the Company ceases to control such entities. In preparing the consolidated financial statements, all intercompany balances and transactions, and unrealised profits arising within the consolidated entity are eliminated in full.
(b) Borrowings
Borrowings are recorded initially at fair value, net of transaction costs.
Subsequent to initial recognition, borrowings are measured at amortised cost with any difference between the initial recognised amount and the redemption value being recognised in profit and loss over the period of the borrowing using the effective interest rate method.
(c) Borrowing Costs
Borrowing costs directly attributable to the acquisition, construction or production of qualifying assets, which are assets that necessarily take a substantial period of time to get ready for their intended use or sale, are added to the cost of those assets, until such time as the assets are substantially ready for their intended use or sale. Investment income earned on the temporary investment of specific borrowings pending their expenditure on qualifying assets is deducted from the borrowing costs eligible for capitalisation.
All other borrowing costs are recognised in profit or loss in the period in which they are incurred.
Annual Report 2021 | Tassal Group Limited and Controlled Entities38
Notes to the Financial Statements for the year ended 30 June 2021
(d) Cash and Cash Equivalents
Cash and cash equivalents comprise cash on hand, cash in banks and investments in money market instruments, net of outstanding bank overdrafts. Bank overdrafts are shown within borrowings in current liabilities in the statement of financial position.
(e) Derivative Financial Instruments
The consolidated entity uses derivative financial instruments, principally foreign exchange and interest rate related, to reduce their exposure to movements in foreign exchange rate and interest rate movements. Further details of derivative financial instruments are disclosed in note 38 to the financial statements.
The consolidated entity has adopted certain principles in relation to derivative financial instruments:
• it does not trade in a derivative that is not used in the hedging of an underlying business exposure of the consolidated entity; and
• derivatives acquired must be able to be recorded on the consolidated entity’s treasury management systems, which contain appropriate internal controls.
The Company and consolidated entity follow the same credit policies, legal processes, monitoring of market and operational risks in the area of derivative financial instruments, as they do in relation to financial assets and liabilities on the statement of financial position, where internal controls operate.
On a continuing basis, the consolidated entity monitors its future exposures and on some occasions hedges all or part of these exposures. The transactions which may be covered are future foreign exchange requirements and interest rate positions.
These exposures are then monitored and may be modified from time to time. The foreign exchange hedge instruments are transacted on a commitment basis and hedge operational transactions the consolidated entity expects to occur in this time frame. Interest rate derivative instruments can be for periods up to 3 – 5 years as the critical terms of the instruments are matched to the life of the borrowings.
Derivatives are initially recognised at fair value on the date a derivative contract is entered into and are subsequently re-measured to their fair value at each reporting date. The resulting gain or loss is recognised in profit or loss immediately unless the derivative is designated and effective as a hedging instrument, in which event, the timing of the recognition in profit or loss depends on the nature of the hedge relationship.
The consolidated entity designates certain derivatives as either hedges of the fair value of recognised assets or liabilities or firm commitments (fair value hedges) or hedges of highly probable forecast transactions (cashflow hedges).
Fair value hedge
Changes in the fair value of derivatives that are designated and qualify as fair value hedges are recorded in profit or loss immediately, together with any changes in the fair value of the hedged asset or liability that is attributable to the hedged risk.
Hedge accounting is discontinued when the hedge instrument expires or is sold, terminated, exercised, or no longer qualifies for hedge accounting. The adjustment to the carrying amount of the hedged item arising from the hedged risk is amortised to profit or loss from that date.
Cashflow hedge
The effective portion of changes in the fair value of derivatives that are designated and qualify as cashflow hedges are deferred in equity. The gain or loss relating to the ineffective portion is recognised immediately in profit or loss as part of other expenses or other income.
Amounts deferred in equity are recycled in profit or loss in the periods when the hedged item is recognised in profit or loss. However, when the forecast transaction that is hedged results in the recognition of a non-financial asset or a non-financial liability, the gains and losses previously deferred in equity are transferred from equity and included in the initial measurement of the cost of the asset or liability.
Hedge accounting is discontinued when the hedging instrument expires or is sold, terminated, or exercised, or no longer qualifies for hedge accounting. At that time, any cumulative gain or loss deferred in equity at that time remains in equity and is recognised when the forecast transaction is ultimately recognised in profit or loss. When a forecast transaction is no longer expected to occur, the cumulative gain or loss that was deferred in equity is recognised immediately in profit or loss.
(f) Employee Benefits
Provision is made for benefits accruing to employees in respect of wages and salaries, annual leave and long service leave when it is probable that settlement will be required and they are capable of being measured reliably.
Provisions made in respect of employee benefits expected to be settled within 12 months, are measured at their nominal values using the remuneration rate expected to apply at the time of settlement.
Provisions made in respect of employee benefits which are not expected to be settled within 12 months are measured as the present value of the estimated future cash outflows to be made by the consolidated entity in respect of services provided by employees up to reporting date.
Contributions to defined contribution superannuation plans are expensed when incurred.
(g) Financial Assets
Investments are recognised and derecognised on trade date where purchase or sale of an investment is under a contract whose terms require delivery of the investment within the timeframe established by the market concerned, and are initially measured at fair value, net of transaction costs.
Subsequent to initial recognition, investments in subsidiaries are measured at cost in the parent accounts. Subsequent to initial recognition, investments in associates are accounted for under the equity method in the consolidated financial statements and the cost method in the Company financial statements.
Other financial assets are classified into the following specified categories: financial assets ‘at fair value through profit or loss’, ‘available-for-sale’ (AFS) financial assets and ‘loans and receivables’. The classification depends on the nature and purpose of the financial assets and is determined at the time of initial recognition.
AFS financial assets
AFS financial assets are non-derivatives that are either designated as AFS or are not classified as (a) loans and

Tassal Group Limited and Controlled Entities | Annual Report 2021 39
receivables, (b) held-to-maturity investments or (c) financial assets at fair value through profit or loss.
The Group has investments in unlisted shares that are not traded in an active market but that are classified as AFS financial assets and stated at fair value (because the directors consider that fair value can be reliably measured). Fair value is determined in the manner described in note 38. Gains and losses arising from changes in fair value are recognised in other comprehensive income and accumulated in the investments revaluation reserve, with the exception of impairment losses, interest calculated using the effective interest method, and foreign exchange gains and losses on monetary assets, which are recognised in profit or loss. Where the investment is disposed of or is determined to be impaired, the cumulative gain or loss previously accumulated in the investments revaluation reserve is reclassified to profit or loss.
Loans and receivables
Trade receivables, loans, and other receivables are recorded at amortised cost using the effective interest method less impairment.
Impairment of financial assets
Financial assets, other than those at fair value through profit or loss, are assessed for indicators of impairment at each balance date. Financial assets are impaired where there is objective evidence that as a result of one or more events that occurred after the initial recognition of the financial asset the estimated future cashflows of the investment have been impacted.
Derecognition of financial assets
The Group derecognises a financial asset only when the contractual rights to the cashflows from the asset expire, or it transfers the financial asset and substantially all the risks and rewards of ownership of the asset to another entity. If the Group neither transfers nor retains substantially all the risks and rewards of ownership and continues to control the transferred asset, the Group recognises its retained interest in the asset and an associated liability for amounts it may have to pay. If the Group retains substantially all the risks and rewards of ownership of a transferred financial asset, the Group continues to recognise the financial asset and also recognises a collateralised borrowing for the proceeds received
(h) Financial Instruments Issued by the Consolidated Entity
Debt and equity instruments
Debt and equity instruments are classified as either liabilities or as equity in accordance with the substance of the contractual arrangement. An equity instrument is any contract that evidences a residual interest in the assets of an entity after deducting all of its liabilities. Equity instruments issued by the Company are recorded at the proceeds received, net of direct issue costs.
Financial guarantee contract liabilities
Financial guarantee contract liabilities are measured initially at their fair values and subsequently at the higher of the amount recognised as a provision and the amount initially recognised less cumulative amortisation in accordance with the revenue recognition policies described in note 1(u).
Financial liabilities
Financial liabilities are classified as either financial liabilities “at fair value through the profit or loss” or other financial liabilities.
Transaction costs on the issue of equity instruments
Transaction costs arising on the issue of equity instruments are recognised directly in equity as a reduction of the proceeds of the equity instruments to which the costs relate. Transaction costs are the costs that are incurred directly in connection with the issue of those equity instruments and which would not have been incurred had those instruments not been issued.
Interest and dividends
Interest and dividends are classified as expenses or as distributions of profit consistent with the statement of financial position classification of the related debt or equity instruments or component parts of compound instruments.
(i) Foreign Currency
Foreign currency transactions
All foreign currency transactions during the period are brought to account using the exchange rate in effect at the date of the transaction. Foreign currency monetary items at reporting date are translated at the exchange rate existing at reporting date. Non-monetary assets and liabilities carried at fair value that are denominated in foreign currencies are translated at the rates prevailing at the date when the fair value was determined.
Exchange differences are recognised in profit or loss in the period in which they arise except that:
• exchange differences which relate to assets under construction for future productive use are included in the cost of those assets where they are regarded as an adjustment to interest costs on foreign currency borrowings; and
• exchange differences on transactions entered into in order to hedge certain foreign currency risks (refer to note 1(e)).
(j) Goods and Service Tax
Revenues, expenses and assets are recognised net of the amount of goods and services tax (GST), except:
• where the amount of GST incurred is not recoverable from the taxation authority, it is recognised as part of the cost of acquisition of an asset or as part of an item of expense; or
• for receivables and payables which are recognised inclusive of GST.
The net amount of GST recoverable from, or payable to, the taxation authority is included as part of receivables or payables.
Cashflows are included in the statement of cashflows on a gross basis. The GST component of cashflows arising from investing and financing activities which is recoverable from, or payable to, the taxation authority is classified as operating cashflows
(k) Goodwill
Goodwill acquired in a business combination is initially measured at its cost, being the excess of the cost of the business combination over the acquirer’s interest in the net fair value of the identifiable assets, liabilities and contingent liabilities recognised. Goodwill is subsequently measured at its cost less any impairment losses.
Annual Report 2021 | Tassal Group Limited and Controlled Entities40
Notes to the Financial Statements for the year ended 30 June 2021
For the purpose of impairment testing, goodwill is allocated to each of the Group’s cash generating units (CGUs) (or groups of CGUs) expected to benefit from the synergies of the business combination. CGUs (or groups of CGUs) to which goodwill has been allocated are tested for impairment annually, or more frequently if events or changes in circumstances indicated that goodwill might be impaired.
If the recoverable amount of the CGU (or group of CGUs) is less than the carrying amount of the CGU (or groups of CGUs), the impairment loss is allocated first to reduce the carrying amount of any goodwill allocated to the CGU (or groups of CGUs) and then to the other assets in the CGU (or groups of CGUs). An impairment loss recognised for goodwill is recognised immediately in profit or loss and is not reversed in a subsequent period.
On disposal of an operation within a CGU, the attributable amount of goodwill is included in the determination of the profit or loss on disposal of the operation.
(l) Government Grants
Government grants are assistance by the government in the form of transfers of resources to the consolidated entity in return for past or future compliance with certain conditions relating to the operating activities of the entity. Government grants include government assistance where there are no conditions specifically relating to the operating activities of the consolidated entity other than the requirement to operate in certain regions or industry sectors.
Government grants are not recognised until there is reasonable assurance that the consolidated entity will comply with the conditions attaching to them and the grants will be received.
Government grants whose primary condition is that the consolidated entity should purchase, construct or otherwise acquire long-term assets are recognised as deferred income in the statement of financial position and recognised as income on a systematic and rational basis over the useful lives of the related assets.
Other government grants are recognised as income over the periods necessary to match them with the related costs which they are intended to compensate, on a systematic basis. Government grants that are receivable as compensation for expenses or losses already incurred or for the purpose of giving immediate financial support to the consolidated entity with no future related costs are recognised as income of the period in which it becomes receivable.
(m) Impairment of Long-lived Assets Excluding Goodwill
At each reporting date, the consolidated entity reviews the carrying amounts of its assets to determine whether there is any indication that those assets have suffered an impairment loss. If any such indication exists, the recoverable amount of the asset is estimated in order to determine the extent of the impairment loss (if any). Where the asset does not generate cashflows that are independent from other assets, the consolidated entity estimates the recoverable amount of the cash-generating unit to which the asset belongs.
Intangible assets with indefinite useful lives and intangible assets not yet available for use are tested for impairment annually and whenever there is an indication that the asset may be impaired.
Recoverable amount is the higher of fair value less costs to sell and value in use. In assessing value in use, the estimated future cashflows are discounted to their present value using a pre-tax discount rate that reflects current market assessments of the time value of money and the risks specific to the asset for which the estimates of future cashflows have not been adjusted.
If the recoverable amount of an asset (or cash-generating unit) is estimated to be less than its carrying amount, the carrying amount of the asset (cash-generating unit) is reduced to its recoverable amount. An impairment loss is recognised in profit or loss immediately unless the relevant asset is carried at fair value, in which case the impairment loss is treated as a revaluation decrease. Refer also note 1(s).
Where an impairment loss subsequently reverses, the carrying amount of the asset (cash-generating unit) is increased to the revised estimate of its recoverable amount, but only to the extent that the increased carrying amount does not exceed the carrying amount that would have been determined had no impairment loss been recognised for the asset (cash-generating unit) in prior years. A reversal of an impairment loss is recognised in profit or loss immediately unless the relevant asset is carried at fair value, in which case the impairment loss is treated as a revaluation decrease. Refer also note 1(s).
(n) Income Tax
Current tax
Current tax is calculated by reference to the amount of income taxes payable or recoverable in respect of the taxable profit or tax loss for the period. It is calculated using tax rates and tax laws that have been enacted or substantively enacted by reporting date. Current tax for current and prior periods is recognised as a liability (or asset) to the extent that it is unpaid (or refundable).
Deferred tax
Deferred tax is accounted for using the comprehensive balance sheet liability method in respect of temporary differences arising from differences between the carrying amount of assets and liabilities in the financial statements and the corresponding tax base of those items. The tax base of an asset or liability is the amount attributed to that asset or liability for tax purposes.
In principle, deferred tax liabilities are recognised for all taxable temporary differences. Deferred tax assets are recognised to the extent that it is probable that sufficient taxable amounts will be available against which deductible temporary differences or unused tax losses and tax offsets can be utilised. However, deferred tax assets and liabilities are not recognised if the temporary differences giving rise to them arise from the initial recognition of assets and liabilities (other than as a result of a business combination) which affects neither taxable income nor accounting profit. Furthermore, a deferred tax liability is not recognised in relation to taxable temporary differences arising from goodwill.
Deferred tax liabilities are recognised for taxable temporary differences arising on investments in subsidiaries, branches, associates and joint ventures except where the consolidated entity is able to control the reversal of the temporary differences and it is probable that the temporary differences will not reverse in the foreseeable future. Deferred tax assets arising from deductible temporary differences associated with these

Tassal Group Limited and Controlled Entities | Annual Report 2021 41
investments and interests are only recognised to the extent that it is probable that there will be sufficient taxable profits against which to utilise the benefits of the temporary differences and they are expected to reverse in the foreseeable future.
Deferred tax assets and liabilities are measured at the tax rates that are expected to apply to the period(s) when the asset and liability giving rise to them are realised or settled, based on tax rates (and tax laws) that have been enacted or substantively enacted by reporting date. The measurement of deferred tax liabilities and assets reflects the tax consequences that would follow from the manner in which the consolidated entity expects, at the reporting date, to recover or settle the carrying amount of its assets and liabilities.
Deferred tax assets and liabilities are offset when they relate to income taxes levied by the same taxation authority and the Company/consolidated entity intends to settle its current tax assets and liabilities on a net basis.
Current and deferred tax for the period
Current and deferred tax is recognised as an expense or income in the income statement, except when it relates to items credited or debited directly to equity, in which case the deferred tax is also recognised directly in equity, or where it arises from the initial accounting for a business combination, in which case it is taken into account in the determination of goodwill or excess.
Tax consolidation
The Company and all its wholly-owned Australian resident entities are part of a tax-consolidated group under Australian taxation law. Tassal Group Limited is the head entity in the tax-consolidated group.
Tax expense/income, deferred tax liabilities and deferred tax assets arising from temporary differences of the members of the tax-consolidated group are recognised in the separate financial statements of the members of the tax-consolidated group using the ‘separate taxpayer within group’ approach. Current tax liabilities and assets and deferred tax assets arising from unused tax losses and tax credits of the members of the tax-consolidated group are recognised by the Company (as head entity in the tax-consolidated group).
Due to the existence of a tax funding arrangement between the entities in the tax-consolidated group, amounts are recognised as payable to or receivable by the Company and each member of the group in relation to the tax contribution amounts paid or payable between the parent entity and the other members of the tax-consolidated group in accordance with the arrangement. Further information about the tax funding arrangement is detailed in note 4 to the financial statements. Where the tax contribution amount recognised by each member of the tax-consolidated group for a particular period is different to the aggregate of the current tax credits in respect of that period, the difference is recognised as a contribution from (or distribution to) equity participants.
(o) Intangible Assets
Research and development costs
Expenditure on research activities is recognised as an expense in the period in which it is incurred. Where no internally-generated intangible asset can be recognised, development expenditure is recognised as an expense in the period as incurred.
An intangible asset arising from development (or from the development phase of an internal project) is recognised if, and only if, all of the following are demonstrated:
• the technical feasibility of completing the intangible asset so that it will be available for use or sale;
• the intention to complete the intangible asset and use or sell it;
• the ability to use or sell the intangible asset;
• how the intangible asset will generate probable future economic benefits;
• the availability of adequate technical, financial and other resources to complete the development and to use or sell the intangible asset; and
• the ability to measure reliably the expenditure attributable to the intangible asset during its development.
The amount initially recognised for internally-generated intangible assets is the sum of the expenditure incurred from the date when the intangible assets first meets the recognition criteria listed above.
Subsequent to initial recognition, internally-generated intangible assets are reported at cost less accumulated amortisation and accumulated impairment losses, on the same basis as intangible assets acquired separately.
Brand names
Brand names recognised by the Company have an indefinite useful life and are not amortised. Each period, the useful life of this asset is reviewed to determine whether events and circumstances continue to support an indefinite useful life assessment for the asset. Such assets are tested for impairment in accordance with the policy stated in note 1(m).
Intangible assets acquired in a business combination
Intangible assets acquired in a business combination are identified and recognised separately from goodwill where they satisfy the definition of an intangible asset and their fair values can be measured reliably.
Subsequent to initial recognition, intangible assets acquired in a business combination are reported at cost less accumulated amortisation and accumulated impairment losses, on the same basis as intangible assets acquired separately.
Intangible assets acquired separately
Intangible assets with finite lives that are acquired separately are carried at cost less accumulated amortisation and accumulated impairment losses. Amortisation is recognised on a straight-line basis over their estimated useful lives. The estimated useful life and amortisation method are reviewed at the end of each reporting period, with the effect of any changes in estimate being accounted for on a prospective basis. Intangible assets with indefinite useful lives that are acquired separately are carried at cost less accumulated impairment losses.
(p) Inventories
Agricultural produce harvested from biological assets is measured at fair value less costs to sell at the point of harvest. Such measurement is the cost at that date when applying AASB 102 ‘Inventories’.

Annual Report 2021 | Tassal Group Limited and Controlled Entities42
Notes to the Financial Statements for the year ended 30 June 2021
Other inventories are valued at the lower of cost and net realisable value. Costs, including an appropriate portion of fixed and variable overhead expenses, are assigned to inventory on hand by the method most appropriate to each particular class of inventory, with the majority being valued on a first in first out or weighted average cost basis. Net realisable value represents the estimated selling price less all estimated costs of completion and costs necessary to make the sale.
(q) Leased Assets
The Group as a lessee
The Group assesses whether a contract is or contains a lease, at inception of the contract. The Group recognises a right-of-use asset and a corresponding lease liability with respect to all lease arrangements in which it is the lessee, except for short-term leases (defined as leases with a lease term of 12 months or less) and leases of low value assets (such as computers, small items of office furniture and telephones). For these leases, the Group recognises the lease payments as an operating expense on a straight-line basis over the term of the lease unless another systematic basis is more representative of the time pattern in which economic benefits from the leased assets are consumed.
The lease liability is initially measured at the present value of the lease payments that are not paid at the commencement date, discounted by using the rate implicit in the lease. If this rate cannot be readily determined, the lessee uses its incremental borrowing rate.
Lease payments included in the measurement of the lease liability comprise:
• Fixed lease payments (including in-substance fixed payments), less any lease incentives receivable;
• Variable lease payments that depend on an index or rate, initially measured using the index or rate at the commencement date;
• The amount expected to be payable by the lessee under residual value guarantees;
• The exercise price of purchase options, if the lessee is reasonably certain to exercise the options; and
• Payments of penalties for terminating the lease, if the lease term reflects the exercise of an option to terminate the lease.
The lease liability is presented as a separate line in the consolidated statement of financial position. The lease liability is subsequently measured by increasing the carrying amount to reflect interest on the lease liability (using the effective interest method) and by reducing the carrying amount to reflect the lease payments made.
The Group remeasures the lease liability (and makes a corresponding adjustment to the related right-of-use asset) whenever:
• The lease term has changed or there is a significant event or change in circumstances resulting in a change in the assessment of exercise of a purchase option, in which case the lease liability is remeasured by discounting the revised lease payments using a revised discount rate.
• The lease payments change due to changes in an index or rate or a change in expected payment under a guaranteed residual value, in which cases the lease liability is remeasured by discounting the revised lease payments using an unchanged discount rate (unless the lease payments change is due to a change in a floating interest rate, in which case a revised discount rate is used).
• A lease contract is modified and the lease modification is not accounted for as a separate lease, in which case the lease liability is remeasured based on the lease term of the modified lease by discounting the revised lease payments using a revised discount rate at the effective date of the modification.
The right-of-use assets comprise the initial measurement of the corresponding lease liability, lease payments made at or before the commencement day, less any lease incentives received and any initial direct costs. They are subsequently measured at cost less accumulated depreciation and impairment losses.
Whenever the Group incurs an obligation for costs to dismantle and remove a leased asset, restore the site on which it is located or restore the underlying asset to the condition required by the terms and conditions of the lease, a provision is recognised and measured under IAS 37. To the extent that the costs relate to a right-of-use asset, the costs are included in the related right-of-use asset, unless those costs are incurred to produce inventories.
Right-of-use assets are depreciated over the shorter period of lease term and useful life of the underlying asset. If a lease transfers ownership of the underlying asset or the cost of the right-of-use asset reflects that the Group expects to exercise a purchase option, the related right-of-use asset is depreciated over the useful life of the underlying asset. The depreciation starts at the commencement date of the lease.
The right-of-use assets are presented as a separate line in the consolidated statement of financial position.
Variable rents that do not depend on an index or rate are not included in the measurement of the lease liability and the right-of-use asset. The related payments are recognised as an expense in the period in which the event or condition that triggers those payments occurs and are included in ‘Other expenses’ in profit or loss. As a practical expedient, AASB 16 permits a lessee not to separate non-lease components, and instead account for any lease and associated non-lease components as a single arrangement. The Group has not used this practical expedient. For contracts that contain a lease component and one or more additional lease or non-lease components, the Group allocates the consideration in the contract to each lease component on the basis of the relative stand-alone price of the lease component and the aggregate stand-alone price of the non-lease components.
(r) Payables
Trade payables and other accounts payable are recognised when the consolidated entity becomes obliged to make future payments resulting from the purchase of goods and services.

Tassal Group Limited and Controlled Entities | Annual Report 2021 43
(s) Property, Plant and Equipment
Land and buildings are measured at fair value. Fair value is determined on the basis of an independent valuation prepared by external experts and in conformance with Australian Valuation Standards. The fair values are recognised in the financial statements of the consolidated entity, and are reviewed at the end of each reporting period to ensure that the carrying value of land and buildings is not materially different from their fair values.
On 30 June 2019, an independent valuation of the consolidated entity’s freehold land and freehold and leasehold buildings was performed by Mr M J Page [B.Bus.(Property)AAPI, CPV] to determine the fair value of land and buildings. Specialised land and buildings have been valued based on the depreciated replacement cost method. The valuation conforms to Australian Valuation Standards.
Any revaluation increase arising on the revaluation of land and buildings is credited to a revaluation reserve, except to the extent that it reverses a revaluation decrease for the same asset previously recognised as an expense in profit or loss, in which case the increase is credited to the income statement to the extent of the decrease previously charged. A decrease in carrying amount arising on the revaluation of land and buildings is charged as an expense in profit or loss to the extent that it exceeds the balance, if any, held in the revaluation reserve relating to a previous revaluation of that asset.
Depreciation on revalued buildings is charged to profit or loss. On the subsequent sale or retirement of a revalued property, the attributable revaluation surplus remaining in the revaluation reserve, net of any related taxes, is transferred directly to retained earnings.
Plant and equipment and equipment under finance lease are stated at cost less accumulated depreciation and impairment. Cost includes expenditure that is directly attributable to the acquisition of the item. In the event that settlement of all or part of the purchase consideration is deferred, cost is determined by discounting the amounts payable in the future to their present value as at the date of acquisition.
Depreciation is provided on property, plant and equipment, including freehold buildings but excluding land. Depreciation is calculated on a straight line basis so as to write off the net cost or other re-valued amount of each asset over its expected useful life to its estimated residual value. The estimated useful lives, residual values and depreciation method is reviewed at the end of each annual reporting period, with the effect of any change recognised on a prospective basis.
Assets held under finance leases are depreciated over their expected useful lives on the same basis as owned assets or, where shorter, the term of the relevant lease.
The gain or loss arising on disposal or retirement of an item of property, plant and equipment is determined as the difference between the sales proceeds and the carrying amount of the asset and is recognised in profit or loss.
The following estimated useful lives are used in the calculation of depreciation:
• Buildings 25 – 50 years
• Plant and equipment 2 – 20 years
• Equipment under finance lease 2 – 20 years
(t) Provisions
Provisions are recognised when the consolidated entity has a present obligation (legal or constructive) as a result of a past event, it is probable that the consolidated entity will be required to settle the obligation, and a reliable estimate can be made of the amount of the obligation.
The amount recognised as a provision is the best estimate of the consideration required to settle the present obligation at reporting date, taking into account the risks and uncertainties surrounding the obligation. Where a provision is measured using the cashflows estimated to settle the present obligation, its carrying amount is the present value of those cashflows.
When some or all of the economic benefits required to settle a provision are expected to be recovered from a third party, a receivable is recognised as an asset if it is virtually certain that reimbursement will be received and the amount of the receivable can be measured reliably.
Onerous Contracts
Present obligations arising under onerous contracts are recognised and measured as a provision. An onerous contract is considered to exist where the consolidated entity has a contract under which the unavoidable costs of meeting the obligations under the contract exceed the economic benefits expected to be received under it.
Restructurings
A restructuring provision is recognised when the consolidated entity has developed a detailed formal plan for the restructuring and has raised a valid expectation in those affected that it will carry out the restructuring by starting to implement the plan or announcing its main features to those affected by it. The measurement of a restructuring provision includes only the direct expenditures arising from the restructuring, which are those amounts that are both necessarily entailed by the restructuring and not associated with the ongoing activities of the entity.
Dividends
A provision is recognised for dividends when they have been approved on or before the reporting date.
(u) Revenue Recognition
Sale of goods
Revenue from the sale of goods is recognised when all the following conditions are satisfied:
• the consolidated entity has transferred to the buyer the significant risks and rewards of ownership of the goods;
• the consolidated entity retains neither continuing managerial involvement to the degree usually associated with ownership nor effective control over the goods sold;
• the amount of revenue can be measured reliably;
• it is probable that the economic benefits associated with the transaction will flow to the entity; and
• the costs incurred or to be incurred in respect of the transaction can be measured reliably.

Annual Report 2021 | Tassal Group Limited and Controlled Entities44
Notes to the Financial Statements for the year ended 30 June 2021
Dividend and interest revenue
Dividend revenue from investments is recognised when the shareholder’s right to receive payment has been established.
Interest revenue is accrued on a time basis, by reference to the principal outstanding and at the effective interest rate applicable, which is the rate that exactly discounts estimated future cash receipts through the expected life of the financial asset to that asset’s net carrying amount.
(v) Share-based Payments
Equity-settled share-based payments with employees are measured at the fair value of the equity instrument at the grant date. Fair value is measured by use of a Monte Carlo simulation model, taking into account the terms and conditions upon which the equity-settled share-based payment were granted. The expected life used in the model has been adjusted, based on management’s best estimate, for the effects of non-transferability, exercise restrictions, and behavioral considerations. Further details on how the fair value of equity-settled share-based transactions has been determined can be found in note 5 (c) (i) to the financial statements.
The fair value determined at the grant date of the equity-settled share-based payments is expensed on a straight-line basis over the vesting period, based on the consolidated entity’s estimate of shares that will eventually vest.
At each reporting date, the Group revises its estimates of the number of equity instruments expected to vest. The impact of the revision of the original estimates, if any, is recognised in profit or loss over the remaining vesting period, with corresponding adjustment to the equity-settled employee benefits reserve.
(w) Biological Assets – Livestock
Livestock assets are valued at fair value less estimated point of sale costs. This fair value is the amount which could be expected to be received from the disposal of the asset in an active and liquid market less the costs expected to be incurred in realising the proceeds of such disposal. The net increment / (decrement) in the fair value of livestock is recognised as income / (expense) in the reporting period.
Where an active and liquid market is not available, fair value is determined using the present value of expected net cashflows from the asset discounted at a current market-determined rate. The net cashflows are reduced for harvesting costs and freight costs to market. Further the expected net cashflows take into account the expected weight of the livestock at harvest, expected costs and sale prices, and incorporates expected possible variations in the net cashflows.
The change in estimated fair value is recognised in the income statement and is classified separately.
Fair value has been determined in accordance with Directors’ valuation.
Historic cost is used as an estimate of fair value where little or no biological transformation has taken place
(x) Financial Risk Management Strategies Relating to Agricultural Activities
The Board considers that there is no satisfactory market for the insurance of livestock (i.e. live salmon and prawns). Recognising this, the consolidated entity has in place a robust and comprehensive risk management strategy to monitor and oversee its agricultural activities (i.e. salmon and prawn farming). The policy framework is broad, with risk management addressed via species diversification, marine and hatchery site geographical diversification, conservative finfish husbandry practices, experienced management with international expertise and extensive investment in infrastructure improvements and automation.
(y) Investments in Associates
An associate is an entity over which the Group has significant influence and that is neither a subsidiary nor an interest in a joint venture. Significant influence is the power to participate in the financial and operating policy decisions of the investee but is not control or joint control over those policies.
The result and assets and liabilities of associates are incorporated in these financial statements using the equity method of accounting, except when the investment is classified as held for sale, in which case it is accounted for in accordance with AASB 5 ‘Non-current Assets Held for Sale and Discontinued Operations’. Under the equity method, investments in associates are carried in the consolidated statement of financial position at cost as adjusted for post-acquisition changes in the Group’s share of the net assets of the associate, less any impairment in the value of individual investments.
Losses of an associate in excess of the Group’s interest in that associate (which includes any long-term interests that, in substance, form part of the Group’s net investment in the associate) are recognised only to the extent that the Group has incurred legal or constructive obligations or made payments on behalf of the associate.
Any excess of the cost of acquisition over the Group’s share of the net fair value of the identifiable assets, liabilities and contingent liabilities of the associate recognised at the date of the acquisition is recognised as goodwill. The goodwill is included within the carrying amount of the investment and is assessed for impairment as part of that investment. Any excess of the Group’s share of the net fair value of the identifiable assets, liabilities and contingent liabilities over the cost of the acquisition, after reassessment, is recognised immediately in profit or loss. Where a Group entity transacts with an associate of the Group, profits and losses are eliminated to the extent of the Group’s interest in the relevant associate.
(z) Investment Property
Investment property, which is property held to earn rentals and/or capital appreciation (including property under construction for such purposes) is measured at cost. An investment property is derecognised upon disposal or when the investment property is permanently withdrawn from use and no future economic benefits are expected from the disposal. Any gain or loss arising from the derecognition of the property (calculated as the difference between the net disposal proceeds and the carrying amount of the asset) is included in profit or loss in the period in which the property is derecognised.

Tassal Group Limited and Controlled Entities | Annual Report 2021 45
2. SUBSEQUENT EVENTS
Final Dividend Declared
On 17 August 2021, the Directors declared a final unfranked dividend of 7.00 cents per ordinary share amounting to $14.864 million in respect of the financial year ended 30 June 2021. The record date for determining entitlements to this dividend is 15 September 2021. The final dividend will be paid on 29 September 2021.
The final dividend has not been recognised in this Annual Financial Report because the final dividend was declared subsequent to 30 June 2021.
3. PROFIT FOR THE YEAR BEFORE TAX
Consolidated 2021
$’000
Consolidated 2020
$’000
Profit from operations before income tax expense includes the following items of revenue and expense:
(a) Revenue
Revenue from the sale of goods:
Domestic wholesale market 153,766 152,768
Domestic retail market 338,702 294,379
Export market 91,390 105,467
Interest revenue 2 92
Total revenue 583,860 552,706
(b) Other income
Gain / (loss) on disposal of property, plant and equipment - (13)
Gain / (loss) on disposal of investment property 2,235 -
Government grants received 3,852 3,349
Other 4,088 6,498
Total other income 10,175 9,834
(c) Expenses
Depreciation of non-current assets 36,823 29,990
Depreciation of right-of-use assets 21,602 8,711
Amortisation of non-current assets 30 30
Total depreciation and amortisation 58,455 38,731
Interest - other entities 6,663 6,587
Interest – lease liabilities 6,634 3,724
Total finance costs (i) 13,297 10,311
Notes:
(i) Additional finance costs of $1.529 million were included in the cost of qualifying assets during the current year (2020: $1.463 million).
(ii) The weighted average capitalisation rate on funds borrowed generally is 0.09% (2020: 0.14%).
Employee benefits expense:
Equity settled share-based payments 75 96
Post-employment benefits 10,081 9,055
Other employee benefits 129,630 116,640
Total employee benefits expense 139,786 125,791
Net bad and doubtful debts – other entities 36 15
Write-downs of inventories to net realisable value 892 886
Research and development costs immediately expensed 978 1,071

Annual Report 2021 | Tassal Group Limited and Controlled Entities46
Notes to the Financial Statements for the year ended 30 June 2021
4. INCOME TAXES
Consolidated 2021
$’000
Consolidated 2020
$’000
(a) Income tax recognised in profit or loss:
Tax (expense)/income comprises:
Current tax (expense)/income (2,961) -
Adjustment recognised in the current year in relation to the current tax of prior years - 427
Deferred tax (expense)/income relating to the origination and reversal of temporary differences and use of carry forward tax losses
(10,480) (27,879)
Total tax (expense)/income (13,441) (27,452)
The prima facie income tax (expense)/income on pre-tax accounting profit from operations reconciles to the income tax (expense)/income in the financial statements as follows:
Profit from operations 48,061 96,563
Income tax (expense)/benefit calculated at 30% (14,418) (28,969)
Non-tax deductible items (70) (120)
Research and development concession 1,047 1,637
Income tax (expense)/benefit (13,441) (27,452)
The tax rate used in the above reconciliation is the corporate tax rate of 30% payable by Australian corporate entities on taxable profits under Australian tax law. There has been no change in the corporate tax rate when compared with the previous reporting period.
(b) Income tax recognised directly in equity
Deferred tax:
Property, plant and equipment - -
Property, plant and equipment – adoption of AASB 16 - 2,940
Employee share reserve 65 64
Revaluation of financial instruments treated as cashflow hedges - (79)
Capital raising costs - 1,557
65 4,482
(c) Current tax balances:
Current tax assets/(liabilities) comprise:
Income tax payable attributable to:
Entities in the tax-consolidated group 1,795 5,680
Research & Development income - 1,358
Net current tax asset/(liability) 1,795 7,038
(d) Deferred tax balances:
Deferred tax assets comprise:
Temporary differences 8,219 8,630
Carry forward tax losses and R&D offsets 18,899 5,580
27,118 14,210
Deferred tax liabilities comprise:
Temporary differences (196,987) (177,153)
(196,987) (177,153)
Net deferred tax asset/(liability) (169,869) (162,943)

Tassal Group Limited and Controlled Entities | Annual Report 2021 47
4. INCOME TAXES
(d) Deferred tax balances: (cont.) Taxable and deductible temporary differences arise from the following:
Opening balance Acquisition
Charged to income
Charged to equity
Closing balance
Consolidated $’000 $’000 $’000 $’000 $’000
2021
Deferred tax liabilities:
Biological assets (129,386) - (3,354) - (132,740)
Inventories (10,415) - (7,428) - (17,843)
Property, plant and equipment (32,527) - (8,739) - (41,266)
Investment in associates (1,352) - (293) - (1,645)
Other financial assets (3,473) - (20) - (3,493)
(177,153) - (19,834) - (196,987)
Deferred tax assets:
Provisions 4,389 - 735 - 5,124
Trade and other payables 219 - 19 - 238
Tax losses and R&D offsets 5,580 - 13,319 - 18,899
Other 4,022 - (1,230) 65 2,857
14,210 - 12,843 65 27,118
(162,943) - (6,991) 65 (169,869)
Reduction arising from:
Revenue tax losses and R&D offset - - - - -
Net deferred tax asset/(liability) (162,943) - (6,991) 65 (169,869)
2020
Deferred tax liabilities:
Biological assets (115,127) - (14,259) - (129,386)
Inventories (7,332) - (3,083) - (10,415)
Property, plant and equipment (22,876) - (9,651) - (32,527)
Investment in associates (839) - (513) - (1,352)
Other financial assets (2,541) - (932) - (3,473)
(148,715) - (28,438) - (177,153)
Deferred tax assets:
Provisions 3,811 - 578 - 4,389
Other intangible assets 99 - (99) - -
Trade and other payables 196 - 23 - 219
Cashflow hedges 79 - - (79) -
Tax losses and R&D offsets - - 5,580 - 5,580
Other 1,269 - (1,808) 4,561 4,022
5,454 - 4,274 4,482 14,210
(143,261) - (24,164) 4,482 (162,943)
Reduction arising from:
Revenue tax losses and R&D offset
Net deferred tax asset/(liability) (143,261) - (24,164) 4,482 (162,943)

Annual Report 2021 | Tassal Group Limited and Controlled Entities48
Notes to the Financial Statements for the year ended 30 June 2021
4. INCOME TAXES (CONT.)
(e) Tax consolidation
Relevance of tax consolidation to the consolidated entity
The Company and its wholly-owned Australian resident entities have formed a tax-consolidated group with effect from 19 September 2003 and are therefore taxed as a single entity from that date. The head entity within the tax-consolidated group is Tassal Group Limited. The members of the tax-consolidated group are identified at note 33.
Nature of tax funding arrangements and tax sharing agreements
Entities within the tax-consolidated group have entered into a tax funding arrangement and a tax-sharing agreement with the head entity.
Under the terms of the tax funding arrangement, Tassal Group Limited and each of the entities in the tax-consolidated group has agreed to pay a tax equivalent payment to or from the head entity, based on the current tax liability or current tax asset of the entity. Such amounts are reflected in amounts receivable from or payable to other entities in the tax-consolidated group.
The tax sharing agreement entered into between members of the tax-consolidated group provides for the determination of the allocation of income tax liabilities between the entities should the head entity default on its tax payment obligations. No amounts have been recognised in the financial statements in respect of this agreement as payment of any amounts under the tax sharing agreement is considered remote.
5. KEY MANAGEMENT PERSONNEL COMPENSATION
(a) Identity of Key Management Personnel:
The following were Key Management Personnel of the consolidated entity at any time during the financial year and unless otherwise indicated were Key Management Personnel for the entire period. Further details of the company’s determination of key management personnel for the 2021 and 2020 financial years are included in the Remuneration Report in the Director’s Report.
Name Title
A. McCallum Chairman, Non-executive Director
M. Ryan Chief Executive Officer and Managing Director
J. Fazzino Non-executive Director
T. Gerber Non-executive Director (resigned 28 October 2020)
R. Haire Non-executive Director
G. Lynch Non-executive Director
J. McArthur Non-executive Director
J. Watson Non-executive Director
Other Key Management Personnel:
Name Title
M. Asman Head of Aquaculture
A. Creswell Chief Financial Officer
D. Williams Head of Sales (until 31 January 2021)
M. Vince Head of Sales (from 1 February 2021)
K. Little Head of People and Communities
B. Daley Head of Supply Chain and Commercial Services

Tassal Group Limited and Controlled Entities | Annual Report 2021 49
5. KEY MANAGEMENT PERSONNEL COMPENSATION (CONT.)
(b) Key Management Personnel Compensation
The aggregate compensation of Key Management Personnel of the consolidated entity is set out below:
Consolidated 2021
$
Consolidated 2020
$
Short-term employee benefits 3,631,379 4,270,505
Post-employment benefits 234,859 223,494
Share-based payment 86,027 17,443
3,952,265 4,511,442
Details of the consolidated entity’s Key Management Personnel compensation policy and details of Key Management Personnel compensation are discussed in section 20 of the Directors’ Report.
(c) Share-based Remuneration
(i) Long-term Incentive Plan
The Company established a Long-term Incentive Plan during the financial year ended 30 June 2007. Employees receiving awards under the Long-term Incentive Plan are those of an Executive level (including the Managing Director and Chief Executive Officer).
Under the Company’s Long-term Incentive Plan, participants are granted performance rights to ordinary shares, subject to the Company meeting specified performance criteria during the performance period. If these performance criteria are satisfied, ordinary shares will be issued at the end of the performance period. The number of ordinary shares that a participant will ultimately receive will depend on the extent to which the performance criteria are met by the Company. If specified minimum performance hurdles are not met no ordinary shares will be issued in respect of the performance rights.
An employee granted performance rights is not legally entitled to shares in the Company before the performance rights allocated under the Plan vest. A performance right to ordinary shares does not entitle a participant under the Plan to voting rights, participation in new issues of securities or to receive dividends. In the event that shares are issued under the Plan at the end of the performance period pursuant to the performance rights, those shares will rank equally with existing ordinary shares, including entitlement to voting rights. Once shares have vested they remain in a holding lock until the earlier of the employee leaving the consolidated entity, the seventh anniversary of the date the performance rights were awarded or the Board approving an application for their release.
Set out below is a summary of performance rights granted to participants under the Plan (Consolidated and Parent Entity):
Grant date Vesting date
Balance at start of year
(Number)
Granted during the year
(Number)
Vested during the year
(Number)
Lapsed during the year
(Number)
Balance at end of year
(Number)
30 Nov 2018 30 Jun 2021 420,716 - - 420,716 -
30 Nov 2019 30 Jun 2022 366,390 - - - 366,390
30 Nov 2020 30 Jun 2023 - 754,495 - - 754,495
787,106 754,495 - 420,716 1,120,885
Details of the performance rights holdings of the respective Key Management Personnel, including details of performance rights granted, vested or lapsed during the year are disclosed in the Director’s report.

Annual Report 2021 | Tassal Group Limited and Controlled Entities50
Notes to the Financial Statements for the year ended 30 June 2021
5. KEY MANAGEMENT PERSONNEL COMPENSATION (CONT.)
The independently assessed fair value at grant date of performance rights granted under the Long-term Incentive Plan during the financial years ended 30 June 2019, 30 June 2020 and 30 June 2021 and applicable to participants was:
Performance conditionValue at grant date
$
Performance rights issued during the financial year ended 30 June 2019:
Operating earnings per share (‘EPS’) 381,321
Operating return on assets (‘ROA’) 668,936
1,050,257
Performance rights issued during the financial year ended 30 June 2020:
Operating earnings per share (‘EPS’) 159,761
Operating return on assets (‘ROA’) 349,059
508,820
Performance rights issued during the financial year ended 30 June 2021:
Operating earnings per share (‘EPS’) 465,887
Operating return on assets (‘ROA’) 609,469
1,075,356
2,634,433
The above performance rights valuations have been determined in line with the requirements of AASB 2 ‘Share-based Payments’. AASB 2 requires the measurement of the fair value of the performance rights at the grant date and then to have that value apportioned in equal amounts over the period from grant date to vesting date.
(i) Long-term Incentive Plan (cont.)
The expense recognised in relation to performance rights applicable to Key Management Personnel for the financial year ended 30 June 2021 is $86,027 (2020: $17,443).
50% of the performance rights granted to Key Management Personnel during the financial year ended 30 June 2020 attach respectively to each of the EPS and ROA performance hurdles.
50% of the performance rights granted to Key Management Personnel during the financial year ended 30 June 2021 attach respectively to each of the EPS and ROA performance hurdles.
The fair value of the performance rights is based on the share price at grant date of $3.63 (2020: $4.34) adjusted for the present value of expected dividends over the vesting Performance Period.
6. REMUNERATION OF AUDITORS
Consolidated 2021
$
Consolidated 2020
$
Audit or review of the financial reports 350,400 325,600
Non-audit services (i) 18,811 14,703
369,211 340,303
Notes:
(i) The “non-audit services” principally refers to the provision of a whistleblower hotline and an economic update Board presentation. Non-audit services are any services provided, excluding audits required by the Corporations Act 2001.
All amounts shown above are exclusive of GST.
The parent entity’s audit fees were paid for by Tassal Operations Pty Ltd, a wholly-owned subsidiary.
Refer to the Directors’ Report for details on compliance with the auditor’s independence requirements of the Corporations Act 2001.
The auditor of Tassal Group Limited is Deloitte Touche Tohmatsu.

Tassal Group Limited and Controlled Entities | Annual Report 2021 51
7. CURRENT TRADE AND OTHER RECEIVABLES
Consolidated 2021
$’000
Consolidated 2020
$’000
Trade receivables (i) 30,589 41,877
Loss allowance (373) (884)
30,216 40,993
Goods and services tax (GST) receivable 3,161 3,737
Other receivables 3,917 3,393
37,294 48,123
Notes:
(i) The average credit period on sales of goods is 30 days from the previous month’s statement date. No interest is charged on the trade receivables for the first 60 days from the date of the invoice. Thereafter, interest may be charged at 2% per month on the outstanding balance. The Group measures the loss allowance for trade receivables at an amount equal to lifetime ECL (expected credit loss). ECL on trade receivables are estimated using a provision matrix by reference to past default experience of the debtor and an analysis of the debtor’s current financial position, adjusted for factors that are specific to the debtor’s, general economic conditions of the industry in which the debtors operate and an assessment of both the current as well as the forecast direction of conditions at the reporting date. The Group has recognised a loss allowance of 75% against all receivables over 120 days past due as historical experience has indicated that the majority of these receivables are generally not recoverable.
The Group writes off a trade receivable when there is information indicating the debtor is in severe financial difficulty and there is no realistic prospect of recovery. None of the trade receivables that have been written off are subject to enforcement activities.
(ii) Transfer of Financial Assets:
During the financial year, Westpac Banking Corporation (‘Westpac’) continued to provide a Trade Finance Facility (‘Receivables Purchase Facility’) under which it may purchase receivables from the Company at a discount. This facility has been provided by Westpac to the Company since 30 June 2006 and is utilised by the Company as a primary source of working capital. The maximum available at any time under the facility was $110.000 million during the financial year. All receivables sold to Westpac are insured by the Company with a 10% deductible per insurance claim in the event of a debtor default, representing the Company’s maximum exposure under the facility. Westpac retains 15% of any receivable purchased as a security deposit until it has received payment for the full face value of the receivable purchased. The Receivables Purchase Facility is committed for two years and revolving.
The funded value of the Company’s Receivables Purchase Facility was $68.125 million as at 30 June 2021 (2020: $75.803 million). The receivables sold by the Company into this facility are de-recognised as an asset as the contractual rights to cashflows from these receivables have expired on acceptance of the sale with Westpac. Further, the amount funded under this facility is also not recognised as a liability. The Company does recognise the security deposit as cash. The security deposit held as at 30 June 2021 was $14.630 million (2020: $12.195 million).
The following table details the risk profile of trade receivables based on the Group’s provision matrix. As the Group’s historical credit loss experience does not show significantly different loss patterns for different customer segments, the provision for loss allowance based on past due status is not further distinguished between the Group’s different customer base.
Trade Receivables - days past due
Not past due >30 days >60 days >90 days >120 days Total
2021 $'000 $'000 $'000 $'000 $'000 $'000
Receivables 21,203 3,629 5,437 256 63 30,589
Expected loss rate (%) 0.50 1.00 2.00 5.00 75.00
Estimated total at default 106 36 109 13 47 311
Lifetime ECL 127 44 130 15 57 373
Trade Receivables - days past due
Not past due >30 days >60 days >90 days >120 days Total
2020 $'000 $'000 $'000 $'000 $'000 $'000
Receivables 26,499 11,204 2,915 607 652 41,877
Expected loss rate (%) 0.49 1.00 2.00 5.00 75.00
Estimated total at default 129 112 58 30 489 818
Lifetime ECL 154 134 70 36 489 884
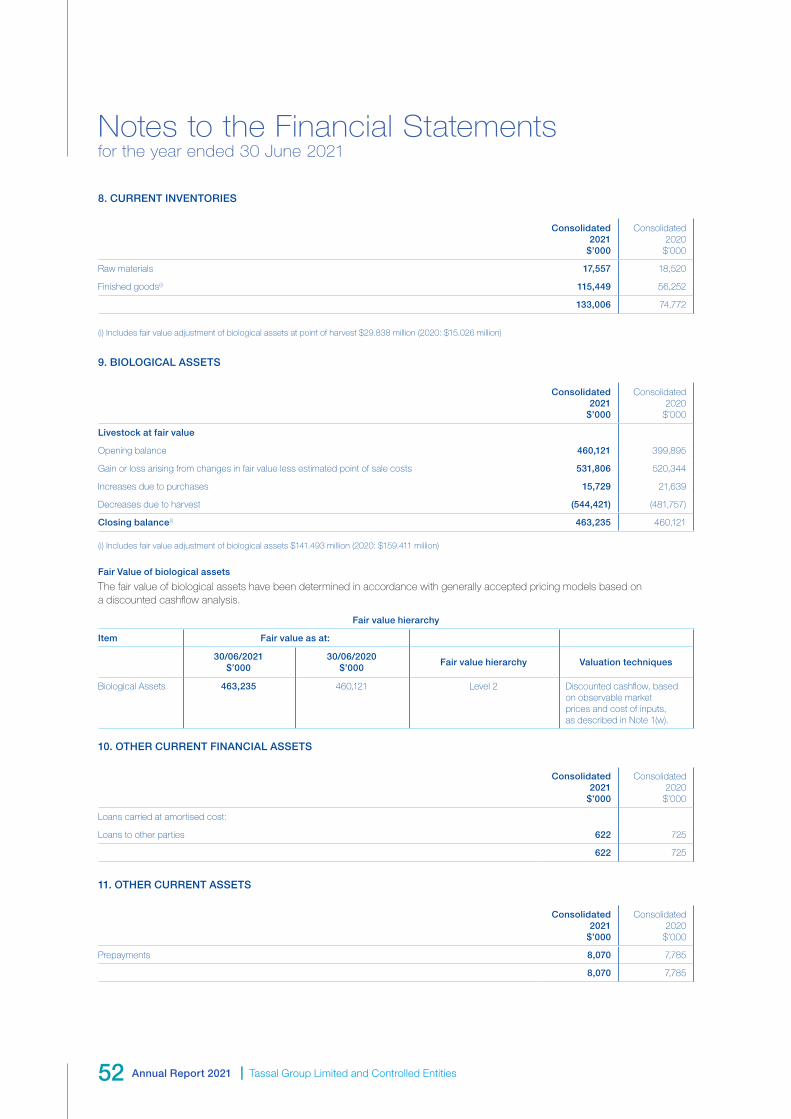
Annual Report 2021 | Tassal Group Limited and Controlled Entities52
Notes to the Financial Statements for the year ended 30 June 2021
8. CURRENT INVENTORIES
Consolidated 2021
$’000
Consolidated 2020
$’000
Raw materials 17,557 18,520
Finished goods(i) 115,449 56,252
133,006 74,772
(i) Includes fair value adjustment of biological assets at point of harvest $29.838 million (2020: $15.026 million)
9. BIOLOGICAL ASSETS
Consolidated 2021
$’000
Consolidated 2020
$’000
Livestock at fair value
Opening balance 460,121 399,895
Gain or loss arising from changes in fair value less estimated point of sale costs 531,806 520,344
Increases due to purchases 15,729 21,639
Decreases due to harvest (544,421) (481,757)
Closing balance(i) 463,235 460,121
(i) Includes fair value adjustment of biological assets $141.493 million (2020: $159.411 million)
Fair Value of biological assets
The fair value of biological assets have been determined in accordance with generally accepted pricing models based on a discounted cashflow analysis.
Fair value hierarchy
Item Fair value as at:
30/06/2021 $’000
30/06/2020 $’000
Fair value hierarchy Valuation techniques
Biological Assets 463,235 460,121 Level 2 Discounted cashflow, based on observable market prices and cost of inputs, as described in Note 1(w).
10. OTHER CURRENT FINANCIAL ASSETS
Consolidated 2021
$’000
Consolidated 2020
$’000
Loans carried at amortised cost:
Loans to other parties 622 725
622 725
11. OTHER CURRENT ASSETS
Consolidated 2021
$’000
Consolidated 2020
$’000
Prepayments 8,070 7,785
8,070 7,785

Tassal Group Limited and Controlled Entities | Annual Report 2021 53
12. INVESTMENTS ACCOUNTED FOR USING THE EQUITY METHOD
Consolidated 2021
$’000
Consolidated 2020
$’000
Investments in associates 12,889 9,752
12,889 9,752
Reconciliation of movement in investments accounted for using the equity method
Balance at the beginning of the financial year 9,752 8,936
Share of profit / (loss) for the year 975 816
Additions 2,162 -
Disposals - -
Balance at the end of the financial year 12,889 9,752
Ownership interest
Name of entity Principal activity Country of Incorporation2021
%2020
%
Associates:
Salmon Enterprises of Tasmania Pty Ltd (i) Atlantic salmon hatchery Australia 72.06 68.94
(i) The Consolidated entity owns 72.06% (2020: 68.94%) of the issued capital and 61.22% (2020: 61.22%) of the voting shares of Salmon Enterprises of Tasmania Pty Ltd (Saltas). Saltas supplies smolt to the Tasmanian aquaculture industry.
The Board has concluded that despite the ownership interest and voting rights held by the consolidated entity, the consolidated entity does not control Saltas. The consolidated entity only has the power to appoint one out of four Directors on the Board of Saltas. Given the consolidated entity’s involvement on the Board of Saltas, the Board has concluded it has significant influence.
Consolidated 2021
$’000
Consolidated 2020
$’000
Summarised financial information of associates: (i)
Current assets 23,701 23,318
Non-current assets 39,134 30,511
62,835 53,829
Current liabilities (10,145) (9,489)
Non-current liabilities (17,144) (12,871)
(27,289) (22,360)
Net assets 35,546 31,469
Revenue 11,584 18,598
Net profit / (loss) 1,261 2,047
Share of associates’ profit / (loss):
Share of profit / (loss) before income tax (361) 1,156
Income tax (expense)/benefit 1,336 (340)
Share of associates’ profit / (loss) – current period 975 816
(i) Profit and loss resulting from upstream and downstream transactions between an investor and an associate are recognised in the investor’s financial statements only to the extent of unrelated investors’ interest in the associate.
13. OTHER NON-CURRENT FINANCIAL ASSETS
Consolidated 2021
$’000
Consolidated 2020
$’000
Shares in other entities at cost 43 43
Loans to other parties 1,867 2,175
1,910 2,218

Annual Report 2021 | Tassal Group Limited and Controlled Entities54
Notes to the Financial Statements for the year ended 30 June 2021
14. PROPERTY, PLANT AND EQUIPMENT
Consolidated 2021
Freehold land at fair value
$’000
Buildings at fair value
$’000
Plant and equipment at
cost $’000
Capital works in progress at
cost $’000
Total $’000
Gross carrying amount
Balance at 30 June 2020 26,732 118,939 490,679 73,689 710,039
Acquisition of business - - - - -
Disposals - (802) (18,486) - (19,288)
Work-In-Progress Additions - - - 114,622 114,622
Capitalisation to asset categories 11,681 40,650 70,665 (122,996) -
Net revaluation increment / (decrement) - - - - -
Balance at 30 June 2021 38,413 158,787 542,858 65,315 805,373
Accumulated depreciation
Balance at 30 June 2020 - (13,896) (173,257) - (187,153)
Depreciation expense - (4,883) (37,933) - (42,816)
Disposals - 803 18,428 - 19,231
Net adjustments from revaluations - - - - -
Balance at 30 June 2021 - (17,976) (192,762) - (210,738)
Net book value
Balance at 30 June 2020 26,732 105,043 317,422 73,689 522,886
Balance at 30 June 2021 38,413 140,811 350,096 65,315 594,635
Consolidated 2020
Freehold land at fair value
$’000
Buildings at fair value
$’000
Plant and equipment at
cost $’000
Capital works in progress at
cost $’000
Total $’000
Gross carrying amount
Balance at 30 June 2019 25,282 94,649 417,681 74,197 611,809
Acquisition of business - - - - -
Disposals - - (10,516) - (10,516)
Work-In-Progress Additions - - - 108,746 108,746
Capitalisation to asset categories 1,450 24,290 83,514 (109,254) -
Net revaluation increment / (decrement) - - - - -
Balance at 30 June 2020 26,732 118,939 490,679 73,689 710,039
Accumulated depreciation
Balance at 30 June 2019 - (9,552) (150,997) - (160,549)
Depreciation expense - (4,344) (32,737) - (37,081)
Disposals - - 10,477 - 10,477
Net adjustments from revaluations - - - - -
Balance at 30 June 2020 - (13,896) (173,257) - (187,153)
Net book value
Balance at 30 June 2019 25,282 85,097 266,684 74,197 451,260
Balance at 30 June 2020 26,732 105,043 317,422 73,689 522,886

Tassal Group Limited and Controlled Entities | Annual Report 2021 55
14. PROPERTY, PLANT AND EQUIPMENT (CONT.)
The Group’s freehold land and buildings are stated at their revalued amounts, being the fair value at the date of revaluation, less any subsequent accumulated depreciation and subsequent accumulated impairment losses. The fair value measurements of the Group’s freehold land and buildings as at 30 June 2019 were performed by Mr M.J.Page [B.Bus.(Property)AAPI CPV], independent valuer not related to the Group. The valuation was based on comparable and observable market prices adjusted for property-specific factors, and conforms to Australian Valuations Standards.
Fair value of land and Buildings
Details of the Group’s freehold land and buildings and information about the fair value hierarchy as at 30 June 2021 are as follows:
Level 1 $’000
Level 2 $’000
Level 3 $’000
Fair value as at 30 June 2021
$’000
Freehold land
Buildings
-
-
-
-
38,413
140,811
38,413
140,811
Fair value of land and Buildings
Details of the Group’s freehold land and buildings and information about the fair value hierarchy as at 30 June 2020 are as follows:
Level 1 $’000
Level 2 $’000
Level 3 $’000
Fair value as at 30 June 2020
$’000
Freehold land
Buildings
-
-
-
-
26,732
105,043
26,732
105,043
15. INVESTMENT PROPERTY
The Company has reassessed the appropriate classification of the Exmoor Station land that was acquired in the previous financial year and has determined that consistent with it’s ASX announcement at the time of acquiring the land, it was always the Company’s intention to dispose of the majority of the land, and it is therefore appropriate to reclassify the land as an Investment Property carried at cost. The balances for the 2020 comparative financial information have been restated accordingly. There is no impact on the reported earnings for the prior period.
The impact on the 2020 balances previously reported is disclosed below:
• Statement of Financial Position – property, plant and equipment reduced from $548.313 million to $522.886 million and investment property increased from nil to $25.427 million
• Statement of Cash Flows – payment for property, plant and equipment reduced from $138.714 million to $113.287 million and payment for investment property increased from nil to $25.427 million
• Property, plant and equipment (note 14)
o Carrying value of land at 30 June 2020 reduced from $52.159 million to $26.732 million
o Capitalisation to asset categories reduced from $26.877 million to $1.450 million
Consolidated 2021
$’000
Consolidated 2020
$’000
Balance at the beginning of financial year 25,427 -
Acquisition of Exmoor Station land - 25,427
Disposal of surplus land (14,765) -
Balance at the end of financial year 10,662 25,427
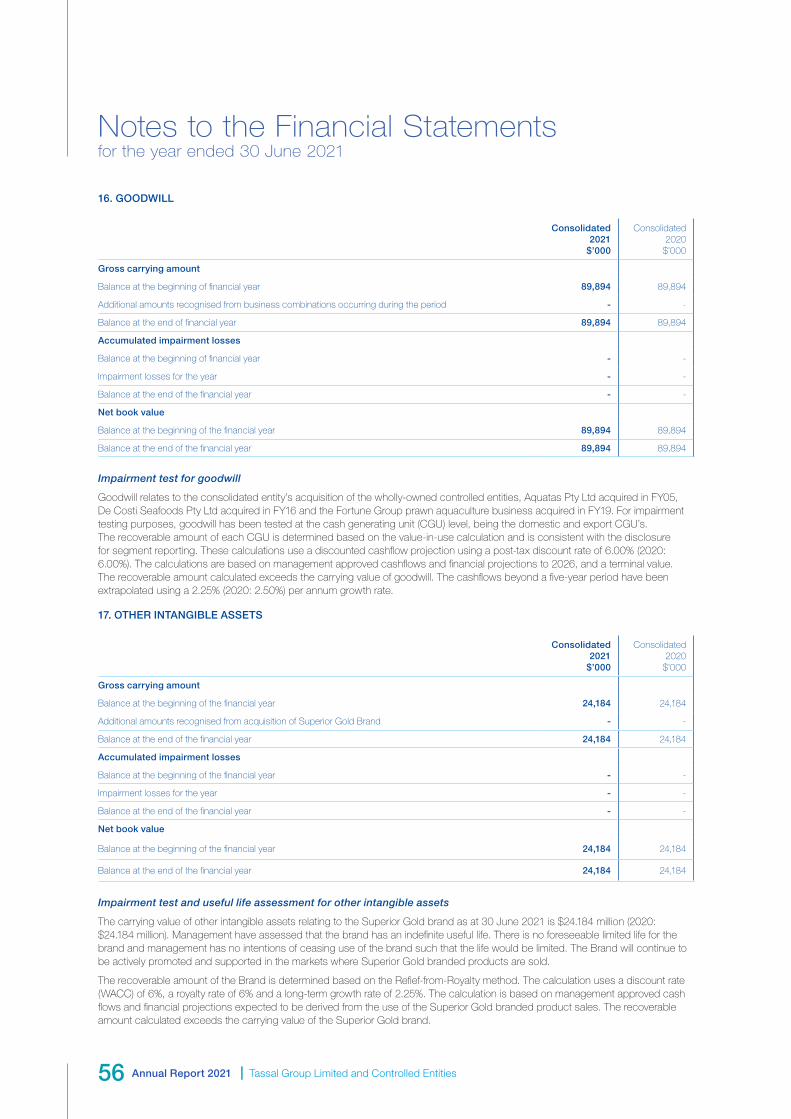
Annual Report 2021 | Tassal Group Limited and Controlled Entities56
Notes to the Financial Statements for the year ended 30 June 2021
16. GOODWILL
Consolidated 2021
$’000
Consolidated 2020
$’000
Gross carrying amount
Balance at the beginning of financial year 89,894 89,894
Additional amounts recognised from business combinations occurring during the period - -
Balance at the end of financial year 89,894 89,894
Accumulated impairment losses
Balance at the beginning of financial year - -
Impairment losses for the year - -
Balance at the end of the financial year - -
Net book value
Balance at the beginning of the financial year 89,894 89,894
Balance at the end of the financial year 89,894 89,894
Impairment test for goodwill
Goodwill relates to the consolidated entity’s acquisition of the wholly-owned controlled entities, Aquatas Pty Ltd acquired in FY05, De Costi Seafoods Pty Ltd acquired in FY16 and the Fortune Group prawn aquaculture business acquired in FY19. For impairment testing purposes, goodwill has been tested at the cash generating unit (CGU) level, being the domestic and export CGU’s. The recoverable amount of each CGU is determined based on the value-in-use calculation and is consistent with the disclosure for segment reporting. These calculations use a discounted cashflow projection using a post-tax discount rate of 6.00% (2020: 6.00%). The calculations are based on management approved cashflows and financial projections to 2026, and a terminal value. The recoverable amount calculated exceeds the carrying value of goodwill. The cashflows beyond a five-year period have been extrapolated using a 2.25% (2020: 2.50%) per annum growth rate.
17. OTHER INTANGIBLE ASSETS
Consolidated 2021
$’000
Consolidated 2020
$’000
Gross carrying amount
Balance at the beginning of the financial year 24,184 24,184
Additional amounts recognised from acquisition of Superior Gold Brand - -
Balance at the end of the financial year 24,184 24,184
Accumulated impairment losses
Balance at the beginning of the financial year - -
Impairment losses for the year - -
Balance at the end of the financial year - -
Net book value
Balance at the beginning of the financial year 24,184 24,184
Balance at the end of the financial year 24,184 24,184
Impairment test and useful life assessment for other intangible assets
The carrying value of other intangible assets relating to the Superior Gold brand as at 30 June 2021 is $24.184 million (2020: $24.184 million). Management have assessed that the brand has an indefinite useful life. There is no foreseeable limited life for the brand and management has no intentions of ceasing use of the brand such that the life would be limited. The Brand will continue to be actively promoted and supported in the markets where Superior Gold branded products are sold.
The recoverable amount of the Brand is determined based on the Refief-from-Royalty method. The calculation uses a discount rate (WACC) of 6%, a royalty rate of 6% and a long-term growth rate of 2.25%. The calculation is based on management approved cash flows and financial projections expected to be derived from the use of the Superior Gold branded product sales. The recoverable amount calculated exceeds the carrying value of the Superior Gold brand.

Tassal Group Limited and Controlled Entities | Annual Report 2021 57
20. CURRENT TRADE AND OTHER PAYABLES
Consolidated 2021
$’000
Consolidated 2020
$’000
Trade payables (i) 92,904 95,671
Other creditors and accruals 8,535 13,169
Goods and services tax (GST) payable 1,120 177
102,559 109,017
(i) The average credit period on purchases of goods is 60 days. No interest is generally charged on trade payables for the first 60 days from the date of the invoice. Thereafter, interest may be charged at varying rates per annum on the outstanding balance. The consolidated entity has financial risk management policies in place to ensure that all payables are paid within the credit timeframe.
21. CURRENT BORROWINGS
Consolidated 2021
$’000
Consolidated 2020
$’000
Secured: At amortised cost
Bank overdrafts (i) - -
Bank loans (ii) - 12,222
- 12,222
Unsecured: At amortised cost
Other loans - -
- 12,222
(i) Secured by registered mortgages over the consolidated entity’s assets and undertakings, freehold land and buildings and shares in other related parties, the current market value of which exceeds the value of the mortgages.
(ii) Secured by assets, the value of which exceeds the loan liability.
18. OTHER NON-CURRENT ASSETS
Consolidated 2021
$’000
Consolidated 2020
$’000
Marine farming lease – at cost 826 826
Accumulated amortisation (i) (604) (574)
Selective breeding program contribution asset (ii) 5,869 5,633
6,091 5,885
(i) Amortisation expense is included in the line item “depreciation and amortisation” in the income statement.
(ii) The Selective Breeding Program (SBP) is controlled by Salmon Enterprises of Tasmania Pty Ltd (Saltas). The success of the SBP and accordingly, the broodstock and resultant progeny is fundamental to the sustainability of Tassal Group Limited. The carrying value of the “selective breeding program contribution asset” is $5.869 million (2020: $5.633 million) and represents payments to the SBP to date.
All future investments in the SBP shall be capitalised to the SBP contribution asset in accordance with the policy. As the SBP eggs and smolt are progressively received by the Group, the capitalised value will transfer from the SBP contribution asset back to the finfish biological asset and be subsequently released to profit and loss as the livestock is harvested and sold.
19. ASSETS PLEDGED AS SECURITY
In accordance with the security arrangements of liabilities, as disclosed in notes 21 and 23 to the financial statements, all current and non-current assets of the consolidated entity, except goodwill and deferred tax assets, have been pledged as security.
The consolidated entity does not hold title to the equipment under finance lease pledged as security.

Annual Report 2021 | Tassal Group Limited and Controlled Entities58
Notes to the Financial Statements for the year ended 30 June 2021
22. CURRENT PROVISIONS
Current provisions comprise:
Consolidated 2021
$’000
Consolidated 2020
$’000
Employee benefits (refer to note 24) 14,186 14,673
14,186 14,673
(i) The current provision for employee entitlements includes $2.933 million (2020: $2.346 million) of annual leave and vested long service leave entitlements accrued but not expected to be taken within twelve months
23. NON-CURRENT BORROWINGS
Consolidated 2021
$’000
Consolidated 2020
$’000
Secured: At amortised cost:
Cash advance (i) 348,443 207,388
348,443 207,388
(i) Secured by registered mortgages over the consolidated entity’s assets and undertakings, freehold land and buildings and shares in other related parties, the current market value of which exceeds the value of the mortgages
24. NON-CURRENT PROVISIONS
Consolidated 2021
$’000
Consolidated 2020
$’000
Non-current provisions comprise:
Employee benefits 2,165 2,178
Remediation & capital maintenance 516 -
2,681 2,178
The aggregate employee benefit liability recognised and included in the financial statements is as follows:
Provision for employee benefits
Current (refer to note 22) 14,186 14,673
Non-current 2,165 2,178
16,351 16,851

Tassal Group Limited and Controlled Entities | Annual Report 2021 59
25. ISSUED CAPITAL
Consolidated
Note 2021 Number
2021 $’000
2020 Number
2020 $’000
(a) Ordinary share capital (fully paid):
Ordinary shares 212,342,143 429,499 209,118,582 418,635
Changes to the Corporations Law abolished the authorised capital and par value concepts in relation to share capital from 1 July 1998. Therefore, the Company does not have a limited amount of authorised capital and issued shares do not have a par value.
(b) Movements in ordinary share capital
Balance as at the beginning of the financial year 209,118,582 418,635 178,450,013 288,814
Issue of shares pursuant to dividend reinvestment plan (i) 3,049,810 10,432 1,743,797 5,266
Issue of shares pursuant to share placement (ii) - - 24,640,001 108,416
Share placement costs - - - (3,060)
Related income tax - - - 1,557
Issue of shares pursuant to share purchase plan (iii) - - 4,188,623 17,431
Issue of shares pursuant to executive long term incentive plan (iv) 173,751 432 96,148 211
Balance as at the end of the financial year 212,342,143 429,499 209,118,582 418,635
Holders of ordinary shares are entitled to receive dividends as declared from time to time and are entitled to one vote per share at shareholders’ meetings.
Current financial year
(i) On 29 September 2020, 2,041,802 ordinary shares were issued pursuant to the Company's dividend reinvestment plan at an issue price of $3.49 per share. A discount of 2% was applicable.
On 30 March 2021, 1,008,008 ordinary shares were issued pursuant to the Company’s dividend reinvestment plan at an issue price of $3.28 per share. A discount of 2% was applicable.
(iv) On 25 August 2020, 173,751 ordinary shares were issued pursuant to the Company’s Long Term Incentive Plan at an issue price of $2.4854 per share. There was no exercise price paid on this conversion.
Previous financial year
(i) On 31 March 2020, 1,743,797 ordinary shares were issued pursuant to the Company's dividend reinvestment plan at an issue price of $3.02 per share. A discount of 2% was applicable.
(ii) On 26 August 2019, 24,640,001 ordinary shares were pursuant to a share placement at an issue price of $4.40 per share to enable the Company to invest in the accelerated prawn growth strategy.
(iii) On 23 September 2019, 4,188,623 ordinary shares were issued pursuant to a share purchase plan at an issue price of $4.1615 per share to enable the Company to invest in the accelerated prawn growth strategy.
(iv) On 26 August 2019, 96,148 ordinary shares were pursuant to the Company’s Long Term Incentive Plan at an issue price of $2.1992 per share. There was no exercise price paid on this conversion.

Annual Report 2021 | Tassal Group Limited and Controlled Entities60
Notes to the Financial Statements for the year ended 30 June 2021
26. RESERVES
Consolidated 2021
$’000
Consolidated 2020
$’000
Hedging - -
Equity-settled employee benefits 1,625 1,982
Asset revaluation 14,090 14,090
15,715 16,072
(a) Hedging reserve
Balance at the beginning of the financial year - (184)
Gain / (loss) recognised on cashflow hedges: Interest rate swap contracts - 263
Income tax related to gains / losses recognised in equity - (79)
Balance at the end of the financial year - -
The hedging reserve represents gains and losses recognised on the effective position of cashflow hedges. The cumulative deferred gain or loss on the hedge is recognised in profit or loss when the hedged transaction impacts the profit or loss, or is included as a basis adjustment to the non-financial hedged item consistent with the applicable accounting policy.
(b) Equity-settled employee benefits reserve
Consolidated 2021
$’000
Consolidated 2020
$’000
Balance at the beginning of the financial year 1,982 2,097
Share-based payment 75 96
Issue of shares pursuant to Executive Long Term Incentive Plan (432) (211)
Balance at the end of the financial year 1,625 1,982
The equity-settled employee benefits reserve arises on the grant of ordinary shares to the Chief Executive Officer pursuant to entitlements under his employment contract and in respect of performance rights issued to the Chief Executive Officer and Senior Executives pursuant to the Company’s Long-term Incentive Plan. Amounts are transferred out of the reserve and into issued capital when the shares are issued.
(c) Asset revaluation reserve
Consolidated 2021
$’000
Consolidated 2020
$’000
Balance as at the beginning of the financial year 14,090 14,090
Revaluation increments / (decrements) - -
Deferred tax liability arising on revaluation - -
Balance at the end of the financial year 14,090 14,090
The asset revaluation reserve arises on the revaluation of freehold land and freehold and leasehold buildings. Where a revalued land or building is sold, that portion of the asset revaluation reserve which relates to that asset, and is effectively realised, is transferred directly to retained profits.
(Refer to note 14 for details of independent valuation of freehold land and freehold and leasehold buildings).

Tassal Group Limited and Controlled Entities | Annual Report 2021 61
27. RETAINED EARNINGS
Consolidated 2021
$’000
Consolidated 2020
$’000
Balance at the beginning of the financial year 354,342 329,041
Effect of change in accounting policy for initial application of IFRS 16 - (6,860)
Net profit attributable to members of the parent entity 34,620 69,111
Dividends provided for or paid (refer to note 29) (33,630) (36,950)
Balance at the end of the financial year 355,332 354,342
28. EARNINGS PER SHARE (EPS)
Consolidated 2021
(Cents per share)
Consolidated 2020
(Cents per share)
Earnings per ordinary share
Basic (cents per share) (i) 16.40 34.03
Diluted (cents per share) (ii) 16.35 33.93
(i) Basic earnings per share is calculated by dividing the net profit for the reporting period by the weighted average number of ordinary shares of the Company.
(ii) Diluted earnings per share is calculated by dividing the net profit for the reporting period by the weighted average number of ordinary shares outstanding including dilutive potential ordinary shares.
2021 No. ‘000
2020 No. ‘000
Weighted average number of ordinary shares used as the denominator in the calculation of EPS
Number for basic EPS 211,061 203,067
Shares deemed to be issued for no consideration in respect of performance rights issued pursuant to Long-term Incentive Plan
741 638
Number for diluted EPS 211,802 203,705
Consolidated 2021
$’000
Consolidated 2020
$’000
Earnings used as the numerator in the calculation of EPS (i)
Earnings for basic EPS 34,620 69,111
Earnings for diluted EPS 34,620 69,111
(i) Earnings used in the calculation of basic and diluted earnings per share is as per net profit in the income statement
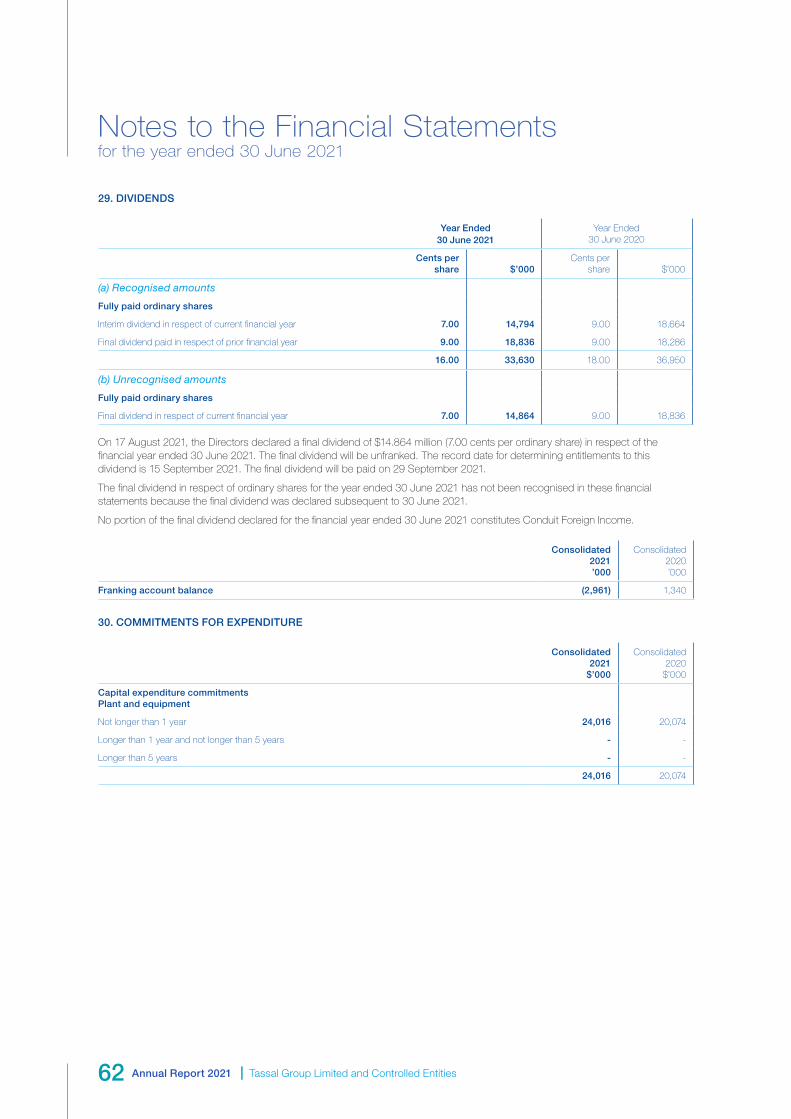
Annual Report 2021 | Tassal Group Limited and Controlled Entities62
Notes to the Financial Statements for the year ended 30 June 2021
29. DIVIDENDS
Year Ended 30 June 2021
Year Ended 30 June 2020
Cents per share $’000
Cents per share $’000
(a) Recognised amounts
Fully paid ordinary shares
Interim dividend in respect of current financial year 7.00 14,794 9.00 18,664
Final dividend paid in respect of prior financial year 9.00 18,836 9.00 18,286
16.00 33,630 18.00 36,950
(b) Unrecognised amounts
Fully paid ordinary shares
Final dividend in respect of current financial year 7.00 14,864 9.00 18,836
On 17 August 2021, the Directors declared a final dividend of $14.864 million (7.00 cents per ordinary share) in respect of the financial year ended 30 June 2021. The final dividend will be unfranked. The record date for determining entitlements to this dividend is 15 September 2021. The final dividend will be paid on 29 September 2021.
The final dividend in respect of ordinary shares for the year ended 30 June 2021 has not been recognised in these financial statements because the final dividend was declared subsequent to 30 June 2021.
No portion of the final dividend declared for the financial year ended 30 June 2021 constitutes Conduit Foreign Income.
Consolidated 2021 ’000
Consolidated 2020 ’000
Franking account balance (2,961) 1,340
30. COMMITMENTS FOR EXPENDITURE
Consolidated 2021
$’000
Consolidated 2020
$’000
Capital expenditure commitments Plant and equipment
Not longer than 1 year 24,016 20,074
Longer than 1 year and not longer than 5 years - -
Longer than 5 years - -
24,016 20,074
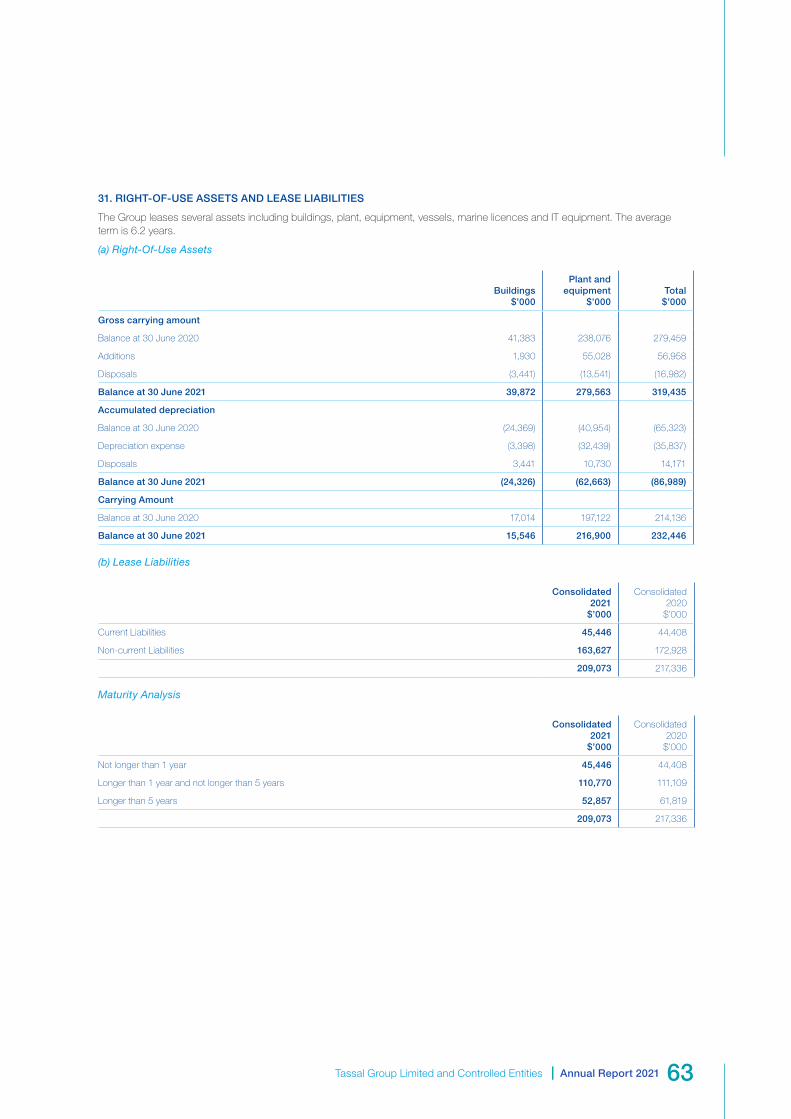
Tassal Group Limited and Controlled Entities | Annual Report 2021 63
31. RIGHT-OF-USE ASSETS AND LEASE LIABILITIES
The Group leases several assets including buildings, plant, equipment, vessels, marine licences and IT equipment. The average term is 6.2 years.
(a) Right-Of-Use Assets
Buildings $’000
Plant and equipment
$’000Total
$’000
Gross carrying amount
Balance at 30 June 2020 41,383 238,076 279,459
Additions 1,930 55,028 56,958
Disposals (3,441) (13,541) (16,982)
Balance at 30 June 2021 39,872 279,563 319,435
Accumulated depreciation
Balance at 30 June 2020 (24,369) (40,954) (65,323)
Depreciation expense (3,398) (32,439) (35,837)
Disposals 3,441 10,730 14,171
Balance at 30 June 2021 (24,326) (62,663) (86,989)
Carrying Amount
Balance at 30 June 2020 17,014 197,122 214,136
Balance at 30 June 2021 15,546 216,900 232,446
(b) Lease Liabilities
Consolidated 2021
$’000
Consolidated 2020
$’000
Current Liabilities 45,446 44,408
Non-current Liabilities 163,627 172,928
209,073 217,336
Maturity Analysis
Consolidated 2021
$’000
Consolidated 2020
$’000
Not longer than 1 year 45,446 44,408
Longer than 1 year and not longer than 5 years 110,770 111,109
Longer than 5 years 52,857 61,819
209,073 217,336

Annual Report 2021 | Tassal Group Limited and Controlled Entities64
Notes to the Financial Statements for the year ended 30 June 2021
32. CONTINGENT LIABILITIES AND CONTINGENT ASSETS
There are no contingent liabilities or contingent assets at the date of this Annual Financial Report.
33. INVESTMENTS IN CONTROLLED ENTITIES
Details of controlled entities are reflected below:
Ownership interest
Name of entity Country of incorporation 2021 2020
Parent entity:
Tassal Group Limited (i) Australia
Controlled entities: (ii)
Tassal Operations Pty Ltd (iii), (v), (vii), (ix) Australia 100% 100%
Aquatas Pty Ltd (iv), (v), (vii), (ix) Australia 100% 100%
De Costi Seafoods Pty Ltd (vi),(viii),(ix) Australia 100% 100%
Notes:
(i) Tassal Group Limited is the head entity within the tax-consolidated group and also the ultimate parent entity.
(ii) These companies are members of the tax-consolidated group.
(iii) Tassal Operations Pty Ltd was established as a wholly-owned subsidiary on 19 September 2003.
(iv) Aquatas Pty Ltd was acquired on 18 March 2005 pursuant to a Merger Agreement with Webster Limited.
(v) On 28th June 2006 Tassal Operations Pty ltd and Aquatas Pty Ltd as wholly-owned subsidiaries entered into a deed of cross guarantee with Tassal Group Limited ( 2006 Deed of Cross Guarantee )for the purpose of obtaining for these wholly-owned subsidiaries the benefit of relief from complying with certain accounting and audit requirements of the Corporations Act (including the requirements to prepare and lodge an audited financial report) granted by ASIC by an order made under sub-section 340(1) of the Corporations Act on 27th June 2006. The order made by ASIC relieved those wholly-owned subsidiaries from complying with the same provisions of the Corporations Act as they would be relieved from complying with if they had satisfied the conditions set out in ASIC Class Order 98/1418.
(vi) De Costi Seafoods Pty Ltd was acquired on 1 July 2015 pursuant to a share sale agreement.
(vii) On 1 June 2016, Tassal Operations Pty Ltd and Aquatas Pty Ltd as wholly-owned subsidiaries entered into a Deed of Variation to the 2006 Deed of Cross Guarantee with Tassal Group Limited.
(viii) On 1 June 2016 De Costi Seafoods Pty Ltd entered into an Assumption Deed with Tassal Group Limited, on behalf of the Group entities to the Deed of Cross Guarantee, to join as a party to the 2006 Deed of Cross Guarantee (as varied).
(ix) Relief is now pursuant to ASIC Class Order 98/1418.

Tassal Group Limited and Controlled Entities | Annual Report 2021 65
34. SEGMENT INFORMATION
The Group has identified operating segments based on the internal reports that are reviewed by the chief operating decision maker (CODM) in assessing performance and in determining the allocation of resources. The CODM at Tassal is considered to be the Board of Directors.
The principal activities of the group are to farm, process, market and sell salmon and prawns and to procure, process, market and sell other seafood species.
Reportable segments are determined by the similarity of goods sold and the method used to distribute the goods. Information reported to the CODM is primarily focused on geographical regions. The Group’s reportable segments under AASB 8 ‘Operating Segments’ are therefore domestic and export markets for the sale of all seafood products.
Operational EBITDA is the measure reported to the CODM for the purposes of resource allocation and assessment of segment performance.
The accounting policies of the reportable segments are the same as the Group's accounting policies.
2021 Domestic Segment $’000
Export Segment $’000
Consolidated $’000
Sales (1) 492,468 91,390 583,858
Segment operational EBITDA 130,321 9,030 139,351
Property transaction costs - - (1,599)
Significant item - export supply chain expense - - (14,832)
Fair value adjustment of biological assets - - (3,106)
Statutory EBITDA - - 119,814
Depreciation & amortisation expense - - (58,455)
Finance costs - - (13,297)
Profit before income tax expense - - 48,061
Income tax expense - - (13,441)
Profit for the period - - 34,620
(1) Sales Information Salmon Seafood Total
$'000 $'000 $'000
Domestic wholesale 116,152 37,614 153,766
Domestic retail 265,795 72,907 338,702
Export 88,592 2,798 91,390
Total sales 470,539 113,319 583,858
2020 Domestic Segment $’000
Export Segment $’000
Consolidated $’000
Sales (1) 447,147 105,467 552,614
Segment operational EBITDA 115,556 22,995 138,551
Property transaction costs - - (2,254)
Significant item - export supply chain expense - - (2,862)
Fair value adjustment of biological assets - - 12,170
Statutory EBITDA - - 145,605
Depreciation & amortisation expense - - (38,731)
Finance costs - - (10,311)
Profit before income tax expense - - 96,563
Income tax expense - - (27,452)
Profit for the period - - 69,111
(1) Sales Information Salmon Seafood Total
$'000 $'000 $'000
Domestic wholesale 127,909 24,859 152,768
Domestic retail 252,743 41,636 294,379
Export 74,902 30,565 105,467
Total sales 455,554 97,060 552,614
The Group had two customers who individually contributed more than 10% of revenue for the year. Included in the domestic market section of revenue from the sale of goods of $492,468 thousand (2020: $447,147 thousand) are sales of $263,979 thousand (2020: $215,021 thousand) which arose from sales to the Group's two largest customers. Additional export supply chain expense was due to COVID-19 and the resulting removal of airfreight capacity.

Annual Report 2021 | Tassal Group Limited and Controlled Entities66
Notes to the Financial Statements for the year ended 30 June 2021
35. SEASONALITY
The consolidated entity’s principal activities, being principally the hatching, farming, processing, sales and marketing of Atlantic Salmon are not generally subject to material or significant seasonal fluctuations.
36. RELATED PARTY DISCLOSURES
Identity of related parties
The following persons and entities are regarded as related parties:
(i) Controlled entities:
Tassal Operations Pty Ltd Aquatas Pty Ltd De Costi Seafoods Pty Ltd (Refer to note 33 for details of equity interests in the above controlled companies).
(ii) Associates:
Salmon Enterprises of Tasmania Pty Ltd (Refer to note 12 for details of equity interests in the above associate).
(iii) Key Management Personnel:
Directors and other Key Management Personnel also include close members of the families of Directors and other Key Management Personnel.
Transactions between related parties
(a) Key Management Personnel
n determining the disclosures noted below, the Key Management Personnel have made appropriate enquiries to the best of their ability and the information presented reflects their knowledge.
Other than as disclosed herein, the Key Management Personnel are not aware of any relevant transactions, other than transactions entered into during the year with Directors and Executives of the Company and its controlled entities and with close members of their families which occur within a normal employee, customer or supplier relationship on terms and conditions no more favourable than those, it is reasonable to expect the entity would have adopted if dealing at arm’s length with an unrelated person.
(i) Loans
There have been no loans entered into during or since the end of the financial year to or from Key Management Personnel.
(ii) Compensation
Details of Key Management Personnel compensation are disclosed in the Remuneration Report and in note 5 to the financial statements.
(iii) Other transactions
Excluding contracts of employment, no Key Management Personnel have entered into a contract or other transactions with the Company or the consolidated entity during the financial year and there were no contracts or other transactions involving Key Management Personnel’s interests subsisting at year end.
(b) Associates
(i) Purchase (sales) of goods and services
The consolidated entity entered into transactions with the following associate for the supply of smolt (juvenile salmon), ancillary related items and the sale of various goods and services. These transactions were conducted on normal commercial terms and conditions.
Entity
Consolidated 2021
$
Consolidated 2020
$
Salmon Enterprises of Tasmania Pty Ltd 9,997,335 13,722,476
9,997,335 13,722,476

Tassal Group Limited and Controlled Entities | Annual Report 2021 67
37. NOTES TO THE STATEMENT OF CASHFLOWS Consolidated 2021
$’000
Consolidated 2020
$’000
(a) For the purposes of the Statement of Cashflows, cash and cash equivalents includes cash on hand and in banks and short-term deposits at call, net of outstanding bank overdrafts. Cash and cash equivalents as at the end of the financial year as shown in the Statement of Cashflows is reconciled to the related items in the Statement of Financial Position as follows:
Cash and cash equivalents 30,623 21,860
Bank overdrafts - -
30,623 21,860
(b) Reconciliation of profit for the period to net cashflows from operating activities:
Profit for the period 34,620 69,111
Depreciation and amortisation of non-current assets 58,455 38,731
Depreciation – impact of allocation to cost of live and processed fish inventories 20,229 24,541
Net (increment)/decrement in biological assets 17,918 (6,109)
Net (increment)/decrement in biological assets at point of harvest (14,812) (6,061)
Gain on disposal of investment property (2,235) 13
Share of associates’ and jointly controlled entities’ profits (975) (816)
Equity settled share-based payment 75 96
(Increase) / decrease in assets:
Inventories (i) (43,422) (18,772)
Biological assets (i) (21,032) (54,117)
Trade and other receivables 10,829 (33,613)
Prepayments (285) 1,274
Other current financial assets 103 99
Current tax asset 5,243 (4,204)
Other non-current financial assets 308 298
Other non-current assets (2,398) (799)
Increase / (decrease) in liabilities:
Current trade and other payables (8,546) 18,455
Other current financial liabilities - (79)
Current provisions (487) 1,931
Deferred tax balances 6,926 19,682
Non-current provisions 503 191
Net cash provided by operating activities 61,017 49,852
(i) Changes in inventories and biological assets are shown net of the profit impact of AASB 141 ‘Agriculture’.
(c) Financing facilities
Secured revolving bank overdraft facility subject to annual review and payable at call
- Amount used - -
- Amount unused 20,000 20,000
20,000 20,000
Secured facilities with various maturity dates
- Amount used 348,443 219,610
- Amount unused 98,557 79,612
447,000 299,222

Annual Report 2021 | Tassal Group Limited and Controlled Entities68
Notes to the Financial Statements for the year ended 30 June 2021
37. NOTES TO THE STATEMENT OF CASHFLOWS (CONT.)
(d) Total liabilities from financing activities
2020 Cash flows
Non-cash changes
2021Acquisition
Foreign exchange
movementFair value changes
$'000 $'000 $'000 $'000 $'000 $'000
Long-term borrowings 207,388 141,055 - - - 348,443
Short-term borrowings 12,222 (12,222) - - - -
Total liabilities from financing activities 219,610 128,883 - - - 348,443
38. FINANCIAL INSTRUMENTS
(a) Significant accounting policies
Details of the significant accounting policies and methods adopted, including the criteria for recognition, the basis of measurement and the basis on which income and expenses are recognised, in respect of each class of financial asset, financial liability and equity instrument are disclosed in note 1 to the financial statements..
(b) Financial risk management objectives and derivative financial instruments
The Group’s activities expose it to a variety of financial risks which include operational control risk, market risk (including currency risk, fair value interest rate risk and price risk), credit risk, liquidity risk and cashflow interest rate risk. The Group’s overall risk management program focuses on the unpredictability of the financial markets and seeks to minimise potential adverse effects on the financial performance of the Group.
The consolidated entity enters into a variety of derivative financial instruments to manage its exposure to interest rate and foreign exchange rate risk, including:
• forward foreign exchange contracts to hedge the exchange rate risk arising on the purchase and sale of imported and exported supply of salmon; and
• interest rate swaps to mitigate the risk of rising interest rates.
The Group uses different methods to mitigate different types of risk to which it is exposed. These methods include sensitivity analysis in the case of interest rate and foreign exchange risk and aging analysis for credit risk.
There has not been any material change to the objectives, policies and processes for managing financial risk during the year or in the prior year.
(c) Capital risk management
The consolidated entity manages its capital to ensure that the Group will be able to continue as a going concern while maximising the return to stakeholders through the optimisation of the debt and equity balance.
The capital structure of the consolidated entity consists of debt, which includes the borrowings disclosed in notes 21 and 23, cash and cash equivalents and equity attributable to equity holders of the parent, comprising issued capital, reserves and retained earnings as disclosed in notes 37(a), 25, 26 and 27 respectively.
Operating cashflows are significantly used to maintain and expand the consolidated entity’s biological asset and property plant and equipment asset base, as well as to make the routine outflows of tax, dividends and timely repayment of maturing debt. The consolidated entity’s policy is to use a mixture of equity and debt funded instruments in order to meet anticipated requirements.
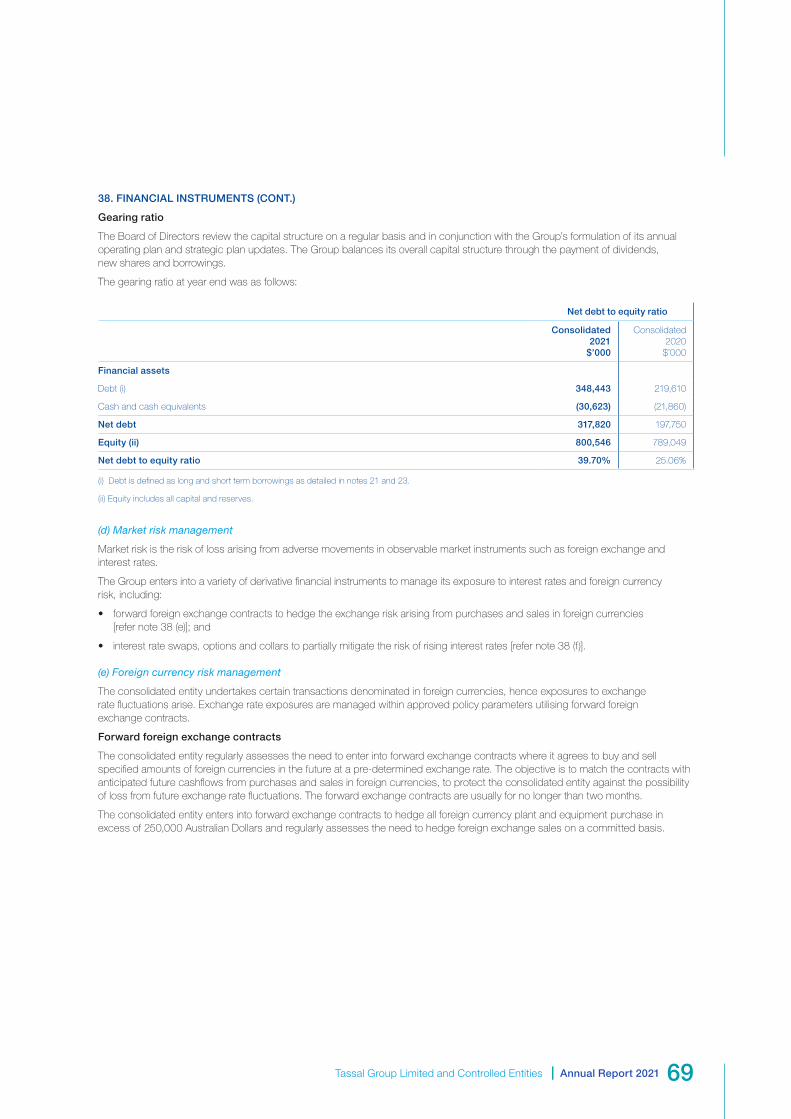
Tassal Group Limited and Controlled Entities | Annual Report 2021 69
38. FINANCIAL INSTRUMENTS (CONT.)
Gearing ratio
The Board of Directors review the capital structure on a regular basis and in conjunction with the Group’s formulation of its annual operating plan and strategic plan updates. The Group balances its overall capital structure through the payment of dividends, new shares and borrowings.
The gearing ratio at year end was as follows:
Net debt to equity ratio
Consolidated 2021
$’000
Consolidated 2020
$’000
Financial assets
Debt (i) 348,443 219,610
Cash and cash equivalents (30,623) (21,860)
Net debt 317,820 197,750
Equity (ii) 800,546 789,049
Net debt to equity ratio 39.70% 25.06%
(i) Debt is defined as long and short term borrowings as detailed in notes 21 and 23.
(ii) Equity includes all capital and reserves.
(d) Market risk management
Market risk is the risk of loss arising from adverse movements in observable market instruments such as foreign exchange and interest rates.
The Group enters into a variety of derivative financial instruments to manage its exposure to interest rates and foreign currency risk, including:
• forward foreign exchange contracts to hedge the exchange risk arising from purchases and sales in foreign currencies [refer note 38 (e)]; and
• interest rate swaps, options and collars to partially mitigate the risk of rising interest rates [refer note 38 (f)].
(e) Foreign currency risk management
The consolidated entity undertakes certain transactions denominated in foreign currencies, hence exposures to exchange rate fluctuations arise. Exchange rate exposures are managed within approved policy parameters utilising forward foreign exchange contracts.
Forward foreign exchange contracts
The consolidated entity regularly assesses the need to enter into forward exchange contracts where it agrees to buy and sell specified amounts of foreign currencies in the future at a pre-determined exchange rate. The objective is to match the contracts with anticipated future cashflows from purchases and sales in foreign currencies, to protect the consolidated entity against the possibility of loss from future exchange rate fluctuations. The forward exchange contracts are usually for no longer than two months.
The consolidated entity enters into forward exchange contracts to hedge all foreign currency plant and equipment purchase in excess of 250,000 Australian Dollars and regularly assesses the need to hedge foreign exchange sales on a committed basis.

Annual Report 2021 | Tassal Group Limited and Controlled Entities70
Notes to the Financial Statements for the year ended 30 June 2021
38. FINANCIAL INSTRUMENTS (CONT.)
(f) Interest rate risk management
The consolidated entity is exposed to interest rate risk as it borrows funds at both fixed and floating interest rates. The risk is managed by the consolidated entity by maintaining an appropriate mix between fixed and floating rate borrowings. Hedging activities are evaluated regularly to align with interest rate views and defined risk appetite; ensuring optimal hedging strategies are applied, by either positioning the statement of financial position or protecting interest expense through different interest rate cycles.
Pursuant to the consolidated entity’s Treasury Policy, the consolidated entity may use interest rate swap contracts to manage interest rate exposure. Under these contracts, the consolidated entity agrees to exchange the difference between fixed and floating interest amounts calculated on agreed notional principal amounts. Such contracts enable the consolidated entity to mitigate the risk of rising interest rates and debt held.
The interest rate swaps and the interest payments on the loan occur simultaneously and the amount accumulated in equity is reclassified to profit or loss over the period that the floating rate interest payments on debt affect profit or loss.
Interest rate sensitivity analysis
The sensitivity analyses in the following table have been determined based on the exposure to interest rates for both derivative and non-derivative instruments at the reporting date and the stipulated change taking place at the beginning of the financial year and held constant throughout the reporting period. The following table details the consolidated entity’s sensitivity to a 1% increase and decrease in interest rates against the relevant exposures. A positive number indicates an increase in profit or loss where interest rates increase. For a reduction in interest rates against the respective exposures, there would be an equal and opposite impact on the profit or loss and the balances below would be reversed.
Interest rate risk
Consolidated 2021
$’000
Consolidated 2020
$’000
Financial Assets
Cash and cash equivalents 306 219
Total Profit / (Loss) 306 219
(g) Liquidity risk management
Liquidity risk refers to the risk that the consolidated entity or the Company will not be able to meet its financial obligations as they fall due. The consolidated entity and the Company undertake the following activities to ensure that there will be sufficient funds available to meet obligations:
• prepare budgeted annual and monthly cashflows;
• measurement and tracking of actual cashflows on a daily basis with comparison to budget on a monthly basis;
• matching the maturity profile of financial assets and liabilities; and
• delivering funding flexibility through maintenance of a committed borrowing facility in excess of budgeted usage levels.
Included in note 37(c) is a summary of additional undrawn facilities that the Group has at its disposal to further reduce liquidity risk.
Liquidity and interest rate tables
The following tables detail the consolidated entity and Company’s expected maturity for its financial assets and contractual maturity for financial liabilities.

Tassal Group Limited and Controlled Entities | Annual Report 2021 71
38. FINANCIAL INSTRUMENTS (CONT.)
Consolidated 2021
Average interest rate
%
Less than 1 year $’000
1 to 5 years $’000
More than 5 years
$’000 Total $’000
Financial assets
Non-interest bearing:
Trade receivables - 30,216 - - 30,216
Other receivables - 7,078 - - 7,078
Other financial assets - 622 1,867 43 2,532
Variable interest rate:
Cash and cash equivalents 0.00% 30,623 - - 30,623
Fixed interest rate maturity:
Other financial assets - - - - -
68,539 1,867 43 70,449
Financial liabilities
Non-interest bearing:
Trade payables - 92,904 - - 92,904
Other payables - 9,655 - - 9,655
Variable interest rate:
Cash advance 0.09% - 348,443 - 348,443
Fixed interest rate maturity:
Interest rate swaps - - - - -
Bank loans - - - - -
Other loans - - - - -
102,559 348,443 - 451,002
Fair value hierarchy
Fair value as at
Fair value hierarchy Valuation techniquesItem
30/06/2021 $’000
30/06/2020 $’000
Interest rate swaps - - Level 2 Discounted cashflow. Future cashflows are estimated based on forward interest rates (from observable yield curves at the end of the reporting period) and contract interest rates, discounted at a rate that reflects the credit risk of various counterparties
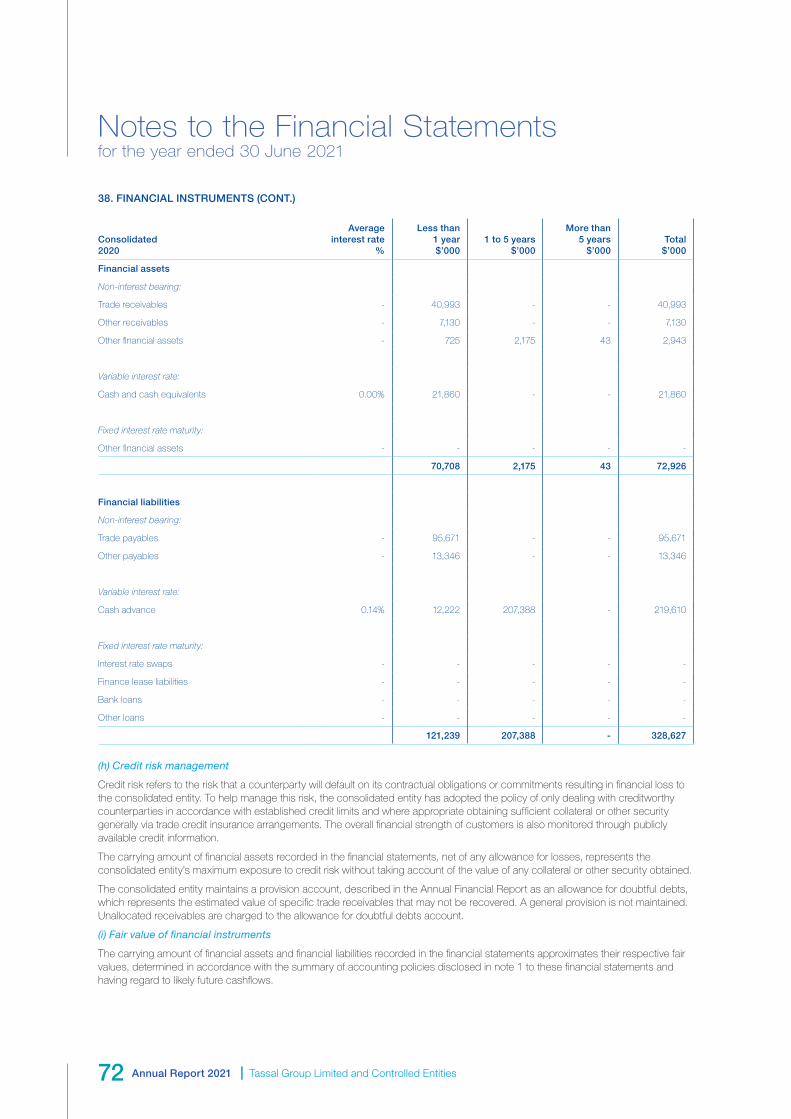
Annual Report 2021 | Tassal Group Limited and Controlled Entities72
Notes to the Financial Statements for the year ended 30 June 2021
38. FINANCIAL INSTRUMENTS (CONT.)
Consolidated 2020
Average interest rate
%
Less than 1 year $’000
1 to 5 years $’000
More than 5 years
$’000 Total $’000
Financial assets
Non-interest bearing:
Trade receivables - 40,993 - - 40,993
Other receivables - 7,130 - - 7,130
Other financial assets - 725 2,175 43 2,943
Variable interest rate:
Cash and cash equivalents 0.00% 21,860 - - 21,860
Fixed interest rate maturity:
Other financial assets - - - - -
70,708 2,175 43 72,926
Financial liabilities
Non-interest bearing:
Trade payables - 95,671 - - 95,671
Other payables - 13,346 - - 13,346
Variable interest rate:
Cash advance 0.14% 12,222 207,388 - 219,610
Fixed interest rate maturity:
Interest rate swaps - - - - -
Finance lease liabilities - - - - -
Bank loans - - - - -
Other loans - - - - -
121,239 207,388 - 328,627
(h) Credit risk management
Credit risk refers to the risk that a counterparty will default on its contractual obligations or commitments resulting in financial loss to the consolidated entity. To help manage this risk, the consolidated entity has adopted the policy of only dealing with creditworthy counterparties in accordance with established credit limits and where appropriate obtaining sufficient collateral or other security generally via trade credit insurance arrangements. The overall financial strength of customers is also monitored through publicly available credit information.
The carrying amount of financial assets recorded in the financial statements, net of any allowance for losses, represents the consolidated entity’s maximum exposure to credit risk without taking account of the value of any collateral or other security obtained.
The consolidated entity maintains a provision account, described in the Annual Financial Report as an allowance for doubtful debts, which represents the estimated value of specific trade receivables that may not be recovered. A general provision is not maintained. Unallocated receivables are charged to the allowance for doubtful debts account.
(i) Fair value of financial instruments
The carrying amount of financial assets and financial liabilities recorded in the financial statements approximates their respective fair values, determined in accordance with the summary of accounting policies disclosed in note 1 to these financial statements and having regard to likely future cashflows.

Tassal Group Limited and Controlled Entities | Annual Report 2021 73
39. PARENT ENTITY INFORMATION
The accounting policies of the parent entity, which have been applied in determining the financial information shown below, are the same as those applied in the consolidated financial statements. Refer to note 1 for a summary of the significant accounting policies relating to the Group.
Statement of financial position
Company 2021
$’000
Company 2020
$’000
Current Assets
Current tax asset 1,795 7,038
Total Current Assets 1,795 7,038
Non-Current Assets
Trade and other receivables 385,600 382,733
Other financial assets 28,119 28,119
Deferred tax assets 19,610 6,727
Total Non-current Assets 433,329 417,579
Total Assets 435,124 424,617
Current Liabilities
Current tax liability - -
Total Current Liabilities - -
Total Liabilities - -
Net Assets 435,124 424,617
Equity
Issued capital 429,499 418,635
Reserves 1,625 1,982
Retained earnings 4,000 4,000
Total Equity 435,124 424,617
Statement of comprehensive income
Profit for the period 33,630 36,950
Other comprehensive income - -
Total comprehensive income 33,630 36,950

Annual Report 2021 | Tassal Group Limited and Controlled Entities74
Directors’ DeclarationDirectors’ Declaration
The Directors declare that:
1. In the opinion of the Directors of Tassal Group Limited (the Company):
(a) there are reasonable grounds to believe that the Company will be able to pay its debts as and when they become due and payable;
(b) the attached financial statements are in compliance with International Financial Reporting Standards, as stated in note 1 to the financial statements; and
(c) the attached financial statements and notes set out on pages 35 - 73 are in accordance with the Corporations Act 2001, including:
(i) giving a true and fair view of the financial position of the consolidated entity as at 30 June 2021 and of their performance, for the year ended on that date; and
(ii) complying with Accounting Standards and the Corporations Act 2001.
2. At the date of this declaration, the Company and its subsidiaries are party to a deed of cross guarantee entered into for the purpose of obtaining for the Company’s subsidiaries the benefit of relief from complying with certain accounting and audit requirements of the Corporations Act granted by ASIC by an order made under subsection 340 (1) of the Corporations Act on 27 June 2006 as varied by Deed of Variation to the 2006 Deed of Cross Guarantee dated 1 June 2016. Relief is now pursuant to ASIC Class Order 98/1418. The nature of the deed of cross guarantee is such that each company which is party to the deed guarantees to each creditor of each other company which is party to the deed payment in full of any debt owed by each other company.
In the Directors’ opinion, there are reasonable grounds to believe that the Company and each of its wholly-owned subsidiaries, being the parties to the deed of cross guarantee as detailed in note 33 to the financial statements will, as a group, be able to meet any obligations or liabilities to which they are, or may become, subject by virtue of the deed of cross guarantee.
3. The Directors have been given the declarations required by section 295A of the Corporations Act 2001 from the Chief Executive Officer and Chief Financial Officer for the financial year ended 30 June 2021.
Signed in accordance with a resolution of the Directors made pursuant to section 295(5) of the Corporations Act 2001.
On behalf of the Directors,
A. D. McCallum, AO Chairman
Hobart, this 17th day of August 2021

Tassal Group Limited and Controlled Entities | Annual Report 2021 75
Deloitte Touche Tohmatsu ABN 74 490 121 060
Level 8 22 Elizabeth Street Hobart TAS 7000 Australia
Tel: +61 3 6237 7000 www.deloitte.com.au
INDEPENDENT AUDITOR’S REPORT TO THE MEMBERS OF TASSAL GROUP LIMITED
Opinion
We have audited the financial report of Tassal Group Limited (the “Company”) and its subsidiaries (the “Group”) which comprises the consolidated statement of financial position as at 30 June 2021, the consolidated income statement, the consolidated statement of comprehensive income, the consolidated statement of changes in equity and the consolidated statement of cash flows for the year then ended, and notes to the financial statements, including a summary of significant accounting policies and other explanatory information, and the directors’ declaration.
In our opinion, the accompanying financial report of the Group is in accordance with the Corporations Act 2001, including:
• Giving a true and fair view of the Group’s financial position as at 30 June 2021 and of its financial performance for the year then ended; and
• Complying with Australian Accounting Standards and the Corporations Regulations 2001.
Basis for Opinion
We conducted our audit in accordance with Australian Auditing Standards. Our responsibilities under those standards are further described in the Auditor’s Responsibilities for the Audit of the Financial Report section of our report. We are independent of the Group in accordance with the auditor independence requirements of the Corporations Act 2001 and the ethical requirements of the Accounting Professional & Ethical Standards Board’s APES 110 Code of Ethics for Professional Accountants (including Independence Standards) (the Code) that are relevant to our audit of the financial report in Australia. We have also fulfilled our other ethical responsibilities in accordance with the Code.
We confirm that the independence declaration required by the Corporations Act 2001, which has been given to the directors of the Company, would be in the same terms if given to the directors as at the time of this auditor’s report.
We believe that the audit evidence we have obtained is sufficient and appropriate to provide a basis for our opinion.
Key Audit Matters
Key audit matters are those matters that, in our professional judgement, were of most significance in our audit of the financial report for the current period. These matters were addressed in the context of our audit of the financial report as a whole, and in forming our opinion thereon, and we do not provide a separate opinion on these matters.
Key Audit Matter How the scope of our audit responded to the Key Audit Matter
Valuation of biological assets
Refer to Note 1(w) Biological Assets – Livestock and Note 9 Biological Assets
As disclosed in Note 9, the Group has biological assets valued at $463.235 million as at 30 June 2021. These biological assets are measured at fair value less estimated point of sale costs.
In order to determine the carrying value, Management prepare a discounted cash flow model which requires them to exercise significant judgement in respect of:
• the forecast harvest weights
• future net market value to be achieved per kilogram of fish/seafood; and
• forecast costs (including feed costs, labour and overhead) to grow the livestock to a harvestable size.
With the support of our valuation specialists, our procedures included, but were not limited to:
• obtaining an understanding of the process including key inputs (such as number and biomass of fish/seafood) used by management to determine fair value
• assessing the appropriateness of the valuation methodology and testing the integrity of the discounted cash flow model
• assessing and challenging the key assumptions in the model as follows:
o forecast harvest weights by comparing to historical trends and the Board approved strategic plan and FY22 budget as well as harvest strategies in place
o future net market value to be achieved per kilogram of livestock by comparing to recent historical sales prices, the Board approved strategic plan and FY22 budget as well as industry data
o forecast costs (including feed costs, labour and overhead) to grow the livestock to a harvestable size by comparing to historical trends and the Board approved strategic plan and FY22 budget
• assessing historical forecasting accuracy
• challenging the appropriateness of the discount rate used in the discounted cash flow model
• performing sensitivity analysis in relation to the key assumptions in the model; and
• assessing the appropriateness of the disclosures to the financial statements
Liability limited by a scheme approved under Professional Standards Legislation. Member of Deloitte Asia Pacific Limited and the Deloitte organisation.

Annual Report 2021 | Tassal Group Limited and Controlled Entities76
INDEPENDENT AUDITOR’S REPORT TO THE MEMBERS OF TASSAL GROUP LIMITED (CONTINUED)
Other Information
The directors are responsible for the other information. The other information comprises the Chairman’s and Chief Executive Officer’s Report and the Directors’ Report, which we obtained prior to the date of this auditor’s report, and also includes the following information which will be included in the Company’s report (but does not include the financial report and our auditor’s report thereon):, Dividend/Distribution – TGR, TGR FY2021 results, TGR FY2021 Results- presentation, Market Briefing on FY2021 results and outlook, additional ASX disclosures and Shareholder Information, which is expected to be made available to us after that date.
Our opinion on the financial report does not cover the other information and we will not express any form of assurance conclusion thereon.
In connection with our audit of the financial report, our responsibility is to read the other information identified above when it becomes available and, in doing so, consider whether the other information is materially inconsistent with the financial report or our knowledge obtained in the audit, or otherwise appears to be materially misstated.
When we read the annual report, if we conclude that there is a material misstatement therein, we are required to communicate the matter to the directors and use our professional judgement to determine the appropriate action.
Responsibilities of the Directors for the Financial Report
The directors of the Company are responsible for the preparation of the financial report that gives a true and fair view in accordance with Australian Accounting Standards and the Corporations Act 2001 and for such internal control as the directors determine is necessary to enable the preparation of the financial report that gives a true and fair view and is free from material misstatement, whether due to fraud or error.
In preparing the financial report, the directors are responsible for assessing the ability of the Group to continue as a going concern, disclosing, as applicable, matters related to going concern and using the going concern basis of accounting unless the directors either intend to liquidate the Group or to cease operations, or has no realistic alternative but to do so.
Auditor’s Responsibilities for the Audit of the Financial Report
Our objectives are to obtain reasonable assurance about whether the financial report as a whole is free from material misstatement, whether due to fraud or error, and to issue an auditor’s report that includes our opinion. Reasonable assurance is a high level of assurance, but is not a guarantee that an audit conducted in accordance with the Australian Auditing Standards will always detect a material misstatement when it exists. Misstatements can arise from fraud or error and are considered material if, individually or in the aggregate, they could reasonably be expected to influence the economic decisions of users taken on the basis of this financial report.
As part of an audit in accordance with the Australian Auditing Standards, we exercise professional judgement and maintain professional scepticism throughout the audit. We also:
• Identify and assess the risks of material misstatement of the financial report, whether due to fraud or error, design and perform audit procedures responsive to those risks, and obtain audit evidence that is sufficient and appropriate to provide a basis for our opinion. The risk of not detecting a material misstatement resulting from fraud is higher than for one resulting from error, as fraud may involve collusion, forgery, intentional omissions, misrepresentations, or the override of internal control.
• Obtain an understanding of internal control relevant to the audit in order to design audit procedures that are appropriate in the circumstances, but not for the purpose of expressing an opinion on the effectiveness of the Group’s internal control.
• Evaluate the appropriateness of accounting policies used and the reasonableness of accounting estimates and related disclosures made by the directors.
• Conclude on the appropriateness of the directors’ use of the going concern basis of accounting and, based on the audit evidence obtained, whether a material uncertainty exists related to events or conditions that may cast significant doubt on the Group’s ability to continue as a going concern. If we conclude that a material uncertainty exists, we are required to draw attention in our auditor’s report to the related disclosures in the financial report or, if such disclosures are inadequate, to modify our opinion. Our conclusions are based on the audit evidence obtained up to the date of our auditor’s report. However, future events or conditions may cause the Group to cease to continue as a going concern.
• Evaluate the overall presentation, structure and content of the financial report, including the disclosures, and whether the financial report represents the underlying transactions and events in a manner that achieves fair presentation.
• Obtain sufficient appropriate audit evidence regarding the financial information of the entities or business activities within the Group to express an opinion on the financial report. We are responsible for the direction, supervision and performance of the Group’s audit. We remain solely responsible for our audit opinion.
Tassal Group Limited and Controlled Entities | Annual Report 2021 77
We communicate with the directors regarding, among other matters, the planned scope and timing of the audit and significant audit findings, including any significant deficiencies in internal control that we identify during our audit.
We also provide the directors with a statement that we have complied with relevant ethical requirements regarding independence, and to communicate with them all relationships and other matters that may reasonably be thought to bear on our independence, and where applicable, actions taken to eliminate threats or safeguards applied.
From the matters communicated with the directors, we determine those matters that were of most significance in the audit of the financial report of the current period and are therefore the key audit matters. We describe these matters in our auditor’s report unless law or regulation precludes public disclosure about the matter or when, in extremely rare circumstances, we determine that a matter should not be communicated in our report because the adverse consequences of doing so would reasonably be expected to outweigh the public interest benefits of such communication.
Report on the Remuneration Report
Opinion on the Remuneration Report
We have audited the Remuneration Report included in pages 16 to 26 of the Directors’ Report for the year ended 30 June 2021.
In our opinion, the Remuneration Report of Tassal Group Limited, for the year ended 30 June 2021, complies with section 300A of the Corporations Act 2001.
Responsibilities
The directors of the Company are responsible for the preparation and presentation of the Remuneration Report in accordance with section 300A of the Corporations Act 2001. Our responsibility is to express an opinion on the Remuneration Report, based on our audit conducted in accordance with Australian Auditing Standards.
DELOITTE TOUCHE TOHMATSU
Chris Biermann
Partner
Chartered Accountants
Hobart, 17 August 2021
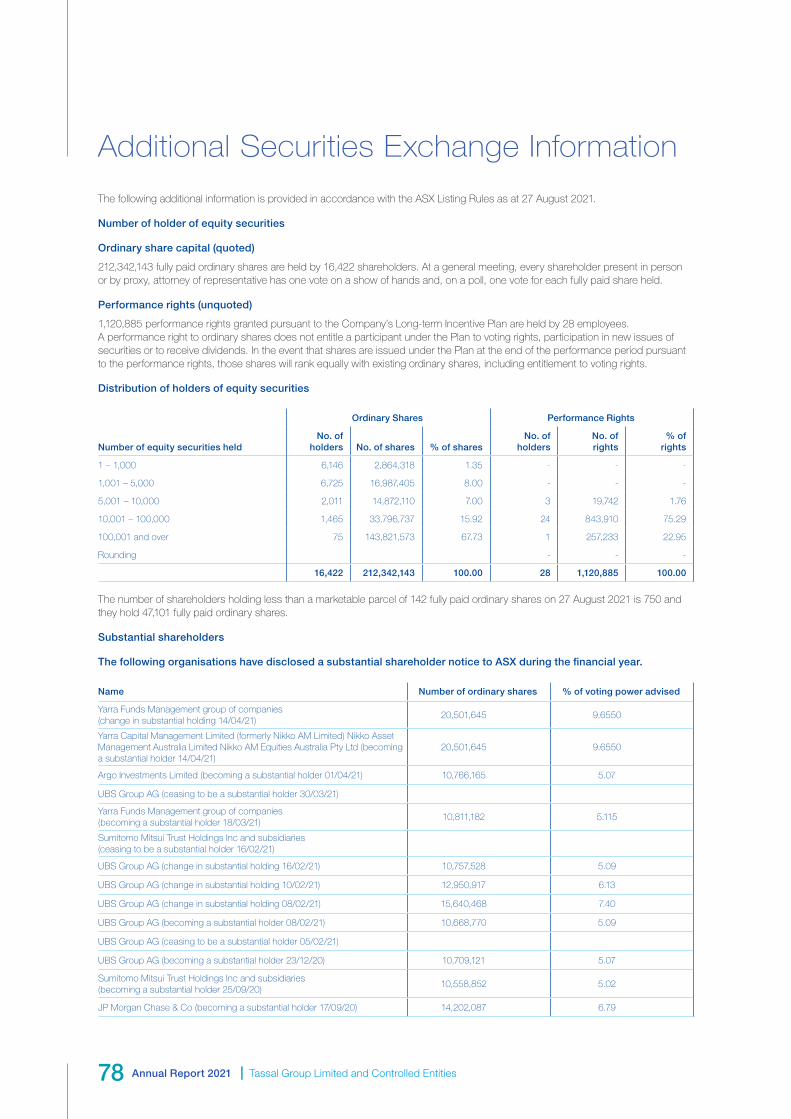
Annual Report 2021 | Tassal Group Limited and Controlled Entities78
Additional Securities Exchange Information
The following additional information is provided in accordance with the ASX Listing Rules as at 27 August 2021.
Number of holder of equity securities
Ordinary share capital (quoted)
212,342,143 fully paid ordinary shares are held by 16,422 shareholders. At a general meeting, every shareholder present in person or by proxy, attorney of representative has one vote on a show of hands and, on a poll, one vote for each fully paid share held.
Performance rights (unquoted)
1,120,885 performance rights granted pursuant to the Company’s Long-term Incentive Plan are held by 28 employees. A performance right to ordinary shares does not entitle a participant under the Plan to voting rights, participation in new issues of securities or to receive dividends. In the event that shares are issued under the Plan at the end of the performance period pursuant to the performance rights, those shares will rank equally with existing ordinary shares, including entitlement to voting rights.
Distribution of holders of equity securities
Ordinary Shares Performance Rights
Number of equity securities heldNo. of
holders No. of shares % of sharesNo. of
holdersNo. of rights
% of rights
1 – 1,000 6,146 2,864,318 1.35 - - -
1,001 – 5,000 6,725 16,987,405 8.00 - - -
5,001 – 10,000 2,011 14,872,110 7.00 3 19,742 1.76
10,001 – 100,000 1,465 33,796,737 15.92 24 843,910 75.29
100,001 and over 75 143,821,573 67.73 1 257,233 22.95
Rounding - - -
16,422 212,342,143 100.00 28 1,120,885 100.00
The number of shareholders holding less than a marketable parcel of 142 fully paid ordinary shares on 27 August 2021 is 750 and they hold 47,101 fully paid ordinary shares.
Substantial shareholders
The following organisations have disclosed a substantial shareholder notice to ASX during the financial year.
Name Number of ordinary shares % of voting power advised
Yarra Funds Management group of companies (change in substantial holding 14/04/21)
20,501,645 9.6550
Yarra Capital Management Limited (formerly Nikko AM Limited) Nikko Asset Management Australia Limited Nikko AM Equities Australia Pty Ltd (becoming a substantial holder 14/04/21)
20,501,645 9.6550
Argo Investments Limited (becoming a substantial holder 01/04/21) 10,766,165 5.07
UBS Group AG (ceasing to be a substantial holder 30/03/21)
Yarra Funds Management group of companies (becoming a substantial holder 18/03/21)
10,811,182 5.115
Sumitomo Mitsui Trust Holdings Inc and subsidiaries (ceasing to be a substantial holder 16/02/21)
UBS Group AG (change in substantial holding 16/02/21) 10,757,528 5.09
UBS Group AG (change in substantial holding 10/02/21) 12,950,917 6.13
UBS Group AG (change in substantial holding 08/02/21) 15,640,468 7.40
UBS Group AG (becoming a substantial holder 08/02/21) 10,668,770 5.09
UBS Group AG (ceasing to be a substantial holder 05/02/21)
UBS Group AG (becoming a substantial holder 23/12/20) 10,709,121 5.07
Sumitomo Mitsui Trust Holdings Inc and subsidiaries (becoming a substantial holder 25/09/20)
10,558,852 5.02
JP Morgan Chase & Co (becoming a substantial holder 17/09/20) 14,202,087 6.79

Tassal Group Limited and Controlled Entities | Annual Report 2021 79
Twenty largest holders of quoted ordinary shares
Rank Name Units % of Units
1 HSBC CUSTODY NOMINEES (AUSTRALIA) LIMITED 34,462,373 16.23
2 CITICORP NOMINEES PTY LIMITED 31,661,129 14.91
3 J P MORGAN NOMINEES AUSTRALIA PTY LIMITED 25,063,409 11.80
4 ARGO INVESTMENTS LIMITED 11,766,165 5.54
5 NATIONAL NOMINEES LIMITED 6,192,677 2.92
6 BNP PARIBAS NOMS PTY LTD <DRP> 4,168,530 1.96
7 NEKON PTY LTD <HERMAN ROCKEFELLER A/C> 2,739,398 1.29
8 HSBC CUSTODY NOMINEES (AUSTRALIA) LIMITED <NT-COMNWLTH SUPER CORP A/C> 2,647,036 1.25
9 RASIN HOLDINGS PTY LTD <G&A COSTI INVESTMENT A/C> 2,500,000 1.18
10 NETWEALTH INVESTMENTS LIMITED <WRAP SERVICES A/C> 2,420,580 1.14
11 BNP PARIBAS NOMINEES PTY LTD <AGENCY LENDING DRP A/C> 1,558,605 0.73
12 MRS PATRICIA GLADYS WRIGHT + MR MARK GREGORY WRIGHT + MR JAMES GREGORY WRIGHT <PG WRIGHT SUPER FUND A/C>
1,111,802 0.52
13 BNP PARIBAS NOMINEES PTY LTD SIX SIS LTD <DRP A/C> 983,225 0.46
14 BNP PARIBAS NOMINEES PTY LTD HUB24 CUSTODIAL SERV LTD <DRP A/C> 903,825 0.43
15 GARMARAL PTY LTD 779,539 0.37
16 KYKUIT PTY LTD 700,000 0.33
17 MR NICHOLAS BARRY DEBENHAM + MRS ANNETTE CECILIA DEBENHAM <N & A DEBENHAM S/FUND A/C>
660,000 0.31
18 BNP PARIBAS NOMINEES PTY LTD ACF CLEARSTREAM 653,832 0.31
19 BRAZIL FARMING PTY LTD 600,000 0.28
20 HUMANA PTY LTD <NEKON SUPER FUND A/C> 515,000 0.24
Totals: Top 20 holders of ORDINARY FULLY PAID SHARES (Total) 132,087,125 62.20
Total Remaining Holders Balance 80,255,018 37.80
On-market buy-back
There is no current on-market buy-back.

Annual Report 2021 | Tassal Group Limited and Controlled Entities80

TASSAL GROUP LIMITEDLEVEL 9, 1 FRANKLIN WHARF, HOBART TAS 7000
+61 3 6244 [email protected]
TASS
ALG
RO
UP.
CO
M.A
U