Embed Size (px)
Citation preview

ANNUAL REPORT 2015
PKC Group 2015 Annual Report
Content
Report by the Board of Directors and Financial Statements 3 Corporate Governance Statement 94 Remuneration Statement 104
Information for Shareholders
Annual General Meeting The Annual General Meeting of PKC Group Plc. shall be held on 6 April 2016 at 1.00 pm in Helsinki, at Pörssitalo at the address Fabianinkatu 14. A shareholder is entitled to attend the meeting if he or she is listed as a shareholder in the company’s shareholder register at Euroclear Finland Ltd, on the record date of 23 March 2016, (holders of nominee registered shares have to be entered on the temporary shareholders’ register by 10 a.m. on 1 April 2016) and who notifies the company of his or her participation by 10 a.m. on 1 April 2016. Notice of the Annual General Meeting has been published as a Stock Exchange Announcement on 7 March 2016 and on the company’s website.
Dividends The Board of Directors proposes that a dividend of EUR 0.70 per share be paid for the year 2015. The record date for dividends is 8 April 2016 and the payment date for dividends is 15 April 2016.
Financial reports for 2016 PKC Group Plc will publish its financial information for 2016 as follows:
Interim Statement 1–3/2016 Wednesday, May 4, 2016 at about 8.15 a.m.
Half-yearly Report 1–6/2016 Wednesday, August 10, 2016 at about 8.15 a.m.
Interim Statement 1–9/2016 Thursday, October 27, 2016 at about 8.15 a.m.
The Financial Reports and stock exchange bulletins are published in Finnish and English on the company’s website at www.pkcgroup.com. The Financial Reports and financial statement bulletins are also available on the website in PDF format. The Annual Report is published in PDF format and is available on the website.
Change of address Shareholders are kindly requested to notify the book-entry register at which their book-entries are kept of any changes in their contact information.
More information may be found on PKC’s website www.pkcgroup.com
2
Report by the Board of Directors and
Financial Statements 2015
PKC Group 2015 Annual Report
Content
Report by the Board of Directors Report by the Board of Directors 5 Key Indicators 13 Calculation of Key Indicators 16 Shares and Shareholders 17
Financial Statements Consolidated Statement of Comprehensive Income 24 Consolidated Statement of Financial Position 25 Consolidated Statement of Cash Flows 26 Consolidated Statement of Changes in Equity 27
Notes to the Consolidated Financial Statements Basis of Preparation and Accounting Policies 29 1. Items related to the Profit for the Period
1.1 Operating Segments 37 1.2 Other Operating Income 40 1.3 Materials and Services 41 1.4 Employee Benefit Expenses 41 1.5 Other Operating Expenses 47 1.6 Income taxes, incl. Deferred Tax Assets and Liabilities 48 1.7 Earnings per Share 52
2. Operating Assets and Liabilities
2.1 Intangible Assets 53 2.2 Impairment Testing 55 2.3 Property, Plant and Equipment 57 2.4 Available-for-sale Financial Assets 59 2.5 Non-Current Other Receivables and Liabilities 59 2.6 Inventories 59 2.7 Trade Receivables and Other Receivables 60 2.8 Trade Payables and Other Non-Interest-Bearing Liabilities 60 2.9 Provisions 61
3. Capital Structure and Financial Expenses 3.1 Classification, Accounting and Valuation Principles, Carrying Amounts and Fair Values of Financial
Assets and Liabilities by Valuation Categories 62
3.2 Interest-Bearing Financial Liabilities 66 3.3 Financial Income and Expenses 66 3.4 Financial Risk Management 67 3.5 Equity 72
4. Other Notes 4.1 Related Party Disclosures 74 4.2 Group Structure 76 4.3 Business Combinations 77 4.4 Established Joint Venture 78 4.5 Operating Leases 79 4.6 Contingent Items and Commitments 79 4.7 Information pursuant to Ministry of Finance Ordinance 1020/2012 79 4.8 Events after the Financial Year 80
Parent Company’s Financial Statements Parent Company´s Income Statement 81 Parent Company´s Balance Sheet 82 Parent Company´s Cash Flow Statement 83 Accounting Policies for the Parent Company´s Financial Statements 84 Notes to the Parent Company´s Financial Statements 1. Net Sales by Market Areas 85 2. Other Operating Income 85 3. Staff Expenses 85 4. Other Operating Expenses 85 5. Financial Income and Expenses 86 6. Group Contribution 86 7. Income Taxes 86 8. Non-Current Assets 87 9. Investments 87 10. Long-term Receivables 88
11. Short-term Receivables 88 12. Equity 89 13. Non-Current Liabilities 90 14. Current Liabilities 90 15. Commitments and Other Obligations 90
Board of Directors´ Proposal for Profit Distribution 91 Signatures of Report by the Board of Directors and Financial Statements 91 Auditor’s Report 92
4
Report by the Board of Directors
PKC Group 2015 Annual Report
Report by the Board of Directors
Review by the President & CEO PKC’s financial year 2015 was a year of positive development, both financially and also in terms of the implementation of the growth strategy. The company’s revenue and operating profit before non-recurring items increased. Revenue amounted to EUR 908.0 million (+9.5%) and operating profit before non-recurring items amounted to EUR 31.6 million (+48.0%). 2015 was full of events. It included expansion into rolling stock customer relationships through the acquisition of Kabel-Technik-Polska Sp. z o.o. and the establishment of a joint venture in China with Huakai specialising in the manufacture of electrical distribution systems. Production reorganisation proceeded in Europe and Brazil. The new wiring systems factories in Lithuania and Serbia speeded up and production in Brazil was consolidated into one factory. PKC’s market position remained strong in all product and geographical areas of operation throughout the financial year. As a sign of this success, customers honoured PKC with several quality awards. PKC’s excellent customer service and reliability are based on the professionally-skilled personnel, who once again succeeded excellently in their work. For this I would like to express my warmest thanks to all those working at PKC.
During year 2016 we will continue with the implementation of our growth strategy. We will concentrate on strengthening our position and creating the prerequisites for growth globally with our rolling stock customers, and with our truck customers especially in China. Our strong balance sheet is enabling us to engage in growth projects. The key reorganisations in European production will gradually end during the year, with the exception of the closure of the Keila factory situated in Estonia which, as a result of customer projects, will not be carried out until Q1/17. Competence units will remain at Keila to serve European and South American business. The closure of the Keila factory will not result in additional non-recurring items. In 2016, we expect the market environment to be fluctuating. The production of trucks in North America and Brazil is forecast to decline. In Europe, production volumes are expected to remain unchanged. In China, the production of trucks is expected to increase, and the positive nature of the market is being increased by the continuation in average price rises brought about by the increasing complexity of electrical distribution systems. The rolling stock market is expected to grow, and the order books of PKC’s rolling stock customers are on a good level. The demand for the products of the Electronics segment is estimated to remain at the current level at the most.
5
Report by the Board of Directors
PKC Group 2015 Annual Report
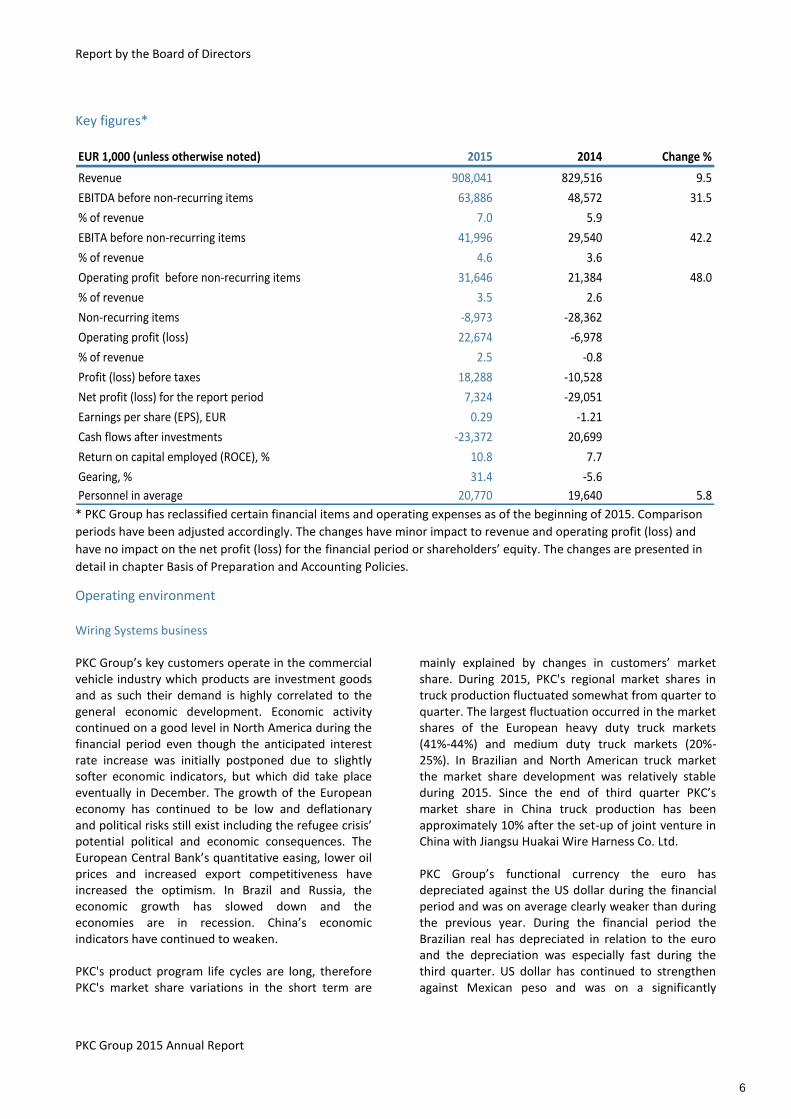
Key figures*
EUR 1,000 (unless otherwise noted) 2015 2014 Change %
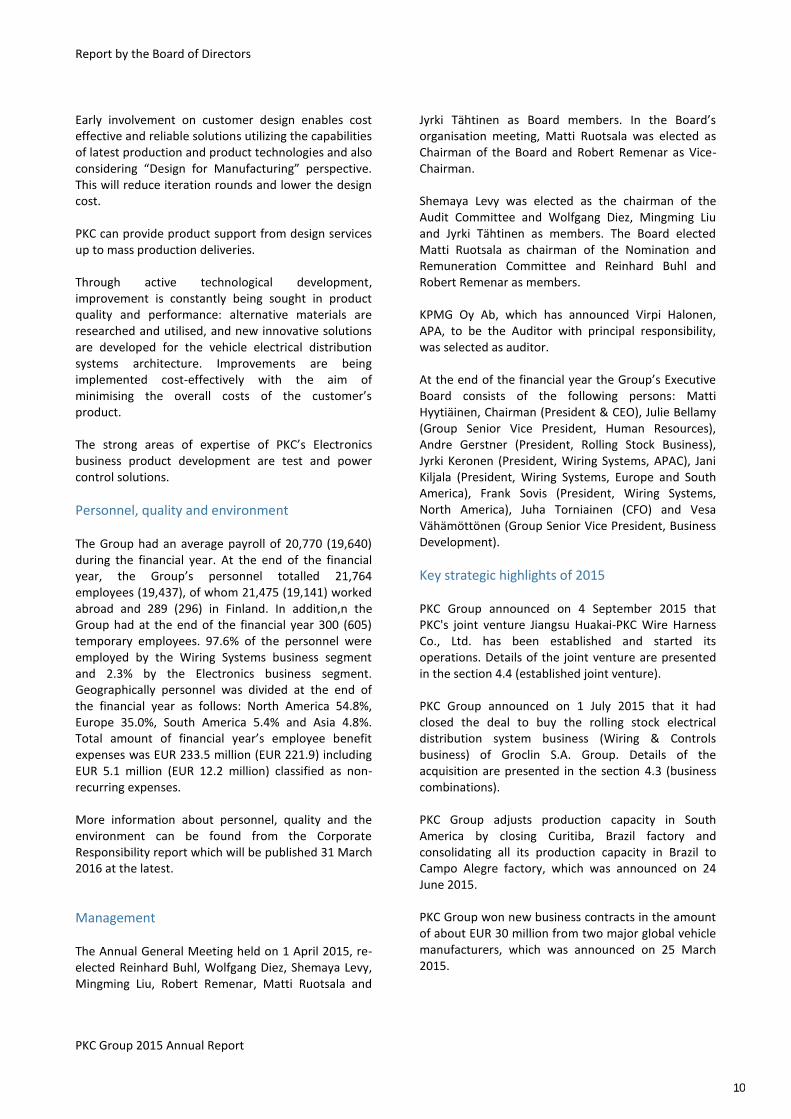
Revenue 908,041 829,516 9.5
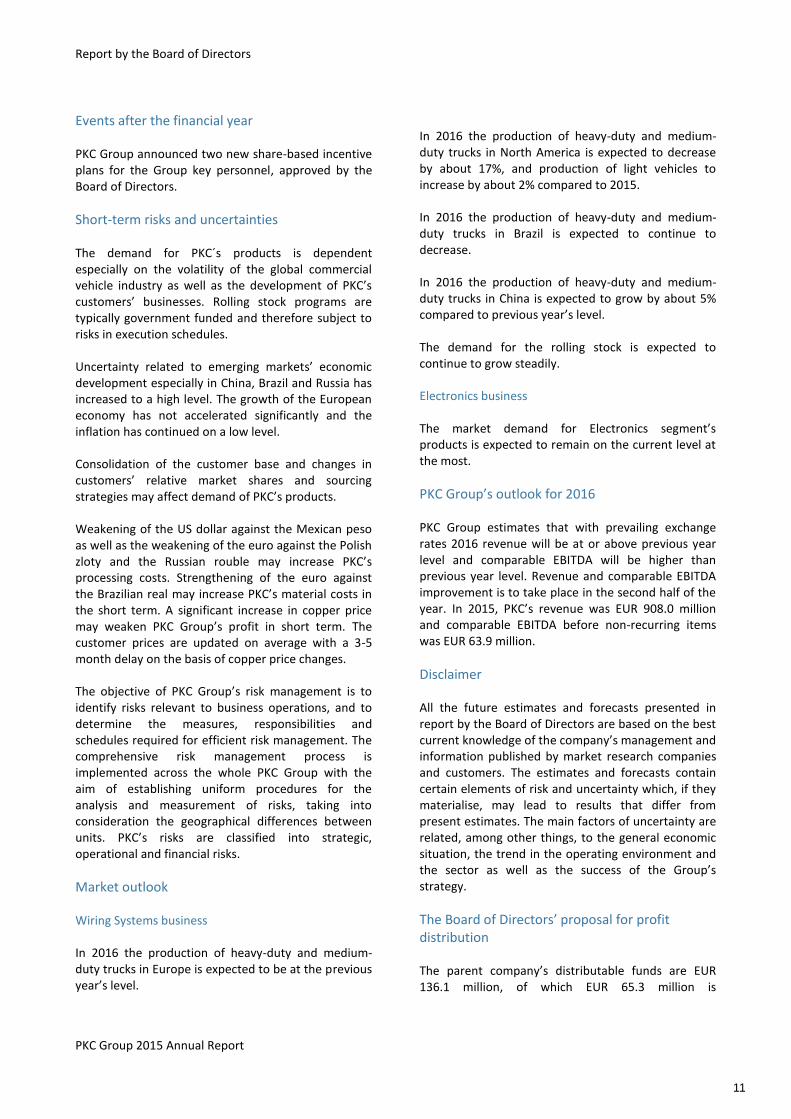
EBITDA before non-recurring items 63,886 48,572 31.5
% of revenue 7.0 5.9
EBITA before non-recurring items 41,996 29,540 42.2
% of revenue 4.6 3.6
Operating profit before non-recurring items 31,646 21,384 48.0
% of revenue 3.5 2.6
Non-recurring items -8,973 -28,362
Operating profit (loss) 22,674 -6,978
% of revenue 2.5 -0.8
Profit (loss) before taxes 18,288 -10,528
Net profit (loss) for the report period 7,324 -29,051
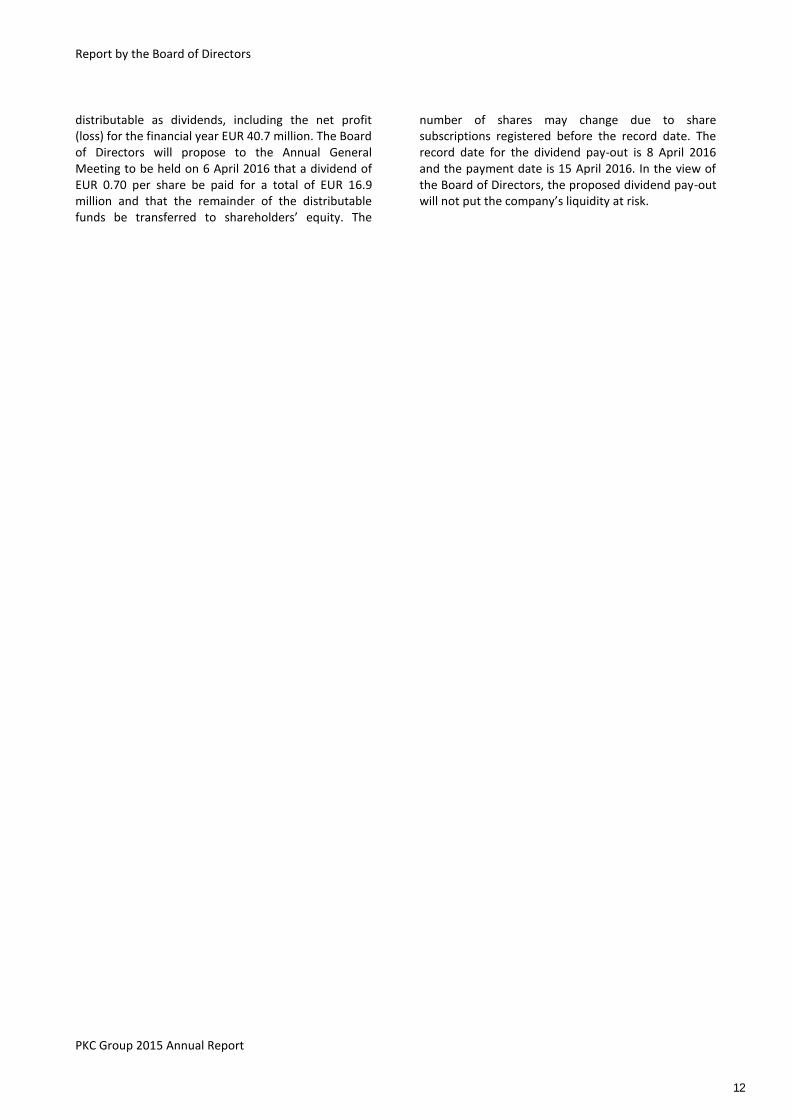
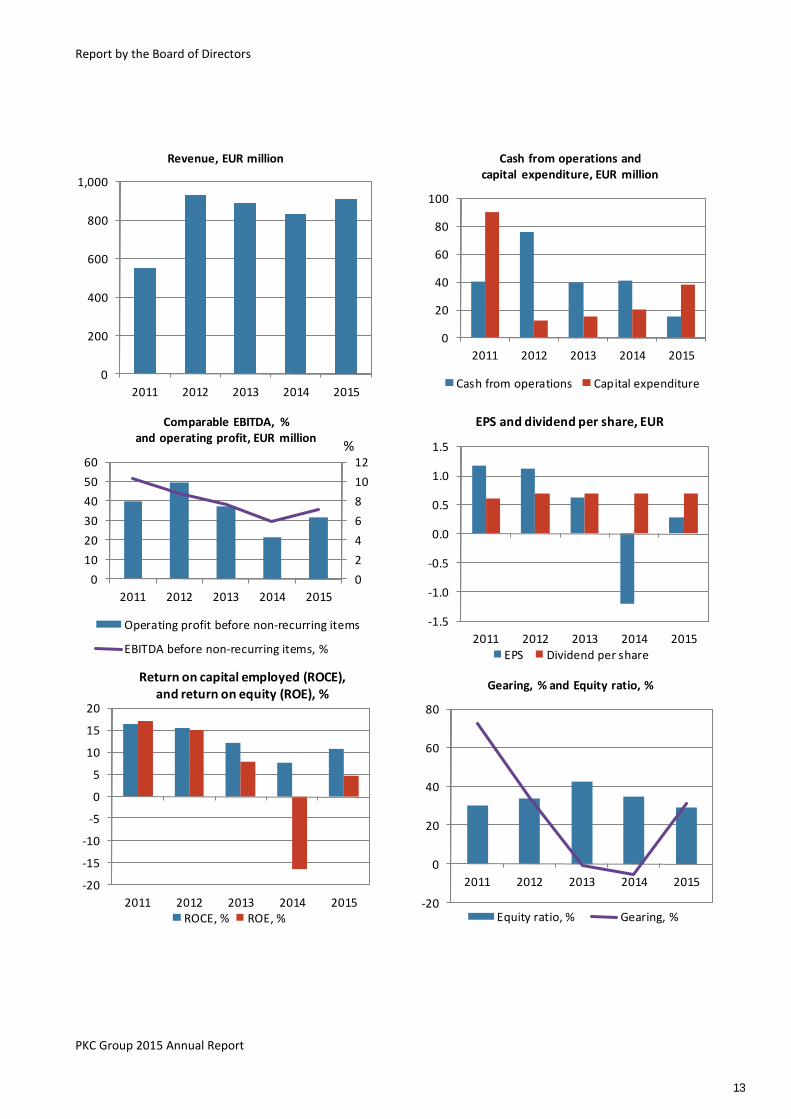
Earnings per share (EPS), EUR 0.29 -1.21
Cash flows after investments -23,372 20,699
Return on capital employed (ROCE), % 10.8 7.7
Gearing, % 31.4 -5.6
Personnel in average 20,770 19,640 5.8 * PKC Group has reclassified certain financial items and operating expenses as of the beginning of 2015. Comparison
periods have been adjusted accordingly. The changes have minor impact to revenue and operating profit (loss) and
have no impact on the net profit (loss) for the financial period or shareholders’ equity. The changes are presented in
detail in chapter Basis of Preparation and Accounting Policies.
Operating environment Wiring Systems business PKC Group’s key customers operate in the commercial vehicle industry which products are investment goods and as such their demand is highly correlated to the general economic development. Economic activity continued on a good level in North America during the financial period even though the anticipated interest rate increase was initially postponed due to slightly softer economic indicators, but which did take place eventually in December. The growth of the European economy has continued to be low and deflationary and political risks still exist including the refugee crisis’ potential political and economic consequences. The European Central Bank’s quantitative easing, lower oil prices and increased export competitiveness have increased the optimism. In Brazil and Russia, the economic growth has slowed down and the economies are in recession. China’s economic indicators have continued to weaken. PKC's product program life cycles are long, therefore PKC's market share variations in the short term are
mainly explained by changes in customers’ market share. During 2015, PKC's regional market shares in truck production fluctuated somewhat from quarter to quarter. The largest fluctuation occurred in the market shares of the European heavy duty truck markets (41%-44%) and medium duty truck markets (20%-25%). In Brazilian and North American truck market the market share development was relatively stable during 2015. Since the end of third quarter PKC’s market share in China truck production has been approximately 10% after the set-up of joint venture in China with Jiangsu Huakai Wire Harness Co. Ltd. PKC Group’s functional currency the euro has depreciated against the US dollar during the financial period and was on average clearly weaker than during the previous year. During the financial period the Brazilian real has depreciated in relation to the euro and the depreciation was especially fast during the third quarter. US dollar has continued to strengthen against Mexican peso and was on a significantly
6
Report by the Board of Directors
PKC Group 2015 Annual Report
stronger level than in the comparison period. The price of key raw material, copper, has continued to decrease during the year ending up on a significantly
lower lever than at the end of comparison period. On average the customer sales prices are updated with a 3-5 month delay on the basis of copper price changes.
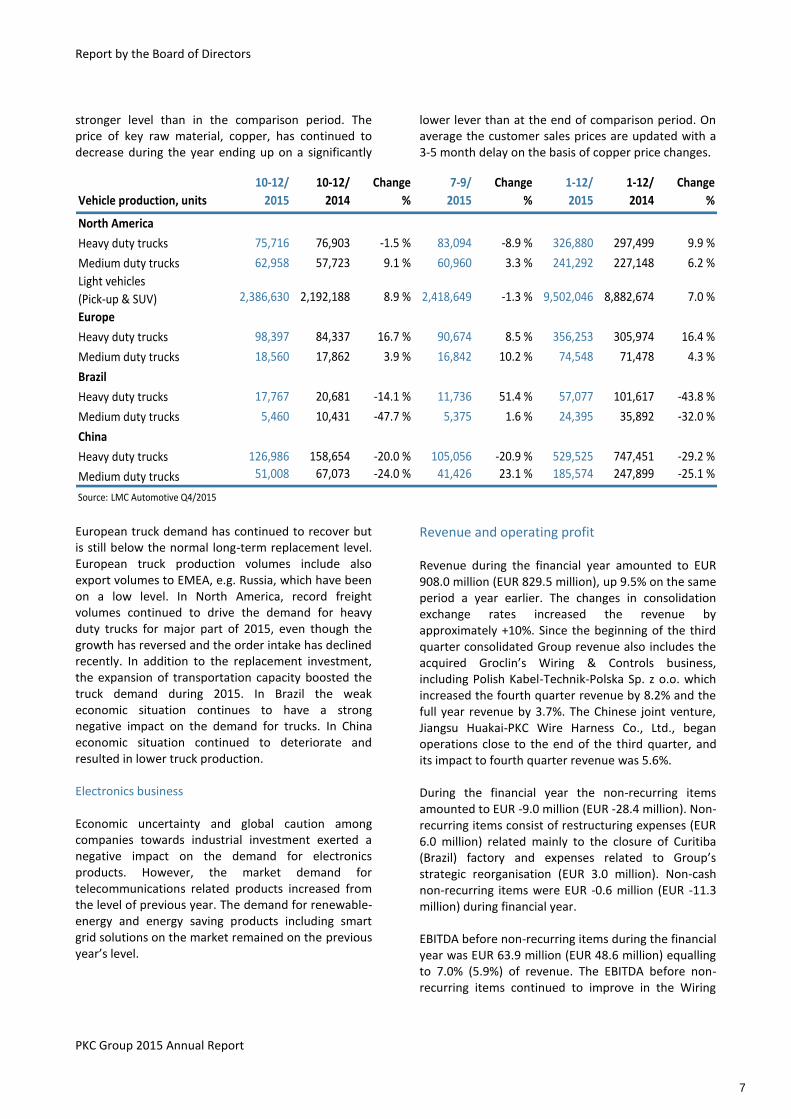
Vehicle production, units
10-12/
2015
10-12/
2014
Change
%
7-9/
2015
Change
%
1-12/
2015
1-12/
2014
Change
%
North America
Heavy duty trucks 75,716 76,903 -1.5 % 83,094 -8.9 % 326,880 297,499 9.9 %
Medium duty trucks 62,958 57,723 9.1 % 60,960 3.3 % 241,292 227,148 6.2 %
Light vehicles
(Pick-up & SUV) 2,386,630 2,192,188 8.9 % 2,418,649 -1.3 % 9,502,046 8,882,674 7.0 %
Europe
Heavy duty trucks 98,397 84,337 16.7 % 90,674 8.5 % 356,253 305,974 16.4 %
Medium duty trucks 18,560 17,862 3.9 % 16,842 10.2 % 74,548 71,478 4.3 %
Brazil
Heavy duty trucks 17,767 20,681 -14.1 % 11,736 51.4 % 57,077 101,617 -43.8 %
Medium duty trucks 5,460 10,431 -47.7 % 5,375 1.6 % 24,395 35,892 -32.0 %
China
Heavy duty trucks 126,986 158,654 -20.0 % 105,056 -20.9 % 529,525 747,451 -29.2 %
Medium duty trucks 51,008 67,073 -24.0 % 41,426 23.1 % 185,574 247,899 -25.1 %
Source: LMC Automotive Q4/2015
European truck demand has continued to recover but is still below the normal long-term replacement level. European truck production volumes include also export volumes to EMEA, e.g. Russia, which have been on a low level. In North America, record freight volumes continued to drive the demand for heavy duty trucks for major part of 2015, even though the growth has reversed and the order intake has declined recently. In addition to the replacement investment, the expansion of transportation capacity boosted the truck demand during 2015. In Brazil the weak economic situation continues to have a strong negative impact on the demand for trucks. In China economic situation continued to deteriorate and resulted in lower truck production. Electronics business Economic uncertainty and global caution among companies towards industrial investment exerted a negative impact on the demand for electronics products. However, the market demand for telecommunications related products increased from the level of previous year. The demand for renewable-energy and energy saving products including smart grid solutions on the market remained on the previous year’s level.
Revenue and operating profit Revenue during the financial year amounted to EUR 908.0 million (EUR 829.5 million), up 9.5% on the same period a year earlier. The changes in consolidation exchange rates increased the revenue by approximately +10%. Since the beginning of the third quarter consolidated Group revenue also includes the acquired Groclin’s Wiring & Controls business, including Polish Kabel-Technik-Polska Sp. z o.o. which increased the fourth quarter revenue by 8.2% and the full year revenue by 3.7%. The Chinese joint venture, Jiangsu Huakai-PKC Wire Harness Co., Ltd., began operations close to the end of the third quarter, and its impact to fourth quarter revenue was 5.6%. During the financial year the non-recurring items amounted to EUR -9.0 million (EUR -28.4 million). Non-recurring items consist of restructuring expenses (EUR 6.0 million) related mainly to the closure of Curitiba (Brazil) factory and expenses related to Group’s strategic reorganisation (EUR 3.0 million). Non-cash non-recurring items were EUR -0.6 million (EUR -11.3 million) during financial year. EBITDA before non-recurring items during the financial year was EUR 63.9 million (EUR 48.6 million) equalling to 7.0% (5.9%) of revenue. The EBITDA before non-recurring items continued to improve in the Wiring
7
Report by the Board of Directors
PKC Group 2015 Annual Report
Systems segment contributed by lower losses in Brazil despite lower revenue, favourable translation impact arising from exchange rates and improved profit in Europe. In addition, recent transactions contributed to consolidated EBITDA. Electronics segment’s EBITDA has improved in the financial period, but was lower in the fourth quarter impacted by unfavorable share of own products in the product mix. Operating profit before non-recurring items and PPA depreciation and amortisation related to acquisitions during the financial year totalled EUR 42.0 million (EUR 29.5 million), accounting for 4.6% of revenue (3.6%). During the financial year Group depreciation, amortisation and impairment losses amounted to EUR 33.0 million (EUR 33.5 million). Excluding PPA related depreciation and amortisation, and impairment losses it amounted to EUR 21.9 million (EUR 19.0 million). During the financial year the Group’s operating profit totalled EUR 22.7 million (EUR -7.0 million), accounting for 2.5% of revenue (-0.8%). Wiring Systems business Revenue during the financial year amounted to EUR 846.7 million (EUR 772.1 million), or 9.7% more than in the comparison period. The changes in consolidation exchange rates increased the revenue by approximately +10%. Since the beginning of the third quarter, Wiring Systems revenue also includes the acquired Groclin’s Wiring & Controls business, including Polish Kabel-Technik-Polska Sp. z o.o., which increased the fourth quarter revenue by 8.7%. The Chinese joint venture, Jiangsu Huakai-PKC Wire Harness Co., Ltd., began operations close to the end of the third quarter, and its impact to segment revenue in the fourth quarter was 5.9%. The revenue in North America included some negative impact due to light vehicle program build-outs where a major individual program ended in December 2014. In Europe, the revenue increased, while the revenue in Brazil decreased significantly due to poor market conditions. The segment’s share of the consolidated revenue was during the financial year 93.2% (93.1%). During the financial year the non-recurring items amounted to EUR -5.8 million (EUR -26.5 million). Non-recurring items include restructuring expenses which are mainly related to the closure of Curitiba (Brazil) factory which were initially recognized in the second quarter of the year. Non-cash non-recurring items were EUR -0.6 million (EUR -11.3 million) during the financial year.
During the financial year EBITDA before non-recurring items was EUR 66.4 million (EUR 51.4 million) and 7.8% (6.7%) of the segment’s revenue. EBITDA before non-recurring items was improved by lower losses in Brazil despite lower revenue, favourable translation impact arising from exchange rates and improved profit in Europe. In addition, recent transactions contributed to consolidated EBITDA. In Europe the development program continues. In South America, the closing of the Curitiba factory and consolidating of all production capacity in Brazil to Campo Alegre factory has taken place. During the financial year operating profit before non-recurring items was EUR 36.0 million (EUR 25.8 million), equivalent to 4.2% of the segment’s revenue (3.3%). During the financial year operating profit was EUR 30.2 million (EUR -0.7 million), equivalent to 3.6% of the segment’s revenue (-0.1%). Electronics business Revenue during the financial year increased by 6.7% to EUR 61.3 million (EUR 57.4 million). During the financial year the revenue generated by own products increased. The segment’s share of the consolidated revenue was during 6.8% (6.9%). During the financial year EUR 0.2 million in non-recurring expenses related to employee benefits were recognised. During the comparison period no non-recurring items were recognised. EBITDA before non-recurring items was EUR 3.7 million (EUR 3.1 million) and 6.1% (5.5%) of the segment’s revenue. Operating profit before non-recurring items was EUR 2.0 million (EUR 1.7 million), equivalent to 3.3% of the segment’s revenue (2.9%). Operating profit was EUR 1.8 million (EUR 1.7 million), equivalent to 3.0% of the segment’s revenue (2.9%). During the financial year profitability was improved due to higher share of own products in the revenue.
Financial items and net profit Financial items were EUR -4.4 million (EUR -3.6 million) during the financial year. Financial items include foreign exchange differences totalling EUR 0.6 million (EUR 0.5 million). Profit before taxes was EUR 18.3 million (EUR -10.5 million) during the financial year. Income tax of the financial year amounted to EUR 11.0 million (EUR 18.5 million). Income tax of the financial year 2014 includes additional taxes of EUR 8.3 million related to previous years. During the financial year the effective tax rate continued to be impacted by PKC Group’s high
8
Report by the Board of Directors
PKC Group 2015 Annual Report
exposure to North America where the tax rates are higher. Furthermore, effective tax rate is influenced by losses, including non-recurring items’ impact, in Brazil, whereby no deferred tax assets are currently recognized. Net profit for the financial year totalled EUR 7.3 million (EUR -29.1 million). Earnings per share for the financial year were EUR 0.29 (EUR -1.21).
Cash flow, financial position and financing During the financial year net cash from operating activities was EUR 14.8 million (EUR 41.0 million) and cash flow after investments was EUR -23.4 million (EUR 20.7 million). The acquisition cash outflow was EUR 22.5 million during the financial year. Net cash from operating activities was reduced by the build-up of working capital in the recently established Chinese joint venture and by increased volumes in the recently acquired rolling stock business. The core net working capital (inventories, trade receivables and trade payables) decreased from the end of previous quarter by EUR 31.8 million. Total net working capital (including all current non-interest bearing items) at the end of December 2015 was EUR 55.1 million (EUR 26.2 million a year earlier) representing a decrease of EUR 41.8 million during the quarter, while in the comparison quarter the decrease was EUR 40.7 million. Typically for the automotive industry, working capital levels are at their lowest around the year end production shut-down period. Total net working capital includes the recording of additional EUR 8.3 million tax liability in the third quarter 2014 and unpaid liabilities related to non-recurring items in Europe, South America and North America which were recorded in 2014 and 2015 and are yet to be paid during 2016. During the financial year the Group’s gross capital expenditure totalled EUR 38.1 million (EUR 19.9 million), representing 4.2% of revenue (2.4%). Gross capital expenditure is geographically divided as follows: Europe 77.5% (40.4%), North America 18.0% (40.7%), APAC 3.1% (9.2%) and South America 1.4% (9.6%). The capital expenditure consisted of regular maintenance investments into production machinery and equipment during the financial period. The total capital expenditure includes the EUR 22.5 million impact of acquisition. PKC estimates that in the medium term, the Group's replacement investment level is close to its annual depreciation and amortisation level excluding PPA related depreciation and amortization, and impairment losses.
At the close of the financial year cash and cash equivalents amounted to EUR 118.3 million (EUR 110.3 million). At the close of the financial year, interest-bearing liabilities totalled EUR 167.7 million (EUR 101.4 million), which consisted of non-current interest-bearing debt of EUR 142.2 million and current interest-bearing debt of EUR 25.5 million. Increase in non-current interest bearing debt was due to funding of the acquisition in July. Current interest-bearing liabilities consist mainly of outstanding of commercial papers. PKC Group has a Finnish commercial paper program whereby PKC Group regularly issues short-term notes. In addition, the group has a committed, un-utilized credit facility of EUR 90.0 million. PKC Group selectively utilizes also non-recourse factoring arrangements with some customers. At the close of the financial period the outstanding amount of such arrangements was EUR 29.4 million (EUR 26.4 million). The effective average interest rate of the interest-bearing debt including the expenses of the unutilized credit facility was at the close of the financial year 2.4% (4.4%). The change in effective average interest rate is mainly related to increased use of commercial papers and financial institution loans. The Group’s equity ratio was 29.0% (34.7%). Net interest-bearing liabilities totalled EUR 49.4 million (EUR -8.9 million) and gearing was 31.4% (-5.6%).
Research & development Research and development costs during the financial year totalled EUR 9.2 million (EUR 8.2 million), representing 1.0% (1.0%) of the consolidated revenue. At the end of financial year 143 (149) people worked in product development, excluding production development and process development personnel. In its product strategy, product development in PKC’s Wiring Systems business takes into consideration the long- and short-term product development needs of PKC’s customers and the latest development trends in the automotive industry. PKC’s main products are individually tailored electrical distribution systems, in addition to which PKC’s product development is a pioneer in the application of new solutions for the needs of its customers. A growing part of PKC’s global product range is vehicle electronics, through which PKC can offer its customers more thoroughly optimised electrical distribution systems.
9
Report by the Board of Directors
PKC Group 2015 Annual Report
Early involvement on customer design enables cost effective and reliable solutions utilizing the capabilities of latest production and product technologies and also considering “Design for Manufacturing” perspective. This will reduce iteration rounds and lower the design cost. PKC can provide product support from design services up to mass production deliveries. Through active technological development, improvement is constantly being sought in product quality and performance: alternative materials are researched and utilised, and new innovative solutions are developed for the vehicle electrical distribution systems architecture. Improvements are being implemented cost-effectively with the aim of minimising the overall costs of the customer’s product. The strong areas of expertise of PKC’s Electronics business product development are test and power control solutions.
Personnel, quality and environment The Group had an average payroll of 20,770 (19,640) during the financial year. At the end of the financial year, the Group’s personnel totalled 21,764 employees (19,437), of whom 21,475 (19,141) worked abroad and 289 (296) in Finland. In addition,n the Group had at the end of the financial year 300 (605) temporary employees. 97.6% of the personnel were employed by the Wiring Systems business segment and 2.3% by the Electronics business segment. Geographically personnel was divided at the end of the financial year as follows: North America 54.8%, Europe 35.0%, South America 5.4% and Asia 4.8%. Total amount of financial year’s employee benefit expenses was EUR 233.5 million (EUR 221.9) including EUR 5.1 million (EUR 12.2 million) classified as non-recurring expenses. More information about personnel, quality and the environment can be found from the Corporate Responsibility report which will be published 31 March 2016 at the latest.
Management The Annual General Meeting held on 1 April 2015, re-elected Reinhard Buhl, Wolfgang Diez, Shemaya Levy, Mingming Liu, Robert Remenar, Matti Ruotsala and
Jyrki Tähtinen as Board members. In the Board’s organisation meeting, Matti Ruotsala was elected as Chairman of the Board and Robert Remenar as Vice-Chairman. Shemaya Levy was elected as the chairman of the Audit Committee and Wolfgang Diez, Mingming Liu and Jyrki Tähtinen as members. The Board elected Matti Ruotsala as chairman of the Nomination and Remuneration Committee and Reinhard Buhl and Robert Remenar as members. KPMG Oy Ab, which has announced Virpi Halonen, APA, to be the Auditor with principal responsibility, was selected as auditor. At the end of the financial year the Group’s Executive Board consists of the following persons: Matti Hyytiäinen, Chairman (President & CEO), Julie Bellamy (Group Senior Vice President, Human Resources), Andre Gerstner (President, Rolling Stock Business), Jyrki Keronen (President, Wiring Systems, APAC), Jani Kiljala (President, Wiring Systems, Europe and South America), Frank Sovis (President, Wiring Systems, North America), Juha Torniainen (CFO) and Vesa Vähämöttönen (Group Senior Vice President, Business Development).
Key strategic highlights of 2015 PKC Group announced on 4 September 2015 that PKC's joint venture Jiangsu Huakai-PKC Wire Harness Co., Ltd. has been established and started its operations. Details of the joint venture are presented in the section 4.4 (established joint venture). PKC Group announced on 1 July 2015 that it had closed the deal to buy the rolling stock electrical distribution system business (Wiring & Controls business) of Groclin S.A. Group. Details of the acquisition are presented in the section 4.3 (business combinations). PKC Group adjusts production capacity in South America by closing Curitiba, Brazil factory and consolidating all its production capacity in Brazil to Campo Alegre factory, which was announced on 24 June 2015. PKC Group won new business contracts in the amount of about EUR 30 million from two major global vehicle manufacturers, which was announced on 25 March 2015.
10
Report by the Board of Directors
PKC Group 2015 Annual Report
Events after the financial year PKC Group announced two new share-based incentive plans for the Group key personnel, approved by the Board of Directors.
Short-term risks and uncertainties The demand for PKC´s products is dependent especially on the volatility of the global commercial vehicle industry as well as the development of PKC’s customers’ businesses. Rolling stock programs are typically government funded and therefore subject to risks in execution schedules. Uncertainty related to emerging markets’ economic development especially in China, Brazil and Russia has increased to a high level. The growth of the European economy has not accelerated significantly and the inflation has continued on a low level. Consolidation of the customer base and changes in customers’ relative market shares and sourcing strategies may affect demand of PKC’s products. Weakening of the US dollar against the Mexican peso as well as the weakening of the euro against the Polish zloty and the Russian rouble may increase PKC’s processing costs. Strengthening of the euro against the Brazilian real may increase PKC’s material costs in the short term. A significant increase in copper price may weaken PKC Group’s profit in short term. The customer prices are updated on average with a 3-5 month delay on the basis of copper price changes. The objective of PKC Group’s risk management is to identify risks relevant to business operations, and to determine the measures, responsibilities and schedules required for efficient risk management. The comprehensive risk management process is implemented across the whole PKC Group with the aim of establishing uniform procedures for the analysis and measurement of risks, taking into consideration the geographical differences between units. PKC’s risks are classified into strategic, operational and financial risks.
Market outlook Wiring Systems business In 2016 the production of heavy-duty and medium-duty trucks in Europe is expected to be at the previous year’s level.
In 2016 the production of heavy-duty and medium-duty trucks in North America is expected to decrease by about 17%, and production of light vehicles to increase by about 2% compared to 2015. In 2016 the production of heavy-duty and medium-duty trucks in Brazil is expected to continue to decrease. In 2016 the production of heavy-duty and medium-duty trucks in China is expected to grow by about 5% compared to previous year’s level. The demand for the rolling stock is expected to continue to grow steadily. Electronics business The market demand for Electronics segment’s products is expected to remain on the current level at the most.
PKC Group’s outlook for 2016 PKC Group estimates that with prevailing exchange rates 2016 revenue will be at or above previous year level and comparable EBITDA will be higher than previous year level. Revenue and comparable EBITDA improvement is to take place in the second half of the year. In 2015, PKC’s revenue was EUR 908.0 million and comparable EBITDA before non-recurring items was EUR 63.9 million.
Disclaimer All the future estimates and forecasts presented in report by the Board of Directors are based on the best current knowledge of the company’s management and information published by market research companies and customers. The estimates and forecasts contain certain elements of risk and uncertainty which, if they materialise, may lead to results that differ from present estimates. The main factors of uncertainty are related, among other things, to the general economic situation, the trend in the operating environment and the sector as well as the success of the Group’s strategy.
The Board of Directors’ proposal for profit distribution The parent company’s distributable funds are EUR 136.1 million, of which EUR 65.3 million is
11
Report by the Board of Directors
PKC Group 2015 Annual Report
distributable as dividends, including the net profit (loss) for the financial year EUR 40.7 million. The Board of Directors will propose to the Annual General Meeting to be held on 6 April 2016 that a dividend of EUR 0.70 per share be paid for a total of EUR 16.9 million and that the remainder of the distributable funds be transferred to shareholders’ equity. The
number of shares may change due to share subscriptions registered before the record date. The record date for the dividend pay-out is 8 April 2016 and the payment date is 15 April 2016. In the view of the Board of Directors, the proposed dividend pay-out will not put the company’s liquidity at risk.
12
Report by the Board of Directors
PKC Group 2015 Annual Report
0
200
400
600
800
1,000
2011 2012 2013 2014 2015
Revenue, EUR million
0
2
4
6
8
10
12
0
10
20
30
40
50
60
2011 2012 2013 2014 2015
Comparable EBITDA, % and operating profit, EUR million
Operating profit before non-recurring items
EBITDA before non-recurring items, %
%
-20
-15
-10
-5
0
5
10
15
20
2011 2012 2013 2014 2015
Return on capital employed (ROCE), and return on equity (ROE), %
ROCE, % ROE, %
0
20
40
60
80
100
2011 2012 2013 2014 2015
Cash from operations and capital expenditure, EUR million
Cash from operations Capital expenditure
-1.5
-1.0
-0.5
0.0
0.5
1.0
1.5
2011 2012 2013 2014 2015
EPS and dividend per share, EUR
EPS Dividend per share
-20
0
20
40
60
80
2011 2012 2013 2014 2015
Gearing, % and Equity ratio, %
Equity ratio, % Gearing, %
13
Report by the Board of Directors
PKC Group 2015 Annual Report
Group’s Financial Key Indicators
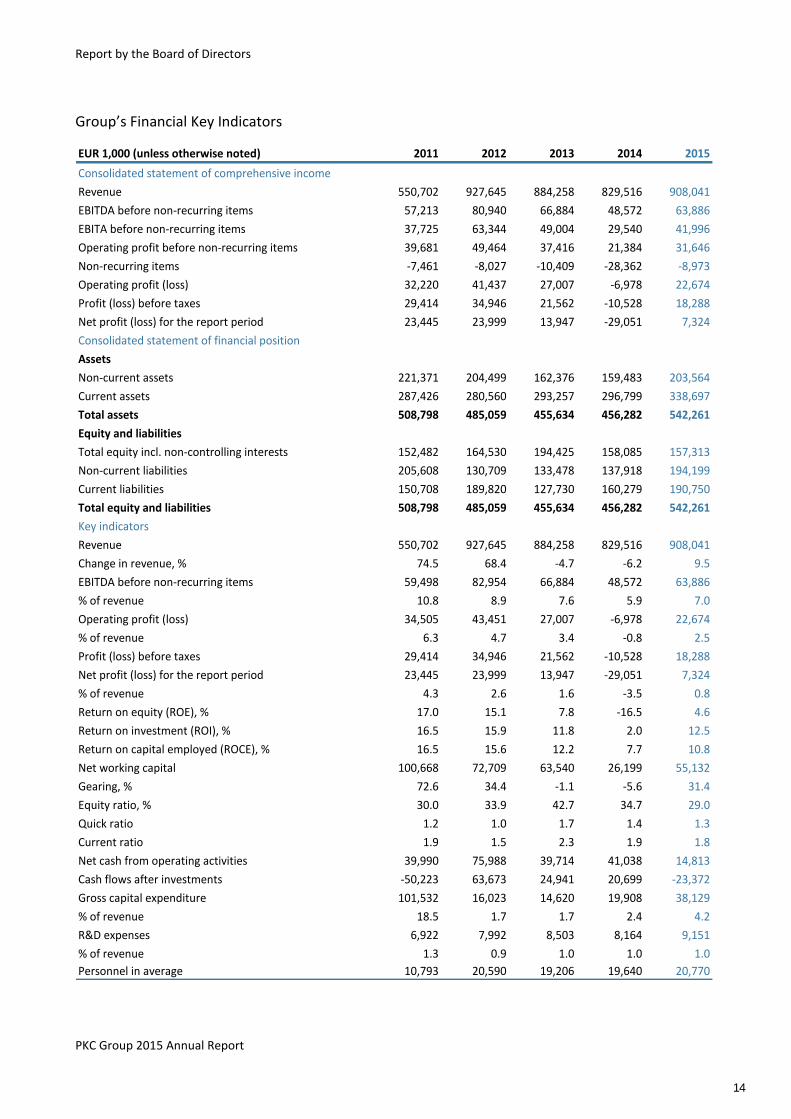
EUR 1,000 (unless otherwise noted) 2011 2012 2013 2014 2015
Consolidated statement of comprehensive income
Revenue 550,702 927,645 884,258 829,516 908,041
EBITDA before non-recurring items 57,213 80,940 66,884 48,572 63,886
EBITA before non-recurring items 37,725 63,344 49,004 29,540 41,996
Operating profit before non-recurring items 39,681 49,464 37,416 21,384 31,646
Non-recurring items -7,461 -8,027 -10,409 -28,362 -8,973
Operating profit (loss) 32,220 41,437 27,007 -6,978 22,674
Profit (loss) before taxes 29,414 34,946 21,562 -10,528 18,288
Net profit (loss) for the report period 23,445 23,999 13,947 -29,051 7,324
Consolidated statement of financial position
Assets
Non-current assets 221,371 204,499 162,376 159,483 203,564
Current assets 287,426 280,560 293,257 296,799 338,697
Total assets 508,798 485,059 455,634 456,282 542,261
Equity and liabilities
Total equity incl. non-controlling interests 152,482 164,530 194,425 158,085 157,313
Non-current liabilities 205,608 130,709 133,478 137,918 194,199
Current liabilities 150,708 189,820 127,730 160,279 190,750
Total equity and liabilities 508,798 485,059 455,634 456,282 542,261
Key indicators
Revenue 550,702 927,645 884,258 829,516 908,041
Change in revenue, % 74.5 68.4 -4.7 -6.2 9.5
EBITDA before non-recurring items 59,498 82,954 66,884 48,572 63,886
% of revenue 10.8 8.9 7.6 5.9 7.0
Operating profit (loss) 34,505 43,451 27,007 -6,978 22,674
% of revenue 6.3 4.7 3.4 -0.8 2.5
Profit (loss) before taxes 29,414 34,946 21,562 -10,528 18,288
Net profit (loss) for the report period 23,445 23,999 13,947 -29,051 7,324
% of revenue 4.3 2.6 1.6 -3.5 0.8
Return on equity (ROE), % 17.0 15.1 7.8 -16.5 4.6
Return on investment (ROI), % 16.5 15.9 11.8 2.0 12.5
Return on capital employed (ROCE), % 16.5 15.6 12.2 7.7 10.8
Net working capital 100,668 72,709 63,540 26,199 55,132
Gearing, % 72.6 34.4 -1.1 -5.6 31.4
Equity ratio, % 30.0 33.9 42.7 34.7 29.0
Quick ratio 1.2 1.0 1.7 1.4 1.3
Current ratio 1.9 1.5 2.3 1.9 1.8
Net cash from operating activities 39,990 75,988 39,714 41,038 14,813
Cash flows after investments -50,223 63,673 24,941 20,699 -23,372
Gross capital expenditure 101,532 16,023 14,620 19,908 38,129
% of revenue 18.5 1.7 1.7 2.4 4.2
R&D expenses 6,922 7,992 8,503 8,164 9,151
% of revenue 1.3 0.9 1.0 1.0 1.0
Personnel in average 10,793 20,590 19,206 19,640 20,770
14
Report by the Board of Directors
PKC Group 2015 Annual Report
Group’s Financial Key Indicators
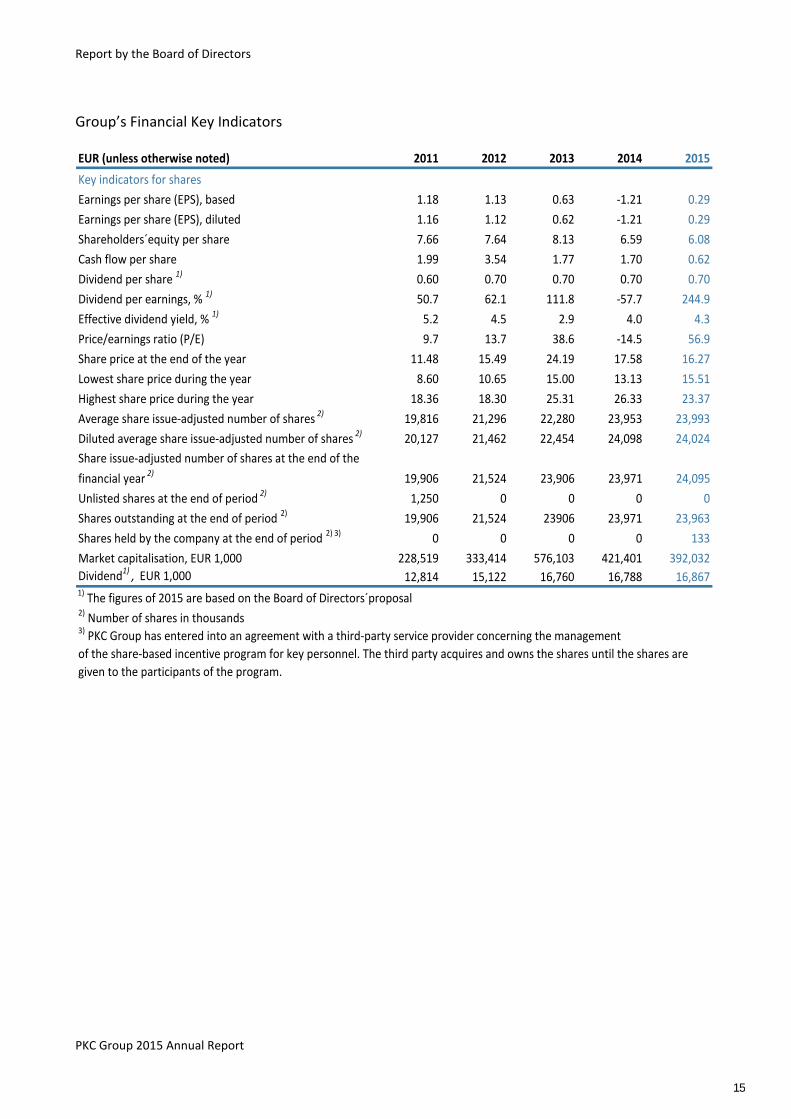
EUR (unless otherwise noted) 2011 2012 2013 2014 2015
Key indicators for shares
Earnings per share (EPS), based 1.18 1.13 0.63 -1.21 0.29
Earnings per share (EPS), diluted 1.16 1.12 0.62 -1.21 0.29
Shareholders´equity per share 7.66 7.64 8.13 6.59 6.08
Cash flow per share 1.99 3.54 1.77 1.70 0.62
Dividend per share 1) 0.60 0.70 0.70 0.70 0.70
Dividend per earnings, % 1) 50.7 62.1 111.8 -57.7 244.9
Effective dividend yield, % 1) 5.2 4.5 2.9 4.0 4.3
Price/earnings ratio (P/E) 9.7 13.7 38.6 -14.5 56.9
Share price at the end of the year 11.48 15.49 24.19 17.58 16.27
Lowest share price during the year 8.60 10.65 15.00 13.13 15.51
Highest share price during the year 18.36 18.30 25.31 26.33 23.37
Average share issue-adjusted number of shares 2) 19,816 21,296 22,280 23,953 23,993
Diluted average share issue-adjusted number of shares 2) 20,127 21,462 22,454 24,098 24,024
Share issue-adjusted number of shares at the end of the
financial year 2) 19,906 21,524 23,906 23,971 24,095
Unlisted shares at the end of period 2) 1,250 0 0 0 0
Shares outstanding at the end of period 2) 19,906 21,524 23906 23,971 23,963
Shares held by the company at the end of period 2) 3) 0 0 0 0 133
Market capitalisation, EUR 1,000 228,519 333,414 576,103 421,401 392,032
Dividend1) , EUR 1,000 12,814 15,122 16,760 16,788 16,8671) The figures of 2015 are based on the Board of Directors´proposal2) Number of shares in thousands3) PKC Group has entered into an agreement with a third-party service provider concerning the management
of the share-based incentive program for key personnel. The third party acquires and owns the shares until the shares are
given to the participants of the program.
15
Report by the Board of Directors
PKC Group 2015 Annual Report
Calculation of Key Indicators
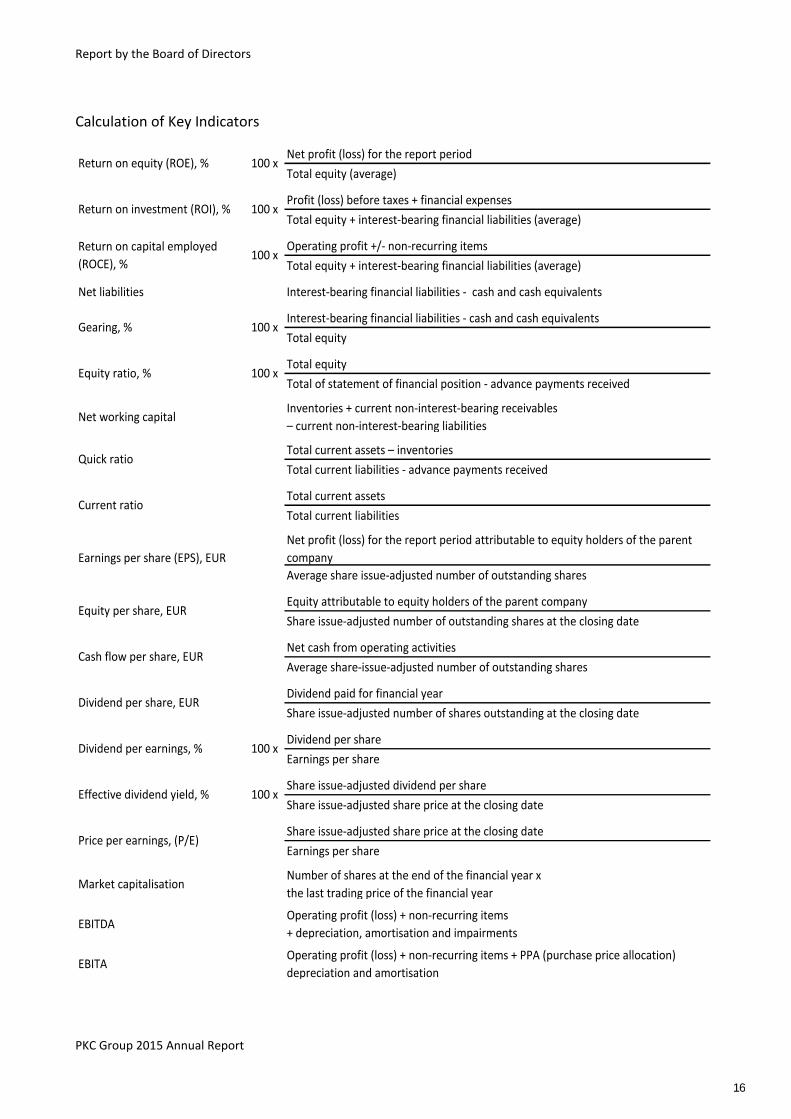
Net profit (loss) for the report period
Total equity (average)
Profit (loss) before taxes + financial expenses
Total equity + interest-bearing financial liabilities (average)
Operating profit +/- non-recurring items
Total equity + interest-bearing financial liabilities (average)
Net liabilities Interest-bearing financial liabilities - cash and cash equivalents
Interest-bearing financial liabilities - cash and cash equivalents
Total equity
Total equity
Total of statement of financial position - advance payments received
Net working capitalInventories + current non-interest-bearing receivables
– current non-interest-bearing liabilities
Total current assets – inventories
Total current liabilities - advance payments received
Total current assets
Total current liabilities
Net profit (loss) for the report period attributable to equity holders of the parent
company
Average share issue-adjusted number of outstanding shares
Equity attributable to equity holders of the parent company
Share issue-adjusted number of outstanding shares at the closing date
Net cash from operating activities
Average share-issue-adjusted number of outstanding shares
Dividend paid for financial year
Share issue-adjusted number of shares outstanding at the closing date
Dividend per share
Earnings per share
Share issue-adjusted dividend per share
Share issue-adjusted share price at the closing date
Share issue-adjusted share price at the closing date
Earnings per share
Market capitalisationNumber of shares at the end of the financial year x
the last trading price of the financial year
EBITDAOperating profit (loss) + non-recurring items
+ depreciation, amortisation and impairments
EBITAOperating profit (loss) + non-recurring items + PPA (purchase price allocation)
depreciation and amortisation
Equity per share, EUR
Return on equity (ROE), % 100 x
Return on investment (ROI), % 100 x
Gearing, % 100 x
Return on capital employed
(ROCE), %100 x
Equity ratio, % 100 x
Quick ratio
Current ratio
Earnings per share (EPS), EUR
Price per earnings, (P/E)
Cash flow per share, EUR
Dividend per share, EUR
Dividend per earnings, % 100 x
Effective dividend yield, % 100 x
16
Report by the Board of Directors
PKC Group 2015 Annual Report
Shares and Shareholders
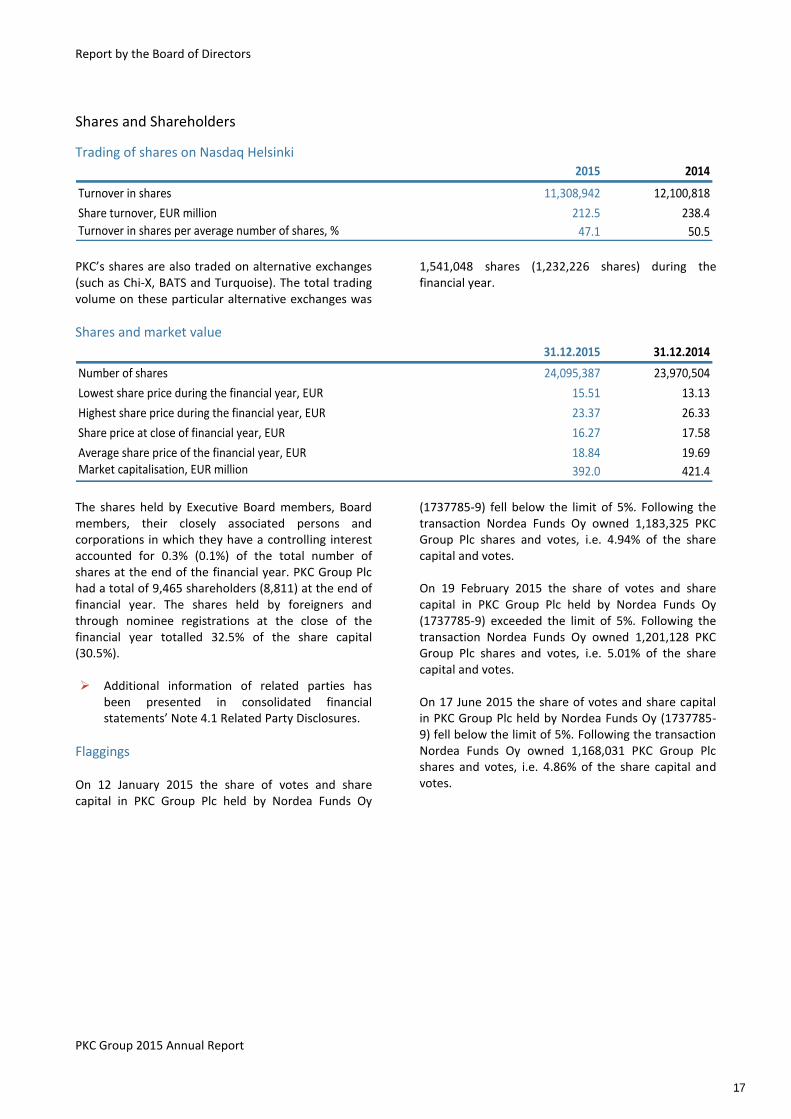
Trading of shares on Nasdaq Helsinki
2015 2014
Turnover in shares 11,308,942 12,100,818
Share turnover, EUR million 212.5 238.4
Turnover in shares per average number of shares, % 47.1 50.5 PKC’s shares are also traded on alternative exchanges (such as Chi-X, BATS and Turquoise). The total trading volume on these particular alternative exchanges was
1,541,048 shares (1,232,226 shares) during the financial year.
Shares and market value
31.12.2015 31.12.2014
Number of shares 24,095,387 23,970,504
Lowest share price during the financial year, EUR 15.51 13.13
Highest share price during the financial year, EUR 23.37 26.33
Share price at close of financial year, EUR 16.27 17.58
Average share price of the financial year, EUR 18.84 19.69Market capitalisation, EUR million 392.0 421.4
The shares held by Executive Board members, Board members, their closely associated persons and corporations in which they have a controlling interest accounted for 0.3% (0.1%) of the total number of shares at the end of the financial year. PKC Group Plc had a total of 9,465 shareholders (8,811) at the end of financial year. The shares held by foreigners and through nominee registrations at the close of the financial year totalled 32.5% of the share capital (30.5%). Additional information of related parties has
been presented in consolidated financial statements’ Note 4.1 Related Party Disclosures.
Flaggings On 12 January 2015 the share of votes and share capital in PKC Group Plc held by Nordea Funds Oy
(1737785-9) fell below the limit of 5%. Following the transaction Nordea Funds Oy owned 1,183,325 PKC Group Plc shares and votes, i.e. 4.94% of the share capital and votes. On 19 February 2015 the share of votes and share capital in PKC Group Plc held by Nordea Funds Oy (1737785-9) exceeded the limit of 5%. Following the transaction Nordea Funds Oy owned 1,201,128 PKC Group Plc shares and votes, i.e. 5.01% of the share capital and votes. On 17 June 2015 the share of votes and share capital in PKC Group Plc held by Nordea Funds Oy (1737785-9) fell below the limit of 5%. Following the transaction Nordea Funds Oy owned 1,168,031 PKC Group Plc shares and votes, i.e. 4.86% of the share capital and votes.
17
Report by the Board of Directors
PKC Group 2015 Annual Report
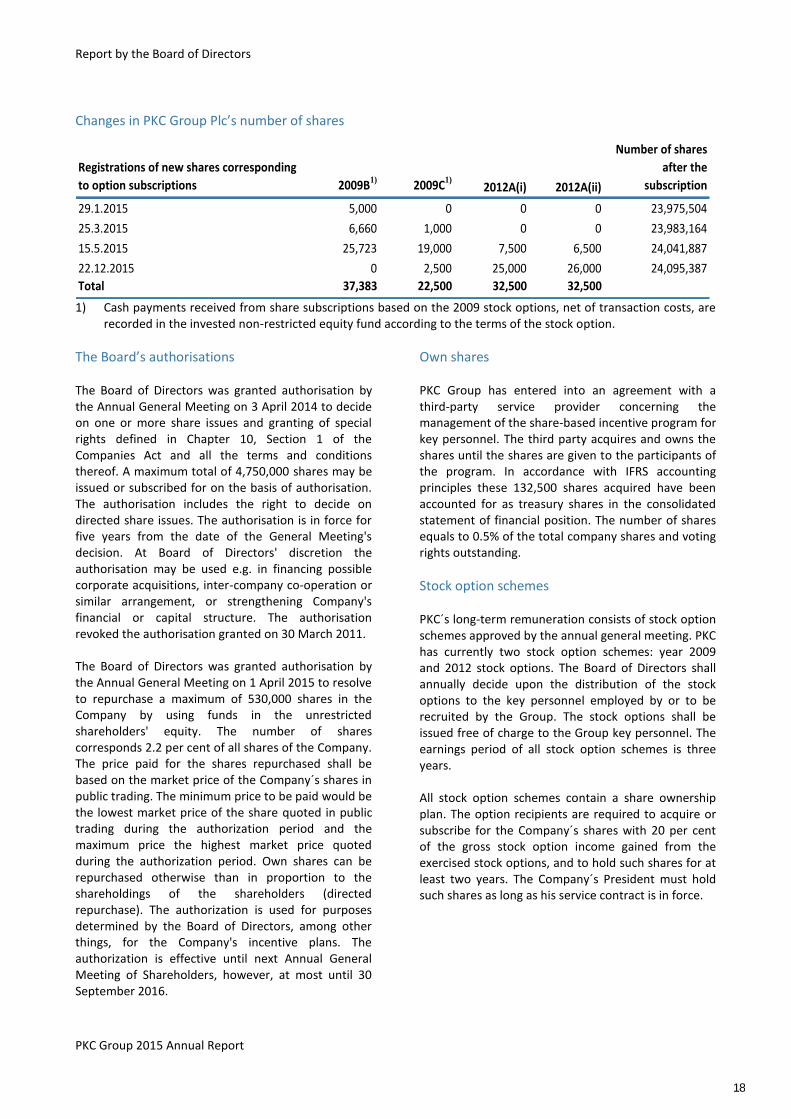
Changes in PKC Group Plc’s number of shares
Registrations of new shares corresponding
to option subscriptions 2009B1) 2009C1)2012A(i) 2012A(ii)
Number of shares
after the
subscription
29.1.2015 5,000 0 0 0 23,975,504
25.3.2015 6,660 1,000 0 0 23,983,164
15.5.2015 25,723 19,000 7,500 6,500 24,041,887
22.12.2015 0 2,500 25,000 26,000 24,095,387
Total 37,383 22,500 32,500 32,500
1) Cash payments received from share subscriptions based on the 2009 stock options, net of transaction costs, are recorded in the invested non-restricted equity fund according to the terms of the stock option.
The Board’s authorisations The Board of Directors was granted authorisation by the Annual General Meeting on 3 April 2014 to decide on one or more share issues and granting of special rights defined in Chapter 10, Section 1 of the Companies Act and all the terms and conditions thereof. A maximum total of 4,750,000 shares may be issued or subscribed for on the basis of authorisation. The authorisation includes the right to decide on directed share issues. The authorisation is in force for five years from the date of the General Meeting's decision. At Board of Directors' discretion the authorisation may be used e.g. in financing possible corporate acquisitions, inter-company co-operation or similar arrangement, or strengthening Company's financial or capital structure. The authorisation revoked the authorisation granted on 30 March 2011. The Board of Directors was granted authorisation by the Annual General Meeting on 1 April 2015 to resolve to repurchase a maximum of 530,000 shares in the Company by using funds in the unrestricted shareholders' equity. The number of shares corresponds 2.2 per cent of all shares of the Company. The price paid for the shares repurchased shall be based on the market price of the Company´s shares in public trading. The minimum price to be paid would be the lowest market price of the share quoted in public trading during the authorization period and the maximum price the highest market price quoted during the authorization period. Own shares can be repurchased otherwise than in proportion to the shareholdings of the shareholders (directed repurchase). The authorization is used for purposes determined by the Board of Directors, among other things, for the Company's incentive plans. The authorization is effective until next Annual General Meeting of Shareholders, however, at most until 30 September 2016.
Own shares PKC Group has entered into an agreement with a third-party service provider concerning the management of the share-based incentive program for key personnel. The third party acquires and owns the shares until the shares are given to the participants of the program. In accordance with IFRS accounting principles these 132,500 shares acquired have been accounted for as treasury shares in the consolidated statement of financial position. The number of shares equals to 0.5% of the total company shares and voting rights outstanding.
Stock option schemes PKC´s long-term remuneration consists of stock option schemes approved by the annual general meeting. PKC has currently two stock option schemes: year 2009 and 2012 stock options. The Board of Directors shall annually decide upon the distribution of the stock options to the key personnel employed by or to be recruited by the Group. The stock options shall be issued free of charge to the Group key personnel. The earnings period of all stock option schemes is three years. All stock option schemes contain a share ownership plan. The option recipients are required to acquire or subscribe for the Company´s shares with 20 per cent of the gross stock option income gained from the exercised stock options, and to hold such shares for at least two years. The Company´s President must hold such shares as long as his service contract is in force.
18
Report by the Board of Directors
PKC Group 2015 Annual Report
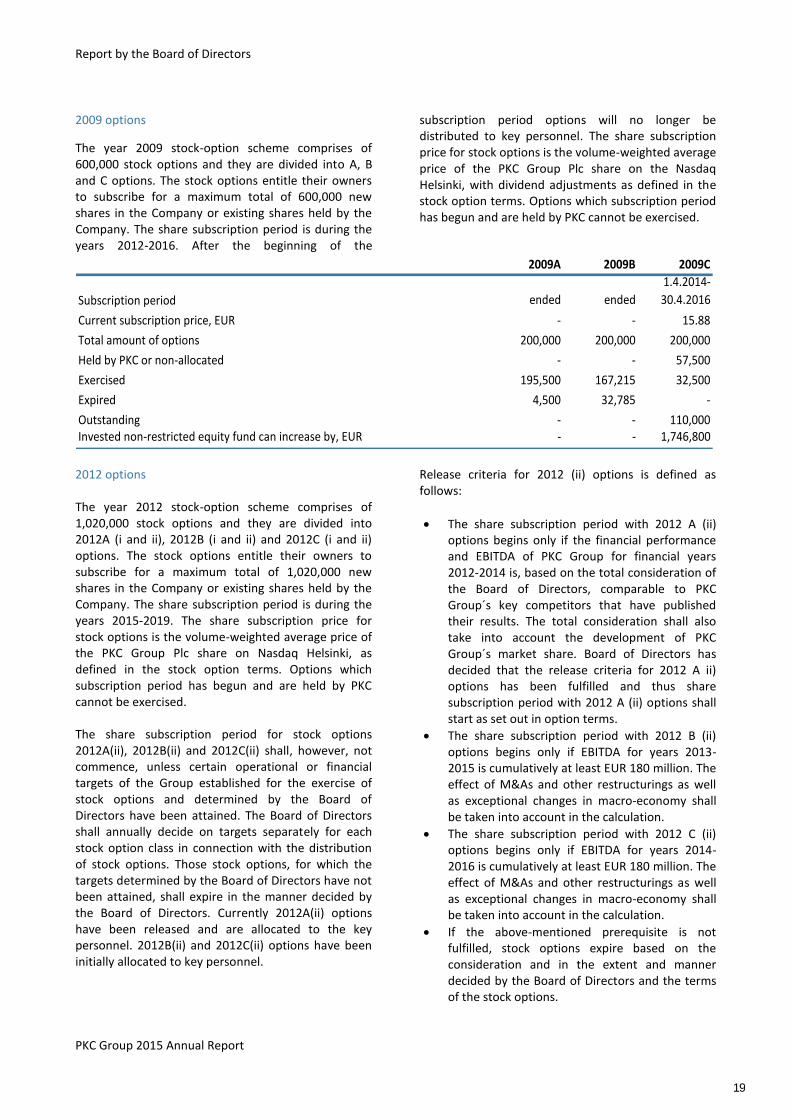
2009 options
The year 2009 stock-option scheme comprises of 600,000 stock options and they are divided into A, B and C options. The stock options entitle their owners to subscribe for a maximum total of 600,000 new shares in the Company or existing shares held by the Company. The share subscription period is during the years 2012-2016. After the beginning of the
subscription period options will no longer be distributed to key personnel. The share subscription price for stock options is the volume-weighted average price of the PKC Group Plc share on the Nasdaq Helsinki, with dividend adjustments as defined in the stock option terms. Options which subscription period has begun and are held by PKC cannot be exercised.
2009A 2009B 2009C
Subscription period ended ended
1.4.2014-
30.4.2016
Current subscription price, EUR - - 15.88
Total amount of options 200,000 200,000 200,000
Held by PKC or non-allocated - - 57,500
Exercised 195,500 167,215 32,500
Expired 4,500 32,785 -
Outstanding - - 110,000Invested non-restricted equity fund can increase by, EUR - - 1,746,800
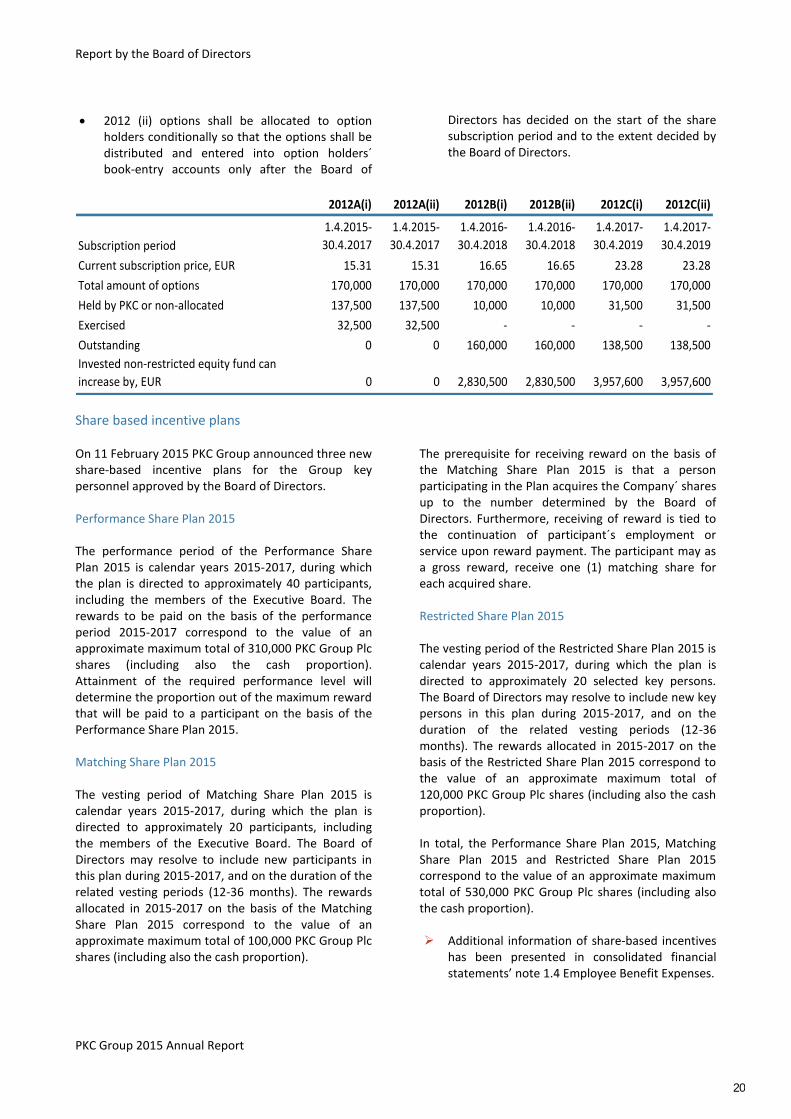
2012 options The year 2012 stock-option scheme comprises of 1,020,000 stock options and they are divided into 2012A (i and ii), 2012B (i and ii) and 2012C (i and ii) options. The stock options entitle their owners to subscribe for a maximum total of 1,020,000 new shares in the Company or existing shares held by the Company. The share subscription period is during the years 2015-2019. The share subscription price for stock options is the volume-weighted average price of the PKC Group Plc share on Nasdaq Helsinki, as defined in the stock option terms. Options which subscription period has begun and are held by PKC cannot be exercised. The share subscription period for stock options 2012A(ii), 2012B(ii) and 2012C(ii) shall, however, not commence, unless certain operational or financial targets of the Group established for the exercise of stock options and determined by the Board of Directors have been attained. The Board of Directors shall annually decide on targets separately for each stock option class in connection with the distribution of stock options. Those stock options, for which the targets determined by the Board of Directors have not been attained, shall expire in the manner decided by the Board of Directors. Currently 2012A(ii) options have been released and are allocated to the key personnel. 2012B(ii) and 2012C(ii) options have been initially allocated to key personnel.
Release criteria for 2012 (ii) options is defined as follows:
The share subscription period with 2012 A (ii) options begins only if the financial performance and EBITDA of PKC Group for financial years 2012-2014 is, based on the total consideration of the Board of Directors, comparable to PKC Group´s key competitors that have published their results. The total consideration shall also take into account the development of PKC Group´s market share. Board of Directors has decided that the release criteria for 2012 A ii) options has been fulfilled and thus share subscription period with 2012 A (ii) options shall start as set out in option terms.
The share subscription period with 2012 B (ii) options begins only if EBITDA for years 2013-2015 is cumulatively at least EUR 180 million. The effect of M&As and other restructurings as well as exceptional changes in macro-economy shall be taken into account in the calculation.
The share subscription period with 2012 C (ii) options begins only if EBITDA for years 2014-2016 is cumulatively at least EUR 180 million. The effect of M&As and other restructurings as well as exceptional changes in macro-economy shall be taken into account in the calculation.
If the above-mentioned prerequisite is not fulfilled, stock options expire based on the consideration and in the extent and manner decided by the Board of Directors and the terms of the stock options.
19
Report by the Board of Directors
PKC Group 2015 Annual Report
2012 (ii) options shall be allocated to option holders conditionally so that the options shall be distributed and entered into option holders´ book-entry accounts only after the Board of
Directors has decided on the start of the share subscription period and to the extent decided by the Board of Directors.
2012A(i) 2012A(ii) 2012B(i) 2012B(ii) 2012C(i) 2012C(ii)
Subscription period
1.4.2015-
30.4.2017
1.4.2015-
30.4.2017
1.4.2016-
30.4.2018
1.4.2016-
30.4.2018
1.4.2017-
30.4.2019
1.4.2017-
30.4.2019
Current subscription price, EUR 15.31 15.31 16.65 16.65 23.28 23.28
Total amount of options 170,000 170,000 170,000 170,000 170,000 170,000
Held by PKC or non-allocated 137,500 137,500 10,000 10,000 31,500 31,500
Exercised 32,500 32,500 - - - -
Outstanding 0 0 160,000 160,000 138,500 138,500
Invested non-restricted equity fund can
increase by, EUR 0 0 2,830,500 2,830,500 3,957,600 3,957,600
Share based incentive plans On 11 February 2015 PKC Group announced three new share-based incentive plans for the Group key personnel approved by the Board of Directors. Performance Share Plan 2015 The performance period of the Performance Share Plan 2015 is calendar years 2015-2017, during which the plan is directed to approximately 40 participants, including the members of the Executive Board. The rewards to be paid on the basis of the performance period 2015-2017 correspond to the value of an approximate maximum total of 310,000 PKC Group Plc shares (including also the cash proportion). Attainment of the required performance level will determine the proportion out of the maximum reward that will be paid to a participant on the basis of the Performance Share Plan 2015. Matching Share Plan 2015 The vesting period of Matching Share Plan 2015 is calendar years 2015-2017, during which the plan is directed to approximately 20 participants, including the members of the Executive Board. The Board of Directors may resolve to include new participants in this plan during 2015-2017, and on the duration of the related vesting periods (12-36 months). The rewards allocated in 2015-2017 on the basis of the Matching Share Plan 2015 correspond to the value of an approximate maximum total of 100,000 PKC Group Plc shares (including also the cash proportion).
The prerequisite for receiving reward on the basis of the Matching Share Plan 2015 is that a person participating in the Plan acquires the Company´ shares up to the number determined by the Board of Directors. Furthermore, receiving of reward is tied to the continuation of participant´s employment or service upon reward payment. The participant may as a gross reward, receive one (1) matching share for each acquired share. Restricted Share Plan 2015 The vesting period of the Restricted Share Plan 2015 is calendar years 2015-2017, during which the plan is directed to approximately 20 selected key persons. The Board of Directors may resolve to include new key persons in this plan during 2015-2017, and on the duration of the related vesting periods (12-36 months). The rewards allocated in 2015-2017 on the basis of the Restricted Share Plan 2015 correspond to the value of an approximate maximum total of 120,000 PKC Group Plc shares (including also the cash proportion). In total, the Performance Share Plan 2015, Matching Share Plan 2015 and Restricted Share Plan 2015 correspond to the value of an approximate maximum total of 530,000 PKC Group Plc shares (including also the cash proportion). Additional information of share-based incentives
has been presented in consolidated financial statements’ note 1.4 Employee Benefit Expenses.
20
Report by the Board of Directors
PKC Group 2015 Annual Report
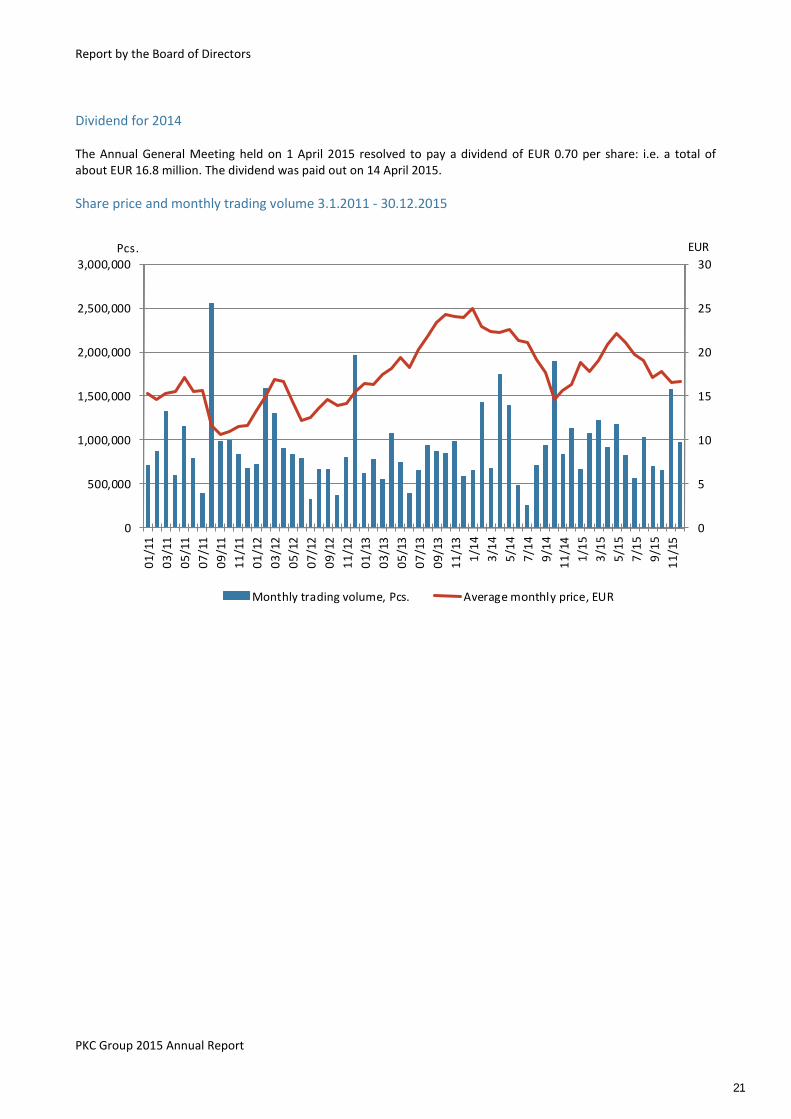
Dividend for 2014 The Annual General Meeting held on 1 April 2015 resolved to pay a dividend of EUR 0.70 per share: i.e. a total of about EUR 16.8 million. The dividend was paid out on 14 April 2015.
Share price and monthly trading volume 3.1.2011 - 30.12.2015
0
5
10
15
20
25
30
0
500,000
1,000,000
1,500,000
2,000,000
2,500,000
3,000,000
01
/11
03
/11
05
/11
07
/11
09
/11
11
/11
01
/12
03
/12
05
/12
07
/12
09
/12
11
/12
01
/13
03
/13
05
/13
07
/13
09
/13
11
/13
1/1
4
3/1
4
5/1
4
7/1
4
9/1
4
11
/14
1/1
5
3/1
5
5/1
5
7/1
5
9/1
5
11
/15
EURPcs.
Monthly trading volume, Pcs. Average monthly price, EUR
21
Report by the Board of Directors
PKC Group 2015 Annual Report
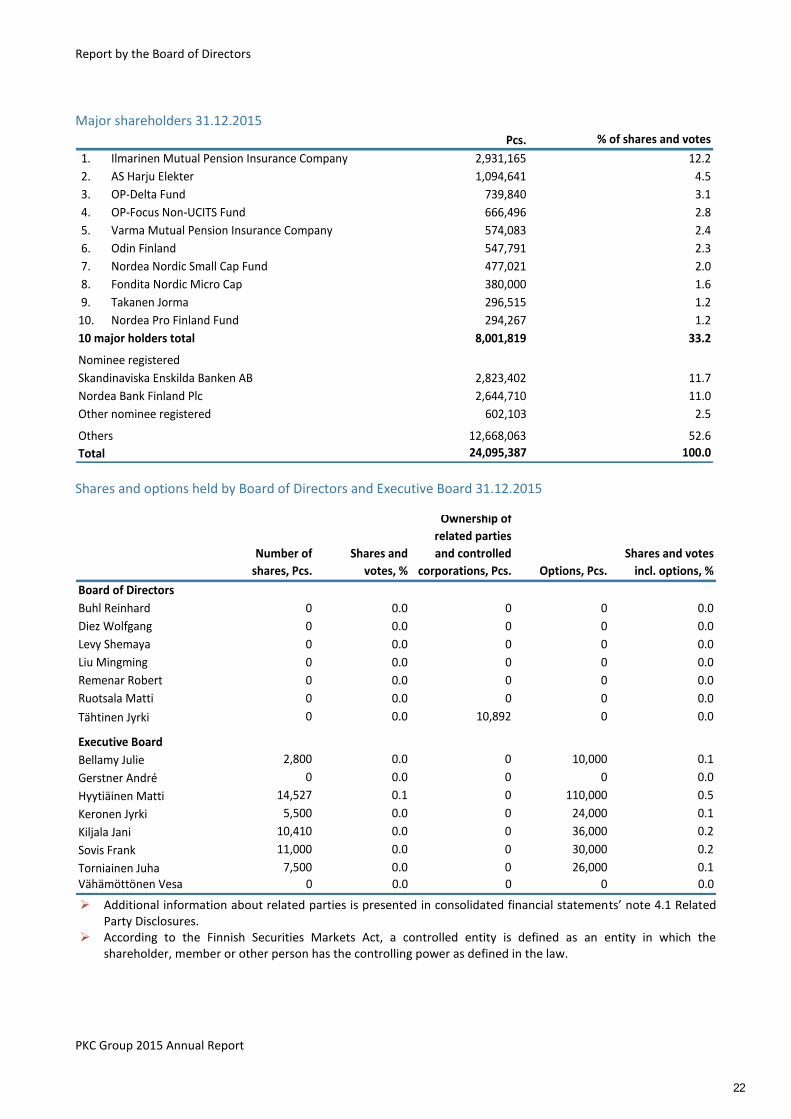
Major shareholders 31.12.2015
Pcs. % of shares and votes
1. Ilmarinen Mutual Pension Insurance Company 2,931,165 12.2
2. AS Harju Elekter 1,094,641 4.5
3. OP-Delta Fund 739,840 3.1
4. OP-Focus Non-UCITS Fund 666,496 2.8
5. Varma Mutual Pension Insurance Company 574,083 2.4
6. Odin Finland 547,791 2.3
7. Nordea Nordic Small Cap Fund 477,021 2.0
8. Fondita Nordic Micro Cap 380,000 1.6
9. Takanen Jorma 296,515 1.2
10. Nordea Pro Finland Fund 294,267 1.2
8,001,819 33.2
2,823,402 11.7
2,644,710 11.0
602,103 2.5
12,668,063 52.6
24,095,387 100.0
Other nominee registered
Others
Total
10 major holders total
Nominee registered
Skandinaviska Enskilda Banken AB
Nordea Bank Finland Plc
Shares and options held by Board of Directors and Executive Board 31.12.2015
Number of
shares, Pcs.
Shares and
votes, %
Ownership of
related parties
and controlled
corporations, Pcs. Options, Pcs.
Shares and votes
incl. options, %
Board of Directors
Buhl Reinhard 0 0.0 0 0 0.0
Diez Wolfgang 0 0.0 0 0 0.0
Levy Shemaya 0 0.0 0 0 0.0
Liu Mingming 0 0.0 0 0 0.0
Remenar Robert 0 0.0 0 0 0.0
Ruotsala Matti 0 0.0 0 0 0.0
Tähtinen Jyrki 0 0.0 10,892 0 0.0
Executive Board
Bellamy Julie 2,800 0.0 0 10,000 0.1
Gerstner André 0 0.0 0 0 0.0
Hyytiäinen Matti 14,527 0.1 0 110,000 0.5
Keronen Jyrki 5,500 0.0 0 24,000 0.1
Kiljala Jani 10,410 0.0 0 36,000 0.2
Sovis Frank 11,000 0.0 0 30,000 0.2
Torniainen Juha 7,500 0.0 0 26,000 0.1
Vähämöttönen Vesa 0 0.0 0 0 0.0
Additional information about related parties is presented in consolidated financial statements’ note 4.1 Related Party Disclosures.
According to the Finnish Securities Markets Act, a controlled entity is defined as an entity in which the shareholder, member or other person has the controlling power as defined in the law.
22
Report by the Board of Directors
PKC Group 2015 Annual Report
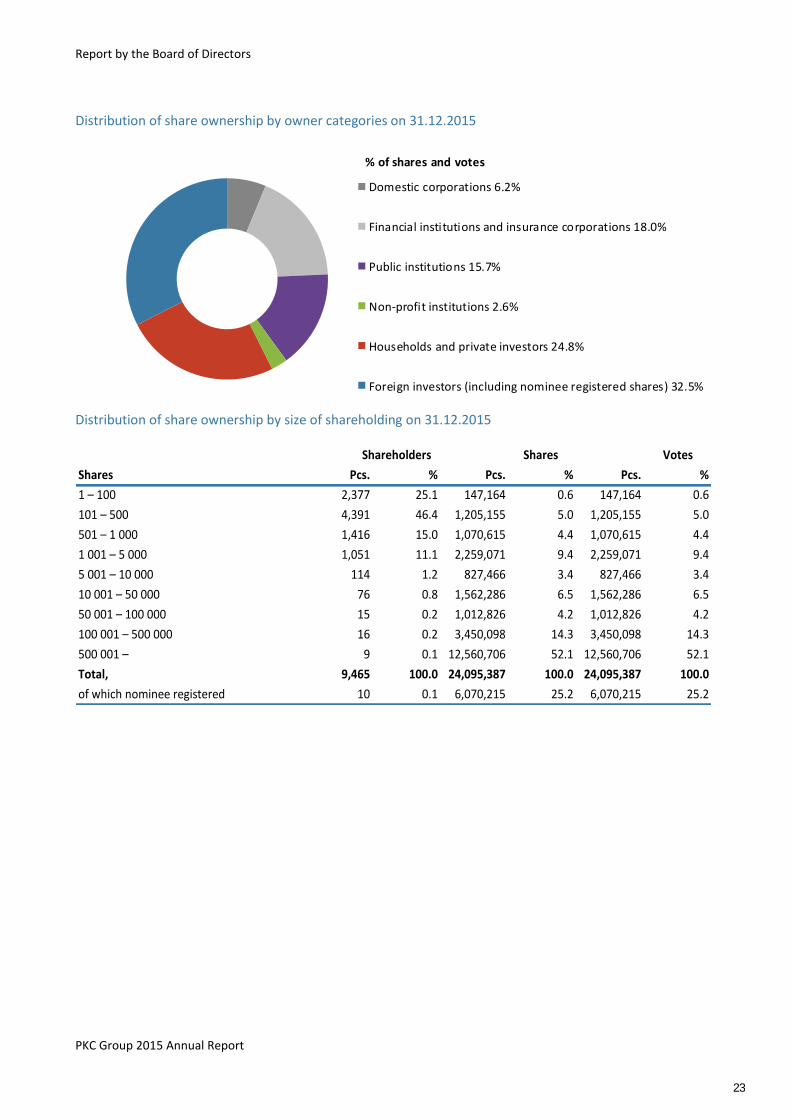
Distribution of share ownership by owner categories on 31.12.2015
% of shares and votes
Domestic corporations 6.2%
Financial institutions and insurance corporations 18.0%
Public institutions 15.7%
Non-profit institutions 2.6%
Households and private investors 24.8%
Foreign investors (including nominee registered shares) 32.5%
Distribution of share ownership by size of shareholding on 31.12.2015
Shares Pcs. % Pcs. % Pcs. %
1 – 100 2,377 25.1 147,164 0.6 147,164 0.6
101 – 500 4,391 46.4 1,205,155 5.0 1,205,155 5.0
501 – 1 000 1,416 15.0 1,070,615 4.4 1,070,615 4.4
1 001 – 5 000 1,051 11.1 2,259,071 9.4 2,259,071 9.4
5 001 – 10 000 114 1.2 827,466 3.4 827,466 3.4
10 001 – 50 000 76 0.8 1,562,286 6.5 1,562,286 6.5
50 001 – 100 000 15 0.2 1,012,826 4.2 1,012,826 4.2
100 001 – 500 000 16 0.2 3,450,098 14.3 3,450,098 14.3
500 001 – 9 0.1 12,560,706 52.1 12,560,706 52.1
Total, 9,465 100.0 24,095,387 100.0 24,095,387 100.0
of which nominee registered 10 0.1 6,070,215 25.2 6,070,215 25.2
Shareholders Shares Votes
23
Financial Statements
PKC Group 2015 Annual Report
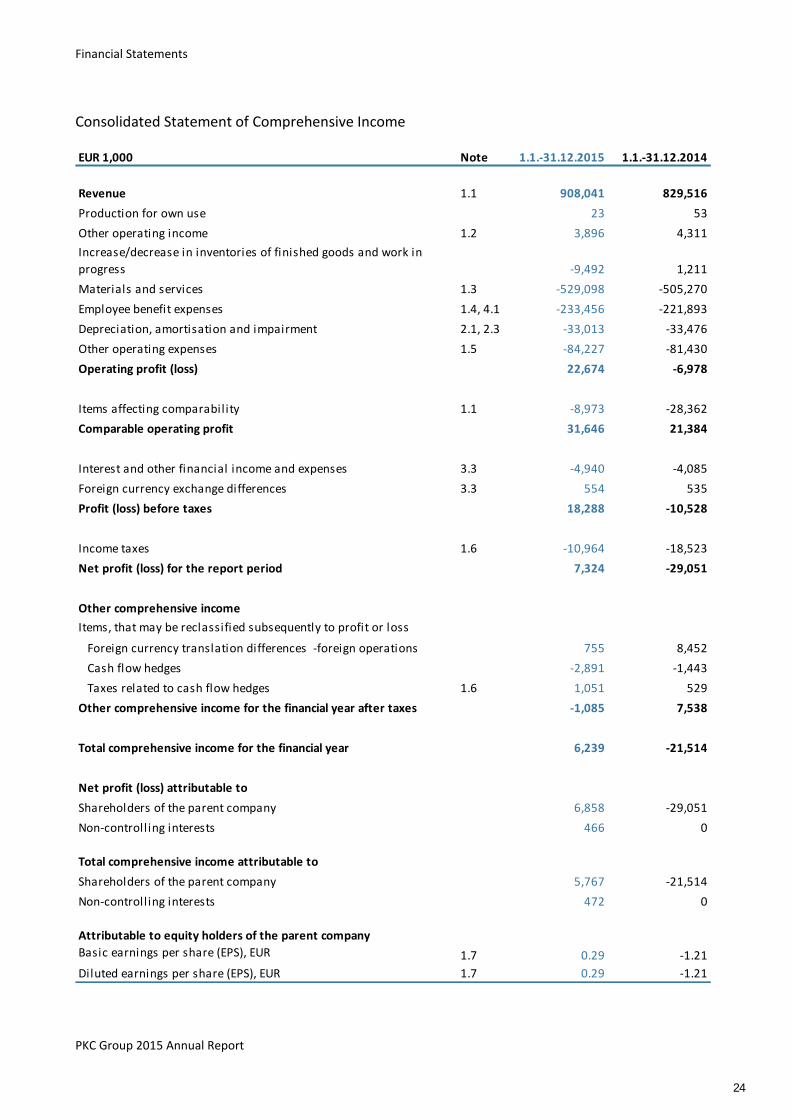
Consolidated Statement of Comprehensive Income
EUR 1,000 Note 1.1.-31.12.2015 1.1.-31.12.2014
Revenue 1.1 908,041 829,516
Production for own use 23 53
Other operating income 1.2 3,896 4,311
Increase/decrease in inventories of finished goods and work in
progress -9,492 1,211
Materials and services 1.3 -529,098 -505,270
Employee benefit expenses 1.4, 4.1 -233,456 -221,893
Depreciation, amortisation and impairment 2.1, 2.3 -33,013 -33,476
Other operating expenses 1.5 -84,227 -81,430
Operating profit (loss) 22,674 -6,978
Items affecting comparability 1.1 -8,973 -28,362
Comparable operating profit 31,646 21,384
Interest and other financial income and expenses 3.3 -4,940 -4,085
Foreign currency exchange differences 3.3 554 535
Profit (loss) before taxes 18,288 -10,528
Income taxes 1.6 -10,964 -18,523
Net profit (loss) for the report period 7,324 -29,051
Other comprehensive income
Foreign currency translation differences -foreign operations 755 8,452
Cash flow hedges -2,891 -1,443
Taxes related to cash flow hedges 1.6 1,051 529
Other comprehensive income for the financial year after taxes -1,085 7,538
Total comprehensive income for the financial year 6,239 -21,514
Net profit (loss) attributable to
Shareholders of the parent company 6,858 -29,051
Non-controlling interests 466 0
Total comprehensive income attributable to
Shareholders of the parent company 5,767 -21,514
Non-controlling interests 472 0
Basic earnings per share (EPS), EUR 1.7 0.29 -1.21
Diluted earnings per share (EPS), EUR 1.7 0.29 -1.21
Attributable to equity holders of the parent company
Items, that may be reclassified subsequently to profit or loss
24
Financial Statements
PKC Group 2015 Annual Report
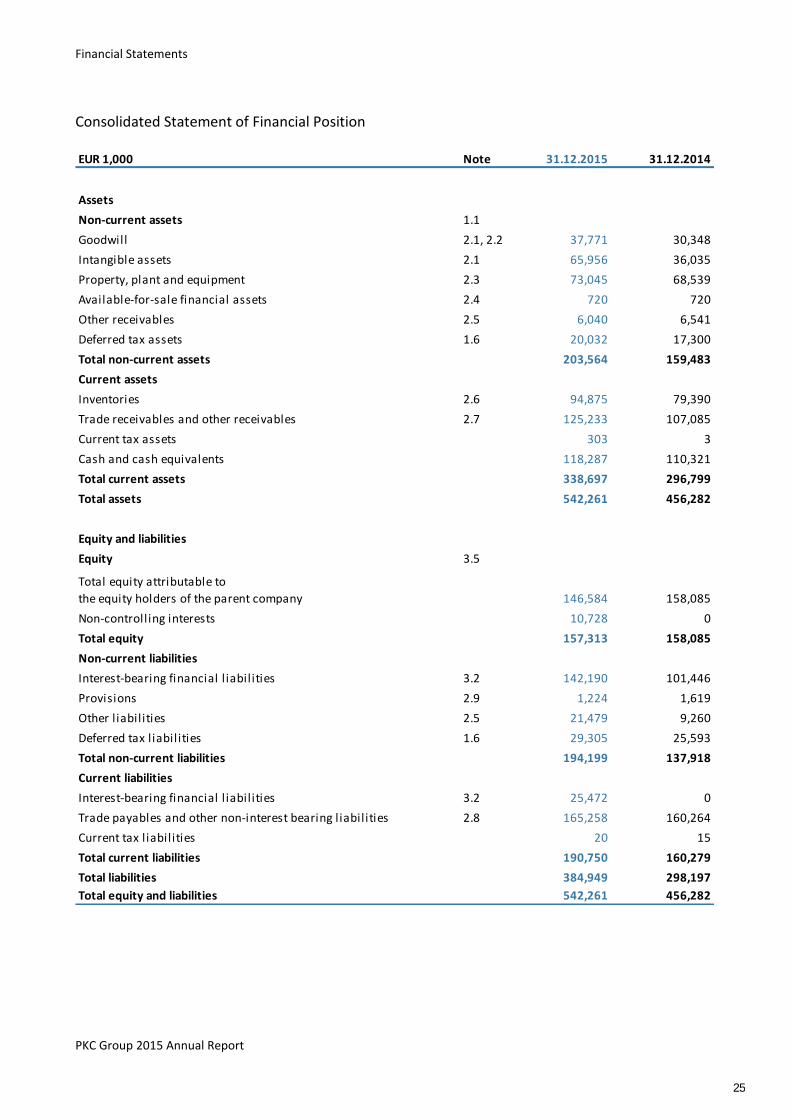
Consolidated Statement of Financial Position
EUR 1,000 Note 31.12.2015 31.12.2014
Assets
Non-current assets 1.1
Goodwill 2.1, 2.2 37,771 30,348
Intangible assets 2.1 65,956 36,035
Property, plant and equipment 2.3 73,045 68,539
Available-for-sale financial assets 2.4 720 720
Other receivables 2.5 6,040 6,541
Deferred tax assets 1.6 20,032 17,300
Total non-current assets 203,564 159,483
Current assets
Inventories 2.6 94,875 79,390
Trade receivables and other receivables 2.7 125,233 107,085
Current tax assets 303 3
Cash and cash equivalents 118,287 110,321
Total current assets 338,697 296,799
Total assets 542,261 456,282
Equity and liabilities
Equity 3.5
Total equity attributable to
the equity holders of the parent company 146,584 158,085
Non-controlling interests 10,728 0
Total equity 157,313 158,085
Non-current liabilities
Interest-bearing financial l iabilities 3.2 142,190 101,446
Provisions 2.9 1,224 1,619
Other liabilities 2.5 21,479 9,260
Deferred tax liabilities 1.6 29,305 25,593
Total non-current liabilities 194,199 137,918
Current liabilities
Interest-bearing financial l iabilities 3.2 25,472 0
Trade payables and other non-interest bearing liabilities 2.8 165,258 160,264
Current tax l iabilities 20 15
Total current liabilities 190,750 160,279
Total liabilities 384,949 298,197
Total equity and liabilities 542,261 456,282
25
Financial Statements
PKC Group 2015 Annual Report
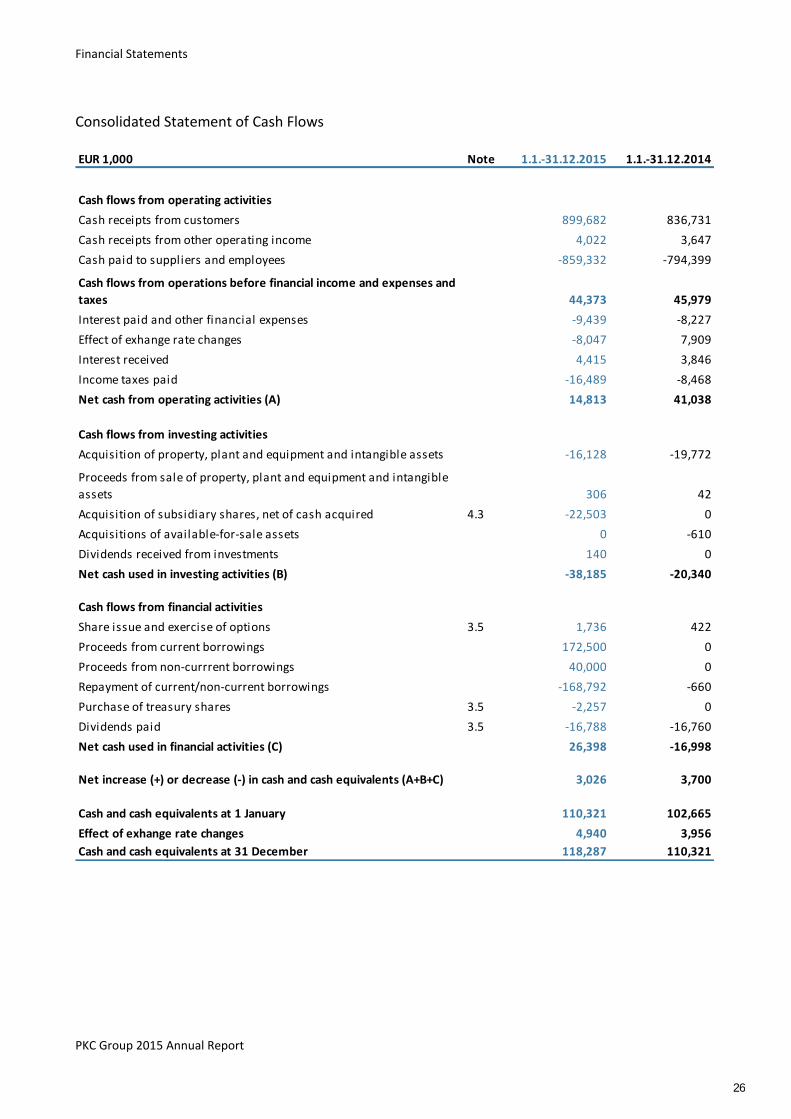
Consolidated Statement of Cash Flows
EUR 1,000 Note 1.1.-31.12.2015 1.1.-31.12.2014
Cash flows from operating activities
Cash receipts from customers 899,682 836,731
Cash receipts from other operating income 4,022 3,647
Cash paid to suppliers and employees -859,332 -794,399
Cash flows from operations before financial income and expenses and
taxes 44,373 45,979
Interest paid and other financial expenses -9,439 -8,227
Effect of exhange rate changes -8,047 7,909
Interest received 4,415 3,846
Income taxes paid -16,489 -8,468
Net cash from operating activities (A) 14,813 41,038
Cash flows from investing activities
Acquisition of property, plant and equipment and intangible assets -16,128 -19,772
Proceeds from sale of property, plant and equipment and intangible
assets 306 42
Acquisition of subsidiary shares, net of cash acquired 4.3 -22,503 0
Acquisitions of available-for-sale assets 0 -610
Dividends received from investments 140 0
Net cash used in investing activities (B) -38,185 -20,340
Cash flows from financial activities
Share issue and exercise of options 3.5 1,736 422
Proceeds from current borrowings 172,500 0
Proceeds from non-currrent borrowings 40,000 0
Repayment of current/non-current borrowings -168,792 -660
Purchase of treasury shares 3.5 -2,257 0
Dividends paid 3.5 -16,788 -16,760
Net cash used in financial activities (C) 26,398 -16,998
Net increase (+) or decrease (-) in cash and cash equivalents (A+B+C) 3,026 3,700
Cash and cash equivalents at 1 January 110,321 102,665
Effect of exhange rate changes 4,940 3,956
Cash and cash equivalents at 31 December 118,287 110,321
26
Financial Statements
PKC Group 2015 Annual Report
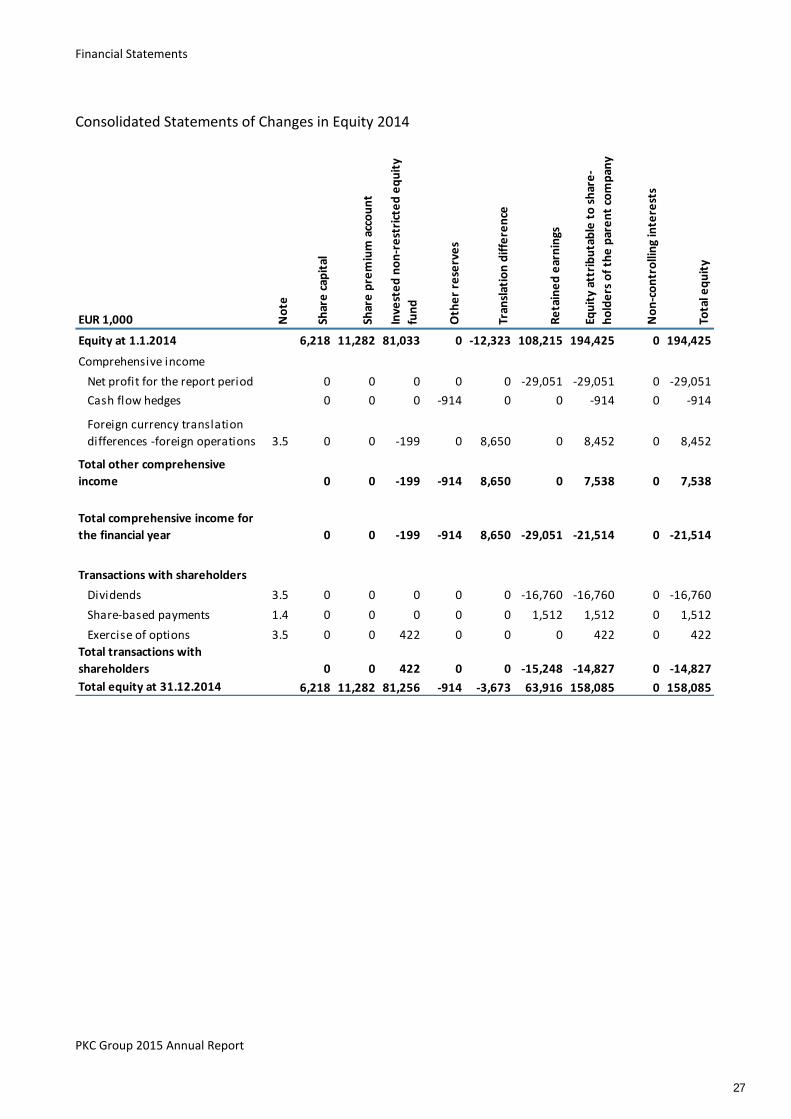
Consolidated Statements of Changes in Equity 2014
EUR 1,000 No
te
Shar
e c
apit
al
Shar
e p
rem
ium
acc
ou
nt
Inve
ste
d n
on
-re
stri
cte
d e
qu
ity
fun
d
Oth
er
rese
rve
s
Tran
slat
ion
dif
fere
nce
Re
tain
ed
ear
nin
gs
Equ
ity
attr
ibu
tab
le t
o s
har
e-
ho
lde
rs o
f th
e p
are
nt
com
pan
y
No
n-c
on
tro
llin
g in
tere
sts
Tota
l eq
uit
y
6,218 11,282 81,033 0 -12,323 108,215 194,425 0 194,425
Comprehensive income
Net profit for the report period 0 0 0 0 0 -29,051 -29,051 0 -29,051
0 0 0 -914 0 0 -914 0 -914
Foreign currency translation
differences -foreign operations 3.5 0 0 -199 0 8,650 0 8,452 0 8,452
Total other comprehensive
income 0 0 -199 -914 8,650 0 7,538 0 7,538
Total comprehensive income for
the financial year 0 0 -199 -914 8,650 -29,051 -21,514 0 -21,514
Transactions with shareholders
Dividends 3.5 0 0 0 0 0 -16,760 -16,760 0 -16,760
Share-based payments 1.4 0 0 0 0 0 1,512 1,512 0 1,512
Exercise of options 3.5 0 0 422 0 0 0 422 0 422
Total transactions with
shareholders 0 0 422 0 0 -15,248 -14,827 0 -14,827
Total equity at 31.12.2014 6,218 11,282 81,256 -914 -3,673 63,916 158,085 0 158,085
Equity at 1.1.2014
Cash flow hedges
27
Financial Statements
PKC Group 2015 Annual Report
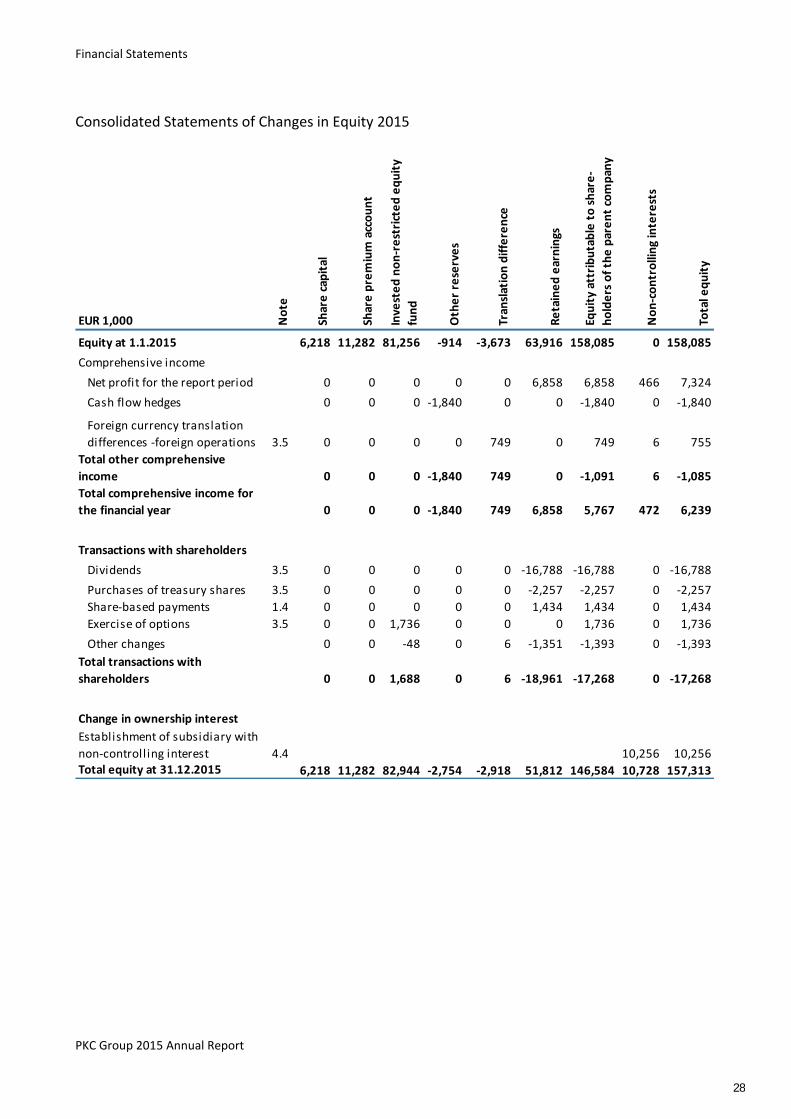
Consolidated Statements of Changes in Equity 2015
EUR 1,000 No
te
Shar
e c
apit
al
Shar
e p
rem
ium
acc
ou
nt
Inve
ste
d n
on
-re
stri
cte
d e
qu
ity
fun
d
Oth
er
rese
rve
s
Tran
slat
ion
dif
fere
nce
Re
tain
ed
ear
nin
gs
Equ
ity
attr
ibu
tab
le t
o s
har
e-
ho
lde
rs o
f th
e p
are
nt
com
pan
y
No
n-c
on
tro
llin
g in
tere
sts
Tota
l eq
uit
y
Equity at 1.1.2015 6,218 11,282 81,256 -914 -3,673 63,916 158,085 0 158,085
Comprehensive income
Net profit for the report period 0 0 0 0 0 6,858 6,858 466 7,324
Cash flow hedges 0 0 0 -1,840 0 0 -1,840 0 -1,840
Foreign currency translation
differences -foreign operations 3.5 0 0 0 0 749 0 749 6 755
Total other comprehensive
income 0 0 0 -1,840 749 0 -1,091 6 -1,085
Total comprehensive income for
the financial year 0 0 0 -1,840 749 6,858 5,767 472 6,239
Transactions with shareholders
Dividends 3.5 0 0 0 0 0 -16,788 -16,788 0 -16,788
Purchases of treasury shares 3.5 0 0 0 0 0 -2,257 -2,257 0 -2,257
Share-based payments 1.4 0 0 0 0 0 1,434 1,434 0 1,434
Exercise of options 3.5 0 0 1,736 0 0 0 1,736 0 1,736
Other changes 0 0 -48 0 6 -1,351 -1,393 0 -1,393
Total transactions with
shareholders 0 0 1,688 0 6 -18,961 -17,268 0 -17,268
Change in ownership interest
Establishment of subsidiary with
non-controlling interest 4.4 10,256 10,256Total equity at 31.12.2015 6,218 11,282 82,944 -2,754 -2,918 51,812 146,584 10,728 157,313
28
Notes to the Consolidated Financial Statements Basis of Preparation and Accounting Policies
PKC Group 2015 Annual Report
Basis of Preparation and Accounting Policies
Group information PKC Group Plc is a Finnish public limited company, domiciled in Helsinki, Finland. The registered address is Bulevardi 7, FI-00120 Helsinki, Finland. PKC Group Plc is the parent company of PKC Group. PKC Group is listed on Nasdaq Helsinki since 3.4.1997. PKC Group is a global partner, designing, manufacturing and integrating electrical distribution systems, electronics and related architecture components for the commercial vehicle industry, rolling stock manufacturers and other selected segments. The revenue of the financial year 2015 totalled EUR 908.0 million and the average amount of personnel was 20,770. The Group operates in four different continents. A copy of the consolidated financial statements is available from the parent company’s head office at Bulevardi 7, FI-00120 Helsinki, Finland. On 10 February 2016, the company’s Board of Directors approved the consolidated financial statements. Under the Finnish Limited Liability Companies Act, the annual general meeting has the right to approve, reject or take the decision to amend the financial statements following their publication.
Basis of preparation The consolidated financial statements of PKC Group Plc are prepared in accordance with the International Financial Reporting Standards (IFRS) in force at December 31, 2015 as adopted by the European Union. The notes to the consolidated financial statements have also been prepared according to Finnish accounting and company legislation supplementing the IFRS standards. The consolidated financial statements have been prepared on a historical cost basis unless otherwise indicated. The functional and presentation currency of the parent company, PKC Group Plc, is euro, which is also the presentation currency of the consolidated financial statements. All figures have been rounded, so the total number of individual figures can deviate from the presented sum figures. The key indicators are calculated using exact figures. The consolidated financial statements are prepared for the calendar year, which is the financial year of the parent company and the Group.
29
Notes to the Consolidated Financial Statements Basis of Preparation and Accounting Policies
PKC Group 2015 Annual Report
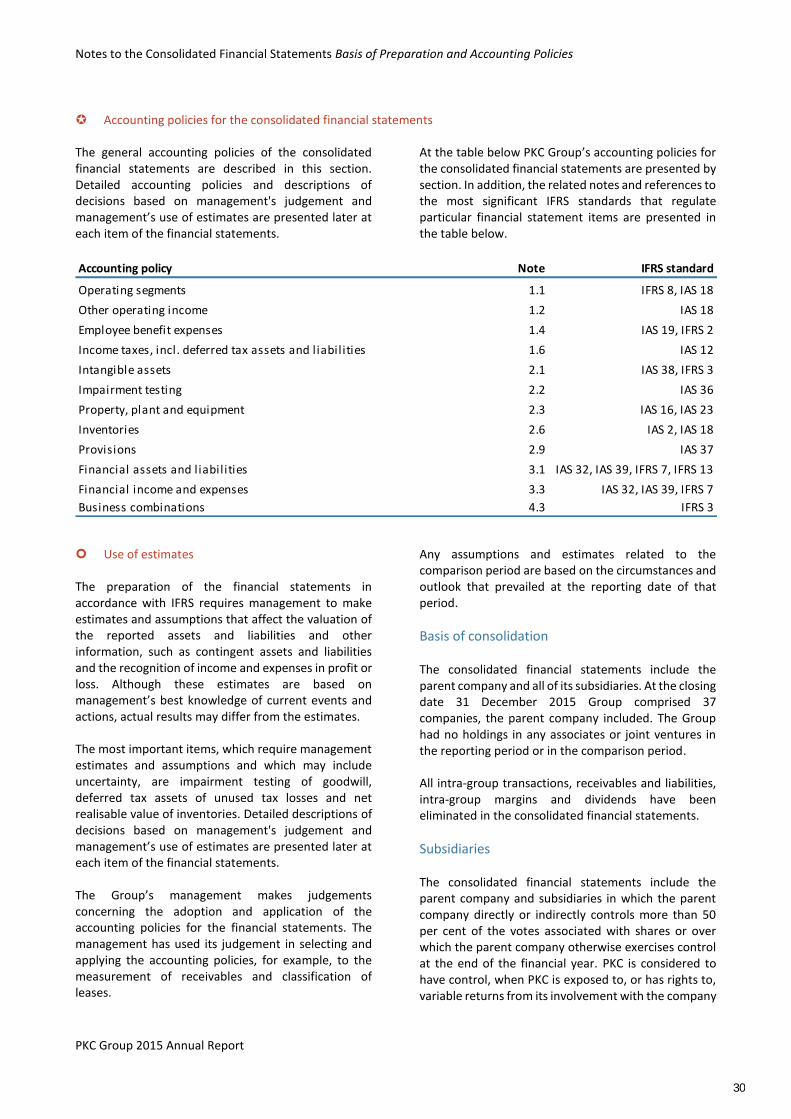
Accounting policies for the consolidated financial statements The general accounting policies of the consolidated financial statements are described in this section. Detailed accounting policies and descriptions of decisions based on management's judgement and management’s use of estimates are presented later at each item of the financial statements.
At the table below PKC Group’s accounting policies for the consolidated financial statements are presented by section. In addition, the related notes and references to the most significant IFRS standards that regulate particular financial statement items are presented in the table below.
Accounting policy Note IFRS standard
Operating segments 1.1 IFRS 8, IAS 18
Other operating income 1.2 IAS 18
Employee benefit expenses 1.4 IAS 19, IFRS 2
Income taxes, incl. deferred tax assets and liabilities 1.6 IAS 12
Intangible assets 2.1 IAS 38, IFRS 3
Impairment testing 2.2 IAS 36
Property, plant and equipment 2.3 IAS 16, IAS 23
Inventories 2.6 IAS 2, IAS 18
Provisions 2.9 IAS 37
Financial assets and liabilities 3.1 IAS 32, IAS 39, IFRS 7, IFRS 13
Financial income and expenses 3.3 IAS 32, IAS 39, IFRS 7
Business combinations 4.3 IFRS 3
Use of estimates The preparation of the financial statements in accordance with IFRS requires management to make estimates and assumptions that affect the valuation of the reported assets and liabilities and other information, such as contingent assets and liabilities and the recognition of income and expenses in profit or loss. Although these estimates are based on management’s best knowledge of current events and actions, actual results may differ from the estimates. The most important items, which require management estimates and assumptions and which may include uncertainty, are impairment testing of goodwill, deferred tax assets of unused tax losses and net realisable value of inventories. Detailed descriptions of decisions based on management's judgement and management’s use of estimates are presented later at each item of the financial statements. The Group’s management makes judgements concerning the adoption and application of the accounting policies for the financial statements. The management has used its judgement in selecting and applying the accounting policies, for example, to the measurement of receivables and classification of leases.
Any assumptions and estimates related to the comparison period are based on the circumstances and outlook that prevailed at the reporting date of that period.
Basis of consolidation The consolidated financial statements include the parent company and all of its subsidiaries. At the closing date 31 December 2015 Group comprised 37 companies, the parent company included. The Group had no holdings in any associates or joint ventures in the reporting period or in the comparison period. All intra-group transactions, receivables and liabilities, intra-group margins and dividends have been eliminated in the consolidated financial statements.
Subsidiaries The consolidated financial statements include the parent company and subsidiaries in which the parent company directly or indirectly controls more than 50 per cent of the votes associated with shares or over which the parent company otherwise exercises control at the end of the financial year. PKC is considered to have control, when PKC is exposed to, or has rights to, variable returns from its involvement with the company
30
Notes to the Consolidated Financial Statements Basis of Preparation and Accounting Policies
PKC Group 2015 Annual Report
and has the ability as well as the power to govern the financial and operating policies of the company to obtain benefits from its activities. The profit for the financial year and items recognised in other comprehensive income are allocated to the owners of the parent company and non-controlling interests and presented in the statement of income and other comprehensive income. Non-controlling interests are presented separately from the equity allocated to the owners of the parent. Comprehensive income is allocated to the owners of the parent company and to non-controlling interests even in situations where the allocation would result in the non-controlling interests’ share being negative, unless non-controlling interests have an exemption not to meet obligations which exceed non-controlling interests’ investment in the company. Subsidiaries acquired or established during the period are included in the consolidated financial statements since the Group has obtained the control or until control ceases. Acquisitions of subsidiaries have been accounted for in the consolidated financial statements by using the acquisition method. Accordingly, the identifiable assets and liabilities of the company acquired are measured at fair value at the date of acquisition. Translation differences of non-euro subsidiaries arising from acquisition cost eliminations and post-acquisition accumulated equity items are recognised in other comprehensive income and presented in equity (item Translation difference). In disposal of a foreign entity the accumulated translation differences are disclosed in profit or loss as part of the gain or loss on disposal. The list of PKC Group’s subsidiaries at 31.12.2015
is presented in note 4.2 Group Structure. The consideration transferred includes the assets transferred by the acquirer, the liabilities incurred by the acquirer to former owners of the acquiree and the equity interests issued by the acquirer, measured at their fair values. All acquisition-related costs, with the exception of costs to issue debt or equity securities, are expensed in the periods in which the costs are incurred and the services rendered. Any contingent consideration is classified as either liability or equity. A contingent consideration classified as liability is remeasured at fair value at the end of each reporting period and the subsequent changes to fair value are recognised in profit or loss. A contingent consideration classified as equity is not remeasured
subsequently. The consideration transferred does not include any transactions accounted for separately from the acquisition, which are accounted for in profit or loss in conjunction with the acquisition. For the business combinations occurred before January 1, 2010 the accounting principles valid at the time of the acquisition have been applied.
Foreign currency transactions Subsidiaries included in the Group report in their financial statements their transactions using the currency of the economic operating environment in which the entity primarily operates (functional currency). The Group companies translate in their accounting foreign currency transactions into their functional currency using the exchange rate of the transaction date. Foreign currency receivables and liabilities are translated into functional currency using the exchange rate of the closing date. Foreign exchange gains and losses arising from foreign currency transactions and translation of monetary items are reported in profit or loss. Foreign exchange gains and losses in business operations are included in the corresponding items above the operating profit. Foreign exchange gains and losses on foreign currency loans are included in financial income and expenses, except for exchange differences arising from foreign currency denominated loans which are classified as net investments in foreign subsidiaries. Exchange rate differences of these loans are recognized in items of other comprehensive income and cumulative exchange rate differences are presented as a separate item in the equity until the disposal of the foreign operation, in whole or in part.
Translation of financial statements of foreign subsidiaries In the consolidated financial statements the income and expenses of the statements of comprehensive income of foreign subsidiaries are translated into euros at the average exchange rates of the reporting period. Items of the statement of the financial position, excluding the profit of the financial year, are translated to euros at the closing rate of the reporting period. Translation of the profit for the financial year and other comprehensive income using average exchange rates of the reporting period and translation of the items of the statement of the financial position using the closing
31
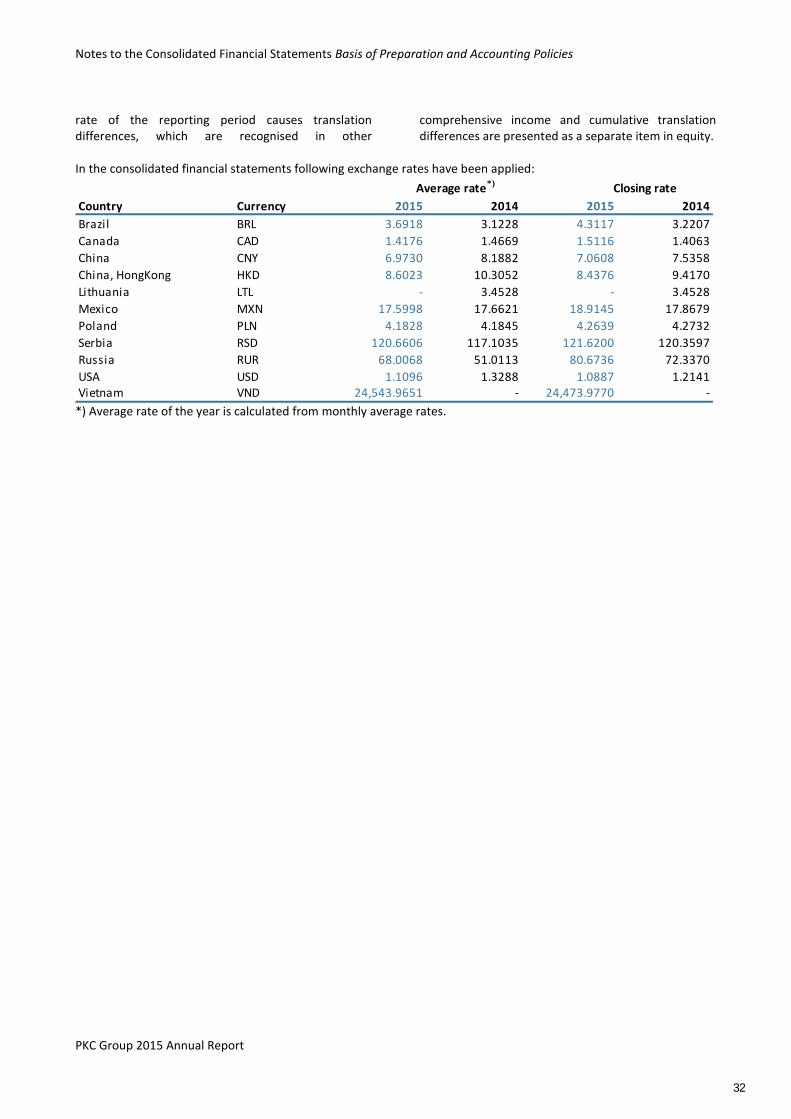
Notes to the Consolidated Financial Statements Basis of Preparation and Accounting Policies
PKC Group 2015 Annual Report
rate of the reporting period causes translation differences, which are recognised in other
comprehensive income and cumulative translation differences are presented as a separate item in equity.
In the consolidated financial statements following exchange rates have been applied:
Country Currency 2015 2014 2015 2014
Brazil BRL 3.6918 3.1228 4.3117 3.2207
Canada CAD 1.4176 1.4669 1.5116 1.4063
China CNY 6.9730 8.1882 7.0608 7.5358
China, HongKong HKD 8.6023 10.3052 8.4376 9.4170
Lithuania LTL - 3.4528 - 3.4528
Mexico MXN 17.5998 17.6621 18.9145 17.8679
Poland PLN 4.1828 4.1845 4.2639 4.2732
Serbia RSD 120.6606 117.1035 121.6200 120.3597
Russia RUR 68.0068 51.0113 80.6736 72.3370
USA USD 1.1096 1.3288 1.0887 1.2141Vietnam VND 24,543.9651 - 24,473.9770 -
Average rate*) Closing rate
*) Average rate of the year is calculated from monthly average rates.
32
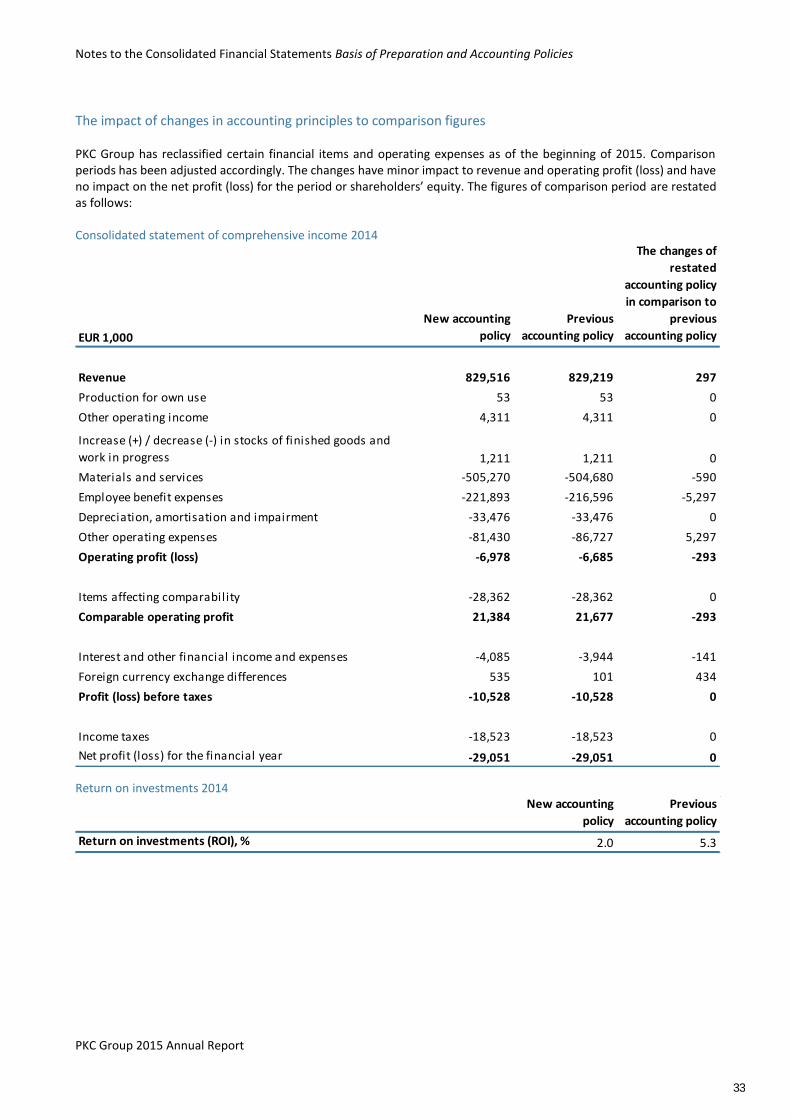
Notes to the Consolidated Financial Statements Basis of Preparation and Accounting Policies
PKC Group 2015 Annual Report
The impact of changes in accounting principles to comparison figures PKC Group has reclassified certain financial items and operating expenses as of the beginning of 2015. Comparison periods has been adjusted accordingly. The changes have minor impact to revenue and operating profit (loss) and have no impact on the net profit (loss) for the period or shareholders’ equity. The figures of comparison period are restated as follows: Consolidated statement of comprehensive income 2014
EUR 1,000
New accounting
policy
Previous
accounting policy
The changes of
restated
accounting policy
in comparison to
previous
accounting policy
Revenue 829,516 829,219 297
Production for own use 53 53 0
Other operating income 4,311 4,311 0
Increase (+) / decrease (-) in stocks of finished goods and
work in progress 1,211 1,211 0
Materials and services -505,270 -504,680 -590
Employee benefit expenses -221,893 -216,596 -5,297
Depreciation, amortisation and impairment -33,476 -33,476 0
Other operating expenses -81,430 -86,727 5,297
Operating profit (loss) -6,978 -6,685 -293
Items affecting comparability -28,362 -28,362 0
Comparable operating profit 21,384 21,677 -293
Interest and other financial income and expenses -4,085 -3,944 -141
Foreign currency exchange differences 535 101 434
Profit (loss) before taxes -10,528 -10,528 0
Income taxes -18,523 -18,523 0
Net profit (loss) for the financial year -29,051 -29,051 0
Return on investments 2014 New accounting
policy
Previous
accounting policy
Return on investments (ROI), % 2.0 5.3
33
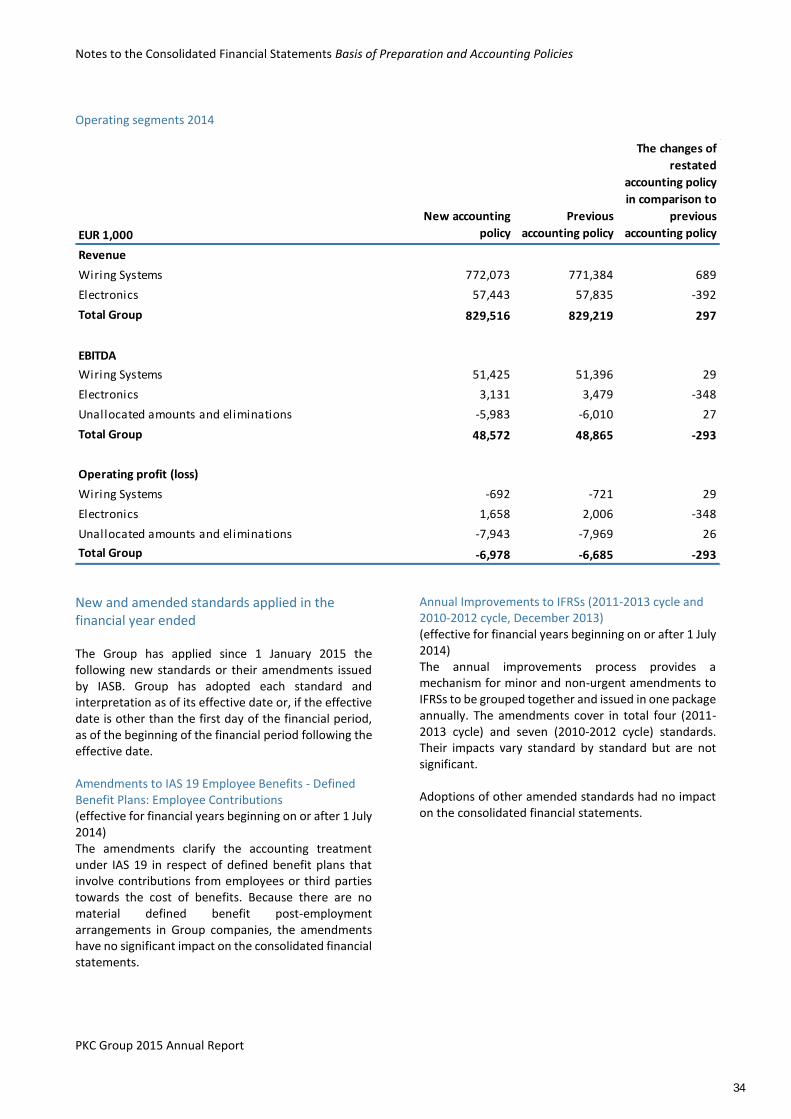
Notes to the Consolidated Financial Statements Basis of Preparation and Accounting Policies
PKC Group 2015 Annual Report
Operating segments 2014
EUR 1,000
New accounting
policy
Previous
accounting policy
The changes of
restated
accounting policy
in comparison to
previous
accounting policy
Revenue
Wiring Systems 772,073 771,384 689
Electronics 57,443 57,835 -392
Total Group 829,516 829,219 297
EBITDA
Wiring Systems 51,425 51,396 29
Electronics 3,131 3,479 -348
Unallocated amounts and eliminations -5,983 -6,010 27
Total Group 48,572 48,865 -293
Operating profit (loss)
Wiring Systems -692 -721 29
Electronics 1,658 2,006 -348
Unallocated amounts and eliminations -7,943 -7,969 26
Total Group -6,978 -6,685 -293
New and amended standards applied in the financial year ended The Group has applied since 1 January 2015 the following new standards or their amendments issued by IASB. Group has adopted each standard and interpretation as of its effective date or, if the effective date is other than the first day of the financial period, as of the beginning of the financial period following the effective date. Amendments to IAS 19 Employee Benefits - Defined Benefit Plans: Employee Contributions (effective for financial years beginning on or after 1 July 2014) The amendments clarify the accounting treatment under IAS 19 in respect of defined benefit plans that involve contributions from employees or third parties towards the cost of benefits. Because there are no material defined benefit post-employment arrangements in Group companies, the amendments have no significant impact on the consolidated financial statements.
Annual Improvements to IFRSs (2011-2013 cycle and 2010-2012 cycle, December 2013) (effective for financial years beginning on or after 1 July 2014) The annual improvements process provides a mechanism for minor and non-urgent amendments to IFRSs to be grouped together and issued in one package annually. The amendments cover in total four (2011-2013 cycle) and seven (2010-2012 cycle) standards. Their impacts vary standard by standard but are not significant. Adoptions of other amended standards had no impact on the consolidated financial statements.
34
Notes to the Consolidated Financial Statements Basis of Preparation and Accounting Policies
PKC Group 2015 Annual Report
Adoption of new and amended standards and interpretations applicable in future financial years The following published new and amended standards and interpretations are not yet effective as at 31 December 2015 and PKC has not applied them in preparation of these consolidated financial statements. The Group will adopt them as of the effective date of each of the standards, or if the effective date is not the first day of the financial year, as of the beginning of the next financial year following the effective date. * = not yet endorsed for use by the European Union as of 31 December 2015. Amendment to IAS 1 Presentation of Financial Statements: Disclosure Initiative* (effective for financial years beginning on or after 1 January 2016) The amendments are designed to encourage companies to apply judgement in determining what information to disclose in the financial statements. For example, the amendments clarify the application of the materiality concept and judgement when determining where and in what order information is presented in the financial disclosures. The interpretation will have no significant impact on the consolidated financial statements. Amendments to IAS 16 Property, Plant and Equipment and IAS 38 Intangible Assets - Clarification of Acceptable Methods of Depreciation and Amortisation* (effective for financial years beginning on or after 1 January 2016) The amendments clarify IAS 16 and IAS 38 that revenue-based method cannot be used to depreciate property, plant and equipment and may only be used in limited circumstances to amortise intangible assets. The amendments will have no impact on the consolidated financial statements. Amendments to IFRS 10 Consolidated Financial Statements, IFRS 12 Disclosure of Interests in Other Entities and IAS 28 Investments in Associates and Joint Ventures: Investment Entities: Applying the Consolidation Exception* (the amendments can be applied immediately; mandatory for financial years beginning on or after 1 January 2016) The narrow-scope amendments to IFRS 10, IFRS 12 and IAS 28 clarify the requirements when accounting for investment entities. The amendments also provide relief in particular circumstances, which will reduce the
costs of applying the Standards. The amendments will have no impact on consolidated financial statements. Amendments to IFRS 11 Joint Arrangements - Accounting for Acquisitions of Interests in Joint Operations (effective for financial years beginning on or after 1 January 2016) The amendments add new guidance to IFRS 11 on how to account for the acquisition of an interest in a joint operation that constitutes a business, i.e. business combination accounting is required to be applied. Amendments to IAS 27 Separate Financial Statements – Equity Method in Separate Financial Statements* (effective for financial years beginning on or after 1 January 2016) The amendments to IAS 27 will allow entities to use the equity method to account for investments in subsidiaries, joint ventures and associates in their separate financial statements. The amendments will not have an impact on the consolidated financial statements. Annual Improvements to IFRSs, (2012-2014 cycle)* (effective for financial years beginning on or after 1 January 2016) The annual improvements process provides a mechanism for minor and non-urgent amendments to IFRSs to be grouped together and issued in one package annually. The amendments relate to four standards. Their impacts vary standard by standard but are not significant. New IFRS 15 Revenue from Contracts with Customers* (effective for financial years beginning on or after 1 January 2018) IFRS 15 establishes a comprehensive framework for determining whether, how much and when revenue is recognised. It replaces existing revenue guidance, including IAS 18 Revenue, IAS 11 Construction Contracts and IFRIC 13 Customer Loyalty Programmes. Under IFRS 15 an entity shall recognise revenue in an amount that reflects the consideration to which the entity expects to be entitled in exchange for those goods or services. The Group is currently assessing the impact of IFRS 15. New IFRS 9 Financial Instruments* (effective for financial years beginning on or after 1 January 2018) IFRS 9 replaces the existing guidance in IAS 39 Financial Instruments: Recognition and Measurement. IFRS 9 includes revised guidance on the classification and measurement of financial instruments, including a new
35
Notes to the Consolidated Financial Statements Basis of Preparation and Accounting Policies
PKC Group 2015 Annual Report
expected credit loss model for calculating impairment on financial assets, and the new general hedge accounting requirements. It also carries forward the
guidance on recognition and derecognition of financial instruments from IAS 39. The Group is assessing the impact of IFRS 9.
36
Notes to the Financial Statements 1. Items Related to the Profit for the Period
PKC Group 2015 Annual Report
1. Items Related to the Profit for the Period
1.1 Operating Segments PKC Group has two business areas: Wiring Systems and Electronics. Wiring Systems The Wiring Systems business designs, manufactures and integrates tailored electrical distribution systems and related architecture components, vehicle electronics, wires and cables especially for trucks and buses, light and recreational vehicles, construction equipment and agricultural and forestry equipment. In addition, segment designs and manufactures electrical cabinets, power packs and electrical distribution systems for rolling stock manufacturers. Segment’s strengths, mass customisation and the excellent skill to integrate into the customer’s operating environment, provide a unique competitive advantage in the market. Product design and effective supply chain management are carried out in close cooperation with customers and in accordance with their requirements. The units of Wiring Systems business are located in Brazil, China, Estonia, Finland, Germany, Lithuania, Mexico, Poland, Russia, Serbia and USA. Electronics The Electronics business offers, in particular, product design, development and manufacture services of testing solutions and power supply systems for the electronics, telecommunications and energy industry. Products designed and manufactured by the segment are used in e.g. power control for machines, the testing of electronic products and energy-saving equipment. The service concept covers the entire product life-cycle. The units of Electronics business are located in Finland, China and Vietnam. Accounting policy of segment information PKC Group’s segment information is consistent with Group’s internal reporting and IFRS standards. The Group’s reportable segments are consistent with the operating segments. Transfer prices between operating segments are based on market prices. Segment assets and liabilities include only those assets and liabilities that can be directly allocated to the respective segments.
Group’s unallocated expenses and income, and eliminations between segments are included in unallocated items of comprehensive income. Unallocated assets include mainly items related to Group management and also taxes and loan receivables. Unallocated liabilities include current and non-current loans and tax liabilities. Information about geographical areas Revenue by market areas is based on customers' geographical locations. PKC Group is active in the following geographical areas: Europe, North America, South America and APAC (Asia and Pacific). The assets and capital expenditure of geographical areas are based on the locations of the assets, i.e., Europe, North America, South America and APAC (Asia and Pacific). Revenue recognition policies Revenue from the sale of goods is recognised when the significant risks, rewards and actual control usually associated with ownership of the goods have been transferred to the buyer. Usually revenue is recognised as income when products are delivered in accordance with the terms of sale. Revenue from services is recognised during the period when the service is rendered and the economic benefit of the transaction is probable. The share of PKC Group’s revenue from services is not significant. PKC Group has no long-term projects, for which the percentage-of-completion method is used. Revenue includes the income of the actual operations measured at fair value and adjusted for discounts given. Revenue also includes foreign exchange rate gains and losses arising from trade receivables. Operating Profit IAS 1 Presentation of Financial Statements does not define the concept of operating profit. According to the definition used by PKC Group, operating profit is the net amount formed when other operating income is added to the net sales, and the following items are then subtracted from the total: materials and services adjusted for the change in inventories of finished goods and work in progress and also for foreign exchanges gains and losses arising from trade payables; the employee benefit expenses; depreciation, amortisation
37
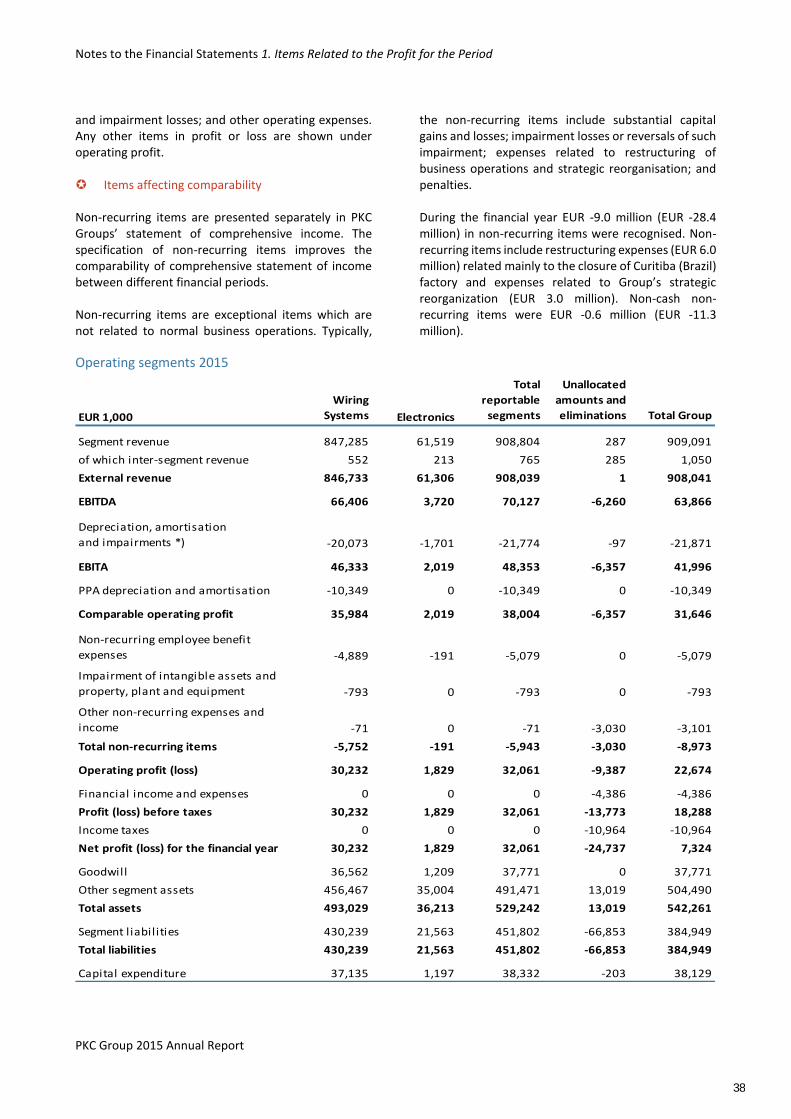
Notes to the Financial Statements 1. Items Related to the Profit for the Period
PKC Group 2015 Annual Report
and impairment losses; and other operating expenses. Any other items in profit or loss are shown under operating profit. Items affecting comparability Non-recurring items are presented separately in PKC Groups’ statement of comprehensive income. The specification of non-recurring items improves the comparability of comprehensive statement of income between different financial periods. Non-recurring items are exceptional items which are not related to normal business operations. Typically,
the non-recurring items include substantial capital gains and losses; impairment losses or reversals of such impairment; expenses related to restructuring of business operations and strategic reorganisation; and penalties. During the financial year EUR -9.0 million (EUR -28.4 million) in non-recurring items were recognised. Non-recurring items include restructuring expenses (EUR 6.0 million) related mainly to the closure of Curitiba (Brazil) factory and expenses related to Group’s strategic reorganization (EUR 3.0 million). Non-cash non-recurring items were EUR -0.6 million (EUR -11.3 million).
Operating segments 2015
EUR 1,000
Wiring
Systems Electronics
Total
reportable
segments
Unallocated
amounts and
eliminations Total Group
Segment revenue 847,285 61,519 908,804 287 909,091
of which inter-segment revenue 552 213 765 285 1,050
External revenue 846,733 61,306 908,039 1 908,041
EBITDA 66,406 3,720 70,127 -6,260 63,866
Depreciation, amortisation
and impairments *) -20,073 -1,701 -21,774 -97 -21,871
EBITA 46,333 2,019 48,353 -6,357 41,996
PPA depreciation and amortisation -10,349 0 -10,349 0 -10,349
Comparable operating profit 35,984 2,019 38,004 -6,357 31,646
Non-recurring employee benefit
expenses -4,889 -191 -5,079 0 -5,079
Impairment of intangible assets and
property, plant and equipment -793 0 -793 0 -793
Other non-recurring expenses and
income -71 0 -71 -3,030 -3,101
Total non-recurring items -5,752 -191 -5,943 -3,030 -8,973
Operating profit (loss) 30,232 1,829 32,061 -9,387 22,674
Financial income and expenses 0 0 0 -4,386 -4,386
Profit (loss) before taxes 30,232 1,829 32,061 -13,773 18,288
Income taxes 0 0 0 -10,964 -10,964
Net profit (loss) for the financial year 30,232 1,829 32,061 -24,737 7,324
Goodwill 36,562 1,209 37,771 0 37,771
Other segment assets 456,467 35,004 491,471 13,019 504,490
Total assets 493,029 36,213 529,242 13,019 542,261
Segment liabilities 430,239 21,563 451,802 -66,853 384,949
Total liabilities 430,239 21,563 451,802 -66,853 384,949
Capital expenditure 37,135 1,197 38,332 -203 38,129
38
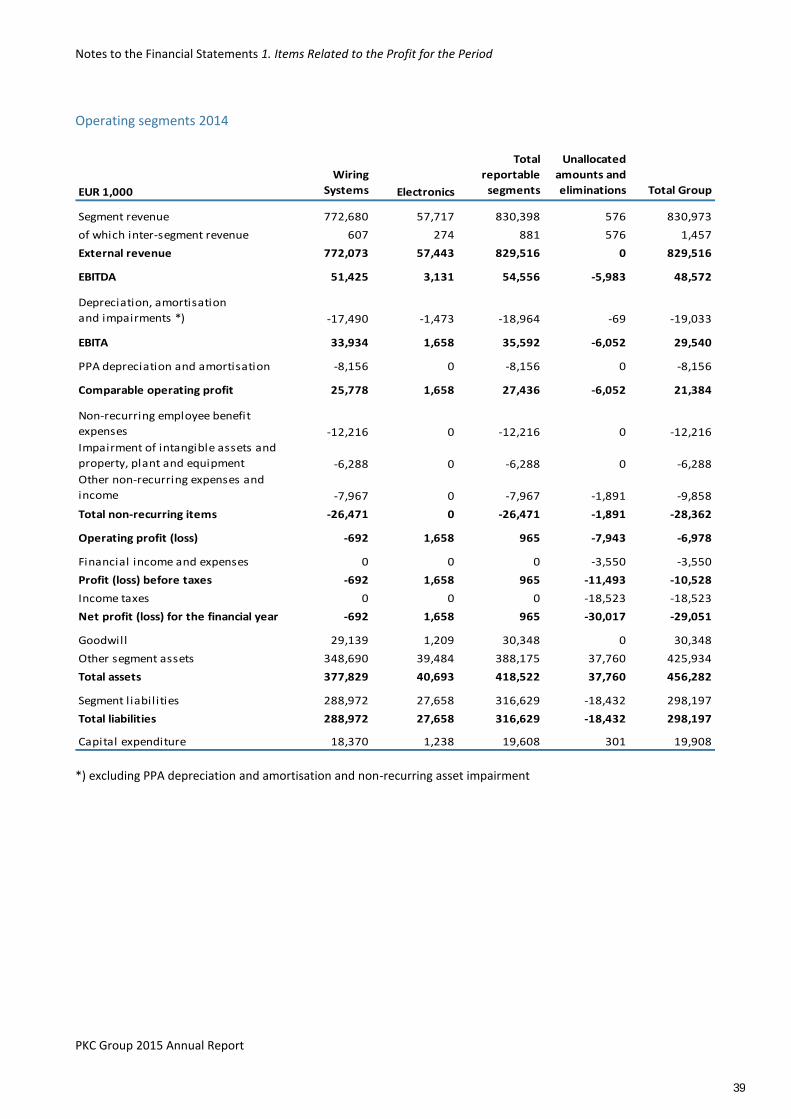
Notes to the Financial Statements 1. Items Related to the Profit for the Period
PKC Group 2015 Annual Report
Operating segments 2014
EUR 1,000
Wiring
Systems Electronics
Total
reportable
segments
Unallocated
amounts and
eliminations Total Group
Segment revenue 772,680 57,717 830,398 576 830,973
of which inter-segment revenue 607 274 881 576 1,457
External revenue 772,073 57,443 829,516 0 829,516
EBITDA 51,425 3,131 54,556 -5,983 48,572
Depreciation, amortisation
and impairments *) -17,490 -1,473 -18,964 -69 -19,033
EBITA 33,934 1,658 35,592 -6,052 29,540
PPA depreciation and amortisation -8,156 0 -8,156 0 -8,156
Comparable operating profit 25,778 1,658 27,436 -6,052 21,384
Non-recurring employee benefit
expenses -12,216 0 -12,216 0 -12,216
Impairment of intangible assets and
property, plant and equipment -6,288 0 -6,288 0 -6,288
Other non-recurring expenses and
income -7,967 0 -7,967 -1,891 -9,858
Total non-recurring items -26,471 0 -26,471 -1,891 -28,362
Operating profit (loss) -692 1,658 965 -7,943 -6,978
Financial income and expenses 0 0 0 -3,550 -3,550
Profit (loss) before taxes -692 1,658 965 -11,493 -10,528
Income taxes 0 0 0 -18,523 -18,523
Net profit (loss) for the financial year -692 1,658 965 -30,017 -29,051
Goodwill 29,139 1,209 30,348 0 30,348
Other segment assets 348,690 39,484 388,175 37,760 425,934
Total assets 377,829 40,693 418,522 37,760 456,282
Segment liabilities 288,972 27,658 316,629 -18,432 298,197
Total liabilities 288,972 27,658 316,629 -18,432 298,197
Capital expenditure 18,370 1,238 19,608 301 19,908 *) excluding PPA depreciation and amortisation and non-recurring asset impairment
39
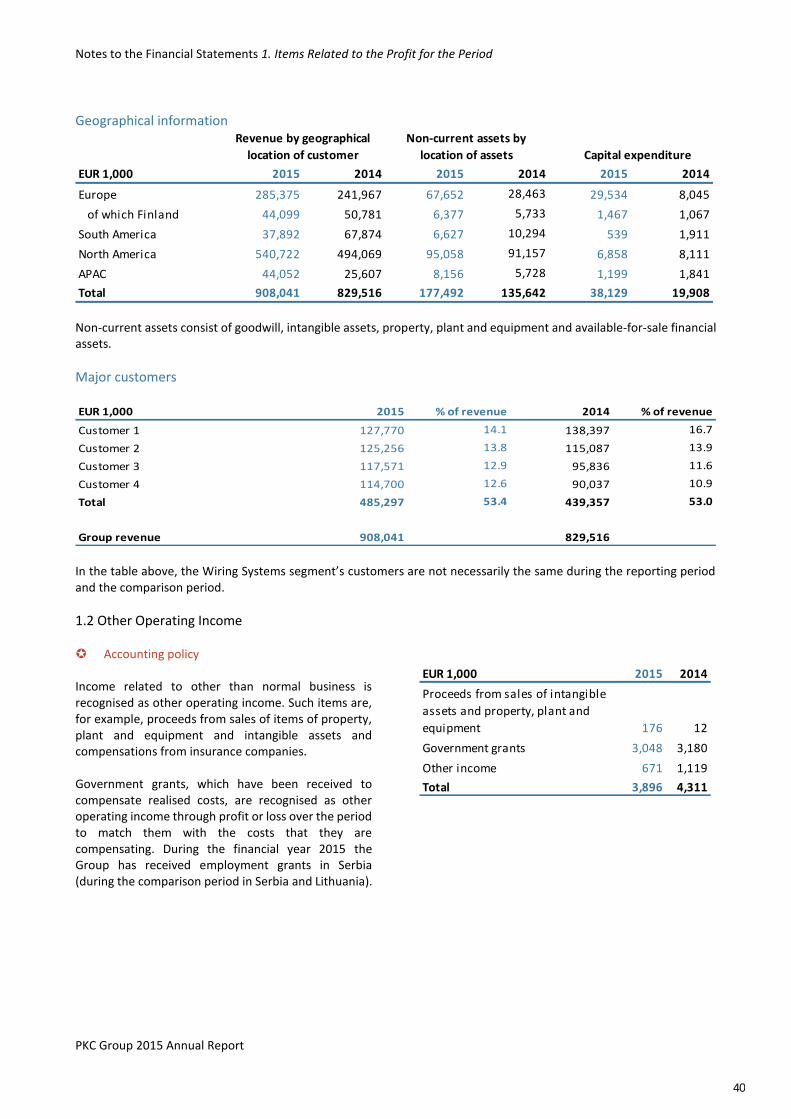
Notes to the Financial Statements 1. Items Related to the Profit for the Period
PKC Group 2015 Annual Report
Geographical information
EUR 1,000 2015 2014 2015 2014 2015 2014
Europe 285,375 241,967 67,652 28,463 29,534 8,045
of which Finland 44,099 50,781 6,377 5,733 1,467 1,067
South America 37,892 67,874 6,627 10,294 539 1,911
North America 540,722 494,069 95,058 91,157 6,858 8,111
APAC 44,052 25,607 8,156 5,728 1,199 1,841
Total 908,041 829,516 177,492 135,642 38,129 19,908
Revenue by geographical
location of customer
Non-current assets by
location of assets Capital expenditure
Non-current assets consist of goodwill, intangible assets, property, plant and equipment and available-for-sale financial assets.
Major customers
EUR 1,000 2015 % of revenue 2014 % of revenue
Customer 1 127,770 14.1 138,397 16.7
Customer 2 125,256 13.8 115,087 13.9
Customer 3 117,571 12.9 95,836 11.6
Customer 4 114,700 12.6 90,037 10.9
Total 485,297 53.4 439,357 53.0
Group revenue 908,041 829,516 In the table above, the Wiring Systems segment’s customers are not necessarily the same during the reporting period and the comparison period.
1.2 Other Operating Income Accounting policy Income related to other than normal business is recognised as other operating income. Such items are, for example, proceeds from sales of items of property, plant and equipment and intangible assets and compensations from insurance companies. Government grants, which have been received to compensate realised costs, are recognised as other operating income through profit or loss over the period to match them with the costs that they are compensating. During the financial year 2015 the Group has received employment grants in Serbia (during the comparison period in Serbia and Lithuania).
EUR 1,000 2015 2014
Proceeds from sales of intangible
assets and property, plant and
equipment 176 12
Government grants 3,048 3,180
Other income 671 1,119
Total 3,896 4,311
40
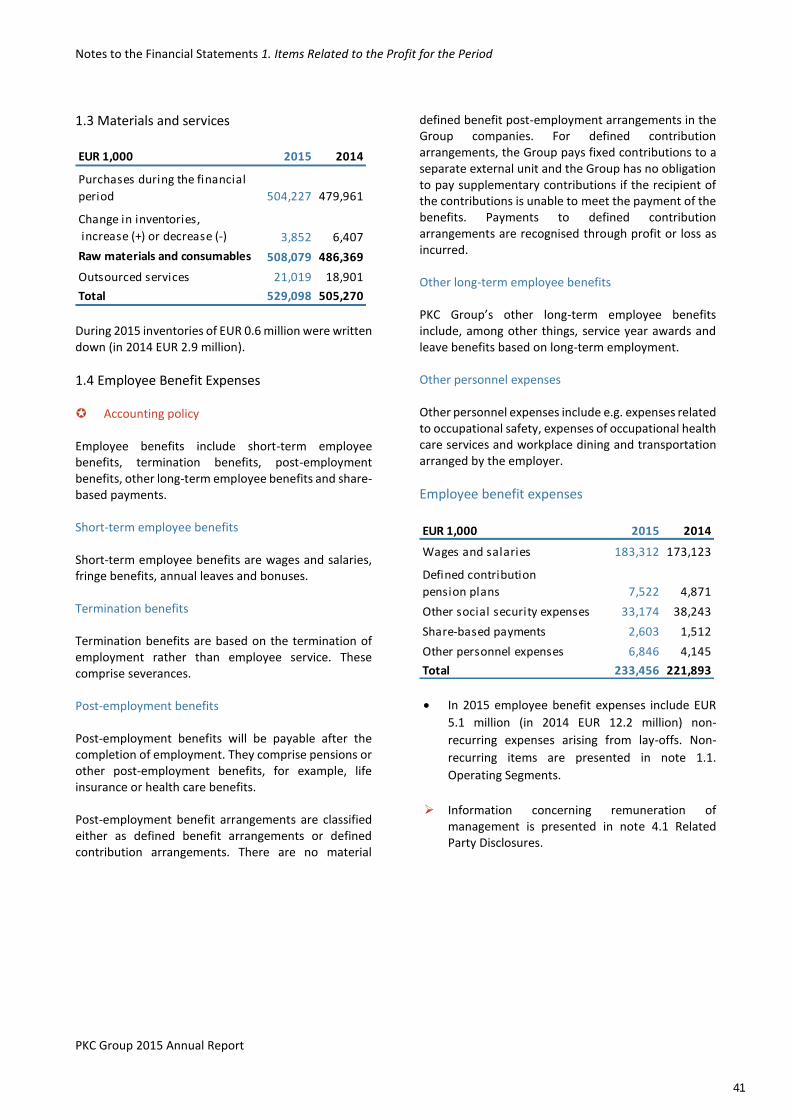
Notes to the Financial Statements 1. Items Related to the Profit for the Period
PKC Group 2015 Annual Report
1.3 Materials and services
EUR 1,000 2015 2014
Purchases during the financial
period 504,227 479,961
Change in inventories,
increase (+) or decrease (-) 3,852 6,407
Raw materials and consumables 508,079 486,369
Outsourced services 21,019 18,901
Total 529,098 505,270 During 2015 inventories of EUR 0.6 million were written down (in 2014 EUR 2.9 million).
1.4 Employee Benefit Expenses Accounting policy Employee benefits include short-term employee benefits, termination benefits, post-employment benefits, other long-term employee benefits and share-based payments. Short-term employee benefits Short-term employee benefits are wages and salaries, fringe benefits, annual leaves and bonuses. Termination benefits Termination benefits are based on the termination of employment rather than employee service. These comprise severances. Post-employment benefits Post-employment benefits will be payable after the completion of employment. They comprise pensions or other post-employment benefits, for example, life insurance or health care benefits. Post-employment benefit arrangements are classified either as defined benefit arrangements or defined contribution arrangements. There are no material
defined benefit post-employment arrangements in the Group companies. For defined contribution arrangements, the Group pays fixed contributions to a separate external unit and the Group has no obligation to pay supplementary contributions if the recipient of the contributions is unable to meet the payment of the benefits. Payments to defined contribution arrangements are recognised through profit or loss as incurred. Other long-term employee benefits PKC Group’s other long-term employee benefits include, among other things, service year awards and leave benefits based on long-term employment. Other personnel expenses Other personnel expenses include e.g. expenses related to occupational safety, expenses of occupational health care services and workplace dining and transportation arranged by the employer.
Employee benefit expenses
EUR 1,000 2015 2014
Wages and salaries 183,312 173,123
Defined contribution
pension plans 7,522 4,871
Other social security expenses 33,174 38,243
Share-based payments 2,603 1,512
Other personnel expenses 6,846 4,145
Total 233,456 221,893
In 2015 employee benefit expenses include EUR
5.1 million (in 2014 EUR 12.2 million) non-
recurring expenses arising from lay-offs. Non-
recurring items are presented in note 1.1.
Operating Segments.
Information concerning remuneration of management is presented in note 4.1 Related Party Disclosures.
41
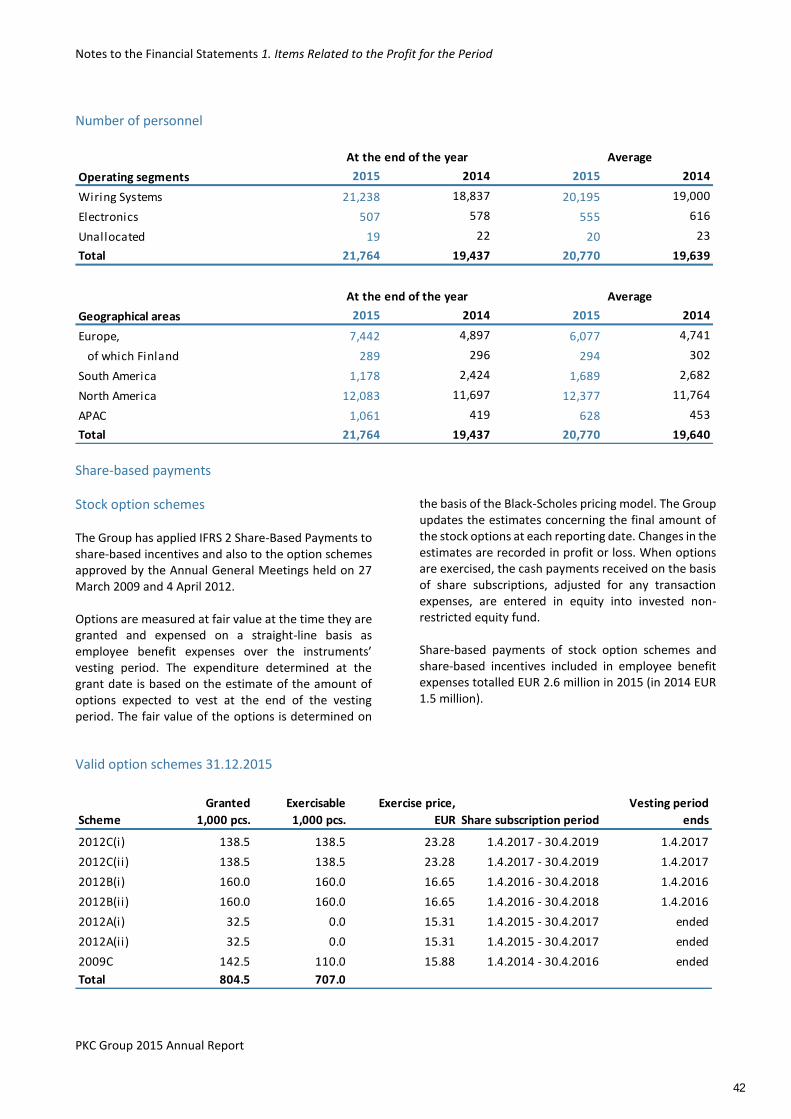
Notes to the Financial Statements 1. Items Related to the Profit for the Period
PKC Group 2015 Annual Report
Number of personnel
Operating segments 2015 2014 2015 2014
Wiring Systems 21,238 18,837 20,195 19,000
Electronics 507 578 555 616
Unallocated 19 22 20 23
Total 21,764 19,437 20,770 19,639
Geographical areas 2015 2014 2015 2014
Europe, 7,442 4,897 6,077 4,741
of which Finland 289 296 294 302
South America 1,178 2,424 1,689 2,682
North America 12,083 11,697 12,377 11,764
APAC 1,061 419 628 453
Total 21,764 19,437 20,770 19,640
At the end of the year Average
At the end of the year Average
Share-based payments
Stock option schemes
The Group has applied IFRS 2 Share-Based Payments to share-based incentives and also to the option schemes approved by the Annual General Meetings held on 27 March 2009 and 4 April 2012. Options are measured at fair value at the time they are granted and expensed on a straight-line basis as employee benefit expenses over the instruments’ vesting period. The expenditure determined at the grant date is based on the estimate of the amount of options expected to vest at the end of the vesting period. The fair value of the options is determined on
the basis of the Black-Scholes pricing model. The Group updates the estimates concerning the final amount of the stock options at each reporting date. Changes in the estimates are recorded in profit or loss. When options are exercised, the cash payments received on the basis of share subscriptions, adjusted for any transaction expenses, are entered in equity into invested non-restricted equity fund. Share-based payments of stock option schemes and share-based incentives included in employee benefit expenses totalled EUR 2.6 million in 2015 (in 2014 EUR 1.5 million).
Valid option schemes 31.12.2015
Scheme
Granted
1,000 pcs.
Exercisable
1,000 pcs.
Exercise price,
EUR Share subscription period
Vesting period
ends
2012C(i) 138.5 138.5 23.28 1.4.2017 - 30.4.2019 1.4.2017
2012C(ii) 138.5 138.5 23.28 1.4.2017 - 30.4.2019 1.4.2017
2012B(i) 160.0 160.0 16.65 1.4.2016 - 30.4.2018 1.4.2016
2012B(ii) 160.0 160.0 16.65 1.4.2016 - 30.4.2018 1.4.2016
2012A(i) 32.5 0.0 15.31 1.4.2015 - 30.4.2017 ended
2012A(ii) 32.5 0.0 15.31 1.4.2015 - 30.4.2017 ended
2009C 142.5 110.0 15.88 1.4.2014 - 30.4.2016 ended
Total 804.5 707.0
42
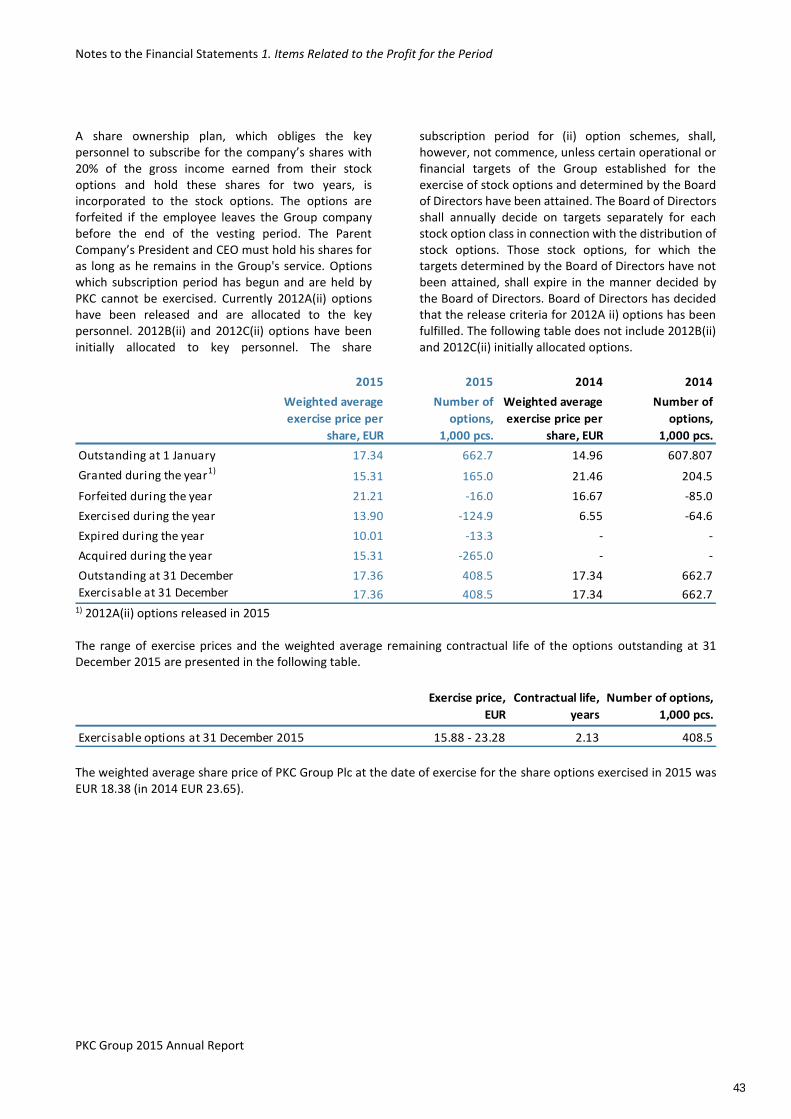
Notes to the Financial Statements 1. Items Related to the Profit for the Period
PKC Group 2015 Annual Report
A share ownership plan, which obliges the key personnel to subscribe for the company’s shares with 20% of the gross income earned from their stock options and hold these shares for two years, is incorporated to the stock options. The options are forfeited if the employee leaves the Group company before the end of the vesting period. The Parent Company’s President and CEO must hold his shares for as long as he remains in the Group's service. Options which subscription period has begun and are held by PKC cannot be exercised. Currently 2012A(ii) options have been released and are allocated to the key personnel. 2012B(ii) and 2012C(ii) options have been initially allocated to key personnel. The share
subscription period for (ii) option schemes, shall, however, not commence, unless certain operational or financial targets of the Group established for the exercise of stock options and determined by the Board of Directors have been attained. The Board of Directors shall annually decide on targets separately for each stock option class in connection with the distribution of stock options. Those stock options, for which the targets determined by the Board of Directors have not been attained, shall expire in the manner decided by the Board of Directors. Board of Directors has decided that the release criteria for 2012A ii) options has been fulfilled. The following table does not include 2012B(ii) and 2012C(ii) initially allocated options.
2015 2015 2014 2014
Weighted average
exercise price per
share, EUR
Number of
options,
1,000 pcs.
Weighted average
exercise price per
share, EUR
Number of
options,
1,000 pcs.
Outstanding at 1 January 17.34 662.7 14.96 607.807
Granted during the year1)15.31 165.0 21.46 204.5
Forfeited during the year 21.21 -16.0 16.67 -85.0
Exercised during the year 13.90 -124.9 6.55 -64.6
Expired during the year 10.01 -13.3 - -
Acquired during the year 15.31 -265.0 - -
Outstanding at 31 December 17.36 408.5 17.34 662.7
Exercisable at 31 December 17.36 408.5 17.34 662.7 1) 2012A(ii) options released in 2015 The range of exercise prices and the weighted average remaining contractual life of the options outstanding at 31 December 2015 are presented in the following table.
Exercise price,
EUR
Contractual life,
years
Number of options,
1,000 pcs.
Exercisable options at 31 December 2015 15.88 - 23.28 2.13 408.5 The weighted average share price of PKC Group Plc at the date of exercise for the share options exercised in 2015 was EUR 18.38 (in 2014 EUR 23.65).
43
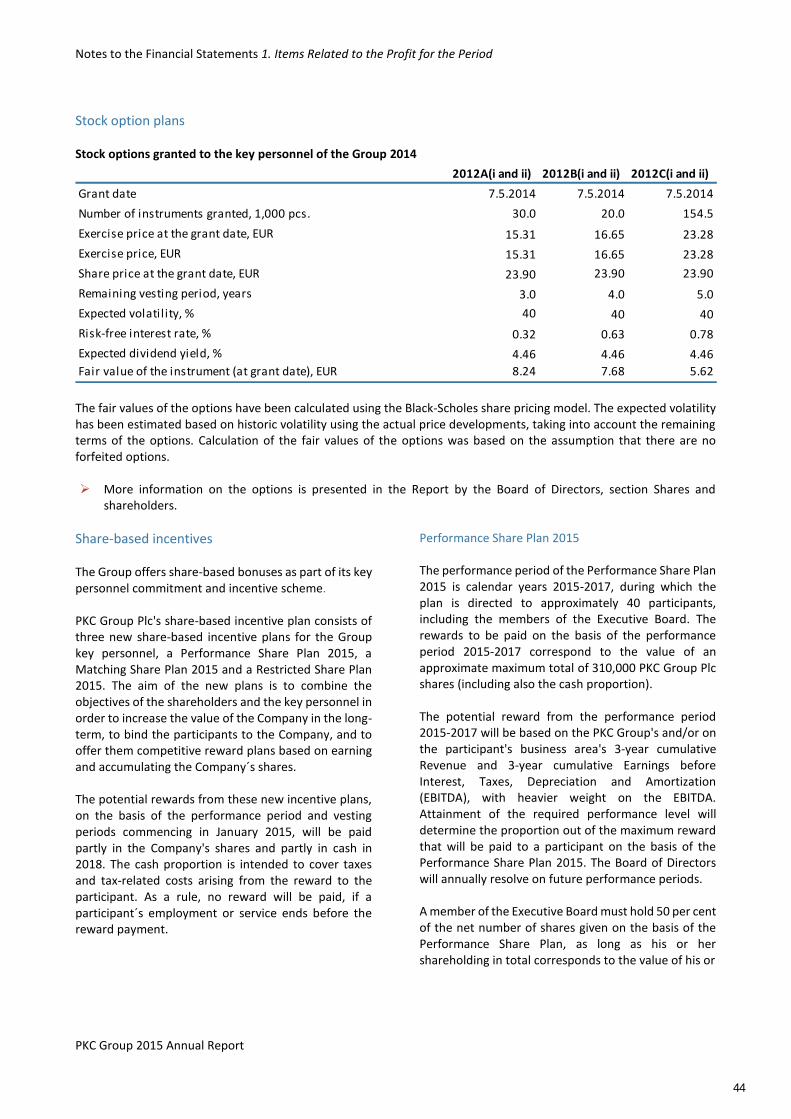
Notes to the Financial Statements 1. Items Related to the Profit for the Period
PKC Group 2015 Annual Report
Stock option plans Stock options granted to the key personnel of the Group 2014
2012A(i and ii) 2012B(i and ii) 2012C(i and ii)
Grant date 7.5.2014 7.5.2014 7.5.2014
Number of instruments granted, 1,000 pcs. 30.0 20.0 154.5
Exercise price at the grant date, EUR 15.31 16.65 23.28
Exercise price, EUR 15.31 16.65 23.28
Share price at the grant date, EUR 23.90 23.90 23.90
Remaining vesting period, years 3.0 4.0 5.0
Expected volatil ity, % 40 40 40
Risk-free interest rate, % 0.32 0.63 0.78
Expected dividend yield, % 4.46 4.46 4.46
Fair value of the instrument (at grant date), EUR 8.24 7.68 5.62
The fair values of the options have been calculated using the Black-Scholes share pricing model. The expected volatility has been estimated based on historic volatility using the actual price developments, taking into account the remaining terms of the options. Calculation of the fair values of the options was based on the assumption that there are no forfeited options. More information on the options is presented in the Report by the Board of Directors, section Shares and
shareholders.
Share-based incentives The Group offers share-based bonuses as part of its key personnel commitment and incentive scheme. PKC Group Plc's share-based incentive plan consists of three new share-based incentive plans for the Group key personnel, a Performance Share Plan 2015, a Matching Share Plan 2015 and a Restricted Share Plan 2015. The aim of the new plans is to combine the objectives of the shareholders and the key personnel in order to increase the value of the Company in the long-term, to bind the participants to the Company, and to offer them competitive reward plans based on earning and accumulating the Company´s shares. The potential rewards from these new incentive plans, on the basis of the performance period and vesting periods commencing in January 2015, will be paid partly in the Company's shares and partly in cash in 2018. The cash proportion is intended to cover taxes and tax-related costs arising from the reward to the participant. As a rule, no reward will be paid, if a participant´s employment or service ends before the reward payment.
Performance Share Plan 2015 The performance period of the Performance Share Plan 2015 is calendar years 2015-2017, during which the plan is directed to approximately 40 participants, including the members of the Executive Board. The rewards to be paid on the basis of the performance period 2015-2017 correspond to the value of an approximate maximum total of 310,000 PKC Group Plc shares (including also the cash proportion). The potential reward from the performance period 2015-2017 will be based on the PKC Group's and/or on the participant's business area's 3-year cumulative Revenue and 3-year cumulative Earnings before Interest, Taxes, Depreciation and Amortization (EBITDA), with heavier weight on the EBITDA. Attainment of the required performance level will determine the proportion out of the maximum reward that will be paid to a participant on the basis of the Performance Share Plan 2015. The Board of Directors will annually resolve on future performance periods. A member of the Executive Board must hold 50 per cent of the net number of shares given on the basis of the Performance Share Plan, as long as his or her shareholding in total corresponds to the value of his or
44
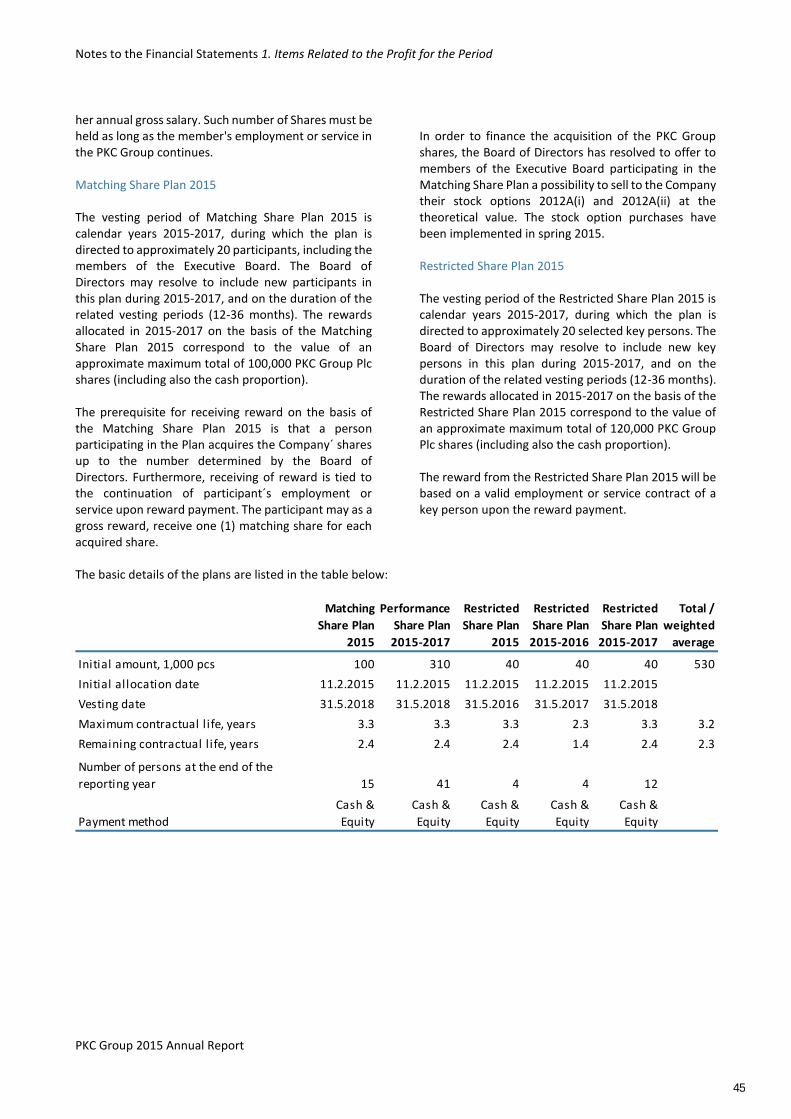
Notes to the Financial Statements 1. Items Related to the Profit for the Period
PKC Group 2015 Annual Report
her annual gross salary. Such number of Shares must be held as long as the member's employment or service in the PKC Group continues. Matching Share Plan 2015 The vesting period of Matching Share Plan 2015 is calendar years 2015-2017, during which the plan is directed to approximately 20 participants, including the members of the Executive Board. The Board of Directors may resolve to include new participants in this plan during 2015-2017, and on the duration of the related vesting periods (12-36 months). The rewards allocated in 2015-2017 on the basis of the Matching Share Plan 2015 correspond to the value of an approximate maximum total of 100,000 PKC Group Plc shares (including also the cash proportion). The prerequisite for receiving reward on the basis of the Matching Share Plan 2015 is that a person participating in the Plan acquires the Company´ shares up to the number determined by the Board of Directors. Furthermore, receiving of reward is tied to the continuation of participant´s employment or service upon reward payment. The participant may as a gross reward, receive one (1) matching share for each acquired share.
In order to finance the acquisition of the PKC Group shares, the Board of Directors has resolved to offer to members of the Executive Board participating in the Matching Share Plan a possibility to sell to the Company their stock options 2012A(i) and 2012A(ii) at the theoretical value. The stock option purchases have been implemented in spring 2015. Restricted Share Plan 2015 The vesting period of the Restricted Share Plan 2015 is calendar years 2015-2017, during which the plan is directed to approximately 20 selected key persons. The Board of Directors may resolve to include new key persons in this plan during 2015-2017, and on the duration of the related vesting periods (12-36 months). The rewards allocated in 2015-2017 on the basis of the Restricted Share Plan 2015 correspond to the value of an approximate maximum total of 120,000 PKC Group Plc shares (including also the cash proportion). The reward from the Restricted Share Plan 2015 will be based on a valid employment or service contract of a key person upon the reward payment.
The basic details of the plans are listed in the table below:
Matching
Share Plan
2015
Performance
Share Plan
2015-2017
Restricted
Share Plan
2015
Restricted
Share Plan
2015-2016
Restricted
Share Plan
2015-2017
Total /
weighted
average
Initial amount, 1,000 pcs 100 310 40 40 40 530
Initial allocation date 11.2.2015 11.2.2015 11.2.2015 11.2.2015 11.2.2015
Vesting date 31.5.2018 31.5.2018 31.5.2016 31.5.2017 31.5.2018
Maximum contractual l ife, years 3.3 3.3 3.3 2.3 3.3 3.2
Remaining contractual l ife, years 2.4 2.4 2.4 1.4 2.4 2.3
Number of persons at the end of the
reporting year 15 41 4 4 12
Payment method
Cash &
Equity
Cash &
Equity
Cash &
Equity
Cash &
Equity
Cash &
Equity
45
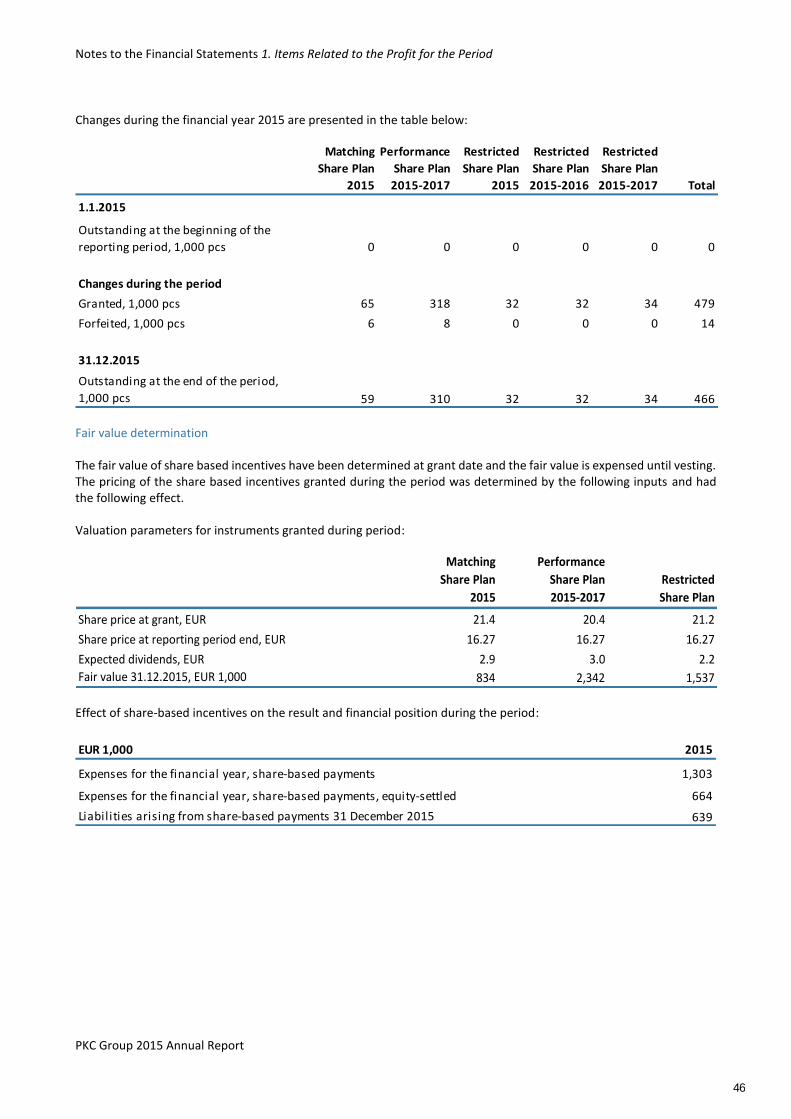
Notes to the Financial Statements 1. Items Related to the Profit for the Period
PKC Group 2015 Annual Report
Changes during the financial year 2015 are presented in the table below:
Matching
Share Plan
2015
Performance
Share Plan
2015-2017
Restricted
Share Plan
2015
Restricted
Share Plan
2015-2016
Restricted
Share Plan
2015-2017 Total
1.1.2015
Outstanding at the beginning of the
reporting period, 1,000 pcs 0 0 0 0 0 0
Changes during the period
Granted, 1,000 pcs 65 318 32 32 34 479
Forfeited, 1,000 pcs 6 8 0 0 0 14
31.12.2015
Outstanding at the end of the period,
1,000 pcs 59 310 32 32 34 466 Fair value determination The fair value of share based incentives have been determined at grant date and the fair value is expensed until vesting. The pricing of the share based incentives granted during the period was determined by the following inputs and had the following effect. Valuation parameters for instruments granted during period:
Matching
Share Plan
2015
Performance
Share Plan
2015-2017
Restricted
Share Plan
Share price at grant, EUR 21.4 20.4 21.2
Share price at reporting period end, EUR 16.27 16.27 16.27
Expected dividends, EUR 2.9 3.0 2.2
Fair value 31.12.2015, EUR 1,000 834 2,342 1,537 Effect of share-based incentives on the result and financial position during the period:
EUR 1,000 2015
Expenses for the financial year, share-based payments 1,303
Expenses for the financial year, share-based payments, equity-settled 664
Liabilities arising from share-based payments 31 December 2015 639
46
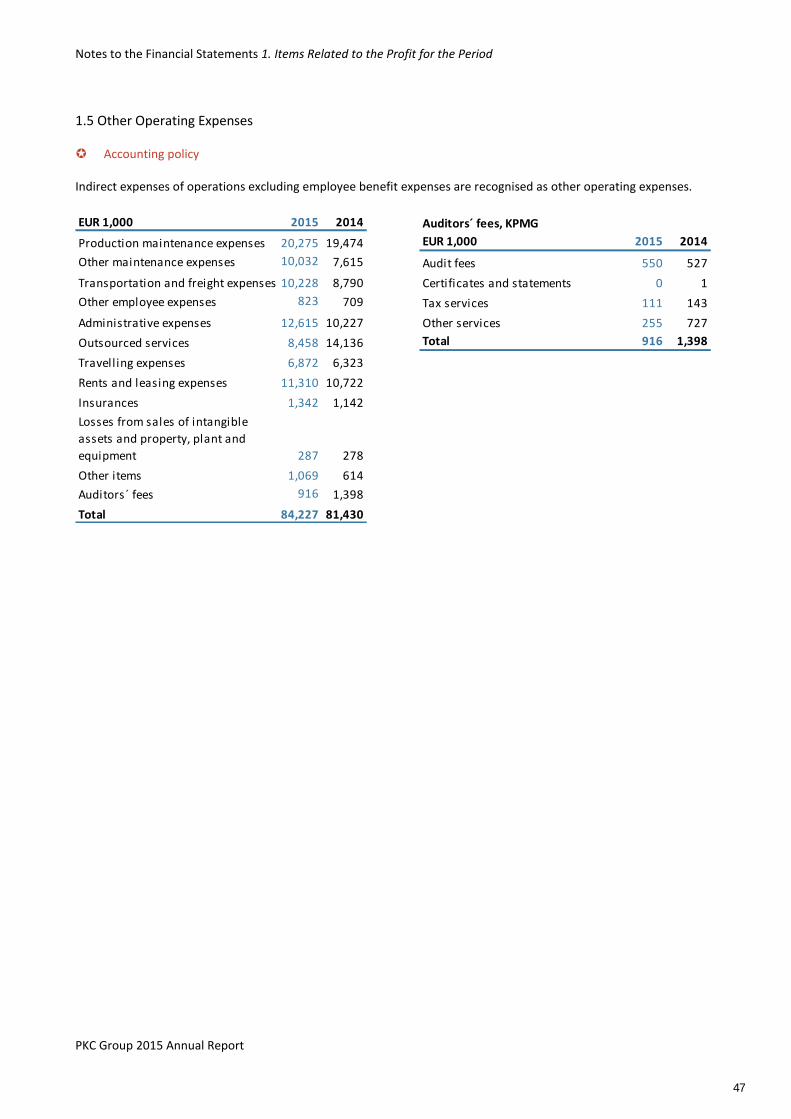
Notes to the Financial Statements 1. Items Related to the Profit for the Period
PKC Group 2015 Annual Report
1.5 Other Operating Expenses Accounting policy Indirect expenses of operations excluding employee benefit expenses are recognised as other operating expenses.
EUR 1,000 2015 2014
Production maintenance expenses 20,275 19,474
Other maintenance expenses 10,032 7,615
Transportation and freight expenses 10,228 8,790
Other employee expenses 823 709
Administrative expenses 12,615 10,227
Outsourced services 8,458 14,136
Travelling expenses 6,872 6,323
Rents and leasing expenses 11,310 10,722
Insurances 1,342 1,142
Losses from sales of intangible
assets and property, plant and
equipment 287 278
Other items 1,069 614
Auditors´ fees 916 1,398
Total 84,227 81,430
Auditors´ fees, KPMG
EUR 1,000 2015 2014
Audit fees 550 527
Certificates and statements 0 1
Tax services 111 143
Other services 255 727
Total 916 1,398
47
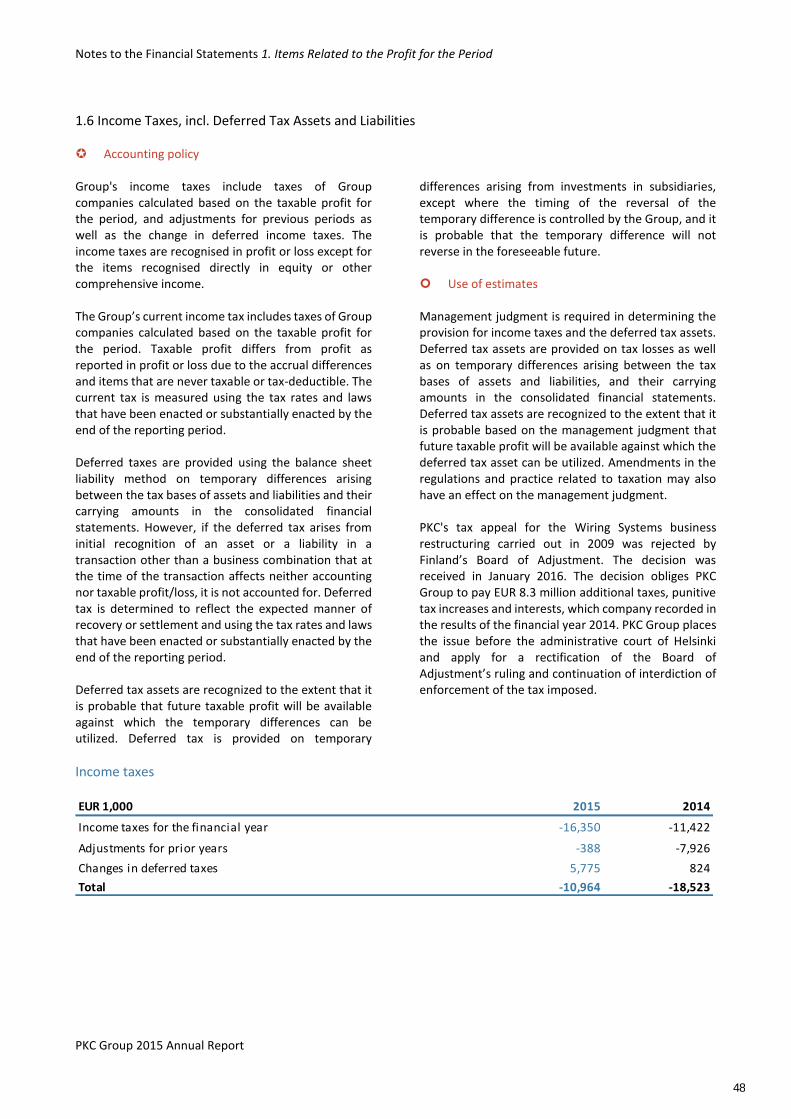
Notes to the Financial Statements 1. Items Related to the Profit for the Period
PKC Group 2015 Annual Report
1.6 Income Taxes, incl. Deferred Tax Assets and Liabilities Accounting policy Group's income taxes include taxes of Group companies calculated based on the taxable profit for the period, and adjustments for previous periods as well as the change in deferred income taxes. The income taxes are recognised in profit or loss except for the items recognised directly in equity or other comprehensive income. The Group’s current income tax includes taxes of Group companies calculated based on the taxable profit for the period. Taxable profit differs from profit as reported in profit or loss due to the accrual differences and items that are never taxable or tax-deductible. The current tax is measured using the tax rates and laws that have been enacted or substantially enacted by the end of the reporting period. Deferred taxes are provided using the balance sheet liability method on temporary differences arising between the tax bases of assets and liabilities and their carrying amounts in the consolidated financial statements. However, if the deferred tax arises from initial recognition of an asset or a liability in a transaction other than a business combination that at the time of the transaction affects neither accounting nor taxable profit/loss, it is not accounted for. Deferred tax is determined to reflect the expected manner of recovery or settlement and using the tax rates and laws that have been enacted or substantially enacted by the end of the reporting period. Deferred tax assets are recognized to the extent that it is probable that future taxable profit will be available against which the temporary differences can be utilized. Deferred tax is provided on temporary
differences arising from investments in subsidiaries, except where the timing of the reversal of the temporary difference is controlled by the Group, and it is probable that the temporary difference will not reverse in the foreseeable future. Use of estimates Management judgment is required in determining the provision for income taxes and the deferred tax assets. Deferred tax assets are provided on tax losses as well as on temporary differences arising between the tax bases of assets and liabilities, and their carrying amounts in the consolidated financial statements. Deferred tax assets are recognized to the extent that it is probable based on the management judgment that future taxable profit will be available against which the deferred tax asset can be utilized. Amendments in the regulations and practice related to taxation may also have an effect on the management judgment. PKC's tax appeal for the Wiring Systems business restructuring carried out in 2009 was rejected by Finland’s Board of Adjustment. The decision was received in January 2016. The decision obliges PKC Group to pay EUR 8.3 million additional taxes, punitive tax increases and interests, which company recorded in the results of the financial year 2014. PKC Group places the issue before the administrative court of Helsinki and apply for a rectification of the Board of Adjustment’s ruling and continuation of interdiction of enforcement of the tax imposed.
Income taxes
EUR 1,000 2015 2014
Income taxes for the financial year -16,350 -11,422
Adjustments for prior years -388 -7,926
Changes in deferred taxes 5,775 824
Total -10,964 -18,523
48
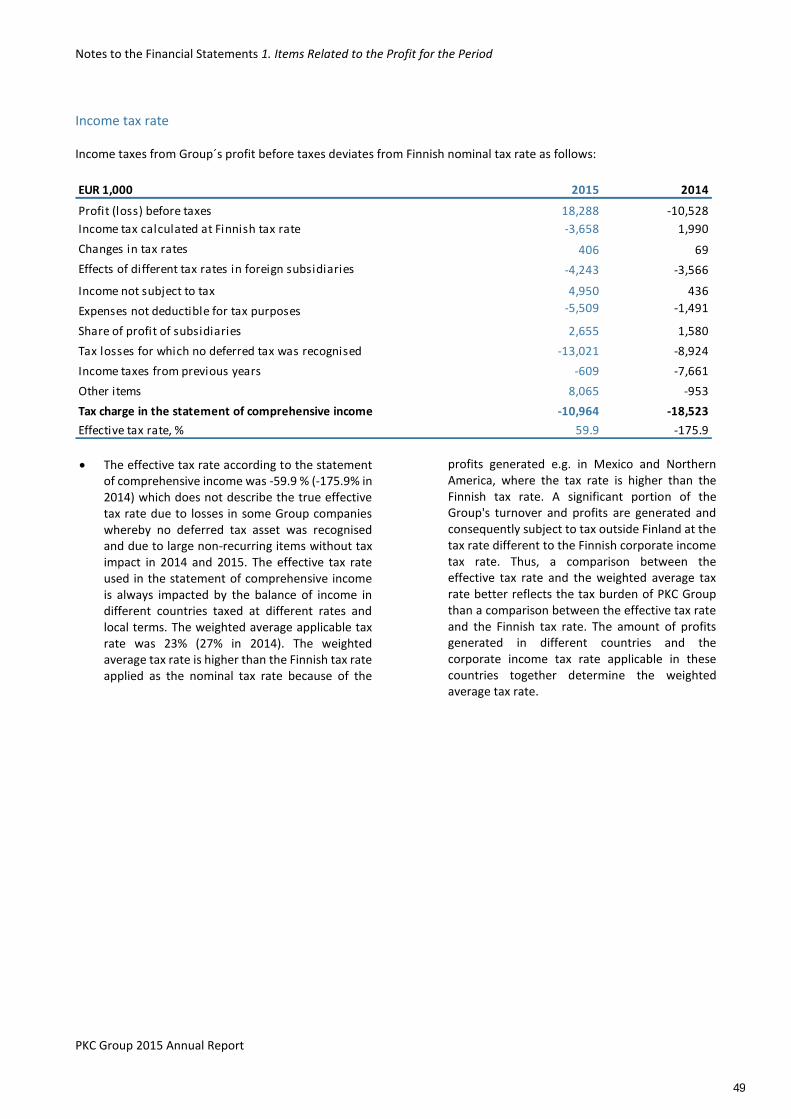
Notes to the Financial Statements 1. Items Related to the Profit for the Period
PKC Group 2015 Annual Report
Income tax rate Income taxes from Group´s profit before taxes deviates from Finnish nominal tax rate as follows:
EUR 1,000 2015 2014
Profit (loss) before taxes 18,288 -10,528
Income tax calculated at Finnish tax rate -3,658 1,990
Changes in tax rates 406 69
Effects of different tax rates in foreign subsidiaries -4,243 -3,566
Income not subject to tax 4,950 436
Expenses not deductible for tax purposes -5,509 -1,491
Share of profit of subsidiaries 2,655 1,580
Tax losses for which no deferred tax was recognised -13,021 -8,924
Income taxes from previous years -609 -7,661
Other items 8,065 -953
Tax charge in the statement of comprehensive income -10,964 -18,523
Effective tax rate, % 59.9 -175.9
The effective tax rate according to the statement of comprehensive income was -59.9 % (-175.9% in 2014) which does not describe the true effective tax rate due to losses in some Group companies whereby no deferred tax asset was recognised and due to large non-recurring items without tax impact in 2014 and 2015. The effective tax rate used in the statement of comprehensive income is always impacted by the balance of income in different countries taxed at different rates and local terms. The weighted average applicable tax rate was 23% (27% in 2014). The weighted average tax rate is higher than the Finnish tax rate applied as the nominal tax rate because of the
profits generated e.g. in Mexico and Northern America, where the tax rate is higher than the Finnish tax rate. A significant portion of the Group's turnover and profits are generated and consequently subject to tax outside Finland at the tax rate different to the Finnish corporate income tax rate. Thus, a comparison between the effective tax rate and the weighted average tax rate better reflects the tax burden of PKC Group than a comparison between the effective tax rate and the Finnish tax rate. The amount of profits generated in different countries and the corporate income tax rate applicable in these countries together determine the weighted average tax rate.
49
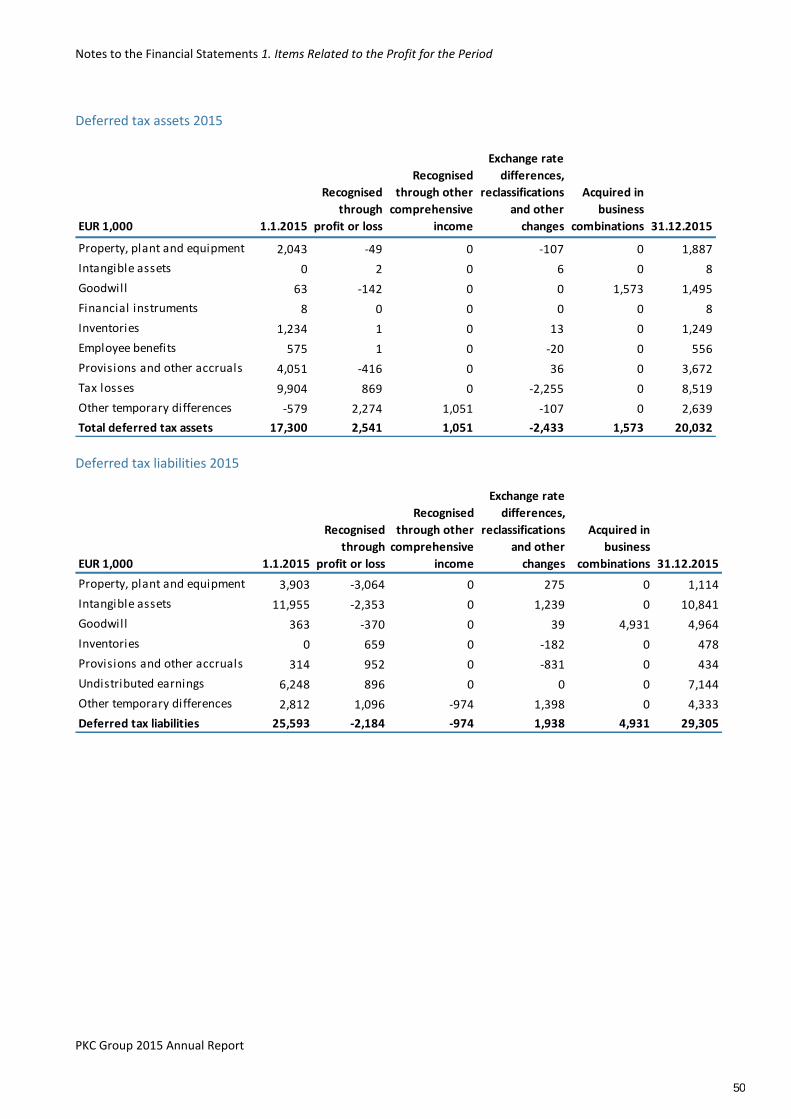
Notes to the Financial Statements 1. Items Related to the Profit for the Period
PKC Group 2015 Annual Report
Deferred tax assets 2015
EUR 1,000 1.1.2015
Recognised
through
profit or loss
Recognised
through other
comprehensive
income
Exchange rate
differences,
reclassifications
and other
changes
Acquired in
business
combinations 31.12.2015
Property, plant and equipment 2,043 -49 0 -107 0 1,887
Intangible assets 0 2 0 6 0 8
Goodwill 63 -142 0 0 1,573 1,495
Financial instruments 8 0 0 0 0 8
Inventories 1,234 1 0 13 0 1,249
Employee benefits 575 1 0 -20 0 556
Provisions and other accruals 4,051 -416 0 36 0 3,672
Tax losses 9,904 869 0 -2,255 0 8,519
Other temporary differences -579 2,274 1,051 -107 0 2,639
Total deferred tax assets 17,300 2,541 1,051 -2,433 1,573 20,032
Deferred tax liabilities 2015
EUR 1,000 1.1.2015
Recognised
through
profit or loss
Recognised
through other
comprehensive
income
Exchange rate
differences,
reclassifications
and other
changes
Acquired in
business
combinations 31.12.2015
Property, plant and equipment 3,903 -3,064 0 275 0 1,114
Intangible assets 11,955 -2,353 0 1,239 0 10,841
Goodwill 363 -370 0 39 4,931 4,964
Inventories 0 659 0 -182 0 478
Provisions and other accruals 314 952 0 -831 0 434
Undistributed earnings 6,248 896 0 0 0 7,144
Other temporary differences 2,812 1,096 -974 1,398 0 4,333
Deferred tax liabilities 25,593 -2,184 -974 1,938 4,931 29,305
50
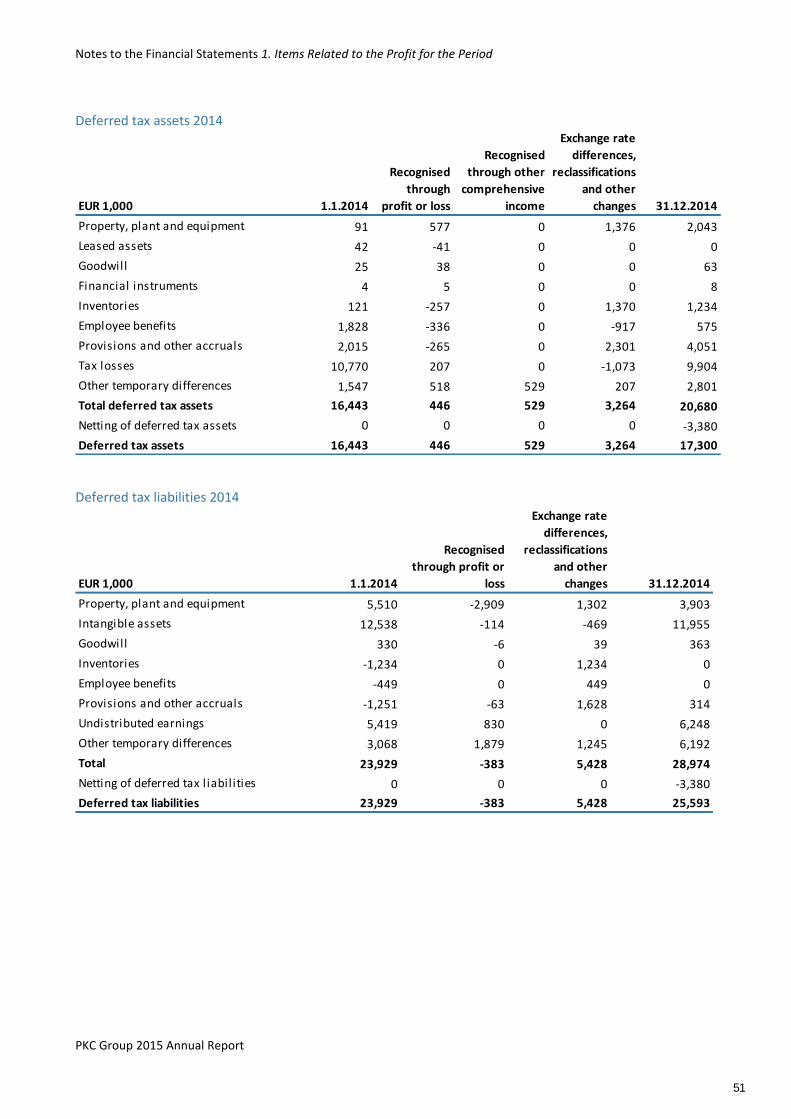
Notes to the Financial Statements 1. Items Related to the Profit for the Period
PKC Group 2015 Annual Report
Deferred tax assets 2014
EUR 1,000 1.1.2014
Recognised
through
profit or loss
Recognised
through other
comprehensive
income
Exchange rate
differences,
reclassifications
and other
changes 31.12.2014
Property, plant and equipment 91 577 0 1,376 2,043
Leased assets 42 -41 0 0 0
Goodwill 25 38 0 0 63
Financial instruments 4 5 0 0 8
Inventories 121 -257 0 1,370 1,234
Employee benefits 1,828 -336 0 -917 575
Provisions and other accruals 2,015 -265 0 2,301 4,051
Tax losses 10,770 207 0 -1,073 9,904
Other temporary differences 1,547 518 529 207 2,801
Total deferred tax assets 16,443 446 529 3,264 20,680
Netting of deferred tax assets 0 0 0 0 -3,380
Deferred tax assets 16,443 446 529 3,264 17,300
Deferred tax liabilities 2014
EUR 1,000 1.1.2014
Recognised
through profit or
loss
Exchange rate
differences,
reclassifications
and other
changes 31.12.2014
Property, plant and equipment 5,510 -2,909 1,302 3,903
Intangible assets 12,538 -114 -469 11,955
Goodwill 330 -6 39 363
Inventories -1,234 0 1,234 0
Employee benefits -449 0 449 0
Provisions and other accruals -1,251 -63 1,628 314
Undistributed earnings 5,419 830 0 6,248
Other temporary differences 3,068 1,879 1,245 6,192
Total 23,929 -383 5,428 28,974
Netting of deferred tax liabilities 0 0 0 -3,380
Deferred tax liabilities 23,929 -383 5,428 25,593
51
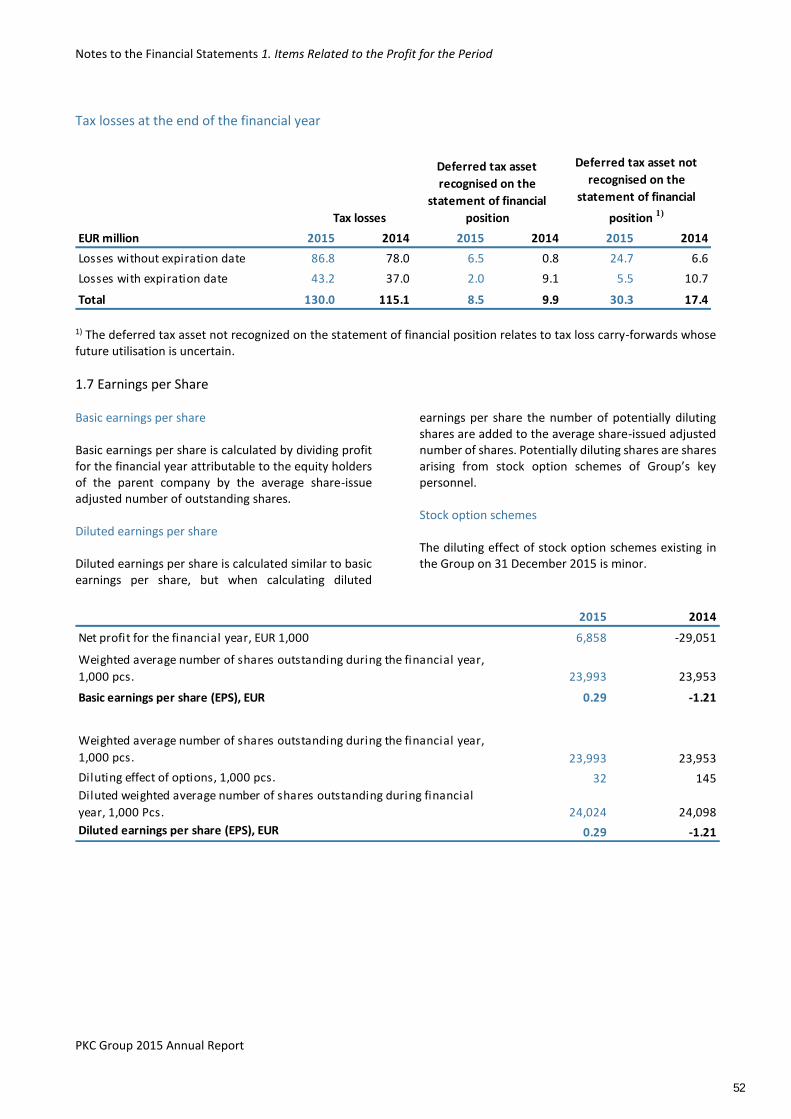
Notes to the Financial Statements 1. Items Related to the Profit for the Period
PKC Group 2015 Annual Report
Tax losses at the end of the financial year
EUR million 2015 2014 2015 2014 2015 2014
Losses without expiration date 86.8 78.0 6.5 0.8 24.7 6.6
Losses with expiration date 43.2 37.0 2.0 9.1 5.5 10.7
Total 130.0 115.1 8.5 9.9 30.3 17.4
Tax losses
Deferred tax asset
recognised on the
statement of financial
position
Deferred tax asset not
recognised on the
statement of financial
position 1)
1) The deferred tax asset not recognized on the statement of financial position relates to tax loss carry-forwards whose future utilisation is uncertain.
1.7 Earnings per Share Basic earnings per share Basic earnings per share is calculated by dividing profit for the financial year attributable to the equity holders of the parent company by the average share-issue adjusted number of outstanding shares. Diluted earnings per share Diluted earnings per share is calculated similar to basic earnings per share, but when calculating diluted
earnings per share the number of potentially diluting shares are added to the average share-issued adjusted number of shares. Potentially diluting shares are shares arising from stock option schemes of Group’s key personnel. Stock option schemes The diluting effect of stock option schemes existing in the Group on 31 December 2015 is minor.
2015 2014
Net profit for the financial year, EUR 1,000 6,858 -29,051
Weighted average number of shares outstanding during the financial year,
1,000 pcs. 23,993 23,953
Basic earnings per share (EPS), EUR 0.29 -1.21
0
Weighted average number of shares outstanding during the financial year,
1,000 pcs. 23,993 23,953
Diluting effect of options, 1,000 pcs. 32 145
Diluted weighted average number of shares outstanding during financial
year, 1,000 Pcs. 24,024 24,098
Diluted earnings per share (EPS), EUR 0.29 -1.21
52
Notes to the Consolidated Financial Statements 2. Operating Assets and Liabilities
PKC Group 2015 Annual Report
2. Operating Assets and Liabilities 2.1 Intangible Assets Accounting policy Goodwill Goodwill arising from a business combination is recognised as the excess of the aggregate of the consideration transferred, the amount of any non-controlling interests in the acquiree and any previously held equity interests in the acquiree, over the Group’s share of the fair value of the identifiable net assets acquired. Goodwill is not amortised but is tested annually for the impairment. Possible impairment losses are recognised in profit or loss immediately as incurred. For the purposes of impairment testing goodwill is allocated to cash-generating units. Customer relationships Existing customer relationships are recognised at fair value at the date of acquisition. Other intangible assets Intangible assets are initially recognised in the statement of financial position at acquisition cost if their cost can be determined reliably and it is probable that they will bring economic benefits for the Group. The cost of an intangible asset comprises the purchase price and all costs that can be directly attributed to preparing an asset for its intended use. Other intangible assets in the Group include patents and software licenses among others.
Intangible assets that have limited useful lives are amortised on a straight-line basis in the statement of income during their known or estimated useful lives. Amortisation is commenced when asset is available for use. An asset which is not yet available for use is tested annually for impairment. Intangible assets’ acquisitions in progress Software projects under preparation and implementation are presented under acquisitions in progress. Amortisation periods for intangible assets Other intangible assets 3-5 years Customer relationships 5-10 years Amortisation ceases when an intangible asset is classified as held for sale. Research and development costs Research costs are recognised in profit or loss. If development costs meet certain capitalisation criteria, they are presented in the statement of financial position under Other intangible assets and are amortised over their useful lives. All the Group’s development costs are expensed as there is insufficient indication of future economic benefits in the development phase of projects.
53
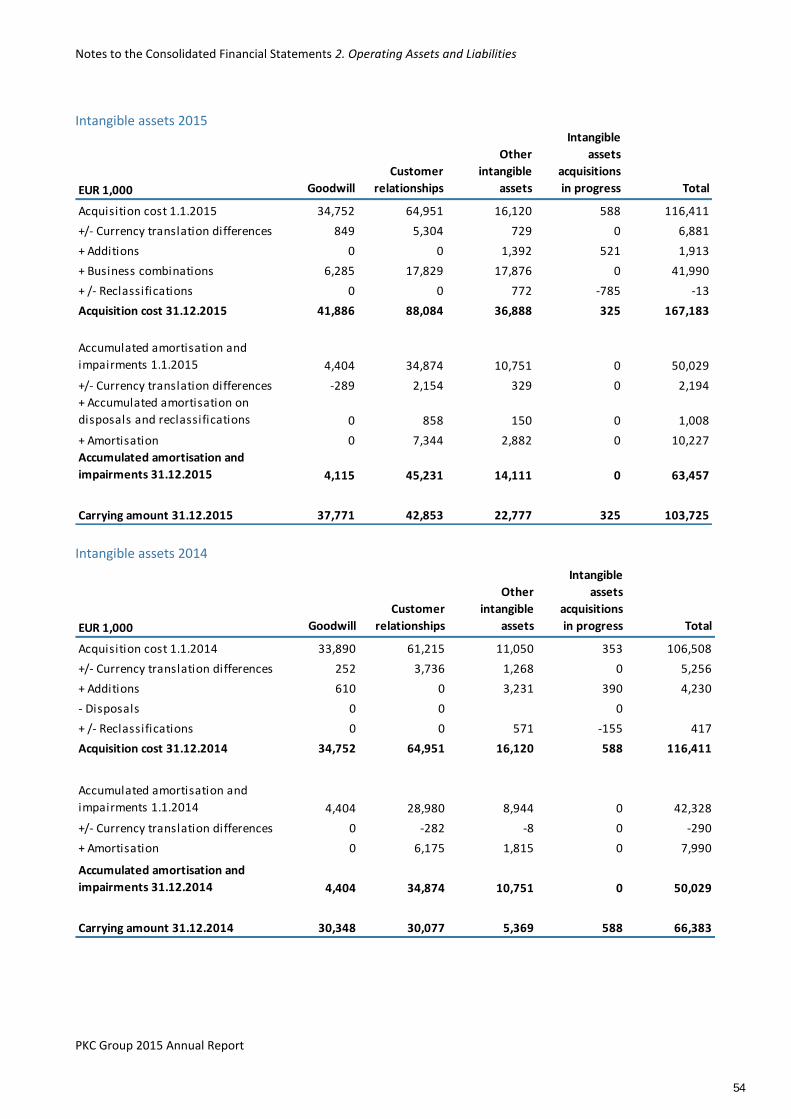
Notes to the Consolidated Financial Statements 2. Operating Assets and Liabilities
PKC Group 2015 Annual Report
Intangible assets 2015
EUR 1,000 Goodwill
Customer
relationships
Other
intangible
assets
Intangible
assets
acquisitions
in progress Total
Acquisition cost 1.1.2015 34,752 64,951 16,120 588 116,411
+/- Currency translation differences 849 5,304 729 0 6,881
+ Additions 0 0 1,392 521 1,913
+ Business combinations 6,285 17,829 17,876 0 41,990
+ /- Reclassifications 0 0 772 -785 -13
Acquisition cost 31.12.2015 41,886 88,084 36,888 325 167,183
Accumulated amortisation and
impairments 1.1.2015 4,404 34,874 10,751 0 50,029
+/- Currency translation differences -289 2,154 329 0 2,194
+ Accumulated amortisation on
disposals and reclassifications 0 858 150 0 1,008
+ Amortisation 0 7,344 2,882 0 10,227
Accumulated amortisation and
impairments 31.12.2015 4,115 45,231 14,111 0 63,457
Carrying amount 31.12.2015 37,771 42,853 22,777 325 103,725
Intangible assets 2014
EUR 1,000 Goodwill
Customer
relationships
Other
intangible
assets
Intangible
assets
acquisitions
in progress Total
Acquisition cost 1.1.2014 33,890 61,215 11,050 353 106,508
+/- Currency translation differences 252 3,736 1,268 0 5,256
+ Additions 610 0 3,231 390 4,230
- Disposals 0 0 0
+ /- Reclassifications 0 0 571 -155 417
Acquisition cost 31.12.2014 34,752 64,951 16,120 588 116,411
Accumulated amortisation and
impairments 1.1.2014 4,404 28,980 8,944 0 42,328
+/- Currency translation differences 0 -282 -8 0 -290
+ Amortisation 0 6,175 1,815 0 7,990
Accumulated amortisation and
impairments 31.12.2014 4,404 34,874 10,751 0 50,029
Carrying amount 31.12.2014 30,348 30,077 5,369 588 66,383
54
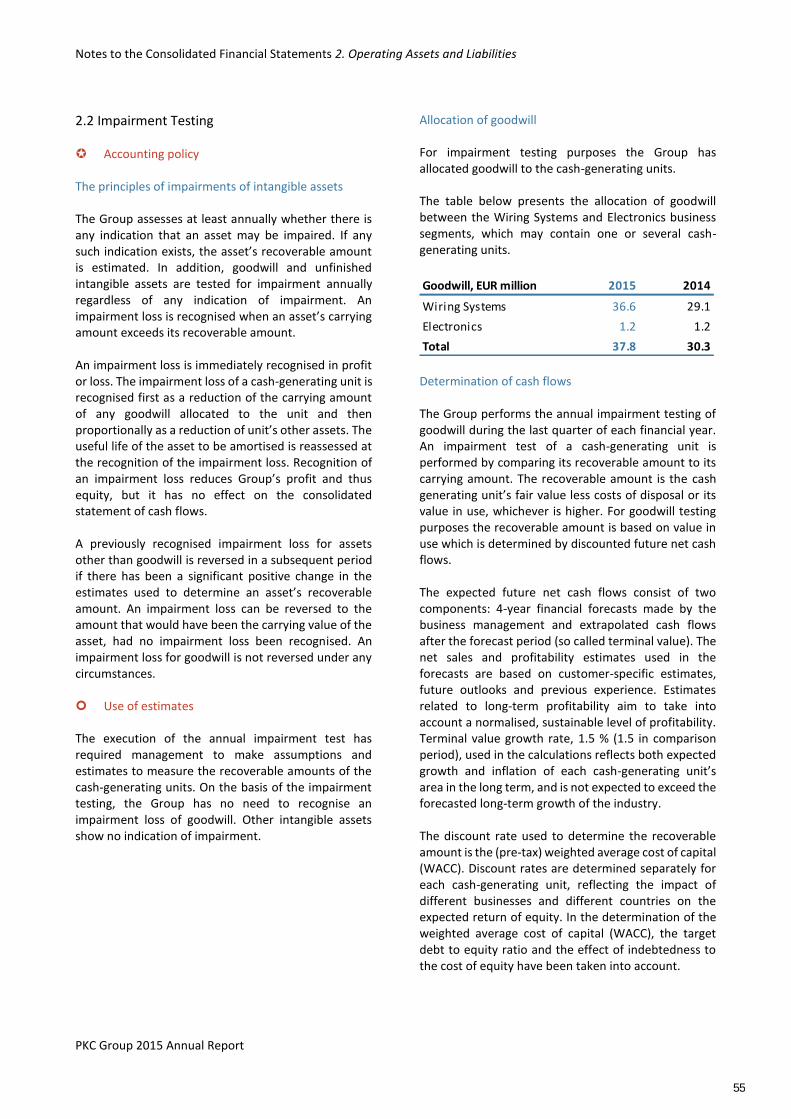
Notes to the Consolidated Financial Statements 2. Operating Assets and Liabilities
PKC Group 2015 Annual Report
2.2 Impairment Testing Accounting policy The principles of impairments of intangible assets The Group assesses at least annually whether there is any indication that an asset may be impaired. If any such indication exists, the asset’s recoverable amount is estimated. In addition, goodwill and unfinished intangible assets are tested for impairment annually regardless of any indication of impairment. An impairment loss is recognised when an asset’s carrying amount exceeds its recoverable amount. An impairment loss is immediately recognised in profit or loss. The impairment loss of a cash-generating unit is recognised first as a reduction of the carrying amount of any goodwill allocated to the unit and then proportionally as a reduction of unit’s other assets. The useful life of the asset to be amortised is reassessed at the recognition of the impairment loss. Recognition of an impairment loss reduces Group’s profit and thus equity, but it has no effect on the consolidated statement of cash flows. A previously recognised impairment loss for assets other than goodwill is reversed in a subsequent period if there has been a significant positive change in the estimates used to determine an asset’s recoverable amount. An impairment loss can be reversed to the amount that would have been the carrying value of the asset, had no impairment loss been recognised. An impairment loss for goodwill is not reversed under any circumstances. Use of estimates The execution of the annual impairment test has required management to make assumptions and estimates to measure the recoverable amounts of the cash-generating units. On the basis of the impairment testing, the Group has no need to recognise an impairment loss of goodwill. Other intangible assets show no indication of impairment.
Allocation of goodwill For impairment testing purposes the Group has allocated goodwill to the cash-generating units. The table below presents the allocation of goodwill between the Wiring Systems and Electronics business segments, which may contain one or several cash-generating units.
Goodwill, EUR million 2015 2014
Wiring Systems 36.6 29.1
Electronics 1.2 1.2
Total 37.8 30.3 Determination of cash flows The Group performs the annual impairment testing of goodwill during the last quarter of each financial year. An impairment test of a cash-generating unit is performed by comparing its recoverable amount to its carrying amount. The recoverable amount is the cash generating unit’s fair value less costs of disposal or its value in use, whichever is higher. For goodwill testing purposes the recoverable amount is based on value in use which is determined by discounted future net cash flows. The expected future net cash flows consist of two components: 4-year financial forecasts made by the business management and extrapolated cash flows after the forecast period (so called terminal value). The net sales and profitability estimates used in the forecasts are based on customer-specific estimates, future outlooks and previous experience. Estimates related to long-term profitability aim to take into account a normalised, sustainable level of profitability. Terminal value growth rate, 1.5 % (1.5 in comparison period), used in the calculations reflects both expected growth and inflation of each cash-generating unit’s area in the long term, and is not expected to exceed the forecasted long-term growth of the industry. The discount rate used to determine the recoverable amount is the (pre-tax) weighted average cost of capital (WACC). Discount rates are determined separately for each cash-generating unit, reflecting the impact of different businesses and different countries on the expected return of equity. In the determination of the weighted average cost of capital (WACC), the target debt to equity ratio and the effect of indebtedness to the cost of equity have been taken into account.
55
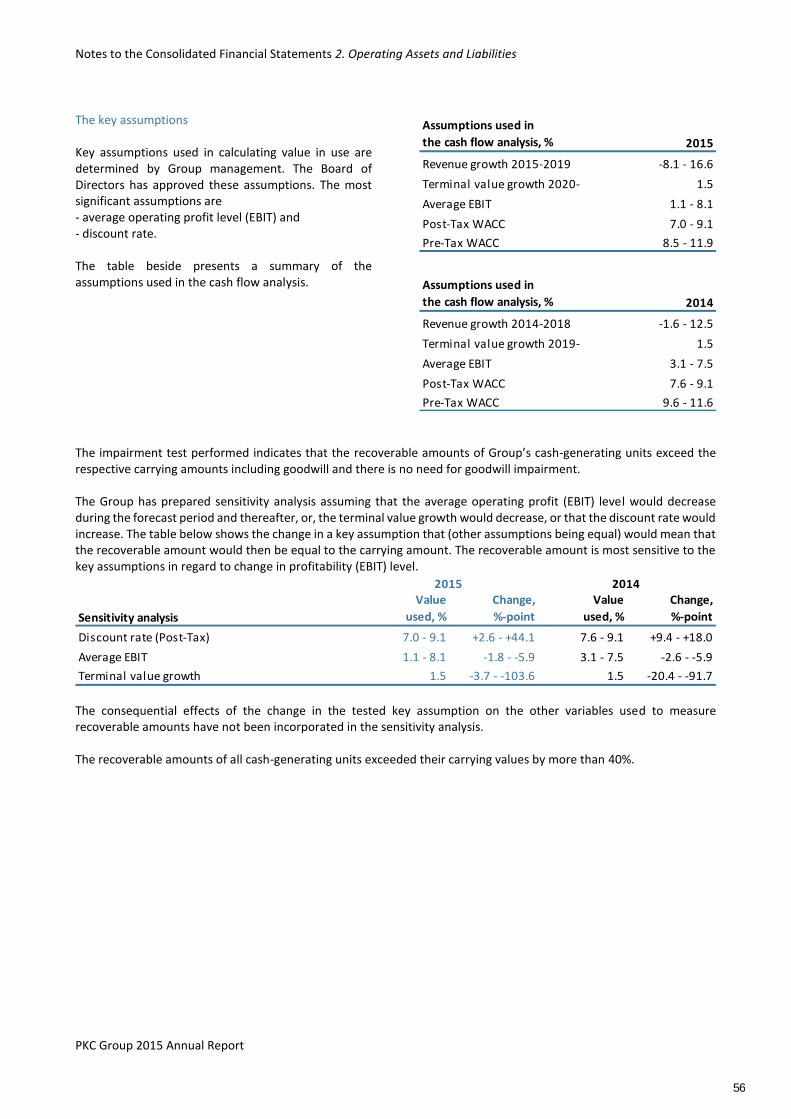
Notes to the Consolidated Financial Statements 2. Operating Assets and Liabilities
PKC Group 2015 Annual Report
The key assumptions Key assumptions used in calculating value in use are determined by Group management. The Board of Directors has approved these assumptions. The most significant assumptions are - average operating profit level (EBIT) and - discount rate. The table beside presents a summary of the assumptions used in the cash flow analysis.
Assumptions used in
the cash flow analysis, % 2015
Revenue growth 2015-2019 -8.1 - 16.6
Terminal value growth 2020- 1.5
Average EBIT 1.1 - 8.1
Post-Tax WACC 7.0 - 9.1
Pre-Tax WACC 8.5 - 11.9
Assumptions used in
the cash flow analysis, % 2014
Revenue growth 2014-2018 -1.6 - 12.5
Terminal value growth 2019- 1.5
Average EBIT 3.1 - 7.5
Post-Tax WACC 7.6 - 9.1
Pre-Tax WACC 9.6 - 11.6
The impairment test performed indicates that the recoverable amounts of Group’s cash-generating units exceed the respective carrying amounts including goodwill and there is no need for goodwill impairment. The Group has prepared sensitivity analysis assuming that the average operating profit (EBIT) level would decrease during the forecast period and thereafter, or, the terminal value growth would decrease, or that the discount rate would increase. The table below shows the change in a key assumption that (other assumptions being equal) would mean that the recoverable amount would then be equal to the carrying amount. The recoverable amount is most sensitive to the key assumptions in regard to change in profitability (EBIT) level.
Sensitivity analysis
Value
used, %
Change,
%-point
Value
used, %
Change,
%-point
Discount rate (Post-Tax) 7.0 - 9.1 +2.6 - +44.1 7.6 - 9.1 +9.4 - +18.0
Average EBIT 1.1 - 8.1 -1.8 - -5.9 3.1 - 7.5 -2.6 - -5.9
Terminal value growth 1.5 -3.7 - -103.6 1.5 -20.4 - -91.7
2015 2014
The consequential effects of the change in the tested key assumption on the other variables used to measure recoverable amounts have not been incorporated in the sensitivity analysis. The recoverable amounts of all cash-generating units exceeded their carrying values by more than 40%.
56
Notes to the Consolidated Financial Statements 2. Operating Assets and Liabilities
PKC Group 2015 Annual Report
2.3 Property, Plant and Equipment Accounting policy Property, plant and equipment are measured at original acquisition cost less accumulated depreciation and impairment losses. The original purchase price of the acquisition is composed of direct expenditure incurred. Borrowing costs are activated into acquisition cost of asset, if the asset meets the conditions set under IAS 23 standard. During the reporting and comparison period the Group did not have such assets. Subsequent costs are added to the carrying amount of the asset only if there is sufficient evidence that they bring future economic benefits for the Group and if their cost can be determined reliably. Assets are depreciated on a straight-line basis during their estimated useful lives. Land areas are not depreciated. Depreciation periods for items of property, plant and equipment Buildings and constructions 5–20 years Machinery and equipment 3–10 years Other tangible assets 5 years The estimated useful lives and residual values of assets are reviewed at the end of each financial year, and if they differ significantly from previous estimates, depreciation periods are adjusted accordingly. Depreciation of property, plant and equipment ceases when an asset is classified as held for sale. Gains and losses from sale Gains from sales of items of property, plant and equipment are included in other operating income and losses from sales in other operating expenses.
Leases Finance leases Leases of property, plant and equipment that substantially transfer all the risks and rewards incidental to the ownership to PKC Group are classified as finance leases. Assets leased under finance leases are recognised according to the nature of the item in the statement of financial position at the lower of the fair value or the present value of the minimum lease payments at the inception date, and depreciated over the useful life or the lease term, whichever is shorter. The lease payment liabilities, net of finance charge, are recognised as interest-bearing liabilities. Operating leases Additional information about leases is presented
in note 4.5 Operating leases.
Impairments of property, plant and equipment The Group assesses at least annually whether there is any indication that an item of property, plant and equipment may be impaired. The review is in practise carried out based on pool of assets. If any such indication exists, the asset’s recoverable amount is estimated. The recoverable amount is the asset’s fair value less costs of disposal or its value in use, whichever is higher. The recoverable amount is based on the discounted estimated future net cash flows at the time of review. An impairment loss is recognised when an asset’s carrying amount exceeds its recoverable amount. An impairment loss is recognised immediately in profit or loss and it is included in Depreciation, amortisation and impairment in comprehensive income. The useful life of the asset to be depreciated is reassessed at the recognition of the impairment loss. An impairment loss is reversed in a subsequent period if there has been a significant positive change in the estimates used to determine an asset’s recoverable amount. An impairment loss can be reversed to the amount that would have been the carrying value of the asset, had no impairment loss been recognised.
57
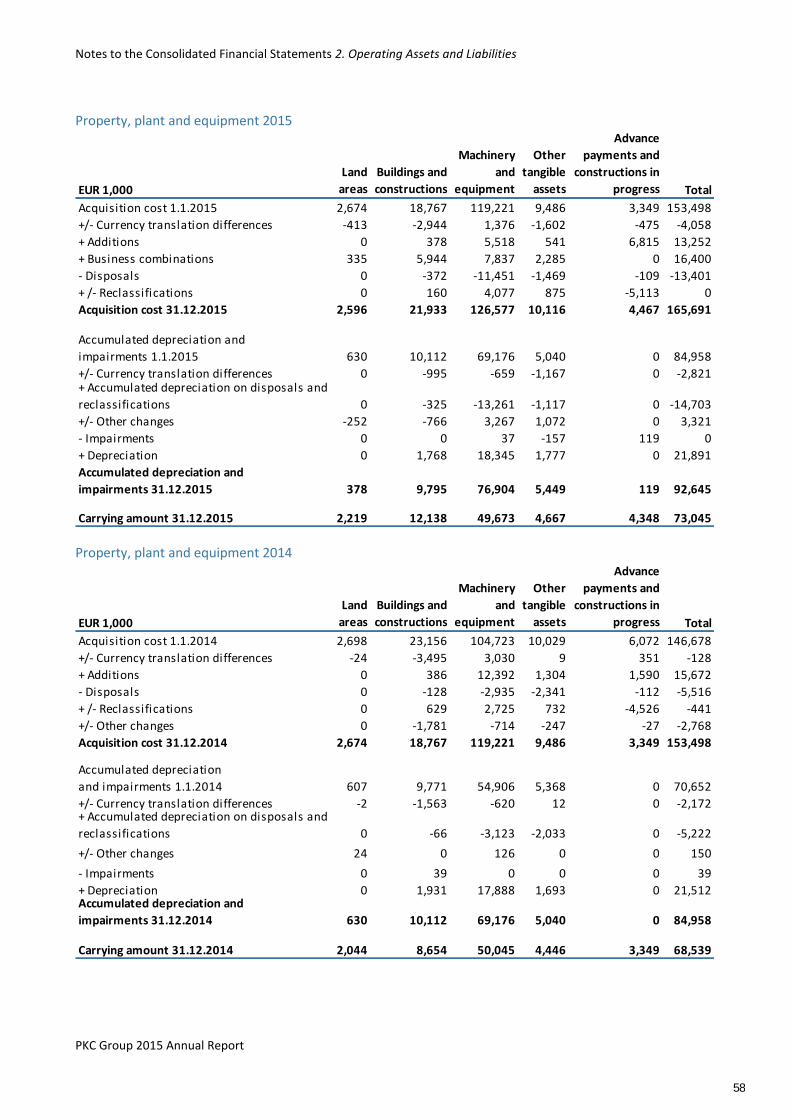
Notes to the Consolidated Financial Statements 2. Operating Assets and Liabilities
PKC Group 2015 Annual Report
Property, plant and equipment 2015
EUR 1,000
Land
areas
Buildings and
constructions
Machinery
and
equipment
Other
tangible
assets
Advance
payments and
constructions in
progress Total
Acquisition cost 1.1.2015 2,674 18,767 119,221 9,486 3,349 153,498
+/- Currency translation differences -413 -2,944 1,376 -1,602 -475 -4,058
+ Additions 0 378 5,518 541 6,815 13,252
+ Business combinations 335 5,944 7,837 2,285 0 16,400
- Disposals 0 -372 -11,451 -1,469 -109 -13,401
+ /- Reclassifications 0 160 4,077 875 -5,113 0
Acquisition cost 31.12.2015 2,596 21,933 126,577 10,116 4,467 165,691
Accumulated depreciation and
impairments 1.1.2015 630 10,112 69,176 5,040 0 84,958
+/- Currency translation differences 0 -995 -659 -1,167 0 -2,821+ Accumulated depreciation on disposals and
reclassifications 0 -325 -13,261 -1,117 0 -14,703
+/- Other changes -252 -766 3,267 1,072 0 3,321
- Impairments 0 0 37 -157 119 0
+ Depreciation 0 1,768 18,345 1,777 0 21,891
Accumulated depreciation and
impairments 31.12.2015 378 9,795 76,904 5,449 119 92,645
Carrying amount 31.12.2015 2,219 12,138 49,673 4,667 4,348 73,045
Property, plant and equipment 2014
EUR 1,000
Land
areas
Buildings and
constructions
Machinery
and
equipment
Other
tangible
assets
Advance
payments and
constructions in
progress Total
Acquisition cost 1.1.2014 2,698 23,156 104,723 10,029 6,072 146,678
+/- Currency translation differences -24 -3,495 3,030 9 351 -128
+ Additions 0 386 12,392 1,304 1,590 15,672
- Disposals 0 -128 -2,935 -2,341 -112 -5,516
+ /- Reclassifications 0 629 2,725 732 -4,526 -441
+/- Other changes 0 -1,781 -714 -247 -27 -2,768
Acquisition cost 31.12.2014 2,674 18,767 119,221 9,486 3,349 153,498
Accumulated depreciation
and impairments 1.1.2014 607 9,771 54,906 5,368 0 70,652
+/- Currency translation differences -2 -1,563 -620 12 0 -2,172+ Accumulated depreciation on disposals and
reclassifications 0 -66 -3,123 -2,033 0 -5,222
+/- Other changes 24 0 126 0 0 150
- Impairments 0 39 0 0 0 39
+ Depreciation 0 1,931 17,888 1,693 0 21,512Accumulated depreciation and
impairments 31.12.2014 630 10,112 69,176 5,040 0 84,958
Carrying amount 31.12.2014 2,044 8,654 50,045 4,446 3,349 68,539
58
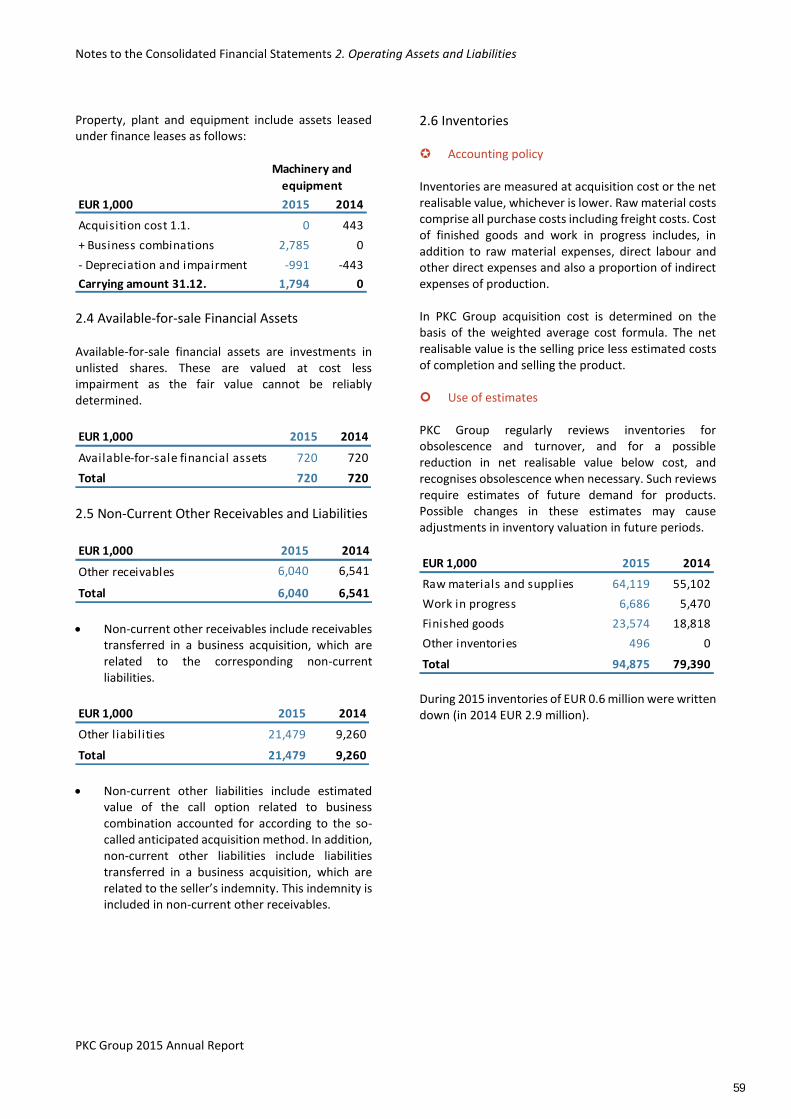
Notes to the Consolidated Financial Statements 2. Operating Assets and Liabilities
PKC Group 2015 Annual Report
Property, plant and equipment include assets leased under finance leases as follows:
EUR 1,000 2015 2014
Acquisition cost 1.1. 0 443
+ Business combinations 2,785 0
- Depreciation and impairment -991 -443
Carrying amount 31.12. 1,794 0
Machinery and
equipment
2.4 Available-for-sale Financial Assets Available-for-sale financial assets are investments in unlisted shares. These are valued at cost less impairment as the fair value cannot be reliably determined.
EUR 1,000 2015 2014
Available-for-sale financial assets 720 720
Total 720 720
2.5 Non-Current Other Receivables and Liabilities
EUR 1,000 2015 2014
Other receivables 6,040 6,541
Total 6,040 6,541
Non-current other receivables include receivables transferred in a business acquisition, which are related to the corresponding non-current liabilities.
EUR 1,000 2015 2014
Other liabilities 21,479 9,260
Total 21,479 9,260
Non-current other liabilities include estimated value of the call option related to business combination accounted for according to the so-called anticipated acquisition method. In addition, non-current other liabilities include liabilities transferred in a business acquisition, which are related to the seller’s indemnity. This indemnity is included in non-current other receivables.
2.6 Inventories Accounting policy Inventories are measured at acquisition cost or the net realisable value, whichever is lower. Raw material costs comprise all purchase costs including freight costs. Cost of finished goods and work in progress includes, in addition to raw material expenses, direct labour and other direct expenses and also a proportion of indirect expenses of production. In PKC Group acquisition cost is determined on the basis of the weighted average cost formula. The net realisable value is the selling price less estimated costs of completion and selling the product. Use of estimates PKC Group regularly reviews inventories for obsolescence and turnover, and for a possible reduction in net realisable value below cost, and recognises obsolescence when necessary. Such reviews require estimates of future demand for products. Possible changes in these estimates may cause adjustments in inventory valuation in future periods.
EUR 1,000 2015 2014
Raw materials and supplies 64,119 55,102
Work in progress 6,686 5,470
Finished goods 23,574 18,818
Other inventories 496 0
Total 94,875 79,390 During 2015 inventories of EUR 0.6 million were written down (in 2014 EUR 2.9 million).
59
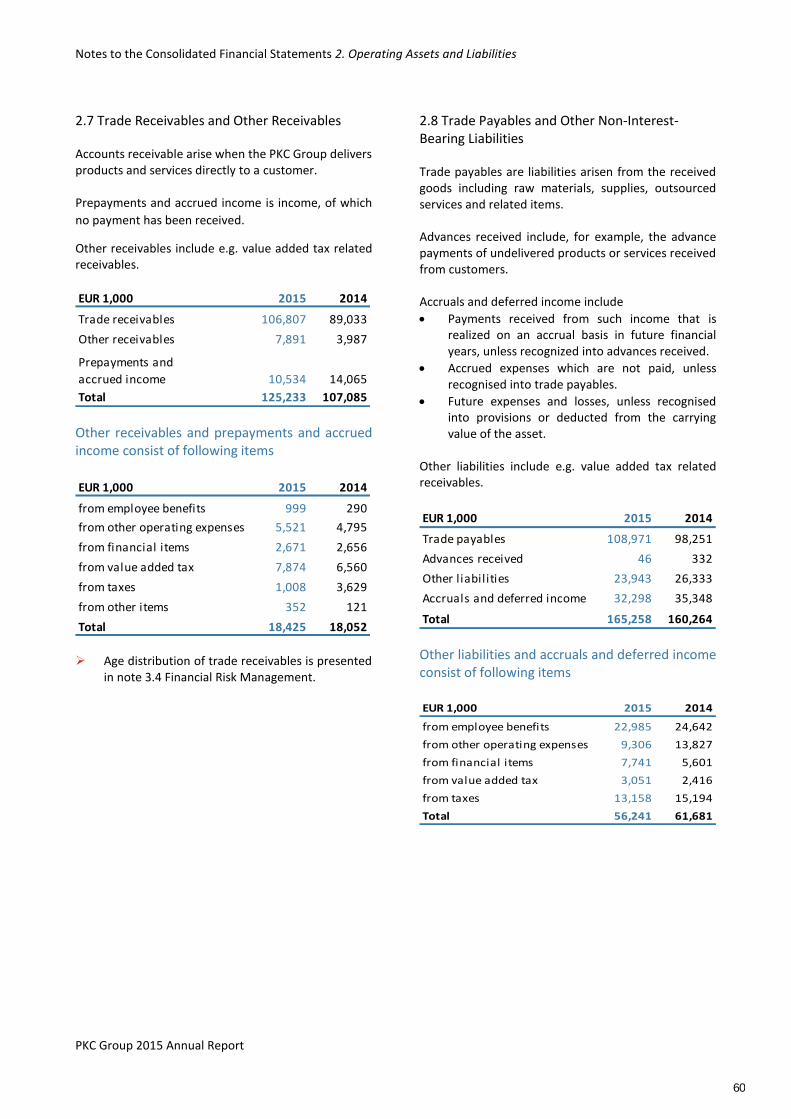
Notes to the Consolidated Financial Statements 2. Operating Assets and Liabilities
PKC Group 2015 Annual Report
2.7 Trade Receivables and Other Receivables Accounts receivable arise when the PKC Group delivers products and services directly to a customer. Prepayments and accrued income is income, of which
no payment has been received.
Other receivables include e.g. value added tax related receivables.
EUR 1,000 2015 2014
Trade receivables 106,807 89,033
Other receivables 7,891 3,987
Prepayments and
accrued income 10,534 14,065
Total 125,233 107,085
Other receivables and prepayments and accrued income consist of following items
EUR 1,000 2015 2014
from employee benefits 999 290
from other operating expenses 5,521 4,795
from financial items 2,671 2,656
from value added tax 7,874 6,560
from taxes 1,008 3,629
from other items 352 121
Total 18,425 18,052 Age distribution of trade receivables is presented
in note 3.4 Financial Risk Management.
2.8 Trade Payables and Other Non-Interest-Bearing Liabilities Trade payables are liabilities arisen from the received goods including raw materials, supplies, outsourced services and related items. Advances received include, for example, the advance payments of undelivered products or services received from customers. Accruals and deferred income include
Payments received from such income that is realized on an accrual basis in future financial years, unless recognized into advances received.
Accrued expenses which are not paid, unless recognised into trade payables.
Future expenses and losses, unless recognised into provisions or deducted from the carrying value of the asset.
Other liabilities include e.g. value added tax related receivables.
EUR 1,000 2015 2014
Trade payables 108,971 98,251
Advances received 46 332
Other liabilities 23,943 26,333
Accruals and deferred income 32,298 35,348
Total 165,258 160,264
Other liabilities and accruals and deferred income consist of following items
EUR 1,000 2015 2014
from employee benefits 22,985 24,642
from other operating expenses 9,306 13,827
from financial items 7,741 5,601
from value added tax 3,051 2,416
from taxes 13,158 15,194
Total 56,241 61,681
60
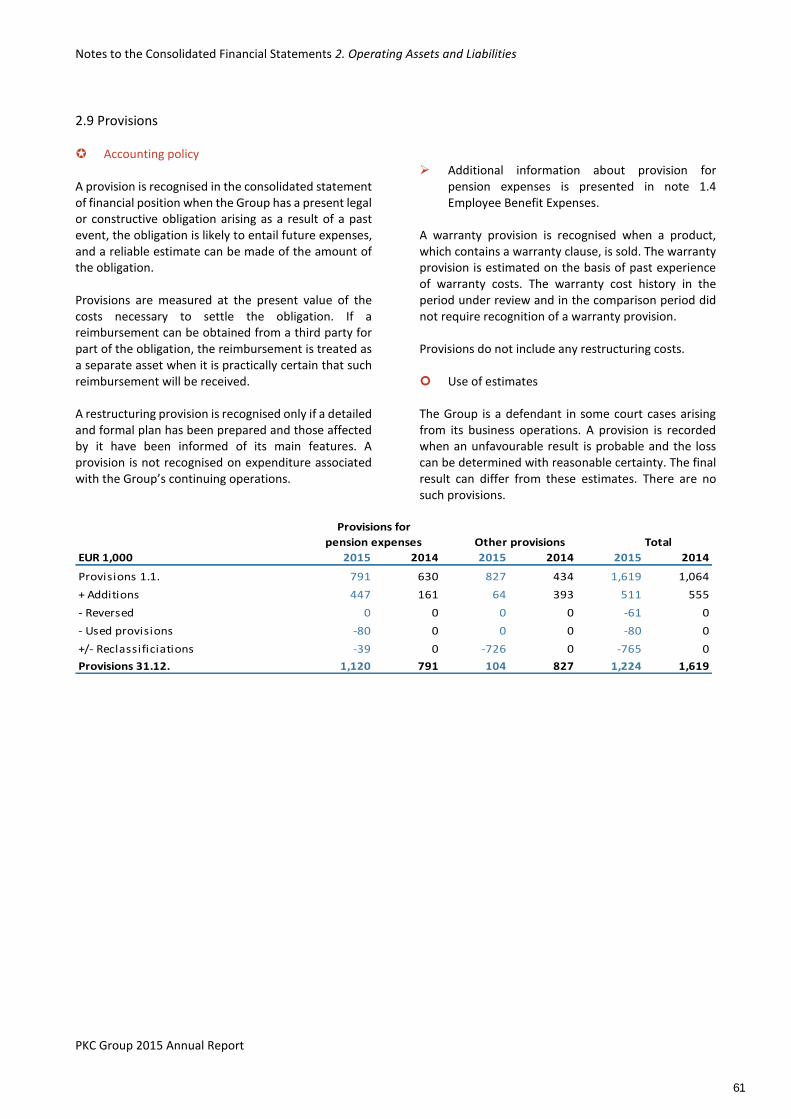
Notes to the Consolidated Financial Statements 2. Operating Assets and Liabilities
PKC Group 2015 Annual Report
2.9 Provisions Accounting policy A provision is recognised in the consolidated statement of financial position when the Group has a present legal or constructive obligation arising as a result of a past event, the obligation is likely to entail future expenses, and a reliable estimate can be made of the amount of the obligation. Provisions are measured at the present value of the costs necessary to settle the obligation. If a reimbursement can be obtained from a third party for part of the obligation, the reimbursement is treated as a separate asset when it is practically certain that such reimbursement will be received. A restructuring provision is recognised only if a detailed and formal plan has been prepared and those affected by it have been informed of its main features. A provision is not recognised on expenditure associated with the Group’s continuing operations.
Additional information about provision for pension expenses is presented in note 1.4 Employee Benefit Expenses.
A warranty provision is recognised when a product, which contains a warranty clause, is sold. The warranty provision is estimated on the basis of past experience of warranty costs. The warranty cost history in the period under review and in the comparison period did not require recognition of a warranty provision. Provisions do not include any restructuring costs. Use of estimates The Group is a defendant in some court cases arising from its business operations. A provision is recorded when an unfavourable result is probable and the loss can be determined with reasonable certainty. The final result can differ from these estimates. There are no such provisions.
EUR 1,000 2015 2014 2015 2014 2015 2014
Provisions 1.1. 791 630 827 434 1,619 1,064
+ Additions 447 161 64 393 511 555
- Reversed 0 0 0 0 -61 0
- Used provisions -80 0 0 0 -80 0
+/- Reclassificiations -39 0 -726 0 -765 0
Provisions 31.12. 1,120 791 104 827 1,224 1,619
Provisions for
pension expenses Other provisions Total
61
Notes to the Consolidated Financial Statements 3. Capital Structure and Financial Expenses
PKC Group 2015 Annual Report
3. Capital Structure and Financial Expenses
3.1 Classification, Accounting and Valuation Principles, Carrying Amounts and Fair Values of Financial Assets and Liabilities by Valuation Categories Accounting policy Classification, accounting and valuation principles The principles PKC Group applies in classifying, recognising, derecognising and valuing of financial assets and liabilities are presented below. The financial assets of PKC Group are classified into the following categories:
Financial assets at fair value through profit and loss
Available-for-sale financial assets
Loans and other receivables The classification of financial assets takes place on the basis of their purpose at initial recognition. The criteria for classification is re-evaluated on each closing date. Transaction costs are included in the initial carrying amount of the financial asset for assets which are not recognised at fair value through profit and loss. All purchases and sales of financial assets are recognised on the trade date. Trade date is the date when PKC Group commits to purchase or sell the asset. Financial assets are derecognised when PKC Group has lost the contractual rights to the cash flow of the financial asset or when the risks and rewards of ownership have been substantially transferred outside PKC Group. The financial liabilities of PKC Group are classified into the following categories:
Financial liabilities at fair value through profit and loss
Financial liabilities at amortised cost (other financial liabilities)
Transaction costs are included in the original carrying amount of financial liabilities at amortised cost. Financial liabilities are classified as current unless PKC Group has an unconditional right to defer settlement of the liability for at least 12 months after end of the reporting period. PKC Group derecognises a financial liability (or part of it) only when it is extinguished, i.e. when the obligation specified in the contract is discharged, cancelled or expired.
Fair value hierarchy A number of PKC Group’s accounting policies and disclosures require the measurement of fair values. For PKC Group this applies primarily to financial assets and liabilities. For financial instruments that are measured in the statement of financial position at fair value, IFRS requires disclosure of fair value measurements by level of the fair value measurement hierarchy. The fair value hierarchy is based on the source of inputs used in determining fair values (used in the valuation techniques) as follows:
Level 1: fair values are based on quoted price in active markets for identical assets or liabilities
Level 2: fair values are based on market rates and prices, discounted future cash flows etc.
Level 3: for assets and liabilities in level three, there is no reliable market source available and thus fair value measurement cannot be based on observable market data.
When measuring the fair value of an asset or a liability, PKC Group uses observable market data to the extent possible. Available-for-sale financial assets Available-for-sale financial assets are non-derivative financial assets which have been designated in this category or which have not been classified in any other category. Unless the intention is to sell them within 12 months of the end of the reporting period, they are included in non-current assets. PKC Group’s investments in other companies are classified as financial assets available-for-sale. Equity investments in unlisted companies are included in this category. Since in the absence of functioning markets the fair value of these investments cannot be determined reliably, they are measured at acquisition cost less any impairment. Thus these investments are classified in the fair value hierarchy to level 3. PKC Group has no intention for now to dispose of these investments.
62
Notes to the Consolidated Financial Statements 3. Capital Structure and Financial Expenses
PKC Group 2015 Annual Report
Loans and other receivables Loans and other receivables are non-derivative financial assets with fixed or determinable payment dates that are not quoted in active markets. They arise when PKC Group provides goods or services directly to a debtor. Loans and other receivables are carried in the consolidated statement of financial position at amortised cost using the effective interest rate method. Loans and other receivables are included in non-current assets, except for maturities less than 12 months after the closing date. Non-current trade receivables and other receivables are presented under Receivables in the consolidated statement of financial position. PKC Group utilises selectively client and/or country specific factoring arrangements when it considers it beneficial for example due to long payment terms. Sold trade receivables are derecognised only up to the amount for which the risks and benefits have been transferred outside PKC Group. The carrying amounts of trade receivables and other receivables are equal to their fair values, as the effect of discounting cash flows is not relevant considering their maturity. Cash and cash equivalents Cash and cash equivalents comprise cash in hand and similar investments. These investments include highly liquid investments with an original maturity of three months or less from the acquisition date. Financial assets and liabilities at fair value through profit and loss In the consolidated statement of financial position all derivative financial instruments, to which hedge accounting is not applied and which are not financial guarantee contracts, are included in this category. These instruments are classified as held for trading. There are no items in the consolidated statement of financial position that would be classified at initial recognition on the basis of IAS 39 fair value option to this category or which would be classified upon this category on the basis of continuous trading. Derivatives are used for hedging risks from fluctuations in currency exchange rates, interest rates and the price of copper. PKC Group uses currency and copper forwards and interest rate swaps in its risk management. Derivative contracts are recognised initially at fair value and later recognised at fair value at the end of each reporting period. Fair value is determined by using
prevailing quoted market rates and applicable valuation methods for each type of derivative as follows:
The fair value of currency and copper derivatives is determined as the difference of the fair value of the derivatives at the end of the reporting period and the fair value at the time the contract was made.
The fair value of interest rate swaps is determined as the present value of the related future cash flows.
Derivatives are classified in the fair value hierarchy on level 2, because their valuation is based on observable market inputs. Realised and unrealised gains and losses from changes in the fair values of copper derivatives are recognised in profit or loss as incurred since PKC Group does not apply hedge accounting to these instruments. PKC Group applies hedge accounting to interest rate swaps and to currency derivatives. The impacts on profit or loss arising from changes in the value of interest rate swaps and currency derivatives which are effective hedges, are presented in a manner consistent with the hedged item. At the end of the reporting period PKC Group had an open euro-denominated interest rate swap based on which it pays Euribor 6 months floating rate interest and receives 5-year fixed rate interest. Derivative instruments are included according to their nature in current assets (prepayments and accrued income) or current liabilities (accruals and deferred income) on the consolidated statement of financial position. At the end of the reporting period 31.12.2015 (and 31.12.2014) PKC Group had no other financial instruments at fair value through profit and loss other than derivatives. There were no changes in the valuation principles or methods during the reporting period. Financial liabilities at amortised cost (other financial liabilities) Other financial liabilities consist of loans taken out by PKC Group, finance lease liabilities and trade payables. Loans and trade payables are initially recognised at fair value. Finance lease liabilities are initially recognised at fair value or at present value of minimum lease
63
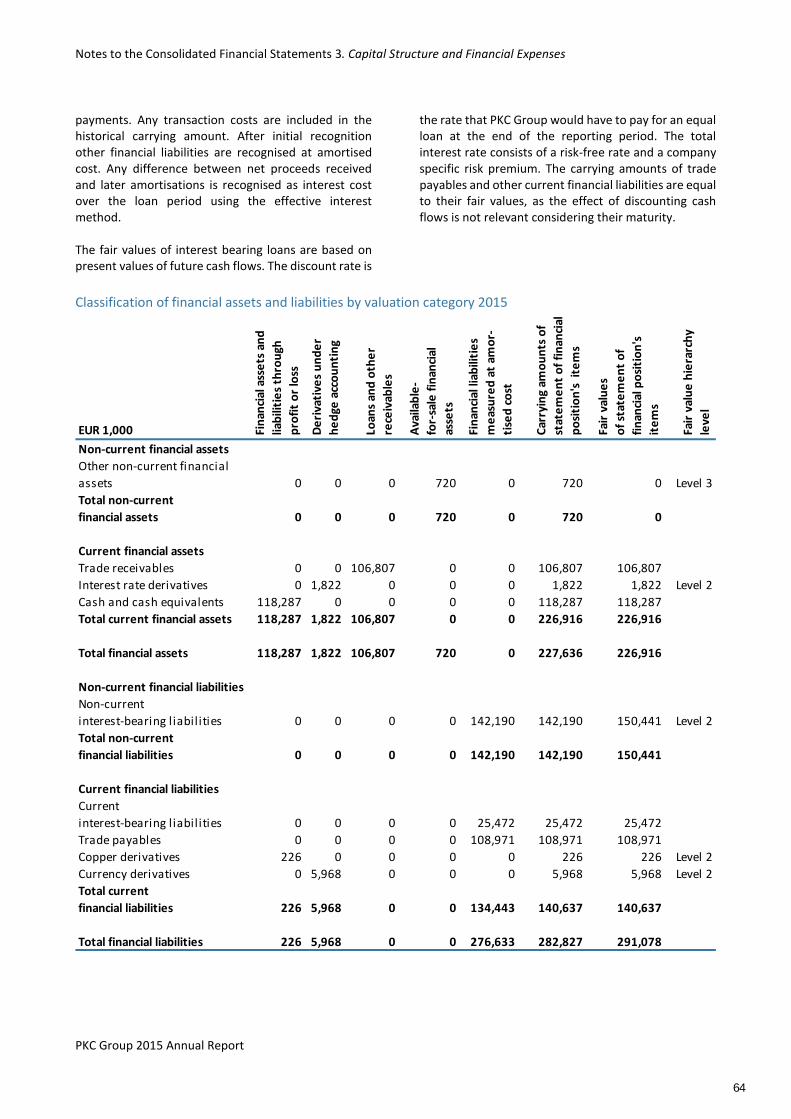
Notes to the Consolidated Financial Statements 3. Capital Structure and Financial Expenses
PKC Group 2015 Annual Report
payments. Any transaction costs are included in the historical carrying amount. After initial recognition other financial liabilities are recognised at amortised cost. Any difference between net proceeds received and later amortisations is recognised as interest cost over the loan period using the effective interest method. The fair values of interest bearing loans are based on present values of future cash flows. The discount rate is
the rate that PKC Group would have to pay for an equal loan at the end of the reporting period. The total interest rate consists of a risk-free rate and a company specific risk premium. The carrying amounts of trade payables and other current financial liabilities are equal to their fair values, as the effect of discounting cash flows is not relevant considering their maturity.
Classification of financial assets and liabilities by valuation category 2015
EUR 1,000 Fin
anci
al a
sse
ts a
nd
liab
iliti
es
thro
ugh
pro
fit
or
loss
De
riva
tive
s u
nd
er
he
dge
acc
ou
nti
ng
Loan
s an
d o
the
r
rece
ivab
les
Ava
ilab
le-
for-
sale
fin
anci
al
asse
ts
Fin
anci
al li
abili
tie
s
me
asu
red
at
amo
r-
tise
d c
ost
Car
ryin
g am
ou
nts
of
stat
em
en
t o
f fi
nan
cial
po
siti
on
's i
tem
s
Fair
val
ue
s
of
stat
em
en
t o
f
fin
anci
al p
osi
tio
n's
ite
ms
Fair
val
ue
hie
rarc
hy
leve
l
Non-current financial assets
Other non-current financial
assets 0 0 0 720 0 720 0 Level 3
Total non-current
financial assets 0 0 0 720 0 720 0
Current financial assets
Trade receivables 0 0 106,807 0 0 106,807 106,807
Interest rate derivatives 0 1,822 0 0 0 1,822 1,822 Level 2
Cash and cash equivalents 118,287 0 0 0 0 118,287 118,287
Total current financial assets 118,287 1,822 106,807 0 0 226,916 226,916
Total financial assets 118,287 1,822 106,807 720 0 227,636 226,916
Non-current financial liabilities
Non-current
interest-bearing liabilities 0 0 0 0 142,190 142,190 150,441 Level 2
Total non-current
financial liabilities 0 0 0 0 142,190 142,190 150,441
Current financial liabilities
Current
interest-bearing liabilities 0 0 0 0 25,472 25,472 25,472
Trade payables 0 0 0 0 108,971 108,971 108,971
Copper derivatives 226 0 0 0 0 226 226 Level 2
Currency derivatives 0 5,968 0 0 0 5,968 5,968 Level 2
Total current
financial liabilities 226 5,968 0 0 134,443 140,637 140,637
Total financial liabilities 226 5,968 0 0 276,633 282,827 291,078
64
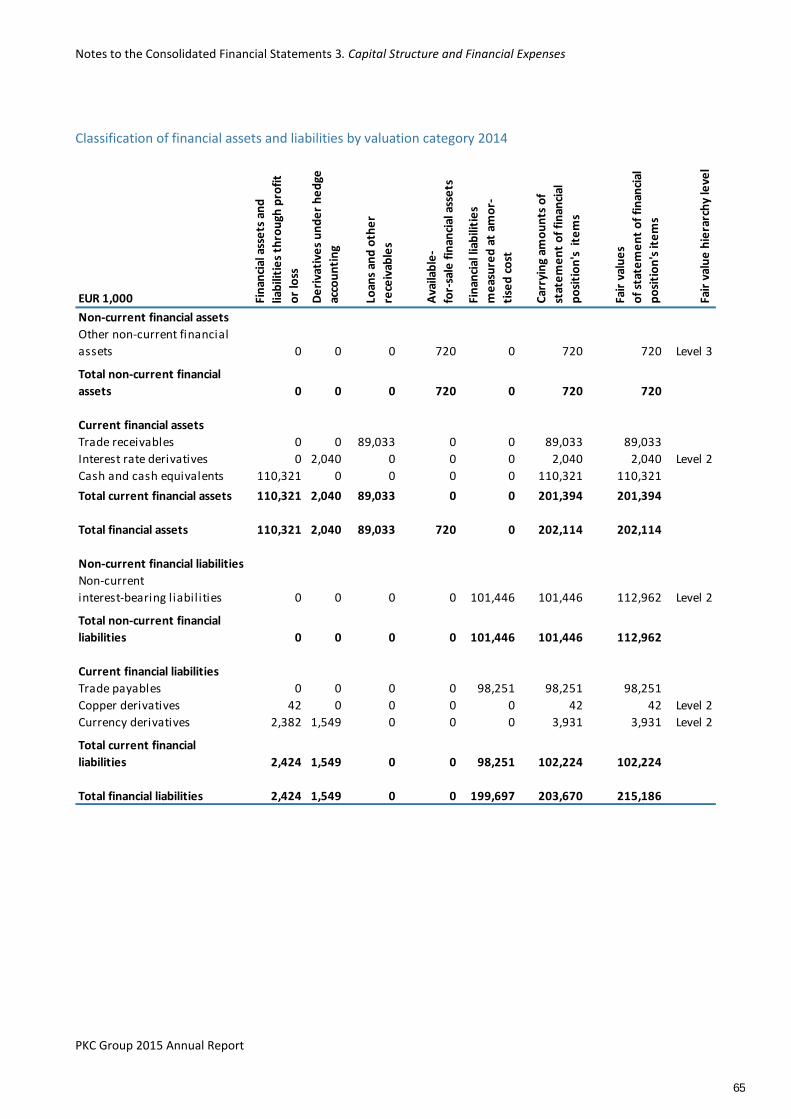
Notes to the Consolidated Financial Statements 3. Capital Structure and Financial Expenses
PKC Group 2015 Annual Report
Classification of financial assets and liabilities by valuation category 2014
EUR 1,000 Fin
anci
al a
sse
ts a
nd
liab
iliti
es
thro
ugh
pro
fit
or
loss
De
riva
tive
s u
nd
er
he
dge
acco
un
tin
g
Loan
s an
d o
the
r
rece
ivab
les
Ava
ilab
le-
for-
sale
fin
anci
al a
sse
ts
Fin
anci
al li
abili
tie
s
me
asu
red
at
amo
r-
tise
d c
ost
Car
ryin
g am
ou
nts
of
stat
em
en
t o
f fi
nan
cial
po
siti
on
's i
tem
s
Fair
val
ue
s
of
stat
em
en
t o
f fi
nan
cial
po
siti
on
's it
em
s
Fair
val
ue
hie
rarc
hy
leve
l
Non-current financial assets
Other non-current financial
assets 0 0 0 720 0 720 720 Level 3
Total non-current financial
assets 0 0 0 720 0 720 720
Current financial assets
Trade receivables 0 0 89,033 0 0 89,033 89,033
Interest rate derivatives 0 2,040 0 0 0 2,040 2,040 Level 2
Cash and cash equivalents 110,321 0 0 0 0 110,321 110,321
Total current financial assets 110,321 2,040 89,033 0 0 201,394 201,394
Total financial assets 110,321 2,040 89,033 720 0 202,114 202,114
Non-current financial liabilities
Non-current
interest-bearing liabilities 0 0 0 0 101,446 101,446 112,962 Level 2
Total non-current financial
liabilities 0 0 0 0 101,446 101,446 112,962
Current financial liabilities
Trade payables 0 0 0 0 98,251 98,251 98,251
Copper derivatives 42 0 0 0 0 42 42 Level 2
Currency derivatives 2,382 1,549 0 0 0 3,931 3,931 Level 2
Total current financial
liabilities 2,424 1,549 0 0 98,251 102,224 102,224
Total financial liabilities 2,424 1,549 0 0 199,697 203,670 215,186
65
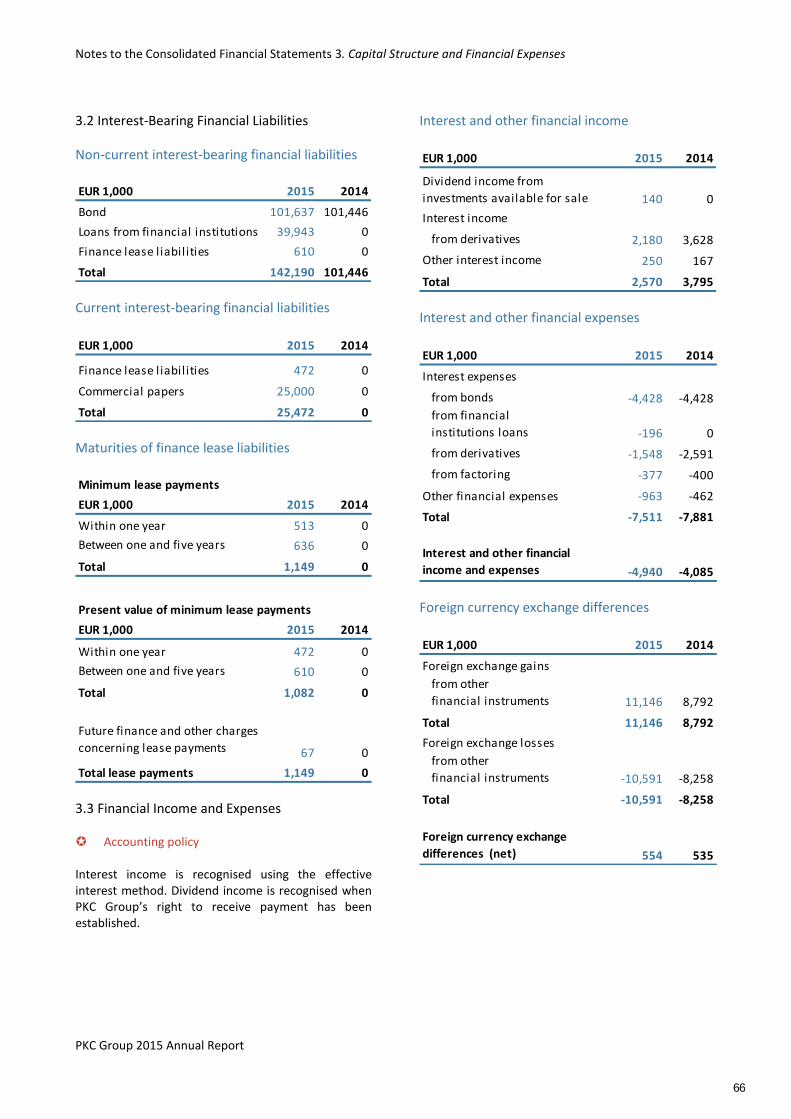
Notes to the Consolidated Financial Statements 3. Capital Structure and Financial Expenses
PKC Group 2015 Annual Report
3.2 Interest-Bearing Financial Liabilities
Non-current interest-bearing financial liabilities
EUR 1,000 2015 2014
Bond 101,637 101,446
Loans from financial institutions 39,943 0
Finance lease liabilities 610 0
Total 142,190 101,446
Current interest-bearing financial liabilities
EUR 1,000 2015 2014Loans from financial institutions 0 0
Finance lease liabilities 472 0
Commercial papers 25,000 0
Total 25,472 0
Maturities of finance lease liabilities
Minimum lease payments
EUR 1,000 2015 2014
Within one year 513 0
Between one and five years 636 0
Total 1,149 0
Present value of minimum lease payments
EUR 1,000 2015 2014
Within one year 472 0
Between one and five years 610 0
Total 1,082 0
Future finance and other charges
concerning lease payments 67 0
Total lease payments 1,149 0
3.3 Financial Income and Expenses Accounting policy Interest income is recognised using the effective interest method. Dividend income is recognised when PKC Group’s right to receive payment has been established.
Interest and other financial income
EUR 1,000 2015 2014
Dividend income from
investments available for sale 140 0
Interest income
from derivatives 2,180 3,628
Other interest income 250 167
Total 2,570 3,795
Interest and other financial expenses
EUR 1,000 2015 2014
Interest expenses
from bonds -4,428 -4,428
from financial
institutions loans -196 0
from derivatives -1,548 -2,591
from factoring -377 -400
Other financial expenses -963 -462
Total -7,511 -7,881
Interest and other financial
income and expenses -4,940 -4,085
Foreign currency exchange differences
EUR 1,000 2015 2014
Foreign exchange gains
from other
financial instruments 11,146 8,792
Total 11,146 8,792
Foreign exchange losses
from other
financial instruments -10,591 -8,258
Total -10,591 -8,258
Foreign currency exchange
differences (net) 554 535
66
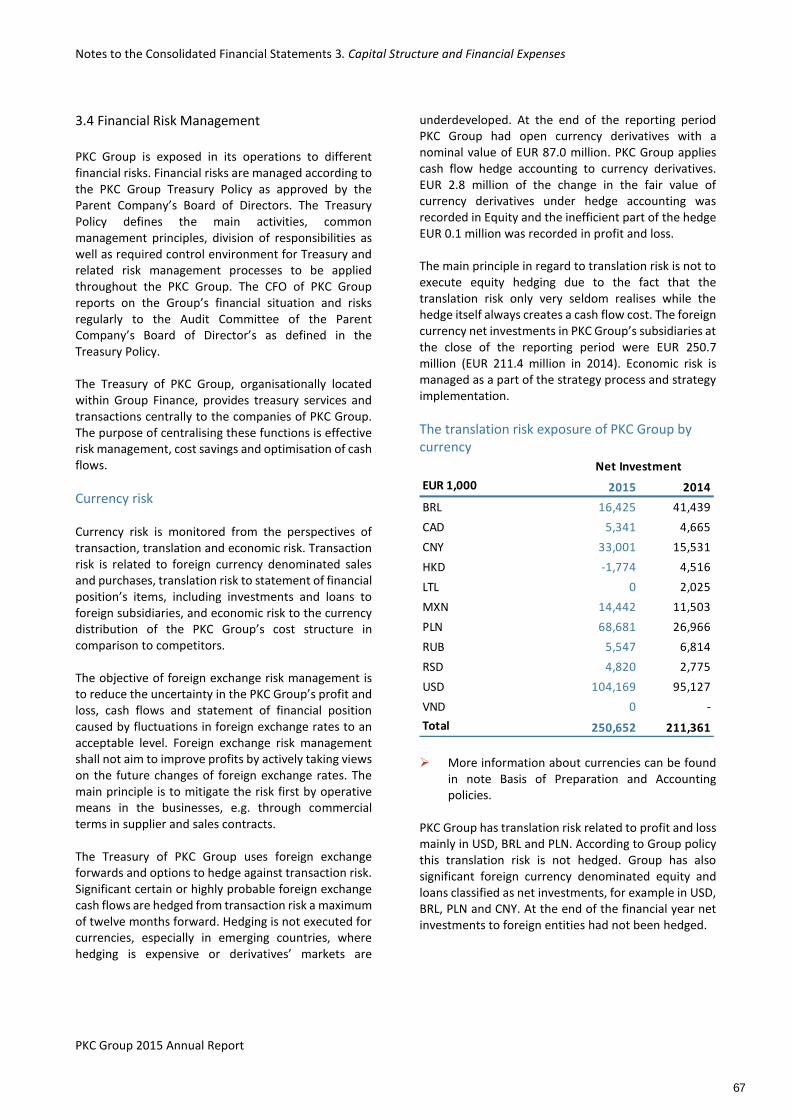
Notes to the Consolidated Financial Statements 3. Capital Structure and Financial Expenses
PKC Group 2015 Annual Report
3.4 Financial Risk Management
PKC Group is exposed in its operations to different financial risks. Financial risks are managed according to the PKC Group Treasury Policy as approved by the Parent Company’s Board of Directors. The Treasury Policy defines the main activities, common management principles, division of responsibilities as well as required control environment for Treasury and related risk management processes to be applied throughout the PKC Group. The CFO of PKC Group reports on the Group’s financial situation and risks regularly to the Audit Committee of the Parent Company’s Board of Director’s as defined in the Treasury Policy. The Treasury of PKC Group, organisationally located within Group Finance, provides treasury services and transactions centrally to the companies of PKC Group. The purpose of centralising these functions is effective risk management, cost savings and optimisation of cash flows.
Currency risk Currency risk is monitored from the perspectives of transaction, translation and economic risk. Transaction risk is related to foreign currency denominated sales and purchases, translation risk to statement of financial position’s items, including investments and loans to foreign subsidiaries, and economic risk to the currency distribution of the PKC Group’s cost structure in comparison to competitors. The objective of foreign exchange risk management is to reduce the uncertainty in the PKC Group’s profit and loss, cash flows and statement of financial position caused by fluctuations in foreign exchange rates to an acceptable level. Foreign exchange risk management shall not aim to improve profits by actively taking views on the future changes of foreign exchange rates. The main principle is to mitigate the risk first by operative means in the businesses, e.g. through commercial terms in supplier and sales contracts. The Treasury of PKC Group uses foreign exchange forwards and options to hedge against transaction risk. Significant certain or highly probable foreign exchange cash flows are hedged from transaction risk a maximum of twelve months forward. Hedging is not executed for currencies, especially in emerging countries, where hedging is expensive or derivatives’ markets are
underdeveloped. At the end of the reporting period PKC Group had open currency derivatives with a nominal value of EUR 87.0 million. PKC Group applies cash flow hedge accounting to currency derivatives. EUR 2.8 million of the change in the fair value of currency derivatives under hedge accounting was recorded in Equity and the inefficient part of the hedge EUR 0.1 million was recorded in profit and loss. The main principle in regard to translation risk is not to execute equity hedging due to the fact that the translation risk only very seldom realises while the hedge itself always creates a cash flow cost. The foreign currency net investments in PKC Group’s subsidiaries at the close of the reporting period were EUR 250.7 million (EUR 211.4 million in 2014). Economic risk is managed as a part of the strategy process and strategy implementation.
The translation risk exposure of PKC Group by currency
EUR 1,000 2015 2014
BRL 16,425 41,439
CAD 5,341 4,665
CNY 33,001 15,531
HKD -1,774 4,516
LTL 0 2,025
MXN 14,442 11,503
PLN 68,681 26,966
RUB 5,547 6,814
RSD 4,820 2,775
USD 104,169 95,127
VND 0 -
Total 250,652 211,361
Net Investment
More information about currencies can be found
in note Basis of Preparation and Accounting policies.
PKC Group has translation risk related to profit and loss mainly in USD, BRL and PLN. According to Group policy this translation risk is not hedged. Group has also significant foreign currency denominated equity and loans classified as net investments, for example in USD, BRL, PLN and CNY. At the end of the financial year net investments to foreign entities had not been hedged.
67
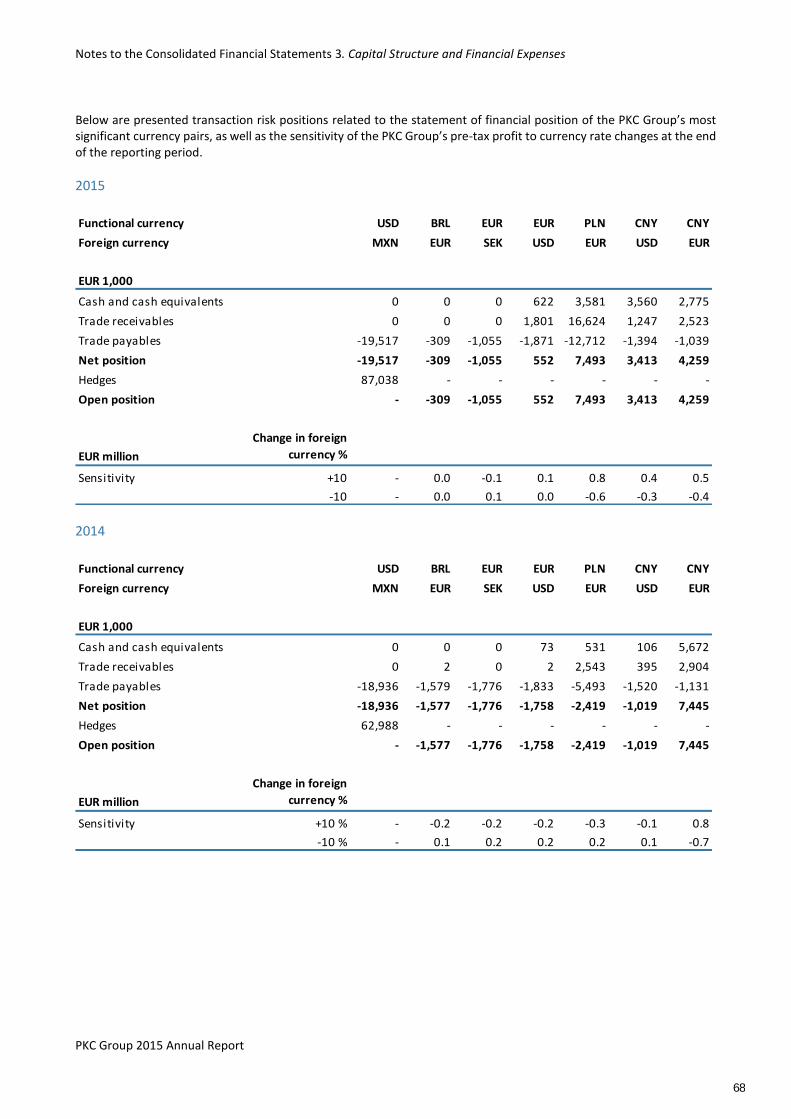
Notes to the Consolidated Financial Statements 3. Capital Structure and Financial Expenses
PKC Group 2015 Annual Report
Below are presented transaction risk positions related to the statement of financial position of the PKC Group’s most significant currency pairs, as well as the sensitivity of the PKC Group’s pre-tax profit to currency rate changes at the end of the reporting period.
2015
Functional currency USD BRL EUR EUR PLN CNY CNY
Foreign currency MXN EUR SEK USD EUR USD EUR
EUR 1,000
Cash and cash equivalents 0 0 0 622 3,581 3,560 2,775
Trade receivables 0 0 0 1,801 16,624 1,247 2,523
Trade payables -19,517 -309 -1,055 -1,871 -12,712 -1,394 -1,039
Net position -19,517 -309 -1,055 552 7,493 3,413 4,259
Hedges 87,038 - - - - - -
Open position - -309 -1,055 552 7,493 3,413 4,259
EUR million
Change in foreign
currency %
Sensitivity +10 - 0.0 -0.1 0.1 0.8 0.4 0.5
-10 - 0.0 0.1 0.0 -0.6 -0.3 -0.4
2014
Functional currency USD BRL EUR EUR PLN CNY CNY
Foreign currency MXN EUR SEK USD EUR USD EUR
EUR 1,000
Cash and cash equivalents 0 0 0 73 531 106 5,672
Trade receivables 0 2 0 2 2,543 395 2,904
Trade payables -18,936 -1,579 -1,776 -1,833 -5,493 -1,520 -1,131
Net position -18,936 -1,577 -1,776 -1,758 -2,419 -1,019 7,445
Hedges 62,988 - - - - - -
Open position - -1,577 -1,776 -1,758 -2,419 -1,019 7,445
EUR million
Change in foreign
currency %
Sensitivity +10 % - -0.2 -0.2 -0.2 -0.3 -0.1 0.8
-10 % - 0.1 0.2 0.2 0.2 0.1 -0.7
68
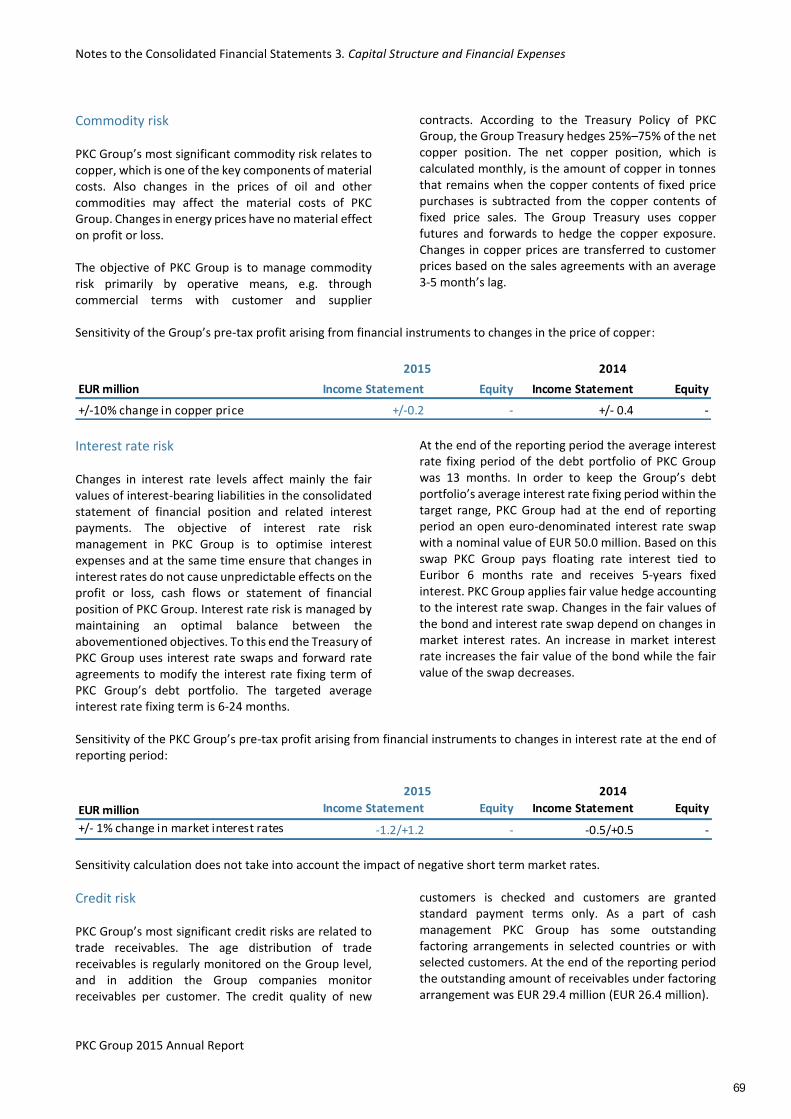
Notes to the Consolidated Financial Statements 3. Capital Structure and Financial Expenses
PKC Group 2015 Annual Report
Commodity risk PKC Group’s most significant commodity risk relates to copper, which is one of the key components of material costs. Also changes in the prices of oil and other commodities may affect the material costs of PKC Group. Changes in energy prices have no material effect on profit or loss. The objective of PKC Group is to manage commodity risk primarily by operative means, e.g. through commercial terms with customer and supplier
contracts. According to the Treasury Policy of PKC Group, the Group Treasury hedges 25%–75% of the net copper position. The net copper position, which is calculated monthly, is the amount of copper in tonnes that remains when the copper contents of fixed price purchases is subtracted from the copper contents of fixed price sales. The Group Treasury uses copper futures and forwards to hedge the copper exposure. Changes in copper prices are transferred to customer prices based on the sales agreements with an average 3-5 month’s lag.
Sensitivity of the Group’s pre-tax profit arising from financial instruments to changes in the price of copper:
EUR million Income Statement Equity Income Statement Equity
+/-10% change in copper price +/-0.2 - +/- 0.4 -
2015 2014
Interest rate risk Changes in interest rate levels affect mainly the fair values of interest-bearing liabilities in the consolidated statement of financial position and related interest payments. The objective of interest rate risk management in PKC Group is to optimise interest expenses and at the same time ensure that changes in interest rates do not cause unpredictable effects on the profit or loss, cash flows or statement of financial position of PKC Group. Interest rate risk is managed by maintaining an optimal balance between the abovementioned objectives. To this end the Treasury of PKC Group uses interest rate swaps and forward rate agreements to modify the interest rate fixing term of PKC Group’s debt portfolio. The targeted average interest rate fixing term is 6-24 months.
At the end of the reporting period the average interest rate fixing period of the debt portfolio of PKC Group was 13 months. In order to keep the Group’s debt portfolio’s average interest rate fixing period within the target range, PKC Group had at the end of reporting period an open euro-denominated interest rate swap with a nominal value of EUR 50.0 million. Based on this swap PKC Group pays floating rate interest tied to Euribor 6 months rate and receives 5-years fixed interest. PKC Group applies fair value hedge accounting to the interest rate swap. Changes in the fair values of the bond and interest rate swap depend on changes in market interest rates. An increase in market interest rate increases the fair value of the bond while the fair value of the swap decreases.
Sensitivity of the PKC Group’s pre-tax profit arising from financial instruments to changes in interest rate at the end of reporting period:
EUR million Income Statement Equity Income Statement Equity
+/- 1% change in market interest rates -1.2/+1.2 - -0.5/+0.5 -
2015 2014
Sensitivity calculation does not take into account the impact of negative short term market rates.
Credit risk PKC Group’s most significant credit risks are related to trade receivables. The age distribution of trade receivables is regularly monitored on the Group level, and in addition the Group companies monitor receivables per customer. The credit quality of new
customers is checked and customers are granted standard payment terms only. As a part of cash management PKC Group has some outstanding factoring arrangements in selected countries or with selected customers. At the end of the reporting period the outstanding amount of receivables under factoring arrangement was EUR 29.4 million (EUR 26.4 million).
69
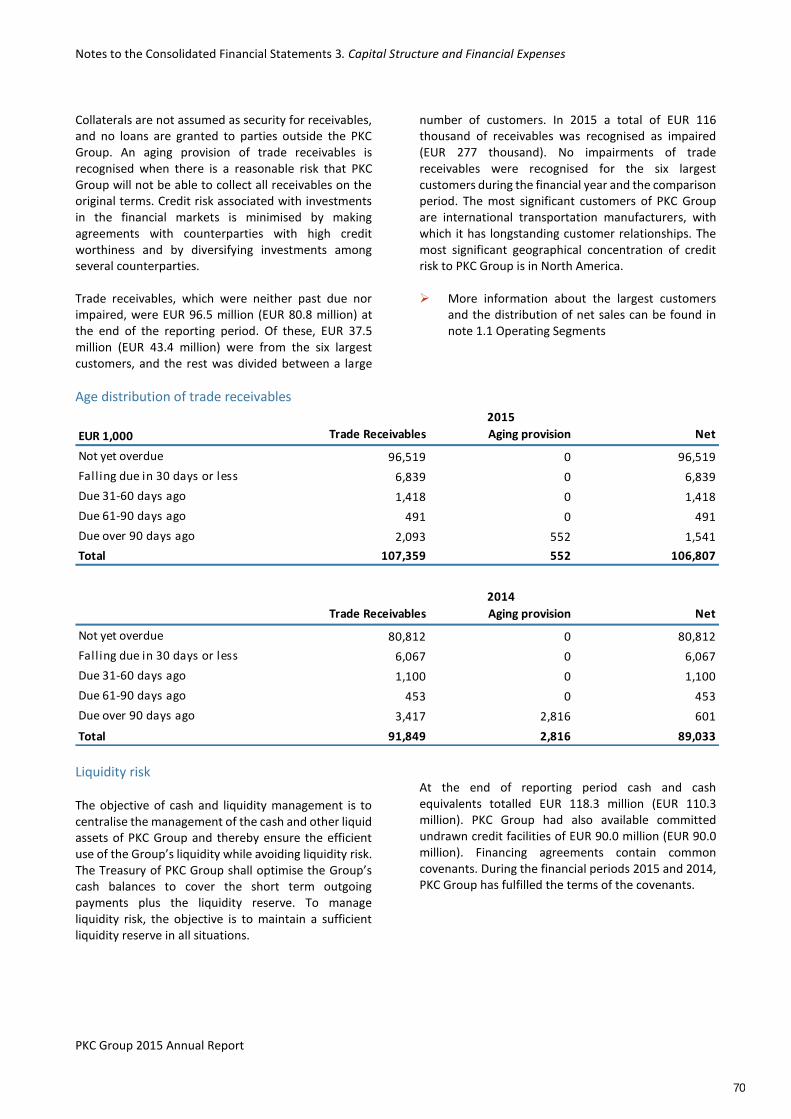
Notes to the Consolidated Financial Statements 3. Capital Structure and Financial Expenses
PKC Group 2015 Annual Report
Collaterals are not assumed as security for receivables, and no loans are granted to parties outside the PKC Group. An aging provision of trade receivables is recognised when there is a reasonable risk that PKC Group will not be able to collect all receivables on the original terms. Credit risk associated with investments in the financial markets is minimised by making agreements with counterparties with high credit worthiness and by diversifying investments among several counterparties. Trade receivables, which were neither past due nor impaired, were EUR 96.5 million (EUR 80.8 million) at the end of the reporting period. Of these, EUR 37.5 million (EUR 43.4 million) were from the six largest customers, and the rest was divided between a large
number of customers. In 2015 a total of EUR 116 thousand of receivables was recognised as impaired (EUR 277 thousand). No impairments of trade receivables were recognised for the six largest customers during the financial year and the comparison period. The most significant customers of PKC Group are international transportation manufacturers, with which it has longstanding customer relationships. The most significant geographical concentration of credit risk to PKC Group is in North America. More information about the largest customers
and the distribution of net sales can be found in note 1.1 Operating Segments
Age distribution of trade receivables
EUR 1,000 Trade Receivables Aging provision Net
Not yet overdue 96,519 0 96,519
Falling due in 30 days or less 6,839 0 6,839
Due 31-60 days ago 1,418 0 1,418
Due 61-90 days ago 491 0 491
Due over 90 days ago 2,093 552 1,541
Total 107,359 552 106,807
Trade Receivables Aging provision Net
Not yet overdue 80,812 0 80,812
Falling due in 30 days or less 6,067 0 6,067
Due 31-60 days ago 1,100 0 1,100
Due 61-90 days ago 453 0 453
Due over 90 days ago 3,417 2,816 601
Total 91,849 2,816 89,033
2015
2014
Liquidity risk The objective of cash and liquidity management is to centralise the management of the cash and other liquid assets of PKC Group and thereby ensure the efficient use of the Group’s liquidity while avoiding liquidity risk. The Treasury of PKC Group shall optimise the Group’s cash balances to cover the short term outgoing payments plus the liquidity reserve. To manage liquidity risk, the objective is to maintain a sufficient liquidity reserve in all situations.
At the end of reporting period cash and cash equivalents totalled EUR 118.3 million (EUR 110.3 million). PKC Group had also available committed undrawn credit facilities of EUR 90.0 million (EUR 90.0 million). Financing agreements contain common covenants. During the financial periods 2015 and 2014, PKC Group has fulfilled the terms of the covenants.
70
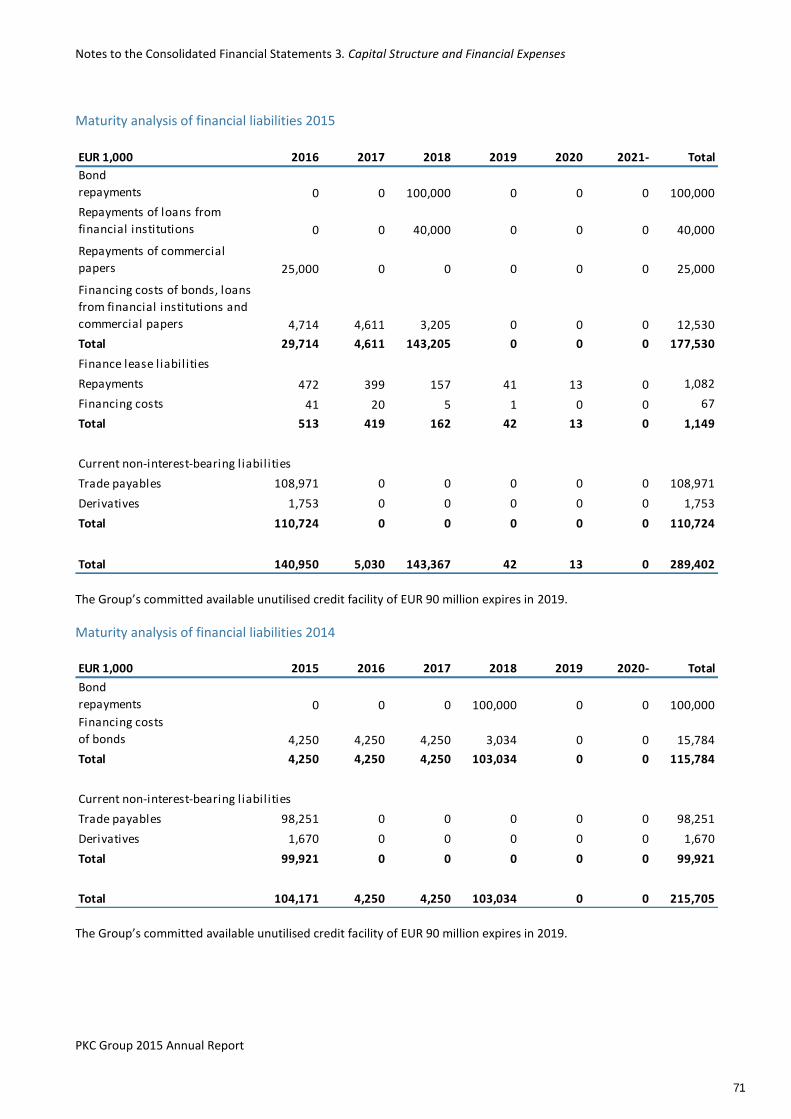
Notes to the Consolidated Financial Statements 3. Capital Structure and Financial Expenses
PKC Group 2015 Annual Report
Maturity analysis of financial liabilities 2015
EUR 1,000 2016 2017 2018 2019 2020 2021- Total
Bond
repayments 0 0 100,000 0 0 0 100,000
Repayments of loans from
financial institutions 0 0 40,000 0 0 0 40,000
Repayments of commercial
papers 25,000 0 0 0 0 0 25,000
Financing costs of bonds, loans
from financial institutions and
commercial papers 4,714 4,611 3,205 0 0 0 12,530
Total 29,714 4,611 143,205 0 0 0 177,530
Finance lease liabilities
Repayments 472 399 157 41 13 0 1,082
Financing costs 41 20 5 1 0 0 67
Total 513 419 162 42 13 0 1,149
Current non-interest-bearing liabilities
Trade payables 108,971 0 0 0 0 0 108,971
Derivatives 1,753 0 0 0 0 0 1,753
Total 110,724 0 0 0 0 0 110,724
Total 140,950 5,030 143,367 42 13 0 289,402 The Group’s committed available unutilised credit facility of EUR 90 million expires in 2019.
Maturity analysis of financial liabilities 2014
EUR 1,000 2015 2016 2017 2018 2019 2020- Total
Bond
repayments 0 0 0 100,000 0 0 100,000
Financing costs
of bonds 4,250 4,250 4,250 3,034 0 0 15,784
Total 4,250 4,250 4,250 103,034 0 0 115,784
Current non-interest-bearing liabilities
Trade payables 98,251 0 0 0 0 0 98,251
Derivatives 1,670 0 0 0 0 0 1,670
Total 99,921 0 0 0 0 0 99,921
Total 104,171 4,250 4,250 103,034 0 0 215,705 The Group’s committed available unutilised credit facility of EUR 90 million expires in 2019.
71
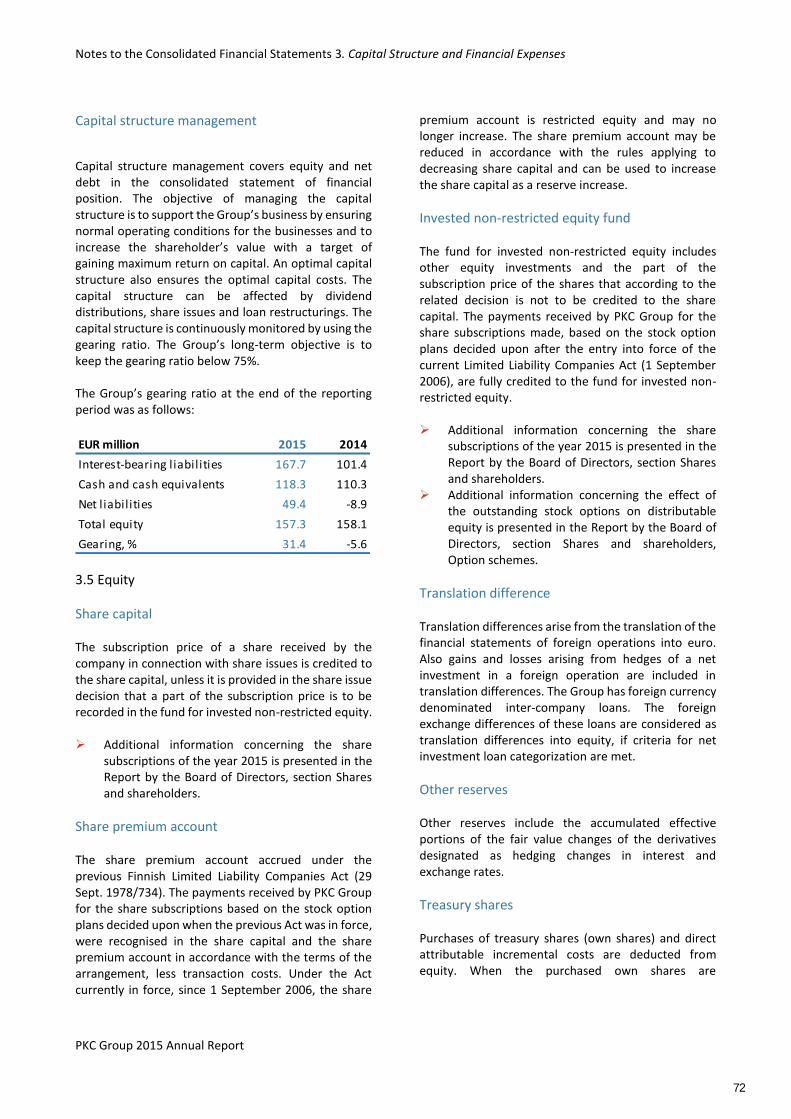
Notes to the Consolidated Financial Statements 3. Capital Structure and Financial Expenses
PKC Group 2015 Annual Report
Capital structure management
Capital structure management covers equity and net debt in the consolidated statement of financial position. The objective of managing the capital structure is to support the Group’s business by ensuring normal operating conditions for the businesses and to increase the shareholder’s value with a target of gaining maximum return on capital. An optimal capital structure also ensures the optimal capital costs. The capital structure can be affected by dividend distributions, share issues and loan restructurings. The capital structure is continuously monitored by using the gearing ratio. The Group’s long-term objective is to keep the gearing ratio below 75%. The Group’s gearing ratio at the end of the reporting period was as follows:
EUR million 2015 2014
Interest-bearing liabilities 167.7 101.4
Cash and cash equivalents 118.3 110.3
Net liabilities 49.4 -8.9
Total equity 157.3 158.1
Gearing, % 31.4 -5.6
3.5 Equity
Share capital The subscription price of a share received by the company in connection with share issues is credited to the share capital, unless it is provided in the share issue decision that a part of the subscription price is to be recorded in the fund for invested non-restricted equity. Additional information concerning the share
subscriptions of the year 2015 is presented in the Report by the Board of Directors, section Shares and shareholders.
Share premium account The share premium account accrued under the previous Finnish Limited Liability Companies Act (29 Sept. 1978/734). The payments received by PKC Group for the share subscriptions based on the stock option plans decided upon when the previous Act was in force, were recognised in the share capital and the share premium account in accordance with the terms of the arrangement, less transaction costs. Under the Act currently in force, since 1 September 2006, the share
premium account is restricted equity and may no longer increase. The share premium account may be reduced in accordance with the rules applying to decreasing share capital and can be used to increase the share capital as a reserve increase.
Invested non-restricted equity fund The fund for invested non-restricted equity includes other equity investments and the part of the subscription price of the shares that according to the related decision is not to be credited to the share capital. The payments received by PKC Group for the share subscriptions made, based on the stock option plans decided upon after the entry into force of the current Limited Liability Companies Act (1 September 2006), are fully credited to the fund for invested non-restricted equity. Additional information concerning the share
subscriptions of the year 2015 is presented in the Report by the Board of Directors, section Shares and shareholders.
Additional information concerning the effect of the outstanding stock options on distributable equity is presented in the Report by the Board of Directors, section Shares and shareholders, Option schemes.
Translation difference Translation differences arise from the translation of the financial statements of foreign operations into euro. Also gains and losses arising from hedges of a net investment in a foreign operation are included in translation differences. The Group has foreign currency denominated inter-company loans. The foreign exchange differences of these loans are considered as translation differences into equity, if criteria for net investment loan categorization are met.
Other reserves Other reserves include the accumulated effective portions of the fair value changes of the derivatives designated as hedging changes in interest and exchange rates.
Treasury shares Purchases of treasury shares (own shares) and direct attributable incremental costs are deducted from equity. When the purchased own shares are
72
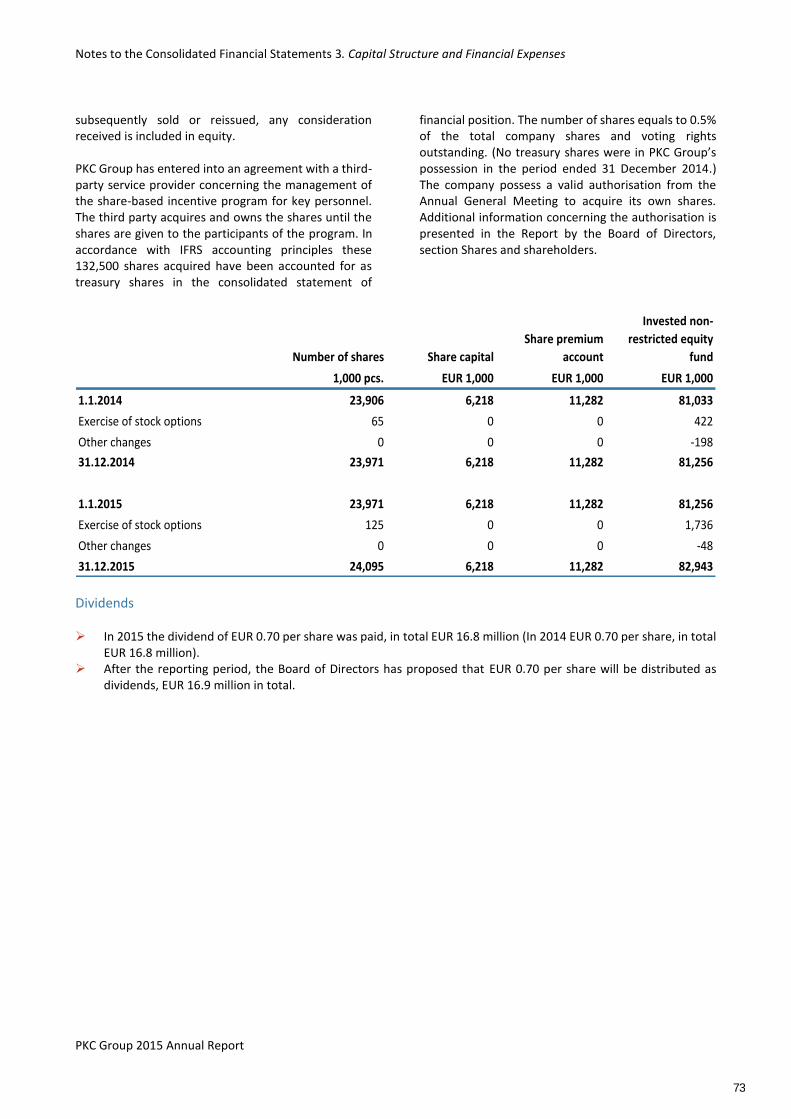
Notes to the Consolidated Financial Statements 3. Capital Structure and Financial Expenses
PKC Group 2015 Annual Report
subsequently sold or reissued, any consideration received is included in equity. PKC Group has entered into an agreement with a third-party service provider concerning the management of the share-based incentive program for key personnel. The third party acquires and owns the shares until the shares are given to the participants of the program. In accordance with IFRS accounting principles these 132,500 shares acquired have been accounted for as treasury shares in the consolidated statement of
financial position. The number of shares equals to 0.5% of the total company shares and voting rights outstanding. (No treasury shares were in PKC Group’s possession in the period ended 31 December 2014.) The company possess a valid authorisation from the Annual General Meeting to acquire its own shares. Additional information concerning the authorisation is presented in the Report by the Board of Directors, section Shares and shareholders.
Number of shares Share capital
Share premium
account
Invested non-
restricted equity
fund
1,000 pcs. EUR 1,000 EUR 1,000 EUR 1,000
1.1.2014 23,906 6,218 11,282 81,033
Exercise of stock options 65 0 0 422
Other changes 0 0 0 -198
31.12.2014 23,971 6,218 11,282 81,256
1.1.2015 23,971 6,218 11,282 81,256
Exercise of stock options 125 0 0 1,736
Other changes 0 0 0 -48
31.12.2015 24,095 6,218 11,282 82,943
Dividends In 2015 the dividend of EUR 0.70 per share was paid, in total EUR 16.8 million (In 2014 EUR 0.70 per share, in total
EUR 16.8 million). After the reporting period, the Board of Directors has proposed that EUR 0.70 per share will be distributed as
dividends, EUR 16.9 million in total.
73
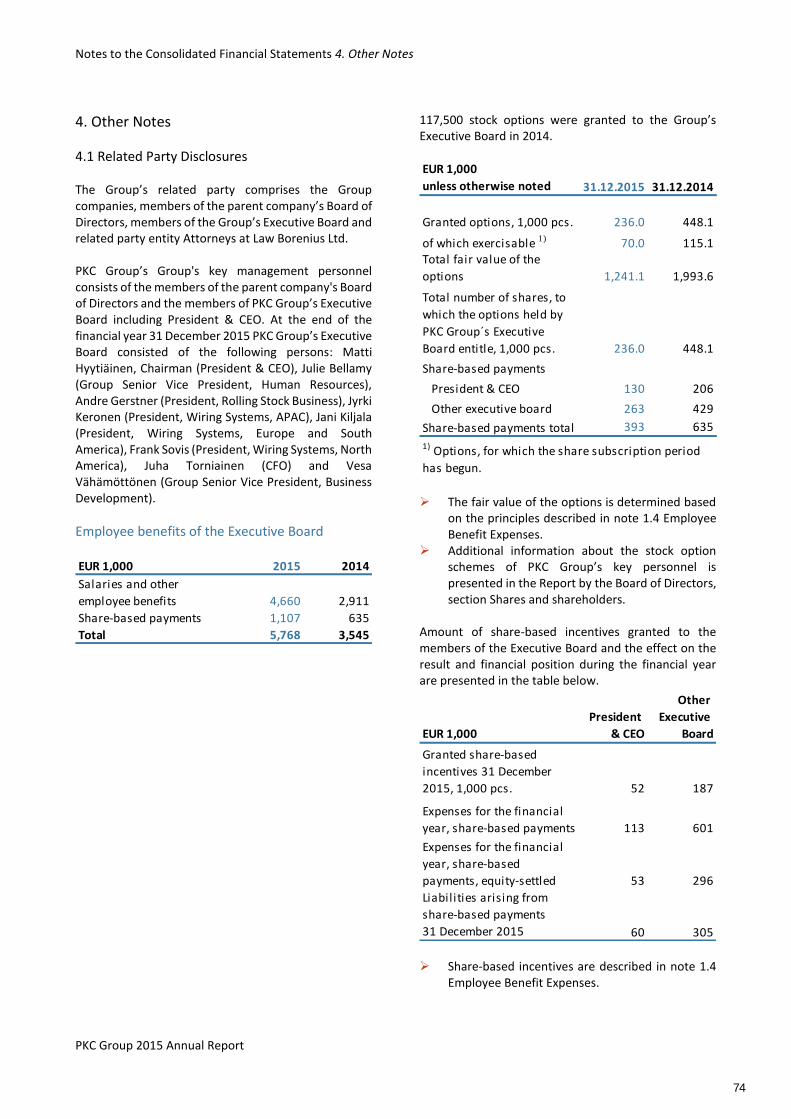
Notes to the Consolidated Financial Statements 4. Other Notes
PKC Group 2015 Annual Report
4. Other Notes
4.1 Related Party Disclosures The Group’s related party comprises the Group companies, members of the parent company’s Board of Directors, members of the Group’s Executive Board and related party entity Attorneys at Law Borenius Ltd. PKC Group’s Group's key management personnel consists of the members of the parent company's Board of Directors and the members of PKC Group’s Executive Board including President & CEO. At the end of the financial year 31 December 2015 PKC Group’s Executive Board consisted of the following persons: Matti Hyytiäinen, Chairman (President & CEO), Julie Bellamy (Group Senior Vice President, Human Resources), Andre Gerstner (President, Rolling Stock Business), Jyrki Keronen (President, Wiring Systems, APAC), Jani Kiljala (President, Wiring Systems, Europe and South America), Frank Sovis (President, Wiring Systems, North America), Juha Torniainen (CFO) and Vesa Vähämöttönen (Group Senior Vice President, Business Development).
Employee benefits of the Executive Board
EUR 1,000 2015 2014
Salaries and other
employee benefits 4,660 2,911
Share-based payments 1,107 635
Total 5,768 3,545
117,500 stock options were granted to the Group’s Executive Board in 2014.
EUR 1,000
unless otherwise noted 31.12.2015 31.12.2014
Granted options, 1,000 pcs. 236.0 448.1
of which exercisable 1) 70.0 115.1Total fair value of the
options 1,241.1 1,993.6
Total number of shares, to
which the options held by
PKC Group´s Executive
Board entitle, 1,000 pcs. 236.0 448.1
Share-based payments
President & CEO 130 206
Other executive board 263 429
Share-based payments total 393 635
1) Options, for which the share subscription period
has begun. The fair value of the options is determined based
on the principles described in note 1.4 Employee Benefit Expenses.
Additional information about the stock option schemes of PKC Group’s key personnel is presented in the Report by the Board of Directors, section Shares and shareholders.
Amount of share-based incentives granted to the members of the Executive Board and the effect on the result and financial position during the financial year are presented in the table below.
EUR 1,000
President
& CEO
Other
Executive
Board
Granted share-based
incentives 31 December
2015, 1,000 pcs. 52 187
Expenses for the financial
year, share-based payments 113 601
Expenses for the financial
year, share-based
payments, equity-settled 53 296
Liabilities arising from
share-based payments
31 December 2015 60 305 Share-based incentives are described in note 1.4
Employee Benefit Expenses.
74
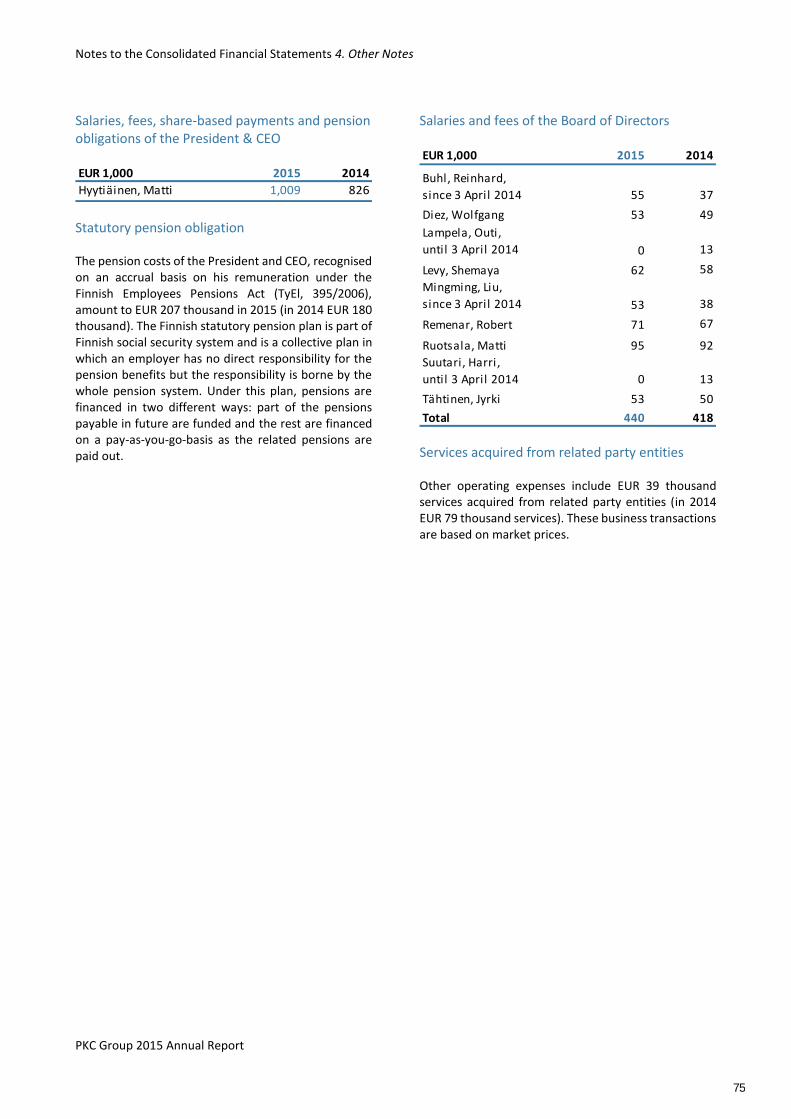
Notes to the Consolidated Financial Statements 4. Other Notes
PKC Group 2015 Annual Report
Salaries, fees, share-based payments and pension obligations of the President & CEO
EUR 1,000 2015 2014
Hyytiäinen, Matti 1,009 826
Statutory pension obligation The pension costs of the President and CEO, recognised on an accrual basis on his remuneration under the Finnish Employees Pensions Act (TyEl, 395/2006), amount to EUR 207 thousand in 2015 (in 2014 EUR 180 thousand). The Finnish statutory pension plan is part of Finnish social security system and is a collective plan in which an employer has no direct responsibility for the pension benefits but the responsibility is borne by the whole pension system. Under this plan, pensions are financed in two different ways: part of the pensions payable in future are funded and the rest are financed on a pay-as-you-go-basis as the related pensions are paid out.
Salaries and fees of the Board of Directors
EUR 1,000 2015 2014
Buhl, Reinhard,
since 3 April 2014 55 37
Diez, Wolfgang 53 49
Lampela, Outi,
until 3 April 2014 0 13
Levy, Shemaya 62 58
Mingming, Liu,
since 3 April 2014 53 38
Remenar, Robert 71 67
Ruotsala, Matti 95 92
Suutari, Harri,
until 3 April 2014 0 13
Tähtinen, Jyrki 53 50
Total 440 418
Services acquired from related party entities Other operating expenses include EUR 39 thousand services acquired from related party entities (in 2014 EUR 79 thousand services). These business transactions are based on market prices.
75
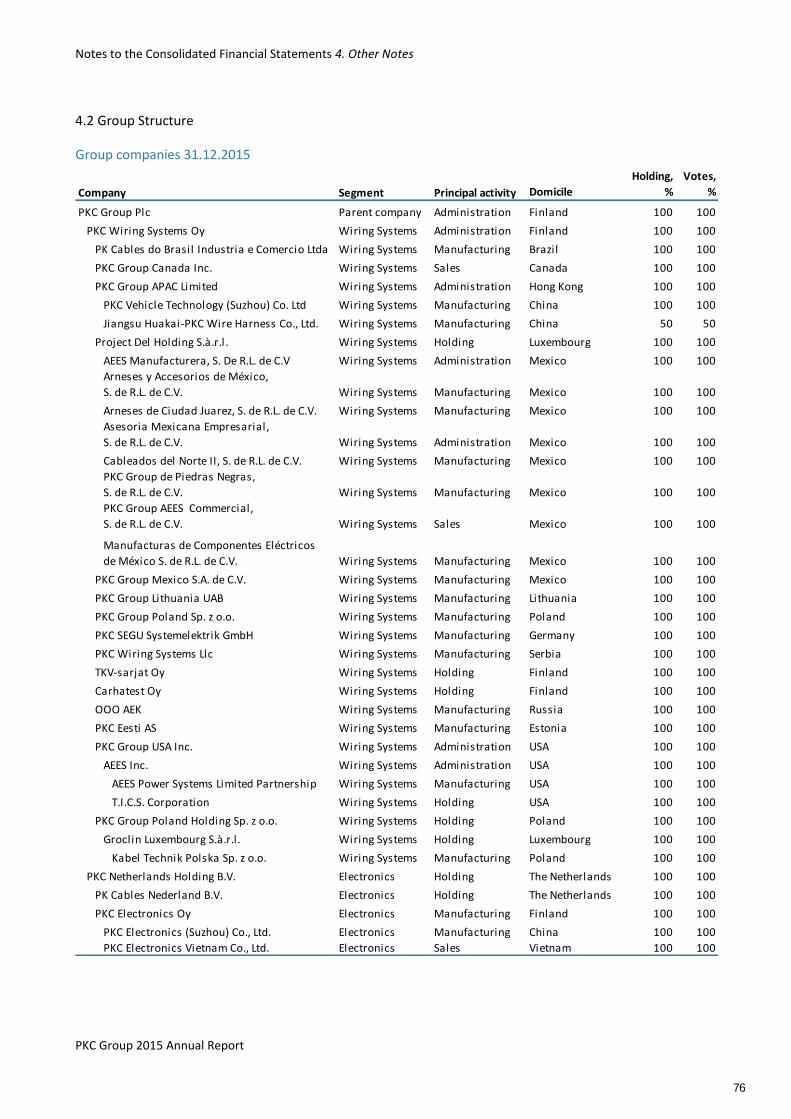
Notes to the Consolidated Financial Statements 4. Other Notes
PKC Group 2015 Annual Report
4.2 Group Structure
Group companies 31.12.2015
Company Segment Principal activity Domicile
Holding,
%
Votes,
%
PKC Group Plc Parent company Administration Finland 100 100
PKC Wiring Systems Oy Wiring Systems Administration Finland 100 100
PK Cables do Brasil Industria e Comercio Ltda Wiring Systems Manufacturing Brazil 100 100
PKC Group Canada Inc. Wiring Systems Sales Canada 100 100
PKC Group APAC Limited Wiring Systems Administration Hong Kong 100 100
PKC Vehicle Technology (Suzhou) Co. Ltd Wiring Systems Manufacturing China 100 100
Jiangsu Huakai-PKC Wire Harness Co., Ltd. Wiring Systems Manufacturing China 50 50
Project Del Holding S.à.r.l. Wiring Systems Holding Luxembourg 100 100
AEES Manufacturera, S. De R.L. de C.V Wiring Systems Administration Mexico 100 100
Arneses y Accesorios de México,
S. de R.L. de C.V. Wiring Systems Manufacturing Mexico 100 100
Arneses de Ciudad Juarez, S. de R.L. de C.V. Wiring Systems Manufacturing Mexico 100 100
Asesoria Mexicana Empresarial,
S. de R.L. de C.V. Wiring Systems Administration Mexico 100 100
Cableados del Norte II, S. de R.L. de C.V. Wiring Systems Manufacturing Mexico 100 100
PKC Group de Piedras Negras,
S. de R.L. de C.V. Wiring Systems Manufacturing Mexico 100 100
PKC Group AEES Commercial,
S. de R.L. de C.V. Wiring Systems Sales Mexico 100 100
Manufacturas de Componentes Eléctricos
de México S. de R.L. de C.V. Wiring Systems Manufacturing Mexico 100 100
PKC Group Mexico S.A. de C.V. Wiring Systems Manufacturing Mexico 100 100
PKC Group Lithuania UAB Wiring Systems Manufacturing Lithuania 100 100
PKC Group Poland Sp. z o.o. Wiring Systems Manufacturing Poland 100 100
PKC SEGU Systemelektrik GmbH Wiring Systems Manufacturing Germany 100 100
PKC Wiring Systems Llc Wiring Systems Manufacturing Serbia 100 100
TKV-sarjat Oy Wiring Systems Holding Finland 100 100
Carhatest Oy Wiring Systems Holding Finland 100 100
OOO AEK Wiring Systems Manufacturing Russia 100 100
PKC Eesti AS Wiring Systems Manufacturing Estonia 100 100
PKC Group USA Inc. Wiring Systems Administration USA 100 100
AEES Inc. Wiring Systems Administration USA 100 100
AEES Power Systems Limited Partnership Wiring Systems Manufacturing USA 100 100
T.I.C.S. Corporation Wiring Systems Holding USA 100 100
PKC Group Poland Holding Sp. z o.o. Wiring Systems Holding Poland 100 100
Groclin Luxembourg S.à.r.l. Wiring Systems Holding Luxembourg 100 100
Kabel Technik Polska Sp. z o.o. Wiring Systems Manufacturing Poland 100 100
PKC Netherlands Holding B.V. Electronics Holding The Netherlands 100 100
PK Cables Nederland B.V. Electronics Holding The Netherlands 100 100
PKC Electronics Oy Electronics Manufacturing Finland 100 100
PKC Electronics (Suzhou) Co., Ltd. Electronics Manufacturing China 100 100
PKC Electronics Vietnam Co., Ltd. Electronics Sales Vietnam 100 100
76
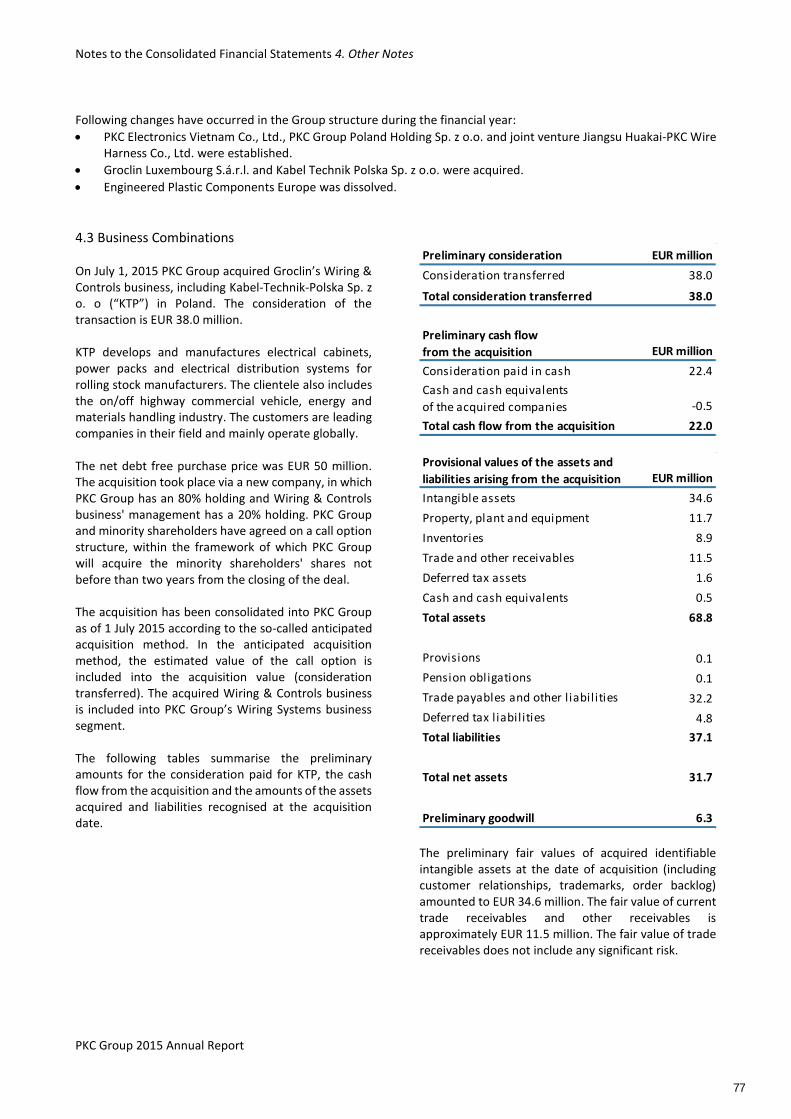
Notes to the Consolidated Financial Statements 4. Other Notes
PKC Group 2015 Annual Report
Following changes have occurred in the Group structure during the financial year:
PKC Electronics Vietnam Co., Ltd., PKC Group Poland Holding Sp. z o.o. and joint venture Jiangsu Huakai-PKC Wire Harness Co., Ltd. were established.
Groclin Luxembourg S.á.r.l. and Kabel Technik Polska Sp. z o.o. were acquired.
Engineered Plastic Components Europe was dissolved.
4.3 Business Combinations On July 1, 2015 PKC Group acquired Groclin’s Wiring & Controls business, including Kabel-Technik-Polska Sp. z o. o (“KTP”) in Poland. The consideration of the transaction is EUR 38.0 million. KTP develops and manufactures electrical cabinets, power packs and electrical distribution systems for rolling stock manufacturers. The clientele also includes the on/off highway commercial vehicle, energy and materials handling industry. The customers are leading companies in their field and mainly operate globally. The net debt free purchase price was EUR 50 million. The acquisition took place via a new company, in which PKC Group has an 80% holding and Wiring & Controls business' management has a 20% holding. PKC Group and minority shareholders have agreed on a call option structure, within the framework of which PKC Group will acquire the minority shareholders' shares not before than two years from the closing of the deal. The acquisition has been consolidated into PKC Group as of 1 July 2015 according to the so-called anticipated acquisition method. In the anticipated acquisition method, the estimated value of the call option is included into the acquisition value (consideration transferred). The acquired Wiring & Controls business is included into PKC Group’s Wiring Systems business segment. The following tables summarise the preliminary amounts for the consideration paid for KTP, the cash flow from the acquisition and the amounts of the assets acquired and liabilities recognised at the acquisition date.
Preliminary consideration EUR million
Consideration transferred 38.0
Total consideration transferred 38.0
Preliminary cash flow
from the acquisition EUR million
Consideration paid in cash 22.4
Cash and cash equivalents
of the acquired companies -0.5
Total cash flow from the acquisition 22.0
Provisional values of the assets and
liabilities arising from the acquisition EUR million
Intangible assets 34.6
Property, plant and equipment 11.7
Inventories 8.9
Trade and other receivables 11.5
Deferred tax assets 1.6
Cash and cash equivalents 0.5
Total assets 68.8
Provisions 0.1
Pension obligations 0.1
Trade payables and other l iabilities 32.2
Deferred tax liabilities 4.8
Total liabilities 37.1
Total net assets 31.7
Preliminary goodwill 6.3 The preliminary fair values of acquired identifiable intangible assets at the date of acquisition (including customer relationships, trademarks, order backlog) amounted to EUR 34.6 million. The fair value of current trade receivables and other receivables is approximately EUR 11.5 million. The fair value of trade receivables does not include any significant risk.
77
Notes to the Consolidated Financial Statements 4. Other Notes
PKC Group 2015 Annual Report
The preliminary goodwill of EUR 6.3 million reflects the value of know-how and expertise in rolling stock business. PKC Group foresees that the new unit will capture new market opportunities and improve the operational efficiency of its customers. The goodwill recognised for KTP is not tax deductible. Purchase price allocation resulted in assets totalling EUR 24.9 million and related depreciation and amortization equal to EUR 3.4 million per year in the beginning. Acquisition-related costs amounted to EUR 2.1 million consisting of external advisory and due diligence fees. The costs have been included in the other operating expenses in the consolidated statement of income and classified as non-recurring items. Had the acquisition occurred on 1 January 2015, management estimates that the consolidated Group revenue would have been EUR 934 million and adjusted EBITDA EUR 66 million in January-December 2015.
4.4 Established Joint Venture PKC Group announced on 4 September 2015 that PKC’s joint venture Jiangsu Huakai-PKC Wire Harness Co., Ltd. has been established and started its operations. The finalisation of the joint venture was subject to usual conditions including e.g. negotiating the related agreements and authority approvals. The conditions have been fulfilled, Huakai’s business has been
transferred to joint venture and the joint venture has started its operations in September. The joint venture was accomplished through a new company that was established by Huakai in Danyang, Jiangsu province in China with an equity value of RMB 150 million / EUR 22 million. PKC will contribute in total RMB 150 million / EUR 22 million via share issues to be financed from PKC's cash resources. After the capital increase the total equity value of the joint venture is RMB 300 million / EUR 44 million and PKC owns 50% and Huakai 50%. The joint venture agreement contains such elements that give PKC the consolidation right and control, accordingly. The joint venture comprises Huakai's current business which develops and manufactures electrical distribution systems to truck, construction vehicle and bus segments in China. The key customers are Foton (and Beijing Foton Daimler Automotive), Kinglong and Iveco. Foton is the fourth biggest truck manufacturer in China with 11% market share in 2014. Had the joint venture been established on 1 January 2015, management estimates that the annual revenue 2015 of the joint venture would have been approximately EUR 44 million with current exchange rate, and employees amount to 715. The joint venture is consolidated into PKC Group as of 1 September 2015. The joint venture will be included into PKC Group’s Wiring Systems business segment.
78
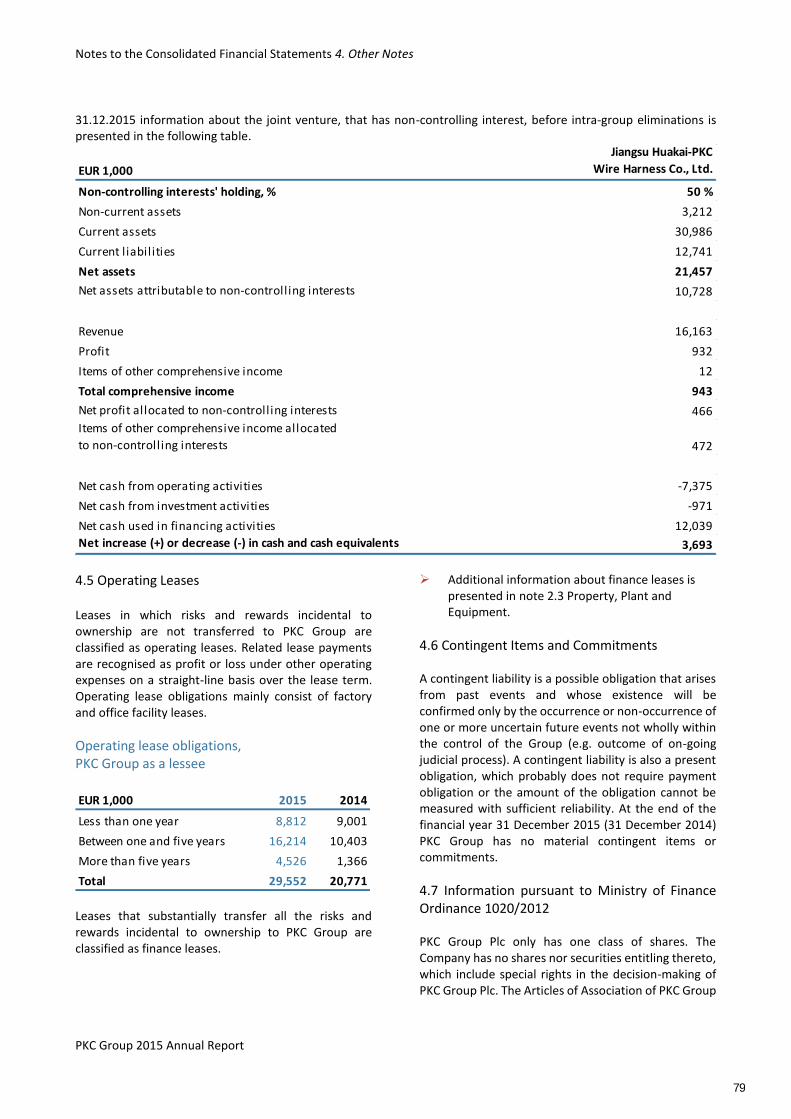
Notes to the Consolidated Financial Statements 4. Other Notes
PKC Group 2015 Annual Report
31.12.2015 information about the joint venture, that has non-controlling interest, before intra-group eliminations is presented in the following table.
EUR 1,000
Jiangsu Huakai-PKC
Wire Harness Co., Ltd.
Non-controlling interests' holding, % 50 %
Non-current assets 3,212
Current assets 30,986
Current l iabilities 12,741
Net assets 21,457
Net assets attributable to non-controlling interests 10,728
Revenue 16,163
Profit 932
Items of other comprehensive income 12
Total comprehensive income 943
Net profit allocated to non-controlling interests 466
Items of other comprehensive income allocated
to non-controlling interests 472
Net cash from operating activities -7,375
Net cash from investment activities -971
Net cash used in financing activities 12,039
Net increase (+) or decrease (-) in cash and cash equivalents 3,693
4.5 Operating Leases Leases in which risks and rewards incidental to ownership are not transferred to PKC Group are classified as operating leases. Related lease payments are recognised as profit or loss under other operating expenses on a straight-line basis over the lease term. Operating lease obligations mainly consist of factory and office facility leases.
Operating lease obligations, PKC Group as a lessee
EUR 1,000 2015 2014
Less than one year 8,812 9,001
Between one and five years 16,214 10,403
More than five years 4,526 1,366
Total 29,552 20,771 Leases that substantially transfer all the risks and rewards incidental to ownership to PKC Group are classified as finance leases.
Additional information about finance leases is presented in note 2.3 Property, Plant and Equipment.
4.6 Contingent Items and Commitments A contingent liability is a possible obligation that arises from past events and whose existence will be confirmed only by the occurrence or non-occurrence of one or more uncertain future events not wholly within the control of the Group (e.g. outcome of on-going judicial process). A contingent liability is also a present obligation, which probably does not require payment obligation or the amount of the obligation cannot be measured with sufficient reliability. At the end of the financial year 31 December 2015 (31 December 2014) PKC Group has no material contingent items or commitments.
4.7 Information pursuant to Ministry of Finance Ordinance 1020/2012 PKC Group Plc only has one class of shares. The Company has no shares nor securities entitling thereto, which include special rights in the decision-making of PKC Group Plc. The Articles of Association of PKC Group
79
Notes to the Consolidated Financial Statements 4. Other Notes
PKC Group 2015 Annual Report
Plc contain no redemption and consent clauses. The prerequisite for the distribution of stock options is that the recipient of the stock options undertakes to acquire or subscribe for the Company´s shares with 20 per cent of the gross stock option income gained from the exercised stock options, and to hold such shares for at least two years. The Company´s President & CEO must hold such shares as long as his service contract is in force. The terms of the stock options include conditions related to takeover bids, among others. The Company has no separate agreements nor conditions related to takeover bids with the members of the Board of Directors or President & CEO. The key information on election and dismissal of the members of the Board of Directors or President & CEO is described in Corporate Governance Statement. The regular terms and conditions and compensation pertaining to termination of the President & CEO are discussed in Group’s Remuneration Statement. Some PKC’s customer agreements contain change of control clauses as a result of which the contracts may be terminated. PKC Group issued a EUR 100 million bond in 2013 and the bond terms contain certain special conditions related to ownership changes. If the majority of shares or the control of PKC Group Plc becomes transferred to an individual party, the bondholders may demand immediate, premature bond repayment. PKC Group has a financing agreements with financial institutions. If the majority of shares or the control of PKC Group Plc becomes transferred to an individual party, the bank may unilaterally demand immediate and premature repayment of its loans and cancellation of its unutilized credit facilities.
4.8 Events after the Financial Year PKC Group announced two new share-based incentive plans for the Group key personnel, approved by the Board of Directors.
80
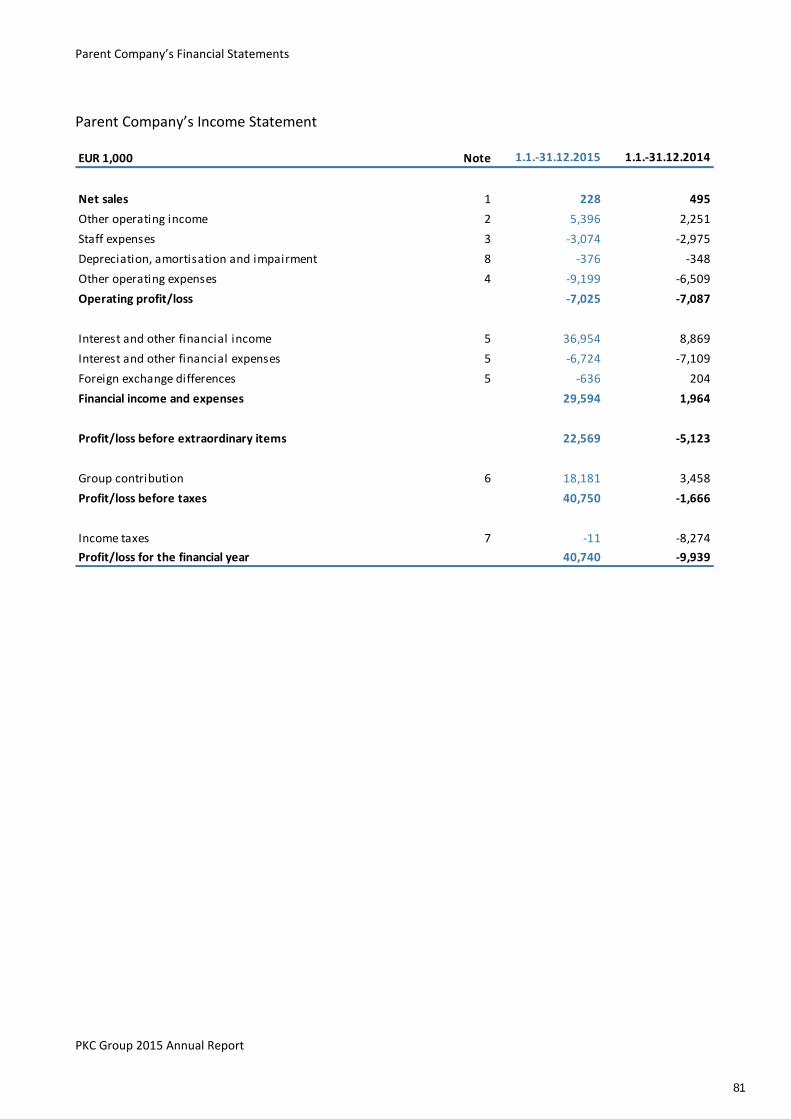
Parent Company’s Financial Statements
PKC Group 2015 Annual Report
Parent Company’s Income Statement
EUR 1,000 Note 1.1.-31.12.2015 1.1.-31.12.2014
Net sales 1 228 495
Other operating income 2 5,396 2,251
Staff expenses 3 -3,074 -2,975
Depreciation, amortisation and impairment 8 -376 -348
Other operating expenses 4 -9,199 -6,509
Operating profit/loss -7,025 -7,087
Interest and other financial income 5 36,954 8,869
Interest and other financial expenses 5 -6,724 -7,109
Foreign exchange differences 5 -636 204
Financial income and expenses 29,594 1,964
Profit/loss before extraordinary items 22,569 -5,123
Group contribution 6 18,181 3,458
Profit/loss before taxes 40,750 -1,666
Income taxes 7 -11 -8,274
Profit/loss for the financial year 40,740 -9,939
81
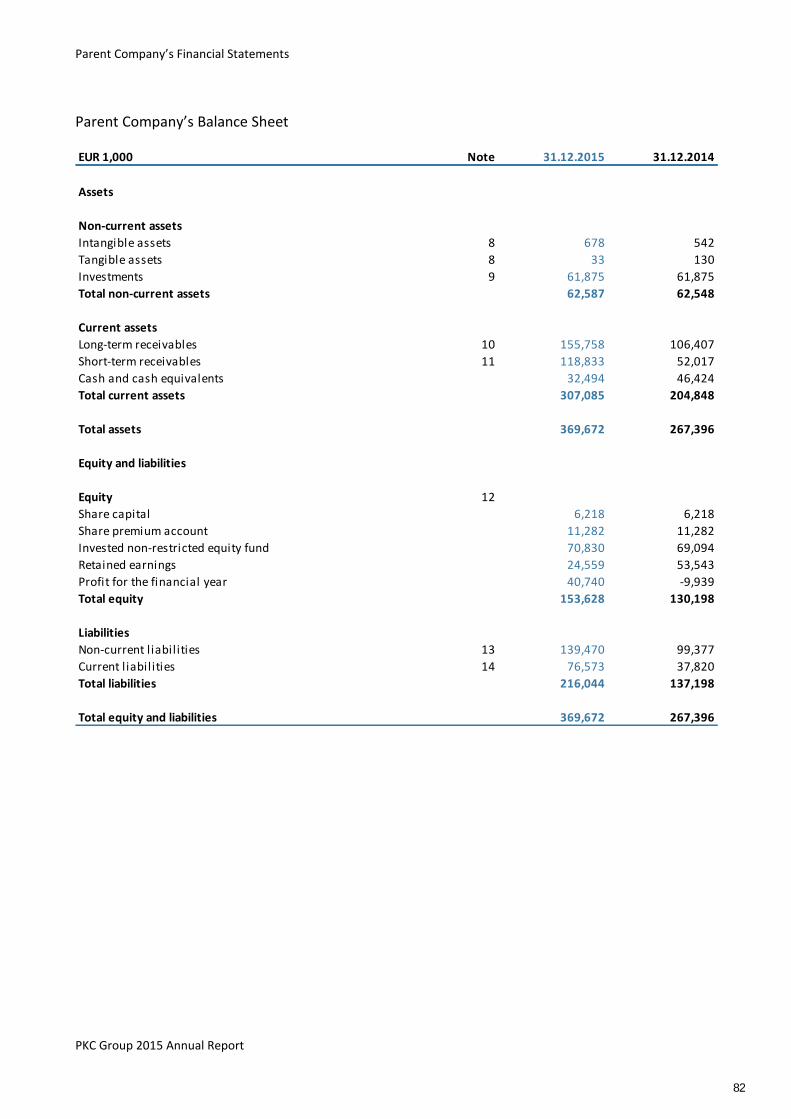
Parent Company’s Financial Statements
PKC Group 2015 Annual Report
Parent Company’s Balance Sheet
EUR 1,000 Note 31.12.2015 31.12.2014
Assets
Non-current assets
Intangible assets 8 678 542
Tangible assets 8 33 130
Investments 9 61,875 61,875
Total non-current assets 62,587 62,548
Current assets
Long-term receivables 10 155,758 106,407
Short-term receivables 11 118,833 52,017
Cash and cash equivalents 32,494 46,424
Total current assets 307,085 204,848
Total assets 369,672 267,396
Equity and liabilities
Equity 12
Share capital 6,218 6,218
Share premium account 11,282 11,282
Invested non-restricted equity fund 70,830 69,094
Retained earnings 24,559 53,543
Profit for the financial year 40,740 -9,939
Total equity 153,628 130,198
Liabilities
Non-current l iabilities 13 139,470 99,377
Current l iabilities 14 76,573 37,820
Total liabilities 216,044 137,198
Total equity and liabilities 369,672 267,396
82
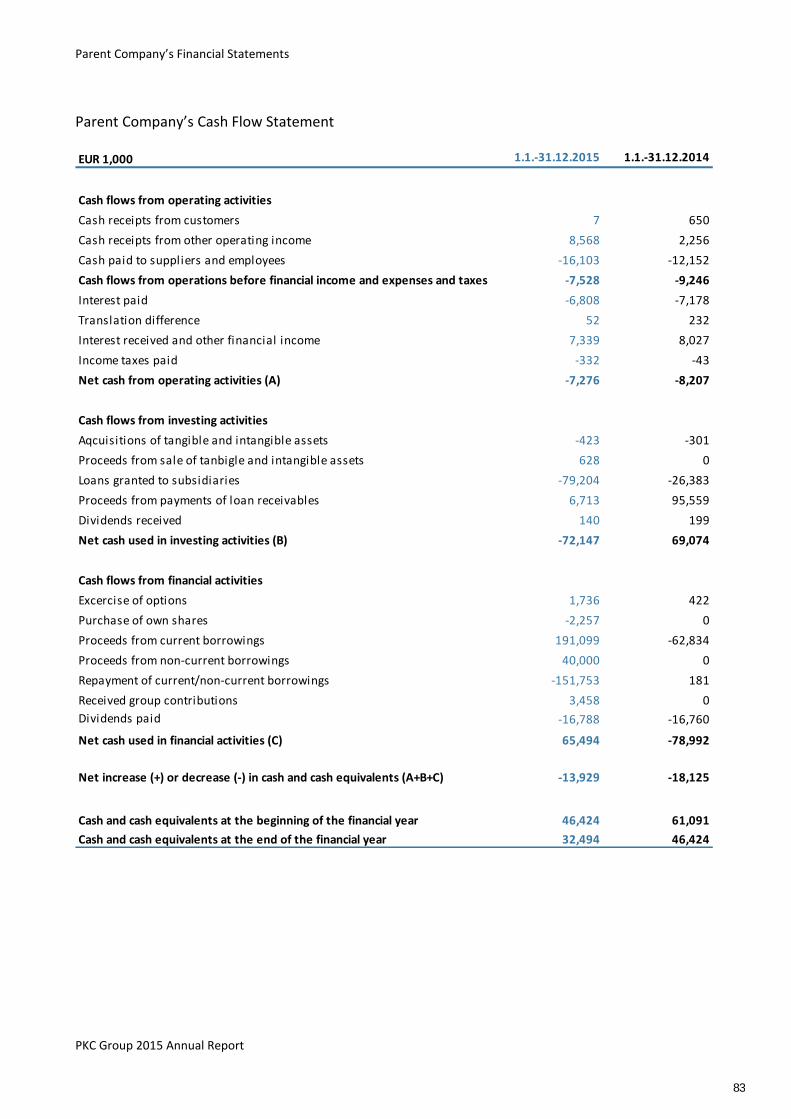
Parent Company’s Financial Statements
PKC Group 2015 Annual Report
Parent Company’s Cash Flow Statement
EUR 1,000 1.1.-31.12.2015 1.1.-31.12.2014
Cash flows from operating activities
Cash receipts from customers 7 650
Cash receipts from other operating income 8,568 2,256
Cash paid to suppliers and employees -16,103 -12,152
Cash flows from operations before financial income and expenses and taxes -7,528 -9,246
Interest paid -6,808 -7,178
Translation difference 52 232
Interest received and other financial income 7,339 8,027
Income taxes paid -332 -43
Net cash from operating activities (A) -7,276 -8,207
Cash flows from investing activities
Aqcuisitions of tangible and intangible assets -423 -301
Proceeds from sale of tanbigle and intangible assets 628 0
Loans granted to subsidiaries -79,204 -26,383
Proceeds from payments of loan receivables 6,713 95,559
Dividends received 140 199
Net cash used in investing activities (B) -72,147 69,074
Cash flows from financial activities
Excercise of options 1,736 422
Purchase of own shares -2,257 0
Proceeds from current borrowings 191,099 -62,834
Proceeds from non-current borrowings 40,000 0
Repayment of current/non-current borrowings -151,753 181
Received group contributions 3,458 0
Dividends paid -16,788 -16,760
Net cash used in financial activities (C) 65,494 -78,992
Net increase (+) or decrease (-) in cash and cash equivalents (A+B+C) -13,929 -18,125
Cash and cash equivalents at the beginning of the financial year 46,424 61,091
Cash and cash equivalents at the end of the financial year 32,494 46,424
83
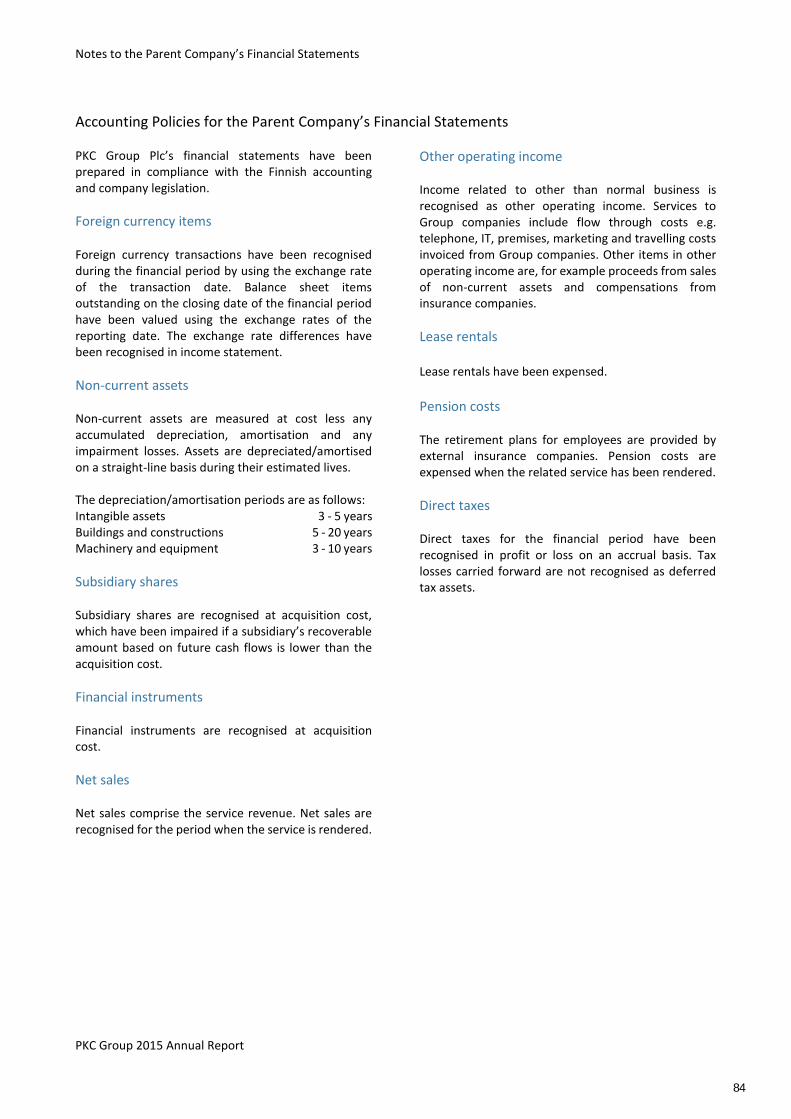
Notes to the Parent Company’s Financial Statements
PKC Group 2015 Annual Report
Accounting Policies for the Parent Company’s Financial Statements PKC Group Plc’s financial statements have been prepared in compliance with the Finnish accounting and company legislation.
Foreign currency items Foreign currency transactions have been recognised during the financial period by using the exchange rate of the transaction date. Balance sheet items outstanding on the closing date of the financial period have been valued using the exchange rates of the reporting date. The exchange rate differences have been recognised in income statement.
Non-current assets Non-current assets are measured at cost less any accumulated depreciation, amortisation and any impairment losses. Assets are depreciated/amortised on a straight-line basis during their estimated lives. The depreciation/amortisation periods are as follows: Intangible assets 3 - 5 years Buildings and constructions 5 - 20 years Machinery and equipment 3 - 10 years
Subsidiary shares Subsidiary shares are recognised at acquisition cost, which have been impaired if a subsidiary’s recoverable amount based on future cash flows is lower than the acquisition cost.
Financial instruments Financial instruments are recognised at acquisition cost.
Net sales Net sales comprise the service revenue. Net sales are recognised for the period when the service is rendered.
Other operating income Income related to other than normal business is recognised as other operating income. Services to Group companies include flow through costs e.g. telephone, IT, premises, marketing and travelling costs invoiced from Group companies. Other items in other operating income are, for example proceeds from sales of non-current assets and compensations from insurance companies.
Lease rentals Lease rentals have been expensed.
Pension costs The retirement plans for employees are provided by external insurance companies. Pension costs are expensed when the related service has been rendered.
Direct taxes Direct taxes for the financial period have been recognised in profit or loss on an accrual basis. Tax losses carried forward are not recognised as deferred tax assets.
84
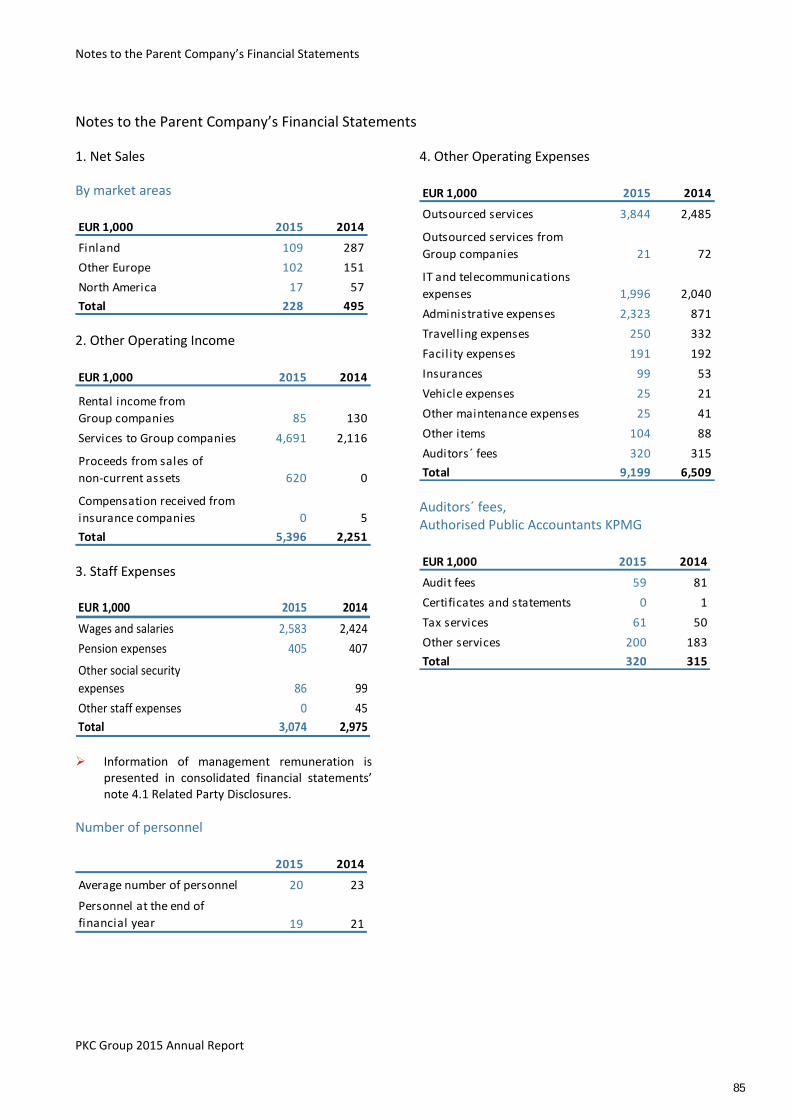
Notes to the Parent Company’s Financial Statements
PKC Group 2015 Annual Report
Notes to the Parent Company’s Financial Statements
1. Net Sales
By market areas
EUR 1,000 2015 2014
Finland 109 287
Other Europe 102 151
North America 17 57
Total 228 495
2. Other Operating Income
EUR 1,000 2015 2014
Rental income from
Group companies 85 130
Services to Group companies 4,691 2,116
Proceeds from sales of
non-current assets 620 0
Compensation received from
insurance companies 0 5
Total 5,396 2,251
3. Staff Expenses
EUR 1,000 2015 2014
Wages and salaries 2,583 2,424
Pension expenses 405 407
Other social security
expenses 86 99
Other staff expenses 0 45
Total 3,074 2,975 Information of management remuneration is
presented in consolidated financial statements’ note 4.1 Related Party Disclosures.
Number of personnel
2015 2014
Average number of personnel 20 23
Personnel at the end of
financial year 19 21
4. Other Operating Expenses
EUR 1,000 2015 2014
Outsourced services 3,844 2,485
Outsourced services from
Group companies 21 72
IT and telecommunications
expenses 1,996 2,040
Administrative expenses 2,323 871
Travelling expenses 250 332
Facility expenses 191 192
Insurances 99 53
Vehicle expenses 25 21
Other maintenance expenses 25 41
Other items 104 88
Auditors´ fees 320 315
Total 9,199 6,509
Auditors´ fees, Authorised Public Accountants KPMG
EUR 1,000 2015 2014
Audit fees 59 81
Certificates and statements 0 1
Tax services 61 50
Other services 200 183
Total 320 315
85
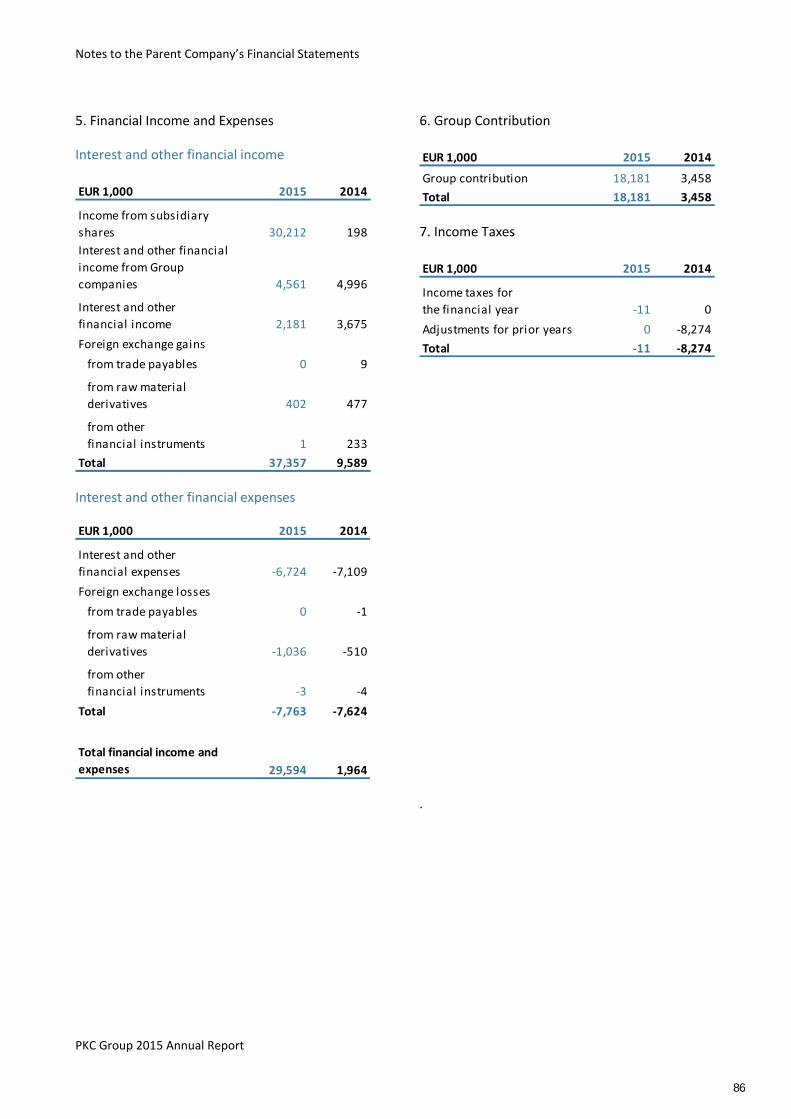
Notes to the Parent Company’s Financial Statements
PKC Group 2015 Annual Report
5. Financial Income and Expenses
Interest and other financial income
EUR 1,000 2015 2014
Income from subsidiary
shares 30,212 198
Interest and other financial
income from Group
companies 4,561 4,996
Interest and other
financial income 2,181 3,675
Foreign exchange gains
from trade payables 0 9
from raw material
derivatives 402 477
from other
financial instruments 1 233
Total 37,357 9,589
Interest and other financial expenses
EUR 1,000 2015 2014
Interest and other
financial expenses -6,724 -7,109
Foreign exchange losses
from trade payables 0 -1
from raw material
derivatives -1,036 -510
from other
financial instruments -3 -4
Total -7,763 -7,624
Total financial income and
expenses 29,594 1,964
6. Group Contribution
EUR 1,000 2015 2014
Group contribution 18,181 3,458
Total 18,181 3,458
7. Income Taxes
EUR 1,000 2015 2014
Income taxes for
the financial year -11 0
Adjustments for prior years 0 -8,274
Total -11 -8,274
.
86
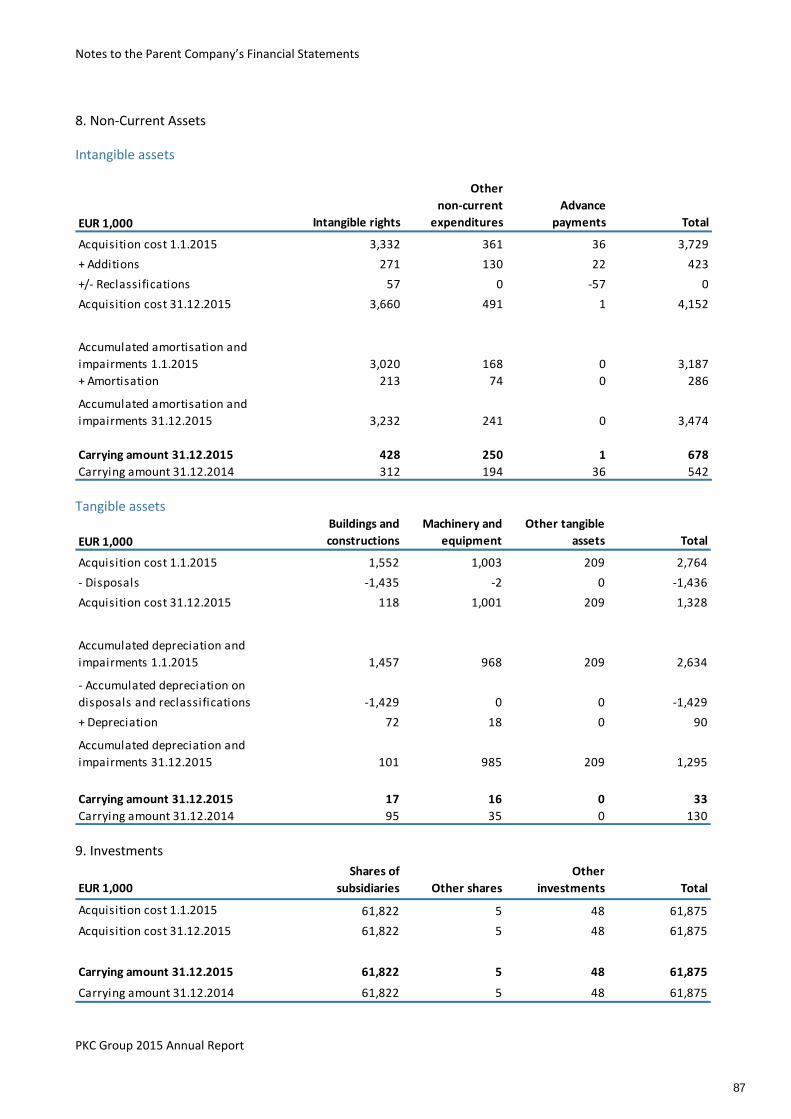
Notes to the Parent Company’s Financial Statements
PKC Group 2015 Annual Report
8. Non-Current Assets
Intangible assets
EUR 1,000 Intangible rights
Other
non-current
expenditures
Advance
payments Total
Acquisition cost 1.1.2015 3,332 361 36 3,729
+ Additions 271 130 22 423
+/- Reclassifications 57 0 -57 0
Acquisition cost 31.12.2015 3,660 491 1 4,152
Accumulated amortisation and
impairments 1.1.2015 3,020 168 0 3,187
+ Amortisation 213 74 0 286
Accumulated amortisation and
impairments 31.12.2015 3,232 241 0 3,474
Carrying amount 31.12.2015 428 250 1 678
Carrying amount 31.12.2014 312 194 36 542
Tangible assets
EUR 1,000
Buildings and
constructions
Machinery and
equipment
Other tangible
assets Total
Acquisition cost 1.1.2015 1,552 1,003 209 2,764
- Disposals -1,435 -2 0 -1,436
Acquisition cost 31.12.2015 118 1,001 209 1,328
Accumulated depreciation and
impairments 1.1.2015 1,457 968 209 2,634
- Accumulated depreciation on
disposals and reclassifications -1,429 0 0 -1,429
+ Depreciation 72 18 0 90
Accumulated depreciation and
impairments 31.12.2015 101 985 209 1,295
Carrying amount 31.12.2015 17 16 0 33
Carrying amount 31.12.2014 95 35 0 130
9. Investments
EUR 1,000
Shares of
subsidiaries Other shares
Other
investments Total
Acquisition cost 1.1.2015 61,822 5 48 61,875
Acquisition cost 31.12.2015 61,822 5 48 61,875
Carrying amount 31.12.2015 61,822 5 48 61,875
Carrying amount 31.12.2014 61,822 5 48 61,875
87
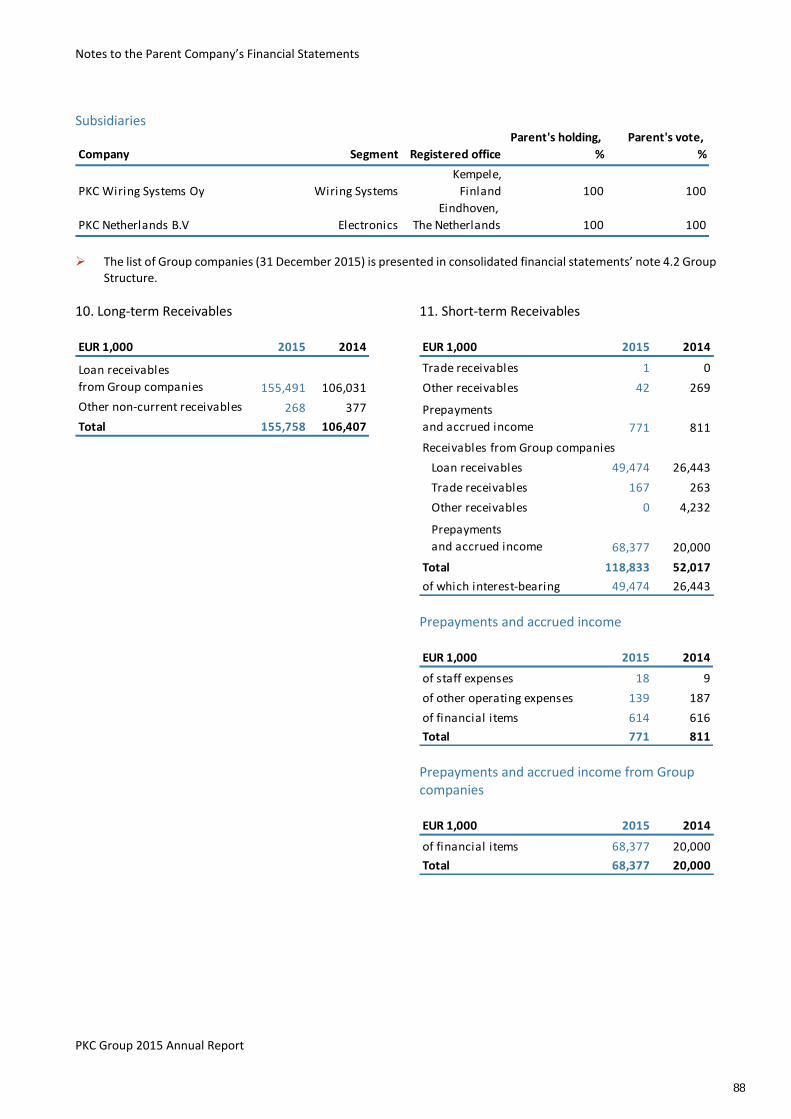
Notes to the Parent Company’s Financial Statements
PKC Group 2015 Annual Report
Subsidiaries
Company Segment Registered office
Parent's holding,
%
Parent's vote,
%
PKC Wiring Systems Oy Wiring Systems
Kempele,
Finland 100 100
PKC Netherlands B.V Electronics
Eindhoven,
The Netherlands 100 100
The list of Group companies (31 December 2015) is presented in consolidated financial statements’ note 4.2 Group
Structure.
10. Long-term Receivables
EUR 1,000 2015 2014
Loan receivables
from Group companies 155,491 106,031
Other non-current receivables 268 377
Total 155,758 106,407
11. Short-term Receivables
EUR 1,000 2015 2014
Trade receivables 1 0
Other receivables 42 269
Prepayments
and accrued income 771 811
Loan receivables 49,474 26,443
Trade receivables 167 263
Other receivables 0 4,232
Prepayments
and accrued income 68,377 20,000
Total 118,833 52,017
of which interest-bearing 49,474 26,443
Receivables from Group companies
Prepayments and accrued income
EUR 1,000 2015 2014
of staff expenses 18 9
of other operating expenses 139 187
of financial items 614 616
Total 771 811
Prepayments and accrued income from Group companies
EUR 1,000 2015 2014
of financial items 68,377 20,000
Total 68,377 20,000
88
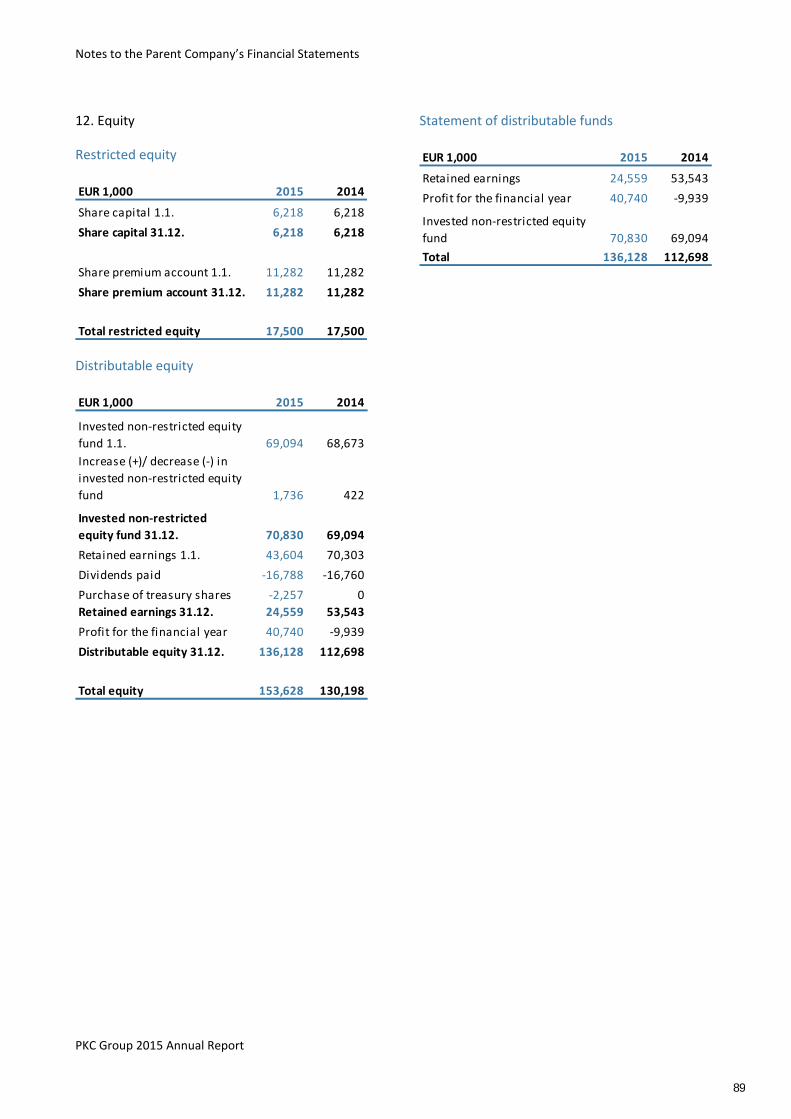
Notes to the Parent Company’s Financial Statements
PKC Group 2015 Annual Report
12. Equity
Restricted equity
EUR 1,000 2015 2014
Share capital 1.1. 6,218 6,218
Share capital 31.12. 6,218 6,218
Share premium account 1.1. 11,282 11,282
Share premium account 31.12. 11,282 11,282
Total restricted equity 17,500 17,500
Distributable equity
EUR 1,000 2015 2014
Invested non-restricted equity
fund 1.1. 69,094 68,673
Increase (+)/ decrease (-) in
invested non-restricted equity
fund 1,736 422
Invested non-restricted
equity fund 31.12. 70,830 69,094
Retained earnings 1.1. 43,604 70,303
Dividends paid -16,788 -16,760
Purchase of treasury shares -2,257 0
Retained earnings 31.12. 24,559 53,543
Profit for the financial year 40,740 -9,939
Distributable equity 31.12. 136,128 112,698
Total equity 153,628 130,198
Statement of distributable funds
EUR 1,000 2015 2014
Retained earnings 24,559 53,543
Profit for the financial year 40,740 -9,939
Invested non-restricted equity
fund 70,830 69,094
Total 136,128 112,698
89
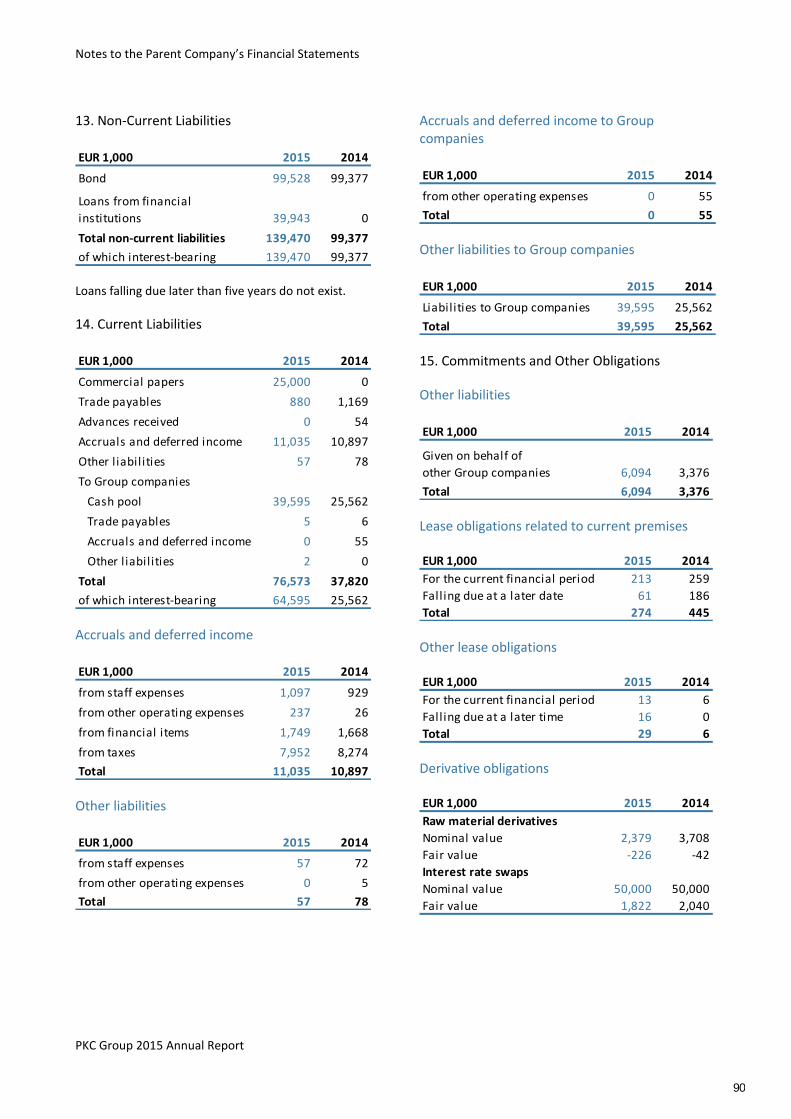
Notes to the Parent Company’s Financial Statements
PKC Group 2015 Annual Report
13. Non-Current Liabilities
EUR 1,000 2015 2014
Bond 99,528 99,377
Loans from financial
institutions 39,943 0
Total non-current liabilities 139,470 99,377
of which interest-bearing 139,470 99,377 Loans falling due later than five years do not exist.
14. Current Liabilities
EUR 1,000 2015 2014
Commercial papers 25,000 0
Trade payables 880 1,169
Advances received 0 54
Accruals and deferred income 11,035 10,897
Other liabilities 57 78
To Group companies
Cash pool 39,595 25,562
Trade payables 5 6
Accruals and deferred income 0 55
Other liabilities 2 0
Total 76,573 37,820
of which interest-bearing 64,595 25,562
Accruals and deferred income
EUR 1,000 2015 2014
from staff expenses 1,097 929
from other operating expenses 237 26
from financial items 1,749 1,668
from taxes 7,952 8,274
Total 11,035 10,897
Other liabilities
EUR 1,000 2015 2014
from staff expenses 57 72
from other operating expenses 0 5
Total 57 78
Accruals and deferred income to Group companies
EUR 1,000 2015 2014
from other operating expenses 0 55
Total 0 55
Other liabilities to Group companies
EUR 1,000 2015 2014
Liabilities to Group companies 39,595 25,562
Total 39,595 25,562
15. Commitments and Other Obligations
Other liabilities
EUR 1,000 2015 2014
Given on behalf of
other Group companies 6,094 3,376
Total 6,094 3,376
Lease obligations related to current premises
EUR 1,000 2015 2014
For the current financial period 213 259
Falling due at a later date 61 186
Total 274 445
Other lease obligations
EUR 1,000 2015 2014
For the current financial period 13 6
Falling due at a later time 16 0
Total 29 6
Derivative obligations
EUR 1,000 2015 2014
Raw material derivatives
Nominal value 2,379 3,708
Fair value -226 -42
Interest rate swaps
Nominal value 50,000 50,000
Fair value 1,822 2,040
90
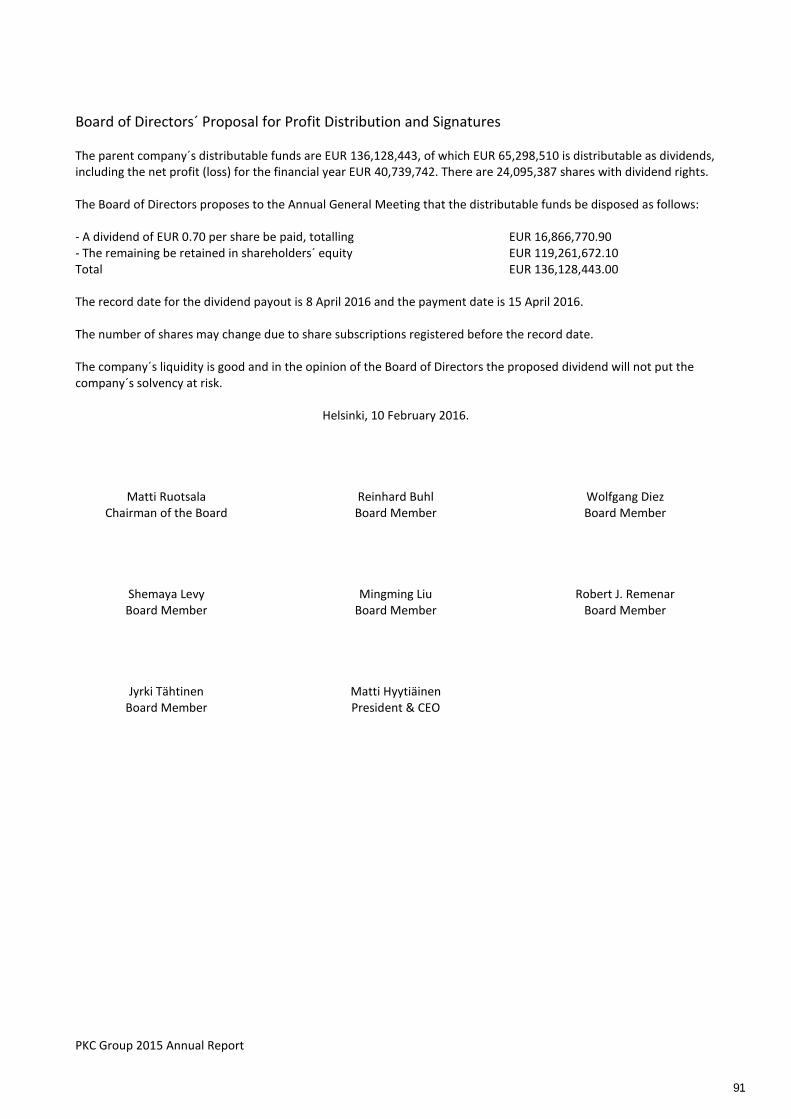
PKC Group 2015 Annual Report
Board of Directors´ Proposal for Profit Distribution and Signatures The parent company´s distributable funds are EUR 136,128,443, of which EUR 65,298,510 is distributable as dividends, including the net profit (loss) for the financial year EUR 40,739,742. There are 24,095,387 shares with dividend rights. The Board of Directors proposes to the Annual General Meeting that the distributable funds be disposed as follows: - A dividend of EUR 0.70 per share be paid, totalling EUR 16,866,770.90 - The remaining be retained in shareholders´ equity EUR 119,261,672.10 Total EUR 136,128,443.00 The record date for the dividend payout is 8 April 2016 and the payment date is 15 April 2016. The number of shares may change due to share subscriptions registered before the record date. The company´s liquidity is good and in the opinion of the Board of Directors the proposed dividend will not put the company´s solvency at risk.
Helsinki, 10 February 2016.
Matti Ruotsala Chairman of the Board
Shemaya Levy Board Member
Jyrki Tähtinen Board Member
Reinhard Buhl Board Member
Mingming Liu Board Member
Matti Hyytiäinen President & CEO
Wolfgang Diez Board Member
Robert J. Remenar Board Member
91
PKC Group 2015 Annual Report
Auditor’s Report
To the Annual General Meeting of PKC Group Plc We have audited the accounting records, the financial statements, the report of the Board of Directors, and the administration of PKC Group Plc for the year ended 31 December, 2015. The financial statements comprise the consolidated statement of financial position, consolidated statement of comprehensive income, consolidated statement of changes in equity and consolidated statement of cash flows and notes to the consolidated financial statements, as well as the parent company’s balance sheet, income statement, cash flow statement and notes to the financial statements.
Responsibility of the Board of Directors and the President and CEO The Board of Directors and the President and CEO are responsible for the preparation of consolidated financial statements that give a true and fair view in accordance with International Financial Reporting Standards (IFRS) as adopted by the EU, as well as for the preparation of financial statements and the report of the Board of Directors that give a true and fair view in accordance with the laws and regulations governing the preparation of the financial statements and the report of the Board of Directors in Finland. The Board of Directors is responsible for the appropriate arrangement of the control of the company’s accounts and finances, and the President and CEO shall see to it that the accounts of the company are in compliance with the law and that its financial affairs have been arranged in a reliable manner.
Auditor’s Responsibility Our responsibility is to express an opinion on the financial statements, on the consolidated financial statements and on the report of the Board of Directors based on our audit. The Auditing Act requires that we comply with the requirements of professional ethics. We conducted our audit in accordance with good auditing practice in Finland. Good auditing practice requires that we plan and perform the audit to obtain reasonable assurance about whether the financial statements and the report of the Board of Directors are free from material misstatement, and whether the members of the Board of Directors of the parent company or the President and CEO are guilty of an act or negligence which may result in liability in damages towards the company or have violated the Limited
Liability Companies Act or the articles of association of the company. An audit involves performing procedures to obtain audit evidence about the amounts and disclosures in the financial statements and the report of the Board of Directors. The procedures selected depend on the auditor’s judgment, including the assessment of the risks of material misstatement, whether due to fraud or error. In making those risk assessments, the auditor considers internal control relevant to the entity’s preparation of financial statements and report of the Board of Directors that give a true and fair view in order to design audit procedures that are appropriate in the circumstances, but not for the purpose of expressing an opinion on the effectiveness of the company’s internal control. An audit also includes evaluating the appropriateness of accounting policies used and the reasonableness of accounting estimates made by management, as well as evaluating the overall presentation of the financial statements and the report of the Board of Directors. We believe that the audit evidence we have obtained is sufficient and appropriate to provide a basis for our audit opinion.
Opinion on the consolidated financial statements In our opinion, the consolidated financial statements give a true and fair view of the financial position, financial performance, and cash flows of the group in accordance with International Financial Reporting Standards (IFRS) as adopted by the EU.
Opinion on the company’s financial statements and the report of the Board of Directors In our opinion, the financial statements and the report of the Board of Directors give a true and fair view of both the consolidated and the parent company’s financial performance and financial position in accordance with the laws and regulations governing the preparation of the financial statements and the report of the Board of Directors in Finland. The information in the report of the Board of Directors is consistent with the information in the financial statements.
92
PKC Group 2015 Annual Report
Other opinions We recommend that the Members of the Board of Directors and the President and CEO should be discharged from liability for the financial period audited by us. Helsinki, February 10, 2016 KPMG Oy Ab Virpi Halonen Authorized Public Accountant
93
Corporate Governance Statement 2015
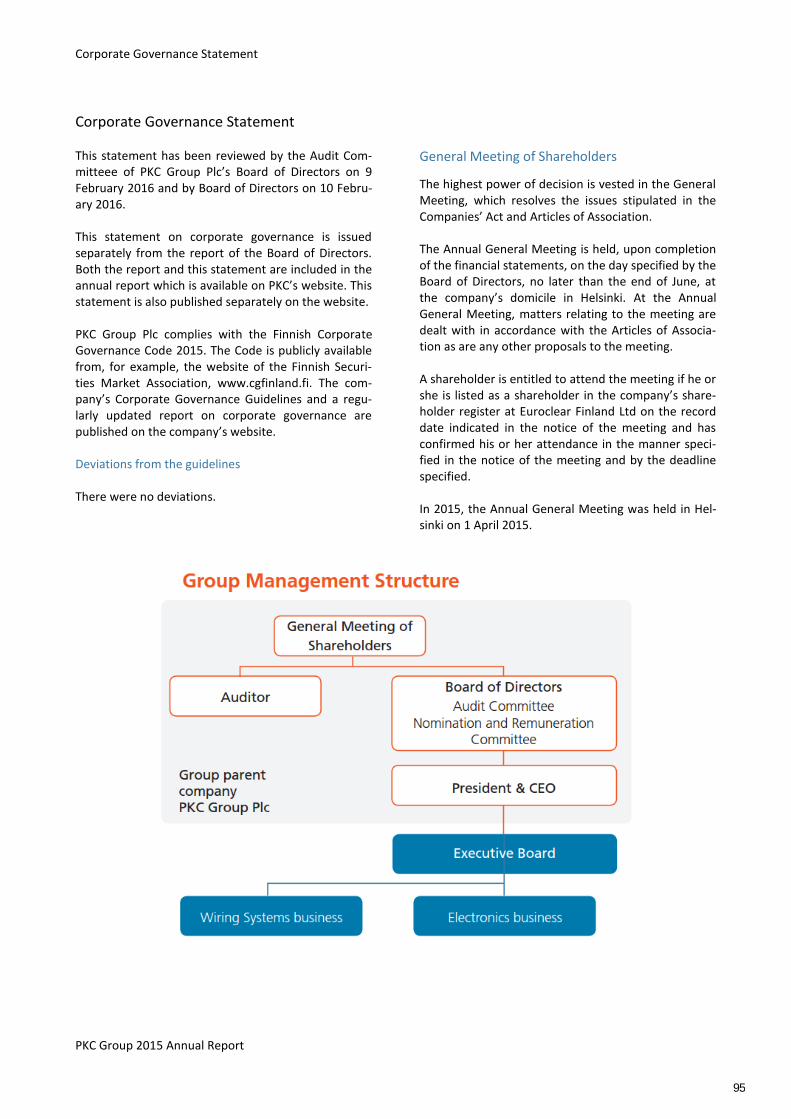
Corporate Governance Statement
PKC Group 2015 Annual Report
Corporate Governance Statement This statement has been reviewed by the Audit Com-mitteee of PKC Group Plc’s Board of Directors on 9 February 2016 and by Board of Directors on 10 Febru-ary 2016. This statement on corporate governance is issued separately from the report of the Board of Directors. Both the report and this statement are included in the annual report which is available on PKC’s website. This statement is also published separately on the website. PKC Group Plc complies with the Finnish Corporate Governance Code 2015. The Code is publicly available from, for example, the website of the Finnish Securi-ties Market Association, www.cgfinland.fi. The com-pany’s Corporate Governance Guidelines and a regu-larly updated report on corporate governance are published on the company’s website. Deviations from the guidelines There were no deviations.
General Meeting of Shareholders
The highest power of decision is vested in the General Meeting, which resolves the issues stipulated in the Companies’ Act and Articles of Association. The Annual General Meeting is held, upon completion of the financial statements, on the day specified by the Board of Directors, no later than the end of June, at the company’s domicile in Helsinki. At the Annual General Meeting, matters relating to the meeting are dealt with in accordance with the Articles of Associa-tion as are any other proposals to the meeting. A shareholder is entitled to attend the meeting if he or she is listed as a shareholder in the company’s share-holder register at Euroclear Finland Ltd on the record date indicated in the notice of the meeting and has confirmed his or her attendance in the manner speci-fied in the notice of the meeting and by the deadline specified. In 2015, the Annual General Meeting was held in Hel-sinki on 1 April 2015.
95
Corporate Governance Statement
PKC Group 2015 Annual Report
Board of Directors The Board of Directors is responsible for the compa-ny’s administration and the due organisation of opera-tions. The Board of Directors has drafted a written charter for its operations, which defines the key tasks and operating principles of the Board. The charter is published in its entirety on the company’s website and its key content is described herein. The Board’s main duties include confirming the com-pany’s strategy and budget, approving the principles of risk management and ensuring the functioning of the management system. The Board shall decide on matters that are unusual or that have far-reaching consequences in light of the scope and quality of the company’s operations and the framework of its field of business. These matters include the following, among others: • to decide on acquisitions, mergers and other re-
organisations that affect the structure of the Group and on strategically important expansions of the business and equity investments,
• to decide on the development of investments and significant individual investments,
• to approve incentive schemes and remuneration systems relating to the whole group.
The Annual General Meeting elects, in accordance with the Articles of Association, 5–7 members to the Board for a term that expires at the end of the next Annual General Meeting. The nomination proposals to the general meeting are prepared by the Board’s Nom-ination and Remuneration Committee. Board mem-bers are elected such that they have the required competence for the task and the ability to devote a sufficient amount of time to the work. Both genders shall, when possible, be represented on the Board. The principles concerning the diversity of the Board shall be defined in 2016. The majority of the Board members must be independent of the company, and at least two of the said majority must be independent of the company’s significant shareholders. The Board of Directors evaluates the independence of its mem-bers annually. The Board elects from among its mem-bers a Chairman, who according to the Articles of Association cannot be the company’s President. The duties and responsibilities of the Chairman and other Board members have not been designated specifically. The Board independently evaluates, on an annual basis, its performance and working methods with an eye on development opportunities. The first time such an evaluation was performed was for the year 2004.
The Board performs a self-evaluation via a question-naire, which the President and all Board members must complete. Board of Directors 31.12.2015 In 2015, the Annual General Meeting elected seven people to the Board. Reinhard Buhl, Wolfgang Diez, Shemaya Levy, Mingming Liu, Robert Remenar, Matti Ruotsala and Jyrki Tähtinen were re-elected as Board members. After the 2015 Annual General Meeting, the Board of Directors elected Matti Ruotsala Chairman and Robert Remenar Vice Chairman. Matti Ruotsala (b. 1956)
Chairman of the Board of Directors
Chairman of the Nomination and Remuneration Committee
M.Sc.(Eng.)
Chief Operating Officer and Deputy to CEO, For-tum Corporation
Independent of the company and of its signifi-cant shareholders
own and controlled corporation’s ownerhip: 0 Reinhard Buhl (b. 1952)
Member of the Nomination and Remuneration Committee
M.Sc. (Mechanical Engineering)
Member of the Board of Management, ZF Frie-drichshafen AG
Independent of Company and of its significant shareholders
own and controlled corporation’s ownerhip: 0 Wolfgang Diez (b. 1953)
Member of the Audit Committee
Diplom-Kaufmann in Business Administration
Independent consultant in automotive and sup-plier industry
Independent of the company and of its signifi-cant shareholders
own and controlled corporation’s ownerhip: 0 Shemaya Levy (b. 1947)
Chairman of the Audit Committee
Graduate of ENSAE (Ecole Nationale de la Statis-tique et de l´Administration Economique)
Board professional
Independent of the company and of significant shareholders
own and controlled corporation’s ownerhip: 0
96
Corporate Governance Statement
PKC Group 2015 Annual Report
Mingming Liu (b. 1951)
Member of the Audit Committee
C-MBA
Executive Director of Technology Centre and Business Development, Sinar Mas Group-App China
Independent of Company and of its significant shareholders
own and controlled corporation’s ownerhip: 0 Robert J. Remenar (b. 1955)
Vice-Chairman of the Board of Directors
Member of the Nomination and Remuneration Committee
Master’s Degree – Business and Professional Ac-countancy
Consultant, Advisor and Board Professional
Independent of the company and of significant shareholders
own and controlled corporation’s ownerhip: 0 Jyrki Tähtinen (b. 1961)
Member of the Audit Committee
LL.M, MBA, Attorney at Law
Borenius Attorneys Ltd´s Chairman of the Board of Directors
Independent of the company and of its signifi-cant shareholders
own and controlled corporation’s ownerhip: 10,892 shares
Meetings of the Board in 2015 On average, the Board meet on a monthly basis and also on other occasions as necessary. In 2015, the Board held 13 meetings, of which 7 were telephone meetings, in addition to which 3 decision minutes were drafted without holding a meeting. Attendance of Board members at the meetings meetings attendance-%
Reinhard Buhl 13/13 100 Wolfgang Diez 13/13 100 Shemaya Levy 12/13 94 Mingming Liu 12/13 94 Robert Remenar 13/13 100 Matti Ruotsala 13/13 100 Jyrki Tähtinen 13/13 100
Average attendance 98
Committees of the Board The Board has established from among its members the Audit Committee and the Nomination and Remu-neration Committee. It has not been deemed neces-sary to establish other committees, as, taking into account the scope and nature of the company’s opera-tions as well as the Board’s working methods, the Board is able to handle matters effectively without such committees. Audit Committee Audit Committee assists the Board by concentrating on issues relating to financial reporting and control, as well as preparing the proposal for resolution on the election of the auditor. The Board of Directors has drafted a written charter for the Audit Committee, which defines the key tasks and operating principles of the Audit Committee. The charter is published in its entirety on the company’s website. The Board elects the members and Chairman of the Committee from among its members at the organisa-tion meeting. In 2015, Shemaya Levy was elected as Chairman of the Audit Committee and Wolfgang Diez, Mingming Liu and Jyrki Tähtinen as members. The members must have the qualifications required for fulfilment of the Committee’s role, and at least one member shall have expertise either in accounting or bookkeeping or in auditing. The Committee must have sufficient expertise in accounting, bookkeeping, audit-ing, internal audit or practices related to financial statements, as the Committee deals with matters relating to the financial reporting and control of the company. The expertise may be based, for example, on experience in corporate management. The members of the Audit Committee must be inde-pendent of the company, and at least one member must be independent of significant shareholders. If the Audit Committee has only two members, both must be independent of significant shareholders. In case the Audit Committee consists of more than three mem-bers, of which three are independent of the company, additional one member not independent of the com-pany may be appointed to the Audit Committee for good reasons. Meetings of the Audit Committee in 2015 The Audit Committee convenes at least four times a year before publication of the financial results and
97
Corporate Governance Statement
PKC Group 2015 Annual Report
whenever necessary. In 2015, the Audit Committee held 7 meetings, of which 5 were telephone meetings. Attendance of Committee members at the meetings meetings attendance-%
Wolfgang Diez 7/7 100 Shemaya Levy 7/7 100 Mingming Liu 6/7 86 Jyrki Tähtinen 7/7 100
Average attendance 96 Nomination and Remuneration Committee Nomination and Remuneration Committee assists the Board by concentrating on matters pertaining to the nomination and remuneration of Board members, the appointment and remuneration of the managing di-rector and other executives of the company as well as the remuneration schemes of the personnel. The Board of Directors has drafted a written charter for the Nomination and Remuneration Committee, which defines the key tasks and operating principles of the Nomination and Remuneration Committee. The char-ter is published in its entirety on the company’s web-site. The Board elects the members and Chairman of the Committee from among its members at the organisa-tion meeting. In 2015, Matti Ruotsala was elected as Chairman of the Committee and Reinhard Buhl and Robert Remenar as members. The members must be independent of the company. The President or any other executive of the company may not be appointed to the Nomination and Remu-neration Committee. Meetings of the Nomination and Remuneration Com-mittee in 2015 The Nomination Committee convenes at least once a year in order to prepare the proposals to be presented to the general meeting and whenever necessary. In 2015, the Nomination Committee held 3 meetings, all as telephone meetings. Attendance of Committee members at the meetings meertings attendance-%
Reinhard Buhl 3/3 100 Robert Remenar 3/3 100 Matti Ruotsala 3/3 100
Average attendance 100
President and Executive Board President The Board appoints the company’s President, who is also the Group CEO. The President supervises the operations and administration of the whole group in accordance with the Companies’ Act, the Articles of Association, the directions of the Board as well as the company’s Corporate Governance Guidelines and other internal guidelines. The President’s service con-tract has been prepared in writing and shall remain valid until further notice. The President operates as the Chairman of the Executive Board. The company´s President & CEO since April 4, 2012 has been Matti Hyytiäinen. In 2013, President & CEO Matti Hyytiäinen has relocated to Hong Kong on an interim basis in order to further grow Group’s business in Asia and China. Executive Board The Executive Board supports the President & CEO in managing the Group, but it does not have any authori-ty based on legislation or the Articles of Association. The tasks of the Executive Board are to improve oper-ations, carry out strategic work, monitor the realisa-tion of the objectives and action plans set in strategic work, and deal with other matters of vital importance to operations. The Executive Board comprises the President & CEO (Chairman) and persons appointed at the proposal of the President. President and Executive Board 31.12.2015 Matti Hyytiäinen (b. 1960)
President & CEO
M. Sc. (Economics)
own and controlled corporation’s ownerhip: 14,527 shares, 60,000 2009C options, 36,000 2012B(i) options, 14,000 2012C(i) options
Julie Bellamy (b. 1962)
Group Senior Vice President, Human Resources
Bachelor of Arts (Business/HR)
own and controlled corporation’s ownerhip: 2,800 shares, 5,000 2012B(i) options and 5,000 2012C(i) options
André Gerstner (b. 1976)
President, Rolling Stock Business
Industrial Engineering studies
own and controlled corporation’s ownerhip: 0
98
Corporate Governance Statement
PKC Group 2015 Annual Report
Jyrki Keronen (b.1966)
President, Wiring Systems, APAC
BSc. Eng., EMBA
own and controlled corporation’s ownerhip: 5,500 shares, 15,800 2012B(i) options, 8,200 2012C(i) options
Jani Kiljala (b. 1975)
President, Wiring Systems, Europe and South America
M.Sc. (Tech.)
own and controlled corporation’s ownerhip: 10,410 shares, 10,000 2009C options, 17,800 2012B(i) options, 8,200 2012C(i) options
Frank Sovis (b. 1961)
President, Wiring Systems, North America
MBA, BBA
own and controlled corporation’s ownerhip: 11,000 shares, 15,000 2012B(i) options, 15,000 2012C(i) options
Juha Torniainen (b. 1966)
CFO
M.Sc. (Econ.)
own and controlled corporation’s ownerhip: 7,500 shares, 17,800 2012B(i) options, 8,200 2012C(i) options
Vesa Vähämöttönen (b. 1966)
Group Senior Vice President, Business Develop-ment
M.Sc. (Eng), Lic.Sc. (Tech.)
own and controlled corporation’s ownerhip: 0
Organisation of the business and group compa-nies The Group’s operations and ownership of subsidiaries are divided into two business areas corresponding to the core competence areas: Wiring Systems and Elec-tronics. The Executive Board and specifically the Executive Board members with business unit responsibility are responsible for the organisation and development of the business. The Executive Board shall decide on policies and strategies relating to the business within the framework approved by PKC’s Board. The board or an equivalent body and the managing director of the group companies are elected, and con-ditions of service are decided, by the parent company President & CEO and/or the responsible Executive
Board member in accordance with the general princi-ples approved by the Board. The boards and equiva-lent governing bodies of the business areas largely comprise of representatives of PKC’s management. The boards and equivalent governing bodies of the group companies are also responsible for the tasks falling within the remit of the board and specified by the legislation and regulations of the relevant coun-tries.
Audit The Annual General Meeting elects an auditor ap-proved by the Finnish Central Chamber of Commerce as the company’s auditor. In 2015, KPMG Oy Ab was elected as the company’s auditor, and KPMG declared Virpi Halonen, Authorised Public Accountant, as the principal auditor. The auditor’s term expires after the conclusion of the next Annual General Meeting follow-ing the election. In 2015, audotor was paid remunera-tion for audit services 59,464 euros and for non-audit services 261,023 euros.
Insider Issues The company complies with the Insider Guidelines of Nasdaq Helsinki. The company’s public insider register has been presented in its entirety on the company’s website. The company’s internal, non-public, compa-ny-specific insiders include persons who regularly handle insider information during the performance of their duties. When major projects are on-going, pro-ject-specific insider registers are also used. The company recommends that the insiders acquire the company’s shares as long-term investments and do not participate in active trading. It is also recom-mended to schedule the trading within 30 days after the publication of financial reports, whilst taking into account the restrictions that possible insider infor-mation imposes. The insiders may not trade in the company’s shares or share-related rights within the 30-day period prior to the publication of the compa-ny’s Q1 and Q3 interim statements and Q2 half-yearly report or the financial statement bulletins, and this closed window ends on the day following the publica-tion of financial results.
99
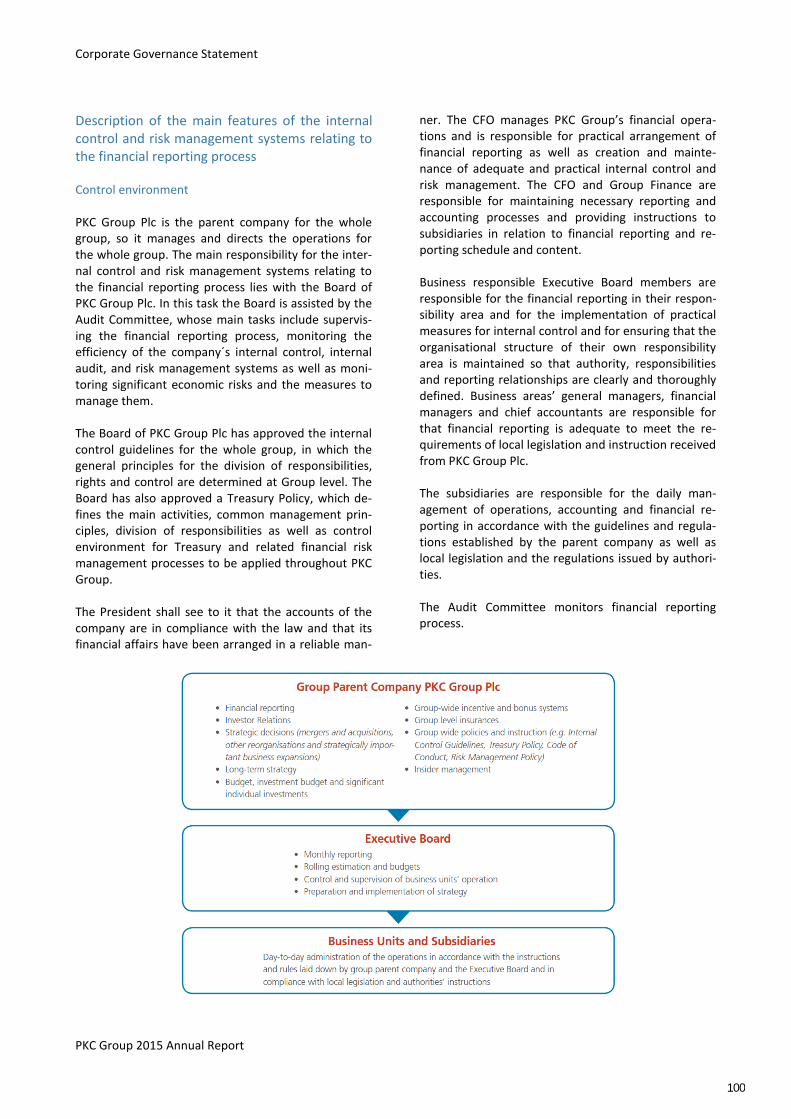
Corporate Governance Statement
PKC Group 2015 Annual Report
Description of the main features of the internal control and risk management systems relating to the financial reporting process Control environment PKC Group Plc is the parent company for the whole group, so it manages and directs the operations for the whole group. The main responsibility for the inter-nal control and risk management systems relating to the financial reporting process lies with the Board of PKC Group Plc. In this task the Board is assisted by the Audit Committee, whose main tasks include supervis-ing the financial reporting process, monitoring the efficiency of the company´s internal control, internal audit, and risk management systems as well as moni-toring significant economic risks and the measures to manage them. The Board of PKC Group Plc has approved the internal control guidelines for the whole group, in which the general principles for the division of responsibilities, rights and control are determined at Group level. The Board has also approved a Treasury Policy, which de-fines the main activities, common management prin-ciples, division of responsibilities as well as control environment for Treasury and related financial risk management processes to be applied throughout PKC Group. The President shall see to it that the accounts of the company are in compliance with the law and that its financial affairs have been arranged in a reliable man-
ner. The CFO manages PKC Group’s financial opera-tions and is responsible for practical arrangement of financial reporting as well as creation and mainte-nance of adequate and practical internal control and risk management. The CFO and Group Finance are responsible for maintaining necessary reporting and accounting processes and providing instructions to subsidiaries in relation to financial reporting and re-porting schedule and content. Business responsible Executive Board members are responsible for the financial reporting in their respon-sibility area and for the implementation of practical measures for internal control and for ensuring that the organisational structure of their own responsibility area is maintained so that authority, responsibilities and reporting relationships are clearly and thoroughly defined. Business areas’ general managers, financial managers and chief accountants are responsible for that financial reporting is adequate to meet the re-quirements of local legislation and instruction received from PKC Group Plc. The subsidiaries are responsible for the daily man-agement of operations, accounting and financial re-porting in accordance with the guidelines and regula-tions established by the parent company as well as local legislation and the regulations issued by authori-ties. The Audit Committee monitors financial reporting process.
100
Corporate Governance Statement
PKC Group 2015 Annual Report
Internal control The Board is responsible for internal control and Board’s Audit Committee is responsible for monitoring the efficiency of the company´s internal control, inter-nal audit, and risk management systems. The Board shall ensure that the company has determined operat-ing principles for internal control and that the compa-ny monitors the effectiveness of control procedures. Moreover, it shall ensure that planning, information and control systems used for risk management are sufficient and support the business objectives. The Board of PKC Group Plc has approved the group-wide internal control guidelines and the Treasury Policy. The President and the CFO are responsible for the practical arrangement of control procedures. The aim of internal control and risk management is to ensure that the company’s operations are efficient and productive, that information is reliable and that regulations and operating principles are followed throughout the Group. The aims of internal control include the following, among others: • the clear definition of responsibilities, authority
and reporting relationships • the promotion of an ethical environment and
honesty • the achievement of the aims and objectives set
and the economical and effective use of re-sources
• appropriate management of risk • validity and reliability of financial data and other
management information • separation of the functions relating to commit-
ments, payments and bookkeeping for assets and liabilities, and the reconciliation of these pro-cesses
• the safeguarding of operations, data and assets • ensuring information flows • ensuring that external regulations as well as in-
ternal operating procedures and standards are followed.
Internal control is an essential part of all Group opera-tions at all levels of the organisation. Control proce-dures are carried out at all levels and in all functions of the whole organisation. The internal control processes include internal guidelines, reporting, various technical systems and procedures relating to operations. They help ensure that management directives are followed and that there is an appropriate response to risks that threaten achievement of the Group’s objectives. The daily tasks include management reviews and audits and operational reviews and audits, carrying out checks that are suitable for each line of business, phys-
ical controls, monitoring compliance with agreed ac-ceptance limits and operating principles and monitor-ing of deviations, a system of approvals and mandates, and various checks and reconciliation arrangements. Internal audit The purpose of Internal Audit is to provide independ-ent, objective assurance and consulting services that are designed to add value and improve PKC Group’s operations. Internal Audit work is expected to cover risks that threaten PKC Group’s strategic, operational, compliance and reporting related objectives. By bring-ing a systematic, disciplined and objective approach Internal Audit helps PKC Group to improve the effec-tiveness of governance, risk management and control processes. Internal audit work supports the achieve-ment of the defined objectives. Internal Audit has complete and unrestricted access to all PKC activities. In order to ensure the independence of the Internal Audit, Internal Audit reports to the Audit Committee and administratively to the Group CFO. Internal Audit conducts regular audits at plants, subsidiaries and other functions, implementing an annual audit plan approved by the Audit Committee, including any spe-cial tasks requested by the management and Audit Committee. Internal Audit and Quality & Risk man-agement organizations cooperate and take into ac-count the other organisation’s results of work in their own plans. Internal Audit Plan is also coordinated with external auditor. Risk management Risk management is an integral part of internal con-trol. Risk management refers to the identification, assessment, measurement, limitation and monitoring of risks that are fundamentally related to the business or are part of it. The aim of risk management is to identify the risks relevant to business operations and to determine the measures, responsibilities and schedules required for effective risk management. Risk management processes go hand-in-hand with internal audit and strategic processes, and the results achieved are used systematically in the annual plan. Risk man-agement is carried out and risks are reported in ac-cordance with the risk management policy, risk man-agement guidelines, the risk management annual plan and the Group’s risk management process. The evalu-ations are performed regularly, according to the schedule arranged by the parent company, in all the units belonging to the Group by function. The Group-level risk management report is reviewed by the Audit Committee and the Board of Directors at least once a year.
101
Corporate Governance Statement
PKC Group 2015 Annual Report
The CFO and group financing is responsible for the management of financial risks and risks relating to financial reporting. For the management of financial risks, the Board of the parent company has confirmed the Group’s Treasury Policy. Financial risks are identi-fied, evaluated and controlled in the context of the Group’s general risk management process and sepa-rately as part of financial management’s own opera-tional processes. Financial reporting It is necessary to provide adequate and comprehen-sive information for decision making. The information must be reliable, relevant and timely, and it shall be supplied in the format agreed. The information to be supplied includes financial and operational data sourced internally, data on compliance with external regulations and internal procedures, and external data on the business environment and market develop-ments. The Board of PKC shall ensure that the compa-ny’s financial statements provide adequate and accu-rate information about the company. The Board of Directors is assisted by the Audit Committee in these tasks. The duties of the Audit Committee include, amongst others • monitoring the reporting process for financial
statements; • supervising the financial reporting process; • monitoring the financial position and financing of
the Group; • reviewing the budget, forecast and assumptions
related thereto; • reviewing financial statements, reports by the
Board of Directors, Q1 and Q3 interim state-ments and Q2 half-yearly reports and financial bulletins before approval by the Board, as well as reviewing the annual reports, including, e.g.:
- ensuring the correctness of the company’s fi-nancial results together with the company’s management and auditors;
- examining the bases of preparation, and the management estimates used in the prepara-tion work;
- reviewing short-term risks and uncertainties as well as the prospects for the future;
- reviewing the description of the main fea-tures of the internal control and risk man-agement systems relating to the financial re-porting process, which is included in the company’s corporate governance statement issued in connection with the financial state-ments and report by the Board of Directors.
The President is responsible for ensuring that the company’s accounting complies with legislation and that the financial administration has been organised in a reliable way. The CFO and the Group finance de-partment determine, support and co-ordinate the financial management for the whole group and the control of operations. The Group finance department is responsible for the monitoring of and compliance with financial reporting standards, the maintenance of bases relating to financial reporting, and providing information and training to units. The duties of the Group finance department also include the financing of Group companies, hedging against foreign exchange and commodity rate risks, investments, the admin-istration of external debt and transfer pricing. Business responsible Executive Board members are responsible for the financial reporting in their respon-sibility area. The managing directors, CFO’s, financial managers and chief accountants of the Group compa-nies are responsible for ensuring that reporting by the companies fulfils the requirements of the Group and those of local legislation. Each business unit, Group company and function is responsible for the accuracy of the figures reported by it and the realism of its forecasts. The data provided by the units’ financial management and ERP systems is standardised and transferred to the Group reporting system so that it can be consolidated via automated interfaces. The Group finance department, managed by the Group CFO, prepares the financial statements speci-fied by IFRS standards and Finnish accounting act as well as the forecasts, analyses and reports for internal accounting prepared in accordance with the guidelines specified in the Group, for both the Executive Board and the Board of Directors. Short-term financial plan-ning for the Group is based on rolling business-area forecasts that are updated monthly. Financial results, the achievement of objectives and forecasts are re-viewed monthly by the management of each business area and unit, by the Group Executive Board and by the Board of Directors. Information on the Group’s financial situation is published via Q1 and Q3 interim statements and Q2 half-yearly reports and financial statement bulletins. In the Group financial statements published in the annual report, the main principles of preparation of these financial statements are de-scribed. Audit The audit shall be performed by an auditing associa-tion authorized by the Central Chamber of Commerce. The parent company is responsible for selecting the
102
Corporate Governance Statement
PKC Group 2015 Annual Report
audit firm. The audit firm selected by PKC Group has overall responsibility for co-ordination of audits for the whole group (audit plans for each Group company) and their cost, together with the CFO of PKC Group Plc and the management of the subsidiaries. Moreover, if required, a local authorised audit firm can be selected to carry out the audit required by local legislation with a prior approval by the CFO. Monitoring The effectiveness of financial reporting, internal con-trol and risk management is continually monitored as part of the daily management of the Group. The Board of Directors, the Audit Committee, the President & CEO, the CFO and the Group Executive Board, and the Group companies participate in the internal control of financial reporting via monitoring of monthly financial reports and regular forecasts and via reviews of pro-cesses and external auditor’s reports. The financial department and external auditor hold regular meet-ings where the areas of focus for the inspections are chosen.
Year 2015 Hihglights Group finance and reporting During 2015 the focus has been on integration and development of finance functions in acquired entity in Poland and established joint venture in China. Fur-thermore, besides strengthening of established pro-cesses and practices, the development initiatives have been directed into tax management, compliance and reporting, liquidity management and cash planning enhancements. Internal Audit Internal audits focused mainly on internal control of processes, compliance and information security.
103
Remuneration Statement 2015
Remuneration Statement
PKC Group 2015 Annual Report
Remuneration Statement
Board of Directors
Remuneration The Annual General Meeting resolves the remunera-tion paid to the Board of Directors. The remuneration proposals to the general meeting are prepared by the Board’s Nomination and Remuneration Committee. According to the resolution made in 2015, the annual remuneration payable to the members of the Board of Directors is as follows: • the annual remuneration payable to the mem-
bers of the Board of Directors to be elected for a term of office ending at the end of the next An-nual General Meeting shall be the following: Chairman EUR 60,000, Vice Chairman EUR 45,000 and other Board members EUR 30,000
• the Chairmen of the Board Committees shall be paid an additional annual remuneration of EUR 10,000 and the other Committee members EUR 5,000
• the meeting fee for attending the Board and Committee meetings shall be the following: Chairmen EUR 1,200 per meeting, and other members EUR 800 per meeting. The meeting fees will be doubled in case member physically partic-ipates in a meeting held in a country, where member is not resident. No meeting fee shall be paid for the decision minutes drafted without holding a meeting.
• In addition, the travel and accommodation ex-penses related to the board and committee meetings shall be paid.
Other benefits The Chairman or the members of the Board of Direc-tors are not in employment relationship or have ser-vice contract with company or its subsidiaries. The Board of Directors is not included in the company’s stock option schemes. The company has not otherwise granted shares or other share related rights as com-pensation to the Board of Directors. The company does not pay Board members fees on any other basis or grant them loans or give guarantees on their behalf.
President and Executive Board
President The Board of Directors decides on the salary and other benefits of the President.
The President is included in the company’s short and long term remuneration plans. The annual bonus is at maximum six months' salary, depending on the achievement of the objectives set annually. In addition to stock option schemes and the share-based incen-tive plans, the President has not otherwise been granted shares or other share related rights as com-pensation. The President's service contract has provi-sion for a notice period of three (3) months on the President's part and six (6) months on the company's part, in addition to which President’s service contract has provision of severance payment of twelve months salary. The retirement age is statutory and no volun-tary pension insurance policies have been taken. Executive Board The Board of Directors confirms the salaries and bene-fits of the members of the Executive Board upon Pres-ident's proposal. The members of the Executive Board are included in the company’s short and long term remuneration plans. The annual bonus is typically 6 months’ salary depending on the achievement of the objectives set annually. In addition to stock option schemes and the share-based incentive plans, the company has not otherwise granted shares or other share related rights as compensation to the Executive Board. The retire-ment age is statutory and no voluntary pension insur-ance policies have been taken.
Short-term Remuneration – Bonus System The Group has in force a result based bonus system approved by the Board of Directors, the purpose of which is to reward achievement of strategic objectives and to offer competitive incentive scheme for person-nel. The principles, terms and conditions, earnings criteria, maximum and minimum limits of targeted yield levels and persons included in the system are confirmed annually by the Board. For year 2015, the result criteria were business unit specific EBITDA and cash flow targets. Within the target ranges, bonuses were determined linearly. Group management and key personnel, and also white and blue collar employ-ees in Finland, are included in the system. The mem-bers of the Executive Board are included in the man-agement's bonus system. The limit of the annual bo-nus is predominantly maximum of six months' salary, depending on the achievement of the objectives set
105
Remuneration Statement
PKC Group 2015 Annual Report
annually. The system's earning period is the financial year.
Long-term Remuneration PKC’s long-term remuneration consists of stock option schemes and the share-based incentive plans. Stock option schemes The Board of Directors shall annually decide upon the distribution of the stock options to the key personnel employed by or to be recruited by the Group. The stock options shall be issued free of charge to the Group key personnel. The earnings period of all stock option schemes is three years. All stock option schemes contain a share ownership plan. The option recipients are required to acquire or subscribe for the Company’s shares with 20 per cent of the gross stock option income gained from the exercised stock options, and to hold such shares for at least two years. The Company’s President must hold such shares as long as his service contract is in force. Options 2009 The year 2009 stock-option scheme comprises of 600,000 stock options and they are divided into A, B and C options. The stock options entitle their owners to subscribe for a maximum total of 600,000 new shares in the Company or existing shares held by the Company. The share subscription period is during the years 2012–2016. The share subscription price for stock options is the volume-weighted average price of the PKC Group plc share on the Nasdaq Helsinki with dividend adjustments as defined in the stock option terms. The share subscription period for 2009A options has ended 30 April 2014. During the share subscription period a total 195,500 shares were subscribed and 4,500 options remained unused. The share subscrip-tion period for 2009B options has ended 30 April 2015. During the share subscription period a total 167,215 shares were subscribed and 32,785 options remained unused. Options 2012 The year 2012 stock-option scheme comprises of 1,020,000 stock options and they are divided into 2012A (i and ii), 2012B (i and ii) and 2012C (i and ii) options. The stock options entitle their owners to
subscribe for a maximum total of 1,020,000 new shares in the Company or existing shares held by the Company. The share subscription period is during the years 2015–2019. The share subscription price for stock options is the volume-weighted average price of the PKC Group plc share on the Nasdaq Helsinki, as defined in the stock option terms. The share subscription period for stock options 2012A(ii), 2012B(ii) and 2012C(ii) shall, however, not commence, unless certain operational or financial targets of the Group established for the exercise of stock options and determined by the Board of Direc-tors have been attained. The Board of Directors shall annually decide on targets separately for each stock option class in connection with the distribution of stock options. If the release criteria is not fulfilled, stock options expire based on the consideration and in the extent and manner decided by the Board of Direc-tors and the terms of the stock options. The 2012 A, B and C (ii) options are allocated to option holders con-ditionally so that the options shall be distributed and entered into option holders´ book-entry accounts only after the Board of Directors has decided on the start of the share subscription period and to the extent decid-ed by the Board of Directors. Release criteria for 2012 A (ii) options: • The share subscription period with 2012 A (ii)
options begins only if the financial performance and EBITDA of PKC Group for financial years 2012–2014 is, based on the total consideration of the Board of Directors, comparable to PKC Group´s key competitors that have published their results. The total consideration shall also take into account the development of PKC Group´s market share.
• In 2015, Board of Directors decided that the re-lease criteria for 2012 A (ii) options has been ful-filled and thus share subscription period with 2012 A (ii) options has started as set out in op-tion terms.
Release criteria for 2012 B (ii) options: • The share subscription period with 2012 B (ii)
options begins only if EBITDA for years 2013–2015 is cumulatively at least EUR 180 million. The effect of M&As and other restructurings as well as exceptional changes in macro-economy shall be taken into account in the calculation.
Release criteria for 2012 C (ii) options: • The share subscription period with 2012 C (ii)
options begins only if EBITDA for years 2014–2016 is cumulatively at least EUR 180 million. The
106
Remuneration Statement
PKC Group 2015 Annual Report
effect of M&As and other restructurings as well as exceptional changes in macro-economy shall be taken into account in the calculation.
Share-based incentive plan 2015
PKC Group Plc's share-based incentive plan consists of three new share-based incentive plans for the Group key personnel, a Performance Share Plan 2015, a Matching Share Plan 2015 and a Restricted Share Plan 2015. The aim of the new plans is to combine the objectives of the shareholders and the key personnel in order to increase the value of the Company in the long-term, to bind the participants to the Company, and to offer them competitive reward plans based on earning and accumulating the Company´s shares. The potential rewards from these new incentive plans, on the basis of the performance period and vesting periods commencing in January 2015, will be paid partly in the Company's shares and partly in cash in 2018. The cash proportion is intended to cover taxes and tax-related costs arising from the reward to the participant. As a rule, no reward will be paid, if a par-ticipant´s employment or service ends before the reward payment. Performance Share Plan 2015 The performance period of the Performance Share Plan 2015 is calendar years 2015-2017, during which the plan is directed to approximately 40 participants, including the members of the Executive Board. The rewards to be paid on the basis of the performance period 2015-2017 correspond to the value of an ap-proximate maximum total of 310,000 PKC Group Plc shares (including also the cash proportion). The potential reward from the performance period 2015-2017 will be based on the PKC Group's and/or on the participant's employer company's 3-year cumula-tive Revenue and 3-year cumulative Earnings before Interest, Taxes, Depreciation and Amortization (EBITDA), with heavier weight on the EBITDA. Attain-ment of the required performance level will determine the proportion out of the maximum reward that will be paid to a participant on the basis of the Perfor-mance Share Plan 2015. The Board of Directors will annually resolve on future performance periods. A member of the Executive Board must hold 50 per cent of the net number of shares given on the basis of the Performance Share Plan, as long as his or her shareholding in total corresponds to the value of his or
her annual gross salary. Such number of Shares must be held as long as the member's employment or ser-vice in the PKC Group continues. Matching Share Plan 2015 The vesting period of Matching Share Plan 2015 is calendar years 2015-2017, during which the plan is directed to approximately 20 participants, including the members of the Executive Board. The Board of Directors may resolve to include new participants in this plan during 2015-2017, and on the duration of the related vesting periods (12-36 months). The rewards allocated in 2015-2017 on the basis of the Matching Share Plan 2015 correspond to the value of an approx-imate maximum total of 100,000 PKC Group Plc shares (including also the cash proportion). The prerequisite for receiving reward on the basis of the Matching Share Plan 2015 is that a person partici-pating in the Plan acquires the Company´ shares up to the number determined by the Board of Directors. Furthermore, receiving of reward is tied to the contin-uation of participant´s employment or service upon reward payment. The participant may as a gross re-ward, receive one (1) matching share for each ac-quired share. In order to finance the acquisition of the PKC Group shares, the Board of Directors has resolved to offer to members of the Executive Board participating in the Matching Share Plan a possibility to sell to the Compa-ny their stock options 2012A(i) and 2012A(ii) at the theoretical value. The stock option purchases were carried out in spring 2015. Restricted Share Plan 2015 The vesting period of the Restricted Share Plan 2015 is calendar years 2015-2017, during which the plan is directed to approximately 20 selected key persons. The Board of Directors may resolve to include new key persons in this plan during 2015-2017, and on the duration of the related vesting periods (12-36 months). The rewards allocated in 2015-2017 on the basis of the Restricted Share Plan 2015 correspond to the value of an approximate maximum total of 120,000 PKC Group Plc shares (including also the cash proportion). The reward from the Restricted Share Plan 2015 will be based on a valid employment or service contract of a key person upon the reward payment.
107
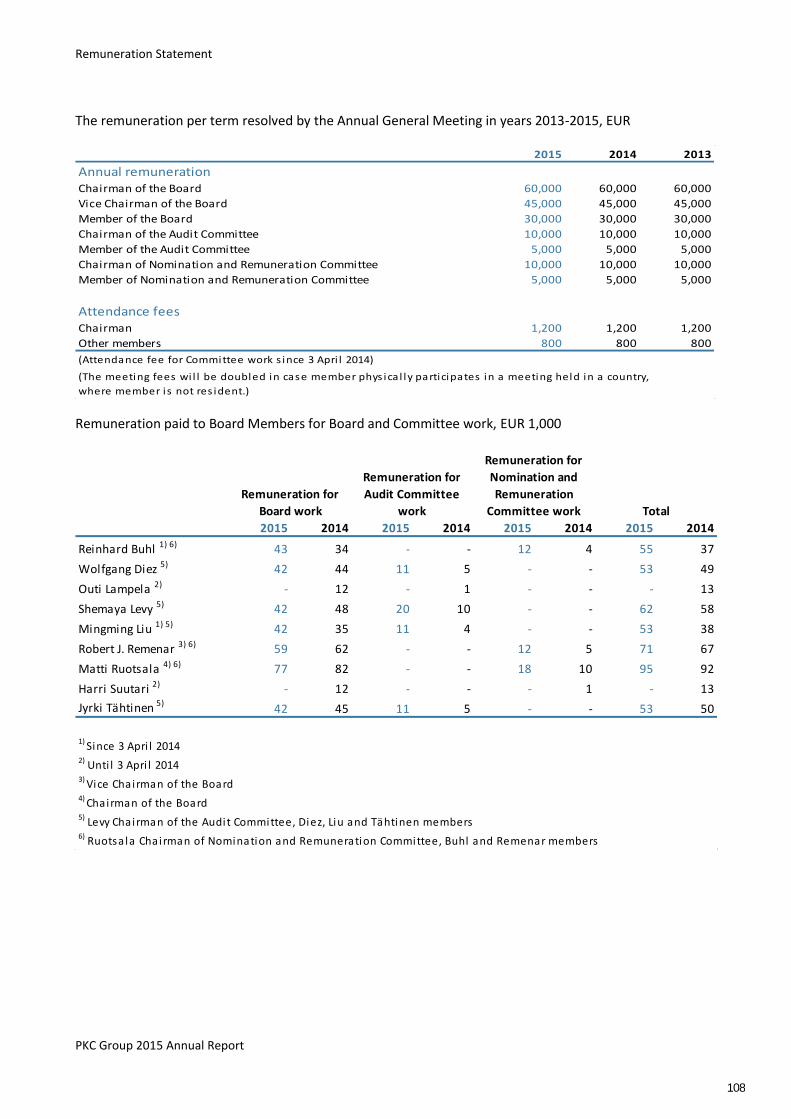
Remuneration Statement
PKC Group 2015 Annual Report
The remuneration per term resolved by the Annual General Meeting in years 2013-2015, EUR
2015 2014 2013
Annual remunerationChairman of the Board 60,000 60,000 60,000
Vice Chairman of the Board 45,000 45,000 45,000
Member of the Board 30,000 30,000 30,000
Chairman of the Audit Committee 10,000 10,000 10,000
Member of the Audit Committee 5,000 5,000 5,000
Chairman of Nomination and Remuneration Committee 10,000 10,000 10,000
Member of Nomination and Remuneration Committee 5,000 5,000 5,000
Attendance feesChairman 1,200 1,200 1,200
Other members 800 800 800
(Attendance fee for Committee work s ince 3 Apri l 2014)
(The meeting fees wi l l be doubled in case member phys ica l ly participates in a meeting held in a country,
where member is not res ident.)
Remuneration paid to Board Members for Board and Committee work, EUR 1,000
2015 2014 2015 2014 2015 2014 2015 2014
Reinhard Buhl 1) 6) 43 34 - - 12 4 55 37
Wolfgang Diez 5) 42 44 11 5 - - 53 49
Outi Lampela 2) - 12 - 1 - - - 13
Shemaya Levy 5) 42 48 20 10 - - 62 58
Mingming Liu 1) 5) 42 35 11 4 - - 53 38
Robert J. Remenar 3) 6) 59 62 - - 12 5 71 67
Matti Ruotsala 4) 6) 77 82 - - 18 10 95 92
Harri Suutari 2) - 12 - - - 1 - 13
Jyrki Tähtinen 5)42 45 11 5 - - 53 50
1) Since 3 Apri l 2014
2) Unti l 3 Apri l 20143)
Vice Chairman of the Board4) Chairman of the Board 5)
Levy Chairman of the Audit Committee, Diez, Liu and Tähtinen members6) Ruotsa la Chairman of Nomination and Remuneration Committee, Buhl and Remenar members
Remuneration for
Board work
Remuneration for
Audit Committee
work
Remuneration for
Nomination and
Remuneration
Committee work Total
108
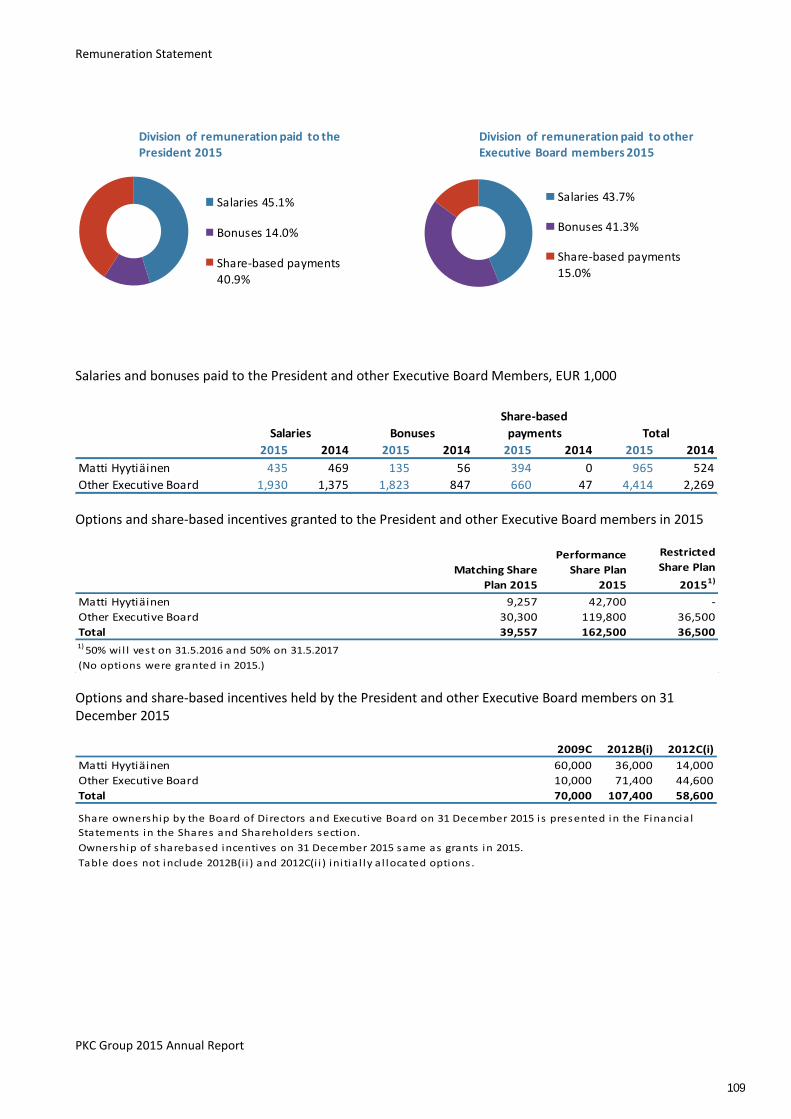
Remuneration Statement
PKC Group 2015 Annual Report
Division of remuneration paid to the President 2015
Salaries 45.1%
Bonuses 14.0%
Share-based payments
40.9%
Division of remuneration paid to other Executive Board members 2015
Salaries 43.7%
Bonuses 41.3%
Share-based payments
15.0%
Salaries and bonuses paid to the President and other Executive Board Members, EUR 1,000
2015 2014 2015 2014 2015 2014 2015 2014
Matti Hyytiäinen 435 469 135 56 394 0 965 524
Other Executive Board 1,930 1,375 1,823 847 660 47 4,414 2,269
Salaries Bonuses
Share-based
payments Total
Options and share-based incentives granted to the President and other Executive Board members in 2015
Matching Share
Plan 2015
Performance
Share Plan
2015
Restricted
Share Plan
20151)
Matti Hyytiäinen 9,257 42,700 -
Other Executive Board 30,300 119,800 36,500
Total 39,557 162,500 36,5001)
50% wi l l vest on 31.5.2016 and 50% on 31.5.2017
(No options were granted in 2015.)
Options and share-based incentives held by the President and other Executive Board members on 31 December 2015
2009C 2012B(i) 2012C(i)
Matti Hyytiäinen 60,000 36,000 14,000
Other Executive Board 10,000 71,400 44,600
Total 70,000 107,400 58,600
Ownership of sharebased incentives on 31 December 2015 same as grants in 2015.
Table does not include 2012B(i i ) and 2012C(i i ) ini tia l ly a l located options .
Share ownership by the Board of Directors and Executive Board on 31 December 2015 is presented in the Financia l
Statements in the Shares and Shareholders section.
109

www.pkcgroup.com