Embed Size (px)
Citation preview

Financial Statements 1.1.2017-31.3.2018

PKC Group 2017 - 2018 Financial Statements
Content
Report by the Board of Directors Report by the Board of Directors 3 Key Indicators 9 Calculation of Key Indicators 11 Measures of Profit and Items Affecting Comparability 12 Shares and Shareholders 13
Financial Statements Consolidated Statement of Comprehensive Income 17 Consolidated Statement of Financial Position 18 Consolidated Statement of Cash Flows 19 Consolidated Statement of Changes in Equity 20
Notes to the Consolidated Financial Statements Basis of Preparation and Accounting Policies 22 1. Items related to the Profit for the Period
1.1 Operating Segments 28 1.2 Other Operating Income 29 1.3 Materials and Services 30 1.4 Employee Benefit Expenses 30 1.5 Other Operating Expenses 33 1.6 Income taxes, incl. Deferred Tax Assets and Liabilities 33 1.7 Earnings per Share 38
2. Operating Assets and Liabilities
2.1 Intangible Assets 39 2.2 Impairment Testing 41 2.3 Property, Plant and Equipment 43 2.4 Available-for-sale Financial Assets 45 2.5 Investments in associated companies 45 2.6 Non-Current Other Receivables and Liabilities 45 2.7 Inventories 45 2.8 Trade Receivables and Other Receivables 46 2.9 Trade Payables and Other Non-Interest-Bearing Liabilities 46 2.10 Provisions 47
3. Capital Structure and Financial Expenses 3.1 Classification, Accounting and Valuation Principles, Carrying Amounts and Fair Values of Financial
Assets and Liabilities by Valuation Categories 48
3.2 Interest-Bearing Financial Liabilities 53 3.3 Financial Income and Expenses 53 3.4 Financial Risk Management 54 3.5 Equity 59 4. Other Notes 4.1 Related Party Disclosures 61 4.2 Group Structure 63 4.3 Business Combinations 64 4.4 Established Companies 64 4.5 Discontinued Operations 66 4.6 Operating Leases 67 4.7 Contingent Items and Commitments 67 4.8 Events after the Financial Year 67
Parent Company’s Financial Statements Parent Company´s Income Statement 68 Parent Company´s Balance Sheet 69 Parent Company´s Cash Flow Statement 70 Accounting Policies for the Parent Company´s Financial Statements 71 Notes to the Parent Company´s Financial Statements 1. Net Sales by Market Areas 72 2. Other Operating Income 72 3. Staff Expenses 72 4. Other Operating Expenses 72 5. Financial Income and Expenses 73 6. Income Taxes 73 7. Non-Current Assets 74 8. Investments 75 9. Long-term Receivables 75
10. Short-term Receivables 75 11. Equity 76 12. Non-Current Liabilities 77 13. Current Liabilities 77 14. Commitments and Other Obligations 77
Board of Directors´ Proposal for Profit Distribution 78 Signatures of Report by the Board of Directors and Financial Statements 78 The Auditor´s Note 79 List of Accounting Books 80 Attachment: Auditor´s Report

Report by the Board of Directors
PKC Group 2017 - 2018 Financial Statements
Report by the Board of Directors
Review by the President & CEO In January 2017 Motherson Sumi Systems Limited (MSSL) published a voluntary public tender offer for all PKC shares and option rights. By combining both companies the target is to create world leading wiring harness and component company to serve transportation industry. This is exciting development for our company and employees, offering us new opportunities in many areas. MSSL gained title to all shares in PKC Group Ltd and PKC Group Ltd’s shares were de-listed on 6 October 2017. In the financial year, PKC improved its performance at many fronts. Revenue grew organically in all geographical areas and growth was accelerated by some inorganic measures. For example, a rolling stock electrical distribution system company Fortitude Industries Inc., in the state of New York (USA) was acquired in March 2017 and a second joint venture in China commenced its full-scale operations in the fall of 2017.
Operations continued to be improved and integrated into MSSL. Numerous improvement and synergy initiatives were implemented e.g. in the areas of material sourcing, manufacturing best practises and quality. These initiatives are to bring further benefits for the combined entity and to strengthen the combined entity’s position in the market place. PKC’s market position continued to be strong in all product and geographical areas. During the financial period, customers honoured PKC with several quality awards. The strong position and recognitions by customers would not be possible without the commitment, professional skills and diligent work of PKC’s personnel. For this, I express my warmest gratitude to each and every employee at PKC.
Key figures* (from continuing operations)
EUR 1,000 (unless otherwise noted) 2017-2018 (15 mon.) 2016 (12 mon.)
Revenue 1,281,946 845,672
Comparable EBITDA 94,224 64,357
% of revenue 7.4 7.6
Comparable EBITA 66,498 42,504
% of revenue 5.2 5.0
Comparable operating profit 54,811 31,890
% of revenue 4.3 3.8
Items affecting comparability -13,035 -5,353
Operating profit (loss) 41,776 26,537
% of revenue 3.3 3.1
Profit (loss) before taxes 33,379 20,588
Net profit (loss) for the report period 30,903 12,235
Earnings per share (EPS), EUR 1.04 0.43
Net cash from operating activities -2,212 35,464
Annualized return on capital employed (ROCE), % 12.9 9.7
Gearing, % 66.7 30.2
Personnel in average 22,650 21,277
* current period numbers are for 15 months hence not comparable
3

Report by the Board of Directors
PKC Group 2017 - 2018 Financial Statements
Operating environment Majority of PKC Group’s key customers operate in the commercial vehicle industry which products are investment goods and as such their demand is highly correlated to the general economic development. Economic activity in North America underperformed somewhat in 2016 whereafter the economy has performed on a higher level. The modest growth of the European economy has continued to pick up and in Brazil and Russia, the economies have started to slowly recover from recession. Growth in China has continued at a level expected and the outlook has improved. PKC's product program life cycles are long, therefore PKC's market share variations in the short term are mainly explained by changes in customers’ market share. During the reporting period, PKC's regional market shares in truck production fluctuated
somewhat from quarter to quarter mainly depending on the changes of PKC’s customers’ market shares. PKC Group’s functional currency the euro appreciated against the US dollar during the reporting period and on average was also on a stronger level. Towards the end of the reporting period the Brazilian real has continued to depreciate in relation to the euro but on average was on a stronger level than in the comparison period. US dollar depreciated against Mexican peso, but in average it was slightly stronger than in the comparison period. The price of key raw material, copper, has increased significantly during the reporting period even though it was relatively stable during the last few months of the period. On average the customer sales prices are updated with a 3-5 month delay on the basis of copper price changes.
Vehicle production, units1/2017-3/2018
(15 mon.)
1-12/2017
(12 mon.)
1-12/2016
(12 mon.)
Change %
(12 mon.)
North America
Heavy duty trucks 331,451 255,950 228,707 11.9%
Medium duty trucks 327,050 261,103 241,760 8.0%
Light vehicles (Pick-up & SUV) 13,161,048 10,390,200 9,990,075 4.0%
Europe
Heavy duty trucks 506,141 407,410 390,113 4.4%
Medium duty trucks 93,917 75,490 74,538 1.3%
Brazil
Heavy duty trucks 69,584 56,232 38,386 46.5%
Medium duty trucks 30,237 24,431 19,863 23.0%
China
Heavy duty trucks 1,493,878 1,149,664 741,362 55.1%
Medium duty trucks 294,943 234,013 231,437 1.1%
Source: LMC Automotive March 2018
During the reporting period, European truck demand has continued to recover and production volumes increased. In North America, the demand for heavy duty trucks decreased significantly in 2016 but has recovered clearly during the reporting period. In Brazil, the economic situation has improved somewhat and production volumes have increased substantially including the impact of clearly higher export volumes. In China, economic situation has improved and truck production has grown partly also due to market adjusting itself into new emission standards. The demand for the rolling stock has continued to grow steadily.
Revenue and profitability from continuing operations Revenue in financial period amounted to EUR 1,281.9 million (EUR 845.7 million) equaling to a growth of 52% compared to a 25% longer financial period (15 months vs 12 months). The revenue grew in all geographical areas and the strongest relative growth took place in APAC where the second joint venture commenced full scale operations during fall of 2017. Revenue grew also organically in all geographical areas.
4

Report by the Board of Directors
PKC Group 2017 - 2018 Financial Statements
The financial period comparable EBITDA before items affecting comparability was EUR 94.2 million (EUR 64.4 million 12 months for previous year numbers) and 7.4% (7.6%) of revenue. During the financial period items affecting the comparability amounted to EUR -13.0 million (EUR -5.4 million). Items affecting comparability in the financial period consist mainly of expenses related to MSSL Estonia WH OÜ’s public tender offer on PKC’s shares and options. The comparable EBITDA grew mainly by increased revenue. The financial period operating profit before items affecting comparability and PPA depreciation and amortisation related to acquisitions totalled EUR 66.5 million (EUR 42.5 million), accounting for 5.2% of revenue (5.0%). The financial period Group depreciation, amortisation and impairment losses amounted to EUR 39.4 million (EUR 32.6 million) equaling to 3.1% of revenue (3.9%). Excluding PPA related depreciation and amortisation, and impairment losses it amounted to EUR 27.7 million (EUR 21.9 million). During the financial period the Group’s operating profit totalled EUR 41.8 million (EUR 26.5 million), accounting for 3.3% of revenue (3.1%).
Financial items and net profit from continuing operations Financial items were EUR -8.4 million (EUR -6.0 million) during the financial period. Financial items include foreign exchange differences totalling EUR -2.0 million (EUR -1.5 million) during the financial period. Profit before taxes during the financial period was EUR 33.4 million (EUR 20.6 million). Income tax in the financial period amounted to EUR 2.5 million (EUR 8.4 million). Net profit for the financial period totalled EUR 30.9 million (EUR 12.2 million). The financial period earnings per share were EUR 1.04 (EUR 0.43).
Cash flow, financial position and financing During the financial period net cash from operating activities was EUR -2.2 million (EUR 35.0 million) and cash flow after investments was EUR -55.4 million (EUR 17.0 million). During the financial period, net cash from operating activities was negatively impacted by the increase of working capital due to higher revenue and seasonality, and by expenses related to MSSL Estonia WH OÜ’s public tender offer on PKC’s shares and options.
Working capital (inventories, trade receivables and trade payables) increased from the end of previous financial period by EUR 50.7 million amounting to EUR 140.5 million at the end March. Total net working capital (including all current non-interest-bearing items) at the end of financial period was EUR 114.7 million (EUR 40.8 million at the end of previous financial period). Total net working capital increased EUR 73.9 million during the financial period, while in the comparison financial period the decrease was EUR 14.3 million. During the financial period, the Group’s gross capital expenditure totalled EUR 67.4 million (EUR 24.4 million), representing 5.3% of revenue (2.9%). Gross capital expenditure is geographically divided as follows: Europe 42.2% (39.5%), APAC 30.2% (6.8%), North America 24.0% (46.9%) and South America 3.6% (4.2%). The capital expenditure consisted of regular maintenance investments into production machinery and equipment during the report period. In addition, it included the impact of the acquisition of Fortitude Industries Inc. in the USA, execution of a call option liability (related to the acquisition of Groclin’s Wiring & Controls business, including Kabel-Technik-Polska Sp. z o. o (“KTP”) in Poland) and the impact of establishing joint ventures in China. At the end of financial period cash and cash equivalents amounted to EUR 74.3 million (EUR 130.1 million) and interest-bearing liabilities totalled EUR 185.1 million (EUR 176.6 million). Interest-bearing liabilities consisted of non-current interest-bearing debt of EUR 0.1 million and current interest-bearing debt of EUR 185.0 million. Current interest-bearing liabilities consist mainly of outstanding commercial papers, bank loans and notes (bond) which are maturing in September, 2018. PKC Group has a Finnish commercial paper program whereby PKC Group regularly issues short-term notes. PKC Group selectively utilizes also non-recourse factoring arrangements with some customers. At the end of financial period, the outstanding amount of such arrangements was EUR 44.8 million (EUR 27.4 million). The effective average interest rate of the interest-bearing debt was at the close of the financial period 2.5% (2.8%). Minority of the noteholders representing less than 3% of the nominal amount of PKC Group Ltd Notes due 2018 used the right to redeem their notes due to change of control event published in March 2017. The Group’s equity ratio was 28.9% (27.4%). Net interest-bearing liabilities totalled EUR 110.8 million (EUR 46.6 million) and gearing was 66.7% (30.2%).
5

Report by the Board of Directors
PKC Group 2017 - 2018 Financial Statements
Discontinued operations PKC Group announced on 27 January 2017 that it divests 100% of PKC Electronics Oy shares to Enics, one of the biggest Electronics Manufacturing Service (EMS) providers in the world focusing on industrial electronic. The requirements of closing have been fulfilled and the closing became effective and ownership and control transferred on 28 February 2017. As a consequence of the sale transaction, a loss of EUR 2.3 million has been recognised in profit for the reporting period from the discontinued operations. Electronics business had been classified as a non-current asset held for sale and reported as discontinued operations as of 31 March 2016. After this change PKC Group has only one primary reporting operating segment which also includes Group functions and other items. More information about discontinued operations can be found from the Consolidated Financials Statement’s note 4.5 Discontinued Operations.
Research & development in continuing operations Research and development costs during the financial period totalled EUR 7.4 million (EUR 6.0 million), representing 0.6% (0.7%) of the consolidated revenue. At the end of financial year 73 (84) people worked in product development, excluding production development and process development personnel. In its product strategy, product development in PKC’s Wiring Systems business takes into consideration the long- and short-term product development needs of PKC’s customers and the latest development trends in the automotive industry. PKC’s main products are individually tailored electrical distribution systems, in addition to which PKC’s product development is a pioneer in the application of new solutions for the needs of its customers. A growing part of PKC’s global product range is vehicle electronics, through which PKC can offer its customers more thoroughly optimised electrical distribution systems. Early involvement on customer design enables cost effective and reliable solutions utilizing the capabilities of latest production and product technologies and also considering “Design for Manufacturing” perspective.
This will reduce iteration rounds and lower the design cost. PKC can provide product support from design services up to mass production deliveries. Through active technological development, improvement is constantly being sought in product quality and performance: alternative materials are researched and utilised, and new innovative solutions are developed for the vehicle electrical distribution systems architecture. Improvements are being implemented cost-effectively with the aim of minimising the overall costs of the customer’s product.
Personnel, quality and environment in continuing operations The Group had an average payroll of 23,511 employees (21,920) including temporary employees during the financial period. At the end of the financial period, the Group’s personnel including temporary employees totalled 25,510 employees (20,426), of whom 25,462 (20,372) worked abroad and 48 (54) in Finland. Geographically personnel was divided at the end of the financial period as follows: North America 46.6% (48.8%), Europe 37.7% (41.4%), South America 5.7% (5.3%) and Asia 10.6% (4.5%). More information about personnel, quality and the environment can be found from the Corporate Responsibility report to be published by MSSL at a later date.
Governance structure The Annual General Meeting held on 5 April 2017, re-elected Robert Remenar and Matti Ruotsala and elected Vivek Chaand Sehgal, Andreas Heuser, Pankaj Mital and Gaya Nand Gauba as new members. In the Board’s organisation meeting, Matti Ruotsala was elected as Chairman of the Board and Pankaj Mital as Vice-Chairman. Matti Ruotsala was elected as the chairman of the Audit Committee and Pankaj Mital and Gaya Nand Gauba as members. The Board elected Andreas Heuser as chairman of the Remuneration Committee and Robert Remenar and Pankaj Mital as members. The Annual General Meeting resolved, selected Authorised Public Accountants Ernst & Young Oy as audit firm, which has announced Jari Karppinen,
6

Report by the Board of Directors
PKC Group 2017 - 2018 Financial Statements
Authorized Public Accountant, to be the Auditor with principal responsibility. At the end of the March the Group’s Executive Board consists of the following persons: Pankaj Mital, Chairman (President & CEO), Julie Bellamy (Group Senior Vice President, Human Resources), Andre Gerstner (President, Rolling Stock Business), Jyrki Keronen (President, Wiring Systems, APAC), Jani Kiljala (President, Wiring Systems, Europe and South America), Frank Sovis (President, Wiring Systems, North America), Juha Torniainen (CFO), Deepak Tyagi (Chief Technical Officer) and Vesa Vähämöttönen (Group Senior Vice President, Business Development).
Key strategic highlights of 2017-2018 PKC Group announced on 27 January 2017 that it divests 100% of PKC Electronics Oy shares to Enics, one of the biggest Electronics Manufacturing Service (EMS) provider in the world focusing on industrial electronic. The requirements of closing have been fulfilled and the closing became effective and ownership and control transferred on 28 February 2017. PKC Group announced on 9 February 2017 that it was negotiating on establishing a company into China with a Chinese wiring harness manufacturer. It was estimated that the company would generate annual sales of about EUR 40 million and that the negotiations would be completed during the financial year. The 60/40 company was accomplished through a new company named Hubei Zhengao PKC Automotive Wiring Company Ltd that was established by Hubei Zhengao Automotive Accessories Co., Ltd. and PKC in city of Shiyan in Hubei province in China with an equity value of RMB 150 million (about EUR 20 million at current exchange rate). PKC will contribute RMB 60 million (about EUR 8 million at current exchange rate) via equity to be financed from PKC's cash resources. The company has commenced operations during the financial year. PKC Group signed and closed a contract to buy the rolling stock electrical distribution system company Fortitude Industries Inc., in the state of New York (USA), which was announced on 31 March 2017. On 1 October 2017 PKC Group acquired from the former Huber+Suhner rolling stock electrical distribution system operations in Tczew (Poland). According to the agreement PKC Group acquired assets together with the transfer of agreements and
related liabilities. PKC Group has recognised this transaction as assets acquisition (as at the closing date it was amounted to about EUR 2 million).
Short-term risks and uncertainties The demand for PKC´s products is dependent especially on the volatility of the global commercial vehicle industry as well as the development of PKC’s customers’ businesses. Rolling stock programs are typically publicly funded and therefore subject to risks in execution schedules. Uncertainty related to emerging markets’ political or economic development especially in China, Brazil and Russia has stabilized or reduced but is higher than the long-term average. Consolidation of the customer base and changes in customers’ relative market shares and sourcing strategies may affect demand of PKC’s products. Weakening of the US dollar against the Mexican peso as well as the weakening of the euro against the Polish zloty and the Russian rouble may increase PKC’s processing costs. Strengthening of the euro against the Brazilian real may increase PKC’s material costs in the short term. A significant increase in copper price may weaken PKC Group’s profit in short term. The customer prices are updated on average with a 3-5 month delay on the basis of copper price changes. The price of copper increased significantly during the reporting period even thought it was relatively stable towards the end of the period.
7

Report by the Board of Directors
PKC Group 2017 - 2018 Financial Statements
Disclaimer All the future estimates and forecasts presented in report by the Board of Directors are based on the best current knowledge of the company’s management and information published by market research companies and customers. The estimates and forecasts contain certain elements of risk and uncertainty which, if they materialise, may lead to results that differ from present estimates. The main factors of uncertainty are related, among other things, to the general economic situation, the trend in the operating environment and the sector as well as the success of the Group’s strategy.
The Board of Directors’ proposal for profit distribution The parent company’s distributable funds are EUR
121.6 million, of which EUR 49.9 million is
distributable as dividends, including the net profit
(loss) for the financial year EUR -9.5 million. The Board
of Directors will propose to the Annual General
Meeting that a dividend of EUR 0.70 per share be paid
for a total of EUR 16.9 million and that the remainder
of the distributable funds be transferred to
shareholders’ equity. The dividend payment will be
settled at the Annual General Meeting held after the
end of the financial year. In the view of the Board of
Directors, the proposed dividend pay-out will not put
the company’s liquidity at risk.
8

Report by the Board of Directors
PKC Group 2017 - 2018 Financial Statements
Group’s Financial Key Indicators*
EUR 1,000 (unless otherwise noted)
2013
(12 mon.)
2014
(12 mon.)
2015
(12 mon.)
2016
(12 mon.)
2017-18
(15 mon.)
Consolidated statement of comprehensive income
Revenue1) 884,258 829,516 847,338 845,672 1,281,946
Operating profit (loss)1) 27,007 -6,978 20,230 26,537 41,776
Profit (loss) before taxes1) 21,562 -10,528 16,860 20,588 33,379
Net profit (loss) for the report period1) 13,947 -29,051 5,873 12,235 30,903
Consolidated statement of financial position
Assets
Non-current assets 162,376 159,483 203,564 181,703 191,418
Current assets 293,257 296,799 338,697 361,837 383,099
Assets classified as held for sale 20,156
Total assets 455,634 456,282 542,261 563,696 574,516
Equity and liabilities
Total equity incl. non-controlling interests 194,425 158,085 157,313 154,399 165,966
Non-current liabilities 133,478 137,918 194,199 172,857 29,487
Current liabilities 127,730 160,279 190,750 226,304 379,064
Liabilities classified as held for sale 10,136
Total equity and liabilities 455,634 456,282 542,261 563,696 574,516
Key indicators
Revenue1) 884,258 829,516 847,338 845,672 1,281,946
Change in revenue, % -4.7 -6.2 2.1 -0.2 51.6
Operating profit (loss)1) 27,007 -6,978 20,230 26,537 41,776
% of revenue 3.1 -0.8 2.4 3.1 3.3
Profit (loss) before taxes1) 21,562 -10,528 16,860 20,588 33,379
Net profit (loss) for the report period1) 13,947 -29,051 5,873 12,235 30,903
% of revenue 1.6 -3.5 0.7 1.4 2.4
Annualized return on equity (ROE)2), % 7.8 -16.5 3.7 7.9 15.4
Annualized return on investment (ROI)2), % 11.8 2.0 11.4 10.7 12.9
Annualized return on capital employed (ROCE)2), % 12.2 7.7 9.9 9.7 12.9
Net working capital3) 63,540 26,199 55,132 40,797 114,684
Working capital3) 84,246 70,172 92,711 89,880 140,542
Net liabilities3) -2,225 -8,875 49,375 46,591 110,755
Gearing3), % -1.1 -5.6 31.4 30.2 66.7
Equity ratio3), % 42.7 34.7 29.0 27.4 28.9
Quick ratio3) 1.7 1.4 1.3 1.2 0.7
Current ratio3) 2.3 1.9 1.8 1.6 1.0
Net cash from operating activities3) 39,714 41,038 14,813 35,464 -2,212
Cash flows after investments3) 24,941 20,699 -23,372 17,030 -55,367
Gross capital expenditure1) 14,620 19,908 36,932 24,484 67,417
% of revenue 1.7 2.4 4.4 2.9 5.3
R&D expenses1) 8,503 8,164 5,350 5,985 7,392
% of revenue 1.0 1.0 0.6 0.7 0.6
Personnel excl temporary in average1)19,206 19,640 20,214 21,277 22,650
1) 2013-2014 incl discontinued operations, 2015- from continuing operations
3) 2013-2015 incl discontinued operations, 2016- from continuing operations
2) 2013-2014 incl discontinued operations, 2015 include assets and liabilities of discontinued operations, 2016-
from continuing operations
* current period numbers are for 15 months hence not comparable
9

Report by the Board of Directors
PKC Group 2017 - 2018 Financial Statements
Group’s Financial Key Indicators
EUR (unless otherwise noted)
2013
(12 mon.)
2014
(12 mon.)
2015
(12 mon.)
2016
(12 mon.)
2017-18
(15 mon.)
Key indicators for shares
Earnings per share (EPS)
incl discontinued operations, basic 0.63 -1.21 0.29 0.13 0.94
Earnings per share (EPS)
incl discontinued operations, diluted 0.62 -1.21 0.29 - -
Earnings per share (EPS) from continuing operations, basic 0.23 0.43 1.04
Earnings per share (EPS) from continuing operations, diluted 0.23 - -
Shareholders´equity per share 8.13 6.59 6.08 5.71 5.80
Cash flow per share
(2013-2015 incl discontinued operations) 1.77 1.70 0.62 1.48 -0.09
Dividend per share 1) 0.70 0.70 0.70 - 0.70
Dividend per earnings, % 1) 111.8 -57.7 244.9 - 74.9
Dividend per earnings, continuing operations, % 1) 310.6 - 67.1
Effective dividend yield, % 1) 2.9 4.0 4.3 - -
Price/earnings ratio (P/E) 38.6 -14.5 56.9 123.4
Price/earnings ratio (P/E), continuing operations 72.2 36.4
Share price at the end of the year 24.19 17.58 16.27 15.81
Lowest share price during the year 15.00 13.13 15.51 12.90
Highest share price during the year 25.31 26.33 23.37 18.80
Average share issue-adjusted number of shares 2) 22,280 23,953 23,993 23,992 24,125
Diluted average share issue-adjusted number of shares 2) 22,454 24,098 24,024 23,911 24,125
Share issue-adjusted number of shares at the end of the
financial year 2) 23,906 23,971 24,095 24,125 24,125
Shares outstanding at the end of period 2) 23,906 23,971 23,963 24,009 24,125
Shares held by the company at the end of period 2) 3) 0 0 133 117 0
Market capitalisation, EUR 1,000 576 421,401 392,032 381,422
Dividend1), EUR 1,000 16,760 16,788 16,867 - 16,888
2) Number of shares in thousands3) PKC Group has entered into an agreement with a third-party service provider concerning the management
of the share-based incentive program for key personnel. The third party acquires and owns the shares until the shares were
given to the participants of the program or otherwise redeemed.
1) The figures of 2017-18 are based on the Board of Directors´proposal.
10

Report by the Board of Directors
PKC Group 2017 - 2018 Financial Statements
Calculation of Key Indicators
Net profit (loss) for the report period
Total equity (average)
Profit (loss) before taxes + financial expenses
Total equity + interest-bearing financial liabilities (average)
Operating profit +/- items affecting comparability
Total equity + interest-bearing financial liabilities (average)
Net liabilities Interest-bearing financial liabilities - cash and cash equivalents
Interest-bearing financial liabilities - cash and cash equivalents
Total equity
Total equity
Total of statement of financial position - advance payments received
Net working capitalInventories + current non-interest-bearing receivables
– current non-interest-bearing liabilities
Working capital Inventories + trade receivables - trade payables
Total current assets – inventories
Total current liabilities - advance payments received
Total current assets
Total current liabilities
Net profit (loss) for the report period attributable to equity holders of the parent
company
Average share issue-adjusted number of outstanding shares
Equity attributable to equity holders of the parent company
Share issue-adjusted number of outstanding shares at the closing date
Net cash from operating activities
Average share-issue-adjusted number of outstanding shares
Dividend paid for financial year
Share issue-adjusted number of shares outstanding at the closing date
Dividend per share
Earnings per share
Share issue-adjusted dividend per share
Share issue-adjusted share price at the closing date
Share issue-adjusted share price at the closing date
Earnings per share
Market capitalisationNumber of shares at the end of the financial year x
the last trading price of the financial year
Price per earnings, (P/E)
Cash flow per share, EUR
Dividend per share, EUR
Dividend per earnings, % 100 x
Effective dividend yield, % 100 x
Equity per share, EUR
Return on equity (ROE), % 100 x
Return on investment (ROI), % 100 x
Gearing, % 100 x
Return on capital employed
(ROCE), %100 x
Equity ratio, % 100 x
Quick ratio
Current ratio
Earnings per share (EPS), EUR
11

Report by the Board of Directors
PKC Group 2017 - 2018 Financial Statements
Measures of Profit and Items Affecting Comparability*1)
EUR 1,000 (unless otherwise noted)
2013
(12 mon.)
2014
(12 mon.)
2015
(12 mon.)
2016
(12 mon.)
2017-18
(15 mon.)
Comparable EBITDA 66,884 48,572 59,528 64,357 94,224% of revenue 7.6 5.9 7.0 7.6 7.4
Depreciation, amortisation and impairments2) -17,880 -19,032 -20,167 -21,853 -27,726Comparable EBITA 49,004 29,540 39,361 42,504 66,498PPA depreciation and amortisation -11,588 -8,156 -10,349 -10,615 -11,687Comparable operating profit 37,416 21,384 29,012 31,890 54,811
Items affecting comparability:Employee benefit expenses -5,312 -12,216 -4,889 -5,577 -9,804Impairment of PPE and intangible assets -3,391 -6,288 -793 -100 30Other items affecting comparability -1,707 -9,858 -3,101 325 -3,262Total items affecting comparability -10,409 -28,362 -8,782 -5,353 -13,035
Operating profit 27,007 -6,978 20,230 26,537 41,7761) 2012-2014 incl discontinued operations, 2015- from continuing operations2) excluding PPA depreciation and amortisation and impairment of PPE and intangible assets affecting comparability * current period numbers are for 15 months hence not comparable
Calculation of Measures of Profit and Items Affecting Comparability
EBITDAOperating profit (loss) + items affecting comparability
+ depreciation, amortisation and impairments
EBITAOperating profit (loss) + items affecting comparability
+ PPA (purchase price allocation) depreciation and amortisation Items affecting comparability Items affecting comparability are exceptional items which are not related to normal business operations. Typically, the items affecting comparability include substantial capital gains and losses; impairment losses or reversals of such impairment; expenses related to restructuring of business operations and strategic reorganisation; and penalties. Presentation of items affecting comparability improve the comparability between financial periods.
During the financial year EUR -13.0 million (EUR -5.4 million) in items affecting comparability were recognised. Items affecting comparability in the financial period consist mainly of expenses related to MSSL Estonia WH OÜ’s public tender offer on PKC’s shares and options. Items affecting comparability in 2016 consisted mainly of expenses related to adjusting North American organisation and production capacity to medium term outlook.
12

Report by the Board of Directors
PKC Group 2017 - 2018 Financial Statements
Shares and Shareholders
MSSL Estonia WH OÜ’s public tender offer Following the completion of the voluntary public tender offer for all outstanding shares and stock options in PKC, MSSL Estonia WH OÜ, a wholly-owned indirect subsidiary of Motherson Sumi Systems Limited has on 6 October 2017 posted a security in connection
with the redemption of the minority shares in PKC and thus acquired title to all the minority shares in PKC in accordance with chapter 18, section 6 of the Finnish Companies Act after which MSSL Estonia WH OÜ owns 100 per cent of the shares of PKC. PKC’s shares have been delisted and shares were listed for the last day on 6 October 2017.
Trading of shares on Nasdaq Helsinki 1-9/2017 2016
Turnover in shares 33,230,281 9,940,968
Share turnover, EUR million 775.3 158.2
Turnover in shares per average number of shares, % 137.7 41.4
Shares and market value
9/2017 31.12.2016
Number of shares 24,125,387 24,125,387
Lowest share price during the financial year, EUR 15.51 12.90
Highest share price during the financial year, EUR 24.42 18.80
Share price at close of financial year, EUR - 15.81
Average share price of the financial year, EUR 23.02 15.91Market capitalisation, EUR million 578.0 381.4
The shares held by Executive Board members, Board members, their closely associated persons and corporations in which they have a controlling interest accounted for 0.0% (0.3%) of the total number of shares at the end of the financial period. PKC Group Ltd had a total of 1 shareholders (8,988) at the end of financial period. The shares held by foreigners and through nominee registrations at the close of the financial period totalled 100.0% of the share capital (32.3%). At the end of financial period PKC Group Ltd does not have any own shares (treasury shares) in its possession. ➢ Additional information of related parties has
been presented in consolidated financial statements’ note 4.1 Related Party Disclosures.
Flaggings On 13 January 2017 the share of votes and share capital in PKC Group Plc owned by Lannebo Fonder AB (Orgnr 556584-7042) fell below the limit of 5%. Following the transaction Lannebo Fonder AB owned 1,171,928 PKC Group Plc shares and votes, i.e. 4.86% of the share capital and votes.
On 27 March 2017 the share of votes and share capital in PKC Group Plc owned by Ilmarinen Mutual Pension Insurance Company fell below the limit of 5%. Following the transaction Ilmarinen Mutual Pension Insurance Company owned 0 PKC Group Plc shares and votes, i.e. 0.00% of the share capital and votes. On 27 March 2017 the share of votes and share capital in PKC Group Plc owned by MSSL Estonia WH OÜ exceeded the limit of 90%. Following the transaction MSSL Estonia WH OÜ owned 23,065,057 PKC Group Plc shares and votes, i.e. 95.6% of the share capital and votes. On 29 March 2017 the share of votes and share capital in PKC Group Plc held directly by Nordea Funds Oy (1737785-9) through its controlled funds fell below the limit of 5%. Following the transaction Nordea Funds Oy owned 0 PKC Group Plc shares and votes, i.e. 0.00% of the share capital and votes.
13

Report by the Board of Directors
PKC Group 2017 - 2018 Financial Statements
Number of shares
The Company’s registered share capital is divided into 24,125,387 shares i.e no change compared to the end of year 2016.
The Board’s authorisations The Board of Directors was granted authorisation by the Annual General Meeting on 3 April 2014 to decide on one or more share issues and granting of special rights defined in Chapter 10, Section 1 of the Companies Act and all the terms and conditions thereof. A maximum total of 4,750,000 shares may be issued or subscribed for on the basis of authorisation. The authorisation includes the right to decide on directed share issue. The authorisation is in force for five years from the date of the General Meeting's decision. At Board of Directors' discretion the authorisation may be used e.g. in financing possible corporate acquisitions, inter-company co-operation or similar arrangement, or strengthening Company's financial or capital structure. The authorisation revoked the authorisation granted on 30 March 2011.
Stock option schemes PKC´s long-term remuneration consists of stock option schemes approved by the annual general meeting. During the financial year remaining 2012 stock options were exercised as cash or expired since PKC’s shares have been delisted 6 October 2017. The Board of Directors shall annually decide upon the distribution of the stock options to the key personnel employed by or to be recruited by the Group. The stock options shall be issued free of charge to the Group key personnel. The earnings period of all stock option schemes is three years. All stock option schemes contain a share ownership plan. The option recipients are required to acquire or subscribe for the Company´s shares with 20 per cent of the gross stock option income gained from the exercised stock options, and to hold such shares for at least two years. The Company´s President must hold such shares as long as his service contract is in force.
2012 options The year 2012 stock-option scheme comprises of 1,020,000 stock options and they are divided into 2012A (i and ii), 2012B (i) and 2012C (i and ii) options. The stock options entitle their owners to subscribe for a maximum total of 1,020,000 new shares in the
Company or existing shares held by the Company. The share subscription period is during the years 2015-2019. The share subscription price for stock options is the volume-weighted average price of the PKC Group Plc share on Nasdaq Helsinki, as defined in the stock option terms. Options which subscription period has begun and are held by PKC cannot be exercised. The share subscription period for stock options 2012A(ii), 2012B(ii) and 2012C(ii) shall, however, not commence, unless certain operational or financial targets of the Group established for the exercise of stock options and determined by the Board of Directors have been attained. The Board of Directors shall annually decide on targets separately for each stock option class in connection with the distribution of stock options. Those stock options, for which the targets determined by the Board of Directors have not been attained, shall expire in the manner decided by the Board of Directors. Currently 2012A(ii) options have been released and are allocated to the key personnel. Also 2012B(ii) options have been released and are allocated to the key personnel and also converted to 2012B(i) options. The release criteria for 2012 C ii) options has not been fulfilled and thus 2012 C (ii) options expire. Release criteria for 2012 (ii) options is defined as follows:
• The share subscription period with 2012 A (ii) options begins only if the financial performance and EBITDA of PKC Group for financial years 2012-2014 is, based on the total consideration of the Board of Directors, comparable to PKC Group´s key competitors that have published their results. The total consideration shall also take into account the development of PKC Group´s market share. Board of Directors has decided that the release criteria for 2012 A ii) options has been fulfilled and thus share subscription period with 2012 A (ii) options shall start as set out in option terms.
• The share subscription period with 2012 B (ii) options begins only if EBITDA for years 2013-2015 is cumulatively at least EUR 180 million. The effect of M&As and other restructurings as well as exceptional changes in macro-economy shall be taken into account in the calculation. Board of Directors has decided that the release criteria for 2012 B ii) options has been fulfilled and thus share subscription period with 2012 B (ii) options shall start as set out in option terms.
14

Report by the Board of Directors
PKC Group 2017 - 2018 Financial Statements
• The share subscription period with 2012 C (ii) options begins only if EBITDA for years 2014-2016 is cumulatively at least EUR 180 million. The effect of M&As and other restructurings as well as exceptional changes in macro-economy shall be taken into account in the calculation. Board of Directors has decided that the release criteria for 2012 C ii) options has not been fulfilled and thus 2012 C (ii) options expire.
Share based incentive plans PKC Group Plc's share-based incentive plan for the Group key personnel consists of Performance Share Plan, Matching Share Plan and a Restricted Share Plan. At the end of March 2018 only Restricted Share Plan 2016 has contractual life remaining and it will be later exercised wholly as cash. Other plans have already been exercised wholly as cash, since MSSL Estonia WH OÜ has gained title to all shares in PKC Group Ltd and PKC Group Ltd’s shares were de-listed. The aim of the plans is to combine the objectives of the shareholders and the key personnel in order to increase the value of the Company in the long-term, to bind the participants to the Company, and to offer them competitive reward plans based on earning and accumulating the Company´s shares. The potential rewards from these incentive plans, on the basis of the performance period and vesting periods, will be paid partly in the Company's shares and partly in cash in 2018. The cash proportion is intended to cover taxes and tax-related costs arising from the reward to the participant. As a rule, no reward will be paid, if a participant´s employment or service ends before the reward payment. Share based incentive plans 2016 On 10 February 2016 PKC Group announced two new share-based incentive plans for the Group key personnel approved by the Board of Directors. In total, the Performance Share Plan 2016 and Restricted Share Plan 2016 correspond to the value of an approximate maximum total of 490,000 PKC Group Plc shares (including also the cash proportion). Performance Share Plan 2016 The performance period of the Performance Share Plan 2016 is calendar years 2016-2018, during which the plan is directed to approximately 60 participants, including the members of the Executive Board. The rewards to be paid on the basis of the performance
period 2016-2018 correspond to the value of an approximate maximum total of 430,000 PKC Group Plc shares (including also the cash proportion). Attainment of the required performance level will determine the proportion out of the maximum reward that will be paid to a participant on the basis of the Performance Share Plan 2016. Restricted Share Plan 2016 The vesting period of the Restricted Share Plan 2016 is calendar years 2016-2018, during which the plan is directed to approximately 20 selected key persons. The rewards allocated in 2016-2018 on the basis of the Restricted Share Plan 2016 correspond to the value of an approximate maximum total of 55,000 PKC Group Plc shares which will be exercised wholly as cash. Share based incentive plans 2015 On 11 February 2015 PKC Group announced new share-based incentive plans for the Group key personnel approved by the Board of Directors. In total, the Performance Share Plan 2015, Matching Share Plan 2015 and Restricted Share Plan 2015 correspond to the value of an approximate maximum total of 530,000 PKC Group Plc shares (including also the cash proportion). Performance Share Plan 2015 The performance period of the Performance Share Plan 2015 is calendar years 2015-2017, during which the plan is directed to approximately 40 participants, including the members of the Executive Board. The rewards to be paid on the basis of the performance period 2015-2017 correspond to the value of an approximate maximum total of 310,000 PKC Group Plc shares (including also the cash proportion). Attainment of the required performance level will determine the proportion out of the maximum reward that will be paid to a participant on the basis of the Performance Share Plan 2015. Matching Share Plan 2015 The vesting period of Matching Share Plan 2015 is calendar years 2015-2017, during which the plan is directed to approximately 20 participants, including the members of the Executive Board. The Board of Directors may resolve to include new participants in this plan during 2015-2017, and on the duration of the related vesting periods (12-36 months). The rewards allocated in 2015-2017 on the basis of the Matching Share Plan 2015 correspond to the value of an
15

Report by the Board of Directors
PKC Group 2017 - 2018 Financial Statements
approximate maximum total of 100,000 PKC Group Plc shares (including also the cash proportion). The prerequisite for receiving reward on the basis of the Matching Share Plan 2015 is that a person participating in the Plan acquires the Company´ shares up to the number determined by the Board of Directors. Furthermore, receiving of reward is tied to the continuation of participant´s employment or service upon reward payment. The participant may as a gross reward, receive one (1) matching share for each acquired share. Restricted Share Plan 2015 The vesting period of the Restricted Share Plan 2015 is calendar years 2015-2017, during which the plan is directed to approximately 20 selected key persons. The Board of Directors may resolve to include new key persons in this plan during 2015-2017, and on the duration of the related vesting periods (12-36
months). The rewards allocated in 2015-2017 on the basis of the Restricted Share Plan 2015 correspond to the value of an approximate maximum total of 120,000 PKC Group Plc shares (including also the cash proportion). ➢ Additional information of share-based incentives
has been presented in consolidated financial statements’ note 1.4 Employee Benefit Expenses.
Dividend for 2016 As a result of the fulfilment of all conditions to complete MSSL Estonia WH OÜ’s [a wholly-owned indirect subsidiary of Motherson Sumi Systems Limited] voluntary recommended public tender offer, the Board’s conditional dividend proposal had lapsed and the Annual General Meeting resolved on 5 April 2017 not to pay dividend.
Share price and monthly trading volume 2.1.2013 - 4.9.2017
0
5
10
15
20
25
30
0
5,000,000
10,000,000
15,000,000
20,000,000
25,000,000
30,000,000
01
/13
03
/13
05
/13
07
/13
09
/13
11
/13
1/1
4
3/1
4
5/1
4
7/1
4
9/1
4
11
/14
1/1
5
3/1
5
5/1
5
7/1
5
9/1
5
11
/15
1/1
6
3/1
6
5/1
6
7/1
6
9/1
6
11
/16
1/1
7
3/1
7
5/1
7
7/1
7
9/1
7
EURPcs.
Monthly trading volume, Pcs. Average monthly price, EUR
16

Financial Statements
PKC Group 2017 - 2018 Financial Statements
Consolidated Statement of Comprehensive Income
1.1.2017 - 1.1.2016 -
31.3.2018 31.12.2016
EUR 1,000 Note (15 mon.) (12 mon.)
Revenue 1.1 1,281,946 845,672
Production for own use 111 32
Other operating income 1.2 1,245 6,1066,762 4,057
Materials and services 1.3 -805,768 -507,368
Employee benefit expenses 1.4, 4.1 -300,292 -211,766
Depreciation, amortisation and impairment 2.1, 2.3 -39,383 -32,568
Other operating expenses 1.5 -102,846 -77,628
Operating profit (loss) 41,776 26,537
Interest and other financial income and expenses 3.3 -6,402 -4,420
Foreign currency exchange differences 3.3 -1,994 -1,530
Profit (loss) before taxes 33,379 20,588
Income taxes 1.6 -2,476 -8,352
Net profit (loss) for the financial year from continuing operations 30,903 12,235
Net profit (loss) for the financial year from discontinued operations 4.5 -2,595 -7,356
Net profit (loss) for the financial year 28,308 4,880
Other comprehensive income
Foreign currency translation differences -foreign operations 3.5 -25,281 2,699
Foreign currency translation differences from discontinued operations 0 -59
Cash flow hedges 3,471 1,210
Taxes related to cash flow hedges 1.6 -1,093 -438
Items that will not be reclassified to the income statement
Actuarial gains and losses on defined benefit plans 120 0
Other comprehensive income for the financial year after taxes -22,782 3,412
Total comprehensive income for the financial year 5,526 8,292
Net profit (loss) attributable to
Shareholders of the parent company 22,560 3,075
Non-controlling interests 5,748 1,805
Total comprehensive income attributable to
Shareholders of the parent company 148 6,857
Non-controlling interests 5,378 1,435
Total comprehensive income attributable to shareholders of the parent company divides as follows
Continuing operations 2,743 14,271
Discontinued operations -2,595 -7,414
Including discontinued operations
Basic earnings per share (EPS), EUR 1.7 0.94 0.13
From continuing operationsBasic earnings per share (EPS), EUR 1.7 1.04 0.43
Attributable to equity holders of the parent company
Items, that may be reclassified subsequently to profit or loss
Increase/decrease in inventories of finished goods and work in progress
17

Financial Statements
PKC Group 2017 – 2018 Financial Statements
Consolidated Statement of Financial Position
EUR 1,000 Note 31.3.2018 31.12.2016
Assets
Non-current assets 1.1
Goodwill 2.1, 2.2 40,263 35,837
Intangible assets 2.1 46,719 57,770
Property, plant and equipment 2.3 67,533 61,105
Available-for-sale financial assets 2.4 713 713
Investment in accociated company 2.5 8,076 0
Other receivables 2.6 8,341 5,439
Deferred tax assets 1.6 19,772 20,839
Total non-current assets 191,418 181,703
Current assets
Inventories 2.7 116,974 99,039
Trade receivables and other receivables 2.8 191,792 132,746
Cash and cash equivalents 74,333 130,052
Total current assets 383,099 361,837
Assets classified as held for sale 4.5 0 20,156
Total assets 574,516 563,695
Equity and liabilities
Equity 3.5
Total equity attributable to
the equity holders of the parent company 140,044 137,656
Non-controlling interests 25,921 16,742
Total equity 165,966 154,399
Non-current liabilities
Interest-bearing financial l iabil ities 3.2 106 141,326
Provisions 2.10 233 973
Other l iabilities 2.6 7,353 5,805
Deferred tax l iabilities 1.6 21,794 24,752
Total non-current liabilities 29,487 172,857
Current liabilities
Interest-bearing financial l iabil ities 3.2 184,982 35,316
Trade payables and other non-interest bearing l iabilities 2.9 194,082 190,988
Total current liabilities 379,064 226,304
Liabilities classified as held for sale 4.5 0 10,136
Total liabilities 408,551 409,297
Total equity and liabilities 574,516 563,695
18

Financial Statements
PKC Group 2017 - 2018 Financial Statements
Consolidated Statement of Cash Flows
1.1.2017 - 1.1.2016 -
31.3.2018 31.12.2016
EUR 1,000 Note (15 mon.) (12 mon.)
Cash flows from operating activities
Cash receipts from customers 1,208,114 827,461
Cash receipts from other operating income 455 4,140
Cash paid to suppliers and employees -1,184,940 -783,400
Cash flows from operations before financial income and expenses and
taxes 23,629 48,200
Interest paid and other financial expenses -5,765 -7,939
Effect of exhange rate changes -3,622 -1,710
Interest received 649 6,931
Income taxes paid -17,103 -10,017
Net cash from operating activities (A) -2,212 35,464
Cash flows from investing activities
Acquisition of property, plant and equipment and intangible assets -35,750 -25,713
Proceeds from sale of property, plant and equipment and intangible
assets 1,786 7,038
Acquisition of subsidiary shares, net of cash acquired 4.3 -24,345 0
Disposal of subsidiaries 12,240 0
Acquisition of associated company -7,329 0
Dividends received from investments 243 241
Net cash used in investing activities (B) -53,155 -18,434
Cash flows from financial activities
Share issue and exercise of options 3.5 0 455
Proceeds from current borrowings 229,329 135,000
Proceeds from non-currrent borrowings 0 128
Repayment of current/non-current borrowings -220,110 -125,506
Change of treasury shares 3.5 2,747 0
Dividends paid 3.5 -1,337 -17,206
Net cash used in financial activities (C) 10,630 -7,128
Net increase (+) or decrease (-) in cash and cash equivalents (A+B+C) -44,736 9,902
Cash and cash equivalents at the beginning of the financial year 130,052 118,287
Effect of exhange rate changes -10,982 1,863
Cash and cash equivalents at the end of the financial year 74,333 130,052 ➢ Net cash from operating activities (A) excludes discontinued operations. Additional information about
discontinued operations’ effect on the cash flow has been presented in note 4.5 Discontinued Operations.
19

Financial Statements
PKC Group 2017 - 2018 Financial Statements
Consolidated Statements of Changes in Equity 2017-2018
EUR 1,000 No
te
Shar
e c
apit
al
Shar
e p
rem
ium
acc
ou
nt
Inve
ste
d n
on
-re
stri
cte
d e
qu
ity
fun
d
Oth
er
rese
rve
s
Tre
asu
ry s
har
es
Tran
slat
ion
dif
fere
nce
Re
tain
ed
ear
nin
gs
Equ
ity
attr
ibu
tab
le t
o s
har
e-
ho
lde
rs o
f th
e p
are
nt
com
pan
y
No
n-c
on
tro
llin
g in
tere
sts
Tota
l eq
uit
y
Equity at 1.1.2017 6,218 11,282 83,433 -1,982 -1,985 -278 40,970 137,656 16,742 154,399
Comprehensive income
Net profit for the report period 0 0 0 0 0 0 22,560 22,560 5,748 28,308
Cash flow hedges 0 0 0 2,379 0 0 0 2,379 0 2,379Foreign currency
translation differences -
foreign operations 3.5 0 0 0 0 0 -25,066 0 -25,066 -215 -25,281
Other changes 0 0 411 0 0 0 120 531 0 531
Total other comprehensive
income 0 0 411 2,379 0 -25,066 120 -22,157 -215 -22,372
Total comprehensive income
for the financial year 0 0 411 2,379 0 -25,066 22,680 403 5,533 5,936
Transactions with shareholders
Dividends 3.5 0 0 0 0 0 0 0 0 -1,337 -1,337
Changes of treasury shares 3.5 0 0 0 0 1,985 0 0 1,985 0 1,985
Total transactions with
shareholders 0 0 0 0 1,985 0 0 1,985 -1,337 649
Change in ownership interest
Establishment of subsidiary
with non-controlling interest 4.4 4,982 4,982Total equity at 31.3.2018 6,218 11,282 83,843 397 0 -25,344 63,649 140,045 25,921 165,966
20

Financial Statements
PKC Group 2017 - 2018 Financial Statements
Consolidated Statements of Changes in Equity 2016
EUR 1,000 No
te
Shar
e c
apit
al
Shar
e p
rem
ium
acc
ou
nt
Inve
ste
d n
on
-re
stri
cte
d e
qu
ity
fun
d
Oth
er
rese
rve
s
Tre
asu
ry s
har
es
Tran
slat
ion
dif
fere
nce
Re
tain
ed
ear
nin
gs
Equ
ity
attr
ibu
tab
le t
o s
har
e-
ho
lde
rs o
f th
e p
are
nt
com
pan
y
No
n-c
on
tro
llin
g in
tere
sts
Tota
l eq
uit
y
Equity at 1.1.2016 6,218 11,282 82,944 -2,754 -2,252 -2,918 54,065 146,584 10,728 157,313
Comprehensive income
Net profit for the report period 0 0 0 0 0 0 3,075 3,075 1,805 4,880
Cash flow hedges 0 0 0 772 0 0 0 772 0 772
Foreign currency
translation differences -
foreign operations 3.5 0 0 0 0 0 2,699 0 2,699 0 2,699Foreign currency
translation differences
from discontinued
operations 3.5 0 0 0 0 0 -59 0 0 0 -59
Total other comprehensive
income 0 0 0 772 0 2,640 0 3,412 0 3,412
Total comprehensive income
for the financial year 0 0 0 772 0 2,640 3,075 6,486 1,805 8,291
Transactions with shareholders
Dividends 3.5 0 0 0 0 0 0 -17,206 -17,206 0 -17,206
Share-based payments 1.4 0 0 0 0 0 0 1,312 1,312 0 1,312
Exercise of options 3.5 0 0 455 0 0 0 0 455 0 455
Other changes 0 0 34 0 267 0 -276 25 0 25
Total transactions with
shareholders 0 0 489 0 267 0 -16,170 -15,414 0 -15,414
Change in ownership interest
Establishment of subsidiary
with non-controlling interest 4.4 4,209 4,209Total equity at 31.12.2016 6,218 11,282 83,433 -1,982 -1,985 -278 40,970 137,656 16,742 154,399
21

Notes to the Consolidated Financial Statements Basis of Preparation and Accounting Policies
PKC Group 2017 - 2018 Financial Statements
Basis of Preparation and Accounting Policies
Group information PKC Group Ltd is a Finnish limited company, domiciled in Helsinki, Finland. The registered address is Bulevardi 7, FI-00120 Helsinki, Finland. PKC Group Ltd is the parent company of PKC Group. PKC Group was listed on Nasdaq Helsinki since 3.4.1997 until 6.10.2017. PKC Group is a global partner, designing, manufacturing and integrating electrical distribution systems, electronics and related architecture components for the commercial vehicle industry, rolling stock manufacturers and other selected segments. The revenue from continuing operations of the financial year 1.1.2017 – 31.3.2018 totalled EUR 1,281.9 million and the average amount of personnel was 22,650. The Group operates in four different continents. On 25 May 2018, the company’s Board of Directors approved the consolidated financial statements. Under the Finnish Limited Liability Companies Act, the annual general meeting has the right to approve, reject or take the decision to amend the financial statements following their publication.
Basis of preparation The consolidated financial statements of PKC Group Ltd are prepared in accordance with the International Financial Reporting Standards (IFRS) in force at March 31, 2018 as adopted by the European Union. The notes to the consolidated financial statements have also been prepared according to Finnish accounting and company legislation supplementing the IFRS standards. The consolidated financial statements have been prepared on a historical cost basis unless otherwise indicated. The functional and presentation currency of the parent company, PKC Group Ltd, is euro, which is also the presentation currency of the consolidated financial statements. All figures have been rounded, so the total number of individual figures can deviate from the presented sum figures. The key indicators are calculated using exact figures. PKC Group Ltd’s financial period has been changed from calendar year to 1.4.-31.3. As a result of financial period change, the financial period that started 1.1.2017 continued until 31.3.2018. Financial period was 15 months while the comparison period was 12 months.
22

Notes to the Consolidated Financial Statements Basis of Preparation and Accounting Policies
PKC Group 2017 - 2018 Financial Statements
Accounting policies for the consolidated financial statements The general accounting policies of the consolidated financial statements are described in this section. Detailed accounting policies and descriptions of decisions based on management's judgement and management’s use of estimates are presented later at each item of the financial statements.
At the table below PKC Group’s accounting policies for the consolidated financial statements are presented by section. In addition, the related notes and references to the most significant IFRS standards that regulate particular financial statement items are presented in the table below.
Accounting policy Note IFRS standard
Operating segments 1.1 IFRS 8, IAS 18
Other operating income 1.2 IAS 18
Employee benefit expenses 1.4 IAS 19, IFRS 2
Income taxes, incl. deferred tax assets and liabilities 1.6 IAS 12
Intangible assets 2.1 IAS 38, IFRS 3
Impairment testing 2.2 IAS 36
Property, plant and equipment 2.3 IAS 16, IAS 23
Accociated company 2.4 IFRS 12
Inventories 2.7 IAS 2, IAS 18
Provisions 2.10 IAS 37
Financial assets and liabilities 3.1 IAS 32, IAS 39, IFRS 7, IFRS 13
Financial income and expenses 3.3 IAS 32, IAS 39, IFRS 7
Business combinations 4.3 IFRS 3
Discontinued operations 4.5 IFRS 5
Use of estimates The preparation of the financial statements in accordance with IFRS requires management to make estimates and assumptions that affect the valuation of the reported assets and liabilities and other information, such as contingent assets and liabilities and the recognition of income and expenses in profit or loss. Although these estimates are based on management’s best knowledge of current events and actions, actual results may differ from the estimates. The most important items, which require management estimates and assumptions and which may include uncertainty, are impairment testing of goodwill, deferred tax assets of unused tax losses and net realisable value of inventories. Detailed descriptions of decisions based on management's judgement and management’s use of estimates are presented later at each item of the financial statements. The Group’s management makes judgements concerning the adoption and application of the accounting policies for the financial statements. The management has used its judgement in selecting and
applying the accounting policies, for example, to the measurement of receivables and classification of leases. Any assumptions and estimates related to the comparison period are based on the circumstances and outlook that prevailed at the reporting date of that period.
Basis of consolidation The consolidated financial statements include the parent company and all of its subsidiaries. At the closing date 31 March 2018 Group comprised 37 companies, the parent company included. In the reporting period the Group had holdings in one associated company but none in joint ventures (The Group had no holdings in any associates or joint ventures in the comparison period). All intra-group transactions, receivables and liabilities, intra-group margins and dividends have been eliminated in the consolidated financial statements.
23

Notes to the Consolidated Financial Statements Basis of Preparation and Accounting Policies
PKC Group 2017 - 2018 Financial Statements
Subsidiaries The consolidated financial statements include the parent company and subsidiaries in which the parent company directly or indirectly controls more than 50 per cent of the votes associated with shares or over which the parent company otherwise exercises control at the end of the financial year. PKC is considered to have control, when PKC is exposed to, or has rights to, variable returns from its involvement with the company and has the ability as well as the power to govern the financial and operating policies of the company to obtain benefits from its activities. The profit for the financial year and items recognised in other comprehensive income are allocated to the owners of the parent company and non-controlling interests and presented in the statement of income and other comprehensive income. Non-controlling interests are presented separately from the equity allocated to the owners of the parent. Comprehensive income is allocated to the owners of the parent company and to non-controlling interests even in situations where the allocation would result in the non-controlling interests’ share being negative, unless non-controlling interests have an exemption not to meet obligations which exceed non-controlling interests’ investment in the company. Subsidiaries acquired or established during the period are included in the consolidated financial statements since the Group has obtained the control or until control ceases. Acquisitions of subsidiaries have been accounted for in the consolidated financial statements by using the acquisition method. Accordingly, the identifiable assets and liabilities of the company acquired are measured at fair value at the date of acquisition. Translation differences of non-euro subsidiaries arising from acquisition cost eliminations and post-acquisition accumulated equity items are recognised in other comprehensive income and presented in equity (item Translation difference). In disposal of a foreign entity the accumulated translation differences are disclosed in profit or loss as part of the gain or loss on disposal. ➢ The list of PKC Group’s subsidiaries at 31.3.2018 is
presented in note 4.2 Group Structure. The consideration transferred includes the assets transferred by the acquirer, the liabilities incurred by the acquirer to former owners of the acquiree and the equity interests issued by the acquirer, measured at
their fair values. All acquisition-related costs, with the exception of costs to issue debt or equity securities, are expensed in the periods in which the costs are incurred and the services rendered. Any contingent consideration is classified as either liability or equity. A contingent consideration classified as liability is remeasured at fair value at the end of each reporting period and the subsequent changes to fair value are recognised in profit or loss. A contingent consideration classified as equity is not remeasured subsequently. The consideration transferred does not include any transactions accounted for separately from the acquisition, which are accounted for in profit or loss in conjunction with the acquisition. For the business combinations occurred before January 1, 2010 the accounting principles valid at the time of the acquisition have been applied.
Associated companies Associates are all entities over which the PKC has
significant influence. Significant influence is presumed
to exist when the PKC owns over 20 per cent of the
voting rights of the company or when the PKC
otherwise exercises significant influence but does not
exercise control.
Associated companies are consolidated in accordance
with the equity method. Associated companies are
consolidated from the date the company becomes an
associated company and divested companies are
consolidated until the date of disposal.
Non-current assets held for sale and discontinued operations Non-current assets held for sale and assets and liabilities related to discontinued operations are classified as held for sale if their carrying amount will be recovered principally through a sale transaction. The prerequisites for the classification as held for sale are considered to be met when the sale is considered highly probable and management is committed to the sale within one year from the date of classification for sale. From the classification date the assets held for sale are measured at lower of their carrying amount or fair value less selling costs. Depreciation of these assets is discontinued on the classification date.
24

Notes to the Consolidated Financial Statements Basis of Preparation and Accounting Policies
PKC Group 2017 - 2018 Financial Statements
Foreign currency transactions Subsidiaries included in the Group report in their financial statements their transactions using the currency of the economic operating environment in which the entity primarily operates (functional currency). The Group companies translate in their accounting foreign currency transactions into their functional currency using the exchange rate of the transaction date. Foreign currency receivables and liabilities are translated into functional currency using the exchange rate of the closing date. Foreign exchange gains and losses arising from foreign currency transactions and translation of monetary items are reported in profit or loss. Foreign exchange gains and losses in business operations are included in the corresponding items above the operating profit. Foreign exchange gains and losses on foreign currency loans are included in financial income and expenses, except for exchange differences arising from foreign currency denominated loans which are classified as net investments in foreign subsidiaries. Exchange rate
differences of these loans are recognised in items of other comprehensive income and cumulative exchange rate differences are presented as a separate item in the equity until the disposal of the foreign operation, in whole or in part.
Translation of financial statements of foreign subsidiaries In the consolidated financial statements the income and expenses of the statements of comprehensive income of foreign subsidiaries are translated into euros at the average exchange rates of the reporting period. Items of the statement of the financial position, excluding the profit of the financial year, are translated to euros at the closing rate of the reporting period. Translation of the profit for the financial year and other comprehensive income using average exchange rates of the reporting period and translation of the items of the statement of the financial position using the closing rate of the reporting period causes translation differences, which are recognised in other comprehensive income and cumulative translation differences are presented as a separate item in equity.
In the consolidated financial statements following exchange rates have been applied:
Country Currency 2017-2018 2016 31.3.2018 31.12.2016
Brazil BRL 3.6827 3.8616 4.0716 3.4305
Canada CAD 1.4821 1.4664 1.5883 1.4188
China CNY 7.6617 7.3496 7.7285 7.3202
China, HongKong HKD 8.9657 8.5900 9.6701 8.1751
Mexico MXN 21.6642 20.6532 22.3626 21.7719
Poland PLN 4.2395 4.3636 4.2158 4.4103
Serbia RSD 120.5445 123.1183 118.1214 123.3730
Russia RUR 66.6635 74.2224 70.3788 64.3000
Vietnam VND - 24,753.1444 - 24,025.9098USA USD 1.1494 1.1066 1.2321 1.0541
Average rate*) Closing rate
*) Average rate of the year is calculated from monthly average rates.
Operating Profit IAS 1 Presentation of Financial Statements does not define the concept of operating profit. According to the definition used by PKC Group, operating profit is the net amount formed when other operating income is added to the net sales, and the following items are then subtracted from the total: materials and services adjusted for the change in inventories of finished goods and work in progress and also for foreign exchanges gains and losses arising from trade payables; the employee benefit expenses; depreciation, amortisation
and impairment losses; and other operating expenses. Any other items in profit or loss are shown under operating profit.
Impact of new ESMA guidelines In accordance with the new guidelines on alternative performance measures issued by the European Securities and Markets Authority (ESMA) PKC has as of 2016 replaced the term non-recurring items (NRI) by the term items affecting comparability. However the definition remains the same. Items affecting
25

Notes to the Consolidated Financial Statements Basis of Preparation and Accounting Policies
PKC Group 2017 - 2018 Financial Statements
comparability (earlier non-recurring items) are exceptional items which are not related to normal business operations. Typically, the items affecting comparability include substantial capital gains and losses; impairment losses or reversals of such impairment; expenses related to restructuring of business operations and strategic reorganisation; and penalties. Alternative performance measures are presented in the chapter Measures of profit and items affecting comparability in the report by the Board of Directors. Alternative Performance Measures (APM) are used in order to better describe the operational business performance and to improve comparability between reporting periods.
New and amended standards applied in the financial year ended The Group has applied since 1 January 2017 the following new standards or their amendments issued by IASB. Group has adopted each standard and interpretation as of its effective date or, if the effective date is other than the first day of the financial period, as of the beginning of the financial period following the effective date. Amendments to IAS 12 Recognition of Deferred Tax Assets for Unrealised Losses* (effective for financial years beginning on or after 1 January 2017) The amendments clarify that the existence of a deductible temporary difference depends solely on a comparison of the carrying amount of an asset and its tax base at the end of the reporting period, and is not affected by possible future changes in the carrying amount or expected manner of recovery of the asset. The amendments had no significant impact on consolidated financial statements. Amendments to IAS 7 Statement of Cash Flows - Disclosure Initiative* (effective for financial years beginning on or after 1 January 2017) The changes were made to enable users of financial statements to evaluate changes in liabilities arising from financing activities, including both changes arising from cash flow and non-cash changes. The amendments had no significant impact on consolidated financial statements. Adoptions of other amended standards had no impact on the consolidated financial statements.
Adoption of new and amended standards and
interpretations applicable in future financial years The following published new and amended standards and interpretations are not yet effective as at 31 March 2018 and PKC has not applied them in preparation of these consolidated financial statements. The Group will adopt them as of the effective date of each of the standards, or if the effective date is not the first day of the financial year, as of the beginning of the next financial year following the effective date. No other new and amended standards and interpretations would be expected to have any impact on consolidated financial statements. New IFRS 15 Revenue from Contracts with Customers (effective for financial years beginning on or after 1 January 2018) The new standard replaces current IAS 18 and IAS 11 -standards and related interpretations. In IFRS 15 a five-step model is applied to determine when to recognize revenue, and at what amount. Revenue is recognised when (or as) a company transfers control of goods or services to a customer either over time or at a point in time. The standard introduces also extensive new disclosure requirements. The impacts of IFRS 15 on PKC’s consolidated financial statements have been assessed as follows:
• Essential concepts in IFRS 15 has been analysed on revenue stream level. PKC’s revenue streams consists of contract with customers in wiring systems business. Current revenue recognition in PKC is based on transfer of risks and rewards to customer. PKC has frame agreements with major customers. Separate purchase orders are covered by frame agreement and as a rule they form a separate performance obligation. Revenue for performance obligations is recognised also in the future at a point in time. Part of the agreements include variable considerations, but based on current analysis timing of their revenue recognition is not expected to change significantly. Warranties given by PKC are more statutory in nature thus accounting for such warranties correspond mainly current practice.
• PKC has continued the analysis in more detailed level. The IFRS 15 project and the impact evaluation will continue on certain individual customer contract details. Based on current analysis, timing of revenue recognition is not expected to have significant changes. Furthermore, the standard will increase disclosure information related to revenue recognition. PKC will implement the standard during the year 2018.
26

Notes to the Consolidated Financial Statements Basis of Preparation and Accounting Policies
PKC Group 2017 - 2018 Financial Statements
New IFRS 9 Financial Instruments (effective for financial years beginning on or after 1 January 2018) IFRS 9 replaces the existing guidance in IAS 39 Financial Instruments: Recognition and Measurement. IFRS 9 includes revised guidance on the classification and measurement of financial instruments, including a new expected credit loss model for calculating impairment on financial assets, and the new general hedge accounting requirements. It also carries forward the guidance on recognition and derecognition of financial instruments from IAS 39. At the end of the financial year the Group is assessing the impact of IFRS 9 not to be significant.
New IFRS 16 Leases (effective for financial years beginning on or after 1 January 2019) IFRS 16 requires the lessees to recognise the lease agreements on the balance sheet as a right-of-use assets and lease liabilities. The accounting model is similar to current finance lease accounting according to IAS 17. The Group is assessing that IFRS 16 has impact on the consolidated financial statements.
27

Notes to the Financial Statements 1. Items Related to the Profit for the Period
PKC Group 2017 - 2018 Financial Statements
1. Items Related to the Profit for the Period
1.1 Operating Segments PKC Group has only one primary business segment, Wiring Systems, which also includes Group functions and other items. The Wiring Systems business designs, manufactures and integrates tailored electrical distribution systems and related architecture components, vehicle electronics, wires and cables especially for trucks and buses, light and recreational products, construction equipment and agricultural and forestry equipment. In addition, segment designs and manufactures electrical cabinets, power packs and electrical distribution systems for rolling stock manufacturers. Segment’s strengths, mass customisation and the excellent skill to integrate into the customer’s operating environment, provide a unique competitive advantage in the market. Product design and effective supply chain management are carried out in close cooperation with customers and in accordance with their requirements. The units of Wiring Systems business are located in Brazil, China, Estonia, Finland, Germany, Lithuania, Mexico, Poland, Russia, Serbia and USA. Accounting policy of segment information PKC Group’s segment information is consistent with Group’s internal reporting and IFRS standards. The Group’s reportable segment are consistent with the operating segments. The business of the Group consists of one business area (reporting operating segment), Wiring Systems. The Wiring Systems business is operated in geographical areas where customers are offered the same product concept applied to different local conditions and requirements. The main products of all geographical areas are the wiring systems modules and related architecture components. The customers of the Wiring Systems business are predominantly globally operating companies that make long-term sourcing decisions on the basis of global purchasing volumes. Internal management reporting is used to monitor the performance of the Wiring Systems business as a whole and on basis of geographical business area. Reporting supports the internal overall target setting and strategic monitoring.
PKC Group’s highest operative decision maker (CODM, Chief Operating Decision Maker) is the President and CEO supported by the Executive Board. President and CEO evaluates the Group’s financial position and its development as a whole, not based on the results of the geographical business areas. Because the Group’s customers predominantly operate globally the reported indicators in a single geographical area do not give a correct picture of the financial situation and the development of the Group’s Wiring Systems business. Due to business model and operative structure, PKC Group’s business cannot be divided into separately reported operating segments. Information about geographical areas Revenue by market areas is based on customers' geographical locations. PKC Group is active in the following geographical areas: Europe, North America, South America and APAC (Asia and Pacific). The assets and capital expenditure of geographical areas are based on the locations of the assets, i.e., Europe, North America, South America and APAC (Asia and Pacific). Revenue recognition policies Revenue from the sale of goods is recognised when the significant risks, rewards and actual control usually associated with ownership of the goods have been transferred to the buyer. Usually revenue is recognised as income when products are delivered in accordance with the terms of sale. Revenue from services is recognised during the period when the service is rendered and the economic benefit of the transaction is probable. The share of PKC Group’s revenue from services is not significant. PKC Group has no long-term projects, for which the percentage-of-completion method is used. Revenue includes the income of the actual operations measured at fair value and adjusted for discounts given. Revenue also includes foreign exchange rate gains and losses arising from trade receivables.
28

Notes to the Financial Statements 1. Items Related to the Profit for the Period
PKC Group 2017 - 2018 Financial Statements
Geographical information
EUR 1,000 2017-2018 2016 2018 2016 2018 2016
Europe 442,792 301,571 53,555 58,201 28,430 9,661
of which Finland 18,982 12,191 270 4,751 17,570 779
South America 75,626 36,591 5,886 6,011 2,427 1,030
North America 597,480 458,942 80,823 83,440 16,194 12,139
APAC 166,049 48,568 23,041 7,774 20,367 1,654
Total 1,281,946 845,672 163,304 155,425 67,417 24,484
Revenue by geographical
location of customer
Non-current assets by
location of assets Capital expenditure
Non-current assets consist of goodwill, intangible assets, property, plant and equipment and available-for-sale financial assets.
Major customers
EUR 1,000 2017-2018 % of revenue 2016 % of revenue
Customer 1 208,820 16.3 122,333 14.5
Customer 2 162,662 12.7 121,488 14.4
Customer 3 131,406 10.3 108,475 12.8
Total 502,889 39.2 352,296 41.7
Group revenue 1,281,946 845,672 In the table above, the customers are not necessarily the same during the reporting period and the comparison period.
1.2 Other Operating Income Accounting policy Income related to other than normal business is recognised as other operating income. Such items are, for example, proceeds from sales of items of property, plant and equipment and intangible assets, government grants and share of net profit of associated company. Government grants, which have been received to
compensate realised costs, are recognised as other
operating income through profit or loss over the period
to match them with the costs that they are
compensating. Government grants relating to the
purchase of property, plant and equipment are
included in non-current liabilities as deferred income
and are credited to profit or loss on a straight-line basis
over the expected lives of the related assets and
presented within other income.
During the comparison period 2016 the Group has received employment grants in Serbia.
EUR 1,000 2017-18 2016
Proceeds from sales of intangible
assets and property, plant and
equipment 176 2,699
Government grants 130 2,538
Other income 191 869
Share of net profit of associated company 748 0
Total 1,245 6,106
29

Notes to the Financial Statements 1. Items Related to the Profit for the Period
PKC Group 2017 - 2018 Financial Statements
1.3 Materials and services
EUR 1,000 2017-18 2016
Purchases during the financial
period 792,177 492,372
Change in inventories,
increase (+) or decrease (-) -16,953 -7,573
Raw materials and consumables 775,224 484,799
Outsourced services 30,544 22,569
Total 805,768 507,368
1.4 Employee Benefit Expenses Accounting policy Employee benefits include short-term employee benefits, termination benefits, post-employment benefits, other long-term employee benefits and share-based payments. Short-term employee benefits Short-term employee benefits are wages and salaries, fringe benefits, annual leaves and bonuses. Termination benefits Termination benefits are based on the termination of employment rather than employee service. These comprise severances. Post-employment benefits Post-employment benefits will be payable after the completion of employment. They comprise pensions or other post-employment benefits, for example, life insurance or health care benefits. Post-employment benefit arrangements are classified either as defined benefit arrangements or defined contribution arrangements. For defined contribution arrangements, the Group pays fixed contributions to a separate external unit and the Group has no obligation to pay supplementary contributions if the recipient of
the contributions is unable to meet the payment of the benefits. Payments to defined contribution arrangements are recognised through profit or loss as incurred. Other long-term employee benefits PKC Group’s other long-term employee benefits include, among other things, service year awards and leave benefits based on long-term employment. Other personnel expenses Other personnel expenses include e.g. expenses related to occupational safety, expenses of occupational health care services and workplace dining and transportation arranged by the employer.
Employee benefit expenses
EUR 1,000 2017-18 2016
Wages and salaries 238,121 168,363
Defined contribution
pension plans 8,633 4,965
Other social security expenses 40,371 31,459
Share-based payments 5,186 2,142
Other personnel expenses 7,981 4,836
Total 300,292 211,766 In 2017-2018 employee benefit expenses include EUR
9.8 million expenses affecting comparability. Items
affecting comparability in the financial period consist
mainly of expenses related to MSSL Estonia WH OÜ’s
public tender offer on PKC’s shares and options. In
comparison period 2016 employee benefit expenses
include EUR 5.6 million expenses affecting
comparability arising from lay-offs. Items affecting
comparability are presented in the Report by the Board
of Directors, chapter Measures of Profit and Items
Affecting Comparability.
➢ Information concerning remuneration of management is presented in note 4.1 Related Party Disclosures.
30

Notes to the Financial Statements 1. Items Related to the Profit for the Period
PKC Group 2017 - 2018 Financial Statements
Number of personnel
Geographical areas 2017-2018 2016 2017-2018 2016
Europe, 8,226 7,750 7,961 7,624
of which Finland 45 54 46 60
South America 1,443 1,081 1,342 1,168
North America 11,888 9,973 11,698 11,613
APAC 2,476 924 1,650 871
Total 24,033 19,728 22,650 21,277
At the end of the year Average
Share-based payments PKC’s long-term remuneration consists of stock option schemes and the share-based incentive plans. The Group has applied IFRS 2 Share-Based Payments to share-based incentives and also to the option schemes. Share-based payments of stock option schemes and share-based incentives included in employee benefit expenses totalled EUR 5.2 million in 2017-2018 (in 2016 EUR 2.1 million). At the end of March 2018 only Restricted Share Plan 2016 has contractual life remaining and it will be later exercised wholly as cash. Other plans have already been exercised wholly as cash, since MSSL Estonia WH OÜ has gained title to all shares in PKC Group Ltd. Stock options were exercised as cash or expired since PKC’s shares have been delisted 6 October 2017.
➢ More information on the share-based incentives and the options is presented in the Report by the Board of Directors, sections Shares and shareholders.
Restricted Share Plan 2016 The vesting period of the Restricted Share Plan 2016 is calendar years 2016-2018, during which the plan is directed to approximately 20 selected key persons. The rewards allocated in 2016-2018 on the basis of the Restricted Share Plan 2016 correspond to the value of an approximate maximum total of 55,000 PKC Group Ltd shares (including also the cash proportion) which will be exercised wholly as cash. The reward from the Restricted Share Plan will be based on a valid employment or service contract of a key person upon the reward payment.
31

Notes to the Financial Statements 1. Items Related to the Profit for the Period
PKC Group 2017 - 2018 Financial Statements
The basic details of the plans are listed in the tables below:
Matching
Share Plan
2015
Performance
Share Plan
2015-2017
Restricted
Share Plan
2015-2016
Restricted
Share Plan
2015-2017
Performance
Share Plan
2016-2018
Restricted
Share Plan
2016-2018
Total /
weighted
average
Initial amount, 1,000 pcs 100 310 40 40 430 60 980
Initial allocation date 11.2.2015 11.2.2015 11.2.2015 11.2.2015 10.2.2016 10.2.2016
Vesting date 31.5.2018 31.5.2018 31.5.2017 31.5.2018 31.5.2019 31.5.2019
Maximum contractual l ife,
years 3.3 3.3 2.3 3.3 3.3 3.3 3.3
Remaining contractual
l ife, years 0.2 0.2 0.0 0.2 1.2 1.2 1.2
Number of persons at the
end of the reporting year 0 0 0 0 0 30
Payment method Cash Cash Cash Cash Cash Cash
Changes during the financial year 2017 - 2018 are presented in the tables below:
1,000 pcs
Matching
Share Plan
2015
Performance
Share Plan
2015-2017
Restricted
Share Plan
2015-2016
Restricted
Share Plan
2015-2017
Performance
Share Plan
2016-2018
Restricted
Share Plan
2016-2018 Total
1.1.2017
Outstanding at the
beginning of the reporting
period 73 290 32 29 416 57 897
Changes during the period
Granted 0 0 0 0 0 2 2
Forfeited 0 210 0 0 394 4 609
Excercised 73 80 32 29 22 0 235
31.3.2018
Excercised at the end of
the period 73 80 32 29 22 0 235
Outstanding at the end of
the period 0 0 0 0 0 55 55
32

Notes to the Financial Statements 1. Items Related to the Profit for the Period
PKC Group 2017 - 2018 Financial Statements
Effect of share-based incentives on the result and financial position during the period:
EUR 1,000 2017-18 2016
Expenses for the financial year, share-based payments 5,073 1,638
Expenses for the financial year, share-based payments, equity-settled 0 808
Liabilities arising from share-based payments at the end of the period 892 1,211
1.5 Other Operating Expenses Accounting policy Indirect expenses of operations excluding employee benefit expenses are recognised as other operating expenses.
EUR 1,000 2017-18 2016
Administrative expenses and
outsourced services 23,015 17,948
Production maintenance expenses 23,295 15,509
Facility expenses 14,204 11,315
IT and telecommunications
expenses 10,864 8,839
Transportation and freight expenses 10,702 8,813
Travelling expenses 9,424 7,099
Other maintenance expenses 4,688 3,412
Other insurance expenses 1,369 1,036
Auditors´ fees 1,138 746
Other employee related expenses 609 608
Losses from sales of intangible
assets and property, plant and
equipment 143 449
Other items 3,395 1,854
Total 102,846 77,628
Auditors´ fees
EUR 1,000 2017-18 2016
Audit fees 870 544
Tax services 264 94
Other services 4 108
Total 1,138 746
1.6 Income Taxes, incl. Deferred Tax Assets and Liabilities Accounting policy Group's income taxes include taxes of Group companies calculated based on the taxable profit for the period, and adjustments for previous periods as well as the change in deferred income taxes. The income taxes are recognised in profit or loss except for the items recognised directly in equity or other comprehensive income. The Group’s current income tax includes taxes of Group companies calculated based on the taxable profit for the period. Taxable profit differs from profit as reported in profit or loss due to the accrual differences and items that are never taxable or tax-deductible. The current tax is measured using the tax rates and laws that have been enacted or substantially enacted by the end of the reporting period. Deferred taxes are provided using the balance sheet liability method on temporary differences arising between the tax bases of assets and liabilities and their carrying amounts in the consolidated financial statements. However, if the deferred tax arises from initial recognition of an asset or a liability in a transaction other than a business combination that at the time of the transaction affects neither accounting nor taxable profit/loss, it is not accounted for. Deferred tax is determined to reflect the expected manner of recovery or settlement and using the tax rates and laws that have been enacted or substantially enacted by the end of the reporting period. Deferred tax assets are recognised to the extent that it is probable that future taxable profit will be available against which the temporary differences can be utilised. Deferred tax is provided on temporary differences arising from investments in subsidiaries, except where the timing of the reversal of the temporary difference is controlled by the Group, and it is probable that the temporary difference will not reverse in the foreseeable future.
33

Notes to the Financial Statements 1. Items Related to the Profit for the Period
PKC Group 2017 - 2018 Financial Statements
Use of estimates Management judgment is required in determining the provision for income taxes and the deferred tax assets. Deferred tax assets are provided on tax losses as well as on temporary differences arising between the tax bases of assets and liabilities, and their carrying amounts in the consolidated financial statements. Deferred tax assets are recognised to the extent that it is probable based on the management judgment that future taxable profit will be available against which the deferred tax asset can be utilised. Amendments in the regulations and practice related to taxation may also have an effect on the management judgment. PKC's tax appeal for the Wiring Systems business
restructuring carried out in 2009 was rejected by
Finland’s Board of Adjustment. The decision was
received in January 2016. The decision obliges PKC
Group to pay EUR 8.3 million additional taxes, punitive
tax increases and interests, which company recorded in
the results of the financial year 2014. PKC Group has
placed the issue before the administrative court of
Northern Finland (Pohjois-Suomen hallinto-oikeus) and
applies for a rectification of the Board of Adjustment’s
ruling and continuation of interdiction of enforcement
of the tax imposed. In September 2017 the
Administrative Court of Northern Finland made
decision which decreased the total of additional taxes,
tax increases and interest rate to EUR 1.7 million. PKC
Group made an appeal and application for leave of
appeal to the Supreme Administrative Court, which did
not grant the leave of appeal, so the Administrative
Court's decision was final. PKC Group has initiated
measures to correct double taxation within the EU.
Income taxes
EUR 1,000 2017-18 2016
Income taxes for the financial year -14,929 -11,782
Adjustments for prior years 7,083 -2,181
Changes in deferred taxes 5,470 5,611
Withholding taxes -100 0
Total -2,476 -8,352
Income tax rate Income taxes from Group´s profit before taxes deviates from Finnish nominal tax rate as follows:
EUR 1,000 2017-18 2016
Profit (loss) before taxes 33,379 20,588
Income tax calculated at Finnish tax rate -6,676 -4,117
Changes in tax rates 3,259 -34
Effects of different tax rates in foreign subsidiaries -2,510 -1,465
Income not subject to tax -3,517 2,247
Expenses not deductible for tax purposes 3,350 -3,741
Share of profit of subsidiaries 2,909 1,078
Tax losses for which no deferred tax was recognised -6,200 -2,288
Income taxes from previous years 7,918 -161
Other items -1,009 130
Discontinued operations - -
Tax charge in the statement of comprehensive income -2,476 -8,352
Effective tax rate, % 7.4 40.6
34

Notes to the Financial Statements 1. Items Related to the Profit for the Period
PKC Group 2017 - 2018 Financial Statements
The effective tax rate according to the statement of
comprehensive income was 7.4 % (40.6% in 2016). The
effective tax rate was impacted by PKC Group’s high
exposure to North America where the tax rates have
decreased (effective January 1,2018) and a prior year
adjustment eliminating a tax liability in Finland due to
litigation closure. The effective tax rate used in the
statement of comprehensive income is always
impacted by the balance of income in different
countries taxed at different rates and local terms. The
weighted absolute average applicable tax rate was 24%
and the average nominal tax rates was 25% in 2017 -
2018. The weighted average tax rate is higher than the
Finnish tax rate applied as the nominal tax rate because
of the profits generated e.g. in Mexico and Northern
America, where the tax rate is higher than the Finnish
tax rate. A significant portion of the Group's turnover
and profits are generated and consequently subject to
tax outside Finland at the tax rate different to the
Finnish corporate income tax rate. Thus, a comparison
between the effective tax rate and the weighted
average tax rate better reflects the tax burden of PKC
Group than a comparison between the effective tax
rate and the Finnish tax rate. The amount of profits
generated in different countries and the corporate
income tax rate applicable in these countries together
determine the weighted average tax rate.
U.S. tax reform
The U.S. tax reform bill was signed into law, known as
the Tax Cuts and Jobs Act of 2017, on December 22,
2017, and it makes major revisions to the U.S. tax code
for both individuals and corporations. The most
significant changes affecting PKC Group are:
1. The federal tax rate decreased from 35% to
21%. The deferred tax liabilities were revalued on
December 31, 2017, recognizing a EUR 3.3 million
tax benefit.
2. New section 163 (j) which is an anti-base erosion
measure limiting the interest expense deduction
for all related and unrelated debt to 30% of
EBITDA.
3. Imposes an additional tax known as the Base
Erosion Minimum Tax (“BEAT”). The BEAT tax
amount is computed as 10 percent (5 percent
transitionally for years beginning in 2018 and 12.5
percent for years beginning in 2026 or later) of
modified taxable income.
The significant changes discussed above are effective
January 1, 2018.
35

Notes to the Financial Statements 1. Items Related to the Profit for the Period
PKC Group 2017 - 2018 Financial Statements
Deferred tax assets 2017-2018
EUR 1,000 1.1.2017
Recognised
through
profit or loss
Recognised
through other
comprehensive
income
Exchange rate
differences,
reclassifications
and other
changes 31.3.2018
Property, plant and equipment 1,463 348 0 -294 1,517
Intangible assets 1 0 0 173 174
Goodwill 237 173 0 -224 186
Financial instruments -96 47 0 3 -46
Inventories 454 54 0 -244 264
Employee benefits 322 -171 0 194 345
Provisions and other accruals 4,296 -59 62 649 4,948
Tax losses 13,300 -730 0 -1,057 11,513
Other temporary differences 862 703 0 -694 871
Total deferred tax assets 20,839 365 62 -1,494 19,772
Deferred tax liabilities 2017-2018
EUR 1,000 1.1.2017
Recognised
through
profit or loss
Recognised
through other
comprehensive
income
Exchange rate
differences,
reclassifications
and other
changes 31.3.2018
Property, plant and equipment -2,120 -401 0 207 -2,314
Intangible assets 9,502 -5,461 1,768 -1,372 4,437
Goodwill 4,157 -958 0 88 3,287
Inventories -524 -77 0 75 -526
Provisions and other accruals 124 -48 0 44 120
Undistributed earnings 7,689 1,488 0 -4 9,173
Other temporary differences 5,924 353 1,092 248 7,617
Deferred tax liabilities 24,752 -5,104 2,860 -714 21,794
36

Notes to the Financial Statements 1. Items Related to the Profit for the Period
PKC Group 2017 - 2018 Financial Statements
Deferred tax assets 2016
EUR 1,000 1.1.2016
Recognised
through
profit or loss
Recognised
through other
comprehensive
income
Exchange rate
differences,
reclassifications
and other
changes
Discontinued
operations 31.12.2016
Property, plant and equipment 1,887 -355 0 -100 31 1,463
Intangible assets 8 5 0 -4 -8 1
Goodwill 1,495 26 0 -1,284 0 237
Financial instruments 8 140 0 -244 0 -96
Inventories 1,249 394 0 -1,189 0 454
Employee benefits 556 45 0 -221 -58 322
Provisions and other accruals 3,672 122 0 622 -120 4,296
Tax losses 8,519 1,516 0 3,553 -288 13,300
Other temporary differences 2,639 -1,627 0 290 -441 862
Total deferred tax assets 20,032 267 0 1,425 -884 20,839
Deferred tax liabilities 2016
EUR 1,000 1.1.2016
Recognised
through
profit or loss
Recognised
through other
comprehensive
income
Exchange rate
differences,
reclassifications
and other
changes
Discontinued
operations 31.12.2016
Property, plant and equipment 1,114 -3,214 0 -20 0 -2,120
Intangible assets 10,841 -1,664 0 326 0 9,502
Goodwill 4,964 -500 0 -307 0 4,157
Inventories 478 162 0 -1,164 0 -524
Provisions and other accruals 434 -62 0 -248 0 124
Undistributed earnings 7,144 544 0 0 0 7,689
Other temporary differences 4,333 -317 243 1,674 -7 5,926
Deferred tax liabilities 29,305 -5,050 243 262 -7 24,752
37

Notes to the Financial Statements 1. Items Related to the Profit for the Period
PKC Group 2017 - 2018 Financial Statements
Tax losses at the end of the financial year
EUR million 2017-18 2016 2017-18 2016 2017-18 2016
Losses without expiration date 97.4 108.3 6.6 8.5 21.2 24.0
Losses with expiration date 81.5 39.7 4.9 4.8 14.9 5.8
Total 178.9 148.0 11.5 13.3 36.1 29.8
Tax losses
Deferred tax asset
recognised on the
statement of financial
position
Deferred tax asset not
recognised on the
statement of financial
position 1)
1) The deferred tax asset not recognised on the statement of financial position relates to tax loss carry-forwards whose future utilisation is uncertain.
1.7 Earnings per Share Basic earnings per share Basic earnings per share is calculated by dividing profit for the financial year attributable to the equity holders of the parent company by the average share-issue adjusted number of outstanding shares. Diluted earnings per share Diluted earnings per share is calculated similar to basic earnings per share, but when calculating diluted earnings per share the number of potentially diluting shares are added to the average share-issued adjusted
number of shares. Potentially diluting shares are shares arising from stock option schemes of Group’s key personnel. Stock option schemes The diluting effect of stock option schemes existing in the Group on 31 December 2016 is negative, therefore diluting effect is not presented. At the end of the financial year 2017 - 2018 PKC Group didn´t have any valid stock option schemes.
2017-18 2016
Net profit including discontinued operations for the financial year, EUR 1,000 22,560 3,075
Net profit from continuing operations for the financial year, EUR 1,000 25,156 10,430
Weighted average number of shares outstanding during the financial year, 1,000 pcs. 24,125 23,992
Basic earnings including discontinued operations per share (EPS), EUR 0.94 0.13
Basic earnings from continuing operations per share (EPS), EUR 1.04 0.43
38

Notes to the Consolidated Financial Statements 2. Operating Assets and Liabilities
PKC Group 2017 - 2018 Financial Statements
2. Operating Assets and Liabilities
2.1 Intangible Assets Accounting policy Goodwill Goodwill arising from a business combination is recognised as the excess of the aggregate of the consideration transferred, the amount of any non-controlling interests in the acquiree and any previously held equity interests in the acquiree, over the Group’s share of the fair value of the identifiable net assets acquired. Goodwill is not amortised but is tested annually for the impairment. Possible impairment losses are recognised in profit or loss immediately as incurred. For the purposes of impairment testing goodwill is allocated to cash-generating units. Customer relationships Existing customer relationships are recognised at fair value at the date of acquisition. Other intangible assets Intangible assets are initially recognised in the statement of financial position at acquisition cost if their cost can be determined reliably and it is probable that they will bring economic benefits for the Group. The cost of an intangible asset comprises the purchase price and all costs that can be directly attributed to preparing an asset for its intended use. Other intangible assets in the Group include patents and software licenses among others.
Intangible assets that have limited useful lives are amortised on a straight-line basis in the statement of income during their known or estimated useful lives. Amortisation is commenced when asset is available for use. An asset which is not yet available for use is tested annually for impairment. Intangible assets’ acquisitions in progress Software projects under preparation and implementation are presented under acquisitions in progress. Amortisation periods for intangible assets Other intangible assets 3-5 years Customer relationships 5-10 years Amortisation ceases when an intangible asset is classified as held for sale. Research and development costs Research costs are recognised in profit or loss. If development costs meet certain capitalisation criteria, they are presented in the statement of financial position under Other intangible assets and are amortised over their useful lives. All the Group’s development costs are expensed as there is insufficient indication of future economic benefits in the development phase of projects.
39

Notes to the Consolidated Financial Statements 2. Operating Assets and Liabilities
PKC Group 2017 - 2018 Financial Statements
Intangible assets 2017-2018
EUR 1,000 Goodwill
Customer
relationships
Other
intangible
assets
Intangible
assets
acquisitions
in progress Total
Acquisition cost 1.1.2017 41,161 90,667 35,494 249 167,571
+/- Currency translation differences -1,000 -147 -1,351 0 -2,498
+ Additions 0 0 1,664 779 2,442
+ Business combinations 5,451 4,177 93 0 9,720
- Disposals 0 0 -1,005 0 -1,005
+ /- Reclassifications 0 3,681 -3,702 -831 -852
Acquisition cost 31.3.2018 45,612 98,377 31,193 197 175,378
Accumulated amortisation and
impairments 1.1.2017 5,324 52,894 15,746 0 73,964
+/- Currency translation differences 0 560 131 0 691
+ Accumulated amortisation on disposals
and reclassifications 0 2,265 -2,445 0 -180
+ Amortisation of business combinations 24 0 0 0 24
+ Amortisation 0 9,067 4,831 0 13,898
Accumulated amortisation and
impairments 31.3.2018 5,348 64,785 18,263 0 88,397
Carrying amount 31.3.2018 40,263 33,592 12,930 197 86,981 Intangible assets 2016
EUR 1,000 Goodwill
Customer
relationships
Other
intangible
assets
Intangible
assets
acquisitions
in progress Total
Acquisition cost 1.1.2016 41,886 88,084 36,888 325 167,183
+/- Currency translation differences -725 1,033 -340 0 -32
+ Additions 0 1,550 1,754 640 3,944
- Disposals 0 0 -1,724 0 -1,724
+ /- Reclassifications 0 0 716 -716 0
- Reclassification to assets held for sale 0 0 -1,800 0 -1,800
Acquisition cost 31.12.2016 41,161 90,667 35,494 249 167,571
Accumulated amortisation and
impairments 1.1.2016 4,115 45,231 14,111 0 63,457
+/- Currency translation differences 0 85 52 0 138
+ Accumulated amortisation on disposals
and reclassifications 0 0 -1,739 0 -1,739
+ Amortisation 1,209 7,577 4,967 0 13,753
- Reclassification to assets held for sale 0 0 -1,645 0 -1,645
Accumulated amortisation and
impairments 31.12.2016 5,324 52,894 15,746 0 73,964
Carrying amount 31.12.2016 35,837 37,773 19,747 249 93,607
40

Notes to the Consolidated Financial Statements 2. Operating Assets and Liabilities
PKC Group 2017 - 2018 Financial Statements
2.2 Impairment Testing Accounting policy The principles of impairments of intangible assets The Group assesses at least annually whether there is any indication that an asset may be impaired. If any such indication exists, the asset’s recoverable amount is estimated. In addition, goodwill and unfinished intangible assets are tested for impairment annually regardless of any indication of impairment. An impairment loss is recognised when an asset’s carrying amount exceeds its recoverable amount. An impairment loss is immediately recognised in profit or loss. The impairment loss of a cash-generating unit is recognised first as a reduction of the carrying amount of any goodwill allocated to the unit and then proportionally as a reduction of unit’s other assets. The useful life of the asset to be amortised is reassessed at the recognition of the impairment loss. Recognition of an impairment loss reduces Group’s profit and thus equity, but it has no effect on the consolidated statement of cash flows. A previously recognised impairment loss for assets other than goodwill is reversed in a subsequent period if there has been a significant positive change in the estimates used to determine an asset’s recoverable amount. An impairment loss can be reversed to the amount that would have been the carrying value of the asset, had no impairment loss been recognised. An impairment loss for goodwill is not reversed under any circumstances. Use of estimates The execution of the annual impairment test has required management to make assumptions and estimates to measure the recoverable amounts of the cash-generating units. On the basis of the impairment testing, the Group has no need to recognise an impairment loss of goodwill. Other intangible assets show no indication of impairment.
Allocation of goodwill For impairment testing purposes the Group has allocated goodwill of EUR 40.3 million (EUR 35.8 million) to the cash-generating units. The Group consists of one business area (reporting operating segment), Wiring Systems. Determination of cash flows The Group performs the annual impairment testing of goodwill during the last quarter of each financial year. An impairment test of a cash-generating unit is performed by comparing its recoverable amount to its carrying amount. The recoverable amount is the cash generating unit’s fair value less costs of disposal or its value in use, whichever is higher. For goodwill testing purposes the recoverable amount is based on value in use which is determined by discounted future net cash flows. The expected future net cash flows consist of two components: 4-year financial forecasts made by the business management and extrapolated cash flows after the forecast period (so called terminal value). The net sales and profitability estimates used in the forecasts are based on customer-specific estimates, future outlooks and previous experience. Estimates related to long-term profitability aim to take into account a normalised, sustainable level of profitability. Terminal value growth rate, 1.5 %-point (1.5 %-point in comparison period), used in the calculations reflects both expected growth and inflation of each cash-generating unit’s area in the long term, and is not expected to exceed the forecasted long-term growth of the industry. The discount rate used to determine the recoverable amount is the (pre-tax) weighted average cost of capital (WACC). Discount rates are determined separately for each cash-generating unit, reflecting the impact of different businesses and different countries on the expected return of equity. In the determination of the weighted average cost of capital (WACC), the target debt to equity ratio and the effect of indebtedness to the cost of equity have been taken into account.
41
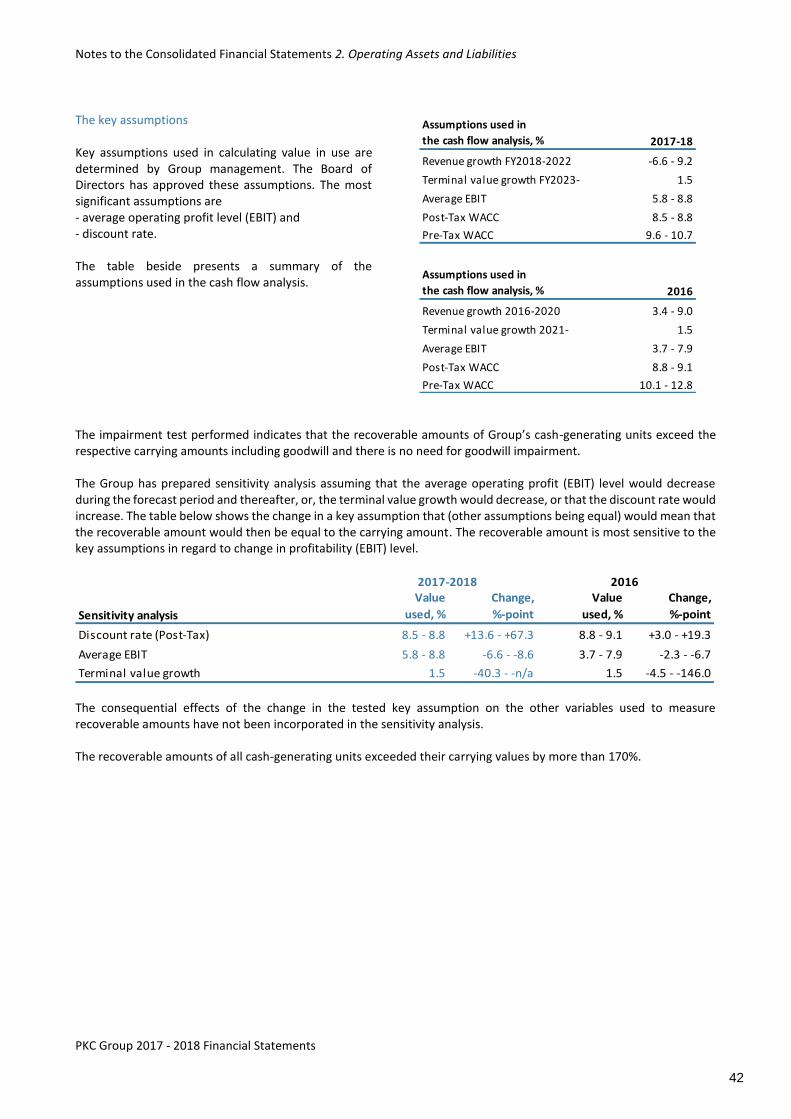
Notes to the Consolidated Financial Statements 2. Operating Assets and Liabilities
PKC Group 2017 - 2018 Financial Statements
The key assumptions Key assumptions used in calculating value in use are determined by Group management. The Board of Directors has approved these assumptions. The most significant assumptions are - average operating profit level (EBIT) and - discount rate. The table beside presents a summary of the assumptions used in the cash flow analysis.
Assumptions used in
the cash flow analysis, % 2017-18
Revenue growth FY2018-2022 -6.6 - 9.2
Terminal value growth FY2023- 1.5
Average EBIT 5.8 - 8.8
Post-Tax WACC 8.5 - 8.8
Pre-Tax WACC 9.6 - 10.7
Assumptions used in
the cash flow analysis, % 2016
Revenue growth 2016-2020 3.4 - 9.0
Terminal value growth 2021- 1.5
Average EBIT 3.7 - 7.9
Post-Tax WACC 8.8 - 9.1
Pre-Tax WACC 10.1 - 12.8
The impairment test performed indicates that the recoverable amounts of Group’s cash-generating units exceed the respective carrying amounts including goodwill and there is no need for goodwill impairment. The Group has prepared sensitivity analysis assuming that the average operating profit (EBIT) level would decrease during the forecast period and thereafter, or, the terminal value growth would decrease, or that the discount rate would increase. The table below shows the change in a key assumption that (other assumptions being equal) would mean that the recoverable amount would then be equal to the carrying amount. The recoverable amount is most sensitive to the key assumptions in regard to change in profitability (EBIT) level.
Sensitivity analysis
Value
used, %
Change,
%-point
Value
used, %
Change,
%-point
Discount rate (Post-Tax) 8.5 - 8.8 +13.6 - +67.3 8.8 - 9.1 +3.0 - +19.3
Average EBIT 5.8 - 8.8 -6.6 - -8.6 3.7 - 7.9 -2.3 - -6.7
Terminal value growth 1.5 -40.3 - -n/a 1.5 -4.5 - -146.0
2017-2018 2016
The consequential effects of the change in the tested key assumption on the other variables used to measure recoverable amounts have not been incorporated in the sensitivity analysis. The recoverable amounts of all cash-generating units exceeded their carrying values by more than 170%.
42

Notes to the Consolidated Financial Statements 2. Operating Assets and Liabilities
PKC Group 2017 - 2018 Financial Statements
2.3 Property, Plant and Equipment Accounting policy Property, plant and equipment are measured at original acquisition cost less accumulated depreciation and impairment losses. The original purchase price of the acquisition is composed of direct expenditure incurred. Borrowing costs are activated into acquisition cost of asset, if the asset meets the conditions set under IAS 23 standard. During the reporting and comparison period the Group did not have such assets. Subsequent costs are added to the carrying amount of the asset only if there is sufficient evidence that they bring future economic benefits for the Group and if their cost can be determined reliably. Assets are depreciated on a straight-line basis during their estimated useful lives. Land areas are not depreciated. Depreciation periods for items of property, plant and equipment Buildings and constructions 5–20 years Machinery and equipment 3–10 years Other tangible assets 5 years The estimated useful lives and residual values of assets are reviewed at the end of each financial year, and if they differ significantly from previous estimates, depreciation periods are adjusted accordingly. Depreciation of property, plant and equipment ceases when an asset is classified as held for sale. Gains and losses from sale Gains from sales of items of property, plant and equipment are included in other operating income and losses from sales in other operating expenses.
Leases Finance leases Leases of property, plant and equipment that substantially transfer all the risks and rewards incidental to the ownership to PKC Group are classified as finance leases. Assets leased under finance leases are recognised according to the nature of the item in the statement of financial position at the lower of the fair value or the present value of the minimum lease payments at the inception date, and depreciated over the useful life or the lease term, whichever is shorter. The lease payment liabilities, net of finance charge, are recognised as interest-bearing liabilities. Operating leases ➢ Additional information about leases is presented
in note 4.6 Operating leases.
Impairments of property, plant and equipment The Group assesses at least annually whether there is any indication that an item of property, plant and equipment may be impaired. The review is in practise carried out based on pool of assets. If any such indication exists, the asset’s recoverable amount is estimated. The recoverable amount is the asset’s fair value less costs of disposal or its value in use, whichever is higher. The recoverable amount is based on the discounted estimated future net cash flows at the time of review. An impairment loss is recognised when an asset’s carrying amount exceeds its recoverable amount. An impairment loss is recognised immediately in profit or loss and it is included in Depreciation, amortisation and impairment in comprehensive income. The useful life of the asset to be depreciated is reassessed at the recognition of the impairment loss. An impairment loss is reversed in a subsequent period if there has been a significant positive change in the estimates used to determine an asset’s recoverable amount. An impairment loss can be reversed to the amount that would have been the carrying value of the asset, had no impairment loss been recognised.
43

Notes to the Consolidated Financial Statements 2. Operating Assets and Liabilities
PKC Group 2017 - 2018 Financial Statements
Property, plant and equipment 2017-2018
EUR 1,000
Land
areas
Buildings and
constructions
Machinery
and
equipment
Other
tangible
assets
Advance
payments and
constructions
in progress Total
Acquisition cost 1.1.2017 2,434 21,250 122,430 8,095 3,705 157,914
+/- Currency translation differences -200 -859 -13,161 -1,168 -252 -15,640
+ Additions 1,104 318 12,495 5,819 15,381 35,116
+ Business combinations 0 0 364 284 0 647
- Disposals 0 -6 -5,743 -1,227 -48 -7,023
+ /- Reclassifications 0 -4,054 9,746 6,962 -12,768 -115
+/- Other changes 0 0 81 -20 37 98
Acquisition cost 31.3.2018 3,338 16,649 126,211 18,744 6,055 170,998
Accumulated depreciation and
impairments 1.1.2017 378 11,891 81,126 4,031 122 97,548
+/- Currency translation differences 0 -756 -9,437 -376 -6 -10,575
+ Accumulated depreciation on disposals
and reclassifications 0 -3,273 -6,994 3,568 0 -6,699
+/- Other changes 0 0 0 -166 0 -166
+ Depreciations of Business combinations 0 353 0 0 0 353
+ Depreciation 15 806 19,424 3,526 0 23,772Accumulated depreciation and
impairments 31.3.2018 393 9,021 84,120 10,582 116 104,232
Carrying amount 31.3.2018 2,945 7,629 42,091 8,162 5,939 66,766 Property, plant and equipment 2016
EUR 1,000
Land
areas
Buildings and
constructions
Machinery
and
equipment
Other
tangible
assets
Advance
payments and
constructions
in progress Total
Acquisition cost 1.1.2016 2,596 21,933 126,577 10,116 4,467 165,690
+/- Currency translation differences -162 1,190 5,089 276 7 6,400
+ Additions 0 61 4,338 1,263 14,839 20,501
- Disposals 0 -2,317 -9,969 -272 0 -12,558
+ /- Reclassifications 0 377 13,480 878 -15,596 -862
+/- Other changes 0 632 0 -3,319 0 -2,687- Reclassification to
assets held for sale 0 -626 -17,085 -846 -12 -18,569
Acquisition cost 31.12.2016 2,434 21,250 122,430 8,095 3,705 157,914
Accumulated depreciation and
impairments 1.1.2016 378 9,795 76,904 5,449 119 92,645
+/- Currency translation differences 0 812 4,644 268 3 5,727+ Accumulated depreciation on disposals
and reclassifications 0 -459 -7,403 -300 0 -8,162
+/- Other changes 0 0 130 -1,848 0 -1,717
+ Depreciation 0 1,751 19,418 1,156 0 22,325- Reclassification to
assets held for sale 0 -7 -12,567 -695 0 -13,269
Accumulated depreciation and
impairments 31.12.2016 378 11,891 81,126 4,031 122 97,548
Carrying amount 31.12.2016 2,057 9,359 41,304 4,064 3,583 60,366
44

Notes to the Consolidated Financial Statements 2. Operating Assets and Liabilities
PKC Group 2017 - 2018 Financial Statements
In addition property, plant and equipment include assets leased under finance leases as follows:
EUR 1,000 2017-18 2016
Carrying amount at the beginnig 740 992
+/- Changes -152 3
- Reclassifications 627 0
- Depreciation and impairment -448 -255
Carrying amount at the end 767 740
Machinery and
equipment
2.4 Available-for-sale Financial Assets Available-for-sale financial assets are mainly investments in unlisted shares. These are valued at cost less impairment as the fair value cannot be reliably determined.
EUR 1,000 2017-18 2016
Available-for-sale financial assets 713 713
Total 713 713
2.5 Investment in associated companies
EUR 1,000 2017-18 2016
Increases 7,323 0
Share of profit or loss for the
financial year 754 0Investment in associated
companies at the end 8,076 0
➢ More information about associated company can
be found in note 4.4.
2.6 Non-Current Other Receivables and Liabilities
EUR 1,000 2017-18 2016
Other receivables 8,341 5,439
Total 8,341 5,439
• Non-current other receivables include receivables related to customer long term assets, long term lease deposits and indemnification assets.
EUR 1,000 2017-18 2016
Other liabilities 7,353 5,805
Total 7,353 5,805
• Non-current other liabilities include liabilities related to long term employee benefits and indemnification liabilities which have a corresponding indemnification asset.
2.7 Inventories Accounting policy Inventories are measured at acquisition cost or the net realisable value, whichever is lower. Raw material costs comprise all purchase costs including freight costs. Cost of finished goods and work in progress includes, in addition to raw material expenses, direct labour and other direct expenses and also a proportion of indirect expenses of production. In PKC Group acquisition cost is determined on the basis of the weighted average cost formula. The net realisable value is the selling price less estimated costs of completion and selling the product. Use of estimates PKC Group regularly reviews inventories for obsolescence and turnover, and for a possible reduction in net realisable value below cost, and recognises obsolescence when necessary. Such reviews require estimates of future demand for products. Possible changes in these estimates may cause adjustments in inventory valuation in future periods.
EUR 1,000 2017-18 2016
Raw materials and supplies 79,216 67,422
Work in progress 10,528 6,913
Finished goods 23,590 23,388
Other inventories 3,639 1,315
Total 116,974 99,039
45

Notes to the Consolidated Financial Statements 2. Operating Assets and Liabilities
PKC Group 2017 - 2018 Financial Statements
2.8 Trade Receivables and Other Receivables Accounts receivable arise when the PKC Group delivers products and services directly to a customer. Prepayments and accrued income is income, of which
no payment has been received.
Other receivables include e.g. value added tax related receivables. Current tax assets include taxes receivable related to the income of the year.
EUR 1,000 2017-18 2016
Trade receivables 168,308 115,377
Other receivables 10,596 4,634
Prepayments and
accrued income 12,679 12,489
Current tax assets 210 245
Total 191,792 132,746
Other receivables and prepayments and accrued income consist of following items
EUR 1,000 2017-18 2016
from employee benefits 451 660
from other operating expenses 10,704 9,469
from financial items 11 688
from value added tax 8,311 4,194
from taxes 290 1,324
from other items 3,508 788
Total 23,274 17,123 ➢ Age distribution of trade receivables is presented
in note 3.4 Financial Risk Management.
2.9 Trade Payables and Other Non-Interest-Bearing Liabilities Trade payables are liabilities arisen from the received goods including raw materials, supplies, outsourced services and related items. Advances received include, for example, the advance payments of undelivered products or services received from customers. Accruals and deferred income include
• Payments received from such income that is realised on an accrual basis in future financial years, unless recognised into advances received.
• Accrued expenses which are not paid, unless recognised into trade payables.
• Future expenses and losses, unless recognised into provisions or deducted from the carrying value of the asset.
Other liabilities include e.g. value added tax related liabilities. In comparison period 2016 current other liabilities include estimated value of the call option related to business combination accounted for according to the so-called anticipated acquisition method. Current tax liabilities include taxes payable related to the income of the year.
EUR 1,000 2017-18 2016
Trade payables 144,739 124,537
Advances received 83 50
Other liabilities 18,304 37,448
Accruals and deferred income 26,084 28,131
Current tax liabilities 4,871 822
Total 194,082 190,988
Other liabilities and accruals and deferred income consist of following items
EUR 1,000 2017-18 2016
from employee benefits 22,189 18,577
from other operating expenses 13,552 7,322
from financial items 2,701 5,397
from value added tax 3,740 1,050
from taxes 2,206 16,631
from acquisitions 0 16,602
Total 44,388 65,579
46

Notes to the Consolidated Financial Statements 2. Operating Assets and Liabilities
PKC Group 2017 - 2018 Financial Statements
2.10 Provisions Accounting policy A provision is recognised in the consolidated statement of financial position when the Group has a present legal or constructive obligation arising as a result of a past event, the obligation is likely to entail future expenses, and a reliable estimate can be made of the amount of the obligation. Provisions are measured at the present value of the costs necessary to settle the obligation. If a reimbursement can be obtained from a third party for part of the obligation, the reimbursement is treated as a separate asset when it is practically certain that such reimbursement will be received. A restructuring provision is recognised only if a detailed and formal plan has been prepared and those affected by it have been informed of its main features. A provision is not recognised on expenditure associated with the Group’s continuing operations.
➢ Additional information about provision for pension expenses is presented in note 1.4 Employee Benefit Expenses.
A warranty provision is recognised when a product, which contains a warranty clause, is sold. The warranty provision is estimated on the basis of past experience of warranty costs. The warranty cost history in the period under review and in the comparison period did not require recognition of a warranty provision. Provisions do not include any restructuring costs. Use of estimates The Group is a defendant in some court cases arising from its business operations. A provision is recorded when an unfavourable result is probable and the loss can be determined with reasonable certainty. The final result can differ from these estimates. There are no such provisions.
EUR 1,000 2017-18 2016 2017-18 2016 2017-18 2016
Provisions at the beginning 872 1,120 100 104 973 1,224
+/- Currency tranlation differences 5 0 3 0 7 0
+ Additions 13 9 47 0 60 9
- Reversed 0 0 -36 0 -36 0
- Used provisions 0 -257 0 -4 0 0
+/- Reclassificiations -771 0 0 0 -771 0
Provisions at the end 119 872 114 100 233 973
Provisions for
pension expenses Other provisions Total
47

Notes to the Consolidated Financial Statements 3. Capital Structure and Financial Expenses
PKC Group 2017 – 2018 Financial Statements
3. Capital Structure and Financial Expenses
3.1 Classification, Accounting and Valuation Principles, Carrying Amounts and Fair Values of Financial Assets and Liabilities by Valuation Categories Accounting policy Classification, accounting and valuation principles The principles PKC Group applies in classifying, recognising, derecognising and valuing of financial assets and liabilities are presented below. The financial assets of PKC Group are classified into the following categories:
• Financial assets at fair value through profit and loss
• Available-for-sale financial assets
• Loans and other receivables The classification of financial assets takes place on the basis of their purpose at initial recognition. The criteria for classification is re-evaluated on each closing date. Transaction costs are included in the initial carrying amount of the financial asset for assets which are not recognised at fair value through profit and loss. All purchases and sales of financial assets are recognised on the trade date. Trade date is the date when PKC Group commits to purchase or sell the asset. Financial assets are derecognised when PKC Group has lost the contractual rights to the cash flow of the financial asset or when the risks and rewards of ownership have been substantially transferred outside PKC Group. The financial liabilities of PKC Group are classified into the following categories:
• Financial liabilities at fair value through profit and loss
• Financial liabilities at amortised cost (other financial liabilities)
Transaction costs are included in the original carrying amount of financial liabilities at amortised cost. Financial liabilities are classified as current unless PKC Group has an unconditional right to defer settlement of the liability for at least 12 months after end of the reporting period. PKC Group derecognises a financial liability (or part of it) only when it is extinguished, i.e. when the obligation specified in the contract is discharged, cancelled or expired.
Fair value hierarchy A number of PKC Group’s accounting policies and disclosures require the measurement of fair values. For PKC Group this applies primarily to financial assets and liabilities. For financial instruments that are measured in the statement of financial position at fair value, IFRS requires disclosure of fair value measurements by level of the fair value measurement hierarchy. The fair value hierarchy is based on the source of inputs used in determining fair values (used in the valuation techniques) as follows:
• Level 1: fair values are based on quoted price in active markets for identical assets or liabilities
• Level 2: fair values are based on market rates and prices, discounted future cash flows etc.
• Level 3: for assets and liabilities in level three, there is no reliable market source available and thus fair value measurement cannot be based on observable market data.
When measuring the fair value of an asset or a liability, PKC Group uses observable market data to the extent possible. Available-for-sale financial assets Available-for-sale financial assets are non-derivative financial assets which have been designated in this category or which have not been classified in any other category. Unless the intention is to sell them within 12 months of the end of the reporting period, they are included in non-current assets. PKC Group’s investments in other companies are classified as financial assets available-for-sale. Equity investments in unlisted companies are included in this category. Since in the absence of functioning markets the fair value of these investments cannot be determined reliably, they are measured at acquisition cost less any impairment. Thus these investments are classified in the fair value hierarchy to level 3. PKC Group has no intention for now to dispose of these investments.
48

Notes to the Consolidated Financial Statements 3. Capital Structure and Financial Expenses
PKC Group 2017 – 2018 Financial Statements
Loans and other receivables Loans and other receivables are non-derivative financial assets with fixed or determinable payment dates that are not quoted in active markets. They arise when PKC Group provides goods or services directly to a debtor. Loans and other receivables are carried in the consolidated statement of financial position at amortised cost using the effective interest rate method. Loans and other receivables are included in non-current assets, except for maturities less than 12 months after the closing date. Non-current trade receivables and other receivables are presented under Receivables in the consolidated statement of financial position. PKC Group utilises selectively client and/or country specific factoring arrangements when it is considered beneficial for example due to long payment terms. Sold trade receivables are derecognised only up to the amount for which the risks and benefits have been transferred outside PKC Group. The carrying amounts of trade receivables and other receivables are equal to their fair values, as the effect of discounting cash flows is not relevant considering their maturity. Cash and cash equivalents Cash and cash equivalents comprise cash in hand and similar investments. These investments include highly liquid investments with an original maturity of three months or less from the acquisition date. Financial assets and liabilities at fair value through profit and loss In the consolidated statement of financial position all derivative financial instruments, to which hedge accounting is not applied and which are not financial guarantee contracts, are included in this category. These instruments are classified as held for trading. There are no items in the consolidated statement of financial position that would be classified at initial recognition on the basis of IAS 39 fair value option to this category or which would be classified upon this category on the basis of continuous trading. Derivatives are used for hedging risks from fluctuations in currency exchange rates, interest rates and the price of copper. PKC Group uses currency and copper forwards and interest rate swaps in its risk management. Derivative contracts are recognised initially at fair value and later recognised at fair value at the end of each reporting period. Fair value is determined by using
prevailing quoted market rates and applicable valuation methods for each type of derivative as follows:
• The fair value of currency and copper derivatives is determined as the difference of the fair value of the derivatives at the end of the reporting period and the fair value at the time the contract was made.
• The fair value of interest rate swaps is determined as the present value of the related future cash flows.
Derivatives are classified in the fair value hierarchy on level 2, because their valuation is based on observable market inputs. Realised and unrealised gains and losses from changes in the fair values of copper derivatives are recognised in profit or loss as incurred since PKC Group does not apply hedge accounting to these instruments. PKC Group applied hedge accounting to all outstanding interest rate swaps during 2016. The positive fair value of interest rate swap with nominal value of EUR 50.0 million that was terminated during 2016 is accrued to financial income until the maturity of the related bond. PKC Group had no open interest rate swaps during 2017-2018. Hedge accounting is applied also to currency derivatives. The impacts on profit or loss arising from changes in the value of interest rate swaps and currency derivatives which are effective hedges, are presented in a manner consistent with the hedged item. Derivative instruments are included according to their nature in current assets (prepayments and accrued income) or current liabilities (accruals and deferred income) on the consolidated statement of financial position. At the end of the reporting period 31.3.2018 (and 31.12.2016) PKC Group did not have financial instruments at fair value through profit and loss other than derivatives. There were no changes in the valuation principles or methods during the reporting period. Financial liabilities at amortised cost (other financial liabilities) Other financial liabilities consist of loans taken out by PKC Group, finance lease liabilities and trade payables.
49

Notes to the Consolidated Financial Statements 3. Capital Structure and Financial Expenses
PKC Group 2017 – 2018 Financial Statements
Loans and trade payables are initially recognised at fair value. Finance lease liabilities are initially recognised at fair value or at present value of minimum lease payments. Any transaction costs are included in the historical carrying amount. After initial recognition other financial liabilities are recognised at amortised cost. Any difference between net proceeds received and later amortisations is recognised as interest cost over the loan period using the effective interest method. The fair values of interest bearing loans are based on present values of future cash flows. The discount rate is the rate that PKC Group would have to pay for an equal loan at the end of the reporting period. The total interest rate consists of a risk-free rate and a company specific risk premium. The carrying amounts of trade payables and other current financial liabilities are equal
to their fair values, as the effect of discounting cash flows is not relevant considering their maturity. Master netting agreements and similar arrangements PKC Group enters into derivatives’ agreements with counterparties following ISDA-agreements. The amounts owed by each counterparty on a single day regarding all transactions outstanding in same currency are aggregated into a single net amount payable by one party to the other. In case of a credit event like default, all outstanding transactions under the agreement are terminated and only one amount is payable to settle all transactions. Derivative assets and liabilities cannot be offset in the consolidated statement of financial position as ISDA-agreements do not meet the criteria for offsetting.
Master netting agreements and similar arrangements
EUR 1,000 2017-18 2016
Derivative Assets
Gross amounts of financial assets in the statement of financial position 2,128 560
Related financial instruments that are not offset 2,128 243
Total 0 317
Derivative liabilities
Gross amounts of financial l iabilities in the statement of financial position 150 4,178
Related financial instruments that are not offset 150 243
Total 0 3,935
50

Notes to the Consolidated Financial Statements 3. Capital Structure and Financial Expenses
PKC Group 2017 – 2018 Financial Statements
Classification of financial assets and liabilities by valuation category 2017-2018
EUR 1,000 Fin
anci
al a
sse
ts a
nd
liab
iliti
es
thro
ugh
pro
fit
or
loss
De
riva
tive
s u
nd
er
he
dge
acc
ou
nti
ng
Loan
s an
d o
the
r re
ceiv
able
s
Ava
ilab
le-
for-
sale
fin
anci
al a
sse
ts
Fin
anci
al li
abili
tie
s m
eas
ure
d a
t am
or-
tise
d c
ost
Car
ryin
g am
ou
nts
of
stat
em
en
t o
f
fin
anci
al p
osi
tio
n's
ite
ms
Fair
val
ue
s
of
stat
em
en
t o
f fi
nan
cial
po
siti
on
's
ite
ms
Fair
val
ue
hie
rarc
hy
leve
l
Non-current financial assets
Other non-current financial
assets 0 0 0 713 0 713 0 Level 3
Total non-current
financial assets 0 0 0 713 0 713 0
Current financial assets
Trade receivables 0 0 168,308 0 0 168,308 168,308
Currency derivatives 0 2,128 0 0 0 2,128 2,128 Level 2
Cash and cash equivalents 74,333 0 0 0 0 74,333 74,333
Total current financial assets 74,333 2,128 168,308 0 0 244,769 244,769
Total financial assets 74,333 2,128 168,308 713 0 245,481 244,769
Non-current financial liabilities
Non-current
interest-bearing liabilities 0 0 0 0 106 106 106 Level 2
Total non-current
financial liabilities 0 0 0 0 106 106 106
Current financial liabilities
Current
interest-bearing liabilities 0 0 0 0 184,983 184,983 188,330
Trade payables 0 0 0 0 144,739 144,739 144,739
Commodity derivatives 150 0 0 0 0 150 150 Level 2
Total current
financial liabilities 150 0 0 0 329,722 329,871 333,219
Total financial liabilities 150 0 0 0 329,827 329,977 333,325
51

Notes to the Consolidated Financial Statements 3. Capital Structure and Financial Expenses
PKC Group 2017 – 2018 Financial Statements
Classification of financial assets and liabilities by valuation category 2016
EUR 1,000 Fin
anci
al a
sse
ts a
nd
liab
iliti
es
thro
ugh
pro
fit
or
loss
De
riva
tive
s u
nd
er
he
dge
acc
ou
nti
ng
Loan
s an
d o
the
r re
ceiv
able
s
Ava
ilab
le-
for-
sale
fin
anci
al a
sse
ts
Fin
anci
al li
abili
tie
s m
eas
ure
d a
t am
or-
tise
d c
ost
Car
ryin
g am
ou
nts
of
stat
em
en
t o
f
fin
anci
al p
osi
tio
n's
ite
ms
Fair
val
ue
s
of
stat
em
en
t o
f fi
nan
cial
po
siti
on
's
ite
ms
Fair
val
ue
hie
rarc
hy
leve
l
Non-current financial assets
Other non-current financial
assets 0 0 0 713 0 713 0 Level 3
Total non-current
financial assets 0 0 0 713 0 713 0
Current financial assets
Trade receivables 0 0 115,377 0 0 115,377 115,377
Commodity derivatives 318 0 0 0 0 318 318 Level 2
Cash and cash equivalents 130,052 0 0 0 0 130,052 130,052
Total current financial assets 130,370 0 115,377 0 0 245,747 245,747
Total financial assets 130,370 0 115,377 713 0 246,460 245,747
Non-current financial liabilities
Non-current
interest-bearing liabilities 0 0 0 0 141,326 141,326 146,944 Level 2
Total non-current
financial liabilities 0 0 0 0 141,326 141,326 146,944
Current financial liabilities
Current
interest-bearing liabilities 0 0 0 0 35,316 35,316 35,316
Trade payables 0 0 0 0 124,537 124,537 124,537
Currency derivatives 0 3,935 0 0 0 3,935 3,935 Level 2
Total current
financial liabilities 0 3,935 0 0 159,853 163,788 163,788
Total financial liabilities 0 3,935 0 0 301,179 305,114 310,732
52

Notes to the Consolidated Financial Statements 3. Capital Structure and Financial Expenses
PKC Group 2017 – 2018 Financial Statements
3.2 Interest-Bearing Financial Liabilities
Non-current interest-bearing financial liabilities
EUR 1,000 2017-18 2016
Bond 0 101,293
Loans from financial institutions 0 39,758
Finance lease liabilities 106 275
Total 106 141,326
Current interest-bearing financial liabilities
EUR 1,000 2017-18 2016
Bond 97,581 0
Loans from financial institutions 42,329 0
Finance lease liabilities 72 316
Commercial papers 45,000 35,000
Total 184,982 35,316
Maturities of finance lease liabilities
Minimum lease payments
EUR 1,000 2017-18 2016
Within one year 76 339
Between one and five years 111 288
Total 187 627
Present value of minimum lease payments
EUR 1,000 2017-18 2016
Within one year 72 316
Between one and five years 106 275
Total 178 591
Future finance and other charges
concerning lease payments 9 36
Total lease payments 187 627
3.3 Financial Income and Expenses Accounting policy Interest income is recognised using the effective interest method. Dividend income is recognised when PKC Group’s right to receive payment has been established.
Interest and other financial income EUR 1,000 2017-18 2016
Dividend income from
investments available for sale 243 149
Interest income
from derivatives 937 1,750
Other interest income 631 573
Total 1,811 2,472
Interest and other financial expenses
EUR 1,000 2017-18 2016
Interest expenses
from bonds -5,422 -4,421
from financial
institutions loans -1,086 -372
from derivatives 0 -615
from factoring -643 -430
Other financial expenses -1,062 -1,054
Total -8,213 -6,892
Interest and other financial
income and expenses -6,402 -4,420 Foreign currency exchange differences EUR 1,000 2017-18 2016
Foreign exchange gains
from other financial
instruments 11,504 6,042
Total 11,504 6,042
Foreign exchange losses
from other
financial instruments -13,499 -7,572
Total -13,499 -7,572
Foreign currency exchange
differences (net) -1,994 -1,530
53

Notes to the Consolidated Financial Statements 3. Capital Structure and Financial Expenses
PKC Group 2017 – 2018 Financial Statements
3.4 Financial Risk Management
PKC Group is exposed in its operations to different financial risks. Financial risks are managed according to the PKC Group Treasury Policy as approved by the Parent Company’s Board of Directors. The Treasury Policy defines the main activities, common management principles, division of responsibilities as well as required control environment for Treasury and related risk management processes to be applied throughout the PKC Group. The CFO of PKC Group reports on the Group’s financial situation and risks regularly to the Audit Committee of the Parent Company’s Board of Director’s as defined in the Treasury Policy. The Treasury of PKC Group, organisationally located within Group Finance, provides treasury services and transactions centrally to the companies of PKC Group. The purpose of centralising these functions is effective risk management, cost savings and optimisation of cash flows.
Currency risk Currency risk is monitored from the perspectives of transaction, translation and economic risk. Transaction risk is related to foreign currency denominated sales and purchases, translation risk to statement of financial position’s items, including investments and loans to foreign subsidiaries, and economic risk to the currency distribution of the PKC Group’s cost structure in comparison to competitors. The objective of foreign exchange risk management is to reduce the uncertainty in the PKC Group’s profit and loss, cash flows and statement of financial position caused by fluctuations in foreign exchange rates to an acceptable level. Foreign exchange risk management shall not aim to improve profits by actively taking views on the future changes of foreign exchange rates. The main principle is to mitigate the risk first by operative means in the businesses, e.g. through commercial terms in supplier and sales contracts. The Treasury of PKC Group uses foreign exchange forwards to hedge against transaction risk. Significant certain or highly probable foreign exchange cash flows are hedged from transaction risk a maximum of twelve months forward. Hedging is not executed for currencies, especially in emerging countries, where hedging is expensive or derivatives’ markets are
underdeveloped. At the end of the reporting period PKC Group had open currency derivatives with a nominal value of EUR 52.5 million. PKC Group applies cash flow hedge accounting to currency derivatives. EUR 0.4 million of the change in the fair value of currency derivatives under hedge accounting was recorded in Equity and the inefficient part of the hedge EUR 1.8 million was recorded in profit and loss. According to Group policy translation risk is not to execute equity hedging due to the fact that the translation risk only very seldom realises while the hedge itself always creates a cash flow cost. The foreign currency net investments in PKC Group’s subsidiaries at the close of the reporting period were EUR 290.2 million (EUR 314.9 million in 2016). Economic risk is managed as a part of the strategy process and strategy implementation.
The translation risk exposure of PKC Group by currency
EUR 1,000 2017-18 2016
BRL 27,370 24,546
CAD 4,674 6,914
CNY 44,580 36,942
HKD -5,626 -3,239
MXN 19,992 15,783
PLN 76,199 76,104
RUB 7,441 6,699
RSD 12,983 7,049
USD 102,569 144,103
VND 0 20
Total 290,182 314,921
Net Investment
➢ More information about currencies can be found
in note Basis of Preparation and Accounting policies.
PKC Group has translation risk related to profit and loss mainly in USD, PLN, CNY and BRL. According to Group policy this translation risk is not hedged. Group has also significant foreign currency denominated equity and loans classified as net investments, for example in USD, BRL, PLN and CNY. At the end of the financial year net investments to foreign entities had not been hedged.
54

Notes to the Consolidated Financial Statements 3. Capital Structure and Financial Expenses
PKC Group 2017 – 2018 Financial Statements
Below are presented transaction risk positions related to the statement of financial position of the PKC Group’s most significant currency pairs, as well as the sensitivity of the PKC Group’s pre-tax profit to currency rate changes at the end of the reporting period.
2017-2018
Functional currency USD BRL EUR EUR PLN CNY CNY
Foreign currency MXN EUR SEK USD EUR USD EUR
EUR 1,000
Cash and cash equivalents 0 0 0 84 57 438 13
Trade receivables 0 75 0 4 33,517 65 0
Trade payables -21,397 -750 -2,133 -34 -24,422 -94 -699
Net position -21,397 -675 -2,133 54 9,152 409 -686
Hedges 52,535 - - - - - -
Open position 0 -675 -2,133 54 9,152 409 -686
EUR million
Change in foreign
currency %
Sensitivity +10 - -0.1 -0.2 0.0 1.0 0.0 -0.1
-10 - 0.1 0.2 0.0 -0.8 0.0 0.1 2016
Functional currency USD BRL EUR EUR PLN CNY CNY
Foreign currency MXN EUR SEK USD EUR USD EUR
EUR 1,000
Cash and cash equivalents 0 0 0 6,652 7,050 4,355 339
Trade receivables 0 116 0 2,243 18,710 2,440 996
Trade payables -21,562 -948 -1,902 -3,961 -14,245 -1,805 -1,107
Net position -21,562 -832 -1,902 4,934 11,515 4,990 228
Hedges 63,197 - - - - - -
Open position - -832 -1,902 4,934 11,515 4,990 228
EUR million
Change in foreign
currency %
Sensitivity +10 - -0.1 -0.2 0.5 1.3 0.6 0.0
-10 - 0.1 0.2 -0.4 -1.0 -0.5 0.0
55

Notes to the Consolidated Financial Statements 3. Capital Structure and Financial Expenses
PKC Group 2017 – 2018 Financial Statements
Commodity risk PKC Group’s most significant commodity risk relates to copper, which is one of the key components of material costs. Also changes in the prices of oil and other commodities may affect the material costs of PKC Group. Changes in energy prices have no material effect on profit or loss. The objective of PKC Group is to manage commodity risk primarily by operative means, e.g. through
commercial terms with customer and supplier contracts. According to the Treasury Policy of PKC Group, the Group Treasury hedges 25%–75% of the net copper position. The net copper position is the amount of copper in tonnes that remains when the copper contents of fixed price purchases is subtracted from the copper contents of fixed price sales. The Group Treasury uses copper forwards to hedge the copper exposure. Changes in copper prices are transferred to customer prices based on the sales agreements with an average lag of 3-5 months.
Sensitivity of the Group’s pre-tax profit arising from financial instruments to changes in the price of copper:
EUR million Income Statement Equity Income Statement Equity
+/-10% change in copper price +/-0.3 - +/-0.2 -
2017-2018 2016
Interest rate risk Changes in interest rate levels affect mainly the fair values of interest-bearing liabilities in the consolidated statement of financial position and related interest payments. The objective of interest rate risk management in PKC Group is to optimise interest expenses and at the same time ensure that changes in interest rates do not cause unpredictable effects on the profit or loss, cash flows or statement of financial position of PKC Group. Interest rate risk is managed by maintaining an optimal balance between the abovementioned objectives. To this end the Treasury of PKC Group uses interest rate swaps and forwards to
modify the interest rate fixing term of PKC Group’s debt portfolio. An interest rate swap with nominal value of EUR 50.0 million where hedge accounting was applied, was terminated during 2016. Based on the terminated swap PKC Group paid floating rate interest tied to Euribor 6 months’s rate and received 5-years fixed interest. Positive fair value of the terminated swap is accrued on profit and loss until the end of related bonds maturity. At the end of reporting period PKC Group did not have any open interest rate derivatives.
Sensitivity of the PKC Group’s pre-tax profit arising from financial instruments (excl. factoring) to changes in interest rate at the end of reporting period:
EUR million Income Statement Equity Income Statement Equity
+/- 1% change in market interest rates -0.8/+0.8 - -0.8/+0.8 -
2017-2018 2016
Sensitivity calculation does not take into account the impact of negative short term market rates.
Credit risk PKC Group’s most significant credit risks are related to trade receivables. The age distribution of trade receivables is regularly monitored on the Group level, and in addition the Group companies monitor receivables per customer. The credit quality of new customers is checked and customers are granted standard payment terms only. As a part of cash
management PKC Group has some outstanding factoring arrangements in selected countries or with selected customers. At the end of the reporting period the outstanding amount of receivables in factoring arrangement was EUR 44.8 million (EUR 27.4 million). Collaterals are not assumed as security for receivables, and no loans are granted to parties outside the PKC Group. An aging provision of trade receivables is
56

Notes to the Consolidated Financial Statements 3. Capital Structure and Financial Expenses
PKC Group 2017 – 2018 Financial Statements
recognised when there is a reasonable risk that PKC Group will not be able to collect all receivables on the original terms. Credit risk associated with investments in the financial markets is minimised by making agreements with counterparties with high credit worthiness and by diversifying investments among several counterparties. Trade receivables, which were neither past due nor impaired, were EUR 142.4 million (EUR 104.4 million) at the end of the reporting period. Of these, EUR 70.5 million (EUR 50.8 million) were from the six largest customers, and the rest was divided between a large number of customers. During the financial period 2017-2018 a total of EUR 9 thousand of receivables was
recognised as impaired (EUR 1 thousand). No impairments of trade receivables were recognised for the six largest customers during the financial year and the comparison period. The most significant customers of PKC Group are international transportation manufacturers, with which it has longstanding customer relationships. The most significant geographical concentration of credit risk to PKC Group is in North America. ➢ More information about the largest customers
and the distribution of net sales can be found in note 1.1 Operating Segments
Age distribution of trade receivables
EUR 1,000 Trade Receivables Aging provision Net
Not yet overdue 142,434 0 142,434
Falling due in 30 days or less 13,906 0 13,906
Due 31-60 days ago 4,438 0 4,438
Due 61-90 days ago 3,099 0 3,099
Due over 90 days ago 5,204 774 4,430
Total 169,081 774 168,307
EUR 1,000 Trade Receivables Aging provision Net
Not yet overdue 104,233 0 104,233
Falling due in 30 days or less 6,944 0 6,944
Due 31-60 days ago 1,812 0 1,812
Due 61-90 days ago 586 0 586
Due over 90 days ago 2,358 556 1,802
Total 115,933 556 115,377
2016
2017-2018
Liquidity risk The objective of cash and liquidity management is to centralise the management of the cash and other liquid assets of PKC Group and thereby ensure the efficient use of the Group’s liquidity while avoiding liquidity risk. The Treasury of PKC Group shall optimise the Group’s cash balances to cover the short term outgoing payments plus the liquidity reserve. To manage
liquidity risk, the objective is to maintain a sufficient liquidity reserve in all situations. At the end of reporting period cash and cash equivalents totalled EUR 74.3 million (EUR 130.1 million). PKC Group had also available undrawn credit facilities of EUR 82.0 million (EUR 90.0 million).
57

Notes to the Consolidated Financial Statements 3. Capital Structure and Financial Expenses
PKC Group 2017 – 2018 Financial Statements
Maturity analysis of financial liabilities 2017-2018
EUR 1,000 2018-19 2019-20 2020-21 2021-22 2022-23 2024- Total
Bond
repayments 97,297 0 0 0 0 0 97,297
Repayments of loans from
financial institutions 42,329 0 0 0 0 0 42,329
Repayments of commercial
papers 45,000 0 0 0 0 0 45,000
Financing costs of bonds, loans
from financial institutions and
commercial papers 4,503 0 0 0 0 0 4,503
Total 189,129 0 0 0 0 0 189,129
Finance lease liabilities
Repayments 73 72 33 0 0 0 178
Financing costs 4 3 2 0 0 0 9
Total 76 75 36 0 0 0 187
Current non-interest-bearing liabilities
Trade payables 144,739 0 0 0 0 0 144,739
Derivatives 150 0 0 0 0 0 150
Total 144,889 0 0 0 0 0 144,889
Total 334,095 75 36 0 0 0 334,206 The Group’s unutilized credit facilities of EUR 82 million will expire in 2018.
Maturity analysis of financial liabilities 2016
EUR 1,000 2017 2018 2019 2020 2021 2022- Total
Bond
repayments 0 100,000 0 0 0 0 100,000
Repayments of loans from
financial institutions 0 40,000 0 0 0 0 40,000
Repayments of commercial
papers 35,000 0 0 0 0 0 35,000
Financing costs of bonds, loans
from financial institutions and
commercial papers 4,738 3,221 0 0 0 0 7,959
Total 39,738 143,221 0 0 0 0 182,959
Finance lease liabilities
Repayments 315 168 54 53 0 0 591
Financing costs 23 10 2 0 0 0 36
Total 338 178 56 53 0 0 625
Current non-interest-bearing liabilities
Trade payables 124,537 0 0 0 0 0 124,537
Derivatives 1,464 0 0 0 0 0 1,464
Total 126,001 0 0 0 0 0 126,001
Total 166,077 143,399 56 53 0 0 309,585
58

Notes to the Consolidated Financial Statements 3. Capital Structure and Financial Expenses
PKC Group 2017 – 2018 Financial Statements
Capital structure management
Capital structure management covers equity and net debt in the consolidated statement of financial position. The objective of managing the capital structure is to support the Group’s business by ensuring normal operating conditions for the businesses and to increase the shareholder’s value with a target of gaining maximum return on capital. An optimal capital structure also ensures the optimal capital costs. The capital structure can be affected by dividend distributions, share issues and loan restructurings. The capital structure is continuously monitored by using the gearing ratio. The Group’s long-term objective is to keep the gearing ratio below 75%. The Group’s gearing ratio at the end of the reporting period was as follows:
EUR million 2017-18 2016
Interest-bearing liabilities 185.1 176.6
Cash and cash equivalents 74.3 130.1
Net liabilities 110.8 46.6
Total equity 166.0 154.4
Gearing, % 66.7 30.2
3.5 Equity
Share capital The subscription price of a share received by the company in connection with share issues is credited to the share capital, unless it is provided in the share issue decision that a part of the subscription price is to be recorded in the fund for invested non-restricted equity.
Share premium account The share premium account accrued under the previous Finnish Limited Liability Companies Act (29 Sept. 1978/734). The payments received by PKC Group for the share subscriptions based on the stock option plans decided upon when the previous Act was in force, were recognised in the share capital and the share premium account in accordance with the terms of the arrangement, less transaction costs. Under the Act currently in force, since 1 September 2006, the share premium account is restricted equity and may no longer increase. The share premium account may be reduced in accordance with the rules applying to decreasing share capital and can be used to increase the share capital as a reserve increase.
Invested non-restricted equity fund The fund for invested non-restricted equity includes other equity investments and the part of the subscription price of the shares that according to the related decision is not to be credited to the share capital. The payments received by PKC Group for the share subscriptions made, based on the stock option plans decided upon after the entry into force of the current Limited Liability Companies Act (1 September 2006), are fully credited to the fund for invested non-restricted equity.
Translation difference Translation differences arise from the translation of the financial statements of foreign operations into euro. Also gains and losses arising from hedges of a net investment in a foreign operation are included in translation differences. The Group has foreign currency denominated inter-company loans. The foreign exchange differences of these loans are considered as translation differences into equity, if criteria for net investment loan categorisation are met. The translation difference by currency in the items of other comprehensive income is presented in the table.
EUR million 2017-18 2016
BRL 5.7 2.4
CAD 0.5 -0.3
CNY 0.0 3.1
HKD 0.2 -0.1
MXN -1.9 -2.0
PLN 0.3 -2.7
RUB 1.8 0.6
RSD 0.0 0.1
USD -32.0 2.0
Total -25.3 3.0
Other reserves Other reserves include the accumulated effective portions of the fair value changes of the derivatives designated as hedging changes in interest and exchange rates.
Treasury shares Purchases of treasury shares (own shares) and direct attributable incremental costs are deducted from
59

Notes to the Consolidated Financial Statements 3. Capital Structure and Financial Expenses
PKC Group 2017 – 2018 Financial Statements
equity. When the purchased own shares are subsequently sold or reissued, any consideration received is included in equity. PKC Group has entered into an agreement with a third-party service provider concerning the management of the share-based incentive program for key personnel. The third party acquired and owned the shares until the shares were given to the participants of the program or
otherwise remeeded. At the end of financial period PKC Group Ltd does not have any own shares. During the comparison period in accordance with IFRS accounting principles these 116,650 shares acquired have been accounted for as treasury shares in the consolidated statement of financial position. During the comparison period the number of shares equalled to 0.5% of the total company shares and voting rights outstanding.
Number of shares Share capital
Share premium
account
Invested non-
restricted equity
fund
1,000 pcs. EUR 1,000 EUR 1,000 EUR 1,000
1.1.2016 24,095 6,218 11,282 82,943
Exercise of stock options 30 0 0 455
Other changes 0 0 0 34
31.12.2016 24,125 6,218 11,282 83,433
1.1.2017 24,125 6,218 11,282 83,433
Other changes 0 0 0 411
31.3.2018 24,125 6,218 11,282 83,843
Dividends ➢ As a result of the fulfilment of all conditions to complete MSSL Estonia WH OÜ’s [a wholly-owned indirect
subsidiary of Motherson Sumi Systems Limited] voluntary recommended public tender offer, the Board’s conditional dividend proposal had lapsed and the Annual General Meeting resolved on 5 April 2017 not to pay dividend. (In 2016 dividend of EUR 0.70 per share was paid, in total EUR 16.9 million).
➢ After the reporting period, the Board of Directors has proposed that EUR 0.70 per share will be distributed as dividends, EUR 16.9 million in total.
60

Notes to the Consolidated Financial Statements 4. Other Notes
PKC Group 2017 - 2018 Financial Statements
4. Other Notes
4.1 Related Party Disclosures The Group’s related party comprises the Group companies, members of the parent company’s Board of Directors and members of the Group’s Executive Board. PKC Group’s key management personnel consists of the members of the parent company's Board of Directors and the members of PKC Group’s Executive Board including President & CEO. Employee benefits, salaries and fees of key management personnel totalled EUR 9.9 million (EUR 5.3 million). At the end of the financial year 31 March 2018 PKC Group’s Executive Board consisted of the following persons: Pankaj Mital, Chairman (President & CEO), Julie Bellamy (Group Senior Vice President, Human Resources), Andre Gerstner (President, Rolling Stock Business), Jyrki Keronen (President, Wiring Systems, APAC), Jani Kiljala (President, Wiring Systems, Europe and South America), Frank Sovis (President, Wiring Systems, North America), Juha Torniainen (CFO), Deepak Tyagi (Chief Technical Officer) and Vesa Vähämöttönen (Group Senior Vice President, Business Development).
Accrued employee benefits of the Executive Board
EUR 1,000 2017-18 2016
Salaries and other
employee benefits 9,593 3,811
Share-based payments 0 979
Total 9,593 4,791
No stock options were granted to the Group’s Executive Board during financial year 2017-2018. 24,000 stock options were granted to the Group’s Executive Board in 2016.
EUR 1,000
unless otherwise noted 31.3.2018 31.12.2016
Granted options, 1,000 pcs. 0 224.1
of which exercisable 1) 0 165.5Total fair value of the
options 0 1,150.8
Total number of shares, to
which the options held by
PKC Group´s Executive
Board entitle, 1,000 pcs. 0 224.1
Share-based payments
President & CEO 7 79
Other executive board 21 191
Share-based payments total 28 270
1) Options, for which the share subscription period
has begun. ➢ Additional information about the stock option
schemes of PKC Group’s key personnel is presented in note 1.4 Employee Benefit Expenses.
Amount of share-based incentives granted to the members of the Executive Board and the effect on the result and financial position during the financial year are presented in the table below.
EUR 1,000
President &
CEO
Other
Executive
Board
President &
CEO
Other
Executive
Board
Granted share-based incentives
at the end of financial year, 1,000 pcs. 0 0 108 312
Expenses for the financial year, share-based payments 627 2,130 133 577
Expenses for the financial year, share-based payments,
equity-settled 0 0 61 286
Liabilities arising from share-based payments
at the end of financial year 0 0 131 596
2017-2018 2016
➢ Share-based incentives are described in note 1.4 Employee Benefit Expenses.
61

Notes to the Consolidated Financial Statements 4. Other Notes
PKC Group 2017 - 2018 Financial Statements
Salaries, fees, share-based payments and pension
obligations of the President & CEO
EUR 1,000 2017-18 2016
Hyytiäinen, Matti 2,013 933
Total 2,013 933
Statutory pension obligation The pension costs of the President and CEO, recognised on an accrual basis on his remuneration under the Finnish Employees Pensions Act (TyEl, 395/2006), amount to EUR 278 thousand in financial year 2017-2018 (in 2016 EUR 223 thousand). The Finnish statutory pension plan is part of Finnish social security system and is a collective plan in which an employer has no direct responsibility for the pension benefits but the responsibility is borne by the whole pension system. Under this plan, pensions are financed in two different ways: part of the pensions payable in future are funded and the rest are financed on a pay-as-you-go-basis as the related pensions are paid out.
Salaries and fees of the Board of Directors
EUR 1,000 2017-18 2016
Buhl, Reinhard,
until 5 April 2017 18 50
Diez, Wolfgang,
until 5 April 2017 18 56
Gauba, G N,
since 5 April 2017 0 0
Heuser, Andreas,
since 5 April 2017 0 0
Lange, Henrik,
until 5 April 2017 19 41
Levy, Shemaya,
until 5 April 2017 22 66
Mingming, Liu,
until 5 April 2017 16 53
Mital, Pankaj,
since 5 April 2017 0 0
Remenar, Robert 60 68
Ruotsala, Matti 101 90
Sehgal, Vivek Chaand,
since 5 April 2017 0 0
Tähtinen, Jyrki,
until 6.4.2016 0 15
Total 255 439
Services acquired from related party entities During the financial year PKC Group acquired in the value EUR 0,5 million and sold in the value of EUR 1,1 million from/to MSSL subsidiaries and its related parties. During the comparison period other operating expenses did not include any services acquired from related party entities. These business transactions are based on market prices.
62

Notes to the Consolidated Financial Statements 4. Other Notes
PKC Group 2017 - 2018 Financial Statements
4.2 Group Structure
Group companies 31.3.2018
Company Principal activity Domicile
Holding,
%
Votes,
%
PKC Group Plc Administration Finland 100 100
PKC Wiring Systems Oy Administration Finland 100 100
PK Cables do Brasil Industria e Comercio Ltda Manufacturing Brazil 100 100
PKC Group Canada Inc. Sales Canada 100 100
PKC Group APAC Limited Administration Hong Kong 100 100
PKC Vehicle Technology (Suzhou) Co. Ltd Manufacturing China 100 100
PKC Vehicle Technology (Hefei) Co., Ltd. Manufacturing China 50 50
Hubei Zhengao PKC Automotive Wiring Company Ltd Manufacturing China 40 40
Jiangsu Huakai-PKC Wire Harness Co., Ltd. Manufacturing China 50 50
Shandong Huakai-PKC Wire Harness co., Ltd *) Manufacturing China
Project Del Holding S.à.r.l. Holding Luxembourg 100 100
AEES Manufacturera, S. De R.L. de C.V Administration Mexico 100 100
Arneses y Accesorios de México,
S. de R.L. de C.V. Manufacturing Mexico 100 100
Arneses de Ciudad Juarez, S. de R.L. de C.V. Manufacturing Mexico 100 100
Asesoria Mexicana Empresarial,
S. de R.L. de C.V. Administration Mexico 100 100
Cableados del Norte II, S. de R.L. de C.V. Manufacturing Mexico 100 100
PKC Group de Piedras Negras,
S. de R.L. de C.V. Manufacturing Mexico 100 100
PKC Group AEES Commercial,
S. de R.L. de C.V. Sales Mexico 100 100
Manufacturas de Componentes Eléctricos
de México S. de R.L. de C.V. Manufacturing Mexico 100 100
PKC Group Mexico S.A. de C.V. Manufacturing Mexico 100 100
PKC SEGU Systemelektrik GmbH Manufacturing Germany 100 100
PKC Wiring Systems Llc Manufacturing Serbia 100 100
TKV-sarjat Oy Holding Finland 100 100
PKC Eesti AS Administration Estonia 100 100
PKC Group Lithuania UAB Manufacturing Lithuania 100 100
PKC Group Poland Sp. z o.o. Manufacturing Poland 100 100
OOO AEK Manufacturing Russia 100 100
PKC Group USA Inc. Administration USA 100 100
AEES Inc. Administration USA 100 100
AEES Power Systems Limited Partnership Manufacturing USA 100 100
Fortitude Industries Inc. Manufacturing USA 100 100
T.I.C.S. Corporation Holding USA 100 100
PKC Group Poland Holding Sp. z o.o. Holding Poland 100 100
Groclin Luxembourg S.à.r.l. Holding Luxembourg 100 100
Kabel Technik Polska Sp. z o.o. Manufacturing Poland 100 100
PKC Netherlands Holding B.V. Holding The Netherlands 100 100
PK Cables Nederland B.V. Holding The Netherlands 100 100
*) Owned by Jiangsu Huakai-PKC Wire Harness Co., Ltd. 100% Following changes have occurred in the Group structure during the financial year:
• Associate company Hubei PKC Automotive Wiring Wiring Company Ltd was established.
• PKC Electronics Oy, PKC Electronics (Suzhou) Co.,Ltd and PKC Electronics Vietnam Co. Ltd were divested.
• Fortitude Industries Inc. was acquired.
• Shangdong Huakai-PKC Wire Harness Co.,Ltd was established by Jiangsu Huakai-PKC Wire harness Co. Ltd
63
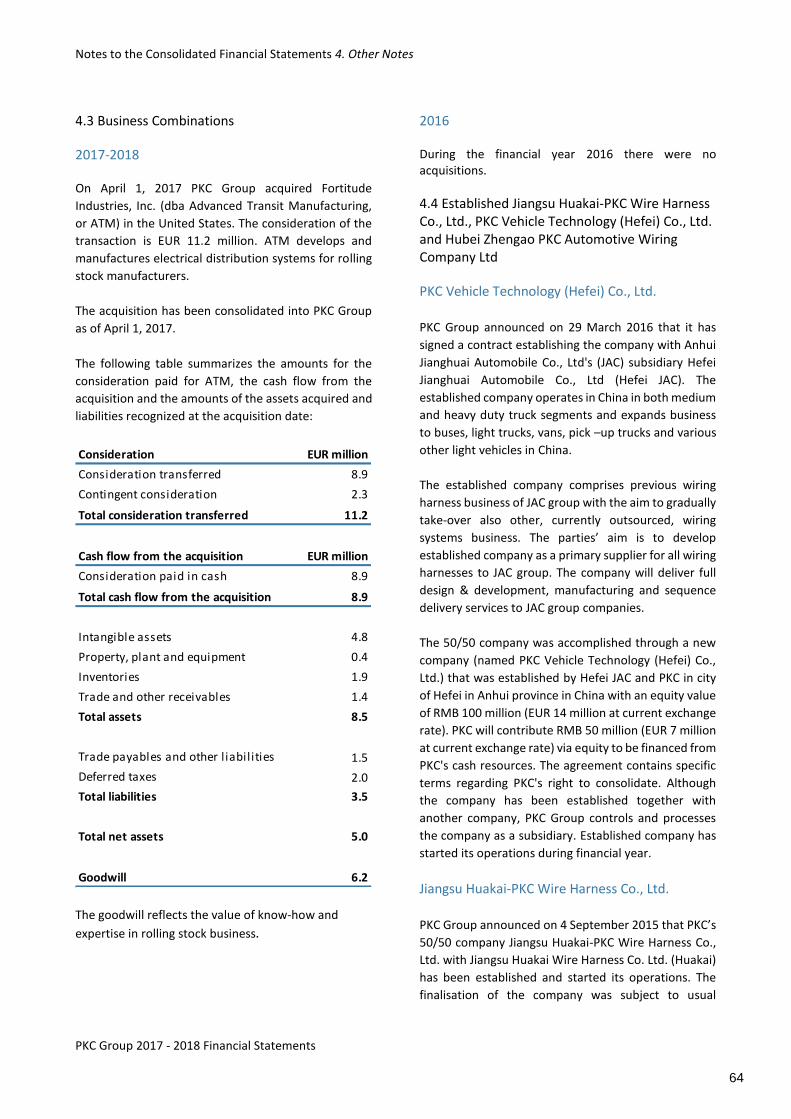
Notes to the Consolidated Financial Statements 4. Other Notes
PKC Group 2017 - 2018 Financial Statements
4.3 Business Combinations
2017-2018 On April 1, 2017 PKC Group acquired Fortitude
Industries, Inc. (dba Advanced Transit Manufacturing,
or ATM) in the United States. The consideration of the
transaction is EUR 11.2 million. ATM develops and
manufactures electrical distribution systems for rolling
stock manufacturers.
The acquisition has been consolidated into PKC Group
as of April 1, 2017.
The following table summarizes the amounts for the
consideration paid for ATM, the cash flow from the
acquisition and the amounts of the assets acquired and
liabilities recognized at the acquisition date:
Consideration EUR million
Consideration transferred 8.9
Contingent consideration 2.3
Total consideration transferred 11.2
Cash flow from the acquisition EUR million
Consideration paid in cash 8.9
Total cash flow from the acquisition 8.9
Intangible assets 4.8
Property, plant and equipment 0.4
Inventories 1.9
Trade and other receivables 1.4
Total assets 8.5
Trade payables and other l iabilities 1.5
Deferred taxes 2.0
Total liabilities 3.5
Total net assets 5.0
Goodwill 6.2
The goodwill reflects the value of know-how and
expertise in rolling stock business.
2016 During the financial year 2016 there were no acquisitions.
4.4 Established Jiangsu Huakai-PKC Wire Harness Co., Ltd., PKC Vehicle Technology (Hefei) Co., Ltd. and Hubei Zhengao PKC Automotive Wiring Company Ltd
PKC Vehicle Technology (Hefei) Co., Ltd.
PKC Group announced on 29 March 2016 that it has
signed a contract establishing the company with Anhui
Jianghuai Automobile Co., Ltd's (JAC) subsidiary Hefei
Jianghuai Automobile Co., Ltd (Hefei JAC). The
established company operates in China in both medium
and heavy duty truck segments and expands business
to buses, light trucks, vans, pick –up trucks and various
other light vehicles in China.
The established company comprises previous wiring
harness business of JAC group with the aim to gradually
take-over also other, currently outsourced, wiring
systems business. The parties’ aim is to develop
established company as a primary supplier for all wiring
harnesses to JAC group. The company will deliver full
design & development, manufacturing and sequence
delivery services to JAC group companies.
The 50/50 company was accomplished through a new
company (named PKC Vehicle Technology (Hefei) Co.,
Ltd.) that was established by Hefei JAC and PKC in city
of Hefei in Anhui province in China with an equity value
of RMB 100 million (EUR 14 million at current exchange
rate). PKC will contribute RMB 50 million (EUR 7 million
at current exchange rate) via equity to be financed from
PKC's cash resources. The agreement contains specific
terms regarding PKC's right to consolidate. Although
the company has been established together with
another company, PKC Group controls and processes
the company as a subsidiary. Established company has
started its operations during financial year.
Jiangsu Huakai-PKC Wire Harness Co., Ltd.
PKC Group announced on 4 September 2015 that PKC’s
50/50 company Jiangsu Huakai-PKC Wire Harness Co.,
Ltd. with Jiangsu Huakai Wire Harness Co. Ltd. (Huakai)
has been established and started its operations. The
finalisation of the company was subject to usual
64

Notes to the Consolidated Financial Statements 4. Other Notes
PKC Group 2017 - 2018 Financial Statements
conditions including e.g. negotiating the related
agreements and authority approvals. The conditions
have been fulfilled, Huakai’s business has been
transferred to the established company and company
has started its operations in September 2015.
The agreement contains specific terms regarding PKC's
right to consolidate. Although the company has been
established together with another company, PKC
Group controls and processes the company as a
subsidiary.
During the financial year 2017-2018 Jiangsu Huakai-PKC Wire harness Co. Ltd. established subisidiary, Shangdong Huakai-PKC Wire Harness Co.,Ltd, owned by 100%.
Balance sheet date information about the subsidiaries, that have non-controlling interest, before intra-group
eliminations is presented in the following table.
Shandong
Huakai - PKC
Wire Harness
Co., Ltd.
EUR 1,000 2017-18 2016 2017-18 2017-18 2016
Non-controlling interests' holding, % 50 % 50 % 50 % 50 % 50 %
Non-current assets 9,475 3,927 1,967 6,470 40
Current assets 59,483 39,760 760 27,239 2,733
Current l iabilities 26,117 13,158 843 26,591 40
Net assets 42,840 30,529 1,885 7,118 2,733
Net assets attributable to non-controlling interests 21,420 15,265 942 3,559 1,367
Revenue 85,511 42,164 23 55,008 0
Profit 14,257 3,608 -825 -1,936 1
Items of other comprehensive income -273 -370 -8 -148 0
Total comprehensive income 13,984 3,238 -833 -2,085 1
Net profit allocated to non-controlling interests 7,128 1,804 -412 -968 1
Items of other comprehensive income allocated
to non-controlling interests 6,992 1,619 -416 -1,042 1
Net cash from operating activities 3,601 5,910 -57 3,613 1
Net cash from investment activities -6,910 -1,027 -2,525 -5,363 0
Net cash used in financing activities 8,771 6,425 2,717 6,470 2,732Net increase (+) or decrease (-) in cash and cash
equivalents 5,462 11,308 136 4,719 2,733
Jiangsu Huakai-PKC
Wire Harness Co.,
Ltd.
PKC Vehicle
Technology
(Hefei) Co., Ltd.
Associated company Hubei Zhengao PKC
Automotive Wiring Company Ltd.
PKC Group announced on 9 February 2017 that it was
negotiating on establishing a company into China with
a Chinese wiring harness manufacturer. It was
estimated that the company would generate annual
sales of about EUR 40 million and that the negotiations
would be completed during the financial year. The
60/40 company was accomplished through a new
company named Hubei Zhengao PKC Automotive
Wiring Company Ltd that was established by Hubei
Zhengao Automotive Accessories Co., Ltd. and PKC in
city of Shiyan in Hubei province in China with an equity
value of RMB 150 million (about EUR 20 million at
current exchange rate). PKC will contribute RMB 60
million (about EUR 8 million at current exchange rate)
via equity to be financed from PKC's cash resources.
65

Notes to the Consolidated Financial Statements 4. Other Notes
PKC Group 2017 - 2018 Financial Statements
The company has commenced operations during the
financial year.
Hubei
Zhengao PKC
Automotive
Wiring
Company,
Ltd.
EUR 1,000 2017-18
Owning % 40 %
Non-current assets 3,767
Current assets 39,610
Total assets 43,378
Current l iabilities 22,081
Total liabilities 22,081
Revenue 37,613
Other operating income 4
Increase/decrease inventory of FG&WIP 3,106
Materials and services -30,290
Employee benefit expenses -5,531
Depreciation, amortization and
impairment -506
Other operating expenses -1,797
Operating profit 2,599
Financial income and expenses -110
Profit before taxes 2,489
Income taxes -621
Profit for the period 1,868
Share of associated companie's profit 754
Investment in associated companies 8,076
4.5 Discontinued Operations
PKC Group announced on 27 January 2017 that it
divests 100% of PKC Electronics Oy shares to Enics, one
of the biggest Electronics Manufacturing Service (EMS)
providers in the world focusing on industrial electronic.
The requirements of closing have been fulfilled and the
closing became effective and ownership and control
transferred on 28 February 2017. As a consequence of
the sale transaction, a loss of EUR 2.3 million has been
recognised in profit for the reporting period from the
discontinued operations.
Electronics business had been classified as a non-
current asset held for sale and reported as discontinued
operations as of 31 March 2016. After this change PKC
Group has only one primary reporting operating
segment which also includes Group functions and other
items.
➢ Accounting policies of the discontinued operations are presented in the Basis of Preparation and Accounting policies’ chapter Non-current assets held for sale and discontinued operations.
The financial information of discontinued operations is
presented in the table.
EUR 1,000 2017-18 2016
Results of Electronics business
Income 6,685 42,040
Expenses -9,188 -48,486
Profit (loss) before taxes -2,503 -6,446
Income taxes -93 -909
Net profit (loss) for the
financial year from
discontinued operations -2,595 -7,356
Items affecting comparability 0 -4,933
Cash flows from Electronics business
Net cash from
operating activities -1,561 -280
Net cash used in
investing activities 1,412 -444
Net cash used in
financial activities 41 0
Total net cash flows -107 -724
EUR 1,000 31.12.2016
Assets and liabilities classified as held for sale
Property, plant and
equipment 4,805
Intangible assets 102
Receivables 7,151
Inventories 8,099
Total assets (A) 20,156
Trade payables and
other non-interest-bearing
liabilities 10,136
Total liabilities (B) 10,136
Net assets and liabilities (A-B) 10,020
66

Notes to the Consolidated Financial Statements 4. Other Notes
PKC Group 2017 - 2018 Financial Statements
4.6 Operating Leases Leases in which risks and rewards incidental to ownership are not transferred to PKC Group are classified as operating leases. Related lease payments are recognised as profit or loss under other operating expenses on a straight-line basis over the lease term. Operating lease obligations mainly consist of factory and office facility leases.
Operating lease obligations, PKC Group as a lessee
EUR 1,000 2017-18 2016
Less than one year 9,519 10,912
Between one and five years 17,344 24,694
More than five years 1,415 4,346
Total 28,278 39,952 Leases that substantially transfer all the risks and rewards incidental to ownership to PKC Group are classified as finance leases. ➢ Additional information about finance leases is
presented in note 2.3 Property, Plant and Equipment.
4.7 Contingent Items and Commitments A contingent liability is a possible obligation that arises from past events and whose existence will be confirmed only by the occurrence or non-occurrence of one or more uncertain future events not wholly within the control of the Group (e.g. outcome of on-going judicial process). A contingent liability is also a present obligation, which probably does not require payment obligation or the amount of the obligation cannot be measured with sufficient reliability. At the end of the financial year 31 March 2018 (31 December 2016) PKC Group has no material contingent items or commitments.
4.8 Events after the Financial Year The group´s management is not aware of any significant events occurring after 31 March 2018.
67

Parent Company’s Financial Statements
PKC Group 2017 - 2018 Financial Statements
Parent Company’s Income Statement
EUR 1,000 Note 1.1.2017-31.3.2018 1.1.-31.12.2016
Net sales 1 1,431 487
Other operating income 2 3,441 2,864
Staff expenses 3 -8,303 -3,481
Depreciation, amortisation and impairment 7 -337 -350
Other operating expenses 4 -13,559 -6,474
Operating profit/loss -17,327 -6,955
Interest and other financial income 5 7,965 10,824
Interest and other financial expenses 5 -6,627 -6,008
Foreign exchange differences 5 -30 -38
Financial income and expenses 1,308 4,777
Profit/loss before appropriations and taxes -16,019 -2,178
Change in cumulative accelerated depreciation -14 14
Group contribution 0 10,998
Appropriations -14 11,012
Income taxes 6 6,566 -16
Profit/loss for the financial year -9,468 8,818
68

Parent Company’s Financial Statements
PKC Group 2017 - 2018 Financial Statements
Parent Company’s Balance Sheet
EUR 1,000 Note 31.3.2018 31.12.2016
Assets
Non-current assets
Intangible assets 7 200 431
Tangible assets 7 23 3
Investments 8 63,838 63,838
Total non-current assets 64,061 64,272
Current assets
Long-term receivables 9 210,685 202,192
Short-term receivables 10 72,897 83,183
Cash and cash equivalents 16,328 18,472
Total current assets 299,911 303,847
Total assets 363,972 368,119
Equity and liabilities
Equity 11
Share capital 6,218 6,218
Share premium account 11,282 11,282
Invested non-restricted equity fund 71,776 71,285
Retained earnings 59,338 48,263
Profit for the financial year -9,468 8,818
Total equity 139,146 145,867
Appropriations
Cumulative accelerated depreciation 0 -14
Total appropriations 0 -14
Liabilities
Non-current l iabilities 12 12,100 139,651
Current l iabilities 13 212,726 82,616
Total liabilities 224,826 222,266
Total equity and liabilities 363,972 368,133
69

Parent Company’s Financial Statements
PKC Group 2017 - 2018 Financial Statements
Parent Company’s Cash Flow Statement
EUR 1,000 1.1.2017 -31.3.2018 1.1.-31.12.2016
Cash flows from operating activities
Cash receipts from customers 1,436 656
Cash receipts from other operating income 3,425 2,496
Cash paid to suppliers and employees -21,801 -10,503
Cash flows from operations before financial income and expenses and taxes -16,940 -7,351
Interest paid -6,292 -4,750
Translation difference -1 0
Interest received and other financial income 6,852 11,292
Income taxes paid -1,491 -152
Net cash from operating activities (A) -17,873 -961
Cash flows from investing activities
Aqcuisitions of tangible and intangible assets -126 -73
Proceeds from sale of tangible and intangible assets 0 5
Loans granted to subsidiaries -34,973 -56,340
Proceeds from payments of loan receivables 9,534 4,195
Dividends received 0 93
Net cash used in investing activities (B) -25,565 -52,119
Cash flows from financial activities
Excercise of options 0 455
Change of own shares 2,747 0
Proceeds from current borrowings 222,802 137,825
Proceeds from non-current borrowings 12,100 0
Repayment of current/non-current borrowings -225,534 -132,519
Received group contributions and dividends 29,179 50,163
Dividends paid 0 -16,867
Net cash used in financial activities (C) 41,294 39,058
Net increase (+) or decrease (-) in cash and cash equivalents (A+B+C) -2,144 -14,023
Cash and cash equivalents at the beginning of the financial year 18,472 32,494
Cash and cash equivalents at the end of the financial year 16,328 18,472
70

Notes to the Parent Company’s Financial Statements
PKC Group 2017 - 2018 Financial Statements
Accounting Policies for the Parent Company’s Financial Statements PKC Group Ltd’s financial statements have been prepared in compliance with the Finnish accounting and company legislation. PKC Group Ltd’s financial period has been changed from calendar year to 1.4.-31.3. As a result of financial period change, the financial period that started 1.1.2017 continued until 31.3.2018. Financial period was 15 months while the comparison period was 12 months.
Foreign currency items Foreign currency transactions have been recognised during the financial period by using the exchange rate of the transaction date. Balance sheet items outstanding on the closing date of the financial period have been valued using the exchange rates of the reporting date. The exchange rate differences have been recognised in income statement.
Non-current assets Non-current assets are measured at cost less any accumulated depreciation, amortisation and any impairment losses. Assets are depreciated/amortised on a straight-line basis during their estimated lives. The depreciation/amortisation periods are as follows: Intangible assets 3 - 4 years Buildings and constructions 7 - 15 years Machinery and equipment 5 - 7 years
Subsidiary shares Subsidiary shares are recognised at acquisition cost, which have been impaired if a subsidiary’s recoverable amount based on future cash flows is lower than the acquisition cost.
Financial instruments Financial instruments are recognised at acquisition cost.
Net sales Net sales comprise the service revenue. Net sales are recognised for the period when the service is rendered.
Other operating income Income related to other than normal business is recognised as other operating income. Services to Group companies include flow through costs e.g. telephone, IT, premises, marketing and travelling costs invoiced from Group companies. Other items in other operating income are, for example proceeds from sales of non-current assets and compensations from insurance companies.
Lease rentals Lease rentals have been expensed.
Pension costs The retirement plans for employees are provided by external insurance companies. Pension costs are expensed when the related service has been rendered.
Direct taxes Direct taxes for the financial period have been recognised in profit or loss on an accrual basis. Tax losses carried forward are not recognised as deferred tax assets Derivative assets and liabilities During 2016 parent company has started to apply the instruction from Finnish Accounting Board (KiLa 2016 1963) relating to the fair values of derivative instruments. In addition to realized profit or loss from derivative agreements also the changes in the fair values of derivatives are recorded as a profit or loss.
71

Notes to the Parent Company’s Financial Statements
PKC Group 2017 - 2018 Financial Statements
Notes to the Parent Company’s Financial Statements
1. Net Sales
By market areas
EUR 1,000 2017-18 2016
Finland 239 213
Other Europe 888 250
North America 304 24
Total 1,431 487
2. Other Operating Income
EUR 1,000 2017-18 2016
Services to Group companies 3,439 2,864
Other income 2 0
Total 3,441 2,864
3. Staff Expenses
EUR 1,000 2017-18 2016
Wages and salaries 7,475 2,860
Pension expenses 615 469
Other social security
expenses 117 113
Other staff expenses 97 38
Total 8,303 3,481 ➢ Information of management remuneration is
presented in consolidated financial statements’ note 4.1 Related Party Disclosures.
Number of personnel
2017-18 2016
Average number of personnel 23 22
Personnel at the end of
financial year 23 19
4. Other Operating Expenses
EUR 1,000 2017-18 2016
Outsourced services 6,846 604
Outsourced services from
Group companies 2,118 214
IT and telecommunications
expenses 3,037 2,342
Administrative expenses 0 2,034
Travelling expenses 496 322
Facility expenses 250 155
Insurances 690 502
Vehicle expenses 33 23
Other maintenance expenses 28 22
Other items 8 149
Auditors´ fees 53 107
Total 13,559 6,474
Auditors´ fees
EUR 1,000 2017-18 2016
Audit fees 53 41
Tax services 0 61
Other services 0 5
Total 53 107
72

Notes to the Parent Company’s Financial Statements
PKC Group 2017 - 2018 Financial Statements
5. Financial Income and Expenses
Interest and other financial income
EUR 1,000 2017-18 2016
Income from subsidiary
shares 0 256
Interest and other financial
income from Group
companies 6,977 5,573
Interest and other
financial income 989 4,995
Foreign exchange gains
from trade payables 30 4
from raw material
derivatives 0 273
Total 7,996 11,100
Interest and other financial expenses
EUR 1,000 2017-18 2016
Interest and other financial
expense from Group
companies -189 0
Interest and other
financial expenses -6,438 -6,008
Foreign exchange losses
from trade payables -2 -3
from raw material
derivatives -57 -312
from other
financial instruments -1 0
Total -6,687 -6,323
Total financial income and
expenses 1,308 4,777
6. Income Taxes
EUR 1,000 2017-18 2016
Income taxes for
the financial year 0 -16
Adjustments for prior years 6,566 0
Total 6,566 -16
.
73

Notes to the Parent Company’s Financial Statements
PKC Group 2017 - 2018 Financial Statements
7. Non-Current Assets
Intangible assets
EUR 1,000 Intangible rights
Other
non-current
expenditures
Acquisitions in
progress Total
Acquisition cost 1.1.2017 2,270 491 0 2,761
+ Additions 0 0 95 95
+/- Reclassifications 575 -491 -91 -8
Acquisition cost 31.3.2018 2,845 0 3 2,848
Accumulated amortisation and
impairments 1.1.2017 1,979 351 0 2,330
- Accumulated amortisation on
disposals and reclassifications 345 -351 0 -6
+ Amortisation 325 0 0 325
Accumulated amortisation and
impairments 31.3.2018 2,649 0 0 2,649
Carrying amount 31.3.2018 196 0 3 200
Carrying amount 31.12.2016 291 140 0 431
Tangible assets
EUR 1,000
Buildings and
constructions
Machinery and
equipment
Other tangible
assets Total
Acquisition cost 1.1.2017 118 1,001 209 1,328
+ Additions 31 0 0 31
+/- Reclassifications -12 113 -94 8
Acquisition cost 31.3.2018 137 1,114 116 1,367
Accumulated depreciation and
impairments 1.1.2017 118 999 209 1,326
- Accumulated depreciation on
disposals and reclassifications 6 116 -116 6
+ Depreciation 5 0 7 12
Accumulated depreciation and
impairments 31.3.2018 129 1,114 101 1,344
Carrying amount 31.3.2018 8 0 15 23
Carrying amount 31.12.2016 0 3 0 3
74

Notes to the Parent Company’s Financial Statements
PKC Group 2017 - 2018 Financial Statements
8. Investments
EUR 1,000
Shares of
subsidiaries
Other
investments Total
Acquisition cost 1.1.2017 63,791 48 63,838
Acquisition cost 31.3.2018 63,791 48 63,838
Carrying amount 31.3.2018 63,791 48 63,838
Carrying amount 31.12.2016 63,791 48 63,838
Subsidiaries
Company Registered office
Parent's holding,
%
Parent's vote,
%
PKC Wiring Systems Oy Wiring Systems
Kempele,
Finland 100 100
PKC Netherlands B.V Electronics
Eindhoven,
The Netherlands 100 100
➢ The list of Group companies (31 March 2018) is presented in consolidated financial statements’ note 4.2 Group
Structure.
9. Long-term Receivables
EUR 1,000 2017-18 2016
Loan receivables
from Group companies 210,671 202,024
Other non-current receivables 14 167
Total 210,685 202,192
10. Short-term Receivables
EUR 1,000 2017-18 2016
Other receivables 138 221
Prepayments
and accrued income 1,214 287
Interest-bearing
loan receivables 69,979 53,117
Trade receivables 384 368
Prepayments and accrued
income of financial items 1,182 29,191
Total 72,897 83,183
Receivables from Group companies
Prepayments and accrued income
EUR 1,000 2017-18 2016
of staff expenses 18 24
of other operating expenses 1,031 205
of financial items 0 57
of taxes 165 0
Total 1,214 287
75

Notes to the Parent Company’s Financial Statements
PKC Group 2017 - 2018 Financial Statements
11. Equity
Restricted equity
EUR 1,000 2017-18 2016
Share capital 1.1. 6,218 6,218
Share capital 31.3./31.12. 6,218 6,218
Share premium account 1.1. 11,282 11,282
Share premium account
31.3./31.12. 11,282 11,282
Total restricted equity 17,500 17,500
Distributable equity
EUR 1,000 2017-18 2016
Invested non-restricted equity
fund 1.1. 71,285 70,830
Increase (+)/ decrease (-) in
invested non-restricted equity
fund 490 455
Invested non-restricted
equity fund 31.3./31.12. 71,776 71,285
Retained earnings 1.1. 57,082 65,130
Dividends paid 0 -16,867
Change of treasury shares 2,257 0
Retained earnings
31.3./31.12. 59,339 48,263
Profit for the financial year -9,468 8,818
Distributable equity
31.3./31.12. 121,646 128,367
Total equity 139,146 145,867
Statement of distributable funds
EUR 1,000 2017-18 2016
Retained earnings 59,339 48,263
Profit for the financial year -9,468 8,818
Invested non-restricted equity
fund 71,776 71,285
Total 121,646 128,367
76

Notes to the Parent Company’s Financial Statements
PKC Group 2017 - 2018 Financial Statements
12. Non-Current Liabilities
EUR 1,000 2017-18 2016
Bond 0 99,681
Loans from financial
institutions 0 39,970
To Group companies
Interest-bearing borrowings 12,100 0
Total non-current liabilities 12,100 139,651
of which interest-bearing 12,100 139,651 Loans falling due later than five years do not exist.
13. Current Liabilities
EUR 1,000 2017-18 2016
Bond 97,297 0
Loans from financial
institutions 33,000 0
Interest-bearing
commercial papers 45,000 35,000
Trade payables 666 792
Advances received
Accruals and deferred income 4,216 11,814
Other liabilities 252 86
To Group companies
Interest-bearing cash pool 31,815 34,874
Trade payables 429 42
Accruals and deferred income
from financial expenses 50 0
Other liabilities 0 7
Total 212,726 82,616
Accruals and deferred income
EUR 1,000 2017-18 2016
from staff expenses 567 968
from other operating expenses 1,098 212
from financial items 2,552 2,754
from taxes 0 7,880
Total 4,216 11,814
Other liabilities
EUR 1,000 2017-18 2016
from staff expenses 246 4
from taxes 5 82
Total 252 86
14. Commitments and Other Obligations
Other liabilities
EUR 1,000 2017-18 2016
Given on behalf of
other Group companies 11,522 14,567
Total 11,522 14,567
Lease obligations related to current premises
EUR 1,000 2017-18 2016
For the current financial period 147 138
Falling due at a later date 143 183
Total 290 321
Other lease obligations
EUR 1,000 2017-18 2016
For the current financial period 12 13
Falling due at a later time 25 3
Total 37 16
77

PKC Group 2017-2018 Financial Statements
Board of Directors´ Proposal for Profit Distribution and Signatures The parent company´s distributable funds are EUR 121,646,325, of which EUR 49,870,752 is distributable as dividends, including the net profit (loss) for the financial year EUR -9,467,768. There are 24,125,387 shares with dividend rights. The Board of Directors proposes to the Annual General Meeting that the distributable funds be disposed as follows: - A dividend of EUR 0.70 per share be paid, totalling EUR 16,887,770.90 - The remaining be retained in shareholders´ equity EUR 104,758,554.10 Total EUR 121,646,325.00 The dividend payment will be settled at the Annual General Meeting held after the end of the financial year. The company´s liquidity is good and in the opinion of the Board of Directors the proposed dividend will not put the company´s solvency at risk.
Helsinki, 25 May 2018.
Matti Ruotsala Chairman of the Board
Robert J. Remenar Board Member
Gaya Nand Gauba Board Member
Vivek Chaand Sehgal Board Member
Andreas Heuser Board Member
Pankaj Mital President & CEO Board Member
78

This document is an English translation of the Finnish Auditor’s note. Only the Finnish version is legally binding.
PKC Group 2017 - 2018 Financial Statements
The Auditor’s Note Our auditor’s report has been issued today. Helsinki, 25 May 2018. Ernst & Young Oy Authorised Public Accountants (signed) Jari Karppinen Authorised Public Accountant
79

PKC Group 2017 - 2018 Financial Statements
List of Accounting Books
• journal and general ledger
• ledger specifications
• ledger vouchers
• memo vouchers
• inventory counting
• list of items of intangible and tangible assets
80
A member firm of Ernst & Young Global Limited
1 (4)
Ernst & Young Oy Alvar Aallon katu 5 C FI-00100 Helsinki FINLAND
Tel. +358 207 280 190 www.ey.com/fi Business ID 2204039-6, domicile Helsinki
AUDITOR’S REPORT (Translation of the Finnish original)
To the Annual General Meeting of PKC Group Oy
Report on the Audit of Financial Statements
Opinion
We have audited the financial statements of PKC Group Oy (business identity code 0972280-0) for the year ended 31 March, 2018. The financial statements comprise the consolidated balance sheet, statement of comprehensive income, statement of changes in equity, statement of cash flows and notes, including a summary of significant accounting policies, as well as the parent company’s balance sheet, income statement, statement of cash flows and notes. In our opinion
• the consolidated financial statements give a true and fair view of the group’s financial position as well as its financial performance and its cash flows in accordance with International Financial Reporting Standards (IFRS) as adopted by the EU.
• the financial statements give a true and fair view of the parent company’s financial performance and financial position in accordance with the laws and regulations governing the preparation of financial statements in Finland and comply with statutory requirements.
Our opinion is consistent with the additional report submitted to the Audit Committee.
Basis for Opinion
We conducted our audit in accordance with good auditing practice in Finland. Our responsibilities under good auditing practice are further described in the Auditor’s Responsibilities for the Audit of Financial Statements section of our report. We are independent of the parent company and of the group companies in accordance with the ethical requirements that are applicable in Finland and are relevant to our audit, and we have fulfilled our other ethical responsibilities in accordance with these requirements.
We have not provided any non-audit services to the parent company or group companies. We believe that the audit evidence we have obtained is sufficient and appropriate to provide a basis for our opinion.
Key Audit Matters Key audit matters are those matters that, in our professional judgment, were of most significance in our audit of the financial statements of the current period. These matters were addressed in the context of our audit of the financial statements as a whole, and in forming our opinion thereon, and we do not provide a separate opinion on these matters. We have fulfilled the responsibilities described in the Auditor’s responsibilities for the audit of the financial statements section of our report, including in relation to these matters. Accordingly, our audit included the performance of procedures designed to respond to our assessment of the risks of material misstatement of the financial statements. The results of our audit procedures, including the procedures performed to address the matters below, provide the basis for our audit opinion on the accompanying financial statements. We have also addressed the risk of management override of internal controls. This includes consideration of whether there was evidence of management bias that represented a risk of material misstatement due to fraud.

A member firm of Ernst & Young Global Limited
2 (4)
Key Audit Matter How our audit addressed the Key Audit Matter
Valuation of Goodwill We refer to the note 2.1 Accounting policy and note 2.2 Impairment testing
• During the previous years the company has expanded its operations by business acquisitions, which has increased the carrying value of goodwill. At the balance sheet date the value of the goodwill amounted to 40.3 m€, which is 7 % of the total assets.
• Revenue recognition was determined to be a key audit matter, because the cash-flow estimates used in the impairment tests include significant management judgement for, among others, revenue growth, profitability and discount rate.
Our audit procedures included, among others,
the following audit procedures:
• We assessed the assumptions and methods applied by the group, specially related to forecasted revenue growth, profit margins and the cost of the weighted average capital.
• We assessed the accuracy of the previous forecasts made by the management.
• We assessed how sensible the range of impairment in CGU testing would be and assessed if any possible change of assumptions could lead to situation where carrying values would exceed the value of use.
• We compared the value-of-use calculated in impairment test with the market value of shares quoted just before the shares were delisted on 6 October 2017.
• We considered the appropriateness of the group’s disclosures in respect of goodwill.
Responsibilities of the Board of Directors and the Managing Director for the Financial Statements The Board of Directors and the Managing Director are responsible for the preparation of consolidated financial statements that give a true and fair view in accordance with International Financial Reporting Standards (IFRS) as adopted by the EU, and of financial statements that give a true and fair view in accordance with the laws and regulations governing the preparation of financial statements in Finland and comply with statutory requirements. The Board of Directors and the Managing Director are also responsible for such internal control as they determine is necessary to enable the preparation of financial statements that are free from material misstatement, whether due to fraud or error. In preparing the financial statements, the Board of Directors and the Managing Director are responsible for assessing the parent company’s and the group’s ability to continue as going concern, disclosing, as applicable, matters relating to going concern and using the going concern basis of accounting. The financial statements are prepared using the going concern basis of accounting unless there is an intention to liquidate the parent company or the group or cease operations, or there is no realistic alternative but to do so.
Auditor’s Responsibilities for the Audit of Financial Statements Our objectives are to obtain reasonable assurance on whether the financial statements as a whole are free from material misstatement, whether due to fraud or error, and to issue an auditor’s report that includes our opinion. Reasonable assurance is a high level of assurance, but is not a guarantee that an audit conducted in accordance with good auditing practice will always detect a material misstatement when it exists. Misstatements can arise from fraud or error and are considered material if, individually or in aggregate, they could reasonably be expected to influence the economic decisions of users taken on the basis of the financial statements.

A member firm of Ernst & Young Global Limited
3 (4)
As part of an audit in accordance with good auditing practice, we exercise professional judgment and maintain professional skepticism throughout the audit. We also:
• Identify and assess the risks of material misstatement of the financial statements, whether due to fraud or error, design and perform audit procedures responsive to those risks, and obtain audit evidence that is sufficient and appropriate to provide a basis for our opinion. The risk of not detecting a material misstatement resulting from fraud is higher than for one resulting from error, as fraud may involve collusion, forgery, intentional omissions, misrepresentations, or the override of internal control.
• Obtain an understanding of internal control relevant to the audit in order to design audit procedures that are appropriate in the circumstances, but not for the purpose of expressing an opinion on the effectiveness of the parent company’s or the group’s internal control.
• Evaluate the appropriateness of accounting policies used and the reasonableness of accounting estimates and related disclosures made by management.
• Conclude on the appropriateness of the Board of Directors’ and the Managing Director’s use of the going concern basis of accounting and based on the audit evidence obtained, whether a material uncertainty exists related to events or conditions that may cast significant doubt on the parent company’s or the group’s ability to continue as a going concern. If we conclude that a material uncertainty exists, we are required to draw attention in our auditor’s report to the related disclosures in the financial statements or, if such disclosures are inadequate, to modify our opinion. Our conclusions are based on the audit evidence obtained up to the date of our auditor’s report. However, future events or conditions may cause the parent company or the group to cease to continue as a going concern.
• Evaluate the overall presentation, structure and content of the financial statements, including the disclosures, and whether the financial statements represent the underlying transactions and events so that the financial statements give a true and fair view.
• Obtain sufficient appropriate audit evidence regarding the financial information of the entities or business activities within the group to express an opinion on the consolidated financial statements. We are responsible for the direction, supervision and performance of the group audit. We remain solely responsible for our audit opinion.
We communicate with those charged with governance regarding, among other matters, the planned scope and timing of the audit and significant audit findings, including any significant deficiencies in internal control that we identify during our audit. We also provide those charged with governance with a statement that we have complied with relevant ethical requirements regarding independence, and communicate with them all relationships and other matters that may reasonably be thought to bear on our independence, and where applicable, related safeguards. From the matters communicated with those charged with governance, we determine those matters that were of most significance in the audit of the financial statements of the current period and are therefore the key audit matters. We describe these matters in our auditor’s report unless law or regulation precludes public disclosure about the matter or when, in extremely rare circumstances, we determine that a matter should not be communicated in our report because the adverse consequences of doing so would reasonably be expected to outweigh the public interest benefits of such communication.
Other Reporting Requirements Information on our audit engagement We were appointed as auditors by the Annual General Meeting on 5 April 2017.

A member firm of Ernst & Young Global Limited
4 (4)
Other information The Board of Directors and the Managing Director are responsible for the other information. The other information comprises the report of the Board of Directors and the information included in the Annual Report, but does not include the financial statements and our auditor’s report thereon. We have obtained the report of the Board of Directors prior to the date of this auditor’s report, and the Annual Report is expected to be made available to us after that date. Our opinion on the financial statements does not cover the other information. In connection with our audit of the financial statements, our responsibility is to read the other information identified above and, in doing so, consider whether the other information is materially inconsistent with the financial statements or our knowledge obtained in the audit, or otherwise appears to be materially misstated. With respect to report of the Board of Directors, our responsibility also includes considering whether the report of the Board of Directors has been prepared in accordance with the applicable laws and regulations. In our opinion, the information in the report of the Board of Directors is consistent with the information in the financial statements and the report of the Board of Directors has been prepared in accordance with the applicable laws and regulations. If, based on the work we have performed on the other information that we obtained prior to the date of this auditor’s report, we conclude that there is a material misstatement of this other information, we are required to report that fact. We have nothing to report in this regard.
Helsinki, 25 May 2018 Ernst & Young Oy Authorized Public Accountant Firm Jari Karppinen Authorized Public Accountant