Embed Size (px)
Citation preview
1
PKC Group PlcInvestor Presentation
Q3/2012
1 November 2012
Matti HyytiäinenPresident & CEO
1
2
PKC’s OperationsBusiness Environment
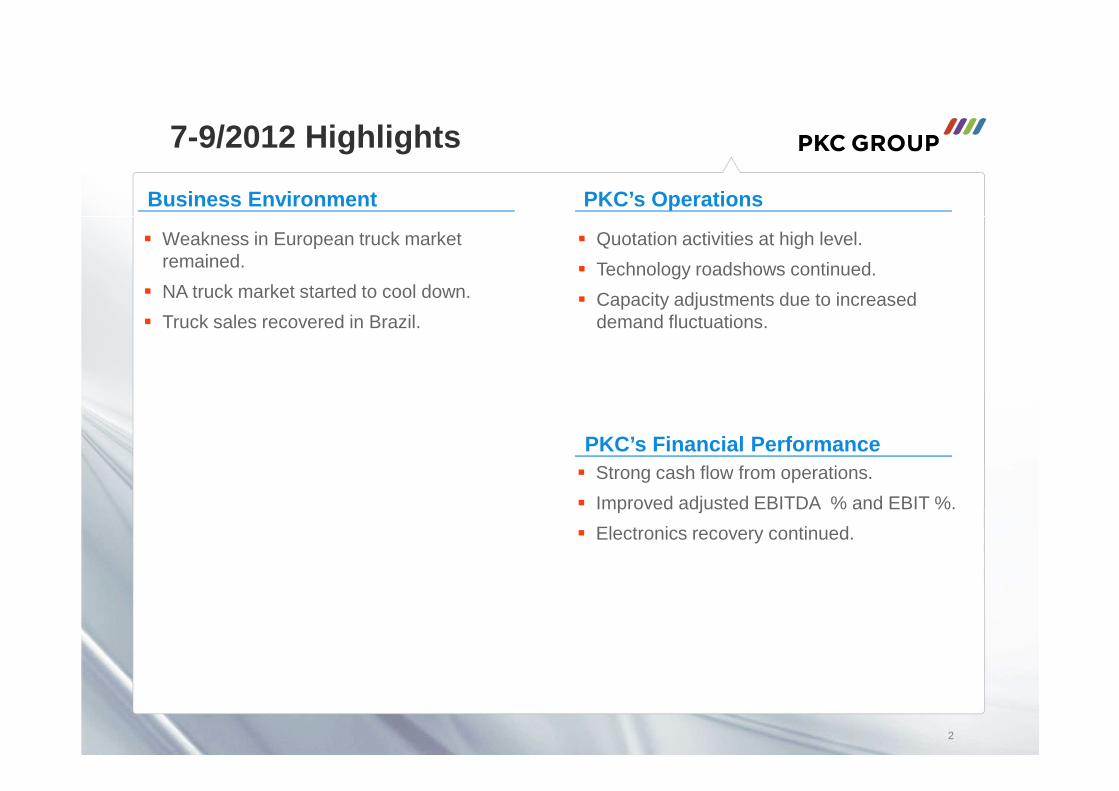
7-9/2012 Highlights
� Weakness in European truck market remained.
� NA truck market started to cool down.
� Truck sales recovered in Brazil.
� Quotation activities at high level.
� Technology roadshows continued.
� Capacity adjustments due to increased demand fluctuations.
PKC’s Financial Performance� Strong cash flow from operations.
� Improved adjusted EBITDA % and EBIT %.
� Electronics recovery continued.
3
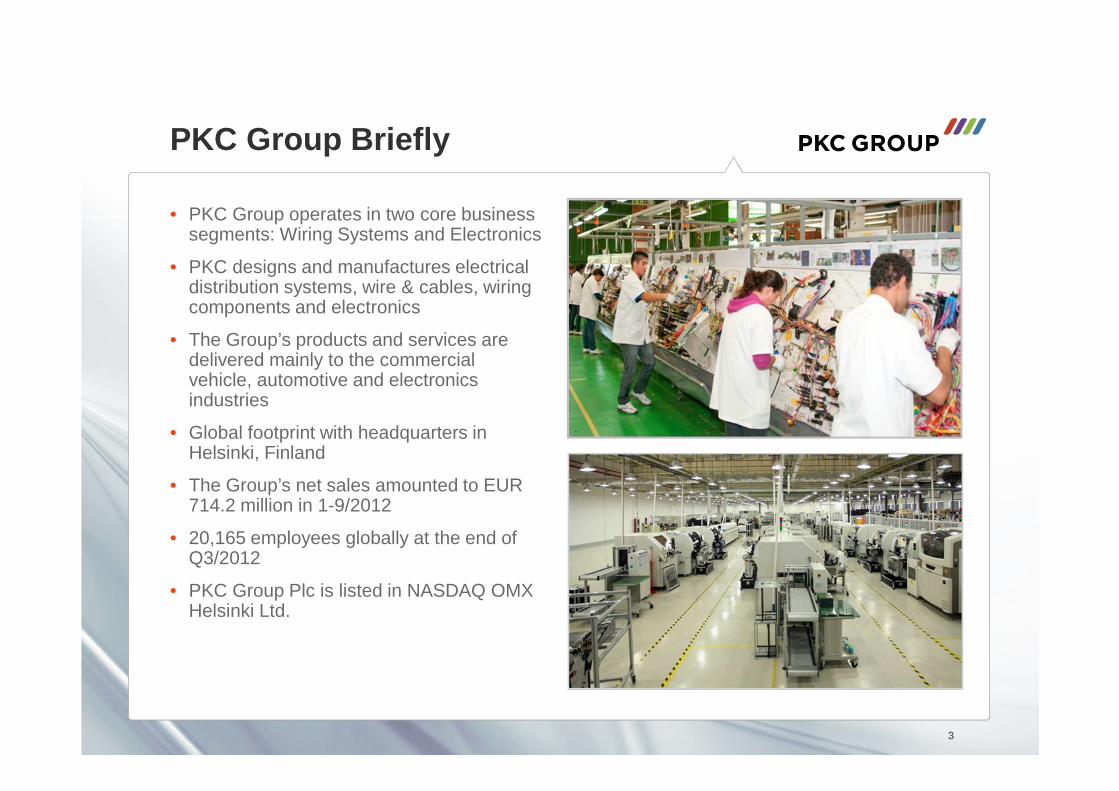
PKC Group Briefly
• PKC Group operates in two core business segments: Wiring Systems and Electronics
• PKC designs and manufactures electrical distribution systems, wire & cables, wiring components and electronics
• The Group’s products and services are delivered mainly to the commercial vehicle, automotive and electronics industries
• Global footprint with headquarters in Helsinki, Finland
• The Group’s net sales amounted to EUR 714.2 million in 1-9/2012
• 20,165 employees globally at the end of Q3/2012
• PKC Group Plc is listed in NASDAQ OMX Helsinki Ltd.
3
4
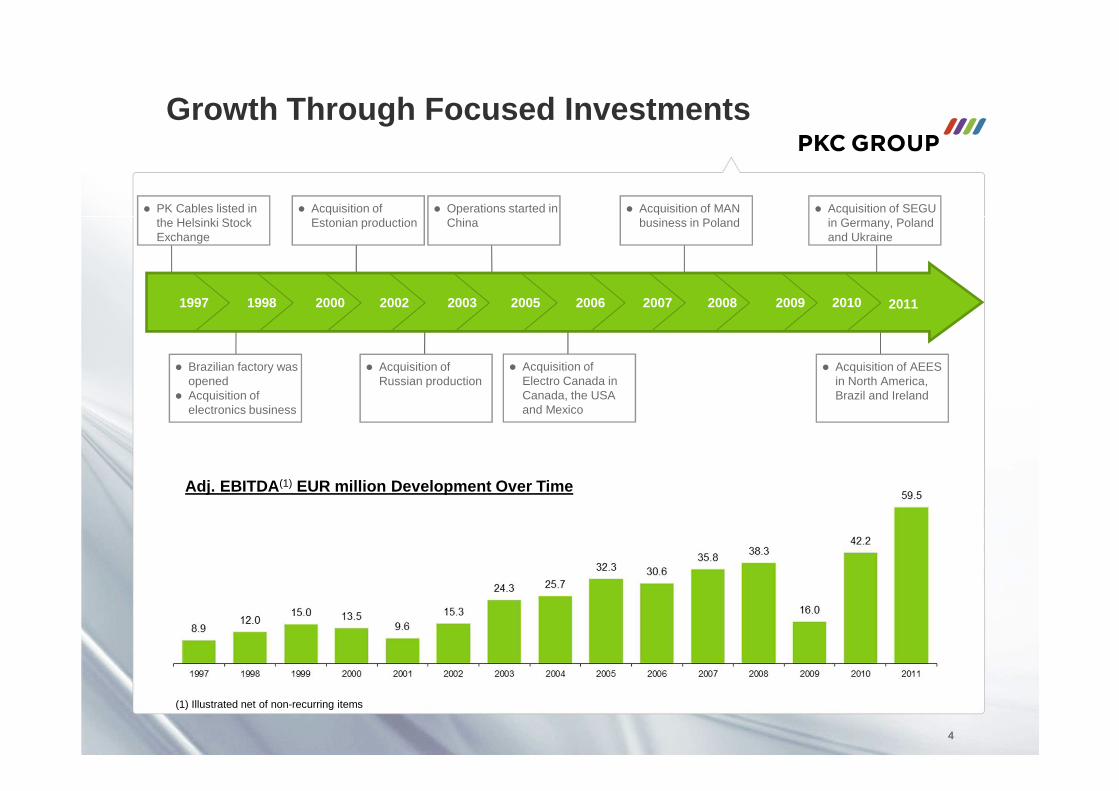
Growth Through Focused Investments
Adj. EBITDA(1) EUR million Development Over Time
(1) Illustrated net of non-recurring items
4
1997 1998 2000 2002 2003 2005 2006 2007 2008 2009
� Brazilian factory was opened
� Acquisition of electronics business
� Acquisition of Estonian production
� Operations started in China
� PK Cables listed in the Helsinki Stock Exchange
� Acquisition of Russian production
� Acquisition of Electro Canada in Canada, the USA and Mexico
� Acquisition of MAN business in Poland
2010 2011
� Acquisition of SEGU in Germany, Poland and Ukraine
� Acquisition of AEES in North America, Brazil and Ireland
5
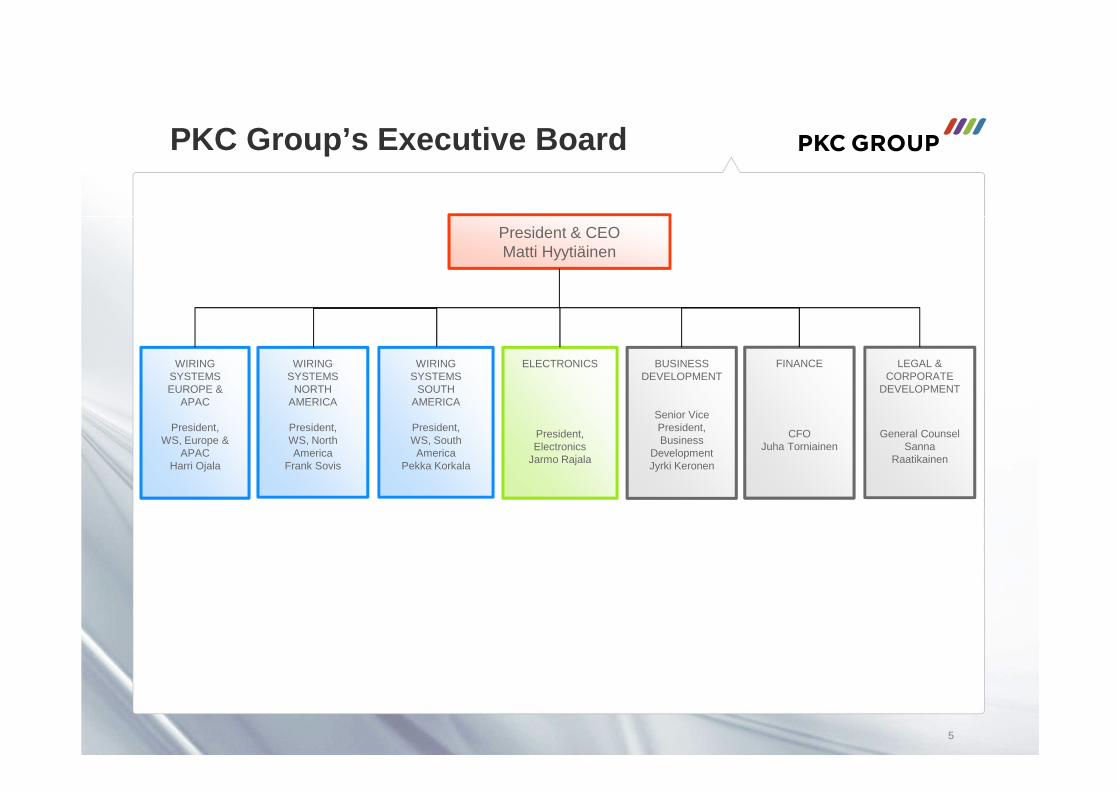
PKC Group’s Executive Board
President & CEOMatti Hyytiäinen
WIRING SYSTEMSEUROPE &
APAC
President, WS, Europe &
APACHarri Ojala
FINANCE
CFOJuha Torniainen
LEGAL & CORPORATE
DEVELOPMENT
General CounselSanna
Raatikainen
WIRING SYSTEMS
SOUTH AMERICA
President, WS, South America
Pekka Korkala
WIRING SYSTEMS
NORTH AMERICA
President, WS, North America
Frank Sovis
BUSINESS DEVELOPMENT
Senior Vice President, Business
Development Jyrki Keronen
ELECTRONICS
President, Electronics
Jarmo Rajala

PKC locations today
66
Barchfeld, Germany (M)Dundalk, Ireland (M)Haapsalu, Estonia (M)Helsinki, Finland (HQ)Keila, Estonia (M)Kempele, Finland Kostomuksha, Russia (M)Mukachewo, Ukraine (M)Munich, GermanyRaahe, Finland (M)Sosnowiec, Poland (M)Starachowice, Poland (M)
Suzhou, China (M)
Campo Alegre, Santa Catarina, Brazil (M)Curitiba, Brazil (M)Itajuba, Brazil (M)São Bento do Sul, Brazil (M)São Paulo, Brazil
Wiring Systems business
Electronics business
Manufacturing
Acuna, Mexico (M)Dallas, TexasGreen Valley, ArizonaFarmington Hills, MichiganJeffersontown, KentuckyJuarez, Mexico (M)Kirkland, WashingtonMonterey, MexicoNogales, Mexico (M)Piedras Negras, Mexico (M)Portland, OregonSan Antonio, TexasTorreon, Mexico (M)Traverse City, Michigan (M)
North America
South America
Europe
Asia (M)
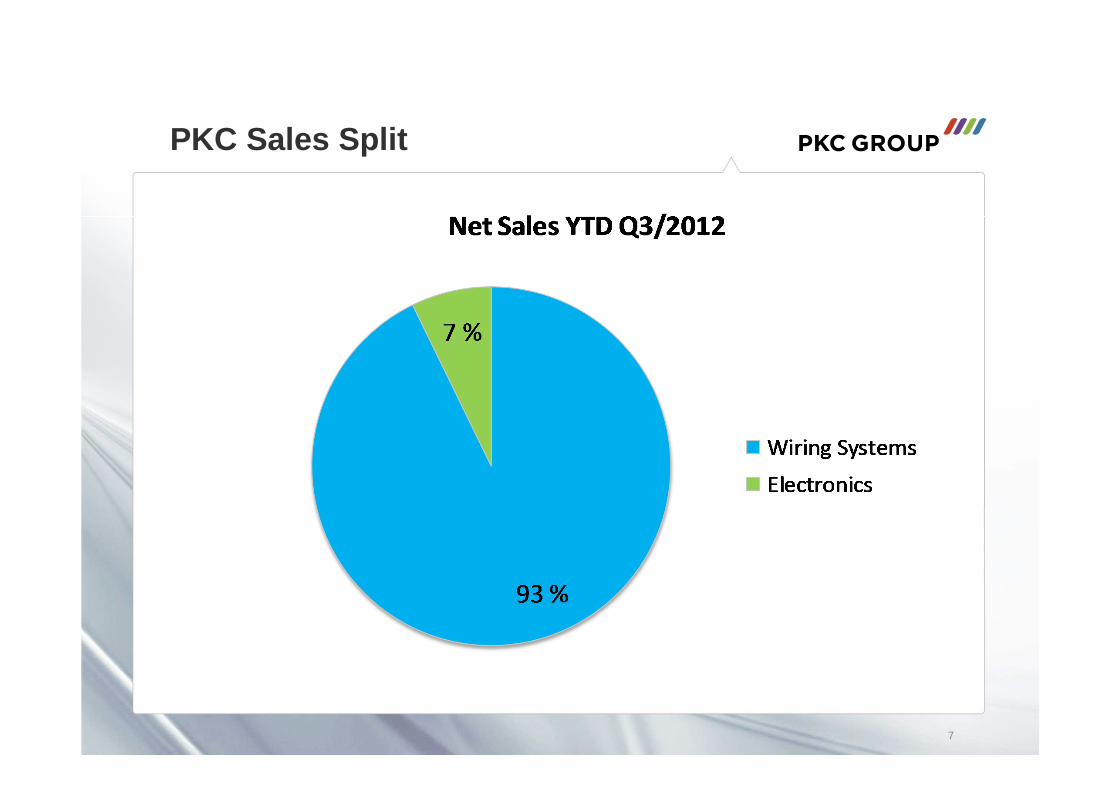
PKC Sales Split
7
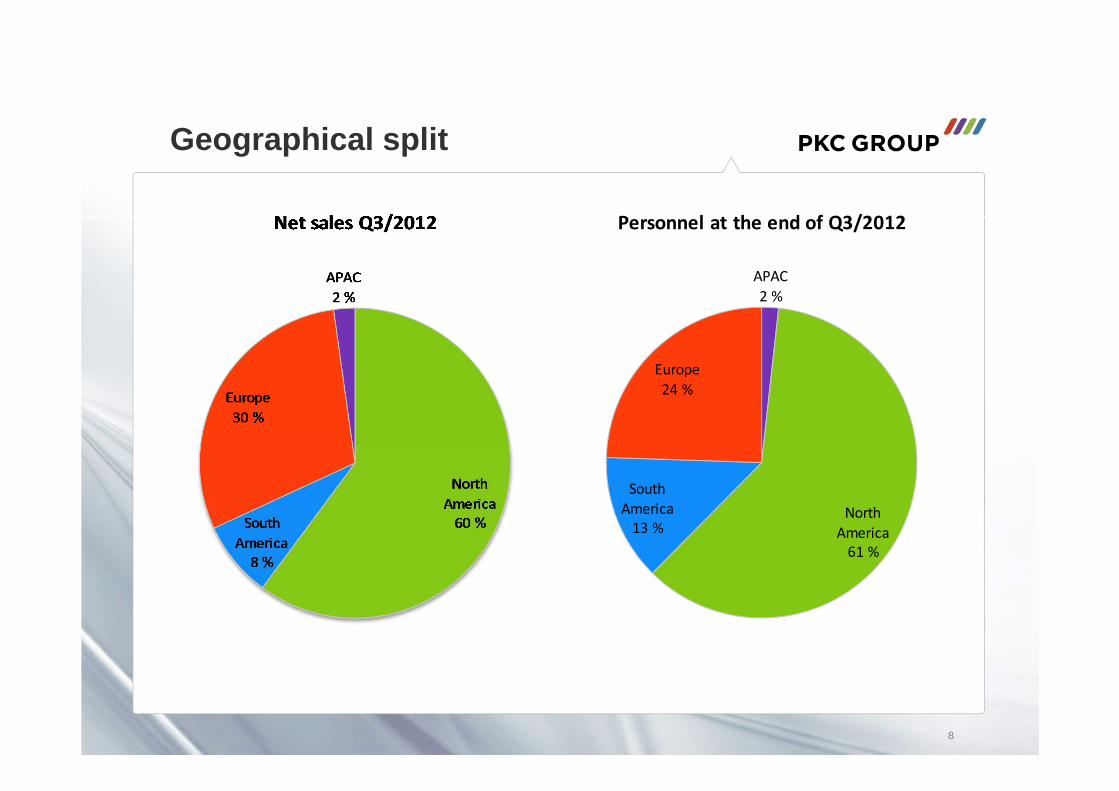
Geographical split
APAC
2 %
North
America
61 %
South
America
13 %
Europe
24 %
Personnel at the end of Q3/2012
8
9
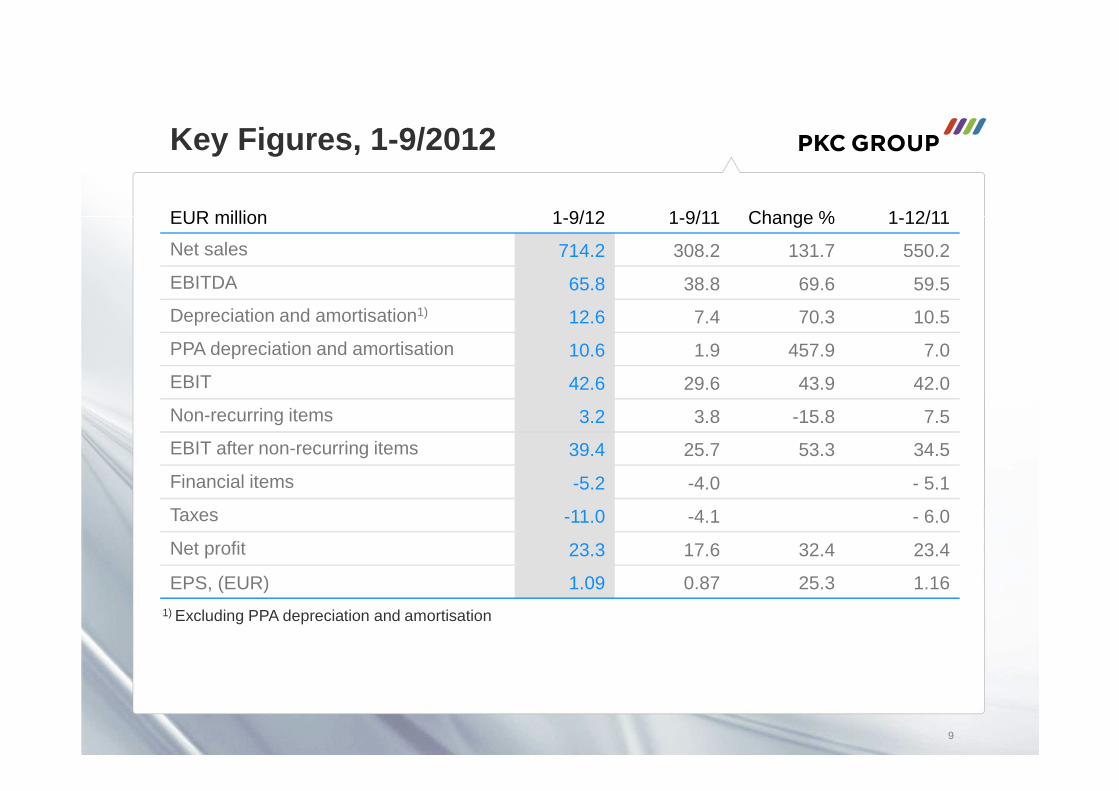
Key Figures, 1-9/2012
EUR million 1-9/12 1-9/11 Change % 1-12/11
Net sales 714.2 308.2 131.7 550.2
EBITDA 65.8 38.8 69.6 59.5
Depreciation and amortisation1) 12.6 7.4 70.3 10.5
PPA depreciation and amortisation 10.6 1.9 457.9 7.0
EBIT 42.6 29.6 43.9 42.0
Non-recurring items 3.2 3.8 -15.8 7.5
EBIT after non-recurring items 39.4 25.7 53.3 34.5
Financial items -5.2 -4.0 - 5.1
Taxes -11.0 -4.1 - 6.0
Net profit 23.3 17.6 32.4 23.4
EPS, (EUR) 1.09 0.87 25.3 1.161) Excluding PPA depreciation and amortisation

10
Key Figures, 7-9/2012
EUR million 7-9/12 7-9/11 Change % 1-12/11
Net sales 227.4 102.0 122.9 550.2
EBITDA 22.5 13.9 61.9 59.5
Depreciation and amortisation1) 4.6 2.6 76.9 10.5
PPA depreciation and amortisation 3.5 0.7 400.0 7.0
EBIT 14.4 10.6 35.8 42.0
Non-recurring items 1.9 1.7 11.8 7.5
EBIT after non-recurring items 12.5 9.0 38.9 34.5
Financial items -2.7 -4.4 - 5.1
Taxes -3.1 -0.9 - 6.0
Net profit 6.7 3.7 81.1 23.4
EPS, (EUR) 0.31 0.19 63.2 1.161) Excluding PPA depreciation and amortisation
11
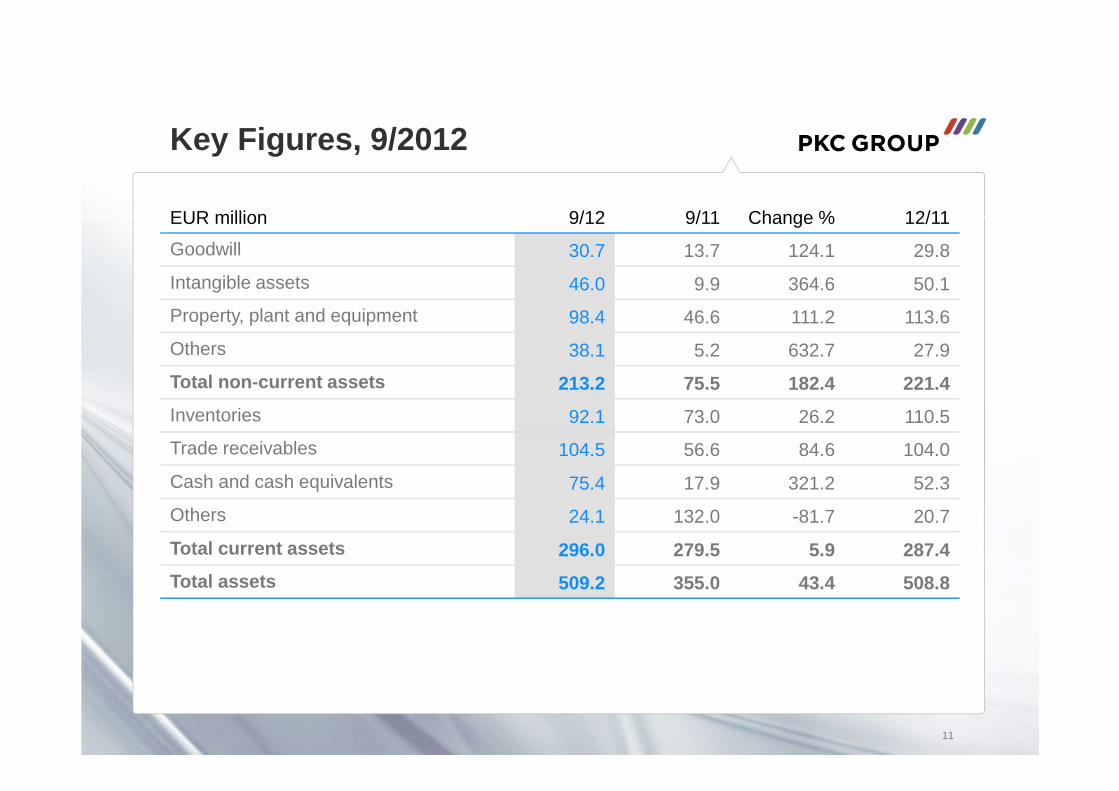
Key Figures, 9/2012
EUR million 9/12 9/11 Change % 12/11
Goodwill 30.7 13.7 124.1 29.8
Intangible assets 46.0 9.9 364.6 50.1
Property, plant and equipment 98.4 46.6 111.2 113.6
Others 38.1 5.2 632.7 27.9
Total non-current assets 213.2 75.5 182.4 221.4
Inventories 92.1 73.0 26.2 110.5
Trade receivables 104.5 56.6 84.6 104.0
Cash and cash equivalents 75.4 17.9 321.2 52.3
Others 24.1 132.0 -81.7 20.7
Total current assets 296.0 279.5 5.9 287.4
Total assets 509.2 355.0 43.4 508.8
12
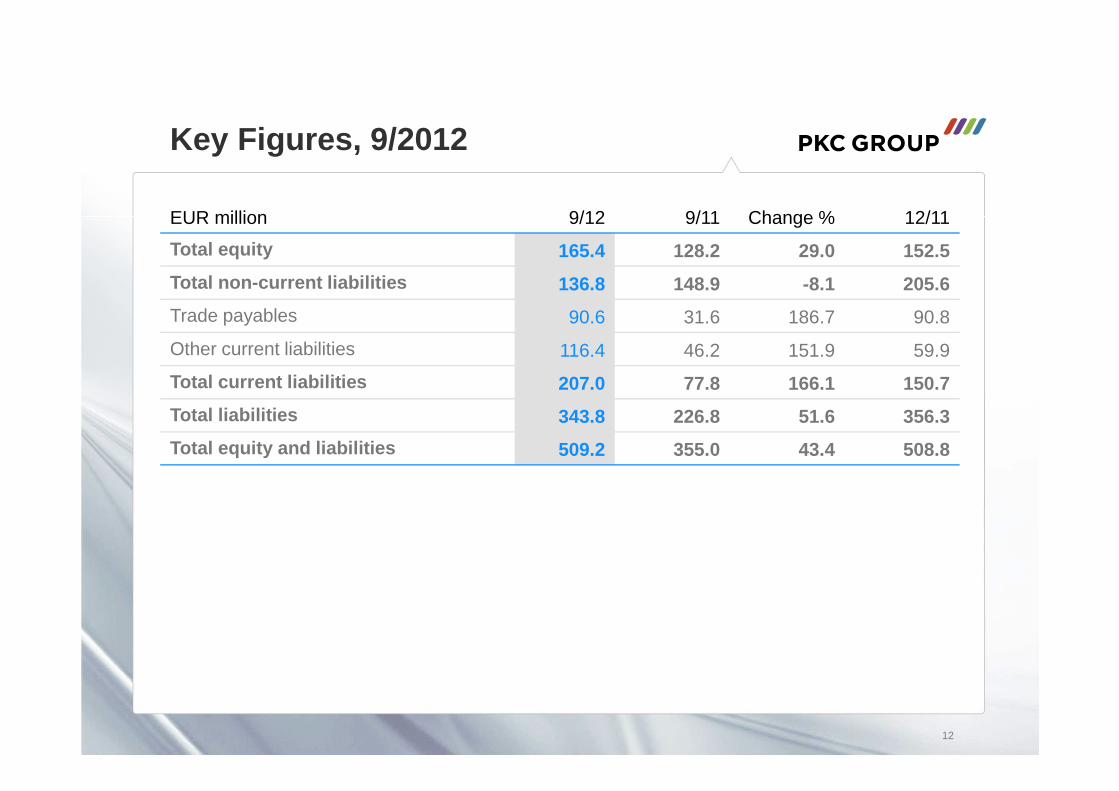
Key Figures, 9/2012
EUR million 9/12 9/11 Change % 12/11
Total equity 165.4 128.2 29.0 152.5
Total non-current liabilities 136.8 148.9 -8.1 205.6
Trade payables 90.6 31.6 186.7 90.8
Other current liabilities 116.4 46.2 151.9 59.9
Total current liabilities 207.0 77.8 166.1 150.7
Total liabilities 343.8 226.8 51.6 356.3
Total equity and liabilities 509.2 355.0 43.4 508.8

13
Key Figures, 1-9/2012
EUR million 1-9/12 1-9/11 Change % 1-12/11
Net cash from operating activities 60.8 4.4 1281.8 40.0
Cash flow after investments 52.1 -16.7 -50.2
Net working capital 82.7 88.0 -6.0 100.7
Net debt 69.4 140.0 110.7
ROI, % 20.1 19.3 18.9
Equity ratio, % 32.5 36.1 30.0
Gearing, % 42.0 109.2 72.6
No. of employees at closing 20,165 8,618 132.8 21,895

14
Net Sales
Adjusted EBITDA % and EBIT %
Net Sales by Geographical Areas
Key Figures, 1-9/2012
46,8 45,4
176,3 166,5
19,4
429,8
50,7
56,8
15,1
15,6
0
100
200
300
400
500
600
700
800
1-9/2011 1-9/2012
Finland Other Europe North America South America APAC
EUR million
60,8
96,9
242,0
81,0
109,3
244,8
82,3
102,0
227,4
91,9
242,0
0
20
40
60
80
100
120
140
160
180
200
220
240
260
2010 2011 2012
Q1 Q2 Q3 Q4
Illustrated net of non-recurring items, %
6,2
12,5
20,4
10,3
12,5
22,9
13,2 13,9
22,5
12,4
20,6
0,0
5,0
10,0
15,0
20,0
25,0
2010 2011 2012
Q1 Q2 Q3 Q4
Adjusted EBITDA
Illustrated net of non-recurring items, EUR million
EUR million
0
2
4
6
8
10
12
14
16
18
Q1/10 Q2/10 Q3/10 Q4/10 Q1/11 Q2/11 Q3/11 Q4/11 Q1/12 Q2/12 Q3/12
EBITDA % Operating profit %

15
Cash Flows after InvestmentsNet Investments
Return on Investment (ROI), %
Key Figures, 1-9/2012
8.1 10.6 7.9 8.7
79.6
13,2
0,0
10,0
20,0
30,0
40,0
50,0
60,0
70,0
80,0
90,0
100,0
2010 2011 Q3/11 Q3/12
Other Investments Acquisition
14.9
-50.2
-16.7
52.1
-60,0
-40,0
-20,0
0,0
20,0
40,0
60,0
2010 2011 Q3/11 Q3/12
25,8
18,9 19,3 20,1
0,0
5,0
10,0
15,0
20,0
25,0
30,0
2010 2011 Q3/11 Q3/12
EUR million EUR million
%
Earnings per Share (EPS)
0,01
0,380,33
0,24
0,31
0,46
0,56
0,19
0,310,29 0,29
0
0,1
0,2
0,3
0,4
0,5
0,6
2010 2011 2012
Q1 Q2 Q3 Q4
EUR
16
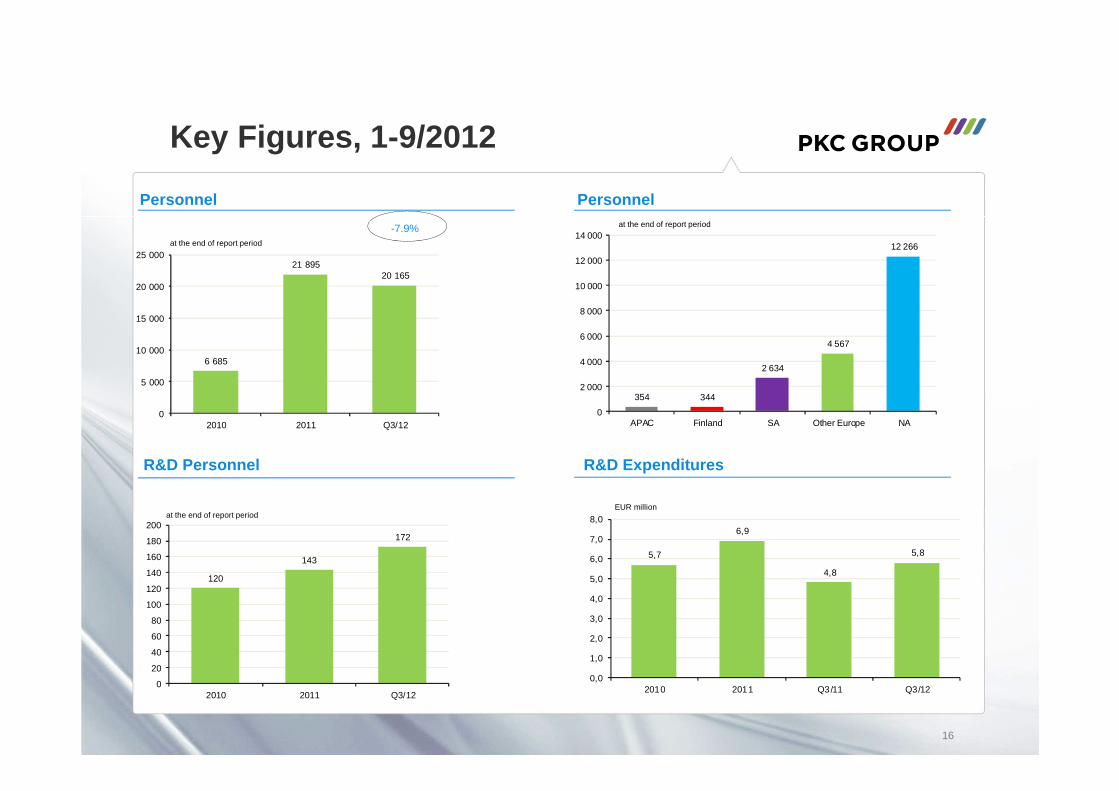
Personnel
R&D Personnel
Key Figures, 1-9/2012
-7.9%
354 344
2 634
4 567
12 266
0
2 000
4 000
6 000
8 000
10 000
12 000
14 000
APAC Finland SA Other Europe NA
at the end of report period
at the end of report period
Personnel
R&D Expenditures
5,7
6,9
4,8
5,8
0,0
1,0
2,0
3,0
4,0
5,0
6,0
7,0
8,0
2010 2011 Q3/11 Q3/12
EUR millionat the end of report period
6 685
21 89520 165
0
5 000
10 000
15 000
20 000
25 000
2010 2011 Q3/12
120
143
172
0
20
40
60
80
100
120
140
160
180
200
2010 2011 Q3/12
17
Wiring Systems Business Segment
17
18
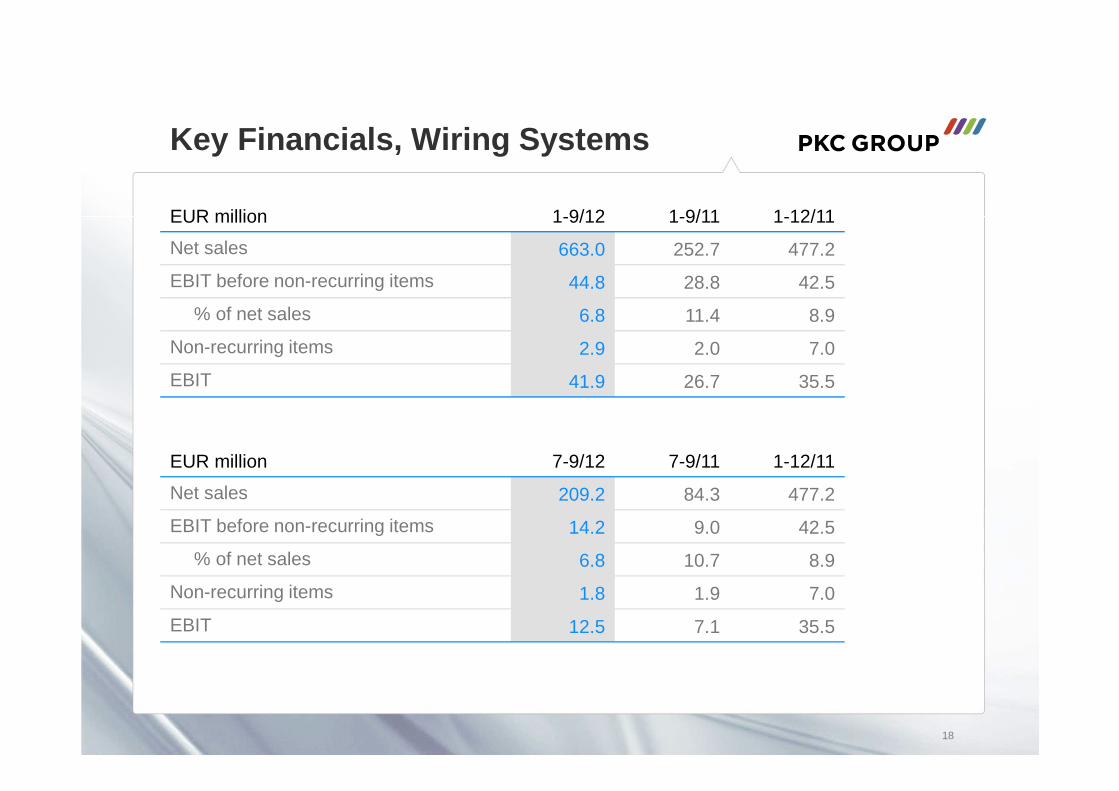
Key Financials, Wiring Systems
EUR million 1-9/12 1-9/11 1-12/11
Net sales 663.0 252.7 477.2
EBIT before non-recurring items 44.8 28.8 42.5
% of net sales 6.8 11.4 8.9
Non-recurring items 2.9 2.0 7.0
EBIT 41.9 26.7 35.5
EUR million 7-9/12 7-9/11 1-12/11
Net sales 209.2 84.3 477.2
EBIT before non-recurring items 14.2 9.0 42.5
% of net sales 6.8 10.7 8.9
Non-recurring items 1.8 1.9 7.0
EBIT 12.5 7.1 35.5
19
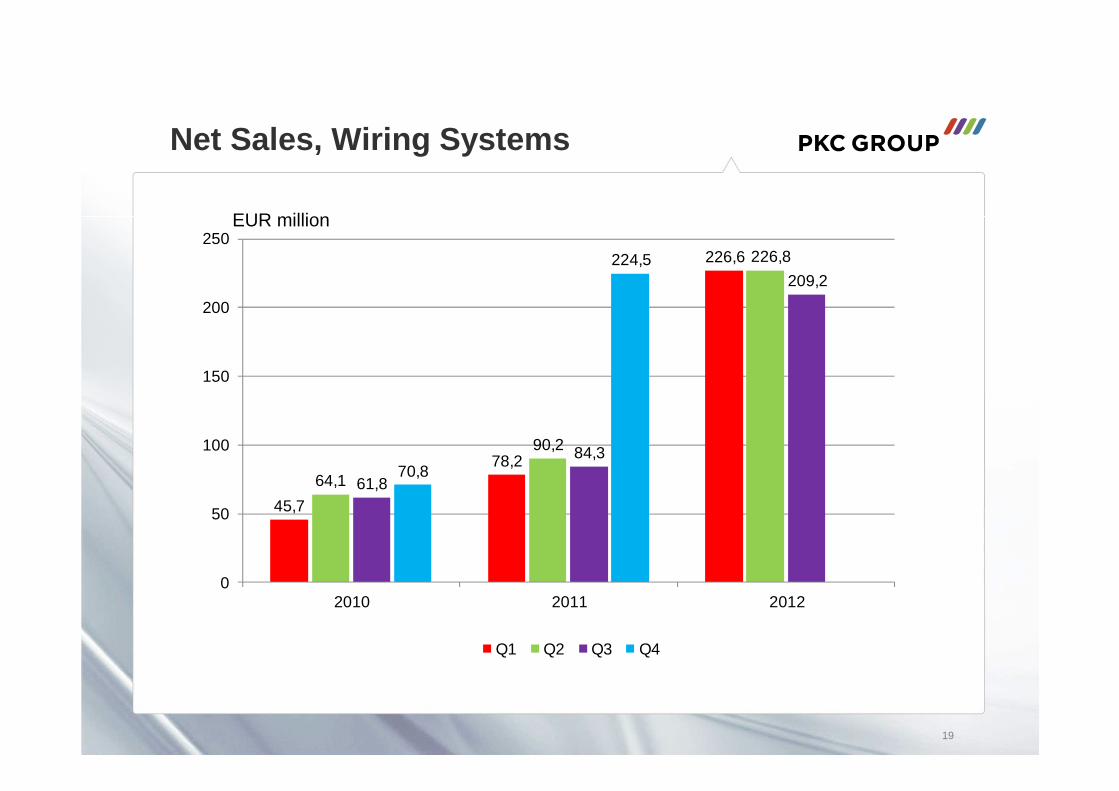
Net Sales, Wiring Systems
45,7
78,2
226,6
64,1
90,2
226,8
61,8
84,3
209,2
70,8
224,5
0
50
100
150
200
250
2010 2011 2012
Q1 Q2 Q3 Q4
EUR million
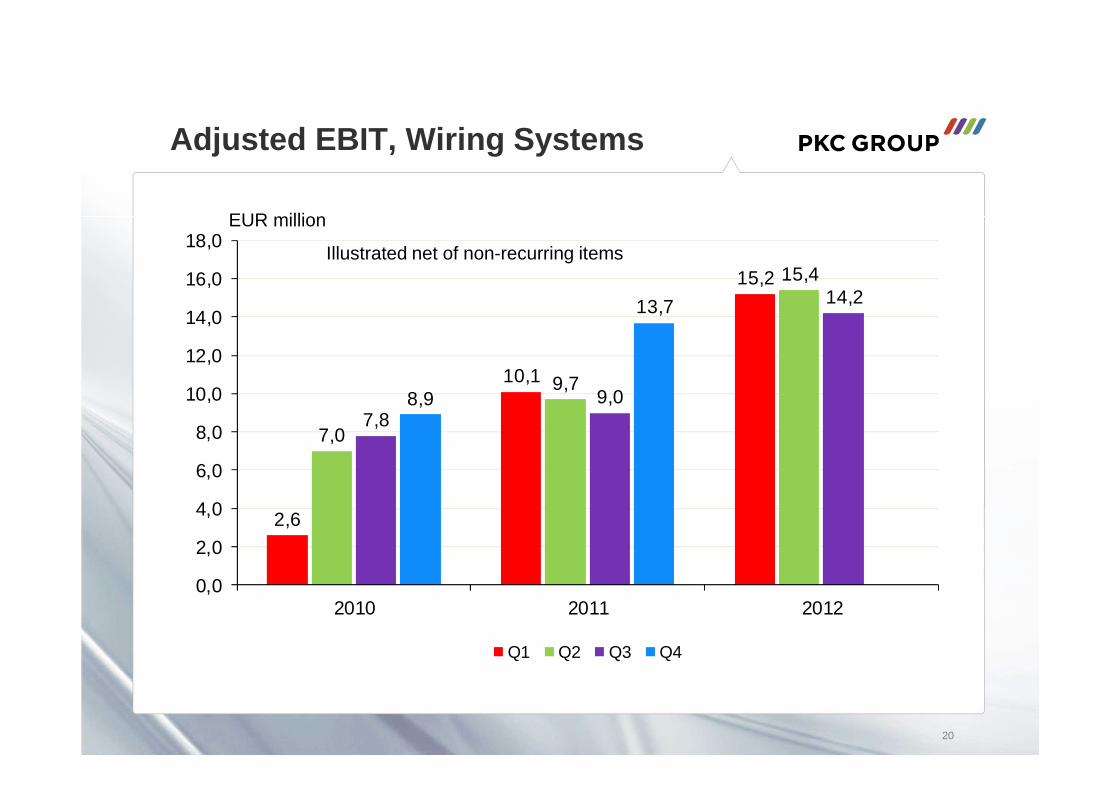
Adjusted EBIT, Wiring Systems
2,6
10,1
15,2
7,0
9,7
15,4
7,89,0
14,2
8,9
13,7
0,0
2,0
4,0
6,0
8,0
10,0
12,0
14,0
16,0
18,0
2010 2011 2012
Q1 Q2 Q3 Q4
20
Illustrated net of non-recurring items
EUR million
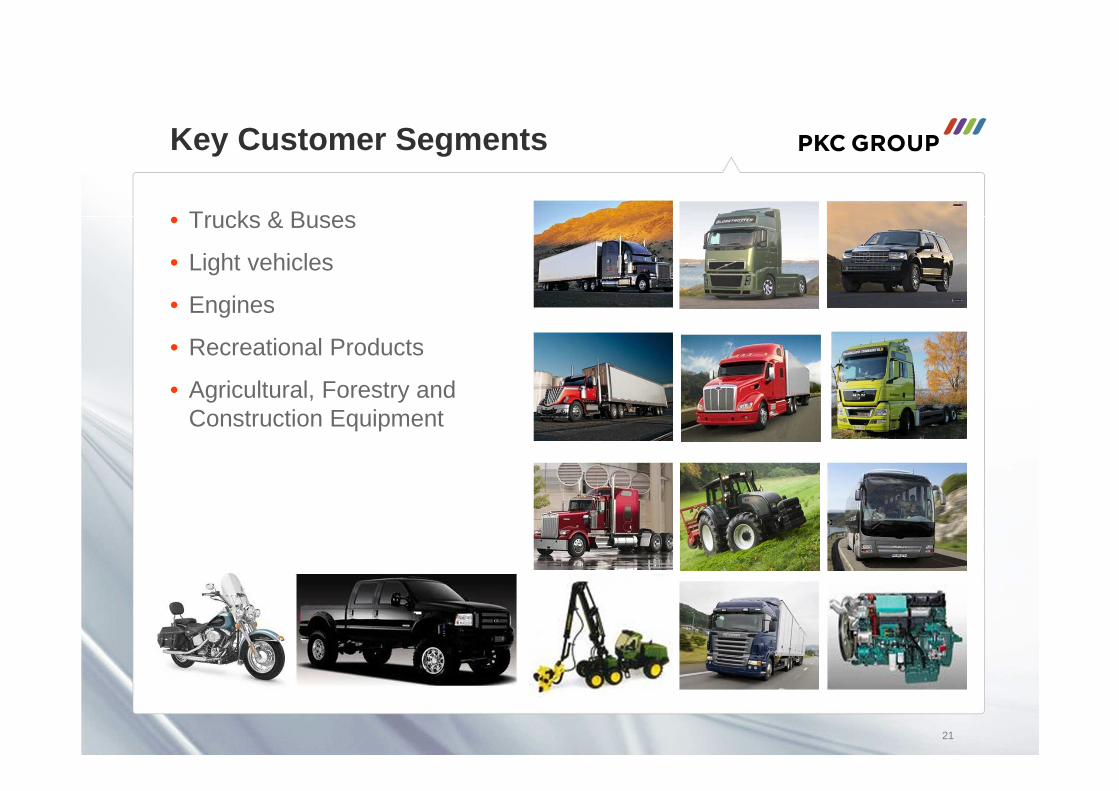
Key Customer Segments
• Trucks & Buses
• Light vehicles
• Engines
• Recreational Products
• Agricultural, Forestry and Construction Equipment
21

22
North America BrazilEurope
MediumTrucks
HeavyTrucks
PKC Group Truck Market Share Globally
PKCOther
Source: ACT, October 2012; LMC Automotive forecasting Q3/2012. Note: Europe comprised of EU27 + Efta
Class 8
Class 5-7

Heavy Trucks Production, EU27+ EFTA
23
Trucks >16t, units
Source: LMC Automotive forecasting Q3/2012
EURO 6

Medium Trucks Production, EU27+ EFTA
24
Trucks <16t, units
Source: LMC Automotive forecasting Q3/2012
EURO 6
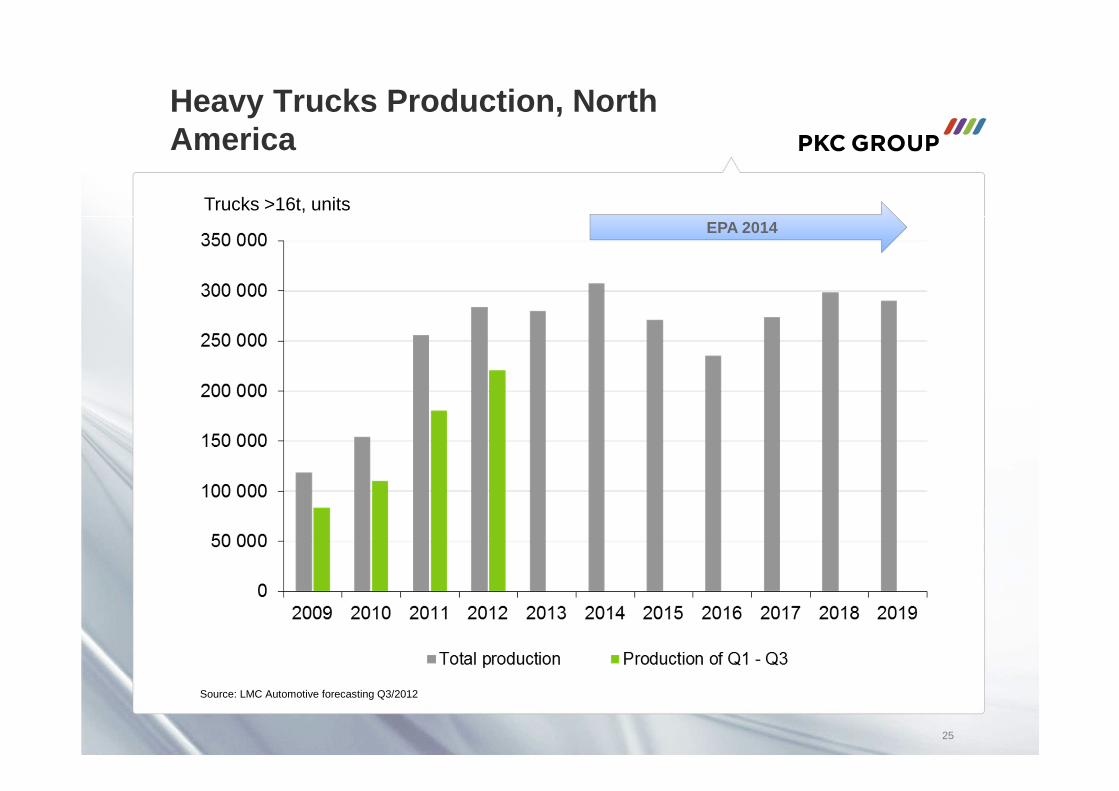
Heavy Trucks Production, North America
25
Trucks >16t, units
Source: LMC Automotive forecasting Q3/2012
EPA 2014

Medium Trucks Production, North America
26
Trucks <16t, units
Source: LMC Automotive forecasting Q3/2012
EPA 2014

Light Vehicle (Pick-up and SUV) Production, North America
27
Units
Source: LMC Automotive forecasting Q3/2012

Heavy Trucks Production, Brazil
28
Source: LMC Automotive forecasting Q3/2012
Trucks >16t, unitsEURO 5 (Brazil)

Medium Trucks Production, Brazil
29
Source: LMC Automotive forecasting Q3/2012
Trucks <16t, unitsEURO 5 (Brazil)

Electrical Distribution Systems, EDS
• Electrical Distribution Systems are responsible for power supply and transfer of information
• Manufacturing for heavy and light vehicles, buses, recreational vehicles as well as agricultural, forestry and construction equipment
• EDS are tailored to the customer-specific requirements and they must work under all conditions
• Strong experience in mass producing product variations (synchro-production)
• Factories in Brazil, China, Estonia, Germany, Mexico, Poland, Russia and Ukraine
3030
Batch harnesses
Engine harnesses
Chassis harnesses
Instrument harnesses
ABS cable
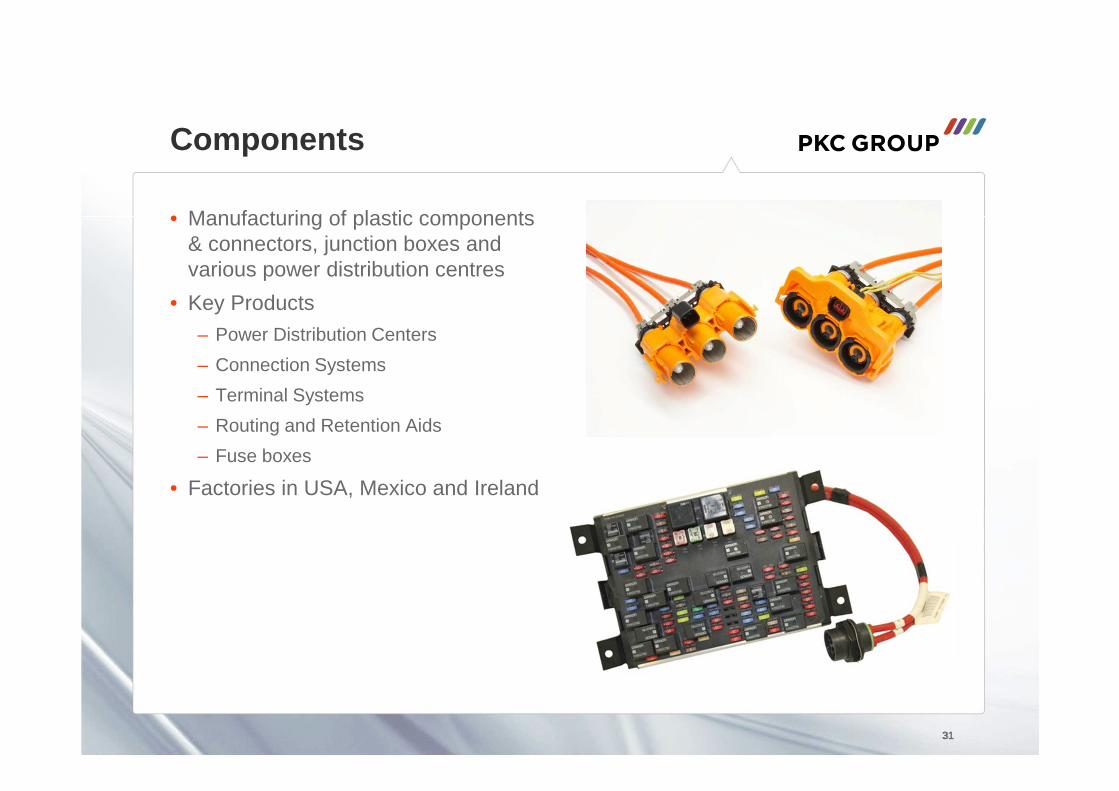
Components
• Manufacturing of plastic components & connectors, junction boxes and various power distribution centres
• Key Products
– Power Distribution Centers
– Connection Systems
– Terminal Systems
– Routing and Retention Aids
– Fuse boxes
• Factories in USA, Mexico and Ireland
3131
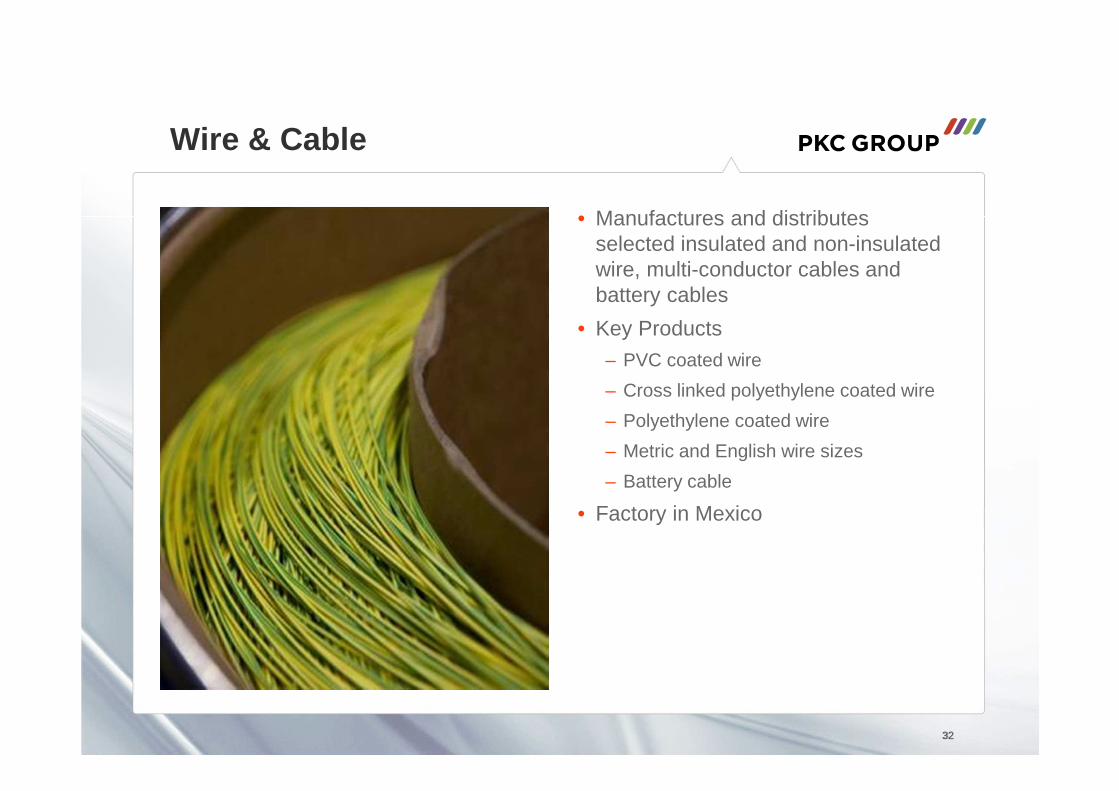
Wire & Cable
• Manufactures and distributes selected insulated and non-insulated wire, multi-conductor cables and battery cables
• Key Products
– PVC coated wire
– Cross linked polyethylene coated wire
– Polyethylene coated wire
– Metric and English wire sizes
– Battery cable
• Factory in Mexico
3232
33
Electronics Business Segment
33

34
Key Financials, Electronics
EUR million 1-9/12 1-9/11 1-12/11
Net sales 51.6 55.5 73.0
EBIT before non-recurring items 1.2 2.7 2.8
% of net sales 2.3 4.9 3.9
Non-recurring items 0.3 0.2 0.5
EBIT 0.9 2.6 2.4
EUR million 7-9/12 7-9/11 1-12/11
Net sales 18.3 17.7 73.0
EBIT before non-recurring items 1.4 1.7 2.8
% of net sales 7.6 9.8 3.9
Non-recurring items 0.1 0.0 0.5
EBIT 1.3 1.7 2.4

35
Net Sales, Electronics
15,1
18,7
15,316,9
19,118,0
20,5
17,7 18,3
21,1
17,5
0
5
10
15
20
25
2010 2011 2012
Q1 Q2 Q3 Q4
EUR million
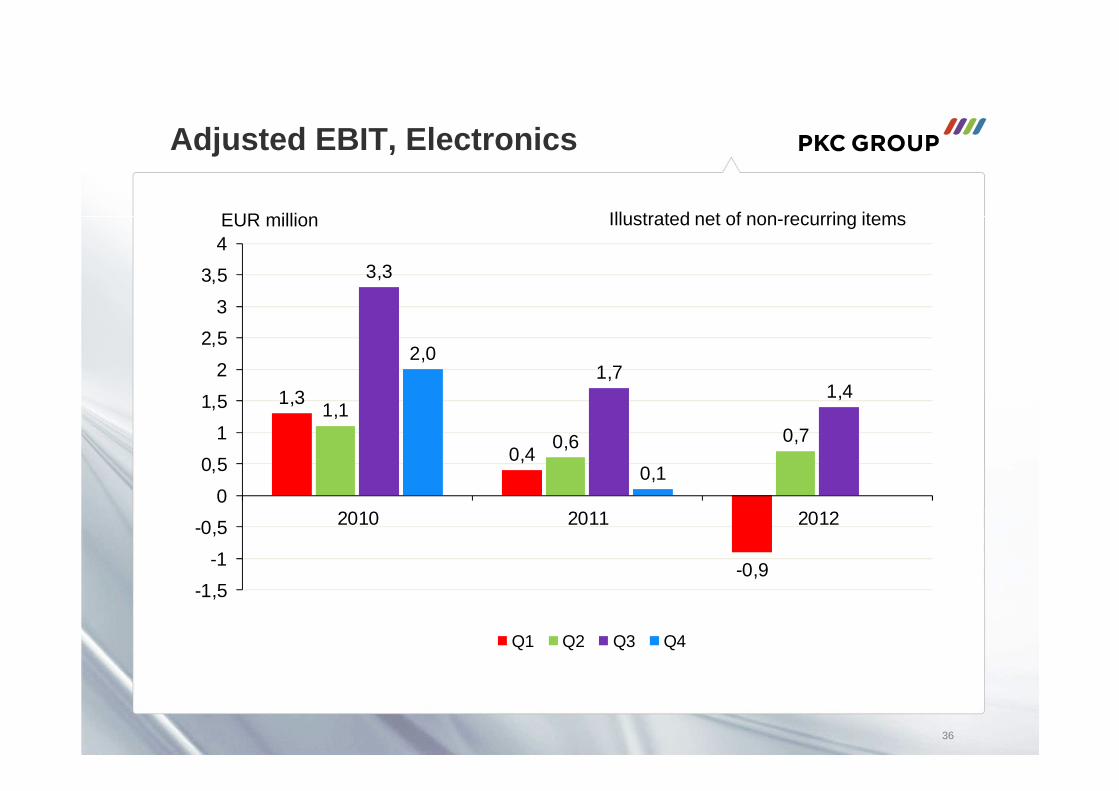
Adjusted EBIT, Electronics
1,3
0,4
-0,9
1,1
0,6 0,7
3,3
1,71,4
2,0
0,1
-1,5
-1
-0,5
0
0,5
1
1,5
2
2,5
3
3,5
4
2010 2011 2012
Q1 Q2 Q3 Q4
36
Illustrated net of non-recurring itemsEUR million
37
Electronics Segment, 1-9/2012
• The economic uncertainty and worldwide drop in industrial investments affected the demand for electronic appliances.
• Investments in renewable energy and telecommunication testing equipment picked up from the modest level of the previous quarter.
• In addition, the volumes of developing and constructing smart grids as well as energy efficient technologies continued to grow.
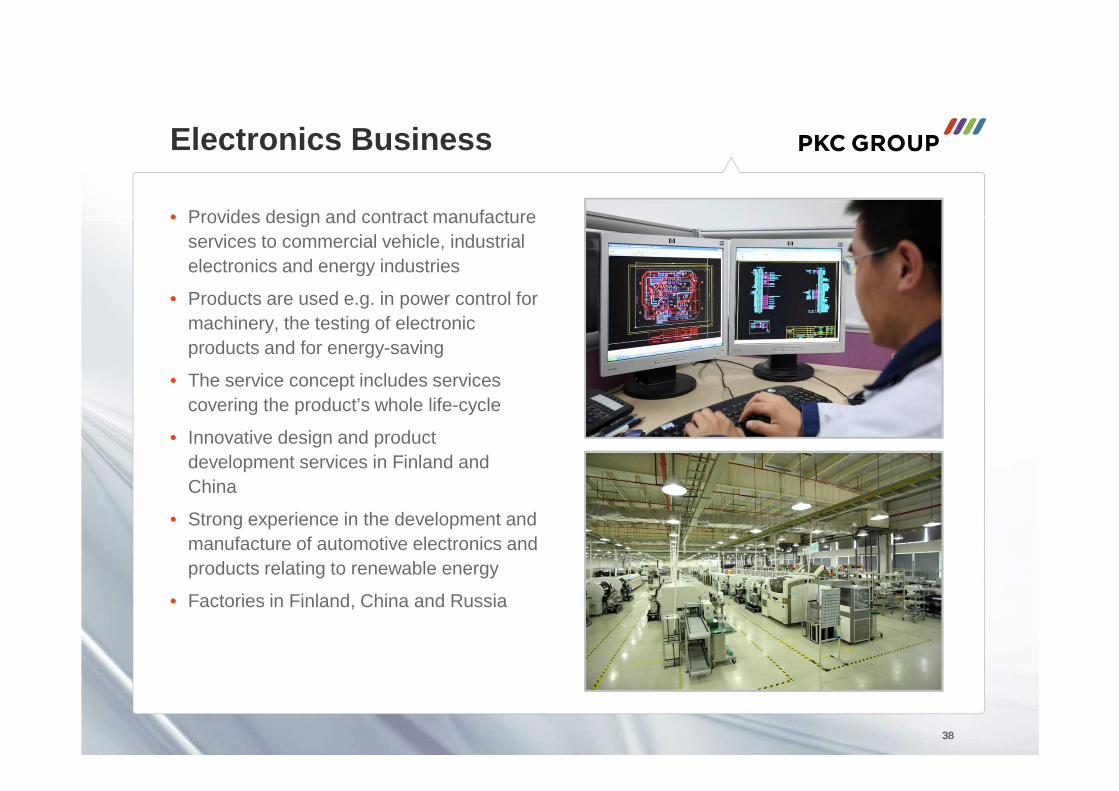
Electronics Business
• Provides design and contract manufacture services to commercial vehicle, industrial electronics and energy industries
• Products are used e.g. in power control for machinery, the testing of electronic products and for energy-saving
• The service concept includes services covering the product’s whole life-cycle
• Innovative design and product development services in Finland and China
• Strong experience in the development and manufacture of automotive electronics and products relating to renewable energy
• Factories in Finland, China and Russia
3838

Products and Industrial Segments
Products • Power supply units
• Electronics control units
• Vehicle electronics
• Testing equipment
• Electronics service devices
• Vehicle computers
• Security products
Industrial Segments• Commercial vehicles
• Energy
• Industrial electronics
• Telecommunication
• Security
39

Outlook for the Future
40

41
Outlook for the Future
• PKC expects that its net sales and comparable operating profit will increase in 2012 from the previous year’s level.
• Net sales in 2011 amounted to EUR 550.2 million and operating profit without non-recurring items was EUR 42.6 million.
• Major part of net sales and profit is generated by the Wiring Systems business.
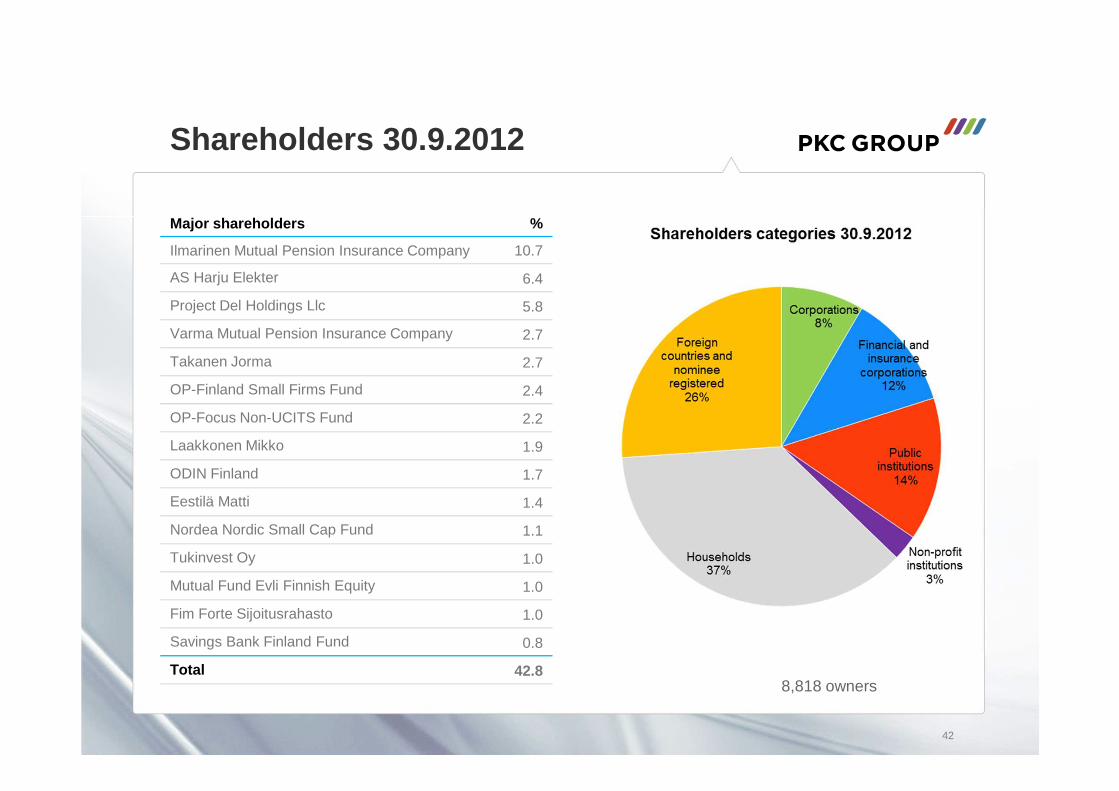
Shareholders 30.9.2012
42
8,818 owners
Major shareholders %
Ilmarinen Mutual Pension Insurance Company 10.7
AS Harju Elekter 6.4
Project Del Holdings Llc 5.8
Varma Mutual Pension Insurance Company 2.7
Takanen Jorma 2.7
OP-Finland Small Firms Fund 2.4
OP-Focus Non-UCITS Fund 2.2
Laakkonen Mikko 1.9
ODIN Finland 1.7
Eestilä Matti 1.4
Nordea Nordic Small Cap Fund 1.1
Tukinvest Oy 1.0
Mutual Fund Evli Finnish Equity 1.0
Fim Forte Sijoitusrahasto 1.0
Savings Bank Finland Fund 0.8
Total 42.8

43
Thank You!
www.pkcgroup.com