Embed Size (px)
Citation preview

Annual Report 2014 | 2015

Key figures of the KWS Group
in € millions 2014/2015 2013/2014 2012/2013 2011/2012 2010/2011
Key figures of the KWS Group in accordance with the corporate controlling structure1
Net sales 1,260.4 1,178.0 1,147.2 986.3 855.4
Operating income (= EBIT) 138.0 138.4 152.1 140.9 116.6
as a % of net sales (= ROS) 10.9 11.8 13.3 14.3 13.6
Net financial income/expenses –7.1 –12.6 –10.3 –5.1 –7.0
Net Income 84.0 80.3 92.3 94.4 72.9
as a % of net sales 6.7 6.8 8.0 9.6 8.5
Operative cash flow 57.7 61.0 84.6 97.9 101.2
Net cash from investing activities –136.3 –75.4 –88.9 –56.6 –52.4
Equity 738.7 637.8 649.7 603.1 530.3
Balance sheet total 1,440.2 1,262.8 1,218.7 1,092.3 902.0
Equity ratio in % 51.3 50.5 53.3 55.2 58.8
Return on equity in % 13.6 12.8 15.8 18.3 15.2
Return on assets in % 7.2 7.3 9.0 10.7 8.9
Capital expenditure 140.6 82.6 65.2 111.5 49.3
Depreciation 51.6 45.8 38.4 28.4 27.6
Average number of employees 5,322 4,847 4,443 3,851 3,560
Personnel costs 256.4 225.8 209.9 182.5 165.0
Key figures of the KWS Group in accordance with IFRS 112
Net sales 986.0 923.5
Operating income (= EBIT) 113.4 118.3
as a % of net sales (= ROS) 11.5 12.8
Net financial income/expenses 16.7 7.5
Net Income 84.0 80.3
as a % of net sales 8.5 8.7
Operative cash flow 48.1 76.0
Net cash from investing activities –123.8 – 63.1
Equity 738.7 637.8
Balance sheet total 1,355.5 1,165.0
Equity ratio in % 54.5 54.7
Return on equity in % 13.6 12.8
Return on assets in % 7.8 7.8
Capital expenditure 132.5 69.4
Depreciation 45.9 41.2
Average number of employees 4,691 4,150
Personnel costs 216.9 189.9
Performance of KWS shares in €
Dividend per share 3.00 3.00
Earnings per share 12.53 11.69
Equity per share 111.92 96.64
1 Our 50:50 joint ventures are included proportionately in accordance with their shares.2 In accordance with IFRS 11, the net sales and expenses of our joint ventures are no longer included in KWS’ statement of comprehensive income. Instead, the shares they contribute to earnings are
carried under net financial income/expenses. In addition, the assets of our joint ventures will be included in the future in the KWS Group’s balance sheet as an equity-accounted financial asset in ac-cordance with the new accounting regulations.

Content
2 To our shareholders
3 Foreword of the Executive Board
5 Report of the Supervisory Board
10 The KWS share
12 Spotlight topic
16 Corporate Sustainability
20 Corporate Governance
23 Combined Management Report
24 Fundamentals
33 Business performance
36 Earnings, financial position and assets
52 Employees
55 Report on events after the balance sheet date
55 Opportunity and risk report
62 Forecast report
64 KWS SAAT SE
(explanations based on the German Commercial Code (HGB))
68 Other disclosures
75 Annual Financial Statements
To o
ur s
hare
hold
ers

Hagen Duenbostel (CEO) Corn, Coporate Development & Communications, ComplianceLéon Broers Research & BreedingEva Kienle Finance, Controlling, Global Services, IT, Legal, Human ResourcesPeter Hofmann Sugarbeet, Cereals, Marketing
To our shareholders

KWS can look back on almost 160 years of plant
breeding experience. In this time, the company has
evolved from its beginnings as a domestic sugar-
beet seed vendor into a leading international plant
breeder. As an independent family business, KWS
now offers high-yielding varieties in some 70 coun-
tries and generates more than 80% of its net sales
outside Germany. In view of the tough climate in the
international agricultural markets, however, keeping
up earnings-driven expansion of KWS’ business is a
particular challenge.
After years of steadily increasing demand for food
and feed and a parallel trend in supply, agricultural
markets now face record cereal inventories. World
market prices for consumer goods have accordingly
fallen sharply and are still not yet trending upward.
Increasing globalization of trade is also causing
greater volatility in commodity prices. However, in-
comes in the farming sector largely correlate with
these trends in commodity prices. Decisions on what
to grow are made on the basis of crop rotation, but
also in particular on the farmer’s revenue situation
and costs. Consumer prices for sugar, corn, potatoes
and oils have dropped to lows that in some cases
have not been seen for decades.
Depending on the market situation, influences from
exchange rate fluctuations and increases in the cost
of capital may exert additional pressure on cultiva-
tion area for the individual crops. These challenges
were especially clear in our international growth
markets, such as Eastern Europe and South Amer-
ica. There were greater economic pressures on
cultivation of grain corn there, for example. As a con-
sequence, cultivation area was reduced, as was the
size of KWS’ potential market.
Plant breeding can offer sustainable solutions to the
long-term growth in demand for food worldwide. The
Foreword of the Executive Board
industry’s high rate of innovation is driven by intense
competition – accompanied by shorter and shorter
development cycles for new technologies. As a re-
sult, research & development expenditure in plant
breeding has risen steadily for years, and KWS again
increased its R&D spending by around 16% to €174
million last fiscal year.
Despite this challenging environment, KWS was able
to hold its own well in fiscal 2014/2015. We grew our
net sales by around 7% to almost €1.3 billion. We
posted an EBIT of €138 million and exceeded our
own profit expectations. That is attributable to the
close collaboration of our currently 5,322 KWS em-
ployees worldwide. They are the crucial foundation
of our innovative strength and the key to our future
growth. What is particularly important for us is to
practice our corporate values with passion, preserve
our family company’s independence and maintain
the trust farmers have in us as a powerful partner by
supplying seed of the very best quality.
In order to achieve that goal and grow in the future,
we are focusing our resources on research & deve-
lopment, expanding distribution and creating the
necessary production capacities. The main emphasis
of our capital spending program last fiscal year was
therefore on expanding and modernizing our seed
processing and production plants worldwide. We
were also able to successfully increase our footprint
in France, one of the world’s most important cereals
markets, by acquiring the remaining 51% stake in the
French seed company SOCIETE DE MARTINVAL S.A
(MOMONT) effective September 30, 2014. We invest-
ed a total of €141 million last fiscal year.
KWS has grown and spread its roots over all the
years. KWS operated outside Germany and was a
European player early in its history, namely at the
beginning of the 20th century. Changing its legal
3Foreword of the Executive Board | To our shareholdersKWS Group | Annual Report 2014/2015

form into a European Stock Corporation (Societas
Europaea/SE) was therefore a logical consequence
of KWS’ development in Europe and its strong inter-
national growth, especially in recent years. In addi-
tion, the interests of European employees are repre-
sented by a European body now that the company
has the legal form of an SE.
We intend to continue implementing our corporate
strategy stringently in the coming year. As part of
that, we will continue to focus strongly on research &
development and product quality to keep on offering
seed of the highest quality. By doing that, we believe
we can grow net sales by 5% to 10% and post an
EBIT margin of at least 10.5%. In this regard I wish to
note that next fiscal year we will see a fundamental
change in our financial communications and that the
KWS Group’s net sales and profit (EBIT) will be lower
since they will not include the revenue and expenses
from our joint ventures. You can find more informa-
tion on page 24.
The main theme of this report is seed of the very best
quality. We therefore present the individual steps of
how we produce it. In the spotlight topic and on the
two-page photo spreads you can find detailed and
informative explanations and impressions. I wish you
a very enjoyable read!
In conclusion, I would like to adress our employees.
Without their commitment and innovative expertise,
our company’s success would not be possible. On
behalf of the whole Executive Board, I would like to
thank them for their outstanding work. I also thank
our customers, investors and partners for their sup-
port and trust. We will continue on our path together.
With best regards from Einbeck on behalf of the
entire Executive Board,
Hagen Duenbostel
Chief Executive Officer
4 To our shareholders | Foreword of the Executive Board Annual Report 2014/2015 | KWS Group

Report of the Supervisory Board
In its meeting on October 15, 2014, the Supervisory
Board decided – following careful examination – to
give its consent to the proposal by the Executive
Board to convert KWS SAAT AG into KWS SAAT SE,
which also entailed a change in the company’s name.
Changes in the company’s name have always marked
the dawning of a new era in KWS’ history. The exten-
sive efforts being made to develop new products and
penetrate new markets are testimony to the excep-
tional dynamism of this dedication to the future. Close
and trusted interaction between the Supervisory
Board and the Executive Board is vital in this regard.
The Supervisory Board discharged the duties incum-
bent on it in accordance with the law, the company’s
Articles of Association and the bylaws, regularly
advised and monitored the Executive Board in its
activities and satisfied itself that the company was
run properly and in compliance with the law and that
it was organized efficiently and cost-effectively. The
Supervisory Board decided on all significant busi-
ness transactions requiring its consent and carefully
accompanied the Executive Board in all fundamental
decisions of importance to the company. The Super-
visory Board discussed the information and assess-
ments that influenced its decisions together with the
Executive Board. Both boards continued their con-
structive cooperation based on mutual trust in every
respect. Among other things, this was demonstrated
by the fact that, as is customary, the Supervisory
Board was involved in all decisions of vital importance
to the company at an early stage. The Supervisory
Board was provided with the necessary information
in written and oral form regularly, promptly and com-
prehensively. This included all key information on
relevant questions of strategy, planning, the business
performance and the situation of the company and the
KWS Group, including the risk situation, risk manage-
ment and compliance. Business transactions requiring
consent were submitted to and discussed and ap-
proved by the Supervisory Board in compliance with
the bylaws for the Executive Board. The company’s
business policy, corporate and financial planning,
profitability and situation, the general development of
the various businesses, market trends and the com-
petitive environment, research and product devel-
opment and, along with important individual projects,
risk management at the KWS Group were also the
subject of detailed discussions. The Chairman of the
Supervisory Board continued the bilateral discussions
with the Chief Executive Officer and individual mem-
bers of the Executive Board in regular talks outside
the meetings of the Supervisory Board. In addition,
there were monthly meetings between the Chairman
of the Supervisory Board and the Executive Board
as a whole, where the company’s current business
development and, in particular, its strategy, occur-
rences of special importance and individual aspects
of the company were dealt with. The Chairman of the
Supervisory Board informed the Supervisory Board
of the results of these meetings. The Supervisory
Board did not make use of its right to conduct an
examination granted by Section 111 (2) AktG (German
Stock Corporation Act) since the reporting by the
Executive Board meant there was no reason to do so.
Focal areas of deliberations
The full Supervisory Board held five regular
meetings in fiscal 2014/2015. The meetings were
always attended by all the members, with the ex-
ception of one where a member was connected
by phone. The meeting of the Supervisory Board of
KWS SAAT AG to discuss the financial statements
on October 15, 2014, was devoted to examining and
approving the financial statements of KWS SAAT AG
and the consolidated financial statements of the
KWS Group as of June 30, 2014. In addition, conver-
sion of KWS SAAT AG into a European Stock Corpo-
ration (Societas Europaea/SE) was discussed. The
change in legal form is intended to reflect our com-
pany’s strong international growth and to emphasize
its large footprint in Europe. In addition, the interests
of European employees are represented by an addi-
tional European body now that the company has the
legal form of an SE. The Supervisory Board decided,
together with the Executive Board, to propose to the
Annual Shareholders’ Meeting on December 18, 2014,
that KWS SAAT AG be converted into KWS SAAT SE.
5Report of the Supervisory Board | To our shareholdersKWS Group | Annual Report 2014/2015

The Annual Shareholders’ Meeting agreed to the
conversion. The resolution on conversion of the
company adopted by the Annual Shareholders’
Meeting also included a resolution on the Articles of
Association of KWS SAAT SE, Sections 8 (1) and (2)
of which specify that the Supervisory Board consists
of six members: four shareholder representatives
and two employee representatives. Section 8 (7) of
the Articles of Association contains provisions on
appointing the shareholder representatives on the
first Supervisory Board of KWS SAAT SE; the same
persons were appointed as shareholder represen-
tatives as were serving on the Supervisory Board of
KWS SAAT AG. The change in the company’s legal
form took effect upon its entry in the commercial reg-
ister on April 15, 2015.
The meetings of the Supervisory Board of
KWS SAAT AG on December 17 and 18, 2014,
focused on KWS’ HR strategy, establishment of its
research center in St. Louis and expansion of corn
production capacities in Eastern Europe. In its last
meeting on March 18, 2015, the Supervisory Board
of KWS SAAT AG heard detailed reports on the
status of product development and the research
projects. The company’s organizational development
was also discussed. Following this meeting, the
first Supervisory Board of KWS SAAT SE convened
for its constitutive meeting on March 18, 2015. The
meeting was not only attended by the shareholder
representatives appointed by the Annual Sharehold-
ers’ Meeting on December 18, 2014, but also by the
employee representatives who had been appointed
on March 15, 2015, pursuant to the agreement be-
tween the Executive Board and the Special Negotiat-
ing Body of the European employees. The employee
representatives were likewise the same persons who
had served in this capacity on the Supervisory Board
of KWS SAAT AG. The first Supervisory Board of
KWS SAAT SE then initially elected Dr. Andreas J.
Büchting as its Chairman and Dr. Arend Oetker as
its Deputy Chairman. The Super visory Board also
adopted the bylaws for the Super visory Board of
KWS SAAT SE. It then formed a Committee for Exec-
utive Board Affairs, a Nominating Committee and an
Audit Committee, appointed their chairpersons and
members and adopted bylaws for the Audit Commit-
tee. The members and chairpersons of these com-
mittees were the same persons who had served in
this capacity on the respective committees of the
Supervisory Board of KWS SAAT AG. Further items
on the agenda were the appointment of the members
of the Executive Board of KWS SAAT SE, namely
the same persons who had served on the Executive
Board of KWS SAAT AG, approval of the supplemen-
tal agreements to the existing contracts with the Ex-
ecutive Board members and adoption of the bylaws
for the Executive Board of KWS SAAT SE. The mem-
bers of the Supervisory Board of KWS SAAT SE also
approved the appointment of the members of the
Executive Board and conclusion of the supplemental
agreements, including in their capacity as members
of the Supervisory Board of KWS SAAT AG. The joint
formation audit report of the first Supervisory Board
and first Executive Board of KWS SAAT SE was
likewise signed on March 18, 2015. The Supervisory
Board of KWS SAAT AG continued to exist alongside
the Super visory Board of KWS SAAT SE until its term
of office expired when the conversion took effect on
April 15, 2015. All the above-mentioned bylaws and
details on the members of the Supervisory Board’s
committees can be obtained on the company’s
homepage.
On June 24, 2015, the agenda as usual included adop-
tion of the corporate planning for fiscal 2015/2016,
including medium-term planning up to 2018/2019.
The Supervisory Board also approved the merger of
KWS MAIS GMBH with KWS SAAT SE. The survey
of the Supervisory Board with the aim of avoiding and
identifying fraud was also conducted. The Supervisory
Board is not aware of any such acts. A further item on
the agenda were the resolutions on the ratio of women
on the Supervisory Board and the Executive Board.
The ratio of women among the shareholder represen-
tatives on the Supervisory Board is currently 25%;
the two seats for the employee representatives are
currently held by men. In accordance with Section
111 (5) AktG (German Stock Corporation Act), the
Super visory Board decided that the ratio of women
on the Super visory Board of KWS SAAT SE is still
to be 16.6% within the statutory period for defining
6 To our shareholders | Report of the Supervisory Board Annual Report 2014/2015 | KWS Group

target figures for the ratio of women, namely by
June 30, 2017. No election to the Supervisory Board
is envisaged within this statutory period. The ratio of
women on the Executive Board of KWS SAAT SE is
still to be 25% within the above period of time. No
new appointments to posts on the Executive Board
are planned within the statutory period of time. In
accordance with Clause 5.4.1 of the German Cor-
porate Governance Code, the Supervisory Board of
KWS SAAT SE also discussed setting a limit on the
length of time members can serve on the Super-
visory Board of KWS SAAT SE and decided not to
comply with these recommendations by the German
Corporate Governance Code, since they would sig-
nificantly restrict the rights of a business with a tradi-
tion of family ownership like KWS, whose family share-
holders hold a majority stake. The Supervisory Board,
in agreement with the Executive Board, then adopted
the declaration of compliance with the German Cor-
porate Governance Code in accordance with section
161 AktG. The company’s declaration of compliance
for fiscal year 2014/2015 has been published on the
company’s homepage.
Annual and consolidated financial statements
and auditing
Deloitte & Touche GmbH Wirtschaftsprüfungs-
gesellschaft, Hanover, the independent auditor chosen
at the Shareholders’ Meeting on December 18, 2014,
and commissioned by the Audit Committee, has
audited the financial statements of KWS SAAT SE that
were presented by the Executive Board and prepared
in accordance with the provisions of the German
Commercial Code (HGB) for fiscal 2014/2015 and
the financial statements of the KWS Group (IFRS
consolidated financial statements), as well as the
Combined Management Report of KWS SAAT SE and
the KWS Group Management Report, including the
accounting reports, and awarded them its unqualified
audit certificate. In addition, the auditor concluded that
the audit of the financial statements did not reveal any
facts that might indicate a misstatement in the decla-
ration of compliance issued by the Executive Board
and the Super visory Board in accordance with section
161 AktG with respect to the “German Commission for
the Corporate Governance Code” (cf. Clause 7.2.3 (2)
of the German Corporate Governance Code).
The Supervisory Board received and discussed the fi-
nancial statements of KWS SAAT SE, the consolidated
financial statements of the KWS Group and Com-
bined Management Report of KWS SAAT SE and the
KWS Group, along with the report by the independent
auditor of KWS SAAT SE and the KWS Group and
the proposal on utilization of the net profit for the
year made by KWS SAAT SE, in due time. Compre-
hensive documents and drafts were submitted to the
members of the Supervisory Board as preparation;
for example, all of them were provi ded with the annual
financial statements, Combined Management Report,
audit reports by the independent auditors, Corporate
Governance Report, Compensation Report and the
proposal by the Executive Board on the appropriation
of the profits. The Supervisory Board also held
detailed discussions of questions on the agenda at
its meeting to discuss the financial statements on
October 14, 2015. The auditor took part in the meeting.
It reported on the main results of the audit and was
also available to answer additional questions and
provide further information for the Supervisory Board.
According to the report of the independent auditor,
there were no material weaknesses in the internal
Supervisory Board Committees
Committee Chairman Members
Audit Committee Hubertus von Baumbach Andreas J. BüchtingJürgen Bolduan
Committee for Executive Board Affairs
Andreas J. Büchting Arend OetkerCathrina Claas-Mühlhäuser
Nominating Committee Andreas J. Büchting Arend OetkerCathrina Claas-Mühlhäuser
7Report of the Supervisory Board | To our shareholdersKWS Group | Annual Report 2014/2015

control and risk management system in relation to
the accounting process. There were also no circum-
stances that might indicate a lack of impartiality on
the part of the independent auditor. The small extent
of services additionally provided by the independent
auditor can be seen from the Notes.
In accordance with the final results of its own exam-
ination, the Supervisory Board endorsed the results
of the audit, among other things as a result of the
vote by the Audit Committee, and did not raise any
objections. The Supervisory Board gave its consent
to the annual financial statements of KWS SAAT SE,
which were prepared by the Executive Board, and
to the consolidated financial statements of the
KWS Group, along with the Combined Management
Report of KWS SAAT SE and the KWS Group. The
financial statements are thereby approved. The
Super visory Board also endorses the proposal by
the Executive Board to the Annual Shareholders’
Meeting on the appropriation of the net retained profit
of KWS SAAT SE after having examined it.
Corporate Governance
The Supervisory Board conducted its efficiency
review in accordance with Clause 5.6 of the German
Corporate Governance Code for fiscal 2013/2014
accompanied and supported by Ernst & Young GmbH
Wirtschaftsprüfungsgesellschaft. Recommendations
and measures derived from it were implemented with-
out exception in fiscal year 2014/2015.
The Supervisory Board regularly addressed the
question of any conflicts of interest on the part of
its members and those of the Executive Board. In
the year under review, there were no such conflicts
of interests that had to be disclosed immediately to
the Supervisory Board and reported to the Annual
Shareholders’ Meeting.
Supervisory Board Committees
The Audit Committee convened for two joint meet-
ings in fiscal 2014/2015 and also held three telephone
conferences, on all occasions with all its members
in attendance. In its meeting on September 29, 2014,
the Audit Committee discussed the 2013/2014
annual financial statements and accounting of
KWS SAAT AG and consolidated financial statements
of the KWS Group. In addition, the required audit
relating to the conversion of KWS SAAT AG into a
European Company (SE) was discussed. The Annual
Compliance Report and the results of the auditing
projects were on the agenda at its second meeting on
March 18, 2015. The audit plan for fiscal 2015/2016
was also discussed and adopted. The quarterly re-
ports and the semiannual report for fiscal 2014/2015
were discussed in detail in three telephone confer-
ences and their publication was approved.
In addition, the Audit Committee obtained the state-
ment of independence from the auditor in accordance
with Clause 7.2.1 of the German Corporate Gover-
nance Code, monitored the auditor’s independence
and examined its qualifications and defined the focal
areas of the audit. The Audit Committee also satisfied
itself that the regulations on internal rotation pursuant
to Section 319a (1) No. 4 HGB were observed by the
independent auditor. The Audit Committee convened
on September 28, 2015, to discuss the current annual
financial statements of KWS SAAT SE and KWS’ con-
solidated financial statements and accounting. The
independent auditor explained the results of its audit
of the 2014/2015 financial statements and pointed
out that there were no grounds for assuming a lack
of impartiality on the part of the independent auditor
in its audit. The Audit Committee also dealt with the
proposal by the Executive Board on the appropriation
of the net retained profit of KWS SAAT SE and recom-
mended that the Supervisory Board approve it.
8 To our shareholders | Report of the Supervisory Board Annual Report 2014/2015 | KWS Group

The Committee for Executive Board Affairs dealt
in the year under review with the examination of the
contracts of the Executive Board members.
At the 2014 Annual Shareholders’ Meeting, the Super-
visory Board said farewell to Philip Freiherr von dem
Bussche, who retired from the Executive Board of
KWS SAAT AG. After working on the Supervisory
Board for five years from 2000 on, Philip von dem
Bussche was appointed as a member of the Execu-
tive Board in 2005 and then, from January 2008,
as Chief Executive Officer. He was responsible for
the product segments Sugarbeet (including potatoes)
and Cereals up to October 2014. In particular, the
Sugar beet Segment performed magnificently during
his era – despite far-reaching changes in market
policies. He also helped shape the establishment of
our corn activities in Brazil, our research joint ven-
ture GENECTIVE and our second research center
in St. Louis. As a farmer and businessman with an
optimistic and entrepreneurial spirit, Philip von dem
Bussche enjoyed the special trust of our customers
worldwide. At the same time, he was someone who
KWS employees worldwide were able to identify with
in our phase of rapid growth. With his boundless
energy and great charisma, Philip von dem Bussche
made a major contribution to the company’s success
over the past decade. The Supervisory Board thanks
him for his extraordinarily successful achievements.
The Supervisory Board also expresses its thanks
to the Executive Board and all employees of
KWS SAAT SE and its subsidiaries for their exemplary
commitment and the outstanding work they again
performed in fiscal 2014/2015.
Einbeck, October 14, 2015
Dr. Drs. h.c. Andreas J. Büchting
Chairman of the Supervisory Board
Andreas J. Büchting, Chairman of the Supervisory Board
9Report of the Supervisory Board | To our shareholdersKWS Group | Annual Report 2014/2015

The KWS share
Key figures for the KWS share1
2014/2015 2013/2014
Number of shares (June 30) in millions 6.6 6.6
Closing price (June 30) in € 298.50 257.50
Low in € 257.00 243.20
High in € 298.50 280.60
Market capitalization (June 30) in € millions 1,970 1,700
1 Xetra trading system
Low interest rate policy of central banks
unchanged
On the capital markets, there was again no change
this year in the interest rate policy of central banks.
The United States Federal Reserve (the Fed) and
the European Central Bank stuck to their policy of
low interest rates in order to keep capital cheap
and stimulate economic growth. There were also
economic and political uncertainties: There was
turbulence in the stock market in China, the political
situation in Eastern Europe remained difficult and
the negotiations between Greece and its mostly Eu-
ropean lenders are still ongoing. In the environment
of low-interest rates, the stock markets as a whole
trended upward, although the prevailing uncertain-
ties were obvious from the strong fluctuations in the
major indices. The DAX, for example, exhibited sharp
swings that continued after the end of our fiscal year:
August 24, 2015, saw the biggest daily loss in many
years (–4.7%), while the next day the DAX climbed
almost 5% again.
KWS share price increases
In KWS’ fiscal year (July 1 to June 30), the German
stock indices DAX, MDAX and SDAX performed
positively overall. The KWS share increased in price
by almost 16% in the period from July 1, 2014, to
June 30, 2015, surpassing the rise in the SDAX (ap-
proximately 15%) and DAX (just over 10%). The share
price was very stable. It was listed at €257.50 at the
beginning of the fiscal year and fell below that mark
on only one day of trading in the next twelve months.
On June 30, the share stood at €298.50, thus reach-
ing its highest level precisely at the end of our fiscal
year. Shortly after the end of our fiscal year, the
consolidation plans of two large companies in our
industry became public, producing the sharp daily
swings in KWS’ share price (July 2, 2015: € +6.60,
July 3, 2015: € +7.25, July 6, 2015: €–13.55). On the
other hand, the share barely responded to the sharp
increase in our EBIT forecast on September 1.
KWS share is a firm part of the SDAX
KWS SAAT SE’s market capitalization was higher
than in the year before: In the year under review it
was €1,970 million on the basis of the closing price
on June 30, 2015 (previous year: €1,700 million);
solely on the basis of the proportion of free float
of 28.9% (29.7%) it was €569.4 (504.9) million. The
share still occupies a mid-range position in the
SDAX, Germany’s most important index for small
caps. Measured in terms of free float market capi-
talization at the relevant key date of June 30, 2015,
the KWS share ranked 18th (17th) in the index, which
comprises 50 companies, and 35th (26th) in terms of
trading volume over the period under review.
Shareholder structure remains largely unchanged
There were only slight changes in KWS SAAT SE’s
shareholder structure in fiscal 2014/2015. Most es-
sential change was Tessner Beteiligungs GmbH which
increased its stake by 0.9 percentage points to 15.1%.
10 Annual Report 2014/2015 | KWS GroupTo our shareholders | The KWS share

Employee Share Program enjoys great popularity
For more than 35 years KWS has offered its em-
ployees the chance to become a shareholder in the
company and thus share in its success and identify
more strongly with it. The content of our Employee
Share Participation Program remained unchanged
in the year under review. Our employees were able
to buy up to 500 KWS shares at a price of €214.40,
including a 20% bonus, which the individual employ-
ees must pay tax on. 401 (401) employees in nine
European countries took up this offer and purchased
a total of 9,878 (11,028) shares, corresponding to
an average stake per employee of 25 (28) shares.
The acquired shares are subject to a lock-up period
of four years. They cannot be sold, transferred or
pledged during this period. As in previous years, the
shares used for the Employee Share Program were
acquired in accordance with the stipulations in Sec-
tion 71 (1) No. 2 of the German Stock Corporation
Act (AktG). A total of €2.7 (2.8) million was used to
buy back the company’s own shares, giving an aver-
age purchase price per share of €271.73 (257.00).
Dividend stable at €3.00 a share
At the Annual Shareholders’ Meeting on Decem-
ber 18, 2014, the shareholders decided to set the divi-
dend per share at €3.00. The number of shares re-
mained unchanged, giving a total amount distributed
of €19.8 million as in the previous year. The dividend
payout ratio relative to the KWS Group’s net income
for the year of €80.3 million in fiscal 2013/2014 was
thus 24.7%.
Proposal on the appropriation of the profits for
fiscal 2014/2015
Surplus supply due to high global stocks of agricul-
tural raw materials, low prices for agricultural raw
materials, a reduction in cultivation area, political and
economic tension in growth markets, and volatile ex-
change rates created a challenging climate for KWS
in the past fiscal year. Nevertheless, the KWS Group
was able to increase its net sales year on year in all
product segments, also after adjustment for exchange
rate effects. This operational earnings strength under-
pinned our rising expenditure on research & develop-
ment and expansion of our international distribution
structures. Despite these planned increases, the KWS
Group’s net income for the year was €84.0 million,
above that of the previous year (€80.3 million). How-
ever, the return on sales remained virtually constant at
6.7% (6.8%).
The Executive and Supervisory Boards will therefore
propose payment of a dividend of €3.00 for the fiscal
year 2014/2015, i. e. at the same level as the previous
year, to the Annual Shareholders’ Meeting. €19.8 million
would thus be distributed to KWS SAAT SE’s share-
holders in December 2015. That means we are able
to stick to our proven dividend policy, which is geared
toward the company’s earnings strength and envis-
ages a payout of 20% to 25% of the KWS Group’s net
income for the year.
Shareholder structure at October 13, 2015 (in %)
Free �oat 28.9
Tessner Beteiligungs GmbH 15.1
56.0 Families Büchting, Arend Oetker, Giesecke
6,600,000 shares
11KWS Group | Annual Report 2014/2015 The KWS share | To our shareholders

all, plants need time to grow. In order to save time and
be able to respond more flexibly to the market, we
also carry out multiplication in South America, for ex-
ample in Chile and Argentina. Since it is summer and
winter at different times in the northern and southern
hemispheres, two generations of seed can be pro-
duced in one year. That saves time, creates flexibility
and reduces our production risks. It also means that
lower yields due to the weather in seed multiplication
in Europe can be compensated for, ensuring we can
supply farmers in the spring.
Where does the seed come from?
Multiplication planning is followed by field production.
It is necessary here to comply with the high – and in
some cases crop-specific – requirements demanded
of the production conditions in order to ensure out-
standing seed quality. That includes, for example,
regulations on the distance between the multiplication
areas for different varieties of a crop. The objective of
such minimum distances is to prevent the presence
of undesirable traits from other populations through
pollination.
However, field production also entails other challenges,
such as in the production of hybrid seed. Hybrid
Quality is produced in the field
To successfully raise crops for food and other
purposes, farmers need high-quality seed. Along
with fertilizer and crop protection, seed is the
farmer’s most important production resource.
Therefore, high and high quality is crucial.
It takes many years to develop a variety. High-quality
seed is vital so that varieties can unfold their genetic
potential to the full. Seed quality is a very complex
property and may be influenced by many internal and
external factors, but especially by the steps involved
in multiplication and processing. Special breeding
and production know-how, such as that of special-
ized companies, is needed to ensure high and con-
stantly improved seed quality.
Why does seed production take so long?
The production process begins with sales and multi-
plication planning. As part of that, the volumes of each
variety that might potentially be cultivated in the indi-
vidual markets are assessed in order to calculate pro-
duction requirements. This planning is continuously
adjusted throughout the production process to make
sure that enough seed of high quality is produced
without high surpluses. Planning commences up to
three years before the seed is sold to farmers – after
Spotlight topic
Our seed: the essence of life!
12 Annual Report 2014/2015 | KWS GroupTo our shareholders | Spotlight topic

breeding is a breeding method that is more than
100 years old. In this method, systematic crossing of
two parents explicitly chosen for their properties cre-
ates progeny that exhibits better growth and a higher
yield than its parent generation. To produce hybrid
seed successfully, it is therefore necessary to ensure
that the pollen of the plant chosen as the “father”
actually pollinates the “mother” plant. Yet how can
that be guaranteed? The answer to that also depends
to a very great extent on the crop in question. There
is a relatively “simple” mechanical possibility for pro-
ducing corn hybrids. The tassels and thus the male
flowers are simply removed (page 14/15). The process
is sometimes far more complicated for other crops.
In the case of sugarbeet, for example, the female and
male flower parts are to be found together in a flower.
So special mother lines that are male-sterile due to a
biological mechanism and do not produce any pollen
are used to obtain hybrid seed. The procedure is
similar for rapeseed and rye.
The populations are monitored by experts throughout
their entire time in the field. It is important to multiply
seed in regions with a favorable climate where the
disease pressure on, and occurrence of pests that
attack, the crops are particularly low and the con-
ditions for pollination and maturation (page 18/19) are
as ideal as possible. Such regions for sugarbeet are
Northern Italy and Southern France.
instance. However, sugarbeet seed – which is angular
by nature – has to be polished and pelleted to obtain
the round “pellet” that enables precision sowing of
individual seeds. The individual seed lots are dressed
as desired by the farmer with crop protection at the
end of processing.
Just looking at the seed, you’d never know how much high-tech it contains.Dr. Ralf Tilcher, Head of Seed Technology
How seed becomes a high-tech product
In order to ensure the high quality of seed produced
on the field, it must be processed after being har-
vested. The seed is cleaned, dried gently and sorted
by size (page 50/51). The precise technical processes
for processing the raw goods depends on the nature
and size of the seed of the various crops, among
other factors. Corn is harvested on the cob and only
separated from the cob after it has been dried, for
How does life stay in the seed?
All the processes are designed to make sure that
the seed is handled carefully so that the seedlings
are kept protected and ideal germination capacity
can be ensured. Each lot is repeatedly examined
throughout the process – whether the seed actual-
ly has the quality features and traits that make the
variety what it is. That includes specific resistance
against diseases or constituents that define its quali-
ty, for instance. The seed’s germination capacity and
spouting strength are also determined (page 34/35).
We set high standards: For instance, the germination
capacity of our sugarbeet seed is at least 96% –
usually even higher!
Only when the seed has been thoroughly examined
and has passed all the checks is it approved for sale,
packaged and shipped (page 66/67). As a result, the
farmer ends up with seed of best quality.
Structure of a sugarbeet pellet
A pellet has four layers added in very specific,
high-tech procedures:
1 Active substance – protects the seed from sources of
fungal damage
2 Coating with substances to promote germination and emergence
3 Active substances – as protection from animals and sources
of fungal damage in the earth
4 Color layer – prevents direct contact with the coating, protects
against friction and gives the pellet its typical orange color
1
2
3
4
Seed
Embryo
13KWS Group | Annual Report 2014/2015 Spotlight topic | To our shareholders
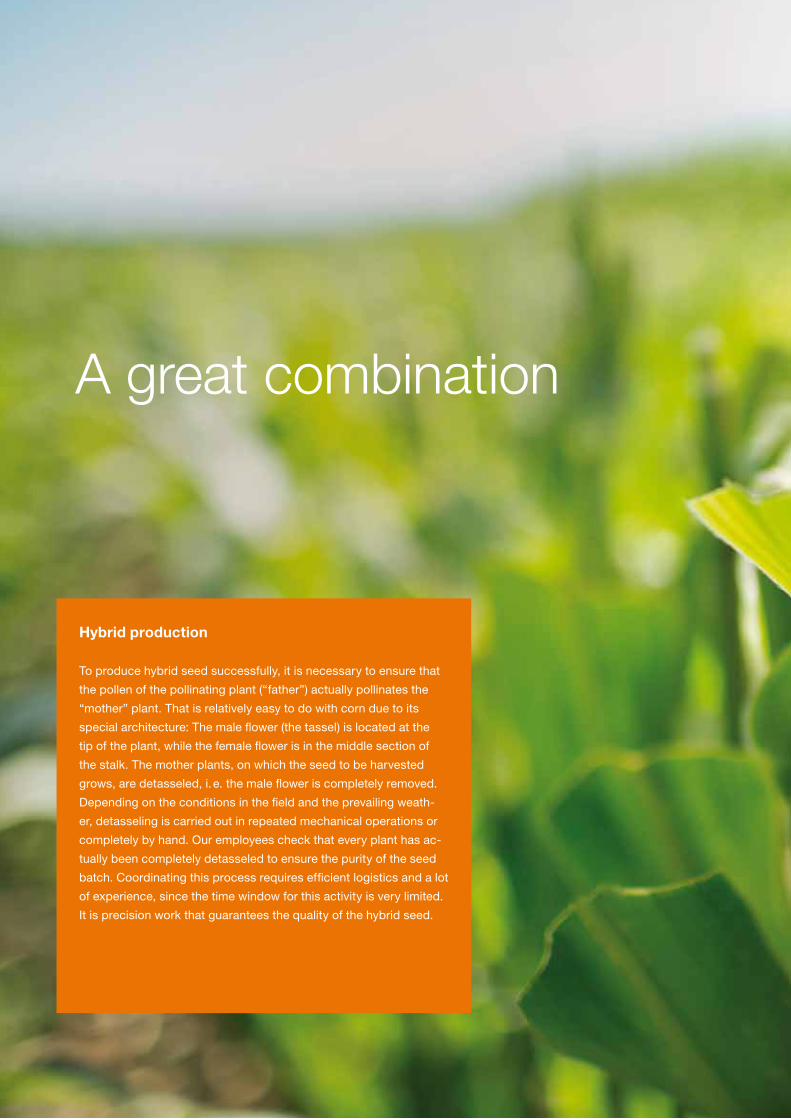
Hybrid production
To produce hybrid seed successfully, it is necessary to ensure that
the pollen of the pollinating plant (“father”) actually pollinates the
“mother” plant. That is relatively easy to do with corn due to its
special architecture: The male flower (the tassel) is located at the
tip of the plant, while the female flower is in the middle section of
the stalk. The mother plants, on which the seed to be harvested
grows, are detasseled, i. e. the male flower is completely removed.
Depending on the conditions in the field and the prevailing weath-
er, detasseling is carried out in repeated mechanical operations or
completely by hand. Our employees check that every plant has ac-
tually been completely detasseled to ensure the purity of the seed
batch. Coordinating this process requires efficient logistics and a lot
of experience, since the time window for this activity is very limited.
It is precision work that guarantees the quality of the hybrid seed.
A great combination


Corporate Sustainability
KWS seeds the future
KWS is a forward-looking company whose missions
is to be commercially successful in the long term
and create values. Proactive planning and action is
therefore the core principal of our corporate gover-
nance. That means we have to carefully address the
economic, ecological and social challenges facing
our company in the future so as to anticipate the
resultant opportunities and risks at an early stage.
Core issues of our long-term
corporate development
KWS’ long-term economic success is mainly shaped
by the following core sustainability issues:
■■ Employees: Our company’s success is founded
on the achievements of our employees. We make
intensive efforts to recruit new employees and
have introduced a process to identify and further
develop junior staffers.
■■ Economics: KWS is one of the leading seed
companies. Key factors in our success include
specializing in our core business, i. e. breeding
high-yielding new varieties. We also pursue a
policy of rigorous customer orientation, orienta-
tion toward growth and profitability, as well as
independence and financial strength.■■ Product innovations: KWS’ product portfolio
is geared to our customers’ needs and require-
ments. Global trends such as climate change and
the limited availability of natural resources, such as
soil and water, as well as the occurrence of plant
diseases and pests, are major factors that influ-
ence breeding objectives in product development. ■■ Modern breeding methods: We use modern
breeding methods to develop varieties that keep on
delivering higher yields and enable resource-sparing
agriculture under changing conditions. That also
includes new biotechnology methods, which are
indispensable to enable goal-oriented, efficient
plant breeding.
The more resistant and undemanding a variety is, the fewer resources are needed to care for it in the vegetation period – a perfect symbiosis of ecology and economics.

■■ Seed quality: Our prime concern is for our cus-
tomers to be satisfied. We develop genetic poten-
tial and produce top-quality seed so that plants’
genetic potential can be fully leveraged after
sowing in the field. Our mission is to provide our
customers with the best-possible consulting, and
we are backed in that by a closely-knit regional
network of consultants.■■ Safe seed: We ensure that our seed is safe for
people and the environment by means of technical
and organizational measures and furnish proof of
that in extensive tests and analyses in compliance
with official requirements – whether it is ecological,
conventional or genetically modified seed.■■ Protection of intellectual property: Adequate
protection of intellectual property is necessary
to refinance our high expenditure on research
& development. We therefore advocate variety
protection and patenting, since both systems
are of major importance for KWS’ breeding and
research activities.■■ Social and ecological standards: As an inter-
national company, we define and apply social and
ecological standards for our group-wide process-
es. That also includes imposing appropriate stipu-
lations on our suppliers and service providers. ■■ Compliance: We support observance of the law
and company requirements by means of effective
compliance management.■■ Work safety and protection of the environment:
Work safety and protection of the environment are
firmly integrated in our production and processing
operations in order to avoid detrimental impacts on
people and the environment. Wherever possible,
we also aim to optimize our use of resources and
apply the principle of recycling.
Social commitment
KWS is part of society and is committed to helping
society. The focus of that is on promoting science
and research in the field of plant breeding and
biotechnology and strengthen ing the regional and
local attractiveness of our locations by fostering
cultural and social life there.
Dialogue with stakeholders
We intend to keep on systematizing the process
for determining the key issues relating to our long-
term corporate development. To enable that, we
aim to expand our dialogue with stakeholders, which
has been conducted to date at our headquarters in
Einbeck, and make it more international in the coming
years. In this way, we obtain feedback from the various
markets and can also discuss critical issues with the
relevant local stakeholders and derive measures for our
company’s further development.
Sustainability Reporting
The latest Sustainability Report for fiscal year
2014/2015 is based on the international reporting
specifications of the Global Reporting Initiative
(GRI G4) and is available online on the company’s
homepage at www.kws.com/sr2015.
We are currently working to internationalize our sus-
tainability reporting, with the objective of expanding
it so that it covers the main aspects of sustainability
for the entire KWS Group and integrating it fully in the
Annual Report in the medium term.
17KWS Group | Annual Report 2014/2015 Corporate Sustainability | To our shareholders

Development worker

Pollination
The flower is the heart of breeding, since crossing processes begin
there: It has to be pollinated to produce seed or fruit. That sounds
banal, but it is vital in seed production. Without pollination there
would be no fertilization and thus no seed. Even though the pol-
len of some plants is transported by wind, most of our crops are
pollinated by insects. That means that beneficial insects, such as
honey-bees, are of great importance to us as a seed producer.
The success of our seed production depends directly on them. We
therefore have specially trained auditors conduct voluntary and in-
dependent checks of our seed processing operations and have the
latter certified in accordance with the German SeedGuard quality
standard. The entire process – from trial dressing and technical pro-
cessing to packaging and storage of the treated seed – is examined.
That enables us to ensure that our processes and products provide
the greatest possible protection of the environment and health.

Corporate Governance
KWS SAAT SE’s successful development since 1856
is founded on thinking long term and acting in terms
of sustainability. Corporate governance is entrenched
at the company and enables us to ensure responsible,
value-creating management and control of the com-
pany. We create trust by heeding the interests of our
customers and employees, the capital markets and
our national and international business partners – and
that makes a key contribution to our lasting success.
We live up to our responsibility and take into account
the relevant legal requirements regarding manage-
ment and supervision of German stock corporations
in our decisions. We also intensively address the
acknowledged standards of good and responsible
corporate governance, in particular the German
Corporate Governance Code.
KWS was converted from a German stock corporation
to a European Stock Corporation (Societas Europaea/
SE) on April 15, 2015. This step reflects our compa-
ny’s strong international growth and emphasizes its
large footprint in Europe. As a European Stock Cor-
poration headquartered in Germany, KWS SAAT SE
is governed by European legal norms and – unless
special provisions stipulate otherwise – by German
SE and corporation law.
KWS has retained the main features of its successful
corporate constitution. That applies in particular to
the dual system of management with the Supervisory
Board and Executive Board and participation of
employees on the Supervisory Board. As in its
former legal form as a German stock corporation,
one-third of KWS SAAT SE’s Supervisory Board
is made up of employee representatives. The first
employee representatives were appointed pursu-
ant to Section 14.1. of the “Agreement on Employ-
ee Involvement at KWS SAAT SE” (“SNB Agree-
ment”) dated March 16, 2015.
The first shareholder representatives were appointed
in accordance with Article 40 (2) Sentence 2 of the
Council Regulation on the Statute for a European
Company pursuant to the Articles of Association of
KWS SAAT SE (Section 8.7), which was adopted by
the Annual Shareholders’ Meeting on December 18,
2014. In the future, the shareholder representatives
will be elected by the Annual Shareholders’ Meeting
in accordance with Section 8.2 of the company’s
Articles of Association. The employee representatives
will be elected by direct vote by the European employ-
ees of the KWS Group in accordance with the provi-
sions of the SNB Agreement. For more information,
please refer to the excerpt from the SNB Agreement
posted on www.kws.de > Unternehmen > Investor
Relations > Hauptversammlungen > 2015 (German
only).
As a listed company based in Germany, KWS SAAT SE
is still subject to the provisions of the German Corpo-
rate Governance Code (DCGK).
You can find detailed information on corporate govern-
ance from our Corporate Governance Report (which
is also the declaration on corporate governance in
accordance with Section 289a of the German Com-
mercial Code (HGB)), which is available on our website
at www.kws.com > Company > Investor Relations >
Corporate Governance. The Compensation Report,
which is presented on pages 69 to 74 of this Annual
Report, contains details on the compensation system
and the individual remuneration of the members of the
Executive Board and the Supervisory Board.
Compliance declaration in accordance with
section 161 AktG (German Stock Corporation Act)
2014/2015
The Executive Board and the Supervisory Board of
KWS SAAT SE declare in compliance with Sec-
tion 161 AktG that the company has complied with
the recommendations of the German Corporate
Governance Code in the version dated June 24,
2014, since the last compliance declaration in
October 2014, and with the recommendations of the
German Corporate Governance Code in the version
dated May 5, 2015, since its publication in the official
section of the Federal Official Gazette, and does
now comply and will comply with them in the future,
with the following exceptions:
20 To our shareholders | Corporate Governance Annual Report 2014/2015 | KWS Group

In accordance with Clause 5.4.1 (2) Sentence 1
of the German Corporate Governance Code, the
Supervisory Board is to set a limit on the length of
time members can serve on the Supervisory Board.
This recommendation is not complied with, since
in a business with a tradition of family ownership like
KWS SAAT SE it would significantly restrict the rights
of the family shareholders, who hold a majority stake
in the company.
In accordance with Clause 5.4.3 Sentence 1 of the
German Corporate Governance Code, elections to
the Supervisory Board are to be made on an individ-
ual basis. The shareholder representatives of the first
Supervisory Board of KWS SAAT SE were appointed
in accordance with Article 40 (2) Sentence 2 of
the Council Regulation on the Statute for a European
Company pursuant to the Articles of Association.
This did not entail any change in the persons rep-
resenting the shareholders; their term of office as
members of the Supervisory Board of KWS SAAT SE
will also not exceed their remaining term for which
they held their seats at the former KWS SAAT AG.
The recommendation in Clause 5.4.3 Sentence 1 of
the German Corporate Governance Code is to be fully
complied with again in the future.
Clause 7.1.2 Sentence 4 of the German Corporate
Governance Code states that the consolidated finan-
cial statements shall be publicly accessible within 90
days of the end of the fiscal year and interim reports
within 45 days of the end of the reporting period.
KWS SAAT SE publishes its consolidated financial
statements and interim reports within the period of
time defined in the regulations for the Prime Standard
of the German Stock Exchange. The company’s sea-
sonal course of business means that it cannot ensure
compliance with the recommended periods in the
German Corporate Governance Code.
Einbeck, October 2015
The Supervisory Board The Executive Board
21Corporate Governance | To our shareholdersKWS Group | Annual Report 2014/2015


Combined Management Report
24 Fundamentals
24 Group structure and business activity
26 Objectives and strategies
28 Control system
30 Research & development
33 Business performance
36 Earnings, financial position and assets
36 In accordance with the corporate controlling structure
36 Earnings
38 Corn Segment
40 Sugarbeet Segment
42 Cereals Segment
44 Corporate Segment
45 Financial situation
46 Assets
47 In accordance with IFRS 11
47 Earnings
48 Financial situation
49 Assets
52 Employees
55 Report on events after the balance sheet date
55 Opportunity and risk report
62 Forecast report
64 KWS SAAT SE (explanations based on the German Commercial Code (HGB))
68 Other disclosures
69 Declaration regarding Corporate Governance
69 Compensation Report
Co
mb
ined
Man
agem
ent
Rep
ort

Combined Management Report
Breeding stationsTest locations for trial cultivation
Breeding activities of the KWS Group
Fundamentals
Group structure and business activity
Since it was founded in 1856, KWS has specialized
in developing, producing and distributing high-quality
seed for agriculture. KWS’ core competence is
breeding new, high-yielding plant varieties. From our
beginnings in sugarbeet breeding, we have evolved
into an innovative international supplier with an exten-
sive portfolio of crops. We cover the complete value
We changed the presentation of the KWS Group’s consolidated financial statements at the beginning of fiscal 2014/2015
due to an amendment to the International Financial Reporting Standards (IFRS 11). The main change is that we can no
longer carry the net sales and costs of our 50:50 joint ventures, which are operated in the Corn Segment, in the statement
of comprehensive income (see page 76) in the KWS Group, so the KWS Group’s reported net sales and EBIT are signif-
icantly lower. The earnings contributed by these companies are instead included under net financial income/expenses. In
addition, their assets will be included in the KWS Group’s balance sheet as equity-accounted financial assets in accordance
with the new accounting regulations.
So as to ensure there is no impairment to the transparency of our operational development compared with the previous
year, this year we still report our joint ventures proportionately in the Combined Management Report in accordance with
our internal corporate controlling structure and present the earnings, financial position and assets both in accordance with
our internal corporate controlling structure and the KWS Group’s consolidated financial statements. We also indicate the
main differences between the two forms of presentation in the Combined Management Report. After the year of transition
2014/2015, we will only report in accordance with the new accounting regulations – with the exception of the segment
reporting.
24 Combined Management Report | Fundamentals Annual Report 2014/2015 | KWS Group

chain of a modern seed company – from breeding of
new varieties, multiplication and processing, to mar-
keting of the seed and consulting for farmers.
Diversified product portfolio
We offer our customers – farmers – a broad range of
agricultural crops that have been adapted by breed-
ing to the conditions of their specific location. These
crops include corn, sugarbeet, the cereals rye, wheat
and barley, oil plants such as rapeseed, sunflower
and soybean, and potatoes. The varieties are mainly
adapted to the moderate climatic zones. Since we
entered the Brazilian market in 2012, varieties for sub-
tropical regions have also been part of our portfolio.
Global footprint
The KWS Group has around 5,3001 employees, has
65 subsidiaries and associated companies at present
and operates in more than 70 countries. We generate
18% of our net sales in Germany and 36% in other
European countries. Another 41% of our revenue is
from North and South America, with the remaining
5% coming from other foreign countries.
Growth through research and breeding
All of KWS’ activities are geared toward exploiting
plants’ potential as well as possible and leveraging
it to tackle the challenges of modern, sustainable
agriculture. Whether it’s plants for producing food,
fodder or energy, conventional, organic or genetically
improved: We offer farmers the ideal variety for their
purposes. Genetically improved varieties, which are
distributed in particular in North and South America,
now contribute 37%2 (34%) of our net sales.
Our company’s long-term success is founded on
research and breeding new varieties. Our highly qual-
ified employees and close collaboration with other
companies and research institutions are key factors
that drive continuous innovation and constant opti-
mization of our varieties. Thanks to our large network
of breeding and trial stations in all the world’s key
markets, we can test the individual candidates under
a wide range of climatic and local conditions to deter-
mine whether the varieties are suitable for cultivation.
The section “Research & Development” on page 30
contains an overview of the main focus of our activities
in this field last fiscal year.
Organization of the KWS Group
KWS SAAT SE is the parent company of the KWS
Group. It multiplies and distributes sugarbeet seed,
breeds a broad range of crops and provides its sub-
sidiaries with new varieties every year for the purpose
of multiplication and distribution. It also conducts
important basic research for the entire KWS Group,
assumes the function of a holding company and man-
ages the Group with its 65 subsidiaries and associated
companies operationally and strategically. An overview
of the subsidiaries and associated companies included
in the consolidated financial statements of the KWS
Group is provided in the Notes on page 96/97.
1 Main differences from the consolidated financial statements: Excluding the joint ventures, KWS employs around 4,700 people and generates 77.3% of its net sales abroad (44.8% in Europe, 25.8% in North and South America and 6.7% in the rest of the world).
2 Main differences from the consolidated financial statements: Net sales from genetically improved varieties account for around 23%, excluding the proportionately consolidated companies.
Distribution of value added (around 30% of the total output)
63% Employees
Lenders 3%
Shareholders 5%
Public sector 13%
Company 16%
€404.7 million
25Fundamentals | Combined Management ReportKWS Group | Annual Report 2014/2015

The KWS Group’s operational business is conducted
in the three segments Corn, Sugarbeet and Cereals
and, including our 50:50 joint ventures in the Corn Seg-
ment, can be described as follows:
The Corn Segment is the KWS Group’s largest divi-
sion in terms of net sales, accounting for around 60%
of the total figure. It covers production and distribution
of corn seed and the product areas of oil and field
seed, which includes rapeseed, sunflower and sor-
ghum. We still generate the lion’s share of net sales in
this segment from corn seed, in particular in the U.S.
and Europe. We are one of the top three largest corn
seed vendors, in terms of cultivation area, in these
markets. The largest share of net sales comes from
regions where sowing is carried out in the spring, with
the result that the segment’s operating performance
is impacted by seasonal fluctuations. The segment
generates just around 10% to 15% of its revenue in
the first half of our fiscal year (July to December),
mainly from winter rapeseed in Europe and corn vari-
eties in South America.
The Sugarbeet Segment generates 31% of the KWS
Group’s net sales. Most of that comes from sugar-
beet seed production and distribution. Around one-
tenth of the segment’s net sales is generated from
seed potato business. Our high-quality sugarbeet
varieties are some of the highest-yielding in the in-
dustry, which is why we are the leader in the field of
sugarbeet seed with a global market share of 53%.
Our main sales markets are still North America, a
region where genetically improved, herbicide-tolerant
sugarbeet varieties are almost exclusively used, and
the EU, where KWS is likewise extremely successful
with conventionally bred, multiple-resistant varieties.
Sugarbeet is sown in the spring, which means that
net sales in this segment are likewise largely generated
in the second half of our fiscal year (January to June).
The Cereals Segment includes production and dis-
tribution of rye, wheat, barley and rapeseed. It con-
tributes 9% of the KWS Group’s net sales. Hybrid rye
accounts for 44% of the segment’s revenue, wheat
21%, barley 20% and other crops around 15%. In
our core markets for cereal seed (Germany, Poland,
England and France), farmers predominantly sow
the crops in the fall. Consequently, we generate most
of our revenue in this segment in the first half of our
fiscal year (July to December).
The Corporate Segment supports the operating
segments with research & development activities
and by providing central functions for controlling the
group. Its relatively low net sales mainly come from
the revenue from our farms. Since all cross-segment
function costs and research expenditure is charged
to this segment, its income is usually negative.
Objectives and strategies
The objective of our corporate strategy, which is
based on long-term, proactive thinking, is to make
sure our diverse range of products meets the chang-
ing and often very specific requirements of our
customers. Our corporate values define the core
framework for our goal of creating sustainable,
profitable growth for our customers, employees and
investors. Particular cornerstones of our business
model are intensive research work, development of
new, high-yielding varieties and continuous expansion
of our global footprint so that we are on the ground in
regional markets with their special climatic conditions.
26 Combined Management Report | Fundamentals Annual Report 2014/2015 | KWS Group
The KWS Group’s medium- and long-term objectives 1
Objectives
Profitable growth ■■ An average increase in consolidated net sales of 5% to 10% p. a.
■■ EBIT margin > 10%
Research & development ■■ R&D intensity of 12% to 15% of consolidated sales■■ 1% to 2% progress in yields p. a. for our customers and development of tolerances and resistances
Internationalization ■■ Foreign sales > 80%■■ Expansion of the portfolio of varieties for subtropical markets
Sustainability ■■ Integration of international subsidiaries
Dividend ■■ A dividend payout ratio of 20% to 25% of the KWS Group’s net income for the year
1 Including our joint ventures. We will revise these medium- and long-term objectives in the coming fiscal year as a consequence of the new accounting regulations from IFRS 11. This change will affect in particular our objectives for the EBIT margin and R&D intensity, which can already be seen from the forecast for fiscal 2015/2016 on page 62/63.
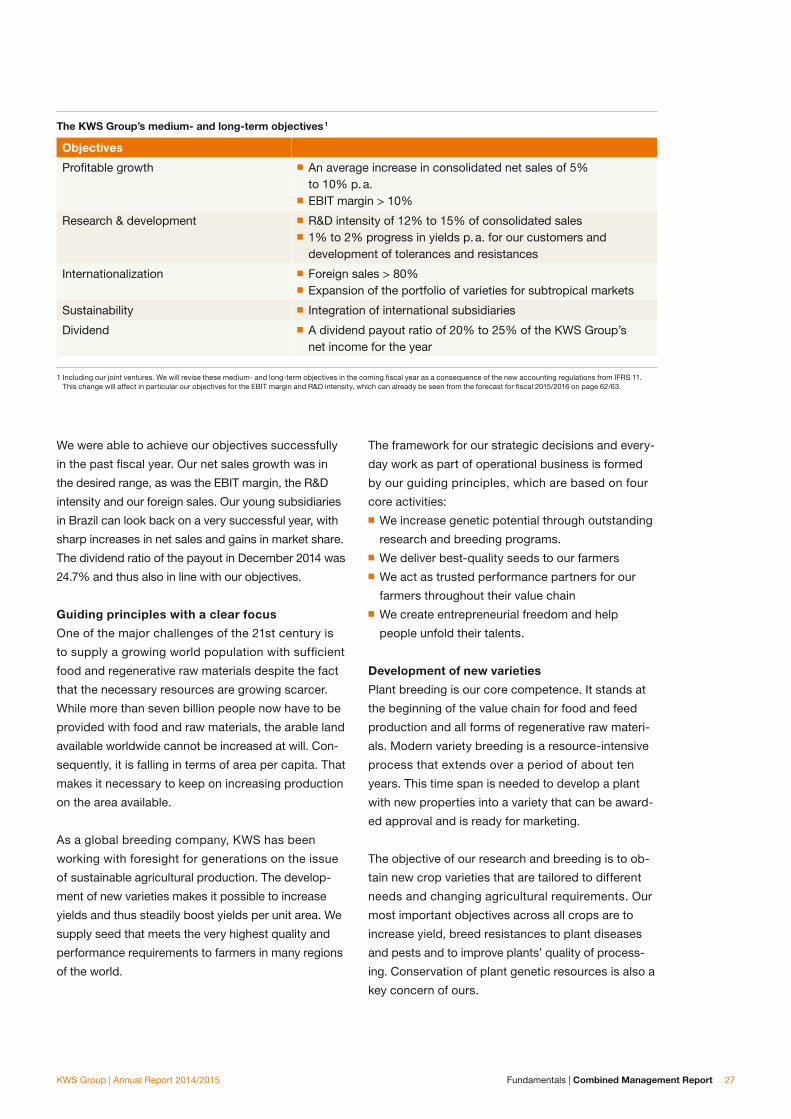
We were able to achieve our objectives successfully
in the past fiscal year. Our net sales growth was in
the desired range, as was the EBIT margin, the R&D
intensity and our foreign sales. Our young subsidiaries
in Brazil can look back on a very successful year, with
sharp increases in net sales and gains in market share.
The dividend ratio of the payout in December 2014 was
24.7% and thus also in line with our objectives.
Guiding principles with a clear focus
One of the major challenges of the 21st century is
to supply a growing world population with sufficient
food and regenerative raw materials despite the fact
that the necessary resources are growing scarcer.
While more than seven billion people now have to be
provided with food and raw materials, the arable land
available worldwide cannot be increased at will. Con-
sequently, it is falling in terms of area per capita. That
makes it necessary to keep on increasing production
on the area available.
As a global breeding company, KWS has been
working with foresight for generations on the issue
of sustainable agricultural production. The develop-
ment of new varieties makes it possible to increase
yields and thus steadily boost yields per unit area. We
supply seed that meets the very highest quality and
performance requirements to farmers in many regions
of the world.
The framework for our strategic decisions and every-
day work as part of operational business is formed
by our guiding principles, which are based on four
core activities:■■ We increase genetic potential through outstanding
research and breeding programs.■■ We deliver best-quality seeds to our farmers■■ We act as trusted performance partners for our
farmers throughout their value chain ■■ We create entrepreneurial freedom and help
people unfold their talents.
Development of new varieties
Plant breeding is our core competence. It stands at
the beginning of the value chain for food and feed
production and all forms of regenerative raw materi-
als. Modern variety breeding is a resource-intensive
process that extends over a period of about ten
years. This time span is needed to develop a plant
with new properties into a variety that can be award-
ed approval and is ready for marketing.
The objective of our research and breeding is to ob-
tain new crop varieties that are tailored to different
needs and changing agricultural requirements. Our
most important objectives across all crops are to
increase yield, breed resistances to plant diseases
and pests and to improve plants’ quality of process-
ing. Conservation of plant genetic resources is also a
key concern of ours.
27Fundamentals | Combined Management ReportKWS Group | Annual Report 2014/2015

Expressed in hard and fast figures, the new varieties
we supply to our customers deliver an average yield
progress of 1% to 2% a year. So that we continue that
success, we will continue to focus strongly on research
& development as part of our corporate planning.
Expansion of our global footprint
With business activities in more than 70 countries
around the world, KWS has become a leading inter-
national plant breeder. We now generate over 80%
of our sales abroad. Nevertheless, our strategic ob-
jective is still to press ahead with further internation-
alizing our company. Our extensive commitment in
Brazil, as well as the joint venture with our longstand-
ing partner Kenfeng in China, are part of that.
Markets such as Brazil, with a subtropical climate and
several harvests a year, not only offer attractive sales
potential – especially for our corn business – but are
also very attractive for another reason: In our core
markets, our main contributors to net sales – corn and
sugarbeet – are only sown in the spring, whereas there
are different sowing and harvesting cycles in other re-
gions. As a result, we can cushion the highly seasonal
nature of our business in the medium term.
High seed quality for our customers
What counts most for us is that farmers trust in KWS.
That is why we demand the very highest standards
as regards the quality of our seed and our consulting.
Our goal as a trusted partner, specialist and consul-
tant to agriculture is at all times to supply high-quality,
innovative seed for producing food and feed, as well
as regenerative raw materials. The KWS Group is a
power ful partner at all stages in the value chain: in re-
search into, breeding of and approval for new vari eties,
in multiplying and processing seed, in distribution, and
when it comes to providing consulting on the ground.
Entrepreneurial freedom for employees
Qualified and motivated employees are the key to
our commercial success. We therefore offer our em-
ployees the opportunity to shape their place of work
and working environment. All employees at the KWS
Group can develop their strengths and press ahead
with pursuing their own ideas. Open dialogue is
the foundation for that. It is a firm part of the culture
of our evolved and innovative family business and
enables maximum flexibility. Our goal is to give every
employee extensive entrepreneurial freedom and
prospects for their individual development, as well as
to encourage them to act on their own responsibility
and sustainably.
Sustainable and profitable growth
Our investments and expenditure for research & de-
velopment are the foundation for sustainable growth.
We aim to increase the KWS Group’s net sales by
an average of 5% to 10% p. a. and achieve a return
(EBIT margin) of at least 10%1. The development of
the key performance indicators is described in the
sections “Earnings, financial position and assets” in
accordance with our corporate controlling structure
starting on page 36 and in accordance with IFRS 11
as of page 47. In line with the principles of our long-
term corporate strategy, we use our earnings strength
to expand research and breeding in particular, as well
as our distribution operations. As a result, we bolster
the KWS Group’s potential and lay the foundation for
future growth.
Control system
The objective of the KWS Group’s corporate strat-
egy is to ensure the company’s long-term growth.
Detailed annual and medium-term operational plans
that include our joint ventures proportionately are used
to control the Group and the three segments Corn,
Sugarbeet and Cereals. The medium-term plan covers
the time frame of the annual plan plus three further
fiscal years. In turn, the medium-term plan is derived
from our strategic corporate planning, which covers a
timescale of ten years.
The targets set in planning are derived from the basis
of the regional economic and legal situation, antici-
pated market trends and assessments of the compa-
ny’s position in the market and the potential product
performance. In a subsequent bottom-up process,
which also includes the development of our joint ven-
tures, these premises are used to define targets for
sales volumes and net sales, production capacities
and quantities, the allocation of resources (including
capital spending and personnel), the level of material
costs and internal charge allocation and the resultant
balance sheet data, along with the financial budget.
A firm part of the planning documentation is an
opportunity/risk assessment which every manager
must conduct for his unit.
1 See also medium and long-term objectives of the KWS Group on page 27.
28 Combined Management Report | Fundamentals Annual Report 2014/2015 | KWS Group

The planning is compared every quarter with the
company’s actual business performance and the
updated estimates on the underlying general con-
ditions. If necessary, suitable countermeasures are
initiated and adjustments made. A detailed forecast
for the current fiscal year is made at the end of each
quarter. At the end of each fiscal year, all units con-
duct a detailed variance analysis of the budgeted
and actual results. That serves to optimize our in-
ternal planning processes and further enhance the
already high quality of our forecasts.
Corporate Controlling is responsible for coordinat-
ing and documenting all planning processes and
our current expectations. It monitors compliance
with adopted budgets and analyzes the efficiency
and cost-effectiveness of business processes and
measures. The Controlling team also advises deci-
sion-makers on economic optimization measures.
The respective heads of the individual areas are
responsible for the contents of the planning and cur-
rent forecasts. They include in particular the heads of
the three product segments, the research & develop-
ment activities and the central functions, as well as
the regional heads of sales.
The Executive Board uses various indicators for plan-
ning, controlling and monitoring the business per-
formance of the KWS Group and operating units. The
main indicators are net sales, operating profitability
(EBIT margin) and R&D intensity (research expenditure
as a ratio of net sales). The development of these key
figures in fiscal 2014/2015 can be found in the report
on the earnings situation on page 36.
Management and control
KWS SAAT SE has a system of dual management,
consisting of the Executive Board and the Super-
visory Board. Both bodies have strictly separated
responsibilities and different members. While the Ex-
ecutive Board manages the company, the Supervisory
Board supervises and advises the Executive Board.
These responsibilities have also been retained follow-
ing the company’s conversion into a European Stock
Corporation (Societas Europaea/SE). The declaration
on corporate governance in accordance with Section
289a of the German Commercial Code (HGB) con-
tains detailed information on the extensive and close
cooperation between the Executive Board and the
Supervisory Board and has been published at
www.kws.com > Company > Investor Relations >
Corporate Governance.
We subject our seed to a stringent selection process during production – just around onefifth of the original quantity is finally packaged and sold. That means only top quality is put on the market.
29Fundamentals | Combined Management ReportKWS Group | Annual Report 2014/2015

Research & development
Breeding progress means sustainable, enhanced crop
performance and higher yields for farmers. According-
ly, we continued to invest last fiscal year in expanding
our research and breeding capacities in order to be
able to develop products that offer high long-term
performance for our international markets. Research
& development expenditure in fiscal 2014/2015 was
€173.8 (150.0) million. As a result, 13.8%1 of KWS’ total
net sales were invested in research & development
activities. 37% of our employees, around 2,0002 peo-
ple, worked in research & development. The success
of our breeding activities is reflected, among other
things, in the number of variety approvals worldwide:
We obtained 429 (336) marketing approvals for new
KWS varieties across all our crops in fiscal 2014/2015,
28% more than in the previous year. That means we
still have a competitive product pipeline.
Opening of the KWS Gateway Research Center
The pace of change in plant research, develop-
ment of methods and product innovation keeps on
growing. As a result, cutting-edge technologies and
research approaches for plant breeding are gaining
importance. KWS has therefore invested in estab-
lishing a new research center in the U.S. in order to
better tap the country’s international excellence in
innovation and strengthen its own presence in plant
research. Also, access to innovative technologies
and top-class research is to be ensured by means of
cooperation ventures and networks.
The establishment of the research center began in
the spring of 2014 in the Bio-Research & Develop-
ment Growth Park (BRDG Park) in St. Louis, Missouri
(U.S.). The center is surrounded by universities,
1 The research & development intensity is going to be restated due to the fact that the requirements under IFRS 11 are mandatory for the first time and will increase sharply as a result. While research & development expenditure is hardly impacted by this change, the KWS Group’s net sales will be lower by the share contributed by the joint ventures. The R&D intensity will therefore be around 17%.
2 The average number of R&D employees excluding joint ventures is around 1,800. See pages 52 to 54 for more information on employees.
Our sugarbeet varieties belong to the species “Beta vulgaris”. They are always given female names. Due to their excellent properties, some of the names are ingrained in our customers’ minds like those of pop stars, e. g. Lisanna, Danicia, Rashida.
30 Combined Management Report | Fundamentals Annual Report 2014/2015 | KWS Group

institutions and various companies from our industry.
It was officially opened in January 2015.
Research in molecular biology will be conducted at
the KWS Gateway Research Center, and the results
will be used specifically to develop new and im-
proved product traits. 15 highly qualified employees
were hired to carry out research in the period under
review and have already initiated their first scientific
projects. The team is to be expanded to around 25
by the end of 2015; an increase to up to 75 research-
ers is planned in the medium-term.
Expansion of corn activities in China
The Chinese market is developing steadily and is
one of KWS’ key markets of the future. China now
has the world’s largest corn cultivation area – almost
38 million hectares in 2015 and more than the U.S.
for the first time. KWS was quick to respond to
this trend and, within the space of five years, has
put together an expert breeding team that is able
to develop high-yielding corn varieties for all major
cultivation areas in China, with the exception of
tropical regions. Last fiscal year, we were able to
submit competitive hybrids for approval in KWS’
important regions in China, for the first time also in
the country’s summer cultivation areas, which total
more than ten million hectares. After the joint venture
KENFENG-KWS was awarded its business license
at the end of 2014, we began activities to commence
commercial operations and establish a joint breeding
program. The first breeding nursery was set up in
Gongzhuling in Jilin Province in the spring of 2015.
Importance of winter breeding nurseries for corn
breeding at KWS
Winter breeding nurseries have been a core com-
ponent of corn breeding at KWS for many years. If it
were not for the large and flexible breeding stations in
the southern hemisphere, no breeding program would
now be competitive, since winter breeding nurseries
speed up variety development significantly and create
a cost advantage. Thanks to the favorable climatic
conditions, two to three generations of corn a year
can be established (depending on the location) and
selected for the desired traits.
As corn breeding at KWS grows sharply, the winter
breeding nurseries also have to be expanded steadi-
ly. Over the past six years, KWS has succeeded in
doubling its capacities at the winter breeding nurs-
eries. To enable that, extensive investments were
made in new stations, the related infrastructure and
machinery. KWS currently has winter breeding nurs-
eries in four different countries in South America and
their capacities are being increased steadily.
Acquisition of MOMONT and initial
breeding activities
After 15 years of excellent cooperation between KWS
and the French company SOCIETE DE MARTINVAL
S.A. (MOMONT), KWS acquired the remaining
51% stake in the company in September 2014. In do-
ing so, we aim to leverage the opportunity to further
expand our cereal breeding activities and strengthen
our market position in France long-term.
MOMONT’s existing structures are an ideal comple-
ment to our organization and allow us to pool joint
activities. To benefit from state-of-the-art breeding
technologies as soon as possible, we established
cutting-edge sowing techniques and an advanced
trial design in the current season. We intend to use
further modern breeding tech nologies soon.
31Fundamentals | Combined Management ReportKWS Group | Annual Report 2014/2015

Increasing importance of nematode-tolerant
varieties and increased leaf health in sugarbeet
Many sugarbeet cultivation areas have experienced
a sharp increase in infestation by cyst nematodes
in the past years. We recognized this development
at an early date and have responded by develop-
ing new high-performance varieties by means of
intensive breeding. The first variety with triple toler-
ance – combining resistance to the Rhizomania virus,
Rhizoctonia and beet cyst nematodes – has been
approved in France.
The requirements demanded of new varieties have
increased constantly: Apart from high yield potential,
the importance of leaf health has also increased,
coupled with reduced use of fungicides. The further
strategic alignment of our breeding programs and
intensified use of new breeding methods have result-
ed in a significant increase in the competitiveness
of KWS’ sugarbeet varieties.
Key figures for research & development1
2014/2015 2013/2014 +/–
R&D employees 1,985 1,836 8.1%
Ratio of R&D employees in % 37 38
R&D expenditure in € millions 173.8 150.0 15.9%
R&D intensity in % 13.8 12.7
Marketing approvals for new varieties 429 336 27.7%
1 Main differences from the consolidated financial statements: R&D expenditure €174.6 million, R&D intensity 17.7%, number of R&D employees 1,777
In plant breeding, you can choose your parents. However, only by choosing the right crossing partners can we reach our goal: to increase our varieties’ resistance.

Forecast versus actual business performance1
Results 2014/2015
Forecast 2014/2015 2
Q3 05/28/2015
Ad-hoc09/01/2015
KWS Group
Net sales +7.0% +5% to 10% Approx. +7.5% Approx. +7%
EBIT – 0.3% ≥ –10.6% Approx. – 9% Approx. +/– 0%
Corn
Net sales +5.5% > +10% Approx. +7% Approx. +5%
EBIT –16.6% – 6% to –14% Approx. –19% Approx. –17%
Sugarbeet
Net sales +11.2% +/– 0% Approx. +9% Approx. +11%
EBIT +32.5% +/– 0% Approx. +21% Approx. +32%
Cereals
Net sales +3.7% +/– 0% Approx. +5% Approx. +4%
EBIT –29.8% +/– 0% Approx. –32% Approx. –30%
1 Including our joint ventures. 2 Forecasts taken from the Annual Report 2013/2014. See also www.kws.com/ir.
We successfully implemented our planning and activ-
ities in line with our corporate strategy for 2014/2015
in the year under review, despite some turbulence on
agricultural markets, a fall in cultivation area in many
places and the fact that farmers felt a greater strain on
their liquidity in some cases. Expansion of research
and breeding to develop new, high-yielding varieties
impacted many projects in the fiscal year and meant
our research & development expenditure rose by
€23.8 million. That we are on the right track is shown
by our good market position in individual regions (see
the segment reports on pages 38 to 44) and the sharp
rise in marketing approvals awarded to our new vari-
eties. We achieved both thanks to outstanding variety
performance and our strong, likewise significantly
expanded distribution network in the relevant markets.
Our operating performance was accompanied by
trade restrictions in Eastern Europe and wild fluctua-
tions in exchange rates: Currencies in Eastern Europe
suffered from a sharp depreciation, while the US
dollar grew in strength. All in all, the KWS Group’s net
sales were positively impacted by currency influences
to an amount of around €30 million, compared with
the significant negative effect in the previous year.
Business performance
When we published our 2013/2014 Annual Report
in October 2014, we forecast that the KWS Group
would grow its net sales by 5% to 10% and post
an EBIT margin of at least 10%. This guidance was
confirmed by our results after the first three quarters;
however, the contribution made by our segments to
net sales and income was different than had been
assumed at the start of the fiscal year, mainly due
to the above-described regional turbulences. The
Sugarbeet Segment significantly surpassed our ex-
pectations. Our good sugarbeet variety performance
resulted in higher net sales than forecast, especially
in regions outside Europe. The segment’s anticipated
EBIT was far exceeded as a result of non-recurring
currency effects and lower counterparty defaults (as-
pects that are difficult to factor into planning), which
is why we increased our income guidance on Sep-
tember 1, 2015, to €138 million (corresponding to an
EBIT margin of 10.9%). Ultimately, our sales grew by
7.0% and the EBIT margin was 10.9%. These trends
include the net sales and expenses of our joint ven-
tures and are based on the forecast in the preceding
Annual Report. They therefore differ from the figures
in the consolidated financial statements. An explana-
tion of the earnings situation in accordance with the
consolidated financial statements can be found on
page 47.
33Business performance | Combined Management ReportKWS Group | Annual Report 2014/2015

Best in class
Quality testing
Seed is one of the most important resources for a farmer. Its quality
– tested several times over to ensure its reliability – is the prerequi-
site for good yields and thus the viability of agricultural enterprises.
That is why seed has to meet the very highest quality requirements
and is checked continuously by various institutions throughout
the production process. Our quality tests start as early as the field
multiplication phase. We then conduct quality tests when we take
delivery of the raw goods. Further tests are performed as part of
drying, cleaning and calibration, up to when the seed is treated with
pesticides and packaged. The seed’s germination capacity, sprout-
ing strength and field emergence are also determined. The minimum
qualities of seed for sale are regulated by law. However, we demand
much higher standards of quality from our seed. Only if these high
requirements are met is the seed accepted, certified and sold.


In this section, we present our business performance
in accordance with our corporate controlling struc-
ture. That means that, as in previous years, our 50:50
joint ventures, which are operated in the Corn Seg-
ment, are shown proportionately in terms of earn-
ings, financial situation and assets in accordance
with the stake in them.
In the following section we present the earnings,
financial situation and assets in accordance with KWS’
consolidated financial statements based on IFRS 11.
The main difference is that we can no longer carry
the net sales and costs of our 50:50 joint ventures in
the individual items of the statement of comprehen-
sive income and the net assets of our joint ventures
are included in the KWS Group’s balance sheet as
equity-accounted financial assets. As a result, the
KWS Group’s net sales, EBIT and total assets are
much lower, whereas net financial income/expenses
increased by the share of earnings contributed by the
joint ventures. Net income for the year is practically
identical under both consolidation methods.
Earnings, financial position and assets in accordance with the corporate controlling structure
Earnings
Abridged income statement
2014/2015 2013/2014 +/–
Net sales in € millions 1,260.4 1,178.0 7.0%
Operating income in € millions 138.0 138.4 – 0.3%
Net financial income/expenses in € millions –7.1 –12.6 43.7%
Result of ordinary activities in € millions 130.9 125.9 4.0%
Taxes in € millions 46.9 45.6 2.9%
Net income for the year in € millions 84.0 80.3 4.6%
Earnings per share in € 12.54 11.69 7.3%
EBIT margin 10.9% 11.8%
7.0% increase in net sales – growth in
all product segments
Net sales at the KWS Group rose by 7.0% to
€1,260.4 (1,178.0) million in fiscal 2014/2015. The in-
crease in net sales at the Sugarbeet Segment was
11.2%, well above the forecasts for the fiscal year.
Net sales rose by 5.5% in the Corn Segment and by
3.7% in the Cereal Segment. In particular in North
and South America, the Sugarbeet Segment (in
North America) and Corn Segment (in North and
South America) posted sharp increases in net sales.
The performance of the US dollar against the euro had
a positive effect in this regard.
Gross margin improved again
Gross profit in the year under review rose to €610.8
(563.5) million. License and material costs were only
slightly higher and again resulted in a below-pro-
portionate increase in the cost of sales by 5.7% to
€649.6 (614.5) million. That gives an improved gross
margin of 48.5% (47.8%).
Function costs rise due to business expansion
Continuous expansion of our business activities
needs to be flanked by expansion of our global dis-
tribution structures. Consequently, selling expenses
in the year under review increased as planned by
36 Annual Report 2014/2015 | KWS GroupCombined Management Report | Earnings, financial position and assets

11.5% to €236.7 (212.3) million. Their ratio of the
KWS Group’s net sales was 18.8% (18.0%). The
high expenditure on distribution is intended to last-
ingly secure KWS’ position in growth markets. This
long-term approach is underscored by the planned
increase in our research & development budget. Re-
search & development costs increased in fiscal year
2014/2015 by 15.9% (6.5%) to €173.8 (150.0) million.
Administrative expenses in the year under review rose
moderately by 5% (10.4%) to €80.5 million.
Operating income at the level of the
previous year
Other operating income was €89.8 (60.7) million,
while other operating expenses totaled
€71.6 (46.8) million. The balance of them rose year
on year by €4.3 million to €18.2 (13.9) million, among
things due to positive currency effects.
Operating income (EBIT) was €138.0 million,
on a par with the previous year (€138.4 million).
The EBIT margin declined accordingly to 10.9%
(11.8%). Net financial income/expenses improved
to € –7.1 (–12.6) million due to a fall in interest ex-
pense and the con tributions to earnings from the
stake acquired in MOMONT. Earnings before taxes
(EBT) rose from €125.9 million in the previous year
to €130.9 million. Income taxes for the year under
review were €46.9 (45.6) million, meaning that our tax
rate improved slightly to 35.8% (36.2%), although it
was still above the long-term average. Losses that
cannot be deducted against tax and the increases
in net sales in countries where the tax rate is above
30% (North America) were key factors influencing
that.
The KWS Group posted net income of
€84.0 (80.3) million for fiscal year 2014/2015.
Minority interests were €1.3 (3.2) million, meaning
€82.7 (77.1) million are attributable to shareholders
of KWS SAAT SE. The number of shares was un-
changed, giving earnings per share of €12.53 (11.69).
One unit of sugarbeet seed with 100,000 pellets is enough to cultivate around a hectare of land and yields (100m x 100m = 10,000 sqm) up to 20 tons of sugar.
37KWS Group | Annual Report 2014/2015 Earnings, financial position and assets | Combined Management Report

Net sales grow by 5.5%
The Corn Segment continued its operational growth
of past years in fiscal 2014/2015 and increased its net
sales by 5.5% to €754.4 (714.9) million. It was able to
grow its sales above all in North and South America.
That was accompanied by different, in some cases
significant currency effects. The positive impacts from
exchange rate developments in the U.S. and Argentina
were offset by depreciation in the currencies of Brazil,
Ukraine and Russia during the year. After adjustment
for exchange rate effects, the segment’s net sales
would have risen by 3.0% to around €736 million.
The planned continuation of our growth strategy
included increasing distribution and research expen-
diture by €31.7 million year on year. Together with
negative non-recurring effects, such as currency
influences from Eastern Europe and allowances on
inventories, the segment’s income (EBIT) fell by 16.6%
to €84.2 (100.9) million. It was thus well below the
previous year which had been impacted by positive
non-recurring effects.
Bumper harvests worldwide – consumer prices
for corn continue to drop
For the second year in a row, record harvests and
high inventories worldwide defined the economic cli-
mate in the corn seed industry. The price for corn for
consumption on the exchange in Chicago fell
in January 2015 to 146.50 USD/ton, a further drop of
15% from the level in January 2014. The current bear-
ish mood on the agricultural commodity markets, ac-
companied by the economic crisis in Eastern Europe,
resulted in untypically high declines in cultivation area
in important markets for corn seed. The exceptionally
high seed harvests in the fall of 2014 also produced a
global supply surplus, resulting in perceptible pres-
sure on prices that varied from region to region.
The regions: Gains in market share despite fall in
cultivation area
Corn cultivation area in North America fell by 2%
to around 36 (37) million hectares. Nevertheless,
AGRELIANT, our 50:50 joint venture with the French
company Vilmorin & Cie., was able to slightly improve
its market position as the third-largest vendor of corn.
AGRELIANT’s net sales in North America rose to
€556 (509) million due to exchange rate effects. De-
mand for high-quality varieties with multiple genetic
resistance to herbicides and insects declined slightly
due to the pressure on U.S. farmers to cut costs.
In our growth market Brazil, we were again able to
increase our net sales of corn and soybean signifi-
cantly: Our net sales in this important corn market
rose by over 20% in total, despite the negative cur-
rency influences due to the depreciation of the Bra-
zilian real. As a result, we were able to expand our
market share sharply. That is a good success for our
companies operating in Brazil, given that corn cul-
tivation area there likewise declined by around 2%.
Corn cultivation area also fell sharply in Argentina. As
one of the few corn seed vendors there, KWS posted
almost constant net sales and so achieved a gratify-
ing 1% gain in market share.
There was also a decline in area totaling 4% in
Europe, although this varied greatly from region to
region. We were able to defend our outstanding mar-
ket position in Germany and Northern Europe, while
we grew our net sales by double digits in individual
markets in Eastern and Southern Europe despite
declines in cultivation area. In contrast, our business
performance was slightly down in France and fell
sharply in Southeastern Europe. All in all, we were
not quite able to achieve our net sales targets in
Europe in a challenging economic climate.
Key figures for the Corn Segment
2014/2015 2013/2014 +/–
Net sales in € millions 754.4 714.9 5.5%
EBIT in € millions 84.2 100.9 –16.6%
EBIT margin in % 11.2 14.1
Corn Segment
38 Annual Report 2014/2015 | KWS GroupCombined Management Report | Earnings, financial position and assets

Corn
Our activities in China are now mainly based on corn
seed licensing business. Net sales from that rose
slightly in the year under review. Along with that, our
corn production and distribution joint venture cleared
the first hurdle to start its operations by obtaining
its business license in December 2014. Together
with our longstanding Chinese partner Kenfeng, we
expect the last step in the approval process to be
accomplished in fiscal 2015/2016.
Oil seed revenue rises by 7.8%
Revenues from our oil seed business rose both in
Europe and America. While soybean is mainly mar-
keted in America, rapeseed and sunflower are more
important in Europe. Net sales from oil seed totaled
€88.6 (82.2) million.
Corn is cultivated on about 180 million hectares
worldwide – a figure that is growing, since the crop delivers the highest yields
per hectare.
KWS Group | Annual Report 2014/2015

Sugarbeet Segment
Significant rise in net sales and profit
outside the EU
Net sales at the Sugarbeet Segment, comprising
sales revenue from our sugarbeet seed and seed
potato business, rose by 11.2% in fiscal 2014/2015 to
€390.5 (351.1) million. With the exception of France,
the increases in net sales were almost exclusively
outside the European Union, in particular in North
America, Russia and Turkey. Sugarbeet seed busi-
ness accounted for €364.4 (318.5) million and seed
potato business for €26.1 (32.6) million of total net
sales. After adjustment for exchange rate effects,
the segment’s net sales would have risen by 8.3% to
€380.4 million.
The segment’s income (EBIT) in the period under
review was €93.0 (70.2) million, mainly due to the ad-
ditional contribution margin from the increase in net
sales, and so was 32.5% up year on year despite the
planned far higher distribution and research expendi-
ture. This significant increase was largely due to our
good performance in North America. As previously
reported on September 1, 2015, there were also
positive exchange rate effects and lower allowances
for receivables in the fourth quarter. Administrative
expenses remained stable.
Low sugar prices worldwide – high inventories,
especially in the EU
Our business activity in the Sugarbeet Segment was
exposed to both positive and negative external influ-
ences in the year under review. High sugar invento-
ries worldwide resulted in a further fall in the price of
sugar, which had a direct impact on sugarbeet cul-
tivation area. The political and economic situation in
Eastern Europe resulted in sharp exchange rate fluc-
tuations there and insolvencies among local farmers,
whereas the strong US dollar had a positive impact
on our performance in North America. Consumer
prices for potatoes reached new lows, diminishing
the revenue prospects for our seed potato business.
The regions: North America boosts sugarbeet
seed business
Expansion of sugarbeet breeding and outstanding
variety performance were the foundation for very
successful business in the past fiscal year in all re-
gions. Net sales in North America increased yet again
over the already high level of the previous year. We
further expanded our clear leadership in the market.
Following a very successful fourth quarter, net sales
in North America were up about 25% year on year.
In the EU 28, high inventories and quotas trans-
ferred from the previous growing season led to a
significant reduction in cultivation area of more than
10%. However, sales were maintained at a virtually
constant level thanks to gains in market share and
were €136.1 million (€137.2 million). Business went
particularly well in France and was accompanied
by sharp gains in market share. In Germany, the
Netherlands and Poland, the reduction in cultivation
area – despite increasing market share – meant that
our net sales declined. In particular in Scandinavia,
our business performance fell sharply as a result of
a large reduction in area.
Net sales outside the EU 28 increased to €228.3
(180.8) million. Apart from our success in North
America, we recorded very positive business in
Turkey, where our market share rose to more than
50%. In addition, net sales rose in Russia and China,
among other countries. However, we were not able
to compensate for trends in Serbia, Croatia and
Key figures for the Sugarbeet Segment
2014/2015 2013/2014 +/–
Net sales in € millions 390.5 351.1 11.2%
EBIT in € millions 93.0 70.2 32.5%
EBIT margin in % 23.8 20.0
40 Annual Report 2014/2015 | KWS GroupCombined Management Report | Earnings, financial position and assets

Sugarbeet
Ukraine, which were affected by sharp declines in
area, by winning market share. In some cases, we
suffered significant declines in net sales here.
We pressed ahead with our cooperation project with
Bayer CropScience to develop a conventional her-
bicide-tolerant sugarbeet. The new technology was
named CONVISO® SMART. The new varieties are
resistant to the herbicide Conviso and enable more
efficient control of weeds in sugarbeet cultivation.
We expect the market launch of the first varieties as
of 2018.
Seed potato business impacted by all-time lows
for consumer prices
Last season, consumer prices for potatoes were at a
record low. That is due, among other things, to high
production volumes and a large supply of potatoes
for consumption. Such a climate tends to foster the
use of farm-saved seed potatoes, since farmers use
their own harvest for the next growing cycle due to
the decline in prices. In this difficult market environ-
ment, net sales from our seed potato business fell
to €26.1 (32.6) million, resulting in a sharply negative
contribution to earnings.
Sugarbeets do not form their seed pods until the second growing season. Seed production – from
requirements planning to packaging – therefore takes up to three years.
KWS Group | Annual Report 2014/2015

Cereals Segment
Segment’s net sales rise slightly – research and
distribution expenditure increased
Net sales in the Cereals Segment rose slightly year
on year by 3.7% to €111.3 (107.3) million. Against the
backdrop of low agricultural commodity prices, our
business with wheat, barley and rapeseed went well:
Net sales for each of the crops increased year on
year – and even by around 50% for barley. However,
revenue from our high-quality hybrid rye varieties de-
clined, since alternative types of cereal are preferred
when consumer prices are low. Nevertheless, hybrid
rye remained the largest contributor to net sales in
the segment, accounting for 44% of the total figure.
Along with operational business, the takeover of the
remaining 51% stake in the French seed company
SOCIETE DE MARTINVAL S.A. (MOMONT) had a
positive impact, adding around €6 million to the seg-
ment’s net sales.
The segment’s income (EBIT) was €12.0 (17.1) million.
The positive effects on income from the increase
in net sales and reduction in the cost of sales were
cancelled out by higher expenditure aimed at se-
curing our future growth: Expenditure on research &
development and on distribution rose as planned and
were the main reason for the year-on-year decline in
EBIT. Due to the time of acquisition, which was after
the segment’s key fall sowing season, not all the pos-
itive contributions to income from the acquisition of
MOMONT were able to be recognized by the Cereals
Segment.
Economic environment: Prices for cereals for
consumption remain low
The market environment for cereals proved to be
tough in fiscal 2014/2015: Consumer prices for cere-
als stagnated at a low level for the second year in a
row. In general, demand for certified seed from plant
breeding companies was lower, since farmers increas-
ingly opted to use farm-saved seed in response to the
above conditions. That meant in particular that net
sales from hybrid rye declined. The greening mea-
sures under agricultural policy, which aim for greater
crop diversity and envisage the provision of ecological
focus areas on arable land, had a stabilizing impact on
the area used to grow rapeseed and barley.
The regions: Growth in core markets,
acquisition in France
KWS’ cereals varieties turned in a promising perfor-
mance compared with the competition in the year
under review. We grew our net sales in all important
regions. While our business went well in key mar-
kets such as the UK, Poland or France, there were
slight declines in net sales in Germany. That is mainly
attributable to the difficult conditions in hybrid rye
business, where – along with the fall in cultivation
area – we suffered slight losses in market share.
France is one of the world’s largest individual mar-
kets for cereals, with around 5 million hectares used
for wheat and some 1.8 million for barley. KWS has
operated in the French cereals market for many years
now and has successfully expanded its footprint in
this important market by acquiring the remaining
51% stake in the French seed company SOCIETE
DE MARTINVAL S.A. (MOMONT) effective Septem-
ber 30, 2014. The already mentioned effects on net
sales and profit are due to the time of the takeover
and the seasonal nature of cereals business.
Sharp increase in the number of marketing
approvals for new varieties
We increased our expenditure on research & devel-
opment in fiscal 2014/2015 in line with our growth
strategy. The cost and effort involved in our diverse
Key figures for the Cereals Segment
2014/2015 2013/2014 +/–
Net sales in € millions 111.3 107.3 3.7%
EBIT in € millions 12.0 17.1 –29.8%
EBIT margin in % 10.8 15.9
42 Annual Report 2014/2015 | KWS GroupCombined Management Report | Earnings, financial position and assets

Cereals
breeding programs is paying off: In the year under
review we significantly increased the number of
marketing approvals for new varieties. They include
new hybrid rye varieties with improved yield perfor-
mance and ergot resistance. They will be launched
in Germany and Poland in fiscal 2015/2016 as part
of our “VorsprungPlus”, a system that gives farmers
early access to newly approved varieties.
Our breeding activities cover not only traditional
breeding of new varieties, but also long-term research
& development projects, such as establishment of
hybrid breeding for barley and wheat and use of state-
of-the-art technologies to optimize breeding processes.
A further objective is to develop hybrid rye varieties
that are adapted to growing conditions in Eastern
Europe or the U.S. and Canada and will help us tap
additional market potential in the medium term.
KWS Cereals set new standards of seed quality
with the QualityPlus system. To ensure that
high standards are met, only selected multipliers
and processors produce the QualityPlus seed for KWS’ cereals varieties.
KWS Group | Annual Report 2014/2015
Corporate Segment
All cross-segment costs are allocated to our Corpo-
rate Segment. They include expenses for all central
functions of the KWS Group and for long-term re-
search projects. The segment’s net sales are mainly
generated from our farms. They were €4.2 (4.7) million
Key figures for the Corporate Segment
2014/2015 2013/2014 +/–
Net sales in € millions 4.2 4.7 –10.6%
EBIT in € millions – 51.2 – 49.7 – 3.0%
Corporate
and were not sufficient to cover the increase in
expenditure. For the above reasons, the segment’s
income (EBIT) is usually negative. Due to an increase
in R&D costs, it was € –51.2 (–49.7) million.
Just 3.5 kilograms of seed are needed to grow one hectare of sugarbeet. This requires the highest seed quality. This can be guaranteed through the centralization of the processing and refining process for our European sugarbeet production operations in Einbeck.

Corporate Segment Financial situation
Selected key figures on the financial situation
2014/2015 2013/2014 +/–
Cash and cash equivalents in € millions 132.4 155.0 –14.5%
Net cash from operating activities in € millions 57.7 61.0 –5.6%
Net cash from investing activities in € millions –136.4 –75.4 – 80.9%
Net cash from financing activities in € millions 41.8 – 31.5 > 100%
KWS’ financial management is geared in particular
to reflect the corporate values of farsightedness and
independence. Consequently, the overriding objec-
tive of financial management is to secure adequate
earnings strength long term and to safeguard the
company’s financial independence. Apart from pro-
viding sufficient liquidity, the objective is to enable it
to expand its business activities flexibly and seize
opportunities as and when they arise. The financial
management organization is controlled in the Group
centrally from Einbeck. A balanced mix of financ-
ing, investment and hedging instruments is used as
the instrument for that. Derivative financial instru-
ments are used only to hedge the risk of interest rate
changes and currency risks.
Operating cash flow of €57.7 million
Cash earnings in fiscal 2014/2015 were €122.2
(110.4) million. The net cash from operating activities
(operating cash flow) was €57.7 (61.0) million. The
increase in working capital resulting from business
expansion in our capital-intensive growth markets
and higher inventories had a negative impact here.
The net cash used in investing activities totaled
€136.3 (75.4) million and includes the payment for
acquisition of the shares in SOCIETE DE MARTINVAL
S.A. and the planned increase in payments for tan-
gible fixed assets. The net cash from financing ac-
tivities was €41.8 (–31.5) million and comprised the
dividend for the fiscal year 2013/2014, higher cash
proceeds from long-term borrowings, and slightly
reduced installments for repayment of raised loans.
In the previous year, it also included the cash paid
to acquire the remaining shares in KWS LOCHOW
GMBH. The KWS Group’s cash and cash equiva-
lents on the balance sheet date at June 30, 2015
totaled €132.4 (155.0) million.
A syndicated loan with a volume of €200 million exists
to provide financing during the year. It was renegoti-
ated in October 2014 and will run until October 2019,
with an option to extend its term until 2021.
Sharp increase in capital expenditure
Total capital expenditure in fiscal year 2014/2015
was €140.6 (82.6) million. Capital expenditure was
increased by 70.2% year on year, largely due to the
takeover of the remaining shares (51%) in MOMONT.
The Group’s capital expenditure was spread region-
ally as follows: 24.7% (35.0%) in North and South
America, 24.1% (28.8%) in Germany and 43.3%
(33.7%) in Europe (excluding Germany). 7.9% (2.5%)
of capital spending was in the rest of the world.
The Corn Segment accounted for 36.9% (51.8%) of
total capital expenditure. Expansion of our production
capacities was driven by investments in production
plants in Serbia, North America and France, among
other countries. We also invested in further breeding
capacities in South America and Europe.
In the Sugarbeet Segment, we continued the drive
we began in previous years to modernize production
plants in the U.S. We also invested in production sites
in Germany and Turkey with the goal of further improv-
ing the quality of our seed. The Sugarbeet Segment
accounted for 17.1% (22.8%) of the KWS Group’s total
capital expenditure.
45KWS Group | Annual Report 2014/2015 Earnings, financial position and assets | Combined Management Report

Assets
Abridged balanced sheet
06/30/2015 06/30/2014 +/–
Assets
Noncurrent assets in € millions 580.6 476.8 21.8%
Current assets in € millions 859.6 786.0 9.4%
Equity and liabilities
Equity in € millions 738.7 637.8 15.8%
Noncurrent liabilities in € millions 336.1 254.2 32.2%
Current liabilities in € millions 365.4 370.8 –1.5%
Total assets in € millions 1,440.2 1,262.8 14.0%
The KWS Group’s total assets rose by 14.0% to
€1,440.2 (1,262.8) million. This was mainly attributable
to high capital expenditure as part of our business
expansion.
Noncurrent assets increased by 21.8% to €580.6
(476.8) million, mainly due to investment in property,
plant, and equipment. The increase in inventories to
€239.7 million and higher trade receivables totaling
€377.5 million, both of which grew due to the planned
expansion of our business, resulted in an increase in
current assets to €859.6 (786.0) million. Cash and cash
equivalents, including securities, fell by €22.5 million
to €132.5 million. After deduction of financial liabilities,
net liquidity was € –88.3 (–12.1) million.
On the other side of the balance sheet, the
KWS Group’s equity rose by 15.8% to €738.7
(637.8) million. The equity ratio increased to 51.3%
(50.5%) and thus remained at a solid level. Equity
at the balance sheet date far exceeded noncurrent
assets by €158.1 (161.0) million. Noncurrent liabil-
ities rose by 32.2% to €336.1 (254.2) million as a
consequence of a further borrower’s note loan that
was raised to fund further business expansion in our
future markets and the acquisition of MOMONT.
Current liabilities on the bal ance sheet date totaled
€365.4 (370.8) million.
Capital spending in the Cereals Segment was in-
creased significantly with our strategic objectives in
mind. The segment’s share of total capital expen-
diture at the KWS Group thus rose from 8.3% in the
previous year to 31.7%. The investments include the
acquisition of the remaining shares in MOMONT and
focused on construction and expansion of produc-
tion plants, as well as on increasing office capacities.
Depreciation and amortization in the year under review
totaled €51.6 (45.8) million. This rise is attributable to
the rapid increase in the KWS Group’s property, plant,
and equipment as a result of the high investment ratio.
46 Annual Report 2014/2015 | KWS GroupCombined Management Report | Earnings, financial position and assets

Earnings, financial position and assets in accordance with IFRS 11
Earnings
Abridged income statement
2014/2015 2013/2014 +/–
Net sales in € millions 986.0 923.5 6.8%
Operating income in € millions 113.4 118.3 – 4.1%
Net financial income/expenses in € millions 16.7 7.5 > 100%
Result of ordinary activities in € millions 130.1 125.8 3.4%
Taxes in € millions 46.1 45.5 1.3%
Net income for the year in € millions 84.0 80.3 4.6%
Earnings per share in € 12.53 11.69 7.2%
EBIT margin 11.5% 12.8% –10.2%
Surplus supply due to high global stocks of agricultural
raw materials, low prices for agricultural raw materials,
a reduction in cultivation area, political and economic
tensions in growth markets, and volatile exchange
rates created a challenging climate for KWS in the past
fiscal year. Nevertheless, the KWS Group was able to
increase its net sales year on year in all product seg-
ments, also after adjustment for exchange rate effects.
Net sales rose by 6.8% to €986.0 (923.5) million in
the year under review. This is mainly attributable to a
significant increase in net sales from our sugarbeet
activities in North America and in net sales in our
growth markets South America, Russia and Turkey.
The increase in net sales was underpinned among
other things by higher sales volumes in the Sugarbeet
Segment. Good variety performance in all major KWS
regions made a considerable contribution to this. The
sales volume in the Corn Segment was maintained
at the level of the previous year against a backdrop
of sharp falls in cultivation area. Acquisition of the re-
maining shares (51%) in the French cereals company
MOMONT increased net sales only slightly. 22.7%
of total net sales were generated in Germany, 44.8%
in Europe (excluding Germany), 25.8% in North and
South America and 6.7% in the other regions.
Gross profit in the year under review rose to
€532.5 (494.2) million. License and material costs
were only slightly higher and again resulted in a be-
low-proportionate increase in the cost of sales by
5.6% to €453.5 (429.3) million. That gives a gross
margin of 54.0% (53.5%).
Our global growth is secured by expansion of our
distribution activities, among other things in new mar-
kets such as Brazil. Consequently, selling expenses
in the year under review increased by €19.0 million to
€189.0 (170.0) million . Their ratio to the KWS Group’s
net sales was 19.2% (18.4%).
Research & development expenditure in-
creased as planned in the year under review to
€174.6 (149.4) million. The research & development
intensity relative to the Group’s net sales was
17.7% (16.2%). General and administrative expens-
es increased below-proportionately relative to net
sales by 4% to €74.8 (71.9) million. Other operating
income was €88.0 (58.2) million, while other operating
expenses totaled €68.7 (42.8) million. The balance
thus rose to €19.3 (15.4) million. The related indi-
vidual items are presented in detail in the Notes on
pages 125 to 127.
The significant differences from the explanations in
Section “Earnings, financial position and assets in
accordance with the corporate controlling structure”
mainly impact the Corn Segment.
47KWS Group | Annual Report 2014/2015 Earnings, financial position and assets | Combined Management Report

The operating income (EBIT) for the KWS Group
was thus €113.4 (118.3) million. The EBIT margin fell
to 11.5% (12.8%).
Net financial income/expenses rose to €16.7 (7.5)
million. Apart from an improvement of €1.9 million
in the interest result, it was mainly impacted by
the net income from equity investments. The latter
rose by 35.9% to €27.5 (20.2) million as a result
of higher income from equity-accounted financial
assets (€ +3.5 million) and income from write-ups
on subsidiaries, joints ventures and participations
(€ +3.7 million). Earnings before taxes (EBT) rose from
€125.8 million in the previous year to €130.1 million.
Income taxes in the year under review rose to
€46.1 (45.5) million, with the result that our tax rate
was 35.4% (36.2%). Although the tax rate therefore
fell slightly, losses that cannot be deducted against
tax and the sharp increases in net sales in high-tax
countries are still above the long-term average. The
KWS Group posted net income of €84.0 (80.3) million
for fiscal year 2014/2015. Minority interests were
€1.3 (3.2) million, meaning €82.7 (77.1) million are
attributable to shareholders of KWS SAAT SE. The
number of shares was unchanged, giving earnings
per share of €12.53 (11.69).
Financial situation
Selected key figures on the financial situation
2014/2015 2013/2014 +/–
Cash and cash equivalents in € millions 108.2 122.3 –11.5%
Net cash from operating activities in € millions 48.1 76.1 – 36.8%
Net cash from investing activities in € millions –123.8 – 63.1 96.2%
Net cash from financing activities in € millions 48.4 – 43.6 > 100%
KWS’ financial management is geared in particular
to reflect the corporate values of farsightedness and
independence. Consequently, the overriding objective
of financial management is to secure adequate earn-
ings strength long term and to safeguard the com-
pany’s financial independence. Apart from providing
the company with sufficient liquidity, the objective is
to enable it to expand its business activities flexibly
and seize opportunities as and when they arise. The
financial management organization is controlled in the
Group centrally from Einbeck. A balanced mix of
financing, investment and hedging instruments is used
as the instrument for that. Derivative financial instru-
ments are used only to hedge the risk of interest rate
changes and currency risks.
Cash earnings in fiscal year 2014/2015 were
€92.1 (85.0) million on the back of higher deprecia-
tion and amortization of assets and lower other non-
cash income. The net cash from operating activities
(operating cash flow) was €48.1 (76.1) million. The lower
increase in trade payables and short-term provisions,
together with the increase in working capital, had
a negative impact on the operating cash flow. The
increase in working capital results from business
expansion in our capital-intensive growth markets
and higher inventories.
The net cash used in investing activities totaled
€123.8 (63.1) million and includes the payment for
acquisition of the shares in MOMONT and the
planned increase in payments for tangible fixed
assets. The net cash from financing activities was
€48.4 (–43.6) million and comprised the dividend
for the fiscal year 2013/2014, which was constant
compared with the previous year, higher cash pro-
ceeds from long-term borrowings, and installments
for repayment of raised loans. Last year they also
included the cash paid to acquire the remaining
shares in KWS LOCHOW GMBH. The KWS Group’s
cash and cash equivalents on the balance sheet
date at June 30, 2015, totaled €108.2 (122.3) million.
A syndicated loan with a volume of €200 million exists
to provide financing during the year. It was renegoti-
ated in October 2014 and will run until October 2019,
with an option to extend its term until 2021.
48 Annual Report 2014/2015 | KWS GroupCombined Management Report | Earnings, financial position and assets

Total capital expenditure in fiscal year 2014/2015
was €132.5 (69.4) million. Capital expenditure was
increased by 90.9% year on year, mainly due to the
takeover of the remaining shares (51%) in MOMONT.
As in the previous year, the main focus of the invest-
ments was on expanding corn processing capacities.
For instance, a corn processing plant was erected
in Serbia. Capital was also invested at the Einbeck
location. Investments were made in construction of a
new research and office building. The Corn Segment
accounted for 29.5% (44.1%) of total capital expendi-
ture, the Sugarbeet Segment for 18.1% (27.3%) and
the Cereals Segment for 37.2% (8.2%). The Group’s
capital expenditure was spread regionally as follows:
17.2% (23.0%) in North and South America, 25.5%
(34.4%) in Germany and 48.9% (39.6%) in Europe
(excluding Germany). 8.3% (2.5%) of capital spend-
ing was in the rest of the world.
Depreciation and amortization in the year under
review totaled €45.9 (41.2) million. This rise is attrib-
utable to the rapid increase in the KWS Group’s
property, plant, and equipment as a result of the high
investment ratio.
Assets
Abridged balanced sheet
06/30/2015 06/30/2014 +/–
Assets
Noncurrent assets in € millions 651.4 538.7 20.9%
Current assets in € millions 704.1 626.3 12.4%
Equity and liabilities
Equity in € millions 738.7 637.8 15.8%
Noncurrent liabilities in € millions 334.9 253.0 32.4%
Current liabilities in € millions 281.9 274.2 2.8%
Total assets in € millions 1,355.5 1,165.0 16.4%
The KWS Group’s total assets rose by 16.4% to
€1,355.5 (1,165.0) million. This was mainly attribut-
able to high capital expenditure as part of our busi-
ness expansion.
Noncurrent assets at the balance sheet date totaled
€651.4 (538.7) million as a result of higher investments
in property, plant, and equipment. As a result of the
planned expansion of business, higher inventories
totaling €178.0 million and trade receivables totaling
€309.7 million resulted in an increase in current assets
to €704.1 (626.3) million. Cash and cash equivalents, in-
cluding securities, fell by €14.1 million to €108.2 million.
Net liquidity was € –105.9 (–31.6) million.
The KWS Group’s equity rose by 15.8% to
€738.7 (637.8) million. The equity ratio declined
slightly to 54.5% (54.7%). The KWS Group’s
financing thus remains solid. Equity at the bal-
ance sheet date far exceeded noncurrent assets by
€87.3 (99.1) million. Noncurrent liabilities rose by
32.4% to €334.9 (253.0) million as a consequence of
a further borrower’s note loan that was raised to fund
further business expansion in our future markets and
the acquisition of MOMONT. Current liabilities on
the balance sheet date totaled €281.9 (274.2) million.
49KWS Group | Annual Report 2014/2015 Earnings, financial position and assets | Combined Management Report

Climate protector

Processing
In order to ensure the high quality of seed produced in the field,
it must be processed after being harvested. Seed processing is a
very time-consuming and labor-intensive process that depends on
the specific crop. The raw goods are always cleaned, gently dried if
necessary and calibrated. All the processes are designed to make
sure that the seed is handled carefully so that the seedlings are
healthy and an ideal quality can be ensured. As part of that, the
necessary resources such as energy, water, auxiliary materials and
supplies are used as economically as possible in all processing
steps. The quantities used may vary from year to year, sometimes
considerably, since they depend on the weather-related fluctuations
in the quantity and quality of seed harvested. The main focus of
environmental protection at the company is therefore on efficient
controlling of the use of resources in the processing plants so that
seed production is as environmentally friendly and resource-saving
as possible.

Employees
Producing high-quality seed entails a great deal of
cost and effort and relies on excellent contributions
from our employees with their high professional
qualifications. We therefore endeavor to offer our
employees a working environment that encourages
continuous progress. An attractive and open interna-
tional work environment, characterized by fairness,
mutual respect and support for each other, enables
us to find unconventional and innovative solutions
together. We foster a corporate culture that is based
on mutual trust and the common goal of keeping KWS
on its path to success. The values of our family busi-
ness with its rich tradition are the basis for our actions.
Europe-wide cooperation strengthened by
change in legal form to KWS SAAT SE
KWS has continued to grow strongly in the interna-
tional arena in the past years. The KWS Group gen-
erates around 53% of its total net sales in Europe.
This trend was reflected by conversion of KWS into a
European Stock Corporation (Societas Europaea/SE),
and an additional employee representative body was
set up at the European level: the European Employee
Committee (EEC). After its initial short term of office
up to 2017, the EEC will be elected for five years and
consists of eleven delegates: Three delegates come
from Germany and the remaining eight from the other
EU countries in which KWS has subsidiaries.
The above-average turnout for the election of the body
at the end of July 2015 showed that our employees at
all European companies have a high degree of identi-
fication with KWS and make use of the opportunities
to help shape it. Following the election of the EEC’s
Chairperson and two deputies in September 2015, the
body commenced its task of representing employees
in cross-border matters within the European Union. It
will hold at least two meetings a year with the Execu-
tive Board to discuss the company’s development and
planned measures.
At the national level, too, the focus is on harmonious
rapport: The collective bargaining agreement for
Germany that was concluded in Einbeck in May 2015
specifically paid tribute to the social component and
the employees’ commitment, as well as raising the
employer’s contributions to capital-forming payments.
This arrangement benefits in particular part-time
employees and trainees, making it easier for them to
build up their own capital.
Outstanding attractiveness as an employer –
more important than ever for KWS
In view of our constant growth and the importance
of qualified employees to our company, it is increas-
ingly vital for KWS to give its employer brand a
sharper profile and position itself internationally as
an attractive place to work. Modern forms of online
communication, participation in selected career fairs
in Germany and abroad and systematic establish-
ment of a significant network are key components
of our employer branding. We have also maintained
intensive contact with relevant professional groups
and intensified and expanded our cooperation with
universities and organizations worldwide – for exam-
ple in Argentina, the U.S. or China.
Seeding the Future: KWS fosters young talents
at an early stage
We believe youngsters should gain an initial insight
into working life as early as possible, i. e. when they
are in school or studying at a university. That is why
KWS offers students the opportunity to learn more
about its various task areas throughout the group: for
example in excursions to the company, as interns or
through scholarships. Students can also write their
degree theses in cooperation with KWS or take dual
courses of study.
Excellent career start at KWS
Good training for our employees is a basic necessity
so that KWS can remain successful in the future. In
fiscal 2014/2015, KWS employed 100 youngsters in
six business administration, agricultural science and
industrial vocations. Around 120 instructors ensure a
high quality of training. KWS offers university gradu-
ates two introductory programs: There is very great
demand for our tried-and-tested internal Trainee
Program and for the “Breeders Academy”, which is
tailored specifically to plant breeding.
52 Combined Management Report | Employees Annual Report 2014/2015 | KWS Group

We give all career starters at KWS extensive insight
into our globalized, highly networked business pro-
cesses. We also attach particular importance to devel-
oping professional qualifications and personal skills.
Focus on employee development
Personnel development at KWS helps our employees
acquire skills that are demanded by our global busi-
ness environment with its ever-changing general con-
ditions: constant innovation, customer orientation and
modern communications. To enable that, a concept for
a group-wide successor and talent management sys-
tem was set up in the year under review. In manage-
ment groups consisting of participants from different
locations and units, potential candidates are identified
in development meetings. The findings obtained help
boost further development of the identified employees.
In addition, the “Orientation Center” (OC) was adapted,
a further training measure whose members include
Executive Board members and external experts and
which aims to identify the strengths of selected em-
ployees and the fields they can develop further. Strate-
gic and intercultural aspects are now taken into greater
account to reflect the company’s environment.
However, we also continued our proven development
programs: For example, the “KWS On Board” program
gives experts and executives who have newly taken
over a management function a better understanding
of KWS’ values, its strategic orientation and its gover-
nance structures. In the course of our ten-month “Inter-
national Development Program” (IDP), potential junior
talents are taught the skills that are particularly required
in KWS’ global business environment. Following the
successful completion of the first IDP in February 2015,
a new intake embarked on the program in June 2015.
Work-life balance at KWS
We want our employees to be able to reconcile their
career and private life in every phase of their life.
KWS supports that goal in Germany with flexitime
models and company agreements on child care
allowances, as well as by letting employees reduce
their working time so that they can look after depen-
dents who need caring for.
The health management initiative launched in Ger-
many in 2013/2014 is now firmly in place. Among
other things, running groups and KWS dragon boot
training are offered at the Einbeck location and a fit-
ness studio accompanies sports programs for entire
departments. Health management is also becoming
established internationally: For example, 86% of all
employees in Brazil take part in the “Quality for Life”
program, in which they are given dietary advice and
regular health checks. As part of that, employees
obtain information on possible risk factors and sug-
gestions for a healthy lifestyle.
Openness and transparency are not only reflected in our architecture, but above all in our daytoday activities.
53Employees | Combined Management ReportKWS Group | Annual Report 2014/2015

Employees in numbers1
The number of employees at the KWS Group rose
again as planned in fiscal 2014/2015 and averaged
5,322 worldwide, 9.8% up from the previous year.
Personnel costs rose by 13.6% to a total of
€256.4 (225.8) million. Of that, €206.8 (180.3) million
went to compensation and €49.7 (45.6) million to
social security contributions, expenses for pension
plans and benefits. The average length of service
in Germany remains at the constantly high level of
13.0 years. All in all, that underscores the attractive-
ness of KWS as a modern and fair employer.
Employees by region
2014/2015 2013/2014 +/–
Germany 1,868 1,763 6.0%
Europe (excluding Germany) 1,401 1,223 14.6%
Americas 1,865 1,711 9.0%
Rest of world 188 150 25.3%
Total 5,322 4,847 9.8%
Employees by function
2014/2015 2013/2014 +/–
Research & Development 1,985 1,836 8.1%
Distribution 1,259 1,241 1.5%
Production 1,408 1,136 23.9%
Administration 670 634 5.7%
Total 5,322 4,847 9.8%
Key figures for employees (in Germany)
2014/2015 2013/2014 +/–
Number of employees in Germany 1,868 1,763 6.0%
of which number of part-time employees 367 350 4.9%
Ratio of men in % 50.9 50.2
Ratio of women in % 49.1 49.8
Number of Apprentices 100 98 2.0%
Apprentice ratio in % 5.3 5.5
Average age in years 40.4 40.2
Length of service in years 13.0 14.0
1 Including our joint ventures. Excluding them, the average number of employees is 4,691.
54 Annual Report 2014/2015 | KWS GroupCombined Management Report | Employees

Report on events after the balance sheet date
We began implementing adaptation of our Euro-
pean Service Center structure at the beginning of
August 2015. As part of that, the Service Center
North was integrated in the Service Centers Medi-
terranean and East effective October 1, 2015. The
Rotter dam location was closed; some of its employ-
ees were offered work in the Service Centers that
took over its activities.
As already announced on several occasions, a
decision was made to merge KWS MAIS GMBH with
KWS SAAT SE. The merger will become effective
upon being entered in the commercial register and
will be carried out in the course of fiscal 2015/2016.
KWS MAIS GMBH now generates the highest net
sales in the KWS Group and consistently makes a
large contribution to earnings. The company’s rein-
tegration marks a first step in simplifying the Group’s
structure. Our objective with the merger is also to
make internal processes more efficient and reduce
Opportunity and risk report
As an international seed company, the KWS Group
operates in a dynamically changing environment.
That results in risks as well as opportunities, which
we have to weigh as the foundation for our entrepre-
neurial decisions.
Opportunities
We understand an opportunity as a development
that might have a positive impact on our earnings,
financial position and assets.
At the KWS Group, opportunity management is an
integral component of the established controlling sys-
tem between the subsidiaries/associated companies
and company management. Strategic opportunities,
such as joint ventures and acquisitions, are handled
by the Executive Board. Operational opportunities
are identified and exploited in our segments, since
they have the greatest knowledge of their markets
our administrative overhead. The structure of our
segments will not be affected by this measure.
As a further step in optimizing the KWS Group’s
structures, the Executive Board and the Supervisory
Board will propose conclusion of a profit and loss
transfer agreement between KWS SAAT SE and
KWS LOCHOW GMBH to the Annual Sharehold-
ers’ Meeting. KWS SAAT SE holds all the shares
in KWS LOCHOW GMBH, which bundles the
KWS Group’s cereals activities. Both companies
have performed successfully in the past years; con-
clusion of the agreement is intended to secure their
successful commercial development, create the
conditions for further organic growth and tap further
group-related advantages.
Apart from that, there were no significant events that,
in the assessment of the Executive Board, might
have an impact on the KWS Group’s earnings, assets
and financial position.
and products. Targeted measures are formulated
together with the Executive Board so that strengths
can be leveraged and strategic growth potentials
tapped. Strategic opportunities of major importance
are handled by the Executive Board. Extensive
strategic planning covering a 10-year time frame is
the basis for opportunity management. In keeping
with our established growth strategy, we exploit
the industry-specific and strategic opportunities
that arise by means of pinpointed investments in
production capacities, research & development and
acquisitions.
We see diverse opportunities for the KWS Group to
develop the company further in line with our strategy.
So that we succeed in achieving sustainable, profit-
able growth in future as well, our prime goal must be
to retain and further increase our innovativeness. The
latter is expressed in seed business by continuous
55KWS Group | Annual Report 2014/2015 Report on events after the balance sheet date | Opportunity and risk report | Combined Management Report

increases in the yields of new varieties. The plants’
yield potential can either be increased or their resis-
tance to detrimental influences, of whatever type,
can be improved. Our target is to offer our customers
an increase in yield of 1% to 2% per annum with our
new varieties. That is why we constantly expand our
research & development activities. A measure of
our innovativeness is the number of newly approved
varieties. In the approval processes, our varieties
are compared directly with rival products in official
performance tests. More details of that and on our
research & development activities can be found on
page 30 of this report.
There are also market opportunities as a result of our
intensified activities in subtropical regions. Our corn
activities in Brazil and China will enable us to tap
additional sales potential for the KWS Group in the
medium to long term in these – for us – new markets
by developing varieties tailored exactly to their cli-
matic conditions. In particular in the highly fragment-
ed Chinese corn market, there is a good opportunity
to participate in the process of consolidation that is
now beginning.
Investing in expansion of our production capacities
and modernization of our seed processing offers
additional opportunities to grow further. Further
development of our variety portfolio and expansion
of capacities are accompanied by expansion of our
distribution structures to enable even more tailored
and intensive information and advice for our custom-
ers on the possible uses of our seed and allow us to
leverage further sales potential. In addition, continu-
ous optimization of processes offers the KWS Group
the opportunity to increase productivity and optimize
cost structures. Short-term opportunities may also
arise as a result of movements in exchange rates.
Our huge seed processing plant in Serbia was opened this fiscal year after being built in less than a year.
56 Combined Management Report | Opportunity and risk report Annual Report 2014/2015 | KWS Group

Risks
We define a risk as a potential future event that might
have a negative impact on our business.
Objectives and strategies in risk management
Our risk management is founded on trust in employ-
ees and the sense of responsibility of every individual.
Our employees are to be enabled to assess and mini-
mize risks on their own.
Our risk management system supports a responsible
approach to risks and decision-making processes. It
consists of organizational measures so that relevant
risks can be identified, assessed and controlled at an
early stage. With proactive strategies to counter risks,
we reduce or avoid negative impacts so that we can
operate successfully on the world market.
Structure of the risk management system
The Executive Board is responsible for risk manage-
ment. The central functions Corporate Finance, Cor-
porate Controlling, Corporate Compliance Office and
Corporate Development & Communications share
the various tasks among themselves (see the figure).
There is also a Risk Committee that reports regularly
on the development of risks.
KWS’ risk management system is organized on the
basis of the internationally recognized COSO model
(Committee of Sponsoring Organizations of the Tread-
way Commission). Risks are identified and assessed
as well as mitigated by suitable control measures. The
principles of our risk management are enshrined in our
group-wide “Rules, Guidelines & Procedures”. Core
contents include principles relating to early detection
and communication and handling of risks. These
standards are implemented by the local subsidiaries.
Our group’s own Service Centers help in preparing
local financial statements and provide a consistent
data model that is subject to the group’s regulations
on accounting and thus ensures that the consolidated
financial statements comply with the rules.
As part of its audit of the annual financial statements
for fiscal year 2014/2015, Deloitte & Touche GmbH
Wirtschaftsprüfungsgesellschaft confirmed that our
system for early detection of risks complies with the
requirements under the German Stock Corporation
Act. It also enables early identification of risks that
jeopardize the company’s existence. Identified weak-
nesses are reported to the Executive Board and the
Supervisory Board and rectified in the continuous
improvement process.
Structure of risk management at the KWS Group
Tasks
Corporate Finance ■■ Early detection of risks■■ Risk management■■ Interest and currency management■■ Insurance■■ Loan management■■ Damage prevention■■ External audits
Corporate Controlling ■■ Planning/budget■■ Current expectations
Corporate Development & Communications ■■ Rules, Guidelines & Procedures■■ Integrated Management System■■ Internal audits■■ Excellence Through Stewardship
Corporate Compliance Office ■■ Compliance Management System■■ Compliance Risk Assessment■■ Compliance training■■ External audits■■ Examinations
57Opportunity and risk report | Combined Management ReportKWS Group | Annual Report 2014/2015

Risk management process
The risk management process at KWS consists of
the phases of identification, assessment, control and
monitoring of risks and risk reporting.
By risk identification, we mean that the persons
responsible for an area of risk identify the potential
risks. The identified risks are plausibilized and sum-
marized in a risk control matrix. The risk inventory
currently contains around 100 risks and means of
controlling them.
This is followed by risk assessment, i. e. qualitative
and quantitative analysis of the risks. Risks are
measured on a net basis, i. e. after risk mitigation
measures have been taken. Their materiality (upper
risk limit) is evaluated either on the basis of their
potential effect on operating income (EBIT) or spe-
cific qualitative indicators. The risks are classified by
their likelihood of occurrence and level of damage
and prioritized according to a traffic light system.
With risk controlling, we create instruments to actively
influence the main risks. Risk controlling comprises
measures to reduce risks, constant monitoring of
them and risk transfer. Our internal control system
(ICS) is used to systematically review and document
whether this controlling is effective. The adequacy and
proper functioning of the controls must be examined
once a year by the person responsible for them at the
respective business segment or a commissioned third
party. External auditing by experienced auditors is
conducted to ensure that internal controls work. The
objects audited are chosen on a risk-based approach.
A report on the ICS’ effectiveness is given to the Audit
Committee of the Supervisory Board once a year. The
Risk Committee is informed quarterly of the current
risk situation for the KWS Group and its fields of
business.
Risk management and the internal control
system in the accounting process
The internal control and risk management system
comprises measures, structures and processes
designed to make sure that business transactions
are included in accounting promptly, consistently
and correctly. Its objective is to ensure compliance
with the law and external and internal accounting
regulations. The completeness of financial reporting,
the Group’s uniform accounting, measurement and
account allocation stipulations, and the authoriza-
tion and access regulations for IT systems used in
accounting are examined regularly. Intra-group
trans actions are consolidated appropriately and
in full. Consolidated accounting is carried out at
KWS SAAT SE by the corporate units Group Account-
ing and Group Controlling.
Main areas of risk
We assess risks as being significant if they might
have a considerable negative impact on our business
activity, financial position or earnings. The order in
which the risk categories and individual risks are
listed reflects their importance. Unless otherwise
specified, the risks apply to all segments of the
KWS Group.
58 Combined Management Report | Opportunity and risk report Annual Report 2014/2015 | KWS Group

Corporate risks
Risk categoryLikelihood of occurrence1 Potential impact 2
Change from the previous year
Market risks■■ Political instability ■■ Fall in sales volumes and/or prices
■■ Currency depreciation■■ Change in interest rates
Possible Significant
Production risks■■ Influence of the weather on multiplication in the field
■■ Outage of production systems
■■ Product liability■■ Genetic mixing
Possible Significant
Procurement risks■■ Non-delivery by suppliers■■ Loss of reputation
Unlikely Moderate
Liquidity risks■■ Insolvency■■ Violation of financial obligations
■■ Default by customers
Unlikely Significant
Legal risks■■ Breaches of contract■■ Anti-trust proceedings■■ Corruption■■ Violation of capital market law
■■ Infringement of proprietary rights
■■ Violation of data protection
Possible Significant
Environmental risks■■ Pollution of the air, soil and water by dusts, waste water and waste
Possible Significant
Personnel risks■■ Demographic change■■ Shortage of skilled workers
Unlikely Moderate
IT risks■■ Non-availability of IT systems
■■ Hacking■■ Data theft■■ Conflict in the authorization process
Possible Significant
1 Unlikely = 1% – 33%. Possible = 34% – 66%. Likely = 67%– 99%.2 Moderate: Hardly perceptible effects on our business activity, financial position or earnings.
Significant: Considerable negative effects on our business activity, financial position or earnings. Existential: Substantial negative effects on our business activity, financial position or earnings that would put the company’s continued existence at jeopardy.
59Opportunity and risk report | Combined Management ReportKWS Group | Annual Report 2014/2015

Market risks
We face political risks in the strongly regulated interna-
tional agricultural industry. The continued uncertainty
in Ukraine and sanctions against Russia may have
a constant negative impact on our business activities
in those countries. We generated net sales totaling
€59.5 million in the two countries in fiscal 2014/2015.
Sale of our products depends on product performance
and the competitive situation. In addition, the state
of the global economy has a major influence on our
net sales and income. We address this challenge with
systematic analyses of the market and the competition
and by developing high-quality seed all over the world.
Currency risks arise from fluctuations in exchange
rates, in particular for outstanding receivables and
liabilities denominated in foreign currency. There are
interest rate risks as a result of potential changes to
market interest rates. The interest payable on finan-
cial obligations with a variable rate of interest may
increase. We address the risk of interest rate changes
and currency risks through the usual hedging instru-
ments, such as derivatives and forward exchange
deals, to reduce the influence on the KWS Group’s
earnings and assets situation. In fiscal 2014/2015, the
research & development expenditure and inter-com-
pany loans were almost completely hedged
in order to avoid exchange rate risks.
Production risks
Breeding and multiplying seed are dependent on
the weather. We reduce the risk of production losses
stemming from bad weather by distributing seed
multiplication and processing over several locations
in Europe and North and South America. Fluctuations
in demand in one region can be compensated for as
part of our global production network. Contra-sea-
sonal multiplication is carried out in the winter half-
year in Chile and Argentina if there are bottlenecks in
seed availability in Europe. We counter the outage of
production facilities by means of regular maintenance,
risk inspections and organizational and technical
damage prevention programs. To cover financial loss,
we maintain group-wide property and business inter-
ruption insurance.
KWS has established extensive checks and tests
throughout the production process to safeguard the
performance and quality of its products. Regular
quality examinations and controls are conducted
at all process levels and also include testing of con-
ventional seed to determine that it is free of genetic
technology. In addition, very strict requirements have
to be met, in particular in relation to genetically modi-
fied products. In the absence of a standardized legal
threshold value, a number of European countries
even practice a policy of zero tolerance.
KWS joined the “Excellence Through Stewardship”
(ETS) initiative in January 2013. This is an internation-
ally standardized quality management program relating
to the use of biotechnology-derived plant material
throughout the product lifecycle. By becoming a mem-
ber, KWS signals its clear and unswerving commitment
to the responsible use of transgenic plant material.
Procurement risks
We reduce supply risks that might arise from the
procurement of pesticides for the seed we treat by
maintaining sufficient stocks. Moreover, the risk of
sources no longer being able to deliver is minimized
by continuous assessment of the quality and ability
to deliver on the part of our suppliers. In addition,
our sustainability principles and requirements are laid
down in our newly introduced Code of Business Eth-
ics for Suppliers. Our suppliers are to respect human
rights and work safety and environmental protection
regulations, as well as to avoid any form of child
labor. Violation of the code harbors the risk of dam-
age to our reputation. We conduct audits of suppliers
to examine whether they comply with the code.
Liquidity risks
Liquidity risks arise if the KWS Group is not able
to fulfill existing or future payment obligations. We
reduce the liquidity risk by means of central liquidity
planning, cash pooling, long-term borrower’s note
loans and syndicated credit lines. As in the previous
year, full use was not made of the variable credit
lines in fiscal 2014/2015. The financial covenants in
our loan agreements were complied with. We use
trade credit insurance to reduce the risk of losing
60 Annual Report 2014/2015 | KWS GroupCombined Management Report | Opportunity and risk report

receivables in risky regions and business segments.
There may be a greater potential for counterparty
default is some regions at present due to political
developments (Ukraine) and economic developments
(exchange rate effects, increase in the price of
goods). Loan management helps us identify drops
in customers’ creditworthiness in good time and to
avoid resultant payment defaults.
Legal risks
The KWS Group faces risks in its operations from of-
ficial proceedings and legal disputes. Legal disputes
are possible in particular with suppliers, customers,
employees and investors and may result in payment
or other obligations. There were no significant legal
proceedings in fiscal 2014/2015. Under our compli-
ance policies and the Code of Business Ethics, our
employees undertake to act in accordance with laws,
contractual provisions, internal regulations and our
corporate values.
Environmental risks
KWS’ international management system regulates the
proper operation of plant and facilities of relevance to
environmental protection so as to minimize negative
influences on people, the environment and material
assets. Implementation of the instructions is audited
internally and externally as part of our continuous
improvement process.
Personnel risks
It is KWS’ conviction that qualified and committed em-
ployees are the key to its success. We therefore have
to remain an attractive employer. Our strategies enable
us to find new talents – career starters and experienced
professionals alike – as well as to further develop the
existing workforce. Our employer branding has posi-
tioned KWS as an attractive place to work in the eyes
of relevant professionals. Extensive vocational training
and induction programs help junior staff get their career
off to an excellent start. Our integrated personnel
development landscape supports our employees in
acquiring professional qualifications and personal skills
that are demanded by our globally networked business
environment with its constantly changing general condi-
tions: continuous innovation, customer orientation and
modern communications.
IT risks
The KWS Group’s business and production processes,
as well as its internal and external communications,
are based on globally networked IT systems. Any
outages in them can result in a significant interruption
to business operations. In addition, theft of sensitive
information can entail a loss of reputation for us. Our
IT security organization and security policies impede
unauthorized access to sensitive electronic company
data. Firewall and antivirus programs are kept up-
to-date and are designed to avoid losses as a result
of hacking and malware. There is also an extensive
authorization concept. Constant external examinations
of our IT security concept and system authorizations
ensure an objective risk assessment of the imple-
mented concepts and measures.
Overall statement on the risk situation by the
Executive Board
The risks presented above do not jeopardize the exis-
tence of the KWS Group, either individually or in their
entirety. All in all, the risk situation did not change sig-
nificantly in fiscal 2014/2015. The main risks for us are
still related to products and the market. The increasing
share of our business in foreign currency, in particular
in emerging countries, means there will be additional
currency risks. Nevertheless, and taking into account
our countermeasures, we assess the potential financial
impact of currency risks as being moderate.
We feel sure that, thanks to our global footprint, our
innovative strength and the high quality of our prod-
ucts, we can seize opportunities and successfully
counter risks as they arise. However, we cannot rule
out the possibility that further factors of which we are
not currently aware or which we do not at present
assess as significant may impact the continued exis-
tence of the KWS Group in the future.
61KWS Group | Annual Report 2014/2015 Opportunity and risk report | Combined Management Report

Forecast report
Forecast for the KWS Group for fiscal 2015/2016
in € millionsSales for 2015/2016
EBIT marginfor 2015/2016
R&D intensityfor 2015/2016
According to the IFRS statement of comprehensive income(application of IFRS 11) 1,035 – 1,085 ≥ 10.5% ~17%
We have changed the KWS Group’s forecast report
due to the previously described amendments to
the International Financial Reporting Standards
(IFRS 11). Apart from the forecast for our segment
reporting, which is of relevance to internal corporate
controlling, we will for the first time specify the KWS
Group’s anticipated operating income excluding
our 50:50 joint ventures (see “Forecast for the KWS
Group”). The forecast is based on our corporate
planning and the information included in it, such as
market expectations or exchange rate developments.
Forecast for segment reporting
We will continue to implement our successful corpo-
rate strategy in fiscal 2015/2016. As part of that, we
intend to expand our business activities in the sales
markets of Brazil and China we have recently tapped
and to further increase our already high level of com-
petitiveness in our core markets. As in previous years,
we will further strengthen KWS’ main success factors:
our innovative strength and our distribution network.
Our expenditure on research & development and
distribution will therefore be increased.
These measures will be flanked by extensive invest-
ments in property, plant and equipment. The main
focus of that will be on expanding and modernizing
production plants in the growth markets of Eastern/
Southeastern Europe and the U.S. We are also
expanding our research & development facilities at
several locations. For example, a new, cutting-edge
greenhouse is being built in Einbeck and a new
breeding station is being set up in Bernburg. We are
expanding our footprint outside Germany, such as in
the U.S. as a result of the research center in St. Louis.
At the Corn Segment, we assume increasing sales
revenues, in particular in North and South America,
but also in Eastern and Southeastern Europe. We
currently expect net sales to increase by between
10% and 15% year on year. Despite the sharp in-
crease in expenditure on research & development
and distribution, the segment’s EBIT margin will prob-
ably be around 11%.
Following the extremely successful fiscal year
2014/2015 for the Sugarbeet Segment, it will be
difficult to achieve further growth in 2015/2016 in
view of the fact that cultivation area will likely remain
stable. In order to repeat the previous year’s suc-
cess, we need to defend the high market shares we
have captured. It will be crucial to our business to
expand our position in the growth markets of Eastern
Europe and successfully establish our varieties,
whose performance is good almost across the
board, in the other individual markets. If we manage
to do that, we expect the segment’s net sales and
income to be at the level of the previous year, despite
the still difficult situation in the potato market.
62 Combined Management Report | Forecast report Annual Report 2014/2015 | KWS Group

At the Cereals Segment, we expect slight growth in
net sales from our acquisition in the important cere-
als market of France. The segment’s EBIT margin is
likely tobe below that of the previous year, however,
due to expected reductions.
At the Corporate Segment, we expect stable net
sales from our farms’ business activities. Due to the
fact that all cross-segment costs at the KWS Group
are allocated to it, we expect the segment to post a
negative EBIT of around € –60 million.
A very good outlook: the very best seed as the foundation for future growth.
Forecast for the KWS Group’s statement
of comprehensive income
The statement of comprehensive income in accor-
dance with IFRS 11 no longer includes the net sales
and costs of our joint ventures. In line with our cor-
porate strategy and annual planning, the Executive
Board expects the KWS Group to post operational
sales growth of 5% to 10% and an EBIT margin of at
least 10.5% in the coming fiscal year. The R&D inten-
sity is expected to be around 17%. We intend to stick
to our dividend policy, with a payout ratio between
20% to 25% of our net income for the year.
63Forecast report | Combined Management ReportKWS Group | Annual Report 2014/2015

The Management Reports of KWS SAAT SE and the
KWS Group have been combined for the first time for
fiscal 2014/2015. The annual financial statements of
KWS SAAT SE in accordance with the German Com-
mercial Code (HGB) and the Combined Management
Report will be published in the Electronic Federal
Gazette at the same time.
Declaration regarding corporate governance
The declaration on corporate governance in accor-
dance with Section 289a of the German Commercial
Code (HGB), which also contains the compliance dec-
laration in accordance with section 161 AktG (German
Stock Corporation Act), has been published in the
Internet at www.kws.com/ir > Corporate Governance.
Compensation Report
The disclosures in accordance with Section 289 (2)
No. 5 of the German Commercial Code (HGB) are con-
tained in the Compensation Report on page 69 to 74.
Disclosures in accordance with Section 289 (4)
of the German Commercial Code (HGB) and
explanatory report of the Executive Board
The disclosures in accordance with Section 289 (4)
of the German Commercial Code (HGB) and the
explanatory report of the Executive Board can be
found on page 68/69.
Business activity, corporate strategy,
corporate controlling and management,
business performance
You can find disclosures on our business activity,
corporate strategy, corporate controlling and manage-
ment, as well as explanations on our business
performance, on pages 24 to 33.
Earnings
KWS SAAT SE’s net sales increased in fiscal
2014/2015 by 5.3% to €284.4 (270.1) million. This is
mainly due to the positive development of revenue
from sugarbeet seed, which – including the sugar-
beet technology fee – rose by 7.8%.
Research & development expenditure, which is
pooled at KWS SAAT SE, increased as planned by
€20.2 million to €158.2 (138.0) million. Expansion of
distribution activities resulted in an increase in selling
expenses to €30.7 (27.5) million. Most of the admin-
istrative functions for the KWS Group are located
in KWS SAAT SE, with the result that administrative
expenses were €53.8 (51.1) million. The balance of
other operating income and other operating expens-
es rose by €12.7 million to €34.7 million and was
impacted positively by the balance of currency trans-
lation differences and exchange rate hedges totaling
€2.3 (4.7) million and lower allowances for receivables
totaling €3.7 (11.4) million.
KWS SAAT SE’s operating income thus fell as expected
to € –23.2 million compared with € –14.3 million in the
previous year, mainly due to the planned increase in
research & development expenditure. The net finan-
cial income/expenses is made up of the net income
from equity investments from eight (seven) companies
and the interest result. The net income from equity
investments increased by 15.0% to €47.6 (41.4) million.
The interest result was € –2.6 (–3.5) million. Taking into
account tax expenditures, KWS SAAT SE posted net
income for the year of €19.7 (23.8) million.
Assets and financial situation
KWS SAAT SE’s total assets increased in the year un-
der review by €61.3 million to €639.8 million. Fixed as-
sets at the balance sheet date were €383.1 (357.0) mil-
lion or 59.9% (61.7%) of total assets. The increase in
fixed assets is mainly due to capital measures at
affiliated and associated companies, as well as in-
vestments in construction of an office and research
building in Einbeck, licenses, laboratory equipment
and agricultural machinery. At the same time current
assets rose to €255.9 (221.3) million, largely as a result
of the fact that receivables and other assets increased
by €60.2 million to €210.0 million. Inventories increased
by 11.8% to €26.1 million. The securities held totaled
€7.0 (24.3) million and cash and cash equivalents fell to
€12.8 (17.6) million.
KWS SAAT SE ( Explanations based on the German Commercial Code (HGB))
64 Combined Management Report | KWS SAAT SE ( Explanations based on the German Commercial Code (HGB)) Annual Report 2014/2015 | KWS Group

The company’s equity was €185.3 million, on a par with
the previous year. The equity ratio on the balance sheet
date was therefore 29.0% (32.0%). Provisions increased
by 4.3% to €102.2 million. There was an increase in
the liabilities to banks of €75.9 million to €150.0 million,
mainly due to the issue of a further borrower’s note loan
with a volume of €100 million and simultaneous repay-
ment of a tranche of the borrower’s note loan that was
issued in 2012. Liabilities to affiliated companies fell by
8.9% to €178.0 million. KWS SAAT SE’s total liabilities
were €347.1 (289.4) million.
At the balance sheet date, fixed assets were covered
by equity to an amount of 48%. A long-term syndicat-
ed loan with a total volume of €200 million exists with
KWS SAAT SE’s principal bankers to finance operat-
ing resources during the year.
Dividend
You can find details on the dividend on page 11.
Employees
An average of 1,195 (1,145) people were employed
at KWS SAAT SE in the year under review, of whom
115 (118) were trainees and interns.
Research & Development
You can find a detailed description of the KWS
Group’s research & development activities on
pages 30 to 32.
Risks and opportunities
The risks and opportunities at KWS SAAT SE are
essentially the same as at the KWS Group. It shares
the risks of its subsidiaries and associated companies
in accordance with its respective stake in them. You
can find a detailed description of the opportunities
and risks and an explanation of the internal control
and risk management system (Section 289 (5) of the
German Commercial Code (HGB)) on pages 55 to 61.
Report on events after the balance sheet date
You can find the report on events after the balance
sheet date for KWS SAAT SE and the KWS Group on
page 55.
Forecast report
KWS SAAT SE generates the main part of its net
sales from sugarbeet seed business and royalties
from basic corn seed. Further development of
sugarbeet seed business depends to a major extent
on developments in our growth markets in Eastern
Europe and cultivation areas in our key markets. We
currently anticipate a slight increase in net sales.
The planned integrated of KWS MAIS GMBH’s corn
activities in fiscal 2015/2016 will also significantly
increase KWS SAAT SE’s net sales.
In turn, KWS SAAT SE’s operating income is primarily
impacted by the KWS Group’s research & develop-
ment expenditure, which will again be increased as
planned in the coming year so as to secure KWS’
good market position. Together with the administra-
tive expenses, which are pooled in KWS SAAT SE,
this resulted in negative operating income in the last
two fiscal years. However, operating income will im-
prove sharply and is expected to be positive again as
a result of the integration of KWS MAIS GMBH.
The detailed annual financial statements of
KWS SAAT SE for fiscal 2014/2015 in accordance
with the German Commercial Code (HGB) have also
been published at www.kws.com > Investor Relations
> Financial Reports.
65KWS Group | Annual Report 2014/2015 KWS SAAT SE ( Explanations based on the German Commercial Code (HGB)) | Combined Management Report

Packaging artist

Packaging and certification
Seed production is predominantly organized by the breeder itself,
but – depending on the crop – is handled in cooperation with many
agricultural partners and processing companies. Our seed’s quality
must be guaranteed throughout the production value chain. The
complex processes of multiplication and processing are therefore
supported organizationally by an Integrated Management System
so that, despite a largely decentralized production structure, the
processes and subsequent goods movements can be influenced at
all times. After undergoing a large number of official tests and quality
inspections of our own, the seed is approved for sale. The seed is
packaged and certified in Germany under official control, for exam-
ple by the Chamber of Agriculture in Hanover. That ensures that only
tested seed with a high germination capacity and varietal purity is
put on the market. The “blue label” on the seed units indicates that
the seed is certified and of top quality.

Other disclosures
Disclosures in accordance with Sections 289 (4) and
(5) and 315 (4) of the German Commercial Code (HGB)
and the explanatory report of the Executive Board
Composition of the subscribed capital
The subscribed capital of KWS SAAT SE is
€19,800,000.00. It is divided into 6,600,000 bearer
shares. Each share grants the holder the right to cast
one vote at the Annual Shareholders’ Meeting.
Restrictions relating to voting rights
or the transfer of shares
There may be restrictions relating to voting rights
or the transfer of shares as a result of statutory or
contractual provisions. For example, shareholders are
barred from voting under certain conditions pursuant
to Section 136 of the German Stock Corporation Act
(AktG) or Section 28 of the German Securities Trading
Act (WpHG). In addition, no voting rights accrue to the
company on the basis of the shares it holds (Section
71b AktG). The Executive Board is not aware of any
contractual restrictions relating to voting rights or
transfer of shares. If there are no restrictions to voting
rights, all shareholders who register for the Annual
Shareholders’ Meeting in time and have submitted
proof of their authorization to participate in the Annual
Shareholders’ Meeting and exercise their voting rights
are authorized to exercise the voting rights conferred
by all the shares they hold and have registered. If
members of the Executive Board or executive em-
ployees have acquired shares as part of the long-term
incentive programs, these shares are subject to a
lock-up period until the end of the fifth year after the
end of the quarter in which they were acquired. The
lock-up period for shares that employees have ac-
quired as part of the Employee Share Programs runs
until the end of the fourth year as of when they are
posted to the employee’s securities account.
Direct and indirect participating interests in
excess of 10% of the voting rights
The company has been informed by shareholders of
the following direct or indirect participating interests
in the capital of KWS SAAT SE in excess of 10% of
the voting rights in accordance with Section 21 and
Section 22 of the German Securities Trading Act
(WpHG) or elsewhere:
The voting shares, including mutual allocations,
of the members and companies of the families
Büchting, Arend Oetker and Giesecke listed below
each exceed 10% and total 56.1%:
■■ Dr. Drs. h.c. Andreas J. Büchting, Germany■■ Christiane Stratmann, Germany■■ Dorothea Schuppert, Germany■■ Michael C.-E. Büchting, Germany■■ Annette Büchting, Germany■■ Stephan O. Büchting, Germany■■ Elke Giesecke, Germany■■ Christa Nagel, Germany■■ Bodo Sohnemann, Germany■■ Matthias Sohnemann, Germany■■ Malte Sohnemann, Germany■■ Arne Sohnemann, Germany■■ AKB Stiftung, Hanover■■ Büchting Beteiligungsgesellschaft mbH, Hanover■■ Zukunftsstiftung Jugend, Umwelt und Kultur,
Einbeck■■ Dr. Arend Oetker, Germany■■ Kommanditgesellschaft Dr. Arend Oetker
Vermögensverwaltungsgesellschaft mbH & Co.,
Berlin
The voting shares, including mutual allocations, of
the shareholders stated below each exceed 10% and
total 15.1%:
■■ Hans-Joachim Tessner, Germany■■ Tessner Beteiligungs GmbH, Goslar ■■ Tessner Holding KG, Goslar
Shares with special rights and voting control
Shares with special rights that grant powers of con-
trol have not been issued by the company.
There is no special type of voting control for the par-
ticipating interests of employees. Employees who
have an interest in the company’s capital exercise their
control rights in the same way as other shareholders.
68 Combined Management Report | Other disclosures Annual Report 2014/2015 | KWS Group

Appointment and removal of members
of the Executive Board
Members of the Executive Board of KWS SAAT SE are
appointed and removed in accordance with Article 9 (1)
and Article 39 (2) of the Council Regulation on the Stat-
ute for a European Company (SE Regulation), Article 46
of the Council Regulation on the Statute for a Euro-
pean Company (SE Regulation) and Sections 84 and
85 AktG (German Stock Corporation Act). Section 6 of
KWS SAAT SE’s Articles of Association also contains
provisions that relate to the appointment of members
of the Executive Board by the Supervisory Board and
that correspond to the statutory regulations.
Amendments to the Articles of Association
The company’s Articles of Association can be amend-
ed by a resolution adopted by the Shareholders’
Meeting in accordance with Article 59 of the Council
Regulation on the Statute for a European Company
(SE Regulation) and Section 179 (a) AktG (German
Stock Corporation Act). In accordance with Article 59
of the Council Regulation on the Statute for a Euro-
pean Company (SE Regulation), Section 179 (1) AktG
(German Stock Corporation Act) and Section 18 of
the Articles of Association of KWS SAAT SE, amend-
ments to the Articles of Association require that at
least half the capital stock be represented and that a
resolution be adopted by the Shareholders’ Meeting
by a simple majority of the capital stock represented
in adoption of the resolution, unless obligatory stat-
utory regulations specify otherwise; if at least half
the capital stock is not represented in adoption of
the resolution to amend the Articles of Association,
the resolution must be passed with a majority of at
least two-thirds of the votes cast. The power to make
amendments to the Articles of Association that only
affect the wording (Section 179 (1) Sentence 2 AktG)
has been conferred on the Supervisory Board in ac-
cordance with Section 22 of the Articles of Associa-
tion of KWS SAAT SE.
Powers of the Executive Board, in particular in
relation to issuing or buying back shares
The Executive Board is not currently authorized to
issue or buy back shares.
Significant agreements in the event of a change
of control, compensation agreements
Significant agreements subject to the condition of a
change in control pursuant to a takeover bid have not
been concluded. The compensation agreements
between the company and members of the Executive
Board and governing the case of a change in control
stipulate that any such compensation will be limited
to the applicable maximum amounts specified by the
German Corporate Governance Code.
Declaration regarding Corporate Governance
The declaration on corporate governance in accor-
dance with Section 289a of the German Commercial
Code (HGB) (which is also the Corporate Governance
Report) is available on our website at www.kws.com
> Company > Investor Relations > Corporate
Governance. Among other things, it contains the dec-
laration in accordance with Section 161 of the German
Stock Corporation Act (AktG) (declaration of compli-
ance), which is also reproduced on page 20/21 of this
report, relevant disclosures on corporate governance
practices and a description of the working practices of
the Executive Board and the Supervisory Board.
Compensation Report
The compensation report contains explanations
on the salient features, structure and level of the
compensation paid to members of the Executive
Board and the Supervisory Board. It is based on the
relevant statutory provisions and takes into account
the pertinent recommendations of the German
Corporate Governance Code.
Compensation for members of
the Supervisory Board
The Supervisory Board’s compensation was set by the
Annual Shareholders’ Meeting on December 17, 2009,
and has remained unchanged since then. It is based
on the size of the company, the duties and responsibil-
ities of the members of the Supervisory Board and the
company’s economic situation. The remuneration in-
cludes not only a fixed payment of €28 thousand p. a.
and a fixed payment for work on committees, but also
a performance-related component. This component is
69Other disclosures | Combined Management ReportKWS Group | Annual Report 2014/2015

geared toward the company’s long-term development.
In keeping with that, members of the Supervisory
Board receive €400 for each full €0.10 by which the
average consolidated annual earnings per share be-
fore minority interests for the past three fiscal years,
starting with the fiscal year for which the compensa-
tion is granted and calculated backward, exceeds the
amount of €4.00. The performance-related payment
is limited to the amount of the fixed payment.
Supervisory Board compensation
in € FixedWork on
committeesPerformance-
related2014/2015
TotalPrevious year
Total
Dr. Andreas J. Büchting 1 84,000.00 0.00 84,000.00 168,000.00 168,000.00
Dr. Arend Oetker 2 42,000.00 0.00 42,000.00 84,000.00 84,000.00
Hubertus von Baumbach 3 28,000.00 25,000.00 28,000.00 81,000.00 81,000.00
Jürgen Bolduan 28,000.00 10,000.00 28,000.00 66,000.00 66,000.00
Cathrina Claas-Mühlhäuser 28,000.00 5,000.00 28,000.00 61,000.00 61,000.00
Dr. Berthold Niehoff 28,000.00 0.00 28,000.00 56,000.00 56,000.00
238,000.00 40,000.00 238,000.00 516,000.00 516,000.00
1 Chairman2 Deputy Chairman3 Chairman of the Audit Committee
The Chairman of the Supervisory Board receives
three times and his or her deputy one-and-a-half
times the fixed compensation of an ordinary mem-
ber. There is currently no extra compensation for
them for work on committees. The Chairman of the
Audit Committee receives €25 thousand p. a. Or-
dinary members of the Supervisory Board receive
€5 thousand p. a. for their work on the Committee
for Executive Board Affairs and €10 thousand p. a.
for their work on the Audit Committee. The mem-
bers of the Supervisory Board are reimbursed for
all expenses – including value-added tax – that they
incur while carrying out the duties of their position.
The compensation for the Supervisory Board in the
year under review was unchanged over the previ-
ous year. Total compensation was €516 thousand
exclusive of value-added tax. In all, 46% (46%) or
€238 (238) thousand of the total compensation is
performance-related.
Compensation for members of the
Executive Board
The compensation of members of the Executive Board
was set by the Supervisory Board and approved by the
Annual Shareholders’ Meeting. It is based on the size
and activity of the company, its economic and financial
situation and the level and structure of compensa-
tion for managing board members at comparable
companies.
The “total compensation” of the Executive Board
comprises five components:
1. A basic fixed annual salary
2. A variable payment in the form of a
performance-related bonus
3. A variable payment in the form of a long-term
incentive (LTI) based on the KWS stock price
4. Any special payments
5. Other remuneration and pension awards.
70 Combined Management Report | Other disclosures Annual Report 2014/2015 | KWS Group

The total compensation of every member of the
Executive Board is limited individually to an overall
amount that can be achieved.
Additional payments for any duties performed in
subsidiaries and associated companies are offset
against the variable payment (performance-related
bonus). This – including the other remuneration – is
limited to an amount of €500 thousand or, in the case
of Dr. Peter Hofmann, to €300 thousand per fiscal
year. If sustainable average net incomes of more than
€100 million in each year are generated in two succes-
sive years, the upper limit for the bonus is increased to
€600 thousand for each Executive Board member as
of the following fiscal year. The increase in the upper
limit for the bonus does not yet apply to the Executive
Board member Dr. Peter Hofmann.
The basic annual salary in the year under review for
Philip von dem Bussche until he left at the end of
2014 was still €216 thousand, that for the Executive
Board members Dr. Hagen Duenbostel, Dr. Leon
Broers and Eva Kienle was €300 thousand, and that
for Dr. Peter Hofmann was €250 thousand. New regu-
lations on the compensation for Dr. Peter Hofmann
have been agreed on as of fiscal 2015/2016 and will
raise his basic salary to the level of the other Executive
Board members. Consequently, the limit on his bonus
and total compensation will be adjusted to €500 thou-
sand and €1,247 thousand respectively per fiscal year.
The Chief Executive Officer receives an extra “CEO
bonus” of 25% on top of the basic annual salary. The
basic compensation is paid as a monthly salary.
The variable payment for Executive Board members
depends on the Company’s performance over three
years. It is calculated on the basis of a linear percent-
age of the average net income of the KWS Group for
the past three fiscal years.
There has also been a stock-based bonus system in-
tended to act as a long-term incentive since fiscal year
2010/2011. Every member of the Executive Board is
obligated to invest a freely selectable amount ranging
between at least 20% and at most 50% of the gross
performance-related bonus payment in shares of
KWS SAAT SE. The long-term incentive (LTI) is paid in
the form of cash compensation after a holding period
of five years. This payment is calculated on the basis
of the share’s performance over the holding period
and on the average return on sales (ROS, based on
segment reporting), measured as the ratio of operat-
ing income to net sales. For persons with contracts as
of July 1, 2014, the LTI payment is limited to a maxi-
mum of 1.5 times (2 times for Dr. Hagen Duenbostel)
of the capital used to acquire the shares. Due to his
leaving the Executive Board, Philip von dem Bussche
took part in the LTI program by acquiring shares for
the last time in January 2015.
Additional special payments were not granted to
the members of the Executive Board in the past
fiscal year.
Apart from these salaries, there is also non-monetary
compensation, such as a company car or a phone, as
fringe benefits. There are also accident insurance pol-
icies for the members of the Executive Board. Pension
obligations are granted both in the form of a direct
obligation to provide benefits and a defined contribu-
tion plan, with the annual anticipated pensions ranging
at present between €13 thousand and €130 thousand.
In fiscal 2014/2015, €279 (108) thousand was paid to
a provident fund backed by a guarantee for pension
commitments to members of the Executive Board.
€143 (115) thousand was allocated to the pension pro-
visions in accordance with IAS 19. Pension provisions
totaling €960 (588) thousand were formed for the
members of the Executive Board of KWS SAAT SE.
Pension commitments
in € 06/30/2015 06/30/2014
Transition from individual commitments to
the Executive BoardInterest
expensesRevaluation
effects
Dr. Hagen Duenbostel 682,379.00 587,861.00 0.00 17,048.00 77,470.00
Dr. Peter Hofmann 278,114.00 229,766.00 6,663.00 41,685.00
960,493.00 587,861.00 229,766.00 23,711.00 119,155.00
71Other disclosures | Combined Management ReportKWS Group | Annual Report 2014/2015
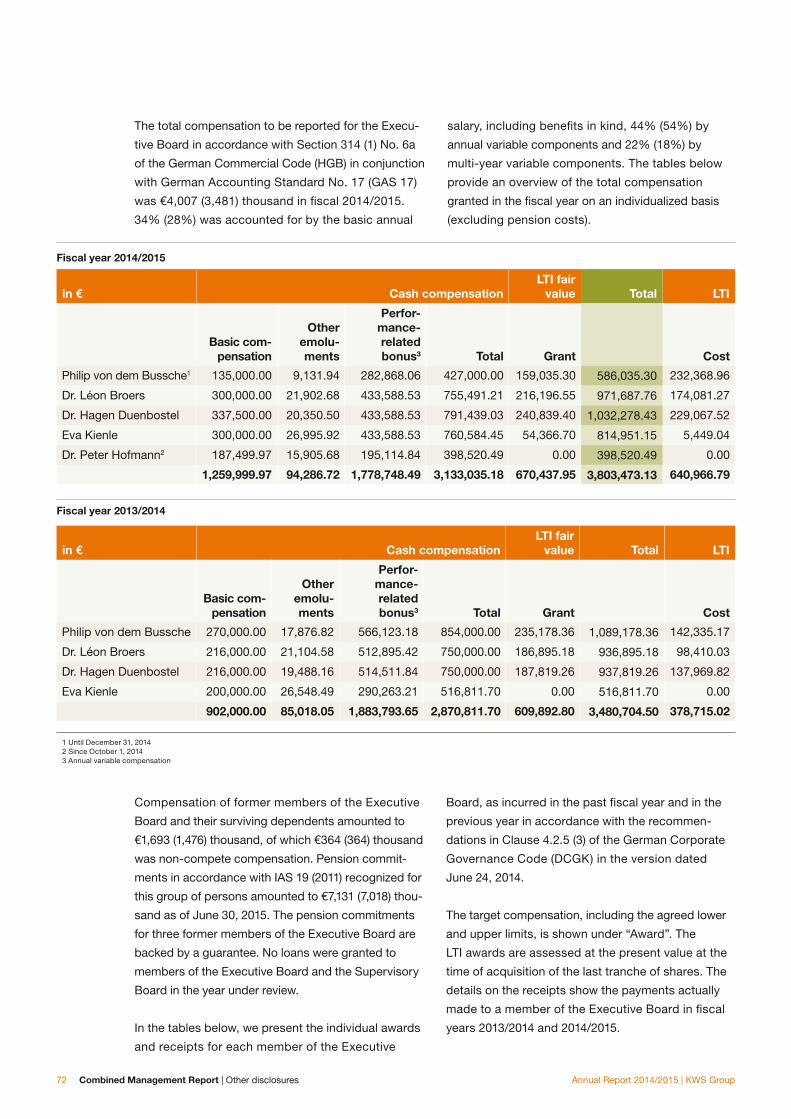
The total compensation to be reported for the Execu-
tive Board in accordance with Section 314 (1) No. 6a
of the German Commercial Code (HGB) in conjunction
with German Accounting Standard No. 17 (GAS 17)
was €4,007 (3,481) thousand in fiscal 2014/2015.
34% (28%) was accounted for by the basic annual
Fiscal year 2014/2015
in € Cash compensation LTI fair
value Total LTI
Basic com-pensation
Otheremolu-ments
Perfor-mance- related bonus3 Total Grant Cost
Philip von dem Bussche1 135,000.00 9,131.94 282,868.06 427,000.00 159,035.30 586,035.30 232,368.96
Dr. Léon Broers 300,000.00 21,902.68 433,588.53 755,491.21 216,196.55 971,687.76 174,081.27
Dr. Hagen Duenbostel 337,500.00 20,350.50 433,588.53 791,439.03 240,839.40 1,032,278.43 229,067.52
Eva Kienle 300,000.00 26,995.92 433,588.53 760,584.45 54,366.70 814,951.15 5,449.04
Dr. Peter Hofmann2 187,499.97 15,905.68 195,114.84 398,520.49 0.00 398,520.49 0.00
1,259,999.97 94,286.72 1,778,748.49 3,133,035.18 670,437.95 3,803,473.13 640,966.79
Fiscal year 2013/2014
in € Cash compensation LTI fair
value Total LTI
Basic com-pensation
Otheremolu-ments
Perfor-mance- related bonus3 Total Grant Cost
Philip von dem Bussche 270,000.00 17,876.82 566,123.18 854,000.00 235,178.36 1,089,178.36 142,335.17
Dr. Léon Broers 216,000.00 21,104.58 512,895.42 750,000.00 186,895.18 936,895.18 98,410.03
Dr. Hagen Duenbostel 216,000.00 19,488.16 514,511.84 750,000.00 187,819.26 937,819.26 137,969.82
Eva Kienle 200,000.00 26,548.49 290,263.21 516,811.70 0.00 516,811.70 0.00
902,000.00 85,018.05 1,883,793.65 2,870,811.70 609,892.80 3,480,704.50 378,715.02
1 Until December 31, 2014 2 Since October 1, 20143 Annual variable compensation
Compensation of former members of the Executive
Board and their surviving dependents amounted to
€1,693 (1,476) thousand, of which €364 (364) thousand
was non-compete compensation. Pension commit-
ments in accordance with IAS 19 (2011) recognized for
this group of persons amounted to €7,131 (7,018) thou-
sand as of June 30, 2015. The pension commitments
for three former members of the Executive Board are
backed by a guarantee. No loans were granted to
members of the Executive Board and the Supervisory
Board in the year under review.
In the tables below, we present the individual awards
and receipts for each member of the Executive
salary, including benefits in kind, 44% (54%) by
annual variable components and 22% (18%) by
multi-year variable components. The tables below
provide an overview of the total compensation
granted in the fiscal year on an individualized basis
(excluding pension costs).
Board, as incurred in the past fiscal year and in the
previous year in accordance with the recommen-
dations in Clause 4.2.5 (3) of the German Corporate
Governance Code (DCGK) in the version dated
June 24, 2014.
The target compensation, including the agreed lower
and upper limits, is shown under “Award”. The
LTI awards are assessed at the present value at the
time of acquisition of the last tranche of shares. The
details on the receipts show the payments actually
made to a member of the Executive Board in fiscal
years 2013/2014 and 2014/2015.
72 Combined Management Report | Other disclosures Annual Report 2014/2015 | KWS Group

Executive Board compensation
in € Grant Receipt
2014/2015Prevoius
year 2014/2015Prevoius
year
min. max.
Philip von dem Bussche (Chief Executive Officer until December 31, 2014)
Fixed payment 135,000.00 135,000.00 135,000.00 270,000.00 135,000.00 270,000.00
Fringe benefits 9,131.94 9,131.94 9,131.94 17,876.82 9,131.94 17,876.82
Subtotal1 144,131.94 135,000.00 144,131.94 287,876.82 144,131.94 287,876.82
Annual variable payment (performance-related bonus)3 282,868.06 0.00 282,868.06 566,123.18 282,868.06 566,123.18
Total cash compensation1 427,000.00 135,000.00 427,000.00 854,000.00 427,000.00 854,000.00
Multi-year variable payment
Long term incentive 2012/2013 235,178.36
Long term incentive 2013/2014 159,035.30 0.00 424,334.10
Subtotal1 586,035.30 135,000.00 851,334.10 1,089,178.36 427,000.00 854,000.00
Pension costs 2 0.00 0.00 0.00 0.00 0.00 0.00
Total Compensation1 586,035.30 135,000.00 851,334.10 1,089,178.36 427,000.00 854,000.00
Hagen Duenbostel (Chief Executive Officer as of January 1, 2015)
Fixed payment 337,500.00 337,500.00 337,500.00 216,000.00 337,500.00 216,000.00
Fringe benefits 20,350.50 20,350.50 20,350.50 19,488.16 20,350.50 19,488.16
Subtotal1 357,850.50 135,000.00 357,850.50 235,488.16 357,850.50 235,488.16
Annual variable payment (performance-related bonus)3 421,424.46 0.00 479,649.50 514,511.84 433,588.53 514,511.84
Total cash compensation1 779,274.96 135,000.00 837,500.00 750,000.00 791,439.03 750,000.00
Multi-year variable payment
Long term incentive 2012/2013 187,819.26
Long term incentive 2013/2014 240,839.40 0.00 642,601.80
Subtotal1 1,020,114.36 135,000.00 1,480,101.80 937,819.26 791,439.03 750,000.00
Pension costs 2 17,048.00 17,048.00 17,048.00 115,076.00 0.00 0.00
Total Compensation1 1,037,162.36 152,048.00 1,765,000.00 1,052,895.26 791,439.03 750,000.00
Léon Broers
Fixed payment 300,000.00 300,000.00 300,000.00 216,000.00 300,000.00 216,000.00
Fringe benefits 21,902.68 21,902.68 21,902.68 21,104.58 21,902.68 21,104.58
Subtotal1 321,902.68 135,000.00 321,902.68 237,104.58 321,902.68 237,104.58
Annual variable payment (performance-related bonus)3 421,424.46 0.00 478,097.32 512,895.42 433,588.53 512,895.42
Total cash compensation1 743,327.14 135,000.00 800,000.00 750,000.00 755,491.21 750,000.00
Multi-year variable payment
Long term incentive 2012/2013 186,895.18
Long term incentive 2013/2014 216,196.55 0.00 346,110.21
Subtotal1 959,523.69 135,000.00 1,146,110.21 936,895.18 755,491.21 750,000.00
Pension costs 2 0.00 0.00 0.00 0.00 0.00 0.00
Total Compensation1 959,523.69 135,000.00 1,547,000.00 936,895.18 755,491.21 750,000.00
1 Taking into account the agreed lower and upper limits. 2 In accordance with IAS 19 from commitments for pensions and other pension benefits; this relates to costs for the company, not the actual entitlement or payment.3 Annual variable compensation.
73Other disclosures | Combined Management ReportKWS Group | Annual Report 2014/2015

Executive Board compensation
in € Grant Receipt
2014/2015Prevoius
year 2014/2015Prevoius
year
min. max.
Eva Kienle
Fixed payment 300,000.00 300,000.00 300,000.00 200,000.00 300,000.00 200,000.00
Fringe benefits 26,995.92 26,995.92 26,995.92 26,548.49 26,995.92 26,548.49
Subtotal1 326,995.92 135,000.00 326,995.92 226,548.49 326,995.92 226,548.49
Annual variable payment (performance-related bonus)3 421,424.46 0.00 473,004.08 292,272.54 433,588.53 290,263.21
Total cash compensation1 748,420.38 135,000.00 800,000.00 518,821.03 760,584.45 516,811.70
Multi-year variable payment
Long term incentive 2012/2013 0.00
Long term incentive 2013/2014 54,366.70 0.00 87,035.94
Subtotal1 802,787.08 135,000.00 887,035.94 518,821.03 760,584.45 516,811.70
Pension costs 2 0.00 0.00 0.00 0.00 0.00 0.00
Total Compensation1 802,787.08 135,000.00 1,247,000.00 518,821.03 760,584.45 516,811.70
Peter Hofmann (since January 10, 2014)
Fixed payment 187,499.97 187,499.97 187,499.97 0.00 187,499.97 0.00
Fringe benefits 15,905.68 15,905.68 15,905.68 0.00 15,905.68 0.00
Subtotal1 203,405.65 135,000.00 203,405.65 0.00 203,405.65 0.00
Annual variable payment (performance-related bonus)3 189,641.01 0.00 209,094.32 0.00 195,114.84 0.00
Total cash compensation1 393,046.66 135,000.00 412,499.97 0.00 398,520.49 0.00
Multi-year variable payment
Long term incentive 2012/2013 0.00
Long term incentive 2013/2014 0.00 0.00 0.00
Subtotal1 393,046.66 135,000.00 412,499.97 0.00 398,520.49 0.00
Pension costs 2 6,663.00 6,663.00 6,663.00 0.00 0.00 0.00
Total Compensation1 399,709.66 141,663.00 635,250.00 0.00 398,520.49 0.00
1 Taking into account the agreed lower and upper limits. 2 In accordance with IAS 19 from commitments for pensions and other pension benefits; this relates to costs for the company, not the actual entitlement or payment.3 Annual variable compensation.
74 Combined Management Report | Other disclosures Annual Report 2014/2015 | KWS Group

Ann
ual F
inan
cial
Sta
tem
ents
76 Statement of comprehensive income
77 Balance sheet
78 Statement of changes in fixed assets
80 Statement of changes in equity
82 Cash flow statement
83 Notes for the KWS Group 2014/2015
88 1. General disclosures
94 2. Disclosures on the annual financial statements
97 3. Segment reporting for the KWS Group
101 4. Notes to the balance sheet
125 5. Notes to the income statement
132 6. Notes to the cash flow statement
132 7. Other notes
135 8. Declaration by legal representatives
136 Auditors’ Report
Annual Financial Statementsfor the KWS Group 2014/2015

Statement of comprehensive income
in € thousand Note no. 2014/2015 Previous year
I. Income statement
Net sales (20) 986,015 923,481
Cost of sales 453,498 429,272
Gross profit on sales 532,517 494,209
Selling expenses 188,991 170,024
Research & development expenses 174,627 149,382
General and administrative expenses 74,756 71,866
Other operating income (21) 87,960 58,107
Other operating expenses (22) 68,686 42,777
Operating income 113,417 118,267
Interest and similar income 1,621 1,717
Interest and similar expenses 12,401 14,428
Income from equity-accounted financial assets 23,747 20,208
Other net income from equity investments 3,722 0
Net financial income/expenses (23) 16,689 7,497
Results of ordinary activities 130,106 125,764
Taxes (24) 46,058 45,488
Net income for the year (27) 84,048 80,276
II. Other income (12)
Revaluation of available-for-sale financial assets –172 –161
Currency translation difference for economically independent foreign units 24,606 –14,915
Currency translation difference from equity-accounted financial assets 21,223 – 4,283
Items that may have to be subsequently reclassified as profit or loss 45,657 –19,359
Revaluation of net liabilities/assets from defined benefit plans – 8,956 – 5,878
Items not reclassified as profit or loss – 8,956 – 5,878
Other income after tax 36,701 – 25,237
III. Comprehensive income (total of I. and II.) 120,749 55,039
Net income after shares of minority interests 82,712 77,124
Share of minority interests 1,336 3,152
Net income for the year 84,048 80,276
Comprehensive income after shares of minority interests 120,282 51,992
Share of minority interests 467 3,047
Comprehensive income 120,749 55,039
Earnings per share (in €) 12.53 11.69
76 Annual Financial Statements | Statement of comprehensive income Annual Report 2014/2015 | KWS Group

Balance sheet
Assets
in € thousand Note no. 06/30/2015 06/30/2014
Intangible assets (2) 85,661 73,877
Property, plant and equipment (3) 351,856 283,893
Equity-accounted financial assets (4) 153,018 126,130
Financial assets (5) 2,465 2,700
Noncurrent tax assets (6) 3,976 4,189
Deferred tax assets (7) 54,319 47,935
Noncurrent assets 651,295 538,724
Inventories (8) 177,990 120,180
Biological assets (8) 12,344 12,568
Trade receivables (9) 309,665 297,780
Securities (10) 66,973 69,188
Cash and cash equivalents (11) 41,211 53,076
Current tax assets (9) 57,549 45,265
Other current financial assets (9) 26,758 14,883
Other current assets (9) 11,756 13,305
Current assets 704,246 626,245
Total assets 1,355,541 1,164,969
Equity and Liabilities
in € thousand Note no. 06/30/2015 06/30/2014
Subscribed capital 19,800 19,800
Capital reserve 5,530 5,530
Retained earnings 705,720 604,376
Minority interest 7,668 8,063
Equity (12) 738,718 637,769
Long-term provisions 110,641 98,951
Long-term borrowings 181,783 113,754
Trade payables 1,600 1,469
Deferred tax liabilities 28,095 26,165
Other noncurrent liabilities 12,756 12,676
Noncurrent liabilities (14) 334,875 253,015
Short-term provisions 87,355 74,825
Short-term borrowings 32,283 40,086
Trade payables 59,658 56,821
Current tax liabilities 30,111 35,426
Other current financial liabilities 15,952 11,617
Other current liabilities 56,589 55,410
Current liabilities (15) 281,948 274,185
Liabilities 616,823 527,200
Total equity and liabilities 1,355,541 1,164,969
Balance sheet | Annual Financial Statements 77KWS Group | Annual Report 2014/2015

Statement of changes in fixed assets
Fiscal year 2014/2015
in € thousand Gross book values Amortization/depreciation Net book values
Currency translation
Change in con
solidated companies Additions Disposals Transfers
Currency translation
Planned additions
Value impairments Disposals Transfers
Balance 07/01/2014
Balance 06/30/2015
Balance 07/01/2014
Balance 06/30/2015
Balance 06/30/2015
Balance 06/30/2014
Patents, industrial property rights and software
88,375
– 2,819
21,511
4,460
585
– 399
110,543
43,411
– 973
10,561
3,905
478
– 21 56,405
54,138
44,964
Goodwill 34,365 0 2,610 0 0 0 36,975 5,452 0 0 0 0 0 5,452 31,523 28,913
Intangible assets 122,740 – 2,819 24,121 4,460 585 – 399 147,518 48,863 – 973 10,561 3,905 478 – 21 61,857 85,661 73,877
Land and buildings 235,426 3,584 6,118 26,163 1,744 14,701 284,248 72,244 1,130 8,729 0 1,640 – 56 80,407 203,841 163,182
Technical equipment and machinery
173,546
1,193
6,017
23,741
2,582
9,295
211,210
108,178
298
13,563
0
1,962
84 120,161
91,049
65,368
Operating and office equipment
81,818
1,441
106
14,002
7,454
576
90,489
54,658
1,200
9,153
0
7,000
– 7 58,004
32,485
27,160
Payments on account 28,185 589 0 20,283 403 – 24,171 24,483 2 0 0 0 0 0 2 24,481 28,183
Property, plant and equipment 518,975 6,807 12,241 84,189 12,183 401 610,430 235,082 2,628 31,445 0 10,602 21 258,574 351,856 283,893
Equityaccounted financial assets
134,523
21,223
–13,278
31,100
12,157
0
161,411
8,393
0
0
0
0
0 8,393
153,018
126,130
Financial assets 3,048 –116 52 182 331 0 2,835 348 123 0 0 101 0 370 2,465 2,700
Assets 779,286 25,095 23,136 119,931 25,256 2 922,194 292,686 1,778 42,006 3,905 11,181 0 329,194 593,000 486,600
Fiscal year 2013/2014
in € thousand Gross book values Amortization/depreciation Net book values
Currency translation
Change in con
solidated companies Additions Disposals Transfers
Currency translation
Planned additions
Value impairments Disposals Transfers
Balance 07/01/2013
Balance 06/30/2014
Balance 07/01/2013
Balance 06/30/2014
Balance 06/30/2014
Balance 06/30/2013
Patents, industrial property rights and software
82,363
– 990
0
6,993
94
103
88,375
30,755
– 35
8,606
4,176
91
0 43,411
44,964
51,608
Goodwill 34,390 0 0 – 25 0 0 34,365 3,302 0 0 2,150 0 0 5,452 28,913 31,088
Intangible assets 116,753 – 990 0 6,968 94 103 122,740 34,057 – 35 8,606 6,326 91 0 48,863 73,877 82,696
Land and buildings 223,986 – 3,337 0 11,179 602 4,200 235,426 65,613 – 283 7,459 0 550 5 72,244 163,182 158,373
Technical equipment and machinery
161,970
– 2,272
0
12,923
2,300
3,225
173,546
100,646
– 974
11,023
0
1,821
– 696 108,178
65,368
61,324
Operating and office equipment
77,166
–1,539
0
8,857
4,741
2,075
81,818
51,262
– 814
7,792
0
4,272
690 54,658
27,160
25,904
Payments on account 10,180 – 297 0 28,056 151 – 9,603 28,185 2 0 0 0 0 0 2 28,183 10,178
Property, plant and equipment 473,302 – 7,445 0 61,015 7,794 –103 518,975 217,523 – 2,071 26,274 0 6,643 –1 235,082 283,893 255,779
Equityaccounted financial assets
128,883
– 4,283
0
21,183
11,272
12
134,523
8,393
0
0
0
0
0 8,393
126,130
120,490
Financial assets 1,738 – 6 0 1,423 95 –12 3,048 167 181 0 0 0 0 348 2,700 1,571
Assets 720,676 –12,724 0 90,589 19,255 0 779,286 260,140 –1,925 34,880 6,326 6,734 –1 292,685 486,600 460,536
78 Annual Financial Statements | Statement of changes in fixed assets Annual Report 2014/2015 | KWS Group

Statement of changes in fixed assets
Fiscal year 2014/2015
in € thousand Gross book values Amortization/depreciation Net book values
Currency translation
Change in con
solidated companies Additions Disposals Transfers
Currency translation
Planned additions
Value impairments Disposals Transfers
Balance 07/01/2014
Balance 06/30/2015
Balance 07/01/2014
Balance 06/30/2015
Balance 06/30/2015
Balance 06/30/2014
Patents, industrial property rights and software
88,375
– 2,819
21,511
4,460
585
– 399
110,543
43,411
– 973
10,561
3,905
478
– 21 56,405
54,138
44,964
Goodwill 34,365 0 2,610 0 0 0 36,975 5,452 0 0 0 0 0 5,452 31,523 28,913
Intangible assets 122,740 – 2,819 24,121 4,460 585 – 399 147,518 48,863 – 973 10,561 3,905 478 – 21 61,857 85,661 73,877
Land and buildings 235,426 3,584 6,118 26,163 1,744 14,701 284,248 72,244 1,130 8,729 0 1,640 – 56 80,407 203,841 163,182
Technical equipment and machinery
173,546
1,193
6,017
23,741
2,582
9,295
211,210
108,178
298
13,563
0
1,962
84 120,161
91,049
65,368
Operating and office equipment
81,818
1,441
106
14,002
7,454
576
90,489
54,658
1,200
9,153
0
7,000
– 7 58,004
32,485
27,160
Payments on account 28,185 589 0 20,283 403 – 24,171 24,483 2 0 0 0 0 0 2 24,481 28,183
Property, plant and equipment 518,975 6,807 12,241 84,189 12,183 401 610,430 235,082 2,628 31,445 0 10,602 21 258,574 351,856 283,893
Equityaccounted financial assets
134,523
21,223
–13,278
31,100
12,157
0
161,411
8,393
0
0
0
0
0 8,393
153,018
126,130
Financial assets 3,048 –116 52 182 331 0 2,835 348 123 0 0 101 0 370 2,465 2,700
Assets 779,286 25,095 23,136 119,931 25,256 2 922,194 292,686 1,778 42,006 3,905 11,181 0 329,194 593,000 486,600
Fiscal year 2013/2014
in € thousand Gross book values Amortization/depreciation Net book values
Currency translation
Change in con
solidated companies Additions Disposals Transfers
Currency translation
Planned additions
Value impairments Disposals Transfers
Balance 07/01/2013
Balance 06/30/2014
Balance 07/01/2013
Balance 06/30/2014
Balance 06/30/2014
Balance 06/30/2013
Patents, industrial property rights and software
82,363
– 990
0
6,993
94
103
88,375
30,755
– 35
8,606
4,176
91
0 43,411
44,964
51,608
Goodwill 34,390 0 0 – 25 0 0 34,365 3,302 0 0 2,150 0 0 5,452 28,913 31,088
Intangible assets 116,753 – 990 0 6,968 94 103 122,740 34,057 – 35 8,606 6,326 91 0 48,863 73,877 82,696
Land and buildings 223,986 – 3,337 0 11,179 602 4,200 235,426 65,613 – 283 7,459 0 550 5 72,244 163,182 158,373
Technical equipment and machinery
161,970
– 2,272
0
12,923
2,300
3,225
173,546
100,646
– 974
11,023
0
1,821
– 696 108,178
65,368
61,324
Operating and office equipment
77,166
–1,539
0
8,857
4,741
2,075
81,818
51,262
– 814
7,792
0
4,272
690 54,658
27,160
25,904
Payments on account 10,180 – 297 0 28,056 151 – 9,603 28,185 2 0 0 0 0 0 2 28,183 10,178
Property, plant and equipment 473,302 – 7,445 0 61,015 7,794 –103 518,975 217,523 – 2,071 26,274 0 6,643 –1 235,082 283,893 255,779
Equityaccounted financial assets
128,883
– 4,283
0
21,183
11,272
12
134,523
8,393
0
0
0
0
0 8,393
126,130
120,490
Financial assets 1,738 – 6 0 1,423 95 –12 3,048 167 181 0 0 0 0 348 2,700 1,571
Assets 720,676 –12,724 0 90,589 19,255 0 779,286 260,140 –1,925 34,880 6,326 6,734 –1 292,685 486,600 460,536
Statement of changes in fixed assets | Annual Financial Statements 79KWS Group | Annual Report 2014/2015

Statement of changes in equity
in € thousand Parent company Parent company Minority interest Group equity
Subscribed capital
Capital reserve
Accumulated group equity from
earningsComprehensive other
group incomeComprehensive other
group income Total Minority interest
Comprehensive other group income Total
Adjustments from currency
translation
Adjustments from currency translation of
equity- accounted
financial assets
Reserve for available-
for-sale financial
assets
Revaluation of defined
benefit plans
Other trans-actions
Adjustments from currency
translation
Revaluation of defined
benefit plans
Other trans-
actions
Balance as at July 1, 2013 19,800 5,530 624,531 – 7,300 – 7,010 230 –18,492 594 617,883 33,227 –1,036 – 425 – 4 31,762 649,645
Dividends paid – 19,800 –19,800 –1,328 –1,328 – 21,128
Net income for the year 77,124 77,124 3,152 3,152 80,276
Other income after tax –14,930 – 4,283 –161 – 5,758 – 25,132 15 –120 –105 – 25,237
Total consolidated gains (losses) 77,124 –14,930 – 4,283 –161 – 5,758 51,992 3,152 15 –120 3,047 55,039
Change in shares of minority interests
–19,559
– 545
– 20,104
– 25,963
545
– 25,418
– 45,522
Other changes –265 – 265 – 265
Balance as at June 30, 2014 19,800 5,530 662,031 – 22,230 –11,293 69 – 24,795 594 629,706 9,088 –1,021 0 – 4 8,063 637,769
Dividends paid –19,800 –19,800 0 0 –19,800
Net income for the year 82,712 82,712 1,336 1,336 84,048
Other income after tax 0 25,463 21,223 –160 – 8,956 37,570 – 857 –12 –869 36,701
Total consolidated gains (losses) 82,712 25,463 21,223 –160 – 8,956 120,282 1,336 – 857 0 –12 467 120,749
Change in shares of minority interests 0 0 862
862 –862
–862
0
Other changes 0 0 0
Balance as at June 30, 2015 19,800 5,530 724,943 3,233 9,930 – 91 – 33,751 1,456 731,050 10,424 –1,878 0 – 878 7,668 738,718
80 Annual Financial Statements | Statement of changes in equity Annual Report 2014/2015 | KWS Group
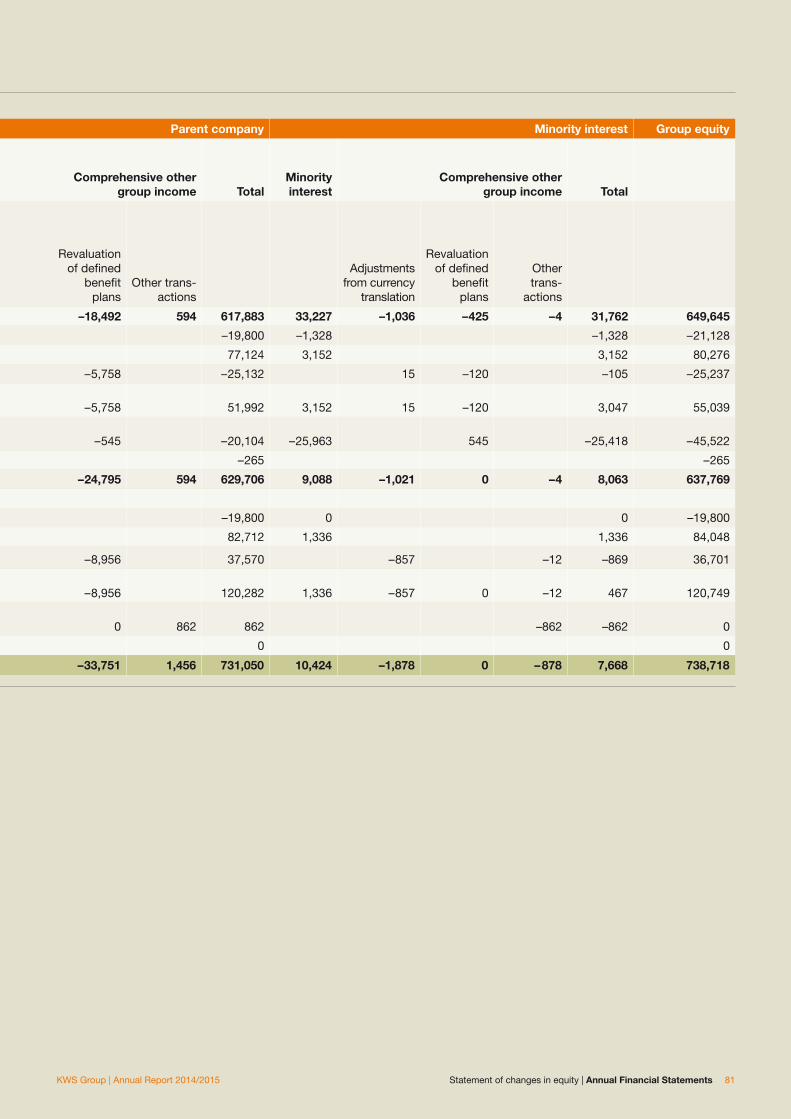
Statement of changes in equity
in € thousand Parent company Parent company Minority interest Group equity
Subscribed capital
Capital reserve
Accumulated group equity from
earningsComprehensive other
group incomeComprehensive other
group income Total Minority interest
Comprehensive other group income Total
Adjustments from currency
translation
Adjustments from currency translation of
equity- accounted
financial assets
Reserve for available-
for-sale financial
assets
Revaluation of defined
benefit plans
Other trans-actions
Adjustments from currency
translation
Revaluation of defined
benefit plans
Other trans-
actions
Balance as at July 1, 2013 19,800 5,530 624,531 – 7,300 – 7,010 230 –18,492 594 617,883 33,227 –1,036 – 425 – 4 31,762 649,645
Dividends paid – 19,800 –19,800 –1,328 –1,328 – 21,128
Net income for the year 77,124 77,124 3,152 3,152 80,276
Other income after tax –14,930 – 4,283 –161 – 5,758 – 25,132 15 –120 –105 – 25,237
Total consolidated gains (losses) 77,124 –14,930 – 4,283 –161 – 5,758 51,992 3,152 15 –120 3,047 55,039
Change in shares of minority interests
–19,559
– 545
– 20,104
– 25,963
545
– 25,418
– 45,522
Other changes –265 – 265 – 265
Balance as at June 30, 2014 19,800 5,530 662,031 – 22,230 –11,293 69 – 24,795 594 629,706 9,088 –1,021 0 – 4 8,063 637,769
Dividends paid –19,800 –19,800 0 0 –19,800
Net income for the year 82,712 82,712 1,336 1,336 84,048
Other income after tax 0 25,463 21,223 –160 – 8,956 37,570 – 857 –12 –869 36,701
Total consolidated gains (losses) 82,712 25,463 21,223 –160 – 8,956 120,282 1,336 – 857 0 –12 467 120,749
Change in shares of minority interests 0 0 862
862 –862
–862
0
Other changes 0 0 0
Balance as at June 30, 2015 19,800 5,530 724,943 3,233 9,930 – 91 – 33,751 1,456 731,050 10,424 –1,878 0 – 878 7,668 738,718
Statement of changes in equity | Annual Financial Statements 81KWS Group | Annual Report 2014/2015

Cash flow statement
in € thousand Note no. 2014/2015 Previous year
Net income for the year 84,048 80,276
Depreciation/reversal of impairment losses (–) on property, plant and equipment
45,911
41,206
Increase/decrease (–) in long-term provisions –1,192 1,631
Other noncash expenses/income (–) – 36,704 – 38,159
Cash earnings 92,063 84,954
Increase/decrease (–) in short-term provisions 14,027 25,567
Net gain (–)/loss from the disposal of assets –160 – 92
Increase (–)/decrease in inventories, trade receivables, and other assets not attributable to investing or financing activities
– 72,809
– 62,626
Increase/decrease (–) in trade payables and other liabilities not attributable to investing or financing activities
2,841
16,932
Proceeds and payments (+) from/for equity-accounted companies 12,157 11,272
Net cash from operating activities (1) 48,119 76,007
Proceeds from disposals of property, plant and equipment 1,741 1,244
Payments (–) for capital expenditure on property, plant and equipment – 82,108 – 56,485
Proceeds from disposals of intangible assets 107 2
Payments (–) for capital expenditure on intangible assets – 4,468 – 7,071
Proceeds from disposals of financial assets 229 95
Payments (–) for capital expenditure on financial assets – 7,535 – 874
Payments (–) for purchase of shares in consolidated subsidiaries and other business units
– 31,727
0
Net cash from investing activities (2) –123,761 – 63,089
Dividend payments (–) to owners and minority shareholders –19,800 – 66,915
Cash proceeds from long-term borrowings 103,678 46,265
Cash repayments of long-term borrowings – 30,907 – 32,902
Changes from proceeds (+)/repayments (–) of short-term borrowings – 4,573 9,994
Net cash from financing activities (3) 48,398 – 43,558
Net cash changes in cash and cash equivalents – 27,244 – 30,640
Changes in cash and cash equivalents due to exchange rate, consolidated group, and measurement changes
13,164
– 2,909
Cash and cash equivalents at beginning of year 122,264 155,813
Cash and cash equivalents at end of year (4) 108,184 122,264
82 Annual Financial Statements | Cash flow statement Annual Report 2014/2015 | KWS Group

The KWS Group (KWS Konzern) is a consolidated group as
defined in the International Financial Reporting Standards
(IFRS) published by the International Accounting Standards
Board (IASB), London, taking into account the interpreta-
tions of the International Financial Reporting Interpreta-
tions Committee (IFRIC) and in addition the commercial
law regulations to be applied pursuant to Section 315 a (1)
of the HGB (German Commercial Code).
KWS SAAT SE is an international company based in
Germany and has its headquarters at Grimsehlstrasse 31,
37574 Einbeck, Germany.
The statements were prepared under the assumption that
the operations of the company will be continued.
The accounting and measurement methods have generally
been retained without change, except for the changes re-
sulting from the new accounting standards IAS 27 (2011),
IAS 28 (2011), IFRS 10, IFRS 11 and IFRS 12.
Unless otherwise stated, all the figures in the Notes are in
thousands of euros (€ thousand) and have been rounded in
accordance with standard commercial practice.
IAS 27 (2011), IAS 28 (2011), IFRS 10, IFRS 11 and
IFRS 12 – Consolidation
IFRS 10 “Consolidated Financial Statements” introduces a
model where control is the single basis for consolidation of
all types of entities. Under the new concept, control exists
when the following three criteria are cumulatively fulfilled:
The potential parent company has power over the potential
subsidiary due to voting rights or other rights, it has the right
to variable returns from the subsidiary and it has the ability
to use its power to affect the amount of these returns.
First-time application of IFRS 10 did not result in any
changes to the companies consolidated in the KWS Group.
IFRS 10 supersedes the previous regulations of IAS 27
“Consolidated and Separate Financial Statements” and
SIC-12 “Consolidation – Special Purpose Entities”.
IFRS 11 “Joint Arrangements” supersedes the previous
regulations of IAS 31, “Interests in Joint Ventures”, and SIC-13,
“Jointly Controlled Entities – Non-monetary Contributions by
Venturers”. IFRS 11 governs the financial reporting of joint
arrangements and prescribes only the equity method for
consolidation of joint ventures. Application of IFRS 11 had
significant impacts on the consolidated financial statements
of the KWS Group.
IFRS 12 contains more extensive disclosure requirements
in connection with subsidiaries, joint ventures, associated
companies and unconsolidated structured companies.
IAS 27 (2011) and IAS 28 (2011) are subsequent amendments
of the new IFRS 10, IFRS 11 and IFRS 12.
There are significant changes for the KWS Group in particular
from application of IFRS 11, since for the first time in
fiscal 2014/2015 the consolidated financial statements no
longer include the proportionate income, expenses, assets,
liabilities and cash flows of the joint ventures AGRELIANT
GENETICS LLC., Westfield, U.S., AGRELIANT GENETICS
INC., Chatham, Canada, and GENECTIVE S.A., Chappes,
France (as well as SOCIETE DE MARTINVAL S.A. in the
previous year).
These new standards were applied for the first time in com-
pliance with the specific transitional provisions.
The new standards on consolidation must be applied for the
first time retrospectively. Consequently, the comparative
figures for the previous year have been adjusted accordingly.
The reconciliation and breakdown of the assets and lia-
bilities for all joint ventures (AGRELIANT GENETICS LLC.,
AGRELIANT GENETICS INC., GENECTIVE S.A. and SOCIE-
TE DE MARTINVAL S.A.) as part of the transition from pro-
portionate accounting to the equity method in accordance
with IAS 8 is as follows for the balance sheets of the pre
vious years:
Notes for the KWS Group 2014/2015
Notes for the KWS Group 2014/2015 | Annual Financial Statements 83KWS Group | Annual Report 2014/2015

Changes to IFRS 11 – Balance sheet
in € thousand06/30/2014(adjusted)
Adjustment(application of IFRS 11)
06/30/2014(before
adjustment)07/01/2013(adjusted)
Adjustment(application of IFRS 11)
07/01/2013(before
adjustment)
Assets
Intangible assets 73,877 – 25,926 99,803 82,696 –19,170 101,866
Property, plant and equipment 283,893 – 38,054 321,947 255,779 – 31,844 287,623
Equity-accounted financial assets
126,130
126,130
0
121,475
121,475
0
Financial assets 2,700 – 74 2,774 4,014 – 3,291 7,305
Noncurrent tax assets 4,189 0 4,189 5,719 0 5,719
Deferred tax assets 47,935 –121 48,056 37,133 – 7,816 44,949
Noncurrent assets 538,724 61,955 476,769 506,816 59,354 447,462
Inventories 120,180 – 60,240 180,420 102,800 – 30,336 133,136
Biological assets 12,568 0 12,568 11,316 0 11,316
Trade receivables 297,780 – 63,796 361,576 288,507 – 71,360 359,867
Securities 69,188 – 7,524 76,712 95,345 – 5,533 100,878
Cash and cash equivalents 53,076 – 25,185 78,261 60,468 – 41,049 101,517
Current tax assets 45,265 – 344 45,609 24,385 0 24,385
Other current financial assets 14,883 – 998 15,881 25,871 – 716 26,587
Other current assets 13,305 –1,728 15,033 11,633 –1,902 13,535
Current assets 626,245 –159,815 786,060 620,325 –150,896 771,221
Total assets 1,164,969 – 97,860 1,262,829 1,127,141 – 91,542 1,218,683
Equity and Liabilities
Subscribed capital 19,800 0 19,800 19,800 0 19,800
Capital reserve 5,530 0 5,530 5,530 0 5,530
Retained earnings 604,376 0 604,376 592,553 0 592,553
Minority interest 8,063 –10 8,073 31,762 0 31,762
Equity 637,769 –10 637,779 649,645 0 649,645
Long-term provisions 98,951 – 683 99,634 84,262 – 6,127 90,389
Long-term borrowings 113,754 0 113,754 98,461 1 98,460
Trade payables 1,469 –1 1,470 1,697 0 1,697
Deferred tax liabilities 26,165 –167 26,332 29,530 –165 29,695
Other noncurrent liabilities 12,676 – 288 12,964 9,076 1 9,075
Noncurrent liabilities 253,015 –1,139 254,154 223,026 – 6,290 229,316
Short-term provisions 74,825 – 57,016 131,841 79,252 – 52,098 131,350
Short-term borrowings 40,086 –13,271 53,357 26,161 – 7,098 33,259
Trade payables 56,821 – 24,290 81,111 63,930 –18,816 82,746
Current tax liabilities 35,426 – 41 35,467 31,930 1 31,929
Other current financial liabilities 11,617 – 574 12,191 11,833 0 11,833
Other current liabilities 55,410 –1,519 56,929 41,364 – 7,241 48,605
Current liabilities 274,185 – 96,711 370,896 254,470 – 85,252 339,722
Liabilities 527,200 – 97,850 625,050 477,496 – 91,542 569,038
Total equity and liabilities 1,164,969 – 97,860 1,262,829 1,127,141 – 91,542 1,218,683
84 Annual Financial Statements | Notes for the KWS Group 2014/2015 Annual Report 2014/2015 | KWS Group

The statement of comprehensive income for fiscal year
2013/2014 and reconciliation of it pursuant to first-time
application of IFRS 11 can be seen from the table below:
Statement of comprehensive income
in € thousand2013/2014(adjusted)
Adjustment(application of
IFRS 11)
2013/2014(before
adjustment)
I. Income statement
Net sales 923,481 – 254,526 1,178,007
Cost of sales 429,272 –185,256 614,528
Gross profit on sales 494,209 – 69,270 563,479
Selling expenses 170,024 – 33,928 203,952
Research & development expenses 149,382 561 148,821
General and administrative expenses 71,866 – 4,875 76,741
Other operating income 58,107 – 2,565 60,672
Other operating expenses 42,777 – 13,428 56,205
Operating income 118,267 – 20,165 138,432
Interest and similar income 1,717 – 193 1,910
Interest and similar expenses 14,428 – 40 14,468
Income from equity-accounted financial assets 20,208 20,208 0
Other net income from equity investments 0 – 7 7
Net financial income/expenses 7,497 20,048 – 12,551
Results of ordinary activities 125,764 –117 125,881
Taxes 45,488 –107 45,595
Net income for the year 80,276 –10 80,286
II. Other comprehensive income
Revaluation of available-for-sale financial assets –161 0 –161
Currency translation difference for economically independent foreign units
–14,915
4,283
–19,198
Currency translation difference from equity-accounted financial assets
– 4,283
– 4,283
0
Items that may have to be subsequently reclassified as profit or loss
–19,359
0
–19,359
Revaluation of net liabilities/assets from defined benefit plans
– 5,878
0
– 5,878
Items not reclassified as profit or loss – 5,878 0 – 5,878
Other comprehensive income after tax – 25,237 0 – 25,237
III. Comprehensive income (total of I. and II.) 55,039 – 10 55,049
Net income for the year 80,276 – 10 80,286
Net income after shares of minority interests 77,124 0 77,124
Share of minority interests 3,152 –10 3,162
Comprehensive income 55,039 –10 55,049
Comprehensive income after shares of minority interests 51,992 0 51,992
Share of minority interests 3,047 –10 3,057
Earnings per share (in €) 11.69 0.00 11.69
Notes for the KWS Group 2014/2015 | Annual Financial Statements 85KWS Group | Annual Report 2014/2015

In addition, the way in which amortization of and impairment
losses on intangible assets acquired as part of business
combinations are presented in the income statement has
changed. In previous periods they were carried as other
operating expenses. In the current fiscal year, they are
allocated to the relevant function costs. The figures for the
previous year have been adjusted accordingly. For the pre-
vious year, that means that other operating expenses fell
by €9,442 thousand, selling expenses increased by €8,306
thousand and research & development costs increased by
€1,136 thousand. The effects of the change in presentation
are summarized in the table relating to the adjustments pur-
suant to first-time application of IFRS 11. This change in pre-
sentation did not have any impact on balance sheet items.
The table below presents reconciliation of the cash flow
statement for the previous year pursuant to first-time
application of IFRS 11:
Cash flow statement
in € thousand2013/2014(adjusted)
Adjustment(application of
IFRS 11)
2013/2014(before ad
justment)
Net income for the year 80,276 –10 80,286
Depreciation/reversal of impairment losses (–) on property, plant and equipment
41,206
– 4,586
45,792
Increase/decrease (–) in long-term provisions 1,631 208 1,423
Other noncash expenses/income (–) – 38,159 – 21,059 –17,100
Cash earnings 84,954 – 25,446 110,400
Increase/decrease (–) in short-term provisions 25,567 4,936 20,631
Net gain (–)/loss from the disposal of assets –92 54 –146
Increase (–)/decrease in inventories, trade receivables, and other assets not attributable to investing or financing activities
– 62,626
28,255
– 90,881
Increase/decrease (–) in trade payables and other liabilities not attributable to investing or financing activities
16,932
–4,082
21,014
Proceeds and payments (+) from/for equity-accounted companies 11,272 11,272 0
Net cash from operating activities 76,007 14,989 61,018
Proceeds from disposals of property, plant and equipment 1,244 –117 1,361
Payments (–) for capital expenditure on property, plant and equipment – 56,485 9,976 – 66,461
Proceeds from disposals of intangible assets 2 0 2
Payments (–) for capital expenditure on intangible assets – 7,071 1,460 – 8,531
Proceeds from disposals of financial assets 95 –14 109
Payments (–) for capital expenditure on financial assets – 874 1,027 –1,901
Net cash from investing activities – 63,089 12,332 – 75,421
Dividend payments (–) to owners and minority shareholders – 66,915 0 – 66,915
Cash proceeds from long-term borrowings 46,265 –12,036 58,301
Cash repayments of long-term borrowings – 32,902 1 – 32,903
Changes from proceeds (+)/repayments (–) of short-term borrowings 9,994 0 9,994
Net cash from financing activities – 43,558 –12,035 – 31,523
Net cash changes in cash and cash equivalents – 30,640 15,286 – 45,926
Changes in cash and cash equivalents due to exchange rate,consolidated group, and measurement changes
– 2,909
–1,413
–1,496
Cash and cash equivalents at beginning of year 155,813 – 46,582 202,395
Cash and cash equivalents at end of year 122,264 – 32,709 154,973
86 Annual Financial Statements | Notes for the KWS Group 2014/2015 Annual Report 2014/2015 | KWS Group

Use is made of the exemption specified in IFRS 11.C1B in
conjunction with IAS 8.28.
In addition, the following standards had to be applied for the
first time in fiscal year 2014/2015:
■■ Amendments to IAS 32 – Financial Instruments: Presenta-
tion: Offsetting Financial Assets and Financial Liabilities■■ Amendments to IAS 36 – Impairment of Assets: Recover-
able Amount Disclosures for Non-Financial Assets■■ Amendments to IAS 39 – Financial Instruments:
Recognition and Measurement: Novation of Derivatives
and Continuation of Hedge Accounting■■ IFRIC 21 – Levies
The new standards and interpretations to be applied did not
result in any significant impact.
The following standards and interpretations, or revisions of
standards or interpretations, were not applied in the year
under review, since they have not yet been adopted by the
EU or application of them for fiscal 2014/2015 was not yet
mandatory:
Financial reporting standards and interpretations Mandatory firsttime application
Amendments to IAS 19 (2011) – Employee Benefits: Employee Contributions In fiscal year 2015/2016
Annual Improvements to the International Financial Reporting Standards (2010 – 2012 cycle)
In fiscal year 2015/2016
Annual Improvements to the International Financial Reporting Standards (2011 – 2013 cycle)
In fiscal year 2015/2016
IFRS 14 – Regulatory Deferral Accounts At the earliest in fiscal year 2016/2017
Amendments to IFRS 11 – Joint Arrangements: Accounting for Acquisitions of Interests in Joint Operations
At the earliest in fiscal year 2016/2017
Amendments to IAS 16 and IAS 38 – Property, Plant and Equipment and Intangible Assets: Clarification of Acceptable Methods of Depreciation and Amortization
At the earliest in fiscal year 2016/2017
Amendments to IAS 16 and IAS 41 – Property, Plant and Equipment and Agriculture: Bearer Plants
At the earliest in fiscal year 2016/2017
Amendments to IAS 27 – Separate Financial Statements: Equity Method in Separate Financial Statements
At the earliest in fiscal year 2016/2017
Amendments to IFRS 10 and IAS 28 – Investments in Associates and Joint Ventures: Sale or Contribution of Assets between an Investor and its Associate or Joint Venture
At the earliest in fiscal year 2016/2017
Annual Improvements to the International Financial Reporting Standards (2012 - 2014 cycle)
At the earliest in fiscal year 2016/2017
Amendments to IAS 1 – Presentation of Financial Statements: Disclosure Initiative At the earliest in fiscal year 2016/2017
Amendments to IFRS 10, IFRS 12 and IAS 28 – Investment Entities: Applying the Consolidation Exception
At the earliest in fiscal year 2016/2017
IFRS 15 – Revenue from Contracts with Customers At the earliest in fiscal year 2017/2018
IFRS 9 – Financial Instruments At the earliest in fiscal year 2018/2019
Notes for the KWS Group 2014/2015 | Annual Financial Statements 87KWS Group | Annual Report 2014/2015
The impact of the standards and interpretations on the
consolidated financial statements of the KWS Group are
currently being examined and determined. On the basis of
the results of this examination to date, KWS does not expect
any significant effects on the consolidated financial state-
ments from application of new or amended standards.
1. General disclosures
Companies consolidated in the KWS Group
The consolidated financial statements of the KWS Group in-
clude the single-entity financial statements of KWS SAAT SE
and its subsidiaries in Germany and other countries, as
well as joint ventures and associated companies, which are
carried using the equity method. A company is a subsidiary
if KWS SAAT SE has existing rights that give it the current
ability to control its relevant activities. Relevant activities are
the activities that significantly affect the company’s returns.
Control therefore only exists if KWS SAAT SE has the ability
to use its power to affect the amount of the variable returns.
Control can usually be derived from holding a majority of the
voting rights directly or indirectly. Subsidiaries and joint ven-
tures that are considered immaterial for the presentation and
evaluation of the financial position and performance of the
Group are not included. Details on the changes in the con-
solidated group are provided in Section 2. “Disclosures on
the annual financial statements – Consolidated group and
changes in the consolidated group”.
Consolidation methods
The single-entity financial statements of the individual
subsidiaries included in the consolidated financial state-
ments and the single-entity financial statements of the
joint ventures and associated companies included using
the equity method were uniformly prepared on the basis
of the accounting and measurement methods applied at
KWS SAAT SE; they were audited by independent auditors.
For fully or proportionately consolidated units acquired be-
fore July 1, 2003, the Group exercised the option allowed by
IFRS 1 to maintain the consolidation procedures chosen to
date. The goodwill reported in the HGB financial statements
as of June 30, 2003, was therefore transferred unchanged at
its carrying amount to the opening IFRS balance sheet. For
acquisitions made after June 30, 2003, capital consolidation
follows the purchase method by allocating the cost of acqui-
sition to the Group’s interest in the subsidiary’s remeasured
equity at the time of acquisition. Any excess of interest in
equity over cost is recognized as an asset, up to the amount
by which fair value exceeds the carrying amount. Any good-
will remaining after first-time consolidation is recognized
under intangible assets.
According to IAS 36, goodwill is not amortized, but tested for
impairment at least once a year (impairment-only approach).
Investments in unconsolidated companies are carried at cost.
Joint ventures are consolidated using the equity method in
application of IFRS 11 and IAS 28. The basis for a joint ven-
ture is a contractual agreement with a third party to manage
a joint venture together. In the case of joint ventures, the
parties who exercise joint management have rights to the
net assets of the agreement.
In the case of joint ventures measured in accordance
with the equity method, the carrying amount is increased
or reduced annually by the equity capital changes corre-
sponding to the KWS Group’s share. In the case of first-time
consolidation of equity investments using the equity method,
differences from first-time consolidation are treated in accor-
dance with the principles of full consolidation. The changes in
the proportionate equity that are recognized in profit or loss
are included, along with impairment of goodwill, under the
item “Income from equity-accounted financial assets” in the
net financial income/expenses.
Associated companies in which a stake between 20% and
50% is held are likewise measured using the equity method.
In the year under review, KENFENG – KWS SEEDS CO.,
LTD., Beijing, China, was carried for the first time as an as-
sociated company in the consolidated financial statements
using the equity method. KWS has a significant influence on
the associated company.
Subsidiaries are always consolidated if such recognition is
considered material for the fair presentation of the financial
position and results of operations of the KWS Group. As
part of the elimination of intra-Group balances, borrowings,
receivables, liabilities, and provisions are netted between
the consolidated companies. Intercompany profits not
realized at Group level are eliminated from intra-Group trans-
actions. Sales, income, and expenses are netted between
consolidated companies, and intra-Group distributions of
profit are eliminated.
88 Annual Financial Statements | Notes for the KWS Group 2014/2015 | 1. General disclosures Annual Report 2014/2015 | KWS Group

Deferred taxes on consolidation transactions recognized
in income are calculated at the tax rate applicable to the
company concerned. These deferred taxes are aggregated
with the deferred taxes recognized in the separate financial
statements.
Minority interests are recognized in the amount of
the imputed percentage of equity in the consolidated
companies.
Currency translation
Under IAS 21, the financial statements of the consolidated
foreign group companies that conduct their business as
financially, economically, and organizationally independent
entities are translated into euros using the functional curren-
cy method and rounded in accordance with standard com-
mercial practice as follows:
■■ Income statement items at the average exchange rate for
the year; ■■ Balance sheet items at the exchange rate on the balance
sheet date.
The following exchange rates were applied in the consoli-
dated financial statements for the main foreign currencies
relative to the euro:
Rate on balance sheet date Average rate
1 EUR/ 06/30/2015 06/30/2014 2014/2015 2013/2014
ARS Argentina 10.16290 11.10030 10.27994 9.49031
BRL Brazil 3.49470 2.99440 3.20855 3.11168
GBP UK 0.71153 0.80120 0.75716 0.83282
RUB Russia 61.52060 45.82510 59.64182 46.21843
UAH Ukraine 23.54140 16.08685 20.80004 12.69831
USD USA 1.11840 1.36510 1.19175 1.36030
The difference resulting from the application of annual
average rates to the net profit for the period in the income
statement is taken directly to equity. According to IAS 21
exchange differences resulting from loans to foreign
subsidiaries are reported in the other comprehensive
income and are not recognized in profit or loss.
Classification of the statement of comprehensive
income
The costs for the functions include all directly attributable
costs, including other taxes. Research & development
expenses are reported separately for reasons of transparency.
Performance-based government grants are not deducted
from the costs to which they relate, but reported gross
under other operating income.
Accounting policies
Consistency of accounting policies
The accounting policies are unchanged from the previous
year, with the exception of the financial reporting standards
IAS 10 and IFRS 11, which had to be applied for the first time
in the year under review.
All estimates and assessments as part of accounting and
measurement are continually reviewed; they are based on
historical patterns and expectations about the future regarded
as reasonable in the particular circumstances.
1. General disclosures | Notes for the KWS Group 2014/2015 | Annual Financial Statements 89KWS Group | Annual Report 2014/2015

Recognition of income and expenses
Net sales include sales of products and services, less reve-
nue reductions. Net sales from the sale of products are re-
alized at the time at which the opportunities and risks pass
to the buyer. Net sales from service transactions are recog-
nized at the time at which the outcome of the transaction
can be reliably estimated in accordance with the percentage
of completion. Other income, such as interest, royalties and
dividends, is recognized in the period it accrues as soon as
there is a contractual or legal entitlement to it.
Performance-based public grants are carried under the
other operating income as part of profit/loss.
Operating expenses are recognized in the income statement
upon the service in question being used or as of the date on
which they occur.
Intangible assets
Purchased intangible assets are carried at cost less
straight-line amortization and impairment losses. It is neces-
sary to examine whether the useful life of intangible assets
is finite or indefinite. Goodwill has an indefinite useful life.
Goodwill and intangible assets with an indefinite useful life
are not amortized, but tested for impairment at least once a
year. The procedure for the impairment test is explained in
the notes to the balance sheet. Intangible assets acquired
as part of business combinations are carried separately
from goodwill if they are separable according to the defini-
tion in IAS 38 or result from a contractual or legal right.
The service life of intangible assets is as follows:
Useful life
Breeding material, proprietary rights to varieties and trademarks 10 years
Other rights 5 – 10 years
Software 3 – 8 years
Distribution rights 5 – 20 years
Property, plant, and equipment
Property, plant, and equipment is measured at cost less
straight-line depreciation and impairment losses. In addition
to directly attributable costs, the cost of self-produced plant
or equipment also includes a proportion of the overheads
and depreciation/amortization.
Useful life
Buildings 10 – 50 years
Operating equipment and other facilities 5 – 25 years
Technical equipment and machinery 5 – 15 years
Laboratory and research facilities 5 – 13 years
Other equipment, operating and office equipment 3 – 15 years
Low-value assets are fully expensed in the year of purchase;
they are reported as additions and disposals in the year of
purchase in the statement of changes in fixed assets.
Impairment losses on property, plant, and equipment are
recognized according to IAS 36 whenever the recoverable
amount of the asset is less than its carrying amount. The
recoverable amount is the higher of the fair value less
costs to sell or the value in use. If the reason for an earlier
impairment loss on property, plant, and equipment no lon-
ger applies, its value is increased to up to the amount that
would have resulted if the impairment loss had not occurred,
taking depreciation into account. In accordance with IAS 20,
government grants are deducted from the costs of the as-
set. Any deferred income is not recognized.
Financial instruments
Financial instruments are in particular financial assets and
financial liabilities. The financial assets consist primarily of
bank balances and cash on hand, trade receivables, other
receivables and securities. The credit risk mainly comprises
trade receivables. The amount recognized in the balance
sheet is net of allowances for receivables expected to be
uncollectible, estimated on the basis of historical patterns
and the current economic environment. The credit risk on
cash and derivative financial instruments is limited because
they are kept with banks that have been given a good credit
rating by international rating agencies. There is no significant
concentration of credit risks, because the risks are spread
over a large number of contract partners and customers.
The entire credit risk is limited to the respective carrying
amount. Comments on the risk management system can be
found in the Management Report.
90 Annual Financial Statements | Notes for the KWS Group 2014/2015 | 1. General disclosures Annual Report 2014/2015 | KWS Group

Available-for-sale financial assets are carried at fair value if
that can be reliably measured. Unrealized gains and losses,
including deferred taxes, are recognized directly in the
reserve for available-for-sale financial assets under equity.
Allowances are recognized immediately through the income
statement. Financial assets belonging to this category of
financial instruments are measured at cost, since there is no
active market. The financial assets include shares in uncon-
solidated subsidiaries and securities classified as noncur-
rent assets. They are subsequently measured at amortized
cost. Borrowings are carried at amortized cost.
The carrying amount of receivables, fixed-income securities
and cash is assumed as the fair value due to their short term
and the fixed-interest structure of the investments.
The financial liabilities comprise in particular trade payables,
borrowings and other liabilities.
The fair value of financial liabilities with a long-term fixed in-
terest rate is determined as present values of the payments
related to the liabilities, using a yield curve applicable on the
balance sheet date.
Derivative instruments are measured at fair value in accor-
dance with IAS 39; they can be assets or liabilities. Com-
mon derivative financial instruments are essentially used
to hedge interest rate and foreign currency risks. The fair
value of the derivative financial instruments is measured on
the basis of the market information available on the balance
sheet date and using recognized mathematical models,
such as present value or Black-Scholes, to calculate option
values, taking their volatility, remaining maturity and capital
market interest rates into account. The instruments must
also be classified in a level of the fair value hierarchy.
Financial instruments in level 1 are measured using quoted
prices in active markets for identical assets or liabilities. In
level 2, they are measured by directly observable market
inputs or derived indirectly on the basis of prices for similar
instruments. Finally, input factors not based on observable
market data are used to calculate the value of level 3 finan-
cial instruments.
Subsequent measurement of the financial instruments de-
pends on their classification in one of the following catego-
ries defined in IAS 39:
■■ Loans and receivables
This category mainly comprises trade receivables, other
receivables, loans and cash, including fixed-income short-
term securities. Loans are measured at cost. Loans that
carry no interest or only low interest are measured at their
present value. Discernable risks are taken into account by
recognition of an impairment loss. After their initial recog-
nition, the other financial assets in this category are mea-
sured at amortized cost using the effective interest meth-
od, minus impairments. Receivables that carry no interest
or only low interest and with a term of more than twelve
months are discounted. Necessary value impairments are
based on the expected credit risk and are carried in sepa-
rate impairment accounts. Receivables are derecognized
if they are settled or uncollectible. Other financial assets
are derecognized at the time they are disposed of or if
they have no value.
■■ Financial assets at fair value
Held-for-trading securities acquired with the intention of
being sold in the short term are assigned to this category.
Derivate financial instruments with a positive market
value are also categorized as held for trading, unless they
are designated hedging instruments in accordance with
IAS 39. They are measured at fair value. Changes in value
are recognized in income. Securities are derecognized
after being sold on the settlement date.
■■ Availableforsale financial assets
This category covers all financial assets that have not
been assigned to one of the above categories. In prin-
ciple, securities are classed as available for sale, unless
a different classification is required due to the fact that
they have an explicit purpose. Equity instruments, such
as shares in (unconsolidated) affiliated companies, which
are measured at amortized cost, and shares held in listed
companies, are also included in this category. In principle,
financial instruments in this category are measured at
their fair value in subsequent recognition. The changes to
their fair value in subsequent recognition are recognized
as unrealized gains and losses directly in equity in the
reserve for available-for-sale financial assets. The real-
ized gains or losses are not recognized as profit or loss
until they are disposed of. If there is objective evidence
of permanent impairment on the balance sheet date, the
instruments are written down to the lower value. Any sub-
sequent decreases in the impairment loss are recognized
directly in equity.
1. General disclosures | Notes for the KWS Group 2014/2015 | Annual Financial Statements 91KWS Group | Annual Report 2014/2015

■■ Financial liabilities measured at amortized cost
All financial liabilities, with the exception of derivative
financial instruments, are measured at amortized cost
using the effective interest method. The liabilities are
derecognized at the time they are settled or when the rea-
son why they were formed no longer exists.
■■ Financial liabilities at fair value
This category covers derivative financial instruments that
have a negative market value and are categorized in prin-
ciple as held for trading. They are measured at fair value.
Changes in value are recognized in income. Derivatives
that are designated hedging instruments in accordance
with IAS 39 are excluded from this provision.
Securities are generally classified as available for sale, which
is why changes in their fair values that require reporting are
taken directly to equity. If securities are carried at their fair
value and have to be recognized in income, changes to the
fair values are directly included in the net income for the
period.
The outstanding purchase price obligation for consolidated
subsidiaries must be carried at the present value of the
anticipated future purchase price payments for minority in-
terests. Changes to the estimates in subsequent years are
recognized in profit or loss. The cost of interest accrued on
the purchase price obligation is carried in the net financial
income/expenses.
Derivatives
The derivatives do not meet the requirements of IAS 39 to be
designated as a hedging instrument. They are measured at
their fair value. The changes in their market value are recog-
nized in the income statement. Derivatives are derecognized
on their day of settlement.
Inventories and biological assets
Inventories are measured at the lower of cost or net realizable
value less an allowance for obsolescent or slow-moving
items. In addition to directly attributable costs, the cost of
sales also includes indirect labor and materials including
depreciation under IAS 2. Under IAS 41, biological assets are
measured at fair value less the estimated costs to sell. Im-
mature biological assets are carried as inventories as of the
time they are harvested. The measurement procedure used is
based on standard industry value tables.
Deferred taxes
Deferred taxes are calculated on differences between the
IFRS carrying amounts of assets and liabilities and their tax
base, and on loss carryforwards; they are reported on a gross
basis. Deferred tax assets are recognized if they result from
deductible temporary differences and sufficient taxable profit
in future periods is expected. Deferred tax liabilities must be
set up for all taxable temporary differences. All deferred taxes
must be assessed individually at each balance sheet date
and must not be discounted. Under IAS 12, deferred taxes
are calculated on the basis of the applicable local income tax.
Provisions for pensions and other employee benefits
The provisions for pensions and other employee benefits are
calculated using actuarial principles in accordance with the
projected unit credit method. Actuarial gains and losses re-
sulting from revaluation of the net liability must be recognized
directly in equity in the other income. If there are planned as-
sets, they are netted off against the associated obligations.
The provisions for semi-retirement include obligations from
concluded semi-retirement agreements. Payment arrears and
top-up amounts for semi-retirement pay and for the contribu-
tions to the statutory pension insurance program are recog-
nized in measuring them.
92 Annual Financial Statements | Notes for the KWS Group 2014/2015 | 1. General disclosures Annual Report 2014/2015 | KWS Group

Other provisions
Provisions are set up if current obligations have accrued from
past events and it is likely that they will be utilized. In addition,
it must be possible to estimate the amount of the anticipated
obligation reliably.
Provisions are measured at their expected amount or most
likely amount, depending on whether they comprise a large
number of items or constitute a single obligation. Provisions
are reviewed regularly and adjusted to reflect new findings
or changes in circumstances. Long-term provisions are dis-
counted taking into account future cost increases and using
capital market interest rates for matching maturities, insofar
as the interest effect is material.
Contingent liabilities
The contingent liabilities result from debt obligations where
outflow of the resource is not probable or the level of the ob-
ligation cannot be estimated with sufficient reliability or from
obligations for loan amounts drawn down by third parties as
of the balance sheet date.
Borrowing costs
In accordance with IAS 23, borrowing costs are capitalized if
they can be classified as qualifying assets.
Discretionary decisions and estimates
The measurement approaches and amounts to be carried
in these IFRS financial statements are partly based on esti-
mates and specifically defined specifications. This relates in
particular to:
■■ Determination of the useful life of the depreciable asset■■ Definition of measurement assumptions and future
results in connection with impairment tests, above all for
capitalized goodwill and in connection with measurement
of outstanding purchase price obligations for fully consoli-
dated subsidiaries■■ Determination of the net selling price for inventories■■ Definition of the parameters required for measuring
pension provisions ■■ Selection of parameters for the model-based measure-
ment of derivatives ■■ Determination whether tax losses carried forward can be
used■■ Determination of the fair value of intangible assets, tan-
gible assets and liabilities acquired as part of a business
combination and determination of the service lives of the
purchased intangible assets and tangible assets■■ Measurement of other provisions
Despite careful estimates, the actual development may devi-
ate from the assumptions.
The Executive Board of KWS SAAT SE prepared the
consolidated financial statements on October 1, 2015, and
released them for distribution to the Supervisory Board.
The Super visory Board has the task of examining the
consolidated financial statements and declaring whether it
approves them.
1. General disclosures | Notes for the KWS Group 2014/2015 | Annual Financial Statements 93KWS Group | Annual Report 2014/2015

2. Disclosures on the annual financial statements
Consolidated group and changes in
the consolidated group
The French service company KWS SERVICES MEDITER-
RANEAN S.A.S., Roye, France, was merged with KWS
FRANCE S.A.R.L., Roye, France, effective July 1, 2014. In
Brazil, the Brazilian company KWS SEMENTES BRASIL
PARTICIPACOES LTDA. was renamed KWS SERVICOS
E PARTICIPACOES SOUTH AMERICA LTDA. effective
July 1, 2014. In addition, KWS BRASIL PARTICIPACOES
LTDA. was split up and merged with the company RIBER
KWS SEMENTES S.A. and KWS MELHORAMENTO LTDA.
The service company KWS SERVICES NORTH AMERICA
LLC., Shakopee, U.S., was founded on July 16, 2014. The
company relocated its headquarters from Shakopee to
Bloomington in March 2015. KWS PODILLYA T.O.V., Kiev,
Ukraine, was founded on January 15, 2015. The company’s
purpose is to acquire and manage land and property.
BEIJING KWS AGRICULTURE TECHNOLOGY CO. LTD.,
Beijing, China, was founded on March 6, 2015. In addition,
our Chinese joint venture KENFENG – KWS SEED CO. LTD.,
which is carried as an associated company in accordance
with the equity method, was awarded its business license by
the Chinese authorities on December 15, 2014.
The remaining shares in the SOCIETE DE MARTINVAL
Group were acquired effective September 30, 2014. The
French breeding company specializes in breeding and dis-
tributing field crops. Apart from cereals, the main revenue
driver, its product portfolio also includes sugarbeets, peas,
oil plants and corn. The main reason for acquiring the 51%
stake held by the Momont family is to strengthen competitive
cereal breeding programs and expand distribution activities
in France. Acquisition of the remaining shares in SOCIETE
DE MARTINVAL S.A. and the simultaneous sale of the
shares in its subsidiary HAMET S.C.A., Mons-en-Pévèle,
France, effective September 30, 2014, mean that the re-
maining four companies of the SOCIETE DE MARTINVAL
Group must be fully consolidated in the KWS Group’s con-
solidated financial statements as of the time of acquisition.
The 51% stake in the French cereals company and measure-
ment of the existing 49% stake at fair value resulted in the
following fully consolidated assets and liabilities at the time
of acquisition:
Number of companies including KWS SAAT SE
06/30/2015 06/30/2014
Domestic Foreign Total Domestic Foreign Total
Fully consolidated 13 49 62 13 44 57
Equity method 0 4 4 0 8 8
Total 13 53 66 13 52 65
94 Annual Financial Statements | Notes for the KWS Group 2014/2015 | 2. Disclosures on the annual financial statements Annual Report 2014/2015 | KWS Group

in € millions 06/30/2014
Intangible assets 21.5
Property, plant and equipment 12.3
Inventories 5.2
Trade receivables 12.2
Cash and cash equivalents 6.7
Other assets 0.1
Total assets 58.1
Provisions 0.4
Liabilities 6.5
Deferred taxes 4.7
Total liabilities 11.6
Net assets 46.4
The acquired property, plant, and equipment was com-
posed of land and buildings totaling €6.1 million and tech-
nical equipment and machinery totaling €6.2 million. The
fair value of the equity shares held previously in the joint
venture was €17,282 thousand. Remeasurement of the shares
resulted in a gain of €3,722 thousand, which was carried
under the net financial income/expenses.
The goodwill of €2.6 million reflects synergy potentials from
expansion of European wheat business. Trade receivables
totaling €12.2 million were acquired as part of the merger;
none has been classified as uncollectible. Deferred taxes
have been carried to an amount of €4.7 million. Transaction
costs totaling €448 thousand were incurred to acquire the
remaining shares and have been recognized under the other
operating expenses in the income statement.
As of the time of full consolidation, the SOCIETE DE
MARTINVAL Group posted net sales of €11,823 thousand
and income of € –2,823 thousand before consolidation. If
the SOCIETE DE MARTINVAL Group had been fully consoli-
dated at July 1, 2014, consolidated net sales would have
increased by €8,876 thousand and consolidated income
would have improved by €3,256 thousand.
A total of 62 (57) companies were fully consolidated in the
consolidated financial statements and four (eight) joint ven-
tures and associated companies were measured using the
equity method at June 30, 2015.
2. Disclosures on the annual financial statements | Notes for the KWS Group 2014/2015 | Annual Financial Statements 95KWS Group | Annual Report 2014/2015

List of shareholdings in accordance with Section 313 HGB (German Commercial Code)
Fully consolidated subsidiaries 1
Sugarbeet
100% BETASEED INC. 2 Bloomington, MN, U.S.
100% KWS FRANCE S. A.R.L. Roye, France100% DELITZSCH
PFLANZENZUCHT GMBH 10 Einbeck100% O.O.O. KWS RUS 12
Lipezk, Russia100% O.O.O. KWS R&D RUS 11 Lipezk, Russia100% KWS ITALIA S.P.A. Forlì, Italy100% KWS POLSKA SP.Z O.O. Poznan, Poland100% KWS SCANDINAVIA A/S 10
Guldborgsund, Denmark100% KWS SEMILLAS
IBERICA S.L. 10
Zaratán, Spain100% SEMILLAS KWS CHILE LTDA. Rancagua, Chile100% KWS SRBIJA D.O.O. New Belgrade, Serbia 100% KWS SUISSE SA Basle, Switzerland100% ACH SEEDS INC. 4
Bloomington, MN, U.S.100% BETASEED
FRANCE S. A.R.L. 18
Bethune, France100% KWS UKRAINE T.O.V. 12 Kiev, Ukraine100% KWS TÜRK TARIM
TICARET A.S. 9
Eskisehir, Turkey100% BETASEED GMBH Frankfurt100% KWS POTATO B.V. 17 Emmeloord, Netherlands 93% DYNAGRI S. A.R.L. 16
Casablanca, Morocco100% KWS Podillya T.O.V. 22
Kiev, Ukraine
Corn
100% KWS MAIS GMBH Einbeck100% KWS BENELUX B.V. 5
Amsterdam, Netherlands100% KWS SEMENA S.R.O. 5
Bratislava, Slovakia100% KWS MAIS FRANCE
S. A.R.L. 5
Champol, France100% KWS AUSTRIA SAAT GMBH 5
Vienna, Austria100% KWS SJEME D.O.O. 5
Pozega, Croatia100% KWS OSIVA S.R.O. 5
Velke Mezirici, Czech Republic100% KWS BULGARIA E.O.O.D. 5
Sofia, Bulgaria100% AGROMAIS GMBH 5
Everswinkel100% KWS MAGYARORSZÁG
KFT. 5
Györ, Hungary100% KWS SEMINTE S.R.L. 13
Bucharest, Romania 99% KWS ARGENTINA S. A. 5
Balcarce, Argentina 51% RAZES HYBRIDES S. A.R.L. 3
Alzonne, France 100% KWS MELHORAMENTO E SEMENTES LTDA. 21
Curitiba, Brazil 50% RIBER KWS SEMENTES
S. A. 21, 24
Patos de Minas, Brazil100% KWS PERU S. A.C. 8
Lima, Peru100% KWS R&D China LTD. 15
Hefei, China
Cereals
100% KWS LOCHOW GMBH Bergen100% KWS UK LTD. 7
Thriplow, UK100% KWS LOCHOW POLSKA SP.Z O.O. 7
Kondratowice, Poland100% SOCIETE DE
MARTINVAL S. A. 7
Mons-en-Pévèle, France100% MOMONT
HENNETTE S. A. 14
Mons-en-Pévèle, France100% LABOGERM S. A.R.L. 14 Mons-en-Pévèle, France100% ADRIEN
MOMONT S. A.R.L. 14
Mons-en-Pévèle, France
Corporate
100% KWS LANDWIRTSCHAFT GMBH * Einbeck100% KWS INTERSAAT GMBH Einbeck100% KWS SEEDS INC. 9
Bloomington, MN, U.S.100% GLH SEEDS INC. 2
Bloomington, MN, U.S.100% KWS SAATFINANZ GMBH Einbeck100% RAGIS KARTOFFELZUCHT-
UND HANDELS-GESELLSCHAFT MBH
Einbeck100% KWS KLOSTERGUT WIEBRECHTSHAUSEN GMBH Northeim-Wiebrechtshausen100% EURO-HYBRID GESELLSCHAFT FÜR GETREIDEZÜCHTUNG MBH Einbeck100% KWS SERVICOS E PARTICI-
PACOES SOUTH AMERICA LTDA. 19
São Paulo, Brazil100% KWS GATEWAY RESEARCH CENTER LLC. 2
St. Louis, MO, U.S. 100% KWS SERVICES
DEUTSCHLAND GMBH Einbeck100% KWS SERVICES EAST GMBH Vienna, Austria100% KWS SERVICES NORTH B.V. Rotterdam, Netherlands100% KWS SERVICES
MEDITERRANEAN S.L. Barcelona, Spain100% KWS SERVICES NORTH AMERICA LLC. Bloomington, MN, U.S.100% BEIJING KWS AGRICULTURE TECHNOLOGY CO., LTD.15
Beijing, China100% KWS CEREALS USA LLC. 2 Champagne, IL, U.S.
Equity-accounted joint ventures 1
Corn
50% AGRELIANT GENETICS LLC. 6
Westfield, IND, U.S. 50% AGRELIANT GENETICS INC. Chatham, Ontario, Canada
50% GENECTIVE S. A. Chappes, France
Equity-accounted associated companies 1
Corn
49% KENFENG – KWS SEEDS CO., LTD.
Beijing, China
Unconsolidated subsidiaries 1
Sugarbeet
65% NOSOMA S.A.R.L. 23
Sahel M'Harza, Morocco 67% VAN RIJN BALCAN S.R.L. 16
Vulcan/Romania
Cereals
74% LOCHOW-PETKUS BELGIUM N.V. 7
Linter, Belgium
Corporate
100% KANT-HARTWIG & VOGEL GMBH
Einbeck
96 Annual Financial Statements | Notes for the KWS Group 2014/2015 | 2. Disclosures on the annual financial statements Annual Report 2014/2015 | KWS Group

3. Segment reporting for the KWS Group
In accordance with its internal reporting system, the KWS Group is primarily organized according to the following business segments:
■■ Corn■■ Sugarbeet■■ Cereals ■■ Corporate
Considered a core competency for the KWS Group’s entire
product range, plant breeding, including the related biotech-
nology research, is essentially concentrated at the parent
company KWS SAAT SE in Einbeck. The breeding material,
including the relevant information and expertise about how
to use it, is owned by KWS SAAT SE with respect to sugar-
beet and corn and by KWS LOCHOW GMBH with respect
to cereals. Product-related R&D costs are carried directly in
the product segments Corn, Sugarbeet and Cereals. Cen-
trally controlled corporate functions are grouped in the Cor-
porate Segment. The distribution and production of oil and
field seed are reported in the Cereals and Corn Segments,
in keeping with the legal entities currently involved.
Description of segments
Corn
KWS MAIS GMBH is the lead company for the Corn Seg-
ment. In addition to KWS MAIS GMBH, business activities
are conducted by one (one) German company and 15 (15)
foreign subsidiaries and three (three) joint ventures of the
KWS Group. The production and distribution activities of
this segment relate to corn for grain and silage corn, and to
oil and field seed.
Sugarbeet
The results of the multiplication, processing and distribution
activities for sugarbeet seed, as well as our seed potato busi-
ness, are reported under the Sugarbeet Segment. Under the
leadership of KWS SAAT SE, 18 (17) foreign subsidiaries and
two (two) subsidiaries in Germany are active in this segment.
Cereals
The lead company of this segment, which essentially con-
cerns the production and distribution of hybrid rye, wheat
and barley, as well as oil and field seed, is KWS LOCHOW
GMBH with its six (three) foreign subsidiaries and zero (five)
joint ventures in France, Great Britain, the U.S. and Poland.
* Profit and loss transfer agreement 1 The percentages shown for each company relate to the share in that company held within the KWS Group. 2 Subsidiary of KWS SEEDS INC. 3 Subsidiary of KWS FRANCE S.A.R.L. 4 Subsidiary of BETASEED INC. 5 Subsidiary of KWS MAIS GMBH 6 Investee of GLH SEEDS INC. 7 Subsidiary of KWS LOCHOW GMBH 8 Subsidiary of KWS CHILE LTDA. and KWS SERVICOS E PARTICIPACOES SOUTH AMERICA LTDA. 9 Subsidiary of KWS INTERSAAT GMBH and KWS SAAT SE10 Subsidiary of KWS INTERSAAT GMBH11 Subsidiary of O.O.O. KWS RUS 12 Subsidiary of EURO-HYBRID GMBH and KWS SAATFINANZ GMBH13 Subsidiary of KWS MAIS GMBH and KWS SAATFINANZ GMBH14 Subsidiary of SOCIETE DE MARTINVAL S.A.15 Subsidiary of EURO-HYBRID GMBH16 Subsidiary of KWS POTATO B.V.17 Subsidiary of RAGIS GMBH18 Subsidiary of BETASEED GMBH19 Subsidiary of KWS INTERSAAT GMBH and KWS SAATFINANZ GMBH20 Subsidiary of KWS SERVICOS E PARTICIPACOES SOUTH AMERICA LTDA. and KWS INTERSAAT GMBH 21 Subsidiary of KWS SERVICOS E PARTICIPACOES SOUTH AMERICA LTDA. 22 Subsidiary of KWS UKRAINE T.O.V. 23 Subsidiary of DYNAGRI S.A.R.L. 24 The KWS Group's stake is 50% plus four shares.
3. Segment reporting for the KWS Group | Notes for the KWS Group 2014/2015 | Annual Financial Statements 97KWS Group | Annual Report 2014/2015

Corporate
Apart from revenue from our farms and services for third
parties, net sales from strategic projects are reported in this
segment. The segment also assumes the costs of all cen-
tral holding functions and expenses for long-term research
projects that have not yet reached market maturity.
It also includes all management services of KWS SAAT SE,
such as holding company and administrative functions, which
are not directly charged to the product segments or indirectly
allocated to them by means of an appropriate cost formula.
Segment information
The Executive Board as the main decision-making body
is responsible for allocating resources and assessing the
earnings strength of the business segments. The segments
and regions are defined in compliance with the internal
controlling and reporting systems (management approach).
The accounting policies used to determine the information
for the segments are basically the same as used for the
KWS Group. The only exception relates to consolidation
of the equity-accounted joint ventures that are assigned to
the Corn Segment, namely AGRELIANT GENETICS LLC.,
AGRELIANT GENETICS INC. and GENECTIVE S.A (as well
as SOCIETE DE MARTINVAL S.A. in the previous year). In
accordance with the accounting practices we have used
up to now, they are still included proportionately in internal
controlling as part of segment reporting.
The segment net sales, segment income, depreciation
and amortization, other noncash items, operating assets,
operating liabilities and capital expenditure on noncurrent
assets by segment have been determined in accordance
with the internal operational controlling structure, with the
joint ventures consolidated proportionately (management
approach). In order to permit better comparability, they have
been reconciled with the figures in the IFRS consolidated
financial statements.
Segment sales contains both net sales from third parties
(external sales) and net sales between the segments (in-
tersegment sales). The prices for intersegment sales are
determined on an arm’s-length basis. Uniform royalty rates
per segment for breeding genetics are used as the basis.
Technology revenues from genetically modified properties
(“tech fees”) are paid as a per-unit royalty on the basis of
the number of units sold, due to their growing competitive
importance.
The Corporate Segment generates 77.1% (68.7%) of its
sales from the other segments. The sales of this segment
represent 0.3% (0.4%) of the Group’s external sales.
The corn segment is the largest contributor of external
sales, accounting for 59.9% (60.7%) of external sales,
followed by sugarbeet with 31.0% (29.8%) and cereals with
8.8% (9.1%).
in € thousand Segment sales Internal sales External sales
2014/2015Previous
year 2014/2015Previous
year 2014/2015Previous
year
Corn 754,458 714,968 16 46 754,442 714,922
Sugarbeet 390,646 351,488 99 439 390,547 351,049
Cereals 113,207 108,435 1,939 1,095 111,268 107,340
Corporate 18,133 15,012 13,981 10,316 4,152 4,696
Segments acc. to management approach 1,276,444 1,189,903 16,035 11,896 1,260,409 1,178,007
Elimination of equityaccounted joint ventures – 274,394 – 254,526
Segments acc. to consolidated financial statements 986,015 923,481
98 Annual Financial Statements | Notes for the KWS Group 2014/2015 | 3. Segment reporting for the KWS Group Annual Report 2014/2015 | KWS Group

in € thousandSegment earnings
Depreciation andamortization
Other noncash items
2014/2015Previous
year 2014/2015Previous
year 2014/2015Previous
year
Corn 84,184 100,859 19,525 16,555 – 4,517 689
Sugarbeet 92,998 70,172 14,974 16,159 15,199 7,036
Cereals 12,019 17,125 7,284 4,351 4,143 – 3,238
Corporate – 51,186 – 49,724 9,840 8,727 22,150 –16,110
Segments acc. to management approach 138,015 138,432 51,623 45,792 36,975 –11,623
Elimination of equity-accounted joint ventures –24,598 –20,165 –5,712 – 4,586 8,680 362
Segments acc. to consolidated financial statements 113,417 118,267 45,911 41,206 45,655 –11,261
Net financial income/expenses 16,689 7,497 0 0 0 0
Earnings before taxes 130,106 125,764 0 0 0 0
The income statements of the consolidated companies are
assigned to the segments by means of profit center alloca-
tion. Operating income, the most important internal para-
meter and an indicator of the earnings strength in the KWS
Group, is used as the segment result. The operating income
of each segment is reported as the segment result. The
segment results are presented on a consolidated basis and
include all directly attributable income and expenses. Items
that are not directly attributable are allocated to the segments
on the basis of an appropriate formula.
Depreciation and amortization charges of €51,623 (45,792)
thousand allocated to the segments relate exclusively to
intangible assets and property, plant, and equipment.
The other noncash items recognized in the income
statement relate to noncash changes in the allowances
on inventories and receivables, and in provisions.
in € thousand Operating assets Operating liabilities
2014/2015Previous
year 2014/2015Previous
year
Corn 644,909 546,753 136,624 151,664
Sugarbeet 274,238 260,088 70,233 74,992
Cereals 120,291 74,280 23,490 17,749
Corporate 102,719 95,193 91,213 67,633
Segments acc. to management approach 1,142,157 976,314 321,560 312,038
Elimination of equity-accounted joint ventures –204,640 –188,016 – 63,698 – 81,990
Segments acc. to consolidated financial statements 937,517 788,298 257,862 230,048
Others 418,024 376,671 358,961 297,152
KWS Group acc. to consolidated financial statements 1,355,541 1,164,969 616,823 527,200
99KWS Group | Annual Report 2014/2015 3. Segment reporting for the KWS Group | Notes for the KWS Group 2014/2015 | Annual Financial Statements

The operating assets of the segments are composed of
intangible assets, property, plant, and equipment, inven-
tories, biological assets and trade receivables that can be
charged directly to the segments or indirectly allocated to
them by means of an appropriate formula.
The operating liabilities attributable to the segments include
the borrowings reported on the balance sheet, less provi-
sions for taxes and the portion of other liabilities that cannot
be charged directly to the segments or indirectly allocated
to them by means of an appropriate formula.
Capital expenditure on assets was increased year on
year by 64.0% to €133,073 (81,165) thousand. Investments
were intensified considerably in the segments Corporate
(€20,120 thousand; previous year: €13,840 thousand),
Cereals (€44,399 thousand; previous year: €6,761 thousand)
and Sugarbeet (€24,026 thousand; previous year:
€18,535 thousand). Investments in the Corn Segment
rose to €44,528 (42,029) thousand.
Investments in longterm assets by segment
in € thousand 2014/2015 Previous year
Corn 44,528 42,029
Sugarbeet 24,026 18,535
Cereals 44,399 6,761
Corporate 20,120 13,840
Segments acc. to management approach 133,073 81,165
Elimination of equity-accounted joint ventures – 8,061 – 13,182
Segments acc. to consolidated financial statements 125,012 67,983
The capital expenditure in the Cereals Segment includes
consolidation-related additions of €28,121 thousand from
acquisition of the SOCIETE DE MARTINVAL Group.
Disclosures by region
The disclosures on the regional composition of net sales,
capital expenditure and operating assets have been made in
accordance with the accounting policies to be applied to the
consolidated financial statements of the KWS Group and thus
without proportionate consolidation of the joint ventures.
The external net sales by sales region are broken down on
the basis of the country where the customer is based. No
individual customer accounted for more than 10% of total
net sales in the current or past fiscal year.
External sales by region
in € thousand 2014/2015 Previous year
Germany 223,885 225,149
Europe (excluding Germany) 441,526 435,508
Thereof in France (107,263) (94,921)
North and South America 254,709 205,600
Thereof in Brazil (66,316) (52,841)
Thereof in the U.S. (164,571) (132,889)
Rest of world 65,895 57,224
KWS Group 986,015 923,481
67.5% (71.5%) of total sales are recorded in Europe (including
Germany).
100 Annual Financial Statements | Notes for the KWS Group 2014/2015 | 3. Segment reporting for the KWS Group Annual Report 2014/2015 | KWS Group

Investments in longterm assets by region
in € thousand 2014/2015 Previous year
Germany 33,859 23,396
Europe (excluding Germany) 64,630 26,947
Thereof in France (44,305) (6,515)
North and South America 22,834 15,627
Thereof in Brazil (2,871) (3,127)
Thereof in the U.S. (17,067) (10,126)
Rest of world 3,689 2,013
KWS Group 125,012 67,983
27.1% (34.4%) of the capital spending was made in Germany.
Of the further capital spending, 18.2% (23.0%) was made in
North and South America, 51.7% (39.6%) in Europe (exclud-
ing Germany) and 3.0% (3.0%) in the rest of the world.
Operating assets by region
in € thousand 06/30/2015 06/30/2014
Germany 300,198 248,943
Europe (excluding Germany) 343,915 278,784
Thereof in France (50,828) (42,462)
North and South America 258,872 228,171
Thereof in Brazil (96,146) (95,492)
Thereof in the U.S. (162,727) (107,573)
Rest of world 34,532 32,400
KWS Group 937,517 788,298
4. Notes to the balance sheet
(1) Assets
The statement of changes in fixed assets contains a
breakdown of assets summarized in the balance sheet
and shows how they changed in 2014/2015. Capital ex-
penditure on property, plant and equipment and intangible
assets was €125,011 (67,983) thousand. Of that, the acqui-
sition of the SOCIETE DE MARTINVAL Group accounts
for €36,353 (0) thousand, which have been presented as
a change to the consolidated companies. The Combined
Management Report describes the significant additions to
assets. Depreciation and amortization and value impair-
ments amounted to €45,911 (41,206) thousand.
(2) Intangible assets
This item includes purchased varieties, rights to varieties
and distribution rights, software licenses for electronic
data processing, and goodwill. The current additions of
€4,460 (6,993) thousand related to software licenses and
patents. The consolidated-related additions mainly relate
to the variety portfolio of SOCIETE DE MARTINVAL S.A.,
which totals €15,600 thousand and has a useful life of
eight years. Amortization of intangible assets amounted to
€14,466 (14,932) thousand, of which €3,905 (6,326) thousand
were value impairments. This charge is included in the rele-
vant function costs, depending on the operational use of the
intangible assets.
The goodwill recognized as an asset relates mainly to
the Brazilian companies RIBER KWS SEMENTES S.A. –
€21,686 (21,686) thousand – and KWS MELHORAMENTO E
SEMENTES LTDA. – €4,115 (4,115) thousand. In the Cereals
Segment, the goodwill of SOCIETE DE MARTINVAL is recog-
nized to an amount of €2,600 (0) thousand and that of KWS
UK LTD. to an amount of €1,693 (1,693) thousand.
In order to meet the requirements of IFRS 3 in combination
with IAS 36 and to determine any impairment of goodwill,
cash-generating units have been defined in line with internal
4. Notes to the balance sheet | Notes for the KWS Group 2014/2015 | Annual Financial Statements 101KWS Group | Annual Report 2014/2015

reporting guidelines. At the KWS Group, these are generally
the legal entities, with the exception of our potato unit,
which as a whole represents the cash-generating unit. To
test for impairment, the carrying amount of each entity is
determined by allocating the assets and liabilities, including
attributable goodwill and intangible assets. An impairment
loss is recognized if the recoverable amount of an entity is
less than its carrying amount. The recoverable amount is
the higher of the fair value less costs to sell and the value in
use of a cash-generating unit. The impairment tests to be
carried out for fiscal 2014/2015 determine the recoverable
amount on the basis of the value in use of the respective
cash-generating unit.
The impairment test uses the expected future cash flows on
which the medium-term plans of the companies are based;
these plans, which cover a period of four years, have been ap-
proved by the Executive Board. They are based on historical
patterns and expectations about future market development.
For the European and American markets, the key
assumptions on which corporate planning is based include
assumptions about price trends for seed, in addition to the
development of market shares and the regulatory framework.
Company-internal projections take the assumptions of indus-
try-specific market analyses and company-related growth
perspectives into account.
Due to the change in the KWS Group’s debt situation, the
discount rate was derived as the weighted average cost of
capital (WACC) in fiscal 2014/2015. The discount rate for the
cash-generating units is 5.46% after tax. A growth rate of
1.5% (1.5%) has been assumed here beyond the detailed
planning horizon in order to allow for extrapolation in line with
the expected inflation rate. In the previous year, a standard
discount rate of 5.1% (after tax) was assumed to calculate
present values.
The impairment tests conducted at the end of fiscal year
2014/2015 confirmed that the existing goodwill is not
impaired. Sensitivity analyses were also carried out for all
cash-generating units to which goodwill is allocated. In our
opinion, realistic changes in the basic assumptions would
not result in the need to recognize an impairment loss at any
cash-generating unit whose goodwill is significant relative to
the total carrying amount of goodwill.
At KWS POTATO B.V., the impairment test revealed the
need for a write-down, which was reflected in a reduction
in the value of its intangible assets by €3,905 thousand;
€2,237 thousand have been allocated to the research &
development costs and €1,668 thousand to the selling ex-
penses, since a number of varieties, customer relationships
and industrial property rights were relinquished. This value
impairment has to be charged to the Sugarbeet Segment.
Tests provided evidence that all the other goodwill recognized
in the consolidated balance sheet and determined for the
cash-generating units is not impaired. Possible changes in
the figures reported in the balance sheet result from currency
translation at the balance sheet date.
The impairment test for KWS POTATO B.V. in the previous
year revealed the need for a write-down, which was reflected
by the capitalized goodwill and intangible assets being
reduced by €6,326 thousand.
(3) Property, plant, and equipment
Capital expenditure amounted to €96,430 (61,015) thousand
and depreciation amounted to €31,445 (26,274) thousand.
That includes consolidation-related additions of
€12,241 thousand from acquisition of the SOCIETE DE
MARTINVAL Group. The Combined Management Report
describes the significant capital expenditure.
102 Annual Financial Statements | Notes for the KWS Group 2014/2015 | 4. Notes to the balance sheet Annual Report 2014/2015 | KWS Group
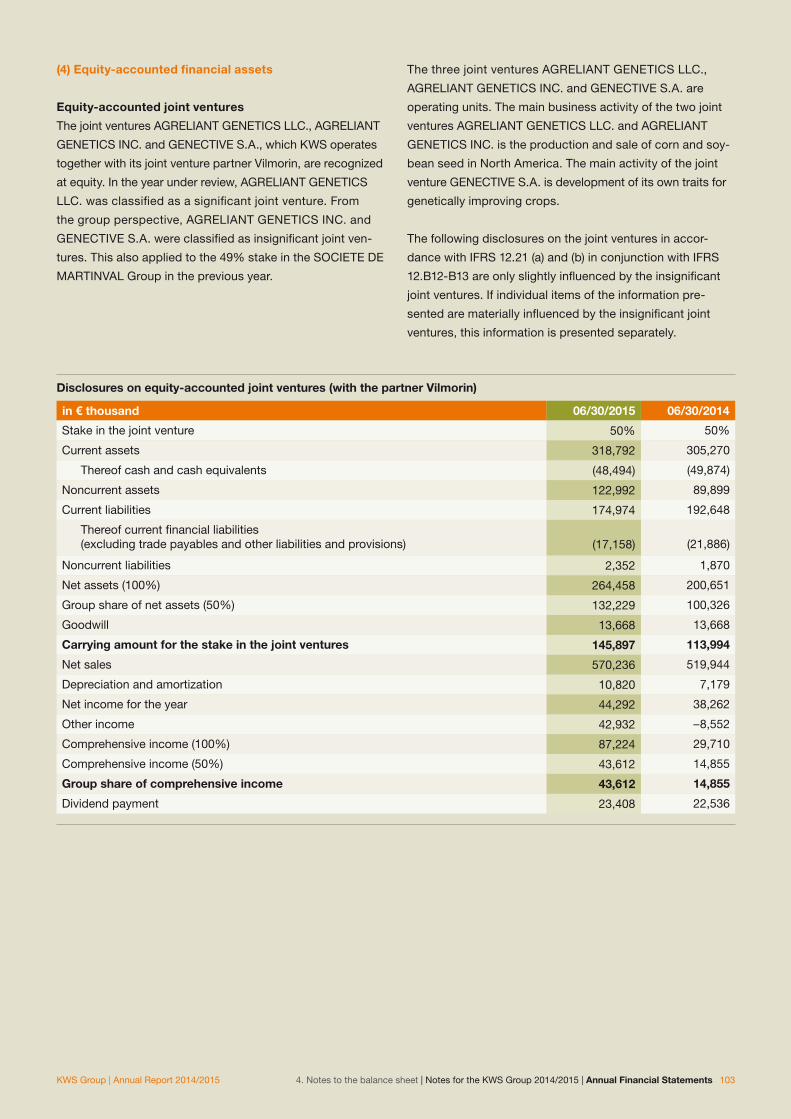
(4) Equityaccounted financial assets
Equityaccounted joint ventures
The joint ventures AGRELIANT GENETICS LLC., AGRELIANT
GENETICS INC. and GENECTIVE S.A., which KWS operates
together with its joint venture partner Vilmorin, are recognized
at equity. In the year under review, AGRELIANT GENETICS
LLC. was classified as a significant joint venture. From
the group perspective, AGRELIANT GENETICS INC. and
GENECTIVE S.A. were classified as insignificant joint ven-
tures. This also applied to the 49% stake in the SOCIETE DE
MARTINVAL Group in the previous year.
The three joint ventures AGRELIANT GENETICS LLC.,
AGRELIANT GENETICS INC. and GENECTIVE S.A. are
operating units. The main business activity of the two joint
ventures AGRELIANT GENETICS LLC. and AGRELIANT
GENETICS INC. is the production and sale of corn and soy-
bean seed in North America. The main activity of the joint
venture GENECTIVE S.A. is development of its own traits for
genetically improving crops.
The following disclosures on the joint ventures in accor-
dance with IFRS 12.21 (a) and (b) in conjunction with IFRS
12.B12-B13 are only slightly influenced by the insignificant
joint ventures. If individual items of the information pre-
sented are materially influenced by the insignificant joint
ventures, this information is presented separately.
Disclosures on equityaccounted joint ventures (with the partner Vilmorin)
in € thousand 06/30/2015 06/30/2014
Stake in the joint venture 50% 50%
Current assets 318,792 305,270
Thereof cash and cash equivalents (48,494) (49,874)
Noncurrent assets 122,992 89,899
Current liabilities 174,974 192,648
Thereof current financial liabilities (excluding trade payables and other liabilities and provisions)
(17,158)
(21,886)
Noncurrent liabilities 2,352 1,870
Net assets (100%) 264,458 200,651
Group share of net assets (50%) 132,229 100,326
Goodwill 13,668 13,668
Carrying amount for the stake in the joint ventures 145,897 113,994
Net sales 570,236 519,944
Depreciation and amortization 10,820 7,179
Net income for the year 44,292 38,262
Other income 42,932 – 8,552
Comprehensive income (100%) 87,224 29,710
Comprehensive income (50%) 43,612 14,855
Group share of comprehensive income 43,612 14,855
Dividend payment 23,408 22,536
4. Notes to the balance sheet | Notes for the KWS Group 2014/2015 | Annual Financial Statements 103KWS Group | Annual Report 2014/2015

This also applied to the SOCIETE DE MARTINVAL Group
in the previous year.
Disclosures on insignificant equityaccounted joint ventures (Société de Martinval S.A.)
in € thousand 06/30/2014
Stake in the joint venture 49%
Current assets 24,712
Thereof cash and cash equivalents (15,859)
Noncurrent assets 11,362
Current liabilities 10,944
Thereof current financial liabilities (excluding trade payables and other liabilities and provisions)
(4,835)
Noncurrent liabilities 232
Net assets (100%) 24,898
Group share of net assets (49%) 12,136
Carrying amount for the stake in the joint ventures 12,136
Net sales 21,520
Depreciation and amortization 1,169
Interest income 143
Interest expense 16
Taxes 220
Net income for the year 2,200
Comprehensive income (100%) 2,200
Comprehensive income (49%) 1,078
Group share of comprehensive income 1,078
Dividend payment 10
104 Annual Financial Statements | Notes for the KWS Group 2014/2015 | 4. Notes to the balance sheet Annual Report 2014/2015 | KWS Group

Equityaccounted associated companies
In the year under review, this relates to our Chinese joint
venture KENFENG – KWS SEED CO. LTD., which is included
in the KWS Group’s consolidated financial statements as an
associated company in accordance with the equity method.
Disclosures on insignificant equityaccounted associated companies
in € thousand 06/30/2015 06/30/2014
Carrying amount for the stake in insignificant associated companies (aggregated) 7,120 0
Net income for the year 20 0
Other comprehensive income – 495 0
Comprehensive income (100%) – 475 0
(5) Financial assets
Investments in unconsolidated subsidiaries totaling €39
(39) thousand and shares in cooperatives and GmbHs that
are of minor significance are reported in principle at their
amortized cost totaling €1,871 (1,936) thousand since the
fair value cannot be reliably determined. Listed shares are
carried at their fair value of €89 (88) thousand. This account
also includes other interest-bearing loans totaling €466 (637)
thousand.
(6) Noncurrent tax assets
This mainly relates to the present value of the corporate
income tax credit balance of the German group compa-
nies, which was last determined at December 31, 2006,
and has been paid in ten equal annual amounts since
September 30, 2008.
(7) Deferred tax assets
Under IAS 12, deferred tax assets are calculated as the
difference between the IFRS balance sheet amount and
the tax base and on the basis of loss carryforwards. They
are reported on a gross basis and total €54,319 (47,935)
thousand, of which €6,660 (5,115) thousand will be carried
forward for the future use of tax losses.
(8) Inventories and biological assets
Inventories increased by €57,586 thousand, or 43.4%, a
figure that includes write-downs of the net realizable value
totaling €51,244 (48,230) thousand. Immature biological
assets relate to living plants in the process of growing
(before harvest). The field inventories of the previous year
have been harvested in full and the fields have been newly
tilled in the year under review. Public subsidies of €1,443
(1,455) thousand, for which all the requirements were met
at the balance sheet date, were granted for the total area
under cultivation of 4,246 (4,326) ha and were recognized in
income. Future public subsidies depend on the further de-
velopment of European agricultural policy.
in € thousand 06/30/2015 Previous year
Raw materials and consumables 18,263 15,995
Work in progress 48,921 38,282
Immature biological assets 12,344 12,568
Finished goods 110,806 65,903
190,334 132,748
The disclosures on insignificant associated companies in
accordance with IFRS 12.21 (c) in conjunction with IFRS
12.B16 are as follows:
4. Notes to the balance sheet | Notes for the KWS Group 2014/2015 | Annual Financial Statements 105KWS Group | Annual Report 2014/2015
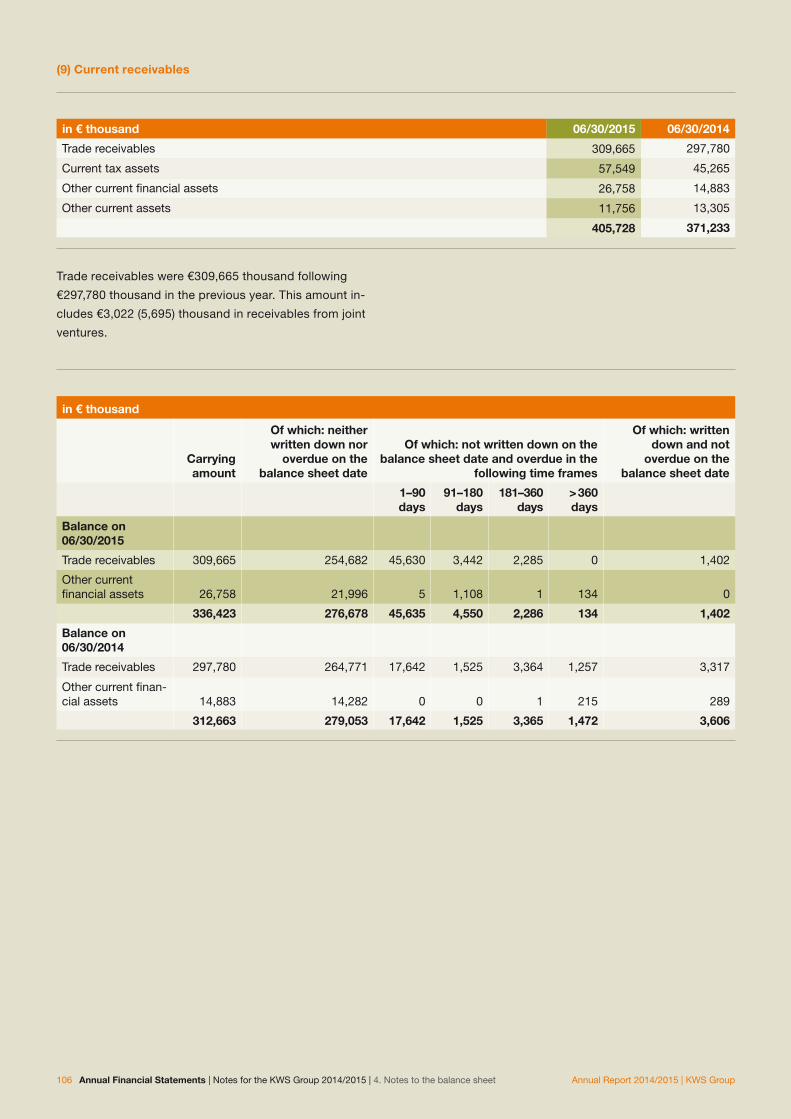
(9) Current receivables
in € thousand 06/30/2015 06/30/2014
Trade receivables 309,665 297,780
Current tax assets 57,549 45,265
Other current financial assets 26,758 14,883
Other current assets 11,756 13,305
405,728 371,233
Trade receivables were €309,665 thousand following
€297,780 thousand in the previous year. This amount in-
cludes €3,022 (5,695) thousand in receivables from joint
ventures.
in € thousand
Carryingamount
Of which: neither written down nor
overdue on the balance sheet date
Of which: not written down on the balance sheet date and overdue in the
following time frames
Of which: written down and not
overdue on the balance sheet date
1–90 days
91–180 days
181–360 days
> 360 days
Balance on 06/30/2015
Trade receivables 309,665 254,682 45,630 3,442 2,285 0 1,402
Other current financial assets 26,758 21,996 5 1,108 1 134 0
336,423 276,678 45,635 4,550 2,286 134 1,402
Balance on 06/30/2014
Trade receivables 297,780 264,771 17,642 1,525 3,364 1,257 3,317
Other current finan-cial assets
14,883
14,282
0
0
1
215
289
312,663 279,053 17,642 1,525 3,365 1,472 3,606
106 Annual Financial Statements | Notes for the KWS Group 2014/2015 | 4. Notes to the balance sheet Annual Report 2014/2015 | KWS Group

The already overdue trade receivables that have been partly
written down amount to €2,224 (5,904) thousand.
There are no indications on the balance sheet date that cus-
tomers who owe trade receivables that have not been written
down and are not overdue will not meet their payment obli-
gations.
The following allowances have mainly been made for possible
risks of non-payment of trade receivables:
in € thousand 07/01 Addition Disposal Reversal 06/30
2014/2015 27,393 7,305 1,219 10,852 22,627
2013/2014 26,999 5,999 747 4,858 27,393
The receivables include an amount of €361 (346) thousand
due after more than one year.
(10) Securities
Securities amounting to €66,973 (69,188) thousand relate
primarily to short-term liabilities securities and fund shares.
(11) Cash and cash equivalents
Cash of €41,211 (53,076) thousand consists of balances with
banks and cash on hand. The cash flow statement explains
the change in this item compared with the previous year,
together with the change in securities.
(12) Equity
The fully paid-up subscribed capital of KWS SAAT SE is still
€19,800 thousand. The no-par bearer shares are certificated
by a global certificate for 6,600,000 shares. The company
does not hold any shares of its own.
The capital reserves essentially comprise the premium
obtained as part of share issues.
The revenue reserves essentially comprise the net income
generated in the past by the companies included in the
consolidated financial statements, minus dividends paid to
shareholders. The differences from currency translation,
the reserve for available-for-sale financial assets and the
reserve for revaluation of net liabilities/assets from defined
benefit plans are also carried here.
Differences from translation of the functional currency of
foreign business operations into the currency used by the
group in reporting (euro) are essentially carried in the item
Adjustments from currency translation. The item Revalu ation
of net liabilities/assets from defined benefit plans includes
the actuarial gains and losses from pensions and other
employee benefits.
4. Notes to the balance sheet | Notes for the KWS Group 2014/2015 | Annual Financial Statements 107KWS Group | Annual Report 2014/2015

is ensured by that. Equity increased by €100,949 thousand
to €738,718 (637,769) thousand. This figure includes an
increase of €45,829 thousand (previous year: decrease of
€19,198 thousand) in the reserve for currency translation for
foreign subsidiaries and equity-accounted joint ventures
and associated companies. Please refer to the statement of
changes in equity for further effects not recognized in the
income statement.
An important indicator in capital management is the equity
ratio. It was 54.5% (54.7%) at June 30, 2015, and thus at a
good and solid level. The capital structure is as follows:
The tax effects on other comprehensive income are as
follows:
Other comprehensive income
in € thousand 2014/2015 Previous year
Before taxes Tax effect After taxes
Before taxes Tax effect After taxes
Items that may have to be subsequently reclassified as profit or loss 45,606 51 45,657 –19,407 48 –19,359
Revaluation of available-for-sale financial assets – 223 51 –172 - 209 48 –161
Currency translation difference for economically independent foreign units 24,606 0 24,606 –14,915 0 –14,915
Currency translation difference from equity-accounted financial assets 21,223 0 21,223 – 4,283 0 – 4,283
Items not reclassified as profit or loss –12,945 3,989 – 8,956 – 8,232 2,354 – 5,878
Revaluation of net liabilities/assets from defined benefit plans –12,945 3,989 – 8,956 – 8,232 2,354 – 5,878
Other comprehensive income 32,661 4,040 36,701 – 27,639 2,402 – 25,237
The objective of KWS’ capital management activities is
to pursue the interests of shareholders and employees in
accordance with the corporate strategy and earn a rea-
sonable return on investment. One main goal is to retain
the trust of investors, lenders and the market so as to
strengthen the company’s future business development.
KWS’ capital management activities intend to optimize the
average cost of capital. Another goal is a balanced mix of
equity and debt capital. Consolidated income (after taxes
and minority interests) is €82,712 (77,124) thousand. How-
ever, there was a total dividend payout of €19,800 (19,800)
thousand in December 2014. Adequate internal financing of
further operating business expansion in the long term-term
108 Annual Financial Statements | Notes for the KWS Group 2014/2015 | 4. Notes to the balance sheet Annual Report 2014/2015 | KWS Group

(13) Minority interest
The accumulated minority interests in RIBER KWS
SEMENTES S.A. at the balance sheet date were €5,576
(6,078) thousand and are carried under minority interests.
The disclosures on significant minority interests in accor-
dance with IFRS 12.12 in conjunction with IFRS 12.B10 are
as follows:
Capital structure
in € thousand 06/30/2015Share of total
capital 06/30/2014Share of total
capital
Equity 738,718 54.5% 637,769 54.7%
Long-term financial borrowings 181,783 113,754
Other noncurrent liabilties 153,092 139,261
Short-term borrowings 32,283 40,086
Other current liabilties 249,665 234,099
Total capital 1,355,541 1,164,969
The focus in selecting financial instruments is on financing
with matching maturities, which is achieved by controlling
the maturities. Long-term financial borrowings increased
by €68,029 (15,293) thousand. This is mainly due to the
increase in long-term financial loans from banks.
Disclosures on subsidiaries with significant minority interests
in € thousand RIBER KWS SEMENTES S.A.
06/30/2015 06/30/2014
Equity 11,152 12,155
Current assets 69,164 57,857
Noncurrent assets 16,259 20,754
Current liabilities 44,300 49,883
Noncurrent liabilities 29,971 16,573
Net sales 65,804 51,894
Profit/loss 2,525 1,085
Other income – 2,465 – 483
Comprehensive income 60 602
Net cash from operating activities 1,446 – 6,405
Net cash from investing activities – 2,237 – 2,866
Net cash from financing activities 2,868 7,690
4. Notes to the balance sheet | Notes for the KWS Group 2014/2015 | Annual Financial Statements 109KWS Group | Annual Report 2014/2015

The voting rights of minority interests in RIBER KWS SE-
MENTES S.A. total 49.99% (49.99%). Consequently, the
share of minority interests in this company’s net income for
the year is €1,263 (543) thousand.
In addition, KWS ARGENTINA S.A., DYNAGRI S.A.R.L.
and RAZES HYBRIDES S.A.R.L. have minority interests,
although these are assessed as being insignificant.
(14) Noncurrent liabilities
Noncurrent liabilities increased by €81,860 thousand. That
is mainly attributable to the increase in long-term financial
borrowings from banks totaling €68,029 thousand.
in € thousand 06/30/2015 06/30/2014
Long-term provisions 110,641 98,951
Long-term borrowings 181,783 113,754
Trade payables 1,600 1,469
Deferred tax liabilities 28,095 26,165
Other noncurrent liabilities 12,756 12,676
334,875 253,015
The trade payables and other long-term liabilities are due for
payment in between one and five (one and five) years.
Longterm provisions
06/30/2014
Changes in the consolidated
group, currency Addition Consumption Reversal 06/30/2015
Pension provisions 89,834 – 56 16,437 4,014 0 102,201
Tax provisions 2,018 97 706 1,429 0 1,392
Other provisions 7,099 –379 871 530 13 7,048
98,951 –338 18,014 5,973 13 110,641
The pension provisions are based on defined benefit ob-
ligations, determined by years of service and pensionable
compensation. They are measured using the projected unit
credit method under IAS 19 (2011), on the basis of assump-
tions about future developments. The assumptions in detail
are that wages and salaries in Germany will increase by
3.00% (3.00%) annually and abroad by 3.75% (3.75%) annu-
ally. An annual increase in pensions of 2.00% (2.00%) is as-
sumed. The discount rate in Germany was 2.50% compared
with 2.90% the year before and averaged 4.60% abroad fol-
lowing 4.40% the previous year.
110 Annual Financial Statements | Notes for the KWS Group 2014/2015 | 4. Notes to the balance sheet Annual Report 2014/2015 | KWS Group

The following mortality tables were used at June 30, 2015:
■■ In Germany: The 2005G mortality table of Klaus Heubeck■■ Abroad: RP-2000 Mortality Table Scale AA
A retirement age of 63 years is imputed for Germany,
whereas a retirement age of 65 years is imputed for the
U.S.
Nature and scope of the pension benefits
In Germany
The following benefits are provided under a company agree-
ment relating to the company retirement pension program:
■■ An old-age pension at the age of 65■■ An early retirement pension before the age of 65, coupled
with benefits from the early retirement pension from the
statutory pension insurance program■■ An invalidity pension for persons who suffer from occu-
pational disability or incapacity to work as defined by the
statutory pension insurance program■■ A widow’s or widower’s pension
For benefit obligations backed by a guarantee by an insurance
company toward three former members of the Executive
Board, the planned assets of €9,446 (9,275) thousand corre-
spond to the present value of the obligation. In accordance
with IAS 19 (2011), the pension commitments are netted off
against the corresponding assets (planned assets).
Abroad
The defined benefit obligations abroad mainly relate to pen-
sion commitments in the U.S. Share funds and bonds were
mainly invested in to cover them. All employees who have
reached the age of 21 are entitled to benefits. In addition,
each employee must have worked at least one year and at
least 1,000 working hours to earn an entitlement.
The following benefits are granted from the pension plan:
■■ An old-age pension at the age of 65■■ An early retirement pension before the age of 65 – to be
eligible, the employee must be at least 55 and the mini-
mum vesting period must be five years■■ A pro-rata pension if the employee reaches the minimum
vesting period of five years, but is below 55
The pension plans are mainly subject to the following risks:
Investment and return
The present value of the defined benefit obligation from the
pension plan is calculated using a discount rate defined on
the basis of the returns on high-quality fixed-income corpo-
rate bonds. If the income from the planned assets is below
this rate of interest, the result is a shortfall in the plan. The
corporate bonds and share funds are chosen to ensure risk
diversification and managed by an external fund manager.
Change in interest rates
The fall in the returns on corporate bonds and thus the dis-
count rate will result in an increase in the obligations, which
is only partly compensated for by a change in the value of
the planned assets.
Life expectancy
The present value of the defined benefit obligation from the
plan is calculated on the basis of the best-possible estimate
using mortality tables. An increase in the life expectancy
of the entitled employees results in an increase in the plan
liabilities.
Wage increases
The present value of the defined benefit obligation from the
plan is calculated on the basis of future salaries. Conse-
quently, increases in the salary of the entitled employees
results in an increase in the plan liabilities.
4. Notes to the balance sheet | Notes for the KWS Group 2014/2015 | Annual Financial Statements 111KWS Group | Annual Report 2014/2015

In previous years, KWS countered the usual risks of direct ob-
ligations by converting the pension obligations from defined
benefit to defined contribution plans. As a result, subsequent
benefits will be provided by a provident fund backed by a
guarantee. The existing obligations, which are partly covered
by planned assets, are funded from the operating cash flow
and are subject to the familiar measurement risks.
The tables below show the changes in the accrued benefit
and planned assets:
Changes in accrued benefit entitlements
2014/2015 2013/2014
Germany Abroad Total Germany Abroad Total
Accrued benefit entitlements from retirement obligations on July 1 95,942 13,865
109,807
88,122
11,948
100,070
Service cost 691 689 1,380 647 1,418 2,065
Interest expense 2,713 671 3,384 3,003 528 3,531
Actuarial gains (–)/losses (+) 12,402 986 13,388 8,691 1,218 9,909
of which due to a change in financialassumptions used for calculation 12,010 747
12,757
7,712
1,058
8,770
of which due to experience adjustments 392 239
631
979
160
1,139
Pension payments made – 4,911 – 678 – 5,589 – 4,521 – 837 – 5,358
Exchange rate changes 2,365 2,365 18 18
Other changes in value 510 510 – 428 – 428
Accrued benefit entitlements from retirement obligations on June 30 106,837 18,408
125,245
95,942
13,865
109,807
Change in planned assets
2014/2015 2013/2014
Germany Abroad Total Germany Abroad Total
Fair value of the planned assets on July 1 9,275 10,698 19,973 9,058 9,500 18,558
Interest income 260 603 863 307 450 757
Income from planned assets excluding amounts already recognized as interest income 491 –47
444
490
1,136
1,626
Pension payments made – 580 – 485 –1,065 – 580 – 388 – 968
Exchange rate changes 2,309 2,309 0 0
Other changes in value 520 520 0 0
Fair value of the planned assets on June 30 9,446 13,598 23,044 9,275 10,698 19,973
112 Annual Financial Statements | Notes for the KWS Group 2014/2015 | 4. Notes to the balance sheet Annual Report 2014/2015 | KWS Group

In order to allow reconciliation with the figures in the bal-
ance sheet, the accrued benefit must be netted off with the
planned assets.
Reconciliation with the balance sheet values for pensions
06/30/2015 06/30/2014
Germany Abroad Total Germany Abroad Total
Accrued benefit entitlements from retirement obligations on June 30 106,837 18,408
125,245
95,942
13,865
109,807
Fair value of the planned assets on June 30
9,446 13,598
23,044
9,275
10,698
19,973
Balance sheet values on June 30 97,391 4,810 102,201 86,667 3,167 89,834
of which pension provisions 106,837 18,408 125,245 95,942 13,865 109,807
of which planned assets 9,446 13,598 23,044 9,275 10,698 19,973
The following amounts were recognized in the statement of
comprehensive income:
Effects on the statement of comprehensive income
2014/2015 2013/2014
Germany Abroad Total Germany Abroad Total
Service cost 691 698 1,389 647 1,418 2,065
Net interest expense (+)/income (–) 2,452 68 2,520 2,697 77 2,774
Amounts recognized in the income statement
3,143 766
3,909
3,344
1,495
4,839
Gains (–)/losses (+) from revaluation of the planned assets (excluding amounts already recognized as interest income) –491 47
–444
– 490
–1,136
–1,626
Actuarial gains (–)/losses (+) due to a change in financial assumptions used for calculation 12,011 747
12,758
7,712
1,007
8,719
Actuarial gains (–)/losses (+) due to experience adjustments 392 239
631
979
160
1,139
Amounts recognized in other comprehensive income 11,912 1,033 12,945 8,201 31 8,232
Total (amounts recognized in the statement of comprehensive income) 15,055 1,799
16,854
11,545
1,526
13,071
The service cost is recognized in operating income in the
respective functional areas by means of an appropriate for-
mula. Net interest expenses and income are carried in the
interest result.
4. Notes to the balance sheet | Notes for the KWS Group 2014/2015 | Annual Financial Statements 113KWS Group | Annual Report 2014/2015

The fair value of the planned assets was split over the fol-
lowing investment categories:
Breakdown of the planned assets by investment category
in € thousand 06/30/2015 06/30/2014
Germany Abroad Total Germany Abroad Total
Corporate bonds 3,646 3,646 3,043 3,043
Equity funds 9,071 9,071 7,173 7,173
Consumer industry 2,010 1,722
Finance 1,068 889
Industry 698 746
Technology 1,396 1,169
Healthcare 1,337 1,040
Other 2,562 1,607
Cash and cash equivalents 881 881 482 482
Reinsurance policies 9,446 9,446 9,275 9,275
Planned assets on June 30 9,446 13,598 23,044 9,275 10,698 19,973
The planned assets abroad relate solely to the U.S.
There is no active market for the reinsurance policies in
Germany. There is an active market for the other planned
assets: the fair value can be derived from their stock market
prices. 82.0% (83.8%) of the corporate bonds and the cash
and cash equivalents have a AAA rating.
The following sensitivity analysis at June 30, 2015, shows
how the present value of the obligation would change given a
change in the actuarial assumptions. No correlations between
the individual assumptions were taken into account in this, i.e.
if an assumption varies, the other assumptions were kept con-
stant. The projected unit credit method used to calculate the
balance sheet values was also used in the sensitivity analysis.
Sensitivity analysis
in € thousand Effect on obligation in 2014/2015 Effect on obligation in 2013/2014
Change in assumption Decrease Increase
Change in assumption Decrease Increase
Discount rate +/– 100 basis points 21,889 –17,286
+/– 100 basis points 17,602 –13,852
Anticipated annual pay increases +/– 50 basis points – 915 991
+/– 50 basis points – 508 533
Anticipated annual pension increase +/– 25 basis points – 3,848 3,991
+/– 25 basis points – 2,471 2,578
Life expectancy +/– 1 year – 4,489 4,563 +/– 1 year – 3,006 3,067
114 Annual Financial Statements | Notes for the KWS Group 2014/2015 | 4. Notes to the balance sheet Annual Report 2014/2015 | KWS Group
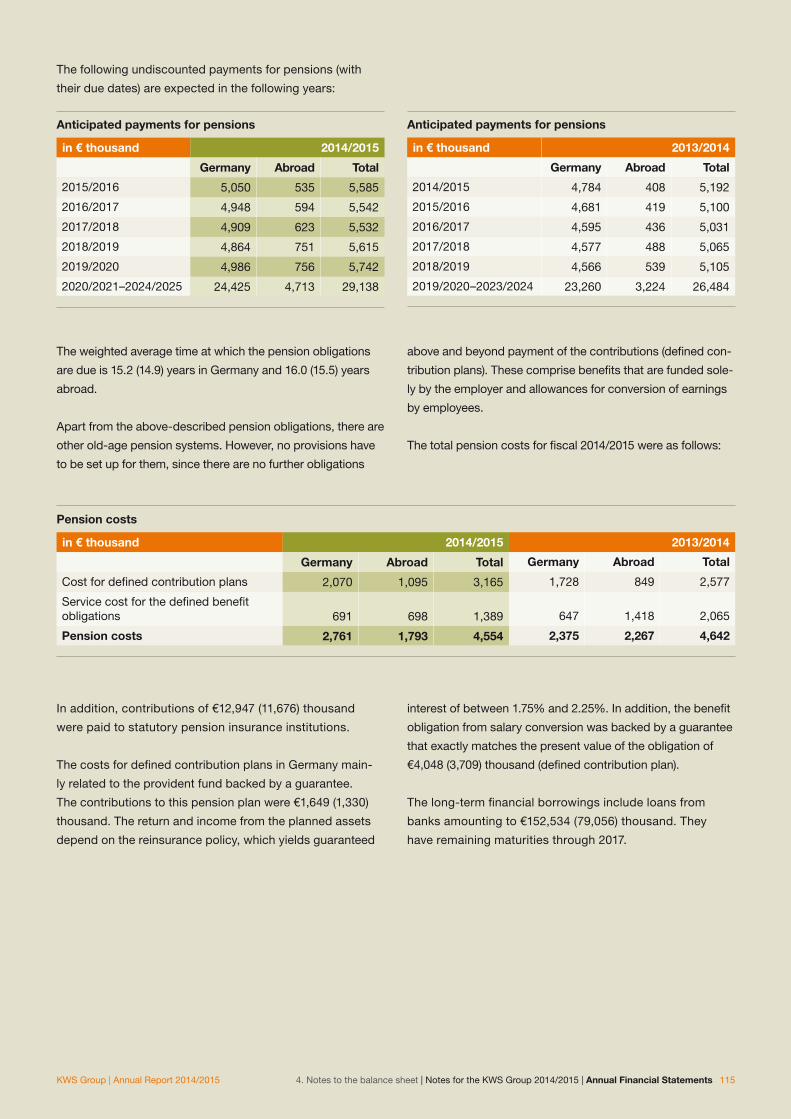
The following undiscounted payments for pensions (with
their due dates) are expected in the following years:
Anticipated payments for pensions
in € thousand 2014/2015
Germany Abroad Total
2015/2016 5,050 535 5,585
2016/2017 4,948 594 5,542
2017/2018 4,909 623 5,532
2018/2019 4,864 751 5,615
2019/2020 4,986 756 5,742
2020/2021–2024/2025 24,425 4,713 29,138
Anticipated payments for pensions
in € thousand 2013/2014
Germany Abroad Total
2014/2015 4,784 408 5,192
2015/2016 4,681 419 5,100
2016/2017 4,595 436 5,031
2017/2018 4,577 488 5,065
2018/2019 4,566 539 5,105
2019/2020 –2023/2024 23,260 3,224 26,484
Pension costs
in € thousand 2014/2015 2013/2014
Germany Abroad Total Germany Abroad Total
Cost for defined contribution plans 2,070 1,095 3,165 1,728 849 2,577
Service cost for the defined benefit obligations 691 698
1,389
647
1,418
2,065
Pension costs 2,761 1,793 4,554 2,375 2,267 4,642
In addition, contributions of €12,947 (11,676) thousand
were paid to statutory pension insurance institutions.
The costs for defined contribution plans in Germany main-
ly related to the provident fund backed by a guarantee.
The contributions to this pension plan were €1,649 (1,330)
thousand. The return and income from the planned assets
depend on the reinsurance policy, which yields guaranteed
interest of between 1.75% and 2.25%. In addition, the benefit
obligation from salary conversion was backed by a guarantee
that exactly matches the present value of the obligation of
€4,048 (3,709) thousand (defined contribution plan).
The long-term financial borrowings include loans from
banks amounting to €152,534 (79,056) thousand. They
have remaining maturities through 2017.
The weighted average time at which the pension obligations
are due is 15.2 (14.9) years in Germany and 16.0 (15.5) years
abroad.
Apart from the above-described pension obligations, there are
other old-age pension systems. However, no provisions have
to be set up for them, since there are no further obligations
above and beyond payment of the contributions (defined con-
tribution plans). These comprise benefits that are funded sole-
ly by the employer and allowances for conversion of earnings
by employees.
The total pension costs for fiscal 2014/2015 were as follows:
4. Notes to the balance sheet | Notes for the KWS Group 2014/2015 | Annual Financial Statements 115KWS Group | Annual Report 2014/2015

Under IAS 12, deferred tax liabilities are calculated as the
difference between the IFRS balance sheet amount and
the tax base. They are reported on a gross basis and total
€28,095 (26,165) thousand. The composition of the de-
ferred tax liabilities is explained in more detail under (24)
Taxes.
(15) Current liabilities
in € thousand 06/30/2015 06/30/2014
Shortterm provisions 87,355 74,825
Current liabilities to banks 31,857 39,537
Current financial liabilities to affiliates 308 301
Other current financial liabilities 118 248
Shortterm borrowings 32,283 40,086
Trade payables to affiliates 1,108 129
Other trade payables 58,550 56,692
Trade payables 59,658 56,821
Tax liabilities 30,111 35,426
Other current financial liabilities 15,952 11,617
Other current liabilities 56,589 55,410
281,948 274,185
Shortterm provisions
in € thousand 06/30/2014
Changes inthe con
solidatedgroup,
currency AdditionCon
sumption Reversal 06/30/2015
Obligations from sales transactions 59,577 4,462 70,333 58,000 3,220 73,152
Obligations from purchase transactions 9,068 103 3,439 4,119 3,096 5,395
Other obligations 6,180 283 4,648 2,204 99 8,808
74,825 4,848 78,420 64,323 6,415 87,355
The obligations from sales transactions essentially relate to
provisions for licenses and returns. The obligations from pur-
chase transactions include provisions for procurement trans-
actions, such as compensation for breeding areas. The other
obligations relate to litigation risks and other provisions that
cannot be assigned to the group of sales transactions or the
group of purchase transactions.
The tax liabilities of €30,111 (35,426) thousand include
amounts for the year under review and the period not yet
concluded by the external tax audit.
116 Annual Financial Statements | Notes for the KWS Group 2014/2015 | 4. Notes to the balance sheet Annual Report 2014/2015 | KWS Group

(16) Derivative financial instruments
in € thousand 06/30/2015 06/30/2014
Nominal volume
Carrying amounts Fair value
Nominal volume
Carrying amounts Fair value
Currency hedges 95,003 1,182 1,182 52,873 272 272
Interest-rate hedges 34,000 –130 –130 54,500 26 26
Commodity hedges 148 0 0 0 0 0
Total 129,151 1,052 1,052 107,373 298 298
Of the currency hedges, hedges with a nominal volume of
€89,248 (48,465) thousand have a remaining maturity of
less than one year and hedges with a nominal volume of
€5,755 (4,408) thousand have a remaining maturity of be-
tween one and five years. Of the interest-rate derivatives,
hedges with a nominal volume of €19,000 (39,500) thousand
will mature within one year and hedges with a nominal value
of €15,000 (15,000) thousand will mature in more than five
years. The commodity hedges have remaining maturities of
less than one (one) year.
(17) Financial instruments
In general, the fair values of financial assets and liabilities
are calculated on the basis of the market data available
on the balance sheet date and are assigned to one of the
three hierarchy levels in accordance with IFRS 13. The
principal market, i.e. the market with the largest volume of
trading and the greatest business activity, is used to calcu-
late the fair value. If this market does not exist for the asset
or liabilities in question, the market that maximizes the
amount that would be received to sell the asset or minimizes
the amount that would be paid to transfer the liability, after
taking into account transaction costs, is used. These are
active and accessible markets for identical assets and lia-
bilities, where the fair value results from quoted prices that
are observable (level 1 input factors). At the KWS Group,
this relates to securities in the category “available-for-sale
financial assets”, as well as fund shares at banks and other
financial assets whose price is likewise quoted in active
markets.
The level 2 input factors relate to derivative financial instru-
ments that have been concluded between KWS companies
and banks. The prices can thus be derived indirectly from
active market prices for similar assets and liabilities. The
level 3 input factors cannot be derived from observable
market information.
4. Notes to the balance sheet | Notes for the KWS Group 2014/2015 | Annual Financial Statements 117KWS Group | Annual Report 2014/2015

The carrying amounts and fair values of the financial assets
(financial instruments), split into the measurement catego-
ries in accordance with IAS 39, are as follows:
06/30/2015
in € thousand Financial instruments
Fair Values Carrying amounts
Loans andreceivables
Financialassets heldfor trading
Available forsale
financialassets
Totalcarryingamount
Financial assets
Financial assets 2,465 0 0 2,465 2,465
Trade receivables 309,665 309,665 0 0 309,665
Securities 66,973 0 0 66,973 66,973
Cash and cash equivalents 41,211 41,211 0 0 41,211
Other current financial assets 26,758 23,756 3,002 0 26,758
of which derivative financial instruments (3,002) (0) (3,002) (0) (3,002)
Total 447,072 374,632 3,002 69,438 447,072
06/30/2014
in € thousand Financial instruments
Fair Values Carrying amounts
Loans andreceivables
Financialassets heldfor trading
Available forsale
financialassets
Totalcarryingamount
Financial assets
Financial assets 2,700 0 0 2,700 2,700
Trade receivables 297,780 297,780 0 0 297,780
Securities 69,188 0 0 69,188 69,188
Cash and cash equivalents 53,076 53,076 0 0 53,076
Other current financial assets 14,883 14,004 879 0 14,883
of which derivative financial instruments (879) (0) (879) (0) (879)
Total 437,627 364,860 879 71,888 437,627
118 Annual Financial Statements | Notes for the KWS Group 2014/2015 | 4. Notes to the balance sheet Annual Report 2014/2015 | KWS Group

The fair value of financial assets (equity instruments) mea-
sured at amortized costs cannot be reliably determined
because there are no active markets. These assets relate
to shares in unconsolidated subsidiaries and associated
companies. It is assumed that the carrying amounts are
the same as the fair values. In addition, the financial assets
include securities classified as noncurrent assets, whose
fair value is measured by their prices on the stock market
(level 1).
The fair value of trade receivables, other current financial
assets and cash and cash equivalents is the same as the
carrying amounts as a result of the short time in which these
instruments are due.
The fair values of securities classified as current assets are
based on the price for them quoted on active markets (level 1).
The fair value of derivative financial instruments is the pres-
ent values of the payments related to these balance sheet
items. These instruments are mainly forward exchange
deals. They are measured on the basis of quoted exchange
rates and yield curves available from the market data and
allowing for counterparty risks (level 2).
The carrying amounts and fair values of the financial liabili-
ties (financial instruments), split into the measurement cate-
gories in accordance with IAS 39, are as follows:
06/30/2015
in € thousand Financial instruments
Fair Values Carrying amounts
Financialliabilities
measured atamortized
cost
Financialliabilities
heldfor trading
Disclosurein acc. with
IFRS 7
Totalcarryingamount
Financial liabilities
Long-term borrowings 183,428 152,534 0 29,249 181,783
of which outstanding purchase price obligations for consolidated subsidiaries (29,249) (0) (0) (29,249) (29,249)
Long-term trade payables 1,600 1,600 0 0 1,600
Short-term borrowings 32,283 32,283 0 0 32,283
Short-term trade payables 59,658 59,658 0 0 59,658
Other current financial liabilities 15,952 14,003 1,949 0 15,952
of which derivative financial instruments (1,949) (0) (1,949) (0) (1,949)
Total 292,921 260,078 1,949 29,249 291,276
4. Notes to the balance sheet | Notes for the KWS Group 2014/2015 | Annual Financial Statements 119KWS Group | Annual Report 2014/2015

The fair value of long-term borrowings was calculated on the
basis of discounted cash flows. To enable that, interest rates
for comparable transactions and yield curves were used
(level 2).
The outstanding purchase price obligation for consolidated
subsidiaries must be carried at the present value of the
anticipated future purchase price payments for minority
interests. This is derived from the anticipated operating income
of the subsidiary and a risk-adjusted discount rate (level 3).
Due to the mainly short times in which trade payables and
other financial liabilities (excluding derivatives) are due by, it is
assumed that their carrying amounts are equal to the fair value.
The method of calculating the fair values of derivative financial
instruments has been presented above under the comments
on financial assets.
None of the reported financial instruments will be held to
maturity.
06/30/2014
in € thousand Financial instruments
Fair Values Carrying amounts
Financialliabilities
measured atamortized
cost
Financialliabilities
heldfor trading
Disclosurein acc. with
IFRS 7
Totalcarryingamount
Financial liabilities
Long-term borrowings 114,224 79,056 0 34,698 113,754
of which outstanding purchase price obliga-tions for consolidated subsidiaries (34,698) (0) (0) (34,698) (34,698)
Long-term trade payables 1,469 1,469 0 0 1,469
Short-term borrowings 40,086 40,086 0 0 40,086
Short-term trade payables 56,821 56,821 0 0 56,821
Other current financial liabilities 11,617 11,036 581 0 11,617
of which derivative financial instruments (581) (0) (581) (0) (581)
Total 224,217 188,468 581 34,698 223,747
120 Annual Financial Statements | Notes for the KWS Group 2014/2015 | 4. Notes to the balance sheet Annual Report 2014/2015 | KWS Group

The table below shows the financial assets and liabilities
measured at fair value:
in € thousand 06/30/2015 06/30/2014
Level 1 Level 2 Level 3 Total Level 1 Level 2 Level 3 Total
Derivative financial instruments not part of a hedge under IAS 39 0 3,002 0
3,002
0
879
0
879
Available-for-sale financial assets 69,104 0 0 69,104 71,443 0 0 71,443
Financial assets 69,104 3,002 0 72,106 71,443 879 0 72,322
Derivative financial instruments not part of a hedge under IAS 39 0 1,949 0
1,949
0
581
0
581
Financial liabilities 0 1,949 0 1,949 0 581 0 581
The derivative financial instruments mainly consists of for-
ward exchange deals, whose fair value is derived from the
forward exchange rates and the use of option pricing models
(level 2).
The table below presents the net gains/losses carried in the
income statement for financial instruments in each measure-
ment category:
in € thousand 06/30/2015 06/30/2014
Available-for-sale financial assets 141 119
Financial assets held for trading 2,141 81
Loans and receivables 3,854 –1,080
Financial liabilities measured at amortized cost –10,644 –10,688
Financial liabilities held for trading –1,471 314
4. Notes to the balance sheet | Notes for the KWS Group 2014/2015 | Annual Financial Statements 121KWS Group | Annual Report 2014/2015

The net income from available-for-sale financial assets
essentially includes income from equity investments in
cooperatives.
The net gains from financial assets held for trading and
financial liabilities held for trading solely comprise changes
in the market value of derivative financial instruments.
The net gain/loss from loans and receivables mainly
includes effects from changes in the allowances for impair-
ment.
The net losses from financial liabilities measured at
amortized cost result mainly from interest expense.
Interest income from financial assets that are not measured
at fair value and recognized in the income statement was
€1,480 (1,583) thousand. Interest expenses for financial bor-
rowings were €10,644 (10,688) thousand.
In order to control the credit risk resulting from receivables
from customers, a regular creditworthiness analysis is con-
ducted by the responsible Credit Manager in accordance
with the credit volume. Security is available for some of
these receivables and is used depending on the local cir-
cumstances. This includes in particular credit insurance,
down payments and guarantees. In general, reservation
of ownership of goods is agreed with our customers.
Credit limits are defined for all customers. Credit risks from
financial transactions are controlled centrally by Corporate
Finance/Treasury. In order to minimize risks, financial trans-
actions are exclusively conducted within defined limits with
banks and partners who always have an investment grade.
Compliance with the risk limits is constantly monitored. The
limits are adjusted depending on the credit volume only sub-
ject to the approval of the regional or divisional management
and the Executive Board.
Liquidity is managed in the euro zone by the central Treasury
unit using a cash pooling system. Liquidity requirements
are generally determined by means of cash planning and
are covered by cash and promised credit lines. In order to
finance acquisition of the shares in KWS LOCHOW GMBH
and the SOCIETE DE MARTINVAL Group, KWS SAAT SE is-
sued a borrower’s note loan with a volume of €100 million in
September 2014. As part of that, €19.5 million of the existing
borrower’s note loan from 2012 was repaid.
There are unutilized credit lines totaling €222 million. A
syndicated loan of €200 million was renegotiated in October
2014. It runs until October 2019, with the option of extending
it up to October 2021. Unlike the old loan, the new agree-
ment only contains one financial covenant. In the case of
financial covenants, the dynamic gearing ratio is used as
a financial indicator. Compliance with the covenants is
regularly reviewed by KWS SAAT SE’s Treasury unit and
reported to the banks every quarter in connection with the
quarterly and annual financial statements.
122 Annual Financial Statements | Notes for the KWS Group 2014/2015 | 4. Notes to the balance sheet Annual Report 2014/2015 | KWS Group

The table below shows the KWS Group’s liquidity analysis
for non-derivative and derivative financial liabilities. The
table is based on contractually agreed, undiscounted pay-
ment flows:
in € thousand Book value Cash flows
Liquidity analysis of financial liabilities 06/30/201506/30/2015
TotalDue in
< 1 year
Due in > 1 year and
< 5 yearsDue in
> 5 years
Financial liabilities 214,066 197,425 42,285 98,814 56,326
Trade payables 61,258 61,258 59,658 1,189 411
Other financial liabilities 14,003 14,003 14,003
Nonderivative financial liabilities 289,327 272,686 115,946 100,003 56,737
Payment claim 40,134 39,868 266
Payment obligation 43,812 43,168 644
Derivative financial liabilities 1,949 3,678 3,300 378
in € thousand Book value Cash flows
Liquidity analysis of financial liabilities 06/30/201406/30/2014
TotalDue in
< 1 year
Due in > 1 year and
< 5 yearsDue in
> 5 years
Financial liabilities 153,840 185,894 60,611 125,090 193
Trade payables 58,290 58,290 56,821 1,146 323
Other financial liabilities 11,036 11,036 11,036
Nonderivative financial liabilities 223,166 255,221 128,468 126,237 516
Payment claim 22,531 22,531
Payment obligation 23,221 23,221
Derivative financial liabilities 581 690 690
4. Notes to the balance sheet | Notes for the KWS Group 2014/2015 | Annual Financial Statements 123KWS Group | Annual Report 2014/2015
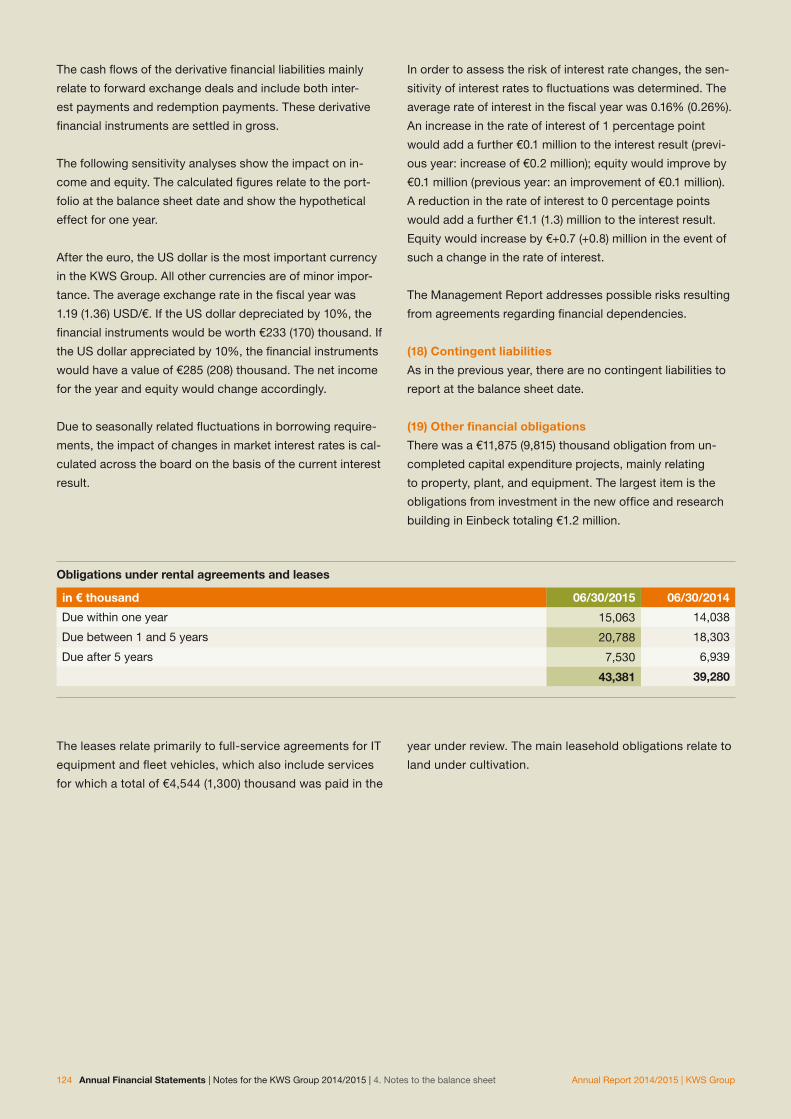
The cash flows of the derivative financial liabilities mainly
relate to forward exchange deals and include both inter-
est payments and redemption payments. These derivative
financial instruments are settled in gross.
The following sensitivity analyses show the impact on in-
come and equity. The calculated figures relate to the port-
folio at the balance sheet date and show the hypothetical
effect for one year.
After the euro, the US dollar is the most important currency
in the KWS Group. All other currencies are of minor impor-
tance. The average exchange rate in the fiscal year was
1.19 (1.36) USD/€. If the US dollar depreciated by 10%, the
financial instruments would be worth €233 (170) thousand. If
the US dollar appreciated by 10%, the financial instruments
would have a value of €285 (208) thousand. The net income
for the year and equity would change accordingly.
Due to seasonally related fluctuations in borrowing require-
ments, the impact of changes in market interest rates is cal-
culated across the board on the basis of the current interest
result.
In order to assess the risk of interest rate changes, the sen-
sitivity of interest rates to fluctuations was determined. The
average rate of interest in the fiscal year was 0.16% (0.26%).
An increase in the rate of interest of 1 percentage point
would add a further €0.1 million to the interest result (previ-
ous year: increase of €0.2 million); equity would improve by
€0.1 million (previous year: an improvement of €0.1 million).
A reduction in the rate of interest to 0 percentage points
would add a further €1.1 (1.3) million to the interest result.
Equity would increase by €+0.7 (+0.8) million in the event of
such a change in the rate of interest.
The Management Report addresses possible risks resulting
from agreements regarding financial dependencies.
(18) Contingent liabilities
As in the previous year, there are no contingent liabilities to
report at the balance sheet date.
(19) Other financial obligations
There was a €11,875 (9,815) thousand obligation from un-
completed capital expenditure projects, mainly relating
to property, plant, and equipment. The largest item is the
obligations from investment in the new office and research
building in Einbeck totaling €1.2 million.
Obligations under rental agreements and leases
in € thousand 06/30/2015 06/30/2014
Due within one year 15,063 14,038
Due between 1 and 5 years 20,788 18,303
Due after 5 years 7,530 6,939
43,381 39,280
The leases relate primarily to full-service agreements for IT
equipment and fleet vehicles, which also include services
for which a total of €4,544 (1,300) thousand was paid in the
year under review. The main leasehold obligations relate to
land under cultivation.
124 Annual Financial Statements | Notes for the KWS Group 2014/2015 | 4. Notes to the balance sheet Annual Report 2014/2015 | KWS Group
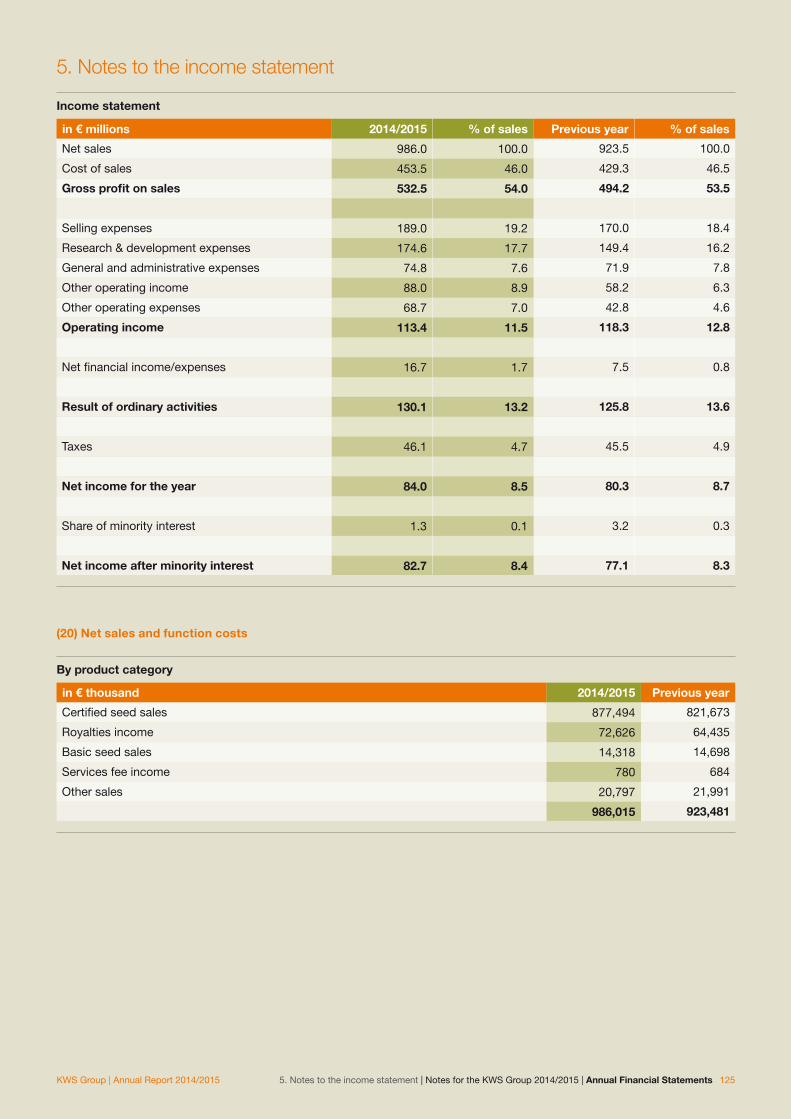
5. Notes to the income statement
Income statement
in € millions 2014/2015 % of sales Previous year % of sales
Net sales 986.0 100.0 923.5 100.0
Cost of sales 453.5 46.0 429.3 46.5
Gross profit on sales 532.5 54.0 494.2 53.5
Selling expenses 189.0 19.2 170.0 18.4
Research & development expenses 174.6 17.7 149.4 16.2
General and administrative expenses 74.8 7.6 71.9 7.8
Other operating income 88.0 8.9 58.2 6.3
Other operating expenses 68.7 7.0 42.8 4.6
Operating income 113.4 11.5 118.3 12.8
Net financial income/expenses 16.7 1.7 7.5 0.8
Result of ordinary activities 130.1 13.2 125.8 13.6
Taxes 46.1 4.7 45.5 4.9
Net income for the year 84.0 8.5 80.3 8.7
Share of minority interest 1.3 0.1 3.2 0.3
Net income after minority interest 82.7 8.4 77.1 8.3
(20) Net sales and function costs
By product category
in € thousand 2014/2015 Previous year
Certified seed sales 877,494 821,673
Royalties income 72,626 64,435
Basic seed sales 14,318 14,698
Services fee income 780 684
Other sales 20,797 21,991
986,015 923,481
5. Notes to the income statement | Notes for the KWS Group 2014/2015 | Annual Financial Statements 125KWS Group | Annual Report 2014/2015

The other sales include net sales from barter transactions
totaling €571 (774) thousand.
For further details of sales, see segment reporting. Sales are
recognized when the agreed goods or services have been
supplied and risk and title pass to the buyer. Any rebates or
discounts are taken into account.
The cost of sales increased by 5.6% to €453,498 (429,272)
thousand, or 46.0% (46.5%) of sales. The total cost of goods
sold was €272,836 (269,012) thousand.
Allowances on inventories totaling €1,755 thousand more
(previous year: lower by €226 thousand) were required. The
allowances were lower by €1,065 thousand for the Cereals
Segment (previous year: lower by €181 thousand), while they
were lower by €1,750 thousand for the Corn Segment (previ-
ous year: higher by €1,042 thousand). Additional allowances
totaling €2,440 thousand were required in the Sugarbeet
Segment (previous year: lower by €1,087 thousand).
The €18,967 thousand increase in selling expenses to
€188,991 (170,024) thousand is attributable to the creation
and expansion of distribution structures. This is 19.2% of
net sales, up from 18.4% the year before.
Research & development is recognized as an expense
in the year it is incurred; in the year under review, this
amounted to €174,627 (149,382) thousand. Development
costs for new varieties are not recognized as an asset
because evidence of future economic benefit can only be
provided after the variety has been officially certified.
General and administrative expenses increased by
€2,890 thousand to €74,756 thousand, representing 7.6%
of sales, after 7.8% the year before.
By region
in € thousand 2014/2015 Previous year
Germany 223,885 225,149
Europe 441,526 435,508
North and South America 254,709 205,600
Rest of world 65,895 57,224
986,015 923,481
(21) Other operating income
in € thousand 2014/2015 Previous year
Income from sales of fixed assets 877 333
Income from the reversal of provisions 6,427 15,638
Exchange rate gains and gains from currency and interest rate hedges 36,640 13,512
Income from reversal of allowances on receivables 10,852 4,858
Performance-based public grants 4,845 5,454
Income relating to previous periods 8,227 6,315
Income from loss compensation received 862 191
Miscellaneous other operating income 19,230 11,806
87,960 58,107
The other operating income mainly comprises foreign ex-
change gains and income from interest rate hedges, as
well as income from the reversal of provisions and miscel-
laneous other operating income.
126 Annual Financial Statements | Notes for the KWS Group 2014/2015 | 5. Notes to the income statement Annual Report 2014/2015 | KWS Group

(22) Other operating expenses
in € thousand 2014/2015 Previous year
Legal form expenses 1,712 1,056
Allowances on receivables 8,478 7,520
Counterparty default 8 392
Exchange rate losses and losses on currency and interest rate hedges 44,304 22,285
Losses from sales of fixed assets 717 241
Expenses relating to previous periods 1,199 1,098
Expense from remeasurement of intangible assets 238 2,366
Other expenses 12,030 7,819
68,686 42,777
In the year under review, allowances for receivables of
€5,636 (3,144) thousand were recognized as an expense
at the Corn Segment, €2,591 (4,242) thousand at the
in € thousand 2014/2015 Previous year
Interest income 1,480 1,598
Interest expenses 9,709 11,471
Income from other financial assets 141 119
Write-down on securities 9 0
Interest effects from pension provisions 2,518 2,762
Interest expense for other long-term provisions 158 192
Financial lease interest expense 7 3
Interest result –10,780 –12,711
Result from equity-accounted financial assets 23,747 20,208
Gain from remeasurement of the existing shares in SOCIéTé DE MARTINVAL S.A. 3,722 0
Net income from equity investments 27,469 20,208
Net financial income/expenses 16,689 7,497
Net income from equity investments increased to
€27,469 (20,208) thousand, largely due to improved in-
come from equity-accounted financial assets totaling
€23,747 (20,208) thousand and gains from remeasurement
of the existing shares in SOCIéTé DE MARTINVAL S.A.
totaling €3,722 (0) thousand. Together with an
interest result of € –10,780 (–12,711) thousand, net
financial income/expenses rose by €9,192 thousand to
€16,689 (7,497) thousand. The interest effects from pen-
sion provisions comprise interest expenses (compounding)
and the planned income.
Sugarbeet Segment, €251 (70) thousand at the Cereals
Segment and €0 (64) thousand at the Corporate Segment.
(23) Net financial income/expenses
5. Notes to the income statement | Notes for the KWS Group 2014/2015 | Annual Financial Statements 127KWS Group | Annual Report 2014/2015

(24) Taxes
Income tax expense is computed as follows:
in € thousand 2014/2015 Previous year
Income taxes, Germany 15,723 15,824
Income taxes, other countries 36,231 34,289
Current expenses from income taxes 51,954 50,113
Thereof from previous years (294) (– 6,829)
Deferred taxes, Germany – 634 –111
Deferred taxes, other countries – 5,262 – 4,514
Deferred tax income/expense – 5,896 – 4,625
Reported income tax expense 46,058 45,488
Adjusted for tax relating to previous periods, KWS pays
tax in Germany at a rate of 29.1%. Corporate income tax of
15.0% (15.0%) and solidarity tax of 5.5% (5.5%) are applied
uniformly to distributed and retained profits. In addition, mu-
nicipal trade tax is payable on profits generated in Germany.
Trade income tax is applied at a weighted average rate of
13.3% (13.3%), resulting in a total tax rate of 29.1% (29.1%).
The “Law on Tax Measures Accompanying Introduction of
the Societas Europaea and Amending Further Tax Regu-
lations” (SEStEG), which was passed at the end of 2006,
means that the corporate income tax credit balance at
December 31, 2006, can be realized. It will be paid out in
ten equal annual amounts from 2008 to 2017. The German
Group companies carried these claims as assets at their
present value totaling €3,702 (4,933) thousand at June 30,
2015. €1,235 (1,235) thousand was recovered in the year
under review and recognized directly in equity.
Under German tax law, both German and foreign dividends
are 95% tax exempt.
The profits generated by Group companies outside
Germany are taxed at the rates applicable in the country
in which they are based.
For the German Group companies, deferred tax was
calculated at 29.1% (29.1%). For foreign Group companies,
deferred tax was calculated using the tax rates applicable in
the country in which they are based.
128 Annual Financial Statements | Notes for the KWS Group 2014/2015 | 5. Notes to the income statement Annual Report 2014/2015 | KWS Group

Deferred taxes result from the following:
in € thousand Deferred tax assets Deferred tax liabilities
2014/2015Previous
year Change 2014/2015Previous
year Change
Intangible assets 273 12 261 8,118 9,431 –1,313
Biological assets 0 0 0 36 33 3
Property, plant and equipment 515 284 231 15,375 13,886 1,489
Financial assets 1,655 1,529 126 1 634 – 633
Inventories 9,645 9,527 118 187 166 21
Current assets 4,760 2,351 2,409 3,363 1,139 2,224
Noncurrent liabilities 18,145 14,327 3,818 954 888 66
Current liabilities 11,547 14,404 – 2,857 87 16 71
Tax loss carryforward 6,660 5,115 1,545 0 0 0
Other consolidation transactions 1,119 386 733 10 5 5
Deferred taxes recognized 54,319 47,935 6,384 28,095 26,165 1,930
The other income includes exchange rate-related changes
to the deferred taxes of €54 (–735) thousand, which were di-
rectly credited to equity, without recognition in profit or loss.
The deferred taxes from temporary differences recognized
in the income statement changed as follows:
Deferred tax expense/income per balance sheet item
in € thousand Recognized in the income statement
Temporary differences from: 2014/2015 Previous year
Intangible assets 5,012 3,038
Property, plant and equipment – 74 206
Financial assets 953 –1,005
Inventories – 315 –123
Current assets 752 – 2,088
Noncurrent liabilities – 39 1,673
Current liabilities – 3,111 – 698
Tax loss carryforward 2,664 3,784
Other 725 58
6,567 4,845
5. Notes to the income statement | Notes for the KWS Group 2014/2015 | Annual Financial Statements 129KWS Group | Annual Report 2014/2015
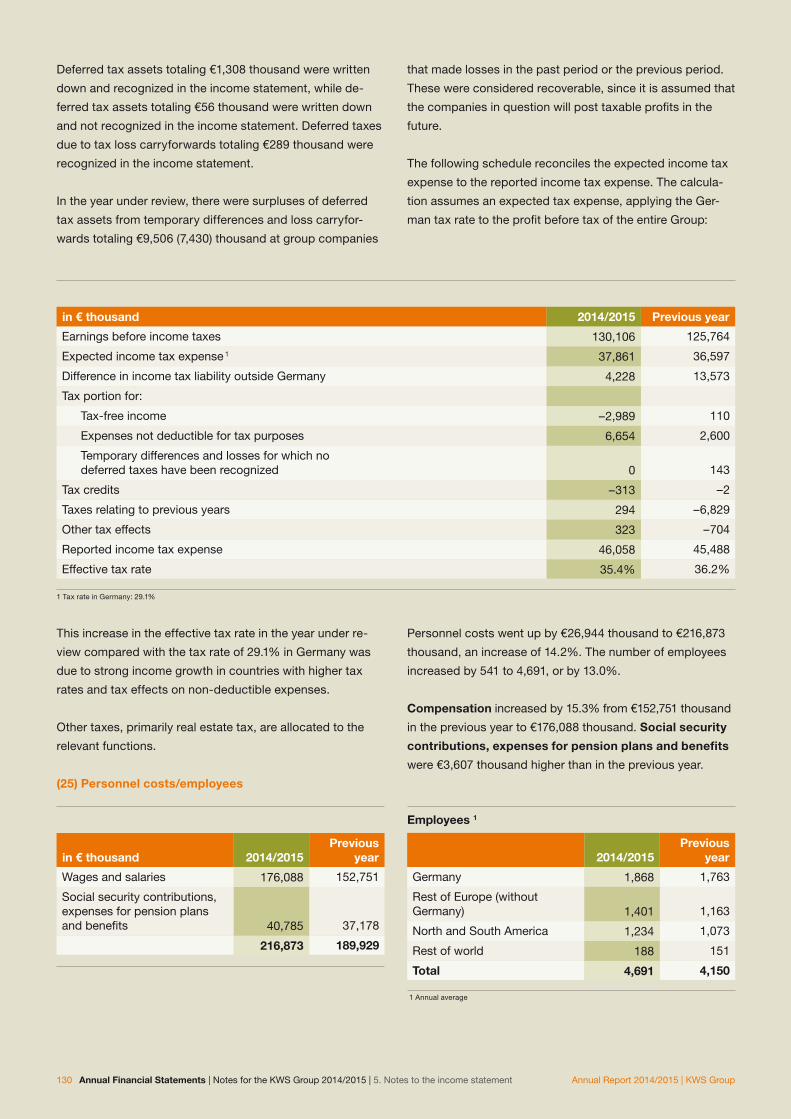
Deferred tax assets totaling €1,308 thousand were written
down and recognized in the income statement, while de-
ferred tax assets totaling €56 thousand were written down
and not recognized in the income statement. Deferred taxes
due to tax loss carryforwards totaling €289 thousand were
recognized in the income statement.
In the year under review, there were surpluses of deferred
tax assets from temporary differences and loss carryfor-
wards totaling €9,506 (7,430) thousand at group companies
that made losses in the past period or the previous period.
These were considered recoverable, since it is assumed that
the companies in question will post taxable profits in the
future.
The following schedule reconciles the expected income tax
expense to the reported income tax expense. The calcula-
tion assumes an expected tax expense, applying the Ger-
man tax rate to the profit before tax of the entire Group:
in € thousand 2014/2015 Previous year
Earnings before income taxes 130,106 125,764
Expected income tax expense 1 37,861 36,597
Difference in income tax liability outside Germany 4,228 13,573
Tax portion for:
Tax-free income – 2,989 110
Expenses not deductible for tax purposes 6,654 2,600
Temporary differences and losses for which no deferred taxes have been recognized
0
143
Tax credits – 313 – 2
Taxes relating to previous years 294 – 6,829
Other tax effects 323 – 704
Reported income tax expense 46,058 45,488
Effective tax rate 35.4% 36.2%
1 Tax rate in Germany: 29.1%
This increase in the effective tax rate in the year under re-
view compared with the tax rate of 29.1% in Germany was
due to strong income growth in countries with higher tax
rates and tax effects on non-deductible expenses.
Other taxes, primarily real estate tax, are allocated to the
relevant functions.
(25) Personnel costs/employees
in € thousand 2014/2015Previous
year
Wages and salaries 176,088 152,751
Social security contributions, expenses for pension plans and benefits
40,785
37,178
216,873 189,929
Personnel costs went up by €26,944 thousand to €216,873
thousand, an increase of 14.2%. The number of employees
increased by 541 to 4,691, or by 13.0%.
Compensation increased by 15.3% from €152,751 thousand
in the previous year to €176,088 thousand. Social security
contributions, expenses for pension plans and benefits
were €3,607 thousand higher than in the previous year.
Employees 1
2014/2015Previous
year
Germany 1,868 1,763
Rest of Europe (without Germany) 1,401 1,163
North and South America 1,234 1,073
Rest of world 188 151
Total 4,691 4,150
1 Annual average
130 Annual Financial Statements | Notes for the KWS Group 2014/2015 | 5. Notes to the income statement Annual Report 2014/2015 | KWS Group

Acquisition of the remaining shares in the SOCIETE DE
MARTINVAL Group meant that its headcount was included
in full in the figures this year. If our joint ventures are in-
cluded proportionately, the headcount is 5,322 (4,847). The
reported number of employees is greatly influenced by sea-
sonal labor.
(26) Sharebased payment
Employee Share Program
KWS has established a share program for employees. All
employees who have been with the company for at least one
year without interruption and have a permanent employment
relationship that has not been terminated at a KWS Group
company that participates in the program are eligible to take
part. That also includes employees who are on maternity
leave or parental leave or who are in semi-retirement.
Each employee can acquire up to 500 shares. A bonus of
20% is deducted from the purchase price, which depends
on the price applicable on the key date. The shares are
subject to a lock-up period of four years beginning when they
are posted to the employee’s securities account. The right
to a dividend, if KWS SAAT SE pays one out, exists during
the lock-up period. Holders can also exercise their right to
participate in the Annual Shareholders’ Meeting during the
lock-up period. They can dispose freely of the shares after
the lock-up period.
9,878 (11,028) shares were repurchased for the Employee
Share Program at a total price of €2,684 (2,834) thousand in
the year under review.
Longterm incentive (LTI)
The stock-based compensation plans awarded at the
KWS Group are recognized in accordance with IFRS 2
“Share-based Payment”. The incentive program, which
was launched in fiscal 2009/2010, involves stock-based
payment transactions with cash compensation, which
are measured at fair value at every balance sheet date.
Members of the Executive Board are obligated to acquire
shares in KWS SAAT SE every year in a freely selectable
amount ranging between 20% and 50% of the gross per-
formance-related bonus. Along with that, all members of
the second management level can likewise take part in an
LTI program. As part of this program, they are obligated
to invest in shares in KWS SAAT SE every year in a freely
selectable amount ranging between 10% and 40% of the
gross performance-related bonus. The members of the
Executive Board and the second management level may
sell these shares at the earliest after a regular holding pe-
riod of five years beginning at the time they are acquired
(end of the quarter in which the shares were acquired).
The entitled persons are paid a long-term incentive (LTI) in
the form of cash compensation after the holding period for
the tranche in question. Its level is calculated on the basis
of KWS SAAT SE’s share performance and on the KWS
Group’s return on sales (ROS), measured as the ratio of
operating income to net sales, over the holding period. For
persons with contracts as of July 1, 2014, the cash com-
pensation for members of the Executive Board is a maxi-
mum of one-and-half times (for the Chief Executive Officer
two times), and for members of the second management
level a maximum of two times their own investment (LTI
cap). The costs of this compensation are recognized in the
income statement over the period and were €1,044 (718)
thousand in the period under review. The provision for it
at June 30, 2015, was €2,170 (1,200) thousand. The LTI fair
values are calculated by an external expert.
(27) Net income for the year
The KWS Group’s net income for the year was €84,048
(80,276) thousand on operating income of €113,417 (118,267)
thousand and net financial income/expenses of €16,689
(7,497) thousand. The return on sales fell slightly to 8.5%
(8.7%). Net income for the year after minority interest is
€82,712 (77,124) thousand. Due to the acquisition of the
remaining shares held by the Momont family, the share of
minority interests in the KWS Group’s income fell sharply
year on year. Earnings per share in the year under review
were €12.53 (11.69).
5. Notes to the income statement | Notes for the KWS Group 2014/2015 | Annual Financial Statements 131KWS Group | Annual Report 2014/2015

6. Notes to the cash flow statement
The cash flow statement, which has been prepared according
to IAS 7 (indirect method), shows the changes in cash and
cash equivalents of the KWS Group in the three categories of
operating activities, investing activities, and financing activi-
ties. The effects of exchange rate changes and changes in the
consolidated group have been eliminated from the respective
balance sheet items, except those affecting cash and cash
equivalents.
(1) Net cash from operating activities
The cash proceeds from operating activities are substantially
determined by cash earnings. In the year under review they
were €92,063 (84,954) thousand. The proportion of cash
earnings included in sales was 9.3% (9.2%). Capital tie-up
amounted to €72,809 (62,626) thousand, mainly due to an
increase in assets not attributable to financing or investing
activity. The cash proceeds from operating activities also in-
clude interest income of €1,479 (1,592) thousand and interest
expense of €6,843 (7,288) thousand. Income tax payments
amounted to €69,552 (67,497) thousand. The dividends re-
ceived from the joint ventures are also carried here and total
€12,157 (11,272) thousand.
(2) Net cash from investing activities
A net total of €123,761 (63,089) thousand was required to
finance investing activities. An amount of €86,576 (63,556)
thousand was paid for intangible and tangible assets and an
amount of €7,535 (874) thousand for financial assets. There
were total cash receipts of €2,077 (1,341) thousand for
disposals of assets. €31,727 (0) thousand was paid to acquire
shares in consolidated companies and other business units.
(3) Net cash from financing activities
Financing activities resulted in cash proceeds of €48,398
thousand (previous year: cash payments of €43,558 thou-
sand). The dividend payments to parent shareholders and
other shareholders comprise the dividends of €19,800
(19,800) thousand paid to the shareholders of KWS SAAT SE,
as well as profit distributions paid to other shareholders of
and at fully consolidated subsidiaries of €0 (1,328) thousand.
In the previous year, this also related to acquisition of the
remaining minority interests in KWS LOCHOW GMBH. In
addition, net borrowings totaling €68,198 (23,357) thousand
were raised.
(4) Supplementary information on the
cash flow statement
Of the changes in cash and cash equivalents caused by ex-
change rate, consolidated group, and measurement changes,
a total of €6,879 (–2,909) thousand results from exchange
rate-related adjustments and a total of €6,285 (0) thousand
from adjustments relating to changes in the consolidated
companies.
As in previous years, cash and cash equivalents are com-
posed of cash (on hand and balances with banks) and current
available-for-sale securities.
7. Other notes
Proposal for the appropriation of net retained profits
KWS SAAT SE posted operating income of € –23,242 thousand
compared with € –14,331 thousand for the previous year.
Allowing for net financial income/expenses of €45,017 (37,911)
thousand and income taxes totaling €2,108 (–265) thousand,
net income in accordance with the German commercial law
regulations was €19,667 (23,845) thousand. Adding the net
profit of €199 (154) thousand brought forward from the previ-
ous year, a net retained profit of €19,866 thousand is available
for distribution.
A proposal will be made to the Annual Shareholders’ Meeting
that an amount of €19,800 thousand of KWS SAAT SE’s net
retained profit should be distributed as a dividend of €3.00
(3.00) for each of the 6,600,000 shares.
The balance of €66 (199) thousand is to be carried forward to
the new account.
Total remuneration of the Supervisory Board and
Executive Board and of former members of the Super
visory Board and Executive Board of KWS SAAT SE
The compensation of the members of the Supervisory Board
consists of a fixed and a variable component, with the vari-
able component being limited to the level of the fixed com-
pensation. As in the previous year, the total compensation for
members of Supervisory Board amounts to €516 (516) thou-
sand, excluding value-added tax. €238 (238) thousand of the
total compensation is performance-related.
132 Annual Financial Statements | Notes for the KWS Group 2014/2015 | 6. Notes to the cash flow statement Annual Report 2014/2015 | KWS Group

In fiscal year 2014/2015, total Executive Board compen-
sation amounted to €4,007 (3,481) thousand. The variable
compensation, which is calculated on the basis of the net
profit for the period of the KWS Group, is made up of a
bonus and a long-term incentive. The bonus totals €1,772
(1,884) thousand; there are contributions from the long-term
incentive tranche for 2013/2014 totaling €881 thousand
(tranche for 2012/2013: €610 thousand).
Compensation of former members of the Executive Board
and their surviving dependents amounted to €1,693 (1,476)
thousand. Pension provisions recognized for this group of
persons amounted to €7,131 (7,018) thousand as of June 30,
2015, before being netted off with the relevant planned
assets.
Shareholdings of members of the Supervisory Board
and the Executive Board (as of July 31, 2015)
Dr. Arend Oetker indirectly holds a total of 1,650,010
(1,650,010) shares and Dr. Andreas J. Büchting 108,030
(108,030) shares in KWS SAAT SE. The members
of the Supervisory Board hold a total of 1,758,735
(1,758,725) shares in KWS SAAT SE.
All together, the members of the Executive Board hold
14,445 (14,699) shares in KWS SAAT SE.
Related party disclosures
As part of its operations, KWS procures goods and services
worldwide from a large number of business partners, in-
cluding companies in which KWS has an interest. Business
dealings with these companies are always conducted on
an arm’s length basis; from the KWS Group’s perspective,
these dealings have not been material. As part of Group
financing, short- and medium-term loans are taken out from
and granted to subsidiaries at market interest rates. A total
of 14 shareholders declared to KWS SAAT SE in 2002 that
as a result of mutual allocations, they respectively hold a
total of more than 50% of the voting rights. The Executive
Board, Supervisory Board and the families of their members
were also defined as related parties. There were no business
transactions or legal transactions that required reporting for
this group of persons in fiscal 2014/2015. The compensa-
tion that has to be disclosed in accordance with IAS 24 for
management in key positons at the Group comprises remu-
neration for the active Executive Board and the Supervisory
Board. It is presented in the Group Management Report. No
other related parties have been identified for whom there is a
special reporting requirement under IAS 24.
There are lease agreements with an annual lease of
€132 (132) thousand between Hans-Joachim Tessner and
KWS SAAT SE. The three equity-accounted joint ventures
provided breeding services for KWS SAAT SE on an arm’s
length basis.
Related parties
in € thousandDeliveries and
services providedReceived deliveries
and services Receivables Payables
2014/2015Previous
year 2014/2015Previous
year 06/30/2015Previous
year 06/30/2015Previous
year
Unconsolidated subsidaries 0 2 0 0 332 262 0 0
Equity-accounted joint ventures 7,887 9,035 22,016 19,360
6,394
5,693
1,108
68
Other related parties 0 0 132 132 0 0 0 0
The receivables from unconsolidated companies in the
current fiscal year total €332 thousand. They are classified
as dubious and so have been completely written down.
7. Other notes | Notes for the KWS Group 2014/2015 | Annual Financial Statements 133KWS Group | Annual Report 2014/2015

Audit of the annual financial statements
On December 18, 2014, the Annual Shareholders’ Meeting
of KWS SAAT SE elected the accounting firm Deloitte &
Touche GmbH, Hanover, to be the Group’s auditors for fiscal
year 2014/2015.
Fee paid to the external auditors under Section 314 (1) No. 9 of the HGB
in € thousand 2014/2015Previous
year
a) Audit of the consolidated financial statements 741 710
b) Other certification services 2 2
c) Tax consulting 0 0
d) Other services 52 45
Total fee paid 795 757
For fiscal year 2015/2016, fees for consulting services (ex-
cluding auditing) of to up to €75 thousand are expected.
Declaration of compliance with the German Corporate
Governance Code
KWS SAAT SE has issued the declaration of compliance
with the German Corporate Governance Code required by
section 161 of the Aktiengesetz (AktG – German Stock Cor-
poration Act) and made it accessible to its shareholders on
the company’s home page at www.kws.com.
Supervisory and Executive Boards of KWS SAAT SE
Supervisory Board
Dr. Drs. h.c. Andreas J. Büchting
Einbeck
Agricultural Biologist
Chairman of the Supervisory Board of KWS SAAT SE
Membership of comparable German and foreign oversight
boards:
■■ Member of the Board of Directors of Ball Horticultural
Company, West Chicago, Illinois (U.S.)
Dr. Arend Oetker
Berlin
Businessman
Managing Partner of Kommanditgesellschaft Dr. Arend
Oetker Vermögensverwaltungsgesellschaft mbH & Co., Berlin
Deputy Chairman of the Supervisory Board of
KWS SAAT SE
Membership of other legally mandated Supervisory Boards:
■■ Schwartauer Werke GmbH & Co. KGaA,
Bad Schwartau (Chairman)■■ Cognos AG, Hamburg (Chairman)
Membership of comparable German and foreign
oversight boards:
■■ Leipziger Messe GmbH, Leipzig
Hubertus von Baumbach
Ingelheim am Rhein
Businessman
Member of Management of Boehringer Ingelheim, Ingelheim
am Rhein
Jürgen Bolduan
Einbeck
Seed Breeding Employee
Chairman of the Central Works Committee
of KWS SAAT SE
Cathrina ClaasMühlhäuser
Frankfurt am Main
Businesswoman
Chairwoman of the Supervisory Board of
CLAAS KGaA mbH, Harsewinkel
Membership of other legally mandated Supervisory Boards:
■■ CLAAS KGaA mbH, Harsewinkel (Chairwoman)
Membership of comparable German and foreign
oversight boards:
■■ CLAAS KGaA mbH, Harsewinkel
(Deputy Chairwoman of the Shareholders’ Committee)
Dr. Berthold Niehoff
Einbeck
Agricultural Scientist
Employee Representative
134 Annual Financial Statements | Notes for the KWS Group 2014/2015 | 7. Other notes Annual Report 2014/2015 | KWS Group

8. Declaration by legal representatives
We declare to the best of our knowledge that the con-
solidated financial statements give a true and fair view of
the assets, financial position and earnings of the Group
in compliance with the generally accepted standards of
consoli dated accounting, and that an accurate picture of
the course of business, including business results, and the
Group’s situation is conveyed by the Group Management
Supervisory Board Committees
Audit Committee
Chairman: Hubertus von Baumbach
Members: Andreas J. Büchting, Jürgen Bolduan
Committee for Executive Board Affairs
Chairman: Andreas J. Büchting
Members: Arend Oetker, Cathrina Claas-Mühlhäuser
Nominating Committee
Chairman: Andreas J. Büchting
Members: Arend Oetker, Cathrina Claas-Mühlhäuser
Executive Board
Philip von dem Bussche (until December 31, 2014)
Einbeck
Chief Executive Officer (until December 31, 2014)
Corporate Development and Communication,
Human Resources
Dr. Hagen Duenbostel
Einbeck
Chief Executive Officer (since January 1, 2015)
Corn, Corporate Development and Communication,
Corporate Compliance
Membership of comparable German and foreign oversight
boards:■■ Hero AG, Lenzburg, CH
(Member of the Board of Administration)
Dr. Léon Broers
Einbeck
Research and Breeding
Dr. Peter Hofmann (since October 1, 2014)
Einbeck
Sugarbeet, Cereals, Marketing
Eva Kienle
Göttingen
Finance, Controlling, Global Services,
IT, Legal, Human Resources
Report, and that it describes the main opportunities and
risks of the Group’s anticipated development.
Einbeck, October 1, 2015
KWS SAAT SE
The Executive Board
H. Duenbostel L. Broers
E. Kienle P. Hofmann
135KWS Group | Annual Report 2014/2015 8. Declaration by legal representatives | Notes for the KWS Group 2014/2015 | Annual Financial Statements

Auditors’ Report
We have audited the annual financial statements of the
KWS Group – consisting of the Balance Sheet, the State-
ment of Comprehensive Income, the Notes, the Cash
Flow Statement, Segment Reporting and the Statement of
Changes in Equity – and the Combined Group Management
Report for the fiscal year from July 1, 2014, to June 30, 2015,
all of which were prepared by KWS SAAT SE, Einbeck. The
preparation of the consolidated financial statements and
the Group Management Report according to the Interna-
tional Financial Reporting Standards (IFRS) as applicable
in the EU, and in addition according to the commercial law
regulations to be applied pursuant to Section 315a (1) of the
HGB (German Commercial Code), is the responsibility of
the Executive Board of the company. Our task is to give, on
the basis of the audit we have conducted, an opinion on the
consolidated financial statements and the Group Manage-
ment Report.
We conducted our audit of the annual financial statements
in accordance with Section 317 HGB and the generally
accepted standards for the audit of financial statements
promulgated by the Institut der Wirtschaftsprüfer (German
Institute of Certified Public Accountants). According to these
standards, the audit must be planned and executed in such
a way that misstatements and violations materially affecting
the presentation of the view of the assets, financial position
and earnings conveyed by the consolidated financial state-
ments, taking into account the applicable regulations on
orderly accounting, and by the Group Management Report
are detected with reasonable certainty. Knowledge of the
business activities and the economic and legal operating
environment of the Group and evaluations of possible errors
are taken into account. The effectiveness of the internal
accounting control system and the evidence supporting the
disclosures in the consolidated financial statements and
the Group Management Report are evaluated mainly on the
basis of test samples within the framework of the audit.
The audit includes the assessment of the annual financial
statements of the companies included in the consolidat-
ed financial statements, the definition of the companies
consolidated, the accounting and consolidation principles
used and any significant estimates made by the Executive
Board, as well as the evaluation of the overall presentation
of the consolidated financial statements and the Group
Management Report. We believe that our audit provides a
reasonable basis for our opinion.
On the basis of our audit, we have no reservations to note.
In our opinion pursuant to the findings gained during
the audit, the consolidated financial statements of
KWS SAAT SE, Einbeck, comply with the IFRS as appli-
cable in the EU, and in addition with the commercial law
regulations to be applied pursuant to Section 315a (1) of
the HGB (German Commercial Code), and give a true and
fair view of the assets, financial position and earnings
of the Group, taking into account these regulations. The
Group Management Report accords with the consolidated
financial statements, conveys overall an accurate view of
the Group’s position and accurately presents the opportu-
nities and risks of future development.
Hanover, October 1, 2015
Deloitte & Touche GmbH
Wirtschaftsprüfungsgesellschaft
(Kompenhans) (Bukowski)
Auditor Auditor
136 Annual Financial Statements | Notes for the KWS Group 2014/2015 | Auditors’ Report Annual Report 2014/2015 | KWS Group

Financial calendar
Date
November 24, 2015 Report on the 1st quarter of 2015/2016
December 17, 2015 Annual Shareholders’ Meeting in Einbeck
February 25, 2016 Report on the 2nd quarter of 2015/2016
May 26, 2016 Report on the 3rd quarter of 2015/2016
October 25, 2016 Publication of 2015/2016 financial statements,annual press and analyst conference in Frankfurt
December 15, 2016 Annual Shareholders’ Meeting
KWS share
Key data of KWS SAAT SE
Securities identification number 707400
ISIN DE0007074007
Stock exchange identifier KWS
Transparency level Prime Standard
Index SDAX
Share class Individual share certificates
Number of shares 6,600,000
Address
Grimsehlstrasse 31
P. O. Box 14 63
37555 Einbeck
Germany
Contact
Phone +49 (0) 5561 311 0
Fax +49 (0) 5561 311 322
www.kws.com
This translation of the original German version of the Annual Report has been prepared for the convenience
of our English-speaking shareholders. The German version is legally binding.
Photos/Illustrations:
Tomasz Ciesielski ■ Jan Eric Euler ■ Eberhard Franke ■ Frank Stefan Kimmel ■ Dominik Obertreis

KWS SAAT SEGrimsehlstrasse 31P.O. Box 146337555 Einbeck/Germanywww.kws.com