Embed Size (px)
Citation preview

ANNUAL REPORT

OUR PURPOSE \ We provide and enable safe,
accessible and efficient movement for the economic and
social prosperity of Western Australia.
2 DEPARTMENT OF TRANSPORT

OUR VISION \ To have the best integrated
and intelligent transport services and solutions
for the State.
OUR VALUES
CLEAR DIRECTION
We set clear direction and have the courage to follow through.
FRESH THINKING
We welcome fresh thinking and better ways of working.
EXCELLENT SERVICE
We work together to deliver excellent service.
GREAT PEOPLE
We make things happen through our great people.
ANNUAL REPORT 2014-15 3
People walking along St George’s Terrace Source: Department of Tourism.
Clear Direction
Fresh Thinking
Excellent Service
Great People

Statement of compliance with the Financial Management Act 2006For the year ended 30 June 2015
To the Minister Hon. Dean Nalder MLA Minister for Transport
In accordance with Section 63 of the Financial Management Act 2006, I hereby submit for your information and presentation to Parliament the Annual Report of the Department of Transport for the financial year ended 30 June 2015.
The Annual Report has been prepared in accordance with the provisions of the Financial Management Act 2006 and fulfils the Department of Transport’s reporting obligations under the Public Sector Management Act 1994, the Disability Services Act 1993 and the Electoral Act 1907.
Reece Waldock Director General – Transport
4 DEPARTMENT OF TRANSPORT

CONTENTS
OVERVIEW 7Director General’s foreword 9
Financial summary 14
Operational structure 16
Performance management framework 24
AGENCY PERFORMANCE 29Report on operations 30
Actual results versus budget targets 59
SIGNIFICANT ISSUES IMPACTING THE AGENCY 61
DISCLOSURES AND LEGAL COMPLIANCE 65Independent Auditor’s report 66
Financial Statements 69
Certification of financial statements 69
Statement of Comprehensive Income 70
Statement of Financial Position 71
Statement of Changes in Equity 72
Statement of Cash Flows 73
Schedule of Income and Expenses by Service 74
Schedule of Assets and Liabilities by Service 75
Summary of Consolidated Account Appropriations and Income Estimates 76
Notes to the Financial Statements 77
Key performance indicators 134
Ministerial directives 158
Other financial disclosures 159
Governance disclosures 166
Other legal requirements 167
Government policy requirements 171
ANNUAL REPORT 2014-15 5

6 DEPARTMENT OF TRANSPORT

Overview
ANNUAL REPORT 2014-15 7

8 DEPARTMENT OF TRANSPORT Perth CBD

As Western Australia’s population continues to grow, so too does the importance of moving our people and goods in the safest, most accessible and efficient way. This not only protects and enhances our lifestyle but secures the economic future of the State and the Department of Transport (DoT) is committed to achieving both.
What is now more clear than ever is that we can’t do it alone. We must work with our portfolio partners, the Public Transport Authority and Main Roads WA, to better integrate and optimise our network, invest in infrastructure and plan and prioritise for the future.
When I reflect on what we have accomplished in 2014-15, I am proud to say we have made strong progress in each of these areas that will ultimately deliver a smarter transport system for our growing community.
DoT continued to lead the way in transport planning, commencing drafting of the Perth Transport Plan for 3.5 million People and Beyond. The plan complements the Western Australian Planning Commission’s Perth and Peel @ 3.5 million suite of strategic documents and will look at options for demand management, mass transit, roads, river crossings, cycling and future technologies.
This long-term vision for Perth’s transport network will be complemented by the Perth Central Area Transport Plan 2025, which outlines a 10-year strategy for the CBD and surrounding key destinations and activity centres.
I am pleased with the direction that these crucial cross-portfolio plans are taking and look forward to finalising them both in 2016.
In the meantime, a number of key infrastructure projects focused on connecting people and places continued across the portfolio in 2014-15, with the
$221 million Butler Line extension completed in September 2014 and procurement for the $2 billion Forrestfield-Airport Link commenced. Further, $88.1 million from the Perth Parking Licensing Account was invested back into CBD transport initiatives aimed at improving traffic flow.
Improvements to cycling infrastructure around the State were completed through the ongoing expansion of the cycling network and a range of projects funded through the Perth and Regional Bicycle Network grants programs. DoT continued to oversee these and other initiatives throughout the year as part of the implementation of the Western Australian Bicycle Network (WABN) Plan 2014-2031.
WA’s first State Aviation Strategy was released in February 2015 following extensive stakeholder and community input. The strategy, which DoT will now turn its attention to implementing, supports the economic and social development of WA through the provision of safe, affordable, efficient and effective aviation services and infrastructure.
As well as looking at the way we move people, DoT worked towards finalising the Perth Freight Transport Network Plan and continued to oversee the implementation of the Western Australian Regional Freight Transport Network Plan. These plans ensure our metropolitan and regional transport networks continue to perform effectively as our freight task increases and lead the way for investment in major projects including Gateway WA, NorthLink WA and Perth Freight Link. Together, the $3.7 billion trio will
DIRECTOR GENERAL’S FOREWORD
ANNUAL REPORT 2014-15 9

create a seamless transport freight link from Muchea to Fremantle, cementing Perth’s freight corridors as some of the most productive and efficient in Australia.
Another area where I believe DoT is setting the standard is in the planning and delivery of coastal infrastructure. This was highlighted in 2014-15 with the successful completion of the Augusta Boat Harbour and Port Geographe coastal reconfiguration in October 2014 and May 2015 respectively. The Augusta facility is truly world-class and as well as providing a welcome safe-haven for vessels, it opens up important commercial and tourism opportunities for the growing South West region.
Safety on and around our waterways is paramount and I am pleased to see WA’s boating community embracing this message that DoT works so hard to promote through its ongoing education and compliance activities.
As regulators of WA’s on-demand transport industry, balancing the needs and expectations of both passengers, drivers and operators is an ongoing challenge – one that I believe we responded to proactively throughout the year. Our trial of purpose built taxis continued with great success and we are on track to start transitioning taxi drivers to a state-wide occupational licensing framework designed to improve service standards and security for passengers in early 2016.
Most significantly, DoT finalised a Green Paper in June 2015 outlining concepts for industry reform. The Green Paper seeks to promote discussion around areas of policy reform that will best deliver a safe, more flexible, responsible and innovative customer service-focused on-demand transport industry.
Customer service is key in everything we do and I am pleased to see this positively reflected in our Driver and Vehicle Services (DVS) 2015 Customer Perception Survey. The results showed improvement across all service delivery channels including metropolitan DVS and vehicle examination centres, regional offices, our Customer Contact Centre and website.
Our Mirrabooka DVS Centre opened in September 2014 to meet growing demand in the north-eastern suburbs, while in regional WA our successful Remote Areas Licensing Program expanded to service the Mid West.
With demand for our full complement of transport services growing state-wide, DoT established three new regions – Northern, Southern and Central – led by Regional Directors to enhance strategic oversight of planning and service delivery across WA. This approach has already improved local decision-making and I am confident it will continue to improve operational and strategic transport outcomes in our regions in the future.
As we look to the future, we do so not only as a unified DoT committed to our customers and the community, but as a unified Transport portfolio. Together, we will continue to strive to deliver the best integrated and intelligent transport services for the State.
Reece Waldock Director General – Transport
10 DEPARTMENT OF TRANSPORT

Safety on and around our waterways is paramount
and I am pleased to see WA’s boating community
embracing this message.
ANNUAL REPORT 2014-15 11

HIGHLIGHTS
State-wide occupational licensing framework for taxi drivers a step closer with Taxi Drivers Licensing Act 2014 passed by State Government.
Green Paper outlining concepts for on-demand transport industry reform finalised.
$36.5 million Augusta Boat Harbour completed in October 2014.
$28.1 million Port Geographe coastal reconfiguration completed.
Mirrabooka Driver and Vehicle Services Centre offered new standard in service for customers.
89% of customers rated their overall experience at a Driver and Vehicle Services Centre as excellent or good.
Success of Your Move Cockburn program recognised with Institute of Public Administration Australia WA Achievement Award.
$88.1 million invested back into CBD transport initiatives from the Perth Parking Licensing Account.
WA’s first State Aviation Strategy released.
Four new regionally-focused port authorities commenced operation.
12 DEPARTMENT OF TRANSPORT

89% of customers rated their overall
experience at a Driver and Vehicle Services
Centre as excellent or good.
ANNUAL REPORT 2014-15 13

FINANCIAL SUMMARY
DoT provides services to a range of customers and stakeholders, aggregated into the following high-level service categories:
y Transport system and services development, planning, operation and regulation;
y Motor vehicle and driver licensing services; and
y Strategic transport policy and integrated planning integrated transport planning.
Gross expenses in 2014-15 totalled $365.96 million and the net cost of services, which takes into account operating revenue, was $32.61 million. The following charts illustrate gross expenses by service and expense categories.
Expenditure by services $365.96 million
106,23373,207
186,517
Transport system planning and regulationMotor vehicle and driver licensing servicesStrategic transport policy and integrated planning
Operating expenses by category $365.96 million
138,414
92,430
2,235
16,542
Employee expensesSupplies and servicesDepreciation and amortisation expense
16,182
100,154
Accommodation expensesGrants and subsidiesAll other expenses
DoT generates income from operating activities primarily in the areas of driver and vehicle services, management of coastal facilities, marine safety, parking levies in the Perth CBD and regulation of the on-demand transport industry. In 2014-15, DoT also retained Motor Vehicle Recording and Motor Driver Licence Fees as controlled income, resulting in an increase over 2013-14 income.
14 DEPARTMENT OF TRANSPORT

DoT managed a diverse physical asset base totalling $472.72 million to deliver its services. The chart below shows the distribution by asset class.
DoT’s equity at 30 June 2015 was $709.69 million.
Assets under management $472.72 million
173,02922,294
33,529
Property, plant and equipmentInfrastructureIntangible assetsConstruction in progress
243,865
Income by category $333.35 million
261,711
13,294
51,186
User charges and feesSalesGrants and subsidies
Interest revenuesAssets assumedOther revenues
4,882
382
1,895
DoT also administers functions where the revenue is taken directly to the Consolidated Fund or to other Government agencies. Total administered revenue from these functions totalled $1.94 billion in 2014-15, as illustrated below.
Administered revenues $1.94 billion
804,268645,332
Motor vehicle registrationsPlate and transfer infringementsSpeed and red light infringement finesStamp dutyThird party motor vehicle insurance premiumsOther
12,008
363,355 8,730
104,039
ANNUAL REPORT 2014-15 15

The Transport portfolioDoT is a key agency in the State Government’s Transport portfolio, integrating and enhancing coordination of the State’s transport operations, regulatory functions and planning and policy development processes.
Throughout 2014-15, Reece Waldock concurrently held the positions of Director General of the Department of Transport, Chief Executive Officer of the Public Transport Authority and Commissioner of Main Roads WA.
The structure of the Transport portfolio is outlined in the Organisational Chart on page 17.
The Department of TransportDoT delivers its services through two divisions – Policy, Planning and Investment; and Transport Services.
Policy, Planning and Investment provides strategic transport policy, integrated transport planning solutions and coordinated investment decisions in collaboration with key stakeholders, to assist in the development of a safe and sustainable transport system for the movement of people and freight.
Transport Services leads and manages the state-wide delivery of a number of specialist transport services, including driver and vehicle services, coastal infrastructure and marine and rail safety, while also regulating WA’s on-demand transport industry.
The core functions of each directorate that make up these divisions are outlined in the Organisational Chart on page 17.
OPERATIONAL STRUCTURE
Changes to the Department in 2014-15DoT renamed and restructured its former Transport Policy and Systems Directorate in 2014-15. The new Transport Strategy and Reform Directorate, which operates within DoT’s Policy, Planning and Investment Division, is focused on aviation policy and programs, congestion mitigation, freight efficiency and strategic transport analysis and reform. The Directorate’s renewed strategic direction allows DoT to better meet the evolving transport needs of its customers and stakeholders.
DoT also established a new Business Information Systems Directorate within its Transport Services Division. The Directorate, scheduled to officially commence operations in August 2015, recognises the important role IT plays in delivering services to our customers and will ensure a coordinated, strategic and customer-focused approach to this.
Enabling legislationDoT was established on 1 July 2009, under the Public Sector Management Act 1994.
Responsible MinisterHon. Dean Nalder MLA, Minister for Transport.
16 DEPARTMENT OF TRANSPORT

Organisational structure
Transport portfolio organisational chart
Public Transport Authority
Department of Transport
Main Roads WA
Port Authority Boards
Graeme Doyle Nina Lyhne Stephen Troughton Mark Burgess
Hon. Dean Nalder MLA
Port Authority Boards
Minister for Transport
Kate Wang
Director, Office of the Director General
Reece Waldock
Commissioner Main Roads WA CEO Public Transport Authority
Director General – Transport
Fremantle Port Authority
Mid West Port Authority
Kimberley Port Authority
Southern Port Authority
Pilbara Port Authority
Managing Director Policy Planning and Investment
Managing Director Transport Services
Managing Director Main Roads WA
Managing Director Public Transport
Authority
As at 30 June 2015
ANNUAL REPORT 2014-15 17

Department of Transport organisational chart
Managing Director Policy, Planning and Investment
Director General Transport
Minister for Transport
Maritime policy
Ports Act and reform
Ports reporting and coordination
Compliance, analysis and
review
Ports capital planning and coordination
Peter Parolo
Strategic transport policy
Freight policy
Aviation policy
Active transport
Brett Hughes
Network planning –
moving freight
Network planning –
moving people
Travel demand management
Steve Beyer
Major transport project
development including:
Lead Agency Framework
Fremantle Port Transport Links
Ports Governance
Review implementation
Esperance Port Multi-User Iron
Ore Facility Project
Catherine Wallace*
Chief Finance Officer
Portfolio investment
coordination
Accounting services
Budget management
Employee services
Workforce management
Organisational development
Katherine Martin*
Fiona Knobel
Legal and legislative services
Accommodation and building
services
Procurement and fleet services
Information management
planning
Dennis O’Reilly
Reece Waldock Kate Wang
Greame Doyle
Portfolio Coordination, Communications, Ministerial and Government Business and Governance and Audit
Director Office of the
Director General
*Denotes Acting
Hon. Dean Nalder MLA
Executive Director Ports & Maritime
Executive Director
Transport Strategy and
Reform
Executive Director
Integrated Transport Planning
Executive Director Major
Transport Projects
Executive Director
Investment and Finance Coordination
Executive Director
People and Organisational Development
Executive Director
Corporate Services
18 DEPARTMENT OF TRANSPORT

Managing Director Transport Services
Business systems and technology
Strategic information
technology plan
Information technology
support
Christian Thompson
Strategy, policy and governance
Customer service delivery
Revenue management and business
support
Ann King
Regional services
Peter Ollerenshaw
Business support
Coastal information
Maritime planning
Project delivery
Coastal facilities management
Steve Jenkins
Business and customer services
Commercial vessel safety
Safety and environment
Operational policy
Waterways safety
management
Raymond Buchholz
Rail safety
Rob Burrows
Industry development
Education and compliance
Business support
Aaron de Rozario
Nina Lyhne
Executive Director Business
Information Systems
General Manager
Driver and Vehicle
Services
General Manager Regional Services
General Manager Coastal
Infrastructure
General Manager
Marine Safety
Director Office of
Rail Safety
General Manager
Passenger Services
As at 30 June 2015
ANNUAL REPORT 2014-15 19

Reece Waldock Director General – Transport
As the head of the Transport portfolio, Reece is responsible for setting the strategic direction of transport in the State, shaping the development of a number of major integrated transport plans and leading the implementation of some of WA’s most transformational capital projects.
With more than 35 years’ experience in strategic management, with particular expertise in organisational reform, his appointment as Director General – Transport in 2010 was the culmination of a 20-year journey within various State Government transport agencies including 14 years as a Chief Executive Officer. Prior to his public sector career, Reece held a number of senior management roles with BHP Pty Ltd.
Reece is also a Commissioner of the Western Australian Planning Commission, Lifeline WA board member and a Director of the Australian Urban Design Research Centre.
Graeme Doyle Managing Director – Policy, Planning and Investment
Graeme was appointed as Managing Director – Policy, Planning and Investment in April 2015. He brings a wealth of knowledge to the role with 35 years of experience in the public sector and has been a valuable member of DoT’s Corporate Executive for almost five years in his previous capacity as Executive Director – Investment and Finance Coordination.
Graeme and his expert team provide policy advice, strategic transport solutions and coordinated investment decisions to State Government to assist in effective movement of people and goods. In doing so, Graeme ensures strong collaboration across the Transport portfolio for a unified approach to planning and delivering WA’s transport services, infrastructure and systems.
Nina Lyhne Managing Director – Transport Services
Nina joined DoT in January 2011 as the Managing Director – Transport Services. Nina holds a Bachelor of Arts degree in Psychology and has previously held the positions of WorkSafe Western Australia Commissioner and the Executive Director of the Office of Road Safety. Nina has worked in diverse roles across government agencies in sectors ranging from trade and commerce to community development and occupational safety and health.
In her key role with DoT, Nina is responsible for the delivery of a wide range of transport services including driver and vehicle services, coastal infrastructure, marine and rail safety and on-demand transport. She also oversees the provision of information technology, people and corporate services for DoT.
Corporate Executive
20 DEPARTMENT OF TRANSPORT
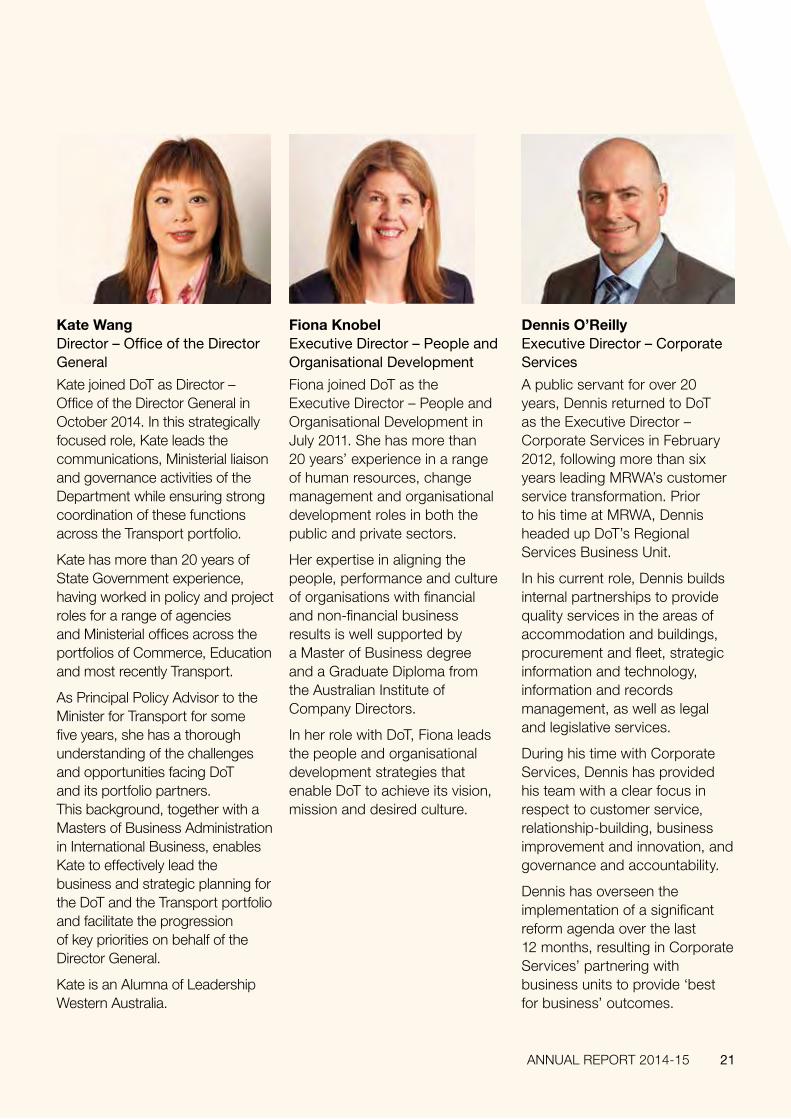
Kate Wang Director – Office of the Director General
Kate joined DoT as Director – Office of the Director General in October 2014. In this strategically focused role, Kate leads the communications, Ministerial liaison and governance activities of the Department while ensuring strong coordination of these functions across the Transport portfolio.
Kate has more than 20 years of State Government experience, having worked in policy and project roles for a range of agencies and Ministerial offices across the portfolios of Commerce, Education and most recently Transport.
As Principal Policy Advisor to the Minister for Transport for some five years, she has a thorough understanding of the challenges and opportunities facing DoT and its portfolio partners. This background, together with a Masters of Business Administration in International Business, enables Kate to effectively lead the business and strategic planning for the DoT and the Transport portfolio and facilitate the progression of key priorities on behalf of the Director General.
Kate is an Alumna of Leadership Western Australia.
Fiona Knobel Executive Director – People and Organisational Development
Fiona joined DoT as the Executive Director – People and Organisational Development in July 2011. She has more than 20 years’ experience in a range of human resources, change management and organisational development roles in both the public and private sectors.
Her expertise in aligning the people, performance and culture of organisations with financial and non-financial business results is well supported by a Master of Business degree and a Graduate Diploma from the Australian Institute of Company Directors.
In her role with DoT, Fiona leads the people and organisational development strategies that enable DoT to achieve its vision, mission and desired culture.
Dennis O’Reilly Executive Director – Corporate Services
A public servant for over 20 years, Dennis returned to DoT as the Executive Director – Corporate Services in February 2012, following more than six years leading MRWA’s customer service transformation. Prior to his time at MRWA, Dennis headed up DoT’s Regional Services Business Unit.
In his current role, Dennis builds internal partnerships to provide quality services in the areas of accommodation and buildings, procurement and fleet, strategic information and technology, information and records management, as well as legal and legislative services.
During his time with Corporate Services, Dennis has provided his team with a clear focus in respect to customer service, relationship-building, business improvement and innovation, and governance and accountability.
Dennis has overseen the implementation of a significant reform agenda over the last 12 months, resulting in Corporate Services’ partnering with business units to provide ‘best for business’ outcomes.
ANNUAL REPORT 2014-15 21

Kathryn Martin Acting Executive Director – Investment and Finance Coordination
Kathryn was appointed Acting Executive Director – Investment and Finance Coordination in April 2014.
Kathryn has almost 20 years of experience as a transport economist, successfully undertaking the position of Director Portfolio Investment Coordination at DoT for the past five years and prior to this held a range of other senior investment and asset management planning roles at Main Roads WA and Austroads.
As Acting Executive Director, Kathryn leads the development of Transport portfolio investment programs and strategies to ensure the State’s transport solutions deliver the maximum benefit to the WA community. She is also responsible for the overall financial management of DoT including accounting functions, resource allocation, budget performance and risk management.
Ann King General Manager – Driver and Vehicle Services
Ann joined DoT as General Manager – Driver and Vehicle Services in January 2015. In her dynamic, customer-focussed role, she is responsible for overseeing all aspects of driver and vehicle licensing in WA to ensure DoT achieves its outcomes of safe drivers, safe vehicles, secure identities and excellence in service.
Ann has experience in both the public and private sectors including expertise in registration and licensing services from her time at NSW Roads and Maritime Services. This experience, together with her extensive strategic policy and planning background and commitment to excellent service and new technologies, mean she is well-placed to lead the delivery of driver and vehicle services state-wide.
In doing this, she balances the needs of DoT’s customers and a strong focus on education and compliance, providing service outcomes that deliver value for money for the WA community.
Ann values her team and is committed to creating a positive culture through collaborative relationships.
Christian Thompson Executive Director – Business Information Systems
Christian commenced as Executive Director – Business Information Systems in April 2015. In this newly created role, Christian provides strategic direction for the development and support of information technology across DoT.
His expertise in leading high-performing, innovative technology teams ensures the smooth delivery of IT services both internally and externally, as DoT continues to improve its online service delivery to meet the growing needs of our customers.
Christian is qualified in geology and IT and has more than 30 years of experience in the latter. He has worked in various IT roles within the mining industry including General Manager of Shared Business Services for Rio Tinto and Chief Information Officer for iron ore junior Citic Pacific Mining.
22 DEPARTMENT OF TRANSPORT

Administered legislation On behalf of the Minister for Transport, DoT administers the following Acts:
y Air Navigation Act 1937
y Civil Aviation (Carriers’ Liability) Act 1961
y Damage by Aircraft Act 1964
y Harbours and Jetties Act 1928
y Jetties Act 1926
y Lights (Navigation Protection) Act 1938
y Marine and Harbours Act 1981
y Marine Navigational Aids Act 1973
y Maritime Fees and Charges (Taxing) Act 1999
y Motor Vehicle Drivers Instructors Act 1963
y Owner-Drivers (Contracts and Disputes) Act 2007
y Perth Parking Management Act 1999
y Perth Parking Management (Consequential Provisions) Act 1999
y Perth Parking Management (Taxing) Act 1999
y Pilots’ Limitation of Liability Act 1962
y Pollution of Waters By Oil and Noxious Substances Act 1987
y Port Authorities Act 1999
y Rail Safety Act 2010
y Railway Discontinuance Act 2006
y Railway Discontinuance Act (No. 2) 2006
y Railway (Butler to Brighton) Act 2010
y Railway (Tilley to Karara) Act 2010
y Road Traffic (Administration) Act 2008
y Road Traffic (Authorisation to Drive) Act 2008
y Road Traffic (Vehicles) Act 2012
y Road Traffic (Vehicles) (Taxing) Act 2008
y Sea-Carriage of Goods Act 1909
y Shipping and Pilotage Act 1967
y Taxi Act 1994
y Trans-Continental Railway Act 1911
y Transport Co-ordination Act 1966
y Western Australian Marine Act 1982
y Western Australian Marine (Sea Dumping) Act 1981
y Wire and Wire Netting Act 1926
y Western Australian Photo Card Act 2014
Other legislation affecting the functions and operation of DoT include:
y State Records Act 2000
y State Trading Concerns Act 1916
y Criminal Code 1913
y Electronic Transactions Act 2011
y Evidence Act 1906
y Financial Management Act 2006
y Freedom of Information Act 1992
y Limitation Act 2005
y Public Sector Management Act 1994
y Disability Services Act 1993
y Equal Opportunity Act 1984
y Industrial Relations Act 1979
y Interpretation Act 1984
y Library Board of Western Australia Act 1951
y Minimum Conditions of Employment Act 1993
y Native Title Act 1993 (Commonwealth)
y Occupational Safety and Health Act 1984
y Royal Commission (Custody of Records) Act 1992
y State Supply Commission Act 1991
y Taxi Driver Licensing Act 2014
ANNUAL REPORT 2014-15 23

Outcome-based management framework Under an outcome-based management framework, DoT contributes to two of the State Government’s strategic goals:
State Government strategic goals DoT outcomes DoT services
Results-based service delivery Greater focus on achieving results in key service delivery areas for the benefit of all Western Australians.
1. An accessible and safe transport system.
1. Transport system and services development, planning, operation and regulation.
2. Vehicles and road users that meet established vehicle standards and driver competencies to deliver safe vehicles and safe drivers.
2. Driver and vehicle services.
State building – major projects Building strategic infrastructure that will create jobs and underpin Western Australia’s long-term economic development.
3. Integrated transport systems that facilitate economic development.
3. Strategic transport policy and integrated planning.
PERFORMANCE MANAGEMENT FRAMEWORK
Changes to outcome-based management framework There were no changes to the Outcome Based Management Framework in 2014-15.
Shared responsibilities with other agencies
Supporting a safe and efficient transport system in the Indian Ocean TerritoriesDoT supports the delivery of a safe, efficient, effective and equitable transport system in the
Indian Ocean Territories (IOT) – consisting of Christmas Island and the Cocos (Keeling) Islands – through a Service Delivery Agreement with the Commonwealth Government.
The arrangement aims for the IOT to achieve consistency, as far as practicable, with WA’s transport system through DoT providing advice, services and support as requested by the Commonwealth Government.
In June 2015, DoT officers visited the IOT to meet with key stakeholders on various operational matters relating to the Service Delivery Agreement. These matters included providing advice and support to assist in the delivery of driver and vehicle services – particularly practical driving
24 DEPARTMENT OF TRANSPORT

assessments, examining and gaining an overview of the port, stevedoring and shipping piloting operations, and other compliance services.
Throughout the year, DoT continued to meet regularly with Commonwealth Government officers to ensure an open dialogue and discuss any issues relating to management of the agreement. As a result, DoT received positive feedback from the Commonwealth Government on the level of advice and support provided.
DoT and the Commonwealth Government are currently negotiating to finalise a new Service Delivery Agreement and this is anticipated to be in place in July 2015.
Moving people and freightDoT works closely with portfolio partners the PTA and MRWA, as well as local, State and Commonwealth government agencies and private sector organisations on a range of integrated transport policy, planning, regulation, investment
coordination and service delivery projects aimed at the safe and sustainable movement of people and freight.
DoT also works closely with WA’s five port authorities, providing leadership in developing investment programs and strategies, supporting reforms and initiatives, and assisting ports to facilitate trade through the development of ports strategies.
The scope and status of these projects is detailed in the Report on Operations on page 30.
Providing a shared IT service In 2014-15, DoT continued to host and operate a shared IT infrastructure service for the Department of Planning. This arrangement is managed through Service Level Agreements and continues to realise economies of scale and cost neutrality for the State Government.
DoT also works closely
with WA’s five port authorities
providing leadership and support.
ANNUAL REPORT 2014-15 25

Enhancing compliance coordination on WA’s waterwaysDoT’s Marine Safety Business Unit works in collaboration with the Western Australia Police, Swan River Trust, Rottnest Island Authority, the Department of Fisheries and the Department of Parks and Wildlife to increase education, compliance and enforcement of the Marine Act 1982 and associated legislation on WA’s waterways.
This collaborative approach enhances coordination and avoids duplication of patrol efforts throughout the year. This has resulted in a significant increase in patrols, ensuring improved compliance with the Marine Act 1982 and Navigable Waters Regulations 1958 by the recreational boating community.
The business unit also works in partnership with the Australian Maritime Safety Authority to deliver the National System for Domestic Commercial Vessels which establishes a safety framework for commercial vessels and seafarers.
As the appointed Hazard Management Agent under the State Emergency Management Regulations 1986 for Maritime Transport Emergencies and Marine Oil Pollution Emergencies, the business unit also works in collaboration with the Australian Maritime Safety Authority, Port Authorities, Department of Fire and Emergency Services, Department of Environment, Department of Parks and Wildlife, Swan River Trust, Rottnest Island Authority, Western Australia Police to ensure adequate prevention, preparation, response and recovery strategies are in place for these emergencies.
Promoting cycle safety In September 2014, DoT and the Office of Road Safety launched a community safety education campaign aimed at cyclists, pedestrians and motorists to assist in addressing growing community concern for cyclist safety.
The joint campaign was designed to complement other initiatives to improve safety for vulnerable road users, reduce barriers to cycling participation and better leverage existing infrastructure assets. It was developed in consultation with cycling and motorist groups and rolled out in two stages.
Stage 1 ran between September and November 2014 and focused on motorists and cyclists sharing the road to encourage safer behaviour. Through a combination of radio advertising as well as advertising on buses and bus shelters, the campaign reached one in three Perth residents.
Stage 2 commenced in March 2015 to coincide with DoT’s Bikeweek and encouraged cyclists and pedestrians to share paths safely. Advertising in newspapers as well as on buses and bus shelters was complemented by over 330 signs on the Principal Shared Path network and a range of fact sheets, educational videos and online promotions employed to spread the safety message.
The campaign, which officially concluded in June 2015, contributed towards the State Government’s goals to create a safer road environment and increase cycling participation.
The campaign contributed towards the State
Government’s goals to create a safer road
environment and increase cycling participation.
26 DEPARTMENT OF TRANSPORT

Bike rider in Perth’s CBD.
ANNUAL REPORT 2014-15 27

28 DEPARTMENT OF TRANSPORT

Agency performance
ANNUAL REPORT 2014-15 29

DoT’s role in achieving government goalsDoT supported the State Government’s goals of ‘results-based service delivery’ and ‘State building – major projects’ in 2014-15 by striving to achieve and exceed three outcomes:
1. an accessible and safe transport system;
2. vehicles and road users that meet established vehicle standards and driver competencies to deliver safe vehicles and safe drivers; and
3. integrated transport systems that facilitate economic development.
To achieve these outcomes, DoT delivered three corresponding services:
1. transport system and services development, planning, operation and regulation;
2. driver and vehicle services; and
3. strategic transport policy and integrated planning.
DoT’s success in delivering these services and, in turn, achieving desired outcomes and contributing to State Government goals are measured through key performance indicators.
This report on operations summarises DoT’s key performance indicators and details projects and programs that have significantly contributed to service delivery designed to meet the three outcomes.
REPORT ON OPERATIONS
30 DEPARTMENT OF TRANSPORT
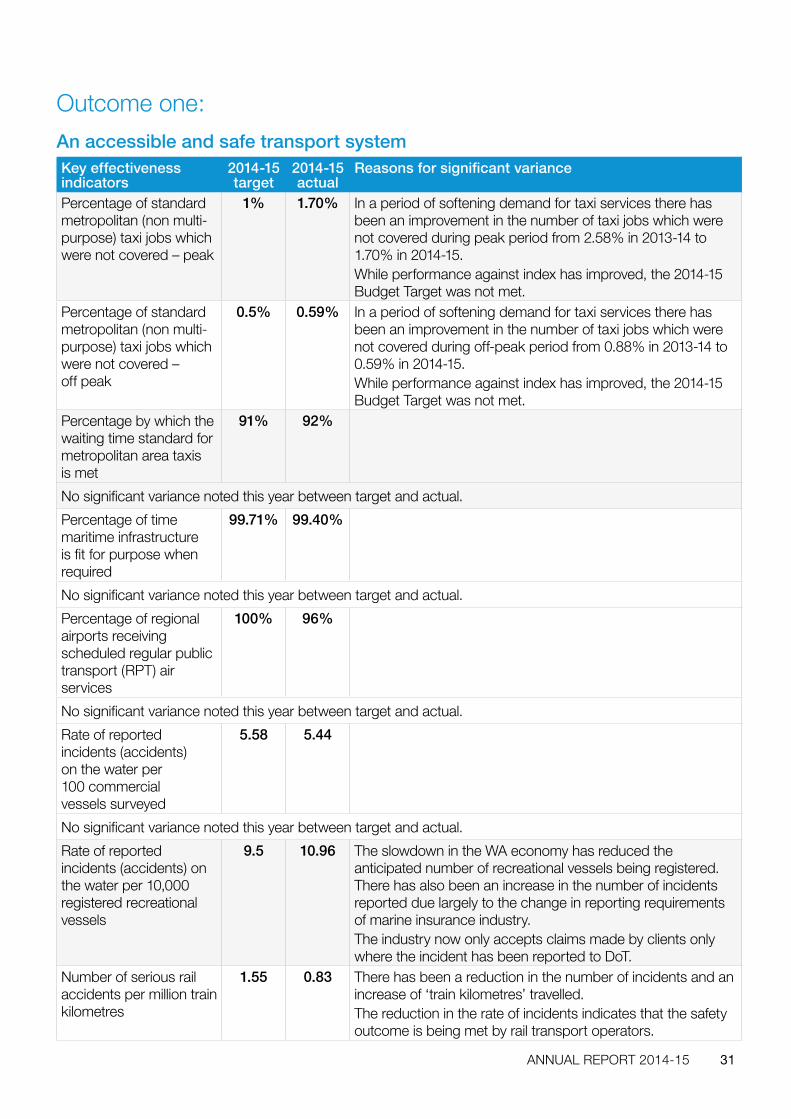
Outcome one:
An accessible and safe transport systemKey effectiveness indicators
2014-15 target
2014-15 actual
Reasons for significant variance
Percentage of standard metropolitan (non multi-purpose) taxi jobs which were not covered – peak
1% 1.70% In a period of softening demand for taxi services there has been an improvement in the number of taxi jobs which were not covered during peak period from 2.58% in 2013-14 to 1.70% in 2014-15. While performance against index has improved, the 2014-15 Budget Target was not met.
Percentage of standard metropolitan (non multi-purpose) taxi jobs which were not covered – off peak
0.5% 0.59% In a period of softening demand for taxi services there has been an improvement in the number of taxi jobs which were not covered during off-peak period from 0.88% in 2013-14 to 0.59% in 2014-15. While performance against index has improved, the 2014-15 Budget Target was not met.
Percentage by which the waiting time standard for metropolitan area taxis is met
91% 92%
No significant variance noted this year between target and actual.
Percentage of time maritime infrastructure is fit for purpose when required
99.71% 99.40%
No significant variance noted this year between target and actual.
Percentage of regional airports receiving scheduled regular public transport (RPT) air services
100% 96%
No significant variance noted this year between target and actual.
Rate of reported incidents (accidents) on the water per 100 commercial vessels surveyed
5.58 5.44
No significant variance noted this year between target and actual.
Rate of reported incidents (accidents) on the water per 10,000 registered recreational vessels
9.5 10.96 The slowdown in the WA economy has reduced the anticipated number of recreational vessels being registered. There has also been an increase in the number of incidents reported due largely to the change in reporting requirements of marine insurance industry. The industry now only accepts claims made by clients only where the incident has been reported to DoT.
Number of serious rail accidents per million train kilometres
1.55 0.83 There has been a reduction in the number of incidents and an increase of ‘train kilometres’ travelled. The reduction in the rate of incidents indicates that the safety outcome is being met by rail transport operators.
ANNUAL REPORT 2014-15 31

Service one:
Transport system and services development, planning, operation and regulationKey effectiveness indicators
2014-15 target
2014-15 actual
Reasons for significant variance
Cost of regulation per taxi plate administered
$3,207.63 $3,478.72 Taxi plate release slowed in response to softening in demand for taxi services. The number of taxi plates regulated did not increase at the rate initially anticipated, resulting in an increased cost of regulation per taxi plate administered.
Average cost per day per maritime infrastructure asset managed
$70.24 $74.90 The total cost to manage maritime infrastructure assets exceeded the 2014-15 published budget by $4.27 million. Additional funds of $1.75 million were spent to address channel dredging and sand bypassing to maintain safety navigation in various locations across the State. Depreciation expenses were over-budget by $2.25 million primarily due to DoT taking over the Two Rocks Marina facility.
Average survey cost per commercial vessel
$2,807.79 $3,383.72 The application of the National Law in July 2013 resulted in a change of definition in what constituted a survey vessel under the previous Western Australian Law. This variation meant that some vessels previously requiring survey are now survey exempt under the National Law and can now be surveyed anywhere in Australia regardless of the area of operation. In addition, a decrease in volumes can be attributed to a demobilisation of vessels involved in major resource construction projects in the North West and a continued reduction in the commercial fishing vessel fleet around the State.
Average cost per private recreational vessel registration
$100.11 $102.74
No significant variance noted this year between target and actual.
Cost to maintain marine pollution response preparedness per registered vessel
$19.65 $17.64 The actual cost is lower than the target due to vacancies not filled during periods in 2014-15.
Average cost per household contacted under the ‘TravelSmart’ scheme
$144.47 $126.63 An additional 259 households above forecast were recruited into the program by 30 June 2015. The program was delivered with reduced resources following a review of DoT’s Transport Strategy and Reform Directorate.
32 DEPARTMENT OF TRANSPORT

DoT plans, develops, operates and regulates a diverse range of transport systems and services to facilitate an accessible and safe transport system for all Western Australians.
In 2014-15, DoT focused on the following key areas:
y regulating WA’s on-demand transport industry, which includes taxi and omnibus drivers and vehicles;
y regulating WA’s intrastate air services;
y planning and developing enhanced maritime infrastructure;
y keeping people safe on and around WA’s waterways; and
y encouraging people to change their travel behaviour to more active transport modes such as walking, cycling or public transport.
Following are some of the key initiatives and services delivered by DoT in 2014-15 to provide Western Australians with accessible and safe transport systems.
High-use taxi ranks upgraded
DoT continued to work with CBD Taxi Rank Reference Group partners – the City of Perth, the Taxi Council of Western Australia and the Taxi Industry Forum of Western Australia – to implement the CBD Taxi Rank Strategy. The strategy is focused on developing visible, accessible and safe taxi ranks that meet short, medium and long-term transport needs in the Perth CBD.
Under the strategy, all eight medium-to-high use taxi ranks in the CBD were upgraded in 2014-15. Following a successful pilot program, multi-function poles that greatly enhance the visibility and usability of the ranks with night-time illuminations, street maps indicating the location of the rank and a flashing LED sign to assist passengers to hail a taxi were installed. Additional street lighting and CCTV cameras were also installed to enhance safety and security for both passengers and drivers.
In 2015-16, DoT will continue to work with the CBD Taxi Rank Reference Group to develop the technical guidelines for the design and location of future taxi ranks.
Taxi driver licensing legislation introduced
The Taxi Drivers Licensing Act 2014 (the Act) received Royal Assent in July 2014, providing a state-wide occupational licensing framework for taxi drivers in a single piece of legislation.
Designed to improve service standards and security for passengers, key features of the framework include a penalty point system for certain breaches of the regulations and the Code of Conduct, mandatory disqualification for serious offences, and new laws to cancel licences for serious or persistent breaches. The Act also provides more scope for additional driver training and a more secure system of taxi driver identification.
During 2014-15, DoT completed the design of the regulatory framework and administrative systems to support the implementation of the Act once the regulations are proclaimed. The simpler, more user-friendly systems will automate a range of administrative processes, saving significant time and reducing the opportunity for human error. Further, the DoTDirect suite of online tools will be enhanced to enable taxi drivers to administer their taxi driver licence online.
Designed to improve service
standards and security
for passengers.
ANNUAL REPORT 2014-15 33

Successful trial of purpose-built taxis
DoT’s four-year trial of purpose-built taxis (PBTs) continued in 2014-15, with 99 London Taxi Company TX4 taxis now participating.
The trial aims to improve the safety, standards and accessibility of Perth taxis. DoT is collecting feedback from passengers, drivers and operators in order to evaluate the advantages of the PBTs when compared to standard taxis.
To date, more than 700 passengers have been surveyed and over 90 per cent of respondents have indicated that they would prefer a PBT over a standard taxi.
Over the last 12 months, DoT worked closely with trial stakeholders to identify and implement improvements to the TX4 vehicles in order to better meet the needs of PBT operators and passengers.
The trial aims to improve the safety,
standards and accessibility of Perth taxis.
A small-scale pilot is also under way to assess the TX4’s suitability to carry passengers in wheelchairs. The pilot, developed in consultation with the Disability Services Commission and the Insurance Commission of Western Australia, involves a small number of PBTs and passengers in wheelchairs who regularly use taxis. As part of the pilot, DoT appointed National Disability Services (NDS) to develop safe practice guidelines for participants and to develop and deliver training to PBT drivers.
It is anticipated that the pilot will conclude in August 2015. NDS will then prepare a report on the outcomes of the pilot and provide advice on the suitability and limitations of the TX4 as a wheelchair-accessible vehicle.
Perth’s ‘London’ Cabs
34 DEPARTMENT OF TRANSPORT

On-demand transport Green Paper finalised
Changing consumer expectations, emerging technologies, new market entrants and economic factors continue to place pressure on WA’s on-demand transport industry to evolve.
In early 2015, the State Government announced that a Green Paper outlining concepts for industry reform was being developed. The Green Paper, finalised by DoT in late June 2015, seeks to promote discussion around areas of policy reform that will best deliver a safe, more flexible, responsible and innovative customer service-focused on-demand transport industry.
It is anticipated that the Green Paper will be released for public comment in July 2015. DoT will then consider the submissions received before providing recommendations to the State Government. While this is an important first step in reforming on-demand transport services and laws in WA, any changes to the regulatory model will be incremental.
More flexible on-demand transport options delivered
DoT continued to work with the community and industry to deliver more flexible on-demand transport services in 2014-15.
In December 2014, a trial of a hybrid taxi–charter–omnibus service commenced in Jurien Bay where traditional taxi services have been found to be unviable. The trial allows operators to negotiate a pre-agreed fare with the passenger, rather than using a regulated fare structure. This enables cost-effective on-demand transport services for passengers.
Feedback from both operators and the Shire of Dandaragan has been positive and DoT will continue to monitor the trial’s success and evaluate whether similar services could be implemented in other population centres where traditional taxi services are unsustainable.
DoT also issued interim approval for two new taxi dispatch services, Ingogo and WA Cabs, to operate in the Perth Taxi Control Area. The interim approval will enable DoT to analyse their respective dispatch systems in order to inform a decision as to whether they meet the requirements for full registration as a taxi dispatch service.
Regulated regular public transport air routes review completed
In 2014-15, DoT completed its Review of Regulated Regular Public Transport (RPT) Air Routes in Western Australia.
As part of the review, a position paper proposing the future approach for eight currently protected RPT air routes was released for public comment in July 2014. These routes connect Perth with the following regional locations:
1. Albany;
2. Carnarvon–Monkey Mia (Shark Bay);
3. Derby;
4. Esperance;
5. Laverton–Leonora;
6. Learmonth (Exmouth);
7. Leinster–Wiluna; and
8. Mount Magnet–Meekatharra.
The position paper also proposed amendments to DoT’s policy for charter air services on RPT routes. The policy is designed to ensure that charter air services do not impact on the viability of RPT air services in WA as a matter of public interest, while also seeking to accommodate the needs of mining companies.
A total of 43 submissions were received during the three-month public comment period. DoT used this feedback, together with the findings of extensive stakeholder and community consultation undertaken over the last two years, to prepare a final report outlining the future regulatory approach to be taken for consideration by State Government.
The final report took into consideration feedback collected through the submissions, regional workshops, biannual Aviation Community Consultation Group meetings for each route and one-on-one meetings with stakeholder organisations. In addition, it was informed by the statistics that provided a demand profile for each route with regard to the unique social and economic context of each community.
The final report has been released and DoT will now undertake a competitive tender process for the provision of RPT air services for all routes that will continue to be regulated beyond February 2016 when the existing agreements expire.
ANNUAL REPORT 2014-15 35

Augusta Boat Harbour completed on schedule
Works on the Royalties for Regions-funded $36.47 million Augusta Boat Harbour were completed on schedule in October 2014. The world-class facility, officially opened in November 2014, now provides a welcome safe-haven for vessels navigating the rugged coastline between Albany and Busselton, as well as important commercial and tourism opportunities for the growing South West region.
The harbour features a four-lane boat launching facility for easy and safe access to the water; a service wharf to allow larger commercial vessels to safely and efficiently transfer passengers and products; 40 boat pens for commercial and recreational vessels; and car and trailer parking for more than 200 vehicles.
Its award-winning breakwaters provide locals and visitors with a unique ocean walk and an excellent base for recreational fishing and diving. They can also enjoy the ambience of the harbour, purchase fresh seafood direct from local operators and picnic in the landscaped plaza area. This vibrant experience will be further enhanced in the future with four fully-serviced lots available for retail development.
Based on the positive feedback received from stakeholders, commercial operators, recreational boating users, residents and tourists, DoT is confident that the harbour will continue to be embraced by all.
Port Geographe coastal reconfiguration completed
The $28.15 million project to reconfigure the coastal structures at Port Geographe was successfully completed and officially opened in May 2015.
The original coastal structures, built as part of a private development in the 1990s, caused serious seagrass wrack accumulation on the western side of the development and amplified coastal erosion on the adjacent eastern coast. Extensive community consultation and scientific research confirmed a complete reconfiguration was required to address environmental and health issues.
DoT managed and delivered the long-awaited project in three stages, with construction commencing in September 2013. With the main component of the project – the construction of the reconfigured breakwaters – completed in June 2014, works throughout 2014-15 included dredging, and beach works and landscaping to transform the foreshore into an attractive and inviting recreational space.
Sand and seagrass are now able to bypass the new coastal structures naturally. This has resulted in reduced seagrass accumulation, and beach erosion at Port Geographe is now at levels consistent with other coastal areas along Geographe Bay. In addition to delivering significant environmental benefits, amenity and access to beaches for local residents and the wider community has been improved. Further, the reconfiguration is expected to reduce ongoing annual coastal maintenance costs at the site.
Exmouth Boat Harbour upgrade commenced
In 2014-15, DoT secured $18.27 million in Royalties for Regions funding for Stage 2 of the Exmouth Boat Harbour upgrade.
Following extensive consultation with users, the preliminary design was completed in March 2015 and the detailed design is nearing completion.
As part of the project, the existing wharf will be extended and a heavy lift facility will be built to provide better access for loading and unloading vessels. To make way for the extension, existing trawler pens will be relocated. The upgrade will also include additional cyclone moorings, augmenting the 25 floating pens that were delivered in Stage 1.
This expanded infrastructure will support local businesses and industries supporting the fishing, charter and resource sectors. It will also deliver economic and community benefits for Exmouth and the Gascoyne region.
On-site works are expected to commence in late 2015 with relocation of the fuel farm and other services within the harbour. Following this, the main construction package will be delivered over 2015-16 and 2016-17, with the project anticipated to be completed in March 2017.
36 DEPARTMENT OF TRANSPORT

Port Geographe coastal reconfiguration completed
ANNUAL REPORT 2014-15 37

Fremantle Fishing Boat Harbour Jetty 2 replacement commenced
Detailed design work to replace Jetty 2 at the Fremantle Fishing Boat Harbour with modern floating pontoon systems was completed in 2014-15.
The $3.9 million redevelopment project will deliver 56 boat pens (ranging from 15 to 20 m) and will provide a higher level of safety and improved level of service for boat harbour users.
Staged demolition of the existing jetty, which was built in the 1960s, commenced in June 2015 and construction of the new jetty is anticipated to be completed in April 2016.
Grants for the Recreational Boating Facilities Scheme administered
DoT administers the Recreational Boating Facilities Scheme (RBFS) on behalf of the State Government. The aim of the scheme is to improve recreational boating infrastructure by providing grants to eligible authorities around the State.
The RBFS is funded directly from recreational boat registration fees and was supplemented by Royalties for Regions funding during grant rounds 16 to 20. Since 1998, the RBFS has allocated almost $42 million for 395 projects located from Wyndham in the north to Esperance in the south.
Examples of projects completed in 2014-15 include:
y remediation of the groyne at the Back Beach boat launching facility in Karratha;
y construction of a new boat launching facility at Illyarrie Street in Leeman;
y upgrades to the Dampier public boat ramp facility;
y installation of two new floating jetties at Riverside Gardens and Tranby House in Bayswater;
y upgrades to the Sykes Foreshore boat ramp facility in Bunbury; and
y extension of the trailer parking area and provision of ablution facilities at the Windy Harbour boat ramp south of Northcliffe.
In April 2015, nearly $5.5 million worth of round 20 RBFS grants for 28 projects throughout WA were announced and will be undertaken over the next two years.
Coastal Adaptation and Protection grants program administered
The Coastal Adaptation and Protection grants program, administered by DoT, is designed to preserve and enhance the Western Australian coastline by funding works that assist coastal managers to sustainably adapt to hazards.
Since 2005, approximately $10 million has been allocated to 142 projects from Port Hedland in the north to Esperance in the south.
Examples of projects completed in 2014-15 include:
y refurbishment of rock groynes at Abbey foreshore in Busselton;
y stabilisation of the foreshore at Locke Estate in Busselton;
y beach monitoring, data collection and numerical modelling to develop long-term coastal management options for Quinns Beach in Quinns Rocks;
y sand nourishment at Esperance Bay; and
y Stage 2 City Beach groyne maintenance.
More than $1 million will be allocated to coastal protection projects across WA in the 2015-16 funding round.
New navigational aids installed at Esperance and Kalbarri
In 2014-15, DoT installed navigational aids in Esperance and Kalbarri to improve water safety for all users.
In Esperance, new navigational aids were installed around Cook Rock, Wylie Head and at Town Beach boat ramp in October 2014. The aids, which assist in safe vessel movement, address community concerns raised during DoT’s aquatic use review of the area.
In February 2015, additional aids were installed at the mouth of the Murchison River in Kalbarri. As the site is recognised as one of the most challenging areas for boating in the State, DoT worked closely with local fishermen and the Volunteer Marine Rescue Group to determine the location for the markers, which now clearly indicate the preferred channel to transit the river mouth.
In addition to the new navigational aids, DoT also released updated boating guides for both Esperance and Kalbarri, highlighting the new markers and other important information for skippers. Both the aids
38 DEPARTMENT OF TRANSPORT

and the boating guides were well-received by the community and DoT plans to replicate this success with the installation of additional markers and upgrades to existing markers at Rottnest Island and Garden Island in 2015-16.
200,000th Recreational Skipper’s Ticket issued
In July 2014, DoT issued WA’s 200,000th Recreational Skipper’s Ticket (RST) – a nationally-recognised certificate of competency designed to ensure skippers possess the minimum knowledge and practical skills needed to safely operate a powerboat on the water.
DoT actively encourages the take-up of RSTs in WA through ongoing community education programs, including the ‘You’re the skipper, you’re responsible’ message. This message has been enthusiastically embraced by the boating community, resulting in a ratio of approximately two RST holders for every registered recreational vessel in the State. Throughout 2015-16, DoT will continue to promote the safe and sustainable use of the State’s waterways by encouraging more Western Australians to obtain an RST.
More accurate and up-to-date information for mariners provided
DoT updates and distributes nautical charts and notices to mariners online to provide seafarers with safety and navigational information. In 2014-15, the website applications through which these charts and notices are made available were upgraded to enable data to be sourced directly from the tools that DoT’s cartographers and geospatial scientists use. The upgrade has delivered more accurate and up-to-date information to customers, while also improving efficiency and reducing system maintenance costs.
In 2015-16, DoT plans to make further improvements to the applications to make them more accessible and responsive for customers.
Regional service delivery improved
DoT delivers transport services and solutions to customers all over the State through its Regional Services Business Unit. To enhance strategic oversight of this service delivery, DoT established three new regions – Northern, Southern and Central – in December 2014.
Recreational boating compliance check on the Swan River.
ANNUAL REPORT 2014-15 39

The regions are led by Directors based in Karratha, Bunbury and Geraldton and supported by on-the-ground Operations Managers in each of the previous seven regions brought together under the new arrangement.
The change aims to improve local decision-making and operational and strategic transport outcomes in the regions. It also provides for an increased focus on service delivery and new opportunities to share resources and multi-skill staff to meet current and future demand across WA.
Success of the Your Move program continued
The Your Move Cockburn program has assisted more than 25,000 residents in the City of Cockburn to swap car trips for more active travel modes such as walking, cycling or public transport and increase levels of physical activity.
The free 12-month program, which concluded in July 2014, was delivered by DoT and the Department of Sport and Recreation with support from the City of Cockburn. The program achieved positive results, with a five per cent reduction in car driver trips per participant, totalling 410,000 fewer trips. Participants also increased their daily physical activity by 10 minutes, with eight per cent moving from insufficient to sufficient levels of activity.
The success of this collaborative approach was recognised in June 2015 with an Institute of
Public Administration Australia WA Achievement Award for Best Practice in Collaboration Across Government Agencies in the Same Jurisdiction.
Following the success in Cockburn, Your Move Wanneroo commenced in April 2015. The joint DoT and Department of Sport and Recreation program was off to a great start with the target of 10,250 households registering to participate ahead of schedule. In addition, eight schools signed up to DoT’s TravelSmart to Schools program and two workplaces will develop travel plans as part of Your Move Wanneroo.
Through the program, participants will receive a personalised information pack and ongoing phone coaching to encourage them to achieve their goals. Program partners – the City of Wanneroo and, RAC with assistance from HBF, PTA, North Metropolitan Public Health Service, Heart Foundation, Nature Play WA and Diabetes WA – will also provide additional support through infrastructure upgrades, bicycle education sessions and fitness classes.
To date, the City of Wanneroo has installed new bicycle facilities across 10 sites and the PTA has installed 45 new information stands at bus stops in the northern suburbs of the City to make it easier for people to get to their destination.
The Your Move program expands to City of Wanneroo.
40 DEPARTMENT OF TRANSPORT

To support participants and keep them up-to-date on the latest program news and information, DoT launched a new Your Move website (yourmove.org.au). The site features a personalised ‘My Hub’ area where participants can log-in to track their progress and connect with others to help them stay motivated.
DoT will continue to work with its partner agencies to deliver the program until it concludes in December 2015. Following this, DoT will conduct follow-up surveys from April to June 2016 to measure the program’s success.
Employees encouraged to switch to active transport modes
DoT continued to assist workplaces to reduce car trips and enable staff to use active, sustainable transport options more often. This was achieved through the delivery of its TravelSmart Workplaces program and the active travel component of the State Government’s Healthier Workplace WA program.
Throughout the year, DoT supported 34 organisations to identify or implement actions to encourage employees to use active travel alternatives. Seven workplace plans were drafted and participating workplaces implemented a range of actions including informing staff about travel options, improving end-of-trip facilities and offering incentives.
The efforts of these workplaces were recognised at DoT’s biennial TravelSmart Awards in October 2014. MBS Environmental, the City of Nedlands, the City of Joondalup and Edith Cowan University, as well as individuals from the City of Vincent and the City of Cockburn, were awarded for their outstanding achievements in engaging employees and embedding sustainable transport practices within the workplace.
In 2015-16, DoT will continue to engage with workplaces, particularly those in the Perth central area, through a range of activities including training and networking forums, workshops and online newsletters and videos.
The Your Move program expands to City of Wanneroo.
ANNUAL REPORT 2014-15 41

Outcome two:
Vehicles and road users that meet established vehicle standards and driver competencies to deliver safe vehicles and safe driversKey effectiveness indicators
2014-15 target
2014-15 actual
Reasons for significant variance
Percentage of vehicle examinations completed in accordance with the Australian Design Rules assessed by audit (Safe Vehicles).
100% 90% DoT has identified improvements in workflow practices associated with the electronic Vehicle Inspection System at Authorised Inspection Stations (AIS). From October 2014, DVS introduced a new online electronic solution whereby AIS providers return the original certificate of inspection forms directly to DVS on a monthly basis which has improved this index. It is anticipated performance will continue to improve once the new process has been in place for a full year.
Percentage of driver licences issued that comply with the Graduated Driver Training and Licensing System (GDTLS) assessed by audit.
100% 96%
No significant variance noted this year between target and actual.
42 DEPARTMENT OF TRANSPORT

Service two:
Vehicles and road users that meet established vehicle standards and driver competencies to deliver safe vehicles and safe driversKey effectiveness indicators
2014-15 target
2014-15 actual
Reasons for significant variance
Average cost per vehicle and driver transaction
$17.58 $17.19
No significant variance noted this year between target and actual.
Average cost per vehicle inspection
$98.07 $111.01 The variance is primarily due to increased Authorised Inspection Station (AIS) commission payments as the proportion of inspections performed in the metropolitan area shifts from DoT to AIS faster than anticipated. DoT will continue to transition its business to accommodate this shift.
Average cost per driver assessment
$103.85 $107.59
No significant variance noted this year between target and actual.
Percentage of driver’s licence cards issued within 21 days of completed application
100% 100%
No significant variance noted this year between target and actual.
ANNUAL REPORT 2014-15 43

As the State’s population continued to grow at one of the fastest rates in the nation, so too did demand for driver and vehicle services. In 2014-15, DoT remained focused on improving the delivery of these services to better meet the changing needs and expectations of the Western Australian community.
The results of the Driver and Vehicle Services 2015 Customer Perception Survey showed improvement across all DoT service delivery channels since 2013, highlighting the success of the projects and programs delivered by DoT.
Following are details on key driver and vehicle services projects and programs completed or significantly progressed in 2014-15.
The survey results showed improvement
across all DoT service delivery channels.
How we delivered driver and vehicle services in 2014-15:
y 1.2 million customers* assisted at our nine metropolitan DVS centres;
y 495,650 customers* assisted at our nine regional offices;
y 12,000 customers assisted in remote Western Australia;
y 1.8 million calls taken at our Customer Contact Centre with an 81 per cent answer rate;
y 4.1 million* online transactions conducted;
y 149,226 vehicle examinations conducted; and
y 134,485 practical driving assessments conducted.
*Financial transactions only.
New standard in services are offered at Mirrabooka DVS Centre.
44 DEPARTMENT OF TRANSPORT

Overall satisfaction with DVS metro centres:
0%
20%
40%
60%
80%
100%
84%
2013 2015
89%
Overall satisfaction with DoT vehicle examination centres:
0%
20%
40%
60%
80%
100%
85%
2013 2015
91%
Overall satisfaction with DoT regional offices:
0%
20%
40%
60%
80%
100%
81%
2013 2015
88%
Overall satisfaction with metro Authorised Inspection Stations:
0%
20%
40%
60%
80%
100%
59%
2013 2015
88%
Overall satisfaction with DoT Customer Contact Centre:
0%
20%
40%
60%
80%
100%
70%
2013 2015
70%
Overall satisfaction with DoT website:
0%
20%
40%
60%
80%
100%
82%
2013 2015
84%
Improved service delivery highlighted by customer perception survey
In 2013, DoT engaged an independent market research organisation to undertake a comprehensive customer perception survey to measure satisfaction with the accessibility, reliability and accuracy of driver and vehicle services.
These results were used to benchmark performance and informed a number of service delivery improvement strategies that have been completed or commenced over the last two years.
In May 2015, DoT repeated the survey to assess current customer satisfaction across its service delivery channels. The survey targeted 2,707 customers who had interacted with DoT in relation to driver and vehicle services matters within the last six months. Of these, 76 per cent were metropolitan and 24 per cent were regional customers.
The survey results showed improvement across all DoT service delivery channels, as detailed below.
DoT will use the findings of the survey to further inform service delivery improvement strategies. A survey will be conducted again in 2017 to measure the effectiveness of these and other strategies in providing excellent service to customers.
iQ helped customers find licensing information fast
In March 2015, DoT launched a new licensing online search tool that helps customers quickly find the information they are looking for. The intuitive search tool, known as iQ, follows natural language, meaning customers can type any licensing question into the search box and it will return the most relevant results from across DoT’s range of information sources, including the Knowledge Management System.
Overall satisfaction = percentage of customers who rated their most recent experience as ‘good’ (6-7 out of 10) or ‘excellent’ (8-10 out of 10).
ANNUAL REPORT 2014-15 45

As the Knowledge Management System is the principal source of licensing information, legislation and business rules for all DoT staff, customers can be assured that iQ is returning the most accurate, up-to-date information in response to their search. The most popular searches and results are recorded to further refine the results and deliver them to customers faster.
Since its launch, DoT customers have embraced iQ as a single access point for licensing information online, with more than 25,000 searches conducted. As its success continues to grow, DoT plans to look at ways to expand the search technology across its other business areas.
Online vehicle transfers introduced
DoT continued to improve customer convenience and choice in 2014-15 by enabling customers to complete vehicle transfers online through DoTDirect. The introduction of this self-service
channel not only allows customers to securely conduct simple transfers 24/7, with 500,000 vehicle transfers processed in person or over the phone each year, it also frees up DoT staff to assist customers with more complex transactions.
Since its launch in October 2014, take-up of online transfers has been steady and is expected to grow in 2015-16 as customer awareness increases and the service is expanded to include organisations and businesses in addition to individuals.
Updating addresses made quicker and easier
More than a quarter of a million change of address requests are received from customers each year and over 80 per cent of these requests are submitted via an online form.
Take-up of online transfers
has been steady and is
expected to grow…
46 DEPARTMENT OF TRANSPORT

To make this process quick and easy for customers, and better verify and safeguard their information, DoT made significant improvements to the online form in 2014-15.
When the updated form launches in July 2015, customers will be able to access it through DoTDirect, making this the most secure and efficient way to change their address.
The form is easier to navigate and features address prompting and validation that allows users to correct any mismatches prior to submission. Improving the accuracy of the data submitted will reduce the number of errors currently forwarded to DoT’s Customer Contact Centre for follow-up and correction, saving time for both customers and staff.
Auxiliary number plates made available in WA first
In May 2015, DoT made auxiliary plates available for purchase for the first time in Western Australia. Available to individuals through DoTDirect, the extra plate can be used on a vehicle when a bicycle or mobility device rack obstructs its rear number plate, ensuring a visible licence number is displayed.
The introduction of auxiliary plates supports law enforcement by improving vehicle identification and increases safe transport options for drivers carrying bicycles or mobility devices. As such, the move has been welcomed by WA Police, the Office of Road Safety and the wider community, particularly cycling and disability groups.
DoT plans to extend the availability of auxiliary plates to include organisations and businesses in addition to individuals in October 2015.
High call volumes supported by leading-edge technology
DoT’s Customer Contact Centre receives close to 1.8 million calls for assistance with driver and vehicle licensing matters every year. To support these high call volumes, significant upgrades were made to the Customer Contact Centre’s technology when it relocated to new premises in Stirling in August 2014.
The new telephony platform and call referral system have assisted centre staff to better serve customers. A more robust system to support call centre coordination for emergency services in the event of a disaster has also resulted.
Together with other integrated systems, these new technologies also provide more accurate data on the 8,000 calls (on average) handled each day, which assists in business forecasting and rostering of staff to meet customer demand.
Further, the custom-designed information and communication technology system supports rapid response to any technical issues in DoT’s licensing databases.
This leading-edge technology, together with the state-of-the-art accommodation, meets not only the current but future needs of the high-performing Customer Contact Centre, enabling DoT to continue to provide excellent service.
New standard in service offered at Mirrabooka centre
In September 2014, DoT opened a new Driver and Vehicle Services (DVS) Centre in Mirrabooka to meet growing customer demand in the north-eastern suburbs. The conveniently-located centre is easily accessible by public transport and provides improved customer parking facilities compared to the previous Morley site.
The spacious interior offers customers a new standard in service, with a concierge, more counters and dedicated areas for learner drivers undertaking theory and hazard perception tests as well as practical driving assessments. The centre also offers free Wi-Fi internet access for the comfort and convenience of customers.
Australia Post partnership expanded to meet customer demand
To assist in meeting existing and projected demand for driver and vehicle services, DoT expanded its partnership with Australia Post in 2014-15. Through the staged expansion, customers can now complete a range of licensing transactions at 32 metropolitan Australia Post Offices, with this number to increase to 33 upon completion in July 2015.
To support the delivery of these services, DoT and Australia Post worked collaboratively to design and implement improvements to the WebPOS system – an interface between DoT’s licensing database and Australia Post’s frontline computer systems. The improvements allow more complex transactions to be completed at select Australia Post Offices, providing customers with greater convenience and choice while easing demand at DoT’s DVS centres.
ANNUAL REPORT 2014-15 47

DoT is currently finalising a comprehensive audit tool to ensure that 100 per cent of all financial and non-financial transactions processed by Australia Post are audited. Monthly performance reports have also been streamlined to provide greater transparency and ensure agreed key performance indicators are met. These initiatives add greater rigour to DoT’s governance and compliance processes, which will remain a high priority as DoT continues to grow its partnership with Australia Post in 2015-16 by expanding the range of services offered.
Heavy vehicle training and assessment program rolled out
Following the 2013 comprehensive trial of the Heavy Vehicle Driver Licence Training and Assessment Partner program in Bunbury, DoT successfully rolled out the new program across Western Australia in 2014-15.
Through a state-wide tender process, DoT appointed 12 registered training organisations (RTOs) to deliver training and conduct practical driving assessments (PDAs) for heavy vehicles in Perth, Bunbury, Busselton, Geraldton, Kalgoorlie and Kununurra.
The partner program, which officially commenced in November 2014 with extensive induction and training, delivers a range of benefits to customers and the wider community. While it was community safety concerns regarding the high volume of heavy vehicle PDAs being conducted in the Bunbury CBD that initially sparked the need for a long-term solution to keep heavy vehicle assessments out of the CBD, the program also offers customers greater convenience and choice in completing these assessments.
Customers have embraced this choice, with the majority of heavy rigid, heavy combination and multi-combination assessments in the above locations conducted by the RTOs. This has, in turn, allowed DoT to reallocate resources from heavy vehicle assessments to other licence classes, in particular C class assessments. Statistics from the first quarter of 2015 indicated that the number of C class PDAs conducted state-wide had increased by approximately 1,000 per month compared to the first quarter of 2014. These figures suggest DoT is on track to make an additional 12,000–15,000 C
class and motorcycle PDAs available annually to meet customer demand.
To support the RTOs in managing, recording and validating the training and assessment of customers, DoT developed an automated eligibility, booking and accounting system known as the Licence Assessment Provider System (LAPS).
LAPS, which is integrated with DoT’s licensing database, provides DoT with an extensive reporting package that allows compliance officers to analyse all aspects of service delivery. This, together with regular on-site audit and compliance checks and dedicated support, allows DoT to ensure that the RTOs continue to deliver services to the highest standard.
‘Chain of Responsibility’ law introduced
In 2014-15, the new regulations required in order for DoT to implement the ‘Chain of Responsibility’ law in Western Australia were drafted. The law, which came into effect on 27 April 2015, extends the responsibility for the safe transport of goods by road beyond the driver to everyone involved – from packers and loaders to those receiving goods, company directors, employers and associations.
Ahead of the launch of the new regulations, DoT and Main Roads WA conducted over 100 information sessions in metropolitan and regional locations to ensure stakeholders and industry members were informed of the upcoming changes to existing legislation and understood the potential impacts.
The changes are expected to improve road safety for all users, as well as reduce infrastructure damage and promote a level playing field for industry.
The changes are expected
to improve road safety
for all users.
48 DEPARTMENT OF TRANSPORT

ANNUAL REPORT 2014-15 49

Outcome three:
Integrated transport systems that facilitate economic developmentKey effectiveness indicators
2014-15 target
2014-15 actual
Reasons for significant variance
Percentage of containerised freight transported via rail in relation to total metropolitan container movements to and from Fremantle port
14.5% 13.2% Rail growth was on target until the temporary closure of the Fremantle rail bridge in August 2014, following damage caused by a vessel. Rail containers were transported by road for three weeks while the bridge was closed, which significantly reduced rail’s market share. Other factors such as a reduction in containerised grain also contributed to the variance.
Service three:
Strategic transport policy and integrated planningKey effectiveness indicators
2014-15 target
2014-15 actual
Reasons for significant variance
Average cost per policy hour for strategic transport policy development
$94.30 $96.04
No significant variance noted this year between target and actual.
Average cost per planning hour for integrated transport planning development
$126.95 $129.18
No significant variance noted this year between target and actual.
50 DEPARTMENT OF TRANSPORT
ANNUAL REPORT 2014-15 51

As the lead agency in the Transport portfolio for policy, planning and investment, DoT develops strategic transport policies and integrated transport plans to keep people and freight moving throughout Western Australia – now and into the future.
During 2014-15, DoT progressed six transport plans of State significance to various stages, from development to implementation:
y Perth Transport Plan for 3.5 million People and Beyond;
y Central Area Transport Plan 2025;
y Western Australian Bicycle Network Plan 2014-2031;
y Western Australian State Aviation Strategy;
y Perth Freight Transport Network Plan; and
y Western Australian Regional Freight Transport Network Plan.
These plans inform Western Australia’s transport policy and infrastructure decisions over the next two decades and beyond to ensure metropolitan and regional networks meet expected demand and continue to help grow the State’s economy.
Drafting of Perth Transport Plan for 3.5 million People and Beyond commenced
DoT commenced work on the Perth Transport Plan for 3.5 million People and Beyond in late 2014-15. The plan, which complements the Western Australian Planning Commission’s Perth and Peel @ 3.5 million suite of strategic documents, will consider what Perth will look like in the future and plan to accommodate its growing population by providing better access and more transport choices for the community.
Specifically, it will look at options for demand management, mass transit, roads, river crossings, cycling and future technologies.
The draft Public Transport Plan for Perth 2031 and the Moving People Network Plan will be used to inform and develop the overarching plan. To inform the mass transit component of the plan, the Transport portfolio is working collaboratively with the Planning and Transport Research Centre of WA to undertake a high-level research study that is expected to be completed in late 2015.
Work on the plan will continue throughout 2015-16, with the view for DoT to present it to State Government for consideration in mid-2016.
Perth Transport Plan aims to accommodate a growing population.
52 DEPARTMENT OF TRANSPORT

Central Area Transport Plan drafting commenced
DoT continued work on the Central Area Transport Plan 2025 together with portfolio partners PTA and Main Roads WA as well as the Metropolitan Redevelopment Authority and the City of Perth.
The plan builds on the CBD Transport Plan to 2016 but has two distinct differences. Firstly, it will provide a longer term, 10-year vision for the transport network in the central metropolitan area. And secondly, it will also include key destinations and activity centres that surround the Perth CBD such as Subiaco, Leederville, Mount Lawley, the QEII/UWA precinct, future Perth Stadium and major development areas on the Burswood Peninsula.
To inform the plan, which will develop initiatives to aid the improvement of all transport modes in the central metropolitan area, the project team has engaged with a range of key stakeholders on major transport issues.
DoT anticipates that the plan will be finalised and submitted to State Government for consideration in 2015-16.
$88.1 million invested in transport initiatives
DoT continued to administer the Perth Parking Licensing Account (PPLA) during 2014-15 to invest revenue from the Perth Parking Levy in transport initiatives in the Perth Parking Management Area. The aim of these initiatives is to deliver balanced transport outcomes for central Perth.
A total of $88.1 million was expended from the PPLA this financial year for the following projects and services across the Transport portfolio:
y Provision of the Central Area Transit (CAT) service and the Free Transit Zone (FTZ)
y Completion of forward works for the William Street transit mall
y Detailed design of the Riverside Drive priority bus lanes
y Construction of the Barrack Street on-road cycle lanes between Riverside Drive and St Georges Terrace to create a north–south cycle route through the central city
y Commencement of the design of the Roe Street/Railway Street Principal Shared Path extension to improve east–west connectivity
y Implementation of parallel walk phases at a further 11 intersections to provide a safer and more efficient pedestrian movement system
y Upgrade of the traffic management system including the Incident Response Service and clearway towing to help ensure better flow of buses and traffic on city streets
y Extension of the Mounts Bay Road merge taper (west of the Point Lewis Rotary) to improve traffic flow and bus efficiency
y Contribution towards the construction of the Perth Busport.
Ongoing funding will be provided for a range of these projects and services, including construction of bus lanes and bicycle lanes, traffic management and the CAT service and FTZ. A three-year CAT bus renewal program will also commence in 2015-16.
Bicycle network plan implementation continued
The Western Australian Bicycle Network (WABN) Plan 2014-2031 provides a blueprint for metropolitan and regional cycling facilities over the next two decades. Overseeing the plan, DoT and the WABN Implementation Reference Group, made significant progress on the following five key initiatives identified in the plan.
1. Cycling network expanded
To meet rising demand, the expansion of the cycling network continued. The focus remained on building Principal Shared Paths (PSPs) along freeways and railway lines, prioritising those within a 15 km radius of the Perth CBD, and included the following projects:
y $700,000 new path from Scandrett Way to London Way along the Kwinana Freeway completed in July 2014
y $3.5 million upgrade to the Thelma Street–Mill Point Road path along the Kwinana Freeway completed in September 2014
y $3.3 million new path from Erindale Road to Balcatta Road along the Mitchell Freeway completed in December 2014
y $3.4 million new path from Bassendean Station to Success Hill Station along the Midland Line completed in December 2014.
ANNUAL REPORT 2014-15 53

In addition to the completion of these projects, the construction of a new path from Loch Street Station to Shenton Park Station along the Fremantle Line was progressed at a cost of $2.6 million, with a further $3.1 million allocated to complete the path in 2015-16.
Significant design work was also completed for the following PSP links:
y Glendalough Station to Hutton Street along the Mitchell Freeway
y Grant Street Station to Cottesloe Station and on to Victoria Street along the Fremantle Line
y Guildford Station to Morrison Road along the Midland Line.
DoT will continue to oversee the expansion and monitor use of the PSP network during 2015-16.
2. Cycling infrastructure improved
DoT administers the Perth Bicycle Network and Regional Bicycle Network grants programs. These grants support local government authorities to build cycling infrastructure and develop bicycle plans.
In 2014-15, 25 projects totalling 11.7 km of shared path and 2.8 km of on-road infrastructure were completed through $1.3 million in Perth Bicycle Network Grants. Through $1.3 million in Regional Bicycle Network Grants, 25 projects totalling 10.7 km of shared path infrastructure were completed.
In the 2015-16 grants programs, 33 local government authorities will share more than $2.7 million to create, design or upgrade 22.1 km of shared pedestrian and cycle paths and 1.4 km of on-road bicycle lanes.
To assist local government authorities to develop high-quality bicycle plans, which provide the strategic direction for these grant investments, DoT released new guidelines for developing a bicycle plan in June 2015.
3. Safe cycling and walking routes audit completed
Following the successful pilot of the Connecting Stations program in 2013-14, an audit of safe cycling and walking routes within a 3 km and 1.5 km radius of Greenwood and Cockburn stations respectively was completed in 2014-15. Connecting Stations aims to encourage cycling for short trips
to assist in reducing congestion and parking pressures while benefitting community health. The program will be further developed in 2015-16 based on the findings of the audit.
4. Perth CBD end-of-trip inventory completed
In 2014-15, DoT completed an end-of-trip inventory of the Perth CBD to ensure the facilities available can support growing demand from commuting cyclists. The inventory identified locations where shortfalls in bicycle parking exist and this information will assist in developing bicycle parking strategies for the future.
5. Cycle counting and monitoring strategy completed
The cycle counting and monitoring strategy for Perth was completed in 2014-15. The strategy outlines proposed improvements to assist in assessing the use of the PSP network and the reporting of information. This information will help to more accurately measure and plan for cycling growth over the next decade.
Innovative cycling solutions explored
In March 2015, DoT and RAC hosted WA’s first Cycling Imagineering Workshop to explore innovative cycling solutions for the State.
The one-day workshop brought together a broad range of stakeholders including representatives from local and State governments, private sector transport and urban planners, academics and advocacy groups. It was an opportunity for all parties, including two Dutch cycling experts, to share knowledge, forge relationships and develop ways to make Western Australia a place where cycling is safe, connected and widely accepted.
As a result of the workshop, planning has already commenced to develop and implement demonstration low-speed bicycle boulevards. These boulevards slow the speed of motorised traffic to provide a safer environment for all road users, and also provide connections to schools, stations and hospitals.
As these and a number of other key actions arising from the workshop progress, DoT will seek input and feedback from the WABN Implementation Reference Group.
54 DEPARTMENT OF TRANSPORT

WA’s first aviation strategy released
The first Western Australian State Aviation Strategy was released in February 2015. The strategy was developed by DoT, with extensive stakeholder and community input, to support the economic and social development of WA through the provision of safe, affordable, efficient and effective aviation services and infrastructure.
The implementation of the strategy commenced immediately after its release and is overseen by an interagency steering committee led by DoT. Each of the 29 actions outlined in the strategy, under seven key priority areas, have been progressed to some degree to date.
In 2015-16, DoT will finalise implementation plans for each of these actions, which are a combination of one-off projects and ongoing responsibilities, and engage with key stakeholders who will play an important role in implementing the strategy in the short and long term.
Air services and safety boosted
In 2014-15, DoT continued to administer the Regional Airports Development Scheme (RADS). The scheme is designed to improve Western Australian air services and safety by providing financial assistance for infrastructure to eligible owners or leaseholders of regional airports that can be accessed by the public.
A total of 34 projects, with a combined grant value of $3.5 million in Royalties for Regions funding, were completed in 2014-15. Projects included the development of runways; improving airport terminals, facilities and grounds; and the completion of planning studies. A further four projects, with a combined grant value of $3 million in Royalties for Regions funding, will be progressed in 2015-16.
Geraldton Airport runway
ANNUAL REPORT 2014-15 55

Perth freight plan neared completion
DoT continued to develop the Perth Freight Transport Network Plan in 2014-15. The plan complements the Western Australian Regional Freight Transport Network Plan and together they form a long-term freight infrastructure, policy, planning and project blueprint for the development of the State’s freight roads, rail lines and port authorities to 2031 and beyond.
Through significant progress achieved in 2014-15, the plan now sets out the following five strategic priorities for the metropolitan freight network:
1. Port planning and development
2. Freight rail demand and investment
3. Intermodal terminal planning and development
4. Major freight road development priorities
5. Measures to better protect the freight network.
Addressing these priorities will allow the network to cope with future demand and ensure the State’s businesses are able to trade freely and efficiently in the domestic and global marketplaces.
DoT will finalise the plan and submit it to State Government for consideration in 2015-16.
Regional freight plan implementation continued
The Western Australian Regional Freight Transport Network Plan, released in May 2013, identifies the long-term strategic planning, policy and project priorities required to facilitate growth in, and ensure optimal network performance for, the State’s regional freight network to 2031.
DoT continued to lead the implementation of the plan throughout 2014-15. In early 2015, a report card highlighting the significant progress made towards the four key themes and 15 strategic directions set out in the plan was published on DoT’s website.
The report card indicates that almost half of the 109 priority activities, studies and projects identified have either secured funding, been commenced or had at least one stage completed – with five per cent of the projects having been completed in their entirety.
DoT has established a monitoring program to continue to track the implementation of the plan and progress reports will be produced every two to three years.
Regional Freight Plan implementation continues.
56 DEPARTMENT OF TRANSPORT

First stage of ports reforms completed
Throughout 2014-15, DoT continued to facilitate the implementation of reforms arising from the Western Australian Ports Governance Review. The reforms will result in a better overall structure for the oversight and governance of WA’s ports and ensure the risks associated with the operations of ports and shipping are managed effectively.
The first stage of the reforms, the amalgamation of seven regional port authorities into four, was completed when the Mid West, Pilbara and Kimberley ports authorities commenced operations on 1 July 2014, followed by the Southern Ports Authority on 1 October 2014. The new ports authorities bring a regional focus to strategic port development planning, policy and priority setting, financial planning, budget allocation and decision-making.
DoT also made substantial progress in the drafting of the Ports Legislation Amendment Bill 2015 (the Bill). The Bill is designed to enable the second stage of the reforms to be carried out – the transfer of nine ports, comprising 13 port facilities, operating under the Shipping and Pilotage Act 1967 to the Port Authorities Act 1999.
Once complete, this will bring all Western Australian ports under a consistent regulatory regime. The nine ports operating under the Shipping and Pilotage Act 1967 will be progressively transferred to come under the Port Authorities Act 1999.
In preparation for this, the ports authorities have been undertaking due diligence activities and meeting with the operators of the 13 port facilities to increase their understanding of the operations and ensure a seamless transition following the passage of legislation.
Preparation for ports divestment continued
In August 2014, the State Government announced the first tranche of public asset sales that will include the sale of the port facilities in Kwinana and Port Hedland – the Kwinana Bulk Terminal and Utah Point Bulk Handling Facility. As part of the 2015-16 State Budget, additional asset sales were announced in May 2015, including the divestment of the assets and operations of the Port of Fremantle (which incorporates the Kwinana Bulk Terminal).
Throughout 2014-15, DoT provided significant input into the preparation for the divestment of the port assets.
DoT will continue to work in close consultation with key stakeholders including the Department of Treasury, Fremantle Port Authority and Pilbara Ports Authority, and the State Government’s external advisors to provide input into the due diligence and subsequent transaction processes required to progress the divestments.
Kewdale Intermodal Rail Supply Chain project completed
Both components of the State and Commonwealth-funded Kewdale Intermodal Rail Supply Chain project were completed as scheduled in 2014-15.
The $32 million extension of the North Quay Rail Terminal was completed by Fremantle Port Authority on behalf of DoT in August 2014. The rail terminal at the Inner Harbour has been extended from 400 m to 690 m, reducing turnaround times for trains delivering containers to and from the port and achieving a better interface with container terminals.
The $6 million Spearwood crossing loop project was completed by portfolio partner the PTA in July 2014. The project involved the replacement of 850 m of narrow-gauge track with dual-gauge track and the installation of new sleepers and turnouts. The passing loop allows freight trains to pass each other on the rail line that connects Fremantle Port with the Kewdale/Forrestfield area, enabling more freight train movements during the day and minimising service delays.
Both projects will help reduce the reliance on heavy road freight vehicles by using rail more efficiently to move goods around the Perth metropolitan area, particularly between inland hubs and Fremantle Port.
Implementation support for national transport reforms provided
During 2014-15, DoT continued to support the implementation of the national transport systems for rail and commercial vessel safety initiated by the Council of Australian Governments.
ANNUAL REPORT 2014-15 57

National law for rail safety
The National Rail Safety Regulator commenced operations in January 2013 and DoT is progressing legislation through State Parliament to establish the Office of the National Rail Safety Regulator in Western Australia.
In November 2014, the Rail Safety National Law (WA) Bill 2014 (the Bill) was passed by the Legislative Assembly. At the same time, it was introduced and had its second reading in the Legislative Council and was referred to the Standing Committee on Uniform Legislation and Statutes Review (the Committee) to consider the impact of the Bill upon the sovereignty and law-making powers of the Parliament of Western Australia and to report its findings back to the Legislative Council.
In December 2014, DoT briefed the Committee to assist with the inquiry. The Committee submitted a final report to the Legislative Council in March 2015. A response to the Committee’s recommendations has been prepared and further detailed consideration of the Bill by the Legislative Council is anticipated to take place during the Spring 2015 sittings.
It is anticipated that Western Australia will commence operations under the Office of the National Rail Safety Regulator in November 2015.
National law for commercial vessel safety
The national law governing commercial vessel safety came into effect in July 2013. Throughout 2014-15, DoT continued drafting the Marine Safety (Domestic Commercial Vessel National Law Application) Bill 2014 to enact the national law in WA, while simultaneously preparing consequential amendments to the Western Australian Marine Act 1982 and other Acts and regulations to ensure the seamless regulation of vessels under the national law and those remaining under the State’s jurisdiction. DoT is continuing to deliver the national system functions in Western Australia as a formal Delegate of the National Regulator.
National heavy vehicle charges
Australia uses a pay-as-you-go model for heavy vehicle charges which is based on a fixed annual registration and fuel-based road-user charges. Revenue recovered through these charges assists in providing better and safer roads.
In most states and territories, heavy vehicle charges are determined by the National Transport Commission (NTC). Each year, the NTC puts forward a new heavy vehicle charges determination or recommends an annual adjustment to ensure heavy vehicle charges keep pace with road spending programs.
In February 2014, the NTC proposed a new schedule of national heavy vehicle charges, which the Transport and Infrastructure Council agreed would be implemented on 1 July 2016.
In recent years, the State’s heavy vehicle charges have not been aligned with the national charges as determined by the NTC. As the determination incorporates an improved modeling process and a new schedule of charges, DoT has been working with the NTC to model the potential impacts of these charges in Western Australia. Should the new charges be considered appropriate for the State’s heavy vehicle fleet, freight task and road conditions, consideration will be given to transitioning to the new national schedule of charges over a number of years.
In the meantime, the State Government agreed to implement a 0.6 per cent annual registration fee increase for 2015-16 in line with other jurisdictions.
Revenue recovered assists in providing better and safer roads.
58 DEPARTMENT OF TRANSPORT

ACTUAL RESULTS VERSUS BUDGET TARGETS
*NotesThese notes should be read in conjunction with the Explanatory Statement to the Financial Statements on page 109.
Note 1: Total cost of services
The total cost of services trailed estimates primarily due to lower than anticipated expenditure on various grants and subsidies.
Note 2: Net cost of services
In addition to lower expenditure on grants and subsidies, higher revenue primarily from the transfer to DoT of the responsibility of the Two Rocks Marina contributed to the lower net cost of service.
Note 3: Total equity
Total equity exceeded estimates reflecting the impact of the favourable operating result for 2014-15.
Note 4: Net increase/(decrease) in cash held
The net decrease in cash held is close to budget.
Note 5: Approved FTE
The actual paid FTE closely reflects the budget, with the small variance primarily due to the retention of Rail Safety staff due to a delay in the transition to the National Rail Safety Regulator.
The following table provides a comparison of the financial targets and outcomes against criteria included in the Resource Agreement between the Chief Executive Officer, the Minister for Transport and the Treasurer.
2014-15 Actual results versus budget targets2014-15 Target $000
2014-15 Actual $000
Variation $000 Note*
Total cost of services 378,069 365,957 12,112 1
Net cost of services 66,986 32,607 34,379 2
Total equity 691,907 709,693 17,786 3
Net increase/(decrease) in cash held (36,622) (34,246) 2,376 4
Approved full time equivalent (FTE) 1,406 1,410 4 5
ANNUAL REPORT 2014-15 59

60 DEPARTMENT OF TRANSPORT

Significant issues impacting the agency
ANNUAL REPORT 2014-15 61

Esplanade Bus Port
62 DEPARTMENT OF TRANSPORT
EconomicThe rapid development of the Perth metropolitan area, the CBD and major activity centres requires a proactive approach to transport planning and delivery of new initiatives to manage traffic growth and ensure a balanced transport system.
To address this need, DoT is developing a suite of strategic transport plans for the medium and long term.
The Perth Transport Plan for 3.5 million People and Beyond will establish a blueprint for the development of, and investment in, the city’s transport network across all modes for a city of 3.5 million people. This is nominally expected by around 2050.
The transport plans for the medium term include the Central Area Transport Plan to 2025 which will underpin further investment in the infrastructure,
policies and services in the CBD such as the CAT bus services. Detailed transport planning and modelling is also being undertaken for the Stirling City Centre, Murdoch, Cannington, Morley, Karrinyup and Bentley/Curtin to inform changes needed for the network and new travel demand management measures to meet the expansion plans for these centres, particularly where large shopping centre expansions are being proposed.
Cycling has increased well above the rate of population growth, with a 32 per cent increase in cyclists on the Principal Shared Path network since 2011. DoT, along with portfolio partners Main Roads WA and the Public Transport Authority, continue to invest in cycling infrastructure to meet this growing demand. In 2015-16, DoT will develop innovative options to create greater separation of cyclists and motorised traffic on roads to further improve safety and support the increased use of cycling as a transport mode.

ANNUAL REPORT 2014-15 63
Demand for new or improved coastal infrastructure facilities continues to grow in both metropolitan and regional locations. DoT has made significant progress in addressing this demand with the completion of the Augusta Boat Harbour and other new boating infrastructure around the State. The $18.27 million Royalties for Regions funded Exmouth Boat Harbour upgrade has commenced to further support the development of marine tourism and recreational activities and enhance business opportunities associated with the resources sector.
Ageing coastal infrastructure around the State continues to impact DoT, requiring ongoing maintenance and ultimately replacement. The $3.9 million replacement of Jetty 2 at the Fremantle Fishing Boat Harbour has commenced and DoT will also replace the 109 year old Denham Jetty with a new $2.2 million Royalties for Regions funded multi-purpose jetty in 2015-16.
Western Australia has seen a significant expansion in regional port facilities and shipping operations in the past decade. Port governance arrangements are being updated to ensure further developments are well planned and the risks associated with the operation of ports and shipping are appropriately managed.
The State Government released Western Australia’s first State Aviation Strategy in February 2015. The strategy provides a framework for future policy, planning and investment in the State’s aviation sector by Government and the private sector. Consistent with the strategy, the State will play a more active role in the aviation sector to ensure air services and airports support Western Australia’s economic and social development.
Social The Western Australian community continues to demand convenient access to Driver and Vehicle Services (DVS) information and transactions. DoT completed a number of initiatives to meet this growing expectation in 2014-15 including the opening of the new Mirrabooka DVS Centre, improving the efficiency of the Customer Contact Centre’s telephony system and introducing online vehicle transfers.
DoT also continued to provide customers with alternative service delivery options for vehicle inspections through its Authorised Inspection Stations network and a range of licensing transactions through its partnership with Australia Post. From July 2015, the governance and compliance programs in place to support these alternative service delivery options will be strengthened by the progressive implementation of audit and data intelligence systems.
Increasing calls for regulatory reform have highlighted the need for definitive changes in the on-demand transport industry. In June 2015, DoT finalised a Green Paper that seeks to promote discussion around areas of policy reform that will best deliver a safe, more flexible, responsible and innovative customer service-focused on-demand transport industry.
Environmental Seagrass accumulation and beach erosion at Port Geographe has been an issue for a number of years. The $28.15 million project to reconfigure the coastal structures at the site was completed in May 2015. Sand and seagrass are now able to bypass the new coastal structures naturally, resulting in reduced seagrass accumulation, and beach erosion at Port Geographe is now at levels consistent with other coastal areas along Geographe Bay. In addition to addressing these environmental issues, the successful project has improved amenity and access to beaches for local residents and the wider community.

64 DEPARTMENT OF TRANSPORT
Disclosures and legal compliance
ANNUAL REPORT 2014-15 65

INDEPENDENT AUDITOR’S REPORT
Auditor General
Page 1 of 3
7th Floor Albert Facey House 469 Wellington Street Perth MAIL TO: Perth BC PO Box 8489 Perth WA 6849 TEL: 08 6557 7500 FAX: 08 6557 7600
INDEPENDENT AUDITOR’S REPORT To the Parliament of Western Australia DEPARTMENT OF TRANSPORT Report on the Financial Statements I have audited the accounts and financial statements of the Department of Transport. The financial statements comprise the Statement of Financial Position as at 30 June 2015, the Statement of Comprehensive Income, Statement of Changes in Equity, Statement of Cash Flows, Schedule of Income and Expenses by Service, Schedule of Assets and Liabilities by Service, and Summary of Consolidated Account Appropriations and Income Estimates for the year then ended, and Notes comprising a summary of significant accounting policies and other explanatory information, including Administered transactions and balances. Director General’s Responsibility for the Financial Statements The Director General is responsible for keeping proper accounts, and the preparation and fair presentation of the financial statements in accordance with Australian Accounting Standards and the Treasurer’s Instructions, and for such internal control as the Director General determines is necessary to enable the preparation of financial statements that are free from material misstatement, whether due to fraud or error. Auditor’s Responsibility As required by the Auditor General Act 2006, my responsibility is to express an opinion on the financial statements based on my audit. The audit was conducted in accordance with Australian Auditing Standards. Those Standards require compliance with relevant ethical requirements relating to audit engagements and that the audit be planned and performed to obtain reasonable assurance about whether the financial statements are free from material misstatement. An audit involves performing procedures to obtain audit evidence about the amounts and disclosures in the financial statements. The procedures selected depend on the auditor’s judgement, including the assessment of the risks of material misstatement of the financial statements, whether due to fraud or error. In making those risk assessments, the auditor considers internal control relevant to the Department’s preparation and fair presentation of the financial statements in order to design audit procedures that are appropriate in the circumstances. An audit also includes evaluating the appropriateness of the accounting policies used and the reasonableness of accounting estimates made by the Director General, as well as evaluating the overall presentation of the financial statements. I believe that the audit evidence obtained is sufficient and appropriate to provide a basis for my audit opinion. Opinion In my opinion, the financial statements are based on proper accounts and present fairly, in all material respects, the financial position of the Department of Transport at 30 June 2015 and its financial performance and cash flows for the year then ended. They are in accordance with Australian Accounting Standards and the Treasurer’s Instructions.
66 DEPARTMENT OF TRANSPORT

Page 2 of 3
Report on Controls I have audited the controls exercised by the Department of Transport during the year ended 30 June 2015. Controls exercised by the Department of Transport are those policies and procedures established by the Director General to ensure that the receipt, expenditure and investment of money, the acquisition and disposal of property, and the incurring of liabilities have been in accordance with legislative provisions. Director General’s Responsibility for Controls The Director General is responsible for maintaining an adequate system of internal control to ensure that the receipt, expenditure and investment of money, the acquisition and disposal of public and other property, and the incurring of liabilities are in accordance with the Financial Management Act 2006 and the Treasurer’s Instructions, and other relevant written law. Auditor’s Responsibility As required by the Auditor General Act 2006, my responsibility is to express an opinion on the controls exercised by the Department of Transport based on my audit conducted in accordance with Australian Auditing and Assurance Standards. An audit involves performing procedures to obtain audit evidence about the adequacy of controls to ensure that the Department complies with the legislative provisions. The procedures selected depend on the auditor’s judgement and include an evaluation of the design and implementation of relevant controls. I believe that the audit evidence obtained is sufficient and appropriate to provide a basis for my audit opinion. Opinion In my opinion, the controls exercised by the Department of Transport are sufficiently adequate to provide reasonable assurance that the receipt, expenditure and investment of money, the acquisition and disposal of property, and the incurring of liabilities have been in accordance with legislative provisions during the year ended 30 June 2015. Report on the Key Performance Indicators I have audited the key performance indicators of the Department of Transport for the year ended 30 June 2015. The key performance indicators are the key effectiveness indicators and the key efficiency indicators that provide information on outcome achievement and service provision. Director General’s Responsibility for the Key Performance Indicators The Director General is responsible for the preparation and fair presentation of the key performance indicators in accordance with the Financial Management Act 2006 and the Treasurer’s Instructions and for such controls as the Director General determines necessary to ensure that the key performance indicators fairly represent indicated performance. Auditor’s Responsibility As required by the Auditor General Act 2006, my responsibility is to express an opinion on the key performance indicators based on my audit conducted in accordance with Australian Auditing and Assurance Standards.
ANNUAL REPORT 2014-15 67

Page 3 of 3
An audit involves performing procedures to obtain audit evidence about the key performance indicators. The procedures selected depend on the auditor’s judgement, including the assessment of the risks of material misstatement of the key performance indicators. In making these risk assessments the auditor considers internal control relevant to the Director General’s preparation and fair presentation of the key performance indicators in order to design audit procedures that are appropriate in the circumstances. An audit also includes evaluating the relevance and appropriateness of the key performance indicators for measuring the extent of outcome achievement and service provision. I believe that the audit evidence obtained is sufficient and appropriate to provide a basis for my audit opinion. Opinion In my opinion, the key performance indicators of the Department of Transport are relevant and appropriate to assist users to assess the Department’s performance and fairly represent indicated performance for the year ended 30 June 2015. Independence In conducting this audit, I have complied with the independence requirements of the Auditor General Act 2006 and Australian Auditing and Assurance Standards, and other relevant ethical requirements. Matters Relating to the Electronic Publication of the Audited Financial Statements and Key Performance Indicators This auditor’s report relates to the financial statements and key performance indicators of the Department of Transport for the year ended 30 June 2015 included on the Department’s website. The Department’s management is responsible for the integrity of the Department’s website. This audit does not provide assurance on the integrity of the Department’s website. The auditor’s report refers only to the financial statements and key performance indicators described above. It does not provide an opinion on any other information which may have been hyperlinked to/from these financial statements or key performance indicators. If users of the financial statements and key performance indicators are concerned with the inherent risks arising from publication on a website, they are advised to refer to the hard copy of the audited financial statements and key performance indicators to confirm the information contained in this website version of the financial statements and key performance indicators.
COLIN MURPHY AUDITOR GENERAL FOR WESTERN AUSTRALIA Perth, Western Australia 7 September 2015
68 DEPARTMENT OF TRANSPORT

CERTIFICATION OF FINANCIAL STATEMENTS
For the year ended 30 June 2015The accompanying financial statements of the Department of Transport have been prepared in compliance with the provisions of the Financial Management Act 2006 from proper accounts and records to present fairly the financial transactions for the financial year ended 30 June 2015 and the financial position as at 30 June 2015.
At the date of signing we are not aware of any circumstances which would render the particulars included in the financial statements misleading or inaccurate.
Kathryn Martin Steve Troughton Chief Finance Officer Accountable Authority
2 September 2015 2 September 2015
ANNUAL REPORT 2014-15 69

Statement of Comprehensive IncomeFor the year ended 30 June 2015
Note2015
$ 000 2014
$ 000 COST OF SERVICESExpenses
Employee benefits expense 4 138 414 135 797 Supplies and services 5 100 154 115 368 Depreciation and amortisation expense 6 16 542 15 964 Accommodation expenses 7 16 182 11 638 Grants and subsidies 8 92 430 89 768 Loss on disposal of non-current assets 13 351 172 Other expenses 9 1 884 5 920
Total cost of services 365 957 374 627
IncomeRevenue
User charges and fees 10 261 711 146 119 Sales 382 541Grants and contributions 11 4 882 5 331 Interest revenue 1 895 1 468Other revenues 12 51 186 53 324 Other income 13 294 -
Total revenue 333 350 206 783
Total income other than income from State Government 333 350 206 783
NET COST OF SERVICES 32 607 167 844
INCOME FROM STATE GOVERNMENT 14Service appropriation 48 251 153 247Assets (transferred)/received (8) 10Services received free of charge 2 348 1 954Royalties for Regions Fund 35 612 31 811
Total income from State Government 86 203 187 022
SURPLUS FOR THE PERIOD 53 596 19 178
OTHER COMPREHENSIVE INCOMEItems not reclassified subsequently to profit or loss
Changes in asset revaluation surplus 31 60 4 498 Total other comprehensive income 60 4 498
TOTAL COMPREHENSIVE INCOME FOR THE PERIOD 53 656 23 676
See also the Schedule of Income and Expenses by Service. The Statement of Comprehensive Income should be read in conjunction with the accompanying notes.
70 DEPARTMENT OF TRANSPORT

Statement of Financial PositionAs at 30 June 2015
Note2015
$ 000 2014
$ 000 ASSETSCurrent Assets
Cash and cash equivalents 15 36 178 32 091
Restricted cash and cash equivalents 16 54 376 89 243 Inventories 17 444 342 Receivables 18 12 101 12 292 Non-current assets held for sale 21 - 1 800 Other current assets 20 2 468 1 079
Total Current Assets 105 567 136 847
Non-Current AssetsRestricted cash and cash equivalents 16 - 3 466 Amounts receivable for services 19 185 554 173 740 Property, plant and equipment 22 173 029 171 757 Infrastructure 23 243 865 190 388 Intangible assets 25 22 294 23 615 Construction in progress 26 33 529 55 688
Total Non-Current Assets 658 271 618 654
TOTAL ASSETS 763 838 755 501
LIABILITIESCurrent Liabilities
Payables 28 13 051 27 345 Provisions 29 27 490 27 432 Other current liabilities 30 7 442 3 565
Total Current Liabilities 47 983 58 342
Non-Current LiabilitiesProvisions 29 6 162 5 887
Total Non-Current Liabilities 6 162 5 887
TOTAL LIABILITIES 54 145 64 229
NET ASSETS 709 693 691 272
EQUITY 31Contributed equity 505 398 540 634Reserves 7 472 7 412 Accumulated surplus 196 823 143 226
TOTAL EQUITY 709 693 691 272
See also the ‘Schedule of Assets and Liabilities by Service’. The Statement of Financial Position should be read in conjunction with the accompanying notes.
ANNUAL REPORT 2014-15 71
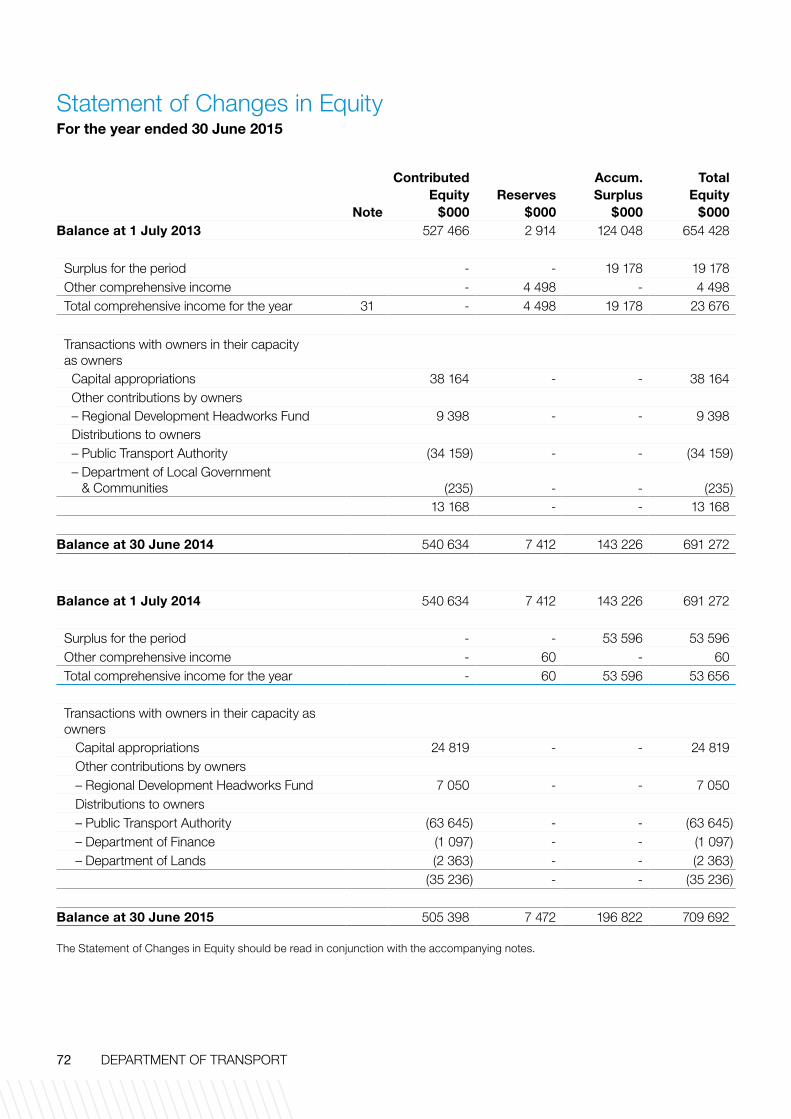
Statement of Changes in EquityFor the year ended 30 June 2015
Note
Contributed Equity
$000 Reserves
$000
Accum. Surplus
$000
Total Equity
$000Balance at 1 July 2013 527 466 2 914 124 048 654 428
Surplus for the period - - 19 178 19 178 Other comprehensive income - 4 498 - 4 498 Total comprehensive income for the year 31 - 4 498 19 178 23 676
Transactions with owners in their capacity as owners
Capital appropriations 38 164 - - 38 164 Other contributions by owners– Regional Development Headworks Fund 9 398 - - 9 398 Distributions to owners– Public Transport Authority (34 159) - - (34 159)– Department of Local Government
& Communities (235) - - (235) 13 168 - - 13 168
Balance at 30 June 2014 540 634 7 412 143 226 691 272
Balance at 1 July 2014 540 634 7 412 143 226 691 272
Surplus for the period - - 53 596 53 596 Other comprehensive income - 60 - 60 Total comprehensive income for the year - 60 53 596 53 656
Transactions with owners in their capacity as owners
Capital appropriations 24 819 - - 24 819 Other contributions by owners– Regional Development Headworks Fund 7 050 - - 7 050 Distributions to owners– Public Transport Authority (63 645) - - (63 645)– Department of Finance (1 097) - - (1 097)– Department of Lands (2 363) - - (2 363)
(35 236) - - (35 236)
Balance at 30 June 2015 505 398 7 472 196 822 709 692
The Statement of Changes in Equity should be read in conjunction with the accompanying notes.
72 DEPARTMENT OF TRANSPORT

Statement of Cash FlowsFor the year ended 30 June 2015
Note2015
$ 000 2014
$ 000 CASH FLOWS FROM STATE GOVERNMENT
Service appropriation 36 437 141 040
Capital appropriations 24 819 38 164
Cash transferred (to)/from other agencies (63 645) (34 394)
Royalties for Regions Fund 42 662 41 209
Net cash provided by State Government 40 273 186 019
Utilised as follows:
CASH FLOWS FROM OPERATING ACTIVITIES
Payments
Employee benefits (137 128) (135 975)
Supplies and services (102 693) (111 802)
Accommodation (16 219) (12 428)
Grants and subsidies (96 894) (91 516)
GST payments on purchases (25 339) (26 706)
Other payments (1 686) (1 048)
Receipts
Sale of goods and services 346 499
User charges and fees 260 727 144 991
Grants and subsidies 4 662 4 840
Interest received 1 853 1 461
GST receipts on sales 7 144 5 228
GST receipts from taxation authority 18 353 18 826
Other receipts 54 370 54 747
Net cash used in operating activities 32 (b) (32 504) (148 883)
CASH FLOWS FROM INVESTING ACTIVITIES
Payments
Purchase of non-current physical assets (42 114) (53 974)
Receipts
Proceeds from sale of non-current physical assets 99 1 992
Net cash used in investing activities (42 015) (51 982)
Net (decrease) / increase in cash and cash equivalents (34 246) (14 846)
Cash and cash equivalents at the beginning of the period 124 800 139 646
CASH AND CASH EQUIVALENTS AT THE END OF THE PERIOD 32(a) 90 554 124 800
The Statement of Cash Flows should be read in conjunction with the accompanying notes.
ANNUAL REPORT 2014-15 73
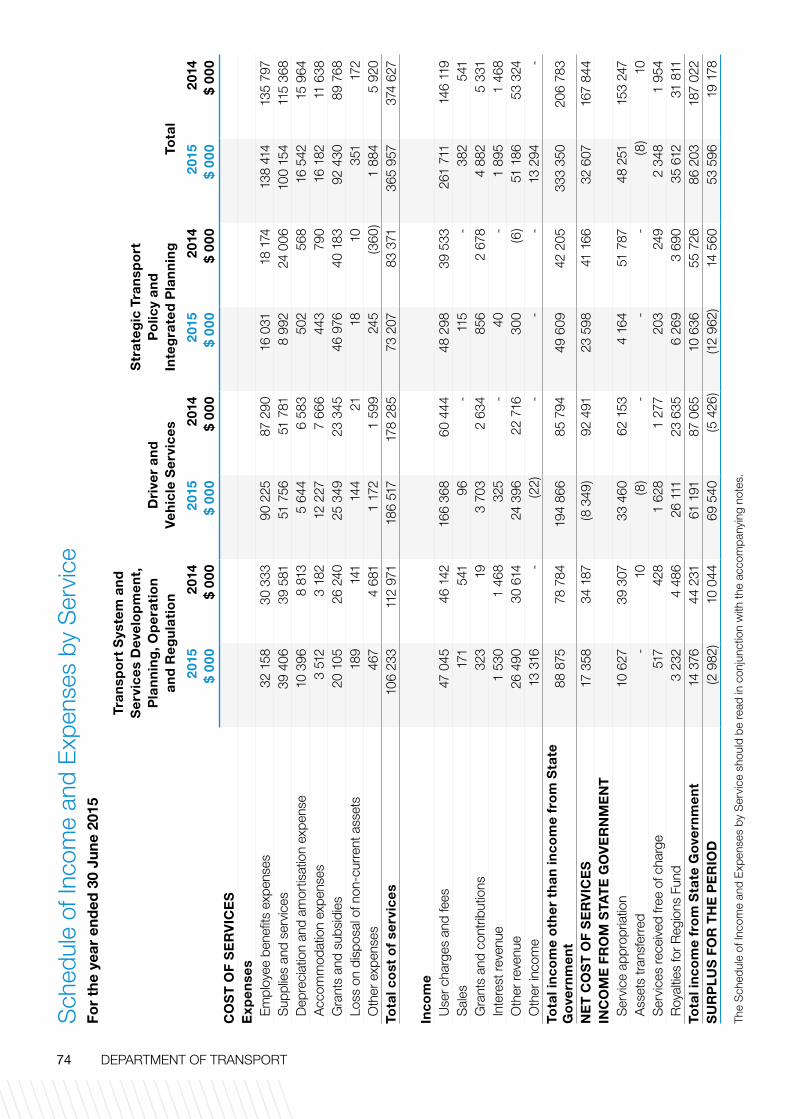
Sch
edul
e of
Inco
me
and
Exp
ense
s by
Ser
vice
Fo
r th
e ye
ar e
nded
30
June
201
5
Tran
spo
rt S
yste
m a
nd
S
ervi
ces
Dev
elo
pm
ent,
P
lan
nin
g, O
per
atio
n
and
Reg
ula
tio
nD
rive
r an
d
Veh
icle
Ser
vice
s
Str
ateg
ic T
ran
spo
rt
Po
licy
and
In
teg
rate
d P
lan
nin
gTo
tal
2015
$
000
2014
$
000
2015
$
000
2014
$
000
2015
$
000
2014
$
000
2015
$
000
2014
$
000
CO
ST
OF
SE
RV
ICE
SE
xpen
ses
Empl
oyee
ben
efits
exp
ense
s 3
2 15
8 3
0 33
3 9
0 22
5 8
7 29
0 1
6 03
1 1
8 17
4 1
38 4
14
135
797
Sup
plie
s an
d se
rvic
es 3
9 40
6 3
9 58
1 5
1 75
6 5
1 78
1 8
992
2
4 00
6 1
00 1
54
115
368
Dep
reci
atio
n an
d am
ortis
atio
n ex
pens
e 1
0 39
6 8
813
5
644
6
583
5
02
568
1
6 54
2 1
5 96
4A
ccom
mod
atio
n ex
pens
es 3
512
3
182
1
2 22
7 7
666
4
43
790
1
6 18
2 1
1 63
8G
rant
s an
d su
bsid
ies
20
105
26
240
25
349
23
345
46
976
40
183
92
430
89
768
Loss
on
disp
osal
of n
on-c
urre
nt a
sset
s 1
89
141
1
44
21
18
10
351
1
72O
ther
exp
ense
s 4
67
4 6
81
1 1
72
1 5
99
245
(3
60)
1 8
84
5 9
20To
tal c
ost
of
serv
ices
106
233
1
12 9
71
186
517
1
78 2
85
73
207
83
371
365
957
3
74 6
27
Inco
me
Use
r cha
rges
and
fees
47
045
46
142
166
368
6
0 44
4 4
8 29
8 3
9 53
3 2
61 7
11
146
119
Sal
es 1
71
541
9
6 -
1
15
-
382
5
41G
rant
s an
d co
ntrib
utio
ns 3
23
19
3 7
03
2 6
34
856
2
678
4
882
5
331
Inte
rest
reve
nue
1 5
30
1 4
68
325
-
4
0 -
1
895
1
468
Oth
er re
venu
e 2
6 49
0 3
0 61
4 2
4 39
6 2
2 71
6 3
00
(6)
51
186
53
324
Oth
er in
com
e 1
3 31
6 -
(2
2) -
-
-
1
3 29
4 -
Tota
l in
com
e o
ther
th
an in
com
e fr
om
Sta
te
Go
vern
men
t 8
8 87
5 7
8 78
4 1
94 8
66
85
794
49
609
42
205
333
350
2
06 7
83
NE
T C
OS
T O
F S
ER
VIC
ES
17
358
34
187
(8 3
49)
92
491
23
598
41
166
32
607
167
844
INC
OM
E F
RO
M S
TAT
E G
OV
ER
NM
EN
TS
ervi
ce a
ppro
pria
tion
10
627
39
307
33
460
62
153
4 1
64
51
787
48
251
153
247
Ass
ets
trans
ferr
ed -
1
0 (8
) -
-
-
(8)
10S
ervi
ces
rece
ived
free
of c
harg
e 5
17
428
1
628
1
277
2
03
249
2
348
1
954
Roy
altie
s fo
r Reg
ions
Fun
d 3
232
4
486
2
6 11
1 2
3 63
5 6
269
3
690
3
5 61
2 3
1 81
1To
tal i
nco
me
fro
m S
tate
Go
vern
men
t 1
4 37
6 4
4 23
1 6
1 19
1 8
7 06
5 1
0 63
6 5
5 72
6 8
6 20
3 1
87 0
22S
UR
PLU
S F
OR
TH
E P
ER
IOD
(2 9
82)
10
044
69
540
(5 4
26)
(12
962)
14
560
53
596
19
178
The
Sch
edul
e of
Inco
me
and
Exp
ense
s by
Ser
vice
sho
uld
be r
ead
in c
onju
nctio
n w
ith th
e ac
com
pany
ing
note
s.
74 DEPARTMENT OF TRANSPORT

Sch
edul
e of
Ass
ets
and
Liab
ilitie
s by
Ser
vice
A
s at
30
June
201
5
Tran
spo
rt S
yste
m a
nd
S
ervi
ces
Dev
elo
pm
ent,
P
lan
nin
g, O
per
atio
n
and
Reg
ula
tio
nD
rive
r an
d
Veh
icle
Ser
vice
s
Str
ateg
ic T
ran
spo
rt
Po
licy
and
In
teg
rate
d P
lan
nin
gTo
tal
2015
$
000
2014
$
000
2015
$
000
2014
$
000
2015
$
000
2014
$
000
2015
$
000
2014
$
000
AS
SE
TS
Cur
rent
Ass
ets
84
925
110
089
2
0 31
8 2
6 33
8 3
24
420
1
05 5
67
136
847
Non
-Cur
rent
Ass
ets
574
562
5
39 9
83
81
252
76
362
2 4
57
2 3
09
658
271
6
18 6
54To
tal A
sset
s 6
59 4
87
650
072
1
01 5
70
102
700
2
781
2
729
7
63 8
38
755
501
LIA
BIL
ITIE
SC
urre
nt L
iabi
litie
s 2
2 84
2 2
7 77
3 2
2 20
7 2
7 00
1 2
934
3
568
4
7 98
3 5
8 34
2N
on-C
urre
nt L
iabi
litie
s 1
444
1
379
4
148
3
963
5
70
545
6
162
5
887
Tota
l Lia
bili
ties
24
286
29
152
26
355
30
964
3 5
04
4 1
13
54
145
64
229
NE
T A
SS
ET
S 6
35 2
01
620
920
7
5 21
5 7
1 73
6 (7
23)
(1 3
84)
709
693
6
91 2
72
The
Sch
edul
e of
Ass
ets
and
Liab
ilitie
s by
Ser
vice
sho
uld
be r
ead
in c
onju
nctio
n w
ith th
e ac
com
pany
ing
note
s.
ANNUAL REPORT 2014-15 75

2015Estimate
$ 000
2015Actual$ 000
2015Variance
$ 000
2014Actual$ 000
2014 Actual$ 000
2014 Variance
$ 000DELIVERY OF SERVICES
Item 110 Net amount appropriated to deliver services 51 364 47 078 (4 286) 47 078 151 859 (104 781)Section 25 Transfer of service appropriation - - - - 255 (255)Amount authorised by other statutes: - – Salaries and Allowances Act 1975 1 173 1 173 - 1 173 1 133 40
Total appropriations provided to deliver services 52 537 48 251 (4 286) 48 251 153 247 (104 996)
CAPITALItem 162 Capital appropriations 24 819 24 819 - 24 819 38 164 (13 345)
ADMINISTERED TRANSACTIONSItem 111 Western Australian Coastal Shipping Commission 95 95 - 95 90 5
Total administered transactions 95 95 - 95 90 5
GRAND TOTAL 77 451 73 165 (4 286) 73 165 191 501 (118 336)
Details of expenses by serviceTransport System and Services Development, Planning, Operation and Regulation 114 393 106 233 (8 160) 106 233 112 971 (6 738)Driver and Vehicle Services 183 535 186 517 2 982 186 517 178 285 8 232 Strategic Transport Policy and Integrated Planning 80 141 73 207 (6 934) 73 207 83 371 (10 164)Total cost of services 378 069 365 957 (12 112) 365 957 374 627 (8 670)Less: Total income 311 083 333 350 22 267 333 350 206 783 126 567 Net cost of services 66 986 32 607 (34 379) 32 607 167 844 (135 237)Adjustments (i) (14 449) 15 644 30 093 15 644 (14 597) 30 241
Total appropriations provided to deliver services 52 537 48 251 (4 286) 48 251 153 247 (104 996)
Capital expenditurePurchase of non-current physical assets 41 303 42 114 811 42 114 53 974 (11 860)Delivery of Services– Internal funds and balances (6 684) (10 245) (3 561) (10 245) (6 412) (3 833)– Royalties for Regions (9 800) (7 050) 2 750 (7 050) (9 398) 2 348
Capital appropriations 24 819 24 819 - 24 819 38 164 (13 345)
DETAILS OF INCOME ESTIMATESIncome disclosed as Administered Income 914 842 1 937 732 1 022 890 1 937 732 1 879 511 58 221
(i) Adjustments comprise movements in cash balances and other accrual items such as receivables, payables and superannuation.
Summary of Consolidated Account Appropriations and Income Estimates For the year ended 30 June 2015
76 DEPARTMENT OF TRANSPORT

1. Australian Accounting Standards
General
The Department’s financial statements for the year ended 30 June 2015 have been prepared in accordance with Australian Accounting Standards. The term ‘Australian Accounting Standards’ includes Standards and interpretations issued by the Australian Accounting Standard Board (AASB).
The Department has adopted any applicable new and revised Australian Accounting Standards from their operative dates.
Early adoption of standards
The Department cannot early adopt an Australian Accounting Standard unless specifically permitted by TI 1101 Application of Australian Accounting Standards and Other Pronouncements. Partial exemption permitting early adoption of AASB 2015-7 Amendments to Australian Accounting Standards – Fair Value Disclosures of Not-for-Profit Public Sector Entities has been granted. Aside from AASB 2015-7, there has been no early adoption of Australian Accounting Standards that have been issued or amended (but not operative) by the Department for the annual reporting period ended 30 June 2015.
2. Summary of significant accounting policies
(a) General statement
The Department is a not-for-profit reporting entity that prepares general purpose financial statements in accordance with Australian Accounting Standards, the Framework, Statements of Accounting Concepts and other authoritative pronouncements of the AASB as applied by the Treasurer’s Instructions. Several of these are modified by the Treasurer’s Instructions to vary application, disclosure, format and wording.
The Financial Management Act 2006 and the Treasurer’s Instructions impose legislative provisions that govern the preparation of financial statements and take precedence over Australian Accounting Standards, the Framework, Statements of Accounting Concepts and other authoritative pronouncements of the AASB.
Where modification is required and has had a material or significant financial effect upon the reported results, details of that modification and the resulting financial effect are disclosed in the notes to the financial statements.
(b) Basis of preparation
The financial statements have been prepared on the accrual basis of accounting using the historical cost convention, except for land and buildings which have been measured at fair value.
The accounting policies adopted in the preparation of the financial statements have been consistently applied throughout all periods presented unless otherwise stated.
The financial statements are presented in Australian dollars and all values are rounded to the nearest thousand dollars ($ 000).
In the process of reporting the Department as a single entity, all intra entity transactions and balances have been eliminated.
(c) Reporting entity
The reporting entity comprises the Department.
Mission
The Department’s mission is to provide and enable safe, accessible and efficient movement for the economic and social prosperity of Western Australia
The Department is predominantly funded by user fees and charges determined by prevailing market forces. It is also funded by other controlled revenues and Parliamentary appropriations.
Services
The Department provides the following services:
Service 1: Transport System and Services Development, Planning, Operation and Regulation
Transport system and services development, planning, operation and regulation is designed to improve accessibility and safety of the transport system for all Western Australians.
Notes to the Financial StatementsFor the year ended 30 June 2015
ANNUAL REPORT 2014-15 77

Service 2: Driver and Vehicle Services
The Road Traffic Act 1974 confers on the Department responsibility for licensing the State’s drivers and registering vehicles.
Service 3: Strategic Transport Policy and Integrated Planning.
Strategic Transport Policy contributes to the achievement of the desired Transport outcome, where integrated transport systems facilitate economic development by providing leadership for strategic transport issues.
Integrated Transport Planning contributes to the achievement of the desired Transport outcome, where integrated transport systems facilitate economic development by providing leadership for strategic transport issues.
(d) Contributed equity
AASB Interpretation 1038 Contributions by Owners Made to Wholly-Owned Public Sector Entities requires transfers in the nature of equity contributions, other than as a result of a restructure of administrative arrangements, to be designated by the Government (the owner) as contributions by owners (at the time of, or prior to transfer) before such transfers can be recognised as equity contributions. Capital appropriations have been designated as contributions by owners by TI 955 Contributions by Owners made to Wholly Owned Public Sector Entities and have been credited directly to Contributed Equity.
The transfers of net assets to/from other agencies, other than as a result of a restructure of administrative arrangements, are designated as contributions by owners where the transfers are non-discretionary and non-reciprocal. See note 31 Equity.
(e) Income
Revenue Recognition
Revenue is recognised and measured at the fair value of consideration received or receivable. Revenue is recognised for the major business activities as follows:
Sale of goods
Revenue is recognised from the sale of goods and disposal of other assets when the significant risks and rewards of ownership transfer to the purchaser and can be measured reliably.
Provision of services
Revenue is recognised on delivery of the service to the client or by reference to the stage of completion of the transaction.
Revenues are received in the form of various registration, examination and licence fees (including Stamp Duty and Third Party Motor Vehicle Insurance). These revenues are received for services provided including undertaking inspections and/or issuing licences associated with the fees. As no part of these charges is refundable, revenues are recognised at the time they are received.
Revenues collected from traffic and cannabis infringements are administered on behalf of the Western Australian Police and recognised when the cash is received.
The revenue from other operating activities including rendering of services and the sale of assets are recognised when the Department has passed control of the goods or other assets or delivery of the service to the customer. Recoups of operating activities are recognised when invoiced.
Interest
Revenue is recognised as the interest accrues.
Service appropriations
Service appropriations are recognised as revenues at fair value in the period in which the Department gains control of the appropriated funds. The Department gains control of appropriated funds at the time those funds are deposited into the Department’s bank account or credited to the Amounts receivable for services (holding account) held at Treasury. See note 14 Income from State Government for further detail.
78 DEPARTMENT OF TRANSPORT

Net appropriation determination
The Treasurer may make a determination providing for prescribed receipts to be retained for services under the control of the Department. In accordance with the determination specified in the 2014-15 Budget Statements, the Department retained $333 million in 2015 ($206 million in 2014) from the following:
Boat registration fees, Indian Ocean Territories Program, jetty licences, marine examinations, duplicate motor drivers licence fees, motor vehicle transfer fees, motor vehicle plate fees, proof of age card, recoup for services provided, temporary permits, and other revenue.
Grants, donations, gifts and other non-reciprocal contributions
Revenue is recognised at fair value when the Department obtains control over the assets comprising the contributions usually when cash is received.
Other non-reciprocal contributions that are not contributions by owners are recognised at their fair value. Contributions of services are only recognised when a fair value can be reliably determined and the services would be purchased if not donated.
Royalties for regions funds are recognised as revenue at fair value in the period in which the Department obtains control over the funds. The Department obtains control of the funds at the time the funds are deposited into the Department’s bank account.
Gains
Realised and unrealised gains are usually recognised on a net basis. These include gains arising on the disposal of non-current assets and some revaluations of non-current assets.
(f) Property, plant and equipment and infrastructure
Capitalisation/expensing of assets
Items of property, plant and equipment and infrastructure costing $5,000 or more are recognised as assets and the cost of utilising assets is expensed (depreciated) over their useful lives. Items of property, plant and equipment and infrastructure costing less than $5,000 are immediately expensed directly to the Statement
of Comprehensive Income (other than where they form part of a group of similar items which are significant in total).
Initial recognition and measurement
Property, plant and equipment and infrastructure are initially recognised at cost. For items of property, plant and equipment and infrastructure acquired at no cost or for nominal cost, the cost is their fair value at the date of acquisition.
Subsequent measurement
Subsequent to initial recognition of an asset, the revaluation model is used for the measurement of land and buildings, and the cost model for all other property, plant, equipment and infrastructure. Land and buildings are carried at fair value less accumulated depreciation (buildings only) and accumulated impairment losses. All other items of property, plant and equipment and infrastructure are stated at historical cost less accumulated depreciation and accumulated impairment losses.
Where market-based evidence is available, the fair value of land and buildings is determined on the basis of current market values determined by reference to recent market transactions.
Where market-based evidence is not available, the fair value of land and buildings is determined on the basis of existing use. This normally applies where buildings are specialised or where land use is restricted. Fair value for existing use buildings is determined by reference to the cost of replacing the remaining future economic benefits embodied in the asset, i.e. the depreciated replacement cost.
When buildings are revalued, the accumulated depreciation is eliminated against the gross carrying amount of the asset and the net amount restated to the revalued amount. Fair value for restricted use land is determined by comparison with market evidence for land with similar approximate utility (high restricted use land) or market value of comparable unrestricted land (low restricted use land).
Independent valuations of land and buildings are provided annually by the Western Australian Land Information Authority (Valuation Services) and recognised annually to ensure that the carrying amount does not differ materially from the asset’s fair value at the end of the reporting period.
ANNUAL REPORT 2014-15 79

The most significant assumptions and judgements in estimating fair value are made in assessing whether to apply the existing use basis to assets and in determining estimated economic life. Professional judgement by the valuer is required where the evidence does not provide a clear distinction between market type assets and existing use assets. Refer to note 22 Property, plant and equipment for further information on revaluations.
Derecognition
Upon disposal or derecognition of an item of property, plant and equipment, any revaluation surplus relating to that asset is retained in the asset revaluation surplus.
Asset revaluation surplus
The asset revaluation surplus is used to record increments and decrements on the revaluation of non-current assets as described in note 22 Property, plant and equipment.
Depreciation
All non-current assets having a limited useful life are systematically depreciated over their estimated useful lives in a manner that reflects the consumption of their future economic benefits.
Land is not depreciated. Depreciation on other assets is calculated using the straight line method, using rates which are reviewed annually. Estimated useful lives for each class of depreciable asset are:
Buildings 20 to 40 years
Computer hardware 4 to 7 years
Refurbishments, furniture and fittings 3 to 20 years
Maritime infrastructure 5 to 100 years
Plant and equipment 5 to 20 years
Vehicles 5 to 20 years
Vessels 10 years
Assets under construction are not depreciated until commissioned.
(g) Intangible assets
Capitalisation/expensing of assets
Acquisitions of intangible assets costing $5,000 or more are capitalised. The cost of utilising the assets is expensed (amortised) over their useful lives. Costs incurred below these thresholds are
immediately expensed directly to the Statement of Comprehensive Income.
Intangible assets are initially recognised at cost. For assets acquired at no cost or for nominal cost, the cost is their fair value at the date of acquisition.
The cost model is applied for subsequent measurement requiring the asset to be carried at cost less any accumulated amortisation and accumulated impairment losses.
Amortisation for intangible assets with finite useful lives is calculated for the period of the expected benefit (estimated useful life) on the straight line basis using rates which are reviewed annually. All intangible assets controlled by the Department have a finite useful life and zero residual value.
The expected useful lives for each class of intangible asset are:
Software not integral to the operation of related hardware 3 to 20 years
Computer software
Software that is an integral part of the related hardware is recognised as property, plant and equipment. Software that is not an integral part of the related hardware is treated as an intangible asset. Software costing less than $5,000 is expensed in the year of acquisition.
(h) Impairment of assets
Property, plant and equipment, infrastructure and intangible assets are tested for any indication of impairment at the end of each reporting period. Where there is an indication of impairment, the recoverable amount is estimated. Where the recoverable amount is less than the carrying amount, the asset is considered impaired and is written down to the recoverable amount and an impairment loss is recognised. Where an asset measured at cost is written down to recoverable amount, an impairment loss is recognised in profit or loss. Where a previously revalued asset is written down to recoverable amount, the loss is recognised as a revaluation decrement in other comprehensive income. As the Department is a not-for-profit entity, unless a specialised asset has been identified as a surplus asset, the recoverable amount is the higher of an asset’s fair value less costs to sell and depreciated replacement cost.
80 DEPARTMENT OF TRANSPORT

The risk of impairment is generally limited to circumstances where an asset’s depreciation is materially understated, where the replacement cost is falling or where there is a significant change in useful life. Each relevant class of assets is reviewed annually to verify that the accumulated depreciation/amortisation reflects the level of consumption or expiration of the asset’s future economic benefits and to evaluate any impairment risk from falling replacement costs.
Intangible assets with an indefinite useful life and intangible assets not yet available for use are tested for impairment at the end of each reporting period irrespective of whether there is any indication of impairment.
The recoverable amount of assets identified as surplus assets is the higher of fair value less costs to sell and the present value of future cash flows expected to be derived from the asset. Surplus assets carried at fair value have no risk of material impairment where fair value is determined by reference to market-based evidence. Where fair value is determined by reference to depreciated replacement cost, surplus assets are at risk of impairment and the recoverable amount is measured. Surplus assets at cost are tested for indications of impairment at the end of each reporting period.
See note 27 Impairment of assets for the outcome of impairment reviews and testing.
See note 2(p) Receivables and note 18 Receivables for impairment of receivables.
(i) Non-current assets (or disposal groups) classified as held for sale
Non-current assets (or disposal groups) held for sale are recognised at the lower of carrying amount and fair value less costs to sell, and are disclosed separately from other assets in the Statement of Financial Position. Assets classified as held for sale are not depreciated or amortised.
(j) Leases
The Department holds operating leases for a number of branch office buildings, motor vehicles and office equipment. Operating lease payments are expensed on a straight line basis over the lease term as this represents the pattern of benefits derived from the leased properties.
(k) Financial Instruments
In addition to cash and cash equivalents, the Department has two categories of financial instrument:
y Receivables; and
y Financial liabilities measured at amortised cost.
Financial instruments have been disaggregated into the following classes:
Financial Assets
y Cash and cash equivalents
y Restricted cash and cash equivalents
y Receivables
y Amounts receivable for services
Financial Liabilities
y Payables
Initial recognition and measurement of financial instruments is at fair value which normally equates to the transaction cost or the face value. Subsequent measurement is at amortised cost using the effective interest method.
The fair value of short-term receivables and payables is the transaction cost or the face value because there is no interest rate applicable and subsequent measurement is not required as the effect of discounting is not material.
(l) Cash and cash equivalents
For the purpose of the ‘Statement of Cash Flows’, cash & cash equivalent (and restricted cash & cash equivalent) assets comprise cash on hand and short-term deposits with original maturities of three months or less that are readily convertible to a known amount of cash and which are subject to insignificant risk of changes in value.
(m) Accrued salaries
Accrued salaries (see note 28 Payables) represent the amount due to staff but unpaid at the end of the financial year. Accrued salaries are settled within a fortnight of the financial year end. The Department considers the carrying amount of accrued salaries to be equivalent to its fair value.
The accrued salaries suspense account (see note 16 Restricted cash and cash equivalents) consists of amounts paid annually into a suspense account
ANNUAL REPORT 2014-15 81

over a period of 10 financial years to largely meet the additional cash outflow in each eleventh year when 27 pay days occur instead of the normal 26. No interest is received on this account.
(n) Amounts receivable for services (Holding Account)
The Department receives funding on an accrual basis. The appropriations are paid partly in cash and partly as an asset (holding account receivable). The accrued amount receivable is accessible on the emergence of the cash funding requirement to cover leave entitlements and asset replacement.
See also note 14 Income from State Government and note 19 Amounts receivable for services.
(o) Inventories
Inventories are measured at the lower of cost and net realisable value. Costs are assigned by the method most appropriate for each particular class of inventory, with the majority being measured on a first in first out basis.
Inventories not held for resale are measured at cost unless they are no longer required, in which case they are measured at net realisable value.
See note 17 Inventories.
(p) Receivables
Receivables are recognised at original invoice amount less an allowance for any uncollectible amounts (i.e. impairment). The collectability of receivables is reviewed on an ongoing basis and any receivables identified as uncollectible are written-off against the allowance account. The allowance for uncollectible amounts (doubtful debts) is raised when there is objective evidence that the Department will not be able to collect the debts. The carrying amount is equivalent to fair value as it is due for settlement within 30 days.
See note 2(k) Financial Instruments and note 18 Receivables.
(q) Payables
Payables are recognised at the amounts payable when the Department becomes obliged to make future payments as a result of a purchase of assets
or services. The carrying amount is equivalent to fair value, as they are generally settled within 30 days.
See note 2(k) Financial Instruments and note 28 Payables.
(r) Provisions
Provisions are liabilities of uncertain timing or amount and are recognised where there is a present legal or constructive obligation as a result of a past event and when the outflow of resources embodying economic benefits is probable and a reliable estimate can be made of the amount of the obligation. Provisions are reviewed at the end of each reporting period.
See note 29 Provisions.
Provisions – employee benefits
All annual leave and long service leave provisions are in respect of employees’ services up to the end of the reporting period.
Annual leave
Annual leave is not expected to be settled wholly within 12 months after the end of the reporting period and is therefore considered to be ‘other long-term employee benefits’. The annual leave liability is recognised and measured at the present value of amounts expected to be paid when the liabilities are settled using the remuneration rate expected to apply at the time of settlement.
When assessing expected future payments consideration is given to expected future wage and salary levels including non-salary components such as employer superannuation contributions, as well as the experience of employee departures and periods of service. The expected future payments are discounted using market yields at the end of the reporting period on national government bonds with terms to maturity that match, as closely as possible, the estimated future cash outflows.
The provision for annual leave is classified as a current liability as the Department does not have an unconditional right to defer settlement of the liability for at least 12 months after the end of the reporting period.
82 DEPARTMENT OF TRANSPORT

Long Service Leave
Long service leave is not expected to be settled wholly within 12 months after the end of the reporting period and is therefore recognised and measured at the present value of amounts expected to be paid when the liabilities are settled using the remuneration rate expected to apply at the time of settlement.
When assessing expected future payments consideration is given to expected future wage and salary levels including non-salary components such as employer superannuation contributions, as well as the experience of employee departures and periods of service. The expected future payments are discounted using market yields at the end of the reporting period on national government bonds with terms to maturity that match, as closely as possible, the estimated future cash outflows.
Unconditional long service leave provisions are classified as current liabilities as the Department does not have an unconditional right to defer settlement of the liability for at least 12 months after the end of the reporting period. Pre-conditional and conditional long service leave provisions are classified as non-current liabilities because the Department has an unconditional right to defer the settlement of the liability until the employee has completed the requisite years of service.
Sick leave
Liabilities for sick leave are recognised when it is probable that sick leave paid in the future will be greater than the entitlement that will accrue in the future. Past history indicates that on average, sick leave taken each reporting period is less than the entitlement accrued. This is expected to continue in future periods. Accordingly, it is unlikely that existing accumulated entitlements will be used by employees and no liability for unused sick leave entitlements is recognised. As sick leave is non-vesting, an expense is recognised in the Statement of Comprehensive Income for this leave as it is taken.
Deferred leave
The provision for deferred leave relates to Public Service employees who have entered into an agreement to self-fund an additional 12 months leave in the fifth year of the agreement.
The provision recognises the value of salary set aside for employees to be used in the fifth year. The provision recognises the value of salary set aside for employees and is measured at the undiscounted amounts expected to be paid when the liabilities are settled. Deferred leave is reported as a current provision as employees can leave the scheme at their discretion at any time.
Purchased leave
The provision for purchased leave relates to Public Service employees who have entered into an agreement to self-fund up to an additional 10 weeks leave per calendar year. The provision recognises the value of salary set aside for employees and is measured at the undiscounted amounts expected to be paid when the liabilities are settled.
Superannuation
The Government Employees Superannuation Board (GESB) and other fund providers administer public sector superannuation arrangements in Western Australia in accordance with legislative requirements. Eligibility criteria for membership in particular schemes for public sector employees vary according to commencement and implementation dates.
Eligible employees contribute to the Pension Scheme, a defined benefit pension scheme closed to new members since 1987, or the Gold State Superannuation Scheme (GSS), a defined benefit lump sum scheme closed to new members since 1995.
Employees commencing employment prior to 16 April 2007 who were not members of either the Pension Scheme or the GSS became non-contributory members of the West State Superannuation Scheme (WSS). Employees commencing employment on or after 16 April 2007 became members of the GESB Super Scheme (GESBS). From 30 March 2012, existing members of the WSS or GESBS and new employees have been able to choose their preferred superannuation fund provider. The Department makes contributions to GESB or other fund providers on behalf of employees in compliance with the Commonwealth Government’s Superannuation Guarantee (Administration) Act 1992. Contributions to these accumulation schemes extinguish the Department’s
ANNUAL REPORT 2014-15 83

liability for superannuation charges in respect of employees who are not members of the Pension Scheme or GSS.
The GSS is a defined benefit scheme for the purposes of employees and whole-of-government reporting. However, it is a defined contribution plan for agency purposes because the concurrent contributions (defined contributions) made by the Department to GESB extinguishes the agency’s obligations to the related superannuation liability.
The Department has no liabilities under the Pension Scheme or the GSS. The liabilities for the unfunded Pension Scheme and the unfunded GSS transfer benefits attributable to members who transferred from the Pension Scheme, are assumed by the Treasurer. All other GSS obligations are funded by concurrent contributions made by the Department to the GESB.
The GESB makes all benefit payments in respect of the Pension Scheme and GSS, and is recouped from the Treasurer for the employer’s share.
See also note 2(s) Superannuation expenses
Provisions – other
Employment on-costs
Employment on-costs, including workers’ compensation insurance, are not employee benefits and are recognised separately as liabilities and expenses when the employment to which they relate has occurred. Employment on-costs are included as part of ‘Other expenses’ and are not included as part of the Department’s ‘Employee benefits expense’. The related liability is included in ‘Employment on-costs provision’.
See note 9 Other Expenses and note 29 Provisions.
(s) Superannuation expense
Superannuation expense is recognised in the profit or loss of the Statement of Comprehensive Income and comprises of employer contributions paid to the GSS (concurrent contributions), the WSS, the GESBS, or other superannuation funds. The employer contribution paid to the GESB in respect of the GSS is paid back into the Consolidated Account by the GESB.
(t) Assets and services received free of charge or for nominal cost
Assets or services received free of charge or for nominal cost that the Department would otherwise purchase if not donated, are recognised as income at the fair value of the assets or services where they can be reliably measured. A corresponding expense is recognised for services received. Receipts of assets are recognised in the Statement of Financial Position.
Assets or services received from other State Government agencies are separately disclosed under Income from State Government in the Statement of Comprehensive Income.
(u) Jointly controlled assets
Interests in jointly controlled assets have been reported in the financial statements. The Department’s interest in jointly controlled assets is disclosed in note 41 Jointly controlled assets.
(v) Comparative figures
Comparative figures are, where appropriate, reclassified to be comparable with the figures presented in the current financial year.
84 DEPARTMENT OF TRANSPORT

3. Disclosure of changes in accounting policy and estimates
Initial application of an Australian Accounting Standard
The Department has applied the following Australian Accounting Standards effective, or adopted, for annual reporting periods beginning on or after 1 July 2014 that impacted on the Department:
Int 21 LeviesThis Interpretation clarifies the circumstances under which a liability to pay a government levy imposed should be recognised. There is no financial impact for the Department at reporting date.
AASB 11 Joint ArrangementsThis Standard, issued in August 2011, supersedes AASB 131 Interests in Joint Ventures, introduces new principles for determining the type of joint arrangement that exists, which are more aligned to the actual rights and obligations of the parties to the arrangement. There is no financial impact for the Department as the new standard continues to require the recognition of the Department’s share of assets and share of liabilities for the unincorporated joint operation.
AASB 1031 MaterialityThis Standard supersedes AASB 1031 (February 2010), removing Australian guidance on materiality not available in IFRSs and refers to guidance on materiality in other Australian pronouncements. There is no financial impact.
AASB 1055 Budgetary ReportingThis Standard requires specific budgetary disclosures in the general purpose financial statements of not-for-profit entities within the General Government Sector. The Department will be required to disclose additional budgetary information and explanations of major variances.
AASB 2012-3 Amendments to Australian Accounting Standards – OffsettingFinancial Assets and Financial Liabilities [AASB 132]. This Standard adds application guidance to AASB 132 to address inconsistencies identified in applying some of the offsetting criteria, including clarifying the meaning of “currently has a legally enforceable right of set-off” and that some gross settlement systems may be considered equivalent to net settlement. There is no financial impact.
AASB 2013-3 Amendments to AASB 136 – Recoverable Amount Disclosures for Non-Financial AssetsThis Standard introduces editorial and disclosure changes. There is no financial impact.
AASB 2013-9 Amendments to Australian Accounting Standards – Conceptual Framework, Materiality and Financial InstrumentsPart B of this omnibus Standard makes amendments to other Standards arising from the deletion of references to AASB 1031 in other Standards for periods beginning on or after 1 January 2014. It has no financial impact.
AASB 2014-1 Amendments to Australian Accounting StandardsPart A of this Standard consists primarily of clarifications to Accounting Standards and has no financial impact for the Department.Part B of this Standard has no financial impact as the Department contributes to schemes that are either defined contribution plans, or deemed to be defined contribution plans.Part C of this Standard has no financial impact as it removes references to AASB 1031 Materiality from a number of Accounting Standards.
AASB 2015-7 Amendments to Australian Accounting Standards – Fair Value Disclosures of Not-for Profit Public Sector EntitiesThis Standard relieves not-for-profit public sector entities from the reporting burden associated with various disclosures required by AASB 13 for assets within the scope of AASB 116 that are held primarily for their current service potential rather than to generate future net cash inflows. It has no financial impact.
ANNUAL REPORT 2014-15 85

Future impact of Australian Accounting Standards not yet operative
The Department cannot early adopt an Australian Accounting Standard unless specifically permitted by Treasurer’s Instruction 1101 Application of Australian Accounting Standards and Other Pronouncements or by an exemption from TI 1101. By virtue of a limited exemption, the Department has early adopted AASB 2015-7 Amendments to Australian Accounting Standards – Fair Value Disclosures of Not-for-Profit Public Sector Entities. Where applicable, the Department plans to apply the following Australian Accounting Standards from their application date.
Operative for reporting periods beginning on/after
AASB 9 Financial InstrumentsThis Standard supersedes AASB 139 Financial Instruments: Recognition and Measurement introducing a number of changes to accounting treatments.The mandatory application date of this Standard is currently 1 January 2018 after being amended by AASB 2012-6, AASB 2013-9 and AASB 2014-1 Amendments to Australian Accounting Standards. The Department has not yet determined the application or the potential impact of the Standard.
1 Jan 2018
AASB 15 Revenue from Contracts with CustomersThis Standard establishes the principles that the Department shall apply to report useful information to users of financial statements about the nature, amount, timing and uncertainty of revenue and cash flows arising from a contract with a customer. The Department has not yet determined the application or the potential impact of the Standard.
1 Jan 2017
AASB 2010-7 Amendments to Australian Accounting Standards arising from AASB 9 (December 2010) [AASB 1, 3, 4, 5, 7, 101, 102, 108, 112, 118, 120, 121, 127, 128, 131, 132, 136, 137, 139, 1023 & 1038 and Int 2, 5, 10, 12, 19 & 127]This Standard makes consequential amendments to other Australian Accounting Standards and Interpretations as a result of issuing AASB 9 in December 2010.The mandatory application date of this Standard has been amended by AASB 2012-6 and AASB 2014-1 to 1 January 2018. The Department has not yet determined the application or the potential impact of the Standard.
1 Jan 2018
AASB 2013-9 Amendments to Australian Accounting Standards Conceptual Framework, Materiality and Financial Instruments.Part C of this omnibus Standard defers the application of AASB 9 to 1 January 2017. The application date of AASB 9 was subsequently deferred to 1 January 2018 by AASB 2014-1. The Department has not yet determined the application or the potential impact of AASB 9.
1 Jan 2015
86 DEPARTMENT OF TRANSPORT

Operative for reporting periods beginning on/after
AASB 2014-1 Amendments to Australian Accounting StandardsPart E of this Standard makes amendments to AASB 9 and consequential amendments to other Standards. It has not yet been assessed by the Department to determine the application or potential impact of the Standard.
1 Jan 2018
AASB 2014-4 Amendments to Australian Accounting Standards – Clarification of Acceptable Methods of Depreciation and Amortisation [AASB 116 & 138]The adoption of this Standard has no financial impact for the Department as depreciation and amortisation is not determined by reference to revenue generation, but by reference to consumption of future economic benefits.
1 Jan 2016
AASB 2014-5 Amendments to Australian Accounting Standards arising from AASB 15This Standard gives effect to the consequential amendments to Australian Accounting Standards (including Interpretations) arising from the issuance of AASB 15. The Department has not yet determined the application or the potential impact of the Standard.
1 Jan 2017
AASB 2014-7 Amendments to Australian Accounting Standards arising from AASB 9 (December 2014)This Standard gives effect to the consequential amendments to Australian Accounting Standards (including Interpretations) arising from the issuance of AASB 9 (December 2014). The Department has not yet determined the application or the potential impact of the Standard.
1 Jan 2018
AASB 2014-8 Amendments to Australian Accounting Standards arising from AASB 9 (December 2014) – Application of AASB 9 (December 2009) and AASB 9 (December 2010) [AASB 9 (2009 & 2010)]This Standard makes amendments to AASB 9 Financial Instruments (December 2009) and AASB 9 Financial Instruments (December 2010), arising from the issuance of AASB 9 Financial Instruments in December 2014. The Department has not yet determined the application or the potential impact of the Standard.
1 Jan 2015
AASB 2015-1 Amendments to Australian Accounting Standards – Annual Improvements to Australian Accounting Standards 2012–2014 Cycle [AASB 1, 2, 3, 5, 7, 11, 110, 119, 121, 133, 134, 137 & 140]These amendments arise from the issuance of International Financial Reporting Standard Annual Improvements to IFRSs 2012–2014 Cycle in September 2014, and editorial corrections. The Department has not yet determined the application or the potential impact of the Standard.
1 Jan 2016
ANNUAL REPORT 2014-15 87

Operative for reporting periods beginning on/after
AASB 2015-2 Amendments to Australian Accounting Standards – Disclosure Initiative: Amendments to AASB 101 [AASB 7, 101, 134 & 1049]This Standard amends AASB 101 to provide clarification regarding the disclosure requirements in AASB 101. Specifically, the Standard proposes narrow-focus amendments to address some of the concerns expressed about existing presentation and disclosure requirements and to ensure entities are able to use judgement when applying a Standard in determining what information to disclose in their financial statements. There is no financial impact.
1 Jan 2016
AASB 2015-3 Amendments to Australian Accounting Standards arising from the Withdrawal of AASB 1031 MaterialityThis Standard completes the withdrawal of references to AASB 1031 in all Australian Accounting Standards and Interpretations, allowing that Standard to effectively be withdrawn. There is no financial impact.
1 Jul 2015
AASB 2015-6 Amendments to Australian Accounting Standards – Extending Related Party Disclosures to Not-for-Profit Public Sector Entities [AASB 10, 124 & 1049]The amendments extend the scope of AASB 124 to include application by not-for-profit public sector entities. Implementation guidance is included to assist application of the Standard by not-for-profit public sector entities. The Department has not yet determined the application of the Standard, though there is no financial impact.
1 Jul 2016
88 DEPARTMENT OF TRANSPORT

2015 $ 000
2014 $ 000
4 Employee benefits expenseWages and salaries (i) 107 882 106 450
Superannuation – defined contribution plans (ii) 12 239 11 513
Long service leave (iii) 4 327 4 200
Annual leave (iii) 10 859 10 175
Other related expenses (iv) 3 107 3 459
138 414 135 797
(i) The wages and salaries expense includes an amount of $2,384,000 (2014: $2,542,000) relating to voluntary severance payments.
(ii) Defined contribution plans include West State, Gold State, GESB Super Scheme and other eligible funds.
(iii) Leave entitlements includes a superannuation contribution component.
(iv) Includes the value of fringe benefits to employees plus the fringe benefits tax component.
Employment on-costs such as workers’ compensation insurance are included at note 9 Other expenses.
5 Supplies and servicesCommunications 9 379 8 353
Consultants and contractors 32 537 47 270
Consumables 19 029 21 032
Commissions 20 884 18 774
Data processing 327 325
Driver licence card production 1 124 2 265
Number plate production 2 092 2 043
Repairs and maintenance 11 748 12 693
Travel 1 386 1 341
Other 1 648 1 272
100 154 115 368
6 Depreciation and amortisation expenseDepreciation
Buildings 1 034 938
Refurbishments, furniture and fittings 1 437 1 426
Plant and equipment 664 573
Computer hardware 1 412 1 554
Vehicles and vessels 391 359
Infrastructure 7 651 6 419
12 589 11 269
Amortisation
Intangible assets 3 953 4 695
Total amortisation 3 953 4 695
Total depreciation and amortisation expense 16 542 15 964
ANNUAL REPORT 2014-15 89
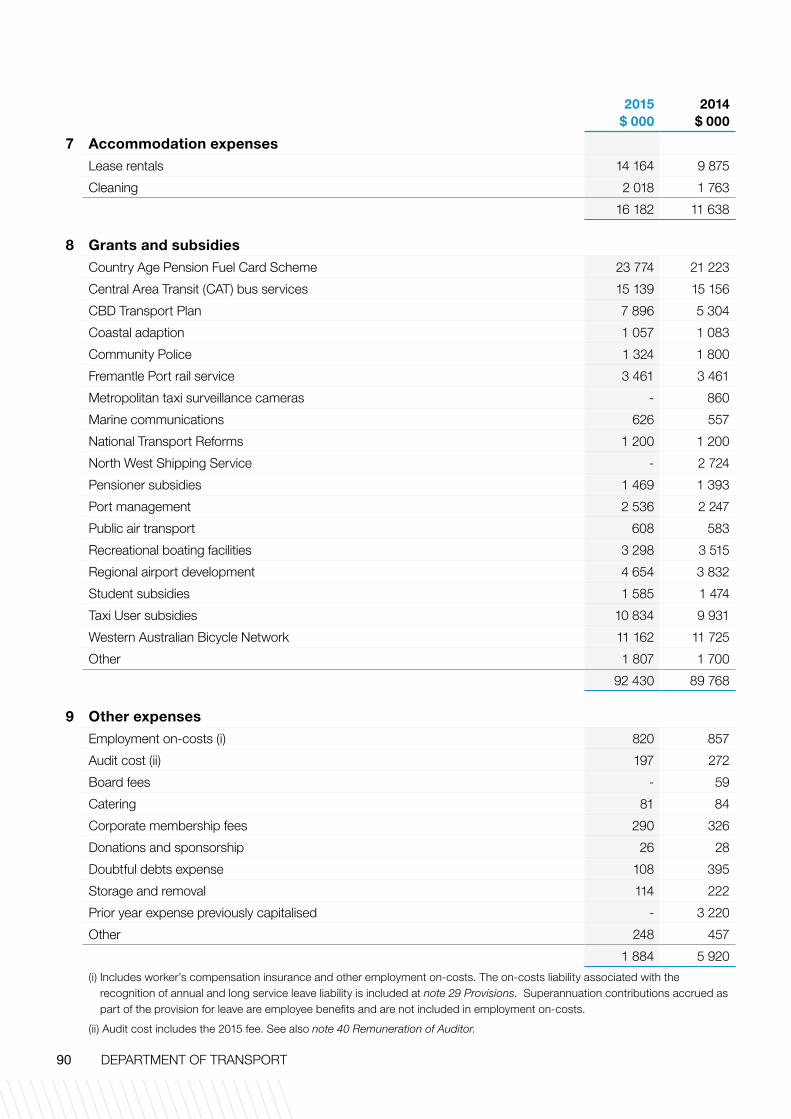
2015 $ 000
2014 $ 000
7 Accommodation expensesLease rentals 14 164 9 875
Cleaning 2 018 1 763
16 182 11 638
8 Grants and subsidiesCountry Age Pension Fuel Card Scheme 23 774 21 223
Central Area Transit (CAT) bus services 15 139 15 156
CBD Transport Plan 7 896 5 304
Coastal adaption 1 057 1 083
Community Police 1 324 1 800
Fremantle Port rail service 3 461 3 461
Metropolitan taxi surveillance cameras - 860
Marine communications 626 557
National Transport Reforms 1 200 1 200
North West Shipping Service - 2 724
Pensioner subsidies 1 469 1 393
Port management 2 536 2 247
Public air transport 608 583
Recreational boating facilities 3 298 3 515
Regional airport development 4 654 3 832
Student subsidies 1 585 1 474
Taxi User subsidies 10 834 9 931
Western Australian Bicycle Network 11 162 11 725
Other 1 807 1 700
92 430 89 768
9 Other expensesEmployment on-costs (i) 820 857
Audit cost (ii) 197 272
Board fees - 59
Catering 81 84
Corporate membership fees 290 326
Donations and sponsorship 26 28
Doubtful debts expense 108 395
Storage and removal 114 222
Prior year expense previously capitalised - 3 220
Other 248 457
1 884 5 920
(i) Includes worker’s compensation insurance and other employment on-costs. The on-costs liability associated with the recognition of annual and long service leave liability is included at note 29 Provisions. Superannuation contributions accrued as part of the provision for leave are employee benefits and are not included in employment on-costs.
(ii) Audit cost includes the 2015 fee. See also note 40 Remuneration of Auditor.
90 DEPARTMENT OF TRANSPORT

2015 $ 000
2014 $ 000
10 User charges and feesBoat registration fees 16 215 14 576
Port charges 1 520 1 420
Small boat harbour fees 11 223 12 185
Other maritime fees 2 008 1 783
Motor drivers’ licence application fees (i) 65 003 17 440
Motor vehicle recording, transfer, plate and inspection fees (i) 99 693 41 841
Perth parking licence fees 48 283 39 529
Rail safety registration fees 3 610 3 442
Taxi licence fees 9 857 10 540
Other fees 4 299 3 363
261 711 146 119
(i) As from 1 July 2014, Motor drivers’ licence fees and Recording fees have been retained by the Department. Prior to this, these fees were paid over to the Consolidated Account.
11 Grants and ContributionsCommonwealth grants 306 2 563
General government grants 4 276 2 723
Other 300 45
4 882 5 331
12 Other revenuesCommissions 22 712 20 455
Rents and leases 17 092 19 308
Recoups of operating expenses 1 494 2 428
Harbour utility charges 5 099 5 182
Service Level Agreements 4 683 5 295
Other 106 656
51 186 53 324
13 Net gain/(loss) on disposal of non-current assetsProceeds from disposal of non-current assets
Property, plant and equipment 110 1 990
Infrastructure - -
Carrying amount of non-current assets disposed
Property, plant and equipment (390) (2 037)
Infrastructure (71) (125)
Net gain/(loss) (351) (172)
ANNUAL REPORT 2014-15 91

2015 $ 000
2014 $ 000
14 Income from State Government
Appropriation received during the period:
Service appropriation (a) 47 078 152 114
Amount authorised by other statutes 1 173 1 133
48 251 153 247
Assets transferred (to)/from other State government agencies during the period:(b)
Infrastructure - 10
Office equipment (8) -
Total assets(transferred)/assumed (8) 10
Services received free of charge from other State government agencies during the period:
Department of Finance 1 026 1 112
Landgate 154 154
State Solicitor’s Office 606 518
Main Roads 154 9
Public Transport Authority 360 50
WA Treasury Corporation 30 111
Department of Planning 18 -
2 348 1 954
Royalties for Regions Fund
Recreational Boating Facilities Scheme (c) 3 146 3 915
Regional Airport Development Scheme (c) 4 669 3 090
Country Age Pension Fuel Card Scheme (c) 25 804 23 635
Port Link Inland Freight Corridor Planning (c) 1 600 600
Other 393 571
35 612 31 811
86 203 187 022
(a) Service appropriation funds the net cost of services delivered. Appropriation revenue comprises a cash component and a receivable (asset). The receivable (holding account) comprises the budgeted depreciation expense for the year and any agreed increase in leave liabilities during the year.
The reduction in appropriation received is primarily a result of the Treasurer’s authorisation for DoT to retain Recording Fees and Motor Driver License Fees from 1 July 2014 (previously these fees had been paid into the Consolidated Account). Appropriation has therefore been reduced in the current year to accommodate the additional revenue.
(b) Service appropriation funds the net cost of services delivered. Appropriation revenue comprises a cash component and a receivable (asset). The receivable (holding account) comprises the budgeted depreciation expense for the year and any agreed increase in leave liabilities during the year.
(c) This is a sub-fund within the over-arching ‘Royalties for Regions Fund’. The recurrent funds are committed to projects and programs in WA regional areas.
92 DEPARTMENT OF TRANSPORT

2015 $ 000
2014 $ 000
15 Cash and cash equivalentsCash and cash equivalents 36 178 32 091
Includes cash received as capital contributions remaining unspent at year end of $6,115,646 (2014: $2,299,617).
16 Restricted cash and cash equivalentsCurrent
Perth Parking Licensing Account (i) 12 586 55 139
Rail Safety Accreditation Account (ii) 2 698 1 617
Taxi Industry Development Account (iii) 31 785 27 984
Royalties for Regions (iv) 3 339 4 400
Small Craft Facilities – User Pays (v) - 103
Accrued salaries suspense account (vi) 3 968 -
54 376 89 243
Non-current
Accrued salaries suspense account (vi) - 3 466
(i) To meet the costs of administering the Perth Parking Management Act 1999 or for a purpose connected with the Perth Parking Policy.
(ii) To meet the costs of administering the Rail Safety Act 1998.
(iii) To pay remuneration and allowances to board members, pay for taxi plates surrendered to the Minister, pay grants for research, promotion and development projects that benefit the taxi industry and meet the costs of administering the Taxi Act 1994.
(iv) To fund projects and programs in WA regional areas.
(v) To fund the provision, maintenance, upgrading and management of small craft facilities.
(vi) Used for the purpose of meeting the 27th pay which occurs every 11 years, and which is due to be paid within 12 months.
17 Inventories
Current
Inventories held for resale
– Charts and publications (at cost) 40 41
– Motor vehicle plates (at cost) 404 301
444 342
See also note 2(o) Inventories
ANNUAL REPORT 2014-15 93

2015 $ 000
2014 $ 000
18 ReceivablesCurrent
Receivables 10 195 9 471
Allowance for impairment of receivables (2 307) (2 654)
7 888 6 817
Goods and services tax receivable 3 262 4 619
Interest receivable 469 427
Staff debtors 261 234
Other debtors 221 195
12 101 12 292
Reconciliation of changes in the allowance for impairment of receivables
Balance at start of the period 2 654 2 864
Doubtful debts expense 108 395
Amounts written off during the year (21) (105)
Amount recovered during the year (434) (500)
Balance at end of the period 2 307 2 654
The Department does not hold any collateral or other credit enhancements as security for receivables.
19 Amounts receivable for servicesNon-current 185 554 173 740
Represents the non-cash component of service appropriation. It is restricted in that it can only be used for asset replacement or payment of leave liability.
20 Other current assetsPrepayments 2 468 1 079
94 DEPARTMENT OF TRANSPORT

2015 $ 000
2014 $ 000
21 Non-current assets classified as held for saleOpening balance
Property, plant and equipment 1 800 -
Less write-down from cost to fair value less selling costs - -
1 800 -
Assets reclassified as held for sale
Property, plant and equipment - 1 800
Less write-down from cost to fair value less selling costs - -
- 1 800
Total assets classified as held for sale
Property, plant and equipment 1 800 1 800
Less write-down from cost to fair value less selling costs - -
1 800 1 800
Less assets sold
Property, plant and equipment 1 800 -
Less write-down from cost to fair value less selling costs - -
1 800 -
Closing balance
Property, plant and equipment - 1 800
Write-down from cost to fair value less selling costs - -
- 1 800
ANNUAL REPORT 2014-15 95

22 Property, plant and equipment
2015 Cost/Fair value
$ 000
Accumulated depreciation
$ 000
Carrying Amount
$ 000
At fair value:
Land 137 904 - 137 904
Buildings 19 169 - 19 169
157 073 - 157 073
At cost:
Refurbishments, furniture and fittings 15 638 9 054 6 584
Plant and equipment 9 980 6 296 3 684
Computer hardware 11 511 8 115 3 396
Vehicles 919 611 308
Vessels 3 725 1 741 1 984
41 773 25 817 15 956
Total 198 846 25 817 173 029
2014
Cost/ Fair value $ 000
Accumulated depreciation
$ 000
Carrying Amount
$ 000
At fair value:
Land 139 084 - 139 084
Buildings 18 145 - 18 145
157 229 - 157 229
At cost:
Refurbishments, furniture and fittings 12 699 7 899 4 800
Plant and equipment 9 132 5 775 3 357
Computer hardware 12 852 8 494 4 358
Vehicles 1 247 831 416
Vessels 3 110 1 513 1 597
39 040 24 512 14 528
Total 196 269 24 512 171 757
Land assets were last revalued as at 1 July 2014 by the Western Australian Land Information Authority (Valuation Services). The valuations were performed during the year ended 30 June 2015 and recognised at 30 June 2015. In undertaking the revaluation, fair value was determined by reference to market value: $16,763,050 (2014: $19,165,200). For the remaining balance, fair value of land was determined on the basis of comparison with market evidence for land with low level utility (high restricted use land). See note 2(f) Property, plant and equipment and infrastructure.
Building assets were last revalued as at 1 July 2014 by the Western Australian Land Information Authority (Valuation Services). The valuations were performed during the year ended 30 June 2015 and recognised at 30 June 2015. In undertaking the revaluation, fair value was determined by reference to market value: $3,756,000 (2014: $3,876,000). For the remaining balance, fair value of buildings was determined on the basis of depreciated replacement cost. See note 2(f) Property, plant and equipment and infrastructure.
Information on fair value measurements is provided in note 24.
96 DEPARTMENT OF TRANSPORT

22P
rop
erty
, pla
nt
and
eq
uip
men
t (c
on
tin
ued
)R
econ
cilia
tions
of t
he c
arry
ing
amou
nts
of p
rope
rty,
pla
nt a
nd e
quip
men
t at t
he b
egin
ning
and
end
of t
he fi
nanc
ial y
ear a
re s
et o
ut in
the
tabl
e be
low
.
2015
Car
ryin
g
amo
un
t at
st
art
of
year
$
000
Ad
dit
ion
s $
000
Rev
alu
atio
n $
000
Dis
po
sals
$
000
Cla
ssifi
ed
as h
eld
fo
r sa
le
$ 00
0 Tr
ansf
ers
$ 00
0 D
epre
ciat
ion
$ 00
0
Wri
te-o
ff
of
asse
ts
$ 00
0
Car
ryin
g
amo
un
t at
en
d o
f ye
ar
$ 00
0
Land
139
084
-
(6
17)
-
-
(563
) -
-
1
37 9
04
Bui
ldin
gs 1
8 14
5 6
94
677
(4
9) -
7
36
(1 0
34)
-
19
169
Ref
urbi
shm
ents
, fu
rnitu
re a
nd fi
tting
s 4
800
3
227
-
(1
11)
-
105
(1
437
) -
6
584
Pla
nt a
nd e
quip
men
t 3
357
1
103
-
(1
04)
-
(8)
(664
) -
3
684
Com
pute
r har
dwar
e 4
358
5
21
-
(71)
-
-
(1 4
12)
-
3 3
96
Vehi
cles
416
6
7 -
(5
0)
-
(22)
(103
) -
3
08
Vess
els
1 5
97
675
-
-
-
-
(2
88)
-
1 9
84
171
757
6
287
6
0 (3
85)
-
248
(4
938
) -
1
73 0
29
2014
Car
ryin
g
amo
un
t at
st
art
of
year
$
000
Ad
dit
ion
s $
000
Rev
alu
atio
n $
000
Dis
po
sals
$
000
Cla
ssifi
ed
as h
eld
fo
r sa
le
$ 00
0 Tr
ansf
ers
$ 00
0 D
epre
ciat
ion
$ 00
0
Wri
te-o
ff
of
asse
ts
$ 00
0
Car
ryin
g
amo
un
t at
en
d o
f ye
ar
$ 00
0
Land
136
964
-
3
870
-
(1
750
) -
-
-
1
39 0
84
Bui
ldin
gs 1
7 69
0 8
15
628
-
(5
0)
-
(938
) -
1
8 14
5
Ref
urbi
shm
ents
, fu
rnitu
re a
nd fi
tting
s 6
581
1
627
-
(1
982
) -
-
(1
426
) -
4
800
Pla
nt a
nd e
quip
men
t 3
032
9
04
-
(3)
-
-
(573
) (3
) 3
357
Com
pute
r har
dwar
e 3
715
2
236
-
(3
9) -
-
(1
554
) -
4
358
Vehi
cles
406
1
28
-
(12)
-
-
(106
) -
4
16
Vess
els
1 6
23
227
-
-
-
-
(2
53)
-
1 5
97
170
011
5
937
4
498
(2
036
) (1
800
) -
(4
850
) (3
) 1
71 7
57
ANNUAL REPORT 2014-15 97

2015 $ 000
2014 $ 000
23 InfrastructureInfrastructure
At cost 378 035 317 406
Accumulated depreciation (134 170) (127 018)
243 865 190 388
Reconciliations of the carrying amounts of infrastructure at the beginning and end of the financial year are set out below.
Infrastructure
Carrying amount at the start of the year 190 388 173 087
Additions 48 725 23 835
Disposals (71) (125)
Transfers 12 474 10
Depreciation (7 651) (6 419)
Carrying amount at the end of the year 243 865 190 388
24 Fair value measurements
Recurring fair value measurements
Level 1 $ 000
Level 2 $ 000
Level 3 $ 000
Fair value at
end of year
$ 000
2015
Non-current assets classified as held for sale (Note 21) - - - -
Land (Note 22) - 16 763 121 141 137 904
Buildings (Note 22) - 3 756 15 413 19 169
- 20 519 136 554 157 073
Transfers into and transfers out of the fair value hierarchy level are recognised on the date of the event or change in circumstances that caused the transfer. There was a transfer of $2,735,000 from Level 2 to Level 3 during the year.
The new valuation type of the properties now reflect the restricted nature of the land which includes parking, part access road and seabed.
Land and buildings classified as held for sale during the period are recognised at the lower of carrying amount and fair value less costs to sell. The fair value of these assets has been determined by reference to market evidence of sale prices of comparable assets.
98 DEPARTMENT OF TRANSPORT

24 Fair value measurements (continued)
Recurring fair value measurements Level 1
$ 000 Level 2
$ 000 Level 3
$ 000
Fair value at
end of year
$ 000
2014
Non-current assets classified as held for sale (Note 21) - 1 800 - 1 800
Land (Note 22) - 19 165 119 919 139 084
Buildings (Note 22) - 3 876 14 269 18 145
- 24 841 134 188 159 029
There was a transfer of $660,000 from Level 2 to Level 3 during the previous year.
The property became a boat harbour and the new valuation type reflects the restricted nature of the land.
There was a transfer of $1,800,000 from Level 2 during the previous year.
This transfer related to the Midland Vehicle Examination Centre property which was assessed as surplus to requirements and was being prepared for sale. The property was classified as non-current assets held for sale.
Valuation techniques to derive Level 2 and Level 3 fair values
Level 2 fair values of land and buildings are derived using the market approach.
Land with public use restrictions have been categorised as Level 3 due to adjustments by Level 3 inputs to the market approach; including restoration costs (low restricted use land) and adjustments to recognise low level utility (high restricted use land). Level 3 fair values of buildings are derived using the cost approach.
There were no changes in the valuation techniques during the year.
The following methods are used to determine fair value measurements:
Land and buildings Level 2 valuation inputs were used to determine the fair value of market type land and building assets.
Fair values have been derived from sale prices of comparable land and buildings after adjusting for differences in key attributes such as property size, assuming open and liquid market transactions and that the land is in a vacant and marketable condition. Adjustments are made for comparable utility. The most significant inputs into this valuation approach is price per square metre.
Level 3 valuation inputs were used to determine the fair value of non-market or current use type land and building assets. Assets were valued at the Level 3 valuation hierarchy where there was no observable market evidence of sale prices for comparable sites or where significant Level 3 inputs were used on a recurring basis.
Fair values for existing use specialised buildings are valued at replacement cost and is determined by reference to the cost of replacing the remaining future economic benefits embodied in the asset, i.e. the depreciated replacement cost. Depreciated replacement cost is the current replacement cost of an asset less accumulated depreciation calculated on the basis of such cost to reflect the already consumed or expired economic benefit, obsolescence, and optimisation (where applicable) of the asset. While unit rates based on square metres can be supported from market evidence, other inputs (such as estimates of residual value, useful life, pattern of consumption and asset condition) required extensive professional judgement and impacted significantly on the determination of fair value, and have therefore been classified as having been valued using Level 3 valuation inputs.
Fair values for restricted use land is based on a market approach, by either using market evidence of sales of comparable land that is unrestricted less restoration costs to return the site to a vacant and marketable condition (low restricted use land) or comparison with market evidence for land with low level utility (high restricted use land).
ANNUAL REPORT 2014-15 99

24 Fair value measurements (continued)
Fair value measurements using significant unobservable inputs (Level 3)
The following table presents the changes in the fair value of assets measured using significant unobservable inputs (Level 3) for recurring fair value measurements.
2015Land $ 000
Buildings $ 000
Fair value at start of year 119 919 14 269
Additions - 1 429
Revaluation increments/(decrements) recognised in Profit or Loss - -
Revaluation increments/(decrements) recognised in Other Comprehensive Income (950) 596
Transfers from/(to) Level 2 2 735 -
Disposals (563) (48)
Depreciation expense - (833)
Fair value at end of year 121 141 15 413
Total gains or losses for the year included in profit or loss, under ‘Other Gains’ - -
2014Land $ 000
Buildings $ 000
Fair value at start of year 113 656 13 960
Additions - 521
Revaluation increments/(decrements) recognised in Profit or Loss - -
Revaluation increments/(decrements) recognised in Other Comprehensive Income 5 603 532
Transfers from/(to) Level 2 660 -
Disposals - -
Depreciation expense - (744)
Fair value at end of year 119 919 14 269
Total gains or losses for the year included in profit or loss, under ‘Other Gains’ - -
100 DEPARTMENT OF TRANSPORT

24 Fair value measurements (continued)
Information about significant unobservable inputs (Level 3) in fair value measurements
The following table summarises the quantitative information about the significant unobservable inputs used in Level 3 fair value measurement. There were no significant interrelationships between the unobservable inputs.
Description
Fair value 2015
$ 000
Fair value 2014
$ 000Valuation technique(s) Unobservable inputs
Land 121 141 119 919 Market approach Selection of land with similar approximate utility
Buildings 15 413 14 269 Depreciated Replacement Cost
Consumed economic benefit/obsolescence of asset
Historical cost per square metre floor area (m2)
Valuation processes
An annual assessment of land and building fair values is undertaken by the Western Australian Land Information Authority (Valuation Services) and are determined by professionally qualified valuers.
Every four years a principle valuation calculation is performed by physical inspection or verification of the asset.
In other years, fair values are determined by indexing the previous year’s valuation amount by a factor which represents the analysis of the movement in valuation inputs from year to year. Changes in Level 2 and Level 3 fair values of land and buildings are analysed by the Department at the end of each reporting period.
In the absence of market based evidence, due to the specialised nature of some land and buildings, these assets are valued at Level 3 of the fair value hierarchy on an existing use basis. The existing use basis recognises that restrictions or limitations have been placed on their use and disposal when they are not determined to be surplus to requirements. These restrictions are imposed by virtue of the assets being held to deliver a specific community service as authorised by legislation. Many of the Department’s land and building assets have a restricted use for harbour purposes under the Marine and Harbours Act.
The main Level 3 inputs used are derived and evaluated as follows:
Selection of land with restricted utility
Due to the restricted nature and unique characteristics of some land, there is no observable market evidence of sale prices. Fair values for restricted use land is determined by comparison with market evidence for land with low level utility and adjustments made to the price per square metre.
Relevant comparators of land with low level utility are selected by the Western Australian Land Information Authority (Valuation Services).
Consumed economic benefit/obsolescence of assets
Represents the difference between the replacement cost of buildings and its current condition.
This is estimated by the Western Australian Land Information Authority (Valuation Services).
Historical cost per square metre floor area (m2)
The cost of constructing specialised buildings are obtained from actual construction costs per square metre of other similar or reference buildings, historical building costs, quantity surveyors and standard rates from construction guides.
ANNUAL REPORT 2014-15 101

2015 $ 000
2014 $ 000
25 Intangible AssetsSoftware
At cost 59 691 57 176
Accumulated amortisation (37 397) (33 561)
22 294 23 615
Reconciliations of the carrying amounts of intangible assets at the beginning and end of the financial year are set out below.
Software
Carrying amount at the start of the year 23 615 20 039
Additions 2 632 8 271
Amortisation expense (3 953) (4 695)
Carrying amount at the end of the year 22 294 23 615
26 Construction in progressAt cost:
Vehicles and vessels 233 232
Computer hardware 6 857 3 809
Buildings and refurbishments 1 194 1 589
Intangibles 12 190 8 673
Infrastructure 13 055 41 385
33 529 55 688
Reconciliations of the carrying amounts of construction in progress at the beginning and end of the financial year are set out below.
Carrying amount at the start of the year 55 688 39 119
Expenditure during the year 34 895 57 031
Transfers (1 097) -
Non-current assets commissioned during the year (55 957) (36 833)
Amounts expensed - (3 629)
Carrying amount at the end of the year 33 529 55 688
27 Impairment of assetsThere were no indications of impairment to property, plant and equipment, infrastructure or intangible assets at 30 June 2015.
The Department held no goodwill or intangible assets with an indefinite useful life during the reporting period.
28 PayablesCurrent
Trade payables 8 757 24 069
Accrued expenses 1 328 629
Accrued salaries 2 965 2 647
13 051 27 345
See also note 2(q) Payables and note 38 Financial instruments.
102 DEPARTMENT OF TRANSPORT

2015 $ 000
2014 $ 000
29 ProvisionsCurrent
Employee benefits provision
Annual leave (i) 11 217 10 893
Long service leave (ii) 15 287 15 561
26 504 26 454
Other provisions
Employment on-costs (iii) 1 009 1 017
Purchased leave (23) (39)
27 490 27 432
Non-current
Employee benefits provision
Long service leave (ii) 6 040 5 767
Deferred salary scheme 39 42
Other provisions
Employment on-costs (iii) 83 78
6 162 5 887
(i) Annual leave liabilities have been classified as current as there is no unconditional right to defer settlement for at least 12 months after the reporting period. Assessments indicate that actual settlement of the liabilities is expected to occur as follows:
Within 12 months of the end of the reporting period 7 204 7 129
More than 12 months after the end of the reporting period 4 013 3 764
11 217 10 893
(ii) Long service leave liabilities have been classified as current where there is no unconditional right to defer settlement for at least 12 months after the reporting period. Assessments indicate that actual settlement of the liabilities is expected to occur as follows:
Within 12 months of the end of the reporting period 5 270 6 248
More than 12 months after the end of the reporting period 16 057 15 080
21 327 21 328
(iii) The settlement of annual and long service leave liabilities gives rise to the payment of employment on-costs including workers’ compensation insurance. The provision is the present value of expected future payments. The associated expense is disclosed in note 9 Other expenses.
Movements in other provisions:
Movements in each class of provisions during the financial year, other than employee benefits, are set out below.
Employment on-costs provision
Carrying amount at the start of the year 1 095 1 254
Additional provisions recognised 1 507 1 442
Payments/other sacrifices of economic benefits (1 510) (1 601)
Carrying amount at end of year 1 092 1 095
ANNUAL REPORT 2014-15 103

2015 $ 000
2014 $ 000
30 Other current liabilitiesIncome received in advance 2 573 3 395
Other liabilities 4 694 -
Accruals and interest payable 175 170
7 442 3 565
31 Equity
Equity represents the residual interest in the net assets of the Department. The Government holds the equity interest in the Department on behalf of the community. The asset revaluation surplus represents that portion of equity resulting from the revaluation of non-current assets.
CONTRIBUTED EQUITY
Balance at the start of the period 540 634 527 466
Contributions by owners
Capital contributions 24 819 38 164
Transfer of net assets
- Regional Development Headworks Fund 7 050 9 398
Distributions to owners
- Public Transport Authority (63 645) (34 159)
- Department of Finance (1 097)
- Department of Local Government and Communities - (235)
- Department of Lands (2 363) -
Balance at the end of the period 505 398 540 634
RESERVES
Asset Revaluation Surplus
Balance at the start of the period 7 412 2 914
Net revaluation increments/(decrements):
Land (617) 3 870
Buildings 677 628
Balance at the end of the period 7 472 7 412
ACCUMULATED SURPLUS
Balance at the start of the period 143 226 124 048
Result for the period 53 597 19 178
Balance at the end of the period 196 823 143 226
Total equity at the end of the period 709 693 691 272
104 DEPARTMENT OF TRANSPORT

2015 $ 000
2014 $ 000
32 Notes to the Statement of Cash Flows(a) Reconciliation of cash
Cash at the end of the financial year as shown in the Statement of Cash Flows is reconciled to the related items in the Statement of Financial Position as follows:
Cash and cash equivalents (i) 36 178 32 091
Restricted cash and cash equivalents (ii) 54 376 92 709
90 554 124 800
Cash transferred (to)/from other sources
- Department of Local Government and Communities - (235)
- Public Transport Authority (63 645) (34 159)
(i) These cash and cash equivalents include $ 6,271,000 capital contribution and funds available to meet expenditure commitments.
(ii) See note 16 Restricted cash and cash equivalents.
(b) Reconciliation of net cost of services to net cash flows provided by/(used in) operating activities
Net cost of services (32 607) (167 844)
Non cash items:
Depreciation and amortisation expense 16 542 15 964
Doubtful debts expense 108 395
Net (gain)/loss on disposal of non-current assets 351 172
Services received free of charge 2 348 1 954
Assets assumed/(transferred) (13 294) -
Expenses previously held in construction in progress - 3 629
(Increase)/decrease in assets
Current inventories (102) (1)
Current receivables (i) (1 165) (1 068)
Other current assets (1 389) 1 044
Increase/(decrease) in liabilities
Current payables (8 566) 1 822
Current provisions 58 701
Other current liabilities 3 877 (1 022)
Non-current provisions 275 (566)
Net GST receipts/payments (ii) 158 (2 653)
Change in GST in receivables/payables (iii) 902 (1 410)
Net cash used in operating activities (32 504) (148 883)
(i) Note that the Australian Taxation Office (ATO) receivable/payable in respect of GST and the receivable/payable in respect of the sale/purchase of non-current assets are not included in these items as they do not form part of the reconciling items.
(ii) This is the net GST paid/received, i.e. cash transactions.
(iii) This reverses out the GST in receivables and payables.
ANNUAL REPORT 2014-15 105

2015 $ 000
2014 $ 000
33 Services provided free of chargeDuring the period the following services were provided to other agencies free of charge for functions outside the normal operations of the Department:
Western Australian Police Service:
Firearm collection fees 82 72
Information requests and other services 104 113
Department of Planning – technical advice - 75
Environmental Protection Authority – technical advice - 15
Various State and Local Government agencies – technical advice - 34
186 309
34 Commitments(a) Capital expenditure commitments
Capital expenditure commitments (inclusive of GST), being contracted capital expenditure additional to the amounts reported in the financial statements, are payable as follows:
Within one year 1 600 10 341
Later than one year but not later than five years - -
Later than five years - -
1 600 10 341
Augusta Boat Harbour - 5 576
Taxi Action Plan security initiatives 1 400 3 625
Jetty replacements - 1 031
Office fitouts - 109
Sharepoint E-forms 100 -
Time and Attendance System 100 -
1 600 10 341
106 DEPARTMENT OF TRANSPORT

2015 $ 000
2014 $ 000
34 Commitments (continued)(b) Other expenditure commitments
Other expenditure commitments (inclusive of GST) contracted for at the end of the reporting period but not recognised as liabilities, are payable as follows:
Within one year 7 547 6 260
Later than one year but not later than five years 4 359 6 431
Later than five years - -
11 906 12 691
The other expenditure commitments include amounts for:
Fremantle Port Rail service support 5 417 8 400
Human Resource Management initiatives 924 -
Maritime – Ports project 100
Perth Parking licensing system 175
Rail Industry Safety Standards Board Funding 97 194
Travelsmart household program 1 200
WA’s contribution to the Office of the National Rail Safety Regulator 650 600
Maintenance of Coral Bay airstrip 120
Mobile taxi security patrol 570 934
Passenger Services Business Unit 1 576 641
Secure taxi ranks 736 312
Other minor commitments 986 15
Your Move Wanneroo Project 950 -
11 906 12 691
(c) Non-cancellable operating lease commitments
Commitments in relation to leases contracted for at the end of the reporting period but not recognised in the financial statements are payable as follows:
Within one year 11 008 11 430
Later than one year but not later than five years 32 402 50 362
Later than five years 45 218 33 450
88 628 95 242
(d) Minimum lease revenue commitments
Future minimum rentals under non-cancellable operating leases are receivable as follows:
Within one year 13 491 12 147
Later than one year but not later than five years 48 558 44 801
Later than five years 134 467 134 849
196 515 191 797
ANNUAL REPORT 2014-15 107

35 Contingent liabilities and contingent assetsContingent liabilities:
The Department’s policy is to disclose, as a contingency, any obligations which may arise due to special circumstances or events. At the date of this report, the Department is aware of the following potential future obligation:
– The Department of Transport (Department), is the department responsible for assisting the Minister of Transport in the administration of Transport related Acts. The Minister on behalf of the State is party to a legal proceeding. As the Department is not a legal entity per se, any potential cost implications of the legal proceedings is not likely to have a material effect on the Department’s financial statements.
Contingent assets:
The Department has no contingent assets for the year ended 30 June 2015.
36 Events occurring after the end of the reporting periodThere are no significant events occurring after the reporting date
108 DEPARTMENT OF TRANSPORT

37
Exp
lan
ato
ry S
tate
men
t
Sta
tem
ent
of
Co
mp
reh
ensi
ve In
com
e
For
the
year
end
ed 3
0 Ju
ne 2
015
Va
ria
nc
e
No
te
Bu
dg
et
2015
$
00
0
Ac
tual
20
15
$ 0
00
Ac
tual
20
14
$ 0
00
Va
ria
nc
e b
etw
een
es
tim
ate
an
d
actu
al
$ 0
00
Va
ria
nc
e b
etw
een
ac
tual
res
ult
s fo
r 20
15 a
nd
201
4 $
00
0
CO
ST
OF
SE
RV
ICE
S
Exp
ense
s
Empl
oyee
ben
efits
exp
ense
132
851
1
38 4
14
135
797
5
563
2
617
Sup
plie
s an
d se
rvic
esA
109
586
1
00 1
54
115
368
(9
432
) (1
5 21
4)
Dep
reci
atio
n an
d am
ortis
atio
n ex
pens
e 1
1
4 21
4 1
6 54
2 1
5 96
4 2
328
5
78
Acc
omm
odat
ion
expe
nses
2, B
11
650
16
182
11
638
4 5
32
4 5
44
Gra
nts
and
subs
idie
s 3
1
06 0
70
92
430
89
768
(13
640
) 2
662
Loss
on
disp
osal
of n
on-c
urre
nt a
sset
s -
3
51
172
3
51
179
Oth
er e
xpen
ses
4, C
3 6
98
1 8
84
5 9
20
(1 8
14)
(4 0
36)
Tota
l co
st o
f se
rvic
es 3
78 0
69
365
957
3
74 6
27
(12
112)
(8 6
70)
Inco
me
Rev
enu
e
Use
r cha
rges
and
fees
D 2
53 6
47
261
711
1
46 1
19
8 0
64
115
592
Sal
esE
158
3
82
541
2
24
(159
)
Gra
nts
and
cont
ribut
ions
3 1
69
4 8
82
5 3
31
1 7
13
(449
)
Inte
rest
reve
nue
5, F
1 4
23
1 8
95
1 4
68
472
4
27
Oth
er re
venu
es 5
2 68
6 5
1 18
6 5
3 32
4 (1
500
) (2
138
)
Oth
er in
com
e6,
G -
1
3 29
4 -
1
3 29
4 1
3 29
4
Tota
l rev
enu
e 3
11 0
83
333
350
2
06 7
83
22
267
126
567
Tota
l in
com
e o
ther
th
an
inco
me
fro
m S
tate
Go
vern
men
t 3
11 0
83
333
350
2
06 7
83
22
267
126
567
NE
T C
OS
T O
F S
ER
VIC
ES
66
986
32
607
167
844
(3
4 37
9) (1
35 2
37)
ANNUAL REPORT 2014-15 109

37
Exp
lan
ato
ry S
tate
men
t (c
on
tin
ued
)
Sta
tem
ent
of
Co
mp
reh
ensi
ve In
com
e (c
on
tin
ued
)
For
the
year
end
ed 3
0 Ju
ne 2
015
Va
ria
nc
e
No
te
Bu
dg
et
2015
$
00
0
Ac
tual
20
15
$ 0
00
Ac
tual
20
14
$ 0
00
Va
ria
nc
e b
etw
een
es
tim
ate
an
d
actu
al
$ 0
00
Va
ria
nc
e b
etw
een
ac
tual
res
ult
s fo
r 20
15 a
nd
201
4 $
00
0
INC
OM
E F
RO
M S
TAT
E G
OV
ER
NM
EN
T
Ser
vice
app
ropr
iatio
nH
52
537
48
251
153
247
(4
286
) (1
04 9
96)
Ass
ets
(tran
sfer
red
)/rec
eive
d -
(8
) 1
0 (8
) (1
8)
Ser
vice
s re
ceiv
ed fr
ee o
f cha
rge
7, I
1 9
89
2 3
48
1 9
54
359
3
94
Roy
altie
s fo
r Reg
ions
Fun
d8,
J 4
4 12
5 3
5 61
2 3
1 81
1 (8
513
) 3
801
Tota
l in
com
e fr
om
Sta
te G
ove
rnm
ent
98 6
51
86
203
187
022
(1
2 44
8) (1
00 8
19)
SU
RP
LUS
FO
R T
HE
PE
RIO
D 3
1 66
5 5
3 59
6 1
9 17
8 2
1 93
1 3
4 41
8
OT
HE
R C
OM
PR
EH
EN
SIV
E IN
CO
ME
Item
s n
ot
recl
assi
fied
su
bse
qu
entl
y to
pro
fit
or
loss
Cha
nges
in a
sset
reva
luat
ion
surp
lus
-
60
4 4
98
60
(4 4
38)
Tota
l oth
er c
om
pre
hen
sive
inco
me
-
60
4 4
98
60
(4 4
38)
TO
TAL
CO
MP
RE
HE
NS
IVE
INC
OM
E F
OR
TH
E P
ER
IOD
31
665
53
656
23
676
21
991
29
980
See
als
o th
e S
ched
ule
of In
com
e an
d E
xpen
ses
by S
ervi
ce.
The
Sta
tem
ent o
f Com
preh
ensi
ve In
com
e sh
ould
be
read
in c
onju
nctio
n w
ith th
e ac
com
pany
ing
note
s.
110 DEPARTMENT OF TRANSPORT

37
Exp
lan
ato
ry S
tate
men
t (c
on
tin
ued
)
Sta
tem
ent
of
Fin
anci
al P
osi
tio
n
As
at 3
0 Ju
ne 2
015
Va
ria
nc
e
No
te
Bu
dg
et
2015
$
00
0
Ac
tual
20
15
$ 0
00
Ac
tual
20
14
$ 0
00
Va
ria
nc
e b
etw
een
es
tim
ate
an
d
actu
al
$ 0
00
Va
ria
nc
e b
etw
een
ac
tual
res
ult
s fo
r 20
15 a
nd
201
4 $
00
0
AS
SE
TS
Cu
rren
t A
sset
s
Cas
h an
d ca
sh e
quiv
alen
ts9,
K 3
0 65
7 3
6 17
8 3
2 09
1 5
521
4
087
Res
tric
ted
cash
and
cas
h eq
uiva
lent
s10
, L 4
7 26
1 5
4 37
6 8
9 24
3 7
115
(3
4 86
7)
Inve
ntor
ies
341
4
44
342
1
03
102
Rec
eiva
bles
11 1
0 41
8 1
2 10
1 1
2 29
2 1
683
(1
91)
Non
-cur
rent
ass
ets
held
for s
ale
M -
-
1
800
-
(1
800
)
Oth
er c
urre
nt a
sset
s2
123
2 4
68
1 0
79
345
1
389
Tota
l Cu
rren
t A
sset
s
90 8
00
105
567
1
36 8
47
14
767
(31
280
)
No
n-C
urr
ent
Ass
ets
Res
tric
ted
cash
and
cas
h eq
uiva
lent
sN
-
-
3 4
66
-
(3 4
66)
Am
ount
s re
ceiv
able
for s
ervi
ces
187
561
1
85 5
54
173
740
(2
007
) 1
1 81
4
Pro
pert
y, p
lant
and
equ
ipm
ent
169
773
1
73 0
29
171
757
3
256
1
272
Infra
stru
ctur
e12
, O 1
46 4
21
243
865
1
90 3
88
97
444
53
477
Inta
ngib
le a
sset
s13
18
677
22
294
23
615
3 6
17
(1 3
21)
Con
stru
ctio
n in
pro
gres
s14
, P 1
39 7
87
33
529
55
688
(106
258
) (2
2 15
9)
Tota
l No
n-C
urr
ent
Ass
ets
662
219
6
58 2
71
618
654
(3
948
) 3
9 61
7
TO
TAL
AS
SE
TS
753
019
7
63 8
38
755
501
1
0 81
9 8
337
ANNUAL REPORT 2014-15 111

37
Exp
lan
ato
ry S
tate
men
t (c
on
tin
ued
)
Sta
tem
ent
of
Fin
anci
al P
osi
tio
n (c
on
tin
ued
)
As
at 3
0 Ju
ne 2
015
Va
ria
nc
e
No
te
Bu
dg
et
2015
$
00
0
Ac
tual
20
15
$ 0
00
Ac
tual
20
14
$ 0
00
Va
ria
nc
e b
etw
een
es
tim
ate
an
d
actu
al
$ 0
00
Va
ria
nc
e b
etw
een
ac
tual
res
ult
s fo
r 20
15 a
nd
201
4 $
00
0
LIA
BIL
ITIE
S
Cu
rren
t L
iab
iliti
es
Pay
able
s15
, Q 2
4 81
9 1
3 05
1 2
7 34
5 (1
1 76
8) (1
4 29
4)
Pro
visi
ons
25
579
27
490
27
432
1 9
11
58
Oth
er c
urre
nt li
abilit
ies
16, R
4 4
00
7 4
42
3 5
65
3 0
42
3 8
77
Tota
l Cu
rren
t L
iab
iliti
es 5
4 79
8 4
7 98
3 5
8 34
2 (6
815
) (1
0 35
9)
No
n-C
urr
ent
Lia
bili
ties
Pro
visi
ons
6 3
14
6 1
62
5 8
87
(152
) 2
75
Oth
er -
-
-
-
-
Tota
l No
n-C
urr
ent
Lia
bili
ties
6 3
14
6 1
62
5 8
87
(152
) 2
75
TO
TAL
LIA
BIL
ITIE
S
61 1
12
54
145
64
229
(6 9
67)
(10
084)
NE
T A
SS
ET
S 6
91 9
07
709
693
6
91 2
72
17
786
18
421
EQ
UIT
Y
Con
trib
uted
equ
ity 5
11 5
87
505
398
5
40 6
34
(6 1
89)
(35
236)
Res
erve
s17
2 9
13
7 4
72
7 4
12
4 5
59
60
Acc
umul
ated
sur
plus
18, S
177
407
1
96 8
23
143
226
1
9 41
6 5
3 59
7
TO
TAL
EQ
UIT
Y 6
91 9
07
709
693
6
91 2
72
17
786
18
421
See
als
o th
e ‘S
ched
ule
of A
sset
s an
d Li
abilit
ies
by S
ervi
ce’.
The
Sta
tem
ent o
f Fin
anci
al P
ositi
on s
houl
d be
rea
d in
con
junc
tion
with
the
acco
mpa
nyin
g no
tes.
112 DEPARTMENT OF TRANSPORT

37
Exp
lan
ato
ry S
tate
men
t (c
on
tin
ued
)
Sta
tem
ent
of
Cas
h F
low
s
For t
he y
ear 3
0 Ju
ne 2
015
Va
ria
nc
e
No
te
Bu
dg
et
2015
$
00
0
Ac
tual
20
15
$ 0
00
Ac
tual
20
14
$ 0
00
Va
ria
nc
e b
etw
een
es
tim
ate
an
d
actu
al
$ 0
00
Va
ria
nc
e b
etw
een
ac
tual
res
ult
s fo
r 20
15 a
nd
201
4 $
00
0
CA
SH
FLO
WS
FR
OM
STA
TE
GO
VE
RN
ME
NT
Ser
vice
app
ropr
iatio
n19
, T 4
0,72
3 3
6 43
7 1
41 0
40
(4 2
86)
(104
603
)
Cap
ital a
ppro
pria
tions
U 2
4,81
9 2
4 81
9 3
8 16
4 -
(1
3 34
5)
Cas
h tra
nsfe
rred
(to)
/from
oth
er a
genc
ies
V (6
3 64
5) (6
3 64
5) (3
4 39
4) -
(2
9 25
1)
Roy
altie
s fo
r Reg
ions
Fun
d20
53,
925
42
662
41
209
(11
263)
1 4
53
Net
cas
h p
rovi
ded
by
Sta
te G
ove
rnm
ent
55
822
40
273
186
019
(1
5 54
9) (1
45 7
46)
Util
ised
as
follo
ws:
CA
SH
FLO
WS
FR
OM
OP
ER
AT
ING
AC
TIV
ITIE
SP
aym
ents
Empl
oyee
ben
efits
(132
428
) (1
37 1
28)
(135
975
) (4
700
) (1
153
)
Sup
plie
s an
d se
rvic
es (1
07 3
68)
(102
693
) (1
11 8
02)
4 6
75
9 1
09
Acc
omm
odat
ion
21, W
(11
879)
(16
219)
(12
428)
(4 3
40)
(3 7
91)
Gra
nts
and
subs
idie
s (1
06 0
70)
(96
894)
(91
516)
9 1
76
(5 3
78)
GS
T pa
ymen
ts o
n pu
rcha
ses
22 (1
107
) (2
5 33
9) (2
6 70
6) (2
4 23
2) 1
367
Oth
er p
aym
ents
23, X
(3 6
98)
(1 6
86)
(1 0
48)
2 0
12
(638
)
Rec
eip
tsS
ale
of g
oods
and
ser
vice
s15
8 3
46
499
1
88
(153
)
Use
r cha
rges
and
fees
Y 2
52 8
66
260
727
1
44 9
91
7 8
61
115
736
Gra
nts
and
subs
idie
s24
3 1
69
4 6
62
4 8
40
1 4
93
(178
)
Inte
rest
rece
ived
1 4
23
1 8
53
1 4
61
430
3
92
GS
T re
ceip
ts o
n sa
les
25, Z
1 1
07
7 1
44
5 2
28
6 0
37
1 9
16
GS
T re
ceip
ts fr
om ta
xatio
n au
thor
ity26
-
18
353
18
826
18
353
(473
)
Oth
er re
ceip
ts 5
2 68
6 5
4 37
0 5
4 74
7 1
684
(3
77)
Net
cas
h u
sed
in o
per
atin
g a
ctiv
itie
s (5
1 14
1) (3
2 50
4) (1
48 8
83)
18
637
116
379
ANNUAL REPORT 2014-15 113

37
Exp
lan
ato
ry S
tate
men
t (c
on
tin
ued
)
Sta
tem
ent
of
Cas
h F
low
s (c
on
tin
ued
)
For t
he y
ear 3
0 Ju
ne 2
015
Va
ria
nc
e
No
te
Bu
dg
et
2015
$
00
0
Ac
tual
20
15
$ 0
00
Ac
tual
20
14
$ 0
00
Va
ria
nc
e b
etw
een
es
tim
ate
an
d
actu
al
$ 0
00
Va
ria
nc
e b
etw
een
ac
tual
res
ult
s fo
r 20
15 a
nd
201
4 $
00
0
CA
SH
FLO
WS
FR
OM
INV
ES
TIN
G A
CT
IVIT
IES
Pay
men
tsP
urch
ase
of n
on-c
urre
nt p
hysi
cal a
sset
sA
A (4
1 30
3) (4
2 11
4) (5
3 97
4) (8
11)
11
860
Rec
eip
tsP
roce
eds
from
sal
e of
non
-cur
rent
phy
sica
l ass
ets
AB
-
99
1 9
92
99
(1 8
93)
Net
cas
h u
sed
in in
vest
ing
act
ivit
ies
(41
303)
(42
015)
(51
982)
(712
) 9
967
Net
(dec
reas
e) /
incr
ease
in c
ash
and
cash
equ
ival
ents
(3
6 62
2) (3
4 24
6) (1
4 84
6) 2
376
(1
9 40
0)
Cas
h an
d ca
sh e
quiv
alen
ts a
t the
beg
inni
ng o
f the
per
iod
114
540
1
24 8
00
139
646
1
0 26
0 (1
4 84
6)
CA
SH
AN
D C
AS
H E
QU
IVA
LE
NT
S A
T T
HE
EN
D O
F T
HE
PE
RIO
D 7
7 91
8 9
0 55
4 1
24 8
00
12
636
(34
246)
The
Sta
tem
ent o
f Cas
h Fl
ows
shou
ld b
e re
ad in
con
junc
tion
with
the
acco
mpa
nyin
g no
tes.
114 DEPARTMENT OF TRANSPORT

Major variances between estimates (original budget) and actual results for 2015, and between the actual results for 2014 and 2015 are shown below. Major variances are considered to be those greater than 10% or $10 million.
Major Estimate and Actual (2015) Variance Narratives for Controlled Operations
1. Depreciation and amortisation expenses exceeded estimates due to the early commissioning of a number of key assets including Port Geographe and Augusta Boat Harbour, together with the Department taking over the responsibility and administration of Two Rocks.
2. Accommodation expenses exceeded estimates by $4.5 million (38.9%) primarily due to costs associated with new office accommodation in Stirling.
3. Grants and subsidies trailed estimates by $13.6 million (12.9%) due to delays in the WA Bicycle Network, Regional Airport Development Scheme and Recreational Boating Facilities Scheme (RBFS) programs; as well as, lower usage by patrons for the Country Age Pensioner Fuel Card Scheme.
4. Other expenses underspends are due to minor underspends in a range of expenditure types across the agency.
5. Interest revenue exceeded estimates due to higher balances in the Department’s interest bearing bank accounts.
6. Other income exceeded estimates by $13.3 million due to the transfer of both the assets and responsibilities for the administration for the Two Rocks Marina.
7. Services received free of charge exceeded estimates due to additional services provided by partner agencies.
8. Royalties for Regions funding trailed estimates by $8.5 million (19.3%) primarily due to the deferral of the Regional Airport Development Scheme and lower than expected usage of the Country Age Pension Fuel Card Scheme (refer note 3).
9. Cash and cash equivalents exceeded estimates by $5.5 million (18.0%) primarily due to delays in the capital program.
10. Restricted cash and cash equivalents exceeded estimates by $7.1 million (15.1%) primarily due to underspends in RfR funded programs (refer note 11) and a delay in transition to the new National rail safety regime.
11. Receivables exceeded estimates due to invoices/accounts issued for motor vehicle transfer fees in June 2015 where receipt of payment is expected in July 2015.
12. Infrastructure exceeded estimates by $97.4 million (66.6%) due to a number of major projects being finalised and commissioned in 2014-15.
13. Intangible assets exceeded estimates due to a number of major projects being finalised and commissioned in 2014-15.
14. Construction in progress trailed estimates by $106.3 million (76%) due to a number of major projects being finalised and commissioned in 2014-15 (refer note 12).
15. Payables trailed estimates primarily due to actions taken to ensure payments to suppliers of goods prior to year end.
16. Other current liabilities exceeded estimates primarily due to an overpayment of service appropriation which was repaid to Treasury in July 2015.
17. Reserves exceeded the budget by $4.6 million (156.5%) primarily due to asset revaluation of the Department’s land and buildings based on Western Australia’s Land Information Authority’s valuation.
18. Accumulated surplus exceeded estimates reflecting the impact of the favourable operating result for 2014-15.
19. Service appropriation trailed estimates primarily due to the deferral of the WA Bicycle Network program, partially offset by increases resulting from the Targeted Separation Scheme.
20. Refer to note 8.
21. Refer to note 2.
37 Explanatory Statement (continued)
ANNUAL REPORT 2014-15 115

22. GST payments on purchases exceeded estimates by $24.2 million (2,189%). Changes to the budget were implemented in 2015-16 to reflect the Department’s actual position.
23. Other payments trailed estimates due to general underspends in miscellaneous activities across the business.
24. Grants and subsidies receipts exceeded estimates due to higher grant funding from the Office of Road Safety.
25. GST receipts on sales exceeded estimates by $6 million (545%). Refer to note 22.
26. GST receipts from taxation authority exceeded estimates by $18.3 million. Refer to note 22.
Major Actual (2015) and Comparative (2014) Variance Narratives for Controlled Operations
A) Supplies and services decreased by $15.2 million (13%) due to the completion of the Max Light Rail project development and planning studies in the 2013-14 financial year.
B) Accommodation expenses increased primarily due to relocation costs associated with the move to new office premises in Stirling.
C) Other expenses decreased due to minor underspends in a range of expenditure types across the agency.
D) User charges and fees increased by $115.6 million (79%) primarily due to the retention of Motor Vehicle Recording and Motor Driver Licence Fees by the Department in 2014-15, which were previously treated as administered revenue.
E) Sales decreased primarily due to the cessation in 2014/15 of Hydrographic survey services provided to external parties.
F) Interest revenue increased due to higher balances in the Department’s interest bearing bank accounts.
G) Other income increased due to the transfer of both the assets and responsibilities for the administration for the Two Rocks Marina.
H) Service appropriation decreased by $105 million (68.5%) due to the retention of revenue from the Recording Fees and Motor Driver License Fees in 2014-15 resulting in a reduction in appropriation (refer to note C).
I) Services received free of charge increased due to minor increases in services provided free of charge by other General Government agencies.
J) Royalties for Regions funding increased by $3.8 million (12%) due to higher funding received for the Regional Airport Development Scheme and Country Age Pension Fuel Card Scheme.
K) Cash and cash equivalents increased primarily due to delays in the capital program.
L) Restricted cash and cash equivalents decreased by $34.9 million (39%) due to a contribution to the Public Transport Authority for the Wellington Street Bus Station works.
M) Non-current assets held for sale increased primarily due to the Midland Vehicle Examination Centre being assessed as surplus to requirement.
N) Restricted cash and cash equivalents decreased due to accrued salaries (used for the purpose of meeting the 27th pay which occurs every 11 years) being reflected as a current asset in 2014-15.
O) Infrastructure assets increased by $53.5 million (28%) primarily due to a number of major projects being finalised and commissioned in 2014-15 (refer to note 1).
P) Construction in progress assets decreased primarily due to a number of major projects being finalised and commissioned in 2014-15 (refer to note 1).
Q) Current payables decreased by $14.3 million (52%) primarily due to actions taken to ensure payments to suppliers of goods prior to year end.
R) Other current liabilities increased primarily due to an overpayment of service appropriation, which was repaid to Treasury in July 2015.
37 Explanatory Statement (continued)
116 DEPARTMENT OF TRANSPORT

S) Accumulated surplus exceeded estimates reflecting the impact of the favourable operating result for 2014/15.
T) Refer to note H.
U) Capital appropriations decreased by $13.3 million (40%) due to the reduction in capital funding for the Port Geographe Redevelopment Project and for the Information and Communications Infrastructure program.
V) Refer to note L.
W) Refer to note B.
X) Other payments increased due to a general increase in payments across all areas of the business.
Y) Refer to note D.
Z) GST receipts on sales increased due to the increased provision of taxable services provided by Coastal Infrastructure and Marine Safety.
AA) Purchase of non-current physical assets reduced due to the reduced requirement for capital expenditure in 2014-15 (refer to note U).
BB) Proceeds from sale of non-current physical assets reduced by $1.9 million (95%) due to a non-recurring reimbursement from the Public Transport Authority for fit- out costs at the Public Transport Centre.
37 Explanatory Statement (continued)
ANNUAL REPORT 2014-15 117

38 Financial Instruments
(a) Financial risk management objectives and policies
Financial instruments held by the Department are cash equivalents (restricted and non-restricted), receivables and payables. The Department has limited exposure to financial risks, and its overall risk management program focuses on managing the risks identified below.
Credit risk
Credit risk arises when there is the possibility of the Department’s receivables defaulting on their contractual obligations resulting in financial loss to the Department.
The maximum exposure to credit risk at the end of the reporting period in relation to each class of recognised financial assets is the gross carrying amount of those assets inclusive of any provisions for impairment, as shown in the table at note 38(c) Financial instrument disclosures and note 18 Receivables.
Credit risk associated with the Department’s financial assets is minimal because the main receivable is the ‘amounts receivable for services’. For receivables other than government, the Department trades only with recognised, creditworthy third parties. The Department has policies in place to ensure that sales of products and services are made to customers with an appropriate credit history. In addition, receivable balances are monitored on an ongoing basis with the result that the Department’s exposure to bad debts is minimal. There were no significant concentrations of credit risk at the end of the reporting period.
Liquidity risk
Liquidity risk arises when the Department is unable to meet its financial obligations as they fall due.
The Department is exposed to liquidity risk through its trading in the normal course of business, and it has appropriate procedures to manage cash flows including drawdowns of appropriations by monitoring forecast cash flows to ensure that sufficient funds are available to meet its commitments.
Market risk
Market risk is the risk that changes in market prices such as foreign exchange rates and interest rates will affect the Department’s income or the value of its holdings of financial instruments. The Department does not trade in foreign currency and is not materially exposed to other price risks (for example, equity securities or commodity prices changes).
Other than as detailed in the interest rate sensitivity analysis table at note 38(c) Financial instrument disclosures, the Department is not exposed to interest rate risk as it has no borrowings, and cash and cash equivalents are non-interest bearing (apart from certain restricted cash accounts).
2015 $ 000
2014 $ 000
(b) Categories of financial instruments
The carrying amounts of each of the following categories of financial assets and financial liabilities at the end of the reporting period are:
Financial Assets
Cash and cash equivalents 36 178 32 091
Restricted cash and cash equivalents 54 376 92 709
Receivables (i) 8 839 7 673
Amounts receivable for services 185 554 173 740
Total Financial Assets 284 947 306 213
Financial Liabilities
Payables 13 051 27 345
Total Financial Liabilities 13 051 27 345
(i) The amount of receivables excludes GST recoverable from the ATO (statutory receivable).
118 DEPARTMENT OF TRANSPORT

38
Fin
anci
al I
nst
rum
ents
(co
nti
nu
ed)
(c)
Fin
anci
al in
stru
men
t d
iscl
osu
res
C
red
it R
isk
The
follo
win
g ta
ble
deta
ils th
e D
epar
tmen
t’s m
axim
um e
xpos
ure
to c
redi
t ris
k an
d th
e ag
ing
anal
ysis
of fi
nanc
ial a
sset
s. T
he D
epar
tmen
t’s m
axim
um e
xpos
ure
to
cred
it ris
k at
the
end
of th
e re
port
ing
perio
d is
the
carr
ying
am
ount
of fi
nanc
ial a
sset
s as
sho
wn
belo
w. T
he ta
ble
disc
lose
s th
e ag
eing
of fi
nanc
ial a
sset
s th
at a
re
past
due
but
not
impa
ired
and
impa
ired
finan
cial
ass
ets.
The
tabl
e is
bas
ed o
n in
form
atio
n pr
ovid
ed to
sen
ior m
anag
emen
t of t
he D
epar
tmen
t.
The
Dep
artm
ent d
oes
not h
old
any
colla
tera
l as
secu
rity
or o
ther
cre
dit e
nhan
cem
ent r
elat
ing
to th
e fin
anci
al a
sset
s it
hold
s.
Ag
ein
g a
nal
ysis
of
fin
anci
al a
sset
s
Pas
t d
ue
bu
t n
ot
imp
aire
d
Car
ryin
g
Am
ou
nt
No
t p
ast
du
e an
d n
ot
imp
aire
dU
p t
o 1
m
on
th1-
3
mo
nth
s3
mo
nth
s to
1 y
ear
1-5
year
s
Mo
re
than
5
year
s
Imp
aire
d
Fin
anci
al
Ass
ets
$ 00
0$
000
$ 00
0$
000
$ 00
0$
000
$ 00
0$
000
2015
Cas
h an
d ca
sh e
quiv
alen
ts 3
6 17
8 3
6 17
8 -
-
-
-
-
-
Res
tric
ted
cash
and
cas
h eq
uiva
lent
s 5
4 37
6 5
4 37
6 -
-
-
-
-
-
Rec
eiva
bles
(i)
8 8
39
7 4
03
927
3
35
89
59
26
-
Am
ount
s re
ceiv
able
for s
ervi
ces
185
554
1
85 5
54
-
-
-
-
-
-
284
947
2
83 5
11
927
3
35
89
59
26
-
2014
Cas
h an
d ca
sh e
quiv
alen
ts 3
2 09
1 3
2 09
1 -
-
-
-
-
-
Res
tric
ted
cash
and
cas
h eq
uiva
lent
s 9
2 70
9 9
2 70
9 -
-
-
-
-
-
Rec
eiva
bles
(i)
7 6
73
5 4
35
1 7
55
249
8
2 1
39
13
-
Am
ount
s re
ceiv
able
for s
ervi
ces
173
740
1
73 7
40
-
-
-
-
-
-
306
213
3
03 9
75
1 7
55
249
8
2 1
39
13
-
(i) T
he a
mou
nt o
f rec
eiva
bles
exc
lude
s G
ST
reco
vera
ble
from
the
Aus
tral
ian
Taxa
tion
Offi
ce (s
tatu
tory
rec
eiva
ble)
.
ANNUAL REPORT 2014-15 119

38
Fin
anci
al I
nst
rum
ents
(co
nti
nu
ed)
(c)
Fin
anci
al in
stru
men
t d
iscl
osu
res
(co
nti
nu
ed)
L
iqu
idit
y ri
sk a
nd
inte
rest
rat
e ex
po
sure
The
follo
win
g ta
ble
deta
ils th
e D
epar
tmen
t’s in
tere
st ra
te e
xpos
ure
and
the
cont
ract
ual m
atur
ity a
naly
sis
of fi
nanc
ial a
sset
s an
d fin
anci
al li
abilit
ies.
The
mat
urity
an
alys
is s
ectio
n in
clud
es in
tere
st a
nd p
rinci
pal c
ash
flow
s. T
he in
tere
st ra
te e
xpos
ure
sect
ion
anal
yses
onl
y th
e ca
rryi
ng a
mou
nts
of e
ach
item
.
Inte
rest
rat
e ex
po
sure
s an
d m
atu
rity
an
alys
is o
f fi
nan
cial
ass
ets
and
fin
anci
al li
abili
ties
Inte
rest
rat
e ex
po
sure
Mat
uri
ty d
ate
Wei
ght
ed
Ave
rag
e E
ffec
tive
In
tere
st
Rat
eC
arry
ing
A
mo
unt
Var
iab
le
Inte
rest
R
ate
No
n In
tere
st
Bea
ring
No
min
al
Am
ou
ntU
p t
o 1
m
ont
h1-
3 m
ont
hs
3 m
ont
hs
to 1
yea
r1-
5 ye
ars
Mo
re
than
5
year
s
2015
%$
000
$ 00
0$
000
$ 00
0$
000
$ 00
0$
000
$ 00
0$
000
Fin
anci
al A
sset
s
Cas
h an
d ca
sh e
quiv
alen
ts 2
.70
36
178
34
884
1 2
94
36
178
36
178
-
-
-
-
Res
tric
ted
cash
and
cas
h eq
uiva
lent
s 2
.70
54
376
35
753
18
623
54
376
54
376
-
-
-
-
Rec
eiva
bles
(i)
-
8 8
39
-
8 8
39
8 8
39
-
-
-
-
-
Am
ount
s re
ceiv
able
for s
ervi
ces
-
185
554
-
1
85 5
54
185
554
-
-
-
1
85 5
54
-
284
947
7
0 63
7 2
14 3
10
284
947
9
0 55
4 -
-
1
85 5
54
-
Fin
anci
al L
iab
iliti
es
Pay
able
s -
1
3 05
1 -
1
3 05
1 1
3 05
1 1
3 05
1 -
-
-
-
13
051
-
13
051
13
051
13 0
51
-
-
-
-
(i) T
he a
mou
nt o
f rec
eiva
bles
exc
lude
s G
ST
reco
vera
ble
from
the
Aus
tral
ian
Taxa
tion
Offi
ce (s
tatu
tory
rec
eiva
ble)
.
120 DEPARTMENT OF TRANSPORT

38
Fin
anci
al I
nst
rum
ents
(co
nti
nu
ed)
(c)
Fin
anci
al in
stru
men
t d
iscl
osu
res
(co
nti
nu
ed)
Inte
rest
rat
e ex
po
sure
s an
d m
atu
rity
an
alys
is o
f fi
nan
cial
ass
ets
and
fin
anci
al li
abili
ties
Inte
rest
rat
e ex
po
sure
Mat
uri
ty d
ate
Wei
ght
ed
Ave
rag
e E
ffec
tive
In
tere
st
Rat
eC
arry
ing
A
mo
unt
Var
iab
le
Inte
rest
R
ate
No
n In
tere
st
Bea
ring
No
min
al
Am
ou
ntU
p t
o 1
m
ont
h1-
3 m
ont
hs
3 m
ont
hs
to 1
yea
r1-
5 ye
ars
Mo
re
than
5
year
s
2014
%$
000
$ 00
0$
000
$ 00
0$
000
$ 00
0$
000
$ 00
0$
000
Fin
anci
al A
sset
s
Cas
h an
d ca
sh e
quiv
alen
ts 2
.82
32
091
37
102
(5 0
11)
32
091
32
091
-
-
-
-
Res
tric
ted
cash
and
cas
h eq
uiva
lent
s 2
.82
92
709
28
087
64
622
92
709
92
709
-
-
-
-
Rec
eiva
bles
(i)
- 7
673
-
7
673
5
435
1
755
2
49
82
139
1
3
Am
ount
s re
ceiv
able
for s
ervi
ces
-
173
740
-
1
73 7
40
173
740
-
-
-
1
73 7
40
-
306
213
65
189
241
024
3
03 9
75
126
555
2
49
82
173
879
1
3
Fin
anci
al L
iab
iliti
es
Pay
able
s -
2
7 34
5 -
2
7 34
5 2
7 34
5 2
7 34
5 -
-
-
-
27
345
-
27
345
27
345
27
345
-
-
-
-
(i) T
he a
mou
nt o
f rec
eiva
bles
exc
lude
s G
ST
reco
vera
ble
from
the
Aus
tral
ian
Taxa
tion
Offi
ce (s
tatu
tory
rec
eiva
ble)
.
ANNUAL REPORT 2014-15 121

38 Financial Instruments (continued)
Interest rate sensitivity analysis
The following table represents a summary of the interest rate sensitivity of the Department’s financial assets and liabilities at the end of the reporting period on the surplus for the period and equity for a 1% change in interest rates. It is assumed that the change in interest rates is held constant throughout the reporting period.
2015
Carrying amount
$ 000
-100 basis points +100 basis points
Surplus $ 000
Equity $ 000
Surplus $ 000
Equity $ 000
Financial Assets
Cash assets 34 884 (349) (349) 349 349
Restricted cash assets 35 753 (358) (358) 358 358
Total Increase/(Decrease) 70 637 (706) (706) 706 706
2014
Financial Assets
Cash assets 37 102 (371) (371) 371 371
Restricted cash assets 28 087 (281) (281) 281 281
Total Increase/(Decrease) 65 189 (652) (652) 652 652
Fair values
All financial assets and liabilities recognised in the Statement of Financial Position, whether they are carried at cost or fair value, are recognised at amounts that represent a reasonable approximation of fair value unless otherwise stated in the applicable notes.
122 DEPARTMENT OF TRANSPORT

2015 2014
39 Remuneration of senior officers
The number of senior officers, whose total of fees, salaries, superannuation, non-monetary benefits and other benefits for the financial year, fall within the following bands are:
$ Number Number
30 001 - 40 000 1 - 80 001 - 90 000 - 1 90 001 - 100 000 3 - 110 001 - 120 000 1 - 140 001 - 150 000 1 - 150 001 - 160 000 1 - 180 001 - 190 000 - 1 190 001 - 200 000 1 2 210 001 - 220 000 1 - 220 001 - 230 000 - 1 230 001 - 240 000 - 1 300 001 - 310 000 1 - 320 001 - 330 000 - 1 390 000 - 400 000 1 - 400 001 - 410 000 - 1 480 001 - 490 000 1 1
$ 000
$ 000
Base remuneration and superannuation 2 143 2 134
Annual leave and long service leave accruals 58 43
Other benefits 133 147
Total remuneration of senior officers 2 334 2 324
The total remuneration includes the superannuation expense incurred by the Department in respect of senior officers.
No senior officers are members of the Pension Scheme.
40 Remuneration of Auditor
Remuneration paid or payable to the Auditor General in respect of the audit for the current financial year is as follows:
Auditing the accounts, financial statements and key performance indicators. 175 170
The expense is included at note 9 Other expenses.
41 Jointly controlled assets
The following represents the Department’s 50% ownership interest in the Marine Operations Centre with the Department of Fisheries. The jointly controlled assets are included in the financial statements.
Non-current assets
Property, plant and equipment 3 989 3 828
Infrastructure 112 123
Total assets 4 101 3 951
ANNUAL REPORT 2014-15 123

2015 $ 000
2014 $ 000
42 Special purpose accounts
Deposits
Opening balance 3 569 3 031
Receipts:
Deposits – Keys - 194
Deposits – Bonds 263 1 052
Deposits – Buyback MPT Plate - 94
Interest 94 89
357 1 429
Payments:
Refunds – Keys - 272
Refunds – Bonds (334) 523
Refunds – Buyback MPT Plate (8) 96
(342) 891
Closing balance 3 584 3 569
This Account holds deposits for the issue of keys to boat owners to access the harbour pens, performance bonds, motor vehicle dealer plates and Multi Purpose Taxi Plate deposits. These monies are held in a private trustee capacity, and in accordance with Treasurer’s Instruction 1101A Financial Reporting by Departments are only reported in these notes to the financial statements.
As of March 2014, this account no longer holds deposits for the issue of keys to boat owners to access the harbour pens.
Off-road Vehicles Account
Opening balance - 297
Receipts:
Licence and plate fees - 34
- 34
Payments:
Supplies and services - 34
Transfer to Department of Local Government and Communities - 297
- 331
Closing balance - -
This Account holds monies collected for the registration of vehicles under the Control of Vehicles (Off-road areas) Act 1978 and to provide funds to meet the expenses of the Department in connection with administration of the Act pursuant to section 43(2) of the Act.
In 2014 the closing balance of this account was transferred to the Department of Local Government and Communities. This account is no longer administered by the Department of Transport.
124 DEPARTMENT OF TRANSPORT

2015 $ 000
2014 $ 000
42 Special purpose accounts (continued)
Perth Parking Licensing Account
Opening balance 55 139 69 748
Receipts:
Licence fees 48 283 39 550
48 283 39 550
Payments:
Grants to State government agencies 89 582 53 330
Grants to Local shires 124 -
Employee costs 331 306
Supplies and services 799 523
90 836 54 159
Closing balance 12 586 55 139
This Account was established to hold funds for the purpose of administering the Perth Parking Management Act 1999.
Rail Safety Accreditation Account
Opening balance 1 617 1 235
Receipts:
Registration fees 3 612 3 441
Recoups and other receipts - 51
3 612 3 492
Payments:
Employee costs 1 634 1 476
Superannuation 179 158
Lease and rental 36 19
Other payments 682 1 457
2 531 3 110
Closing balance 2 698 1 617
This Account was established to hold funds for the purpose of administering the Rail Safety Act 1998.
ANNUAL REPORT 2014-15 125

2015 $ 000
2014 $ 000
42 Special purpose accounts (continued)
Small Craft Facilities
Opening balance 103 -
Receipts:
Boat harbour fees 10 503 5 336
Recoups 121 7
Funds for dredging 2 453 3 509
Other revenue 40 2 267
13 117 11 119
Payments:
Employment costs 139 153
Contractors 68 26
Administration expenses 1 410 321
Recreational Boat Scheme 5 226 4 309
Maintenance 3 980 4 356
Power, water and sewerage 1 414 1 152
Other operating expenses 983 699
13 220 11 016
Closing balance - 103
This account holds funds for the purpose of funding the provision, maintenance, upgrading and management of small craft facilities.
During the year, the Minister approved the closure of the Small Craft Facilities Trust Funds as a result of a series of financial and administrative reforms.
126 DEPARTMENT OF TRANSPORT

2015 $ 000
2014 $ 000
42 Special purpose accounts (continued)
Taxi Fare Evasion Recoupment Account
Opening balance - -
Receipts:
Deposits 1 1
1 1
Payments:
Refunds 1 1
1 1
Closing balance - -
The purpose of this Account is to reimburse taxi drivers with monies collected from passengers who failed to pay their fare.
Taxi Industry Development Account
Opening balance 27 984 25 436
Receipts:
Licence fees 9 275 9 727
Interest income 819 732
Other revenue - 1 965
10 094 12 424
Payments:
Consultants’ fees 1 571 1 682
Other payments 4 722 8 194
6 293 9 876
Closing balance 31 785 27 984
The purpose of this Account is to hold funds received by the Department for the purposes of the Taxi Act 1994.
Receipts in Suspense
Opening balance 5 459 4 586
Receipts credited to suspense account 7 760 11 541
Receipts transferred from suspense account 7 543 10 668
Closing balance 5 676 5 459
Pursuant to section 26 (2) of the Financial Management Act 2006, the purpose of this Account is to hold funds pending identification of the purpose for which these monies were received.
ANNUAL REPORT 2014-15 127

2015 $ 000
2014 $ 000
43 Supplementary financial information
(a) Write-offs
Public and other property, revenue and debts due to the State were written-off in accordance with section 48 of the Financial Management Act 2006 under the authority of:
(i) Bad Debts
The Accountable Authority (a) 476 105
(a) Of the debts written off, $455,000 had been previously provided for.
(ii) Assets
The Accountable Authority - 3
(b) Losses through theft, defaults and other causes
The Department suffered no losses of public money or other property through theft, defaults or other causes during the current financial period.
(c) Gifts of public property
The Department provided no gifts of public property during the current financial year.
44 Indian Ocean Territories Service Level Agreement
The provision of services to the Indian Ocean Territories are recouped from the Commonwealth government.
Balance at the start of the year 42 3
Receipts 366 403
Payments (367) (364)
Balance at the end of the year 41 42
128 DEPARTMENT OF TRANSPORT

45D
iscl
osu
re o
f ad
min
iste
red
exp
ense
s an
d in
com
e b
y se
rvic
e
Tran
spo
rt S
yste
m a
nd
S
ervi
ces
Dev
elo
pm
ent,
P
lan
nin
g, O
per
atio
n an
d
Reg
ula
tio
nD
rive
r an
d
Veh
icle
Ser
vice
s
Str
ateg
ic T
ran
spo
rt
Po
licy
and
Inte
gra
ted
P
lan
nin
gTo
tal
2015
$ 00
020
14$
000
2015
$ 00
020
14$
000
2015
$ 00
020
14$
000
2015
$ 00
020
14$
000
Exp
ense
sTr
ansf
er P
aym
ents
–
Con
solid
ated
Acc
ount
-
-
1
197
528
1
198
642
-
-
1
197
528
1
198
642
– D
epar
tmen
t of L
ocal
Gov
ernm
ent a
nd
Com
mun
ities
-
-
3
0 -
-
-
3
0 -
– In
sura
nce
Com
mis
sion
of W
este
rn A
ustr
alia
-
-
6
45 3
32
605
558
-
-
6
45 3
32
605
558
– M
ain
Roa
ds W
este
rn A
ustr
alia
-
-
8
3 49
2 6
6 08
0 -
-
8
3 49
2 6
6 08
0–
Wes
tern
Aus
tral
ia P
olic
e -
-
4
308
4
145
-
-
4
308
4
145
– W
A C
oast
al S
hipp
ing
Com
mis
sion
-
-
-
-
9
5 9
0 9
5 9
0–
Fede
ral a
nd In
ters
tate
Age
ncie
s 3
125
3
300
2
268
2
418
-
-
5
393
5
718
Oth
er e
xpen
ses
-
-
1 4
06
-
-
-
1 4
06
-To
tal a
dmin
iste
red
expe
nses
3
125
3
300
1
934
364
1
876
843
9
5 9
0 1
937
584
1
880
233
Rev
enue
sFo
r tra
nsfe
r to
the
Con
solid
ated
Acc
ount
or A
genc
ies
App
ropr
iatio
ns fo
r tra
nsfe
r to
the:
Wes
tern
Aus
tral
ian
Coa
stal
Shi
ppin
g C
omm
issi
on -
-
-
-
9
5 9
0 9
5 9
0In
fring
emen
tsP
late
and
tran
sfer
infri
ngem
ents
-
-
8 7
30
7 7
99
-
-
8 7
30
7 7
99S
peed
and
red
light
infri
ngem
ent fi
nes
-
-
104
039
8
8 43
6 -
-
1
04 0
39
88
436
Fina
l dem
and
fees
– tr
affic
infri
ngem
ents
-
-
2 0
06
1 8
81
-
-
2 0
06
1 8
81D
eale
r Pla
tes
-
-
101
9
9 -
-
1
01
99
Mot
or d
river
s’ li
cenc
es -
-
-
4
2 73
1 -
-
-
4
2 73
1M
otor
veh
icle
regi
stra
tions
Mot
or v
ehic
le fe
es -
-
3
0 -
-
-
3
0 -
Mot
or v
ehic
le re
gist
ratio
ns -
-
8
04 2
68
686
983
-
-
8
04 2
68
686
983
Rec
ordi
ng fe
es -
-
-
5
2 80
8 -
-
-
5
2 80
8S
tam
p du
ty -
-
3
63 3
55
383
210
-
-
3
63 3
55
383
210
Third
par
ty m
otor
veh
icle
insu
ranc
e pr
emiu
ms
-
-
645
332
6
05 5
58
-
-
645
332
6
05 5
58C
olle
ctio
n of
inte
rsta
te li
cens
ing
fees
-
-
2 3
43
2 4
71
-
-
2 3
43
2 4
71Fi
rear
m li
cenc
e fe
es -
-
4
308
4
145
-
-
4
308
4
145
Col
lect
ion
of v
esse
l sur
vey
fees
3 1
25
3 3
00
-
-
-
-
3 1
25
3 3
00To
tal a
dm
inis
tere
d in
com
e 3
125
3
300
1
934
512
1
876
121
9
5 9
0 1
937
732
1
879
511
ANNUAL REPORT 2014-15 129

46E
xpla
nat
ory
Sta
tem
ent
for
Ad
min
iste
red
Item
s
Tota
lV
aria
nce
bet
wee
n es
tim
ate
and
act
ual
Var
ian
ce b
etw
een
actu
al r
esu
lts
for
2015
an
d 2
014
Var
ian
ce
No
teB
ud
get
201
5$
000
Act
ual
201
5$
000
Act
ual
201
4$
000
$ 00
0$
000
Exp
ense
sTr
ansf
er P
aym
ents
– C
onso
lidat
ed A
ccou
nt
1 8
24 9
07
1 1
97 5
28
1 1
98 6
42
372
621
(1
114
)–
Dep
artm
ent o
f Loc
al G
over
nmen
t and
C
omm
uniti
es
-30
-
3030
– In
sura
nce
Com
mis
sion
of W
este
rn A
ustra
lia
2 -
6
45 3
32
605
558
6
45 3
32
39
774
– M
ain
Roa
ds W
este
rn A
ustra
lia
A 8
2 12
3 8
3 49
2 6
6 08
0 1
369
1
7 41
2–
Wes
tern
Aus
tralia
Pol
ice
3 3
900
4
308
4
145
4
08
163
– W
A C
oast
al S
hipp
ing
Com
mis
sion
9
5 9
5 9
0 -
5
– Fe
dera
l and
Inte
rsta
te A
genc
ies
4 3
817
5
393
5
718
1
576
(3
25)
Oth
er e
xpen
ses
5, B
-
1 4
06
-
1 4
06
1 4
06To
tal a
dmin
iste
red
expe
nses
9
14 8
42
1 9
37 5
84
1 8
80 2
33
1 0
22 7
42
57
351
Rev
enu
esFo
r tra
nsfe
r to
the
Con
solid
ated
Acc
ount
or A
genc
ies
App
ropr
iatio
ns fo
r tra
nsfe
r to
the:
Wes
tern
Aus
tralia
n C
oast
al S
hipp
ing
Com
mis
sion
95
95
90
-
5C
onse
rvan
cy -
-
-
-
-In
fring
emen
tsP
late
and
tran
sfer
infri
ngem
ents
6, C
7 5
65
8 7
30
7 7
99
1 1
65
931
Spe
ed a
nd re
d lig
ht in
fring
emen
t fine
sD
109
165
1
04 0
39
88
436
(5 1
26)
15
603
Fina
l dem
and
fees
- tr
affic
infri
ngem
ents
2 0
00
2 0
06
1 8
81
6
125
Dea
ler P
late
s 9
9 1
01
99
2
2M
otor
driv
ers’
lice
nces
E -
-
4
2 73
1 -
(4
2 73
1)M
otor
veh
icle
regi
stra
tions
Mot
or v
ehic
le fe
es -
3
0 -
3
0 3
0M
otor
veh
icle
regi
stra
tions
F 7
88 2
01
804
268
6
86 9
83
16
067
117
285
Rec
ordi
ng fe
esG
-
-
52
808
-
(52
808)
Sta
mp
duty
7 -
36
3 35
5 38
3 21
0 36
3 35
5 (1
9 85
5)Th
ird p
arty
mot
or v
ehic
le in
sura
nce
prem
ium
s8
-
645
332
605
558
645
332
39
774
Col
lect
ion
of in
ters
tate
lice
nsin
g fe
es9
-
2 34
3 2
471
2 3
43 (1
28)
Fire
arm
lice
nce
fees
10 3
900
4
308
4
145
4
08
163
Col
lect
ion
of v
esse
l sur
vey
fees
11 3
817
3
125
3
300
(6
92)
(175
)To
tal a
dm
inis
tere
d in
com
e 9
14 8
42
1 9
37 7
32
1 8
79 5
11
1 0
22 8
90
58
221
130 DEPARTMENT OF TRANSPORT

46 Explanatory Statement for Administered Items (continued)
Major variances between estimates (original budget) and actual results for 2015, and between the actual results for 2014 and 2015 are shown below. Major variances are considered to be those greater than 10% or $10 million.
Major Estimate and Actual (2015) Variance Narratives for Administered Items
1. Consolidated account transfer payments exceeded estimates by $372.2 million (45%) due to stamp duty on motor vehicle registrations collected on behalf of the Office of State Revenue and transferred to the Consolidated Account. This item is not reflected in the Department’s budget statements.
2. Insurance Commission of Western Australia transfer payments totalled $645 million from Third Party insurance premiums collected on behalf and transferred to Insurance Commission of WA. This item is not reflected in the Department’s budget statements.
3. Western Australia Police transfer payments exceeded estimates due to higher revenue collected for firearms as a result of an increase in firearm licences processed by the Department on behalf of the WA Police.
4. Federal and Interstate Agency transfer payments exceeded estimates primarily due to the collection of Interstate Motor Vehicle Licence Fees which is not reflected in the budget statements.
5. Other administered expenses exceeded estimates by $1.4 million due to an increase in accounts receivables resulting in an adjustment to the provision for doubtful debts.
6. Plate and transfer infringements revenue exceeded estimates due to an increase in infringements issued and processed.
7. Stamp duty revenue totalled $363 million due to stamp duty on motor vehicle registrations collected on behalf of the Office of State Revenue. This item is not reflected in the Department’s budget statements (refer to note 1).
8. Refer to note 2.
9. Collection of interstate licensing fees totalled $2.3 million. This item is not reflected in the budget statements.
10. Refer to note 3.
11. Collection of vessel survey fees trailed estimates by $0.7 million (18%). The number of vessels surveyed in Western Australia fell from an estimated 2060 to 1397 due to the application of the National Law in July 2013 that resulted in a change of definition in what constituted a survey vessel under the previous Western Australian Law.
Major Actual (2015) and Comparative (2014) Variance Narratives for Administered Items
A) Main Roads Western Australia transfer payments increased by $17.4 million (21%) primarily due to an increase in the level of operational activities performed by the WA Police and the number of speed and red light cameras deployed.
B) Other administered expenses increased due to an increase in accounts receivables resulting in the creation of a provision for doubtful debts.
C) Plate and transfer infringements revenue increased due to an increase in the number and value of infringements issued.
D) Speed and red light infringement fines revenue increased by $15.6 million (15%) due to an increase in infringements issued and processed in 2014-15.
E) Motor drivers’ licences revenue decreased by $42.7 million due to Motor Driver Licenses becoming a net appropriated revenue and retained by the Department of Transport as from 1 July 2014 .
F) Motor vehicle registrations revenue increased by $117.3 million (14.6%) due to increases in the number of vehicles registered and fees.
G) Recording fees revenue decreased by $52.8 million due to recording fees becoming a net appropriated revenue and retained by the Department of Transport as of 1 July 2014.
ANNUAL REPORT 2014-15 131

2015 $ 000
2014 $ 000
47 Administered assets and liabilitiesCurrent assets
Cash 10 937 10 238
Accounts receivable (i) 4 903 4 830
Total current assets 15 840 15 068
Total administered assets 15 840 15 068
Current liabilities
Payables 5 291 4 567
Accruals and interest payable 4 995 5 096
Total current liabilities 10 286 9 663
Total administered liabilities 10 286 9 663
(i) Notes to the Schedules of Administered Items – Accounts receivable
Current Receivables 14 121 12 642
Allowance for impairment of receivables (9 218) (7 812)
4 903 4 830
132 DEPARTMENT OF TRANSPORT

ANNUAL REPORT 2014-15 133

CERTIFICATION OF KEY PERFORMANCE INDICATORS
For the year ended 30 June 2015I hereby certify that the key performance indicators are based on proper records, are relevant and appropriate for assisting users to assess Department of Transport’s performance, and fairly represent the performance of the Department of Transport for the financial year ended 30 June 2015.
Steve Troughton Accountable Authority
2 September 2015
134 DEPARTMENT OF TRANSPORT

KEY PERFORMANCE INDICATORSFor the year ended 30 June 2015The transport function is integral to business and commerce and is important for social interaction and connecting communities. DoT’s focus is on strategic transport policy and planning, regulation, and the delivery of safe and sustainable transport services and programs. This includes the licensing of drivers, vehicles and vessels, developing and planning infrastructure, and setting and ensuring service and safety standards across the range of public and commercial transport systems in WA.
Together with its portfolio partners, DoT has the expertise to deliver the high quality and integrated transport policy, services and plans needed to connect a complex, inter-related economic and social network. DoT connects people with goods and services through an intricate system of roads, railways, airports, ports and waterways, and keeps people safe within those networks through an integrated approach to planning, licensing, education and compliance strategies.
The breadth and diversity of DoT’s functions and services mean that DoT contributes to two of the Government’s strategic goals outlined below.
Government strategic goals DoT outcomes DoT services
Results based service deliveryGreater focus on achieving results in key service delivery areas for the benefit of all Western Australians.
1. An accessible and safe transport system
1. Transport system and services development, planning, operation and regulation
2. Vehicles and road users that meet established vehicle standards and driver competencies to deliver safe vehicles and safe drivers
2. Driver and vehicle services
State building – major projectsBuilding strategic infrastructure that will create jobs and underpin Western Australia’s long-term economic development.
3. Integrated transport systems that facilitate economic development
3. Strategic transport policy and integrated planning
ANNUAL REPORT 2014-15 135

Outcome one:
An accessible and safe transport systemDoT’s responsibility for the accessibility and safety of the transport system derives from the Transport Co-ordination Act 1966 (the Act). The Act confers on DoT the responsibility for coordinating and planning the transport system and enabling accessibility and safety considerations.
There are varying degrees of accessibility and safety across the agency for the different modes of transport. For example, the Marine Safety Business Unit provides regulation, education, training and compliance monitoring in regards to safety of marine vessels, whereas accessibility to marine related infrastructure and waterways is the responsibility of the Coastal Infrastructure Business Unit.
Rail safety is managed by the Office of Rail Safety which is charged with administering the Rail Safety Act 2010 in WA and nationally as part of a national approach to rail safety regulation. It does this by ensuring railway owners and operators comply with regulatory standards to construct, operate and maintain railways. Accessibility to railways is the responsibility of the owners and operators.
Accessibility to taxis is the responsibility of the Passenger Services Business Unit whereby they are responsible for ensuring an adequate taxi service is being provided to the public of WA. Safety in taxis in regards to vehicles and drivers is the responsibility of Driver and Vehicle Services in its role in administering road laws as defined in Road Traffic (Administration) Act 2008 and is covered under outcome two of the Department’s outcome structure – “Vehicles and road users that meet established vehicle standards and driver competencies to deliver safe vehicles and safe drivers”. Safety for taxi operators and passengers not related to use on the road is the responsibility of the WA Police in its community safety role.
Accessibility to regular public transport air services is the responsibility of DoT’s Transport Strategy and Reform Directorate which ensures an adequate air service is provided to key regional communities throughout the State. Aviation safety is controlled through the Commonwealth Government’s Civil Aviation Safety Authority. DoT ensures all aircraft that carry passengers for regular public transport or charter purposes within WA are licensed annually.
The effectiveness indicators below measure transport system accessibility and safety for DoT:
Accessibility
y Percentage of standard metropolitan (non-multi-purpose) taxi jobs which were not covered – peak;
y Percentage of standard metropolitan (non-multi-purpose) taxi jobs which were not covered – off-peak;
y Percentage by which the waiting time standard, for Metropolitan Area taxis is met;
y Percentage of Time Maritime Infrastructure is Fit for Purpose when required; and
y Percentage of Regional Airports Receiving Scheduled Regular Public Transport.
Safety
y Rate of Reported Incidents (Accidents) on the Water per 100 Commercial Vessels Surveyed;
y Rate of Reported Incidents (Accidents) on the Water per 10,000 Registered Recreational Vessels; and
y Rate of Serious Accidents per Million Train Kilometres.
136 DEPARTMENT OF TRANSPORT

Effectiveness key performance indicatorsPercentage of standard metropolitan (non multi-purpose) taxi jobs which were not covered – peak
DoT is responsible for regulation of the Perth Metropolitan Taxi Industry via the administration of the Taxi Act 1994.
Following the 1999 National Competition Policy Review of the Perth Metropolitan Taxi Industry, the then Department for Planning and Infrastructure introduced performance standards for the industry. Performance standards have been in place since 1 July 2000 to ensure that the public receives acceptable levels of service. The taxi industry is required to meet these performance standards. An independent external consultant analyses taxi industry data, sourced from the Taxi Dispatch Service (TDS) providers, and reports on taxi demand and industry viability trends as well as the performance of the taxi industry against the industry standards on a monthly and quarterly basis.
This assessment gives DoT the ability to provide the Minister for Transport with evidence-based policy recommendations and therefore directly assists the regulatory function of the Department.
The key performance indicator of taxi jobs not covered – Peak (JNC – Peak) is the percentage
of total jobs going unserviced in the peak period (Friday and Saturday nights from 5pm to 6am).
Until the 2012-13 financial year the peak and off-peak JNC was reported as a single KPI. The total number of jobs not covered in all hours was divided by the total number of phone orders advertised to taxi drivers. This did not allow evaluation of the sharp differences in service delivery in different times of the week. Since the 2012-13 financial year peak and off-peak periods have been reported separately.
Trends from this indicator assist with determining supply and demand requirements for the industry and provide rationale for determining whether there is a requirement to release additional taxi plates.
Industry performance is assessed by obtaining and analysing data from the two major TDS providers in the metropolitan area. Of these, both the number of customer telephone orders placed on and advertised through the taxi company dispatch system and the number of jobs not covered against these orders during peak periods are recorded.
2011-12 actual
2012-13 actual
2013-14 actual
2014-15 target
2014-15 actual
Reasons for significant variance
Percentage of standard metropolitan (non-multi-purpose) taxi jobs which were not covered – peak
4.53% 4.75% 2.58% 1.00% 1.70% In a period of softening demand for taxi services there has been an improvement in the number of taxi jobs which were not covered during peak period from 2.58% in 2013-14 to 1.70% in 2014-15. While performance against index has improved, the 2014-15 Budget Target was not met.
ANNUAL REPORT 2014-15 137

Percentage of standard metropolitan (non multi-purpose) taxi jobs which were not covered – off-peak
DoT is responsible for regulation of the Perth Metropolitan Taxi Industry via the administration of the Taxi Act 1994.
Following the 1999 National Competition Policy Review of the Perth Metropolitan Taxi Industry, the then Department for Planning and Infrastructure introduced performance standards for the industry. Performance standards have been in place since 1 July 2000 to ensure that the public receives acceptable levels of service. The taxi industry is required to meet these performance standards. An independent external consultant analyses taxi industry data, sourced from the Taxi Dispatch Service (TDS) providers, and reports on taxi demand and industry viability trends as well as the performance of the taxi industry against the industry standards on a monthly and quarterly basis.
This assessment gives DoT the ability to provide the Minister for Transport with evidence-based policy recommendations and therefore directly assists the regulatory function of the Department.
The key performance indicator of taxi jobs not covered – Off-peak (JNC – off-peak) is the percentage of total jobs going unserviced in the
off-peak period (all times with the exception of the peak period which is Friday and Saturday night, 5pm to 6am).
Until the 2012-13 financial year the peak and off-peak JNC was reported as a single KPI.
The total number of jobs not covered in all hours was divided by the total number of phone orders advertised to taxi drivers. This did not allow evaluation of the sharp differences in service delivery in different times of the week. Since the 2012-13 financial year peak and off-peak periods have been reported separately.
Trends from this indicator assist with determining supply and demand requirements for the industry and provide rationale for determining whether there is a requirement to release additional taxi plates.
Industry performance is assessed by obtaining and analysing data from the two major TDS providers in the metropolitan area. Of these, both the number of customer telephone orders placed on and advertised through the taxi company dispatch system and the number of jobs not covered against these orders during the off-peak period are recorded.
2011-12 actual
2012-13 actual
2013-14 actual
2014-15 target
2014-15 actual
Reasons for significant variance
Percentage of standard metropolitan (non-multi-purpose) taxi jobs which were not covered – off-peak
1.65% 1.67% 0.88% 0.50% 0.59% In a period of softening demand for taxi services there has been an improvement in the number of taxi jobs which were not covered during off-peak period from 0.88% in 2013-14 to 0.59% in 2014-15. While performance against index has improved, the 2014-15 Budget Target was not met.
138 DEPARTMENT OF TRANSPORT

Percentage by which the waiting time standard for metropolitan area taxis is met
DoT is responsible for regulation of the Perth Metropolitan Taxi Industry via the administration of the Taxi Act 1994. Following the 1999 National Competition Policy Review of the Perth Metropolitan Taxi Industry, the then Department for Planning and Infrastructure introduced performance standards for the industry. Performance standards have been in place since 1 July 2000. The taxi industry is required to meet these performance standards.
An independent external consultant analyses taxi industry data, sourced from the TDS providers, and reports on taxi demand and industry viability trends as well as the performance of the taxi industry against the industry standards on a monthly and quarterly basis.
This assessment gives DoT the ability to provide the Minister for Transport with evidence-based policy recommendations and therefore directly assists the regulatory function of the Department.
In addition to JNC, taxi performance is measured by determining the average time a customer has
to wait for a taxi following a booking, during both peak and off-peak times, and then comparing the result against the relevant performance standards. To calculate this measure the wait times for taxis requested as soon as possible (ASAP) have been measured during both peak and off-peak times and bookings that meet the performance standard determined and presented as a percentage against all ASAP bookings.
Trends from this indicator assists with determining supply versus demand requirements for the industry and provides rationale for determining whether there is a requirement to release additional taxi plates.
Industry performance is assessed by obtaining and analysing data from the two major TDS providers in the metropolitan area. Waiting time information is available from the TDS systems and measured as the difference between when the customer first requested the taxi and when the driver turned on their meter to start the job.
2011-12 actual
2012-13 actual
2013-14 actual
2014-15 target
2014-15 actual
Reasons for significant variance
Percentage by which the waiting time standard for metropolitan area taxis is met
91.5% 91.7% 92.3% 91% 92% No significant variance noted this year between target and actual.
ANNUAL REPORT 2014-15 139

Percentage of time maritime infrastructure is fit for purpose when required
DoT is responsible for the planning, creation, enhancement and management of new and existing land and water based maritime facilities for small craft throughout WA.
DoT manages and maintains a variety of maritime infrastructure assets, including jetties, wharves, boat launching facilities, pens and moorings at approximately 50 discrete locations throughout the State, to service the fishing and commercial maritime industries and the recreational boating needs of Western Australians.
In addition to this, DoT maintains associated navigational aids which are strategically placed in water and onshore to ensure that the boating
community can safely transit through waterways. It also maintains the navigable waters at its managed maritime facilities as well as at a small number of other locations, including two commercial ports, throughout the State by providing access via dredged channels.
The facilities and their purpose vary for each location and the associated management and maintenance plans vary accordingly.
A consistently high percentage of availability will confirm that maritime infrastructure is being appropriately maintained and is accessible to the boating industries and the public of WA.
2011-12 actual
2012-13 actual
2013-14 actual
2014-15 target
2014-15 actual
Reasons for significant variance
Percentage of time maritime infrastructure is fit for purpose when required
99.76% 99.53% 99.07% 99.71% 99.40% No significant variance noted this year between target and actual.
140 DEPARTMENT OF TRANSPORT

Percentage of regional airports receiving scheduled regular public transport (RPT) air services
DoT provides advice on a range of aviation issues. It provides grants to support the development of airport infrastructure through the Regional Airports Development Scheme and regulates intrastate air services to ensure that key WA regional communities receive sustainable regular public transport (RPT) air services.
Under the Transport Co-ordination Act 1966, all aircraft that carry passengers for RPT or charter purposes within WA are required to be licensed annually. In addition, the Minister for Transport has powers to apply conditions to aircraft licences to determine where they may fly in WA. Where there are insufficient passenger numbers to support competition to a key regional centre, the WA Government protects the service by offering it through a public tender process, so that a limited number of airlines may service it.
The objective is that communities in WA with populations of more than 500 are located within a 250 kilometre radius of an airport accessible by
a safe road which provides two or more weekly RPT air services or have access to other forms of public transport.
To ensure that charter operations do not undermine the RPT service, charter operators are limited by a condition on their aircraft licence to providing one return flight per client per week to an RPT airport in WA. Approval from the Minister for Transport is required to provide additional charter services over RPT air routes.
The licensing arrangements and deeds for the protected and subsidised services are monitored through monthly statistics and meetings with the airlines to ensure that the outcome of the regional centres having a sustainable RPT service is achieved.
A reduction in the percentage of key regional centres being serviced by RPT air services or other forms of public transport would indicate that services to remote communities are not being maintained.
2011-12 actual
2012-13 actual
2013-14 actual
2014-15 target
2014-15 actual
Reasons for significant variance
Percentage of regional airports receiving scheduled regular public transport (RPT) air services
100% 96% 96% 100% 96% No significant variance noted this year between target and actual.
ANNUAL REPORT 2014-15 141

Rate of reported incidents (accidents) on the water per 100 commercial vessels surveyed
The Commercial Vessel Safety Branch (CVS) is a delegate to the National System for Domestic Commercial Vessel Safety under the auspice of the Marine Safety (Domestic Commercial Vessel) National Law 2012. With the National Regulator CVS ensures all commercial vessels in WA are subject to survey to certify they meet minimum standards for construction and equipment safety before they are allowed to operate.
A commercial vessel must hold a current certificate to show that it meets national and international construction standards to continue to operate.
All accidents or incidents that result in serious injury or death, or cause damage to the vessel rendering it unseaworthy or unsafe must be reported. An incident (accident) is defined as any commercial vessel which is involved in a collision that sustains:
(a) casualty;
(b) damage affecting her seaworthiness or efficiency, either in hull or in any part of the boilers and machinery; or
(c) causes the loss or damage to any other vessel, or where by reason of a casualty happening to, or on board a commercial vessel, loss of life or serious injury to any person ensues.
It is a requirement under the National Law for people to report any accident or incident involving a domestic commercial vessel.
The information for this indicator is derived from DoT’s commercial vessel database and the marine incidents database, and is calculated by dividing the number of incidents by the number of commercial vessels holding current survey certificates (expressed as a rate per hundred vessels).
2011-12 actual
2012-13 actual
2013-14 actual
2014-15 target
2014-15 actual
Reasons for significant variance
Rate of reported incidents (accidents) on the water per 100 commercial vessels surveyed
4.97 4.82 6.54 5.58 5.44 No significant variance noted this year between target and actual.
142 DEPARTMENT OF TRANSPORT

Rate of reported incidents (accidents) on the water per 10,000 registered recreational vessels
WA’s temperate climate and unique marine environment entice an estimated 250,000 people to make recreational use of the State’s waterways each year.
DoT takes a lead role in ensuring the safety of the State’s mariners through:
y setting standards for recreational vessels and registering only those that meet legislative requirements;
y requiring recreational mariners to meet basic safety competencies through the Recreational Skipper’s Ticket (compulsory from 1 April 2008);
y maintaining marine charts and signs to promote safe navigation and warn of hazards;
y responding to oil spills and other pollutants;
y maintaining navigational aids (navaids); and
y educating and informing mariners on marine safety matters.
Under the Navigable Waters Regulations 1958, all vessels that have a motor or have the capacity to have a motor fitted, must be registered to operate on navigable waters in WA. In addition, it is a requirement under the WA Marine Act 1982 for people to report any accident or incident that results in serious injury or death, or the vessel being damaged enough to make it unseaworthy or unsafe.
The data for this indicator is taken from DoT’s recreational vessel registration database and the marine incidents database, and is calculated by dividing the number of incidents by the number of registered recreational vessels (expressed as a rate per ten thousand vessels).
A reduction in the rate of incidents per registered recreational vessel indicates that the safety outcome is being met in relation to recreational boating.
2011-12 actual
2012-13 actual
2013-14 actual
2014-15 target
2014-15 actual
Reasons for significant variance
Rate of reported incidents (accidents) on the water per 10,000 registered recreational vessels
10.69 9.48 10.56 9.50 10.96 The slowdown in the WA economy has reduced the anticipated number of recreational vessels being registered. There has also been an increase in the number of incidents reported due largely to the change in reporting requirements of marine insurance industry.
The industry now only accepts claims made by clients only where the incident has been reported to DoT.
ANNUAL REPORT 2014-15 143
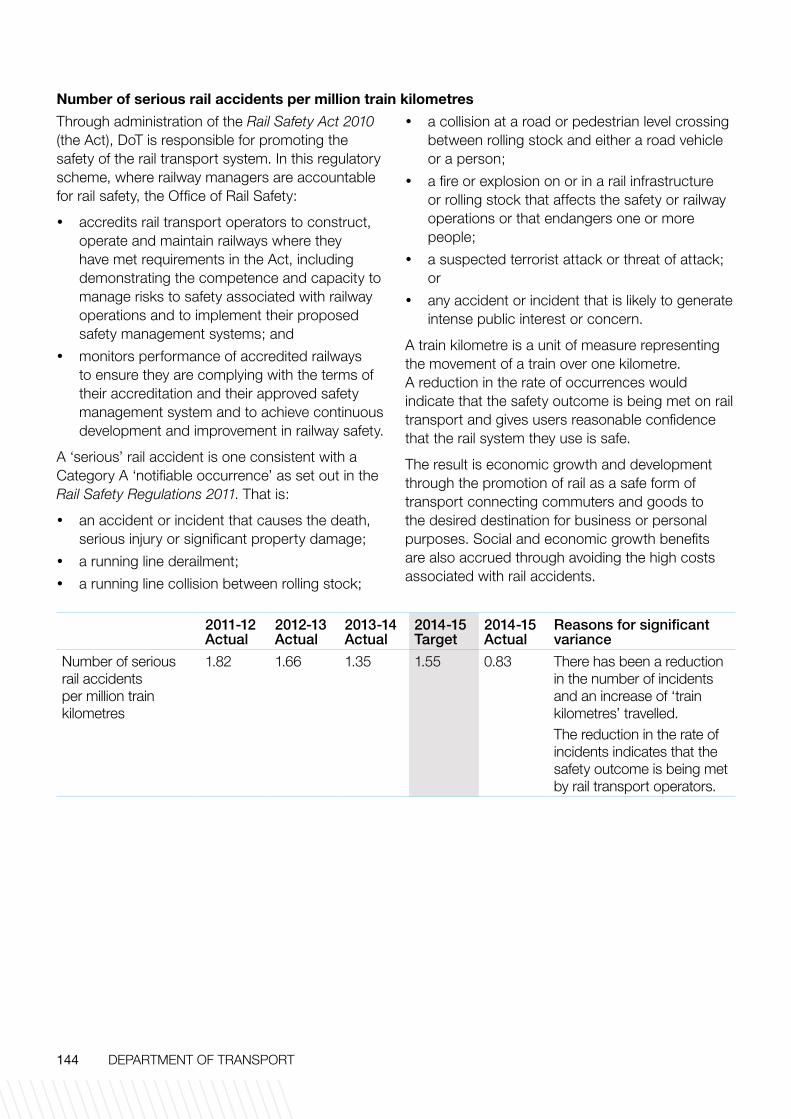
Number of serious rail accidents per million train kilometres
Through administration of the Rail Safety Act 2010 (the Act), DoT is responsible for promoting the safety of the rail transport system. In this regulatory scheme, where railway managers are accountable for rail safety, the Office of Rail Safety:
y accredits rail transport operators to construct, operate and maintain railways where they have met requirements in the Act, including demonstrating the competence and capacity to manage risks to safety associated with railway operations and to implement their proposed safety management systems; and
y monitors performance of accredited railways to ensure they are complying with the terms of their accreditation and their approved safety management system and to achieve continuous development and improvement in railway safety.
A ‘serious’ rail accident is one consistent with a Category A ‘notifiable occurrence’ as set out in the Rail Safety Regulations 2011. That is:
y an accident or incident that causes the death, serious injury or significant property damage;
y a running line derailment;
y a running line collision between rolling stock;
y a collision at a road or pedestrian level crossing between rolling stock and either a road vehicle or a person;
y a fire or explosion on or in a rail infrastructure or rolling stock that affects the safety or railway operations or that endangers one or more people;
y a suspected terrorist attack or threat of attack; or
y any accident or incident that is likely to generate intense public interest or concern.
A train kilometre is a unit of measure representing the movement of a train over one kilometre. A reduction in the rate of occurrences would indicate that the safety outcome is being met on rail transport and gives users reasonable confidence that the rail system they use is safe.
The result is economic growth and development through the promotion of rail as a safe form of transport connecting commuters and goods to the desired destination for business or personal purposes. Social and economic growth benefits are also accrued through avoiding the high costs associated with rail accidents.
2011-12 Actual
2012-13 Actual
2013-14 Actual
2014-15 Target
2014-15 Actual
Reasons for significant variance
Number of serious rail accidents per million train kilometres
1.82 1.66 1.35 1.55 0.83 There has been a reduction in the number of incidents and an increase of ‘train kilometres’ travelled. The reduction in the rate of incidents indicates that the safety outcome is being met by rail transport operators.
144 DEPARTMENT OF TRANSPORT

ANNUAL REPORT 2014-15 145

Efficiency Key Performance Indicators
Service one: Transport system and services development, planning, operation and regulationTransport system and services development, planning, operation and regulation are designed to improve accessibility and safety of the transport system for all Western Australians.
This service contributes to the Government’s Framework for Strategic Management Goal – Results Based Service Delivery through:
y integration between and within transport modes;
y managing heavy vehicle freight movement to major industrial and intermodal sites;
y increasing accessibility to a reasonable level of transport services for all individuals, businesses and communities;
y encouraging sustainable choices through programs, such as TravelSmart and cycling promotions;
y provision and management of infrastructure, including small craft facilities and marine navigation aids, to maintain safe and accessible transport operations;
y setting competencies/standards and monitoring compliance for operators, vehicles and vessels in the on-demand transport and maritime industries;
y developing policies, standards and guidelines for rail safety regulation, accrediting rail owners and rail operators in accordance with relevant standards, and ensuring rail owners and operators comply with the terms of their accreditation;
y developing and implementing policies and strategies to facilitate safe navigation and safe use of the State’s waterways;
y maintaining effective contingency response strategies and mechanisms to combat marine transport emergencies and marine environmental pollution incidents;
y safe jetties through licensing;
y marine and transport related data collection, analysis and dissemination; and
y provision of cartographic information services.
146 DEPARTMENT OF TRANSPORT

The key efficiency performance indicators used to measure this performance are detailed below:
Cost of regulation per taxi plate administered
2011-12Actual
2012-13Actual
2013-14Actual
2014-15ActualBudget
2014-15Actual
$0
$500
$1000
$1500
$2000
$2500
$3000
$3500
$3,0
61
$3,0
97.9
1
$3,3
01.3
2
$3,2
07.6
3
$3,4
78.7
2
Reasons for significant varianceTaxi plate release slowed in response to softening in demand for taxi services. The number of taxi plates regulated did not increase at the rate initially anticipated, resulting in an increased cost of regulation per taxi plate administered.
Average cost per day per maritime infrastructure asset managed
2011-12Actual
2012-13Actual
2013-14Actual
2014-15ActualBudget
2014-15Actual
$0
$10
$20
$30
$40
$50
$60
$70
$80
$62.
81 $7
9.23
$76.
34
$70.
24
$74.
90
Reasons for significant varianceThe total cost to manage maritime infrastructure assets exceeded the 2014-15 published budget by $4.27 million. Additional funds of $1.75 million were spent to address channel dredging and sand bypassing to maintain safety navigation in various locations across the State. Depreciation expenses were over-budget by $2.25 million primarily due to DoT taking over the Two Rocks Marina facility.
Average survey cost per commercial vessel
2011-12Actual
2012-13Actual
2013-14Actual
2014-15ActualBudget
2014-15Actual
$0
$500
$1000
$1500
$2000
$2500
$3000
$3500
$4000
$2,4
88
$2,6
91
$3,5
14
$2,8
07.7
9
$3,3
83.7
2
Reasons for significant varianceNo significant variance noted this year between target and actual.
ANNUAL REPORT 2014-15 147

Average cost per recreational vessel registration
2011-12Actual
2012-13Actual
2013-14Actual
2014-15ActualBudget
2014-15Actual
$0
$20
$40
$60
$80
$100
$120
$94.
71
$105
.77
$98.
34
$100
.11
$102
.74
Reasons for significant varianceNo significant variance noted this year between target and actual.
Cost to maintain marine pollution response preparedness per registered vessel
2011-12Actual
2012-13Actual
2013-14Actual
2014-15ActualBudget
2014-15Actual
$0
$5
$10
$15
$20
$25
$23.
04
$20.
05
$18.
52
$19.
65
$17.
64
Reasons for significant varianceThe application of the National Law in July 2013 resulted in a change of definition in what constituted a survey vessel under the previous Western Australian Law. This variation meant that some vessels previously requiring survey are now survey exempt under the National Law and can now be surveyed anywhere in Australia regardless of the area of operation. In addition, a decrease in volumes can be attributed to a demobilisation of vessels involved in major resource construction projects in the North West and a continued reduction in the commercial fishing vessel fleet around the State. The actual cost is lower than the target due to vacancies not filled during periods in 2014-15.
Average cost per household contacted under the ‘TravelSmart’ scheme
2011-12Actual
2012-13Actual
2013-14Actual
2014-15ActualBudget
2014-15Actual
$0
$50
$100
$150
$200
$250
$300
$265
.51
$164
.09
$0
$144
.47
$126
.63
Reasons for significant varianceAn additional 259 households above forecast were recruited into the program by 30 June 2015.The program was delivered with reduced resources following a review of DoT’s Transport Strategy and Reform Directorate.
148 DEPARTMENT OF TRANSPORT

Outcome two:
Vehicles and road users that meet established vehicle standards and driver competencies to deliver safe vehicles and safe driversThe Road Traffic Act 1974 (until 26 April 2015) and thereafter the Road Traffic (Authorisation to Drive) Act 2008, Road Traffic (Vehicles) Act 2012 and Road Traffic (Administration) Act 2008 confers on DoT through Driver and Vehicle Services (DVS), the responsibility for licensing the State’s drivers and registering vehicles. Drivers must demonstrate that they are competent to drive a vehicle through complying with the requirements of Section 16 of the Road Traffic (Authorisation To Drive) Regulations 2014. Vehicles must be registered before they may lawfully be used on the road. Road Traffic (Vehicles) Regulations 2014 details the specific requirements for examination against the Australian Design Rules which allow a vehicle to be deemed roadworthy.
DoT measures its effectiveness in meeting this outcome through measuring:
y The percentage of vehicle examinations completed in accordance with the Australian Design Rules assessed by audit; and
y The percentage of driver licences issued that comply with the Graduated Driver Training and Licensing System assessed by audit.
ANNUAL REPORT 2014-15 149

Effectiveness Key Performance IndicatorsPercentage of vehicle examinations completed in accordance with the Australian Design Rules assessed by audit
The road laws as defined in the Road Traffic (Administration) Act 2008 confers on DoT responsibility for licensing the State’s vehicles. Vehicles must be licensed before they may lawfully be used on the road. Registration is conferred only where a vehicle is deemed roadworthy (passed examination).
This indicator measures the extent to which vehicle examinations are conducted according to processes designed to establish levels of roadworthiness pursuant to the provisions of the road laws as defined in the Road Traffic (Administration) Act 2008 and related regulations.
The Road Traffic (Vehicles) Regulations 2014 detail specific requirements for vehicles, including dimensions, braking, lighting and emissions – all of which must conform to the Australian Design Rules (as at the date of manufacture of the vehicle). DoT’s Vehicle Examiners and personnel at Authorised Inspection Stations (AIS) are registered motor vehicle mechanics and trained to examine vehicles in accordance with the Australian Design Rules.
The Motor Vehicle “Certificate of Inspection” form is used to record details of the vehicle examination.
2011-12 actual
2012-13 actual
2013-14 actual
2014-15 target
2014-15 Actual
Reasons for significant variance
Percentage of vehicle examinations completed in accordance with the Australian Design Rules assessed by audit (safe vehicles)
99.25% 87.75% 85% 100% 90% DoT has identified improvements in workflow practices associated with the electronic Vehicle Inspection System at Authorised Inspection Stations (AIS).
From October 2014, DVS introduced a new online electronic solution whereby AIS providers return the original certificate of inspection forms directly to DVS on a monthly basis which has improved this index.
It is anticipated performance will continue to improve once the new process has been in place for a full year.
150 DEPARTMENT OF TRANSPORT
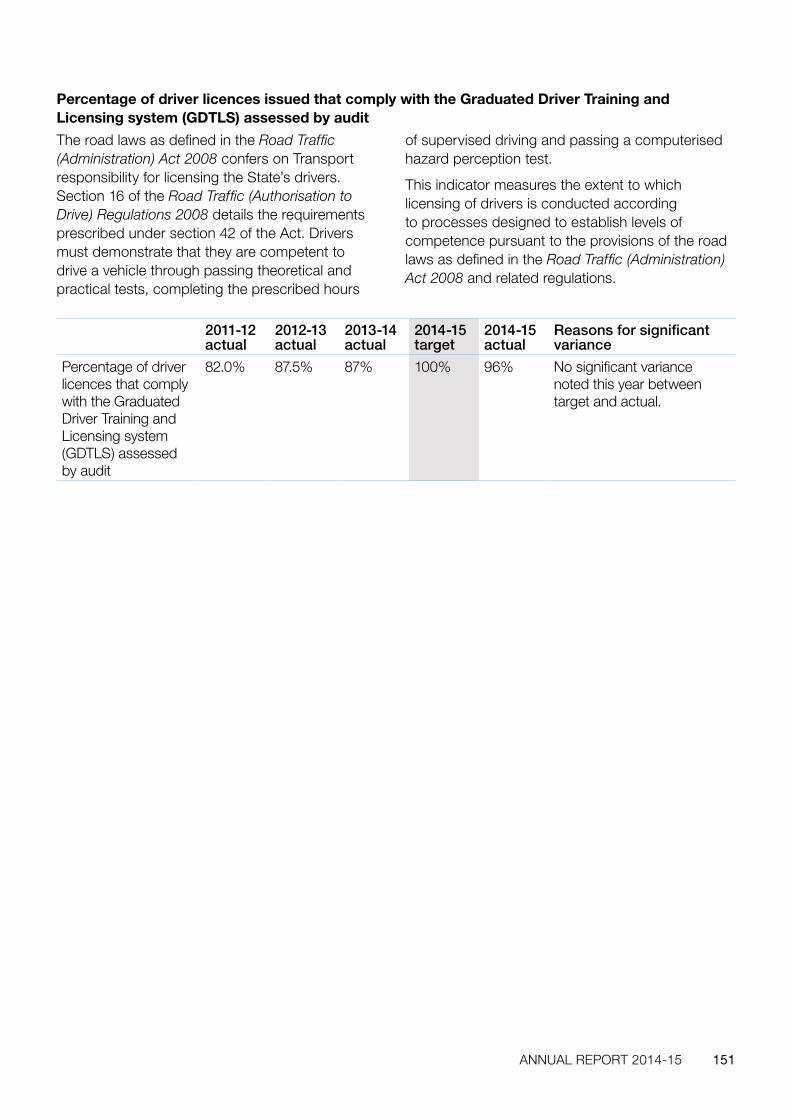
Percentage of driver licences issued that comply with the Graduated Driver Training and Licensing system (GDTLS) assessed by audit
The road laws as defined in the Road Traffic (Administration) Act 2008 confers on Transport responsibility for licensing the State’s drivers. Section 16 of the Road Traffic (Authorisation to Drive) Regulations 2008 details the requirements prescribed under section 42 of the Act. Drivers must demonstrate that they are competent to drive a vehicle through passing theoretical and practical tests, completing the prescribed hours
of supervised driving and passing a computerised hazard perception test.
This indicator measures the extent to which licensing of drivers is conducted according to processes designed to establish levels of competence pursuant to the provisions of the road laws as defined in the Road Traffic (Administration) Act 2008 and related regulations.
2011-12 actual
2012-13 actual
2013-14 actual
2014-15 target
2014-15 actual
Reasons for significant variance
Percentage of driver licences that comply with the Graduated Driver Training and Licensing system (GDTLS) assessed by audit
82.0% 87.5% 87% 100% 96% No significant variance noted this year between target and actual.
ANNUAL REPORT 2014-15 151
Efficiency Key Performance Indicators
Service two: Driver and vehicle servicesThe road laws as defined in the Road Traffic (Administration) Act 2008 confers on DoT responsibility for licensing the State’s drivers and registering vehicles. Drivers must demonstrate that they are competent to drive a vehicle through passing theoretical and practical tests, completing the prescribed hours of supervised driving and passing a computerised hazard perception test.
Vehicles must be registered before they may lawfully be used on the road. Registration is conferred only where a vehicle is roadworthy.
This service contributes to the Government’s Results Based Service Delivery of ‘Greater focus on achieving results in key service delivery areas for the benefit of all Western Australians’, through:
y setting motor vehicle standards in accordance with national and State Government requirements, examining motor vehicles for compliance with those standards and registering and transferring compliant motor vehicles;
y setting standards and requirements within government policies for the issue of a licence to drive on roads;
y assessing driver competency, issuing and renewing driver licences in accordance with national and state government requirements and driver competency standards;
y maintaining a database of registered vehicles and drivers, and managing vehicle identification numbers, to support the enforcement of road traffic and other relevant laws;
y collecting revenue for vehicle and driver licensing on behalf of other government agencies; and
y informing and educating road users about driver licensing, vehicle registration and related requirements.
152 DEPARTMENT OF TRANSPORT

The key efficiency performance indicators used to measure this performance are:
Average cost per vehicle and driver transaction
2011-12Actual
2012-13Actual
2013-14Actual
2014-15ActualBudget
2014-15Actual
$0
$5
$10
$15
$20
$17.
57
$18.
28
$17.
35
$17.
58
$17.
19
Reasons for significant varianceNo significant variance noted this year between target and actual.
Average cost per vehicle inspection
2011-12Actual
2012-13Actual
2013-14Actual
2014-15ActualBudget
2014-15Actual
$0
$20
$40
$60
$80
$100
$120
$85.
63
$99.
43
$111
.82
$98.
07
$111
.01
Reasons for significant varianceThe variance is primarily due to increased Authorised Inspection Station (AIS) commission payments as the proportion of inspections performed in the metropolitan area shifts from DoT to AIS faster than anticipated. DoT will continue to transition its business to accommodate this shift.
ANNUAL REPORT 2014-15 153

Average cost per driver assessment
2011-12Actual
2012-13Actual
2013-14Actual
2014-15ActualBudget
2014-15Actual
$0
$20
$40
$60
$80
$100
$120
$83.
41 $99.
54
$108
.35
$103
.85
$107
.59
Reasons for significant varianceNo significant variance noted this year between target and actual.
Percentage of drivers’ licence cards issued within 21 days of completed application
2011-12Actual
2012-13Actual
2013-14Actual
2014-15ActualBudget
2014-15Actual
$0
$20
$40
$60
$80
$100
100%
99.9
0%
100%
100%
100%
Reasons for significant varianceNo significant variance noted this year between target and actual.
154 DEPARTMENT OF TRANSPORT

Outcome three:
Integrated transport systems that facilitate economic developmentThe transport function is integral to business and commerce and important for social interaction and connecting communities. Therefore a major focus of DoT is on strategic transport policy and planning across the range of public and commercial transport systems that service WA.
DoT, through its Policy, Planning and Investment Division, develops, integrates and regulates the State’s transport systems and infrastructure.
DoT determines, through its policy and planning role, the location of major transport routes and
infrastructure, their suitability for a range of transport services and how each integrates into the broader transport system for boats, trains, planes and vehicles.
DoT measures its effectiveness in meeting this outcome through measuring:
y Percentage of containerised freight transported via rail in relation to total metropolitan container movements to and from Fremantle port.
A major focus of DoT is on strategic transport policy and
planning across transport systems that service WA.
ANNUAL REPORT 2014-15 155

Percentage of containerised freight transported via rail in relation to total metropolitan container movements to and from Fremantle Port
The Fremantle Inner Harbour is serviced by both road and rail. The rail container service plays an important role in reducing truck movements on port roads and thereby addressing road congestion, noise, accidents and emissions. The State Government has a long-term target of transporting 30 per cent of all Inner Harbour containers by rail.
The North Quay Rail Terminal (NQRT) operator has received financial support in the form of a subsidy from the State Government since 2006 to support the abovementioned objectives. The support has been in recognition of the strategic importance of rail and the difficulty for rail to compete with road transport over short distances. DoT manages the current five year $15.5 million subsidy allocation. The current arrangement will cease in June 2017.
The subsidy received by the NQRT operator is passed on to its customers through reduced prices. The price per container transported by rail includes the additional handling costs associated with rail and the cost to transport containers between
NQRT and the stevedore yards or to other container parks located in the Inner Harbour. These NQRT related costs are not incurred when road transport services are used from the outset. The subsidy assists in reducing the difference between the road and rail transport costs associated with transporting a container, thereby making rail transport a more attractive option.
The total annual subsidy amount and rate per Twenty Foot Equivalent Unit (TEU) container gradually reduces over time. The intention is for funding assistance to reduce over time as rail volumes grow and rail establishes itself in the market.
The rail container service experiences short to medium term fluctuations in the number of containers transported due to general economic conditions, commercial decisions and seasonal factors. However, total container trade through the port, including rail volumes, are expected to continue to grow over the long-term.
2011-12 actual
2012-13 actual
2013-14 actual
2014-15 target
2014-15 actual
Reasons for significant variance
Percentage of containerised freight transported via rail in relation to total metropolitan container movements to and from Fremantle Port
13.4% 13.8% 13.6% 14.5% 13.2% Rail growth was on target until the temporary closure of the Fremantle rail bridge in August 2014, following damage caused by a vessel. Rail containers were transported by road for three weeks while the bridge was closed, which significantly reduced rail’s market share. Other factors such as a reduction in containerised grain also contributed to the variance.
156 DEPARTMENT OF TRANSPORT

Efficiency Key Performance Indicators
Service three: Strategic transport policy and integrated planningThis service contributes to the Government’s Framework for the Strategic Management goal ‘State building – major projects’ by providing leadership for strategic management, development and protection of economic transport nodes and networks through:
y the provision of an integrated transport policy framework to guide Government and the private sector in decision making;
y the provision and coordination of integrated state-wide transport policy including those of national significance and those involving multi-modal solutions;
y ensuring the transport policy framework supports cost effective transport systems and services.
y developing an agreed state-wide integrated transport strategy;
y undertaking state wide capital investment planning, evaluation and prioritisation;
y integrated planning for major transport system projects;
y development of funding principles and pricing signals to ensure appropriate development and use of transport assets;
y improving freight access to key terminals, improving freight flows and increasing competitiveness through reduced costs;
y reducing the costs associated with road trauma by enhancing the accessibility and safety of public transport systems;
y providing for the efficient distribution of goods and services to business and the community;
y ensuring flexibility to meet the demands of a changing economy and market environments; and
y enabling commuter access to industrial centres and to the services and goods they require.
ANNUAL REPORT 2014-15 157

The key efficiency performance indicators used to measure this performance are:
Average cost per policy hour for strategic transport policy development
2011-12Actual
2012-13Actual
2013-14Actual
2014-15ActualBudget
2014-15Actual
$0
$20
$40
$60
$80
$100
$120
$88.
79
$103
.94
$86.
49
$94.
03
$96.
04
Reasons for significant variance No significant variance noted this year between target and actual.
Average cost per planning hour for integrated transport planing development
2011-12Actual
2012-13Actual
2013-14Actual
2014-15ActualBudget
2014-15Actual
$0
$30
$60
$90
$120
$150
$126
.38
$96.
13
$104
.64
$126
.95
$129
.18
Reasons for significant variance No significant variance noted this year between target and actual.
MINISTERIAL DIRECTIVESNo ministerial directives were received during the 2014-15 financial year.
158 DEPARTMENT OF TRANSPORT

OTHER FINANCIAL DISCLOSURESPricing policies of services providedDoT reviews fees and charges annually to reflect, where legally permissible, full cost recovery in the provision of services, pursuant to the departmental policy for costing and pricing.
The following gazettes contain variations to DoT’s fees and charges for the 2014-15 financial year:
y Western Australian Government Gazette No. 71 dated 16 May 2014;
y Western Australian Government Gazette No. 77 dated 30 May 2014;
y Western Australian Government Gazette No. 85 dated 13 June 2014; and
y Western Australian Government Gazette No. 95 dated 27 June 2014.
Major capital projectsMajor capital projects are those over $5 million.
Capital projects incompleteExmouth Boat Harbour
Expected year of completion: 2015-16
$’000
Project life spent up to 30 June 2015 1,000
Estimated cost to complete 17,275
Estimated total cost of project 18,275
ANNUAL REPORT 2014-15 159

EMPLOYMENT AND INDUSTRIAL RELATIONS
Full-time equivalents (FTE) and headcount, as at 30 June 2015:
Status Headcount* FTE*
Permanent full-time 1,135 1,135.00
Permanent part-time 200 124.05
Temporary full-time 134 134.00
Temporary part-time 26 16.68
Senior Executive Service 19 19.00
Total 1,514 1,428.73
*Headcount and FTE numbers include paid employees and employees on unpaid leave.
During 2014-15, DoT continued to work in partnership with the Joint Consultative Committee and union delegates to discuss initiatives and address any issues.
160 DEPARTMENT OF TRANSPORT
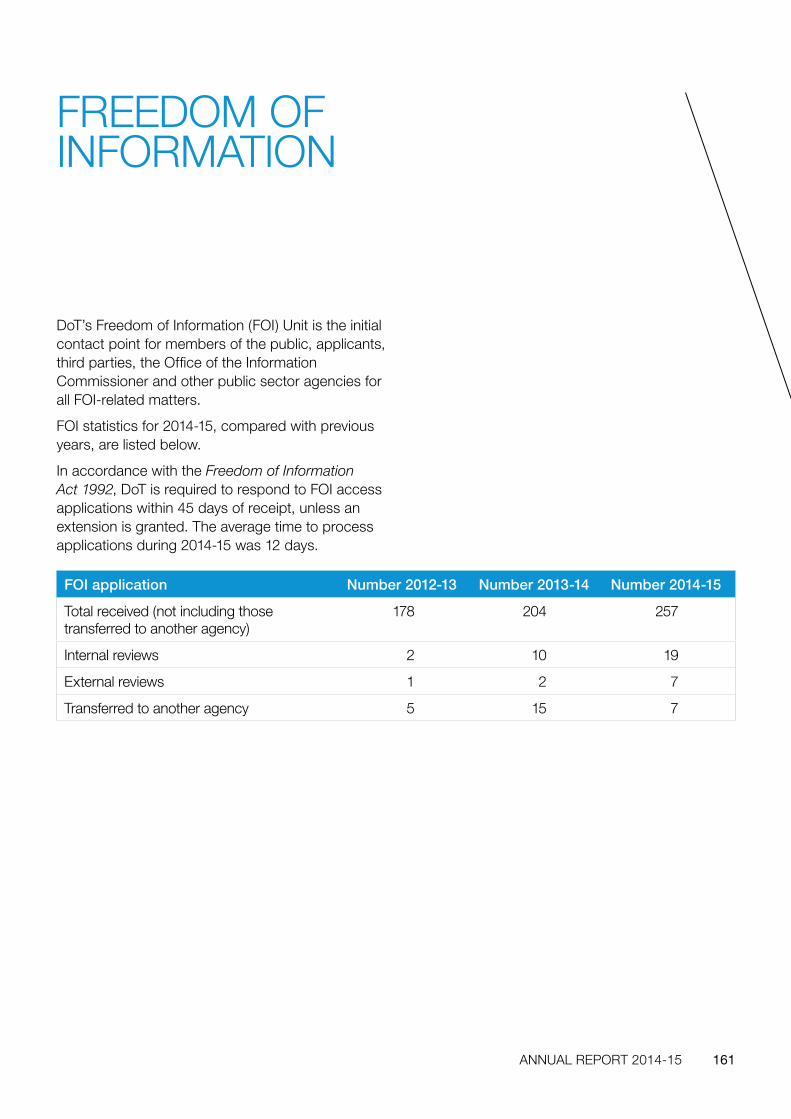
FREEDOM OF INFORMATION
DoT’s Freedom of Information (FOI) Unit is the initial contact point for members of the public, applicants, third parties, the Office of the Information Commissioner and other public sector agencies for all FOI-related matters.
FOI statistics for 2014-15, compared with previous years, are listed below.
In accordance with the Freedom of Information Act 1992, DoT is required to respond to FOI access applications within 45 days of receipt, unless an extension is granted. The average time to process applications during 2014-15 was 12 days.
FOI application Number 2012-13 Number 2013-14 Number 2014-15
Total received (not including those transferred to another agency)
178 204 257
Internal reviews 2 10 19
External reviews 1 2 7
Transferred to another agency 5 15 7
ANNUAL REPORT 2014-15 161

DoT’s Complaints Handling Policy provides a flexible approach where complaints can be made in person, by phone, fax, online or in writing.
The implementation of this policy in line with the Australian Standard on Complaints Handling (AS ISO 10002-2006) is guided by DoT’s Complaints Handling Procedures.
Complaints are managed through DoT’s Customer Feedback System (CFS), which is administered within Objective – the department’s electronic document and record management system.
As well as complaints, the CFS records compliments, general feedback and requests for information. However, this feedback may also be handled directly by individual DoT directorates.
Customer feedback may relate to access to information, service standards and facilities (including fees, fines and costs) or the legislation, regulations and standards that DoT administers.
Feedback statistics recorded through the CFS for 2014-15, compared with previous years, are shown below.
The total feedback received by DoT in 2014-15 decreased by two per cent from 2013-14. DoT’s largest directorate, Driver and Vehicle Services, accounted for 90 per cent of the feedback received.
CUSTOMER FEEDBACK
Feedback type Number received 2012-13
Number received 2013-14
Number received 2014-15
Complaints 1,426 2,060 2,225
Compliments, feedback and requests for information
1,407 1,700 1,468
Total 2,833 3,760 3,693
Driver and Vehicle Services,
accounted for 90 per cent of
the feedback received.
162 DEPARTMENT OF TRANSPORT

Developing our people managers In 2014-15, DoT continued to place a high priority on developing the people management competencies of its frontline leaders.
People Managers ProgramThrough the ongoing success of the People Managers Program, an additional 40 first-time and entry-level managers were equipped with practical skills to build and lead high-performing teams.
The 12-month program is specifically tailored to DoT’s operations so participants can apply their new skills and knowledge in their everyday roles. People managers take part in four hands-on workshops and undertake a range of assessment activities, with successful completion earning them a nationally-accredited Certificate IV in Frontline Management.
In February 2015, 20 managers graduated from the program, with the remaining 20 due to graduate in September 2015. The program has been well-received by both the managers and their teams and will continue to mid-2016 when it scheduled to be reviewed.
Leadership Development and Induction ProgramDoT developed and implemented a Leadership Development and Induction Program for new DVS Centre Team Leaders in 2014-15. The program is specifically tailored to the skills required to succeed as a leader in the dynamic centre environment and covers key competencies required to be an effective people manager as well as personal and leadership development.
The program assisted 16 newly appointed Team Leaders to excel in their unique and challenging roles in 2014-15 and will be used to induct similar intakes in the future.
Setting staff up for success through Performance Partnership ProgramDoT’s Performance Partnership Program (PPP) provides a framework for people managers and employees to have ongoing discussions about performance objectives, measures and training and development needs.
In 2014-15, DoT continued to implement and improve the PPP to ensure all staff have individual performance plans in place aligned to its strategic direction.
A tailored ‘PPP Express’ training program was rolled out to support managers in setting their teams up for success. The five, shorter, more interactive modules offered cover a range of topics including addressing performance issues. To date, 21 per cent of people managers have attended at least one module and this number is expected to grow as the training continues.
INVESTING IN OUR GREAT PEOPLE
ANNUAL REPORT 2014-15 163

An upward feedback process was also successfully piloted and incorporated into the program. It gives employees the opportunity to provide their managers with constructive feedback based on how well they believe their performance is aligned to DoT’s core values. Managers then participate in a coaching session to explore the results and complete an action plan to assist in further aligning their behaviours to the values.
Overall, employee participation in the PPP improved throughout the year, with the number of staff with an individual performance plan in place increasing from 73 per cent in September 2014 to 93 per cent in February 2015. Further, program reporting indicates that 98 per cent of DoT staff are meeting expectation.
In 2015-16, DoT will continue to improve the PPP by developing career coaching skills for managers and learning sessions for employees.
Building priority skills with scholarship program DoT’s scholarship program demonstrates its commitment to ongoing learning for staff by supporting employees to undertake relevant formal study.
The program provides valuable opportunities for employees to improve their skills and knowledge in fields that have been identified as being of high priority in enabling DoT to achieve its business objectives.
In 2014-15, the program targeted business-related study, with 11 scholarships awarded to recipients in the fields of transport economics, policy and engineering as well as project and asset management and business administration.
The People Managers Program
164 DEPARTMENT OF TRANSPORT

Moving towards a more culturally diverse and aware workforceDoT continues to implement strategies outlined in the DoT Workforce and Diversity Plan 2012-2016 to move towards a more culturally diverse and aware workforce.
Key among these strategies is ongoing participation in the Public Sector Aboriginal Traineeship Program to increase Aboriginal representation within DoT. DoT aims to increase its participation levels in 2015-16, requesting five metropolitan and three regionally based trainee placements.
Other achievements contributing to the implementation of the plan in 2014-15 include:
y conducting a review of the DoT diversity framework to enable a more effective approach to embracing and improving cultural diversity;
y providing online training courses for new and existing staff aimed at increasing awareness and understanding of the needs of Aboriginal and Torres Islander peoples and other ethnic groups; and
y embracing National Aborigines and Islanders Day Observance Committee (NAIDOC) Week celebrations.
In 2015-16, DoT will review the strategies outlined in the plan and identify new strategies to continue to enable a culturally diverse and aware workforce from 2016-2020.
Continuing our cultural development journey Throughout the year, DoT continued to embed its core values of Clear Direction, Fresh Thinking, Excellent Service and Great People across the agency through a number of cultural development activities.
The activities are aimed at bringing these values – which represent who we are, what we do and how we want to work – to life at DoT.
The Fresh Think Tank, DoT’s online innovation forum, is now home to almost 500 business improvement ideas submitted by employees all over the state. More than 70 of these ideas have been successfully implemented and are delivering benefits to DoT staff and customers.
In April 2015, a cross-organisation team focusing on Excellent Service came together to identify, share and promote examples of DoT staff living this value and develop tools and resources to benefit our internal and external customers.
This approach has proved successful in embedding the values of Clear Direction and Fresh Thinking in previous years and will continue in 2015-16 with Great People. DoT will also continue to ensure its policies, procedures, plans and people practices are aligned to the values.
CREATING A WORKPLACE WHERE PEOPLE WANT TO BELONG
ANNUAL REPORT 2014-15 165

Enhancing staff wellbeing DoT offered a range of health promotion initiatives to enhance the wellbeing of staff in 2014-15. The initiatives, delivered through DoT’s Wellness Program, included online and one-on-one health checks, flu vaccinations and access to a range of information and services through the annual Health Fair.
DoT also offered ALERT (Awareness Links and Enable Resilient Teams) sessions aimed at increasing awareness and understanding of mental health, depression, anxiety and suicide prevention.
Recognising exceptional employees DoT’s annual reward and recognition program, the Radar Awards, continued to acknowledge exceptional employees living DoT’s values and contributing to its strategic goals.
GOVERNANCE DISCLOSURESContracts with senior officersDuring 2014-15, other than normal contracts for employment of services, no senior officers or firms of which senior officers are members, or entities in which senior officers have substantial interests, had any interests in existing or proposed contracts with DoT.
166 DEPARTMENT OF TRANSPORT

Act of Grace paymentsDoT did not make any Act of Grace payments in 2014-15.
Advertising As required under section 175ZE of the Electoral Act 1907, the following statement relates to advertising expenditure, which includes creative development, media placement, market research, polling and direct mail.
OTHER LEGAL REQUIREMENTS
Advertising agency 2014/15
Cooch Creative Pty Ltd $15,740
$15,740
Media advertising
Media advertising – non-campaign
Adcorp Australia Limited $102,900
Media advertising – campaign
Carat Australia Media Services Pty Ltd $47,440
$150,340
Market research $89,950
Polling Nil
Direct mail Nil
Total $256,030
ANNUAL REPORT 2014-15 167

Disability Access and Inclusion Plan DoT is committed to providing people with disabilities, their families and carers, the same opportunities to access our products and services as any other member of the community.
This commitment is demonstrated in the Disability Access and Inclusion Plan (DAIP) 2012-17, which identifies a number of key strategies to improve access and inclusion.
These strategies are applied to projects and services delivered across DoT and in 2014-15, universal access to the new Augusta Boat Harbour and Port Geographe coastal facilities was delivered.
Key accessibility features of the Augusta Boat Harbour, which opened in October 2014, include:
y a universal access pontoon, including ramp access, to provide unassisted wheelchair access to vessels for boarding;
y unassisted wheelchair access from bus parking bays to the floating pen system;
y boat launching ramps with two floating jetties that meet assisted accessibility requirements; and
y landscaped plaza area with accessible grade ramps and tactiles.
The new recreational spaces at Port Geographe, completed as the final component of the reconfiguration project in May 2015, provide improved access through:
y accessible playground equipment including an Ability Play Whirl that can accommodate wheelchairs;
y accessible boardwalk to the lagoon beach;
y accessible concrete path grades and ramps with tactiles; and
y a wheelchair-accessible pathway right to the end of the western breakwater.
As part of its four-year trial of purpose-built taxis (PBTs), DoT also commenced a small-scale pilot to access the London Taxi Company TX4 taxi’s suitability to carry passengers in wheelchairs.
The pilot, developed in consultation with the Disability Services Commission and the Insurance Commission of Western Australia, involves a small number of PBTs and passengers in wheelchairs who regularly use taxis. As part of the pilot, DoT appointed National Disability Services (NDS) to develop safe practice guidelines for participants and to develop and deliver training to PBT drivers.
It is anticipated that the pilot will conclude in August 2015. NDS will then prepare a report on the outcomes of the pilot and provide advice on the suitability and limitations of the TX4 as a wheelchair-accessible vehicle.
Port Geographe
Ability Play Whirl that can
accommodate wheelchairs
168 DEPARTMENT OF TRANSPORT

Reconciliation Action PlanDoT is committed to conducting business in ways which promote our relationships with all Aboriginal and Torres Strait Islander people.
This commitment is demonstrated in the Reconciliation Action Plan 2012-2016, which outlines strategies aimed at promoting awareness of the diversity, history, heritage and culture of Aboriginal and Torres Strait Islander people and increasing opportunities for participation.
In 2014-15, DoT continued to effectively engage with Aboriginal and Torres Strait Islander people through a variety of formal and informal mechanisms. Specifically, DoT:
y engaged with the Department of Aboriginal Affairs on general reconciliation planning;
y engaged with the CEO Aboriginal Corporation in relation to provision Regional Airports Development Scheme funding;
y engaged with Aboriginal corporations and private industry to deliver licensing services through the Remote Areas Licensing program; and
y participated in the National Indigenous Driver Licensing Working Group to assist in developing national solutions to issues faced by Aboriginal people seeking to obtain a driver’s licence.
DoT continued to provide marine safety training for Aboriginal students through its Marine Safety Education Boatshed throughout the year. Thirteen students from Clontarf Aboriginal College attended a Recreational Skipper’s Ticket course in the metropolitan area, gaining the knowledge and practical skills needed to safely operate a powerboat in WA. DoT also provided nine weeks of marine education training to young people in regional areas, including Aboriginal youths from remote communities.
In February 2015, DoT established a 12-month contract with stationery supplier Kulbardi Pty Ltd. Kulbardi is Australia’s largest Aboriginal business and contributes part of its profits back to Aboriginal communities.
In recognition of the State Government Aboriginal Economic Participation strategy and amendments to the State Supply Commissions policy, the Department of Finance granted DoT exemption
from the mandatory use of current Common Use Agreement’s for the purchase of copy paper, envelopes, office stationery and kitchen supplies.
The contract leads the way in DoT’s investment in Aboriginal economic participation and DoT looks forward to fostering a working partnership with Kulbardi.
Compliance with Public Sector Standards and ethical codesDoT is committed to fostering a culture of ethical behaviour and ensuring the highest standards of probity and accountability in all interactions. As public servants, DoT’s employees are ultimately working for the people of Western Australia, who expect them to act with integrity and to look after their interests. This places DoT in a position of trust, requiring standards of ethical behaviour that reflect community expectations.
During 2014-15, DoT continued to review its human resource management policies and procedures to empower managers to effectively manage their people in line with DoT’s culture and values.
These reviews resulted in the following:
y The Suspected Breaches of Discipline Policy and Procedure was updated to provide managers with clear direction on how to manage breaches of discipline.
y The Grievance Resolution Policy and Procedure was updated to assist managers and employees to better understand and resolve these types of situations.
y The Conflict of Interest Policy and Procedure and DoT Code of Conduct were updated to ensure DoT employees do not accept gifts, incentives or hospitality from external customers, contractors or members of the public.
y New leave management, time and attendance and flexible working hours policies and procedures were developed to ensure managers and employees understand their responsibilities concerning the accrual and acquittal of leave. In 2015-16, DoT will commence work on a new time and attendance recording system to allow for more streamlined and effective management of leave bookings and approvals.
ANNUAL REPORT 2014-15 169

Additionally, a Management of Displaced Employees Policy and Procedure was developed to incorporate new State Government regulations concerning displaced employees. The new policy and procedure will ensure a greater responsibility is placed on managers to support and manage displaced officers to ensure a positive outcome is reached for both the employee and DoT.
DoT continued to make its Accountable and Ethical Decision Making online training program available to staff throughout 2014-15, with over 95 per cent of employees having completed the program. To ensure staff are consistently provided with up-to-date information around accountable and ethical decision making, DoT also developed an online refresher training program in 2014-15.
Compliance issuesTen breach of standard claims relating to the Employment Standard were received in 2014-15.
Four of the claims were considered and dismissed by the Public Sector Commissioner; three were withdrawn by the claimants; and one was considered by DoT and upheld. The remaining two claims remain ongoing.
In 2014-15, 12 cases of non-compliance with the Code of Ethics/Code of Conduct were reported, eight of which resulted in disciplinary investigations.
Better recordkeepingDoT is committed to best practice recordkeeping to ensure compliance with the State Records Act 2000 (the Act) as well as enable best for business outcomes for the agency. The following information is provided in accordance with the State Records Commission Standard 2, Principle 6.
Efficiency and effectiveness of DoT’s recordkeeping systemsDoT has systems in place to effectively manage records and is committed to electronic recordkeeping including the digitisation of hardcopy records where appropriate.
All DoT staff have access to Objective, the department’s electronic document and record management system, and use it to capture and manage records in line with departmental policies and procedures.
Recordkeeping training and induction programsThe Online Recordkeeping Awareness Training Course is mandatory for all DoT staff. The course covers individual employee’s obligations to comply with both DoT’s recordkeeping policies and the Act.
Assessment of the course is integrated into the online module and feedback provided by staff is monitored and reviewed. Course content is regularly assessed to ensure it reflects current operational and administrative practices and processes.
Around 1,500 DoT staff, including contractors, are enrolled in the online module and of these, 88 per cent have completed the course.
An Objective online training course is available for all new staff and as a resource for existing staff. Comprehensive face-to-face training is also provided to individuals and groups as required.
DoT’s employee induction program also includes information on recordkeeping and the use of Objective and addresses employees’ roles and responsibilities in creating, managing and maintaining government records.
Training effectivenessThe effectiveness of DoT’s recordkeeping and Objective training is evidenced by the increasing number of corporate documents stored and managed in Objective. DoT continues to consolidate Objective as the corporate repository through its focus on electronic recordkeeping.
170 DEPARTMENT OF TRANSPORT

Substantive equalityDoT is committed to providing services to WA’s diverse community in a fair and non-discriminatory manner. In order to achieve this, DoT recognises the cultural diversity of its customers and caters for this appropriately.
During the year, the elimination of barriers to equality in existing services, policies and practices continued to be a priority, with a focus on raising staff awareness of substantive equality, improving the way we communicate with Culturally and Linguistically Diverse (CaLD) customers and improving outcomes for people in remote Western Australia through the obtainment and retention of a driver’s licence.
In doing this, DoT worked closely with the Equal Opportunity Commission and the Office of Multicultural Interests. DoT also continued to engage with and participate in the CaLD community through the CaLD Driver Licensing Reference Group and the Western Australian CaLD Across Government Network.
Raising staff awarenessDoT continued to raise awareness of substantive equality by offering online training to all staff through Diverse WA’s Cultural Competency Training program and making this compulsory for customer-facing employees. Information on substantive equality was also provided to new employees through DoT’s induction program.
Communicating with CaLD customersDoT’s Language Services Policy and Procedure ensures employees are aware of the strategies and available resources to effectively and appropriately communicate with CaLD and hearing impaired customers.
In 2014-15, DoT appointed ONCALL Interpreters and Translators to provide interpreting and translating services under a contact arrangement. ONCALL provided awareness training to key staff, including those based in DoT’s Driver and Vehicle Services (DVS) centres and Customer Contact Centre.
To assist these staff in identifying when to engage interpreting and translating services, DVS developed Language Services Policy Business Rules. The rules also provide clear direction on how to work with an interpreter or translator to ensure equal access to DoT services and have since been adopted and tailored for use by other business areas across DoT.
GOVERNMENT POLICY REQUIREMENTS
DoT is committed to providing services to WA’s diverse
community in a fair and non-discriminatory manner.
ANNUAL REPORT 2014-15 171

Improving outcomes for remote customersDoT’s Remote Areas Licensing program continued to provide licensing services to customers in remote locations across the State in 2014-15.
The program is a combination of strategic project and operational work which aims to:
y reduce barriers faced by people in remote areas when seeking to enter the driver licensing system;
y increase access to all driver and vehicle licensing services for people living in remote areas and provide equitable and sustainable delivery of service to all customers; and
y increase education and awareness of driver and vehicle licence requirements in remote areas.
Mobile service delivery to remote areas was expanded to the Mid West region with a Remote Licensing team commencing operation out of DoT’s Geraldton office in December 2014.
Throughout the financial year, four regionally-based teams servicing Mid West, Goldfields, Gascoyne, Kimberley and Pilbara:
y issued, re-issued, transferred or renewed a total of 279 driver’s licences;
y conducted 428 practical driving assessments; and
y delivered 433 learner’s permit theory tests (including verbal tests).
The teams also attended a number of community open days, organised by the Department of the Attorney General, as part of a multi-agency approach to driver licensing and Aboriginal justice issues.
Theory testing agreements were expanded, with a new provider appointed in Carnarvon. In 2014-15, 469 people successfully completed a theory test through one of DoT’s authorised providers. Program staff continue to work closely with these providers by delivering training, materials and ongoing support.
Audit and Risk Management CommitteeThe Audit and Risk Management Committee (ARMC) plays a key role in fulfilling the DoT’s corporate governance and monitoring responsibilities in relation to reporting, internal control structure, risk management systems, external audit and internal audit functions.
The committee is made up of the following members:
y Director General – Transport (Chair of the committee);
y Managing Director – Policy Planning and Investment;
y Managing Director – Transport Services;
y Director – Office of the Director General;
y MRWA Executive Director – Finance and Commercial Services; and
y KPMG (contracted internal auditor).
The committee also contains two ex-officio members:
y Executive Director – Investment and Finance Coordination (Chief Finance Officer); and
y Manager – Governance and Audit (Office of the Director General).
A representative from the Office of the Auditor General also attends meetings as an independent observer.
The committee met five times in 2014-15.
172 DEPARTMENT OF TRANSPORT

Internal AuditDoT’s internal audits are conducted by DoT’s contracted internal auditors, KPMG, in accordance with the Financial Management Act 2006 and Institute of Internal Auditors International Standards for the Professional Practice of Internal Auditing.
During 2014-15, internal audits were carried out on:
y budget system management processes;
y coastal infrastructure standardisation of fees and charges;
y driver’s licence processing;
y information technology systems development;
y omnibus licensing and compliance process; and
y vehicle inspections governance.
Recommendations derived from the internal audits are managed and monitored through DoT’s Audit Recommendation Management System. The implementation status of these recommendations is reported to the ARMC on a quarterly basis.
Risk ManagementDoT’s comprehensive risk management process meets the requirements of Treasurer’s Instruction 825 and the Public Sector Commissioner’s Circular 2015/03: Risk Management and Business Continuity Planning, and is aligned to the international standard AS/NZS ISO 31000:2009 Risk Management – Principles and Guidelines.
DoT’s structured Risk Management approach is integrated into planning, management and operational processes and assists DoT to achieve its desired outcomes by providing a transparent process that identifies what is essential to success and demonstrates the decision making process regarding the acceptance of risks.
The ARMC provides oversight for risk management across DoT. Risks rated as high are reported on to Corporate Executive and the ARMC on a quarterly basis.
Marine Safety compliance
ANNUAL REPORT 2014-15 173

In accordance with the Public Sector Commissioner’s Circular 2009-11: Code of Practice: Occupational Safety and Health in the Western Australian Public Sector, DoT complies with the requirements of the Occupational Safety and Health Act 1984, the Workers’ Compensation and Injury Management Act 1981 and the Code of Practice: Occupational Safety and Health in the Western Australian Public Sector 2007.
Our commitment DoT recognises the value of its employees and is committed to preventing injury and illness by providing a safe and healthy work environment. The success of occupational health and safety (OHS) and injury management (IM) activities is reliant upon the active participation and cooperation of all staff. DoT’s OHS commitment is designed to raise awareness of safety and health obligations and to promote safer work practices.
This commitment is strongly supported at the executive level. DoT’s OHS Policy has been endorsed by the Director General and the Corporate OHS Management Committee was established on the Director General’s behalf. The committee is comprised of all Executive Directors, General Managers and DoT’s OHS Branch and is accountable for the management of OHS within DoT, responsible for identifying and implementing initiatives, and charged with making recommendations on policy and strategy to the Corporate Executive.
In the event that a workplace injury occurs, DoT has an established IM program which details the steps taken to assist injured employees to return to work as soon as medically appropriate. The procedure ensures that IM intervention occurs promptly and effectively, so that injured employees can remain at work or return to work at the earliest appropriate time. DoT’s IM procedure is compliant with the requirements of the Workers’ Compensation and Injury Management Act 1981 and the Workers’ Compensation Code of Practice (Injury Management) 2005.
Both DoT’s OHS and IM systems are available to staff on the intranet. OHS and IM information is widely communicated as part of training sessions designed for new employees and managers/supervisors.
OHS information is also communicated through various OHS sub-committees. Due to the variation in roles and functions of DoT’s business units, as well as the different physical locations, there are three sub-committees chaired by a relevant Executive Director or General Manager: the Marine House and Regional Services OHS Sub-committee; the Driver and Vehicles Services and Passenger Services OHS Sub-committee; and the 140 William Street OHS Sub-committee.
OCCUPATIONAL SAFETY, HEALTH AND INJURY MANAGEMENT
174 DEPARTMENT OF TRANSPORT

Key achievements A number of key OHS and IM achievements were made in 2014-15:
y New Alcohol and Drug Policy and Procedure developed and endorsed. The policy and procedure outline a zero tolerance approach to alcohol and drugs in the workplace in line with DoT’s values.
y Continued focus on training, with 88 per cent of managers trained in their OHS and IM responsibilities and 98 per cent of safety and health representatives completing a mandatory five-day training course tailored to DoT’s OHS policies, procedures and guidelines.
y Ergonomic information sessions conducted at major DoT sites and sessions focusing on vehicle ergonomics conducted in all regional offices.
y Quarterly coaching sessions provided to safety and health representatives.
y OHS and IM training offered to employees based in regional offices via video conference.
y Successful delivery of DoT’s Wellbeing program which included flu vaccinations, online and one-on-one health checks, Lunch and Learn information sessions and access to corporate gym membership and corporate health insurance discounts.
y ALERT (Awareness Links and Enable Resilient Teams) sessions aimed at increasing awareness and understanding of mental health, depression, anxiety and suicide prevention included in DoT’s ongoing corporate training.
y Successful ongoing implementation of the Management of Customer Aggression Policy and Guidelines and Managing Difficult Customer Interactions training sessions, which support employees in managing difficult and aggressive customers.
y ‘DoT’s traffic light approach to dealing with aggressive customers’ visual prompt developed for display at customer-facing work stations to assist employees in dealing with aggressive customers.
y Successful staff relocations to new DoT premises in the Stirling precinct and Mirrabooka DVS Centre, which included the review of office layout, furniture, emergency procedures, risk assessments and first aid requirements.
y Suspicious Packages and Hazchem Spill Kit and accompanying procedures and instructions distributed to all DoT locations where mail is opened.
y Bomb Threat Checklist made available on DoT’s intranet to inform and educate employees and guide them in the event that a threat is received.
The new DoT location in the Stirling precinct.
ANNUAL REPORT 2014-15 175
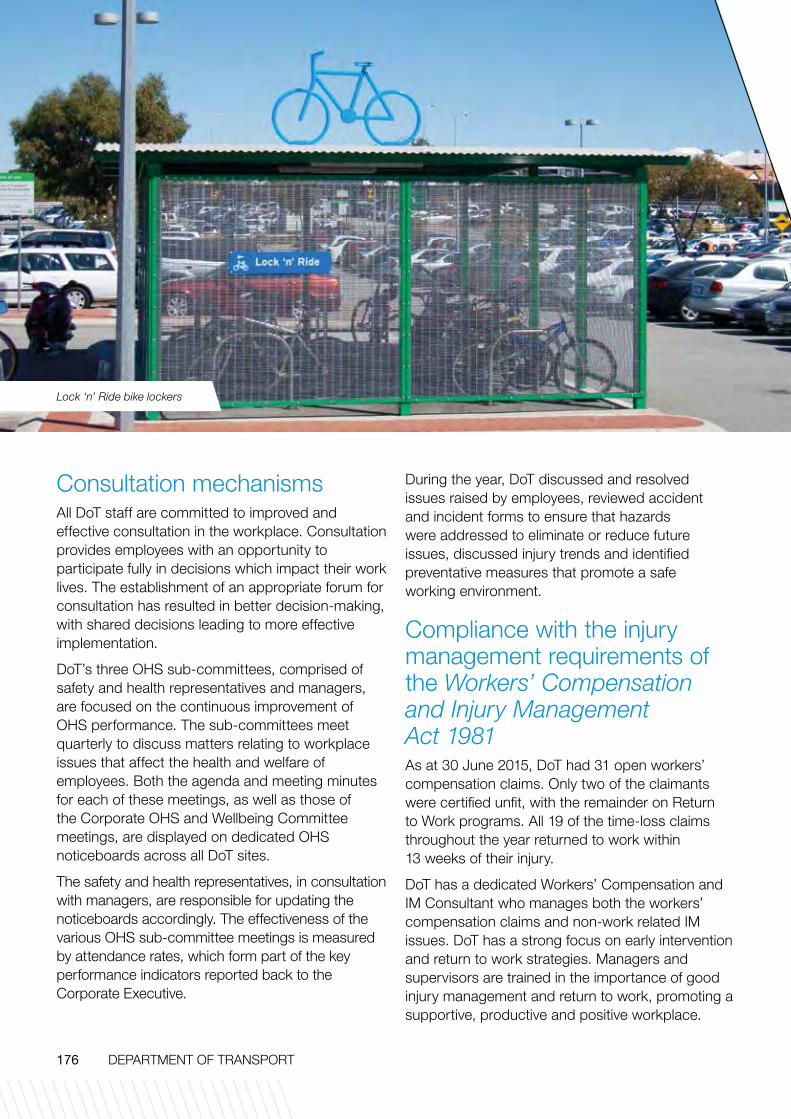
Consultation mechanismsAll DoT staff are committed to improved and effective consultation in the workplace. Consultation provides employees with an opportunity to participate fully in decisions which impact their work lives. The establishment of an appropriate forum for consultation has resulted in better decision-making, with shared decisions leading to more effective implementation.
DoT’s three OHS sub-committees, comprised of safety and health representatives and managers, are focused on the continuous improvement of OHS performance. The sub-committees meet quarterly to discuss matters relating to workplace issues that affect the health and welfare of employees. Both the agenda and meeting minutes for each of these meetings, as well as those of the Corporate OHS and Wellbeing Committee meetings, are displayed on dedicated OHS noticeboards across all DoT sites.
The safety and health representatives, in consultation with managers, are responsible for updating the noticeboards accordingly. The effectiveness of the various OHS sub-committee meetings is measured by attendance rates, which form part of the key performance indicators reported back to the Corporate Executive.
During the year, DoT discussed and resolved issues raised by employees, reviewed accident and incident forms to ensure that hazards were addressed to eliminate or reduce future issues, discussed injury trends and identified preventative measures that promote a safe working environment.
Compliance with the injury management requirements of the Workers’ Compensation and Injury Management Act 1981As at 30 June 2015, DoT had 31 open workers’ compensation claims. Only two of the claimants were certified unfit, with the remainder on Return to Work programs. All 19 of the time-loss claims throughout the year returned to work within 13 weeks of their injury.
DoT has a dedicated Workers’ Compensation and IM Consultant who manages both the workers’ compensation claims and non-work related IM issues. DoT has a strong focus on early intervention and return to work strategies. Managers and supervisors are trained in the importance of good injury management and return to work, promoting a supportive, productive and positive workplace.
Lock ‘n’ Ride bike lockers
176 DEPARTMENT OF TRANSPORT

OHS system assessment and resultsAn OHS Safety Management System audit of DoT’s safety documentation was conducted in July 2014 to assist DoT in developing a new Corporate OHS Safety Management System aligned to the Australian/New Zealand Standard for Safety Management Systems (AS/NZS 4810).
The audit was conducted by external consultant RiskLink using the WorkSafe Plan Audit Tool and identified positive findings as well as areas for improvement.
The following are the main positive findings:
y There was strong evidence to show management’s support of safety, health and wellbeing within DoT.
y Each DoT workplace has an OHS Safety Folder containing site-specific OHS documentation including policies, procedures, training matrixes and emergency plans.
y DoT supports employees’ flexible working arrangements, including working part-time, purchasing leave and flexi-time. Working from home is also facilitated where possible. All staff working from home undergo a home-based ergonomic assessment.
y The Working in Remote Areas Policy and Procedure was developed and endorsed by the Corporate OHS and Wellbeing Management Committee. This policy and procedure provides both managers and staff with the tools and advice needed to travel to WA locations.
y Robust processes are in place for managing first aid. All first aid kits are regularly inspected and stocked accordingly, and all staff members providing first aid are adequately trained.
y Workplace inspections are conducted bi-monthly, with all hazards identified and managed accordingly in consultation with staff.
y All staff are provided with the necessary personal protective equipment to safely undertake their duties.
y All managers and supervisors have completed the necessary OHS and IM for Managers training session.
y All staff have received both manual tasks and ergonomics training.
The main areas identified for improvement were:
y Develop a Corporate OHS Safety Management System to ensure consistency across all DoT business units.
y Develop an OSH Risk Register including common public sector hazards as described in the Code of Practice: Occupational Safety and Health in the Western Australian Public Sector 2007 (bullying, violence/aggression, manual handling, working alone, organisational changes, inadequate physical working environment, inadequate workstations, inadequate work organisation).
y Develop an Independent Contractor Management Policy and Procedure for managing contactors visiting DoT sites.
y Develop and deliver OHS training for all DoT staff to complement the strong existing OHS induction session for new employees.
y Consider including pre-employment as part of the Health Management Strategy.
y Continue to align local site-specific OHS activities with the corporate requirements, utilising support from the OHS Branch.
y Establish an OHS Training Matrix to record all OHS training undertaken employees.
y Include OHS responsibilities in individual job descriptions.
These recommendations for improvement have been detailed in an Action Plan and many are currently being addressed. Most significantly, in 2014-15 DoT completed its new Corporate OHS Safety Management System and is in the process of rolling it out across the business.
ANNUAL REPORT 2014-15 177
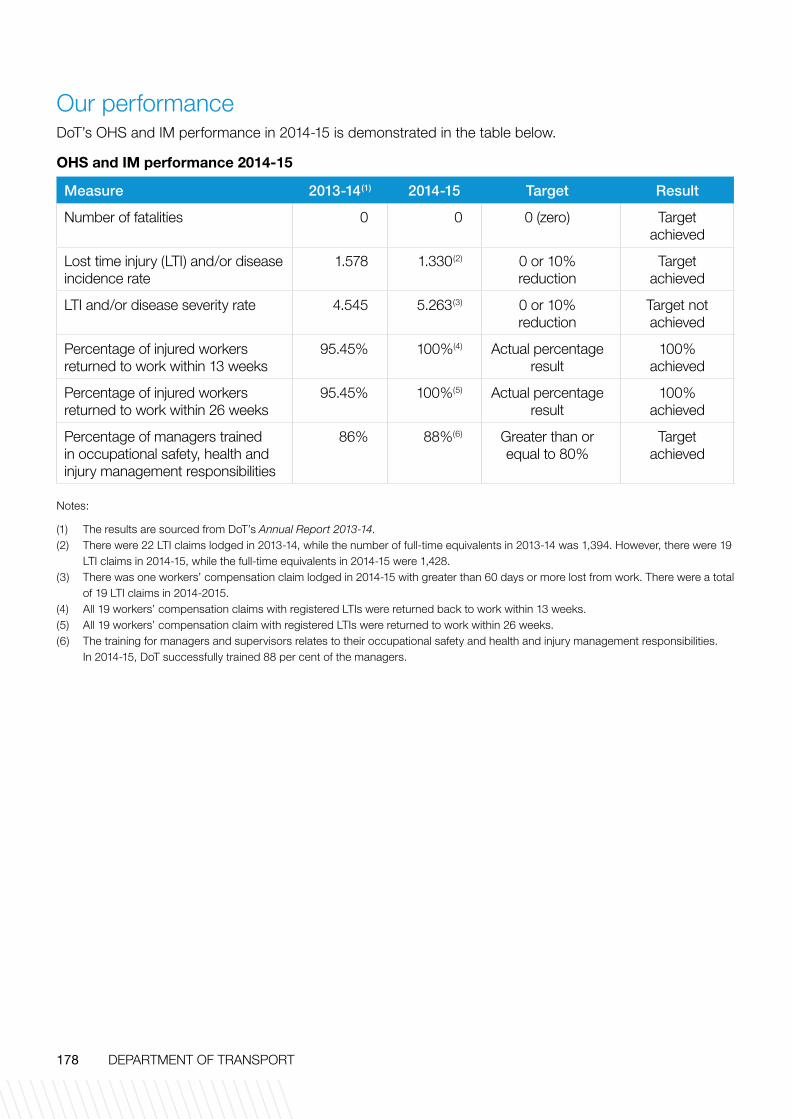
Our performanceDoT’s OHS and IM performance in 2014-15 is demonstrated in the table below.
OHS and IM performance 2014-15
Measure 2013-14(1) 2014-15 Target Result
Number of fatalities 0 0 0 (zero) Target achieved
Lost time injury (LTI) and/or disease incidence rate
1.578 1.330(2) 0 or 10% reduction
Target achieved
LTI and/or disease severity rate 4.545 5.263(3) 0 or 10% reduction
Target not achieved
Percentage of injured workers returned to work within 13 weeks
95.45% 100%(4) Actual percentage result
100% achieved
Percentage of injured workers returned to work within 26 weeks
95.45% 100%(5) Actual percentage result
100% achieved
Percentage of managers trained in occupational safety, health and injury management responsibilities
86% 88%(6) Greater than or equal to 80%
Target achieved
Notes:
(1) The results are sourced from DoT’s Annual Report 2013-14.(2) There were 22 LTI claims lodged in 2013-14, while the number of full-time equivalents in 2013-14 was 1,394. However, there were 19
LTI claims in 2014-15, while the full-time equivalents in 2014-15 were 1,428. (3) There was one workers’ compensation claim lodged in 2014-15 with greater than 60 days or more lost from work. There were a total
of 19 LTI claims in 2014-2015.(4) All 19 workers’ compensation claims with registered LTIs were returned back to work within 13 weeks.(5) All 19 workers’ compensation claim with registered LTIs were returned to work within 26 weeks.(6) The training for managers and supervisors relates to their occupational safety and health and injury management responsibilities.
In 2014-15, DoT successfully trained 88 per cent of the managers.
178 DEPARTMENT OF TRANSPORT

ANNUAL REPORT 2014-15 179

The information contained in this publication is provided in good faith and believed to be accurate at time
of publication. The State shall in no way be liable for any loss
sustained or incurred by anyone relying on the information.
36607_0915


![24 ANNUAL REPORT th 2014-15 - rajeshwaranandpaper.comrajeshwaranandpaper.com/annual-reports/2014-15.pdf24 ANNUAL REPORTth 2014-15 Shree Rajeshwaranand Paper Mills Limited [CIN: L21093GJ1991PLC057244]](https://img.pdfslide.us/doc/110x75/5fe4d7f1ac13ef78bd05517e/24-annual-report-th-2014-15-24-annual-reportth-2014-15-shree-rajeshwaranand-paper.jpg)