Embed Size (px)
Citation preview
RIIO Electricity Transmission Annual Report 2014-15
Annual Report
Contact: Anthony Mungall
Publication date: 10 December 2015 Team: Electricity Transmission Cost & Outputs
Tel: 0141 331 6010
Email: [email protected]
Target Audience: This document may be of particular interest to users of the transmission
networks, licensees, and providers of finance and consumer groups.
Overview:
RIIO-T1 is the first electricity transmission price control that utilises the RIIO (Revenue =
Incentives + Innovation + Outputs) price control model. This price control began on 1 April
2013 and runs for eight years, to 31 March 2021.
This report reviews the price control information received from the onshore electricity
transmission companies for the second year of RIIO-T1 (2014-15). It reviews their performance
against the outputs they committed to deliver and compares the actual costs they have incurred
to date as well as forecast information across the whole price control period against their
allowed revenues. In addition, the report outlines the performance of the electricity system
operator (SO) company, whose role is to ensure that the electricity transmission system
remains in balance.
All financial figures (including forecasts) are quoted in 2014-15 prices, unless stated otherwise.
RIIO Electricity Transmission Annual Report 2014-15
Context
The electricity transmission network in Great Britain (GB) consists of the high voltage
electricity wires and cables which convey electricity from power stations to local
distribution networks and large customers directly connected to the transmission
system. There are three onshore monopoly providers of electricity transmission services
(transmission owners, or TOs):
National Grid Electricity Transmission plc (NGET), which owns the high voltage
electricity network in England and Wales
Scottish Hydro Electric Transmission plc (SHE Transmission), which owns the high
voltage electricity network in the north of Scotland and Scottish island groups
SP Transmission plc (SPT), which owns the high voltage electricity network in the
south of Scotland.
In addition to its TO responsibilities, NGET is the designated electricity and system
operator (SO) responsible for day-to-day system operation and management.
Ofgem’s principal objective is to protect the interests of consumers. One way we do this
is by periodic price controls, which set the revenue that TOs are allowed to recover from
users of the electricity transmission network and the outputs that they are required to
deliver.
RIIO-T1 is the first period under the RIIO (Revenue = Incentives + Innovation +
Outputs) model. The price control started in April 2013 and lasts for eight years. Our
final proposals on the RIIO-T1 price control were published in April 2012 for the Scottish
TOs and in December 2012 for NGET.
Outputs are at the heart of RIIO-T1. They capture the key areas within which consumers
expect the delivery of high quality services. Network companies are provided with
revenue allowances based on certain levels of outputs, but they are responsible for
determining how best to deliver against these outputs. The revenue allowances can vary
as the needs for the transmission system changes and/or if their performance exceeds or
falls short of the pre-set targets.
RIIO-T1 also contains incentives for the network companies to deliver outputs efficiently.
When a network company spends less than the allowance to deliver an agreed output, it
retains around 50% of any efficiency gain and an allowance for the tax due on that
incentive payment. The remainder is passed onto customers by reducing allowances to
be recovered through network charges. The sharing is symmetrical if there is an
overspend.
The second year of the price control period ended on 31 March 2015, and this report
reviews how the electricity transmission companies have performed against the output
based requirements. It also compares the costs incurred against allowances.
RIIO Electricity Transmission Annual Report 2014-15
3
Associated documents
Price Control Documents
RIIO-T1: Final Proposals for NGGT and NGET - Overview
RIIO-T1: Final Proposals for NGGT and NGET – Outputs, incentives and innovation
RIIO-T1: Final Proposals for NGET and NGGT – Cost assessment and uncertainty
RIIO-T1: Final Proposals for NGGT and NGET – Finance
RIIO-T1: Final proposals for SP Transmission Ltd and Scottish Hydro Electricity
Transmission
ET1 Price Control Financial Handbook
Transmission networks own reports on their performance
RIIO-T1: performance data
NGET’s 2013-14 & 2014-15 performance report
SHE Transmission’s 2013-14 and 2014 -15 performance report
SPT’s 2013-14 and 2014-15 performance report
RIIO Electricity Transmission Annual Report 2014-15
Contents
Executive Summary 5
1. Revenue and Customer Bill Impact 7 Electricity Transmission Revenues 7 Customer Bill Impact 12
2. Outputs & Incentives 14 Outputs, measures and performance 14 Safety Output Measures 17 Reliability Output Measures 17
Energy not supplied (ENS) 17 Availability Output Measures 19
Network Access Policy (NAP) 19 Customer Satisfaction 20
Customer/stakeholder satisfaction survey 20 Connections and Wider Works Output Measures 22 Environmental Output Measures 24
Limit ing sulphur hexafluoride (SF6) emissions 24 Business carbon footprint (BCF) 26 Losses 27 Environmental discretionary reward 28
3. Innovation 30 Network Innovation Allowance 30 Network Innovation Competition 30 Innovation Rollout Mechanism 31
4. Expenditure 32 Introduction 32 Total expenditure (Totex) performance and forecasts 32 Load-related capex (LR capex) 34 Non load-related capex (NLR capex) 40 Network capital delivery 47 Non-operational capex 52 Operating costs (Opex) and forecasts 55
5. SO performance 60
6. Financial Performance 63 Regulatory Asset Value 63 Return on Regulatory Equity (RoRE) 65
7. Forward Look: 2015-16 Regulatory Reporting Year 67
Appendices 69
RIIO Electricity Transmission Annual Report 2014-15
5
Executive Summary
In July 2015 the onshore electricity transmission licensees submitted their regulatory
reporting packs covering the second year of RIIO-T1 (2014-15). We have now reviewed
these packs and discussed them with the individual companies. In RIIO the focus of our
analysis is on outputs, incentives and innovation as well as total expenditure (totex).
Some of the required outputs will not be fully delivered until the end of RIIO-T1 (2020-
21) and therefore this report considers forecast performance across the whole price
control as well as actual performance over the first two years of the control period.
As part of the agreed initiative to make company performance more transparent in RIIO,
the providers of onshore electricity transmission services (transmission owners, or TOs)
have already published their own annual performance reports on their company websites
at the end of September 2015. Rather than just re-presenting numbers which are
already in the public domain, this report gives a combined picture of the results, as well
as our analysis of the TOs’ performance and, in the case of NGET, its performance as
electricity system operator (SO). We also highlight areas where we will be focusing our
attention in future years.
2014-15 Performance Headlines
TO Expenditure and Customer Bill Impact
Current forecasts by the TOs comprise expenditure of almost £18bn over the course of
the RIIO-T1 control. If this is realised, the onshore transmission element of an average
consumer electricity bill will increase by about 21% in real terms.
Financial performance
The financial performance of transmission companies is presented using the return on
regulatory equity (RoRE) measure. Based on the latest forecasts from the TOs, all of
them expect to exceed the allowed return of 7%, by 2-3 percentage points. These rates
of return are in line with those achieved during the previous transmission price control.
The forecast RoRE is dependent on future delivery of outputs, which is not confirmed at
this stage, and so this should be seen as the TOs’ best estimate of the outcome.
The regulatory asset values (RAV) of the electricity TOs are forecast to grow by over
£8bn over the RIIO-T1 period, reflecting the necessary investment to accommodate new
generation and other changes in the use of the network, as well as maintaining the
existing network.
Output Performance
All TOs expect that output delivery will meet or exceed the targets set against five of the
six output categories, namely: safety; reliability; availability; customer satisfaction; and
environmental. So far, the TOs have earned just under £44m of incentive payments for
exceeding targets on these output categories during the first two years of the control
period.
RIIO Electricity Transmission Annual Report 2014-15
For the remaining output category, ‘connections and wider works’, changes from the
original baseline will result in volume adjusted revenue allowances.
Totex performance
In 2014-15 all TOs have spent less than their allowances.
All of the TOs are expecting to outperform their volume adjusted allowances (including
Strategic Wider Works) over the entirety of RIIO-T1 by between 4-10%. Due to the
revenue adjustment mechanisms within the price control, a proportion of these savings
will be shared with consumers.
We have tried to identify the factors that are contributing to the companies’ levels of
underspend. Among these are changes in requirements for generation and demand
connections and smaller increases in real price effects since the start of the price control,
relative to the assumptions when setting the allowances.
Quality of regulatory reporting submissions
Having reviewed the reporting from the TOs in 2014-15 we have identified scope for
improvements. These developments should help us to better understand and critically
review TOs’ performance during RIIO-T1 and improve the information within the annual
report. We will be progressing these changes with the TOs over the coming months.
RIIO Electricity Transmission Annual Report 2014-15
7
1. Revenue and Customer Bill Impact
Chapter Summary
This chapter explains how expenditure by the electricity TOs to improve GB’s
transmission infrastructure in RIIO-T1 impacts on customer bills.
Electricity Transmission Revenues
1.1. Over RIIO-T1, the onshore electricity transmission licensees expect to spend
c.£18bn1 reflecting the necessary investment to accommodate new generation and other
changes in the use of the network, as well as maintain the existing network. If TOs’
investment in the network proceeds in line with their forecasts, it will result in a c.21%
increase in average transmission charges for consumers by 2020-21, as compared with
the equivalent level of charges at the start of the price control period.
Allowed revenue
1.2. The TOs’ licences include price control conditions which determine the maximum
amount of annual revenue they can earn from their activit ies of maintaining, reinforcing
and upgrading the transmission systems they are responsible for. The allowed revenues
are recovered from users of the transmission network through Transmission Network
Use of System (TNUoS) charges. These charges are levied and collected by NGET (in its
role as system operator) on behalf of all TOs.
1.3. The maximum allowed revenue that each TO may recover is set by a formula in
Special Condition 3A of its transmission licence. The main elements are as follows:
Transmission Base Revenue: This includes a baseline derived from the TO’s
Business Plan, adjustments reflecting changes in requirements and a sharing
mechanism for total expenditure (totex).
Pass-through costs: Some costs that are both outside the TO’s control and
difficult to predict can be passed on to the consumer (eg licence fees).
Incentive adjustments: These relate to the TO’s performance under mechanisms
set out in the licence.
Innovation: These are costs associated with the Network Innovation Allowance
(NIA) and Network Innovation Competition (NIC)2.
1 This represents actual total expenditure (totex) for 2013-15 plus six years forecast spend for
2015-21 based upon the TOs’ latest published figures. 2 See chapter 3 for further details on these mechanisms and allowances.
RIIO Electricity Transmission Annual Report 2014-15
Transmission Investment for Renewable Generation (TIRG): A mechanism from
the previous price control specifically to fund transmission projects for
connecting renewable generation.
Correction factor: A revenue adjustment for under/over recovery of charges
against allowed revenue in prior years.
Annual Process of Setting Revenue Allowances
1.4. RIIO-T1 includes an Annual Iteration Process (AIP)3 which calculates the level of
change to revenues in light of prevailing financial conditions, operational developments,
and output levels achieved during the price control period. Revenues change as a result
of TO performance following a two year lag. For example, the allowed revenue
modification as a consequence of 2014-15 actual performance will impact allowed
revenues for 2016-17. This reduces the need to log-up financial adjustments during the
price control period and simplifies implementation of uncertainty mechanisms.
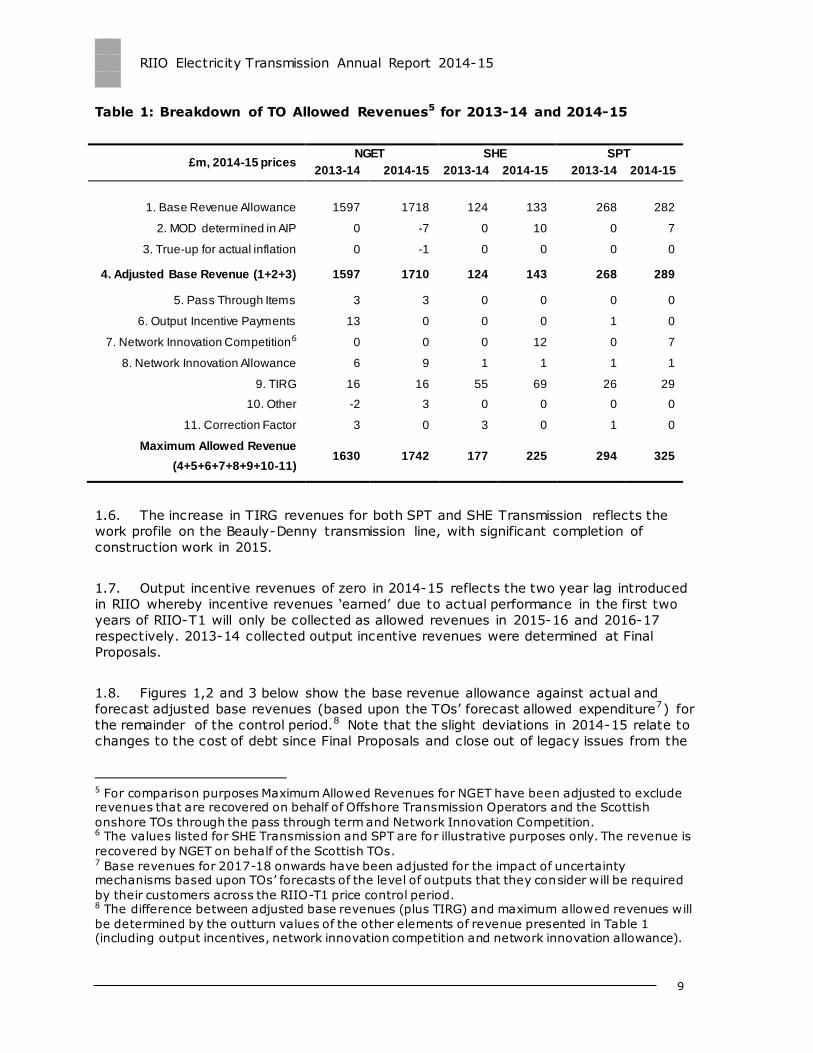
1.5. Table 1 below shows the value of the baseline base revenue set at the time of
Final Proposals for 2013-14 and 2014-15 for each TO (row 1) and the updates we have
made to these allowances to reflect the TO’s actual outturn through the AIP and inflation
(rows 2 and 3, respectively). The resulting base allowance is shown in row 4. Table 1
also summarises the other individual elements of the allowed revenue formula for each
onshore TO in the first two years of the price control period (rows 5 to 11). The values in
row 12 are the maximum allowed revenue4 attributable to the onshore TOs. These
values are produced by our Price Control Financial Model (PCFM) and will differ from
previous published forecast values due to differences in the inflation forecast used.
3 Further details on the workings of the AIP can be found in the ET1 Price Control Financial
Handbook. 4 Excluding the costs associated with pre-vesting connections.
RIIO Electricity Transmission Annual Report 2014-15
9
Table 1: Breakdown of TO Allowed Revenues5 for 2013-14 and 2014-15
£m, 2014-15 prices NGET SHE SPT
2013-14 2014-15 2013-14 2014-15 2013-14 2014-15
1. Base Revenue Allowance 1597 1718 124 133 268 282
2. MOD determined in AIP 0 -7 0 10 0 7
3. True-up for actual inflation 0 -1 0 0 0 0
4. Adjusted Base Revenue (1+2+3) 1597 1710 124 143 268 289
5. Pass Through Items 3 3 0 0 0 0
6. Output Incentive Payments 13 0 0 0 1 0
7. Network Innovation Competition6 0 0 0 12 0 7
8. Network Innovation Allowance 6 9 1 1 1 1
9. TIRG 16 16 55 69 26 29
10. Other -2 3 0 0 0 0
11. Correction Factor 3 0 3 0 1 0
Maximum Allowed Revenue
(4+5+6+7+8+9+10-11) 1630 1742 177 225 294 325
1.6. The increase in TIRG revenues for both SPT and SHE Transmission reflects the
work profile on the Beauly-Denny transmission line, with significant completion of
construction work in 2015.
1.7. Output incentive revenues of zero in 2014-15 reflects the two year lag introduced
in RIIO whereby incentive revenues ‘earned’ due to actual performance in the first two
years of RIIO-T1 will only be collected as allowed revenues in 2015-16 and 2016-17
respectively. 2013-14 collected output incentive revenues were determined at Final
Proposals.
1.8. Figures 1,2 and 3 below show the base revenue allowance against actual and
forecast adjusted base revenues (based upon the TOs’ forecast allowed expenditure7) for
the remainder of the control period.8 Note that the slight deviations in 2014-15 relate to
changes to the cost of debt since Final Proposals and close out of legacy issues from the
5 For comparison purposes Maximum Allowed Revenues for NGET have been adjusted to exclude revenues that are recovered on behalf of Offshore Transmission Operators and the Scottish
onshore TOs through the pass through term and Network Innovation Competition. 6 The values listed for SHE Transmission and SPT are for illustrative purposes only. The revenue is
recovered by NGET on behalf of the Scottish TOs. 7 Base revenues for 2017-18 onwards have been adjusted for the impact of uncertainty mechanisms based upon TOs’ forecasts of the level of outputs that they consider will be required
by their customers across the RIIO-T1 price control period. 8 The difference between adjusted base revenues (plus TIRG) and maximum allowed revenues will
be determined by the outturn values of the other elements of revenue presented in Table 1 (including output incentives, network innovation competition and network innovation allowance).
RIIO Electricity Transmission Annual Report 2014-15
previous price control (‘TPCR4’, which ended on 31 March 2013). There is no impact
from totex performance in the final year of TPCR4 (2012-13).
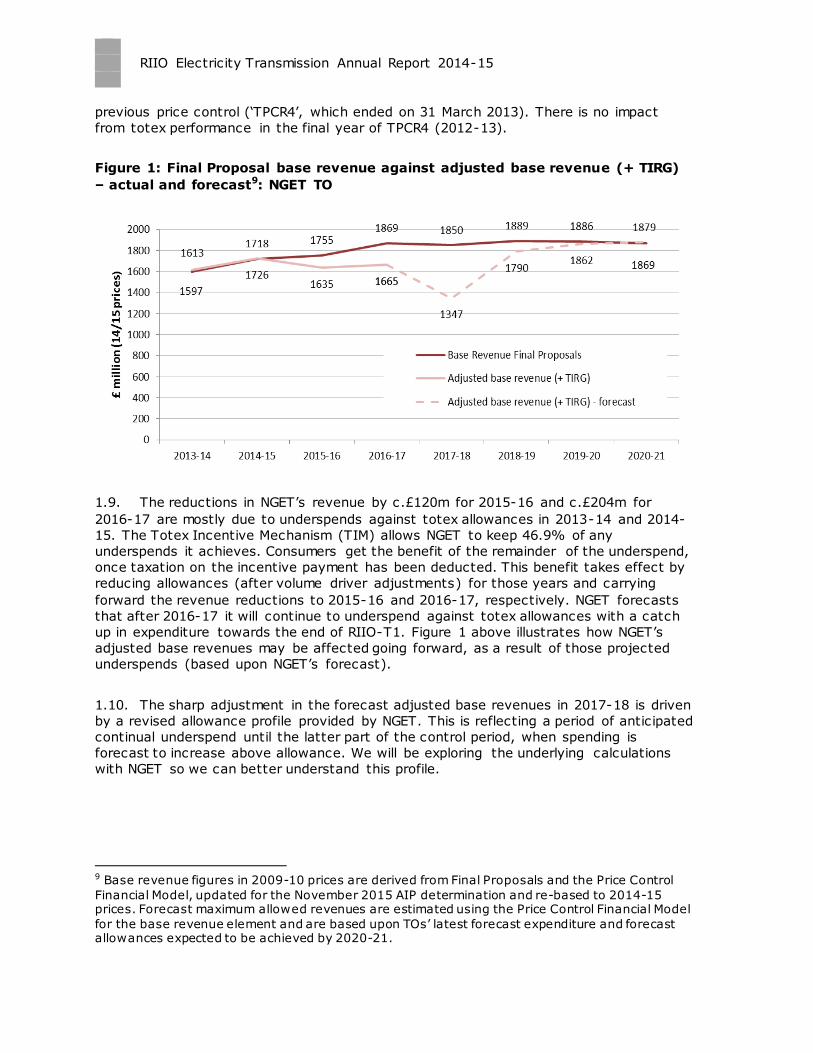
Figure 1: Final Proposal base revenue against adjusted base revenue (+ TIRG)
– actual and forecast9: NGET TO
1.9. The reductions in NGET’s revenue by c.£120m for 2015-16 and c.£204m for
2016-17 are mostly due to underspends against totex allowances in 2013-14 and 2014-
15. The Totex Incentive Mechanism (TIM) allows NGET to keep 46.9% of any
underspends it achieves. Consumers get the benefit of the remainder of the underspend,
once taxation on the incentive payment has been deducted. This benefit takes effect by
reducing allowances (after volume driver adjustments) for those years and carrying
forward the revenue reductions to 2015-16 and 2016-17, respectively. NGET forecasts
that after 2016-17 it will continue to underspend against totex allowances with a catch
up in expenditure towards the end of RIIO-T1. Figure 1 above illustrates how NGET’s
adjusted base revenues may be affected going forward, as a result of those projected
underspends (based upon NGET’s forecast).
1.10. The sharp adjustment in the forecast adjusted base revenues in 2017-18 is driven
by a revised allowance profile provided by NGET. This is reflecting a period of anticipated
continual underspend until the latter part of the control period, when spending is
forecast to increase above allowance. We will be exploring the underlying calculations
with NGET so we can better understand this profile.
9 Base revenue figures in 2009-10 prices are derived from Final Proposals and the Price Control
Financial Model, updated for the November 2015 AIP determination and re-based to 2014-15 prices. Forecast maximum allowed revenues are estimated using the Price Control Financial Model
for the base revenue element and are based upon TOs’ latest forecast expenditure and forecast allowances expected to be achieved by 2020-21.
RIIO Electricity Transmission Annual Report 2014-15
11
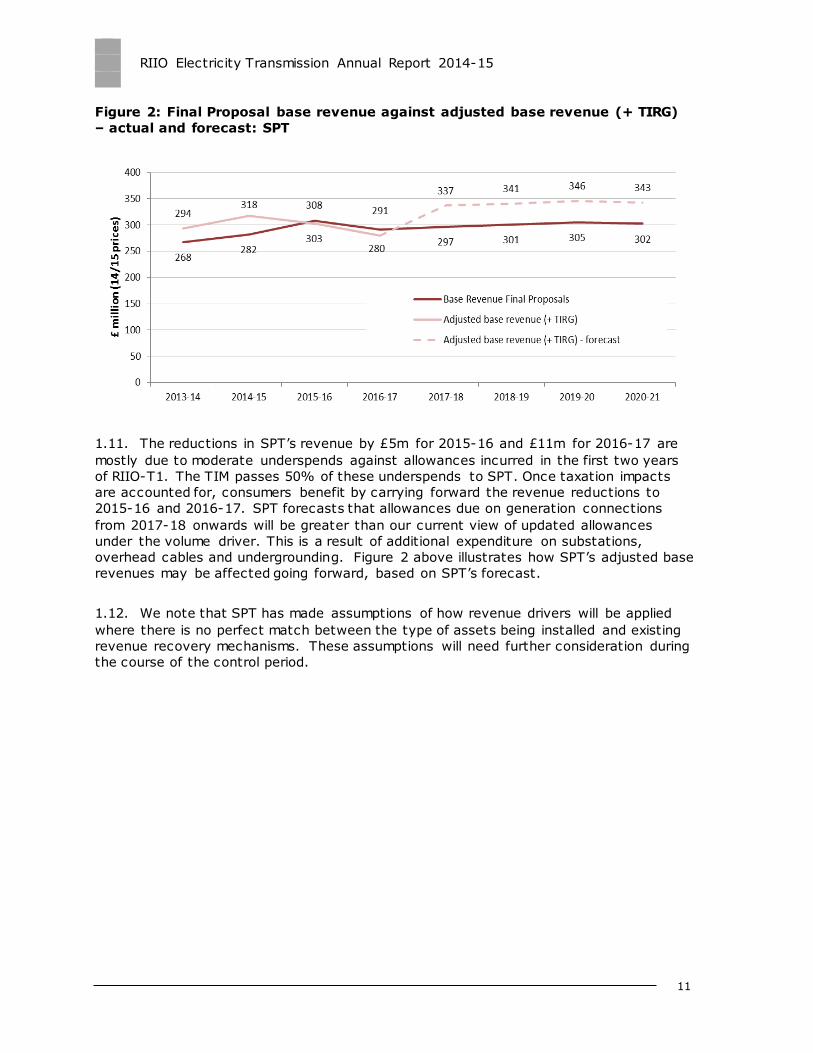
Figure 2: Final Proposal base revenue against adjusted base revenue (+ TIRG)
– actual and forecast: SPT
1.11. The reductions in SPT’s revenue by £5m for 2015-16 and £11m for 2016-17 are
mostly due to moderate underspends against allowances incurred in the first two years
of RIIO-T1. The TIM passes 50% of these underspends to SPT. Once taxation impacts
are accounted for, consumers benefit by carrying forward the revenue reductions to
2015-16 and 2016-17. SPT forecasts that allowances due on generation connections
from 2017-18 onwards will be greater than our current view of updated allowances
under the volume driver. This is a result of additional expenditure on substations,
overhead cables and undergrounding. Figure 2 above illustrates how SPT’s adjusted base
revenues may be affected going forward, based on SPT’s forecast.
1.12. We note that SPT has made assumptions of how revenue drivers will be applied
where there is no perfect match between the type of assets being installed and existing
revenue recovery mechanisms. These assumptions will need further consideration during
the course of the control period.
RIIO Electricity Transmission Annual Report 2014-15
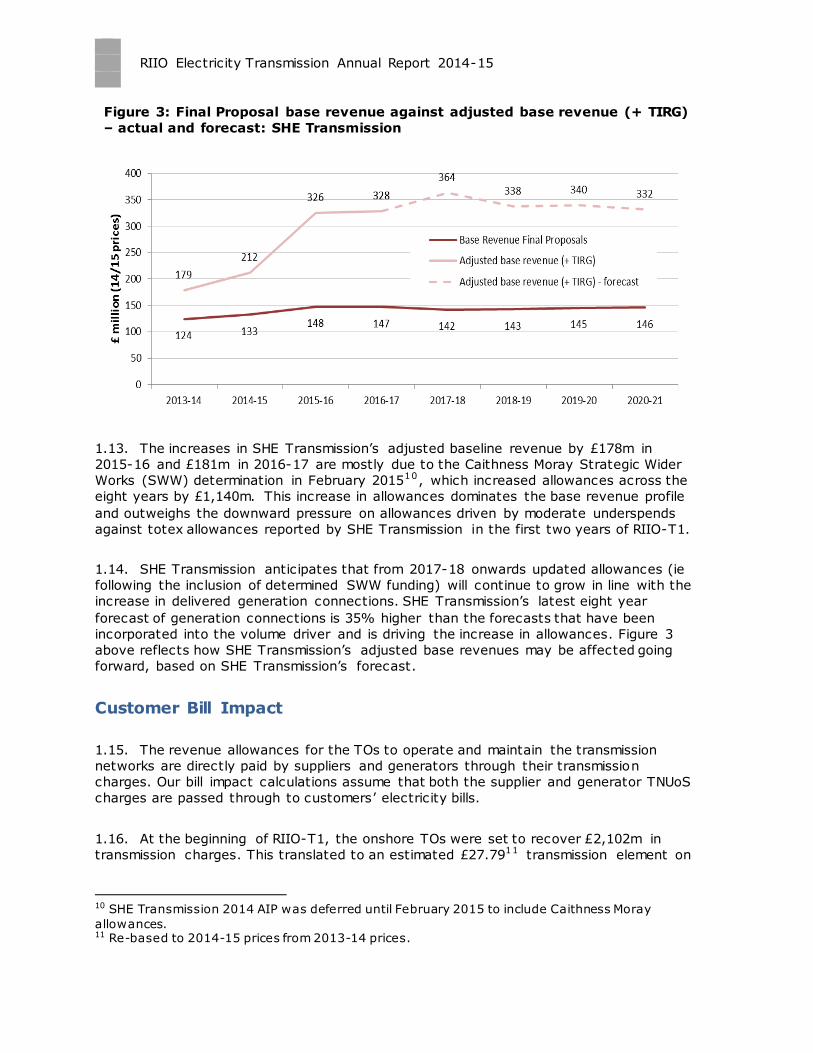
Figure 3: Final Proposal base revenue against adjusted base revenue (+ TIRG)
– actual and forecast: SHE Transmission
1.13. The increases in SHE Transmission’s adjusted baseline revenue by £178m in
2015-16 and £181m in 2016-17 are mostly due to the Caithness Moray Strategic Wider
Works (SWW) determination in February 201510, which increased allowances across the
eight years by £1,140m. This increase in allowances dominates the base revenue profile
and outweighs the downward pressure on allowances driven by moderate underspends
against totex allowances reported by SHE Transmission in the first two years of RIIO-T1.
1.14. SHE Transmission anticipates that from 2017-18 onwards updated allowances (ie
following the inclusion of determined SWW funding) will continue to grow in line with the
increase in delivered generation connections. SHE Transmission’s latest eight year
forecast of generation connections is 35% higher than the forecasts that have been
incorporated into the volume driver and is driving the increase in allowances. Figure 3
above reflects how SHE Transmission’s adjusted base revenues may be affected going
forward, based on SHE Transmission’s forecast.
Customer Bill Impact
1.15. The revenue allowances for the TOs to operate and maintain the transmission
networks are directly paid by suppliers and generators through their transmission
charges. Our bill impact calculations assume that both the supplier and generator TNUoS
charges are passed through to customers’ electricity bills.
1.16. At the beginning of RIIO-T1, the onshore TOs were set to recover £2,102m in
transmission charges. This translated to an estimated £27.7911 transmission element on
10 SHE Transmission 2014 AIP was deferred until February 2015 to include Caithness Moray
allowances. 11 Re-based to 2014-15 prices from 2013-14 prices.

RIIO Electricity Transmission Annual Report 2014-15
13
an average domestic electricity bill. TO forecasts for revenues in 2020-21 total £2,544m.
This indicates that the onshore element of the transmission charge would increase by
c.21% if investment occurs at the level projected by the TOs. It should also be noted
that these forecasts anticipate significant spending on projects that are not yet agreed
with Ofgem, but do not account for incentive payments, innovation funding or other
adjusting items that may change these revenue projections.
RIIO Electricity Transmission Annual Report 2014-15
2. Outputs & Incentives
Chapter Summary
This chapter examines the second year performance and forecast performance of the
TOs in meeting their output commitments over the RIIO-T1 period. It also indicates the
levels of incentive payments achieved by the onshore TOs in respect of their
performance levels.
Outputs, measures and performance
2.1. As part of RIIO-T1, we set primary outputs the onshore electricity Transmission
Owners (the TOs) have committed to deliver over the price control period. The following
six outputs form the cornerstone of the RIIO price control framework12:
i. safety
ii. reliability
iii. availability
iv. customer satisfaction
v. connections/wider works
vi. environmental
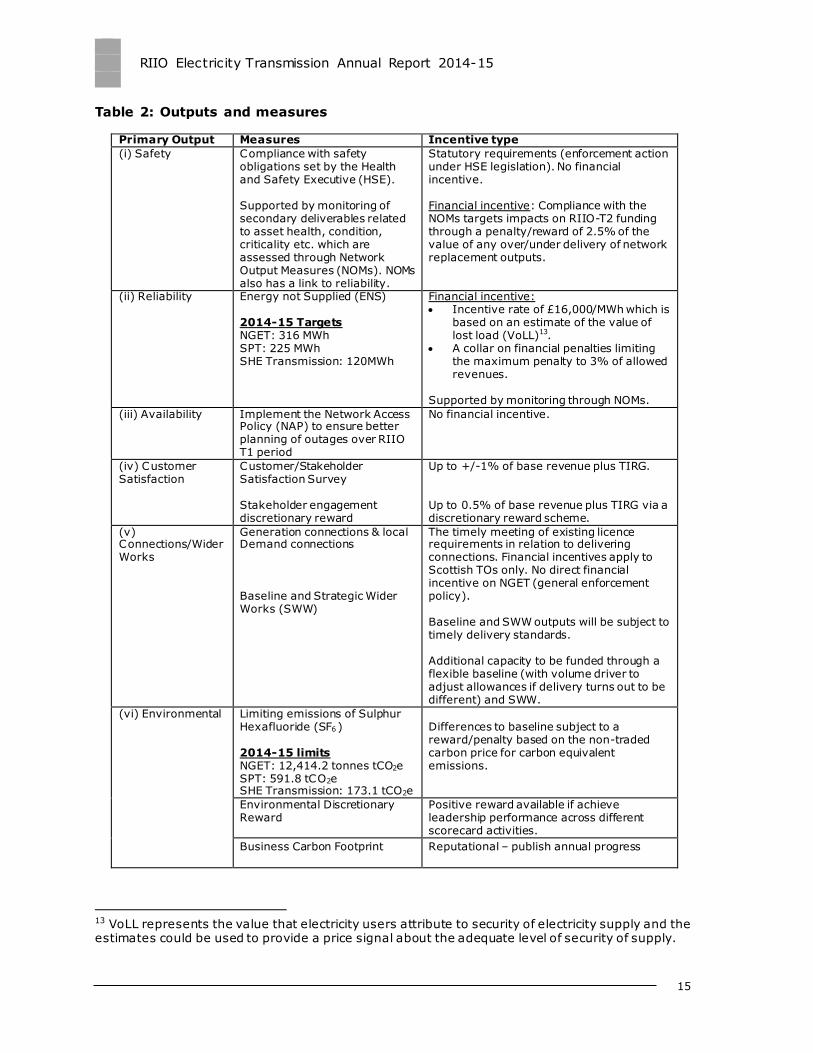
2.2. This chapter considers delivery by the TOs. For outputs that have multiple
metrics, we present some quantifiable measures for illustrative purposes; these are
shown in table 2 below. If TOs achieve the targeted level of all measures satisfactorily
we consider that they will have achieved the primary outputs.
12 Further detail of the outputs framework in RIIO-T1 is available on the Ofgem website in the link:
RIIO-T1: Final Proposals for NGGT and NGET – Outputs, incentives and innovation
RIIO Electricity Transmission Annual Report 2014-15
15
Table 2: Outputs and measures
Primary Output Measures Incentive type
(i) Safety Compliance with safety obligations set by the Health and Safety Executive (HSE). Supported by monitoring of secondary deliverables related to asset health, condition, criticality etc. which are assessed through Network Output Measures (NOMs). NOMs also has a link to reliability.
Statutory requirements (enforcement action under HSE legislation). No financial incentive. Financial incentive: Compliance with the NOMs targets impacts on RIIO-T2 funding through a penalty/reward of 2.5% of the value of any over/under delivery of network replacement outputs.
(ii) Reliability Energy not Supplied (ENS) 2014-15 Targets NGET: 316 MWh SPT: 225 MWh SHE Transmission: 120MWh
Financial incentive: Incentive rate of £16,000/MWh which is
based on an estimate of the value of lost load (VoLL)13.
A collar on financial penalties limiting the maximum penalty to 3% of allowed revenues.
Supported by monitoring through NOMs.
(iii) Availability Implement the Network Access Policy (NAP) to ensure better planning of outages over RIIO T1 period
No financial incentive.
(iv) Customer Satisfaction
Customer/Stakeholder Satisfaction Survey Stakeholder engagement discretionary reward
Up to +/-1% of base revenue plus TIRG. Up to 0.5% of base revenue plus TIRG via a discretionary reward scheme.
(v) Connections/Wider Works
Generation connections & local Demand connections Baseline and Strategic Wider Works (SWW)
The timely meeting of existing licence requirements in relation to delivering connections. Financial incentives apply to Scottish TOs only. No direct financial incentive on NGET (general enforcement policy). Baseline and SWW outputs will be subject to timely delivery standards. Additional capacity to be funded through a flexible baseline (with volume driver to adjust allowances if delivery turns out to be different) and SWW.
(vi) Environmental Limiting emissions of Sulphur Hexafluoride (SF6 ) 2014-15 limits NGET: 12,414.2 tonnes tCO2e SPT: 591.8 tCO2e SHE Transmission: 173.1 tCO2e
Differences to baseline subject to a reward/penalty based on the non-traded carbon price for carbon equivalent emissions.
Environmental Discretionary Reward
Positive reward available if achieve leadership performance across different scorecard activities.
Business Carbon Footprint
Reputational – publish annual progress
13 VoLL represents the value that electricity users attribute to security of electricity supply and the estimates could be used to provide a price signal about the adequate level of security of supply.
RIIO Electricity Transmission Annual Report 2014-15
Losses Reputational – publish annual progress
Visual impact: to reduce the visual impact of transmission assets in designated areas.
Reputational incentive in the context of its performance in the utilisation of two mechanisms:
(1) baseline and uncertainty mechanism funding for additional cost of mitigation technologies required for development consent of new infrastructure (e.g. undergrounding) (2) an expenditure cap of almost £600m allow all electricity TOs to work on mitigating impacts of existing infrastructure in designated areas from the beginning of RIIO-T1.
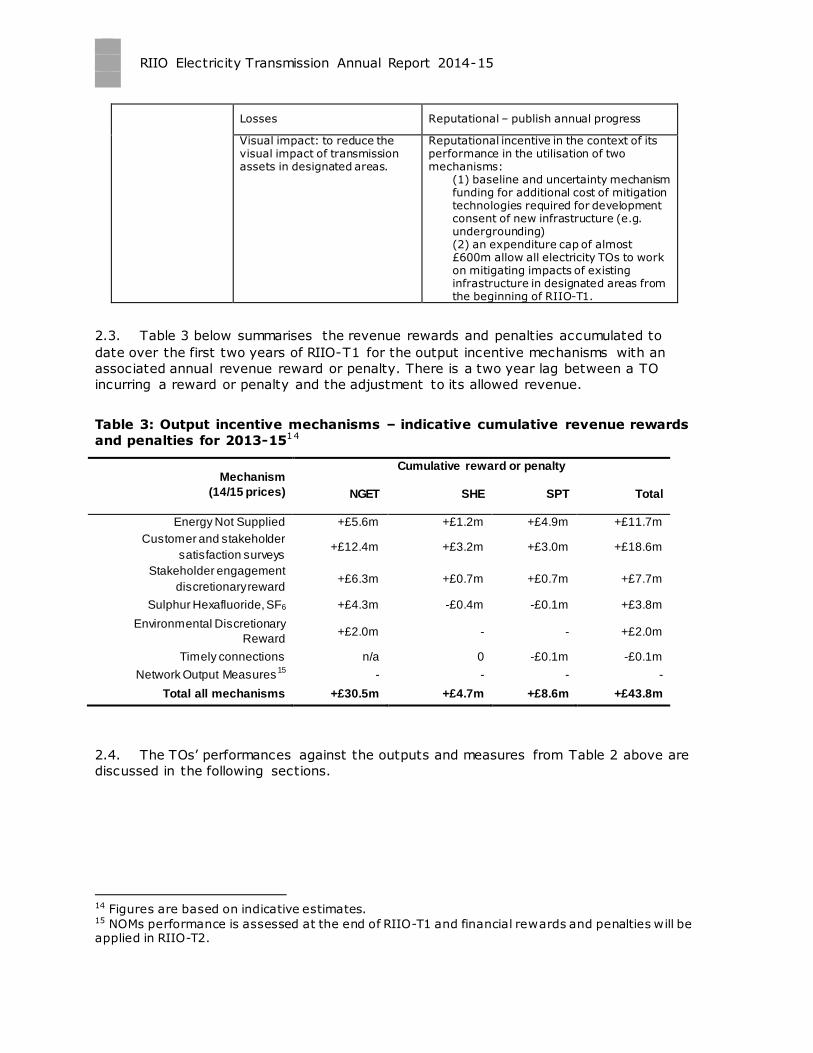
2.3. Table 3 below summarises the revenue rewards and penalties accumulated to
date over the first two years of RIIO-T1 for the output incentive mechanisms with an
associated annual revenue reward or penalty. There is a two year lag between a TO
incurring a reward or penalty and the adjustment to its allowed revenue.
Table 3: Output incentive mechanisms – indicative cumulative revenue rewards
and penalties for 2013-1514
Mechanism
(14/15 prices)
Cumulative reward or penalty
NGET SHE SPT Total
Energy Not Supplied +£5.6m +£1.2m +£4.9m +£11.7m
Customer and stakeholder
satisfaction surveys +£12.4m +£3.2m +£3.0m +£18.6m
Stakeholder engagement
discretionary reward +£6.3m +£0.7m +£0.7m +£7.7m
Sulphur Hexafluoride, SF6 +£4.3m -£0.4m -£0.1m +£3.8m
Environmental Discretionary
Reward +£2.0m - - +£2.0m
Timely connections n/a 0 -£0.1m -£0.1m
Network Output Measures15
- - - -
Total all mechanisms +£30.5m +£4.7m +£8.6m +£43.8m
2.4. The TOs’ performances against the outputs and measures from Table 2 above are
discussed in the following sections.
14 Figures are based on indicative estimates. 15 NOMs performance is assessed at the end of RIIO-T1 and financial rewards and penalties will be applied in RIIO-T2.
RIIO Electricity Transmission Annual Report 2014-15
17
Safety Output Measures
Compliance with safety obligations
2.5. The output in this area is for each network company to be compliant with its legal
safety requirements. These are requirements monitored by the Health and Safety
Executive (HSE), as the safety regulator. We are not aware of any breaches of company
safety obligations.
2.6. A suite of secondary measures inform both the safety and reliability of its network
relating to asset health and condition measures known as network output measures
(NOMs). These are discussed further below.
Reliability Output Measures
Energy not supplied (ENS)
2.7. ENS is the volume of energy to customers that is lost (not supplied) as a result of
faults or failures on a TO’s network. Each TO has annual targets for total volume (MWh)
of ENS. A TO receives a financial reward if the actual volume of unsupplied energy is
below the target volume, and a financial penalty if the volume is above target. An
individual TO has the same target volume each year and these are set at 316 MWh for
NGET, 120 MWh for SHE Transmission, and 225 MWh for SPT.
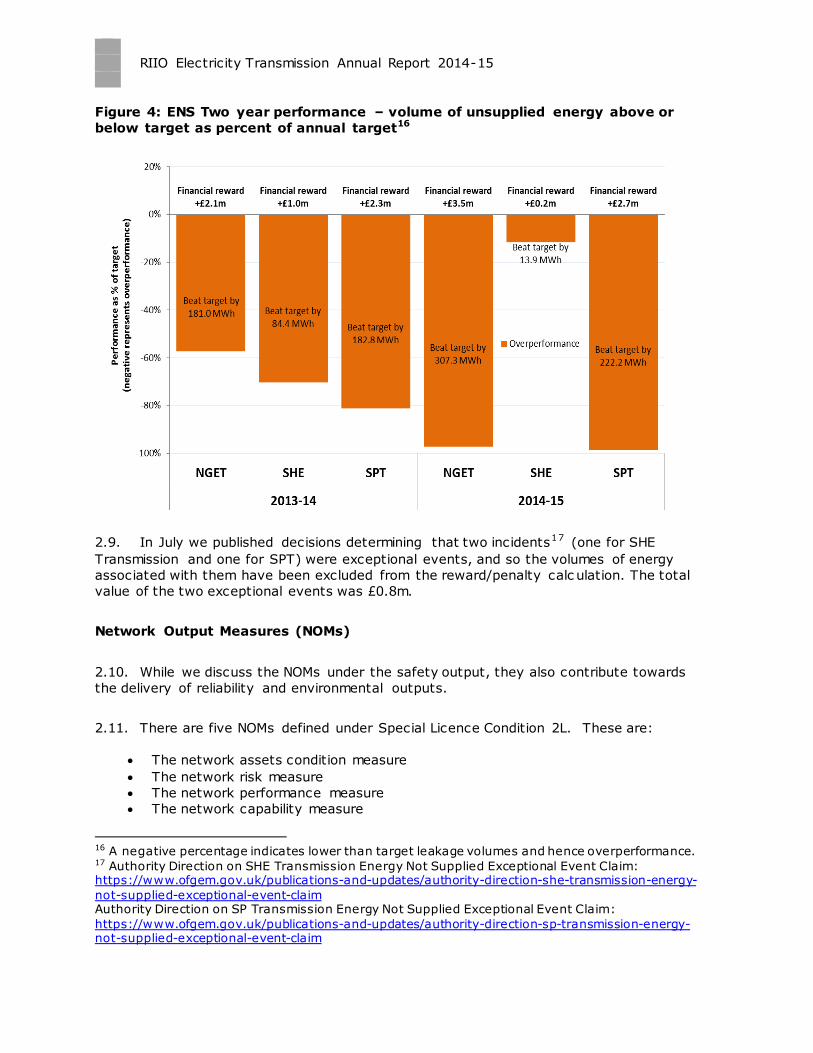
2.8. As was the case in year 1 (2013-14), all three TOs have significantly
outperformed against their targets in year 2 (2014-15); see figure 4 below. The 2014-15
overperformance will be reflected in additional £5.4m in allowed revenue to the three
TOs, but this is £0.9m down on their reward for 2013-14.
RIIO Electricity Transmission Annual Report 2014-15
Figure 4: ENS Two year performance – volume of unsupplied energy above or
below target as percent of annual target16
2.9. In July we published decisions determining that two incidents17 (one for SHE
Transmission and one for SPT) were exceptional events, and so the volumes of energy
associated with them have been excluded from the reward/penalty calc ulation. The total
value of the two exceptional events was £0.8m.
Network Output Measures (NOMs)
2.10. While we discuss the NOMs under the safety output, they also contribute towards
the delivery of reliability and environmental outputs.
2.11. There are five NOMs defined under Special Licence Condition 2L. These are:
The network assets condition measure
The network risk measure
The network performance measure
The network capability measure
16 A negative percentage indicates lower than target leakage volumes and hence overperformance. 17 Authority Direction on SHE Transmission Energy Not Supplied Exceptional Event Claim: https://www.ofgem.gov.uk/publications-and-updates/authority-direction-she-transmission-energy-
not-supplied-exceptional-event-claim Authority Direction on SP Transmission Energy Not Supplied Exceptional Event Claim:
https://www.ofgem.gov.uk/publications-and-updates/authority-direction-sp-transmission-energy-not-supplied-exceptional-event-claim
RIIO Electricity Transmission Annual Report 2014-15
19
The Network Replacement Outputs
2.12. Of these five NOMs, the final measure (the Network Replacement Outputs) is the
only one with directly associated allowances and financial reward or penalty related to
delivery. However, assessment of both the asset condition measure and the network risk
measure are integral components of the Network Replacement Outputs.
2.13. Under Special Condition 2M, TOs have allowances totalling approximately £6.5bn
over RIIO-T1 to deliver their Network Replacement Outputs (NOMs targets). The TOs’
expenditure against these allowances is discussed in the ‘Non- load related capex’ section
of Chapter 4. The NOMs targets are set for the end of the price control. If by that time a
TO has delivered above or below its NOMs targets then it will receive a revenue reward
or penalty in the next price control period. Any reward or penalty is dependent on
whether the over or under delivery is justified or unjustified.
2.14. All TOs currently indicate that they will meet their end of period NOMs targets.
TOs are currently developing their NOMs methodology and once this work is complete it
will enable us to carry out a more informed assessment of TOs’ performance than is
currently possible. Further explanation of the NOMs development is given in Appendix 1.
Availability Output Measures
Network Access Policy (NAP)
2.15. The output in this area is for each onshore TO to produce and maintain a NAP
document to contribute to better SO:TO interaction and cooperation in both short -term
and long-term network outage planning. The aim of the NAP is to support improved
communication and coordination between NGET, in its role as the SO across GB, and the
TOs, to reduce overall costs to consumers (including constraint costs).
2.16. In June 2015 the Authority approved a single common NAP for Scotland,
applicable to both SPT and SHE Transmission, and a separate NAP for England and
Wales, capturing NGET’s functions of SO for GB and TO in England and Wales.18
2.17. While we are confident that the network companies are operating consistently
with NAP documentation, we believe there are some further activities that the TOs could
undertake to develop this policy. These are discussed in Chapter 7.
18 https://www.ofgem.gov.uk/publications-and-updates/authority-decision-approve-network-access-policy-nap
RIIO Electricity Transmission Annual Report 2014-15
Customer Satisfaction
Customer/stakeholder satisfaction survey
2.18. The customer satisfaction output incorporates several component incentives:
NGET operate customer and stakeholder satisfaction surveys, against which they
are financially rewarded or penalised.
SPT and SHE Transmission operate stakeholder satisfaction surveys, with
associated financial incentives. Both also have key performance indicators19
(KPIs) related to stakeholders around which they are rewarded or penalised
financially.
2.19. These components together account for an incentive of +/- 1% of annual baseline
revenue.
NGET
2.20. NGET reports both customer and stakeholder satisfaction surveys. NGET ’s scores
are illustrated below in Table 4, against baselines.
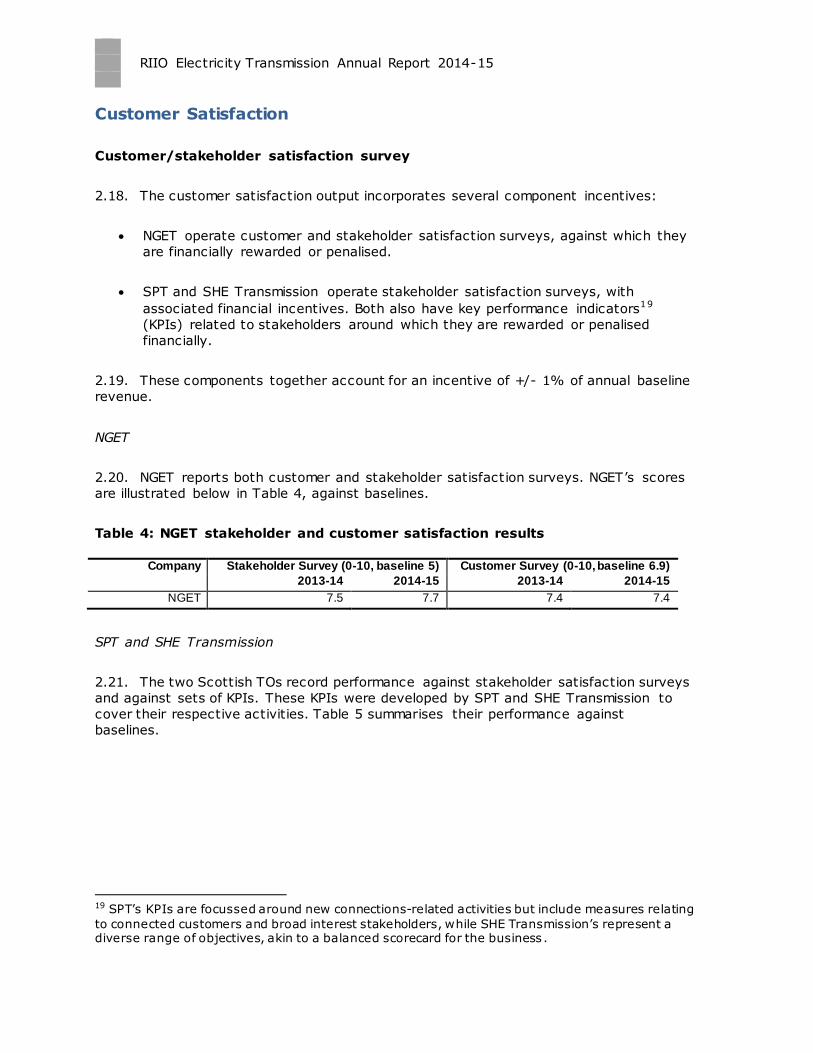
Table 4: NGET stakeholder and customer satisfaction results
Company Stakeholder Survey (0-10, baseline 5) Customer Survey (0-10, baseline 6.9)
2013-14 2014-15 2013-14 2014-15
NGET 7.5 7.7 7.4 7.4
SPT and SHE Transmission
2.21. The two Scottish TOs record performance against stakeholder satisfaction surveys
and against sets of KPIs. These KPIs were developed by SPT and SHE Transmission to
cover their respective activities. Table 5 summarises their performance against
baselines.
19 SPT’s KPIs are focussed around new connections-related activities but include measures relating
to connected customers and broad interest stakeholders, while SHE Transmission’s represent a diverse range of objectives, akin to a balanced scorecard for the business.
RIIO Electricity Transmission Annual Report 2014-15
21
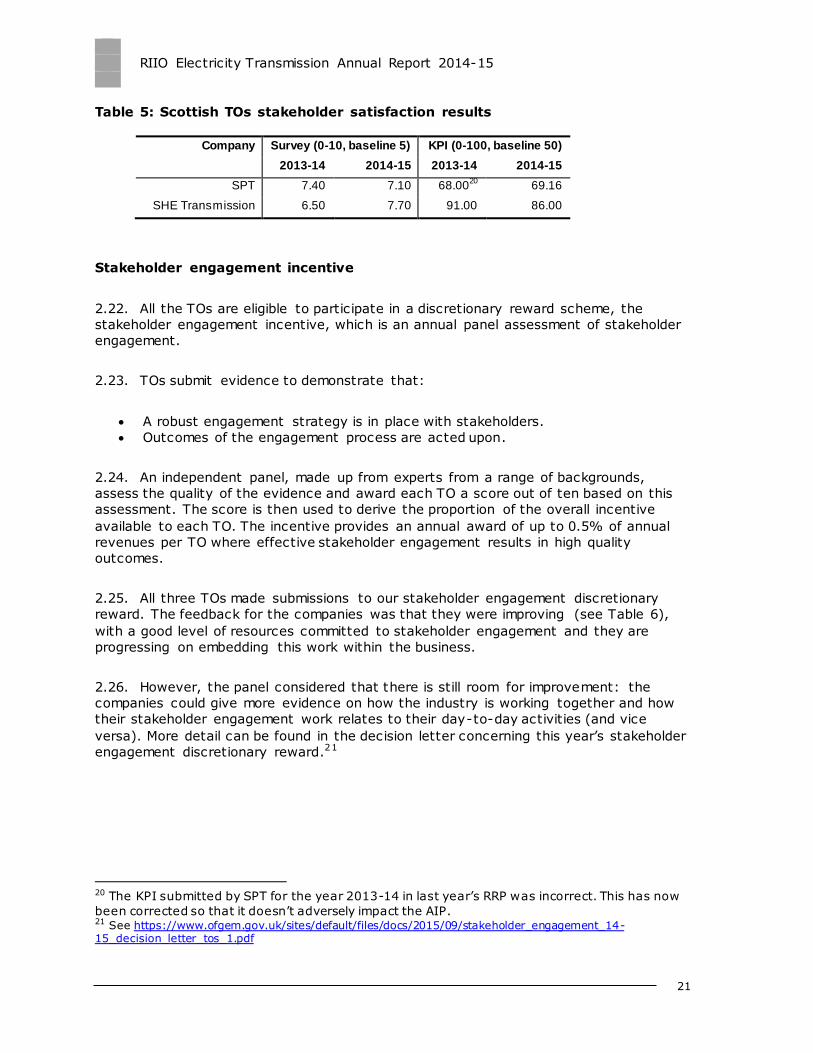
Table 5: Scottish TOs stakeholder satisfaction results
Company Survey (0-10, baseline 5) KPI (0-100, baseline 50)
2013-14 2014-15 2013-14 2014-15
SPT 7.40 7.10 68.0020
69.16
SHE Transmission 6.50 7.70 91.00 86.00
Stakeholder engagement incentive
2.22. All the TOs are eligible to participate in a discretionary reward scheme, the
stakeholder engagement incentive, which is an annual panel assessment of stakeholder
engagement.
2.23. TOs submit evidence to demonstrate that:
A robust engagement strategy is in place with stakeholders.
Outcomes of the engagement process are acted upon.
2.24. An independent panel, made up from experts from a range of backgrounds,
assess the quality of the evidence and award each TO a score out of ten based on this
assessment. The score is then used to derive the proportion of the overall incentive
available to each TO. The incentive provides an annual award of up to 0.5% of annual
revenues per TO where effective stakeholder engagement results in high quality
outcomes.
2.25. All three TOs made submissions to our stakeholder engagement discretionary
reward. The feedback for the companies was that they were improving (see Table 6),
with a good level of resources committed to stakeholder engagement and they are
progressing on embedding this work within the business.
2.26. However, the panel considered that there is still room for improvement: the
companies could give more evidence on how the industry is working together and how
their stakeholder engagement work relates to their day-to-day activities (and vice
versa). More detail can be found in the decision letter concerning this year’s stakeholder
engagement discretionary reward.21
20 The KPI submitted by SPT for the year 2013-14 in last year’s RRP was incorrect. This has now
been corrected so that it doesn’t adversely impact the AIP. 21 See https://www.ofgem.gov.uk/sites/default/files/docs/2015/09/stakeholder_engagement_14-15_decision_letter_tos_1.pdf
RIIO Electricity Transmission Annual Report 2014-15
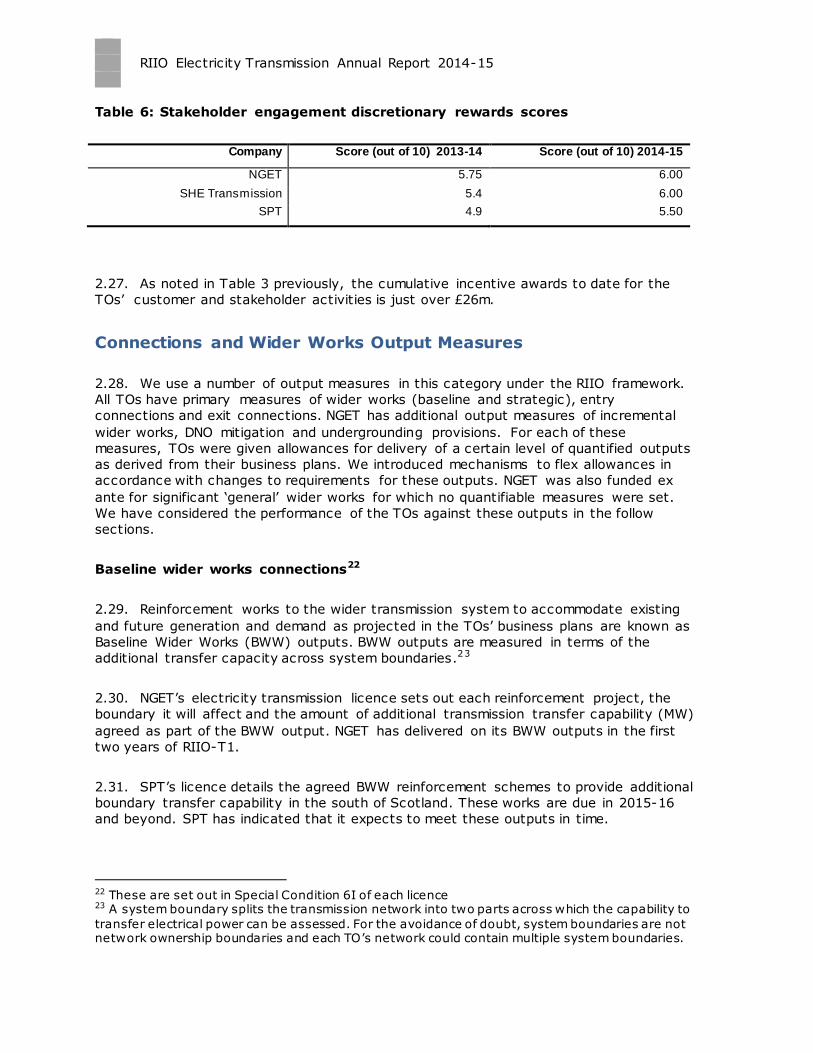
Table 6: Stakeholder engagement discretionary rewards scores
Company Score (out of 10) 2013-14 Score (out of 10) 2014-15
NGET 5.75 6.00
SHE Transmission 5.4 6.00
SPT 4.9 5.50
2.27. As noted in Table 3 previously, the cumulative incentive awards to date for the
TOs’ customer and stakeholder activities is just over £26m.
Connections and Wider Works Output Measures
2.28. We use a number of output measures in this category under the RIIO framework.
All TOs have primary measures of wider works (baseline and strategic), entry
connections and exit connections. NGET has additional output measures of incremental
wider works, DNO mitigation and undergrounding provisions. For each of these
measures, TOs were given allowances for delivery of a certain level of quantified outputs
as derived from their business plans. We introduced mechanisms to flex allowances in
accordance with changes to requirements for these outputs. NGET was also funded ex
ante for significant ‘general’ wider works for which no quantifiable measures were set.
We have considered the performance of the TOs against these outputs in the follow
sections.
Baseline wider works connections22
2.29. Reinforcement works to the wider transmission system to accommodate existing
and future generation and demand as projected in the TOs’ business plans are known as
Baseline Wider Works (BWW) outputs. BWW outputs are measured in terms of the
additional transfer capacity across system boundaries.23
2.30. NGET’s electricity transmission licence sets out each reinforcement project, the
boundary it will affect and the amount of additional transmission transfer capability (MW)
agreed as part of the BWW output. NGET has delivered on its BWW outputs in the first
two years of RIIO-T1.
2.31. SPT ’s licence details the agreed BWW reinforcement schemes to provide additional
boundary transfer capability in the south of Scotland. These works are due in 2015-16
and beyond. SPT has indicated that it expects to meet these outputs in time.
22 These are set out in Special Condition 6I of each licence 23 A system boundary splits the transmission network into two parts across which the capability to
transfer electrical power can be assessed. For the avoidance of doubt, system boundaries are not network ownership boundaries and each TO ’s network could contain multiple system boundaries.
RIIO Electricity Transmission Annual Report 2014-15
23
2.32. SHE Transmission’s electricity transmission licence sets out the agreed BWW
reinforcement schemes to provide additional boundary transfer capability in the north of
Scotland. These are due from 2015-16. SHE Transmission is forecasting to connect all of
its baseline wider works schemes on time.
Strategic wider works connections
2.33. In their RIIO-T1 business plans, the three onshore TOs identified transmission
projects totalling approximately £9 billion that may be needed over the next decade, but
there is significant uncertainty with some of these projects. RIIO-T1 put in place the
SWW process for the approval of future major investments that were neither in the
baseline nor captured by the volume drivers. These schemes are subject to a within-
period determination by the Authority.
2.34. In 2013-14 we approved three projects proposed by SHE Transmission: Kintyre-
Hunterston, Beauly-Mossford and Caithness-Moray. SHE transmission report that these
projects are progressing according to schedule. Neither NGET nor SPT have any
approved SWW schemes, but NGET expect a number of their proposed SWW schemes to
go ahead in the future. SPT has one proposed SWW scheme to commence in RIIO-T1,
which is currently under development.
General connection activity
2.35. TOs are required to deliver timely and effective connections to the network
through their licences. SPT and SHE Transmission both face a timely connections
financial incentive, by which their revenues are reduced if they fail to offer connection
terms within the specified period. NGET has no financial incentive on timeliness of
connection offers but needs to comply with its licence condition obligations.
2.36. SHE Transmission completed all 98 of its offers within time.
2.37. SPT failed, on two of its 88 offers, to meet the three month timescale as set out in
its licence, although we understand that this did not result in an overall delay to the
customers receiving the corresponding offers from NGET. The allowed revenue
modification as a consequence of 2014-15 underperformance will have the impact of
reducing SPT’s maximum allowed revenue for 2016-17 in line with the provisions in the
licence.24
2.38. NGET completed all 235 of its offers within the specified period.
24 Set out in Special Condition 3G (Financial Incentive for Timely Connections Output) of the Scottish TO’s electricity transmission licence.
RIIO Electricity Transmission Annual Report 2014-15
Local Generation Connections (Entry)
2.39. Last year, NGET reported an approximate 21GW reduction from its baseline
forecast for generation connections of 33GW. This year, NGET has further revised its
generation connections activity forecast down to 11.15GW. We will continue to work with
NGET to keep under review both its forecasts and the implications these have through
the revenue adjustment mechanisms in the licence.
2.40. SPT has forecast an increase of 1GW in the generation connection output for sole-
use infrastructure and 3.2GVA on shared-use infrastructure capacity above its business
plan baseline (2.5GW and 1GVA respectively).
2.41. SHE Transmission is forecasting to significantly exceed its baseline generation
output of 1.2GW for sole use connections and 1GVA for shared use. Its current forecast
is at 2.1GW and 6.2GVA respectively.
Local Demand Connections (Exit)
2.42. NGET has seen a significant fall in terms of demand connections, reducing the
required number of supergrid transformers (SGTs) from 72 to 48 and overhead line from
27km to 7.2km.
2.43. SHE Transmission is not forecasting to deliver any local demand connections for
which it has allowances (Shetlands 132kV). Any unspent allowances will be shared with
consumers.
Incremental wider works25
2.44. Incremental Wider Works (IWW) are transmission infrastructure works that
deliver an increase in boundary transfer capability which NGET determines is required, in
line with the implementation of its Network Development Policy.
2.45. NGET has a considerable number of IWW schemes. In the first two years of RIIO-
T1, NGET has delivered on its baseline level of additional boundary capacity. Over the
rest of the RIIO-T1 period, NGET is now forecasting a substantial fall in its IWW delivery
against its baseline levels due to a fall in generation and demand connections.
Environmental Output Measures
Limiting sulphur hexafluoride (SF6) emissions
2.46. SF6 is an extremely effective electrical insulator and so is used in high-voltage
switchgear and other electrical equipment. It is also a potent greenhouse gas with a
25 Detailed in Special Condition 6J of NGET’s licence
RIIO Electricity Transmission Annual Report 2014-15
25
radiative forcing 23,900 times higher than Carbon Dioxide (CO2). TOs are therefore
subject to a financial incentive to limit their emission levels of the gas.
2.47. Both NGET and SPT outperformed against target emissions levels of SF 6 in 2014-
15 and, based on the information we currently have, will receive a financial reward of
£2.5m and £0.1m respectively. SHE Transmission exceeded its target emissions level
and will therefore be penalised by £0.2m under the SF6 incentive mechanism.
2.48. Both NGET and SHE Transmission have uncovered errors in their previously
reported SF6 figures. These errors affect both the SF6 leakage and inventory figures
reported to us.
2.49. The SF6 performance figures reported in last year’s annual report also assumed
that two exceptional event claims from SPT that were awaiting the Authority’s decision
would be approved. The Authority has subsequently rejected both claims.26
2.50. The performance figures in figure 5 below have been amended based on these
updated leakage figures and Authority decisions. This has resulted in a £663k reduction
in reward for NGET, an £139k increase in penalty for SHE Transmission, and a £199k
increase in penalty for SPT. 27
2.51. The net impact of these adjustments is that both SHE Transmission and SPT will,
based on the information we currently have, be penalised by £0.2m and £0.1m
respectively for their SF6 leakage in 2013-14, while NGET will receive a reward of £1.8m.
26 Authority decision on SP Transmission SF6 Exceptional Event claim:
https://www.ofgem.gov.uk/publications-and-updates/authority-decision-sp-transmission-sf6-exceptional-event-claim 27 We have yet to confirm the impact of an error in NGET’s SF6 inventory. The effect of the error is likely to be a minor increase in its leakage target.
RIIO Electricity Transmission Annual Report 2014-15
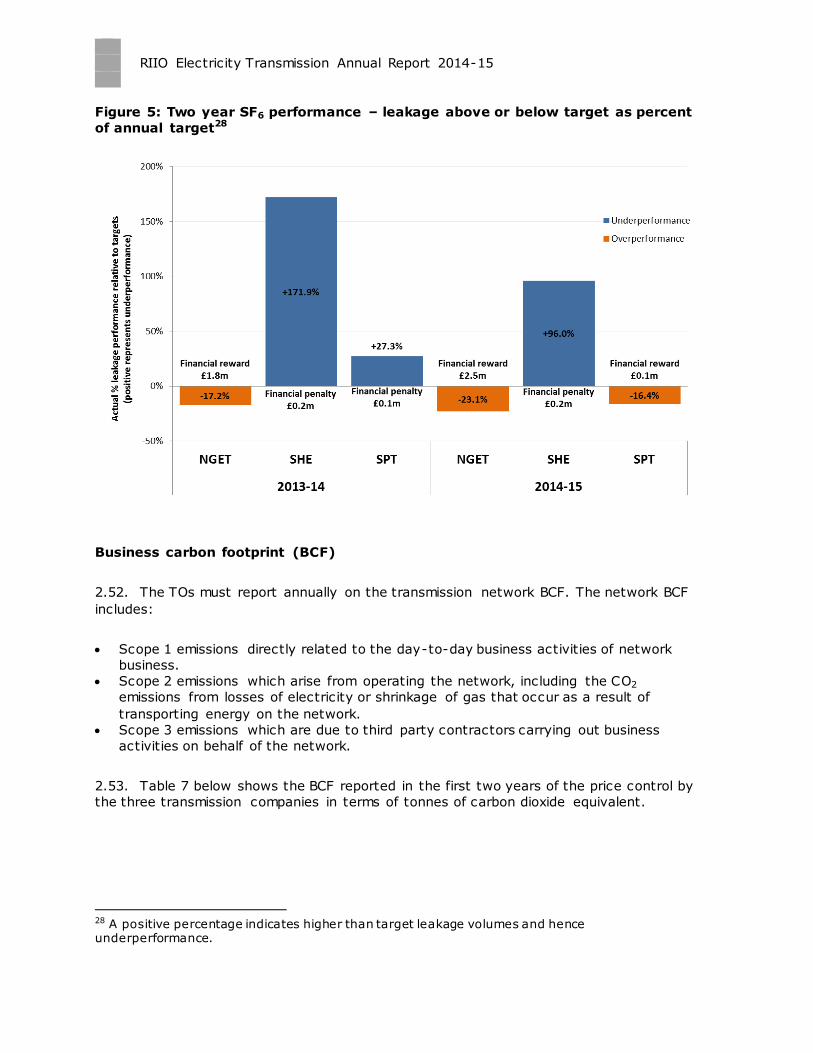
Figure 5: Two year SF6 performance – leakage above or below target as percent
of annual target28
Business carbon footprint (BCF)
2.52. The TOs must report annually on the transmission network BCF. The network BCF
includes:
Scope 1 emissions directly related to the day-to-day business activities of network
business.
Scope 2 emissions which arise from operating the network, including the CO2
emissions from losses of electricity or shrinkage of gas that occur as a result of
transporting energy on the network.
Scope 3 emissions which are due to third party contractors carrying out business
activities on behalf of the network.
2.53. Table 7 below shows the BCF reported in the first two years of the price control by
the three transmission companies in terms of tonnes of carbon dioxide equivalent.
28 A positive percentage indicates higher than target leakage volumes and hence underperformance.
RIIO Electricity Transmission Annual Report 2014-15
27
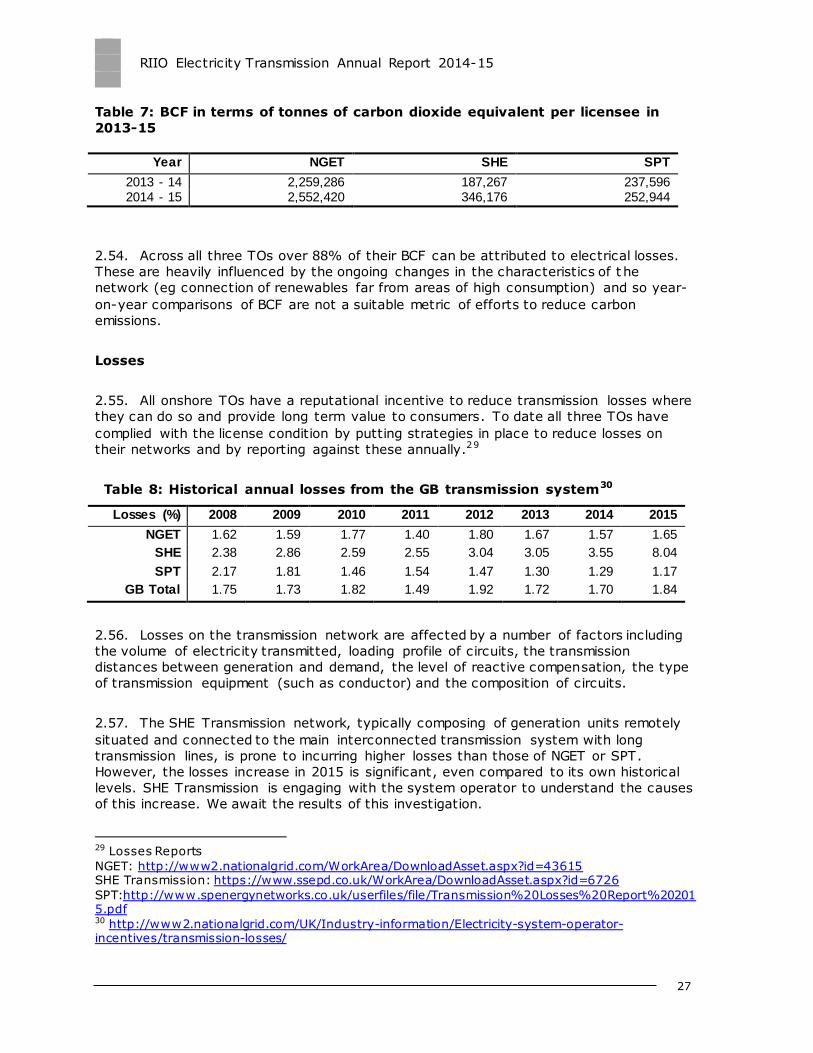
Table 7: BCF in terms of tonnes of carbon dioxide equivalent per licensee in
2013-15
Year NGET SHE SPT
2013 - 14 2,259,286 187,267 237,596 2014 - 15 2,552,420 346,176 252,944
2.54. Across all three TOs over 88% of their BCF can be attributed to electrical losses.
These are heavily influenced by the ongoing changes in the characteristics of t he
network (eg connection of renewables far from areas of high consumption) and so year-
on-year comparisons of BCF are not a suitable metric of efforts to reduce carbon
emissions.
Losses
2.55. All onshore TOs have a reputational incentive to reduce transmission losses where
they can do so and provide long term value to consumers. To date all three TOs have
complied with the license condition by putting strategies in place to reduce losses on
their networks and by reporting against these annually.29
Table 8: Historical annual losses from the GB transmission system30
Losses (%) 2008 2009 2010 2011 2012 2013 2014 2015
NGET 1.62 1.59 1.77 1.40 1.80 1.67 1.57 1.65
SHE 2.38 2.86 2.59 2.55 3.04 3.05 3.55 8.04
SPT 2.17 1.81 1.46 1.54 1.47 1.30 1.29 1.17
GB Total 1.75 1.73 1.82 1.49 1.92 1.72 1.70 1.84
2.56. Losses on the transmission network are affected by a number of factors including
the volume of electricity transmitted, loading profile of circuits, the transmission
distances between generation and demand, the level of reactive compensation, the type
of transmission equipment (such as conductor) and the composition of circuits.
2.57. The SHE Transmission network, typically composing of generation units remotely
situated and connected to the main interconnected transmission system with long
transmission lines, is prone to incurring higher losses than those of NGET or SPT.
However, the losses increase in 2015 is significant, even compared to its own historical
levels. SHE Transmission is engaging with the system operator to understand the causes
of this increase. We await the results of this investigation.
29 Losses Reports
NGET: http://www2.nationalgrid.com/WorkArea/DownloadAsset.aspx?id=43615 SHE Transmission: https://www.ssepd.co.uk/WorkArea/DownloadAsset.aspx?id=6726
SPT:http://www.spenergynetworks.co.uk/userfiles/file/Transmission%20Losses%20Report%202015.pdf 30 http://www2.nationalgrid.com/UK/Industry-information/Electricity-system-operator-incentives/transmission-losses/
RIIO Electricity Transmission Annual Report 2014-15
Environmental discretionary reward
2.58. The Environmental Discretionary Reward (EDR) is a reputational and financial
incentive for electricity transmission licensees. The aims of the scheme are to sharpen
companies’ focus on strategic environmental considerations and to encourage corporate
and operational culture change to facilitate a growth in low carbon energy.31
2.59. A company must provide evidence of its activity in each category to show how it
has met the required criteria. We score the evidence and assign a company to a
performance band (‘engaged’, ‘proactive’, or ‘leadership’). Only companies that achieve
a leadership score can get a financial reward. The reward is related to their specific score
and those of others that also achieve leadership performance. We indicate in the scheme
guidance that to achieve leadership performance a company must show evidence of how
it is looking beyond business as usual, takes a whole system perspective, and
collaborates with a range of stakeholders to achieve outstanding performance across the
scheme categories. Our assessment is reviewed at the strategic level by an independent
panel of experts.
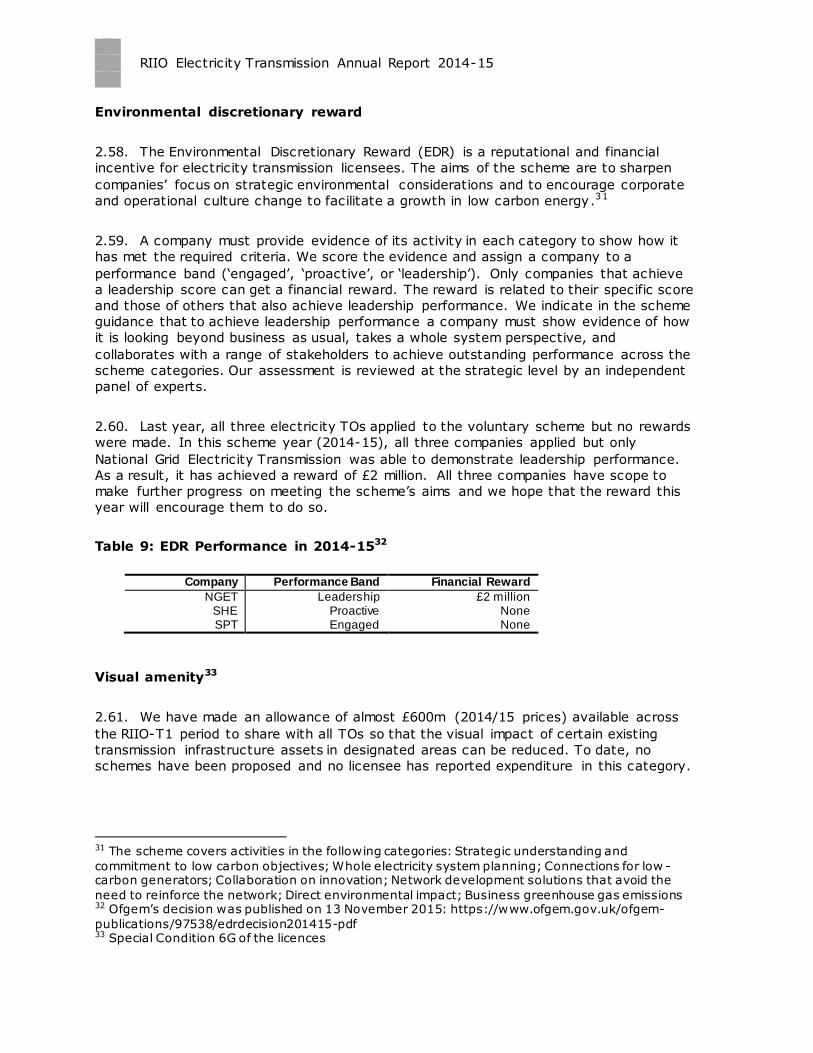
2.60. Last year, all three electricity TOs applied to the voluntary scheme but no rewards
were made. In this scheme year (2014-15), all three companies applied but only
National Grid Electricity Transmission was able to demonstrate leadership performance.
As a result, it has achieved a reward of £2 million. All three companies have scope to
make further progress on meeting the scheme’s aims and we hope that the reward this
year will encourage them to do so.
Table 9: EDR Performance in 2014-1532
Company Performance Band Financial Reward
NGET Leadership £2 million SHE Proactive None SPT Engaged None
Visual amenity33
2.61. We have made an allowance of almost £600m (2014/15 prices) available across
the RIIO-T1 period to share with all TOs so that the visual impact of certain existing
transmission infrastructure assets in designated areas can be reduced. To date, no
schemes have been proposed and no licensee has reported expenditure in this category.
31 The scheme covers activities in the following categories: Strategic understanding and
commitment to low carbon objectives; Whole electricity system planning; Connections for low -carbon generators; Collaboration on innovation; Network development solutions that avoid the
need to reinforce the network; Direct environmental impact; Business greenhouse gas emissions 32 Ofgem’s decision was published on 13 November 2015: https://www.ofgem.gov.uk/ofgem-
publications/97538/edrdecision201415-pdf 33 Special Condition 6G of the licences

RIIO Electricity Transmission Annual Report 2014-15
29
2.62. We understand that NGET is developing technical plans to reduce the impact of
electricity infrastructure associated with sections of high voltage lines in four areas,
namely: Dorset (near Winterbourne Abbas), New Forest National Park, Peak District
National Park and the Snowdonia National Park. NGET is also set to use part of the
allocation for smaller localised visual improvement projects. This is expected to be
progressed in Winter 2015-16. We will update on progress as part of next year’s annual
report.
2.63. No schemes to improve visual amenity have yet been proposed in the designated
areas by the two Scottish TOs, although SPT have identified that 136km of overhead line
is eligible for consideration under this mechanism. SHE Transmission have identified the
potential for visual amenity works for 429km of overhead line and 13 substations across
ten locations and is aiming to finalise its accompanying Methodology Statement in
Autumn 2015.
RIIO Electricity Transmission Annual Report 2014-15
3. Innovation
Chapter Summary
This chapter presents an overview of TOs’ expenditure in relation to the various
innovation incentives in RIIO-T1
Network Innovation Allowance
3.1. The Network Innovation Allowance (NIA) was established as part of the RIIO-T1
price control. The NIA provides each licensee with a ‘use it or lose it’ allowance to spend
on innovation projects in line with the NIA Governance Document .34 Both NGET and SHE
Transmission have an allowance of 0.7% of annual base revenue; SPT’s allowance is
0.5% of annual base revenue. In the second year of RIIO-T1 all licensees have begun
NIA projects. If successful, these should bring a wide variety of operational,
environmental and safety benefits.
3.2. Licensees have begun to develop useful learning from this investment. Details on
all projects can be found on the Energy Network Association’s (ENA’s) Smarter Networks
Portal.35While we are pleased that the NIA is working well and developing new learning
we need to ensure this is shared effectively. We recently published an open letter
encouraging the TOs to improve the quality of project reporting on the Smarter
Networks Portal36. We encourage all licensees to consider how this can be improved.
While we are concerned regarding the standard of project reporting we were generally
pleased with the Annual Summary of NIA Activity published by licensees.37
Network Innovation Competition
3.3. The Network Innovation Competitions (NIC) is an annual competition to which
transmission companies can apply. The competitions help to encourage Network
Licensees to innovate in the design, build, development and operation of their networks.
3.4. The NIC provides funding to a small number of large-scale innovation projects.
Trials financed through the NIC will generate learning for all Network Licensees and will
be made available to all interested parties. This learning brings potential benefits and
cost savings for current and future consumers. In 2014, two onshore electricity
34The Electricity Network Innovation Allowance Governance Document can be found
here:https://www.ofgem.gov.uk/publications-and-updates/electricity-network-innovation-
allowance-governance-document. 35 http://www.smarternetworks.org/ 36 The letter can be found here: https://www.ofgem.gov.uk/sites/default/files/docs/2014/12/open_letter_on_knowledge_transfer_
0.pdf 37 http://www.smarternetworks.org/Project.aspx?ProjectID=738#downloads
RIIO Electricity Transmission Annual Report 2014-15
31
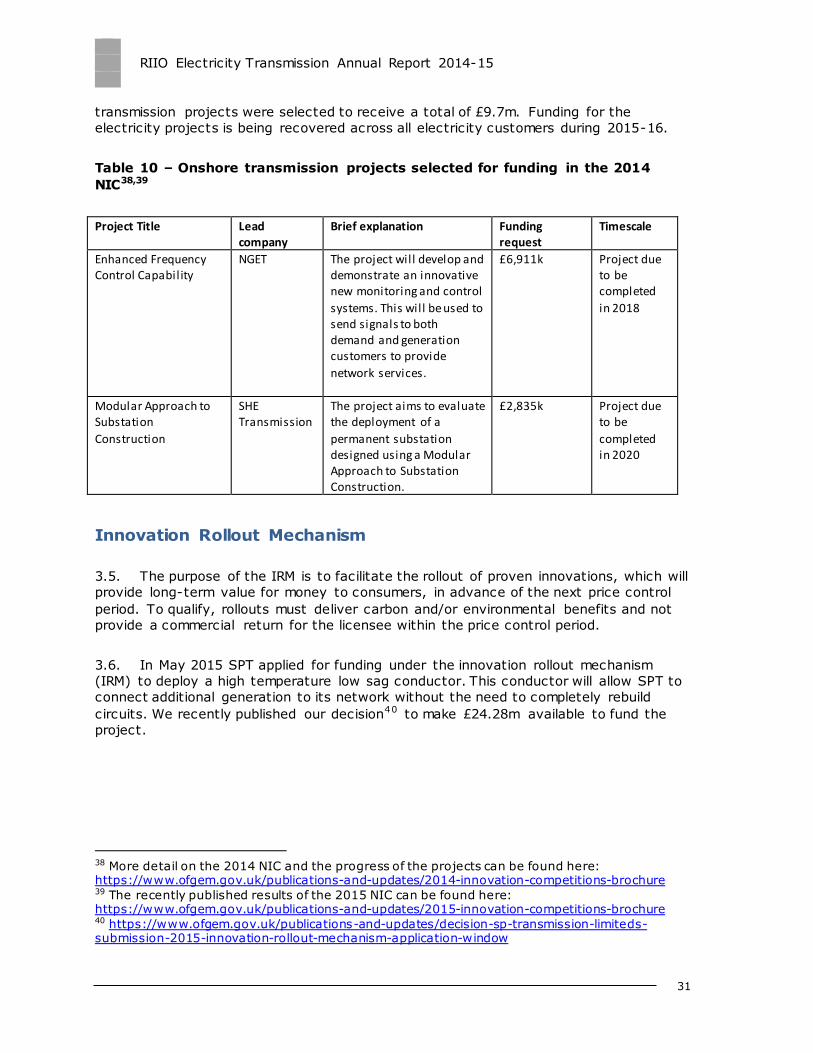
transmission projects were selected to receive a total of £9.7m. Funding for the
electricity projects is being recovered across all electricity customers during 2015-16.
Table 10 – Onshore transmission projects selected for funding in the 2014
NIC38,39
Project Title Lead company
Brief explanation Funding request
Timescale
Enhanced Frequency Control Capability
NGET The project will develop and demonstrate an innovative new monitoring and control
systems. This will be used to send signals to both demand and generation customers to provide
network services.
£6,911k Project due to be completed
in 2018
Modular Approach to Substation
Construction
SHE Transmission
The project aims to evaluate the deployment of a
permanent substation designed using a Modular Approach to Substation Construction.
£2,835k
Project due to be
completed in 2020
Innovation Rollout Mechanism
3.5. The purpose of the IRM is to facilitate the rollout of proven innovations, which will
provide long-term value for money to consumers, in advance of the next price control
period. To qualify, rollouts must deliver carbon and/or environmental benefits and not
provide a commercial return for the licensee within the price control period.
3.6. In May 2015 SPT applied for funding under the innovation rollout mechanism
(IRM) to deploy a high temperature low sag conductor. This conductor will allow SPT to
connect additional generation to its network without the need to completely rebuild
circuits. We recently published our decision40 to make £24.28m available to fund the
project.
38 More detail on the 2014 NIC and the progress of the projects can be found here: https://www.ofgem.gov.uk/publications-and-updates/2014-innovation-competitions-brochure 39 The recently published results of the 2015 NIC can be found here: https://www.ofgem.gov.uk/publications-and-updates/2015-innovation-competitions-brochure 40 https://www.ofgem.gov.uk/publications-and-updates/decision-sp-transmission-limiteds-submission-2015-innovation-rollout-mechanism-application-window
RIIO Electricity Transmission Annual Report 2014-15
4. Expenditure
Chapter Summary
This chapter evaluates actual and forecast expenditure for onshore electricity
transmission against the costs allowed in the RIIO-T1 settlement. The focus is on load
and non-load capital expenditure, since those categories form the majority of TO spend.
Introduction
4.1. This chapter looks at the TOs’ expenditure, and their forecasts of expenditure for
the remainder of the control, against allowances. We firstly consider the overall
expenditure (totex), then examine the two main components: load related capital
expenditure (capex) and non-load related capex.
4.2. Load-related capex is the installation of new assets on the network to
accommodate changes in the level or pattern of electricity supply and demand. Non
load-related capex is expenditure to maintain the existing network including through
asset replacement. Load and non-load related expenditure together make up
approximately 87-96% of TOs’ forecast totex, and therefore is an important focus of our
analysis.
4.3. We present some high level analysis of the drivers of the deviation of TOs’ capex
from the allowances and assess the TOs’ performance on capital delivery. We conclude
the chapter with a look at non-operational capex41 and operating costs (opex).
Total expenditure (Totex) performance and forecasts
4.4. A fundamental change between the previous price control and the RIIO framework
is that companies are incentivised to deliver outputs based on total whole life costs,
rather than being driven to preferring either opex or capex under different incentives.
This enables the companies to select the best solutions and optimise costs and benefits.
4.5. The RIIO-T1 arrangements include setting a totex allowance, which is
automatically adjusted to account for uncertainty in the volume of requirements.
Underspend or overspend against this allowance is subject to a single incentive
mechanism with a symmetrical sharing factor.
4.6. We monitor deviations from adjusted allowances both to allow us to correctly
apply the totex incentive mechanisms and to better inform our understanding of how the
TOs are achieving their performance levels. This understanding will also be an important
element to input to the development of the RIIO-T2 framework.
41 This covers expenditure on equipment not directly related to the transmission operations, for example, IT capital expenditure
RIIO Electricity Transmission Annual Report 2014-15
33
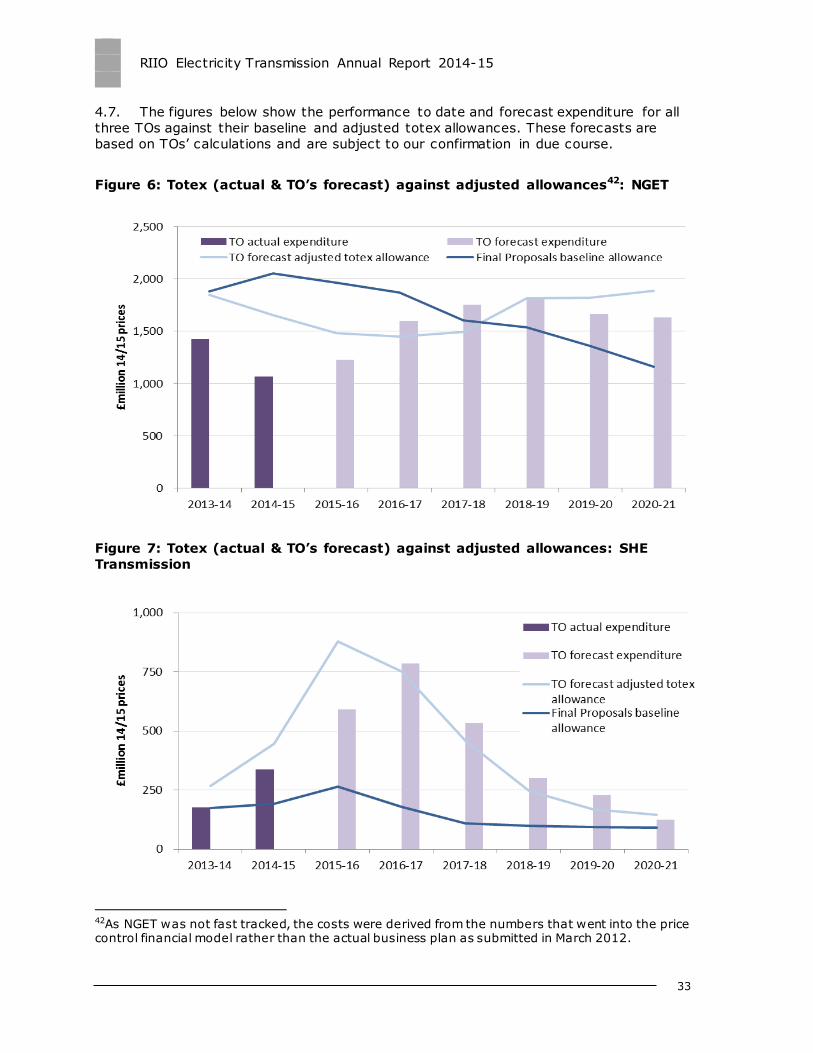
4.7. The figures below show the performance to date and forecast expenditure for all
three TOs against their baseline and adjusted totex allowances. These forecasts are
based on TOs’ calculations and are subject to our confirmation in due course.
Figure 6: Totex (actual & TO’s forecast) against adjusted allowances42: NGET
Figure 7: Totex (actual & TO’s forecast) against adjusted allowances: SHE
Transmission
42As NGET was not fast tracked, the costs were derived from the numbers that went into the price control financial model rather than the actual business plan as submitted in March 2012.
RIIO Electricity Transmission Annual Report 2014-15
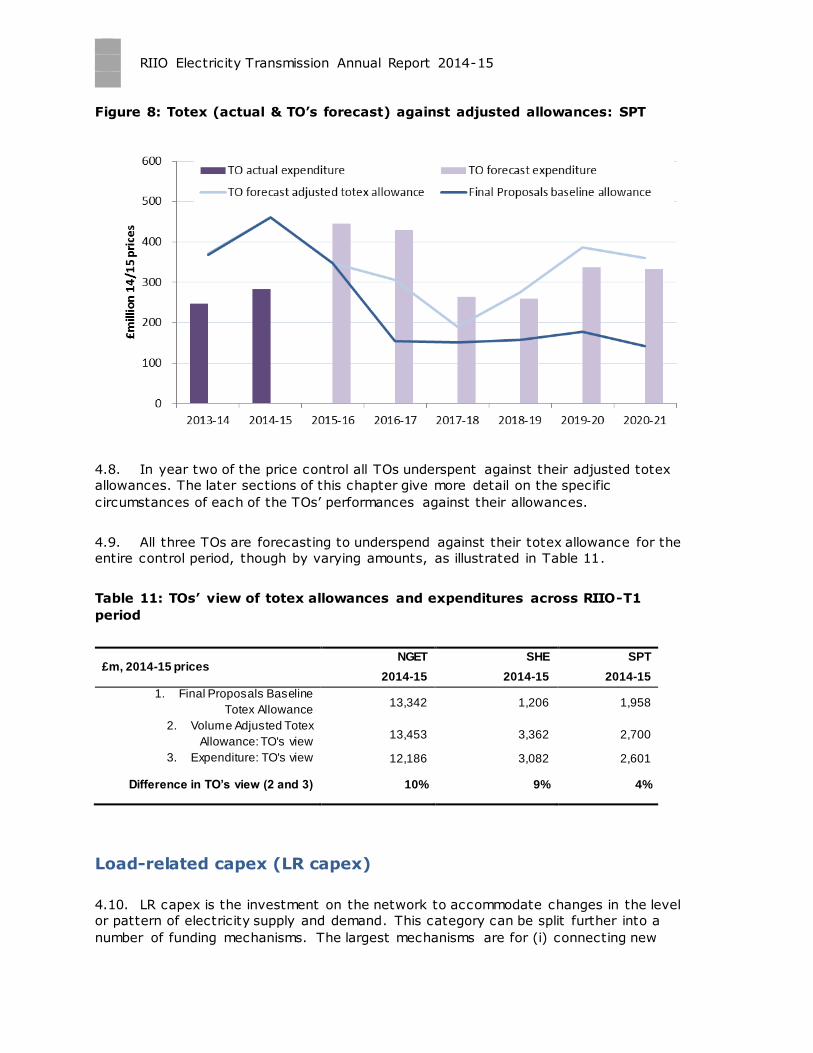
Figure 8: Totex (actual & TO’s forecast) against adjusted allowances: SPT
4.8. In year two of the price control all TOs underspent against their adjusted totex
allowances. The later sections of this chapter give more detail on the specific
circumstances of each of the TOs’ performances against their allowances.
4.9. All three TOs are forecasting to underspend against their totex allowance for the
entire control period, though by varying amounts, as illustrated in Table 11.
Table 11: TOs’ view of totex allowances and expenditures across RIIO-T1
period
£m, 2014-15 prices NGET SHE SPT
2014-15 2014-15 2014-15
1. Final Proposals Baseline
Totex Allowance 13,342 1,206 1,958
2. Volume Adjusted Totex
Allowance: TO's view 13,453 3,362 2,700
3. Expenditure: TO's view 12,186 3,082 2,601
Difference in TO’s view (2 and 3) 10% 9% 4%
Load-related capex (LR capex)
4.10. LR capex is the investment on the network to accommodate changes in the level
or pattern of electricity supply and demand. This category can be split further into a
number of funding mechanisms. The largest mechanisms are for (i) connecting new
RIIO Electricity Transmission Annual Report 2014-15
35
electricity generation sources, (ii) connecting new demand sources, and (iii) ‘wider
works’ which are associated reinforcements that facilitate these connections whilst
maintaining network integrity. Lesser mechanisms include provisions for undergrounding
cables and for mitigating works on the electricity distribution systems (‘DNO mitigation’).
4.11. The capex allowance for these elements comprises a baseline level, reflecting a
‘best-view’ business plan by the TOs, mechanisms to flex the allowance in accordance
with the actual outturn demand and consequential system-wide requirements.
4.12. As part of the RIIO-T1 price control we put in place a mechanism to allow TOs to
bring forward large investment projects – known as Strategic Wider Works (SWW) –
where funding had not been awarded as part of the price control settlement. This
mechanism allows us to consider the need and funding for these projects during the
price control period, so that delivery of these outputs can be brought forward in a timely
manner.
4.13. The transmission licensees have identified in their business plans a number of
projects that they consider are suitable for future consideration under the Strategic
Wider Works arrangements. To date, only SHE Transmission have gained approval for
project funding under the SWW mechanism, but the other TOs have included some as
yet unapproved projects in their expenditure forecasts. We have adjusted the TOs’
expenditure forecasts to exclude such unapproved capex.
NGET
4.14. Since the start of the price control there has been a substantial shift in the
forecast of load related works. At the time of setting the price control, NGET ‘s business
plan forecast connecting 33GW of new generation. Now in the second year of the price
control, NGET’s connection profile has fallen to a third of that anticipated (11.15GW).
Demand connections have also fallen. These changes will lead to a downward
adjustment to the allowances across the price control period.
4.15. In light of the reduction in volume of demand and generation connections, NGET
currently anticipates that a large amount of wider works expenditure, required to
maintain network integrity within and across network boundaries, has either become
unnecessary or will be deferred beyond RIIO-T1.
4.16. This is reflected in its 2014-15 performance, where NGET has underspent on load-
related capital expenditure by £268m against its forecast allowance. NGET’s explanation
is that this is in part due to a fall in the need for ‘general’ wider works for which there is
no quantified outputs, and consequently no automatic allowance adjustment .
RIIO Electricity Transmission Annual Report 2014-15
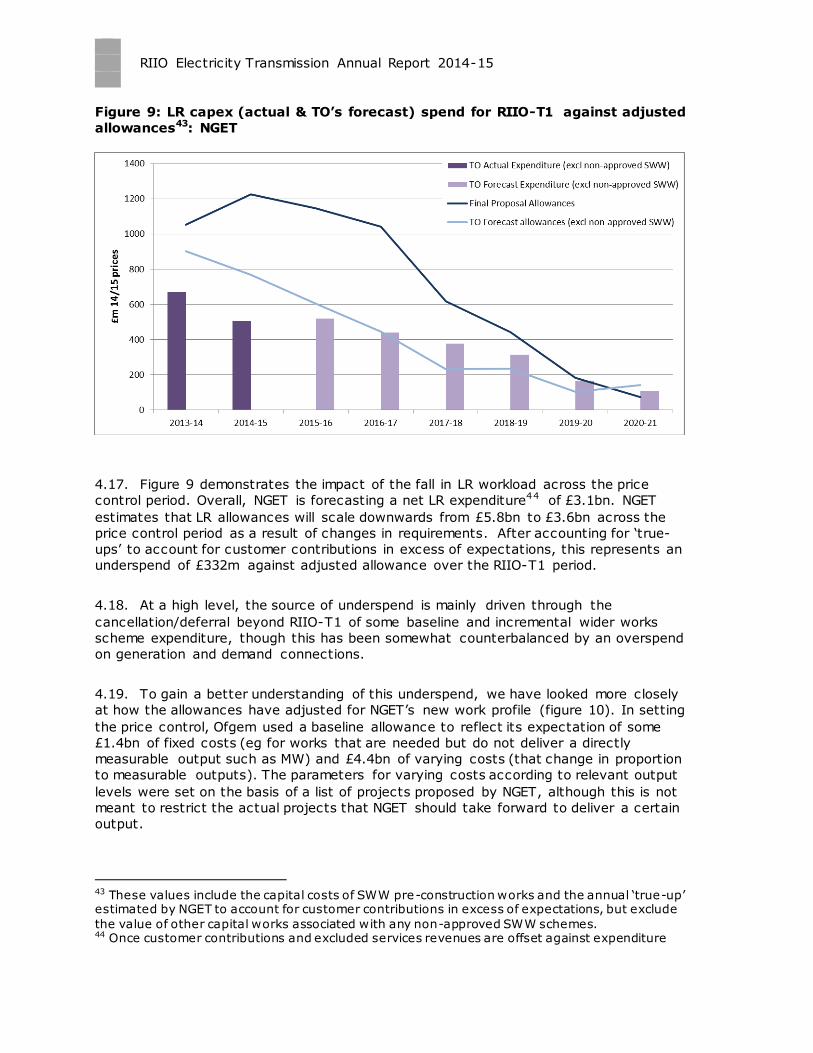
Figure 9: LR capex (actual & TO’s forecast) spend for RIIO-T1 against adjusted
allowances43: NGET
4.17. Figure 9 demonstrates the impact of the fall in LR workload across the price
control period. Overall, NGET is forecasting a net LR expenditure44 of £3.1bn. NGET
estimates that LR allowances will scale downwards from £5.8bn to £3.6bn across the
price control period as a result of changes in requirements. After accounting for ‘true-
ups’ to account for customer contributions in excess of expectations, this represents an
underspend of £332m against adjusted allowance over the RIIO-T1 period.
4.18. At a high level, the source of underspend is mainly driven through the
cancellation/deferral beyond RIIO-T1 of some baseline and incremental wider works
scheme expenditure, though this has been somewhat counterbalanced by an overspend
on generation and demand connections.
4.19. To gain a better understanding of this underspend, we have looked more closely
at how the allowances have adjusted for NGET’s new work profile (figure 10). In setting
the price control, Ofgem used a baseline allowance to reflect its expectation of some
£1.4bn of fixed costs (eg for works that are needed but do not deliver a directly
measurable output such as MW) and £4.4bn of varying costs (that change in proportion
to measurable outputs). The parameters for varying costs according to relevant output
levels were set on the basis of a list of projects proposed by NGET, although this is not
meant to restrict the actual projects that NGET should take forward to deliver a certain
output.
43 These values include the capital costs of SWW pre-construction works and the annual ‘true-up’ estimated by NGET to account for customer contributions in excess of expectations, but exclude
the value of other capital works associated with any non-approved SWW schemes. 44 Once customer contributions and excluded services revenues are offset against expenditure
RIIO Electricity Transmission Annual Report 2014-15
37
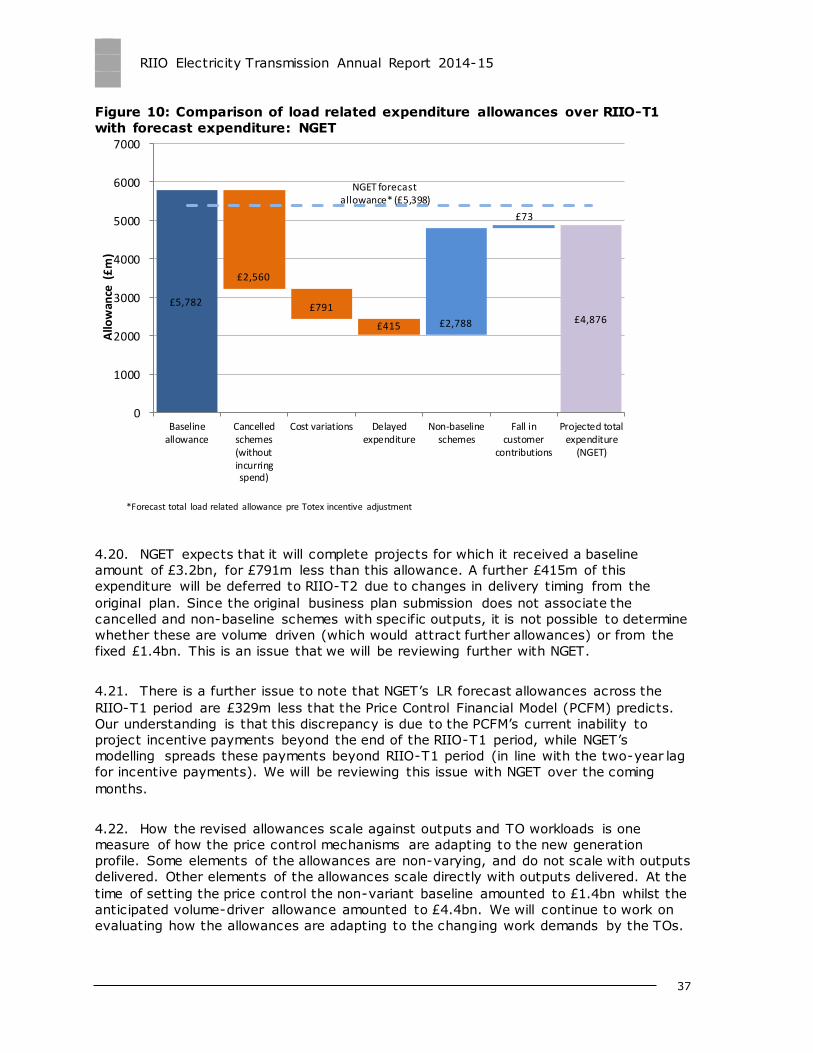
Figure 10: Comparison of load related expenditure allowances over RIIO-T1
with forecast expenditure: NGET
4.20. NGET expects that it will complete projects for which it received a baseline
amount of £3.2bn, for £791m less than this allowance. A further £415m of this
expenditure will be deferred to RIIO-T2 due to changes in delivery timing from the
original plan. Since the original business plan submission does not associate the
cancelled and non-baseline schemes with specific outputs, it is not possible to determine
whether these are volume driven (which would attract further allowances) or from the
fixed £1.4bn. This is an issue that we will be reviewing further with NGET.
4.21. There is a further issue to note that NGET’s LR forecast allowances across the
RIIO-T1 period are £329m less that the Price Control Financial Model (PCFM) predicts.
Our understanding is that this discrepancy is due to the PCFM’s current inability to
project incentive payments beyond the end of the RIIO-T1 period, while NGET’s
modelling spreads these payments beyond RIIO-T1 period (in line with the two-year lag
for incentive payments). We will be reviewing this issue with NGET over the coming
months.
4.22. How the revised allowances scale against outputs and TO workloads is one
measure of how the price control mechanisms are adapting to the new generation
profile. Some elements of the allowances are non-varying, and do not scale with outputs
delivered. Other elements of the allowances scale directly with outputs delivered. At the
time of setting the price control the non-variant baseline amounted to £1.4bn whilst the
anticipated volume-driver allowance amounted to £4.4bn. We will continue to work on
evaluating how the allowances are adapting to the changing work demands by the TOs.
£5,782
£2,560
£791
£415 £2,788
£73
£4,876
NGET forecast allowance* (£5,398)
0
1000
2000
3000
4000
5000
6000
7000
Baselineallowance
Cancelledschemes(withoutincurringspend)
Cost variations Delayedexpenditure
Non-baselineschemes
Fall incustomer
contributions
Projected totalexpenditure
(NGET)
Allo
wan
ce (
£m
)
*Forecast total load related allowance pre Totex incentive adjustment
RIIO Electricity Transmission Annual Report 2014-15
SHE Transmission
4.23. A number of significant changes within the first two years of the price control
have affected SHE Transmission’s RIIO-T1 workload. Generation connections have
increased markedly and, in terms of expenditure, Ofgem has approved three Strategic
Wider Works schemes; Caithness-Moray, Kintyre-Hunterson and Beauly-Mossford. SHE
Transmission is forecasting to significantly exceed its baseline generation output
(c.170% sole use and c.600% shared use, against respective baseline) and expenditure
(£874m against a baseline of £216m).
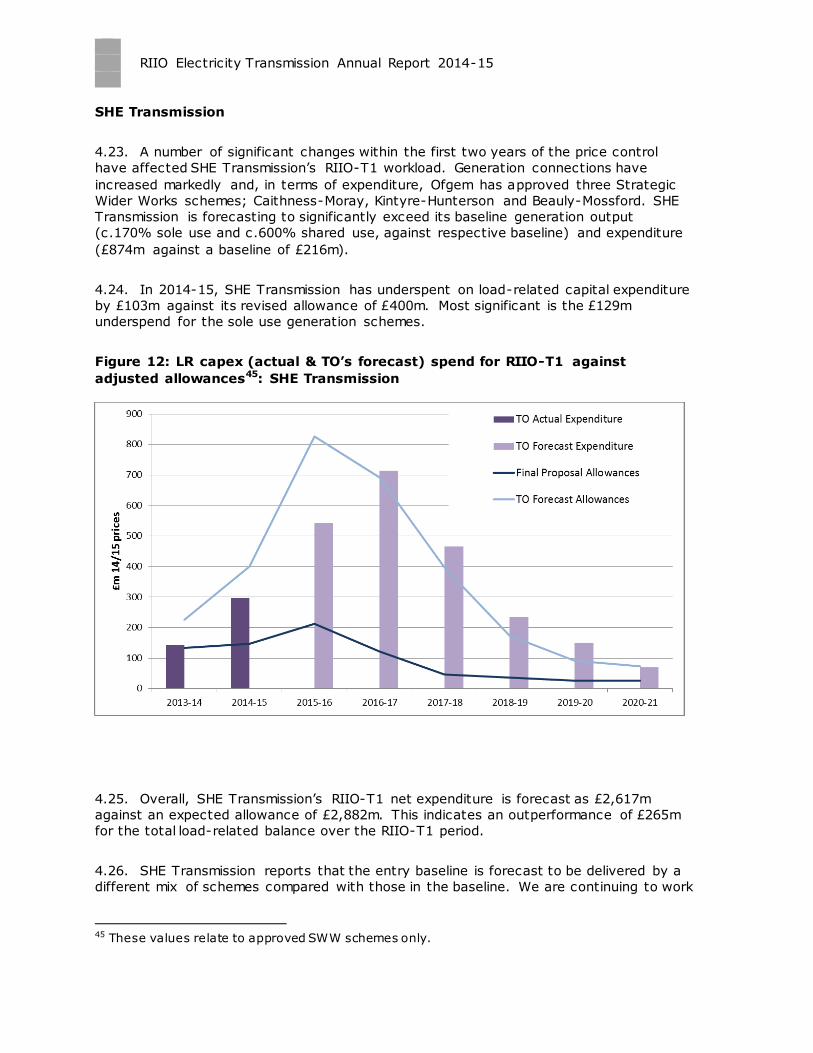
4.24. In 2014-15, SHE Transmission has underspent on load-related capital expenditure
by £103m against its revised allowance of £400m. Most significant is the £129m
underspend for the sole use generation schemes.
Figure 12: LR capex (actual & TO’s forecast) spend for RIIO-T1 against
adjusted allowances45: SHE Transmission
4.25. Overall, SHE Transmission’s RIIO-T1 net expenditure is forecast as £2,617m
against an expected allowance of £2,882m. This indicates an outperformance of £265m
for the total load-related balance over the RIIO-T1 period.
4.26. SHE Transmission reports that the entry baseline is forecast to be delivered by a
different mix of schemes compared with those in the baseline. We are continuing to work
45 These values relate to approved SWW schemes only.
RIIO Electricity Transmission Annual Report 2014-15
39
with SHE Transmission to understand how this mix has led to underspend. In particular,
we are looking to understand whether SHE Transmission has successfully underspent
against its forecasts and our allowances for schemes in the business plans, or whether
any underspend is driven by new schemes being progressed which are fundamentally
lower cost than the volume driver allowances.
SPT
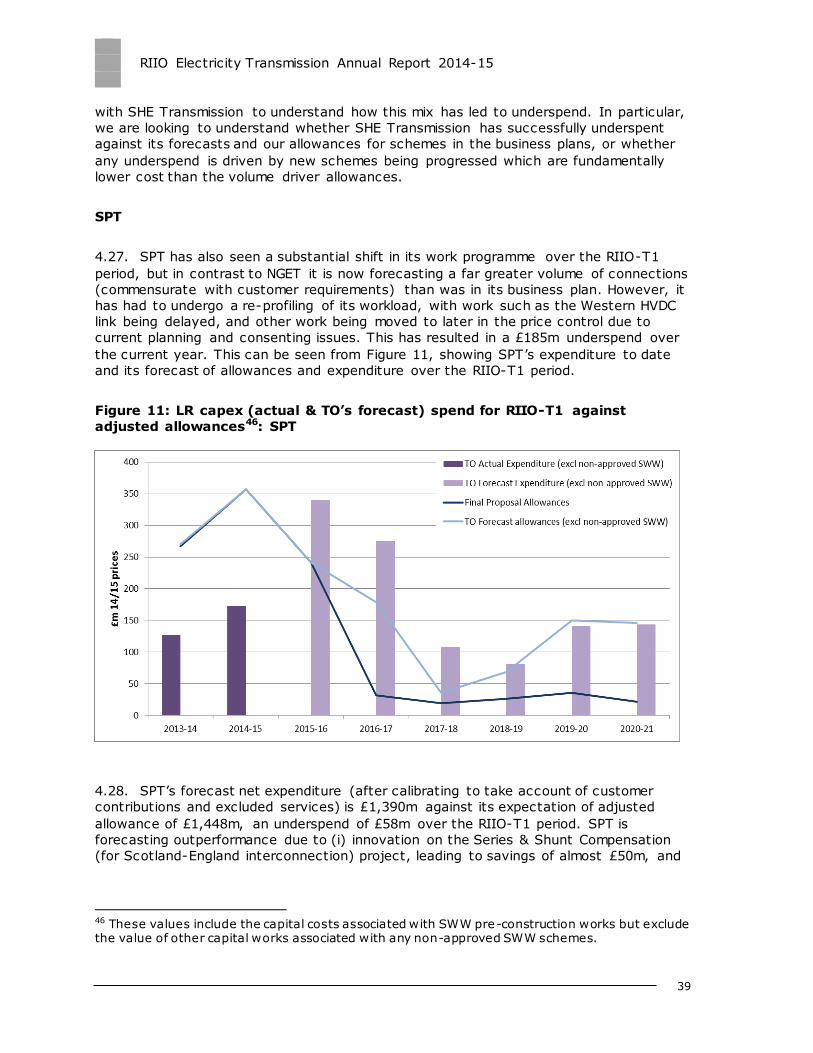
4.27. SPT has also seen a substantial shift in its work programme over the RIIO-T1
period, but in contrast to NGET it is now forecasting a far greater volume of connections
(commensurate with customer requirements) than was in its business plan. However, it
has had to undergo a re-profiling of its workload, with work such as the Western HVDC
link being delayed, and other work being moved to later in the price control due to
current planning and consenting issues. This has resulted in a £185m underspend over
the current year. This can be seen from Figure 11, showing SPT ’s expenditure to date
and its forecast of allowances and expenditure over the RIIO-T1 period.
Figure 11: LR capex (actual & TO’s forecast) spend for RIIO-T1 against
adjusted allowances46: SPT
4.28. SPT’s forecast net expenditure (after calibrating to take account of customer
contributions and excluded services) is £1,390m against its expectation of adjusted
allowance of £1,448m, an underspend of £58m over the RIIO-T1 period. SPT is
forecasting outperformance due to (i) innovation on the Series & Shunt Compensation
(for Scotland-England interconnection) project, leading to savings of almost £50m, and
46 These values include the capital costs associated with SWW pre-construction works but exclude the value of other capital works associated with any non-approved SWW schemes.
RIIO Electricity Transmission Annual Report 2014-15
(ii) savings on the Installation of Mechanically Switched Capacitor Damping Networks
(MSCDNs) to Upgrade Scotland – England Interconnection (circa £8m below allowance).
4.29. We estimate that SPT’s forecast allowance includes c.£160m of works for which
there is no perfectly matched asset type funding mechanism. We will be reviewing this
with the company to determine the appropriate way forward.
4.30. SPT is not proposing substantial change in scheme composition from those that
were in its baseline plan. On the exit connection side, SPT is planning to deliver the
same schemes as those in the baseline, but at almost 10% lower cost.
Non load-related capex (NLR capex)
Overview
4.31. NLR capex is capital investment made by a TO to maintain its current network
including through asset replacement. This investment covers mainly replacement and
refurbishment of assets47.
4.32. Non load related expenditure is split into lead asset48and non lead asset
expenditure. Lead assets are the main assets comprising the transmission network that
are required for the safe and reliable transfer of electricity from one point on the network
to another. Non-lead assets include monitoring, telecommunications, protection
equipment (except for switchgear), and any assets below 132kV (including assets in the
lead asset category types). Non lead asset expenditure also covers cost incurred to
maintain or improve weather related resilience.
4.33. The Network Output Measures (NOMs) are the primary means of measuring
outputs delivered by NLR expenditure. The NOMs relate only to lead assets and at the
time that allowances were set it was assumed that about three-quarters of NLR
expenditure would be on assets covered by the NOMs targets. As a consequence, our
focus to date has been on NOMs outputs. As noted in Chapter 2, the development of the
NOMs methodology (which is further detailed in Appendix 1), will better inform the
assessment of such outputs. The latest information from TOs indicates that only around
half of the three TOs’ current RIIO-T1 total forecast NLR expenditure will directly
contribute to the delivery of NOMs outputs. This proportional change raises the
importance of our assessment of non-lead asset expenditure and we therefore intend to
give it greater scrutiny in the future.
47 The figures quoted in this section and in the Network capital delivery section of this chapter
exclude NLR uncertain costs. NLR uncertain costs relate mainly to enhanced physical site security
upgrade programme (PSUP). We published our decision on PSUP on 30th September 2015: https://www.ofgem.gov.uk/publications-and-updates/decision-tpcr4-cost-reviews-and-riio-t1gd1-
uncertainty-mechanisms-enhanced-security-upgrades 48 For reporting purposes the following asset categories are lead assets: circuit breakers,
transformers, reactors, underground cables, over head line (OHL) conductors, OHL fittings, OHL towers (SHE transmission and SPT only).
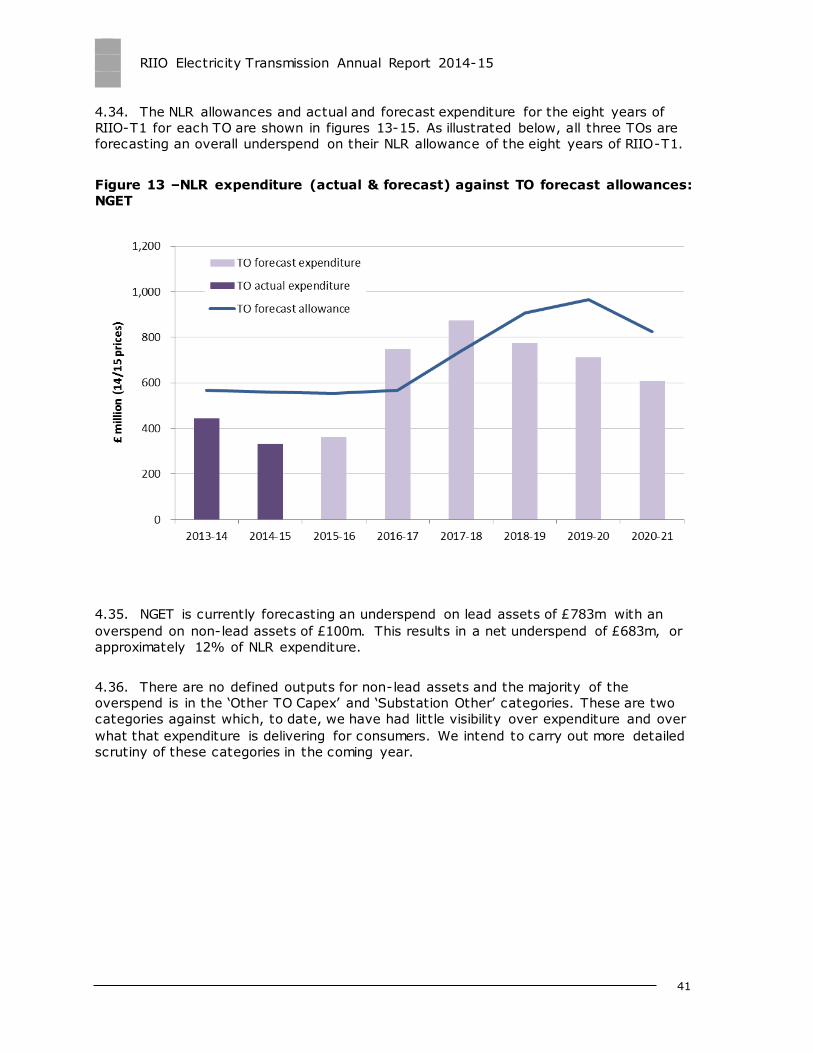
RIIO Electricity Transmission Annual Report 2014-15
41
4.34. The NLR allowances and actual and forecast expenditure for the eight years of
RIIO-T1 for each TO are shown in figures 13-15. As illustrated below, all three TOs are
forecasting an overall underspend on their NLR allowance of the eight years of RIIO-T1.
Figure 13 –NLR expenditure (actual & forecast) against TO forecast allowances:
NGET
4.35. NGET is currently forecasting an underspend on lead assets of £783m with an
overspend on non-lead assets of £100m. This results in a net underspend of £683m, or
approximately 12% of NLR expenditure.
4.36. There are no defined outputs for non-lead assets and the majority of the
overspend is in the ‘Other TO Capex’ and ‘Substation Other’ categories. These are two
categories against which, to date, we have had little visibility over expenditure and over
what that expenditure is delivering for consumers. We intend to carry out more detailed
scrutiny of these categories in the coming year.
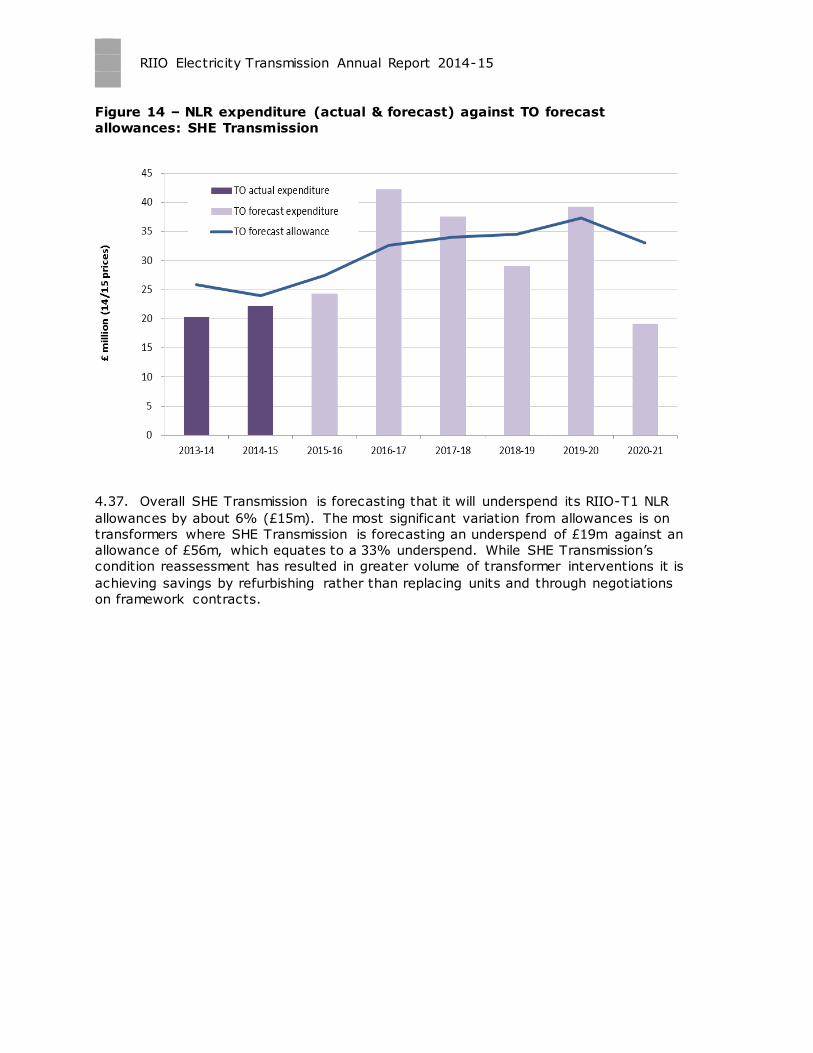
RIIO Electricity Transmission Annual Report 2014-15
Figure 14 – NLR expenditure (actual & forecast) against TO forecast
allowances: SHE Transmission
4.37. Overall SHE Transmission is forecasting that it will underspend its RIIO-T1 NLR
allowances by about 6% (£15m). The most significant variation from allowances is on
transformers where SHE Transmission is forecasting an underspend of £19m against an
allowance of £56m, which equates to a 33% underspend. While SHE Transmission’s
condition reassessment has resulted in greater volume of transformer interventions it is
achieving savings by refurbishing rather than replacing units and through negotiations
on framework contracts.
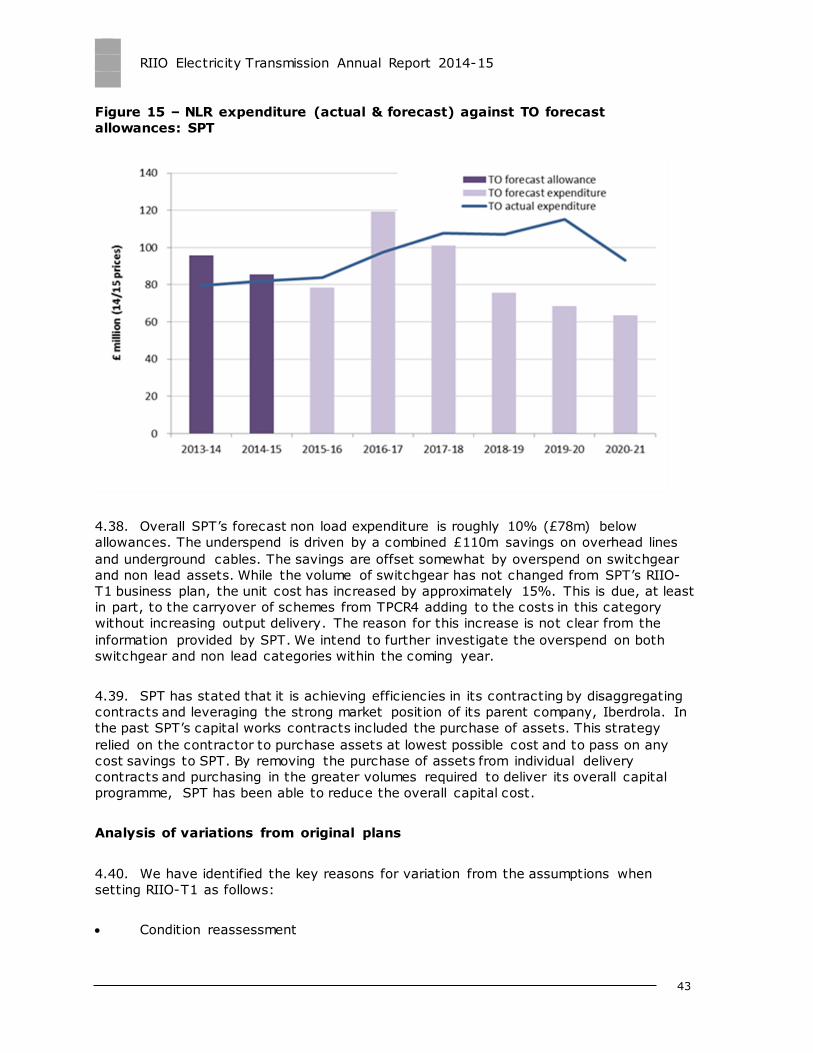
RIIO Electricity Transmission Annual Report 2014-15
43
Figure 15 – NLR expenditure (actual & forecast) against TO forecast
allowances: SPT
4.38. Overall SPT’s forecast non load expenditure is roughly 10% (£78m) below
allowances. The underspend is driven by a combined £110m savings on overhead lines
and underground cables. The savings are offset somewhat by overspend on switchgear
and non lead assets. While the volume of switchgear has not changed from SPT’s RIIO-
T1 business plan, the unit cost has increased by approximately 15%. This is due, at least
in part, to the carryover of schemes from TPCR4 adding to the costs in this category
without increasing output delivery. The reason for this increase is not clear from the
information provided by SPT. We intend to further investigate the overspend on both
switchgear and non lead categories within the coming year.
4.39. SPT has stated that it is achieving efficiencies in its contracting by disaggregating
contracts and leveraging the strong market position of its parent company, Iberdrola. In
the past SPT’s capital works contracts included the purchase of assets. This strategy
relied on the contractor to purchase assets at lowest possible cost and to pass on any
cost savings to SPT. By removing the purchase of assets from individual delivery
contracts and purchasing in the greater volumes required to deliver its overall capital
programme, SPT has been able to reduce the overall capital cost.
Analysis of variations from original plans
4.40. We have identified the key reasons for variation from the assumptions when
setting RIIO-T1 as follows:
Condition reassessment
RIIO Electricity Transmission Annual Report 2014-15
Data revisions
Deferral of work delivering outputs in RIIO-T2
Other factors
4.41. These are further discussed below.
Condition reassessment
4.42. We expect TOs to take reasonable measures to accurately determine the condition
of the assets on their networks and to revise their investment programmes if necessary.
Both NGET and SHE Transmission undertook a widespread condition reassessment
programme during 2013-14.
4.43. NGET’s condition reassessment resulted in changes to its asset replacement
priorities and some replanning of its NLR programme. Using a consistent unit cost
analysis we estimate that NGET’s condition reassessment has added approximately
£57m to its NLR lead asset costs over the RIIO-T1 period. NGET indicates that its revised
NLR programme will deliver levels of network risk at the end of RIIO-T1 equivalent to its
NOMs targets.
4.44. SHE Transmission has also revised its non-load related programme following
condition reassessment of its assets. This has increased costs in some asset categories
and reduced them in others. In our estimation, the condition reassessment has overall
effectively increased the cost of SHE Transmission’s non load related programme by
approximately £9m when we compare using a consistent unit cost analysis. In addition,
even when the same assets are worked upon, the content of the work has been
adjusted. For example, the original estimates in SHE Transmission’s RIIO-T1 business
plan were based on the full reconductoring and reinsulation of overhead lines. Following
condition assessment some circuits will now be refitting only, some will be earth wire
reconductoring only, and some will additionally involve tower painting and steelwork
replacement. These scheme changes give rise to further deviation in the cost from
original plan in addition to the £9m estimated above.
4.45. SPT has not undertaken a widespread asset condition reassessment programme
and has stated that it does not expect to carry out any such programme in RIIO-T1. SPT
also stated that it assesses the condition of its assets at the time of replacement and as
part of its routine inspection and maintenance programmes. To date the condition
assessments have confirmed the assets were in need of replacement as assumed when
SPT devised its non-load programme.
4.46. SPT’s licence (Special Condition 6H) contains provision for the award of additional
allowances to fund five overhead line replacement schemes. The additional allowances
are only triggered if certain load related schemes go ahead. SPT states that replacement
of the overhead lines will be required due to their age and condition. However, it is
unlikely that the conditions required to trigger the additional allowances will be met. SPT
has included the cost of these schemes (£69m) in its overall forecasts. We will consider
RIIO Electricity Transmission Annual Report 2014-15
45
the appropriate treatment of these schemes in our ongoing work. These costs are not
included in the figures quoted in this chapter.
Data revisions
4.47. TOs are expected to maintain robust quality of their asset data. Since the start of
RIIO-T1, NGET’s data assurance processes have uncovered some errors in its
transformer and overhead line volume estimates and replacement priority
categorisations. NGET reports that the financial impact of correcting these data errors is
to add in the region of £17m to the cost required to deliver its NOMs targets.
4.48. Neither SHE Transmission or SPT have reported any financial impact of data
revisions. However, this does not mean that their data is error free. In the case of SHE
Transmission, it has identified data errors such as physical ownership of certain assets
but without any financial impact. SHE Transmission is planning a significant programme
of investment in its IT systems and processes associated with the gathering,
management, validation, and reporting of its asset data. As well as transmission, this
investment will include SSE’s distribution businesses. SHE Transmission is not yet in a
position to estimate the likely extent or impact of any data revisions arising from this
programme.
Deferral of work delivering outputs in RIIO-T2
4.49. NGET’s original RIIO-T1 business plan against which its allowances were set
included a number of schemes where the outputs were to be delivered in RIIO-T2 but
with proportion of forecast expenditure in RIIO-T1. While RIIO-T1 expenditure on these
schemes was factored into NGET’s RIIO-T1 NLR allowances, the expenditure would not
contribute to the delivery of RIIO-T1 targets. Some of these schemes have now been
cancelled or fully deferred to RIIO-T2. We estimate the impact of these deferrals and
cancellations to be in the region of £300m in allowance not required. The majority of this
(c. £220m) is coming from the deferral of underground cable expenditure.
4.50. Both SHE Transmission and SPT state that their original plans did not contain any
lead asset schemes with forecast expenditure in RIIO-T1 and output delivery in T2.
4.51. We would expect that our discussions on the need for a Mid Period Review will
consider how to take account of the deferral of work already funded under RIIO-T1.
Other factors
4.52. There are a number of other factors contributing to the variation in NLR
expenditure from allowances. We have not attempted to individually assess the precise
contribution of each these factors but may do so in the future. These include:
Impact of changes in the load related plan, for example, requirements to replace
assets that were previously assumed would be replaced as part of a LR scheme
that has subsequently been cancelled.
Replacement priority changes arising from changes in criticality assessment.
RIIO Electricity Transmission Annual Report 2014-15
Programme changes to achieve overall more efficient delivery of work, for
example aligning work to minimise system outages or with DNO replacement
plans.
Delayed decommissioning of assets into the RIIO-T2 period, or earlier than
planned decommissioning of assets prior to RIIO-T1.
Condition driven changes to non-lead asset programme, non-lead asset data
revisions, and other workload changes in non-lead asset programmes.
Some movements between capex and opex either as a result of trade-off or
accounting changes (which is further explained in the section on Opex later).
Changes associated with schemes carried over from TPCR4. This is the main
driver of cost increases for SPT’s program of works.
Efficiencies in implementing NLR works.
Summary of NLR variations from allowances
4.53. A proportion of the forecast underspend for each TO may be additionally
explained by changes in input prices relative to assumptions when setting RIIO-T1 and
by measures taken to mitigate risks and other delivery related efficiencies. These factors
are discussed further in the Capital Delivery section below.
4.54. Table 12 below splits the TOs’ forecast variation from allowances into our current
estimates of the various contributory factors. The costs shown in this table are our best
estimates to date.49 These estimates may change considerably over time as we improve
our estimates based on better information from the companies and externally and
through refinement of our assessment approaches. Our final estimates will be used to
inform our strategies and assessments going into RIIO-T2.
49 Where no costs are shown, this does not necessarily mean that the factor is not relevant. It may mean that we have not yet been able to assess the impact of the specific factor.
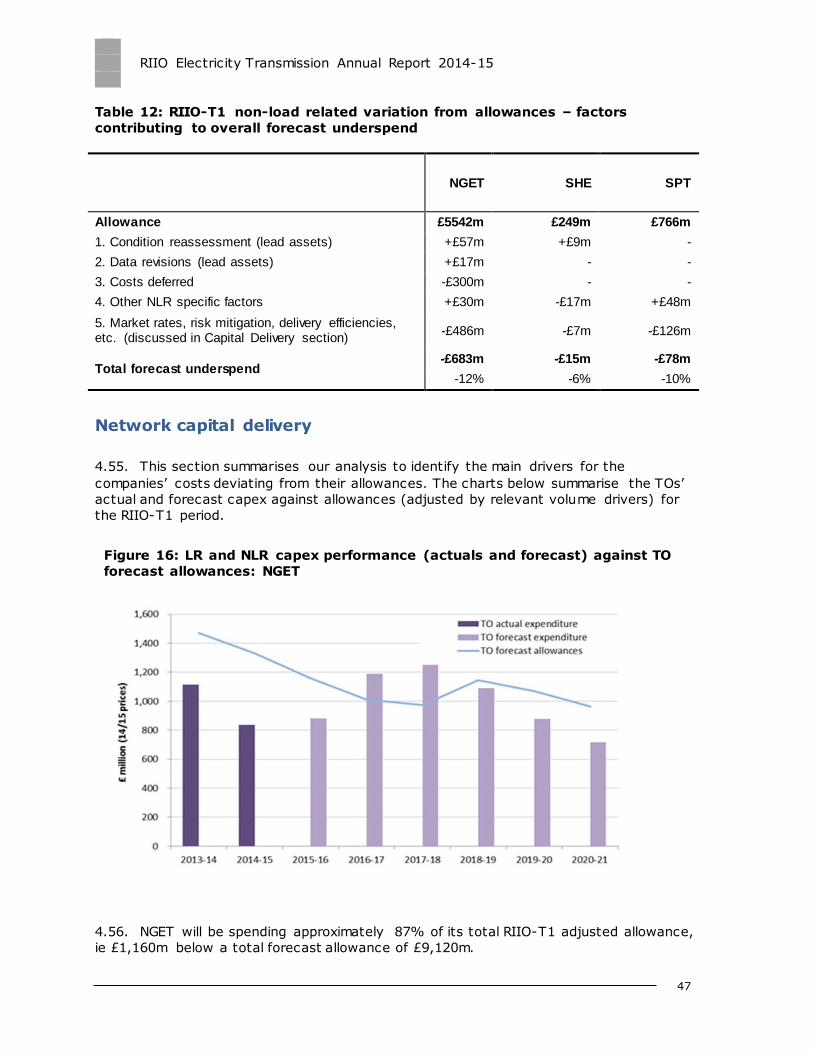
RIIO Electricity Transmission Annual Report 2014-15
47
Table 12: RIIO-T1 non-load related variation from allowances – factors
contributing to overall forecast underspend
NGET SHE SPT
Allowance £5542m £249m £766m
1. Condition reassessment (lead assets) +£57m +£9m -
2. Data revisions (lead assets) +£17m - -
3. Costs deferred -£300m - -
4. Other NLR specific factors +£30m -£17m +£48m
5. Market rates, risk mitigation, delivery efficiencies, etc. (discussed in Capital Delivery section)
-£486m -£7m -£126m
Total forecast underspend -£683m -£15m -£78m
-12% -6% -10%
Network capital delivery
4.55. This section summarises our analysis to identify the main drivers for the
companies’ costs deviating from their allowances. The charts below summarise the TOs’
actual and forecast capex against allowances (adjusted by relevant volume drivers) for
the RIIO-T1 period.
Figure 16: LR and NLR capex performance (actuals and forecast) against TO
forecast allowances: NGET
4.56. NGET will be spending approximately 87% of its total RIIO-T1 adjusted allowance,
ie £1,160m below a total forecast allowance of £9,120m.
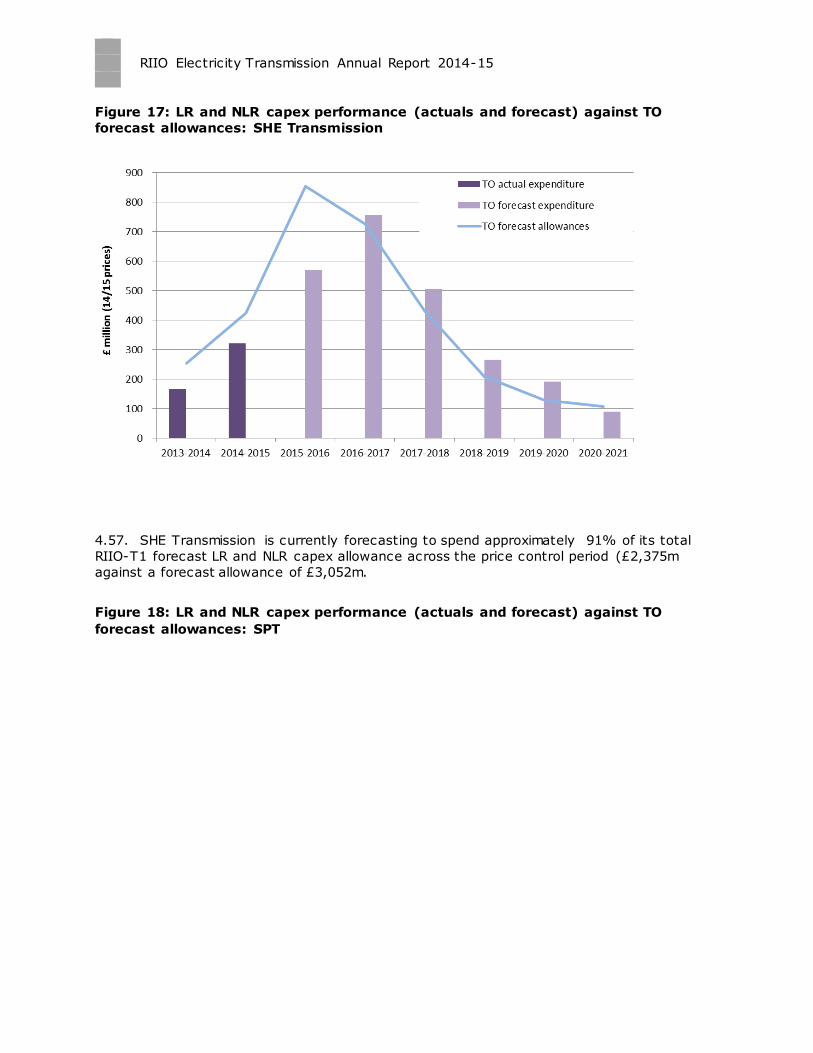
RIIO Electricity Transmission Annual Report 2014-15
Figure 17: LR and NLR capex performance (actuals and forecast) against TO
forecast allowances: SHE Transmission
4.57. SHE Transmission is currently forecasting to spend approximately 91% of its total
RIIO-T1 forecast LR and NLR capex allowance across the price control period (£2,375m
against a forecast allowance of £3,052m.
Figure 18: LR and NLR capex performance (actuals and forecast) against TO
forecast allowances: SPT
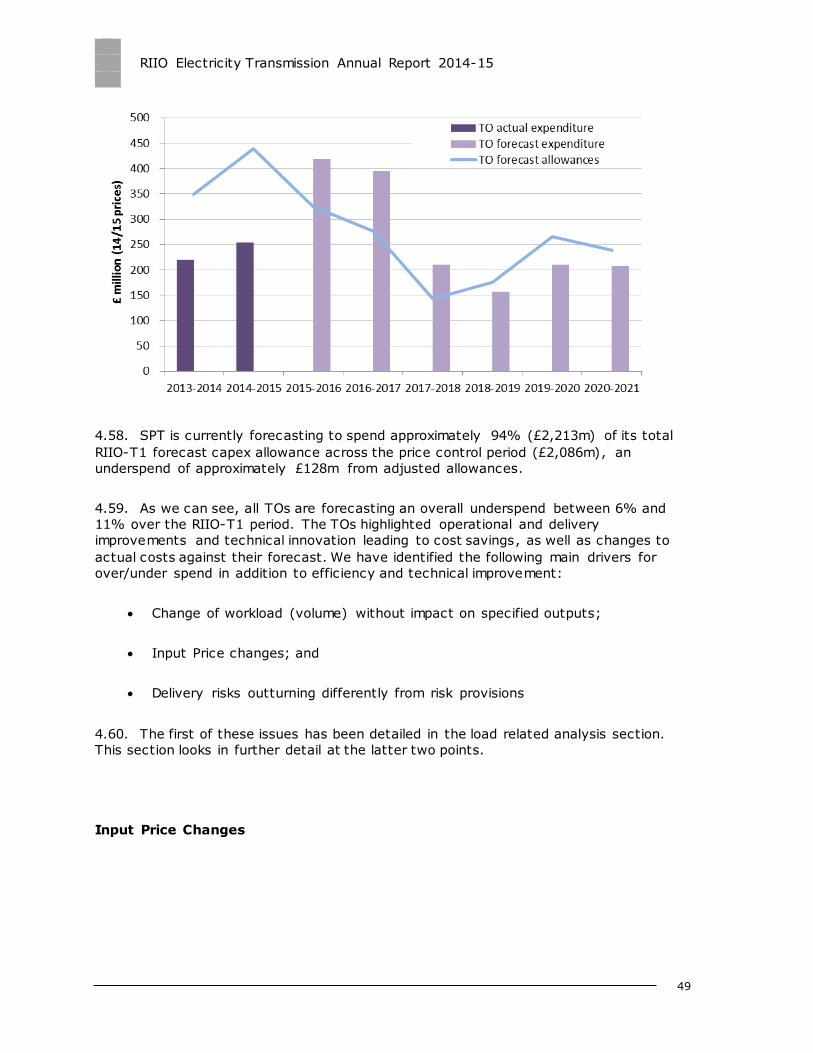
RIIO Electricity Transmission Annual Report 2014-15
49
4.58. SPT is currently forecasting to spend approximately 94% (£2,213m) of its total
RIIO-T1 forecast capex allowance across the price control period (£2,086m), an
underspend of approximately £128m from adjusted allowances.
4.59. As we can see, all TOs are forecasting an overall underspend between 6% and
11% over the RIIO-T1 period. The TOs highlighted operational and delivery
improvements and technical innovation leading to cost savings, as well as changes to
actual costs against their forecast. We have identified the following main drivers for
over/under spend in addition to efficiency and technical improvement:
Change of workload (volume) without impact on specified outputs;
Input Price changes; and
Delivery risks outturning differently from risk provisions
4.60. The first of these issues has been detailed in the load related analysis section.
This section looks in further detail at the latter two points.
Input Price Changes
RIIO Electricity Transmission Annual Report 2014-15
4.61. In our final proposals we have set ex-ante allowances for Real Price Effects
(RPEs)50 and leave it to the TOs to manage the actual fluctuation in commodity prices.
4.62. As the actual outturn and updated forecast of the input prices have changed
significantly from the assumption behind the RPEs, we have carried out a high level
analysis to allow us to better understand the impact on TOs’ costs.
4.63. Over the past two years, input prices (actuals and forecast) have been lower than
the ones set in our final decision. The lower prices for labour, materials and other
elements should have enabled the TOs to achieve better rates in contracts. Some of
these savings are already reflected in the actual spending of the companies (2014-
2015), and some are reflected in their forecast for 2015-2017 as some of the contracts
have been agreed at this point. We expect that the forecast expenditure beyond 2017
should also reflect those changes.
4.64. The information provided to us by the TOs has enabled us to conduct a high level
analysis to understand the scale of underspending we would expect to be achievable due
to the impact of lower input price rates. Our current view of the scale of the ac hievable
savings for the three TOs are given below.
Table 13: Estimated savings related to changes in input prices (RPEs) forecast
Transmission Owner NGET SHE SPT
Adjusted allowances incl. original assumed RPEs 8,975.3 3,130.8 2,254.6
Expected savings due to changes in input prices 237.3 129.2 95.8
Expected savings due to changes in input prices (%) 2.6% 4.1% 4.3%
Adjusted allowances incl. original provisional RPEs 7,346 2,523 1,815
4.65. NGET: We estimate that the potential scale of underspend due to lower input
prices forecast should be approximately £237m for the period 2017-2021. This does not
include any actual savings that the company has incurred in the first 2 years of RIIO-T1,
or year 2016, as many of the contracts have already been agreed.
4.66. SHE Transmission: we have used forecast RPEs submitted by SPT to run the
analysis for both Scottish companies. Based on that information we assess that SHE
Transmission will be spending approximately £129m less than adjusted allowances due
to changes in input prices only between 2016 and 2021. This does not include any actual
savings achieved via lower input prices in years 2013-15.
50 Allowed revenues are indexed by the Retail Price Index (RPI) as part of the price control. However, several key inputs (labour, material equipment/plant) do not necessarily change in line
with RPI. To account for this differential, we provided an ex ante allowance based on the Real Price Effects (RPEs) forecast. The RPE values were different for each TO. More information can be found
in the following document: https://www.ofgem.gov.uk/sites/default/files/docs/2012/12/5_riiogd1_fp_rpe_dec12_0.pdf
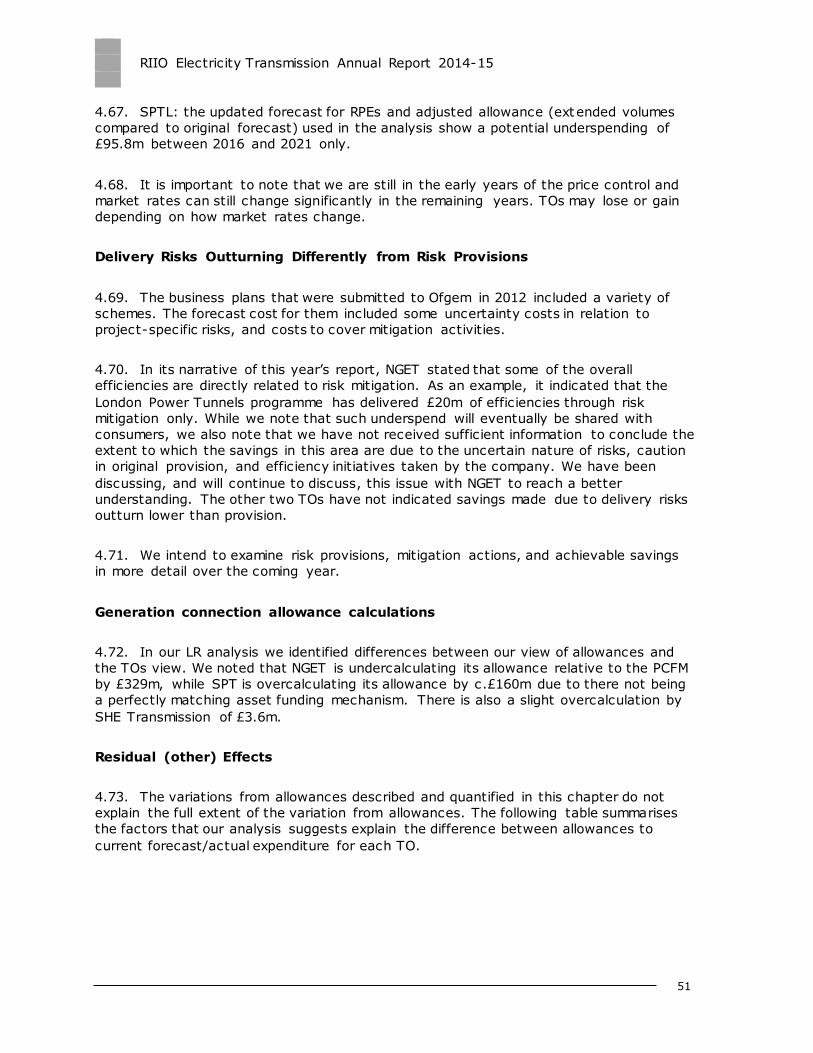
RIIO Electricity Transmission Annual Report 2014-15
51
4.67. SPTL: the updated forecast for RPEs and adjusted allowance (extended volumes
compared to original forecast) used in the analysis show a potential underspending of
£95.8m between 2016 and 2021 only.
4.68. It is important to note that we are still in the early years of the price control and
market rates can still change significantly in the remaining years. TOs may lose or gain
depending on how market rates change.
Delivery Risks Outturning Differently from Risk Provisions
4.69. The business plans that were submitted to Ofgem in 2012 included a variety of
schemes. The forecast cost for them included some uncertainty costs in relation to
project-specific risks, and costs to cover mitigation activities.
4.70. In its narrative of this year’s report, NGET stated that some of the overall
efficiencies are directly related to risk mitigation. As an example, it indicated that the
London Power Tunnels programme has delivered £20m of efficiencies through risk
mitigation only. While we note that such underspend will eventually be shared with
consumers, we also note that we have not received sufficient information to conclude the
extent to which the savings in this area are due to the uncertain nature of risks, caution
in original provision, and efficiency initiatives taken by the company. We have been
discussing, and will continue to discuss, this issue with NGET to reach a better
understanding. The other two TOs have not indicated savings made due to delivery risks
outturn lower than provision.
4.71. We intend to examine risk provisions, mitigation actions, and achievable savings
in more detail over the coming year.
Generation connection allowance calculations
4.72. In our LR analysis we identified differences between our view of allowances and
the TOs view. We noted that NGET is undercalculating its allowance relative to the PCFM
by £329m, while SPT is overcalculating its allowance by c.£160m due to there not being
a perfectly matching asset funding mechanism. There is also a slight overcalculation by
SHE Transmission of £3.6m.
Residual (other) Effects
4.73. The variations from allowances described and quantified in this chapter do not
explain the full extent of the variation from allowances. The following table summarises
the factors that our analysis suggests explain the difference between allowances to
current forecast/actual expenditure for each TO.
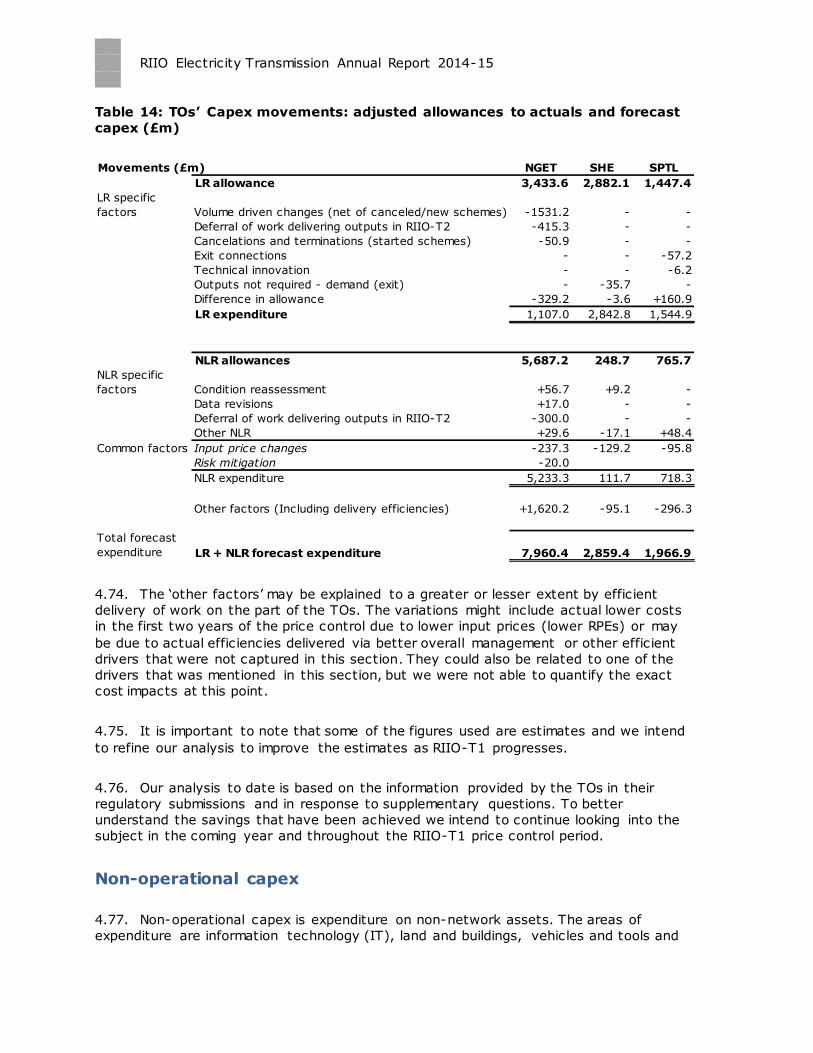
RIIO Electricity Transmission Annual Report 2014-15
Table 14: TOs’ Capex movements: adjusted allowances to actuals and forecast
capex (£m)
4.74. The ‘other factors’ may be explained to a greater or lesser extent by efficient
delivery of work on the part of the TOs. The variations might include actual lower costs
in the first two years of the price control due to lower input prices (lower RPEs) or may
be due to actual efficiencies delivered via better overall management or other efficient
drivers that were not captured in this section. They could also be related to one of the
drivers that was mentioned in this section, but we were not able to quantify the exact
cost impacts at this point.
4.75. It is important to note that some of the figures used are estimates and we intend
to refine our analysis to improve the estimates as RIIO-T1 progresses.
4.76. Our analysis to date is based on the information provided by the TOs in their
regulatory submissions and in response to supplementary questions. To better
understand the savings that have been achieved we intend to continue looking into the
subject in the coming year and throughout the RIIO-T1 price control period.
Non-operational capex
4.77. Non-operational capex is expenditure on non-network assets. The areas of
expenditure are information technology (IT), land and buildings, vehicles and tools and
Movements (£m) NGET SHE SPTL
LR allowance 3,433.6 2,882.1 1,447.4
LR specific
factors Volume driven changes (net of canceled/new schemes) -1531.2 - -
Deferral of work delivering outputs in RIIO-T2 -415.3 - -
Cancelations and terminations (started schemes) -50.9 - -
Exit connections - - -57.2
Technical innovation - - -6.2
Outputs not required - demand (exit) - -35.7 -
Difference in allowance -329.2 -3.6 +160.9
LR expenditure 1,107.0 2,842.8 1,544.9
NLR allowances 5,687.2 248.7 765.7
NLR specific
factors Condition reassessment +56.7 +9.2 -
Data revisions +17.0 - -
Deferral of work delivering outputs in RIIO-T2 -300.0 - -
Other NLR +29.6 -17.1 +48.4
Common factors Input price changes -237.3 -129.2 -95.8
Risk mitigation -20.0
NLR expenditure 5,233.3 111.7 718.3
Other factors (Including delivery efficiencies) +1,620.2 -95.1 -296.3
Total forecast
expenditure LR + NLR forecast expenditure 7,960.4 2,859.4 1,966.9
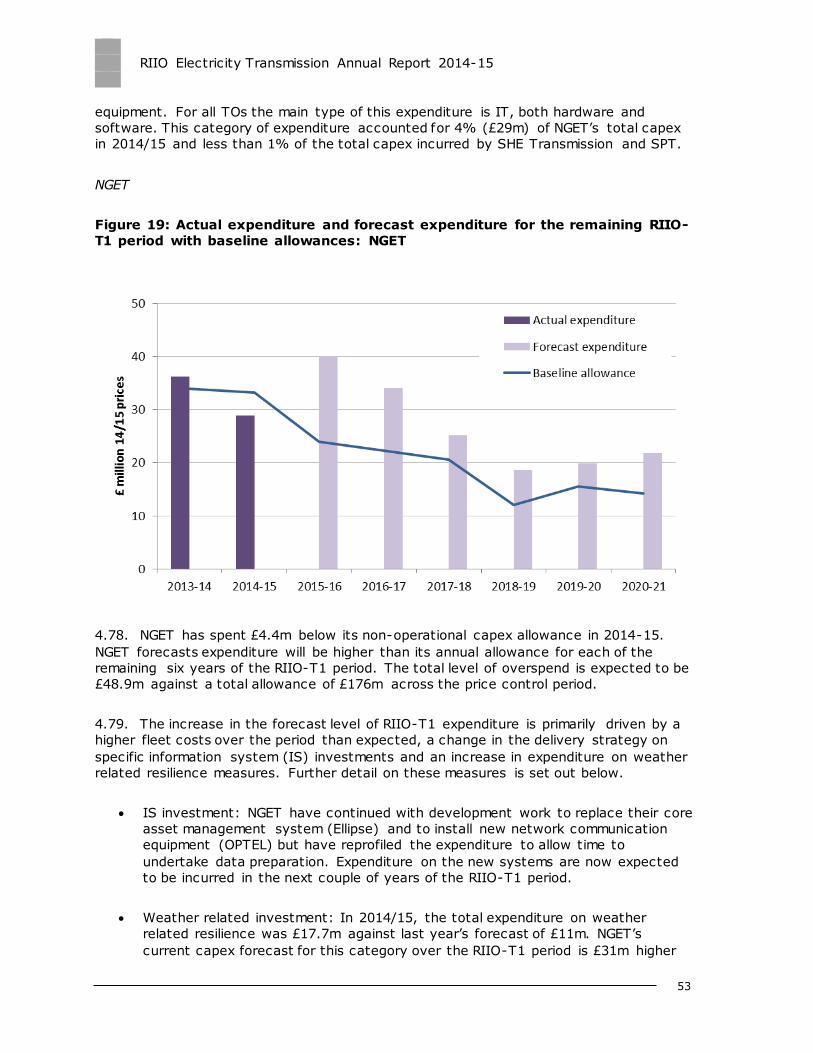
RIIO Electricity Transmission Annual Report 2014-15
53
equipment. For all TOs the main type of this expenditure is IT, both hardware and
software. This category of expenditure accounted for 4% (£29m) of NGET’s total capex
in 2014/15 and less than 1% of the total capex incurred by SHE Transmission and SPT.
NGET
Figure 19: Actual expenditure and forecast expenditure for the remaining RIIO-
T1 period with baseline allowances: NGET
4.78. NGET has spent £4.4m below its non-operational capex allowance in 2014-15.
NGET forecasts expenditure will be higher than its annual allowance for each of the
remaining six years of the RIIO-T1 period. The total level of overspend is expected to be
£48.9m against a total allowance of £176m across the price control period.
4.79. The increase in the forecast level of RIIO-T1 expenditure is primarily driven by a
higher fleet costs over the period than expected, a change in the delivery strategy on
specific information system (IS) investments and an increase in expenditure on weather
related resilience measures. Further detail on these measures is set out below.
IS investment: NGET have continued with development work to replace their core
asset management system (Ellipse) and to install new network communication
equipment (OPTEL) but have reprofiled the expenditure to allow time to
undertake data preparation. Expenditure on the new systems are now expected
to be incurred in the next couple of years of the RIIO-T1 period.
Weather related investment: In 2014/15, the total expenditure on weather
related resilience was £17.7m against last year’s forecast of £11m. NGET’s
current capex forecast for this category over the RIIO-T1 period is £31m higher
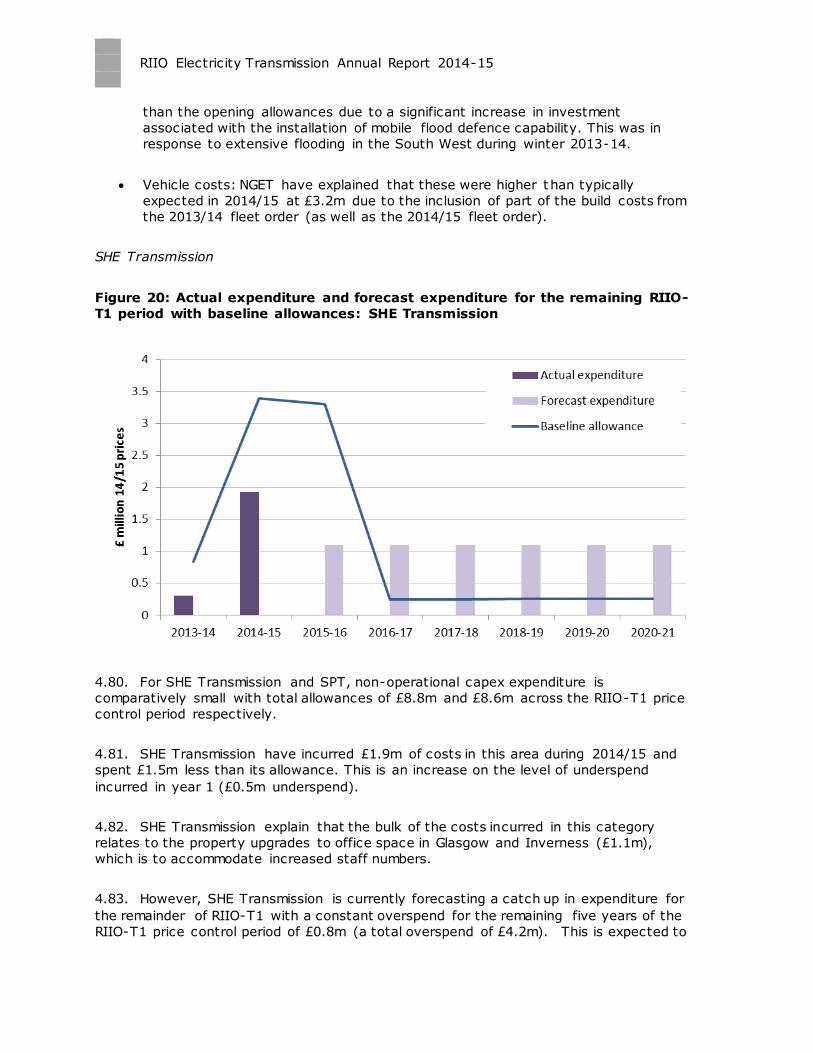
RIIO Electricity Transmission Annual Report 2014-15
than the opening allowances due to a significant increase in investment
associated with the installation of mobile flood defence capability. This was in
response to extensive flooding in the South West during winter 2013-14.
Vehicle costs: NGET have explained that these were higher than typically
expected in 2014/15 at £3.2m due to the inclusion of part of the build costs from
the 2013/14 fleet order (as well as the 2014/15 fleet order).
SHE Transmission
Figure 20: Actual expenditure and forecast expenditure for the remaining RIIO-
T1 period with baseline allowances: SHE Transmission
4.80. For SHE Transmission and SPT, non-operational capex expenditure is
comparatively small with total allowances of £8.8m and £8.6m across the RIIO-T1 price
control period respectively.
4.81. SHE Transmission have incurred £1.9m of costs in this area during 2014/15 and
spent £1.5m less than its allowance. This is an increase on the level of underspend
incurred in year 1 (£0.5m underspend).
4.82. SHE Transmission explain that the bulk of the costs incurred in this category
relates to the property upgrades to office space in Glasgow and Inverness (£1.1m),
which is to accommodate increased staff numbers.
4.83. However, SHE Transmission is currently forecasting a catch up in expenditure for
the remainder of RIIO-T1 with a constant overspend for the remaining five years of the
RIIO-T1 price control period of £0.8m (a total overspend of £4.2m). This is expected to
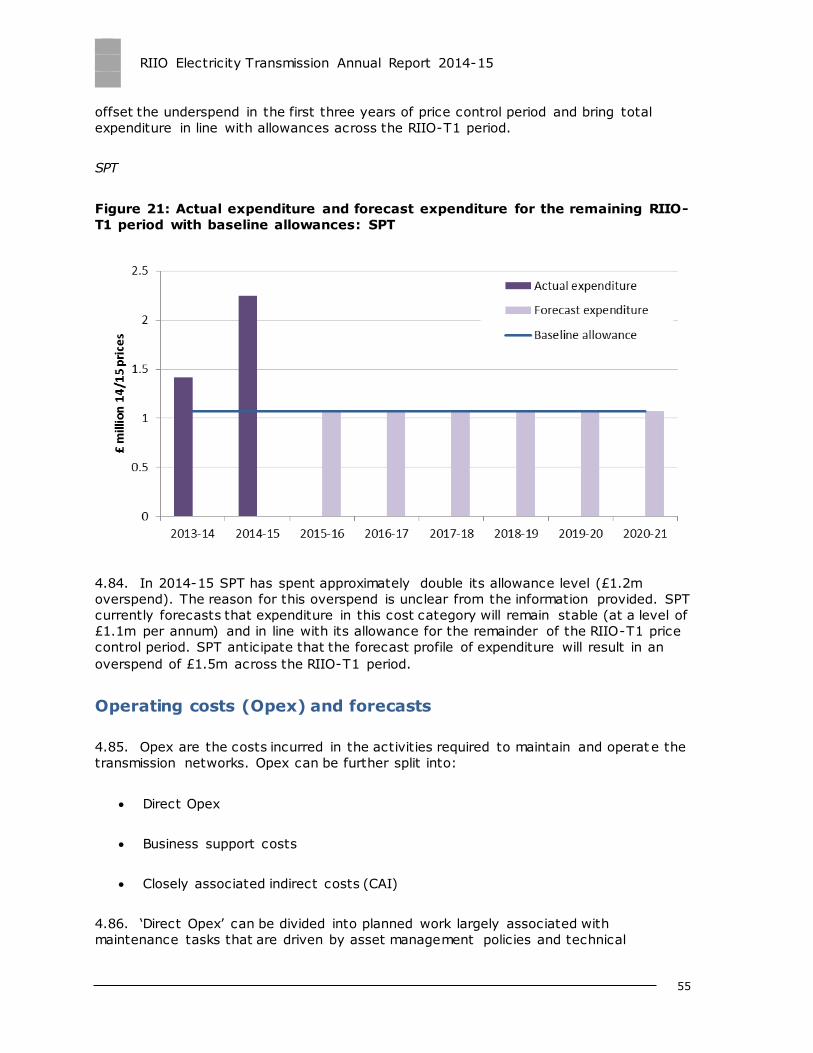
RIIO Electricity Transmission Annual Report 2014-15
55
offset the underspend in the first three years of price control period and bring total
expenditure in line with allowances across the RIIO-T1 period.
SPT
Figure 21: Actual expenditure and forecast expenditure for the remaining RIIO-
T1 period with baseline allowances: SPT
4.84. In 2014-15 SPT has spent approximately double its allowance level (£1.2m
overspend). The reason for this overspend is unclear from the information provided. SPT
currently forecasts that expenditure in this cost category will remain stable (at a level of
£1.1m per annum) and in line with its allowance for the remainder of the RIIO-T1 price
control period. SPT anticipate that the forecast profile of expenditure will result in an
overspend of £1.5m across the RIIO-T1 period.
Operating costs (Opex) and forecasts
4.85. Opex are the costs incurred in the activities required to maintain and operat e the
transmission networks. Opex can be further split into:
Direct Opex
Business support costs
Closely associated indirect costs (CAI)
4.86. ‘Direct Opex’ can be divided into planned work largely associated with
maintenance tasks that are driven by asset management policies and technical
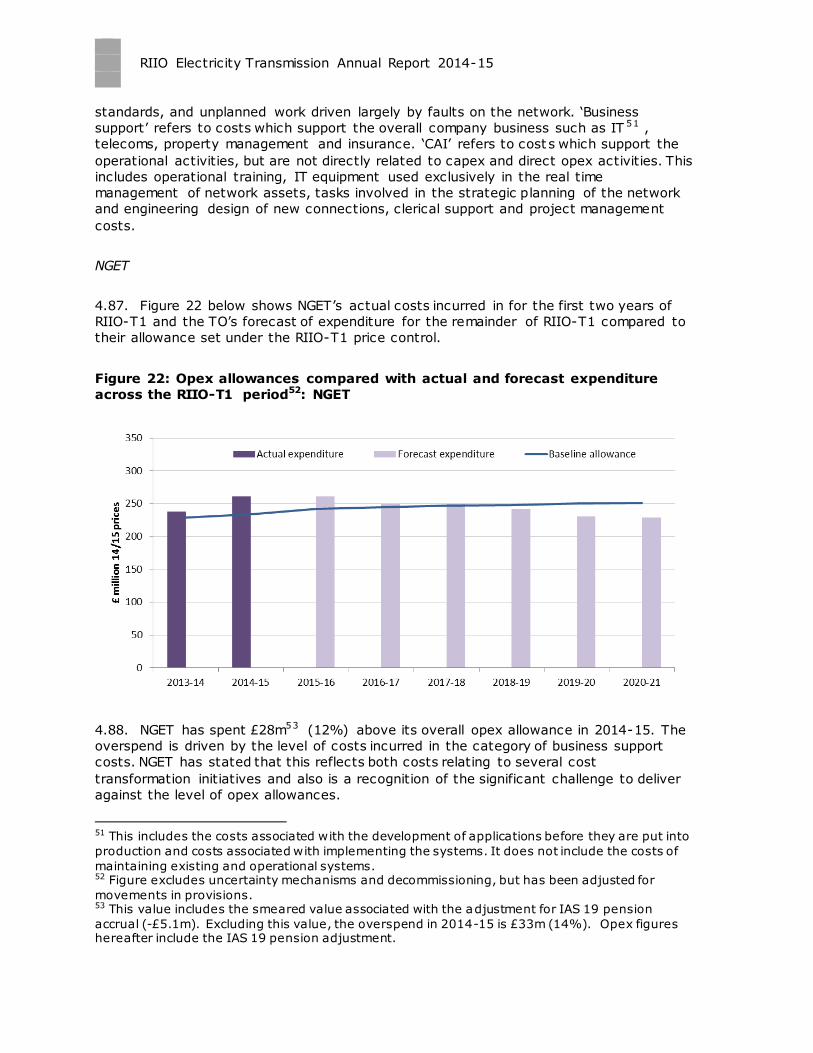
RIIO Electricity Transmission Annual Report 2014-15
standards, and unplanned work driven largely by faults on the network. ‘Business
support’ refers to costs which support the overall company business such as IT 51 ,
telecoms, property management and insurance. ‘CAI’ refers to costs which support the
operational activities, but are not directly related to capex and direct opex activities. This
includes operational training, IT equipment used exclusively in the real time
management of network assets, tasks involved in the strategic planning of the network
and engineering design of new connections, clerical support and project management
costs.
NGET
4.87. Figure 22 below shows NGET’s actual costs incurred in for the first two years of
RIIO-T1 and the TO’s forecast of expenditure for the remainder of RIIO-T1 compared to
their allowance set under the RIIO-T1 price control.
Figure 22: Opex allowances compared with actual and forecast expenditure
across the RIIO-T1 period52: NGET
4.88. NGET has spent £28m53 (12%) above its overall opex allowance in 2014-15. The
overspend is driven by the level of costs incurred in the category of business support
costs. NGET has stated that this reflects both costs relating to several cost
transformation initiatives and also is a recognition of the significant challenge to deliver
against the level of opex allowances.
51 This includes the costs associated with the development of applications before they are put into
production and costs associated with implementing the systems. It does not include the costs of
maintaining existing and operational systems. 52 Figure excludes uncertainty mechanisms and decommissioning, but has been adjusted for
movements in provisions. 53 This value includes the smeared value associated with the adjustment for IAS 19 pension
accrual (-£5.1m). Excluding this value, the overspend in 2014-15 is £33m (14%). Opex figures hereafter include the IAS 19 pension adjustment.
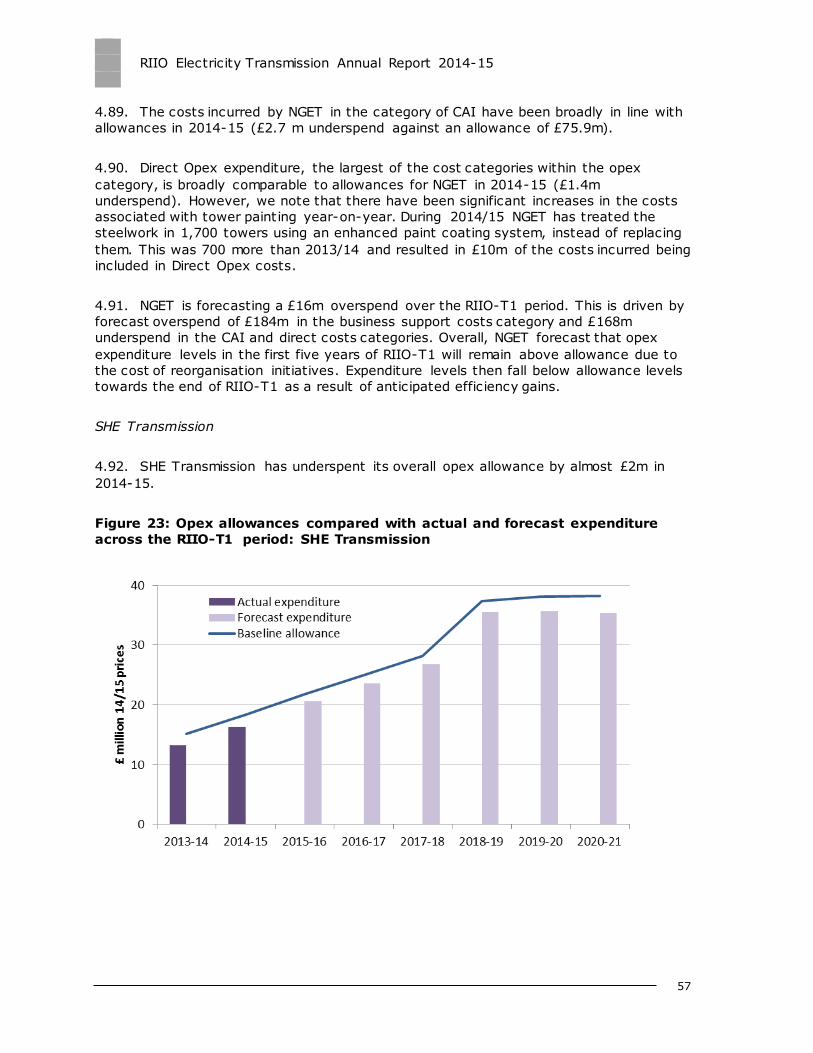
RIIO Electricity Transmission Annual Report 2014-15
57
4.89. The costs incurred by NGET in the category of CAI have been broadly in line with
allowances in 2014-15 (£2.7 m underspend against an allowance of £75.9m).
4.90. Direct Opex expenditure, the largest of the cost categories within the opex
category, is broadly comparable to allowances for NGET in 2014-15 (£1.4m
underspend). However, we note that there have been significant increases in the costs
associated with tower painting year-on-year. During 2014/15 NGET has treated the
steelwork in 1,700 towers using an enhanced paint coating system, instead of replacing
them. This was 700 more than 2013/14 and resulted in £10m of the costs incurred being
included in Direct Opex costs.
4.91. NGET is forecasting a £16m overspend over the RIIO-T1 period. This is driven by
forecast overspend of £184m in the business support costs category and £168m
underspend in the CAI and direct costs categories. Overall, NGET forecast that opex
expenditure levels in the first five years of RIIO-T1 will remain above allowance due to
the cost of reorganisation initiatives. Expenditure levels then fall below allowance levels
towards the end of RIIO-T1 as a result of anticipated efficiency gains.
SHE Transmission
4.92. SHE Transmission has underspent its overall opex allowance by almost £2m in
2014-15.
Figure 23: Opex allowances compared with actual and forecast expenditure
across the RIIO-T1 period: SHE Transmission
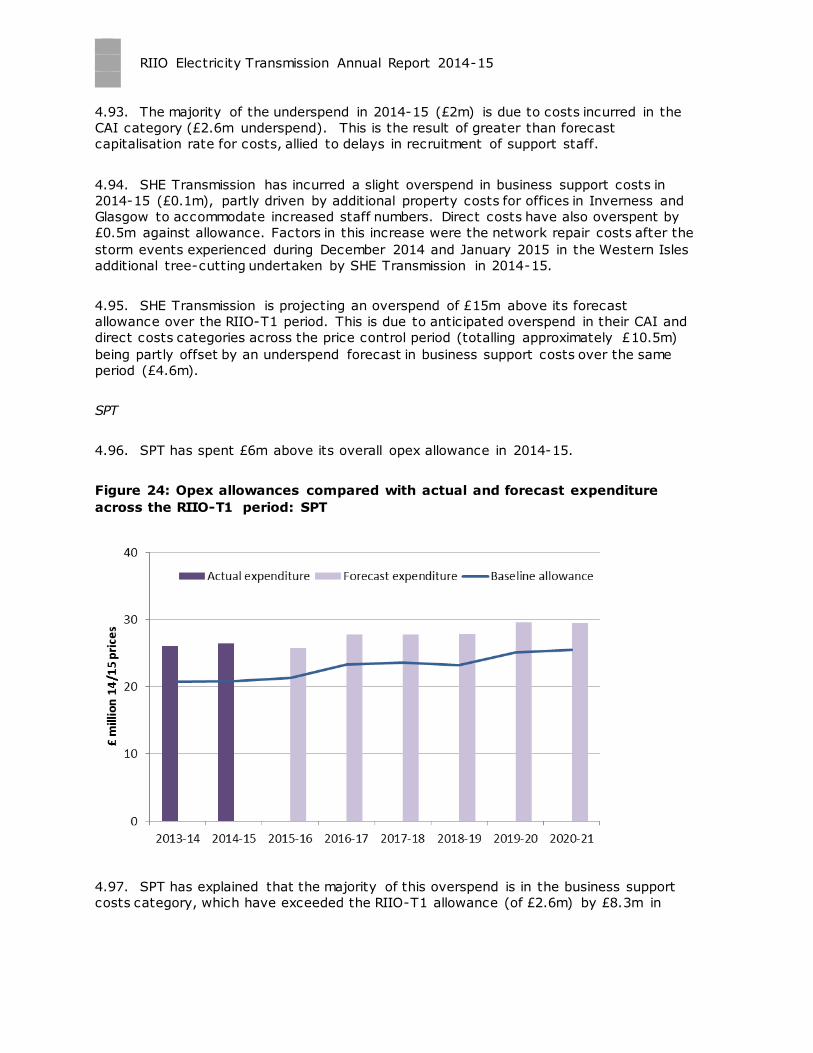
RIIO Electricity Transmission Annual Report 2014-15
4.93. The majority of the underspend in 2014-15 (£2m) is due to costs incurred in the
CAI category (£2.6m underspend). This is the result of greater than forecast
capitalisation rate for costs, allied to delays in recruitment of support staff.
4.94. SHE Transmission has incurred a slight overspend in business support costs in
2014-15 (£0.1m), partly driven by additional property costs for offices in Inverness and
Glasgow to accommodate increased staff numbers. Direct costs have also overspent by
£0.5m against allowance. Factors in this increase were the network repair costs after the
storm events experienced during December 2014 and January 2015 in the Western Isles
additional tree-cutting undertaken by SHE Transmission in 2014-15.
4.95. SHE Transmission is projecting an overspend of £15m above its forecast
allowance over the RIIO-T1 period. This is due to anticipated overspend in their CAI and
direct costs categories across the price control period (totalling approximately £10.5m)
being partly offset by an underspend forecast in business support costs over the same
period (£4.6m).
SPT
4.96. SPT has spent £6m above its overall opex allowance in 2014-15.
Figure 24: Opex allowances compared with actual and forecast expenditure
across the RIIO-T1 period: SPT
4.97. SPT has explained that the majority of this overspend is in the business support
costs category, which have exceeded the RIIO-T1 allowance (of £2.6m) by £8.3m in
RIIO Electricity Transmission Annual Report 2014-15
59
2014-1554. The main reason for this increase is due to a change of its accounting
procedures for fixed assets, to bring it into line with the rest of the industry.
4.98. The level of overspend in business costs is partly offset by underspend in the CAI
cost category (£3.1m). This underspend is due to the impact of delays in system
availability, obtaining landowner agreements and necessary consents for wider works
and other capex projects.
4.99. SPT has spent £0.5m above its direct opex allowance level in this cost area in
2014-15. It has provided a number of reasons for this overspend, including increases in
minor cable defect repairs, greater levels of tower painting and increases in switchgear
fault repair costs.
4.100. SPT is forecasting a total overspend on RIIO-T1 opex allowances of £37m. The
main reason for this is due to a change in accounting approach. This will result in a
reduction in capex project costs of approximately £60-65m during the RIIO-T1 price
control period with a corresponding increase in business support costs above the original
expenditure allowance level set at Final Proposals. We will continue to monitor this
during RIIO-T1.
54 This value includes the smeared value associated with the adjustment for IAS 19 pension accrual (-£0.3m) across opex cost categories. Excluding this value, the overspend in 2014-15 in
the business support category is £8.4m. Opex figures hereafter include the IAS 19 pension adjustment.
RIIO Electricity Transmission Annual Report 2014-15
5. SO performance
Chapter Summary
This chapter evaluates RIIO-T1 actual and forecast expenditure for NGET in its role as
SO against the costs allowed to deliver the associated outputs. It looks at the various
cost categories and activities which make up total expenditure. It also explains how we
incorporate uncertain costs.
5.1. NGET is the designated electricity System Operator (SO) responsible for day-to-
day system operation, including balancing supply and demand and constraint
management. To do this NGET buys and sells electricity and procures associated
services. The cost NGET incurs is recovered from users of the system via Balancing
Services Use of System (BSUoS) charges.
5.2. There are various costs that NGET incurs as SO and for which it seeks to recover
revenue through its price controls. The RIIO-T1 price control for NGET SO includes
allowances for capex (primarily related to investment in IT systems) and opex (covering
the ongoing costs of running the business, including support for IT systems).
5.3. All SO cost allowances for system balancing are determined via a separate
process outside the RIIO-T1 mechanism. The main incentive is the Balancing Services
Incentive Scheme (BSIS) which incentivises NGET (SO) on actions it has to take to
operate the GB electricity transmission system.
Performance
5.4. The figures below show the performance to date and forecast expenditure for
NGET (SO) over the course of the RIIO-T1 price control period against its adjusted totex
allowances. These forecasts are based on NGET’s calculations and are subject to our
confirmation in due course.
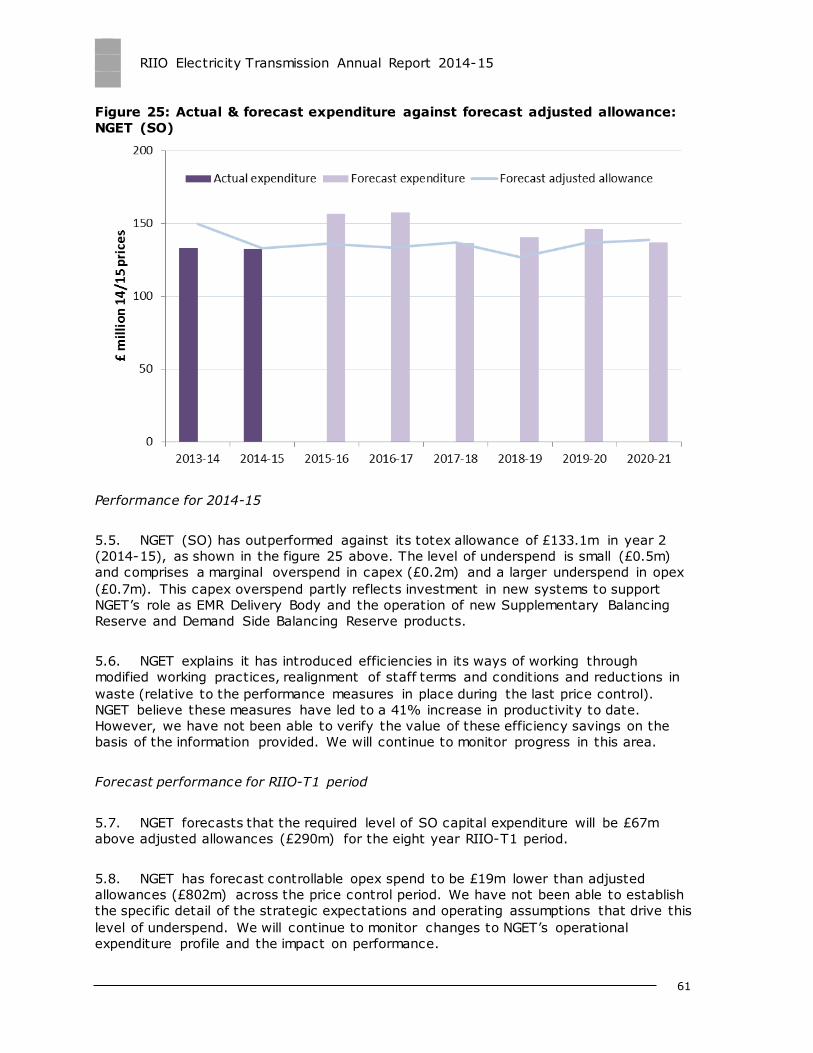
RIIO Electricity Transmission Annual Report 2014-15
61
Figure 25: Actual & forecast expenditure against forecast adjusted allowance:
NGET (SO)
Performance for 2014-15
5.5. NGET (SO) has outperformed against its totex allowance of £133.1m in year 2
(2014-15), as shown in the figure 25 above. The level of underspend is small (£0.5m)
and comprises a marginal overspend in capex (£0.2m) and a larger underspend in opex
(£0.7m). This capex overspend partly reflects investment in new systems to support
NGET’s role as EMR Delivery Body and the operation of new Supplementary Balancing
Reserve and Demand Side Balancing Reserve products.
5.6. NGET explains it has introduced efficiencies in its ways of working through
modified working practices, realignment of staff terms and conditions and reductions in
waste (relative to the performance measures in place during the last price control).
NGET believe these measures have led to a 41% increase in productivity to date.
However, we have not been able to verify the value of these efficiency savings on the
basis of the information provided. We will continue to monitor progress in this area.
Forecast performance for RIIO-T1 period
5.7. NGET forecasts that the required level of SO capital expenditure will be £67m
above adjusted allowances (£290m) for the eight year RIIO-T1 period.
5.8. NGET has forecast controllable opex spend to be £19m lower than adjusted
allowances (£802m) across the price control period. We have not been able to establish
the specific detail of the strategic expectations and operating assumptions that drive this
level of underspend. We will continue to monitor changes to NGET’s operational
expenditure profile and the impact on performance.
RIIO Electricity Transmission Annual Report 2014-15
5.9. The figures include NGET’s expectation of the additional costs needed to
undertake the roles associated with EMR Delivery and the enhanced SO role under ITPR.
Both of these areas are not yet currently funded in full55 and as such expected costs are
above allowances in some years. While NGET is forecasting to partially offset these costs
through effective planning and delivering efficiencies from their business change
activities, the expectation is that the costs of these additional requirements will drive an
overspend across the RIIO-T1 period. NGET is currently forecasting to overspend against
its adjusted totex allowances of £1,092m across the RIIO-T1 period to the value of
£48m.
5.10. However, the forecast level of SO capex investment during the RIIO-T1 period is
subject to change and will be dependent on future developments in the following notable
areas:
The level of additional investment required to deliver an efficient long term
strategic solution to provide the required level of security and availability for
Critical National Infrastructure systems and the development of NGET’s data
centre strategy. The costs included in NGET’s submission reflect their current
view of the long term capex strategy required to support the required level of
security to safeguard the customer supply of electricity in the UK. This strategy
drives a current expectation that required SO capex investment will exceed
allowances over the RIIO-T1 period.
The change to NGET’s investment plan driven by the replacement of the ‘Gone
Green’ scenario with the ‘Slow Progression’ scenario. The investment plan is
therefore not progressing as rapidly as expected which has allowed certain
investments to be deferred and allow NGET to offset some of the cost pressures
resulting from its Market Facilitation activities and Operational Control
improvements (eg replacement of the generation dispatch balancing model). We
will continue to monitor changes to NGET’s investment profile and the impact on
efficiency savings.
5.11. NGET’s submission reflects their current view on the additional funding
requirement to accommodate various future enhancements to the SO's role, which will
impose additional costs not considered when determining revenue allowances for the
current price control. We will give further consideration to these uncertain events as part
of our Mid Period Review process. Through this process we will seek to determine the
appropriate level of adjustments to the SO totex allowances for the additional
incremental costs we expect NGET to incur. Further consideration will also be given to
the need for further uncertainty mechanisms to allow NGET to recover costs in respect of
major changes to the scope of the work during the period or uncertain costs crystallising
during the RIIO-T1 period.
55 A document setting out our decisions on setting revenue, outputs and incentives for NGET’s SO roles in EMR from August 2014 to March 2021 is available from our website:
https://www.ofgem.gov.uk/sites/default/files/docs/2015/09/decision_on_revenue_outputs_and_incentives_for_nget_plcs_roles_in_electricity_market_reform_0.pdf
RIIO Electricity Transmission Annual Report 2014-15
63
6. Financial Performance
Chapter Summary
This chapter presents the opening and forecast closing position of the Regulatory Asset
Value (RAV) for RIIO-T1 and estimates of the TOs’ return on regulatory equity (RoRE)
performance. It also identifies the contribution of each main element to the total RoRE
Regulatory Asset Value
6.1. Regulatory Asset Value (RAV) is financial balance representing the capitalised
component of total expenditure on building and operating the network assets used to
transmit energy. The opening RAV balance for each TO for RIIO-T1 comprises the closing
RAV balance from TPCR4. Additions to the RAV during RIIO-T1 are based on the
proportion of totex (i.e. the totex capitalisation rate) that we remunerate over the longer
term. The relevant capitalisation rates for each TO were set at RIIO-T1 final proposals.
6.2. The price control allows licensees a return on RAV and return of money invested
in the RAV, which comprises:
A return on the RAV to compensate the risk and opportunity cost borne by
shareholders and debt holders who fund the capitalised expenditure (the
weighted average cost of capital or ‘WACC’). The WACC is designed to encourage
licensees to enter into long-term financing arrangements needed for efficient
investment in the network.
An allowance to reflect depreciation over the average useful life of regulated
assets. Depreciation allowances are deducted from the RAV.
6.3. Table 15 shows an increase from the opening RAV at 1 April 2013 to the closing
RAV at the end of the price control year 2014-15, alongside a forecast for the end of the
price control period. The closing RAV is calculated as:
- opening RAV plus RAV additions (net of disposals) less RAV depreciation.
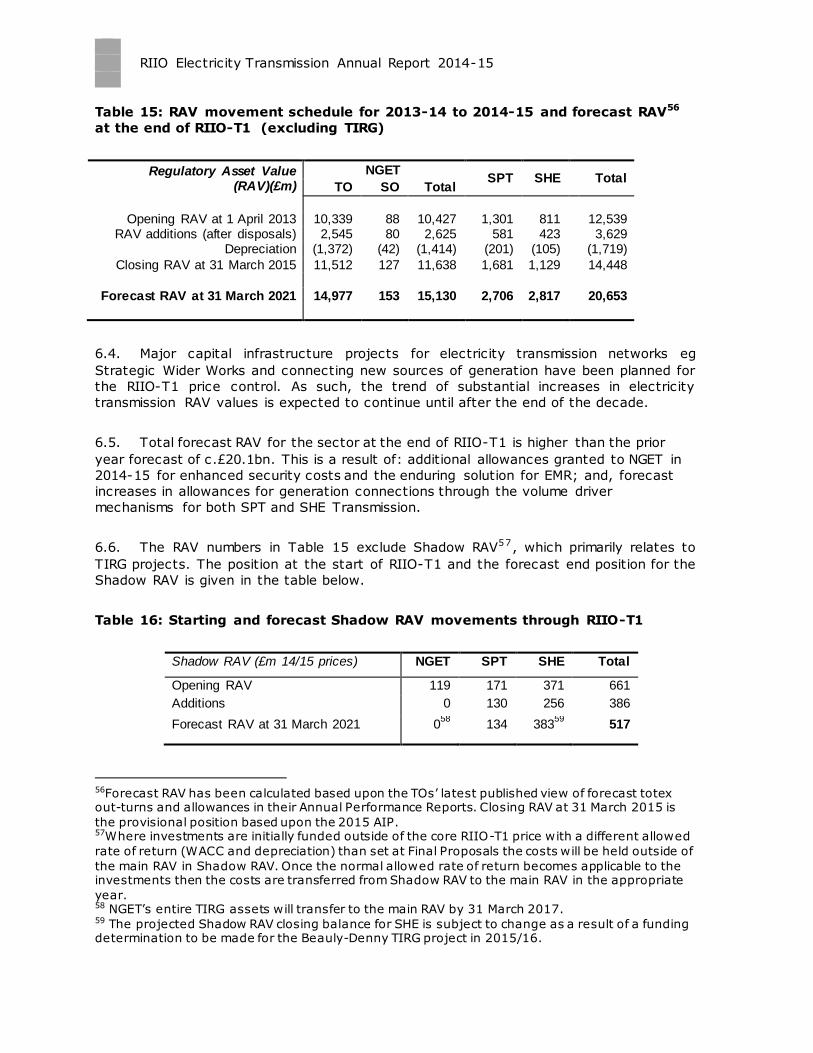
RIIO Electricity Transmission Annual Report 2014-15
Table 15: RAV movement schedule for 2013-14 to 2014-15 and forecast RAV56
at the end of RIIO-T1 (excluding TIRG)
Regulatory Asset Value (RAV)(£m)
NGET SPT SHE Total
TO SO Total
Opening RAV at 1 April 2013 10,339 88 10,427 1,301 811 12,539 RAV additions (after disposals) 2,545 80 2,625 581 423 3,629
Depreciation (1,372) (42) (1,414) (201) (105) (1,719)
Closing RAV at 31 March 2015 11,512 127 11,638 1,681 1,129 14,448
Forecast RAV at 31 March 2021 14,977 153 15,130 2,706 2,817 20,653
6.4. Major capital infrastructure projects for electricity transmission networks eg
Strategic Wider Works and connecting new sources of generation have been planned for
the RIIO-T1 price control. As such, the trend of substantial increases in electricity
transmission RAV values is expected to continue until after the end of the decade.
6.5. Total forecast RAV for the sector at the end of RIIO-T1 is higher than the prior
year forecast of c.£20.1bn. This is a result of: additional allowances granted to NGET in
2014-15 for enhanced security costs and the enduring solution for EMR; and, forecast
increases in allowances for generation connections through the volume driver
mechanisms for both SPT and SHE Transmission.
6.6. The RAV numbers in Table 15 exclude Shadow RAV57, which primarily relates to
TIRG projects. The position at the start of RIIO-T1 and the forecast end position for the
Shadow RAV is given in the table below.
Table 16: Starting and forecast Shadow RAV movements through RIIO-T1
Shadow RAV (£m 14/15 prices) NGET SPT SHE Total
Opening RAV 119 171 371 661
Additions 0 130 256 386
Forecast RAV at 31 March 2021 058
134 38359
517
56Forecast RAV has been calculated based upon the TOs’ latest published view of forecast totex out-turns and allowances in their Annual Performance Reports. Closing RAV at 31 March 2015 is
the provisional position based upon the 2015 AIP. 57Where investments are initially funded outside of the core RIIO-T1 price with a different allowed
rate of return (WACC and depreciation) than set at Final Proposals the costs will be held outside of
the main RAV in Shadow RAV. Once the normal allowed rate of return becomes applicable to the investments then the costs are transferred from Shadow RAV to the main RAV in the appropriate
year. 58 NGET’s entire TIRG assets will transfer to the main RAV by 31 March 2017. 59 The projected Shadow RAV closing balance for SHE is subject to change as a result of a funding determination to be made for the Beauly-Denny TIRG project in 2015/16.
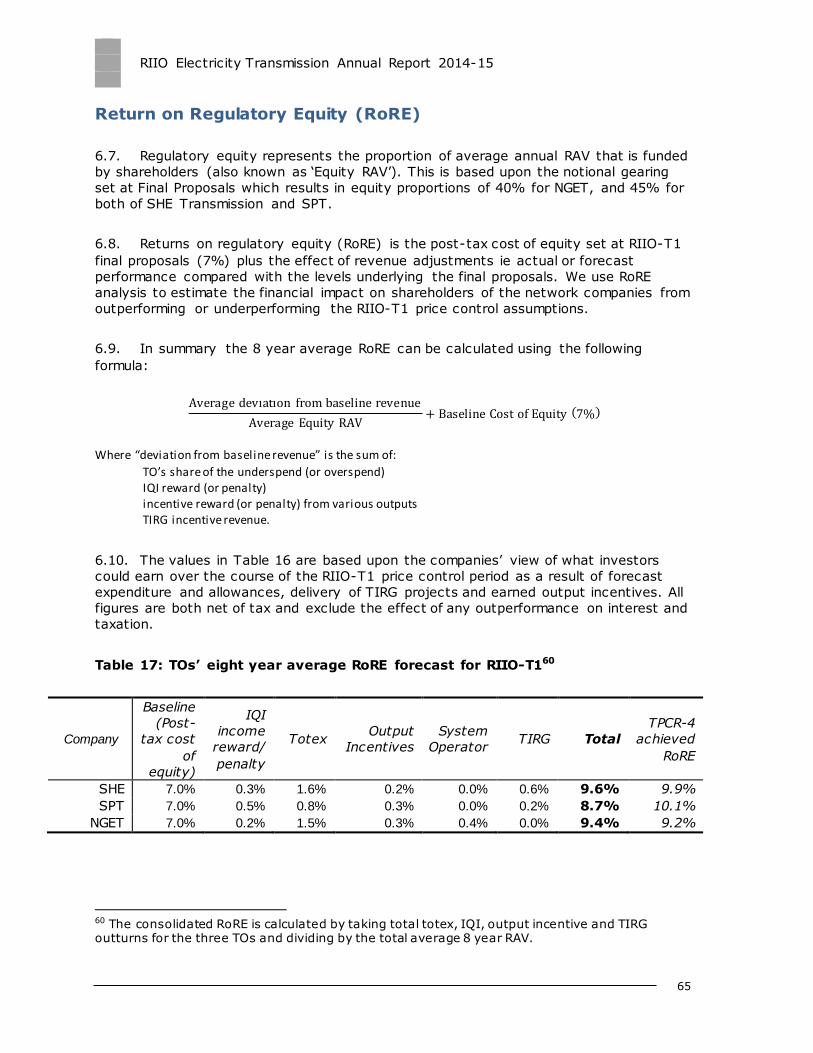
RIIO Electricity Transmission Annual Report 2014-15
65
Return on Regulatory Equity (RoRE)
6.7. Regulatory equity represents the proportion of average annual RAV that is funded
by shareholders (also known as ‘Equity RAV’). This is based upon the notional gearing
set at Final Proposals which results in equity proportions of 40% for NGET, and 45% for
both of SHE Transmission and SPT.
6.8. Returns on regulatory equity (RoRE) is the post-tax cost of equity set at RIIO-T1
final proposals (7%) plus the effect of revenue adjustments ie actual or forecast
performance compared with the levels underlying the final proposals. We use RoRE
analysis to estimate the financial impact on shareholders of the network companies from
outperforming or underperforming the RIIO-T1 price control assumptions.
6.9. In summary the 8 year average RoRE can be calculated using the following
formula:
Average deviation from baseline revenue
Average Equity RAV+ Baseline Cost of Equity (7%)
Where “deviation from baseline revenue” is the sum of:
TO’s share of the underspend (or overspend) IQI reward (or penalty) incentive reward (or penalty) from various outputs TIRG incentive revenue.
6.10. The values in Table 16 are based upon the companies’ view of what investors
could earn over the course of the RIIO-T1 price control period as a result of forecast
expenditure and allowances, delivery of TIRG projects and earned output incentives. All
figures are both net of tax and exclude the effect of any outperformance on interest and
taxation.
Table 17: TOs’ eight year average RoRE forecast for RIIO-T160
Company
Baseline
(Post-
tax cost
of
equity)
IQI
income
reward/
penalty
Totex Output
Incentives
System
Operator TIRG Total
TPCR-4
achieved
RoRE
SHE 7.0% 0.3% 1.6% 0.2% 0.0% 0.6% 9.6% 9.9%
SPT 7.0% 0.5% 0.8% 0.3% 0.0% 0.2% 8.7% 10.1%
NGET 7.0% 0.2% 1.5% 0.3% 0.4% 0.0% 9.4% 9.2%
60 The consolidated RoRE is calculated by taking total totex, IQI, output incentive and TIRG outturns for the three TOs and dividing by the total average 8 year RAV.
RIIO Electricity Transmission Annual Report 2014-15
6.11. The output incentive performance shown in Table 16 considers earned incentives
for year 1 (2013-14) and year 2 (2014-15) and assumes that the average level of
performance will be carried forward for the remaining six years of RIIO-T1.
6.12. The estimated returns in excess of the baseline level of 7% are driven by material
underspend61 against totex allowances and the associated IQI incentives. For the
Scottish TOs, a significant part of the RoRE increment is due to allowances related to
efficient expenditure on TIRG projects (awarded a higher rate of return of 8.8% for the
post-construction incentive period of 5 years before entering the main RAV and receiving
baseline cost of equity of 7%).
6.13. Current levels of outperformance based on TOs’ forecasts are moderate and
broadly in line with the range achieved by TOs during TPCR4. These figures can change
in subsequent years as a result of actual and forecast totex performance and delivery of
volumes and outputs against targets.
61 The totex underspend figure that feeds into NGET TO’s RoRE calculation includes a deduction of £112.6m (14/15 prices) from expenditure for a legal settlement that relates to TPCR-4 and not
underlying performance in RIIO-T1. The estimated impact of excluding this item from the 8 year average RoRE of NGET is -0.1%.
RIIO Electricity Transmission Annual Report 2014-15
67
7. Forward Look: 2015-16 Regulatory
Reporting Year
7.1. This report covers the 2014-15 reporting year, which started on 1s t April 2014 and
ended on the 31s t March 2015. The purpose of this section is to give a brief overview of
activities we expect to undertake in preparation for the receipt of data for 2015-16
performance year, and highlight areas of focus for next year’s report .
Reporting packs and guidance
7.2. The analysis of company submissions is a resource intensive process, for both
Ofgem and the TOs. It has become apparent in the course of this year’s exercise that the
regulatory reporting packs are not yet fully fit for purpose. The TOs have proposed
various amendments to the current reporting packs and the associated guidance; Ofgem
also has views on how the packs could be amended to facilitate a more informative and
efficient process. We have already begun our engagement with the TOs to achieve this
goal.
Data quality
7.3. Through the report we have noted a number of areas where there have been data
revisions provided by the TOs, which have resulted in prior year adjustments.
7.4. While we welcome the TOs taking actions to uncover and report the errors, we
remain concerned as to the lack of reliability of the originally reported data. Ofgem and
the TOs have developed a Data Assurance Guidance methodology for introducing rigor
into data review and reporting processes, to avoid these anomalies in the future. Now
that this methodology is in place, we would expect any such misreporting to be dealt
with in a more robust manner, including taking a view on whether enforcement action is
appropriate.
Mid-period review
7.5. RIIO Final Proposals included provision for a potential mid-period review (MPR)
during the eight year price control period with scope driven by:
changes to outputs that can be justified by clear changes in government policy;
and
the introduction of new outputs that are needed to meet the needs of consumers
and other network users.
RIIO Electricity Transmission Annual Report 2014-15
7.6. In November 2015 we issued a consultation document on whether there is a need
to initiate a mid-period review in Electricity Transmission. Depending on the outcome of
the public consultation we may commence a mid-period review in July 2016.
Network Output Measures (NOMs)
7.7. We expect a final revised methodology to be submitted for Authority approval by
early 2016. However, we expect that further work will be required throughout 2016
before the NOMs methodology achieves its objectives.
Network Access Policy (NAP)
7.8. One of the outputs required of TOs the licensees is that they should produce and
maintain a NAP document to contribute to better SO:TO interaction and cooperation in
both short-term and long-term network outage planning. This has been achieved, with
the separate NAP documents for Scotland and England and Wales being approved by
Ofgem in June, and we are satisfied that the network companies have been working
increasingly closer in both the short and long term time frames. However we expect that
continued progress to be made in developing the principles that the NAP sets out,
including incorporating the issues identified in the consultation Ofgem held before
making its decision to approve the NAP.
7.9. Special condition 2J of the electricity transmission licence requires the NAP to be
regularly reviewed and updated as necessary. There is an ongoing governance process,
in which Ofgem is an integral partner. We expect this process to facilitate evolution of
future updates to the NAPs to incorporate any relevant changes arising from our
conclusions on Integrated Transmission Planning and Regulation in March 2015 and
other key events. Among other things, this decided on various future enhancements to
the SO's role, including for the SO to be more proactive in supporting certain aspects of
system planning. We therefore expect updates to the NAP documentation to be
progressed in a timely manner and for the result of this work to be reported to the
Authority in the first instance. We will continue to monitor progress in this area.
7.10. In keeping with the principal of transparency on which the NAPs are based we
encourage licensees to ensure the NAP is applied in an open and transparent manner
and appropriate stakeholder engagement is carried out ahead of any proposals to amend
the NAP.
RIIO Electricity Transmission Annual Report 2014-15
69
Appendices
Index
Appendix Name of Appendix Page Number
1 NOMs targets, performance and development
of methodology 70
2 Glossary 75
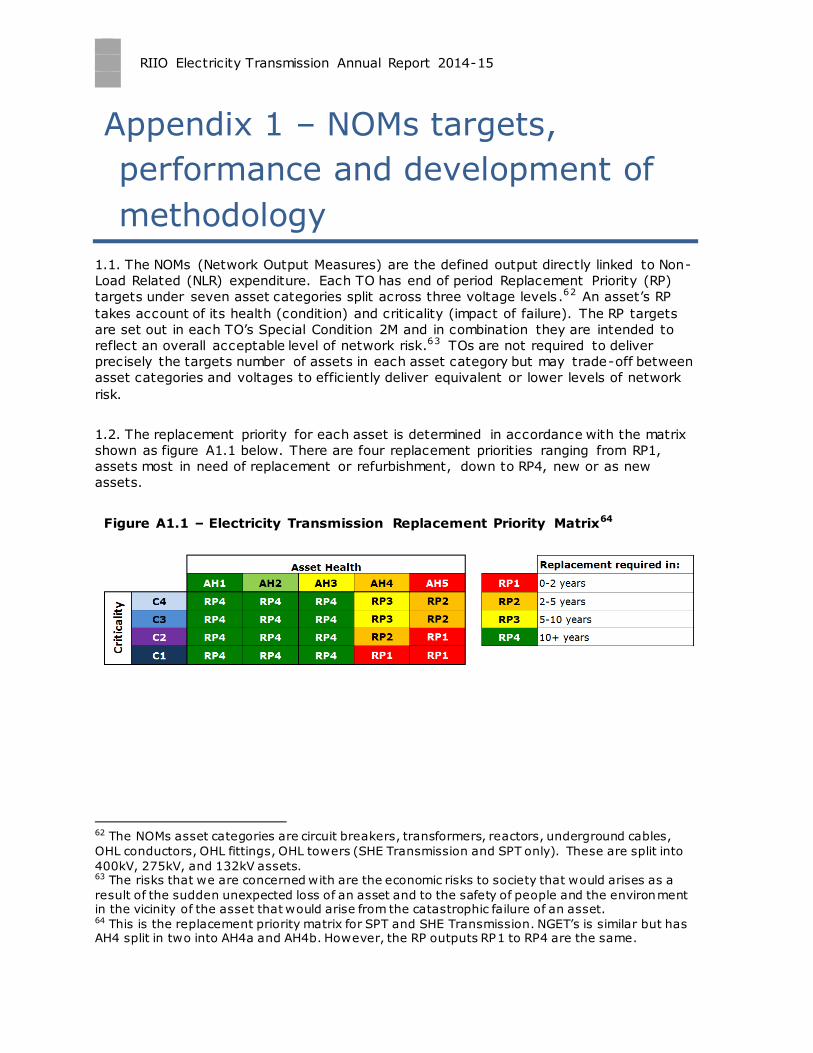
RIIO Electricity Transmission Annual Report 2014-15
Appendix 1 – NOMs targets,
performance and development of
methodology
1.1. The NOMs (Network Output Measures) are the defined output directly linked to Non-
Load Related (NLR) expenditure. Each TO has end of period Replacement Priority (RP)
targets under seven asset categories split across three voltage levels.62 An asset’s RP
takes account of its health (condition) and criticality (impact of failure). The RP targets
are set out in each TO’s Special Condition 2M and in combination they are intended to
reflect an overall acceptable level of network risk.63 TOs are not required to deliver
precisely the targets number of assets in each asset category but may trade-off between
asset categories and voltages to efficiently deliver equivalent or lower levels of network
risk.
1.2. The replacement priority for each asset is determined in accordance with the matrix
shown as figure A1.1 below. There are four replacement priorities ranging from RP1,
assets most in need of replacement or refurbishment, down to RP4, new or as new
assets.
Figure A1.1 – Electricity Transmission Replacement Priority Matrix64
62 The NOMs asset categories are circuit breakers, transformers, reactors, underground cables,
OHL conductors, OHL fittings, OHL towers (SHE Transmission and SPT only). These are split into
400kV, 275kV, and 132kV assets. 63 The risks that we are concerned with are the economic risks to society that would arises as a
result of the sudden unexpected loss of an asset and to the safety of people and the environment in the vicinity of the asset that would arise from the catastrophic failure of an asset. 64 This is the replacement priority matrix for SPT and SHE Transmission. NGET’s is similar but has AH4 split in two into AH4a and AH4b. However, the RP outputs RP1 to RP4 are the same.
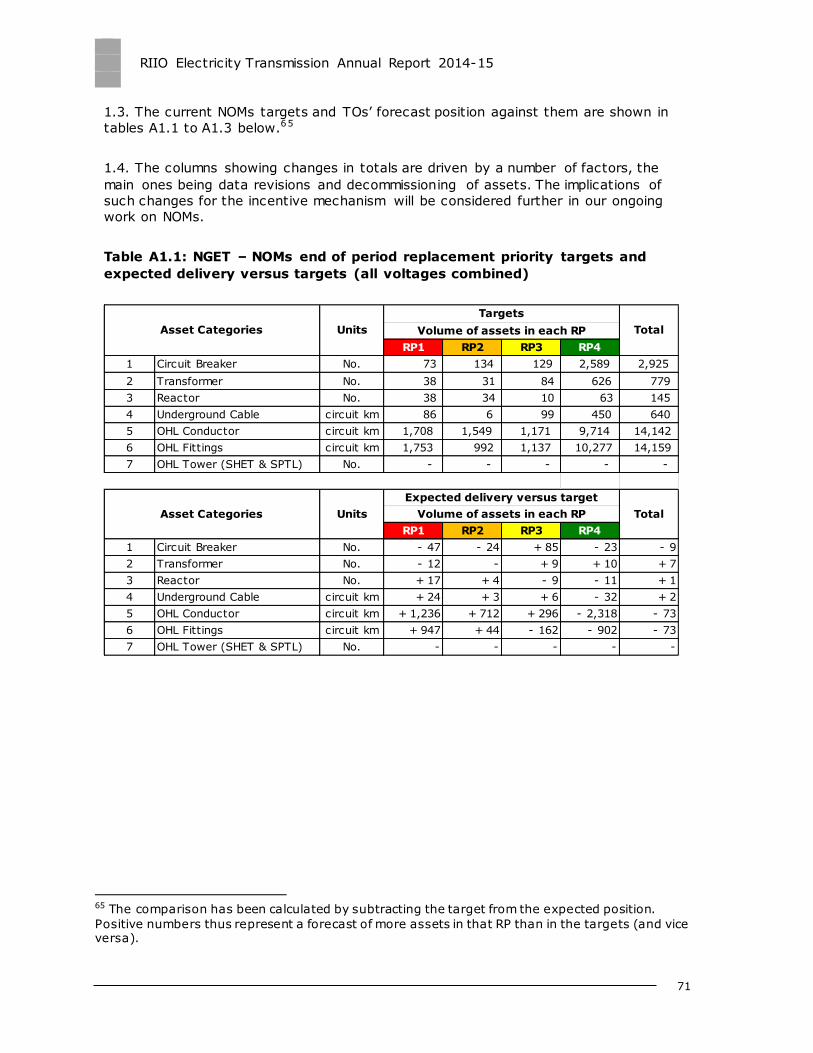
RIIO Electricity Transmission Annual Report 2014-15
71
1.3. The current NOMs targets and TOs’ forecast position against them are shown in
tables A1.1 to A1.3 below.65
1.4. The columns showing changes in totals are driven by a number of factors, the
main ones being data revisions and decommissioning of assets. The implications of
such changes for the incentive mechanism will be considered further in our ongoing
work on NOMs.
Table A1.1: NGET – NOMs end of period replacement priority targets and
expected delivery versus targets (all voltages combined)
65 The comparison has been calculated by subtracting the target from the expected position.
Positive numbers thus represent a forecast of more assets in that RP than in the targets (and vice versa).
RP1 RP2 RP3 RP4
1 Circuit Breaker No. 73 134 129 2,589 2,925
2 Transformer No. 38 31 84 626 779
3 Reactor No. 38 34 10 63 145
4 Underground Cable circuit km 86 6 99 450 640
5 OHL Conductor circuit km 1,708 1,549 1,171 9,714 14,142
6 OHL Fittings circuit km 1,753 992 1,137 10,277 14,159
7 OHL Tower (SHET & SPTL) No. - - - - -
RP1 RP2 RP3 RP4
1 Circuit Breaker No. - 47 - 24 + 85 - 23 - 9
2 Transformer No. - 12 - + 9 + 10 + 7
3 Reactor No. + 17 + 4 - 9 - 11 + 1
4 Underground Cable circuit km + 24 + 3 + 6 - 32 + 2
5 OHL Conductor circuit km + 1,236 + 712 + 296 - 2,318 - 73
6 OHL Fittings circuit km + 947 + 44 - 162 - 902 - 73
7 OHL Tower (SHET & SPTL) No. - - - - -
Asset Categories Units
Expected delivery versus target
TotalVolume of assets in each RP
Asset Categories Units
Targets
TotalVolume of assets in each RP
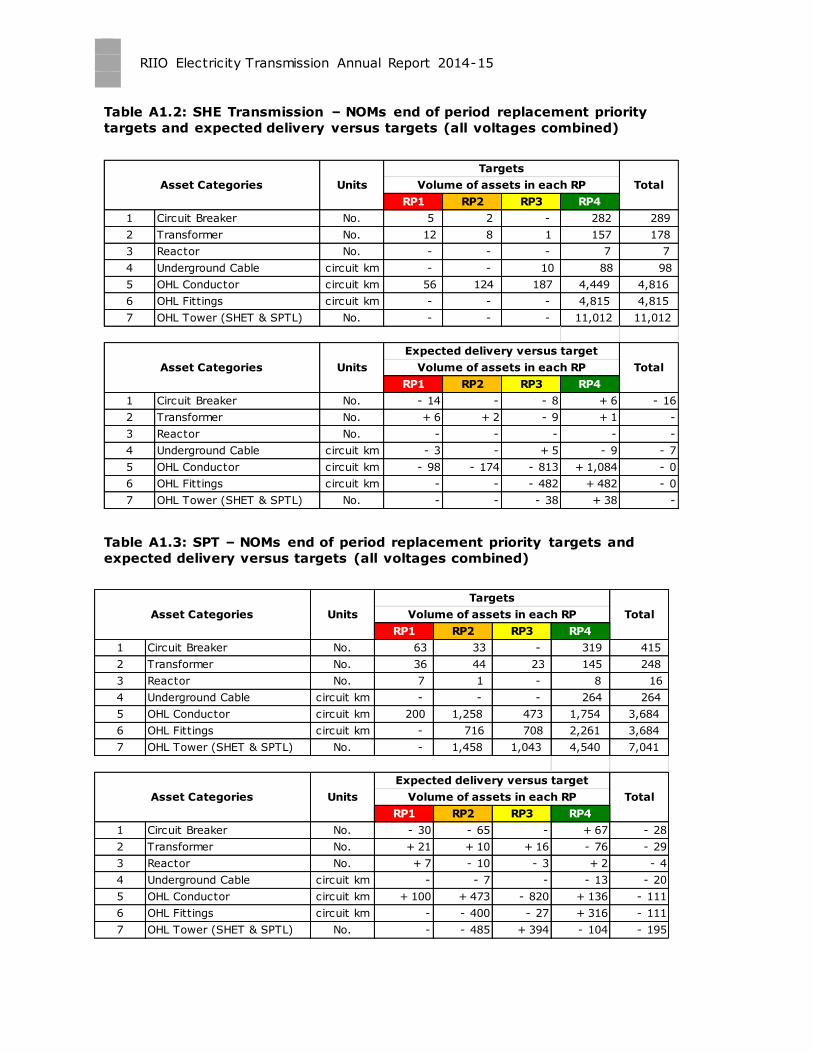
RIIO Electricity Transmission Annual Report 2014-15
Table A1.2: SHE Transmission – NOMs end of period replacement priority
targets and expected delivery versus targets (all voltages combined)
Table A1.3: SPT – NOMs end of period replacement priority targets and
expected delivery versus targets (all voltages combined)
RP1 RP2 RP3 RP4
1 Circuit Breaker No. 5 2 - 282 289
2 Transformer No. 12 8 1 157 178
3 Reactor No. - - - 7 7
4 Underground Cable circuit km - - 10 88 98
5 OHL Conductor circuit km 56 124 187 4,449 4,816
6 OHL Fittings circuit km - - - 4,815 4,815
7 OHL Tower (SHET & SPTL) No. - - - 11,012 11,012
RP1 RP2 RP3 RP4
1 Circuit Breaker No. - 14 - - 8 + 6 - 16
2 Transformer No. + 6 + 2 - 9 + 1 -
3 Reactor No. - - - - -
4 Underground Cable circuit km - 3 - + 5 - 9 - 7
5 OHL Conductor circuit km - 98 - 174 - 813 + 1,084 - 0
6 OHL Fittings circuit km - - - 482 + 482 - 0
7 OHL Tower (SHET & SPTL) No. - - - 38 + 38 -
Asset Categories Units
Expected delivery versus target
TotalVolume of assets in each RP
Units
Targets
TotalVolume of assets in each RPAsset Categories
RP1 RP2 RP3 RP4
1 Circuit Breaker No. 63 33 - 319 415
2 Transformer No. 36 44 23 145 248
3 Reactor No. 7 1 - 8 16
4 Underground Cable circuit km - - - 264 264
5 OHL Conductor circuit km 200 1,258 473 1,754 3,684
6 OHL Fittings circuit km - 716 708 2,261 3,684
7 OHL Tower (SHET & SPTL) No. - 1,458 1,043 4,540 7,041
RP1 RP2 RP3 RP4
1 Circuit Breaker No. - 30 - 65 - + 67 - 28
2 Transformer No. + 21 + 10 + 16 - 76 - 29
3 Reactor No. + 7 - 10 - 3 + 2 - 4
4 Underground Cable circuit km - - 7 - - 13 - 20
5 OHL Conductor circuit km + 100 + 473 - 820 + 136 - 111
6 OHL Fittings circuit km - - 400 - 27 + 316 - 111
7 OHL Tower (SHET & SPTL) No. - - 485 + 394 - 104 - 195
Asset Categories Units
Expected delivery versus target
TotalVolume of assets in each RP
Asset Categories Units
Targets
TotalVolume of assets in each RP
RIIO Electricity Transmission Annual Report 2014-15
73
1.5. The TOs are required by their licence to develop their NOMs methodology to allow
us to properly assess performance. The purpose of the NOMs is to show whether the TOs
are managing network risk effectively and whether their NLR investments are providing
consumers with long-term value for money. It should therefore enable Ofgem to
administer the incentive mechanism. To do this, the methodology must be transparent
and should enable the objective assessment of over and under delivery.
1.6. The approach taken by the TOs so far is to use a monetisation approach to quantify
the risk of all individual assets. A monetisation approach would mean placing values on
the expected consequences of individual assets failing and then weighting the
consequences by the probability of them occuring. This would then give a monetised risk
value for the risks carried by each asset. The individual asset risk values may then be
summed to arrive at a single total network risk figure (expressed in £m).
1.7. The TOs published a draft methodology for consultation on 16th October 2015. The
consultation has recently closed.66
1.8. In general terms, we see that the monetisation approach, once sufficiently
developed, could faciliate better assessment of performance. At present we will need to
exercise some judgement when assessing a spread of over and underdelivery in different
asset categories’ individual RP groups, as seen in the TOs’ own expectation of
performance at the end of RIIO-T1. Translating these into monetised values of risks
should better inform that assessment, as illustrated in Figure A1.2 below.
66 The NOMs consultation was published on each of the TOs’ websites on 16 October 2015 NGET: http://www.talkingnetworkstx.com/current-consultations.aspx
SPT: www.spenergynetworks.co.uk/pages/tnoms SHE Transmission: https://www.ssepd.co.uk/NOP/
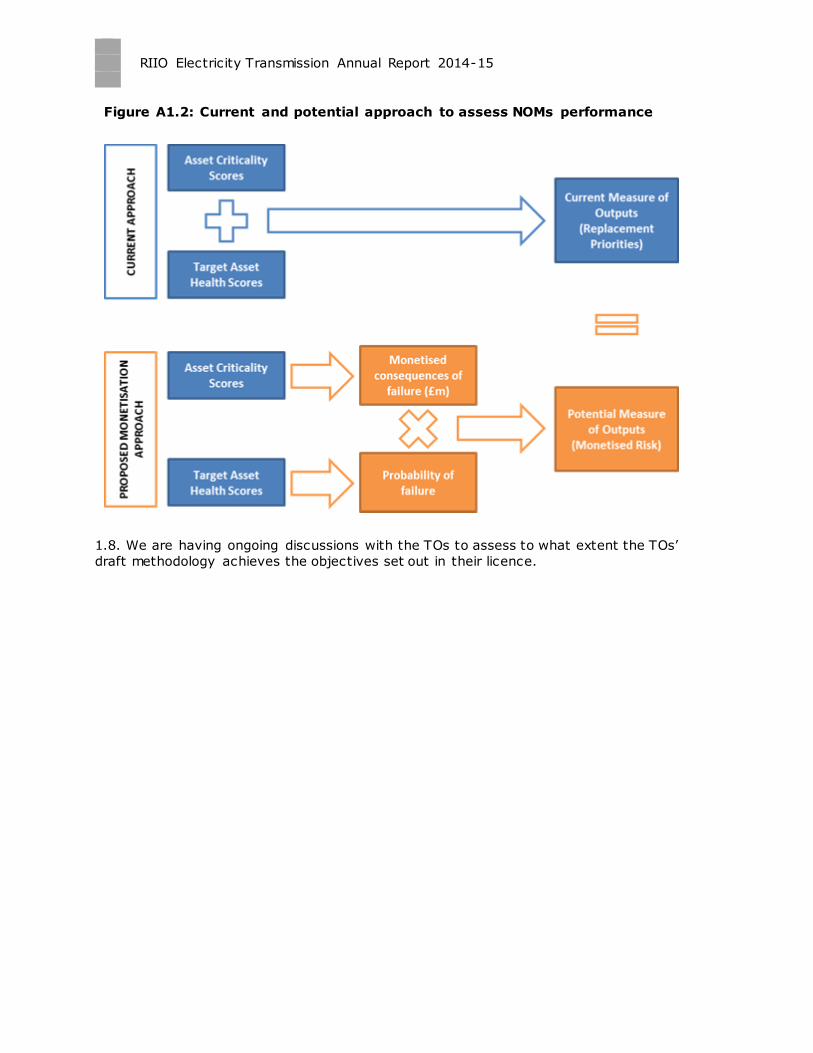
RIIO Electricity Transmission Annual Report 2014-15
Figure A1.2: Current and potential approach to assess NOMs performance
1.8. We are having ongoing discussions with the TOs to assess to what extent the TOs’
draft methodology achieves the objectives set out in their licence.
RIIO Electricity Transmission Annual Report 2014-15
75
Appendix 2 – Glossary of Terms
Used in This Report
Annual Iteration Process
The annual iteration process is the process of annually updating the variable (blue box)
values in the Price Control Financial Model (PCFM) and running its calculation functions in
order to provide updated MOD and SOMOD values.
Base Revenue
Base revenue is the opening base revenue allowance, plus any incremental change to
the opening base revenue allowance under the Annual Iteration Process.
MOD Term
The term of that name included in the formula for Base Transmission Revenue (System
Operator Internal Revenue) set out in Special Condition 3A (or Special Condition 4A for
SO) of the Electricity Transmission licence. It represents the incremental change to be
applied to the licensee’s Opening Base Revenue Allowance for the Relevant Year
concerned. The value of the MOD term is calculated through the Annual Iteration Process
for the ET1 Price Control Financial Model (see Chapter 1) and is specified in a direction
given by the Authority by 30 November in each Relevant Year.
Pass through Costs
Costs passed through to the customer from the licensee.
RAV – Regulatory Asset Value
A financial balance representing expenditure by the licensee which has been capitalised
under regulatory rules. The licensee receives a return and depreciation on its RAV in its
price control allowed revenues.
TIRG
This is a mechanism for funding transmission projects specific to connecting renewable
generation. The mechanism was implemented during TPCR4, outside of the price control
allowance, to minimise delays.
Totex Incentive Mechanism (TIM)
TIM is the financial reward (or penalty) that companies are given in allowances for under
or over spend on Totex. For RIIO-T1 Final Proposals Opening Base Revenue Allowances
have been modelled on the basis that actual Totex expenditure levels are expected to
RIIO Electricity Transmission Annual Report 2014-15
equal allowed Totex expenditure levels (allowances). If actual (outturn) expenditure
differs from allowances, for any Relevant Year during the Price Control Period, the TIM
provides for an appropriate sharing of the incremental amount (whether an overspend or
underspend) between consumers and licensees.
WACC
The Vanilla Weighted Average Cost of Capital is Ofgem’s preferred way of expressing the
rate of return allowed on the Regulatory Asset Values (RAV) of price controlled network
companies. The use of Vanilla WACC means that the company’s tax cost is separate ly
calculated as a discrete allowance so that only the following have to be factored in:
the pre-tax cost of debt – ie the percentage charge levied by lenders, and
the post-tax cost of equity – ie the percentage return equity investors expect to
actually receive,
weighted according to the price control gearing assumption.
‘Real Vanilla WACC’ is used which gives a lower percentage than ‘Nominal Vanilla WACC’
would (when inflation is positive). This is because inflation isn't taken into account in the
determination of the Real Vanilla WACC percentage.