Embed Size (px)
Citation preview

KONICA MINOLTA HOLDINGS, INC.Annual Report 2012 Summary PDF
At a Glance ................................ 1
Management Message ............... 3
Business Technologies Business .. 5
Industrial Business ...................... 9
Healthcare Business ................... 11
Reinforcement of Our Global Management Base ... 13
Financial Review and Data .......... 15
Annual Report 2012KONICA MINOLTA HOLDINGS, INC.
At a GG
Maann
BuBu
I
Quality Global Growth
Contents
Total net sales for FY March 2012
767.8billion
Industrial Business
The Konica Minolta Group operates in sectors ranging from business technologies, where our products are typified by MFPs (multi-functional peripherals), and Industrial Business (former Opicts Business), where our products include pickup lenses for optical disks, and TAC film, a key material used in LCD panels, to healthcare, where we make digital X-ray diagnostic imaging systems.
* Note: In the former Optics Business, the Sensing Business merged with the new functional materials-related business, which includes the OLED (organic light emitting diode) lighting business. As of FY March 2013, the segment name has changed from the Optics Business to the Industrial Business.
Business Technologies Business
At a Glance
Healthcare Business
71%
16%
10%
3%
Business Technologies Business
Industrial Business(Optics Business*)
HealthcareBusiness
Others
1

▶ Page 9
▶ Page 11
▶ Page 5This business company consists of the mainstay offi ce fi eld and the growth fi eld of production print.
■Offi ce fi eld Konica Minolta Business Technologies, Inc. is engaged in the worldwide manufacture and sale of offi ce equipment centered on A3 MFPs (multi-functional peripherals) and A4 MFPs based on laser printers, as well as equipment maintenance services and IT solutions.
■Production print fi eldIn addition to the existing “business convenience store” business fi eld, offering services related to intensive in-house printing, copying and data printouts, the Company is involved in manufacture and sales of equipment for production print systems and graphic arts, and solution services in the fi eld of digital commercial printing. Substantial market growth is projected in commercial printing going forward, driven by small lot printing of multiple items.
This business company consists of businesses in the fi elds of display materials, memory devices and image input/output components.
■Display materials fi eld Konica Minolta Advanced Layers, Inc. develops TAC fi lm for LCD polarizers and VA-TAC fi lm for increasing viewing angle, both of which are widely used in monitors for televisions, PCs and mobile phones.
■Memory devices fi eld Konica Minolta Optics, Inc. has businesses in pickup lenses for optical disks, particularly objective lenses used in DVD and Blu-ray Disc™ drives for AV equipment and PCs, in addition to glass substrates for HDDs used mainly in 2.5-inch hard disks for notebook PCs.
■ Image input/output components fi eldOperations involve the development of lens units for digital cameras, digital video cameras, and mobile phones with inbuilt cameras.
In the healthcare fi eld, where digitization is gaining momentum, Konica Minolta MEDICAL & GRAPHIC, INC. is promoting manufacture, sales, maintenance and service businesses for diagnostic imaging systems, centered on high-resolution digital X-ray diagnostic image readers that take advantage of cutting-edge image processing technology.
■Market position (Konica Minolta Estimete)
Displaymaterials fi eld
Top share
Near complete dominancein Blu-ray Disc / recordable DVD market
Ranked 2nd in industry
Display materials fi eldVA-TAC fi lms
Plain TAC fi lms for LCD polarizers
Pickup lenses for optical disks
Glass substratesfor HDDs
Ranked 2nd inindustry
■Market position
Offi ce fi eld A3 color MFPs: Top-level share in markets outside Japan
Share by geographical region
North America Europe
Production print fi eld Global top share
No.2 No.2
Japan
No.5
China
No.1
■Net sales for FY March 2012
Production print fieldOffice field
18%82%
2

Masatoshi MatsuzakiPresident and CEO
Management Message
3
FY March 2012 was the first year of “G PLAN
2013,” our medium-term business plan with
“growth” as its keyword. During the year, we aimed
to improve our business performance by focusing
management resources in growth areas.
Our operating environment remained
challenging, with marked appreciation of the yen and
the European debt crisis in addition to the impact
of natural disasters such as the Great East Japan
Earthquake and flooding in Thailand. The initiatives
we forcefully promoted to achieve the targets of “G
PLAN 2013” showed results, reflected in increased
operating income despite a decrease in net sales due
to the substantial impact of the strong yen.
In the Business Technologies Business, three
new color digital printing systems led results in the
production print field, which we have positioned
as a growth driver, and sales in this field exceeded
¥100 billion as we captured the top share of the
global market. In OPS (Optimized Print Services),
which we continued to systematically enhance as
a growth sector of the office field, we substantially
expanded the number of global major accounts,
mainly in Europe and the United States, to which
we provide office equipment management
services, including Bayerische Motoren Werke AG
(BMW) and the National Aeronautics and Space
Administration (NASA). These results demonstrated
the success of our strengthened sales organization,
as our sales subsidiaries in Europe and the U.S
achieved record high sales on a local currency basis.
Sales also reached record highs in China and other
emerging countries, as well as in Japan.
In the Optics Business, both plain TAC films
for LCD polarizers and VA-TAC films for increasing
viewing angle performed steadily throughout the
year as we leveraged the competitive advantage of
the thin-film technologies that are one of Konica
Minolta’s strengths.
As initiatives for future growth, we signed
a global partnership agreement with Komori
Corporation, a leading manufacturer of sheet-fed
offset printers, to further expand our scale in the
commercial printing area of the production print
field. In addition, we acquired FedEx Kinko’s Japan
Co., Ltd. to strengthen the in-house printing field
in Japan. We also acquired ten IT service providers
in Europe and the United States as part of our
efforts to expand our operations and capabilities in
the IT services business.
As these results show, it has been a favorable
year, in which we not only achieved organic
growth, but also enhanced our foundation for
future growth through strategic alliances and
M&A. This reaffirms my conviction that the basic
policies of our strategy are on the right track.
FY March 2013 is the middle year of “G
PLAN 2013.” In addition to our ongoing efforts
to make further headway in the production print
field, which is a growth driver, we will work for
further growth by prioritizing business expansion
in emerging economies, which remained
somewhat of an issue in FY March 2012, and the
expansion of our IT service business operations.
We have split the Optics Business into TAC film
and optical divisions to concentrate our human
and technological resources and will work to
expand results over the medium-to-long term by
accelerating the promotion of new businesses,
including incorporating Organic Light Emitting
Diodes (OLED) lighting and other new business
themes in the TAC film field.
To be a business group that can achieve sustained
global growth, the Konica Minolta Group will continue
to focus on a basic policy of “Achieving strong growth,
expanding business scale,” realized by steadily and
boldly advancing our initiatives for “Changing into a
‘Global Company’” and “Increasing the recognition
of the Konica Minolta brand.” I would like to request
your ongoing support as our shareholders and
investors and your expectations of the Konica Minolta
Group as we aim for strong growth.
August 2012
Masatoshi Matsuzaki
President and CEO
Our initiatives during the fi scal year showed results, refl ected in increased operating income in a challenging business climate. We will continue to achieve strong growth by steadily carrying out our strategies.
4
Growth Strategy
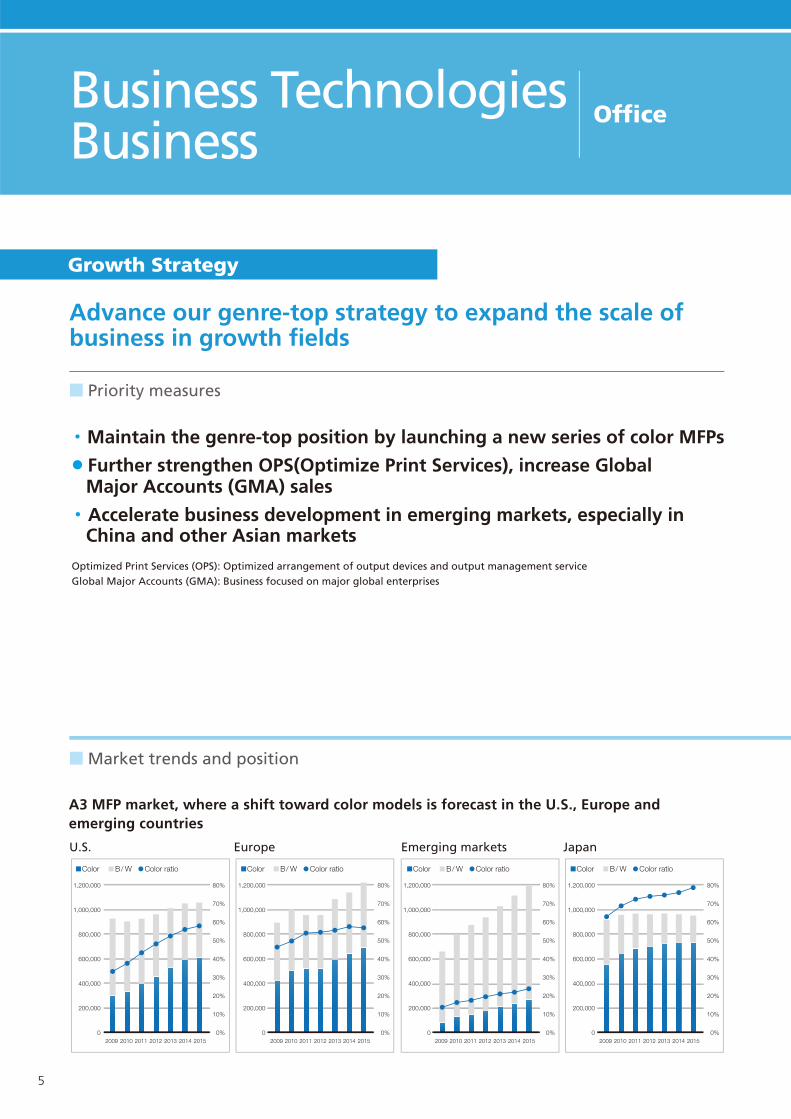
Advance our genre-top strategy to expand the scale of business in growth fields
■ Market trends and position
・Maintain the genre-top position by launching a new series of color MFPs
・ ・ Further strengthen OPS(Optimize Print Services), increase Global Major Accounts (GMA) sales
・ Accelerate business development in emerging markets, especially in China and other Asian markets
A3 MFP market, where a shift toward color models is forecast in the U.S., Europe and emerging countries
Optimized Print Services (OPS): Optimized arrangement of output devices and output management serviceGlobal Major Accounts (GMA): Business focused on major global enterprises
■ Priority measures
Business TechnologiesBusiness
U.S. Europe JapanEmerging markets
Offi ce
1,200,000
1,000,000
800,000
600,000
400,000
200,000
2009 2010 2011 2012 2013 2014 20150
80%
70%
60%
50%
40%
30%
20%
10%
0%
Color B/ W Color ratio Color B/ W Color ratio Color B/ W Color ratioColor B/ W Color ratio
1,200,000
1,000,000
800,000
600,000
400,000
200,000
2009 2010 2011 2012 2013 2014 20150
80%
70%
60%
50%
40%
30%
20%
10%
0%
1,200,000
1,000,000
800,000
600,000
400,000
200,000
2009 2010 2011 2012 2013 2014 20150
80%
70%
60%
50%
40%
30%
20%
10%
0%
1,200,000
1,000,000
800,000
600,000
400,000
200,000
2009 2010 2011 2012 2013 2014 20150
80%
70%
60%
50%
40%
30%
20%
10%
0%
5

Review of Operations
Although the sales volume of the bizhub series monochrome A3 MFPs was only on par with the previous fi scal year, sales
volumes of the bizhub color MFPs increased in all regions―Japan, the U.S., Europe, and Other regions including Asia―, re-
sulting in increased total sales of A3 MFPs year on year. In OPS (Optimized Print Services), which is a growth area for the fi eld,
the strengthening of the global sales structure was a success, and we entered into multi-year contracts for the management
of offi ce equipment with 15 companies including the major automobile manufacturer BMW and NASA. In addition, we also
promoted the expansion of our IT services network in Europe and the U.S. by purchasing a total of 10 IT service providers in
the regions, with the aim of expanding operations to the IT services business in which future growth is anticipated. We also
launched the bizhub C754/C654 color models as high-end models of the series in January 2012, further reinforcing product
competitiveness in the fi eld.
Solid share of the A3 color MFP market in the U.S., Europe and China, where growth is expected
■ Development of Global Major Accounts (GMA) in the office field progressing smoothly
U.S. Europe China Japan
bizhub C754
(CY)
40%
30%
20%
10%
0%2009 2010 2011
19% 19%120%19% 19%20%
(CY)
40%
30%
20%
10%
0%2009 2010 2011
18%%8%%81 9%9119%919%18% 18% 19%
40%
30%
20%
10%
0%2009 2010 2011(CY)
40%
30%
20%
10%
0%2009 2010 2011
38%
32% 33%40%
30%
20%
10%
0%2009 2010 2011(CY)
40%
30%
20%
10%
0%2009 2010 2011
%%7%7%77% %%7%7%77% %%7%7%77%7% 7% 7%
Color
Sales of the A3 MFP for office use(units)
B/ W
150
100114 118
6261 69100
50
FY2009
38 53 49
* Base index: FY2009 = 100
FY2010 FY20110
KM A company B company C company D company E company
6
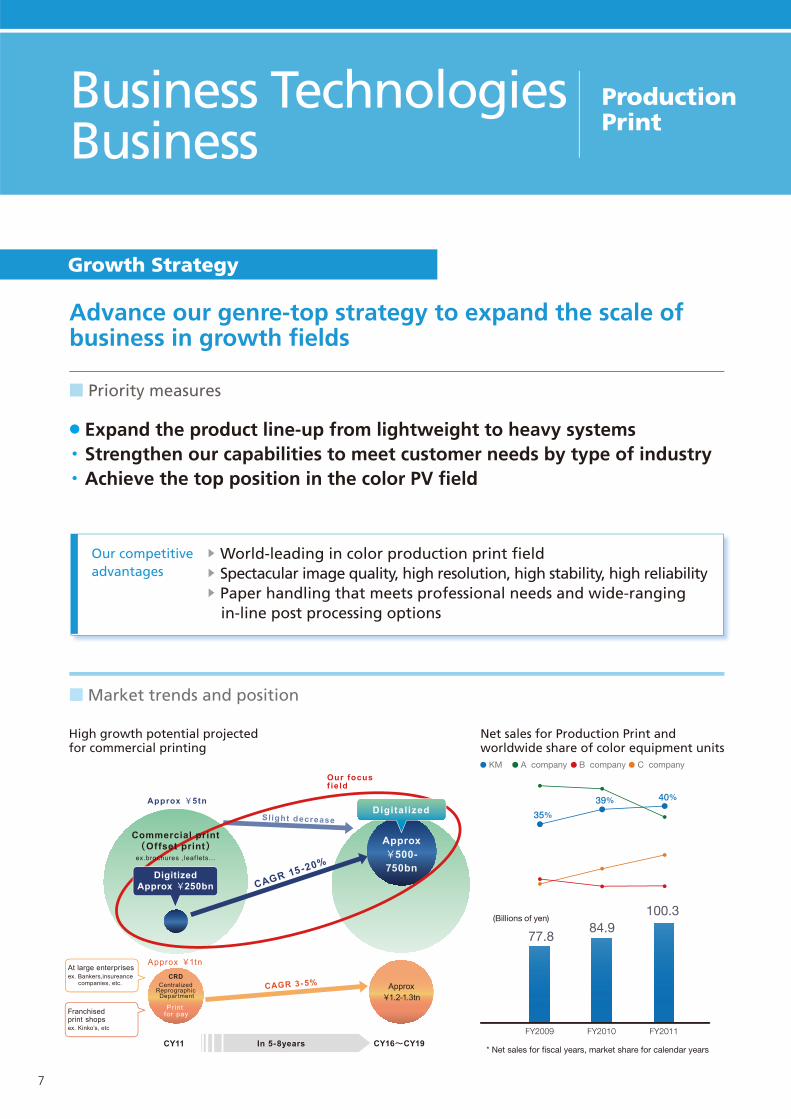
Growth Strategy
Advance our genre-top strategy to expand the scale of business in growth fi elds
■ Market trends and position
・ ・ Expand the product line-up from lightweight to heavy systems ・Strengthen our capabilities to meet customer needs by type of industry ・Achieve the top position in the color PV field
■ Priority measures
ProductionPrint
High growth potential projected for commercial printing
Net sales for Production Print and worldwide share of color equipment units
Business Technologies Business
▶ World-leading in color production print field▶ Spectacular image quality, high resolution, high stability, high reliability▶ Paper handling that meets professional needs and wide-ranging in-line post processing options
Our competitive advantages
Approx ¥5tn
CAGR 15-20%
Approx ¥1tnAt large enterprisesex. Bankers,insureance companies, etc.
Franchisedprint shopsex. Kinko’s, etc
CAGR 3-5%
CY16~CY19In 5-8years CY11
CRDCentralized
Reprographic Department
Pr int for pay
Approx¥1.2-1.3tn
Approx¥500-750bn
Our focusf ield
DigitizedApprox ¥250bn
Digitalized
Commercial print(Offset print)ex.brochures ,leaf lets…
Slight decrease
KM A company B company C company
* Net sales for fiscal years, market share for calendar years
FY2009 FY2010 FY2011
(Billions of yen)
35%
39% 40%
77.884.9
100.3
7
Review of Operations
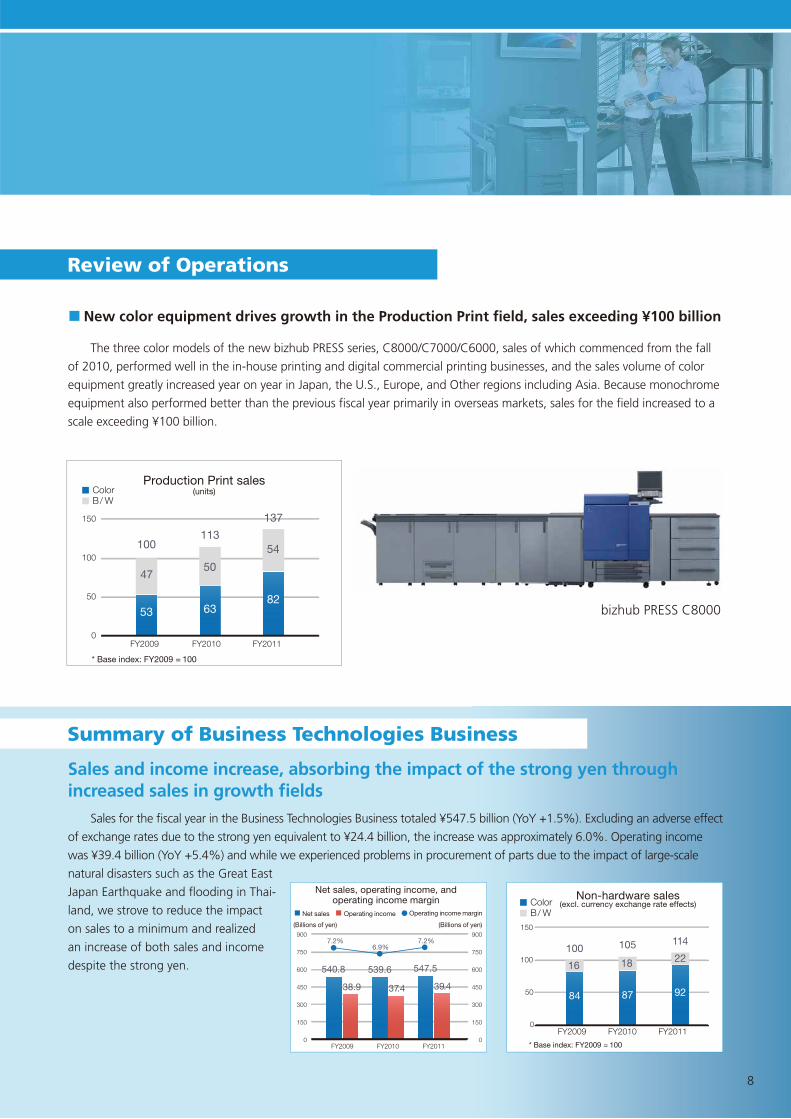
Sales and income increase, absorbing the impact of the strong yen throughincreased sales in growth fi elds
Sales for the fi scal year in the Business Technologies Business totaled ¥547.5 billion (YoY +1.5%). Excluding an adverse effect
of exchange rates due to the strong yen equivalent to ¥24.4 billion, the increase was approximately 6.0%. Operating income
was ¥39.4 billion (YoY +5.4%) and while we experienced problems in procurement of parts due to the impact of large-scale
natural disasters such as the Great East
Japan Earthquake and fl ooding in Thai-
land, we strove to reduce the impact
on sales to a minimum and realized
an increase of both sales and income
despite the strong yen.
The three color models of the new bizhub PRESS series, C8000/C7000/C6000, sales of which commenced from the fall
of 2010, performed well in the in-house printing and digital commercial printing businesses, and the sales volume of color
equipment greatly increased year on year in Japan, the U.S., Europe, and Other regions including Asia. Because monochrome
equipment also performed better than the previous fi scal year primarily in overseas markets, sales for the fi eld increased to a
scale exceeding ¥100 billion.
■ New color equipment drives growth in the Production Print field, sales exceeding ¥100 billion
Summary of Business Technologies Business
bizhub PRESS C8000
150
100113
137
100
50
FY2009
53 6382
4750
54
FY2010 FY20110
Production Print sales(units)Color
B/ W
* Base index: FY2009 = 100
Net sales, operating income, andoperating income margin
Net sales
(Billions of yen) (Billions of yen)
Operating income Operating income margin
FY2009 FY2010 FY2011
540.8
7.2% 7.2%6.9%
38.9 37.4 39.4
539.6 547.5
900
750
600
450
300
150
0
900
750
600
450
300
150
0
Non-hardware sales(excl. currency exchange rate effects)
84 87 92
16
100 105 114
18 22
FY2009 FY2010 FY2011
150
100
50
0
ColorB/ W
* Base index: FY2009 = 100
8

Industrial Business
Growth Strategy
Supplement the TAC fi lm earnings base by establishing second and third earnings drivers
Functional materials/New business development
Optical products and Sensing
・ ・ TAC fi lm: Secure growth using the advantage of thin plain TAC fi lms
・Accelerate commercialization centered on functional materials including OLED-related products, barrier fi lm and functional window fi lm
・ ・ Expand sales in growth areas such as optical units for interchangeable replacement lenses for digital single- lens reflex cameras and smartphones
・ ・ Expand operations for industrial applications in China and emerging economies
Barrier film: Preserves the quality of mobile devices, solar panels and OLED devices, etc.Functional window film: High-performance window film with a line-up of four types – heat insulation film, heat insulation + dirt-
resistant film, dirt-resistant film and shatter-resistant film
■ Priority measures
■ Priority measures
Continued strong growth in the TAC film business LCD panel demand has continued to grow steadily after the launch of OLED
FY2007 FY2008 FY2009 FY2010 FY2011
100 111
148 157
190* Base index: FY2007 = 100 LCD and OLED demand forecast (Million m2)
09’ 10’ 11’ 12’ 13’ 14’ 15’ 16’ 17’ 18’0
20
40
60
80
100
120
140
160
LCD
OLED
9
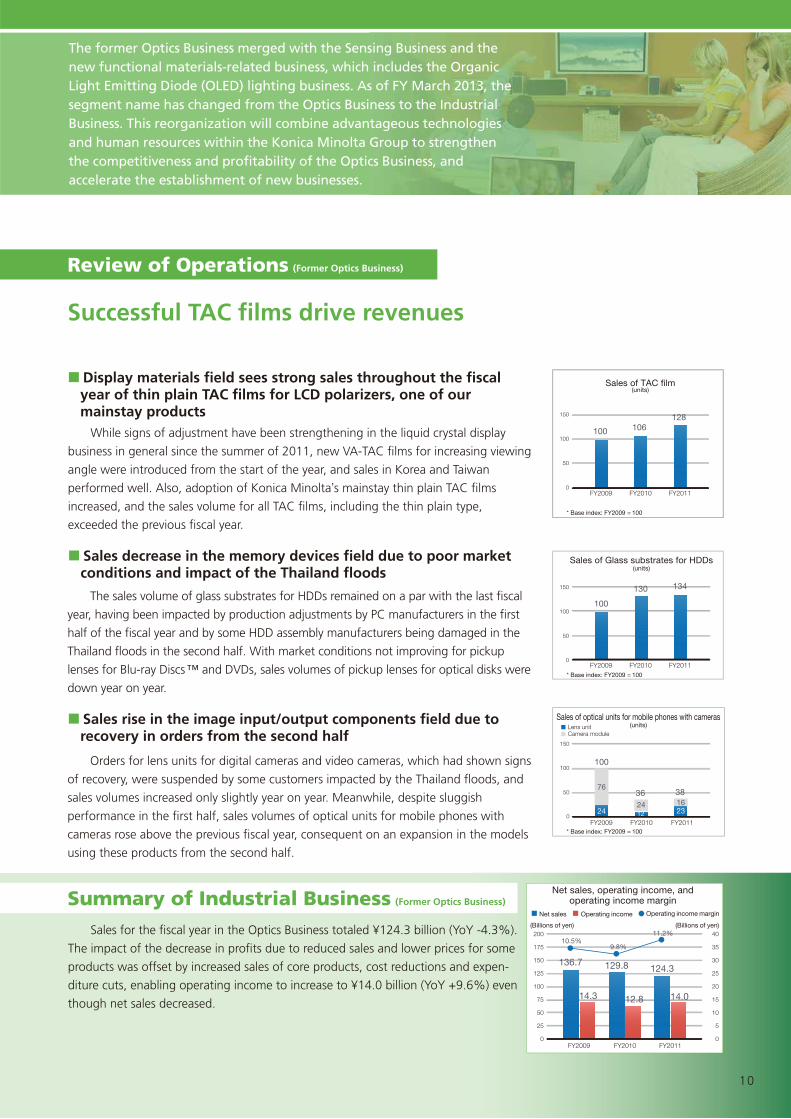
Review of Operations (Former Optics Business)
Successful TAC films drive revenues
■ Display materials fi eld sees strong sales throughout the fi scal year of thin plain TAC fi lms for LCD polarizers, one of our mainstay products
While signs of adjustment have been strengthening in the liquid crystal display
business in general since the summer of 2011, new VA-TAC fi lms for increasing viewing
angle were introduced from the start of the year, and sales in Korea and Taiwan
performed well. Also, adoption of Konica Minolta’s mainstay thin plain TAC fi lms
increased, and the sales volume for all TAC fi lms, including the thin plain type,
exceeded the previous fi scal year.
■ Sales decrease in the memory devices fi eld due to poor market conditions and impact of the Thailand fl oods
The sales volume of glass substrates for HDDs remained on a par with the last fi scal
year, having been impacted by production adjustments by PC manufacturers in the fi rst
half of the fi scal year and by some HDD assembly manufacturers being damaged in the
Thailand fl oods in the second half. With market conditions not improving for pickup
lenses for Blu-ray Discs™ and DVDs, sales volumes of pickup lenses for optical disks were
down year on year.
■ Sales rise in the image input/output components fi eld due to recovery in orders from the second half
Orders for lens units for digital cameras and video cameras, which had shown signs
of recovery, were suspended by some customers impacted by the Thailand fl oods, and
sales volumes increased only slightly year on year. Meanwhile, despite sluggish
performance in the fi rst half, sales volumes of optical units for mobile phones with
cameras rose above the previous fi scal year, consequent on an expansion in the models
using these products from the second half.
Summary of Industrial Business (Former Optics Business)
Sales for the fi scal year in the Optics Business totaled ¥124.3 billion (YoY -4.3%).
The impact of the decrease in profi ts due to reduced sales and lower prices for some
products was offset by increased sales of core products, cost reductions and expen-
diture cuts, enabling operating income to increase to ¥14.0 billion (YoY +9.6%) even
though net sales decreased.
The former Optics Business merged with the Sensing Business and the new functional materials-related business, which includes the Organic Light Emitting Diode (OLED) lighting business. As of FY March 2013, the segment name has changed from the Optics Business to the Industrial Business. This reorganization will combine advantageous technologies and human resources within the Konica Minolta Group to strengthen the competitiveness and profitability of the Optics Business, and accelerate the establishment of new businesses.
Sales of TAC film(units)
150
100 106128
100
50
0FY2009 FY2010 FY2011
* Base index: FY2009 = 100
Sales of Glass substrates for HDDs(units)
150
100
50
0
100
130 134
FY2009 FY2010 FY2011* Base index: FY2009 = 100
Sales of optical units for mobile phones with cameras(units)
150
100
763624
3816
100
50
0FY2009 FY2010 FY2011
24 12 23
* Base index: FY2009 = 100
Lens unitCamera module
10.5%11.2%
9.8%
Net sales, operating income, andoperating income margin
Net sales
(Billions of yen) (Billions of yen)
Operating income Operating income margin
FY2009 FY2010 FY2011
200
175
150
125
100
50
25
75
0
40
35
30
25
20
15
10
5
0
136.7 129.8 124.3
14.012.814.3
10

Healthcare Business
Growth Strategy
Change our business structure to achieve revenue sources in digital equipment and IT services
・ ・ Full-scale commercialization of proprietary Digital Radiography (DR) line-up and expansion of our genre-top position in small Computed Radi ography (CR) systems in the clinical market
・ ・ Expand sales of CR systems in the Asian market, focusing on China and India
・ ・ Expand new value-added services using the Internet in addition to revenues from services, especially maintenance, leveraging the customer base established in the digital equipment fi eld
■ Priority measures
■ Priority measures
■ Priority measures
DR: X-ray diagnostic imaging systems featuring high sensitivity and high definitionCR: Widely used X-ray diagnostic imaging systems.
Our competitive advantages
▶ The world’s lightest weight, superior screen quality, low radiation emissions, high durability
Digital equipment
Asian market
Services
11
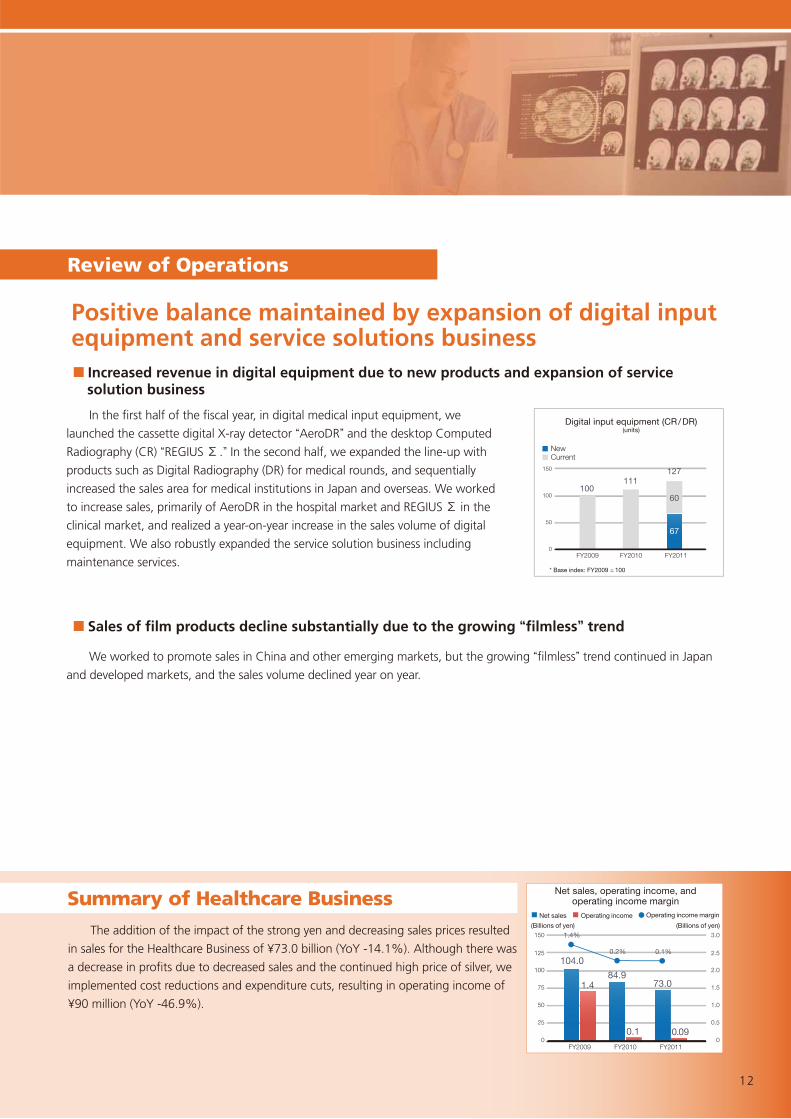
Review of Operations
Positive balance maintained by expansion of digital input equipment and service solutions business ■ Increased revenue in digital equipment due to new products and expansion of service solution business
■ Sales of film products decline substantially due to the growing “filmless” trend
In the fi rst half of the fi scal year, in digital medical input equipment, we
launched the cassette digital X-ray detector “AeroDR” and the desktop Computed
Radiography (CR) “REGIUS Σ .” In the second half, we expanded the line-up with
products such as Digital Radiography (DR) for medical rounds, and sequentially
increased the sales area for medical institutions in Japan and overseas. We worked
to increase sales, primarily of AeroDR in the hospital market and REGIUS Σ in the
clinical market, and realized a year-on-year increase in the sales volume of digital
equipment. We also robustly expanded the service solution business including
maintenance services.
We worked to promote sales in China and other emerging markets, but the growing “fi lmless” trend continued in Japan
and developed markets, and the sales volume declined year on year.
Summary of Healthcare BusinessThe addition of the impact of the strong yen and decreasing sales prices resulted
in sales for the Healthcare Business of ¥73.0 billion (YoY -14.1%). Although there was
a decrease in profi ts due to decreased sales and the continued high price of silver, we
implemented cost reductions and expenditure cuts, resulting in operating income of
¥90 million (YoY -46.9%).
1.4%
0.2% 0.1%
Net sales, operating income, andoperating income margin
Net sales
(Billions of yen) (Billions of yen)
Operating income Operating income margin
FY2009 FY2010 FY2011
150
125
100
75
50
25
0
3.0
2.5
2.0
1.5
1.0
0.5
0
104.0
84.973.0
0.090.1
1.4
100111
127
67
60
Digital input equipment (CR/DR)(units)
150
100
50
0FY2009 FY2010 FY2011
* Base index: FY2009 = 100
NewCurrent
12

Reinforcement of Our Global Management Base
Basic policy
Reinforcing our management base to truly global standards, we aim to increase recognition of the Konica Minolta brand as an innovative corporation in the fi eld of imaging and realize powerful growth.
Changing into a “Global Company”
■ Priority measures
・ Introducing a global human resource system to cultivate and leverage global human resources
Considering human resource optimization from a worldwide perspective to be indispensable in providing the
highest value to customers around the world, we have constructed a global HR database that we are now actively
using. We are also developing initiatives to foster future management personnel from a global perspective, such as
periodically implementing management training programs across the group for selected personnel. In addition, we will
go on to construct and deploy a common structure for HR evaluations to appoint talented people from different
organizations and countries.
・ Structural enhancements for global Optimized Print Services (OPS) As a new growth area for the offi ce fi eld in the Business Technologies Business, we are strengthening our sales
structure on a global scale for the OPS concept, with the aim of providing an optimal print environment to customers.
We achieved the acquisition of 2,800 new client companies (aggregate number of clients: 4,000 companies) and sales
of ¥20.3 billion (YoY +134%) in FY March 2012.
・ Expansion of Global Major Accounts (GMA) by providing high-quality services worldwide
As a result of promoting marketing to GMA operating in Europe, the U.S. and the rest of the world through the
window of OPS, steady growth was achieved in FY March 2012, having entered into multi-year contracts for the
management of offi ce equipment with 15 companies including the major German automobile manufacturer BMW
and NASA.
13

Increasing the recognition of the Konica Minolta brand
・ Promoting the communication message “Giving Shape to Ideas”
■ Priority measures
This communication message clearly expresses our strong determination to fulfi lling our customers’ needs through
creative technological innovation. Under this message, we will endeavor each day to resolve our customers’ problems
through the reliable technological strengths and problem-solving abilities we have fostered in all the businesses in
which the Group companies engage, and deliver value beyond expectations.
14

Operating Environment
The Great East Japan Earthquake that occurred in March 2011, damaging fl oods in
Thailand from July 2011, and other unprecedented disasters directly and indirectly
affected the procurement and production operations of the Konica Minolta Group (the
Group) by disrupting supply chains in the related industries.
Regarding macroeconomic circumstances in Japan and overseas, increasing
economic uncertainty in Europe as a result of the sovereign debt crisis and its potential
impact on the global economy were cause for concern. However, the U.S. economy was
relatively solid and the economies of emerging countries including China maintained high
growth rates overall. Economic conditions remained challenging in Japan, especially for
export-oriented manufacturers, because of the rapid appreciation of the yen, the impact
of the earthquake in Japan and the fl ooding in Thailand.
Operating Results
Net Sales
In the fi scal year ended March 31, 2012, net sales decreased ¥10.0 billion, or
1.3%, year on year to ¥767.8 billion. Amid the Great East Japan Earthquake, fl ooding
in Thailand, the recession in Europe and other factors, the Group implemented
initiatives such as introducing new products, acquiring large customers, and
strengthening sales in emerging countries. However, currency translation reduced net
sales by ¥29.7 billion.
Operating Income
Gross profi t increased ¥0.7 billion, or 0.2%, year on year to ¥355.3 billion. Although
net sales decreased and procurement costs rose while orders stagnated as a result of
the Great East Japan Earthquake and the fl ooding in Thailand, sales of main products
increased and the entire Group worked to reduce costs and raise productivity. As a result
of these and other factors, the gross profi t margin improved 0.7 points year on year to
46.3 percent.
Selling, general and administrative (SG&A) expenses increased ¥0.4 billion year on
year as assiduous efforts to reduce SG&A expenses offset increased expenses due to
aggressive mergers and acquisitions.
As a result of the above, operating income increased ¥0.3 billion, or 0.8%, year on
year to ¥40.3 billion. Excluding a decrease of ¥7.4 billion due to currency translation,
operating income would have increased 19.3% year on year.
Income before Income Taxes and Minority Interests
Income before income taxes and minority interests increased ¥4.7 billion, or 16.7%,
year on year to ¥32.8 billion. Gain on reversal of foreign currency translation adjustment
of ¥3.7 billion partially offset foreign exchange loss, net of ¥2.5 billion, write-down of
investment securities of ¥2.7 billion, and business structure improvement expenses of
¥1.1 billion.
Net Income
Net income decreased ¥5.4 billion, or 21.1%, year on year to ¥20.4 billion. Among
other factors, revision of the corporate tax rate in Japan increased income taxes and
reduced net income by ¥3.3 billion.
Operating Results by Segment
Business Technologies Business
In the offi ce fi eld, overall sales volume of the A3 multi function peripherals (MFPs) of
the bizhub series for the fi scal year ended March 31, 2012 increased year on year,
refl ecting stronger unit sales of color MFPs in all regions – Japan, the United States,
Europe, and other regions including Asia – and level sales volume of monochrome MFPs.
The Company enhanced its global sales system based on the concept of Optimized Print
Services (OPS), a growth strategy that aims at providing optimal printing environments to
customers. Sales to major global accounts increased steadily as a result. For example,
the Company successfully concluded multi-year global contracts with BMW AG, a major
Net sales1,000
804.4 777.9 767.8800
400
600
200
FY2009 FY2010 FY20110
(Billions of yen)
Operating income50
43.940.0 40.3
40
20
30
10
FY2009 FY2010 FY20110
(Billions of yen)
Net income30
16.9
25.8
20.425
15
20
10
5
FY2009 FY2010 FY20110
(Billions of yen)
Management’s Discussion and Analysis
15

European automobile manufacturer headquartered in Germany, and the National
Aeronautics and Space Administration (NASA) for the management and maintenance of
offi ce equipment at their offi ces. The Company also acquired IT service providers to
strengthen its IT service capability, which is key to expanding service businesses in the
future and achieving sustainable growth. In Europe, the Company acquired Sweden-
based Koneo AB in April 2011. In the United States, California-based subsidiary All
Covered Inc., which became a member of the Group in December 2010, acquired nine
companies including Illinois-based Techcare LLC. The effective date for the acquisition of
two of these companies was April 1, 2012. With these initiatives, the Company expanded
its IT service network in North America and European markets. In addition, the Company
launched two new color MFPs, bizhub C754 and C654, as the highest-end products in
the bizhub series in January 2012 to enhance its product competitiveness in this fi eld.
In the production print fi eld, sales volume of color equipment for production printing
systems for the fi scal year ended March 31, 2012 increased signifi cantly year on year in
all regions – Japan, the United States, Europe, and other regions including Asia. This
performance refl ected strong sales of three new color digital printing systems, the bizhub
PRESS C8000, C7000 and C6000, which were launched in autumn 2010 and are used
in in-house printing and digital commercial printing. Sales of monochrome MFPs also
increased year on year, especially in overseas markets. Consequently, overall sales in this
fi eld remained robust throughout the fi scal year ended March 31, 2012.
As a result, Business Technologies Business segment sales to outside customers
increased 1.5% year on year to ¥547.5 billion. Excluding a decrease of ¥24.4 billion in
sales due to the effect of the strong yen on currency translation, segment sales would
have increased about 6.0% year on year. Segment profi t increased 5.4% year on year to
¥39.4 billion. During the fi scal year ended March 31, 2012, large-scale natural disasters
such as the Great East Japan Earthquake and fl ooding in Thailand caused diffi culties in
procuring certain materials and components. The Company took steps to minimize the
effect on sales by strengthening cooperation among its development, procurement, and
production divisions. As a result, both segment sales and segment profi t increased year
on year despite the strong yen.
Optics Business
In the display materials fi eld, the Group introduced new cellulose triacetate fi lms for
increasing viewing angle (VA-TAC fi lm) from early 2012. Sales of VA-TAC fi lms remained
favorable in Korea and Taiwan during the fi scal year ended March 31, 2012 despite
widespread production adjustments in the liquid crystal display (LCD) industry from
summer 2011. In addition, adoption of thin plain TAC fi lms, a strong Group product,
increased steadily. As a result, overall TAC fi lm sales volume for the fi scal year ended
March 31, 2012 increased year on year.
In the memory devices fi eld, sales volume of glass substrates for hard disk drives (HDDs)
was level year on year, refl ecting production adjustments adopted by personal computer
manufacturers in the fi rst half of the fi scal year and the effects of damage certain HDD set
manufacturers suffered due to the fl ooding in Thailand in the second half. Sales volume of
pickup lenses for optical disks for the fi scal year ended March 31, 2012 decreased year on
year because the markets for both Blu-ray DiscsTM and DVDs failed to recover.
In the image input/output components fi eld, sales of lens units for digital and video
cameras had been rebounding but stalled because of stagnant orders from certain
customers that were affected by the fl ooding in Thailand. Sales volume only increased
slightly year on year as a result. Meanwhile, sales volume of optical units for cell phones
with cameras increased year on year, with increased use of Konica Minolta optical units
in the second half compensating for a weak fi rst half.
As a result, Optics Business segment sales to outside customers decreased 4.3%
year on year to ¥124.3 billion. Segment profi t increased 9.6% year on year to ¥14.0
billion because increased sales of main products and initiatives to reduce costs and
expenses compensated for the decrease in segment profi t from lower sales and prices
for certain products.
Healthcare Business
In the Healthcare Business, the Company launched two models of digital medical
input equipment, the AeroDR cassette digital X-ray detector and the REGIUS Σ desktop
16
computed radiography (CR) unit, in the fi rst half, and expanded its lineup with a mobile
digital radiography (DR) unit for hospital rounds in the second half. The Company also
continued to expand the areas in which it sells to medical facilities in Japan and abroad.
Digital equipment sales volume increased year on year because the Company
concentrated on increasing sales of AeroDR in the hospital market and REGIUS Σ in the
clinic market. In fi lm products, the Company concentrated on China to expand sales in
emerging economies. However, the use of fi lmless equipment in Japan and other
developed countries increased unabated, causing fi lm product sales volume for the fi scal
year ended March 31, 2012 to decreased year on year.
In addition to the above, the impact of the strong yen and lower market prices
caused Healthcare Business segment sales to outside customers to decrease 14.1%
year on year to ¥73.0 billion. Segment profi t decreased 46.9% year on year to ¥90
million, with the impact of lower sales and the surge in the price of silver partly offset by
moves to reduce costs and expenses.
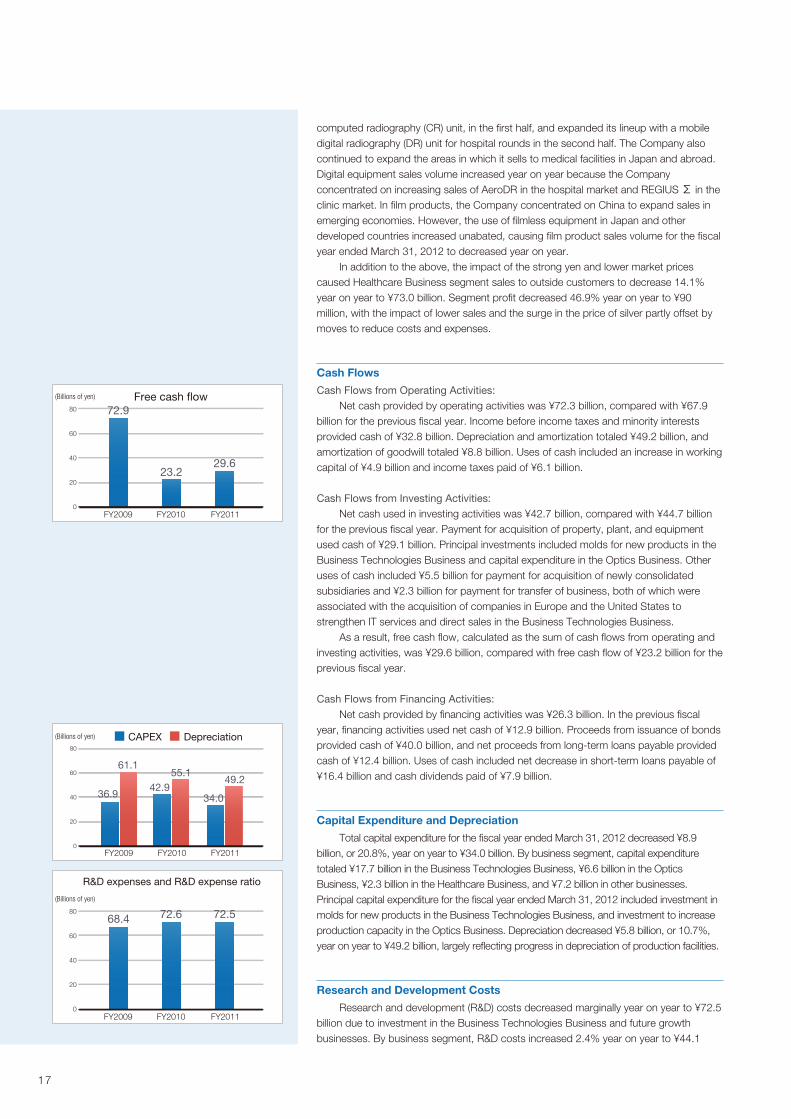
Cash Flows
Cash Flows from Operating Activities:
Net cash provided by operating activities was ¥72.3 billion, compared with ¥67.9
billion for the previous fi scal year. Income before income taxes and minority interests
provided cash of ¥32.8 billion. Depreciation and amortization totaled ¥49.2 billion, and
amortization of goodwill totaled ¥8.8 billion. Uses of cash included an increase in working
capital of ¥4.9 billion and income taxes paid of ¥6.1 billion.
Cash Flows from Investing Activities:
Net cash used in investing activities was ¥42.7 billion, compared with ¥44.7 billion
for the previous fi scal year. Payment for acquisition of property, plant, and equipment
used cash of ¥29.1 billion. Principal investments included molds for new products in the
Business Technologies Business and capital expenditure in the Optics Business. Other
uses of cash included ¥5.5 billion for payment for acquisition of newly consolidated
subsidiaries and ¥2.3 billion for payment for transfer of business, both of which were
associated with the acquisition of companies in Europe and the United States to
strengthen IT services and direct sales in the Business Technologies Business.
As a result, free cash fl ow, calculated as the sum of cash fl ows from operating and
investing activities, was ¥29.6 billion, compared with free cash fl ow of ¥23.2 billion for the
previous fi scal year.
Cash Flows from Financing Activities:
Net cash provided by fi nancing activities was ¥26.3 billion. In the previous fi scal
year, fi nancing activities used net cash of ¥12.9 billion. Proceeds from issuance of bonds
provided cash of ¥40.0 billion, and net proceeds from long-term loans payable provided
cash of ¥12.4 billion. Uses of cash included net decrease in short-term loans payable of
¥16.4 billion and cash dividends paid of ¥7.9 billion.
Capital Expenditure and Depreciation
Total capital expenditure for the fi scal year ended March 31, 2012 decreased ¥8.9
billion, or 20.8%, year on year to ¥34.0 billion. By business segment, capital expenditure
totaled ¥17.7 billion in the Business Technologies Business, ¥6.6 billion in the Optics
Business, ¥2.3 billion in the Healthcare Business, and ¥7.2 billion in other businesses.
Principal capital expenditure for the fi scal year ended March 31, 2012 included investment in
molds for new products in the Business Technologies Business, and investment to increase
production capacity in the Optics Business. Depreciation decreased ¥5.8 billion, or 10.7%,
year on year to ¥49.2 billion, largely refl ecting progress in depreciation of production facilities.
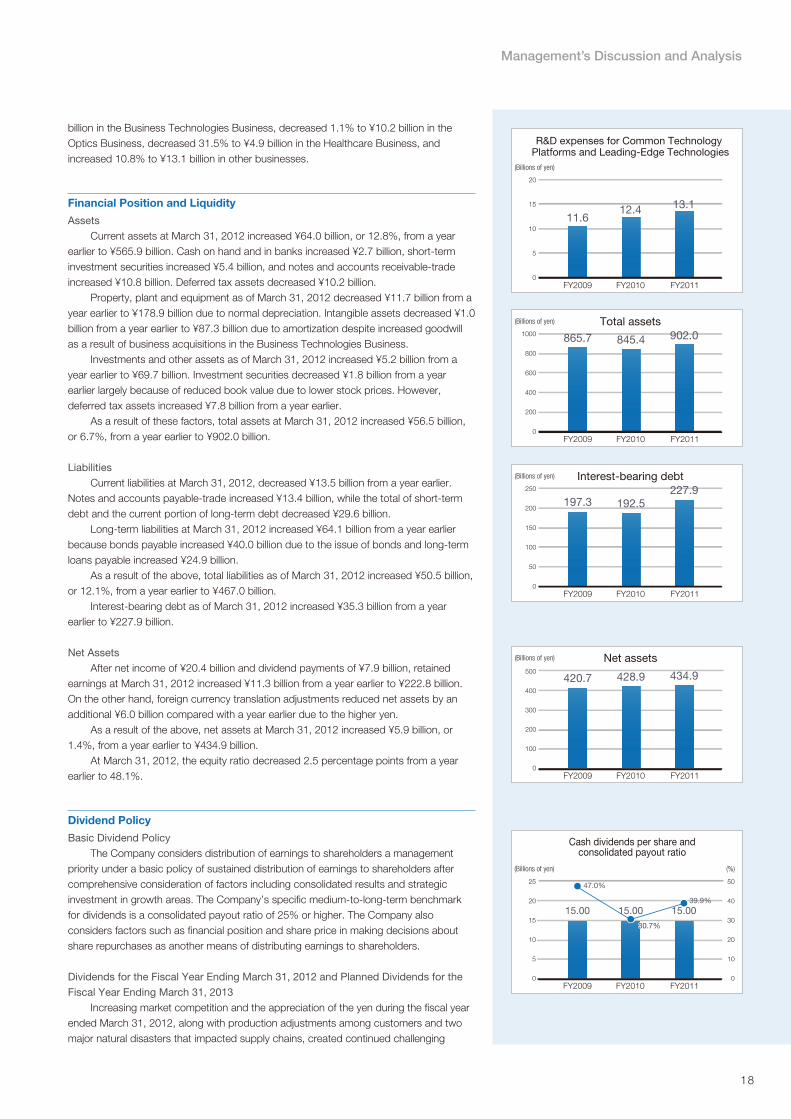
Research and Development Costs
Research and development (R&D) costs decreased marginally year on year to ¥72.5
billion due to investment in the Business Technologies Business and future growth
businesses. By business segment, R&D costs increased 2.4% year on year to ¥44.1
Free cash flow80 72.9
23.229.6
60
40
20
FY2009 FY2010 FY20110
(Billions of yen)
FY2009 FY2010 FY2011
36.9
61.1
42.934.0
49.255.1
(Billions of yen)
80
60
40
20
0
CAPEX Depreciation
R&D expenses and R&D expense ratio
8068.4 72.6 72.5
60
40
20
FY2009 FY2010 FY20110
(Billions of yen)
17
billion in the Business Technologies Business, decreased 1.1% to ¥10.2 billion in the
Optics Business, decreased 31.5% to ¥4.9 billion in the Healthcare Business, and
increased 10.8% to ¥13.1 billion in other businesses.
Financial Position and Liquidity
Assets
Current assets at March 31, 2012 increased ¥64.0 billion, or 12.8%, from a year
earlier to ¥565.9 billion. Cash on hand and in banks increased ¥2.7 billion, short-term
investment securities increased ¥5.4 billion, and notes and accounts receivable-trade
increased ¥10.8 billion. Deferred tax assets decreased ¥10.2 billion.
Property, plant and equipment as of March 31, 2012 decreased ¥11.7 billion from a
year earlier to ¥178.9 billion due to normal depreciation. Intangible assets decreased ¥1.0
billion from a year earlier to ¥87.3 billion due to amortization despite increased goodwill
as a result of business acquisitions in the Business Technologies Business.
Investments and other assets as of March 31, 2012 increased ¥5.2 billion from a
year earlier to ¥69.7 billion. Investment securities decreased ¥1.8 billion from a year
earlier largely because of reduced book value due to lower stock prices. However,
deferred tax assets increased ¥7.8 billion from a year earlier.
As a result of these factors, total assets at March 31, 2012 increased ¥56.5 billion,
or 6.7%, from a year earlier to ¥902.0 billion.
Liabilities
Current liabilities at March 31, 2012, decreased ¥13.5 billion from a year earlier.
Notes and accounts payable-trade increased ¥13.4 billion, while the total of short-term
debt and the current portion of long-term debt decreased ¥29.6 billion.
Long-term liabilities at March 31, 2012 increased ¥64.1 billion from a year earlier
because bonds payable increased ¥40.0 billion due to the issue of bonds and long-term
loans payable increased ¥24.9 billion.
As a result of the above, total liabilities as of March 31, 2012 increased ¥50.5 billion,
or 12.1%, from a year earlier to ¥467.0 billion.
Interest-bearing debt as of March 31, 2012 increased ¥35.3 billion from a year
earlier to ¥227.9 billion.
Net Assets
After net income of ¥20.4 billion and dividend payments of ¥7.9 billion, retained
earnings at March 31, 2012 increased ¥11.3 billion from a year earlier to ¥222.8 billion.
On the other hand, foreign currency translation adjustments reduced net assets by an
additional ¥6.0 billion compared with a year earlier due to the higher yen.
As a result of the above, net assets at March 31, 2012 increased ¥5.9 billion, or
1.4%, from a year earlier to ¥434.9 billion.
At March 31, 2012, the equity ratio decreased 2.5 percentage points from a year
earlier to 48.1%.
Dividend Policy
Basic Dividend Policy
The Company considers distribution of earnings to shareholders a management
priority under a basic policy of sustained distribution of earnings to shareholders after
comprehensive consideration of factors including consolidated results and strategic
investment in growth areas. The Company’s specifi c medium-to-long-term benchmark
for dividends is a consolidated payout ratio of 25% or higher. The Company also
considers factors such as fi nancial position and share price in making decisions about
share repurchases as another means of distributing earnings to shareholders.
Dividends for the Fiscal Year Ending March 31, 2012 and Planned Dividends for the
Fiscal Year Ending March 31, 2013
Increasing market competition and the appreciation of the yen during the fi scal year
ended March 31, 2012, along with production adjustments among customers and two
major natural disasters that impacted supply chains, created continued challenging
Management’s Discussion and Analysis
R&D expenses for Common Technology Platforms and Leading-Edge Technologies
20
11.612.4 13.115
10
5
FY2009 FY2010 FY20110
(Billions of yen)
Total assets1000 865.7 845.4 902.0800
600
400
200
FY2009 FY2010 FY20110
(Billions of yen)
Interest-bearing debt250
197.3 192.5227.9
200
150
100
50
FY2009 FY2010 FY20110
(Billions of yen)
Net assets500
420.7 428.9 434.9400
300
200
100
FY2009 FY2010 FY20110
(Billions of yen)
Cash dividends per share andconsolidated payout ratio
25
15.00 15.00 15.0020
15
10
5
FY2009 FY2010 FY20110
50
40
30
20
10
0
(Billions of yen) (%)
30.7%30.7%
47.0%
39.9%
18

conditions for sales. However, increased sales of profi table core
products and thorough cost controls enabled the Group to
generally achieve its earnings targets from operating income to
net income. Based on these circumstances, the Company
declared a year-end cash dividend of ¥7.50 per share. In
conjunction with the interim cash dividend, cash dividends per
share for the year ended March 31, 2012 totaled ¥15.00.
While the operating environment remains uncertain, for the
fi scal year ending March 31, 2013, the Company assumes it
will achieve its performance targets and therefore plans to pay
an interim and a year-end cash dividend per share of ¥7.50
each for total annual dividends of ¥15.00 per share.
Outlook for the Fiscal Year Ending March 31, 2013
Looking at the global economic conditions surrounding the
Group, the outlook for the European economy remains
uncertain due to its fi scal problems. We expect that the United
States will grow moderately overall but will continue to expand
and contract. Growth in emerging economies, especially China,
India, and other Asian economies, is expected to slow, but we
expect these economies to maintain higher economic growth
rates than those of developed economies. The Japanese
economy is expected to recover, backed by demand
associated with post-earthquake reconstruction.
In the Business Technologies Business, we expect that
demand for production printing products will continue to
expand both in Japan and in overseas markets. We also
forecast that growth in emerging markets will drive demand for
offi ce MFPs. In developed countries, we expect to boost
demand from global major accounts by leveraging the
development of OPS. In the Industrial Business*, prolonged
adjustments of digital consumer electronics inventory, including
LCD TVs, are expected to come to an end, bringing an overall
recovery in demand. In the Healthcare Business, we anticipate
that demand for cassette DR and compact CR will continue to
expand, especially in the hospital and clinic markets.
* The reportable segments in the fi scal year ended March 31, 2012 were the
Business Technologies Business, the Optics Business, and the Healthcare
Business. However, with the reorganization of the Group in April 2012, the
reportable segments will be the Business Technologies Business, Industrial
Business, and Healthcare Business from the fi scal year ending March 31, 2013.
Considering the above circumstances, we have made the
following forecasts for the fi scal year ending March 31, 2013.
We assume exchange rates of JPY 80 to USD 1 and JPY
100 to EUR 1.
Konica Minolta Group Risks
The following risks could have a signifi cant effect on the
judgment of investors in the Group. Further, the forward-looking
statements in the following section are the Group’s judgments
as of June 21, 2012.
Economic Risks
(1) Economic Trends in Primary Markets
The Group provides MFPs, production printing
equipment, image input/output components, display
materials, products and equipment for use in healthcare, and
related services to customers worldwide. Economic
conditions in national markets signifi cantly affect sales and
earnings in these businesses.
Risks of concern in the global economy include the
protracted debt problems in Europe, high crude oil prices due
to political instability in oil-producing countries, and economic
policy revisions in leading countries due to major elections.
Japan’s economy is expected to recover moderately because
of the impact of reconstruction and restoration demand
following the Great East Japan Earthquake and the fl ooding in
Thailand, but conditions remain unclear. Recessions in
national markets that cause customers to restrain investment,
reduce operating expenses or reduce consumption could
adversely affect the Group’s results or fi nances in ways such
as causing inventories to increase, reducing sales prices by
increasing competition, or reducing sales volume.
(2) Changes in Exchange Rates
Overseas sales account for 72.0% of the Group’s net
sales. The Group operates globally and is signifi cantly affected
by exchange rate fl uctuations.
The Group ameliorates the impact of exchange rates by
conducting hedging transactions centered on futures
contracts for major currencies including the U.S. dollar and
the euro. In addition, the impact of USD-denominated
procurement for the MFPs and printers the Business
Technologies Business produces in China is light because it is
basically offset by sales and payables in regions where sales
are denominated in U.S. dollars. However, fl uctuations in euro
exchange rates directly impact earnings. Generally, yen
appreciation versus the U.S. dollar and euro negatively affects
results, while yen depreciation versus these currencies
positively affects results.
The Group takes steps to ameliorate the impact of
currency exchange rate fl uctuations because yen appreciation
negatively affects its results. However, continued yen
appreciation could negatively affect the Group’s results.
Industry and Business Activity Risks
(3) Competition in Technology Innovation
The ability to innovate faster than other companies is the
primary source of competitive advantage in the Group’s core
businesses including MFPs, production printing equipment
and other information equipment, TAC polarizing fi lm for
LCDs, and pickup lenses for optical disks, and in the Group’s
key areas for future development including organic
electroluminescent (EL) lighting.
Performance Forecast for the Fiscal Year Ending March 31, 2013 (As of July 27, 2012)
(Billions of yen)
Net sales 800.0
Operating income 48.0
Operating income ratio 6.0%
Amortization of goodwill 8.8
Operating income before amortization of goodwill 56.8
Operating income ratio before amortization of goodwill 7.1%
Net income 22.0
Capital expenditure 50.0
Depreciation 55.0
Research and development costs 73.0
Free cash flow (10.0)
CF from operating activities - CF from investing activities 30.0
19

The Group continually takes on the challenge of innovative
technology development and invests aggressively in R&D and
facilities, but these efforts may not be timely enough. Moreover,
competitors may develop similar or alternative technologies
more quickly. Accurately determining new directions in
technology innovation to meet customer needs is crucial, and
failure to do so could reduce the Group’s competitiveness in its
core and new businesses.
(4) Operating Environment in the Equipment and Service
Businesses
Solution and service needs are increasing in conjunction
with rising demand for high-value-added products that are
networked and multifunctional, including information equipment
such as MFPs, printers and production printing equipment, and
healthcare equipment. In addition, companies are strengthening
their sales channels through acquisitions, reorganization and
alliances with IT companies, particularly in the information
equipment industry. Competition among manufacturers and
distributors that respond to this trend is expected to further
intensify competition within the industry.
The Group operates under a policy of being the genre
leader in its Business Technologies Business, the Group’s
largest business and growth driver. The Group led the industry
in concentrating resources to expand its offi ce-use color MFP
and production printing equipment businesses, thus
establishing itself as the leading Group in European and North
American markets. However, the Group cannot guarantee
continued competitive advantage because technological
innovation is rapid in this fi eld and the importance of the
solutions and services business is further increasing. Slower
growth resulting from inability to maintain competitiveness in
technology and sales channels in the Business Technologies
Business could adversely affect the Group’s results. Moreover,
restrained corporate investment or cost reductions could cause
installation of new MFPs to decrease, which could adversely
affect the Group’s results in the future.
(5) Operating Environment in the Industrial Business
The Industrial Business supplies components and
materials for LCD televisions, DVD and HDD products, and
other products in the digital home appliance market. Selling
prices continue to trend downward due to intense competition
among manufacturers in this market, which affects component
and material suppliers such as the Group. At the same time,
shorter product lifecycles require component and material
manufacturers to sell mass-produced products in a short time.
Rapid changes in supply and demand due to production
adjustments caused by market competition could adversely
affect the Group’s results.
In addition, the Industrial Business’s major customers are
digital home appliance manufacturers. Rapid changes in
demand or decreases in prices in addition to failure to respond
suffi ciently to the industry trends the Group identifi es, such as
global reorganization of the digital home appliance industry or
next-generation products, could result in loss of customers and
adversely affect the Group’s results.
(6) Quality Problems
The Group has created a rigorous quality assurance
system for Group companies and contract manufacturers in
Japan and overseas, and provides customers with high-
performance, reliable products and services. The Group could
be responsible for compensation for damages that result if the
Group should happen to provide defective products or
services. Moreover, remedying such defects may result in
signifi cant expenses. In addition, media reports on such
problems could adversely affect the Group’s operations and
image.
(7) Global Business Activities
The Group conducts a majority of its business outside
Japan in North America, Europe, and Asian countries. These
global corporate activities entail the following risks:
• Exchange rate movements
• Political and economic uncertainties
• Unanticipated changes to legal, regulatory and tax codes
• Hiring and retaining outstanding employees
• Industrial infrastructure vulnerabilities
Business expansion in overseas markets is a primary
objective of the Group. However, inability to respond adequately
to the risks that are characteristic of global business activities
could adversely affect the Group’s results and growth strategies.
The Group is concentrating on expanding production in
China to enhance cost competitiveness in its core Business
Technologies Business and Industrial Business. The Business
Technologies Business has established production bases in
Dongguan, Shenzen and Wuxi that produce and ship nearly all
of the MFPs and printers it sells globally. In addition, the
Industrial Business has established production bases in Dalian
and Shanghai that produce image input/output components
and other products.
China continues to develop economically and make
progress in areas such as improving its legal system and
upgrading infrastructure. However, legal changes, labor policy
diffi culties, increased personnel expenses, appreciation of the
Chinese yuan, changes in import and export regulations and
the tax code, and other developments that are diffi cult to
anticipate may occur. Inability of the Group to effectively handle
the risks inherent in having a large percentage of the
manufacturing activities of its core businesses in China could
adversely affect the Group’s results and growth strategies.
(8) Securing Human Resources
Skilled human resources are the source of growth for the
Group. The Group increasingly requires outstanding engineers
and highly skilled workers who can further develop core
technologies in businesses including optics, materials, precision
processing, and imaging in order to maintain the Group’s high
level of competitiveness in the future. In addition, prevailing over
competitors as digitalization and networking advance requires
the Group to secure outstanding engineers and systems
engineers to quickly strengthen information and communication
technologies such as software and control technologies.
Beyond technology, the Group has a growing need for
personnel in areas such as marketing, sales and service to
create new sources of earnings from businesses including
solutions and services.
Management’s Discussion and Analysis
20

While these personnel requirements are pronounced,
competition among companies acquire human resources is
intense. Inability to recruit and retain competent human
resources could adversely affect execution of the Group’s
growth strategy.
(9) Alliances with Other Companies
The Group is enhancing competitiveness and effi ciency by
collaborating with other companies through means including
technology and business alliances and joint ventures.
In the Business Technologies Business, the Group moved
to enhance its IT services by continuing to make acquisitions in
North America and Europe during the fi scal year ended March
31, 2012 that strengthened its business base. In the production
print business, the Group responded to diversifying needs in
the commercial printing market by concluding a global sales
agreement in the commercial printing market in February 2012
with Japan-based Komori Corporation. In May 2012, the Group
also acquired FedEx Kinko's Japan Co., Ltd. to provide various
solutions in the corporate in-house printing market. The Group
will continue to forge alliances and make acquisitions as a
strategic growth option.
Mutually supplementing technology and expertise under
agreements with other companies strongly helps the Group to
provide new products and services that respond to customer
needs in a timely manner. Inability to continue collaborative
relationships for operating, fi nancial or other reasons or
inability to achieve the expected outcomes of such
relationships could adversely affect the Group’s growth
strategy.
(10) Rising Raw Material Prices
Rising prices for metal products including silver, steel and
aluminum; petrochemical products made from crude oil; and
other raw materials that the Group uses in its production
activities could affect the Group’s results. The Group works to
reduce costs and raise the prices of its products as raw
material prices rise, but cannot guarantee that it will be able to
completely compensate higher raw material prices. Raising
product selling prices may also reduce sales volume.
(11) Raw Material and Resource Procurement
The Group procures specifi ed products, components and
materials from external suppliers. Unanticipated contingencies
among these suppliers could adversely affect the Group’s
production and supply capabilities.
In addition, the limited supply of scarce natural resources
such as rare earths remains a concern. While the Group is
working to reduce the amount used and fi nd alternatives for
these scarce resources, supply disruptions could interfere with
production continuity and adversely affect the Group’s results.
Legal and Litigation Risk
(12) Intellectual Property
The Group accumulates differentiating technologies and
expertise in the course of product development to ensure the
competitiveness of its businesses, and works to protect these
intellectual property rights. However, legal constraints in certain
regional areas may preclude full protection of intellectual
property and render the Group unable to prevent third parties
from manufacturing and selling products that employ the
Group’s intellectual property.
Furthermore, the Group tries to avoid infringing on the
rights of other companies in developing products. However,
differences of opinion or other factors may result in the
assumption that the Group is infringing on the rights of other
companies, which could render the Group unable to use
important technologies or make the Group responsibile for
paying signifi cant monetary compensation.
Furthermore, in the future the Group may be prohibited
from using intellectual property rights it currently licenses
from third parties, or such use may be subject to
unreasonable conditions.
(13) Healthcare Systems
The Group’s Healthcare Business is subject to the
ongoing infl uence of the healthcare systems and approval
processes of the countries in which it operates. Factors
including healthcare system reform could result in signifi cant
and unanticipated changes healthcare administration policy.
Inability to respond quickly to changes in the operating
environment in the Healthcare Business could adversely affect
the Group’s results.
(14) Environmental Regulations
The Group is subject to various environmental laws and
regulations governing issues including air pollution, water
pollution, removal of hazardous substances, waste treatment,
product recycling, and soil and groundwater contamination.
The Group may incur expenses and fi nancial liabilities for
environmental obligations associated with past and present
manufacturing activities. In addition, the Group may incur
additional compliance obligations and expenses if
environmental laws and regulations become more rigorous in
the future, which could adversely affect the Group’s results.
(15) Information Leaks
The Group obtains personal and confi dential information
on customers and business partners in the course of
operations. The Group has a system for managing this
information and implements measures including employee
training, but unexpected contingencies could cause this
information to leak externally. This could expose the Group to
liability for damages to injured parties, and could adversely
affect the Group’s credibility and image.
In addition, leakage of the Group’s confi dential information
related to matters including technology, contracts and
personnel could adversely affect the Group’s results.
Disasters and Other Risks
(16) Disasters
The Group centers on a holding company, Konica Minolta
Holdings, Inc., and operates globally. It encompasses bases
worldwide involved in activities including R&D, procurement,
production and sales. Disasters including earthquakes, fi res,
typhoons or fl ooding; pandemics similar to the outbreak of
H1N1 infl uenza; or war, acts of terrorism or computer viruses
could damage the Group’s facilities, temporarily halt operations
21

or delay production and shipments. Such disasters could also
disrupt or restrict use of essential utilities such as electricity, gas
and water; cause supply shortages of components and raw
materials by damaging suppliers; halt distribution; or disrupt
markets. Such circumstances could reduce net sales below
initial plans, incur signifi cant expenses to restore damaged
facilities, or have other outcomes that could adversely affect the
Group’s results.
The Group essentially resolved the component and raw
material procurement problems caused by the Great East
Japan Earthquake by the end of the second quarter of the fi scal
year ended March 31, 2012. Moreover, the fl ooding in Thailand
did not directly affect Group operations because the Group
does not have a production base there. However, the Group
has experienced increased procurement costs, suspended
orders and other issues resulting from supply chain disruptions
caused by the fl ooding. In the future, the impact of disasters on
suppliers or customers or the impact of issues such as
electricity shortages could adversely affect the Group’s results.
(17) Impairment of Long-Lived Assets
Effective the fi scal year ended March 31, 2006, the Group
adopted accounting standards for impairment of long-lived
assets including property, plant, equipment and goodwill. The
Group periodically evaluates the carrying value of long-lived
assets on the consolidated balance sheets to determine if their
residual value is recoverable with expected future cash fl ows
from the asset. The Group recognizes impairment when the
asset no longer generates suffi cient cash fl ow because its
operating profi tability has decreased due to competition or
other reasons, which could adversely affect the Group’s results.
Management’s Discussion and Analysis
22

23
CONSOLIDATED BALANCE SHEETSKonica Minolta Holdings, Inc. and Consolidated SubsidiariesMarch 31, 2012 and 2011
Millions of yen
Thousands of U.S. dollars
(Note 3)
Assets 2012 2011 2012
Current Assets:
Cash on hand and in banks (Note 5) . . . . . . . . . . . . . . . . . . . . . . . . . . . . . . . . . . . . . . . . . . . . . . . . . . . . . . . . . . . . . . . . . . . . . . . ¥ 90,640 ¥ 87,886 $ 1,102,811
Notes and accounts receivable–trade (Notes 5 and 12) . . . . . . . . . . . . . . . . . . . . . . . . . . . . . . . . . . . . . . . . . . 174,193 163,363 2,119,394
Lease receivables and investment assets (Note 12) . . . . . . . . . . . . . . . . . . . . . . . . . . . . . . . . . . . . . . . . . . . . . . . . 13,775 14,327 167,599
Short-term investment securities (Notes 5 and 6). . . . . . . . . . . . . . . . . . . . . . . . . . . . . . . . . . . . . . . . . . . . . . . . . . . . 141,293 87,261 1,719,102
Inventories (Note 10) . . . . . . . . . . . . . . . . . . . . . . . . . . . . . . . . . . . . . . . . . . . . . . . . . . . . . . . . . . . . . . . . . . . . . . . . . . . . . . . . . . . . . . . . . . . . . . . . 105,080 100,243 1,278,501
Deferred tax assets (Note 8) . . . . . . . . . . . . . . . . . . . . . . . . . . . . . . . . . . . . . . . . . . . . . . . . . . . . . . . . . . . . . . . . . . . . . . . . . . . . . . . . . . . . 20,100 30,393 244,555
Other accounts receivable . . . . . . . . . . . . . . . . . . . . . . . . . . . . . . . . . . . . . . . . . . . . . . . . . . . . . . . . . . . . . . . . . . . . . . . . . . . . . . . . . . . . . . . 13,467 10,536 163,852
Other current assets . . . . . . . . . . . . . . . . . . . . . . . . . . . . . . . . . . . . . . . . . . . . . . . . . . . . . . . . . . . . . . . . . . . . . . . . . . . . . . . . . . . . . . . . . . . . . . . . 11,759 12,084 143,071
Allowance for doubtful accounts . . . . . . . . . . . . . . . . . . . . . . . . . . . . . . . . . . . . . . . . . . . . . . . . . . . . . . . . . . . . . . . . . . . . . . . . . . . . . (4,385) (4,220) (53,352)
Total current assets . . . . . . . . . . . . . . . . . . . . . . . . . . . . . . . . . . . . . . . . . . . . . . . . . . . . . . . . . . . . . . . . . . . . . . . . . . . . . . . . . . . . . . . . . . . . . . . 565,923 501,876 6,885,546
Property, Plant and Equipment (Note 17):
Buildings and structures . . . . . . . . . . . . . . . . . . . . . . . . . . . . . . . . . . . . . . . . . . . . . . . . . . . . . . . . . . . . . . . . . . . . . . . . . . . . . . . . . . . . . . . . . . 169,648 167,918 2,064,095
Machinery and equipment . . . . . . . . . . . . . . . . . . . . . . . . . . . . . . . . . . . . . . . . . . . . . . . . . . . . . . . . . . . . . . . . . . . . . . . . . . . . . . . . . . . . . . . 244,086 242,223 2,969,777
Tools and furniture . . . . . . . . . . . . . . . . . . . . . . . . . . . . . . . . . . . . . . . . . . . . . . . . . . . . . . . . . . . . . . . . . . . . . . . . . . . . . . . . . . . . . . . . . . . . . . . . . . . 138,773 142,003 1,688,441
Land . . . . . . . . . . . . . . . . . . . . . . . . . . . . . . . . . . . . . . . . . . . . . . . . . . . . . . . . . . . . . . . . . . . . . . . . . . . . . . . . . . . . . . . . . . . . . . . . . . . . . . . . . . . . . . . . . . . . . . . . 33,631 33,795 409,186
Lease assets . . . . . . . . . . . . . . . . . . . . . . . . . . . . . . . . . . . . . . . . . . . . . . . . . . . . . . . . . . . . . . . . . . . . . . . . . . . . . . . . . . . . . . . . . . . . . . . . . . . . . . . . . . . . 818 726 9,953
Construction in progress . . . . . . . . . . . . . . . . . . . . . . . . . . . . . . . . . . . . . . . . . . . . . . . . . . . . . . . . . . . . . . . . . . . . . . . . . . . . . . . . . . . . . . . . . 7,817 6,589 95,109
Rental business-use assets . . . . . . . . . . . . . . . . . . . . . . . . . . . . . . . . . . . . . . . . . . . . . . . . . . . . . . . . . . . . . . . . . . . . . . . . . . . . . . . . . . . . . 37,373 39,425 454,715
Total . . . . . . . . . . . . . . . . . . . . . . . . . . . . . . . . . . . . . . . . . . . . . . . . . . . . . . . . . . . . . . . . . . . . . . . . . . . . . . . . . . . . . . . . . . . . . . . . . . . . . . . . . . . . . . . . . . . . . . . 632,149 632,682 7,691,313
Accumulated depreciation . . . . . . . . . . . . . . . . . . . . . . . . . . . . . . . . . . . . . . . . . . . . . . . . . . . . . . . . . . . . . . . . . . . . . . . . . . . . . . . . . . . . . . . (453,150) (441,980) (5,513,444)
Net property, plant and equipment . . . . . . . . . . . . . . . . . . . . . . . . . . . . . . . . . . . . . . . . . . . . . . . . . . . . . . . . . . . . . . . . . . . . . . . 178,999 190,701 2,177,868
Intangible Fixed Assets:
Goodwill . . . . . . . . . . . . . . . . . . . . . . . . . . . . . . . . . . . . . . . . . . . . . . . . . . . . . . . . . . . . . . . . . . . . . . . . . . . . . . . . . . . . . . . . . . . . . . . . . . . . . . . . . . . . . . . . . . 59,727 63,146 726,694
Other intangible fi xed assets . . . . . . . . . . . . . . . . . . . . . . . . . . . . . . . . . . . . . . . . . . . . . . . . . . . . . . . . . . . . . . . . . . . . . . . . . . . . . . . . . . . 27,613 25,225 335,965
Total intangible fi xed assets . . . . . . . . . . . . . . . . . . . . . . . . . . . . . . . . . . . . . . . . . . . . . . . . . . . . . . . . . . . . . . . . . . . . . . . . . . . . . . . . . . . 87,341 88,371 1,062,672
Investments and Other Assets (Note 17):
Investment securities (Notes 5 and 6) . . . . . . . . . . . . . . . . . . . . . . . . . . . . . . . . . . . . . . . . . . . . . . . . . . . . . . . . . . . . . . . . . . . . . . 19,073 20,893 232,060
Long-term loans . . . . . . . . . . . . . . . . . . . . . . . . . . . . . . . . . . . . . . . . . . . . . . . . . . . . . . . . . . . . . . . . . . . . . . . . . . . . . . . . . . . . . . . . . . . . . . . . . . . . . . 133 154 1,618
Long-term prepaid expenses . . . . . . . . . . . . . . . . . . . . . . . . . . . . . . . . . . . . . . . . . . . . . . . . . . . . . . . . . . . . . . . . . . . . . . . . . . . . . . . . . . 2,650 3,030 32,242
Deferred tax assets (Note 8) . . . . . . . . . . . . . . . . . . . . . . . . . . . . . . . . . . . . . . . . . . . . . . . . . . . . . . . . . . . . . . . . . . . . . . . . . . . . . . . . . . . . 38,281 30,404 465,762
Other. . . . . . . . . . . . . . . . . . . . . . . . . . . . . . . . . . . . . . . . . . . . . . . . . . . . . . . . . . . . . . . . . . . . . . . . . . . . . . . . . . . . . . . . . . . . . . . . . . . . . . . . . . . . . . . . . . . . . . . . 10,355 10,752 125,989
Allowance for doubtful accounts . . . . . . . . . . . . . . . . . . . . . . . . . . . . . . . . . . . . . . . . . . . . . . . . . . . . . . . . . . . . . . . . . . . . . . . . . . . . . (706) (732) (8,590)
Total investments and other assets . . . . . . . . . . . . . . . . . . . . . . . . . . . . . . . . . . . . . . . . . . . . . . . . . . . . . . . . . . . . . . . . . . . . . . . 69,788 64,504 849,106
Total assets . . . . . . . . . . . . . . . . . . . . . . . . . . . . . . . . . . . . . . . . . . . . . . . . . . . . . . . . . . . . . . . . . . . . . . . . . . . . . . . . . . . . . . . . . . . . . . . . . . . . . . . . . . . . ¥902,052 ¥845,453 $10,975,204
The accompanying Notes to the Consolidated Financial Statements are an integral part of these fi nancial statements.

24
Millions of yen
Thousands of U.S. dollars
(Note 3)
Liabilities and Net Assets 2012 2011 2012
Current Liabilities:
Short-term debt (Notes 5, 7 and 12) . . . . . . . . . . . . . . . . . . . . . . . . . . . . . . . . . . . . . . . . . . . . . . . . . . . . . . . . . . . . . . . . . . . . . . . . ¥ 32,913 ¥ 50,018 $ 400,450
Current portion of long-term debt (Note 7) . . . . . . . . . . . . . . . . . . . . . . . . . . . . . . . . . . . . . . . . . . . . . . . . . . . . . . . . . . . . . . 11,994 24,516 145,930
Notes and accounts payable–trade (Note 5) . . . . . . . . . . . . . . . . . . . . . . . . . . . . . . . . . . . . . . . . . . . . . . . . . . . . . . . . . . . 88,129 74,640 1,072,259
Accrued expenses . . . . . . . . . . . . . . . . . . . . . . . . . . . . . . . . . . . . . . . . . . . . . . . . . . . . . . . . . . . . . . . . . . . . . . . . . . . . . . . . . . . . . . . . . . . . . . . . . . . 36,335 35,324 442,085
Accrued income taxes (Note 8) . . . . . . . . . . . . . . . . . . . . . . . . . . . . . . . . . . . . . . . . . . . . . . . . . . . . . . . . . . . . . . . . . . . . . . . . . . . . . . . 6,908 5,199 84,049
Reserve for discontinued operations . . . . . . . . . . . . . . . . . . . . . . . . . . . . . . . . . . . . . . . . . . . . . . . . . . . . . . . . . . . . . . . . . . . . . . . – 26 –
Other current liabilities (Note 7) . . . . . . . . . . . . . . . . . . . . . . . . . . . . . . . . . . . . . . . . . . . . . . . . . . . . . . . . . . . . . . . . . . . . . . . . . . . . . . . . 52,678 52,755 640,930
Total current liabilities . . . . . . . . . . . . . . . . . . . . . . . . . . . . . . . . . . . . . . . . . . . . . . . . . . . . . . . . . . . . . . . . . . . . . . . . . . . . . . . . . . . . . . . . . . . . . 228,958 242,480 2,785,716
Long-Term Liabilities:
Long-term debt (Notes 5 and 7) . . . . . . . . . . . . . . . . . . . . . . . . . . . . . . . . . . . . . . . . . . . . . . . . . . . . . . . . . . . . . . . . . . . . . . . . . . . . . . 183,025 118,033 2,226,852
Accrued retirement benefi ts (Note 22) . . . . . . . . . . . . . . . . . . . . . . . . . . . . . . . . . . . . . . . . . . . . . . . . . . . . . . . . . . . . . . . . . . . . . 44,545 44,734 541,976
Accrued retirement benefi ts for directors and statutory auditors . . . . . . . . . . . . . . . . . . . . . . . . . . . . 341 329 4,149
Deferred tax liabilities on land revaluation (Note 8) . . . . . . . . . . . . . . . . . . . . . . . . . . . . . . . . . . . . . . . . . . . . . . . . . . 3,269 3,733 39,774
Asset retirement obligations . . . . . . . . . . . . . . . . . . . . . . . . . . . . . . . . . . . . . . . . . . . . . . . . . . . . . . . . . . . . . . . . . . . . . . . . . . . . . . . . . . . . 931 963 11,327
Other long-term liabilities (Note 7) . . . . . . . . . . . . . . . . . . . . . . . . . . . . . . . . . . . . . . . . . . . . . . . . . . . . . . . . . . . . . . . . . . . . . . . . . . . . 5,992 6,192 72,904
Total long-term liabilities . . . . . . . . . . . . . . . . . . . . . . . . . . . . . . . . . . . . . . . . . . . . . . . . . . . . . . . . . . . . . . . . . . . . . . . . . . . . . . . . . . . . . . . . . 238,105 173,985 2,897,007
Total liabilities . . . . . . . . . . . . . . . . . . . . . . . . . . . . . . . . . . . . . . . . . . . . . . . . . . . . . . . . . . . . . . . . . . . . . . . . . . . . . . . . . . . . . . . . . . . . . . . . . . . . . . . . . 467,064 416,465 5,682,735
Contingent Liabilities (Note 11)
Net Assets (Notes 9 and 27):
Common stock:
Authorized—1,200,000,000 shares in 2012 and 2011
Issued—531,664,337 shares in 2012 and 2011 . . . . . . . . . . . . . . . . . . . . . . . . . . . . . . . . . . . . . . . . . . . . . . . . . . . . . 37,519 37,519 456,491
Capital surplus . . . . . . . . . . . . . . . . . . . . . . . . . . . . . . . . . . . . . . . . . . . . . . . . . . . . . . . . . . . . . . . . . . . . . . . . . . . . . . . . . . . . . . . . . . . . . . . . . . . . . . . . . 204,142 204,140 2,483,781
Retained earnings . . . . . . . . . . . . . . . . . . . . . . . . . . . . . . . . . . . . . . . . . . . . . . . . . . . . . . . . . . . . . . . . . . . . . . . . . . . . . . . . . . . . . . . . . . . . . . . . . . . . 222,848 211,467 2,711,376
Less: Treasury stock, at cost; Common stock,
1,381,591 shares in 2012 and
1,436,447 shares in 2011 . . . . . . . . . . . . . . . . . . . . . . . . . . . . . . . . . . . . . . . . . . . . . . . . . . . . . . . . . . . . . . . . . . . . . . . . . . . . . . . . . . . . . . . (1,597) (1,670) (19,431)
Unrealized gains on securities, net of taxes . . . . . . . . . . . . . . . . . . . . . . . . . . . . . . . . . . . . . . . . . . . . . . . . . . . . . . . . . . . . . 1,183 478 14,393
Unrealized losses on hedging derivatives, net of taxes . . . . . . . . . . . . . . . . . . . . . . . . . . . . . . . . . . . . . . . . . . . (228) (94) (2,774)
Foreign currency translation adjustments . . . . . . . . . . . . . . . . . . . . . . . . . . . . . . . . . . . . . . . . . . . . . . . . . . . . . . . . . . . . . . . . (30,199) (24,193) (367,429)
Share subscription rights (Notes 7 and 24) . . . . . . . . . . . . . . . . . . . . . . . . . . . . . . . . . . . . . . . . . . . . . . . . . . . . . . . . . . . . . . 682 658 8,298
Minority interests . . . . . . . . . . . . . . . . . . . . . . . . . . . . . . . . . . . . . . . . . . . . . . . . . . . . . . . . . . . . . . . . . . . . . . . . . . . . . . . . . . . . . . . . . . . . . . . . . . . . . 635 682 7,726
Total net assets . . . . . . . . . . . . . . . . . . . . . . . . . . . . . . . . . . . . . . . . . . . . . . . . . . . . . . . . . . . . . . . . . . . . . . . . . . . . . . . . . . . . . . . . . . . . . . . . . . . . . . 434,987 428,987 5,292,457
Total liabilities and net assets . . . . . . . . . . . . . . . . . . . . . . . . . . . . . . . . . . . . . . . . . . . . . . . . . . . . . . . . . . . . . . . . . . . . . . . . . . . . . . . . . ¥902,052 ¥845,453 $10,975,204

25
CONSOLIDATED STATEMENTS OF INCOME AND CONSOLIDATED STATEMENTS OF COMPREHENSIVE INCOMEKonica Minolta Holdings, Inc. and Consolidated SubsidiariesFor the fi scal years ended March 31, 2012 and 2011
Consolidated Statements of Income
Millions of yen
Thousands of U.S. dollars
(Note 3)
2012 2011 2012
Net Sales . . . . . . . . . . . . . . . . . . . . . . . . . . . . . . . . . . . . . . . . . . . . . . . . . . . . . . . . . . . . . . . . . . . . . . . . . . . . . . . . . . . . . . . . . . . . . . . . . . . . . . . . . . . . . . . . . . ¥767,879 ¥777,953 $9,342,730
Cost of Sales (Note 13) . . . . . . . . . . . . . . . . . . . . . . . . . . . . . . . . . . . . . . . . . . . . . . . . . . . . . . . . . . . . . . . . . . . . . . . . . . . . . . . . . . . . . . . . . . . . 412,562 423,372 5,019,613
Gross profi t . . . . . . . . . . . . . . . . . . . . . . . . . . . . . . . . . . . . . . . . . . . . . . . . . . . . . . . . . . . . . . . . . . . . . . . . . . . . . . . . . . . . . . . . . . . . . . . . . . . . . . . . . . . . . 355,317 354,580 4,323,117
Selling, General and Administrative Expenses (Note 14) . . . . . . . . . . . . . . . . . . . . . . . . . . . . . . . . . . . . . 314,971 314,558 3,832,230
Operating income . . . . . . . . . . . . . . . . . . . . . . . . . . . . . . . . . . . . . . . . . . . . . . . . . . . . . . . . . . . . . . . . . . . . . . . . . . . . . . . . . . . . . . . . . . . . . . . . . . . 40,346 40,022 490,887
Other Income (Expenses):
Interest and dividend income . . . . . . . . . . . . . . . . . . . . . . . . . . . . . . . . . . . . . . . . . . . . . . . . . . . . . . . . . . . . . . . . . . . . . . . . . . . . . . . . . 1,563 1,806 19,017
Interest expenses . . . . . . . . . . . . . . . . . . . . . . . . . . . . . . . . . . . . . . . . . . . . . . . . . . . . . . . . . . . . . . . . . . . . . . . . . . . . . . . . . . . . . . . . . . . . . . . . . . . (2,519) (3,129) (30,648)
Foreign exchange loss, net . . . . . . . . . . . . . . . . . . . . . . . . . . . . . . . . . . . . . . . . . . . . . . . . . . . . . . . . . . . . . . . . . . . . . . . . . . . . . . . . . . . . . (2,567) (3,762) (31,233)
Loss on sales and disposals of property, plant and equipment, net . . . . . . . . . . . . . . . . . . . . . . (1,693) (1,527) (20,599)
Write-down of investment securities . . . . . . . . . . . . . . . . . . . . . . . . . . . . . . . . . . . . . . . . . . . . . . . . . . . . . . . . . . . . . . . . . . . . . . . (2,700) (680) (32,851)
Gain on sales of investment securities, net . . . . . . . . . . . . . . . . . . . . . . . . . . . . . . . . . . . . . . . . . . . . . . . . . . . . . . . . . . . . 2 3 24
Gain on sales of investments in affi liated companies, net . . . . . . . . . . . . . . . . . . . . . . . . . . . . . . . . . . . . . . – 12 –
Gain on sales of investments in capital . . . . . . . . . . . . . . . . . . . . . . . . . . . . . . . . . . . . . . . . . . . . . . . . . . . . . . . . . . . . . . . . . . . 604 – 7,349
Loss on impairment of fi xed assets (Note 17) . . . . . . . . . . . . . . . . . . . . . . . . . . . . . . . . . . . . . . . . . . . . . . . . . . . . . . . . . (893) (1,027) (10,865)
Gain on discontinued operations . . . . . . . . . . . . . . . . . . . . . . . . . . . . . . . . . . . . . . . . . . . . . . . . . . . . . . . . . . . . . . . . . . . . . . . . . . . 19 2,498 231
Equity in income of unconsolidated subsidiaries and affi liates, net . . . . . . . . . . . . . . . . . . . . . . . . 67 112 815
Gain on reversal of foreign currency translation adjustment (Note 15) . . . . . . . . . . . . . . . . . . . . 3,730 – 45,383
Other extraordinary gain of overseas subsidiaries (Note 16) . . . . . . . . . . . . . . . . . . . . . . . . . . . . . . . . . . 241 505 2,932
Business structure improvement expenses (Note 18) . . . . . . . . . . . . . . . . . . . . . . . . . . . . . . . . . . . . . . . . . . . . (1,198) (3,394) (14,576)
Loss on adjustment for changes of accounting standard
for asset retirement obligations. . . . . . . . . . . . . . . . . . . . . . . . . . . . . . . . . . . . . . . . . . . . . . . . . . . . . . . . . . . . . . . . . . . . . . . . . . . . – (983) –
Loss on disaster . . . . . . . . . . . . . . . . . . . . . . . . . . . . . . . . . . . . . . . . . . . . . . . . . . . . . . . . . . . . . . . . . . . . . . . . . . . . . . . . . . . . . . . . . . . . . . . . . . . . (57) (450) (694)
Other, net . . . . . . . . . . . . . . . . . . . . . . . . . . . . . . . . . . . . . . . . . . . . . . . . . . . . . . . . . . . . . . . . . . . . . . . . . . . . . . . . . . . . . . . . . . . . . . . . . . . . . . . . . . . . . . . . (2,132) (1,894) (25,940)
Total . . . . . . . . . . . . . . . . . . . . . . . . . . . . . . . . . . . . . . . . . . . . . . . . . . . . . . . . . . . . . . . . . . . . . . . . . . . . . . . . . . . . . . . . . . . . . . . . . . . . . . . . . . . . . . . . . . . . . (7,531) (11,910) (91,629)
Income before income taxes and minority interests . . . . . . . . . . . . . . . . . . . . . . . . . . . . . . . . . . . . . . . . . . . . . . . 32,815 28,111 399,258
Income Taxes (Note 8):
Current. . . . . . . . . . . . . . . . . . . . . . . . . . . . . . . . . . . . . . . . . . . . . . . . . . . . . . . . . . . . . . . . . . . . . . . . . . . . . . . . . . . . . . . . . . . . . . . . . . . . . . . . . . . . . . . . . . . . 9,553 9,580 116,231
Deferred . . . . . . . . . . . . . . . . . . . . . . . . . . . . . . . . . . . . . . . . . . . . . . . . . . . . . . . . . . . . . . . . . . . . . . . . . . . . . . . . . . . . . . . . . . . . . . . . . . . . . . . . . . . . . . . . . . 2,776 (7,420) 33,775
Total . . . . . . . . . . . . . . . . . . . . . . . . . . . . . . . . . . . . . . . . . . . . . . . . . . . . . . . . . . . . . . . . . . . . . . . . . . . . . . . . . . . . . . . . . . . . . . . . . . . . . . . . . . . . . . . . . . . . . 12,330 2,160 150,018
Income before minority interests . . . . . . . . . . . . . . . . . . . . . . . . . . . . . . . . . . . . . . . . . . . . . . . . . . . . . . . . . . . . . . . . . . . . . . . . . . . . 20,484 25,951 249,227
Minority Interests in Net Income of Consolidated Subsidiaries . . . . . . . . . . . . . . . . . . . . . . . . . 60 54 730
Net Income . . . . . . . . . . . . . . . . . . . . . . . . . . . . . . . . . . . . . . . . . . . . . . . . . . . . . . . . . . . . . . . . . . . . . . . . . . . . . . . . . . . . . . . . . . . . . . . . . . . . . . . . . . . . . . . ¥ 20,424 ¥ 25,896 $ 248,497
Yen
U.S. dollars (Note 3)
2012 2011 2012
Per Share Data (Notes 9 and 27):
Net income —Basic . . . . . . . . . . . . . . . . . . . . . . . . . . . . . . . . . . . . . . . . . . . . . . . . . . . . . . . . . . . . . . . . . . . . . . . . . . . . . . . . . . . . . . . . . . . . . . . . ¥38.52 ¥48.84 $0.47
—Diluted . . . . . . . . . . . . . . . . . . . . . . . . . . . . . . . . . . . . . . . . . . . . . . . . . . . . . . . . . . . . . . . . . . . . . . . . . . . . . . . . . . . . . . . . . . . . . . 37.28 47.28 0.45
Cash dividends . . . . . . . . . . . . . . . . . . . . . . . . . . . . . . . . . . . . . . . . . . . . . . . . . . . . . . . . . . . . . . . . . . . . . . . . . . . . . . . . . . . . . . . . . . . . . . . . . . . . . . . 15 15 0.18
The accompanying Notes to the Consolidated Financial Statements are an integral part of these fi nancial statements.
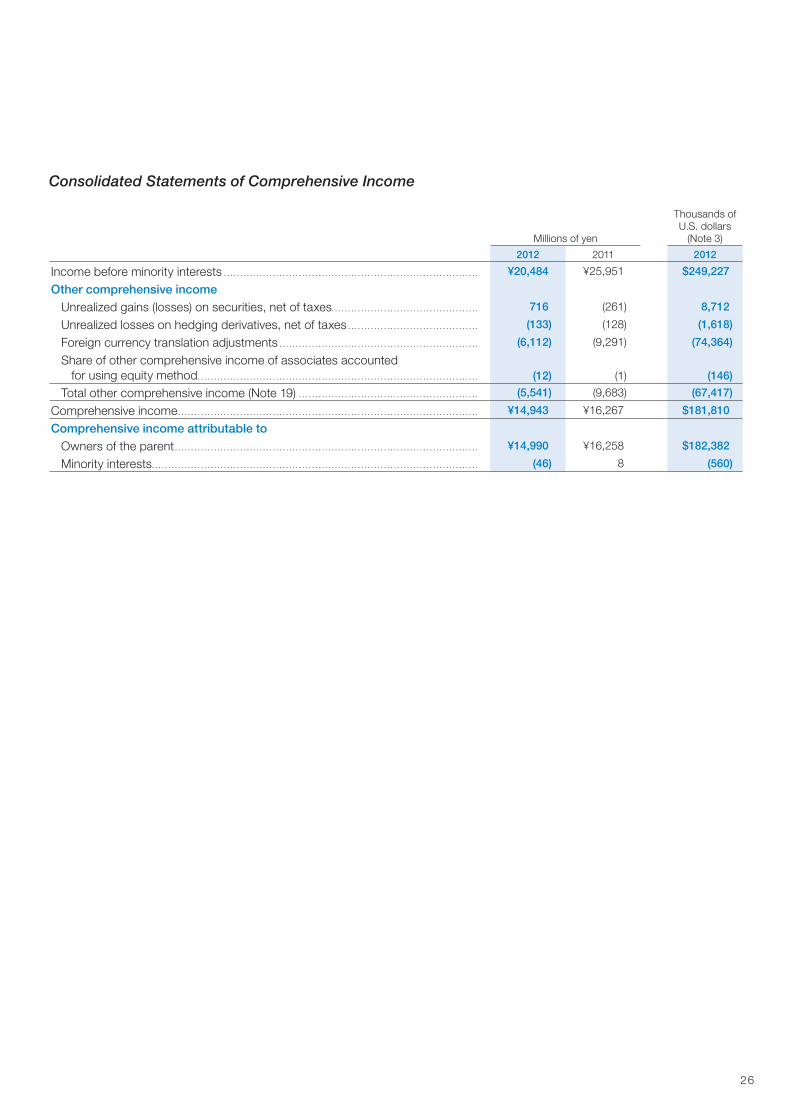
26
Consolidated Statements of Comprehensive Income
Millions of yen
Thousands of U.S. dollars
(Note 3)
2012 2011 2012
Income before minority interests . . . . . . . . . . . . . . . . . . . . . . . . . . . . . . . . . . . . . . . . . . . . . . . . . . . . . . . . . . . . . . . . . . . . . . . . . . . . . . ¥20,484 ¥25,951 $249,227
Other comprehensive income
Unrealized gains (losses) on securities, net of taxes . . . . . . . . . . . . . . . . . . . . . . . . . . . . . . . . . . . . . . . . . . . . . 716 (261) 8,712
Unrealized losses on hedging derivatives, net of taxes . . . . . . . . . . . . . . . . . . . . . . . . . . . . . . . . . . . . . . . . (133) (128) (1,618)
Foreign currency translation adjustments . . . . . . . . . . . . . . . . . . . . . . . . . . . . . . . . . . . . . . . . . . . . . . . . . . . . . . . . . . . . . (6,112) (9,291) (74,364)
Share of other comprehensive income of associates accounted
for using equity method . . . . . . . . . . . . . . . . . . . . . . . . . . . . . . . . . . . . . . . . . . . . . . . . . . . . . . . . . . . . . . . . . . . . . . . . . . . . . . . . . . . . . . (12) (1) (146)
Total other comprehensive income (Note 19) . . . . . . . . . . . . . . . . . . . . . . . . . . . . . . . . . . . . . . . . . . . . . . . . . . . . . . . (5,541) (9,683) (67,417)
Comprehensive income . . . . . . . . . . . . . . . . . . . . . . . . . . . . . . . . . . . . . . . . . . . . . . . . . . . . . . . . . . . . . . . . . . . . . . . . . . . . . . . . . . . . . . . . . . . . ¥14,943 ¥16,267 $181,810
Comprehensive income attributable to
Owners of the parent . . . . . . . . . . . . . . . . . . . . . . . . . . . . . . . . . . . . . . . . . . . . . . . . . . . . . . . . . . . . . . . . . . . . . . . . . . . . . . . . . . . . . . . . . . . . . ¥14,990 ¥16,258 $182,382
Minority interests . . . . . . . . . . . . . . . . . . . . . . . . . . . . . . . . . . . . . . . . . . . . . . . . . . . . . . . . . . . . . . . . . . . . . . . . . . . . . . . . . . . . . . . . . . . . . . . . . . . . (46) 8 (560)

27
CONSOLIDATED STATEMENTS OF CHANGES IN NET ASSETSKonica Minolta Holdings, Inc. and Consolidated SubsidiariesFor the fi scal years ended March 31, 2012 and 2011
Millions of yen
Shares of
issued
common stock
Common
stock
Capital
surplus
Retained
earnings
Treasury
stock
Unrealized
gains on
securities, net
of taxes
Unrealized
gains (losses)
on hedging
derivatives, net
of taxes
Foreign
currency
translation
adjustments
Share
subscription
rights
Minority
interests Total
(From April 1, 2010 to March 31, 2011)
Net Assets at April 1, 2010 . . . . . . . . . . . . . 531,664,337 ¥37,519 ¥204,140 ¥193,790 ¥(1,743) ¥ 741 ¥ 33 ¥(14,947) ¥617 ¥622 ¥420,775
Dividends paid from retained earnings . . (7,953) (7,953)
Net income . . . . . . . . . . . . . . . . . . . . . . . . . . . . . . 25,896 25,896
Purchase of treasury stock . . . . . . . . . . . . . (76) (76)
Re-issuance of treasury stock . . . . . . . . . . (54) 148 94
Pension liabilities adjustment of
overseas subsidiaries . . . . . . . . . . . . . . . . . (211) (211)
Net changes during the period . . . . . . . . . (263) (128) (9,245) 41 59 (9,536)
Total changes during the period . . . . . . . . . — — 17,676 72 (263) (128) (9,245) 41 59 8,212
Balance at March 31, 2011 . . . . . . . . . . . . . 531,664,337 ¥37,519 ¥204,140 ¥211,467 ¥(1,670) ¥ 478 ¥ (94) ¥(24,193) ¥658 ¥682 ¥428,987
(From April 1, 2011 to March 31, 2012)
Net Assets at April 1, 2011 . . . . . . . . . . . . . 531,664,337 ¥37,519 ¥204,140 ¥211,467 ¥(1,670) ¥ 478 ¥ (94) ¥(24,193) ¥658 ¥682 ¥428,987
Dividends paid from retained earnings . . (7,953) (7,953)
Net income . . . . . . . . . . . . . . . . . . . . . . . . . . . . . . 20,424 20,424
Change in the scope of consolidation . . (38) (38)
Purchase of treasury stock . . . . . . . . . . . . . (11) (11)
Re-issuance of treasury stock . . . . . . . . . . 1 84 86
Pension liabilities adjustment of
overseas subsidiaries (Note 20) . . . . . . . (1,050) (1,050)
Net changes during the period . . . . . . . . . 704 (133) (6,005) 24 (46) (5,456)
Total changes during the period . . . . . . . . . — 1 11,381 73 704 (133) (6,005) 24 (46) 5,999
Balance at March 31, 2012 . . . . . . . . . . . . . 531,664,337 ¥37,519 ¥204,142 ¥222,848 ¥(1,597) ¥1,183 ¥(228) ¥(30,199) ¥682 ¥635 ¥434,987
Thousands of U.S. dollars (Note 3)
Shares of
issued
common stock
Common
stock
Capital
surplus
Retained
earnings
Treasury
stock
Unrealized
gains on
securities, net
of taxes
Unrealized
gains (losses)
on hedging
derivatives, net
of taxes
Foreign
currency
translation
adjustments
Share
subscription
rights
Minority
interests Total
(From April 1, 2011 to March 31, 2012)
Net Assets at April 1, 2011 . . . . . . . . . . . . . 531,664,337 $456,491 $2,483,757 $2,572,904 $(20,319) $ 5,816 $(1,144) $(294,355) $8,006 $8,298 $5,219,455
Dividends paid from retained earnings . . (96,764) (96,764)
Net income . . . . . . . . . . . . . . . . . . . . . . . . . . . . . . 248,497 248,497
Change in the scope of consolidation . . (462) (462)
Purchase of treasury stock . . . . . . . . . . . . . (134) (134)
Re-issuance of treasury stock . . . . . . . . . . 12 1,022 1,046
Pension liabilities adjustment of
overseas subsidiaries (Note 20) . . . . . . . (12,775) (12,775)
Net changes during the period . . . . . . . . . 8,566 (1,618) (73,062) 292 (560) (66,383)
Total changes during the period . . . . . . . . . — 12 138,472 888 8,566 (1,618) (73,062) 292 (560) 72,989
Balance at March 31, 2012 . . . . . . . . . . . . . 531,664,337 $456,491 $2,483,781 $2,711,376 $(19,431) $14,393 $(2,774) $(367,429) $8,298 $7,726 $5,292,457
The accompanying Notes to the Consolidated Financial Statements are an integral part of these fi nancial statements.

28
Millions of yen
Thousands of U.S. dollars
(Note 3)2012 2011 2012
Cash Flows from Operating Activities:
Income before income taxes and minority interests . . . . . . . . . . . . . . . . . . . . . . . . . . . . . . . . . . . . . . . . . . . . . . . . . . . . . . . . . ¥ 32,815 ¥ 28,111 $ 399,258
Depreciation and amortization . . . . . . . . . . . . . . . . . . . . . . . . . . . . . . . . . . . . . . . . . . . . . . . . . . . . . . . . . . . . . . . . . . . . . . . . . . . . . . . . . . . . . . 49,239 55,129 599,087
Loss on impairment of fi xed assets . . . . . . . . . . . . . . . . . . . . . . . . . . . . . . . . . . . . . . . . . . . . . . . . . . . . . . . . . . . . . . . . . . . . . . . . . . . . . . . 893 1,027 10,865
Amortization of goodwill . . . . . . . . . . . . . . . . . . . . . . . . . . . . . . . . . . . . . . . . . . . . . . . . . . . . . . . . . . . . . . . . . . . . . . . . . . . . . . . . . . . . . . . . . . . . . . . 8,804 8,401 107,118
Interest and dividend income . . . . . . . . . . . . . . . . . . . . . . . . . . . . . . . . . . . . . . . . . . . . . . . . . . . . . . . . . . . . . . . . . . . . . . . . . . . . . . . . . . . . . . . . (1,563) (1,807) (19,017)
Interest expense . . . . . . . . . . . . . . . . . . . . . . . . . . . . . . . . . . . . . . . . . . . . . . . . . . . . . . . . . . . . . . . . . . . . . . . . . . . . . . . . . . . . . . . . . . . . . . . . . . . . . . . . . 2,519 3,129 30,648
Loss on sales and disposals of property, plant and equipment . . . . . . . . . . . . . . . . . . . . . . . . . . . . . . . . . . . . . . . . . 1,693 1,526 20,599
Loss on sales and write-down of investment securities . . . . . . . . . . . . . . . . . . . . . . . . . . . . . . . . . . . . . . . . . . . . . . . . . . . . 2,698 678 32,826
Gain on sales of investments in capital . . . . . . . . . . . . . . . . . . . . . . . . . . . . . . . . . . . . . . . . . . . . . . . . . . . . . . . . . . . . . . . . . . . . . . . . . . . (604) — (7,349)
Gain on reversal of foreign currency translation adjustment . . . . . . . . . . . . . . . . . . . . . . . . . . . . . . . . . . . . . . . . . . . . . . (3,730) — (45,383)
Decrease in provision for bonuses . . . . . . . . . . . . . . . . . . . . . . . . . . . . . . . . . . . . . . . . . . . . . . . . . . . . . . . . . . . . . . . . . . . . . . . . . . . . . . . . (85) (203) (1,034)
Increase (Decrease) in accrued retirement benefi ts. . . . . . . . . . . . . . . . . . . . . . . . . . . . . . . . . . . . . . . . . . . . . . . . . . . . . . . . . . 359 (8,358) 4,368
Decrease in reserve for discontinued operations . . . . . . . . . . . . . . . . . . . . . . . . . . . . . . . . . . . . . . . . . . . . . . . . . . . . . . . . . . . . . (26) (4,688) (316)
Decrease (Increase) in trade notes and accounts receivable . . . . . . . . . . . . . . . . . . . . . . . . . . . . . . . . . . . . . . . . . . . . . (13,442) 3,411 (163,548)
Increase in inventories . . . . . . . . . . . . . . . . . . . . . . . . . . . . . . . . . . . . . . . . . . . . . . . . . . . . . . . . . . . . . . . . . . . . . . . . . . . . . . . . . . . . . . . . . . . . . . . . . (6,268) (7,800) (76,262)
Increase in trade notes and accounts payable . . . . . . . . . . . . . . . . . . . . . . . . . . . . . . . . . . . . . . . . . . . . . . . . . . . . . . . . . . . . . . . . 14,715 433 179,036
Transfer of rental business-use assets . . . . . . . . . . . . . . . . . . . . . . . . . . . . . . . . . . . . . . . . . . . . . . . . . . . . . . . . . . . . . . . . . . . . . . . . . . . (4,700) (5,324) (57,185)
Increase in accounts receivable–other . . . . . . . . . . . . . . . . . . . . . . . . . . . . . . . . . . . . . . . . . . . . . . . . . . . . . . . . . . . . . . . . . . . . . . . . . . . (4,449) (543) (54,131)
Increase in accounts payable–other and accrued expenses . . . . . . . . . . . . . . . . . . . . . . . . . . . . . . . . . . . . . . . . . . . . . 866 2,402 10,537
Decrease/increase in consumption taxes receivable/payable . . . . . . . . . . . . . . . . . . . . . . . . . . . . . . . . . . . . . . . . . . . 1,249 (479) 15,196
Other . . . . . . . . . . . . . . . . . . . . . . . . . . . . . . . . . . . . . . . . . . . . . . . . . . . . . . . . . . . . . . . . . . . . . . . . . . . . . . . . . . . . . . . . . . . . . . . . . . . . . . . . . . . . . . . . . . . . . . . . . (1,543) 3,603 (18,774)
Subtotal . . . . . . . . . . . . . . . . . . . . . . . . . . . . . . . . . . . . . . . . . . . . . . . . . . . . . . . . . . . . . . . . . . . . . . . . . . . . . . . . . . . . . . . . . . . . . . . . . . . . . . . . . . . . . . . . . . . 79,439 78,650 966,529
Interest and dividend income received . . . . . . . . . . . . . . . . . . . . . . . . . . . . . . . . . . . . . . . . . . . . . . . . . . . . . . . . . . . . . . . . . . . . . . . . . . . 1,534 1,808 18,664
Interest paid . . . . . . . . . . . . . . . . . . . . . . . . . . . . . . . . . . . . . . . . . . . . . . . . . . . . . . . . . . . . . . . . . . . . . . . . . . . . . . . . . . . . . . . . . . . . . . . . . . . . . . . . . . . . . . . (2,414) (3,098) (29,371)
Income taxes paid . . . . . . . . . . . . . . . . . . . . . . . . . . . . . . . . . . . . . . . . . . . . . . . . . . . . . . . . . . . . . . . . . . . . . . . . . . . . . . . . . . . . . . . . . . . . . . . . . . . . . . . (6,192) (9,402) (75,338)
Net cash provided by operating activities . . . . . . . . . . . . . . . . . . . . . . . . . . . . . . . . . . . . . . . . . . . . . . . . . . . . . . . . . . . . . . . . . . . . . . . 72,367 67,957 880,484
Cash Flows from Investing Activities:
Payment for acquisition of property, plant and equipment . . . . . . . . . . . . . . . . . . . . . . . . . . . . . . . . . . . . . . . . . . . . . . . . (29,104) (37,026) (354,106)
Proceeds from sales of property, plant and equipment . . . . . . . . . . . . . . . . . . . . . . . . . . . . . . . . . . . . . . . . . . . . . . . . . . . . 504 1,155 6,132
Payment for acquisition of intangible fi xed assets . . . . . . . . . . . . . . . . . . . . . . . . . . . . . . . . . . . . . . . . . . . . . . . . . . . . . . . . . . . . (5,862) (5,808) (71,323)
Proceeds from transfer of business . . . . . . . . . . . . . . . . . . . . . . . . . . . . . . . . . . . . . . . . . . . . . . . . . . . . . . . . . . . . . . . . . . . . . . . . . . . . . . . — 577 —
Payment for transfer of business . . . . . . . . . . . . . . . . . . . . . . . . . . . . . . . . . . . . . . . . . . . . . . . . . . . . . . . . . . . . . . . . . . . . . . . . . . . . . . . . . . . (2,393) — (29,115)
Payment for acquisition of newly consolidated subsidiaries . . . . . . . . . . . . . . . . . . . . . . . . . . . . . . . . . . . . . . . . . . . . . . (5,506) (2,508) (66,991)
Payment for loans receivable . . . . . . . . . . . . . . . . . . . . . . . . . . . . . . . . . . . . . . . . . . . . . . . . . . . . . . . . . . . . . . . . . . . . . . . . . . . . . . . . . . . . . . . . (248) (475) (3,017)
Proceeds from collection of loans receivable . . . . . . . . . . . . . . . . . . . . . . . . . . . . . . . . . . . . . . . . . . . . . . . . . . . . . . . . . . . . . . . . . . 138 240 1,679
Payment for acquisition of investment securities . . . . . . . . . . . . . . . . . . . . . . . . . . . . . . . . . . . . . . . . . . . . . . . . . . . . . . . . . . . . . (6) (96) (73)
Proceeds from sales of investment securities . . . . . . . . . . . . . . . . . . . . . . . . . . . . . . . . . . . . . . . . . . . . . . . . . . . . . . . . . . . . . . . . . 2 29 24
Proceeds from sales of investments in capital . . . . . . . . . . . . . . . . . . . . . . . . . . . . . . . . . . . . . . . . . . . . . . . . . . . . . . . . . . . . . . . . . 1,315 — 16,000
Payment for acquisition of other investments . . . . . . . . . . . . . . . . . . . . . . . . . . . . . . . . . . . . . . . . . . . . . . . . . . . . . . . . . . . . . . . . . . (1,773) (1,271) (21,572)
Other . . . . . . . . . . . . . . . . . . . . . . . . . . . . . . . . . . . . . . . . . . . . . . . . . . . . . . . . . . . . . . . . . . . . . . . . . . . . . . . . . . . . . . . . . . . . . . . . . . . . . . . . . . . . . . . . . . . . . . . . . 177 445 2,154
Net cash used in investing activities . . . . . . . . . . . . . . . . . . . . . . . . . . . . . . . . . . . . . . . . . . . . . . . . . . . . . . . . . . . . . . . . . . . . . . . . . . . . . (42,757) (44,738) (520,221)
Cash Flows from Financing Activities:
Decrease in short-term loans payable . . . . . . . . . . . . . . . . . . . . . . . . . . . . . . . . . . . . . . . . . . . . . . . . . . . . . . . . . . . . . . . . . . . . . . . . . . . . (16,439) (6,551) (200,012)
Proceeds from long-term loans payable . . . . . . . . . . . . . . . . . . . . . . . . . . . . . . . . . . . . . . . . . . . . . . . . . . . . . . . . . . . . . . . . . . . . . . . . . 38,304 989 466,042
Repayment of long-term loans payable . . . . . . . . . . . . . . . . . . . . . . . . . . . . . . . . . . . . . . . . . . . . . . . . . . . . . . . . . . . . . . . . . . . . . . . . . . (25,805) (27,565) (313,968)
Proceeds from issuance of bonds . . . . . . . . . . . . . . . . . . . . . . . . . . . . . . . . . . . . . . . . . . . . . . . . . . . . . . . . . . . . . . . . . . . . . . . . . . . . . . . . . 40,000 30,000 486,677
Repayments of lease obligations . . . . . . . . . . . . . . . . . . . . . . . . . . . . . . . . . . . . . . . . . . . . . . . . . . . . . . . . . . . . . . . . . . . . . . . . . . . . . . . . . . . (1,715) (1,838) (20,866)
Proceeds from disposal of treasury stock . . . . . . . . . . . . . . . . . . . . . . . . . . . . . . . . . . . . . . . . . . . . . . . . . . . . . . . . . . . . . . . . . . . . . . 3 4 37
Payment for purchase of treasury stock . . . . . . . . . . . . . . . . . . . . . . . . . . . . . . . . . . . . . . . . . . . . . . . . . . . . . . . . . . . . . . . . . . . . . . . . . (11) (76) (134)
Dividend payments . . . . . . . . . . . . . . . . . . . . . . . . . . . . . . . . . . . . . . . . . . . . . . . . . . . . . . . . . . . . . . . . . . . . . . . . . . . . . . . . . . . . . . . . . . . . . . . . . . . . . (7,945) (7,942) (96,666)
Dividend proceeds from minority shareholders in consolidated subsidiaries . . . . . . . . . . . . . . . . . . . . . . . — 51 —
Net cash provided by (used in) fi nancing activities . . . . . . . . . . . . . . . . . . . . . . . . . . . . . . . . . . . . . . . . . . . . . . . . . . . . . . . . . 26,390 (12,928) 321,085
Effect of Exchange Rate Changes on Cash and Cash Equivalents . . . . . . . . . . . . . . . . . . . . . . . . . . . . . . . . . . . 785 711 9,551
Increase in Cash and Cash Equivalents . . . . . . . . . . . . . . . . . . . . . . . . . . . . . . . . . . . . . . . . . . . . . . . . . . . . . . . . . . . . . . . . . . . . . . . . . 56,785 11,002 690,899
Cash and Cash Equivalents at the Beginning of the Year (Note 4) . . . . . . . . . . . . . . . . . . . . . . . . . . . . . . . . . . . . . 175,148 164,146 2,131,014
Cash and Cash Equivalents at the End of the Year (Note 4) . . . . . . . . . . . . . . . . . . . . . . . . . . . . . . . . . . . . . . . . . . . . . . ¥231,933 ¥175,148 $2,821,913
The accompanying Notes to the Consolidated Financial Statements are an integral part of these fi nancial statements.
CONSOLIDATED STATEMENTS OF CASH FLOWSKonica Minolta Holdings, Inc. and Consolidated SubsidiariesFor the fi scal years ended March 31, 2012 and 2011

29
NOTES TO THE CONSOLIDATED FINANCIAL STATEMENTSKonica Minolta Holdings, Inc. and Consolidated SubsidiariesFor the fi scal years ended March 31, 2012 and 2011
1. BASIS OF PRESENTING FINANCIAL STATEMENTSThe accompanying consolidated fi nancial statements of Konica Minolta
Holdings, Inc., (the “Company”) and its consolidated subsidiaries (the
“Companies”) are prepared on the basis of accounting principles
generally accepted in Japan, which are different in certain respects
regarding application and disclosure requirements of International
Financial Reporting Standards, and are compiled from the consolidated
fi nancial statements prepared by the Company as required by the
Securities and Exchange Law of Japan. Accounting principles generally
accepted in Japan allow consolidation of foreign subsidiaries based on
their fi nancial statements in conformity with International Financial
Reporting Standards and accounting principles generally accepted in the
United States.
The accompanying consolidated fi nancial statements incorporate
certain reclassifi cations in order to present them in a format that is more
appropriate to readers outside Japan. In addition, the notes to the
consolidated fi nancial statements include information that is not
required under generally accepted accounting principles in Japan, but
is provided herein as additional information.
As permitted under the Securities and Exchange Law of Japan,
amounts of less than one million yen have been omitted. As a result, the
totals shown in the accompanying consolidated fi nancial statements
(both in yen and in dollars) do not necessarily agree with the sums of the
individual amounts.
2. SUMMARY OF SIGNIFICANT ACCOUNTING POLICIES(a) Principles of Consolidation
The consolidated fi nancial statements include the accounts of the
Company and, with certain exceptions which are not material, those of
its 92 subsidiaries (89 subsidiaries for 2011) for which it retains control.
All signifi cant intercompany transactions, balances and unrealized
profi ts among the Companies are eliminated on consolidation.
Investments in 3 unconsolidated subsidiaries (3 unconsolidated
subsidiaries for 2011) and 2 signifi cant affi liates (2 signifi cant affi liates for
2011) are accounted for using the equity method of accounting.
Investments in the other unconsolidated subsidiaries and affi liates are
stated at cost, since they have no material effect on the consolidated
fi nancial statements.
(b) Translation of Foreign Currencies
Translation of Foreign Currency Transactions and Balances
All monetary assets and liabilities denominated in foreign currencies,
whether long-term or short-term, are translated into Japanese yen at the
exchange rates prevailing at the balance sheet date. The resulting
exchange gains and losses are charged or credited to income.
Translation of Foreign Currency Financial Statements
The translation of foreign currency fi nancial statements of overseas
consolidated subsidiaries into Japanese yen is done by applying the
exchange rates prevailing at the balance sheet dates for balance sheet
items, except common stock, additional paid-in capital and retained
earnings accounts, which are translated at the historical rates, and the
statements of income and retained earnings which are translated at
average exchange rates.
(c) Cash and Cash Equivalents
Cash and cash equivalents in the consolidated cash fl ow statements
comprise cash on hand and short-term investments that are due for
redemption in one year or less and are easily converted into cash with
little risk to changes in value.
(d) Allowance for Doubtful Accounts
The allowance for doubtful accounts is provided for possible losses
from uncollectible receivables based on specifi c doubtful accounts
identifi ed and historical loss experience.
(e) Inventories
Inventories held by domestic consolidated subsidiaries are mainly
stated using the cost price method (carrying amount in the balance
sheet is calculated with consideration of write-down due to decreased
profi tability) determined using the total average method. Inventories held
by overseas consolidated subsidiaries are mainly stated at the lower of
cost or market value or net realizable value, where cost is determined
using the fi rst-in, fi rst-out method.
(f) Property, Plant and Equipment
Depreciation of property, plant and equipment (excluding lease assets)
for the Company and domestic consolidated subsidiaries is calculated
using the declining balance method, except for depreciation of buildings
acquired after April 1, 1998, which are depreciated using the
straight-line method over their estimated useful lives. Depreciation of
property, plant and equipment (excluding lease assets) for overseas
consolidated subsidiaries is calculated using the straight-line method.
For fi nance leases where ownership is not transferred, depreciation
is calculated using the straight-line method over the lease period
utilizing a residual value of zero. For fi nance leases held by the Company
and its domestic consolidated subsidiaries that do not transfer
ownership and for which the starting date for the lease transaction is
prior to March 31, 2008, lease payments are recognized as an expense.
(g) Intangible Assets
Intangible assets (excluding lease assets) are depreciated using the
straight-line method. In addition, software is depreciated using the
straight-line method over its estimated useful life (5 years).
(h) Goodwill
Goodwill is amortized on a straight-line basis over a period not
exceeding 20 years.
(i) Income Taxes
Deferred income taxes are recognized based on temporary differences
between the tax basis of assets and liabilities and those as reported in
the consolidated fi nancial statements.
(j) Research and Development Costs
Research and development costs are expensed as incurred.
(k) Financial Instruments
Derivatives
All derivatives are stated at fair market value, with changes in fair market
value included in net income for the period in which they arise, except
for derivatives that are designated as “hedging instruments” (see Hedge
Accounting below).
Securities
Investments in equity securities issued by unconsolidated subsidiaries
and affi liates are accounted for using the equity method of accounting;
however, investments in certain unconsolidated subsidiaries and
affi liates are stated at cost due to the effect of the application of the
equity method of accounting being immaterial.

30
Held-to-maturity securities are recognized using the amortized cost
method (straight-line method).
Other securities for which market quotes are available are stated at
fair market value. Net unrealized gains or losses on these securities are
reported, net of tax, as a separate component of net assets.
Other securities for which market quotes are unavailable are stated
at cost, except in cases where the fair market value of equity securities
issued by unconsolidated subsidiaries and affi liates or other securities
has declined signifi cantly and such decrease in value is deemed other
than temporary. In these instances, securities are written down to the
fair market value and the resulting losses are charged to income during
the period.
Hedge Accounting
Gains or losses arising from changes in fair market value of derivatives
designated as “hedging instruments” are deferred as an asset or a
liability and charged or credited to income in the same period that the
gains and losses on the hedged items or transactions are recognized.
Derivatives designated as hedging instruments are primarily interest
rate swaps, currency options and forward foreign currency exchange
contracts. The related hedged items are trade accounts receivable,
trade accounts payable and long-term bank loans.
The Companies’ policy is to utilize the above hedging instruments in
order to reduce exposure to the risks of interest rate and exchange rate
fl uctuations. As such, the Companies’ purchases of the hedging
instruments are limited to, at maximum, the amounts of the hedged
items.
The Companies evaluate the effectiveness of their hedging activities
by reference to the accumulated gains or losses on the hedging
instruments and the related hedged items on the date of commencement
of the hedges.
(l) Retirement Benefi t Plans
Retirement Benefi ts for Employees
The Company, domestic consolidated subsidiaries and certain overseas
consolidated subsidiaries have obligations to make defi ned benefi t
retirement payments to their employees and, therefore, provide for
accrued retirement benefi ts based on the estimated amount of
projected benefi t obligations and the fair value of plan assets.
For the Company and its domestic consolidated subsidiaries,
unrecognized prior service cost is amortized using the straight-line
method over a 10-year period, which is shorter than the average
remaining years of service of the eligible employees. Unrecognized net
actuarial gains or losses are primarily amortized in the following year
using the straight-line method over a 10-year period, which is shorter
than the average remaining years of service of the eligible employees.
Accrued Retirement Benefi ts for Directors and Statutory Auditors
Domestic consolidated subsidiaries recognize a reserve for retirement
benefi ts for directors and statutory auditors based on the amount
payable at the end of the period in accordance with their internal
regulations.
(m) Per Share Data
Net income per share of common stock is calculated based on the
weighted-average number of shares outstanding during the year.
Cash dividends per share for each year as disclosed in the
accompanying consolidated fi nancial statements are dividends declared
for the respective year.
(n) Practical Solution on Unifi cation of Accounting Policies
Applied to Foreign Subsidiaries for Consolidated Financial
Statements
Effective from the year ended March 31, 2009, the Company applied
the “Practical Solution on Unifi cation of Accounting Policies Applied to
Foreign Subsidiaries for Consolidated Financial Statements”
(Accounting Standards Board of Japan (ASBJ) Practical Issues Task
Force (PITF) No. 18, issued by the ASBJ on May 17, 2006).
The Company has made necessary adjustments upon consolidation
to unify accounting standards for foreign subsidiaries to be consistent
with the Company.
(o) Accounting Changes and Error Corrections
Application of Accounting Standards
The Company adopted “Accounting Standard for Accounting Changes
and Error Corrections” (ASBJ Statement No. 24, issued on December 4,
2009) and “Guidance on Accounting Standard for Accounting Changes
and Error Corrections” (ASBJ Guidance No. 24, issued on December 4,
2009) for accounting changes and corrections of prior period errors
which are made from the fi scal year beginning on April 1, 2011.
3. U.S. DOLLAR AMOUNTSThe translation effect of Japanese yen amounts into U.S. dollars is
included solely for the convenience of the reader, using the prevailing
exchange rate at March 31, 2012, of ¥82.19 to U.S.$1.00. The translations
should not be construed as representations that the Japanese yen
amounts have been, could have been, or could in the future be,
converted into U.S. dollars at this or any other exchange rate.

31
4. CASH AND CASH EQUIVALENTS Cash and cash equivalents as of March 31, 2012 and 2011 are as follows:
Millions of yen
Thousands of
U.S. dollars
2012 2011 2012
Cash on hand and in banks . . . . . . . . . . . . . . . . . . . . . . . . . . . . . . . . . . . . . . . . . . . . . . . . . . . . . . . . . . . . . . . . . . . . . . . . . . . . ¥ 90,640 ¥ 87,886 $1,102,811
Short-term investments . . . . . . . . . . . . . . . . . . . . . . . . . . . . . . . . . . . . . . . . . . . . . . . . . . . . . . . . . . . . . . . . . . . . . . . . . . . . . . . . . . 141,293 87,261 1,719,102
Cash and cash equivalents . . . . . . . . . . . . . . . . . . . . . . . . . . . . . . . . . . . . . . . . . . . . . . . . . . . . . . . . . . . . . . . . . . . . . . . . . . . . . ¥231,933 ¥175,148 $2,821,913
5. FINANCIAL INSTRUMENTS Conditions of Financial Instruments
The Companies raise short-term working capital mainly by bank borrowings and invest temporary surplus funds in fi nancial instruments deemed to have
lower risk. The Companies enter into derivative transactions based on the need for these transactions in accordance with their internal regulations.
In principle, the risk of currency fl uctuations relating to receivables and payables denominated in foreign currencies are hedged using forward
exchange contracts and currency options. With respect to the interest volatility risk arising on certain long-term loans payable, the Companies lock in
interest expenses using interest-rate swaps.
Investment securities comprise mainly stocks, and the market values of listed stocks are determined on a quarterly basis.
The Companies try to reduce the credit risk of customers arising on notes and accounts receivable–trade through regular monitoring and the
comprehensive management of aging balances.
Fair Values of Financial Instruments
The book value on consolidated balance sheets, fair value, and difference as of March 31, 2012 and 2011 are as follows:
Millions of yen Thousands of U.S. dollars
2012 2011 2012
Book value Fair value Difference Book value Fair value Difference Book value Fair value Difference
Assets
(1) Cash on hand and in banks. . . ¥ 90,640 ¥ 90,640 ¥ — ¥ 87,886 ¥ 87,886 ¥ — $1,102,811 $1,102,811 $ —
(2) Notes and accounts receivable–trade . . . . . . . . . . . . . 174,193 174,193 — 163,363 163,363 — 2,119,394 2,119,394 —
(3) Short-term investment securitiesand investment securities
(i) Held-to-maturity securities . . 10 10 — 10 10 — 122 122 —
(ii) Other securities . . . . . . . . . . 156,977 156,977 — 103,111 103,111 — 1,909,928 1,909,928 —
Total . . . . . . . . . . . . . . . . . . . . . . . . . . . . . . . ¥421,820 ¥421,820 ¥ — ¥354,371 ¥354,371 ¥ — $5,132,255 $5,132,255 $ —
Liabilities
(1) Notes and accountspayable–trade . . . . . . . . . . . . . . . . . 88,129 88,129 — 74,640 74,640 — 1,072,259 1,072,259 —
(2) Short-term loans (*1) . . . . . . . . — — — 50,018 50,018 — —
(3) Bonds . . . . . . . . . . . . . . . . . . . . . . . . . . . 110,000 110,278 278 70,000 69,469 (531) 1,338,362 1,341,745 3,382
(4) Long-term loans . . . . . . . . . . . . . . 73,025 73,366 341 48,033 48,374 341 888,490 892,639 4,149
Total . . . . . . . . . . . . . . . . . . . . . . . . . . . . . . ¥271,154 ¥271,773 ¥619 ¥242,692 ¥242,502 ¥(189) $3,299,112 $3,306,643 $7,531
Derivatives (*2) . . . . . . . . . . . . . . . . . . . . ¥ (2,032) ¥ (2,032) ¥ — ¥ (1,318) ¥ (1,318) ¥ — $ (24,723) $ (24,723) $ —
Notes: *1. Since the book value of short-term loans as of March 31, 2012 is not material, relevant information is not presented in the table above.
*2. Derivative assets and liabilities are presented on a net basis, and the net liability position is enclosed in parentheses.
(i) Methods of calculating the fair value of fi nancial instruments and securities and derivatives transactions
Assets
(1) Cash on hand and in banks and (2) Notes and accounts receivable–trade
The fair value equates to the book value due to the short-term nature of these instruments.
(3) Short-term investment securities and investment securities
(i) Held-to-maturity securities
The fair value approximates the book value as the securities are entirely school bonds and credit risk of the issuers has not changed signifi cantly
since the date of acquisition.
(ii) Other securities
The fair value of equity securities is determined based on the prevailing market price. The fair value of bonds is based on the prevailing market
price or the price provided by third-party fi nancial institutions. These other securities are described further in ‘Note 6. INVESTMENT SECURITIES’.

32
Liabilities
(1) Notes and accounts payable–trade and (2) Short-term loans
The fair value equates to the book value due to the short-term nature of these instruments.
(3) Bonds
The fair value of bonds payable is based on the value provided by third-party fi nancial institutions.
(4) Long-term loans
Fair value of long-term loans with fi xed interest rates is based on the present value of future cash fl ows discounted using the current borrowing rate
for similar debt of a comparable maturity.
Fair value of long-term loans with variable interest rates approximates book value as the Company’s credit risk has not signifi cantly changed since
the date of commencement of the borrowing.
For loans subject to the special treatment of interest rate swaps (Please see ‘Derivatives’ below), the total amount of the principal and interest that
were accounted for as a single item with the relevant interest rate swap is discounted with a rate that is assumed to be applied when a new, similar
loan is issued.
Derivatives
Derivatives are described further in ‘Note 23. DERIVATIVES’.
(ii) Financial instruments for which the fair value is extremely diffi cult to measure
Millions of yen
Thousands of
U.S. dollars
2012 2011 2012
Book value Book value Book value
Unlisted equity securities . . . . . . . . . . . . . . . . . . . . . . . . . . . . . . . . . . . . . . . . . . . . . . . . . . . . . . . . . . . . . . . . . . . . . . . . . . . . . . . . . . . ¥ 560 ¥2,225 $ 6,813
Investments in unconsolidated subsidiaries and affi liated companies . . . . . . . . . . . . . . . . . . . . . . . 2,819 2,808 34,299
Above are not included in ‘(3)(ii) Other securities’ because there is no market value and it is diffi cult to measure the fair value.
(iii) Redemption schedule for money claim and securities with maturity date subsequent to the consolidated balance sheets date
Millions of yen Thousands of U.S. dollars
2012 2011 2012
Within one year
More than one
year, within fi ve
years Within one year
More than one
year, within fi ve
years Within one year
More than one
year, within fi ve
years
Cash on hand and in banks . . . . . . . . . . . . . . . . . . . . . . . . . . . . . . . . . . . . . . . . . . . . . ¥ 90,640 ¥ — ¥ 87,886 ¥— $1,102,811 $ —
Notes and accounts receivable–trade . . . . . . . . . . . . . . . . . . . . . . . . . . . . . . . 174,193 — 163,363 — 2,119,394 —
Short-term investment securities and investment securities
Held-to-maturity securities . . . . . . . . . . . . . . . . . . . . . . . . . . . . . . . . . . . . . . . . . . . . — 10 — 10 — 122
Other securities
(1) Bonds . . . . . . . . . . . . . . . . . . . . . . . . . . . . . . . . . . . . . . . . . . . . . . . . . . . . . . . . . . . . . . . . . 7,593 — 9,261 — 92,384 —
(2) Other . . . . . . . . . . . . . . . . . . . . . . . . . . . . . . . . . . . . . . . . . . . . . . . . . . . . . . . . . . . . . . . . . . 133,700 — 78,000 — 1,626,719 —
Total . . . . . . . . . . . . . . . . . . . . . . . . . . . . . . . . . . . . . . . . . . . . . . . . . . . . . . . . . . . . . . . . . . . . . . . . . . . . ¥406,126 ¥10 ¥338,511 ¥10 $4,941,307 $122
(iv) Redemption schedule for bonds and long-term loans subsequent to the consolidated balance sheets date
Millions of yen Thousands of U.S. dollars
2012 2011 2012
More than one
year, within fi ve
years
More than fi ve
years, within
ten years
More than one
year, within fi ve
years
More than fi ve
years, within
ten years
More than one
year, within fi ve
years
More than fi ve
years, within
ten years
Bonds . . . . . . . . . . . . . . . . . . . . . . . . . . . . . . . . . . . . . . . . . . . . . . . . . . . . . . . . . . . . . . . . . . . . . . . . . . ¥80,000 ¥30,000 ¥20,000 ¥50,000 $973,354 $365,008
Long-term loans . . . . . . . . . . . . . . . . . . . . . . . . . . . . . . . . . . . . . . . . . . . . . . . . . . . . . . . . . . . . . 59,023 14,001 45,031 3,002 718,129 170,349
33
6. INVESTMENT SECURITIES(1) Other Securities with Quoted Market Values
Millions of yen Thousands of U.S. dollars
2012 2011 2012
Market value
at the
consolidated
balance
sheet date
Original
purchase value
Unrealized
gains (losses)
Market value
at the
consolidated
balance
sheet date
Original
purchase value
Unrealized
gains (losses)
Market value
at the
consolidated
balance
sheet date
Original
purchase value
Unrealized
gains (losses)
Securities for which the
amounts in the consolidated
balance sheet exceed the
original purchase value
(1) Shares . . . . . . . . . . . . . . . . . . . . . . . . . ¥ 9,348 ¥ 6,357 ¥ 2,990 ¥ 6,497 ¥ 3,283 ¥ 3,214 $ 113,736 $ 77,345 $ 36,379
(2) Bonds . . . . . . . . . . . . . . . . . . . . . . . . . . — — — — — — — — —
(3) Other
(i) Short-term investment securities . . . . . . . . . . . . . . . . . . — — — — — — — — —
(Negotiable deposits)
(ii) Other . . . . . . . . . . . . . . . . . . . . . . . 11 10 0 12 10 1 134 122 0
Subtotal ¥ 9,359 ¥ 6,368 ¥ 2,991 ¥ 6,509 ¥ 3,293 ¥ 3,215 $ 113,870 $ 77,479 $ 36,391
Securities for which the
amounts in the consolidated
balance sheet do not exceed
the original purchase value
(1) Shares . . . . . . . . . . . . . . . . . . . . . . . . . ¥ 6,319 ¥ 7,708 ¥(1,389) ¥ 9,335 ¥ 11,641 ¥(2,305) $ 76,883 $ 93,783 $(16,900)
(2) Bonds . . . . . . . . . . . . . . . . . . . . . . . . . . 7,593 7,616 (23) 9,261 9,279 (18) 92,384 92,663 (280)
(3) Other
(i) Short-term investmentsecurities . . . . . . . . . . . . . . . . . . .
(Negotiable deposits)
133,700 133,700 — 78,000 78,000 — 1,626,719 1,626,719 —
(ii) Other . . . . . . . . . . . . . . . . . . . . . . . . 4 5 (0) 4 5 (1) 49 61 (0)
Subtotal . . . . . . . . . . . . . . . . . . . . . . . . . . . ¥147,617 ¥149,030 ¥(1,413) ¥ 96,601 ¥ 98,927 ¥(2,325) $1,796,046 $1,813,238 $(17,192)
Total . . . . . . . . . . . . . . . . . . . . . . . . . . . . . . . . ¥156,977 ¥155,399 ¥ 1,578 ¥103,111 ¥102,220 ¥ 890 $1,909,928 $1,890,729 $ 19,199
(2) Other Securities Sold during the Years Ended March 31, 2012 and 2011
Millions of yen Thousands of U.S. dollars
2012 2011 2012
Sale value Total profi t Total loss Sale value Total profi t Total loss Sale value Total profi t Total loss
Shares . . . . . . . . . . . . . . . . . . . . . . . . . . . . . . ¥2 ¥2 ¥— ¥29 ¥5 ¥2 $24 $24 $ —
(3) Securities for Which Loss on Impairment is Recognized
The Companies have recognized loss on impairment for securities of ¥2,700 million ($32,851 thousand) and ¥680 million for the years ended March 31,
2012 and 2011, respectively.
For securities with quoted market values, if the market value has declined by more than 50% from the acquisition cost at the end of the period, or if
the market value has declined by more than 30% but not more than 50% from the acquisition cost at the end of the period for two years in succession
and has declined more than in the preceding year, the Companies record an impairment loss, taking into consideration recoverability and other factors,
assuming that the market value has “signifi cantly declined.”
For securities without quoted market values, if the net assets per share have fallen by more than 50% from the acquisition cost, the Companies
recognize an impairment loss, assuming that the market value has “signifi cantly declined.”
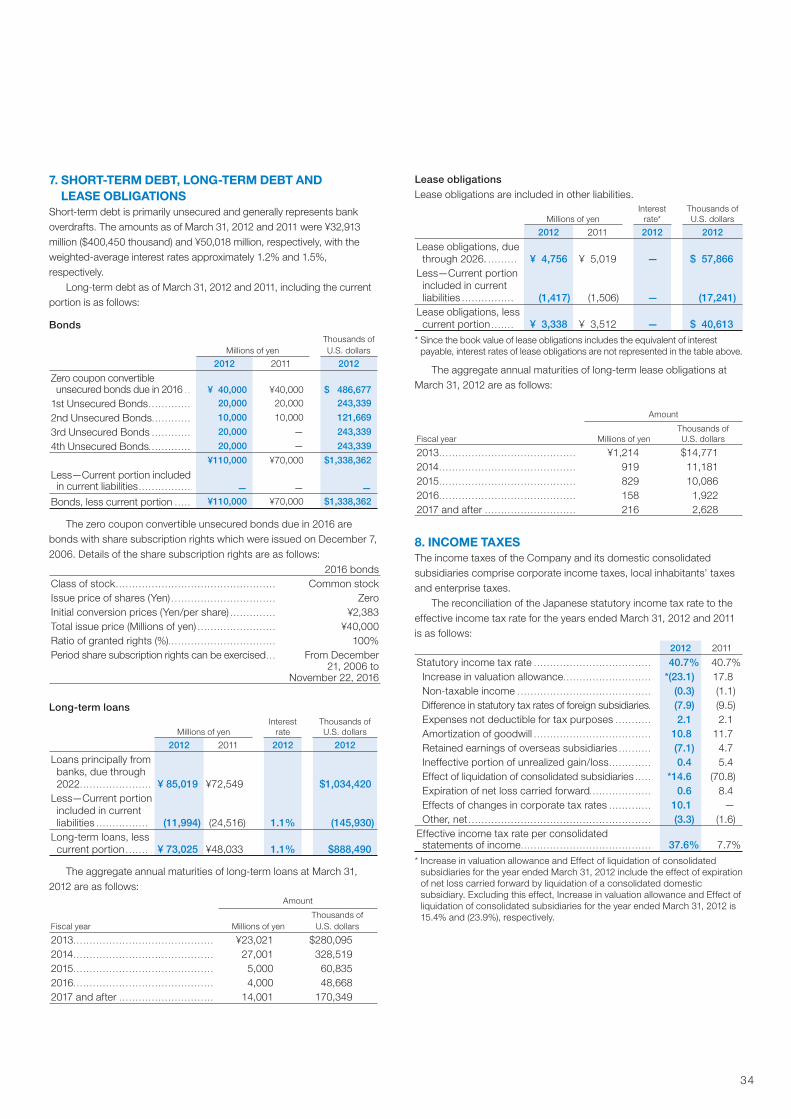
34
7. SHORT-TERM DEBT, LONG-TERM DEBT AND LEASE OBLIGATIONS
Short-term debt is primarily unsecured and generally represents bank
overdrafts. The amounts as of March 31, 2012 and 2011 were ¥32,913
million ($400,450 thousand) and ¥50,018 million, respectively, with the
weighted-average interest rates approximately 1.2% and 1.5%,
respectively.
Long-term debt as of March 31, 2012 and 2011, including the current
portion is as follows:
Bonds
Millions of yen
Thousands of
U.S. dollars
2012 2011 2012
Zero coupon convertible unsecured bonds due in 2016 . . ¥ 40,000 ¥40,000 $ 486,677
1st Unsecured Bonds . . . . . . . . . . . . . 20,000 20,000 243,339
2nd Unsecured Bonds . . . . . . . . . . . . 10,000 10,000 121,669
3rd Unsecured Bonds . . . . . . . . . . . . 20,000 — 243,339
4th Unsecured Bonds . . . . . . . . . . . . . 20,000 — 243,339
¥110,000 ¥70,000 $1,338,362
Less—Current portion included in current liabilities . . . . . . . . . . . . . . . . — — —
Bonds, less current portion . . . . . ¥110,000 ¥70,000 $1,338,362
The zero coupon convertible unsecured bonds due in 2016 are
bonds with share subscription rights which were issued on December 7,
2006. Details of the share subscription rights are as follows:
2016 bonds
Class of stock . . . . . . . . . . . . . . . . . . . . . . . . . . . . . . . . . . . . . . . . . . . . . . . . . Common stock
Issue price of shares (Yen) . . . . . . . . . . . . . . . . . . . . . . . . . . . . . . . . Zero
Initial conversion prices (Yen/per share) . . . . . . . . . . . . . . ¥2,383
Total issue price (Millions of yen) . . . . . . . . . . . . . . . . . . . . . . . . ¥40,000
Ratio of granted rights (%) . . . . . . . . . . . . . . . . . . . . . . . . . . . . . . . . . 100%
Period share subscription rights can be exercised . . . From December 21, 2006 to
November 22, 2016
Long-term loans
Millions of yen
Interest
rate
Thousands of
U.S. dollars
2012 2011 2012 2012
Loans principally from banks, due through
2022 . . . . . . . . . . . . . . . . . . . . . . ¥ 85,019 ¥72,549 $1,034,420
Less—Current portion included in current
liabilities . . . . . . . . . . . . . . . . (11,994) (24,516) 1.1% (145,930)
Long-term loans, less current portion . . . . . . . ¥ 73,025 ¥48,033 1.1% $888,490
The aggregate annual maturities of long-term loans at March 31,
2012 are as follows:
Amount
Fiscal year Millions of yen
Thousands of
U.S. dollars
2013 . . . . . . . . . . . . . . . . . . . . . . . . . . . . . . . . . . . . . . . . . . . ¥23,021 $280,095
2014 . . . . . . . . . . . . . . . . . . . . . . . . . . . . . . . . . . . . . . . . . . . 27,001 328,519
2015 . . . . . . . . . . . . . . . . . . . . . . . . . . . . . . . . . . . . . . . . . . . 5,000 60,835
2016 . . . . . . . . . . . . . . . . . . . . . . . . . . . . . . . . . . . . . . . . . . . 4,000 48,668
2017 and after . . . . . . . . . . . . . . . . . . . . . . . . . . . . . 14,001 170,349
Lease obligations
Lease obligations are included in other liabilities.
Millions of yen
Interest
rate*
Thousands of
U.S. dollars
2012 2011 2012 2012
Lease obligations, due through 2026. . . . . . . . . . ¥ 4,756 ¥ 5,019 — $ 57,866
Less—Current portion included in current
liabilities . . . . . . . . . . . . . . . . (1,417) (1,506) — (17,241)
Lease obligations, less current portion . . . . . . . ¥ 3,338 ¥ 3,512 — $ 40,613
* Since the book value of lease obligations includes the equivalent of interest
payable, interest rates of lease obligations are not represented in the table above.
The aggregate annual maturities of long-term lease obligations at
March 31, 2012 are as follows:
Amount
Fiscal year Millions of yen
Thousands of
U.S. dollars
2013 . . . . . . . . . . . . . . . . . . . . . . . . . . . . . . . . . . . . . . . . . . ¥1,214 $14,771
2014 . . . . . . . . . . . . . . . . . . . . . . . . . . . . . . . . . . . . . . . . . . 919 11,181
2015 . . . . . . . . . . . . . . . . . . . . . . . . . . . . . . . . . . . . . . . . . . 829 10,086
2016 . . . . . . . . . . . . . . . . . . . . . . . . . . . . . . . . . . . . . . . . . . 158 1,922
2017 and after . . . . . . . . . . . . . . . . . . . . . . . . . . . . 216 2,628
8. INCOME TAXES The income taxes of the Company and its domestic consolidated
subsidiaries comprise corporate income taxes, local inhabitants’ taxes
and enterprise taxes.
The reconciliation of the Japanese statutory income tax rate to the
effective income tax rate for the years ended March 31, 2012 and 2011
is as follows:
2012 2011
Statutory income tax rate . . . . . . . . . . . . . . . . . . . . . . . . . . . . . . . . . . . . 40.7% 40.7%
Increase in valuation allowance . . . . . . . . . . . . . . . . . . . . . . . . . . . *(23.1) 17.8
Non-taxable income . . . . . . . . . . . . . . . . . . . . . . . . . . . . . . . . . . . . . . . . . (0.3) (1.1)
Difference in statutory tax rates of foreign subsidiaries . (7.9) (9.5)
Expenses not deductible for tax purposes . . . . . . . . . . . 2.1 2.1
Amortization of goodwill . . . . . . . . . . . . . . . . . . . . . . . . . . . . . . . . . . . . 10.8 11.7
Retained earnings of overseas subsidiaries . . . . . . . . . . (7.1) 4.7
Ineffective portion of unrealized gain/loss . . . . . . . . . . . . . 0.4 5.4
Effect of liquidation of consolidated subsidiaries . . . . . *14.6 (70.8)
Expiration of net loss carried forward . . . . . . . . . . . . . . . . . . . 0.6 8.4
Effects of changes in corporate tax rates . . . . . . . . . . . . . 10.1 —
Other, net . . . . . . . . . . . . . . . . . . . . . . . . . . . . . . . . . . . . . . . . . . . . . . . . . . . . . . . . (3.3) (1.6)
Effective income tax rate per consolidated statements of income . . . . . . . . . . . . . . . . . . . . . . . . . . . . . . . . . . . . . . . . 37.6% 7.7%
* Increase in valuation allowance and Effect of liquidation of consolidated
subsidiaries for the year ended March 31, 2012 include the effect of expiration
of net loss carried forward by liquidation of a consolidated domestic
subsidiary. Excluding this effect, Increase in valuation allowance and Effect of
liquidation of consolidated subsidiaries for the year ended March 31, 2012 is
15.4% and (23.9%), respectively.
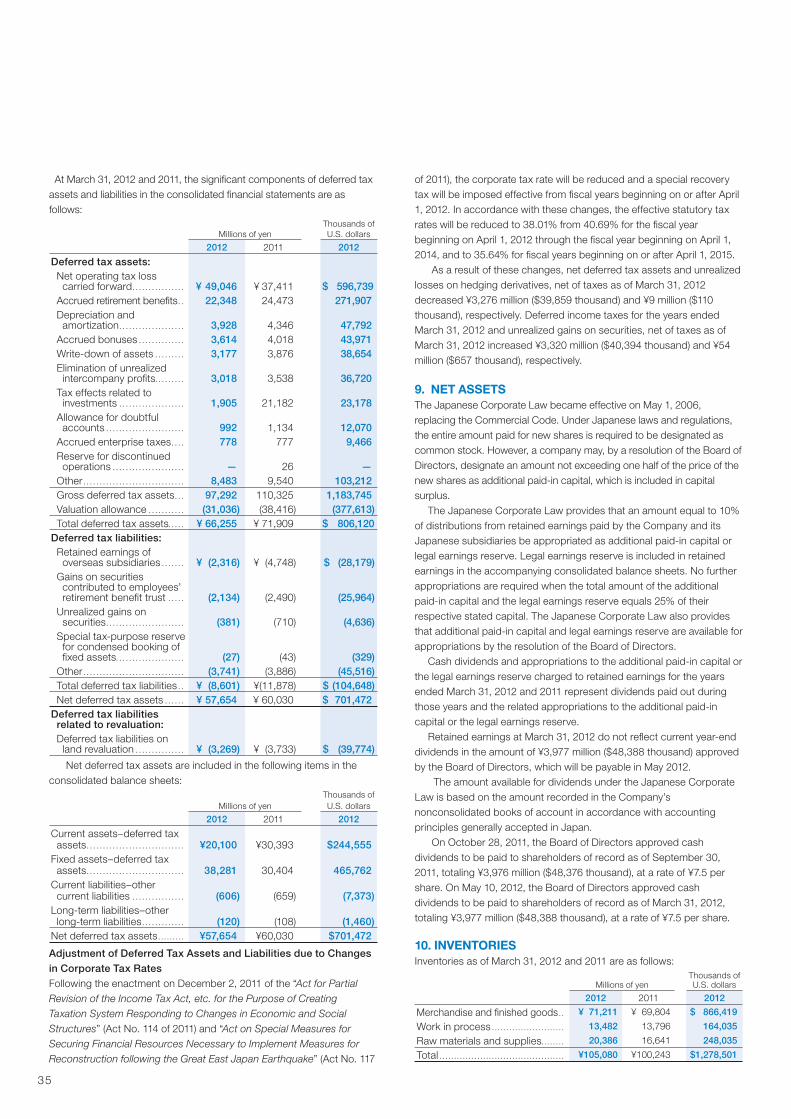
35
9. NET ASSETSThe Japanese Corporate Law became effective on May 1, 2006,
replacing the Commercial Code. Under Japanese laws and regulations,
the entire amount paid for new shares is required to be designated as
common stock. However, a company may, by a resolution of the Board of
Directors, designate an amount not exceeding one half of the price of the
new shares as additional paid-in capital, which is included in capital
surplus.
The Japanese Corporate Law provides that an amount equal to 10%
of distributions from retained earnings paid by the Company and its
Japanese subsidiaries be appropriated as additional paid-in capital or
legal earnings reserve. Legal earnings reserve is included in retained
earnings in the accompanying consolidated balance sheets. No further
appropriations are required when the total amount of the additional
paid-in capital and the legal earnings reserve equals 25% of their
respective stated capital. The Japanese Corporate Law also provides
that additional paid-in capital and legal earnings reserve are available for
appropriations by the resolution of the Board of Directors.
Cash dividends and appropriations to the additional paid-in capital or
the legal earnings reserve charged to retained earnings for the years
ended March 31, 2012 and 2011 represent dividends paid out during
those years and the related appropriations to the additional paid-in
capital or the legal earnings reserve.
Retained earnings at March 31, 2012 do not refl ect current year-end
dividends in the amount of ¥3,977 million ($48,388 thousand) approved
by the Board of Directors, which will be payable in May 2012.
The amount available for dividends under the Japanese Corporate
Law is based on the amount recorded in the Company’s
nonconsolidated books of account in accordance with accounting
principles generally accepted in Japan.
On October 28, 2011, the Board of Directors approved cash
dividends to be paid to shareholders of record as of September 30,
2011, totaling ¥3,976 million ($48,376 thousand), at a rate of ¥7.5 per
share. On May 10, 2012, the Board of Directors approved cash
dividends to be paid to shareholders of record as of March 31, 2012,
totaling ¥3,977 million ($48,388 thousand), at a rate of ¥7.5 per share.
10. INVENTORIESInventories as of March 31, 2012 and 2011 are as follows:
Millions of yenThousands of U.S. dollars
2012 2011 2012
Merchandise and fi nished goods . . ¥ 71,211 ¥ 69,804 $ 866,419
Work in process . . . . . . . . . . . . . . . . . . . . . . . . . 13,482 13,796 164,035
Raw materials and supplies . . . . . . . . 20,386 16,641 248,035
Total . . . . . . . . . . . . . . . . . . . . . . . . . . . . . . . . . . . . . . . . . . . ¥105,080 ¥100,243 $1,278,501
At March 31, 2012 and 2011, the signifi cant components of deferred tax
assets and liabilities in the consolidated fi nancial statements are as
follows:
Millions of yen
Thousands of
U.S. dollars
2012 2011 2012
Deferred tax assets:
Net operating tax loss carried forward . . . . . . . . . . . . . . . . ¥ 49,046 ¥ 37,411 $ 596,739
Accrued retirement benefi ts . . 22,348 24,473 271,907
Depreciation and amortization . . . . . . . . . . . . . . . . . . . . 3,928 4,346 47,792
Accrued bonuses . . . . . . . . . . . . . . 3,614 4,018 43,971
Write-down of assets . . . . . . . . . 3,177 3,876 38,654
Elimination of unrealized intercompany profi ts . . . . . . . . . 3,018 3,538 36,720
Tax effects related to investments . . . . . . . . . . . . . . . . . . . . 1,905 21,182 23,178
Allowance for doubtful accounts . . . . . . . . . . . . . . . . . . . . . . . . 992 1,134 12,070
Accrued enterprise taxes . . . . 778 777 9,466
Reserve for discontinued operations . . . . . . . . . . . . . . . . . . . . . . — 26 —
Other . . . . . . . . . . . . . . . . . . . . . . . . . . . . . . . 8,483 9,540 103,212
Gross deferred tax assets . . . 97,292 110,325 1,183,745
Valuation allowance . . . . . . . . . . . (31,036) (38,416) (377,613)
Total deferred tax assets. . . . . ¥ 66,255 ¥ 71,909 $ 806,120
Deferred tax liabilities:
Retained earnings of overseas subsidiaries . . . . . . . ¥ (2,316) ¥ (4,748) $ (28,179)
Gains on securities contributed to employees’
retirement benefi t trust . . . . . (2,134) (2,490) (25,964)
Unrealized gains on securities . . . . . . . . . . . . . . . . . . . . . . . . (381) (710) (4,636)
Special tax-purpose reserve for condensed booking of
fi xed assets . . . . . . . . . . . . . . . . . . . . . (27) (43) (329)
Other . . . . . . . . . . . . . . . . . . . . . . . . . . . . . . . (3,741) (3,886) (45,516)
Total deferred tax liabilities . . ¥ (8,601) ¥(11,878) $ (104,648)
Net deferred tax assets . . . . . . ¥ 57,654 ¥ 60,030 $ 701,472
Deferred tax liabilities related to revaluation:
Deferred tax liabilities on land revaluation . . . . . . . . . . . . . . . ¥ (3,269) ¥ (3,733) $ (39,774)
Net deferred tax assets are included in the following items in the
consolidated balance sheets:
Millions of yen
Thousands of
U.S. dollars
2012 2011 2012
Current assets–deferred tax assets . . . . . . . . . . . . . . . . . . . . . . . . . . . . . . ¥20,100 ¥30,393 $244,555
Fixed assets–deferred tax assets . . . . . . . . . . . . . . . . . . . . . . . . . . . . . . 38,281 30,404 465,762
Current liabilities–other current liabilities . . . . . . . . . . . . . . . . (606) (659) (7,373)
Long-term liabilities–other long-term liabilities . . . . . . . . . . . . . (120) (108) (1,460)
Net deferred tax assets . . . . . . . . . ¥57,654 ¥60,030 $701,472
Adjustment of Deferred Tax Assets and Liabilities due to Changes
in Corporate Tax Rates
Following the enactment on December 2, 2011 of the “Act for Partial
Revision of the Income Tax Act, etc. for the Purpose of Creating
Taxation System Responding to Changes in Economic and Social
Structures” (Act No. 114 of 2011) and “Act on Special Measures for
Securing Financial Resources Necessary to Implement Measures for
Reconstruction following the Great East Japan Earthquake” (Act No. 117
of 2011), the corporate tax rate will be reduced and a special recovery
tax will be imposed effective from fi scal years beginning on or after April
1, 2012. In accordance with these changes, the effective statutory tax
rates will be reduced to 38.01% from 40.69% for the fi scal year
beginning on April 1, 2012 through the fi scal year beginning on April 1,
2014, and to 35.64% for fi scal years beginning on or after April 1, 2015.
As a result of these changes, net deferred tax assets and unrealized
losses on hedging derivatives, net of taxes as of March 31, 2012
decreased ¥3,276 million ($39,859 thousand) and ¥9 million ($110
thousand), respectively. Deferred income taxes for the years ended
March 31, 2012 and unrealized gains on securities, net of taxes as of
March 31, 2012 increased ¥3,320 million ($40,394 thousand) and ¥54
million ($657 thousand), respectively.
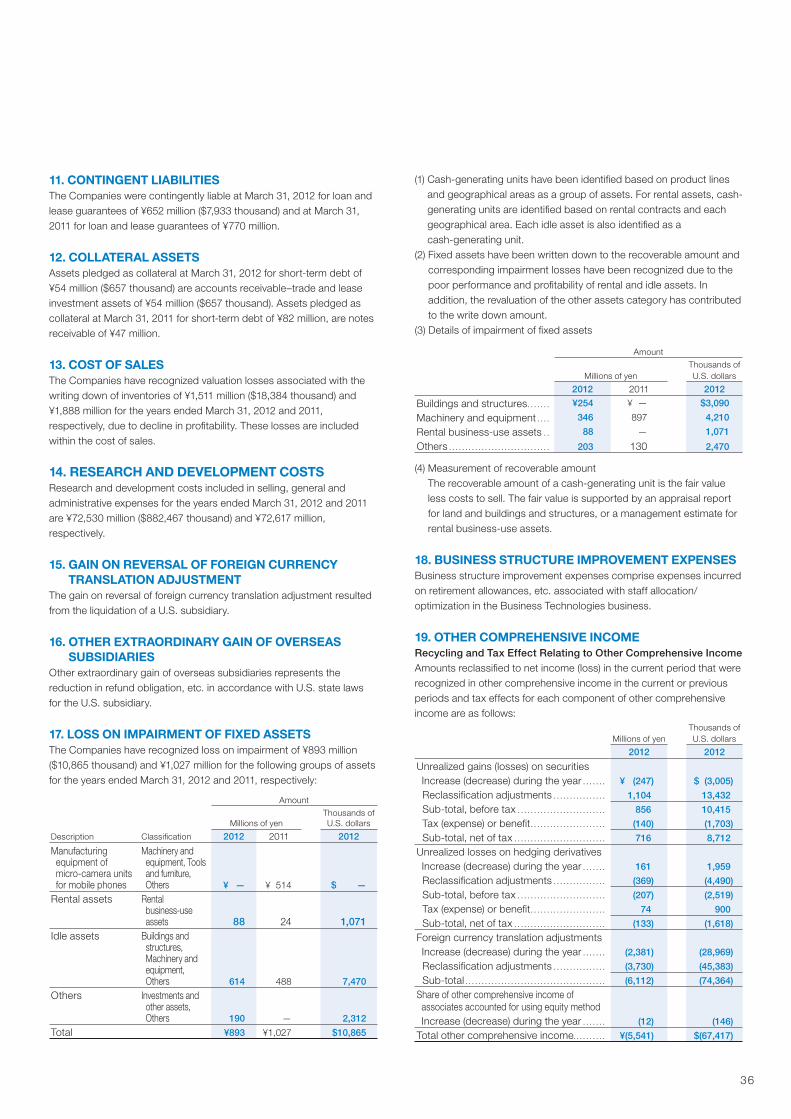
36
11. CONTINGENT LIABILITIESThe Companies were contingently liable at March 31, 2012 for loan and
lease guarantees of ¥652 million ($7,933 thousand) and at March 31,
2011 for loan and lease guarantees of ¥770 million.
12. COLLATERAL ASSETSAssets pledged as collateral at March 31, 2012 for short-term debt of
¥54 million ($657 thousand) are accounts receivable–trade and lease
investment assets of ¥54 million ($657 thousand). Assets pledged as
collateral at March 31, 2011 for short-term debt of ¥82 million, are notes
receivable of ¥47 million.
13. COST OF SALESThe Companies have recognized valuation losses associated with the
writing down of inventories of ¥1,511 million ($18,384 thousand) and
¥1,888 million for the years ended March 31, 2012 and 2011,
respectively, due to decline in profi tability. These losses are included
within the cost of sales.
14. RESEARCH AND DEVELOPMENT COSTSResearch and development costs included in selling, general and
administrative expenses for the years ended March 31, 2012 and 2011
are ¥72,530 million ($882,467 thousand) and ¥72,617 million,
respectively.
15. GAIN ON REVERSAL OF FOREIGN CURRENCY TRANSLATION ADJUSTMENT
The gain on reversal of foreign currency translation adjustment resulted
from the liquidation of a U.S. subsidiary.
16. OTHER EXTRAORDINARY GAIN OF OVERSEAS SUBSIDIARIES
Other extraordinary gain of overseas subsidiaries represents the
reduction in refund obligation, etc. in accordance with U.S. state laws
for the U.S. subsidiary.
17. LOSS ON IMPAIRMENT OF FIXED ASSETSThe Companies have recognized loss on impairment of ¥893 million
($10,865 thousand) and ¥1,027 million for the following groups of assets
for the years ended March 31, 2012 and 2011, respectively:
Amount
Millions of yen
Thousands of
U.S. dollars
Description Classifi cation 2012 2011 2012
Manufacturing equipment of
micro-camera units for mobile phones
Machinery and equipment, Tools and furniture, Others ¥ — ¥ 514 $ —
Rental assets Rental business-use assets 88 24 1,071
Idle assets Buildings and structures, Machinery and equipment, Others 614 488 7,470
Others Investments and other assets, Others 190 — 2,312
Total ¥893 ¥1,027 $10,865
(1) Cash-generating units have been identifi ed based on product lines
and geographical areas as a group of assets. For rental assets, cash-
generating units are identifi ed based on rental contracts and each
geographical area. Each idle asset is also identifi ed as a
cash-generating unit.
(2) Fixed assets have been written down to the recoverable amount and
corresponding impairment losses have been recognized due to the
poor performance and profi tability of rental and idle assets. In
addition, the revaluation of the other assets category has contributed
to the write down amount.
(3) Details of impairment of fi xed assets
Amount
Millions of yen
Thousands of
U.S. dollars
2012 2011 2012
Buildings and structures . . . . . . . ¥254 ¥ — $3,090
Machinery and equipment . . . . 346 897 4,210
Rental business-use assets . . 88 — 1,071
Others . . . . . . . . . . . . . . . . . . . . . . . . . . . . . . . 203 130 2,470
(4) Measurement of recoverable amount
The recoverable amount of a cash-generating unit is the fair value
less costs to sell. The fair value is supported by an appraisal report
for land and buildings and structures, or a management estimate for
rental business-use assets.
18. BUSINESS STRUCTURE IMPROVEMENT EXPENSESBusiness structure improvement expenses comprise expenses incurred
on retirement allowances, etc. associated with staff allocation/
optimization in the Business Technologies business.
19. OTHER COMPREHENSIVE INCOMERecycling and Tax Effect Relating to Other Comprehensive Income
Amounts reclassifi ed to net income (loss) in the current period that were
recognized in other comprehensive income in the current or previous
periods and tax effects for each component of other comprehensive
income are as follows:
Millions of yen
Thousands of
U.S. dollars
2012 2012
Unrealized gains (losses) on securities
Increase (decrease) during the year . . . . . . . ¥ (247) $ (3,005)
Reclassifi cation adjustments . . . . . . . . . . . . . . . . 1,104 13,432
Sub-total, before tax . . . . . . . . . . . . . . . . . . . . . . . . . . . 856 10,415
Tax (expense) or benefi t . . . . . . . . . . . . . . . . . . . . . . . (140) (1,703)
Sub-total, net of tax . . . . . . . . . . . . . . . . . . . . . . . . . . . . 716 8,712
Unrealized losses on hedging derivatives
Increase (decrease) during the year . . . . . . . 161 1,959
Reclassifi cation adjustments . . . . . . . . . . . . . . . . (369) (4,490)
Sub-total, before tax . . . . . . . . . . . . . . . . . . . . . . . . . . . (207) (2,519)
Tax (expense) or benefi t . . . . . . . . . . . . . . . . . . . . . . . 74 900
Sub-total, net of tax . . . . . . . . . . . . . . . . . . . . . . . . . . . . (133) (1,618)
Foreign currency translation adjustments
Increase (decrease) during the year . . . . . . . (2,381) (28,969)
Reclassifi cation adjustments . . . . . . . . . . . . . . . . (3,730) (45,383)
Sub-total . . . . . . . . . . . . . . . . . . . . . . . . . . . . . . . . . . . . . . . . . . . (6,112) (74,364)
Share of other comprehensive income of associates accounted for using equity method
Increase (decrease) during the year . . . . . . . (12) (146)
Total other comprehensive income. . . . . . . . . . ¥(5,541) $(67,417)

37
20. PENSION LIABILITIES ADJUSTMENT OF OVERSEAS SUBSIDIARIES
The pension liabilities adjustment of overseas subsidiaries results from
the accounting treatment of retirement benefi ts that affect a certain
consolidated subsidiary in the United States.
21. LEASE TRANSACTIONSProforma information on the Company and its domestic consolidated
subsidiaries’ fi nance lease transactions (except for those which are
deemed to transfer the ownership of the leased assets to the lessee)
and operating lease transactions is as follows:
As Lessee
(1) Finance Leases (not involving transfer of ownership commencing on
or before March 31, 2008)
Millions of yen
Thousands of
U.S. dollars
2012 2011 2012
Purchase cost:
Buildings and structures . . . . . ¥ 6,485 ¥ 6,544 $ 78,903
Machinery and equipment . . 112 161 1,363
Tools and furniture . . . . . . . . . . . . . 560 1,647 6,813
Rental business-use assets — 121 —
7,157 8,475 87,079
Less: Accumulated depreciation . . . . . . . . . . . . . . . . . . . . (6,304) (7,158) (76,700)
Loss on impairment of leased assets . . . . . . . . . . . . . . . . . . (0) (0) (0)
Net book value . . . . . . . . . . . . . . . . . . . . ¥ 852 ¥ 1,316 $ 10,366
The scheduled maturities of future lease rental payments on such
lease contracts at March 31, 2012 and 2011 are as follows:
Millions of yen
Thousands of
U.S. dollars
2012 2011 2012
Due within one year . . . . . . . . . . . . . . . ¥243 ¥ 473 $ 2,957
Due over one year . . . . . . . . . . . . . . . 610 843 7,422
Total . . . . . . . . . . . . . . . . . . . . . . . . . . . . . . . . . . ¥853 ¥1,316 $10,378
Lease rental expenses and depreciation equivalents under the fi nance
leases which are accounted for in the same manner as operating leases
for the years ended March 31, 2012 and 2011 are as follows:
Millions of yen
Thousands of
U.S. dollars
2012 2011 2012
Lease rental expenses for the period . . . ¥438 ¥750 $5,329
Depreciation equivalents . . . . . . 438 739 5,329
Depreciation equivalents are calculated based on the straight-line
method over the lease terms of the leased assets.
Accumulated loss on impairment of leased assets as of March 31,
2012 and 2011 is as follows:
Millions of yen
Thousands of
U.S. dollars
2012 2011 2012
Reserve for loss . . . . . . . . . . . . . . . . . . ¥0 ¥0 $0
Reversals of loss on impairment of leased assets for the years
ended March 31, 2012 and 2011 are as follows:
Millions of yen
Thousands of
U.S. dollars
2012 2011 2012
Reversals of loss . . . . . . . . . . . . . . . . . ¥ — ¥11 $ —
2) Operating Leases
The scheduled maturities of future rental payments of operating
noncancelable leases as of March 31, 2012 and 2011 are as follows:
Millions of yen
Thousands of
U.S. dollars
2012 2011 2012
Due within one year . . . . . . . . . . . . . . ¥ 4,439 ¥ 4,862 $ 54,009
Due over one year . . . . . . . . . . . . . . . . 11,314 10,678 137,657
Total . . . . . . . . . . . . . . . . . . . . . . . . . . . . . . . . . . ¥15,753 ¥15,541 $191,666
As Lessor
Operating Leases
The scheduled maturities of future rental incomes of operating
noncancelable leases as of March 31, 2012 and 2011 are as follows:
Millions of yen
Thousands of
U.S. dollars
2012 2011 2012
Due within one year . . . . . . . . . . . . . . ¥1,616 ¥1,787 $19,662
Due over one year . . . . . . . . . . . . . . . . 2,322 2,597 28,252
Total . . . . . . . . . . . . . . . . . . . . . . . . . . . . . . . . . . ¥3,938 ¥4,385 $47,913
22. RETIREMENT BENEFIT PLANSThe Companies have defi ned benefi t retirement plans that include
corporate defi ned benefi t pensions plans, tax-qualifi ed pension plans
and lump-sum payment plans. In addition, the Companies have defi ned
contributory pension plans. Certain overseas consolidated subsidiaries
have defi ned benefi t retirement plans and defi ned contribution
retirement plans. The Companies may pay additional retirement benefi ts
to employees at their discretion.
Additionally, the Company and certain domestic consolidated
subsidiaries contribute to a retirement benefi t trust.
The reserve for retirement benefi ts as of March 31, 2012 and 2011 is
calculated as follows:
Millions of yen
Thousands of
U.S. dollars
2012 2011 2012
a. Retirement benefi t obligations . . ¥(151,396) ¥(146,942) $(1,842,025)
b. Plan assets . . . . . . . . . . . . . . . . . . . . . . . . . 97,614 94,980 1,187,663
c. Unfunded retirement benefi t obligations (a+b) . . . . . . . . . . . . . . . . . (53,781) (51,962) (654,350)
d. Unrecognized actuarial differences . . . . . . . . . . . . . . . . . . . . . . . . . . 12,681 12,273 154,289
e. Unrecognized prior service costs . . (2,203) (3,421) (26,804)
f. Net amount on consolidated balance sheets (c+d+e) . . . . . . . (43,303) (43,110) (526,865)
g. Prepaid pension costs . . . . . . . . 1,242 1,623 15,111
h. Accrued retirement benefi ts (f-g) . . ¥ (44,545) ¥ (44,734) $ (541,976)
Note: Certain subsidiaries use a simplifi ed method for the calculation of benefi t
obligation.
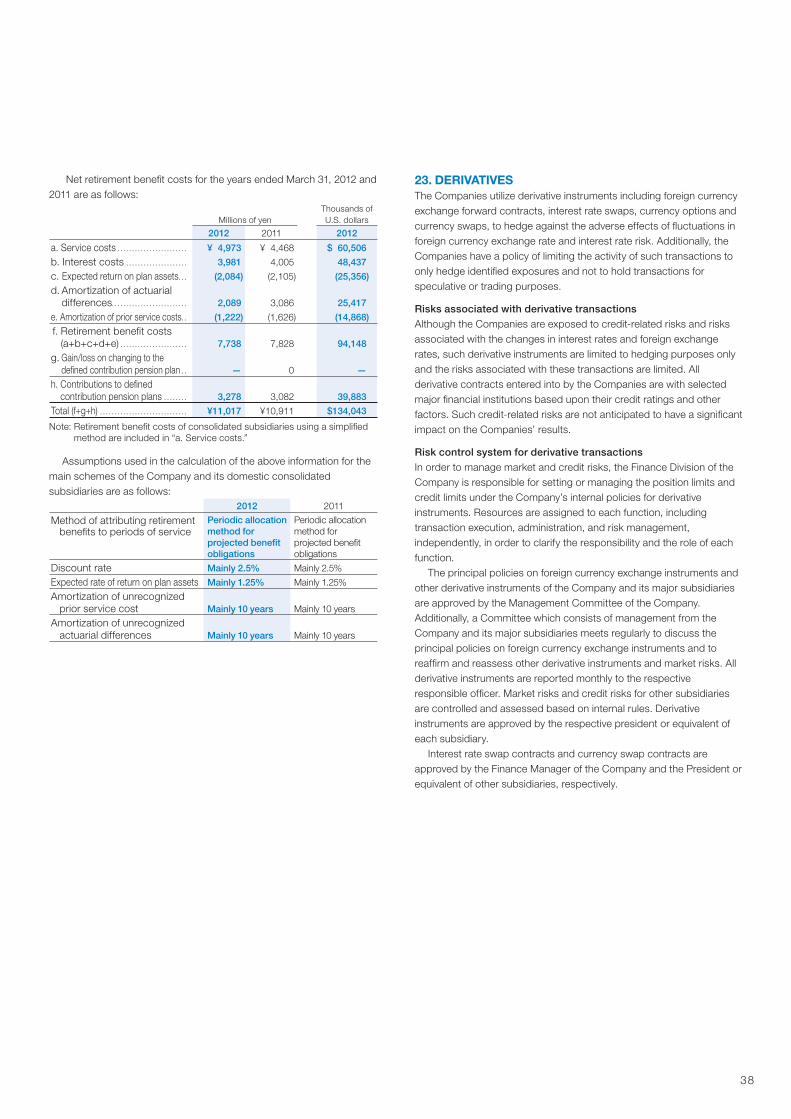
38
Net retirement benefi t costs for the years ended March 31, 2012 and
2011 are as follows:
Millions of yen
Thousands of
U.S. dollars
2012 2011 2012
a. Service costs . . . . . . . . . . . . . . . . . . . . . . . . ¥ 4,973 ¥ 4,468 $ 60,506
b. Interest costs . . . . . . . . . . . . . . . . . . . . . 3,981 4,005 48,437
c. Expected return on plan assets . . . (2,084) (2,105) (25,356)
d. Amortization of actuarial differences. . . . . . . . . . . . . . . . . . . . . . . . . . 2,089 3,086 25,417
e. Amortization of prior service costs . . (1,222) (1,626) (14,868)
f. Retirement benefi t costs (a+b+c+d+e) . . . . . . . . . . . . . . . . . . . . . . . 7,738 7,828 94,148
g. Gain/loss on changing to the defi ned contribution pension plan . . — 0 —
h. Contributions to defi ned contribution pension plans . . . . . . . . 3,278 3,082 39,883
Total (f+g+h) . . . . . . . . . . . . . . . . . . . . . . . . . . . . . . ¥11,017 ¥10,911 $134,043
Note: Retirement benefi t costs of consolidated subsidiaries using a simplifi ed
method are included in “a. Service costs.”
Assumptions used in the calculation of the above information for the
main schemes of the Company and its domestic consolidated
subsidiaries are as follows:
2012 2011
Method of attributing retirement benefi ts to periods of service
Periodic allocation
method for
projected benefi t
obligations
Periodic allocation
method for
projected benefi t
obligations
Discount rate Mainly 2.5% Mainly 2.5%
Expected rate of return on plan assets Mainly 1.25% Mainly 1.25%
Amortization of unrecognized prior service cost Mainly 10 years Mainly 10 years
Amortization of unrecognized actuarial differences Mainly 10 years Mainly 10 years
23. DERIVATIVESThe Companies utilize derivative instruments including foreign currency
exchange forward contracts, interest rate swaps, currency options and
currency swaps, to hedge against the adverse effects of fl uctuations in
foreign currency exchange rate and interest rate risk. Additionally, the
Companies have a policy of limiting the activity of such transactions to
only hedge identifi ed exposures and not to hold transactions for
speculative or trading purposes.
Risks associated with derivative transactions
Although the Companies are exposed to credit-related risks and risks
associated with the changes in interest rates and foreign exchange
rates, such derivative instruments are limited to hedging purposes only
and the risks associated with these transactions are limited. All
derivative contracts entered into by the Companies are with selected
major fi nancial institutions based upon their credit ratings and other
factors. Such credit-related risks are not anticipated to have a signifi cant
impact on the Companies’ results.
Risk control system for derivative transactions
In order to manage market and credit risks, the Finance Division of the
Company is responsible for setting or managing the position limits and
credit limits under the Company’s internal policies for derivative
instruments. Resources are assigned to each function, including
transaction execution, administration, and risk management,
independently, in order to clarify the responsibility and the role of each
function.
The principal policies on foreign currency exchange instruments and
other derivative instruments of the Company and its major subsidiaries
are approved by the Management Committee of the Company.
Additionally, a Committee which consists of management from the
Company and its major subsidiaries meets regularly to discuss the
principal policies on foreign currency exchange instruments and to
reaffi rm and reassess other derivative instruments and market risks. All
derivative instruments are reported monthly to the respective
responsible offi cer. Market risks and credit risks for other subsidiaries
are controlled and assessed based on internal rules. Derivative
instruments are approved by the respective president or equivalent of
each subsidiary.
Interest rate swap contracts and currency swap contracts are
approved by the Finance Manager of the Company and the President or
equivalent of other subsidiaries, respectively.
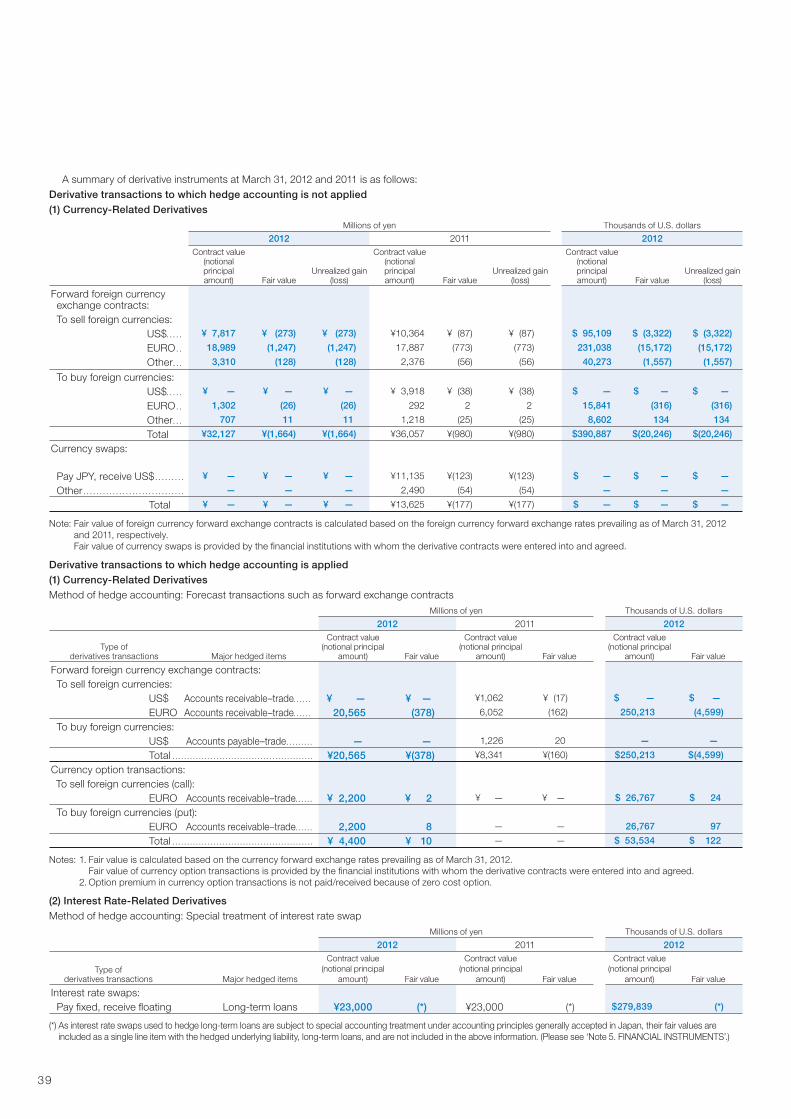
39
A summary of derivative instruments at March 31, 2012 and 2011 is as follows:
Derivative transactions to which hedge accounting is not applied
(1) Currency-Related Derivatives
Millions of yen Thousands of U.S. dollars
2012 2011 2012
Contract value (notional principal amount) Fair value
Unrealized gain (loss)
Contract value (notional principal amount) Fair value
Unrealized gain (loss)
Contract value (notional principal amount) Fair value
Unrealized gain (loss)
Forward foreign currency exchange contracts:
To sell foreign currencies:
US$. . . . . ¥ 7,817 ¥ (273) ¥ (273) ¥10,364 ¥ (87) ¥ (87) $ 95,109 $ (3,322) $ (3,322)
EURO . . 18,989 (1,247) (1,247) 17,887 (773) (773) 231,038 (15,172) (15,172)
Other . . . 3,310 (128) (128) 2,376 (56) (56) 40,273 (1,557) (1,557)
To buy foreign currencies:
US$. . . . . ¥ — ¥ — ¥ — ¥ 3,918 ¥ (38) ¥ (38) $ — $ — $ —
EURO . . 1,302 (26) (26) 292 2 2 15,841 (316) (316)
Other . . . 707 11 11 1,218 (25) (25) 8,602 134 134
Total ¥32,127 ¥(1,664) ¥(1,664) ¥36,057 ¥(980) ¥(980) $390,887 $(20,246) $(20,246)
Currency swaps:
Pay JPY, receive US$ . . . . . . . . . ¥ — ¥ — ¥ — ¥11,135 ¥(123) ¥(123) $ — $ — $ —
Other . . . . . . . . . . . . . . . . . . . . . . . . . . . . . . . — — — 2,490 (54) (54) — — —
Total ¥ — ¥ — ¥ — ¥13,625 ¥(177) ¥(177) $ — $ — $ —
Note: Fair value of foreign currency forward exchange contracts is calculated based on the foreign currency forward exchange rates prevailing as of March 31, 2012
and 2011, respectively.
Fair value of currency swaps is provided by the fi nancial institutions with whom the derivative contracts were entered into and agreed.
Derivative transactions to which hedge accounting is applied
(1) Currency-Related Derivatives
Method of hedge accounting: Forecast transactions such as forward exchange contracts
Millions of yen Thousands of U.S. dollars
2012 2011 2012
Type of derivatives transactions Major hedged items
Contract value (notional principal
amount) Fair value
Contract value (notional principal
amount) Fair value
Contract value (notional principal
amount) Fair value
Forward foreign currency exchange contracts:
To sell foreign currencies:
US$ Accounts receivable–trade . . . . . . ¥ — ¥ — ¥1,062 ¥ (17) $ — $ —
EURO Accounts receivable–trade . . . . . . 20,565 (378) 6,052 (162) 250,213 (4,599)
To buy foreign currencies:
US$ Accounts payable–trade . . . . . . . . . — — 1,226 20 — —
Total . . . . . . . . . . . . . . . . . . . . . . . . . . . . . . . . . . . . . . . . . . . . . . . . ¥20,565 ¥(378) ¥8,341 ¥(160) $250,213 $(4,599)
Currency option transactions:
To sell foreign currencies (call):
EURO Accounts receivable–trade . . . . . . ¥ 2,200 ¥ 2 ¥ — ¥ — $ 26,767 $ 24
To buy foreign currencies (put):
EURO Accounts receivable–trade . . . . . . 2,200 8 — — 26,767 97
Total . . . . . . . . . . . . . . . . . . . . . . . . . . . . . . . . . . . . . . . . . . . . . . . . ¥ 4,400 ¥ 10 — — $ 53,534 $ 122
Notes: 1. Fair value is calculated based on the currency forward exchange rates prevailing as of March 31, 2012.
Fair value of currency option transactions is provided by the fi nancial institutions with whom the derivative contracts were entered into and agreed.
2. Option premium in currency option transactions is not paid/received because of zero cost option.
(2) Interest Rate-Related Derivatives
Method of hedge accounting: Special treatment of interest rate swap
Millions of yen Thousands of U.S. dollars
2012 2011 2012
Type of derivatives transactions Major hedged items
Contract value
(notional principal
amount) Fair value
Contract value
(notional principal
amount) Fair value
Contract value
(notional principal
amount) Fair value
Interest rate swaps:
Pay fi xed, receive fl oating Long-term loans ¥23,000 (*) ¥23,000 (*) $279,839 (*)
(*) As interest rate swaps used to hedge long-term loans are subject to special accounting treatment under accounting principles generally accepted in Japan, their fair values are
included as a single line item with the hedged underlying liability, long-term loans, and are not included in the above information. (Please see ‘Note 5. FINANCIAL INSTRUMENTS’.)

40
24. STOCK OPTION PLANS The following tables summarize details of stock option plans as of March 31, 2012.
Position and number of grantees Directors and Executive Offi cers: 26
Class and number of stock Common Stock: 194,500
Date of issue August 23, 2005
Condition of settlement of rights No provisions
Period grantees provide service in return for stock options From August 23, 2005 to June 30, 2006
Period stock options can be exercised From August 23, 2005 to June 30, 2025
Position and number of grantees Directors and Executive Offi cers: 23
Class and number of stock Common Stock: 105,500
Date of issue September 1, 2006
Condition of settlement of rights No provisions
Period grantees provide service in return for stock options From September 1, 2006 to June 30, 2007
Period stock options can be exercised From September 2, 2006 to June 30, 2026
Position and number of grantees Directors and Executive Offi cers: 24
Class and number of stock Common Stock: 113,000
Date of issue August 22, 2007
Condition of settlement of rights No provisions
Period grantees provide service in return for stock options From August 22, 2007 to June 30, 2008
Period stock options can be exercised From August 23, 2007 to June 30, 2027
Position and number of grantees Directors and Executive Offi cers: 25
Class and number of stock Common Stock: 128,000
Date of issue August 18, 2008
Condition of settlement of rights No provisions
Period grantees provide service in return for stock options From August 18, 2008 to June 30, 2009
Period stock options can be exercised From August 19, 2008 to June 30, 2028
Position and number of grantees Directors and Executive Offi cers: 25
Class and number of stock Common Stock: 199,500
Date of issue August 19, 2009
Condition of settlement of rights No provisions
Period grantees provide service in return for stock options From August 19, 2009 to June 30, 2010
Period stock options can be exercised From August 20, 2009 to June 30, 2029
Position and number of grantees Directors and Executive Offi cers: 24
Class and number of stock Common Stock: 188,000
Date of issue August 27, 2010
Condition of settlement of rights No provisions
Period grantees provide service in return for stock options From August 27, 2010 to June 30, 2011
Period stock options can be exercised From August 28, 2010 to June 30, 2030
Position and number of grantees Directors and Executive Offi cers: 24
Class and number of stock Common Stock: 239,500
Date of issue August 23, 2011
Condition of settlement of rights No provisions
Period grantees provide service in return for stock options From August 23, 2011 to June 30, 2012
Period stock options can be exercised From August 24, 2011 to June 30, 2031
The following table summarizes price information of stock options
exercised during the period and outstanding stock options as of
March 31, 2012.
Per unit information Exercised
Outstanding at
March 31, 2012
Exercise price of stock options . . . . . . . . . . . . . ¥ 1 ¥ 1
A verage market price of the stock at the time of exercise . . . . . . . . . . . . . . . . . . . . . . . . . . . . . . . . 594 —
Fair value per unit (as of grant date) . . . . . . . 1,358 851
The following table summarizes the movement of outstanding
stock options for the years ended March 31, 2012 and 2011.
Number of Shares
Stock options outstanding at March 31, 2010 . . . . . . . . 681,500
Granted . . . . . . . . . . . . . . . . . . . . . . . . . . . . . . . . . . . . . . . . . . . . . . . . . . . . . . . . . . . 188,000
Exercised . . . . . . . . . . . . . . . . . . . . . . . . . . . . . . . . . . . . . . . . . . . . . . . . . . . . . . . . . 120,500
Forfeited . . . . . . . . . . . . . . . . . . . . . . . . . . . . . . . . . . . . . . . . . . . . . . . . . . . . . . . . . . 2,500
Stock options outstanding at March 31, 2011 . . . . . . . . 746,500
Granted . . . . . . . . . . . . . . . . . . . . . . . . . . . . . . . . . . . . . . . . . . . . . . . . . . . . . . . . . . . 239,500
Exercised . . . . . . . . . . . . . . . . . . . . . . . . . . . . . . . . . . . . . . . . . . . . . . . . . . . . . . . . . 68,000
Forfeited . . . . . . . . . . . . . . . . . . . . . . . . . . . . . . . . . . . . . . . . . . . . . . . . . . . . . . . . . . 2,000
Stock options outstanding at March 31, 2012 . . . . . . . . 916,000
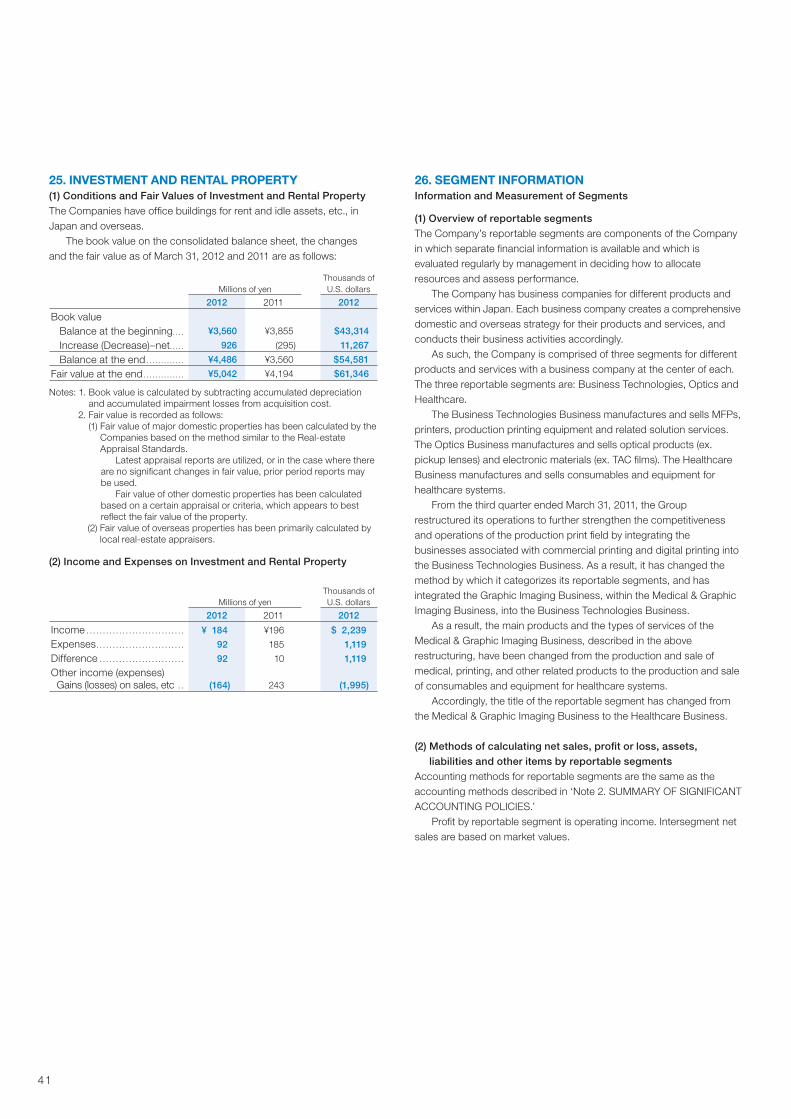
41
25. INVESTMENT AND RENTAL PROPERTY(1) Conditions and Fair Values of Investment and Rental Property
The Companies have offi ce buildings for rent and idle assets, etc., in
Japan and overseas.
The book value on the consolidated balance sheet, the changes
and the fair value as of March 31, 2012 and 2011 are as follows:
Millions of yen
Thousands of
U.S. dollars
2012 2011 2012
Book value
Balance at the beginning . . . . ¥3,560 ¥3,855 $43,314
Increase (Decrease)–net . . . . . 926 (295) 11,267
Balance at the end . . . . . . . . . . . . . ¥4,486 ¥3,560 $54,581
Fair value at the end . . . . . . . . . . . . . . ¥5,042 ¥4,194 $61,346
Notes: 1. Book value is calculated by subtracting accumulated depreciation
and accumulated impairment losses from acquisition cost.
2. Fair value is recorded as follows:
(1) Fair value of major domestic properties has been calculated by the
Companies based on the method similar to the Real-estate
Appraisal Standards.
Latest appraisal reports are utilized, or in the case where there
are no signifi cant changes in fair value, prior period reports may
be used.
Fair value of other domestic properties has been calculated
based on a certain appraisal or criteria, which appears to best
refl ect the fair value of the property.
(2) Fair value of overseas properties has been primarily calculated by
local real-estate appraisers.
(2) Income and Expenses on Investment and Rental Property
Millions of yen
Thousands of
U.S. dollars
2012 2011 2012
Income . . . . . . . . . . . . . . . . . . . . . . . . . . . . . . ¥ 184 ¥196 $ 2,239
Expenses . . . . . . . . . . . . . . . . . . . . . . . . . . . 92 185 1,119
Difference . . . . . . . . . . . . . . . . . . . . . . . . . . 92 10 1,119
Other income (expenses) Gains (losses) on sales, etc . . (164) 243 (1,995)
26. SEGMENT INFORMATIONInformation and Measurement of Segments
(1) Overview of reportable segments
The Company’s reportable segments are components of the Company
in which separate fi nancial information is available and which is
evaluated regularly by management in deciding how to allocate
resources and assess performance.
The Company has business companies for different products and
services within Japan. Each business company creates a comprehensive
domestic and overseas strategy for their products and services, and
conducts their business activities accordingly.
As such, the Company is comprised of three segments for different
products and services with a business company at the center of each.
The three reportable segments are: Business Technologies, Optics and
Healthcare.
The Business Technologies Business manufactures and sells MFPs,
printers, production printing equipment and related solution services.
The Optics Business manufactures and sells optical products (ex.
pickup lenses) and electronic materials (ex. TAC fi lms). The Healthcare
Business manufactures and sells consumables and equipment for
healthcare systems.
From the third quarter ended March 31, 2011, the Group
restructured its operations to further strengthen the competitiveness
and operations of the production print fi eld by integrating the
businesses associated with commercial printing and digital printing into
the Business Technologies Business. As a result, it has changed the
method by which it categorizes its reportable segments, and has
integrated the Graphic Imaging Business, within the Medical & Graphic
Imaging Business, into the Business Technologies Business.
As a result, the main products and the types of services of the
Medical & Graphic Imaging Business, described in the above
restructuring, have been changed from the production and sale of
medical, printing, and other related products to the production and sale
of consumables and equipment for healthcare systems.
Accordingly, the title of the reportable segment has changed from
the Medical & Graphic Imaging Business to the Healthcare Business.
(2) Methods of calculating net sales, profi t or loss, assets,
liabilities and other items by reportable segments
Accounting methods for reportable segments are the same as the
accounting methods described in ‘Note 2. SUMMARY OF SIGNIFICANT
ACCOUNTING POLICIES.’
Profi t by reportable segment is operating income. Intersegment net
sales are based on market values.
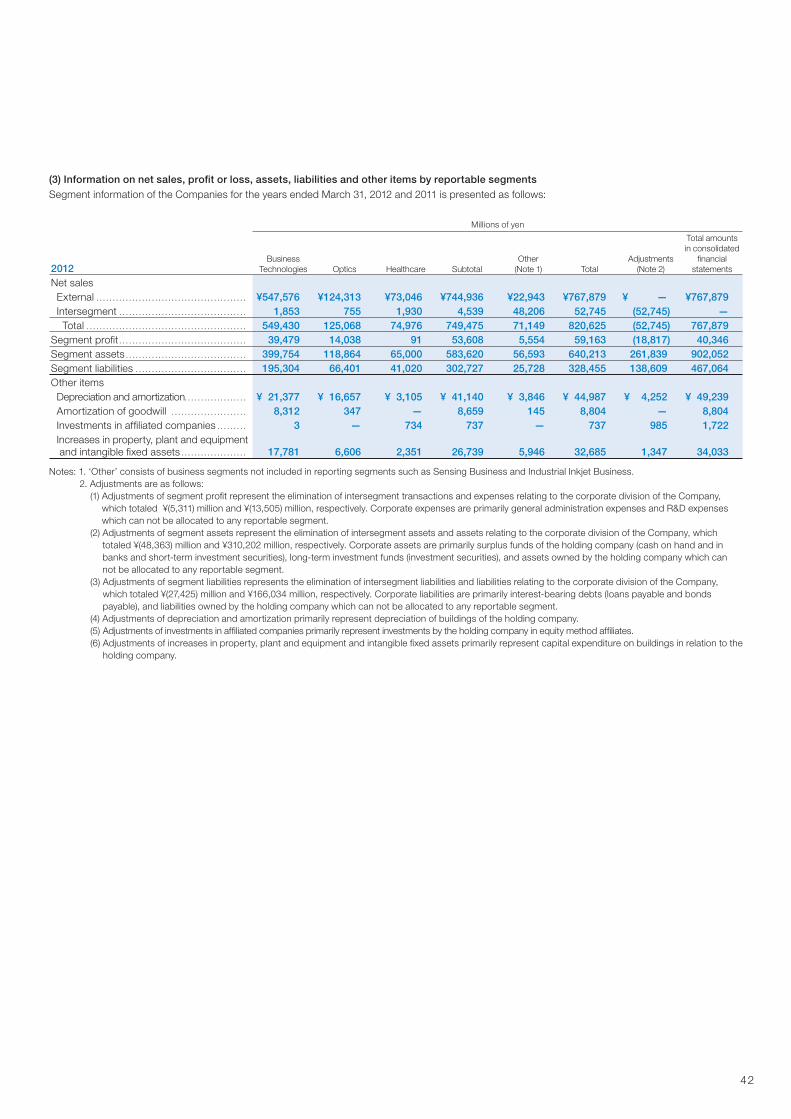
42
(3) Information on net sales, profi t or loss, assets, liabilities and other items by reportable segments
Segment information of the Companies for the years ended March 31, 2012 and 2011 is presented as follows:
Millions of yen
2012Business
Technologies Optics Healthcare Subtotal
Other
(Note 1) Total
Adjustments
(Note 2)
Total amounts
in consolidated
fi nancial
statements
Net sales
External . . . . . . . . . . . . . . . . . . . . . . . . . . . . . . . . . . . . . . . . . . . . . . ¥547,576 ¥124,313 ¥73,046 ¥744,936 ¥22,943 ¥767,879 ¥ — ¥767,879
Intersegment . . . . . . . . . . . . . . . . . . . . . . . . . . . . . . . . . . . . . . . 1,853 755 1,930 4,539 48,206 52,745 (52,745) —
Total . . . . . . . . . . . . . . . . . . . . . . . . . . . . . . . . . . . . . . . . . . . . . . . . . 549,430 125,068 74,976 749,475 71,149 820,625 (52,745) 767,879
Segment profi t . . . . . . . . . . . . . . . . . . . . . . . . . . . . . . . . . . . . . . . 39,479 14,038 91 53,608 5,554 59,163 (18,817) 40,346
Segment assets . . . . . . . . . . . . . . . . . . . . . . . . . . . . . . . . . . . . . 399,754 118,864 65,000 583,620 56,593 640,213 261,839 902,052
Segment liabilities . . . . . . . . . . . . . . . . . . . . . . . . . . . . . . . . . . 195,304 66,401 41,020 302,727 25,728 328,455 138,609 467,064
Other items
Depreciation and amortization . . . . . . . . . . . . . . . . . . . ¥ 21,377 ¥ 16,657 ¥ 3,105 ¥ 41,140 ¥ 3,846 ¥ 44,987 ¥ 4,252 ¥ 49,239
Amortization of goodwill . . . . . . . . . . . . . . . . . . . . . . . 8,312 347 — 8,659 145 8,804 — 8,804
Investments in affi liated companies . . . . . . . . . 3 — 734 737 — 737 985 1,722
Increases in property, plant and equipment and intangible fi xed assets . . . . . . . . . . . . . . . . . . . . 17,781 6,606 2,351 26,739 5,946 32,685 1,347 34,033
Notes: 1. ‘Other’ consists of business segments not included in reporting segments such as Sensing Business and Industrial Inkjet Business.
2. Adjustments are as follows:
(1) Adjustments of segment profi t represent the elimination of intersegment transactions and expenses relating to the corporate division of the Company,
which totaled ¥(5,311) million and ¥(13,505) million, respectively. Corporate expenses are primarily general administration expenses and R&D expenses
which can not be allocated to any reportable segment.
(2) Adjustments of segment assets represent the elimination of intersegment assets and assets relating to the corporate division of the Company, which
totaled ¥(48,363) million and ¥310,202 million, respectively. Corporate assets are primarily surplus funds of the holding company (cash on hand and in
banks and short-term investment securities), long-term investment funds (investment securities), and assets owned by the holding company which can
not be allocated to any reportable segment.
(3) Adjustments of segment liabilities represents the elimination of intersegment liabilities and liabilities relating to the corporate division of the Company,
which totaled ¥(27,425) million and ¥166,034 million, respectively. Corporate liabilities are primarily interest-bearing debts (loans payable and bonds
payable), and liabilities owned by the holding company which can not be allocated to any reportable segment.
(4) Adjustments of depreciation and amortization primarily represent depreciation of buildings of the holding company.
(5) Adjustments of investments in affi liated companies primarily represent investments by the holding company in equity method affi liates.
(6) Adjustments of increases in property, plant and equipment and intangible fi xed assets primarily represent capital expenditure on buildings in relation to the
holding company.

43
Millions of yen
2011Business
Technologies Optics
Healthcare
(Note 2) Subtotal
Other
(Note 1) Total Adjustments
Total amounts
in consolidated
fi nancial
statements
Net sales
External . . . . . . . . . . . . . . . . . . . . . . . . . . . . . . . . . . . . . . . . . . . . . . ¥539,639 ¥129,836 ¥84,990 ¥754,465 ¥23,487 ¥777,953 ¥ — ¥777,953
Intersegment . . . . . . . . . . . . . . . . . . . . . . . . . . . . . . . . . . . . . . . 3,067 799 1,598 5,466 50,451 55,917 (55,917) —
Total . . . . . . . . . . . . . . . . . . . . . . . . . . . . . . . . . . . . . . . . . . . . . . . . . 542,706 130,636 86,589 759,932 73,939 833,871 (55,917) 777,953
Segment profi t . . . . . . . . . . . . . . . . . . . . . . . . . . . . . . . . . . . . . . . 37,457 12,813 171 50,442 5,455 55,898 (15,876) 40,022
Segment assets . . . . . . . . . . . . . . . . . . . . . . . . . . . . . . . . . . . . . 390,299 130,592 61,032 581,924 54,869 636,794 208,659 845,453
Segment liabilities . . . . . . . . . . . . . . . . . . . . . . . . . . . . . . . . . . 196,669 81,952 39,054 317,676 74,413 392,089 24,375 416,465
Other items
Depreciation and amortization . . . . . . . . . . . . . . . . . . . ¥ 24,337 ¥ 21,093 ¥ 3,185 ¥ 48,615 ¥ 2,222 ¥ 50,837 ¥ 4,291 ¥ 55,129
Amortization of goodwill . . . . . . . . . . . . . . . . . . . . . . . . 7,854 402 — 8,256 145 8,401 — 8,401
Investments in affi liated companies . . . . . . . . . 3 — 732 735 — 735 928 1,664
Increases in property, plant and equipment and intangible fi xed assets . . . . 12,960 19,624 3,002 35,587 1,695 37,283 5,699 42,982
Notes: 1. ‘Other’ consists of business segments not included in reporting segments such as Sensing Business and Industrial Inkjet Business.
2. In the year ended March 31, 2011, the segment title of the Medical & Graphic Imaging Business, which was utilized until the fi rst half of the fi scal year, was
changed to the Healthcare Business from to the third quarter. The results of the Healthcare Business for the fi scal year include those of the Medical &
Graphic Imaging Business for the fi rst half.
3. Information calculated based on segment information for the year ended March 31, 2012.
Obtaining the necessary comparative information to prepare segment information for the previous fi scal year or for the year ended March 31, 2012 in
accordance with the effective segment guidance/standard for the year ended March 31, 2012 has proved to be diffi cult. Doing so will impose an
excessive burden on the Company. Furthermore, no such segment information has been reported to management. Considering those reasons and the
utilization of such segment information, we have not disclosed such information except for in regards to external net sales.
If segment information was prepared for the previous fi scal year based on segment information for the year ended March 31, 2012, net sales in the
Business Technologies Business and the Healthcare Business are ¥544,506 million and ¥80,122 million, respectively. Net sales in the Business Technologies
Business include ¥4,867 million of the former Graphic Imaging Business.
Thousands of U.S. dollars
2012Business
Technologies Optics Healthcare Subtotal Other Total Adjustments
Total amounts
in consolidated
fi nancial
statements
Net sales
External . . . . . . . . . . . . . . . . . . . . . . . . . . . . . . . . . . . . . . . . . . . . . . $6,662,319 $1,512,508 $888,746 $9,063,584 $279,146 $9,342,730 $ — $ 9,342,730
Intersegment . . . . . . . . . . . . . . . . . . . . . . . . . . . . . . . . . . . . . . . 22,545 9,186 23,482 55,226 586,519 641,745 (641,745) —
Total . . . . . . . . . . . . . . . . . . . . . . . . . . . . . . . . . . . . . . . . . . . . . . . . . 6,684,877 1,521,694 912,228 9,118,810 865,665 9,984,487 (641,745) 9,342,730
Segment profi t . . . . . . . . . . . . . . . . . . . . . . . . . . . . . . . . . . . . . . . 480,338 170,799 1,107 652,245 67,575 719,832 (228,945) 490,887
Segment assets . . . . . . . . . . . . . . . . . . . . . . . . . . . . . . . . . . . . . 4,863,779 1,446,210 790,850 7,100,864 688,563 7,789,427 3,185,777 10,975,204
Segment liabilities . . . . . . . . . . . . . . . . . . . . . . . . . . . . . . . . . . 2,376,250 807,896 499,087 3,683,258 313,031 3,996,289 1,686,446 5,682,735
Other items
Depreciation and amortization . . . . . . . . . . . . . . . . . . . $ 260,092 $ 202,665 $ 37,778 $ 500,548 $ 46,794 $ 547,354 $ 51,734 $ 599,087
Amortization of goodwill . . . . . . . . . . . . . . . . . . . . . . . . 101,132 4,222 — 105,353 1,764 107,118 — 107,118
Investments in affi liated companies . . . . . . . . . 37 — 8,931 8,967 — 8,967 11,984 20,951
Increases in property, plant and equipment and intangible fi xed assets . . . . 216,340 80,375 28,604 325,332 72,345 397,676 16,389 414,077
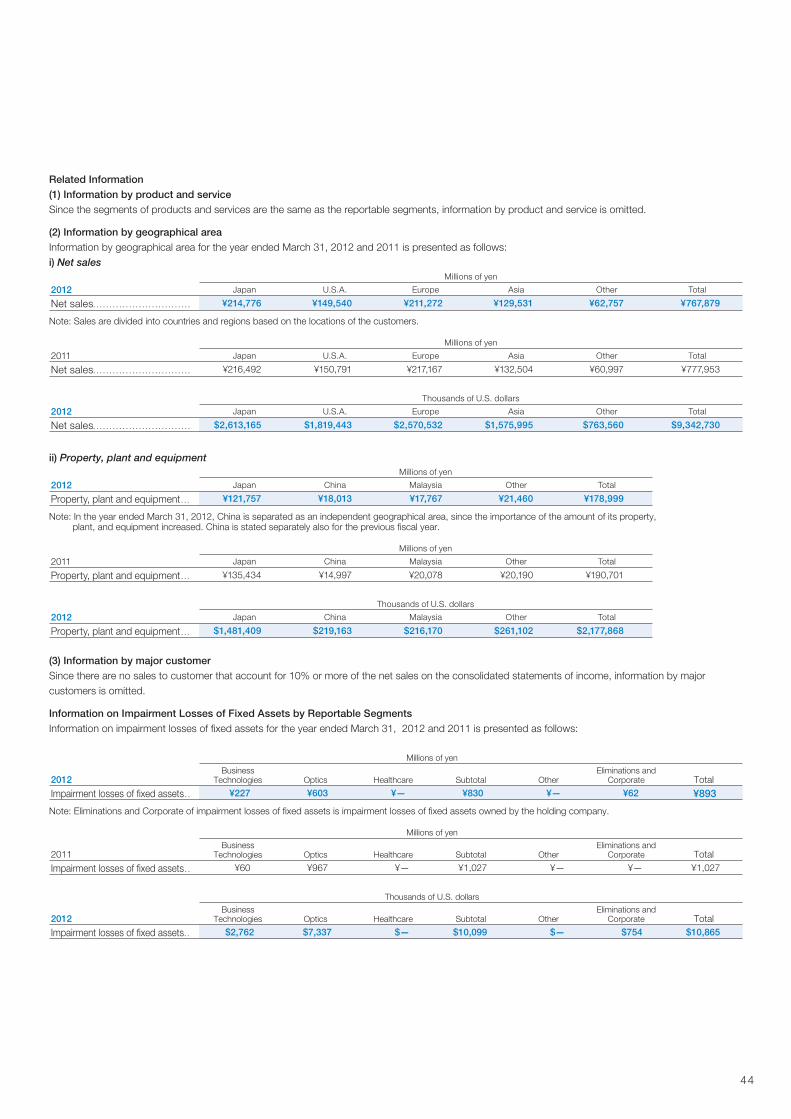
44
Related Information
(1) Information by product and service
Since the segments of products and services are the same as the reportable segments, information by product and service is omitted.
(2) Information by geographical area
Information by geographical area for the year ended March 31, 2012 and 2011 is presented as follows:
i) Net sales
Millions of yen
2012 Japan U.S.A. Europe Asia Other Total
Net sales . . . . . . . . . . . . . . . . . . . . . . . . . . . . . . ¥214,776 ¥149,540 ¥211,272 ¥129,531 ¥62,757 ¥767,879
Note: Sales are divided into countries and regions based on the locations of the customers.
Millions of yen
2011 Japan U.S.A. Europe Asia Other Total
Net sales . . . . . . . . . . . . . . . . . . . . . . . . . . . . . . ¥216,492 ¥150,791 ¥217,167 ¥132,504 ¥60,997 ¥777,953
Thousands of U.S. dollars
2012 Japan U.S.A. Europe Asia Other Total
Net sales . . . . . . . . . . . . . . . . . . . . . . . . . . . . . . $2,613,165 $1,819,443 $2,570,532 $1,575,995 $763,560 $9,342,730
ii) Property, plant and equipment
Millions of yen
2012 Japan China Malaysia Other Total
Property, plant and equipment . . . ¥121,757 ¥18,013 ¥17,767 ¥21,460 ¥178,999
Note: In the year ended March 31, 2012, China is separated as an independent geographical area, since the importance of the amount of its property, plant, and equipment increased. China is stated separately also for the previous fi scal year.
Millions of yen
2011 Japan China Malaysia Other Total
Property, plant and equipment . . . ¥135,434 ¥14,997 ¥20,078 ¥20,190 ¥190,701
Thousands of U.S. dollars
2012 Japan China Malaysia Other Total
Property, plant and equipment . . . $1,481,409 $219,163 $216,170 $261,102 $2,177,868
(3) Information by major customer
Since there are no sales to customer that account for 10% or more of the net sales on the consolidated statements of income, information by major
customers is omitted.
Information on Impairment Losses of Fixed Assets by Reportable Segments
Information on impairment losses of fi xed assets for the year ended March 31, 2012 and 2011 is presented as follows:
Millions of yen
2012Business
Technologies Optics Healthcare Subtotal OtherEliminations and
Corporate Total
Impairment losses of fi xed assets . . ¥227 ¥603 ¥— ¥830 ¥— ¥62 ¥893
Note: Eliminations and Corporate of impairment losses of fi xed assets is impairment losses of fi xed assets owned by the holding company.
Millions of yen
2011Business
Technologies Optics Healthcare Subtotal OtherEliminations and
Corporate Total
Impairment losses of fi xed assets . . ¥60 ¥967 ¥— ¥1,027 ¥— ¥— ¥1,027
Thousands of U.S. dollars
2012Business
Technologies Optics Healthcare Subtotal OtherEliminations and
Corporate Total
Impairment losses of fi xed assets . . $2,762 $7,337 $— $10,099 $— $754 $10,865

45
Information on Amortization of Goodwill and Balance of Goodwill by Reportable Segments
Information on amortization of goodwill and balance of goodwill for the years ended March 31, 2012 and 2011 is presented as follows:
Millions of yen
2012Business
Technologies Optics Healthcare Subtotal OtherEliminations and
Corporate Total
Amortization of goodwill . . . . . . . . . . ¥ 8,312 ¥ 347 ¥— ¥ 8,659 ¥ 145 ¥— ¥ 8,804
Balance of goodwill . . . . . . . . . . . . . . . . 54,694 3,355 — 58,050 1,677 — 59,727
Note: ‘Other’ consists of business segments not included in reporting segments such as Sensing Business.
Millions of yen
2011Business
Technologies Optics Healthcare Subtotal OtherEliminations and
Corporate Total
Amortization of goodwill . . . . . . . . . . ¥ 7,854 ¥ 402 ¥— ¥ 8,256 ¥ 145 ¥— ¥ 8,401
Balance of goodwill . . . . . . . . . . . . . . . . 57,621 3,702 — 61,323 1,822 — 63,146
Thousands of U.S. dollars
2012Business
Technologies Optics Healthcare Subtotal OtherEliminations and
Corporate Total
Amortization of goodwill . . . . . . . . . . $101,132 $ 4,222 $— $105,353 $ 1,764 $— $107,118
Balance of goodwill . . . . . . . . . . . . . . . . 665,458 40,820 — 706,290 20,404 — 726,694
Information on Gain on Negative Goodwill by Reportable Segments
None.
27. NET INCOME PER SHARECalculations of net income per share for the years ended March 31, 2012 and 2011 are as follows:
Millions of yen
Thousands of
U.S. dollars
2012 2011 2012
Net income:
Income attributable to common shares . . . . . . . . . . . . . . . . . . . . . . . . . . . . . . . . . . . . . . . . . . . . . . . . . . . . . . . . . . . . . . . ¥20,424 ¥25,896 $248,497
Income available to common stockholders . . . . . . . . . . . . . . . . . . . . . . . . . . . . . . . . . . . . . . . . . . . . . . . . . . . . . . . . . . 20,424 25,896 248,497
Thousands of shares
2012 2011
Weighted average number of common shares outstanding:
Basic . . . . . . . . . . . . . . . . . . . . . . . . . . . . . . . . . . . . . . . . . . . . . . . . . . . . . . . . . . . . . . . . . . . . . . . . . . . . . . . . . . . . . . . . . . . . . . . . . . . . . . . . . . . . 530,254 530,222
Diluted . . . . . . . . . . . . . . . . . . . . . . . . . . . . . . . . . . . . . . . . . . . . . . . . . . . . . . . . . . . . . . . . . . . . . . . . . . . . . . . . . . . . . . . . . . . . . . . . . . . . . . . . . . 547,896 547,723
Yen U.S. dollars
2012 2011 2012
Net income per common share:
Basic . . . . . . . . . . . . . . . . . . . . . . . . . . . . . . . . . . . . . . . . . . . . . . . . . . . . . . . . . . . . . . . . . . . . . . . . . . . . . . . . . . . . . . . . . . . . . . . . . . . . . . . . . . . . ¥38.52 ¥48.84 $0.47
Diluted . . . . . . . . . . . . . . . . . . . . . . . . . . . . . . . . . . . . . . . . . . . . . . . . . . . . . . . . . . . . . . . . . . . . . . . . . . . . . . . . . . . . . . . . . . . . . . . . . . . . . . . . . . 37.28 47.28 0.45
28. SIGNIFICANT SUBSEQUENT EVENTSChange in reportable segments
In the consolidated fi scal year ended March 31, 2012, the Company’s reportable segments within the segmental information disclosure are the
Business Technologies Business, Optics Business, and Healthcare Business. However, following the reorganization of the Companies in April 2012,
reportable segments will be revised to the Business Technologies Business, Industrial Business, and Healthcare Business.
The revision in the business segments disclosure of the Companies will not affect total consolidated net sales, income, assets and liabilities, or other
fi nancial data.

46
Independent Auditor’s Report

KONICA MINOLTA HOLDINGS, INC. JP TOWER, 2-7-2 Marunouchi, Chiyoda-ku, Tokyo 100-7015, JapanTel (81) 3-6250-2111 http://konicaminolta.com