Embed Size (px)
Citation preview


annual report 2010
1
Board of Directors
Non-Executive Directors Executive Directors
Chairman Chief Operating OfficerS. M. Datta r. Kirpalani
Vice-Chairmann. K. Kshatriya
Directors Directorsr. Gopalakrishnan S. Malekar
r. Hewins S. Vaidya
S. Mukundan
D. S. parekh
H. McCabe – Alternate to R. Hewins
General Manager – Legal & Company Secretarya. H. Mody
BankersDeutsche Bank
HDFC Bank ltd.
the Hongkong & Shanghai Banking Corporation ltd.
State Bank of India
Citibank n.a.
Solicitors & AdvocatesCrawford Bayley & Co.
Dhru & Co.
udwadia & udeshi
AuditorsS. r. Batliboi & Co.
Registered Officetechnopolis Knowledge park
Mahakali Caves road, andheri (east)
Mumbai 400 093.
Share DepartmenttSr Darashaw limited(formerly known as tata Share registry limited)
unit: Castrol India limited
6-10, Haji Moosa patrawala Industrial estate,
20, Dr. e. Moses road,
Mahalaxmi, Mumbai 400 011.
CASTROL INDIA LIMITED
Board of Dir.indd 1 4/30/2011 10:08:18 aM

Riding on the passion and excitement created by
Castrol’s global sponsorship of the FIFA 2010 World
CupTM, a consumer promotion campaign for Castrol
Power1 offered consumers the opportunity to meet
Cristiano Ronaldo, one of the world’s leading
footballers, in Spain
Castrol Activ, India’s largest selling 4T motorcycle oil was relaunched with
‘improved protection’ formula in a new ‘secure seal’ pack
Sanjeevani, an intensive consumer contact program has reached
out to over one million tractor owners to bring alive the benefits of
Castrol CRB
STRONG BRANDS

A consumer promotion for Castrol Edge, a premium synthetic
engine oil created to perform under extreme conditions, enabled
select consumers to win a ‘Castrol Edge Experience’ at
Nurburgring - the toughest racing circuit in the world
Castrol Golden Edge Club - a special initiative for high performing
dealers promoting synthetic brands like Castrol Edge and Castrol
Magnatec, has been launched across major cities in India
A delighted Castrol consumer poses with his Nano car
which was driven to Khardungla - the highest motorable
road in the world, on Castrol Compact, a high
performance engine oil, co-engineered for Tata Nano
Castrol’s high performance range of Specialty Products was redesigned
globally and relaunched in India to offer consumers high performance
products and ease of choice

CASAs (Castrol Authorised Service Associates) enable Castrol to
reach out to smaller independent mechanics mainly in remote
locations and rural markets
A major retail signalization program was
undertaken to announce Castrol’s
partnership with ICC (International Cricket
Council) and to promote the Castrol ‘World
Cup ka Hero’ consumer program
Castrol Pitstops are multi-brand
car workshops trained and
equipped by Castrol
Castrol offers small and mid-size motorcycle service centres
the opportunity to upgrade their workshops through offer of
equipment and mechanic training. Castrol now has a vast
network of Castrol BikePoints which offer convenience of
multi-brand bike service to consumers
REACHING OUT

Castrol CRB Prima is specially recommended by Mahindra
Tractors. The longer drain intervals of Castrol CRB Prima were
extensively communicated to tractor owners through Mahindra
Service Camps and Workshops
Castrol has a strong global partnership with Volkswagen Group which
continues in India as well. Picture shows Castrol branded car participating in
the VW Polo Cup Racing championship
Continuing to build on its strong global relationships with
Volkswagen Group, Castrol signed a new three year partnership
agreement with Skoda Auto in India. Picture shows Thomas Kuehl,
Member of the board, Sales & Marketing, Skoda Auto India (on
left) with Ravi Kirpalani, Automotive Director & COO, Castrol India
Tata Motors and Castrol enjoy a strong and
enduring relationship built over a decade.
Picture shows senior leaders of the two teams
after signing a five year renewal agreement
‘Progress with Prima’ is an innovative workshop program
designed for Mahindra dealers aimed at enhancing their
productivity, service quality and customer satisfaction levels.
Picture shows a Mahindra dealer signing up for the initiative
ENDURINGRELATIONSHIPS
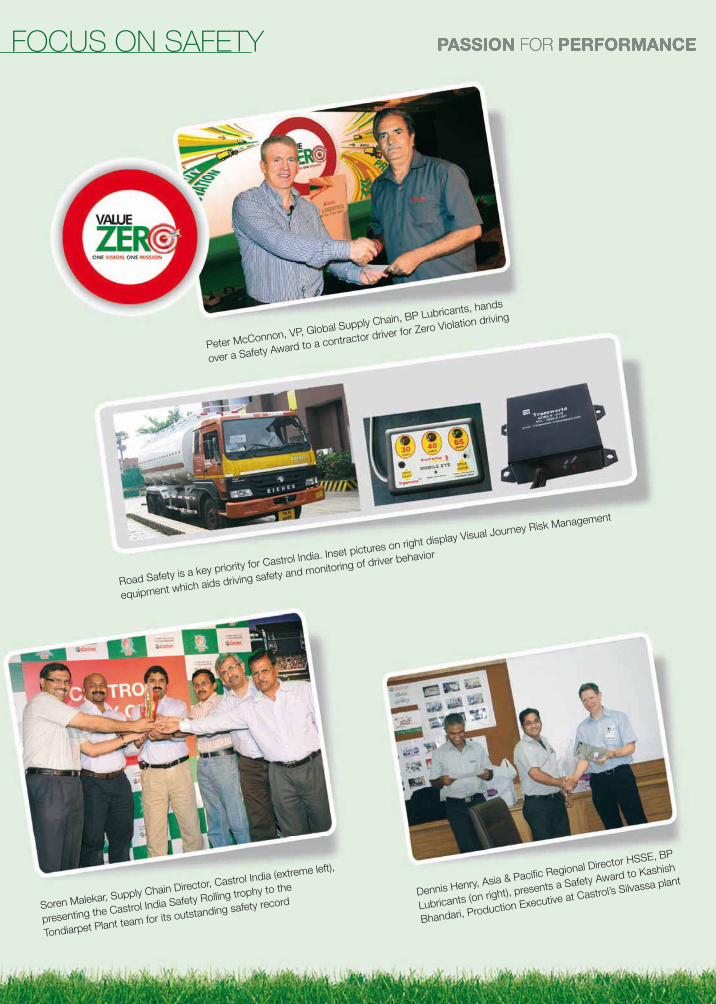
Soren Malekar, Supply Chain Director, Castrol India (extreme left),
presenting the Castrol India Safety Rolling trophy to the
Tondiarpet Plant team for its outstanding safety recordDennis Henry, Asia & Pacific Regional Director HSSE, BP
Lubricants (on right), presents a Safety Award to Kashish
Bhandari, Production Executive at Castrol’s Silvassa plant
Road Safety is a key priority for Castrol India. Inset pictures on right display Visual Journey Risk Management
equipment which aids driving safety and monitoring of driver behavior
FOCUS ON SAFETY
Peter McConnon, VP, Global Supply Chain, BP Lubricants, hands
over a Safety Award to a contractor driver for Zero Violation driving
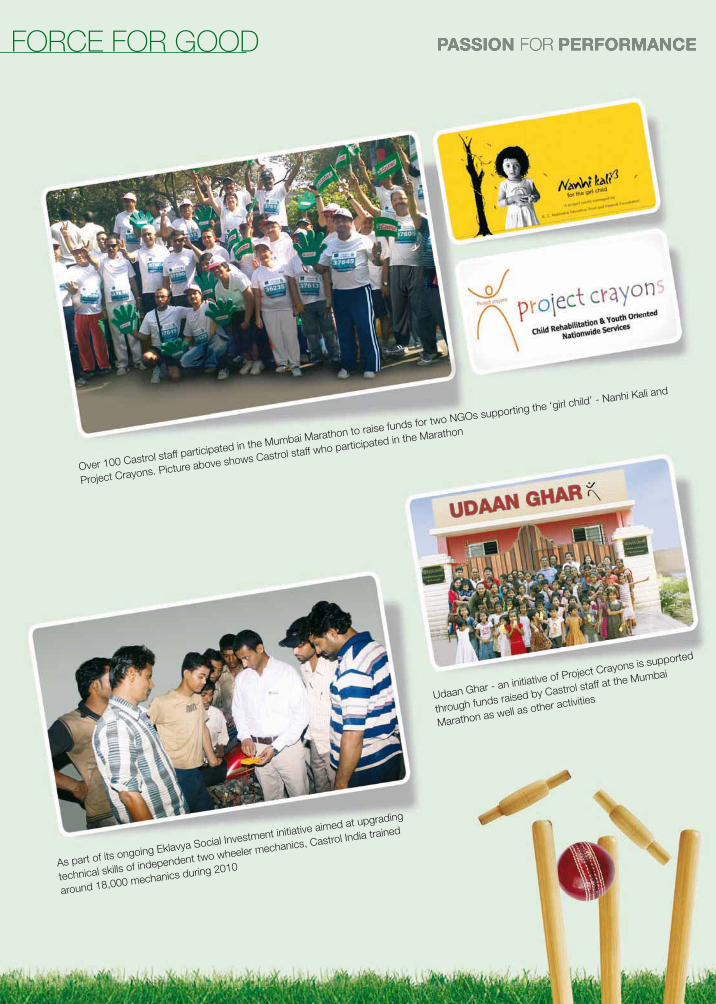
FORCE FOR GOOD
Over 100 Castrol staff participated in the Mumbai Marathon to raise funds for two NGOs supporting the ‘girl child’ - Nanhi Kali and
Project Crayons. Picture above shows Castrol staff who participated in the Marathon
Udaan Ghar - an initiative of Project Crayons is supported
through funds raised by Castrol staff at the Mumbai
Marathon as well as other activities
As part of its ongoing Eklavya Social Investment initiative aimed at upgrading
technical skills of independent two wheeler mechanics, Castrol India trained
around 18,000 mechanics during 2010

Passion for CricketAs the Official Performance Partner of the ICC, Castrol India strengthened its association with cricket through exciting and innovative consumer promotions, digital activation and advertising driven by an impressive array of Brand Ambassadors


12
FINANCIALS
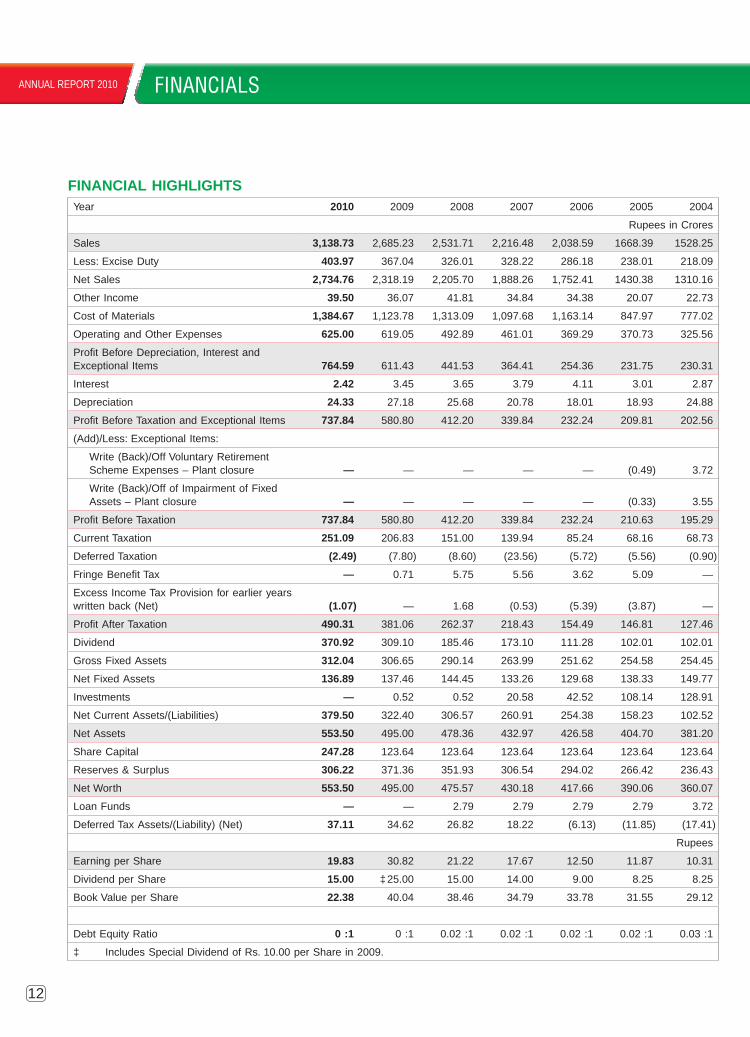
Year 2010 2009 2008 2007 2006 2005 2004
Rupees in Crores
Sales 3,138.73 2,685.23 2,531.71 2,216.48 2,038.59 1668.39 1528.25
Less: Excise Duty 403.97 367.04 326.01 328.22 286.18 238.01 218.09
Net Sales 2,734.76 2,318.19 2,205.70 1,888.26 1,752.41 1430.38 1310.16
Other Income 39.50 36.07 41.81 34.84 34.38 20.07 22.73
Cost of Materials 1,384.67 1,123.78 1,313.09 1,097.68 1,163.14 847.97 777.02
Operating and Other Expenses 625.00 619.05 492.89 461.01 369.29 370.73 325.56
Profit Before Depreciation, Interest and Exceptional Items 764.59 611.43 441.53 364.41 254.36 231.75 230.31
Interest 2.42 3.45 3.65 3.79 4.11 3.01 2.87
Depreciation 24.33 27.18 25.68 20.78 18.01 18.93 24.88
Profit Before Taxation and Exceptional Items 737.84 580.80 412.20 339.84 232.24 209.81 202.56
(Add)/Less: Exceptional Items:
Write (Back)/Off Voluntary Retirement Scheme Expenses – Plant closure — — — — — (0.49) 3.72
Write (Back)/Off of Impairment of Fixed Assets – Plant closure — — — — — (0.33) 3.55
Profit Before Taxation 737.84 580.80 412.20 339.84 232.24 210.63 195.29
Current Taxation 251.09 206.83 151.00 139.94 85.24 68.16 68.73
Deferred Taxation (2.49) (7.80) (8.60) (23.56) (5.72) (5.56) (0.90)
Fringe Benefit Tax — 0.71 5.75 5.56 3.62 5.09 —
Excess Income Tax Provision for earlier years written back (Net) (1.07) — 1.68 (0.53) (5.39) (3.87) —
Profit After Taxation 490.31 381.06 262.37 218.43 154.49 146.81 127.46
Dividend 370.92 309.10 185.46 173.10 111.28 102.01 102.01
Gross Fixed Assets 312.04 306.65 290.14 263.99 251.62 254.58 254.45
Net Fixed Assets 136.89 137.46 144.45 133.26 129.68 138.33 149.77
Investments — 0.52 0.52 20.58 42.52 108.14 128.91
Net Current Assets/(Liabilities) 379.50 322.40 306.57 260.91 254.38 158.23 102.52
Net Assets 553.50 495.00 478.36 432.97 426.58 404.70 381.20
Share Capital 247.28 123.64 123.64 123.64 123.64 123.64 123.64
Reserves & Surplus 306.22 371.36 351.93 306.54 294.02 266.42 236.43
Net Worth 553.50 495.00 475.57 430.18 417.66 390.06 360.07
Loan Funds — — 2.79 2.79 2.79 2.79 3.72
Deferred Tax Assets/(Liability) (Net) 37.11 34.62 26.82 18.22 (6.13) (11.85) (17.41)
Rupees
Earning per Share 19.83 30.82 21.22 17.67 12.50 11.87 10.31
Dividend per Share 15.00 ‡ 25.00 15.00 14.00 9.00 8.25 8.25
Book Value per Share 22.38 40.04 38.46 34.79 33.78 31.55 29.12
Debt Equity Ratio 0 :1 0 :1 0.02 :1 0.02 :1 0.02 :1 0.02 :1 0.03 :1
‡ Includes Special Dividend of Rs. 10.00 per Share in 2009.
FINANCIAL HIGHLIGHTS
ANNuAL REPORT 2010
Financial.indd 12 4/30/2011 10:11:38 AM

annual report 2010 annual report 2010
13
DIRECTORS’ REPORT
REPORT OF THE DIRECTORS FOR THE YEAR ENDED 31ST DECEMBER, 2010
the Directors have pleasure in presenting their report and Statement of accounts for the year ended
31st December, 2010.
For the year ended 31st December, 2010
(Rupees in Crores)
For the year ended
31st December, 2009
(rupees in Crores)
FINANCIAL RESULTS
Profit before Depreciation, Exceptional Items & Tax 762.17 607.98
Deducting therefrom:
Depreciation 24.33 27.18
provision for tax
Current [Including Wealth tax of Rs. 0.16 Crore
(2009: rs. 0.16 Crore)] 251.09 206.83
Deferred taxation (2.49) (7.80)
Fringe Benefit tax — 0.71
excess Income tax provision for earlier years written back (1.07) —
Profit after Tax 490.31 381.06
adding thereto:
Balance as per last Balance Sheet brought forward 31.18 50.75
profit available for appropriation 521.49 431.81
The appropriations are:
Dividend
Interim 173.10 123.64
Final 197.82 61.82
Special — 123.64
tax on Dividend
Interim 28.75 21.01
Final 32.86 10.51
Final 2009 (0.24) —
Special – 2009 (0.48) 21.01
transfer to General reserve 49.03 39.00
Balance carried forward 40.65 31.18
521.49 431.81
Directors-1.indd 13 5/7/2011 10:20:08 aM

annual report 2010
14
annual report 2010 annual report 2010DIRECTORS’ REPORT
PERFORMANCE
Sales increased by 18% over the previous year to
rs. 2735 crores mainly due to an increase in unit sales
realizations and higher volumes.
Costs of materials have increased by 23% over the
previous year to rs.1385 crores due to an increase in
Base oil prices and higher volumes.
pro-active Cost Containment Strategies helped your
Company to grow its gross profits by 13%.
operating & other expenses increased by rs. 6 Crores
only compared to 2009, though there was an increase
in spend on advertisement & Sales promotion
expenses by rs. 13 Crores, the same being offset
by savings in processing charges and miscellaneous
expenditure.
profit before tax increased by 27% over the previous
year to rs. 738 Crores.
tax rate for the current year has remained at nearly
the same level as that of the previous year. profit
after tax increased by 29% over the previous year to
rs. 490 Crores.
BONUS SHARES
as the members are aware, the Board of Directors
had recommended, subject to the approval of the
shareholders, one Bonus equity Share for every
one equity Share of rs. 10/- each held on the
record Date. accordingly, the approval of the
shareholders was obtained by way of a postal Ballot
on 30th March, 2010. the Bonus Shares were
thereafter allotted on 13th april, 2010.
CORPORATE GOVERNANCE
pursuant to Clause 49 of the listing agreement, a
Management Discussion and analysis report and
a report on Corporate Governance are given as
annexure ‘a’ and ‘B’ respectively to this report.
a certificate from the Statutory auditors of the Company
regarding the Compliance by the Company of the
conditions stipulated under clause 49 of the listing
agreement is also attached to this report.
the declaration by the Chief operating officer pursuant
to clause 49(1) (ii) of the listing agreement stating
that all the Board Members and Senior Management
personnel have affirmed their compliance with the
Company’s Code of Conduct for the year ended 31st
December, 2010 is also attached to this report and
marked annexure “C”.
DIRECTORS’ RESPONSIBILITY STATEMENT
as required under Section 217 (2aa) of the Companies
act, 1956 your Directors confirm that:
(i) In the preparation of the annual accounts, the
applicable accounting standards have been
followed and no material departures have been
made from the same.
(ii) the Directors have selected such accounting
policies and applied them consistently and made
judgments and estimates that are reasonable
and prudent so as to give a true and fair view of
the state of affairs of the Company as on 31st
December, 2010 and of the profits of the Company
for the year ended 31st December, 2010.
(iii) the Directors have taken proper and sufficient
care for the maintenance of adequate accounting
records in accordance with the provisions of the
Companies act, 1956 for safeguarding the assets
of the Company and for preventing and detecting
fraud and other irregularities.
(iv) the Directors have prepared the annual accounts
on a going concern basis.
DIVIDEND
the Interim Dividend in respect of the year ended
31st December, 2010 of rs. 7/- per share on
Directors-1.indd 14 5/7/2011 10:20:08 aM

annual report 2010annual report 2010 annual report 2010
15
DIRECTORS’ REPORT
24,72,80,596 equity Shares was paid to the
Shareholders of the Company whose names appeared
on the register of Members on 2nd august, 2010.
the Directors recommend a payment of final dividend
of rs. 8/- per share on 24,72,80,596 equity Shares.
DIRECTORS
Mr. amish Mehta resigned with effect from close
of business hours of 15th november, 2010 as the
Wholetime Director of the Company designated as
Director – Finance.
Mr Sujit Vaidya was at the Board Meeting held on
12th october, 2010 and was appointed with effect
from the said date as an additional Director of the
Company. at the said Board Meeting, he was also
appointed with effect from 16th november, 2010 as
a Wholetime Director of the Company designated as
Director – Finance.
In accordance with section 260 of the Companies
act, 1956 (the act), Mr. Vaidya holds office up to the
date of the forthcoming annual General Meeting of
the Company. notice has been received under section
257 of the act along with the requisite deposit from a
shareholder proposing Mr. Vaidya as a candidate for
the office of Director.
Your Directors wish to place on record their
gratitude for the guidance and advice received from
Mr. Mehta during his tenure as a Director of the
Company.
Mr. r. Gopalakrishnan and Mr. S. Malekar retire by
rotation and are eligible for re-appointment.
the information on the particulars of Directors
seeking appointment/re-appointment as required
under Clause 49 of the listing agreement executed
with the Bombay Stock exchange limited and the
national Stock exchange of India limited have been
given under Corporate Governance (annexure ‘B’) of
this report.
CONSERVATION OF ENERGY
(a) Energy conservation measures taken:
energy conservation during the financial year has
accrued as a result of the following steps taken at
the various factories of the Company:
Patalganga:
1. tube lights were replaced with compact
fluorescent lamps
2. Variable Frequency Drives have been installed
on pumps.
3. energy savers have been installed on air
conditioners.
4. auto on /off system provided for street lighting
with day light sensor.
Silvassa:
1. Installation of Variable Frequency Drive for
transfer and filling pumps.
2. automatic stoppage of blending agitators on
completion of blending recipe.
Paharpur:
1. automation of power factor panel to ensure
high power factor close to one.
2. optimising the thermopack efficiency by
preventive maintenance.
3. Installation of solar lighting panel for street
lights during the night.
4. Variable Frequency Drives installed for air
compressor & thermopack pump which has
led to energy efficiency.
5. replacement of pumps with energy efficient
pumps.
6. optimising blending temperature of products
which helped reduce energy consumption.
Directors-1.indd 15 5/7/2011 10:20:08 aM

annual report 2010
16
annual report 2010 annual report 2010DIRECTORS’ REPORT
(b) Additional Investments and proposals, if any, being implemented for reduction of consumption of energy.
the measure mentioned in (a) above have led to
reduction in fuel and electricity consumption as
well as improvement in the productivity.
Further energy efficient luminaries have been
installed in the laboratory, supply and dispatch
area.
(c) Impact of measures at (a) and (b) above for reduction of energy consumption and the consequent impact on the cost of production of goods.
the measure mentioned above have led to
reduction in fuel and electricity consumption as
well as improvement in the productivity.
TECHNOLOGY ABSORPTION
1. Site Safety and Security continued to remain
an area of focus at the technology Centre. the
technology Centre transitioned into the “operating
Management System” with a management of
change to align with Global Standards.
2. the year 2010 was a year of site upgradation for
the technology Centre. the focus on safety at all
levels ensured that your Company completed the
year without a single incident.
3. the research & Development centre was
recertified to the latest ISo specification of
9001 – 2008.
4. Huge emphasis was laid on technology protection
and alignment with global requirements by ensuring
that all product formulations and raw materials
have global codes and are entered in databases
like Streamline and Fusion.
5. Your Company secured business for various new
products with oeM’s in India to further strengthen
its partnership (tata nano, Mahindra & Mahindra,
Maruti etc.).
6. Various products were launched throughout
the year with superior properties and stronger
differentiations. Some key launches were
Magnatec 5W-30 and rX CnG. Work is already
in progress to make sure your Company has the
pipeline managed for product launches throughout
the years 2011 and 2012.
7. Formulation optimization initiatives by technology
team with support from Supply Chain and
Marketing was an area of focus, which brought
about significant savings in raw material costs as
well help to manage the security of supplies for
our raw materials.
8. Your Company has developed and installed
“truck Driving Simulator” at their technology
Centre to meet increasing requirement for fuel
economy and safe driving in India. the project,
costing rs. 4.8 million is aimed at providing
such training to drivers. Fuel economy is a key
development area for all the oeM’s but limitations
are being faced in significantly improving the
same by conventional means. a two hour training
session of drivers can improve their driving
habits resulting in fuel efficient and safe driving
contributing to cleaner environment and reduced
number of accidents.
FOREIGN EXCHANGE EARNINGS AND OUTGO
1. Activities relating to Export
there were no significant exports by the Company
during the year. However, some of the countries
where our products were exported were China,
Saudi arabia, and thailand.
2. Earnings and Outgo
Members are requested to refer to note nos. 18 &
19 and of Schedule l forming part of the Balance
Sheet and profit and loss account for the year
ended 31st December, 2010.
Directors-1.indd 16 5/7/2011 10:20:08 aM

annual report 2010annual report 2010 annual report 2010
17
DIRECTORS’ REPORT
PARTICULARS OF EMPLOYEES
the information required to be published under the
provisions of section 217(2a) of the Companies act,
1956 (the act) read with Companies (particulars of
employees) rules, 1975 as amended, forms part of
this report.
AUDITORS
the Shareholders of the Company are requested
to appoint auditors and to fix their remuneration.
M/s. S. r. Batliboi & Co., Chartered accountants,
the retiring auditors have furnished to the Company
the required certificate under section 224(1B) of
the Companies act, 1956 and are therefore eligible for
re-appointment as auditors of the Company.
PERSONNEL
the Board wishes to place on record its sincere
appreciation of the efforts put in by the Company’s
workers, staff and executives for achieving excellent
results under difficult conditions.
STAKEHOLDERS
the Board also wishes to thank its Shareholders,
Distributors, Bankers and other business associates
for their support during the year.
on behalf of the Board of Directors
n. K. Kshatriya r. Kirpalani Vice Chairman Director – Automotive & Chief Operating Officer
S. Malekar S. Vaidya Director – Supply Chain Director – Finance
Mumbai
Dated: 27th April, 2011
Directors-1.indd 17 5/7/2011 10:20:08 aM

18
annual report 2010 DIRECTORS’ REPORTannual report 2010 annual report 2010
ANNEXURE A
MANAGEMENT DISCUSSION & ANALYSIS REPORT
pursuant to Clause 49 of the listing agreement, a
Management Discussion & analysis report covering
segment-wise performance and outlook is given
below:
(A) Industry structure and developments – 2010
the lubricant industry in India is broadly divided into
three major market sectors: automotive, Industrial and
Marine & energy applications. the industry is led by
four major players (Castrol India limited, Indian oil
Corporation limited, Bharat petroleum Corporation
limited and Hindustan petroleum Corporation limited)
who contribute to approximately 70% of the market.
there are numerous players, including global players,
operating in the remaining 30% of the market, leading
to a highly competitive scenario.
the automotive industry saw very good growth in
2010. the growth was across categories, with the
passenger vehicles segment growing by over 29% and
the commercial vehicles segment growing by 28%. It
is believed this upward trend will be sustained in the
foreseeable future due to a strong domestic market
and increased thrust on exports.
the luxury car segment has taken off substantially in
the last three years and current data suggests demand
will be sustained in the long term. additionally, the
automobile industry is yet to fully tap into demand from
rural areas but most original equipment Manufacturers
(oeMs) are targeting the rural customer and there
has been a gradual but steady growth in demand for
passenger vehicles from these areas. rural markets
and the luxury car segment are expected to play a
significant role as the Indian automobile industry seeks
to double total sales over the next decade.
India is truly emerging as a global hub for compact cars
with almost every oeM wanting to have a presence
in this segment. Interestingly for Castrol, its global
partners Ford and Volkswagen successfully launched
their small car offerings Figo and polo in the Indian
market.
Castrol extended its strong partnerships with leading
automotive oeMs by tying up with Skoda India. this
tie up will benefit the synthetic segment of our portfolio.
With more global oeMs coming into India, this trend
presents us with strong partnership opportunities in
2011 and beyond.
Major industry developments
1. Economic scenario
the global economy has seen a revival with the outlook
across north america and europe improving. While
growth continues to be strong in asia, many countries,
including India, have seen inflation rising and emerging
as a threat to the growth outlook in the medium term.
to combat inflation, driven by economic recovery and
rising commodity prices, the reserve Bank of India has
continuously raised interest rates.
In India, inflation has now spread from agricultural
commodities to manufactured goods, with the outlook
remaining at an elevated 7-8%.
on the back of a global recovery, exports from India
are up and employment outlook is strong, putting
more people into the job market and providing more
purchasing power to prospective vehicle owners.
annex a.indd 18 5/7/2011 10:32:53 aM

annual report 2010
19
annual report 2010 annual report 2010 DIRECTORS’ REPORT
While demand for automobiles continues to remain
strong, rising commodity prices and interest rates could
temper growth rates. Most forecasts for automobile
sales range between 12-16%.
2. Crude oil
the buoyancy in crude oil prices was the key
economic driver in 2010 for lubricant input materials.
the supply and demand dynamics in favor of the latter
also influenced significant inflation in input materials.
the year saw considerable fluctuation in the foreign
exchange rates of the uS Dollar versus the Indian
rupee and as a consequence, price stability was short
lived.
the graph below depicts the trend of crude prices
and the exchange rate between the uS Dollar and the
Indian rupee in the year 2010.
the asia and pacific region has seen a robust growth
in the demand for base oils, led largely by China and
India. a number of refinery shutdowns in the region,
planned and unplanned – some for prolonged periods,
put pressure on supply. this coupled with rising crude
price, put pressure on refining margins and resulted in
prices of base oils moving up by over 25% during the
course of the year.
While the performance additives and chemicals
category witnessed more than a double digit hike in
prices on account of growing demand and rise in
crude oil prices, the impact on commodity chemicals,
solvents and refinery products was significantly higher
at 35% over the last year.
unseasonal rains in most parts of the country
leading to crop failures created a demand supply
imbalance in dependant commodity categories such
as vegetable oils and derivatives. a rising trend in
steel prices also impacted prices of metal drums
adversely.
Your Company recognized the challenge of inflation
and has kept a strong focus on strategic sourcing
decisions. these included creation of alternative
sources of supply, a focus on value engineering and
working closely with key supplier partners. there
was a considerable focus on value based inventory
management which helped achieve balanced service
and cash release.
Market behavior and outlook
Automotive sector outlook
the automotive lubricants sector can be segmented as
per the following vehicle categories:
(a) trucks, tractors and off-road equipment – mainly
diesel engine oils
(b) passenger cars – mainly gasoline engine oils
(c) Motorcycles and three wheelers – two stroke and
four stroke oils
annex a.indd 19 5/7/2011 10:32:55 aM

20
annual report 2010 DIRECTORS’ REPORTannual report 2010 annual report 2010
1. Market growth: the year 2010 was a year of
robust recovery for the automotive lubricant market.
the market is estimated to have grown volumes by
4-5%. this has been led by growth across categories,
but primarily by the increased four stroke motorcycle
and passenger car sales, recovery in agri-driven
lubricants consumption and a growing new generation,
high technology, truck segment. these trends are
expected to continue in 2011. the old generation truck
market and the two stroke motorcycle lubes market
are projected to continue declining.
the building & construction segment and the mining
segment, feeding the infrastructure sector, are also
expected to continue growing at a fast pace. thus,
lubricant consumption is projected to grow robustly in
passenger cars, four stroke motorcycles, building &
construction equipment and mining sectors.
the monsoon in 2010 was substantial. Given good
monsoon and extended winters, it is expected that
better ground levels of water would facilitate a good
summer agriculture season. overall in 2011, the
lubricant market is projected to grow at around 3-4%
in volume terms.
2. Channels: With the burgeoning growth of
the vehicle industry, especially passenger cars,
two-wheelers and micro lCVs (light Commercial
Vehicles), almost all distribution channels have seen
a growth in recent times. While the traditional retail
channel continues to be dominant, oeM dealerships
and authorized workshops registered a faster pace
of growth on the back of higher vehicle sales and
higher retention period of vehicle servicing at the oeM
authorized workshops. However, since the growth in
the number of workshops continues to lag the growth
in vehicle population, the small independent workshops
have also been witnessing a rapid pace of growth. the
historically dominant channels, like petrol stations,
continue to decline and are no longer a dominant
channel for the industry. this trend is expected to
continue.
organized retail and the entry of global retailers, which
have had a minimal impact till date, are expected to
gradually pick up pace over the next few years, subject
to changes in Foreign Direct Investment (FDI) norms
in retail.
3. Competitive activity
the competitive situation remains largely unchanged
with all major international lubricant players having
been present in the market for several years now.
Despite competitive activity increasing in the latter half
of 2010, your Company continues to be the leading
brand in the retail sector, followed by the public sector
brands. However the smaller players have been
competing aggressively with lower prices and higher
sales promotions to gain market share.
Castrol continues to be a major player in the automotive
lubricant market and holds a volume market share of
approximately 20% in the overall market, according to
internal estimates.
Non-Automotive sector outlook
the Indian Manufacturing Industry is poised for a
sustained period of high growth. Industrial output,
measured through the General IIp (Index of Industrial
production) has shown impressive 10% growth during
2010. Industrial production is also expected to grow at
a healthy pace during 2011 and 2012. the growth will
annex a.indd 20 5/7/2011 10:32:55 aM

annual report 2010
21
annual report 2010 annual report 2010 DIRECTORS’ REPORT
be driven by rise in both consumption and investment
demand.
rise in income of urban consumers, higher income in
hands of farmers, laborers and industrial workers and
record capacity additions across industries are some
of the key factors that would drive the demand for
consumables and the industrial production during the
next two years.
In the automotive sector, production of passenger car
and the two wheeler segments is expected to grow
in double digits driven by rising income levels, easy
availability of finance and new model launches. Increase
in industrial production and domestic trade, along with
a faster growth in road construction is also expected
to fuel the demand for commercial vehicles. overall
growth in all the segments of automobiles is expected
to generate good demand for automotive components.
Commissioning of significant investment projects and
the healthy order books is expected to generate good
demand in the machinery manufacturing segment.
Metals, cements and textiles are amongst the segments
which are likely to post significant growth next year.
(B) Opportunities and threats
(i) Opportunities
Automotive sector
a. Overall economic activity: With an expected
GDp growth of around 8% in 2011 and growth in the
industry and infrastructure services sector, the basic
consumption drivers for lubricants remain intact and
are all set to make the industry grow. We expect growth
in the economy to impact directly the movement of
goods and hence increase consumption of commercial
vehicle engine oils.
b. Growth in personal mobility: Growing personal
disposable incomes, double income households and
aggressive marketing by automobile manufacturers
continue to drive demand for passenger cars and two
wheelers. Castrol has strong brand equity in these
segments and growth in the personal mobility segment
would have a positive impact on your Company’s
performance. the business in these segments,
especially passenger cars, is driven to a large extent
by the workshop channel where superior service
propositions, along with strong brands, can lead to
significant business gains. It is also expected that the
growth of four stroke motorcycle sales in rural markets
will outstrip urban demand in the foreseeable future.
this trend presents both an opportunity as well as a
challenge to your Company.
c. Original Equipment Manufacturers: India is
home to a vibrant automobile market. It has been
one of the few markets worldwide which saw growth
in passenger car sales even during the global
downturn. In fact, 2010 has recorded the highest
volumes ever in terms of vehicle production. While the
Indian automobile industry seeks to double total
sales on the back of steady growth over the next
decade, the relatively under-tapped demand
segments like rural markets, youth, women, luxury
cars and infrastructure growth, are expected to
play a significant role. Castrol, with its strong
relationships with global, asian and local oeMs, is
strongly poised to leverage this emerging boom in
India’s auto industry.
d. Changes in engine technology: oeMs are
increasingly investing in new technology in engine
hardware as well as fuels and lubes. this is driven
annex a.indd 21 5/7/2011 10:32:55 aM
22
annual report 2010 DIRECTORS’ REPORTannual report 2010 annual report 2010
by increasing concerns on emissions and fuel
economy. additionally, with India emerging as an
important export hub for automobiles, manufacturers
are rapidly upgrading technology to meet stringent
european norms. this is driving the lubricant
market to low viscosity, synthetic lubricants. Castrol
with its proven technology and marketing leadership
is well poised to meet the requirements of high
performance, technologically superior products and
services.
e. Infrastructure growth: In the 2010 Finance Bill,
the government announced that it would significantly
increase spending on various infrastructure projects.
this move will stimulate demand growth in the building
and construction sector and thereby have a positive
impact on lubricant demand.
f. Demand for automotive services: With the
rapid pace of urbanization in the country, the
consumer is increasingly becoming cash-rich and
time-poor. as a result, there is an emerging trend of
movement from ‘shop’ (retail buying of products) to
‘workshop’ (buying a full service package). to leverage
this trend, your Company has greatly increased the
number of Castrol Bikepoints, Castrol pitstops and
Castrol Car Care centres which offer superior service
solutions to vehicle owners.
In addition to the above, the rapid growth of vehicle
population and penetration, especially outside
the key urban centres, has meant that the market
is now more geographically dispersed than ever
before. to address optimally this shift in market
coverage trend, your Company had implemented a new
initiative aimed at bettering its reach and availability
to its consumers. this has led to the emergence of
the ‘Castrol authorized Service associate’ or CaSa
concept, which reaches out to small individual
mechanics.
g. Environmentally friendly products and
services: With the government’s increased focus on
emission control measures and any future growth in
technology being subject to the requirements of lower
carbon-footprint and emission control, your Company
is in an advantageous position. this is primarily due
to our ability to have ready access to Castrol’s global
technology and products and services which are
environmentally friendly and proven in markets across
the world.
h. Association with sports: Castrol has historically
been associated with various sport sponsorships,
as a means to connecting with its target audience.
ever since the inception of the Company, Castrol has
built a strong association with motorsport and with
record breaking feats on land, sea and air. Castrol
extended its global sponsorship activities to football
in 2008 and your Company leveraged this association
during the 2010 FIFa World Cup™ through a series
of consumer promotion activities and advertising
campaigns.
In october 2010, your Company became the official
performance partner of the International Cricket
Council (ICC) for a period of five years, till the
end of the 2015 ICC Cricket World Cup. this is a
strategic association and will go a long way in further
strengthening the Castrol brand equity in the fast
growing categories of motorcycle and car lubricants.
the partnership will leverage Castrol’s existing
annex a.indd 22 5/7/2011 10:32:55 aM

annual report 2010
23
annual report 2010 annual report 2010 DIRECTORS’ REPORT
property – the Castrol Index for cricket, in a big way
to lend credibility to its association with the ICC as its
performance partner. the Castrol Index offers analysis
and insights which help enhance the fans’ enjoyment
of the game.
the ICC partnership also leverages the deployment
of your Company’s other cricket assets, such as the
Castrol awards for Cricketing excellence and the
popular cricket website - castrolcricket.com.
Your Company has also signed up with leading
cricketers and commentators like Sachin tendulkar,
Brett lee, Shakib al Hasan, Harsha Bhogle and ravi
Shastri as its Brand ambassadors.
Non-Automotive sector
the buoyancy in production of core industrial segments
like automotive, machinery manufacturing and
metals is expected to continue. rising income levels,
increase in agricultural output, generation of fresh
employment due to capacity additions and a likely
correction in inflation is expected to increase purchasing
power of Indian consumers and push up demand for
goods and services. record capacity additions in the
manufacturing sector will ensure that the industry
does not face any capacity constraints in meeting the
rising demand.
Indian industry is expected to complete projects
worth rs.15 lac crores in the next two years. the
largest contributor to the completion of the projects
will be the power sector. the other sectors that will
see a substantial amount of project commissioning
are telecommunication services, steel, road transport
and allied services and petroleum products. the
commissioning of fresh capacities across industrial
sectors will enhance production and will increase the
demand for lubricants and allied services.
(ii) Threats
Automotive sector
a. Input costs: With crude oil prices pushing up
cost of base oils, additives and packaging material,
margins are expected to be under pressure during the
year and potentially impact demand as the lubricant
industry passes a portion of the increased costs
to customers.
b. Competitive activity: the Indian lubricant
market is highly competitive. Given the fact that most
international players have identified India as a focus
market, this is likely to intensify.
c. Longer oil drain intervals: this can significantly
impact volume growth in the market, especially in the
commercial vehicle segment.
d. Price undercutting: In the Industrial sector, price
undercutting by small regional players and the tendency
of pSu players to focus on volume rather than value,
may put your Company’s margins and volume market
share under pressure.
Your Company will focus on creating sustainable
competitive advantage while continuing to invest in
strengthening its Brand and technology.
Non-Automotive sector
a. Input costs: Manufacturing companies will
continue to feel the heat of rise in raw material prices
and if not mitigated, this might impact the growth
momentum. Crude oil prices have been going up
persistently. Higher base oil prices, coupled with
annex a.indd 23 5/7/2011 10:32:55 aM
24
annual report 2010 DIRECTORS’ REPORTannual report 2010 annual report 2010
increase in other raw material costs, are likely to impact
input costs adversely.
b. Industrial growth: Whilst the manufacturing
sector has recovered and is in the growth phase, the
global situation may still impact its trajectory. Further,
in spite of robust growth in the industrial environment,
the focus on operational efficiency could dampen the
growth rate for lubricants.
(C) Segment-wise / Product-wise performance
I. Automotive performance
In a challenging competitive environment, your
Company delivered a stellar performance in the year
2010, with top line growth of 18% and a growth of
28% in operating profits in the automotive segment.
this was achieved through a continued focus on the
high-growth and high-margin segments.
(i) Distinctive propositions
Castrol has always focused on meeting consumers’
needs by delivering distinctive and diversified
propositions through its brand portfolio. In 2010,
Castrol launched its global product Brand
architecture in India for its Specialties range of
products. Castrol launched “advance performance
Series” & “protector Series” range of greases,
gear oils and coolants, across different vehicle
segments.
In line with our long-term strategy, our lead brand for
two-wheelers – Castrol activ 4t – was also upgraded
to a superior formulation during the year. Castrol activ
4t which already enjoys enviable brand equity in the
market, thereby further strengthened its proposition of
better all-round protection.
(ii) Diesel Engine Oils (Consumer Truck & Heavy
Duty Vehicles)
a large scale communication program targeting
micro-lCV commercial vehicle consumers was
implemented during the year. this program drove home
the benefits of using Castrol lubricants for vehicle
maintenance.
We continued with our intensive tractor consumer
contact program – Sanjeevani, which has been highly
successful. this program has been instrumental in
reaching consumers not only at the point of consumption
but also in their own villages, thereby driving brand
preference and sales.
(iii) Motorcycle Oils (MCO)
the year 2010 has been a milestone year for
the motorcycle engine oil category in your Company.
Castrol activ 4t continued to build its equity
and gained momentum in the market with the
launch of ‘Secure Seal Cap + Improved protection
Formula’. this launch was supported by an
integrated marketing program which included
advertising, influencer (mechanic) engagement, market
storming and dealer activation. over 35000 mechanics
were educated on the secure seal caps as an
anti-counterfeit measure and on apI Sl technology
upgrade.
Castrol power 1 gained a foothold as a mainstream
brand, successfully leveraging the 2010 FIFa World
Cup™ sponsorship and brand association with
Cristiano ronaldo, through “Meet ronaldo in Spain”
Campaign. the Castrol Bikepoint agenda continued to
expand with about 2000 Bikepoints added during the
year under review.
annex a.indd 24 5/7/2011 10:32:55 aM

annual report 2010
25
annual report 2010 annual report 2010 DIRECTORS’ REPORT
(iv) Passenger Car Oils (PCO)
In 2010, the passenger car oils segment continued
its rapid growth trajectory. Your Company accelerated
its reach out to the mechanic community through
innovative and engaging programs like the “Golden
Spanner Mechanic loyalty program.” In addition,
recognizing the growing importance of the emerging
synthetic segment, your Company initiated a unique
dealer program called the “Synthetic Club”, targeted at
increasing market share.
the re-launch campaign for our lead brand Castrol
GtX reached out to millions of consumers and
influencers across all the channels, using an integrated
communication approach which led to a strong growth
of the brand.
During the second half of the year under review, your
Company invested in Castrol Magnatec to enhance its
share in the fast emerging synthetic segment. a new
brand variant was launched backed by mass media
investment which further led to robust growth of the
brand and higher market share.
(v) Heavy Duty Channel (Transport fleets, Building
& Construction and Mining)
During the year under review, the heavy-duty segment
continued to grow in both volume and value. this was
enabled by the strong relationships and preferred
partner status your Company enjoys with key oeMs
and customers. During the course of the year, we
strengthened our offers and association with strategic
accounts. We launched transport fleet management
solutions – “tranSMart” – consisting of superior
products and services to support large fleets in the
on-road customer segment. In line with our intent
to take advantage of the booming infrastructure industry,
we launched a series of products and services like “total
lube management” for off road segment in Building &
Construction and emerging Mining segment. With our
association and commitment to jointly working with the
oeMs in creating and delivering value to customers
with new products and initiatives, the performance of
this segment in the coming years will continue to be
strong.
(vi) Workshops
as the market for cars and motorcycles continues to
grow impressively and manufacturers focus on bringing
in contemporary engine technology into the country,
the significance of the workshop channel, especially
the workshops affiliated to oeMs, is growing rapidly.
Your Company continues to focus on being ahead
of the curve as the market transitions from “shop” to
“workshop”.
Your Company has leveraged its local partnership with
market leading oeMs such as Maruti Suzuki and tata
Motors, to consolidate its position in the workshops
affiliated to these oeMs. this has resulted in impressive
volume growth in the business. With Castrol’s global
partners such as BMW, Jaguar land rover, Ford and
the Volkswagen Group scaling up operations in India,
Castrol has seen a rapid growth in its premium products
which are co-engineered with these oeMs and sold
exclusively within workshops affiliated to them.
II. Non-automotive performance
Industrial Lubricants and Services Business
the year 2010 was a very successful one for Castrol
Industrial business. Your Company consolidated its
position as the leading supplier of metal working
annex a.indd 25 5/7/2011 10:32:56 aM
26
annual report 2010 DIRECTORS’ REPORTannual report 2010 annual report 2010
fluids and high performance lubricants which are
technologically superior and deliver substantial value
to the customers.
With the introduction of new generation metal working
fluids supported with technical expertise, your Company
is jointly working with customers to add value to their
operations and deliver benefits, not only in terms of
metal working fluid consumption but also in terms of
other costs associated with the processes like tooling
cost, coolant sump life, machine down time etc. Your
Company’s endeavor is to address each of the cost
components in the manufacturing process of the
customer to reduce overall cost per component against
mutually agreed timeline and on a sustainable basis.
Your Company is jointly working with a global company
and a leading supplier of machine tools to a number of
key industries – aerospace, medical, automotive and
machinery manufacture, for providing manufacturing
solutions and to develop new technology to meet
customer’s needs.
In the manufacturing sector today, the pressure to
minimize environment impact has never been greater.
With a complete range of environment friendly
products, your Company’s emphasis is on helping
reduce customer’s fluid usage and waste management
costs, while cost effectively meeting local compliance
targets.
Marine & Energy Lubricants Business
the market environment in the Marine business was
extremely challenging during 2010. excess capacity
coupled with slow down in cargo movement, continued
to result in low freight rates. In the offshore sector, while
the shallow water jack up rig market rates decreased
significantly, the deep water rig market continued
to be attractive. the competition in the market also
intensified with the entrance of two new competitors
in this space.
Castrol Marine responded to the change in environment
by revisiting its strategy as a result of which your
Company will now market the Castrol as well as Bp
Marine brands. Your Company will also focus on new
“route to market” initiatives during 2011. the new
marine modular offer will also be piloted with Indian
customers.
(D) Risks and Concerns
Key business risks are around the following areas:
a. Continued increase in drain intervals in the
commercial vehicle segment
b. High levels of employee attrition
c. reviving economy leading to inflationary pressure
resulting in a sharp increase of input costs
d. price under-cutting by low-cost as well as
international competitors in an attempt to gain
volume share
e. Hardening interest rates leading to slowdown in
sale of commercial and personal mobility vehicles
Your Company has put together a plan to address the
impact of the identified risks and has put in place the
necessary mitigating actions.
(E) Technology
automotive and Industrial advances and the demand
for environment friendly products are placing greater
demands on lubricant technology. Your Company is
well placed to seize the opportunities with its range of
annex a.indd 26 5/7/2011 10:32:56 aM

annual report 2010
27
annual report 2010 annual report 2010 DIRECTORS’ REPORT
high performance lubricants – both in automotive and
industrial sectors – especially at the premium end of
the market.
the journey on synthetics continues with strong product
portfolios for oeMs and retail products, positively
impacting sales. In the Industrial part of the business
your Company launched various premium synthetic
products under the Syntilo umbrella brand, that has
led to a larger share and greater profitability.
Several formulation optimization initiatives were
undertaken jointly by the technology, supply chain and
marketing teams, resulting in significant savings in raw
material costs plus providing flexibility in formulations
in times of short supply.
the Castrol Customer engagement Centre that was set
up last year to demonstrate Castrol product superiority
and benefits, has started drawing a steady flow of
visitors including leading oeM engineers, customers
and end users.
(F) Internal Control Systems and their adequacy
Your Company maintains an adequate and effective
Internal Control system commensurate with its size
and complexity. We believe that these internal control
systems provide, among other things, a reasonable
assurance that transactions are executed with
management authorization and that they are recorded
in all material respects to permit preparation of financial
statements in conformity with established accounting
principles and that the assets of your Company are
adequately safe-guarded against significant misuse
or loss. an independent Internal audit function is an
important element of your Company’s internal control
system. the internal control system is supplemented
through an extensive internal audit program and
periodic review by management and audit committee.
(G) Health, Safety, Security and Environment
Health, Safety, Security and environment (HSSe) is a
core value of your Company. Simply stated, our goals
are: no accidents, no harm to people and no damage
to environment. the health, safety and security of
everyone who works for your Company is critical to
the success of the business.
Your Company’s road safety program has been
successfully running for the past several years
and is recognized as the benchmark on road
safety initiatives in India. Your Company has a driving
behavior monitoring program in place for all its
drivers including third party contractors. this has
greatly helped improve driving behavior and in turn
has positively impacted your Company’s road safety
performance. this and other road safety programs
undertaken by your Company, continue to be
recognized externally, as well as internally, within the
Bp Group.
the blending plants continued their strong safety
performance. two of our plants have been injury
free for thirteen years and another one for ten years.
one of the blend plants achieved one year of zero
first aid incident free performance. two of the
blend plants have received awards from national
Safety Council for consistent three year safety
performance.
all the blending plants are certified for the environment
Management system (ISo 14001) and occupational
Health & Safety Management System (oHSaS 18001).
these systems have been certified by accredited
annex a.indd 27 5/7/2011 10:32:56 aM

28
annual report 2010 DIRECTORS’ REPORTannual report 2010 annual report 2010
bodies recognized internationally. the blend plants
have now implemented Bp’s operating Management
System (oMS) which is an enabler for enhanced safety
performance.
(H) Developments in Human Resources
Management
During the year under review, development of
leadership capability in your Company continued to
be the key focus with greater emphasis on leadership
behaviors and its integration with all people processes.
a number of training and development initiatives
directed towards leadership development, like
‘ascent’ and ‘leading the charge’ were undertaken
during the year. Your Company continued its focus
on building the talent pipeline across all functions in
the business.
During the year, your Company embarked upon
building a diverse and inclusive workforce and focused
its efforts in attracting, retaining and developing a talent
pool which reflects the diversity of the communities
it operates in. as a part of the journey, we engaged
senior leadership through a workshop to co-create
the Business case for Diversity. this was followed by
engagement workshops covering all our executives to
sensitize and to create a common understanding of
our diversity and inclusion agenda.
Your Company continued its focus on employee
communication through engagement programs.
Building the functional capability of our employees
continued to be a key focus during the year under
review. Your Company embarked upon a number
of initiatives to improve its brand as an employer
to attract and retain talent in your Company and to
realize its dream of making your Company a great
place to work.
During the year, your Company participated in the
reputed “Great places to Work” study and was
rated amongst the top 100 great companies to
work for in the country. Your Company received
the “Best prax Compass leadership award” for
structured deployment of a best practice – Individual
performance Management – from Global Best practice
network, a global organization which promotes
benchmarking and sharing of best practices in
organizations.
our talent continues to be recognized within the Bp
Group and a number of employees undertook overseas
assignments during the year.
Your Company signed a long term wage agreement
before the expiry of the subsisting wage agreement
at its paharpur blending plant. the agreement will
be in force for a period of 4 years and will benefit
41 bargainable employees. our relations with our
employees continued to remain cordial and peaceful
during the year.
the total number of people employed in your Company
as on 31st December 2010 was 792.
(I) Discussion on Financial Performance with
respect to Operational Performance
Your Company delivered a significant increase in profits
due to rigorous execution of its long term strategy of
“winning in lubricants”. this has been achieved by
“in year focus” on defending and growing margins,
attacking cost inefficiencies and reducing working
capital.
annex a.indd 28 5/7/2011 10:32:56 aM

annual report 2010
29
annual report 2010 annual report 2010 DIRECTORS’ REPORT
Sales realization in 2010 grew by 18% due to
higher volumes, improved product mix and judicious
pricing. the total cost of material has increased
by 23% due to higher volumes and increase in raw
material costs. Margin improvement has been achieved
through a combination of premium product mix and
better sales realizations. Your Company continues to
invest strongly in costs which build value – technology,
brand, innovation, growth business opportunities and
people. We continue to focus heavily on safety in
operations. this has led to a strong profit after tax
(pat) growth by 29%.
Higher profit after tax, partly offset by increased
working capital (due to higher raw material cost), has
resulted in higher Cash flow for 2010.
the management team is confident that your Company
has the ability to deliver a sustainable winning
performance going forward.
on behalf of the Board of Directors
n. K. Kshatriya r. Kirpalani Vice Chairman Director – Automotive & Chief Operating Officer
S. Malekar S. Vaidya Director – Supply Chain Director – Finance
Mumbai
Dated: 27th April, 2011
annex a.indd 29 5/7/2011 10:32:56 aM

annual report 2010 DIRECTORS’ REPORT
30
annual report 2010 annual report 2010
CORPORATE GOVERNANCE
A. MANDATORY REQUIREMENTS
1. Company’s Philosophy on Code of Governance
the Company’s purpose is business and to maximise long-term shareholder value by selling its goods and services. therefore, our Corporate Governance processes are directed at ensuring that Company actions, assets and agents are directed to achieving this purpose while complying with the Code of Governance and the Company’s own policies and expectations. the Company’s policies reflect those adopted by the parent Company in the uK – Bp plc. and covers aspects such as ethical conduct, health, safety and the environment; control and finance; commitment to employees; and relationships. Key aspects of the Company’s Governance processes are:
• Clear statements of Board Processes and Board Executive linkage.
• Disclosure, accountability, transparency, adequate systems and procedures to monitor the state of affairs of the Company to enable the Board to effectively discharge its responsibilities to the stakeholders of the Company.
• Identification and management of key risks to delivery of performance of the Company.
2. Board of Directors
(a) Composition
as of the year ended 31st December, 2010, the Board of Directors had 9 members comprising of 3 executive Directors and 6 non-executive Directors. the non-executive Directors included 3 members who were Independent Directors and 3 members who had been nominated by Castrol ltd., u.K. as provided in the articles of association of the Company. the Chairman of the Board is a non-executive Independent Director.
(b) Attendance of each Director at the Board Meetings and the last Annual General Meeting
4 Board Meetings were held during the financial year from 1st January, 2010 to 31st December, 2010.
ANNEXURE B the attendance of each of the Directors at the said Board Meetings is given below:
name of Director Category of
Director-ship
no. of Meetings attended
% of total Meetings attended
during the tenure as a Director
Mr. S. M. Datta neD 4 100Mr. n. K. Kshatriya nD 4 100Mr. r. Kirpalani eD 4 100Mr. a. p. Mehta (Ceased to be Director w.e.f. 16-11-2010)
eD 4 100
Mr. S. Malekar eD 4 100Mr. S. Vaidya (appointed w.e.f. 16-11-2010)
eD – –
Mr. r. Gopalakrishnan neD 4 100Mr. ralph Hewins or his alternate
nD 4 100
Mr. S. Mukundan nD 3 75Mr. D. S. parekh neD 3 75
neD — non-executive DirectoreD — executive DirectornD — nominee Director of Castrol ltd., u.K.
all Directors except Mr. Sashi Mukundan attended the annual General Meeting held on 30th april, 2010.
(c) Number of other Companies or Committees the Director is a Director/Member/Chairman of
name of the Director(s) number of other Companies
(excluding Foreign and private Companies)
in which Director (excluding alternate/
nominee Director)
number of Committees (other than
Castrol India limited)in whichMember
Mr. S. M. Datta 12 (1) 5 (2)Mr. n. K. Kshatriya — —Mr. r. Kirpalani — —Mr. S. Vaidya — —Mr. S. Malekar — —Mr. r. Gopalakrishnan 7 (3) 3 Mr. S. Mukundan 2 —Mr. D. S. parekh 12 (4) 6 (5)Mr. ralph Hewins — —notes:1. Includes 5 Companies in which Chairman2. Includes 1 Committee in which Chairman3. Includes 2 Companies in which Chairman4. Includes 7 Companies in which Chairman5. Includes 4 Committees in which Chairman
annex B-27-4.indd 30 5/7/2011 10:50:45 aM

annual report 2010annual report 2010 annual report 2010 DIRECTORS’ REPORT
31
(d) Number of Board Meetings held and the dates of the Board Meeting
4 Board Meetings were held during the financial year 1st January, 2010 to 31st December, 2010. the dates on which the said meetings were held are given below:
18th February, 2010
15th april, 2010
15th July, 2010
12th october, 2010
3. Audit Committee
(a) Terms of Reference
i. to investigate any activity within its terms of reference.
ii. to seek information from any employee.
iii. to obtain outside legal or other professional advice.
iv. to secure attendance of outsiders with relevant expertise, if it considers necessary.
It may be clarified that the role of the audit Committee includes matters specified under the revised Clause 49 of the listing agreement entered into between the Company and the Bombay Stock exchange limited and the national Stock exchange of India limited on which the Company’s shares are listed.
(b) Composition, name of members and Chairperson
as on 31st December, 2010, the audit Committee comprised of 4 non-executive Directors viz. Mr. D. S. parekh, Mr. S. M. Datta, Mr. r. Gopalakrishnan and Mr. r. Hewins with the Company Secretary being the Secretary of the Committee. Mr. D. S. parekh an Independent Director is the Chairman of the Committee. Mr. r. Gopalakrishnan and Mr. S. M. Datta are Independent Directors on the Committee whereas Mr. r. Hewins is a nominee Director of Castrol ltd., u.K.
(c) Meetings and attendance during the year
4 meetings were held during the financial year 1st January, 2010 to 31st December, 2010. the attendance of each Member of the Committee is given below:
no. of Meetings attended
% of total Meetings
attended during the tenure as a
Director
Mr. D. S. parekh 3 75
Mr. r. Gopalakrishnan 4 100
Mr. r. Hewins 4 100
Mr. S. M. Datta 4 100
4. Remuneration Committee
(a) Terms of Reference
the remuneration Committee recommends remuneration, promotions, increments etc. for the executive Directors to the Board for approval.
(b) Composition, names of members and Chairperson
as of 31st December, 2010, the Committee comprised of 3 non-executive Directors viz. Mr. r. Gopalakrishnan, Mr. r. Hewins, and Mr. n. K. Kshatriya. Mr. r. Gopalakrishnan is an Independent Director whilst Mr. r. Hewins and Mr. n. K. Kshatriya are nominee Directors of Castrol ltd., u.K. Mr. r. Gopalakrishnan is the Chairman of the Committee.
(c) Attendance during the year
two Meetings were held during the year. the attendance of each Member of the Committee is given below:
name(s) of theCommittee Members
no. of Meetings attended
% of total Meetings attended
during the tenure as a
Director
Mr. r. Gopalakrishnan 2 100
Mr. n. K. Kshatriya 2 100
Mr. r. Hewins 2 100
annex B-27-4.indd 31 5/7/2011 10:50:45 aM

annual report 2010 DIRECTORS’ REPORT
32
annual report 2010 annual report 2010
(d) Remuneration Policy
the Directors are paid Salary and performance linked Bonus, which is calculated, based on pre-determined parameters of performance.
(e) Details of Remuneration paid to all Directors (for the period 1st January, 2010 to 31st December, 2010)
all
elements
of remu-
neration
package
i.e. Salary
benefits
bonuses,
pension,
etc.
(rs. in
lacs)
Fixed
compo-
nent &
perfor-
mance
linked
incen-
tives
along
with the
perform-
ance
criteria
(rs. in
lacs)
Service
Cont-
racts
notice
period,
sever-
ance
fees
Stock
option with
details,
if any and
whether
issued at
a discount
as well as
the period
over which
accrued
and over
which
exercis-
able
i. Wholetime Director(s)
Mr. r. Kirpalani 205.18 41.73
please see n
ote ‘a’
please see n
ote ‘b’
Mr. a.p. Mehta
(upto 15th november,
2010)
68.45 —
Mr. S. Malekar 120.89 22.06
Mr. S. Vaidya
(appointed w.e.f. 16th
november, 2010)
16.02 4.29
notes
(a) the agreement with each Wholetime Director is for a period
of 5 years or the normal retirement date whichever is earlier.
Further, either party to the agreement is entitled to terminate
the agreement by giving not less than six calendar months
notice in writing to the other party.
(b) presently, the Company does not have a scheme for grant
of stock options to its employees. However the Management
staff are entitled to the Shares of Bp plc under the Bp
Sharematch scheme as in force.
ii. Non-Wholetime Director(s)
Sitting Fees (rs.)
Commission (rs. in lacs)
Mr. S. M. Datta 1,30,000 10.00
Mr. r. Gopalakrishnan 1,00,000 8.00
Mr. D. S. parekh 60,000 8.00
as on 31st December, 2010, Mr. S. M. Datta is a joint-holder of 11,618 equity shares and Mr. n. K. Kshatriya holds 400 equity shares in the Company.
5. Transfer & Shareholders’/Investors’ Grievance Committee
as on 31st December, 2010, the transfer and Shareholders’/Investors’ Grievance Committee comprised of Mr. S. M. Datta, Chairman, Mr. r. Kirpalani, and Mr. S. Vaidya. the Company Secretary is the Secretary of the Committee.
Mr. S. Vaidya was appointed w.e.f. 16th november, 2010 as a member of the Committee in place of Mr. a. p. Mehta
Mr. a. p. Mehta ceased to be a member of the Committee with effect from close of business hours of 15th november, 2010.
(a) name of the non-executive Director heading the Committee
: Mr. S. M. Datta
(b) name and Designation of Compliance officer
: Mr. a. H. ModyGeneral Manager – legal & Company Secretary
(c) no. of Shareholders complaints received during the financial year
: 25 complaints were received from Stock exchange/Securities and exchange Board of India (SeBI)/nSDl/CDSl and were reported to the transfer and Shareholders’/ Investors’ Grievance Committee in terms of Circular no.1(96-97) dated 25.7.96 of SeBI.
annex B-27-4.indd 32 5/7/2011 10:50:45 aM

annual report 2010annual report 2010 annual report 2010 DIRECTORS’ REPORT
33
(d) number of complaints solved to the satisfaction of shareholders
: 24 complaints were resolved to the satisfaction of Complainants, except for disputed cases and sub-judice matters which would be solved after the matter is duly disposed off by the Court.
(e) number of pending complaints as on 31st December, 2010.
: 1 complaint regarding transfer of shares was pending as on 31st December, 2010 due to submission of incomplete documents by the Complainant. Duly completed documents were submitted on 28th December, 2010 and the complaint was resolved in January, 2011.
6A. General Body Meetings
(a) location and time where last three aGMs were held
location Date time
(i) Y.B. Chavan Centre, General Jagannath Bhosale Marg, next to Sachivalya Gymkhana
Mumbai 400 021
: 30.4.2010 11.00 a.m.
(ii) Birla Matushri Sabhagar 19, Marine lines Mumbai 400 020
: 27.4.2009 3.30 p.m.
(iii) Birla Matushri Sabhagar 19, Marine lines Mumbai 400 020
: 29.4.2008 3.30 p.m.
(b) Whether any Special resolutions were passed in the previous 3 aGMs
: Yes
(c) Whether any Special resolution was passed through postal Ballot last year
: Yes
For amendments to the capital clause in the articles of association of the Company and for increase in the authorised Capital consequent to issue of bonus shares.
Details of voting pattern : 99.99% votes in favour of the resolution and 0.01% votes against the resolution
(d) persons who conducted the postal Ballot exercise
: Ms. Shirin K. Bharucha Scrutineer
(e) Whether any Special resolution is proposed to be conducted through postal Ballot
: no
(f) procedure for postal Ballot
: the postal Ballots along with the notice & explanatory Statement was posted to all the shareholders of the Company under Certificate of posting. the Scrutineer forwarded the results of the postal Ballot to the Chairman and the same was published on 2nd april, 2010, in the Indian express & loksatta newspapers. the entire postal Ballot process was carried out pursuant to section 192a of the Companies act, 1956 read with the Companies (passing of resolution by postal Ballot) rules, 2001
annex B-27-4.indd 33 5/7/2011 10:50:45 aM

annual report 2010 DIRECTORS’ REPORT
34
annual report 2010 annual report 2010
6B. notes on Directors seeking re-appointment as required under Clause 49 IV G (i) of the listing agreement entered into with Bombay Stock exchange limited and national Stock exchange of India limited
(i) Mr. R. Gopalakrishnan Mr. Gopalakrishnan studied physics at Calcutta
university and engineering at IIt. From 1967, he served in Hindustan unilever ltd. for over three decades in various capacities. the appointments held by Mr. Gopalakrishnan from 1990 onwards were: Chairman of unilever arabia (based in Jeddah), followed by Managing Director of Brooke Bond lipton India (based in Bangalore), followed by Vice Chairman of then Hindustan lever limited.
He joined tata Sons in September 1998. He is currently a Director of tata Sons ltd.
Mr. r. Gopalakrishnan is a Director in the following Companies:
tata Sons ltd. Director
tata Chemicals ltd. Vice Chairman
tata power Company ltd. Director
rallis India ltd. Chairman
tata autoComp Systems ltd. Chairman
tata technologies ltd. Director
akzo nobel India limited Director
Mr. r. Gopalakrishnan does not hold any Shares in the Company
(ii) Mr. S. Malekar Mr. Soren Malekar is a post Graduate in Management
from the narsee Monjee Institute of Management Studies, specializing in operations. He has done his graduation in Mechanical engineering (B.e.) from Mumbai university.
He has over 20 years of experience in manufacturing, quality management, safety and supply chain functions.
He joined Castrol in 2007 as Vice president-Supply Chain. Since then, he has been a part of the strategic
planning team for Castrol, led the supply chain on various ambitious initiatives in growth, productivity and efficiency and participated in cross functional projects for Castrol. Since 2009, he also has the added responsibility of the supply chain for Bp in the Middle east.
prior to joining Castrol, he had 16 years of supply chain experience with asian paints limited, a leading company in the Indian paint industry.
Mr. Malekar is also an independent director on the Board of the Middle east lubricants Company, uae.
Mr. Malekar does not hold any shares in the Company
(iii) Mr. S. Vaidya
Mr. Sujit Vaidya is an associate Member of the Institute of Chartered accountants of India. He has over 22 years of experience in Finance, accounts, Commercial and Business advisory Services. prior to joining Castrol India ltd., he had spent over 14 years working with organizations such as Citicorp, procter & Gamble India ltd., ItC-agro tech. ltd. and the Boston Consulting Group. He joined Castrol India limited in March 2003 as the performance Manager. Since then he has managed various senior roles within Bp Group in India as well as in united Kingdom.
Mr. S. Vaidya does not hold any shares in the Company
(iv) Mr. A.P. Mehta
Mr. amish Mehta is a member of the Institute of Chartered accountants of India. In 1997 he joined ernst & Young as a Service Manager to their Business advisory Service Group. In 1998, he joined Mobil India private limited as a Chief Financial officer for the lpG segment and in 1999 was promoted as the Chief executive officer. From September 2001, he was a Director of ernst & Young private limited and was on deputation as Chief Financial officer to Media labs asia.
annex B-27-4.indd 34 5/7/2011 10:50:46 aM
annual report 2010annual report 2010 annual report 2010 DIRECTORS’ REPORT
35
In January 2003, he joined Bp India Services private limited a company which is a part of the Bp group of companies worldwide and was the Financial Control Manager-transcon.
as on 31st December, 2010, Mr. Mehta holds 17470 shares in the Company.
7. Disclosure
(a) Disclosures on materially significant related party transactions that may have potential conflict with the interests of Company at large.
} none
(b) Details of non-compliance by the company, penalties, strictures imposed on the Company by Stock exchange or SeBI or any statutory authority, on any matter related to capital markets, during the last three years.
} none in the last three years
(c) Whistle Blower policy and affirmation that no personnel has been denied access to the audit committee.
presently, the Company does not have a Whistle Blower policy but has a policy similar to it for the entire Bp Group of Companies worldwide which is called open talk.
no personnel of the Company has been denied access to the audit Committee.
(d) Details of Compliance with mandatory requirements and adoption of the non-Mandatory requirements of this clause.
the Company has complied with all the Mandatory requirements of this clause.
as regards the non-Mandatory requirements the extent of Compliance has been stated in this report against each item.
8. Means of Communication
(a) Quarterly results. : published in the newspapers in terms of Clause 41 of the listing agreement.
(b) newspapers in which results are normally published in
: (i) Economic Times and Business Standard
Mumbai, new Delhi, Kolkata, ahmedabad, Bangalore, Bhubaneshwar,
Chandigarh,
Chennai, Hyderabad,
Kochi,
lucknow, and
pune in english editions.
: (ii) Maharashtra Times and Sakal in Marathi.
any website, where displayed
: Yes – www.castrol.co.in
Whether it also displays official news releases
: Yes
the presentations made to institutional investors or to the analysts
: no
annex B-27-4.indd 35 5/7/2011 10:50:46 aM
annual report 2010 DIRECTORS’ REPORT
36
annual report 2010 annual report 2010
9. General Shareholder Information
(a) aGM : Monday,
Date, time and Venue
27th June, 2011,3.30 p.m. at Birla Matushri Sabhagar, 19, Marine lines, Mumbai 400020
(b) Financial year : (i) January 2011 to December 2011.
: (ii) First Quarter – 2011 results – 3rd/4th week of april, 2011.
: (iii) Half yearly results – 2011 – 1st/2nd week of august, 2011.
: (iv) third Quarter – 2011 results – 3rd/4th week of october, 2011.
: (v) results for the year ending 31st December, 2011 – January/February – 2012.
(c) Date of Book closure
: 15th June, 2011 to 27th June, 2011(both days inclusive).
(d) Dividend payment date(s)
: Interim – 2nd august, 2010Final – on 11th July, 2011.
(e) listing on the Bombay Stock exchange, limited (BSe) and national Stock exchange of India limited (nSe)
: the Company has paid the listing fees for the period 1st april, 2010 to 31st March, 2011 in relation to both BSe & nSe.
(f) (i) Stock Code – physical –
BSe nSe
:
500870CaStrol
(ii) Demat ISIn number for nSDl & CDSl
: Ine 172a01019
(g) Market price Data High/low during each month in last Financial Year
: please See annexure I of this report.
(h) Stock performance in comparison to Broad-based indices such as BSe Sensex, CrISIl Index etc.
: please See annexure II of this report
(i) registrar and transfer agents
: tSr Darashaw limited (formerly known as tata Share registry limited), 6-10 Haji Moosa patrawala Industrial estate, 20 Dr. e. Moses road, Mahalakshmi, Mumbai 400 011
(j) Share transfer System
: the Company Secretary has been authorized to approve the transfer of shares which is done within the time-limit stipulated by the listing agreement. the said transfers are then noted at the subsequent transfer and Shareholders’/ Investors’ Grievance Committee Meeting.
(k) Distribution of Shareholding as on 31-12-2010
no. of Shares
no. of Share-
holders
% of Share-holders
upto 500 6692505 54712 80.83
501 – 1000 4086051 5483 8.10
1001 – 2000 5111252 3459 5.11
2001 – 3000 3395566 1358 2.00
3001 – 4000 3681477 1071 1.58
4001 – 5000 2014656 445 0.66
5001 – 100000 5624247 851 1.26
100001 and above 216674842 311 0.46
Grand total 247280596 67690 100.00
annex B-27-4.indd 36 5/7/2011 10:50:46 aM
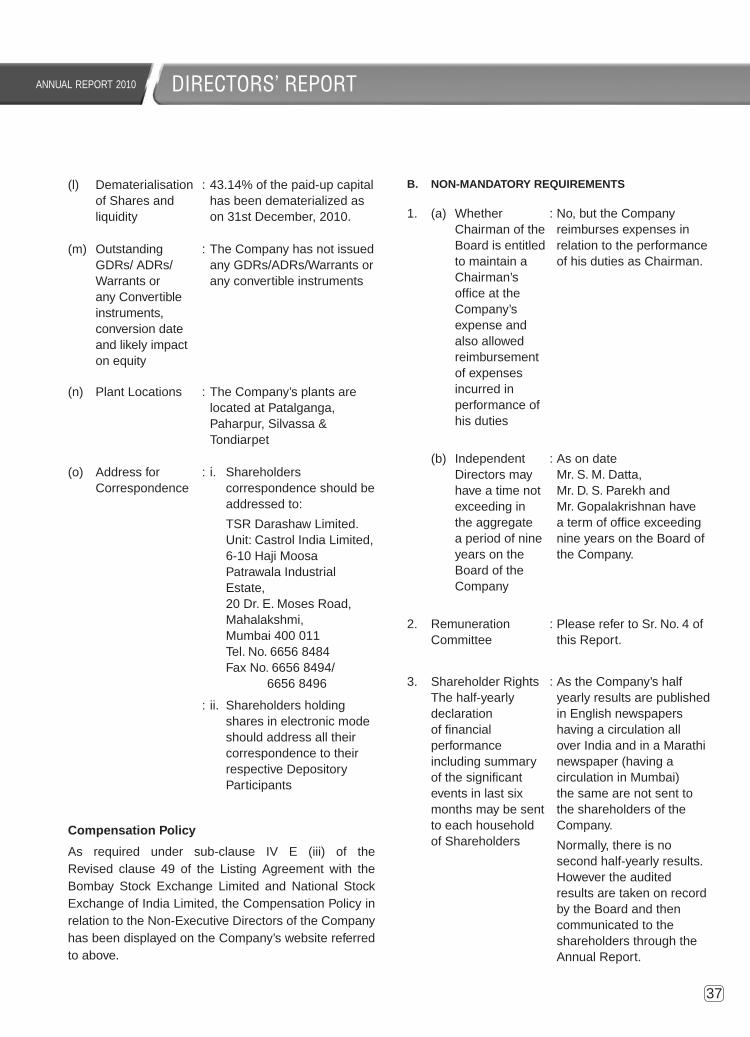
annual report 2010annual report 2010 annual report 2010 DIRECTORS’ REPORT
37
(l) Dematerialisation of Shares and liquidity
: 43.14% of the paid-up capital has been dematerialized as on 31st December, 2010.
(m) outstanding GDrs/ aDrs/Warrants or any Convertible instruments, conversion date and likely impact on equity
: the Company has not issued any GDrs/aDrs/Warrants or any convertible instruments
(n) plant locations : the Company’s plants are located at patalganga, paharpur, Silvassa & tondiarpet
(o) address for Correspondence
: i. Shareholders correspondence should be addressed to:
tSr Darashaw limited. unit: Castrol India limited, 6-10 Haji Moosa
patrawala Industrial estate, 20 Dr. e. Moses road, Mahalakshmi, Mumbai 400 011
tel. no. 6656 8484 Fax no. 6656 8494/ 6656 8496
: ii. Shareholders holding shares in electronic mode should address all their correspondence to their respective Depository participants
Compensation Policy
as required under sub-clause IV e (iii) of the revised clause 49 of the listing agreement with the Bombay Stock exchange limited and national Stock exchange of India limited, the Compensation policy in relation to the non-executive Directors of the Company has been displayed on the Company’s website referred to above.
B. NON-MANDATORY REQUIREMENTS
1. (a) Whether Chairman of the Board is entitled to maintain a Chairman’s office at the Company’s expense and also allowed reimbursement of expenses incurred in performance of his duties
: no, but the Company reimburses expenses in relation to the performance of his duties as Chairman.
(b) Independent Directors may have a time not exceeding in the aggregate a period of nine years on the Board of the Company
: as on date Mr. S. M. Datta, Mr. D. S. parekh and Mr. Gopalakrishnan have a term of office exceeding nine years on the Board of the Company.
2. remuneration Committee
: please refer to Sr. no. 4 of this report.
3. Shareholder rightsthe half-yearly declaration of financial performance including summary of the significant events in last six months may be sent to each household of Shareholders
: as the Company’s half yearly results are published in english newspapers having a circulation all over India and in a Marathi newspaper (having a circulation in Mumbai) the same are not sent to the shareholders of the Company.
normally, there is no second half-yearly results. However the audited results are taken on record by the Board and then communicated to the shareholders through the annual report.
annex B-27-4.indd 37 5/7/2011 10:50:46 aM

annual report 2010 DIRECTORS’ REPORT
38
annual report 2010 annual report 2010
4. audit Qualification : presently not applicable to the Company
5. training of Board Members. Company may train its Board Members in the business model of the Company as well as the risk profile of the business parameters of the Company, their responsibilities as directors, and the best ways to discharge them
: presently the Company does not have such a training programme
6. Mechanism for evaluating non-executive Board Members – the performance evaluation of non-executive Directors may be done by a peer group comprising the entire Board of Directors, excluding the Director being evaluated; and peer Group evaluation should be the mechanism to determine whether to extend/continue the terms of appointment of non-executive Directors
: presently the Company does not have a mechanism as contemplated for evaluating the performance of non-executive Board Members
7. Whistle Blower policy – the Company to have such a policy
: presently the Company does not have a Whistle Blower policy but has a policy similar to it for the entire Bp Group of Companies worldwide which is referred to as “open talk”.
on behalf of the Board of Directors
n. K. Kshatriya r. Kirpalani
Vice Chairman Director – Automotive &
Chief Operating Officer
S. Malekar S. Vaidya
Director – Supply Chain Director – Finance
MumbaiDated: 27th April, 2011
annex B-27-4.indd 38 5/7/2011 10:50:47 aM

annual report 2010annual report 2010 annual report 2010 DIRECTORS’ REPORT
39
Annexure I
Market Price Data - High/Low during each month in the Year 2010
Month rate (rs.)
Highest lowest
January 630.15 592.30February 711.50 621.00March 697.10 659.45april* 730.10 361.95May 383.45 361.90June 444.00 372.60July 471.05 425.70august 506.20 455.05September 526.65 486.40october 504.95 459.10november 485.60 433.75December 476.70 445.50
*note: Bonus shares were allotted on 13th april, 2010 in the ratio of 1:1
Annexure II
on behalf of the Board of Directors
n. K. Kshatriya r. Kirpalani S. Malekar S. Vaidya Vice Chairman Director – Automotive & Chief Operating Officer Director – Supply Chain Director – Finance
Mumbai Dated: 27th April, 2011
Castrol India Limited
annex B-27-4.indd 39 5/7/2011 10:50:47 aM
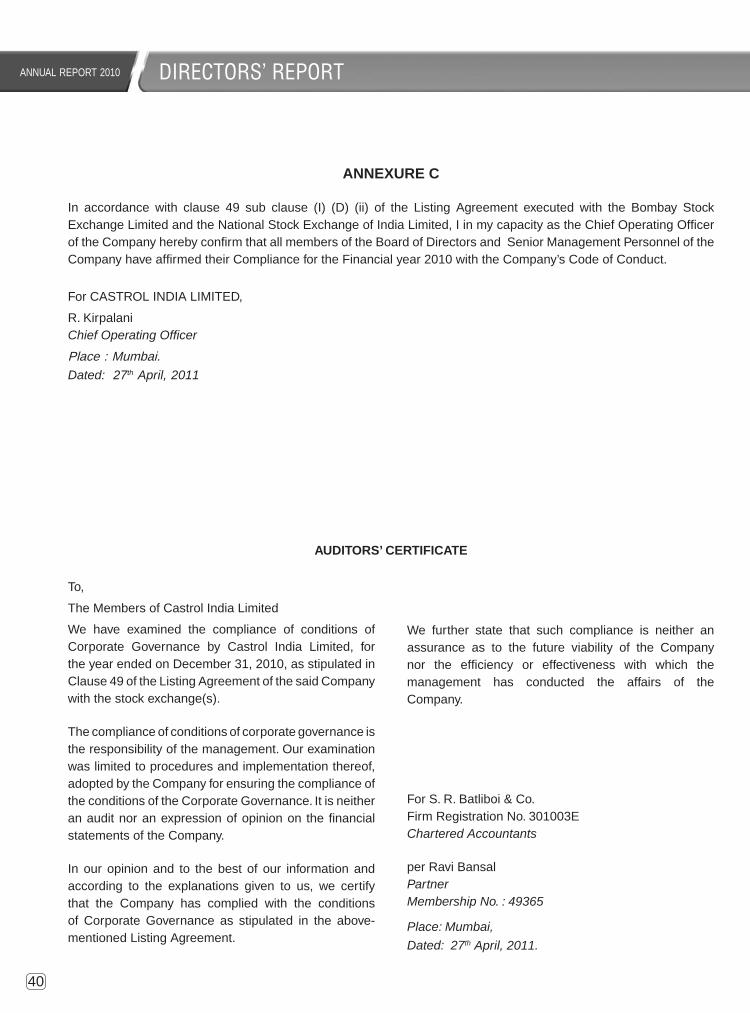
annual report 2010 DIRECTORS’ REPORT
40
annual report 2010 annual report 2010
to,
the Members of Castrol India limited
We have examined the compliance of conditions of Corporate Governance by Castrol India limited, for the year ended on December 31, 2010, as stipulated in Clause 49 of the listing agreement of the said Company with the stock exchange(s).
the compliance of conditions of corporate governance is the responsibility of the management. our examination was limited to procedures and implementation thereof, adopted by the Company for ensuring the compliance of the conditions of the Corporate Governance. It is neither an audit nor an expression of opinion on the financial statements of the Company.
In our opinion and to the best of our information and according to the explanations given to us, we certify that the Company has complied with the conditions of Corporate Governance as stipulated in the above-mentioned listing agreement.
We further state that such compliance is neither an assurance as to the future viability of the Company nor the efficiency or effectiveness with which the management has conducted the affairs of the Company.
For S. r. Batliboi & Co. Firm registration no. 301003eChartered Accountants
per ravi Bansal Partner Membership No. : 49365
Place: Mumbai,
Dated: 27th April, 2011.
AUDITORS’ CERTIFICATE
ANNEXURE C
In accordance with clause 49 sub clause (I) (D) (ii) of the listing agreement executed with the Bombay Stock exchange limited and the national Stock exchange of India limited, I in my capacity as the Chief operating officer of the Company hereby confirm that all members of the Board of Directors and Senior Management personnel of the Company have affirmed their Compliance for the Financial year 2010 with the Company’s Code of Conduct.
For CaStrol InDIa lIMIteD,
r. KirpalaniChief Operating Officer
place : Mumbai.Dated: 27th April, 2011
annex B-27-4.indd 40 5/7/2011 10:50:47 aM

annual report 2010annual report 2010 annual report 2010 DIRECTORS’ REPORT
41
Sr. No. Category No. of Shareholders No. of Shares held % to paid-up capital
(i) Foreign Collaborator 1 175374910 70.92
(ii) Foreign Company 1 270948 0.11
(iii) Foreign Institutional Investors 54 17397126 7.04
(iv) Overseas Bodies Corporate 2 2000 0.00
(v) Non-Resident Individuals 854 548332 0.22
(vi) Financial Institutions 18 11705186 4.73
(vii) Indian Mutual Funds 45 4531721 1.83
(viii) (a) Nationalised Banks 22 35608 0.01
(b) Other Banks 51 15696 0.01
(ix) Domestic Companies 1326 4306710 1.74
(x) Resident Individuals 65314 33080341 13.38
(xi) Directors & Relatives 2 12018 0.01
Grand Total 67690 247280596 100
Shareholding Pattern as on 31st December, 2010
annex B-27-4.indd 41 5/7/2011 10:50:47 aM
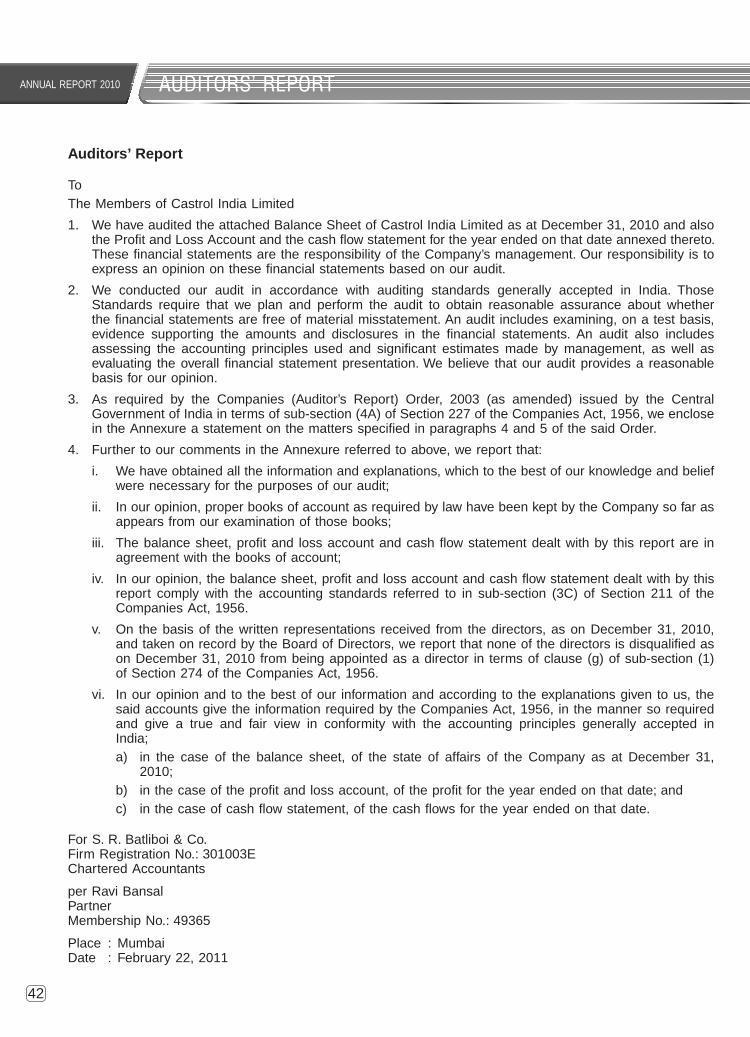
annual report 2010
42
annual report 2010 annual report 2010
tothe Members of Castrol India limited
1. We have audited the attached Balance Sheet of Castrol India limited as at December 31, 2010 and also the profit and loss account and the cash flow statement for the year ended on that date annexed thereto. these financial statements are the responsibility of the Company’s management. our responsibility is to express an opinion on these financial statements based on our audit.
2. We conducted our audit in accordance with auditing standards generally accepted in India. those Standards require that we plan and perform the audit to obtain reasonable assurance about whether the financial statements are free of material misstatement. an audit includes examining, on a test basis, evidence supporting the amounts and disclosures in the financial statements. an audit also includes assessing the accounting principles used and significant estimates made by management, as well as evaluating the overall financial statement presentation. We believe that our audit provides a reasonable basis for our opinion.
3. as required by the Companies (auditor’s report) order, 2003 (as amended) issued by the Central Government of India in terms of sub-section (4a) of Section 227 of the Companies act, 1956, we enclose in the annexure a statement on the matters specified in paragraphs 4 and 5 of the said order.
4. Further to our comments in the annexure referred to above, we report that:
i. We have obtained all the information and explanations, which to the best of our knowledge and belief were necessary for the purposes of our audit;
ii. In our opinion, proper books of account as required by law have been kept by the Company so far as appears from our examination of those books;
iii. the balance sheet, profit and loss account and cash flow statement dealt with by this report are in agreement with the books of account;
iv. In our opinion, the balance sheet, profit and loss account and cash flow statement dealt with by this report comply with the accounting standards referred to in sub-section (3C) of Section 211 of the Companies act, 1956.
v. on the basis of the written representations received from the directors, as on December 31, 2010, and taken on record by the Board of Directors, we report that none of the directors is disqualified as on December 31, 2010 from being appointed as a director in terms of clause (g) of sub-section (1) of Section 274 of the Companies act, 1956.
vi. In our opinion and to the best of our information and according to the explanations given to us, the said accounts give the information required by the Companies act, 1956, in the manner so required and give a true and fair view in conformity with the accounting principles generally accepted in India;
a) in the case of the balance sheet, of the state of affairs of the Company as at December 31, 2010;
b) in the case of the profit and loss account, of the profit for the year ended on that date; and c) in the case of cash flow statement, of the cash flows for the year ended on that date.
For S. r. Batliboi & Co.Firm registration no.: 301003eChartered accountants
per ravi BansalpartnerMembership no.: 49365
place : MumbaiDate : February 22, 2011
Auditors’ Report
AUDITORS’ REPORT
auditor report.indd 42 5/6/2011 1:39:34 pM

annual report 2010annual report 2010 annual report 2010
43
Annexure referred to in paragraph 3 of our report of even date
re: Castrol India Limited (‘the Company’)
AUDITORS’ REPORT
(i) (a) the Company has maintained proper records showing full particulars, including quantitative details and situation of fixed assets.
(b) all fixed assets have not been physically verified by the management during the year but there is a regular programme of verification which, in our opinion, is reasonable having regard to the size of the Company and the nature of its assets. as informed to us, no material discrepancies were noticed on such verification.
(c) there was no substantial disposal of fixed assets during the year.
(ii) (a) the management has conducted physical verification of inventory at reasonable intervals during the year.
(b) the procedures of physical verification of inventory followed by the management are reasonable and adequate in relation to the size of the Company and the nature of its business.
(c) the Company is maintaining proper records of inventory and no material discrepancies were noticed on physical verification.
(iii) (a) as informed to us, the Company has not granted any loans, secured or unsecured to companies, firms or other parties covered in the register maintained under Section 301 of the Companies act, 1956. accordingly, provisions of clause 4(iii) (b), (c) and (d) of the Companies (auditor’s report) order, 2003 (as amended) are not applicable to the Company.
(e) as informed to us, the Company has not taken any loans, secured or unsecured from companies, firms or other parties covered in the register maintained under Section 301 of the Companies act, 1956. accordingly, provisions of clause 4(iii) (f) and (g) of the Companies (auditor’s report) order, 2003 (as amended) are not applicable to the Company.
(iv) In our opinion and according to the information and explanations given to us, there is an adequate internal control system commensurate with the size of the Company and the nature of its business, for the purchase of inventory and fixed assets and for the sale of goods and services. During the course of our audit, no major weakness has been noticed in the internal control system in respect of these areas. During the course of our audit, we have not observed any continuing failure to correct major weakness in internal control system of the company.
(v) (a) according to the information and explanations provided by the management, we are of the opinion that the particulars of contracts or arrangements referred to in Section 301 of the act that need to be entered into the register maintained under Section 301 have been so entered.
(b) In our opinion and according to the information and explanations given to us, the transactions made in pursuance of such contracts or arrangements exceeding value of rupees five lakhs have been entered into during the financial year at prices which are reasonable having regard to the prevailing market prices at the relevant time except in respect of certain transactions, where because of the unique and specialized nature of the items involved and absence of any comparable prices, we are unable to comment whether the transactions were made at the prevailing market prices at the relevant time.
(vi) the Company has not accepted any deposits from the public.
(vii) In our opinion, the Company has an internal audit system commensurate with the size and nature of its business.
(viii) We have broadly reviewed the books of account maintained by the Company pursuant to the rules made by the Central Government for the maintenance of cost records under Section 209(1)(d) of the
auditor report.indd 43 5/6/2011 1:39:34 pM
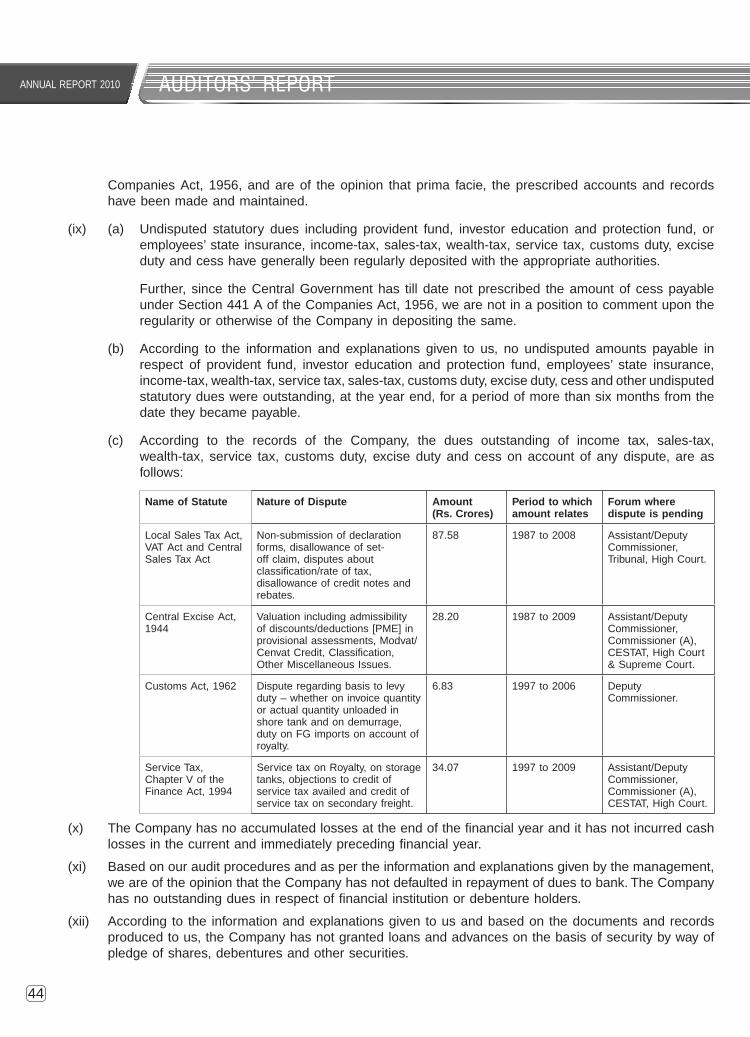
annual report 2010
44
annual report 2010 annual report 2010AUDITORS’ REPORT
Companies act, 1956, and are of the opinion that prima facie, the prescribed accounts and records have been made and maintained.
(ix) (a) undisputed statutory dues including provident fund, investor education and protection fund, or employees’ state insurance, income-tax, sales-tax, wealth-tax, service tax, customs duty, excise duty and cess have generally been regularly deposited with the appropriate authorities.
Further, since the Central Government has till date not prescribed the amount of cess payable under Section 441 a of the Companies act, 1956, we are not in a position to comment upon the regularity or otherwise of the Company in depositing the same.
(b) according to the information and explanations given to us, no undisputed amounts payable in respect of provident fund, investor education and protection fund, employees’ state insurance, income-tax, wealth-tax, service tax, sales-tax, customs duty, excise duty, cess and other undisputed statutory dues were outstanding, at the year end, for a period of more than six months from the date they became payable.
(c) according to the records of the Company, the dues outstanding of income tax, sales-tax, wealth-tax, service tax, customs duty, excise duty and cess on account of any dispute, are as follows:
Name of Statute Nature of Dispute Amount (Rs. Crores)
Period to which amount relates
Forum where dispute is pending
local Sales tax act, Vat act and Central Sales tax act
non-submission of declaration forms, disallowance of set-off claim, disputes about classification/rate of tax, disallowance of credit notes and rebates.
87.58 1987 to 2008 assistant/Deputy Commissioner, tribunal, High Court.
Central excise act, 1944
Valuation including admissibility of discounts/deductions [pMe] in provisional assessments, Modvat/ Cenvat Credit, Classification, other Miscellaneous Issues.
28.20 1987 to 2009 assistant/Deputy Commissioner, Commissioner (a), CeStat, High Court & Supreme Court.
Customs act, 1962 Dispute regarding basis to levy duty – whether on invoice quantity or actual quantity unloaded in shore tank and on demurrage, duty on FG imports on account of royalty.
6.83 1997 to 2006 Deputy Commissioner.
Service tax, Chapter V of the Finance act, 1994
Service tax on royalty, on storage tanks, objections to credit of service tax availed and credit of service tax on secondary freight.
34.07 1997 to 2009 assistant/Deputy Commissioner, Commissioner (a), CeStat, High Court.
(x) the Company has no accumulated losses at the end of the financial year and it has not incurred cash losses in the current and immediately preceding financial year.
(xi) Based on our audit procedures and as per the information and explanations given by the management, we are of the opinion that the Company has not defaulted in repayment of dues to bank. the Company has no outstanding dues in respect of financial institution or debenture holders.
(xii) according to the information and explanations given to us and based on the documents and records produced to us, the Company has not granted loans and advances on the basis of security by way of pledge of shares, debentures and other securities.
auditor report.indd 44 5/6/2011 1:39:35 pM
annual report 2010annual report 2010 annual report 2010
45
AUDITORS’ REPORT
(xiii) In our opinion, the Company is not a chit fund or a nidhi/mutual benefit fund/society. therefore, the provisions of clause 4(xiii) of the Companies (auditor’s report) order, 2003 (as amended) are not applicable to the Company.
(xiv) In respect of dealing/trading in shares, securities, debentures and other investments, in our opinion and according to the information and explanations given to us, proper records have been maintained of the transactions and contracts and timely entries have been made therein. the shares, securities, debentures and other investments have been held by the Company, in its own name.
(xv) according to the information and explanations given to us, the Company has not given any guarantee for loans taken by others from bank or financial institutions.
(xvi) the Company did not have any term loans outstanding during the year.
(xvii) according to the information and explanations given to us and on an overall examination of the balance sheet and cash flow statement of the Company, we report that no funds raised on short-term basis have been used for long-term investment.
(xviii) the Company has not made any preferential allotment of shares during the year to parties or companies covered in the register maintained under section 301 of the Companies act, 1956.
(xix) the Company did not have any outstanding debentures during the year.
(xx) the Company has not raised any money through public issue during the year. accordingly, the provisions of clause 4(xx) of the Companies (auditor’s report) order, 2003 (as amended) are not applicable to the Company.
(xxi) Based upon the audit procedures performed for the purpose of reporting the true and fair view of the financial statements and as per the information and explanations given by the management, we report that no material fraud on or by the Company has been noticed or reported during the course of our audit.
For S. r. Batliboi & Co.Firm registration no.: 301003eChartered accountants
per ravi BansalpartnerMembership no.: 49365
place : MumbaiDate : February 22, 2011
auditor report.indd 45 5/6/2011 1:39:35 pM
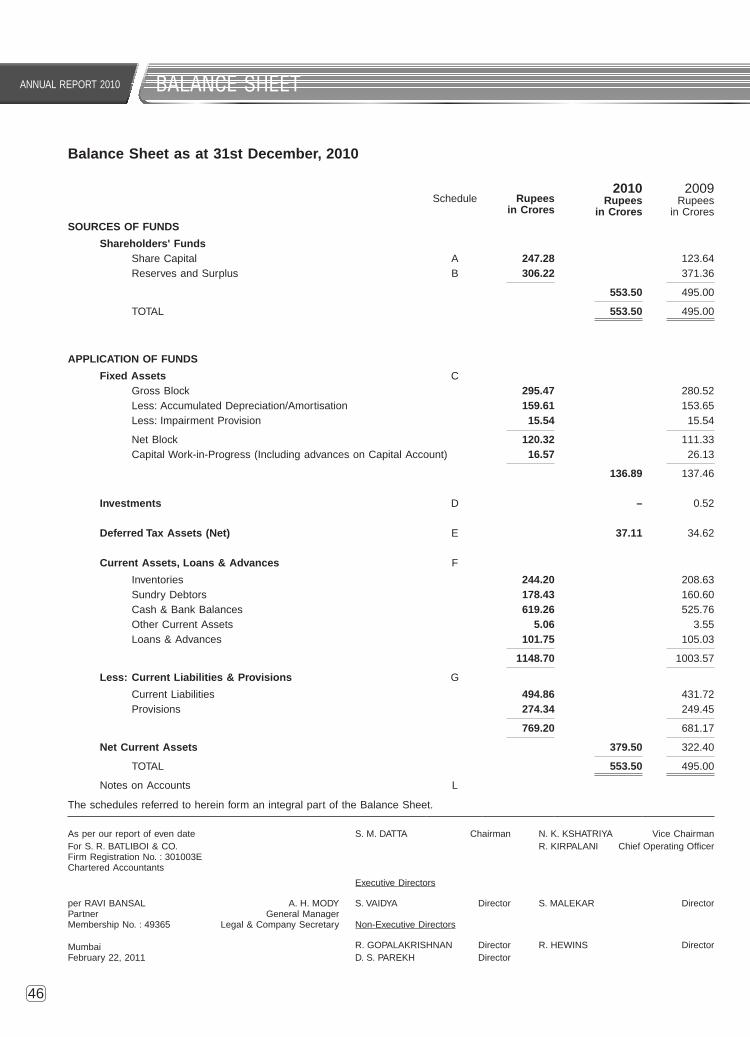
annual report 2010
46
Balance Sheet as at 31st December, 2010
BALANCE SHEET
Schedule Rupeesin Crores
2010 Rupees
in Crores
2009 rupees
in CroresSOURCES OF FUNDS
Shareholders' Funds Share Capital a 247.28 123.64 reserves and Surplus B 306.22 371.36
553.50 495.00
total 553.50 495.00
APPLICATION OF FUNDS
Fixed Assets C Gross Block 295.47 280.52 less: accumulated Depreciation/amortisation 159.61 153.65 less: Impairment provision 15.54 15.54
net Block 120.32 111.33 Capital Work-in-progress (Including advances on Capital account) 16.57 26.13
136.89 137.46
Investments D – 0.52
Deferred Tax Assets (Net) e 37.11 34.62
Current Assets, Loans & Advances F
Inventories 244.20 208.63 Sundry Debtors 178.43 160.60 Cash & Bank Balances 619.26 525.76 other Current assets 5.06 3.55 loans & advances 101.75 105.03
1148.70 1003.57
Less: Current Liabilities & Provisions G
Current liabilities 494.86 431.72 provisions 274.34 249.45
769.20 681.17
Net Current Assets 379.50 322.40
total 553.50 495.00
notes on accounts l
the schedules referred to herein form an integral part of the Balance Sheet.
as per our report of even date S. M. Datta Chairman n. K. KSHatrIYa Vice ChairmanFor S. r. BatlIBoI & Co. r. KIrpalanI Chief operating officerFirm registration no. : 301003eChartered accountants
executive Directors
per raVI BanSal a. H. MoDY S. VaIDYa Director S. MaleKar Directorpartner General ManagerMembership no. : 49365 legal & Company Secretary non-executive Directors
MumbaiFebruary 22, 2011
r. GopalaKrISHnan Director r. HeWInS DirectorD. S. pareKH Director
accounts-new.indd 46 5/6/2011 1:38:11 pM
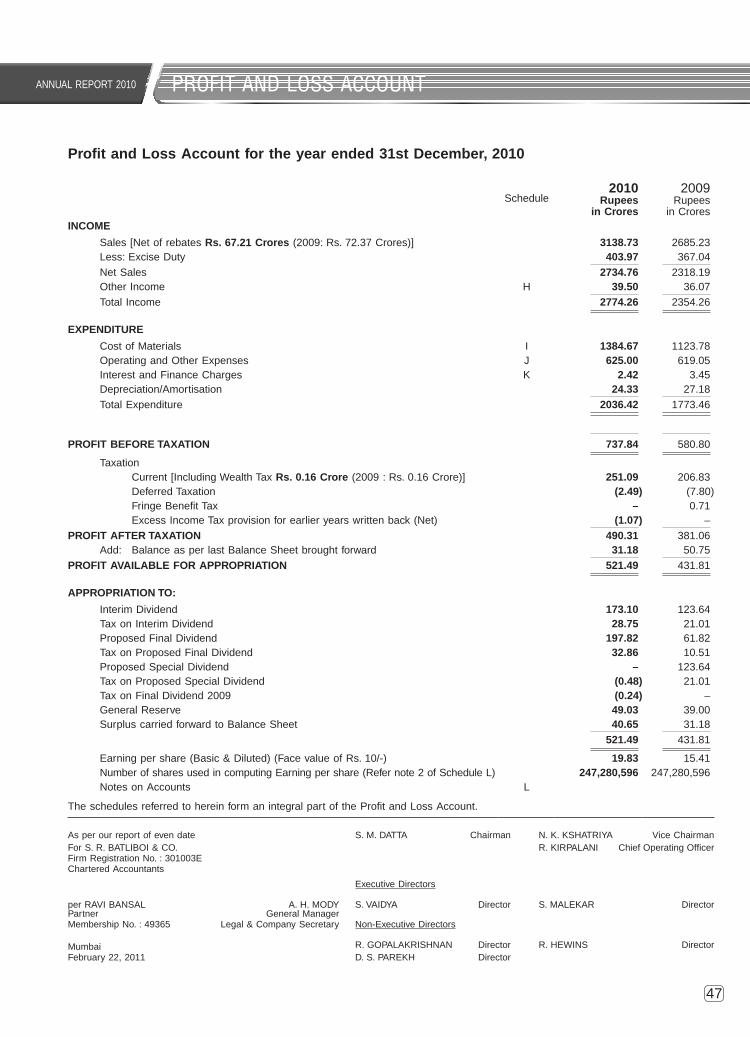
annual report 2010
47
Schedule2010
Rupeesin Crores
2009 rupees
in CroresINCOME
Sales [net of rebates Rs. 67.21 Crores (2009: rs. 72.37 Crores)] 3138.73 2685.23 less: excise Duty 403.97 367.04
net Sales 2734.76 2318.19 other Income H 39.50 36.07
total Income 2774.26 2354.26
EXPENDITURE
Cost of Materials I 1384.67 1123.78 operating and other expenses J 625.00 619.05 Interest and Finance Charges K 2.42 3.45 Depreciation/amortisation 24.33 27.18
total expenditure 2036.42 1773.46
PROFIT BEFORE TAXATION 737.84 580.80
taxation Current [Including Wealth tax Rs. 0.16 Crore (2009 : rs. 0.16 Crore)] 251.09 206.83 Deferred taxation (2.49) (7.80) Fringe Benefit tax – 0.71 excess Income tax provision for earlier years written back (net) (1.07) –
PROFIT AFTER TAXATION 490.31 381.06 add: Balance as per last Balance Sheet brought forward 31.18 50.75
PROFIT AVAILABLE FOR APPROPRIATION 521.49 431.81
APPROPRIATION TO:
Interim Dividend 173.10 123.64 tax on Interim Dividend 28.75 21.01 proposed Final Dividend 197.82 61.82 tax on proposed Final Dividend 32.86 10.51 proposed Special Dividend – 123.64 tax on proposed Special Dividend (0.48) 21.01 tax on Final Dividend 2009 (0.24) – General reserve 49.03 39.00 Surplus carried forward to Balance Sheet 40.65 31.18
521.49 431.81
earning per share (Basic & Diluted) (Face value of rs. 10/-) 19.83 15.41 number of shares used in computing earning per share (refer note 2 of Schedule l) 247,280,596 247,280,596 notes on accounts l
the schedules referred to herein form an integral part of the profit and loss account.
Profit and Loss Account for the year ended 31st December, 2010
PROFIT AND LOSS ACCOUNT
as per our report of even date S. M. Datta Chairman n. K. KSHatrIYa Vice ChairmanFor S. r. BatlIBoI & Co. r. KIrpalanI Chief operating officerFirm registration no. : 301003eChartered accountants
executive Directors
per raVI BanSal a. H. MoDY S. VaIDYa Director S. MaleKar Directorpartner General ManagerMembership no. : 49365 legal & Company Secretary non-executive Directors
MumbaiFebruary 22, 2011
r. GopalaKrISHnan Director r. HeWInS DirectorD. S. pareKH Director
accounts-new.indd 47 5/6/2011 1:38:12 pM
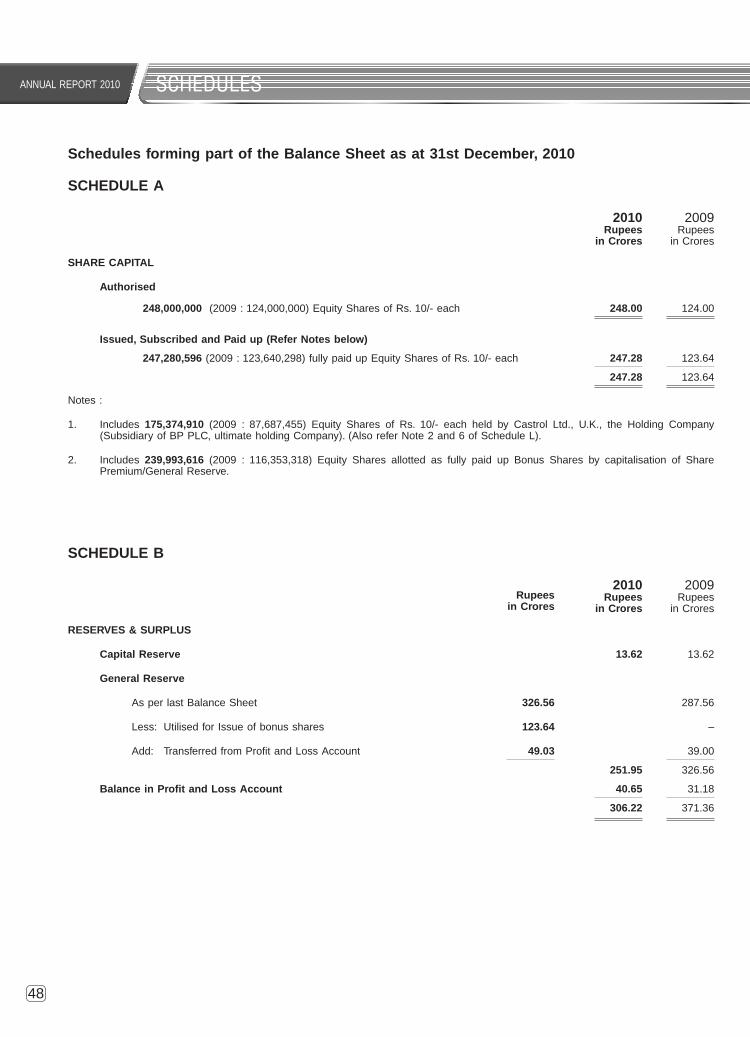
annual report 2010
48
Schedules forming part of the Balance Sheet as at 31st December, 2010
SCHEDULE A
2010 Rupees
in Crores
2009 rupees
in Crores
SHARE CAPITAL
Authorised
248,000,000 (2009 : 124,000,000) equity Shares of rs. 10/- each 248.00 124.00
Issued, Subscribed and Paid up (Refer Notes below)
247,280,596 (2009 : 123,640,298) fully paid up equity Shares of rs. 10/- each 247.28 123.64
247.28 123.64
notes :
1. Includes 175,374,910 (2009 : 87,687,455) equity Shares of rs. 10/- each held by Castrol ltd., u.K., the Holding Company (Subsidiary of Bp plC, ultimate holding Company). (also refer note 2 and 6 of Schedule l).
2. Includes 239,993,616 (2009 : 116,353,318) equity Shares allotted as fully paid up Bonus Shares by capitalisation of Share premium/General reserve.
SCHEDULE B
Rupeesin Crores
2010 Rupees
in Crores
2009 rupees
in Crores
RESERVES & SURPLUS
Capital Reserve 13.62 13.62
General Reserve
as per last Balance Sheet 326.56 287.56
less: utilised for Issue of bonus shares 123.64 –
add: transferred from profit and loss account 49.03 39.00
251.95 326.56
Balance in Profit and Loss Account 40.65 31.18
306.22 371.36
SCHEDULES
accounts-new.indd 48 5/6/2011 1:38:12 pM

annual report 2010
49
Schedules forming part of the Balance Sheet as at 31st December, 2010
SCHEDULES
SCHEDULE CFIXED ASSETS [Refer Notes 1(c) & 1(d) of Schedule L] Rupees in Crores
GROSS BLOCK DEPRECIATION / AMORTISATION IMPAIRMENT LOSS #
NET BLOCK
As at1.1.2010
Additionsfor the year
Deductionsfor the year
As at31.12.2010
As at1.1.2010
For the Year
On Deductions
As at31.12.2010
As at31.12.2010
as at31.12.2009
Freehold land 6.44 – – 6.44 – – – – – 6.44 6.44
leasehold land (1) 0.92 – – 0.92 0.40 0.02 – 0.42 – 0.50 0.52
Buildings (2) 64.64 3.92 0.03 68.53 25.29 2.97 0.01 28.25 – 40.28 39.35
plant & Machinery 148.50 17.10 19.21 146.39 92.75 14.55 17.29 90.01 3.47 52.91 52.28
plant & Machinery Intangibles 5.66 0.39 – 6.05 2.95 0.53 – 3.48 0.72 1.85 1.99
Furniture & Fixtures 32.31 11.41 0.53 43.19 21.98 5.41 0.53 26.86 2.45 13.88 7.88
office equipments 21.17 2.42 0.59 23.00 9.95 0.73 0.54 10.14 8.59 4.27 2.63
Motor Vehicles 0.88 0.07 – 0.95 0.33 0.12 – 0.45 0.31 0.19 0.24
280.52 35.31 20.36 295.47 153.65 24.33 18.37 159.61 15.54 120.32 111.33
previous Year 265.17 33.49 18.14 280.52 142.58 27.18 16.11 153.65 15.54
Capital Work-in-progress (Including advances on Capital account)
# there is no movement in the impairment provision during the year.
16.57 26.13
136.89 137.46
notes:
(1) Cost includes Rs. 0.49 Crore (2009 : rs. 0.49 Crore) for which execution of land lease agreement in respect of plots in Mumbai is in progress.
(2) Comprises of cost of premises including shares of paid up value of Rs. 0.01 Crore (2009 : rs. 0.01 Crore) in Co-operative Societies.
(3) Freehold land Rs. 1.26 Crores (2009 : rs.1.26 Crores), Building Rs. 1.41 Crores (2009 : rs. 1.41 Crores), plant & Machinery Rs. 0.39 Crore (2009 : rs. 0.39 Crore), Furniture & Fixtures Rs. Nil (2009 : rs. nil) and office equipments Rs. Nil (2009 : rs. nil) are retired from active use and held for disposal. accordingly these assets are carried at lower of net book value and net realisable value. the total carrying value of such assets as at 31st December, 2010 is Rs. 3.06 Crores (2009 : rs. 3.06 Crores).
accounts-new.indd 49 5/6/2011 1:38:13 pM

annual report 2010
50
Schedules forming part of the Balance Sheet as at 31st December, 2010
SCHEDULES
SCHEDULE D
Rupeesin Crores
2010Rupees
in Crores
2009rupees
in Crores
INVESTMENTS – [Refer Note 1(e) of Schedule L]
LONG TERM (At cost)
Other than trade:
Unquoted:
Nil (2009 : 500) – 5.25% non-Convertible redeemable taxable Bonds of rural electrification Corporation ltd. of rs. 10,000/- each – 0.50
CURRENT (Lower of cost and market value)
Other than trade:
Unquoted:
Government Securities * [Matured Face value Rs. Nil (2009 : rs. 0.02 Crore)] 0.02 0.02
less: Written off 0.02 – –
– 0.52
* Government Securities lodged with Mumbai port trust.
SCHEDULE E
Rupeesin Crores
2010 Rupees
in Crores
2009 rupees
in Crores
DEFERRED TAX ASSETS (NET) [Refer Note 1(k) of Schedule L]
Deferred tax assets and (liabilities) are attributable to the following items:
Deferred Tax Assets
provision for Doubtful Debts 1.11 1.09
provision for Doubtful advances 2.91 2.97
Voluntary retirement Scheme expenses 1.90 3.03
accrual for expenses allowable only on payment 20.08 16.14
tDS payable on provision for expenses 14.79 15.56
others 4.34 3.00
45.13 41.79
Less: Deferred Tax Liabilities
Differences in depreciation in block of fixed assets as per tax books and financial books 8.02 7.17
37.11 34.62
accounts-new.indd 50 5/6/2011 1:38:13 pM

annual report 2010
51
Schedules forming part of the Balance Sheet as at 31st December, 2010
SCHEDULES
SCHEDULE F2010
Rupeesin Crores
2009 rupees
in CroresCURRENT ASSETS, LOANS AND ADVANCES
Inventories [(lower of cost and net realisable value)* (See note 1(f) of Schedule l)] raw Materials 110.53 104.51 Finished products 103.90 83.35 traded Items 23.20 14.79 packages 5.29 4.75 Stores & Consumables 1.28 1.23
244.20 208.63 * Including Goods in transit Rs. 12.34 Crores (2009 : rs. 22.19 Crores)
Sundry Debtors @ Secured, considered good exceeding six months – – others 5.63 4.49 unsecured, considered good exceeding six months 0.65 1.02 others 172.15 155.09 unsecured, considered doubtful exceeding six months 3.09 2.87 others 0.26 0.35
181.78 163.82 less: provision for doubtful debts 3.35 3.22
178.43 160.60
@ Includes amount due from Companies under same management Rs. 3.61 Crores (2009 : rs. 5.65 Crores), maximum amount due at any time during the year Rs. 5.87 Crores (2009 : rs. 22.12 Crores) is given below:
Rupees in Crores Rupees in Croresname of Company 2010 2009 name of Company 2010 2009 arabian prod. & Marketing lub. Co. ltd. 0.09 0.03
Bp Southern africa (proprietary) limited 0.02 –
Bp (China) Industrial lubricants Co. 0.13 0.24 Bp Singapore pte ltd. 0.22 0.01 Bp Castrol (thailand) ltd. 0.06 0.10 Bp Singapore Spec Ind lubes – 1.19 Bp egypt oil – 0.01 Bp Singapore – lSC 0.04 0.07 Bp exploration (alpha) ltd. 0.03 0.03 Bp Singapore – Marine 0.03 – Bp India Services pvt. ltd. 1.05 2.82 Castrol pakistan private limited 0.14 – Bp International limited 0.01 – Castrol (Shenzhen) Co. ltd. – 0.03 Bp Marine limited 1.56 0.51 lubricants uK ltd. 0.19 0.59 Bp Middle east 0.04 – pt Castrol Indonesia – 0.02
Cash and Bank Balances Cash on Hand 0.03 0.02 With Scheduled banks: on Current account [including cheques on hand Rs. 4.25 Crores
(2009 : rs. 4.57 Crores)] 14.50 31.06 on Deposit account [including Margin Deposit Rs. 10.08 Crores (2009 : rs. nil)] 599.87 490.14 unclaimed Dividend accounts* 4.86 4.54
619.26 525.76 * these balances are not available for use by the Company as they represent
corresponding unpaid dividend liabilities.
Other Current Assets Interest accrued on Bank Fixed Deposits 5.06 3.54 Interest accrued on Investments – 0.01
5.06 3.55
accounts-new.indd 51 5/6/2011 1:38:14 pM

annual report 2010
52
Schedules forming part of the Balance Sheet as at 31st December, 2010
SCHEDULES
SCHEDULE F (Contd.)2010
Rupeesin Crores
2009 rupees
in Crores Loans and Advances (unsecured, considered good, unless otherwise stated) advances recoverable in cash or in kind or for value to be received (refer note below) Considered good 91.69 93.59 Considered doubtful 8.77 8.72 less: provision for doubtful advances 8.77 8.72
91.69 93.59 Balances with Customs, port trust and excise authorities 9.26 6.57 advance tax (net of provision) – 3.07 Fringe Benefit tax (net of provision) 0.80 1.80
101.75 105.03
note: amounts due from Directors of the Company Rs. 0.16 Crore (2009 : rs. 0.16 Crore) and maximum amount due from Directors of the Company at any time during the year Rs. 0.16 Crore (2009 : rs. 0.54 Crore).
1148.70 1003.57 SCHEDULE G
Rupeesin Crores
2010 Rupees
in Crores
2009 rupees
in CroresCURRENT LIABILITIES AND PROVISIONS Current Liabilities Sundry Creditors: Dues to Micro enterprises and Small enterprises
(refer note 14 of Schedule l) 2.97 0.40 Dues to other than Micro enterprises and Small enterprises 429.11 374.93
432.08 375.33 advances from Customers 5.12 3.87 Investor education and protection Fund shall be credited as and when
due by the following amount (refer note 1 below): unclaimed Dividends 4.86 4.54 Interest accrued and not due on Deposits 0.03 0.01 amount retained for taxation liability of Castrol ltd., u.K. 1.00 1.01 other liabilities 51.77 46.96
494.86 431.72 Provisions provision for Indirect taxation (refer note 2 below) 32.87 32.47 provision for Current taxation (net of advance tax) 10.79 – proposed Final Dividend 197.82 61.82 tax on proposed Final Dividend 32.86 10.51 proposed Special Dividend – 123.64 tax on proposed Special Dividend – 21.01
274.34 249.45
769.20 681.17 notes: (1) there is no amount due and outstanding as at 31st December, 2010 to be credited to
Investor education and protection Fund. (2) Movement in provision for Indirect taxation
Rupees in Crores2010 2009
Excise, Customs
& Service tax matters
Sales Tax & VAT
matters
Total excise, Customs
& Service tax matters
Sales tax & Vat
matters
total
Balance as at 1st January 7.15 25.32 32.47 5.40 20.60 26.00 additions during the year 1.18 1.22 2.40 2.06 5.23 7.29 reversals during the year (0.86) (1.14) (2.00) (0.31) (0.51) (0.82) Balance as at 31st December 7.47 25.40 32.87 7.15 25.32 32.47
(3) the Company has made provisions for known litigation cases and pending assessments in respect of taxes, duties and other levies, the outflow of which would depend on the cessation of the respective events.
accounts-new.indd 52 5/6/2011 4:16:49 pM

annual report 2010
53
Schedules forming part of the Profit and Loss Account for the year ended 31st December, 2010
SCHEDULES
SCHEDULE H
Rupeesin Crores
2010 Rupees
in Crores
2009 rupees
in Crores
OTHER INCOME Interest (Gross)
From long term Investments (non trade) – 0.03
on Bank Deposits [tax deducted at source Rs. 2.47 Crores (2009 : rs. 2.92 Crores)] 25.66 18.55
others 0.27 0.25
25.93 18.83
royalty & Commission Income 8.15 9.82
Miscellaneous Income [tax deducted at source Rs. 1.52 Crores (2009 : rs. 0.88 Crore)] 5.40 6.96
Debts written off in earlier years, realised 0.02 0.01
excess provision for doubtful debts written back (net) – 0.45
39.50 36.07
SCHEDULE I2010
Rupeesin Crores
2009 rupees
in Crores
COST OF MATERIALS
opening Stock
raw Materials and packages 109.26 139.74
traded Items 14.79 15.21
124.05 154.95
add: purchases
raw Materials and packages 1,374.37 1,043.80
traded Items 40.46 26.58
1,538.88 1,225.33
less: Closing Stock
raw Materials and packages 115.82 109.26
traded Items 23.20 14.79
139.02 124.05
Cost of Materials
raw Materials and packages 1,367.81 1,074.28
traded Items 32.05 27.00
1,399.86 1,101.28
(Increase)/Decrease in Stock in Finished products
opening Stock 83.35 111.47
Closing Stock 103.90 83.35
(20.55) 28.12
excise Duty on account of Increase/(Decrease) in Stock of Finished products 5.36 (5.62)
1,384.67 1,123.78
note: purchases include foreign exchange difference on imports — Gain Rs. 1.02 Crores (2009 : Gain rs. 0.24 Crore)
accounts-new.indd 53 5/6/2011 1:38:15 pM

annual report 2010
54
Schedules forming part of the Profit and Loss Account for the year ended 31st December, 2010
SCHEDULE J
Rupeesin Crores
2010 Rupees
in Crores
2009 rupees
in Crores
OPERATING AND OTHER EXPENSES personnel Cost Salaries, Wages and Bonus [refer note 1(g) of Schedule l] 78.46 83.97 performance linked Incentive to Wholetime Directors 1.01 3.75 Contribution to provident and other Funds [refer note 1(g) and 8 of Schedule l] 9.94 7.61 Gratuity [refer note 1(g) and 8 of Schedule l] 4.77 0.91 Staff Welfare expenses 8.76 8.15
102.94 104.39 rent 13.12 12.83 rates & taxes 8.51 8.64 power & Fuel 3.64 3.48 Stores & Consumables 1.25 1.22 Freight & Forwarding Charges 79.08 68.67 Insurance 1.86 1.65 repairs & Maintenance – land & Building 3.45 3.43 repairs & Maintenance – plant & Machinery 3.12 3.26 repairs & Maintenance – others 9.53 9.88 Bad Debts written off 0.18 0.54 provision for Doubtful Debts 0.13 – provision for Doubtful advances 0.02 0.44 Investments Written off 0.02 – processing & Filling Charges 11.44 21.03 advertisement & Sales promotion 162.40 149.46 Stock point operating Charges 18.25 17.21 loss on Disposal/Write off of Fixed assets (net) (includes impairment provision of
Rs. Nil, 2009 : rs. 12.43 Crores)1.91 14.24
Directors’ Sitting Fees 0.03 0.02 Voluntary retirement Scheme expenses (refer note 1(g) of Schedule l) 0.55 7.84 Commission to resident non-Wholetime Indian Directors 0.26 0.26 royalty 77.53 63.12 Sales promotion fee 74.75 60.07 travelling expenses 12.22 13.17 legal and professional Fees (refer note 13 of Schedule l) 22.51 25.85 Miscellaneous expenses (net) 16.30 28.35
625.00 619.05
note: operating and other expenses include foreign exchange differences (net) — Gain Rs. 0.14 Crore (2009 : loss rs. 0.40 Crore).
SCHEDULE K2010
Rupeesin Crores
2009 rupees
in Crores
INTEREST AND FINANCE CHARGES Bank Charges 0.88 1.06 Interest on others 1.54 2.39
2.42 3.45
SCHEDULES
accounts-new.indd 54 5/6/2011 1:38:16 pM

annual report 2010 annual report 2010
55
SCHEDULES
Schedules forming part of the Balance Sheet as at 31st December, 2010 and the Profit and Loss Account for the year ended on that date.
SCHEDULE L
NOTES ON ACCOUNTS1. Accounting Policies :
(a) Basis of Preparation of Accounts :
the Financial Statements have been prepared to comply in all material aspects with applicable accounting principles in India, mandatory accounting Standards notified by the Companies (accounting Standards) rule, 2006 (as amended) and the relevant provisions of the Companies act, 1956. the Financial Statements have been prepared under the historical cost convention on an accrual basis except in case of assets for which provision for impairment is made and revaluation is carried out. the accounting policies applied by the Company are consistent with those used in the previous year, except for the changes in accounting policy, if any.
(b) Use of estimates :
the preparation of Financial Statements in conformity with generally accepted accounting principles requires management to make estimates and assumptions that affect the reported amounts of assets and liabilities and disclosure of contingent liabilities at the date of the financial statements and the results of operations during the reporting period. although these estimates are based upon management’s best knowledge of current events and actions, actual results could differ from these estimates.
(c) Fixed Assets and Depreciation :
Fixed assets (including plant & Machinery Intangibles) are stated at cost less accumulated depreciation and impairment provision. Cost comprises the purchase price (net of Cenvat and Vat wherever applicable) and any attributable cost of bringing the assets to its working condition for its intended use. lease-hold land and lease-hold Improvements are being amortised on a straight-line basis over the period of lease.
Depreciation is provided pro-rata to the period of use on straight-line method based on the estimated useful lives of the assets, which have been determined by management, as stated below. these rates of depreciation are higher than the rates specified under Schedule XIV of the Companies act, 1956.
FIXeD aSSetS uSeFul lIVeS FIXeD aSSetS uSeFul lIVeS
residential and office Building 25 years office equipments 10 years
Factory Building 30 years Computers 4 years
plant & Machinery 10 years to 21 years Vehicles 4 years
plant & Machinery Intangibles 4 years Workshop equipments * 2 years to 4 years
Moulds 4 years Dealer Boards 3 years
Furniture & Fixtures 8 years
* Workshop equipments provided against Sales agreements are depreciated over the standard period of agreement.
assets individually costing less than rs. 5,000/- are fully depreciated in the year of acquisition.
(d) Impairment of Assets :
(i) the carrying amounts of assets are reviewed at each Balance Sheet date if there is any indication of impairment based on internal/external factors. an impairment loss is recognized wherever the carrying amount of an asset exceeds its recoverable amount. the recoverable amount is the greater of the assets net selling price and value in use. In assessing value in use, the estimated future cash flows are discounted to their present value at the weighted average cost of capital.
(ii) after impairment, depreciation is provided on the revised carrying amount of the assets over its remaining useful life.
(iii) a previously recognized impairment loss is increased or reversed depending on changes in circumstances. However, the carrying value after reversal is not increased beyond the carrying value that would have prevailed by charging usual depreciation if there was no impairment.
(e) Valuation of Investments :
long term Investments are stated at cost less provision, if any, for diminution which is other than temporary in nature.
Current Investments are valued at lower of cost and net realisable value determined on individual investment basis.
(f) Valuation of Inventories :
raw Materials, packages, traded Items and Finished Goods are valued at lower of real time weighted average cost and net realisable value. Cost of Finished Goods includes material and packaging cost, proportion of manufacturing overheads based on normal operating capacity and excise Duty. Custom Duty on stock lying in Bonded Warehouses is included in cost. Stores and Consumables are valued at cost.
notes.indd 55 5/6/2011 12:12:46 pM
annual report 2010
56
SCHEDULE L (Contd.)
SCHEDULESannual report 2010 annual report 2010
Accounting Policies : (Contd.)
(g) Employee Benefits :
(i) Defined Contribution plan
Company’s contributions paid/payable during the year to Company’s pension Fund, eSIC and labour Welfare Fund, Medical Insurance Benefits, post retiral Medical Benefit scheme and share match are recognised in the profit and loss account.
(ii) Defined Benefit plan Company’s liabilities towards gratuity, provident fund, survivor protection (death benefit), pension benefit to past
employees are actuarially determined using the projected unit credit method which considers each period of service as giving rise to an additional unit of benefit entitlement and measures each unit separately to build up the final obligation. past services in relation to benefits mentioned above are recognised on a straight line basis over the average period until the amended benefits become vested. actuarial gain and losses are recognised immediately in the statement of profit and loss account as income or expense. obligation is measured at the present value of estimated future cash flows using a discounted rate that is determined by reference to market yields at the Balance Sheet date on Government Securities where the currency and terms of the Government Securities are consistent with the currency and estimated terms of the defined benefit obligation.
(iii) long term compensated absences are provided for based on actuarial valuation. the actuarial valuation is done as per projected unit credit method.
(iv) Short term employee benefits are recognised as an expense at the undiscounted amount in the profit and loss account of the year in which the related service is rendered.
(v) Voluntary retirement Scheme expenses are fully charged to the profit and loss account in the year in which they accrue.
please refer note 8 for disclosure as per revised aS 15.
(h) Recognition of Income and Expenditure :
Sales are recognised when goods are supplied and are recorded net of rebates and Sales tax/Vat and inclusive of excise Duty. Interest income is recognised on time proportion basis. expenses are accounted for on accrual basis and provision is made for all known losses and expenses. revenue is recognised to the extent that it is probable that the economic benefits will flow to the Company and the revenue can be reliably measured.
(i) Foreign Currency Transactions :
Foreign currency transactions are recorded in the reporting currency, by applying to the foreign currency amount the exchange rate between the reporting currency and the foreign currency at the date of the transaction. premium on forward cover contracts, if any, in respect of import of raw materials is charged to profit and loss account over the period of contract. all monetary assets and liabilities as at the Balance Sheet date, not covered by forward contracts are reinstated at the applicable exchange rates prevailing on that date. all exchange differences arising on transactions, not covered by forward contracts, are charged to profit and loss account.
(j) Provision :
a provision is recognized when an enterprise has a present obligation as a result of past event and it is probable that an outflow of resources will be required to settle the obligation, in respect of which a reliable estimate can be made. provisions are not discounted to its present value and are determined based on management estimate required to settle the obligation at the Balance Sheet date. these are reviewed at each Balance Sheet date and adjusted to reflect the current best estimates.
(k) Taxation :
(i) tax expense comprises of Current, Deferred and Fringe Benefit tax. Current Income tax and Fringe Benefit tax is measured at the amount expected to be paid to the tax authorities in accordance with the Indian Income tax act, 1961.
(ii) Deferred tax is measured based on the tax rates and the tax laws enacted or substantively enacted at the Balance Sheet date. Deferred tax is recognised at the Balance Sheet date, subject to the considerations of prudence, on timing differences, being the difference between taxable income and accounting income that originate in one period and are capable of reversal in one or more subsequent periods.
Deferred tax assets are recognised only to the extent that there is reasonable certainty that sufficient future taxable income will be available against which such Deferred tax assets can be realised.
(iii) the tax year for the Company being the year ending 31st March, the provision for taxation for the year is the aggregate of the provision made for the three months ended on 31st March, 2010 and the provision for the remaining period of nine months ending on 31st December, 2010. the provision for the remaining period of nine months has been arrived at by applying the effective tax rate of the financial year 2010-11 to profit Before tax of the said period.
notes.indd 56 5/6/2011 12:12:47 pM

annual report 2010annual report 2010 annual report 2010
57
SCHEDULE L (Contd.)
SCHEDULES
Accounting Policies : (Contd.)
(l) Earning Per Share :
Basic earning per share is calculated by dividing the net profit or loss for the year attributable to equity shareholders (after deducting attributable taxes) by the weighted average number of equity shares outstanding during the year. the weighted average number of equity shares outstanding during the year is adjusted for events of bonus issue; bonus element in a rights issue to existing shareholders; share split; and reverse share split (consolidation of shares). For the purpose of calculating diluted earning per share, the net profit or loss for the year attributable to equity shareholders and the weighted average number of shares outstanding during the year are adjusted for the effects of all dilutive potential equity shares.
(m) Leases :
leases where the lessor effectively retains substantially all the risks and benefits of ownership of the leased term, are classified as operating leases. operating lease payments are recognized as an expense in the profit and loss account on a straight-line basis over the lease term.
(n) Cash and Cash Equivalents :
Cash and cash equivalents in the cash flow statement comprise cash at bank and in hand, fixed deposits and short-term investments which are readily convertible into known amounts of cash.
(o) Segment Reporting Policies :
the Company prepares its segment information in conformity with the accounting policies adopted for preparing and presenting the Financial Statements of the company as a whole. the Company’s operating businesses are organized and managed separately according to the nature of products and services provided. the analysis of geographical segments is based on the areas in which major operating divisions of the Company operate. revenues and expenses directly attributable to segments are reported under each reportable segment. revenues and expenses, which relate to the Company as a whole and are not allocable to segments on a reasonable basis, have been included under “unallocable”.
2. the Company has allotted bonus shares on 13th april, 2010 in the ratio of one equity share for every one equity share of rs. 10/- each held in the Company on the record Date. the Basic and Diluted epS has been calculated for all periods presented after taking into account the bonus issue.
3. estimated amount of contracts (net of advances) remaining to be executed on capital account and not provided for Rs. 7.47 Crores (2009 : rs. 2.41 Crores).
4. Contingent Liabilities not provided for in the accounts : 31st December,
2010 Rupees
in Crores
31st December, 2009
rupees in Crores
(a) Guarantees and Counter Guarantees given by the Company 34.45 6.68
(b) excise/Sales tax Demands made by the authorities, in respect of which appeals have been filed 19.81 18.07
(c) Claims against the Company not acknowledged as debts estimated at :
(i) Income tax – 1.17
(ii) In respect of third parties – Miscellaneous 1.63 1.43 Future cash outflows in respect of (b) above are determinable only on receipt of judgements/decisions pending with various
forums/authorities.
5. (a) the Company had received in prior years, show cause notices from excise authorities in respect of input and Finished Goods stock differences at some of its plants aggregating to Rs. 18.30 Crores (2009 : rs. 18.30 Crores). there have been three orders in favour of the Company though department has filed appeals against two of them. the orders were passed upholding the Company’s contention that the stock differences have been almost fully reconciled/explained. the pending demands on account of stock differences aggregate to Rs. 4.66 Crores (2009 : rs. 4.96 Crores) including the amounts involved in the cases where department has filed appeals. Considering that favourable orders have been received setting out a ratio that minor differences are condonable, the demands at other plants are also likely to be eventually dropped. the Company has also obtained legal opinions which concur with this view. However, as a matter of abundant caution, the Company has upto date made a provision of rs. 0.47 Crore and payments of rs. 1.40 Crores relating to excise cases of stock differences as on 31st December, 2010.
(b) Certain disputed demand notices relating to Indirect taxes amounting to Rs. 106.74 Crores (2009 : rs. 100.50 Crores) have neither been considered as contingent liabilities nor acknowledged as claims, based on expert legal opinions obtained/internal assessment. the Company is of the view that the possibility of the demands materialising is remote.
notes.indd 57 5/6/2011 12:12:47 pM

annual report 2010
58
SCHEDULE L (Contd.)
SCHEDULESannual report 2010 annual report 2010
6. a shareholder of the Company had filed a public Interest petition in the Delhi High Court interalia challenging the allotment of 3,537,862 equity shares on preferential basis to Castrol ltd., uK. the said petition has been dismissed by the Delhi High Court on 11th January, 2005. However, the Shareholder has gone to appeal by way of a Special leave petition to the Supreme Court of India. the appeal has been admitted but no interim relief has been granted.
7. Segment Information :
the business segment has been considered as the primary segment. the Company is organised into two business segments, automotive & non-automotive.
the above business segments have been identified considering :
– the customers
– the differing risks and returns
– the organisation structure
– the internal financial reporting system
Segment revenue, results, assets and liabilities have been accounted for on the basis of their relationship to the operating activities of the segment and amounts allocated on a reasonable basis.
Rupees in Crores31st December, 2010 31st December, 2009
Automotive Non- Automotive
Unallocated Total automotive non- automotive
unallocated total
Revenue
net Sales/Income from operations 2364.80 369.96 – 2734.76 2008.30 309.89 – 2318.19
Results
Segment results 610.87 103.45 – 714.32 477.94 87.49 – 565.43
unallocable Income net of unallocable (expenditure)
– – 25.94 25.94 – – 18.82 18.82
Interest and Finance Charges – – 2.42 2.42 – – 3.45 3.45
profit Before taxation – – – 737.84 – – – 580.80
provision for Current taxation – – – 251.09 – – – 206.83
Deferred taxation – – – (2.49) – – – (7.80)
Fringe Benefit tax – – – – – – – 0.71
excess Income tax provision for earlier years written back (net) – – – (1.07) – – – –
profit after taxation – – – 490.31 – – – 381.06
Other Information
Segment assets 528.39 132.87 661.44 1322.70 495.54 111.30 569.33 1176.17
Segment liabilities 465.59 48.04 255.57 769.20 411.20 41.84 228.13 681.17
Capital expenditure (Including Capital Work-in-progress) 23.97 1.78 – 25.75 32.01 2.64 – 34.65
Depreciation/amortisation 23.20 1.13 – 24.33 26.09 1.09 – 27.18
Geographical Segment
Revenue
India 2732.80 2315.21
outside India 1.96 2.98
2734.76 2318.19
Assets
India 1320.17 1173.37
outside India 2.53 2.80
1322.70 1176.17
Capital Expenditure (Including Capital Work-in-Progress)
India 25.75 34.65
outside India – –
25.75 34.65
notes.indd 58 5/6/2011 12:12:47 pM
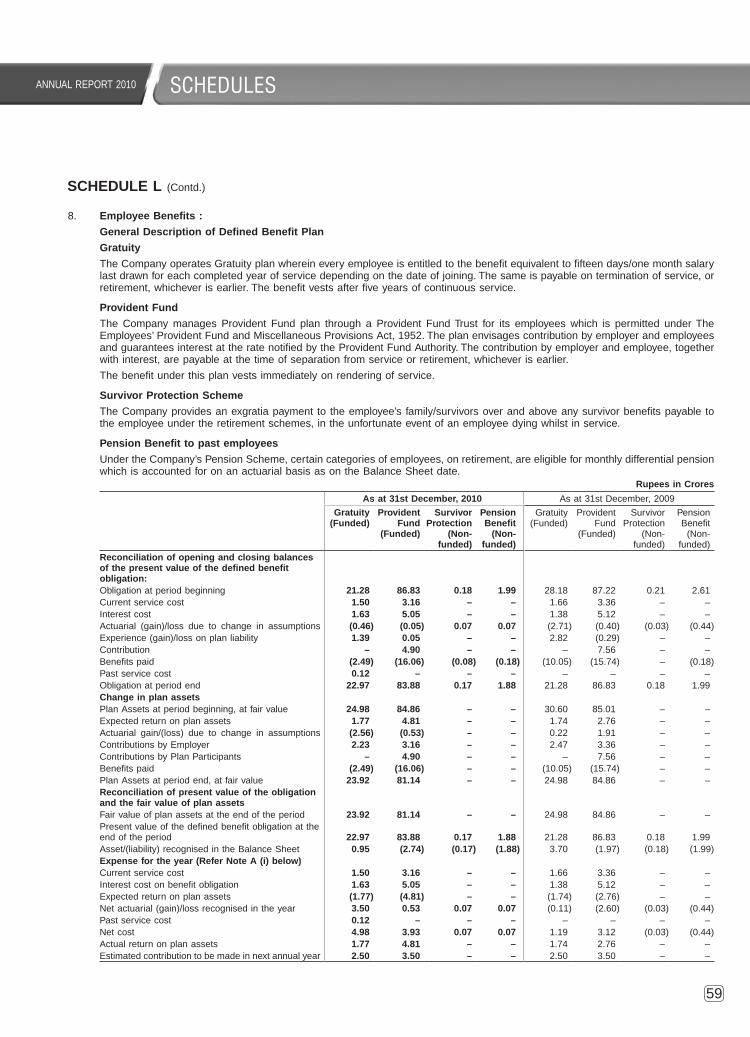
annual report 2010annual report 2010 annual report 2010
59
SCHEDULE L (Contd.)
SCHEDULES
8. Employee Benefits :
General Description of Defined Benefit Plan
Gratuity
the Company operates Gratuity plan wherein every employee is entitled to the benefit equivalent to fifteen days/one month salary last drawn for each completed year of service depending on the date of joining. the same is payable on termination of service, or retirement, whichever is earlier. the benefit vests after five years of continuous service.
Provident Fund
the Company manages provident Fund plan through a provident Fund trust for its employees which is permitted under the employees’ provident Fund and Miscellaneous provisions act, 1952. the plan envisages contribution by employer and employees and guarantees interest at the rate notified by the provident Fund authority. the contribution by employer and employee, together with interest, are payable at the time of separation from service or retirement, whichever is earlier.
the benefit under this plan vests immediately on rendering of service.
Survivor Protection Scheme
the Company provides an exgratia payment to the employee’s family/survivors over and above any survivor benefits payable to the employee under the retirement schemes, in the unfortunate event of an employee dying whilst in service.
Pension Benefit to past employees
under the Company’s pension Scheme, certain categories of employees, on retirement, are eligible for monthly differential pension which is accounted for on an actuarial basis as on the Balance Sheet date.
Rupees in Crores
As at 31st December, 2010 as at 31st December, 2009
Gratuity (Funded)
Provident Fund
(Funded)
Survivor Protection
(Non-funded)
Pension Benefit
(Non-funded)
Gratuity (Funded)
provident Fund
(Funded)
Survivor protection
(non-funded)
pension Benefit
(non-funded)
Reconciliation of opening and closing balances of the present value of the defined benefit obligation:obligation at period beginning 21.28 86.83 0.18 1.99 28.18 87.22 0.21 2.61 Current service cost 1.50 3.16 – – 1.66 3.36 – – Interest cost 1.63 5.05 – – 1.38 5.12 – – actuarial (gain)/loss due to change in assumptions (0.46) (0.05) 0.07 0.07 (2.71) (0.40) (0.03) (0.44)experience (gain)/loss on plan liability 1.39 0.05 – – 2.82 (0.29) – – Contribution – 4.90 – – – 7.56 – – Benefits paid (2.49) (16.06) (0.08) (0.18) (10.05) (15.74) – (0.18)past service cost 0.12 – – – – – – – obligation at period end 22.97 83.88 0.17 1.88 21.28 86.83 0.18 1.99 Change in plan assetsplan assets at period beginning, at fair value 24.98 84.86 – – 30.60 85.01 – – expected return on plan assets 1.77 4.81 – – 1.74 2.76 – – actuarial gain/(loss) due to change in assumptions (2.56) (0.53) – – 0.22 1.91 – – Contributions by employer 2.23 3.16 – – 2.47 3.36 – – Contributions by plan participants – 4.90 – – – 7.56 – – Benefits paid (2.49) (16.06) – – (10.05) (15.74) – – plan assets at period end, at fair value 23.92 81.14 – – 24.98 84.86 – – Reconciliation of present value of the obligation and the fair value of plan assetsFair value of plan assets at the end of the period 23.92 81.14 – – 24.98 84.86 – – present value of the defined benefit obligation at the end of the period 22.97 83.88 0.17 1.88 21.28 86.83 0.18 1.99 asset/(liability) recognised in the Balance Sheet 0.95 (2.74) (0.17) (1.88) 3.70 (1.97) (0.18) (1.99)Expense for the year (Refer Note A (i) below)Current service cost 1.50 3.16 – – 1.66 3.36 – – Interest cost on benefit obligation 1.63 5.05 – – 1.38 5.12 – – expected return on plan assets (1.77) (4.81) – – (1.74) (2.76) – – net actuarial (gain)/loss recognised in the year 3.50 0.53 0.07 0.07 (0.11) (2.60) (0.03) (0.44)past service cost 0.12 – – – – – – – net cost 4.98 3.93 0.07 0.07 1.19 3.12 (0.03) (0.44)actual return on plan assets 1.77 4.81 – – 1.74 2.76 – – estimated contribution to be made in next annual year 2.50 3.50 – – 2.50 3.50 – –
notes.indd 59 5/6/2011 12:12:48 pM

annual report 2010
60
SCHEDULE L (Contd.)
SCHEDULESannual report 2010 annual report 2010
Employee Benefits : (Contd.)
Rupees in Crores
As at 31st December, 2010 as at 31st December, 2009
Assumptions Gratuity Provident Fund
Survivor Protection
Pension Benefit
Gratuity provident Fund
Survivor protection
pension Benefit
Discount rate 8.0% 8.0% 8.0% 8.0% 7.5% 7.5% 7.5% 7.5%
employee turnover 8.0% 8.0% – – 8.0% 8.0% – –
Mortality LIC Ultimate 94-96
LIC Ultimate 94-96
LIC Ultimate 94-96
– lIC ultimate 94-96
lIC ultimate 94-96
lIC ultimate 94-96
–
the estimates of future salary increases, considered in actuarial valuation, take account of inflation, seniority, promotion, and other relevant factors, such as supply and demand in the employment market.
As at 31st December, 2010 as at 31st December, 2009
Gratuity Provident Fund Gratuity provident Fund
The composition of plan assets
Debt Instruments 83% 73% 85% 73%
others 17% 27% 15% 27%
100% 100% 100% 100%
Amount for the current and previous periods are as follows :
Rupees in Crores
As at 31st December, 2010 as at 31st December, 2009
Gratuity (Funded)
Provident Fund
(Funded)
Survivor Protection
(Non-funded)
Pension Benefit
(Non-funded)
Gratuity (Funded)
provident Fund
(Funded)
Survivor protection
(non-funded)
pension Benefit
(non-funded)
experience (gain)/loss on plan liability 1.39 0.05 – – 2.82 (0.29) – –
Fair value of plan assets at the end of the period 23.92 81.14 – – 24.98 84.86 – –
present value of the defined benefit obligation at the end of the period 22.97 83.88 0.17 1.88 21.28 86.83 0.18 1.99
asset/(liability) recognised in the Balance Sheet 0.95 (2.74) (0.17) (1.88) 3.70 (1.97) (0.18) (1.99)
as at 31st December, 2008 as at 31st December, 2007
Gratuity (Funded)
provident Fund
(Funded)
Survivor protection
(non-funded)
pension Benefit
(non-funded)
Gratuity (Funded)
provident Fund
(Funded)
Survivor protection
(non-funded)
pension Benefit
(non-funded)
experience (gain)/loss on plan liability 1.02 0.58 – – – – – –
Fair value of plan assets at the end of the period 30.60 85.00 – – 29.75 78.26 – –
present value of the defined benefit obligation at the end of the period 28.20 87.22 0.21 2.61 25.03 81.64 0.21 1.97
asset/(liability) recognised in the Balance Sheet 2.40 (2.22) (0.21) (2.61) 4.72 (3.38) (0.21) (1.97)
notes.indd 60 5/6/2011 12:12:48 pM

annual report 2010annual report 2010 annual report 2010
61
SCHEDULE L (Contd.)
SCHEDULES
Employee Benefits : (Contd.)
a. Amounts recognised as an expense :
(i) Defined Benefit Plan
Gratuity in Schedule J includes gratuity cost of Rs. 4.77 Crores (2009 : rs. 0.91 Crore) (net of recoveries of Rs. 0.21 Crore (2009 : nil) towards employees on secondment from group companies). Contribution to provident and other Funds in Schedule J includes Rs. 3.93 Crores (2009 : rs. 2.93 Crores) for provident Fund.
Salaries, wages and bonus in Schedule J includes leave encashment, survivor protection (death benefit), pension benefit to past employees, Rs. 0.15 Crore (2009 : rs. 0.36 Crore).
(ii) Defined Contribution Plan
Contribution to provident and other Funds’ in Schedule J includes Rs. 4.90 Crores (2009 : rs. 4.63 Crores) for pension Fund, eSIC and labour Welfare Fund and ‘Insurance’ includes Rs. 1.15 Crores (2009 : rs. 0.81 Crore) for Medical Insurance benefits and post retiral medical benefit scheme. Salaries, wages and bonus in Schedule J includes Rs. 0.93 Crore (2009 : rs. 1.09 Crores) for Share Match.
B. Basis used to determine expected rate of return on assets :
the major portion of the assets are invested in debt instruments. expected rate of return on investments for all defined benefit plans is determined based on the assessment made by the Company at the beginning of the year on the return expected on its existing portfolio since these are generally held to maturity, along with the estimated incremental investments to be made during the year. expected rate of return on plan assets is 8% (2009 : 8%).
9. Related Party Disclosures :
a. name of the related party and nature of relationship where control exists :
(a) Holding Companies Castrol ltd., u.K. (Holding Company of Castrol India ltd.)Burmah Castrol Holdings ltd. (Holding Company of Castrol ltd., u.K.)Bp plC (Holding Company of Burmah Castrol Holdings ltd.)
(b) other related parties arabian prod. & Marketing lub. Co. ltd. Bp Japan KK (where transaction exists) aspac lubricants (Malaysia) Sdn Bhd Bp Korea limited
aspac lubricants Malaysia Bp lub. Shanghai SIBuBp China aspac HKD lub. Bp lubricants uSa, Inc.Bp France Bp Marine ltd.Bp (China) Industrial lubricants ltd. Bp Mauritius ltd.Bp alternative energy International ltd. Bp Middle eastBp australia pty ltd. Bp oil Head officeBp Castrol (thailand) ltd. Bp oil International ltd.Bp Castrol KK Bp oil uK ltd.Bp Castrol lubricants (Malaysia) SDn Bp Shipping ltd. Bp China Holding ltd. Bp Singapore – lSC regionalBp Corporation na Inc. Bp Singapore MarineBp egypt Company Bp Singapore pte. ltd.Bp egypt oil (335 GupCo) Bp Singapore Spec Ind. lubesBp energy India pvt. ltd. Bp South africaBp europa Se Bp South West pacific limitedBp europa Se – Bp Belgium (Branch) Bp S. W. pacific oaZBp exploration (alpha) ltd. – CBM India Bp Southern africa (proprietary) limitedBp exploration (alpha) ltd. Bp turkiya oeuBp exploration (In Salah) ltd. BpoI – ISt Ho CostsBp France Sa Branch office BpSa lubes (trading as Bp Middle east) Burmah Castrol australia ptY ltd.Bp India Services pvt. ltd. Castrol (Shenzhen) Co. ltd.Bp International ltd. Castrol (Shenzhen) Company ltd.Bp Italia Spa (Shanghai Branch)
notes.indd 61 5/6/2011 12:12:49 pM

annual report 2010
62
SCHEDULE L (Contd.)
SCHEDULESannual report 2010 annual report 2010
Related Party Disclosures : (Contd.)
(b) other related parties (where Castrol (uK) ltd. Deutsche Bp transaction exists) (Contd.) Castrol australia pte. ltd. Deutsche Bp aG
Castrol austria aG First energy India limitedCastrol austria GmbH lubricants uK ltd.Castrol Bp petco ltd. nordic lubricants aBCastrol Bp petco limited liability Company nordic lubricants aSCastrol Industrial north america Inc. premier lubes aspac ltd.Castrol ltd. uK. premier lubricants (S) pte. ltd.Castrol offshore pt Castrol IndonesiaCastrol pakistan private ltd. tata Bp Solar India ltd.
(c) associates (where Castrol India ltd. employees’ provident Fund transaction exists) Castrol India ltd. Staff pension Fund
Castrol India ltd. employees’ Gratuity Fund
(d) Key Management personnel n. K. Kshatriya Managing Director upto 8th May, 2009 (where transaction exists) r. Kirpalani Director – automotive
& Chief operating officer
From 8th May, 2009
a. S. ramchander executive Director upto 30th april, 2009a. p. Mehta executive Director upto 15th november, 2010S. Vaidya executive Director From 16th november, 2010S. Malekar executive Director From 1st May, 2008
B. transactions with related parties as per the books of account. Rupees in Crores
31st December, 2010 31st December, 2009
Holding Companies
Sub- sidiary
Asso- ciates
Key Manage-
ment Personnel
Fellow Sub-
sidiaries
Holding Companies
Sub- sidiary
asso- ciates
Key Manage-
ment personnel
Fellow Sub-
sidiaries
Purchase of Materials/ Finished Goods
Bp europa Se – – – – 14.53 – – – – –
Bp oil International ltd. – – – – 35.77 – – – – 34.50
Castrol Industrial north america – – – – 9.80 – – – – –
others – – – – 10.98 – – – – 19.24
Sale of Goods & Related Expenses
Bp (China) Industrial lubricants ltd. – – – – 0.58 – – – – 0.70
Bp Castrol (thailand) ltd. – – – – 0.15 – – – – 0.14
Bp Middle east – – – – – – – – – 0.04
others – – – – 0.08 – – – – 0.14
Receiving of Services
Bp International ltd. – – – – 0.72 – – – – –
Bp oil Head office – – – – – – – – – 0.80
lubricants uK ltd. – – – – 4.41 – – – – 5.03
others – – – – 1.51 – – – – 2.06
Rendering of Services & Deputation of Employees
Bp India Services pvt. ltd. – – – – 7.52 – – – – 7.70
Bp Middle east – – – – – – – – – 7.08
others – – – – 1.71 – – – – 6.68
notes.indd 62 5/6/2011 12:12:49 pM

annual report 2010annual report 2010 annual report 2010
63
SCHEDULE L (Contd.)
SCHEDULES
B. transactions with related parties as per the books of account. (Contd.)Rupees in Crores
31st December, 2010 31st December, 2009
Holding Companies
Sub- sidiary
Asso- ciates
Key Manage-
ment Personnel
Fellow Sub-
sidiaries
Holding Companies
Sub- sidiary
asso- ciates
Key Manage-
ment personnel
Fellow Sub-
sidiaries
Transfer of Employee related balances
Bp India Services pvt. ltd. – transfer out
– – – – 0.59 – – – – 1.51
Bp India Services pvt. ltd. – transfer in
– – – – 0.50 – – – – 0.58
Commission Income
Bp Marine ltd. – – – – 4.56 – – – – 3.85
Contribution to Funds
Castrol India ltd. employees’ provident Fund – – 3.93 – – – – 2.93 – –
Castrol India ltd. Staff pension Fund – – 4.40 – – – – 4.08 – –
Castrol India ltd. employees’ Gratuity Fund – – 4.77 – – – – 0.91 – –
Dividend
Castrol ltd., u.K. 263.06 – – – – 219.22 – – – –
others – – – – 0.41 – – – – 0.34
Royalty Expense
Castrol ltd., u.K. 77.53 – – – – 63.12 – – – –
Amounts Payable
Castrol ltd., u.K. 210.65 – – – – 186.20 – – – –
Bp oil International ltd. – – – – – – – – – 10.96
others – – – – 9.35 – – – – 6.32
Amounts Receivable
Bp India Services pvt. ltd. – – – – 1.35 – – – – 2.82
Bp Marine ltd. – – – – 1.56 – – – – –
Bp Singapore Spec Ind. lubes – – – – – – – – – 1.18
lubricants uK ltd. – – – – – – – – – 0.59
others – – – – 1.04 – – – – 1.06
Remuneration to Managing Director
n. K. Kshatriya – – – – – – – – 2.95 –
Remuneration to Executive Directors
a. S. ramchander – – – – – – – – 0.92 –
a. p. Mehta – – – 0.68 – – – – 1.43 –
Soren Malekar – – – 1.27 – – – – 1.24 –
ravi Kirpalani – – – 2.11 – – – – 1.18 –
Sujit Vaidya – – – 0.15 – – – – – –
Loan Outstanding
ravi Kirpalani – – – 0.16 – – – – 0.16 –
Recovery of Loan & Interest thereon
ravi Kirpalani – – – 0.01 – – – – 0.01 –
notes.indd 63 5/6/2011 12:12:50 pM
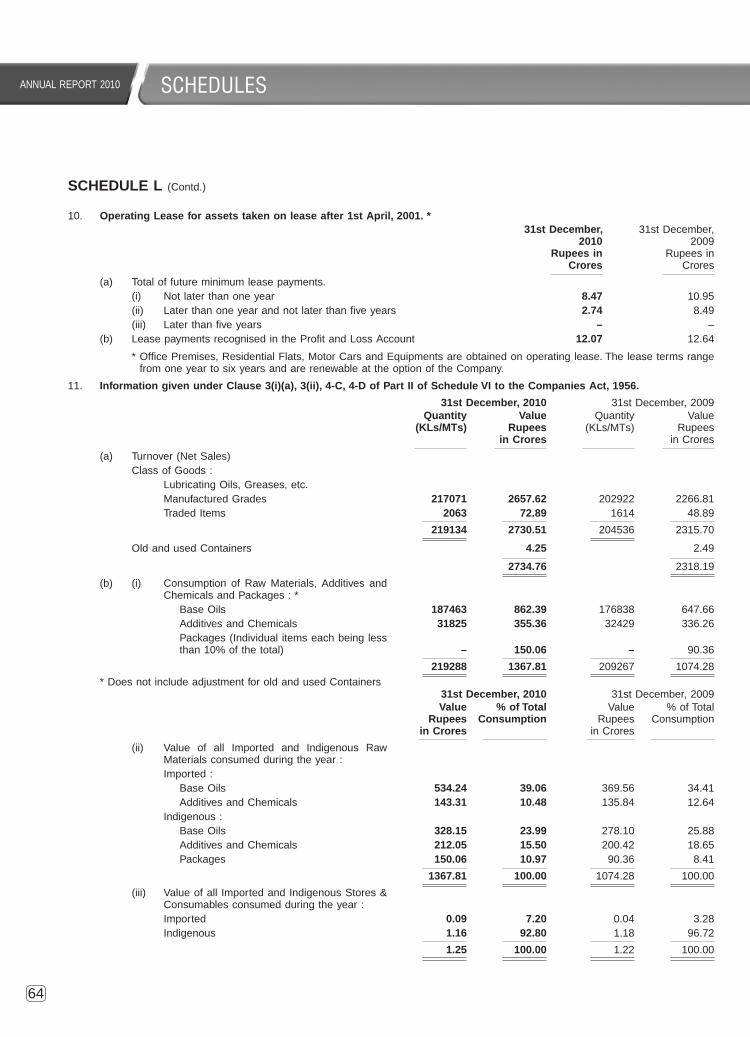
annual report 2010
64
SCHEDULE L (Contd.)
SCHEDULESannual report 2010 annual report 2010
10. Operating Lease for assets taken on lease after 1st April, 2001. *31st December,
2010 Rupees in
Crores
31st December, 2009
rupees in Crores
(a) total of future minimum lease payments. (i) not later than one year 8.47 10.95 (ii) later than one year and not later than five years 2.74 8.49 (iii) later than five years – – (b) lease payments recognised in the profit and loss account 12.07 12.64
* office premises, residential Flats, Motor Cars and equipments are obtained on operating lease. the lease terms range from one year to six years and are renewable at the option of the Company.
11. Information given under Clause 3(i)(a), 3(ii), 4-C, 4-D of Part II of Schedule VI to the Companies Act, 1956.
31st December, 2010 31st December, 2009 Quantity
(KLs/MTs) Value
Rupees in Crores
Quantity (Kls/Mts)
Value rupees
in Crores
(a) turnover (net Sales) Class of Goods : lubricating oils, Greases, etc. Manufactured Grades 217071 2657.62 202922 2266.81 traded Items 2063 72.89 1614 48.89
219134 2730.51 204536 2315.70
old and used Containers 4.25 2.49
2734.76 2318.19
(b) (i) Consumption of raw Materials, additives and Chemicals and packages : *
Base oils 187463 862.39 176838 647.66 additives and Chemicals 31825 355.36 32429 336.26 packages (Individual items each being less
than 10% of the total) – 150.06 – 90.36
219288 1367.81 209267 1074.28 * Does not include adjustment for old and used Containers
31st December, 2010 31st December, 2009Value
Rupees in Crores
% of Total Consumption
Value rupees
in Crores
% of total Consumption
(ii) Value of all Imported and Indigenous raw Materials consumed during the year :
Imported : Base oils 534.24 39.06 369.56 34.41 additives and Chemicals 143.31 10.48 135.84 12.64 Indigenous : Base oils 328.15 23.99 278.10 25.88 additives and Chemicals 212.05 15.50 200.42 18.65 packages 150.06 10.97 90.36 8.41
1367.81 100.00 1074.28 100.00
(iii) Value of all Imported and Indigenous Stores & Consumables consumed during the year :
Imported 0.09 7.20 0.04 3.28 Indigenous 1.16 92.80 1.18 96.72
1.25 100.00 1.22 100.00
notes.indd 64 5/6/2011 12:12:50 pM

annual report 2010annual report 2010 annual report 2010
65
SCHEDULE L (Contd.)
SCHEDULES
Information given under Clause 3(i)(a), 3(ii), 4-C, 4-D of Part II of Schedule VI to the Companies Act, 1956. (Contd.)
31st December, 2010 31st December, 2009
Quantity (KLs/MTs)
Value Rupees
in Crores
Quantity (Kls/Mts)
Value rupees
in Crores
(c) opening and Closing Stock of Goods produced : Manufactured Grades : lubricating oils and Greases opening Stock [Including Quantity held
on account of free of cost scheme 2409 KLs/MTs (2009 : 1623 Kls/Mts)] 11602 83.35 11733 111.47
Closing Stock [excluding shortages/ losses – 61 KLs/MTs (2009 : 107 Kls/Mts)] [Including Quantity held on account of free of cost scheme 2371 KLs/MTs (2009 : 2409 Kls/Mts)] 12363 103.90 11602 83.35
(d) traded Items: lubricating oils and Greases opening Stock 882 14.79 912 15.21 purchases 2627 40.46 1584 26.58 Closing Stock [excluding Shortages/losses
3 KLs (2009 : nil Kls)] 1443 23.20 882 14.79
(e) licensed and Installed Capacity : (i) licensed Capacity – not applicable as per legal advice
(ii) Installed Capacity [technically evaluated as certified by the Management (per Year on a single shift basis)]31st December,
2010 (KLs/MTs)
31st December, 2009
(Kls/Mts)
For production of lubricating oils, Greases, Brake Fluids at patalganga, Kolkata, Chennai & Silvassa
236000 236000
(f) production of lubricating oils, Greases, etc. [Including processing done by third parties 14071 KLs/MTs (2009 : 14895 Kls/Mts)]
217542 203684
(g) (i) Consumption includes adjustments for shortage/excess, etc. and the effects of reduction of inventory to realisable value. (ii) Quantities of turnover, consumption, production, opening and closing stocks of additives and chemicals are made
up of Kilolitres and Metric tons, but the constituent units of measurement of the items have not been separately identified and indicated.
(iii) as the Company manufactures and trades, the information required by Clause 3(ii) (a) of Schedule VI part II to the Companies act, 1956 is interpreted to require total amounts to be disclosed in respect of opening stock, closing stock and purchases of traded items.
12. Directors’ Emoluments 31st December,
2010 Rupees
in Crores
31st December, 2009
rupees in Crores
total remuneration (excluding sitting fees) [refer (b) and (c) below] 4.48 7.99
Includes:(i) Salary and allowances 2.29 3.01 (ii) Contribution to provident and other funds 0.42 0.58 (iii) estimated value of perquisites * 0.50 0.39 (iv) performance linked Incentive to Whole time Directors 1.01 3.75 (v) Commission to resident non-Whole time Indian Directors [refer (c) below] 0.26 0.26
* evaluated as per Income-tax rules wherever applicable.
notes.indd 65 5/6/2011 12:12:51 pM
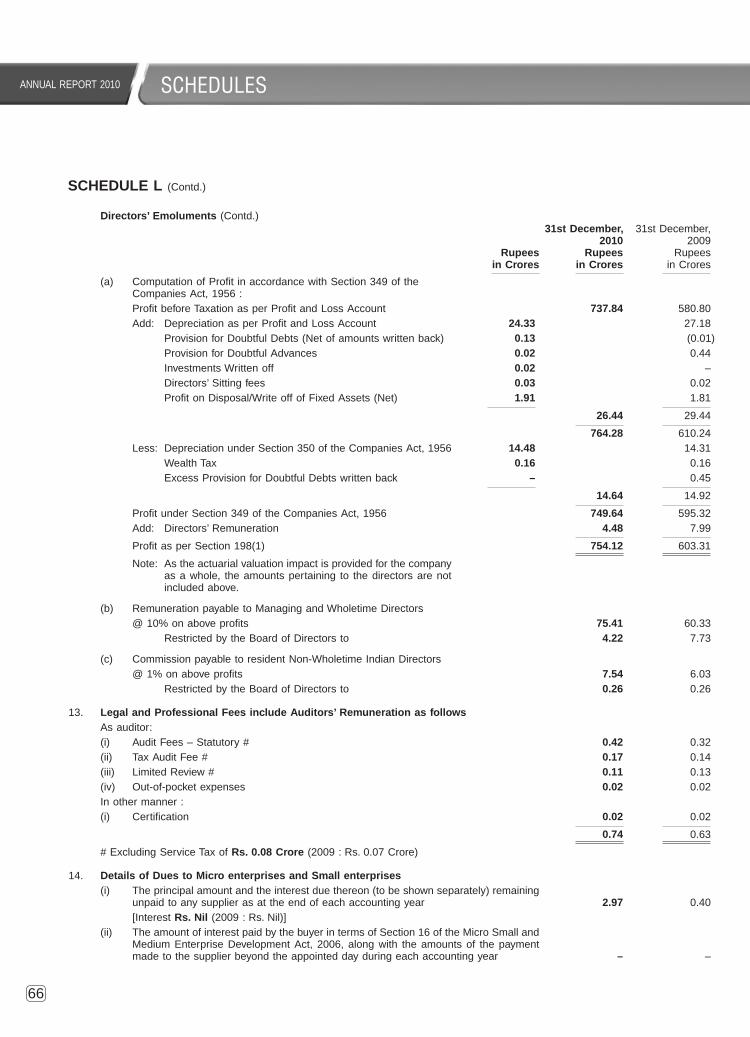
annual report 2010
66
SCHEDULE L (Contd.)
SCHEDULESannual report 2010 annual report 2010
Directors’ Emoluments (Contd.)
Rupees in Crores
31st December, 2010
Rupees in Crores
31st December, 2009
rupees in Crores
(a) Computation of profit in accordance with Section 349 of the Companies act, 1956 :
profit before taxation as per profit and loss account 737.84 580.80 add: Depreciation as per profit and loss account 24.33 27.18 provision for Doubtful Debts (net of amounts written back) 0.13 (0.01) provision for Doubtful advances 0.02 0.44 Investments Written off 0.02 – Directors’ Sitting fees 0.03 0.02 profit on Disposal/Write off of Fixed assets (net) 1.91 1.81
26.44 29.44
764.28 610.24 less: Depreciation under Section 350 of the Companies act, 1956 14.48 14.31 Wealth tax 0.16 0.16 excess provision for Doubtful Debts written back – 0.45
14.64 14.92
profit under Section 349 of the Companies act, 1956 749.64 595.32 add: Directors’ remuneration 4.48 7.99
profit as per Section 198(1) 754.12 603.31
note: as the actuarial valuation impact is provided for the company as a whole, the amounts pertaining to the directors are not included above.
(b) remuneration payable to Managing and Wholetime Directors @ 10% on above profits 75.41 60.33 restricted by the Board of Directors to 4.22 7.73
(c) Commission payable to resident non-Wholetime Indian Directors @ 1% on above profits 7.54 6.03 restricted by the Board of Directors to 0.26 0.26
13. Legal and Professional Fees include Auditors’ Remuneration as follows as auditor:(i) audit Fees – Statutory # 0.42 0.32 (ii) tax audit Fee # 0.17 0.14 (iii) limited review # 0.11 0.13 (iv) out-of-pocket expenses 0.02 0.02 In other manner :(i) Certification 0.02 0.02
0.74 0.63
# excluding Service tax of Rs. 0.08 Crore (2009 : rs. 0.07 Crore)
14. Details of Dues to Micro enterprises and Small enterprises (i) the principal amount and the interest due thereon (to be shown separately) remaining
unpaid to any supplier as at the end of each accounting year 2.97 0.40 [Interest Rs. Nil (2009 : rs. nil)](ii) the amount of interest paid by the buyer in terms of Section 16 of the Micro Small and
Medium enterprise Development act, 2006, along with the amounts of the payment made to the supplier beyond the appointed day during each accounting year – –
notes.indd 66 5/6/2011 12:12:51 pM

annual report 2010annual report 2010 annual report 2010
67
SCHEDULE L (Contd.)
SCHEDULES
Details of Dues to Micro enterprises and Small enterprises : (Contd.)31st December,
2010 Rupees
in Crores
31st December, 2009
rupees in Crores
(iii) the amount of interest due and payable for the period of delay in making payment (which have been paid but beyond the appointed day during the year) but without adding the interest specified under Micro Small and Medium enterprise Development act, 2006. – –
(iv) the amount of interest accrued and remaining unpaid at the end of each accounting year. – –
(v) the amount of further interest remaining due and payable even in the succeeding years, until such date when the interest dues as above are actually paid to the small enterprise for the purpose of disallowance as a deductible expenditure under Section 23 of the Micro Small and Medium enterprise Development act, 2006. – –
15. research and Development expenses amounting to Rs. 8.02 Crores (net) (2009 : rs. 8.26 Crores) are included under relevant heads of expense.
16. Foreign currency exposures which are not hedged as at the Balance Sheet date.
Particulars Foreign Currency
AUD EURO GBP JPY SGD USD SEK31st December, 2010 Sundry Creditors – Foreign currency 1551 956808 14475 862224 19746 8035185 – Sundry Creditors – rs. in Crores 0.01 5.63 0.10 0.05 0.07 36.05 – Sundry Debtors – Foreign currency – – – – – 777924 – Sundry Debtors – rs. in Crores – – – – – 3.49 – loans and advances – Foreign currency – 3436 – – – 1088398 – loans and advances – rs. in Crores – 0.02 – – – 4.88 –31st December, 2009 Sundry Creditors – Foreign currency 6528 660463 7502 959438 109402 13474882 14248 Sundry Creditors – rs. in Crores 0.03 4.43 0.06 0.05 0.36 62.89 0.01 Sundry Debtors – Foreign currency – – – – – 588174 – Sundry Debtors – rs. in Crores – – – – – 2.74 – loans and advances – Foreign currency – – – – – 490997 – loans and advances – rs. in Crores – – – – – 2.29 –
31st December, 2010
Rupees in Crores
31st December, 2009
rupees in Crores
17. C.I.F. Value of Imports : raw Materials 548.29 406.26 Capital Goods 3.63 1.60
18. Expenditure in Foreign Currency (on accrual basis) : travel 1.32 1.02 Import of goods for resale 30.74 12.83 royalty (Gross) [tax deducted at source Rs. 8.19 Crores (2009 : rs. 9.46 Crores)] 77.53 63.12 others (net of tax where applicable) 13.03 19.72
19. Earnings in Foreign Exchange (on accrual basis) : Supplies to Foreign Vessels 10.83 14.38 Commission 4.56 3.85 FoB value of goods exported 1.96 2.98
notes.indd 67 5/6/2011 12:12:51 pM

annual report 2010
68
SCHEDULE L (Contd.)
SCHEDULESannual report 2010 annual report 2010
20. Details of Dividend remitted during the year, to Two (2009 : two) non-resident shareholders are as follows :
31st December, 2010
Rupees in Crores
31st December, 2009
rupees in Crores
Dividend in respect
of the year ended
no. of
Shares
31-12-2008 (Final) 87822929 – 79.04
31-12-2009 (Interim) 87822929 – 87.82
31-12-2009 (Final & Special) 87822929 131.73 –
31-12-2010 (Interim) 175645858 122.95 –
21. previous year’s figures have been regrouped wherever necessary.
as per our report of even date S. M. Datta Chairman n. K. KSHatrIYa Vice ChairmanFor S. r. BatlIBoI & Co. r. KIrpalanI Chief operating officerFirm registration no. : 301003eChartered accountants
executive Directors
per raVI BanSal a. H. MoDY S. VaIDYa Director S. MaleKar Directorpartner General ManagerMembership no. : 49365 legal & Company Secretary non-executive Directors
MumbaiFebruary 22, 2011
r. GopalaKrISHnan Director r. HeWInS DirectorD. S. pareKH Director
notes.indd 68 5/6/2011 12:12:52 pM

annual report 2010annual report 2010 annual report 2010
69
Additional Information as required under Part IV of Schedule VI to the Companies Act, 1956.
S. M. Datta Chairman n. K. KSHatrIYa Vice Chairmanr. KIrpalanI Chief operating officer
executive Directors
a. H. MoDY S. VaIDYa Director S. MaleKar DirectorGeneral Manager
legal & Company Secretary non-executive Directors
MumbaiFebruary 22, 2011
r. GopalaKrISHnan Director r. HeWInS DirectorD. S. pareKH Director
BALANCE SHEET ABSTRACT AND COMPANY’S GENERAL BUSINESS PROFILE
Balance Sheet abstract and Company’s General Business profile :
I. Registration Details
registration no. 2 1 3 5 9 State Code 1 1
Balance Sheet Date 3 1 1 2 2 0 1 0
Date Month Year
II. Capital raised during the year (amount in rs. thousands)
public Issue rights Issue
– –
Bonus Issue private placement
1 2 3 6 4 0 0 –
III. Position of Mobilisation and Deployment of Funds (amount in rs. thousands)
total liabilities total assets
1 3 2 2 7 0 0 0 1 3 2 2 7 0 0 0
Sources of Funds :
paid up Capital reserves & Surplus
2 4 7 2 8 0 0 3 0 6 2 2 0 0
Secured loans unsecured loans
– –
Application of Funds :
net Fixed assets Investments
1 3 6 8 9 0 0 –
Deferred tax assets/(liability) (net) net Current assets
3 7 1 1 0 0 3 7 9 5 0 0 0
Miscellaneous expenditure accumulated losses
– –
IV. Performance of the Company (amount in rs. thousands)
turnover total expenditure
2 7 3 4 7 6 0 0 2 0 3 6 4 2 0 0
profit/(loss) before tax profit/(loss) after tax
7 3 7 8 4 0 0 4 9 0 3 1 0 0
earning per share (rs.) Dividend rate %
1 9 . 8 3 1 5 0
V. Generic Names of Principal Products/Services of the Company
Item Code no. 2 7 1 0 0 0 . 6 1(ItC Code)
product Description l u B r I C a t I n G o I l S
notes.indd 69 5/6/2011 12:12:52 pM

annual report 2010
70
annual report 2010 annual report 2010
Rupees in Crores
2010 Rupees
in Crores
2009 rupees
in Crores
A. CASH FLOW FROM OPERATING ACTIVITIES
Net profit before Tax 737.84 580.80
adjustments for :
Depreciation 24.33 27.18
Interest and Finance Charges 2.42 3.45
Interest Income (25.93) (18.83)
provision for Doubtful advances (net) 0.02 0.44
provision for Doubtful Debts (net) 0.31 0.09
Investments Written off 0.02 –
unrealised foreign exchange (gain)/loss (0.45) (0.22)
loss on Disposal/Write off of Fixed assets (net) 1.91 14.24
Miscellaneous Income – (0.81)
Operating Profit before Working Capital Changes 740.47 606.34
Movement in Working Capital (Increase)/Decrease
Sundry Debtors (18.14) 1.62
Inventories (35.57) 58.67
other loans & advances 3.26 (13.21)
Current liabilities 63.97 134.53
Cash generated from Operations 753.99 787.95
Income tax paid (239.23) (218.38)
Fringe Benefit tax paid – (1.12)
NET CASH FLOW FROM OPERATING ACTIVITIES 514.76 568.45
B. CASH FLOW FROM INVESTING ACTIVITIES
purchase of Fixed assets (25.75) (34.65)
Sale of Fixed assets 0.08 0.22
Sale of Investments 0.50 –
Interest received 24.42 16.39
Margin Money Deposit (10.08) –
NET CASH FLOW FROM INVESTING ACTIVITIES (10.83) (18.04)
CASH FLOW
Cash Flow Statement for the year ended 31st December, 2010
notes.indd 70 5/6/2011 12:12:53 pM

annual report 2010annual report 2010 annual report 2010
71
Rupees in Crores
2010 Rupees
in Crores
2009 rupees
in Crores
C. CASH FLOW FROM FINANCING ACTIVITIES
repayment of long term borrowings – (1.98)
Interest paid (2.40) (3.46)
Dividend paid (358.56) (234.92)
Dividend tax paid (59.55) (39.92)
NET CASH FLOW FROM FINANCING ACTIVITIES (420.51) (280.28)
D. NET INCREASE/(DECREASE) IN CASH AND CASH EQUIVALENTS (A) + (B) + (C) 83.42 270.13
CASH AND CASH EQUIVALENTS, beginning of the year 525.76 255.63
CASH AND CASH EQUIVALENTS, end of the year 609.18 525.76
notes: (1) the above Cash Flow Statement has been prepared under the “Indirect Method” as set out in the accounting Standard-3 on Cash Flow Statement as notified under Companies (accounting Standards) rule, 2006 (as amended).
(2) Cash and Bank Balance (refer Schedule F and note 3 below) 619.26
less: Margin Money Deposit 10.08
Cash and Cash equivalents as above 609.18
(3) Cash and Cash equivalents as at the end of December 31, 2010 include Bank Deposits of rs. 334.22 Crores with a maturity period exceeding three months and which are readily convertible into known amounts of cash.
(4) previous year’s figures have been regrouped wherever necessary.
as per our report of even date S. M. Datta Chairman n. K. KSHatrIYa Vice ChairmanFor S. r. BatlIBoI & Co. r. KIrpalanI Chief operating officerFirm registration no. : 301003eChartered accountants
executive Directors
per raVI BanSal a. H. MoDY S. VaIDYa Director S. MaleKar Directorpartner General ManagerMembership no. : 49365 legal & Company Secretary non-executive Directors
MumbaiFebruary 22, 2011
r. GopalaKrISHnan Director r. HeWInS DirectorD. S. pareKH Director
CASH FLOW
Cash Flow (Contd.)
notes.indd 71 5/6/2011 12:12:53 pM

Notes
notes.indd 72 5/6/2011 12:12:53 pM