Embed Size (px)
Citation preview

Bringing
world class brands
to your home
Annual Report
2009-10
Bringing
world class brands
to your home
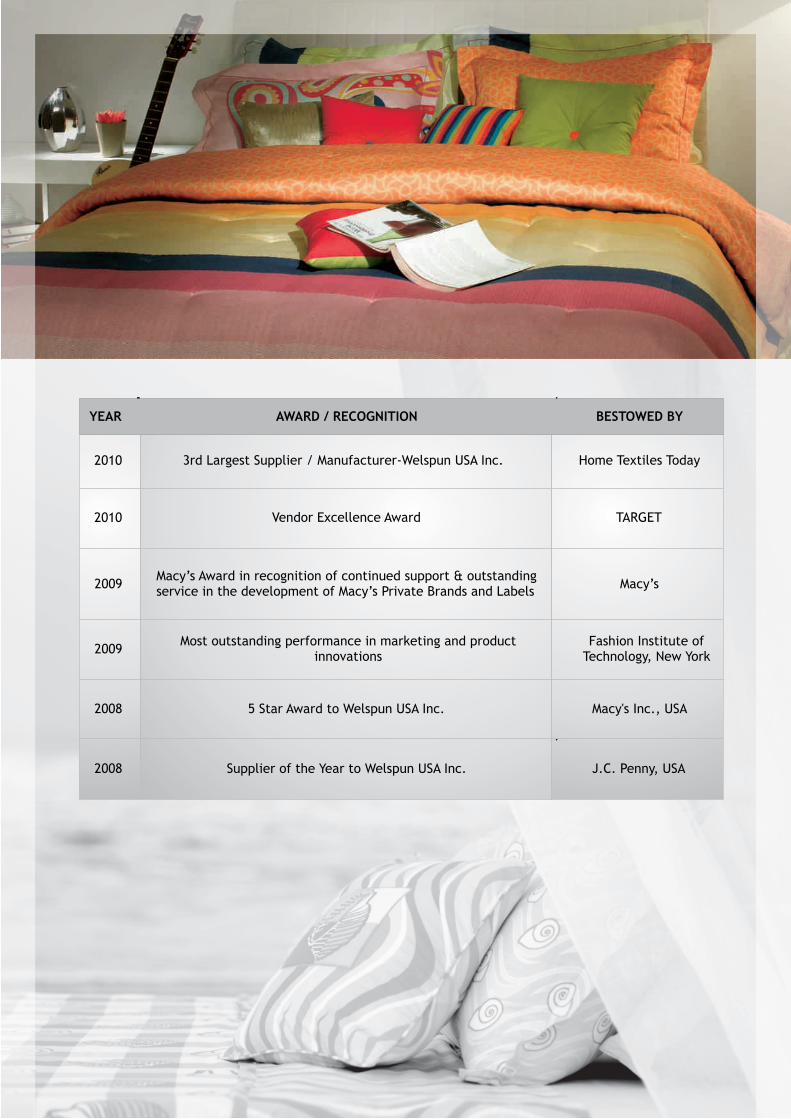
3rd Largest Supplier / Manufacturer-Welspun USA Inc. Home Textiles Today
Vendor Excellence Award TARGET
Macy’s Award in recognition of continued support & outstanding service in the development of Macy’s Private Brands and Labels
Macy’s
Most outstanding performance in marketing and product innovations
Fashion Institute of Technology, New York
5 Star Award to Welspun USA Inc. Macy's Inc., USA
Supplier of the Year to Welspun USA Inc. J.C. Penny, USA
2010
2010
2009
2009
2008
2008
AWARD / RECOGNITION BESTOWED BY YEAR
Contents
1Corporate Information
3Chairman’s Statement
7Directors' Report
11Corporate Governance Report
19Management Discussion and Analysis
39Financial Section
Forward looking statement
In this Annual Report we have disclosed forward-looking information to enable investors to comprehend our
prospects and take informed investment decisions. This report and other statements that set out anticipated
results based on the management's plans and assumptions. We have tried wherever possible to identify such
statements by using words as 'anticipate', 'estimate', 'expects', 'projects', 'intends', 'plans', 'believes', and words of
similar substance in connection with any discussion of future performance. We cannot guarantee that these
forward-looking statements will be realized, although we believe we have been prudent in assumptions. Should
known or unknown risks or uncertainties materialize, or should underlying assumptions prove inaccurate, actual
results could vary materially from those anticipated, estimated or projected. Readers should bear this in mind. We
undertake no obligation to publicity update any forward-looking statements, whether as a result of new information,
future events or otherwise.
Annual Report
2009-10
WELSPUN GLOBAL BRANDS LTD.
1
WELSPUN GLOBAL BRANDS LTD.
CORPORATE INFORMATION
Board Of Directors:
Mr. B.K. Goenka Mr. R.R. Mandawewala
Mr. Arun Todarwal Mr. K.H. Vishwanathan
Mr. Atul Desai Mr. Arvind Singhal
Company Secretary: Audit Committee:
Mr. Devendra Patil Mr. K.H. Vishwanathan
Mr. Atul Desai
Statutory Auditors Mr. Arun Todarwal
Price Waterhouse & Co.
Shareholders’/ Investors’ Grievance Committee : Remuneration Committee :
Mr. Atul Desai Mr. K.H. Vishwanathan
Mr. B.K. Goenka Mr. Arun Todarwal
Mr. R.R. Mandawewala Mr. Atul Desai
Mr. Arun Todarwal
Registered Office:
Welspun City, Major Subsidiaries :
Village Versamedi,
Tal : Anjar, (i) Sorema: R. Limites No.145,
Dist. Kutch, Apt. 195,4501-860, Espinho, Portugal
Gujarat – 370 110
Tel: +91-2836- 662222 (ii) Christy : Carrfied Mills, Newton Street,
Fax : +91-2836-279010 Hyde, Cheshire SK14,4NR, UK
Corporate Office:
Welspun House, (iii) Welspun USA Inc.
6th Floor, 295, Fifth Avenue, Suite 1118,
Kamala City, New York – 10016.
Senapati Bapat Marg,
Lower Parel, Mumbai – 400 013. (iv) Welspun Retail Limited
Tel : +91-22- 66136000 Corp Office : B-9, Trade World,Kamala Mills,
Fax : + 91-22-24908020 Senapati Bapat Marg,Lower Parel, Mumbai - 13
Registrar And Transfer Agents:
Link Intime India Private Limited
C-13, Pannalal Silk Mills Compound,
L.B.S. Marg, Bhandup (West)
Mumbai – 400 078.
Bankers:
State Bank of Bikaner & Jaipur State Bank of India
Punjab National Bank Andhra Bank
Canara Bank Exim Bank Ltd.
State Bank of Patiala Bank of Baroda
Oriental Bank of Commerce IDBI Bank
Bank of India

Key Management Team
Mr. B.K. GoenkaChairman, WGBL*
Mr. R.R. Mandawewala Managing Director, WGBL*
Ms. Dipali GoenkaExecutive Director, WIL
* Member of the Board of Directors
Mr. J Barry LeonardCEO, Welspun USA
Mr. Robert WalkerDirector, Christy
Mr. Anurag SharmaPresident, WGBL
Mr. Charles GaenslenCOO, Welspun USA
Mr. Duarte RelvasCEO, Sorema
Mr. Rajiv HandaCEO, WRL
Mr. Updeep SinghPresident, WIL
2
2009-2010Annual Report
My dear fellow Stakeholders,
Welspun Global Brands Limited (WGBL), an international brands, sales, marketing and distribution company of Welspun is
effectively operational from April 1, 2009, after demerger from Welspun India Limited (WIL). WGBL is focused on markets across
the globe with a vision to be the leading player in global Home Textiles. With some of the most prestigious brands under its
banner, WGBL is committed to excellence in product innovation, design, marketing and distribution, thereby creating strong
brand equity for our products.
We have cemented our place in the market through our international associations, which represent some of the most premium
international brands like Christy, Sorema and products retailed under Welspun USA. Christy, our brand in the UK is an iconic
name in towels and holds the coveted position of number one towel brand in that market. Christy is the exclusive supplier of
towels to the prestigious Wimbledon Tennis Championships, synonymous with tennis excellence. Besides Christy, we also offer
products under VFM brands like Kingsley, Pure Opulence and Humming Bird to cater to the bedding market in the UK. Similarly,
our European subsidiary, Sorema, is the number one rugs brand in Portugal and Spain.
WGBL is now investing in brands and expanding in new geographies like Europe, Japan, China, Russia, Canada, South America
and Australia. Our sales and distribution network has greatly contributed to our success, owing to excellent partnerships with
our top retailers like WALMART, TARGET, Costco Wholesale, KOHL's, J.C. Penny, Bed, Bath & Beyond and Macy's. We have been
able to augment replenishment business due to high quality and innovative products, support on design and development and
strategic input on consumer preferences. This relationship with marquee clients has been a significant factor to our success. Our
market presence of Welspun USA has grown tremendously in the US. Testament to its success is Welspun USA's ranking - 3rd
amongst the top 15 home textile suppliers in the US market (Source: Home Textiles Today).
In a few years, we aim to strengthen our association with the end customer, by way of the retail chain for home textiles through
our brands and private labels. With a focus on escalating our retail presence, our 79 retail outlets in the UK will act as a catalyst to
growth, strengthening our visibility to become the preferred choice of consumers. Similarly, Sorema's 67 outlets will facilitate a
direct connection to our customers, thereby increasing profitability. While our international subsidiaries are present in the retail
chains through our own and licensed brands, Welspun Retail, a subsidiary in India, has approximately 150 stores across the
country. We are the first of a kind retail chain in India, which is focused on Home Textiles. In India, retail is leaping ahead at a rate
of 12% on a base of $350 billion (Source: BMI India Retail Report). Organized retail is only around 6% of the retail sales and
provides ample opportunity for Welspun to capture a larger share of the Home Textiles business. As consumer sentiment picks
up, the Indian retail market is ripe with potential. In particular, Home Textiles is being viewed in a new light as consumers
increasingly identify home décor with fashion, creating a significant opportunity for WGBL.
Welspun aims to create value for the end user through innovative offerings and our skilled design studios. We employ extensive
market research to identify our consumers' aspirations, in order to cater to their specific needs. Innovation is therefore a part of
our corporate DNA, steering us in the creation of products like Hygrocotton, Drylon and Permaback. This pursuit of innovation
has been critical to our differentiation in the market, resulting in attaining a larger market share. We aim to earn 40% of our
revenues from innovative product offerings in the coming years, from the current ~ 20%.
Financial Scorecard
At a standalone level, WGBL had a revenue of Rs. 1,609.22 crores and a consolidated revenue of Rs. 2,153.78 crores. Despite the
recession and resultant reduction in consumer spend, WGBL posted a net EBITDA of Rs. 54 crore at the consolidated level. With a
focus on cementing our market presence to facilitate business growth, our subsidiaries have taken the necessary steps to
strengthen their position in the market. This process will help business growth, with increased profitability, strong brand
presence and a preferred relationship with top retailers of the world.
Message from Chairman
3
WELSPUN GLOBAL BRANDS LTD.
B. K. Goenka
Chairman
Human Capital
All our achievements in the past are a direct result of the
dedication and efforts of our employees, who have
shown unflinching commitment and drive towards
excellence, leading to this phenomenal growth. We have
been able to implement our geographic and brand
expansion strategy, owing to the dedicated efforts of
this team.
Sustainability & Corporate Social Responsibility
As a Group, Welspun has earmarked a large sum of
money for activities focused on the environment and
well-being of the community at large. Our initiatives
follow the 3 guiding principles of Education,
Empowerment and Environment. This philosophy has
led to empowering the women in our worker's families,
as they now create products that are sold through our
retail chains.
Finally, I would like to put on record my sincere
appreciation to the financial institutions, banks, equity
partners, Government authorities and each Welspunite
for their unflinching support. I believe we have all the
ingredients to become one of the largest and best home
textiles brand and marketing companies in the world
and for that, I solicit your continued support.
Welspun USA ranked 3rd
amongst the top 15 home textile
suppliers in the US market
“
4
2009-2010Annual Report


7
DIRECTORS' REPORT
To,
The Members,
WELSPUN GLOBAL BRANDS LIMITED
Your directors are pleased to present their 10th Annual Report together with the Audited Statement of Accounts for the
period ended March 31, 2010.
Acquisition of Marketing Division pursuant to a scheme of arrangement:
During the year under report, your Company has acquired the Marketing Division of Welspun India Limited pursuant to
the Composite Scheme of Arrangement in the nature of Demerger for transfer of Marketing Division of Welspun India
Limited to Welspun Global Brands Limited and Restructure of Capital of these companies (“Scheme”), which was
sanctioned by the Hon'ble High Court of Gujarat at Ahmedabad on May 8, 2009. The Scheme became effective on June
12,2009 i.e. the date of filing of a copy of the Order with the Registrar of Companies, Gujarat (“Effective Date”). Pursuant
to the Scheme, the Company has issued and allotted 7,308,952 equity shares of Rs. 10/- each on July 14, 2009 to the
equity shareholders of WIL holding equity shares as on record date, June 26, 2009 in the ratio of 1 (one) Equity Share of
Rs.10/- each for every 10 (ten) equity shares of Rs.10/- each held in Welspun India Limited, leaving apart fractional
entitlements which will be dealt with pursuant to the Scheme. Besides, as mentioned in the Scheme, the Company has
acquired 10,200,000 (then 51%) equity shares in Welspun Retail Limited (“WRL”) held by the other promoters of WRL,
at the price equivalent to the price at which 9,800,000 (then 49%) equity shares in WRL held by Marketing Division of
WIL and in consideration of that the Company has allotted 3,166,544 equity shares to them, which is proportionate to
the equity shares attributable to the shares transferred to the Company by WIL under the Scheme. As WRL had
increased its capital, the Company's shareholding in WRL amounted to 85% of the equity share capital in WRL.
Accordingly, as on March 31, 2010 , the aggregate paid up capital of the Company is Rs.10,47,54,960 consisting of
10,475,496 equity shares of Rs. 10/- each.
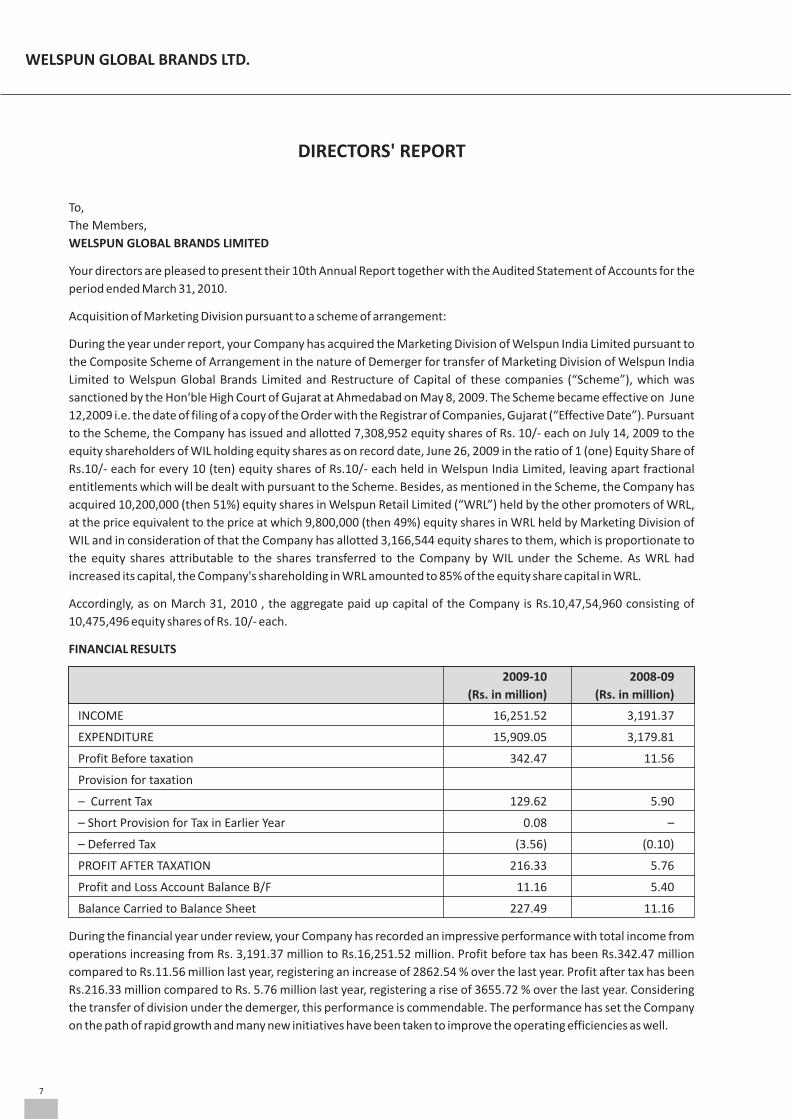
FINANCIAL RESULTS
2009-10 2008-09
(Rs. in million) (Rs. in million)
INCOME 16,251.52 3,191.37
EXPENDITURE 15,909.05 3,179.81
Profit Before taxation 342.47 11.56
Provision for taxation
– Current Tax 129.62 5.90
– Short Provision for Tax in Earlier Year 0.08 –
– Deferred Tax (3.56) (0.10)
PROFIT AFTER TAXATION 216.33 5.76
Profit and Loss Account Balance B/F 11.16 5.40
Balance Carried to Balance Sheet 227.49 11.16
During the financial year under review, your Company has recorded an impressive performance with total income from
operations increasing from Rs. 3,191.37 million to Rs.16,251.52 million. Profit before tax has been Rs.342.47 million
compared to Rs.11.56 million last year, registering an increase of 2862.54 % over the last year. Profit after tax has been
Rs.216.33 million compared to Rs. 5.76 million last year, registering a rise of 3655.72 % over the last year. Considering
the transfer of division under the demerger, this performance is commendable. The performance has set the Company
on the path of rapid growth and many new initiatives have been taken to improve the operating efficiencies as well.
WELSPUN GLOBAL BRANDS LTD.
8
DIVIDEND
With a view to plough back the profits for consolidating financial position of the Company to achieve long term growth,
your directors do not recommend any dividend for the period ended March 31, 2010. Your directors are of the opinion
that this is in the long term interest of the Company as well as its stakeholders.
LISTING OF EQUITY SHARES
The Company has applied for permission for getting relaxation from applicability of Rule 19 (2) (b) under the Securities
Contract (Regulations) Rules, 1957 to Securities and Exchange Board of India (SEBI). After receipt of the said permission,
the equity shares of the Company will be listed on Bombay Stock Exchange Limited (BSE) and National Stock Exchange of
India Limited (NSE).
PUBLIC DEPOSITS
The Company does not accept any deposit from public and hence has not contravened provisions of section 58A of the
Companies Act, 1956 and Companies (Acceptance of Deposits) Rules, 1975 and Reserve Bank of India Rules, if any.
DIRECTORS
The Board of Directors of the Company at its meeting held on September 15, 2009, had appointed Mr. Arun Todarwal,
Mr. Arvind Singhal, Mr. Atul Desai and Mr. K.H. Vishwanathan as Additional Directors of your Company. As per the
provisions of Section 260 of the Companies Act, 1956 these Directors will hold office until the conclusion of the
forthcoming Annual General Meeting of the Company. The Company has received notices under Section 257 of the Act
along with requisite deposit in respect of the aforesaid persons, proposing their appointment as directors of the
Company.
Mr. M.L. Mittal and Mr. Mohan Manikkan ceased to be directors of the Company w.e.f September 15, 2009. The Board
of Directors places on record its appreciation for the valuable contribution made by both of them during their tenures as
directors of the Company.
In term of the provision of the Companies Act, 1956 and as per the Articles of Association of the Company, Mr. B.K.
Goenka, Director of the company retires by rotation and being eligible offers himself for re-appointment.
AUDITORS
The Auditors of the Company, M/s Price Waterhouse & Co. Chartered Accountants shall retire at the conclusion of the
ensuing Annual General Meeting of the Company and, being eligible, offer themselves for re- appointment.
CONSERVATION OF ENERGY, TECHNOLOGY ABSORPTION, FOREIGN EXCHANGE EARNINGS AND OUTGO
Your Company has no activity relating to Conservation of Energy and Technology absorption as stipulated in the
Companies (Disclosure of Particulars in the Report of Board of Directors) Rules, 1988.
During the year under review, the expenditure of your company in foreign currency was Rs.559.81 million (previous
year Rs.22.12 million) and income in foreign currency was Rs. 40.59 million (previous year :nil)
PARTICULARS OF EMPLOYEES
A statement containing details of employees in receipt of remuneration equal to or exceeding the limits prescribed
under Section 217(2A) of the Companies Act, 1956 read with the Companies (Particulars of Employees) Rules, 1975 is
attached hereto and forms part of this report.
PARTICULARS OF SUBSIDIARIES
The Statement pursuant to Section 212 of the Companies Act, 1956 containing details of subsidiaries of the Company,
forms part of the Annual Report
2009-2010Annual Report
9
The Company has been granted exemption for the year ended March 31, 2010 by the Ministry of Corporate Affairs from
attaching the individual Annual Report of its subsidiary companies to its Balance Sheet. In terms of the approval,
Balance Sheet, Profit and Loss Account, report of Board of Directors and Auditors of the subsidiaries have not been
attached with the Annual Report of the Company. These documents would be made available upon request in writing
by any member of the Company interested in obtaining the same. However, as directed by Central Government, the
financial details of the subsidiaries have been furnished under 'Statement relating Subsidiaries', which forms part of
Annual Report.
DIRECTORS RESPONSIBILITY STATEMENT
The Directors confirm that they had:
a. followed in the preparation of annual accounts, the applicable accounting standards and given proper explanation
relating to material departures, if any;
b. selected such accounting policies and applied them consistently and made judgments and estimates that are
reasonable and prudent so as to give a true and fair view of the state of affairs of the company at the end of the
financial year and of the profit and loss of the company for that period;
c. taken proper and sufficient care for the maintenance of adequate accounting records in accordance with the
provisions of the Act so as to safeguard the assets of the company and to prevent and detect fraud and other
irregularities; and
d. Prepared the accounts on a going concern basis.
ACKNOWLEDGEMENTS
Your directors wish to place on record their appreciation for the valuable support and assistance received by your
Company from Banks, Government and their departments, Regulatory authorities and Stakeholders. The Board also
thanks the employees at all levels for their dedication, commitment and hard work put in by them for the Company's
achievements.
For and on behalf of the Board
May 27, 2010 B. K. Goenka
Mumbai Chairman
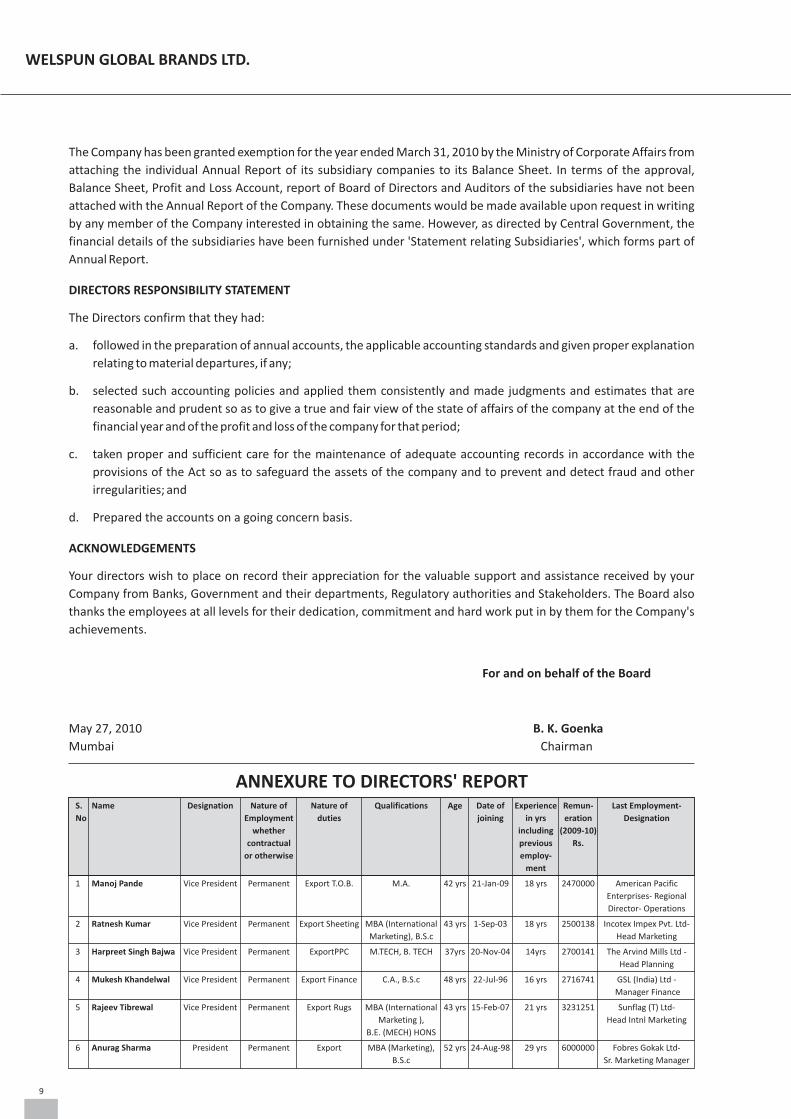
S. Name Designation Nature of Nature of Qualifications Age Date of Experience Remun- Last Employment-
No Employment duties joining in yrs eration Designation
whether including (2009-10)
contractual previous Rs.
or otherwise employ-
ment
1 Manoj Pande Vice President Permanent Export T.O.B. M.A. 42 yrs 21-Jan-09 18 yrs 2470000 American Pacific
Enterprises- Regional
Director- Operations
2 Ratnesh Kumar Vice President Permanent Export Sheeting MBA (International 43 yrs 1-Sep-03 18 yrs 2500138 Incotex Impex Pvt. Ltd-
Marketing), B.S.c Head Marketing
3 Harpreet Singh Bajwa Vice President Permanent ExportPPC M.TECH, B. TECH 37yrs 20-Nov-04 14yrs 2700141 The Arvind Mills Ltd -
Head Planning
4 Mukesh Khandelwal Vice President Permanent Export Finance C.A., B.S.c 48 yrs 22-Jul-96 16 yrs 2716741 GSL (India) Ltd -
Manager Finance
5 Rajeev Tibrewal Vice President Permanent Export Rugs MBA (International 43 yrs 15-Feb-07 21 yrs 3231251 Sunflag (T) Ltd-
Marketing ), Head Intnl Marketing
B.E. (MECH) HONS
6 Anurag Sharma President Permanent Export MBA (Marketing), 52 yrs 24-Aug-98 29 yrs 6000000 Fobres Gokak Ltd-
B.S.c Sr. Marketing Manager
ANNEXURE TO DIRECTORS' REPORT
WELSPUN GLOBAL BRANDS LTD.

CORPORATE GOVERNANCE REPORT
I. Philosophy on Corporate Governance:
Board of Directors of the Company acts as a trustee and assumes fiduciary responsibility of protecting the interests
of the shareholders and other stakeholders of the Company. The Company is committed to good corporate
governance with accountability and transparency in all its dealing, and places emphasis on business ethics to
achieve fairness to all stakeholders. Board supports the broad principles of Corporate Governance. In order to
attain the highest level of good Corporate Governance practice, Board lays strong emphasis on transparency,
accountability and integrity. It is believed that the importance for good Corporate Governance lies not merely in
drafting a code of Corporate Governance but in practising it.
II. Board of Directors.
Your Company is managed and controlled by the professional Board of Directors. The Board comprises of a
balanced combination of executive / non- executive and independent directors. Your Company's Board consists of
eminent persons with considerable professional expertise and experience.
Composition and category of directors; attendance of each director at the board meetings and the last AGM;
number of other companies on the Board or Committees of which, a director is a Director; and number of board
meetings, dates on which held, are as under:
Name of Director Category Board
Meetings at the Directorships in Chairmanship(s)/
Attended Last AGM other Indian Membership(s)
during Public Limited of Committees in
the Year Companies other Public
2009-10 Ltd Cos.@
Chairman Member
ships ships
Mr. B.K. Goenka – Chairman P, NE, C, S 12 Yes 14 – 5
Mr. R.R. Mandawewala – P, E, S 12 Yes 13 1 3
Managing Director
( w.e.f October 24, 2009)
Mr. K.H. Vishwanathan* NE, I 3 N.A# 1 2 1
Mr.Atul Desai* NE, I 3 N.A# 4 5 1
Mr.Arvind Singhal* NE, I 2 N.A# – – –
Mr. Arun Todarwal* – NE,S 2 N.A# 7 1 7
Nominee –
Dunearn Investments
Mr. M. L. Mittal NE 14 Yes 11 – 5
(Resigned w.e.f.
September 15, 2009)
Mr. Mohan Manikkan NE 12 – 5 – –
(Resigned w.e.f.
September 15, 2009)
* Appointed as an Additional Director w.e.f September 15, 2009
@ Only two Committees, namely, Audit Committee and Shareholders' /Investors' Grievance Committee have been considered
# Not a Director at the time of last AGM
Abbreviations:
P = Promoter, E = Executive, NE = Non-Executive, I = Independent, S = Shareholders, C = Chairman.
Attendance No. of No. of
11
WELSPUN GLOBAL BRANDS LTD.
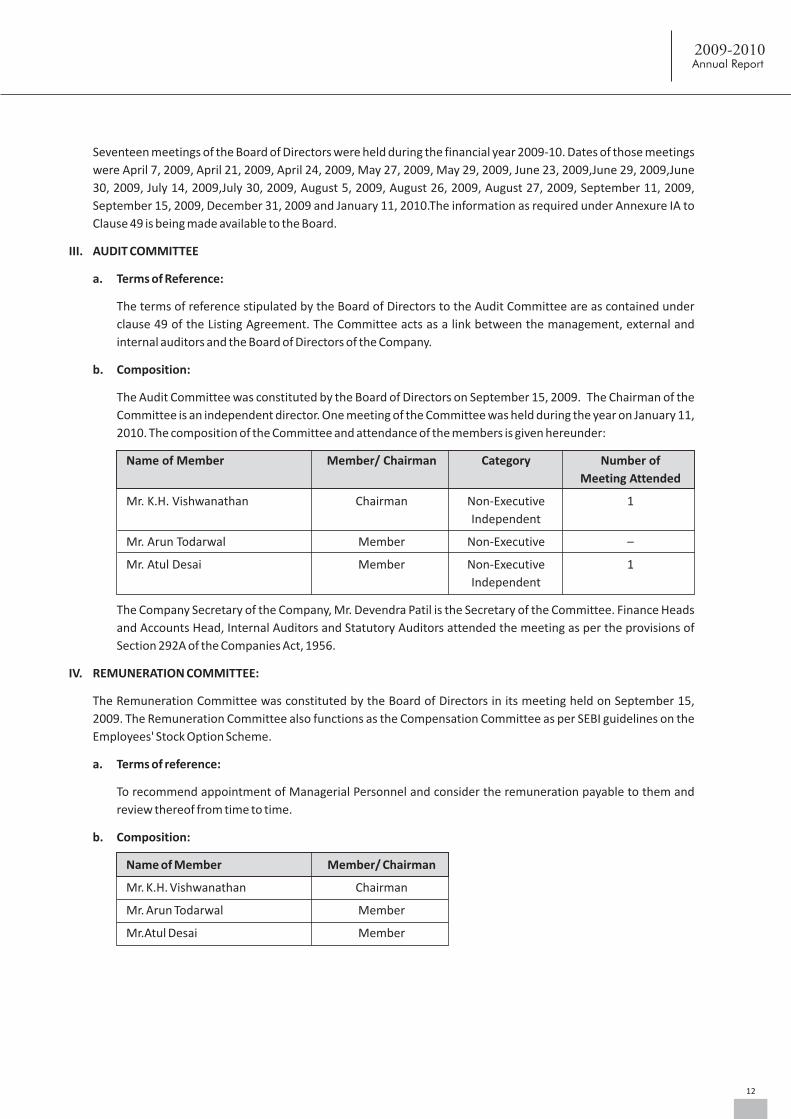
Seventeen meetings of the Board of Directors were held during the financial year 2009-10. Dates of those meetings
were April 7, 2009, April 21, 2009, April 24, 2009, May 27, 2009, May 29, 2009, June 23, 2009,June 29, 2009,June
30, 2009, July 14, 2009,July 30, 2009, August 5, 2009, August 26, 2009, August 27, 2009, September 11, 2009,
September 15, 2009, December 31, 2009 and January 11, 2010.The information as required under Annexure IA to
Clause 49 is being made available to the Board.
III. AUDIT COMMITTEE
a. Terms of Reference:
The terms of reference stipulated by the Board of Directors to the Audit Committee are as contained under
clause 49 of the Listing Agreement. The Committee acts as a link between the management, external and
internal auditors and the Board of Directors of the Company.
b. Composition:
The Audit Committee was constituted by the Board of Directors on September 15, 2009. The Chairman of the
Committee is an independent director. One meeting of the Committee was held during the year on January 11,
2010. The composition of the Committee and attendance of the members is given hereunder:
Name of Member Member/ Chairman Category Number of
Meeting Attended
Mr. K.H. Vishwanathan Chairman Non-Executive 1
Independent
Mr. Arun Todarwal Member Non-Executive –
Mr. Atul Desai Member Non-Executive 1
Independent
The Company Secretary of the Company, Mr. Devendra Patil is the Secretary of the Committee. Finance Heads
and Accounts Head, Internal Auditors and Statutory Auditors attended the meeting as per the provisions of
Section 292A of the Companies Act, 1956.
IV. REMUNERATION COMMITTEE:
The Remuneration Committee was constituted by the Board of Directors in its meeting held on September 15,
2009. The Remuneration Committee also functions as the Compensation Committee as per SEBI guidelines on the
Employees' Stock Option Scheme.
a. Terms of reference:
To recommend appointment of Managerial Personnel and consider the remuneration payable to them and
review thereof from time to time.
b. Composition:
Name of Member Member/ Chairman
Mr. K.H. Vishwanathan Chairman
Mr. Arun Todarwal Member
Mr.Atul Desai Member
12
2009-2010Annual Report
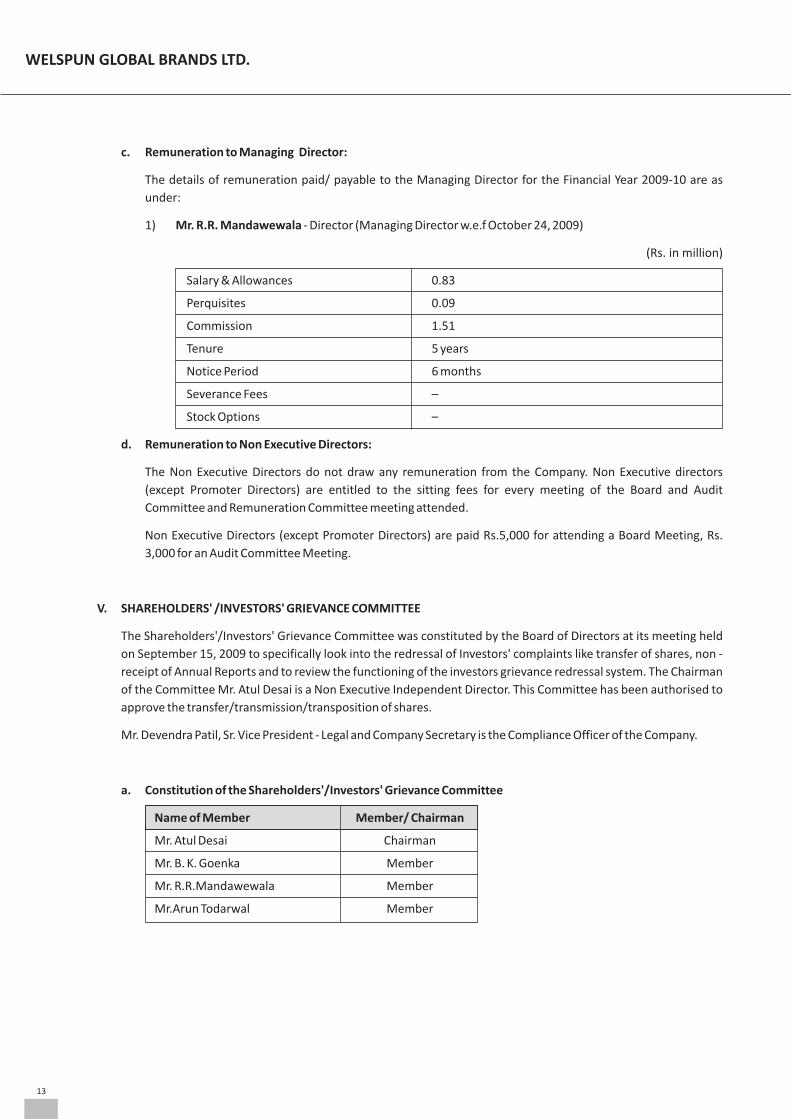
c. Remuneration to Managing Director:
The details of remuneration paid/ payable to the Managing Director for the Financial Year 2009-10 are as
under:
1) Mr. R.R. Mandawewala - Director (Managing Director w.e.f October 24, 2009)
(Rs. in million)
Salary & Allowances 0.83
Perquisites 0.09
Commission 1.51
Tenure 5 years
Notice Period 6 months
Severance Fees –
Stock Options –
d. Remuneration to Non Executive Directors:
The Non Executive Directors do not draw any remuneration from the Company. Non Executive directors
(except Promoter Directors) are entitled to the sitting fees for every meeting of the Board and Audit
Committee and Remuneration Committee meeting attended.
Non Executive Directors (except Promoter Directors) are paid Rs.5,000 for attending a Board Meeting, Rs.
3,000 for an Audit Committee Meeting.
V. SHAREHOLDERS' /INVESTORS' GRIEVANCE COMMITTEE
The Shareholders'/Investors' Grievance Committee was constituted by the Board of Directors at its meeting held
on September 15, 2009 to specifically look into the redressal of Investors' complaints like transfer of shares, non -
receipt of Annual Reports and to review the functioning of the investors grievance redressal system. The Chairman
of the Committee Mr. Atul Desai is a Non Executive Independent Director. This Committee has been authorised to
approve the transfer/transmission/transposition of shares.
Mr. Devendra Patil, Sr. Vice President - Legal and Company Secretary is the Compliance Officer of the Company.
a. Constitution of the Shareholders'/Investors' Grievance Committee
Name of Member Member/ Chairman
Mr. Atul Desai Chairman
Mr. B. K. Goenka Member
Mr. R.R.Mandawewala Member
Mr.Arun Todarwal Member
13
WELSPUN GLOBAL BRANDS LTD.
b. Number of Shareholders complaints received during the year:
During the Year under review, a total of 89 Investor complaints/requests were received and were processed.
All the complaints received during the year under review were processed/solved within the time limit to the
satisfaction of the investors/shareholders and no complaint is pending as at March 31, 2010 for a period over
30 days.
VI. MANAGEMENT
a. Management Discussion and Analysis
Management Discussion and Analysis of various businesses of the Company is separately given in the Annual
Report.
b. Disclosures by Management to the Board
All details relating to financial and commercial transactions where directors may have a pecuniary interest are
provided to the Board, and the interested directors neither participated in the discussion, nor do they vote on
such matters.
VII. GENERAL BODY MEETINGS
(i) The details of Annual General Meetings held in the last three years are given hereunder:
Meeting Day & Date of Meeting Time Place
7th Annual Saturday, September 29, 2007 10.30 a.m. Survey No.76, Village Morai,
General Meeting Vapi, Dist. Valsad, Gujarat - 396191
8th Annual Monday, September 8, 2008 10.30 a.m. Survey No.76, Village Morai, Vapi,
General Meeting Dist. Valsad, Gujarat - 396191
9th Annual Thursday, June 11, 2009 1.00 p.m. Survey No.76, Village Morai, Vapi,
General Meeting Dist. Valsad, Gujarat - 396191
(ii) Special Resolutions passed in the previous Annual General Meeting:
(a) To approve the Employees Stock Option Scheme titled as 'WELSOP 2009' to the permanent employees,
who are in employment of the Company and its present and future subsidiaries.
(b) To alter the Articles of Association by way of substituting with new set of Articles of Association bearing
Articles No. 1 to 220.
(c) To give loans for a sum not exceeding Rs. 20 Crores to Welspun Retail Limited, a Welspun Group Company
(d) To seek approval pursuant to Section 149 (2A) of the Companies Act, 1956 to commence the business
specified in the Clause III (C) 94 of the Memorandum of Association.
VIII. DISCLOSURE
a. Details of related party transactions
Refer Note No. 17(ii) to the Accounts for list of related party transactions.
b. Details of information on appointment of new directors
Name of the director, nature of expertise in specific functional areas, names of companies in which the person
already holds directorship and membership of committees of the Board and his shareholdings in the Company
forms part of the Notice of General Meeting, annexed to this Annual Report.
14
2009-2010Annual Report
c. Details of non-compliance
There was no non compliance by the Company, nor were there any penalty or stricture imposed on the
Company by the Stock Exchange or SEBI or any authority on any matter related to capital market during the last
3 years.
IX. MEANS OF COMMUNICATION
The Company has filed an application for listing of the Equity Shares with Bombay Stock Exchange Limited (BSE) and
National Stock Exchange of India Limited (NSE) and awaiting listing.
Once the Equity Shares gets listed on BSE and NSE, the Company will publish the quarterly/half- yearly /annual
financial results after the same are approved / taken on record by the Board of Directors in newspapers as required
under the Listing Agreements entered into with the Stock Exchanges.
The Financial results will also be placed on the Company's website: www. welspunglobalbrands.com
Management Discussion and Analysis form part of this Annual Report.
X. GENERAL SHAREHOLDER INFORMATION
AGM will be held on Tuesday, September 28, 2010 at 12.30 p.m. at the Registered Office of the Company at
Welspun City, Village Versamedi, Taluka Anjar, District Kutch, Gujarat - 370 100.
Financial Year of the Company is April 1 to March 31.
Date of Book Closure: Tuesday, September 21, 2010 to Tuesday, September 28, 2010 (Both days inclusive)
Dividend payment date: Not applicable.
The Company's Equity Shares are proposed to get listed on Bombay Stock Exchange Limited (BSE) and National
Stock Exchange of India Limited (NSE).
Market Price Data and Performance in comparison BSE Sensex and NSE Nifty is not available as the Company's
shares are not listed.
Registrar and Transfer Agent: The Company has appointed Registrar and Transfer agent to handle the share transfer
work and to solve the complaints of Shareholders. Name, Address and telephone number of Registrar and Transfer
Agent is given hereunder:
M/s. Link Intime India Private Limited
Unit: Welspun Global Brands Limited
C-13, Pannalal Silk Mills Compound,
LBS Marg, Bhandup (West),
Mumbai - 400078
Tel : + 91- 22- 25946970
Email : [email protected]
Contact person: Mr. Joy Verghese/ Mr. Raghunath Poojary
15
WELSPUN GLOBAL BRANDS LTD.
16
2009-2010Annual Report
Share Transfer System:
Share Transfers in physical form can be lodged with Link Intime India Private Limited at the above mentioned
address. The transfer requests are normally processed within 15-20 days of receipt of the documents, if
documents are found in order. Shares under objection are returned within two weeks.
Distribution of Shareholding:
No. of Equity No. of Percentage of Total No. of Percentage of
Shares held shareholders Shareholders shares held Shares held
Upto-5000 28583 99.29 5851400 5.58
5001-10000 84 0.29 658150 0.62
10001-20000 48 0.16 685420 0.65
20001-30000 19 0.06 470610 0.44
30001-40000 12 0.04 414820 0.39
40001-50000 3 0.01 140110 0.13
50001-100000 14 0.04 1010260 0.96
100001- above 24 0.08 95524190 91.18
Total 28787 100.00 104754960 100.00
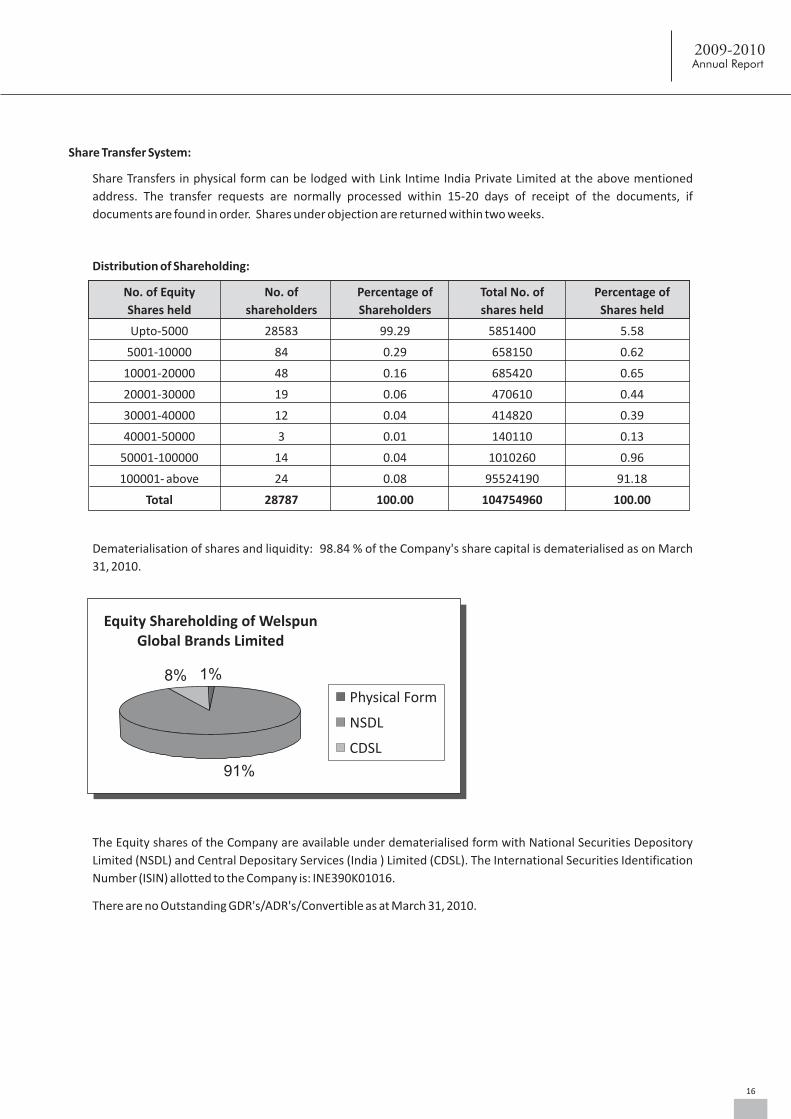
Dematerialisation of shares and liquidity: 98.84 % of the Company's share capital is dematerialised as on March
31, 2010.
The Equity shares of the Company are available under dematerialised form with National Securities Depository
Limited (NSDL) and Central Depositary Services (India ) Limited (CDSL). The International Securities Identification
Number (ISIN) allotted to the Company is: INE390K01016.
There are no Outstanding GDR's/ADR's/Convertible as at March 31, 2010.
1%
91%
8%
Physical Form
NSDL
CDSL
Equity Shareholding of Welspun Global Brands Limited
17
WELSPUN GLOBAL BRANDS LTD.
Address for correspondence:
Company Secretary
Welspun Global Brands Limited
Welspun House, 6th Floor,
Kamala City, Senapati Bapat Marg,
Lower Parel, Mumbai 400013
Tel: +91-22-24908000, +91-22-66136000
Fax: +91-22-24908020
E-mail : [email protected]
For and on behalf of the Board
May 27, 2010 B. K. Goenka
Mumbai Chairman

MANAGEMENT DISCUSSION AND ANALYSIS
The Management Discussion and Analysis (MD&A) should be read in conjunction with the Audited Consolidated Financial Statement
of Welspun Global Brands Ltd (”Welspun” or the “Company”), and the notes thereto for the year ended March 31, 2010. This MD&A
covers Welspun's financial position and operations for the year ended March 31, 2010. Amounts are stated in Indian Rupees unless
otherwise indicated. The numbers used in the analysis are on a consolidated basis, the corresponding number for the previous year
have been regrouped and reclassified wherever necessary.
Forward-Looking Statements
This report contains forward-looking statements, which may be identified by their use of words like 'plans', 'expects',
'will','anticipates', 'believes', 'intends', 'projects', 'estimates' or other words of similar meaning. All statements that address
expectations or projections about the future, including but not limited to statements about the Company's strategy for growth,
product development, market position, expenditures, and financial results, are forward-looking statements. Forward-looking
statements are based on certain assumptions and expectations of future events. The Company assumes no responsibility to publicly
amend, modify or revise any forward looking statements, on the basis of any subsequent developments, information or events
BUSINESS ORGANIZATION / BACKGROUND
Welspun Global Brands Limited (WGBL), the sales and marketing arm of Welspun India Limited (WIL), is a strategic
vendor to some of the top global retailers. Its manufacturing, sales and distribution network is spread over 32 countries.
WGBL products differentiates itself in home fashion textile industry based on its full assortment of high quality home
fashion products, a superior value proposition and branded products with strong consumer recognition.
W.e.f. April 1, 2009, the marketing division of WIL was transferred to WGBL and since then it operates as an international
sales and marketing company. Its major customers in the international market are international retail chains, specialty
stores, fashion stores, and merchants..
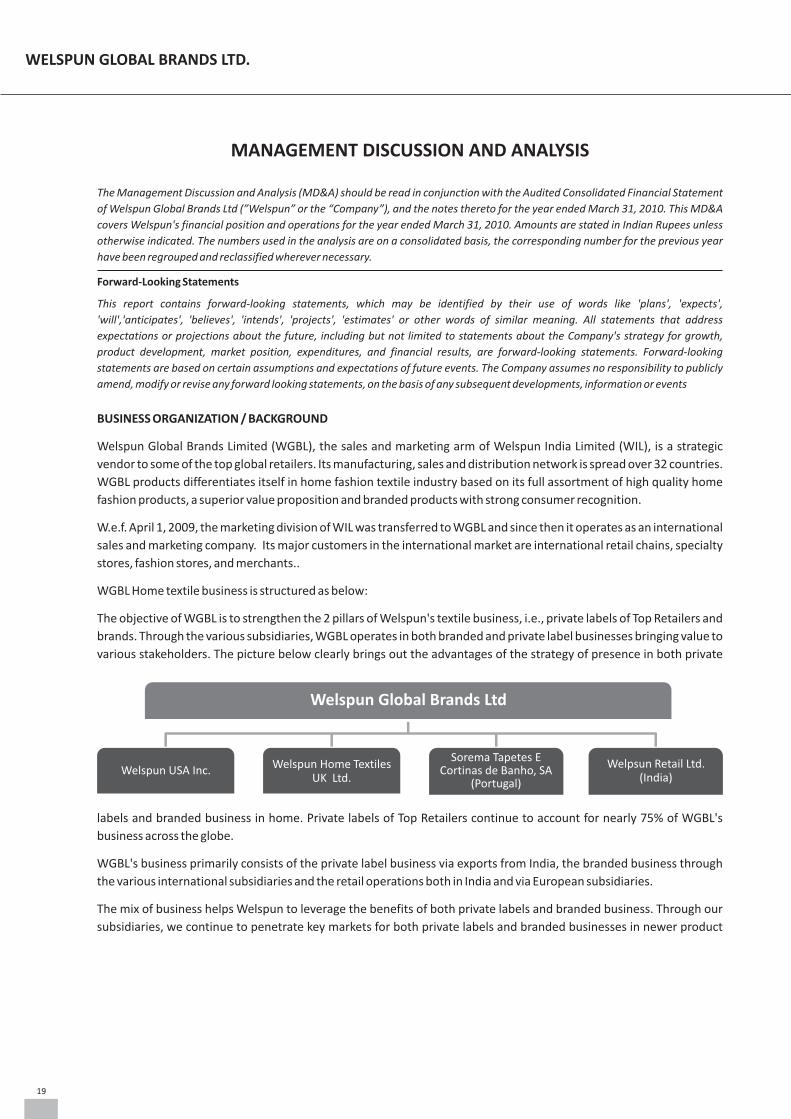
WGBL Home textile business is structured as below:
The objective of WGBL is to strengthen the 2 pillars of Welspun's textile business, i.e., private labels of Top Retailers and
brands. Through the various subsidiaries, WGBL operates in both branded and private label businesses bringing value to
various stakeholders. The picture below clearly brings out the advantages of the strategy of presence in both private
labels and branded business in home. Private labels of Top Retailers continue to account for nearly 75% of WGBL's
business across the globe.
WGBL's business primarily consists of the private label business via exports from India, the branded business through
the various international subsidiaries and the retail operations both in India and via European subsidiaries.
The mix of business helps Welspun to leverage the benefits of both private labels and branded business. Through our
subsidiaries, we continue to penetrate key markets for both private labels and branded businesses in newer product
Welspun Global Brands Ltd
Welspun USA Inc.Welspun Home Textiles
UK Ltd.
Sorema Tapetes E Cortinas de Banho, SA
(Portugal)
Welpsun Retail Ltd.(India)
19
WELSPUN GLOBAL BRANDS LTD.
categories.
GLOBAL ECONOMIC ENVIRONMENT
Post the economic downturn in 2009, the global economy is showing signs of revival. The various stimuli that were put
in place by governments are yielding results and the global GDP is expected to grow at 3.3% in 2010. This growth is
expected to drive increase in both private and government consumption levels. Consumption is expected to grow at
2.6% world-wide.
The key markets, i.e., the developed economies of USA, UK and Western Europe are expected to grow at 2.1% The US
market is expected to grow at 2.6% and 2.4% in 2010 and 2011 respectively, while the developing markets are expected
to grow at an average rate of 6.2%.What is encouraging is that world trade volume of goods and services is expected to
rise by 5.8% in 2010 after a fall of 12.9% in 2009. As a global company where majority of our revenues come from
international trade, this is a very positive development. These signs are further strengthened by the fact that 11 out of 1the 13 major retailers in the US reported positive like-for-like sales growth in June 2010. Post April 2010, both UK and
the Eurozone have also shown positive growth in like-for-like retail sales.
The overall positive macro-economic trends have resulted in rising per capita income, increased consumerism and
higher consumer spending. A large proportion of this higher consumer spending is towards textiles, apparel and
lifestyle products. The chief reason for this has been India's changing demographic profile. The disposable income in
India is also expected to increase significantly over the next decade. Welspun believes that the above factors strongly
suggest an ongoing structural shift in the demand pattern for textiles within the domestic markets. This indicates that
the textile industry is on the threshold of higher consumer demand and consequently higher growth.
India's economy is on the fulcrum of an ever-increasing growth curve. With positive indicators such as a stable 8-9
percent annual growth, rising foreign exchange reserves and rapidly expanding FDI inflows, India has emerged as the
second fastest growing major economy in the world after China.
GLOBAL TEXTILE MARKET - Demand & Supply scenario
The global economic crisis which began in 2008-09 continued to impact the global textile and apparel trade in 2009-10
as well, leading to lower growth rates. 2008-09 saw a worldwide drop in consumption due to consumers cutting back on 2discretionary spends impacting demand for textiles. In the last quarter of FY10, we have seen increasing demand at the
retail level, both domestically and internationally. This leads us to believe that the textile industry is on a path to
recovery. We expect the industry demand to stabilize and grow in the near future.
3Currently, the global textile and apparel trade is estimated to be over US$ 450 billion. The global market for textile trade
includes yarns, fabrics, apparel, and non-apparel finished products.
Post the expiry of the Agreement on Textiles and Clothing (ATC) in 2005, India's share of textile imports into the
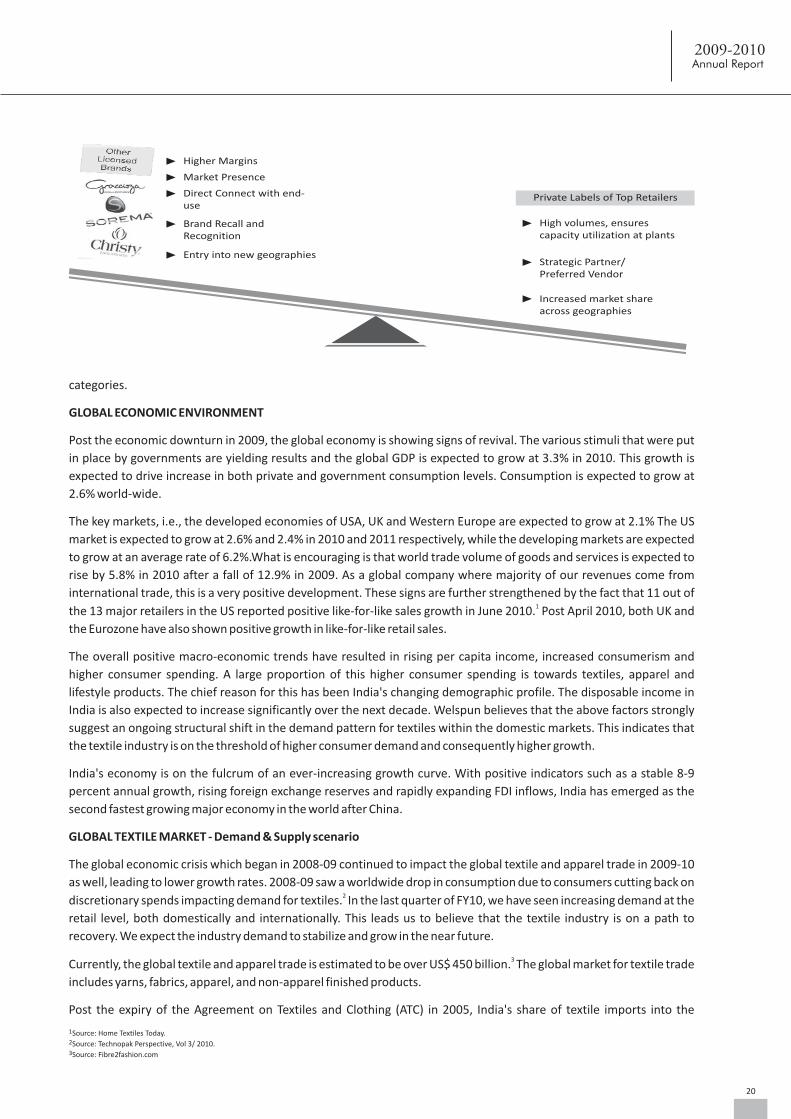
Private Labels of Top Retailers
High volumes, ensurescapacity utilization at plants
Higher Margins
Market Presence
Direct Connect with end-use
Entry into new geographies
Brand Recall andRecognition
Strategic Partner/Preferred Vendor
Increased market shareacross geographies
1Source: Home Textiles Today.2Source: Technopak Perspective, Vol 3/ 2010.3Source: Fibre2fashion.com
20
2009-2010Annual Report
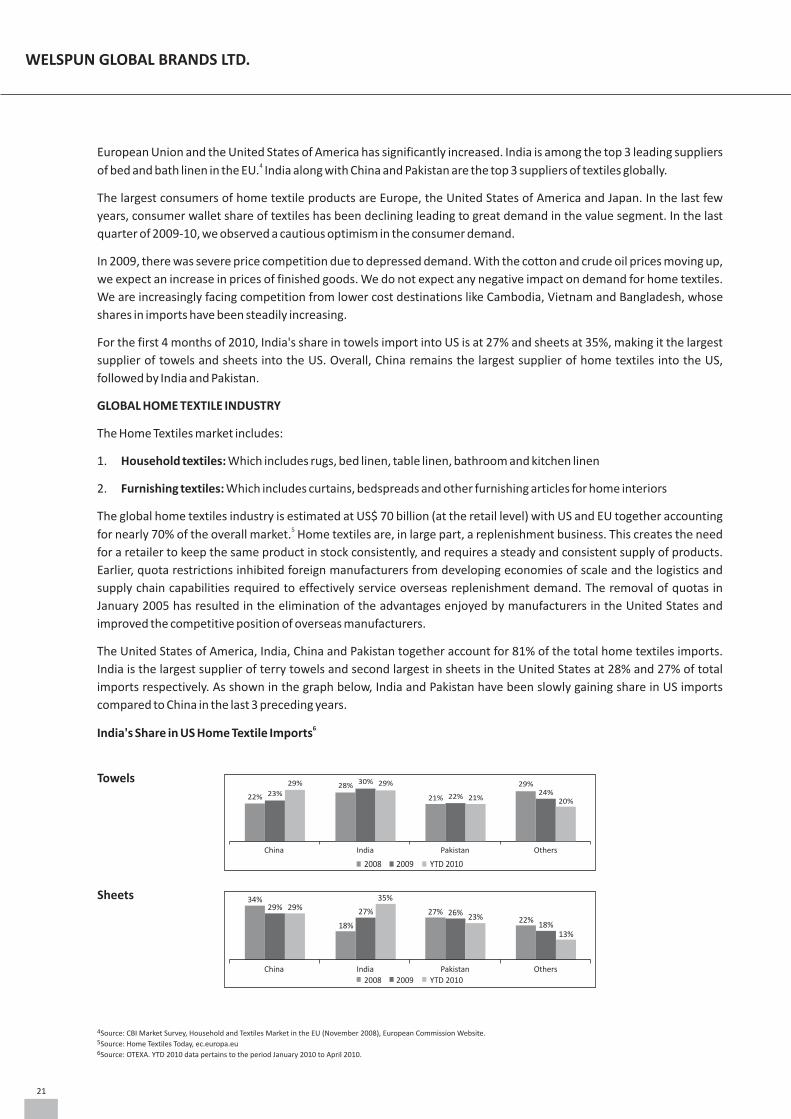
European Union and the United States of America has significantly increased. India is among the top 3 leading suppliers 4of bed and bath linen in the EU. India along with China and Pakistan are the top 3 suppliers of textiles globally.
The largest consumers of home textile products are Europe, the United States of America and Japan. In the last few
years, consumer wallet share of textiles has been declining leading to great demand in the value segment. In the last
quarter of 2009-10, we observed a cautious optimism in the consumer demand.
In 2009, there was severe price competition due to depressed demand. With the cotton and crude oil prices moving up,
we expect an increase in prices of finished goods. We do not expect any negative impact on demand for home textiles.
We are increasingly facing competition from lower cost destinations like Cambodia, Vietnam and Bangladesh, whose
shares in imports have been steadily increasing.
For the first 4 months of 2010, India's share in towels import into US is at 27% and sheets at 35%, making it the largest
supplier of towels and sheets into the US. Overall, China remains the largest supplier of home textiles into the US,
followed by India and Pakistan.
GLOBAL HOME TEXTILE INDUSTRY
The Home Textiles market includes:
1. Household textiles: Which includes rugs, bed linen, table linen, bathroom and kitchen linen
2. Furnishing textiles: Which includes curtains, bedspreads and other furnishing articles for home interiors
The global home textiles industry is estimated at US$ 70 billion (at the retail level) with US and EU together accounting 5for nearly 70% of the overall market. Home textiles are, in large part, a replenishment business. This creates the need
for a retailer to keep the same product in stock consistently, and requires a steady and consistent supply of products.
Earlier, quota restrictions inhibited foreign manufacturers from developing economies of scale and the logistics and
supply chain capabilities required to effectively service overseas replenishment demand. The removal of quotas in
January 2005 has resulted in the elimination of the advantages enjoyed by manufacturers in the United States and
improved the competitive position of overseas manufacturers.
The United States of America, India, China and Pakistan together account for 81% of the total home textiles imports.
India is the largest supplier of terry towels and second largest in sheets in the United States at 28% and 27% of total
imports respectively. As shown in the graph below, India and Pakistan have been slowly gaining share in US imports
compared to China in the last 3 preceding years.
6India's Share in US Home Textile Imports
Towels
Sheets
4Source: CBI Market Survey, Household and Textiles Market in the EU (November 2008), European Commission Website. 5Source: Home Textiles Today, ec.europa.eu6Source: OTEXA. YTD 2010 data pertains to the period January 2010 to April 2010.
China India Pakistan Others
2008 2009 YTD 2010
22% 23%
29% 28%30% 29%
21% 22% 21%
29%24%
20%
China India Pakistan Others
2008 2009 YTD 2010
34%29% 29%
18%
27%
35%
27% 26%23% 22%
18%13%
21
WELSPUN GLOBAL BRANDS LTD.
Top of Beds
Basic Bedding
Total: Home Textiles
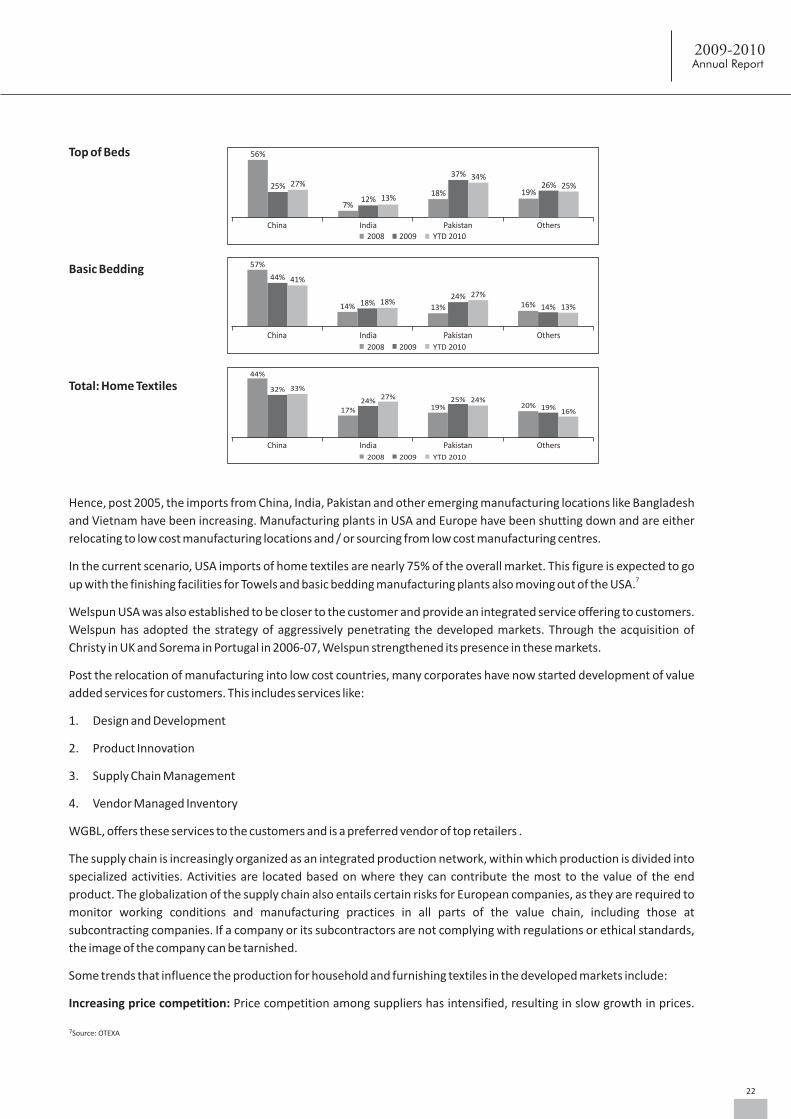
Hence, post 2005, the imports from China, India, Pakistan and other emerging manufacturing locations like Bangladesh
and Vietnam have been increasing. Manufacturing plants in USA and Europe have been shutting down and are either
relocating to low cost manufacturing locations and / or sourcing from low cost manufacturing centres.
In the current scenario, USA imports of home textiles are nearly 75% of the overall market. This figure is expected to go 7up with the finishing facilities for Towels and basic bedding manufacturing plants also moving out of the USA.
Welspun USA was also established to be closer to the customer and provide an integrated service offering to customers.
Welspun has adopted the strategy of aggressively penetrating the developed markets. Through the acquisition of
Christy in UK and Sorema in Portugal in 2006-07, Welspun strengthened its presence in these markets.
Post the relocation of manufacturing into low cost countries, many corporates have now started development of value
added services for customers. This includes services like:
1. Design and Development
2. Product Innovation
3. Supply Chain Management
4. Vendor Managed Inventory
WGBL, offers these services to the customers and is a preferred vendor of top retailers .
The supply chain is increasingly organized as an integrated production network, within which production is divided into
specialized activities. Activities are located based on where they can contribute the most to the value of the end
product. The globalization of the supply chain also entails certain risks for European companies, as they are required to
monitor working conditions and manufacturing practices in all parts of the value chain, including those at
subcontracting companies. If a company or its subcontractors are not complying with regulations or ethical standards,
the image of the company can be tarnished.
Some trends that influence the production for household and furnishing textiles in the developed markets include:
Increasing price competition: Price competition among suppliers has intensified, resulting in slow growth in prices.
China India Pakistan Others
2008 2009 YTD 2010
56%
25% 27%
7%12% 13%
18%
37% 34%
19%26% 25%
China India Pakistan Others2008 2009 YTD 2010
57%
44% 41%
14% 18% 18%13%
24% 27%16% 14% 13%
44%
32% 33%
17%24%
27%
19%25% 24%
20% 19%16%
China India Pakistan Others
2008 2009 YTD 2010
7Source: OTEXA
22
2009-2010Annual Report
This is causing concern among producers in developed markets who are finding it increasingly difficult to match low
import prices.
Increasing internationalization: Textile manufacturing and retail companies are expanding their activities on a global
scale at a rapid pace and their products are available in many developed markets resulting in increased competitive
pressures.
High degree value chain integration: Several producers have opened their own chain(s) and many suppliers have
started a close and long-term co-operation with distribution channels, thereby increasing the entry barriers for new
suppliers.
Consolidation: The number of suppliers has decreased and many suppliers have merged or have taken over other
suppliers. This is resulting in greater economies of scale and value chain efficiencies, forcing their less competitive
counterparts out.
Specialization: Several manufacturers of home textiles have specialized in specific functions (such as design) or in
specific markets (such as the contract market), while other manufacturers have shifted from manufacturing for private
labels to introducing their own brands.
THE MARKET STRUCTURE
Consumers
A majority of purchases in the home textiles segment are made for replacement purposes and are discretionary in
nature. The purchase of home textiles, therefore, gets deferred during periods of economic slowdown and a
subsequent economic upturn tends to be steeper than the normal rate of consumption growth. Consumption patterns
of households vary substantially across geographies due to differences in culture, traditions and tastes. In the
household textiles sector, Welspun believes that brand awareness among consumers is limited, as can be derived from
the high market shares for interior department stores, Specialty chains and variety chains operating with their own
private label and textile discounters, while super and hyper markets sell unknown or fancy brand names.
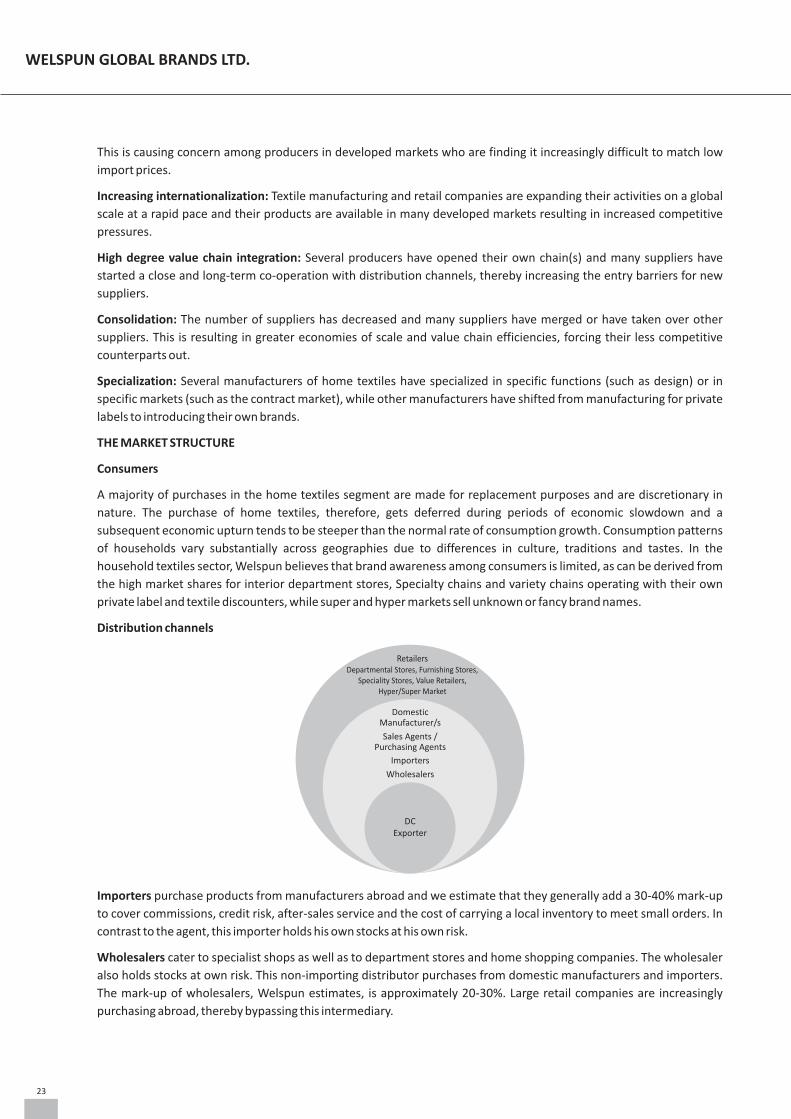
Distribution channels
Importers purchase products from manufacturers abroad and we estimate that they generally add a 30-40% mark-up
to cover commissions, credit risk, after-sales service and the cost of carrying a local inventory to meet small orders. In
contrast to the agent, this importer holds his own stocks at his own risk.
Wholesalers cater to specialist shops as well as to department stores and home shopping companies. The wholesaler
also holds stocks at own risk. This non-importing distributor purchases from domestic manufacturers and importers.
The mark-up of wholesalers, Welspun estimates, is approximately 20-30%. Large retail companies are increasingly
purchasing abroad, thereby bypassing this intermediary.
DC Exporter
DomesticManufacturer/s
Sales Agents /Purchasing Agents
Importers
Wholesalers
RetailersDepartmental Stores, Furnishing Stores,
Speciality Stores, Value Retailers,Hyper/Super Market
23
WELSPUN GLOBAL BRANDS LTD.
Purchasing agents are widely used by retailers and wholesalers due to their wide network of contacts and knowledge of
foreign markets. They do not carry their own stock but purchase solely on the request of their customers.
Domestic manufacturers: The domestic manufacturers either import the raw material required for the finishing
operations or are primarily manufacturing products which are freight unfriendly or difficult to manage with long supply
chains. These manufacturers have the advantage of proximity to the source of raw material as well as the customer.
Sales agents are independent intermediaries between the (foreign) manufacturer and the retailer or retail
organization, receiving a commission from the former. The sales agent does not take title to the merchandise, but is
limited to presenting samples to potential clients, obtaining orders, and forwarding these to the exporter.
Retailers constitute the final stage before products reach the consumer. A criterion for dividing the market is the
composition of the total assortment: wholly or partly specialized in selling home textiles.
Being in the Private Label business of Top retailers also helps us generate value for the customer through our own
innovations. Welspun believes in investing in innovation as a key to remain ahead in business. Today, Welspun's
innovations are being looked at as growth drivers.
THE INDIAN TEXTILES INDUSTRY: An Overview
The textile industry plays a crucial role in the Indian economy. The size of the Indian textile industry is estimated at
approximately USD 60 billion. It contributes about 14 per cent to the industrial production of the country and 4% to the
GDP.
As regards employment, it is the second largest after agriculture, employing nearly 35 million people and accounting 20 8percent of the total workforce of the nation. Its contribution to forex earnings is around 17 per cent. Textiles sector has
been identified as one of the priority sectors having high growth potential and higher multiplier effects for employment
generation.
India occupies a prominent position in the global textile industry. It is the second largest producer of textiles in the
world, with China being the largest. India's competitive advantages are supplemented by the fact that it contributes 923.7% to global cotton production, being the second largest producer in the world. India is also the second largest
producer of man-made fiber, polyester and filament yarns in the world. India produces a large variety of textile products
based on natural fibers (cotton, wool and silk) as well as man-made fibers (polyester, viscose and acrylic). Of the above,
cotton accounts for a majority share of India's overall textile output.
India – A Manufacturing Destination
India has several inherent advantages, which lend it the potential and ability to emerge as a key global outsourcing hub
for textile products:
Self sufficiency of raw materials
9India has a vast pool of raw materials for textiles, both natural and man-made . Cotton textiles and clothing account for
approximately one-third of global textile trade. Three countries, China, India and US, account for approximately two
thirds of global cotton production. Further, India is a country which has surplus cotton production, as a result of its
increased productivity in the last few years. Other Asian countries such as China, Bangladesh, Pakistan, Thailand and
Indonesia are net importers of cotton. India's self sufficiency in cotton provides it with a strong competitive advantage
in global textile and clothing trade.
Labour Cost Advantage
On account of its vast population, India enjoys manufacturing cost competitiveness due to easy availability of low cost
skilled labor across different industries. The textile industry is no such exception whereby India's cost of production
ranks amongst the lowest in the world today.
9Source: USDA.
8Source: Ministry of Textiles, 2009-10 Annual Report.
24
2009-2010Annual Report

Design Skills and Value Addition Capabilities
Welspun believes that India has high value addition skills, which enable it to service niche markets worldwide.
This has been acknowledged by the world's leading global retailers.
Economies of Scale owing to a Huge Domestic Market
India is among the largest textile manufacturers and consumers in the world. The size of the domestic textile industry
has been estimated at USD 40 billion. This gives India a natural advantage of economies of scale, which enables it to
lower manufacturing overheads and improve operational efficiencies.
KEY TRENDS IN THE RETAIL SECTOR
Indian retail market is one of the fastest growing retail markets in the world. According to the BMI India Retail Report for
the third-quarter of 2010, on the back of Strong underlying economic growth, population expansion, the increasing
wealth of individuals and the rapid construction of organised retail infrastructure, total retail sales are expected to grow
from an estimated US$ $353 billion in 2010 to US$ 543.2 billion by 2014. With an ever-expanding middle and upper
class consumer base, there will also be huge opportunities in India's tier II and tier III cities. The greater availability of
personal credit and a growing vehicle population that provides improved mobility will also contribute to a trend
towards annual retail sales growth of approx 11-12%. (Source: BMI India Retail Report)
The growth in the overall retail market will be driven, in large part, by the explosion in the organized retail market.
Currently organized retail have a share of 5-6% (~US$ 21.2bn) of total sales and hence the opportunity for organized
retail in India remains immense. By 2014 the share of organized retail sales is expected to grow to 12-13% of the total
retail sales.
In 2009-10, the apparel sector witnessed a rebound in growth mainly during the last quarter of FY 2010. Improvement
in sales was mainly because of a continued switch to ready-to-wear branded garment and general higher consumer
spending sentiment. In addition, rentals have fallen around 25-30% from their peak in 2007-08. Lower rentals have
given more comfort to the expansion plans of organized retail and this is encouraging the apparel brands' store
expansion in retail operations. A vast majority of India's young population favors branded garments. With the influence
of electronic media, urban consumer trends have spread across the rural areas also. The shopping spree of the young
Indians for clothing, favorable income demographics, increasing population of young people joining the workforce with
considerably higher disposable income, has unleashed new possibilities for retail growth even in the rural areas. Thus,
85% of the retail boom which was focused only in the metros has started to infiltrate towards smaller cities and towns.
Tier-II cities are already receiving focused attention of retailers and the other smaller towns and even villages are likely
to join in the coming years. This is a positive trend, and the contribution of these tier-II cities to total organized retail
sales is expected to grow to 20-25%.
WELSPUN's PRODUCTS:
Welspun has a wide ranging portfolio of home textile products comprising terry towels, bed sheets, bath robes, bath
rugs, basic bedding and decorative bedding.
Terry Towels
Welspun's terry towels are in different shapes and sizes. Some of the towels are intended for use in a particular setting,
such as beach towels, or for a particular purpose, such as kitchen towels and baby hood towels, or in sizes convenient
for a special use, such as hand towels, face towels and bath sheets. Being woven out of 100% cotton yarn, these fabrics
acquire significant hygroscopic property, which is the prime reason for using terry fabrics in home textiles in general and
towels and bath robes in particular.
25
WELSPUN GLOBAL BRANDS LTD.
Bed Sheets
Welspun's bed sheets are in different shapes and sizes based on different bed sizes and mattress depth. Its bed sheets
are made from cotton or various blends, such as polyester cotton, cotton bamboo and cotton eucalyptus. The main
reason for using blends is the cost and ease of maintenance of the product by the consumer.
Bath Robes
Welspun's bath robes are in different designs, shades and weights as per customer requirements. It has piece dyed,
yarn dyed, jacquard and velour bath robes. The bath robes are in different styles such as "kimono", "hood", "zipper",
and "shawl". Welspun specializes in a specific category of bath robes called "wraps". Welspun also provides
embellishments, embroidery and prints as per customer requirements. The fabric for its bath robes is similar to the
fabric of the towels, which enables us to leverage the product development and innovation undertaken in terry towels.
Bath Rugs
Welspun's rugs are of different designs with multiple fiber lengths within a rug. Its bath rugs are generally made of
cotton, nylon or micro fiber and can be latex-backed, depending on consumer preferences. Based on customer
requirements, the rugs are of different sizes and weights including reversible rugs.
Basic Bedding and Decorative Bedding
Welspun's basic bedding products include mattress pads, blown and garneted pillows and basic comforters while
decorative bedding products include comforters, bed skirts, shams, decorative pillows and bolsters. Most of these
products are made of polyester fiber fill wadding. The fill for each product varies according to customer requirements.
Since the decorative products provide the look and feel to a bedroom, the products are design-oriented.
"Value Added" Products
In addition to these products, Welspun also has "value added" products such as "quick dry towels" and "the perfect
sheet". Welspun believes that these product offerings are examples of how consumer research-driven innovation can
enhance functionality in its product offerings.
ADVANTAGE WELSPUN
Wide ranging product portfolio
Welspun's wide ranging product portfolio enables it to cater to the entire home furnishing requirements of end
consumers. While its key products have been terry towels and bed linen, basic and decorative beddings and bath rugs
were added to its portfolio in 2008. Welspun believes that the addition of other home textile products to its product
portfolio, such as basic and decorative beddings and bath rugs, has strengthened its position as a fully integrated
complete home textile manufacturer. Welspun believes that consumer-centric product innovation is a key driver to its
growth and that continued emphasis on consumer research will help it create a niche in all product categories, improve
product mix and satisfy consumer product requirements for home textile products.
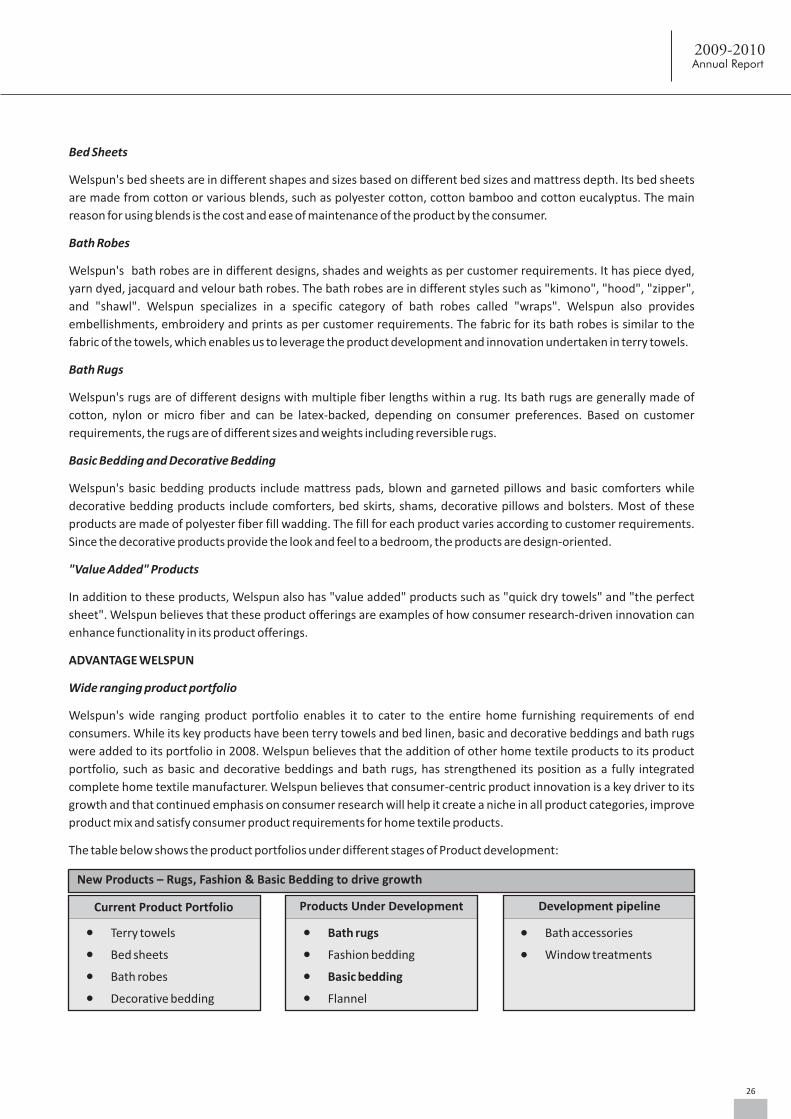
The table below shows the product portfolios under different stages of Product development:
Current Product Portfolio
New Products – Rugs, Fashion & Basic Bedding to drive growth
l Terry towels
l Bed sheets
l Bath robes
l Decorative bedding
Products Under Development
l Bath rugs
l Fashion bedding
l Basic bedding
l Flannel
Development pipeline
l Bath accessories
l Window treatments
26
2009-2010Annual Report
Focus on cost reduction
Welspun intends to retain its focus on improving manpower productivity and the synergies of its global operations with
the overall aim of reducing the cost of operations. Welspun also continues to strive to remove bottlenecks from its
operations to ensure smooth distribution of its products in the Home textile market globally.
Focus on quality
Welspun believes that as its products are sold in some of the most competitive markets globally, ensuring quality of
products is important to maintain competitive advantage. Welspun strives to continue to consistently supply high
quality products to meet the standards of its consumers. Welspun believes that its reputation for high quality products
will enable it to attain a leadership position in each of its product segments.
Global recognitions
Welspun USA (WUSA) is ranked 3rd amongst the Top 15 Home Textile Suppliers (Source: Home Textile Today (HTT) Top
15 Supplier Giants) with
Rank # 1: in Bath towels
Rank # 3: in Bed Sheets & Pillow cases
Rank # 5: in Comforters (Decorative Bedding)
Brand Sales providing growth
WGBL has a portfolio of Own Brands and Licensed Brands. While own brands like Hygrocotton, Luxus, Smart and
Eversmooth, Christy, Graccioza by Sorema are finding increasing customer recognition and acceptance, Licensed
Brands like Amy Butler and Waverly provide access to retailers
Retail Presence via 305 doors:
l WELHOME, India: 144
l Christy, U.K.: 71
l Sorema (Across Europe) : 90
New Channels to drive future growth
Geographic diversification
Welspun is increasing its Penetration in New Geographies and also strengthening presence outside USA & UK It has
setup a Sales Network set up in Europe, Dedicated Sales Team for South America, Canada. It is closely working with
Customers in China, Japan & Russia, China with Luolai, Japan with Yoshi for product development, and Russia with
Ecotex.
l Retailers
l Own retail operations
l Internet / websites
l Hospitality
l Small & Boutique
retailers
l Television: Home
shopping network
l Catalogues and
Mail orders
CURRENT CHANNELSCHANNELS UNDER
DEVELOPMENTDEVELOPMENT PIPELINE
27
WELSPUN GLOBAL BRANDS LTD.
Strategic Supply arrangement with WIL provides unique advantages:
l Strategically located manufacturing facilities of WIL
WIL has strategically located manufacturing facilities in Anjar and Vapi in Gujarat, India, close to its source of
cotton, the primary raw material for our products and to seaports on the western coast of India. Locating two of
WIL's manufacturing facilities in Gujarat provides us with a competitive advantage because India is the one of the
largest producers of cotton in the world and Gujarat is one of its major cotton-producing states. With cotton
accounting for the major portion of our cost of goods sold, WIL has been able to establish synergies between raw
material sourcing and its manufacturing facilities that allow it to achieve superior cost control and improved
margins.
l Economies of scale with modern manufacturing facilities of WIL
WIL modern manufacturing facilities also enable us to consistently supply high-quality products that exceed the
demands of our customers and end consumers. WIL manufacturing facilities at Vapi and Anjar operate in strict
accordance with ISO 9001:2008 certifications and our manufacturing facility at Vapi also operates in accordance
with ISO 14001:2004. Both of these certifications are by Intertek Systems Certification.
l Integration across the production chain under WIL
Welspun has integrated manufacturing facilities which allows it to undertake all of the production processes
(Spinning, weaving, processing, cut and sew, packing and logistics) involved in the manufacture of its products. This
helps us to exercise control over and to make profit from the major part of the value chain starting from the
procurement of cotton to the distribution of our products.
WELSPUN's STRATEGY
WGBL's Strategy is to be a “Brand and Marketing Company” for Home Textiles. It will focus on upgraded marketing,
product development and innovation, superior designs, additional distribution channels and its customer
service.Revenue growth by being partners with existing customers (top retailers) and improve profitability by
increasing own / licensed brands sales.
Further to this WGBL Strategy would be as under:
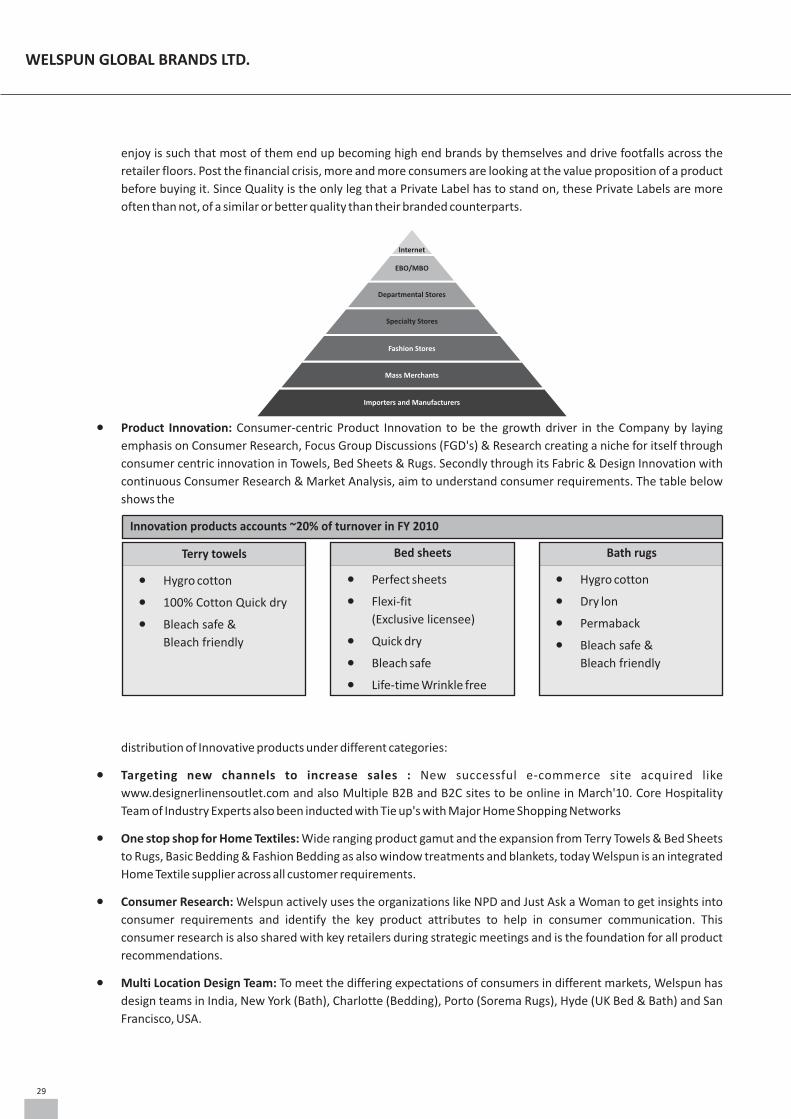
l Customer Centric approach: WGBL directly address its end customers through its owned and licensed brands,
which apart from being available at various top retailers around the world, are also made available through
Exclusive Brand Outlets or Shop-in-shops/ Concessionaires (SIS Format). Other than these channels, Welspun also
addresses its customers through the internet with channels such as the Designer Linens Outlet website. The
pyramid above tells us about the various different types of retailers that we reach our customers through. The top
two layers give us an opportunity to not only reach our end customers, but also get to understand what exactly
their needs are. Welspun aims to become a leader in Home Textiles across the globe, and that is why it believes
that Brands is the way to go. It is this belief that has led Welspun to acquire brands like Christy and Sorema and with
this Welspun continues with its approach towards a happy end customer. Welspun's India operations boast of a
strong network of Company and Franchisee owned outlets for its Home textiles brand like 'Welhome' and a wide
Shop-in-shop presence across the country for premium Home textiles brand 'Spaces'.
Apart from these channels, there are various other Mass merchants, Fashion Stores and Specialty Stores who help
to reach the customers through not only Welspun brands, but also through their own Private Label goods. Private
labels, also known as “store brands” or “house brands”, have long been associated with inexpensive name-brand
knockoffs. In recent years, however, retailers have begun marketing higher-quality products under their private
labels. The result has been a huge increase in the market share of private label brands. Of every $100 spent around
the world, $17 is spent on a private label. The private label industry is worth an estimated one trillion US dollars,
and its growth is outpacing that of manufacturer brands. The quality and loyalty that these Private Label brands
28
2009-2010Annual Report
enjoy is such that most of them end up becoming high end brands by themselves and drive footfalls across the
retailer floors. Post the financial crisis, more and more consumers are looking at the value proposition of a product
before buying it. Since Quality is the only leg that a Private Label has to stand on, these Private Labels are more
often than not, of a similar or better quality than their branded counterparts.
l Product Innovation: Consumer-centric Product Innovation to be the growth driver in the Company by laying
emphasis on Consumer Research, Focus Group Discussions (FGD's) & Research creating a niche for itself through
consumer centric innovation in Towels, Bed Sheets & Rugs. Secondly through its Fabric & Design Innovation with
continuous Consumer Research & Market Analysis, aim to understand consumer requirements. The table below
shows the
distribution of Innovative products under different categories:
l Targeting new channels to increase sales : New successful e-commerce site acquired like
www.designerlinensoutlet.com and also Multiple B2B and B2C sites to be online in March'10. Core Hospitality
Team of Industry Experts also been inducted with Tie up's with Major Home Shopping Networks
l One stop shop for Home Textiles: Wide ranging product gamut and the expansion from Terry Towels & Bed Sheets
to Rugs, Basic Bedding & Fashion Bedding as also window treatments and blankets, today Welspun is an integrated
Home Textile supplier across all customer requirements.
l Consumer Research: Welspun actively uses the organizations like NPD and Just Ask a Woman to get insights into
consumer requirements and identify the key product attributes to help in consumer communication. This
consumer research is also shared with key retailers during strategic meetings and is the foundation for all product
recommendations.
l Multi Location Design Team: To meet the differing expectations of consumers in different markets, Welspun has
design teams in India, New York (Bath), Charlotte (Bedding), Porto (Sorema Rugs), Hyde (UK Bed & Bath) and San
Francisco, USA.
Internet
EBO/MBO
Departmental Stores
Specialty Stores
Fashion Stores
Mass Merchants
Importers and Manufacturers
Terry towels
Innovation products accounts ~20% of turnover in FY 2010
l Hygro cotton
l 100% Cotton Quick dry
l Bleach safe &
Bleach friendly
Bed sheets
l Perfect sheets
l Flexi-fit
(Exclusive licensee)
l Quick dry
l Bleach safe
l Life-time Wrinkle free
Bath rugs
l Hygro cotton
l Dry lon
l Permaback
l Bleach safe &
Bleach friendly
29
WELSPUN GLOBAL BRANDS LTD.
l Product Development and Innovation: Welspun believes that Product Development & Innovation is a key area to
create a sustainable competitive advantage. Using the inputs from the consumer research and through tracking
the new developments, we have added new towel products like nanospun, eco-lite (quick dry), cotton bamboo,
eucalyptus and texture towels to our product basket.
On the Bed Linen front, we have added products like Ever Smooth MXL Wrinkle Free, Quick Dry Sheets, Flexifit
sheets and the Perfect Sheet incorporating all the qualities mentioned.
l Packaging and Point Of Sale: Welspun has a Marketing team in USA at Charlotte and in India which works on
developing the packaging for different products. POS communication is also developed in order to ensure that the
key functional product attributes are communicated to the consumer at the retail floor.
l Extended SCM: Welspun is among the few companies who provide Collaborative Forecasting, Planning and
Replenishment to its customers over more than 30 programs from POS to production at plant level.
l Global Market intelligence: Welspun has presence at multiple locations across the world and uses this presence to
build the market intelligence for different markets. In addition to this, secondary research using published Industry
sources helps to build the market intelligence.
l Technology: Along with WIL, WGBL offers State-of-the art technology, machinery know-how from the best
international suppliers and vertically integrated plants give Welspun a very strong footprint in this particular
industry. Welspun is flexible, change oriented and innovative.
l Reliability: A strong client base and a great track record in terms of client servicing and on time delivery is our key
strength.
l Projected growth of textile industry: The exponential growth anticipated in the textile industry gives a great
futuristic hope for companies like us who have implemented process and technology of global standards and are
ready to meet future demands.
WELSPUN'S EFFORTS TO SHARPEN COMPETITIVE EDGE
In 2010-11, Welspun plans to:
l Grow its market share of Towels in USA and UK
l Improve its market share of Bed Linen in all Markets
l Enhance Product design and development
l Utilize the Sales Network set up in Europe to increase sales across all product categories
l Acquire/ License Brands across the major markets
l Increase revenues in Fashion Bedding, Basic Bedding and Bath Rugs
l Develop new Markets like Mexico, Japan, Russia and China
l Consumer Research and product development
l Innovative products share to further increase total revenue.
l Seamless sourcing relation with WIL to cater to the customers across the globe
l Grow capability for Hospitality sector
Developing a Competitive Advantage
l Offering a Business Proposition
30
2009-2010Annual Report
– Be a strategic partner to Customers
l Sharing of Common Objective with Customer
– Maximize inventory turns
– Optimize ROI for Customer & Welspun
l Integration
– Supply Chain Integration with Client data base
l Quick response through USA distribution
PRINCIPAL FACTORS AFFECTING RESULTS OF OPERATIONS
l General economic conditions;
l Condition and performance of Indian and international textile industry;
l Price and availability of raw materials;
l Demand and supply of products;
l Foreign exchange fluctuations
l Competition.
HUMAN RESOURCES POLICY
Our HR policies cover our objectives, eligibility and coverage, policy and procedures. We review, revise and update our
Human Resource policies from time to time to make them relevant, effective and useful to its employees.
OUTLOOK
Welspun is already a strategic vendor to major retailers in the USA. It has been able to sustain its growth even in the
current economic scenario where the retail sales in its key market of US dropped since Sept'08. As a result of reduced
consumer spending, the retailers also corrected the inventory in the entire supply chain leading to low orders.
In 2008-09, Welspun USA signed a License for a leading brand for North America for Fashion Bedding, Fashion Bath,
Blankets/ Throws and Area Rugs in addition to the earlier license of Bath, Solid Sheets and rugs. The new license has
helped Welspun in becoming a key player in the Fashion Bedding segment.
Welspun today differentiates itself from the other manufacturers by focusing on Consumer Research driven
innovations, use of new technologies, a global manufacturing & sales footprint and ability to offer a comprehensive end
to end solution to the customers. A recent example of a consumer research driven innovation has been the Quick Dry
Towel and the Perfect Sheet.
Welspun occupies a strong market positioning with its customer partnership and brand sales. Going forward we target
to enhance our market share. With Improvement in consumer sentiments in North America and Europe demand
outlook is positive.
31
WELSPUN GLOBAL BRANDS LTD.
INTERNAL CONTROL SYSTEM AND THEIR ADEQUACY
At Welspun, the internal control system encompasses the policies, processes, tasks, behaviours and other aspects of
Welspun that taken together, facilitate effective and efficient operation, quality of internal and external reporting,
compliance with applicable laws and regulations. Welspun's objectives, its internal organization and the environment
in which it operates are continually evolving and, as a result, the risks it faces are continually changing. In order to make
its internal control effective and sound, Welspun thoroughly and regularly evaluates the nature and extent of the risks
to which the Company is exposed. The operation and monitoring of the system of internal control has been taken by
individuals who collectively possess the necessary skills, technical knowledge, objectivity and understanding of the
Company and the industries and markets in which it operates. Welspun also outsources management auditors to
periodically check the adequacy of its systems and processes so as to make it more responsive in this volatile
environment. The qualified, experienced and independent Audit Committee of the Board of Directors actively reviews
the adequacy and effectiveness of internal controls systems and suggests improvements for strengthening them.
Welspun has a strong Management Information System which is an integral part of the control mechanism.
The system is improved and modified continuously to meet the changes in business conditions, statutory and
accounting requirements.
DISCUSSION OF FINANCIAL PERFORMANCE
The discussion of the Financial Performance and Analysis below relates to the consolidated audited financial statements
of Welspun Global Brands Ltd (WGBL). The discussion should be read in conjunction with the consolidated financial
statements and the related 'Notes to the Accounts' for the year ended March 31st 2010.
W.e.f. April 1, 2009, the marketing division of WIL was transferred to WGBL and since then it operates as an international
sales and marketing company. Therefore, no comparables are applicable with respect to the previous year.
KEY FINANCIAL DATA (Profit & Loss a/c for the year ended March 31, 2010) (Rs. million)
Particulars Standalone Consolidated
FY 10 % FY 10 %
Sales 16,092 100.00 21,538 100.00
Other Income 159 0.99 185 0.86
Cost of Goods Sold 14,641 90.98 17,549 81.48
Employee Cost 104 0.65 1,190 5.52
Selling Administration and Other Expenses 963 5.98 2,445 11.35
Reported EBIDTA 544 3.38 540 2.51
Depreciation 0.44 – 155 0.72
PBIT 544 3.38 385 1.79
Financial Expenses (net) 201 1.25 361 1.68
Profit Before Tax 342 2.13 23 0.11
Taxes 126 0.78 162 0.75
Net Profit (Loss) 216 1.34 (139) (0.65)
Share of Associate's Net Loss – – (21) (0.10)
Minority's Share of Loss in Certain Subsidiary
Companies – – (46) (0.21)
Profit (Loss) After Tax 216 1.34 (115) (0.53)
32
2009-2010Annual Report
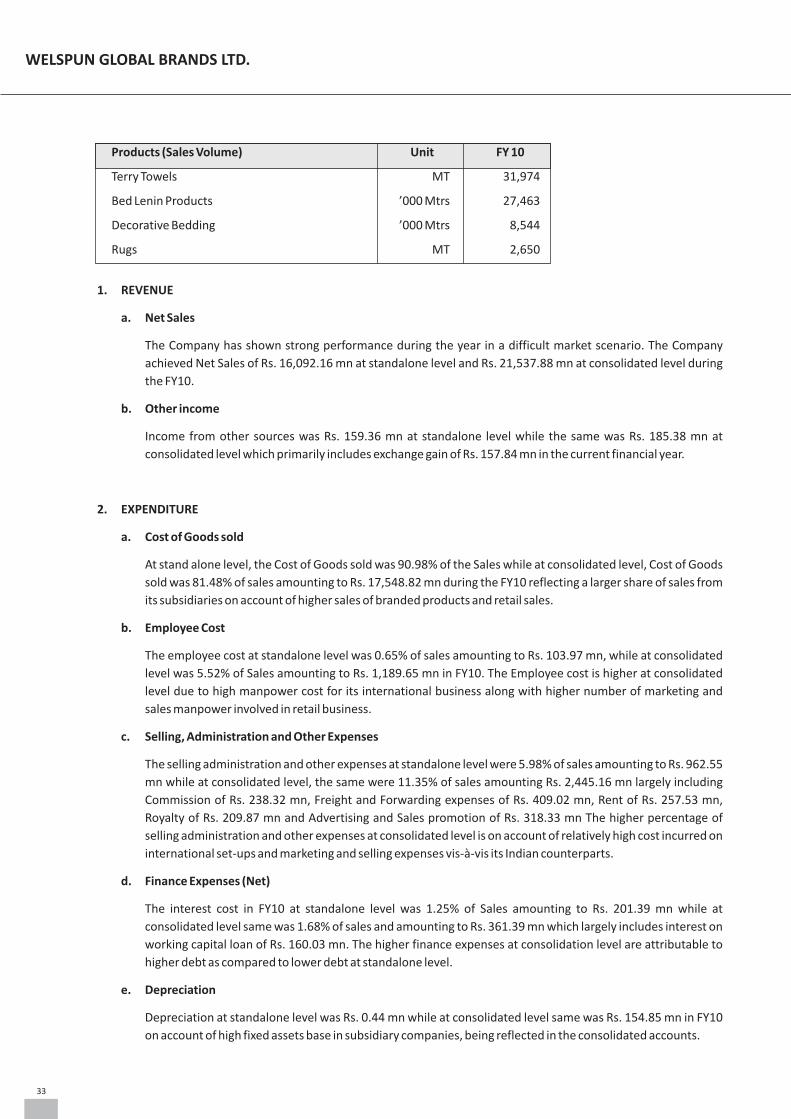
Products (Sales Volume) Unit FY 10
Terry Towels MT 31,974
Bed Lenin Products ’000 Mtrs 27,463
Decorative Bedding ’000 Mtrs 8,544
Rugs MT 2,650
1. REVENUE
a. Net Sales
The Company has shown strong performance during the year in a difficult market scenario. The Company
achieved Net Sales of Rs. 16,092.16 mn at standalone level and Rs. 21,537.88 mn at consolidated level during
the FY10.
b. Other income
Income from other sources was Rs. 159.36 mn at standalone level while the same was Rs. 185.38 mn at
consolidated level which primarily includes exchange gain of Rs. 157.84 mn in the current financial year.
2. EXPENDITURE
a. Cost of Goods sold
At stand alone level, the Cost of Goods sold was 90.98% of the Sales while at consolidated level, Cost of Goods
sold was 81.48% of sales amounting to Rs. 17,548.82 mn during the FY10 reflecting a larger share of sales from
its subsidiaries on account of higher sales of branded products and retail sales.
b. Employee Cost
The employee cost at standalone level was 0.65% of sales amounting to Rs. 103.97 mn, while at consolidated
level was 5.52% of Sales amounting to Rs. 1,189.65 mn in FY10. The Employee cost is higher at consolidated
level due to high manpower cost for its international business along with higher number of marketing and
sales manpower involved in retail business.
c. Selling, Administration and Other Expenses
The selling administration and other expenses at standalone level were 5.98% of sales amounting to Rs. 962.55
mn while at consolidated level, the same were 11.35% of sales amounting Rs. 2,445.16 mn largely including
Commission of Rs. 238.32 mn, Freight and Forwarding expenses of Rs. 409.02 mn, Rent of Rs. 257.53 mn,
Royalty of Rs. 209.87 mn and Advertising and Sales promotion of Rs. 318.33 mn The higher percentage of
selling administration and other expenses at consolidated level is on account of relatively high cost incurred on
international set-ups and marketing and selling expenses vis-à-vis its Indian counterparts.
d. Finance Expenses (Net)
The interest cost in FY10 at standalone level was 1.25% of Sales amounting to Rs. 201.39 mn while at
consolidated level same was 1.68% of sales and amounting to Rs. 361.39 mn which largely includes interest on
working capital loan of Rs. 160.03 mn. The higher finance expenses at consolidation level are attributable to
higher debt as compared to lower debt at standalone level.
e. Depreciation
Depreciation at standalone level was Rs. 0.44 mn while at consolidated level same was Rs. 154.85 mn in FY10
on account of high fixed assets base in subsidiary companies, being reflected in the consolidated accounts.
33
WELSPUN GLOBAL BRANDS LTD.

3. MARGINS
a. EBIDTA
The EBIDTA margin at standalone level was 3.38% of sales amounting to Rs. 544.30 mn and at consolidated
level was 2.51% of sales and amounting Rs. 539.61 mn in FY10. It is to be noted that the company is in business
of sales and marketing and purchases goods for forward sale. Therefore COGS share as a percentage of
revenue is higher.
b. Profit Before Tax
The Profit Before Tax (PBT) at standalone level was Rs. 342.47 mn and at consolidated level it was Rs. 23.37 mn
in FY 10.
c. Taxes
Taxes at standalone level was Rs. 126.14 mn while at consolidated level was Rs. 162.43 mn in FY 10. The
difference is attributable to reversal of Rs. 42.25 mn of deferred tax assets in subsidiaries for the prior period.
d. Profit (Loss) After Tax
At standalone level the net Profit (Loss) After Tax was Rs. 216.33 mn while at consolidated level was Rs.
(114.58) mn after adjustment of share of Associate's loss of Rs. (21.38) mn and Minority's share of loss in
certain subsidiaries of Rs. (45.86) mn in FY 10.
4. TABLE: BALANCE SHEET (Rs. million)
Particulars Standalone Consolidated
As at As at% %
March 31, 2010 March 31, 2010
SOURCES OF FUNDS
SHAREHOLDERS' FUNDS
Share Capital 105 4.17% 105 2.48%
Reserves and Surplus 1,292 51.46% 912 21.60%
Total 1,397 55.63% 1,017 24.08%
Minority Interest – – 397 9.40%
LOAN FUNDS
Secured Loans 803 19.01%
Unsecured Loans 1,114 44.37% 2,006 47.51%
Total 1,114 44.37% 2,809 66.52%
TOTAL 2,510 100.00% 4,223 100.00%
APPLICATION OF FUNDS
FIXED ASSETS
Gross Block 3 0.13% 2,233 52.88%
Less : Depreciation 1 0.04% 839 19.88%
Net Block 2 0.10% 1,394 33.00%
Capital Work-in-progress 1 0.03%
Total 2 0.10% 1,395 33.03%
34
2009-2010Annual Report
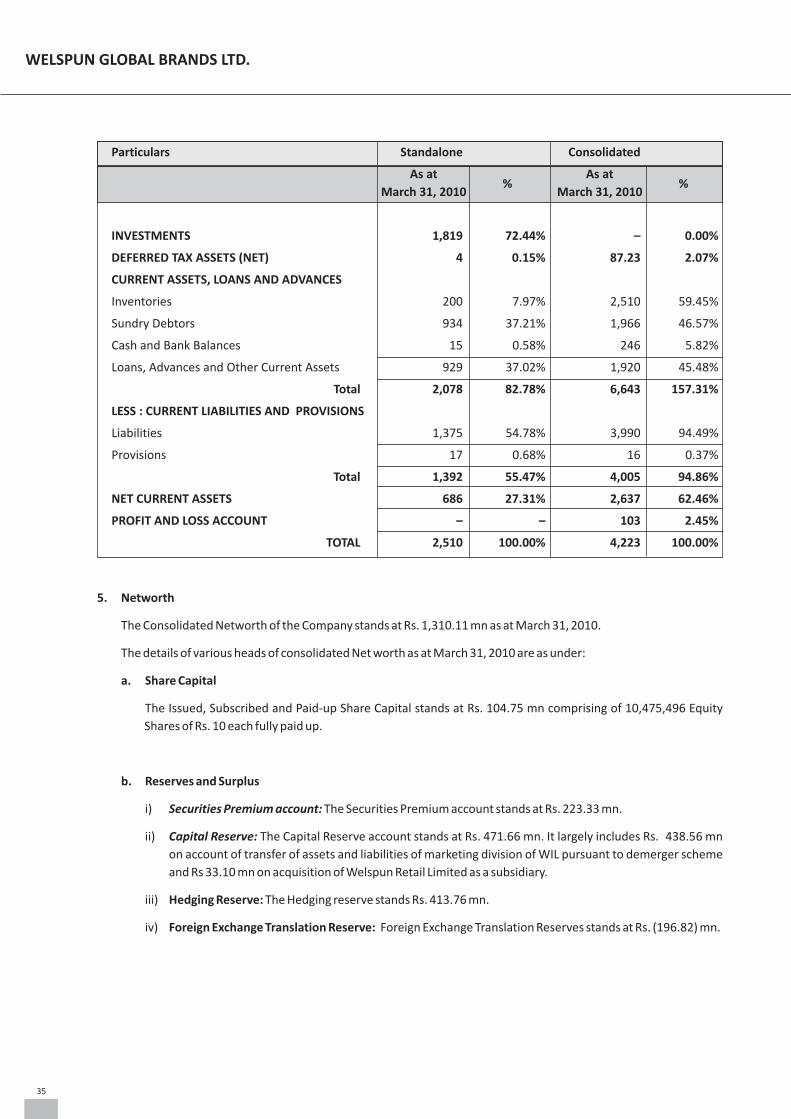
Particulars Standalone Consolidated
As at As at% %
March 31, 2010 March 31, 2010
INVESTMENTS 1,819 72.44% – 0.00%
DEFERRED TAX ASSETS (NET) 4 0.15% 87.23 2.07%
CURRENT ASSETS, LOANS AND ADVANCES
Inventories 200 7.97% 2,510 59.45%
Sundry Debtors 934 37.21% 1,966 46.57%
Cash and Bank Balances 15 0.58% 246 5.82%
Loans, Advances and Other Current Assets 929 37.02% 1,920 45.48%
Total 2,078 82.78% 6,643 157.31%
LESS : CURRENT LIABILITIES AND PROVISIONS
Liabilities 1,375 54.78% 3,990 94.49%
Provisions 17 0.68% 16 0.37%
Total 1,392 55.47% 4,005 94.86%
NET CURRENT ASSETS 686 27.31% 2,637 62.46%
PROFIT AND LOSS ACCOUNT – – 103 2.45%
TOTAL 2,510 100.00% 4,223 100.00%
5. Networth
The Consolidated Networth of the Company stands at Rs. 1,310.11 mn as at March 31, 2010.
The details of various heads of consolidated Net worth as at March 31, 2010 are as under:
a. Share Capital
The Issued, Subscribed and Paid-up Share Capital stands at Rs. 104.75 mn comprising of 10,475,496 Equity
Shares of Rs. 10 each fully paid up.
b. Reserves and Surplus
i) Securities Premium account: The Securities Premium account stands at Rs. 223.33 mn.
ii) Capital Reserve: The Capital Reserve account stands at Rs. 471.66 mn. It largely includes Rs. 438.56 mn
on account of transfer of assets and liabilities of marketing division of WIL pursuant to demerger scheme
and Rs 33.10 mn on acquisition of Welspun Retail Limited as a subsidiary.
iii) Hedging Reserve: The Hedging reserve stands Rs. 413.76 mn.
iv) Foreign Exchange Translation Reserve: Foreign Exchange Translation Reserves stands at Rs. (196.82) mn.
35
WELSPUN GLOBAL BRANDS LTD.
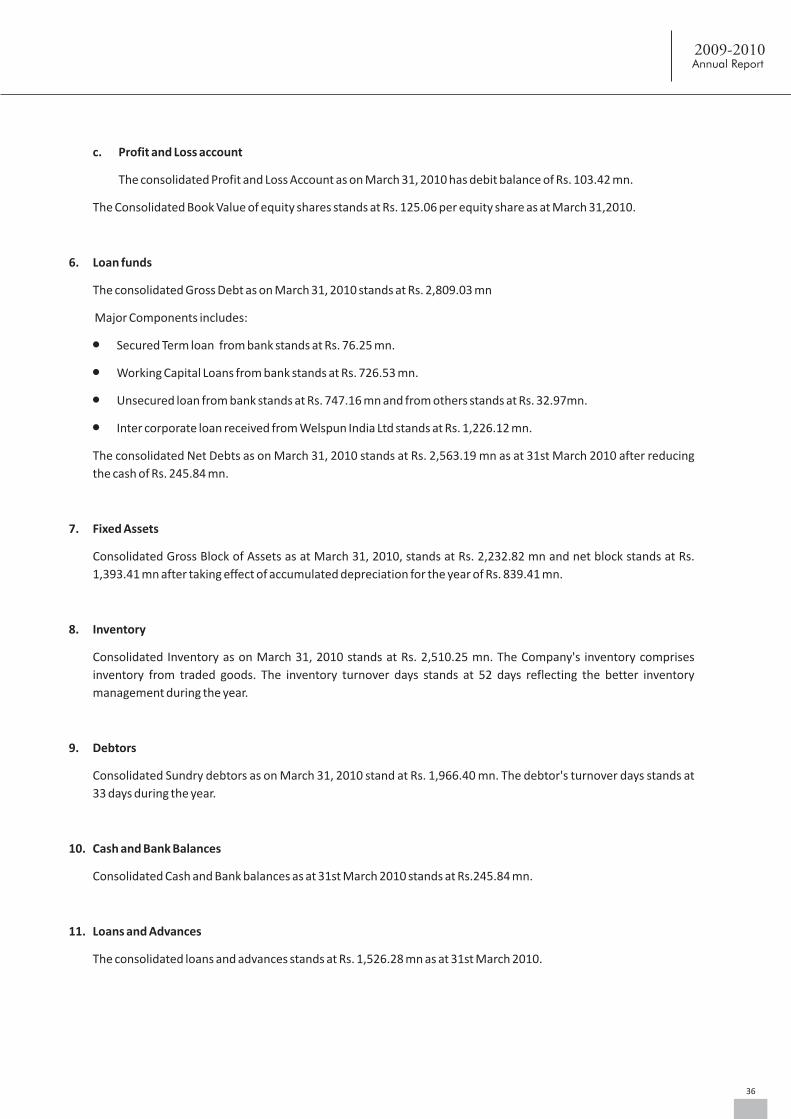
c. Profit and Loss account
The consolidated Profit and Loss Account as on March 31, 2010 has debit balance of Rs. 103.42 mn.
The Consolidated Book Value of equity shares stands at Rs. 125.06 per equity share as at March 31,2010.
6. Loan funds
The consolidated Gross Debt as on March 31, 2010 stands at Rs. 2,809.03 mn
Major Components includes:
l Secured Term loan from bank stands at Rs. 76.25 mn.
l Working Capital Loans from bank stands at Rs. 726.53 mn.
l Unsecured loan from bank stands at Rs. 747.16 mn and from others stands at Rs. 32.97mn.
l Inter corporate loan received from Welspun India Ltd stands at Rs. 1,226.12 mn.
The consolidated Net Debts as on March 31, 2010 stands at Rs. 2,563.19 mn as at 31st March 2010 after reducing
the cash of Rs. 245.84 mn.
7. Fixed Assets
Consolidated Gross Block of Assets as at March 31, 2010, stands at Rs. 2,232.82 mn and net block stands at Rs.
1,393.41 mn after taking effect of accumulated depreciation for the year of Rs. 839.41 mn.
8. Inventory
Consolidated Inventory as on March 31, 2010 stands at Rs. 2,510.25 mn. The Company's inventory comprises
inventory from traded goods. The inventory turnover days stands at 52 days reflecting the better inventory
management during the year.
9. Debtors
Consolidated Sundry debtors as on March 31, 2010 stand at Rs. 1,966.40 mn. The debtor's turnover days stands at
33 days during the year.
10. Cash and Bank Balances
Consolidated Cash and Bank balances as at 31st March 2010 stands at Rs.245.84 mn.
11. Loans and Advances
The consolidated loans and advances stands at Rs. 1,526.28 mn as at 31st March 2010.
36
2009-2010Annual Report
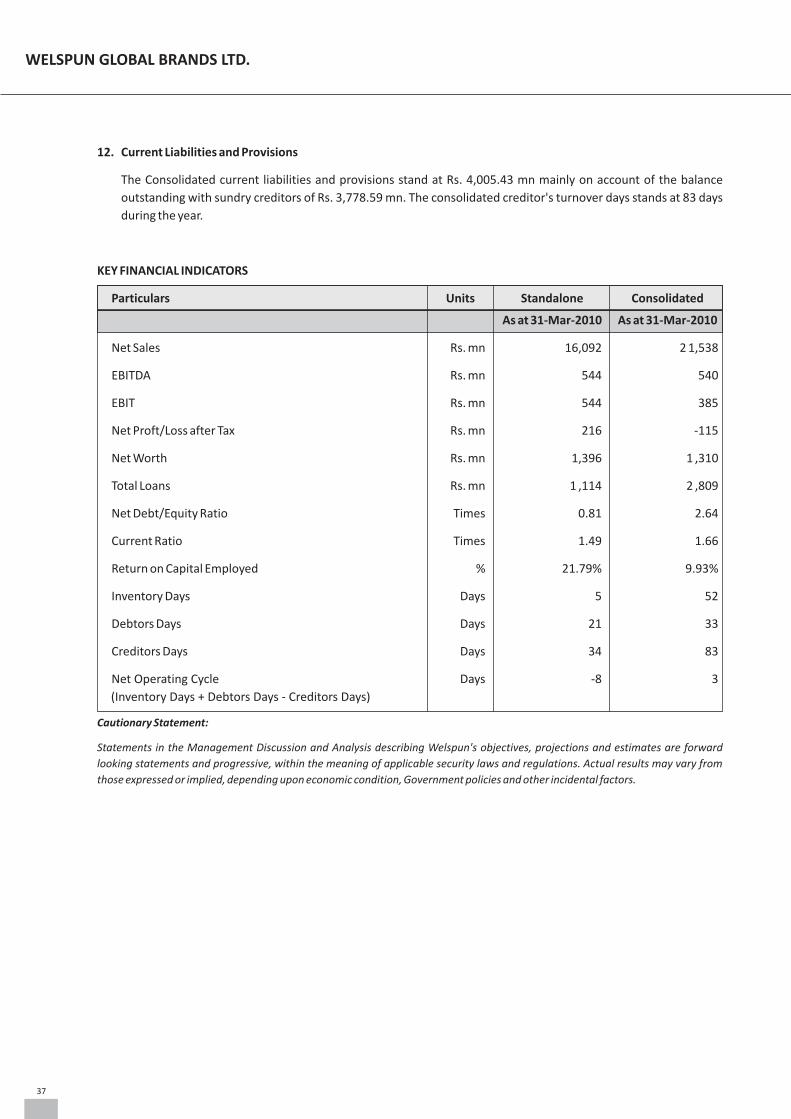
37
WELSPUN GLOBAL BRANDS LTD.
12. Current Liabilities and Provisions
The Consolidated current liabilities and provisions stand at Rs. 4,005.43 mn mainly on account of the balance
outstanding with sundry creditors of Rs. 3,778.59 mn. The consolidated creditor's turnover days stands at 83 days
during the year.
KEY FINANCIAL INDICATORS
Particulars Units Standalone Consolidated
As at 31-Mar-2010 As at 31-Mar-2010
Net Sales Rs. mn 16,092 2 1,538
EBITDA Rs. mn 544 540
EBIT Rs. mn 544 385
Net Proft/Loss after Tax Rs. mn 216 -115
Net Worth Rs. mn 1,396 1 ,310
Total Loans Rs. mn 1 ,114 2 ,809
Net Debt/Equity Ratio Times 0.81 2.64
Current Ratio Times 1.49 1.66
Return on Capital Employed % 21.79% 9.93%
Inventory Days Days 5 52
Debtors Days Days 21 33
Creditors Days Days 34 83
Net Operating Cycle Days -8 3
(Inventory Days + Debtors Days - Creditors Days)
Cautionary Statement:
Statements in the Management Discussion and Analysis describing Welspun's objectives, projections and estimates are forward
looking statements and progressive, within the meaning of applicable security laws and regulations. Actual results may vary from
those expressed or implied, depending upon economic condition, Government policies and other incidental factors.

Financials Section
Standalone Accounts
Audit Report 40
Balance Sheet 45
Profit & Loss Account 46
Schedules 47
Cashflow Statement 65
Balance Sheet Abstract 66
Consolidated Accounts
Audit Report 67
Balance Sheet 69
Profit & Loss Account 70
Schedules 71
Cashflow Statement 90
Section 212 disclosure 91
39
WELSPUN GLOBAL BRANDS LTD.
AUDITORS' REPORT TO THE MEMBERS OFWELSPUN GLOBAL BRANDS LIMITED
1. We have audited the attached Balance Sheet of Welspun Global Brands Limited (the “Company”) as at March 31,
2010, and the related Profit and Loss Account and Cash Flow Statement for the year ended on that date annexed
thereto, which we have signed under reference to this report. These financial statements are the responsibility of
the Company's Management. Our responsibility is to express an opinion on these financial statements based on
our audit.
2. We conducted our audit in accordance with the auditing standards generally accepted in India. Those Standards
require that we plan and perform the audit to obtain reasonable assurance about whether the financial statements
are free of material misstatement. An audit includes examining, on a test basis, evidence supporting the amounts
and disclosures in the financial statements. An audit also includes assessing the accounting principles used and
significant estimates made by Management, as well as evaluating the overall financial statement presentation. We
believe that our audit provides a reasonable basis for our opinion.
3. As required by the Companies (Auditor's Report) Order, 2003, as amended by the Companies (Auditor's Report)
(Amendment) Order, 2004 (together the “Order”), issued by the Central Government of India in terms of sub-
section (4A) of Section 227 of 'The Companies Act, 1956' of India (the 'Act') and on the basis of such checks of the
books and records of the Company as we considered appropriate and according to the information and
explanations given to us, we give in the Annexure a statement on the matters specified in paragraphs 4 and 5 of the
Order.
4. Without qualifying our opinion, we draw your attention to:
(a) Note 6 on Schedule 18, regarding the year end investments of Rs. 499.63 million in Welspun Retail Limited
('WRL') and loans of Rs. 134.65 million to WRL, a subsidiary which has incurred significant losses up to the year-
end, for which no provisions have been made in these financial statements for the reasons stated therein
which, however, are susceptible to inherent uncertainties around the performance of WRL in the environment
in which it operates. If WRL does not achieve its projected financial results, the carrying value of investments
in, and loans to, WRL at the year end could be significantly impacted.
(b) Note 7 on Schedule 18, regarding the Company's dependence on Welspun India Limited ('WIL') for
procurement of all of its products. If the arrangement between the Company and WIL is discontinued, the
business of the Company could be adversely impacted.
(c) Notes 8 and 3 on Schedule 18, regarding a corporate guarantee of Rs. 5,887.40 million at the year end, issued
consequent to the demerger of the marketing division of WIL into the Company, to the bankers of WIL in
relation to the debt facilities provided by them to WIL, and a corporate guarantee of Rs. 330 million at the year
end, disclosed in Note 3 on Schedule 18, issued to a bank on behalf of WRL. If WIL and WRL are unable to meet
their obligations as they fall due, the financial condition and cash flows of the Company could be adversely
impacted.
5. Further to our comments in the Annexure referred to in paragraph 3 above, we report that:
(a) We have obtained all the information and explanations which, to the best of our knowledge and belief, were
necessary for the purposes of our audit;
(b) In our opinion, proper books of account as required by law have been kept by the Company so far as appears
from our examination of those books;
(c) The Balance Sheet, Profit and Loss Account and Cash Flow Statement dealt with by this report are in
agreement with the books of account;
40
2009-2010Annual Report
(d) In our opinion, the Balance Sheet, Profit and Loss Account and Cash Flow Statement dealt with by this report
comply with the accounting standards referred to in sub-section (3C) of Section 211 of the Act;
(e) On the basis of written representations received from the directors, as on March 31, 2010 and taken on record
by the Board of Directors, none of the directors is disqualified as on March 31, 2010 from being appointed as a
director in terms of clause (g) of sub-section (1) of Section 274 of the Act;
(f) In our opinion and to the best of our information and according to the explanations given to us, the said
financial statements together with the notes thereon and attached thereto give, in the prescribed manner, the
information required by the Act, and give a true and fair view in conformity with the accounting principles
generally accepted in India:
(i) in the case of the Balance Sheet, of the state of affairs of the Company as at March 31, 2010;
(ii) in the case of the Profit and Loss Account, of the profit for the year ended on that date; and
(iii) in the case of the Cash Flow Statement, of the cash flows for the year ended on that date.
For Price Waterhouse & Co.
Firm Registration Number: 007567S
Chartered Accountants
Neeraj Gupta
Place: Mumbai Partner
Date: May 27, 2010 Membership Number F055158
41
WELSPUN GLOBAL BRANDS LTD.
ANNEXURE TO AUDITORS' REPORT
Referred to in paragraph 3 of the Auditors' Report of even date to the members of Welspun Global Brands Limited on
the financial statements for the year ended March 31, 2010
1. (a) The Company is maintaining proper records showing full particulars, including quantitative details and
situation, of fixed assets.
(b) The fixed assets of the Company have been physically verified by the Management during the year and no
discrepancies between the book records and the physical inventory have been noticed. In our opinion, the
frequency of verification is reasonable.
(c) In our opinion and according to the information and explanations given to us, a substantial part of fixed assets
has not been disposed of by the Company during the year.
2. (a) Goods purchased by the Company from its supplier are immediately dispatched to customers. In the absence
of any inventory being stocked by the Company, clauses (ii)(a) and (ii)(b) of paragraph 4 of the Order are not
applicable.
(b) On the basis of our examination of the inventory records, in our opinion, the Company has maintained proper
records of inventory.
3. (a) The Company has not granted any loans, secured or unsecured, to companies, firms or other parties covered
in the register maintained under Section 301 of the Act.
(b) The Company has not taken any loans, secured or unsecured, from companies, firms or other parties covered
in the register maintained under Section 301 of the Act.
4. In our opinion and according to the information and explanations given to us, there is an adequate internal control
system commensurate with the size of the Company and the nature of its business for the purchase of inventory,
fixed assets and for the sale of goods. Further, on the basis of our examination of the books and records of the
Company, and according to the information and explanations given to us, no major weakness have been noticed or
reported.
5. According to the information and explanations given to us, there have been no contracts or arrangements referred
to in Section 301 of the Act during the year to be entered in the register required to be maintained under that
Section. Accordingly, the question of commenting on transactions made in pursuance of such contracts or
arrangements does not arise.
6. The Company has not accepted any deposits from the public within the meaning of Sections 58A and 58AA of the
Act and the rules framed there under.
42
2009-2010Annual Report

7. In our opinion, the Company has an internal audit system commensurate with its size and nature of its business.
8. The Central Government of India has not prescribed the maintenance of cost records under clause (d) of sub-
section (1) of Section 209 of the Act for any of the products of the Company.
9. (a) According to the information and explanations given to us and the records of the Company examined by us, in
our opinion, the Company is regular in depositing the undisputed statutory dues including provident fund,
investor education and protection fund, employees' state insurance, income-tax, service tax, customs duty,
cess and other material statutory dues as applicable with the appropriate authorities.
(b) According to the information and explanations given to us and the records of the Company examined by us,
there are no dues of income-tax, service-tax, customs duty and cess which have not been deposited on
account of any dispute.
10. The Company has no accumulated losses as at March 31, 2010 and it has not incurred any cash losses in the
financial year ended on that date or in the immediately preceding financial year.
11. According to the records of the Company examined by us and the information and explanation given to us, the
Company has not defaulted in repayment of dues to any financial institution or bank or debenture holders as at the
balance sheet date.
12. The Company has not granted any loans and advances on the basis of security by way of pledge of shares,
debentures and other securities.
13. The provisions of any special statute applicable to chit fund/ nidhi/ mutual benefit fund/ societies are not
applicable to the Company.
14. In our opinion, the Company is not a dealer or trader in shares, securities, debentures and other investments.
15. In our opinion and according to the information and explanations given to us, the terms and conditions of the
guarantees given by the Company, for loans taken by others from banks or financial institutions during the year, are
not prejudicial to the interest of the Company.
16. In our opinion, and according to the information and explanations given to us, on an overall basis, the term loans
have been applied for the purposes for which they were obtained.
17. On the basis of an overall examination of the balance sheet of the Company, in our opinion and according to the
information and explanations given to us, there are no funds raised on a short term basis which have been used for
long-term investment.
43
WELSPUN GLOBAL BRANDS LTD.
18. The Company has not made any preferential allotment of shares to parties and companies covered in the register
maintained under Section 301 of the Act during the year.
19. The Company has not issued any debentures during the year.
20. The Company has not raised any money by public issues during the year.
21. During the course of our examination of the books and records of the Company, carried out in accordance with the
generally accepted auditing practices in India, and according to the information and explanations given to us, we
have neither come across any instance of fraud on or by the Company, noticed or reported during the year, nor
have we been informed of such case by the Management.
For Price Waterhouse & Co.
Firm Registration Number: 007567S
Chartered Accountants
Neeraj Gupta
Place: Mumbai Partner
Date: May 27, 2010 Membership Number F055158
2009-2010Annual Report
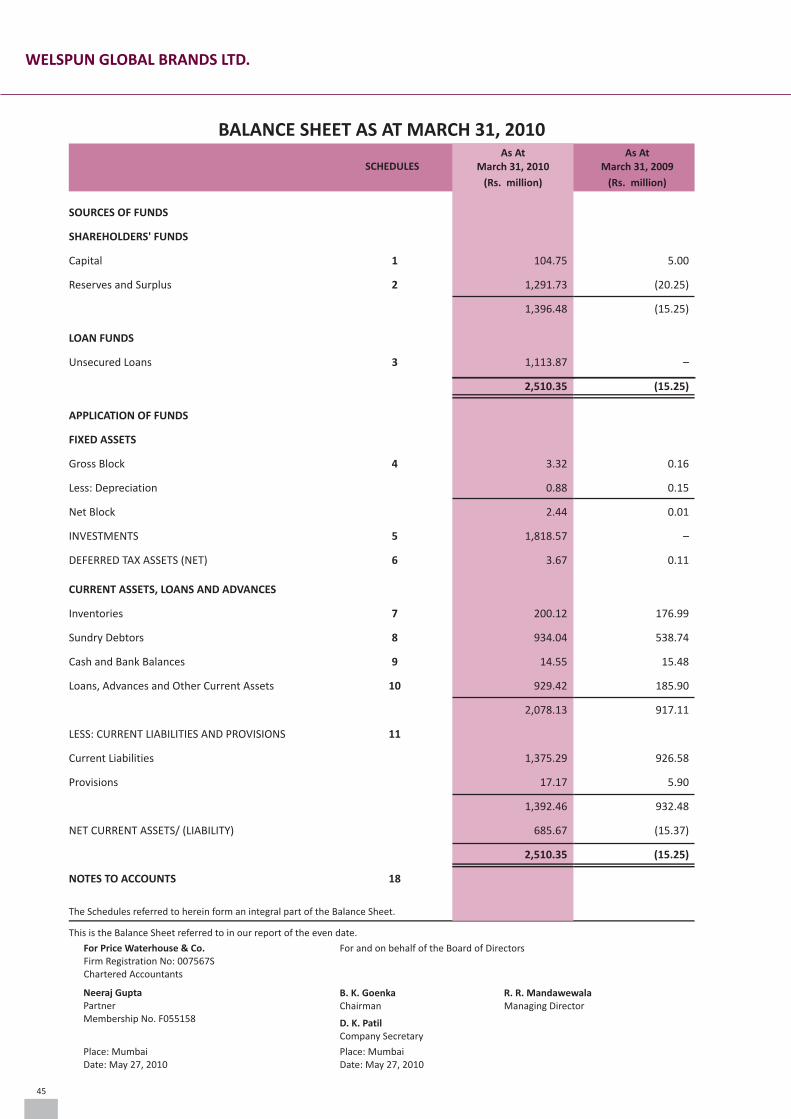
The Schedules referred to herein form an integral part of the Balance Sheet.
This is the Balance Sheet referred to in our report of the even date.
For Price Waterhouse & Co.Firm Registration No: 007567SChartered Accountants
For and on behalf of the Board of Directors
Neeraj GuptaPartnerMembership No. F055158
B. K. GoenkaChairman
R. R. MandawewalaManaging Director
D. K. PatilCompany Secretary
Place: MumbaiDate: May 27, 2010
Place: MumbaiDate: May 27, 2010
45
SOURCES OF FUNDS
SHAREHOLDERS' FUNDS
Capital 1 104.75 5.00
Reserves and Surplus 2 1,291.73 (20.25)
1,396.48 (15.25)
LOAN FUNDS
Unsecured Loans 3 1,113.87 –
2,510.35 (15.25)
APPLICATION OF FUNDS
FIXED ASSETS
Gross Block 4 3.32 0.16
Less: Depreciation 0.88 0.15
Net Block 2.44 0.01
INVESTMENTS 5 1,818.57 –
DEFERRED TAX ASSETS (NET) 6 3.67 0.11
CURRENT ASSETS, LOANS AND ADVANCES
Inventories 7 200.12 176.99
Sundry Debtors 8 934.04 538.74
Cash and Bank Balances 9 14.55 15.48
Loans, Advances and Other Current Assets 10 929.42 185.90
2,078.13 917.11
LESS: CURRENT LIABILITIES AND PROVISIONS 11
Current Liabilities 1,375.29 926.58
Provisions 17.17 5.90
1,392.46 932.48
NET CURRENT ASSETS/ (LIABILITY) 685.67 (15.37)
2,510.35 (15.25)
NOTES TO ACCOUNTS 18
BALANCE SHEET AS AT MARCH 31, 2010
As At
March 31, 2009
(Rs. million)
SCHEDULESAs At
March 31, 2010
(Rs. million)
WELSPUN GLOBAL BRANDS LTD.
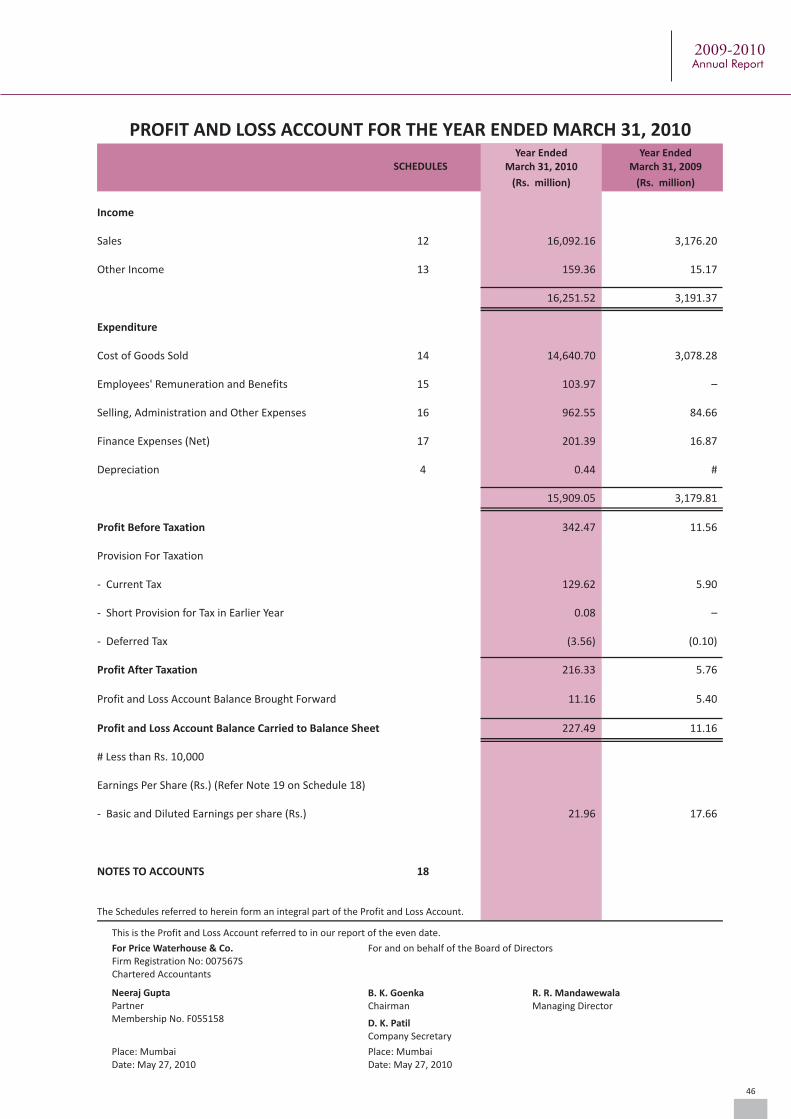
The Schedules referred to herein form an integral part of the Profit and Loss Account.
This is the Profit and Loss Account referred to in our report of the even date.
For Price Waterhouse & Co.Firm Registration No: 007567SChartered Accountants
For and on behalf of the Board of Directors
Neeraj GuptaPartnerMembership No. F055158
B. K. GoenkaChairman
R. R. MandawewalaManaging Director
D. K. PatilCompany Secretary
Place: MumbaiDate: May 27, 2010
Place: MumbaiDate: May 27, 2010
Year Ended
March 31, 2009
(Rs. million)
SCHEDULESYear Ended
March 31, 2010
(Rs. million)
Income
Sales 12 16,092.16 3,176.20
Other Income 13 159.36 15.17
16,251.52 3,191.37
Expenditure
Cost of Goods Sold 14 14,640.70 3,078.28
Employees' Remuneration and Benefits 15 103.97 –
Selling, Administration and Other Expenses 16 962.55 84.66
Finance Expenses (Net) 17 201.39 16.87
Depreciation 4 0.44 #
15,909.05 3,179.81
Profit Before Taxation 342.47 11.56
Provision For Taxation
- Current Tax 129.62 5.90
- Short Provision for Tax in Earlier Year 0.08 –
- Deferred Tax (3.56) (0.10)
Profit After Taxation 216.33 5.76
Profit and Loss Account Balance Brought Forward 11.16 5.40
Profit and Loss Account Balance Carried to Balance Sheet 227.49 11.16
# Less than Rs. 10,000
Earnings Per Share (Rs.) (Refer Note 19 on Schedule 18)
- Basic and Diluted Earnings per share (Rs.) 21.96 17.66
NOTES TO ACCOUNTS 18
PROFIT AND LOSS ACCOUNT FOR THE YEAR ENDED MARCH 31, 2010
46
2009-2010Annual Report
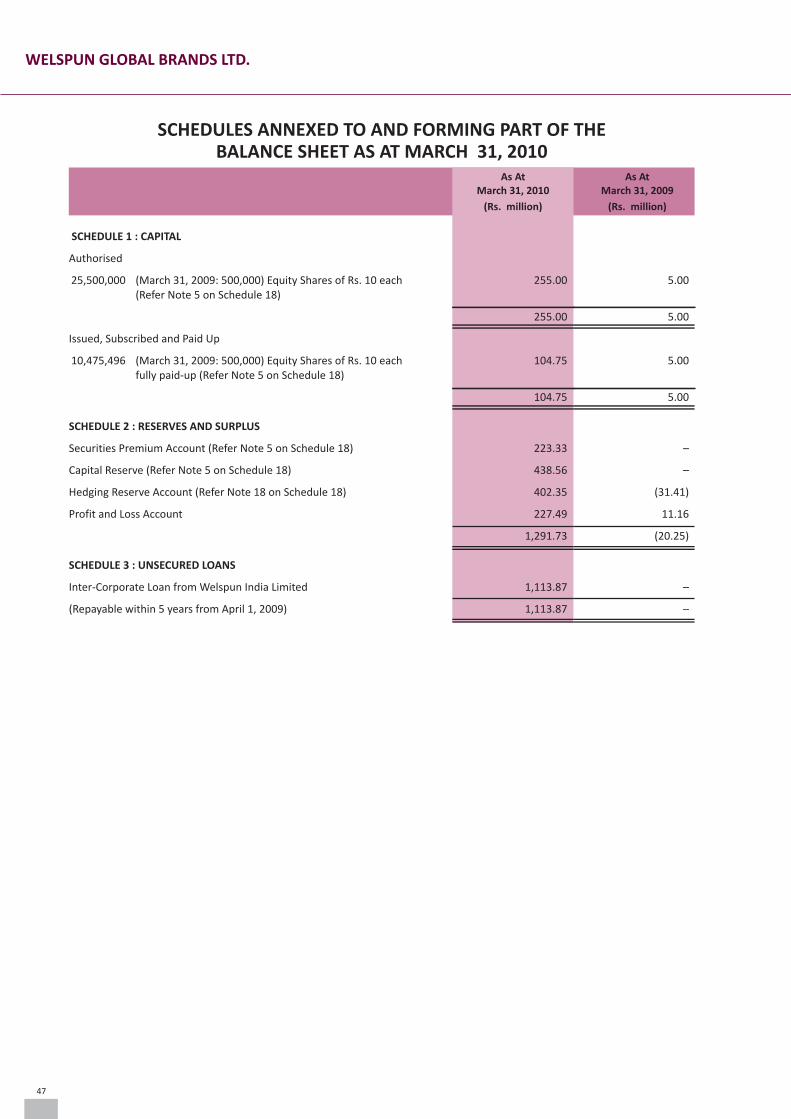
SCHEDULES ANNEXED TO AND FORMING PART OF THEBALANCE SHEET AS AT MARCH 31, 2010
As AtMarch 31, 2009
(Rs. million)
As AtMarch 31, 2010
(Rs. million)
SCHEDULE 1 : CAPITAL
Authorised
25,500,000 (March 31, 2009: 500,000) Equity Shares of Rs. 10 each 255.00 5.00(Refer Note 5 on Schedule 18)
255.00 5.00
Issued, Subscribed and Paid Up
10,475,496 (March 31, 2009: 500,000) Equity Shares of Rs. 10 each 104.75 5.00fully paid-up (Refer Note 5 on Schedule 18)
104.75 5.00
SCHEDULE 2 : RESERVES AND SURPLUS
Securities Premium Account (Refer Note 5 on Schedule 18) 223.33 –
Capital Reserve (Refer Note 5 on Schedule 18) 438.56 –
Hedging Reserve Account (Refer Note 18 on Schedule 18) 402.35 (31.41)
Profit and Loss Account 227.49 11.16
1,291.73 (20.25)
SCHEDULE 3 : UNSECURED LOANS
Inter-Corporate Loan from Welspun India Limited 1,113.87 –
(Repayable within 5 years from April 1, 2009) 1,113.87 –
47
WELSPUN GLOBAL BRANDS LTD.
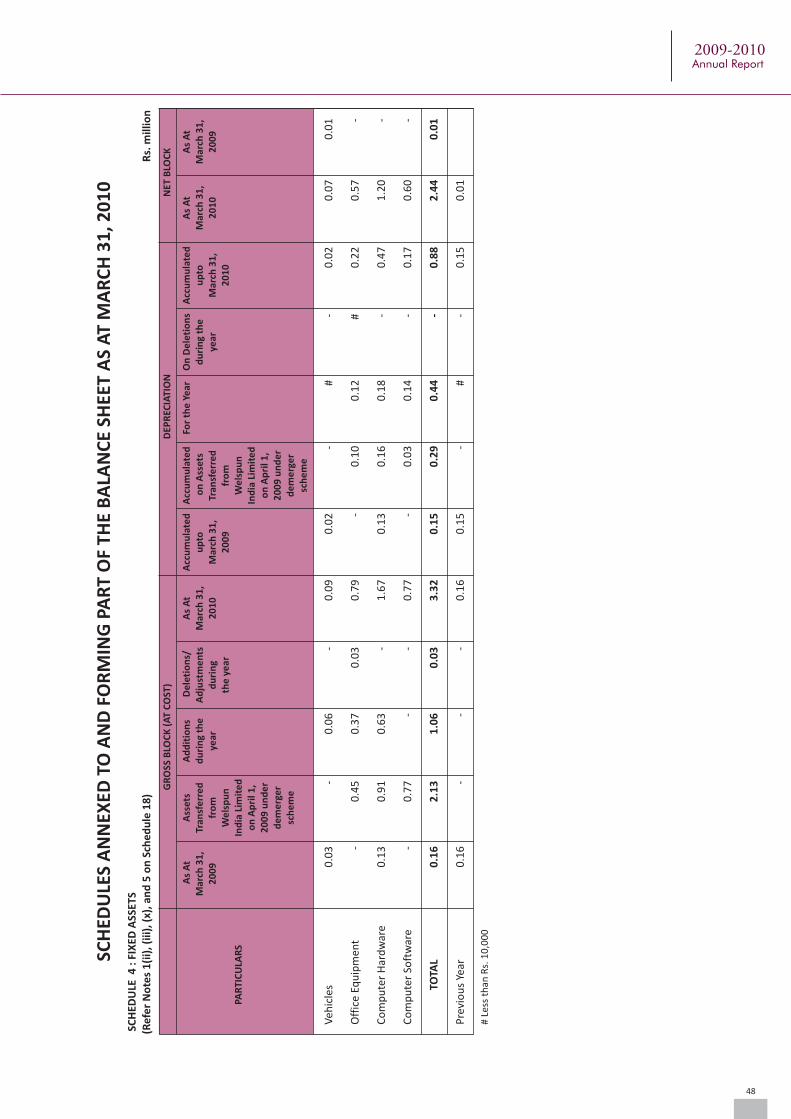
SCH
EDU
LES
AN
NEX
ED T
O A
ND
FO
RM
ING
PA
RT
OF
THE
BA
LAN
CE
SHEE
T A
S A
T M
AR
CH
31
, 20
10
SC
HED
ULE
4 :
FIX
ED A
SSET
S(R
efe
r N
ote
s 1
(ii)
, (iii
), (
x), a
nd
5 o
n S
che
du
le 1
8)
Rs.
mill
ion
G
RO
SS B
LOC
K (
AT
CO
ST)
DEP
REC
IATI
ON
NET
BLO
CK
As
At
Ass
ets
Ad
dit
ion
s D
ele
tio
ns/
As
At
Acc
um
ula
ted
Acc
um
ula
ted
For
the
Ye
arO
n D
ele
tio
ns
Acc
um
ula
ted
As
At
As
At
Mar
ch 3
1,
Tran
sfe
rre
dd
uri
ng
the
Ad
just
me
nts
Mar
ch 3
1,
up
to o
n A
sset
sd
uri
ng
the
up
toM
arch
31
,M
arch
31
,2
00
9fr
om
year
du
rin
g2
01
0M
arch
31
,Tr
ansf
err
ed
year
Mar
ch 3
1,
20
10
20
09
We
lsp
un
the
ye
ar2
00
9fr
om
20
10
PAR
TIC
ULA
RS
Ind
ia L
imit
ed
We
lsp
un
on
Ap
ril 1
,In
dia
Lim
ite
d2
00
9 u
nd
er
on
Ap
ril 1
,d
em
erg
er
20
09
un
de
rsc
he
me
de
me
rge
rsc
he
me
Veh
icle
s 0
.03
-
0
.06
-
0
.09
0
.02
-
#
-
0
.02
0
.07
0
.01
Off
ice
Equ
ipm
ent
-
0.4
5
0.3
7
0.0
3
0.7
9
-
0.1
0
0.1
2
#
0.2
2
0.5
7
-
Co
mp
ute
r H
ard
war
e 0
.13
0
.91
0
.63
-
1
.67
0
.13
0
.16
0
.18
-
0
.47
1
.20
-
Co
mp
ute
r So
ftw
are
-
0.7
7
-
-
0.7
7
-
0.0
3
0.1
4
-
0.1
7
0.6
0
-
TOTA
L 0
.16
2
.13
1
.06
0
.03
3
.32
0
.15
0
.29
0
.44
-
0
.88
2
.44
0
.01
Pre
vio
us
Year
0
.16
-
-
-
0
.16
0
.15
-
#
-
0
.15
0
.01
# Le
ss t
han
Rs.
10
,00
0
48
2009-2010Annual Report
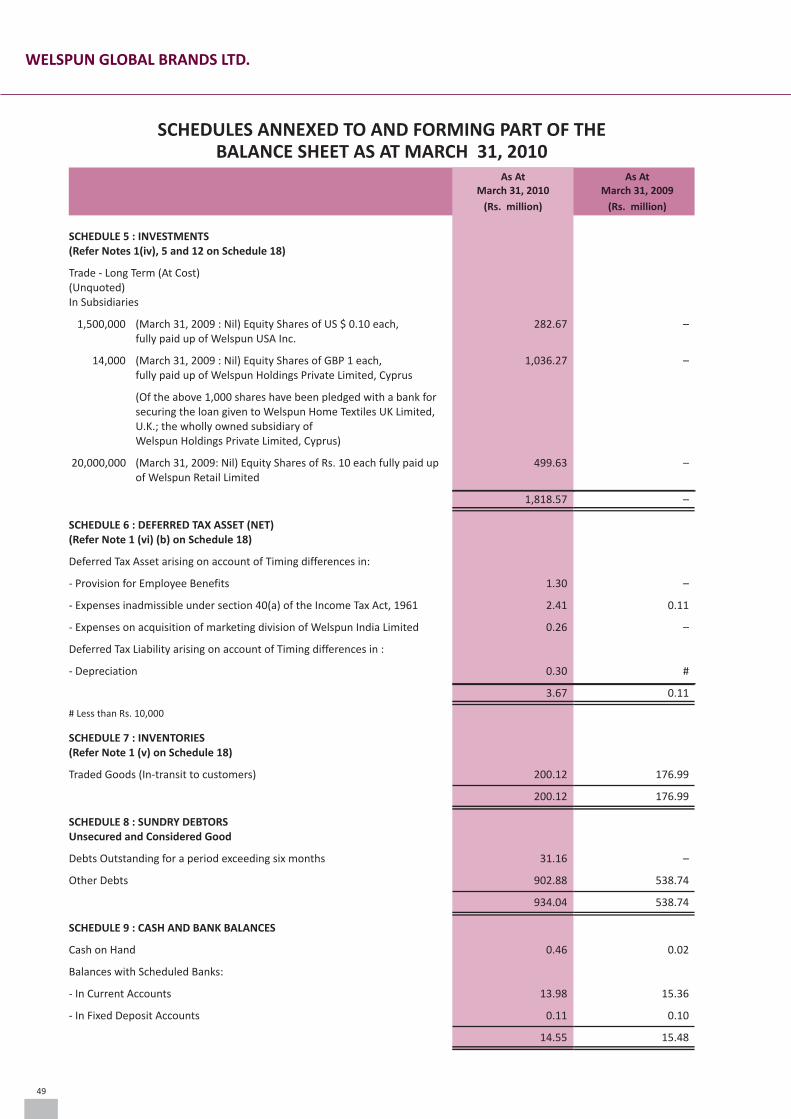
SCHEDULES ANNEXED TO AND FORMING PART OF THEBALANCE SHEET AS AT MARCH 31, 2010
As AtMarch 31, 2009
(Rs. million)
As AtMarch 31, 2010
(Rs. million)
SCHEDULE 5 : INVESTMENTS(Refer Notes 1(iv), 5 and 12 on Schedule 18)
Trade - Long Term (At Cost)(Unquoted)In Subsidiaries
1,500,000 (March 31, 2009 : Nil) Equity Shares of US $ 0.10 each, 282.67 –fully paid up of Welspun USA Inc.
14,000 (March 31, 2009 : Nil) Equity Shares of GBP 1 each, 1,036.27 –fully paid up of Welspun Holdings Private Limited, Cyprus
(Of the above 1,000 shares have been pledged with a bank forsecuring the loan given to Welspun Home Textiles UK Limited,U.K.; the wholly owned subsidiary ofWelspun Holdings Private Limited, Cyprus)
20,000,000 (March 31, 2009: Nil) Equity Shares of Rs. 10 each fully paid up 499.63 –of Welspun Retail Limited
1,818.57 –
SCHEDULE 6 : DEFERRED TAX ASSET (NET)(Refer Note 1 (vi) (b) on Schedule 18)
Deferred Tax Asset arising on account of Timing differences in:
- Provision for Employee Benefits 1.30 –
- Expenses inadmissible under section 40(a) of the Income Tax Act, 1961 2.41 0.11
- Expenses on acquisition of marketing division of Welspun India Limited 0.26 –
Deferred Tax Liability arising on account of Timing differences in :
- Depreciation 0.30 #
3.67 0.11
# Less than Rs. 10,000
SCHEDULE 7 : INVENTORIES(Refer Note 1 (v) on Schedule 18)
Traded Goods (In-transit to customers) 200.12 176.99
200.12 176.99
SCHEDULE 8 : SUNDRY DEBTORSUnsecured and Considered Good
Debts Outstanding for a period exceeding six months 31.16 –
Other Debts 902.88 538.74
934.04 538.74
SCHEDULE 9 : CASH AND BANK BALANCES
Cash on Hand 0.46 0.02
Balances with Scheduled Banks:
- In Current Accounts 13.98 15.36
- In Fixed Deposit Accounts 0.11 0.10
14.55 15.48
49
WELSPUN GLOBAL BRANDS LTD.
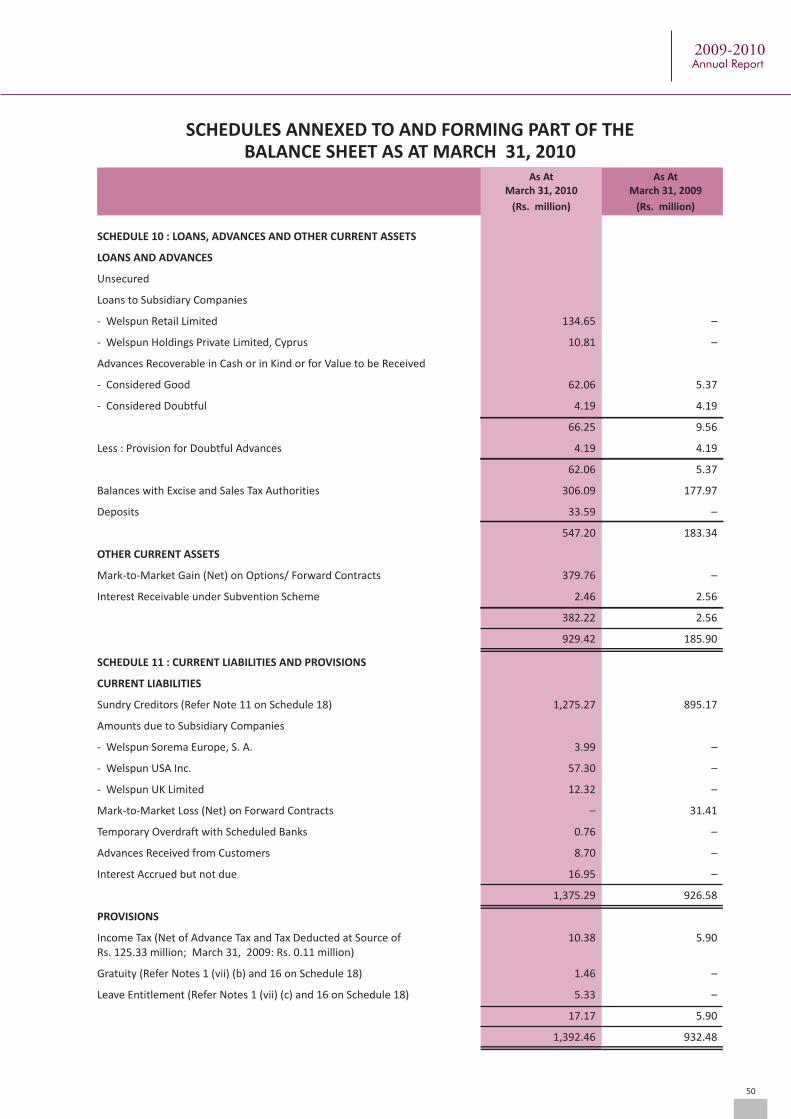
SCHEDULES ANNEXED TO AND FORMING PART OF THEBALANCE SHEET AS AT MARCH 31, 2010
As AtMarch 31, 2009
(Rs. million)
As AtMarch 31, 2010
(Rs. million)
SCHEDULE 10 : LOANS, ADVANCES AND OTHER CURRENT ASSETS
LOANS AND ADVANCES
Unsecured
Loans to Subsidiary Companies
- Welspun Retail Limited 134.65 –
- Welspun Holdings Private Limited, Cyprus 10.81 –
Advances Recoverable in Cash or in Kind or for Value to be Received
- Considered Good 62.06 5.37
- Considered Doubtful 4.19 4.19
66.25 9.56
Less : Provision for Doubtful Advances 4.19 4.19
62.06 5.37
Balances with Excise and Sales Tax Authorities 306.09 177.97
Deposits 33.59 –
547.20 183.34
OTHER CURRENT ASSETS
Mark-to-Market Gain (Net) on Options/ Forward Contracts 379.76 –
Interest Receivable under Subvention Scheme 2.46 2.56
382.22 2.56
929.42 185.90
SCHEDULE 11 : CURRENT LIABILITIES AND PROVISIONS
CURRENT LIABILITIES
Sundry Creditors (Refer Note 11 on Schedule 18) 1,275.27 895.17
Amounts due to Subsidiary Companies
- Welspun Sorema Europe, S. A. 3.99 –
- Welspun USA Inc. 57.30 –
- Welspun UK Limited 12.32 –
Mark-to-Market Loss (Net) on Forward Contracts – 31.41
Temporary Overdraft with Scheduled Banks 0.76 –
Advances Received from Customers 8.70 –
Interest Accrued but not due 16.95 –
1,375.29 926.58
PROVISIONS
Income Tax (Net of Advance Tax and Tax Deducted at Source of 10.38 5.90Rs. 125.33 million; March 31, 2009: Rs. 0.11 million)
Gratuity (Refer Notes 1 (vii) (b) and 16 on Schedule 18) 1.46 –
Leave Entitlement (Refer Notes 1 (vii) (c) and 16 on Schedule 18) 5.33 –
17.17 5.90
1,392.46 932.48
50
2009-2010Annual Report
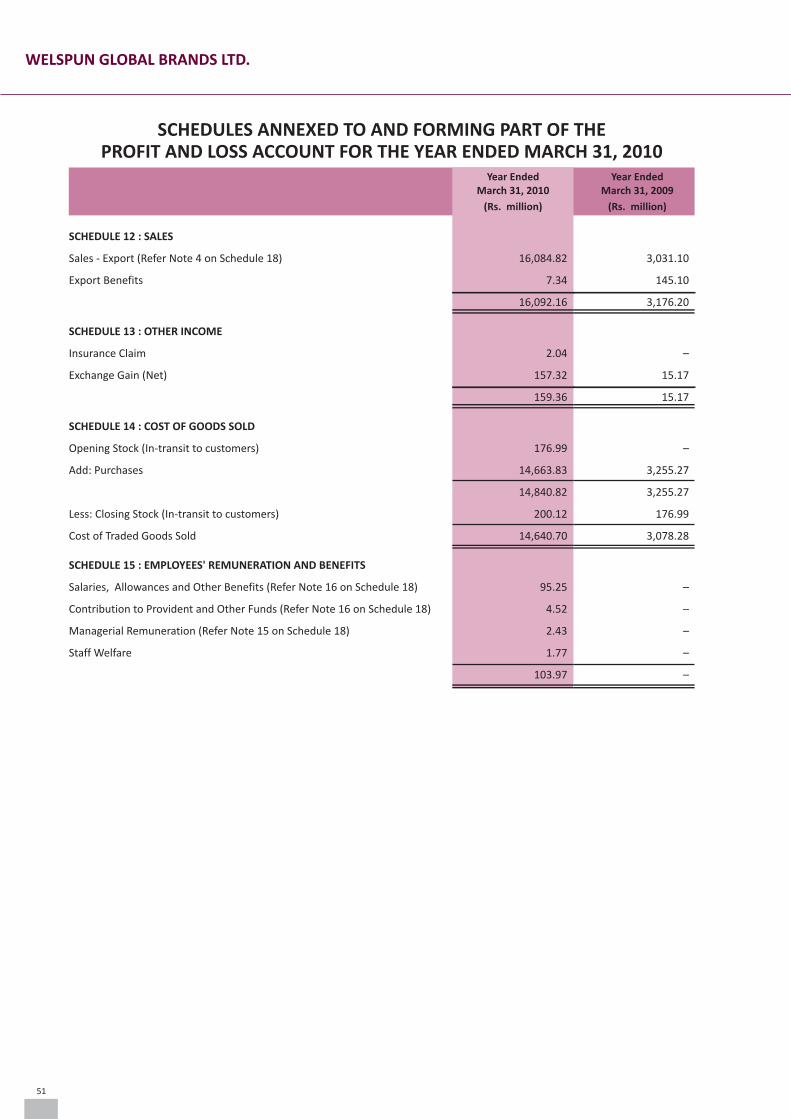
SCHEDULES ANNEXED TO AND FORMING PART OF THEPROFIT AND LOSS ACCOUNT FOR THE YEAR ENDED MARCH 31, 2010
Year EndedMarch 31, 2009
(Rs. million)
Year EndedMarch 31, 2010
(Rs. million)
SCHEDULE 12 : SALES
Sales - Export (Refer Note 4 on Schedule 18) 16,084.82 3,031.10
Export Benefits 7.34 145.10
16,092.16 3,176.20
SCHEDULE 13 : OTHER INCOME
Insurance Claim 2.04 –
Exchange Gain (Net) 157.32 15.17
159.36 15.17
SCHEDULE 14 : COST OF GOODS SOLD
Opening Stock (In-transit to customers) 176.99 –
Add: Purchases 14,663.83 3,255.27
14,840.82 3,255.27
Less: Closing Stock (In-transit to customers) 200.12 176.99
Cost of Traded Goods Sold 14,640.70 3,078.28
SCHEDULE 15 : EMPLOYEES' REMUNERATION AND BENEFITS
Salaries, Allowances and Other Benefits (Refer Note 16 on Schedule 18) 95.25 –
Contribution to Provident and Other Funds (Refer Note 16 on Schedule 18) 4.52 –
Managerial Remuneration (Refer Note 15 on Schedule 18) 2.43 –
Staff Welfare 1.77 –
103.97 –
51
WELSPUN GLOBAL BRANDS LTD.
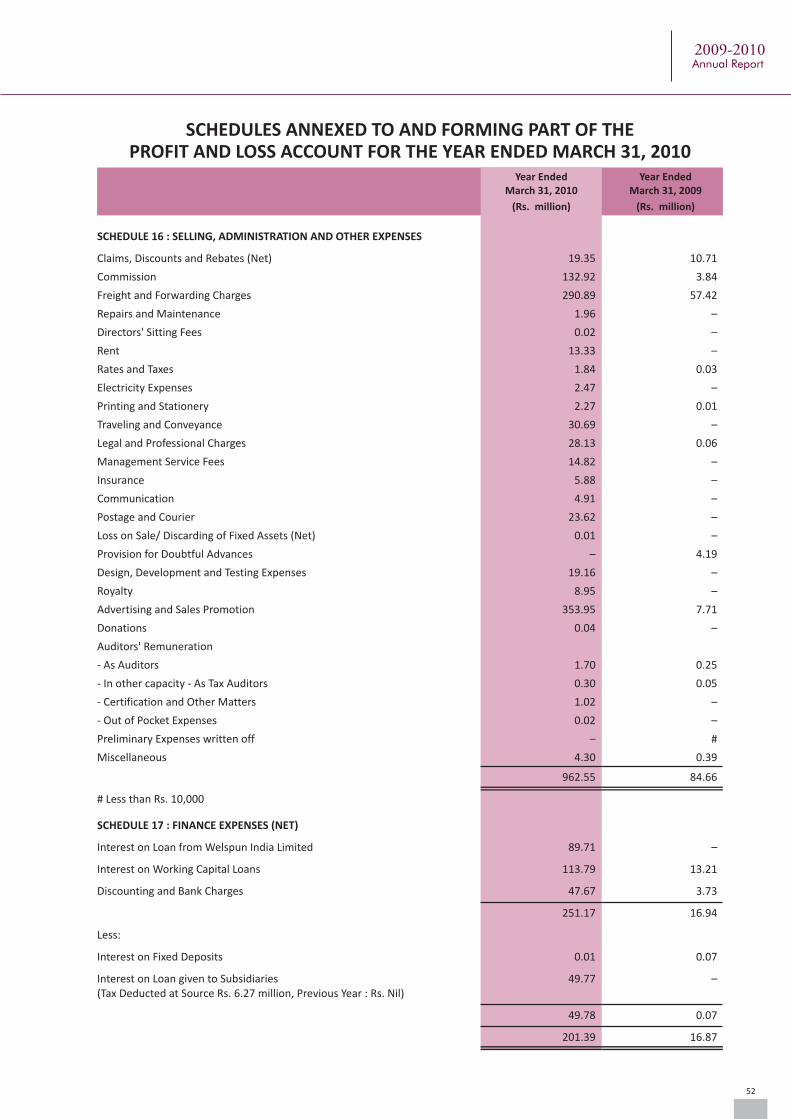
SCHEDULES ANNEXED TO AND FORMING PART OF THEPROFIT AND LOSS ACCOUNT FOR THE YEAR ENDED MARCH 31, 2010
Year EndedMarch 31, 2009
(Rs. million)
Year EndedMarch 31, 2010
(Rs. million)
SCHEDULE 16 : SELLING, ADMINISTRATION AND OTHER EXPENSES
Claims, Discounts and Rebates (Net) 19.35 10.71
Commission 132.92 3.84
Freight and Forwarding Charges 290.89 57.42
Repairs and Maintenance 1.96 –
Directors' Sitting Fees 0.02 –
Rent 13.33 –
Rates and Taxes 1.84 0.03
Electricity Expenses 2.47 –
Printing and Stationery 2.27 0.01
Traveling and Conveyance 30.69 –
Legal and Professional Charges 28.13 0.06
Management Service Fees 14.82 –
Insurance 5.88 –
Communication 4.91 –
Postage and Courier 23.62 –
Loss on Sale/ Discarding of Fixed Assets (Net) 0.01 –
Provision for Doubtful Advances – 4.19
Design, Development and Testing Expenses 19.16 –
Royalty 8.95 –
Advertising and Sales Promotion 353.95 7.71
Donations 0.04 –
Auditors' Remuneration
- As Auditors 1.70 0.25
- In other capacity - As Tax Auditors 0.30 0.05
- Certification and Other Matters 1.02 –
- Out of Pocket Expenses 0.02 –
Preliminary Expenses written off – #
Miscellaneous 4.30 0.39
962.55 84.66
# Less than Rs. 10,000
SCHEDULE 17 : FINANCE EXPENSES (NET)
Interest on Loan from Welspun India Limited 89.71 –
Interest on Working Capital Loans 113.79 13.21
Discounting and Bank Charges 47.67 3.73
251.17 16.94
Less:
Interest on Fixed Deposits 0.01 0.07
Interest on Loan given to Subsidiaries 49.77 –(Tax Deducted at Source Rs. 6.27 million, Previous Year : Rs. Nil)
49.78 0.07
201.39 16.87
52
2009-2010Annual Report
SCHEDULES ANNEXED TO AND FORMING PART OF THE BALANCE SHEET AS AT MARCH 31, 2010AND PROFIT AND LOSS ACCOUNT FOR THE YEAR ENDED MARCH 31, 2010
SCHEDULE - 18 : NOTES TO ACCOUNTS
1. Significant Accounting Policies
(i) Accounting Convention
The Financial Statements are prepared to comply in all material aspects with all the applicable accounting
principles in India, the applicable accounting standards notified under Section 211 (3C) of the Companies Act,
1956 (the "Act") and the relevant provisions of the Act.
(ii) Fixed Assets
Fixed Assets are stated at cost less accumulated depreciation and impairment loss, if any. Cost of software
includes license fees and implementation/ integration expenses.
(iii) Depreciation
(a) Depreciation on Fixed Assets is provided on straight-line method at the rates and in the manner
prescribed under Schedule XIV to the Act. Depreciation on additions/ deletions to fixed assets is
calculated pro-rata from/ up to the date of such additions/ deletions.
(b) Computer software is amortised on the straight-line method over a period of five years.
(c) Assets individually costing Rs. 5,000 or less are fully depreciated in the year of purchase.
(iv) Investments
Long term investments are stated at cost less provision, if any, for diminution in value other than temporary.
(v) Inventories
(a) Inventories are valued at lower of cost and net realisable value.
(b) Cost of traded goods is determined on first-in-first out basis. Net realisable value is the estimate of the
selling price in the ordinary course of the business, less the estimated costs of completion and estimated
selling expenses.
(vi) Accounting for Taxes on Income
(a) Current Taxation
The current tax is determined as the amount of tax payable in respect of taxable income for the period as
per the Income Tax Act, 1961, of India.
(b) Deferred Taxation
Deferred tax resulting from timing differences between book and tax profits is accounted for under the
liability method, at the current/ substantially enacted rate of tax to the extent that the timing differences
are expected to crystallise.
(vii) Employee Benefits
(a) Defined Contribution Plans
The Company contributes on a defined contribution basis to Employee's Provident Fund, Employee's
State Insurance Fund and Employee's Pension Scheme towards post employment benefits, all of which
are administered by the respective Government authorities, and has no further obligation beyond making
its contribution, which is expensed in the period to which it pertains.
53
WELSPUN GLOBAL BRANDS LTD.
(b) Defined Benefit Plans
The Company has a Defined Benefit Plan namely Gratuity for all its employees. The liability for the
defined benefit plan of Gratuity is determined on the basis of an actuarial valuation, calculated using
projected unit credit method, by an independent actuary at the year end.
Gratuity Fund is recognized by the income tax authorities and is administered through trustees. The
Employee's Gratuity Trust takes group gratuity policies with insurance companies. Actuarial gains and
losses which comprise experience adjustment and the effect of changes in actuarial assumptions are
recognised in the Profit and Loss Account.
(c) Employee Leave Entitlement
The employees of the Company are entitled to leave as per the leave policy of the Company. The liability in
respect of unutilised leave balances is provided based on an actuarial valuation carried out by an
independent actuary as at the period end and charged to the Profit and Loss Account.
(viii)Foreign Currency Transactions, Derivative Instruments and Hedge Accounting
(a) Foreign currency transactions are recorded at the exchange rates prevailing on the date of such
transactions. Monetary assets and liabilities as at the Balance Sheet date are translated at the rates of
exchange prevailing at the date of the Balance Sheet. Gains and losses arising on account of differences in
foreign exchange rates on settlement/ translation of monetary assets and liabilities are recognised in the
Profit and Loss Account. Non-monetary foreign currency items are carried at cost.
(b) In respect of forward contracts, other than forward contracts in respect of firm commitments and highly
probable forecast transactions, the premium or discount arising at the inception of forward exchange
contract, is amortised as expense or income over the life of the contract. Exchange differences on such
contracts are recognised in the Profit and Loss Account in the reporting period in which the exchange rates
change. Any profit or loss arising on cancellation or renewal of such a forward exchange contract is
recognised as income or as expense for the period.
(c) In respect of forward contracts and currency options taken to hedge the risks associated with foreign
currency fluctuations relating to firm commitments and highly probable forecast transactions, the
Company has adopted AS 30 'Financial Instruments: Recognition and Measurement'. Accordingly, foreign
currency fluctuations relating to firm commitments and highly probable forecast transactions are fair
valued at each reporting date.
Changes in the fair value of these hedging instruments that are designated and considered as effective
hedges of highly probable forecasted transactions are recognised directly in shareholders' funds under
'Hedging Reserve Account' to be recognised in the Profit and Loss Account when the underlying
transaction occurs. Changes in the fair value of the hedging instruments that do not qualify for hedge
accounting are recognised in the Profit and Loss Account as they arise.
(ix) Revenue Recognition
Sales revenue is recognised on transfer of significant risks and rewards of ownership of the goods to the buyer.
Export sales are recognised on the date of cargo receipts, bill of lading or other relevant documents, in
accordance with the terms and conditions for sales. Realised exchange differences on export debtors are
included in sales.
SCHEDULES ANNEXED TO AND FORMING PART OF THE BALANCE SHEET AS AT MARCH 31, 2010AND PROFIT AND LOSS ACCOUNT FOR THE YEAR ENDED MARCH 31, 2010
54
2009-2010Annual Report
SCHEDULES ANNEXED TO AND FORMING PART OF THE BALANCE SHEET AS AT MARCH 31, 2010AND PROFIT AND LOSS ACCOUNT FOR THE YEAR ENDED MARCH 31, 2010
(x) Impairment of Assets
The Company assesses at each balance sheet date whether there is any indication that an asset may be
impaired. If any such indication exists, the Company estimates the recoverable amount of the asset. If such
recoverable amount of the asset or recoverable amount of the cash generating unit to which the asset belongs
is less than its carrying amount, the carrying amount is reduced to its recoverable amount. The reduction is
treated as an impairment loss and is recognised in the Profit and Loss Account. If at the Balance Sheet date
there is an indication that if a previously assessed impairment loss no longer exists, the recoverable amount is
reassessed and the asset is reflected at the recoverable amount.
(xi) Provisions and Contingent Liabilities
The Company recognises a provision when there is a present obligation as a result of a past event that probably
requires an outflow of resources and a reliable estimate can be made of the amount of the obligation. A
disclosure for a contingent liability is made when there is a possible obligation or a present obligation that may,
but probably will not, require an outflow of resources. Where there is a possible obligation or a present
obligation but the likelihood of outflow of resources is remote, no provision or disclosure as specified in
Accounting Standard 29 -
" Provisions, Contingent Liabilities and Contingent Assets", issued by the Institute of Chartered Accountants of
India is made.
(xii) Accounting Estimates
The preparation of financial statements requires estimates and assumptions to be made that affect the
reported amounts of assets and liabilities on the date of financial statements and the reported amounts of
revenue and expenses during the reporting period. Difference between the actual results and the estimates
are recognised in the period in which the results are known/ materialised.
2. Contingent Liabilities
Bills discounted in respect of export debtors Rs. 2,261.93 million (March 31, 2009: Rs. 819.33 million).
3. Corporate Guarantees given by the Company Rs. million
As at As at
March 31, 2010 March 31, 2009
Guarantee in favour of Consortium of Bankers on behalf 5,887.40* –
of Welspun India Limited in relation to Pre-shipment
debt facilities availed by Welspun India Limited.
Guarantee in favour of IDBI Bank Limited on behalf of 330.00* –
Welspun Retail Limited for availment of credit facilities.
*These guarantees are subject to approval of the shareholders under Section 372A of the Companies Act, 1956.
4. Sales include prior period adjustment of Rs. 6.26 million (Previous Year: Rs. Nil) for loss on a cross currency forward
contract.
5. The High Court of Gujarat at Ahmedabad by its order dated May 8, 2009 has approved the Scheme of Arrangement
between Welspun India Limited (WIL), Welspun Global Brands Limited (WGBL) and Welspun Investments Limited
and their respective members and creditors. As per the Scheme, assets and liabilities of the marketing division of
WIL (as tabulated below) were transferred to WGBL with effect from the appointed date (April 1, 2009). Upon the
55
WELSPUN GLOBAL BRANDS LTD.
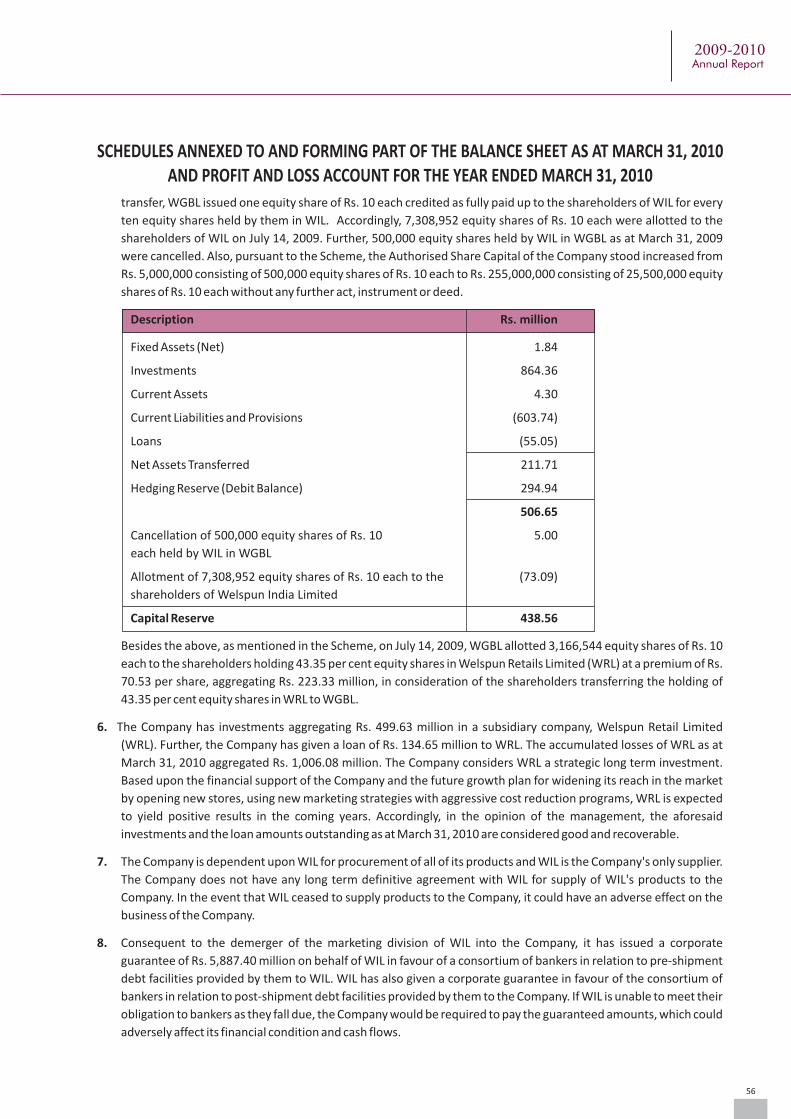
transfer, WGBL issued one equity share of Rs. 10 each credited as fully paid up to the shareholders of WIL for every
ten equity shares held by them in WIL. Accordingly, 7,308,952 equity shares of Rs. 10 each were allotted to the
shareholders of WIL on July 14, 2009. Further, 500,000 equity shares held by WIL in WGBL as at March 31, 2009
were cancelled. Also, pursuant to the Scheme, the Authorised Share Capital of the Company stood increased from
Rs. 5,000,000 consisting of 500,000 equity shares of Rs. 10 each to Rs. 255,000,000 consisting of 25,500,000 equity
shares of Rs. 10 each without any further act, instrument or deed.
Description Rs. million
Fixed Assets (Net) 1.84
Investments 864.36
Current Assets 4.30
Current Liabilities and Provisions (603.74)
Loans (55.05)
Net Assets Transferred 211.71
Hedging Reserve (Debit Balance) 294.94
506.65
Cancellation of 500,000 equity shares of Rs. 10 5.00
each held by WIL in WGBL
Allotment of 7,308,952 equity shares of Rs. 10 each to the (73.09)
shareholders of Welspun India Limited
Capital Reserve 438.56
Besides the above, as mentioned in the Scheme, on July 14, 2009, WGBL allotted 3,166,544 equity shares of Rs. 10
each to the shareholders holding 43.35 per cent equity shares in Welspun Retails Limited (WRL) at a premium of Rs.
70.53 per share, aggregating Rs. 223.33 million, in consideration of the shareholders transferring the holding of
43.35 per cent equity shares in WRL to WGBL.
6. The Company has investments aggregating Rs. 499.63 million in a subsidiary company, Welspun Retail Limited
(WRL). Further, the Company has given a loan of Rs. 134.65 million to WRL. The accumulated losses of WRL as at
March 31, 2010 aggregated Rs. 1,006.08 million. The Company considers WRL a strategic long term investment.
Based upon the financial support of the Company and the future growth plan for widening its reach in the market
by opening new stores, using new marketing strategies with aggressive cost reduction programs, WRL is expected
to yield positive results in the coming years. Accordingly, in the opinion of the management, the aforesaid
investments and the loan amounts outstanding as at March 31, 2010 are considered good and recoverable.
7. The Company is dependent upon WIL for procurement of all of its products and WIL is the Company's only supplier.
The Company does not have any long term definitive agreement with WIL for supply of WIL's products to the
Company. In the event that WIL ceased to supply products to the Company, it could have an adverse effect on the
business of the Company.
8. Consequent to the demerger of the marketing division of WIL into the Company, it has issued a corporate
guarantee of Rs. 5,887.40 million on behalf of WIL in favour of a consortium of bankers in relation to pre-shipment
debt facilities provided by them to WIL. WIL has also given a corporate guarantee in favour of the consortium of
bankers in relation to post-shipment debt facilities provided by them to the Company. If WIL is unable to meet their
obligation to bankers as they fall due, the Company would be required to pay the guaranteed amounts, which could
adversely affect its financial condition and cash flows.
SCHEDULES ANNEXED TO AND FORMING PART OF THE BALANCE SHEET AS AT MARCH 31, 2010AND PROFIT AND LOSS ACCOUNT FOR THE YEAR ENDED MARCH 31, 2010
56
2009-2010Annual Report
SCHEDULES ANNEXED TO AND FORMING PART OF THE BALANCE SHEET AS AT MARCH 31, 2010AND PROFIT AND LOSS ACCOUNT FOR THE YEAR ENDED MARCH 31, 2010
9. In accordance with the Company's policy given in Note 1 (viii) above, net exchange gain of Rs. 505 million (Previous
Year: net exchange gain of Rs. 46.77 million) has been accounted in Profit and Loss Account.
10. Leases
The Company has taken various office premises and godowns under operating lease agreements that are
renewable on a periodic basis at the option of both the lessor and the lessee. The initial tenure of lease is generally
for eleven months to ninety sixty months and are renewable by mutual consent on mutually agreed terms.
The aggregate rental expenses of all the operating leases for the year are Rs. 13.33 million (Previous Year: Rs. Nil)
11. Disclosure for Micro and Small Enterprises
There are no Micro and Small Enterprises, to whom the Company owes dues, which are outstanding as at March 31,
2010. This information required to be disclosed under the Micro, Small andMedium Enterprises Development Act,
2006 has been determined on the basis of information available with the Company.
12. During the year, loans including accrued interest aggregating Rs. 699.21 million given to Welspun Holdings Private
Limited (WHPL) were converted into investments in the equity share capital of WHPL.
13. Segment Information for the year ended March 31, 2010
(i) Information about Primary Business Segment
The Company is exclusively engaged in the business of Home Textiles which, in the context of Accounting
Standard 17 on Segment Reporting, issued by the Institute of Chartered Accountants of India, is considered to
constitute a single primary segment. Thus, the segment revenue, segment results, total carrying amount of
segment assets, total carrying amount of segment liabilities, total cost incurred to acquire segment assets,
total amount of charge for depreciation during the year are all as reflected in the financial statements for the
year ended March 31, 2010 and as on that date.
(ii) Information about Secondary Geographical Segments:
The Company is exclusively engaged in sales to customers located outside India. Consequently the Company
does not have separate reportable geographical segment.
57
WELSPUN GLOBAL BRANDS LTD.
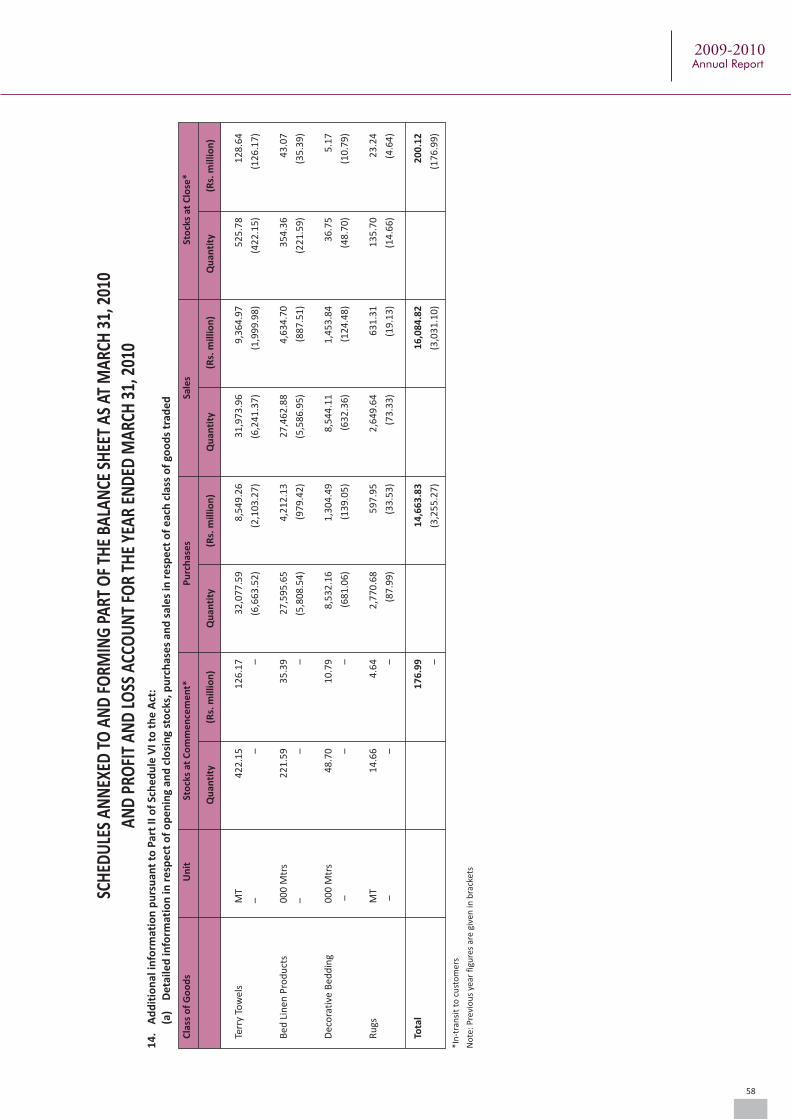
14
.A
dd
itio
nal
info
rmat
ion
pu
rsu
ant
to P
art
II o
f Sc
he
du
le V
I to
th
e A
ct:
(a)
Det
aile
d in
form
atio
n in
re
spe
ct o
f o
pe
nin
g an
d c
losi
ng
sto
cks,
pu
rch
ase
s an
d s
ale
s in
re
spe
ct o
f e
ach
cla
ss o
f go
od
s tr
ade
d
Cla
ss o
f G
oo
ds
Un
itSt
ock
s at
Co
mm
en
cem
en
t*P
urc
has
es
Sale
sSt
ock
s at
Clo
se*
Qu
anti
ty(R
s. m
illio
n)
Qu
anti
ty (
Rs.
mill
ion
) Q
uan
tity
(R
s. m
illio
n)
Qu
anti
ty (
Rs.
mill
ion
)
Terr
y To
wel
sM
T 4
22
.15
1
26
.17
3
2,0
77
.59
8
,54
9.2
6
31
,97
3.9
6
9,3
64
.97
5
25
.78
1
28
.64
––
– (
6,6
63
.52
) (
2,1
03
.27
) (
6,2
41
.37
) (
1,9
99
.98
) (
42
2.1
5)
(1
26
.17
)
Bed
Lin
en P
rod
uct
s0
00
Mtr
s 2
21
.59
3
5.3
9
27
,59
5.6
5
4,2
12
.13
2
7,4
62
.88
4
,63
4.7
0
35
4.3
6
43
.07
––
–(5
,80
8.5
4)
(9
79
.42
) (
5,5
86
.95
) (
88
7.5
1)
(2
21
.59
) (
35
.39
)
Dec
ora
tive
Bed
din
g 0
00
Mtr
s 4
8.7
0
10
.79
8,5
32
.16
1
,30
4.4
9
8,5
44
.11
1
,45
3.8
4
36
.75
5
.17
––
–(6
81
.06
) (
13
9.0
5)
(6
32
.36
) (
12
4.4
8)
(4
8.7
0)
(1
0.7
9)
Ru
gsM
T 1
4.6
6
4.6
4
2,7
70
.68
5
97
.95
2
,64
9.6
4
63
1.3
1
13
5.7
0
23
.24
––
–(8
7.9
9)
(3
3.5
3)
(7
3.3
3)
(1
9.1
3)
(1
4.6
6)
(4
.64
)
Tota
l 1
76
.99
1
4,6
63
.83
1
6,0
84
.82
2
00
.12
–
(3
,25
5.2
7)
(3
,03
1.1
0)
(1
76
.99
)
*In
-tra
nsi
t to
cu
sto
mer
s
No
te: P
revi
ou
s ye
ar f
igu
res
are
give
n in
bra
cket
s
SCH
EDU
LES
ANN
EXED
TO
AN
D F
ORM
ING
PAR
T O
F TH
E BA
LAN
CE S
HEE
T AS
AT
MAR
CH 3
1, 2
010
AND
PRO
FIT
AND
LO
SS A
CCO
UN
T FO
R TH
E YE
AR E
ND
ED M
ARCH
31,
201
0
58
2009-2010Annual Report
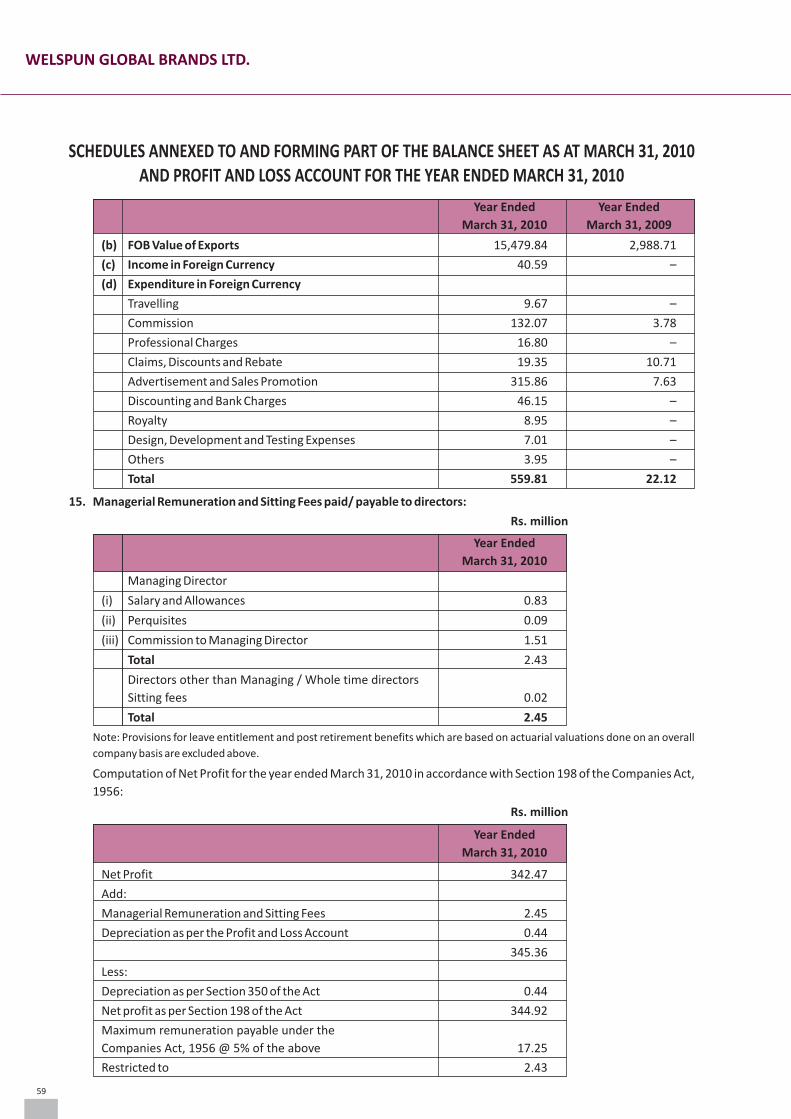
SCHEDULES ANNEXED TO AND FORMING PART OF THE BALANCE SHEET AS AT MARCH 31, 2010AND PROFIT AND LOSS ACCOUNT FOR THE YEAR ENDED MARCH 31, 2010
Year Ended Year Ended
March 31, 2010 March 31, 2009
(b) FOB Value of Exports 15,479.84 2,988.71
(c) Income in Foreign Currency 40.59 –
(d) Expenditure in Foreign Currency
Travelling 9.67 –
Commission 132.07 3.78
Professional Charges 16.80 –
Claims, Discounts and Rebate 19.35 10.71
Advertisement and Sales Promotion 315.86 7.63
Discounting and Bank Charges 46.15 –
Royalty 8.95 –
Design, Development and Testing Expenses 7.01 –
Others 3.95 –
Total 559.81 22.12
15. Managerial Remuneration and Sitting Fees paid/ payable to directors:
Rs. million
Year Ended
March 31, 2010
Managing Director
(i) Salary and Allowances 0.83
(ii) Perquisites 0.09
(iii) Commission to Managing Director 1.51
Total 2.43
Directors other than Managing / Whole time directors
Sitting fees 0.02
Total 2.45
Note: Provisions for leave entitlement and post retirement benefits which are based on actuarial valuations done on an overall
company basis are excluded above.
Computation of Net Profit for the year ended March 31, 2010 in accordance with Section 198 of the Companies Act,
1956:
Rs. million
Year Ended
March 31, 2010
Net Profit 342.47
Add:
Managerial Remuneration and Sitting Fees 2.45
Depreciation as per the Profit and Loss Account 0.44
345.36
Less:
Depreciation as per Section 350 of the Act 0.44
Net profit as per Section 198 of the Act 344.92
Maximum remuneration payable under the
Companies Act, 1956 @ 5% of the above 17.25
Restricted to 2.43
59
WELSPUN GLOBAL BRANDS LTD.
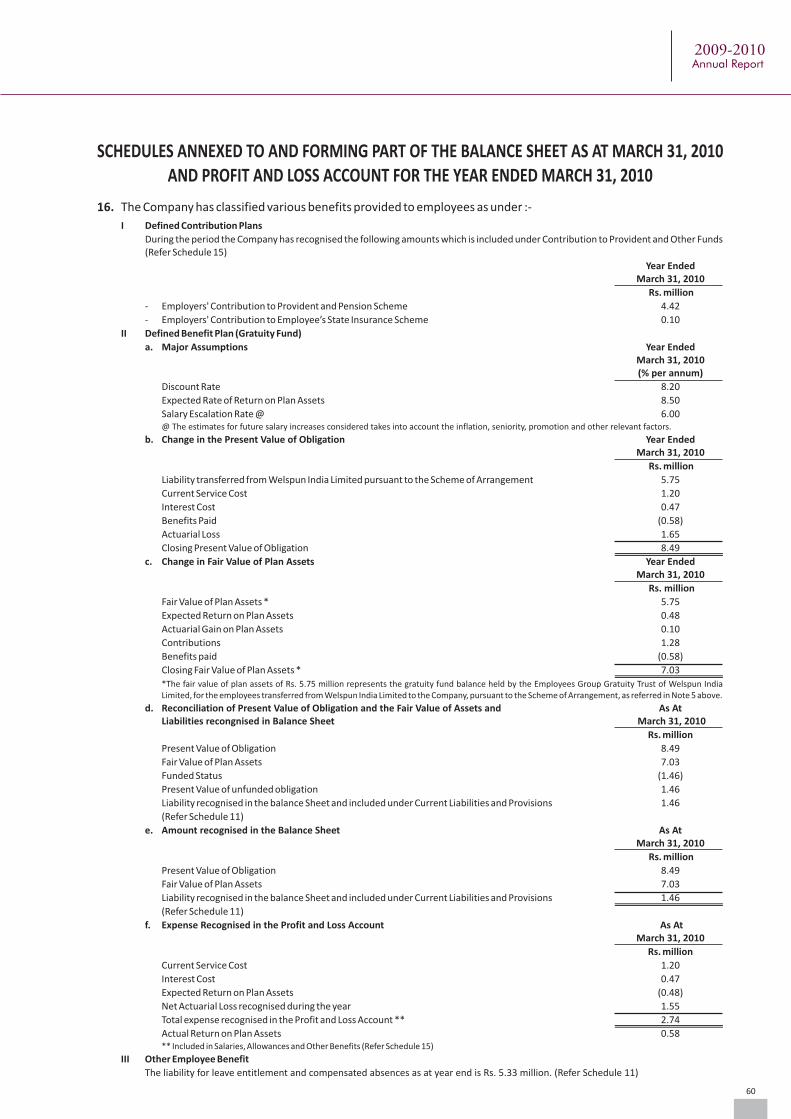
SCHEDULES ANNEXED TO AND FORMING PART OF THE BALANCE SHEET AS AT MARCH 31, 2010AND PROFIT AND LOSS ACCOUNT FOR THE YEAR ENDED MARCH 31, 2010
16. The Company has classified various benefits provided to employees as under :-
I Defined Contribution Plans
During the period the Company has recognised the following amounts which is included under Contribution to Provident and Other Funds (Refer Schedule 15)
Year EndedMarch 31, 2010
Rs. million
- Employers' Contribution to Provident and Pension Scheme 4.42
- Employers' Contribution to Employee’s State Insurance Scheme 0.10
II Defined Benefit Plan (Gratuity Fund)
a. Major Assumptions Year EndedMarch 31, 2010(% per annum)
Discount Rate 8.20
Expected Rate of Return on Plan Assets 8.50
Salary Escalation Rate @ 6.00@ The estimates for future salary increases considered takes into account the inflation, seniority, promotion and other relevant factors.
b. Change in the Present Value of Obligation Year EndedMarch 31, 2010
Rs. million
Liability transferred from Welspun India Limited pursuant to the Scheme of Arrangement 5.75
Current Service Cost 1.20
Interest Cost 0.47
Benefits Paid (0.58)
Actuarial Loss 1.65
Closing Present Value of Obligation 8.49
c. Change in Fair Value of Plan Assets Year EndedMarch 31, 2010
Rs. million
Fair Value of Plan Assets * 5.75
Expected Return on Plan Assets 0.48
Actuarial Gain on Plan Assets 0.10
Contributions 1.28
Benefits paid (0.58)
Closing Fair Value of Plan Assets * 7.03
*The fair value of plan assets of Rs. 5.75 million represents the gratuity fund balance held by the Employees Group Gratuity Trust of Welspun India Limited, for the employees transferred from Welspun India Limited to the Company, pursuant to the Scheme of Arrangement, as referred in Note 5 above.
d. Reconciliation of Present Value of Obligation and the Fair Value of Assets and As AtLiabilities recongnised in Balance Sheet March 31, 2010
Rs. million
Present Value of Obligation 8.49
Fair Value of Plan Assets 7.03
Funded Status (1.46)
Present Value of unfunded obligation 1.46
Liability recognised in the balance Sheet and included under Current Liabilities and Provisions 1.46
(Refer Schedule 11)
e. Amount recognised in the Balance Sheet As AtMarch 31, 2010
Rs. million
Present Value of Obligation 8.49
Fair Value of Plan Assets 7.03
Liability recognised in the balance Sheet and included under Current Liabilities and Provisions 1.46
(Refer Schedule 11)
f. Expense Recognised in the Profit and Loss Account As AtMarch 31, 2010
Rs. million
Current Service Cost 1.20
Interest Cost 0.47
Expected Return on Plan Assets (0.48)
Net Actuarial Loss recognised during the year 1.55
Total expense recognised in the Profit and Loss Account ** 2.74
Actual Return on Plan Assets 0.58** Included in Salaries, Allowances and Other Benefits (Refer Schedule 15)
III Other Employee Benefit
The liability for leave entitlement and compensated absences as at year end is Rs. 5.33 million. (Refer Schedule 11)
60
2009-2010Annual Report
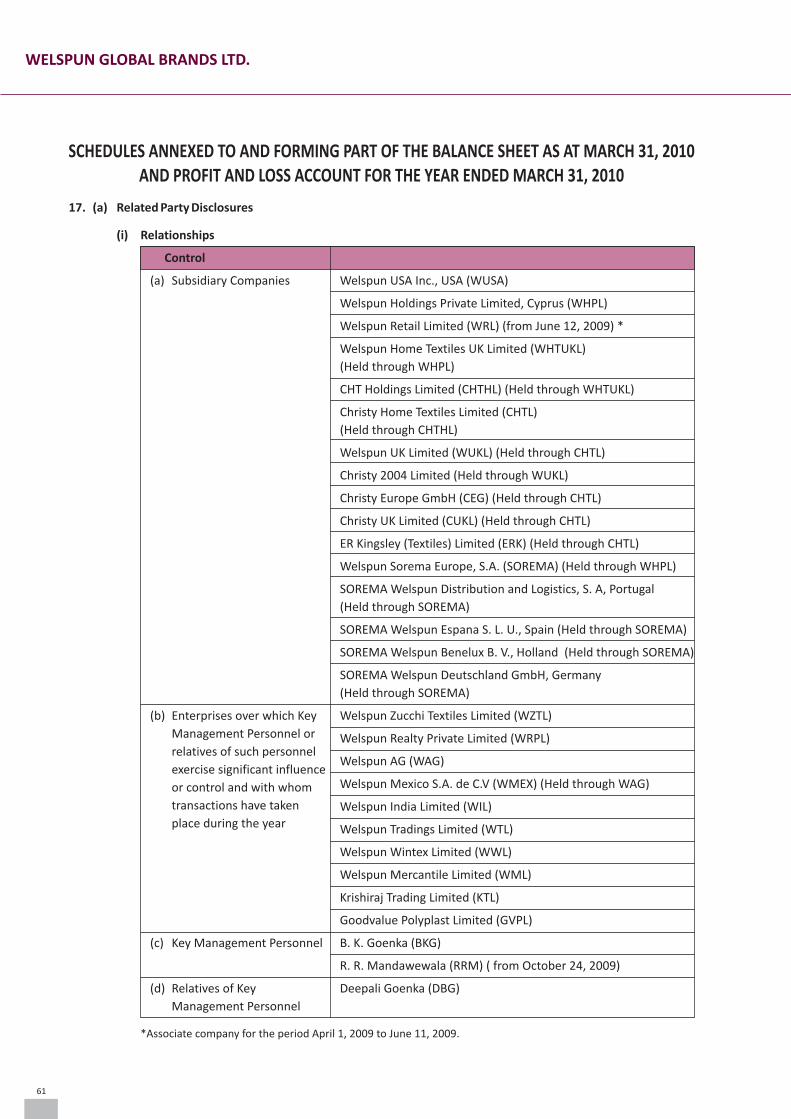
SCHEDULES ANNEXED TO AND FORMING PART OF THE BALANCE SHEET AS AT MARCH 31, 2010AND PROFIT AND LOSS ACCOUNT FOR THE YEAR ENDED MARCH 31, 2010
17. (a) Related Party Disclosures
(i) Relationships
Control
(a) Subsidiary Companies Welspun USA Inc., USA (WUSA)
Welspun Holdings Private Limited, Cyprus (WHPL)
Welspun Retail Limited (WRL) (from June 12, 2009) *
Welspun Home Textiles UK Limited (WHTUKL)
(Held through WHPL)
CHT Holdings Limited (CHTHL) (Held through WHTUKL)
Christy Home Textiles Limited (CHTL)
(Held through CHTHL)
Welspun UK Limited (WUKL) (Held through CHTL)
Christy 2004 Limited (Held through WUKL)
Christy Europe GmbH (CEG) (Held through CHTL)
Christy UK Limited (CUKL) (Held through CHTL)
ER Kingsley (Textiles) Limited (ERK) (Held through CHTL)
Welspun Sorema Europe, S.A. (SOREMA) (Held through WHPL)
SOREMA Welspun Distribution and Logistics, S. A, Portugal
(Held through SOREMA)
SOREMA Welspun Espana S. L. U., Spain (Held through SOREMA)
SOREMA Welspun Benelux B. V., Holland (Held through SOREMA)
SOREMA Welspun Deutschland GmbH, Germany
(Held through SOREMA)
(b) Enterprises over which Key Welspun Zucchi Textiles Limited (WZTL)
Management Personnel or Welspun Realty Private Limited (WRPL)relatives of such personnel
Welspun AG (WAG) exercise significant influence
Welspun Mexico S.A. de C.V (WMEX) (Held through WAG)or control and with whom
transactions have taken Welspun India Limited (WIL)
place during the year Welspun Tradings Limited (WTL)
Welspun Wintex Limited (WWL)
Welspun Mercantile Limited (WML)
Krishiraj Trading Limited (KTL)
Goodvalue Polyplast Limited (GVPL)
(c) Key Management Personnel B. K. Goenka (BKG)
R. R. Mandawewala (RRM) ( from October 24, 2009)
(d) Relatives of Key Deepali Goenka (DBG)
Management Personnel
*Associate company for the period April 1, 2009 to June 11, 2009.
61
WELSPUN GLOBAL BRANDS LTD.
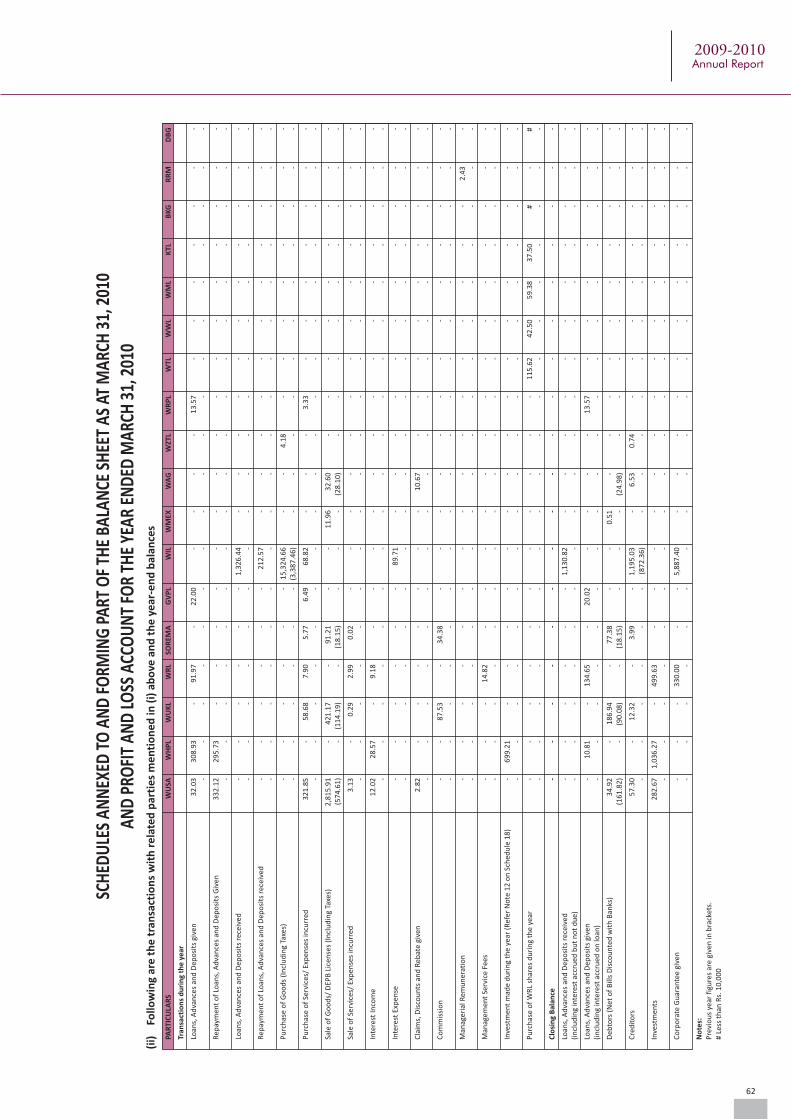
SCH
EDU
LES
ANN
EXED
TO
AN
D F
ORM
ING
PAR
T O
F TH
E BA
LAN
CE S
HEE
T AS
AT
MAR
CH 3
1, 2
010
AND
PRO
FIT
AND
LO
SS A
CCO
UN
T FO
R TH
E YE
AR E
ND
ED M
ARCH
31,
201
0(i
i)Fo
llow
ing
are
th
e t
ran
sact
ion
s w
ith
re
late
d p
arti
es
me
nti
on
ed
in (
i) a
bo
ve a
nd
th
e y
ear
-en
d b
alan
ces
PAR
TIC
ULA
RS
WU
SA
WH
PL
WU
KL
WR
L S
OR
EMA
G
VP
L W
IL
WM
EX
WA
G W
ZTL
WR
PL
WTL
W
WL
WM
L K
TL
BK
G R
RM
DB
G
Tran
sact
ion
s d
uri
ng
the
ye
ar
Loan
s, A
dva
nce
s an
d D
epo
sits
giv
en 3
2.0
3
30
8.9
3
-
91
.97
-
2
2.0
0
-
-
-
-
13
.57
-
-
-
-
-
-
-
-
-
-
-
-
-
-
-
-
-
-
-
-
-
-
-
-
-
Rep
aym
ent
of
Loan
s, A
dva
nce
s an
d D
epo
sits
Giv
en 3
32
.12
2
95
.73
-
-
-
-
-
-
-
-
-
-
-
-
-
-
-
- -
-
-
-
-
-
-
-
-
-
-
-
-
-
-
-
-
-
Loan
s, A
dva
nce
s an
d D
epo
sits
rec
eive
d -
-
-
-
-
-
1,3
26
.44
-
-
-
-
-
-
-
-
-
-
-
-
-
-
-
-
-
-
-
-
-
-
-
-
-
-
-
-
-
Rep
aym
ent
of
Loan
s, A
dva
nce
s an
d D
epo
sits
rec
eive
d -
-
-
-
-
-
21
2.5
7
-
-
-
-
-
-
-
-
-
-
-
-
-
-
-
-
-
-
-
-
-
-
-
-
-
-
-
-
-
Pu
rch
ase
of
Go
od
s (I
ncl
ud
ing
Taxe
s) -
-
-
-
-
-
15
,32
4.6
6
-
- 4
.18
-
-
-
-
-
-
-
-
-
-
-
-
-
-
(3,3
87
.46
) -
-
-
-
-
-
-
-
-
-
-
Pu
rch
ase
of
Serv
ices
/ Ex
pen
ses
incu
rred
32
1.8
5
-
58
.68
7
.90
5
.77
6
.49
6
8.8
2
-
-
-
3.3
3
-
-
-
-
-
-
-
-
-
-
-
-
-
-
-
-
-
-
-
-
-
-
-
-
-
Sale
of
Go
od
s/ D
EPB
Lic
ense
s (I
ncl
ud
ing
Taxe
s) 2
,81
5.9
1
-
42
1.1
7
-
91
.21
-
-
1
1.9
6
32
.60
-
-
-
-
-
-
-
-
-
(
57
4.6
1)
-(1
14
.19
) -
(
18
.15
) -
-
-
(
28
.10
) -
-
-
-
-
-
-
-
-
Sale
of
Serv
ices
/ Ex
pen
ses
incu
rred
3.1
3
-
0.2
9
2.9
9
0.0
2
-
-
-
- -
-
-
-
-
-
-
-
-
-
-
-
-
-
-
-
-
- -
-
-
-
-
-
-
-
-
Inte
rest
Inco
me
12
.02
2
8.5
7
-
9.1
8
-
-
-
-
- -
-
-
-
-
-
-
-
-
-
-
-
-
-
-
-
-
- -
-
-
-
-
-
-
-
-
Inte
rest
Exp
ense
-
-
-
-
-
-
89
.71
-
-
-
-
-
-
-
-
-
-
-
-
-
-
-
-
-
-
-
-
-
-
-
-
-
-
-
-
-
Cla
ims,
Dis
cou
nts
an
d R
ebat
e gi
ven
2.8
2
-
-
-
-
-
-
-
10
.67
-
-
-
-
-
-
-
-
-
-
-
-
-
-
-
-
-
- -
-
-
-
-
-
-
-
-
Co
mm
issi
on
-
-
87
.53
-
3
4.3
8
-
-
-
- -
-
-
-
-
-
-
-
-
-
-
-
-
-
-
-
-
-
-
-
-
-
-
-
-
-
-
Man
ager
ial R
emu
ner
atio
n -
-
-
-
-
-
-
-
-
-
-
-
-
-
-
-
2.4
3
-
-
-
-
-
-
-
-
-
- -
-
-
-
-
-
-
-
-
Man
agem
ent
Serv
ice
Fees
-
-
-
1
4.8
2
-
-
-
-
- -
-
-
-
-
-
-
-
-
-
-
-
-
-
-
-
-
-
-
-
-
-
-
-
-
-
-
Inve
stm
ent
mad
e d
uri
ng
the
year
(R
efer
No
te 1
2 o
n S
ched
ule
18
) -
6
99
.21
-
-
-
-
-
-
-
-
-
-
-
-
-
-
-
-
-
-
-
-
-
-
-
-
-
-
-
-
-
-
-
-
-
-
Pu
rch
ase
of
WR
L sh
ares
du
rin
g th
e ye
ar -
-
-
-
-
-
-
-
-
-
-
11
5.6
2
42
.50
5
9.3
8
37
.50
#
-
#
-
-
-
-
-
-
-
-
-
-
-
-
-
-
-
-
-
-
Clo
sin
g B
alan
ce -
-
-
-
-
-
-
-
-
-
-
-
-
-
-
-
-
-
Loan
s, A
dva
nce
s an
d D
epo
sits
rec
eive
d
-
-
-
-
-
-
1,1
30
.82
-
-
-
-
-
-
-
-
-
-
-(i
ncl
ud
ing
inte
rest
acc
rued
bu
t n
ot
du
e) -
-
-
-
-
-
-
-
-
-
-
-
-
-
-
-
-
-
Loan
s, A
dva
nce
s an
d D
epo
sits
giv
en -
1
0.8
1
-
13
4.6
5
-
20
.02
-
-
-
-
13
.57
-
-
-
-
-
-
-
(in
clu
din
g in
tere
st a
ccru
ed o
n lo
an)
-
-
-
-
-
-
-
-
-
-
-
-
-
-
-
-
-
-
Deb
tors
(N
et o
f B
ills
Dis
cou
nte
d w
ith
Ban
ks)
34
.92
-
1
86
.94
-
7
7.3
8
-
-
0.5
1
-
-
-
-
-
-
-
-
-
-
(1
61
.82
) -
(
90
.08
) -
(
18
.15
) -
-
-
(
24
.98
) -
-
-
-
-
-
-
-
-
Cre
dit
ors
57
.30
-
1
2.3
2
-
3.9
9
-
1,1
95
.03
-
6
.53
0
.74
-
-
-
-
-
-
-
-
-
-
-
-
-
-
(8
72
.36
) -
-
-
-
-
-
-
-
-
-
-
Inve
stm
ents
2
82
.67
1
,03
6.2
7
-
49
9.6
3
-
-
-
-
-
-
-
-
-
-
-
-
-
- -
-
-
-
-
-
-
-
-
-
-
-
-
-
-
-
-
-
Co
rpo
rate
Gu
aran
tee
give
n -
-
-
3
30
.00
-
-
5
,88
7.4
0
-
-
-
-
-
-
-
-
-
-
- -
-
-
-
-
-
-
-
-
-
-
-
-
-
-
-
-
-
No
tes:
P
revi
ou
s ye
ar f
igu
res
are
give
n in
bra
cket
s.#
Less
th
an R
s. 1
0,0
00
62
2009-2010Annual Report
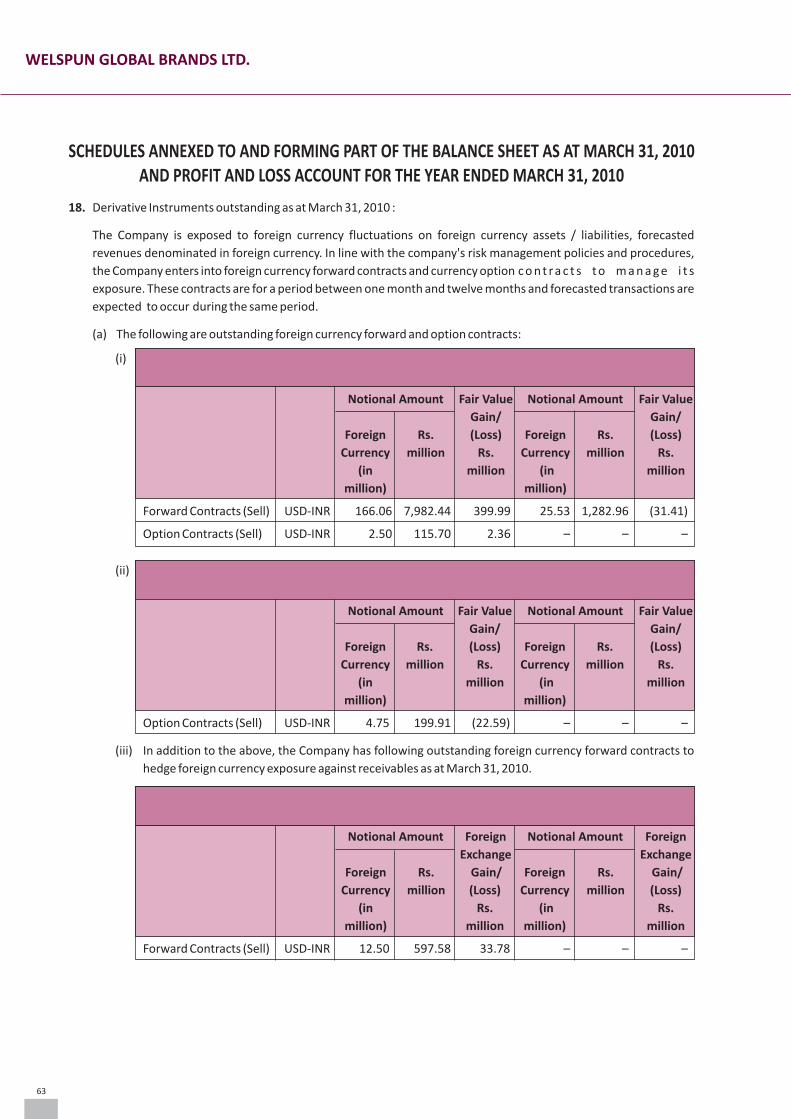
SCHEDULES ANNEXED TO AND FORMING PART OF THE BALANCE SHEET AS AT MARCH 31, 2010AND PROFIT AND LOSS ACCOUNT FOR THE YEAR ENDED MARCH 31, 2010
18. Derivative Instruments outstanding as at March 31, 2010 :
The Company is exposed to foreign currency fluctuations on foreign currency assets / liabilities, forecasted
revenues denominated in foreign currency. In line with the company's risk management policies and procedures,
the Company enters into foreign currency forward contracts and currency option c o n t ra c t s t o m a n a g e i t s
exposure. These contracts are for a period between one month and twelve months and forecasted transactions are
expected to occur during the same period.
(a) The following are outstanding foreign currency forward and option contracts:
(i) Designated Cash Flow Currency March 31, 2010 March 31, 2009
Hedges Pair
Notional Amount Fair Value Notional Amount Fair Value
Gain/ Gain/
Foreign Rs. (Loss) Foreign Rs. (Loss)
Currency million Rs. Currency million Rs.
(in million (in million
million) million)
Forward Contracts (Sell) USD-INR 166.06 7,982.44 399.99 25.53 1,282.96 (31.41)
Option Contracts (Sell) USD-INR 2.50 115.70 2.36 – – –
(ii) Non-Designated Currency March 31, 2010 March 31, 2009
Hedges Pair
Notional Amount Fair Value Notional Amount Fair Value
Gain/ Gain/
Foreign Rs. (Loss) Foreign Rs. (Loss)
Currency million Rs. Currency million Rs.
(in million (in million
million) million)
Option Contracts (Sell) USD-INR 4.75 199.91 (22.59) – – –
(iii) In addition to the above, the Company has following outstanding foreign currency forward contracts to
hedge foreign currency exposure against receivables as at March 31, 2010.
Currency March 31, 2010 March 31, 2009
Pair
Notional Amount Foreign Notional Amount Foreign
Exchange Exchange
Foreign Rs. Gain/ Foreign Rs. Gain/
Currency million (Loss) Currency million (Loss)
(in Rs. (in Rs.
million) million million) million
Forward Contracts (Sell) USD-INR 12.50 597.58 33.78 – – –
63
WELSPUN GLOBAL BRANDS LTD.
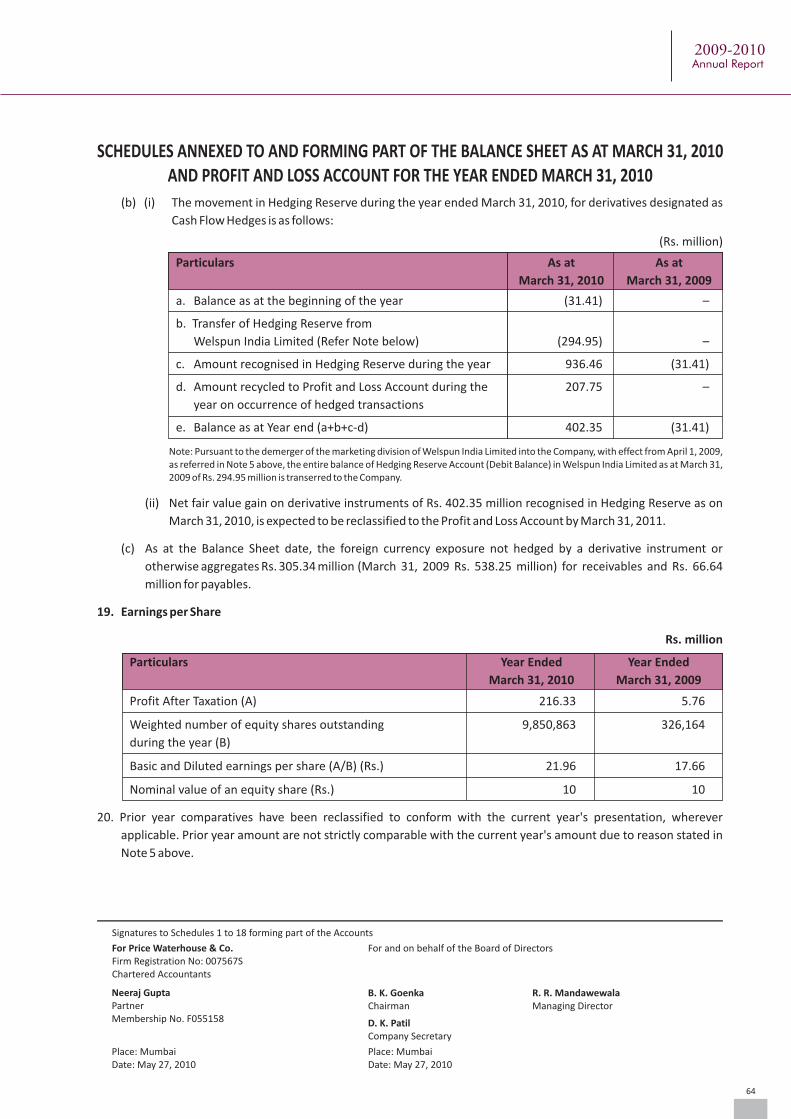
For Price Waterhouse & Co.Firm Registration No: 007567SChartered Accountants
For and on behalf of the Board of Directors
Neeraj GuptaPartnerMembership No. F055158
B. K. GoenkaChairman
R. R. MandawewalaManaging Director
D. K. PatilCompany Secretary
Place: MumbaiDate: May 27, 2010
Place: MumbaiDate: May 27, 2010
(b) (i) The movement in Hedging Reserve during the year ended March 31, 2010, for derivatives designated as
Cash Flow Hedges is as follows:
(Rs. million)
Particulars As at As at
March 31, 2010 March 31, 2009
a. Balance as at the beginning of the year (31.41) –
b. Transfer of Hedging Reserve from
Welspun India Limited (Refer Note below) (294.95) –
c. Amount recognised in Hedging Reserve during the year 936.46 (31.41)
d. Amount recycled to Profit and Loss Account during the 207.75 –
year on occurrence of hedged transactions
e. Balance as at Year end (a+b+c-d) 402.35 (31.41)
Note: Pursuant to the demerger of the marketing division of Welspun India Limited into the Company, with effect from April 1, 2009, as referred in Note 5 above, the entire balance of Hedging Reserve Account (Debit Balance) in Welspun India Limited as at March 31, 2009 of Rs. 294.95 million is transerred to the Company.
(ii) Net fair value gain on derivative instruments of Rs. 402.35 million recognised in Hedging Reserve as on
March 31, 2010, is expected to be reclassified to the Profit and Loss Account by March 31, 2011.
(c) As at the Balance Sheet date, the foreign currency exposure not hedged by a derivative instrument or
otherwise aggregates Rs. 305.34 million (March 31, 2009 Rs. 538.25 million) for receivables and Rs. 66.64
million for payables.
19. Earnings per Share
Rs. million
Particulars Year Ended Year Ended
March 31, 2010 March 31, 2009
Profit After Taxation (A) 216.33 5.76
Weighted number of equity shares outstanding 9,850,863 326,164
during the year (B)
Basic and Diluted earnings per share (A/B) (Rs.) 21.96 17.66
Nominal value of an equity share (Rs.) 10 10
20. Prior year comparatives have been reclassified to conform with the current year's presentation, wherever
applicable. Prior year amount are not strictly comparable with the current year's amount due to reason stated in
Note 5 above.
SCHEDULES ANNEXED TO AND FORMING PART OF THE BALANCE SHEET AS AT MARCH 31, 2010AND PROFIT AND LOSS ACCOUNT FOR THE YEAR ENDED MARCH 31, 2010
64
Signatures to Schedules 1 to 18 forming part of the Accounts
2009-2010Annual Report
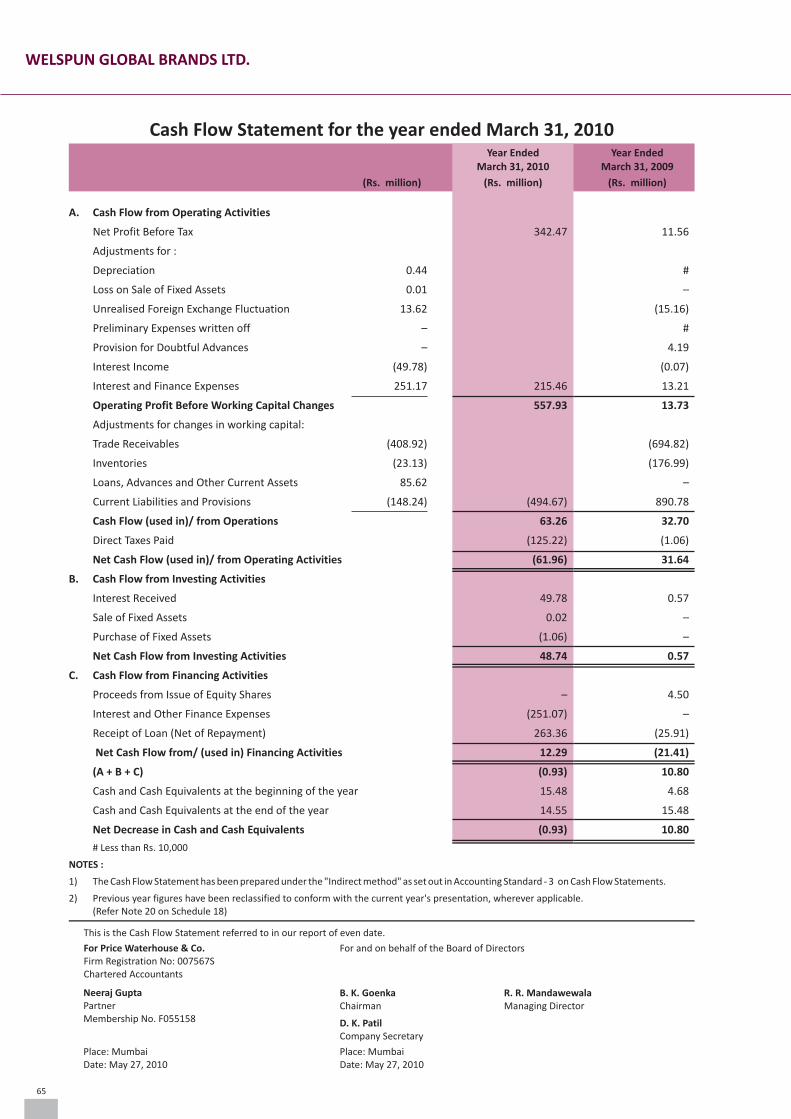
65
Cash Flow Statement for the year ended March 31, 2010
This is the Cash Flow Statement referred to in our report of even date.
For Price Waterhouse & Co.Firm Registration No: 007567SChartered Accountants
For and on behalf of the Board of Directors
Neeraj GuptaPartnerMembership No. F055158
B. K. GoenkaChairman
R. R. MandawewalaManaging Director
D. K. PatilCompany Secretary
Place: MumbaiDate: May 27, 2010
Place: MumbaiDate: May 27, 2010
Year EndedMarch 31, 2009
(Rs. million)(Rs. million)
Year EndedMarch 31, 2010
(Rs. million)
A. Cash Flow from Operating Activities
Net Profit Before Tax 342.47 11.56
Adjustments for :
Depreciation 0.44 #
Loss on Sale of Fixed Assets 0.01 –
Unrealised Foreign Exchange Fluctuation 13.62 (15.16)
Preliminary Expenses written off – #
Provision for Doubtful Advances – 4.19
Interest Income (49.78) (0.07)
Interest and Finance Expenses 251.17 215.46 13.21
Operating Profit Before Working Capital Changes 557.93 13.73
Adjustments for changes in working capital:
Trade Receivables (408.92) (694.82)
Inventories (23.13) (176.99)
Loans, Advances and Other Current Assets 85.62 –
Current Liabilities and Provisions (148.24) (494.67) 890.78
Cash Flow (used in)/ from Operations 63.26 32.70
Direct Taxes Paid (125.22) (1.06)
Net Cash Flow (used in)/ from Operating Activities (61.96) 31.64
B. Cash Flow from Investing Activities
Interest Received 49.78 0.57
Sale of Fixed Assets 0.02 –
Purchase of Fixed Assets (1.06) –
Net Cash Flow from Investing Activities 48.74 0.57
C. Cash Flow from Financing Activities
Proceeds from Issue of Equity Shares – 4.50
Interest and Other Finance Expenses (251.07) –
Receipt of Loan (Net of Repayment) 263.36 (25.91)
Net Cash Flow from/ (used in) Financing Activities 12.29 (21.41)
(A + B + C) (0.93) 10.80
Cash and Cash Equivalents at the beginning of the year 15.48 4.68
Cash and Cash Equivalents at the end of the year 14.55 15.48
Net Decrease in Cash and Cash Equivalents (0.93) 10.80
# Less than Rs. 10,000
NOTES :
1) The Cash Flow Statement has been prepared under the "Indirect method" as set out in Accounting Standard - 3 on Cash Flow Statements.
2) Previous year figures have been reclassified to conform with the current year's presentation, wherever applicable.(Refer Note 20 on Schedule 18)
WELSPUN GLOBAL BRANDS LTD.
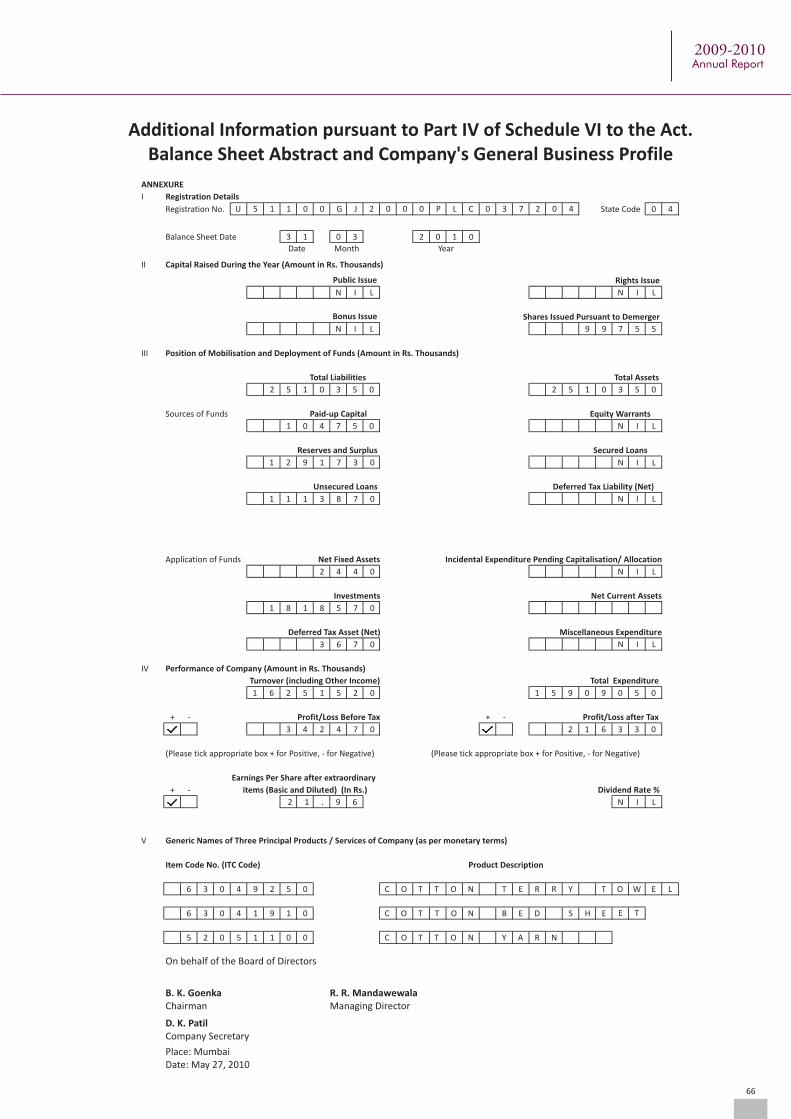
Additional Information pursuant to Part IV of Schedule VI to the Act.Balance Sheet Abstract and Company's General Business Profile
ANNEXURE
I Registration Details
Registration No. State Code 0 4
Balance Sheet Date 3 1 0 3 2 0 1 0
II Capital Raised During the Year (Amount in Rs. Thousands)
Rights Issue
N I L N I L
Shares Issued Pursuant to Demerger
N I L 79 59 5
III Position of Mobilisation and Deployment of Funds (Amount in Rs. Thousands)
Total Liabilities Total Assets
2 5 1 0 3 5 0 2 5 1 0 3 5 0
Sources of Funds Paid-up Capital Equity Warrants
1 0 4 7 5 0 N
N
N
N
I
I
I
I
L
L
L
L
Reserves and Surplus Secured Loans
Unsecured Loans Deferred Tax Liability (Net)
Application of Funds Net Fixed Assets Incidental Expenditure Pending Capitalisation/ Allocation
Investments Net Current Assets
Deferred Tax Asset (Net) Miscellaneous Expenditure
N I L
IV Performance of Company (Amount in Rs. Thousands)
Turnover (including Other Income) Total Expenditure
+ - Profit/Loss Before Tax + - Profit/Loss after Tax
(Please tick appropriate box + for Positive, - for Negative) (Please tick appropriate box + for Positive, - for Negative)
Earnings Per Share after extraordinary
+ - items (Basic and Diluted) (In Rs.) Dividend Rate %
Public Issue
Bonus Issue
Date Month Year
V Generic Names of Three Principal Products / Services of Company (as per monetary terms)
Item Code No. (ITC Code) Product Description
6 3 0 9 2 5 0 C O T T O N T E R R Y T O W E L
6 3 0 1 9 1 0 C O T T O N B E D S H E E T
5 2 0 1 1 0 0 C O T T O N Y A R N
66
B. K. GoenkaChairman
R. R. MandawewalaManaging Director
D. K. PatilCompany Secretary
Place: MumbaiDate: May 27, 2010
On behalf of the Board of Directors
4
4
5
N I L
U 5 1 1 0 0 G J 2 0 0 0 P L C 0 3 7 2 0 4
1 2 9 1 7 3 0
1 1 1 3 8 7 0
2 4 4 0
1 8 1 8 5 7 0
3 6 7 0
1 6 2 5 1 5 2 0
3 4 2 4 7 0
2 1 . 9 6
1 5 9 0 9 0 5 0
2 1 6 3 3 0
2009-2010Annual Report
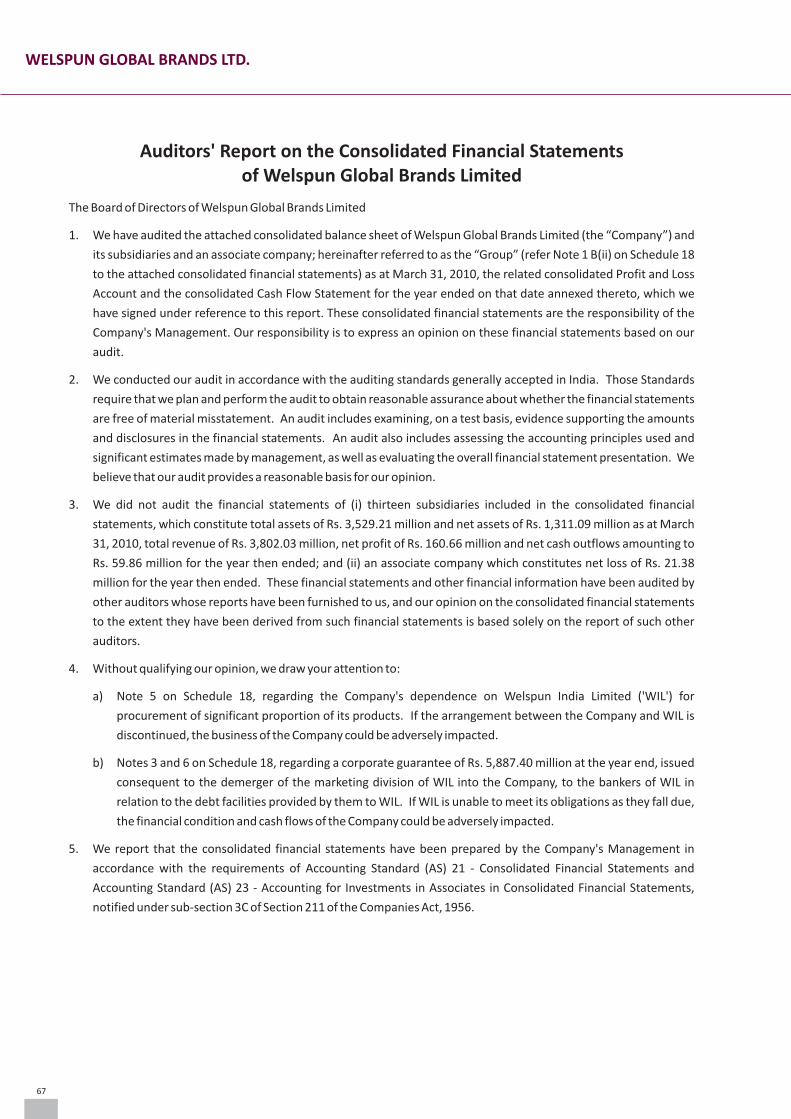
Auditors' Report on the Consolidated Financial Statementsof Welspun Global Brands Limited
The Board of Directors of Welspun Global Brands Limited
1. We have audited the attached consolidated balance sheet of Welspun Global Brands Limited (the “Company”) and
its subsidiaries and an associate company; hereinafter referred to as the “Group” (refer Note 1 B(ii) on Schedule 18
to the attached consolidated financial statements) as at March 31, 2010, the related consolidated Profit and Loss
Account and the consolidated Cash Flow Statement for the year ended on that date annexed thereto, which we
have signed under reference to this report. These consolidated financial statements are the responsibility of the
Company's Management. Our responsibility is to express an opinion on these financial statements based on our
audit.
2. We conducted our audit in accordance with the auditing standards generally accepted in India. Those Standards
require that we plan and perform the audit to obtain reasonable assurance about whether the financial statements
are free of material misstatement. An audit includes examining, on a test basis, evidence supporting the amounts
and disclosures in the financial statements. An audit also includes assessing the accounting principles used and
significant estimates made by management, as well as evaluating the overall financial statement presentation. We
believe that our audit provides a reasonable basis for our opinion.
3. We did not audit the financial statements of (i) thirteen subsidiaries included in the consolidated financial
statements, which constitute total assets of Rs. 3,529.21 million and net assets of Rs. 1,311.09 million as at March
31, 2010, total revenue of Rs. 3,802.03 million, net profit of Rs. 160.66 million and net cash outflows amounting to
Rs. 59.86 million for the year then ended; and (ii) an associate company which constitutes net loss of Rs. 21.38
million for the year then ended. These financial statements and other financial information have been audited by
other auditors whose reports have been furnished to us, and our opinion on the consolidated financial statements
to the extent they have been derived from such financial statements is based solely on the report of such other
auditors.
4. Without qualifying our opinion, we draw your attention to:
a) Note 5 on Schedule 18, regarding the Company's dependence on Welspun India Limited ('WIL') for
procurement of significant proportion of its products. If the arrangement between the Company and WIL is
discontinued, the business of the Company could be adversely impacted.
b) Notes 3 and 6 on Schedule 18, regarding a corporate guarantee of Rs. 5,887.40 million at the year end, issued
consequent to the demerger of the marketing division of WIL into the Company, to the bankers of WIL in
relation to the debt facilities provided by them to WIL. If WIL is unable to meet its obligations as they fall due,
the financial condition and cash flows of the Company could be adversely impacted.
5. We report that the consolidated financial statements have been prepared by the Company's Management in
accordance with the requirements of Accounting Standard (AS) 21 - Consolidated Financial Statements and
Accounting Standard (AS) 23 - Accounting for Investments in Associates in Consolidated Financial Statements,
notified under sub-section 3C of Section 211 of the Companies Act, 1956.
67
WELSPUN GLOBAL BRANDS LTD.
6. Based on our audit and on consideration of reports of other auditors on separate financial statements and on the
other financial information of the components of the Group as referred to above, and to the best of our
information and according to the explanations given to us, in our opinion, the attached consolidated financial
statements give a true and fair view in conformity with the accounting principles generally accepted in India:
(a) in the case of the consolidated Balance Sheet, of the state of affairs of the Group as at March 31, 2010;
(b) in the case of the consolidated Profit and Loss Account, of the results of the Group for the year ended on that
date; and
(c) in the case of the consolidated Cash Flow Statement, of the cash flows of the Group for the year ended on that
date.
For Price Waterhouse & Co.
Firm Registration Number: 007567S
Chartered Accountants
Neeraj Gupta
Place: Mumbai Partner
Date: May 27, 2010 Membership Number F055158
68
2009-2010Annual Report

CONSOLIDATED BALANCE SHEET AS AT MARCH 31, 2010
The Schedules referred to herein form an integral part of the Consolidated Balance Sheet.
This is the Consolidated Balance Sheet referred to in our report of the even date.
For Price Waterhouse & Co.Firm Registration No: 007567SChartered Accountants
For and on behalf of the Board of Directors
Neeraj GuptaPartnerMembership No. F055158
B. K. GoenkaChairman
R. R. MandawewalaManaging Director
D. K. PatilCompany Secretary
Place: MumbaiDate: May 27, 2010
Place: MumbaiDate: May 27, 2010
As AtMarch 31, 2010
(Rs. million)
SCHEDULES
SOURCES OF FUNDS
SHAREHOLDERS' FUNDS
Capital 1 104.75
Reserves and Surplus 2 911.93
1,016.68
MINORITY INTEREST 396.85
LOAN FUNDS
Secured Loans 3 802.78
Unsecured Loans 4 2,006.25
2,809.03
4,222.56
APPLICATION OF FUNDS
FIXED ASSETS 5
Gross Block 2,232.82
Less: Depreciation 839.41
Net Block 1,393.41
Capital Work-in-progress 1.22
1,394.63
DEFERRED TAX ASSETS (NET) 6 87.23
CURRENT ASSETS, LOANS AND ADVANCES
Inventories 7 2,510.25
Sundry Debtors 8 1,966.40
Cash and Bank Balances 9 245.84
Loans, Advances and Other Current Assets 10 1,920.22
6,642.71
LESS: CURRENT LIABILITIES AND PROVISIONS 11
Current Liabilities 3,989.91
Provisions 15.52
4,005.43
NET CURRENT ASSETS 2,637.28
PROFIT AND LOSS ACCOUNT (DEBIT BALANCE) 103.42
4,222.56
NOTES TO ACCOUNTS 18
69
WELSPUN GLOBAL BRANDS LTD.
Year EndedMarch 31, 2010
(Rs. million)
SCHEDULES
INCOME
Sales 12 21,537.88
Other Income 13 185.38
21,723.26
EXPENDITURE
Cost of Goods Sold 14 17,548.82
Employees' Remuneration and Benefits 15 1,189.65
Selling, Administration and Other Expenses 16 2,445.18
Finance Expenses (Net) 17 361.39
Depreciation 154.85
21,699.89
PROFIT BEFORE TAXATION 23.37
Provision For Taxation
– Current Tax 116.33
– Short Provision for Tax in Earlier Year 0.15
– Deferred Tax 45.95
LOSS AFTER TAXATION AND BEFORE SHARE OF LOSS OF ASSOCIATES (139.06)AND MINORITY SHAREHOLDERS
Share of Associate's Net Loss (21.38)
LOSS AFTER TAXATION AND BEFORE SHARE OF LOSS (160.44)OF MINORITY SHAREHOLDERS
Minority's Share of Loss in Subsidiary Companies (45.86)
NET LOSS (114.58)
Profit and Loss Account Balance Brought Forward 11.16
Profit and Loss Account Deficit Carried to Balance Sheet (103.42)
Loss Per Share (Rs.) - (Refer Note 9 on Schedule 18)
– Basic and Diluted Loss Per Share (11.63)
NOTES TO ACCOUNTS 18
The Schedules referred to herein form an integral part of the Consolidated Profit and Loss Account.
This is the Consolidated Profit and Loss Account referred to in our report of the even date.
For Price Waterhouse & Co.Firm Registration No: 007567SChartered Accountants
For and on behalf of the Board of Directors
Neeraj GuptaPartnerMembership No. F055158
B. K. GoenkaChairman
R. R. MandawewalaManaging Director
D. K. PatilCompany Secretary
Place: MumbaiDate: May 27, 2010
Place: MumbaiDate: May 27, 2010
PROFIT AND LOSS ACCOUNT FOR THE YEAR ENDED MARCH 31, 2010
70
2009-2010Annual Report
SCHEDULES ANNEXED TO AND FORMING PART OF THECONSOLIDATED BALANCE SHEET AS AT MARCH 31, 2010
71
As AtMarch 31, 2010
(Rs. million)
SCHEDULE 1 : CAPITAL
Authorised
25,500,000 Equity Shares of Rs. 10 each 255.00 (Refer Note 4 on Schedule 18)
255.00
Issued, Subscribed and Paid Up
10,475,496 Equity Shares of Rs. 10 each fully paid-up (Refer Note 4 on Schedule 18) 104.75
104.75
SCHEDULE 2 : RESERVES AND SURPLUS
Securities Premium Account (Refer Note 4 on Schedule 18) 223.33
Capital Reserve
– On demerger of Marketing Division of Welspun India Limited into the Company 438.56 (Refer Note 4 on Schedule 18)
– On acquisition of a subsidiary 33.10
Hedging Reserve Account (Refer Note 15 on Schedule 18) 413.76
Foreign Exchange Translation Reserve (196.82)
911.93
SCHEDULE 3 : SECURED LOANS
Term Loans from Banks 76.25
Working Capital Loans from Banks 726.53
802.78
SCHEDULE 4 : UNSECURED LOANS
Loans :
– From Banks 747.16
– From Others 32.97
Inter-Corporate Loan from Welspun India Limited 1,226.12
2,006.25
WELSPUN GLOBAL BRANDS LTD.
72
SC
HED
ULE
5 :
FIX
ED A
SSET
S(R
efer
No
tes
1(c
) (i
), (
ii), (
viii)
an
d 4
on
Sch
edu
le 1
8)
Rs.
mill
ion
PAR
TIC
ULA
RS
GR
OSS
BLO
CK
(A
T C
OST
) D
EPR
ECIA
TIO
NN
ET B
LOC
K
As
at
As
at
Acc
um
ula
ted
Acc
um
ula
ted
As
atA
s at
Mar
ch 3
1, 2
00
9M
arch
31
, 20
10
up
tou
pto
Mar
ch 3
1, 2
01
0M
arch
31
, 20
09
Mar
ch 3
1, 2
00
9M
arch
31
, 20
10
Free
ho
ld L
and
–
11
.27
–
–
11
.27
–
Bu
ildin
gs
– 3
2.6
0
–
0.5
4
32
.06
–
Leas
eho
ld Im
pro
vem
ents
–
11
0.8
3
–
37
.38
7
3.4
5
–
Pla
nt
and
Mac
hin
ery
–
3
25
.71
–
2
47
.40
7
8.3
1
–
Veh
icle
s 0
.03
3
1.1
5
0.0
2
21
.65
9
.50
0
.01
Furn
itu
re a
nd
Fix
ture
s –
3
18
.89
–
1
46
.96
1
71
.93
–
Off
ice
Equ
ipm
ent
–
70
.90
–
2
9.3
1
41
.59
–
Co
mp
ute
r H
ard
war
e 0
.13
1
46
.82
0
.13
8
9.0
2
57
.80
–
Co
mp
ute
r So
ftw
are
–
42
.25
–
1
9.2
1
23
.04
–
Go
od
will
on
Co
nso
lidat
ion
of
Sub
sid
iari
es
–
1,0
31
.44
–
1
66
.97
8
64
.47
–
Pro
ject
Dev
elo
pm
ent
Exp
end
itu
re
–
11
0.9
6
–
80
.97
2
9.9
9
–
TOTA
L 0
.16
2
,23
2.8
2
0.1
5
83
9.4
1
1,3
93
.41
0
.01
Cap
ital
Wo
rk-i
n-p
rogr
ess
1.2
2
–
1,3
94
.63
0
.01
SCH
EDU
LES
AN
NEX
ED T
O A
ND
FO
RM
ING
PA
RT
OF
THE
CO
NSO
LID
ATE
D B
ALA
NC
E SH
EET
AS
AT
MA
RC
H 3
1, 2
01
0
2009-2010Annual Report
73
SCHEDULES ANNEXED TO AND FORMING PART OF THECONSOLIDATED BALANCE SHEET AS AT MARCH 31, 2010
As AtMarch 31, 2010
(Rs. million)
SCHEDULE 6 : DEFERRED TAX ASSETS (NET)(Refer Note 1(iv)(b) on Schedule 18)
Deferred Tax Liability arising on account of Timing differences in :
– Depreciation 19.62
Deferred Tax Asset arising on account of Timing differences in:
– Expenses on acquisition of marketing division of Welspun India Limited 0.26
– Provision for Employee Benefits 1.30
– Deferred Rent 9.18
– Unabsorbed Depreciation and Business Losses of Subsidiaries 30.04
– Inventory Allowances 37.46
– Others 28.61
87.23
SCHEDULE 7 : INVENTORIES(Refer Note 1(c)(iii) on Schedule 18)
Raw Materials 101.99
Finished Goods 246.62
Traded Goods (Including In Transit for Customers) 2,161.64
2,510.25
SCHEDULE 8 : SUNDRY DEBTORS
Unsecured
Debts Outstanding for a period exceeding six months :
– Considered Good 43.45
– Considered Doubtful 14.58
58.03
Other Debts :
– Considered Good 1,922.95
– Considered Doubtful 8.99
1,931.94
Less : Provision for Doubtful Debts 23.57
1,966.40
SCHEDULE 9 : CASH AND BANK BALANCES
Cash on Hand 13.45
Remittance in Transit 6.05
Bank Balances :
– with Scheduled Banks
– In Current Accounts 25.15
– In Fixed Deposit Accounts 8.27
– with Others
– In Current Accounts in Foreign Currency 169.85
– In Fixed Deposit Accounts 23.07
– In Joint Deposit Accounts (Escrow) 227.25
Less - Held in Trust (227.25)
245.84
WELSPUN GLOBAL BRANDS LTD.
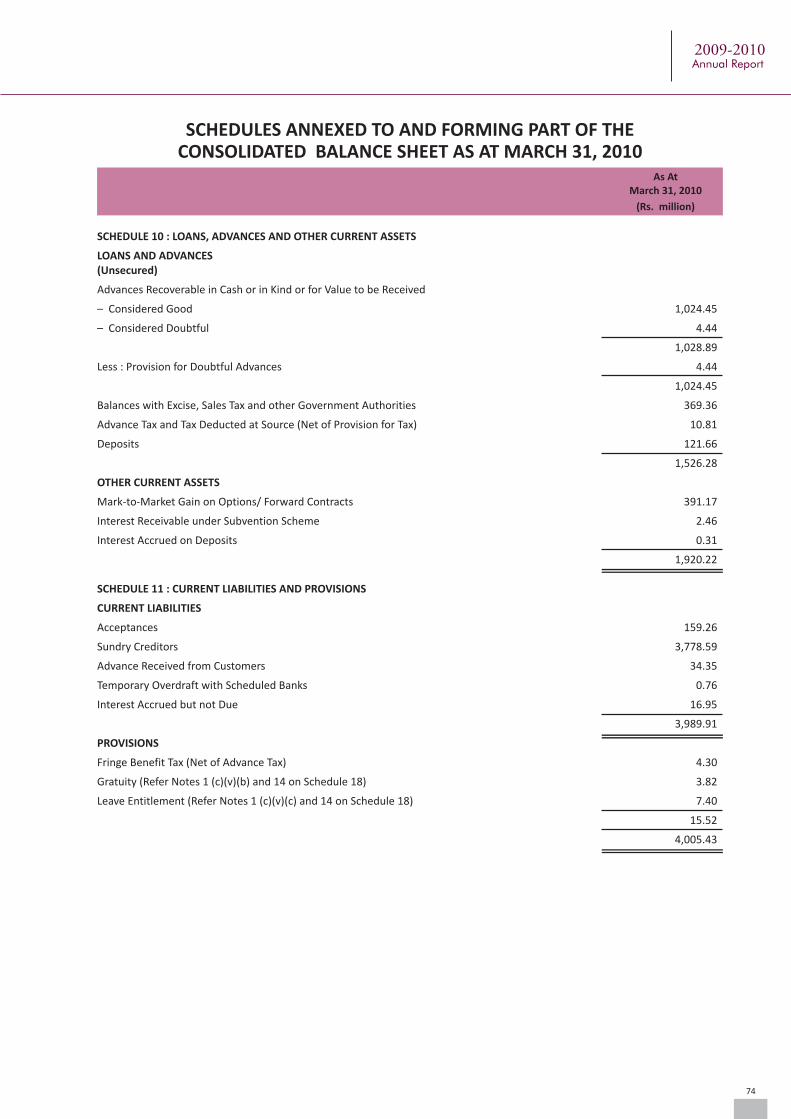
74
SCHEDULES ANNEXED TO AND FORMING PART OF THECONSOLIDATED BALANCE SHEET AS AT MARCH 31, 2010
As AtMarch 31, 2010
(Rs. million)
SCHEDULE 10 : LOANS, ADVANCES AND OTHER CURRENT ASSETS
LOANS AND ADVANCES (Unsecured)
Advances Recoverable in Cash or in Kind or for Value to be Received
– Considered Good 1,024.45
– Considered Doubtful 4.44
1,028.89
Less : Provision for Doubtful Advances 4.44
1,024.45
Balances with Excise, Sales Tax and other Government Authorities 369.36
Advance Tax and Tax Deducted at Source (Net of Provision for Tax) 10.81
Deposits 121.66
1,526.28
OTHER CURRENT ASSETS
Mark-to-Market Gain on Options/ Forward Contracts 391.17
Interest Receivable under Subvention Scheme 2.46
Interest Accrued on Deposits 0.31
1,920.22
SCHEDULE 11 : CURRENT LIABILITIES AND PROVISIONS
CURRENT LIABILITIES
Acceptances 159.26
Sundry Creditors 3,778.59
Advance Received from Customers 34.35
Temporary Overdraft with Scheduled Banks 0.76
Interest Accrued but not Due 16.95
3,989.91
PROVISIONS
Fringe Benefit Tax (Net of Advance Tax) 4.30
Gratuity (Refer Notes 1 (c)(v)(b) and 14 on Schedule 18) 3.82
Leave Entitlement (Refer Notes 1 (c)(v)(c) and 14 on Schedule 18) 7.40
15.52
4,005.43
2009-2010Annual Report
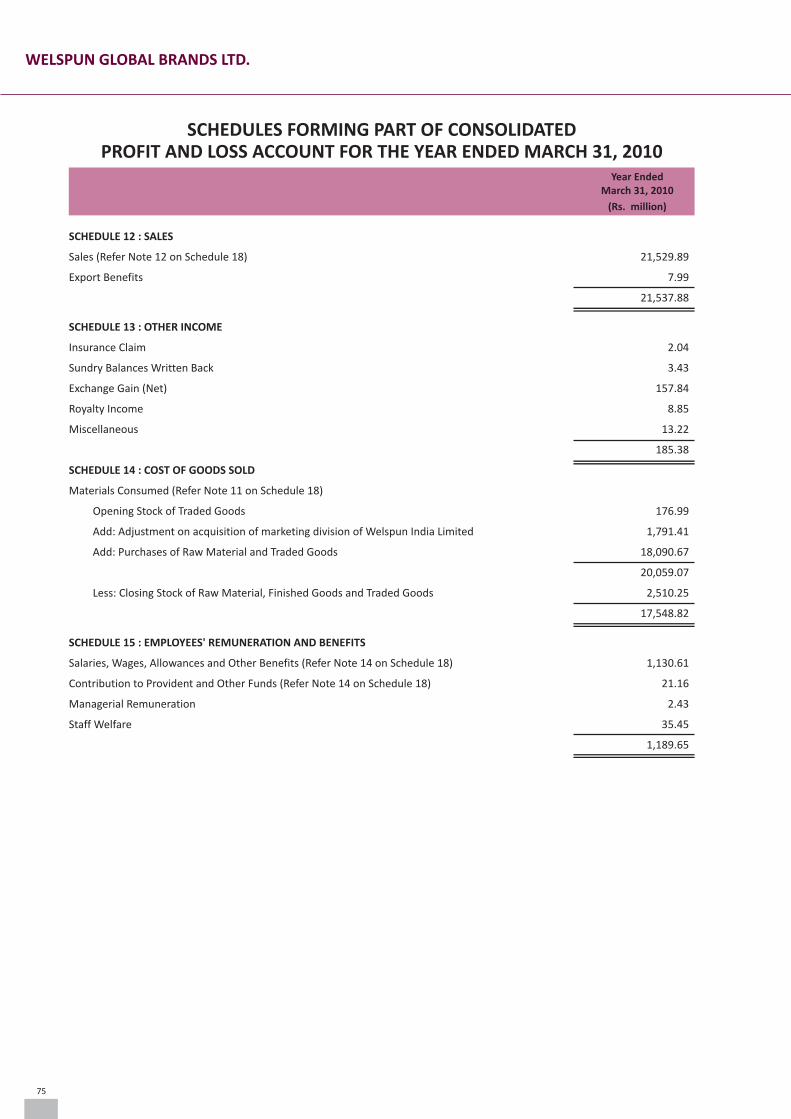
75
SCHEDULES FORMING PART OF CONSOLIDATEDPROFIT AND LOSS ACCOUNT FOR THE YEAR ENDED MARCH 31, 2010
Year EndedMarch 31, 2010
(Rs. million)
SCHEDULE 12 : SALES
Sales (Refer Note 12 on Schedule 18) 21,529.89
Export Benefits 7.99
21,537.88
SCHEDULE 13 : OTHER INCOME
Insurance Claim 2.04
Sundry Balances Written Back 3.43
Exchange Gain (Net) 157.84
Royalty Income 8.85
Miscellaneous 13.22
185.38
SCHEDULE 14 : COST OF GOODS SOLD
Materials Consumed (Refer Note 11 on Schedule 18)
Opening Stock of Traded Goods 176.99
Add: Adjustment on acquisition of marketing division of Welspun India Limited 1,791.41
Add: Purchases of Raw Material and Traded Goods 18,090.67
20,059.07
Less: Closing Stock of Raw Material, Finished Goods and Traded Goods 2,510.25
17,548.82
SCHEDULE 15 : EMPLOYEES' REMUNERATION AND BENEFITS
Salaries, Wages, Allowances and Other Benefits (Refer Note 14 on Schedule 18) 1,130.61
Contribution to Provident and Other Funds (Refer Note 14 on Schedule 18) 21.16
Managerial Remuneration 2.43
Staff Welfare 35.45
1,189.65
WELSPUN GLOBAL BRANDS LTD.
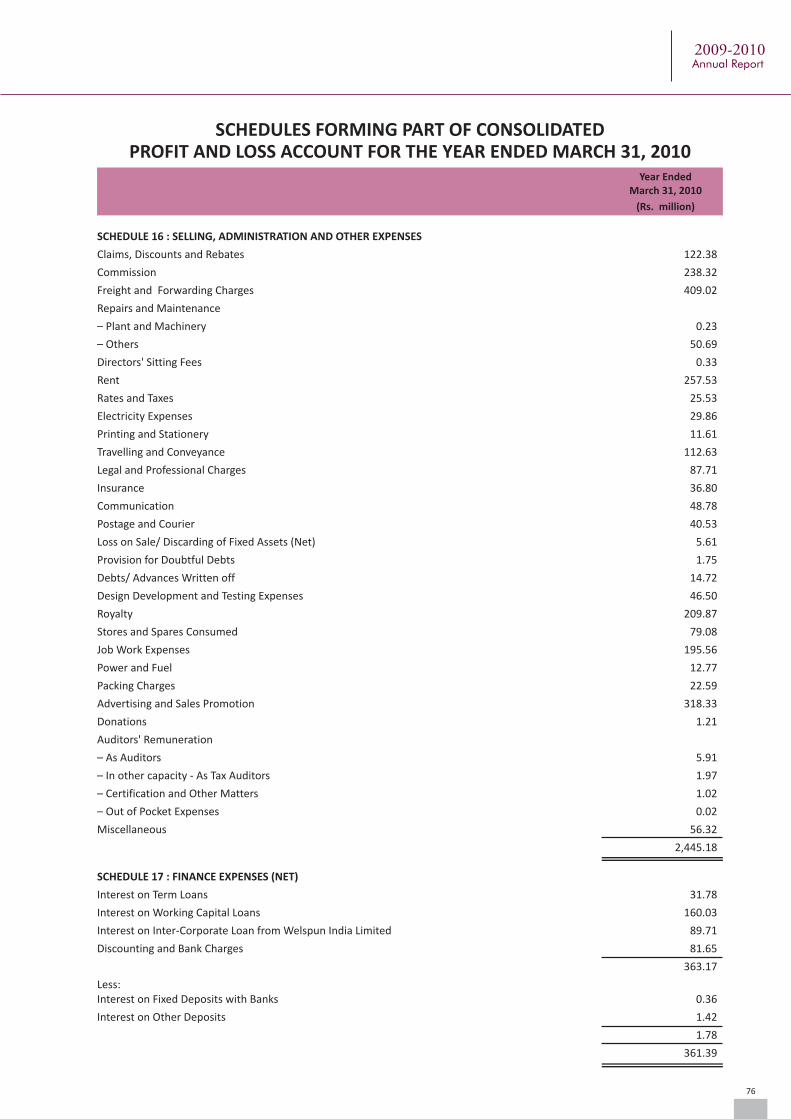
76
SCHEDULES FORMING PART OF CONSOLIDATEDPROFIT AND LOSS ACCOUNT FOR THE YEAR ENDED MARCH 31, 2010
Year EndedMarch 31, 2010
(Rs. million)
SCHEDULE 16 : SELLING, ADMINISTRATION AND OTHER EXPENSES
Claims, Discounts and Rebates 122.38
Commission 238.32
Freight and Forwarding Charges 409.02
Repairs and Maintenance
– Plant and Machinery 0.23
– Others 50.69
Directors' Sitting Fees 0.33
Rent 257.53
Rates and Taxes 25.53
Electricity Expenses 29.86
Printing and Stationery 11.61
Travelling and Conveyance 112.63
Legal and Professional Charges 87.71
Insurance 36.80
Communication 48.78
Postage and Courier 40.53
Loss on Sale/ Discarding of Fixed Assets (Net) 5.61
Provision for Doubtful Debts 1.75
Debts/ Advances Written off 14.72
Design Development and Testing Expenses 46.50
Royalty 209.87
Stores and Spares Consumed 79.08
Job Work Expenses 195.56
Power and Fuel 12.77
Packing Charges 22.59
Advertising and Sales Promotion 318.33
Donations 1.21
Auditors' Remuneration
– As Auditors 5.91
– In other capacity - As Tax Auditors 1.97
– Certification and Other Matters 1.02
– Out of Pocket Expenses 0.02
Miscellaneous 56.32
2,445.18
SCHEDULE 17 : FINANCE EXPENSES (NET)
Interest on Term Loans 31.78
Interest on Working Capital Loans 160.03
Interest on Inter-Corporate Loan from Welspun India Limited 89.71
Discounting and Bank Charges 81.65
363.17
Less: Interest on Fixed Deposits with Banks 0.36
Interest on Other Deposits 1.42
1.78
361.39
2009-2010Annual Report

SCHEDULES ANNEXED TO AND FORMING PART OF THE CONSOLIDATED BALANCE SHEET AS AT MARCH 31, 2010AND CONSOLIDATED PROFIT AND LOSS ACCOUNT FOR THE YEAR ENDED MARCH 31, 2010
1) Significant Accounting Policies
A. Basis of Accounting
The consolidated financial statements are prepared under historical cost convention in accordance with
generally accepted accounting principles applicable in India and the Accounting Standards notified under Sub
Section (3C) of Section 211 of the Companies Act, 1956 (the "Act") and other relevant provisions of the Act .
B. Principles of Consolidation
(i) The consolidated financial statements relate to Welspun Global Brands Limited (the "Company"), its
Subsidiary Companies and Associate Company. The consolidated financial statements have been
prepared on the following basis:
(a) The financial statements of the Company and its Subsidiary Companies have been combined on a
line-by-line basis by adding together the book values of like items of assets, liabilities, income and
expenses, after fully eliminating intra-group balances, intra-group transactions and resulting
unrealised profits or losses on intra-group transactions.
(b) The difference between the cost of investment in the subsidiaries over the Company's portion of
equity of the subsidiary is recognised in the financial statements as Goodwill or Capital Reserve.
(c) Minority Interest in the net assets of consolidated subsidiaries consist of :
– the amount of equity attributable to minorities at the date on which investment in a subsidiary is
made; and
– the minorities' share of movements in equity since the date the parent subsidiary relationship
comes into existence.
(d) Investments in Associates have been accounted for under AS-23 using equity method whereby the
investment is initially recorded at cost, identifying any goodwill/ capital reserve arising at the time of
acquisition. The carrying amount of the investment is adjusted thereafter for the post acquisition
change in the investor's share of net assets of the investee.
(e) The consolidated financial statements have been prepared using uniform accounting policies for like
transactions and other events in similar circumstances and are prepared to the extent possible, in the
same manner as the Company's separate financial statements.
77
WELSPUN GLOBAL BRANDS LTD.
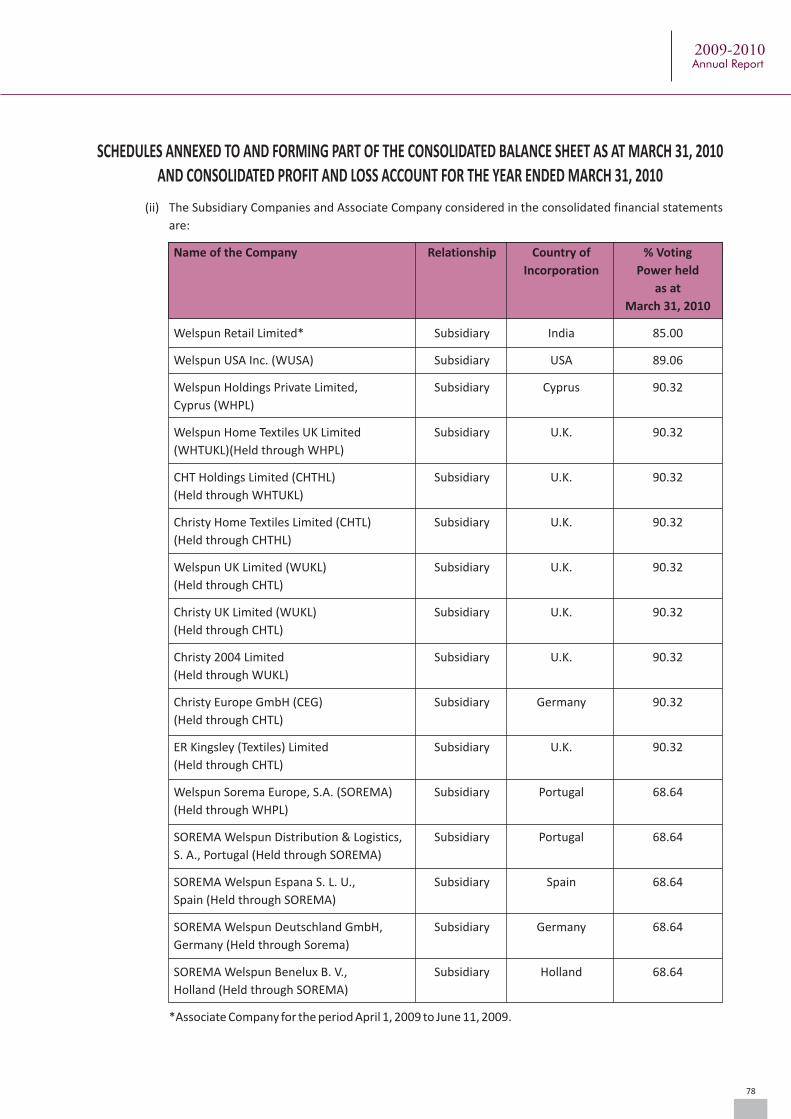
(ii) The Subsidiary Companies and Associate Company considered in the consolidated financial statements
are:
Name of the Company Relationship Country of % Voting
Incorporation Power held
as at
March 31, 2010
Welspun Retail Limited* Subsidiary India 85.00
Welspun USA Inc. (WUSA) Subsidiary USA 89.06
Welspun Holdings Private Limited, Subsidiary Cyprus 90.32
Cyprus (WHPL)
Welspun Home Textiles UK Limited Subsidiary U.K. 90.32
(WHTUKL)(Held through WHPL)
CHT Holdings Limited (CHTHL) Subsidiary U.K. 90.32
(Held through WHTUKL)
Christy Home Textiles Limited (CHTL) Subsidiary U.K. 90.32
(Held through CHTHL)
Welspun UK Limited (WUKL) Subsidiary U.K. 90.32
(Held through CHTL)
Christy UK Limited (WUKL) Subsidiary U.K. 90.32
(Held through CHTL)
Christy 2004 Limited Subsidiary U.K. 90.32
(Held through WUKL)
Christy Europe GmbH (CEG) Subsidiary Germany 90.32
(Held through CHTL)
ER Kingsley (Textiles) Limited Subsidiary U.K. 90.32
(Held through CHTL)
Welspun Sorema Europe, S.A. (SOREMA) Subsidiary Portugal 68.64
(Held through WHPL)
SOREMA Welspun Distribution & Logistics, Subsidiary Portugal 68.64
S. A., Portugal (Held through SOREMA)
SOREMA Welspun Espana S. L. U., Subsidiary Spain 68.64
Spain (Held through SOREMA)
SOREMA Welspun Deutschland GmbH, Subsidiary Germany 68.64
Germany (Held through Sorema)
SOREMA Welspun Benelux B. V., Subsidiary Holland 68.64
Holland (Held through SOREMA)
*Associate Company for the period April 1, 2009 to June 11, 2009.
SCHEDULES ANNEXED TO AND FORMING PART OF THE CONSOLIDATED BALANCE SHEET AS AT MARCH 31, 2010AND CONSOLIDATED PROFIT AND LOSS ACCOUNT FOR THE YEAR ENDED MARCH 31, 2010
78
2009-2010Annual Report
SCHEDULES ANNEXED TO AND FORMING PART OF THE CONSOLIDATED BALANCE SHEET AS AT MARCH 31, 2010AND CONSOLIDATED PROFIT AND LOSS ACCOUNT FOR THE YEAR ENDED MARCH 31, 2010
C. Significant Accounting Policies
(i) Fixed Assets
Fixed Assets are stated at cost (net of cenvat credit, wherever applicable) less accumulated depreciation
and impairment loss, if any. The cost includes cost of acquisition, construction, erection, installation etc.,
and preoperative expenses. Cost of software includes license fees and implementation/ integration
expenses.
(ii) Depreciation and Amortisation
(a) Depreciation on Fixed Assets is provided on the straight-line method so as to write off the cost of fixed
assets over estimated useful lives of the assets. Depreciation on additions/ deletions to fixed assets
is calculated pro-rata from/ up to the date of such additions/ deletions.
(b) Computer software is amortised on the straight-line method over a period of three to five years.
(c) Amortisation of leasehold improvements is computed on the straight line method over the term of
the related lease including extensions which are reasonably expected to occur, which is not in excess
of the estimated useful lives of such improvements.
(d) Goodwill arising on consolidation of a certain subsidiary sub-group is amortised on a straight line
basis over its estimated useful economic life of 20 years. Further, goodwill on consolidation is tested
for impairment on an annual basis.
(e) Project Development Expenditure is amortised on a straight line basis over a period of 3 years.
(iii) Inventories
(a) Inventories are valued at lower of cost and net realisable value.
(b) Cost of traded goods is determined on first-in-first-out basis except in the case of the subsidiaries
where it is determined on weighted average basis. Cost of raw materials and stores and spares is
determined on weighted average basis. Cost of finished goods comprises of raw material, direct
labor, other direct costs and related overheads but exclude interest expense. Net realisable value is
the estimate of the selling price in the ordinary course of the business, less the estimated costs of
completion and estimated selling expenses.
(iv) Accounting for Taxes on Income/ Minimum Alternate Tax Credit
Income tax expense comprises current tax and deferred tax charge or credit.
(a) Current Taxation
Current tax is determined as the amount of tax payable in respect of taxable income for the year.
(b) Deferred Taxation
l Deferred tax resulting from timing differences between book and tax profits is accounted for
under the liability method, at the current/ substantially enacted rate of tax to the extent that the
timing differences are expected to crystallise.
l Deferred tax assets arising in situations where there are brought forward losses and unabsorbed
depreciation, are recognised only when there is a virtual certainty supported by convincing
evidence that such assets will be realised.
79
WELSPUN GLOBAL BRANDS LTD.

(v) Employee Benefits
(a) Defined Contribution Plans
The Company contributes on a defined contribution basis towards post employment benefits to
Employee's Provident Fund, Employee's State Insurance Fund, Employee's Pension Scheme and
various other social security funds generally administered by the respective Government authorities,
and has no further obligation beyond making its contribution, which is expensed in the period to
which it pertains.
(b) Defined Benefit Plans
The liability for the defined benefit plan of Gratuity of the Company is determined on the basis of an
actuarial valuation, calculated using projected unit credit method, by an independent actuary at the
year end.
(c) Employee Leave Entitlement
The employees of the Company and its subsidiaries are entitled to leave as per the applicable leave
policies of their employers. The liability in respect of unutilised leave balances is provided based on
an actuarial valuation carried out by an independent actuary as at the year end and charged to the
Profit and Loss Account.
(vi) Foreign Currency Transactions, Derivative Instruments and Hedge Accounting
(a) In respect of the Company, it's subsidiaries incorporated in India and its associate, foreign currency
transactions are recorded at the exchange rates prevailing on the date of such transactions.
Monetary assets and liabilities as at the Balance Sheet date are translated at the rates of exchange
prevailing at the date of the Balance Sheet. Gains and losses arising on account of differences in
foreign exchange rates on settlement/ translation of monetary assets and liabilities are recognised in
the Profit and Loss Account. Non-monetary foreign currency items are carried at cost.
(b) In respect of non-integral operations, assets and liabilities are translated using the exchange rates in
effect at the balance sheet date, for revenue, costs and expenses using the average exchange rates
prevailing during the reporting periods and for share capital, using the exchange rate at the date of
transaction. The resultant translation exchange gain/ loss has been disclosed as Foreign Exchange
Translation Reserve under Reserves and Surplus.
(c) In respect of forward contracts, other than forward contracts in respect of firm commitments and
highly probable forecast transactions, the premium or discount arising at the inception of forward
exchange contract, is amortised as expense or income over the life of the contract. Exchange
differences on such contracts are recognised in the Profit and Loss Account in the reporting period in
which the exchange rates change. Any profit or loss arising on cancellation or renewal of such a
forward exchange contract is recognised as income or as expense for the period.
(d) In respect of forward contracts and currency options taken to hedge the risks associated with foreign
currency fluctuations relating to firm commitments and highly probable forecast transactions, the
Company has adopted AS 30. 'Financial Instruments: Recognition and Measurement'. Accordingly,
foreign currency fluctuations relating to firm commitments and highly probable forecast transactions
are fair valued at each reporting date.
Changes in the fair value of these hedging instruments that are designated and considered as
effective hedges of highly probable forecasted transactions are recognised directly in shareholders'
SCHEDULES ANNEXED TO AND FORMING PART OF THE CONSOLIDATED BALANCE SHEET AS AT MARCH 31, 2010AND CONSOLIDATED PROFIT AND LOSS ACCOUNT FOR THE YEAR ENDED MARCH 31, 2010
80
2009-2010Annual Report
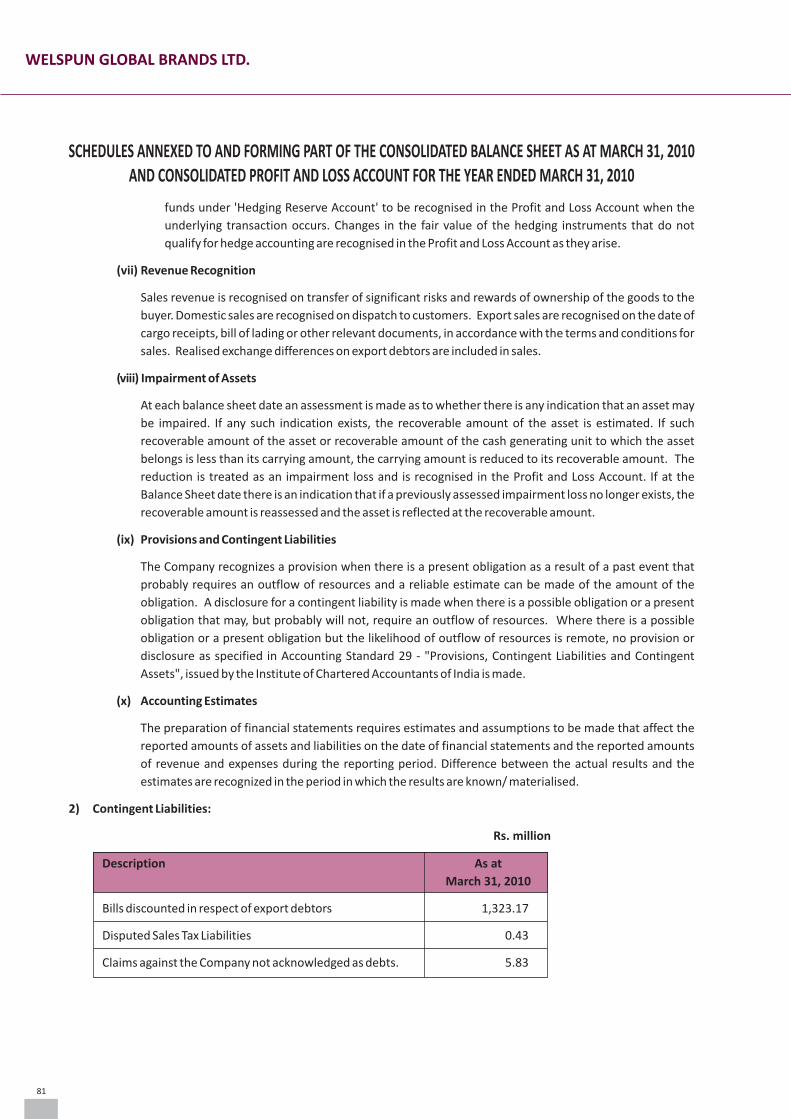
SCHEDULES ANNEXED TO AND FORMING PART OF THE CONSOLIDATED BALANCE SHEET AS AT MARCH 31, 2010AND CONSOLIDATED PROFIT AND LOSS ACCOUNT FOR THE YEAR ENDED MARCH 31, 2010
funds under 'Hedging Reserve Account' to be recognised in the Profit and Loss Account when the
underlying transaction occurs. Changes in the fair value of the hedging instruments that do not
qualify for hedge accounting are recognised in the Profit and Loss Account as they arise.
(vii) Revenue Recognition
Sales revenue is recognised on transfer of significant risks and rewards of ownership of the goods to the
buyer. Domestic sales are recognised on dispatch to customers. Export sales are recognised on the date of
cargo receipts, bill of lading or other relevant documents, in accordance with the terms and conditions for
sales. Realised exchange differences on export debtors are included in sales.
(viii) Impairment of Assets
At each balance sheet date an assessment is made as to whether there is any indication that an asset may
be impaired. If any such indication exists, the recoverable amount of the asset is estimated. If such
recoverable amount of the asset or recoverable amount of the cash generating unit to which the asset
belongs is less than its carrying amount, the carrying amount is reduced to its recoverable amount. The
reduction is treated as an impairment loss and is recognised in the Profit and Loss Account. If at the
Balance Sheet date there is an indication that if a previously assessed impairment loss no longer exists, the
recoverable amount is reassessed and the asset is reflected at the recoverable amount.
(ix) Provisions and Contingent Liabilities
The Company recognizes a provision when there is a present obligation as a result of a past event that
probably requires an outflow of resources and a reliable estimate can be made of the amount of the
obligation. A disclosure for a contingent liability is made when there is a possible obligation or a present
obligation that may, but probably will not, require an outflow of resources. Where there is a possible
obligation or a present obligation but the likelihood of outflow of resources is remote, no provision or
disclosure as specified in Accounting Standard 29 - "Provisions, Contingent Liabilities and Contingent
Assets", issued by the Institute of Chartered Accountants of India is made.
(x) Accounting Estimates
The preparation of financial statements requires estimates and assumptions to be made that affect the
reported amounts of assets and liabilities on the date of financial statements and the reported amounts
of revenue and expenses during the reporting period. Difference between the actual results and the
estimates are recognized in the period in which the results are known/ materialised.
2) Contingent Liabilities:
Rs. million
Description As at
March 31, 2010
Bills discounted in respect of export debtors 1,323.17
Disputed Sales Tax Liabilities 0.43
Claims against the Company not acknowledged as debts. 5.83
81
WELSPUN GLOBAL BRANDS LTD.
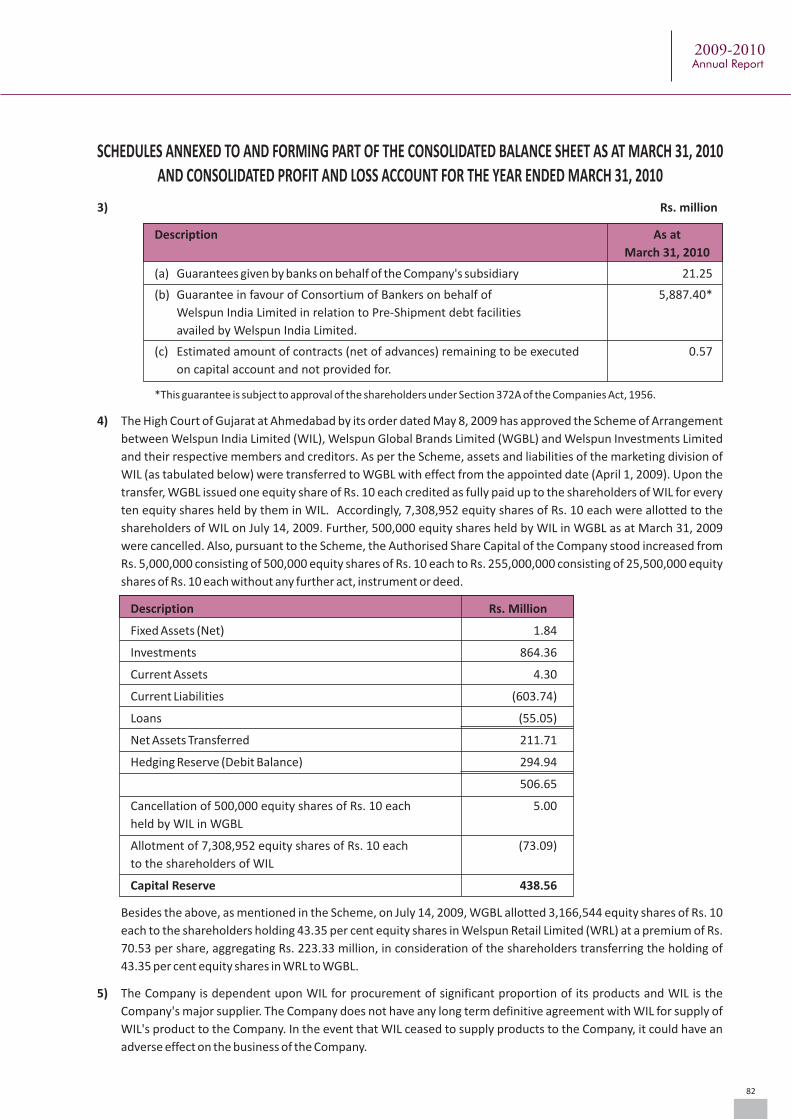
3) Rs. million
Description As at
March 31, 2010
(a) Guarantees given by banks on behalf of the Company's subsidiary 21.25
(b) Guarantee in favour of Consortium of Bankers on behalf of 5,887.40*
Welspun India Limited in relation to Pre-Shipment debt facilities
availed by Welspun India Limited.
(c) Estimated amount of contracts (net of advances) remaining to be executed 0.57
on capital account and not provided for.
*This guarantee is subject to approval of the shareholders under Section 372A of the Companies Act, 1956.
4) The High Court of Gujarat at Ahmedabad by its order dated May 8, 2009 has approved the Scheme of Arrangement
between Welspun India Limited (WIL), Welspun Global Brands Limited (WGBL) and Welspun Investments Limited
and their respective members and creditors. As per the Scheme, assets and liabilities of the marketing division of
WIL (as tabulated below) were transferred to WGBL with effect from the appointed date (April 1, 2009). Upon the
transfer, WGBL issued one equity share of Rs. 10 each credited as fully paid up to the shareholders of WIL for every
ten equity shares held by them in WIL. Accordingly, 7,308,952 equity shares of Rs. 10 each were allotted to the
shareholders of WIL on July 14, 2009. Further, 500,000 equity shares held by WIL in WGBL as at March 31, 2009
were cancelled. Also, pursuant to the Scheme, the Authorised Share Capital of the Company stood increased from
Rs. 5,000,000 consisting of 500,000 equity shares of Rs. 10 each to Rs. 255,000,000 consisting of 25,500,000 equity
shares of Rs. 10 each without any further act, instrument or deed.
Description Rs. Million
Fixed Assets (Net) 1.84
Investments 864.36
Current Assets 4.30
Current Liabilities (603.74)
Loans (55.05)
Net Assets Transferred 211.71
Hedging Reserve (Debit Balance) 294.94
506.65
Cancellation of 500,000 equity shares of Rs. 10 each 5.00
held by WIL in WGBL
Allotment of 7,308,952 equity shares of Rs. 10 each (73.09)
to the shareholders of WIL
Capital Reserve 438.56
Besides the above, as mentioned in the Scheme, on July 14, 2009, WGBL allotted 3,166,544 equity shares of Rs. 10
each to the shareholders holding 43.35 per cent equity shares in Welspun Retail Limited (WRL) at a premium of Rs.
70.53 per share, aggregating Rs. 223.33 million, in consideration of the shareholders transferring the holding of
43.35 per cent equity shares in WRL to WGBL.
5) The Company is dependent upon WIL for procurement of significant proportion of its products and WIL is the
Company's major supplier. The Company does not have any long term definitive agreement with WIL for supply of
WIL's product to the Company. In the event that WIL ceased to supply products to the Company, it could have an
adverse effect on the business of the Company.
SCHEDULES ANNEXED TO AND FORMING PART OF THE CONSOLIDATED BALANCE SHEET AS AT MARCH 31, 2010AND CONSOLIDATED PROFIT AND LOSS ACCOUNT FOR THE YEAR ENDED MARCH 31, 2010
82
2009-2010Annual Report
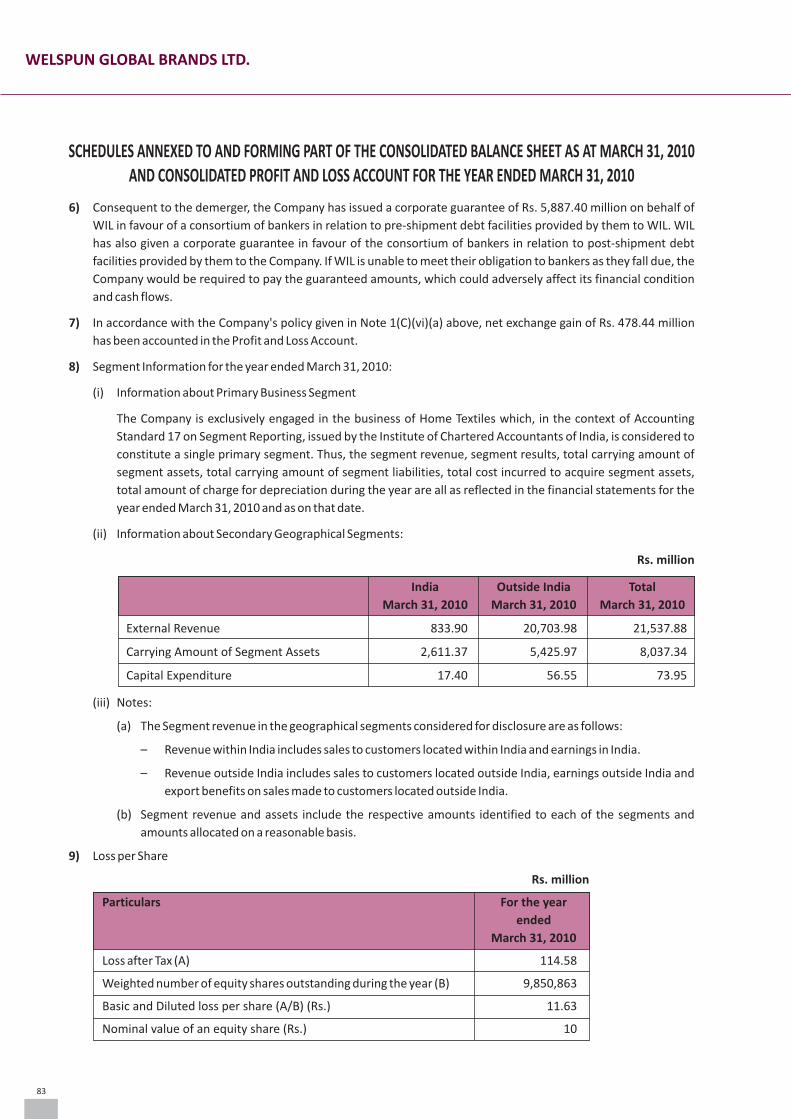
SCHEDULES ANNEXED TO AND FORMING PART OF THE CONSOLIDATED BALANCE SHEET AS AT MARCH 31, 2010AND CONSOLIDATED PROFIT AND LOSS ACCOUNT FOR THE YEAR ENDED MARCH 31, 2010
6) Consequent to the demerger, the Company has issued a corporate guarantee of Rs. 5,887.40 million on behalf of
WIL in favour of a consortium of bankers in relation to pre-shipment debt facilities provided by them to WIL. WIL
has also given a corporate guarantee in favour of the consortium of bankers in relation to post-shipment debt
facilities provided by them to the Company. If WIL is unable to meet their obligation to bankers as they fall due, the
Company would be required to pay the guaranteed amounts, which could adversely affect its financial condition
and cash flows.
7) In accordance with the Company's policy given in Note 1(C)(vi)(a) above, net exchange gain of Rs. 478.44 million
has been accounted in the Profit and Loss Account.
8) Segment Information for the year ended March 31, 2010:
(i) Information about Primary Business Segment
The Company is exclusively engaged in the business of Home Textiles which, in the context of Accounting
Standard 17 on Segment Reporting, issued by the Institute of Chartered Accountants of India, is considered to
constitute a single primary segment. Thus, the segment revenue, segment results, total carrying amount of
segment assets, total carrying amount of segment liabilities, total cost incurred to acquire segment assets,
total amount of charge for depreciation during the year are all as reflected in the financial statements for the
year ended March 31, 2010 and as on that date.
(ii) Information about Secondary Geographical Segments:
Rs. million
India Outside India Total
March 31, 2010 March 31, 2010 March 31, 2010
External Revenue 833.90 20,703.98 21,537.88
Carrying Amount of Segment Assets 2,611.37 5,425.97 8,037.34
Capital Expenditure 17.40 56.55 73.95
(iii) Notes:
(a) The Segment revenue in the geographical segments considered for disclosure are as follows:
– Revenue within India includes sales to customers located within India and earnings in India.
– Revenue outside India includes sales to customers located outside India, earnings outside India and
export benefits on sales made to customers located outside India.
(b) Segment revenue and assets include the respective amounts identified to each of the segments and
amounts allocated on a reasonable basis.
9) Loss per Share
Rs. million
Particulars For the year
ended
March 31, 2010
Loss after Tax (A) 114.58
Weighted number of equity shares outstanding during the year (B) 9,850,863
Basic and Diluted loss per share (A/B) (Rs.) 11.63
Nominal value of an equity share (Rs.) 10
83
WELSPUN GLOBAL BRANDS LTD.
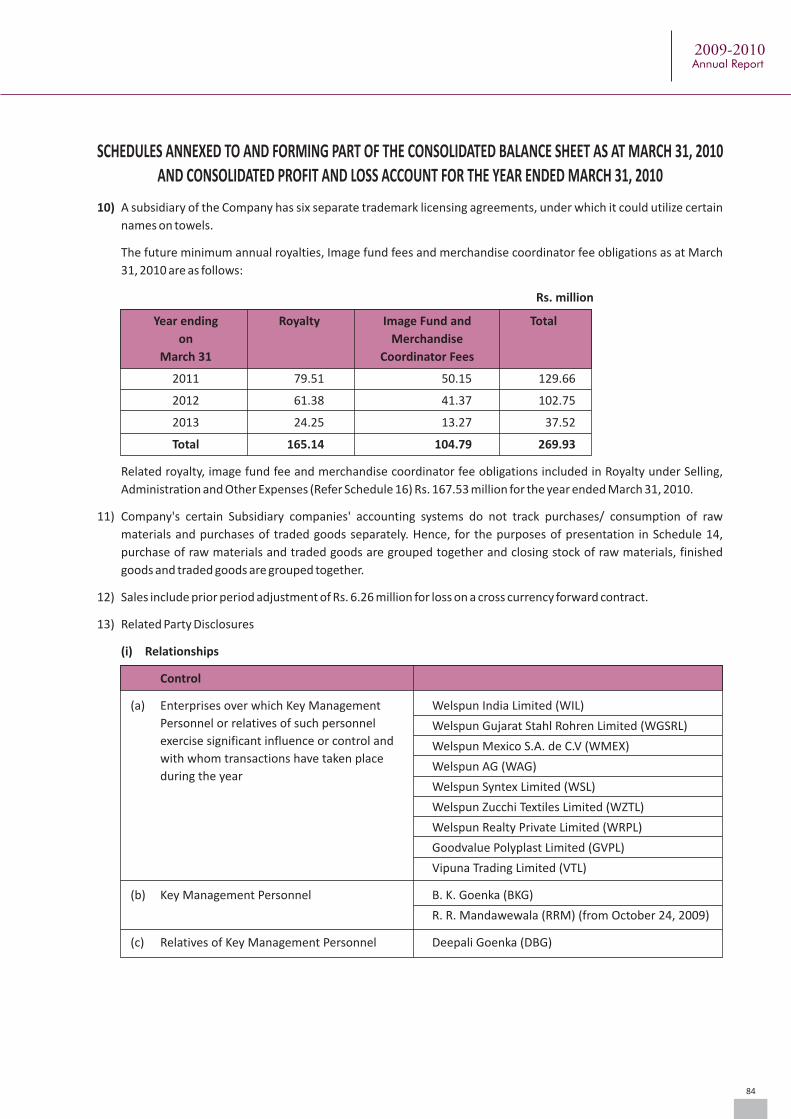
10) A subsidiary of the Company has six separate trademark licensing agreements, under which it could utilize certain
names on towels.
The future minimum annual royalties, Image fund fees and merchandise coordinator fee obligations as at March
31, 2010 are as follows:
Rs. million
Year ending Royalty Image Fund and Total
on Merchandise
March 31 Coordinator Fees
2011 79.51 50.15 129.66
2012 61.38 41.37 102.75
2013 24.25 13.27 37.52
Total 165.14 104.79 269.93
Related royalty, image fund fee and merchandise coordinator fee obligations included in Royalty under Selling,
Administration and Other Expenses (Refer Schedule 16) Rs. 167.53 million for the year ended March 31, 2010.
11) Company's certain Subsidiary companies' accounting systems do not track purchases/ consumption of raw
materials and purchases of traded goods separately. Hence, for the purposes of presentation in Schedule 14,
purchase of raw materials and traded goods are grouped together and closing stock of raw materials, finished
goods and traded goods are grouped together.
12) Sales include prior period adjustment of Rs. 6.26 million for loss on a cross currency forward contract.
13) Related Party Disclosures
(i) Relationships
Control
(a) Enterprises over which Key Management Welspun India Limited (WIL)
Personnel or relatives of such personnel Welspun Gujarat Stahl Rohren Limited (WGSRL)exercise significant influence or control and Welspun Mexico S.A. de C.V (WMEX)with whom transactions have taken place
Welspun AG (WAG)during the year
Welspun Syntex Limited (WSL)
Welspun Zucchi Textiles Limited (WZTL)
Welspun Realty Private Limited (WRPL)
Goodvalue Polyplast Limited (GVPL)
Vipuna Trading Limited (VTL)
(b) Key Management Personnel B. K. Goenka (BKG)
R. R. Mandawewala (RRM) (from October 24, 2009)
(c) Relatives of Key Management Personnel Deepali Goenka (DBG)
SCHEDULES ANNEXED TO AND FORMING PART OF THE CONSOLIDATED BALANCE SHEET AS AT MARCH 31, 2010AND CONSOLIDATED PROFIT AND LOSS ACCOUNT FOR THE YEAR ENDED MARCH 31, 2010
84
2009-2010Annual Report
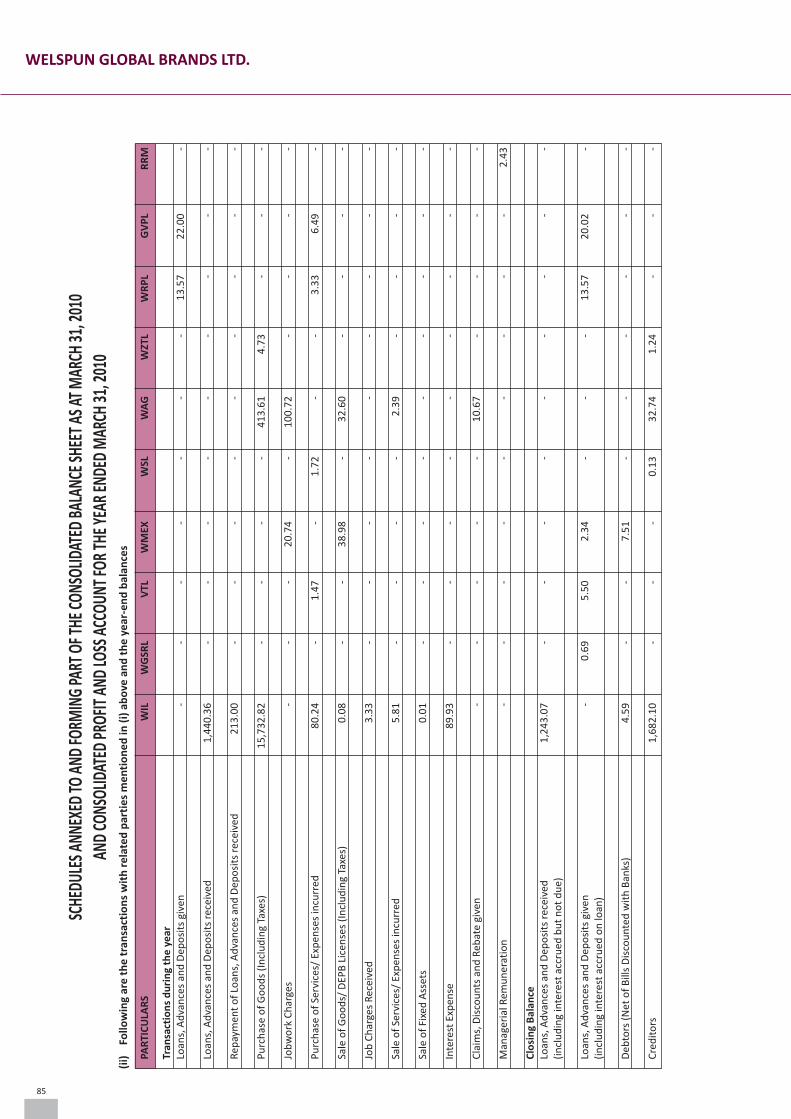
SCHE
DULE
S ANN
EXED
TO A
ND FO
RMIN
G PA
RT O
F THE
CON
SOLID
ATED
BAL
ANCE
SHEE
T AS A
T MAR
CH 3
1, 2
010
AND
CONS
OLID
ATED
PRO
FIT A
ND LO
SS A
CCOU
NT FO
R TH
E YEA
R EN
DED
MAR
CH 3
1, 2
010
(ii)
Follo
win
g ar
e t
he
tra
nsa
ctio
ns
wit
h r
ela
ted
par
tie
s m
en
tio
ne
d in
(i)
ab
ove
an
d t
he
ye
ar-e
nd
bal
ance
s
PAR
TIC
ULA
RS
WIL
W
GSR
L V
TL
WM
EX
WSL
W
AG
W
ZTL
WR
PL
GV
PL
RR
M
Tran
sact
ion
s d
uri
ng
the
ye
arLo
ans,
Ad
van
ces
and
Dep
osi
ts g
iven
-
-
-
-
-
-
-
13
.57
2
2.0
0
-
Loan
s, A
dva
nce
s an
d D
epo
sits
rec
eive
d 1
,44
0.3
6
-
-
-
-
-
-
-
-
-
Rep
aym
ent
of
Loan
s, A
dva
nce
s an
d D
epo
sits
rec
eive
d 2
13
.00
-
-
-
-
-
-
-
-
-
Pu
rch
ase
of
Go
od
s (I
ncl
ud
ing
Taxe
s) 1
5,7
32
.82
-
-
-
-
4
13
.61
4
.73
-
-
-
Job
wo
rk C
har
ges
-
-
-
20
.74
-
1
00
.72
-
-
-
-
Pu
rch
ase
of
Serv
ices
/ Ex
pen
ses
incu
rred
80
.24
-
1
.47
-
1
.72
-
-
3
.33
6
.49
-
Sale
of
Go
od
s/ D
EPB
Lic
ense
s (I
ncl
ud
ing
Taxe
s) 0
.08
-
-
3
8.9
8
-
32
.60
-
-
-
-
Job
Ch
arge
s R
ecei
ved
3.3
3
-
-
-
-
-
-
-
-
-
Sale
of
Serv
ices
/ Ex
pen
ses
incu
rred
5.8
1
-
-
-
-
2.3
9
-
-
-
-
Sale
of
Fixe
d A
sset
s 0
.01
-
-
-
-
-
-
-
-
-
Inte
rest
Exp
ense
89
.93
-
-
-
-
-
-
-
-
-
Cla
ims,
Dis
cou
nts
an
d R
ebat
e gi
ven
-
-
-
-
-
10
.67
-
-
-
-
Man
ager
ial R
emu
ner
atio
n -
-
-
-
-
-
-
-
-
2
.43
Clo
sin
g B
alan
ceLo
ans,
Ad
van
ces
and
Dep
osi
ts r
ecei
ved
1,2
43
.07
-
-
-
-
-
-
-
-
-
(i
ncl
ud
ing
inte
rest
acc
rued
bu
t n
ot
du
e)
Loan
s, A
dva
nce
s an
d D
epo
sits
giv
en -
0
.69
5
.50
2
.34
-
-
-
1
3.5
7
20
.02
-
(in
clu
din
g in
tere
st a
ccru
ed o
n lo
an)
Deb
tors
(N
et o
f B
ills
Dis
cou
nte
d w
ith
Ban
ks)
4.5
9
-
-
7.5
1
-
-
-
-
-
-
Cre
dit
ors
1,6
82
.10
-
-
-
0
.13
3
2.7
4
1.2
4
-
-
-
85
WELSPUN GLOBAL BRANDS LTD.
SCHEDULES ANNEXED TO AND FORMING PART OF THE CONSOLIDATED BALANCE SHEET AS AT MARCH 31, 2010AND CONSOLIDATED PROFIT AND LOSS ACCOUNT FOR THE YEAR ENDED MARCH 31, 2010
86
14. The Company has classified various benefits provided to employees as under :-I Defined Contribution Plans
During the period the Company has recognised the following amounts which is included under Contributionto Provident and Other Fund (Refer Schedule 15)
Year EndedMarch 31, 2010
Rs. million
– Employers' Contribution to Provident and Pension Scheme 8.15
– Employers' Contribution to Employee’s State Insurance Scheme 1.04
– Employers' Contribution to 401 (k) Retirement Plan 11.26
– Other Social Security Funds 0.71
II Defined Benefit Plan (Gratuity Fund)
a. Major Assumptions Year EndedMarch 31, 2010(% per annum)
Discount Rate 7.75 - 8.20
Expected Rate of Return on Plan Assets 8.5
Salary Escalation Rate @ 5 - 6 @ The estimates for future salary increases considered takes into account the inflation, seniority, promotionand other relevant factors.
b. Change in the Present Value of Obligation Year EndedMarch 31, 2010
Rs. million
Opening Present Value of Obligation –
Liability transferred from Welspun India Limited 7.54
Current Service Cost 2.59
Interest Cost 0.66
Benefits Paid (1.40)
Actuarial Loss 1.46
Closing Present Value of Obligation 10.85
c. Change in Fair Value of Plan Assets As AtMarch 31, 2010
Rs. million
Fair Value of Plan Assets* 5.75
Expected Return on Plan Assets 0.48
Actuarial Gain on Plan Assets 0.10
Contributions 1.28
Benefits paid (0.58)
Closing Fair Value of Plan Assets * 7.03*The fair value of plan assets of Rs. 5.75 million represents the gratuity fund balance held by the EmployeesGroup Gratuity Trust of Welspun India Limited, for the employees transferred from Welspun India Limited tothe Company, pursuant to the Scheme of Arrangement, as referred in Note 4 above.
d. Reconciliation of Present Value of Obligation and the Fair Value of Assets to Assets and Liabilities As Atrecongnised in Balance Sheet March 31, 2010
Rs. million
Present Value of Obligation 10.85Fair Value of Plan Assets 7.03Present Value of unfunded obligation 3.82 Liability recognised in the Balance Sheet and included under Current Liabilities and Provisions 3.82 (Refer Schedule 11)
e. Amount recognised in the Balance Sheet As AtMarch 31, 2010
Rs. million
Present Value of Obligation 10.85
Fair Value of Plan Assets 7.03
Liability recognised in the balance Sheet and included under Current Liabilities and Provisions 3.82(Refer Schedule 11)
f. Expense Recognised in the Profit and Loss Account As AtMarch 31, 2010
Rs. million
Current Service Cost 2.59Interest Cost 0.66Expected Return on Plan Assets (0.48)Net Actuarial Loss Recognised in the year 1.36Total expense recognised in the Profit and Loss Account ** 4.13
Actual Return on Plan Assets 0.58** Included in Salaries, Allowances and Other Benefits (Refer Schedule 15)
III Other Employee Benefit The liability for leave entitlement and compensated absences as at year end is Rs. 7.40 million.(Refer Schedule 11)
2009-2010Annual Report

15) Derivative Instruments outstanding as at March 31, 2010 :
The Company is exposed to foreign currency fluctuations on foreign currency assets / liabilities, forecasted
revenues denominated in foreign currency. In line with the Company's risk management policies and procedures,
the Company enters into foreign currency forward contracts and currency option contracts to manage its
exposure. These contracts are for a period between one month and twelve months and forecasted transactions are
expected to occur during the same period.
(a) The following are outstanding foreign currency forward and option contracts:
(i) Designated Cash Flow Currency March 31, 2010
Hedges Pair
Notional Amount Fair Value
Foreign Currency Gain/ (Loss)Rs. million
(in million) Rs. million
Forward Contracts (Sell) USD-INR 166.06 7,982.44 399.99
Option Contracts (Sell) USD-INR 2.50 115.70 2.36
Forward Contracts(Buy) USD-GBP 5.00 224.50 11.41
(ii) Non-Designated Hedges CurrencyMarch 31, 2010
Pair
Notional Amount Fair Value
Foreign Currency Gain/ (Loss)Rs. million
(in million) Rs. million
Option Contracts (Sell) USD-INR 4.75 199.91 (22.59)
(iii) In addition to the above, the Company has following outstanding foreign currency forward contracts to
hedge foreign currency exposure against receivables as at March 31, 2010:
CurrencyMarch 31, 2010
Pair
Notional Amount Foreign
Exchange
Foreign Currency Gain/ (Loss)Rs. million(in million) Rs. million
Forward Contracts (Sell) USD-INR 12.50 597.58 33.78
SCHEDULES ANNEXED TO AND FORMING PART OF THE CONSOLIDATED BALANCE SHEET AS AT MARCH 31, 2010AND CONSOLIDATED PROFIT AND LOSS ACCOUNT FOR THE YEAR ENDED MARCH 31, 2010
87
WELSPUN GLOBAL BRANDS LTD.
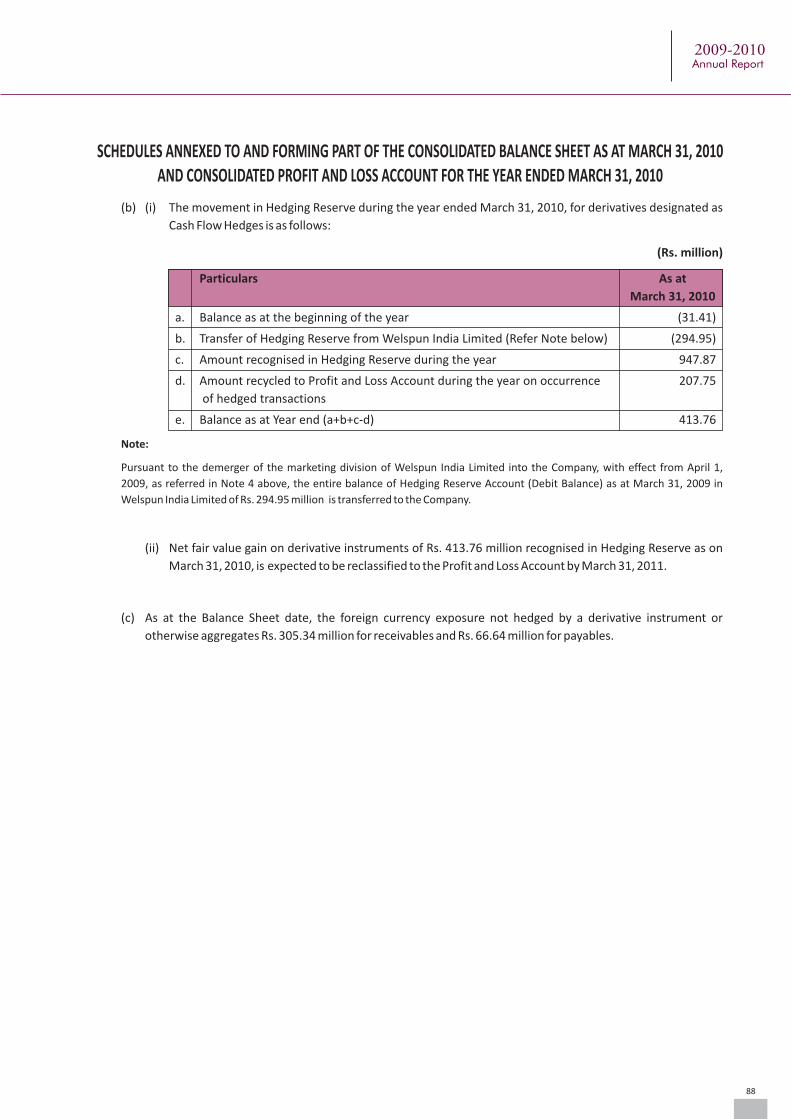
SCHEDULES ANNEXED TO AND FORMING PART OF THE CONSOLIDATED BALANCE SHEET AS AT MARCH 31, 2010AND CONSOLIDATED PROFIT AND LOSS ACCOUNT FOR THE YEAR ENDED MARCH 31, 2010
88
(b) (i) The movement in Hedging Reserve during the year ended March 31, 2010, for derivatives designated as
Cash Flow Hedges is as follows:
(Rs. million)
Particulars As at
March 31, 2010
a. Balance as at the beginning of the year (31.41)
b. Transfer of Hedging Reserve from Welspun India Limited (Refer Note below) (294.95)
c. Amount recognised in Hedging Reserve during the year 947.87
d. Amount recycled to Profit and Loss Account during the year on occurrence 207.75
of hedged transactions
e. Balance as at Year end (a+b+c-d) 413.76
Note:
Pursuant to the demerger of the marketing division of Welspun India Limited into the Company, with effect from April 1,
2009, as referred in Note 4 above, the entire balance of Hedging Reserve Account (Debit Balance) as at March 31, 2009 in
Welspun India Limited of Rs. 294.95 million is transferred to the Company.
(ii) Net fair value gain on derivative instruments of Rs. 413.76 million recognised in Hedging Reserve as on
March 31, 2010, is expected to be reclassified to the Profit and Loss Account by March 31, 2011.
(c) As at the Balance Sheet date, the foreign currency exposure not hedged by a derivative instrument or
otherwise aggregates Rs. 305.34 million for receivables and Rs. 66.64 million for payables.
2009-2010Annual Report

89
WELSPUN GLOBAL BRANDS LTD.
Signatures to Schedules 1 to 18 forming part of the Accounts
For Price Waterhouse & Co.Firm Registration No: 007567SChartered Accountants
For and on behalf of the Board of Directors
Neeraj GuptaPartnerMembership No. F055158
B. K. GoenkaChairman
R. R. MandawewalaManaging Director
D. K. PatilCompany Secretary
Place: MumbaiDate: May 27, 2010
Place: MumbaiDate: May 27, 2010
16) Operating Lease:
The Company and its certain subsidiaries have taken various residential, office premises, godowns and vehicles
under operating lease agreements that are renewable on a periodic basis at the option of both the lessor and the
lessee. The initial tenure of lease is generally for eleven months to seventy two months.
The minimum rental payments under the operating leases under non-cancellable lease term as at March 31, 2010
are as under:
Rs. million
Not later than Later than 1 year and Later than 5 years
1 year not later than 5 years
142.01 377.13 39.28
The aggregate rental expenses of all the operating leases for the year are Rs. 257.53 million.
17) These consolidated financial statements have been prepared for the first time. In accordance with the transitional
provision of AS - 21, previous year comparative figures have not been presented.
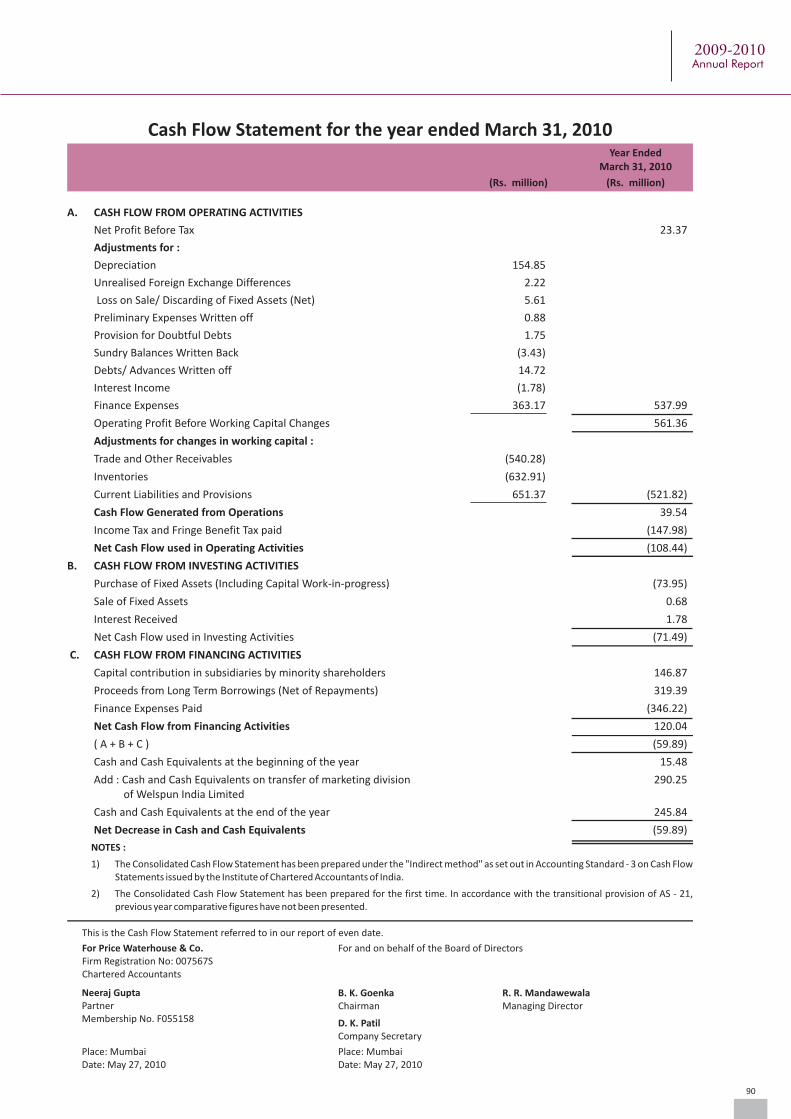
Cash Flow Statement for the year ended March 31, 2010Year Ended
March 31, 2010
(Rs. million)(Rs. million)
A. CASH FLOW FROM OPERATING ACTIVITIES
Net Profit Before Tax 23.37
Adjustments for :
Depreciation 154.85
Unrealised Foreign Exchange Differences 2.22
Loss on Sale/ Discarding of Fixed Assets (Net) 5.61
Preliminary Expenses Written off 0.88
Provision for Doubtful Debts 1.75
Sundry Balances Written Back (3.43)
Debts/ Advances Written off 14.72
Interest Income (1.78)
Finance Expenses 363.17 537.99
Operating Profit Before Working Capital Changes 561.36
Adjustments for changes in working capital :
Trade and Other Receivables (540.28)
Inventories (632.91)
Current Liabilities and Provisions 651.37 (521.82)
Cash Flow Generated from Operations 39.54
Income Tax and Fringe Benefit Tax paid (147.98)
Net Cash Flow used in Operating Activities (108.44)
B. CASH FLOW FROM INVESTING ACTIVITIES
Purchase of Fixed Assets (Including Capital Work-in-progress) (73.95)
Sale of Fixed Assets 0.68
Interest Received 1.78
Net Cash Flow used in Investing Activities (71.49)
C. CASH FLOW FROM FINANCING ACTIVITIES
Capital contribution in subsidiaries by minority shareholders 146.87
Proceeds from Long Term Borrowings (Net of Repayments) 319.39
Finance Expenses Paid (346.22)
Net Cash Flow from Financing Activities 120.04
( A + B + C ) (59.89)
Cash and Cash Equivalents at the beginning of the year 15.48
Add : Cash and Cash Equivalents on transfer of marketing division 290.25 of Welspun India Limited
Cash and Cash Equivalents at the end of the year 245.84
Net Decrease in Cash and Cash Equivalents (59.89)
NOTES :
1) The Consolidated Cash Flow Statement has been prepared under the "Indirect method" as set out in Accounting Standard - 3 on Cash Flow Statements issued by the Institute of Chartered Accountants of India.
2) The Consolidated Cash Flow Statement has been prepared for the first time. In accordance with the transitional provision of AS - 21, previous year comparative figures have not been presented.
This is the Cash Flow Statement referred to in our report of even date.
For Price Waterhouse & Co.Firm Registration No: 007567SChartered Accountants
For and on behalf of the Board of Directors
Neeraj GuptaPartnerMembership No. F055158
B. K. GoenkaChairman
R. R. MandawewalaManaging Director
D. K. PatilCompany Secretary
Place: MumbaiDate: May 27, 2010
Place: MumbaiDate: May 27, 2010
90
2009-2010Annual Report
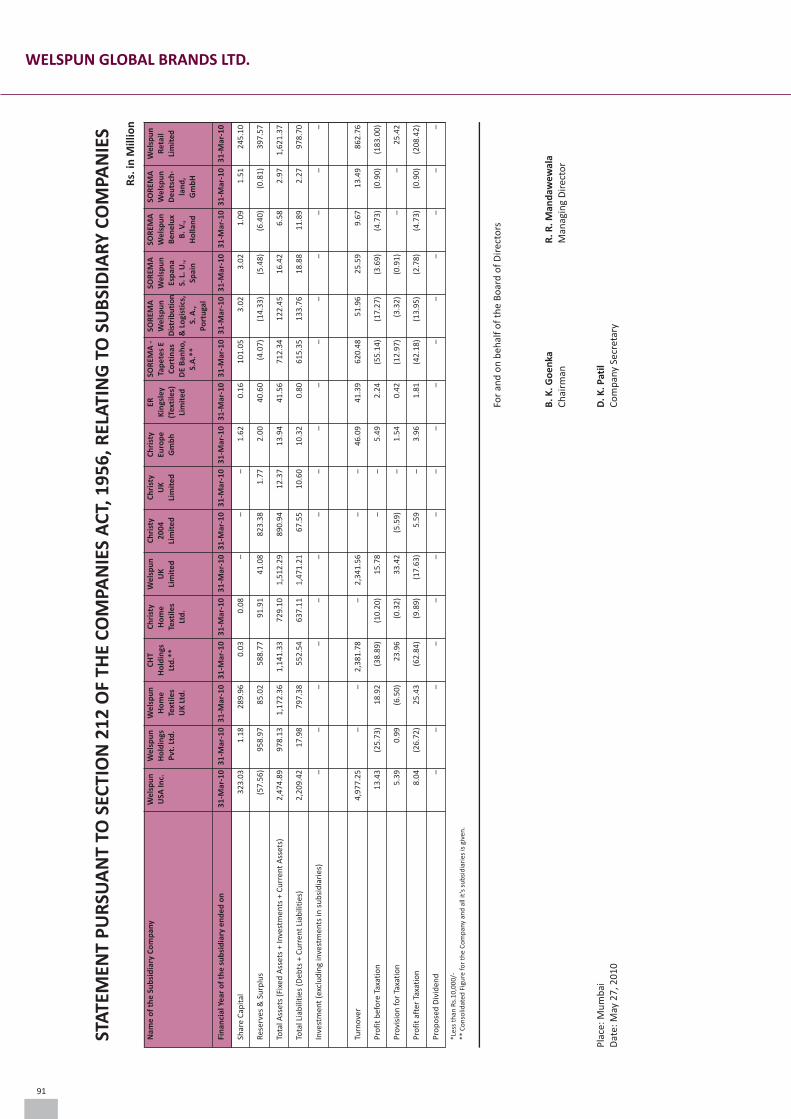
91
WELSPUN GLOBAL BRANDS LTD.
B. K
. Go
en
kaC
hai
rman
R. R
. Man
daw
ew
ala
Man
agin
g D
irec
tor
For
and
on
beh
alf
of
the
Bo
ard
of
Dir
ecto
rs
D. K
. Pat
ilC
om
pan
y Se
cret
ary
Pla
ce: M
um
bai
Dat
e: M
ay 2
7, 2
01
0
STA
TEM
ENT
PU
RSU
AN
T TO
SEC
TIO
N 2
12
OF
THE
CO
MPA
NIE
S A
CT,
19
56
, REL
ATI
NG
TO
SU
BSI
DIA
RY
CO
MPA
NIE
S
Rs.
in M
illio
n
Nam
e o
f th
e S
ub
sid
iary
Co
mp
any
We
lsp
un
We
lsp
un
We
lsp
un
CH
TC
hri
sty
We
lsp
un
Ch
rist
yC
hri
sty
Ch
rist
yER
SOR
EMA
-SO
REM
ASO
REM
ASO
REM
ASO
REM
AW
els
pu
nU
SA In
c.H
old
ings
Ho
me
Ho
ldin
gsH
om
eU
K2
00
4U
KEu
rop
eK
ings
ley
Tap
ete
s E
We
lsp
un
We
lsp
un
We
lsp
un
We
lsp
un
Re
tail
Pvt
. Ltd
.Te
xtile
sLt
d.*
*Te
xtile
sLi
mit
ed
Lim
ite
dLi
mit
ed
Gm
bh
(Tex
tile
s)C
ort
inas
Dis
trib
uti
on
Esp
ana
Be
ne
lux
De
uts
ch-
Lim
ite
dU
K L
td.
Ltd
.
Lim
ite
dD
E B
anh
o,
& L
ogi
stic
s,S.
L. U
.,B
. V.,
lan
d,
S.A
.**
S. A
.,Sp
ain
Ho
llan
dG
mb
HP
ort
uga
l
Fin
anci
al Y
ear
of
the
su
bsi
dia
ry e
nd
ed
on
3
1-M
ar-1
03
1-M
ar-1
03
1-M
ar-1
03
1-M
ar-1
03
1-M
ar-1
03
1-M
ar-1
03
1-M
ar-1
03
1-M
ar-1
03
1-M
ar-1
03
1-M
ar-1
03
1-M
ar-1
03
1-M
ar-1
03
1-M
ar-1
03
1-M
ar-1
03
1-M
ar-1
03
1-M
ar-1
0
Shar
e C
apit
al 3
23
.03
1
.18
2
89
.96
0
.03
0
.08
–
––
1
.62
0
.16
1
01
.05
3
.02
3
.02
1
.09
1
.51
2
45
.10
Res
erve
s &
Su
rplu
s (
57
.56
) 9
58
.97
8
5.0
2
58
8.7
7
91
.91
4
1.0
8
82
3.3
8
1.7
7
2.0
0
40
.60
(
4.0
7)
(1
4.3
3)
(5
.48
) (
6.4
0)
(0
.81
) 3
97
.57
Tota
l Ass
ets
(Fix
ed A
sset
s +
Inve
stm
ents
+ C
urr
ent
Ass
ets)
2,4
74
.89
9
78
.13
1
,17
2.3
6
1,1
41
.33
7
29
.10
1
,51
2.2
9
89
0.9
4
12
.37
1
3.9
4
41
.56
7
12
.34
1
22
.45
1
6.4
2
6.5
8
2.9
7
1,6
21
.37
Tota
l Lia
bili
ties
(D
ebts
+ C
urr
ent
Liab
iliti
es)
2,2
09
.42
1
7.9
8
79
7.3
8
55
2.5
4
63
7.1
1
1,4
71
.21
6
7.5
5
10
.60
1
0.3
2
0.8
0
61
5.3
5
13
3.7
6
18
.88
1
1.8
9
2.2
7
97
8.7
0
Inve
stm
ent
(exc
lud
ing
inve
stm
ents
in s
ub
sid
iari
es)
––
–
––
–
–
––
––
––
–
–
–
Turn
ove
r 4
,97
7.2
5
–
–
2,3
81
.78
–
2
,34
1.5
6
–
–
46
.09
4
1.3
9
62
0.4
8
51
.96
2
5.5
9
9.6
7
13
.49
8
62
.76
Pro
fit
bef
ore
Tax
atio
n 1
3.4
3
(2
5.7
3)
18
.92
(
38
.89
) (
10
.20
) 1
5.7
8
–
–
5.4
9
2.2
4
(5
5.1
4)
(1
7.2
7)
(3
.69
) (
4.7
3)
(0
.90
) (
18
3.0
0)
Pro
visi
on
fo
r Ta
xati
on
5.3
9
0.9
9
(6
.50
) 2
3.9
6
(0
.32
) 3
3.4
2
(5
.59
) –
1
.54
0
.42
(
12
.97
) (
3.3
2)
(0
.91
) –
–
2
5.4
2
Pro
fit
afte
r Ta
xati
on
8.0
4
(2
6.7
2)
25
.43
(
62
.84
) (
9.8
9)
(1
7.6
3)
5.5
9
–
3.9
6
1.8
1
(4
2.1
8)
(1
3.9
5)
(2
.78
) (
4.7
3)
(0
.90
) (
20
8.4
2)
Pro
po
sed
Div
iden
d –
––
–
–
–
–
–
–
–
–
–
–
––
–
*Les
s th
an R
s.1
0,0
00
/-**
Co
nso
lidat
ed F
igu
re f
or
the
Co
mp
any
and
all
it’s
su
bsi
dia
ries
is g
iven
.


AMY BUTLER
Get in touch with nature at home

Welspun Global Brands Ltd. Welspun House, 5th Floor, Kamala Mills Compound, Senapati Bapat Marg, Lower Parel (West), Mumbai - 400 013
www.welspunglobalbrands.com