Embed Size (px)
DESCRIPTION
The complete annual report 2004 of the Belgacom Group.
Citation preview

Belg
aco
m
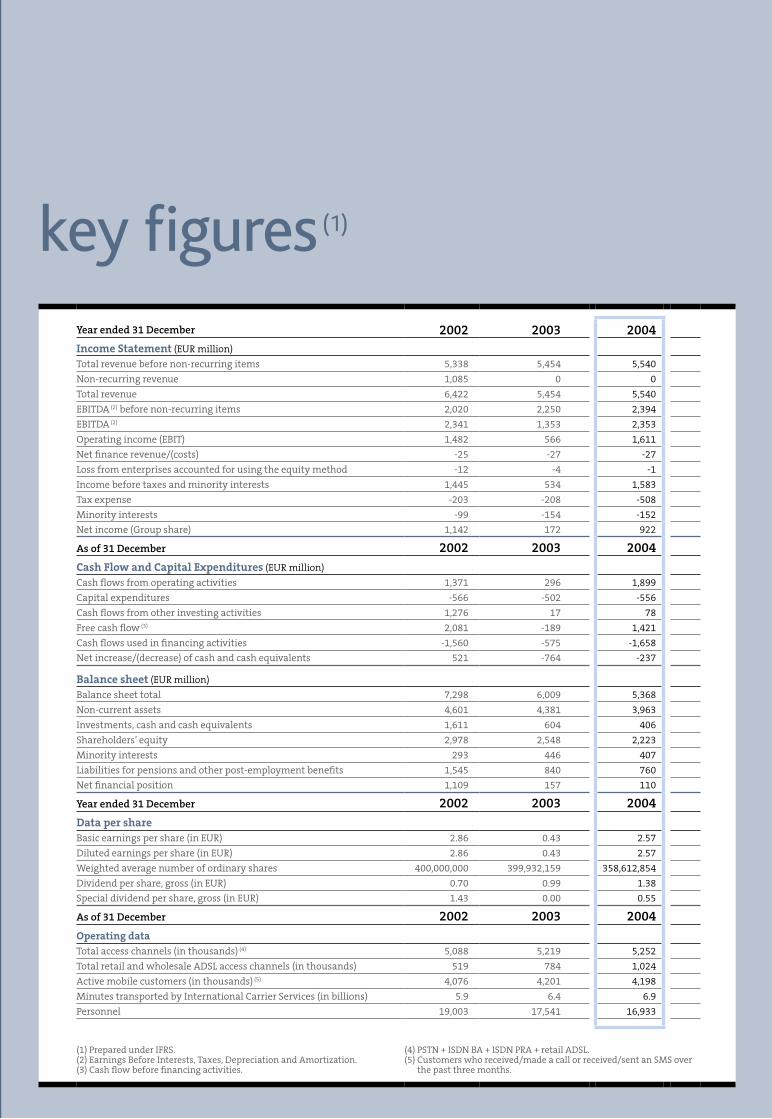
Year ended 31 December 2002 2003 2004Income Statement (EUR million)
Total revenue before non-recurring items 5,338 5,454 5,540
Non-recurring revenue 1,085 0 0
Total revenue 6,422 5,454 5,540
EBITDA (2) before non-recurring items 2,020 2,250 2,394
EBITDA (2) 2,341 1,353 2,353
Operating income (EBIT) 1,482 566 1,611
Net finance revenue/(costs) -25 -27 -27
Loss from enterprises accounted for using the equity method -12 -4 -1
Income before taxes and minority interests 1,445 534 1,583
Tax expense -203 -208 -508
Minority interests -99 -154 -152
Net income (Group share) 1,142 172 922
As of 31 December 2002 2003 2004Cash Flow and Capital Expenditures (EUR million)
Cash flows from operating activities 1,371 296 1,899
Capital expenditures -566 -502 -556
Cash flows from other investing activities 1,276 17 78
Free cash flow (3) 2,081 -189 1,421
Cash flows used in financing activities -1,560 -575 -1,658
Net increase/(decrease) of cash and cash equivalents 521 -764 -237
Balance sheet (EUR million)
Balance sheet total 7,298 6,009 5,368
Non-current assets 4,601 4,381 3,963
Investments, cash and cash equivalents 1,611 604 406
Shareholders’ equity 2,978 2,548 2,223
Minority interests 293 446 407
Liabilities for pensions and other post-employment benefits 1,545 840 760
Net financial position 1,109 157 110
Year ended 31 December 2002 2003 2004Data per shareBasic earnings per share (in EUR) 2.86 0.43 2.57
Diluted earnings per share (in EUR) 2.86 0.43 2.57
Weighted average number of ordinary shares 400,000,000 399,932,159 358,612,854
Dividend per share, gross (in EUR) 0.70 0.99 1.38
Special dividend per share, gross (in EUR) 1.43 0.00 0.55
As of 31 December 2002 2003 2004Operating dataTotal access channels (in thousands) (4) 5,088 5,219 5,252
Total retail and wholesale ADSL access channels (in thousands) 519 784 1,024
Active mobile customers (in thousands) (5) 4,076 4,201 4,198
Minutes transported by International Carrier Services (in billions) 5.9 6.4 6.9
Personnel 19,003 17,541 16,933
(1) Prepared under IFRS.(2) Earnings Before Interests, Taxes, Depreciation and Amortization.(3) Cash flow before financing activities.
(4) PSTN + ISDN BA + ISDN PRA + retail ADSL.(5) Customers who received/made a call or received/sent an SMS over
the past three months.a n n u a l r e p o r t • 2 0 0 4
The commitment of a leader. The spirit of a challenger.
key figures (1)
glossary
ADSL (Asymmetric Digital Subscriber Line): technology enabling a one-to-one, high-speed, digital connection (up to eight megabits per second (Mbps) in receive mode and 640 Kilobits per second (Kbps) in send mode) on a single pair of copper wires.
ARPU (Average Revenue Per Unit): Average revenue generated per mobile telephone subscriber.
ATM (Asynchronous Transfer Mode): technique enabling the high-speed transfer of digital data. It consists of dividing information flow (voice, data and image) into fixed-size packets, known as “cells”.
BACKBONE This is a high bandwidth line which acts as the mainstay linking access providers to the world network.
BILAN (Belgacom Interconnection of LAN): a total solution based on the Internet Protocol (IP), Frame Relay and ATM networks.
BIT (Contraction of Binary digIT): the basic unit of information. A bit has two possible values, 1 or 0. Each print character has an eight-bit code. Eight bits make one octet, or byte.
BROADBAND Network capable of high-speed transmission of several Megabits per second (Mbps), generally much faster than on the telephone network. These networks are composed of coaxial cable, optic fiber or wireless media.
CDMA (Code Division Multiple Access): digital technique in which dif-ferent conversations can be transmitted simultaneously and are differentiated by being tagged with a code.
CHAT Type of messaging done over the Internet, involving short text messages and often used by strangers to meet.
DWDM (Dense Wavelength Division Multiplexing): see WDM.
ETHERNET The most common LAN (Local Area Network) technology, devel-oped originally by Xerox, DEC and Intel. Conventionally, the Ethernet LAN uses coaxial cables or high-quality twisted cable. The most widely installed Ethernet network is known as 10BASE-T, which enables transmission at a speed of up to 10 Mbps. With Fast Ethernet, or 100BASE-T, speeds of up to 100 Megabits per second (Mbps) are possible.
EXTRANET Intranet to which a company’s suppliers, customers and partners have access. A network essential for e-business.
FRAME RELAY Data transport protocol that divides a physical communications line into several virtual channels. Technology part-way between X25 packet switching and ATM.
GPRS (General Packet Radio Service): a second-generation mobile telephony standard. It enables direct Internet access and data exchange at speeds 18 times faster than those of the GSM protocol and allows volume-based pricing.
GPS (Global Positioning System): system enabling a vehicle or person to pinpoint their position within approximately 50 meters or so anywhere in the world. It functions thanks to a network of 24 satellites put in place by the US Department of Defense.
GSM (Global System for Mobile Communications): an abbreviation which is often synonymous, in common parlance, with mobile terminal or telephone. In reality, it is a European standard for a common digital cellular telephony system.
INTRANET Application of Internet technologies (e-mail, Web, etc.) to a com-pany’s local area network (LAN).
IP (Internet Protocol): packet data protocol used for routing and car-riage of messages across the Internet.
annu
al r
epor
t 20
04
Belg
aco
m
Year ended 31 December 2002 2003 2004Income Statement (EUR million)
Total revenue before non-recurring items 5,338 5,454 5,540
Non-recurring revenue 1,085 0 0
Total revenue 6,422 5,454 5,540
EBITDA (2) before non-recurring items 2,020 2,250 2,394
EBITDA (2) 2,341 1,353 2,353
Operating income (EBIT) 1,482 566 1,611
Net finance revenue/(costs) -25 -27 -27
Loss from enterprises accounted for using the equity method -12 -4 -1
Income before taxes and minority interests 1,445 534 1,583
Tax expense -203 -208 -508
Minority interests -99 -154 -152
Net income (Group share) 1,142 172 922
As of 31 December 2002 2003 2004Cash Flow and Capital Expenditures (EUR million)
Cash flows from operating activities 1,371 296 1,899
Capital expenditures -566 -502 -556
Cash flows from other investing activities 1,276 17 78
Free cash flow (3) 2,081 -189 1,421
Cash flows used in financing activities -1,560 -575 -1,658
Net increase/(decrease) of cash and cash equivalents 521 -764 -237
Balance sheet (EUR million)
Balance sheet total 7,298 6,009 5,368
Non-current assets 4,601 4,381 3,963
Investments, cash and cash equivalents 1,611 604 406
Shareholders’ equity 2,978 2,548 2,223
Minority interests 293 446 407
Liabilities for pensions and other post-employment benefits 1,545 840 760
Net financial position 1,109 157 110
Year ended 31 December 2002 2003 2004Data per shareBasic earnings per share (in EUR) 2.86 0.43 2.57
Diluted earnings per share (in EUR) 2.86 0.43 2.57
Weighted average number of ordinary shares 400,000,000 399,932,159 358,612,854
Dividend per share, gross (in EUR) 0.70 0.99 1.38
Special dividend per share, gross (in EUR) 1.43 0.00 0.55
As of 31 December 2002 2003 2004Operating dataTotal access channels (in thousands) (4) 5,088 5,219 5,252
Total retail and wholesale ADSL access channels (in thousands) 519 784 1,024
Active mobile customers (in thousands) (5) 4,076 4,201 4,198
Minutes transported by International Carrier Services (in billions) 5.9 6.4 6.9
Personnel 19,003 17,541 16,933
(1) Prepared under IFRS.(2) Earnings Before Interests, Taxes, Depreciation and Amortization.(3) Cash flow before financing activities.
(4) PSTN + ISDN BA + ISDN PRA + retail ADSL.(5) Customers who received/made a call or received/sent an SMS over
the past three months.a n n u a l r e p o r t • 2 0 0 4
The commitment of a leader. The spirit of a challenger.
key figures (1)
glossary
ADSL (Asymmetric Digital Subscriber Line): technology enabling a one-to-one, high-speed, digital connection (up to eight megabits per second (Mbps) in receive mode and 640 Kilobits per second (Kbps) in send mode) on a single pair of copper wires.
ARPU (Average Revenue Per Unit): Average revenue generated per mobile telephone subscriber.
ATM (Asynchronous Transfer Mode): technique enabling the high-speed transfer of digital data. It consists of dividing information flow (voice, data and image) into fixed-size packets, known as “cells”.
BACKBONE This is a high bandwidth line which acts as the mainstay linking access providers to the world network.
BILAN (Belgacom Interconnection of LAN): a total solution based on the Internet Protocol (IP), Frame Relay and ATM networks.
BIT (Contraction of Binary digIT): the basic unit of information. A bit has two possible values, 1 or 0. Each print character has an eight-bit code. Eight bits make one octet, or byte.
BROADBAND Network capable of high-speed transmission of several Megabits per second (Mbps), generally much faster than on the telephone network. These networks are composed of coaxial cable, optic fiber or wireless media.
CDMA (Code Division Multiple Access): digital technique in which dif-ferent conversations can be transmitted simultaneously and are differentiated by being tagged with a code.
CHAT Type of messaging done over the Internet, involving short text messages and often used by strangers to meet.
DWDM (Dense Wavelength Division Multiplexing): see WDM.
ETHERNET The most common LAN (Local Area Network) technology, devel-oped originally by Xerox, DEC and Intel. Conventionally, the Ethernet LAN uses coaxial cables or high-quality twisted cable. The most widely installed Ethernet network is known as 10BASE-T, which enables transmission at a speed of up to 10 Mbps. With Fast Ethernet, or 100BASE-T, speeds of up to 100 Megabits per second (Mbps) are possible.
EXTRANET Intranet to which a company’s suppliers, customers and partners have access. A network essential for e-business.
FRAME RELAY Data transport protocol that divides a physical communications line into several virtual channels. Technology part-way between X25 packet switching and ATM.
GPRS (General Packet Radio Service): a second-generation mobile telephony standard. It enables direct Internet access and data exchange at speeds 18 times faster than those of the GSM protocol and allows volume-based pricing.
GPS (Global Positioning System): system enabling a vehicle or person to pinpoint their position within approximately 50 meters or so anywhere in the world. It functions thanks to a network of 24 satellites put in place by the US Department of Defense.
GSM (Global System for Mobile Communications): an abbreviation which is often synonymous, in common parlance, with mobile terminal or telephone. In reality, it is a European standard for a common digital cellular telephony system.
INTRANET Application of Internet technologies (e-mail, Web, etc.) to a com-pany’s local area network (LAN).
IP (Internet Protocol): packet data protocol used for routing and car-riage of messages across the Internet.
annu
al r
epor
t 20
04
5,200 5,300 5,400 5,500 5,600 1,800 1,900 2,000 2,100 2,200 2,300 2,400
0 200 400 600 800 1,000 1,200 0.0 0.5 1.0 1.5 2.0 2.5 3.0
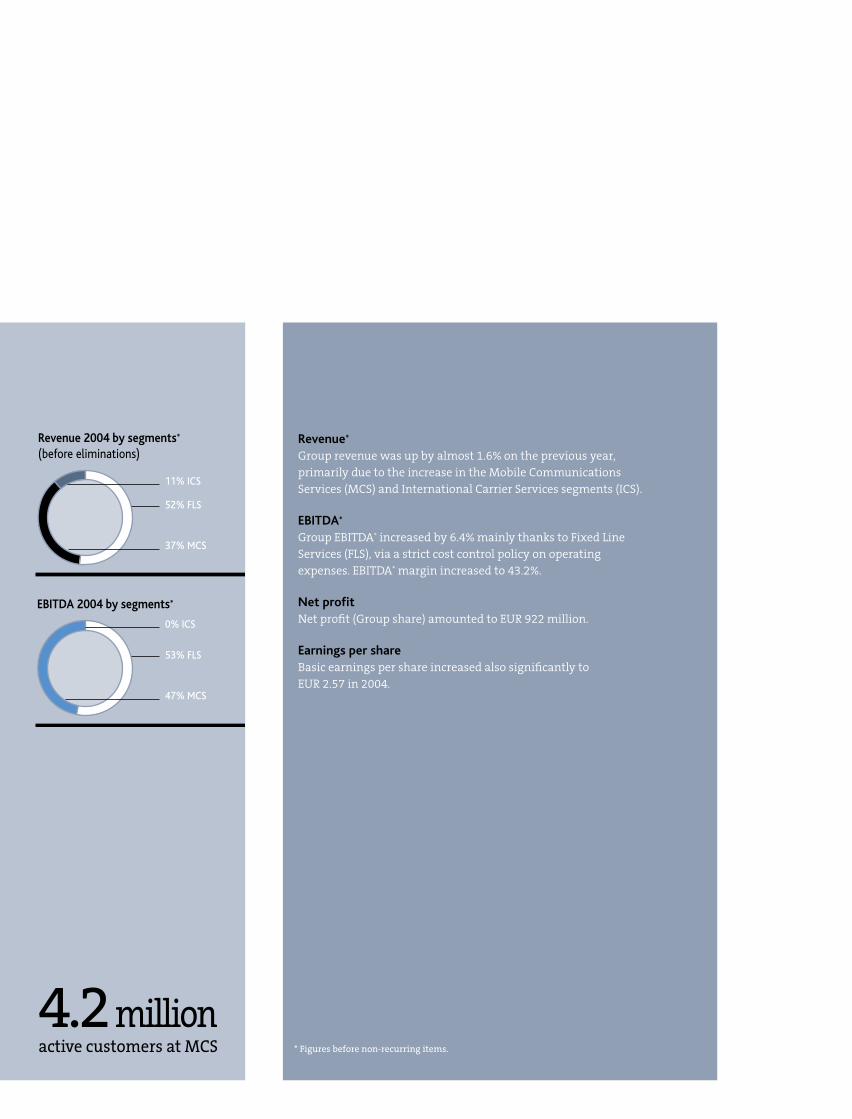
11% ICS
52% FLS
37% MCS
0% ICS
53% FLS
47% MCS
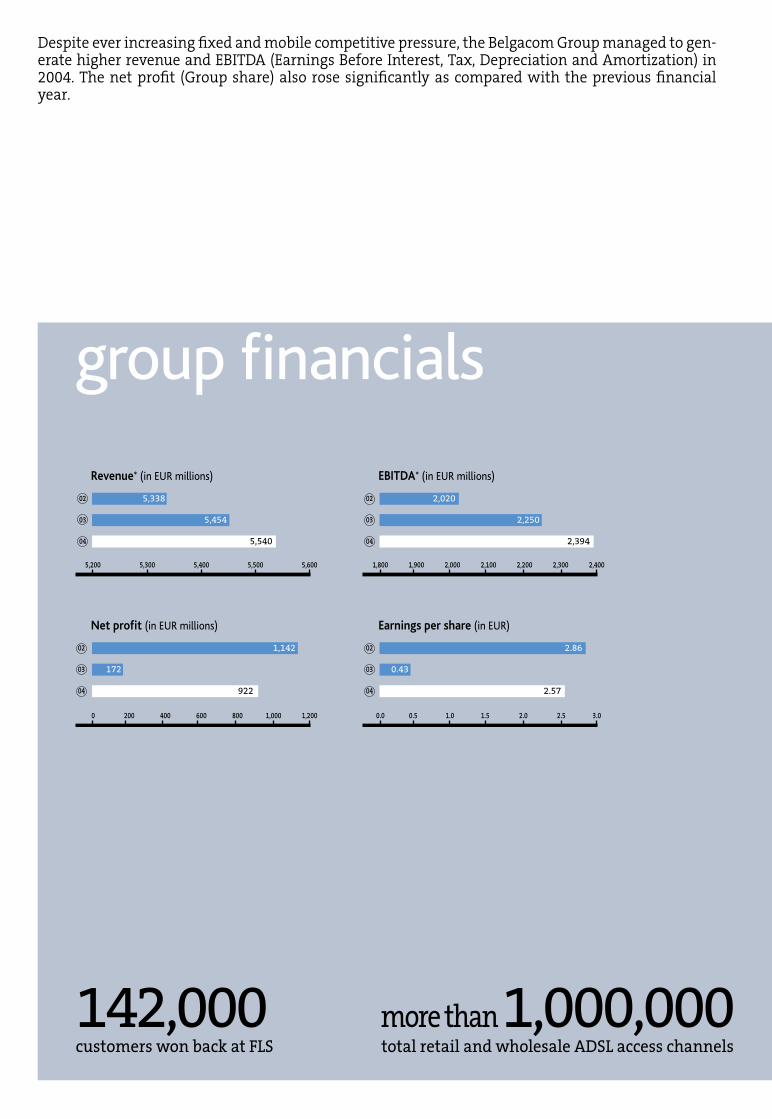
5,33802
5,45403
5,54004
1,14202
17203
92204
2,02002
2,25003
2,39404
2.8602
0.4303
2.5704
Revenue 2004 by segments* (before eliminations)
EBITDA 2004 by segments*
Revenue*
Group revenue was up by almost 1.6% on the previous year, primarily due to the increase in the Mobile Communications Services (MCS) and International Carrier Services segments (ICS).
EBITDA*
Group EBITDA* increased by 6.4% mainly thanks to Fixed Line Services (FLS), via a strict cost control policy on operating expenses. EBITDA* margin increased to 43.2%.
Net profitNet profit (Group share) amounted to EUR 922 million.
Earnings per shareBasic earnings per share increased also significantly to EUR 2.57 in 2004.
4.2 millionactive customers at MCS
group financials
Revenue* (in EUR millions)
142,000customers won back at FLS
more than 1,000,000total retail and wholesale ADSL access channels
Net profit (in EUR millions)
EBITDA* (in EUR millions)
Earnings per share (in EUR)
glossary
IP VPN (Internet Protocol Virtual Private Network): A VPN offers the advantages of a private network (security, etc.) while using the resources of a public switched network. The user thereby saves money on network infrastructure and manage-ment costs.
ISDN (Integrated Services Digital Network): fully digitized network ena-bling simultaneous, high-speed transmission of speech, text, data and images (still or animated). There are two types of ISDN lines: the ISDN-2, equipped with two communication channels, and the ISDN-30, equipped with thirty communication channels.
ISP (Internet Service Provider): a company providing Internet access to its customers and a personal e-mail address.
LARGE BAND See Broadband.
MMS (Multimedia Messaging Service): possibility to illustrate text mes-sages on mobile phones with photographs, images and sound.
PABX (Private Automatic Branch Exchange): company exchange around which the company’s internal telephone network is organized. It also enables data transmission.
PORTAL Site offering to act as a gateway to the World Wide Web (WWW) for a large number of surfers, ideally immediately on connection. Many Internet Access Providers offer portals to their customers (e.g., the Belgacom Skynet portal).
SERVER Machine that assists in providing information and/or resources in a network, be it public or private.
SDSL A technology that transports data at a maximum bit rate of 2.3 Mbits/s in both directions.
SMS (Short Message Service): enables written messages to be received and displayed on a GSM.
STREAMING Technique for downloading multimedia files enabling surfers to read the file in real-time, without waiting for full download. This is the case, for example, with sound or video on the Internet.
TCP-IP (Transmission Control Protocol – Internet Protocol): a protocol used in conjunction with the Internet Protocol (IP) to send data in the form of message units (datagrams, or packets) between com-puters over the Internet. IP handles the actual delivery of the data, while TCP keeps track of the individual units of data for efficient routing through the Internet.
UMTS (Universal Mobile Telecommunications System): a third-genera-tion telecommunications system capable of providing multimedia services at a very-high speed.
VIDEO- Communication in which the callers can be seen as well as heard CONFERENCING (video conference).
VPN (Virtual Private Network): a data network that shares telecommu-nications infrastructure but acts as a secure private network, with an architecture based on the use of the TCP-IP (Time Compression Multiplexing - Internet Protocol).
WAP (Wireless Application Protocol): new protocol enabling GSMs to be transformed into Internet and multimedia terminals.
WDM (Wavelength Division Multiplexing) or DWDM (Dense Wavelength Division Multiplexing): technique enabling several independent flows of digital information to coexist on the same optical fiber.
WIFI Stands for wireless fidelity. Technology makes possible wireless, high-speed surfing from a hotspot.
Despite ever increasing fixed and mobile competitive pressure, the Belgacom Group managed to gen-erate higher revenue and EBITDA (Earnings Before Interest, Tax, Depreciation and Amortization) in 2004. The net profit (Group share) also rose significantly as compared with the previous financial year.
* Figures before non-recurring items.
5,200 5,300 5,400 5,500 5,600 1,800 1,900 2,000 2,100 2,200 2,300 2,400
0 200 400 600 800 1,000 1,200 0.0 0.5 1.0 1.5 2.0 2.5 3.0
11% ICS
52% FLS
37% MCS
0% ICS
53% FLS
47% MCS
5,33802
5,45403
5,54004
1,14202
17203
92204
2,02002
2,25003
2,39404
2.8602
0.4303
2.5704
Revenue 2004 by segments* (before eliminations)
EBITDA 2004 by segments*
Revenue*
Group revenue was up by almost 1.6% on the previous year, primarily due to the increase in the Mobile Communications Services (MCS) and International Carrier Services segments (ICS).
EBITDA*
Group EBITDA* increased by 6.4% mainly thanks to Fixed Line Services (FLS), via a strict cost control policy on operating expenses. EBITDA* margin increased to 43.2%.
Net profitNet profit (Group share) amounted to EUR 922 million.
Earnings per shareBasic earnings per share increased also significantly to EUR 2.57 in 2004.
4.2 millionactive customers at MCS
group financials
Revenue* (in EUR millions)
142,000customers won back at FLS
more than 1,000,000total retail and wholesale ADSL access channels
Net profit (in EUR millions)
EBITDA* (in EUR millions)
Earnings per share (in EUR)
glossary
IP VPN (Internet Protocol Virtual Private Network): A VPN offers the advantages of a private network (security, etc.) while using the resources of a public switched network. The user thereby saves money on network infrastructure and manage-ment costs.
ISDN (Integrated Services Digital Network): fully digitized network ena-bling simultaneous, high-speed transmission of speech, text, data and images (still or animated). There are two types of ISDN lines: the ISDN-2, equipped with two communication channels, and the ISDN-30, equipped with thirty communication channels.
ISP (Internet Service Provider): a company providing Internet access to its customers and a personal e-mail address.
LARGE BAND See Broadband.
MMS (Multimedia Messaging Service): possibility to illustrate text mes-sages on mobile phones with photographs, images and sound.
PABX (Private Automatic Branch Exchange): company exchange around which the company’s internal telephone network is organized. It also enables data transmission.
PORTAL Site offering to act as a gateway to the World Wide Web (WWW) for a large number of surfers, ideally immediately on connection. Many Internet Access Providers offer portals to their customers (e.g., the Belgacom Skynet portal).
SERVER Machine that assists in providing information and/or resources in a network, be it public or private.
SDSL A technology that transports data at a maximum bit rate of 2.3 Mbits/s in both directions.
SMS (Short Message Service): enables written messages to be received and displayed on a GSM.
STREAMING Technique for downloading multimedia files enabling surfers to read the file in real-time, without waiting for full download. This is the case, for example, with sound or video on the Internet.
TCP-IP (Transmission Control Protocol – Internet Protocol): a protocol used in conjunction with the Internet Protocol (IP) to send data in the form of message units (datagrams, or packets) between com-puters over the Internet. IP handles the actual delivery of the data, while TCP keeps track of the individual units of data for efficient routing through the Internet.
UMTS (Universal Mobile Telecommunications System): a third-genera-tion telecommunications system capable of providing multimedia services at a very-high speed.
VIDEO- Communication in which the callers can be seen as well as heard CONFERENCING (video conference).
VPN (Virtual Private Network): a data network that shares telecommu-nications infrastructure but acts as a secure private network, with an architecture based on the use of the TCP-IP (Time Compression Multiplexing - Internet Protocol).
WAP (Wireless Application Protocol): new protocol enabling GSMs to be transformed into Internet and multimedia terminals.
WDM (Wavelength Division Multiplexing) or DWDM (Dense Wavelength Division Multiplexing): technique enabling several independent flows of digital information to coexist on the same optical fiber.
WIFI Stands for wireless fidelity. Technology makes possible wireless, high-speed surfing from a hotspot.
Despite ever increasing fixed and mobile competitive pressure, the Belgacom Group managed to gen-erate higher revenue and EBITDA (Earnings Before Interest, Tax, Depreciation and Amortization) in 2004. The net profit (Group share) also rose significantly as compared with the previous financial year.
* Figures before non-recurring items.
1
>
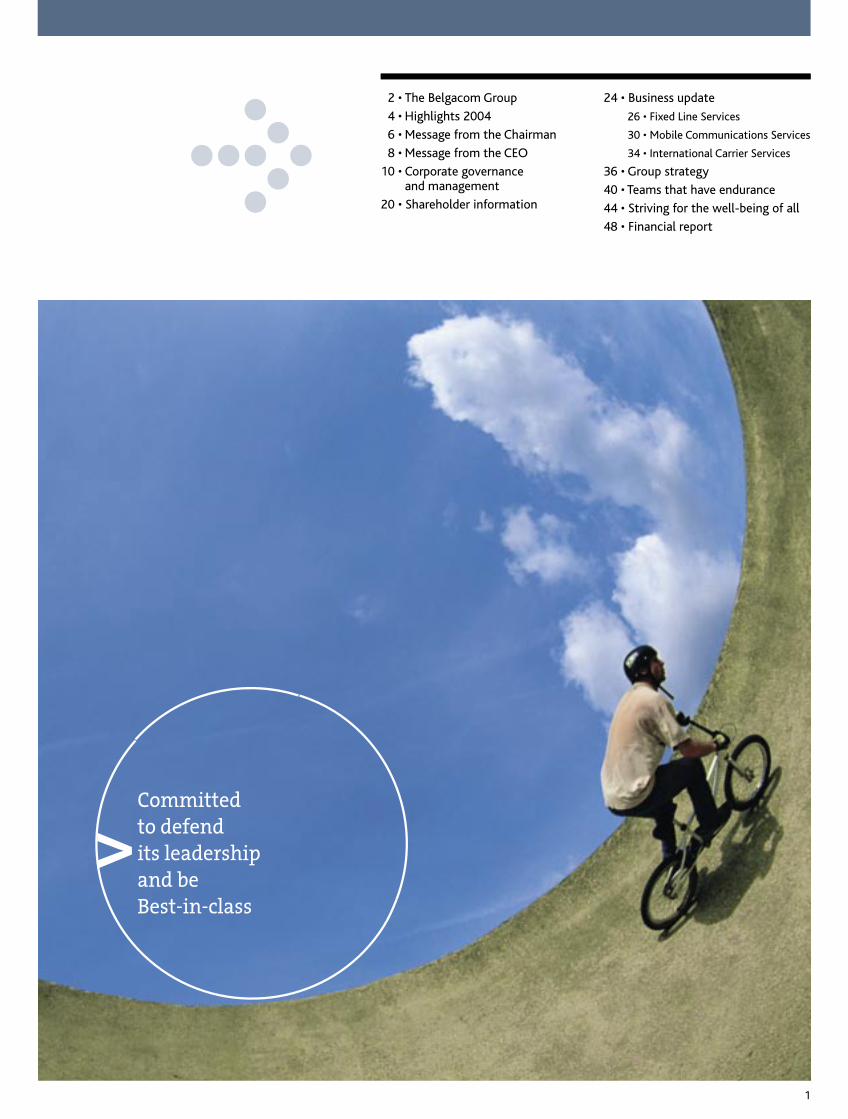
02 • The Belgacom Group
04 • Highlights 2004
06 • Message from the Chairman
08 • Message from the CEO
10 • Corporate governance and management
20 • Shareholder information
24 • Business update
26 • Fixed Line Services
30 • Mobile Communications Services
34 • International Carrier Services
36 • Group strategy
40 • Teams that have endurance
44 • Striving for the well-being of all
48 • Financial report
Committed to defend its leadership and beBest-in-class

2
The commitment of a leader.The spirit of a challenger.
3
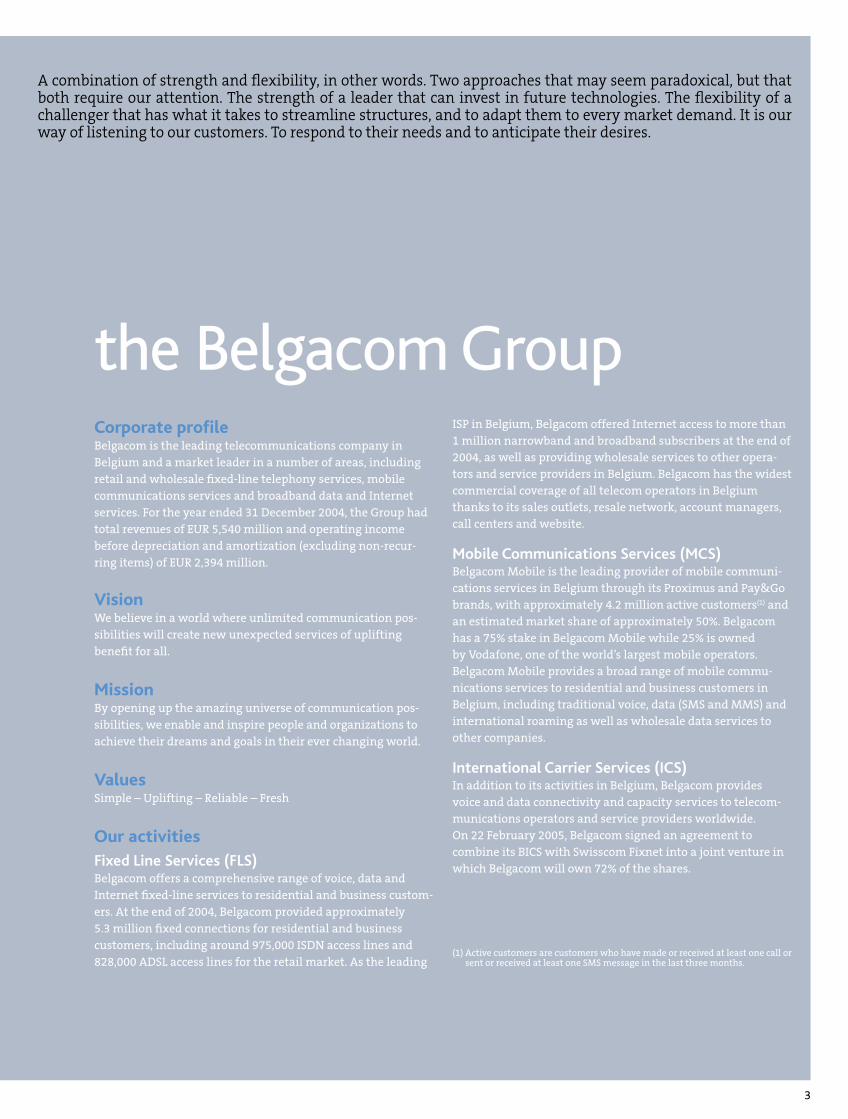
the Belgacom GroupCorporate profileBelgacom is the leading telecommunications company in Belgium and a market leader in a number of areas, including retail and wholesale fixed-line telephony services, mobile communications services and broadband data and Internet services. For the year ended 31 December 2004, the Group had total revenues of EUR 5,540 million and operating income before depreciation and amortization (excluding non-recur-ring items) of EUR 2,394 million.
VisionWe believe in a world where unlimited communication pos-sibilities will create new unexpected services of uplifting benefit for all.
MissionBy opening up the amazing universe of communication pos-sibilities, we enable and inspire people and organizations to achieve their dreams and goals in their ever changing world.
ValuesSimple – Uplifting – Reliable – Fresh
Our activitiesFixed Line Services (FLS)Belgacom offers a comprehensive range of voice, data and Internet fixed-line services to residential and business custom-ers. At the end of 2004, Belgacom provided approximately 5.3 million fixed connections for residential and business customers, including around 975,000 ISDN access lines and 828,000 ADSL access lines for the retail market. As the leading
ISP in Belgium, Belgacom offered Internet access to more than 1 million narrowband and broadband subscribers at the end of 2004, as well as providing wholesale services to other opera-tors and service providers in Belgium. Belgacom has the widest commercial coverage of all telecom operators in Belgium thanks to its sales outlets, resale network, account managers, call centers and website.
Mobile Communications Services (MCS)Belgacom Mobile is the leading provider of mobile communi-cations services in Belgium through its Proximus and Pay&Go brands, with approximately 4.2 million active customers(1) and an estimated market share of approximately 50%. Belgacom has a 75% stake in Belgacom Mobile while 25% is owned by Vodafone, one of the world’s largest mobile operators. Belgacom Mobile provides a broad range of mobile commu-nications services to residential and business customers in Belgium, including traditional voice, data (SMS and MMS) and international roaming as well as wholesale data services to other companies.
International Carrier Services (ICS)In addition to its activities in Belgium, Belgacom provides voice and data connectivity and capacity services to telecom-munications operators and service providers worldwide. On 22 February 2005, Belgacom signed an agreement to combine its BICS with Swisscom Fixnet into a joint venture in which Belgacom will own 72% of the shares.
A combination of strength and flexibility, in other words. Two approaches that may seem paradoxical, but that both require our attention. The strength of a leader that can invest in future technologies. The flexibility of a challenger that has what it takes to streamline structures, and to adapt them to every market demand. It is our way of listening to our customers. To respond to their needs and to anticipate their desires.
(1) Active customers are customers who have made or received at least one call or sent or received at least one SMS message in the last three months.
4
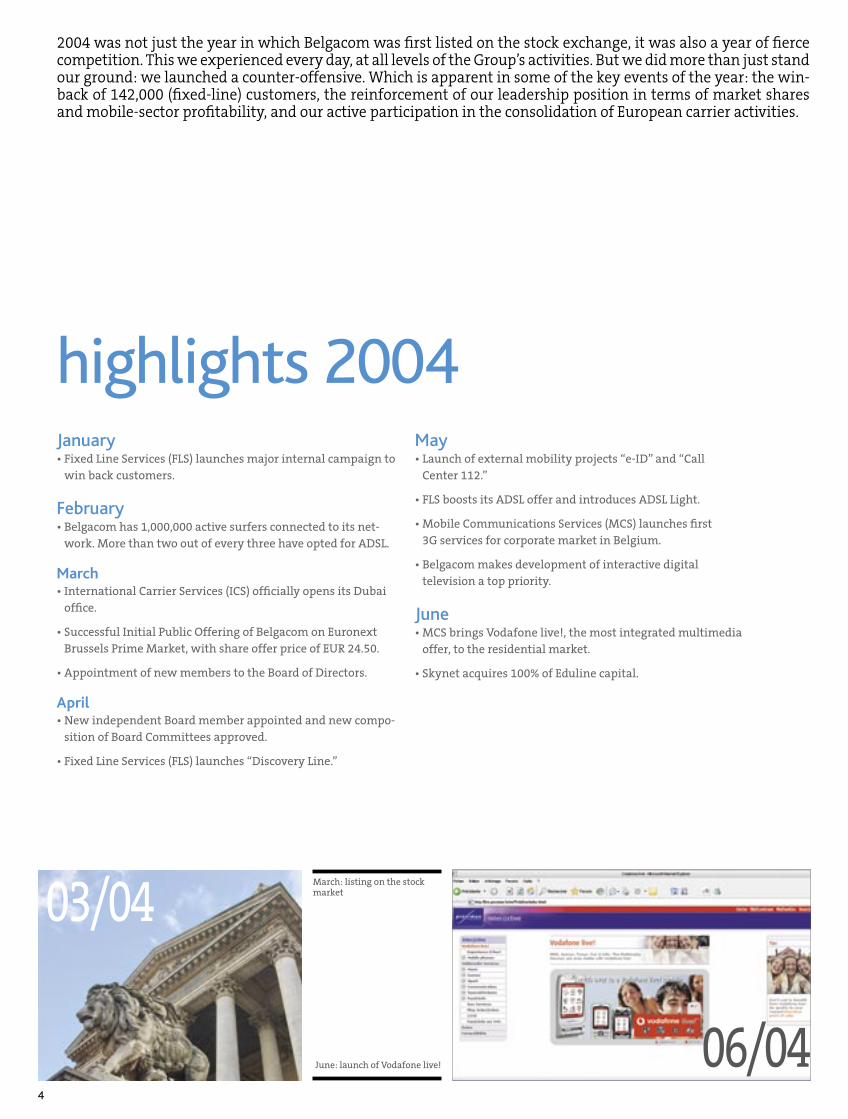
03/04
May• Launch of external mobility projects “e-ID” and “Call
Center 112.”
• FLS boosts its ADSL offer and introduces ADSL Light.
• Mobile Communications Services (MCS) launches first 3G services for corporate market in Belgium.
• Belgacom makes development of interactive digital television a top priority.
June• MCS brings Vodafone live!, the most integrated multimedia
offer, to the residential market.
• Skynet acquires 100% of Eduline capital.
January• Fixed Line Services (FLS) launches major internal campaign to
win back customers.
February• Belgacom has 1,000,000 active surfers connected to its net-
work. More than two out of every three have opted for ADSL.
March• International Carrier Services (ICS) officially opens its Dubai
office.
• Successful Initial Public Offering of Belgacom on Euronext Brussels Prime Market, with share offer price of EUR 24.50.
• Appointment of new members to the Board of Directors.
April• New independent Board member appointed and new compo-
sition of Board Committees approved.
• Fixed Line Services (FLS) launches “Discovery Line.”
2004 was not just the year in which Belgacom was first listed on the stock exchange, it was also a year of fierce competition. This we experienced every day, at all levels of the Group’s activities. But we did more than just stand our ground: we launched a counter-offensive. Which is apparent in some of the key events of the year: the win-back of 142,000 (fixed-line) customers, the reinforcement of our leadership position in terms of market shares and mobile-sector profitability, and our active participation in the consolidation of European carrier activities.
highlights 2004
June: launch of Vodafone live!
March: listing on the stock market
06/04
5
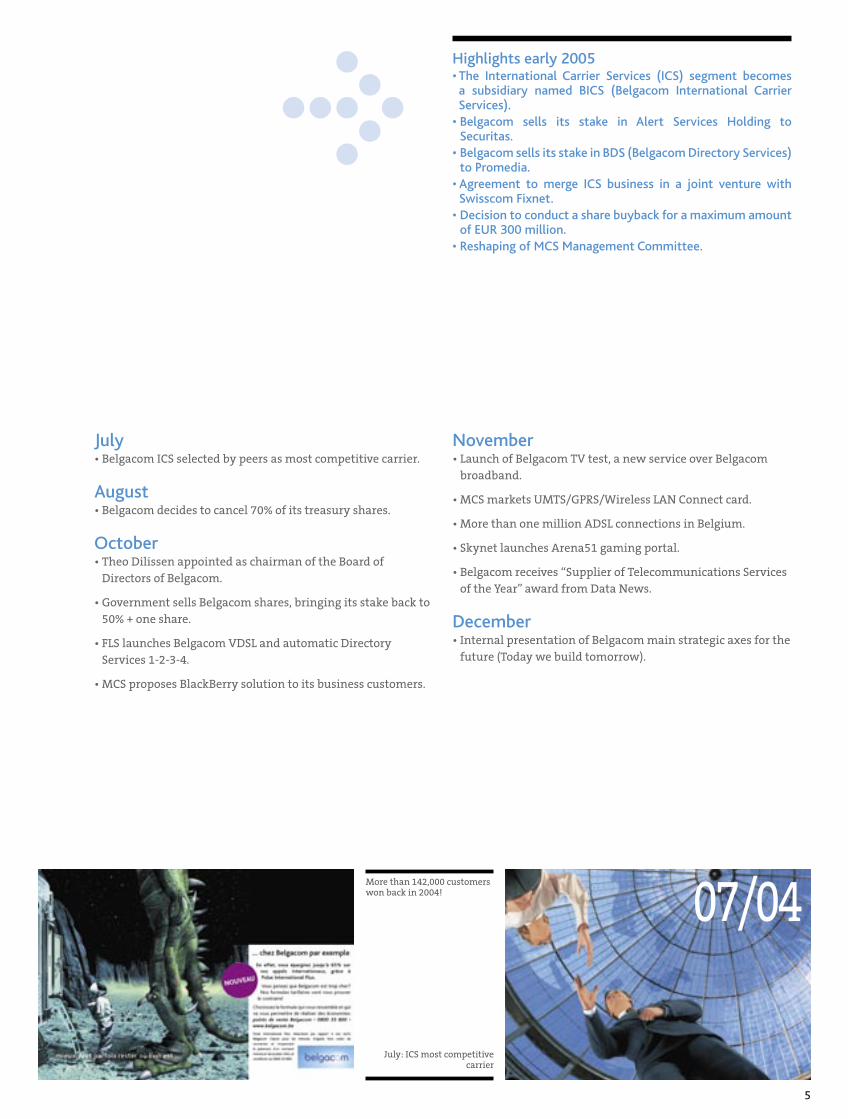
07/04
July• Belgacom ICS selected by peers as most competitive carrier.
August• Belgacom decides to cancel 70% of its treasury shares.
October• Theo Dilissen appointed as chairman of the Board of
Directors of Belgacom.
• Government sells Belgacom shares, bringing its stake back to 50% + one share.
• FLS launches Belgacom VDSL and automatic Directory Services 1-2-3-4.
• MCS proposes BlackBerry solution to its business customers.
November• Launch of Belgacom TV test, a new service over Belgacom
broadband.
• MCS markets UMTS/GPRS/Wireless LAN Connect card.
• More than one million ADSL connections in Belgium.
• Skynet launches Arena51 gaming portal.
• Belgacom receives “Supplier of Telecommunications Services of the Year” award from Data News.
December• Internal presentation of Belgacom main strategic axes for the
future (Today we build tomorrow).
Highlights early 2005• The International Carrier Services (ICS) segment becomes a subsidiary named BICS (Belgacom International Carrier Services).
• Belgacom sells its stake in Alert Services Holding to Securitas.
• Belgacom sells its stake in BDS (Belgacom Directory Services) to Promedia.
• Agreement to merge ICS business in a joint venture with Swisscom Fixnet.
• Decision to conduct a share buyback for a maximum amount of EUR 300 million.
• Reshaping of MCS Management Committee.
July: ICS most competitive carrier
More than 142,000 customers won back in 2004!
06/04
6
An exciting future is opening up for Belgacom. One that will be
marked by change and progress. We will continue to move further
away from the former monopoly to become more of a service
company, offering not only access and bandwidth but also appli-
cations and content.
Stock market listingFor Belgacom, 2004 was a year marked above all by a fundamental
transition: on 22 March 2004, Belgacom was listed for the first
time on the Euronext Brussels stock market. My thanks and con-
gratulations go to all those who helped prepare the Initial Public
Offering (IPO), the largest ever on the Belgian market! The opera-
tion was flawlessly executed, and the investors who have placed
their trust in the company’s management have ample reason to be
pleased.
The listing on the stock market has created new obligations of
transparency and corporate governance for Belgacom, which the
company has met as a positive challenge. On a practical level, the
IPO brought about changes in the composition of the Board of
Directors: as part of our efforts to apply principles of good corpo-
rate governance, eight new Directors joined the Board.
Committees created to ensure proper management, such as
the Audit and Compliance Committee, the Nomination and
Remuneration Committee and the Strategic and Business
Development Committee, have functioned extremely well. Several
Belgacom Board members were active participants in the work of
the Lippens Commission, which in December 2004 established a
new code of corporate governance. I would like to extend my most
sincere thanks to the Board Members for the excellent work they
Today, Belgacom is a de facto leader in the field of electronic
communications. Belgacom has played, is playing now and will
continue to play a fundamental role in helping individuals and
businesses communicate.
The liberalization of the telecom market is now a well-established
fact. Inevitably, when Belgacom ceased to be a monopoly, it lost
market share. And today Belgacom, like any other company, has to
fight day in and day out to maintain its leadership position and to
attract and keep customers.
Confidence in the futureThanks to its healthy financial situation and absence of debt,
Belgacom is in a position to develop exciting projects, to look to
the future with confidence and ambition.
• We are investing heavily in the construction of very high-speed
broadband networks, thereby laying the foundations for tomor-
row’s information highway, for e-Belgium.
• Belgacom, which remains Belgium’s telecommunications leader,
is now positioning itself to be a challenger in the world of broad-
casting. We are not taking this step simply for the pleasure of
diversifying our activities: Belgacom is bringing to the effort its
expertise, its networks and, thanks to interactivity, an innovative
way of thinking about television.
• Lastly, Belgacom can now look beyond Belgium’s frontiers and
consider opportunities for expansion. Finding a partner for our
international wholesale activities… seizing profitable oppor-
tunities… Belgacom is ready for these new challenges and will
evaluate them with a simple question: do they create value for
our shareholders?
message from the Chairman
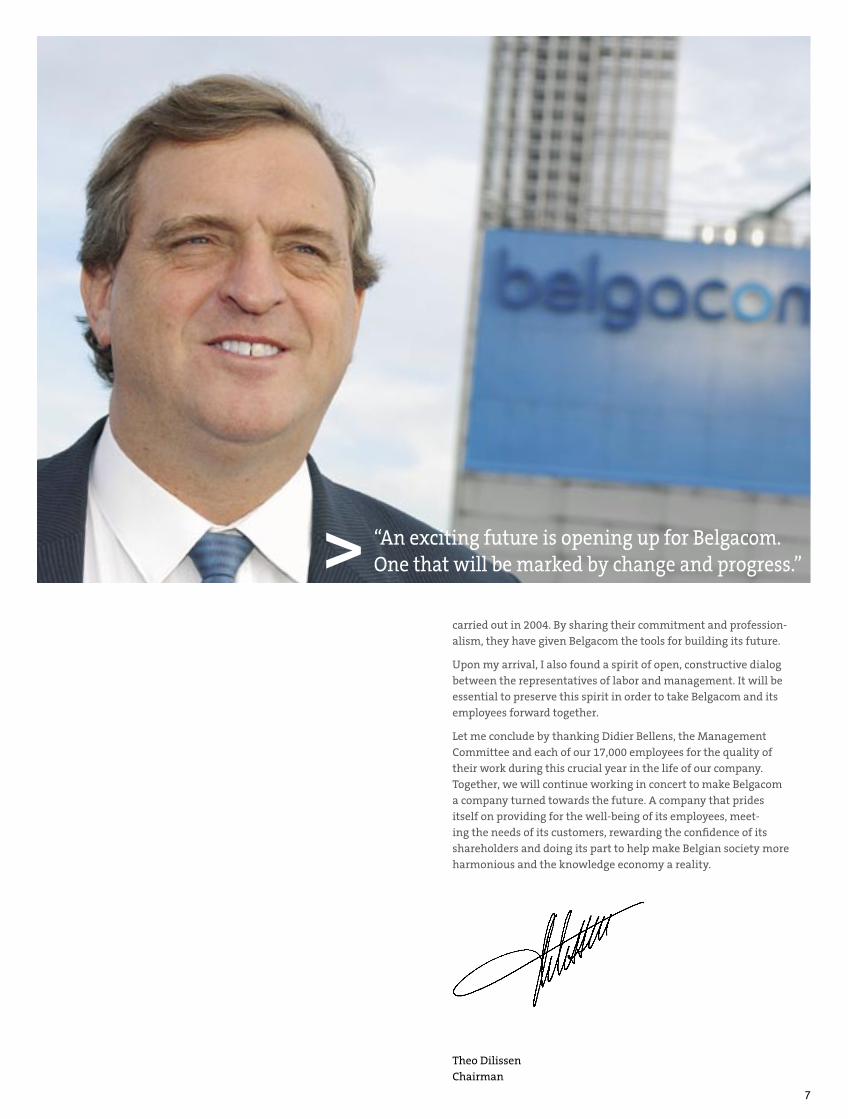
Belgacom has come an long way over the last ten years. I myself arrived in October 2004, following my appoint-ment as the Chairman of the Board of Directors. And one of the first things that struck me was how different today’s Belgacom — dynamic, state-of-the-art — is from yesterday’s monopoly operator.
7
carried out in 2004. By sharing their commitment and profession-alism, they have given Belgacom the tools for building its future.
Upon my arrival, I also found a spirit of open, constructive dialog between the representatives of labor and management. It will be essential to preserve this spirit in order to take Belgacom and its employees forward together.
Let me conclude by thanking Didier Bellens, the Management Committee and each of our 17,000 employees for the quality of their work during this crucial year in the life of our company. Together, we will continue working in concert to make Belgacom a company turned towards the future. A company that prides itself on providing for the well-being of its employees, meet-ing the needs of its customers, rewarding the confidence of its shareholders and doing its part to help make Belgian society more harmonious and the knowledge economy a reality.
Theo Dilissen Chairman
“An exciting future is opening up for Belgacom. One that will be marked by change and progress.”>
8
same time, we conducted a large-scale communication campaign
to show that the rates applied by Belgacom are indeed attractive.
Mobile telephonyAs for mobile telephony, we are the Belgian market leader and are
determined to maintain this position. In the business segment,
we are still the biggest, by far. On the other hand, for the first time
since Proximus launched mobile technology ten years earlier, we
noted in 2004 that the market was reaching a high level of matu-
rity. Competition is fierce, which explains why growth was limited.
Here too, we turned to new uses and applications for the future,
such as mobile payment, location-based services and videophony.
Once again Mobile Communications Services demonstrated its
capacity for innovation by being the first operator to deploy a UMTS
network and propose a veritable multimedia portal (Vodafone live!)
to its customers, in anticipation of the services of the future. In
addition, new types of rate plans and targeted customer-retention
campaigns allowed Proximus to make good its promises.
International Carrier ServicesFinally, our international operations (Carrier & Wholesale) also
had a positive year, even though competition is fierce in this sec-
tor too. The results recorded by Belgacom International Carrier
Services (BICS) show that the decision to put greater emphasis on
the mobile segment was a good one. At the end of 2004, this activ-
ity was completely spun off to enable BICS to take full advantage
of the consolidation opportunities that will present themselves.
The objective is to reach sufficient critical size to improve profit-
ability in this global call-termination market, where volumes
continue to increase but rates are constantly under pressure.
There is certainly no shortage of challenges half way through this
first decade of the new century: technologies are developing at
high speed, the landscape is constantly changing through increas-
ingly intensive competition, the regulatory context is complex.
In this extremely complicated environment, 2004 has proved a
highly satisfactory year for Belgacom, despite ever fiercer competi-
tion, both in the mobile and the fixed-line sectors.
For Belgacom, the opening up of the market obviously meant losing
a share of that market. In 2004, we entered into a new phase in
which the emphasis was placed on retaining and winning back cus-
tomers. Today Belgacom is fighting to create value for the company
and its shareholders. Belgacom intends to create this value by being
Best-in-class and by innovating. New uses, new services and new
rates have enabled Belgacom to meet its objectives in 2004.
Fixed-line telephonyWhere fixed-line telephony is concerned, Belgacom decided to
take the offensive with a vigorous program to win back customers
who had left for the competition and a communication campaign
to increase awareness of the attractive rate plans available at
Belgacom. At the very beginning of the year, from January on,
we launched the Winback program, which enabled Belgacom to
recover more than 142,000 customers who had left for the com-
petition. This daily effort manifested itself in great operational
dynamism: new products, new offers, etc. We launched Discovery
Line, a discount program for conventional fixed-line telephony
subscriptions which allowed us to keep and win back a significant
number of customers; we developed our ADSL range of products,
providing ever more users with high-speed Internet access. At the
message from the CEO
Today Belgacom is fighting to create value for the company and its shareholders. Belgacom intends to create this value by being Best-in-class and by innovating. New uses, new services and new rates have enabled Belgacom to meet its objectives in 2004.
9
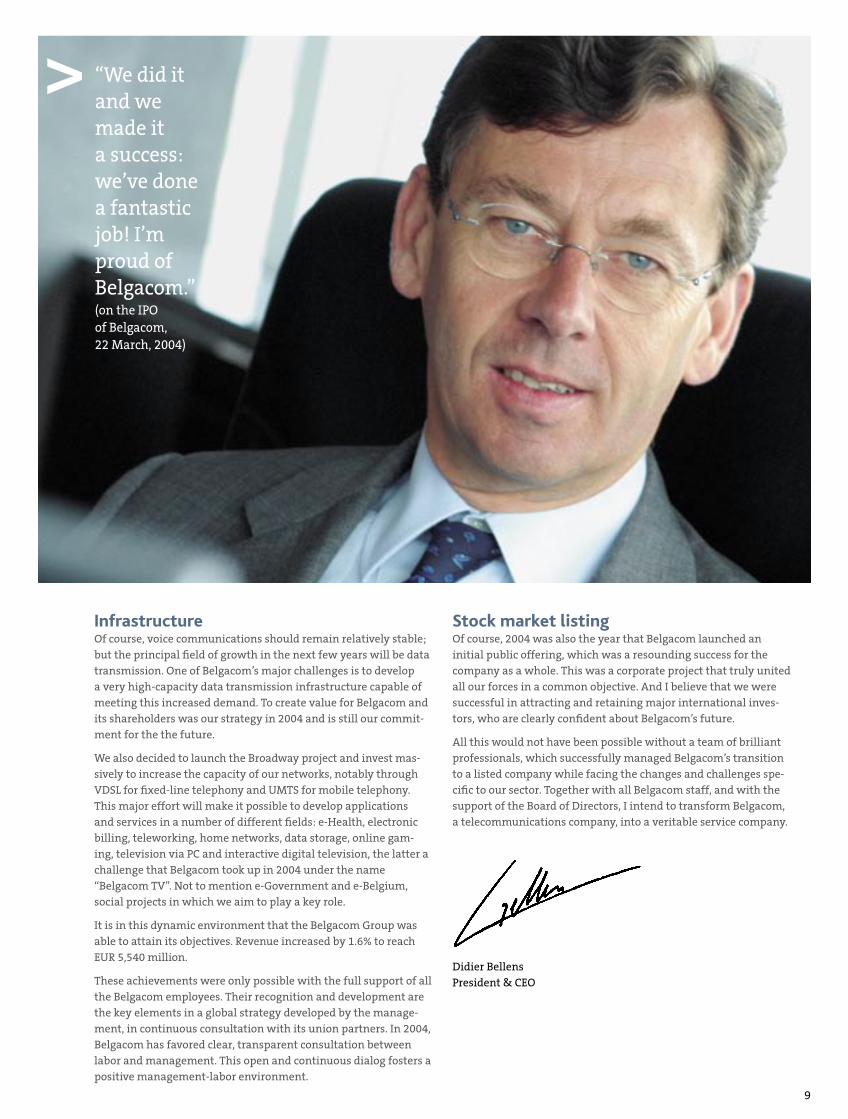
> “We did it and we made it a success: we’ve done a fantastic job! I’m proud of Belgacom.”(on the IPO of Belgacom, 22 March, 2004)
InfrastructureOf course, voice communications should remain relatively stable; but the principal field of growth in the next few years will be data transmission. One of Belgacom’s major challenges is to develop a very high-capacity data transmission infrastructure capable of meeting this increased demand. To create value for Belgacom and its shareholders was our strategy in 2004 and is still our commit-ment for the the future.
We also decided to launch the Broadway project and invest mas-sively to increase the capacity of our networks, notably through VDSL for fixed-line telephony and UMTS for mobile telephony. This major effort will make it possible to develop applications and services in a number of different fields: e-Health, electronic billing, teleworking, home networks, data storage, online gam-ing, television via PC and interactive digital television, the latter a challenge that Belgacom took up in 2004 under the name “Belgacom TV”. Not to mention e-Government and e-Belgium, social projects in which we aim to play a key role.
It is in this dynamic environment that the Belgacom Group was able to attain its objectives. Revenue increased by 1.6% to reach EUR 5,540 million.
These achievements were only possible with the full support of all the Belgacom employees. Their recognition and development are the key elements in a global strategy developed by the manage-ment, in continuous consultation with its union partners. In 2004, Belgacom has favored clear, transparent consultation between labor and management. This open and continuous dialog fosters a positive management-labor environment.
Stock market listingOf course, 2004 was also the year that Belgacom launched an initial public offering, which was a resounding success for the company as a whole. This was a corporate project that truly united all our forces in a common objective. And I believe that we were successful in attracting and retaining major international inves-tors, who are clearly confident about Belgacom’s future.
All this would not have been possible without a team of brilliant professionals, which successfully managed Belgacom’s transition to a listed company while facing the changes and challenges spe-cific to our sector. Together with all Belgacom staff, and with the support of the Board of Directors, I intend to transform Belgacom, a telecommunications company, into a veritable service company.
Didier Bellens President & CEO

10
>Good corporate governance leads to increased transparency
11
corporate governanceand management
Corporate governance aims to define a set of rules and behaviors according to which companies are properly managed and controlled, the result being increased transparency. Belgacom is preparing itself to conform to the recommendations made by the market authorities and more specifically to best practices of Belgium’s “Lippens Code,” published on 9 December 2004. Additionally it has continued to reinforce its internal compliance program.
The key features of Belgacom’s governance model are:
• a Board of Directors, which defines Belgacom’s general policy
and strategy and supervises operational management;
• the creation by the Board of Directors within its structure
of an Audit and Compliance Committee, a Nomination and
Remuneration Committee and a Strategic and Business
Development Committee;
• a Chief Executive Officer, who takes primary responsibility and
ownership for operational management (including, but not lim-
ited to, day-to-day management); and
• a Management Committee which, apart from a number of spe-
cific responsibilities attributed to it by the 1991 law, assists the
Chief Executive Officer in the exercise of his duties.
Board of DirectorsAs provided for in the 1991 Law, the Board of Directors is com-
posed of:
• Directors appointed by the Belgian State pro rata to its share-
holding; the aggregate number of directors being determined
by the shareholders’ meeting; and
• Directors appointed by a separate vote among the other share-
holders, for the remaining seats.
The Lippens CodeAt the European Commission level, several initiatives have been taken to improve governance and strengthen shareholders’rights. In Belgium, in order to align with international practices and EU recommendations, the Banking, Finance and Insurance Commission, Euronext Brussels and the Federation of Belgian Enterprises established a committee in January 2004 to draft one single code for listed companies.
The goal of the code is to set forth principles of good governance and transparency that will help companies develop and improve their image vis-à-vis investors and the general public. This code of best practices on corporate governance is based on the “comply or explain” system.
Belgacom governance modelAt Belgacom, the Articles of Association are strongly influenced by the specific legal status of the company. As a limited liability company under public law, Belgacom is in first instance governed by the Law of 21 March 1991 on autonomous public-sector enter-prises (“the 1991 Law”). The 1991 Law was not modified on the occasion of the IPO. For matters not explicitly regulated otherwise by the 1991 Law, Belgacom is governed by Belgian corporate law.
12
12 3
4
5
6
7
8
910
11
12 13
14
15
1617
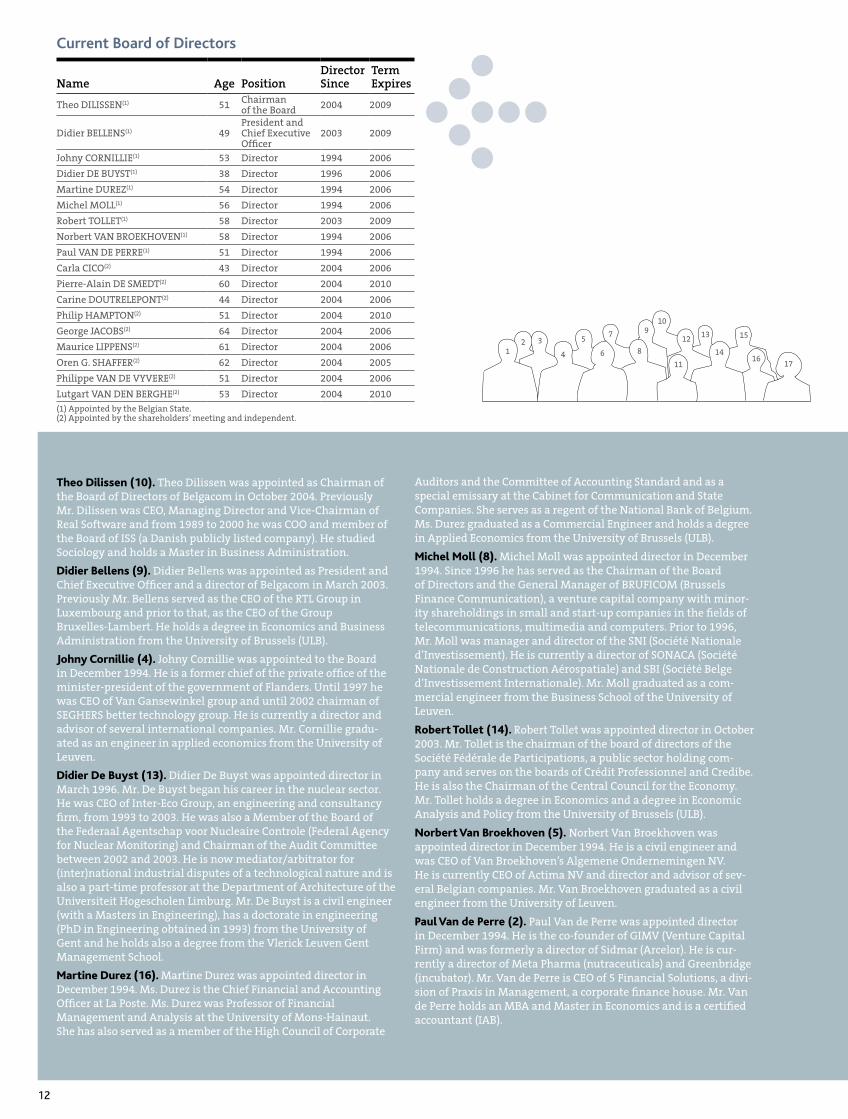
Current Board of Directors
Name Age PositionDirector Since
Term Expires
Theo DILISSEN(1) 51 Chairman of the Board 2004 2009
Didier BELLENS(1) 49President and Chief Executive Officer
2003 2009
Johny CORNILLIE(1) 53 Director 1994 2006
Didier DE BUYST(1) 38 Director 1996 2006
Martine DUREZ(1) 54 Director 1994 2006
Michel MOLL(1) 56 Director 1994 2006
Robert TOLLET(1) 58 Director 2003 2009
Norbert VAN BROEKHOVEN(1) 58 Director 1994 2006
Paul VAN DE PERRE(1) 51 Director 1994 2006
Carla CICO(2) 43 Director 2004 2006
Pierre-Alain DE SMEDT(2) 60 Director 2004 2010
Carine DOUTRELEPONT(2) 44 Director 2004 2006
Philip HAMPTON(2) 51 Director 2004 2010
George JACOBS(2) 64 Director 2004 2006
Maurice LIPPENS(2) 61 Director 2004 2006
Oren G. SHAFFER(2) 62 Director 2004 2005
Philippe VAN DE VYVERE(2) 51 Director 2004 2006
Lutgart VAN DEN BERGHE(2) 53 Director 2004 2010
(1) Appointed by the Belgian State. (2) Appointed by the shareholders’ meeting and independent.
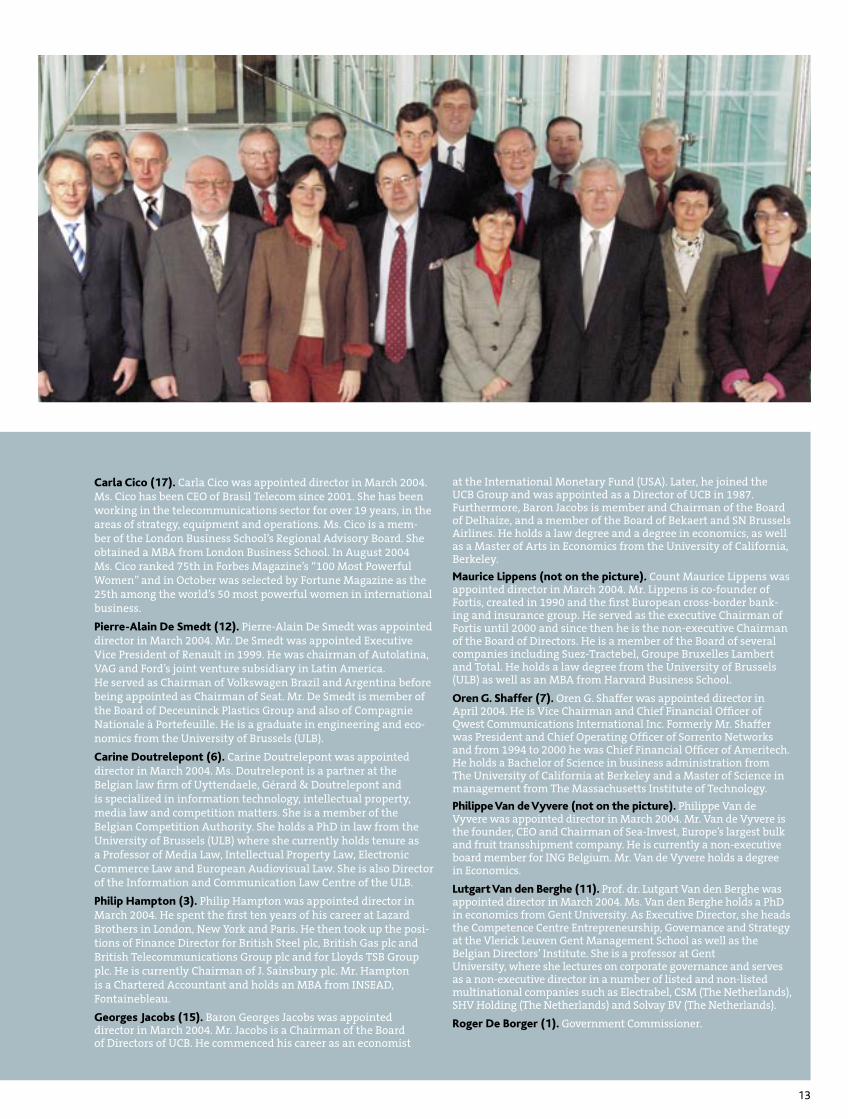
Theo Dilissen (10). Theo Dilissen was appointed as Chairman of the Board of Directors of Belgacom in October 2004. Previously Mr. Dilissen was CEO, Managing Director and Vice-Chairman of Real Software and from 1989 to 2000 he was COO and member of the Board of ISS (a Danish publicly listed company). He studied Sociology and holds a Master in Business Administration.
Didier Bellens (9). Didier Bellens was appointed as President and Chief Executive Officer and a director of Belgacom in March 2003. Previously Mr. Bellens served as the CEO of the RTL Group in Luxembourg and prior to that, as the CEO of the Group Bruxelles-Lambert. He holds a degree in Economics and Business Administration from the University of Brussels (ULB).
Johny Cornillie (4). Johny Cornillie was appointed to the Board in December 1994. He is a former chief of the private office of the minister-president of the government of Flanders. Until 1997 he was CEO of Van Gansewinkel group and until 2002 chairman of SEGHERS better technology group. He is currently a director and advisor of several international companies. Mr. Cornillie gradu-ated as an engineer in applied economics from the University of Leuven.
Didier De Buyst (13). Didier De Buyst was appointed director in March 1996. Mr. De Buyst began his career in the nuclear sector. He was CEO of Inter-Eco Group, an engineering and consultancy firm, from 1993 to 2003. He was also a Member of the Board of the Federaal Agentschap voor Nucleaire Controle (Federal Agency for Nuclear Monitoring) and Chairman of the Audit Committee between 2002 and 2003. He is now mediator/arbitrator for (inter)national industrial disputes of a technological nature and is also a part-time professor at the Department of Architecture of the Universiteit Hogescholen Limburg. Mr. De Buyst is a civil engineer (with a Masters in Engineering), has a doctorate in engineering (PhD in Engineering obtained in 1993) from the University of Gent and he holds also a degree from the Vlerick Leuven Gent Management School.
Martine Durez (16). Martine Durez was appointed director in December 1994. Ms. Durez is the Chief Financial and Accounting Officer at La Poste. Ms. Durez was Professor of Financial Management and Analysis at the University of Mons-Hainaut. She has also served as a member of the High Council of Corporate
Auditors and the Committee of Accounting Standard and as a special emissary at the Cabinet for Communication and State Companies. She serves as a regent of the National Bank of Belgium. Ms. Durez graduated as a Commercial Engineer and holds a degree in Applied Economics from the University of Brussels (ULB).
Michel Moll (8). Michel Moll was appointed director in December 1994. Since 1996 he has served as the Chairman of the Board of Directors and the General Manager of BRUFICOM (Brussels Finance Communication), a venture capital company with minor-ity shareholdings in small and start-up companies in the fields of telecommunications, multimedia and computers. Prior to 1996, Mr. Moll was manager and director of the SNI (Société Nationale d’Investissement). He is currently a director of SONACA (Société Nationale de Construction Aérospatiale) and SBI (Société Belge d’Investissement Internationale). Mr. Moll graduated as a com-mercial engineer from the Business School of the University of Leuven.
Robert Tollet (14). Robert Tollet was appointed director in October 2003. Mr. Tollet is the chairman of the board of directors of the Société Fédérale de Participations, a public sector holding com-pany and serves on the boards of Crédit Professionnel and Credibe. He is also the Chairman of the Central Council for the Economy. Mr. Tollet holds a degree in Economics and a degree in Economic Analysis and Policy from the University of Brussels (ULB).
Norbert Van Broekhoven (5). Norbert Van Broekhoven was appointed director in December 1994. He is a civil engineer and was CEO of Van Broekhoven’s Algemene Ondernemingen NV. He is currently CEO of Actima NV and director and advisor of sev-eral Belgian companies. Mr. Van Broekhoven graduated as a civil engineer from the University of Leuven.
Paul Van de Perre (2). Paul Van de Perre was appointed director in December 1994. He is the co-founder of GIMV (Venture Capital Firm) and was formerly a director of Sidmar (Arcelor). He is cur-rently a director of Meta Pharma (nutraceuticals) and Greenbridge (incubator). Mr. Van de Perre is CEO of 5 Financial Solutions, a divi-sion of Praxis in Management, a corporate finance house. Mr. Van de Perre holds an MBA and Master in Economics and is a certified accountant (IAB).
13
Carla Cico (17). Carla Cico was appointed director in March 2004. Ms. Cico has been CEO of Brasil Telecom since 2001. She has been working in the telecommunications sector for over 19 years, in the areas of strategy, equipment and operations. Ms. Cico is a mem-ber of the London Business School’s Regional Advisory Board. She obtained a MBA from London Business School. In August 2004 Ms. Cico ranked 75th in Forbes Magazine’s “100 Most Powerful Women” and in October was selected by Fortune Magazine as the 25th among the world’s 50 most powerful women in international business.
Pierre-Alain De Smedt (12). Pierre-Alain De Smedt was appointed director in March 2004. Mr. De Smedt was appointed Executive Vice President of Renault in 1999. He was chairman of Autolatina, VAG and Ford’s joint venture subsidiary in Latin America. He served as Chairman of Volkswagen Brazil and Argentina before being appointed as Chairman of Seat. Mr. De Smedt is member of the Board of Deceuninck Plastics Group and also of Compagnie Nationale à Portefeuille. He is a graduate in engineering and eco-nomics from the University of Brussels (ULB).
Carine Doutrelepont (6). Carine Doutrelepont was appointed director in March 2004. Ms. Doutrelepont is a partner at the Belgian law firm of Uyttendaele, Gérard & Doutrelepont and is specialized in information technology, intellectual property, media law and competition matters. She is a member of the Belgian Competition Authority. She holds a PhD in law from the University of Brussels (ULB) where she currently holds tenure as a Professor of Media Law, Intellectual Property Law, Electronic Commerce Law and European Audiovisual Law. She is also Director of the Information and Communication Law Centre of the ULB.
Philip Hampton (3). Philip Hampton was appointed director in March 2004. He spent the first ten years of his career at Lazard Brothers in London, New York and Paris. He then took up the posi-tions of Finance Director for British Steel plc, British Gas plc and British Telecommunications Group plc and for Lloyds TSB Group plc. He is currently Chairman of J. Sainsbury plc. Mr. Hampton is a Chartered Accountant and holds an MBA from INSEAD, Fontainebleau.
Georges Jacobs (15). Baron Georges Jacobs was appointed director in March 2004. Mr. Jacobs is a Chairman of the Board of Directors of UCB. He commenced his career as an economist
at the International Monetary Fund (USA). Later, he joined the UCB Group and was appointed as a Director of UCB in 1987. Furthermore, Baron Jacobs is member and Chairman of the Board of Delhaize, and a member of the Board of Bekaert and SN Brussels Airlines. He holds a law degree and a degree in economics, as well as a Master of Arts in Economics from the University of California, Berkeley.
Maurice Lippens (not on the picture). Count Maurice Lippens was appointed director in March 2004. Mr. Lippens is co-founder of Fortis, created in 1990 and the first European cross-border bank-ing and insurance group. He served as the executive Chairman of Fortis until 2000 and since then he is the non-executive Chairman of the Board of Directors. He is a member of the Board of several companies including Suez-Tractebel, Groupe Bruxelles Lambert and Total. He holds a law degree from the University of Brussels (ULB) as well as an MBA from Harvard Business School.
Oren G. Shaffer (7). Oren G. Shaffer was appointed director in April 2004. He is Vice Chairman and Chief Financial Officer of Qwest Communications International Inc. Formerly Mr. Shaffer was President and Chief Operating Officer of Sorrento Networks and from 1994 to 2000 he was Chief Financial Officer of Ameritech. He holds a Bachelor of Science in business administration from The University of California at Berkeley and a Master of Science in management from The Massachusetts Institute of Technology.
Philippe Van de Vyvere (not on the picture). Philippe Van de Vyvere was appointed director in March 2004. Mr. Van de Vyvere is the founder, CEO and Chairman of Sea-Invest, Europe’s largest bulk and fruit transshipment company. He is currently a non-executive board member for ING Belgium. Mr. Van de Vyvere holds a degree in Economics.
Lutgart Van den Berghe (11). Prof. dr. Lutgart Van den Berghe was appointed director in March 2004. Ms. Van den Berghe holds a PhD in economics from Gent University. As Executive Director, she heads the Competence Centre Entrepreneurship, Governance and Strategy at the Vlerick Leuven Gent Management School as well as the Belgian Directors’ Institute. She is a professor at Gent University, where she lectures on corporate governance and serves as a non-executive director in a number of listed and non-listed multinational companies such as Electrabel, CSM (The Netherlands), SHV Holding (The Netherlands) and Solvay BV (The Netherlands).
Roger De Borger (1). Government Commissioner.
14
Nomination and Remuneration CommitteeThe Nomination and Remuneration Committee (NRC) consists of
four directors. Pursuant to its charter, this committee is chaired by
the Chairman of the Board of Directors, who is an ex-officio mem-
ber. One member is chosen from among the directors appointed
by the Belgian State. Two members must be appointed among the
independent directors.
The Nomination and Remuneration Committee’s role is to assist
and advise the Board of Directors regarding:
• the nomination of candidates for appointment to the Board of
Directors and the Board Committees;
• the appointment of the President and Chief Executive Officer and
appointment by the President and Chief Executive Officer of the
members of the Management Committee;
• the remuneration of the members of the Board of Directors and
the Board Committees (legal duties and others);
• the remuneration of the President and Chief Executive Officer
and members of the Management Committee; the review on
an annual basis of the remuneration philosophy and strategy of
all personnel and specifically the compensation packages of top
senior management; and
• the oversight of the decisions of the President and Chief
Executive Officer with respect to the appointment, the dismissal
and the compensation of management, in order to allow the
Board of Directors, when it chooses to do so, to exercise its overall
supervising duties.
In its session of October 2004, the Board of Directors decided to
extend the role of the Nomination and Remuneration Committee
and requested it to also assist and advise the Board of Directors
regarding Corporate Governance issues.
The Nomination and Remuneration Committee meets at least two
times annually.
Mr. Theo Dilissen (Chairman), Ms. Martine Durez, Mr. Georges
Jacobs and Ms. Lutgart Van den Berghe are the members of the
Nomination and Remuneration Committee.
Strategic and Business Development CommitteeThe Strategic and Business Development Committee (SBDC) consists
of five directors. Pursuant to its charter, the President and Chief
Executive Officer and the Chairman of the Board of Directors are
ex officio members, and the committee is chaired by the Chairman
of the Board of Directors. One additional member is chosen among
the directors appointed by the Belgian State. Two members must be
appointed from among the independent directors.
The Strategic and Business Development Committee’s role is to
assist and advise the Board of Directors on matters concerning the
Company’s general policy and strategy, as well as on major issues
regarding its strategic development.
The Strategic and Business Development Committee meets at
least two times annually.
Functioning of the Board of DirectorsThe Board of Directors meets whenever the interests of the company so require or at the request of at least two directors. In principle, the Board of Directors meets six times a year.
The agenda for each meeting contains items of an informational nature and items on which a decision must be made.
In principle, the Board’s decisions are made by a simple major-ity of the directors present or represented. For certain issues, a qualified majority is required. The Board of Directors has adopted a Board Charter which, together with the charters of the Board Committees, reflects the principles by which the Board of Directors and its Committees operate. The Board Charter provides, among other things, that important decisions should have broad support, understood as a qualitative concept indicating effective decision-making within the Board of Directors following a constructive dialogue between directors. They should be prepared by standing or ad hoc Board Committees having significant representation of non-executive, independent directors within the meaning of Article 524, § 4 of the Belgian Commercial Companies Code.
Committees of the Board of DirectorsThe Board of Directors adopted formal charters for its Committees at its meeting of 19 February 2004. Amendments to key prin-ciples with respect to the composition and core tasks of such Committees, as set out in their respective charters, require broad support within the Board of Directors.
Audit and Compliance CommitteeThe Audit and Compliance Committee (ACC) consists of five non-executive directors, the majority of whom must be independent. Pursuant to its charter, the ACC is chaired by an independent director.
The Audit and Compliance Committee’s role is to assist and advise the Board of Directors in its oversight of:• the quality and integrity of the statutory and the consolidated
annual accounts and the financial statements of the Company;• the relationship with the Company’s statutory auditors;• the Company’s internal audit function;• the Company’s compliance with legal and regulatory require-
ments; and• compliance within the Company with the Company’s Code of
Conduct and its Policies, which must include dealings in finan-cial instruments of the Company, equal opportunity treatment among the sexes and sexual harassment.
The Audit and Compliance Committee meets at least once every quarter.
Mr. Philip Hampton (Chairman), Messrs. Pierre-Alain De Smedt, Michel Moll, Oren G. Shaffer and Paul Van de Perre are the mem-bers of the Audit and Compliance Committee.
The President and CEO is invited to meetings to state the manage-ment’s view on audit findings.
15
Mr. Theo Dilissen (Chairman), Mr. Didier Bellens, Ms. Carla Cico and Messrs. Maurice Lippens and Robert Tollet are the members of the Strategic and Business Development Committee.
At times, the Committee invites other Board members to the meetings.
Changes in the composition of the Board of DirectorsIn addition to the changes in the composition of the Board of Directors that occurred on the occasion of the company’s IPO in March 2004, the following changes occurred at the level of the Board of Directors.
In conformity with his commitment, Mr. Lloyd Kelley resigned in April 2004, since ADSB Telecommunications BV retained less than 7.5% of the voting stocks after the IPO. The Board of Directors has filled the vacancy by appointing Mr. Oren Shaffer as independent director through cooptation, upon the recommendation of the Nomination and Remuneration Committee. The shareholders will be requested to ratify this appointment during their 13 April 2005 meeting.
Mr. Oren Shaffer is considered independent since he meets all the independence conditions of the Belgian Code on Corporate Governance.
In October 2004, Mr. Jan Coene resigned for personal reasons as member and Chairman of the Board of Directors.
The Belgian State appointed Mr. Theo Dilissen as member and Chairman of the Board of Directors.
Directors’ remunerationBy virtue of a decision taken by the General Meeting on 12 April 1995, members of the Board of Directors that were appointed by the Belgian State, with the exception of the President & CEO, have the right to an attendance fee of EUR 619.73 per meeting, up to a ceiling of EUR 9,915.74 a year. They also have the right to directors’ emoluments for an amount equal to the attendance fee.
On 19 February 2004, the General Meeting changed these directors’ remunerations and compensations as follows. An annual fixed com-pensation of EUR 50,000 for the Chairman of the Board of Directors and of EUR 25,000 for the other members of the Board of Directors, with the exception of the President & CEO, is foreseen. All members of the Board of Directors, with the exception of the President & CEO, have the right to an attendance fee of EUR 5,000 per attended meeting of the Board of Directors. Finally attendance fees of EUR 2,500 have been foreseen for each member, with the exception of the President & CEO, of an advising committee to the Board of Directors. For the Chairman these attendance fees are doubled.
For 2004, a total amount of EUR 1,011,000 has been paid out.
As of 2005, individidual compensation will be published in con-formity with the Code Lippens’ recommendations.
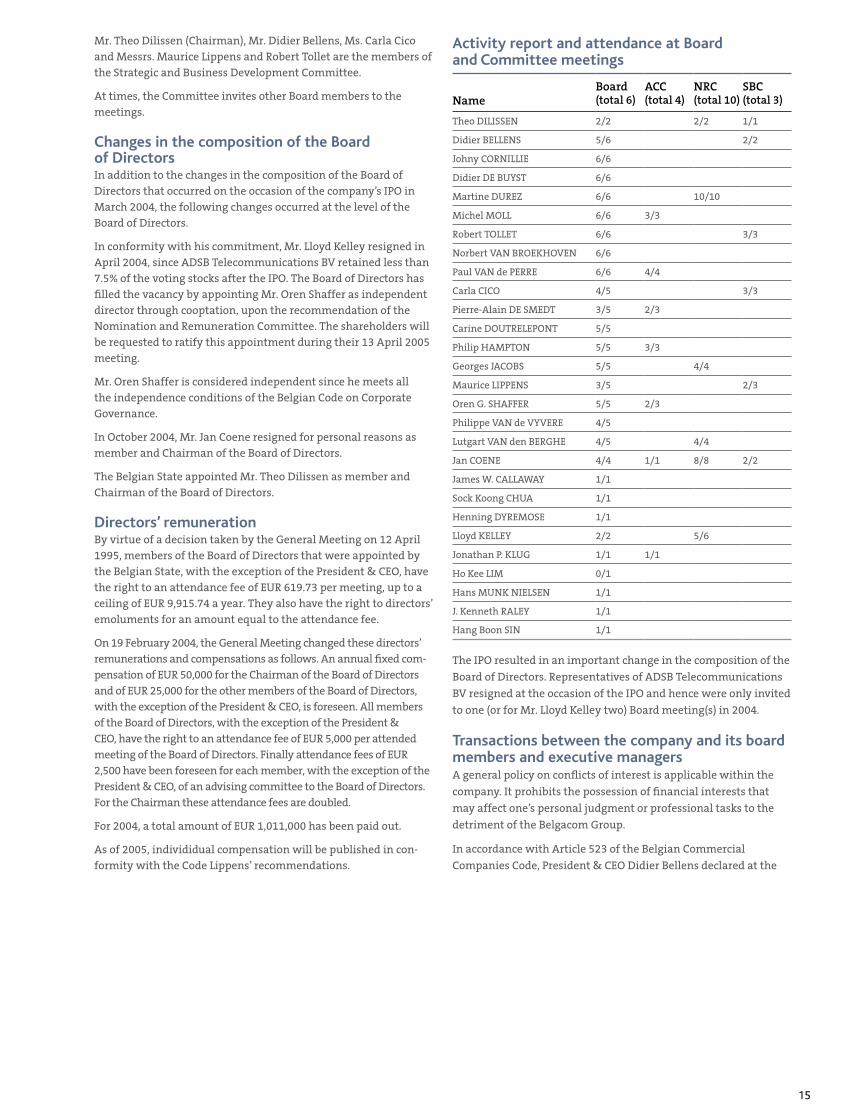
Activity report and attendance at Board and Committee meetings
NameBoard (total 6)
ACC (total 4)
NRC (total 10)
SBC (total 3)
Theo DILISSEN 2/2 2/2 1/1
Didier BELLENS 5/6 2/2
Johny CORNILLIE 6/6
Didier DE BUYST 6/6
Martine DUREZ 6/6 10/10
Michel MOLL 6/6 3/3
Robert TOLLET 6/6 3/3
Norbert VAN BROEKHOVEN 6/6
Paul VAN de PERRE 6/6 4/4
Carla CICO 4/5 3/3
Pierre-Alain DE SMEDT 3/5 2/3
Carine DOUTRELEPONT 5/5
Philip HAMPTON 5/5 3/3
Georges JACOBS 5/5 4/4
Maurice LIPPENS 3/5 2/3
Oren G. SHAFFER 5/5 2/3
Philippe VAN de VYVERE 4/5
Lutgart VAN den BERGHE 4/5 4/4
Jan COENE 4/4 1/1 8/8 2/2
James W. CALLAWAY 1/1
Sock Koong CHUA 1/1
Henning DYREMOSE 1/1
Lloyd KELLEY 2/2 5/6
Jonathan P. KLUG 1/1 1/1
Ho Kee LIM 0/1
Hans MUNK NIELSEN 1/1
J. Kenneth RALEY 1/1
Hang Boon SIN 1/1
The IPO resulted in an important change in the composition of the
Board of Directors. Representatives of ADSB Telecommunications
BV resigned at the occasion of the IPO and hence were only invited
to one (or for Mr. Lloyd Kelley two) Board meeting(s) in 2004.
Transactions between the company and its board members and executive managersA general policy on conflicts of interest is applicable within the
company. It prohibits the possession of financial interests that
may affect one’s personal judgment or professional tasks to the
detriment of the Belgacom Group.
In accordance with Article 523 of the Belgian Commercial
Companies Code, President & CEO Didier Bellens declared at the
16
1 2 3
19 February 2004 and 13 December 2004 Board of Directors meetings that he had a conflict of interest in connection with the Employee Incentive Plans item of the agenda of these Board meetings. He is in fact a proposed beneficiary of the Senior Management Long-term Incentive Plans 2004 and 2005 and the Short-term Incentive Plans 2004 and 2005.
Mr. Bellens has also been offered the opportunity to purchase shares at a discount under the Belgacom Discounted Share Purchase Plan 2004 (DSPP). He has informed Belgacom’s auditor of these conflicts of interests and has decided not to participate in the deliberation or voting on such items on the agenda.
Other members of the Belgacom Management Committee (BMC) are also proposed beneficiaries under the Senior Management Long-term Incentive Plans 2004 and 2005 and the Short-term Incentive Plans 2004 and 2005. Additionally, in the context of the 2004 DSPP, the BMC members have been offered the opportunity to purchase shares at a discount, just as any other employee of the Group.
Application of the measures taken by the company in order to comply with existing legislation on insider trading and market manipulation (market abuse)In order to comply with existing legislation on insider dealing and market manipulation, Belgacom adopted a dealing code prior to the IPO. This code aims at creating awareness about possible improper conduct by employees, officers and directors and the pos-sible sanctions attached thereto. This dealing code has been widely communicated and is available to all employees. A list of key per-sons is kept, and all directors and key employees were requested to sign a affidavit that they have read, understand and agree to comply with the dealing code. Closed periods (including prohibited periods) are defined, and any deal must be communicated to and cleared by the Head of Compliance Services before the transaction (see “Compliance” section p. 18).
ManagementPresident and Chief Executive OfficerThe President and Chief Executive Officer is entrusted with the day-to-day management and reports to the Board of Directors.
In addition, pursuant to the 1991 Law and the company’s Articles of Association, the Board of Directors may, deciding by a majority of two thirds of its members present or represented, delegate all or part of its powers to the President and Chief Executive Officer with the exception of:
• the approval of the Management Contract with the Belgian State and changes thereto;
• the establishment of the business plan and general policy of the company;
• the supervision of the President and Chief Executive Officer; and• other powers explicitly reserved by law to the Board of Directors
which include, for example, the establishment of the annual accounts for submission to the General Shareholders Meeting and the preparation of merger proposals.
The Board of Directors has delegated broad powers to the President and Chief Executive Officer.
The composition and, with the exception of certain specific pow-ers entrusted to the Management Committee by the 1991 Law, the powers of the Management Committee are determined by the President and Chief Executive Officer.
The President and Chief Executive Officer is appointed by the Belgian State by Royal Decree deliberated in the Council of Ministers for a renewable six-year term. The President and Chief Executive Officer and the Chairman of the Board of Directors must come from different language groups. The President and Chief Executive Officer may only be removed from office by Royal Decree deliberated in the Council of Ministers. Pursuant to the 1991 Law and the Company’s Articles of Association, the President and Chief Executive Officer is a member of the Board of Directors.
The current President and Chief Executive Officer is Mr. Didier Bellens.
Management CommitteeThe Management Committee’s role, apart from exercising the specific powers entrusted by the 1991 Law to the Management Committee, is to assist the President and Chief Executive Officer in the exercise of his duties. The Management Committee aims to decide by consensus, but in the event of disagreement, the view of the President and Chief Executive Officer will prevail. The Management Committee generally meets on a weekly basis. Pursuant to the 1991 Law and the Articles of Association, the President and Chief Executive Officer serves as a member of the Management Committee, which he chairs. There must be the same number of French-speaking members and Dutch-speaking members on the Management Committee, the President and Chief Executive Officer excepted in case of an uneven number. Members who are neither French-speaking nor Dutch-speaking shall not be taken into account for the calculation of this linguistic parity requirement.
The current members of the Management Committee are as follows:
17
4 5 6
Didier Bellens. Didier Bellens (49) was appointed as President and Chief Executive Officer and a director of Belgacom in March 2003. Previously Mr. Bellens served as the CEO of the RTL Group in Luxembourg and prior to that, as the CEO of the Group Bruxelles-Lambert. He holds a degree in Economics and Business Administration from the University of Brussels (ULB).
Scott Alcott (1). Scott Alcott (38) is Chief Operating Officer of Belgacom’s Fixed Line Services since July 2004. Previously, Mr. Alcott served as Belgacom’s Chief Strategy Officer, Chief Information and Technology Officer, General Manager of Marketing and Product Management, director at Skynet and director at Belgacom’s Multi-Media Venture Capital Fund. In 1995, Mr. Alcott joined Ameritech (now SBC) as Director of Marketing & Product Management – Long Distance Division, and later as Director of New Product Development/Packaging. Mr. Alcott holds a B.S. in Economics from the Wharton School at the University of Pennsylvania.
Bridget P. Cosgrave (2). Bridget Cosgrave (43) has served as the President of the International Carrier Services of Belgacom since 2001, and she joined the Board of Directors of Belgacom Mobile in 2004. From 1993 to 1996, Ms. Cosgrave was a Project Director at British Telecom Plc. In 1996, she was elected and served her full term as the Deputy Director General of the European Telecommunications Standards Institute (ETSI). Ms. Cosgrave has a B.A. (Hons.) from Queen’s University at Kingston, Canada and a MBA from the London Business School.
Astrid De Lathauwer (3). Astrid De Lathauwer (41) has served as Chief Human Resources Officer for Belgacom since 2002. Ms. De Lathauwer joined Belgacom in 2000 and previously held the positions of Top Group Resources & Talent Director and HR Director of Belgacom. Prior to joining Belgacom, Ms. De Lathauwer
worked in marketing and human resources with Monsanto. Ms. De Lathauwer holds a degree in History of Art from the University of Gent and a degree in International Politics and Diplomatic Sciences from the University of Leuven.
William Mosseray (4). William Mosseray (40) was appointed Chief Strategy Officer in July 2004 and has served as Belgacom’s Chief Restructuring and Change Officer since 2002. Mr. Mosseray joined Belgacom in 1993 and has served as Executive Advisor to the CEO, General Manager for the Special Business Division, Head of Corporate Strategy & Development and Chief Human Resources Officer. He obtained a law degree from the University of Leuven and a tax law degree from ICHEC. Mr. Mosseray also holds an MBA from the Vlerick Leuven Gent Management School.
Ray Stewart (5). Ray Stewart (55) has served as the Chief Financial Officer of Belgacom since 1997. Mr. Stewart was employed by SBC, but became an employee of Belgacom on 1 April 2004. From 1994 to 1997, Mr. Stewart was the CFO of Matav, a Hungarian telecom oper-ator in which Ameritech bought a shareholding. Mr. Stewart holds an undergraduate degree in Accounting and an MBA in Finance from Indiana University and is a certified public accountant.
Philippe Vander Putten (6). Philippe Vander Putten (45) has served as the CEO of Belgacom Mobile since 1998 where he is also an executive director, since 1998. Mr. Vander Putten started his professional career at Procter & Gamble, working in the FMCG sector at L’Oréal. In 1986, Mr. Vander Putten joined the Kraft Jacobs Suchard Group (now Kraft Foods) and held several positions in Marketing & Sales before becoming the Managing Director of Kraft General Foods for Benelux in 1991. Mr. Vander Putten holds a bachelor’s degree and a master’s degree in administration and management from the University of Leuven.
Belgacom Management Committee
18
Compensation of the members of the Management CommitteeThe total amount paid to members of the Belgacom Management Committee (BMC) as a whole, including the President & CEO, amounted to EUR 4,897,000 in the year ending 31 December 2004. The members of the Belgacom Management Committee are Ms. B. Cosgrave, Ms. A. De Lathauwer and Messrs. D. Bellens, R. Stewart, Ph. Vander Putten, W. Mosseray and S. Alcott. This total covers the pecuniary benefits, both direct or immediate (basic pay, variable pay) and indirect (insurance, long-term profit-sharing scheme), which are related directly to the office held or which are awarded to members of the BMC.
In addition to these pecuniary benefits, the BMC as a whole, including the President & CEO, participated in the Discounted Share Purchase Plan (510,410 shares bought at an introduction price of EUR 24.50 with a discount of 16, 66 %) and the Employee Stock Option Plan (355,581 stock options acquired at a strike price of EUR 24.50).
As of 2005, compensation details of members of the Management Committee will be published in conformity with the Lippens Code recommendations.
Board of AuditorsThe Board of Auditors of the company is composed of the follow-ing persons:• ERNST & YOUNG Reviseurs d’Entreprises S.C.C.R.L./
Bedrijfsrevisoren B.C.V.B.A., represented by Ludo Swolfs, also Chairman of the Board of Auditors
• Romain LESAGE, Member of the Court of Auditors, Commissaire• Pierre RION, Member of the Court of Auditors, Commissaire• CALLENS, GUEVAR, VAN IMPE & Co S.C.C.R.L./B.C.V.B.A., repre-
sented by Herman VAN IMPE, Commissaire
Ernst & Young is responsible for the audit of the consolidated financial statements of Belgacom and its subsidiaries. The other members of the Board of Auditors are, together with Ernst & Young, entrusted with the audit of the non-consolidated financial statements of the parent company.
Mr. Lesage’s mandate will expire on 30 June 2008, the mandates of Mr. Rion, Ernst & Young, and Callens, Guévar, Van Impe & Co. will expire at the annual General Shareholders Meeting in 2010.
Additional fees paid to the statutory auditorsIn accordance with the provisions of Article 134 § 2 of the Belgian Company Law, Belgacom declares the supplementary fees that it granted during the 2004 financial year to two auditors, mem-
bers of the Joints Auditors: Ernst & Young Reviseurs d’entreprises S.C.C.R.L. and Callens, Guevar, Van Impe & Co. S.C.C.R.L.
The overview of the subject and the remuneration linked to excep-tional assignments executed by the auditors within Belgacom SA under public law or a Belgian enterprise affiliated to Belgacom SA under public law in the sense of article 11 or a foreign affiliate is as follows:• to Ernst & Young Reviseurs d’entreprises: EUR 1,026,330 for
control assignments concerning the initial public offering, EUR 350,218 for other control assignments and EUR 6,250 for other assignments within Belgacom SA under public law and EUR 39,000 for other control assignments in affiliated enterprises in Belgium;
• to other members of the Ernst & Young network: EUR 20,758 for other assignments in foreign affiliates;
• to Callens, Guevar, Van Impe & Co.: EUR 5,750 for other control assignments in Belgacom SA under public law.
Government CommissionerThe State has appointed Mr. Roger De Borger as Government Commissioner in order to supervise, in conformity with the 1991 law, the management of Belgacom from an administrative point of view.
ComplianceTowards more transparencyBelgacom has consistently considered compliance as an important part of sound corporate governance. As early as 1998, it introduced a code of conduct, and today more than 40 policies have been implemented in matters as diverse as competition law, e-mail usage and business continuity management.
Aware that it is operating in an increasingly complex regulatory environment and because of the legitimate high expectations of its customers, shareholders and other stakeholders, Belgacom has decided to integrate these different existing initiatives into one central Compliance Office, as of 1 October 2004.
Furthermore, various public initiatives such as the Sarbanes Oxley Act in the United States and the European Union action plan on enhancing corporate governance have in the meantime further strengthened the case for a coherent compliance approach. In Belgium, this was also the case with the publication of the “Belgian Code on Corporate Governance” (Lippens Code).
19
Belgacom Compliance OfficeSince the IPO of 22 March 2004, compliance is defined at the Belgacom board level, in the Audit & Compliance Committee (ACC).
In the ACC Charter, the ACC has been given the responsibility of regularly reviewing Belgacom’s compliance with legal/regulatory requirements and the Belgacom Group’s codes of conduct and policies.
The Belgacom SA Code of Conduct and a set of 40 policies provide guidelines to employees so as to clarify what is expected from them in given situations. The guidelines cover all fields of the business, including customer and business relations, corporate culture, assets and corporate citizenship. A similar structure is in place at Belgacom Mobile.
The Compliance Office began operations on 1 October 2004, building upon the existing Code and Policies team. The ACC has appointed a senior executive as Head of Compliance Services, with a direct reporting line to the ACC Chairman and to the President and CEO.
A Group Compliance Council has been set up. It meets quar-terly under the presidency of the Head of Compliance Services and is composed of key executives from Internal Audit, Risk Management, Human Resources, Corporate Communications, Internal Services, Belgacom Mobile and BICS.
Rules, tools and consistencyIt is every employee’s personal responsibility to ensure that the company and its employees comply with the internal and external rules and regulations. Belgacom’s compliance office has three responsibilities: to clarify the rules, to provide tools and to ensure consistency.• In the identified compliance areas, the compliance office ensures
that the rules, as set by the area owners and endorsed by man-agement, are clearly defined, properly communicated and easily accessible.
• The compliance office ensures that the necessary implementa-tion, training and reporting tools for compliance are in place, so that management is properly equipped to make sure that the rules are satisfactorily complied with.
• The compliance office ensures that the rules are consistent throughout the Belgacom Group.
The main instruments of the compliance office in 2004 have been the Code & Policies intranet website, regular policy-related email information, the availability of a “Helpdesk policies” mailbox and the forum of the Group Compliance Council.
Belgacom compliance programIn an effort to streamline existing initiatives and enhance employees’ awareness of the importance of proper compliance, the Compliance Office has identified 10 compliance areas which together constitute the Belgacom Compliance Program:
Code of Conduct Corporate Governance
Regulatory Compliance Accounting Practices
Risk Management Competition Law
Chinese Walls Privacy
Environment Dealing Code
The 10 compliance areas have been established based on the specific activities and operating environment of Belgacom, as confirmed through internal questionnaires, Enterprise Risk Management and benchmarking. For each of these different areas, a specific compliance plan will be developed, involving consoli-dation of various existing initiatives into the plans as well as
developing new efforts.
With the creation of the Compliance Office, Belgacom is taking an important step forward in its challenge to continue to play a lead-ing role in an environment of complex legislation and demanding markets.
20
Welcome to our new shareholders! 22 March 2004 was a historic date for Belgacom, as it made its entry on the Euronext Brussels stock exchange. In addition to the arrival of new partners in our capital, this listing has brought sweeping change to our corporate culture and to how the company is perceived in the telecommuni-cations world and financial markets. Belgacom now has an additional tool for implementing its Best-in-class strategy and taking up further challenges.
From the IPO until the end of 2004, a total volume of 191 million
shares were traded on the Euronext Brussels stock exchange. The
average trading volume from 1 April until year end was approxi-
mately 778,500 shares per day.
Belgacom shares
Belgacom shares on the stock market
Stock market: First Market of Euronext Brussels
Ticker: BELG
ISIN: BE0003810273
National SVM code: 3810.27
Bloomberg code: BELG BB
Reuters code: BCOM
Changes in the share capital and number of sharesShare splitAt the Extraordinary General Meeting held on 19 February 2004,
the shareholders approved a ten-for-one share split, subsequent
to which ten new ordinary shares were issued for each ordinary
share existing on that date. Following the share split, the aggre-
gate number of ordinary shares amounted to 400,000,000. Of
these, 12,380,950 were owned by Belgacom (first share buyback on
30 December 2003).
Share buyback and cancellationIn March 2004, concurrently to the IPO, Belgacom repur-
chased 38,761,905 shares from its exiting shareholder ADSB
Telecommunications BV for EUR 949,666,673.
In Belgium, companies are prohibited by law from owning more
than 10% of their outstanding share capital. Prior to this purchase,
Belgacom therefore cancelled the 12,380,950 ordinary shares bought
back at the end of December 2003. Under Belgian law, the voting and
dividend rights in respect of treasury shares are suspended.
A successful IPO!In March 2004, the main private shareholders in the consortium
ADSB Telecommunications BV sold their stake in Belgacom.
Despite weak and volatile financial markets due to the bomb
attacks in Madrid and tension in the Middle East during the first
quarter of the year, both retail and institutional investors rushed
to buy Belgacom shares.
The size of the Belgacom IPO (including green shoe) was EUR 3.6
billion, making it the largest IPO ever in Belgium, the largest in
Europe since 2001 and the biggest in the world in 2004.
The institutional tranche of the offering was more than three
times oversubscribed, and the new shareholder structure exhibits
a healthy mix of large European institutions with a majority in
the UK, France and Belgium.
The retail market participation represented an impressive demand
of EUR 1.2 billion (approximately 2.5 times the amount of allo-
cated shares) and, in the end, 22.6 million shares were allocated to
individual investors in Belgium.
Solid market debutOn 22 March, the shares were floated at EUR 24.50, slightly below
the middle of the indicative price range (EUR 23 to 26.50), and on
the first day of trading closed up 4.8% from the IPO price.
For the remainder of the year, the Belgacom share price has
performed extremely well, closing at EUR 31.80 (+29.80%) on
31 December. It has consistently outperformed its peers (DJ Stoxx
Telecom index, +11.31%) as well as the Belgian BEL20 index
(+24.32%). The lowest price was EUR 24.30, slightly below the IPO
price, and it peaked at EUR 32.64 on 29 December.
With 361.77 million shares outstanding, the market capitalization
reached EUR 11.5 billion at the end of December 2004.
The Belgacom share has been included in a total of 53 indexes,
including the BEL20 (20 main Belgian caps) and the major
European/telecom indexes.
shareholder information

21
>Committed to return value to
its shareholders
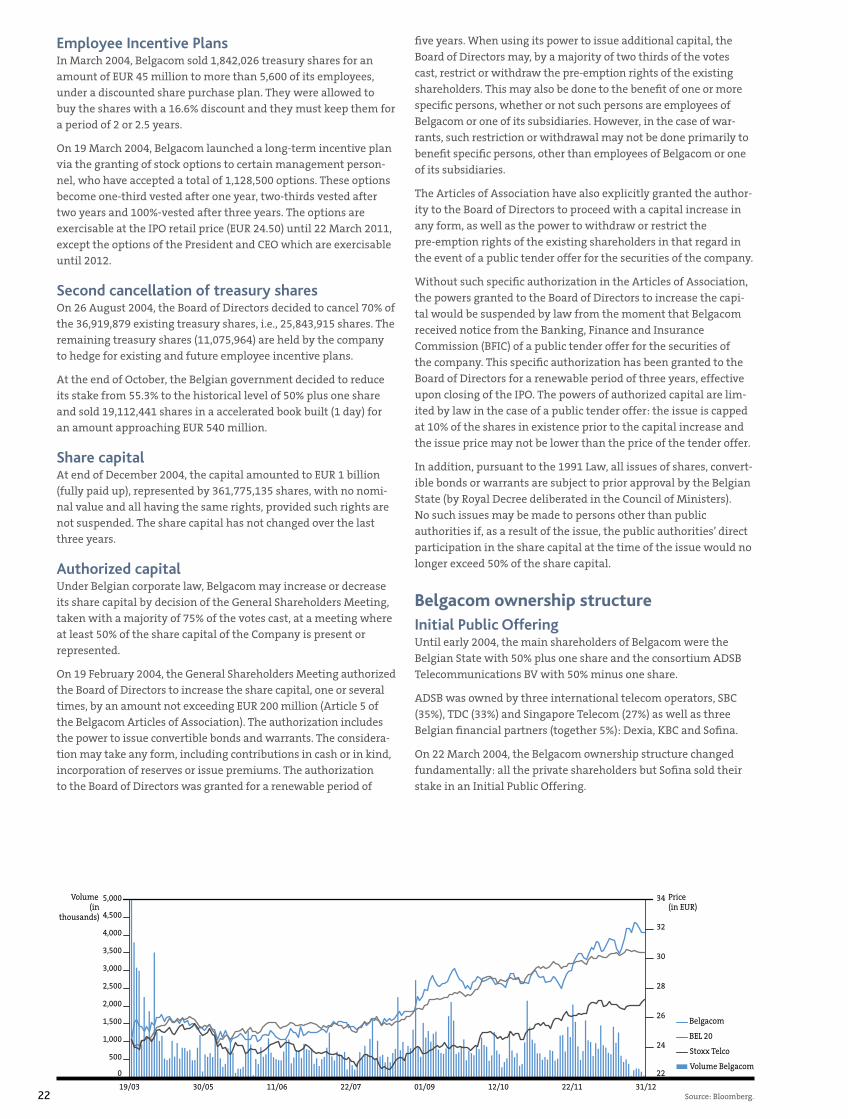
22
five years. When using its power to issue additional capital, the
Board of Directors may, by a majority of two thirds of the votes
cast, restrict or withdraw the pre-emption rights of the existing
shareholders. This may also be done to the benefit of one or more
specific persons, whether or not such persons are employees of
Belgacom or one of its subsidiaries. However, in the case of war-
rants, such restriction or withdrawal may not be done primarily to
benefit specific persons, other than employees of Belgacom or one
of its subsidiaries.
The Articles of Association have also explicitly granted the author-
ity to the Board of Directors to proceed with a capital increase in
any form, as well as the power to withdraw or restrict the
pre-emption rights of the existing shareholders in that regard in
the event of a public tender offer for the securities of the company.
Without such specific authorization in the Articles of Association,
the powers granted to the Board of Directors to increase the capi-
tal would be suspended by law from the moment that Belgacom
received notice from the Banking, Finance and Insurance
Commission (BFIC) of a public tender offer for the securities of
the company. This specific authorization has been granted to the
Board of Directors for a renewable period of three years, effective
upon closing of the IPO. The powers of authorized capital are lim-
ited by law in the case of a public tender offer: the issue is capped
at 10% of the shares in existence prior to the capital increase and
the issue price may not be lower than the price of the tender offer.
In addition, pursuant to the 1991 Law, all issues of shares, convert-
ible bonds or warrants are subject to prior approval by the Belgian
State (by Royal Decree deliberated in the Council of Ministers).
No such issues may be made to persons other than public
authorities if, as a result of the issue, the public authorities’ direct
participation in the share capital at the time of the issue would no
longer exceed 50% of the share capital.
Belgacom ownership structureInitial Public OfferingUntil early 2004, the main shareholders of Belgacom were the
Belgian State with 50% plus one share and the consortium ADSB
Telecommunications BV with 50% minus one share.
ADSB was owned by three international telecom operators, SBC
(35%), TDC (33%) and Singapore Telecom (27%) as well as three
Belgian financial partners (together 5%): Dexia, KBC and Sofina.
On 22 March 2004, the Belgacom ownership structure changed
fundamentally: all the private shareholders but Sofina sold their
stake in an Initial Public Offering.
Employee Incentive PlansIn March 2004, Belgacom sold 1,842,026 treasury shares for an
amount of EUR 45 million to more than 5,600 of its employees,
under a discounted share purchase plan. They were allowed to
buy the shares with a 16.6% discount and they must keep them for
a period of 2 or 2.5 years.
On 19 March 2004, Belgacom launched a long-term incentive plan
via the granting of stock options to certain management person-
nel, who have accepted a total of 1,128,500 options. These options
become one-third vested after one year, two-thirds vested after
two years and 100%-vested after three years. The options are
exercisable at the IPO retail price (EUR 24.50) until 22 March 2011,
except the options of the President and CEO which are exercisable
until 2012.
Second cancellation of treasury sharesOn 26 August 2004, the Board of Directors decided to cancel 70% of
the 36,919,879 existing treasury shares, i.e., 25,843,915 shares. The
remaining treasury shares (11,075,964) are held by the company
to hedge for existing and future employee incentive plans.
At the end of October, the Belgian government decided to reduce
its stake from 55.3% to the historical level of 50% plus one share
and sold 19,112,441 shares in a accelerated book built (1 day) for
an amount approaching EUR 540 million.
Share capitalAt end of December 2004, the capital amounted to EUR 1 billion
(fully paid up), represented by 361,775,135 shares, with no nomi-
nal value and all having the same rights, provided such rights are
not suspended. The share capital has not changed over the last
three years.
Authorized capitalUnder Belgian corporate law, Belgacom may increase or decrease
its share capital by decision of the General Shareholders Meeting,
taken with a majority of 75% of the votes cast, at a meeting where
at least 50% of the share capital of the Company is present or
represented.
On 19 February 2004, the General Shareholders Meeting authorized
the Board of Directors to increase the share capital, one or several
times, by an amount not exceeding EUR 200 million (Article 5 of
the Belgacom Articles of Association). The authorization includes
the power to issue convertible bonds and warrants. The considera-
tion may take any form, including contributions in cash or in kind,
incorporation of reserves or issue premiums. The authorization
to the Board of Directors was granted for a renewable period of
Source: Bloomberg.
22
34
24
26
28
30
32
0
500
1,000
1,500
2,000
2,500
3,000
3,500
4,000
4,500
5,000Volume(in
thousands)
Price(in EUR)
Belgacom
Volume Belgacom
19/03 30/05 11/06 22/07 01/09 12/10 22/11 31/12
Stoxx Telco
BEL 20
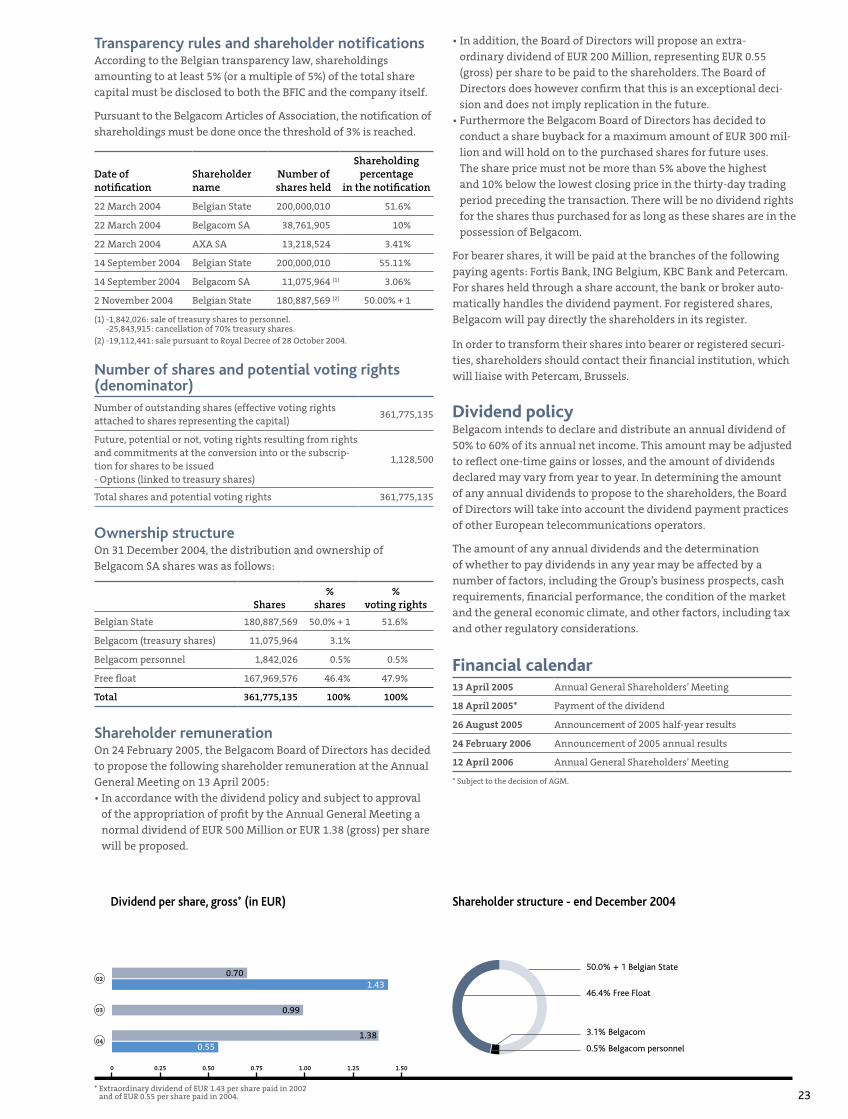
23
Transparency rules and shareholder notificationsAccording to the Belgian transparency law, shareholdings amounting to at least 5% (or a multiple of 5%) of the total share capital must be disclosed to both the BFIC and the company itself.
Pursuant to the Belgacom Articles of Association, the notification of shareholdings must be done once the threshold of 3% is reached.
Date of notification
Shareholder name
Number of shares held
Shareholding percentage
in the notification
22 March 2004 Belgian State 200,000,010 (1) 51.6%
22 March 2004 Belgacom SA 38,761,905 (1) 10%
22 March 2004 AXA SA 13,218,524 (1) 3.41%
14 September 2004 Belgian State 200,000,010 (1) 55.11%
14 September 2004 Belgacom SA 11,075,964 (1) 3.06%
2 November 2004 Belgian State 180,887,569 (2) 50.00% + 1
(1) -1,842,026: sale of treasury shares to personnel. -25,843,915: cancellation of 70% treasury shares.
(2) -19,112,441: sale pursuant to Royal Decree of 28 October 2004.
Number of shares and potential voting rights (denominator)Number of outstanding shares (effective voting rights attached to shares representing the capital)
361,775,135
Future, potential or not, voting rights resulting from rights and commitments at the conversion into or the subscrip-tion for shares to be issued - Options (linked to treasury shares)
1,128,500
Total shares and potential voting rights 361,775,135
Ownership structureOn 31 December 2004, the distribution and ownership of Belgacom SA shares was as follows:
Shares%
shares%
voting rights
Belgian State 180,887,569 50.0% + 1 51.6%
Belgacom (treasury shares) 11,075,964 3.1%
Belgacom personnel 1,842,026 0.5% 0.5%
Free float 167,969,576 46.4% 47.9%
Total 361,775,135 100% 100%
Shareholder remunerationOn 24 February 2005, the Belgacom Board of Directors has decided to propose the following shareholder remuneration at the Annual General Meeting on 13 April 2005:• In accordance with the dividend policy and subject to approval
of the appropriation of profit by the Annual General Meeting a normal dividend of EUR 500 Million or EUR 1.38 (gross) per share will be proposed.
• In addition, the Board of Directors will propose an extra- ordinary dividend of EUR 200 Million, representing EUR 0.55 (gross) per share to be paid to the shareholders. The Board of Directors does however confirm that this is an exceptional deci-sion and does not imply replication in the future.
• Furthermore the Belgacom Board of Directors has decided to conduct a share buyback for a maximum amount of EUR 300 mil-lion and will hold on to the purchased shares for future uses. The share price must not be more than 5% above the highestand 10% below the lowest closing price in the thirty-day trading period preceding the transaction. There will be no dividend rights for the shares thus purchased for as long as these shares are in the possession of Belgacom.
For bearer shares, it will be paid at the branches of the following paying agents: Fortis Bank, ING Belgium, KBC Bank and Petercam. For shares held through a share account, the bank or broker auto-matically handles the dividend payment. For registered shares, Belgacom will pay directly the shareholders in its register.
In order to transform their shares into bearer or registered securi-ties, shareholders should contact their financial institution, which will liaise with Petercam, Brussels.
Dividend policyBelgacom intends to declare and distribute an annual dividend of 50% to 60% of its annual net income. This amount may be adjusted to reflect one-time gains or losses, and the amount of dividends declared may vary from year to year. In determining the amount of any annual dividends to propose to the shareholders, the Board of Directors will take into account the dividend payment practices of other European telecommunications operators.
The amount of any annual dividends and the determination of whether to pay dividends in any year may be affected by a number of factors, including the Group’s business prospects, cash requirements, financial performance, the condition of the market and the general economic climate, and other factors, including tax and other regulatory considerations.
Financial calendar13 April 2005 Annual General Shareholders’ Meeting
18 April 2005* Payment of the dividend
26 August 2005 Announcement of 2005 half-year results
24 February 2006 Announcement of 2005 annual results
12 April 2006 Annual General Shareholders’ Meeting
* Subject to the decision of AGM.
Shareholder structure - end December 2004
* Extraordinary dividend of EUR 1.43 per share paid in 2002 and of EUR 0.55 per share paid in 2004.
Dividend per share, gross* (in EUR)
04
0 0.25 0.50 0.75 1.00 1.25 1.50
50.0% + 1 Belgian State
3.1% Belgacom
0.5% Belgacom personnel
46.4% Free Float
021.43
0.70
03 0.99
1.380.55

24
> A commitment to listen even more to our customers
25
business update
In 2004, the Group’s various areas of activity faced even more aggressive competition. We stood up to it. Our teams stepped up their efforts to defend and increase our market share, striving to respond even more closely to customers’ needs, whether residential customers, business customers or other actors in the telecom sector. We also focused on achieving operational excellence by streamlining and automating procedures.
In the Mobile Communications Services division, the battle to
retain or win over customers was also tougher. After launching
segmented offers and new products and services, MCS finished the
year with a market share (of active customers) estimated at 50%.
It also confirmed its leadership position in terms of profitability,
with a slight rise in average revenue per user and a cost structure
that was well under control.
For International Carrier Services, 2004 was a time to prepare for
the sector’s consolidation: it formed an autonomous company
(BICS) and searched for a partner. In this highly competitive
line of activity, winning “the race for size” is what is required to
remain profitable. ICS succeeded in increasing its traffic volume
and appreciably reducing the per-minute operational costs of
the network. Its efforts were rewarded by its being named “Most
Competitive Carrier.”
2004 was characterized by fierce attacks from our competitors.
Fixed and mobile operators targeted our fixed-line services by
launching a number of promotional offers encouraging users to
cancel their fixed-line subscriptions with Belgacom by running
very aggressive rate-awareness campaigns. Fixed Line Services
responded successfully by launching initiatives to:
• secure the loyalty of as many customers as possible, win back
customers who had switched to the competition, and acquire
new customers;
• develop and market new products and services in order to gener-
ate new revenue sources.
Communication campaigns were launched to improve the price
perception of FLS on the market, and to respond to the com-
petition’s advertisements. The main objective was to increase
awareness of our rate plans.
26
Broadband Internet market shares
EOP 2002 2003 2004
FLS Retail ADSL 50% 53% 52%**
Other ADSL (Bitstream Access + Wholesale) 10% 09% 13%**
Cable 40% 38% 35%**
FLS Flanders* 43% 45% 45%**
Telenet Flanders 57% 55% 55%**
Source: ISPA and BIPT for Cable.* No data on other ADSL and non-Telenet cable for Flanders.** June 2004 figures.
In this tough telecom environment, the FLS business unit remains
market leader in its different activities.
Ever-increasing competitionVoice market2004 began with a very aggressive attack from our competitors.
Both fixed and mobile operators hit FLS with numerous promo-
tions, cut-the-wire campaigns and aggressive price-perception
campaigns.
Towards the end of the year, competitors started to reshape their
strategies.
• On top of their existing product portfolio, fixed operators have
changed their customer approach by marketing bundled offers
combining voice (fixed and/or mobile) with Internet services.
Some of them also have announced and/or implemented Mobile
Virtual Network Operator (MVNO) activities, adding mobile voice
services to their fixed portfolio offers.
• New pricing plans such as flat fee offers (e.g., unlimited fixed off-
peak calls for a flat monthly fee) were also launched.
Internet marketThe Internet market in Belgium continued to grow in 2004
(+ 7% vs. December 2003).
Narrowband Internet access is decreasing further (32% fewer users)
in favor of broadband Internet access (+27%). Broadband is by far
the most popular Internet access technology; 79% of all Internet
connections in Belgium are broadband. Belgium has one of the
Constantly changing marketBoth the Belgian population as a whole and the number of house-holds have increased slightly. The market share of mobile-only, other licensed operators (OLO) and cable telephony companies is increasing.
Year end 2002 2003 2004
Population (in thousands) 10,310 10,351 10,396
Households (in thousands) 4,325 4,361 4,402
Market share of households (in %)
No phone / Mobile-Only 24% 25% 26%
Fixed Telephony 76% 75% 74%
Belgacom 72% 70% 67%
Cable and OLOs 4% 5% 7%
Source: NIS, BGC data, Telecom Universe.
This increase is mainly due to competition. In 2004, the fixed-line market was subject to intensified competition, putting pressure on our market share.
Total fixed-line voice market
Year end (in EUR millions) 2002 2003 2004
FLS Access Revenues 963 957 931
FLS Traffic Revenues 990 908 802
FLS Total 1,953 1,865 1,733
FLS Retail Voice Market Share (Value) 83.0% 80.6% 76.1%
FLS Retail Traffic Market Share (Volume)* 82.7% 74.5% 67.9%
Source: Company figures, market share based on estimates from Gartner.* On own network.
Despite fierce competition from cable companies in the broadband Internet market, especially in Flanders, and the growing success of regulated offers (bitstream access), in 2004 FLS managed to limit market share loss to 1% in Belgium and kept its market share in Flanders at same level.
Fixed Line Services (FLS)
With 5.3 million fixed connections, including 828,000 ADSL access lines for the retail market, FLS offers a compre-hensive range of voice, data and Internet fixed-line services to residential and business customers. As the leading ISP in Belgium, Belgacom offers Internet access to more than 1 million narrowband and broadband subscribers. It also provides wholesale services to other operators and service providers in Belgium.
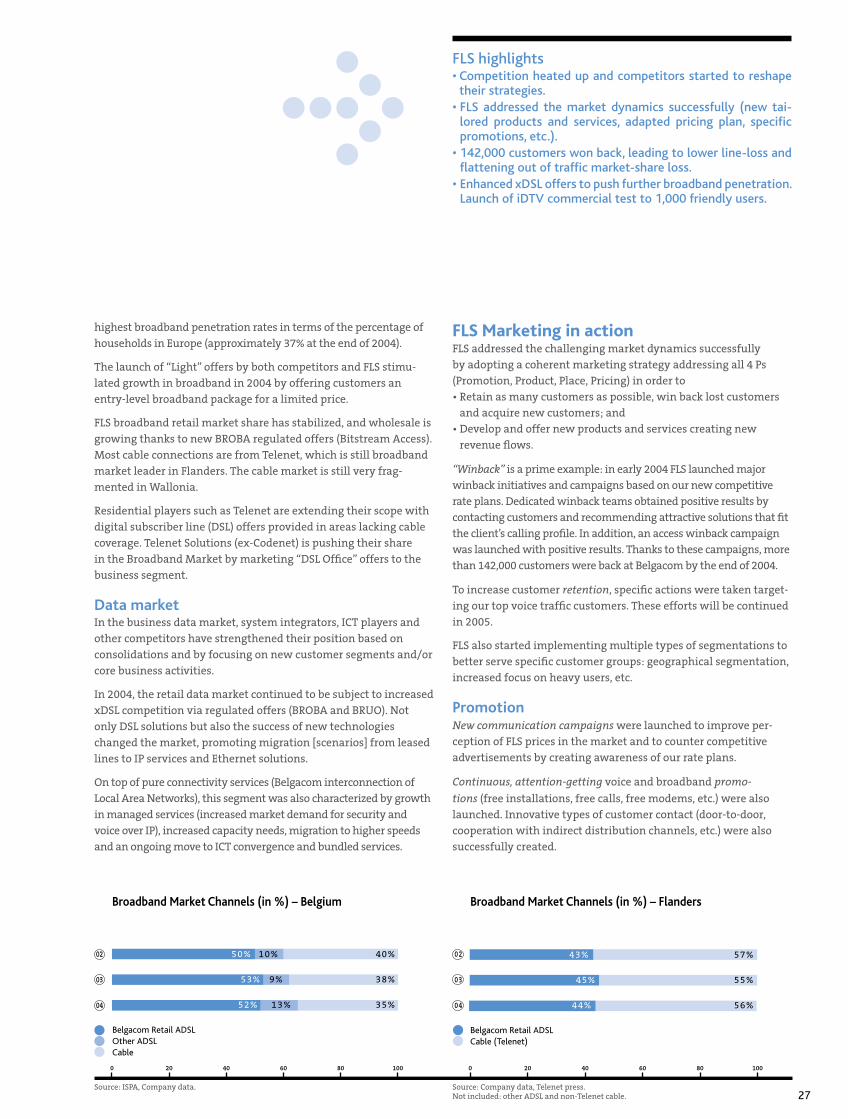
27
highest broadband penetration rates in terms of the percentage of
households in Europe (approximately 37% at the end of 2004).
The launch of “Light” offers by both competitors and FLS stimu-
lated growth in broadband in 2004 by offering customers an
entry-level broadband package for a limited price.
FLS broadband retail market share has stabilized, and wholesale is
growing thanks to new BROBA regulated offers (Bitstream Access).
Most cable connections are from Telenet, which is still broadband
market leader in Flanders. The cable market is still very frag-
mented in Wallonia.
Residential players such as Telenet are extending their scope with
digital subscriber line (DSL) offers provided in areas lacking cable
coverage. Telenet Solutions (ex-Codenet) is pushing their share
in the Broadband Market by marketing “DSL Office” offers to the
business segment.
Data marketIn the business data market, system integrators, ICT players and
other competitors have strengthened their position based on
consolidations and by focusing on new customer segments and/or
core business activities.
In 2004, the retail data market continued to be subject to increased
xDSL competition via regulated offers (BROBA and BRUO). Not
only DSL solutions but also the success of new technologies
changed the market, promoting migration [scenarios] from leased
lines to IP services and Ethernet solutions.
On top of pure connectivity services (Belgacom interconnection of
Local Area Networks), this segment was also characterized by growth
in managed services (increased market demand for security and
voice over IP), increased capacity needs, migration to higher speeds
and an ongoing move to ICT convergence and bundled services.
FLS Marketing in actionFLS addressed the challenging market dynamics successfully
by adopting a coherent marketing strategy addressing all 4 Ps
(Promotion, Product, Place, Pricing) in order to
• Retain as many customers as possible, win back lost customers
and acquire new customers; and
• Develop and offer new products and services creating new
revenue flows.
“Winback” is a prime example: in early 2004 FLS launched major
winback initiatives and campaigns based on our new competitive
rate plans. Dedicated winback teams obtained positive results by
contacting customers and recommending attractive solutions that fit
the client’s calling profile. In addition, an access winback campaign
was launched with positive results. Thanks to these campaigns, more
than 142,000 customers were back at Belgacom by the end of 2004.
To increase customer retention, specific actions were taken target-
ing our top voice traffic customers. These efforts will be continued
in 2005.
FLS also started implementing multiple types of segmentations to
better serve specific customer groups: geographical segmentation,
increased focus on heavy users, etc.
PromotionNew communication campaigns were launched to improve per-
ception of FLS prices in the market and to counter competitive
advertisements by creating awareness of our rate plans.
Continuous, attention-getting voice and broadband promo-
tions (free installations, free calls, free modems, etc.) were also
launched. Innovative types of customer contact (door-to-door,
cooperation with indirect distribution channels, etc.) were also
successfully created.
FLS highlights• Competition heated up and competitors started to reshape
their strategies.• FLS addressed the market dynamics successfully (new tai-
lored products and services, adapted pricing plan, specific promotions, etc.).
• 142,000 customers won back, leading to lower line-loss and flattening out of traffic market-share loss.
• Enhanced xDSL offers to push further broadband penetration. Launch of iDTV commercial test to 1,000 friendly users.
Broadband Market Channels (in %) – Belgium Broadband Market Channels (in %) – Flanders
Source: ISPA, Company data. Source: Company data, Telenet press. Not included: other ADSL and non-Telenet cable.
0 20 40 60 80 100 0 20 40 60 80 100
02 40%10% 02 57%
03 38%9% 03 55%
04 56%04 35%13%
Belgacom Retail ADSLOther ADSLCable
Belgacom Retail ADSLCable (Telenet)
50% 43%
53% 45%
44%52%
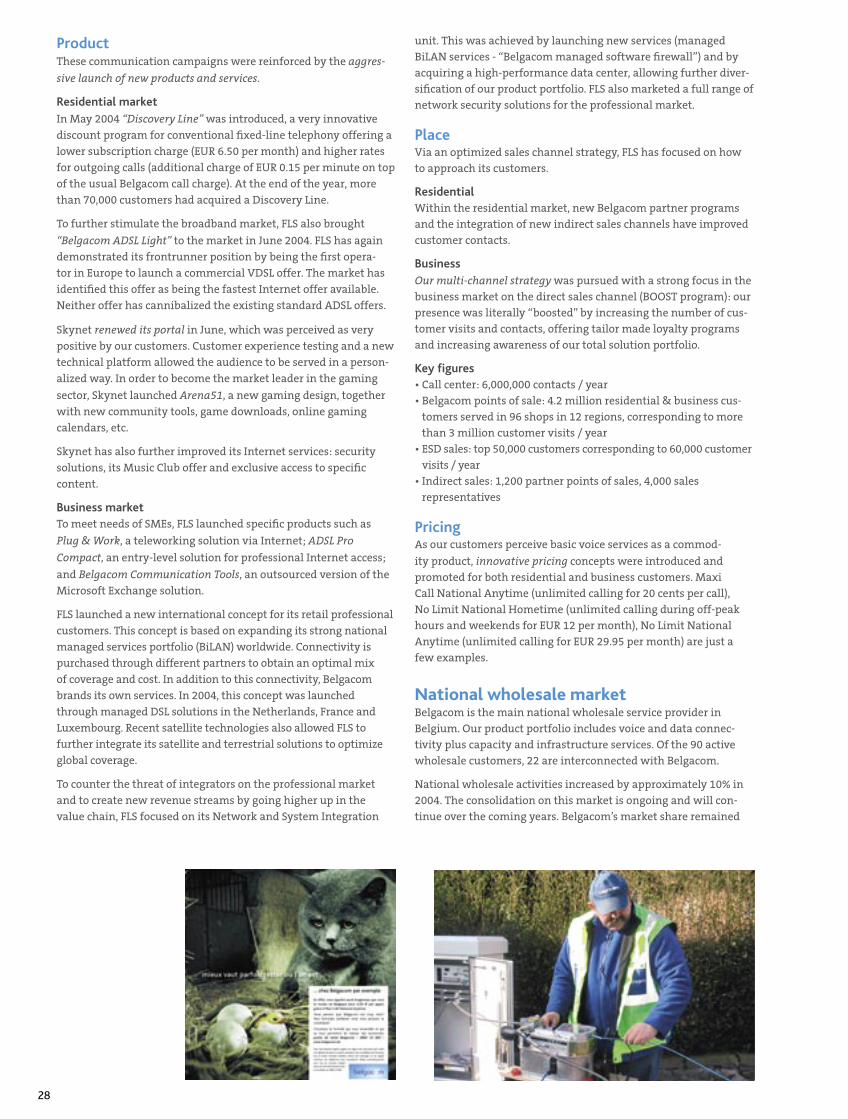
28
ProductThese communication campaigns were reinforced by the aggres-
sive launch of new products and services.
Residential marketIn May 2004 “Discovery Line” was introduced, a very innovative
discount program for conventional fixed-line telephony offering a
lower subscription charge (EUR 6.50 per month) and higher rates
for outgoing calls (additional charge of EUR 0.15 per minute on top
of the usual Belgacom call charge). At the end of the year, more
than 70,000 customers had acquired a Discovery Line.
To further stimulate the broadband market, FLS also brought
“Belgacom ADSL Light” to the market in June 2004. FLS has again
demonstrated its frontrunner position by being the first opera-
tor in Europe to launch a commercial VDSL offer. The market has
identified this offer as being the fastest Internet offer available.
Neither offer has cannibalized the existing standard ADSL offers.
Skynet renewed its portal in June, which was perceived as very
positive by our customers. Customer experience testing and a new
technical platform allowed the audience to be served in a person-
alized way. In order to become the market leader in the gaming
sector, Skynet launched Arena51, a new gaming design, together
with new community tools, game downloads, online gaming
calendars, etc.
Skynet has also further improved its Internet services: security
solutions, its Music Club offer and exclusive access to specific
content.
Business marketTo meet needs of SMEs, FLS launched specific products such as
Plug & Work, a teleworking solution via Internet; ADSL Pro
Compact, an entry-level solution for professional Internet access;
and Belgacom Communication Tools, an outsourced version of the
Microsoft Exchange solution.
FLS launched a new international concept for its retail professional
customers. This concept is based on expanding its strong national
managed services portfolio (BiLAN) worldwide. Connectivity is
purchased through different partners to obtain an optimal mix
of coverage and cost. In addition to this connectivity, Belgacom
brands its own services. In 2004, this concept was launched
through managed DSL solutions in the Netherlands, France and
Luxembourg. Recent satellite technologies also allowed FLS to
further integrate its satellite and terrestrial solutions to optimize
global coverage.
To counter the threat of integrators on the professional market
and to create new revenue streams by going higher up in the
value chain, FLS focused on its Network and System Integration
unit. This was achieved by launching new services (managed
BiLAN services - “Belgacom managed software firewall”) and by
acquiring a high-performance data center, allowing further diver-
sification of our product portfolio. FLS also marketed a full range of
network security solutions for the professional market.
PlaceVia an optimized sales channel strategy, FLS has focused on how
to approach its customers.
ResidentialWithin the residential market, new Belgacom partner programs
and the integration of new indirect sales channels have improved
customer contacts.
BusinessOur multi-channel strategy was pursued with a strong focus in the
business market on the direct sales channel (BOOST program): our
presence was literally “boosted” by increasing the number of cus-
tomer visits and contacts, offering tailor made loyalty programs
and increasing awareness of our total solution portfolio.
Key figures• Call center: 6,000,000 contacts / year
• Belgacom points of sale: 4.2 million residential & business cus-
tomers served in 96 shops in 12 regions, corresponding to more
than 3 million customer visits / year
• ESD sales: top 50,000 customers corresponding to 60,000 customer
visits / year
• Indirect sales: 1,200 partner points of sales, 4,000 sales
representatives
PricingAs our customers perceive basic voice services as a commod-
ity product, innovative pricing concepts were introduced and
promoted for both residential and business customers. Maxi
Call National Anytime (unlimited calling for 20 cents per call),
No Limit National Hometime (unlimited calling during off-peak
hours and weekends for EUR 12 per month), No Limit National
Anytime (unlimited calling for EUR 29.95 per month) are just a
few examples.
National wholesale marketBelgacom is the main national wholesale service provider in
Belgium. Our product portfolio includes voice and data connec-
tivity plus capacity and infrastructure services. Of the 90 active
wholesale customers, 22 are interconnected with Belgacom.
National wholesale activities increased by approximately 10% in
2004. The consolidation on this market is ongoing and will con-
tinue over the coming years. Belgacom’s market share remained
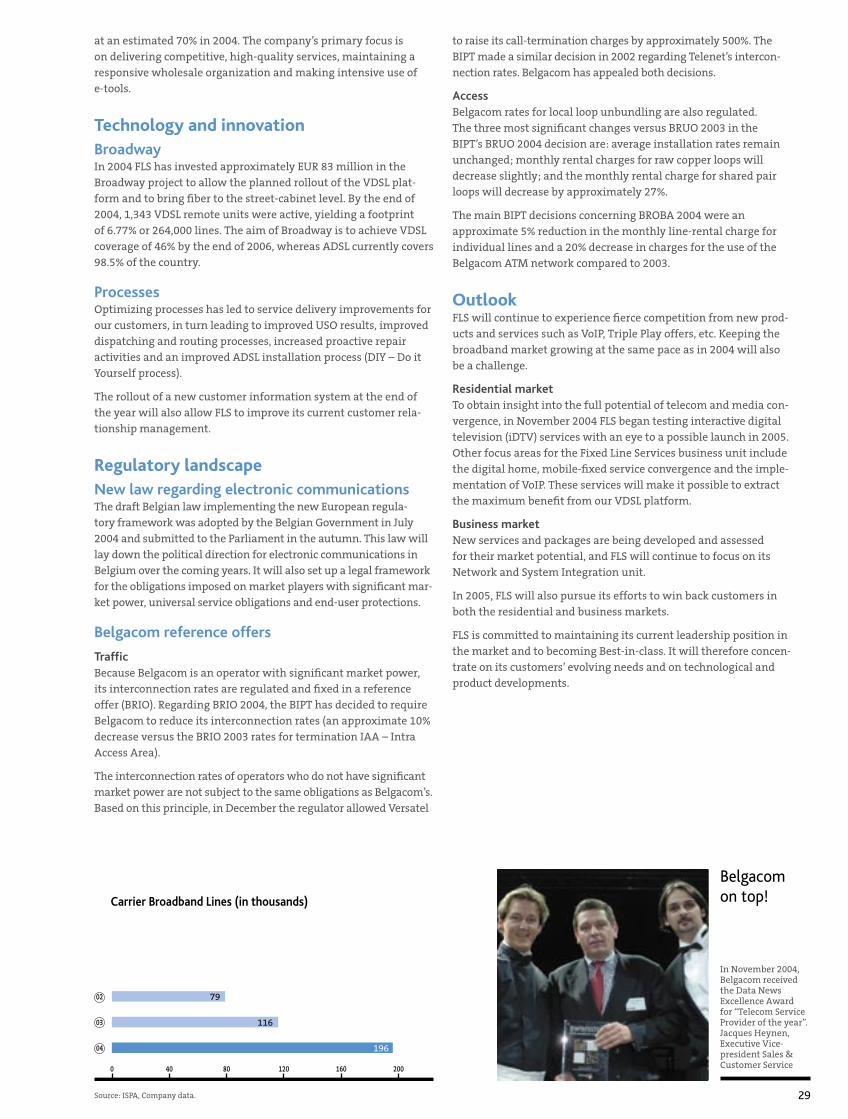
29
at an estimated 70% in 2004. The company’s primary focus is on delivering competitive, high-quality services, maintaining a responsive wholesale organization and making intensive use of e-tools.
Technology and innovationBroadwayIn 2004 FLS has invested approximately EUR 83 million in the Broadway project to allow the planned rollout of the VDSL plat-form and to bring fiber to the street-cabinet level. By the end of 2004, 1,343 VDSL remote units were active, yielding a footprint of 6.77% or 264,000 lines. The aim of Broadway is to achieve VDSL coverage of 46% by the end of 2006, whereas ADSL currently covers 98.5% of the country.
ProcessesOptimizing processes has led to service delivery improvements for our customers, in turn leading to improved USO results, improved dispatching and routing processes, increased proactive repair activities and an improved ADSL installation process (DIY – Do it Yourself process).
The rollout of a new customer information system at the end of the year will also allow FLS to improve its current customer rela-tionship management.
Regulatory landscapeNew law regarding electronic communicationsThe draft Belgian law implementing the new European regula-tory framework was adopted by the Belgian Government in July 2004 and submitted to the Parliament in the autumn. This law will lay down the political direction for electronic communications in Belgium over the coming years. It will also set up a legal framework for the obligations imposed on market players with significant mar-ket power, universal service obligations and end-user protections.
Belgacom reference offers
TrafficBecause Belgacom is an operator with significant market power, its interconnection rates are regulated and fixed in a reference offer (BRIO). Regarding BRIO 2004, the BIPT has decided to require Belgacom to reduce its interconnection rates (an approximate 10% decrease versus the BRIO 2003 rates for termination IAA – Intra Access Area).
The interconnection rates of operators who do not have significant market power are not subject to the same obligations as Belgacom’s. Based on this principle, in December the regulator allowed Versatel
to raise its call-termination charges by approximately 500%. The BIPT made a similar decision in 2002 regarding Telenet’s intercon-nection rates. Belgacom has appealed both decisions.
AccessBelgacom rates for local loop unbundling are also regulated. The three most significant changes versus BRUO 2003 in the BIPT’s BRUO 2004 decision are: average installation rates remain unchanged; monthly rental charges for raw copper loops will decrease slightly; and the monthly rental charge for shared pair loops will decrease by approximately 27%.
The main BIPT decisions concerning BROBA 2004 were an approximate 5% reduction in the monthly line-rental charge for individual lines and a 20% decrease in charges for the use of the Belgacom ATM network compared to 2003.
OutlookFLS will continue to experience fierce competition from new prod-ucts and services such as VoIP, Triple Play offers, etc. Keeping the broadband market growing at the same pace as in 2004 will also be a challenge.
Residential marketTo obtain insight into the full potential of telecom and media con-vergence, in November 2004 FLS began testing interactive digital television (iDTV) services with an eye to a possible launch in 2005. Other focus areas for the Fixed Line Services business unit include the digital home, mobile-fixed service convergence and the imple-mentation of VoIP. These services will make it possible to extract the maximum benefit from our VDSL platform.
Business marketNew services and packages are being developed and assessed for their market potential, and FLS will continue to focus on its Network and System Integration unit.
In 2005, FLS will also pursue its efforts to win back customers in both the residential and business markets.
FLS is committed to maintaining its current leadership position in the market and to becoming Best-in-class. It will therefore concen-trate on its customers’ evolving needs and on technological and product developments.
0 40 80 120 160 200
04 196
02 79
03 116
Carrier Broadband Lines (in thousands)
Source: ISPA, Company data.
Belgacom on top!
In November 2004, Belgacom received the Data News Excellence Award for “Telecom Service Provider of the year”. Jacques Heynen, Executive Vice-president Sales & Customer Service
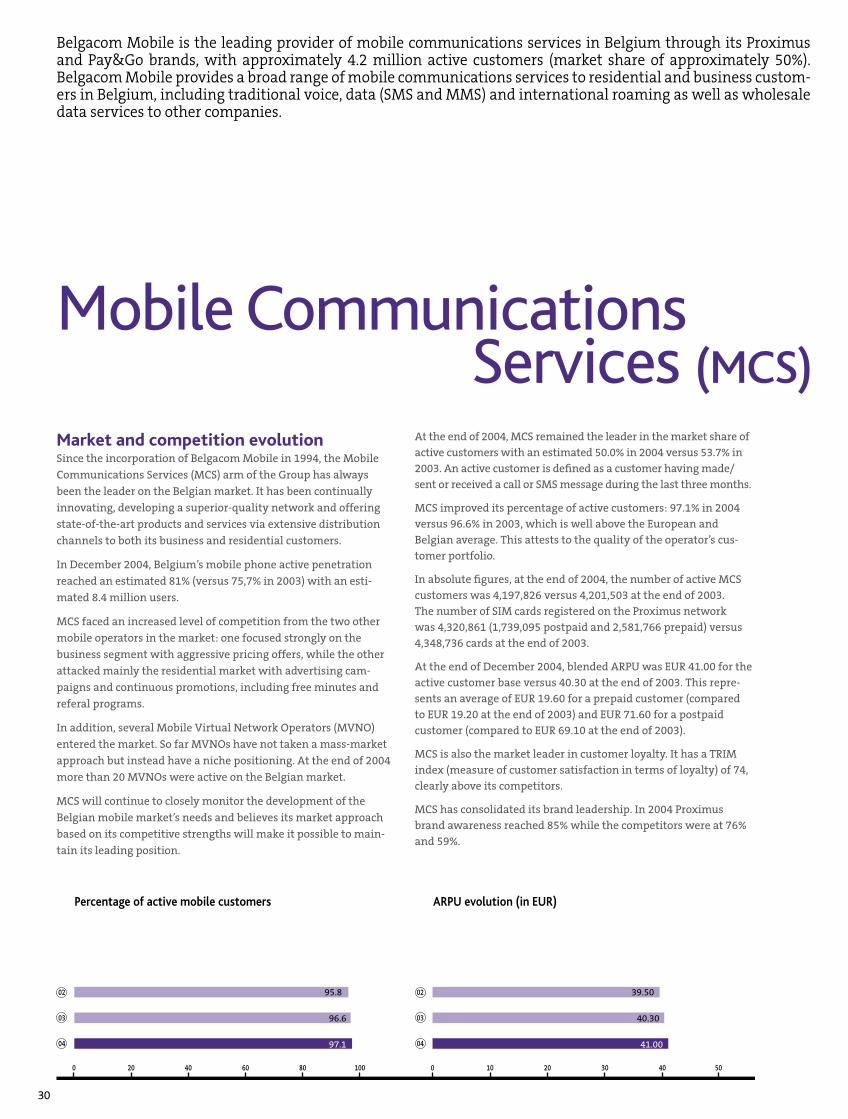
30
At the end of 2004, MCS remained the leader in the market share of active customers with an estimated 50.0% in 2004 versus 53.7% in 2003. An active customer is defined as a customer having made/sent or received a call or SMS message during the last three months.
MCS improved its percentage of active customers: 97.1% in 2004 versus 96.6% in 2003, which is well above the European and Belgian average. This attests to the quality of the operator’s cus-tomer portfolio.
In absolute figures, at the end of 2004, the number of active MCS customers was 4,197,826 versus 4,201,503 at the end of 2003. The number of SIM cards registered on the Proximus network was 4,320,861 (1,739,095 postpaid and 2,581,766 prepaid) versus 4,348,736 cards at the end of 2003.
At the end of December 2004, blended ARPU was EUR 41.00 for the active customer base versus 40.30 at the end of 2003. This repre-sents an average of EUR 19.60 for a prepaid customer (compared to EUR 19.20 at the end of 2003) and EUR 71.60 for a postpaid customer (compared to EUR 69.10 at the end of 2003).
MCS is also the market leader in customer loyalty. It has a TRIM index (measure of customer satisfaction in terms of loyalty) of 74, clearly above its competitors.
MCS has consolidated its brand leadership. In 2004 Proximus brand awareness reached 85% while the competitors were at 76% and 59%.
Market and competition evolutionSince the incorporation of Belgacom Mobile in 1994, the Mobile
Communications Services (MCS) arm of the Group has always
been the leader on the Belgian market. It has been continually
innovating, developing a superior-quality network and offering
state-of-the-art products and services via extensive distribution
channels to both its business and residential customers.
In December 2004, Belgium’s mobile phone active penetration
reached an estimated 81% (versus 75,7% in 2003) with an esti-
mated 8.4 million users.
MCS faced an increased level of competition from the two other
mobile operators in the market: one focused strongly on the
business segment with aggressive pricing offers, while the other
attacked mainly the residential market with advertising cam-
paigns and continuous promotions, including free minutes and
referal programs.
In addition, several Mobile Virtual Network Operators (MVNO)
entered the market. So far MVNOs have not taken a mass-market
approach but instead have a niche positioning. At the end of 2004
more than 20 MVNOs were active on the Belgian market.
MCS will continue to closely monitor the development of the
Belgian mobile market’s needs and believes its market approach
based on its competitive strengths will make it possible to main-
tain its leading position.
Mobile CommunicationsServices (MCS)
Percentage of active mobile customers ARPU evolution (in EUR)
Belgacom Mobile is the leading provider of mobile communications services in Belgium through its Proximus and Pay&Go brands, with approximately 4.2 million active customers (market share of approximately 50%). Belgacom Mobile provides a broad range of mobile communications services to residential and business custom-ers in Belgium, including traditional voice, data (SMS and MMS) and international roaming as well as wholesale data services to other companies.
0 20 40 60 80 100 0 10 20 30 40 50
02
03
04
95.8 02 39.50
96.6 03 40.30
04 41.0097.1
31
A top class networkCovering more than 99% of the population, the Proximus GSM/GPRS network was deployed on 3,320 antenna sites at the end of 2004. The cutting-edge technologies that were set up, matched with careful maintenance, ensure first-rate quality and reliability. As for value for money, MCS ranks in the top 5 of the operators of the Vodafone group; as for the limitation of service disruptions, MCS is in the top 3.
In 2004 MCS was the first mobile operator to start 3G services in Belgium and was still the only operator to offer such services at the end of 2004. MCS business customers can use the Vodafone Mobile Connect datacard via the UMTS network in 12 major Belgian cities. The Proximus UMTS network covered 28% of the population at the end of 2004. In 2004 more than EUR 50 million were invested in the UMTS network.
In June 1999 MCS was the first operator to provide coverage in the Brussels underground. Driven by its continuous concern to improve its services, as of December 2004 MCS has also become the only Belgian mobile operator to enable its customers to use their GSMs in the undergrounds of Charleroi and Antwerp.
MCS leads the Belgian market in terms of worldwide reach. Its postpaid customers can use their mobile phone via the GSM network in 171 countries thanks to voice roaming agreements with 308 operators. Its prepaid customers can do the same with 67 operators in 46 countries. MCS has also GPRS roaming agree-ments with 94 operators in 50 countries and UMTS roaming agreements in 12 countries.
Innovation in products & servicesBusiness customersIn May 2004, MCS was the first mobile operator in Belgium to commercially launch 3G for laptop users. MCS offers the Vodafone Mobile Connect UMTS/GPRS data-card, the first high-speed datac-ard for laptops in Europe, to its customers. MCS extended its range of datacards in November 2004 with the Vodafone Mobile Connect UMTS/GPRS/WLAN datacard, enabling users to select between three technologies, UMTS, GPRS or Wireless LAN, to have access to their business applications. More than 1,300 datacards were in use at the end of 2004.
MCS steadily increased its number of Wireless LAN hotspots to 44 end December 2004 including the Brussels airport. MCS wants to offer businesspeople a total mobility solution and thus integrated the hotspots into its range of high-speed data services to provide
its customers with the best possible connection (GSM, GPRS, UMTS
or Wireless LAN).
To make the life of large companies easier by automatically
integrating their mobile bills into their accounting system, MCS
launched eBill, a certified electronic bill solution in collaboration
with Certipost.
With Business Package Easy, MCS introduced a new rate for SMEs
and the self-employed who above all want to be reachable. The
users pay a per-minute rate, regardless of the time of day or net-
work used.
MCS launched SMS Communicator, a professional solution to send
SMS messages from a PC or laptop simultaneously to a number of
recipients.
In October 2004, MCS launched the BlackBerry solution for cor-
porate customers. Thanks to this push architecture, e-mails and
appointments are delivered automatically to the BlackBerry device
without having to dial in.
Residential customersSince March 2004 Dexia bank customers have been able to do all
their banking transactions via their GSM via Dexia Direct Mobile,
a simple and secure application.
Vodafone live!, the most integrated mobile multimedia offer, was
introduced to residential clients in June 2004. This industry-lead-
ing, multimedia consumer service offering, opens up a world of
mobile color communication, bringing news, information, email,
chat, location-based services, games, ringtones, etc. to customers’
mobile devices. Vodafone live! has an exclusive range of MMS-
compatible handsets with color screens and built-in cameras.
MCS introduced two new rates plans for its postpaid customers
in 2004: Exprimo with the possibility to send 10 SMS messages or
call for 10 minutes for EUR 1 and FreeStyle, which makes it pos-
sible to combine the advantages of a postpaid subscription and a
prepaid card in one single formula.
MCS was the first mobile operator to introduce the Real Tones, a
new generation of ring tones, in Belgium.
For its prepaid customers, MCS launched a new reload value of
EUR 5 and a new simple prepaid formula, called Pay&Go Evening
Talk. Pay&Go customers can also reload their prepaid card via
1-2-ring (directly via their GSM), whatever their bank. The prepaid
card loyalty program with free calling credit, Pay&Go Club, was
also launched.
MCS highlights• Active customers market share maintained at approximately
50%.• Commercial launch of UMTS for business customers.• Vodafone live!, the most integrated mobile multimedia offer, introduced in June.
• Launch of the BlackBerry solution for business customers in October.
• Introduction of multiple new rate plans for residential and business customers.
• In 2005, Philippe Vander Putten hands over his function of CEO to Michel Georgis (ex-COO) and becomes President of the Board of Directors of MCS.
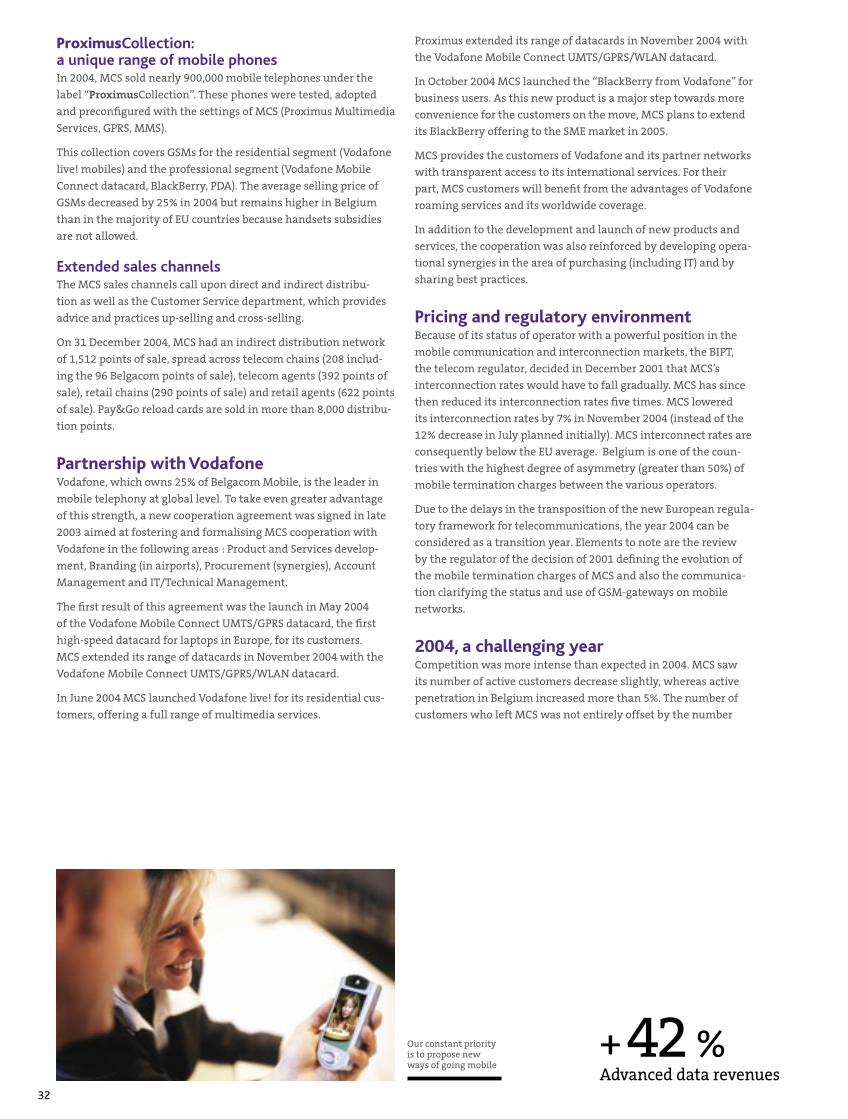
32
ProximusCollection: a unique range of mobile phonesIn 2004, MCS sold nearly 900,000 mobile telephones under the
label “ProximusCollection”. These phones were tested, adopted
and preconfigured with the settings of MCS (Proximus Multimedia
Services, GPRS, MMS).
This collection covers GSMs for the residential segment (Vodafone
live! mobiles) and the professional segment (Vodafone Mobile
Connect datacard, BlackBerry, PDA). The average selling price of
GSMs decreased by 25% in 2004 but remains higher in Belgium
than in the majority of EU countries because handsets subsidies
are not allowed.
Extended sales channelsThe MCS sales channels call upon direct and indirect distribu-
tion as well as the Customer Service department, which provides
advice and practices up-selling and cross-selling.
On 31 December 2004, MCS had an indirect distribution network
of 1,512 points of sale, spread across telecom chains (208 includ-
ing the 96 Belgacom points of sale), telecom agents (392 points of
sale), retail chains (290 points of sale) and retail agents (622 points
of sale). Pay&Go reload cards are sold in more than 8,000 distribu-
tion points.
Partnership with VodafoneVodafone, which owns 25% of Belgacom Mobile, is the leader in
mobile telephony at global level. To take even greater advantage
of this strength, a new cooperation agreement was signed in late
2003 aimed at fostering and formalising MCS cooperation with
Vodafone in the following areas : Product and Services develop-
ment, Branding (in airports), Procurement (synergies), Account
Management and IT/Technical Management.
The first result of this agreement was the launch in May 2004
of the Vodafone Mobile Connect UMTS/GPRS datacard, the first
high-speed datacard for laptops in Europe, for its customers.
MCS extended its range of datacards in November 2004 with the
Vodafone Mobile Connect UMTS/GPRS/WLAN datacard.
In June 2004 MCS launched Vodafone live! for its residential cus-
tomers, offering a full range of multimedia services.
Proximus extended its range of datacards in November 2004 with
the Vodafone Mobile Connect UMTS/GPRS/WLAN datacard.
In October 2004 MCS launched the “BlackBerry from Vodafone” for
business users. As this new product is a major step towards more
convenience for the customers on the move, MCS plans to extend
its BlackBerry offering to the SME market in 2005.
MCS provides the customers of Vodafone and its partner networks
with transparent access to its international services. For their
part, MCS customers will benefit from the advantages of Vodafone
roaming services and its worldwide coverage.
In addition to the development and launch of new products and
services, the cooperation was also reinforced by developing opera-
tional synergies in the area of purchasing (including IT) and by
sharing best practices.
Pricing and regulatory environmentBecause of its status of operator with a powerful position in the
mobile communication and interconnection markets, the BIPT,
the telecom regulator, decided in December 2001 that MCS’s
interconnection rates would have to fall gradually. MCS has since
then reduced its interconnection rates five times. MCS lowered
its interconnection rates by 7% in November 2004 (instead of the
12% decrease in July planned initially). MCS interconnect rates are
consequently below the EU average. Belgium is one of the coun-
tries with the highest degree of asymmetry (greater than 50%) of
mobile termination charges between the various operators.
Due to the delays in the transposition of the new European regula-
tory framework for telecommunications, the year 2004 can be
considered as a transition year. Elements to note are the review
by the regulator of the decision of 2001 defining the evolution of
the mobile termination charges of MCS and also the communica-
tion clarifying the status and use of GSM-gateways on mobile
networks.
2004, a challenging yearCompetition was more intense than expected in 2004. MCS saw
its number of active customers decrease slightly, whereas active
penetration in Belgium increased more than 5%. The number of
customers who left MCS was not entirely offset by the number
+ 42 %Advanced data revenues
Our constant priority is to propose new ways of going mobile
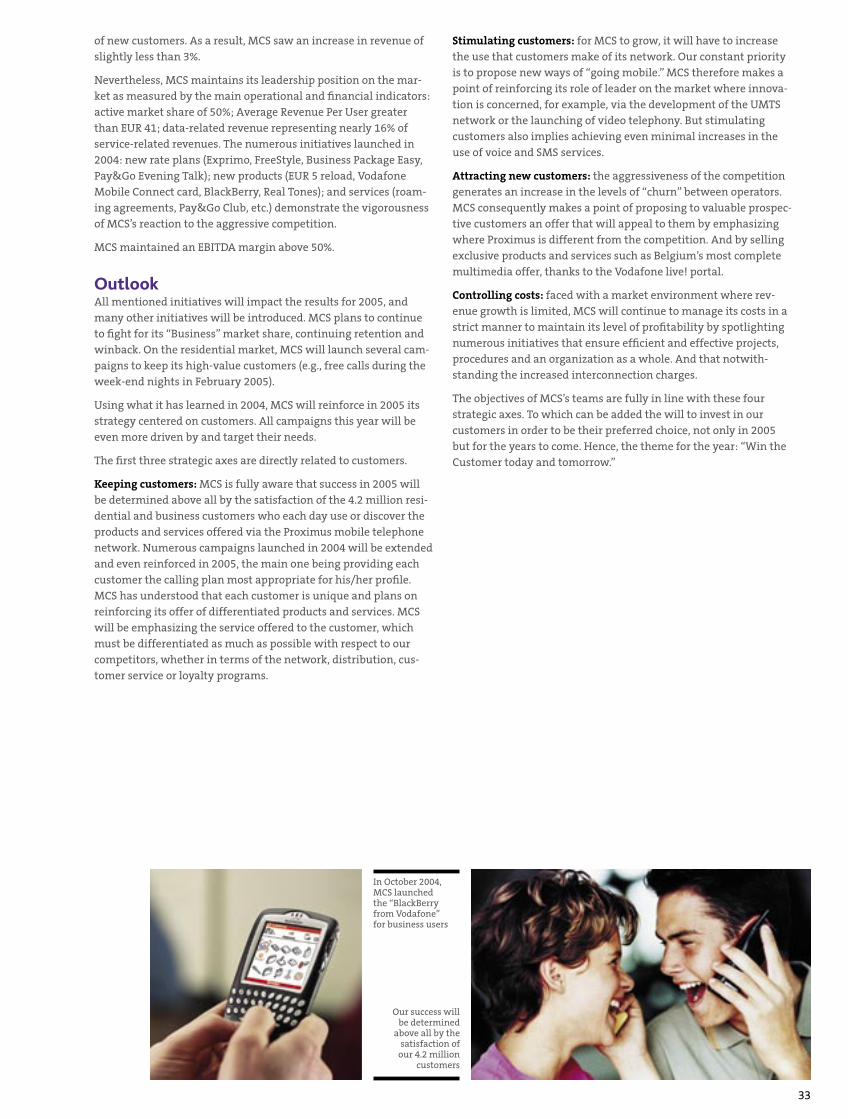
33
of new customers. As a result, MCS saw an increase in revenue of slightly less than 3%.
Nevertheless, MCS maintains its leadership position on the mar-ket as measured by the main operational and financial indicators: active market share of 50%; Average Revenue Per User greater than EUR 41; data-related revenue representing nearly 16% of service-related revenues. The numerous initiatives launched in 2004: new rate plans (Exprimo, FreeStyle, Business Package Easy, Pay&Go Evening Talk); new products (EUR 5 reload, Vodafone Mobile Connect card, BlackBerry, Real Tones); and services (roam-ing agreements, Pay&Go Club, etc.) demonstrate the vigorousness of MCS’s reaction to the aggressive competition.
MCS maintained an EBITDA margin above 50%.
OutlookAll mentioned initiatives will impact the results for 2005, and many other initiatives will be introduced. MCS plans to continue to fight for its “Business” market share, continuing retention and winback. On the residential market, MCS will launch several cam-paigns to keep its high-value customers (e.g., free calls during the week-end nights in February 2005).
Using what it has learned in 2004, MCS will reinforce in 2005 its strategy centered on customers. All campaigns this year will be even more driven by and target their needs.
The first three strategic axes are directly related to customers.
Keeping customers: MCS is fully aware that success in 2005 will be determined above all by the satisfaction of the 4.2 million resi-dential and business customers who each day use or discover the products and services offered via the Proximus mobile telephone network. Numerous campaigns launched in 2004 will be extended and even reinforced in 2005, the main one being providing each customer the calling plan most appropriate for his/her profile. MCS has understood that each customer is unique and plans on reinforcing its offer of differentiated products and services. MCS will be emphasizing the service offered to the customer, which must be differentiated as much as possible with respect to our competitors, whether in terms of the network, distribution, cus-tomer service or loyalty programs.
Stimulating customers: for MCS to grow, it will have to increase the use that customers make of its network. Our constant priority is to propose new ways of “going mobile.” MCS therefore makes a point of reinforcing its role of leader on the market where innova-tion is concerned, for example, via the development of the UMTS network or the launching of video telephony. But stimulating customers also implies achieving even minimal increases in the use of voice and SMS services.
Attracting new customers: the aggressiveness of the competition generates an increase in the levels of “churn” between operators. MCS consequently makes a point of proposing to valuable prospec-tive customers an offer that will appeal to them by emphasizing where Proximus is different from the competition. And by selling exclusive products and services such as Belgium’s most complete multimedia offer, thanks to the Vodafone live! portal.
Controlling costs: faced with a market environment where rev-enue growth is limited, MCS will continue to manage its costs in a strict manner to maintain its level of profitability by spotlighting numerous initiatives that ensure efficient and effective projects, procedures and an organization as a whole. And that notwith-standing the increased interconnection charges.
The objectives of MCS’s teams are fully in line with these four strategic axes. To which can be added the will to invest in our customers in order to be their preferred choice, not only in 2005 but for the years to come. Hence, the theme for the year: “Win the Customer today and tomorrow.”
Our success will be determined
above all by the satisfaction of
our 4.2 million customers
In October 2004, MCS launched the “BlackBerry from Vodafone” for business users
34
Foreign exchange issues are present in the international carrier segment, where the evolution of the US dollar in 2004 has made pricing in euro less competitive towards customers buying in this currency.
Competitive landscapeDuring the first half of 2004, ICS faced tough competition in the international voice market, due to aggressive pricing by competi-tors. During the second half of 2004, ICS was able to regain most of the market share and revenue losses incurred during the first half of the year. Belgacom ICS’s voice transit traffic grew from 3.5 billion minutes in 2003 to 4.2 billion in 2004, a volume increase of 18%.
Products and services evolutionNew mobile products SMS transit and MMS transit, launched in 2004, generated encouraging revenues. Contracts signed in the last quarter and contracts pending with major mobile groups should be sources of incremental revenue in the future.
After 11 months of operations, the sales office in Dubai has been most satisfactory both in terms of traffic terminated in the region and new contracts. Further developments in parallel with liberali-zation are planned, including a network point of presence and the reinforcement of the local sales force.
Towards increased efficiencyDespite a sharp increase in traffic and the implementation of new services, ICS managed to reduce by 12% its network, HR and other operating expenses (excluding impairment bookings).
ICS maintained investment for the future through a switching-platform upgrade to provide full IP compliancy and capacity increase; implementation of Best-in-class operating and support system (OSS) tools; and a new trading platform.
StrategyConsolidation in the international carrier services market is expected to continue. Belgacom is well positioned to benefit from consolidation opportunities, which can increase stable traffic
Belgacom around the worldBelgacom International Carrier Services (ICS) provides voice, data
and capacity services to mobile and fixed telecommunications
operators and service providers worldwide.
2004 was a challenging year, as price and margin declines contin-
ued in the wholesale market. In spite of this, ICS performed well,
regaining market share, cutting costs and compensating some
revenue losses incurred in the first half-year. In addition, ICS made
the necessary changes to participate proactively in the strategic
consolidation taking place in the market.
Market dynamicsThe size of the international inter-operator market targeted by
ICS is estimated (1) to have grown by 1.2% during 2004 to EUR 13.2
billion. International voice still represents more than 90% of this
market. The international wholesale voice market volumes (tran-
sit) are calculated to have grown by 13% from 2003 to 2004.
The market of carrier services to mobile operators has expanded in
2004. This growth is present across the spectrum of the interna-
tional carrier products: voice, messaging and roaming services,
data and capacity. Mobile voice traffic is expected (2) to grow by
20%, and ICS expects mobile data revenues to increase by 25% over
the next five years.
Liberalization and the pace of economic growth are creating
important opportunities outside Europe, especially in the mobile
sector. The biggest growth is expected from India, China, the
Middle East and Africa, where countries will progressively open
up their markets.
The total market of voice traffic from fixed operators continues to
decline, as mobile and VoIP substitution continues. The develop-
ment of the VoIP retail interface allows ISPs & ASPs to collect voice
traffic directly from end users and has created a new customer
segment for the carrier industry. VoIP traffic is estimated(2) to have
reached 30 billion minutes in 2004, accounting for more than 13%
of the world’s international traffic.
InternationalCarrier Services (ICS)
(1) Based on Telegeography 2005, Ovum and company estimates.(2) According to Telegeography 2005.
In addition to its activities in Belgium, Belgacom provides voice and data connectivity and capacity services to telecommunications operators and service providers worldwide. On 22 February 2005, BICS signed an agree-ment to combine its business with Swisscom Fixnet in a joint venture of whose shares Belgacom will own 72%.
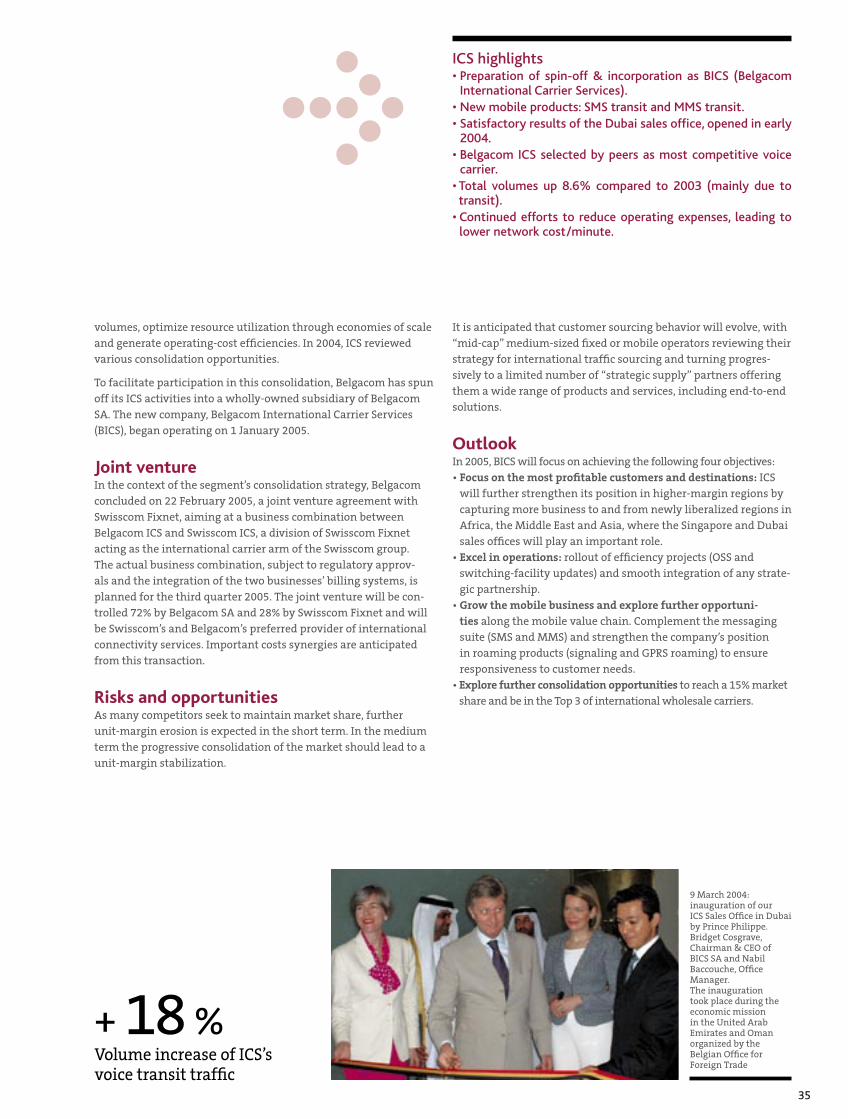
35
volumes, optimize resource utilization through economies of scale and generate operating-cost efficiencies. In 2004, ICS reviewed various consolidation opportunities.
To facilitate participation in this consolidation, Belgacom has spun off its ICS activities into a wholly-owned subsidiary of Belgacom SA. The new company, Belgacom International Carrier Services (BICS), began operating on 1 January 2005.
Joint ventureIn the context of the segment’s consolidation strategy, Belgacom concluded on 22 February 2005, a joint venture agreement with Swisscom Fixnet, aiming at a business combination between Belgacom ICS and Swisscom ICS, a division of Swisscom Fixnet acting as the international carrier arm of the Swisscom group. The actual business combination, subject to regulatory approv-als and the integration of the two businesses’ billing systems, is planned for the third quarter 2005. The joint venture will be con-trolled 72% by Belgacom SA and 28% by Swisscom Fixnet and will be Swisscom’s and Belgacom’s preferred provider of international connectivity services. Important costs synergies are anticipated from this transaction.
Risks and opportunitiesAs many competitors seek to maintain market share, further unit-margin erosion is expected in the short term. In the medium term the progressive consolidation of the market should lead to a unit-margin stabilization.
It is anticipated that customer sourcing behavior will evolve, with “mid-cap” medium-sized fixed or mobile operators reviewing their strategy for international traffic sourcing and turning progres-sively to a limited number of “strategic supply” partners offering them a wide range of products and services, including end-to-end solutions.
OutlookIn 2005, BICS will focus on achieving the following four objectives:• Focus on the most profitable customers and destinations: ICS
will further strengthen its position in higher-margin regions by capturing more business to and from newly liberalized regions in Africa, the Middle East and Asia, where the Singapore and Dubai sales offices will play an important role.
• Excel in operations: rollout of efficiency projects (OSS and switching-facility updates) and smooth integration of any strate-gic partnership.
• Grow the mobile business and explore further opportuni-ties along the mobile value chain. Complement the messaging suite (SMS and MMS) and strengthen the company’s position in roaming products (signaling and GPRS roaming) to ensure responsiveness to customer needs.
• Explore further consolidation opportunities to reach a 15% market share and be in the Top 3 of international wholesale carriers.
ICS highlights• Preparation of spin-off & incorporation as BICS (Belgacom
International Carrier Services).• New mobile products: SMS transit and MMS transit.• Satisfactory results of the Dubai sales office, opened in early
2004.• Belgacom ICS selected by peers as most competitive voice
carrier.• Total volumes up 8.6% compared to 2003 (mainly due to transit).
• Continued efforts to reduce operating expenses, leading to lower network cost/minute.
Volume increase of ICS’s voice transit traffic
+ 18 %
9 March 2004: inauguration of our ICS Sales Office in Dubai by Prince Philippe. Bridget Cosgrave, Chairman & CEO of BICS SA and Nabil Baccouche, Office Manager. The inauguration took place during the economic mission in the United Arab Emirates and Oman organized by the Belgian Office for Foreign Trade

36
>Focus on core business to maintain profitable leadership
37
group strategy
The world today is full of challenges: technology is constantly evolving, competition is making itself felt and regulators are redesigning the telecom landscape. To stay ahead, our group has adopted a clear and focused strategy firmly rooted in three main pillars: maintaining its leadership position on the Belgian mar-ket, achieving operational efficiency and investing in profitable growth.
Best-in-classBelgacom’s strategy remains to focus on the core business areas where it has competitive advantages in order to retain its posi-tion as the preferred provider of telecommunications services in Belgium while maintaining profitability.
Our goal is to become Best-in-class.
Belgacom makes a point of setting its goals high. In order to stretch the thinking of the company to reach top performance, the Best-in-class concept is used internally to help efforts to dramati-cally improve business performance.
One prerequisite is to instill new behaviors in the organization
through the development of a new corporate culture.
Several new competencies like customer focus, agility and results-orientation have been identified as key to realizing Belgacom’s ambitions. The company will encourage the development of these behaviors in order to guarantee that our Group’s workforce will be a key asset in today’s market dynamics.
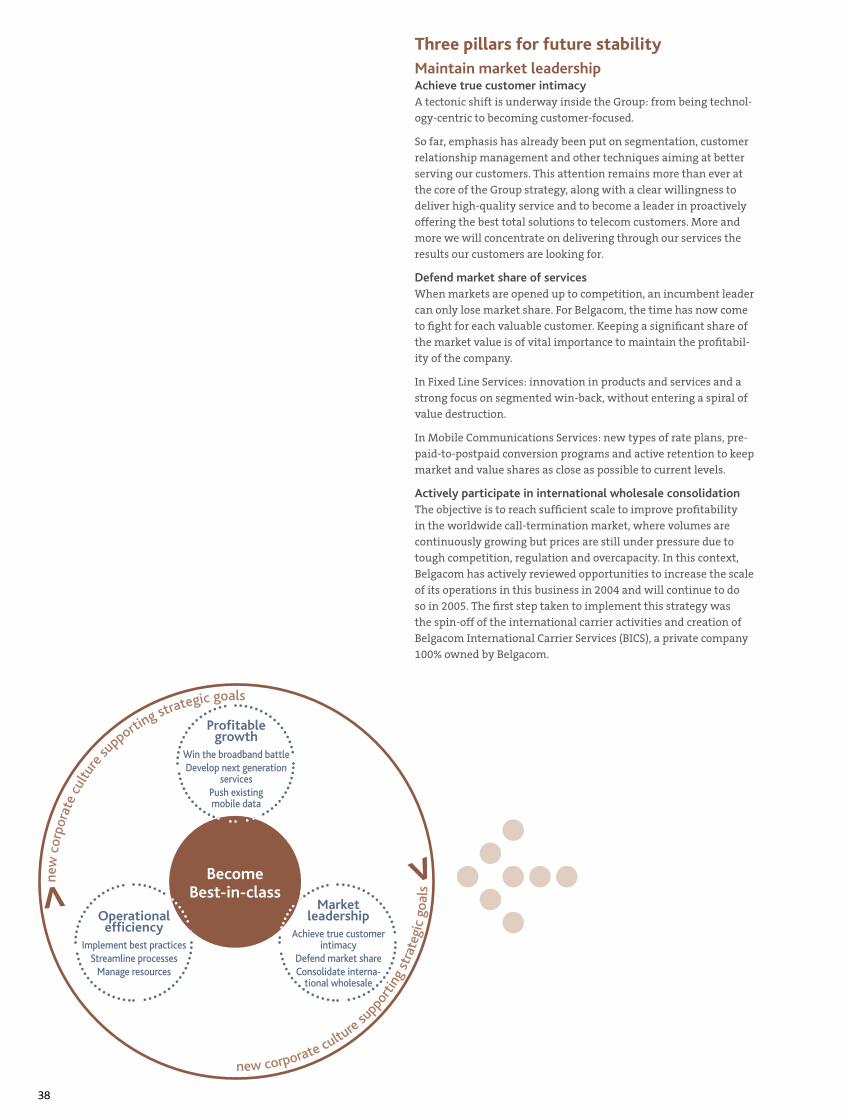
38
Marketleadership
Achieve true customer intimacy
Defend market shareConsolidate interna-
tional wholesale
Profitablegrowth
Win the broadband battleDevelop next generation
servicesPush existing mobile data
new
cor
pora
te c
ultu
re su
pporting strategic goals
Operationalefficiency
Implement best practicesStreamline processes
Manage resources
BecomeBest-in-class>
>
new corporate culture su
ppor
ting
stra
tegi
c go
als
Three pillars for future stabilityMaintain market leadershipAchieve true customer intimacyA tectonic shift is underway inside the Group: from being technol-
ogy-centric to becoming customer-focused.
So far, emphasis has already been put on segmentation, customer
relationship management and other techniques aiming at better
serving our customers. This attention remains more than ever at
the core of the Group strategy, along with a clear willingness to
deliver high-quality service and to become a leader in proactively
offering the best total solutions to telecom customers. More and
more we will concentrate on delivering through our services the
results our customers are looking for.
Defend market share of servicesWhen markets are opened up to competition, an incumbent leader
can only lose market share. For Belgacom, the time has now come
to fight for each valuable customer. Keeping a significant share of
the market value is of vital importance to maintain the profitabil-
ity of the company.
In Fixed Line Services: innovation in products and services and a
strong focus on segmented win-back, without entering a spiral of
value destruction.
In Mobile Communications Services: new types of rate plans, pre-
paid-to-postpaid conversion programs and active retention to keep
market and value shares as close as possible to current levels.
Actively participate in international wholesale consolidationThe objective is to reach sufficient scale to improve profitability
in the worldwide call-termination market, where volumes are
continuously growing but prices are still under pressure due to
tough competition, regulation and overcapacity. In this context,
Belgacom has actively reviewed opportunities to increase the scale
of its operations in this business in 2004 and will continue to do
so in 2005. The first step taken to implement this strategy was
the spin-off of the international carrier activities and creation of
Belgacom International Carrier Services (BICS), a private company
100% owned by Belgacom.
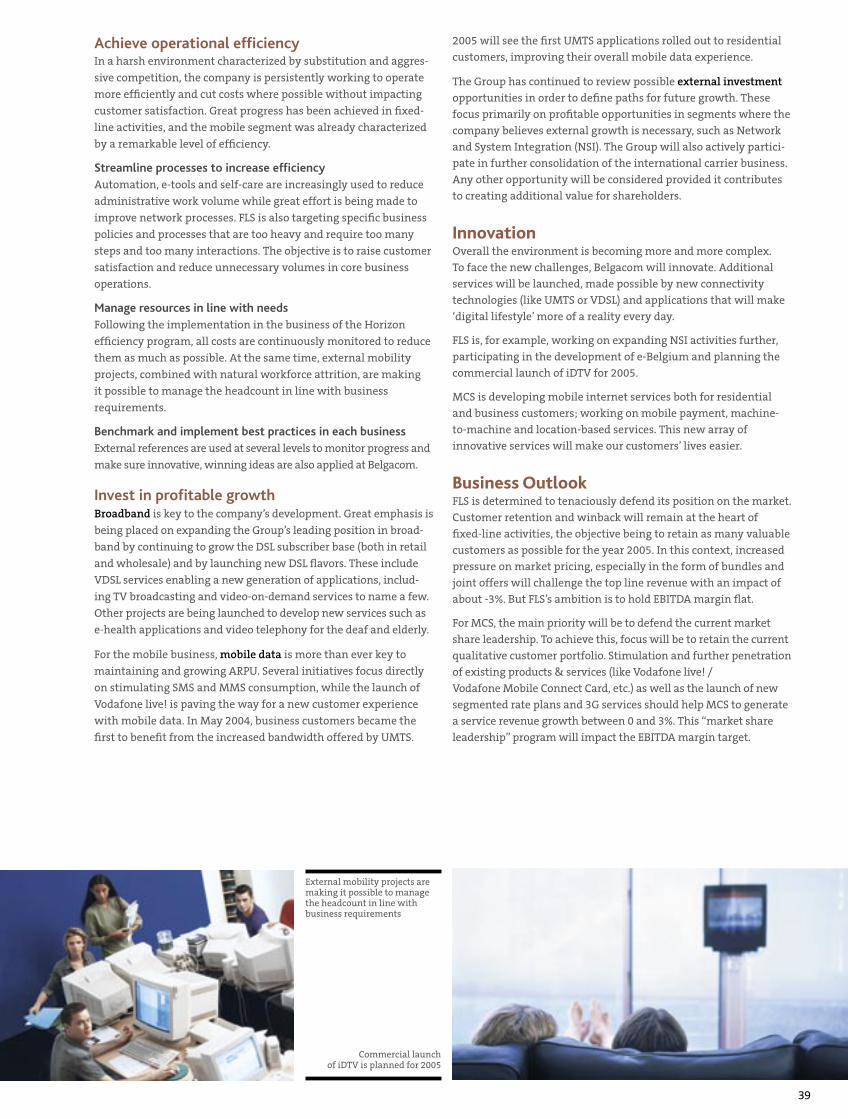
39
Achieve operational efficiencyIn a harsh environment characterized by substitution and aggres-
sive competition, the company is persistently working to operate
more efficiently and cut costs where possible without impacting
customer satisfaction. Great progress has been achieved in fixed-
line activities, and the mobile segment was already characterized
by a remarkable level of efficiency.
Streamline processes to increase efficiencyAutomation, e-tools and self-care are increasingly used to reduce
administrative work volume while great effort is being made to
improve network processes. FLS is also targeting specific business
policies and processes that are too heavy and require too many
steps and too many interactions. The objective is to raise customer
satisfaction and reduce unnecessary volumes in core business
operations.
Manage resources in line with needsFollowing the implementation in the business of the Horizon
efficiency program, all costs are continuously monitored to reduce
them as much as possible. At the same time, external mobility
projects, combined with natural workforce attrition, are making
it possible to manage the headcount in line with business
requirements.
Benchmark and implement best practices in each businessExternal references are used at several levels to monitor progress and
make sure innovative, winning ideas are also applied at Belgacom.
Invest in profitable growthBroadband is key to the company’s development. Great emphasis is
being placed on expanding the Group’s leading position in broad-
band by continuing to grow the DSL subscriber base (both in retail
and wholesale) and by launching new DSL flavors. These include
VDSL services enabling a new generation of applications, includ-
ing TV broadcasting and video-on-demand services to name a few.
Other projects are being launched to develop new services such as
e-health applications and video telephony for the deaf and elderly.
For the mobile business, mobile data is more than ever key to
maintaining and growing ARPU. Several initiatives focus directly
on stimulating SMS and MMS consumption, while the launch of
Vodafone live! is paving the way for a new customer experience
with mobile data. In May 2004, business customers became the
first to benefit from the increased bandwidth offered by UMTS.
2005 will see the first UMTS applications rolled out to residential
customers, improving their overall mobile data experience.
The Group has continued to review possible external investment
opportunities in order to define paths for future growth. These
focus primarily on profitable opportunities in segments where the
company believes external growth is necessary, such as Network
and System Integration (NSI). The Group will also actively partici-
pate in further consolidation of the international carrier business.
Any other opportunity will be considered provided it contributes
to creating additional value for shareholders.
InnovationOverall the environment is becoming more and more complex.
To face the new challenges, Belgacom will innovate. Additional
services will be launched, made possible by new connectivity
technologies (like UMTS or VDSL) and applications that will make
‘digital lifestyle’ more of a reality every day.
FLS is, for example, working on expanding NSI activities further,
participating in the development of e-Belgium and planning the
commercial launch of iDTV for 2005.
MCS is developing mobile internet services both for residential
and business customers; working on mobile payment, machine-
to-machine and location-based services. This new array of
innovative services will make our customers’ lives easier.
Business OutlookFLS is determined to tenaciously defend its position on the market.
Customer retention and winback will remain at the heart of
fixed-line activities, the objective being to retain as many valuable
customers as possible for the year 2005. In this context, increased
pressure on market pricing, especially in the form of bundles and
joint offers will challenge the top line revenue with an impact of
about -3%. But FLS’s ambition is to hold EBITDA margin flat.
For MCS, the main priority will be to defend the current market
share leadership. To achieve this, focus will be to retain the current
qualitative customer portfolio. Stimulation and further penetration
of existing products & services (like Vodafone live! /
Vodafone Mobile Connect Card, etc.) as well as the launch of new
segmented rate plans and 3G services should help MCS to generate
a service revenue growth between 0 and 3%. This “market share
leadership” program will impact the EBITDA margin target.
Commercial launch of iDTV is planned for 2005
External mobility projects are making it possible to manage the headcount in line with business requirements

40
It is the mission of Human Resources to maintain a balance between the company’s needs and the aspirations of its employees, who are the company’s driving force. In the hectic environment of the telecom sector which has been unsettled by liberalization and characterized by intensive competition and technological transformations, one of the main drivers of growth is human resources.
Optimal deployment of human capitalWe must equip all our employees with the skills that will enable them to meet the forthcoming changes in the market and our customers’ needs. And continuously reinforce a forwardthinking mindset that will keep us in the vanguard.
Learning is a key factor for the survival and growth of an organiza-tion. That is why the Belgacom Corporate University (BCU) strives to be a proactive business partner. Why it gives Belgacom employ-ees the means to acquire skills that are strategic for our line of business. The use of the term “university” reflects Belgacom’s intention to offer the highest standard of learning to all its employees. BCU is divided into nine schools, representing nine major functional groups in our company. The purpose of the BCU is to enhance the performance, corporate culture, personal growth and career development of every employee.
With a number of training programs, Belgacom is developing the potential that will better equip the company for tomorrow’s chal-lenges.
In 2004, 86% of our employees took at least one training course. The average time spent per employee on courses rose from 30 hours in 2003 to 36 in 2004.
The total training cost rose from EUR 36 million in 2003 to more than EUR 38 million in 2004. E-learning is still increasing, account-ing for 15% of learning time.
In 2005, Belgacom will continue to invest in employee training. Not only do we want to pay special attention to the leadership profile of our managers, but we also want to step up our training efforts for more administrative and technical employees.
The recognition and development of our employees are the key elements in a global strategy defined by the highest level of man-agement, in continuous consultation with its union partners.
Three strong points of this strategy are:
• giving our employees the means to lead fulfilling working and private lives;
• remuneration as a management tool;• internal communication.
IPO – the new benchmarkIn the upheaval experienced by the telecommunications sector in the past ten years, our teams have proven that not only can they adapt to change, but that they can also initiate it. A prime exam-ple is the successful engineering of Belgacom’s IPO on 22 March 2004.
But this is no time for self-satisfaction. Although this accomplish-ment has demonstrated the competency of our staff, it also points to new challenges. The IPO has given us a new benchmark; 2004 ushered in a new era in which change is the order of the day. For Belgacom, the only certainty is change.
Given the competitiveness and the ever-changing technologies in the telecom sector, the challenges facing the Human Resources department are clear. We must ensure that all our employees maintain a Best-in-class level of competence.
teams that have endurance!

41
>Competent men and women
in a changing organization
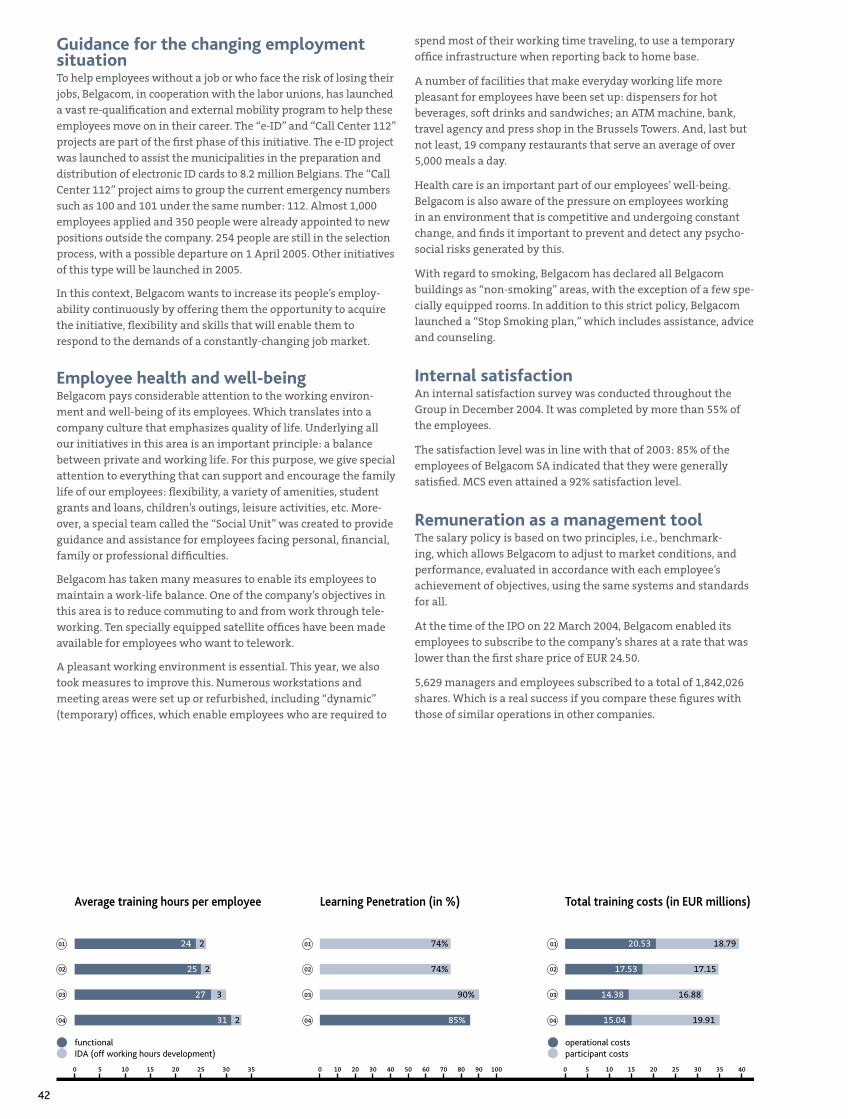
42
Guidance for the changing employment situationTo help employees without a job or who face the risk of losing their jobs, Belgacom, in cooperation with the labor unions, has launched a vast re-qualification and external mobility program to help these employees move on in their career. The “e-ID” and “Call Center 112” projects are part of the first phase of this initiative. The e-ID project was launched to assist the municipalities in the preparation and distribution of electronic ID cards to 8.2 million Belgians. The “Call Center 112” project aims to group the current emergency numbers such as 100 and 101 under the same number: 112. Almost 1,000 employees applied and 350 people were already appointed to new positions outside the company. 254 people are still in the selection process, with a possible departure on 1 April 2005. Other initiatives of this type will be launched in 2005.
In this context, Belgacom wants to increase its people’s employ-ability continuously by offering them the opportunity to acquire the initiative, flexibility and skills that will enable them to respond to the demands of a constantly-changing job market.
Employee health and well-beingBelgacom pays considerable attention to the working environ-ment and well-being of its employees. Which translates into a company culture that emphasizes quality of life. Underlying all our initiatives in this area is an important principle: a balance between private and working life. For this purpose, we give special attention to everything that can support and encourage the family life of our employees: flexibility, a variety of amenities, student grants and loans, children’s outings, leisure activities, etc. More-over, a special team called the “Social Unit” was created to provide guidance and assistance for employees facing personal, financial, family or professional difficulties.
Belgacom has taken many measures to enable its employees to maintain a work-life balance. One of the company’s objectives in this area is to reduce commuting to and from work through tele-working. Ten specially equipped satellite offices have been made available for employees who want to telework.
A pleasant working environment is essential. This year, we also took measures to improve this. Numerous workstations and meeting areas were set up or refurbished, including “dynamic” (temporary) offices, which enable employees who are required to
spend most of their working time traveling, to use a temporary office infrastructure when reporting back to home base.
A number of facilities that make everyday working life more pleasant for employees have been set up: dispensers for hot beverages, soft drinks and sandwiches; an ATM machine, bank, travel agency and press shop in the Brussels Towers. And, last but not least, 19 company restaurants that serve an average of over 5,000 meals a day.
Health care is an important part of our employees’ well-being. Belgacom is also aware of the pressure on employees working in an environment that is competitive and undergoing constant change, and finds it important to prevent and detect any psycho-social risks generated by this.
With regard to smoking, Belgacom has declared all Belgacom buildings as “non-smoking” areas, with the exception of a few spe-cially equipped rooms. In addition to this strict policy, Belgacom launched a “Stop Smoking plan,” which includes assistance, advice and counseling.
Internal satisfactionAn internal satisfaction survey was conducted throughout the Group in December 2004. It was completed by more than 55% of the employees.
The satisfaction level was in line with that of 2003: 85% of the employees of Belgacom SA indicated that they were generally satisfied. MCS even attained a 92% satisfaction level.
Remuneration as a management toolThe salary policy is based on two principles, i.e., benchmark-ing, which allows Belgacom to adjust to market conditions, and performance, evaluated in accordance with each employee’s achievement of objectives, using the same systems and standards for all.
At the time of the IPO on 22 March 2004, Belgacom enabled its employees to subscribe to the company’s shares at a rate that was lower than the first share price of EUR 24.50.
5,629 managers and employees subscribed to a total of 1,842,026 shares. Which is a real success if you compare these figures with those of similar operations in other companies.
Average training hours per employee Learning Penetration (in %) Total training costs (in EUR millions)
02
03
04
functionalIDA (off working hours development)
0 5 10 15 2520 30 35 0 20 30 50 70 9010 40 60 80 100 0 105 15 25 3520 30 40
02
01 01 01
03
04
02
03
04
operational costsparticipant costs
74%
74%
90%
85%
17.15
18.79
17.53
20.53
16.8814.38
19.9115.04
2
2
25
24
327
231
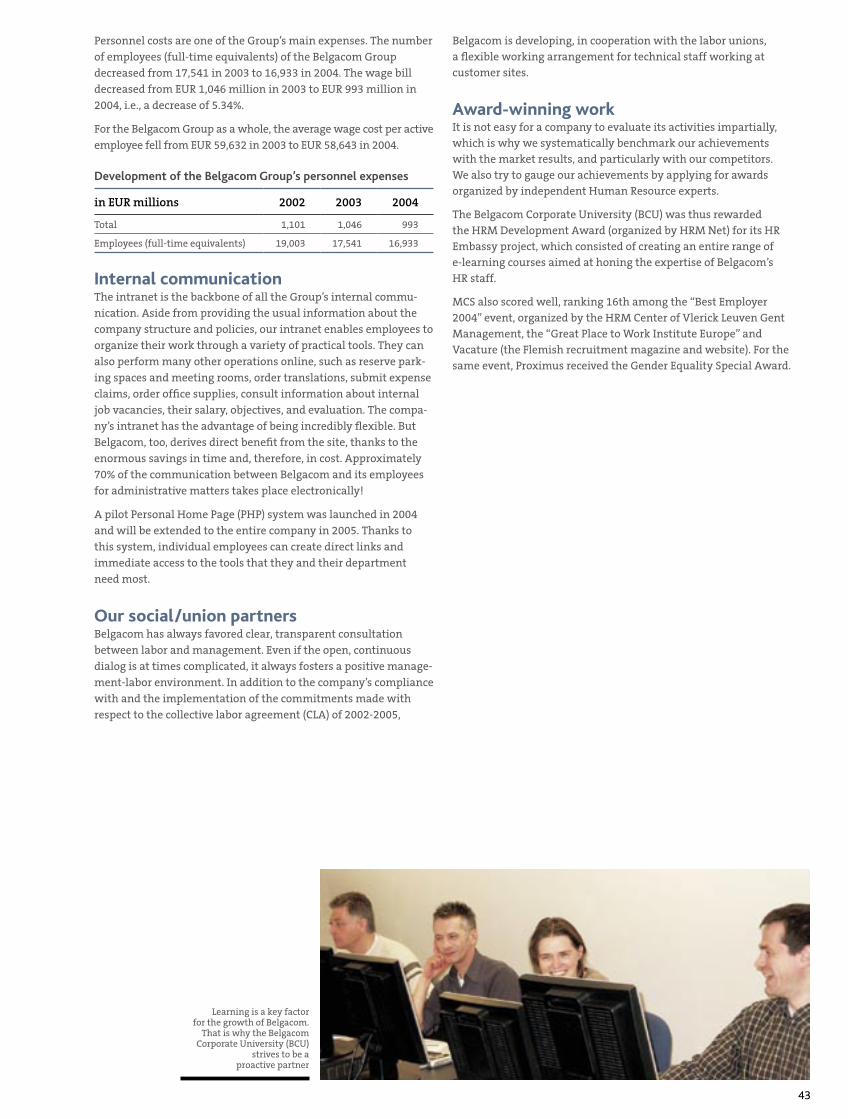
43
Belgacom is developing, in cooperation with the labor unions, a flexible working arrangement for technical staff working at customer sites.
Award-winning workIt is not easy for a company to evaluate its activities impartially, which is why we systematically benchmark our achievements with the market results, and particularly with our competitors. We also try to gauge our achievements by applying for awards organized by independent Human Resource experts.
The Belgacom Corporate University (BCU) was thus rewarded the HRM Development Award (organized by HRM Net) for its HR Embassy project, which consisted of creating an entire range of e-learning courses aimed at honing the expertise of Belgacom’s HR staff.
MCS also scored well, ranking 16th among the “Best Employer 2004” event, organized by the HRM Center of Vlerick Leuven Gent Management, the “Great Place to Work Institute Europe” and Vacature (the Flemish recruitment magazine and website). For the same event, Proximus received the Gender Equality Special Award.
Personnel costs are one of the Group’s main expenses. The number
of employees (full-time equivalents) of the Belgacom Group
decreased from 17,541 in 2003 to 16,933 in 2004. The wage bill
decreased from EUR 1,046 million in 2003 to EUR 993 million in
2004, i.e., a decrease of 5.34%.
For the Belgacom Group as a whole, the average wage cost per active
employee fell from EUR 59,632 in 2003 to EUR 58,643 in 2004.
Development of the Belgacom Group’s personnel expenses
in EUR millions 2002 2003 2004
Total 1,101 1,046 993
Employees (full-time equivalents) 19,003 17,541 16,933
Internal communicationThe intranet is the backbone of all the Group’s internal commu-
nication. Aside from providing the usual information about the
company structure and policies, our intranet enables employees to
organize their work through a variety of practical tools. They can
also perform many other operations online, such as reserve park-
ing spaces and meeting rooms, order translations, submit expense
claims, order office supplies, consult information about internal
job vacancies, their salary, objectives, and evaluation. The compa-
ny’s intranet has the advantage of being incredibly flexible. But
Belgacom, too, derives direct benefit from the site, thanks to the
enormous savings in time and, therefore, in cost. Approximately
70% of the communication between Belgacom and its employees
for administrative matters takes place electronically!
A pilot Personal Home Page (PHP) system was launched in 2004
and will be extended to the entire company in 2005. Thanks to
this system, individual employees can create direct links and
immediate access to the tools that they and their department
need most.
Our social/union partnersBelgacom has always favored clear, transparent consultation
between labor and management. Even if the open, continuous
dialog is at times complicated, it always fosters a positive manage-
ment-labor environment. In addition to the company’s compliance
with and the implementation of the commitments made with
respect to the collective labor agreement (CLA) of 2002-2005,
Learning is a key factor for the growth of Belgacom.
That is why the Belgacom Corporate University (BCU)
strives to be a proactive partner
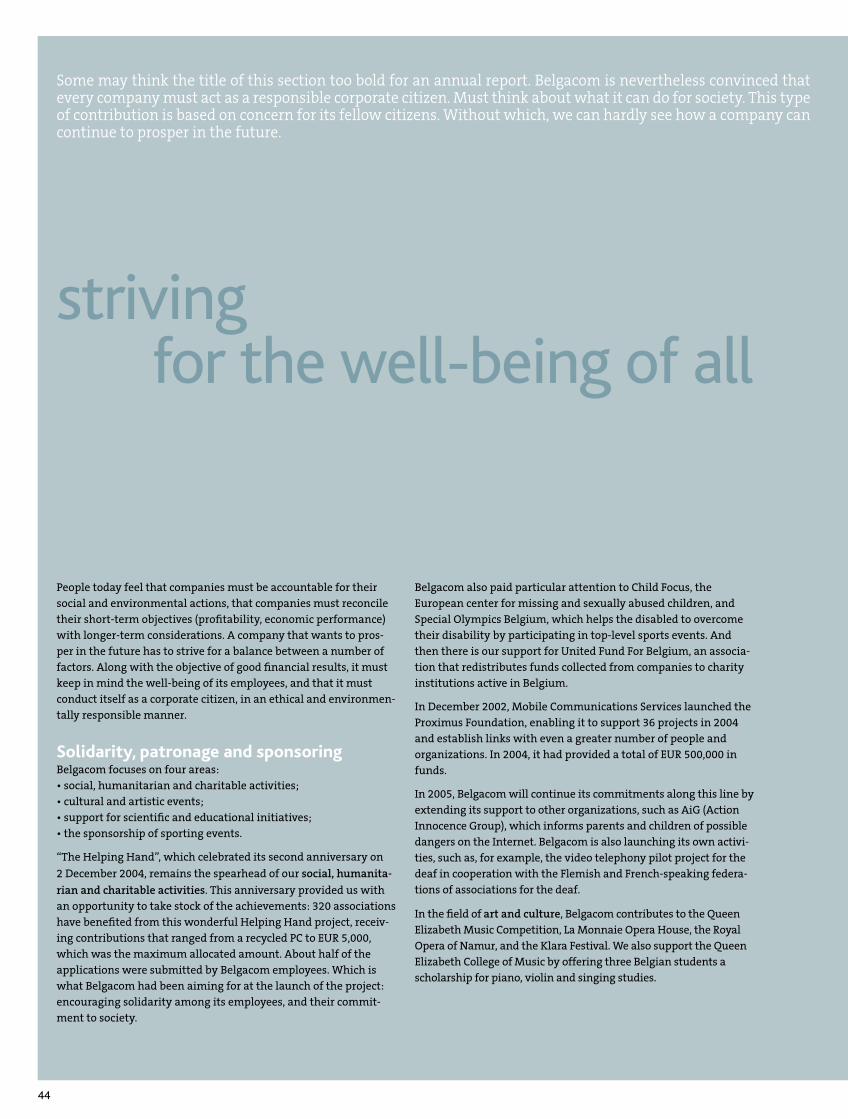
44
Some may think the title of this section too bold for an annual report. Belgacom is nevertheless convinced that every company must act as a responsible corporate citizen. Must think about what it can do for society. This type of contribution is based on concern for its fellow citizens. Without which, we can hardly see how a company can continue to prosper in the future.
Belgacom also paid particular attention to Child Focus, the European center for missing and sexually abused children, and Special Olympics Belgium, which helps the disabled to overcome their disability by participating in top-level sports events. And then there is our support for United Fund For Belgium, an associa-tion that redistributes funds collected from companies to charity institutions active in Belgium.
In December 2002, Mobile Communications Services launched the Proximus Foundation, enabling it to support 36 projects in 2004 and establish links with even a greater number of people and organizations. In 2004, it had provided a total of EUR 500,000 in funds.
In 2005, Belgacom will continue its commitments along this line by extending its support to other organizations, such as AiG (Action Innocence Group), which informs parents and children of possible dangers on the Internet. Belgacom is also launching its own activi-ties, such as, for example, the video telephony pilot project for the deaf in cooperation with the Flemish and French-speaking federa-tions of associations for the deaf.
In the field of art and culture, Belgacom contributes to the Queen Elizabeth Music Competition, La Monnaie Opera House, the Royal Opera of Namur, and the Klara Festival. We also support the Queen Elizabeth College of Music by offering three Belgian students a scholarship for piano, violin and singing studies.
People today feel that companies must be accountable for their social and environmental actions, that companies must reconcile their short-term objectives (profitability, economic performance) with longer-term considerations. A company that wants to pros-per in the future has to strive for a balance between a number of factors. Along with the objective of good financial results, it must keep in mind the well-being of its employees, and that it must conduct itself as a corporate citizen, in an ethical and environmen-tally responsible manner.
Solidarity, patronage and sponsoringBelgacom focuses on four areas:• social, humanitarian and charitable activities;• cultural and artistic events;• support for scientific and educational initiatives;• the sponsorship of sporting events.
“The Helping Hand”, which celebrated its second anniversary on
2 December 2004, remains the spearhead of our social, humanita-
rian and charitable activities. This anniversary provided us with an opportunity to take stock of the achievements: 320 associations have benefited from this wonderful Helping Hand project, receiv-ing contributions that ranged from a recycled PC to EUR 5,000, which was the maximum allocated amount. About half of the applications were submitted by Belgacom employees. Which is what Belgacom had been aiming for at the launch of the project: encouraging solidarity among its employees, and their commit-ment to society.
strivingfor the well-being of all
45
>Committed to accountability
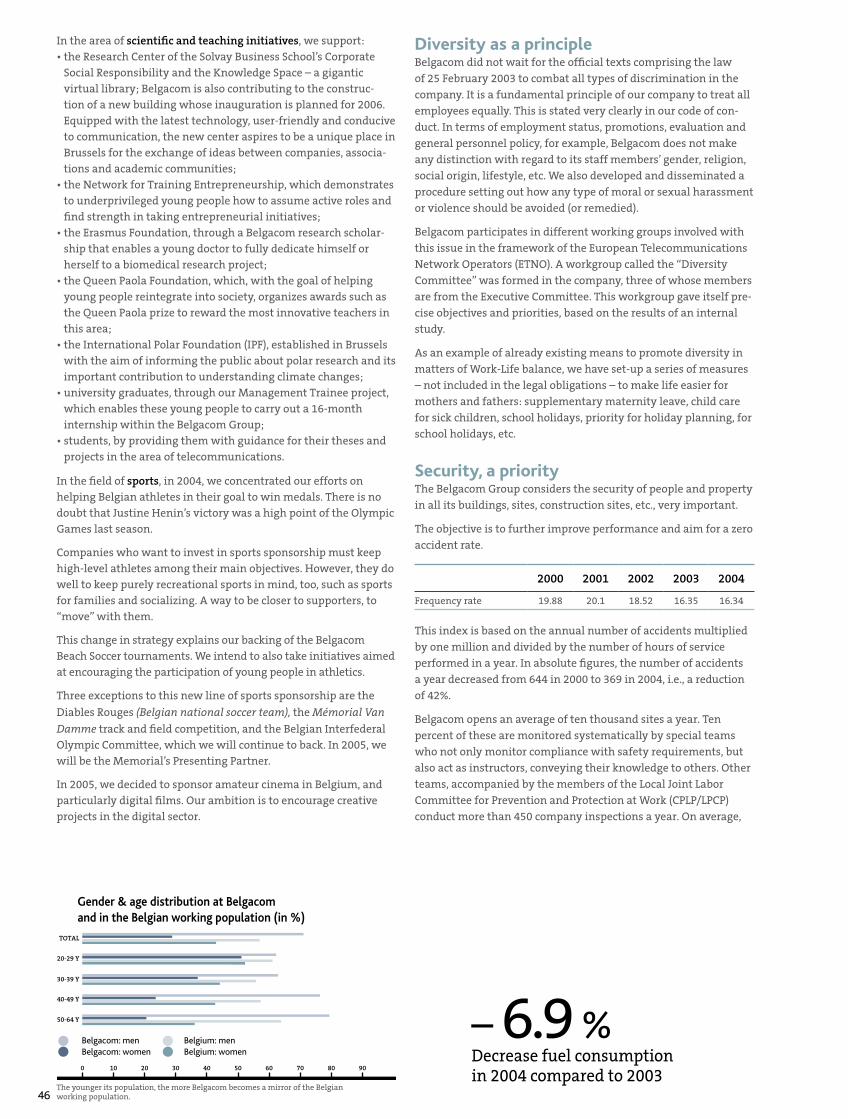
46
In the area of scientific and teaching initiatives, we support:• the Research Center of the Solvay Business School’s Corporate
Social Responsibility and the Knowledge Space – a gigantic virtual library; Belgacom is also contributing to the construc-tion of a new building whose inauguration is planned for 2006. Equipped with the latest technology, user-friendly and conducive to communication, the new center aspires to be a unique place in Brussels for the exchange of ideas between companies, associa-tions and academic communities;
• the Network for Training Entrepreneurship, which demonstrates to underprivileged young people how to assume active roles and find strength in taking entrepreneurial initiatives;
• the Erasmus Foundation, through a Belgacom research scholar-ship that enables a young doctor to fully dedicate himself or herself to a biomedical research project;
• the Queen Paola Foundation, which, with the goal of helping young people reintegrate into society, organizes awards such as the Queen Paola prize to reward the most innovative teachers in this area;
• the International Polar Foundation (IPF), established in Brussels with the aim of informing the public about polar research and its important contribution to understanding climate changes;
• university graduates, through our Management Trainee project, which enables these young people to carry out a 16-month internship within the Belgacom Group;
• students, by providing them with guidance for their theses and projects in the area of telecommunications.
In the field of sports, in 2004, we concentrated our efforts on helping Belgian athletes in their goal to win medals. There is no doubt that Justine Henin’s victory was a high point of the Olympic Games last season.
Companies who want to invest in sports sponsorship must keep high-level athletes among their main objectives. However, they do well to keep purely recreational sports in mind, too, such as sports for families and socializing. A way to be closer to supporters, to “move” with them.
This change in strategy explains our backing of the Belgacom Beach Soccer tournaments. We intend to also take initiatives aimed at encouraging the participation of young people in athletics.
Three exceptions to this new line of sports sponsorship are the
Diables Rouges (Belgian national soccer team), the Mémorial Van
Damme track and field competition, and the Belgian Interfederal Olympic Committee, which we will continue to back. In 2005, we will be the Memorial’s Presenting Partner.
In 2005, we decided to sponsor amateur cinema in Belgium, and particularly digital films. Our ambition is to encourage creative projects in the digital sector.
Diversity as a principleBelgacom did not wait for the official texts comprising the law
of 25 February 2003 to combat all types of discrimination in the
company. It is a fundamental principle of our company to treat all
employees equally. This is stated very clearly in our code of con-
duct. In terms of employment status, promotions, evaluation and
general personnel policy, for example, Belgacom does not make
any distinction with regard to its staff members’ gender, religion,
social origin, lifestyle, etc. We also developed and disseminated a
procedure setting out how any type of moral or sexual harassment
or violence should be avoided (or remedied).
Belgacom participates in different working groups involved with
this issue in the framework of the European Telecommunications
Network Operators (ETNO). A workgroup called the “Diversity
Committee” was formed in the company, three of whose members
are from the Executive Committee. This workgroup gave itself pre-
cise objectives and priorities, based on the results of an internal
study.
As an example of already existing means to promote diversity in
matters of Work-Life balance, we have set-up a series of measures
– not included in the legal obligations – to make life easier for
mothers and fathers: supplementary maternity leave, child care
for sick children, school holidays, priority for holiday planning, for
school holidays, etc.
Security, a priorityThe Belgacom Group considers the security of people and property
in all its buildings, sites, construction sites, etc., very important.
The objective is to further improve performance and aim for a zero
accident rate.
2000 2001 2002 2003 2004
Frequency rate 19.88 20.1 18.52 16.35 16.34
This index is based on the annual number of accidents multiplied
by one million and divided by the number of hours of service
performed in a year. In absolute figures, the number of accidents
a year decreased from 644 in 2000 to 369 in 2004, i.e., a reduction
of 42%.
Belgacom opens an average of ten thousand sites a year. Ten
percent of these are monitored systematically by special teams
who not only monitor compliance with safety requirements, but
also act as instructors, conveying their knowledge to others. Other
teams, accompanied by the members of the Local Joint Labor
Committee for Prevention and Protection at Work (CPLP/LPCP)
conduct more than 450 company inspections a year. On average,
Gender & age distribution at Belgacom and in the Belgian working population (in %)
The younger its population, the more Belgacom becomes a mirror of the Belgian working population.
20-29 Y
TOTAL
30-39 Y
40-49 Y
50-64 Y
Belgacom: menBelgacom: women
Belgium: menBelgium: women
20100 4030 50 70 80 9060
– 6.9 %Decrease fuel consumptionin 2004 compared to 2003
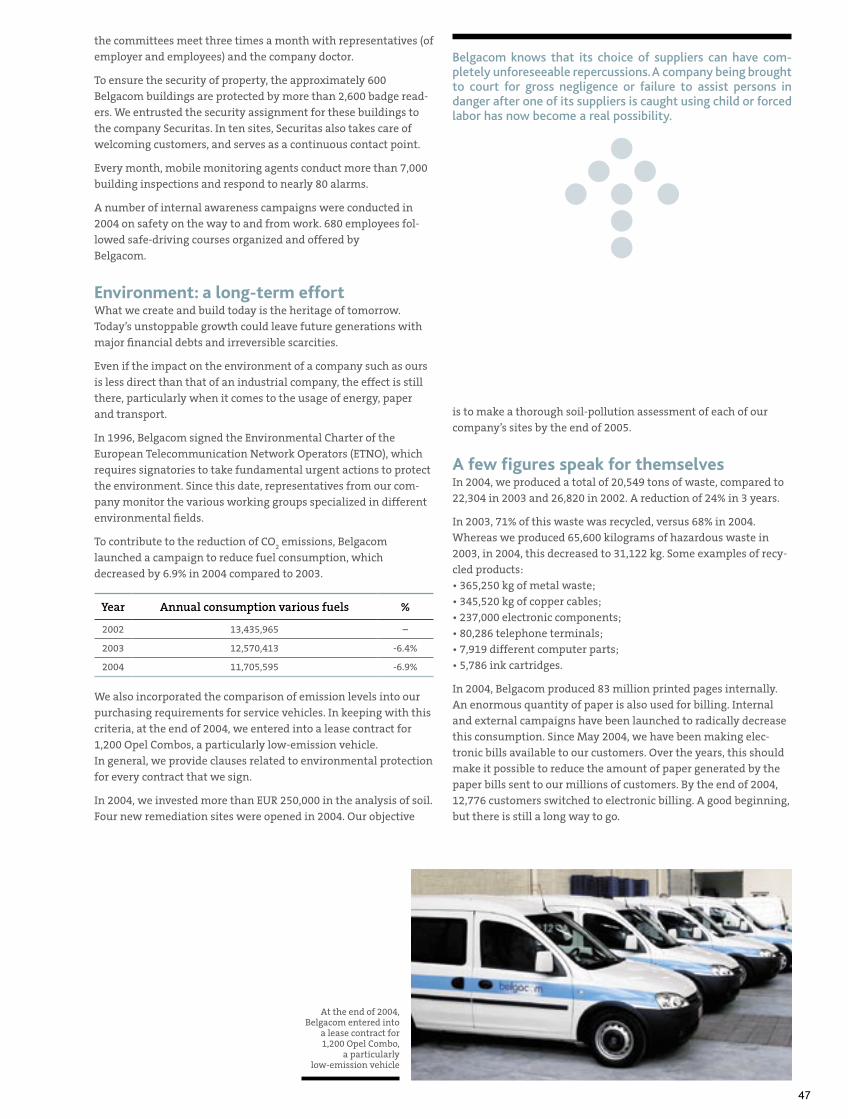
47
is to make a thorough soil-pollution assessment of each of our company’s sites by the end of 2005.
A few figures speak for themselvesIn 2004, we produced a total of 20,549 tons of waste, compared to 22,304 in 2003 and 26,820 in 2002. A reduction of 24% in 3 years.
In 2003, 71% of this waste was recycled, versus 68% in 2004. Whereas we produced 65,600 kilograms of hazardous waste in 2003, in 2004, this decreased to 31,122 kg. Some examples of recy-cled products:• 365,250 kg of metal waste;• 345,520 kg of copper cables;• 237,000 electronic components;• 80,286 telephone terminals;• 7,919 different computer parts;• 5,786 ink cartridges.
In 2004, Belgacom produced 83 million printed pages internally. An enormous quantity of paper is also used for billing. Internal and external campaigns have been launched to radically decrease this consumption. Since May 2004, we have been making elec-tronic bills available to our customers. Over the years, this should make it possible to reduce the amount of paper generated by the paper bills sent to our millions of customers. By the end of 2004, 12,776 customers switched to electronic billing. A good beginning, but there is still a long way to go.
the committees meet three times a month with representatives (of
employer and employees) and the company doctor.
To ensure the security of property, the approximately 600
Belgacom buildings are protected by more than 2,600 badge read-
ers. We entrusted the security assignment for these buildings to
the company Securitas. In ten sites, Securitas also takes care of
welcoming customers, and serves as a continuous contact point.
Every month, mobile monitoring agents conduct more than 7,000
building inspections and respond to nearly 80 alarms.
A number of internal awareness campaigns were conducted in
2004 on safety on the way to and from work. 680 employees fol-
lowed safe-driving courses organized and offered by
Belgacom.
Environment: a long-term effortWhat we create and build today is the heritage of tomorrow.
Today’s unstoppable growth could leave future generations with
major financial debts and irreversible scarcities.
Even if the impact on the environment of a company such as ours
is less direct than that of an industrial company, the effect is still
there, particularly when it comes to the usage of energy, paper
and transport.
In 1996, Belgacom signed the Environmental Charter of the
European Telecommunication Network Operators (ETNO), which
requires signatories to take fundamental urgent actions to protect
the environment. Since this date, representatives from our com-
pany monitor the various working groups specialized in different
environmental fields.
To contribute to the reduction of CO2 emissions, Belgacom
launched a campaign to reduce fuel consumption, which
decreased by 6.9% in 2004 compared to 2003.
Year Annual consumption various fuels %
2002 13,435,965 –
2003 12,570,413 -6.4%
2004 11,705,595 -6.9%
We also incorporated the comparison of emission levels into our
purchasing requirements for service vehicles. In keeping with this
criteria, at the end of 2004, we entered into a lease contract for
1,200 Opel Combos, a particularly low-emission vehicle.
In general, we provide clauses related to environmental protection
for every contract that we sign.
In 2004, we invested more than EUR 250,000 in the analysis of soil.
Four new remediation sites were opened in 2004. Our objective
Belgacom knows that its choice of suppliers can have com-pletely unforeseeable repercussions. A company being brought to court for gross negligence or failure to assist persons in danger after one of its suppliers is caught using child or forced labor has now become a real possibility.
At the end of 2004, Belgacom entered into
a lease contract for 1,200 Opel Combo,
a particularly low-emission vehicle
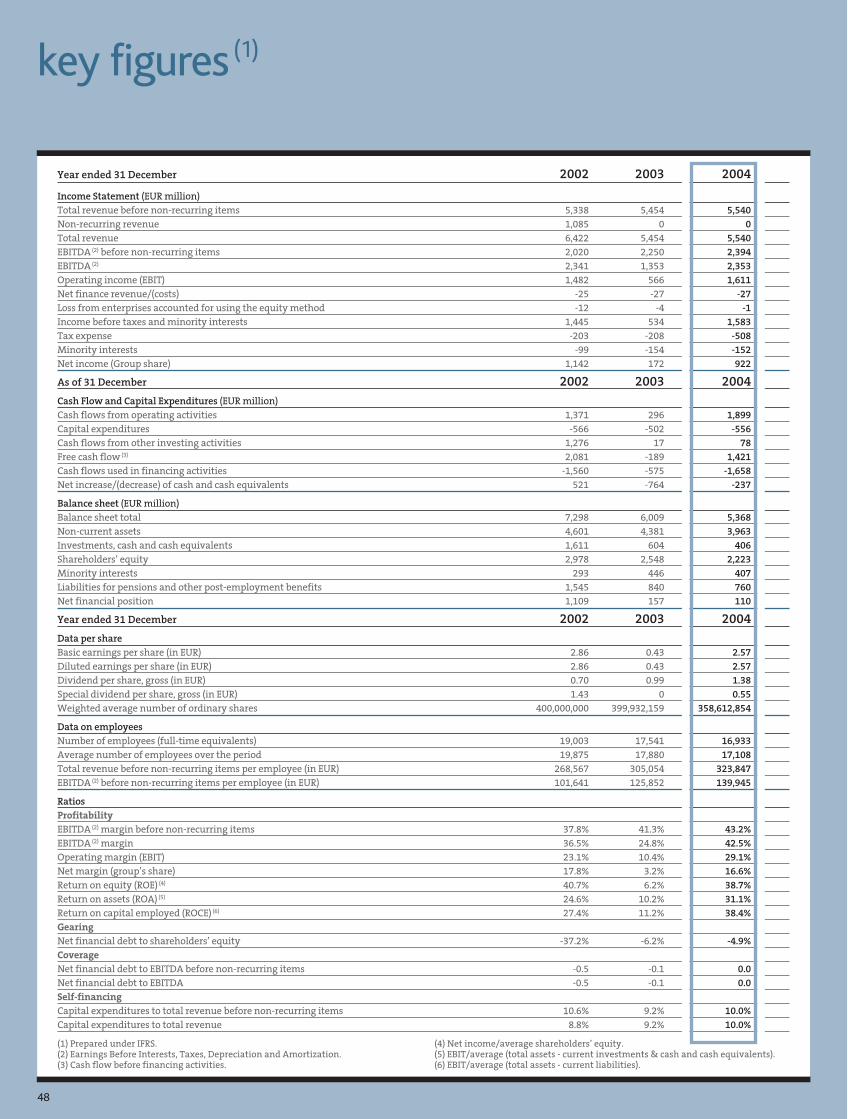
key figures(1)
Year ended 31 December 2002 2003 2004
Income Statement (EUR million)Total revenue before non-recurring items 5,338 5,454 5,540Non-recurring revenue 1,085 0 0Total revenue 6,422 5,454 5,540EBITDA (2) before non-recurring items 2,020 2,250 2,394EBITDA (2) 2,341 1,353 2,353Operating income (EBIT) 1,482 566 1,611Net finance revenue/(costs) -25 -27 -27Loss from enterprises accounted for using the equity method -12 -4 -1Income before taxes and minority interests 1,445 534 1,583Tax expense -203 -208 -508Minority interests -99 -154 -152Net income (Group share) 1,142 172 922
As of 31 December 2002 2003 2004Cash Flow and Capital Expenditures (EUR million)Cash flows from operating activities 1,371 296 1,899Capital expenditures -566 -502 -556Cash flows from other investing activities 1,276 17 78Free cash flow (3) 2,081 -189 1,421Cash flows used in financing activities -1,560 -575 -1,658Net increase/(decrease) of cash and cash equivalents 521 -764 -237
Balance sheet (EUR million)Balance sheet total 7,298 6,009 5,368Non-current assets 4,601 4,381 3,963Investments, cash and cash equivalents 1,611 604 406Shareholders’ equity 2,978 2,548 2,223Minority interests 293 446 407Liabilities for pensions and other post-employment benefits 1,545 840 760Net financial position 1,109 157 110
Year ended 31 December 2002 2003 2004Data per shareBasic earnings per share (in EUR) 2.86 0.43 2.57Diluted earnings per share (in EUR) 2.86 0.43 2.57Dividend per share, gross (in EUR) 0.70 0.99 1.38Special dividend per share, gross (in EUR) 1.43 0 0.55Weighted average number of ordinary shares 400,000,000 399,932,159 358,612,854
Data on employeesNumber of employees (full-time equivalents) 19,003 17,541 16,933Average number of employees over the period 19,875 17,880 17,108Total revenue before non-recurring items per employee (in EUR) 268,567 305,054 323,847EBITDA (2) before non-recurring items per employee (in EUR) 101,641 125,852 139,945
RatiosProfitabilityEBITDA (2) margin before non-recurring items 37.8% 41.3% 43.2%EBITDA (2) margin 36.5% 24.8% 42.5%Operating margin (EBIT) 23.1% 10.4% 29.1%Net margin (group’s share) 17.8% 3.2% 16.6%Return on equity (ROE) (4) 40.7% 6.2% 38.7%Return on assets (ROA) (5) 24.6% 10.2% 31.1%Return on capital employed (ROCE) (6) 27.4% 11.2% 38.4%GearingNet financial debt to shareholders’ equity -37.2% -6.2% -4.9%CoverageNet financial debt to EBITDA before non-recurring items -0.5 -0.1 0.0Net financial debt to EBITDA -0.5 -0.1 0.0Self-financingCapital expenditures to total revenue before non-recurring items 10.6% 9.2% 10.0%Capital expenditures to total revenue 8.8% 9.2% 10.0%
(1) Prepared under IFRS. (4) Net income/average shareholders’ equity.(2) Earnings Before Interests, Taxes, Depreciation and Amortization. (5) EBIT/average (total assets - current investments & cash and cash equivalents).(3) Cash flow before financing activities. (6) EBIT/average (total assets - current liabilities).
48
management discussionand analysis of operating results
50 • Comments on consolidated figures
54 • Management discussion and analysisof operating results per business segment
59 • Liquidity and capital resources
49
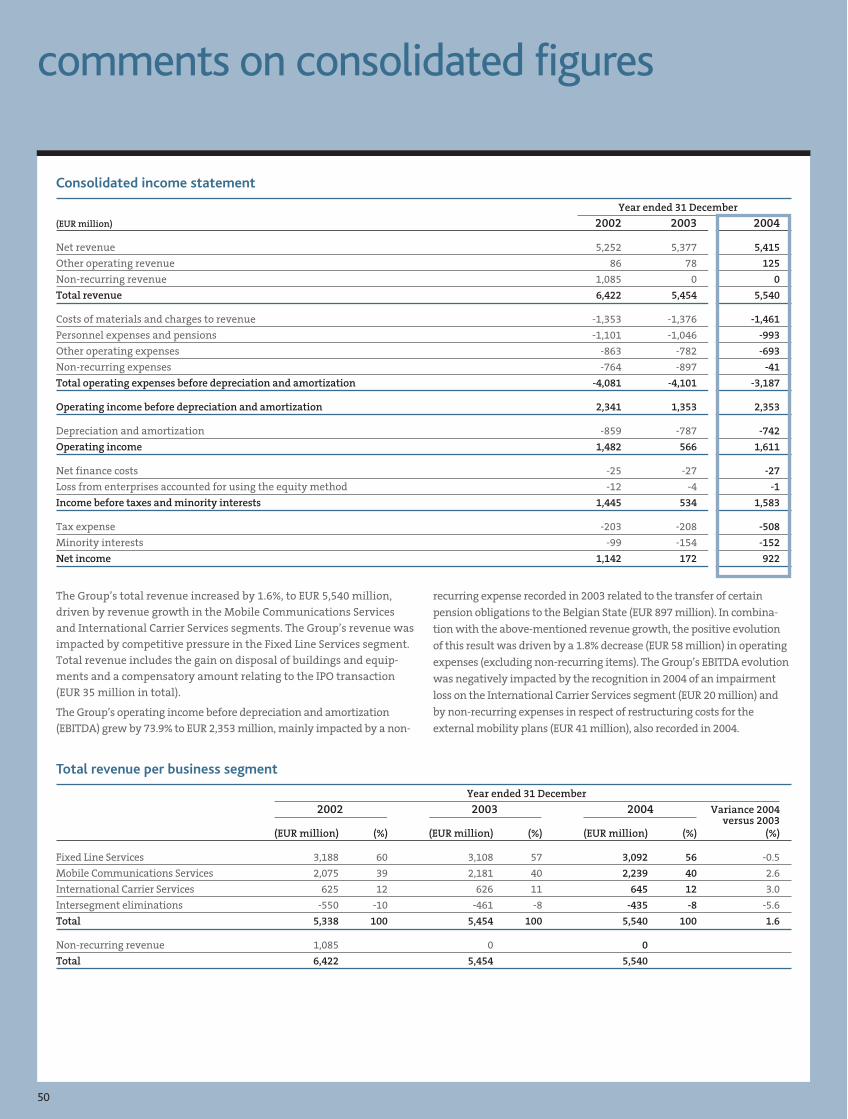
50
comments on consolidated figures
Consolidated income statement
Year ended 31 December
(EUR million) 2002 2003 2004
Net revenue 5,252 5,377 5,415
Other operating revenue 86 78 125
Non-recurring revenue 1,085 0 0
Total revenue 6,422 5,454 5,540
Costs of materials and charges to revenue -1,353 -1,376 -1,461
Personnel expenses and pensions -1,101 -1,046 -993
Other operating expenses -863 -782 -693
Non-recurring expenses -764 -897 -41
Total operating expenses before depreciation and amortization -4,081 -4,101 -3,187
Operating income before depreciation and amortization 2,341 1,353 2,353
Depreciation and amortization -859 -787 -742
Operating income 1,482 566 1,611
Net finance costs -25 -27 -27
Loss from enterprises accounted for using the equity method -12 -4 -1
Income before taxes and minority interests 1,445 534 1,583
Tax expense -203 -208 -508
Minority interests -99 -154 -152
Net income 1,142 172 922
The Group’s total revenue increased by 1.6%, to EUR 5,540 million,
driven by revenue growth in the Mobile Communications Services
and International Carrier Services segments. The Group’s revenue was
impacted by competitive pressure in the Fixed Line Services segment.
Total revenue includes the gain on disposal of buildings and equip-
ments and a compensatory amount relating to the IPO transaction
(EUR 35 million in total).
The Group’s operating income before depreciation and amortization
(EBITDA) grew by 73.9% to EUR 2,353 million, mainly impacted by a non-
recurring expense recorded in 2003 related to the transfer of certain
pension obligations to the Belgian State (EUR 897 million). In combina-
tion with the above-mentioned revenue growth, the positive evolution
of this result was driven by a 1.8% decrease (EUR 58 million) in operating
expenses (excluding non-recurring items). The Group’s EBITDA evolution
was negatively impacted by the recognition in 2004 of an impairment
loss on the International Carrier Services segment (EUR 20 million) and
by non-recurring expenses in respect of restructuring costs for the
external mobility plans (EUR 41 million), also recorded in 2004.
Total revenue per business segment
Year ended 31 December
2002 2003 2004 Variance 2004versus 2003
(EUR million) (%) (EUR million) (%) (EUR million) (%) (%)
Fixed Line Services 3,188 60 3,108 57 3,092 56 -0.5
Mobile Communications Services 2,075 39 2,181 40 2,239 40 2.6
International Carrier Services 625 12 626 11 645 12 3.0
Intersegment eliminations -550 -10 -461 -8 -435 -8 -5.6
Total 5,338 100 5,454 100 5,540 100 1.6
Non-recurring revenue 1,085 0 0
Total 6,422 5,454 5,540

51
For the year ended 31 December 2004, total revenue increased by 1.6%:
• Fixed Line Services revenue decreased year-over-year by 0.5%. Thegrowth in broadband and in national wholesale nearly offset thedecline in the traditional voice business. Two one-time items (thegain on the sale of buildings and equipments and a compensatoryamount related to the IPO transaction, for EUR 35 million in total)also positively impacted the segment revenue.
• Mobile Communications Services revenue increased by 2.6%, as aresult of service revenue growth (+3.3%). This was, however, partlyoffset by certain exceptional credits and discounts granted for the
Excluding non-recurring expenses, total operating expenses beforedepreciation and amortization decreased by 1.8% or EUR 58 million.
Costs of materials and charges to revenueFor the year ended 31 December 2004, the costs of material andcharges to revenue increased by 6.1%. This increase is mainly relatedto higher expenses for interconnection within MobileCommunications Services and to the impact on costs of mobile desti-nation traffic growth in the International Carrier Services segment.
Fixed Line Services cost of materials and charges to revenue decreasedby 0.6%, the cost increase in National Wholesale being more thanoffset by the cost decrease in the retail business.
Personnel expenses and pensions
Year ended 31 December
(EUR million) 2002 2003 2004
Salaries and wages 822 782 746
Social security expenses 142 142 163
Pension costs 110 100 17
Post-employment benefitsother than pensions 9 7 39
Other personnel expenses 18 15 27
Total 1,101 1,046 993
Number of employees(full-time equivalents) (1) 19,003 17,541 16,933
(1) Number of full-time equivalents, calculated on the basis of the consolidationpercentage of subsidiaries owned less than 100%.
Salaries and wages decreased in 2004 by EUR 35 million or 4.5%. Thedecrease is driven by the overall headcount reduction at BelgacomGroup level (minus 608 full-time equivalents or -3.5%, some of whichwere the result of the BeST program and external mobility projects),offset in part by annual increases in salary levels (including index-related 2% increases at Mobile Communications Services in July 2004and at Fixed Line Services and International Carrier Services inNovember 2004).
The increase in social security expenses in 2004 was mainly driven(for EUR 30 million) by additional social security contributions paid tothe Belgian State for statutory employees (which is a consequence ofthe Pension Fund transfer at the end of 2003) and partly offset byfewer social security expenses following the headcount reduction.
Due to the transfer of the fully funded Pension Fund for statutoryemployees in 2003 and to the reclassification of interest costs relatedto BeST and PTS liabilities under “post-employment benefits otherthan pensions” in 2004, pension-related charges declined fromEUR 100 million in 2003 to EUR 17 million in 2004. The EUR 17 millionare in respect of pension benefits for statutory and non-statutoryemployees in excess of legal pension benefits.
Post-employment benefits other than pensions increased year-over-year 2004 versus 2003 by EUR 33 million. The increase wasmainly driven by interest costs related to BeST and PTS liabilities(EUR 26 million), which previously had been classified under pensioncosts.
10th anniversary of Belgacom Mobile that impacted the first half ofthe year 2004.
• International Carrier Services revenue increased by 3.0%, thanks tothe growth of mobile destination traffic (+24.4%).
For the year ended 31 December 2003, total revenue decreased byEUR 968 million, to EUR 5,454 million. This decrease was primarilydriven by the recognition of non-recurring revenue in 2002(EUR 1,085 million), mainly in respect of gains arising from the saleof Ben Nederland and Belgacom France.
Operating expenses before depreciation and amortization
Year ended 31 December Variance 2004(EUR million) 2002 2003 2004 versus 2003
Costs of materials and charges to revenue 1,353 1,376 1,461 6.1%
Personnel expenses and pensions 1,101 1,046 993 -5.0%
Other operating expenses 863 782 693 -11.4%
Total 3,318 3,204 3,146 -1.8%
Non-recurring expenses 764 897 41
Total 4,081 4,101 3,187
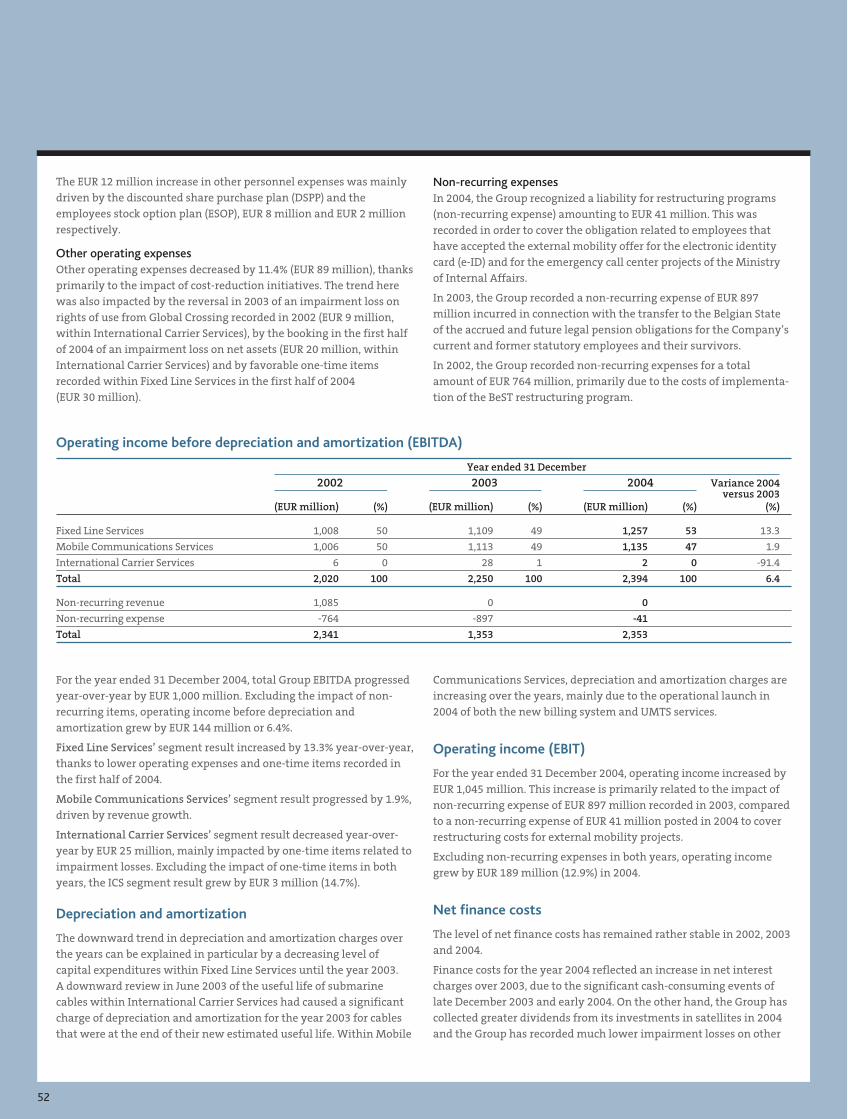
52
The EUR 12 million increase in other personnel expenses was mainlydriven by the discounted share purchase plan (DSPP) and theemployees stock option plan (ESOP), EUR 8 million and EUR 2 millionrespectively.
Other operating expensesOther operating expenses decreased by 11.4% (EUR 89 million), thanksprimarily to the impact of cost-reduction initiatives. The trend herewas also impacted by the reversal in 2003 of an impairment loss onrights of use from Global Crossing recorded in 2002 (EUR 9 million,within International Carrier Services), by the booking in the first halfof 2004 of an impairment loss on net assets (EUR 20 million, withinInternational Carrier Services) and by favorable one-time itemsrecorded within Fixed Line Services in the first half of 2004(EUR 30 million).
For the year ended 31 December 2004, total Group EBITDA progressedyear-over-year by EUR 1,000 million. Excluding the impact of non-recurring items, operating income before depreciation andamortization grew by EUR 144 million or 6.4%.
Fixed Line Services’ segment result increased by 13.3% year-over-year,thanks to lower operating expenses and one-time items recorded inthe first half of 2004.
Mobile Communications Services’ segment result progressed by 1.9%,driven by revenue growth.
International Carrier Services’ segment result decreased year-over-year by EUR 25 million, mainly impacted by one-time items related toimpairment losses. Excluding the impact of one-time items in bothyears, the ICS segment result grew by EUR 3 million (14.7%).
Depreciation and amortization
The downward trend in depreciation and amortization charges overthe years can be explained in particular by a decreasing level ofcapital expenditures within Fixed Line Services until the year 2003.A downward review in June 2003 of the useful life of submarinecables within International Carrier Services had caused a significantcharge of depreciation and amortization for the year 2003 for cablesthat were at the end of their new estimated useful life. Within Mobile
Communications Services, depreciation and amortization charges areincreasing over the years, mainly due to the operational launch in2004 of both the new billing system and UMTS services.
Operating income (EBIT)
For the year ended 31 December 2004, operating income increased byEUR 1,045 million. This increase is primarily related to the impact ofnon-recurring expense of EUR 897 million recorded in 2003, comparedto a non-recurring expense of EUR 41 million posted in 2004 to coverrestructuring costs for external mobility projects.
Excluding non-recurring expenses in both years, operating incomegrew by EUR 189 million (12.9%) in 2004.
Net finance costs
The level of net finance costs has remained rather stable in 2002, 2003and 2004.
Finance costs for the year 2004 reflected an increase in net interestcharges over 2003, due to the significant cash-consuming events oflate December 2003 and early 2004. On the other hand, the Group hascollected greater dividends from its investments in satellites in 2004and the Group has recorded much lower impairment losses on other
Non-recurring expensesIn 2004, the Group recognized a liability for restructuring programs(non-recurring expense) amounting to EUR 41 million. This wasrecorded in order to cover the obligation related to employees thathave accepted the external mobility offer for the electronic identitycard (e-ID) and for the emergency call center projects of the Ministryof Internal Affairs.
In 2003, the Group recorded a non-recurring expense of EUR 897million incurred in connection with the transfer to the Belgian Stateof the accrued and future legal pension obligations for the Company’scurrent and former statutory employees and their survivors.
In 2002, the Group recorded non-recurring expenses for a totalamount of EUR 764 million, primarily due to the costs of implementa-tion of the BeST restructuring program.
Operating income before depreciation and amortization (EBITDA)
Year ended 31 December
2002 2003 2004 Variance 2004versus 2003
(EUR million) (%) (EUR million) (%) (EUR million) (%) (%)
Fixed Line Services 1,008 50 1,109 49 1,257 53 13.3
Mobile Communications Services 1,006 50 1,113 49 1,135 47 1.9
International Carrier Services 6 0 28 1 2 0 -91.4
Total 2,020 100 2,250 100 2,394 100 6.4
Non-recurring revenue 1,085 0 0
Non-recurring expense -764 -897 -41
Total 2,341 1,353 2,353
53
participating interests that are not fully compensated by higher costsfor the remeasurement to fair value of financial instruments.
Loss from enterprises accountedfor using the equity method
For the years 2003 and 2004, enterprises accounted for using theequity method consist only of Alert Services Holding.
Tax expense
The effective income tax rate of the year 2004 amounts to 32.1%. Thismeans an effective percentage lower than the tax rate applicable inBelgium (33.99% as from 1 January 2003) due to non-taxable income ofsome subsidiaries exceeding non-deductible expenditures of the Group.
Minority interests
The Group’s most significant minority interest is Vodafone’s 25%stake in Belgacom Mobile. In 2002, this line also included the specialpurpose vehicle formed in connection with the transfer of the sharesof Ben Nederland.
Net income
Net income (Group share) increased from EUR 172 million in 2003to EUR 922 million in 2004 thanks to a positive evolution of theoperating income. In 2003, it was however impacted by anon-recurring cost of EUR 897 million.
Fixed Line Services International Carrier Services
Belgacom Skynet 100%WIN 100%CERTIPOST 50%Connectimmo 100%DAD 85%Expercom 100%Belgacom finance 100%Finbel Re 100%Belgacom services 100%Belgacom Opal 100%
72%*
BICS
100%
Points of presence companies in 15 countries
* Subject to clearance of transaction with Swisscom.
Belgacom SA
Mobile Communications Services
100%Belgacom
Invest
75%
Belgacom Mobile
Organizational chart on 01/03/2005
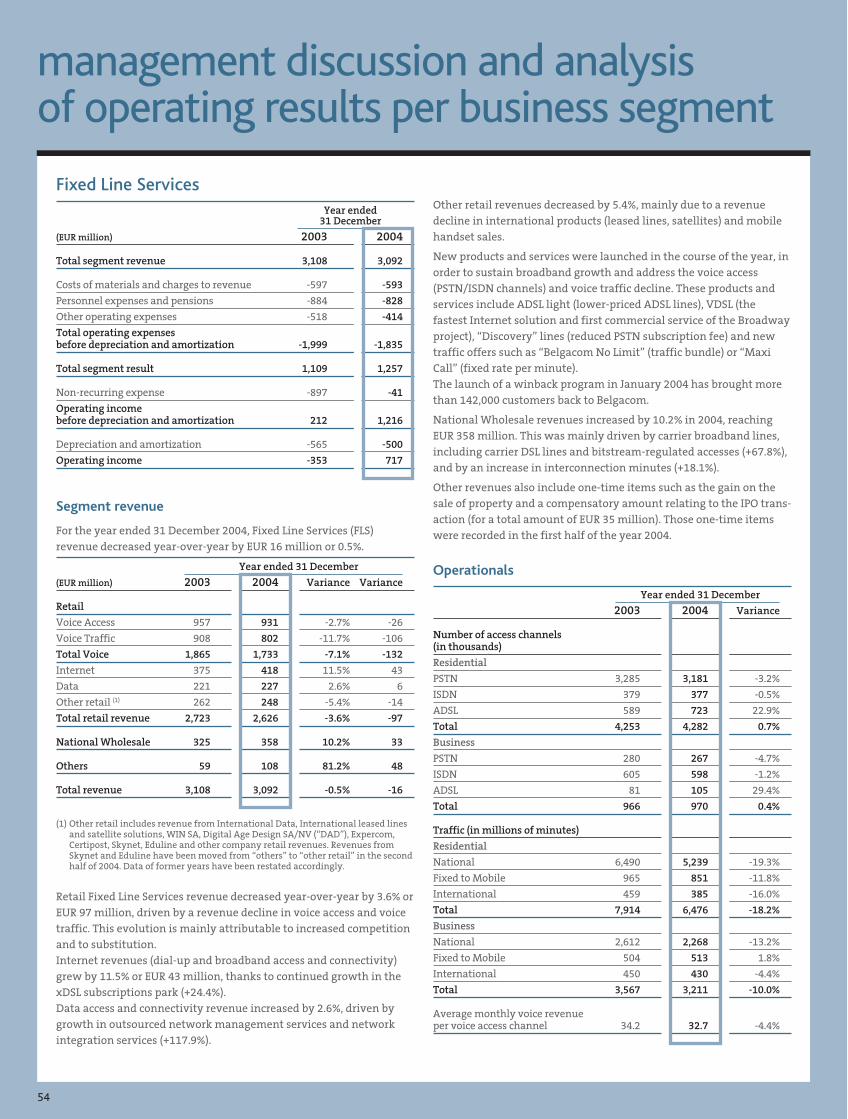
54
management discussion and analysisof operating results per business segment
Fixed Line ServicesYear ended
31 December
(EUR million) 2003 2004
Total segment revenue 3,108 3,092
Costs of materials and charges to revenue -597 -593
Personnel expenses and pensions -884 -828
Other operating expenses -518 -414
Total operating expensesbefore depreciation and amortization -1,999 -1,835
Total segment result 1,109 1,257
Non-recurring expense -897 -41
Operating incomebefore depreciation and amortization 212 1,216
Depreciation and amortization -565 -500
Operating income -353 717
Segment revenue
For the year ended 31 December 2004, Fixed Line Services (FLS)revenue decreased year-over-year by EUR 16 million or 0.5%.
Year ended 31 December
(EUR million) 2003 2004 Variance Variance
Retail
Voice Access 957 931 -2.7% -26
Voice Traffic 908 802 -11.7% -106
Total Voice 1,865 1,733 -7.1% -132
Internet 375 418 11.5% 43
Data 221 227 2.6% 6
Other retail (1) 262 248 -5.4% -14
Total retail revenue 2,723 2,626 -3.6% -97
National Wholesale 325 358 10.2% 33
Others 59 108 81.2% 48
Total revenue 3,108 3,092 -0.5% -16
(1) Other retail includes revenue from International Data, International leased linesand satellite solutions, WIN SA, Digital Age Design SA/NV (“DAD”), Expercom,Certipost, Skynet, Eduline and other company retail revenues. Revenues fromSkynet and Eduline have been moved from “others” to “other retail” in the secondhalf of 2004. Data of former years have been restated accordingly.
Retail Fixed Line Services revenue decreased year-over-year by 3.6% orEUR 97 million, driven by a revenue decline in voice access and voicetraffic. This evolution is mainly attributable to increased competitionand to substitution.Internet revenues (dial-up and broadband access and connectivity)grew by 11.5% or EUR 43 million, thanks to continued growth in thexDSL subscriptions park (+24.4%).Data access and connectivity revenue increased by 2.6%, driven bygrowth in outsourced network management services and networkintegration services (+117.9%).
Other retail revenues decreased by 5.4%, mainly due to a revenuedecline in international products (leased lines, satellites) and mobilehandset sales.
New products and services were launched in the course of the year, inorder to sustain broadband growth and address the voice access(PSTN/ISDN channels) and voice traffic decline. These products andservices include ADSL light (lower-priced ADSL lines), VDSL (thefastest Internet solution and first commercial service of the Broadwayproject), “Discovery” lines (reduced PSTN subscription fee) and newtraffic offers such as “Belgacom No Limit” (traffic bundle) or “MaxiCall” (fixed rate per minute).The launch of a winback program in January 2004 has brought morethan 142,000 customers back to Belgacom.
National Wholesale revenues increased by 10.2% in 2004, reachingEUR 358 million. This was mainly driven by carrier broadband lines,including carrier DSL lines and bitstream-regulated accesses (+67.8%),and by an increase in interconnection minutes (+18.1%).
Other revenues also include one-time items such as the gain on thesale of property and a compensatory amount relating to the IPO trans-action (for a total amount of EUR 35 million). Those one-time itemswere recorded in the first half of the year 2004.
Operationals
Year ended 31 December
2003 2004 Variance
Number of access channels(in thousands)
Residential
PSTN 3,285 3,181 -3.2%
ISDN 379 377 -0.5%
ADSL 589 723 22.9%
Total 4,253 4,282 0.7%
Business
PSTN 280 267 -4.7%
ISDN 605 598 -1.2%
ADSL 81 105 29.4%
Total 966 970 0.4%
Traffic (in millions of minutes)
Residential
National 6,490 5,239 -19.3%
Fixed to Mobile 965 851 -11.8%
International 459 385 -16.0%
Total 7,914 6,476 -18.2%
Business
National 2,612 2,268 -13.2%
Fixed to Mobile 504 513 1.8%
International 450 430 -4.4%
Total 3,567 3,211 -10.0%
Average monthly voice revenueper voice access channel 34.2 32.7 -4.4%
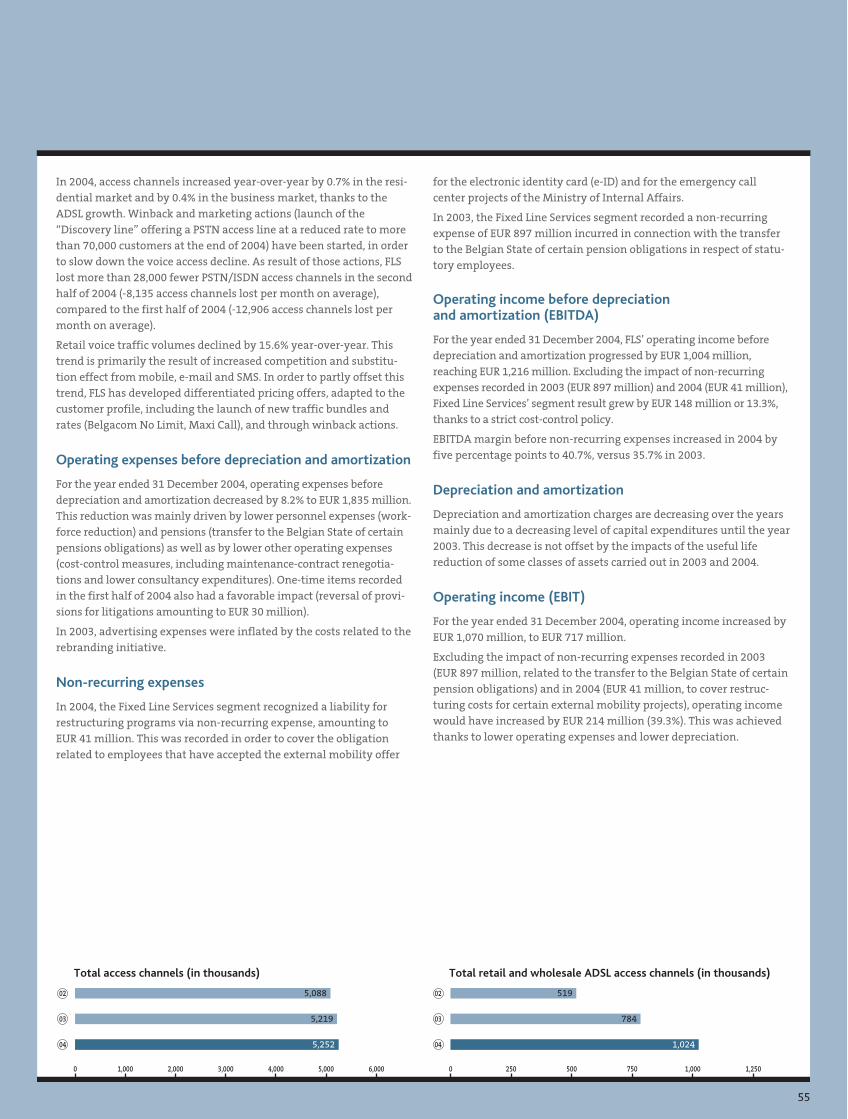
55
In 2004, access channels increased year-over-year by 0.7% in the resi-dential market and by 0.4% in the business market, thanks to theADSL growth. Winback and marketing actions (launch of the“Discovery line” offering a PSTN access line at a reduced rate to morethan 70,000 customers at the end of 2004) have been started, in orderto slow down the voice access decline. As result of those actions, FLSlost more than 28,000 fewer PSTN/ISDN access channels in the secondhalf of 2004 (-8,135 access channels lost per month on average),compared to the first half of 2004 (-12,906 access channels lost permonth on average).
Retail voice traffic volumes declined by 15.6% year-over-year. Thistrend is primarily the result of increased competition and substitu-tion effect from mobile, e-mail and SMS. In order to partly offset thistrend, FLS has developed differentiated pricing offers, adapted to thecustomer profile, including the launch of new traffic bundles andrates (Belgacom No Limit, Maxi Call), and through winback actions.
Operating expenses before depreciation and amortization
For the year ended 31 December 2004, operating expenses beforedepreciation and amortization decreased by 8.2% to EUR 1,835 million.This reduction was mainly driven by lower personnel expenses (work-force reduction) and pensions (transfer to the Belgian State of certainpensions obligations) as well as by lower other operating expenses(cost-control measures, including maintenance-contract renegotia-tions and lower consultancy expenditures). One-time items recordedin the first half of 2004 also had a favorable impact (reversal of provi-sions for litigations amounting to EUR 30 million).
In 2003, advertising expenses were inflated by the costs related to therebranding initiative.
Non-recurring expenses
In 2004, the Fixed Line Services segment recognized a liability forrestructuring programs via non-recurring expense, amounting toEUR 41 million. This was recorded in order to cover the obligationrelated to employees that have accepted the external mobility offer
for the electronic identity card (e-ID) and for the emergency callcenter projects of the Ministry of Internal Affairs.
In 2003, the Fixed Line Services segment recorded a non-recurringexpense of EUR 897 million incurred in connection with the transferto the Belgian State of certain pension obligations in respect of statu-tory employees.
Operating income before depreciationand amortization (EBITDA)
For the year ended 31 December 2004, FLS’ operating income beforedepreciation and amortization progressed by EUR 1,004 million,reaching EUR 1,216 million. Excluding the impact of non-recurringexpenses recorded in 2003 (EUR 897 million) and 2004 (EUR 41 million),Fixed Line Services’ segment result grew by EUR 148 million or 13.3%,thanks to a strict cost-control policy.
EBITDA margin before non-recurring expenses increased in 2004 byfive percentage points to 40.7%, versus 35.7% in 2003.
Depreciation and amortization
Depreciation and amortization charges are decreasing over the yearsmainly due to a decreasing level of capital expenditures until the year2003. This decrease is not offset by the impacts of the useful lifereduction of some classes of assets carried out in 2003 and 2004.
Operating income (EBIT)
For the year ended 31 December 2004, operating income increased byEUR 1,070 million, to EUR 717 million.
Excluding the impact of non-recurring expenses recorded in 2003(EUR 897 million, related to the transfer to the Belgian State of certainpension obligations) and in 2004 (EUR 41 million, to cover restruc-turing costs for certain external mobility projects), operating incomewould have increased by EUR 214 million (39.3%). This was achievedthanks to lower operating expenses and lower depreciation.
02
03
04
0 1,000 2,000 3,000 4,000 5,000 6,000
5,088
5,219
5,252
02
03
04
0 250 500 750 1,000 1,250
519
784
1,024
Total retail and wholesale ADSL access channels (in thousands)Total access channels (in thousands)
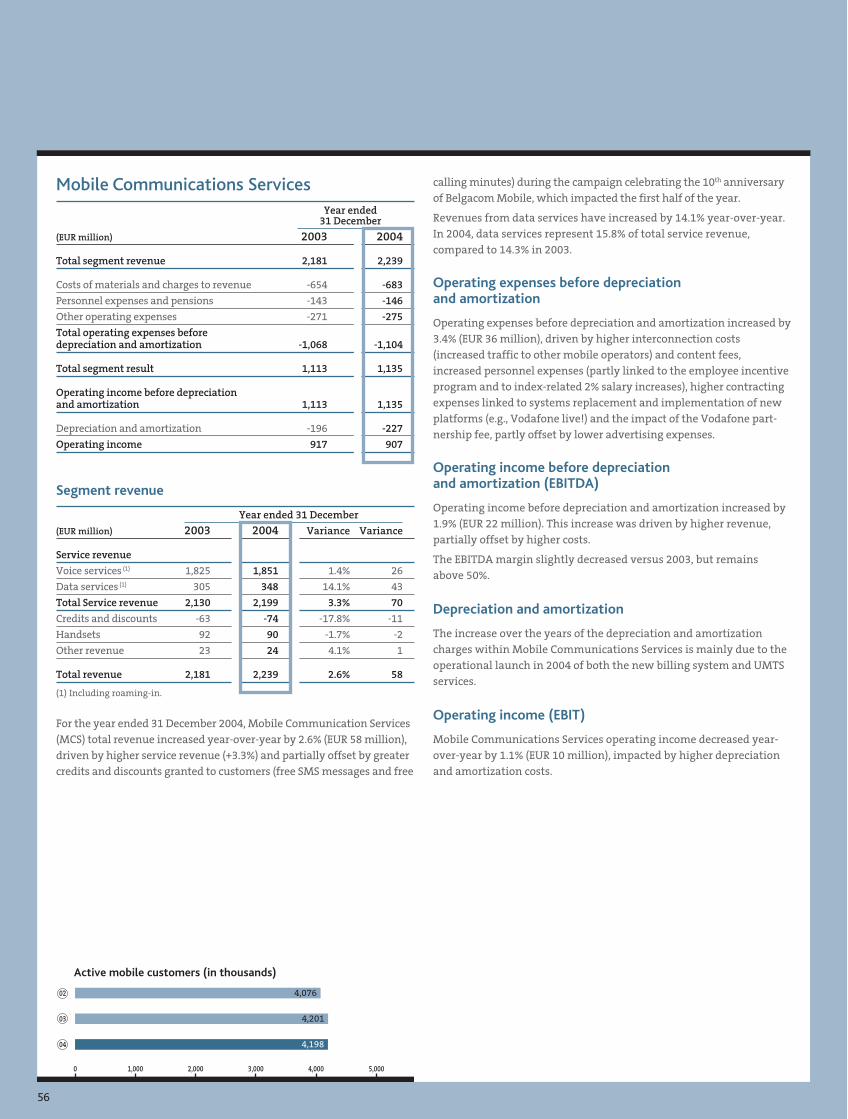
56
Mobile Communications ServicesYear ended
31 December
(EUR million) 2003 2004
Total segment revenue 2,181 2,239
Costs of materials and charges to revenue -654 -683
Personnel expenses and pensions -143 -146
Other operating expenses -271 -275
Total operating expenses beforedepreciation and amortization -1,068 -1,104
Total segment result 1,113 1,135
Operating income before depreciationand amortization 1,113 1,135
Depreciation and amortization -196 -227
Operating income 917 907
Segment revenue
Year ended 31 December
(EUR million) 2003 2004 Variance Variance
Service revenue
Voice services (1) 1,825 1,851 1.4% 26
Data services (1) 305 348 14.1% 43
Total Service revenue 2,130 2,199 3.3% 70
Credits and discounts -63 -74 -17.8% -11
Handsets 92 90 -1.7% -2
Other revenue 23 24 4.1% 1
Total revenue 2,181 2,239 2.6% 58
(1) Including roaming-in.
For the year ended 31 December 2004, Mobile Communication Services(MCS) total revenue increased year-over-year by 2.6% (EUR 58 million),driven by higher service revenue (+3.3%) and partially offset by greatercredits and discounts granted to customers (free SMS messages and free
calling minutes) during the campaign celebrating the 10th anniversaryof Belgacom Mobile, which impacted the first half of the year.
Revenues from data services have increased by 14.1% year-over-year.In 2004, data services represent 15.8% of total service revenue,compared to 14.3% in 2003.
Operating expenses before depreciationand amortization
Operating expenses before depreciation and amortization increased by3.4% (EUR 36 million), driven by higher interconnection costs(increased traffic to other mobile operators) and content fees,increased personnel expenses (partly linked to the employee incentiveprogram and to index-related 2% salary increases), higher contractingexpenses linked to systems replacement and implementation of newplatforms (e.g., Vodafone live!) and the impact of the Vodafone part-nership fee, partly offset by lower advertising expenses.
Operating income before depreciationand amortization (EBITDA)
Operating income before depreciation and amortization increased by1.9% (EUR 22 million). This increase was driven by higher revenue,partially offset by higher costs.
The EBITDA margin slightly decreased versus 2003, but remainsabove 50%.
Depreciation and amortization
The increase over the years of the depreciation and amortizationcharges within Mobile Communications Services is mainly due to theoperational launch in 2004 of both the new billing system and UMTSservices.
Operating income (EBIT)
Mobile Communications Services operating income decreased year-over-year by 1.1% (EUR 10 million), impacted by higher depreciationand amortization costs.
02
03
04
0 1,000 2,000 3,000 4,000 5,000
4,076
4,201
4,198
Active mobile customers (in thousands)
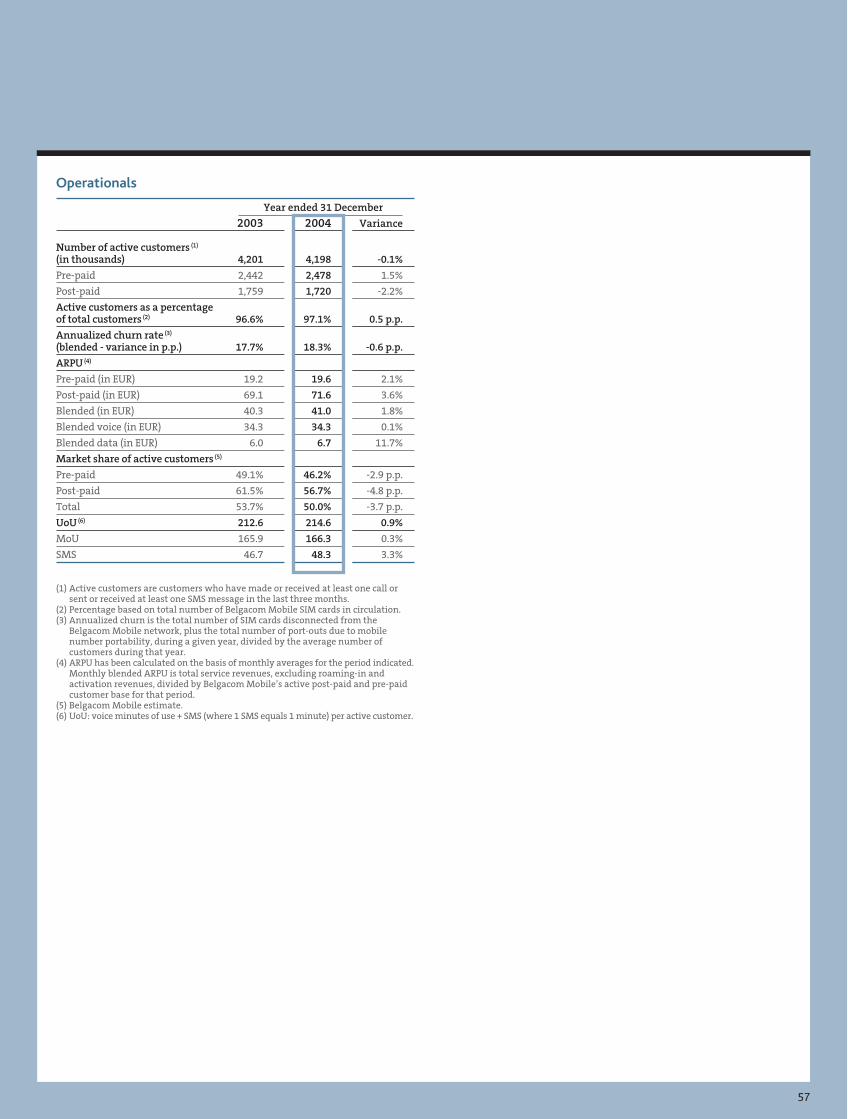
57
Operationals
Year ended 31 December
2003 2004 Variance
Number of active customers (1)
(in thousands) 4,201 4,198 -0.1%
Pre-paid 2,442 2,478 1.5%
Post-paid 1,759 1,720 -2.2%
Active customers as a percentageof total customers (2) 96.6% 97.1% 0.5 p.p.
Annualized churn rate (3)
(blended - variance in p.p.) 17.7% 18.3% -0.6 p.p.
ARPU (4)
Pre-paid (in EUR) 19.2 19.6 2.1%
Post-paid (in EUR) 69.1 71.6 3.6%
Blended (in EUR) 40.3 41.0 1.8%
Blended voice (in EUR) 34.3 34.3 0.1%
Blended data (in EUR) 6.0 6.7 11.7%
Market share of active customers (5)
Pre-paid 49.1% 46.2% -2.9 p.p.
Post-paid 61.5% 56.7% -4.8 p.p.
Total 53.7% 50.0% -3.7 p.p.
UoU (6) 212.6 214.6 0.9%
MoU 165.9 166.3 0.3%
SMS 46.7 48.3 3.3%
(1) Active customers are customers who have made or received at least one call orsent or received at least one SMS message in the last three months.
(2) Percentage based on total number of Belgacom Mobile SIM cards in circulation.(3) Annualized churn is the total number of SIM cards disconnected from the
Belgacom Mobile network, plus the total number of port-outs due to mobilenumber portability, during a given year, divided by the average number ofcustomers during that year.
(4) ARPU has been calculated on the basis of monthly averages for the period indicated.Monthly blended ARPU is total service revenues, excluding roaming-in andactivation revenues, divided by Belgacom Mobile’s active post-paid and pre-paidcustomer base for that period.
(5) Belgacom Mobile estimate.(6) UoU: voice minutes of use + SMS (where 1 SMS equals 1 minute) per active customer.
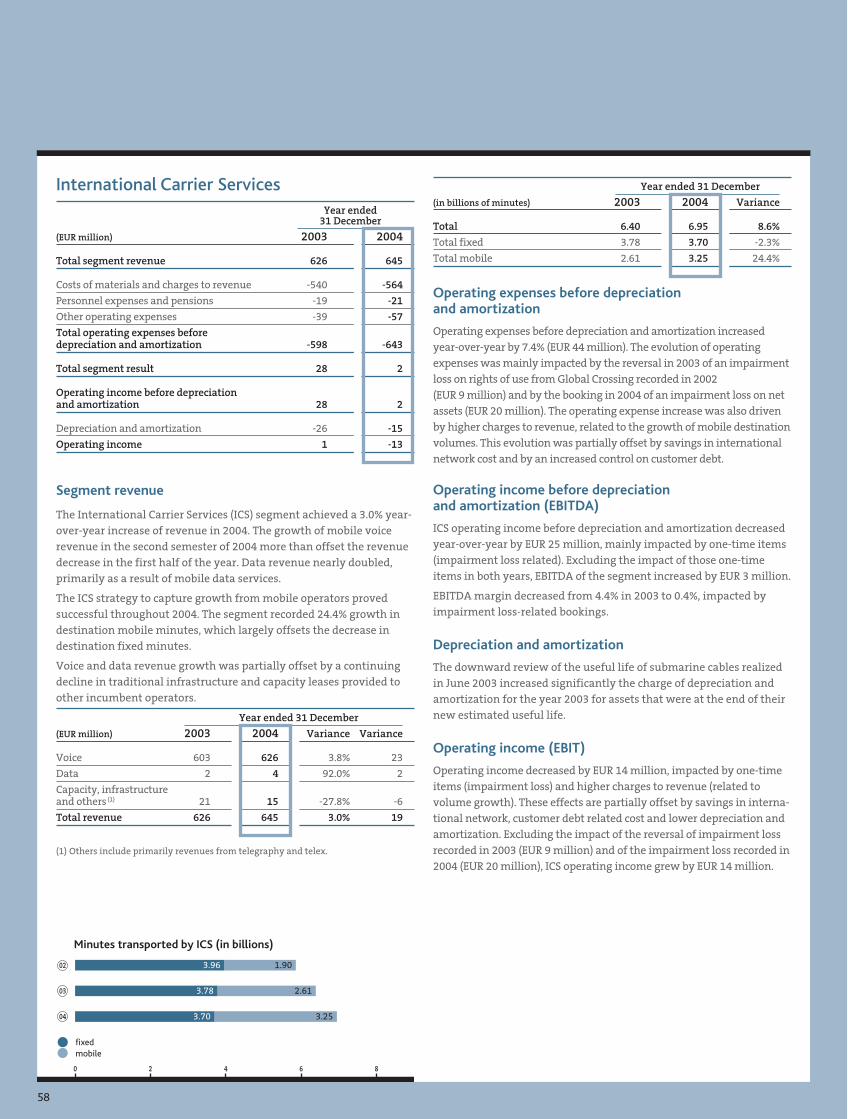
58
International Carrier ServicesYear ended
31 December
(EUR million) 2003 2004
Total segment revenue 626 645
Costs of materials and charges to revenue -540 -564
Personnel expenses and pensions -19 -21
Other operating expenses -39 -57
Total operating expenses beforedepreciation and amortization -598 -643
Total segment result 28 2
Operating income before depreciationand amortization 28 2
Depreciation and amortization -26 -15
Operating income 1 -13
Segment revenue
The International Carrier Services (ICS) segment achieved a 3.0% year-over-year increase of revenue in 2004. The growth of mobile voicerevenue in the second semester of 2004 more than offset the revenuedecrease in the first half of the year. Data revenue nearly doubled,primarily as a result of mobile data services.
The ICS strategy to capture growth from mobile operators provedsuccessful throughout 2004. The segment recorded 24.4% growth indestination mobile minutes, which largely offsets the decrease indestination fixed minutes.
Voice and data revenue growth was partially offset by a continuingdecline in traditional infrastructure and capacity leases provided toother incumbent operators.
Year ended 31 December
(EUR million) 2003 2004 Variance Variance
Voice 603 626 3.8% 23
Data 2 4 92.0% 2
Capacity, infrastructureand others (1) 21 15 -27.8% -6
Total revenue 626 645 3.0% 19
(1) Others include primarily revenues from telegraphy and telex.
Year ended 31 December
(in billions of minutes) 2003 2004 Variance
Total 6.40 6.95 8.6%
Total fixed 3.78 3.70 -2.3%
Total mobile 2.61 3.25 24.4%
Operating expenses before depreciationand amortization
Operating expenses before depreciation and amortization increasedyear-over-year by 7.4% (EUR 44 million). The evolution of operatingexpenses was mainly impacted by the reversal in 2003 of an impairmentloss on rights of use from Global Crossing recorded in 2002(EUR 9 million) and by the booking in 2004 of an impairment loss on netassets (EUR 20 million). The operating expense increase was also drivenby higher charges to revenue, related to the growth of mobile destinationvolumes. This evolution was partially offset by savings in internationalnetwork cost and by an increased control on customer debt.
Operating income before depreciationand amortization (EBITDA)
ICS operating income before depreciation and amortization decreasedyear-over-year by EUR 25 million, mainly impacted by one-time items(impairment loss related). Excluding the impact of those one-timeitems in both years, EBITDA of the segment increased by EUR 3 million.
EBITDA margin decreased from 4.4% in 2003 to 0.4%, impacted byimpairment loss-related bookings.
Depreciation and amortization
The downward review of the useful life of submarine cables realizedin June 2003 increased significantly the charge of depreciation andamortization for the year 2003 for assets that were at the end of theirnew estimated useful life.
Operating income (EBIT)
Operating income decreased by EUR 14 million, impacted by one-timeitems (impairment loss) and higher charges to revenue (related tovolume growth). These effects are partially offset by savings in interna-tional network, customer debt related cost and lower depreciation andamortization. Excluding the impact of the reversal of impairment lossrecorded in 2003 (EUR 9 million) and of the impairment loss recorded in2004 (EUR 20 million), ICS operating income grew by EUR 14 million.
Minutes transported by ICS (in billions)
02
03
04
0 2 4 6 8
fixedmobile
3.96 1.90
3.78 2.61
3.70 3.25
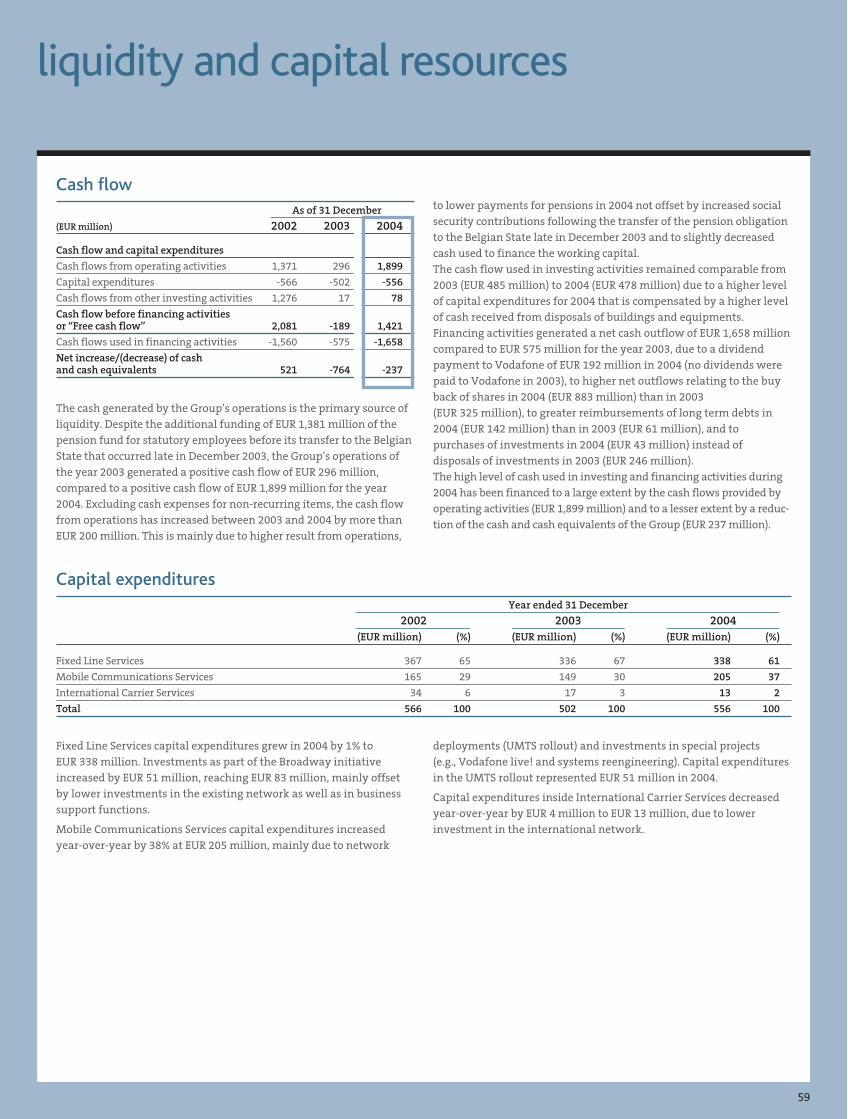
59
liquidity and capital resources
Cash flowAs of 31 December
(EUR million) 2002 2003 2004
Cash flow and capital expenditures
Cash flows from operating activities 1,371 296 1,899
Capital expenditures -566 -502 -556
Cash flows from other investing activities 1,276 17 78
Cash flow before financing activitiesor “Free cash flow” 2,081 -189 1,421
Cash flows used in financing activities -1,560 -575 -1,658
Net increase/(decrease) of cashand cash equivalents 521 -764 -237
The cash generated by the Group’s operations is the primary source ofliquidity. Despite the additional funding of EUR 1,381 million of thepension fund for statutory employees before its transfer to the BelgianState that occurred late in December 2003, the Group’s operations ofthe year 2003 generated a positive cash flow of EUR 296 million,compared to a positive cash flow of EUR 1,899 million for the year2004. Excluding cash expenses for non-recurring items, the cash flowfrom operations has increased between 2003 and 2004 by more thanEUR 200 million. This is mainly due to higher result from operations,
Fixed Line Services capital expenditures grew in 2004 by 1% toEUR 338 million. Investments as part of the Broadway initiativeincreased by EUR 51 million, reaching EUR 83 million, mainly offsetby lower investments in the existing network as well as in businesssupport functions.
Mobile Communications Services capital expenditures increasedyear-over-year by 38% at EUR 205 million, mainly due to network
deployments (UMTS rollout) and investments in special projects(e.g., Vodafone live! and systems reengineering). Capital expendituresin the UMTS rollout represented EUR 51 million in 2004.
Capital expenditures inside International Carrier Services decreasedyear-over-year by EUR 4 million to EUR 13 million, due to lowerinvestment in the international network.
Capital expendituresYear ended 31 December
2002 2003 2004(EUR million) (%) (EUR million) (%) (EUR million) (%)
Fixed Line Services 367 65 336 67 338 61
Mobile Communications Services 165 29 149 30 205 37
International Carrier Services 34 6 17 3 13 2
Total 566 100 502 100 556 100
to lower payments for pensions in 2004 not offset by increased socialsecurity contributions following the transfer of the pension obligationto the Belgian State late in December 2003 and to slightly decreasedcash used to finance the working capital.The cash flow used in investing activities remained comparable from2003 (EUR 485 million) to 2004 (EUR 478 million) due to a higher levelof capital expenditures for 2004 that is compensated by a higher levelof cash received from disposals of buildings and equipments.Financing activities generated a net cash outflow of EUR 1,658 millioncompared to EUR 575 million for the year 2003, due to a dividendpayment to Vodafone of EUR 192 million in 2004 (no dividends werepaid to Vodafone in 2003), to higher net outflows relating to the buyback of shares in 2004 (EUR 883 million) than in 2003(EUR 325 million), to greater reimbursements of long term debts in2004 (EUR 142 million) than in 2003 (EUR 61 million), and topurchases of investments in 2004 (EUR 43 million) instead ofdisposals of investments in 2003 (EUR 246 million).The high level of cash used in investing and financing activities during2004 has been financed to a large extent by the cash flows provided byoperating activities (EUR 1,899 million) and to a lesser extent by a reduc-tion of the cash and cash equivalents of the Group (EUR 237 million).
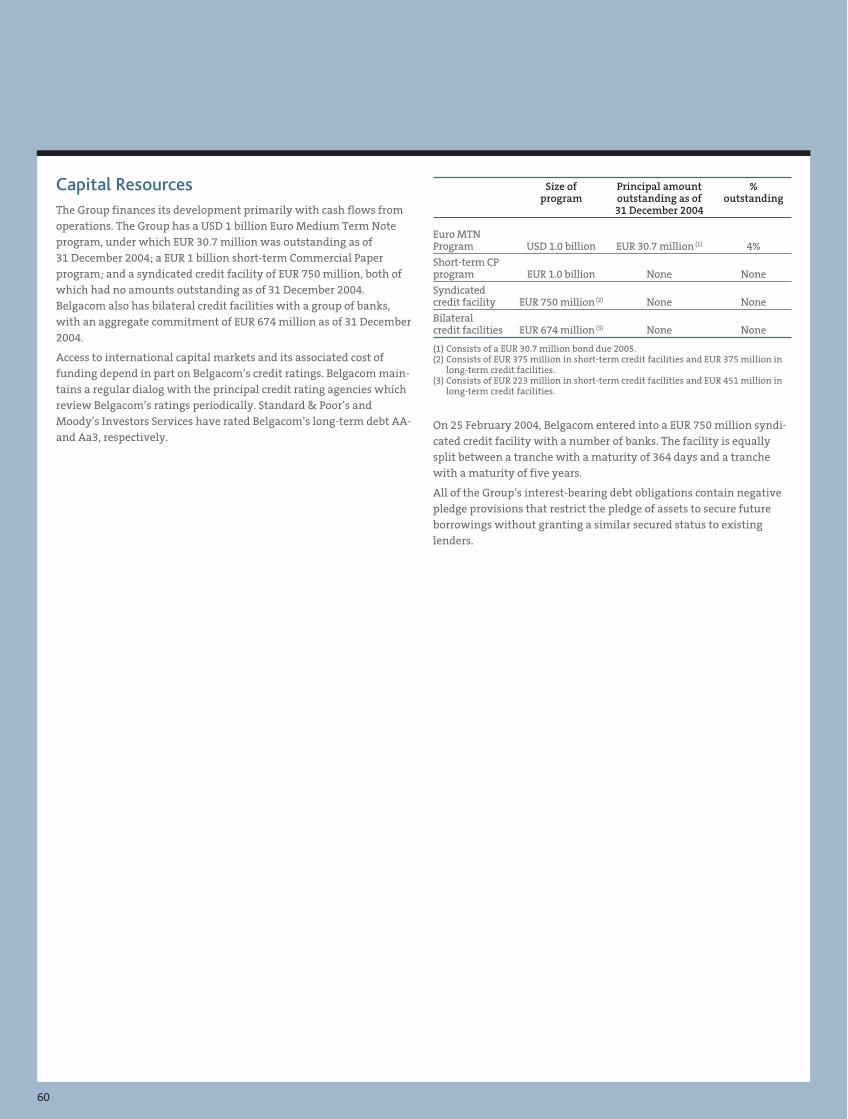
60
Capital ResourcesThe Group finances its development primarily with cash flows fromoperations. The Group has a USD 1 billion Euro Medium Term Noteprogram, under which EUR 30.7 million was outstanding as of31 December 2004; a EUR 1 billion short-term Commercial Paperprogram; and a syndicated credit facility of EUR 750 million, both ofwhich had no amounts outstanding as of 31 December 2004.Belgacom also has bilateral credit facilities with a group of banks,with an aggregate commitment of EUR 674 million as of 31 December2004.
Access to international capital markets and its associated cost offunding depend in part on Belgacom’s credit ratings. Belgacom main-tains a regular dialog with the principal credit rating agencies whichreview Belgacom’s ratings periodically. Standard & Poor’s andMoody’s Investors Services have rated Belgacom’s long-term debt AA-and Aa3, respectively.
Size of Principal amount %program outstanding as of outstanding
31 December 2004
Euro MTNProgram USD 1.0 billion EUR 30.7 million (1) 4%
Short-term CPprogram EUR 1.0 billion None None
Syndicatedcredit facility EUR 750 million (2) None None
Bilateralcredit facilities EUR 674 million (3) None None
(1) Consists of a EUR 30.7 million bond due 2005.(2) Consists of EUR 375 million in short-term credit facilities and EUR 375 million in
long-term credit facilities.(3) Consists of EUR 223 million in short-term credit facilities and EUR 451 million in
long-term credit facilities.
On 25 February 2004, Belgacom entered into a EUR 750 million syndi-cated credit facility with a number of banks. The facility is equallysplit between a tranche with a maturity of 364 days and a tranchewith a maturity of five years.
All of the Group’s interest-bearing debt obligations contain negativepledge provisions that restrict the pledge of assets to secure futureborrowings without granting a similar secured status to existinglenders.
61
financial report 2004
62 • Consolidated Financial Statements
62 • Consolidated income statement
63 • Consolidated balance sheet
64 • Consolidated cash flow statement
65 • Consolidated statement of changesin shareholders’ equity
66 • Notes to the consolidated financialstatements
66 • Corporate information
66 • Significant accounting policies
71 • Intangible assets
72 • Property, plant and equipment
74 • Investments in subsidiariesand joint ventures
75 • Enterprises accounted for under the equitymethod
76 • Other participating interests
76 • Income taxes
78 • Assets and liabilities for pensions,other post-employment benefits andtermination benefits
82 • Other non-current assets
82 • Trade receivables
82 • Other current assets
82 • Investments
83 • Cash and cash equivalents
83 • Shareholders’ equity
83 • Interest-bearing liabilities
85 • Provisions
86 • Other non-current payables
86 • Other current payables
86 • Derivatives
88 • Financial risk management objectivesand policies
90 • Net revenue
90 • Other operating revenue
90 • Non-recurring revenue
90 • Costs of materials and chargesto revenue
90 • Personnel expenses and pensions
91 • Other operating expenses
91 • Non-recurring expenses
91 • Depreciation and amortization
91 • Finance costs (net)
92 • Earnings per share
92 • Dividends paid and proposed
92 • Related party disclosures
94 • Rights, commitments and contingentliabilities
95 • Cross-border lease arrangements
96 • Net financial position of the Group
96 • Fair value of financial instruments
97 • Share-based payment
97 • Segment reporting
101 • Post balance sheet events
101 • Recent IFRS pronouncements
102 • Report of the independent auditors
103 • Extract of the statutory financialstatements of Belgacom S.A. underpublic law - Belgian GAAP
109 • General information
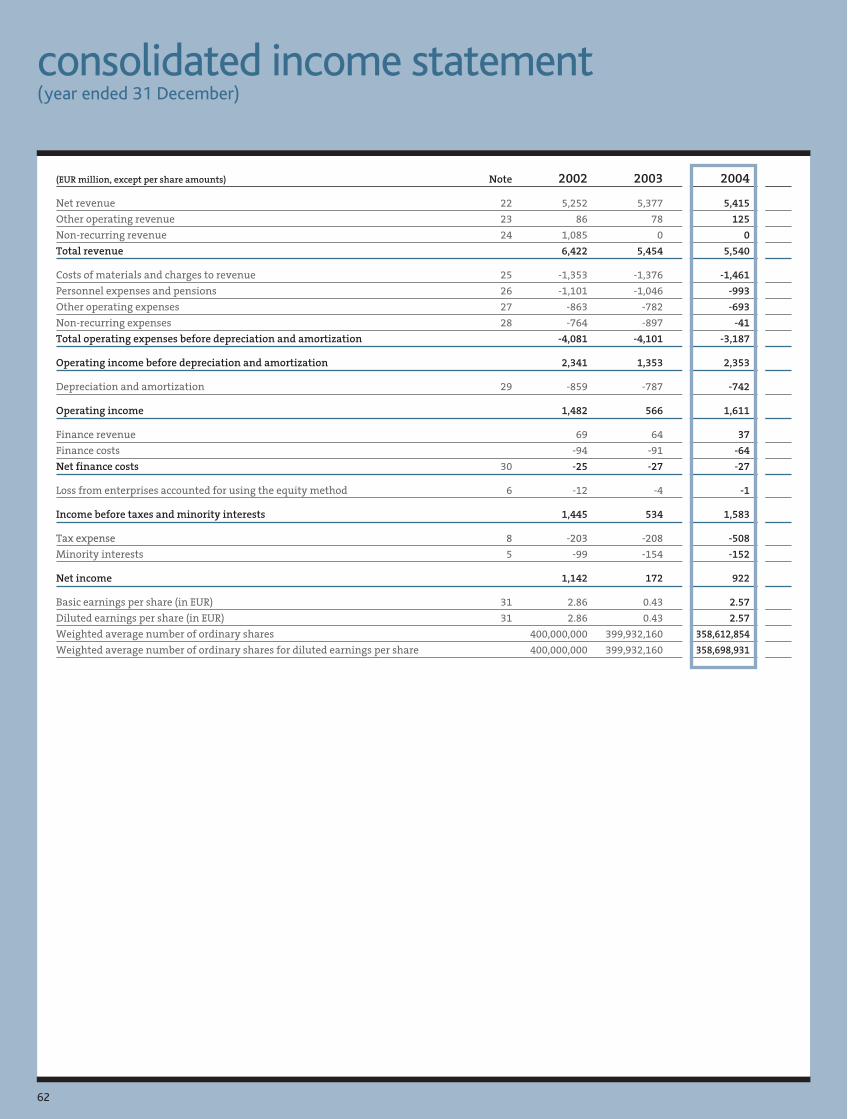
(EUR million, except per share amounts) Note 2002 2003 2004
Net revenue 22 5,252 5,377 5,415
Other operating revenue 23 86 78 125
Non-recurring revenue 24 1,085 0 0
Total revenue 6,422 5,454 5,540
Costs of materials and charges to revenue 25 -1,353 -1,376 -1,461
Personnel expenses and pensions 26 -1,101 -1,046 -993
Other operating expenses 27 -863 -782 -693
Non-recurring expenses 28 -764 -897 -41
Total operating expenses before depreciation and amortization -4,081 -4,101 -3,187
Operating income before depreciation and amortization 2,341 1,353 2,353
Depreciation and amortization 29 -859 -787 -742
Operating income 1,482 566 1,611
Finance revenue 69 64 37
Finance costs -94 -91 -64
Net finance costs 30 -25 -27 -27
Loss from enterprises accounted for using the equity method 6 -12 -4 -1
Income before taxes and minority interests 1,445 534 1,583
Tax expense 8 -203 -208 -508
Minority interests 5 -99 -154 -152
Net income 1,142 172 922
Basic earnings per share (in EUR) 31 2.86 0.43 2.57
Diluted earnings per share (in EUR) 31 2.86 0.43 2.57
Weighted average number of ordinary shares 400,000,000 399,932,160 358,612,854
Weighted average number of ordinary shares for diluted earnings per share 400,000,000 399,932,160 358,698,931
62
consolidated income statement(year ended 31 December)
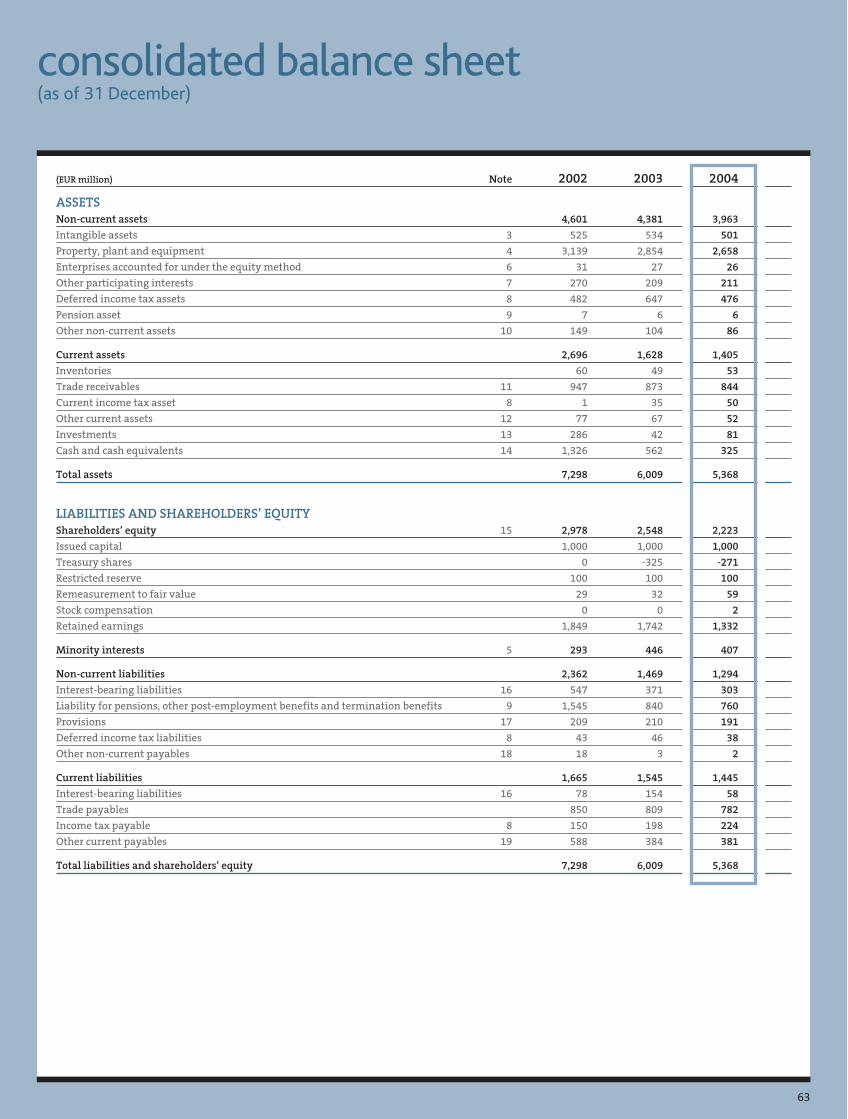
63
(EUR million) Note 2002 2003 2004
ASSETSNon-current assets 4,601 4,381 3,963
Intangible assets 3 525 534 501
Property, plant and equipment 4 3,139 2,854 2,658
Enterprises accounted for under the equity method 6 31 27 26
Other participating interests 7 270 209 211
Deferred income tax assets 8 482 647 476
Pension asset 9 7 6 6
Other non-current assets 10 149 104 86
Current assets 2,696 1,628 1,405
Inventories 60 49 53
Trade receivables 11 947 873 844
Current income tax asset 8 1 35 50
Other current assets 12 77 67 52
Investments 13 286 42 81
Cash and cash equivalents 14 1,326 562 325
Total assets 7,298 6,009 5,368
LIABILITIES AND SHAREHOLDERS’ EQUITYShareholders’ equity 15 2,978 2,548 2,223
Issued capital 1,000 1,000 1,000
Treasury shares 0 -325 -271
Restricted reserve 100 100 100
Remeasurement to fair value 29 32 59
Stock compensation 0 0 2
Retained earnings 1,849 1,742 1,332
Minority interests 5 293 446 407
Non-current liabilities 2,362 1,469 1,294
Interest-bearing liabilities 16 547 371 303
Liability for pensions, other post-employment benefits and termination benefits 9 1,545 840 760
Provisions 17 209 210 191
Deferred income tax liabilities 8 43 46 38
Other non-current payables 18 18 3 2
Current liabilities 1,665 1,545 1,445
Interest-bearing liabilities 16 78 154 58
Trade payables 850 809 782
Income tax payable 8 150 198 224
Other current payables 19 588 384 381
Total liabilities and shareholders’ equity 7,298 6,009 5,368
consolidated balance sheet(as of 31 December)
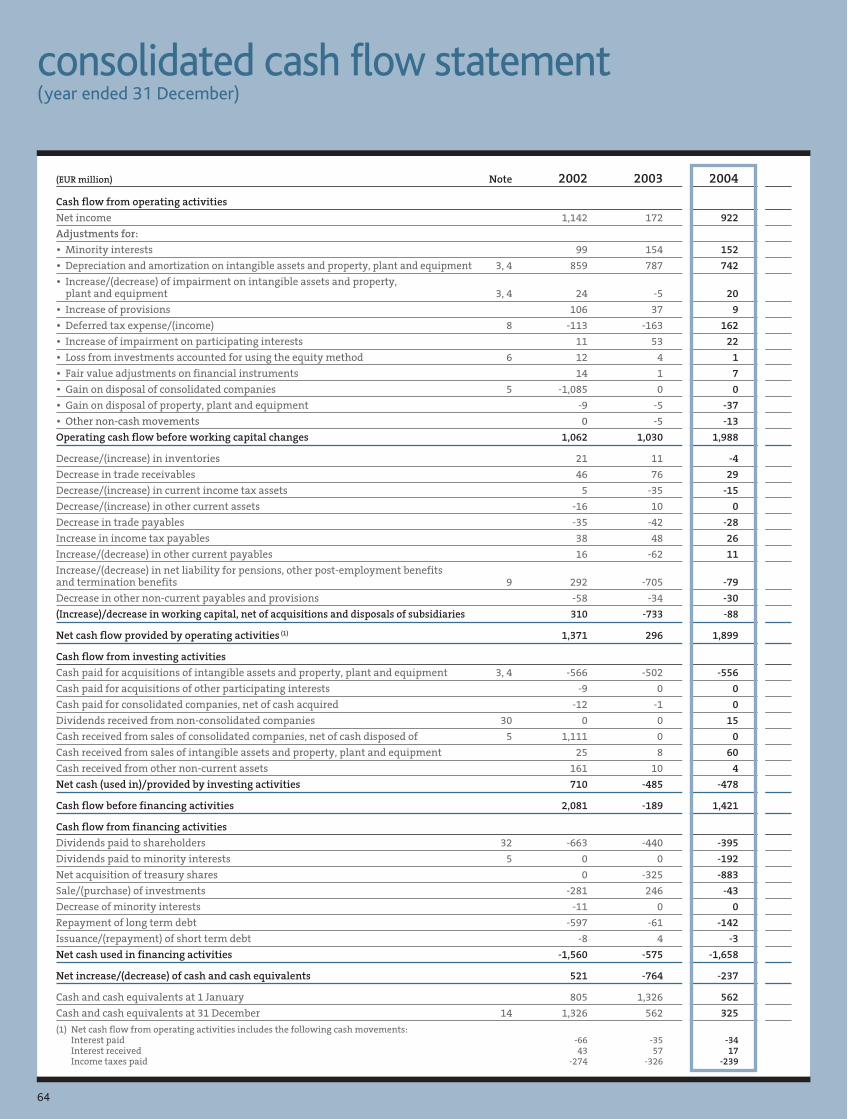
(EUR million) Note 2002 2003 2004
Cash flow from operating activities
Net income 1,142 172 922
Adjustments for:
• Minority interests 99 154 152
• Depreciation and amortization on intangible assets and property, plant and equipment 3, 4 859 787 742
• Increase/(decrease) of impairment on intangible assets and property,plant and equipment 3, 4 24 -5 20
• Increase of provisions 106 37 9
• Deferred tax expense/(income) 8 -113 -163 162
• Increase of impairment on participating interests 11 53 22
• Loss from investments accounted for using the equity method 6 12 4 1
• Fair value adjustments on financial instruments 14 1 7
• Gain on disposal of consolidated companies 5 -1,085 0 0
• Gain on disposal of property, plant and equipment -9 -5 -37
• Other non-cash movements 0 -5 -13
Operating cash flow before working capital changes 1,062 1,030 1,988
Decrease/(increase) in inventories 21 11 -4
Decrease in trade receivables 46 76 29
Decrease/(increase) in current income tax assets 5 -35 -15
Decrease/(increase) in other current assets -16 10 0
Decrease in trade payables -35 -42 -28
Increase in income tax payables 38 48 26
Increase/(decrease) in other current payables 16 -62 11
Increase/(decrease) in net liability for pensions, other post-employment benefitsand termination benefits 9 292 -705 -79
Decrease in other non-current payables and provisions -58 -34 -30
(Increase)/decrease in working capital, net of acquisitions and disposals of subsidiaries 310 -733 -88
Net cash flow provided by operating activities (1) 1,371 296 1,899
Cash flow from investing activities
Cash paid for acquisitions of intangible assets and property, plant and equipment 3, 4 -566 -502 -556
Cash paid for acquisitions of other participating interests -9 0 0
Cash paid for consolidated companies, net of cash acquired -12 -1 0
Dividends received from non-consolidated companies 30 0 0 15
Cash received from sales of consolidated companies, net of cash disposed of 5 1,111 0 0
Cash received from sales of intangible assets and property, plant and equipment 25 8 60
Cash received from other non-current assets 161 10 4
Net cash (used in)/provided by investing activities 710 -485 -478
Cash flow before financing activities 2,081 -189 1,421
Cash flow from financing activities
Dividends paid to shareholders 32 -663 -440 -395
Dividends paid to minority interests 5 0 0 -192
Net acquisition of treasury shares 0 -325 -883
Sale/(purchase) of investments -281 246 -43
Decrease of minority interests -11 0 0
Repayment of long term debt -597 -61 -142
Issuance/(repayment) of short term debt -8 4 -3
Net cash used in financing activities -1,560 -575 -1,658
Net increase/(decrease) of cash and cash equivalents 521 -764 -237
Cash and cash equivalents at 1 January 805 1,326 562
Cash and cash equivalents at 31 December 14 1,326 562 325
(1) Net cash flow from operating activities includes the following cash movements:Interest paid -66 -35 -34Interest received 43 57 17Income taxes paid -274 -326 -239
64
consolidated cash flow statement(year ended 31 December)
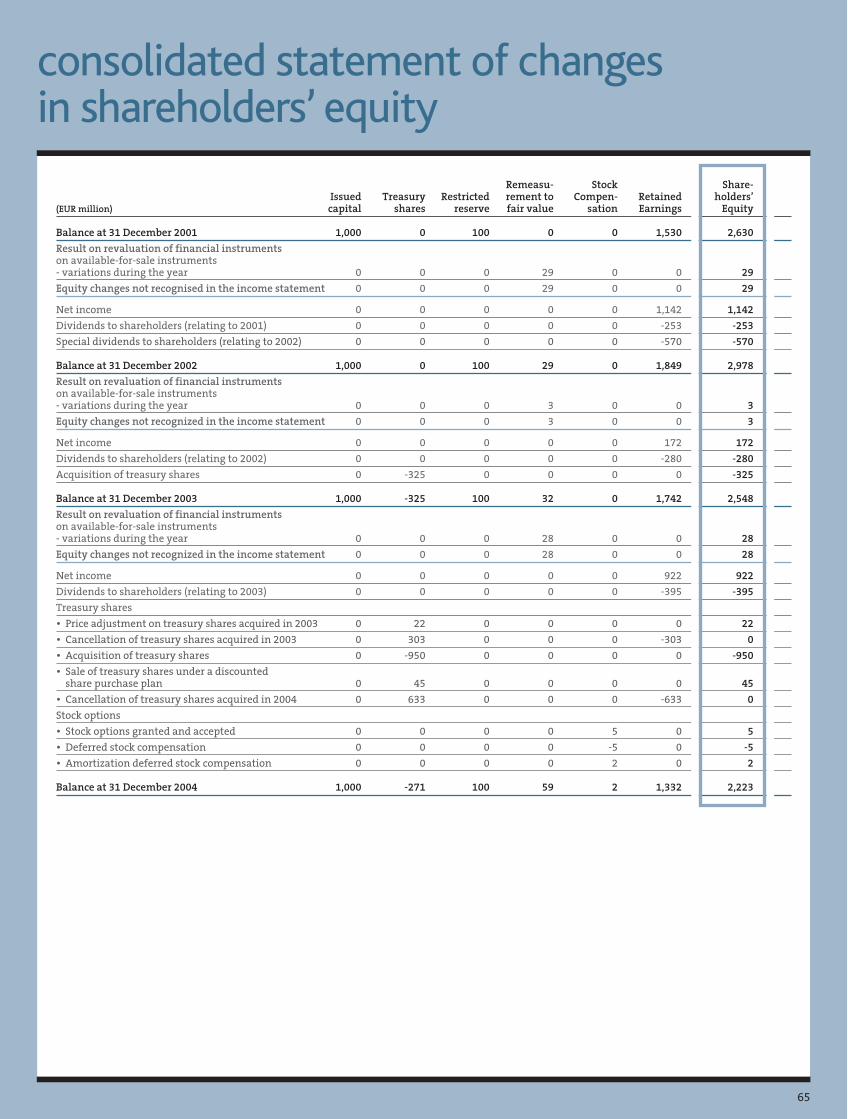
65
Remeasu- Stock Share-Issued Treasury Restricted rement to Compen- Retained holders’
(EUR million) capital shares reserve fair value sation Earnings Equity
Balance at 31 December 2001 1,000 0 100 0 0 1,530 2,630
Result on revaluation of financial instrumentson available-for-sale instruments - variations during the year 0 0 0 29 0 0 29
Equity changes not recognised in the income statement 0 0 0 29 0 0 29
Net income 0 0 0 0 0 1,142 1,142
Dividends to shareholders (relating to 2001) 0 0 0 0 0 -253 -253
Special dividends to shareholders (relating to 2002) 0 0 0 0 0 -570 -570
Balance at 31 December 2002 1,000 0 100 29 0 1,849 2,978
Result on revaluation of financial instrumentson available-for-sale instruments- variations during the year 0 0 0 3 0 0 3
Equity changes not recognized in the income statement 0 0 0 3 0 0 3
Net income 0 0 0 0 0 172 172
Dividends to shareholders (relating to 2002) 0 0 0 0 0 -280 -280
Acquisition of treasury shares 0 -325 0 0 0 0 -325
Balance at 31 December 2003 1,000 -325 100 32 0 1,742 2,548
Result on revaluation of financial instrumentson available-for-sale instruments- variations during the year 0 0 0 28 0 0 28
Equity changes not recognized in the income statement 0 0 0 28 0 0 28
Net income 0 0 0 0 0 922 922
Dividends to shareholders (relating to 2003) 0 0 0 0 0 -395 -395
Treasury shares
• Price adjustment on treasury shares acquired in 2003 0 22 0 0 0 0 22
• Cancellation of treasury shares acquired in 2003 0 303 0 0 0 -303 0
• Acquisition of treasury shares 0 -950 0 0 0 0 -950
• Sale of treasury shares under a discountedshare purchase plan 0 45 0 0 0 0 45
• Cancellation of treasury shares acquired in 2004 0 633 0 0 0 -633 0
Stock options
• Stock options granted and accepted 0 0 0 0 5 0 5
• Deferred stock compensation 0 0 0 0 -5 0 -5
• Amortization deferred stock compensation 0 0 0 0 2 0 2
Balance at 31 December 2004 1,000 -271 100 59 2 1,332 2,223
consolidated statement of changesin shareholders’ equity
66
notes to the consolidated financialstatements
Note 1. Corporate informationThe consolidated financial statements of Belgacom SA (hereafter “theGroup”) at 31 December 2004, 2003 and 2002 were approved by theBoard of Directors on 24 February 2005.
Belgacom SA is a “Limited Liability Company of Public Law” registeredin Belgium. The transformation of Belgacom SA from “AutonomousState Company” into a “Limited Liability Company of Public Law” wasimplemented by the Royal Decree of 16 December, 1994. Belgacom SAheadquarters are located at Boulevard du Roi Albert II, 27 1030 Brussels,Belgium.
The main activities of the Group are: Fixed Line Services, MobileCommunications Services and International Carrier Services. Furtherinformation concerning the business segments is included undernote 39.
The number of employees of the Group (in full time equivalents)amounted to 16,933 at 31 December 2004, 17,541 at 31 December2003 and 19,003 at 31 December 2002.
Note 2. Significant accounting policies
Basis of preparation
Until 31 December 2002, the Group maintained its official accountingrecords and prepared its consolidated financial statements for statu-tory purposes in accordance with accounting and reporting laws andregulations applicable in Belgium (“Belgian GAAP”). In application ofarticle 125 of the Company Code, the Group obtained on 27 November2003 a formal authorization from the Belgian Minister of Economy topublish consolidated financial statements in conformity withInternational Financial Reporting Standards (“IFRS”).
The accompanying consolidated financial statements as of31 December 2004 and for the year then ended have been prepared inaccordance with applicable IFRS. In addition, the Group has earlyadopted IFRS 2 “Share-Based Payment” in 2004. The Group did notearly adopt any other IASB standards or interpretations in 2004.
The accompanying consolidated financial statements as of31 December 2002 and 2003 have been prepared in accordance withthe IFRS applicable at the reporting date 31 December 2003, with adate of transition to IFRS of 1 January 2001. As a first-time adopter ofIFRS in 2003, the Group elected to apply IFRS 1 “First-time adoption ofIFRS”, together with its exemption in respect of business combina-tions. Therefore, the Group did not apply IAS 22 “Businesscombinations” to business combinations that occurred prior to thetransition date of 1 January 2001. The Group did not early adopt anyother IASB standards or interpretations in 2002 and 2003.
The accompanying consolidated financial statements as of31 December 2002 and for the year then ended differ from thosepreviously issued under Belgian GAAP.
The consolidated financial statements have been prepared on anhistorical cost basis, except for the measurement at fair value ofderivatives and available-for-sale financial assets. The carryingvalues of assets and liabilities that are hedged with fair-value hedges
are adjusted to record the change in the fair value attributable to the
risks that are being hedged.
Basis of consolidation
The consolidated financial statements comprise the financial state-
ments of Belgacom SA and its subsidiaries and joint ventures as well
as the Group’s share of results in associates. Notes 5 and 6 list the
Group’s subsidiaries, joint ventures and associates.
Subsidiaries are those entities controlled by the Group. Control exists
when Belgacom has the power to govern the financial and operating
policies of an entity so as to obtain benefits from its activities. The
investments in subsidiaries are consolidated from the date on which
control is transferred to the Group and cease to be consolidated from
the date on which control is transferred out of the Group. Inter-
company balances and transactions, and resulting unrealized profits
or losses between Group companies are eliminated in consolidation.
When necessary, accounting policies of subsidiaries are adjusted to
ensure that the consolidated financial statements are prepared using
uniform accounting policies.
Companies that are jointly controlled (defined as those entities in
which the Group has joint control through a contractual arrangement
with one or more venturers entities) are included using the propor-
tionate consolidation method, whereby the Group’s share of the
assets, liabilities, expenses, incomes and cash-flow of joint ventures
are combined on a line-by-line basis with similar items in the consoli-
dated financial statements. The Group’s proportionate share of the
inter-company balance and transactions and resulting unrealized
profits or losses between Group companies and jointly controlled
entities are eliminated in consolidation.
Associated companies in which the Group has a significant influence,
defined as an investee in which Belgacom has the power to partici-
pate in its financial and operating policy decisions (but not to control
the investee), are accounted for using the equity method. Under that
method, the investments held in associates are initially recorded at
cost and the carrying amount is subsequently adjusted to recognize
the Group’s share in the profit or losses of the associate as from the
date of acquisition. These investments and the equity share of results
for the period are shown in the balance sheet and income statement
as investments in enterprises accounted for under the equity method
and share in the result of the enterprises accounted for using the
equity method, respectively.
Subsidiaries are excluded from consolidation when the control is
intended to be temporary because the subsidiary is acquired and held
exclusively with a view of subsequent disposal in the near future or
when it operates under severe long-term restrictions that impair its
ability to transfer funds to the Group.
Use of estimates
The preparation of financial statements in conformity with IFRS
requires that management make certain estimates and assumptions
that affect the amounts reported in the financial statements and
accompanying notes.
67
Estimates that have been made at each reporting date reflect condi-tions that existed at those dates (e.g. market prices, interest rates andforeign exchange rates). Although these estimates are based onmanagement’s best knowledge of current events and actions that theGroup may undertake, actual results may differ from those estimates.
Foreign currency translation
Foreign currency transactionsThe reporting currency for the Group is the Euro. Foreign currencytransactions are translated, on initial recognition, at the foreignexchange rate prevailing at the date of the transaction. Monetaryassets and liabilities denominated in foreign currencies are translatedinto Euro at the balance sheet date using the closing rate at that date.Net exchange differences on the translation of monetary assets andliabilities are classified in “other operating expenses” in the incomestatement in the period in which they arise.
Foreign operationsThe assets and liabilities of foreign subsidiaries and joint venturesoperating under currencies other than the Euro (i.e., financial state-ments of the Points of Presence (hereafter the “POP’s”) in the UK,Sweden, Switzerland, the Asia-Pacific region and the USA) have beentranslated according to the monetary/non-monetary method sincethese entities are classified as foreign operations that are integral to theoperations of the reporting enterprise. Monetary assets and liabilitiesare translated at the closing rate, non-monetary assets and liabilitiesare translated at the historical rate, while revenue and expenses aretranslated at the average rate. The resulting exchange differences areclassified in “other operating expenses” in the income statement.
Intangible assets
Intangible assets consist primarily of the excess of consideration paidover the fair value of net assets acquired in business combinations(Goodwill), the Global System for Mobile communication (“GSM”)license, the Universal Mobile Telecommunication System (“UMTS”)license and other intangible assets which predominantly consist ofinternally or externally developed software.
Intangible assets are stated at cost less accumulated amortization andaccumulated impairment losses. The residual value of intangibleassets is assumed to be zero. Intangible assets are amortized on astraight-line basis over their estimated useful life. Amortizationcommences when the intangible asset is ready for its intended use.
The Group capitalizes certain costs incurred in connection with deve-loping or purchasing software for internal use when they meet thecriteria set out in IAS 38. Capitalized software costs are included ininternally generated and other intangible assets and are amortizedover three to five years.
The useful life of the GSM and UMTS intangible assets has been deter-mined based on the license terms.
The useful life of goodwill reflects the best estimate of the period duringwhich future economic benefits are expected to flow to the Group.
The useful lives are assigned as follows:
Useful life (years)
Goodwill 5 to 15
GSM/UMTS licenses 15 to 20
Other intangible assets and internally generatedassets, including software 3 to 20
The amortization of intangible assets, including goodwill, is classified
as depreciation and amortization in the income statement.
Property, plant and equipment
Property, plant and equipment are stated at cost less accumulated
depreciation and accumulated impairment losses. The cost of addi-
tions and substantial improvements to property, plant and
equipment is capitalized. The cost of maintenance and repairs of
property, plant and equipment is charged to operating expenses
when they do not extend the life of the asset or do not significantly
increase its capacity to generate revenue.
Depreciation of an asset commences when the asset is ready for its
intended use. Depreciation is calculated using the straight-line
method over the estimated useful life of the asset.
The useful lives are assigned as follows:
Useful life (years)
Land and buildings
• Land indefinite
• Building and constructions 5 to 33
Technical and network equipment
• Switches 3 to 10
• Cables and Operational support systems 4 to 20
• Transmission 4 to 10
• Equipment installed at client premises 2 to 5
• Equipment for data transfer business 3 to 5
• Mobile antennas 6
Furniture and vehicles
• Furniture and office equipment 3 to 10
• Vehicles 5
Other tangible assets 3 to 33
Income from own capitalized costs related to network construction is
reported in the income statement net of the corresponding operating
expense.
Leasehold improvements are depreciated over the shorter of their
estimated useful life or the remaining term of the lease.
Fixed assets retired from active use and held for disposal are carried
at their carrying amount at the date when the asset is retired from
active use. At the end of the financial year, an impairment test is
applied to these assets.
Borrowing costs are expensed when incurred.
68
Impairment of assets
The Group reviews its assets regularly for any indication of impair-ment. When such indications exist, an impairment loss is recognizedwhen the carrying value exceeds the estimated recoverable amount,being the higher of the asset’s net selling price and its value in use forthe Group. Impairment losses are recorded in operating expenses.
Deferred taxation
Deferred taxation is provided for all temporary differences betweenthe carrying amount of assets and liabilities in the consolidatedbalance sheet and their respective taxation bases. Deferred taxation isnot provided on differences relating to goodwill for which amortiza-tion is not deductible for taxation purposes.
Deferred tax assets associated to deductible temporary differences andunused tax losses carried forward are recognized to the extent that it isprobable that taxable profit will be available against which thedeductible temporary difference or the unused tax losses can be utilized.
Deferred tax assets and liabilities are measured at the tax rates thatare expected to apply to the period when the asset will be realized orthe liability is settled, based on tax rates (and tax laws) that havebeen enacted or substantively enacted at the balance sheet date.
Provision for taxation that could arise if undistributed retained profitof certain subsidiaries is remitted to the parent company, is onlymade where a decision has been taken to remit such retained profit,i. e., where the subsidiary intends to distribute a dividend.
Pensions, other post-employment benefitsand termination benefits
The Group operates two defined benefit pension plans to which thecontributions are made through separately managed funds. A thirdplan was settled in the course of 2003 (see note 9). The Group alsoagreed to provide additional post-employment benefits to certainemployees. The cost of providing benefits under the plans is deter-mined separately for each plan using the projected credit unit actuarialvaluation method. Actuarial gains and losses are recognized as incomeor expense when the cumulative unrecognized gains or losses for anindividual plan at the end of the previous reporting period exceed 10%of the higher of the present value of the defined benefit obligation andthe fair value of plan assets at the beginning of the year. These gainsand losses are recognized over the average remaining service life of theemployees participating in the individual plan.
The Group has a legal obligation to provide child allowance paymentsto dependents of certain retirees, and operates several restructuringprograms that involve termination benefits or other forms of addi-tional compensation. The actuarial gains and losses on theseliabilities are immediately recognized in the income statement.
Short-term and long-term employee benefits
The cost of all short-term and long-term employee benefits, such assalaries, employee entitlements to leave pay, bonuses, medical aid
and other contributions, are recognized during the period in whichthe employee renders the related service. The Group recognizes thosecosts only when the Group has a present legal or constructive obliga-tion to make such payment and a reliable estimate of the liability canbe made.
Financial instruments
Fair value of financial instrumentsThe following methods and assumptions were used to estimate thefair value of financial instruments:
• for investments in quoted companies and mutual funds, the fair valueis their quoted price;
• for investments in non-quoted companies, fair value is estimatedby using different valuation techniques such as discounted futurecash flow models and multiples methods, or by recent sales transac-tions on the shares of these non-quoted companies;
• for investments in non-quoted companies for which no fair valuecan be reliably determined, fair value is based on the historicalacquisition cost, adjusted for impairment losses, if any;
• for other non-current financial assets (other than derivatives), theamortized cost is assumed to approximate fair value;
• for long term debts carrying a floating interest rate, the amortizedcost is assumed to approximate fair value;
• for long term debts carrying a fixed interest rate, the fair value isdetermined based on the discounted future cash flows;
• for trade receivables, trade payables, other current assets andcurrent liabilities, the carrying amounts reported in the balancesheet approximate their fair value considering their short maturity;
• for cash and cash equivalents, the carrying amounts reported in thebalance sheet approximate their fair value considering their shortmaturity;
• for derivatives, fair values have been estimated by using differentvaluation techniques, in particular the discounting of future cashflows.
Criteria for initial recognition and for de-recognitionof financial assets and liabilitiesFinancial instruments are initially recognized when the Groupbecomes party to the contractual terms of the instruments. “Regularway” purchases and sales of financial assets are accounted for at theirsettlement dates.
Financial assets (or a portion thereof) are de-recognized when theGroup realizes the rights to the benefits specified in the contract, therights expire or the Group surrenders or otherwise loses control of thecontractual rights that comprise the financial asset. Financial liabili-ties (or a portion thereof) are de-recognized when the obligationspecified in the contract is discharged, cancelled or expires.
Criteria for offsetting financial assets and liabilitiesWhere a legally enforceable right of offset exists for recognized finan-cial assets and liabilities, and there is an intention to settle theliability and realize the asset simultaneously, or to settle on a netbasis, all related financial effects are offset.
69
Other participating interestsOther participating interests are initially recognized at cost, being thefair value of the consideration given and including acquisition costsassociated with the investment. These interests are classified as avail-able-for-sale financial assets in the balance sheet.
After initial recognition, other participating interests are carried atfair value, with recognition of the changes in fair value directly inequity, until the financial asset is sold, collected or otherwisedisposed of, or until the asset is determined to be impaired, at whichtime the cumulative gain or loss previously reported in equity isincluded in financial income or expenses. Impairment losses are clas-sified in financial expenses.
Other non-current financial assetsOther non-current financial assets include derivatives (see below),long-term interest-bearing receivables such as loans to joint ventures,personnel and cash guarantees and long-term investments such asnotes and purchased bonds. Long-term receivables are accounted foras loans and receivables originated by the company and are carried atamortized cost. Long-term investments are classified as held-to-matu-rity and are carried at amortized cost. An impairment loss is recordedwhen the carrying amount is greater than the estimated recoverableamount, and is classified in financial expenses.
Trade receivables and other current assetsTrade receivables and other current assets are shown on the balancesheet at nominal value (generally, the original invoice amount) lessthe allowance for doubtful debts. Such allowance is recorded in oper-ating result when it is probable that the company will not be able tocollect all amounts due. Allowances are calculated on an individualbasis, and on a portfolio basis for groups of receivables that are notindividually identified as impaired.
InvestmentsInvestments include shares, fixed income securities and deposits witha maturity greater than three months but less than one year.
Shares are initially recognized at cost, being the fair value of theconsideration given and including acquisition costs associated withthe investment. After initial recognition, shares are treated as avail-able-for-sale, with re-measurement to fair value recorded directly inequity until the investment is sold, collected or otherwise disposed of,at which time the cumulative gain or loss previously reported inequity is included in financial income or expenses.
Fixed income securities are initially recognized at cost, being the fairvalue of the consideration given and including acquisition costs asso-ciated with the investment. After initial recognition, fixed incomesecurities that are classified as available-for-sale, are measured at fairvalue, with gains and losses on remeasurement recognized in equityuntil the investment is sold, collected or otherwise disposed of, atwhich time the cumulative gains or loss reported in equity is includedin financial income or expense. Fixed income securities that areintended to be held-to-maturity are measured at amortized cost,using the effective interest rate method.
Deposits are considered as held-to-maturity and measured at amor-tized cost.
Cash and cash equivalentsCash and cash equivalents include cash, current bank accounts andinvestments with an original maturity of less than three months.
Cash and cash equivalents are carried at nominal value when theyare assets held with financial institutions, and at amortized cost in allother cases. An impairment loss is recorded in financial expensewhen the recoverable amount at the closing date is lower than thecarrying amount.
Interest-bearing liabilitiesAll loans and borrowings are initially recognized at cost, being the fairvalue of the consideration received, net of issuance costs associatedwith the borrowings.
After initial recognition, debts not hedged are measured at amortizedcost, with amortization of discounts or premiums through the incomestatement.
Debts that are hedged with interest rate swaps (IRS), and interest rateand currency swaps (IRCS) (fair value hedges) are re-measured to theextent of the risk being hedged. The gain or loss attributable to thehedged risk resulting from re-measurement to fair value is recognizedin financial income or expense.
DerivativesThe Group makes use of derivatives such as IRS, IRCS, forward foreignexchange contracts and currency options to reduce its risks associatedwith interest rate and foreign currency fluctuations on underlyingassets, liabilities and anticipated transactions. The derivatives arecarried at fair value under the captions other assets (non-current andcurrent), interest-bearing liabilities (non-current and current) andother payables (non-current and current).
The Group uses IRS and IRCS to reduce its exposure to interest rateand foreign currency fluctuations on long-term debts. The interestcoupons receivable and payable under the terms of these swaps areaccrued over the period to which the coupon relates.
The table below summarizes the relationship between hedged itemsand hedging instruments:
Hedging Hedged Type of hedge Risk(s) beinginstrument item relationship hedged
Interest rate Fixed rate Fair value Currency andand currency debt in foreign interest rate risksswap currency
Interest rate Fixed rate Fair value Interest rate riskswap debt
Most of these swaps are fair value hedges, so their revaluationmatches the revaluation of the hedged items in the incomestatement.
Belgacom does not hold or issue derivative financial instruments fortrading purposes but some of its derivative contracts do not meet thecriteria set by IAS 39 to be considered as hedges and are therefore
70
treated as derivatives held-for-trading, with changes in fair valuerecorded in the income statement.
Belgacom uses currency options and forward foreign exchangecontracts to manage its foreign currency exposure arising from opera-tional contracts. Nevertheless, since the matching between theseinstruments and the underlying exposure is not sufficiently effective,or the effectiveness cannot be easily demonstrated, these instrumentsare not accounted for as hedges and are consequently carried at fairvalue, with changes in fair value posted to the income statement.
Some debts issued by Belgacom include embedded derivatives. Suchderivatives are separated from their host contract and carried atmarket value with changes in fair value posted to the income state-ment. These debts are hedged by derivatives neutralising the effect ofthe embedded derivatives.
Inventories
Inventories are stated at the lower of cost and net realizable value.Cost is determined by the weighted average cost method.
Leases
Leases where the lessor retains substantially all the risks and thebenefits of ownership of the asset are classified as operating leases.Operating lease payments are recognized as an expense in the incomestatement on a straight-line basis over the lease term.
Provisions
Provisions are recognized when the Group has a present legal orconstructive obligation resulting from past events, for which it isprobable that an outflow of resources embodying economic benefitswill be required to settle the obligation and a reliable estimate of theamount of the obligation can be made. A past event is deemed to giverise to a present obligation if, taking into account the availableevidence, it is more likely than not that a present obligation exists atthe balance sheet date.
Certain assets and improvements that are situated on propertyowned by third parties must eventually be dismantled, and the pro-perty must be restored to its original condition. The estimated costsassociated with dismantling and restorations are recorded underproperty, plant and equipment and depreciated over the life of theasset. The total estimated cost required for dismantling and restora-tion, discounted to its present value, is recorded under provisions.
Share based payments
The fair value of share options issued under the Group’s Employee
Stock Option Plan is determined at grant date taking into account the
terms and conditions upon which the options are granted, and by
using a valuation technique that is consistent with generally
accepted valuation methodologies for pricing financial instruments,
and that incorporates all factors and assumptions that knowledge-
able, willing market participants would consider in setting the price.
The fair value of the share options is recognized in personnel
expenses over their vesting period.
Revenue and operating expenses
Revenue is recognized to the extent that it is probable that the
economic benefits will flow to the Group and the revenue can be reli-
ably measured. Specific revenue streams and related recognition
criteria are as follows:
• Revenue from wireline, carrier and mobile traffic is recognized on
usage.
• Revenue from connection fees and installation fees is recognized in
income at the time of connection or installation.
• Revenue from sales of communication equipment is recognized
upon delivery to the customer.
• Revenues relating to the monthly rent or access fees, which are
applicable to wireline and mobile revenues are recognized in the
period in which the services are provided.
• Subscription fees are recognized as revenue over the subscription
period on a pro-rata basis.
• Prepaid revenue such as revenue from prepaid fixed and mobile
phone cards is deferred and recognized based on usage of the cards.
The Group’s consolidated income statement presents operating
expenses by nature. Operating expenses are reported net of work
performed by the enterprise that is capitalized.
The costs of materials and charges to revenues include the costs for
purchases of materials and services directly related to revenue.
Costs for commissions to dealers, advertising costs and other
marketing costs are expensed as incurred.
Non-recurring revenues and operating expenses include gains or
losses on the disposal of consolidated companies exceeding individu-
ally EUR 5 million in a particular year, restructuring costs and the
transfer (in 2003) of the pension liability in respect of statutory
personnel towards the Belgian State.
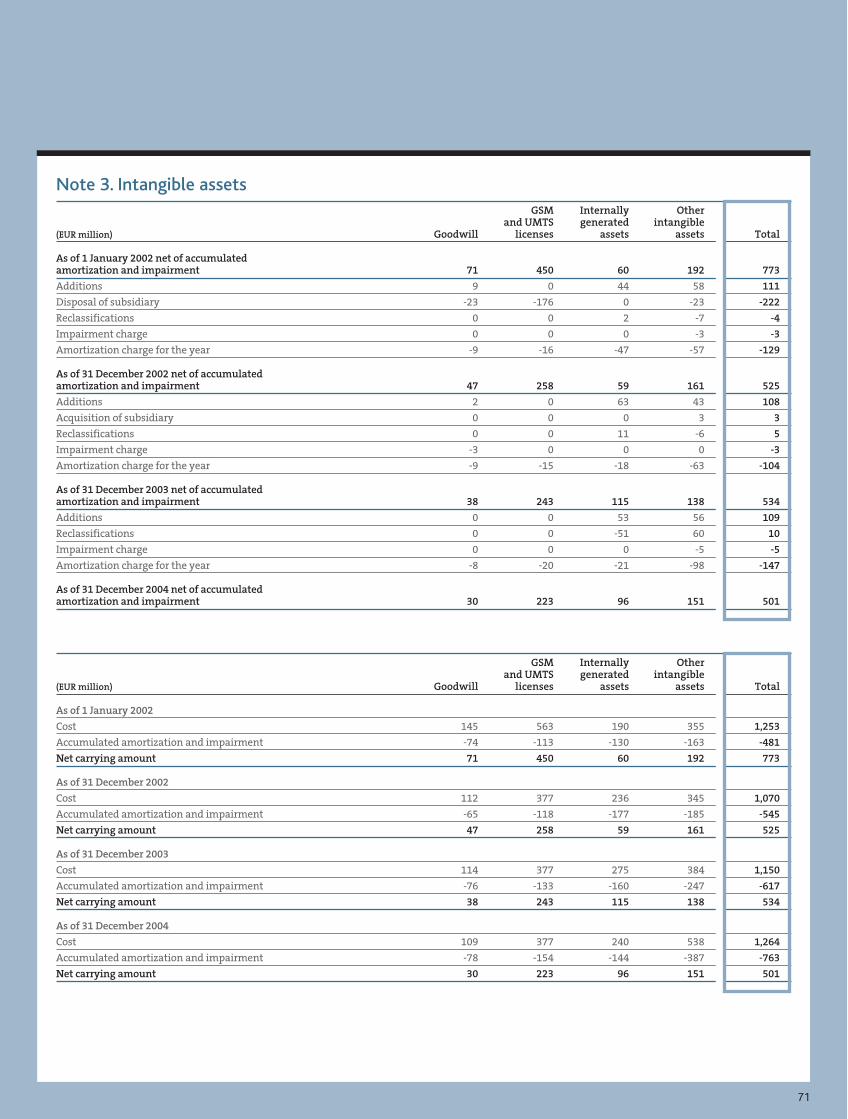
71
Note 3. Intangible assetsGSM Internally Other
and UMTS generated intangible(EUR million) Goodwill licenses assets assets Total
As of 1 January 2002 net of accumulatedamortization and impairment 71 450 60 192 773
Additions 9 0 44 58 111
Disposal of subsidiary -23 -176 0 -23 -222
Reclassifications 0 0 2 -7 -4
Impairment charge 0 0 0 -3 -3
Amortization charge for the year -9 -16 -47 -57 -129
As of 31 December 2002 net of accumulatedamortization and impairment 47 258 59 161 525
Additions 2 0 63 43 108
Acquisition of subsidiary 0 0 0 3 3
Reclassifications 0 0 11 -6 5
Impairment charge -3 0 0 0 -3
Amortization charge for the year -9 -15 -18 -63 -104
As of 31 December 2003 net of accumulatedamortization and impairment 38 243 115 138 534
Additions 0 0 53 56 109
Reclassifications 0 0 -51 60 10
Impairment charge 0 0 0 -5 -5
Amortization charge for the year -8 -20 -21 -98 -147
As of 31 December 2004 net of accumulatedamortization and impairment 30 223 96 151 501
GSM Internally Otherand UMTS generated intangible
(EUR million) Goodwill licenses assets assets Total
As of 1 January 2002
Cost 145 563 190 355 1,253
Accumulated amortization and impairment -74 -113 -130 -163 -481
Net carrying amount 71 450 60 192 773
As of 31 December 2002
Cost 112 377 236 345 1,070
Accumulated amortization and impairment -65 -118 -177 -185 -545
Net carrying amount 47 258 59 161 525
As of 31 December 2003
Cost 114 377 275 384 1,150
Accumulated amortization and impairment -76 -133 -160 -247 -617
Net carrying amount 38 243 115 138 534
As of 31 December 2004
Cost 109 377 240 538 1,264
Accumulated amortization and impairment -78 -154 -144 -387 -763
Net carrying amount 30 223 96 151 501
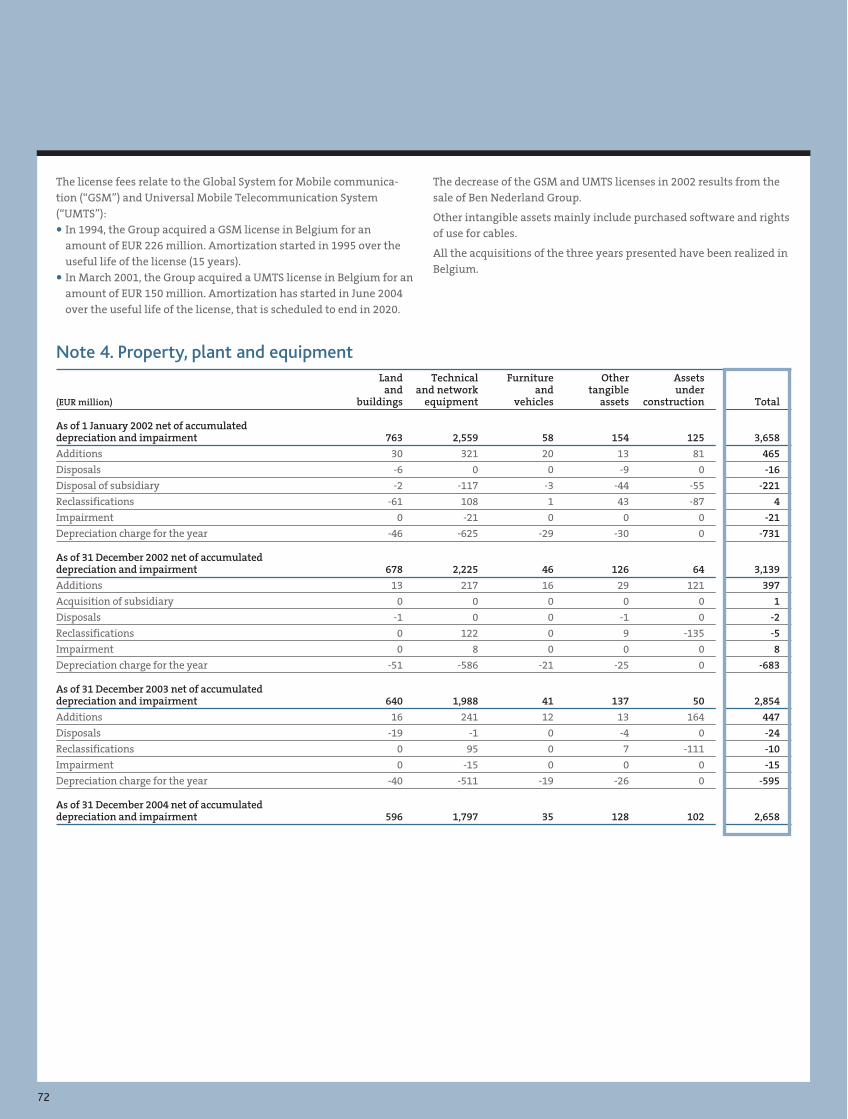
72
The license fees relate to the Global System for Mobile communica-tion (“GSM”) and Universal Mobile Telecommunication System(“UMTS”):
• In 1994, the Group acquired a GSM license in Belgium for anamount of EUR 226 million. Amortization started in 1995 over theuseful life of the license (15 years).
• In March 2001, the Group acquired a UMTS license in Belgium for anamount of EUR 150 million. Amortization has started in June 2004over the useful life of the license, that is scheduled to end in 2020.
Note 4. Property, plant and equipmentLand Technical Furniture Other Assets
and and network and tangible under(EUR million) buildings equipment vehicles assets construction Total
As of 1 January 2002 net of accumulateddepreciation and impairment 763 2,559 58 154 125 3,658
Additions 30 321 20 13 81 465
Disposals -6 0 0 -9 0 -16
Disposal of subsidiary -2 -117 -3 -44 -55 -221
Reclassifications -61 108 1 43 -87 4
Impairment 0 -21 0 0 0 -21
Depreciation charge for the year -46 -625 -29 -30 0 -731
As of 31 December 2002 net of accumulateddepreciation and impairment 678 2,225 46 126 64 3,139
Additions 13 217 16 29 121 397
Acquisition of subsidiary 0 0 0 0 0 1
Disposals -1 0 0 -1 0 -2
Reclassifications 0 122 0 9 -135 -5
Impairment 0 8 0 0 0 8
Depreciation charge for the year -51 -586 -21 -25 0 -683
As of 31 December 2003 net of accumulateddepreciation and impairment 640 1,988 41 137 50 2,854
Additions 16 241 12 13 164 447
Disposals -19 -1 0 -4 0 -24
Reclassifications 0 95 0 7 -111 -10
Impairment 0 -15 0 0 0 -15
Depreciation charge for the year -40 -511 -19 -26 0 -595
As of 31 December 2004 net of accumulateddepreciation and impairment 596 1,797 35 128 102 2,658
The decrease of the GSM and UMTS licenses in 2002 results from thesale of Ben Nederland Group.
Other intangible assets mainly include purchased software and rightsof use for cables.
All the acquisitions of the three years presented have been realized inBelgium.
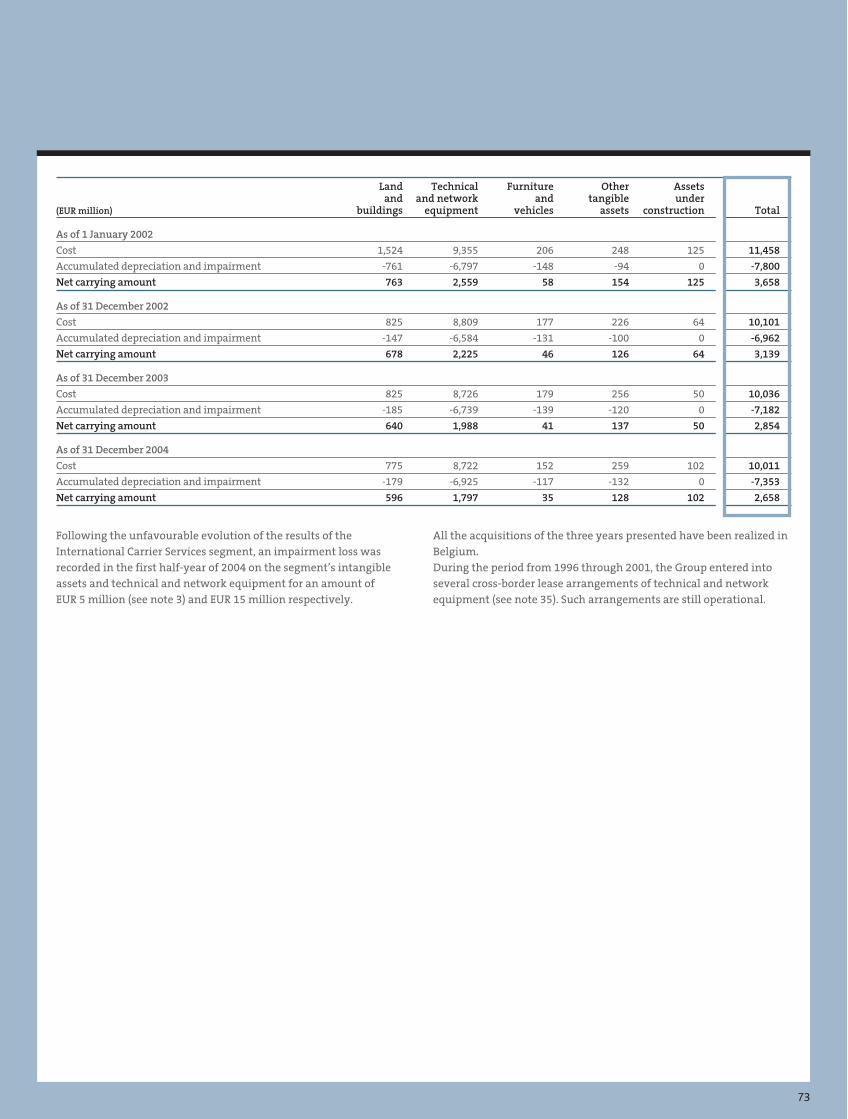
73
Land Technical Furniture Other Assetsand and network and tangible under
(EUR million) buildings equipment vehicles assets construction Total
As of 1 January 2002
Cost 1,524 9,355 206 248 125 11,458
Accumulated depreciation and impairment -761 -6,797 -148 -94 0 -7,800
Net carrying amount 763 2,559 58 154 125 3,658
As of 31 December 2002
Cost 825 8,809 177 226 64 10,101
Accumulated depreciation and impairment -147 -6,584 -131 -100 0 -6,962
Net carrying amount 678 2,225 46 126 64 3,139
As of 31 December 2003
Cost 825 8,726 179 256 50 10,036
Accumulated depreciation and impairment -185 -6,739 -139 -120 0 -7,182
Net carrying amount 640 1,988 41 137 50 2,854
As of 31 December 2004
Cost 775 8,722 152 259 102 10,011
Accumulated depreciation and impairment -179 -6,925 -117 -132 0 -7,353
Net carrying amount 596 1,797 35 128 102 2,658
Following the unfavourable evolution of the results of theInternational Carrier Services segment, an impairment loss wasrecorded in the first half-year of 2004 on the segment’s intangibleassets and technical and network equipment for an amount ofEUR 5 million (see note 3) and EUR 15 million respectively.
All the acquisitions of the three years presented have been realized inBelgium.During the period from 1996 through 2001, the Group entered intoseveral cross-border lease arrangements of technical and networkequipment (see note 35). Such arrangements are still operational.
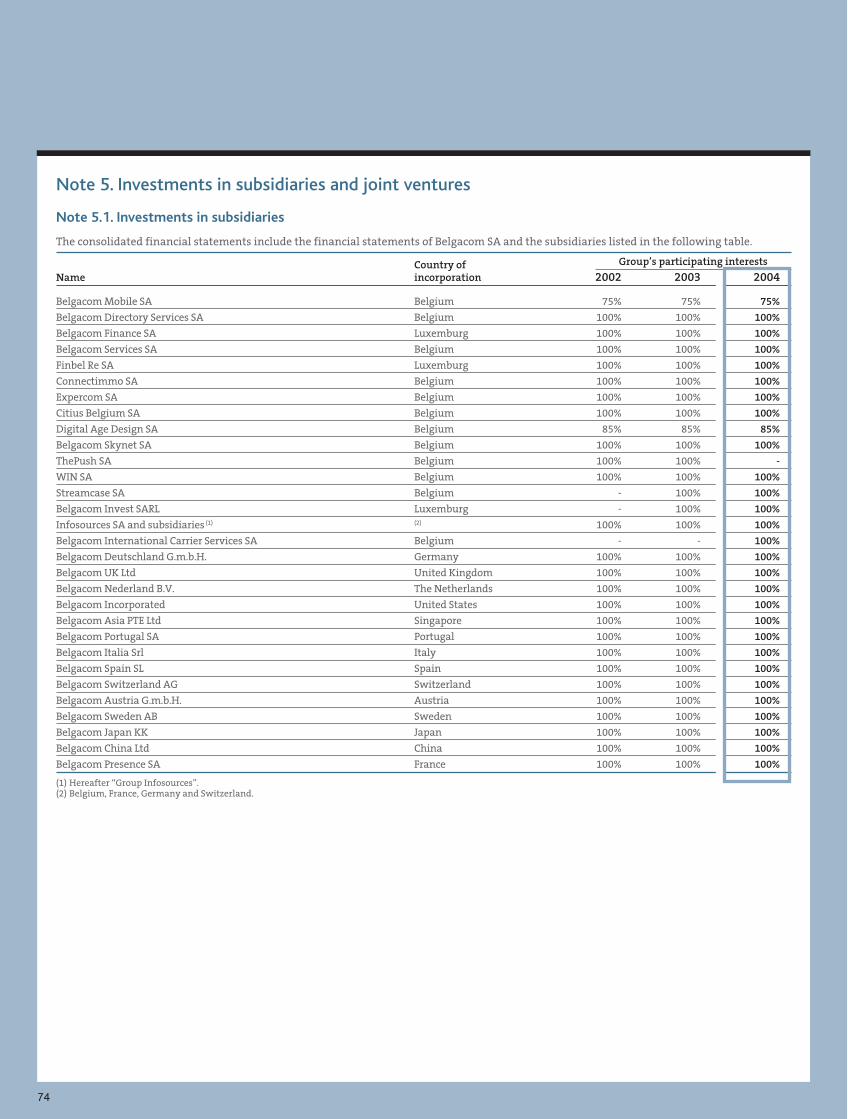
74
Note 5. Investments in subsidiaries and joint ventures
Note 5.1. Investments in subsidiaries
The consolidated financial statements include the financial statements of Belgacom SA and the subsidiaries listed in the following table.
Country of Group’s participating interests
Name incorporation 2002 2003 2004
Belgacom Mobile SA Belgium 75% 75% 75%
Belgacom Directory Services SA Belgium 100% 100% 100%
Belgacom Finance SA Luxemburg 100% 100% 100%
Belgacom Services SA Belgium 100% 100% 100%
Finbel Re SA Luxemburg 100% 100% 100%
Connectimmo SA Belgium 100% 100% 100%
Expercom SA Belgium 100% 100% 100%
Citius Belgium SA Belgium 100% 100% 100%
Digital Age Design SA Belgium 85% 85% 85%
Belgacom Skynet SA Belgium 100% 100% 100%
ThePush SA Belgium 100% 100% -
WIN SA Belgium 100% 100% 100%
Streamcase SA Belgium - 100% 100%
Belgacom Invest SARL Luxemburg - 100% 100%
Infosources SA and subsidiaries (1) (2) 100% 100% 100%
Belgacom International Carrier Services SA Belgium - - 100%
Belgacom Deutschland G.m.b.H. Germany 100% 100% 100%
Belgacom UK Ltd United Kingdom 100% 100% 100%
Belgacom Nederland B.V. The Netherlands 100% 100% 100%
Belgacom Incorporated United States 100% 100% 100%
Belgacom Asia PTE Ltd Singapore 100% 100% 100%
Belgacom Portugal SA Portugal 100% 100% 100%
Belgacom Italia Srl Italy 100% 100% 100%
Belgacom Spain SL Spain 100% 100% 100%
Belgacom Switzerland AG Switzerland 100% 100% 100%
Belgacom Austria G.m.b.H. Austria 100% 100% 100%
Belgacom Sweden AB Sweden 100% 100% 100%
Belgacom Japan KK Japan 100% 100% 100%
Belgacom China Ltd China 100% 100% 100%
Belgacom Presence SA France 100% 100% 100%
(1) Hereafter “Group Infosources”.(2) Belgium, France, Germany and Switzerland.
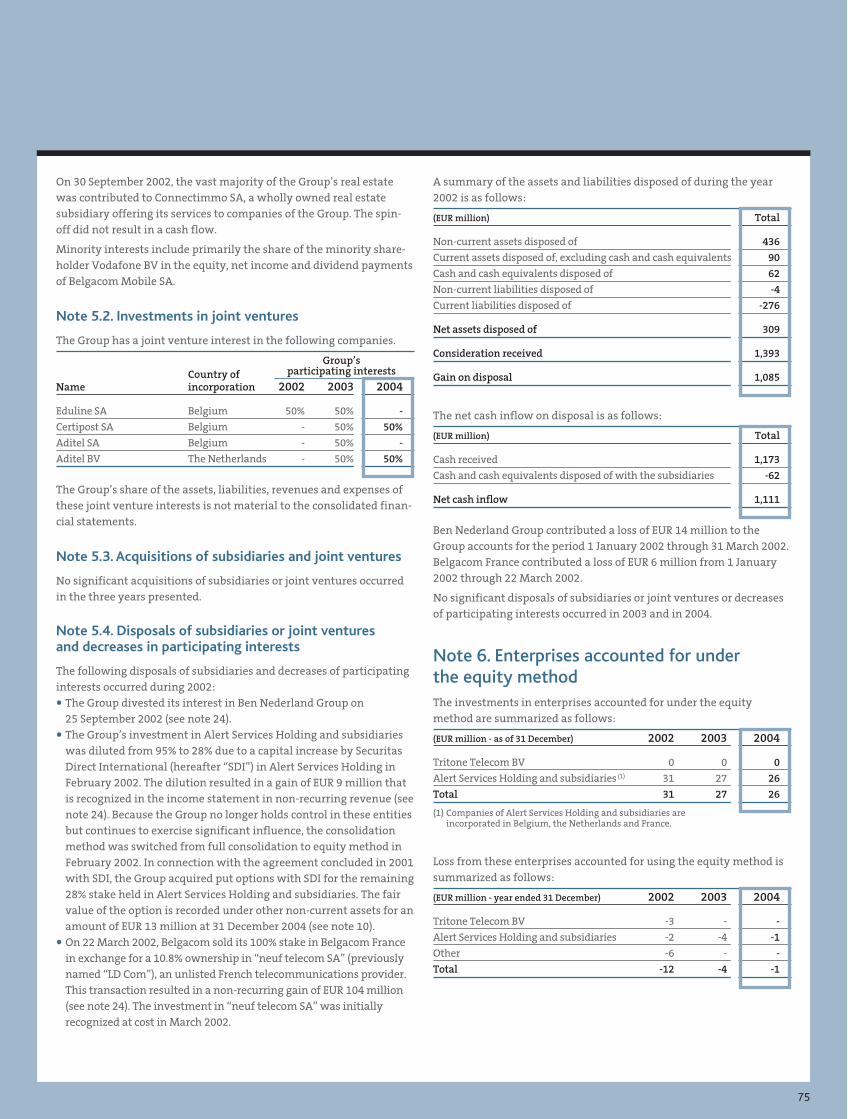
75
On 30 September 2002, the vast majority of the Group’s real estatewas contributed to Connectimmo SA, a wholly owned real estatesubsidiary offering its services to companies of the Group. The spin-off did not result in a cash flow.
Minority interests include primarily the share of the minority share-holder Vodafone BV in the equity, net income and dividend paymentsof Belgacom Mobile SA.
Note 5.2. Investments in joint ventures
The Group has a joint venture interest in the following companies.
Group’sCountry of participating interests
Name incorporation 2002 2003 2004
Eduline SA Belgium 50% 50% -
Certipost SA Belgium - 50% 50%
Aditel SA Belgium - 50% -
Aditel BV The Netherlands - 50% 50%
The Group’s share of the assets, liabilities, revenues and expenses ofthese joint venture interests is not material to the consolidated finan-cial statements.
Note 5.3. Acquisitions of subsidiaries and joint ventures
No significant acquisitions of subsidiaries or joint ventures occurredin the three years presented.
Note 5.4. Disposals of subsidiaries or joint venturesand decreases in participating interests
The following disposals of subsidiaries and decreases of participatinginterests occurred during 2002:
• The Group divested its interest in Ben Nederland Group on25 September 2002 (see note 24).
• The Group’s investment in Alert Services Holding and subsidiarieswas diluted from 95% to 28% due to a capital increase by SecuritasDirect International (hereafter “SDI”) in Alert Services Holding inFebruary 2002. The dilution resulted in a gain of EUR 9 million thatis recognized in the income statement in non-recurring revenue (seenote 24). Because the Group no longer holds control in these entitiesbut continues to exercise significant influence, the consolidationmethod was switched from full consolidation to equity method inFebruary 2002. In connection with the agreement concluded in 2001with SDI, the Group acquired put options with SDI for the remaining28% stake held in Alert Services Holding and subsidiaries. The fairvalue of the option is recorded under other non-current assets for anamount of EUR 13 million at 31 December 2004 (see note 10).
• On 22 March 2002, Belgacom sold its 100% stake in Belgacom Francein exchange for a 10.8% ownership in “neuf telecom SA” (previouslynamed “LD Com”), an unlisted French telecommunications provider.This transaction resulted in a non-recurring gain of EUR 104 million(see note 24). The investment in “neuf telecom SA” was initiallyrecognized at cost in March 2002.
A summary of the assets and liabilities disposed of during the year2002 is as follows:
(EUR million) Total
Non-current assets disposed of 436
Current assets disposed of, excluding cash and cash equivalents 90
Cash and cash equivalents disposed of 62
Non-current liabilities disposed of -4
Current liabilities disposed of -276
Net assets disposed of 309
Consideration received 1,393
Gain on disposal 1,085
The net cash inflow on disposal is as follows:
(EUR million) Total
Cash received 1,173
Cash and cash equivalents disposed of with the subsidiaries -62
Net cash inflow 1,111
Ben Nederland Group contributed a loss of EUR 14 million to theGroup accounts for the period 1 January 2002 through 31 March 2002.Belgacom France contributed a loss of EUR 6 million from 1 January2002 through 22 March 2002.
No significant disposals of subsidiaries or joint ventures or decreasesof participating interests occurred in 2003 and in 2004.
Note 6. Enterprises accounted for underthe equity methodThe investments in enterprises accounted for under the equitymethod are summarized as follows:
(EUR million - as of 31 December) 2002 2003 2004
Tritone Telecom BV 0 0 0
Alert Services Holding and subsidiaries (1) 31 27 26
Total 31 27 26
(1) Companies of Alert Services Holding and subsidiaries areincorporated in Belgium, the Netherlands and France.
Loss from these enterprises accounted for using the equity method issummarized as follows:
(EUR million - year ended 31 December) 2002 2003 2004
Tritone Telecom BV -3 - -
Alert Services Holding and subsidiaries -2 -4 -1
Other -6 - -
Total -12 -4 -1
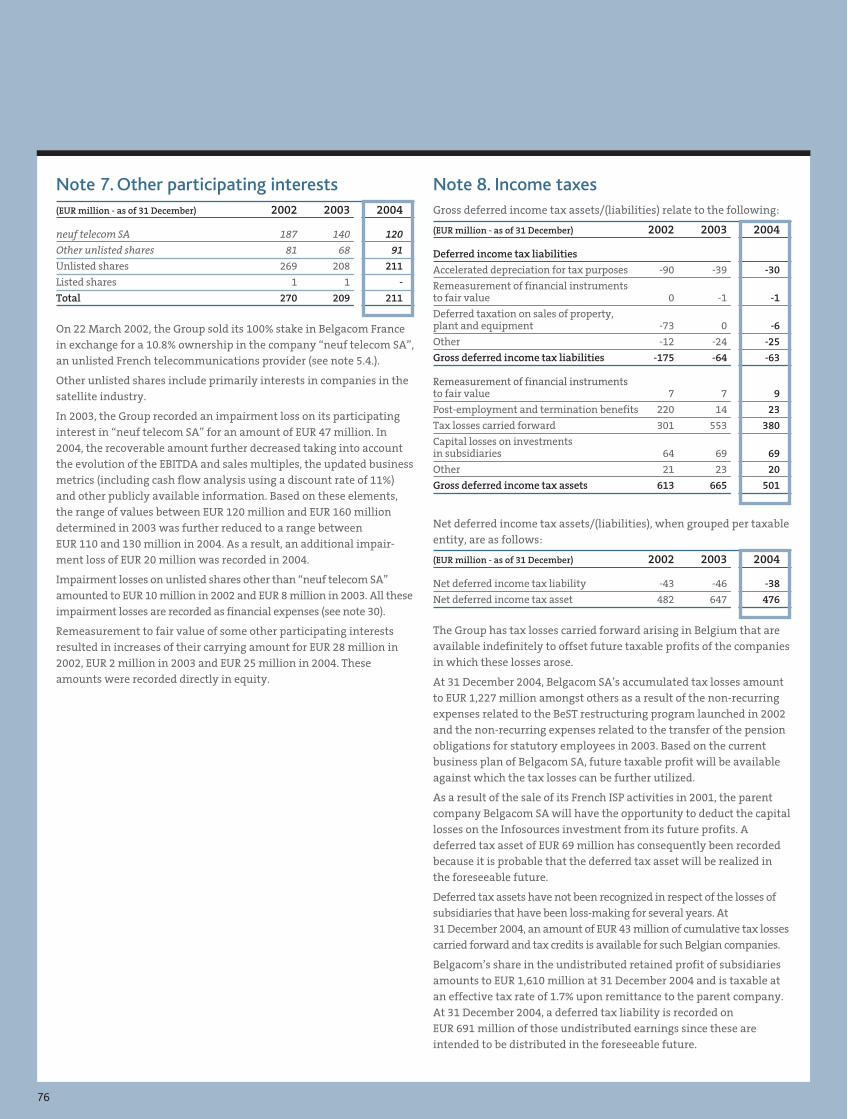
76
Note 7. Other participating interests(EUR million - as of 31 December) 2002 2003 2004
neuf telecom SA 187 140 120
Other unlisted shares 81 68 91
Unlisted shares 269 208 211
Listed shares 1 1 -
Total 270 209 211
On 22 March 2002, the Group sold its 100% stake in Belgacom Francein exchange for a 10.8% ownership in the company “neuf telecom SA”,an unlisted French telecommunications provider (see note 5.4.).
Other unlisted shares include primarily interests in companies in thesatellite industry.
In 2003, the Group recorded an impairment loss on its participatinginterest in “neuf telecom SA” for an amount of EUR 47 million. In2004, the recoverable amount further decreased taking into accountthe evolution of the EBITDA and sales multiples, the updated businessmetrics (including cash flow analysis using a discount rate of 11%)and other publicly available information. Based on these elements,the range of values between EUR 120 million and EUR 160 milliondetermined in 2003 was further reduced to a range betweenEUR 110 and 130 million in 2004. As a result, an additional impair-ment loss of EUR 20 million was recorded in 2004.
Impairment losses on unlisted shares other than “neuf telecom SA”amounted to EUR 10 million in 2002 and EUR 8 million in 2003. All theseimpairment losses are recorded as financial expenses (see note 30).
Remeasurement to fair value of some other participating interestsresulted in increases of their carrying amount for EUR 28 million in2002, EUR 2 million in 2003 and EUR 25 million in 2004. Theseamounts were recorded directly in equity.
Note 8. Income taxesGross deferred income tax assets/(liabilities) relate to the following:
(EUR million - as of 31 December) 2002 2003 2004
Deferred income tax liabilities
Accelerated depreciation for tax purposes -90 -39 -30
Remeasurement of financial instrumentsto fair value 0 -1 -1
Deferred taxation on sales of property,plant and equipment -73 0 -6
Other -12 -24 -25
Gross deferred income tax liabilities -175 -64 -63
Remeasurement of financial instrumentsto fair value 7 7 9
Post-employment and termination benefits 220 14 23
Tax losses carried forward 301 553 380
Capital losses on investmentsin subsidiaries 64 69 69
Other 21 23 20
Gross deferred income tax assets 613 665 501
Net deferred income tax assets/(liabilities), when grouped per taxableentity, are as follows:
(EUR million - as of 31 December) 2002 2003 2004
Net deferred income tax liability -43 -46 -38
Net deferred income tax asset 482 647 476
The Group has tax losses carried forward arising in Belgium that areavailable indefinitely to offset future taxable profits of the companiesin which these losses arose.
At 31 December 2004, Belgacom SA’s accumulated tax losses amountto EUR 1,227 million amongst others as a result of the non-recurringexpenses related to the BeST restructuring program launched in 2002and the non-recurring expenses related to the transfer of the pensionobligations for statutory employees in 2003. Based on the currentbusiness plan of Belgacom SA, future taxable profit will be availableagainst which the tax losses can be further utilized.
As a result of the sale of its French ISP activities in 2001, the parentcompany Belgacom SA will have the opportunity to deduct the capitallosses on the Infosources investment from its future profits. Adeferred tax asset of EUR 69 million has consequently been recordedbecause it is probable that the deferred tax asset will be realized inthe foreseeable future.
Deferred tax assets have not been recognized in respect of the losses ofsubsidiaries that have been loss-making for several years. At31 December 2004, an amount of EUR 43 million of cumulative tax lossescarried forward and tax credits is available for such Belgian companies.
Belgacom’s share in the undistributed retained profit of subsidiariesamounts to EUR 1,610 million at 31 December 2004 and is taxable atan effective tax rate of 1.7% upon remittance to the parent company.At 31 December 2004, a deferred tax liability is recorded onEUR 691 million of those undistributed earnings since these areintended to be distributed in the foreseeable future.
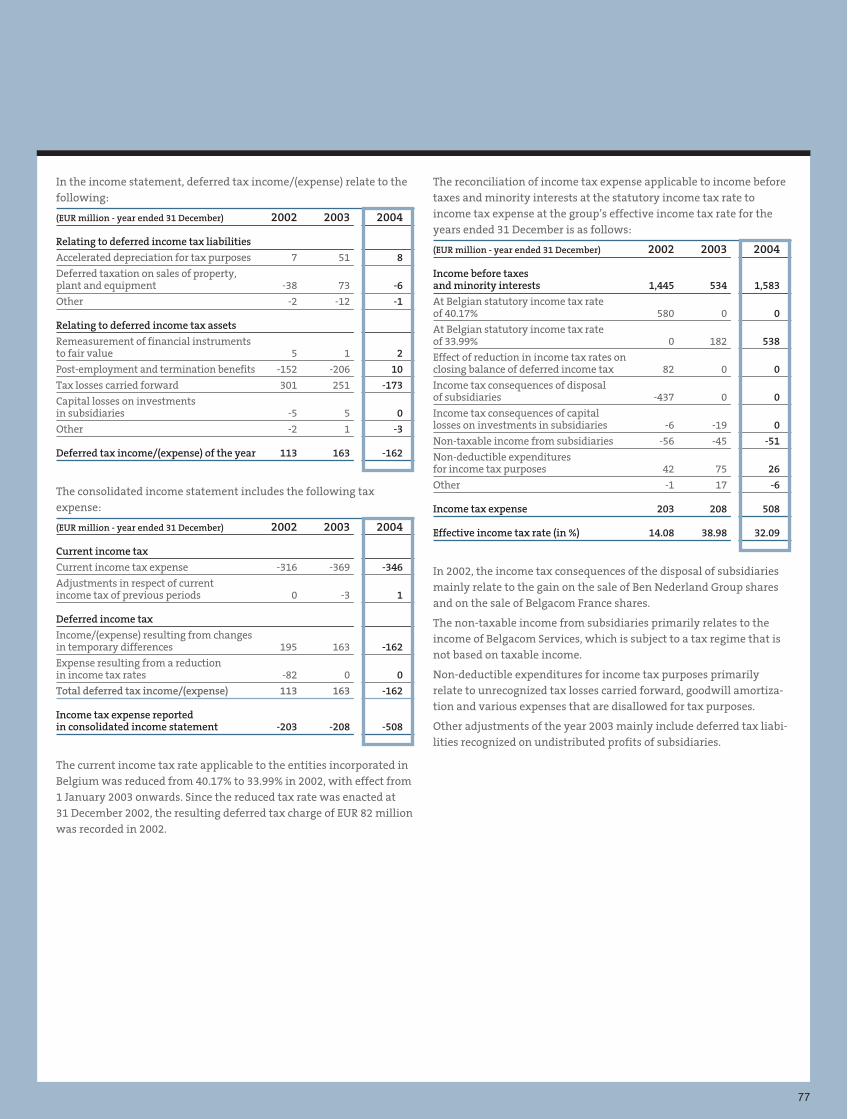
77
In the income statement, deferred tax income/(expense) relate to thefollowing:
(EUR million - year ended 31 December) 2002 2003 2004
Relating to deferred income tax liabilities
Accelerated depreciation for tax purposes 7 51 8
Deferred taxation on sales of property,plant and equipment -38 73 -6
Other -2 -12 -1
Relating to deferred income tax assets
Remeasurement of financial instrumentsto fair value 5 1 2
Post-employment and termination benefits -152 -206 10
Tax losses carried forward 301 251 -173
Capital losses on investmentsin subsidiaries -5 5 0
Other -2 1 -3
Deferred tax income/(expense) of the year 113 163 -162
The consolidated income statement includes the following taxexpense:
(EUR million - year ended 31 December) 2002 2003 2004
Current income tax
Current income tax expense -316 -369 -346
Adjustments in respect of currentincome tax of previous periods 0 -3 1
Deferred income tax
Income/(expense) resulting from changesin temporary differences 195 163 -162
Expense resulting from a reductionin income tax rates -82 0 0
Total deferred tax income/(expense) 113 163 -162
Income tax expense reportedin consolidated income statement -203 -208 -508
The current income tax rate applicable to the entities incorporated inBelgium was reduced from 40.17% to 33.99% in 2002, with effect from1 January 2003 onwards. Since the reduced tax rate was enacted at31 December 2002, the resulting deferred tax charge of EUR 82 millionwas recorded in 2002.
The reconciliation of income tax expense applicable to income beforetaxes and minority interests at the statutory income tax rate toincome tax expense at the group’s effective income tax rate for theyears ended 31 December is as follows:
(EUR million - year ended 31 December) 2002 2003 2004
Income before taxesand minority interests 1,445 534 1,583
At Belgian statutory income tax rateof 40.17% 580 0 0
At Belgian statutory income tax rateof 33.99% 0 182 538
Effect of reduction in income tax rates onclosing balance of deferred income tax 82 0 0
Income tax consequences of disposalof subsidiaries -437 0 0
Income tax consequences of capitallosses on investments in subsidiaries -6 -19 0
Non-taxable income from subsidiaries -56 -45 -51
Non-deductible expendituresfor income tax purposes 42 75 26
Other -1 17 -6
Income tax expense 203 208 508
Effective income tax rate (in %) 14.08 38.98 32.09
In 2002, the income tax consequences of the disposal of subsidiariesmainly relate to the gain on the sale of Ben Nederland Group sharesand on the sale of Belgacom France shares.
The non-taxable income from subsidiaries primarily relates to theincome of Belgacom Services, which is subject to a tax regime that isnot based on taxable income.
Non-deductible expenditures for income tax purposes primarilyrelate to unrecognized tax losses carried forward, goodwill amortiza-tion and various expenses that are disallowed for tax purposes.
Other adjustments of the year 2003 mainly include deferred tax liabi-lities recognized on undistributed profits of subsidiaries.
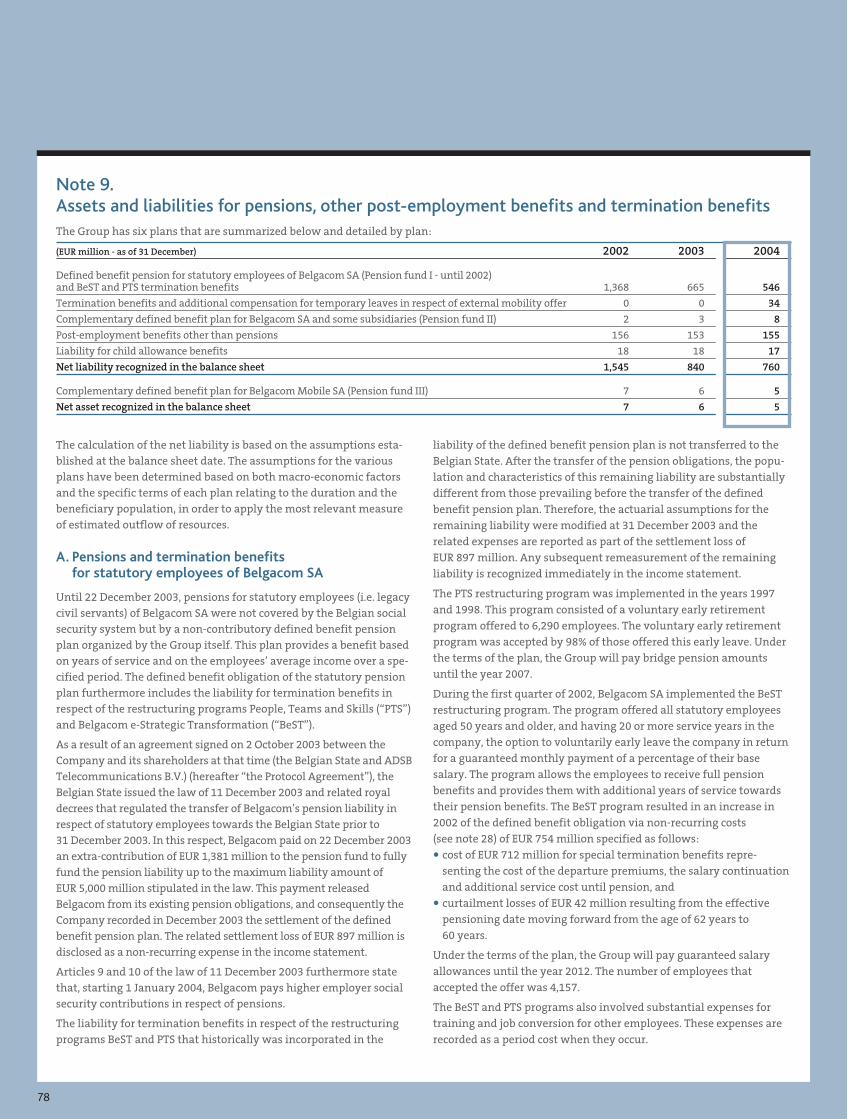
78
The calculation of the net liability is based on the assumptions esta-blished at the balance sheet date. The assumptions for the variousplans have been determined based on both macro-economic factorsand the specific terms of each plan relating to the duration and thebeneficiary population, in order to apply the most relevant measureof estimated outflow of resources.
A. Pensions and termination benefitsfor statutory employees of Belgacom SA
Until 22 December 2003, pensions for statutory employees (i.e. legacycivil servants) of Belgacom SA were not covered by the Belgian socialsecurity system but by a non-contributory defined benefit pensionplan organized by the Group itself. This plan provides a benefit basedon years of service and on the employees’ average income over a spe-cified period. The defined benefit obligation of the statutory pensionplan furthermore includes the liability for termination benefits inrespect of the restructuring programs People, Teams and Skills (“PTS”)and Belgacom e-Strategic Transformation (“BeST”).
As a result of an agreement signed on 2 October 2003 between theCompany and its shareholders at that time (the Belgian State and ADSBTelecommunications B.V.) (hereafter “the Protocol Agreement”), theBelgian State issued the law of 11 December 2003 and related royaldecrees that regulated the transfer of Belgacom’s pension liability inrespect of statutory employees towards the Belgian State prior to31 December 2003. In this respect, Belgacom paid on 22 December 2003an extra-contribution of EUR 1,381 million to the pension fund to fullyfund the pension liability up to the maximum liability amount ofEUR 5,000 million stipulated in the law. This payment releasedBelgacom from its existing pension obligations, and consequently theCompany recorded in December 2003 the settlement of the definedbenefit pension plan. The related settlement loss of EUR 897 million isdisclosed as a non-recurring expense in the income statement.
Articles 9 and 10 of the law of 11 December 2003 furthermore statethat, starting 1 January 2004, Belgacom pays higher employer socialsecurity contributions in respect of pensions.
The liability for termination benefits in respect of the restructuringprograms BeST and PTS that historically was incorporated in the
liability of the defined benefit pension plan is not transferred to the
Belgian State. After the transfer of the pension obligations, the popu-
lation and characteristics of this remaining liability are substantially
different from those prevailing before the transfer of the defined
benefit pension plan. Therefore, the actuarial assumptions for the
remaining liability were modified at 31 December 2003 and the
related expenses are reported as part of the settlement loss of
EUR 897 million. Any subsequent remeasurement of the remaining
liability is recognized immediately in the income statement.
The PTS restructuring program was implemented in the years 1997
and 1998. This program consisted of a voluntary early retirement
program offered to 6,290 employees. The voluntary early retirement
program was accepted by 98% of those offered this early leave. Under
the terms of the plan, the Group will pay bridge pension amounts
until the year 2007.
During the first quarter of 2002, Belgacom SA implemented the BeST
restructuring program. The program offered all statutory employees
aged 50 years and older, and having 20 or more service years in the
company, the option to voluntarily early leave the company in return
for a guaranteed monthly payment of a percentage of their base
salary. The program allows the employees to receive full pension
benefits and provides them with additional years of service towards
their pension benefits. The BeST program resulted in an increase in
2002 of the defined benefit obligation via non-recurring costs
(see note 28) of EUR 754 million specified as follows:
• cost of EUR 712 million for special termination benefits repre-
senting the cost of the departure premiums, the salary continuation
and additional service cost until pension, and
• curtailment losses of EUR 42 million resulting from the effective
pensioning date moving forward from the age of 62 years to
60 years.
Under the terms of the plan, the Group will pay guaranteed salary
allowances until the year 2012. The number of employees that
accepted the offer was 4,157.
The BeST and PTS programs also involved substantial expenses for
training and job conversion for other employees. These expenses are
recorded as a period cost when they occur.
Note 9.Assets and liabilities for pensions, other post-employment benefits and termination benefitsThe Group has six plans that are summarized below and detailed by plan:
(EUR million - as of 31 December) 2002 2003 2004
Defined benefit pension for statutory employees of Belgacom SA (Pension fund I - until 2002)and BeST and PTS termination benefits 1,368 665 546
Termination benefits and additional compensation for temporary leaves in respect of external mobility offer 0 0 34
Complementary defined benefit plan for Belgacom SA and some subsidiaries (Pension fund II) 2 3 8
Post-employment benefits other than pensions 156 153 155
Liability for child allowance benefits 18 18 17
Net liability recognized in the balance sheet 1,545 840 760
Complementary defined benefit plan for Belgacom Mobile SA (Pension fund III) 7 6 5
Net asset recognized in the balance sheet 7 6 5
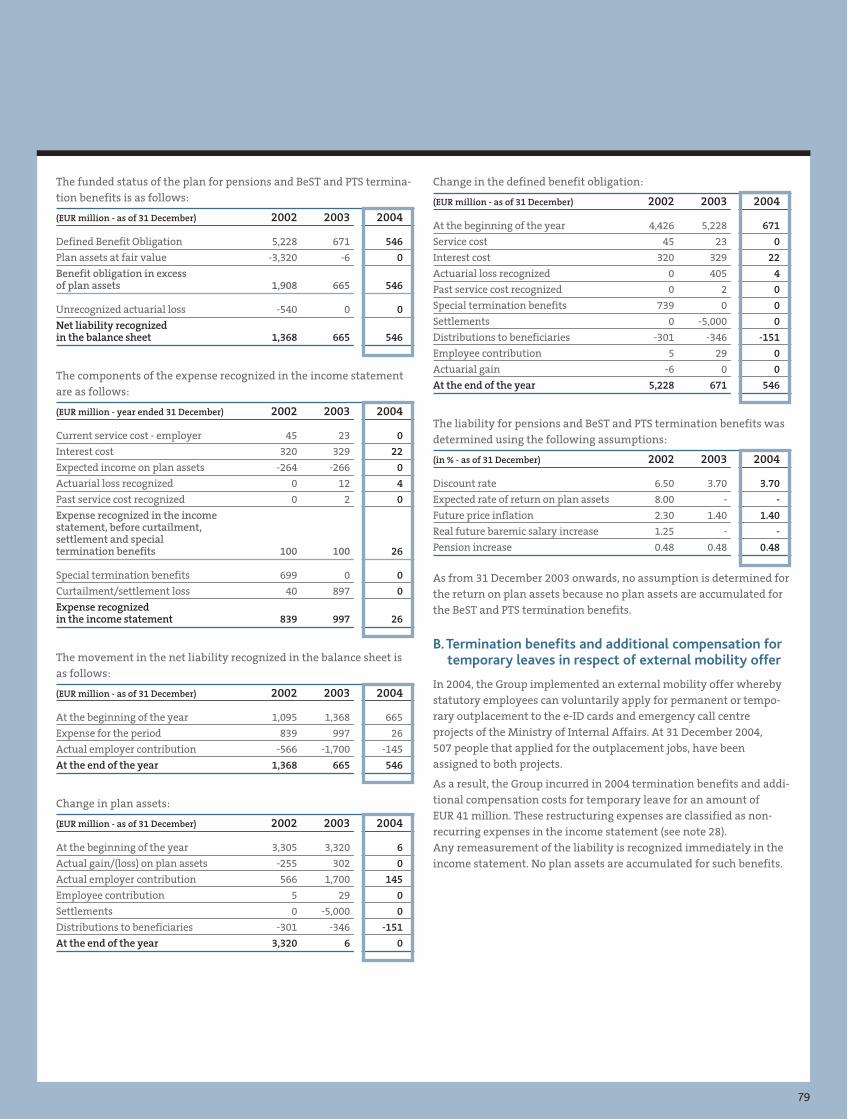
79
The funded status of the plan for pensions and BeST and PTS termina-tion benefits is as follows:
(EUR million - as of 31 December) 2002 2003 2004
Defined Benefit Obligation 5,228 671 546
Plan assets at fair value -3,320 -6 0
Benefit obligation in excessof plan assets 1,908 665 546
Unrecognized actuarial loss -540 0 0
Net liability recognizedin the balance sheet 1,368 665 546
The components of the expense recognized in the income statementare as follows:
(EUR million - year ended 31 December) 2002 2003 2004
Current service cost - employer 45 23 0
Interest cost 320 329 22
Expected income on plan assets -264 -266 0
Actuarial loss recognized 0 12 4
Past service cost recognized 0 2 0
Expense recognized in the incomestatement, before curtailment,settlement and specialtermination benefits 100 100 26
Special termination benefits 699 0 0
Curtailment/settlement loss 40 897 0
Expense recognizedin the income statement 839 997 26
The movement in the net liability recognized in the balance sheet isas follows:
(EUR million - as of 31 December) 2002 2003 2004
At the beginning of the year 1,095 1,368 665
Expense for the period 839 997 26
Actual employer contribution -566 -1,700 -145
At the end of the year 1,368 665 546
Change in plan assets:
(EUR million - as of 31 December) 2002 2003 2004
At the beginning of the year 3,305 3,320 6
Actual gain/(loss) on plan assets -255 302 0
Actual employer contribution 566 1,700 145
Employee contribution 5 29 0
Settlements 0 -5,000 0
Distributions to beneficiaries -301 -346 -151
At the end of the year 3,320 6 0
Change in the defined benefit obligation:
(EUR million - as of 31 December) 2002 2003 2004
At the beginning of the year 4,426 5,228 671
Service cost 45 23 0
Interest cost 320 329 22
Actuarial loss recognized 0 405 4
Past service cost recognized 0 2 0
Special termination benefits 739 0 0
Settlements 0 -5,000 0
Distributions to beneficiaries -301 -346 -151
Employee contribution 5 29 0
Actuarial gain -6 0 0
At the end of the year 5,228 671 546
The liability for pensions and BeST and PTS termination benefits wasdetermined using the following assumptions:
(in % - as of 31 December) 2002 2003 2004
Discount rate 6.50 3.70 3.70
Expected rate of return on plan assets 8.00 - -
Future price inflation 2.30 1.40 1.40
Real future baremic salary increase 1.25 - -
Pension increase 0.48 0.48 0.48
As from 31 December 2003 onwards, no assumption is determined forthe return on plan assets because no plan assets are accumulated forthe BeST and PTS termination benefits.
B.Termination benefits and additional compensation fortemporary leaves in respect of external mobility offer
In 2004, the Group implemented an external mobility offer wherebystatutory employees can voluntarily apply for permanent or tempo-rary outplacement to the e-ID cards and emergency call centreprojects of the Ministry of Internal Affairs. At 31 December 2004,507 people that applied for the outplacement jobs, have beenassigned to both projects.
As a result, the Group incurred in 2004 termination benefits and addi-tional compensation costs for temporary leave for an amount ofEUR 41 million. These restructuring expenses are classified as non-recurring expenses in the income statement (see note 28).Any remeasurement of the liability is recognized immediately in theincome statement. No plan assets are accumulated for such benefits.
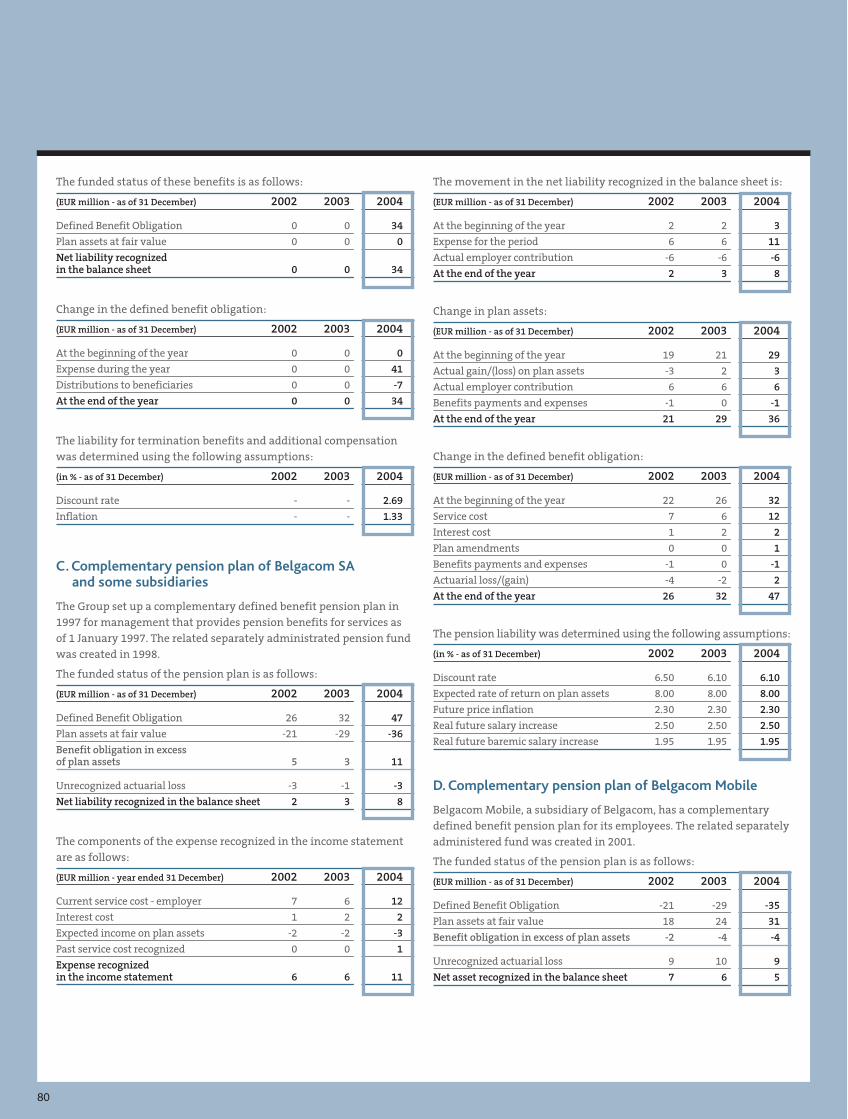
80
The funded status of these benefits is as follows:
(EUR million - as of 31 December) 2002 2003 2004
Defined Benefit Obligation 0 0 34
Plan assets at fair value 0 0 0
Net liability recognizedin the balance sheet 0 0 34
Change in the defined benefit obligation:
(EUR million - as of 31 December) 2002 2003 2004
At the beginning of the year 0 0 0
Expense during the year 0 0 41
Distributions to beneficiaries 0 0 -7
At the end of the year 0 0 34
The liability for termination benefits and additional compensationwas determined using the following assumptions:
(in % - as of 31 December) 2002 2003 2004
Discount rate - - 2.69
Inflation - - 1.33
C. Complementary pension plan of Belgacom SAand some subsidiaries
The Group set up a complementary defined benefit pension plan in1997 for management that provides pension benefits for services asof 1 January 1997. The related separately administrated pension fundwas created in 1998.
The funded status of the pension plan is as follows:
(EUR million - as of 31 December) 2002 2003 2004
Defined Benefit Obligation 26 32 47
Plan assets at fair value -21 -29 -36
Benefit obligation in excessof plan assets 5 3 11
Unrecognized actuarial loss -3 -1 -3
Net liability recognized in the balance sheet 2 3 8
The components of the expense recognized in the income statementare as follows:
(EUR million - year ended 31 December) 2002 2003 2004
Current service cost - employer 7 6 12
Interest cost 1 2 2
Expected income on plan assets -2 -2 -3
Past service cost recognized 0 0 1
Expense recognizedin the income statement 6 6 11
The movement in the net liability recognized in the balance sheet is:
(EUR million - as of 31 December) 2002 2003 2004
At the beginning of the year 2 2 3
Expense for the period 6 6 11
Actual employer contribution -6 -6 -6
At the end of the year 2 3 8
Change in plan assets:
(EUR million - as of 31 December) 2002 2003 2004
At the beginning of the year 19 21 29
Actual gain/(loss) on plan assets -3 2 3
Actual employer contribution 6 6 6
Benefits payments and expenses -1 0 -1
At the end of the year 21 29 36
Change in the defined benefit obligation:
(EUR million - as of 31 December) 2002 2003 2004
At the beginning of the year 22 26 32
Service cost 7 6 12
Interest cost 1 2 2
Plan amendments 0 0 1
Benefits payments and expenses -1 0 -1
Actuarial loss/(gain) -4 -2 2
At the end of the year 26 32 47
The pension liability was determined using the following assumptions:
(in % - as of 31 December) 2002 2003 2004
Discount rate 6.50 6.10 6.10
Expected rate of return on plan assets 8.00 8.00 8.00
Future price inflation 2.30 2.30 2.30
Real future salary increase 2.50 2.50 2.50
Real future baremic salary increase 1.95 1.95 1.95
D. Complementary pension plan of Belgacom Mobile
Belgacom Mobile, a subsidiary of Belgacom, has a complementarydefined benefit pension plan for its employees. The related separatelyadministered fund was created in 2001.
The funded status of the pension plan is as follows:
(EUR million - as of 31 December) 2002 2003 2004
Defined Benefit Obligation -21 -29 -35
Plan assets at fair value 18 24 31
Benefit obligation in excess of plan assets -2 -4 -4
Unrecognized actuarial loss 9 10 9
Net asset recognized in the balance sheet 7 6 5
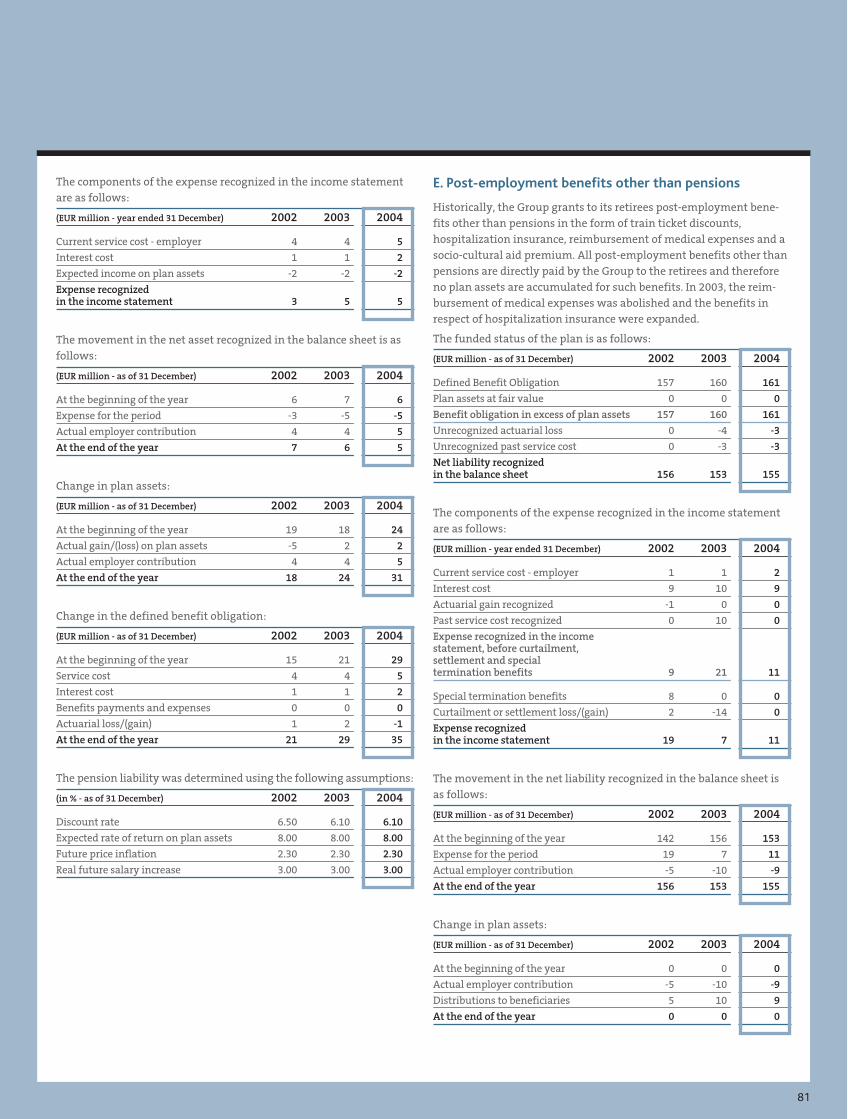
81
The components of the expense recognized in the income statementare as follows:
(EUR million - year ended 31 December) 2002 2003 2004
Current service cost - employer 4 4 5
Interest cost 1 1 2
Expected income on plan assets -2 -2 -2
Expense recognizedin the income statement 3 5 5
The movement in the net asset recognized in the balance sheet is asfollows:
(EUR million - as of 31 December) 2002 2003 2004
At the beginning of the year 6 7 6
Expense for the period -3 -5 -5
Actual employer contribution 4 4 5
At the end of the year 7 6 5
Change in plan assets:
(EUR million - as of 31 December) 2002 2003 2004
At the beginning of the year 19 18 24
Actual gain/(loss) on plan assets -5 2 2
Actual employer contribution 4 4 5
At the end of the year 18 24 31
Change in the defined benefit obligation:
(EUR million - as of 31 December) 2002 2003 2004
At the beginning of the year 15 21 29
Service cost 4 4 5
Interest cost 1 1 2
Benefits payments and expenses 0 0 0
Actuarial loss/(gain) 1 2 -1
At the end of the year 21 29 35
The pension liability was determined using the following assumptions:
(in % - as of 31 December) 2002 2003 2004
Discount rate 6.50 6.10 6.10
Expected rate of return on plan assets 8.00 8.00 8.00
Future price inflation 2.30 2.30 2.30
Real future salary increase 3.00 3.00 3.00
E. Post-employment benefits other than pensions
Historically, the Group grants to its retirees post-employment bene-fits other than pensions in the form of train ticket discounts,hospitalization insurance, reimbursement of medical expenses and asocio-cultural aid premium. All post-employment benefits other thanpensions are directly paid by the Group to the retirees and thereforeno plan assets are accumulated for such benefits. In 2003, the reim-bursement of medical expenses was abolished and the benefits inrespect of hospitalization insurance were expanded.
The funded status of the plan is as follows:
(EUR million - as of 31 December) 2002 2003 2004
Defined Benefit Obligation 157 160 161
Plan assets at fair value 0 0 0
Benefit obligation in excess of plan assets 157 160 161
Unrecognized actuarial loss 0 -4 -3
Unrecognized past service cost 0 -3 -3
Net liability recognizedin the balance sheet 156 153 155
The components of the expense recognized in the income statementare as follows:
(EUR million - year ended 31 December) 2002 2003 2004
Current service cost - employer 1 1 2
Interest cost 9 10 9
Actuarial gain recognized -1 0 0
Past service cost recognized 0 10 0
Expense recognized in the incomestatement, before curtailment,settlement and specialtermination benefits 9 21 11
Special termination benefits 8 0 0
Curtailment or settlement loss/(gain) 2 -14 0
Expense recognizedin the income statement 19 7 11
The movement in the net liability recognized in the balance sheet isas follows:
(EUR million - as of 31 December) 2002 2003 2004
At the beginning of the year 142 156 153
Expense for the period 19 7 11
Actual employer contribution -5 -10 -9
At the end of the year 156 153 155
Change in plan assets:
(EUR million - as of 31 December) 2002 2003 2004
At the beginning of the year 0 0 0
Actual employer contribution -5 -10 -9
Distributions to beneficiaries 5 10 9
At the end of the year 0 0 0
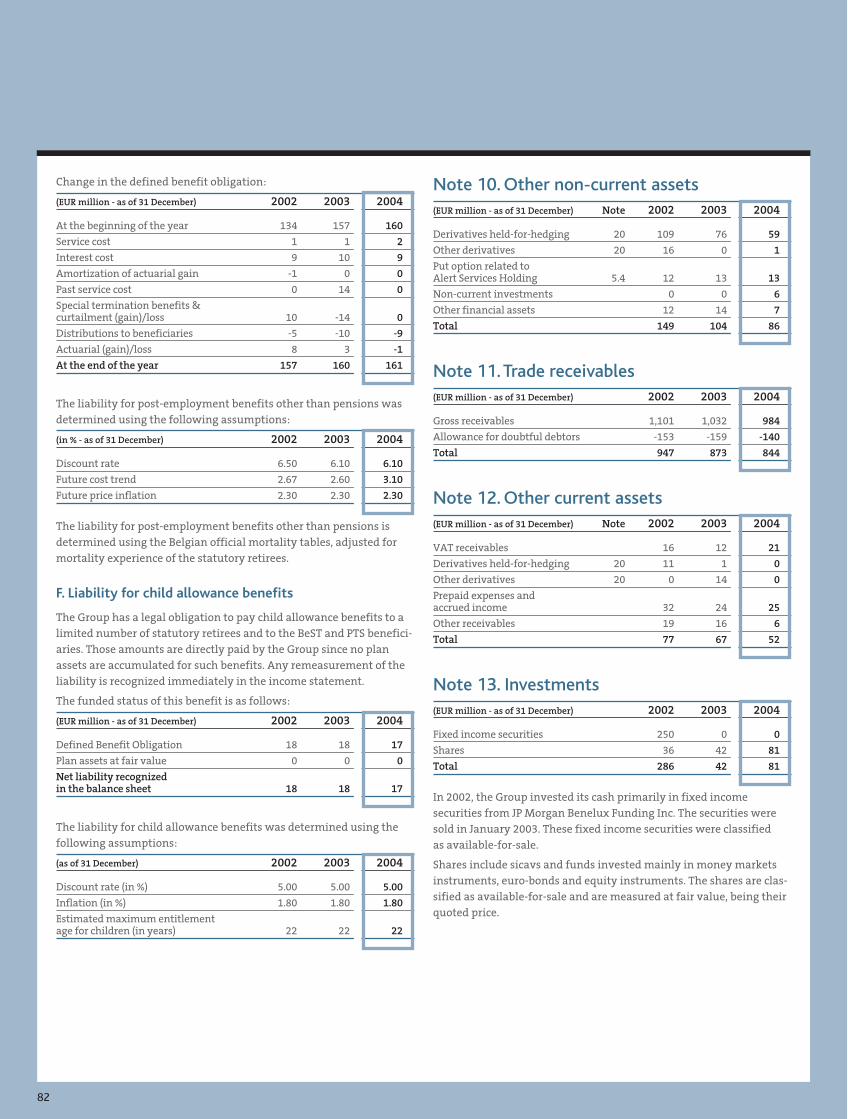
82
Change in the defined benefit obligation:
(EUR million - as of 31 December) 2002 2003 2004
At the beginning of the year 134 157 160
Service cost 1 1 2
Interest cost 9 10 9
Amortization of actuarial gain -1 0 0
Past service cost 0 14 0
Special termination benefits &curtailment (gain)/loss 10 -14 0
Distributions to beneficiaries -5 -10 -9
Actuarial (gain)/loss 8 3 -1
At the end of the year 157 160 161
The liability for post-employment benefits other than pensions wasdetermined using the following assumptions:
(in % - as of 31 December) 2002 2003 2004
Discount rate 6.50 6.10 6.10
Future cost trend 2.67 2.60 3.10
Future price inflation 2.30 2.30 2.30
The liability for post-employment benefits other than pensions isdetermined using the Belgian official mortality tables, adjusted formortality experience of the statutory retirees.
F. Liability for child allowance benefits
The Group has a legal obligation to pay child allowance benefits to alimited number of statutory retirees and to the BeST and PTS benefici-aries. Those amounts are directly paid by the Group since no planassets are accumulated for such benefits. Any remeasurement of theliability is recognized immediately in the income statement.
The funded status of this benefit is as follows:
(EUR million - as of 31 December) 2002 2003 2004
Defined Benefit Obligation 18 18 17
Plan assets at fair value 0 0 0
Net liability recognizedin the balance sheet 18 18 17
The liability for child allowance benefits was determined using thefollowing assumptions:
(as of 31 December) 2002 2003 2004
Discount rate (in %) 5.00 5.00 5.00
Inflation (in %) 1.80 1.80 1.80
Estimated maximum entitlementage for children (in years) 22 22 22
Note 10. Other non-current assets(EUR million - as of 31 December) Note 2002 2003 2004
Derivatives held-for-hedging 20 109 76 59
Other derivatives 20 16 0 1
Put option related toAlert Services Holding 5.4 12 13 13
Non-current investments 0 0 6
Other financial assets 12 14 7
Total 149 104 86
Note 11. Trade receivables(EUR million - as of 31 December) 2002 2003 2004
Gross receivables 1,101 1,032 984
Allowance for doubtful debtors -153 -159 -140
Total 947 873 844
Note 12. Other current assets(EUR million - as of 31 December) Note 2002 2003 2004
VAT receivables 16 12 21
Derivatives held-for-hedging 20 11 1 0
Other derivatives 20 0 14 0
Prepaid expenses andaccrued income 32 24 25
Other receivables 19 16 6
Total 77 67 52
Note 13. Investments(EUR million - as of 31 December) 2002 2003 2004
Fixed income securities 250 0 0
Shares 36 42 81
Total 286 42 81
In 2002, the Group invested its cash primarily in fixed incomesecurities from JP Morgan Benelux Funding Inc. The securities weresold in January 2003. These fixed income securities were classifiedas available-for-sale.
Shares include sicavs and funds invested mainly in money marketsinstruments, euro-bonds and equity instruments. The shares are clas-sified as available-for-sale and are measured at fair value, being theirquoted price.
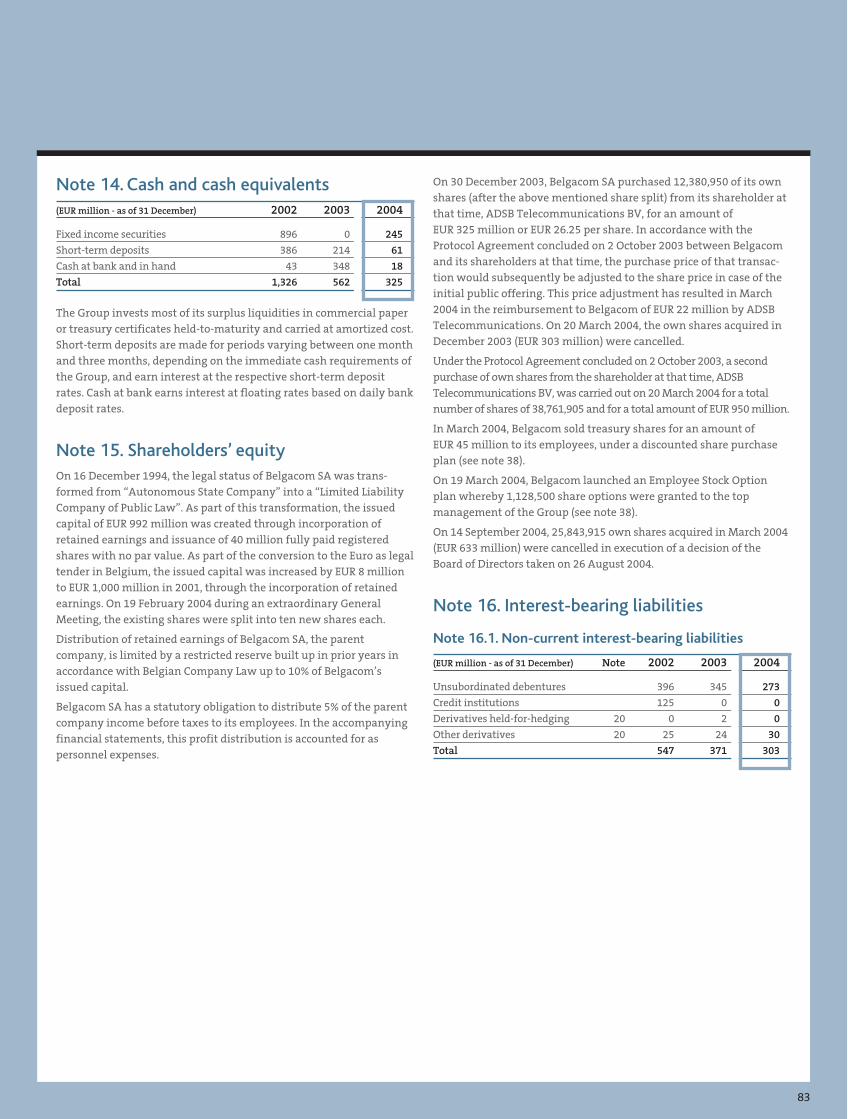
83
Note 14. Cash and cash equivalents(EUR million - as of 31 December) 2002 2003 2004
Fixed income securities 896 0 245
Short-term deposits 386 214 61
Cash at bank and in hand 43 348 18
Total 1,326 562 325
The Group invests most of its surplus liquidities in commercial paperor treasury certificates held-to-maturity and carried at amortized cost.Short-term deposits are made for periods varying between one monthand three months, depending on the immediate cash requirements ofthe Group, and earn interest at the respective short-term depositrates. Cash at bank earns interest at floating rates based on daily bankdeposit rates.
Note 15. Shareholders’ equityOn 16 December 1994, the legal status of Belgacom SA was trans-formed from “Autonomous State Company” into a “Limited LiabilityCompany of Public Law”. As part of this transformation, the issuedcapital of EUR 992 million was created through incorporation ofretained earnings and issuance of 40 million fully paid registeredshares with no par value. As part of the conversion to the Euro as legaltender in Belgium, the issued capital was increased by EUR 8 millionto EUR 1,000 million in 2001, through the incorporation of retainedearnings. On 19 February 2004 during an extraordinary GeneralMeeting, the existing shares were split into ten new shares each.
Distribution of retained earnings of Belgacom SA, the parentcompany, is limited by a restricted reserve built up in prior years inaccordance with Belgian Company Law up to 10% of Belgacom’sissued capital.
Belgacom SA has a statutory obligation to distribute 5% of the parentcompany income before taxes to its employees. In the accompanyingfinancial statements, this profit distribution is accounted for aspersonnel expenses.
On 30 December 2003, Belgacom SA purchased 12,380,950 of its ownshares (after the above mentioned share split) from its shareholder atthat time, ADSB Telecommunications BV, for an amount ofEUR 325 million or EUR 26.25 per share. In accordance with theProtocol Agreement concluded on 2 October 2003 between Belgacomand its shareholders at that time, the purchase price of that transac-tion would subsequently be adjusted to the share price in case of theinitial public offering. This price adjustment has resulted in March2004 in the reimbursement to Belgacom of EUR 22 million by ADSBTelecommunications. On 20 March 2004, the own shares acquired inDecember 2003 (EUR 303 million) were cancelled.
Under the Protocol Agreement concluded on 2 October 2003, a secondpurchase of own shares from the shareholder at that time, ADSBTelecommunications BV, was carried out on 20 March 2004 for a totalnumber of shares of 38,761,905 and for a total amount of EUR 950 million.
In March 2004, Belgacom sold treasury shares for an amount ofEUR 45 million to its employees, under a discounted share purchaseplan (see note 38).
On 19 March 2004, Belgacom launched an Employee Stock Optionplan whereby 1,128,500 share options were granted to the topmanagement of the Group (see note 38).
On 14 September 2004, 25,843,915 own shares acquired in March 2004(EUR 633 million) were cancelled in execution of a decision of theBoard of Directors taken on 26 August 2004.
Note 16. Interest-bearing liabilities
Note 16.1. Non-current interest-bearing liabilities
(EUR million - as of 31 December) Note 2002 2003 2004
Unsubordinated debentures 396 345 273
Credit institutions 125 0 0
Derivatives held-for-hedging 20 0 2 0
Other derivatives 20 25 24 30
Total 547 371 303
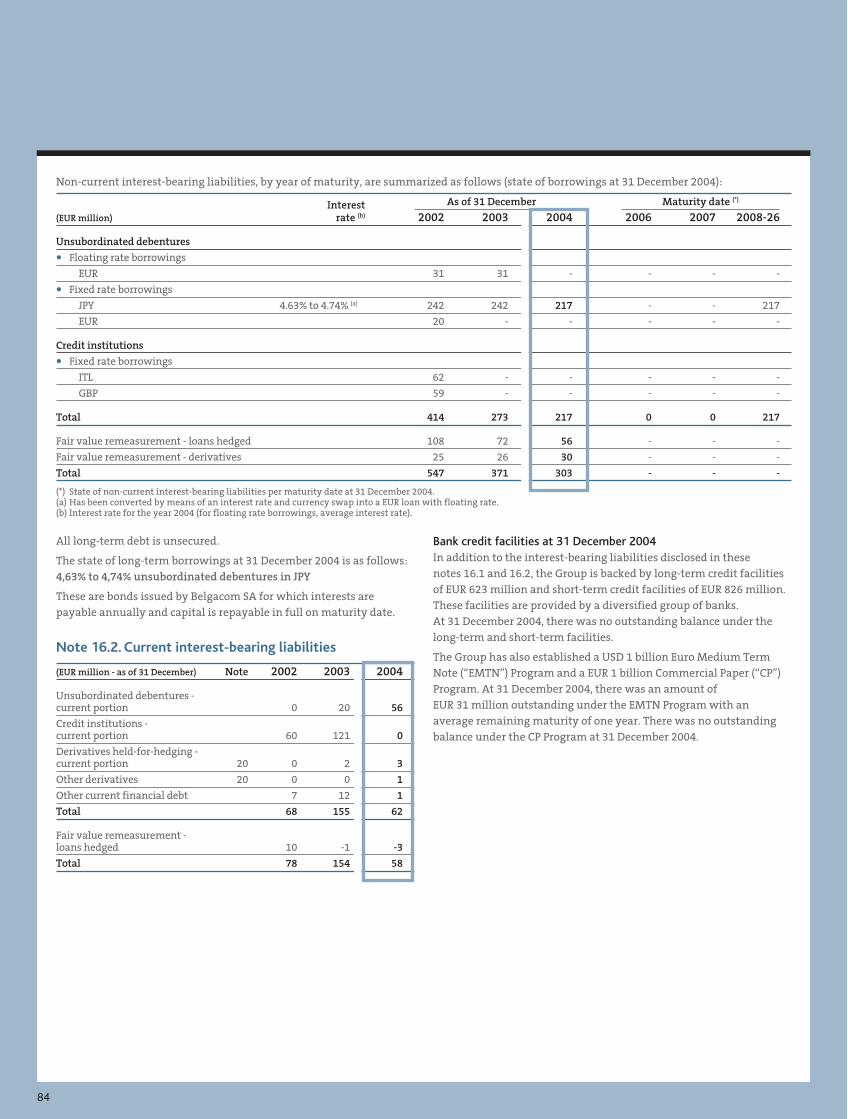
84
Non-current interest-bearing liabilities, by year of maturity, are summarized as follows (state of borrowings at 31 December 2004):
Interest As of 31 December Maturity date (*)
(EUR million) rate (b) 2002 2003 2004 2006 2007 2008-26
Unsubordinated debentures
• Floating rate borrowings
EUR 31 31 - - - -
• Fixed rate borrowings
JPY 4.63% to 4.74% (a) 242 242 217 - - 217
EUR 20 - - - - -
Credit institutions
• Fixed rate borrowings
ITL 62 - - - - -
GBP 59 - - - - -
Total 414 273 217 0 0 217
Fair value remeasurement - loans hedged 108 72 56 - - -
Fair value remeasurement - derivatives 25 26 30 - - -
Total 547 371 303 - - -
(*) State of non-current interest-bearing liabilities per maturity date at 31 December 2004.(a) Has been converted by means of an interest rate and currency swap into a EUR loan with floating rate.(b) Interest rate for the year 2004 (for floating rate borrowings, average interest rate).
All long-term debt is unsecured.
The state of long-term borrowings at 31 December 2004 is as follows:4,63% to 4,74% unsubordinated debentures in JPY
These are bonds issued by Belgacom SA for which interests arepayable annually and capital is repayable in full on maturity date.
Note 16.2. Current interest-bearing liabilities
(EUR million - as of 31 December) Note 2002 2003 2004
Unsubordinated debentures -current portion 0 20 56
Credit institutions -current portion 60 121 0
Derivatives held-for-hedging -current portion 20 0 2 3
Other derivatives 20 0 0 1
Other current financial debt 7 12 1
Total 68 155 62
Fair value remeasurement -loans hedged 10 -1 -3
Total 78 154 58
Bank credit facilities at 31 December 2004In addition to the interest-bearing liabilities disclosed in thesenotes 16.1 and 16.2, the Group is backed by long-term credit facilitiesof EUR 623 million and short-term credit facilities of EUR 826 million.These facilities are provided by a diversified group of banks.At 31 December 2004, there was no outstanding balance under thelong-term and short-term facilities.
The Group has also established a USD 1 billion Euro Medium TermNote (“EMTN”) Program and a EUR 1 billion Commercial Paper (“CP”)Program. At 31 December 2004, there was an amount ofEUR 31 million outstanding under the EMTN Program with anaverage remaining maturity of one year. There was no outstandingbalance under the CP Program at 31 December 2004.
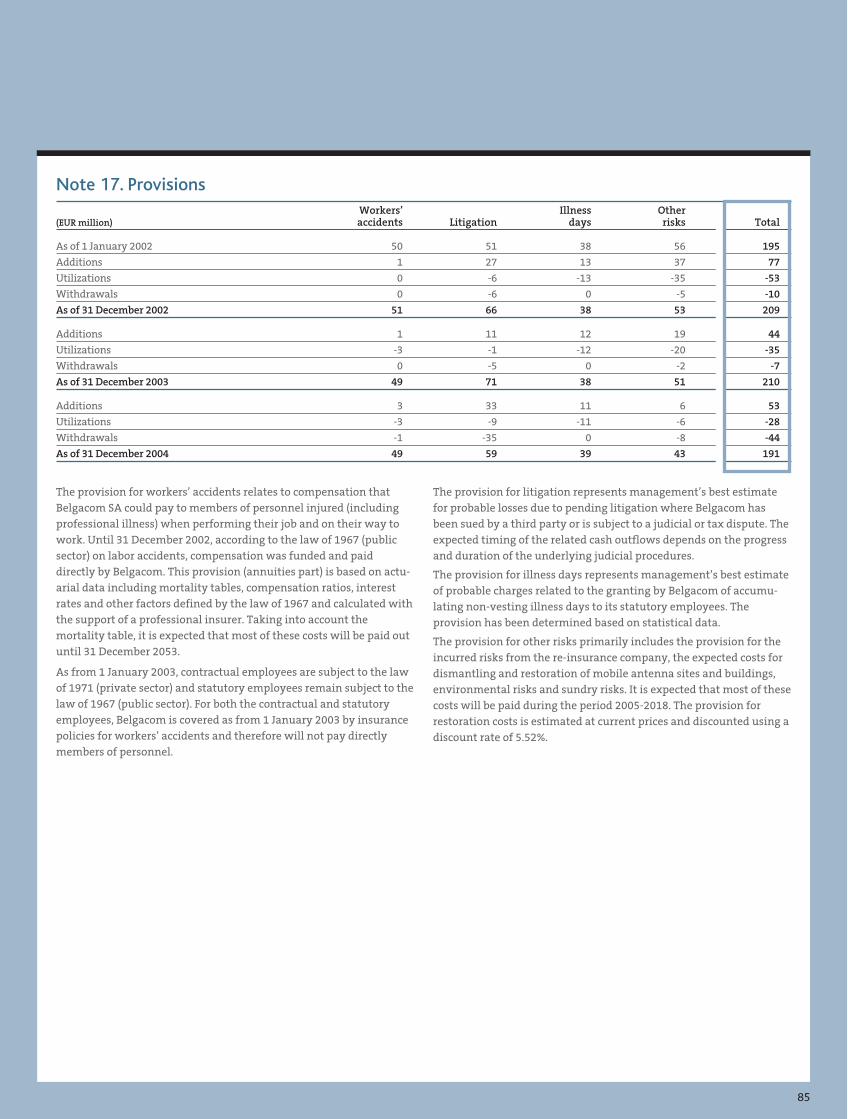
85
Note 17. ProvisionsWorkers’ Illness Other
(EUR million) accidents Litigation days risks Total
As of 1 January 2002 50 51 38 56 195
Additions 1 27 13 37 77
Utilizations 0 -6 -13 -35 -53
Withdrawals 0 -6 0 -5 -10
As of 31 December 2002 51 66 38 53 209
Additions 1 11 12 19 44
Utilizations -3 -1 -12 -20 -35
Withdrawals 0 -5 0 -2 -7
As of 31 December 2003 49 71 38 51 210
Additions 3 33 11 6 53
Utilizations -3 -9 -11 -6 -28
Withdrawals -1 -35 0 -8 -44
As of 31 December 2004 49 59 39 43 191
The provision for workers’ accidents relates to compensation thatBelgacom SA could pay to members of personnel injured (includingprofessional illness) when performing their job and on their way towork. Until 31 December 2002, according to the law of 1967 (publicsector) on labor accidents, compensation was funded and paiddirectly by Belgacom. This provision (annuities part) is based on actu-arial data including mortality tables, compensation ratios, interestrates and other factors defined by the law of 1967 and calculated withthe support of a professional insurer. Taking into account themortality table, it is expected that most of these costs will be paid outuntil 31 December 2053.
As from 1 January 2003, contractual employees are subject to the lawof 1971 (private sector) and statutory employees remain subject to thelaw of 1967 (public sector). For both the contractual and statutoryemployees, Belgacom is covered as from 1 January 2003 by insurancepolicies for workers’ accidents and therefore will not pay directlymembers of personnel.
The provision for litigation represents management’s best estimatefor probable losses due to pending litigation where Belgacom hasbeen sued by a third party or is subject to a judicial or tax dispute. Theexpected timing of the related cash outflows depends on the progressand duration of the underlying judicial procedures.
The provision for illness days represents management’s best estimateof probable charges related to the granting by Belgacom of accumu-lating non-vesting illness days to its statutory employees. Theprovision has been determined based on statistical data.
The provision for other risks primarily includes the provision for theincurred risks from the re-insurance company, the expected costs fordismantling and restoration of mobile antenna sites and buildings,environmental risks and sundry risks. It is expected that most of thesecosts will be paid during the period 2005-2018. The provision forrestoration costs is estimated at current prices and discounted using adiscount rate of 5.52%.
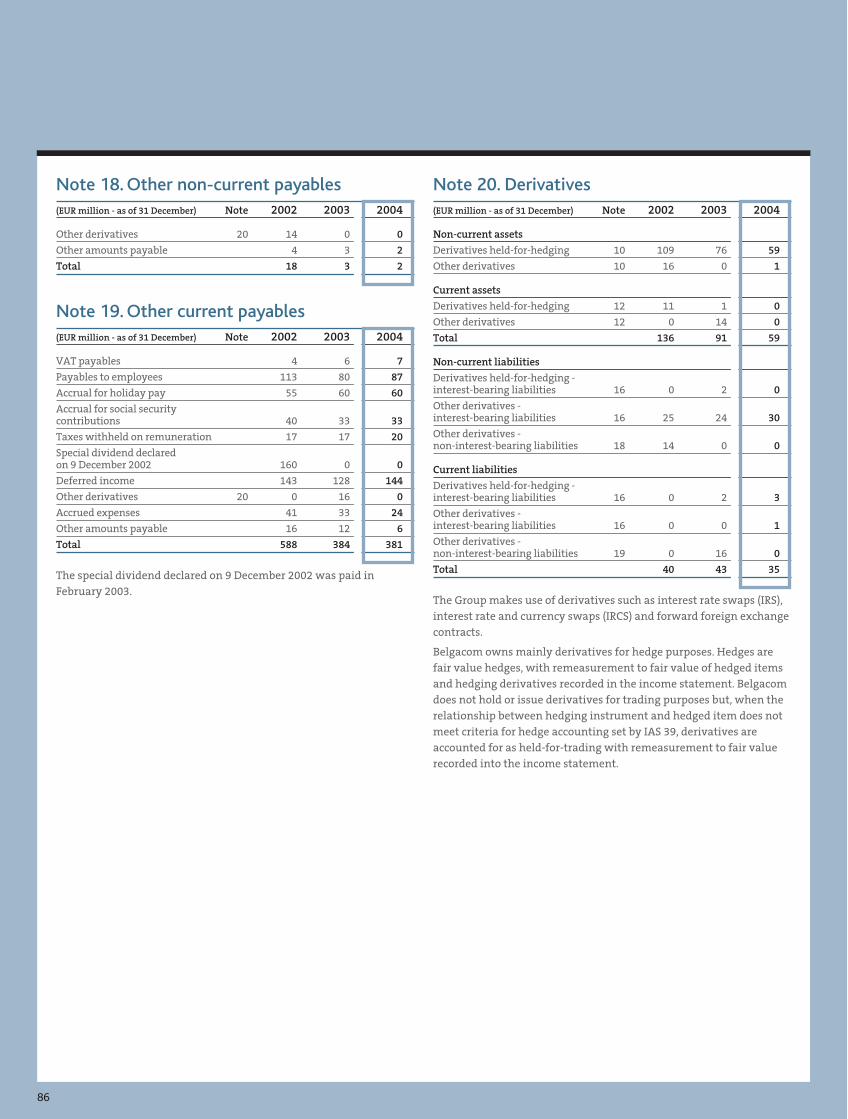
86
Note 18. Other non-current payables(EUR million - as of 31 December) Note 2002 2003 2004
Other derivatives 20 14 0 0
Other amounts payable 4 3 2
Total 18 3 2
Note 19. Other current payables(EUR million - as of 31 December) Note 2002 2003 2004
VAT payables 4 6 7
Payables to employees 113 80 87
Accrual for holiday pay 55 60 60
Accrual for social securitycontributions 40 33 33
Taxes withheld on remuneration 17 17 20
Special dividend declaredon 9 December 2002 160 0 0
Deferred income 143 128 144
Other derivatives 20 0 16 0
Accrued expenses 41 33 24
Other amounts payable 16 12 6
Total 588 384 381
The special dividend declared on 9 December 2002 was paid inFebruary 2003.
Note 20. Derivatives(EUR million - as of 31 December) Note 2002 2003 2004
Non-current assets
Derivatives held-for-hedging 10 109 76 59
Other derivatives 10 16 0 1
Current assets
Derivatives held-for-hedging 12 11 1 0
Other derivatives 12 0 14 0
Total 136 91 59
Non-current liabilities
Derivatives held-for-hedging -interest-bearing liabilities 16 0 2 0
Other derivatives -interest-bearing liabilities 16 25 24 30
Other derivatives -non-interest-bearing liabilities 18 14 0 0
Current liabilities
Derivatives held-for-hedging -interest-bearing liabilities 16 0 2 3
Other derivatives -interest-bearing liabilities 16 0 0 1
Other derivatives -non-interest-bearing liabilities 19 0 16 0
Total 40 43 35
The Group makes use of derivatives such as interest rate swaps (IRS),interest rate and currency swaps (IRCS) and forward foreign exchangecontracts.
Belgacom owns mainly derivatives for hedge purposes. Hedges arefair value hedges, with remeasurement to fair value of hedged itemsand hedging derivatives recorded in the income statement. Belgacomdoes not hold or issue derivatives for trading purposes but, when therelationship between hedging instrument and hedged item does notmeet criteria for hedge accounting set by IAS 39, derivatives areaccounted for as held-for-trading with remeasurement to fair valuerecorded into the income statement.
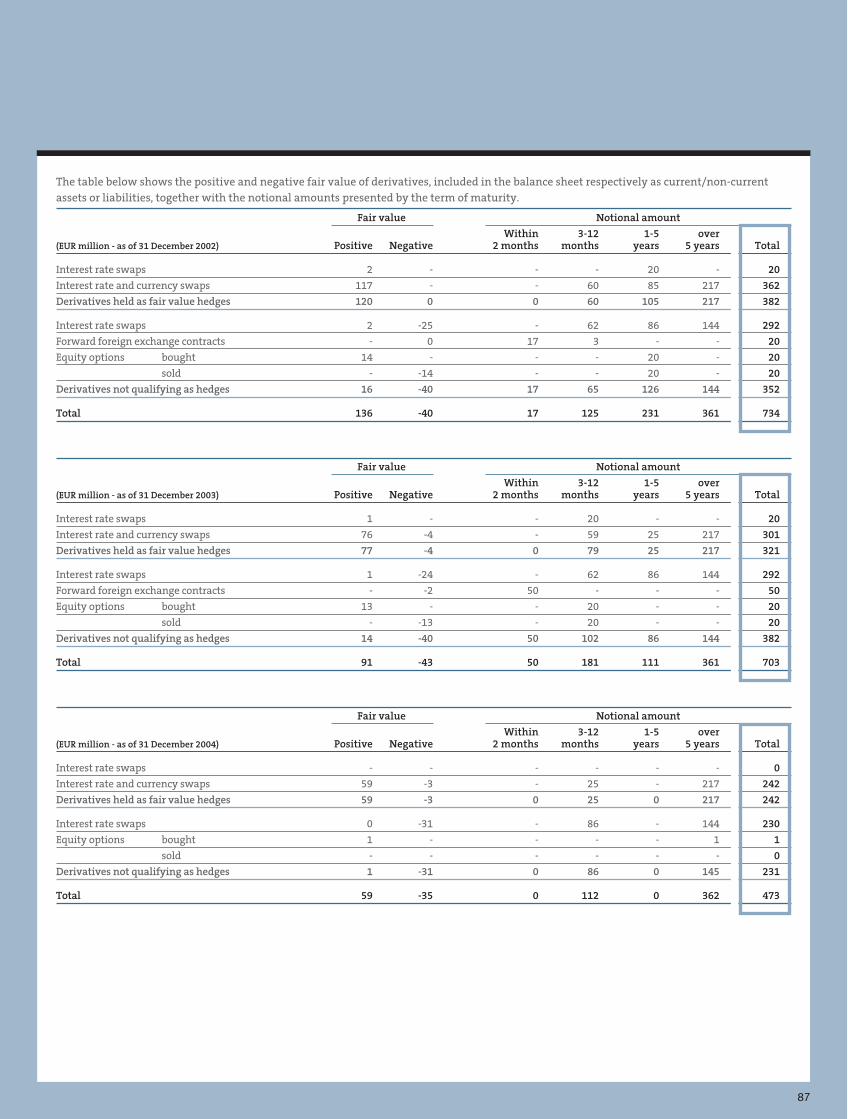
87
The table below shows the positive and negative fair value of derivatives, included in the balance sheet respectively as current/non-currentassets or liabilities, together with the notional amounts presented by the term of maturity.
Fair value Notional amount
Within 3-12 1-5 over(EUR million - as of 31 December 2002) Positive Negative 2 months months years 5 years Total
Interest rate swaps 2 - - - 20 - 20
Interest rate and currency swaps 117 - - 60 85 217 362
Derivatives held as fair value hedges 120 0 0 60 105 217 382
Interest rate swaps 2 -25 - 62 86 144 292
Forward foreign exchange contracts - 0 17 3 - - 20
Equity options bought 14 - - - 20 - 20
sold - -14 - - 20 - 20
Derivatives not qualifying as hedges 16 -40 17 65 126 144 352
Total 136 -40 17 125 231 361 734
Fair value Notional amount
Within 3-12 1-5 over(EUR million - as of 31 December 2003) Positive Negative 2 months months years 5 years Total
Interest rate swaps 1 - - 20 - - 20
Interest rate and currency swaps 76 -4 - 59 25 217 301
Derivatives held as fair value hedges 77 -4 0 79 25 217 321
Interest rate swaps 1 -24 - 62 86 144 292
Forward foreign exchange contracts - -2 50 - - - 50
Equity options bought 13 - - 20 - - 20
sold - -13 - 20 - - 20
Derivatives not qualifying as hedges 14 -40 50 102 86 144 382
Total 91 -43 50 181 111 361 703
Fair value Notional amount
Within 3-12 1-5 over(EUR million - as of 31 December 2004) Positive Negative 2 months months years 5 years Total
Interest rate swaps - - - - - - 0
Interest rate and currency swaps 59 -3 - 25 - 217 242
Derivatives held as fair value hedges 59 -3 0 25 0 217 242
Interest rate swaps 0 -31 - 86 - 144 230
Equity options bought 1 - - - - 1 1
sold - - - - - - 0
Derivatives not qualifying as hedges 1 -31 0 86 0 145 231
Total 59 -35 0 112 0 362 473
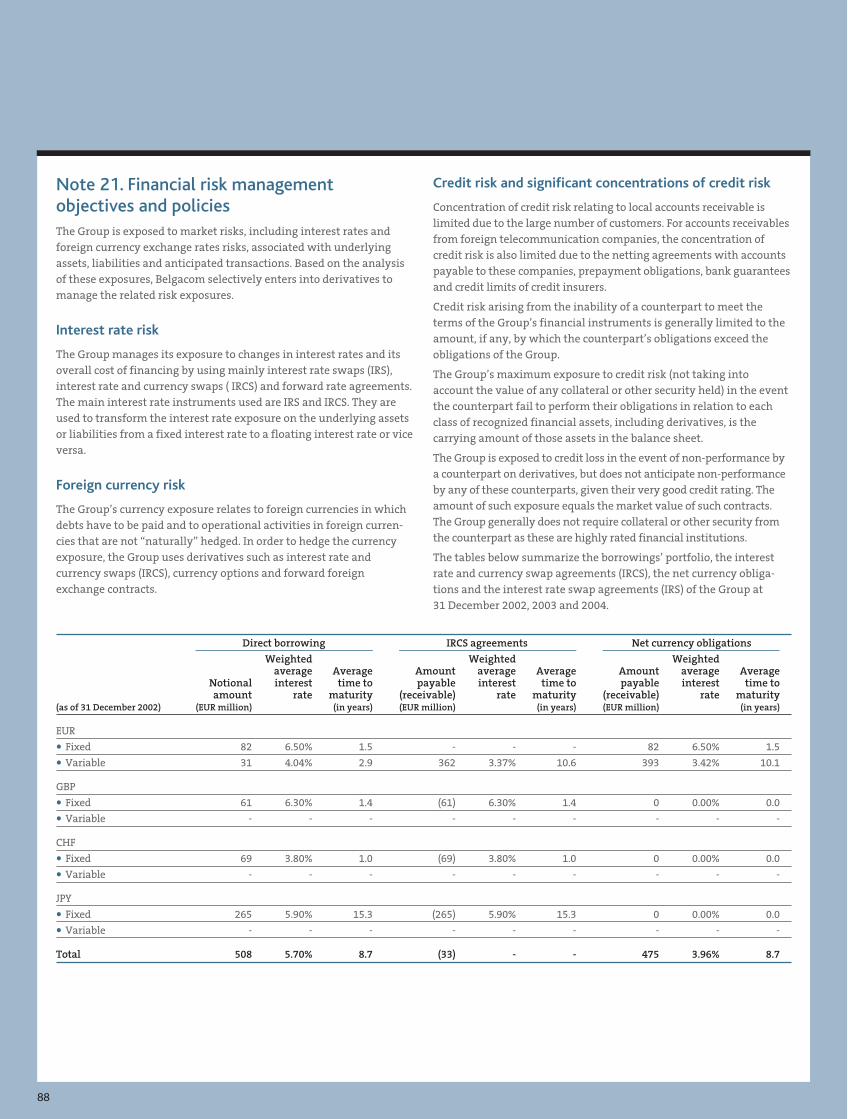
88
Note 21. Financial risk managementobjectives and policiesThe Group is exposed to market risks, including interest rates andforeign currency exchange rates risks, associated with underlyingassets, liabilities and anticipated transactions. Based on the analysisof these exposures, Belgacom selectively enters into derivatives tomanage the related risk exposures.
Interest rate risk
The Group manages its exposure to changes in interest rates and itsoverall cost of financing by using mainly interest rate swaps (IRS),interest rate and currency swaps ( IRCS) and forward rate agreements.The main interest rate instruments used are IRS and IRCS. They areused to transform the interest rate exposure on the underlying assetsor liabilities from a fixed interest rate to a floating interest rate or viceversa.
Foreign currency risk
The Group’s currency exposure relates to foreign currencies in whichdebts have to be paid and to operational activities in foreign curren-cies that are not “naturally” hedged. In order to hedge the currencyexposure, the Group uses derivatives such as interest rate andcurrency swaps (IRCS), currency options and forward foreignexchange contracts.
Credit risk and significant concentrations of credit risk
Concentration of credit risk relating to local accounts receivable islimited due to the large number of customers. For accounts receivablesfrom foreign telecommunication companies, the concentration ofcredit risk is also limited due to the netting agreements with accountspayable to these companies, prepayment obligations, bank guaranteesand credit limits of credit insurers.
Credit risk arising from the inability of a counterpart to meet theterms of the Group’s financial instruments is generally limited to theamount, if any, by which the counterpart’s obligations exceed theobligations of the Group.
The Group’s maximum exposure to credit risk (not taking intoaccount the value of any collateral or other security held) in the eventthe counterpart fail to perform their obligations in relation to eachclass of recognized financial assets, including derivatives, is thecarrying amount of those assets in the balance sheet.
The Group is exposed to credit loss in the event of non-performance bya counterpart on derivatives, but does not anticipate non-performanceby any of these counterparts, given their very good credit rating. Theamount of such exposure equals the market value of such contracts.The Group generally does not require collateral or other security fromthe counterpart as these are highly rated financial institutions.
The tables below summarize the borrowings’ portfolio, the interestrate and currency swap agreements (IRCS), the net currency obliga-tions and the interest rate swap agreements (IRS) of the Group at31 December 2002, 2003 and 2004.
Direct borrowing IRCS agreements Net currency obligations
Weighted Weighted Weightedaverage Average Amount average Average Amount average Average
Notional interest time to payable interest time to payable interest time toamount rate maturity (receivable) rate maturity (receivable) rate maturity
(as of 31 December 2002) (EUR million) (in years) (EUR million) (in years) (EUR million) (in years)
EUR
• Fixed 82 6.50% 1.5 - - - 82 6.50% 1.5
• Variable 31 4.04% 2.9 362 3.37% 10.6 393 3.42% 10.1
GBP
• Fixed 61 6.30% 1.4 (61) 6.30% 1.4 0 0.00% 0.0
• Variable - - - - - - - - -
CHF
• Fixed 69 3.80% 1.0 (69) 3.80% 1.0 0 0.00% 0.0
• Variable - - - - - - - - -
JPY
• Fixed 265 5.90% 15.3 (265) 5.90% 15.3 0 0.00% 0.0
• Variable - - - - - - - - -
Total 508 5.70% 8.7 (33) - - 475 3.96% 8.7
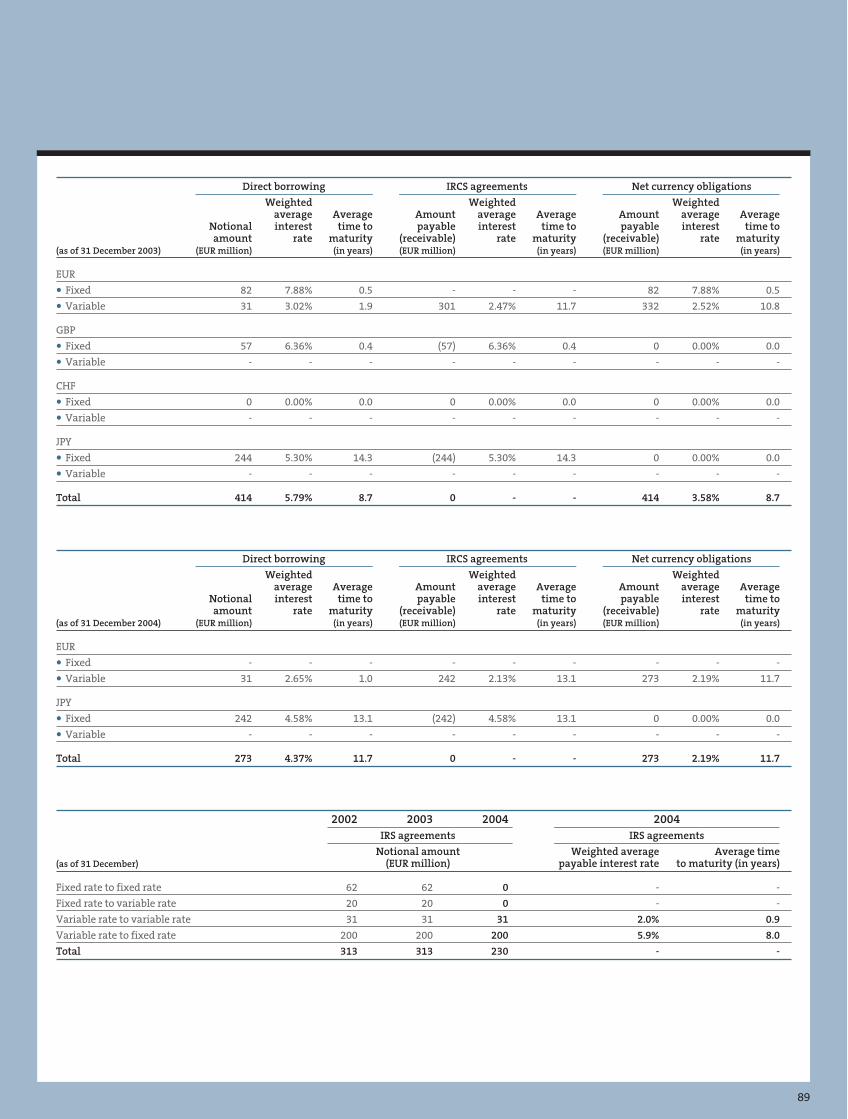
89
Direct borrowing IRCS agreements Net currency obligations
Weighted Weighted Weightedaverage Average Amount average Average Amount average Average
Notional interest time to payable interest time to payable interest time toamount rate maturity (receivable) rate maturity (receivable) rate maturity
(as of 31 December 2003) (EUR million) (in years) (EUR million) (in years) (EUR million) (in years)
EUR
• Fixed 82 7.88% 0.5 - - - 82 7.88% 0.5
• Variable 31 3.02% 1.9 301 2.47% 11.7 332 2.52% 10.8
GBP
• Fixed 57 6.36% 0.4 (57) 6.36% 0.4 0 0.00% 0.0
• Variable - - - - - - - - -
CHF
• Fixed 0 0.00% 0.0 0 0.00% 0.0 0 0.00% 0.0
• Variable - - - - - - - - -
JPY
• Fixed 244 5.30% 14.3 (244) 5.30% 14.3 0 0.00% 0.0
• Variable - - - - - - - - -
Total 414 5.79% 8.7 0 - - 414 3.58% 8.7
Direct borrowing IRCS agreements Net currency obligations
Weighted Weighted Weightedaverage Average Amount average Average Amount average Average
Notional interest time to payable interest time to payable interest time toamount rate maturity (receivable) rate maturity (receivable) rate maturity
(as of 31 December 2004) (EUR million) (in years) (EUR million) (in years) (EUR million) (in years)
EUR
• Fixed - - - - - - - - -
• Variable 31 2.65% 1.0 242 2.13% 13.1 273 2.19% 11.7
JPY
• Fixed 242 4.58% 13.1 (242) 4.58% 13.1 0 0.00% 0.0
• Variable - - - - - - - - -
Total 273 4.37% 11.7 0 - - 273 2.19% 11.7
2002 2003 2004 2004IRS agreements IRS agreements
Notional amount Weighted average Average time(as of 31 December) (EUR million) payable interest rate to maturity (in years)
Fixed rate to fixed rate 62 62 0 - -
Fixed rate to variable rate 20 20 0 - -
Variable rate to variable rate 31 31 31 2.0% 0.9
Variable rate to fixed rate 200 200 200 5.9% 8.0
Total 313 313 230 - -
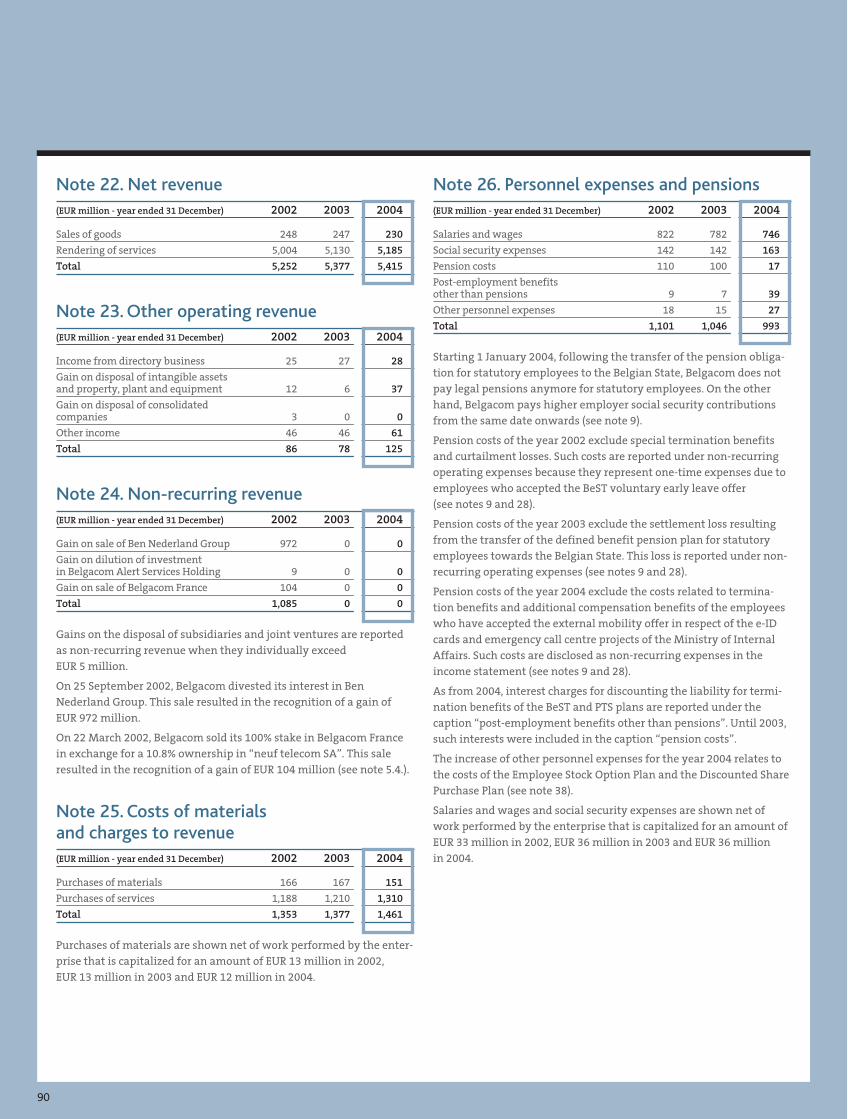
90
Note 22. Net revenue(EUR million - year ended 31 December) 2002 2003 2004
Sales of goods 248 247 230
Rendering of services 5,004 5,130 5,185
Total 5,252 5,377 5,415
Note 23. Other operating revenue(EUR million - year ended 31 December) 2002 2003 2004
Income from directory business 25 27 28
Gain on disposal of intangible assetsand property, plant and equipment 12 6 37
Gain on disposal of consolidatedcompanies 3 0 0
Other income 46 46 61
Total 86 78 125
Note 24. Non-recurring revenue(EUR million - year ended 31 December) 2002 2003 2004
Gain on sale of Ben Nederland Group 972 0 0
Gain on dilution of investmentin Belgacom Alert Services Holding 9 0 0
Gain on sale of Belgacom France 104 0 0
Total 1,085 0 0
Gains on the disposal of subsidiaries and joint ventures are reportedas non-recurring revenue when they individually exceedEUR 5 million.
On 25 September 2002, Belgacom divested its interest in BenNederland Group. This sale resulted in the recognition of a gain ofEUR 972 million.
On 22 March 2002, Belgacom sold its 100% stake in Belgacom Francein exchange for a 10.8% ownership in “neuf telecom SA”. This saleresulted in the recognition of a gain of EUR 104 million (see note 5.4.).
Note 25. Costs of materialsand charges to revenue(EUR million - year ended 31 December) 2002 2003 2004
Purchases of materials 166 167 151
Purchases of services 1,188 1,210 1,310
Total 1,353 1,377 1,461
Purchases of materials are shown net of work performed by the enter-prise that is capitalized for an amount of EUR 13 million in 2002,EUR 13 million in 2003 and EUR 12 million in 2004.
Note 26. Personnel expenses and pensions(EUR million - year ended 31 December) 2002 2003 2004
Salaries and wages 822 782 746
Social security expenses 142 142 163
Pension costs 110 100 17
Post-employment benefitsother than pensions 9 7 39
Other personnel expenses 18 15 27
Total 1,101 1,046 993
Starting 1 January 2004, following the transfer of the pension obliga-tion for statutory employees to the Belgian State, Belgacom does notpay legal pensions anymore for statutory employees. On the otherhand, Belgacom pays higher employer social security contributionsfrom the same date onwards (see note 9).
Pension costs of the year 2002 exclude special termination benefitsand curtailment losses. Such costs are reported under non-recurringoperating expenses because they represent one-time expenses due toemployees who accepted the BeST voluntary early leave offer(see notes 9 and 28).
Pension costs of the year 2003 exclude the settlement loss resultingfrom the transfer of the defined benefit pension plan for statutoryemployees towards the Belgian State. This loss is reported under non-recurring operating expenses (see notes 9 and 28).
Pension costs of the year 2004 exclude the costs related to termina-tion benefits and additional compensation benefits of the employeeswho have accepted the external mobility offer in respect of the e-IDcards and emergency call centre projects of the Ministry of InternalAffairs. Such costs are disclosed as non-recurring expenses in theincome statement (see notes 9 and 28).
As from 2004, interest charges for discounting the liability for termi-nation benefits of the BeST and PTS plans are reported under thecaption “post-employment benefits other than pensions”. Until 2003,such interests were included in the caption “pension costs”.
The increase of other personnel expenses for the year 2004 relates tothe costs of the Employee Stock Option Plan and the Discounted SharePurchase Plan (see note 38).
Salaries and wages and social security expenses are shown net ofwork performed by the enterprise that is capitalized for an amount ofEUR 33 million in 2002, EUR 36 million in 2003 and EUR 36 millionin 2004.
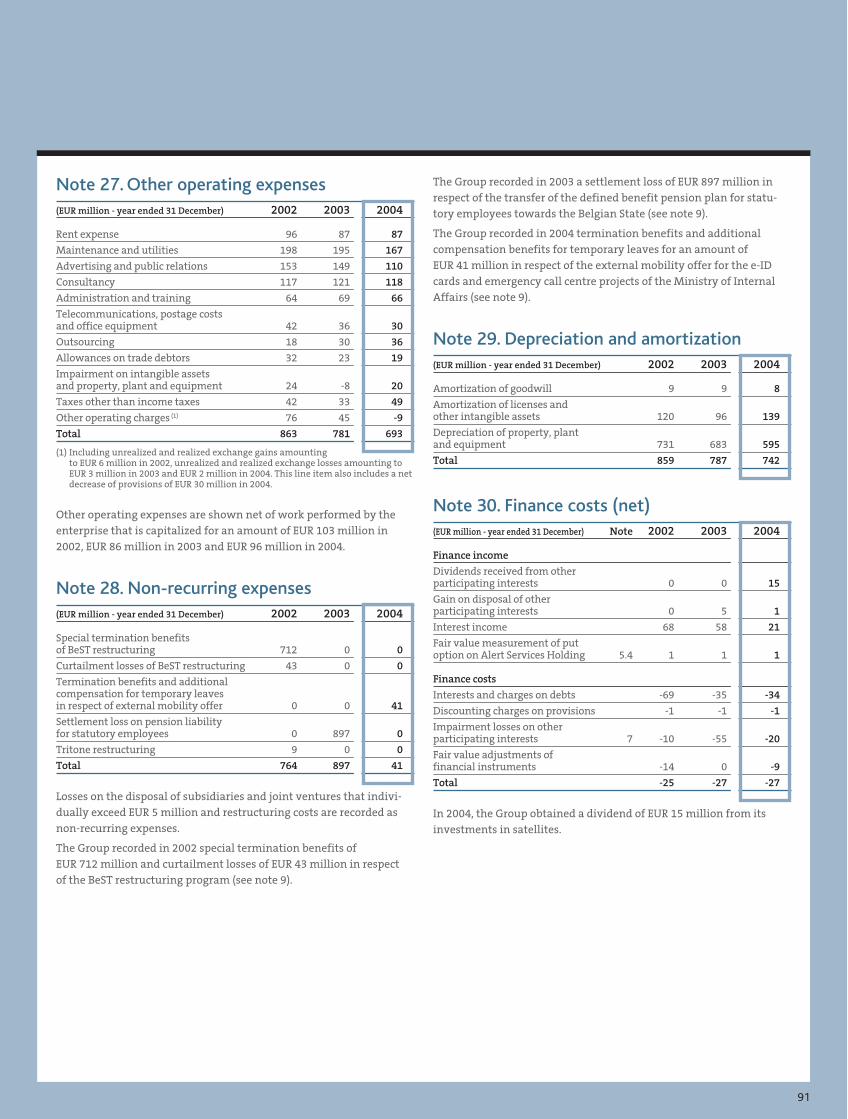
91
Note 27. Other operating expenses(EUR million - year ended 31 December) 2002 2003 2004
Rent expense 96 87 87
Maintenance and utilities 198 195 167
Advertising and public relations 153 149 110
Consultancy 117 121 118
Administration and training 64 69 66
Telecommunications, postage costsand office equipment 42 36 30
Outsourcing 18 30 36
Allowances on trade debtors 32 23 19
Impairment on intangible assetsand property, plant and equipment 24 -8 20
Taxes other than income taxes 42 33 49
Other operating charges (1) 76 45 -9
Total 863 781 693
(1) Including unrealized and realized exchange gains amountingto EUR 6 million in 2002, unrealized and realized exchange losses amounting toEUR 3 million in 2003 and EUR 2 million in 2004. This line item also includes a netdecrease of provisions of EUR 30 million in 2004.
Other operating expenses are shown net of work performed by theenterprise that is capitalized for an amount of EUR 103 million in2002, EUR 86 million in 2003 and EUR 96 million in 2004.
Note 28. Non-recurring expenses(EUR million - year ended 31 December) 2002 2003 2004
Special termination benefitsof BeST restructuring 712 0 0
Curtailment losses of BeST restructuring 43 0 0
Termination benefits and additionalcompensation for temporary leavesin respect of external mobility offer 0 0 41
Settlement loss on pension liabilityfor statutory employees 0 897 0
Tritone restructuring 9 0 0
Total 764 897 41
Losses on the disposal of subsidiaries and joint ventures that indivi-dually exceed EUR 5 million and restructuring costs are recorded asnon-recurring expenses.
The Group recorded in 2002 special termination benefits ofEUR 712 million and curtailment losses of EUR 43 million in respectof the BeST restructuring program (see note 9).
The Group recorded in 2003 a settlement loss of EUR 897 million inrespect of the transfer of the defined benefit pension plan for statu-tory employees towards the Belgian State (see note 9).
The Group recorded in 2004 termination benefits and additionalcompensation benefits for temporary leaves for an amount ofEUR 41 million in respect of the external mobility offer for the e-IDcards and emergency call centre projects of the Ministry of InternalAffairs (see note 9).
Note 29. Depreciation and amortization(EUR million - year ended 31 December) 2002 2003 2004
Amortization of goodwill 9 9 8
Amortization of licenses andother intangible assets 120 96 139
Depreciation of property, plantand equipment 731 683 595
Total 859 787 742
Note 30. Finance costs (net)(EUR million - year ended 31 December) Note 2002 2003 2004
Finance income
Dividends received from otherparticipating interests 0 0 15
Gain on disposal of otherparticipating interests 0 5 1
Interest income 68 58 21
Fair value measurement of putoption on Alert Services Holding 5.4 1 1 1
Finance costs
Interests and charges on debts -69 -35 -34
Discounting charges on provisions -1 -1 -1
Impairment losses on otherparticipating interests 7 -10 -55 -20
Fair value adjustments offinancial instruments -14 0 -9
Total -25 -27 -27
In 2004, the Group obtained a dividend of EUR 15 million from itsinvestments in satellites.
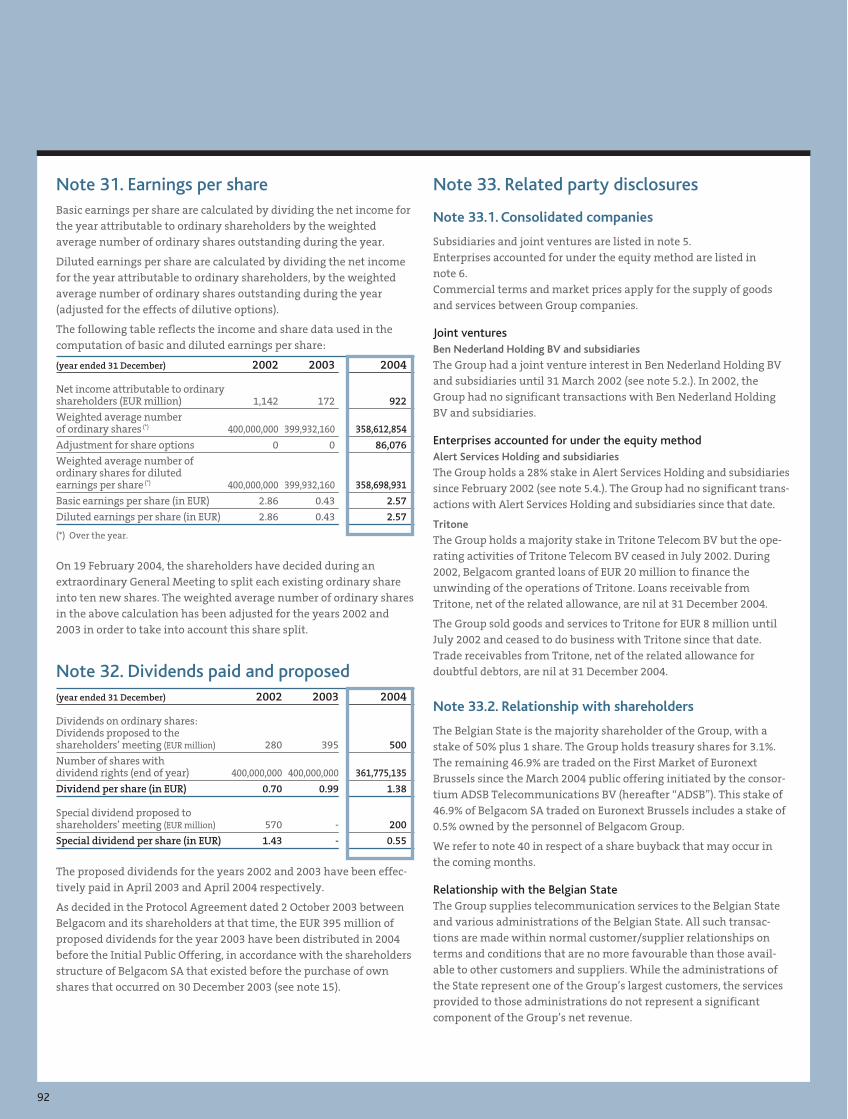
92
Note 31. Earnings per shareBasic earnings per share are calculated by dividing the net income forthe year attributable to ordinary shareholders by the weightedaverage number of ordinary shares outstanding during the year.
Diluted earnings per share are calculated by dividing the net incomefor the year attributable to ordinary shareholders, by the weightedaverage number of ordinary shares outstanding during the year(adjusted for the effects of dilutive options).
The following table reflects the income and share data used in thecomputation of basic and diluted earnings per share:
(year ended 31 December) 2002 2003 2004
Net income attributable to ordinaryshareholders (EUR million) 1,142 172 922
Weighted average numberof ordinary shares (*) 400,000,000 399,932,160 358,612,854
Adjustment for share options 0 0 86,076
Weighted average number ofordinary shares for dilutedearnings per share (*) 400,000,000 399,932,160 358,698,931
Basic earnings per share (in EUR) 2.86 0.43 2.57
Diluted earnings per share (in EUR) 2.86 0.43 2.57
(*) Over the year.
On 19 February 2004, the shareholders have decided during anextraordinary General Meeting to split each existing ordinary shareinto ten new shares. The weighted average number of ordinary sharesin the above calculation has been adjusted for the years 2002 and2003 in order to take into account this share split.
Note 32. Dividends paid and proposed(year ended 31 December) 2002 2003 2004
Dividends on ordinary shares:Dividends proposed to theshareholders’ meeting (EUR million) 280 395 500
Number of shares withdividend rights (end of year) 400,000,000 400,000,000 361,775,135
Dividend per share (in EUR) 0.70 0.99 1.38
Special dividend proposed toshareholders’ meeting (EUR million) 570 - 200
Special dividend per share (in EUR) 1.43 - 0.55
The proposed dividends for the years 2002 and 2003 have been effec-tively paid in April 2003 and April 2004 respectively.
As decided in the Protocol Agreement dated 2 October 2003 betweenBelgacom and its shareholders at that time, the EUR 395 million ofproposed dividends for the year 2003 have been distributed in 2004before the Initial Public Offering, in accordance with the shareholdersstructure of Belgacom SA that existed before the purchase of ownshares that occurred on 30 December 2003 (see note 15).
Note 33. Related party disclosures
Note 33.1. Consolidated companies
Subsidiaries and joint ventures are listed in note 5.Enterprises accounted for under the equity method are listed innote 6.Commercial terms and market prices apply for the supply of goodsand services between Group companies.
Joint venturesBen Nederland Holding BV and subsidiaries
The Group had a joint venture interest in Ben Nederland Holding BVand subsidiaries until 31 March 2002 (see note 5.2.). In 2002, theGroup had no significant transactions with Ben Nederland HoldingBV and subsidiaries.
Enterprises accounted for under the equity methodAlert Services Holding and subsidiaries
The Group holds a 28% stake in Alert Services Holding and subsidiariessince February 2002 (see note 5.4.). The Group had no significant trans-actions with Alert Services Holding and subsidiaries since that date.
Tritone
The Group holds a majority stake in Tritone Telecom BV but the ope-rating activities of Tritone Telecom BV ceased in July 2002. During2002, Belgacom granted loans of EUR 20 million to finance theunwinding of the operations of Tritone. Loans receivable fromTritone, net of the related allowance, are nil at 31 December 2004.
The Group sold goods and services to Tritone for EUR 8 million untilJuly 2002 and ceased to do business with Tritone since that date.Trade receivables from Tritone, net of the related allowance fordoubtful debtors, are nil at 31 December 2004.
Note 33.2. Relationship with shareholders
The Belgian State is the majority shareholder of the Group, with astake of 50% plus 1 share. The Group holds treasury shares for 3.1%.The remaining 46.9% are traded on the First Market of EuronextBrussels since the March 2004 public offering initiated by the consor-tium ADSB Telecommunications BV (hereafter “ADSB”). This stake of46.9% of Belgacom SA traded on Euronext Brussels includes a stake of0.5% owned by the personnel of Belgacom Group.
We refer to note 40 in respect of a share buyback that may occur inthe coming months.
Relationship with the Belgian StateThe Group supplies telecommunication services to the Belgian Stateand various administrations of the Belgian State. All such transac-tions are made within normal customer/supplier relationships onterms and conditions that are no more favourable than those avail-able to other customers and suppliers. While the administrations ofthe State represent one of the Group’s largest customers, the servicesprovided to those administrations do not represent a significantcomponent of the Group’s net revenue.
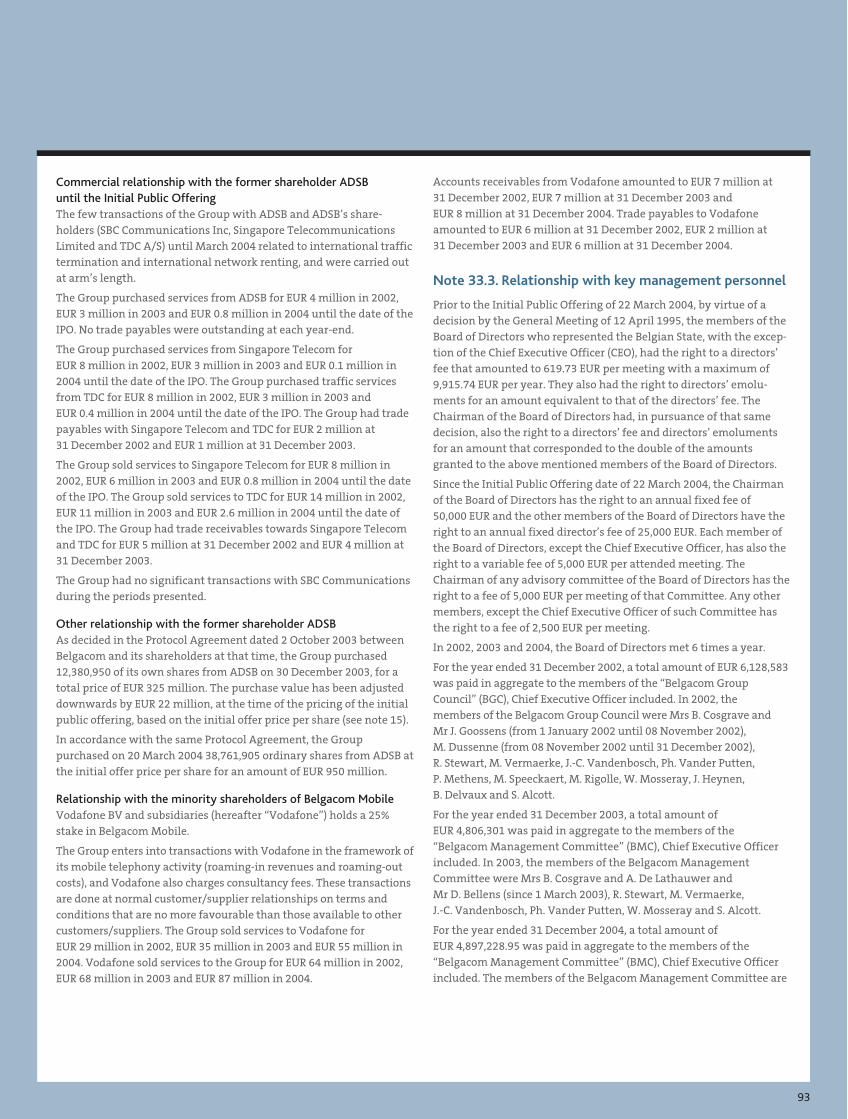
93
Commercial relationship with the former shareholder ADSBuntil the Initial Public OfferingThe few transactions of the Group with ADSB and ADSB’s share-holders (SBC Communications Inc, Singapore TelecommunicationsLimited and TDC A/S) until March 2004 related to international traffictermination and international network renting, and were carried outat arm’s length.
The Group purchased services from ADSB for EUR 4 million in 2002,EUR 3 million in 2003 and EUR 0.8 million in 2004 until the date of theIPO. No trade payables were outstanding at each year-end.
The Group purchased services from Singapore Telecom forEUR 8 million in 2002, EUR 3 million in 2003 and EUR 0.1 million in2004 until the date of the IPO. The Group purchased traffic servicesfrom TDC for EUR 8 million in 2002, EUR 3 million in 2003 andEUR 0.4 million in 2004 until the date of the IPO. The Group had tradepayables with Singapore Telecom and TDC for EUR 2 million at31 December 2002 and EUR 1 million at 31 December 2003.
The Group sold services to Singapore Telecom for EUR 8 million in2002, EUR 6 million in 2003 and EUR 0.8 million in 2004 until the dateof the IPO. The Group sold services to TDC for EUR 14 million in 2002,EUR 11 million in 2003 and EUR 2.6 million in 2004 until the date ofthe IPO. The Group had trade receivables towards Singapore Telecomand TDC for EUR 5 million at 31 December 2002 and EUR 4 million at31 December 2003.
The Group had no significant transactions with SBC Communicationsduring the periods presented.
Other relationship with the former shareholder ADSBAs decided in the Protocol Agreement dated 2 October 2003 betweenBelgacom and its shareholders at that time, the Group purchased12,380,950 of its own shares from ADSB on 30 December 2003, for atotal price of EUR 325 million. The purchase value has been adjusteddownwards by EUR 22 million, at the time of the pricing of the initialpublic offering, based on the initial offer price per share (see note 15).
In accordance with the same Protocol Agreement, the Grouppurchased on 20 March 2004 38,761,905 ordinary shares from ADSB atthe initial offer price per share for an amount of EUR 950 million.
Relationship with the minority shareholders of Belgacom MobileVodafone BV and subsidiaries (hereafter “Vodafone”) holds a 25%stake in Belgacom Mobile.
The Group enters into transactions with Vodafone in the framework ofits mobile telephony activity (roaming-in revenues and roaming-outcosts), and Vodafone also charges consultancy fees. These transactionsare done at normal customer/supplier relationships on terms andconditions that are no more favourable than those available to othercustomers/suppliers. The Group sold services to Vodafone forEUR 29 million in 2002, EUR 35 million in 2003 and EUR 55 million in2004. Vodafone sold services to the Group for EUR 64 million in 2002,EUR 68 million in 2003 and EUR 87 million in 2004.
Accounts receivables from Vodafone amounted to EUR 7 million at31 December 2002, EUR 7 million at 31 December 2003 andEUR 8 million at 31 December 2004. Trade payables to Vodafoneamounted to EUR 6 million at 31 December 2002, EUR 2 million at31 December 2003 and EUR 6 million at 31 December 2004.
Note 33.3. Relationship with key management personnel
Prior to the Initial Public Offering of 22 March 2004, by virtue of adecision by the General Meeting of 12 April 1995, the members of theBoard of Directors who represented the Belgian State, with the excep-tion of the Chief Executive Officer (CEO), had the right to a directors’fee that amounted to 619.73 EUR per meeting with a maximum of9,915.74 EUR per year. They also had the right to directors’ emolu-ments for an amount equivalent to that of the directors’ fee. TheChairman of the Board of Directors had, in pursuance of that samedecision, also the right to a directors’ fee and directors’ emolumentsfor an amount that corresponded to the double of the amountsgranted to the above mentioned members of the Board of Directors.
Since the Initial Public Offering date of 22 March 2004, the Chairmanof the Board of Directors has the right to an annual fixed fee of50,000 EUR and the other members of the Board of Directors have theright to an annual fixed director’s fee of 25,000 EUR. Each member ofthe Board of Directors, except the Chief Executive Officer, has also theright to a variable fee of 5,000 EUR per attended meeting. TheChairman of any advisory committee of the Board of Directors has theright to a fee of 5,000 EUR per meeting of that Committee. Any othermembers, except the Chief Executive Officer of such Committee hasthe right to a fee of 2,500 EUR per meeting.
In 2002, 2003 and 2004, the Board of Directors met 6 times a year.
For the year ended 31 December 2002, a total amount of EUR 6,128,583was paid in aggregate to the members of the “Belgacom GroupCouncil” (BGC), Chief Executive Officer included. In 2002, themembers of the Belgacom Group Council were Mrs B. Cosgrave andMr J. Goossens (from 1 January 2002 until 08 November 2002),M. Dussenne (from 08 November 2002 until 31 December 2002),R. Stewart, M. Vermaerke, J.-C. Vandenbosch, Ph. Vander Putten,P. Methens, M. Speeckaert, M. Rigolle, W. Mosseray, J. Heynen,B. Delvaux and S. Alcott.
For the year ended 31 December 2003, a total amount ofEUR 4,806,301 was paid in aggregate to the members of the“Belgacom Management Committee” (BMC), Chief Executive Officerincluded. In 2003, the members of the Belgacom ManagementCommittee were Mrs B. Cosgrave and A. De Lathauwer andMr D. Bellens (since 1 March 2003), R. Stewart, M. Vermaerke,J.-C. Vandenbosch, Ph. Vander Putten, W. Mosseray and S. Alcott.
For the year ended 31 December 2004, a total amount ofEUR 4,897,228.95 was paid in aggregate to the members of the“Belgacom Management Committee” (BMC), Chief Executive Officerincluded. The members of the Belgacom Management Committee are
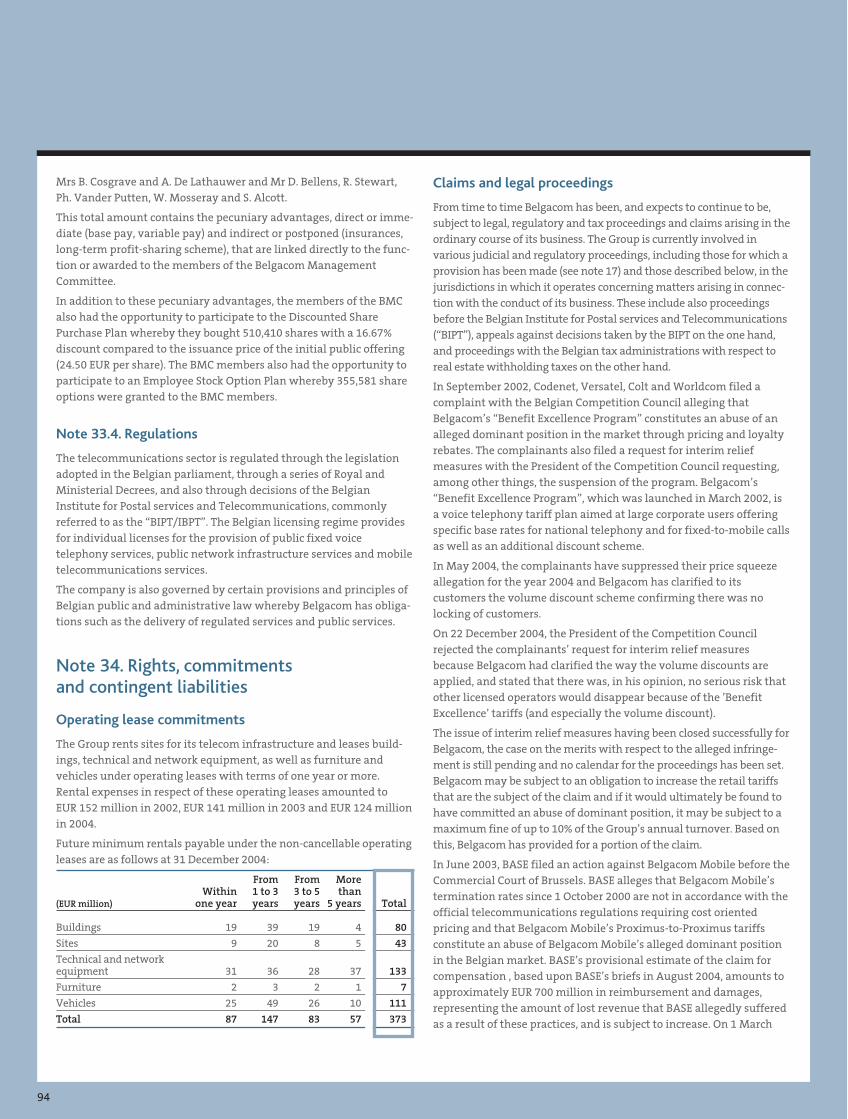
94
Mrs B. Cosgrave and A. De Lathauwer and Mr D. Bellens, R. Stewart,Ph. Vander Putten, W. Mosseray and S. Alcott.
This total amount contains the pecuniary advantages, direct or imme-diate (base pay, variable pay) and indirect or postponed (insurances,long-term profit-sharing scheme), that are linked directly to the func-tion or awarded to the members of the Belgacom ManagementCommittee.
In addition to these pecuniary advantages, the members of the BMCalso had the opportunity to participate to the Discounted SharePurchase Plan whereby they bought 510,410 shares with a 16.67%discount compared to the issuance price of the initial public offering(24.50 EUR per share). The BMC members also had the opportunity toparticipate to an Employee Stock Option Plan whereby 355,581 shareoptions were granted to the BMC members.
Note 33.4. Regulations
The telecommunications sector is regulated through the legislationadopted in the Belgian parliament, through a series of Royal andMinisterial Decrees, and also through decisions of the BelgianInstitute for Postal services and Telecommunications, commonlyreferred to as the “BIPT/IBPT”. The Belgian licensing regime providesfor individual licenses for the provision of public fixed voicetelephony services, public network infrastructure services and mobiletelecommunications services.
The company is also governed by certain provisions and principles ofBelgian public and administrative law whereby Belgacom has obliga-tions such as the delivery of regulated services and public services.
Note 34. Rights, commitmentsand contingent liabilities
Operating lease commitments
The Group rents sites for its telecom infrastructure and leases build-ings, technical and network equipment, as well as furniture andvehicles under operating leases with terms of one year or more.Rental expenses in respect of these operating leases amounted toEUR 152 million in 2002, EUR 141 million in 2003 and EUR 124 millionin 2004.
Future minimum rentals payable under the non-cancellable operatingleases are as follows at 31 December 2004:
From From MoreWithin 1 to 3 3 to 5 than
(EUR million) one year years years 5 years Total
Buildings 19 39 19 4 80
Sites 9 20 8 5 43
Technical and networkequipment 31 36 28 37 133
Furniture 2 3 2 1 7
Vehicles 25 49 26 10 111
Total 87 147 83 57 373
Claims and legal proceedings
From time to time Belgacom has been, and expects to continue to be,subject to legal, regulatory and tax proceedings and claims arising in theordinary course of its business. The Group is currently involved invarious judicial and regulatory proceedings, including those for which aprovision has been made (see note 17) and those described below, in thejurisdictions in which it operates concerning matters arising in connec-tion with the conduct of its business. These include also proceedingsbefore the Belgian Institute for Postal services and Telecommunications(“BIPT”), appeals against decisions taken by the BIPT on the one hand,and proceedings with the Belgian tax administrations with respect toreal estate withholding taxes on the other hand.
In September 2002, Codenet, Versatel, Colt and Worldcom filed acomplaint with the Belgian Competition Council alleging thatBelgacom’s “Benefit Excellence Program” constitutes an abuse of analleged dominant position in the market through pricing and loyaltyrebates. The complainants also filed a request for interim reliefmeasures with the President of the Competition Council requesting,among other things, the suspension of the program. Belgacom’s“Benefit Excellence Program”, which was launched in March 2002, isa voice telephony tariff plan aimed at large corporate users offeringspecific base rates for national telephony and for fixed-to-mobile callsas well as an additional discount scheme.
In May 2004, the complainants have suppressed their price squeezeallegation for the year 2004 and Belgacom has clarified to itscustomers the volume discount scheme confirming there was nolocking of customers.
On 22 December 2004, the President of the Competition Councilrejected the complainants’ request for interim relief measuresbecause Belgacom had clarified the way the volume discounts areapplied, and stated that there was, in his opinion, no serious risk thatother licensed operators would disappear because of the ’BenefitExcellence’ tariffs (and especially the volume discount).
The issue of interim relief measures having been closed successfully forBelgacom, the case on the merits with respect to the alleged infringe-ment is still pending and no calendar for the proceedings has been set.Belgacom may be subject to an obligation to increase the retail tariffsthat are the subject of the claim and if it would ultimately be found tohave committed an abuse of dominant position, it may be subject to amaximum fine of up to 10% of the Group’s annual turnover. Based onthis, Belgacom has provided for a portion of the claim.
In June 2003, BASE filed an action against Belgacom Mobile before theCommercial Court of Brussels. BASE alleges that Belgacom Mobile’stermination rates since 1 October 2000 are not in accordance with theofficial telecommunications regulations requiring cost orientedpricing and that Belgacom Mobile’s Proximus-to-Proximus tariffsconstitute an abuse of Belgacom Mobile’s alleged dominant positionin the Belgian market. BASE’s provisional estimate of the claim forcompensation , based upon BASE’s briefs in August 2004, amounts toapproximately EUR 700 million in reimbursement and damages,representing the amount of lost revenue that BASE allegedly sufferedas a result of these practices, and is subject to increase. On 1 March
95
2004, Mobistar filed a request to intervene voluntarily in the actionbrought by BASE against Belgacom Mobile. Mobistar alleges that ifthe Commercial Court of Brussels were to find that Belgacom Mobile’stermination rates were not in accordance with the obligation of cost-oriented pricing, Mobistar should be awarded damages provisionallyestimated by Mobistar to range between EUR 967,000 andEUR 56,000,000 depending on the termination rates upheld by theCourt. Furthermore, Mobistar alleges that in addition to the Proximus-to-Proximus tariffs, certain tariff schemes offered by Belgacom Mobileto business and corporate customers constitute an abuse of BelgacomMobile’s allegedly dominant position. Mobistar requests the Court toappoint a court expert to calculate the amount of alleged damagesand seeks compensation for such damages, provisionally estimated ata minimum of EUR 50,000,000. As with the action filed by BASE,Belgacom Mobile is contesting the claim made by Mobistar. Belgacombelieves that its mobile termination rates were in line with therulings of the BIPT. Accordingly, no provision was recorded in thefinancial statements at 31 December 2004.
On 13 May 2004, the Netherlands Arbitration Institute has ruled infavor of Belgacom in the request for binding arbitration that the Danishoperator TDC A/S had initiated against the company in October 2002for an amount of EUR 91 million. The dispute related to the allocationof an alleged capital gain resulting from the entry of a new investor inthe share capital of Ben Nederland Group in 2000. As a consequenceBelgacom no longer provides for this claim at 31 December 2004.
Capital expenditures commitments
At 31 December 2004, the Group has contracted commitments ofEUR 56 million, mainly for the acquisition of intangible assets andtechnical and network equipment.
Other rights and commitments
At 31 December 2004, the Group has the following other rights andcommitments:
• the Group received bank guarantees from its suppliers to guaranteethe completion of works ordered by the Group for an amount ofEUR 20 million;
• the Group granted bank guarantees to its customers to guarantee,among others, the completion of works ordered by its clients andthe payment of rental expenses for renting of sites for antennasinstallation for an amount of EUR 31 million;
• the Group granted bank guarantees to the Walloon Region ofBelgium to guarantee execution by Wallonie Intranet SA (hereafter“WIN SA”) of all obligations provided for in WIN SA’s contractualagreement with the Walloon Region. The commitment, which isrenewable, amounts to EUR 7.4 million;
• the Group has a put option from 1 January 2003 through 1 January2009 whereby the Group can sell at a strike price of minimumEUR 40 million the remaining 28% stake it currently owns in AlertServices Holding SA. The Group exercised this put option towardsthe co-shareholder Securitas Direct International in 3 January 2005(see note 40).
Note 35. Cross-border lease arrangementsDuring the period 1996 through 2001, the Group entered into severalcross-border lease arrangements with foreign investors relating topart of its fixed and mobile switches equipment. Under the terms ofthese agreements, which range in duration from 13 to 16 years, theGroup received at the inception date of the arrangements a totalamount of USD 684 million and placed a total amount ofUSD 654 million on deposit. The Group entered, in respect of thedeposits, into non-refundable payment undertaking agreements withhighly rated banks.
Based on interpretation 27 (SIC-27, “Evaluating the substance oftransactions involving the legal form of a lease”), the Groupconcluded that these arrangements in substance do not involve alease and that the related lease debts and deposits must not be recog-nized in the financial statements because they do not meet thedefinition of an asset and a liability under IFRS.
In respect of these arrangements, the Group received fees from theforeign investors or realized gains for a total amount of EUR 23 million.These fees or gains are recognized in the income statement under thecaption “other operating revenue” over the lifetime of the respectiveagreements. The fees effectively recognized in income amount toEUR 1.6 million in 2002, 2003 and 2004.
On 25 September 2002, the Group sold its investment in BenNederland Group but agreed it will continue to guarantee thepayment of leasing debts amounting at 31 December 2004 toUSD 63 million (EUR 46 million), in case the payment undertakers onthe related cross-border lease arrangement would become insolvent.The risk that this guarantee will result in a payment by the Group ismitigated by the fact that the deposit institutions involved are ratedAAA or AA by Standard & Poors. The term of the related leasing debtexpires in 2012.
96
Note 36. Net financial position of the GroupThe Group defines net financial position as the net amount of invest-ments, cash and cash equivalents, interest-bearing liabilities andrelated derivatives (including remeasurement to fair value).
(EUR million - as of 31 December) Note 2002 2003 2004
Assets
Investments (*) 10, 13 286 42 87
Cash and cash equivalents (*) 14 1,326 562 325
Non-current derivatives 10 111 77 59
Current derivatives 12 11 1 0
Liabilities
Non-current interest-bearing liabilities (*) 16 -547 -371 -303
Current interest-bearing liabilities (*) 16 -78 -154 -58
Net financial position 1,109 157 110
(*) After remeasurement to fair value, if applicable.
Non-current interest-bearing liabilities include non-current deriva-tives at fair value amounting to EUR 25 million in 2002, EUR 24 millionin 2003 and EUR 30 million in 2004 (see note 16).
Note 37. Fair value of financial instrumentsThe estimated fair values of financial assets and liabilities which arenot carried at fair value in the balance sheet are presented in thefollowing tables:
(EUR million - Carrying Estimatedas of 31 December 2002) Note amount fair value Difference
Financial assets
Other participating interests 7 207 207 0
Other non-current assets 10 12 12 0
Trade receivables 11 947 947 0
Current income tax asset 8 1 1 0
Other current assets 12 66 66 0
Investments 13 250 250 0
Cash and cash equivalents 14 1,326 1,326 0
Financial liabilities
Interest-bearing liabilities,non-current and current 16 -100 -101 -1
Other non-current payables 18 -4 -4 0
Trade payables -850 -850 0
Income tax payable 8 -150 -150 0
Other current payables 19 -588 -588 0
Net difference between recordedamount and estimated fair value -1
(EUR million - Carrying Estimatedas of 31 December 2003) Note amount fair value Difference
Financial assets
Other non-current assets 10 14 14 0
Trade receivables 11 873 873 0
Current income tax asset 8 35 35 0
Other current assets 12 53 53 0
Cash and cash equivalents 14 562 562 0
Financial liabilities
Interest-bearing liabilities,non-current and current 16 -107 -104 3
Other non-current payables 18 -3 -3 0
Trade payables -809 -809 0
Income tax payable 8 -198 -198 0
Other current payables 19 -366 -366 0
Net difference between recordedamount and estimated fair value 3
(EUR million - Carrying Estimatedas of 31 December 2004) Note amount fair value Difference
Financial assets
Other non-current assets 10 14 14 0
Trade receivables 11 844 844 0
Current income tax asset 8 50 50 0
Other current assets 12 52 52 0
Cash and cash equivalents 14 325 325 0
Financial liabilities
Interest-bearing liabilities,non-current and current 16 -32 -33 0
Other non-current payables 18 -2 -2 0
Trade payables -782 -782 0
Income tax payable 8 -224 -224 0
Other current payables 19 -381 -381 0
Net difference between recordedamount and estimated fair value 0
97
Note 38. Share-based Payment
Discounted Share Purchase Plan
In March 2004, the Group launched a Discounted Share Purchase Plan(hereafter “DSPP”), that provided all employees the opportunity tobuy shares of the company at a 16.67% discount compared to theissuance price of the initial public offering (24.50 EUR per share).
Under the plan, the employees purchased a total number of1,842,026 shares at the discounted price of 20.42 EUR per share. Thecost of the discount amounted to EUR 7.5 million and was recorded inpersonnel expenses (see note 26).
Employee Stock Option Plan
In March 2004, Belgacom launched an Employee Stock Option Plan(hereafter “ESOP”) whereby 1,128,500 share options were granted tothe top management of the Group. In respect of this arrangement, theGroup has early adopted IFRS 2 (“Share-based Payments”), as issuedon 19 February 2004.
The fair value of the share options at inception date (amounting toEUR 5 million) is recognized over their vesting period. The shareoptions vest over a three year period in accordance with the gradedvesting method. The annual charge of the graded vesting is recog-nized in personnel expenses and amounts to EUR 2 million in 2004.
At the moment of exercise, the employee will pay the exercise price of24.50 EUR per share, with physical delivery of the share. The shareoptions are exercisable until 22 March 2011 at the latest, except theshare options of the Chief Executive Officer that are exercisable until2012 at the latest.
The ESOP rules define specific vesting conditions and exercise periodsfor the share options in case of voluntary or involuntary leave of aplan participant. In case of voluntary leave of the employee, allunvested options forfeit except during the first year, for which thefirst third of the options vests immediately and must be exercisedwithin two years as from the date of leave. In case of involuntaryleave of the employee, all unvested options vest immediately andmust be exercised within two years as from the date of leave.
The evolution of the shares option plan is as follows:
Number of Weighted averagestock options exercise price (in EUR)
Outstanding at 1 January 2004 0 -
Movements during the period:
Granted 1,128,500 24.50
Forfeited 0 -
Exercised 0 -
Expired 0 -
Total 1,128,500 24.50
Outstanding at 31 December 2004 1,128,500 24.50
Exercisable at 31 December 2004 5,331 24.50
The following assumptions were used for determining the weightedaverage fair value of the share options at grant date (EUR 4.29):
Option pricing model Binomial
Contractual life of the options 7 years
Expected life 5 (to 6) years
Exercise price EUR 24.50
Expected volatility (compared to peer groupvolatility) 27.50%
Expected dividend pay-out ratio 50% - 60%
Risk free interest rate Euro swap annual rate
On 31 December 2004, no share option has been exercised yet.
Note 39. Segment reportingThe Board of Directors and the Chief Executive Officer manage theoperations of Belgacom Group by business segments. These businesssegments are the primary segments and can be described as follows:
• Fixed Line Services. This segment provides retail voice, data andInternet services, to residential and business customers in Belgium,as well as regulated and commercial wholesale services to othercarriers and service providers in Belgium.
• Mobile Communications Services. This segment provides retailmobile telephony services to residential and business customers inBelgium and provides wholesale data services to third parties. Priorto the disinvestment in March 2002 of the Group’s interest in theBen Nederland Group, the results of operations of the BenNederland Group were also included in this business segment.
• International Carrier Services. This segment provides voice, dataand capacity and infrastructure services to telecommunicationsoperators worldwide.
The Group’s head office and central functions are included for finan-cial reporting purposes within the Fixed Line Services segment.
When a legal entity includes more than one segment, adjustments forinter-segment pricing are determined on an arm’s length basis.Segment results, assets and liabilities include items attributable to asegment as well as those that can be allocated on a reasonable basis.
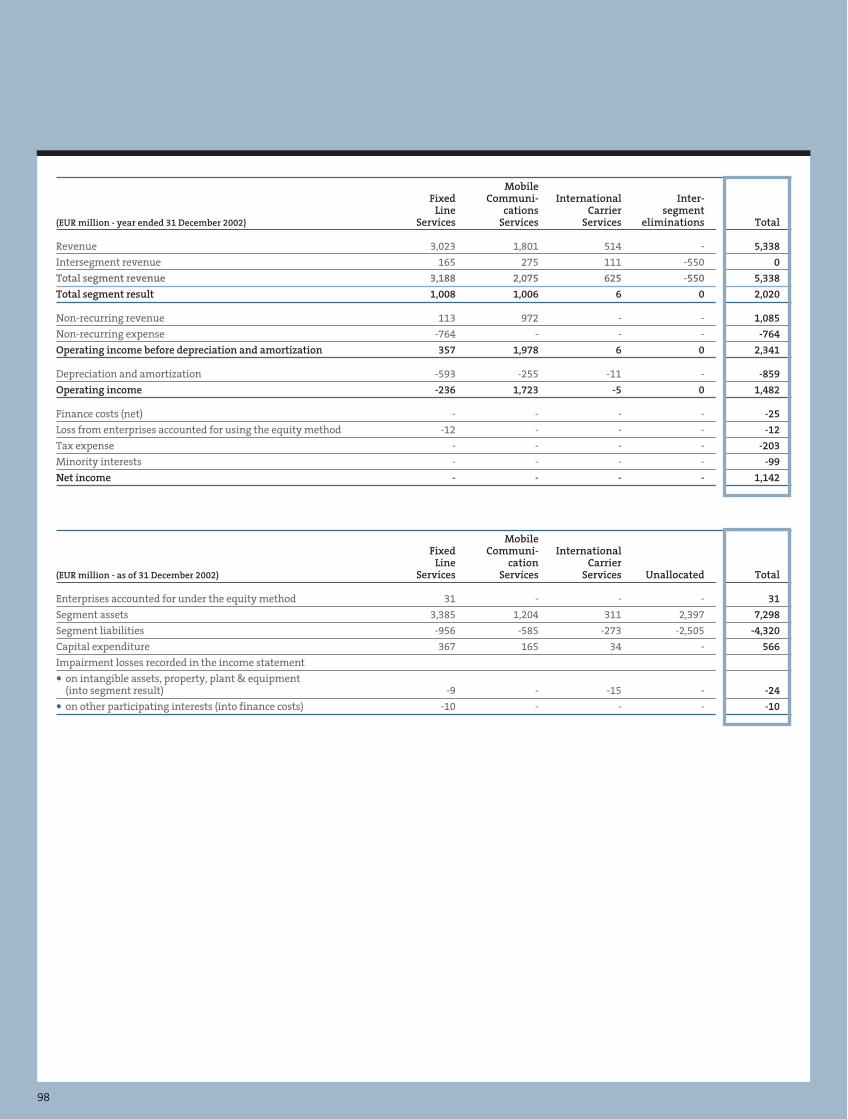
98
MobileFixed Communi- International Inter-
Line cations Carrier segment(EUR million - year ended 31 December 2002) Services Services Services eliminations Total
Revenue 3,023 1,801 514 - 5,338
Intersegment revenue 165 275 111 -550 0
Total segment revenue 3,188 2,075 625 -550 5,338
Total segment result 1,008 1,006 6 0 2,020
Non-recurring revenue 113 972 - - 1,085
Non-recurring expense -764 - - - -764
Operating income before depreciation and amortization 357 1,978 6 0 2,341
Depreciation and amortization -593 -255 -11 - -859
Operating income -236 1,723 -5 0 1,482
Finance costs (net) - - - - -25
Loss from enterprises accounted for using the equity method -12 - - - -12
Tax expense - - - - -203
Minority interests - - - - -99
Net income - - - - 1,142
MobileFixed Communi- International
Line cation Carrier(EUR million - as of 31 December 2002) Services Services Services Unallocated Total
Enterprises accounted for under the equity method 31 - - - 31
Segment assets 3,385 1,204 311 2,397 7,298
Segment liabilities -956 -585 -273 -2,505 -4,320
Capital expenditure 367 165 34 - 566
Impairment losses recorded in the income statement
• on intangible assets, property, plant & equipment(into segment result) -9 - -15 - -24
• on other participating interests (into finance costs) -10 - - - -10

99
MobileFixed Communi- International Inter-
Line cations Carrier segment(EUR million - year ended 31 December 2003) Services Services Services eliminations Total
Revenue 2,971 1,957 527 - 5,454
Intersegment revenue 137 225 99 -461 0
Total segment revenue 3,108 2,181 626 -461 5,454
Total segment result 1,109 1,113 28 0 2,250
Non-recurring expense -897 - - - -897
Operating income before depreciation and amortization 212 1,113 28 0 1,353
Depreciation and amortization -565 -196 -26 - -787
Operating income -353 917 1 0 566
Finance costs (net) - - - - -27
Loss from enterprises accounted for using the equity method -4 - - - -4
Tax expense - - - - -208
Minority interests - - - - -154
Net income - - - - 172
MobileFixed Communi- International
Line cation Carrier(EUR million - as of 31 December 2003) Services Services Services Unallocated Total
Enterprises accounted for under the equity method 27 - - - 27
Segment assets 3,084 1,160 243 1,522 6,009
Segment liabilities -916 -576 -231 -1,738 -3,461
Capital expenditure 336 149 17 - 502
Impairment losses recorded in the income statement
• on intangible assets, property, plant & equipment(into segment result) - -1 9 - 8
• on consolidated companies (into segment result) -2 - - - -2
• on other participating interests (into finance costs) -55 - - - -55
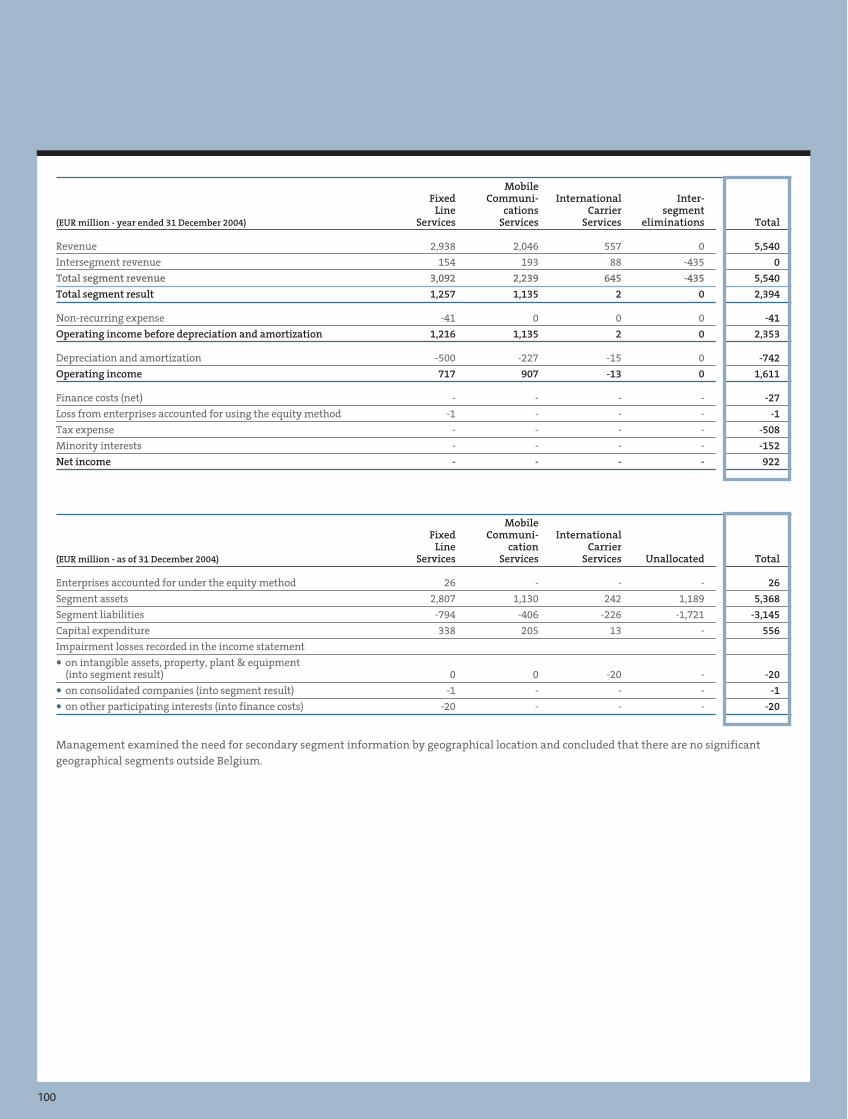
100
MobileFixed Communi- International Inter-
Line cations Carrier segment(EUR million - year ended 31 December 2004) Services Services Services eliminations Total
Revenue 2,938 2,046 557 0 5,540
Intersegment revenue 154 193 88 -435 0
Total segment revenue 3,092 2,239 645 -435 5,540
Total segment result 1,257 1,135 2 0 2,394
Non-recurring expense -41 0 0 0 -41
Operating income before depreciation and amortization 1,216 1,135 2 0 2,353
Depreciation and amortization -500 -227 -15 0 -742
Operating income 717 907 -13 0 1,611
Finance costs (net) - - - - -27
Loss from enterprises accounted for using the equity method -1 - - - -1
Tax expense - - - - -508
Minority interests - - - - -152
Net income - - - - 922
MobileFixed Communi- International
Line cation Carrier(EUR million - as of 31 December 2004) Services Services Services Unallocated Total
Enterprises accounted for under the equity method 26 - - - 26
Segment assets 2,807 1,130 242 1,189 5,368
Segment liabilities -794 -406 -226 -1,721 -3,145
Capital expenditure 338 205 13 - 556
Impairment losses recorded in the income statement
• on intangible assets, property, plant & equipment(into segment result) 0 0 -20 - -20
• on consolidated companies (into segment result) -1 - - - -1
• on other participating interests (into finance costs) -20 - - - -20
Management examined the need for secondary segment information by geographical location and concluded that there are no significantgeographical segments outside Belgium.
101
Note 40. Post balance sheet eventsIn January 2005, Belgacom SA sold to Securitas Direct Internationalfor EUR 50 million its 28% minority stake in Alert Services Holding SAvia the exercise of its put option foreseen in the initial agreementwith Securitas signed in April 2001.
In January 2005, Belgacom SA contributed the branch of activityof its International Carrier Services segment to its subsidiaryBelgacom International Carrier Services SA (BICS) incorporated on27 August 2004.
In February 2005, Belgacom signed a joint venture agreement withSwisscom stipulating that Swisscom Fixnet AG will transfer all of itscarrier activities in BICS in exchange of a stake of 28% in the capitalof BICS.
In January 2005, Belgacom SA sold all shares of Belgacom DirectoryServices SA, a subsidiary of the Group, to Promedia SA for an amountof EUR 285 million.
On 24 February 2005, the Belgacom Board of Directors decided toconduct a share buyback for a maximum amount of EUR 300 millionand for a share price that must not be more than 5% above and 10%below the highest closing price in the thirty-day trading periodpreceding the transaction.
Note 41. Recent IFRS pronouncementsBelgacom does not early adopt any IASB standards or interpretationsexcept IFRS 2 (“Share-based Payment”) in 2004 and IFRS 1 (“First timeAdoption of IFRS”) in 2002 and 2003.
102
report of the independent auditors
Ernst & Young Tel : +32 (0)2 774 91 11
Reviseurs d’Entreprises Fax : +32 (0)2 774 90 90
Bedrijfsrevisoren
Avenue Marcel Thiry 204
Marcel Thirylaan 204
B-1200 Bruxelles - Brussel
To the Shareholders of Belgacom SA de droit public/NV van publiek recht
We have audited the accompanying consolidated balance sheets of Belgacom SA de droit public/NV van publiek recht and subsidiaries(“Belgacom Group”) as of 31 December 2002, 2003 and 2004, and the related consolidated statements of income, of changes in shareholders’equity and cash flows for the years then ended. These consolidated financial statements are the responsibility of the Company’s Board ofDirectors. Our responsibility is to express an opinion on these consolidated financial statements based on our audits.
We conducted our audits in accordance with International Standards on Auditing. Those standards require that we plan and perform the auditsto obtain reasonable assurance about whether the consolidated financial statements are free of material misstatement. An audit includesexamining, on a test basis, evidence supporting the amounts and disclosures in the consolidated financial statements. An audit also includesassessing the accounting principles used and significant estimates made by management, as well as evaluating the overall consolidatedfinancial statement presentation. We believe that our audits provide a reasonable basis for our opinion.
In our opinion, the consolidated financial statements present fairly, in all material respects, the consolidated financial position of BelgacomGroup as of 31 December 2002, 2003 and 2004, and of the consolidated results of their operations and their cash flows for the years then endedin accordance with International Financial Reporting Standards (“IFRS”).
We also reported separately on the consolidated financial statements of Belgacom Group for the year ended at 31 December 2002 prepared inaccordance with accounting and reporting laws and regulations applicable in Belgium.
Brussels, Belgium, 18 March 2005
Ernst & Young Reviseurs d’Entreprises S.C.C.R.L./Bedrijfsrevisoren B.C.V.B.A. represented by
Ludo SWOLFSPartner
103
extract of the statutory financial statementsof Belgacom S.A. under public law - Belgian GAAP
104 • Income statement
106 • Balance sheet after appropriation
108 • Appropriation statement
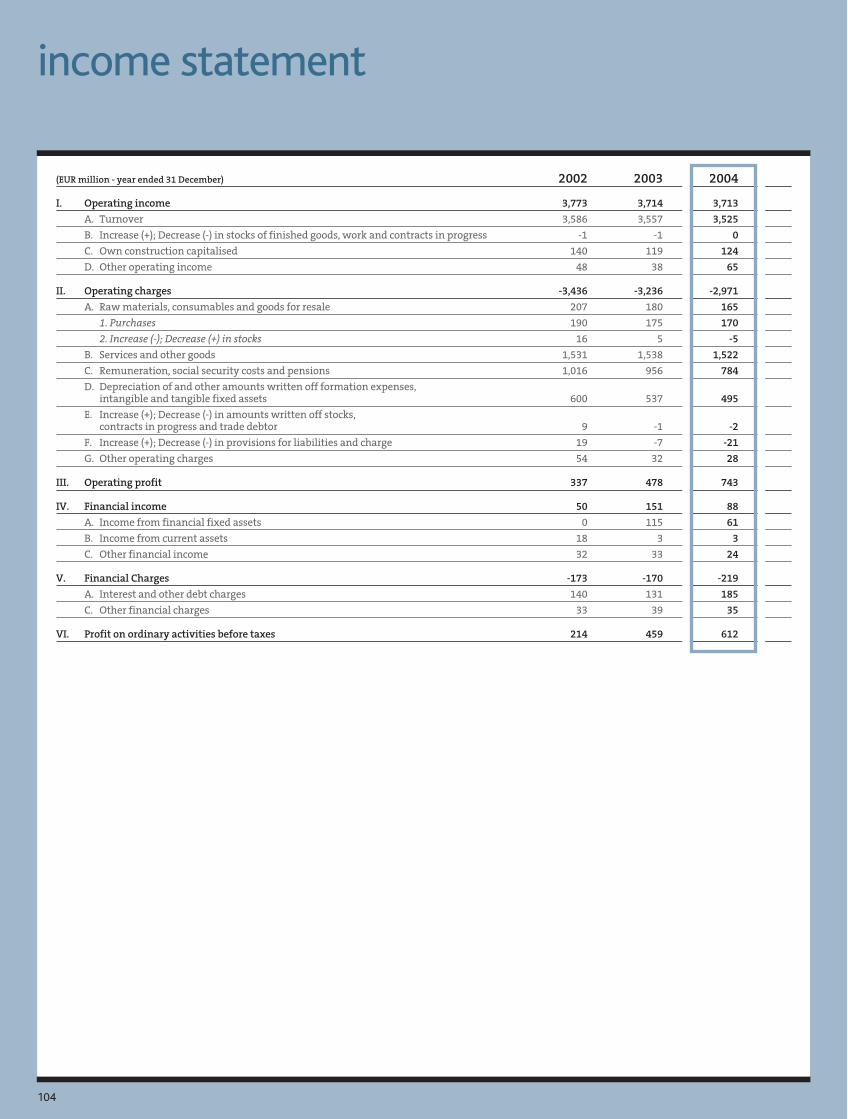
(EUR million - year ended 31 December) 2002 2003 2004
I. Operating income 3,773 3,714 3,713
A. Turnover 3,586 3,557 3,525
B. Increase (+); Decrease (-) in stocks of finished goods, work and contracts in progress -1 -1 0
C. Own construction capitalised 140 119 124
D. Other operating income 48 38 65
II. Operating charges -3,436 -3,236 -2,971
A. Raw materials, consumables and goods for resale 207 180 165
1. Purchases 190 175 170
2. Increase (-); Decrease (+) in stocks 16 5 -5
B. Services and other goods 1,531 1,538 1,522
C. Remuneration, social security costs and pensions 1,016 956 784
D. Depreciation of and other amounts written off formation expenses,intangible and tangible fixed assets 600 537 495
E. Increase (+); Decrease (-) in amounts written off stocks,contracts in progress and trade debtor 9 -1 -2
F. Increase (+); Decrease (-) in provisions for liabilities and charge 19 -7 -21
G. Other operating charges 54 32 28
III. Operating profit 337 478 743
IV. Financial income 50 151 88
A. Income from financial fixed assets 0 115 61
B. Income from current assets 18 3 3
C. Other financial income 32 33 24
V. Financial Charges -173 -170 -219
A. Interest and other debt charges 140 131 185
C. Other financial charges 33 39 35
VI. Profit on ordinary activities before taxes 214 459 612
104
income statement
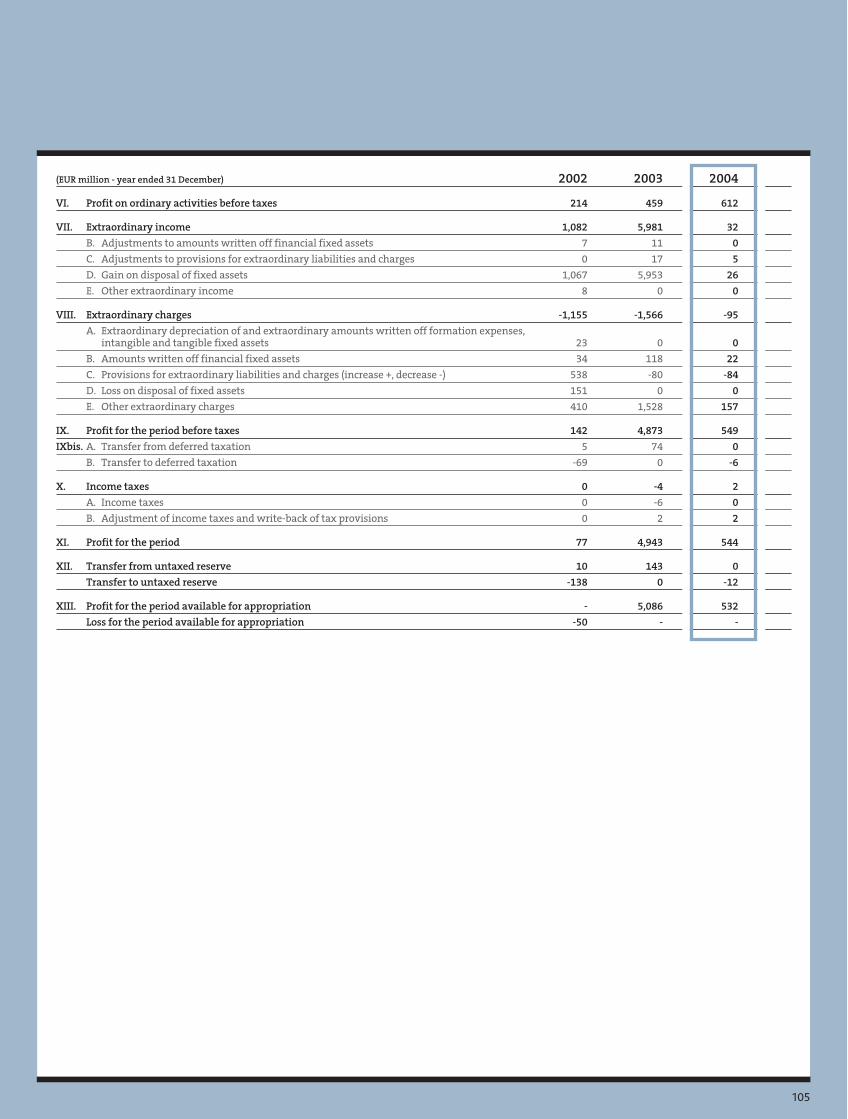
105
(EUR million - year ended 31 December) 2002 2003 2004
VI. Profit on ordinary activities before taxes 214 459 612
VII. Extraordinary income 1,082 5,981 32
B. Adjustments to amounts written off financial fixed assets 7 11 0
C. Adjustments to provisions for extraordinary liabilities and charges 0 17 5
D. Gain on disposal of fixed assets 1,067 5,953 26
E. Other extraordinary income 8 0 0
VIII. Extraordinary charges -1,155 -1,566 -95
A. Extraordinary depreciation of and extraordinary amounts written off formation expenses,intangible and tangible fixed assets 23 0 0
B. Amounts written off financial fixed assets 34 118 22
C. Provisions for extraordinary liabilities and charges (increase +, decrease -) 538 -80 -84
D. Loss on disposal of fixed assets 151 0 0
E. Other extraordinary charges 410 1,528 157
IX. Profit for the period before taxes 142 4,873 549
IXbis. A. Transfer from deferred taxation 5 74 0
B. Transfer to deferred taxation -69 0 -6
X. Income taxes 0 -4 2
A. Income taxes 0 -6 0
B. Adjustment of income taxes and write-back of tax provisions 0 2 2
XI. Profit for the period 77 4,943 544
XII. Transfer from untaxed reserve 10 143 0
Transfer to untaxed reserve -138 0 -12
XIII. Profit for the period available for appropriation - 5,086 532
Loss for the period available for appropriation -50 - -
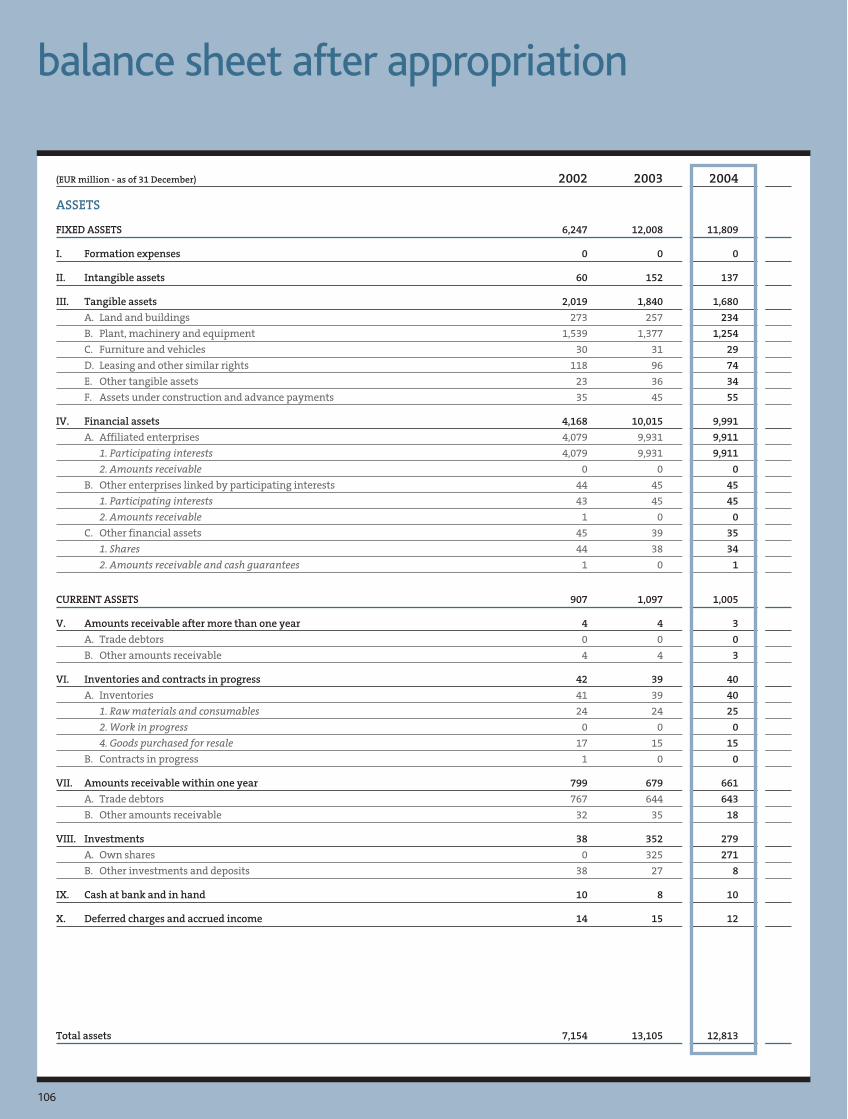
(EUR million - as of 31 December) 2002 2003 2004
ASSETS
FIXED ASSETS 6,247 12,008 11,809
I. Formation expenses 0 0 0
II. Intangible assets 60 152 137
III. Tangible assets 2,019 1,840 1,680
A. Land and buildings 273 257 234
B. Plant, machinery and equipment 1,539 1,377 1,254
C. Furniture and vehicles 30 31 29
D. Leasing and other similar rights 118 96 74
E. Other tangible assets 23 36 34
F. Assets under construction and advance payments 35 45 55
IV. Financial assets 4,168 10,015 9,991
A. Affiliated enterprises 4,079 9,931 9,911
1. Participating interests 4,079 9,931 9,911
2. Amounts receivable 0 0 0
B. Other enterprises linked by participating interests 44 45 45
1. Participating interests 43 45 45
2. Amounts receivable 1 0 0
C. Other financial assets 45 39 35
1. Shares 44 38 34
2. Amounts receivable and cash guarantees 1 0 1
CURRENT ASSETS 907 1,097 1,005
V. Amounts receivable after more than one year 4 4 3
A. Trade debtors 0 0 0
B. Other amounts receivable 4 4 3
VI. Inventories and contracts in progress 42 39 40
A. Inventories 41 39 40
1. Raw materials and consumables 24 24 25
2. Work in progress 0 0 0
4. Goods purchased for resale 17 15 15
B. Contracts in progress 1 0 0
VII. Amounts receivable within one year 799 679 661
A. Trade debtors 767 644 643
B. Other amounts receivable 32 35 18
VIII. Investments 38 352 279
A. Own shares 0 325 271
B. Other investments and deposits 38 27 8
IX. Cash at bank and in hand 10 8 10
X. Deferred charges and accrued income 14 15 12
Total assets 7,154 13,105 12,813
106
balance sheet after appropriation
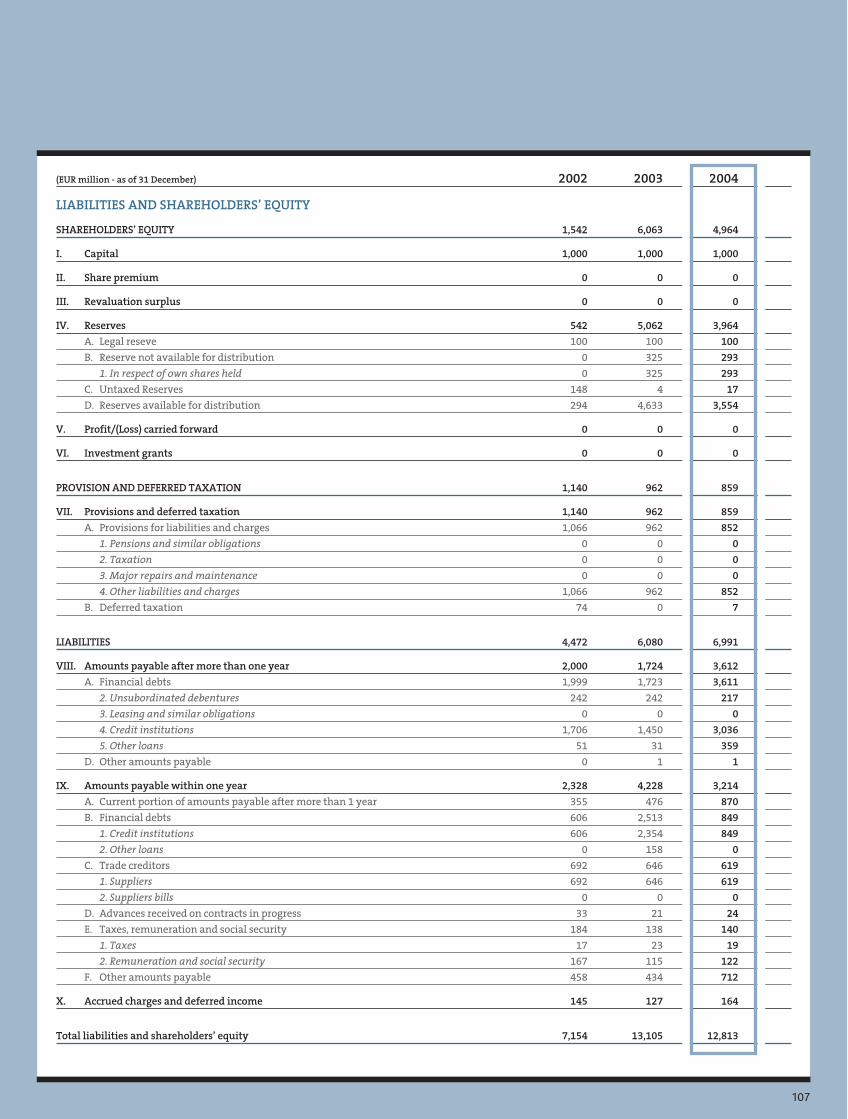
107
(EUR million - as of 31 December) 2002 2003 2004
LIABILITIES AND SHAREHOLDERS’ EQUITY
SHAREHOLDERS’ EQUITY 1,542 6,063 4,964
I. Capital 1,000 1,000 1,000
II. Share premium 0 0 0
III. Revaluation surplus 0 0 0
IV. Reserves 542 5,062 3,964
A. Legal reseve 100 100 100
B. Reserve not available for distribution 0 325 293
1. In respect of own shares held 0 325 293
C. Untaxed Reserves 148 4 17
D. Reserves available for distribution 294 4,633 3,554
V. Profit/(Loss) carried forward 0 0 0
VI. Investment grants 0 0 0
PROVISION AND DEFERRED TAXATION 1,140 962 859
VII. Provisions and deferred taxation 1,140 962 859
A. Provisions for liabilities and charges 1,066 962 852
1. Pensions and similar obligations 0 0 0
2. Taxation 0 0 0
3. Major repairs and maintenance 0 0 0
4. Other liabilities and charges 1,066 962 852
B. Deferred taxation 74 0 7
LIABILITIES 4,472 6,080 6,991
VIII. Amounts payable after more than one year 2,000 1,724 3,612
A. Financial debts 1,999 1,723 3,611
2. Unsubordinated debentures 242 242 217
3. Leasing and similar obligations 0 0 0
4. Credit institutions 1,706 1,450 3,036
5. Other loans 51 31 359
D. Other amounts payable 0 1 1
IX. Amounts payable within one year 2,328 4,228 3,214
A. Current portion of amounts payable after more than 1 year 355 476 870
B. Financial debts 606 2,513 849
1. Credit institutions 606 2,354 849
2. Other loans 0 158 0
C. Trade creditors 692 646 619
1. Suppliers 692 646 619
2. Suppliers bills 0 0 0
D. Advances received on contracts in progress 33 21 24
E. Taxes, remuneration and social security 184 138 140
1. Taxes 17 23 19
2. Remuneration and social security 167 115 122
F. Other amounts payable 458 434 712
X. Accrued charges and deferred income 145 127 164
Total liabilities and shareholders’ equity 7,154 13,105 12,813
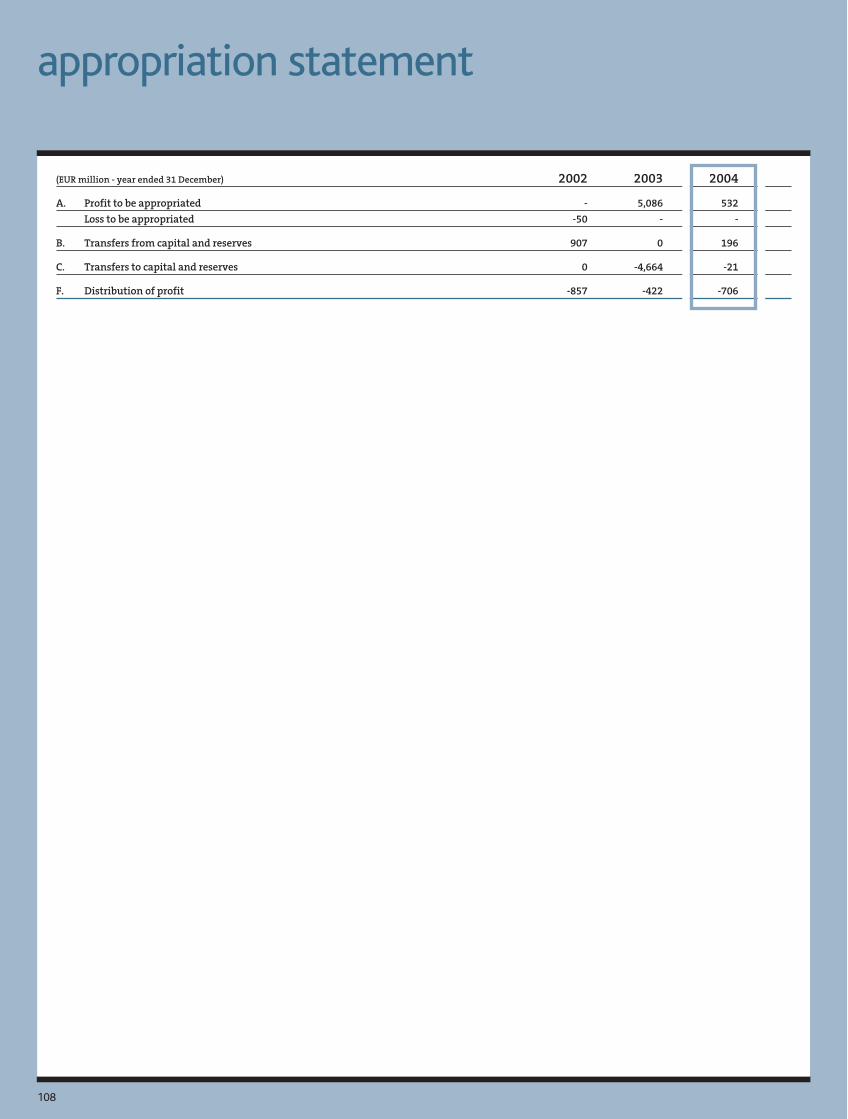
(EUR million - year ended 31 December) 2002 2003 2004
A. Profit to be appropriated - 5,086 532
Loss to be appropriated -50 - -
B. Transfers from capital and reserves 907 0 196
C. Transfers to capital and reserves 0 -4,664 -21
F. Distribution of profit -857 -422 -706
108
appropriation statement
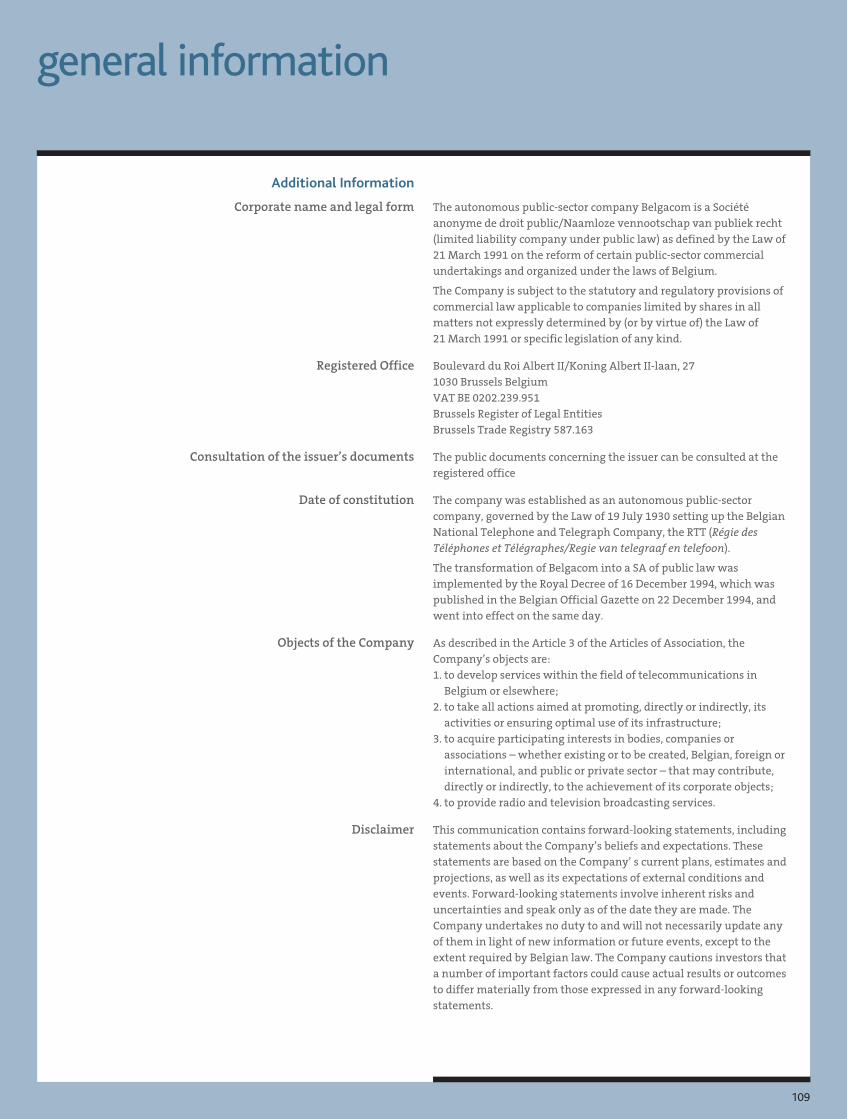
109
general information
Additional Information
Corporate name and legal form
Registered Office
Consultation of the issuer’s documents
Date of constitution
Objects of the Company
Disclaimer
The autonomous public-sector company Belgacom is a Sociétéanonyme de droit public/Naamloze vennootschap van publiek recht(limited liability company under public law) as defined by the Law of21 March 1991 on the reform of certain public-sector commercialundertakings and organized under the laws of Belgium.
The Company is subject to the statutory and regulatory provisions ofcommercial law applicable to companies limited by shares in allmatters not expressly determined by (or by virtue of) the Law of21 March 1991 or specific legislation of any kind.
Boulevard du Roi Albert II/Koning Albert II-laan, 271030 Brussels BelgiumVAT BE 0202.239.951Brussels Register of Legal EntitiesBrussels Trade Registry 587.163
The public documents concerning the issuer can be consulted at theregistered office
The company was established as an autonomous public-sectorcompany, governed by the Law of 19 July 1930 setting up the BelgianNational Telephone and Telegraph Company, the RTT (Régie desTéléphones et Télégraphes/Regie van telegraaf en telefoon).
The transformation of Belgacom into a SA of public law wasimplemented by the Royal Decree of 16 December 1994, which waspublished in the Belgian Official Gazette on 22 December 1994, andwent into effect on the same day.
As described in the Article 3 of the Articles of Association, theCompany’s objects are:1. to develop services within the field of telecommunications in
Belgium or elsewhere;2. to take all actions aimed at promoting, directly or indirectly, its
activities or ensuring optimal use of its infrastructure;3. to acquire participating interests in bodies, companies or
associations – whether existing or to be created, Belgian, foreign orinternational, and public or private sector – that may contribute,directly or indirectly, to the achievement of its corporate objects;
4. to provide radio and television broadcasting services.
This communication contains forward-looking statements, includingstatements about the Company’s beliefs and expectations. Thesestatements are based on the Company’ s current plans, estimates andprojections, as well as its expectations of external conditions andevents. Forward-looking statements involve inherent risks anduncertainties and speak only as of the date they are made. TheCompany undertakes no duty to and will not necessarily update anyof them in light of new information or future events, except to theextent required by Belgian law. The Company cautions investors thata number of important factors could cause actual results or outcomesto differ materially from those expressed in any forward-lookingstatements.
110
For financial information, please contact
Ingvild Van Lysebetten
For further information, please contact
Thierry Bouckaert
Investor Relations ManagerBd du Roi Albert II/Koning Albert II-laan, 27B - 1030 BrusselsTel: + 32 2 202 40 23Fax: + 32 2 201 54 94E-Mail: [email protected]
Press Relations DirectorBd du Roi Albert II/Koning Albert II-laan, 27B - 1030 BrusselsTel: + 32 2 202 82 50Fax: + 32 2 203 65 93E-Mail: [email protected]
Visit Belgacom’s website: www.belgacom.beBelgacom’s Annual Report is also published in Dutch andin French
111111
glossary
ADSL (Asymmetric Digital Subscriber Line): technologyenabling a one-to-one, high-speed, digital connection(up to eight megabits per second (Mbps) in receivemode and 640 Kilobits per second (Kbps) in send mode)on a single pair of copper wires.
ARPU (Average Revenue Per Unit): Average revenue gener-ated per mobile telephone subscriber.
ATM (Asynchronous Transfer Mode): technique enabling thehigh-speed transfer of digital data. It consists ofdividing information flow (voice, data and image) intofixed-size packets, known as “cells”.
BACKBONE This is a high bandwidth line which acts as the main-stay linking access providers to the world network.
BILAN (Belgacom Interconnection of LAN): a total solutionbased on the Internet Protocol (IP), Frame Relay andATM networks.
BIT (Contraction of Binary digIT): the basic unit of informa-tion. A bit has two possible values, 1 or 0. Each printcharacter has an eight-bit code. Eight bits make oneoctet, or byte.
BROADBAND Network capable of high-speed transmission of severalMegabits per second (Mbps), generally much fasterthan on the telephone network. These networks arecomposed of coaxial cable, optic fiber or wirelessmedia.
CDMA (Code Division Multiple Access): digital technique inwhich different conversations can be transmittedsimultaneously and are differentiated by being taggedwith a code.
CHAT Type of messaging done over the Internet, involvingshort text messages and often used by strangers tomeet.
DWDM (Dense Wavelength Division Multiplexing): see WDM.
ETHERNET The most common LAN (Local Area Network) techno-logy, developed originally by Xerox, DEC and Intel.Conventionally, the Ethernet LAN uses coaxial cablesor high-quality twisted cable. The most widelyinstalled Ethernet network is known as 10BASE-T,which enables transmission at a speed of up to 10Mbps. With Fast Ethernet, or 100BASE-T, speeds of upto 100 Megabits per second (Mbps) are possible.
EXTRANET Intranet to which a company’s suppliers, customersand partners have access. A network essential fore-business.
FRAME RELAY Data transport protocol that divides a physical commu-nications line into several virtual channels.Technology part-way between X25 packet switchingand ATM.
GPRS (General Packet Radio Service): a second-generationmobile telephony standard. It enables direct Internetaccess and data exchange at speeds 18 times fasterthan those of the GSM protocol and allows volume-based pricing.
GPS (Global Positioning System): system enabling a vehicleor person to pinpoint their position within approxi-mately 50 meters or so anywhere in the world. Itfunctions thanks to a network of 24 satellites put inplace by the US Department of Defense.
GSM (Global System for Mobile Communications): an abbre-viation which is often synonymous, in commonparlance, with mobile terminal or telephone. In reality,it is a European standard for a common digital cellulartelephony system.
INTRANET Application of Internet technologies (e-mail, Web, etc.)to a company’s local area network (LAN).
IP (Internet Protocol): packet data protocol used forrouting and carriage of messages across the Internet.
IP VPN (Internet Protocol Virtual Private Network): A VPNoffers the advantages of a private network (security,etc.) while using the resources of a public switchednetwork. The user thereby saves money on networkinfrastructure and management costs.
ISDN (Integrated Services Digital Network): fully digitizednetwork enabling simultaneous, high-speed transmis-sion of speech, text, data and images (still oranimated). There are two types of ISDN lines: theISDN-2, equipped with two communication channels,and the ISDN-30, equipped with thirty communicationchannels.
ISP (Internet Service Provider): a company providingInternet access to its customers and a personal e-mailaddress.
LARGE BAND See Broadband.
MMS (Multimedia Messaging Service): possibility to illus-trate text messages on mobile phones withphotographs, images and sound.
PABX (Private Automatic Branch Exchange): companyexchange around which the company’s internal tele-phone network is organized. It also enables datatransmission.
PORTAL Site offering to act as a gateway to the World WideWeb (WWW) for a large number of surfers, ideallyimmediately on connection. Many Internet AccessProviders offer portals to their customers (e.g., theBelgacom Skynet portal).
SERVER Machine that assists in providing information and/orresources in a network, be it public or private.
SDSL A technology that transports data at a maximum bitrate of 2.3 Mbits/s in both directions.
SMS (Short Message Service): enables written messages tobe received and displayed on a GSM.
STREAMING Technique for downloading multimedia files enablingsurfers to read the file in real-time, without waiting forfull download. This is the case, for example, withsound or video on the Internet.
TCP-IP (Transmission Control Protocol – Internet Protocol): aprotocol used in conjunction with the Internet Protocol(IP) to send data in the form of message units (data-grams, or packets) between computers over theInternet. IP handles the actual delivery of the data,while TCP keeps track of the individual units of datafor efficient routing through the Internet.
UMTS (Universal Mobile Telecommunications System): athird-generation telecommunications system capableof providing multimedia services at a very-high speed.
VIDEO- Communication in which the callers can be seenCONFERENCING as well as heard (video conference).
VPN (Virtual Private Network): a data network that sharestelecommunications infrastructure but acts as a secureprivate network, with an architecture based on the useof the TCP-IP (Time Compression Multiplexing -Internet Protocol).
WAP (Wireless Application Protocol): new protocol enablingGSMs to be transformed into Internet and multimediaterminals.
WDM (Wavelength Division Multiplexing) or DWDM (DenseWavelength Division Multiplexing): techniqueenabling several independent flows of digital informa-tion to coexist on the same optical fiber.
WIFI Stands for wireless fidelity. Technology makes possiblewireless, high-speed surfing from a hotspot.

112
Editor-in-chief:Philippe RoggeBd du Roi Albert II/Koning Albert II-laan, 27 – B - 1030 BrusselsConception and coordination:Baudhuin Pringiers - Belgacom Corporate Communication ManagerBernard Caroyez - Investor RelationsGraphics: Chris Communications - www.chriscom.bePrepress: Snel GraficsPrinting: GamPictures: Belgacom, Jean-Michel Byl, Getty Images, Zefa and Photonica

5,200 5,300 5,400 5,500 5,600 1,800 1,900 2,000 2,100 2,200 2,300 2,400
0 200 400 600 800 1,000 1,200 0.0 0.5 1.0 1.5 2.0 2.5 3.0
11% ICS
52% FLS
37% MCS
0% ICS
53% FLS
47% MCS
5,33802
5,45403
5,54004
1,14202
17203
92204
2,02002
2,25003
2,39404
2.8602
0.4303
2.5704
Revenue 2004 by segments* (before eliminations)
EBITDA 2004 by segments*
Revenue*
Group revenue was up by almost 1.6% on the previous year, primarily due to the increase in the Mobile Communications Services (MCS) and International Carrier Services segments (ICS).
EBITDA*
Group EBITDA* increased by 6.4% mainly thanks to Fixed Line Services (FLS), via a strict cost control policy on operating expenses. EBITDA* margin increased to 43.2%.
Net profitNet profit (Group share) amounted to EUR 922 million.
Earnings per shareBasic earnings per share increased also significantly to EUR 2.57 in 2004.
4.2 millionactive customers at MCS
group financials
Revenue* (in EUR millions)
142,000customers won back at FLS
more than 1,000,000total retail and wholesale ADSL access channels
Net profit (in EUR millions)
EBITDA* (in EUR millions)
Earnings per share (in EUR)
glossary
IP VPN (Internet Protocol Virtual Private Network): A VPN offers the advantages of a private network (security, etc.) while using the resources of a public switched network. The user thereby saves money on network infrastructure and manage-ment costs.
ISDN (Integrated Services Digital Network): fully digitized network ena-bling simultaneous, high-speed transmission of speech, text, data and images (still or animated). There are two types of ISDN lines: the ISDN-2, equipped with two communication channels, and the ISDN-30, equipped with thirty communication channels.
ISP (Internet Service Provider): a company providing Internet access to its customers and a personal e-mail address.
LARGE BAND See Broadband.
MMS (Multimedia Messaging Service): possibility to illustrate text mes-sages on mobile phones with photographs, images and sound.
PABX (Private Automatic Branch Exchange): company exchange around which the company’s internal telephone network is organized. It also enables data transmission.
PORTAL Site offering to act as a gateway to the World Wide Web (WWW) for a large number of surfers, ideally immediately on connection. Many Internet Access Providers offer portals to their customers (e.g., the Belgacom Skynet portal).
SERVER Machine that assists in providing information and/or resources in a network, be it public or private.
SDSL A technology that transports data at a maximum bit rate of 2.3 Mbits/s in both directions.
SMS (Short Message Service): enables written messages to be received and displayed on a GSM.
STREAMING Technique for downloading multimedia files enabling surfers to read the file in real-time, without waiting for full download. This is the case, for example, with sound or video on the Internet.
TCP-IP (Transmission Control Protocol – Internet Protocol): a protocol used in conjunction with the Internet Protocol (IP) to send data in the form of message units (datagrams, or packets) between com-puters over the Internet. IP handles the actual delivery of the data, while TCP keeps track of the individual units of data for efficient routing through the Internet.
UMTS (Universal Mobile Telecommunications System): a third-genera-tion telecommunications system capable of providing multimedia services at a very-high speed.
VIDEO- Communication in which the callers can be seen as well as heard CONFERENCING (video conference).
VPN (Virtual Private Network): a data network that shares telecommu-nications infrastructure but acts as a secure private network, with an architecture based on the use of the TCP-IP (Time Compression Multiplexing - Internet Protocol).
WAP (Wireless Application Protocol): new protocol enabling GSMs to be transformed into Internet and multimedia terminals.
WDM (Wavelength Division Multiplexing) or DWDM (Dense Wavelength Division Multiplexing): technique enabling several independent flows of digital information to coexist on the same optical fiber.
WIFI Stands for wireless fidelity. Technology makes possible wireless, high-speed surfing from a hotspot.
Despite ever increasing fixed and mobile competitive pressure, the Belgacom Group managed to gen-erate higher revenue and EBITDA (Earnings Before Interest, Tax, Depreciation and Amortization) in 2004. The net profit (Group share) also rose significantly as compared with the previous financial year.
* Figures before non-recurring items.

Belg
aco
m
Year ended 31 December 2002 2003 2004Income Statement (EUR million)
Total revenue before non-recurring items 5,338 5,454 5,540
Non-recurring revenue 1,085 0 0
Total revenue 6,422 5,454 5,540
EBITDA (2) before non-recurring items 2,020 2,250 2,394
EBITDA (2) 2,341 1,353 2,353
Operating income (EBIT) 1,482 566 1,611
Net finance revenue/(costs) -25 -27 -27
Loss from enterprises accounted for using the equity method -12 -4 -1
Income before taxes and minority interests 1,445 534 1,583
Tax expense -203 -208 -508
Minority interests -99 -154 -152
Net income (Group share) 1,142 172 922
As of 31 December 2002 2003 2004Cash Flow and Capital Expenditures (EUR million)
Cash flows from operating activities 1,371 296 1,899
Capital expenditures -566 -502 -556
Cash flows from other investing activities 1,276 17 78
Free cash flow (3) 2,081 -189 1,421
Cash flows used in financing activities -1,560 -575 -1,658
Net increase/(decrease) of cash and cash equivalents 521 -764 -237
Balance sheet (EUR million)
Balance sheet total 7,298 6,009 5,368
Non-current assets 4,601 4,381 3,963
Investments, cash and cash equivalents 1,611 604 406
Shareholders’ equity 2,978 2,548 2,223
Minority interests 293 446 407
Liabilities for pensions and other post-employment benefits 1,545 840 760
Net financial position 1,109 157 110
Year ended 31 December 2002 2003 2004Data per shareBasic earnings per share (in EUR) 2.86 0.43 2.57
Diluted earnings per share (in EUR) 2.86 0.43 2.57
Weighted average number of ordinary shares 400,000,000 399,932,159 358,612,854
Dividend per share, gross (in EUR) 0.70 0.99 1.38
Special dividend per share, gross (in EUR) 1.43 0.00 0.55
As of 31 December 2002 2003 2004Operating dataTotal access channels (in thousands) (4) 5,088 5,219 5,252
Total retail and wholesale ADSL access channels (in thousands) 519 784 1,024
Active mobile customers (in thousands) (5) 4,076 4,201 4,198
Minutes transported by International Carrier Services (in billions) 5.9 6.4 6.9
Personnel 19,003 17,541 16,933
(1) Prepared under IFRS.(2) Earnings Before Interests, Taxes, Depreciation and Amortization.(3) Cash flow before financing activities.
(4) PSTN + ISDN BA + ISDN PRA + retail ADSL.(5) Customers who received/made a call or received/sent an SMS over
the past three months.a n n u a l r e p o r t • 2 0 0 4
The commitment of a leader. The spirit of a challenger.
key figures (1)
glossary
ADSL (Asymmetric Digital Subscriber Line): technology enabling a one-to-one, high-speed, digital connection (up to eight megabits per second (Mbps) in receive mode and 640 Kilobits per second (Kbps) in send mode) on a single pair of copper wires.
ARPU (Average Revenue Per Unit): Average revenue generated per mobile telephone subscriber.
ATM (Asynchronous Transfer Mode): technique enabling the high-speed transfer of digital data. It consists of dividing information flow (voice, data and image) into fixed-size packets, known as “cells”.
BACKBONE This is a high bandwidth line which acts as the mainstay linking access providers to the world network.
BILAN (Belgacom Interconnection of LAN): a total solution based on the Internet Protocol (IP), Frame Relay and ATM networks.
BIT (Contraction of Binary digIT): the basic unit of information. A bit has two possible values, 1 or 0. Each print character has an eight-bit code. Eight bits make one octet, or byte.
BROADBAND Network capable of high-speed transmission of several Megabits per second (Mbps), generally much faster than on the telephone network. These networks are composed of coaxial cable, optic fiber or wireless media.
CDMA (Code Division Multiple Access): digital technique in which dif-ferent conversations can be transmitted simultaneously and are differentiated by being tagged with a code.
CHAT Type of messaging done over the Internet, involving short text messages and often used by strangers to meet.
DWDM (Dense Wavelength Division Multiplexing): see WDM.
ETHERNET The most common LAN (Local Area Network) technology, devel-oped originally by Xerox, DEC and Intel. Conventionally, the Ethernet LAN uses coaxial cables or high-quality twisted cable. The most widely installed Ethernet network is known as 10BASE-T, which enables transmission at a speed of up to 10 Mbps. With Fast Ethernet, or 100BASE-T, speeds of up to 100 Megabits per second (Mbps) are possible.
EXTRANET Intranet to which a company’s suppliers, customers and partners have access. A network essential for e-business.
FRAME RELAY Data transport protocol that divides a physical communications line into several virtual channels. Technology part-way between X25 packet switching and ATM.
GPRS (General Packet Radio Service): a second-generation mobile telephony standard. It enables direct Internet access and data exchange at speeds 18 times faster than those of the GSM protocol and allows volume-based pricing.
GPS (Global Positioning System): system enabling a vehicle or person to pinpoint their position within approximately 50 meters or so anywhere in the world. It functions thanks to a network of 24 satellites put in place by the US Department of Defense.
GSM (Global System for Mobile Communications): an abbreviation which is often synonymous, in common parlance, with mobile terminal or telephone. In reality, it is a European standard for a common digital cellular telephony system.
INTRANET Application of Internet technologies (e-mail, Web, etc.) to a com-pany’s local area network (LAN).
IP (Internet Protocol): packet data protocol used for routing and car-riage of messages across the Internet.
annu
al r
epor
t 20
04