Embed Size (px)
Citation preview
2 0 0 4 S U M M A R Y A N N U A L R E P O R T
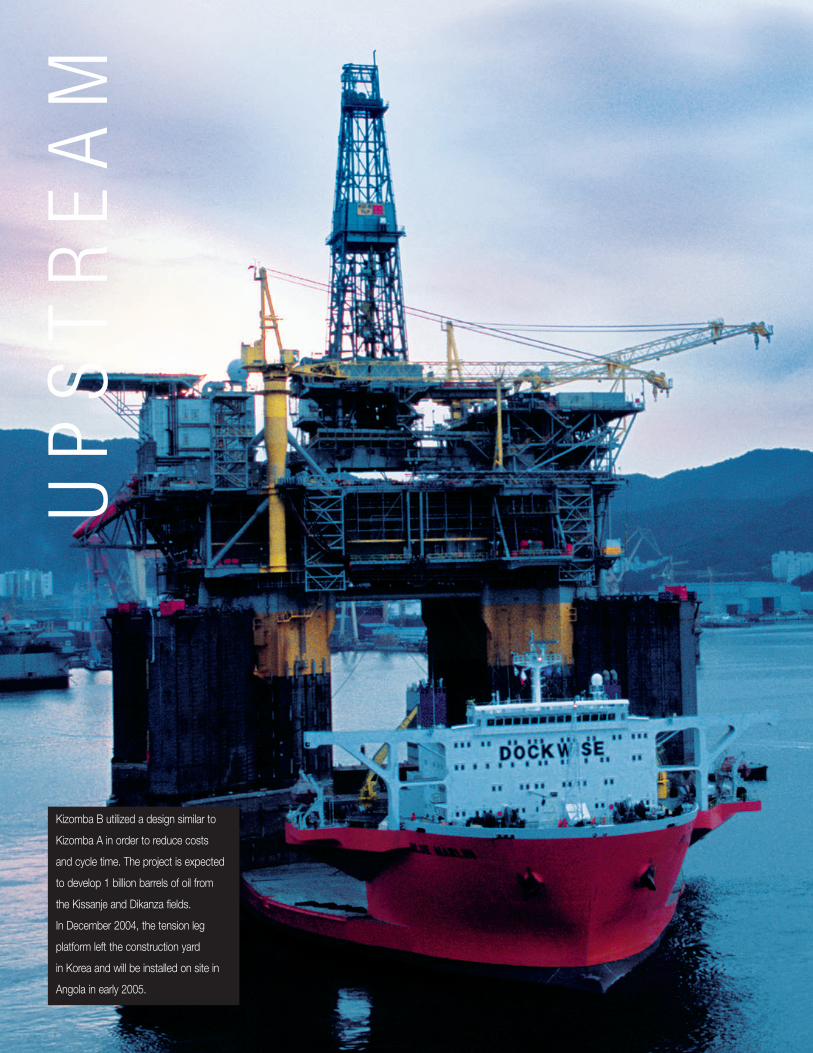
Initial production from the Kizomba Aproject occurred in August 2004, settingan industry record for project executiontime from contract award to first oil for a project of this size. Production from the36-slot tension leg platform (shown hereand on the cover) is transferred to theworld’s largest floating production, storage, and offloading vessel.
To Our Shareholders 2 -3
Financial Highlights 4 -5
Technology 6 -7
Upstream 8 -17
Downstream 18 -25
Chemical 26 -31
Corporate Citizenship 32 -36
Financial Summary 37-43
Frequently Used Terms 44-45
Directors, Officers, and Affiliated Companies 46 -47
Investor Information 48 -49
TA B L E O F C O N T E N T S
The term Upstream refers to exploration, development, production, and
gas and power marketing. Downstream refers to the refining and marketing
of petroleum products such as motor fuels and lubricants.
Projections, targets, expectations, estimates, and business plans in this
report are forward-looking statements. Actual future results, including demand
growth and energy mix; capacity growth; the impact of new technologies;
capital expenditures; project plans, dates, and capacities; production rates
and resource recoveries; and efficiency gains and cost savings could differ
materially due to, for example, changes in long-term oil and gas prices or
other market conditions affecting the oil and gas industry; reservoir
performance; timely completion of development projects; war and other
political or security disturbances; changes in law or government regulation;
the actions of competitors; unexpected technological developments; the
occurrence and duration of economic recessions; the outcome of commercial
negotiations; unforeseen technical difficulties; and other factors discussed
in this report and under the heading “Factors Affecting Future Results” in
Item 1 of ExxonMobil’s most recent Form 10-K.
Definitions of certain financial and operating measures and other terms used
in this report are contained in the section titled “Frequently Used Terms” on
pages 44 and 45. In the case of financial measures, the definitions also include
information required by SEC Regulation G to the extent we believe applicable.
“Factors Affecting Future Results” and “Frequently Used Terms” are also
posted on our website and are updated from time to time during the year.
Certain reclassifications to prior years have been made to conform to
the 2004 presentation.
To grow and prosper, the world will need 50 percent more
energy by 2030 – an enormous challenge. This challenge
demands more than the foresight to push ahead in new
areas and markets. It requires people who are committed
to finding better solutions through new technology and with
the collective experience to successfully apply them. Not just
quarter to quarter but decade to decade. To this challenge
we bring continued dedication to the values we live by –
discipline, integrity, reliability, consistency,
and a commitment to technology. These principles
are fundamental to our success today, and will remain so
as we take on the world’s toughest energy challenges.
2
E X X O N M O B I L C O R P O R A T I O N • 2 0 0 4 S U M M A R Y A N N U A L R E P O R T
Our disciplined approach generated strong performancein each of our business lines and enabled us to fullycapture the benefits of a robust business environment.The Upstream recorded the highest earnings in ourhistory and generated more net income per barrel thanour competitors over the past five years. Downstreamearnings were also a record and increased 62 percentfrom 2003. And our Chemical business set a new earnings record – more than doubling 2003 results –and exceeded competitors’ returns.
The strength of our performance in recent years
speaks to the success of the merger. The breadth and scale of our combined businesses provided a platform for a step-change improvement in our financial and operating performance, our ability to leverage technology, and our capability to execute. And wecontinue to see more opportunity.
ExxonMobil is well-positioned to meet the challenges ofa rapidly changing and developing world. Our industry is constantly evolving. The industry has globalized asthe world’s economies have expanded. Partners andcompetition change. New opportunities are larger, more capital intensive, and often in remote areas or difficult physical environments. Business cycles fluctuate, but our long-term view provides us withconsistent direction. Finally, technology has improvedthe methods we employ and the results we achieve in meeting the world’s energy challenges.
The challenges are enormous. Even with significant energy efficiency gains, we estimate the world’s oil and gas needs are likely to grow 50 percent by 2030.The industry must develop approximately 170 million oil-equivalent barrels per day of new production – about one-third higher than the current rate. Meetingthese needs in a safe, environmentally responsible way is essential to support the development that drives improvement in the world’s standard of living.
Change associated with this challenge is inevitable andis likely to accelerate. ExxonMobil embraces change asa source of business opportunity. Our ability to adaptand balance reward with risk is a competitive strengththat will be of increasing importance.
The challenges ahead play to ExxonMobil’s strengths.
We achieve results through the disciplined implementa-tion of strategies that are unique to each of ourbusinesses. But, at the core, these strategies are underpinned by principles that are fundamental to all ofour businesses and practiced by our employees in eachof the roughly 200 countries and territories in which weoperate around the world. We can count on these coreprinciples for stability and consistency as we progressour long-term business objectives and adapt to change.
Our approach begins with safety – an area where we continuously improve upon our industry-leadingperformance. We believe an organization that has a
disciplined, successful approach to safety carries
that discipline into all aspects of its operations.
To Our Shareholders
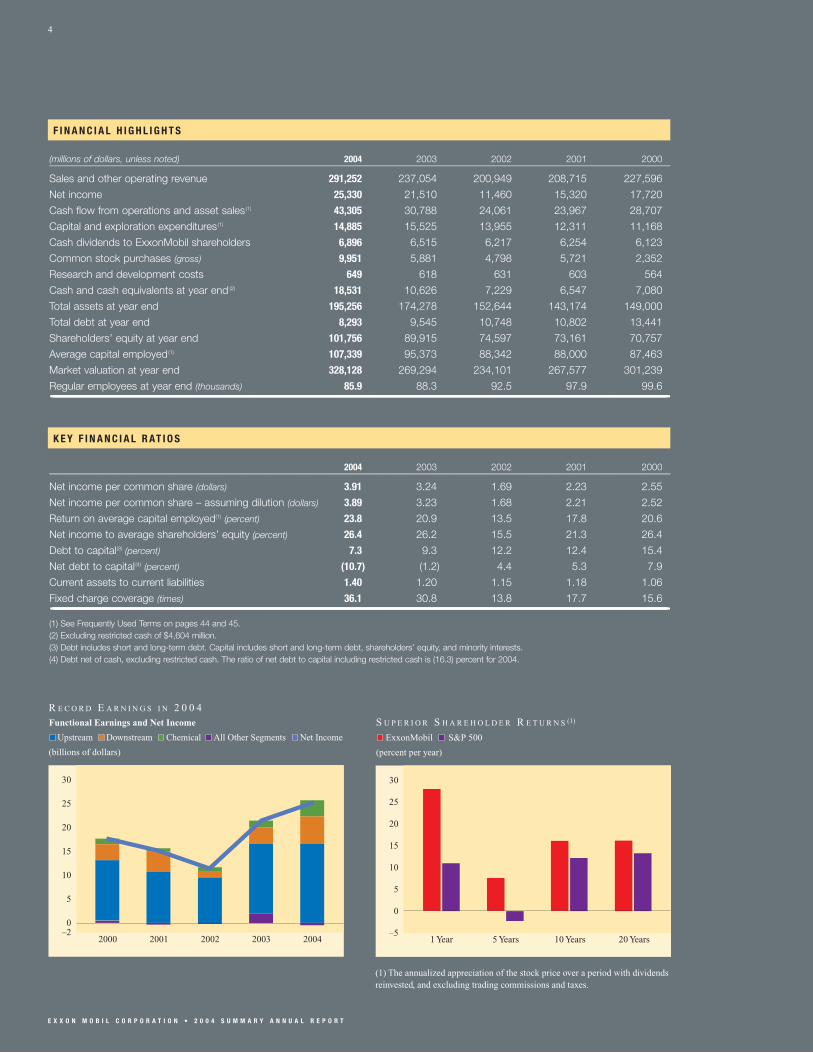
2004 was an outstanding year for our Company. We earned net income of $25.3 billion,
the highest in the history of the Corporation. Cash flow from operations and asset sales was
$43.3 billion, also a record. Return on average capital employed increased to 24 percent.
And we returned nearly $15 billion to shareholders in dividends and share buybacks.
Cumulatively since the merger, we have paid $33 billion in dividends and distributed
nearly $24 billion through share purchases, reducing shares outstanding by over 8 percent.
T O O U R S H A R E H O L D E R S 3
E X X O N M O B I L C O R P O R A T I O N • 2 0 0 4 S U M M A R Y A N N U A L R E P O R T
Our operational excellence is demonstrated by projectscompleted on time and on budget. We meet our
commitments and set industry benchmarks in the
process. We are relentless in our pursuit of efficiencies,which are enabled by our rigorous project management,operating systems, and work processes deployed in our global functional organization.
Our selective and disciplined investment approach
has delivered pacesetting returns. Our unmatchedfinancial strength gives us the flexibility to pursuemultiple world-scale opportunities. We select only thoseinvestments that increase long-term shareholder value,and that are resilient across the business cycle. In 2004,we invested $15 billion, and continue to make substan-tial progress in advancing our significant portfolio ofhigh-quality projects.
Advantages do not last forever. Our robust proprietaryresearch effort is essential to improve performancecapabilities faster than competition. ExxonMobil’s
commitment and success in technology differentiate
us from others and distinguish us as a partner of
choice. The changing nature of opportunities plays toour strength in technology.
And finally, we have long recognized the importanceand value of maintaining high standards of ethics andbusiness integrity. We believe that both results and
the manner in which those results are achieved
matter. The people of ExxonMobil take great pride inknowing that our behavior in all aspects is consistentwith this belief.
These fundamental beliefs and values form the
backbone of our business approach and are
encompassed by our overarching commitment to
excellence in everything we do. They are embedded
in our culture. We are confident that they will continueto serve us well as our Company embraces the changingworld and takes on the toughest energy challenges.
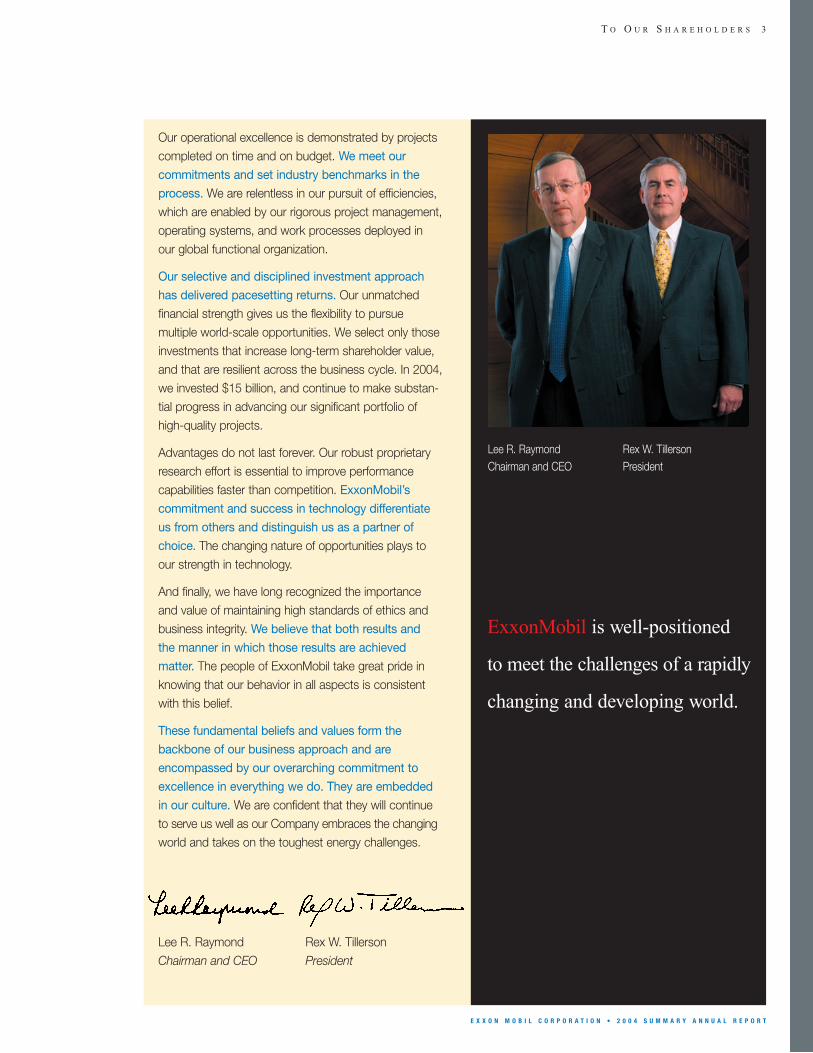
Lee R. Raymond Rex W. TillersonChairman and CEO President
ExxonMobil is well-positioned
to meet the challenges of a rapidly
changing and developing world.
Lee R. RaymondChairman and CEO
Rex W. TillersonPresident
4
E X X O N M O B I L C O R P O R A T I O N • 2 0 0 4 S U M M A R Y A N N U A L R E P O R T
2000 2001 2002 2003 2004
30
25
20
15
10
5
0–2
R E C O R D E A R N I N G S I N 2 0 0 4
(billions of dollars)
Functional Earnings and Net Income
Upstream Downstream Chemical All Other Segments Net Income
1 Year 5 Years 10 Years 20 Years
30
25
20
15
10
5
0
–5
S U P E R I O R S H A R E H O L D E R R E T U R N S (1)
(percent per year)
ExxonMobil S&P 500
(1) The annualized appreciation of the stock price over a period with dividends reinvested, and excluding trading commissions and taxes.
K E Y F I N A N C I A L R AT I O S
2004 2003 2002 2001 2000___________________________________________________________________________________________________________________________________________________________________________________________________________________________________________________________________________________________________________________________________________________________________________________________________________________________________________________________________________________
Net income per common share (dollars) 3.91 3.24 1.69 2.23 2.55
Net income per common share – assuming dilution (dollars) 3.89 3.23 1.68 2.21 2.52
Return on average capital employed(1) (percent) 23.8 20.9 13.5 17.8 20.6
Net income to average shareholders’ equity (percent) 26.4 26.2 15.5 21.3 26.4
Debt to capital(3) (percent) 7.3 9.3 12.2 12.4 15.4
Net debt to capital(4) (percent) (10.7) (1.2) 4.4 5.3 7.9
Current assets to current liabilities 1.40 1.20 1.15 1.18 1.06
Fixed charge coverage (times) 36.1 30.8 13.8 17.7 15.6_______________________________________________________________________________________________________________________________________________________________________________________________________________________________________________________________________________________________________________________________________________________________________________________________________________________________________________________________________________(1) See Frequently Used Terms on pages 44 and 45.(2) Excluding restricted cash of $4,604 million.(3) Debt includes short and long-term debt. Capital includes short and long-term debt, shareholders’ equity, and minority interests.(4) Debt net of cash, excluding restricted cash. The ratio of net debt to capital including restricted cash is (16.3) percent for 2004.
F I N A N C I A L H I G H L I G H T S
(millions of dollars, unless noted) 2004 2003 2002 2001 2000___________________________________________________________________________________________________________________________________________________________________________________________________________________________________________________________________________________________________________________________________________________________________________________________________________________________________________________________________________________
Sales and other operating revenue 291,252 237,054 200,949 208,715 227,596
Net income 25,330 21,510 11,460 15,320 17,720
Cash flow from operations and asset sales(1) 43,305 30,788 24,061 23,967 28,707
Capital and exploration expenditures(1) 14,885 15,525 13,955 12,311 11,168
Cash dividends to ExxonMobil shareholders 6,896 6,515 6,217 6,254 6,123
Common stock purchases (gross) 9,951 5,881 4,798 5,721 2,352
Research and development costs 649 618 631 603 564
Cash and cash equivalents at year end (2) 18,531 10,626 7,229 6,547 7,080
Total assets at year end 195,256 174,278 152,644 143,174 149,000
Total debt at year end 8,293 9,545 10,748 10,802 13,441
Shareholders’ equity at year end 101,756 89,915 74,597 73,161 70,757
Average capital employed(1) 107,339 95,373 88,342 88,000 87,463
Market valuation at year end 328,128 269,294 234,101 267,577 301,239
Regular employees at year end (thousands) 85.9 88.3 92.5 97.9 99.6_______________________________________________________________________________________________________________________________________________________________________________________________________________________________________________________________________________________________________________________________________________________________________________________________________________________________________________________________________________
E X X O N M O B I L C O R P O R A T I O N • 2 0 0 4 S U M M A R Y A N N U A L R E P O R T
C O R P O R A T E 5
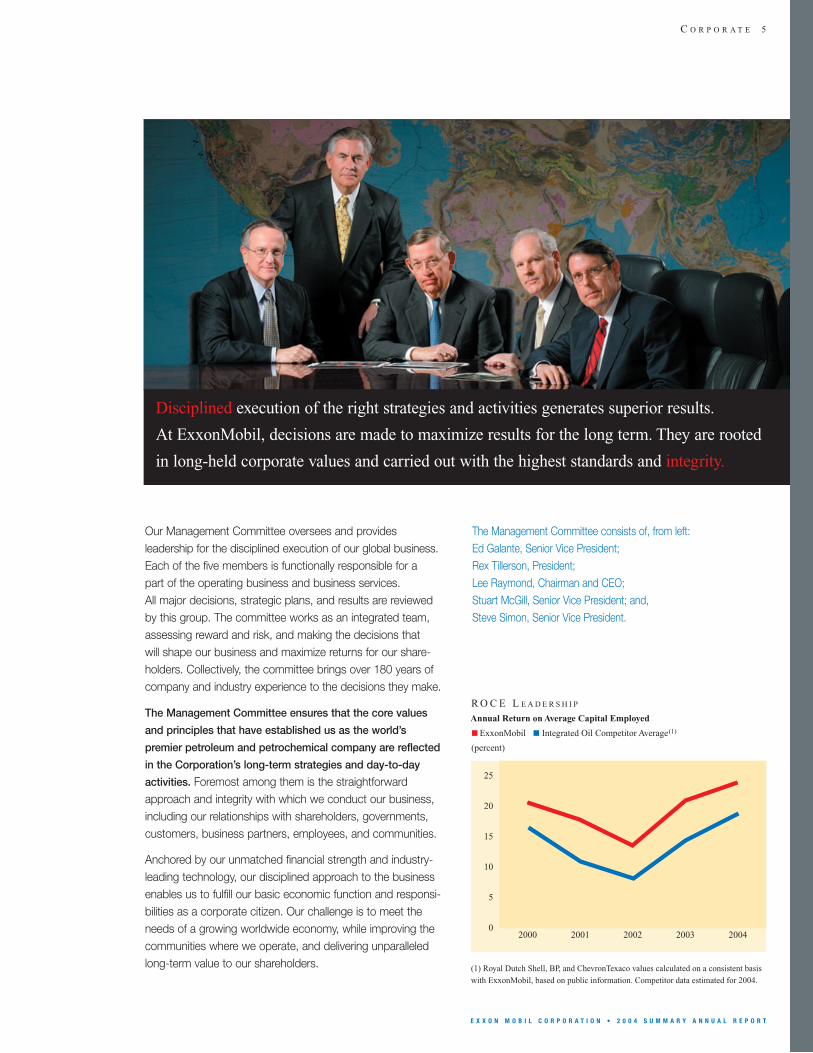
Disciplined execution of the right strategies and activities generates superior results.
At ExxonMobil, decisions are made to maximize results for the long term. They are rooted
in long-held corporate values and carried out with the highest standards and integrity.
(1) Royal Dutch Shell, BP, and ChevronTexaco values calculated on a consistent basis with ExxonMobil, based on public information. Competitor data estimated for 2004.
2000 2001 2002 2003 2004
R O C E L E A D E R S H I P
(percent)
25
20
15
10
5
0
Annual Return on Average Capital Employed
ExxonMobil Integrated Oil Competitor Average(1)
The Management Committee consists of, from left: Ed Galante, Senior Vice President; Rex Tillerson, President; Lee Raymond, Chairman and CEO; Stuart McGill, Senior Vice President; and,Steve Simon, Senior Vice President.
Our Management Committee oversees and provides leadership for the disciplined execution of our global business.Each of the five members is functionally responsible for a part of the operating business and business services. All major decisions, strategic plans, and results are reviewed by this group. The committee works as an integrated team,assessing reward and risk, and making the decisions that will shape our business and maximize returns for our share-holders. Collectively, the committee brings over 180 years ofcompany and industry experience to the decisions they make.
The Management Committee ensures that the core values
and principles that have established us as the world’s
premier petroleum and petrochemical company are reflected
in the Corporation’s long-term strategies and day-to-day
activities. Foremost among them is the straightforwardapproach and integrity with which we conduct our business,including our relationships with shareholders, governments,customers, business partners, employees, and communities.
Anchored by our unmatched financial strength and industry-leading technology, our disciplined approach to the businessenables us to fulfill our basic economic function and responsi-bilities as a corporate citizen. Our challenge is to meet theneeds of a growing worldwide economy, while improving thecommunities where we operate, and delivering unparalleledlong-term value to our shareholders.
6
E X X O N M O B I L C O R P O R A T I O N • 2 0 0 4 S U M M A R Y A N N U A L R E P O R T
T E C H N O L O G YTechnology
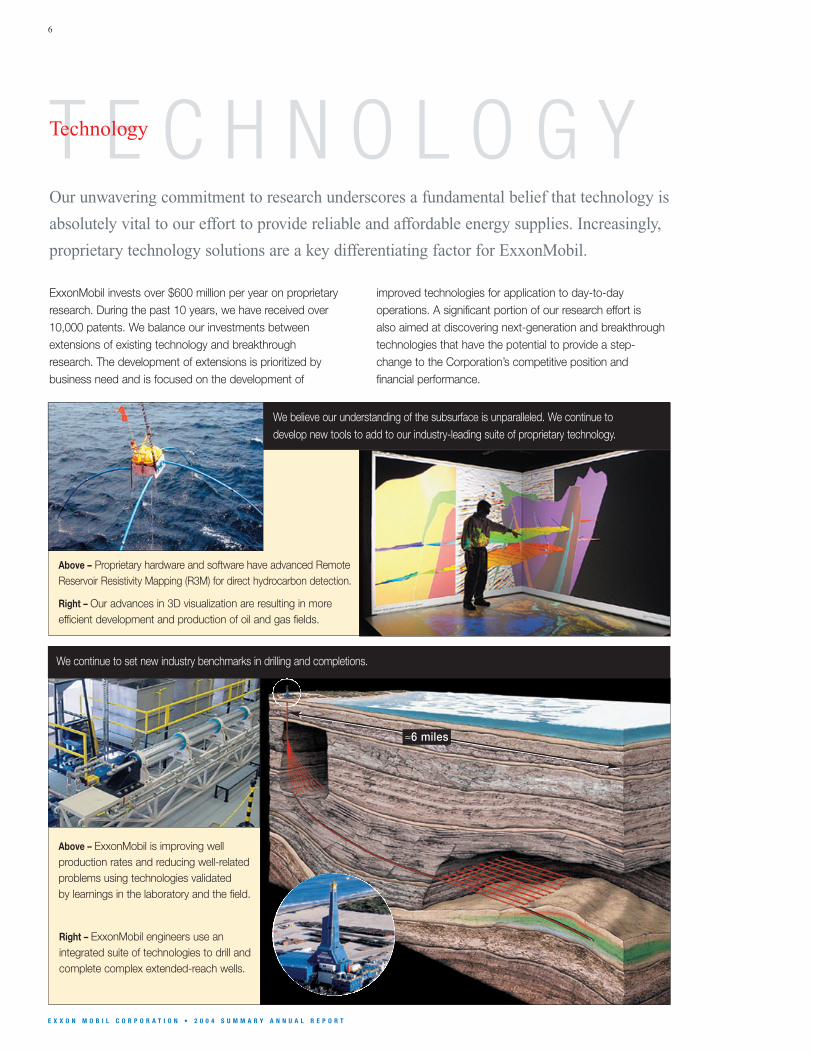
Our unwavering commitment to research underscores a fundamental belief that technology is
absolutely vital to our effort to provide reliable and affordable energy supplies. Increasingly,
proprietary technology solutions are a key differentiating factor for ExxonMobil.
We continue to set new industry benchmarks in drilling and completions.
Above – Proprietary hardware and software have advanced RemoteReservoir Resistivity Mapping (R3M) for direct hydrocarbon detection.
Right – Our advances in 3D visualization are resulting in more efficient development and production of oil and gas fields.
Right – ExxonMobil engineers use an integrated suite of technologies to drill andcomplete complex extended-reach wells.
Above – ExxonMobil is improving wellproduction rates and reducing well-relatedproblems using technologies validated by learnings in the laboratory and the field.
We believe our understanding of the subsurface is unparalleled. We continue todevelop new tools to add to our industry-leading suite of proprietary technology.
ExxonMobil invests over $600 million per year on proprietaryresearch. During the past 10 years, we have received over10,000 patents. We balance our investments betweenextensions of existing technology and breakthroughresearch. The development of extensions is prioritized bybusiness need and is focused on the development of
improved technologies for application to day-to-day operations. A significant portion of our research effort is also aimed at discovering next-generation and breakthroughtechnologies that have the potential to provide a step-change to the Corporation’s competitive position andfinancial performance.
≈6 miles
T E C H N O L O G Y 7
E X X O N M O B I L C O R P O R A T I O N • 2 0 0 4 S U M M A R Y A N N U A L R E P O R T
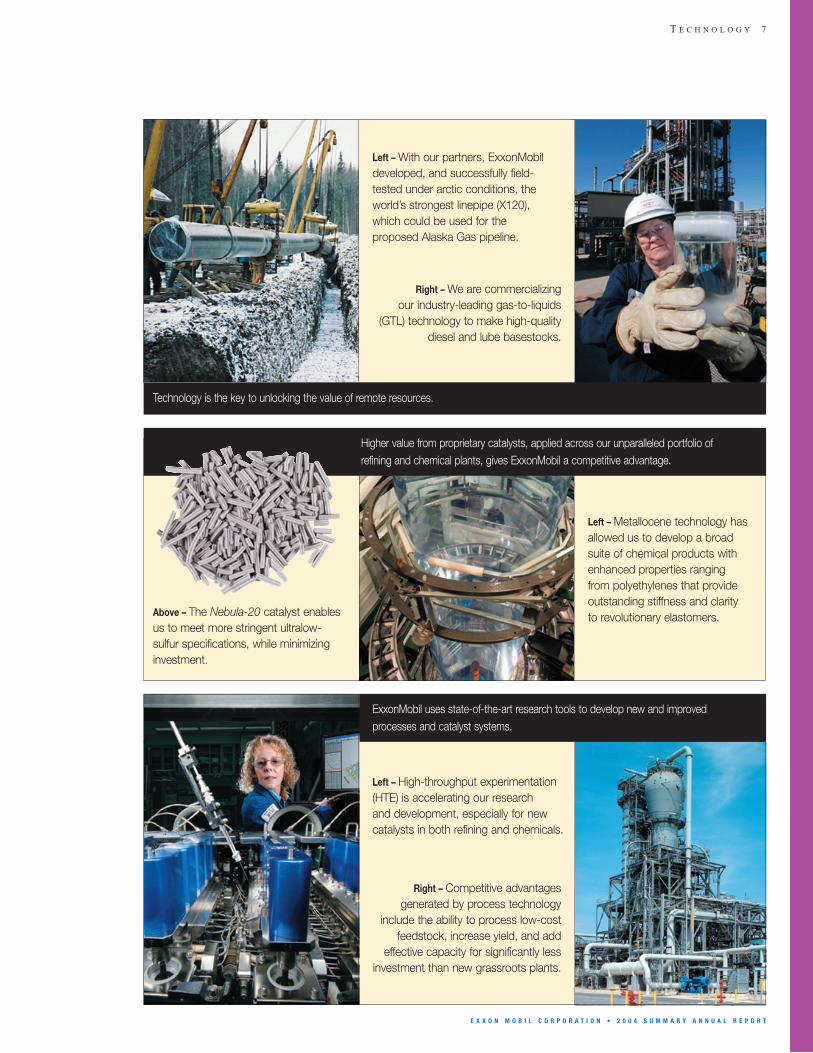
Above – The Nebula-20 catalyst enables us to meet more stringent ultralow-sulfur specifications, while minimizing investment.
Right – We are commercializing our industry-leading gas-to-liquids
(GTL) technology to make high-qualitydiesel and lube basestocks.
Left – Metallocene technology hasallowed us to develop a broadsuite of chemical products withenhanced properties ranging from polyethylenes that provideoutstanding stiffness and clarity to revolutionary elastomers.
Left – With our partners, ExxonMobildeveloped, and successfully field-tested under arctic conditions, theworld’s strongest linepipe (X120), which could be used for the proposed Alaska Gas pipeline.
Technology is the key to unlocking the value of remote resources.
ExxonMobil uses state-of-the-art research tools to develop new and improvedprocesses and catalyst systems.
Left – High-throughput experimentation(HTE) is accelerating our research and development, especially for newcatalysts in both refining and chemicals.
Right – Competitive advantages generated by process technology
include the ability to process low-costfeedstock, increase yield, and add
effective capacity for significantly lessinvestment than new grassroots plants.
Higher value from proprietary catalysts, applied across our unparalleled portfolio ofrefining and chemical plants, gives ExxonMobil a competitive advantage.
UP
ST
RE
AM
Kizomba B utilized a design similar to
Kizomba A in order to reduce costs
and cycle time. The project is expected
to develop 1 billion barrels of oil from
the Kissanje and Dikanza fields.
In December 2004, the tension leg
platform left the construction yard
in Korea and will be installed on site in
Angola in early 2005.
E X X O N M O B I L C O R P O R A T I O N • 2 0 0 4 S U M M A R Y A N N U A L R E P O R T
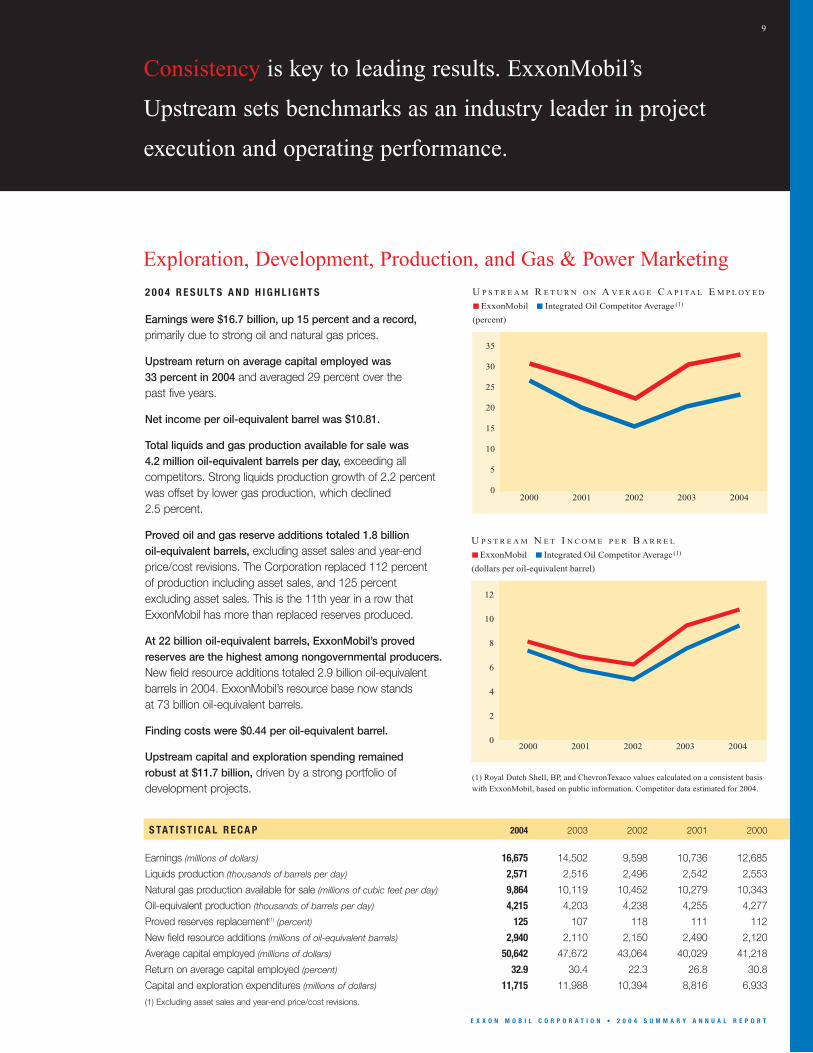
2 0 0 4 R E S U LT S A N D H I G H L I G H T S
Earnings were $16.7 billion, up 15 percent and a record,primarily due to strong oil and natural gas prices.
Upstream return on average capital employed was 33 percent in 2004 and averaged 29 percent over the past five years.
Net income per oil-equivalent barrel was $10.81.
Total liquids and gas production available for sale was 4.2 million oil-equivalent barrels per day, exceeding allcompetitors. Strong liquids production growth of 2.2 percentwas offset by lower gas production, which declined 2.5 percent.
Proved oil and gas reserve additions totaled 1.8 billion oil-equivalent barrels, excluding asset sales and year-endprice/cost revisions. The Corporation replaced 112 percent of production including asset sales, and 125 percentexcluding asset sales. This is the 11th year in a row thatExxonMobil has more than replaced reserves produced.
At 22 billion oil-equivalent barrels, ExxonMobil’s provedreserves are the highest among nongovernmental producers.New field resource additions totaled 2.9 billion oil-equivalentbarrels in 2004. ExxonMobil’s resource base now stands at 73 billion oil-equivalent barrels.
Finding costs were $0.44 per oil-equivalent barrel.
Upstream capital and exploration spending remained robust at $11.7 billion, driven by a strong portfolio of development projects.
Consistency is key to leading results. ExxonMobil’s
Upstream sets benchmarks as an industry leader in project
execution and operating performance.
12
10
8
6
4
2
0
U P S T R E A M N E T I N C O M E P E R B A R R E L
(dollars per oil-equivalent barrel)
ExxonMobil Integrated Oil Competitor Average(1)
(1) Royal Dutch Shell, BP, and ChevronTexaco values calculated on a consistent basis with ExxonMobil, based on public information. Competitor data estimated for 2004.
2000 2001 2002 2003 2004
9
Exploration, Development, Production, and Gas & Power Marketing
35
30
25
20
15
10
5
0
U P S T R E A M R E T U R N O N A V E R A G E C A P I TA L E M P L OY E D
(percent)
ExxonMobil Integrated Oil Competitor Average (1)
2000 2001 2002 2003 2004
S TAT I S T I C A L R E C A P 2004 2003 2002 2001 2000
Earnings (millions of dollars) 16,675 14,502 9,598 10,736 12,685
Liquids production (thousands of barrels per day) 2,571 2,516 2,496 2,542 2,553
Natural gas production available for sale (millions of cubic feet per day) 9,864 10,119 10,452 10,279 10,343
Oil-equivalent production (thousands of barrels per day) 4,215 4,203 4,238 4,255 4,277
Proved reserves replacement(1) (percent) 125 107 118 111 112
New field resource additions (millions of oil-equivalent barrels) 2,940 2,110 2,150 2,490 2,120
Average capital employed (millions of dollars) 50,642 47,672 43,064 40,029 41,218
Return on average capital employed (percent) 32.9 30.4 22.3 26.8 30.8
Capital and exploration expenditures (millions of dollars) 11,715 11,988 10,394 8,816 6,933
(1) Excluding asset sales and year-end price/cost revisions.
10
E X X O N M O B I L C O R P O R A T I O N • 2 0 0 4 S U M M A R Y A N N U A L R E P O R T
Functional Organization Capitalizes on Strengths
ExxonMobil has an experienced, dedicated, and diversework force of exceptional quality. The Upstream iscomprised of four global functional organizations –Exploration, Development, Production, and Gas & PowerMarketing. Each organization is supported by the UpstreamResearch Company. This global functional structure lever-ages our upstream strengths. Our structure was not created
O U R U P S T R E A M S T R AT E G I E S
Regardless of the business environment, our coreupstream strategies continue to deliver solid results. They are enhanced by an unparalleled commitment totechnology, leveraged by our global functional organiza-tion, and supported by our dedication to superiorexecution, operational excellence, and a continual focuson cost management.
Although conditions and opportunities change from yearto year, our core strategies remain constant. These keystrategies are:
■ Maximize profitability of existing oil and gas production;
■ Identify and pursue all attractive exploration opportunities;
■ Invest in projects that deliver superior returns; and,
■ Capitalize on growing natural gas and power markets.
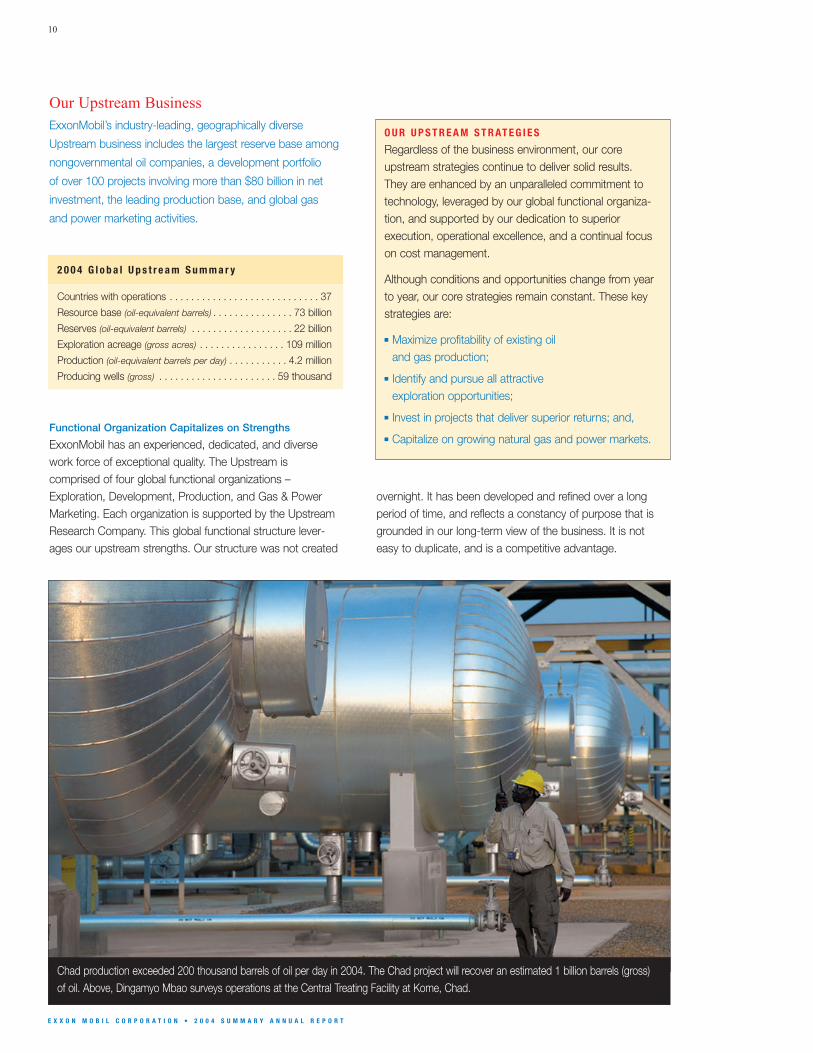
Chad production exceeded 200 thousand barrels of oil per day in 2004. The Chad project will recover an estimated 1 billion barrels (gross)of oil. Above, Dingamyo Mbao surveys operations at the Central Treating Facility at Kome, Chad.
Our Upstream BusinessExxonMobil’s industry-leading, geographically diverse
Upstream business includes the largest reserve base among
nongovernmental oil companies, a development portfolio
of over 100 projects involving more than $80 billion in net
investment, the leading production base, and global gas
and power marketing activities.
overnight. It has been developed and refined over a longperiod of time, and reflects a constancy of purpose that isgrounded in our long-term view of the business. It is noteasy to duplicate, and is a competitive advantage.
2 0 0 4 G l o b a l U p s t r e a m S u m m a r y
Countries with operations . . . . . . . . . . . . . . . . . . . . . . . . . . . . 37
Resource base (oil-equivalent barrels) . . . . . . . . . . . . . . . 73 billion
Reserves (oil-equivalent barrels) . . . . . . . . . . . . . . . . . . . 22 billion
Exploration acreage (gross acres) . . . . . . . . . . . . . . . . 109 million
Production (oil-equivalent barrels per day) . . . . . . . . . . . 4.2 million
Producing wells (gross) . . . . . . . . . . . . . . . . . . . . . . 59 thousand
E X X O N M O B I L C O R P O R A T I O N • 2 0 0 4 S U M M A R Y A N N U A L R E P O R T
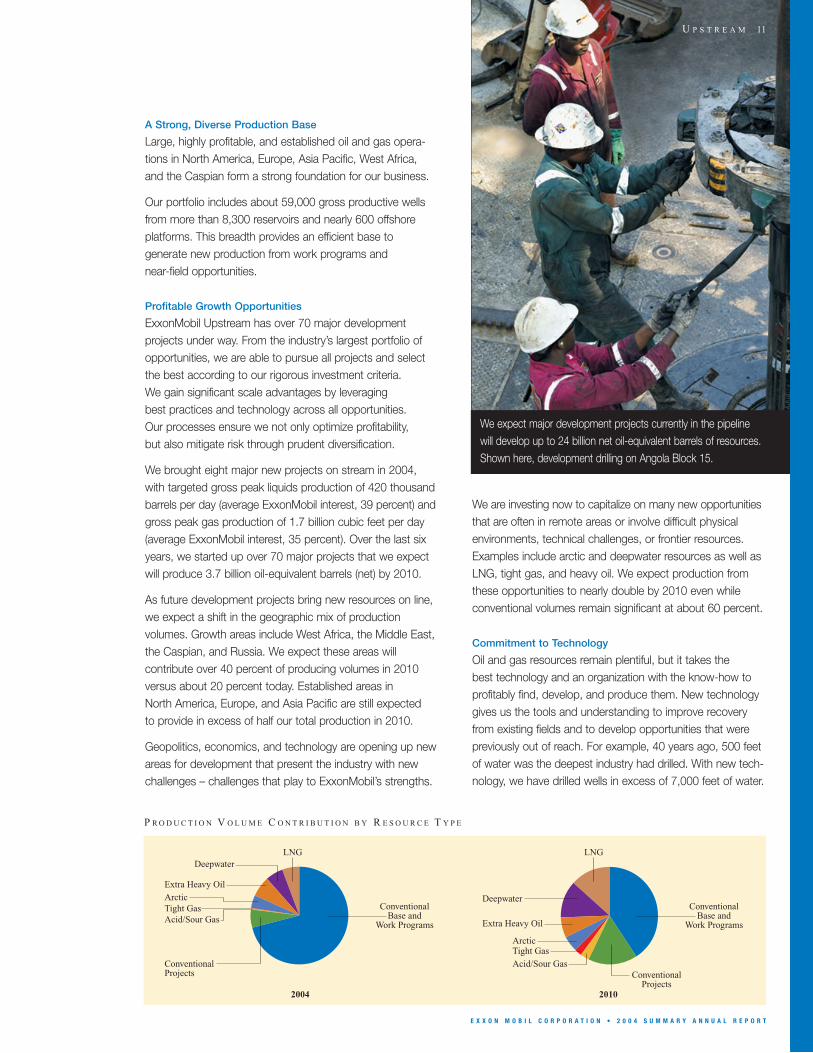
We expect major development projects currently in the pipeline will develop up to 24 billion net oil-equivalent barrels of resources.Shown here, development drilling on Angola Block 15.
A Strong, Diverse Production Base
Large, highly profitable, and established oil and gas opera-tions in North America, Europe, Asia Pacific, West Africa,and the Caspian form a strong foundation for our business.
Our portfolio includes about 59,000 gross productive wellsfrom more than 8,300 reservoirs and nearly 600 offshoreplatforms. This breadth provides an efficient base togenerate new production from work programs and near-field opportunities.
Profitable Growth Opportunities
ExxonMobil Upstream has over 70 major development projects under way. From the industry’s largest portfolio ofopportunities, we are able to pursue all projects and selectthe best according to our rigorous investment criteria. We gain significant scale advantages by leveraging best practices and technology across all opportunities. Our processes ensure we not only optimize profitability, but also mitigate risk through prudent diversification.
We brought eight major new projects on stream in 2004, with targeted gross peak liquids production of 420 thousandbarrels per day (average ExxonMobil interest, 39 percent) andgross peak gas production of 1.7 billion cubic feet per day(average ExxonMobil interest, 35 percent). Over the last sixyears, we started up over 70 major projects that we expectwill produce 3.7 billion oil-equivalent barrels (net) by 2010.
As future development projects bring new resources on line,we expect a shift in the geographic mix of productionvolumes. Growth areas include West Africa, the Middle East,the Caspian, and Russia. We expect these areas willcontribute over 40 percent of producing volumes in 2010versus about 20 percent today. Established areas in North America, Europe, and Asia Pacific are still expected to provide in excess of half our total production in 2010.
Geopolitics, economics, and technology are opening up newareas for development that present the industry with newchallenges – challenges that play to ExxonMobil’s strengths.
We are investing now to capitalize on many new opportunitiesthat are often in remote areas or involve difficult physical environments, technical challenges, or frontier resources.Examples include arctic and deepwater resources as well asLNG, tight gas, and heavy oil. We expect production fromthese opportunities to nearly double by 2010 even whileconventional volumes remain significant at about 60 percent.
Commitment to Technology
Oil and gas resources remain plentiful, but it takes the best technology and an organization with the know-how toprofitably find, develop, and produce them. New technologygives us the tools and understanding to improve recoveryfrom existing fields and to develop opportunities that werepreviously out of reach. For example, 40 years ago, 500 feetof water was the deepest industry had drilled. With new tech-nology, we have drilled wells in excess of 7,000 feet of water.
ConventionalBase and
Work Programs
LNG
2004 2010
Deepwater
Extra Heavy Oil
Tight GasArctic
Acid/Sour Gas
ConventionalProjects
P R O D U C T I O N V O L U M E C O N T R I B U T I O N B Y R E S O U R C E T Y P E
ConventionalBase and
Work Programs
LNG
Deepwater
Extra Heavy Oil
Tight GasArctic
Acid/Sour GasConventional
Projects
U P S T R E A M 11
12
E X X O N M O B I L C O R P O R A T I O N • 2 0 0 4 S U M M A R Y A N N U A L R E P O R T
and revisions are subject to a long-standing, structuredmanagement review process regarding the reasonable certainty of recovery, which is the standard set by the Securities and Exchange Commission.
T H E A M E R I C A S
ExxonMobil’s operations in Northand South America contributedabout 42 percent of 2004Upstream earnings. We optimizethis diverse portfolio through invest-ment in high-return opportunities,while enhancing existing capacity andselectively divesting properties when it adds value.
For example, in 2004, we arranged to farm out some of our undeveloped Canadian properties, transfer a number ofmature producing assets in West Texas, and, with a partner,jointly explore deep gas plays on more than 800,000 acresonshore Louisiana and offshore Gulf of Mexico. Opportunitieslike these maximize value from mature properties and addresources efficiently and through broader application of proprietary technologies.
United States
We continue to develop one of the leading acreage positions in the Gulf of Mexico. In the ultra-deepwater foldbelt, weparticipated in the successful appraisal of the St. Malo discovery(ExxonMobil interest, 4 percent) in 2003. This provided us withvaluable geotechnical data to assess the exploration potentialof surrounding ExxonMobil acreage in the Walker Ridge area,where we are the predominant acreage holder.
Additional development projects are slated to add to theproduction from more than 40 existing Gulf of Mexico fieldswhere ExxonMobil has an interest. Production began in 2004from the Llano field (ExxonMobil interest, 23 percent) and theSouth Diana field (ExxonMobil interest, 100 percent). The start-up of the deepwater Thunder Horse development (ExxonMobilinterest, 25 percent) is projected for the second half of 2005.
2 0 0 4 G l o b a l P r o d u c t i o n S u m m a r y
Region Liquids Gas Percent*(kBD) (MCFD)
United States . . . . . . . . . . . . . . . . . . . . .557 1,947 21
Canada . . . . . . . . . . . . . . . . . . . . . . . . . .355 972 12
Europe . . . . . . . . . . . . . . . . . . . . . . . . . . .583 4,614 32
Africa . . . . . . . . . . . . . . . . . . . . . . . . . . . .572 – 14
Middle East . . . . . . . . . . . . . . . . . . . . . . .158 642 6
Asia Pacific . . . . . . . . . . . . . . . . . . . . . . .202 1,519 11
Other Areas . . . . . . . . . . . . . . . . . . . . . .144 170 4
Total Worldwide . . . . . . . . . . . . . . . .2,571 9,864 100
*Percent of oil-equivalent total
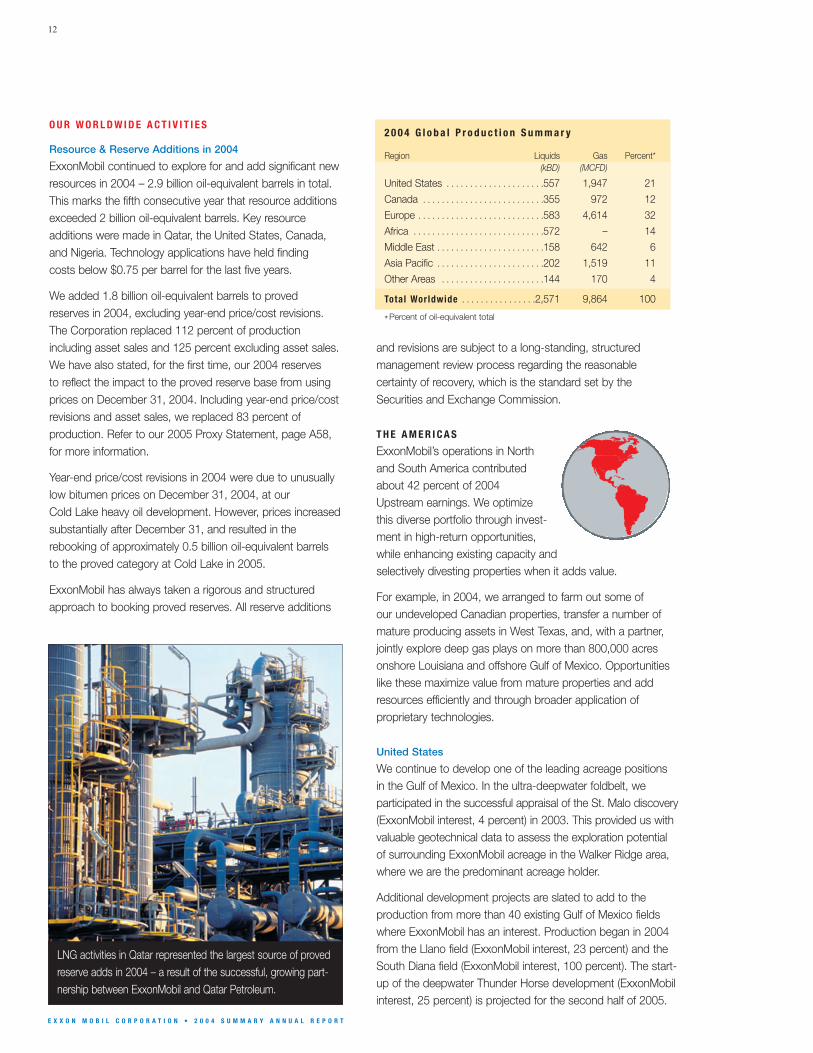
LNG activities in Qatar represented the largest source of provedreserve adds in 2004 – a result of the successful, growing part-nership between ExxonMobil and Qatar Petroleum.
O U R W O R L D W I D E A C T I V I T I E S
Resource & Reserve Additions in 2004
ExxonMobil continued to explore for and add significant newresources in 2004 – 2.9 billion oil-equivalent barrels in total.This marks the fifth consecutive year that resource additionsexceeded 2 billion oil-equivalent barrels. Key resource additions were made in Qatar, the United States, Canada,and Nigeria. Technology applications have held finding costs below $0.75 per barrel for the last five years.
We added 1.8 billion oil-equivalent barrels to proved reserves in 2004, excluding year-end price/cost revisions.The Corporation replaced 112 percent of productionincluding asset sales and 125 percent excluding asset sales.We have also stated, for the first time, our 2004 reserves to reflect the impact to the proved reserve base from usingprices on December 31, 2004. Including year-end price/costrevisions and asset sales, we replaced 83 percent ofproduction. Refer to our 2005 Proxy Statement, page A58,for more information.
Year-end price/cost revisions in 2004 were due to unusuallylow bitumen prices on December 31, 2004, at our Cold Lake heavy oil development. However, prices increasedsubstantially after December 31, and resulted in therebooking of approximately 0.5 billion oil-equivalent barrels to the proved category at Cold Lake in 2005.
ExxonMobil has always taken a rigorous and structuredapproach to booking proved reserves. All reserve additions
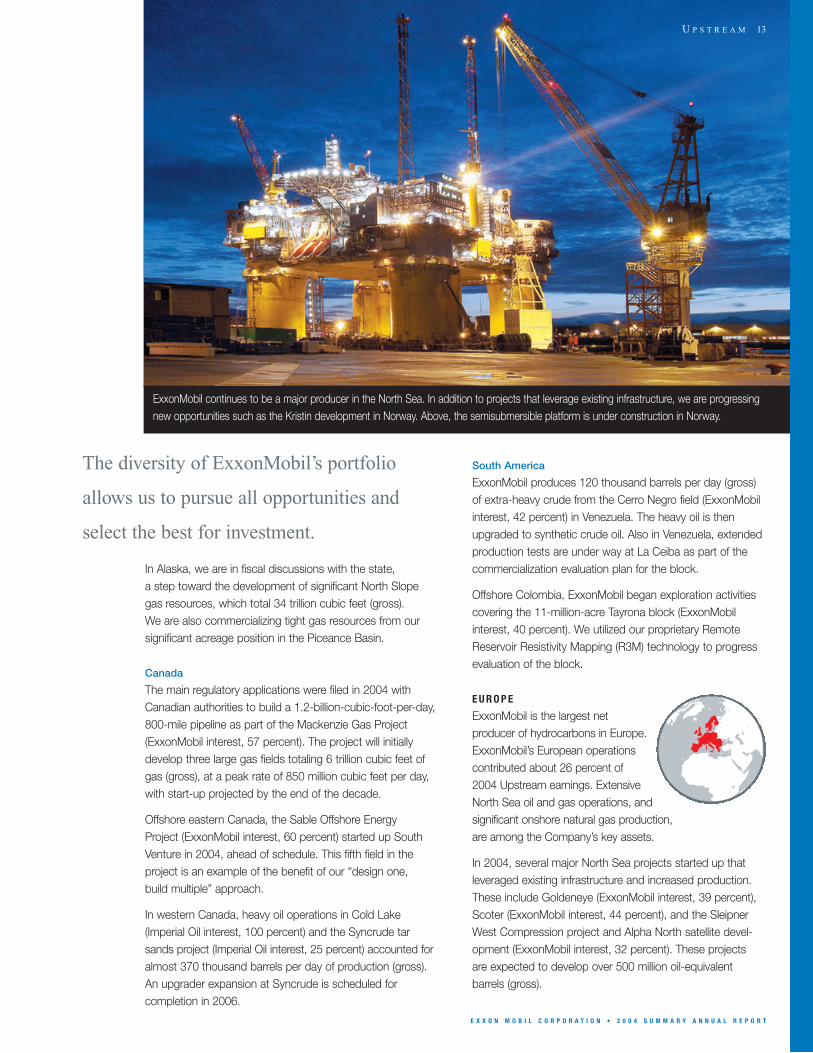
ExxonMobil continues to be a major producer in the North Sea. In addition to projects that leverage existing infrastructure, we are progressingnew opportunities such as the Kristin development in Norway. Above, the semisubmersible platform is under construction in Norway.
U P S T R E A M 13
E X X O N M O B I L C O R P O R A T I O N • 2 0 0 4 S U M M A R Y A N N U A L R E P O R T
South America
ExxonMobil produces 120 thousand barrels per day (gross)of extra-heavy crude from the Cerro Negro field (ExxonMobilinterest, 42 percent) in Venezuela. The heavy oil is thenupgraded to synthetic crude oil. Also in Venezuela, extendedproduction tests are under way at La Ceiba as part of thecommercialization evaluation plan for the block.
Offshore Colombia, ExxonMobil began exploration activitiescovering the 11-million-acre Tayrona block (ExxonMobilinterest, 40 percent). We utilized our proprietary RemoteReservoir Resistivity Mapping (R3M) technology to progressevaluation of the block.
E U R O P E
ExxonMobil is the largest net producer of hydrocarbons in Europe.ExxonMobil’s European operationscontributed about 26 percent of 2004 Upstream earnings. ExtensiveNorth Sea oil and gas operations, and significant onshore natural gas production, are among the Company’s key assets.
In 2004, several major North Sea projects started up thatleveraged existing infrastructure and increased production.These include Goldeneye (ExxonMobil interest, 39 percent),Scoter (ExxonMobil interest, 44 percent), and the SleipnerWest Compression project and Alpha North satellite devel-opment (ExxonMobil interest, 32 percent). These projects are expected to develop over 500 million oil-equivalentbarrels (gross).
The diversity of ExxonMobil’s portfolio
allows us to pursue all opportunities and
select the best for investment.
In Alaska, we are in fiscal discussions with the state, a step toward the development of significant North Slopegas resources, which total 34 trillion cubic feet (gross). We are also commercializing tight gas resources from oursignificant acreage position in the Piceance Basin.
Canada
The main regulatory applications were filed in 2004 withCanadian authorities to build a 1.2-billion-cubic-foot-per-day,800-mile pipeline as part of the Mackenzie Gas Project(ExxonMobil interest, 57 percent). The project will initiallydevelop three large gas fields totaling 6 trillion cubic feet ofgas (gross), at a peak rate of 850 million cubic feet per day,with start-up projected by the end of the decade.
Offshore eastern Canada, the Sable Offshore Energy Project (ExxonMobil interest, 60 percent) started up SouthVenture in 2004, ahead of schedule. This fifth field in theproject is an example of the benefit of our “design one, build multiple” approach.
In western Canada, heavy oil operations in Cold Lake(Imperial Oil interest, 100 percent) and the Syncrude tarsands project (Imperial Oil interest, 25 percent) accounted foralmost 370 thousand barrels per day of production (gross).An upgrader expansion at Syncrude is scheduled forcompletion in 2006.
14
E X X O N M O B I L C O R P O R A T I O N • 2 0 0 4 S U M M A R Y A N N U A L R E P O R T
New deepwater North Sea developments are also underway at Kristin (ExxonMobil interest, 11 percent) and the giant Ormen Lange field (ExxonMobil interest, 7 percent).Together they are expected to produce 2.5 billion cubic feet of gas per day (gross).
ExxonMobil is the largest gas producer in continental Europewhere the world-class Groningen field in the Netherlands, and key fields in Germany, combine to help meet Europeangas demand. Compression projects are under way to ensurecontinued long-term integrity of the facilities and to extendfield life.
Restructuring of our European gas marketing operations has progressed in anticipation of the impact of the EuropeanGas Directives. Part of this effort includes an agreement torestructure the ownership and business activities of Gasuniein the Netherlands. This will position ExxonMobil to competeeffectively in the future European gas market.
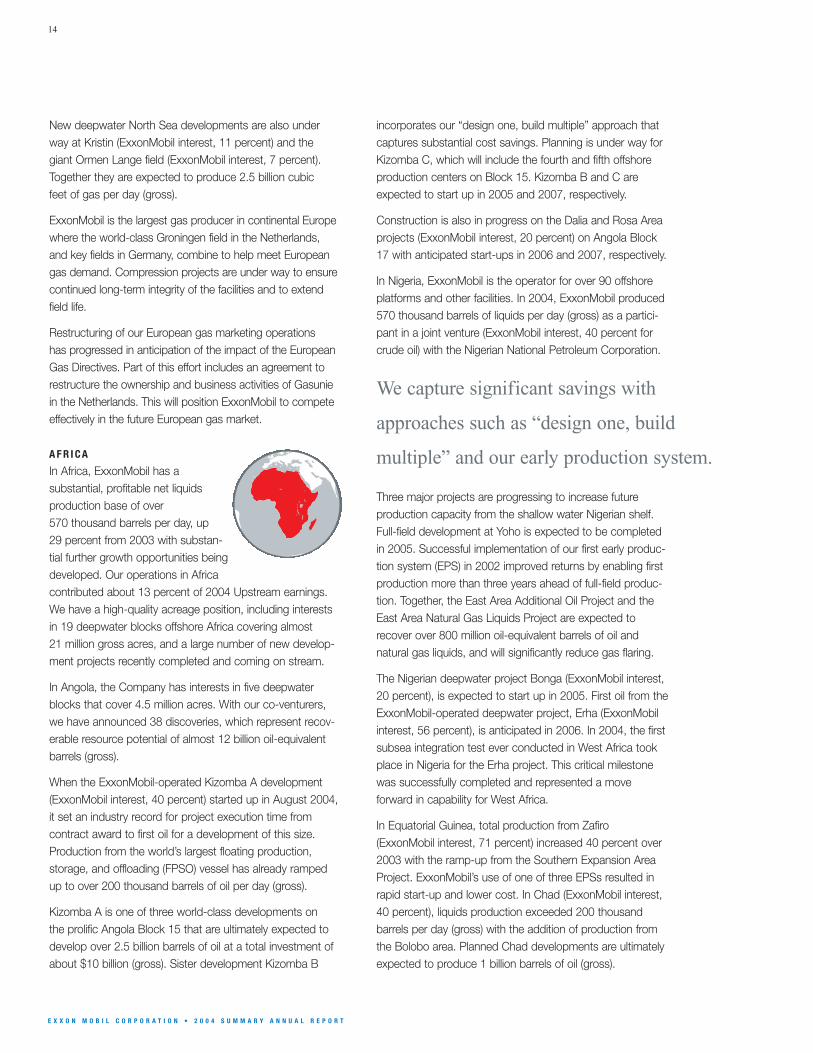
A F R I C A
In Africa, ExxonMobil has asubstantial, profitable net liquidsproduction base of over 570 thousand barrels per day, up29 percent from 2003 with substan-tial further growth opportunities beingdeveloped. Our operations in Africacontributed about 13 percent of 2004 Upstream earnings.We have a high-quality acreage position, including interestsin 19 deepwater blocks offshore Africa covering almost 21 million gross acres, and a large number of new develop-ment projects recently completed and coming on stream.
In Angola, the Company has interests in five deepwaterblocks that cover 4.5 million acres. With our co-venturers,we have announced 38 discoveries, which represent recov-erable resource potential of almost 12 billion oil-equivalentbarrels (gross).
When the ExxonMobil-operated Kizomba A development(ExxonMobil interest, 40 percent) started up in August 2004, it set an industry record for project execution time fromcontract award to first oil for a development of this size.Production from the world’s largest floating production,storage, and offloading (FPSO) vessel has already rampedup to over 200 thousand barrels of oil per day (gross).
Kizomba A is one of three world-class developments on the prolific Angola Block 15 that are ultimately expected todevelop over 2.5 billion barrels of oil at a total investment of about $10 billion (gross). Sister development Kizomba B
incorporates our “design one, build multiple” approach thatcaptures substantial cost savings. Planning is under way forKizomba C, which will include the fourth and fifth offshoreproduction centers on Block 15. Kizomba B and C areexpected to start up in 2005 and 2007, respectively.
Construction is also in progress on the Dalia and Rosa Areaprojects (ExxonMobil interest, 20 percent) on Angola Block17 with anticipated start-ups in 2006 and 2007, respectively.
In Nigeria, ExxonMobil is the operator for over 90 offshoreplatforms and other facilities. In 2004, ExxonMobil produced570 thousand barrels of liquids per day (gross) as a partici-pant in a joint venture (ExxonMobil interest, 40 percent forcrude oil) with the Nigerian National Petroleum Corporation.
Three major projects are progressing to increase futureproduction capacity from the shallow water Nigerian shelf.Full-field development at Yoho is expected to be completedin 2005. Successful implementation of our first early produc-tion system (EPS) in 2002 improved returns by enabling firstproduction more than three years ahead of full-field produc-tion. Together, the East Area Additional Oil Project and theEast Area Natural Gas Liquids Project are expected torecover over 800 million oil-equivalent barrels of oil andnatural gas liquids, and will significantly reduce gas flaring.
The Nigerian deepwater project Bonga (ExxonMobil interest,20 percent), is expected to start up in 2005. First oil from theExxonMobil-operated deepwater project, Erha (ExxonMobilinterest, 56 percent), is anticipated in 2006. In 2004, the firstsubsea integration test ever conducted in West Africa tookplace in Nigeria for the Erha project. This critical milestonewas successfully completed and represented a moveforward in capability for West Africa.
In Equatorial Guinea, total production from Zafiro(ExxonMobil interest, 71 percent) increased 40 percent over2003 with the ramp-up from the Southern Expansion AreaProject. ExxonMobil’s use of one of three EPSs resulted inrapid start-up and lower cost. In Chad (ExxonMobil interest,40 percent), liquids production exceeded 200 thousandbarrels per day (gross) with the addition of production fromthe Bolobo area. Planned Chad developments are ultimatelyexpected to produce 1 billion barrels of oil (gross).
We capture significant savings with
approaches such as “design one, build
multiple” and our early production system.
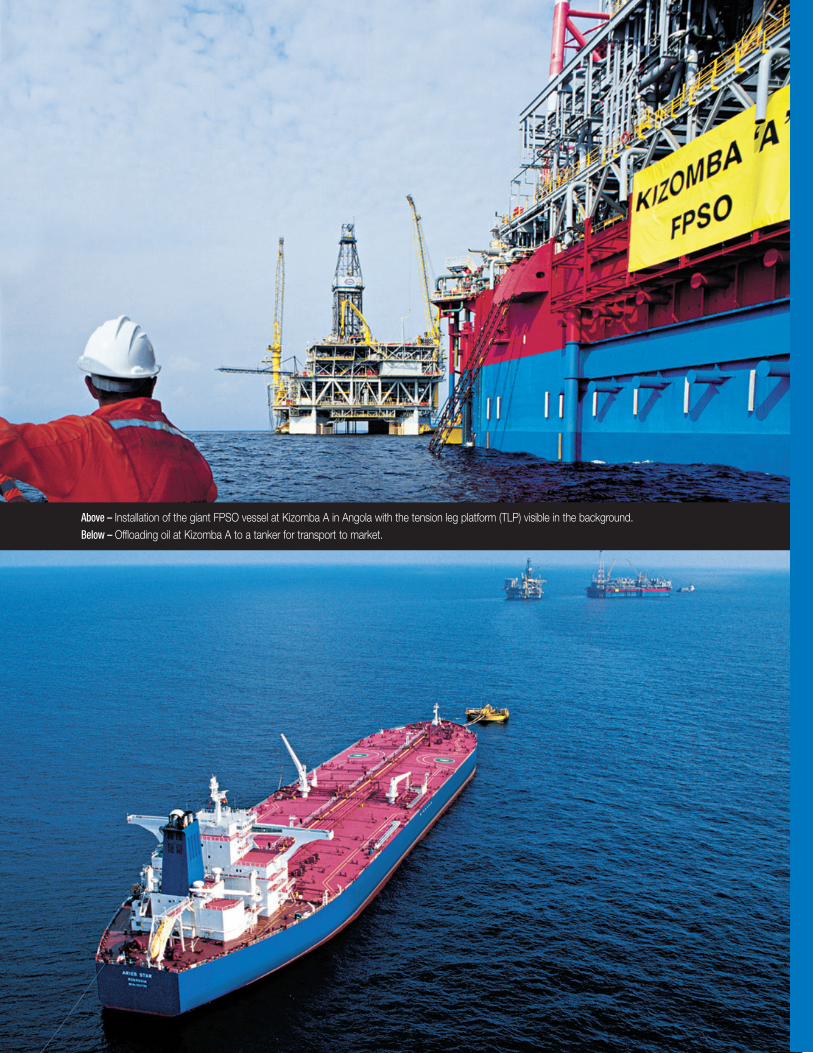
Above – Installation of the giant FPSO vessel at Kizomba A in Angola with the tension leg platform (TLP) visible in the background.Below – Offloading oil at Kizomba A to a tanker for transport to market.
16
E X X O N M O B I L C O R P O R A T I O N • 2 0 0 4 S U M M A R Y A N N U A L R E P O R T
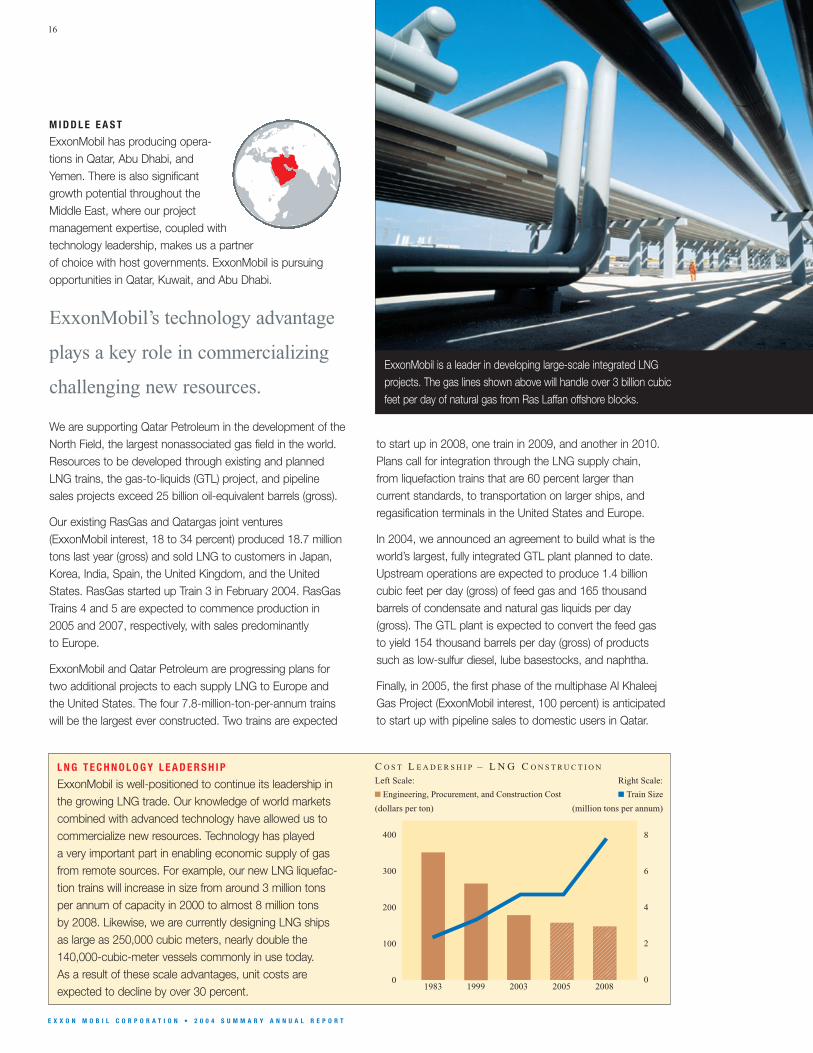
M I D D L E E A S T
ExxonMobil has producing opera-tions in Qatar, Abu Dhabi, andYemen. There is also significantgrowth potential throughout theMiddle East, where our projectmanagement expertise, coupled withtechnology leadership, makes us a partnerof choice with host governments. ExxonMobil is pursuingopportunities in Qatar, Kuwait, and Abu Dhabi.
We are supporting Qatar Petroleum in the development of theNorth Field, the largest nonassociated gas field in the world.Resources to be developed through existing and plannedLNG trains, the gas-to-liquids (GTL) project, and pipelinesales projects exceed 25 billion oil-equivalent barrels (gross).
Our existing RasGas and Qatargas joint ventures (ExxonMobil interest, 18 to 34 percent) produced 18.7 milliontons last year (gross) and sold LNG to customers in Japan,Korea, India, Spain, the United Kingdom, and the UnitedStates. RasGas started up Train 3 in February 2004. RasGasTrains 4 and 5 are expected to commence production in2005 and 2007, respectively, with sales predominantly to Europe.
ExxonMobil and Qatar Petroleum are progressing plans fortwo additional projects to each supply LNG to Europe andthe United States. The four 7.8-million-ton-per-annum trainswill be the largest ever constructed. Two trains are expected
L N G T E C H N O L O G Y L E A D E R S H I P
ExxonMobil is well-positioned to continue its leadership inthe growing LNG trade. Our knowledge of world marketscombined with advanced technology have allowed us tocommercialize new resources. Technology has played a very important part in enabling economic supply of gasfrom remote sources. For example, our new LNG liquefac-tion trains will increase in size from around 3 million tonsper annum of capacity in 2000 to almost 8 million tons by 2008. Likewise, we are currently designing LNG ships as large as 250,000 cubic meters, nearly double the140,000-cubic-meter vessels commonly in use today. As a result of these scale advantages, unit costs areexpected to decline by over 30 percent. �
����
����
�������
(dollars per ton) (million tons per annum)
Left Scale: Right Scale:
C O S T L E A D E R S H I P – L N G C O N S T R U C T I O N
Engineering, Procurement, and Construction Cost Train Size
400
300
200
100
0
8
6
4
2
019991983 2003 2005 2008
ExxonMobil’s technology advantage
plays a key role in commercializing
challenging new resources.
to start up in 2008, one train in 2009, and another in 2010.Plans call for integration through the LNG supply chain, from liquefaction trains that are 60 percent larger thancurrent standards, to transportation on larger ships, andregasification terminals in the United States and Europe.
In 2004, we announced an agreement to build what is theworld’s largest, fully integrated GTL plant planned to date.Upstream operations are expected to produce 1.4 billioncubic feet per day (gross) of feed gas and 165 thousandbarrels of condensate and natural gas liquids per day(gross). The GTL plant is expected to convert the feed gasto yield 154 thousand barrels per day (gross) of productssuch as low-sulfur diesel, lube basestocks, and naphtha.
Finally, in 2005, the first phase of the multiphase Al KhaleejGas Project (ExxonMobil interest, 100 percent) is anticipatedto start up with pipeline sales to domestic users in Qatar.
ExxonMobil is a leader in developing large-scale integrated LNG projects. The gas lines shown above will handle over 3 billion cubic feet per day of natural gas from Ras Laffan offshore blocks.
U P S T R E A M 17
E X X O N M O B I L C O R P O R A T I O N • 2 0 0 4 S U M M A R Y A N N U A L R E P O R T
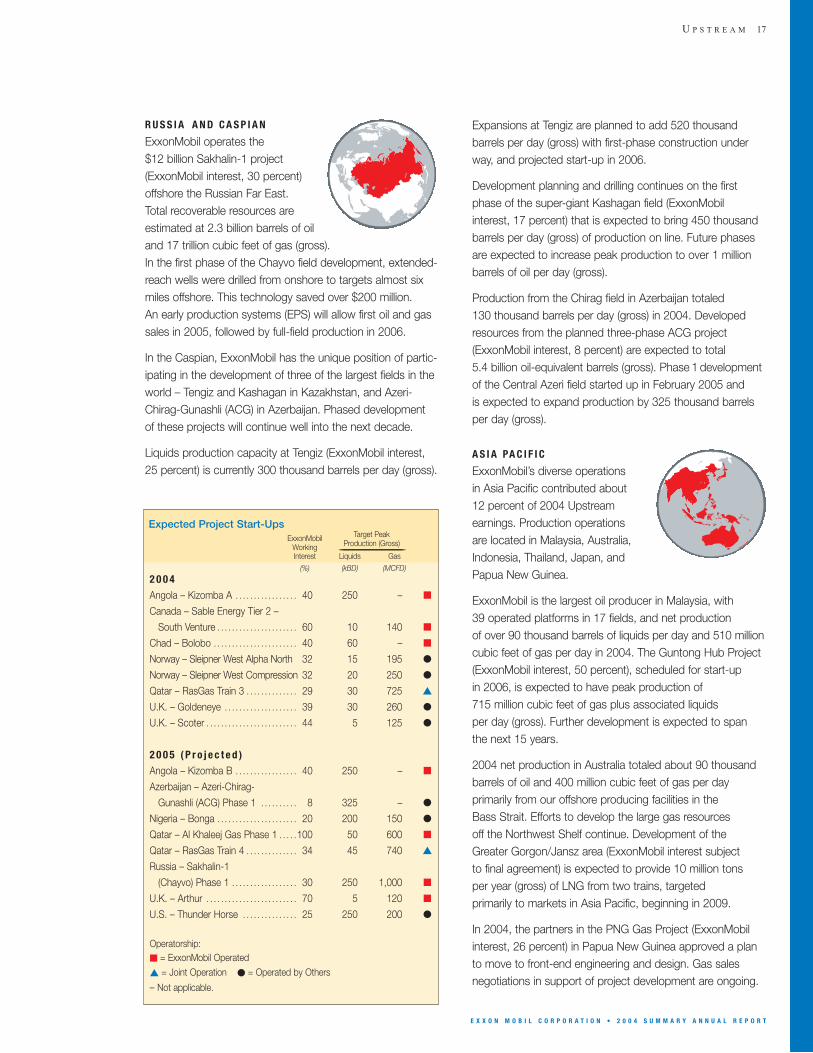
R U S S I A A N D C A S P I A N
ExxonMobil operates the $12 billion Sakhalin-1 project(ExxonMobil interest, 30 percent)offshore the Russian Far East. Total recoverable resources are estimated at 2.3 billion barrels of oiland 17 trillion cubic feet of gas (gross). In the first phase of the Chayvo field development, extended-reach wells were drilled from onshore to targets almost sixmiles offshore. This technology saved over $200 million. An early production systems (EPS) will allow first oil and gassales in 2005, followed by full-field production in 2006.
In the Caspian, ExxonMobil has the unique position of partic-ipating in the development of three of the largest fields in theworld – Tengiz and Kashagan in Kazakhstan, and Azeri-Chirag-Gunashli (ACG) in Azerbaijan. Phased developmentof these projects will continue well into the next decade.
Liquids production capacity at Tengiz (ExxonMobil interest, 25 percent) is currently 300 thousand barrels per day (gross).
Expansions at Tengiz are planned to add 520 thousandbarrels per day (gross) with first-phase construction underway, and projected start-up in 2006.
Development planning and drilling continues on the firstphase of the super-giant Kashagan field (ExxonMobilinterest, 17 percent) that is expected to bring 450 thousandbarrels per day (gross) of production on line. Future phasesare expected to increase peak production to over 1 millionbarrels of oil per day (gross).
Production from the Chirag field in Azerbaijan totaled 130 thousand barrels per day (gross) in 2004. Developedresources from the planned three-phase ACG project(ExxonMobil interest, 8 percent) are expected to total 5.4 billion oil-equivalent barrels (gross). Phase 1 developmentof the Central Azeri field started up in February 2005 and is expected to expand production by 325 thousand barrelsper day (gross).
A S I A PA C I F I C
ExxonMobil’s diverse operations in Asia Pacific contributed about 12 percent of 2004 Upstreamearnings. Production operations are located in Malaysia, Australia,Indonesia, Thailand, Japan, and Papua New Guinea.
ExxonMobil is the largest oil producer in Malaysia, with 39 operated platforms in 17 fields, and net production of over 90 thousand barrels of liquids per day and 510 millioncubic feet of gas per day in 2004. The Guntong Hub Project(ExxonMobil interest, 50 percent), scheduled for start-up in 2006, is expected to have peak production of 715 million cubic feet of gas plus associated liquids per day (gross). Further development is expected to span the next 15 years.
2004 net production in Australia totaled about 90 thousand barrels of oil and 400 million cubic feet of gas per day primarily from our offshore producing facilities in the Bass Strait. Efforts to develop the large gas resources off the Northwest Shelf continue. Development of theGreater Gorgon/Jansz area (ExxonMobil interest subject to final agreement) is expected to provide 10 million tons per year (gross) of LNG from two trains, targeted primarily to markets in Asia Pacific, beginning in 2009.
In 2004, the partners in the PNG Gas Project (ExxonMobilinterest, 26 percent) in Papua New Guinea approved a planto move to front-end engineering and design. Gas salesnegotiations in support of project development are ongoing.
ExxonMobil Target Peak
Working Production (Gross)_______________________________________________Interest Liquids Gas
(%) (kBD) (MCFD)
2 0 0 4
Angola – Kizomba A . . . . . . . . . . . . . . . . . 40 250 – ■
Canada – Sable Energy Tier 2 –
South Venture . . . . . . . . . . . . . . . . . . . . . . 60 10 140 ■
Chad – Bolobo . . . . . . . . . . . . . . . . . . . . . . . 40 60 – ■
Norway – Sleipner West Alpha North 32 15 195 ●
Norway – Sleipner West Compression 32 20 250 ●
Qatar – RasGas Train 3 . . . . . . . . . . . . . . 29 30 725 ▲
U.K. – Goldeneye . . . . . . . . . . . . . . . . . . . . 39 30 260 ●
U.K. – Scoter . . . . . . . . . . . . . . . . . . . . . . . . . 44 5 125 ●
2 0 0 5 ( P r o j e c t e d )
Angola – Kizomba B . . . . . . . . . . . . . . . . . 40 250 – ■
Azerbaijan – Azeri-Chirag-
Gunashli (ACG) Phase 1 . . . . . . . . . . 8 325 – ●
Nigeria – Bonga . . . . . . . . . . . . . . . . . . . . . . 20 200 150 ●
Qatar – Al Khaleej Gas Phase 1 . . . . .100 50 600 ■
Qatar – RasGas Train 4 . . . . . . . . . . . . . . 34 45 740 ▲
Russia – Sakhalin-1
(Chayvo) Phase 1 . . . . . . . . . . . . . . . . . . 30 250 1,000 ■
U.K. – Arthur . . . . . . . . . . . . . . . . . . . . . . . . . 70 5 120 ■
U.S. – Thunder Horse . . . . . . . . . . . . . . . 25 250 200 ●
Expected Project Start-Ups
Operatorship:■ = ExxonMobil Operated
▲ = Joint Operation ● = Operated by Others
– Not applicable.
DO
WN
ST
RE
AM
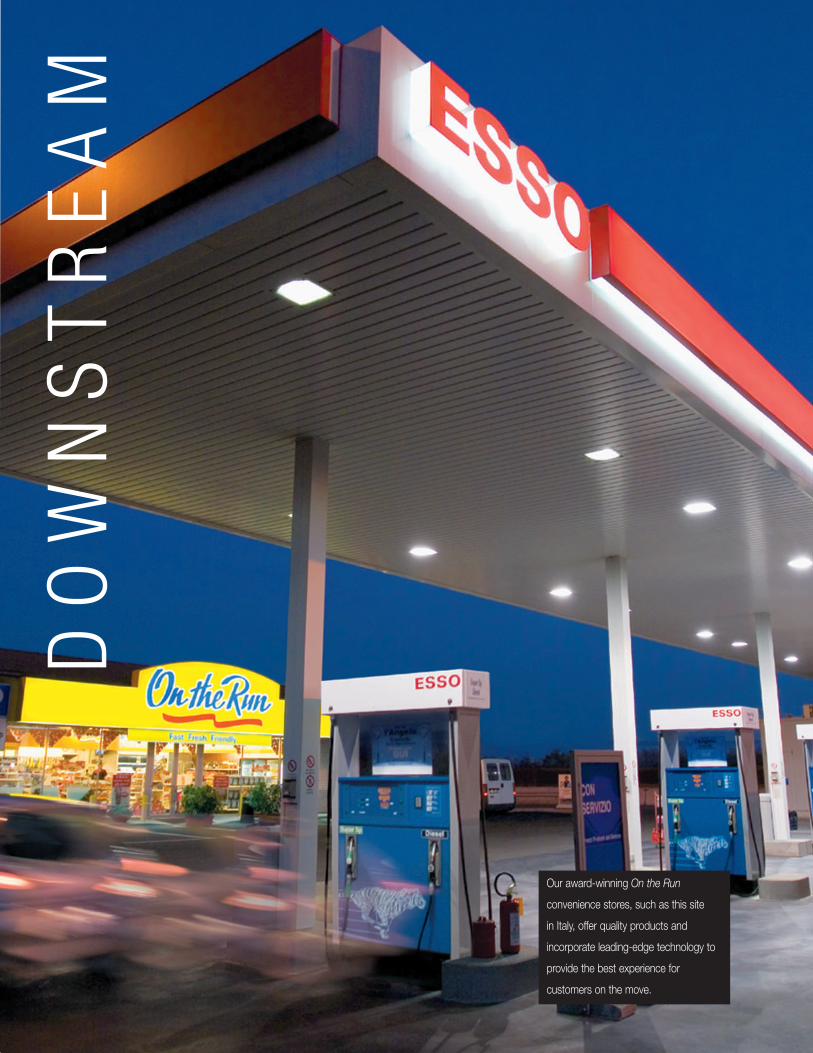
Our award-winning On the Run
convenience stores, such as this site
in Italy, offer quality products and
incorporate leading-edge technology to
provide the best experience for
customers on the move.
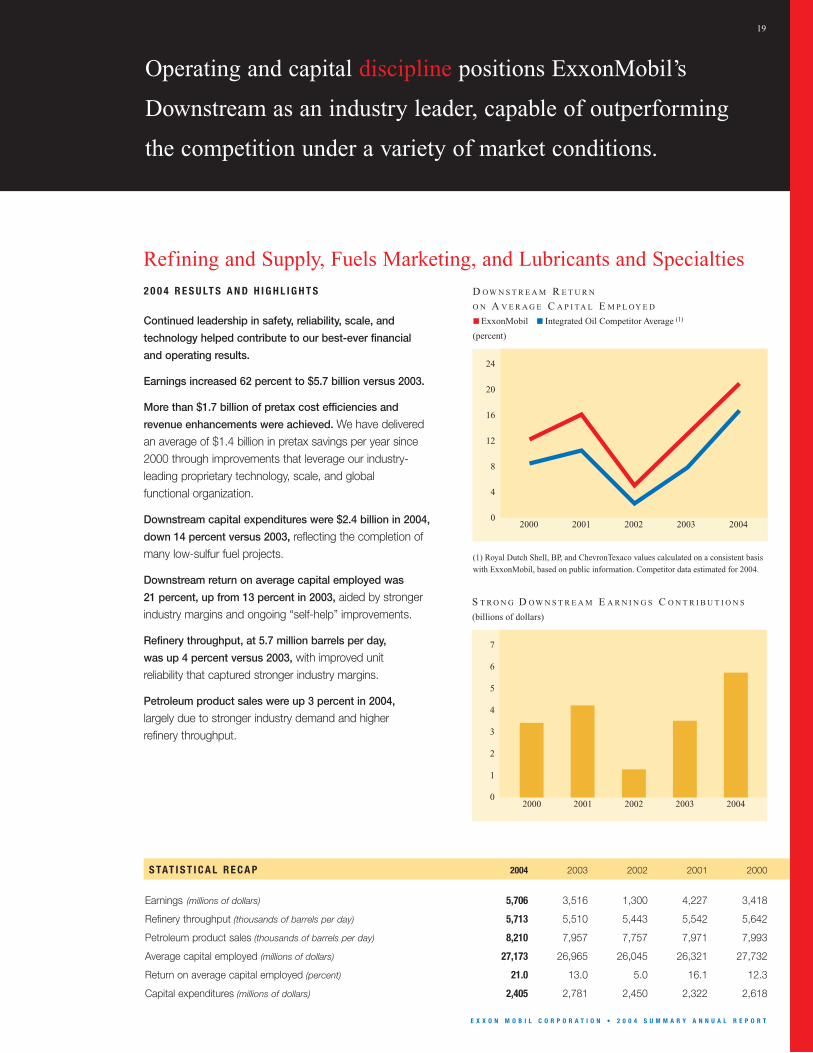
S TAT I S T I C A L R E C A P 2004 2003 2002 2001 2000
Earnings (millions of dollars) 5,706 3,516 1,300 4,227 3,418
Refinery throughput (thousands of barrels per day) 5,713 5,510 5,443 5,542 5,642
Petroleum product sales (thousands of barrels per day) 8,210 7,957 7,757 7,971 7,993
Average capital employed (millions of dollars) 27,173 26,965 26,045 26,321 27,732
Return on average capital employed (percent) 21.0 13.0 5.0 16.1 12.3
Capital expenditures (millions of dollars) 2,405 2,781 2,450 2,322 2,618
E X X O N M O B I L C O R P O R A T I O N • 2 0 0 4 S U M M A R Y A N N U A L R E P O R T
2 0 0 4 R E S U LT S A N D H I G H L I G H T S
Continued leadership in safety, reliability, scale, and
technology helped contribute to our best-ever financial
and operating results.
Earnings increased 62 percent to $5.7 billion versus 2003.
More than $1.7 billion of pretax cost efficiencies and
revenue enhancements were achieved. We have deliveredan average of $1.4 billion in pretax savings per year since2000 through improvements that leverage our industry-leading proprietary technology, scale, and global functional organization.
Downstream capital expenditures were $2.4 billion in 2004,
down 14 percent versus 2003, reflecting the completion ofmany low-sulfur fuel projects.
Downstream return on average capital employed was
21 percent, up from 13 percent in 2003, aided by strongerindustry margins and ongoing “self-help” improvements.
Refinery throughput, at 5.7 million barrels per day,
was up 4 percent versus 2003, with improved unit reliability that captured stronger industry margins.
Petroleum product sales were up 3 percent in 2004,
largely due to stronger industry demand and higher refinery throughput.
Operating and capital discipline positions ExxonMobil’s
Downstream as an industry leader, capable of outperforming
the competition under a variety of market conditions.
2000 2001 2002 2003 2004
24
20
16
12
8
4
0
D O W N S T R E A M R E T U R N
O N A V E R A G E C A P I TA L E M P L OY E D
(percent)
ExxonMobil Integrated Oil Competitor Average (1)
(1) Royal Dutch Shell, BP, and ChevronTexaco values calculated on a consistent basis with ExxonMobil, based on public information. Competitor data estimated for 2004.
2000 2001 2002 2003 2004
7
6
5
4
3
2
1
0
S T R O N G D O W N S T R E A M E A R N I N G S C O N T R I B U T I O N S
(billions of dollars)
19
Refining and Supply, Fuels Marketing, and Lubricants and Specialties
20
E X X O N M O B I L C O R P O R A T I O N • 2 0 0 4 S U M M A R Y A N N U A L R E P O R T
ExxonMobil has refining operations in 25 countries,
over 37,000 retail sites in more than 100 countries, and
lubricants marketing in about 200 countries and territories.
We have created sustainable competitive advantages
that enable us to execute a broad array of “self-help”
measures that generate attractive returns and create
value for our shareholders.
O U R D O W N S T R E A M S T R AT E G I E S
Our financial objectives in the Downstream can be summa-rized into three broad areas: margin enhancement, costefficiency, and capital discipline. Delivering on these objec-tives enables us to create value for shareholders throughindustry-leading return on average capital employed. Thekey strategies we pursue to meet these objectives are:
■ Maintain best-in-class operations in all respects;
■ Provide quality, valued products and services to our customers;
■ Lead industry in efficiency and effectiveness;
■ Capitalize on integration with other ExxonMobil businesses;
■ Selectively invest for resilient, advantaged returns; and,
■ Maximize value from leading-edge technology.
ExxonMobil utilizes its world-class
scale, along with industry-leading
integration, efficiency, and technology
to maximize shareholder value.
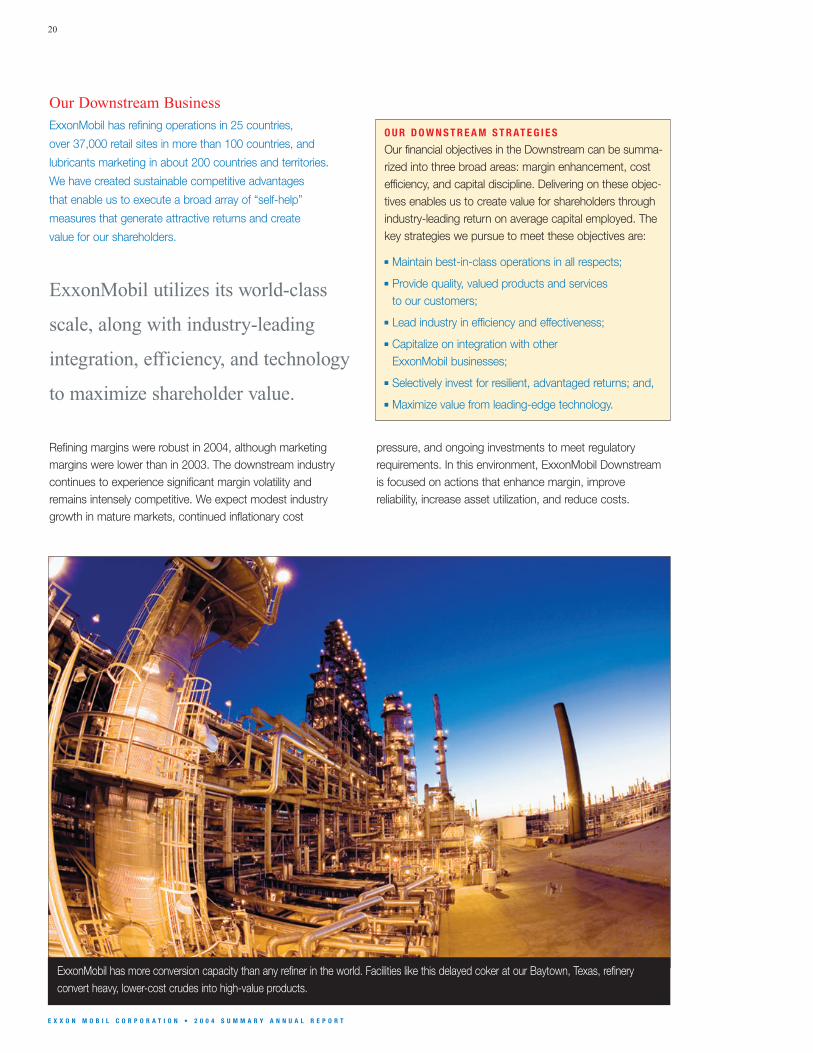
Our Downstream Business
Refining margins were robust in 2004, although marketingmargins were lower than in 2003. The downstream industrycontinues to experience significant margin volatility andremains intensely competitive. We expect modest industrygrowth in mature markets, continued inflationary cost
pressure, and ongoing investments to meet regulatoryrequirements. In this environment, ExxonMobil Downstreamis focused on actions that enhance margin, improve reliability, increase asset utilization, and reduce costs.
ExxonMobil has more conversion capacity than any refiner in the world. Facilities like this delayed coker at our Baytown, Texas, refineryconvert heavy, lower-cost crudes into high-value products.
D O W N S T R E A M 21
E X X O N M O B I L C O R P O R A T I O N • 2 0 0 4 S U M M A R Y A N N U A L R E P O R T
Different qualities of crude feedstocks can produce verydifferent product slates, depending on the type of refinery.The cost differences between crude grades can vary significantly, as they did in 2004. This environment presentsa tremendous opportunity for refiners that are configured to capture the benefits.
We have made prudent investments over time to install theright configuration where it counts. Our ability to convertlower-cost crudes into a higher yield of high-value productsand chemical feedstocks maximizes our refining margin.With disciplined investment and industry-leading globalscale, we generate better returns than our competition.
Leveraging Global Scale and Integration
Our global diversity, scale, and integration provide competitive advantages that increase returns and allow us to prudently manage risk. Overall, our refineries are 70 percent larger than the industry average, which enablesus to reduce unit costs below the industry average.Integration at many locations with our petrochemical facilities, combined with our proprietary technology advantage, enables us to optimize production to the highest-value outlet on a daily basis.
Increasing Reliability
One of the most straightforward ways to improve profitabilityis to increase refinery utilization and raise the overall yield of higher-value products. In 2004, we reduced unplanned
capacity loss by over 20 percent versus 2003, driven byimprovements from the disciplined application of our Reliabilityand Maintenance Management System. Since its introduction,we have reduced maintenance costs by 30 percent.
Delivering Efficiencies
Energy and work force costs comprise two-thirds of totalrefining cash costs. A disciplined effort to reduce costs inthese areas delivers results that flow directly to the bottomline. Since its inception in 1999, our proprietary GlobalEnergy Management System (GEMS) has enabled us toidentify more than $1 billion in pretax energy savings. Also,since 1998, Refining and Supply staffing has been reducedby 25 percent, driven mainly by work force efficiencies.
Growing Selectively
World-class scale and integration, industry-leading efficiency,leading-edge technology, and globally respected brandsenable ExxonMobil to take advantage of attractive emerginggrowth opportunities. In 2004, we signed an agreement with Sinopec, Saudi Aramco, and Fujian Petrochemical toprogress the design of the first fully integrated Sino-foreignpetroleum and petrochemical project in China.
We also continue to pursue low-cost ways to incrementallyadd capacity in our existing facilities. Historically, we haveadded 1 to 2 percent per year to our refining capacity – the equivalent of building a new grassroots refinery everythree years.
L a r g e s t G l o b a l R e f i n e r
Refinery interests . . . . . . . . . . . . . . . . . . . . . . . . . . . . . . . . . . . . . . . . 45
Distillation capacity (barrels per day) . . . . . . . . . . . . . . . . 6.4 million
Lube basestock capacity (barrels per day) . . . . . . . 145 thousand
Crude oil and product tanker interests (>1kDWT). . . . . . . . . . . . 32
Major petroleum products terminals . . . . . . . . . . . . . . . . . . . . . . 282
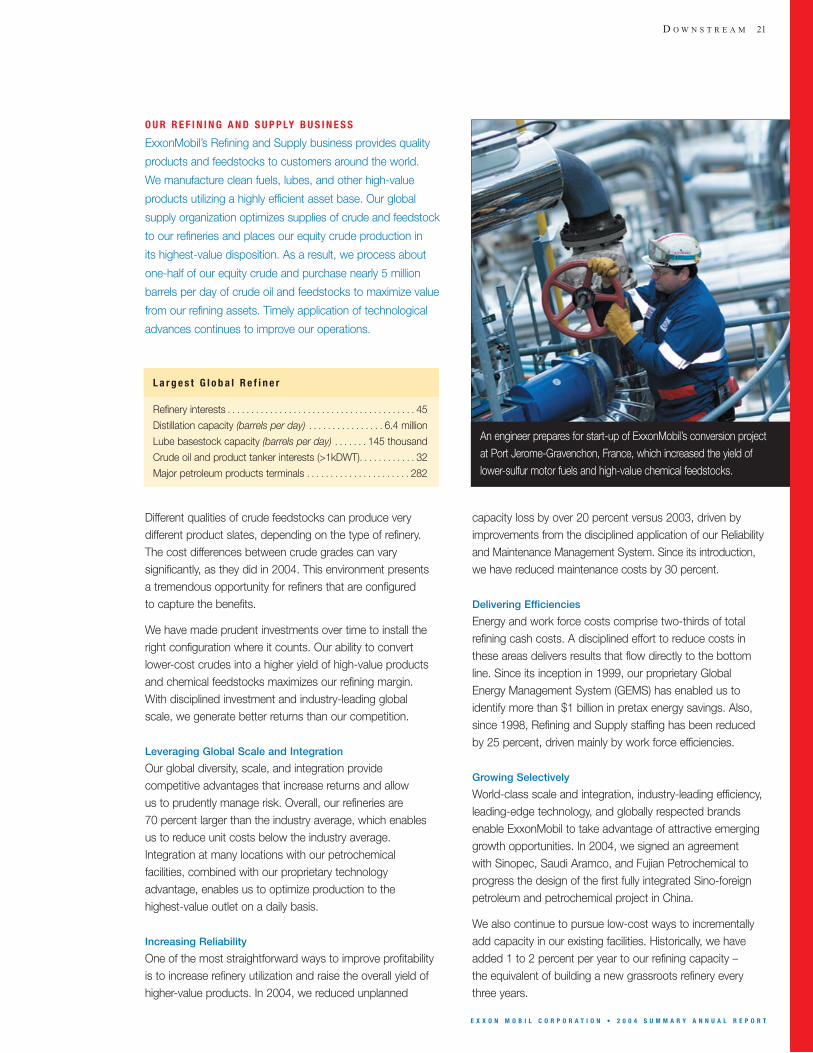
O U R R E F I N I N G A N D S U P P LY B U S I N E S S
ExxonMobil’s Refining and Supply business provides quality
products and feedstocks to customers around the world.
We manufacture clean fuels, lubes, and other high-value
products utilizing a highly efficient asset base. Our global
supply organization optimizes supplies of crude and feedstock
to our refineries and places our equity crude production in
its highest-value disposition. As a result, we process about
one-half of our equity crude and purchase nearly 5 million
barrels per day of crude oil and feedstocks to maximize value
from our refining assets. Timely application of technological
advances continues to improve our operations.
An engineer prepares for start-up of ExxonMobil’s conversion projectat Port Jerome-Gravenchon, France, which increased the yield oflower-sulfur motor fuels and high-value chemical feedstocks.
22
E X X O N M O B I L C O R P O R A T I O N • 2 0 0 4 S U M M A R Y A N N U A L R E P O R T
by applying best practices and common systems through our worldwide functional organization. In 2004, our efforts reduced pretax costs by over $200 million.
In retail, effective category management, car wash facilities, and strategic alliances with leading food andgrocery marketers increased nonfuels income. The cumulative benefit of our cost efficiencies and nonfuelsincome growth initiatives results in a reduction in the fuels margin we require to break even. In the United States, for example, we have reduced this margin by 15 percent since 2000.
Nonfuels Income Initiatives Drive Margin Enhancement
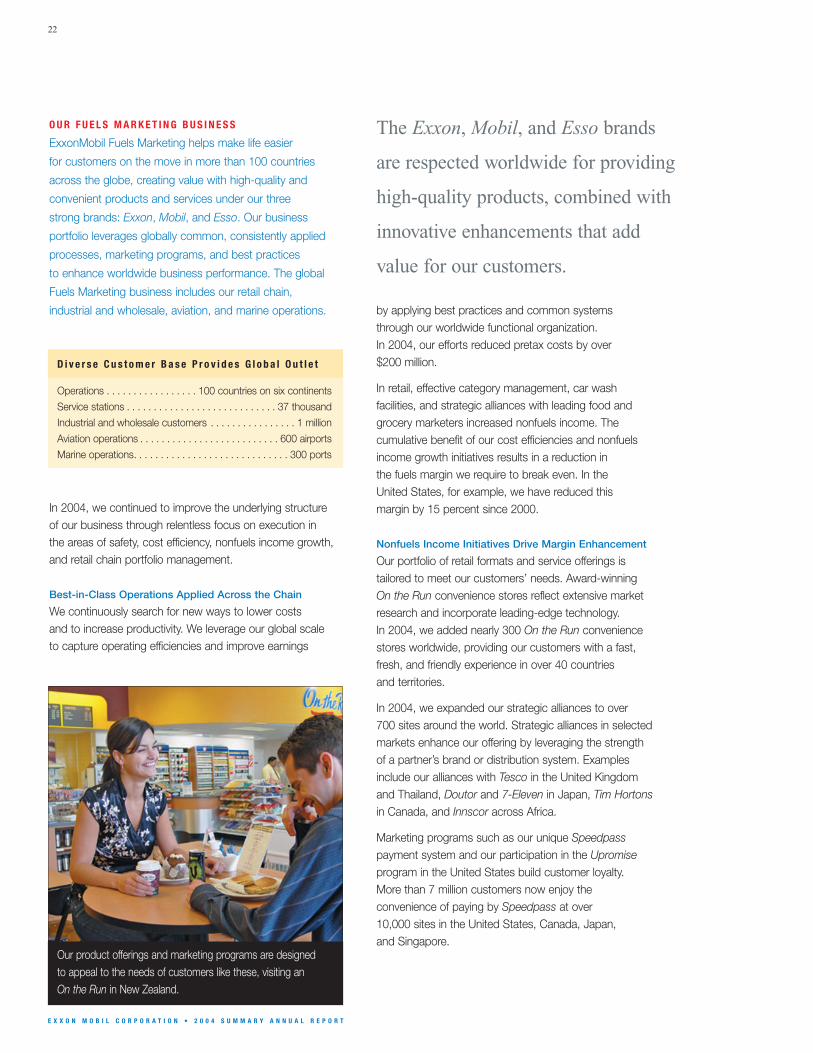
Our portfolio of retail formats and service offerings is tailored to meet our customers’ needs. Award-winning On the Run convenience stores reflect extensive marketresearch and incorporate leading-edge technology. In 2004, we added nearly 300 On the Run conveniencestores worldwide, providing our customers with a fast, fresh, and friendly experience in over 40 countries and territories.
In 2004, we expanded our strategic alliances to over 700 sites around the world. Strategic alliances in selectedmarkets enhance our offering by leveraging the strength of a partner’s brand or distribution system. Examples include our alliances with Tesco in the United Kingdom and Thailand, Doutor and 7-Eleven in Japan, Tim Hortonsin Canada, and Innscor across Africa.
Marketing programs such as our unique Speedpasspayment system and our participation in the Upromiseprogram in the United States build customer loyalty. More than 7 million customers now enjoy the convenience of paying by Speedpass at over 10,000 sites in the United States, Canada, Japan, and Singapore.
The Exxon, Mobil, and Esso brands
are respected worldwide for providing
high-quality products, combined with
innovative enhancements that add
value for our customers.
In 2004, we continued to improve the underlying structure of our business through relentless focus on execution in the areas of safety, cost efficiency, nonfuels income growth,and retail chain portfolio management.
Best-in-Class Operations Applied Across the Chain
We continuously search for new ways to lower costs and to increase productivity. We leverage our global scale to capture operating efficiencies and improve earnings
O U R F U E L S M A R K E T I N G B U S I N E S S
ExxonMobil Fuels Marketing helps make life easier
for customers on the move in more than 100 countries
across the globe, creating value with high-quality and
convenient products and services under our three
strong brands: Exxon, Mobil, and Esso. Our business
portfolio leverages globally common, consistently applied
processes, marketing programs, and best practices
to enhance worldwide business performance. The global
Fuels Marketing business includes our retail chain,
industrial and wholesale, aviation, and marine operations.
D i v e r s e C u s t o m e r B a s e P r o v i d e s G l o b a l O u t l e t
Operations . . . . . . . . . . . . . . . . . 100 countries on six continents
Service stations . . . . . . . . . . . . . . . . . . . . . . . . . . . . 37 thousand
Industrial and wholesale customers . . . . . . . . . . . . . . . . 1 million
Aviation operations . . . . . . . . . . . . . . . . . . . . . . . . . . 600 airports
Marine operations. . . . . . . . . . . . . . . . . . . . . . . . . . . . . 300 ports
Our product offerings and marketing programs are designed to appeal to the needs of customers like these, visiting an On the Run in New Zealand.
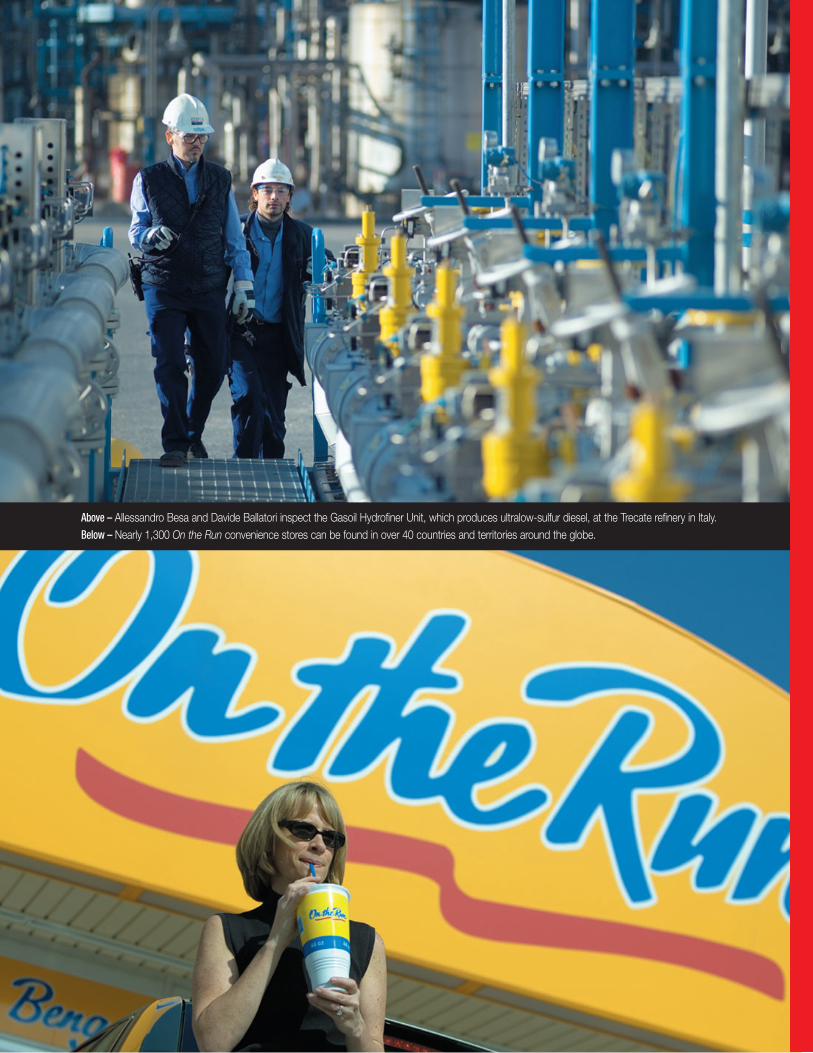
Above – Allessandro Besa and Davide Ballatori inspect the Gasoil Hydrofiner Unit, which produces ultralow-sulfur diesel, at the Trecate refinery in Italy.Below – Nearly 1,300 On the Run convenience stores can be found in over 40 countries and territories around the globe.
24
E X X O N M O B I L C O R P O R A T I O N • 2 0 0 4 S U M M A R Y A N N U A L R E P O R T
Discipline Improves Capital Efficiency
We maintain a productive asset base by utilizing a disciplinedstrategy to manage capital resources. Using our focusedmarket approach, we select and prioritize potential marketsthrough a comprehensive planning process. For each market,we assess customer preferences, develop detailed marketmodels, and produce a resilient network plan. In marketswhere we have implemented this approach, our resulting retailchain is significantly more efficient and higher performing.
Market effectiveness, which is the ratio of the percentage of volume sold to the percentage of industry retail sites in agiven market, is a common measure of asset performance in the retail business. Our market effectiveness is 50 percentbetter than industry in markets where we have seen the fullbenefits of a focused market approach, indicating thesuccess of our retail chain highgrading efforts.
Strategic sponsorships and alliances with
high-performing motorsports teams and
leading original-equipment manufacturers
are a powerful endorsement of ExxonMobil’s
superiority in finished lubes.
G l o b a l L u b e s L e a d e r s h i p P o s i t i o n
Lube basestock refineries . . . . . . . . . . . . . . . . . . . . . . . . . . . . . . . . 12
Average capacity per site. . . . . . . . . . . . . . . . . . . . . 2 times industry
Blend plants . . . . . . . . . . . . . . . . . . . . . . . . . . . . . . . . . . . . . . . . . . . . 58
Lube basestock market share . . . . . . . . . . . . . . . . . . . . . 18 percent
Finished lubricant market share. . . . . . . . . . . . . . . . . . . . 13 percent
O U R L U B R I C A N T S A N D S P E C I A LT I E S B U S I N E S S
ExxonMobil is the world’s largest supplier of lube basestocks
and a leading marketer of finished lubricants and specialty
products. Leveraging three strong global brands, Mobil,
Exxon, and Esso, along with the world’s leading full-synthetic
motor oil, Mobil 1, we are trusted by customers to deliver
technically superior products in a global market. A dedicated
organization and a strong distributor network supply high-
quality lubricants and our application expertise to customers
around the world.
A successful, industry-leading lubricant business shouldhave global scale, a well-respected finished lubricant brand,a strong premium product line, leading-edge technology, and an efficient and effective supply chain.
ExxonMobil has all of these. We produce high-quality basestocks and lubricants through our interests in 12 luberefineries and 58 blend plants around the world. We havethree brands recognized for quality products and services,and we deliver them efficiently to customers around theworld. In total, we supply twice the volume of the nextlargest competitor.
We have implemented sophisticated supply-chain planningtools and simplified our system by consolidating blend plantsand reducing product formulations. This contributed to areduction in overall cost to serve customers by 5 percent in 2004 – a result that flowed directly to the bottom line.
ExxonMobil Aviation supplies aviation fuel at more than 600airports worldwide, delivered through an extensive distributionnetwork that is monitored for efficiency and quality control from start to finish.
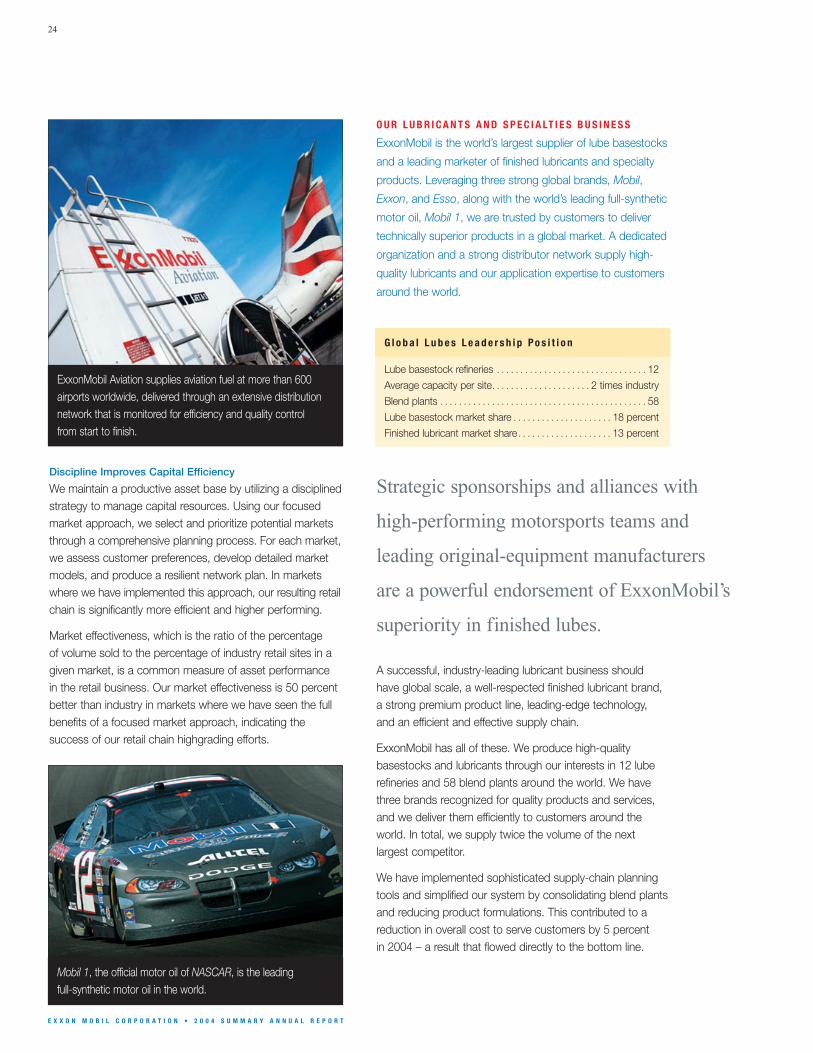
Mobil 1, the official motor oil of NASCAR, is the leading full-synthetic motor oil in the world.
D O W N S T R E A M 25
E X X O N M O B I L C O R P O R A T I O N • 2 0 0 4 S U M M A R Y A N N U A L R E P O R T
Leveraging Our Brand and Technology
Customers rely on high-quality Mobil, Exxon, and Essobranded finished lubricants to serve their automotive, industrial, commercial, aviation, and marine needs. Eachapplication is supported by tailored marketing programs andan experienced sales force. Our global approach enablesExxonMobil to deliver consistent global brand messages –Mobil for the customer who requires high performance, andExxon or Esso for customers who value quality and reliability.
Motorsports sponsorships like those with the West McLarenMercedes and Toyota teams, plus strategic alliances withleading original-equipment manufacturers like Caterpillar, area powerful endorsement of the technological superiority ofour branded finished lubes. In passenger car lubricants,technological advancements enabled the introduction of anew line of Mobil lubricants in the United States that offersextended engine protection. In basestocks, our proprietary
catalysis research has produced the MSDW-2 catalyst,which is used in the industry’s leading technology for making high-quality lube basestocks at lower cost.
Profitable Growth in Emerging Markets
Developing nations, with increasing demand for both industrial and automotive lubricants, present growth opportunities for ExxonMobil lubricants and specialties. In Eastern Europe, Russia, and China, sales have grown at double-digit rates for several consecutive years. In countries like China, we have leveraged our well-recognized brands, strong equipment manufacturerrelationships, and technical expertise to develop a leadingmarket position among foreign marketers. China is now our fourth largest market for finished lubricants.
Outstanding global brands, proprietary technology, and a low-cost, efficient supply chain help position us forcontinued growth and success in new markets.
G R O W I N G F L A G S H I P A N D P R E M I U M P R O D U C T S
As the world’s economies grow, so does the demand for higher-quality lubricants. ExxonMobil continues togrow market share in this most profitable part of thefinished lubes business.
■ Mobil 1 is the endorsed, recommended, and/orapproved engine oil for more than 50 percent of newluxury vehicles in the North American market. No othermotor oil holds as many engine specification approvals.
■ The growing list of automotive manufacturers recommending Mobil 1 for their high-performance vehicles include the makers of Aston Martin, Bentley,BMW, Cadillac, Corvette, Chrysler, Dodge, MercedesBenz, Porsche, and Saab.
■ In 2005, we introduced new higher mileage, extendedperformance Mobil 1 and Mobil product lines in theUnited States that will further differentiate thesepremium brands.
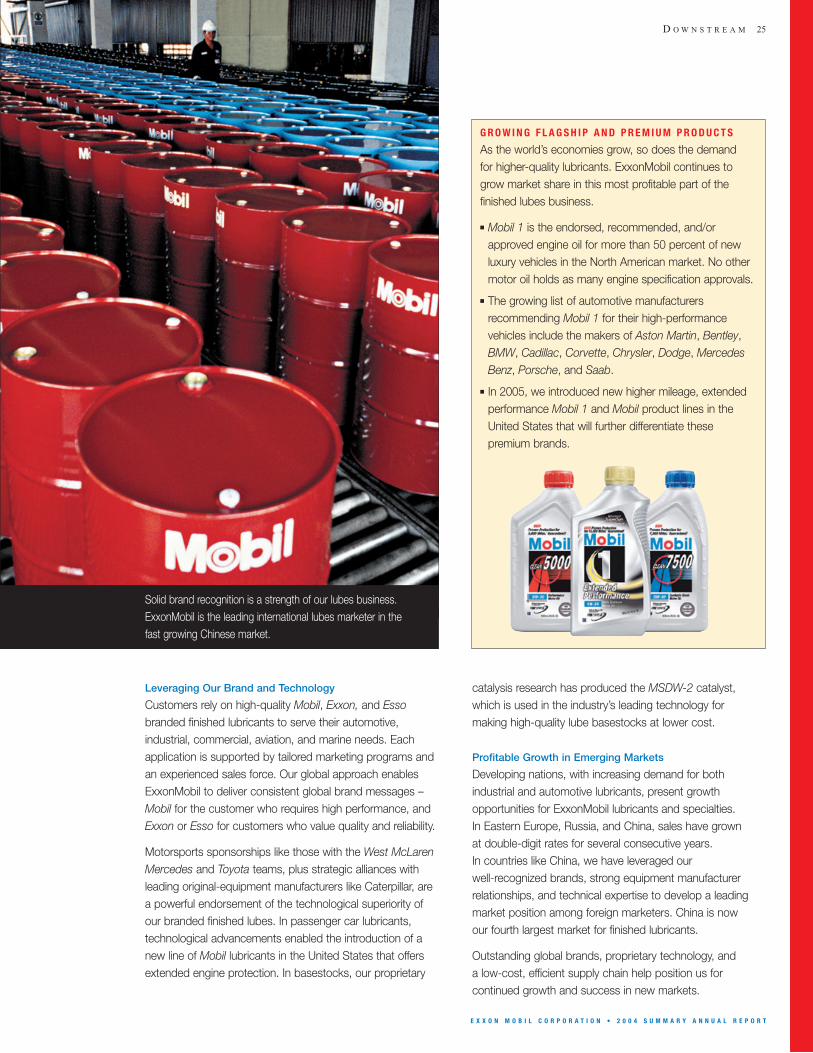
Solid brand recognition is a strength of our lubes business.ExxonMobil is the leading international lubes marketer in the fast growing Chinese market.
CH
EM
ICA
L
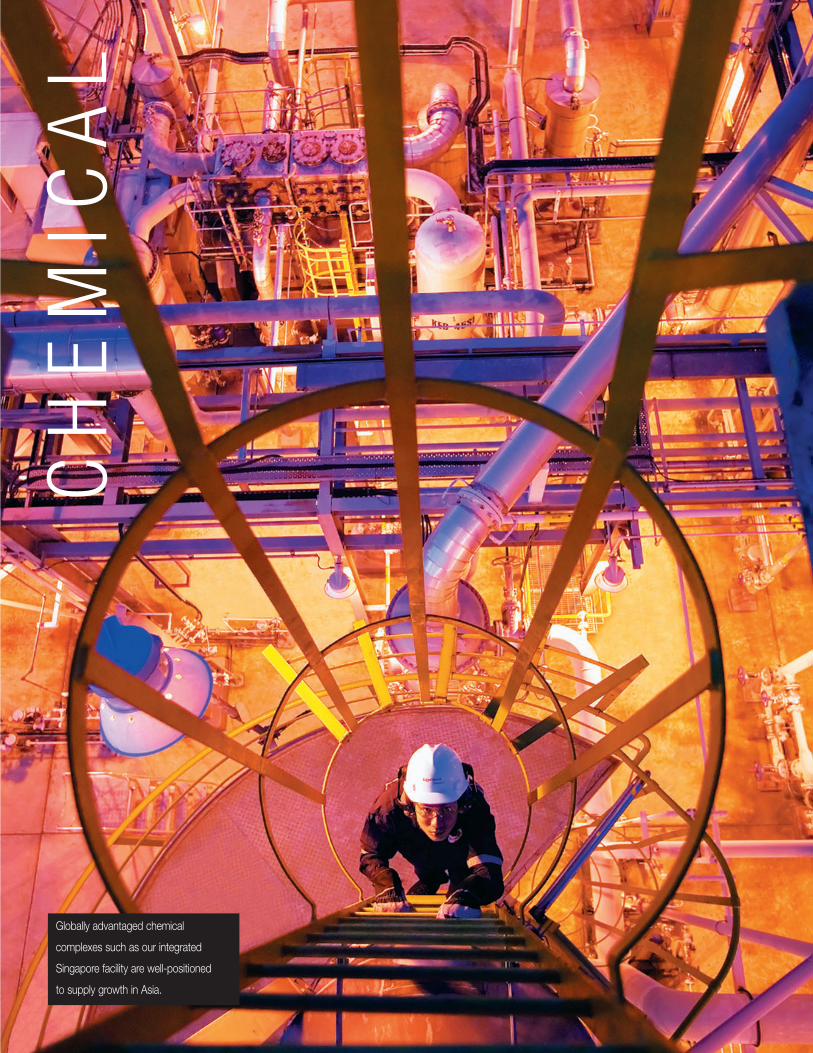
Globally advantaged chemical
complexes such as our integrated
Singapore facility are well-positioned
to supply growth in Asia.
S TAT I S T I C A L R E C A P 2004 2003 2002 2001 2000
Earnings (1) (millions of dollars) 3,428 1,432 830 882 1,161
Prime product sales(2) (thousands of metric tons) 27,788 26,567 26,606 25,780 25,637
Average capital employed (millions of dollars) 14,608 14,099 13,645 13,839 13,814
Return on average capital employed (percent) 23.5 10.2 6.1 6.4 8.4
Capital expenditures (millions of dollars) 690 692 954 872 1,468
(1) Earnings included a $175 million extraordinary gain on asset divestitures in 2001.(2) Prime product sales include ExxonMobil’s share of equity-company volumes and finished-product transfers to the Downstream. Carbon-black oil volumes are excluded.
E X X O N M O B I L C O R P O R A T I O N • 2 0 0 4 S U M M A R Y A N N U A L R E P O R T
2 0 0 4 R E S U LT S A N D H I G H L I G H T S
2004 earnings of $3.4 billion set a record – more than
double those in 2003. Our unique mix of businesses, broad geographic coverage, and feedstock and integrationadvantages ideally positioned ExxonMobil to capitalize on an improved industry environment.
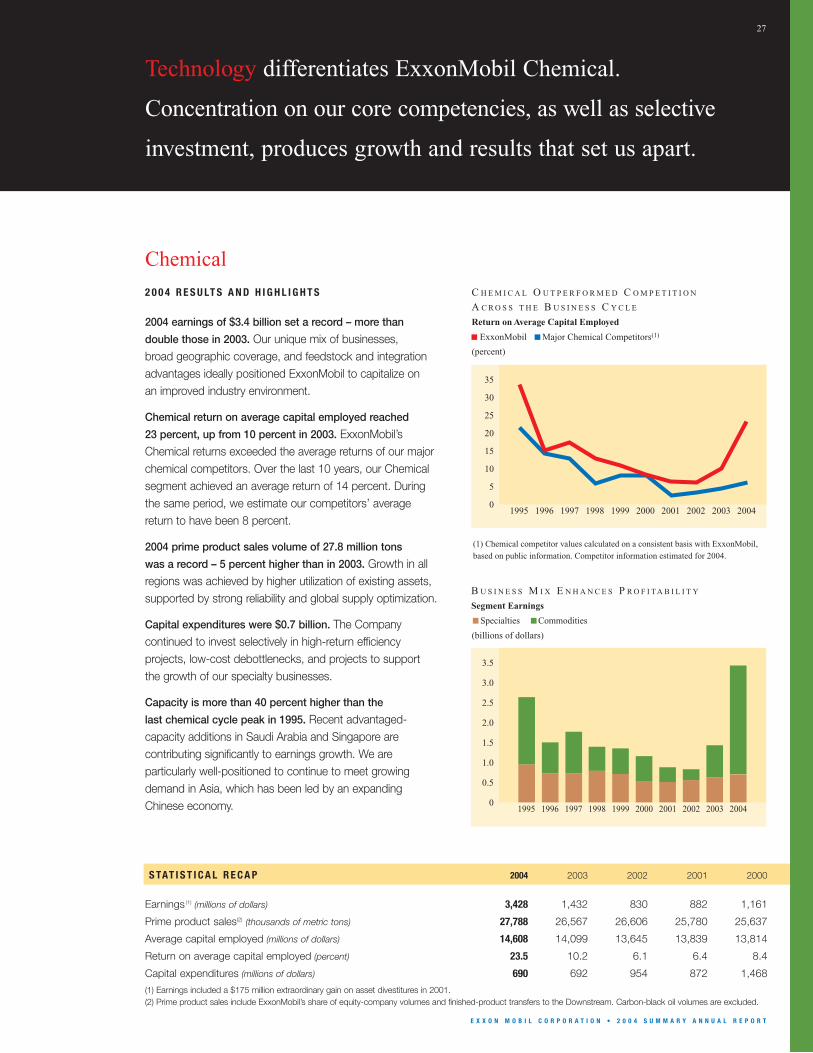
Chemical return on average capital employed reached
23 percent, up from 10 percent in 2003. ExxonMobil’sChemical returns exceeded the average returns of our majorchemical competitors. Over the last 10 years, our Chemicalsegment achieved an average return of 14 percent. Duringthe same period, we estimate our competitors’ averagereturn to have been 8 percent.
2004 prime product sales volume of 27.8 million tons
was a record – 5 percent higher than in 2003. Growth in allregions was achieved by higher utilization of existing assets,supported by strong reliability and global supply optimization.
Capital expenditures were $0.7 billion. The Companycontinued to invest selectively in high-return efficiency projects, low-cost debottlenecks, and projects to support the growth of our specialty businesses.
Capacity is more than 40 percent higher than the
last chemical cycle peak in 1995. Recent advantaged-capacity additions in Saudi Arabia and Singapore arecontributing significantly to earnings growth. We are particularly well-positioned to continue to meet growingdemand in Asia, which has been led by an expandingChinese economy.
Technology differentiates ExxonMobil Chemical.
Concentration on our core competencies, as well as selective
investment, produces growth and results that set us apart.
ExxonMobil
(percent)
Major Chemical Competitors(1)
35
30
25
20
15
10
5
0
C H E M I C A L O U T P E R F O R M E D C O M P E T I T I O N
A C R O S S T H E B U S I N E S S C Y C L E
Return on Average Capital Employed
(1) Chemical competitor values calculated on a consistent basis with ExxonMobil, based on public information. Competitor information estimated for 2004.
2004200320022001200019991998199719961995
27
(billions of dollars)
Specialties Commodities
3.5
3.0
2.5
2.0
1.5
1.0
0.5
0
B U S I N E S S M I X E N H A N C E S P R O F I TA B I L I T Y
Segment Earnings
2004200320022001200019991998199719961995
Chemical
28
E X X O N M O B I L C O R P O R A T I O N • 2 0 0 4 S U M M A R Y A N N U A L R E P O R T
Our high-volume commodity chemical portfolio, a growthdriver in times when the global economy is expanding,provided strong earnings in 2004. We are one of the largestproducers of olefins, a basic petrochemical building blockthat is used as a raw material in a variety of consumer applications including packaging, automotive parts, andhousehold goods. We are the largest producer of polyolefins,which include polyethylene, the largest-volume plastic; andpolypropylene, one of the fastest growing polymers.
Profitability continued to improve in our aromatics businessin 2004 where industry demand grew by 6 percent. We arethe largest producer of paraxylene, the main raw material inpolyester fibers and polyethylene terephthalate (PET) recyclable bottles; and benzene, a primary component in abroad array of products ranging from nylon to polystyrene.
In addition to being a leading supplier of primary petrochemical products, we also have a premier position in highly profitable specialty chemicals. Earnings for theseproducts are less volatile than commodity petrochemicalsand, over the business cycle, provide a significant return uplift to the entire portfolio. ExxonMobil continues to growand strengthen these businesses through new productdevelopment and expansion into new markets.
We manufacture our products in 55 wholly owned and joint-venture facilities around the world. Our sites are located to benefit from low-cost raw materials and to optimize supply into the major demand centers.
ExxonMobil Chemical leads the industry
with innovative applications of complex
catalyst technologies and process
integrations that drive more efficient
production and stronger margins for
our diverse slate of products.
O U R C H E M I C A L S T R AT E G I E S
We derive strong competitive advantages from ourunique combination of low-cost feedstocks, proprietarytechnology, lower costs through operational excellence,product application expertise, and integration synergies.Our competitors, both chemical companies and othermajor oil companies, may benefit from one or more ofthese attributes. But none of the competition has beenable to replicate the advantage we gain from the combination of the parts.
Our strategies capitalize on these advantages and arehighlighted below:
■ Focus on businesses that capitalize on core competencies;
■ Capture full benefits of integration across all ExxonMobil operations;
■ Continuously reduce costs to achieve best-in-class performance;
■ Build proprietary technology positions; and,
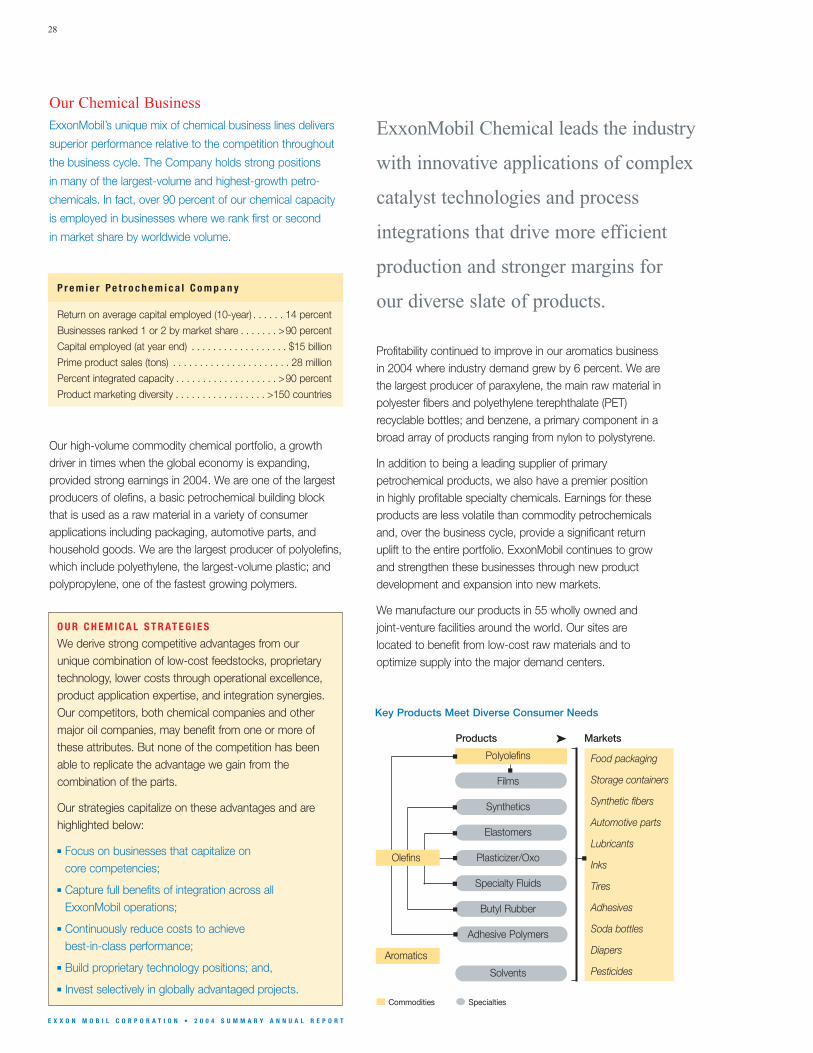
■ Invest selectively in globally advantaged projects.■ Commodities ● Specialties
Food packaging
Storage containers
Synthetic fibers
Automotive parts
Lubricants
Inks
Tires
Adhesives
Soda bottles
Diapers
Pesticides
Key Products Meet Diverse Consumer Needs
Products Markets
Our Chemical BusinessExxonMobil’s unique mix of chemical business lines delivers
superior performance relative to the competition throughout
the business cycle. The Company holds strong positions
in many of the largest-volume and highest-growth petro-
chemicals. In fact, over 90 percent of our chemical capacity
is employed in businesses where we rank first or second
in market share by worldwide volume.
➤
P r e m i e r P e t r o c h e m i c a l C o m p a n y
Return on average capital employed (10-year) . . . . . . 14 percent
Businesses ranked 1 or 2 by market share . . . . . . . >90 percent
Capital employed (at year end) . . . . . . . . . . . . . . . . . . $15 billion
Prime product sales (tons) . . . . . . . . . . . . . . . . . . . . . . 28 million
Percent integrated capacity . . . . . . . . . . . . . . . . . . . >90 percent
Product marketing diversity . . . . . . . . . . . . . . . . . >150 countries
Polyolefins
Films
Synthetics
Elastomers
Olefins Plasticizer/Oxo
Specialty Fluids
Butyl Rubber
Adhesive Polymers
Aromatics
Solvents
C H E M I C A L 29
Above – Integration at many sites, including our Baton Rouge refinery and chemical complex, enables us to optimize production to the highest-value outlet. Below – We manufacture adhesive polymers – used to make tape, labels, and other adhesive products – in North America, Europe, Japan, and China.
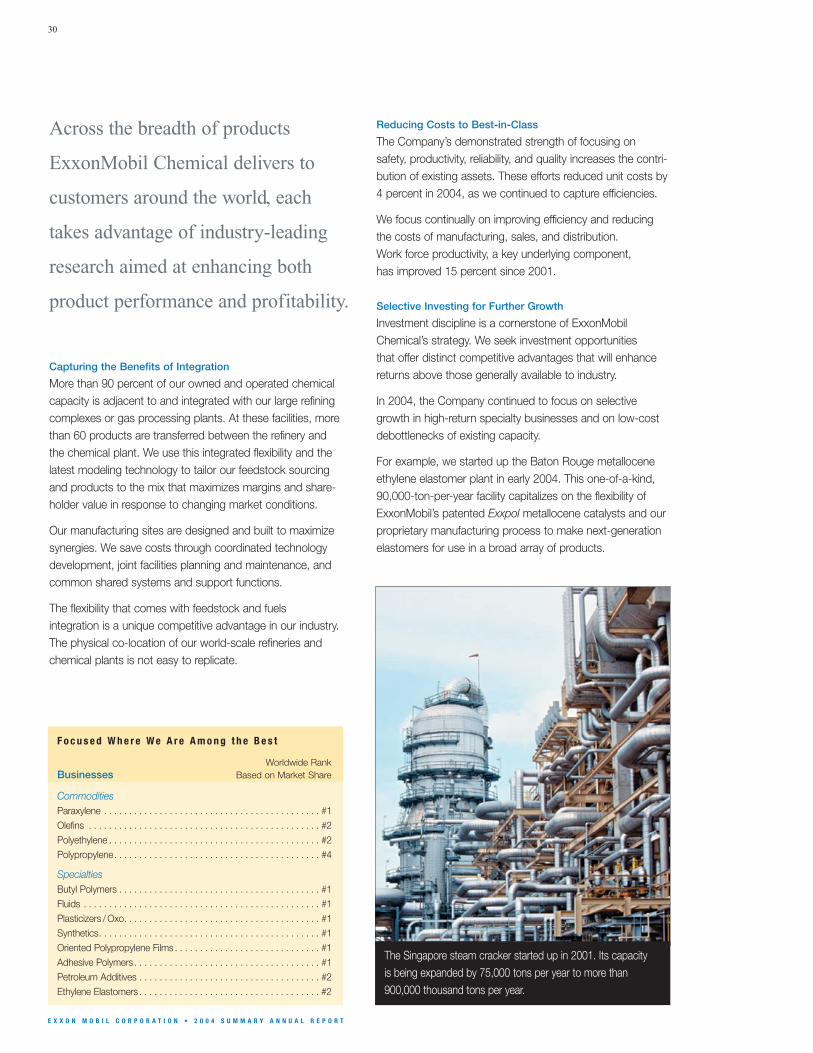
30
E X X O N M O B I L C O R P O R A T I O N • 2 0 0 4 S U M M A R Y A N N U A L R E P O R T
Reducing Costs to Best-in-Class
The Company’s demonstrated strength of focusing onsafety, productivity, reliability, and quality increases the contri-bution of existing assets. These efforts reduced unit costs by 4 percent in 2004, as we continued to capture efficiencies.
We focus continually on improving efficiency and reducingthe costs of manufacturing, sales, and distribution. Work force productivity, a key underlying component, has improved 15 percent since 2001.
Selective Investing for Further Growth
Investment discipline is a cornerstone of ExxonMobilChemical’s strategy. We seek investment opportunities that offer distinct competitive advantages that will enhancereturns above those generally available to industry.
In 2004, the Company continued to focus on selectivegrowth in high-return specialty businesses and on low-costdebottlenecks of existing capacity.
For example, we started up the Baton Rouge metalloceneethylene elastomer plant in early 2004. This one-of-a-kind, 90,000-ton-per-year facility capitalizes on the flexibility ofExxonMobil’s patented Exxpol metallocene catalysts and ourproprietary manufacturing process to make next-generationelastomers for use in a broad array of products.
Worldwide RankBusinesses Based on Market Share
CommoditiesParaxylene . . . . . . . . . . . . . . . . . . . . . . . . . . . . . . . . . . . . . . . . . . . #1Olefins . . . . . . . . . . . . . . . . . . . . . . . . . . . . . . . . . . . . . . . . . . . . . . #2Polyethylene . . . . . . . . . . . . . . . . . . . . . . . . . . . . . . . . . . . . . . . . . . #2Polypropylene. . . . . . . . . . . . . . . . . . . . . . . . . . . . . . . . . . . . . . . . . #4
SpecialtiesButyl Polymers . . . . . . . . . . . . . . . . . . . . . . . . . . . . . . . . . . . . . . . . #1Fluids . . . . . . . . . . . . . . . . . . . . . . . . . . . . . . . . . . . . . . . . . . . . . . . #1Plasticizers / Oxo. . . . . . . . . . . . . . . . . . . . . . . . . . . . . . . . . . . . . . . #1Synthetics. . . . . . . . . . . . . . . . . . . . . . . . . . . . . . . . . . . . . . . . . . . . #1Oriented Polypropylene Films . . . . . . . . . . . . . . . . . . . . . . . . . . . . . #1Adhesive Polymers . . . . . . . . . . . . . . . . . . . . . . . . . . . . . . . . . . . . . #1Petroleum Additives . . . . . . . . . . . . . . . . . . . . . . . . . . . . . . . . . . . . #2Ethylene Elastomers . . . . . . . . . . . . . . . . . . . . . . . . . . . . . . . . . . . . #2
Across the breadth of products
ExxonMobil Chemical delivers to
customers around the world, each
takes advantage of industry-leading
research aimed at enhancing both
product performance and profitability.
F o c u s e d W h e r e W e A r e A m o n g t h e B e s t
Capturing the Benefits of Integration
More than 90 percent of our owned and operated chemicalcapacity is adjacent to and integrated with our large refiningcomplexes or gas processing plants. At these facilities, morethan 60 products are transferred between the refinery andthe chemical plant. We use this integrated flexibility and thelatest modeling technology to tailor our feedstock sourcingand products to the mix that maximizes margins and share-holder value in response to changing market conditions.
Our manufacturing sites are designed and built to maximizesynergies. We save costs through coordinated technologydevelopment, joint facilities planning and maintenance, andcommon shared systems and support functions.
The flexibility that comes with feedstock and fuels integration is a unique competitive advantage in our industry.The physical co-location of our world-scale refineries andchemical plants is not easy to replicate.
The Singapore steam cracker started up in 2001. Its capacity is being expanded by 75,000 tons per year to more than900,000 thousand tons per year.
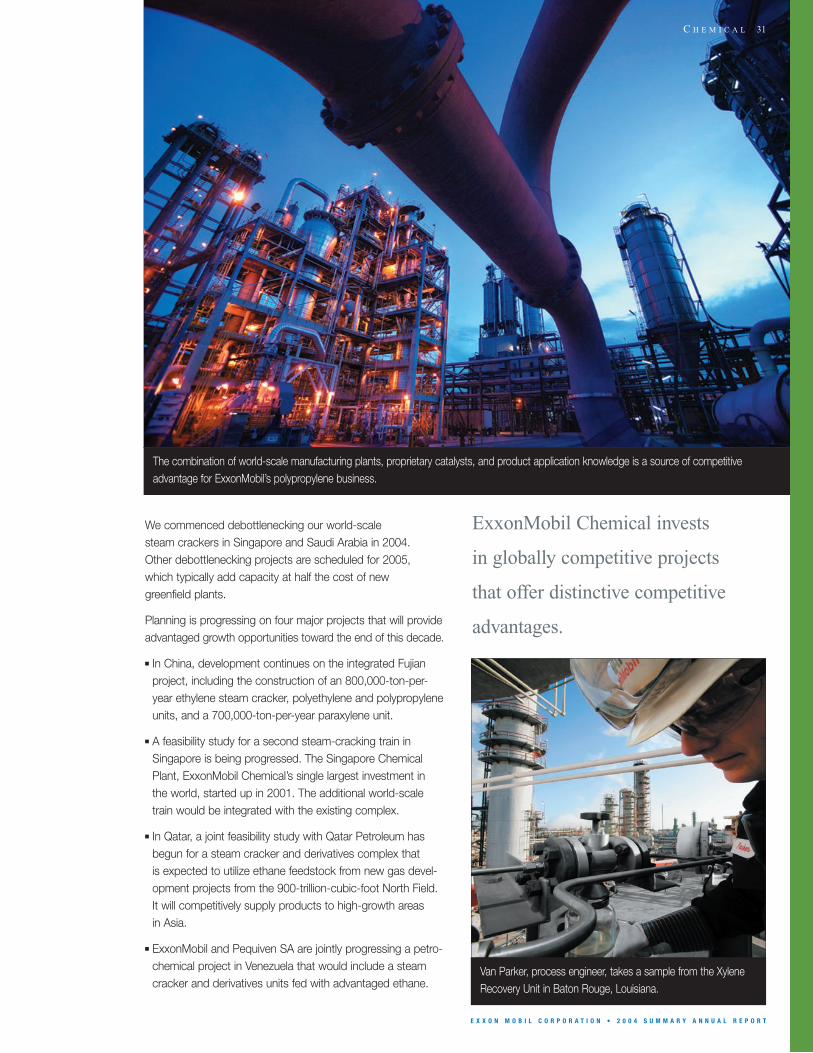
E X X O N M O B I L C O R P O R A T I O N • 2 0 0 4 S U M M A R Y A N N U A L R E P O R T
We commenced debottlenecking our world-scale steam crackers in Singapore and Saudi Arabia in 2004. Other debottlenecking projects are scheduled for 2005, which typically add capacity at half the cost of new greenfield plants.
Planning is progressing on four major projects that will provideadvantaged growth opportunities toward the end of this decade.
■ In China, development continues on the integrated Fujianproject, including the construction of an 800,000-ton-per-year ethylene steam cracker, polyethylene and polypropyleneunits, and a 700,000-ton-per-year paraxylene unit.
■ A feasibility study for a second steam-cracking train inSingapore is being progressed. The Singapore ChemicalPlant, ExxonMobil Chemical’s single largest investment in the world, started up in 2001. The additional world-scaletrain would be integrated with the existing complex.
■ In Qatar, a joint feasibility study with Qatar Petroleum hasbegun for a steam cracker and derivatives complex that is expected to utilize ethane feedstock from new gas devel-opment projects from the 900-trillion-cubic-foot North Field.It will competitively supply products to high-growth areas in Asia.
■ ExxonMobil and Pequiven SA are jointly progressing a petro-chemical project in Venezuela that would include a steamcracker and derivatives units fed with advantaged ethane.
ExxonMobil Chemical invests
in globally competitive projects
that offer distinctive competitive
advantages.
Van Parker, process engineer, takes a sample from the XyleneRecovery Unit in Baton Rouge, Louisiana.
C H E M I C A L 31
The combination of world-scale manufacturing plants, proprietary catalysts, and product application knowledge is a source of competitiveadvantage for ExxonMobil’s polypropylene business.
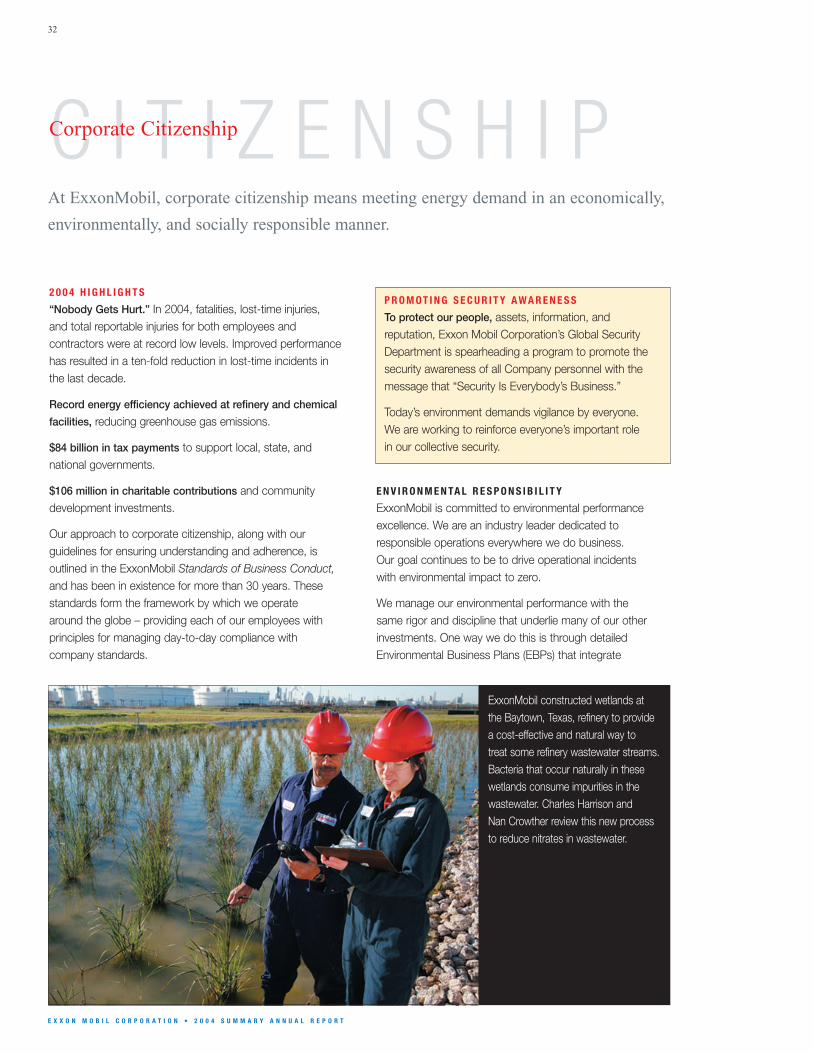
C I T I Z E N S H I P
32
Corporate Citizenship
2 0 0 4 H I G H L I G H T S
“Nobody Gets Hurt.” In 2004, fatalities, lost-time injuries, and total reportable injuries for both employees and contractors were at record low levels. Improved performancehas resulted in a ten-fold reduction in lost-time incidents in the last decade.
Record energy efficiency achieved at refinery and chemical
facilities, reducing greenhouse gas emissions.
$84 billion in tax payments to support local, state, andnational governments.
$106 million in charitable contributions and community development investments.
Our approach to corporate citizenship, along with our guidelines for ensuring understanding and adherence, isoutlined in the ExxonMobil Standards of Business Conduct,and has been in existence for more than 30 years. Thesestandards form the framework by which we operate around the globe – providing each of our employees with principles for managing day-to-day compliance with company standards.
At ExxonMobil, corporate citizenship means meeting energy demand in an economically,
environmentally, and socially responsible manner.
E N V I R O N M E N TA L R E S P O N S I B I L I T Y
ExxonMobil is committed to environmental performanceexcellence. We are an industry leader dedicated to responsible operations everywhere we do business. Our goal continues to be to drive operational incidents with environmental impact to zero.
We manage our environmental performance with the same rigor and discipline that underlie many of our otherinvestments. One way we do this is through detailedEnvironmental Business Plans (EBPs) that integrate
E X X O N M O B I L C O R P O R A T I O N • 2 0 0 4 S U M M A R Y A N N U A L R E P O R T
P R O M O T I N G S E C U R I T Y A W A R E N E S S
To protect our people, assets, information, and reputation, Exxon Mobil Corporation’s Global SecurityDepartment is spearheading a program to promote thesecurity awareness of all Company personnel with themessage that “Security Is Everybody’s Business.”
Today’s environment demands vigilance by everyone. We are working to reinforce everyone’s important role in our collective security.
ExxonMobil constructed wetlands at the Baytown, Texas, refinery to providea cost-effective and natural way to treat some refinery wastewater streams.Bacteria that occur naturally in thesewetlands consume impurities in thewastewater. Charles Harrison and Nan Crowther review this new processto reduce nitrates in wastewater.
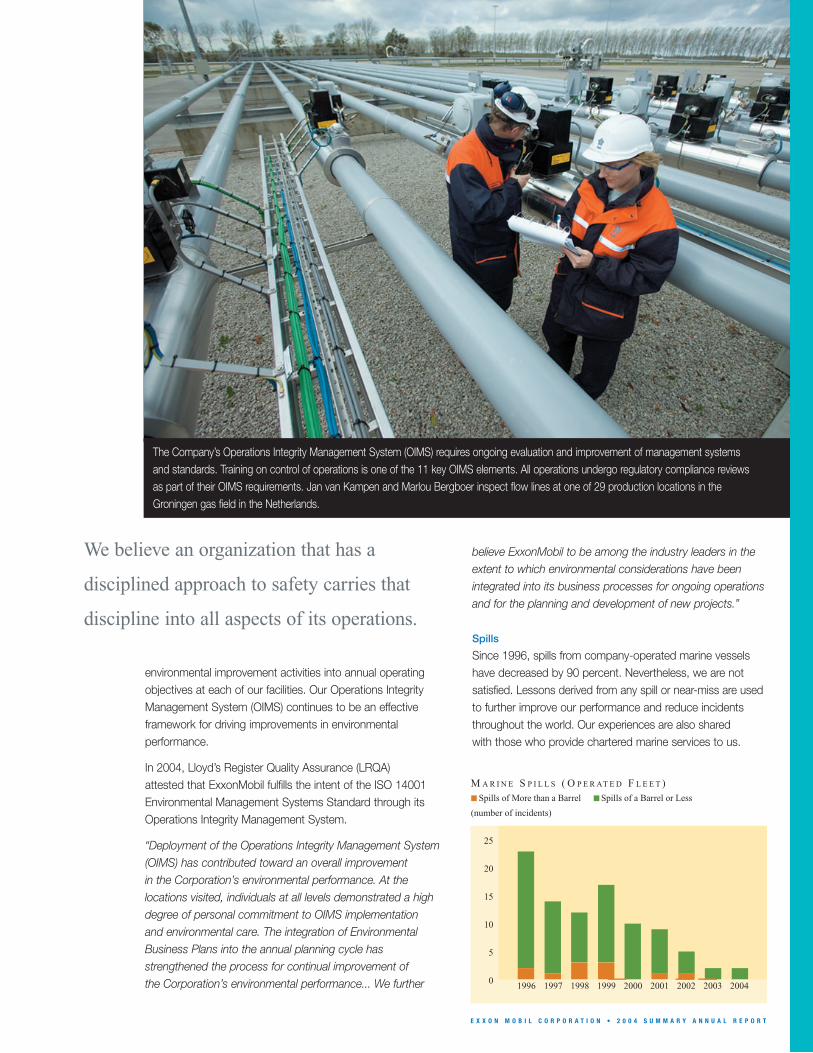
E X X O N M O B I L C O R P O R A T I O N • 2 0 0 4 S U M M A R Y A N N U A L R E P O R T
environmental improvement activities into annual operatingobjectives at each of our facilities. Our Operations IntegrityManagement System (OIMS) continues to be an effectiveframework for driving improvements in environmentalperformance.
In 2004, Lloyd’s Register Quality Assurance (LRQA) attested that ExxonMobil fulfills the intent of the ISO 14001Environmental Management Systems Standard through itsOperations Integrity Management System.
“Deployment of the Operations Integrity Management System(OIMS) has contributed toward an overall improvement in the Corporation’s environmental performance. At the locations visited, individuals at all levels demonstrated a highdegree of personal commitment to OIMS implementation and environmental care. The integration of EnvironmentalBusiness Plans into the annual planning cycle has strengthened the process for continual improvement of the Corporation’s environmental performance... We further
believe ExxonMobil to be among the industry leaders in theextent to which environmental considerations have been integrated into its business processes for ongoing operationsand for the planning and development of new projects.”
Spills
Since 1996, spills from company-operated marine vesselshave decreased by 90 percent. Nevertheless, we are notsatisfied. Lessons derived from any spill or near-miss are usedto further improve our performance and reduce incidentsthroughout the world. Our experiences are also shared with those who provide chartered marine services to us.
25
20
15
10
5
0
M A R I N E S P I L L S ( O P E R AT E D F L E E T )
(number of incidents)
Spills of a Barrel or LessSpills of More than a Barrel
2000 2003 20041996 1997 1998 1999 2001 2002
We believe an organization that has a
disciplined approach to safety carries that
discipline into all aspects of its operations.
The Company’s Operations Integrity Management System (OIMS) requires ongoing evaluation and improvement of management systems and standards. Training on control of operations is one of the 11 key OIMS elements. All operations undergo regulatory compliance reviews as part of their OIMS requirements. Jan van Kampen and Marlou Bergboer inspect flow lines at one of 29 production locations in theGroningen gas field in the Netherlands.
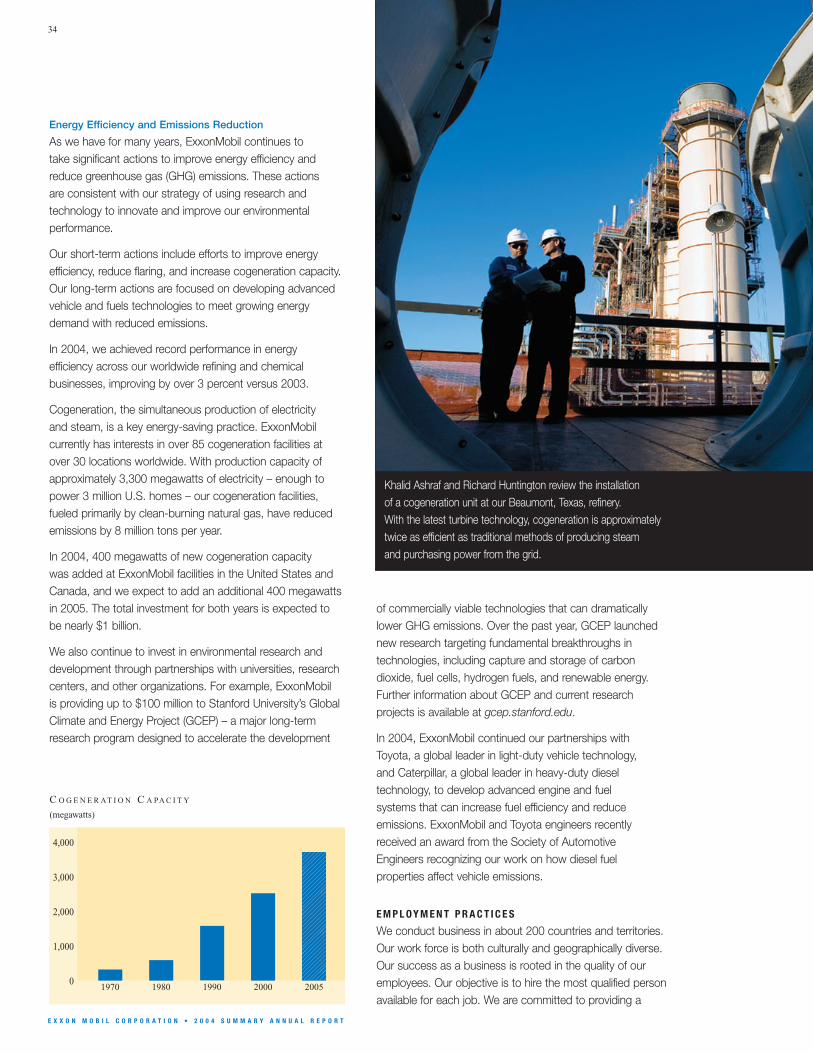
34
E X X O N M O B I L C O R P O R A T I O N • 2 0 0 4 S U M M A R Y A N N U A L R E P O R T
Energy Efficiency and Emissions Reduction
As we have for many years, ExxonMobil continues to take significant actions to improve energy efficiency andreduce greenhouse gas (GHG) emissions. These actions are consistent with our strategy of using research and technology to innovate and improve our environmentalperformance.
Our short-term actions include efforts to improve energy efficiency, reduce flaring, and increase cogeneration capacity.Our long-term actions are focused on developing advancedvehicle and fuels technologies to meet growing energydemand with reduced emissions.
In 2004, we achieved record performance in energy efficiency across our worldwide refining and chemical businesses, improving by over 3 percent versus 2003.
Cogeneration, the simultaneous production of electricity and steam, is a key energy-saving practice. ExxonMobilcurrently has interests in over 85 cogeneration facilities atover 30 locations worldwide. With production capacity ofapproximately 3,300 megawatts of electricity – enough topower 3 million U.S. homes – our cogeneration facilities,fueled primarily by clean-burning natural gas, have reducedemissions by 8 million tons per year.
In 2004, 400 megawatts of new cogeneration capacity was added at ExxonMobil facilities in the United States andCanada, and we expect to add an additional 400 megawattsin 2005. The total investment for both years is expected tobe nearly $1 billion.
We also continue to invest in environmental research anddevelopment through partnerships with universities, researchcenters, and other organizations. For example, ExxonMobilis providing up to $100 million to Stanford University’s GlobalClimate and Energy Project (GCEP) – a major long-termresearch program designed to accelerate the development
of commercially viable technologies that can dramaticallylower GHG emissions. Over the past year, GCEP launchednew research targeting fundamental breakthroughs in technologies, including capture and storage of carbondioxide, fuel cells, hydrogen fuels, and renewable energy.Further information about GCEP and current research projects is available at gcep.stanford.edu.
In 2004, ExxonMobil continued our partnerships with Toyota, a global leader in light-duty vehicle technology, and Caterpillar, a global leader in heavy-duty diesel technology, to develop advanced engine and fuel systems that can increase fuel efficiency and reduce emissions. ExxonMobil and Toyota engineers recentlyreceived an award from the Society of Automotive Engineers recognizing our work on how diesel fuel properties affect vehicle emissions.
E M P L O Y M E N T P R A C T I C E S
We conduct business in about 200 countries and territories.Our work force is both culturally and geographically diverse.Our success as a business is rooted in the quality of ouremployees. Our objective is to hire the most qualified personavailable for each job. We are committed to providing a
4,000
3,000
2,000
1,000
01970 1980 1990 2000 2005
C O G E N E R AT I O N C A PA C I T Y
(megawatts)
�����
����
�����
Khalid Ashraf and Richard Huntington review the installation of a cogeneration unit at our Beaumont, Texas, refinery. With the latest turbine technology, cogeneration is approximatelytwice as efficient as traditional methods of producing steam and purchasing power from the grid.
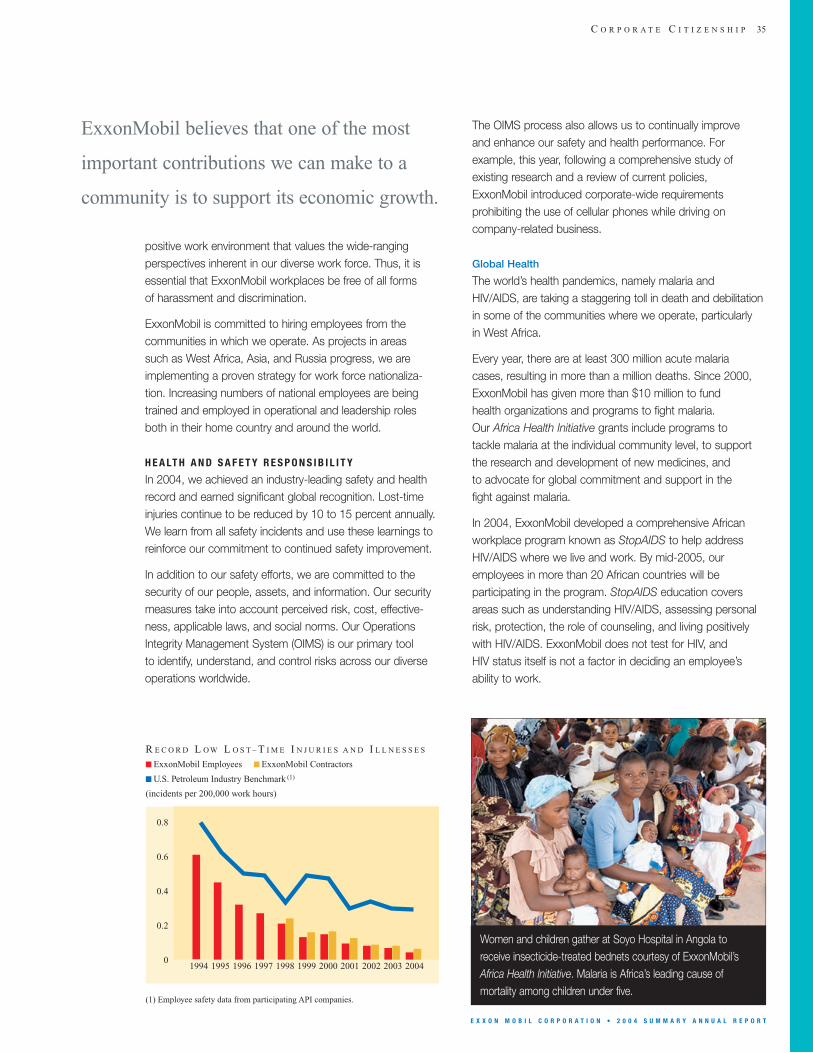
C O R P O R A T E C I T I Z E N S H I P 35
E X X O N M O B I L C O R P O R A T I O N • 2 0 0 4 S U M M A R Y A N N U A L R E P O R T
positive work environment that values the wide-rangingperspectives inherent in our diverse work force. Thus, it isessential that ExxonMobil workplaces be free of all forms of harassment and discrimination.
ExxonMobil is committed to hiring employees from thecommunities in which we operate. As projects in areas such as West Africa, Asia, and Russia progress, we areimplementing a proven strategy for work force nationaliza-tion. Increasing numbers of national employees are beingtrained and employed in operational and leadership rolesboth in their home country and around the world.
H E A LT H A N D S A F E T Y R E S P O N S I B I L I T Y
In 2004, we achieved an industry-leading safety and healthrecord and earned significant global recognition. Lost-timeinjuries continue to be reduced by 10 to 15 percent annually.We learn from all safety incidents and use these learnings toreinforce our commitment to continued safety improvement.
In addition to our safety efforts, we are committed to thesecurity of our people, assets, and information. Our securitymeasures take into account perceived risk, cost, effective-ness, applicable laws, and social norms. Our OperationsIntegrity Management System (OIMS) is our primary tool to identify, understand, and control risks across our diverseoperations worldwide.
The OIMS process also allows us to continually improve and enhance our safety and health performance. Forexample, this year, following a comprehensive study ofexisting research and a review of current policies,ExxonMobil introduced corporate-wide requirementsprohibiting the use of cellular phones while driving oncompany-related business.
Global Health
The world’s health pandemics, namely malaria and HIV/AIDS, are taking a staggering toll in death and debilitationin some of the communities where we operate, particularly in West Africa.
Every year, there are at least 300 million acute malaria cases, resulting in more than a million deaths. Since 2000,ExxonMobil has given more than $10 million to fund health organizations and programs to fight malaria. Our Africa Health Initiative grants include programs to tackle malaria at the individual community level, to support the research and development of new medicines, and to advocate for global commitment and support in the fight against malaria.
In 2004, ExxonMobil developed a comprehensive Africanworkplace program known as StopAIDS to help addressHIV/AIDS where we live and work. By mid-2005, ouremployees in more than 20 African countries will be participating in the program. StopAIDS education coversareas such as understanding HIV/AIDS, assessing personalrisk, protection, the role of counseling, and living positivelywith HIV/AIDS. ExxonMobil does not test for HIV, and HIV status itself is not a factor in deciding an employee’sability to work.
ExxonMobil believes that one of the most
important contributions we can make to a
community is to support its economic growth.
(1) Employee safety data from participating API companies.
0.8
0.6
0.4
0.2
0
R E C O R D L O W L O S T – T I M E I N J U R I E S A N D I L L N E S S E S
(incidents per 200,000 work hours)
ExxonMobil Employees ExxonMobil Contractors
U.S. Petroleum Industry Benchmark (1)
1994 1995 1996 1997 1998 1999 2000 2001 2002 2003 2004
Women and children gather at Soyo Hospital in Angola toreceive insecticide-treated bednets courtesy of ExxonMobil’sAfrica Health Initiative. Malaria is Africa’s leading cause ofmortality among children under five.
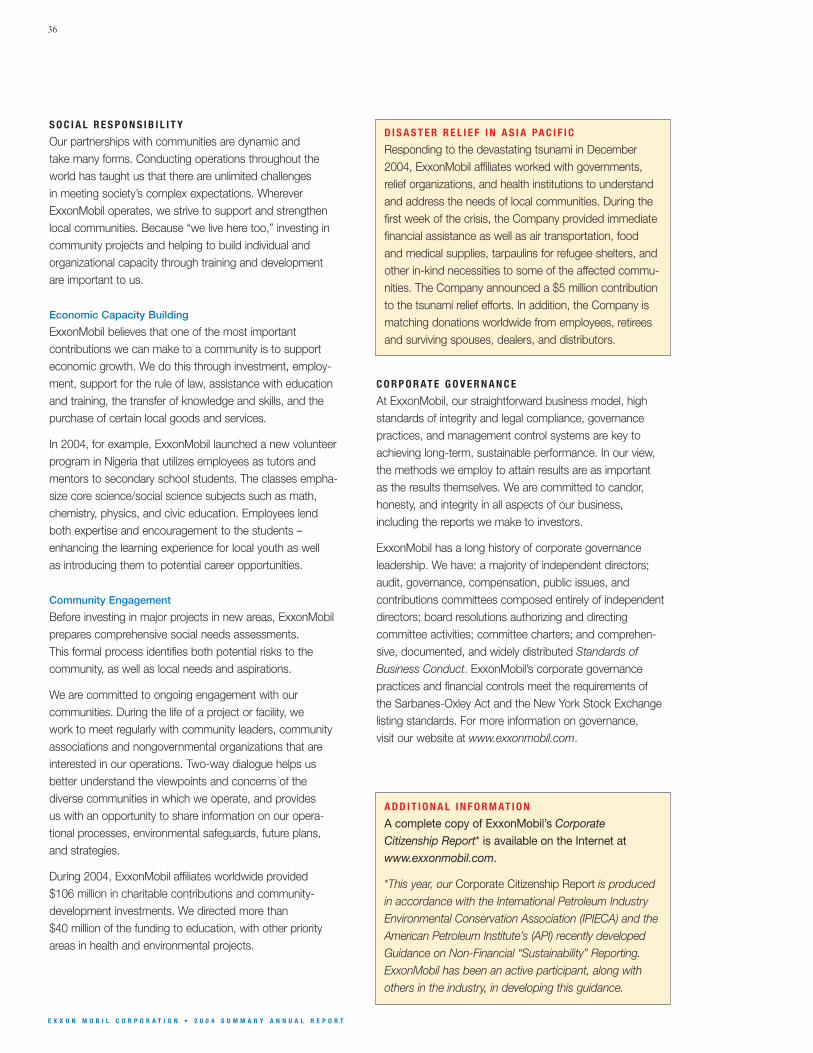
36
E X X O N M O B I L C O R P O R A T I O N • 2 0 0 4 S U M M A R Y A N N U A L R E P O R T
S O C I A L R E S P O N S I B I L I T Y
Our partnerships with communities are dynamic and take many forms. Conducting operations throughout theworld has taught us that there are unlimited challenges in meeting society’s complex expectations. WhereverExxonMobil operates, we strive to support and strengthenlocal communities. Because “we live here too,” investing incommunity projects and helping to build individual and organizational capacity through training and development are important to us.
Economic Capacity Building
ExxonMobil believes that one of the most important contributions we can make to a community is to supporteconomic growth. We do this through investment, employ-ment, support for the rule of law, assistance with educationand training, the transfer of knowledge and skills, and thepurchase of certain local goods and services.
In 2004, for example, ExxonMobil launched a new volunteerprogram in Nigeria that utilizes employees as tutors andmentors to secondary school students. The classes empha-size core science/social science subjects such as math,chemistry, physics, and civic education. Employees lendboth expertise and encouragement to the students –enhancing the learning experience for local youth as well as introducing them to potential career opportunities.
Community Engagement
Before investing in major projects in new areas, ExxonMobilprepares comprehensive social needs assessments. This formal process identifies both potential risks to thecommunity, as well as local needs and aspirations.
We are committed to ongoing engagement with ourcommunities. During the life of a project or facility, we work to meet regularly with community leaders, communityassociations and nongovernmental organizations that areinterested in our operations. Two-way dialogue helps usbetter understand the viewpoints and concerns of thediverse communities in which we operate, and provides us with an opportunity to share information on our opera-tional processes, environmental safeguards, future plans, and strategies.
During 2004, ExxonMobil affiliates worldwide provided $106 million in charitable contributions and community-development investments. We directed more than $40 million of the funding to education, with other priorityareas in health and environmental projects.
D I S A S T E R R E L I E F I N A S I A PA C I F I C
Responding to the devastating tsunami in December2004, ExxonMobil affiliates worked with governments,relief organizations, and health institutions to understandand address the needs of local communities. During thefirst week of the crisis, the Company provided immediatefinancial assistance as well as air transportation, food and medical supplies, tarpaulins for refugee shelters, andother in-kind necessities to some of the affected commu-nities. The Company announced a $5 million contributionto the tsunami relief efforts. In addition, the Company ismatching donations worldwide from employees, retirees and surviving spouses, dealers, and distributors.
A D D I T I O N A L I N F O R M AT I O N
A complete copy of ExxonMobil’s CorporateCitizenship Report* is available on the Internet atwww.exxonmobil.com.
*This year, our Corporate Citizenship Report is producedin accordance with the International Petroleum IndustryEnvironmental Conservation Association (IPIECA) and theAmerican Petroleum Institute’s (API) recently developedGuidance on Non-Financial “Sustainability” Reporting.ExxonMobil has been an active participant, along withothers in the industry, in developing this guidance.
C O R P O R AT E G O V E R N A N C E
At ExxonMobil, our straightforward business model, highstandards of integrity and legal compliance, governancepractices, and management control systems are key toachieving long-term, sustainable performance. In our view,the methods we employ to attain results are as important as the results themselves. We are committed to candor,honesty, and integrity in all aspects of our business, including the reports we make to investors.
ExxonMobil has a long history of corporate governance leadership. We have: a majority of independent directors;audit, governance, compensation, public issues, and contributions committees composed entirely of independentdirectors; board resolutions authorizing and directingcommittee activities; committee charters; and comprehen-sive, documented, and widely distributed Standards ofBusiness Conduct. ExxonMobil’s corporate governance practices and financial controls meet the requirements of the Sarbanes-Oxley Act and the New York Stock Exchangelisting standards. For more information on governance, visit our website at www.exxonmobil.com.
37
E X X O N M O B I L C O R P O R A T I O N • 2 0 0 4 S U M M A R Y A N N U A L R E P O R T
R E P O R T O F I N D E P E N D E N T R E G I S T E R E D P U B L I C A C C O U N T I N G F I R M
T O T H E S H A R E H O L D E R S O F E X X O N M O B I L C O R P O R AT I O N :
We have audited, in accordance with the standards of the Public Company Accounting Oversight Board (United States), the consolidated financial statements of Exxon Mobil Corporation as of December 31, 2004, and 2003, and for each of the three years in the period endedDecember 31, 2004 (not presented herein), management’s assessment of the effectiveness of the Corporation’s internal control over financialreporting as of December 31, 2004 (not presented herein) and the effectiveness of the Corporation’s internal control over financial reporting as of December 31, 2004; and in our report dated February 28, 2005, we expressed unqualified opinions thereon. The consolidated financial statements and management’s assessment of the effectiveness of internal control over financial reporting referred to above appear in Appendix A to the Proxy Statement for the 2005 annual meeting of shareholders of the Corporation.
In our opinion, the information set forth in the accompanying condensed consolidated financial statements is fairly stated, in all materialrespects, in relation to the consolidated financial statements from which it has been derived.
Dallas, TexasFebruary 28, 2005
S U M M A R Y O F A C C O U N T I N G P O L I C I E S A N D P R A C T I C E S
The Corporation’s accounting and financial reporting fairly reflect its straightforward business model involving the extracting, refining, andmarketing of hydrocarbons and hydrocarbon-based products. The preparation of financial statements in conformity with generally acceptedaccounting principles requires management to make estimates and judgments that affect the reported amounts of assets, liabilities, revenues,and expenses, and the disclosure of contingent assets and liabilities. Actual results could differ from these estimates.
The summary financial statements include the accounts of those significant subsidiaries owned directly or indirectly with more than 50 percentof the voting rights held by the Corporation, and for which other shareholders do not possess the right to participate in significant manage-ment decisions. Also included are certain affiliates owned less than 50 percent, but where the Corporation has a majority economic interest.
Revenues associated with sales of crude oil, natural gas, petroleum and chemical products, and all other items are recorded when title passes to the customer.
The Corporation makes limited use of derivative instruments to offset its economic exposures associated with interest rates, foreign currencyexchange rates, and hydrocarbon prices. Derivative instruments are recorded at fair value, and gains and losses arising from changes in fair valueof those instruments are recorded in income. All derivatives activity is immaterial.
Inventories of crude oil, products, and merchandise are carried at the lower of current market value or cost (generally determined under the last-in,first-out method – LIFO). Inventories of materials and supplies are valued at cost or less.
The Corporation’s exploration and production activities are accounted for under the “successful efforts” method. Depreciation, depletion, andamortization, based on cost less estimated salvage value of the asset, are primarily determined under either the unit-of-production method or thestraight-line method. Unit-of-production rates are based on oil, gas, and other mineral reserves estimated to be recoverable from existing facilities.The straight-line method is based on estimated asset service life taking obsolescence into consideration.
Asset retirement obligations that may be incurred at the end of the operating life of upstream properties are recorded as liabilities at fair value whenthe assets are installed. Over time, the liabilities are accreted for the change in present value. Liabilities for environmental costs are recorded whenit is probable that obligations have been incurred and the amounts can be reasonably estimated.
The “functional currency” for translating the accounts of the majority of downstream and chemical operations outside the United States is the localcurrency. Local currency is also used for upstream operations that are relatively self-contained and integrated within a particular country. The U.S.dollar is used for operations in highly inflationary economies and certain other countries.
Effective January 1, 2003, the fair value of future grants of employee stock-based awards is recorded in compensation expense over the vestingperiod. For grants made prior to that date, no expense is recorded for stock option awards, but for awards granted in the form of restricted stock,compensation expense based on the value of the shares on the date of grant is recorded over the vesting period.
A variety of claims have been made against ExxonMobil and certain of its consolidated subsidiaries in a number of pending lawsuits and taxdisputes. For further information on litigation and other contingencies, see note 16 on page A46 of ExxonMobil’s 2005 Proxy Statement.
Further information on the Corporation’s accounting policies and practices can be found in ExxonMobil’s 2005 Proxy Statement on pages A17 through A23 (Critical Accounting Policies) and on pages A30 through A32 (note 1 to the Financial Statements).
Financial Information
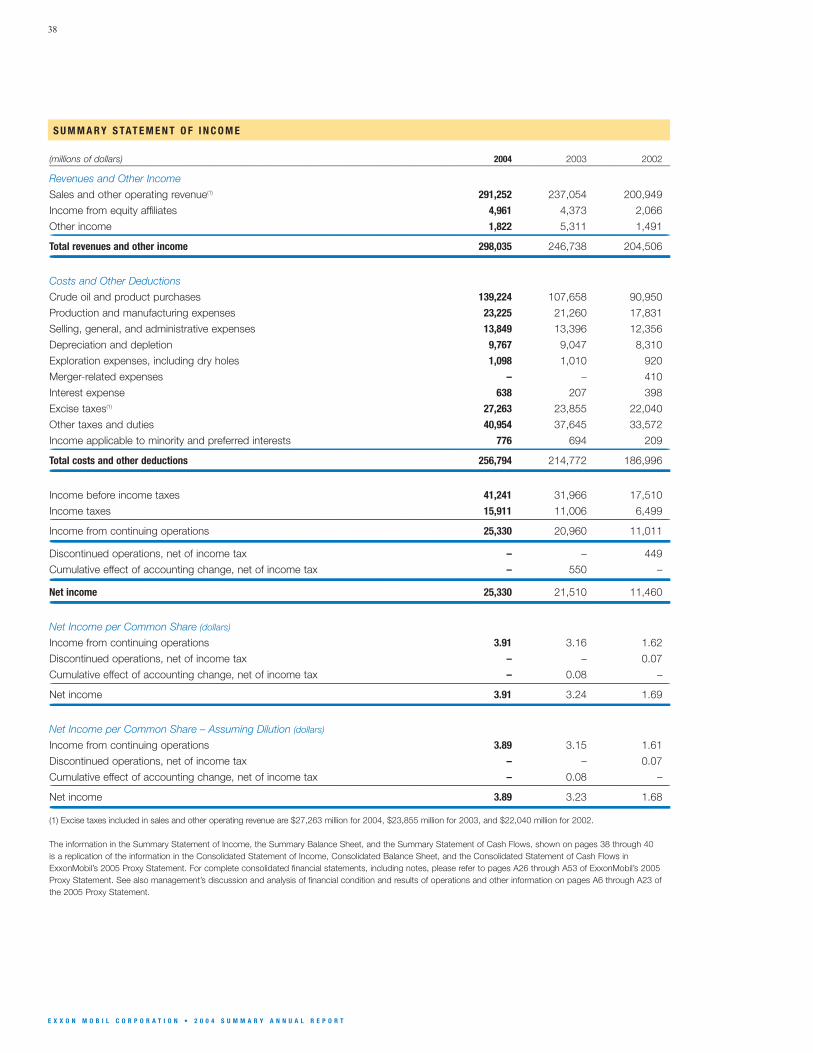
38
E X X O N M O B I L C O R P O R A T I O N • 2 0 0 4 S U M M A R Y A N N U A L R E P O R T
S U M M A R Y S TAT E M E N T O F I N C O M E
(millions of dollars) 2004 2003 2002___________________________________________________________________________________________________________________________________________________________________________________________________________________________________________________________________________________________________________________________________________________________________________________________________________________________________________________________________________________
Revenues and Other Income
Sales and other operating revenue(1) 291,252 237,054 200,949
Income from equity affiliates 4,961 4,373 2,066
Other income 1,822 5,311 1,491_______________________________________________________________________________________________________________________________________________________________________________________________________________________________________________________________________________________________________________________________________________________________________________________________________________________________________________________________________________
Total revenues and other income 298,035 246,738 204,506__________________________________________________________________________________________________________________________________________________________________________________________________________________________________________________________________________________________________________________________________________________________________________________________________________________________________________________________________________________Costs and Other Deductions
Crude oil and product purchases 139,224 107,658 90,950
Production and manufacturing expenses 23,225 21,260 17,831
Selling, general, and administrative expenses 13,849 13,396 12,356
Depreciation and depletion 9,767 9,047 8,310
Exploration expenses, including dry holes 1,098 1,010 920
Merger-related expenses – – 410
Interest expense 638 207 398
Excise taxes(1) 27,263 23,855 22,040
Other taxes and duties 40,954 37,645 33,572
Income applicable to minority and preferred interests 776 694 209_______________________________________________________________________________________________________________________________________________________________________________________________________________________________________________________________________________________________________________________________________________________________________________________________________________________________________________________________________________
Total costs and other deductions 256,794 214,772 186,996__________________________________________________________________________________________________________________________________________________________________________________________________________________________________________________________________________________________________________________________________________________________________________________________________________________________________________________________________________________Income before income taxes 41,241 31,966 17,510
Income taxes 15,911 11,006 6,499_______________________________________________________________________________________________________________________________________________________________________________________________________________________________________________________________________________________________________________________________________________________________________________________________________________________________________________________________________________
Income from continuing operations 25,330 20,960 11,011__________________________________________________________________________________________________________________________________________________________________________________________________________________________________________________________________________________________________________________________________________________________________________________________________________________________________________________________________________________Discontinued operations, net of income tax – – 449
Cumulative effect of accounting change, net of income tax – 550 –__________________________________________________________________________________________________________________________________________________________________________________________________________________________________________________________________________________________________________________________________________________________________________________________________________________________________________________________________________________Net income 25,330 21,510 11,460__________________________________________________________________________________________________________________________________________________________________________________________________________________________________________________________________________________________________________________________________________________________________________________________________________________________________________________________________________________Net Income per Common Share (dollars)
Income from continuing operations 3.91 3.16 1.62
Discontinued operations, net of income tax – – 0.07
Cumulative effect of accounting change, net of income tax – 0.08 –_______________________________________________________________________________________________________________________________________________________________________________________________________________________________________________________________________________________________________________________________________________________________________________________________________________________________________________________________________________
Net income 3.91 3.24 1.69__________________________________________________________________________________________________________________________________________________________________________________________________________________________________________________________________________________________________________________________________________________________________________________________________________________________________________________________________________________Net Income per Common Share – Assuming Dilution (dollars)
Income from continuing operations 3.89 3.15 1.61
Discontinued operations, net of income tax – – 0.07
Cumulative effect of accounting change, net of income tax – 0.08 –_______________________________________________________________________________________________________________________________________________________________________________________________________________________________________________________________________________________________________________________________________________________________________________________________________________________________________________________________________________
Net income 3.89 3.23 1.68__________________________________________________________________________________________________________________________________________________________________________________________________________________________________________________________________________________________________________________________________________________________________________________________________________________________________________________________________________________(1) Excise taxes included in sales and other operating revenue are $27,263 million for 2004, $23,855 million for 2003, and $22,040 million for 2002.
The information in the Summary Statement of Income, the Summary Balance Sheet, and the Summary Statement of Cash Flows, shown on pages 38 through 40 is a replication of the information in the Consolidated Statement of Income, Consolidated Balance Sheet, and the Consolidated Statement of Cash Flows inExxonMobil’s 2005 Proxy Statement. For complete consolidated financial statements, including notes, please refer to pages A26 through A53 of ExxonMobil’s 2005Proxy Statement. See also management’s discussion and analysis of financial condition and results of operations and other information on pages A6 through A23 ofthe 2005 Proxy Statement.
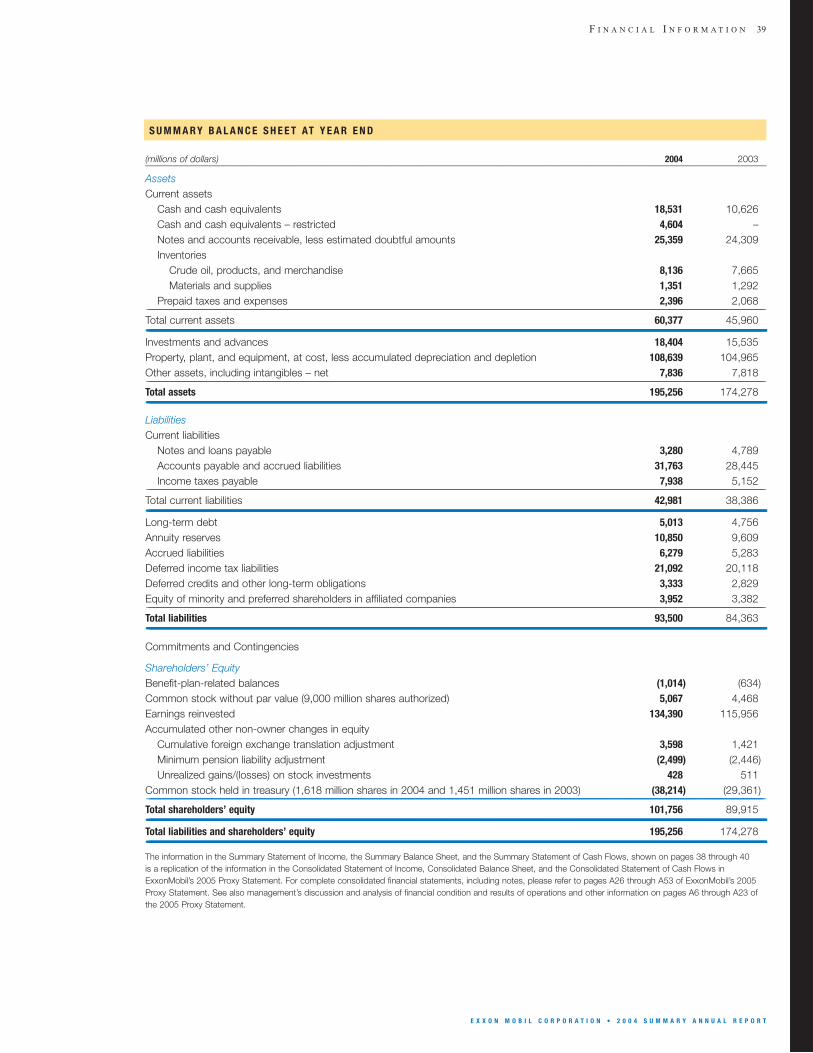
F I N A N C I A L I N F O R M A T I O N 39
E X X O N M O B I L C O R P O R A T I O N • 2 0 0 4 S U M M A R Y A N N U A L R E P O R T
S U M M A R Y B A L A N C E S H E E T AT Y E A R E N D
(millions of dollars) 2004 2003___________________________________________________________________________________________________________________________________________________________________________________________________________________________________________________________________________________________________________________________________________________________________________________________________________________________________________________________________________________
AssetsCurrent assets
Cash and cash equivalents 18,531 10,626Cash and cash equivalents – restricted 4,604 –Notes and accounts receivable, less estimated doubtful amounts 25,359 24,309Inventories
Crude oil, products, and merchandise 8,136 7,665Materials and supplies 1,351 1,292
Prepaid taxes and expenses 2,396 2,068_______________________________________________________________________________________________________________________________________________________________________________________________________________________________________________________________________________________________________________________________________________________________________________________________________________________________________________________________________________Total current assets 60,377 45,960__________________________________________________________________________________________________________________________________________________________________________________________________________________________________________________________________________________________________________________________________________________________________________________________________________________________________________________________________________________Investments and advances 18,404 15,535Property, plant, and equipment, at cost, less accumulated depreciation and depletion 108,639 104,965Other assets, including intangibles – net 7,836 7,818_______________________________________________________________________________________________________________________________________________________________________________________________________________________________________________________________________________________________________________________________________________________________________________________________________________________________________________________________________________Total assets 195,256 174,278__________________________________________________________________________________________________________________________________________________________________________________________________________________________________________________________________________________________________________________________________________________________________________________________________________________________________________________________________________________LiabilitiesCurrent liabilities
Notes and loans payable 3,280 4,789Accounts payable and accrued liabilities 31,763 28,445Income taxes payable 7,938 5,152_______________________________________________________________________________________________________________________________________________________________________________________________________________________________________________________________________________________________________________________________________________________________________________________________________________________________________________________________________________
Total current liabilities 42,981 38,386__________________________________________________________________________________________________________________________________________________________________________________________________________________________________________________________________________________________________________________________________________________________________________________________________________________________________________________________________________________Long-term debt 5,013 4,756Annuity reserves 10,850 9,609Accrued liabilities 6,279 5,283Deferred income tax liabilities 21,092 20,118Deferred credits and other long-term obligations 3,333 2,829Equity of minority and preferred shareholders in affiliated companies 3,952 3,382_______________________________________________________________________________________________________________________________________________________________________________________________________________________________________________________________________________________________________________________________________________________________________________________________________________________________________________________________________________Total liabilities 93,500 84,363__________________________________________________________________________________________________________________________________________________________________________________________________________________________________________________________________________________________________________________________________________________________________________________________________________________________________________________________________________________Commitments and Contingencies
Shareholders’ EquityBenefit-plan-related balances (1,014) (634)Common stock without par value (9,000 million shares authorized) 5,067 4,468Earnings reinvested 134,390 115,956Accumulated other non-owner changes in equity
Cumulative foreign exchange translation adjustment 3,598 1,421Minimum pension liability adjustment (2,499) (2,446)Unrealized gains/(losses) on stock investments 428 511
Common stock held in treasury (1,618 million shares in 2004 and 1,451 million shares in 2003) (38,214) (29,361)_______________________________________________________________________________________________________________________________________________________________________________________________________________________________________________________________________________________________________________________________________________________________________________________________________________________________________________________________________________Total shareholders’ equity 101,756 89,915__________________________________________________________________________________________________________________________________________________________________________________________________________________________________________________________________________________________________________________________________________________________________________________________________________________________________________________________________________________Total liabilities and shareholders’ equity 195,256 174,278__________________________________________________________________________________________________________________________________________________________________________________________________________________________________________________________________________________________________________________________________________________________________________________________________________________________________________________________________________________The information in the Summary Statement of Income, the Summary Balance Sheet, and the Summary Statement of Cash Flows, shown on pages 38 through 40 is a replication of the information in the Consolidated Statement of Income, Consolidated Balance Sheet, and the Consolidated Statement of Cash Flows inExxonMobil’s 2005 Proxy Statement. For complete consolidated financial statements, including notes, please refer to pages A26 through A53 of ExxonMobil’s 2005Proxy Statement. See also management’s discussion and analysis of financial condition and results of operations and other information on pages A6 through A23 ofthe 2005 Proxy Statement.
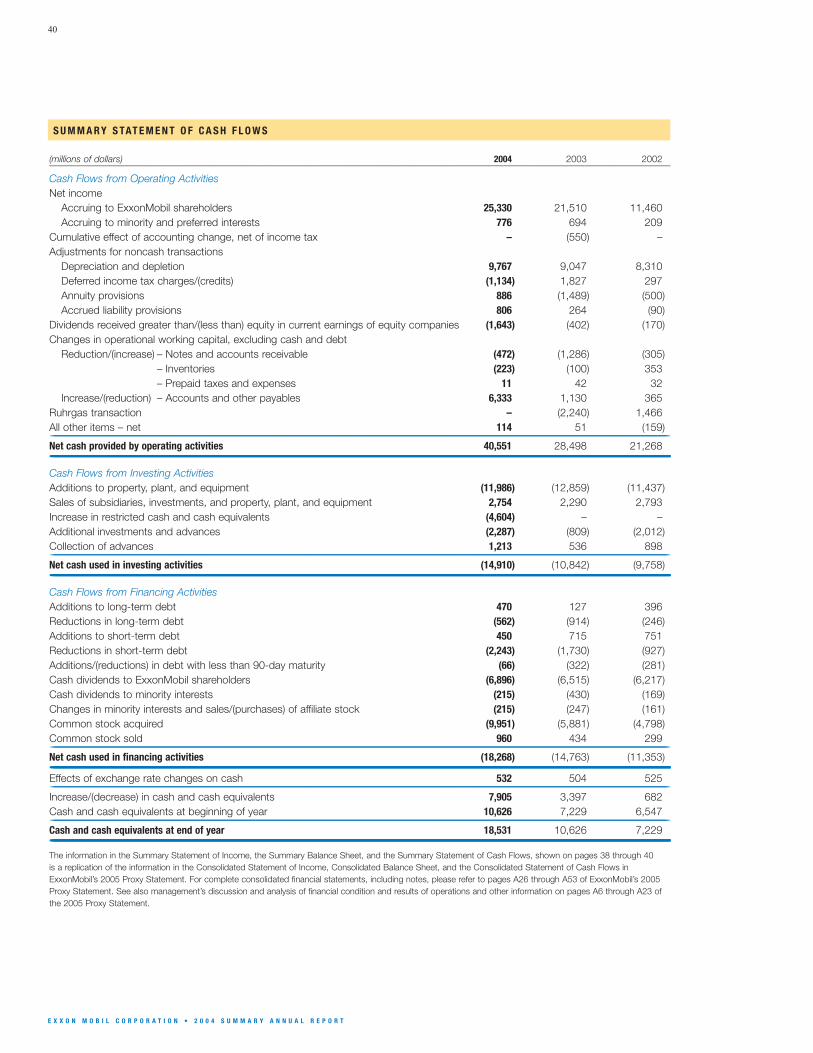
40
E X X O N M O B I L C O R P O R A T I O N • 2 0 0 4 S U M M A R Y A N N U A L R E P O R T
S U M M A R Y S TAT E M E N T O F C A S H F L O W S
(millions of dollars) 2004 2003 2002___________________________________________________________________________________________________________________________________________________________________________________________________________________________________________________________________________________________________________________________________________________________________________________________________________________________________________________________________________________
Cash Flows from Operating ActivitiesNet income
Accruing to ExxonMobil shareholders 25,330 21,510 11,460Accruing to minority and preferred interests 776 694 209
Cumulative effect of accounting change, net of income tax – (550) –Adjustments for noncash transactions
Depreciation and depletion 9,767 9,047 8,310Deferred income tax charges/(credits) (1,134) 1,827 297Annuity provisions 886 (1,489) (500)Accrued liability provisions 806 264 (90)
Dividends received greater than/(less than) equity in current earnings of equity companies (1,643) (402) (170)Changes in operational working capital, excluding cash and debt
Reduction/(increase) – Notes and accounts receivable (472) (1,286) (305)– Inventories (223) (100) 353– Prepaid taxes and expenses 11 42 32
Increase/(reduction) – Accounts and other payables 6,333 1,130 365Ruhrgas transaction – (2,240) 1,466All other items – net 114 51 (159)_______________________________________________________________________________________________________________________________________________________________________________________________________________________________________________________________________________________________________________________________________________________________________________________________________________________________________________________________________________Net cash provided by operating activities 40,551 28,498 21,268__________________________________________________________________________________________________________________________________________________________________________________________________________________________________________________________________________________________________________________________________________________________________________________________________________________________________________________________________________________Cash Flows from Investing ActivitiesAdditions to property, plant, and equipment (11,986) (12,859) (11,437)Sales of subsidiaries, investments, and property, plant, and equipment 2,754 2,290 2,793Increase in restricted cash and cash equivalents (4,604) – –Additional investments and advances (2,287) (809) (2,012)Collection of advances 1,213 536 898_______________________________________________________________________________________________________________________________________________________________________________________________________________________________________________________________________________________________________________________________________________________________________________________________________________________________________________________________________________Net cash used in investing activities (14,910) (10,842) (9,758)__________________________________________________________________________________________________________________________________________________________________________________________________________________________________________________________________________________________________________________________________________________________________________________________________________________________________________________________________________________Cash Flows from Financing ActivitiesAdditions to long-term debt 470 127 396Reductions in long-term debt (562) (914) (246)Additions to short-term debt 450 715 751Reductions in short-term debt (2,243) (1,730) (927)Additions/(reductions) in debt with less than 90-day maturity (66) (322) (281)Cash dividends to ExxonMobil shareholders (6,896) (6,515) (6,217)Cash dividends to minority interests (215) (430) (169)Changes in minority interests and sales/(purchases) of affiliate stock (215) (247) (161)Common stock acquired (9,951) (5,881) (4,798)Common stock sold 960 434 299_______________________________________________________________________________________________________________________________________________________________________________________________________________________________________________________________________________________________________________________________________________________________________________________________________________________________________________________________________________Net cash used in financing activities (18,268) (14,763) (11,353)__________________________________________________________________________________________________________________________________________________________________________________________________________________________________________________________________________________________________________________________________________________________________________________________________________________________________________________________________________________Effects of exchange rate changes on cash 532 504 525_______________________________________________________________________________________________________________________________________________________________________________________________________________________________________________________________________________________________________________________________________________________________________________________________________________________________________________________________________________Increase/(decrease) in cash and cash equivalents 7,905 3,397 682Cash and cash equivalents at beginning of year 10,626 7,229 6,547_______________________________________________________________________________________________________________________________________________________________________________________________________________________________________________________________________________________________________________________________________________________________________________________________________________________________________________________________________________Cash and cash equivalents at end of year 18,531 10,626 7,229__________________________________________________________________________________________________________________________________________________________________________________________________________________________________________________________________________________________________________________________________________________________________________________________________________________________________________________________________________________The information in the Summary Statement of Income, the Summary Balance Sheet, and the Summary Statement of Cash Flows, shown on pages 38 through 40 is a replication of the information in the Consolidated Statement of Income, Consolidated Balance Sheet, and the Consolidated Statement of Cash Flows inExxonMobil’s 2005 Proxy Statement. For complete consolidated financial statements, including notes, please refer to pages A26 through A53 of ExxonMobil’s 2005Proxy Statement. See also management’s discussion and analysis of financial condition and results of operations and other information on pages A6 through A23 ofthe 2005 Proxy Statement.
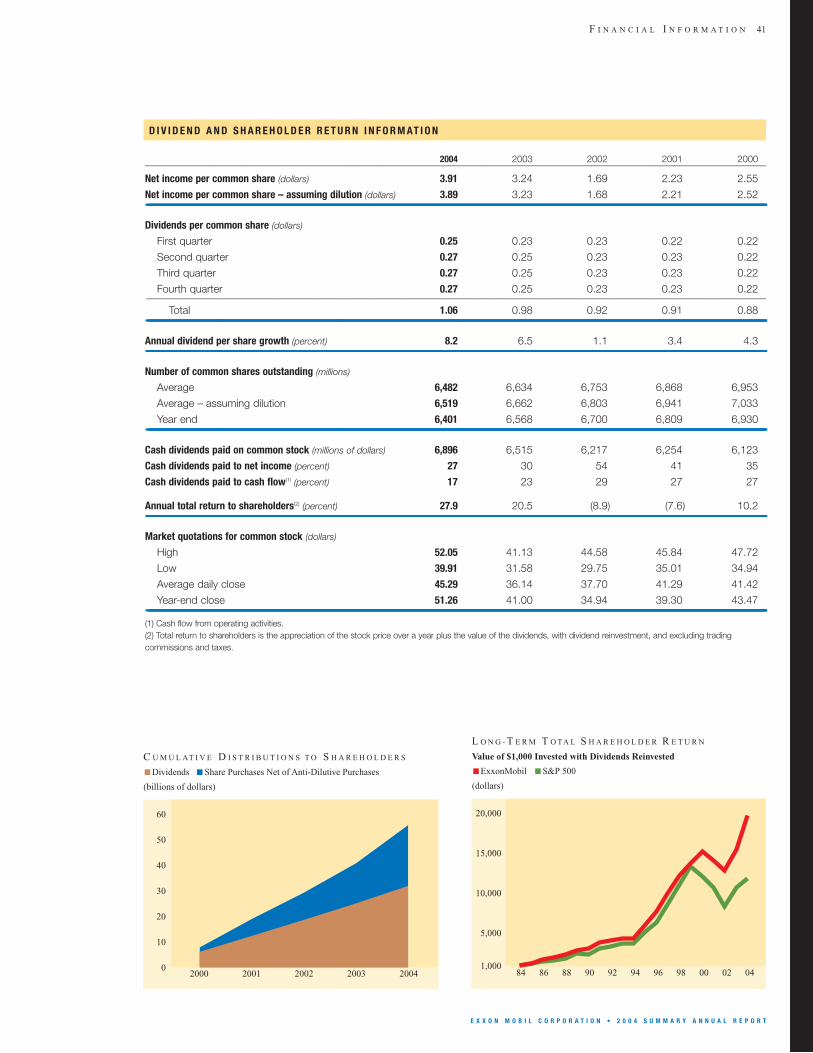
F I N A N C I A L I N F O R M A T I O N 41
E X X O N M O B I L C O R P O R A T I O N • 2 0 0 4 S U M M A R Y A N N U A L R E P O R T
D I V I D E N D A N D S H A R E H O L D E R R E T U R N I N F O R M AT I O N
2004 2003 2002 2001 2000___________________________________________________________________________________________________________________________________________________________________________________________________________________________________________________________________________________________________________________________________________________________________________________________________________________________________________________________________________________
Net income per common share (dollars) 3.91 3.24 1.69 2.23 2.55
Net income per common share – assuming dilution (dollars) 3.89 3.23 1.68 2.21 2.52__________________________________________________________________________________________________________________________________________________________________________________________________________________________________________________________________________________________________________________________________________________________________________________________________________________________________________________________________________________Dividends per common share (dollars)
First quarter 0.25 0.23 0.23 0.22 0.22
Second quarter 0.27 0.25 0.23 0.23 0.22
Third quarter 0.27 0.25 0.23 0.23 0.22
Fourth quarter 0.27 0.25 0.23 0.23 0.22__________________________________________________________________________________________________________________________________________________________________________________________________________________________________________________________________________________________________________________________________________________________________________________________________________________________________________________________________________________
Total 1.06 0.98 0.92 0.91 0.88__________________________________________________________________________________________________________________________________________________________________________________________________________________________________________________________________________________________________________________________________________________________________________________________________________________________________________________________________________________Annual dividend per share growth (percent) 8.2 6.5 1.1 3.4 4.3__________________________________________________________________________________________________________________________________________________________________________________________________________________________________________________________________________________________________________________________________________________________________________________________________________________________________________________________________________________Number of common shares outstanding (millions)
Average 6,482 6,634 6,753 6,868 6,953
Average – assuming dilution 6,519 6,662 6,803 6,941 7,033
Year end 6,401 6,568 6,700 6,809 6,930__________________________________________________________________________________________________________________________________________________________________________________________________________________________________________________________________________________________________________________________________________________________________________________________________________________________________________________________________________________Cash dividends paid on common stock (millions of dollars) 6,896 6,515 6,217 6,254 6,123
Cash dividends paid to net income (percent) 27 30 54 41 35
Cash dividends paid to cash flow(1) (percent) 17 23 29 27 27
Annual total return to shareholders(2) (percent) 27.9 20.5 (8.9) (7.6) 10.2__________________________________________________________________________________________________________________________________________________________________________________________________________________________________________________________________________________________________________________________________________________________________________________________________________________________________________________________________________________Market quotations for common stock (dollars)
High 52.05 41.13 44.58 45.84 47.72
Low 39.91 31.58 29.75 35.01 34.94
Average daily close 45.29 36.14 37.70 41.29 41.42
Year-end close 51.26 41.00 34.94 39.30 43.47__________________________________________________________________________________________________________________________________________________________________________________________________________________________________________________________________________________________________________________________________________________________________________________________________________________________________________________________________________________(1) Cash flow from operating activities.(2) Total return to shareholders is the appreciation of the stock price over a year plus the value of the dividends, with dividend reinvestment, and excluding tradingcommissions and taxes.
2000 2001 2002 2003 2004
60
50
40
30
20
10
0
C U M U L AT I V E D I S T R I B U T I O N S T O S H A R E H O L D E R S
(billions of dollars)
Dividends Share Purchases Net of Anti-Dilutive Purchases
84 86 88 90 92 94 96 98 00 02 04
20,000
15,000
10,000
5,000
L O N G - T E R M T O TA L S H A R E H O L D E R R E T U R N
(dollars)
Value of $1,000 Invested with Dividends Reinvested
ExxonMobil S&P 500
1,000
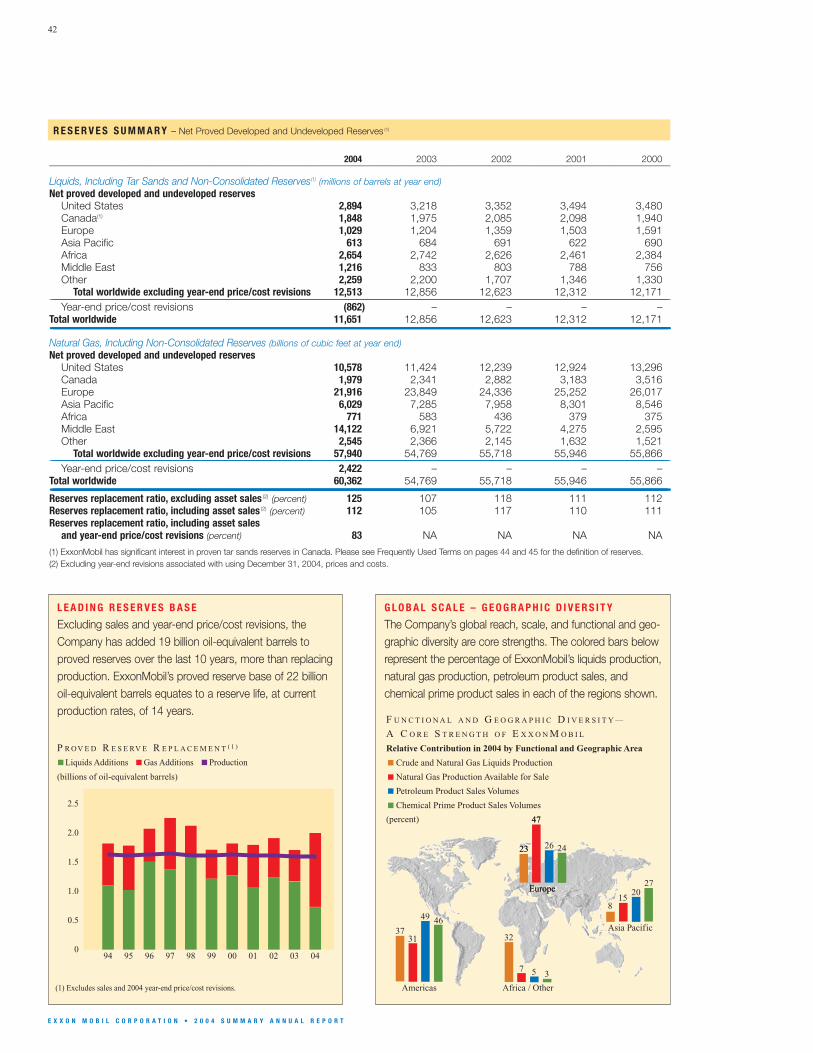
G L O B A L S C A L E – G E O G R A P H I C D I V E R S I T Y
The Company’s global reach, scale, and functional and geo-graphic diversity are core strengths. The colored bars belowrepresent the percentage of ExxonMobil’s liquids production,natural gas production, petroleum product sales, and chemical prime product sales in each of the regions shown.
42
E X X O N M O B I L C O R P O R A T I O N • 2 0 0 4 S U M M A R Y A N N U A L R E P O R T
R E S E R V E S S U M M A R Y – Net Proved Developed and Undeveloped Reserves (1)
2004 2003 2002 2001 2000___________________________________________________________________________________________________________________________________________________________________________________________________________________________________________________________________________________________________________________________________________________________________________________________________________________________________________________________________________________
Liquids, Including Tar Sands and Non-Consolidated Reserves(1) (millions of barrels at year end)Net proved developed and undeveloped reserves
United States 2,894 3,218 3,352 3,494 3,480Canada(1) 1,848 1,975 2,085 2,098 1,940Europe 1,029 1,204 1,359 1,503 1,591Asia Pacific 613 684 691 622 690Africa 2,654 2,742 2,626 2,461 2,384Middle East 1,216 833 803 788 756Other 2,259 2,200 1,707 1,346 1,330
Total worldwide excluding year-end price/cost revisions 12,513 12,856 12,623 12,312 12,171________________________________________________________________________________________________________________________________________________________________________________________________________________________________________________________________________________________________________________________________________________________________________________________________________________________________________________________________________________Year-end price/cost revisions (862) – – – –
Total worldwide 11,651 12,856 12,623 12,312 12,171________________________________________________________________________________________________________________________________________________________________________________________________________________________________________________________________________________________________________________________________________________________________________________________________________________________________________________________________________________Natural Gas, Including Non-Consolidated Reserves (billions of cubic feet at year end)Net proved developed and undeveloped reserves
United States 10,578 11,424 12,239 12,924 13,296Canada 1,979 2,341 2,882 3,183 3,516Europe 21,916 23,849 24,336 25,252 26,017Asia Pacific 6,029 7,285 7,958 8,301 8,546Africa 771 583 436 379 375Middle East 14,122 6,921 5,722 4,275 2,595Other 2,545 2,366 2,145 1,632 1,521
Total worldwide excluding year-end price/cost revisions 57,940 54,769 55,718 55,946 55,866________________________________________________________________________________________________________________________________________________________________________________________________________________________________________________________________________________________________________________________________________________________________________________________________________________________________________________________________________________Year-end price/cost revisions 2,422 – – – –
Total worldwide 60,362 54,769 55,718 55,946 55,866________________________________________________________________________________________________________________________________________________________________________________________________________________________________________________________________________________________________________________________________________________________________________________________________________________________________________________________________________________Reserves replacement ratio, excluding asset sales (2) (percent) 125 107 118 111 112Reserves replacement ratio, including asset sales (2) (percent) 112 105 117 110 111Reserves replacement ratio, including asset sales
and year-end price/cost revisions (percent) 83 NA NA NA NA
(1) ExxonMobil has significant interest in proven tar sands reserves in Canada. Please see Frequently Used Terms on pages 44 and 45 for the definition of reserves.(2) Excluding year-end revisions associated with using December 31, 2004, prices and costs.
2.5
2.0
1.5
1.0
0.5
00403020100999897969594
(1) Excludes sales and 2004 year-end price/cost revisions.
P R OV E D R E S E RV E R E P L A C E M E N T ( 1 )
(billions of oil-equivalent barrels)
Liquids Additions Gas Additions Production
L E A D I N G R E S E R V E S B A S E
Excluding sales and year-end price/cost revisions, theCompany has added 19 billion oil-equivalent barrels toproved reserves over the last 10 years, more than replacingproduction. ExxonMobil’s proved reserve base of 22 billionoil-equivalent barrels equates to a reserve life, at currentproduction rates, of 14 years.
F U N C T I O N A L A N D G E O G R A P H I C D I V E R S I T Y —
A C O R E S T R E N G T H O F E X X O N M O B I L
(percent)
Relative Contribution in 2004 by Functional and Geographic Area
Crude and Natural Gas Liquids Production
Natural Gas Production Available for Sale
Petroleum Product Sales Volumes
Chemical Prime Product Sales Volumes
Americas
3731
49 46
Africa / Other
32
7 5 3
Asia Pacific
815
2027
EuropeEurope
2323
47
26 24
47
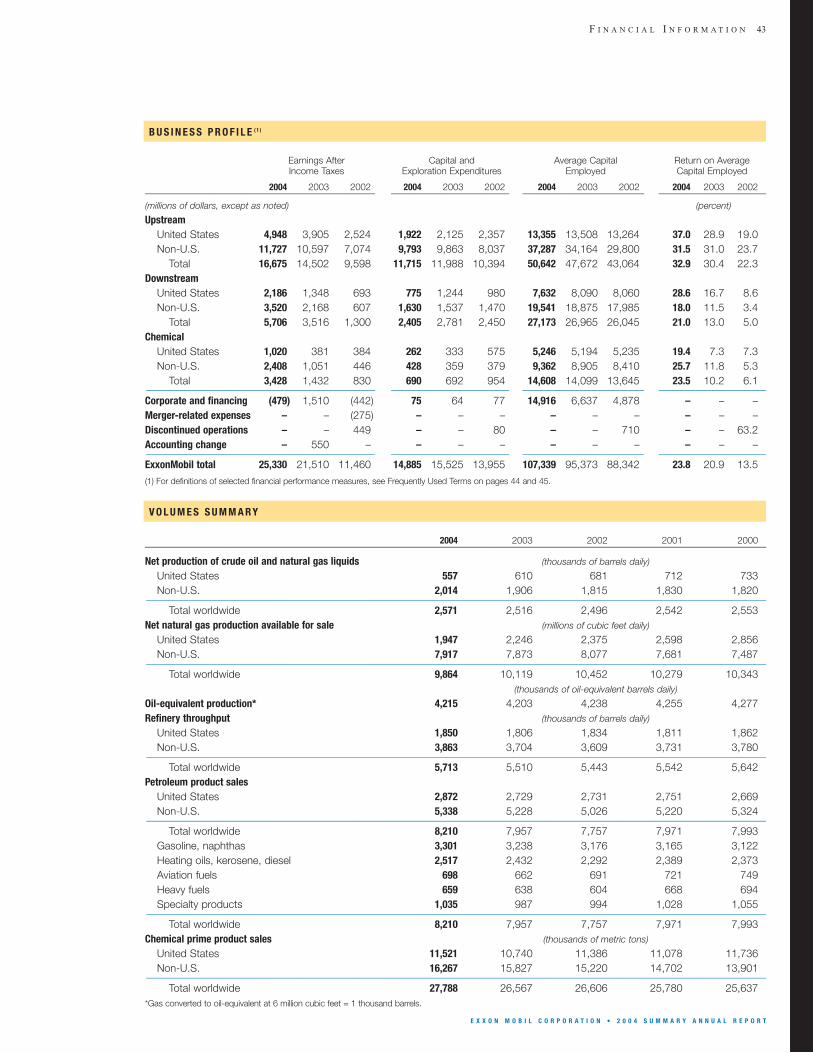
F I N A N C I A L I N F O R M A T I O N 43
E X X O N M O B I L C O R P O R A T I O N • 2 0 0 4 S U M M A R Y A N N U A L R E P O R T
V O L U M E S S U M M A R Y
2004 2003 2002 2001 2000___________________________________________________________________________________________________________________________________________________________________________________________________________________________________________________________________________________________________________________________________________________________________________________________________________________________________________________________________________________
Net production of crude oil and natural gas liquids (thousands of barrels daily)
United States 557 610 681 712 733Non-U.S. 2,014 1,906 1,815 1,830 1,820__________________________________________________________________________________________________________________________________________________________________________________________________________________________________________________________________________________________________________________________________________________________________________________________________________________________________________________________________________________
Total worldwide 2,571 2,516 2,496 2,542 2,553Net natural gas production available for sale (millions of cubic feet daily)
United States 1,947 2,246 2,375 2,598 2,856Non-U.S. 7,917 7,873 8,077 7,681 7,487__________________________________________________________________________________________________________________________________________________________________________________________________________________________________________________________________________________________________________________________________________________________________________________________________________________________________________________________________________________
Total worldwide 9,864 10,119 10,452 10,279 10,343(thousands of oil-equivalent barrels daily)
Oil-equivalent production* 4,215 4,203 4,238 4,255 4,277Refinery throughput (thousands of barrels daily)
United States 1,850 1,806 1,834 1,811 1,862Non-U.S. 3,863 3,704 3,609 3,731 3,780__________________________________________________________________________________________________________________________________________________________________________________________________________________________________________________________________________________________________________________________________________________________________________________________________________________________________________________________________________________
Total worldwide 5,713 5,510 5,443 5,542 5,642Petroleum product sales
United States 2,872 2,729 2,731 2,751 2,669Non-U.S. 5,338 5,228 5,026 5,220 5,324__________________________________________________________________________________________________________________________________________________________________________________________________________________________________________________________________________________________________________________________________________________________________________________________________________________________________________________________________________________
Total worldwide 8,210 7,957 7,757 7,971 7,993Gasoline, naphthas 3,301 3,238 3,176 3,165 3,122Heating oils, kerosene, diesel 2,517 2,432 2,292 2,389 2,373Aviation fuels 698 662 691 721 749Heavy fuels 659 638 604 668 694Specialty products 1,035 987 994 1,028 1,055__________________________________________________________________________________________________________________________________________________________________________________________________________________________________________________________________________________________________________________________________________________________________________________________________________________________________________________________________________________
Total worldwide 8,210 7,957 7,757 7,971 7,993Chemical prime product sales (thousands of metric tons)
United States 11,521 10,740 11,386 11,078 11,736Non-U.S. 16,267 15,827 15,220 14,702 13,901__________________________________________________________________________________________________________________________________________________________________________________________________________________________________________________________________________________________________________________________________________________________________________________________________________________________________________________________________________________
Total worldwide 27,788 26,567 26,606 25,780 25,637*Gas converted to oil-equivalent at 6 million cubic feet = 1 thousand barrels.
B U S I N E S S P R O F I L E ( 1 )
Earnings After Capital and Average Capital Return on AverageIncome Taxes Exploration Expenditures Employed Capital Employed
2004 2003 2002 2004 2003 2002 2004 2003 2002 2004 2003 2002___________________________________________________________________________________________________________________________________________________________________________________________________________________________________________________________________________________________________________________________________________________________________________________________________________________________________________________________________________________
(millions of dollars, except as noted) (percent)
UpstreamUnited States 4,948 3,905 2,524 1,922 2,125 2,357 13,355 13,508 13,264 37.0 28.9 19.0Non-U.S. 11,727 10,597 7,074 9,793 9,863 8,037 37,287 34,164 29,800 31.5 31.0 23.7
Total 16,675 14,502 9,598 11,715 11,988 10,394 50,642 47,672 43,064 32.9 30.4 22.3Downstream
United States 2,186 1,348 693 775 1,244 980 7,632 8,090 8,060 28.6 16.7 8.6Non-U.S. 3,520 2,168 607 1,630 1,537 1,470 19,541 18,875 17,985 18.0 11.5 3.4
Total 5,706 3,516 1,300 2,405 2,781 2,450 27,173 26,965 26,045 21.0 13.0 5.0Chemical
United States 1,020 381 384 262 333 575 5,246 5,194 5,235 19.4 7.3 7.3Non-U.S. 2,408 1,051 446 428 359 379 9,362 8,905 8,410 25.7 11.8 5.3
Total 3,428 1,432 830 690 692 954 14,608 14,099 13,645 23.5 10.2 6.1__________________________________________________________________________________________________________________________________________________________________________________________________________________________________________________________________________________________________________________________________________________________________________________________________________________________________________________________________________________Corporate and financing (479) 1,510 (442) 75 64 77 14,916 6,637 4,878 – – –Merger-related expenses – – (275) – – – – – – – – –Discontinued operations – – 449 – – 80 – – 710 – – 63.2Accounting change – 550 – – – – – – – – – –__________________________________________________________________________________________________________________________________________________________________________________________________________________________________________________________________________________________________________________________________________________________________________________________________________________________________________________________________________________ExxonMobil total 25,330 21,510 11,460 14,885 15,525 13,955 107,339 95,373 88,342 23.8 20.9 13.5
(1) For definitions of selected financial performance measures, see Frequently Used Terms on pages 44 and 45.
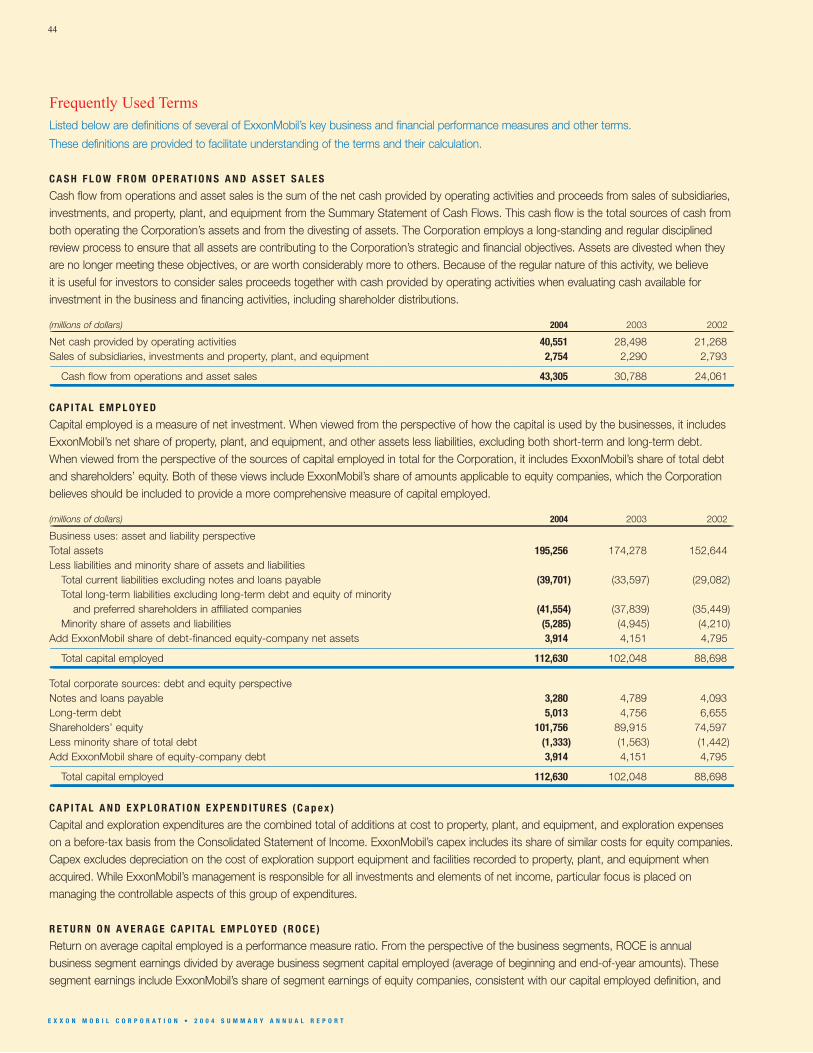
44
E X X O N M O B I L C O R P O R A T I O N • 2 0 0 4 S U M M A R Y A N N U A L R E P O R T
Listed below are definitions of several of ExxonMobil’s key business and financial performance measures and other terms.
These definitions are provided to facilitate understanding of the terms and their calculation.
C A S H F L O W F R O M O P E R AT I O N S A N D A S S E T S A L E S
Cash flow from operations and asset sales is the sum of the net cash provided by operating activities and proceeds from sales of subsidiaries,investments, and property, plant, and equipment from the Summary Statement of Cash Flows. This cash flow is the total sources of cash fromboth operating the Corporation’s assets and from the divesting of assets. The Corporation employs a long-standing and regular disciplinedreview process to ensure that all assets are contributing to the Corporation’s strategic and financial objectives. Assets are divested when theyare no longer meeting these objectives, or are worth considerably more to others. Because of the regular nature of this activity, we believe it is useful for investors to consider sales proceeds together with cash provided by operating activities when evaluating cash available forinvestment in the business and financing activities, including shareholder distributions.
(millions of dollars) 2004 2003 2002_______________________________________________________________________________________________________________________________________________________________________________________________________________________________________________________________________________________________________________________________________________________________________________________________________________________________________________________________________________________________________________________________Net cash provided by operating activities 40,551 28,498 21,268Sales of subsidiaries, investments and property, plant, and equipment 2,754 2,290 2,793__________________________________________________________________________________________________________________________________________________________________________________________________________________________________________________________________________________________________________________________________________________________________________________________________________________________________________________________________________________________________________________________________
Cash flow from operations and asset sales 43,305 30,788 24,061_________________________________________________________________________________________________________________________________________________________________________________________________________________________________________________________________________________________________________________________________________________________________________________________________________________________________________________________________________________________________________________________________C A P I TA L E M P L O Y E D
Capital employed is a measure of net investment. When viewed from the perspective of how the capital is used by the businesses, it includesExxonMobil’s net share of property, plant, and equipment, and other assets less liabilities, excluding both short-term and long-term debt. When viewed from the perspective of the sources of capital employed in total for the Corporation, it includes ExxonMobil’s share of total debtand shareholders’ equity. Both of these views include ExxonMobil’s share of amounts applicable to equity companies, which the Corporationbelieves should be included to provide a more comprehensive measure of capital employed.
(millions of dollars) 2004 2003 2002_______________________________________________________________________________________________________________________________________________________________________________________________________________________________________________________________________________________________________________________________________________________________________________________________________________________________________________________________________________________________________________________________Business uses: asset and liability perspectiveTotal assets 195,256 174,278 152,644Less liabilities and minority share of assets and liabilities
Total current liabilities excluding notes and loans payable (39,701) (33,597) (29,082)Total long-term liabilities excluding long-term debt and equity of minority
and preferred shareholders in affiliated companies (41,554) (37,839) (35,449)Minority share of assets and liabilities (5,285) (4,945) (4,210)
Add ExxonMobil share of debt-financed equity-company net assets 3,914 4,151 4,795__________________________________________________________________________________________________________________________________________________________________________________________________________________________________________________________________________________________________________________________________________________________________________________________________________________________________________________________________________________________________________________________________Total capital employed 112,630 102,048 88,698_________________________________________________________________________________________________________________________________________________________________________________________________________________________________________________________________________________________________________________________________________________________________________________________________________________________________________________________________________________________________________________________________
Total corporate sources: debt and equity perspectiveNotes and loans payable 3,280 4,789 4,093Long-term debt 5,013 4,756 6,655Shareholders’ equity 101,756 89,915 74,597Less minority share of total debt (1,333) (1,563) (1,442)Add ExxonMobil share of equity-company debt 3,914 4,151 4,795__________________________________________________________________________________________________________________________________________________________________________________________________________________________________________________________________________________________________________________________________________________________________________________________________________________________________________________________________________________________________________________________________
Total capital employed 112,630 102,048 88,698_________________________________________________________________________________________________________________________________________________________________________________________________________________________________________________________________________________________________________________________________________________________________________________________________________________________________________________________________________________________________________________________________C A P I TA L A N D E X P L O R AT I O N E X P E N D I T U R E S ( C a p e x )
Capital and exploration expenditures are the combined total of additions at cost to property, plant, and equipment, and exploration expenseson a before-tax basis from the Consolidated Statement of Income. ExxonMobil’s capex includes its share of similar costs for equity companies.Capex excludes depreciation on the cost of exploration support equipment and facilities recorded to property, plant, and equipment whenacquired. While ExxonMobil’s management is responsible for all investments and elements of net income, particular focus is placed onmanaging the controllable aspects of this group of expenditures.
R E T U R N O N A V E R A G E C A P I TA L E M P L O Y E D ( R O C E )
Return on average capital employed is a performance measure ratio. From the perspective of the business segments, ROCE is annual business segment earnings divided by average business segment capital employed (average of beginning and end-of-year amounts). Thesesegment earnings include ExxonMobil’s share of segment earnings of equity companies, consistent with our capital employed definition, and
Frequently Used Terms
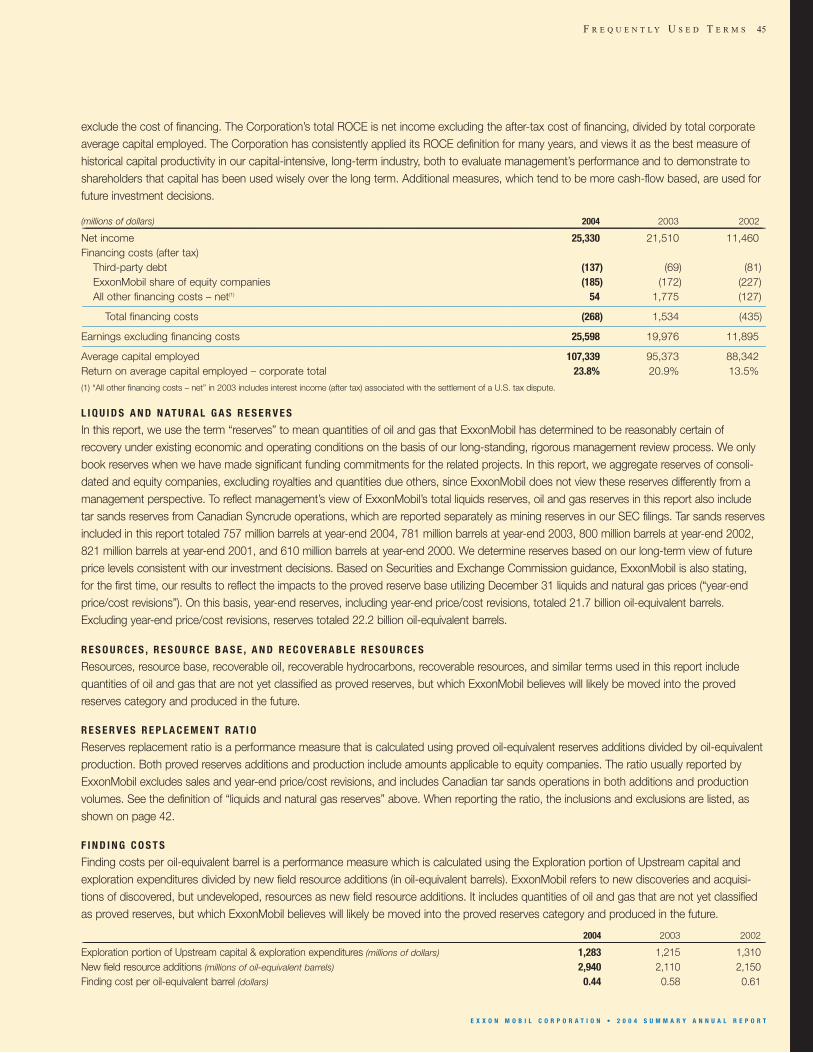
F R E Q U E N T L Y U S E D T E R M S 45
E X X O N M O B I L C O R P O R A T I O N • 2 0 0 4 S U M M A R Y A N N U A L R E P O R T
exclude the cost of financing. The Corporation’s total ROCE is net income excluding the after-tax cost of financing, divided by total corporateaverage capital employed. The Corporation has consistently applied its ROCE definition for many years, and views it as the best measure ofhistorical capital productivity in our capital-intensive, long-term industry, both to evaluate management’s performance and to demonstrate toshareholders that capital has been used wisely over the long term. Additional measures, which tend to be more cash-flow based, are used forfuture investment decisions.
(millions of dollars) 2004 2003 2002_______________________________________________________________________________________________________________________________________________________________________________________________________________________________________________________________________________________________________________________________________________________________________________________________________________________________________________________________________________________________________________________________Net income 25,330 21,510 11,460Financing costs (after tax)
Third-party debt (137) (69) (81)ExxonMobil share of equity companies (185) (172) (227)All other financing costs – net(1) 54 1,775 (127)__________________________________________________________________________________________________________________________________________________________________________________________________________________________________________________________________________________________________________________________________________________________________________________________________________________________________________________________________________________________________________________________________
Total financing costs (268) 1,534 (435)__________________________________________________________________________________________________________________________________________________________________________________________________________________________________________________________________________________________________________________________________________________________________________________________________________________________________________________________________________________________________________________________________Earnings excluding financing costs 25,598 19,976 11,895__________________________________________________________________________________________________________________________________________________________________________________________________________________________________________________________________________________________________________________________________________________________________________________________________________________________________________________________________________________________________________________________________Average capital employed 107,339 95,373 88,342Return on average capital employed – corporate total 23.8% 20.9% 13.5%
(1) “All other financing costs – net” in 2003 includes interest income (after tax) associated with the settlement of a U.S. tax dispute.
L I Q U I D S A N D N AT U R A L G A S R E S E R V E S
In this report, we use the term “reserves” to mean quantities of oil and gas that ExxonMobil has determined to be reasonably certain ofrecovery under existing economic and operating conditions on the basis of our long-standing, rigorous management review process. We onlybook reserves when we have made significant funding commitments for the related projects. In this report, we aggregate reserves of consoli-dated and equity companies, excluding royalties and quantities due others, since ExxonMobil does not view these reserves differently from amanagement perspective. To reflect management’s view of ExxonMobil’s total liquids reserves, oil and gas reserves in this report also includetar sands reserves from Canadian Syncrude operations, which are reported separately as mining reserves in our SEC filings. Tar sands reservesincluded in this report totaled 757 million barrels at year-end 2004, 781 million barrels at year-end 2003, 800 million barrels at year-end 2002,821 million barrels at year-end 2001, and 610 million barrels at year-end 2000. We determine reserves based on our long-term view of futureprice levels consistent with our investment decisions. Based on Securities and Exchange Commission guidance, ExxonMobil is also stating, for the first time, our results to reflect the impacts to the proved reserve base utilizing December 31 liquids and natural gas prices (“year-endprice/cost revisions”). On this basis, year-end reserves, including year-end price/cost revisions, totaled 21.7 billion oil-equivalent barrels.Excluding year-end price/cost revisions, reserves totaled 22.2 billion oil-equivalent barrels.
R E S O U R C E S , R E S O U R C E B A S E , A N D R E C O V E R A B L E R E S O U R C E S
Resources, resource base, recoverable oil, recoverable hydrocarbons, recoverable resources, and similar terms used in this report includequantities of oil and gas that are not yet classified as proved reserves, but which ExxonMobil believes will likely be moved into the provedreserves category and produced in the future.
R E S E R V E S R E P L A C E M E N T R AT I O
Reserves replacement ratio is a performance measure that is calculated using proved oil-equivalent reserves additions divided by oil-equivalentproduction. Both proved reserves additions and production include amounts applicable to equity companies. The ratio usually reported byExxonMobil excludes sales and year-end price/cost revisions, and includes Canadian tar sands operations in both additions and productionvolumes. See the definition of “liquids and natural gas reserves” above. When reporting the ratio, the inclusions and exclusions are listed, asshown on page 42.
F I N D I N G C O S T S
Finding costs per oil-equivalent barrel is a performance measure which is calculated using the Exploration portion of Upstream capital andexploration expenditures divided by new field resource additions (in oil-equivalent barrels). ExxonMobil refers to new discoveries and acquisi-tions of discovered, but undeveloped, resources as new field resource additions. It includes quantities of oil and gas that are not yet classifiedas proved reserves, but which ExxonMobil believes will likely be moved into the proved reserves category and produced in the future.
2004 2003 2002_______________________________________________________________________________________________________________________________________________________________________________________________________________________________________________________________________________________________________________________________________________________________________________________________________________________________________________________________________________________________________________________________Exploration portion of Upstream capital & exploration expenditures (millions of dollars) 1,283 1,215 1,310New field resource additions (millions of oil-equivalent barrels) 2,940 2,110 2,150Finding cost per oil-equivalent barrel (dollars) 0.44 0.58 0.61
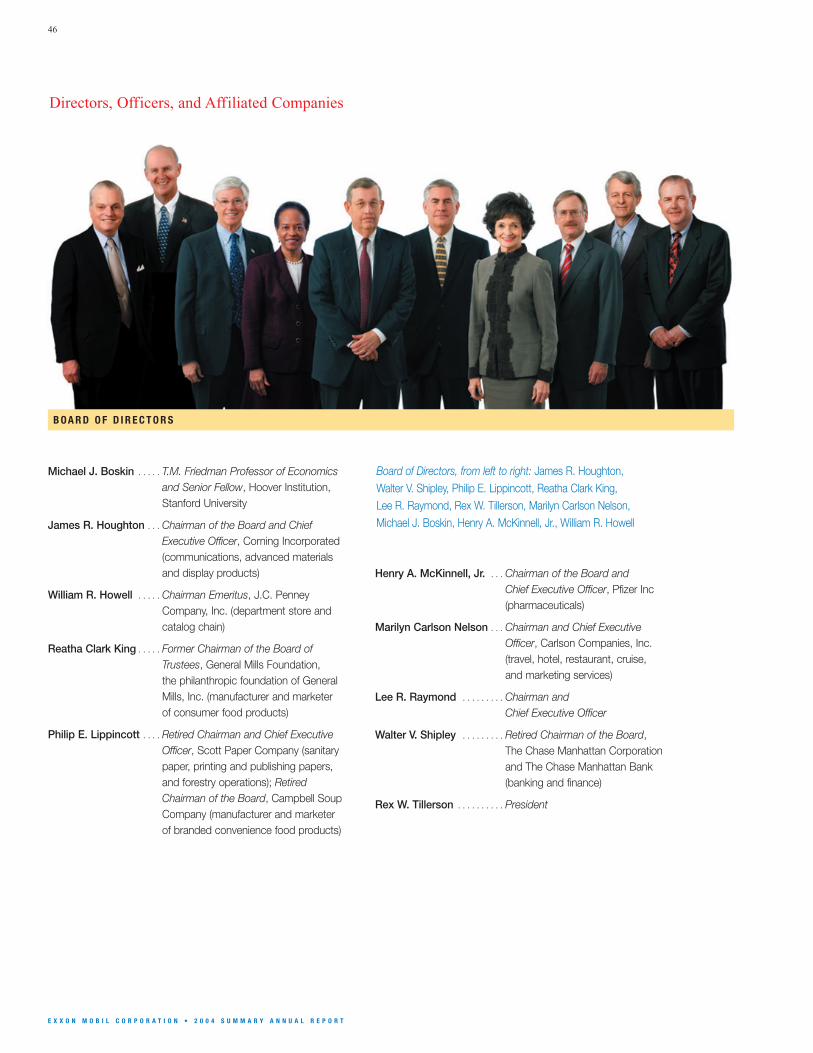
46
E X X O N M O B I L C O R P O R A T I O N • 2 0 0 4 S U M M A R Y A N N U A L R E P O R T
Michael J. Boskin . . . . . T.M. Friedman Professor of Economicsand Senior Fellow, Hoover Institution,Stanford University
James R. Houghton . . . Chairman of the Board and ChiefExecutive Officer, Corning Incorporated(communications, advanced materialsand display products)
William R. Howell . . . . . Chairman Emeritus, J.C. PenneyCompany, Inc. (department store andcatalog chain)
Reatha Clark King . . . . . Former Chairman of the Board ofTrustees, General Mills Foundation, the philanthropic foundation of GeneralMills, Inc. (manufacturer and marketer of consumer food products)
Philip E. Lippincott . . . . Retired Chairman and Chief ExecutiveOfficer, Scott Paper Company (sanitarypaper, printing and publishing papers,and forestry operations); RetiredChairman of the Board, Campbell SoupCompany (manufacturer and marketerof branded convenience food products)
Board of Directors, from left to right: James R. Houghton,Walter V. Shipley, Philip E. Lippincott, Reatha Clark King, Lee R. Raymond, Rex W. Tillerson, Marilyn Carlson Nelson, Michael J. Boskin, Henry A. McKinnell, Jr., William R. Howell
Directors, Officers, and Affiliated Companies
Henry A. McKinnell, Jr. . . . Chairman of the Board and Chief Executive Officer, Pfizer Inc(pharmaceuticals)
Marilyn Carlson Nelson . . . Chairman and Chief ExecutiveOfficer, Carlson Companies, Inc.(travel, hotel, restaurant, cruise, and marketing services)
Lee R. Raymond . . . . . . . . . Chairman and Chief Executive Officer
Walter V. Shipley . . . . . . . . . Retired Chairman of the Board, The Chase Manhattan Corporationand The Chase Manhattan Bank (banking and finance)
Rex W. Tillerson . . . . . . . . . . President
B O A R D O F D I R E C T O R S
D I R E C T O R S A N D O F F I C E R S 47
E X X O N M O B I L C O R P O R A T I O N • 2 0 0 4 S U M M A R Y A N N U A L R E P O R T
*Required to file reports under Section 16 of the Securities Exchange Act of 1934.
Audit Committee . . . . . . . . . . . . . . . . . . . . . . . . . . . . . . . . . . . . J.R. Houghton (Chair), W.R. Howell, R.C. King, H.A. McKinnell, Jr.
Board Advisory Committee on Contributions . . . . . . . . . . M.C. Nelson (Chair), W.R. Howell, R.C. King, P.E. Lippincott
Board Affairs Committee . . . . . . . . . . . . . . . . . . . . . . . . . . . . . W.V. Shipley (Chair), M.J. Boskin, P.E. Lippincott, H.A. McKinnell, Jr.
Compensation Committee . . . . . . . . . . . . . . . . . . . . . . . . . . . W.R. Howell (Chair), J.R. Houghton, R.C. King, W.V. Shipley
Finance Committee . . . . . . . . . . . . . . . . . . . . . . . . . . . . . . . . . . L.R. Raymond (Chair), M.J. Boskin, J.R. Houghton, P.E. Lippincott, M.C. Nelson
Public Issues Committee. . . . . . . . . . . . . . . . . . . . . . . . . . . . . M.J. Boskin (Chair), H.A. McKinnell, Jr., M.C. Nelson, W.V. Shipley
Executive Committee . . . . . . . . . . . . . . . . . . . . . . . . . . . . . . . . L.R. Raymond (Chair), J.R. Houghton, W.R. Howell, P.E. Lippincott, M.C. Nelson
L.R. Raymond . . . . . . . . . . . Chairman of the Board*
R.W. Tillerson . . . . . . . . . . . President*
E.G. Galante . . . . . . . . . . . . Senior Vice President*
S.R. McGill . . . . . . . . . . . . . . Senior Vice President*
J.S. Simon . . . . . . . . . . . . . . Senior Vice President*
L.J. Cavanaugh . . . . . . . . . Vice President – Human Resources
A.T. Cejka . . . . . . . . . . . . . . . Vice President*
K.P. Cohen . . . . . . . . . . . . . . Vice President – Public Affairs
H.R. Cramer . . . . . . . . . . . . Vice President*
P.J. Dingle . . . . . . . . . . . . . . . Vice President*
M.J. Dolan . . . . . . . . . . . . . . Vice President*
M.E. Foster . . . . . . . . . . . . . Vice President*
H.H. Hubble . . . . . . . . . . . . . Vice President – Investor Relations
and Secretary*
D.D. Humphreys . . . . . . . . . Vice President and Treasurer*
G.L. Kohlenberger . . . . . . . Vice President*
C.W. Matthews . . . . . . . . . . Vice President and General Counsel*
P.T. Mulva . . . . . . . . . . . . . . . Vice President and Controller*
R.D. Nelson . . . . . . . . . . . . . Vice President – Washington Office
S.D. Pryor . . . . . . . . . . . . . . . Vice President*
J.M. Spellings . . . . . . . . . . . General Manager – Corporate Planning
S.K. Stuewer . . . . . . . . . . . . Vice President – Safety, Health
and Environment
P.E. Sullivan . . . . . . . . . . . . . Vice President and General Tax Counsel*
Upstream
A.T. Cejka . . . . . . . . . . President, ExxonMobil Exploration Company*
M.W. Albers . . . . . . . . President, ExxonMobil Development Company*
M.E. Foster . . . . . . . . . President, ExxonMobil Production Company*
P.J. Dingle . . . . . . . . . . President, ExxonMobil Gas &
Power Marketing Company*
S.M. Cassiani . . . . . . . President, ExxonMobil Upstream Research
Company; President, ExxonMobil Upstream
Technical Computing Company
Downstream
S.D. Pryor . . . . . . . . . . President, ExxonMobil Refining
& Supply Company*
H.R. Cramer . . . . . . . . President, ExxonMobil
Fuels Marketing Company*
G.L. Kohlenberger . . . President, ExxonMobil Lubricants
& Petroleum Specialties Company*
W.R.K. Innes . . . . . . . . President, ExxonMobil Research
and Engineering Company
Chemical
M.J. Dolan . . . . . . . . . . President, ExxonMobil Chemical Company*
Other
T.J. Hearn . . . . . . . . . . Chairman of the Board, Imperial Oil Limited
S.J. Glass, Jr. . . . . . . . President, ExxonMobil Global Services
Company
O F F I C E R S F U N C T I O N A L A N D S E R V I C E O R G A N I Z AT I O N S
S TA N D I N G C O M M I T T E E S O F T H E B O A R D
48
E X X O N M O B I L C O R P O R A T I O N • 2 0 0 4 S U M M A R Y A N N U A L R E P O R T
Investor Information
SHAREHOLDER SERVICES
Shareholder inquiries should be addressed to ExxonMobilShareholder Services at EquiServe Trust Company, N.A.,ExxonMobil’s transfer agent:
ExxonMobil Shareholder Services
P.O. Box 43008Providence, RI 02940-3008
1-800-252-1800
(Within the continental U.S. and Canada)1-781-575-2058
(Outside the continental U.S. and Canada)
An automated voice-response system is available 24 hours a day, 7 days a week. Service representatives are availableduring normal business hours.
Registered shareholders can access information about their ExxonMobil stock accounts via the Internet at www.exxonmobil.equiserve.com.
STOCK PURCHASE AND DIVIDEND REINVESTMENT PLAN
EquiServe Trust Company, N.A. sponsors a stock purchaseand dividend reinvestment plan, the EquiServe InvestmentPlan for Exxon Mobil Corporation Common Stock, in whichparticipants can purchase ExxonMobil stock and reinvestdividends without contacting a broker. You do not have tobe a shareholder to enroll. For more information and planmaterials, go to www.exxonmobil.equiserve.com and select Shareholder Services or call or write ExxonMobilShareholder Services.
DIVIDEND DIRECT DEPOSIT
Shareholders may have their dividends deposited directlyinto their bank accounts. If you’d like to elect this option, go to www.exxonmobil.equiserve.com or call or writeExxonMobil Shareholder Services for an authorization form.
ELECTRONIC DELIVERY OF DOCUMENTS
Registered shareholders can receive the following online, instead of by mail:■ Summary Annual Report■ Proxy Statement■ Tax Documents■ Dividend Reinvestment Statements
E X X O N M O B I L O N T H E I N T E R N E T
A Quick, Easy Way to Get Information About ExxonMobil
ExxonMobil publications and important shareholder information are available on the Internet at:
www.exxonmobil.com■ Shareholder Publications■ Current Stock Price■ Dividend Information■ Contact Information■ Stock Purchase and Dividend Reinvestment Plan■ Press Releases■ Management Presentations■ Economic and Energy Outlook■ Corporate Governance Guidelines
ExxonMobil offers its shareholders a wide
range of services and several ways to access
important company information.
EXXONMOBIL PUBLICATIONS
The publications listed below, all of which can be found on the Internet at www.exxonmobil.com, are available without charge to shareholders. Requests for printed copies should be directed to ExxonMobil Shareholder Services.
■ 2004 Summary Annual Report■ 2004 Annual Report on Form 10-K
■ 2004 Financial and Operating Review, a report onExxonMobil’s businesses, strategies, and results
■ 2004 Corporate Citizenship Report
■ The Lamp, a quarterly shareholder magazine with newsand features about ExxonMobil’s worldwide activities
■ A Report of Energy Trends, Greenhouse Gas Emissionsand Alternative Energy
DUPLICATE ANNUAL REPORTS
Shareholders may eliminate duplicate report mailings by marking their proxy card, or by writing or calling ExxonMobilShareholder Services.
CORPORATE GOVERNANCE
Our Corporate Governance Guidelines are available by selecting Investor Information on our website at www.exxonmobil.com.
EXECUTIVE CERTIFICATIONS
ExxonMobil has included as Exhibit 31 to its 2004 Annual Reporton Form 10-K filed with the Securities and Exchange Commissioncertificates of the chief executive officer, principal accountingofficer, and principal financial officer of the Company regarding the quality of the Company’s public disclosure. The Company hasalso submitted to the New York Stock Exchange (NYSE) a certifi-cate of the CEO certifying that he is not aware of any violation bythe Company of NYSE corporate governance listing standards.
Exxon Mobil Corporation has numerous affiliates, many with names that include ExxonMobil, Exxon, Mobil, and Esso. For convenience and simplicity, those terms andterms such as Corporation, company, our, we, and its are sometimes used as abbreviated references to specific affiliates or affiliate groups. Abbreviated referencesdescribing global or regional operational organizations, and global or regional business lines are also sometimes used for convenience and simplicity. Similarly, ExxonMobilhas business relationships with thousands of customers, suppliers, governments, and others. For convenience and simplicity, words such as venture, joint venture, partnership, co-venturer, and partner are used to indicate business relationships involving common activities and interests, and those words may not indicate precise legal relationships. The following are trademarks, service marks, or proprietary process names of Exxon Mobil Corporation or one of its subsidiaries: Esso, Exxon, Exxpol, Mobil, Mobil 1, MSDW-2, On the Run, and Speedpass. Aston Martin, Bentley, BMW, Cadillac, Chrysler, Corvette, Dodge, Doutor, Innscor, McLaren, Mercedes,NASCAR, Nebula-20, Porsche, Saab, 7-Eleven, Tesco, Tim Hortons, Toyota, Upromise, and West are trademarks of third-party companies.
Corporate Headquarters
Exxon Mobil Corporation5959 Las Colinas BoulevardIrving, TX 75039-2298
Additional copies may be obtained by writing or phoning:Phone: 972-444-1000Fax: 972-444-1505
Shareholder Relations
Exxon Mobil CorporationP.O. Box 140369Irving, TX 75014-0369
Market Information
The New York Stock Exchange is the principal exchange on which Exxon Mobil Corporation common stock (symbol XOM) is traded.
Annual Meeting
The 2005 Annual Meeting of Shareholders will be held at 9:00 a.m. Central Time on Wednesday, May 25, at:
The Morton H. Meyerson Symphony Center2301 Flora StreetDallas, Texas 75201
The meeting will be audiocast live on the Internet.Instructions for listening to this audiocast will be available on the Internet at www.exxonmobil.comapproximately one week prior to the event.
General Information
Included in this Summary Annual Report are financial and operating highlights and summary financial statements. For complete financial statements, including notes,please refer to the Proxy Statement for ExxonMobil’s 2005 Annual Meeting. The Proxy Statement also includes management’s discussion and analysis of financial condition and results of operations. The ExxonMobil website, www.exxonmobil.com, contains the Proxy Statement and other company publications, includingExxonMobil’s Financial and Operating Review, which provides additional detail about the Company’s global operations.
WH
ET
ST
ON
E D
ES
IGN
LA
B /
RB
MM
©20
05
EXX
ON
MO
BIL
CO
RP
OR
ATI
ON
PR
INT
ED
IN
U.S
.A.
5959 Las Colinas Boulevard
Irving, Texas 75039-2298
www.exxonmobil.com
Printed entirely on recycled paper
3300-AR-05