Embed Size (px)
Citation preview
ANNUAL PerformANce rePorT fIScAL YeAr 2011
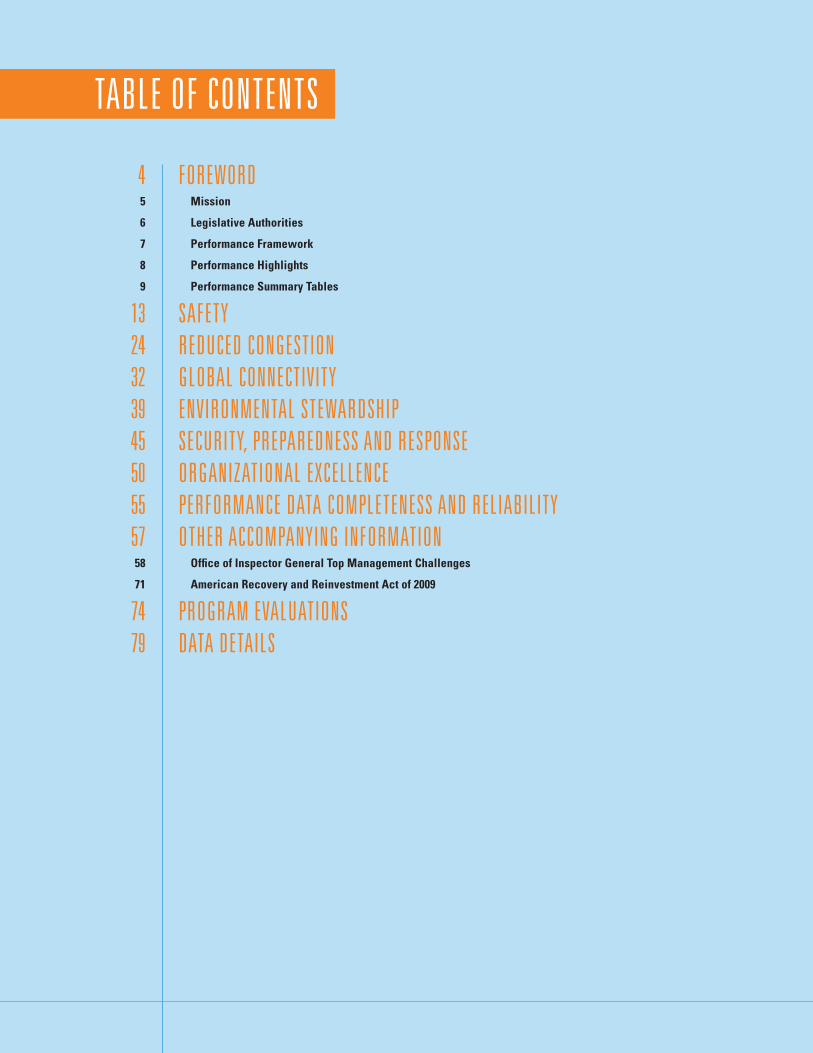
TABLe of coNTeNTS
foreword Mission
Legislative Authorities
Performance Framework
Performance Highlights
Performance Summary Tables
SAfeTYredUced coNgeSTIoNgLoBAL coNNecTIvITYeNvIroNmeNTAL STewArdShIPSecUrITY, PrePAredNeSS ANd reSPoNSeorgANIzATIoNAL exceLLeNcePerformANce dATA comPLeTeNeSS ANd reLIABILITYoTher AccomPANYINg INformATIoN Office of Inspector General Top Management Challenges
American Recovery and Reinvestment Act of 2009
ProgrAm evALUATIoNSdATA deTAILS
45
6
7
8
9
132432394550555758
71
7479

mANAgemeNT’S dIScUSSIoN ANd ANALYSIS
foreword

The United States Department of Transportation’s (DOT or the Department) Annual Performance Report (APR) for fiscal year (FY) 2011 provides an overview of the Department’s performance and results to Congress, the President and the American people.
THe AnnuAL PeRFORMAnCe RePORT provides information about our performance as an organization, our achievements, initiatives and our challenges.
This report is one in a series of reports required under the Adminis-tration’s Pilot Program for Alternative Approaches to Performance and Accountability Reporting. This is the second year that the Department has participated in this voluntary program in an effort to strengthen its annual reporting documents and to present more streamlined and timely information. It also clarifies the relationship between performance, budgetary resources and financial reporting.
The Department’s FY 2011 annual reporting includes the following components:
AnnuAL PeRFORMAnCe RePORT (APR) [AvAILAbLe FebRuARy 2012]The APR is produced in conjunction with the FY 2013 President’s Budget Request and provides detailed performance information and descriptions of results by each key performance measure.
AGenCy FInAnCIAL RePORT (AFR) [PubLISHed nOveMbeR 2011]The AFR is organized into three major sections:
The Management’s Discussion and Analysis section provides executive-level information on the Department’s history, mission, organization, key activities, analysis of financial statements, systems, controls and legal compliance, accomplishments for the fiscal year and management and performance challenges facing the Department.
The Financial Details section provides a message from the Chief Financial Officer, consolidated and combined financial statements, the Department’s notes to the financial statements and the report of independent auditors.
The Other Accompanying Information section provides Improper Payments Information Act reporting details and other statutory reporting requirements.
Both reports will be available on the Department’s Web site at: www.dot.gov/about.html#perfbudgplan
foreword
4 U.S. DEPARTMENT OF TRANSPORTATION4 ANNUAL PERFORMANCE REPORT FISCAL YEAR 2011
FedeRAL AvIATIOn AdMInISTRATIOn
FedeRAL HIGHWAy AdMInISTRATIOn
FedeRAL MOTOR CARRIeR SAFeTy
AdMInISTRATIOn
FedeRAL RAILROAd AdMInISTRATIOn
FedeRAL TRAnSIT AdMInISTRATIOn
MARITIMe AdMInISTRATIOn
nATIOnAL HIGHWAy TRAFFIC SAFeTy
AdMInISTRATIOn
OFFICe OF InSPeCTOR
GeneRAL
PIPeLIne And HAZARdOuS
MATeRIALS SAFeTy AdMInISTRATIOn
ReSeARCH And InOvATIve
TeCHnOLOGy AdMInSTRATIOn
SAInT LAWRenCe SeAWAy
deveLOPMenT CORPORATIOn
SuRFACe TRAnSPORTATIOn
bOARd
SeCReTARy/ dePuTy SeCReTARy
undeRSeCReTARy FOR POLICy
ANNUAL PERFORMANCE REPORT FISCAL YEAR 2011U.S. DEPARTMENT OF TRANSPORTATION5
mISSIoN
UNITed STATeS dePArTmeNT of TrANSPorTATIoN mISSIoN ANd vALUeSMISSIOnThe Department’s mission is to serve the United States by ensuring a fast, safe, efficient, accessible and convenient transportation system that underpins our economy, meets our vital National interests and enhances the quality of life of the American people, today and into the future.
orgANIzATIoNHISTORyEstablished in 1967, DOT sets Federal transportation policy and works with State, local, and private sector partners to promote a safe, secure, efficient, and interconnected National transportation system of roads, railways, pipelines, airways, and seaways. DOT’s overall objective of creating a safer, simpler, and smarter transportation program is the guiding principle as we move forward to achieve specific goals.
HOW We ARe ORGAnIZedDOT employs almost 60,000 people across the country, in the Office of the Secretary of Transportation (OST) and through twelve Operating Administrations (OAs) and bureaus, each with its own management and organizational structure.
The Office of the Secretary of Transportation provides overall leadership and management direction, administers aviation economic and consumer protection programs, and provides administrative support. The Office of Inspector General (OIG) and the Surface Transportation Board (STB), while formally part of DOT, are independent by law.
orgANIzATIoNAL chArT
ANNUAL PERFORMANCE REPORT FISCAL YEAR 2011U.S. DEPARTMENT OF TRANSPORTATION6
overvIew of LegISLATIve AUThorITIeSThe DOT strategic plan summarizes the legislative authorities of each Operating Administration (OA). To provide a context for the reader, highlights of the responsibilities of each OA are listed below.
OFFICe OF THe SeCReTARyThe Office of the Secretary (OST) oversees the formulation of National transportation policy and promotes intermodal transportation. Other responsibilities range from negotiation and implementation of international transportation agreements, assuring the fitness of U.S. airlines, enforcing airline consumer protection regulations and issuance of regulations to prevent alcohol and illegal drug use in transportation systems.
FedeRAL AvIATIOn AdMInISTRATIOnThe Federal Aviation Administration’s (FAA) mission is to promote aviation safety and mobility by building, maintaining, and operating the Nation’s air traffic control system; overseeing commercial and general aviation safety through regulation and inspection; and providing assistance to improve the capacity and safety of our airports. FAA is developing the Next Generation (NextGen) air traffic control system.
FedeRAL HIGHWAy AdMInISTRATIOnThe mission of the Federal Highway Administration (FHWA) is to improve mobility on our Nation’s highways through National leadership, innovation, and program delivery.
FedeRAL MOTOR CARRIeR SAFeTy AdMInISTRATIOnThe Federal Motor Carrier Safety Administration’s (FMCSA) primary mission is to reduce crashes, injuries and fatalities involving large trucks and buses.
FedeRAL RAILROAd AdMInISTRATIOnThe Federal Railroad Administration’s (FRA) mission is to ensure the safety of the Nation’s passenger and freight rail operations and infrastructure by promoting safe, efficient, accessible and environ-mentally sound rail transportation.
FedeRAL TRAnSIT AdMInISTRATIOnThe Federal Transit Administration (FTA) provides leadership, technical assistance, and financial resources for safe, technologically advanced public transportation that enhances mobility and acces-sibility, improves America’s communities, preserves the natural environment, advances economic growth, and ensures that transit systems are prepared to function during and after natural or unnatural disasters.
MARITIMe AdMInISTRATIOnThe Maritime Administration’s (MARAD) mission is to promote the development and maintenance of an adequate, well-balanced U.S. merchant marine that is sufficient to carry the Nation’s domestic waterborne commerce and a substantial portion of its waterborne foreign commerce, and to serve as a naval and military auxiliary in time of war or National emergency.
nATIOnAL HIGHWAy TRAFFIC SAFeTy AdMInISTRATIOnThe National Highway Traffic Safety Administration’s (NHTSA) mission is to save lives, prevent injuries and reduce economic costs due to road traffic crashes through education, research, safety standards, and enforcement activity.
OFFICe OF InSPeCTOR GeneRALThe Inspector General Act of 1978, as amended, established the Office of Inspector General (OIG) as an independent and objective organization within the DOT. The OIG’s mission is to promote economy, effectiveness, and efficiency and to prevent and detect fraud, waste, and abuse in DOT operations and programs by conducting and supervising independent and objective audits and investigations.
PIPeLIne And HAZARdOuS MATeRIALS SAFeTy AdMInISTRATIOnPHMSA’s mission is to protect people and the environment from the risks inherent in transportation of hazardous materials—by pipeline and other modes of transportation.
ReSeARCH And InnOvATIve TeCHnOLOGy AdMInISTRATIOnThe Research and Innovative Technology Administration (RITA) works to advance DOT priorities for innovation and research in transportation technologies and concepts.
SAInT LAWRenCe SeAWAy deveLOPMenT CORPORATIOnThe U.S. Saint Lawrence Seaway Development Corporation (SLSDC), a wholly owned government corporation, is responsible for the operations and maintenance of the U.S. portion of the St. Lawrence Seaway between Montreal and Lake Erie.
SuRFACe TRAnSPORTATIOn bOARdThe Surface Transportation Board (STB) is charged with promoting substantive and procedural regulatory reform in the economic regu-lation of surface transportation, and with providing an efficient and effective forum for the resolution of disputes and the facilitation of appropriate business transactions.

ANNUAL PERFORMANCE REPORT FISCAL YEAR 2011U.S. DEPARTMENT OF TRANSPORTATION7
PerformANce frAmeworKEverything we do at DOT is aimed toward making measurable improvements in our transportation system, the security of our Nation, and the quality of American life. In the Annual Performance Report we hold ourselves accountable to the public for effectively bringing to bear the Department’s resources in improving the Nation’s transportation system. We use these results to improve our strategies and resource decisions.
DOT’s performance framework is as follows:
The DOT Strategic Plan provides a comprehensive vision for improving the Nation’s complex and vital transportation system. DOT is drafting a new Strategic Plan covering FY 2012–2016, which will be the framework for future reports. This year’s report, however, is framed by the FY 2006–2011 Strategic Plan and provides a public accounting of our FY 2011 performance results. The plan outlines five strategic objectives in the areas of safety, reduced congestion, global connectivity, security and environmental stewardship that articulate the longer term focus of the Department. In addition to the broad objectives, the plan targets specific outcomes we want to achieve, and identifies key challenges.
The DOT Performance Budget operationalizes the Strategic Plan, and provides direct linkages between DOT’s budget request and the results the public can expect for programs within each of our Operating Administrations. The performance budget defines the performance goals and measures used to manage progress toward our strategic objectives. It describes in detail one fiscal year’s resources and programmatic effort within a strategic context. The performance budget also aligns each dollar requested to one of our strategic objectives.
Performance accountability for DOT organizations, executives, and employees embed the philosophy of “managing for performance” into the Department’s culture and daily practices. Performance accountability within the Department is accomplished through the following mechanisms: dOT ORGAnIZATIOnAL ASSeSSMenTS OF PeRFORMAnCe: A review of each Operating Administration’s performance is done at the end of the fiscal year to assess the organization’s success in the following areas: meeting Department-wide performance targets; results of program assessments and efforts associated with addressing any management challenges or material weaknesses identified by DOT’s Office of Inspector General. The results of these assessments are then factored in to the personal performance evaluations of our senior executives and program managers. eMPLOyee PeRFORMAnCe PLAnS: Prepared for each fiscal year, these plans document expected levels of employee performance that clearly link to our strategic objectives through the performance framework.
how doT worKS To AchIeve ITS STrATegIc oBJecTIveS ANd PerformANce goALSThe Department achieves its goals through its leadership role in U.S. transportation policy, operations, investment, and research. To influence results, DOT programs rely on a number of processes and tools. These include:
Direct operations and investment in DOT capital assets that provide capability, such as air traffic control and the St. Lawrence Seaway operations.
Infrastructure investments and other grants, such as grants for investment in highway, rail, transit, marine highways and shipyards, airport, and Amtrak capital infrastructure, and grants for safety, job access, or other important transpor-tation programs.
�Innovative�financial�tools�and�credit�programs, such as those provided for by the Transportation Infrastructure Finance and Innovation Act, and the Railroad Rehabilitation and Improvement Financing Program.
Rulemaking, in areas such as equipment, vehicle, or operator standards; for improving safety; and providing aviation consumer protection, just to name a few.
State/local organizational capacity building, through training, best practices, peer-to-peer exchanges and other activities that strengthen the capability of State Departments of Transportation, Metropolitan Planning Organizations, and local governments to play their essential front-line role in plan-ning, investing in, and operating highway and transit systems.
Enforcement to ensure compliance, including inspections, investigations, and penalty actions.
Research and technology development and application, such as fostering new materials and technologies in transpor-tation, and transportation-related research.
Education and outreach, such as consumer awareness, and campaigns to influence personal behavior.
Public Information, such as that provided by the Bureau of Transportation Statistics, and each DOT Operating Administration, so that States, localities, regions, and private sector entities can better plan their programs.
Some of these interventions and actions reside entirely within the Federal Government, but most involve significant partnering with State and local authorities and with the transportation industry. These are the broad areas of action that DOT—and State and local governments—commonly use to bring about desired results.

ANNUAL PERFORMANCE REPORT FISCAL YEAR 2011U.S. DEPARTMENT OF TRANSPORTATION8
PerformANce hIghLIghTSThis is the last year that the Department will report against
“New Ideas for a Nation on the Move”, our Strategic Plan for Fiscal Years 2006–2011. The Department will continue to track many of the measures found in the following pages, but as the agency builds upon progress in improving transportation and develops new strategic priorities, some measures will be dropped and new ones developed.
Preliminary results indicate that Department met nearly 80% of its performance targets for the year. Like every government agency, however, there are areas that we can improve upon. A brief discussion of our results by strategic objective follows.
SAFeTyDOT tracks the safety of Americans on the highways, in the air, on transit systems, on railroads and near pipelines. In FY 2011, pre-liminary results show that we met 7 out of 10 safety goals. Fatalities in general aviation (GA) did not decline as quickly as anticipated. Most of the fatalities occurred in the area of experimental aircraft, which are predominately amateur-built. These aircraft accounted for approximately 26 percent of GA fatal accidents while only contributing 5 percent of GA flying hours. FAA continues to pursue multiple avenues for addressing this issue.
ReduCed COnGeSTIOnOne of DOT’s strategic objectives is to reduce the congestion across the modes of transportation. We do this in a variety of ways, from providing funds that keep our highways in a state of good repair, managing air traffic efficiently, and encouraging the use of mass transit in order to reduce traffic on roadways. While transit ridership did not reach the targeted level of growth, initial FY2011 data shows that transit providers have started to recover from the effects of the economic downturn.
GLObAL COnneCTIvITyDOT contributes to the economy and American businesses’ connection with markets across the world by moving products, goods, and vehicles with as little delay as possible. In FY 2011, the St. Lawrence Seaway, which is a vital waterway between the upper Midwest and global markets, was open 99% of the shipping season. On the roadways we continue to improve the flow of traffic in freight corridors, but results were mixed in limiting delays at border crossings. Three of the five monitored crossings saw a decrease in delays, while those in Buffalo, NY, and Blaine, WA, saw increases. An increase in North American trade and the resulting growth in commercial vehicle traffic likely contributed to the mixed results and additional unexpected delay.
envIROnMenTAL STeWARdSHIPThe transportation system has a significant impact on the environment and DOT mitigates that impact whenever possible. For the fourth year in a row, there were no violations of air pollution standards in major metropolitan areas. Streamlining the process for completing environmental impact statements, however, continues to be a challenge.
SeCuRITy, PRePARedneSS And ReSPOnSeWhile the Department of Homeland Security has primary responsibility for the security of the transportation system, DOT must ensure it is prepared to continue operating during a crisis. To this end, DOT tracks the readiness of key staff and member agencies. DOT, through the Maritime Administration, has a role in supporting the Department of Defense during military mobilization. For the fourth year in a row we have exceeded the readiness requirements for shipping capacity and commercial ports.
ORGAnIZATIOnAL eXCeLLenCeMindful of the need to wisely use taxpayer money, DOT tracks the cost and scheduling associated with major system purchases and major infrastructure projects. Although we did not make our cost and schedule targets for major infrastructure projects as a whole, we are seeing improvements within individual projects. DOT agencies will continue to review the finance plans, project management plans, and cost estimates that are required for each major project.
ANNUAL PERFORMANCE REPORT FISCAL YEAR 2011U.S. DEPARTMENT OF TRANSPORTATION9
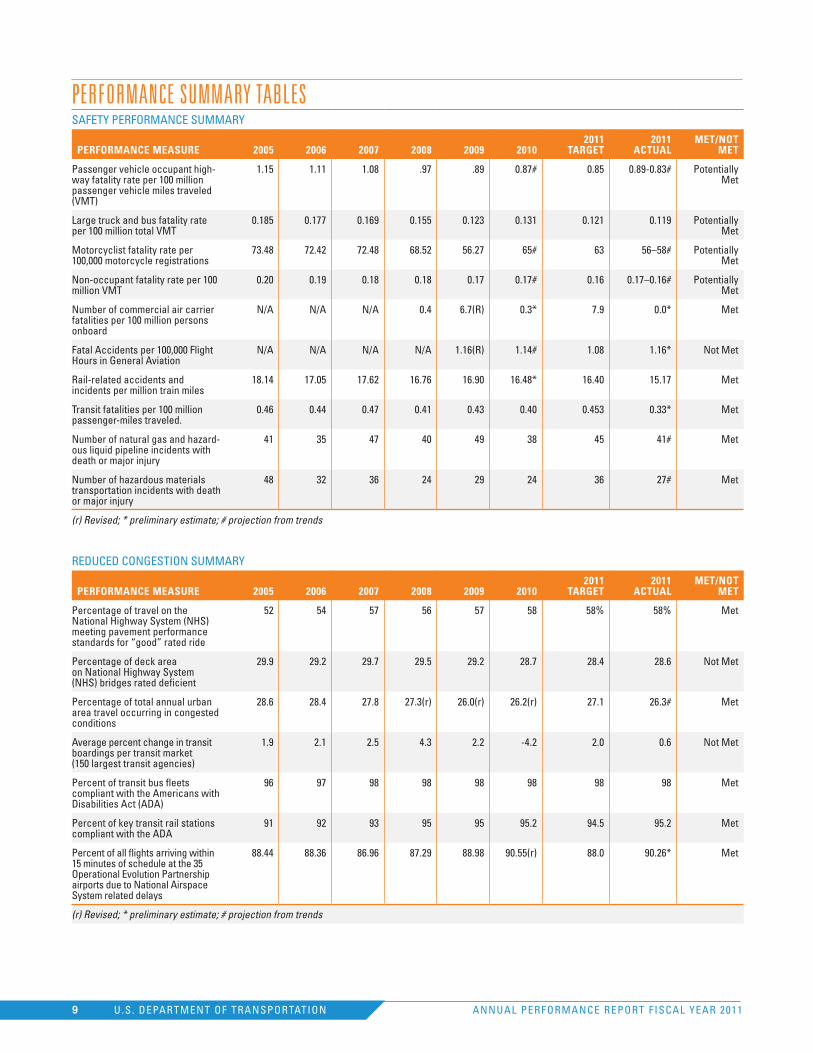
PerformANce SUmmArY TABLeSSAFETY PERFORMANCE SUMMARY
PeRFORMAnCe MeASuRe 2005 2006 2007 2008 2009 2010 2011
TARGeT2011
ACTuALMeT/nOT
MeT
Passenger vehicle occupant high-way fatality rate per 100 million passenger vehicle miles traveled (VMT)
1.15 1.11 1.08 .97 .89 0.87# 0.85 0.89-0.83# Potentially Met
Large truck and bus fatality rate per 100 million total VMT
0.185 0.177 0.169 0.155 0.123 0.131 0.121 0.119 Potentially Met
Motorcyclist fatality rate per 100,000 motorcycle registrations
73.48 72.42 72.48 68.52 56.27 65# 63 56–58# Potentially Met
Non-occupant fatality rate per 100 million VMT
0.20 0.19 0.18 0.18 0.17 0.17# 0.16 0.17–0.16# Potentially Met
Number of commercial air carrier fatalities per 100 million persons onboard
N/A N/A N/A 0.4 6.7(R) 0.3* 7.9 0.0* Met
Fatal Accidents per 100,000 Flight Hours in General Aviation
N/A N/A N/A N/A 1.16(R) 1.14# 1.08 1.16* Not Met
Rail-related accidents and incidents per million train miles
18.14 17.05 17.62 16.76 16.90 16.48* 16.40 15.17 Met
Transit fatalities per 100 million passenger-miles traveled.
0.46 0.44 0.47 0.41 0.43 0.40 0.453 0.33* Met
Number of natural gas and hazard-ous liquid pipeline incidents with death or major injury
41 35 47 40 49 38 45 41# Met
Number of hazardous materials transportation incidents with death or major injury
48 32 36 24 29 24 36 27# Met
(r) Revised; * preliminary estimate; # projection from trends
REDUCED CONGESTION SUMMARY
PeRFORMAnCe MeASuRe 2005 2006 2007 2008 2009 2010 2011
TARGeT2011
ACTuALMeT/nOT
MeT
Percentage of travel on the National Highway System (NHS) meeting pavement performance standards for “good” rated ride
52 54 57 56 57 58 58% 58% Met
Percentage of deck area on National Highway System (NHS) bridges rated deficient
29.9 29.2 29.7 29.5 29.2 28.7 28.4 28.6 Not Met
Percentage of total annual urban area travel occurring in congested conditions
28.6 28.4 27.8 27.3(r) 26.0(r) 26.2(r) 27.1 26.3# Met
Average percent change in transit boardings per transit market (150 largest transit agencies)
1.9 2.1 2.5 4.3 2.2 -4.2 2.0 0.6 Not Met
Percent of transit bus fleets compliant with the Americans with Disabilities Act (ADA)
96 97 98 98 98 98 98 98 Met
Percent of key transit rail stations compliant with the ADA
91 92 93 95 95 95.2 94.5 95.2 Met
Percent of all flights arriving within 15 minutes of schedule at the 35 Operational Evolution Partnership airports due to National Airspace System related delays
88.44 88.36 86.96 87.29 88.98 90.55(r) 88.0 90.26* Met
(r) Revised; * preliminary estimate; # projection from trends
ANNUAL PERFORMANCE REPORT FISCAL YEAR 2011U.S. DEPARTMENT OF TRANSPORTATION10
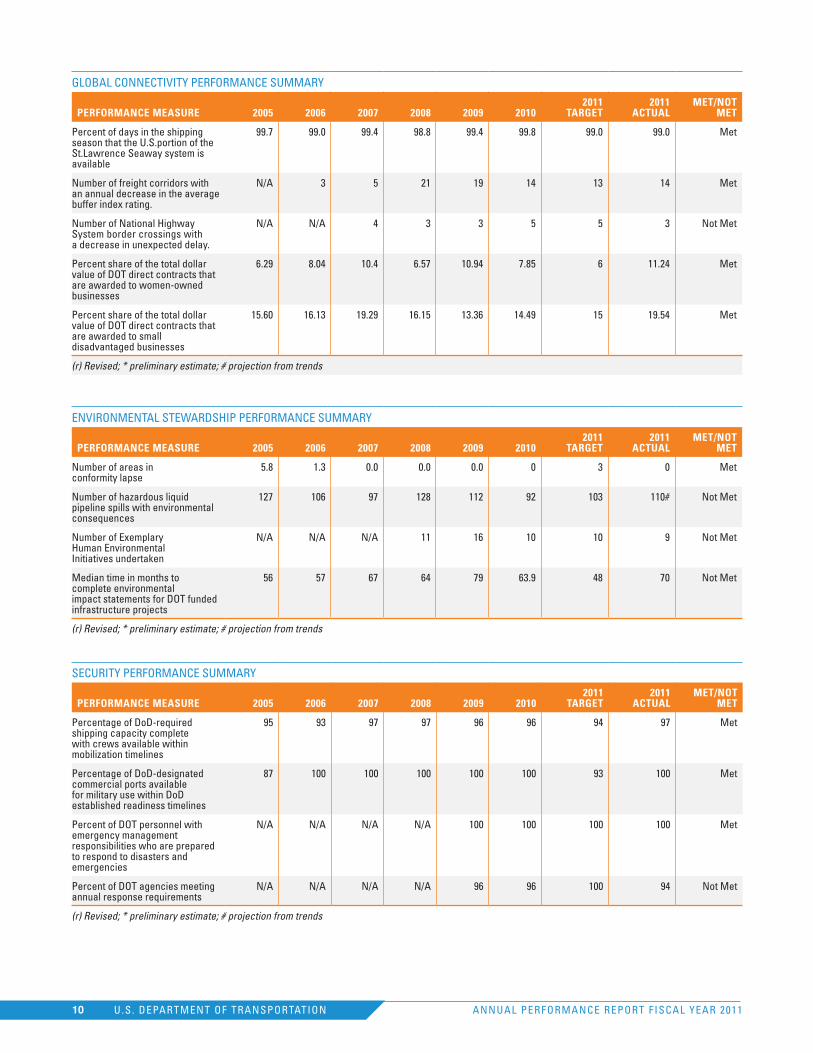
GLOBAL CONNECTIVITY PERFORMANCE SUMMARY
PeRFORMAnCe MeASuRe 2005 2006 2007 2008 2009 20102011
TARGeT2011
ACTuALMeT/nOT
MeT
Percent of days in the shipping season that the U.S.portion of the St.Lawrence Seaway system is available
99.7 99.0 99.4 98.8 99.4 99.8 99.0 99.0 Met
Number of freight corridors with an annual decrease in the average buffer index rating.
N/A 3 5 21 19 14 13 14 Met
Number of National Highway System border crossings with a decrease in unexpected delay.
N/A N/A 4 3 3 5 5 3 Not Met
Percent share of the total dollar value of DOT direct contracts that are awarded to women-owned businesses
6.29 8.04 10.4 6.57 10.94 7.85 6 11.24 Met
Percent share of the total dollar value of DOT direct contracts that are awarded to small disadvantaged businesses
15.60 16.13 19.29 16.15 13.36 14.49 15 19.54 Met
(r) Revised; * preliminary estimate; # projection from trends
ENVIRONMENTAL STEWARDSHIP PERFORMANCE SUMMARY
PeRFORMAnCe MeASuRe 2005 2006 2007 2008 2009 20102011
TARGeT2011
ACTuALMeT/nOT
MeT
Number of areas in conformity lapse
5.8 1.3 0.0 0.0 0.0 0 3 0 Met
Number of hazardous liquid pipeline spills with environmental consequences
127 106 97 128 112 92 103 110# Not Met
Number of Exemplary Human Environmental Initiatives undertaken
N/A N/A N/A 11 16 10 10 9 Not Met
Median time in months to complete environmental impact statements for DOT funded infrastructure projects
56 57 67 64 79 63.9 48 70 Not Met
(r) Revised; * preliminary estimate; # projection from trends
SECURITY PERFORMANCE SUMMARY
PeRFORMAnCe MeASuRe 2005 2006 2007 2008 2009 20102011
TARGeT2011
ACTuALMeT/nOT
MeT
Percentage of DoD-required shipping capacity complete with crews available within mobilization timelines
95 93 97 97 96 96 94 97 Met
Percentage of DoD-designated commercial ports available for military use within DoD established readiness timelines
87 100 100 100 100 100 93 100 Met
Percent of DOT personnel with emergency management responsibilities who are prepared to respond to disasters and emergencies
N/A N/A N/A N/A 100 100 100 100 Met
Percent of DOT agencies meeting annual response requirements
N/A N/A N/A N/A 96 96 100 94 Not Met
(r) Revised; * preliminary estimate; # projection from trends
ANNUAL PERFORMANCE REPORT FISCAL YEAR 2011U.S. DEPARTMENT OF TRANSPORTATION11
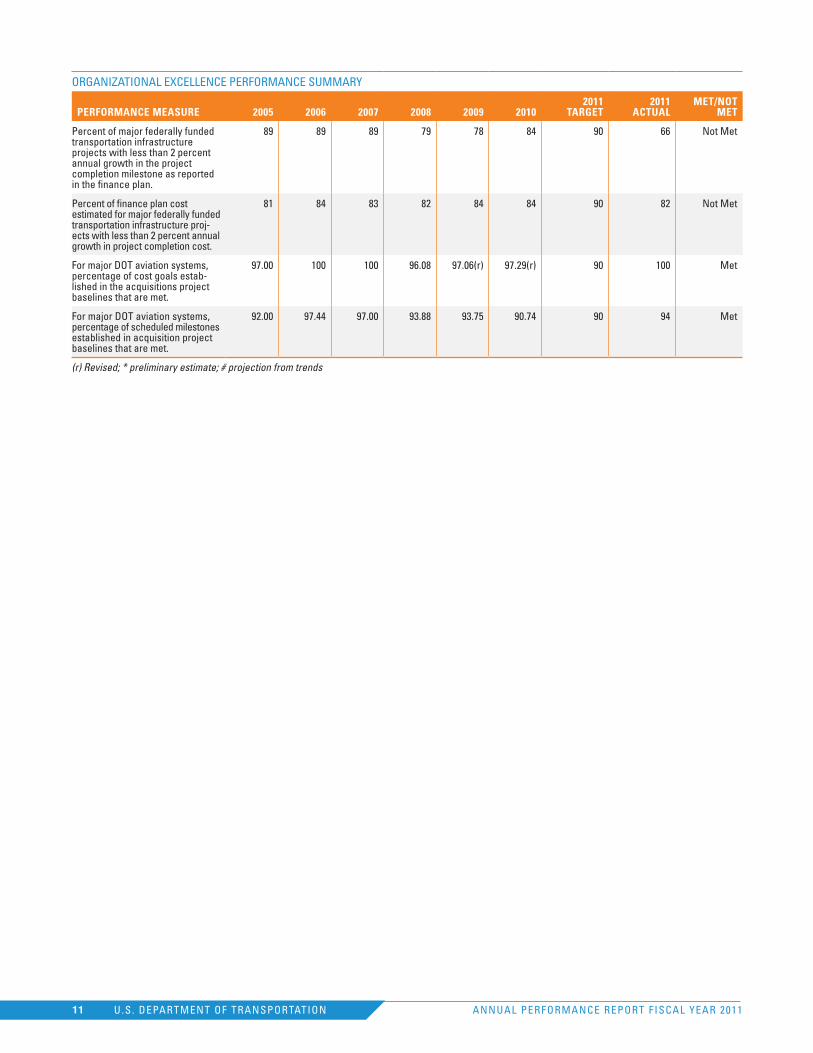
ORGANIZATIONAL EXCELLENCE PERFORMANCE SUMMARY
PeRFORMAnCe MeASuRe 2005 2006 2007 2008 2009 20102011
TARGeT2011
ACTuALMeT/nOT
MeT
Percent of major federally funded transportation infrastructure projects with less than 2 percent annual growth in the project completion milestone as reported in the finance plan.
89 89 89 79 78 84 90 66 Not Met
Percent of finance plan cost estimated for major federally funded transportation infrastructure proj-ects with less than 2 percent annual growth in project completion cost.
81 84 83 82 84 84 90 82 Not Met
For major DOT aviation systems, percentage of cost goals estab-lished in the acquisitions project baselines that are met.
97.00 100 100 96.08 97.06(r) 97.29(r) 90 100 Met
For major DOT aviation systems, percentage of scheduled milestones established in acquisition project baselines that are met.
92.00 97.44 97.00 93.88 93.75 90.74 90 94 Met
(r) Revised; * preliminary estimate; # projection from trends
mANAgemeNT’S dIScUSSIoN ANd ANALYSIS
SAfeTY
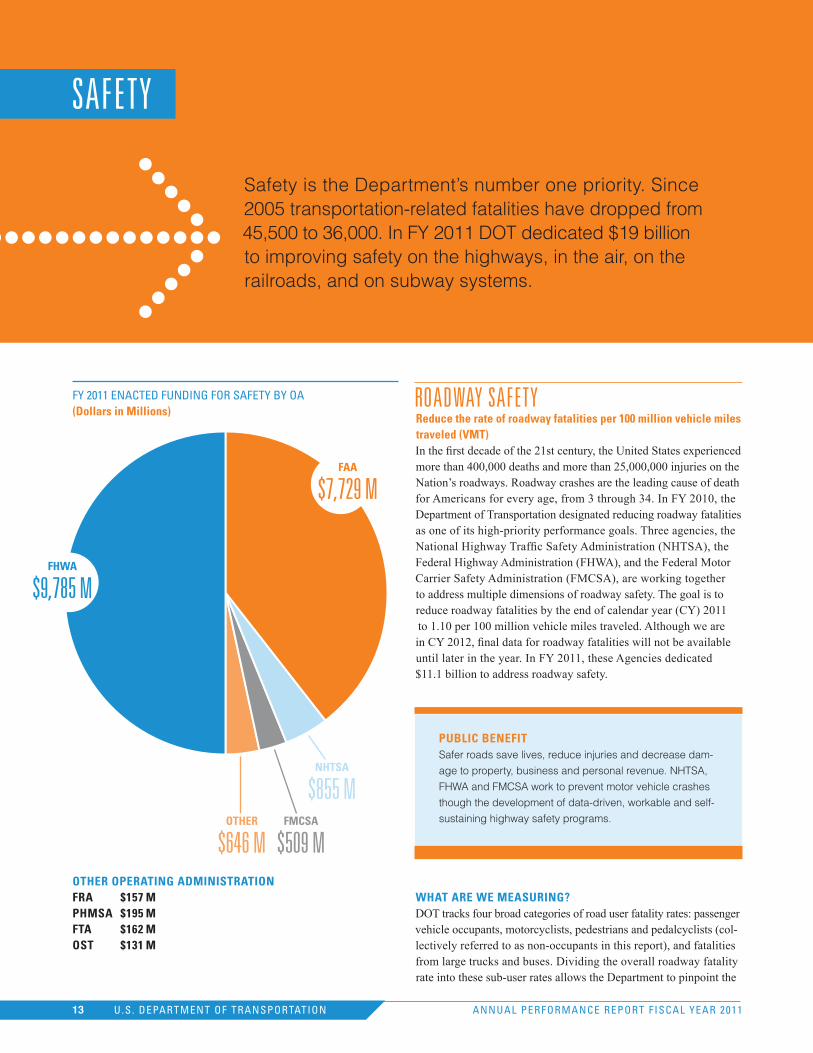
roAdwAY SAfeTYReduce the rate of roadway fatalities per 100 million vehicle miles traveled (vMT)In the first decade of the 21st century, the United States experienced more than 400,000 deaths and more than 25,000,000 injuries on the Nation’s roadways. Roadway crashes are the leading cause of death for Americans for every age, from 3 through 34. In FY 2010, the Department of Transportation designated reducing roadway fatalities as one of its high-priority performance goals. Three agencies, the National Highway Traffic Safety Administration (NHTSA), the Federal Highway Administration (FHWA), and the Federal Motor Carrier Safety Administration (FMCSA), are working together to address multiple dimensions of roadway safety. The goal is to reduce roadway fatalities by the end of calendar year (CY) 2011 to 1.10 per 100 million vehicle miles traveled. Although we are in CY 2012, final data for roadway fatalities will not be available until later in the year. In FY 2011, these Agencies dedicated $11.1 billion to address roadway safety.
PubLIC beneFITSafer roads save lives, reduce injuries and decrease dam-
age to property, business and personal revenue. NHTSA,
FHWA and FMCSA work to prevent motor vehicle crashes
though the development of data-driven, workable and self-
sustaining highway safety programs.
WHAT ARe We MeASuRInG?DOT tracks four broad categories of road user fatality rates: passenger vehicle occupants, motorcyclists, pedestrians and pedalcyclists (col-lectively referred to as non-occupants in this report), and fatalities from large trucks and buses. Dividing the overall roadway fatality rate into these sub-user rates allows the Department to pinpoint the
SAfeTY
Safety is the Department’s number one priority. Since 2005 transportation-related fatalities have dropped from 45,500 to 36,000. In FY 2011 DOT dedicated $19 billion to improving safety on the highways, in the air, on the railroads, and on subway systems.
FY 2011 ENACTED FUNDING FOR SAFETY BY OA(dollars in Millions)
OTHeR OPeRATInG AdMInISTRATIOnFRA $157 M PHMSA $195 MFTA $162 MOST $131 M
nHTSA
$855 m
FAA
$7,729 m
FHWA
$9,785 m
OTHeR
$646 mFMCSA
$509 m
13 U.S. DEPARTMENT OF TRANSPORTATION13 ANNUAL PERFORMANCE REPORT FISCAL YEAR 2011
challenges associated with each area and develop targeted solutions to reduce roadway fatalities.
deSCRIPTIOn OF ReSuLTSSince reaching a near-term high in 2005, there has been an un-precedented decline in roadway fatalities. In 2010, the latest year for which complete data is available, roadway fatalities reached the lowest level since 1949. The latest data show that the number of people who died on the Nation’s roads fell from 33,883 in 2009 to 32,885 in 2010. This translates to a 2.9-percent decrease in fatalities from 2009 to 2010, even though the number of vehicle miles traveled (VMT) in 2010 is estimated to have increased by 1.6-percent from 2009 VMT.
The following four performance measures are components of the Department’s overarching high-priority roadway fatality rate performance goal:
meASUre #1Rate of passenger vehicle occupant fatalities per 100 million passenger vehicle miles traveled2011 ReSuLTS: TARGeT POTenTIALLy MeTTarget: 0.85 passenger vehicle occupant fatalities per 100 million passenger vehicle VMT Actual: Projected Range: 0.89–0.83 passenger vehicle occupant fatalities per 100 million passenger vehicle VMT
1.1: PASSENGER VEHICLE OCCUPANT HIGHWAY FATALITY RATE PER 100 MILLION PASSENGER VEHICLE MILES TRAVELED
1.2
1.0
0.8
0.62006 2007 2008 2009 2010 2011 2012
ACTuAL
TARGeT
FISCAL yeAR
deSCRIPTIOn OF ReSuLTSPassenger vehicle occupant fatalities are projected to decline in 2011.
States significantly increased their spending of the $1.6 billion Highway Safety Improvement program funds available in 2011. Highway safety obligations rose from 72 % in 2010 to 76% in 2011. This increase in safety spending translates into many additional safety infrastructure projects, like safety edges, roundabouts, and road safety audits, that will support continued reductions in high-way fatalities and serious injuries nationwide.
NHTSA continued to vigorously promote the successful “Click It or Ticket” high visibility enforcement (HVE) campaign in 2011. Largely as a result of these efforts, which involved more than 10,000 police agencies nationwide, National seat belt use stands at 84 percent. Distracted driving also continues to be a major focus and a priority of Secretary LaHood.
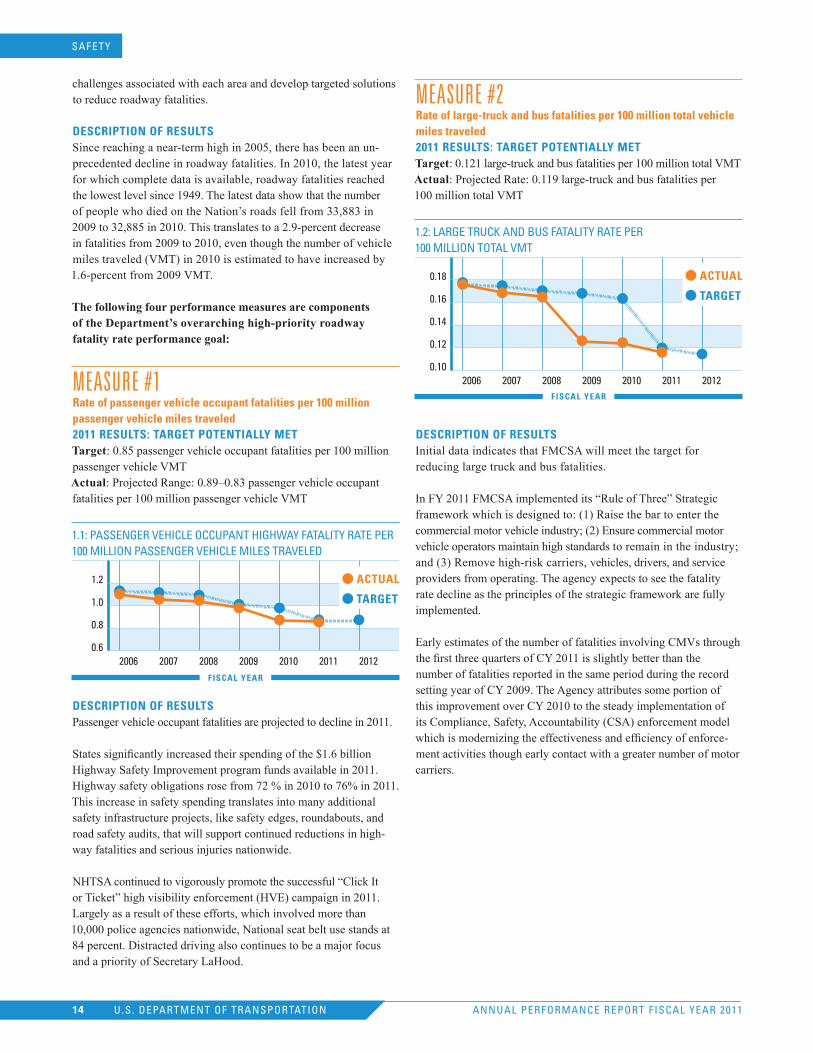
meASUre #2Rate of large-truck and bus fatalities per 100 million total vehicle miles traveled2011 ReSuLTS: TARGeT POTenTIALLy MeTTarget: 0.121 large-truck and bus fatalities per 100 million total VMT Actual: Projected Rate: 0.119 large-truck and bus fatalities per 100 million total VMT
1.2: LARGE TRUCk AND BUS FATALITY RATE PER 100 MILLION TOTAL VMT
0.18
0.16
0.14
0.12
0.102006 2007 2008 2009 2010 2011 2012
ACTuAL
TARGeT
FISCAL yeAR
deSCRIPTIOn OF ReSuLTSInitial data indicates that FMCSA will meet the target for reducing large truck and bus fatalities.
In FY 2011 FMCSA implemented its “Rule of Three” Strategic framework which is designed to: (1) Raise the bar to enter the commercial motor vehicle industry; (2) Ensure commercial motor vehicle operators maintain high standards to remain in the industry; and (3) Remove high-risk carriers, vehicles, drivers, and service providers from operating. The agency expects to see the fatality rate decline as the principles of the strategic framework are fully implemented.
Early estimates of the number of fatalities involving CMVs through the first three quarters of CY 2011 is slightly better than the number of fatalities reported in the same period during the record setting year of CY 2009. The Agency attributes some portion of this improvement over CY 2010 to the steady implementation of its Compliance, Safety, Accountability (CSA) enforcement model which is modernizing the effectiveness and efficiency of enforce-ment activities though early contact with a greater number of motor carriers.
ANNUAL PERFORMANCE REPORT FISCAL YEAR 2011U.S. DEPARTMENT OF TRANSPORTATION14
SAFETY
meASUre #3Rate of motorcyclist fatalities per 100,000 motorcycle registrations2011 ReSuLTS: TARGeT POTenTIALLy MeTTarget: 63 motorcyclist fatalities per 100,000 motorcycle registrations Actual: Projected Range: 56-58 motorcyclist fatalities per 100,000 motorcycle registrations
1.3: MOTORCYCLE FATALITY RATE PER 100,000 MOTORCYCLE REGISTRATIONS
90
80
70
60
502006 2007 2008 2009 2010 2011 2012
ACTuAL
TARGeT
FISCAL yeAR
deSCRIPTIOn OF ReSuLTSNHTSA prioritized the National Agenda for Motorcycle Safety to help stakeholders employ effective countermeasures to reduce motorcycle fatalities, and published a final rule that upgraded the
“DOT” certification labeling requirements to make it more difficult to mislabel novelty motorcycle helmets. The agency developed the “Model National Standards for Entry-Level Motorcycle Rider Training,” and also focused on strengthening enforcement efforts. NHTSA estimates that helmets saved the lives of 1,483 motorcyclists in 2009. An additional 732 lives could have been saved if all riders had worn helmets during the year. Only 20 States, the District of Columbia and Puerto Rico require helmet use by all motorcyclists. Research shows that motorcycle helmet use rates drop significantly after a State repeals mandatory helmet law while fatalities rise. Currently there is pending legislation in nine States to repeal the mandatory helmet use law for all motorcyclists.
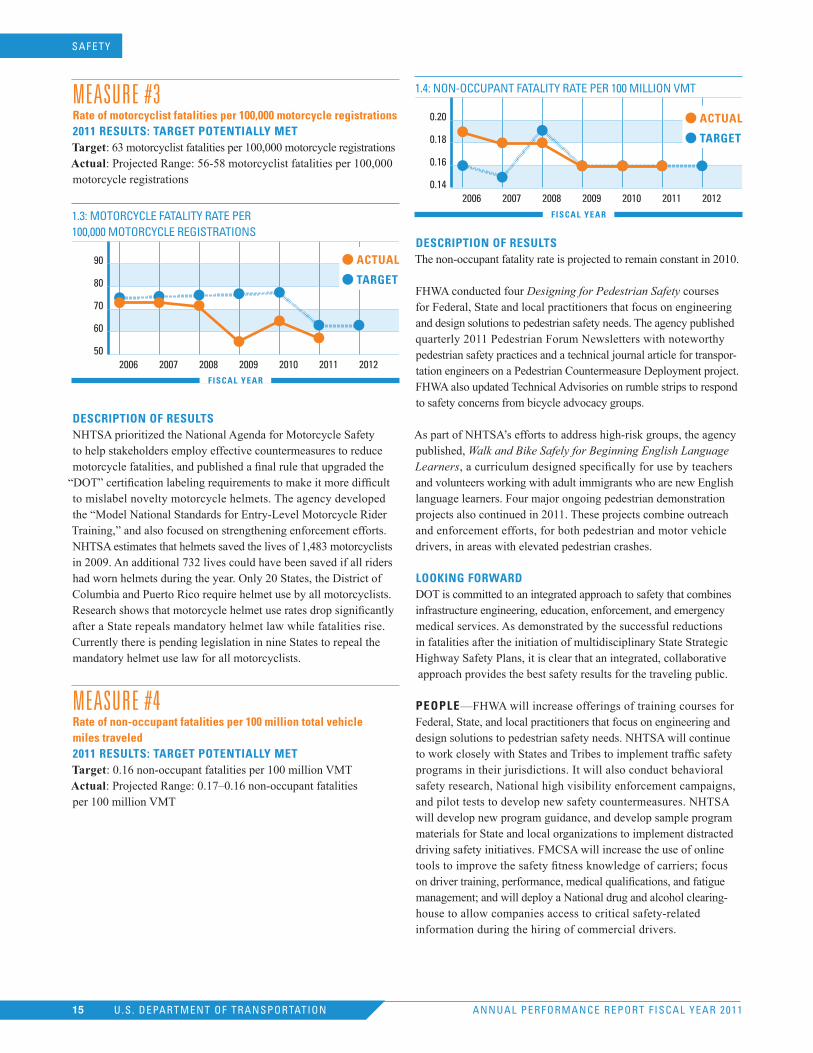
meASUre #4Rate of non-occupant fatalities per 100 million total vehicle miles traveled2011 ReSuLTS: TARGeT POTenTIALLy MeTTarget: 0.16 non-occupant fatalities per 100 million VMT Actual: Projected Range: 0.17–0.16 non-occupant fatalities per 100 million VMT
1.4: NON-OCCUPANT FATALITY RATE PER 100 MILLION VMT
0.20
0.18
0.16
0.142006 2007 2008 2009 2010 2011 2012
ACTuAL
TARGeT
FISCAL yeAR
deSCRIPTIOn OF ReSuLTSThe non-occupant fatality rate is projected to remain constant in 2010.
FHWA conducted four Designing for Pedestrian Safety courses for Federal, State and local practitioners that focus on engineering and design solutions to pedestrian safety needs. The agency published quarterly 2011 Pedestrian Forum Newsletters with noteworthy pedestrian safety practices and a technical journal article for transpor-tation engineers on a Pedestrian Countermeasure Deployment project. FHWA also updated Technical Advisories on rumble strips to respond to safety concerns from bicycle advocacy groups.
As part of NHTSA’s efforts to address high-risk groups, the agency published, Walk and Bike Safely for Beginning English Language Learners, a curriculum designed specifically for use by teachers and volunteers working with adult immigrants who are new English language learners. Four major ongoing pedestrian demonstration projects also continued in 2011. These projects combine outreach and enforcement efforts, for both pedestrian and motor vehicle drivers, in areas with elevated pedestrian crashes.
LOOkInG FORWARdDOT is committed to an integrated approach to safety that combines infrastructure engineering, education, enforcement, and emergency medical services. As demonstrated by the successful reductions in fatalities after the initiation of multidisciplinary State Strategic Highway Safety Plans, it is clear that an integrated, collaborative approach provides the best safety results for the traveling public.
PeOPLe—FHWA will increase offerings of training courses for Federal, State, and local practitioners that focus on engineering and design solutions to pedestrian safety needs. NHTSA will continue to work closely with States and Tribes to implement traffic safety programs in their jurisdictions. It will also conduct behavioral safety research, National high visibility enforcement campaigns, and pilot tests to develop new safety countermeasures. NHTSA will develop new program guidance, and develop sample program materials for State and local organizations to implement distracted driving safety initiatives. FMCSA will increase the use of online tools to improve the safety fitness knowledge of carriers; focus on driver training, performance, medical qualifications, and fatigue management; and will deploy a National drug and alcohol clearing-house to allow companies access to critical safety-related information during the hiring of commercial drivers.
ANNUAL PERFORMANCE REPORT FISCAL YEAR 2011U.S. DEPARTMENT OF TRANSPORTATION15
SAFETY
InFRASTRuCTuRe—FHWA will pursue a broad range of activities that will translate into safer roadways, including:
Working with States to expand data collection, analysis, and evaluation to focus on improvements that address the highest risks and provide the greatest safety benefits;
Engaging the full suite of resources—peer exchanges, safety summits, technical assistance, training courses and workshops
—to advance deployment of the most effective tools and countermeasures; and,
Using research technologies, physical improvements, safety anal-ysis tools, data collection and management, and best practices.
veHICLeS—NHTSA is at the forefront of efforts to advance vehicle safety in the U.S. Ongoing research of new technologies in FY 2012 may offer great potential for enhancing vehicle safety, such as vehicle-to-vehicle (V2V) and vehicle-to-infrastructure (V2I) communications. But since technology can also contribute to driver distraction, NHTSA will continue to implement a multi-year comprehensive research plan to address this growing challenge in FY 2012. This includes a survey of electronic device use by drivers. FMCSA will partner with other DOT agencies on safety standards for large trucks and buses. It also intends to implement new large-truck and bus-related safety measures under its “Rule of Three” strategic framework.
eXTeRnAL FACTORSThe combined effects of fluctuating gas prices, the economic downturn, and the change in both the mix of vehicles (towards increased use of smaller cars and motorcycles) and the means of transportation (towards walking and bicycling, as well as mass transit) indicate fundamental changes in the Nation’s transportation system. Though improvements can be made to affect the number and rate of roadway fatalities, these statistics are also affected by the number of people using occupant and personal protection (e.g., seat belts, child safety seats, motorcycle helmets, air bags, etc.), the number of impaired drivers on the road, the number of drivers who are speeding, and the number of drivers who are distracted. These numbers are impacted by laws passed by States, which DOT can influence but not control.
PARTneRSDOT works closely with partners at the Federal, State, Tribal, and local levels to address every facet of transportation safety. The Department provides guidance and technical assistance to States, Tribal Nations, local governments, and Metropolitan Planning Organizations to help them develop and implement comprehensive safety programs and improve roadway safety. DOT also develops effective countermeasures and enforcement programs to promote safe driving behaviors for passenger and commercial vehicle drivers. Safety partner groups play an important role in disseminating and implementing training and educational efforts. DOT also works with partners in the private sector on the devel-opment of safer vehicles and roads, and on improved business practices for commercial operators.
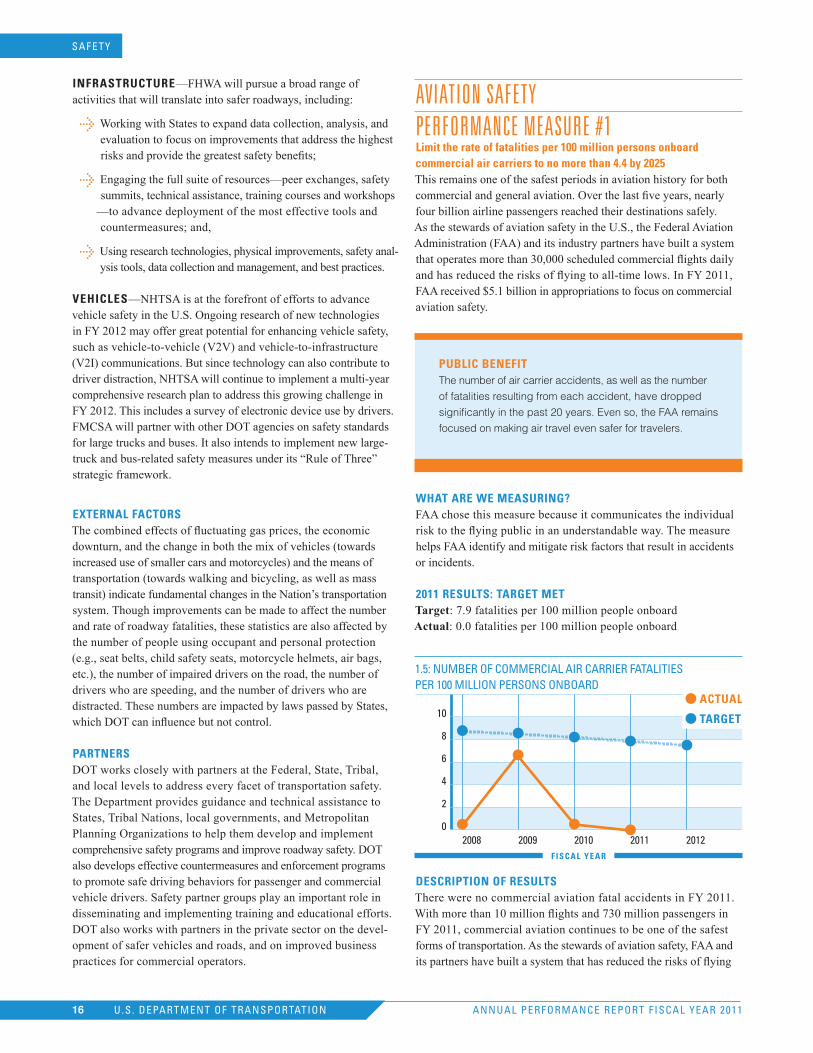
AvIATIoN SAfeTYPerformANce meASUre #1Limit the rate of fatalities per 100 million persons onboard commercial air carriers to no more than 4.4 by 2025This remains one of the safest periods in aviation history for both commercial and general aviation. Over the last five years, nearly four billion airline passengers reached their destinations safely. As the stewards of aviation safety in the U.S., the Federal Aviation Administration (FAA) and its industry partners have built a system that operates more than 30,000 scheduled commercial flights daily and has reduced the risks of flying to all-time lows. In FY 2011, FAA received $5.1 billion in appropriations to focus on commercial aviation safety.
PubLIC beneFITThe number of air carrier accidents, as well as the number
of fatalities resulting from each accident, have dropped
significantly in the past 20 years. Even so, the FAA remains
focused on making air travel even safer for travelers.
WHAT ARe We MeASuRInG?FAA chose this measure because it communicates the individual risk to the flying public in an understandable way. The measure helps FAA identify and mitigate risk factors that result in accidents or incidents.
2011 ReSuLTS: TARGeT MeTTarget: 7.9 fatalities per 100 million people onboard Actual: 0.0 fatalities per 100 million people onboard
1.5: NUMBER OF COMMERCIAL AIR CARRIER FATALITIES PER 100 MILLION PERSONS ONBOARD
10
8
6
4
2
02008 2009 2010 2011 2012
ACTuAL
TARGeT
FISCAL yeAR
deSCRIPTIOn OF ReSuLTSThere were no commercial aviation fatal accidents in FY 2011. With more than 10 million flights and 730 million passengers in FY 2011, commercial aviation continues to be one of the safest forms of transportation. As the stewards of aviation safety, FAA and its partners have built a system that has reduced the risks of flying
ANNUAL PERFORMANCE REPORT FISCAL YEAR 2011U.S. DEPARTMENT OF TRANSPORTATION16
SAFETY
to all-time lows. Commercial aviation includes both scheduled and nonscheduled flights of U.S. passenger and cargo air carriers and scheduled passenger flights of regional operators. Accidents involving passengers, crew, ground personnel, and the public are all included in this fatality rate.
Certain initiatives helped the FAA focus on recently identified risks and maintain a higher level of safety throughout the National Airspace System (NAS). Achievements in these areas include:
Continued implementation of Performance-Based Navigation (PBN) routes and procedures. FAA continues to develop stan-dards, criteria, and policies for flight technologies and proce-dures supporting safe flight using advanced navigation systems.
Development of draft Helicopter Localizer Performance with Vertical Navigation (LPV) instrument standards for helicopters. LPV are high-precision GPS aviation instrument-approach procedures. These Helicopter LPV standards will serve as the instrument-approach basis for the helicopter infrastructure and will help reduce emergency medical service accidents. The helicopter infrastructure was developed as a result of the NTSB recommendation for the FAA to develop a low-altitude airspace infrastructure that can accommodate safe helicopter emergency medical services operations.
Publication of the Initial Navigation Procedures Project Implementation Plan in June 2011. The project will implement recommendations to streamline the development and delivery of all instrument flight procedures.
LOOkInG FORWARdFAA’s commercial safety record indicates that the Agency has suc-cessfully addressed the majority of known system risks contributing to accidents or incidents. As FAA develops and deploys NextGen systems, the increased degree of complexity will require improved analytical methods and tools for evaluating the safety risks of proposed changes. To manage these complex changes, FAA is es-tablishing a Safety Management System (SMS) while working with stakeholders to establish their own SMSs to identify potential risk areas. With the interoperable SMS in place, FAA and the aviation industry can work together to identify and manage systemic risks using a three-pronged strategy: (1) Continue to react to incidents and accidents; (2) Increase the ability to proactively respond to warnings and precursors; and (3) Develop systematic method-ologies to anticipate hazards.
Additionally, FAA has undertaken several prominent rulemaking projects in areas including:
Pilot flight and duty limitations as well as rest requirements;
Crewmember and aircraft dispatcher training and qualification requirements;
Pilot mentoring as well as leadership and command training; and,
Air ambulance operations.
eXTeRnAL FACTORSApproximately 80 percent of fatal accidents are directly related to some form or combination of human factors. To address some of these risks, FAA will continue to work with aviation industry stakeholders to establish a Safety Management System in their own organizations to identify potential risk areas.
PARTneRSFAA’s partners in this area include the Bureau of Transportation Statistics, Congress, National Transportation Safety Board, manufac-turers, air carriers, unions, associations, International Civil Aviation Organization, Civil Airworthiness Authority.
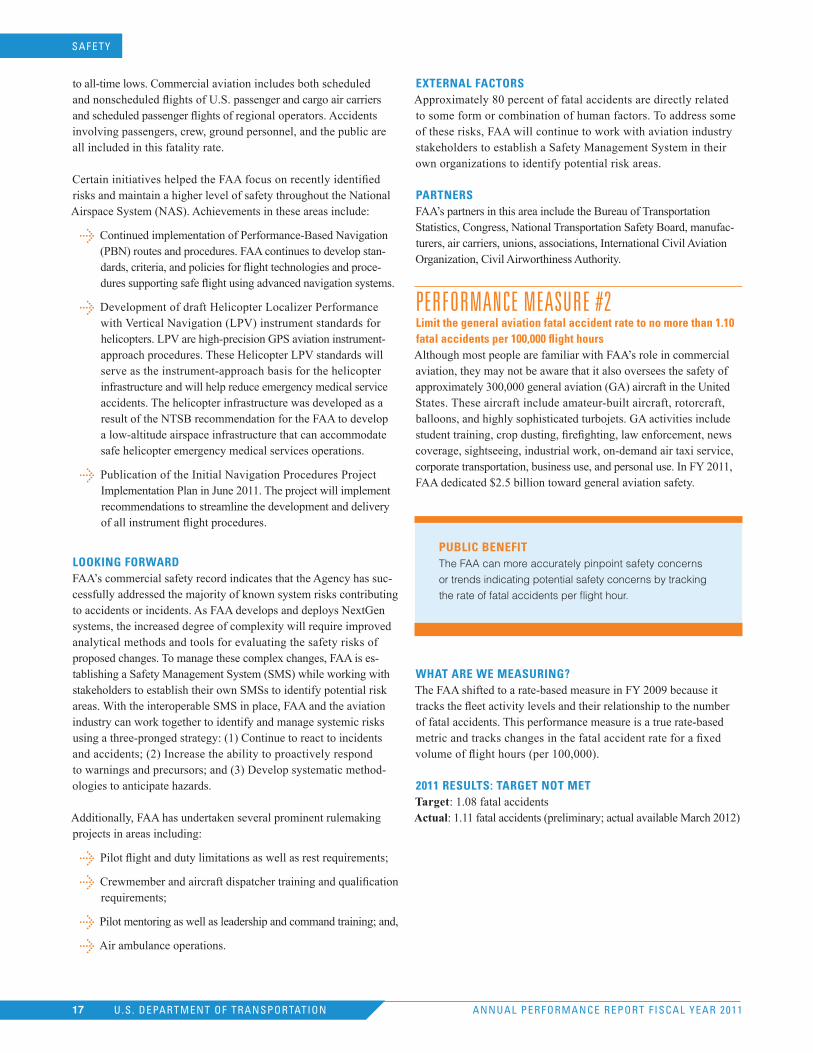
PerformANce meASUre #2Limit the general aviation fatal accident rate to no more than 1.10 fatal accidents per 100,000 flight hoursAlthough most people are familiar with FAA’s role in commercial aviation, they may not be aware that it also oversees the safety of approximately 300,000 general aviation (GA) aircraft in the United States. These aircraft include amateur-built aircraft, rotorcraft, balloons, and highly sophisticated turbojets. GA activities include student training, crop dusting, firefighting, law enforcement, news coverage, sightseeing, industrial work, on-demand air taxi service, corporate transportation, business use, and personal use. In FY 2011, FAA dedicated $2.5 billion toward general aviation safety.
PubLIC beneFITThe FAA can more accurately pinpoint safety concerns
or trends indicating potential safety concerns by tracking
the rate of fatal accidents per flight hour.
WHAT ARe We MeASuRInG?The FAA shifted to a rate-based measure in FY 2009 because it tracks the fleet activity levels and their relationship to the number of fatal accidents. This performance measure is a true rate-based metric and tracks changes in the fatal accident rate for a fixed volume of flight hours (per 100,000).
2011 ReSuLTS: TARGeT nOT MeTTarget: 1.08 fatal accidents Actual: 1.11 fatal accidents (preliminary; actual available March 2012)
ANNUAL PERFORMANCE REPORT FISCAL YEAR 2011U.S. DEPARTMENT OF TRANSPORTATION17
SAFETY
1.6: FATAL ACCIDENTS PER 100,000 FLIGHT HOURS IN GENERAL AVIATION
1
1
1
1
0
02009 2010 2011 2012
ACTuAL
TARGeT
FISCAL yeAR
deSCRIPTIOn OF ReSuLTSAlthough commercial aviation makes more headlines, general aviation is just as important to our aviation system. GA comprises a diverse range of aviation activities, from single-seat homebuilt aircraft, helicopters, balloons, single and multiple engine land and seaplanes to highly sophisticated extended range turbojets. More people perish from GA accidents each year than in U.S. commercial air carriers. Therefore, reducing the rate of fatal GA accidents is a top priority for FAA.
FAA did not meet the target this year for reducing the general avia-tion fatal accident rate per 100,000 flight hours. The year ended with a rate of 1.16 fatal accidents per 100,000 flight hours. Most of the fatalities occurred in the area of experimental aircraft, many caused by human factors. An experimental aircraft is predominately amateur-built, meaning that it has been fabricated and assembled by persons who undertook the construction project solely for their own education or recreation. These aircraft accounted for approximately 26 percent of GA fatal accidents in FY 2011 while contributing just 5 percent of GA hours.
LOOkInG FORWARdFAA’s Flight Standards organization is spearheading several aggressive initiatives to address the troubling GA accident trends. One initiative has refocused the Agency’s Safety Team on general aviation in broad terms. Another initiative addresses issues with amateur-built aircraft.
FAA is working with industry to help reduce the GA accident rate. In FY 2011, the Agency re-energized the General Aviation Joint Steering Committee to take a more focused, data-driven approach to understanding fatal accident causes and contributing factors. This is a government-industry group that manages efforts to reduce fatal general aviation accidents. The steering committee meets to re-view GA accident trends, establish areas for special emphasis, and share information. In addition, FAA updated training guidance and is working with various members of the GA community, including aero-medical evacuation, charter services, and others, to promote education and training on night landings, weather, and other areas of concern.
Other activities FAA will pursue include:
Continuing general aviation safety outreach and education through the FAA Safety Team (FAASTeam).
Examining the root causes of loss of control accidents through review of policy and guidance, training, and testing. Develop recommendations to address root causes.
Providing aero-medical safety training to at least 2,200 GA pilots. Aero-medical safety training is medical training that is designed to give crew members a working knowledge of the most vital survival techniques for varying terrain and weather conditions.
The FAA will provide recommendations for revisions to training and operating guidance for experimental amateur-built aircraft.
eXTeRnAL FACTORSApproximately 80 percent of GA fatal accidents are directly related to some form or combination of human factors. These human factor influences are occurring throughout this GA community from more highly regulated on-demand air taxi service in sophisticated aircraft to more loosely regulated recreational flying in homebuilt aircraft.
PARTneRSFAA’s partners in this effort include the National Transportation Safety Board and General Aviation Joint Steering Committee, Congress, manufacturers, training schools, associations, Civil Airworthiness Authority.
HIGH PRIORITy PeRFORMAnCe GOALReduce the risk of accidents during aircraft
departures and landings by reducing the number
of runway incursions
A runway incursion is any unauthorized intrusion onto a
runway, regardless of whether or not an aircraft presents
a potential conflict. This includes the incorrect presence
of an aircraft, vehicle, or person on the protected area of
a surface designated for the landing and takeoff of aircraft.
Such an event can create dangerous situations that can
lead to serious accidents that potentially involve fatalities,
injuries, and significant property damage.
FY 2011 Target: no more than 959
FY 2011 Actual: 953
In FY 2011, FAA met the target of reducing the number of
runway incursions to 959. The agency ended the year with
953 runway incursions.
SAFETY
ANNUAL PERFORMANCE REPORT FISCAL YEAR 2011U.S. DEPARTMENT OF TRANSPORTATION18
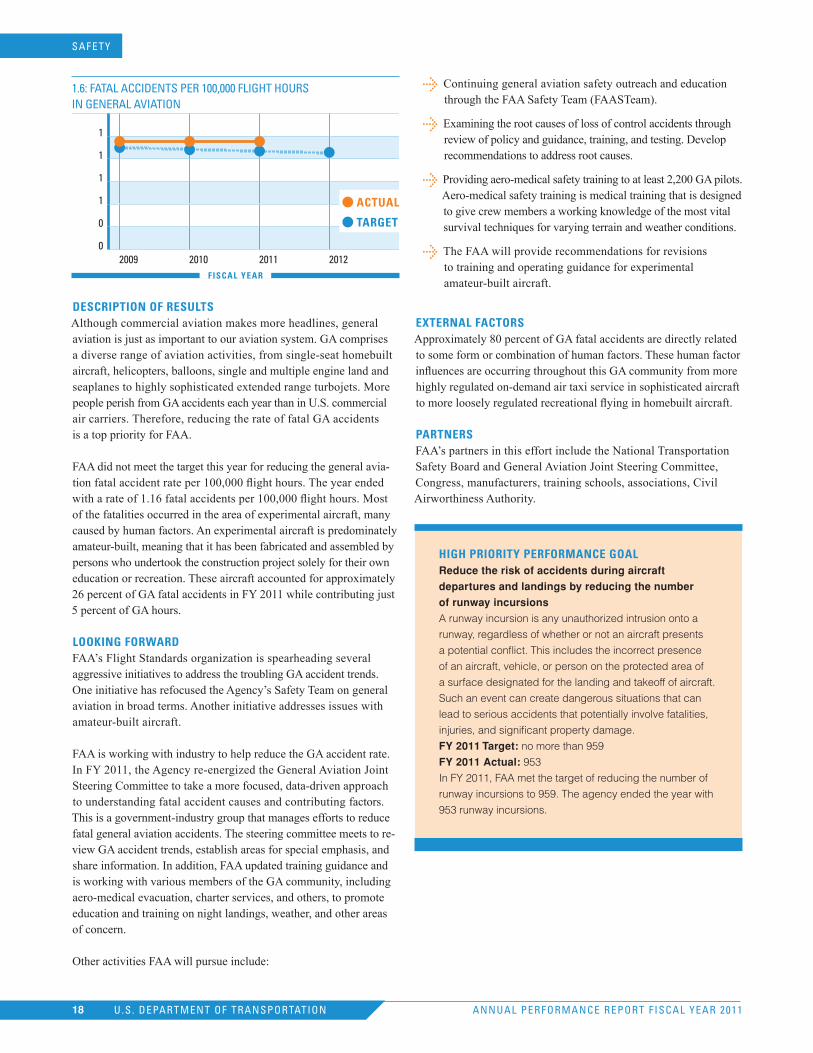
rAIL SAfeTYRail-related accident and incident rate per million train-milesIn the past 10 years, the Federal Railroad Administration (FRA) has successfully reduced the total number of rail-related accidents nationwide and the rate of accidents per million train-miles. From FY 2001 through FY 2011, total accidents declined by 32 percent, while the rate of total accidents per million train-miles has dropped by almost 30 percent. Significantly, these declines occurred while rail traffic rose more than 11 percent through FY 2007. In FY 2011, FRA’s budget included $157 million for rail safety.
PubLIC beneFITIncreased awareness of train safety at grade crossings
and through operator behavior results in fewer deaths and
injuries, fewer hazmat releases into the environment, and
lower hospital and insurance expenses.
WHAT ARe We MeASuRInG?This measure provides an overarching gauge of FRA’s six internal safety performance measures and reflects the vastness of America’s rail environment (e.g., train accidents, employee accidents/incidents, grade crossing incidents, trespasser incidents, etc.).
2011 ReSuLTS: TARGeT MeTTarget: 16.40 rail-related accidents and incidents per million train miles Actual: 15.17 rail-related accidents and incidents per million train miles
1.7: RAIL-RELATED ACCIDENTS AND INCIDENTS PER MILLION TRAIN MILES
20
18
16
14
122006 2007 2008 2009 2010 2011 2012
ACTuAL
TARGeT
FISCAL yeAR
deSCRIPTIOn OF ReSuLTSIn FY 2011, the rate of rail-related accidents and incidents was at its lowest level since FRA began collecting safety data in the 1970s. From 2001 to 2011, the number of reportable rail-related accidents and incidents declined from 16,699 to 11,417 (32 percent); train accidents fell from 3,093 to 1,914 (38 percent); grade crossing incidents decreased from 3,415 to 1,979 (42 percent); and the number of casualties dropped from 12,349 to 8,925 (28 percent). Preliminary data for FY 2011, along with analytical forecasting,
indicate that this downward trend will continue for the next several years. The accompanying chart shows the decline in the rate during the past five years.
LOOkInG FORWARdFRA will continue to strengthen its inspector force and implement new approaches to reduce further rail-related accident and incident rates. In the next two years, FRA will:
Develop and implement risk reduction programs on each Class I railroad, each railroad with an inadequate safety record, and each passenger railroad.
Expand the Confidential Close Call Reporting System from 12 pilot projects on four railroads to a nationwide program. This initiative enhances railroad safety cultures by building trust and relying on the program’s core operating principles—voluntary, confidential, non-punitive reporting and using the data to recommend corrective actions.
Integrate automated methods into the track inspection program, increasing efficiency and cost-effectiveness.
Issue a report to Congress on rail carriers’ progress implementing positive train control systems and hours of service pilot projects.
eXTeRnAL FACTORSTwo categories of incidents—both with strong behavior influences—accounted for almost 97 percent of FY 2011 rail-related deaths. Consequently, these incidents are difficult to address effectively. Many of the 216 people killed in grade-crossing incidents died because motor vehicle drivers illegally avoided protective devices at grade crossings. Additionally, 346 people died while trespassing on rail rights-of-way.
PARTneRSFRA’s partners in this effort include private rail operators; State and local governments; domestic and international associations and organizations as members of the Rail Safety Advisory Committee; Operation Lifesaver.
TrANSIT SAfeTYTransit fatalities per 100 million passenger-miles traveledTransit is one of the safest modes of travel per passenger-mile traveled. However, DOT believes it must take serious, cost-effective steps now to make it even safer and ensure that it remains safe as systems age and ridership grows. The DOT-proposed rail transit safety legislation would correct the current patchwork safety system of 27 State agencies with inconsistent rail safety standards, inadequate power, and insufficient staffing.
According to the National Safety Council, passengers on the Nation’s bus, rail, and commuter rail systems are 40 times less likely to be involved in a fatal accident than passengers in cars and trucks. The challenge is to further reduce the rate of fatalities and injuries even as the total number of people using transit increases. In FY 2011,
SAFETY
ANNUAL PERFORMANCE REPORT FISCAL YEAR 2011U.S. DEPARTMENT OF TRANSPORTATION19
the Federal Transit Administration (FTA) received $162 million to address transit safety.
PubLIC beneFITTaking advantage of transit leads to a cleaner environment,
reduced dependence on foreign oil, mobility and accessi-
bility for underserved populations and a positive contribu-
tion to reducing travel costs and travel time through less
congested roads.
WHAT ARe We MeASuRInG?This measure demonstrates the effectiveness of the FTA safety initiatives.
A fatality is reported for any death occurring within 30 days of a transit incident as a result of that incident. Although suicides are reported as transit incidents, they are not included in the data on transit fatalities. Fatalities may occur while traveling on transit or while boarding, alighting, or waiting for transit vehicles to arrive. An injury or fatality may also occur while not using transit, such as in the cases of being struck by a transit vehicle.
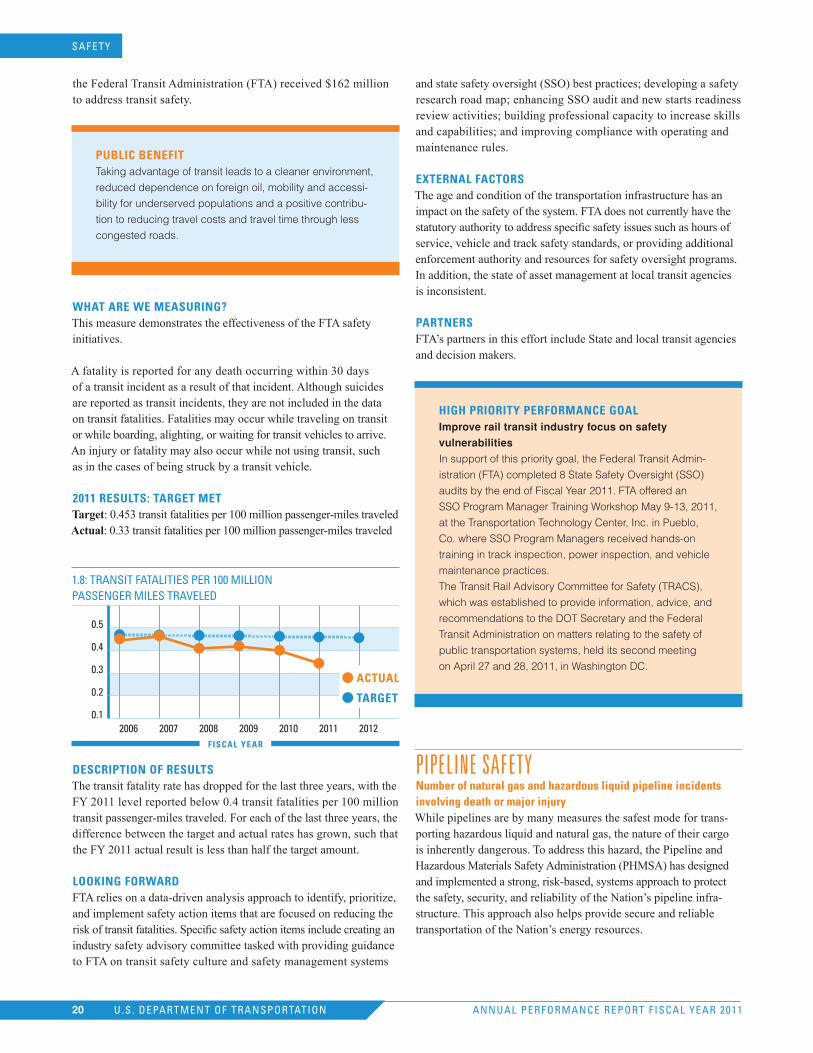
2011 ReSuLTS: TARGeT MeTTarget: 0.453 transit fatalities per 100 million passenger-miles traveled Actual: 0.33 transit fatalities per 100 million passenger-miles traveled
1.8: TRANSIT FATALITIES PER 100 MILLION PASSENGER MILES TRAVELED
0.5
0.4
0.3
0.2
0.12006 2007 2008 2009 2010 2011 2012
ACTuAL
TARGeT
FISCAL yeAR
deSCRIPTIOn OF ReSuLTSThe transit fatality rate has dropped for the last three years, with the FY 2011 level reported below 0.4 transit fatalities per 100 million transit passenger-miles traveled. For each of the last three years, the difference between the target and actual rates has grown, such that the FY 2011 actual result is less than half the target amount.
LOOkInG FORWARdFTA relies on a data-driven analysis approach to identify, prioritize, and implement safety action items that are focused on reducing the risk of transit fatalities. Specific safety action items include creating an industry safety advisory committee tasked with providing guidance to FTA on transit safety culture and safety management systems
and state safety oversight (SSO) best practices; developing a safety research road map; enhancing SSO audit and new starts readiness review activities; building professional capacity to increase skills and capabilities; and improving compliance with operating and maintenance rules.
eXTeRnAL FACTORSThe age and condition of the transportation infrastructure has an impact on the safety of the system. FTA does not currently have the statutory authority to address specific safety issues such as hours of service, vehicle and track safety standards, or providing additional enforcement authority and resources for safety oversight programs. In addition, the state of asset management at local transit agencies is inconsistent.
PARTneRSFTA’s partners in this effort include State and local transit agencies and decision makers.
HIGH PRIORITy PeRFORMAnCe GOALImprove rail transit industry focus on safety
vulnerabilities
In support of this priority goal, the Federal Transit Admin-
istration (FTA) completed 8 State Safety Oversight (SSO)
audits by the end of Fiscal Year 2011. FTA offered an
SSO Program Manager Training Workshop May 9-13, 2011,
at the Transportation Technology Center, Inc. in Pueblo,
Co. where SSO Program Managers received hands-on
training in track inspection, power inspection, and vehicle
maintenance practices.
The Transit Rail Advisory Committee for Safety (TRACS),
which was established to provide information, advice, and
recommendations to the DOT Secretary and the Federal
Transit Administration on matters relating to the safety of
public transportation systems, held its second meeting
on April 27 and 28, 2011, in Washington DC.
PIPeLINe SAfeTYnumber of natural gas and hazardous liquid pipeline incidents involving death or major injuryWhile pipelines are by many measures the safest mode for trans-porting hazardous liquid and natural gas, the nature of their cargo is inherently dangerous. To address this hazard, the Pipeline and Hazardous Materials Safety Administration (PHMSA) has designed and implemented a strong, risk-based, systems approach to protect the safety, security, and reliability of the Nation’s pipeline infra-structure. This approach also helps provide secure and reliable transportation of the Nation’s energy resources.
SAFETY
ANNUAL PERFORMANCE REPORT FISCAL YEAR 2011U.S. DEPARTMENT OF TRANSPORTATION20
PHMSA recognizes the importance of a strong continued focus on excavation or construction-related damage—the leading cause of serious pipeline incidents involving death or injury, especially in natural gas distribution systems where people work and live in closest proximity to pipelines. In FY 2011, PHMSA’s budget included $118 million to address pipeline safety.
PubLIC beneFITReducing pipeline incidents that lead to major injuries or
death directly impacts public and occupational safety
and contributes toward DOT’s strategic goal for safety.
WHAT ARe We MeASuRInG?Deaths and injuries reflect the most important safety outcomes in transportation, and the number of incidents with death or major injury reflects the risk of these outcomes.
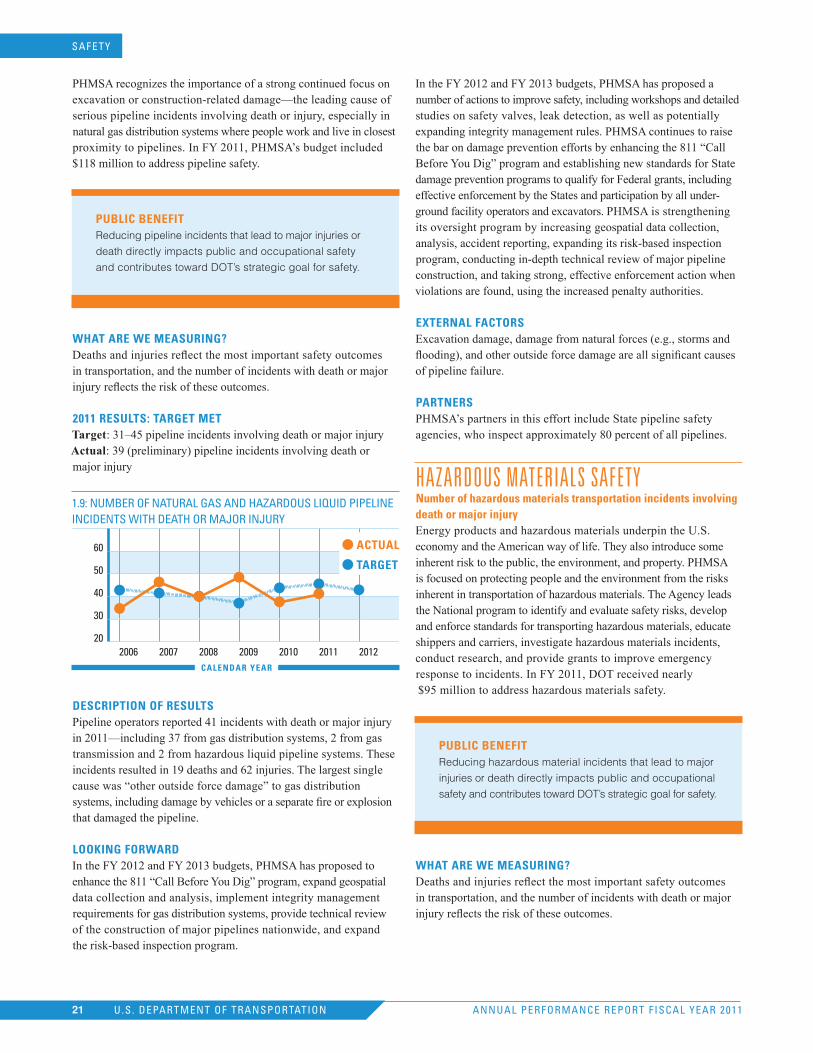
2011 ReSuLTS: TARGeT MeTTarget: 31–45 pipeline incidents involving death or major injury Actual: 39 (preliminary) pipeline incidents involving death or major injury
1.9: NUMBER OF NATURAL GAS AND HAZARDOUS LIqUID PIPELINE INCIDENTS WITH DEATH OR MAjOR INjURY
60
50
40
30
202006 2007 2008 2009 2010 2011 2012
ACTuAL
TARGeT
CALendAR yeAR
deSCRIPTIOn OF ReSuLTSPipeline operators reported 41 incidents with death or major injury in 2011—including 37 from gas distribution systems, 2 from gas transmission and 2 from hazardous liquid pipeline systems. These incidents resulted in 19 deaths and 62 injuries. The largest single cause was “other outside force damage” to gas distribution systems, including damage by vehicles or a separate fire or explosion that damaged the pipeline.
LOOkInG FORWARdIn the FY 2012 and FY 2013 budgets, PHMSA has proposed to enhance the 811 “Call Before You Dig” program, expand geospatial data collection and analysis, implement integrity management requirements for gas distribution systems, provide technical review of the construction of major pipelines nationwide, and expand the risk-based inspection program.
In the FY 2012 and FY 2013 budgets, PHMSA has proposed a number of actions to improve safety, including workshops and detailed studies on safety valves, leak detection, as well as potentially expanding integrity management rules. PHMSA continues to raise the bar on damage prevention efforts by enhancing the 811 “Call Before You Dig” program and establishing new standards for State damage prevention programs to qualify for Federal grants, including effective enforcement by the States and participation by all under-ground facility operators and excavators. PHMSA is strengthening its oversight program by increasing geospatial data collection, analysis, accident reporting, expanding its risk-based inspection program, conducting in-depth technical review of major pipeline construction, and taking strong, effective enforcement action when violations are found, using the increased penalty authorities.
eXTeRnAL FACTORSExcavation damage, damage from natural forces (e.g., storms and flooding), and other outside force damage are all significant causes of pipeline failure.
PARTneRSPHMSA’s partners in this effort include State pipeline safety agencies, who inspect approximately 80 percent of all pipelines.
hAzArdoUS mATerIALS SAfeTYnumber of hazardous materials transportation incidents involving death or major injuryEnergy products and hazardous materials underpin the U.S. economy and the American way of life. They also introduce some inherent risk to the public, the environment, and property. PHMSA is focused on protecting people and the environment from the risks inherent in transportation of hazardous materials. The Agency leads the National program to identify and evaluate safety risks, develop and enforce standards for transporting hazardous materials, educate shippers and carriers, investigate hazardous materials incidents, conduct research, and provide grants to improve emergency response to incidents. In FY 2011, DOT received nearly $95 million to address hazardous materials safety.
PubLIC beneFITReducing hazardous material incidents that lead to major
injuries or death directly impacts public and occupational
safety and contributes toward DOT’s strategic goal for safety.
WHAT ARe We MeASuRInG?Deaths and injuries reflect the most important safety outcomes in transportation, and the number of incidents with death or major injury reflects the risk of these outcomes.
SAFETY
ANNUAL PERFORMANCE REPORT FISCAL YEAR 2011U.S. DEPARTMENT OF TRANSPORTATION21
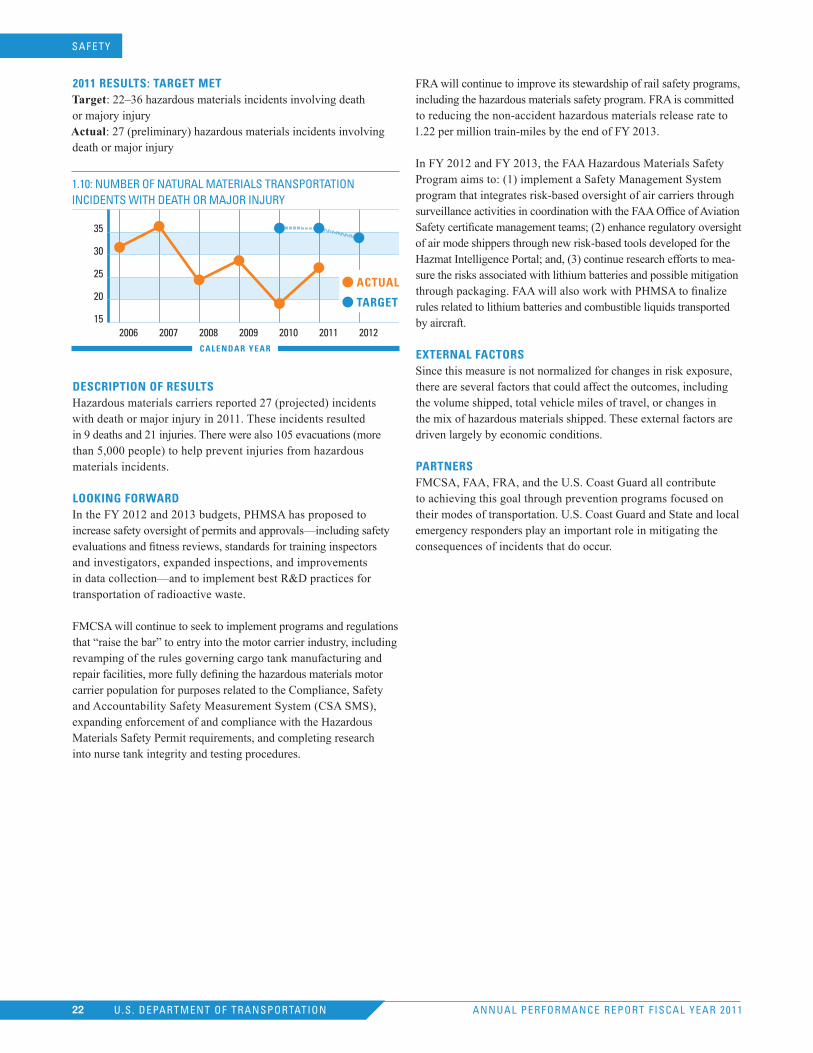
2011 ReSuLTS: TARGeT MeTTarget: 22–36 hazardous materials incidents involving death or majory injury Actual: 27 (preliminary) hazardous materials incidents involving death or major injury
1.10: NUMBER OF NATURAL MATERIALS TRANSPORTATION INCIDENTS WITH DEATH OR MAjOR INjURY
35
30
25
20
152006 2007 2008 2009 2010 2011 2012
ACTuAL
TARGeT
CALendAR yeAR
deSCRIPTIOn OF ReSuLTSHazardous materials carriers reported 27 (projected) incidents with death or major injury in 2011. These incidents resulted in 9 deaths and 21 injuries. There were also 105 evacuations (more than 5,000 people) to help prevent injuries from hazardous materials incidents.
LOOkInG FORWARdIn the FY 2012 and 2013 budgets, PHMSA has proposed to increase safety oversight of permits and approvals—including safety evaluations and fitness reviews, standards for training inspectors and investigators, expanded inspections, and improvements in data collection—and to implement best R&D practices for transportation of radioactive waste.
FMCSA will continue to seek to implement programs and regulations that “raise the bar” to entry into the motor carrier industry, including revamping of the rules governing cargo tank manufacturing and repair facilities, more fully defining the hazardous materials motor carrier population for purposes related to the Compliance, Safety and Accountability Safety Measurement System (CSA SMS), expanding enforcement of and compliance with the Hazardous Materials Safety Permit requirements, and completing research into nurse tank integrity and testing procedures.
FRA will continue to improve its stewardship of rail safety programs, including the hazardous materials safety program. FRA is committed to reducing the non-accident hazardous materials release rate to 1.22 per million train-miles by the end of FY 2013.
In FY 2012 and FY 2013, the FAA Hazardous Materials Safety Program aims to: (1) implement a Safety Management System program that integrates risk-based oversight of air carriers through surveillance activities in coordination with the FAA Office of Aviation Safety certificate management teams; (2) enhance regulatory oversight of air mode shippers through new risk-based tools developed for the Hazmat Intelligence Portal; and, (3) continue research efforts to mea-sure the risks associated with lithium batteries and possible mitigation through packaging. FAA will also work with PHMSA to finalize rules related to lithium batteries and combustible liquids transported by aircraft.
eXTeRnAL FACTORSSince this measure is not normalized for changes in risk exposure, there are several factors that could affect the outcomes, including the volume shipped, total vehicle miles of travel, or changes in the mix of hazardous materials shipped. These external factors are driven largely by economic conditions.
PARTneRSFMCSA, FAA, FRA, and the U.S. Coast Guard all contribute to achieving this goal through prevention programs focused on their modes of transportation. U.S. Coast Guard and State and local emergency responders play an important role in mitigating the consequences of incidents that do occur.
SAFETY
ANNUAL PERFORMANCE REPORT FISCAL YEAR 2011U.S. DEPARTMENT OF TRANSPORTATION22
mANAgemeNT’S dIScUSSIoN ANd ANALYSIS
redUced coNgeSTIoN
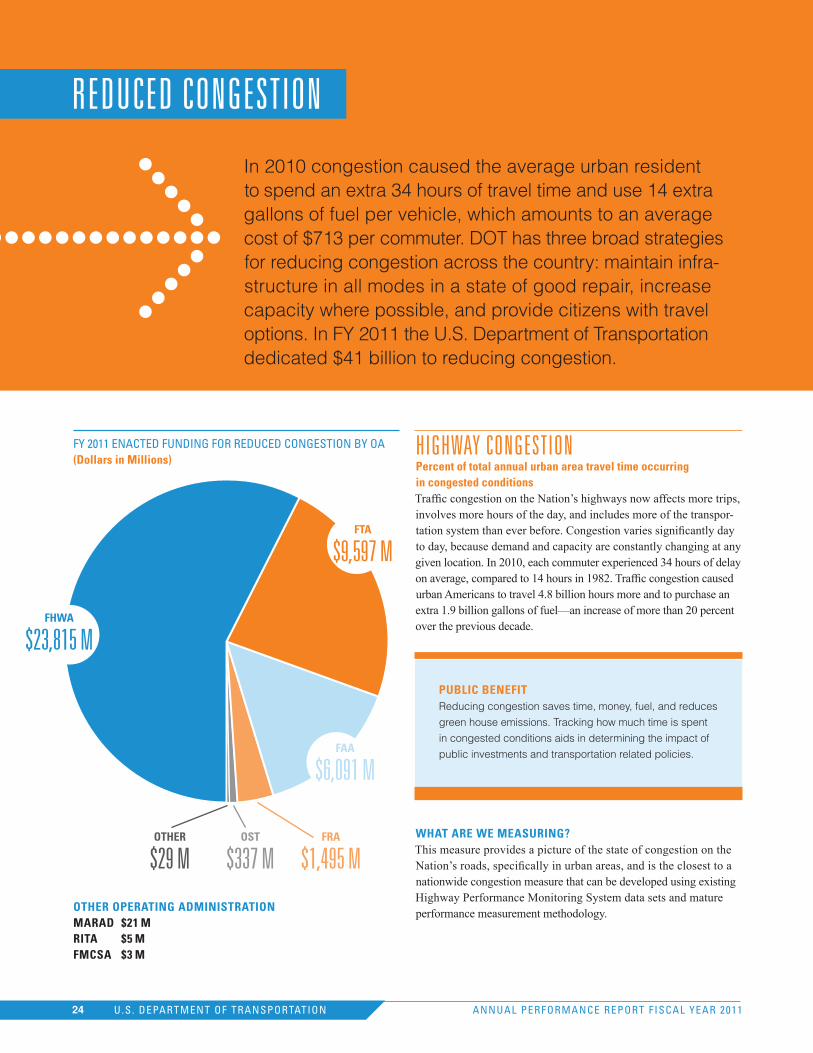
In 2010 congestion caused the average urban resident to spend an extra 34 hours of travel time and use 14 extra gallons of fuel per vehicle, which amounts to an average cost of $713 per commuter. DOT has three broad strategies for reducing congestion across the country: maintain infra-structure in all modes in a state of good repair, increase capacity where possible, and provide citizens with travel options. In FY 2011 the U.S. Department of Transportation dedicated $41 billion to reducing congestion.
redUced coNgeSTIoN
hIghwAY coNgeSTIoNPercent of total annual urban area travel time occurring in congested conditionsTraffic congestion on the Nation’s highways now affects more trips, involves more hours of the day, and includes more of the transpor-tation system than ever before. Congestion varies significantly day to day, because demand and capacity are constantly changing at any given location. In 2010, each commuter experienced 34 hours of delay on average, compared to 14 hours in 1982. Traffic congestion caused urban Americans to travel 4.8 billion hours more and to purchase an extra 1.9 billion gallons of fuel—an increase of more than 20 percent over the previous decade.
PubLIC beneFITReducing congestion saves time, money, fuel, and reduces
green house emissions. Tracking how much time is spent
in congested conditions aids in determining the impact of
public investments and transportation related policies.
WHAT ARe We MeASuRInG?This measure provides a picture of the state of congestion on the Nation’s roads, specifically in urban areas, and is the closest to a nationwide congestion measure that can be developed using existing Highway Performance Monitoring System data sets and mature performance measurement methodology.
FY 2011 ENACTED FUNDING FOR REDUCED CONGESTION BY OA(dollars in Millions)
OTHeR OPeRATInG AdMInISTRATIOnMARAd $21 M RITA $5 MFMCSA $3 M
FHWA
$23,815 m
FTA
$9,597 m
FAA
$6,091 m
FRA
$1,495 mOST
$337 mOTHeR
$29 m
24 U.S. DEPARTMENT OF TRANSPORTATION24 ANNUAL PERFORMANCE REPORT FISCAL YEAR 2011

REDUCED CONGESTION
ANNUAL PERFORMANCE REPORT FISCAL YEAR 2011U.S. DEPARTMENT OF TRANSPORTATION25
2011 ReSuLTS: TARGeT MeTTarget: 27.% of total annual urban area travel occuring in congested conditions. Actual: 26.3% of total annual urban area travel occuring in congested conditions.
2.1: PERCENTAGE OF TOTAL ANNUAL URBAN AREA TRAVEL OCCURING IN CONGESTED CONDITIONS
40
35
30
25
20
152006 2007 2008 2009 2010 2011
FISCAL yeAR
ACTuAL
TARGeT
deSCRIPTIOn OF ReSuLTSTraffic congestion nationwide increased to 26.3 percent (projected) in FY 2011, a slight increase from 26.2 percent in 2010. Traffic congestion is expected to increase slightly in FY 2012, but will likely increase at a slower rate than previously forecast since travel has slowed following the economic downturn that started in 2008. The Federal Highway Administration (FHWA) expects to see an increase in travel nationwide with an improvement in the economy. This trend may create a further increase in traffic congestion levels nationwide.
LOOkInG FORWARdFHWA and its partner agencies will continue to focus on operating the highway transportation system more efficiently through strategies such as pricing travel demand management, adding capacity in critical locations, and providing more options to travelers in order to minimize congestion increases.
The following activities will positively affect future performance:
Implementing traffic incident management, traffic signal management, work zone management, and congestion pricing in the 40 largest metropolitan areas;
Adopting construction options that mitigate or eliminate bottleneck traffic congestion and using comprehensive bottleneck reduction programs;
Using Adaptive Signal Control Technology tools to guide programming and implementation of adaptive signal control strategies and systems; and,
Continuing to research and test promising active traffic man-agement strategies including integrated corridor management, dynamic shoulder use, and speed harmonization.
Federal funds are obligated to the States to accelerate projects that will expand capacity and alleviate congestion in selected Interstate locations. American Recovery and Reinvestment Act funds are being used to advance the Dallas Fort Worth Connector, which will double the existing highway capacity on a State Highway corridor where traffic volume is projected to grow rapidly over the next 20 years. Federal funds are also helping to advance several projects to build congestion-priced High Occupancy Toll (HOT) lanes on Interstates in Los Angeles and San Diego, as well as adding to the capacity of existing Interstate roadways in Florida, Indiana, Nevada, Texas, and Wisconsin.
eXTeRnAL FACTORSThere are a number of external factors such as the level of unem-ployment, the number of freight shipments, and the price of fuel that can affect the volume of travel and, consequently, the level of congestion.
PARTneRSFHWA’s partners in this effort include State and local Departments of Transportation and Metropolitan Planning Organizations are FHWA’s direct partners in trying to reduce congestion. Industry associations, the private sector, and academic researchers are partners in developing this performance measurement methodology.
HIGH PRIORITy PeRFORMAnCe GOALEstablish High Speed Rail Capability
The focus of this priority goal is to measure the Department’s
progress and effectiveness in implementing the initial
investments for high-speed rail funded under the American
Recovery and Reinvestment Act (ARRA) of 2009. These
investments lay the foundation for achieving the President’s
goal of providing 80 percent of Americans access to
high-speed rail within 25 years.
The Federal Railroad Administration (FRA) is on track
to achieve the goal of obligating 100 percent of ARRA
funds by September 30, 2012. As of September 30, 2011,
FRA had obligated nearly $7.8 billion (97 percent) in
cooperative agreements of the nearly $8 billion in ARRA
High-Speed Intercity Passenger Rail program (HSIPR)
funds. FRA is entering the next phase of HSIPR with a
focus on managing the program and overseeing project
implementation.
TrANSIT rIderShIPAverage percent change in transit boardings per transit market(in the 150 largest transit agencies)According to a recent Texas Transportation Institute analysis, Americans wasted 4.8 billion hours and 1.9 billion gallons of fuel sitting in traffic in 2010. Traffic congestion now costs motorists in
ANNUAL PERFORMANCE REPORT FISCAL YEAR 2011U.S. DEPARTMENT OF TRANSPORTATION26
the Nation’s top urban areas about $101 billion a year in wasted time and fuel. Mass transit, however, offset $10.2 billion in wasted fuel and time. In FY 2011, the Federal Transit Administration (FTA) managed approximately $9.1 billion to support local transit service.
PubLIC beneFITAn increase in transit ridership indicates that the public is
choosing transit over more energy intensive and congested
modes of travel. The public benefits include a cleaner envi-
ronment, reduced dependence on foreign oil, mobility and
accessibility for underserved populations. Transit ridership
allows for less congested roads, contributing to a reduction
in travel costs and time.
WHAT ARe We MeASuRInG?FTA tracks transit ridership in order to assess the impact of its programs. By tracking the average change in ridership across the urbanized areas which have the largest 150 transit agencies (by number of boardings per year), FTA develops a broad indicator of the health of the U.S. transit industry. Increases in this indicator, beyond population and travel growth, show that transit is capturing a larger share of the transportation market.
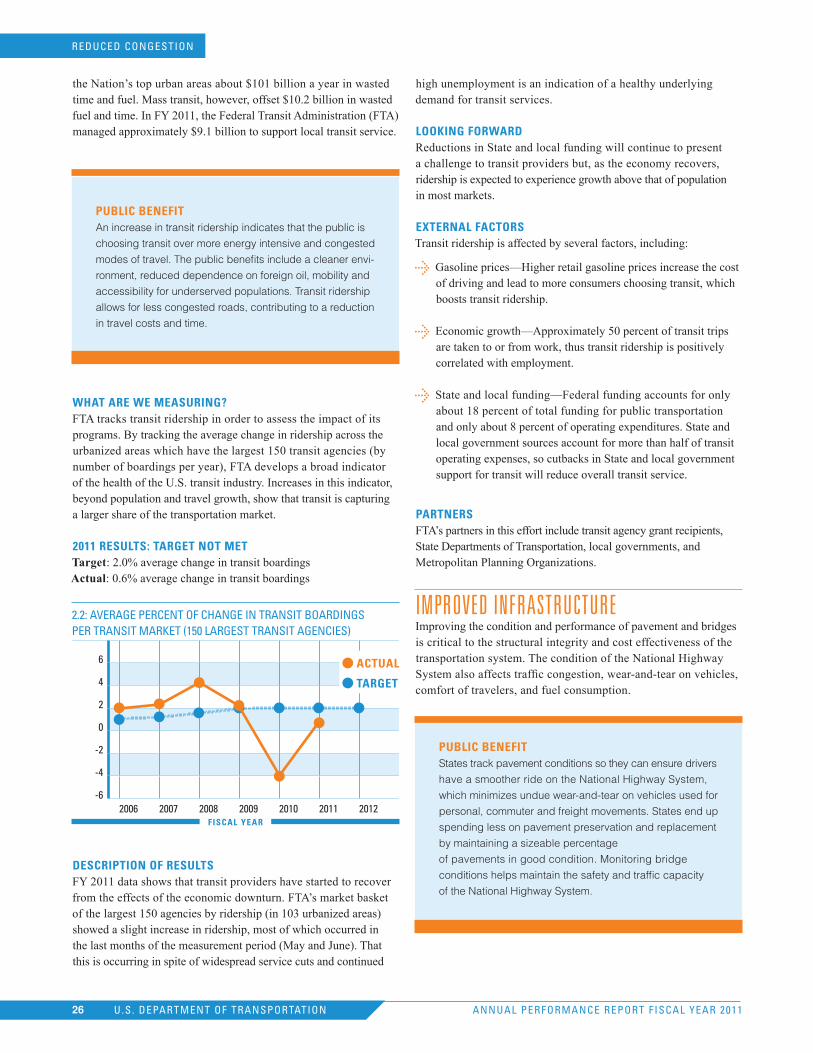
2011 ReSuLTS: TARGeT nOT MeTTarget: 2.0% average change in transit boardings Actual: 0.6% average change in transit boardings
2.2: AVERAGE PERCENT OF CHANGE IN TRANSIT BOARDINGS PER TRANSIT MARkET (150 LARGEST TRANSIT AGENCIES)
6
4
2
0
-2
-4
-62006 2007 2008 2009 2010 2011 2012
ACTuAL
TARGeT
FISCAL yeAR
deSCRIPTIOn OF ReSuLTSFY 2011 data shows that transit providers have started to recover from the effects of the economic downturn. FTA’s market basket of the largest 150 agencies by ridership (in 103 urbanized areas) showed a slight increase in ridership, most of which occurred in the last months of the measurement period (May and June). That this is occurring in spite of widespread service cuts and continued
high unemployment is an indication of a healthy underlying demand for transit services.
LOOkInG FORWARdReductions in State and local funding will continue to present a challenge to transit providers but, as the economy recovers, ridership is expected to experience growth above that of population in most markets.
eXTeRnAL FACTORSTransit ridership is affected by several factors, including:
Gasoline prices—Higher retail gasoline prices increase the cost of driving and lead to more consumers choosing transit, which boosts transit ridership.
Economic growth—Approximately 50 percent of transit trips are taken to or from work, thus transit ridership is positively correlated with employment.
State and local funding—Federal funding accounts for only about 18 percent of total funding for public transportation and only about 8 percent of operating expenditures. State and local government sources account for more than half of transit operating expenses, so cutbacks in State and local government support for transit will reduce overall transit service.
PARTneRSFTA’s partners in this effort include transit agency grant recipients, State Departments of Transportation, local governments, and Metropolitan Planning Organizations.
ImProved INfrASTrUcTUreImproving the condition and performance of pavement and bridges is critical to the structural integrity and cost effectiveness of the transportation system. The condition of the National Highway System also affects traffic congestion, wear-and-tear on vehicles, comfort of travelers, and fuel consumption.
PubLIC beneFITStates track pavement conditions so they can ensure drivers
have a smoother ride on the National Highway System,
which minimizes undue wear-and-tear on vehicles used for
personal, commuter and freight movements. States end up
spending less on pavement preservation and replacement
by maintaining a sizeable percentage
of pavements in good condition. Monitoring bridge
conditions helps maintain the safety and traffic capacity
of the National Highway System.
REDUCED CONGESTION
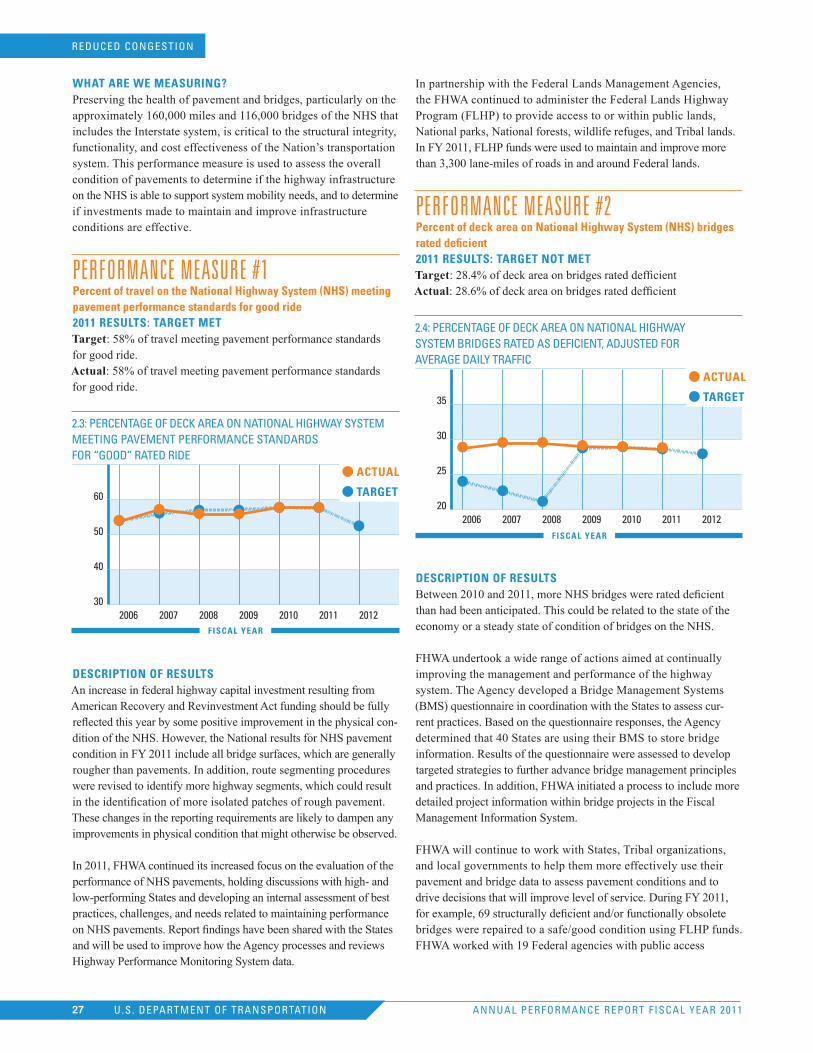
ANNUAL PERFORMANCE REPORT FISCAL YEAR 2011U.S. DEPARTMENT OF TRANSPORTATION27
WHAT ARe We MeASuRInG?Preserving the health of pavement and bridges, particularly on the approximately 160,000 miles and 116,000 bridges of the NHS that includes the Interstate system, is critical to the structural integrity, functionality, and cost effectiveness of the Nation’s transportation system. This performance measure is used to assess the overall condition of pavements to determine if the highway infrastructure on the NHS is able to support system mobility needs, and to determine if investments made to maintain and improve infrastructure conditions are effective.
PerformANce meASUre #1Percent of travel on the national Highway System (nHS) meeting pavement performance standards for good ride2011 ReSuLTS: TARGeT MeTTarget: 58% of travel meeting pavement performance standards for good ride. Actual: 58% of travel meeting pavement performance standards for good ride.
2.3: PERCENTAGE OF DECk AREA ON NATIONAL HIGHWAY SYSTEM MEETING PAVEMENT PERFORMANCE STANDARDS FOR “GOOD” RATED RIDE
60
50
40
302006 2007 2008 2009 2010 2011 2012
ACTuAL
TARGeT
FISCAL yeAR
deSCRIPTIOn OF ReSuLTSAn increase in federal highway capital investment resulting from American Recovery and Revinvestment Act funding should be fully reflected this year by some positive improvement in the physical con-dition of the NHS. However, the National results for NHS pavement condition in FY 2011 include all bridge surfaces, which are generally rougher than pavements. In addition, route segmenting procedures were revised to identify more highway segments, which could result in the identification of more isolated patches of rough pavement. These changes in the reporting requirements are likely to dampen any improvements in physical condition that might otherwise be observed.
In 2011, FHWA continued its increased focus on the evaluation of the performance of NHS pavements, holding discussions with high- and low-performing States and developing an internal assessment of best practices, challenges, and needs related to maintaining performance on NHS pavements. Report findings have been shared with the States and will be used to improve how the Agency processes and reviews Highway Performance Monitoring System data.
In partnership with the Federal Lands Management Agencies, the FHWA continued to administer the Federal Lands Highway Program (FLHP) to provide access to or within public lands, National parks, National forests, wildlife refuges, and Tribal lands. In FY 2011, FLHP funds were used to maintain and improve more than 3,300 lane-miles of roads in and around Federal lands.
PerformANce meASUre #2Percent of deck area on national Highway System (nHS) bridges rated deficient2011 ReSuLTS: TARGeT nOT MeTTarget: 28.4% of deck area on bridges rated defficient Actual: 28.6% of deck area on bridges rated defficient
2.4: PERCENTAGE OF DECk AREA ON NATIONAL HIGHWAY SYSTEM BRIDGES RATED AS DEFICIENT, ADjUSTED FOR AVERAGE DAILY TRAFFIC
35
30
25
202006 2007 2008 2009 2010 2011 2012
ACTuAL
TARGeT
FISCAL yeAR
deSCRIPTIOn OF ReSuLTSBetween 2010 and 2011, more NHS bridges were rated deficient than had been anticipated. This could be related to the state of the economy or a steady state of condition of bridges on the NHS.
FHWA undertook a wide range of actions aimed at continually improving the management and performance of the highway system. The Agency developed a Bridge Management Systems (BMS) questionnaire in coordination with the States to assess cur-rent practices. Based on the questionnaire responses, the Agency determined that 40 States are using their BMS to store bridge information. Results of the questionnaire were assessed to develop targeted strategies to further advance bridge management principles and practices. In addition, FHWA initiated a process to include more detailed project information within bridge projects in the Fiscal Management Information System.
FHWA will continue to work with States, Tribal organizations, and local governments to help them more effectively use their pavement and bridge data to assess pavement conditions and to drive decisions that will improve level of service. During FY 2011, for example, 69 structurally deficient and/or functionally obsolete bridges were repaired to a safe/good condition using FLHP funds. FHWA worked with 19 Federal agencies with public access
REDUCED CONGESTION
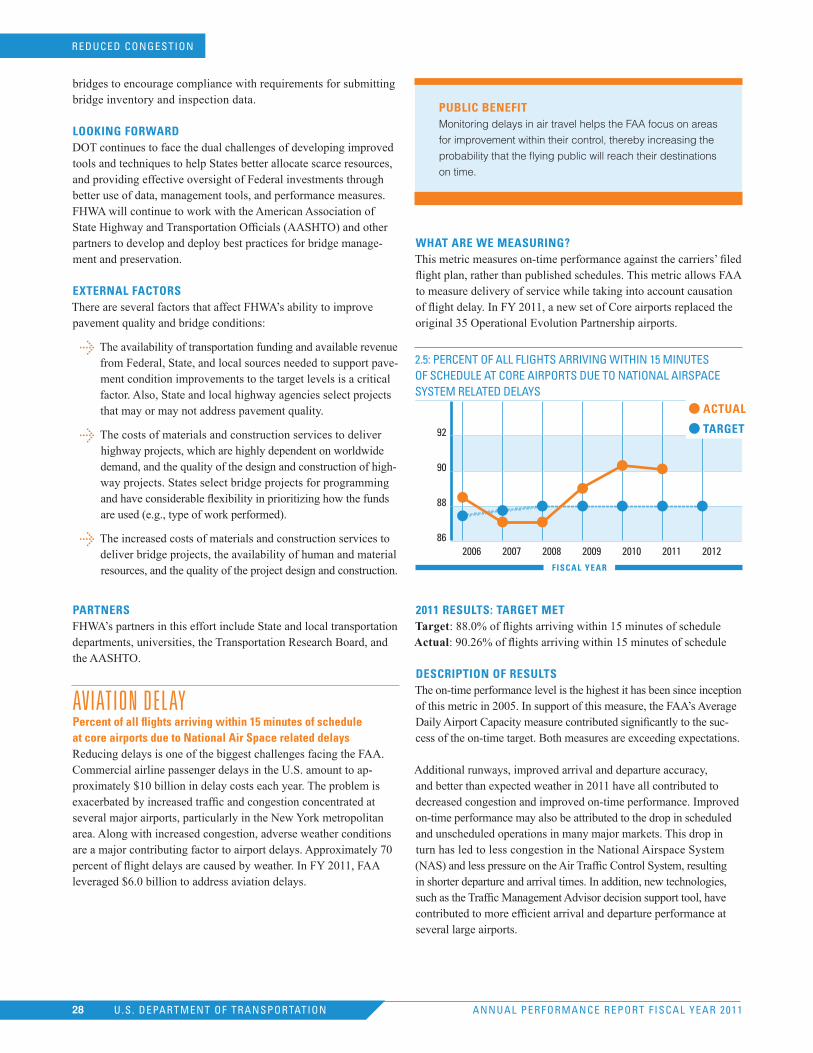
ANNUAL PERFORMANCE REPORT FISCAL YEAR 2011U.S. DEPARTMENT OF TRANSPORTATION28
bridges to encourage compliance with requirements for submitting bridge inventory and inspection data.
LOOkInG FORWARdDOT continues to face the dual challenges of developing improved tools and techniques to help States better allocate scarce resources, and providing effective oversight of Federal investments through better use of data, management tools, and performance measures. FHWA will continue to work with the American Association of State Highway and Transportation Officials (AASHTO) and other partners to develop and deploy best practices for bridge manage-ment and preservation.
eXTeRnAL FACTORSThere are several factors that affect FHWA’s ability to improve pavement quality and bridge conditions:
The availability of transportation funding and available revenue from Federal, State, and local sources needed to support pave-ment condition improvements to the target levels is a critical factor. Also, State and local highway agencies select projects that may or may not address pavement quality.
The costs of materials and construction services to deliver highway projects, which are highly dependent on worldwide demand, and the quality of the design and construction of high-way projects. States select bridge projects for programming and have considerable flexibility in prioritizing how the funds are used (e.g., type of work performed).
The increased costs of materials and construction services to deliver bridge projects, the availability of human and material resources, and the quality of the project design and construction.
PARTneRSFHWA’s partners in this effort include State and local transportation departments, universities, the Transportation Research Board, and the AASHTO.
AvIATIoN deLAYPercent of all flights arriving within 15 minutes of schedule at core airports due to national Air Space related delaysReducing delays is one of the biggest challenges facing the FAA. Commercial airline passenger delays in the U.S. amount to ap-proximately $10 billion in delay costs each year. The problem is exacerbated by increased traffic and congestion concentrated at several major airports, particularly in the New York metropolitan area. Along with increased congestion, adverse weather conditions are a major contributing factor to airport delays. Approximately 70 percent of flight delays are caused by weather. In FY 2011, FAA leveraged $6.0 billion to address aviation delays.
PubLIC beneFITMonitoring delays in air travel helps the FAA focus on areas
for improvement within their control, thereby increasing the
probability that the flying public will reach their destinations
on time.
WHAT ARe We MeASuRInG?This metric measures on-time performance against the carriers’ filed flight plan, rather than published schedules. This metric allows FAA to measure delivery of service while taking into account causation of flight delay. In FY 2011, a new set of Core airports replaced the original 35 Operational Evolution Partnership airports.
2.5: PERCENT OF ALL FLIGHTS ARRIVING WITHIN 15 MINUTES OF SCHEDULE AT CORE AIRPORTS DUE TO NATIONAL AIRSPACE SYSTEM RELATED DELAYS
92
90
88
862006 2007 2008 2009 2010 2011 2012
ACTuAL
TARGeT
FISCAL yeAR
2011 ReSuLTS: TARGeT MeTTarget: 88.0% of flights arriving within 15 minutes of schedule Actual: 90.26% of flights arriving within 15 minutes of schedule
deSCRIPTIOn OF ReSuLTSThe on-time performance level is the highest it has been since inception of this metric in 2005. In support of this measure, the FAA’s Average Daily Airport Capacity measure contributed significantly to the suc-cess of the on-time target. Both measures are exceeding expectations.
Additional runways, improved arrival and departure accuracy, and better than expected weather in 2011 have all contributed to decreased congestion and improved on-time performance. Improved on-time performance may also be attributed to the drop in scheduled and unscheduled operations in many major markets. This drop in turn has led to less congestion in the National Airspace System (NAS) and less pressure on the Air Traffic Control System, resulting in shorter departure and arrival times. In addition, new technologies, such as the Traffic Management Advisor decision support tool, have contributed to more efficient arrival and departure performance at several large airports.
REDUCED CONGESTION
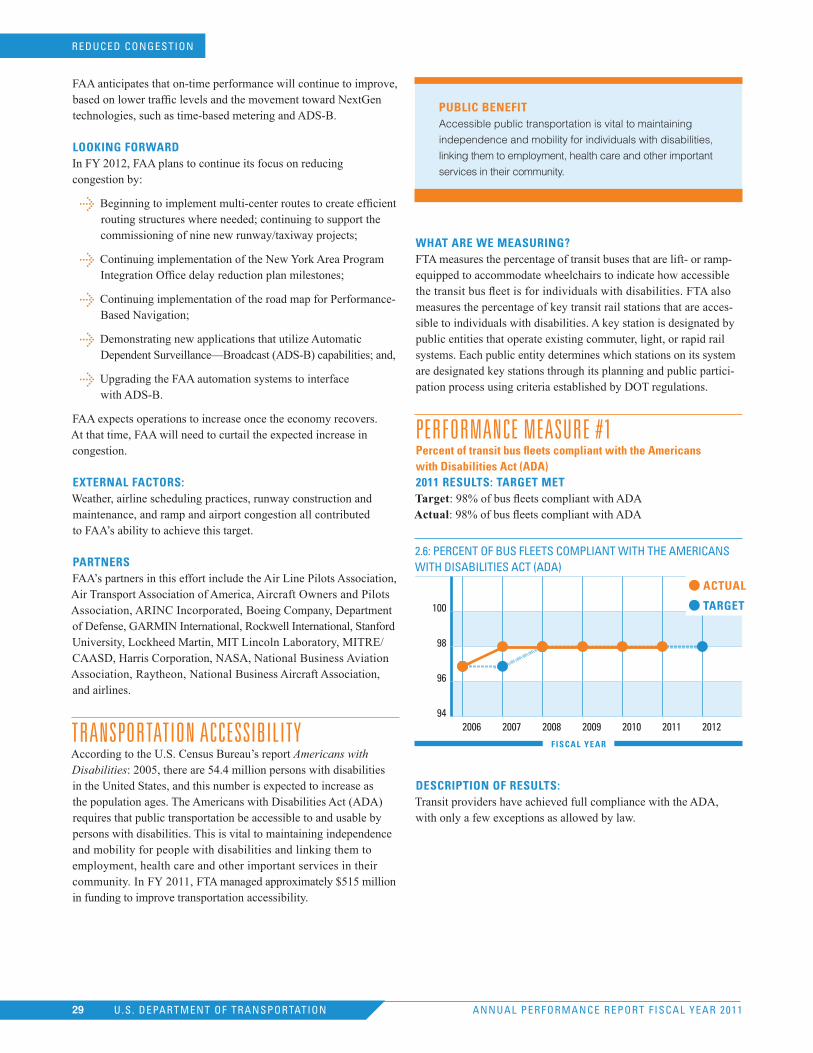
ANNUAL PERFORMANCE REPORT FISCAL YEAR 2011U.S. DEPARTMENT OF TRANSPORTATION29
FAA anticipates that on-time performance will continue to improve, based on lower traffic levels and the movement toward NextGen technologies, such as time-based metering and ADS-B.
LOOkInG FORWARdIn FY 2012, FAA plans to continue its focus on reducing congestion by:
Beginning to implement multi-center routes to create efficient routing structures where needed; continuing to support the commissioning of nine new runway/taxiway projects;
Continuing implementation of the New York Area Program Integration Office delay reduction plan milestones;
Continuing implementation of the road map for Performance-Based Navigation;
Demonstrating new applications that utilize Automatic Dependent Surveillance—Broadcast (ADS-B) capabilities; and,
Upgrading the FAA automation systems to interface with ADS-B.
FAA expects operations to increase once the economy recovers. At that time, FAA will need to curtail the expected increase in congestion.
eXTeRnAL FACTORS:Weather, airline scheduling practices, runway construction and maintenance, and ramp and airport congestion all contributed to FAA’s ability to achieve this target.
PARTneRSFAA’s partners in this effort include the Air Line Pilots Association, Air Transport Association of America, Aircraft Owners and Pilots Association, ARINC Incorporated, Boeing Company, Department of Defense, GARMIN International, Rockwell International, Stanford University, Lockheed Martin, MIT Lincoln Laboratory, MITRE/CAASD, Harris Corporation, NASA, National Business Aviation Association, Raytheon, National Business Aircraft Association, and airlines.
TrANSPorTATIoN AcceSSIBILITYAccording to the U.S. Census Bureau’s report Americans with Disabilities: 2005, there are 54.4 million persons with disabilities in the United States, and this number is expected to increase as the population ages. The Americans with Disabilities Act (ADA) requires that public transportation be accessible to and usable by persons with disabilities. This is vital to maintaining independence and mobility for people with disabilities and linking them to employment, health care and other important services in their community. In FY 2011, FTA managed approximately $515 million in funding to improve transportation accessibility.
PubLIC beneFITAccessible public transportation is vital to maintaining
independence and mobility for individuals with disabilities,
linking them to employment, health care and other important
services in their community.
WHAT ARe We MeASuRInG?FTA measures the percentage of transit buses that are lift- or ramp-equipped to accommodate wheelchairs to indicate how accessible the transit bus fleet is for individuals with disabilities. FTA also measures the percentage of key transit rail stations that are acces-sible to individuals with disabilities. A key station is designated by public entities that operate existing commuter, light, or rapid rail systems. Each public entity determines which stations on its system are designated key stations through its planning and public partici-pation process using criteria established by DOT regulations.
PerformANce meASUre #1Percent of transit bus fleets compliant with the Americans with disabilities Act (AdA)2011 ReSuLTS: TARGeT MeTTarget: 98% of bus fleets compliant with ADA Actual: 98% of bus fleets compliant with ADA
2.6: PERCENT OF BUS FLEETS COMPLIANT WITH THE AMERICANS WITH DISABILITIES ACT (ADA)
100
98
96
942006 2007 2008 2009 2010 2011 2012
ACTuAL
TARGeT
FISCAL yeAR
deSCRIPTIOn OF ReSuLTS:Transit providers have achieved full compliance with the ADA, with only a few exceptions as allowed by law.
REDUCED CONGESTION
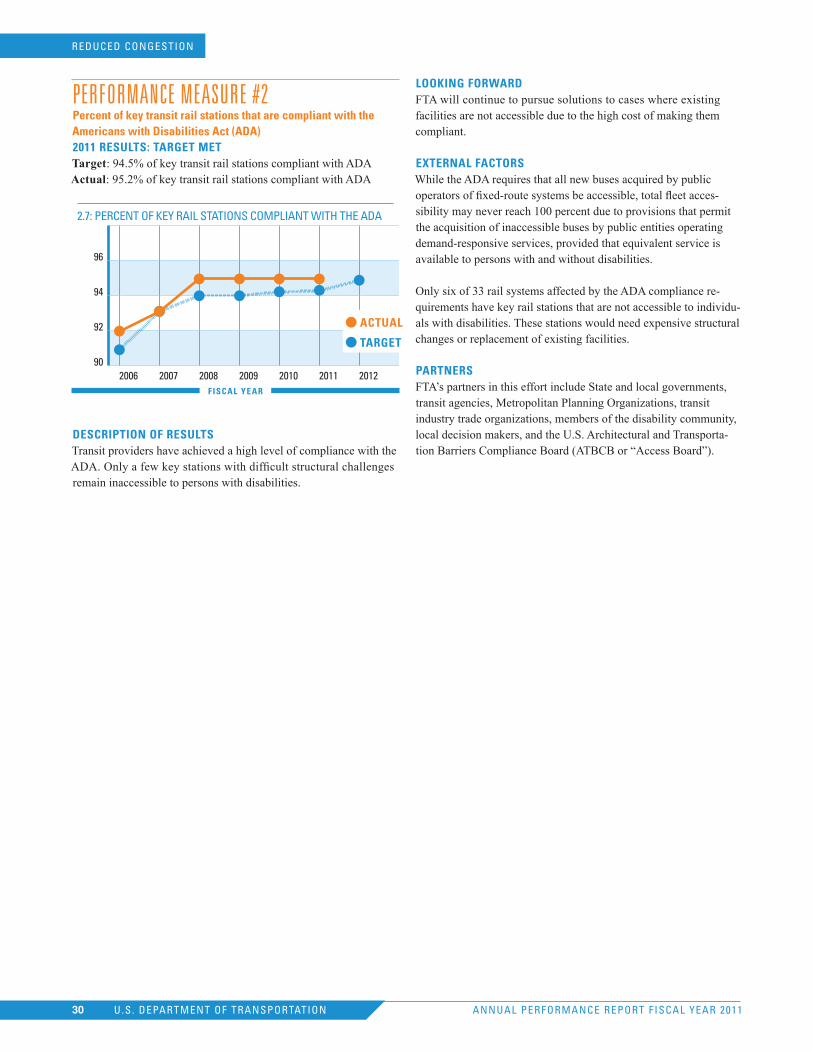
PerformANce meASUre #2Percent of key transit rail stations that are compliant with the Americans with disabilities Act (AdA)2011 ReSuLTS: TARGeT MeTTarget: 94.5% of key transit rail stations compliant with ADA Actual: 95.2% of key transit rail stations compliant with ADA
2.7: PERCENT OF kEY RAIL STATIONS COMPLIANT WITH THE ADA
96
94
92
902006 2007 2008 2009 2010 2011 2012
ACTuAL
TARGeT
FISCAL yeAR
deSCRIPTIOn OF ReSuLTSTransit providers have achieved a high level of compliance with the ADA. Only a few key stations with difficult structural challenges remain inaccessible to persons with disabilities.
LOOkInG FORWARdFTA will continue to pursue solutions to cases where existing facilities are not accessible due to the high cost of making them compliant.
eXTeRnAL FACTORSWhile the ADA requires that all new buses acquired by public operators of fixed-route systems be accessible, total fleet acces-sibility may never reach 100 percent due to provisions that permit the acquisition of inaccessible buses by public entities operating demand-responsive services, provided that equivalent service is available to persons with and without disabilities.
Only six of 33 rail systems affected by the ADA compliance re-quirements have key rail stations that are not accessible to individu-als with disabilities. These stations would need expensive structural changes or replacement of existing facilities.
PARTneRSFTA’s partners in this effort include State and local governments, transit agencies, Metropolitan Planning Organizations, transit industry trade organizations, members of the disability community, local decision makers, and the U.S. Architectural and Transporta-tion Barriers Compliance Board (ATBCB or “Access Board”).
ANNUAL PERFORMANCE REPORT FISCAL YEAR 2011U.S. DEPARTMENT OF TRANSPORTATION30
REDUCED CONGESTION

mANAgemeNT’S dIScUSSIoN ANd ANALYSIS
gLoBAL coNNecTIvITY
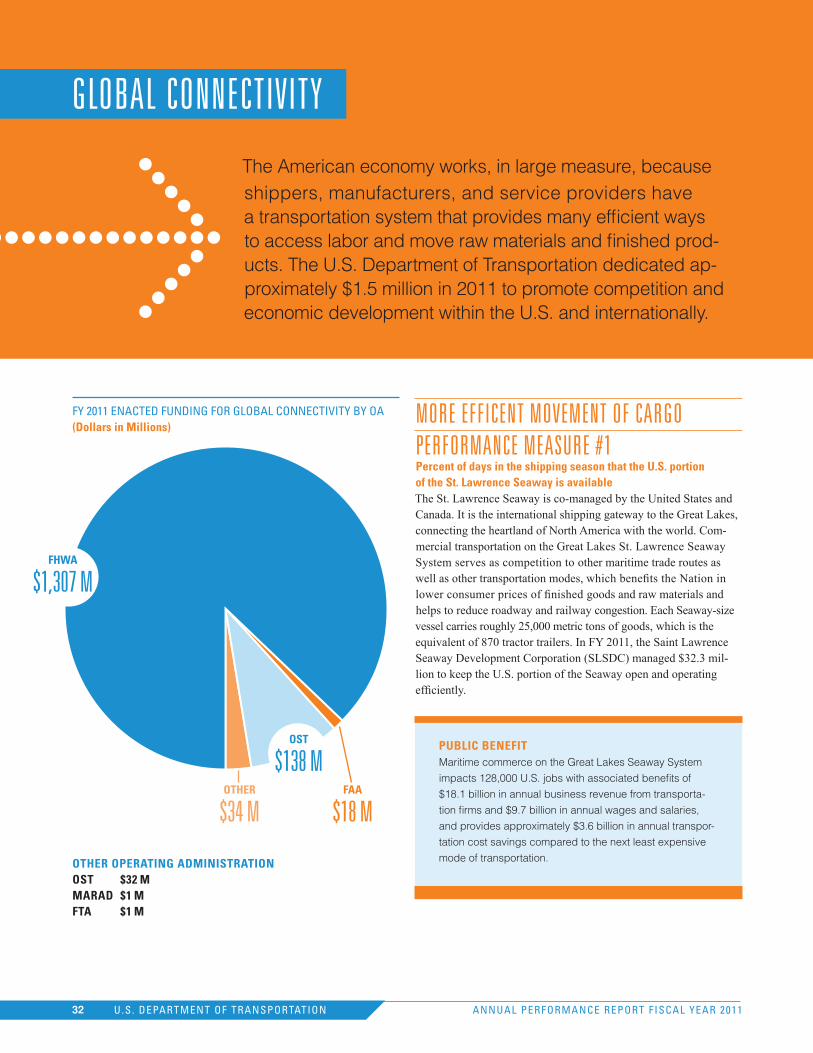
The American economy works, in large measure, because shippers, manufacturers, and service providers have a transportation system that provides many efficient ways to access labor and move raw materials and finished prod-ucts. The U.S. Department of Transportation dedicated ap-proximately $1.5 million in 2011 to promote competition and economic development within the U.S. and internationally.
gLoBAL coNNecTIvITY
FY 2011 ENACTED FUNDING FOR GLOBAL CONNECTIVITY BY OA(dollars in Millions)
OTHeR OPeRATInG AdMInISTRATIOnOST $32 M MARAd $1 MFTA $1 M
FHWA
$1,307 m
OST
$138 mOTHeR
$34 mFAA
$18 m
32 U.S. DEPARTMENT OF TRANSPORTATION32 ANNUAL PERFORMANCE REPORT FISCAL YEAR 2011
more effIceNT movemeNT of cArgoPerformANce meASUre #1Percent of days in the shipping season that the u.S. portion of the St. Lawrence Seaway is availableThe St. Lawrence Seaway is co-managed by the United States and Canada. It is the international shipping gateway to the Great Lakes, connecting the heartland of North America with the world. Com-mercial transportation on the Great Lakes St. Lawrence Seaway System serves as competition to other maritime trade routes as well as other transportation modes, which benefits the Nation in lower consumer prices of finished goods and raw materials and helps to reduce roadway and railway congestion. Each Seaway-size vessel carries roughly 25,000 metric tons of goods, which is the equivalent of 870 tractor trailers. In FY 2011, the Saint Lawrence Seaway Development Corporation (SLSDC) managed $32.3 mil-lion to keep the U.S. portion of the Seaway open and operating efficiently.
PubLIC beneFITMaritime commerce on the Great Lakes Seaway System
impacts 128,000 U.S. jobs with associated benefits of
$18.1 billion in annual business revenue from transporta-
tion firms and $9.7 billion in annual wages and salaries,
and provides approximately $3.6 billion in annual transpor-
tation cost savings compared to the next least expensive
mode of transportation.
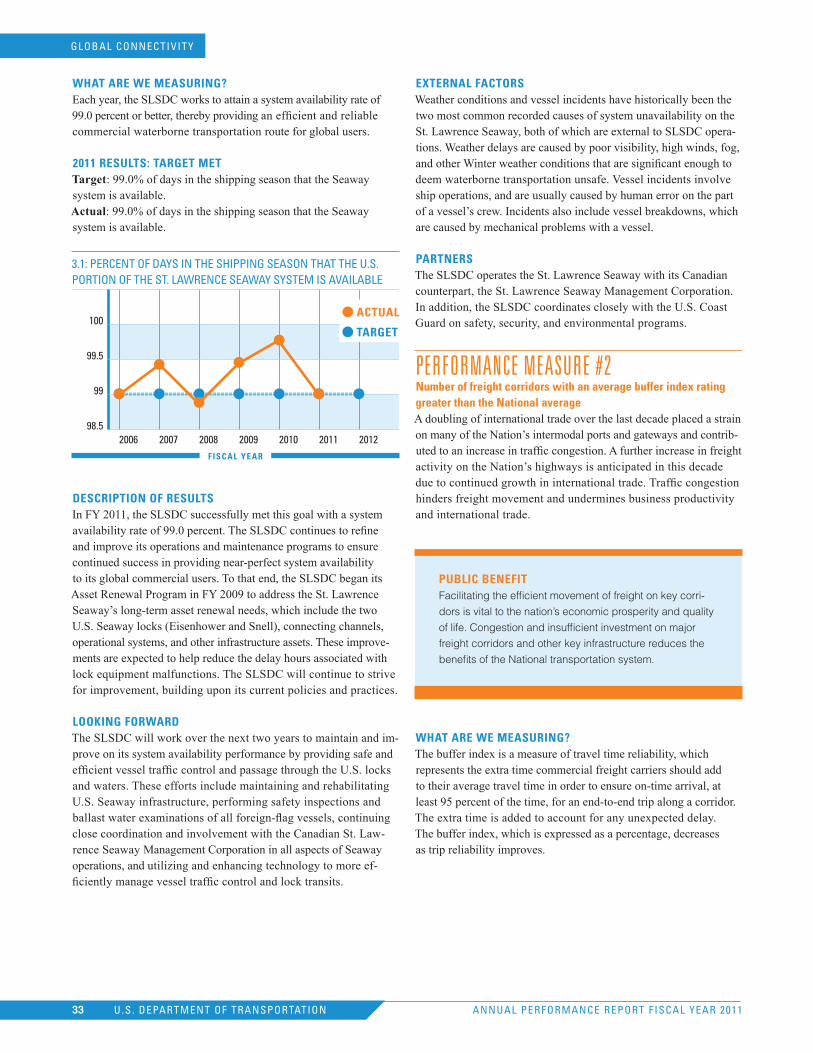
ANNUAL PERFORMANCE REPORT FISCAL YEAR 2011U.S. DEPARTMENT OF TRANSPORTATION33
WHAT ARe We MeASuRInG?Each year, the SLSDC works to attain a system availability rate of 99.0 percent or better, thereby providing an efficient and reliable commercial waterborne transportation route for global users.
2011 ReSuLTS: TARGeT MeTTarget: 99.0% of days in the shipping season that the Seaway system is available. Actual: 99.0% of days in the shipping season that the Seaway system is available.
3.1: PERCENT OF DAYS IN THE SHIPPING SEASON THAT THE U.S. PORTION OF THE ST. LAWRENCE SEAWAY SYSTEM IS AVAILABLE
100
99.5
99
98.52006 2007 2008 2009 2010 2011 2012
ACTuAL
TARGeT
FISCAL yeAR
deSCRIPTIOn OF ReSuLTSIn FY 2011, the SLSDC successfully met this goal with a system availability rate of 99.0 percent. The SLSDC continues to refine and improve its operations and maintenance programs to ensure continued success in providing near-perfect system availability to its global commercial users. To that end, the SLSDC began its Asset Renewal Program in FY 2009 to address the St. Lawrence Seaway’s long-term asset renewal needs, which include the two U.S. Seaway locks (Eisenhower and Snell), connecting channels, operational systems, and other infrastructure assets. These improve-ments are expected to help reduce the delay hours associated with lock equipment malfunctions. The SLSDC will continue to strive for improvement, building upon its current policies and practices.
LOOkInG FORWARdThe SLSDC will work over the next two years to maintain and im-prove on its system availability performance by providing safe and efficient vessel traffic control and passage through the U.S. locks and waters. These efforts include maintaining and rehabilitating U.S. Seaway infrastructure, performing safety inspections and ballast water examinations of all foreign-flag vessels, continuing close coordination and involvement with the Canadian St. Law-rence Seaway Management Corporation in all aspects of Seaway operations, and utilizing and enhancing technology to more ef-ficiently manage vessel traffic control and lock transits.
eXTeRnAL FACTORSWeather conditions and vessel incidents have historically been the two most common recorded causes of system unavailability on the St. Lawrence Seaway, both of which are external to SLSDC opera-tions. Weather delays are caused by poor visibility, high winds, fog, and other Winter weather conditions that are significant enough to deem waterborne transportation unsafe. Vessel incidents involve ship operations, and are usually caused by human error on the part of a vessel’s crew. Incidents also include vessel breakdowns, which are caused by mechanical problems with a vessel.
PARTneRSThe SLSDC operates the St. Lawrence Seaway with its Canadian counterpart, the St. Lawrence Seaway Management Corporation. In addition, the SLSDC coordinates closely with the U.S. Coast Guard on safety, security, and environmental programs.
PerformANce meASUre #2number of freight corridors with an average buffer index rating greater than the national averageA doubling of international trade over the last decade placed a strain on many of the Nation’s intermodal ports and gateways and contrib-uted to an increase in traffic congestion. A further increase in freight activity on the Nation’s highways is anticipated in this decade due to continued growth in international trade. Traffic congestion hinders freight movement and undermines business productivity and international trade.
PubLIC beneFITFacilitating the efficient movement of freight on key corri-
dors is vital to the nation’s economic prosperity and quality
of life. Congestion and insufficient investment on major
freight corridors and other key infrastructure reduces the
benefits of the National transportation system.
WHAT ARe We MeASuRInG?The buffer index is a measure of travel time reliability, which represents the extra time commercial freight carriers should add to their average travel time in order to ensure on-time arrival, at least 95 percent of the time, for an end-to-end trip along a corridor. The extra time is added to account for any unexpected delay. The buffer index, which is expressed as a percentage, decreases as trip reliability improves.
GLOBAL CONNECTIVITY
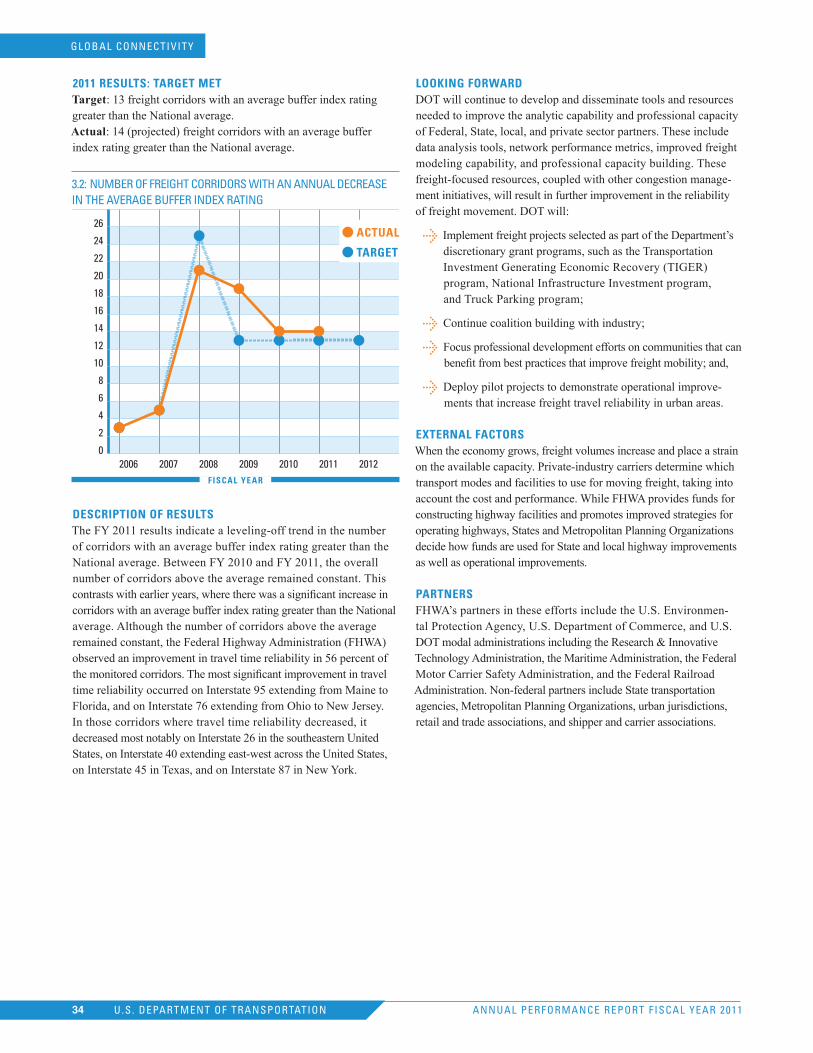
ANNUAL PERFORMANCE REPORT FISCAL YEAR 2011U.S. DEPARTMENT OF TRANSPORTATION34
2011 ReSuLTS: TARGeT MeTTarget: 13 freight corridors with an average buffer index rating greater than the National average. Actual: 14 (projected) freight corridors with an average buffer index rating greater than the National average.
3.2: NUMBER OF FREIGHT CORRIDORS WITH AN ANNUAL DECREASE IN THE AVERAGE BUFFER INDEX RATING
26
24
22
20
18
16
14
12
10
8
6
4
2
02006 2007 2008 2009 2010 2011 2012
ACTuAL
TARGeT
FISCAL yeAR
deSCRIPTIOn OF ReSuLTSThe FY 2011 results indicate a leveling-off trend in the number of corridors with an average buffer index rating greater than the National average. Between FY 2010 and FY 2011, the overall number of corridors above the average remained constant. This contrasts with earlier years, where there was a significant increase in corridors with an average buffer index rating greater than the National average. Although the number of corridors above the average remained constant, the Federal Highway Administration (FHWA) observed an improvement in travel time reliability in 56 percent of the monitored corridors. The most significant improvement in travel time reliability occurred on Interstate 95 extending from Maine to Florida, and on Interstate 76 extending from Ohio to New Jersey. In those corridors where travel time reliability decreased, it decreased most notably on Interstate 26 in the southeastern United States, on Interstate 40 extending east-west across the United States, on Interstate 45 in Texas, and on Interstate 87 in New York.
LOOkInG FORWARdDOT will continue to develop and disseminate tools and resources needed to improve the analytic capability and professional capacity of Federal, State, local, and private sector partners. These include data analysis tools, network performance metrics, improved freight modeling capability, and professional capacity building. These freight-focused resources, coupled with other congestion manage-ment initiatives, will result in further improvement in the reliability of freight movement. DOT will:
Implement freight projects selected as part of the Department’s discretionary grant programs, such as the Transportation Investment Generating Economic Recovery (TIGER) program, National Infrastructure Investment program, and Truck Parking program;
Continue coalition building with industry;
Focus professional development efforts on communities that can benefit from best practices that improve freight mobility; and,
Deploy pilot projects to demonstrate operational improve-ments that increase freight travel reliability in urban areas.
eXTeRnAL FACTORSWhen the economy grows, freight volumes increase and place a strain on the available capacity. Private-industry carriers determine which transport modes and facilities to use for moving freight, taking into account the cost and performance. While FHWA provides funds for constructing highway facilities and promotes improved strategies for operating highways, States and Metropolitan Planning Organizations decide how funds are used for State and local highway improvements as well as operational improvements.
PARTneRSFHWA’s partners in these efforts include the U.S. Environmen-tal Protection Agency, U.S. Department of Commerce, and U.S. DOT modal administrations including the Research & Innovative Technology Administration, the Maritime Administration, the Federal Motor Carrier Safety Administration, and the Federal Railroad Administration. Non-federal partners include State transportation agencies, Metropolitan Planning Organizations, urban jurisdictions, retail and trade associations, and shipper and carrier associations.
GLOBAL CONNECTIVITY
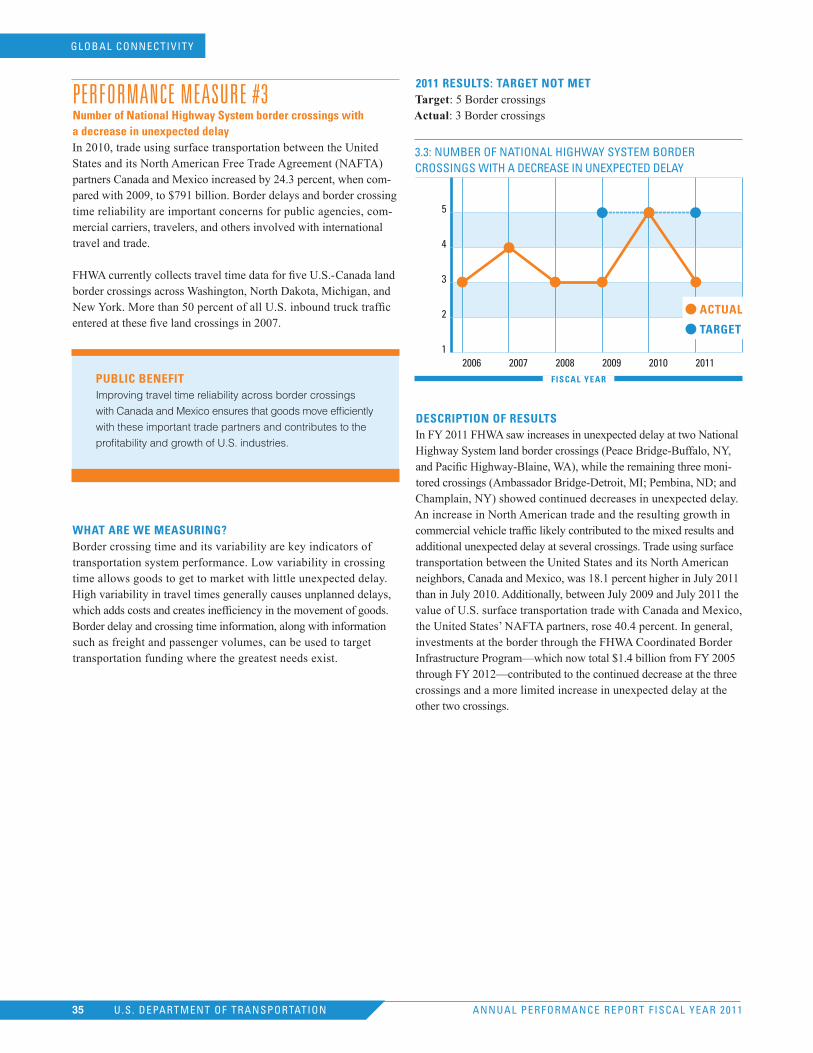
ANNUAL PERFORMANCE REPORT FISCAL YEAR 2011U.S. DEPARTMENT OF TRANSPORTATION35
PerformANce meASUre #3number of national Highway System border crossings with a decrease in unexpected delayIn 2010, trade using surface transportation between the United States and its North American Free Trade Agreement (NAFTA) partners Canada and Mexico increased by 24.3 percent, when com-pared with 2009, to $791 billion. Border delays and border crossing time reliability are important concerns for public agencies, com-mercial carriers, travelers, and others involved with international travel and trade.
FHWA currently collects travel time data for five U.S.-Canada land border crossings across Washington, North Dakota, Michigan, and New York. More than 50 percent of all U.S. inbound truck traffic entered at these five land crossings in 2007.
PubLIC beneFITImproving travel time reliability across border crossings
with Canada and Mexico ensures that goods move efficiently
with these important trade partners and contributes to the
profitability and growth of U.S. industries.
WHAT ARe We MeASuRInG?Border crossing time and its variability are key indicators of transportation system performance. Low variability in crossing time allows goods to get to market with little unexpected delay. High variability in travel times generally causes unplanned delays, which adds costs and creates inefficiency in the movement of goods. Border delay and crossing time information, along with information such as freight and passenger volumes, can be used to target transportation funding where the greatest needs exist.
2011 ReSuLTS: TARGeT nOT MeTTarget: 5 Border crossings Actual: 3 Border crossings
3.3: NUMBER OF NATIONAL HIGHWAY SYSTEM BORDER CROSSINGS WITH A DECREASE IN UNEXPECTED DELAY
5
4
3
2
12006 2007 2008 2009 2010 2011
ACTuAL
TARGeT
FISCAL yeAR
deSCRIPTIOn OF ReSuLTSIn FY 2011 FHWA saw increases in unexpected delay at two National Highway System land border crossings (Peace Bridge-Buffalo, NY, and Pacific Highway-Blaine, WA), while the remaining three moni-tored crossings (Ambassador Bridge-Detroit, MI; Pembina, ND; and Champlain, NY) showed continued decreases in unexpected delay. An increase in North American trade and the resulting growth in commercial vehicle traffic likely contributed to the mixed results and additional unexpected delay at several crossings. Trade using surface transportation between the United States and its North American neighbors, Canada and Mexico, was 18.1 percent higher in July 2011 than in July 2010. Additionally, between July 2009 and July 2011 the value of U.S. surface transportation trade with Canada and Mexico, the United States’ NAFTA partners, rose 40.4 percent. In general, investments at the border through the FHWA Coordinated Border Infrastructure Program—which now total $1.4 billion from FY 2005 through FY 2012—contributed to the continued decrease at the three crossings and a more limited increase in unexpected delay at the other two crossings.
GLOBAL CONNECTIVITY
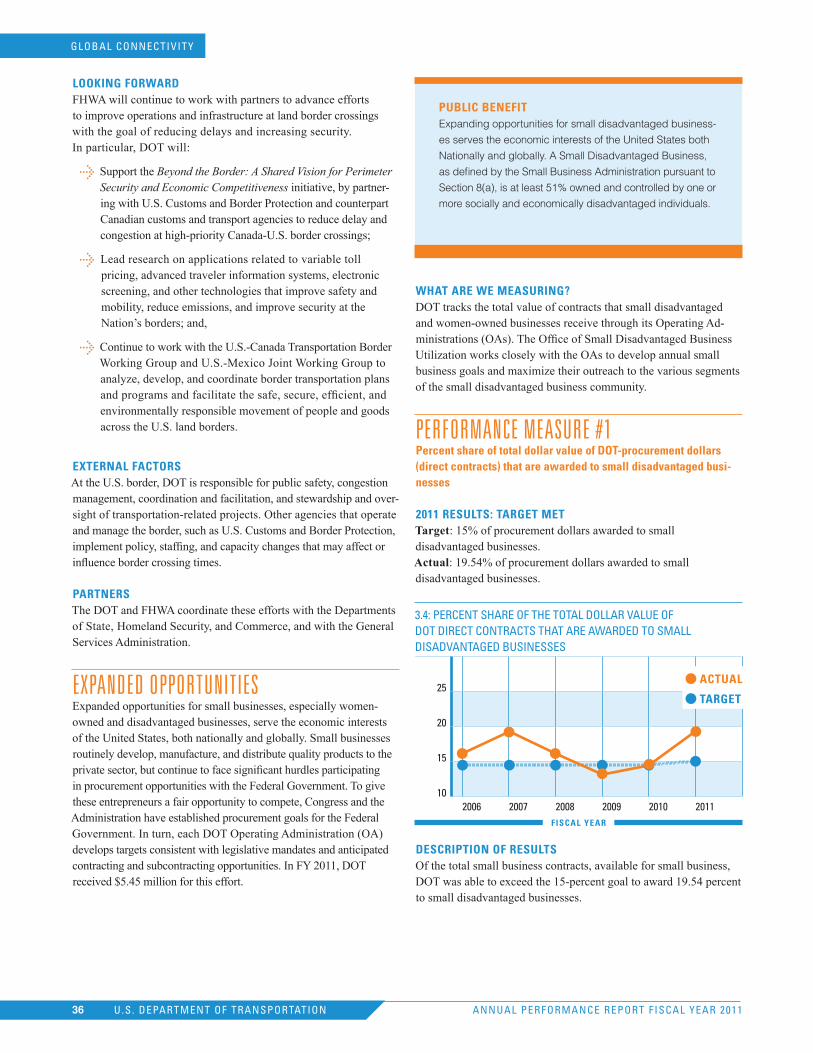
ANNUAL PERFORMANCE REPORT FISCAL YEAR 2011U.S. DEPARTMENT OF TRANSPORTATION36
LOOkInG FORWARdFHWA will continue to work with partners to advance efforts to improve operations and infrastructure at land border crossings with the goal of reducing delays and increasing security. In particular, DOT will:
Support the Beyond the Border: A Shared Vision for Perimeter Security and Economic Competitiveness initiative, by partner-ing with U.S. Customs and Border Protection and counterpart Canadian customs and transport agencies to reduce delay and congestion at high-priority Canada-U.S. border crossings;
Lead research on applications related to variable toll pricing, advanced traveler information systems, electronic screening, and other technologies that improve safety and mobility, reduce emissions, and improve security at the Nation’s borders; and,
Continue to work with the U.S.-Canada Transportation Border Working Group and U.S.-Mexico Joint Working Group to analyze, develop, and coordinate border transportation plans and programs and facilitate the safe, secure, efficient, and environmentally responsible movement of people and goods across the U.S. land borders.
eXTeRnAL FACTORSAt the U.S. border, DOT is responsible for public safety, congestion management, coordination and facilitation, and stewardship and over-sight of transportation-related projects. Other agencies that operate and manage the border, such as U.S. Customs and Border Protection, implement policy, staffing, and capacity changes that may affect or influence border crossing times.
PARTneRSThe DOT and FHWA coordinate these efforts with the Departments of State, Homeland Security, and Commerce, and with the General Services Administration.
exPANded oPPorTUNITIeSExpanded opportunities for small businesses, especially women-owned and disadvantaged businesses, serve the economic interests of the United States, both nationally and globally. Small businesses routinely develop, manufacture, and distribute quality products to the private sector, but continue to face significant hurdles participating in procurement opportunities with the Federal Government. To give these entrepreneurs a fair opportunity to compete, Congress and the Administration have established procurement goals for the Federal Government. In turn, each DOT Operating Administration (OA) develops targets consistent with legislative mandates and anticipated contracting and subcontracting opportunities. In FY 2011, DOT received $5.45 million for this effort.
PubLIC beneFITExpanding opportunities for small disadvantaged business-
es serves the economic interests of the United States both
Nationally and globally. A Small Disadvantaged Business,
as defined by the Small Business Administration pursuant to
Section 8(a), is at least 51% owned and controlled by one or
more socially and economically disadvantaged individuals.
WHAT ARe We MeASuRInG?DOT tracks the total value of contracts that small disadvantaged and women-owned businesses receive through its Operating Ad-ministrations (OAs). The Office of Small Disadvantaged Business Utilization works closely with the OAs to develop annual small business goals and maximize their outreach to the various segments of the small disadvantaged business community.
PerformANce meASUre #1Percent share of total dollar value of dOT-procurement dollars (direct contracts) that are awarded to small disadvantaged busi-nesses
2011 ReSuLTS: TARGeT MeTTarget: 15% of procurement dollars awarded to small disadvantaged businesses. Actual: 19.54% of procurement dollars awarded to small disadvantaged businesses.
3.4: PERCENT SHARE OF THE TOTAL DOLLAR VALUE OF DOT DIRECT CONTRACTS THAT ARE AWARDED TO SMALL DISADVANTAGED BUSINESSES
25
20
15
102006 2007 2008 2009 2010 2011
ACTuAL
TARGeT
FISCAL yeAR
deSCRIPTIOn OF ReSuLTSOf the total small business contracts, available for small business, DOT was able to exceed the 15-percent goal to award 19.54 percent to small disadvantaged businesses.
GLOBAL CONNECTIVITY
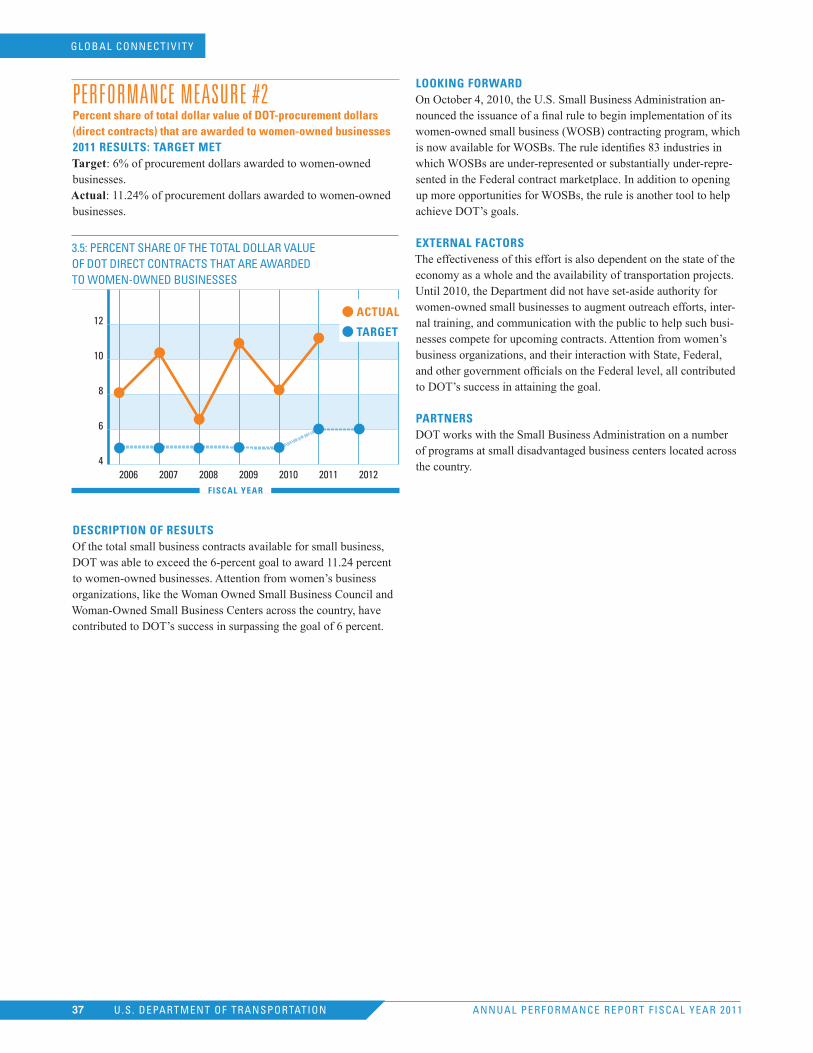
PerformANce meASUre #2Percent share of total dollar value of dOT-procurement dollars (direct contracts) that are awarded to women-owned businesses2011 ReSuLTS: TARGeT MeTTarget: 6% of procurement dollars awarded to women-owned businesses. Actual: 11.24% of procurement dollars awarded to women-owned businesses.
3.5: PERCENT SHARE OF THE TOTAL DOLLAR VALUE OF DOT DIRECT CONTRACTS THAT ARE AWARDED TO WOMEN-OWNED BUSINESSES
12
10
8
6
42006 2007 2008 2009 2010 2011 2012
ACTuAL
TARGeT
FISCAL yeAR
deSCRIPTIOn OF ReSuLTSOf the total small business contracts available for small business, DOT was able to exceed the 6-percent goal to award 11.24 percent to women-owned businesses. Attention from women’s business organizations, like the Woman Owned Small Business Council and Woman-Owned Small Business Centers across the country, have contributed to DOT’s success in surpassing the goal of 6 percent.
LOOkInG FORWARdOn October 4, 2010, the U.S. Small Business Administration an-nounced the issuance of a final rule to begin implementation of its women-owned small business (WOSB) contracting program, which is now available for WOSBs. The rule identifies 83 industries in which WOSBs are under-represented or substantially under-repre-sented in the Federal contract marketplace. In addition to opening up more opportunities for WOSBs, the rule is another tool to help achieve DOT’s goals.
eXTeRnAL FACTORSThe effectiveness of this effort is also dependent on the state of the economy as a whole and the availability of transportation projects. Until 2010, the Department did not have set-aside authority for women-owned small businesses to augment outreach efforts, inter-nal training, and communication with the public to help such busi-nesses compete for upcoming contracts. Attention from women’s business organizations, and their interaction with State, Federal, and other government officials on the Federal level, all contributed to DOT’s success in attaining the goal.
PARTneRSDOT works with the Small Business Administration on a number of programs at small disadvantaged business centers located across the country.
ANNUAL PERFORMANCE REPORT FISCAL YEAR 2011U.S. DEPARTMENT OF TRANSPORTATION37
GLOBAL CONNECTIVITY

mANAgemeNT’S dIScUSSIoN ANd ANALYSIS
eNvIroNmeNTAL STewArdShIP
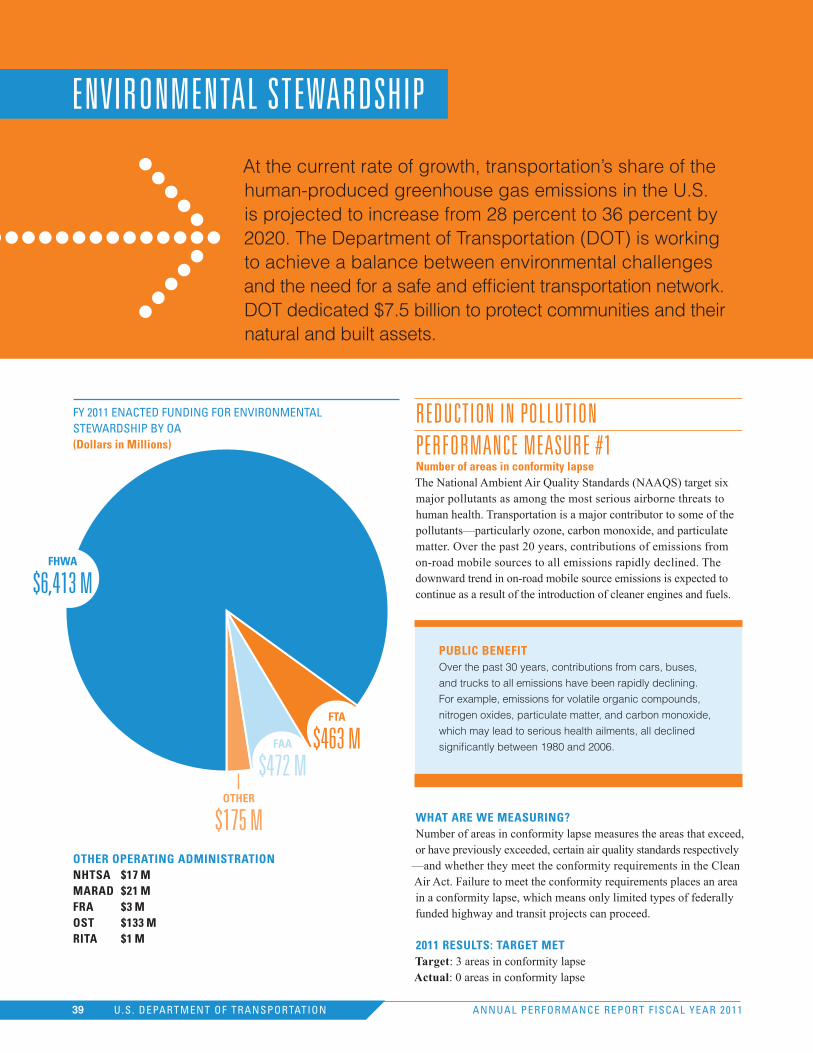
At the current rate of growth, transportation’s share of the human-produced greenhouse gas emissions in the U.S. is projected to increase from 28 percent to 36 percent by 2020. The Department of Transportation (DOT) is working to achieve a balance between environmental challenges and the need for a safe and efficient transportation network. DOT dedicated $7.5 billion to protect communities and their natural and built assets.
eNvIroNmeNTAL STewArdShIP
redUcTIoN IN PoLLUTIoNPerformANce meASUre #1number of areas in conformity lapseThe National Ambient Air Quality Standards (NAAQS) target six major pollutants as among the most serious airborne threats to human health. Transportation is a major contributor to some of the pollutants—particularly ozone, carbon monoxide, and particulate matter. Over the past 20 years, contributions of emissions from on-road mobile sources to all emissions rapidly declined. The downward trend in on-road mobile source emissions is expected to continue as a result of the introduction of cleaner engines and fuels.
PubLIC beneFITOver the past 30 years, contributions from cars, buses,
and trucks to all emissions have been rapidly declining.
For example, emissions for volatile organic compounds,
nitrogen oxides, particulate matter, and carbon monoxide,
which may lead to serious health ailments, all declined
significantly between 1980 and 2006.
WHAT ARe We MeASuRInG?Number of areas in conformity lapse measures the areas that exceed, or have previously exceeded, certain air quality standards respectively
—and whether they meet the conformity requirements in the Clean Air Act. Failure to meet the conformity requirements places an area in a conformity lapse, which means only limited types of federally funded highway and transit projects can proceed.
2011 ReSuLTS: TARGeT MeTTarget: 3 areas in conformity lapse Actual: 0 areas in conformity lapse
FY 2011 ENACTED FUNDING FOR ENVIRONMENTAL STEWARDSHIP BY OA(dollars in Millions)
OTHeR OPeRATInG AdMInISTRATIOnnHTSA $17 M MARAd $21 MFRA $3 MOST $133 MRITA $1 M
FHWA
$6,413 m
FTA
$463 mFAA
$472 mOTHeR
$175 m
39 U.S. DEPARTMENT OF TRANSPORTATION39 ANNUAL PERFORMANCE REPORT FISCAL YEAR 2011
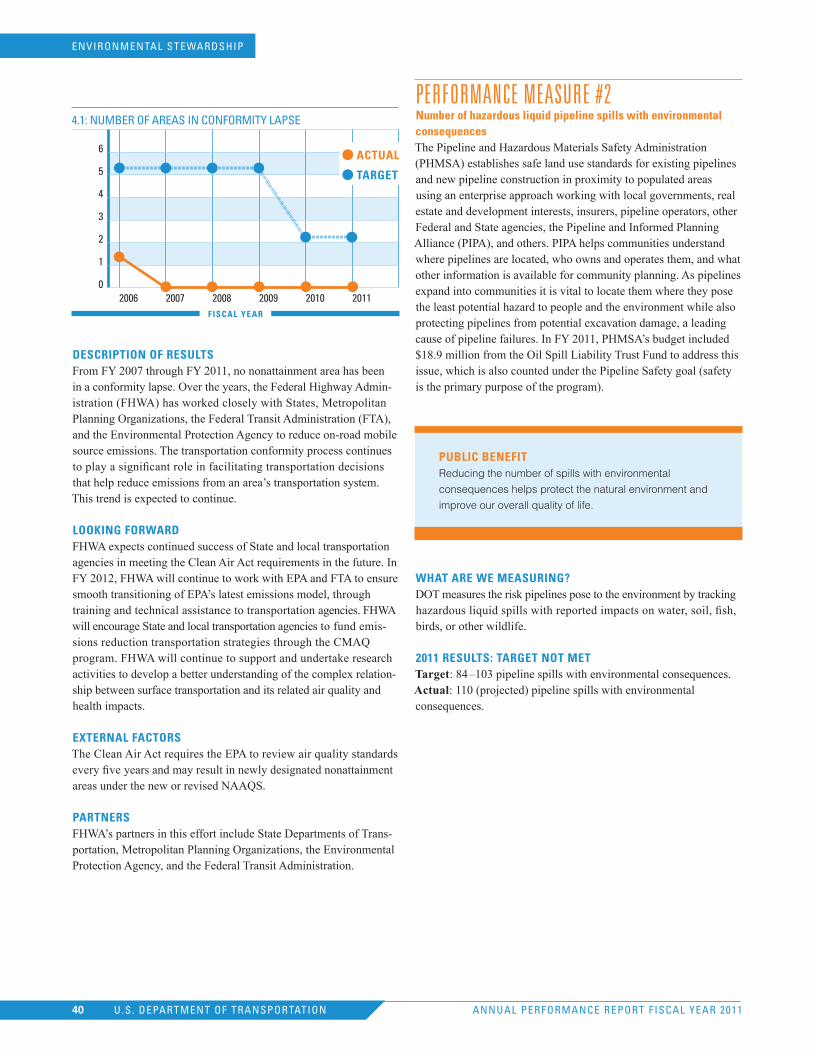
ANNUAL PERFORMANCE REPORT FISCAL YEAR 2011U.S. DEPARTMENT OF TRANSPORTATION40
4.1: NUMBER OF AREAS IN CONFORMITY LAPSE
6
5
4
3
2
1
02006 2007 2008 2009 2010 2011
ACTuAL
TARGeT
FISCAL yeAR
deSCRIPTIOn OF ReSuLTSFrom FY 2007 through FY 2011, no nonattainment area has been in a conformity lapse. Over the years, the Federal Highway Admin-istration (FHWA) has worked closely with States, Metropolitan Planning Organizations, the Federal Transit Administration (FTA), and the Environmental Protection Agency to reduce on-road mobile source emissions. The transportation conformity process continues to play a significant role in facilitating transportation decisions that help reduce emissions from an area’s transportation system. This trend is expected to continue.
LOOkInG FORWARdFHWA expects continued success of State and local transportation agencies in meeting the Clean Air Act requirements in the future. In FY 2012, FHWA will continue to work with EPA and FTA to ensure smooth transitioning of EPA’s latest emissions model, through training and technical assistance to transportation agencies. FHWA will encourage State and local transportation agencies to fund emis-sions reduction transportation strategies through the CMAQ program. FHWA will continue to support and undertake research activities to develop a better understanding of the complex relation-ship between surface transportation and its related air quality and health impacts.
eXTeRnAL FACTORSThe Clean Air Act requires the EPA to review air quality standards every five years and may result in newly designated nonattainment areas under the new or revised NAAQS.
PARTneRSFHWA’s partners in this effort include State Departments of Trans-portation, Metropolitan Planning Organizations, the Environmental Protection Agency, and the Federal Transit Administration.
PerformANce meASUre #2number of hazardous liquid pipeline spills with environmental consequencesThe Pipeline and Hazardous Materials Safety Administration (PHMSA) establishes safe land use standards for existing pipelines and new pipeline construction in proximity to populated areas using an enterprise approach working with local governments, real estate and development interests, insurers, pipeline operators, other Federal and State agencies, the Pipeline and Informed Planning Alliance (PIPA), and others. PIPA helps communities understand where pipelines are located, who owns and operates them, and what other information is available for community planning. As pipelines expand into communities it is vital to locate them where they pose the least potential hazard to people and the environment while also protecting pipelines from potential excavation damage, a leading cause of pipeline failures. In FY 2011, PHMSA’s budget included $18.9 million from the Oil Spill Liability Trust Fund to address this issue, which is also counted under the Pipeline Safety goal (safety is the primary purpose of the program).
PubLIC beneFITReducing the number of spills with environmental
consequences helps protect the natural environment and
improve our overall quality of life.
WHAT ARe We MeASuRInG?DOT measures the risk pipelines pose to the environment by tracking hazardous liquid spills with reported impacts on water, soil, fish, birds, or other wildlife.
2011 ReSuLTS: TARGeT nOT MeTTarget: 84–103 pipeline spills with environmental consequences. Actual: 110 (projected) pipeline spills with environmental consequences.
ENVIRONMENTAL STEWARDSHIP
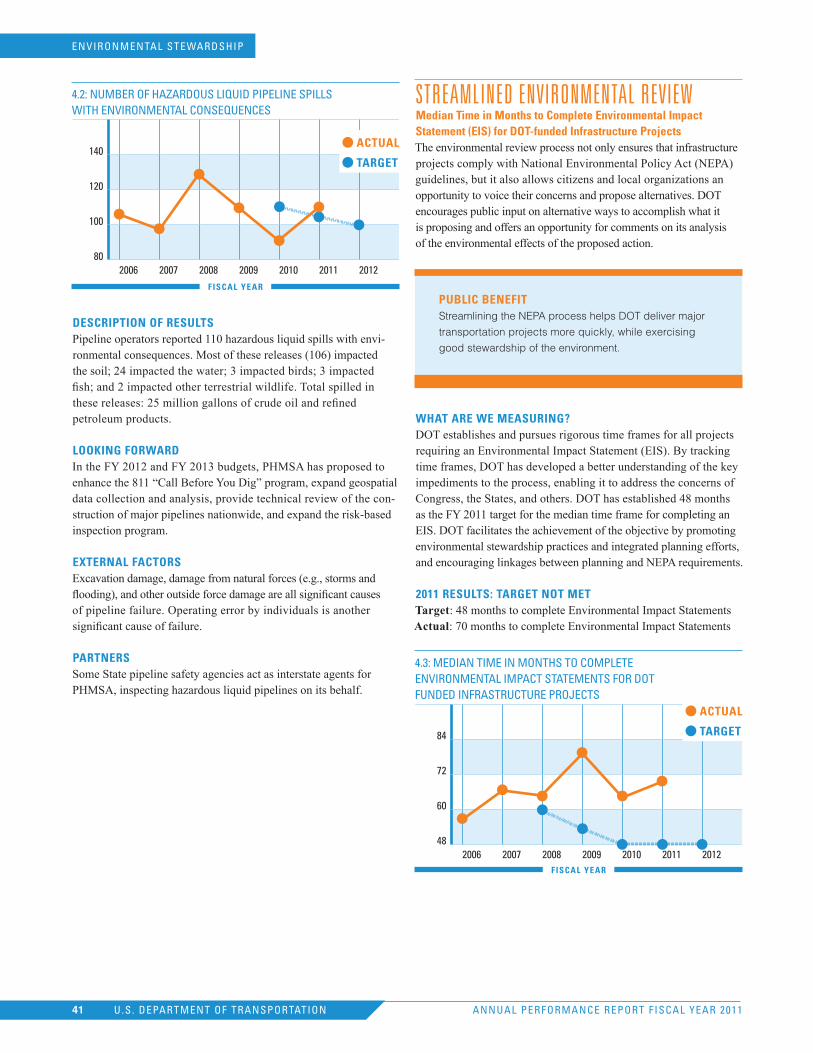
ANNUAL PERFORMANCE REPORT FISCAL YEAR 2011U.S. DEPARTMENT OF TRANSPORTATION41
4.2: NUMBER OF HAZARDOUS LIqUID PIPELINE SPILLS WITH ENVIRONMENTAL CONSEqUENCES
140
120
100
802006 2007 2008 2009 2010 2011 2012
ACTuAL
TARGeT
FISCAL yeAR
deSCRIPTIOn OF ReSuLTSPipeline operators reported 110 hazardous liquid spills with envi-ronmental consequences. Most of these releases (106) impacted the soil; 24 impacted the water; 3 impacted birds; 3 impacted fish; and 2 impacted other terrestrial wildlife. Total spilled in these releases: 25 million gallons of crude oil and refined petroleum products.
LOOkInG FORWARdIn the FY 2012 and FY 2013 budgets, PHMSA has proposed to enhance the 811 “Call Before You Dig” program, expand geospatial data collection and analysis, provide technical review of the con-struction of major pipelines nationwide, and expand the risk-based inspection program.
eXTeRnAL FACTORSExcavation damage, damage from natural forces (e.g., storms and flooding), and other outside force damage are all significant causes of pipeline failure. Operating error by individuals is another significant cause of failure.
PARTneRSSome State pipeline safety agencies act as interstate agents for PHMSA, inspecting hazardous liquid pipelines on its behalf.
STreAmLINed eNvIroNmeNTAL revIewMedian Time in Months to Complete environmental Impact Statement (eIS) for dOT-funded Infrastructure ProjectsThe environmental review process not only ensures that infrastructure projects comply with National Environmental Policy Act (NEPA) guidelines, but it also allows citizens and local organizations an opportunity to voice their concerns and propose alternatives. DOT encourages public input on alternative ways to accomplish what it is proposing and offers an opportunity for comments on its analysis of the environmental effects of the proposed action.
PubLIC beneFITStreamlining the NEPA process helps DOT deliver major
transportation projects more quickly, while exercising
good stewardship of the environment.
WHAT ARe We MeASuRInG?DOT establishes and pursues rigorous time frames for all projects requiring an Environmental Impact Statement (EIS). By tracking time frames, DOT has developed a better understanding of the key impediments to the process, enabling it to address the concerns of Congress, the States, and others. DOT has established 48 months as the FY 2011 target for the median time frame for completing an EIS. DOT facilitates the achievement of the objective by promoting environmental stewardship practices and integrated planning efforts, and encouraging linkages between planning and NEPA requirements.
2011 ReSuLTS: TARGeT nOT MeTTarget: 48 months to complete Environmental Impact Statements Actual: 70 months to complete Environmental Impact Statements
4.3: MEDIAN TIME IN MONTHS TO COMPLETE ENVIRONMENTAL IMPACT STATEMENTS FOR DOT FUNDED INFRASTRUCTURE PROjECTS
84
72
60
482006 2007 2008 2009 2010 2011 2012
ACTuAL
TARGeT
FISCAL yeAR
ENVIRONMENTAL STEWARDSHIP
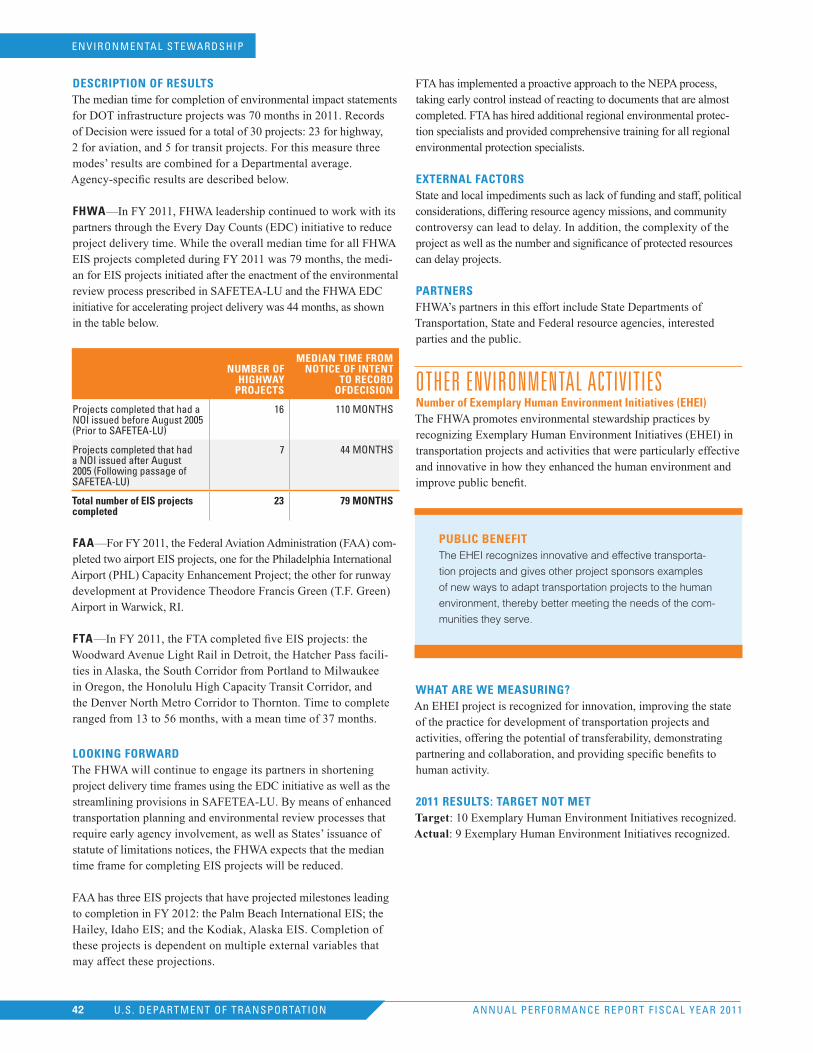
ANNUAL PERFORMANCE REPORT FISCAL YEAR 2011U.S. DEPARTMENT OF TRANSPORTATION42
deSCRIPTIOn OF ReSuLTSThe median time for completion of environmental impact statements for DOT infrastructure projects was 70 months in 2011. Records of Decision were issued for a total of 30 projects: 23 for highway, 2 for aviation, and 5 for transit projects. For this measure three modes’ results are combined for a Departmental average. Agency-specific results are described below.
FHWA—In FY 2011, FHWA leadership continued to work with its partners through the Every Day Counts (EDC) initiative to reduce project delivery time. While the overall median time for all FHWA EIS projects completed during FY 2011 was 79 months, the medi-an for EIS projects initiated after the enactment of the environmental review process prescribed in SAFETEA-LU and the FHWA EDC initiative for accelerating project delivery was 44 months, as shown in the table below.
nuMbeR OF HIGHWAy
PROjeCTS
MedIAn TIMe FROM nOTICe OF InTenT
TO ReCORd OFdeCISIOn
Projects completed that had a NOI issued before August 2005 (Prior to SAFETEA-LU)
16 110 MONTHS
Projects completed that had a NOI issued after August 2005 (Following passage of SAFETEA-LU)
7 44 MONTHS
Total number of eIS projects completed
23 79 MOnTHS
FAA—For FY 2011, the Federal Aviation Administration (FAA) com-pleted two airport EIS projects, one for the Philadelphia International Airport (PHL) Capacity Enhancement Project; the other for runway development at Providence Theodore Francis Green (T.F. Green) Airport in Warwick, RI.
FTA—In FY 2011, the FTA completed five EIS projects: the Woodward Avenue Light Rail in Detroit, the Hatcher Pass facili-ties in Alaska, the South Corridor from Portland to Milwaukee in Oregon, the Honolulu High Capacity Transit Corridor, and the Denver North Metro Corridor to Thornton. Time to complete ranged from 13 to 56 months, with a mean time of 37 months.
LOOkInG FORWARdThe FHWA will continue to engage its partners in shortening project delivery time frames using the EDC initiative as well as the streamlining provisions in SAFETEA-LU. By means of enhanced transportation planning and environmental review processes that require early agency involvement, as well as States’ issuance of statute of limitations notices, the FHWA expects that the median time frame for completing EIS projects will be reduced.
FAA has three EIS projects that have projected milestones leading to completion in FY 2012: the Palm Beach International EIS; the Hailey, Idaho EIS; and the Kodiak, Alaska EIS. Completion of these projects is dependent on multiple external variables that may affect these projections.
FTA has implemented a proactive approach to the NEPA process, taking early control instead of reacting to documents that are almost completed. FTA has hired additional regional environmental protec-tion specialists and provided comprehensive training for all regional environmental protection specialists.
eXTeRnAL FACTORSState and local impediments such as lack of funding and staff, political considerations, differing resource agency missions, and community controversy can lead to delay. In addition, the complexity of the project as well as the number and significance of protected resources can delay projects.
PARTneRSFHWA’s partners in this effort include State Departments of Transportation, State and Federal resource agencies, interested parties and the public.
oTher eNvIroNmeNTAL AcTIvITIeSnumber of exemplary Human environment Initiatives (eHeI)The FHWA promotes environmental stewardship practices by recognizing Exemplary Human Environment Initiatives (EHEI) in transportation projects and activities that were particularly effective and innovative in how they enhanced the human environment and improve public benefit.
PubLIC beneFITThe EHEI recognizes innovative and effective transporta-
tion projects and gives other project sponsors examples
of new ways to adapt transportation projects to the human
environment, thereby better meeting the needs of the com-
munities they serve.
WHAT ARe We MeASuRInG?An EHEI project is recognized for innovation, improving the state of the practice for development of transportation projects and activities, offering the potential of transferability, demonstrating partnering and collaboration, and providing specific benefits to human activity.
2011 ReSuLTS: TARGeT nOT MeTTarget: 10 Exemplary Human Environment Initiatives recognized. Actual: 9 Exemplary Human Environment Initiatives recognized.
ENVIRONMENTAL STEWARDSHIPENVIRONMENTAL STEWARDSHIP
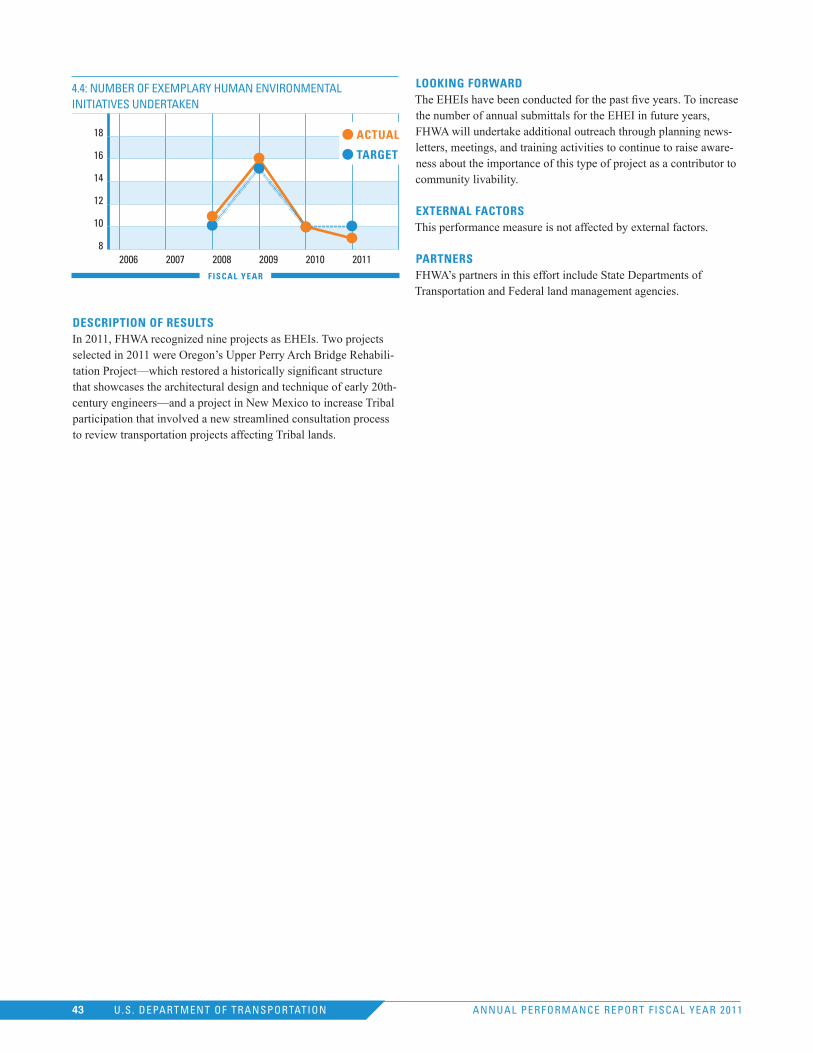
4.4: NUMBER OF EXEMPLARY HUMAN ENVIRONMENTAL INITIATIVES UNDERTAkEN
18
16
14
12
10
82006 2007 2008 2009 2010 2011
ACTuAL
TARGeT
FISCAL yeAR
deSCRIPTIOn OF ReSuLTSIn 2011, FHWA recognized nine projects as EHEIs. Two projects selected in 2011 were Oregon’s Upper Perry Arch Bridge Rehabili-tation Project—which restored a historically significant structure that showcases the architectural design and technique of early 20th-century engineers—and a project in New Mexico to increase Tribal participation that involved a new streamlined consultation process to review transportation projects affecting Tribal lands.
LOOkInG FORWARdThe EHEIs have been conducted for the past five years. To increase the number of annual submittals for the EHEI in future years, FHWA will undertake additional outreach through planning news-letters, meetings, and training activities to continue to raise aware-ness about the importance of this type of project as a contributor to community livability.
eXTeRnAL FACTORSThis performance measure is not affected by external factors.
PARTneRSFHWA’s partners in this effort include State Departments of Transportation and Federal land management agencies.
ANNUAL PERFORMANCE REPORT FISCAL YEAR 2011U.S. DEPARTMENT OF TRANSPORTATION43

mANAgemeNT’S dIScUSSIoN ANd ANALYSIS
SecUrITY, PrePAredNeSS ANd reSPoNSe

heAdLINe
Transportation systems are an element of the Nation’s critical infrastructure for response and recovery, yet they are vulnerable to damage from human-caused incidents or the result of natural disasters. DOT dedicated $490 million to security, preparedness and response in FY 2011.
SecUrITY, PrePAredNeSS ANd reSPoNSe
INTeLLIgeNce, PrePAredNeSS ANd reSPoNSeDOT continues to ensure readiness to undertake its role as defined in the National Response Framework, issued in 2008. In this capacity, DOT provides support to the Department of Homeland Security by assisting Federal, State, Tribal, and local government entities, voluntary organizations, nongovernmental organizations, and the private sector in the management of transportation systems and infrastructure during domestic threats or in response to incidents. DOT also participates in prevention, preparedness, response, recovery, and mitigation activities, and carries out its statutory responsibilities—including regulation of transportation, management of the Nation’s airspace, and ensuring the safety and security of the National trans-portation system. In FY 2011, the Office of the Secretary committed $13 million to address readiness issues.
PubLIC beneFITDOT tracks this activity to ensure that its staff is able to
make effective transportation decisions at all levels to
sustain transportation services, mitigate adverse economic
impacts and meet National needs following a disaster.
WHAT ARe We MeASuRInG? DOT is in its third year reporting on these performance measures. The first performance measure tracks staff participation in training courses and exercises that simulate disasters, in order to prepare them to conduct the Department’s activities during an emergency. Those required to take the training or participate in the exercises are the Secretary’s Emergency Response Team, emergency coordinators in the Operating Administrations (OA), and others who have been identified as having emergency management responsibili-
FY 2010 ENACTED FUNDING FOR SECURITY BY OA(dollars in Millions)
OTHeR OPeRATInG AdMInISTRATIOnOST $9 M FMCSA $7 MFRA $2 M
MARAd
$294 m
FAA
$135 m
FTA
$42 mOTHeR
$18 m
45 U.S. DEPARTMENT OF TRANSPORTATION45 ANNUAL PERFORMANCE REPORT FISCAL YEAR 2011
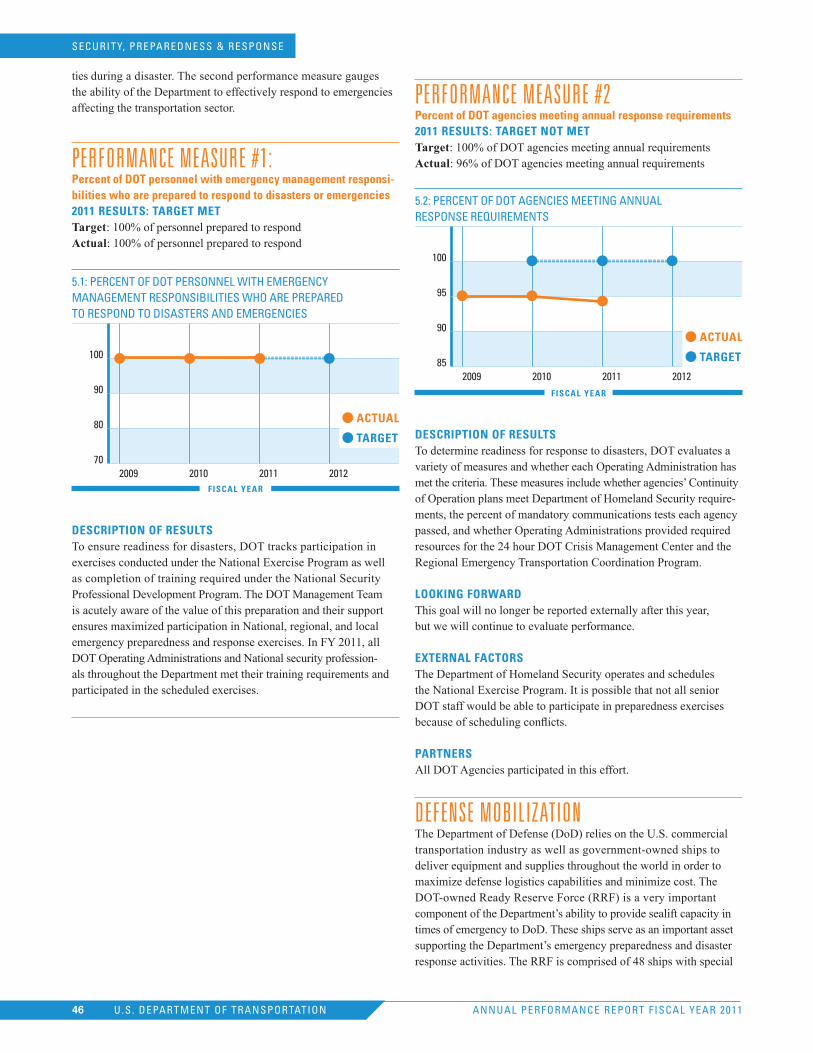
ties during a disaster. The second performance measure gauges the ability of the Department to effectively respond to emergencies affecting the transportation sector.
PerformANce meASUre #1: Percent of dOT personnel with emergency management responsi-bilities who are prepared to respond to disasters or emergencies2011 ReSuLTS: TARGeT MeTTarget: 100% of personnel prepared to respond Actual: 100% of personnel prepared to respond
5.1: PERCENT OF DOT PERSONNEL WITH EMERGENCY MANAGEMENT RESPONSIBILITIES WHO ARE PREPARED TO RESPOND TO DISASTERS AND EMERGENCIES
100
90
80
702009 2010 2011 2012
ACTuAL
TARGeT
FISCAL yeAR
deSCRIPTIOn OF ReSuLTSTo ensure readiness for disasters, DOT tracks participation in exercises conducted under the National Exercise Program as well as completion of training required under the National Security Professional Development Program. The DOT Management Team is acutely aware of the value of this preparation and their support ensures maximized participation in National, regional, and local emergency preparedness and response exercises. In FY 2011, all DOT Operating Administrations and National security profession-als throughout the Department met their training requirements and participated in the scheduled exercises.
PerformANce meASUre #2Percent of dOT agencies meeting annual response requirements2011 ReSuLTS: TARGeT nOT MeTTarget: 100% of DOT agencies meeting annual requirements Actual: 96% of DOT agencies meeting annual requirements
5.2: PERCENT OF DOT AGENCIES MEETING ANNUAL RESPONSE REqUIREMENTS
100
95
90
852009 2010 2011 2012
ACTuAL
TARGeT
FISCAL yeAR
deSCRIPTIOn OF ReSuLTSTo determine readiness for response to disasters, DOT evaluates a variety of measures and whether each Operating Administration has met the criteria. These measures include whether agencies’ Continuity of Operation plans meet Department of Homeland Security require-ments, the percent of mandatory communications tests each agency passed, and whether Operating Administrations provided required resources for the 24 hour DOT Crisis Management Center and the Regional Emergency Transportation Coordination Program.
LOOkInG FORWARdThis goal will no longer be reported externally after this year, but we will continue to evaluate performance.
eXTeRnAL FACTORSThe Department of Homeland Security operates and schedules the National Exercise Program. It is possible that not all senior DOT staff would be able to participate in preparedness exercises because of scheduling conflicts.
PARTneRSAll DOT Agencies participated in this effort.
defeNSe moBILIzATIoNThe Department of Defense (DoD) relies on the U.S. commercial transportation industry as well as government-owned ships to deliver equipment and supplies throughout the world in order to maximize defense logistics capabilities and minimize cost. The DOT-owned Ready Reserve Force (RRF) is a very important component of the Department’s ability to provide sealift capacity in times of emergency to DoD. These ships serve as an important asset supporting the Department’s emergency preparedness and disaster response activities. The RRF is comprised of 48 ships with special
SECURITY, PREPAREDNESS & RESPONSE
ANNUAL PERFORMANCE REPORT FISCAL YEAR 2011U.S. DEPARTMENT OF TRANSPORTATION46

capabilities that can carry or offload heavy and oversized military cargoes which regular U.S.-flag commercial cargo ships cannot carry. RRF ships meet approximately half of the U.S. Transportation Command’s surge (or initial) sealift requirement during a mobiliza-tion. In FY 2011, MARAD received approximately $295 million for activities in support of defense mobilization.
PubLIC beneFITThe Ready Reserve Force, the Maritime Security Program,
and the Voluntary Intermodal Sealift Agreement program
provide support to U.S. military operations worldwide.
PerformANce meASUre #1Percentage of dod-required shipping capacity (both commercial and government-owned), complete with crews and available within mobilization timelinesWHAT ARe We MeASuRInG? MARAD tracks the number of cargo ships with full crews that are available to meet military requirements on short notice. This level of readiness ensures there is sufficient shipping capacity available to transport cargo in support of U.S. military actions around the world.
2011 ReSuLTS: TARGeT MeTTarget: 94% of shipping capacity available Actual: 97% of shipping capacity available
5.3: PERCENT OF DOD-REqUIRED SHIPPING CAPACITY COMPLETE WITH CREWS AVAILABLE WITHIN MOBILIZATION TIMELINES
100
95
90
852006 2007 2008 2009 2010 2011 2012
ACTuAL
TARGeT
FISCAL yeAR
deSCRIPTIOn OF ReSuLTSMARAD has exceeded the target of 94%. Each of the commercial vessels enrolled in the Maritime Security Program (MSP) and/or Voluntary Intermodal Sealift (VISA) programs are registered under the U.S. flag and are crewed with U.S.-citizen merchant marines. Both annual and long-term targets are ambitious and are based on historic performance levels.
LOOkInG FORWARdThe ability to sustain readiness of shipping capacity to transport cargo and meet future military requirements will depend on maintaining a sufficient number of active MSP and VISA vessels and crews op-erating in U.S. international trade and the ability to maintain the RRF in a ready status at all times. Targets should be achievable absent a reduction of funding, cargo availability or major casualties to vessels operating in these programs.
eXTeRnAL FACTORSDoD requirements help determine the size of both the government-owned and commercial fleets.
PARTneRSMARAD’s partners in this effort include the Department of Defense, the U.S. Transportation Command, U.S. flag ship operators, Ready Reserve Force Ship Managers, and Maritime Labor Organizations (e.g., Marine Engineers’ Beneficial Association, American Maritime Officers, and Seafarers International Union).
PerformANce meASUre #2Percentage of dOd commercial ports available for military use within dod-established readiness timelinesWHAT ARe We MeASuRInG?This measure helps MARAD assess the readiness of the commercial ports that will be used to transport military equipment and supplies.
2011 ReSuLTS: TARGeT MeTTarget: 93% of commercial ports available for military use Actual: 100% of commercial ports available for military use
FISCAL yeAR
5.4: PERCENTAGE OF DOD-DESIGNATED COMMERCIAL PORTS AVAILABLE FOR MILITARY USE WITHIN DOD ESTABLISHED READINESS TIMELINES
100
95
902006 2007 2008 2009 2010 2011 2012
ACTuAL
TARGeT
deSCRIPTIOn OF ReSuLTSCommercial ports have continued to exceed the target for timely availability of port facilities for military use in contingencies. This success is the result of close coordination among MARAD, military users, and strategic ports.
SECURITY, PREPAREDNESS & RESPONSE
ANNUAL PERFORMANCE REPORT FISCAL YEAR 2011U.S. DEPARTMENT OF TRANSPORTATION47
LOOkInG FORWARdMARAD and its partners in the National Port Readiness Network (NPRN) continue to improve the processes for military use of strategic commercial ports. These efforts are currently focused on revising and updating the Memorandum of Understanding that is the founding document of the NPRN and which guides the activities of its members.
eXTeRnAL FACTORS The size and timeline of the deployment, available commercial port and intermodal capacity, readiness of the port, and weather condi-tions all affect this performance measure. Port readiness is depen-dent on training, exercises, deployment coordination and monthly and semi-annual readiness assessments.
PARTneRSMARAD’s partners in this effort include commercial strategic ports and the National Port Readiness Network, which is comprised of the U.S. Transportation Command, Military Surface Deployment and Distribution Command, U.S. Coast Guard, Transportation Se-curity Administration, U.S. Army Corps of Engineers, U.S. Northern Command, U.S. Army Forces Command, U.S. Army Installation Management Command, Military Sealift Command.
SECURITY, PREPAREDNESS & RESPONSE
ANNUAL PERFORMANCE REPORT FISCAL YEAR 2011U.S. DEPARTMENT OF TRANSPORTATION48
mANAgemeNT’S dIScUSSIoN ANd ANALYSIS
orgANIzATIoNAL exceLLeNce

orgANIzAToNAL exceLLeNce
The Department of Transportation (DOT) cannot achieve its strategic goals without leadership and continuous improve-ment in all the supporting functions of the Department. DOT actively pursues both externally driven and internally driven initiatives that improve the operations of the entire Department through each and every DOT agency. DOT leveraged $2.2 billion in FY 2011 to provide leadership in human resources, commercial services, financial management, performance improvement, and electronic government.
2011 federAL emPLoYee vIewPoINT SUrveYThe 2011 Employee Viewpoint Survey (EVS) provides an opportunity for DOT employees to shape the Department’s culture and work envi-ronment. By gathering information about how employees regard their work experience at DOT, the Department hopes to design manage-ment best practices and work environments that better suit employee needs, while ensuring positive organizational outcomes.
After last year’s survey, DOT was recognized as one of the most improved agencies in the Federal Government, and the 2011 EVS results continued to reflect some modest increases in positive response rates. Generally, in areas where DOT has historically performed well it continued to do so, and the same can be said for survey items where the Department tends to perform more negatively.
Overall, Department-wide 2011 EVS results reveal a trend of incremental improvements since 2008. However, these results also illustrate that DOT still has considerable work to do to increase the favorability in employees’ perceptions of the workplace, particularly in the areas of Leadership and Performance Culture. As such, DOT will continue to engage in action planning that will concentrate on discovering the root causes of employees’ perceptions in the areas where DOT is lacking and develop strategies to increase favorable perceptions, while maintaining progress in areas of the survey where the Department has performed well historically.
FY 2011 ENACTED FUNDING FOR ORGANIZATIONAL EXCELLENCE BY OA(dollars in Millions)
OTHeR OPeRATInG AdMInISTRATIOnFTA $31 M FMCSA $29 MRITA $7 MMARAd $23 M
FAA
$1,483 m
FHWA
$525 m
FRA
$37 mOTHeR
$91 mOST
$109 m
50 U.S. DEPARTMENT OF TRANSPORTATION50 ANNUAL PERFORMANCE REPORT FISCAL YEAR 2011
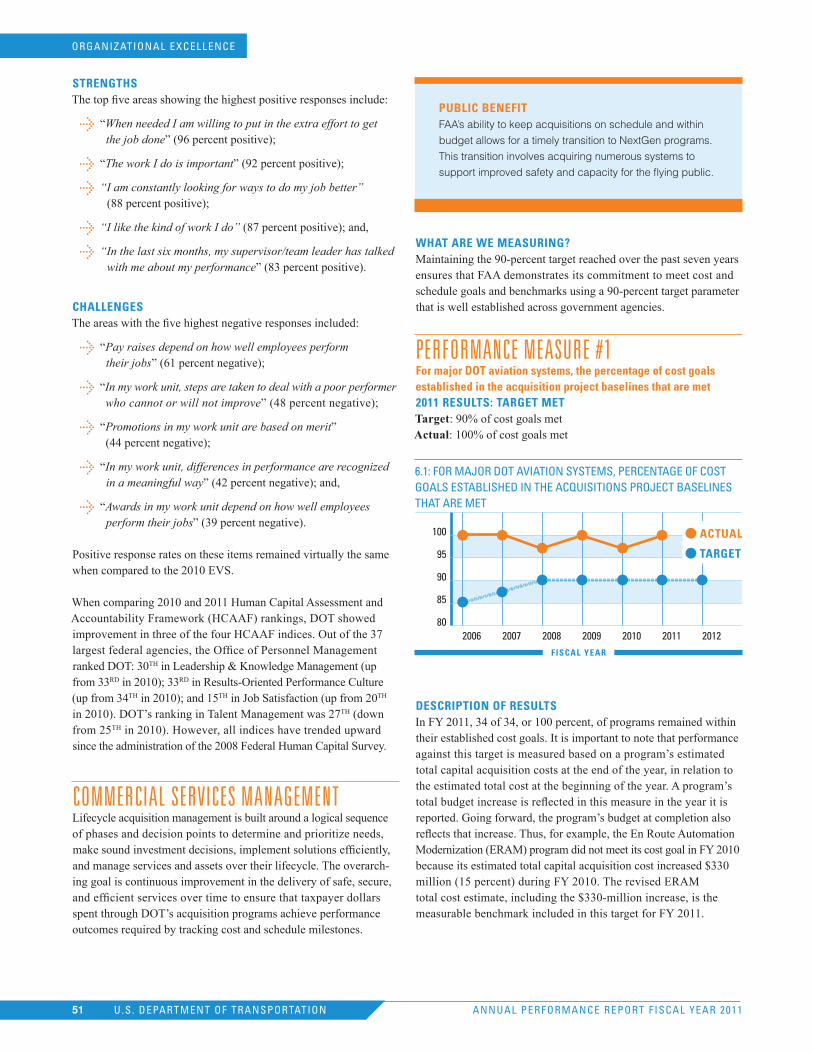
ORGANIZATIONAL EXCELLENCE
ANNUAL PERFORMANCE REPORT FISCAL YEAR 2011U.S. DEPARTMENT OF TRANSPORTATION51
STRenGTHSThe top five areas showing the highest positive responses include:
“ When needed I am willing to put in the extra effort to get the job done” (96 percent positive);
“The work I do is important” (92 percent positive);
“ I am constantly looking for ways to do my job better” (88 percent positive);
“ I like the kind of work I do” (87 percent positive); and,
“ In the last six months, my supervisor/team leader has talked with me about my performance” (83 percent positive).
CHALLenGeSThe areas with the five highest negative responses included:
“ Pay raises depend on how well employees perform their jobs” (61 percent negative);
“ In my work unit, steps are taken to deal with a poor performer who cannot or will not improve” (48 percent negative);
“ Promotions in my work unit are based on merit” (44 percent negative);
“ In my work unit, differences in performance are recognized in a meaningful way” (42 percent negative); and,
“ Awards in my work unit depend on how well employees perform their jobs” (39 percent negative).
Positive response rates on these items remained virtually the same when compared to the 2010 EVS.
When comparing 2010 and 2011 Human Capital Assessment and Accountability Framework (HCAAF) rankings, DOT showed improvement in three of the four HCAAF indices. Out of the 37 largest federal agencies, the Office of Personnel Management ranked DOT: 30TH in Leadership & Knowledge Management (up from 33RD in 2010); 33RD in Results-Oriented Performance Culture (up from 34TH in 2010); and 15TH in Job Satisfaction (up from 20TH in 2010). DOT’s ranking in Talent Management was 27TH (down from 25TH in 2010). However, all indices have trended upward since the administration of the 2008 Federal Human Capital Survey.
commercIAL ServIceS mANAgemeNTLifecycle acquisition management is built around a logical sequence of phases and decision points to determine and prioritize needs, make sound investment decisions, implement solutions efficiently, and manage services and assets over their lifecycle. The overarch-ing goal is continuous improvement in the delivery of safe, secure, and efficient services over time to ensure that taxpayer dollars spent through DOT’s acquisition programs achieve performance outcomes required by tracking cost and schedule milestones.
PubLIC beneFITFAA’s ability to keep acquisitions on schedule and within
budget allows for a timely transition to NextGen programs.
This transition involves acquiring numerous systems to
support improved safety and capacity for the flying public.
WHAT ARe We MeASuRInG?Maintaining the 90-percent target reached over the past seven years ensures that FAA demonstrates its commitment to meet cost and schedule goals and benchmarks using a 90-percent target parameter that is well established across government agencies.
PerformANce meASUre #1For major dOT aviation systems, the percentage of cost goals established in the acquisition project baselines that are met2011 ReSuLTS: TARGeT MeTTarget: 90% of cost goals met Actual: 100% of cost goals met
6.1: FOR MAjOR DOT AVIATION SYSTEMS, PERCENTAGE OF COST GOALS ESTABLISHED IN THE ACqUISITIONS PROjECT BASELINES THAT ARE MET
100
95
90
85
802006 2007 2008 2009 2010 2011 2012
ACTuAL
TARGeT
FISCAL yeAR
deSCRIPTIOn OF ReSuLTSIn FY 2011, 34 of 34, or 100 percent, of programs remained within their established cost goals. It is important to note that performance against this target is measured based on a program’s estimated total capital acquisition costs at the end of the year, in relation to the estimated total cost at the beginning of the year. A program’s total budget increase is reflected in this measure in the year it is reported. Going forward, the program’s budget at completion also reflects that increase. Thus, for example, the En Route Automation Modernization (ERAM) program did not meet its cost goal in FY 2010 because its estimated total capital acquisition cost increased $330 million (15 percent) during FY 2010. The revised ERAM total cost estimate, including the $330-million increase, is the measurable benchmark included in this target for FY 2011.
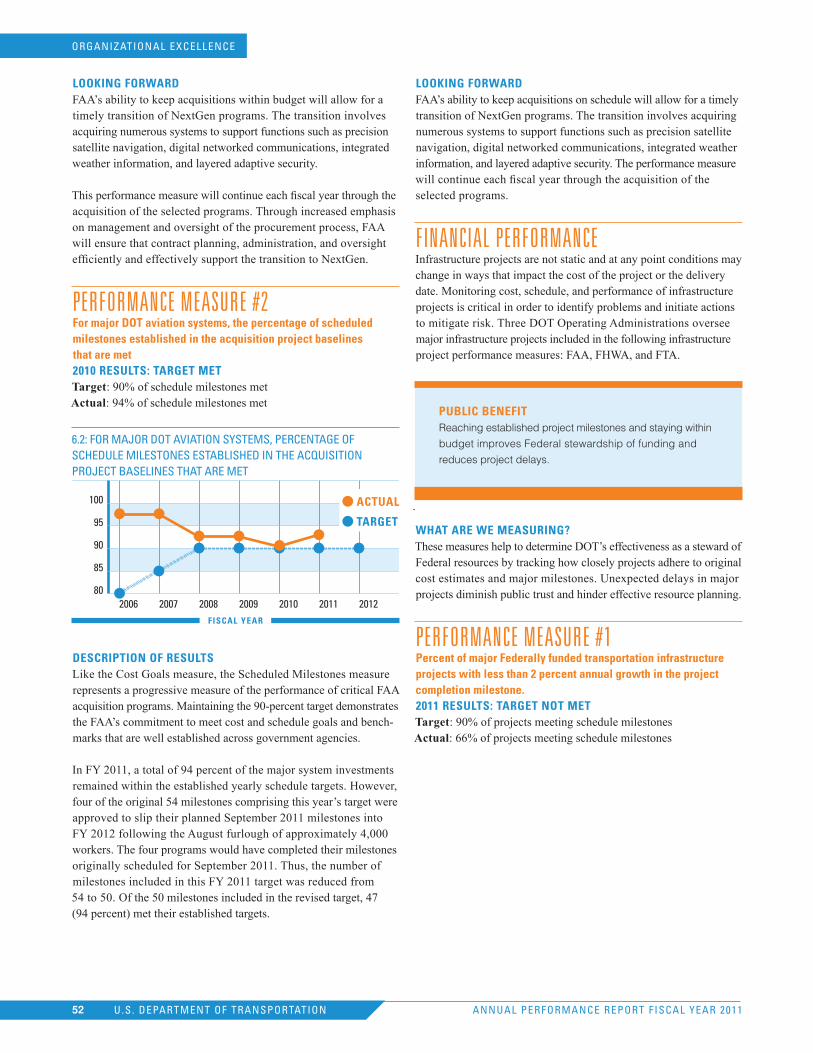
ORGANIZATIONAL EXCELLENCE
ANNUAL PERFORMANCE REPORT FISCAL YEAR 2011U.S. DEPARTMENT OF TRANSPORTATION52
LOOkInG FORWARdFAA’s ability to keep acquisitions within budget will allow for a timely transition of NextGen programs. The transition involves acquiring numerous systems to support functions such as precision satellite navigation, digital networked communications, integrated weather information, and layered adaptive security.
This performance measure will continue each fiscal year through the acquisition of the selected programs. Through increased emphasis on management and oversight of the procurement process, FAA will ensure that contract planning, administration, and oversight efficiently and effectively support the transition to NextGen.
PerformANce meASUre #2For major dOT aviation systems, the percentage of scheduled milestones established in the acquisition project baselines that are met2010 ReSuLTS: TARGeT MeTTarget: 90% of schedule milestones met Actual: 94% of schedule milestones met
6.2: FOR MAjOR DOT AVIATION SYSTEMS, PERCENTAGE OF SCHEDULE MILESTONES ESTABLISHED IN THE ACqUISITION PROjECT BASELINES THAT ARE MET
100
95
90
85
802006 2007 2008 2009 2010 2011 2012
ACTuAL
TARGeT
FISCAL yeAR
deSCRIPTIOn OF ReSuLTSLike the Cost Goals measure, the Scheduled Milestones measure represents a progressive measure of the performance of critical FAA acquisition programs. Maintaining the 90-percent target demonstrates the FAA’s commitment to meet cost and schedule goals and bench-marks that are well established across government agencies.
In FY 2011, a total of 94 percent of the major system investments remained within the established yearly schedule targets. However, four of the original 54 milestones comprising this year’s target were approved to slip their planned September 2011 milestones into FY 2012 following the August furlough of approximately 4,000 workers. The four programs would have completed their milestones originally scheduled for September 2011. Thus, the number of milestones included in this FY 2011 target was reduced from 54 to 50. Of the 50 milestones included in the revised target, 47 (94 percent) met their established targets.
LOOkInG FORWARdFAA’s ability to keep acquisitions on schedule will allow for a timely transition of NextGen programs. The transition involves acquiring numerous systems to support functions such as precision satellite navigation, digital networked communications, integrated weather information, and layered adaptive security. The performance measure will continue each fiscal year through the acquisition of the selected programs.
fINANcIAL PerformANceInfrastructure projects are not static and at any point conditions may change in ways that impact the cost of the project or the delivery date. Monitoring cost, schedule, and performance of infrastructure projects is critical in order to identify problems and initiate actions to mitigate risk. Three DOT Operating Administrations oversee major infrastructure projects included in the following infrastructure project performance measures: FAA, FHWA, and FTA.
PubLIC beneFITReaching established project milestones and staying within
budget improves Federal stewardship of funding and
reduces project delays.
.
WHAT ARe We MeASuRInG?These measures help to determine DOT’s effectiveness as a steward of Federal resources by tracking how closely projects adhere to original cost estimates and major milestones. Unexpected delays in major projects diminish public trust and hinder effective resource planning.
PerformANce meASUre #1Percent of major Federally funded transportation infrastructure projects with less than 2 percent annual growth in the project completion milestone.2011 ReSuLTS: TARGeT nOT MeTTarget: 90% of projects meeting schedule milestones Actual: 66% of projects meeting schedule milestones
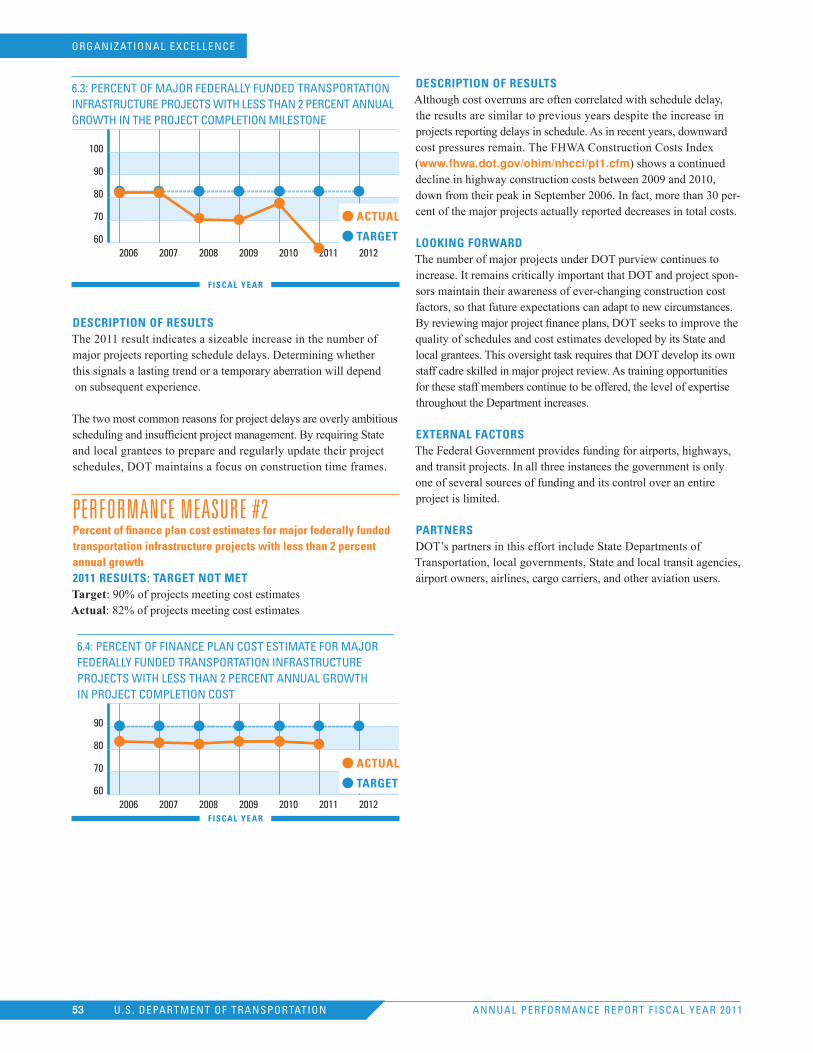
ORGANIZATIONAL EXCELLENCE
ANNUAL PERFORMANCE REPORT FISCAL YEAR 2011U.S. DEPARTMENT OF TRANSPORTATION53
6.3: PERCENT OF MAjOR FEDERALLY FUNDED TRANSPORTATION INFRASTRUCTURE PROjECTS WITH LESS THAN 2 PERCENT ANNUAL GROWTH IN THE PROjECT COMPLETION MILESTONE
100
90
80
70
602006 2007 2008 2009 2010 2011 2012
ACTuAL
TARGeT
FISCAL yeAR
deSCRIPTIOn OF ReSuLTSThe 2011 result indicates a sizeable increase in the number of major projects reporting schedule delays. Determining whether this signals a lasting trend or a temporary aberration will depend on subsequent experience.
The two most common reasons for project delays are overly ambitious scheduling and insufficient project management. By requiring State and local grantees to prepare and regularly update their project schedules, DOT maintains a focus on construction time frames.
PerformANce meASUre #2Percent of finance plan cost estimates for major federally funded transportation infrastructure projects with less than 2 percent annual growth2011 ReSuLTS: TARGeT nOT MeTTarget: 90% of projects meeting cost estimates Actual: 82% of projects meeting cost estimates
6.4: PERCENT OF FINANCE PLAN COST ESTIMATE FOR MAjOR FEDERALLY FUNDED TRANSPORTATION INFRASTRUCTURE PROjECTS WITH LESS THAN 2 PERCENT ANNUAL GROWTH IN PROjECT COMPLETION COST
90
80
70
602006 2007 2008 2009 2010 2011 2012
ACTuAL
TARGeT
FISCAL yeAR
deSCRIPTIOn OF ReSuLTSAlthough cost overruns are often correlated with schedule delay, the results are similar to previous years despite the increase in projects reporting delays in schedule. As in recent years, downward cost pressures remain. The FHWA Construction Costs Index (www.fhwa.dot.gov/ohim/nhcci/pt1.cfm) shows a continued decline in highway construction costs between 2009 and 2010, down from their peak in September 2006. In fact, more than 30 per-cent of the major projects actually reported decreases in total costs.
LOOkInG FORWARdThe number of major projects under DOT purview continues to increase. It remains critically important that DOT and project spon-sors maintain their awareness of ever-changing construction cost factors, so that future expectations can adapt to new circumstances. By reviewing major project finance plans, DOT seeks to improve the quality of schedules and cost estimates developed by its State and local grantees. This oversight task requires that DOT develop its own staff cadre skilled in major project review. As training opportunities for these staff members continue to be offered, the level of expertise throughout the Department increases.
eXTeRnAL FACTORSThe Federal Government provides funding for airports, highways, and transit projects. In all three instances the government is only one of several sources of funding and its control over an entire project is limited.
PARTneRSDOT’s partners in this effort include State Departments of Transportation, local governments, State and local transit agencies, airport owners, airlines, cargo carriers, and other aviation users.
mANAgemeNT’S dIScUSSIoN ANd ANALYSIS
PerformANce dATA comPLeTeNeSS ANd reLIABILITY
PerformANce dATA comPLeTeNeSS ANd reLIABILITY
Performance measurement is dependent on the availability of useful data that will indicate level of performance and help progress toward achieving organizational goals. Because all data are imperfect in some fashion, pursuing perfect data may consume public resources without creating appreciable value. For this reason, there must be an approach that provides sufficient accuracy and timeliness but at a reasonable cost. This section of the report provides information on how DOT uses performance data, assesses limitations of the data, and plans to improve DOT’s data.
55 U.S. DEPARTMENT OF TRANSPORTATION55 ANNUAL PERFORMANCE REPORT FISCAL YEAR 2011
IN geNerALIn an attempt to bring consistency and quality to its performance reporting, DOT has implemented some general rules regarding the data it uses and how it is evaluated.
AnnuAL dATAWhenever available, the data in this document are reported on a Federal Government fiscal year basis. However, there are instances where fiscal year data are not available, so calendar year data are used instead. This often occurs when data are collected and reported to DOT by external sources and a calendar year reporting requirement is specified in the implementing regulation.
COMPLeTeneSS OF dATA FOR AnnuAL ReSuLTSIf available, the results for the most recent year in the report are listed as Actual for each performance measure. When an actual value is not available for the current year, either an estimate or a projection is provided instead. In general, estimates are based on partial-year data that are extrapolated to cover a full 12-month period. Historical trend information, supplemented by program expertise, is then applied to estimate the remaining months of performance for which actual data is unavailable. The result is identified as a preliminary estimate in the report. If partial-year data are not available, then past trend information is analyzed and supplemented by program knowledge to develop a projected value for the annual performance measure. The result is identified as a projection in the report. As data are finalized, the projections and preliminary estimates are replaced by actual results, with resulting changes denoted by an (r). Results are also amended as errors and omissions are identified
in the data verification process, as updated information is provided by the reporting sources, or because of legal or other action that changes a previously-reported value.
ReLIAbILITy OF MeASuReMenT dATADOT performance data are generally reliable (useful to program managers and policy makers). But because performance results in a given year are influenced by multiple factors, some of which are beyond DOT’s control, and some of which are due to random chance, there may be considerable variation from year to year. A better “picture” of performance may be gained by looking at results over time to determine if there is a trend.
We have compiled Source and Accuracy Statements for each of the DOT data programs used in this report, which can be found at: www.bts.gov/programs/statistical_policy_and_research/source_and_accuracy_compendium/index.html. The Source and Accuracy Statements give more detail on the methods used to collect the data, sources of variation and bias in the data, and methods used to verify and validate the data.
Assessing and, where possible, eliminating sources of error in DOT data collection programs has always been an important task for data program managers. As part of their ongoing work, managers of departmental data programs use quality control techniques to identify where errors can be introduced into the data collection system. Program managers also use computerized edit checks and range checks to minimize errors that may be introduced into the data of their respective programs. In addition, quality measurement tech-niques are employed to measure the effects of unanticipated errors.
ANNUAL PERFORMANCE REPORT FISCAL YEAR 2011U.S. DEPARTMENT OF TRANSPORTATION56
These include verification of data collection and coding, as well as coverage, response and non-response error studies to measure the extent of human error affecting the data. As sources of error are identified, data collection is improved.
The data used in measuring performance come from a wide variety of sources. Much of it originates from sources outside of the Department and, therefore, outside of the direct control of the Department. The data often come from administrative records or from sample surveys. While DOT may not have a strong voice in improving the quality of outside data, the Department takes all available information about the limitations and known biases in outside data into account when using the data. To help the Operating Administrations (OAs) address these issues, the Bureau of Transportation Statistics (BTS) is developing a statistical policy framework where the OAs will work together to identify and imple-ment the current statistical best practices in all aspects of their data collection programs. This project is consistent with the data capacity discussions found in the DOT Strategic Plan.
dATA LImITATIoNSdOT dATA SOuRCe LIMITATIOnSTimeliness is the most significant limitation for DOT performance measurement data. Some DOT data are not collected annually; for example, the National Household Travel Survey and the Commodity Flow Survey each collect data every five years. Data that are collected each year (or more frequently) require time to analyze, confirm and report results; for example, Highway Performance Monitoring System vehicle-miles traveled (VMT) data require several months of post-collection processing, making final results unavailable for this performance report. Other performance measure-ment data limitations are identified in the previously mentioned Source and Accuracy Statements for DOT data programs. These statements contain descriptions of data collection program design, estimates of sampling errors (if applicable), and discussions of non-sampling errors. Non-sampling errors include under coverage, item and unit non-response, interviewer and respondent response errors, processing errors, and errors made in data analysis.
eSTIMATInG And PROjeCTIOn TeCHnIqueS uSedAs discussed under completeness, most of the FY 2011 measures must be projected from either partial-year data or historical trends. The projections based on partial-year data from FY 2011 are more likely to reflect changes effected by current DOT policies and pro-grams. The measures projected from FY 2010 and prior historical data reflect continuing trends from ongoing programs, but do not reflect the effects of changes implemented in FY 2011.
eXTeRnAL dATA SOuRCe LIMITATIOnSData that originate from external or third-party sources are not directly controlled by DOT. These data often come from administrative records or from sample surveys. Timeliness is also a significant limitation. For example, many DOT internal data programs rely on data provided by State DOTs. DOT partners closely with the States, but does not have direct control over these programs.
SECURITY PREPAREDNESS & RESPONSE

mANAgemeNT’S dIScUSSIoN ANd ANALYSIS
oTher AccomPANYINg INformATIoN
ANNUAL PERFORMANCE REPORT FISCAL YEAR 2011U.S. DEPARTMENT OF TRANSPORTATION58
INSPecTor geNerAL’S fY 2011 ToP mANAgemeNT chALLeNgeSdePARTMenT OF TRAnSPORTATIOn OFFICe OF InSPeCTOR GeneRAL APPROACHThe Office of Inspector General (OIG) issues its annual report on the Department of Transportation’s top management challenges to provide a forward-looking assessment for the coming fiscal year. The purpose of the report is to aid Department of Transportation (DOT) agencies in focusing attention on and mapping work strate-gies for the most significant management and performance issues facing the Department.
In selecting the challenges for each year’s list, the OIG continually focuses on the Department’s key strategic goals to improve trans-portation safety, capacity, and efficiency. In addition to the OIG’s vigilant oversight of DOT programs, budgetary issues, and progress milestones, it also draws from several dynamic factors to identify key challenges. These include new initiatives, cooperative goals with other Federal departments, recent changes in the Nation’s transportation environment and industry, as well as global issues that could have implications for the United States’ traveling public. As such, the challenges included on the OIG’s list vary each year to reflect the most relevant issues and provide the most useful and effective oversight to DOT agencies.
As required by OMB Circular A-136, the OIG’s report briefly as-sesses DOT’s progress in addressing the challenges identified. To track management challenges identified from year to year, the OIG provides an exhibit to the report that compares the current list of management challenges with the list published the previous fiscal year. In addition, the OIG may refine the scope of the management challenge from year to year based on program developments, exter-nal factors, or other information that becomes available.
The OIG has not reviewed all of the actions included in this summary.
mANAgemeNT chALLeNge 1: eNSUrINg TrANSPAreNcY ANd AccoUNTABILITY IN The dePArTmeNT’S recoverY AcT ProgrAmSISSue 1A: OveRSeeInG AMeRICAn ReCOveRy And ReInveSTMenT ACT (ARRA) PROjeCTS And eXPendITuReSSeCTIOn I: WHy IS THIS ISSue SIGnIFICAnT?The Office of Inspector General’s (OIG) June 2011 Recovery Act Advisory reported that the Federal Highway Administration (FHWA) did not ensure that States conducted federally required value engineering studies on all highway and bridge projects prior to contract award. Further, the Government Accountability Office recently reported that staffing shortages may limit States’ ability to properly implement and manage Recovery Act programs. To ensure that these programs are effectively and properly implemented by the States, it is critical that the Department identify high-risk areas and
target its resources accordingly. Additionally, the Office of Manage-ment and Budget directed agencies to use single audit reports to identify high-risk grantees, ensure resolution of audit findings, and consider additional monitoring and inspections of these grantees.
SeCTIOn II : ACTIOnS TAken In Fy 2011FHWA met the aggressive goal to obligate all apportioned funds by March 1, 2010. In 2010 and 2011, FHWA pursued ongoing mitigation strategies including enhancing resources, conducting outreach, strengthening oversight, and measuring and monitoring success. Through the National Review Team (NRT) assessments of state ARRA management processes and compliance with Federal requirements, FHWA identified problems needing corrective action as well as National trends and potential new risks:
FHWA Division Offices provided a high level of oversight by conducting 5,033 project inspections on Recovery Act projects.
Eighty-three percent of Recovery Act project funds were expended as of October 19, 2011.
NRT completed a total of 226 State site visits, reviewing 305 risk areas and 1,419 Recovery Act projects through September 30, 2011.
SeCTIOn III : ACTIOnS ReMAInInG And eXPeCTed COMPLeTIOn dATeAccording to the provisions of the Recovery Act, funds apportioned and allocated to the States and other grantees were available for obligation until September 30, 2010. Obligated balances are available for expenses incurred until September 30, 2015, at which point any remaining balance will be canceled. FHWA will continue to review and monitor inactive obligations:
September 2012—FHWA will implement National Review Team corrective actions (most are done within 90 to 120 days).
June 2014—Incorporate lessons learned from the Recovery Act processes to improve standard business practices.
September 2015—Highway infrastructure investment projects funded through the Recovery Act must be completed.
FHWA will continue to ensure the delivery of TIGER grants through technical assistance and proactive leadership. TIGER 1 projects must be completed by September 2016.
SeCTIOn Iv: ReSuLTS OR eXPeCTed ReSuLTSA Recovery Act best practices summit was held to discuss how lessons learned can be incorporated into standard business practices for the federal-aid program. Of the 22 follow-up recommendations, 16 were completed or are currently under way.
FHWA increased the level of attention on projects administered by local agencies. Among other things, the number of spot checks and payment reviews increased. The local agencies section of the
ANNUAL PERFORMANCE REPORT FISCAL YEAR 2011U.S. DEPARTMENT OF TRANSPORTATION59
Agency’s stewardship and oversight guidance was strengthened; guidance for responsible charge, Buy America, and consultant services was issued.
ISSue 1b: eXeCuTInG OST’S TIGeR dISCReTIOnARy GRAnTS PROGRAMSeCTIOn I: WHy IS THIS ISSue SIGnIFICAnT?The public investment through the Recovery Act requires that the Department manage the TIGER discretionary grant program with unprecedented accountability and transparency. The Office of the Secretary (OST) has entered into a unique partnership with four relevant modal administrations (Federal Highway Administra-tion, Federal Transit Administration, Maritime Administration, and Federal Railroad Administration) to ensure that the TIGER discretionary grants program is managed properly. Pursuant to this partnership, the modal administrations are responsible for day-to-day management of the TIGER discretionary grants—relying on ex-perience and expertise developed with other grant programs—while OST is responsible for oversight and monitoring of the TIGER dis-cretionary grants and programmatic reporting and decision making.
SeCTIOn II : ACTIOnS TAken In 2011OST made significant progress executing the TIGER discretionary grants program in 2011. Working closely with the modal adminis-trations, OST ensured that TIGER discretionary grant funds for all projects were obligated by December 2010, in advance of the Sep-tember 30, 2011, statutory deadline for obligating funds. In addition, certain funds that were obligated for particular TIGER projects, but which remained unused, needed to be reallocated to other projects. This too was completed by the September 30, 2011, deadline. By early 2011, all TIGER projects executed grant agreements, and by the end of the year, 47 out of 51 total projects completed perfor-mance measurement plans. Also, by the end of 2011, OST executed a plan to conduct limited onsite monitoring for TIGER projects, to supplement the more extensive project oversight activities con-ducted by the modal administrations.
SeCTIOn III : ACTIOnS ReMAInInG And eXPeCTed COMPLeTIOn dATeOversee and monitor all 51 TIGER discretionary grants through their full expenditure and project completion over 5 to 10 years.
SeCTIOn Iv: ReSuLTS OR eXPeCTed ReSuLTSBy the end of FY 2012 the majority of TIGER projects will be under way and DOT will begin to see the impact of a few projects. Accordingly, OST will be able to implement lessons learned to improve the administration and oversight of the TIGER program. Moreover, the Department will be able to analyze data collected from performance measures. This data will be a useful tool as the Department looks for ways to improve current formula programs. Over time, each project will be audited for its performance and compared against its anticipated results. Over a 5-to-10-year period, this process will yield valuable data for analysis and recom-mendations for improving other surface transportation programs.
mANAgemeNT chALLeNge 2: mAINTAININg momeNTUm IN The dePArTmeNT’S overSIghT of hIghwAY, moTor vehIcLe, hAzArdoUS mATerIALS, ANd TrANSIT SAfeTYISSue 2A: AddReSSInG MOTOR veHICLe SAFeTy deFeCTSSeCTIOn I: WHy IS THIS ISSue SIGnIFICAnT?Congress and the American public expect NHTSA to maintain a robust system for identifying potential vehicle safety defects and for taking corrective action if needed. Addressing this issue will strengthen the vehicle safety assurance process in the U.S., and build consumer trust and confidence in the vehicle defect identification and recall process.
SeCTIOn II : ACTIOnS TAken In Fy 2011NHTSA has developed an Office of Defects Investigations (ODI) action plan to address the management recommendations of the OIG report. Several elements have already been implemented:
The computer tracking system has been upgraded to ensure a more effective review and response to the 40,000+ consumer complaints received every year.
NHTSA is developing a new computer program that increases the analytic power to synthesize safety complaints and information from the manufacturers to better identify emerging trends or concerns.
Thee Agency has taken steps to ensure that all personal information of consumers who submit complaints is protected.
NHTSA also convened the first-ever meeting of vehicle safety enforcement agencies from other countries in June 2011 to support the development of an international network and working group on enforcement issues to better identity safety defects and exchange information on recalls.
SeCTIOn III : ACTIOnS ReMAInInG And eXPeCTed COMPLeTIOn dATeA number of other key elements of the plan that will be implemented in FY 2012 include:
Better coordination and linkage of pre-investigation information from disparate sources, such as insurance company data;
Development of a formal training program for ODI staff to ensure that investigators stay-up-to-date with the latest technology; and,
Implementation of a standard documentation and filing procedure to ensure more consistent and complete records.
ANNUAL PERFORMANCE REPORT FISCAL YEAR 2011U.S. DEPARTMENT OF TRANSPORTATION60
SeCTIOn Iv: ReSuLTS OR eXPeCTed ReSuLTSNumerous changes to the vehicle defect and recall system will be implemented to improve the timeliness of the process and the standardization of investigation documentation procedures. This along with additional staff training will result in a more efficient and effective system that will allow NHTSA to better identify, document, and address vehicle safety issues. For more detailed information on the OIG’s recommendations and NHTSA’s response and plans, see the OIG report page 47 at www.oig.dot.gov/library-item/5638.
ISSue 2b: STRenGTHenInG MOTOR CARRIeR enFORCeMenT PROGRAMS And COMMeRCIAL dRIveR’S LICenSe (CdL) STAndARdSSeCTIOn I: WHy IS THIS ISSue SIGnIFICAnT?Despite the recent decrease in large-truck and bus fatalities, the OIG’s Top Management Challenges report for FY 2011 stated that the Federal Motor Carrier Safety Administration (FMCSA) must take additional actions to remove unsafe commercial drivers and motor carriers from the Nation’s highways. The OIG focused on FMCSA’s Commercial Driver’s License (CDL) program, new entrant carrier vetting initiative, implementation of the Compliance Safety Accountability (CSA), and census data reporting.
SeCTIOn II : ACTIOnS TAken In Fy 2011In FY 2011, FMCSA closed or requested closure on the 11 remaining open recommendations pertaining to the OIG’s Top Management Challenge dealing with the CDL program. The catalyst for closing the majority of the recommendations was a comprehensive rulemak-ing entitled “Commercial Driver’s License Testing and Commercial Learner’s Permit Standards.” The rule amends the commercial driver’s license knowledge and skills testing standards and establishes new minimum Federal standards for States to issue the commercial learner’s permit (CLP). The rule requires that a CLP holder meet virtually the same requirements as those for a CDL holder, meaning that a driver holding a CLP will be subject to the same driver disqualification penalties that apply to a CDL holder.
Additionally, FMCSA continues to modify/strengthen the New Entrant Safety Assurance program to better identify start-up truck and bus companies deficient in key safety areas. The Agency continues to expand the impact of its New Applicant Screening tool, which detects unsafe carriers that are attempting to reincarnate as new entities in an attempt to avoid their previous safety records.
In FY 2011, the FMCSA completed a nine-state, 29-month CSA Operational Model Test. CSA is focused on initiating contact with more carriers and drivers, developing a new safety measurement system, applying a wider range of progressive interventions to correct high-risk behavior, and improving the efficient use of Agency resources. One such progressive intervention was a warning letter sent to underperforming carriers. The University of Michigan Transportation Research Institute performed an evaluation of CSA which concluded that the warning letter intervention is highly effective and found that a year after receiving a warning letter, 83 percent of the test carriers had resolved identified safety problems. The study also concluded that the expected number of carriers
touched by CSA annually will be approximately 2.9 times greater than the current system based on compliance reviews alone.
SeCTIOn III : ACTIOnS ReMAInInG And eXPeCTed COMPLeTIOn dATeThe Agency states in its 2012–2016 Strategic Plan that FMCSA is committed to removing high-risk carriers, drivers, and service providers from operation by creating and applying appropriate interventions and enforcement sanctions that bring about satisfactory behavior and improved safety performance.
SeCTIOn Iv: ReSuLTS OR eXPeCTed ReSuLTSThe safety initiatives implemented in FY 2011 will improve safety, increase efficiency, and contribute to a reduction in highway fatalities, crashes, and injuries on the Nation’s roadways.
ISSue 2C: STRenGTHenInG PHMSA’S SPeCIAL PeRMITS And APPROvALS PROGRAM TO ACHIeve ITS SAFeTy MISSIOnSeCTIOn I: WHy IS THIS ISSue SIGnIFICAnT?The Pipeline and Hazardous Materials Safety Administration (PHMSA) regulates up to 1 million movements of hazardous ma-terials a day. Some of these materials are transported under special permits and approvals which under certain conditions allow relief from the Hazardous Materials regulations. In 2009–2010, audits from the U.S. Congress and the DOT Inspector General revealed programmatic deficiencies and shortcomings in PHMSA’s Special Permits and Approvals programs.
SeCTIOn II : ACTIOnS TAken In Fy 2011PHMSA developed and implemented two comprehensive action plans to address the concerns identified by the OIG. Some of the initiatives include the development and implementation of standard operating procedures, renewed interoffice coordination policies, and increases in process transparency. These actions were completed in early FY 2011 and resulted in extensive increases in program accountability and consistency. PHMSA’s focused efforts to complete the action plans resulted in the closure of all 10 of the OIG recommendations by February 2011.
SeCTIOn III : ACTIOnS ReMAInInG And eXPeCTed COMPLeTIOn dATeAlthough the 10 OIG recommendations are closed, PHMSA continues to work diligently to strengthen its oversight of the Special Permits and Approvals programs. Part of the action plans also included an IT modernization component to re-engineer and develop IT solutions to improve business efficiencies.
SeCTIOn Iv: ReSuLTS OR eXPeCTed ReSuLTSThe efforts taken under the action plans have greatly increased the accountability, transparency, and consistency of the Special Permits and Approvals programs. PHMSA’s continuing efforts to implement IT solutions, including improved online access and system automation, will garner greater efficiency in its safety program.
ANNUAL PERFORMANCE REPORT FISCAL YEAR 2011U.S. DEPARTMENT OF TRANSPORTATION61
mANAgemeNT chALLeNge 3: mAINTAININg momeNTUm IN AddreSSINg hUmAN fAcTorS ANd ImProvINg SAfeTY overSIghT of The AvIATIoN INdUSTrYISSue 3A: AdvAnCInG InduSTRy And GOveRnMenT eFFORTS TO AddReSS PILOT TRAInInG And FATIGue ISSueSSeCTIOn I: WHy IS THIS ISSue SIGnIFICAnT?Fatigue threatens aviation safety because it increases the risk of pilot error that could lead to an accident. Several aviation-specific work schedule factors can affect sleep and subsequent alertness. These include early start times, extended work periods, insufficient time off between work periods, insufficient recovery time off between consecutive work periods, amount of work time within a shift or duty period, insufficient time off between work periods, number of consecutive work periods, night work through one’s window of circadian low, daytime sleep periods, and day-to-night or night-to-day transitions.
SeCTIOn II : ACTIOnS TAken In Fy 2011The FAA took several actions to address pilot fatigue in 2011. These actions include: issuing guidance to Part 121 air carriers on the development and approval of fatigue risk management programs; contracting with the National Academy of Sciences (NAS) for a study on the effects of commuting on pilot fatigue; and issuing proposed new regulations for flight and duty limitations and rest requirements for Part 121 air carrier operations.
The Airline Safety and Federal Aviation Administration Extension Act of 2010 required all Part 121 air carriers to develop and submit a fatigue risk management plan (FRMP) by November 1, 2010. An FRMP is an air carrier’s management plan outlining policies and procedures for reducing the risks of flightcrew member fatigue and improving flightcrew member alertness. The plan can also serve as the framework for an air carrier to develop a fatigue risk management system. To facilitate the development of an air carrier FRMP, the FAA issued an Information for Operators notice on Au-gust 19, 2010. All Part 121 air carriers have developed an FRMP. The FAA reviewed and approved all plans by August 15, 2011.
The FAA entered into an agreement with NAS to study the effects of commuting on pilot fatigue. In its report, NAS concluded that it had insufficient evidence to determine the extent to which commuting is a safety risk in commercial aviation. The FAA has reviewed the NAS report and determined that its current activities surrounding FRMP and rulemaking address the NAS recommendations.
SeCTIOn III : ACTIOnS ReMAInInG And eXPeCTed COMPLeTIOn dATeThe FAA has developed its proposed final rule, which was published in 2012.
SeCTIOn Iv: ReSuLTS OR eXPeCTed ReSuLTSThe FAA expects to see a reduction in pilot error resulting from fatigue. Individual air carriers will make revisions to their scheduling practices as a result of the fatigue reporting associated with the fatigue risk management programs. Air carrier pilots will know how to manage their personal contributors to fatigue as a result of improved education, which is also required by an FRMP. In the long term, FAA expects Part 121 air carriers to revise their scheduling practices to comply with the final rule.
ISSue 3b: enHAnCInG RISk-bASed OveRSIGHT OF PART 121 AIR CARRIeRS And FOReIGn And dOMeSTIC RePAIR STATIOnSSeCTIOn I: WHy IS THIS ISSue SIGnIFICAnT?The Office of the Inspector General (OIG) considers FAA’s National-level oversight of Air Transportation Oversight System (ATOS) inspections to be ineffective. The OIG also stated that FAA needs to do a better job identifying aircraft repair stations that perform safety-critical repairs and target its surveillance accordingly.
SeCTIOn II : ACTIOnS TAken In Fy 2011To improve its oversight of ATOS inspections, FAA is tracking uncompleted ATOS inspections. This data is used to ensure that inspections are scheduled and staffing resources are assigned appropriately.
To better target aircraft repair stations, FAA defined a new category of safety-critical maintenance as “essential maintenance” and requires its inspectors to perform an initial inspection of essential maintenance providers followed by triennial recurring inspections. The Agency clarified internal guidance to target resources for repair station inspections and published an advisory circular on contract maintenance best practices.
SeCTIOn III : ACTIOnS ReMAInInG And eXPeCTed COMPLeTIOn dATeFAA will continue developing the Flight Standards Safety Assurance System, an improved system for oversight of air carriers and repair stations using system-safety principles. The Agency intends to complete system development by December 2013.
SeCTIOn Iv: ReSuLTS OR eXPeCTed ReSuLTSBeginning in FY 2010, FAA updated inspector guidance to clearly identify maintenance facilities that perform safety-critical mainte-nance and required an initial inspection of these facilities followed by triennial recurring inspections. These activities continued in FY 2011 and resulted in more rigorous oversight of foreign and domestic repair stations performing safety-critical maintenance.
Beginning in FY 2011, the Agency had the benefit of trending infor-mation regarding uncompleted ATOS inspections. This information is useful for ensuring compliance with National policy and identify-ing field office staffing disparities.
ANNUAL PERFORMANCE REPORT FISCAL YEAR 2011U.S. DEPARTMENT OF TRANSPORTATION62
Beginning in FY 2014, FAA will use its Safety Assurance System to provide enhanced oversight of air carriers and repair stations.
mANAgemeNT chALLeNge 4: ImProvINg The dePArTmeNT’S overSIghT of hIghwAY, TrANSIT, ANd PIPeLINe INfrASTrUcTUreISSue 4A: TRACkInG And MOnITORInG STATeS’ And LOCALITIeS’ uSe OF FedeRAL FundSSeCTIOn I: WHy IS THIS ISSue SIGnIFICAnT?OIG maintains that the FHWA Fiscal Management Information System (FMIS) lacks sufficient detail on States’ use of Highway Bridge Program (HBP) funds.
SeCTIOn II : ACTIOnS TAken In Fy 2011The FHWA fulfilled the Federal-aid program requirements using existing legacy systems. Specifically, FHWA uses National Bridge Inventory (NBI) data to determine the States’ bridge needs and to apportion HBP funds. FHWA monitors and tracks the condition of the Nation’s bridges through information in the NBI. In response to the OIG’s January 2010 report, the FHWA initiated actions to explore possible enhancements to FMIS for collecting and analyzing expenditures on the Nation’s bridges. Possible enhancements considered include more detailed project cost information. FHWA is currently evaluating the integration of existing standalone legacy systems and the collection of more detailed bridge project data.
SeCTIOn III : ACTIOnS ReMAInInG And eXPeCTed COMPLeTIOn dATeInitial implementation of system enhancements to FMIS, which will include more detailed bridge project data, is targeted for September 2012. However, actual implementation is contingent upon funding and other factors.
SeCTIOn Iv: ReSuLTS OR eXPeCTed ReSuLTSFHWA aims to obtain additional data in a cost-effective way that will provide more detailed information to analyze and track activities undertaken by the States to improve the Nation’s bridges. FHWA will continue to take necessary steps to close OIG’s recommendation issued in its January 2010 report.
ISSue 4b: enSuRInG InFRASTRuCTuRe SAFeTy And PROTeCTInG FedeRALLy Funded HIGHWAy And TRAnSIT PROjeCTS FROM FRAudSeCTIOn I: WHy IS THIS ISSue SIGnIFICAnT?The OIG maintains that FHWA must determine with greater consistency whether States complied with National Bridge Inspection Standards (NBIS) and define procedural steps for enforcing compliance; and that the DOT and Operating Administrations must aggressively combat fraud, waste, and abuse.
SeCTIOn II : ACTIOnS TAken In Fy 2011Enhancing bridge safety and improving oversight of the National Bridge Inspection Program is a long-standing objective of FHWA. In support of that goal, and in response to OIG’s recommendations, FHWA completed its effort to establish clearly defined levels of compliance and developed a uniform method for determining those levels of compliance. FHWA’s new oversight approach, launched in March 2011, includes 23 NBIS metrics (or quantified requirements) that can be independently assessed to determine compliance. A key difference from past practice is that FHWA moved from an overall compliance determination for a State to an individual compliance determination for each metric.
In an effort to combat fraud, waste, and abuse, FHWA established a dedicated team within the Office of Chief Counsel to work with FHWA’s Associate Administrator for Infrastructure, who serves as the Agency’s debarring official. This team is responsible for identification, review, and disposition of all pending suspension and matters within stated deadlines. The team immediately set about developing and implementing a revised set of detailed case processing protocols. Notably, FHWA’s revised protocols call for issuing suspension and proposed debarment orders within 45 days of notification to FHWA of an indictment from any source, or making a written justification as to why a suspension or debarment is not war-ranted under the circumstances. FHWA completed a comprehensive inventory of cases on hand and established a case tracking system that includes monthly status reports to management. Work is ongoing to reconcile FHWA tracking with the database managed by the Office of the Secretary.
SeCTIOn III : ACTIOnS ReMAInInG And eXPeCTed COMPLeTIOn dATeActions to address OIG’s recommendations issued in its January 2009 report (“Develop and implement minimum requirements for data-driven, risk-based bridge oversight during bridge engineers’ annual NBIS compliance reviews” and “Develop a comprehensive plan to routinely conduct systematic, data-driven analysis to identify nationwide bridge safety risks, prioritize them, and target those higher priority risks for remediation in coordination with States”) are complete. OIG closed both recommendations in March 2011.
Action is ongoing to combat fraud, waste, and abuse. Specifically, subsequent to the OIG May 2009 Recovery Act Advisory on suspension and debarment, FHWA implemented a comprehensive review of suspension and debarment policies, processes, backlogs, and resources, and has actions completed and under way to substan-tially improve its handling of suspension and debarment referrals.
SeCTIOn Iv: ReSuLTS OR eXPeCTed ReSuLTSThe Office of the Senior Procurement Executive (OSPE) concurred with OIG’s recommendation to “Improve the Office of the Senior Procurement Executive’s internal controls for the entry of accurate, complete, and timely suspension and debarment information to Exclude Parties List System (EPLS), such as periodic reconciliations between SharePoint and EPLS.” Once OSPE’s revised SharePoint site is fully operational, DOT and the Operating Administrations
ANNUAL PERFORMANCE REPORT FISCAL YEAR 2011U.S. DEPARTMENT OF TRANSPORTATION63
will have the capability to continuously monitor and report on all suspension and debarment actions. FHWA continues to work with OSPE to ensure data accuracy in the SharePoint system that enables the Department to capture and document suspension and debarment actions in a more comprehensive manner than previously available.
ISSue 4C: enSuRInG PIPeLIne OPeRATORS IdenTIFy And RePAIR deFeCTS In OIL And GAS PIPeLIneS In A TIMeLy MAnneRSeCTIOn I: WHy IS THIS ISSue SIGnIFICAnT?PHMSA and its State partners regulate more than 2.5 million miles of hazardous liquid and natural gas pipelines in the U.S. Many of these pipelines are more than 60 years old and may have been constructed from materials that would not be acceptable by today’s standards. Some may have been unknowingly damaged by outside forces, such as backhoes, and contain flaws that increase in severity with continued use of the pipeline. It is important that pipeline companies identify and repair these defects before they grow to critical size and put American lives at risk.
SeCTIOn II : ACTIOnS TAken In Fy 2011August 2 marked the implementation date of new PHMSA regulations for Distribution Integrity Management Plans (DIMP). This important rulemaking requires companies that supply natural gas to homes and businesses via distribution pipelines to apply risk management principles to their facilities. Companies must now identify threats to these pipelines and perform a risk assessment and integrity evaluation to ensure continued safe operation. The DIMP rule complements similar regulations already in place for natural gas transmission and hazardous liquid pipelines. PHMSA and its State partners continue to conduct focused integrity management inspections on all types of pipelines to ensure that pipeline risks are addressed.
PHMSA issued an advance notice of proposed rulemaking in 2011 requesting comment on whether integrity management regulations for gas transmission pipelines should be extended beyond areas where a failure “could affect” high consequence areas or sensitive environmental areas. PHMSA also continues to increase public awareness of 811 “Call Before You Dig” programs and damage prevention programs to decrease outside force damage. PHMSA continues to urge all stakeholders to increase research and development funding for pipeline safety technology needs.
SeCTIOn II I : ACTIOnS ReMAInInG And eXPeCTed COMPLeTIOn dATePHMSA will evaluate comments on extending the integrity management regulations and develop rulemaking as appropriate during 2012–2013; complete rulemaking to enforce State damage prevention laws in 2012; and develop a National 811 public aware-ness campaign in 2012. In 2012, PHMSA will hold a research and development workshop to identify gaps in technology. PHMSA research funds will be allocated to address the highest value projects that will respond to the identified gaps.
SeCTIOn Iv: ReSuLTS OR eXPeCTed ReSuLTSResults of these activities will reduce the number of new damages to pipelines and remove defects currently existing in all types of pipelines across the country.
mANAgemeNT chALLeNge 5: IdeNTIfYINg SUffIcIeNT fUNdINg SoUrceS To SUPPorT fUTUre federAL INveSTmeNT IN SUrfAce TrANSPorTATIoN INfrASTrUcTUreSeCTIOn I: WHy IS THIS ISSue SIGnIFICAnT?Revenues into the Highway Trust Fund are below authorized expenditures, creating funding shortfalls. Short-term authorizations make it impossible for States and local governments to develop necessary long-term plans for highway, bridge, and transit repair and construction.
SeCTIOn II : ACTIOnS TAken In Fy 2011In February 2011, the Department submitted the Administration’s six-year Surface Transportation Plan, with funding levels. The Department continued stakeholder outreach and coordination, which will be ongoing until Congress passes a bill.
SeCTIOn III : ACTIOnS ReMAInInG And eXPeCTed COMPLeTIOn dATeRelevant Congressional leaders are targeting March 2012 to pass a Reauthorization Bill at substantially the same levels as the last bill.
SeCTIOn Iv: ReSuLTS OR eXPeCTed ReSuLTSDOT anticipates a six-year solution to Highway Trust Fund solvency in or after March 2012.
mANAgemeNT chALLeNge 6: TrANSformINg frA To AddreSS SIgNIfIcANTLY exPANded overSIghT reSPoNSIBILITIeSISSue 6A: PROvIdInG SuFFICIenT OveRSIGHT OF THe IMPLeMenTATIOn And MAnAGeMenT OF THe HIGH-SPeed And InTeRCITy PASSenGeR RAIL (HSIPR) PROGRAMSeCTIOn I: WHy IS THIS ISSue SIGnIFICAnT?Utilizing high-speed rail grant funds could be a significant challenge for States. The Federal Railroad Administration (FRA) will not disburse funds until States finalize agreements with freight railroads that specify the improvements the projects are to achieve. Freight railroads have voiced concerns about certain requirements in these agreements. Specifically, the railroads claim that requiring the freight railroads to incur all expenses necessary to ensure that passenger rail service meets on-time metrics would be unduly burdensome.

ANNUAL PERFORMANCE REPORT FISCAL YEAR 2011U.S. DEPARTMENT OF TRANSPORTATION64
SeCTIOn II : ACTIOnS TAken In Fy 2011FRA has made substantial progress in working with States and freight railroads on finalizing agreements to get funds obligated. As of September 30, 2011, FRA had obligated more than $8 Billion for high-speed and intercity passenger rail projects, including 98 percent of Recovery Act funds. FRA has increased its efforts to further clarify for States and freight railroads the types of agreements and conditions that are required to obligate funds, and to date has entered into agreements with all but one of the Class I freight railroads that have an HSIPR project. Discussions with States and negotiations with the freight railroads have significantly resolved misconceptions and misunderstandings, and further guidance will allow for continued progress and more acceptable agreements.
SeCTIOn III : ACTIOnS ReMAInInG And eXPeCTed COMPLeTIOn dATeFRA is continuing to obligate funds as projects meet the obligation requirements. FRA anticipates obligating the remaining $1.7 billion of awards by September 30, 2012. FRA expects to:
Provide specific guidance to States and freight railroads on the types of agreements and conditions required to obligate funds; and,
Continue working with the States and freight railroads to complete acceptable agreements.
SeCTIOn Iv: ReSuLTS OR eXPeCTed ReSuLTSAcceptable agreements will be in place for the program that will allow FRA to obligate HSIPR funds and projects to move forward.
ISSue 6b: AddReSSInG neW PASSenGeR RAIL IMPROve-MenT And InveSTMenT ACT (PRIIA) RequIReMenTS TO enHAnCe PASSenGeR RAILSeCTIOn I: WHy IS THIS ISSue SIGnIFICAnT?FRA must balance such new PRIIA requirements as initiatives to improve or establish intercity passenger rail service; design a long-range National rail plan; and develop metrics for passenger rail service quality with FRA’s traditional grant and loan programs. The Rail Line Relocation discretionary grant, Railroad Rehabilitation and Improvement Financing loan, and Amtrak grant programs accounted for 37 percent of FRA’s $4.4-billion FY 2010 budget.
SeCTIOn II : ACTIOnS TAken In Fy 2011FRA is realigning its organizational structure by establishing regional managers whose portfolios will include projects from all programs that the Office of Passenger and Freight Programs administers. Procedures for managing the portfolios are being developed, including status reports for management and other stakeholders. These pro-cedures and performance targets and metrics will be included in the regional managers’ performance plans. Specific training requirements in the areas of grant management and project development, delivery, and oversight are being identified in the performance plans. FRA is also establishing working groups to define and develop internal business processes, technical guidance for grantees, and a long-term project monitoring program.
SeCTIOn III : ACTIOnS ReMAInInG And eXPeCTed COMPLeTIOn dATeIn FY 2012, FRA expects to:
Complete all administrative requirements for the new organizational structure and performance planning;
Develop procedures for managing project portfolios, including reporting schedules and formats;
Conduct training in the areas of grant management and project development, delivery, and oversight; and,
Develop internal business processes, technical guidance for grantees, and a long-term project monitoring program.
SeCTIOn Iv: ReSuLTS OR eXPeCTed ReSuLTSFRA will have an organizational structure and processes in place that will provide for efficient and effective management and oversight of all programs through an integrated approach.
ISSue 6C: enSuRInG THe SAFe And SeCuRe MOveMenT OF PeOPLe And GOOdS WHILe undeRTAkInG InCReASed PASSenGeR RAIL ReSPOnSIbILITIeSSeCTIOn I: WHy IS THIS ISSue SIGnIFICAnT?The Railroad Safety Improvement Act (RSIA) requires FRA to develop a long-term strategy for improving railroad safety, including annual plans to address six specified goals. RSIA further requires FRA to establish a discretionary grant program to support the development and deployment of positive train control (PTC) technologies.
SeCTIOn II : ACTIOnS TAken In Fy 2011FRA uses the following tools to address this issue:
National Inspection Program;
Risk Reduction Program;
Rail Safety Technology and other grants;
Regulations and regulatory relief;
Rail Safety Advisory Committee; and,
Stakeholder outreach and dialogue.
FRA will periodically revise its safety strategy and annual plans to reflect the most current data. FRA has awarded funds appropriated to date for Rail Safety Technology grants.
SeCTIOn III : ACTIOnS ReMAInInG And eXPeCTed COMPLeTIOn dATeFRA plans to continue these activities in FY 2012:
Rail Safety Technology grant oversight;
Outreach to freight, passenger, and commuter railroads to identify and resolve development and installation issues associated with PTC; and,
ANNUAL PERFORMANCE REPORT FISCAL YEAR 2011U.S. DEPARTMENT OF TRANSPORTATION65
Outreach to new passenger railroads and host freight railroads to ensure safe operation.
FRA also plans to undertake these activities in FY 2012:
Issue Notices of Proposed Rulemaking on risk reduction programs for freight and passenger railroads to provide PTC regulatory relief;
Issue a proposed rule on emergency notification systems for grade crossings;
Issue final rules on hours of service and crew fatigue for passenger carriers, conductor certification, and safety and health requirements related to camp cars;
Complete regulatory guidance for structural and occupant protection for high-speed equipment; and,
Type approval of the Electronic Train Management System and Vital Electronic Train Management PTC systems.
SeCTIOn Iv: ReSuLTS OR eXPeCTed ReSuLTSIn FY 2012 FRA expects to see:
Fewer train accidents and non-accident releases of hazardous materials;
Significant progress toward resolution of PTC development and deployment issues; and,
Significant progress toward PTC system deployment.
In the future FRA expects to see:
Enhanced freight railroad capacity;
Expanded passenger service, including high-speed rail;
Successful implementation of PTC systems; and
Improved ability to address emerging problems quickly and effectively.
ISSue 6d: bALAnCInG An InCReASed And dIveRSIFIed WORkLOAd WITH THe COnTInuInG need TO OveRSee AMTRAk OPeRATIOnSSeCTIOn I: WHy IS THIS ISSue SIGnIFICAnT?The PRIIA requires FRA to produce quarterly reports on Amtrak’s cost recovery, ridership, on-time performance, minutes and causes of delay, on-board services, stations, facilities, and equipment. Also, FRA must oversee Amtrak compliance with requirements to ensure that its services and facilities are accessible to individuals with disabilities.
SeCTIOn II : ACTIOnS TAken In Fy 2011FRA has produced the required quarterly reports on the performance and service quality of intercity passenger train operations. The reports are available at www.fra.dot.gov/rpd/passenger/2165.shtml.
FRA has interagency agreements in place with the Volpe Center to oversee Amtrak’s Americans with Disabilities Act and Rehabilitation Act projects. In addition, the Agency uses a database to track the status of projects. The Office of Civil Rights audits Amtrak compliance with the Americans with Disabilities Act and Rehabilitation Act requirements.
FRA and Amtrak cooperatively developed the PRIIA-required cost accounting system. FRA’s report on the system is available at www.fra.dot.gov/rpd/ passenger/1240.shtml.
The Next Generation Equipment Committee has been established and published technical specifications for bi-level and single-level passenger cars and locomotives. Information on the Committee’s activities is available at www.highspeedrail.org/Pages/ Section305Committee.aspx.
SeCTIOn III : ACTIOnS ReMAInInG And eXPeCTed COMPLeTIOn dATeIn FY 2012, FRA expects to continue using the Volpe Center to conduct oversight of Amtrak’s future-year capital programs. Using FY 2010 appropriated funds, FRA has a grant agreement with Amtrak to support the Next Generation Equipment Committee. The Agency intends to amend the existing grant agreement with Amtrak to add FY 2011 appropriated funds.
SeCTIOn Iv: ReSuLTS OR eXPeCTed ReSuLTSFRA expects that Amtrak will continue making substantial progress toward complying with the Americans with Disabilities Act and Rehabilitation Act. The Next Generation Equipment Committee will also continue developing specifications for near-term equipment purchases.
mANAgemeNT chALLeNge 7: AdvANcINg The NexT geNerATIoN AIr TrANSPorTATIoN SYSTem whILe eNSUrINg The SAfe ANd effIcIeNT oPerATIoN of The NATIoNAL AIrSPAce SYSTemISSue 7A: eSTAbLISHInG ReALISTIC PLAnS And SeTTInG eXPeCTATIOnS FOR neXTGenSeCTIOn I: WHy IS THIS ISSue SIGnIFICAnT?The Next Generation Air Transportation System (NextGen), a satellite-based air traffic control system intended to replace the current ground-based system, is vital to revolutionizing the U.S. aviation system and sustaining the Nation’s long-term economic growth. FAA has struggled to establish realistic plans and set expectations for NextGen in the near, mid, and long term. FAA has not yet established detailed milestones to complete initiatives at high-activity locations that affect delays Nationwide.
ANNUAL PERFORMANCE REPORT FISCAL YEAR 2011U.S. DEPARTMENT OF TRANSPORTATION66
SeCTIOn II : ACTIOnS TAken In Fy 2011The NextGen Management Board, chaired by the FAA Deputy Administrator, and the NextGen Review Board developed a set of milestones to track key NextGen issues. These milestones are drawn from NextGen’s multiple programs and are parallel. These milestones and their results are as follows:
Milestone 1—Approve Area Navigation (RNAV) and Required Navigation Performance (RNP) for closely spaced parallel runway approaches. In September 2011, the FAA updated Order 7110.65 to approve any combination of RNAV, RNP, Localizer Performance with Vertical Guidance and Instrument Landing System for simultaneous independent and dependent approaches to closely spaced parallel runways.
Milestone 2—Metroplex Optimization of Airspace and Procedures. The study phase was completed for the Charlotte, Northern California, and Houston metroplexes in September 2011. Additional studies in Atlanta and Southern California were under way in September 2011.
Milestone 3—Continuous Low Energy, Emissions and Noise (CLEEN). By September 30, 2011, the FAA had completed a low-speed wind tunnel demonstration of a subscale B737 aircraft.
Milestone 4—Automated Terminal Proximity Alert (ATPA). ATPA has been implemented at Minneapolis, St. Louis, Denver, and Chicago.
Milestone 5—NavLean Implementation Plan. The NavLean Implementation Plan was approved in June 2011.
Milestone 6—Recommendations from the ADS-B Aviation Rulemaking Committee (ARC). The ADS-B ARC completed its final recommendations as of September 30, 2011.
Milestone 7—System Wide Information Management (SWIM). SWIM-related work for the activities was completed and implemented on September 30, 2011, except for the portion that depends on a later ERAM release.
SeCTIOn III : ACTIOnS ReMAInInG And eXPeCTed COMPLeTIOn dATeAn FAA internal group has been working closely with the NextGen Advisory Committee and will deliver a final set of FAA NextGen metrics to the NextGen Management Board for approval in December 2011.
SeCTIOn Iv: ReSuLTS OR eXPeCTed ReSuLTSThese efforts will immediately improve efficiency and the operational availability of NAS resources. Establishing FAA NextGen metrics in FY 2012 will improve FAA’s long-term planning for NextGen.
ISSue 7b: AddReSSInG PRObLeMS WITH OnGOInG MOdeRnIZATIOn PROjeCTS THAT ARe eSSenTIAL TO neXTGen’S SuCCeSSSeCTIOn I: WHy IS THIS ISSue SIGnIFICAnT?FAA’s ERAM program missed critical baseline milestones in FY 2009 and FY 2010. ERAM is considered a transformational program that is necessary for the agency to sustain current en route operations as well as facilitate usage of the planned NextGen capabilities.
SeCTIOn II : ACTIOnS TAken In Fy 2011During FY 2011, the ERAM team received authorization to deploy the solution on March 29, 2011. Shortly after, due to continuing concerns with some core air traffic control functionality in ERAM, a TIGER team was established to determine improvements necessary to give the Agency confidence in moving through the complete deployment of ERAM. This TIGER team developed a list of 117 issues needing to be corrected prior to commencing the wa-terfall deployment. The 117 improvements have been developed in three software releases between April and September.
The Agency expects that ERAM will achieve initial operations (defined as IOC) on ERAM at four to six additional sites by the end of calendar year 2011. This will begin the transition from initial through extended and on to continuous operations at these sites following a site benchmarking process.
In June 2011, the FAA re-baselined the ERAM program based on the missed program baseline milestones. The acquisition cost baseline was increased by $330 million and the acquisition program baseline schedule was extended to a last site operational readiness date (ORD) of August 2014.
SeCTIOn III : ACTIOnS ReMAInInG And eXPeCTed COMPLeTIOn dATeContinue with the waterfall deployment of ERAM in FY2012 and FY2013. At each Air Route Traffic Control Centers (ARTCC) site these activities include: air traffic and technical operations system checkout, conducting air traffic and technical operations refresher training, setting up site-specific adaptation parameters, and delivering software releases with site-specific content. Expected results include:
Achieve initial operation at four to six ARTCC sites by December 31, 2011;
Achieve initial operation at five to seven additional ARTCC sites by September 30, 2012; and,
Achieve initial operation at remaining seven ARTCC sites by September 30, 2013.
ANNUAL PERFORMANCE REPORT FISCAL YEAR 2011U.S. DEPARTMENT OF TRANSPORTATION67
SeCTIOn Iv: ReSuLTS OR eXPeCTed ReSuLTSAccomplish the overall ERAM acquisition program baseline by achieving last site operations by August 2014.
ISSue 7C: MAXIMIZInG THe deLIveRy And IMPLeMenTATIOn OF neW PeRFORMAnCe-bASed nAvIGATIOn InITIATIveS THAT CAn enHAnCe CAPACITy And ReduCe deLAySSeCTIOn I: WHy IS THIS ISSue SIGnIFICAnT?As air travel continues to be a way of life, increasing demands are made on airspace capacity. Although FAA is maximizing the ef-ficiency and safety of the National Airspace System (NAS) through performance-based navigation (PBN) and airspace redesign, there is a need to streamline and expedite the implementation processes. Consistent implementation methodology and developing integrated benefit-focused projects are two key areas that will resolve the issue.
SeCTIOn II : ACTIOnS TAken In Fy 2011In FY 2011, FAA continued to refine the integrated airspace and procedures concept. The goal is to ensure that the system works for everyone, including air traffic controllers, pilots, airports, and the community.
In FY 2011, FAA completed the Draft FAA Order, “Process for Development and Implementation of Performance-Based Navigation (PBN) Procedures and Routes.” This order provides a standardized process for the development and implementation of applications.
FAA’s PBN goals were aligned with the Administrator’s Destination 2025 strategic vision. The new benefit-focused PBN goals were approved by the Administrator in February 2011. These include integrated PBN projects in metroplex areas, high-altitude area navigation routes, and promoting PBN concepts globally.
SeCTIOn III : ACTIOnS ReMAInInG And eXPeCTed COMPLeTIOn dATe
Review and approve the new Safety Management System-com-pliant PBN Order scheduled for completion by September 2012.
Release Interim Guidance documents for streamlined processing of Standard Instrument Departures/Standard Terminal Arrival Routes and Required Navigation Performance processes PBN Order in FY 2012.
SeCTIOn Iv: ReSuLTS OR eXPeCTed ReSuLTSThe expected result, this year and in the future, is to have a streamlined process for design and implementation of benefit-focused integrated PBN projects.
ISSue 7d: enSuRInG A SuFFICIenT nuMbeR OF CeRTIFIed PROFeSSIOnAL COnTROLLeRS AT CRITICAL FACILITIeSSeCTIOn I: WHy IS THIS ISSue SIGnIFICAnT?The FAA estimates that it will need to hire and train nearly 11,000 new air traffic controllers between FY 2011 and FY 2020. Some of these new hires will be assigned to complex facilities. Because of this, the FAA needs to minimize the risk that less
experienced controllers impose on the most critical facilities to the National Airspace System (NAS). Key challenges will be ensuring adequate staffing, training resources, and other support to maintain continuity of facility operations.
SeCTIOn II : ACTIOnS TAken In Fy 2011The FAA certified more than 1,000 controllers by the end of July 2011, two months ahead of the fiscal-year goal. It published its annual Controller Workforce Plan update in March, detailing the latest staffing strategy, initiatives, and results. The Agency continues to closely monitor workforce attrition.
In order to staff NAS-critical facilities with experienced controllers, beginning in FY 2011 FAA restricted placement of inexperienced new hires into the busiest facilities. To attract internal certified professional controllers to the critical facilities, the FAA offered relocation funds and bonuses.
In addition, FAA is piloting the Operational Assessment Program (OAP), which screens applicants who want to transfer to TRACON facilities with more complex air traffic. The program includes a knowledge exam and skills assessment as part of the pre-selection criteria, which would provide the hiring manager with additional data to consider in making the hiring decisions. OAP could screen out applicants who lack skills to succeed at more complex and NAS-critical facilities.
The FAA required all new hires destined to the busiest TRACONs to attend the FAA Academy’s Terminal Skills Enhancement Workshop, which provides additional practice in simulators to prepare students for a more complex air traffic environment, many of which are NAS-critical facilities.
The FAA also deployed additional simulators and training equipment to the field to expand use of e-learning content delivery, enhance realism for training scenarios, and increase automation. The Agency installed the SimFast terminal radar simulator capability at more than 50 locations that did not previously have access to a terminal radar simulator and deployed six additional Tower Simulator Systems to the field and the FAA Academy. By increasing use of simulators for refresher training, controllers have the opportunity to hone air traffic skills and increase technical proficiency.
SeCTIOn III : ACTIOnS ReMAInInG And eXPeCTed COMPLeTIOn dATeEnsuring adequate staffing at NAS-critical facilities is an ongoing goal for the FAA. Upcoming milestones include:
Expand OAP pilot to Atlanta and Southern California TRACONs in the first quarter of FY 2012;
Use additional vacancy announcements in FY 2012 to transfer controllers with previous air traffic experience to NAS-critical facilities;
Develop a refresher course for On-the-Job Training Instructors to improve their teaching competency and performance as instructors in FY 2012;
ANNUAL PERFORMANCE REPORT FISCAL YEAR 2011U.S. DEPARTMENT OF TRANSPORTATION68
Develop and implement a skill enhancement workshop at the FAA Academy for students assigned to the busiest control towers so students arrive at their assigned facilities better prepared for a more complex air traffic environment; and,
Manage training content using a Learning Content Management System, which allows content developers to search, find, and reuse learning.
SeCTIOn Iv: ReSuLTS OR eXPeCTed ReSuLTSThe FAA expects that controllers-in-training at NAS-critical facilities will benefit from recent enhancements to FAA training and will progress to earn facility ratings in line with FAA goals. By shifting more experienced controllers to more complex facilities instead of training inexperienced new hires at those sites, the FAA will see reduced attrition and quicker time to certification. As the Agency executes the comprehensive Controller Workforce Plan, it continues to modify curriculum and upgrade technology to improve how it teaches today’s workforce. FAA expects to more effectively provide training-related data on a regular basis. This allows stakeholders to identify trends and strategically target support to improve field training delivery.
mANAgemeNT chALLeNge 8: ImPLemeNTINg ProceSSeS To ImProve The dePArTmeNT’S AcqUISITIoNS ANd coNTrAcT mANAgemeNTISSue 8A: STRenGTHenInG PROCeSSeS TO GOveRn THe APPROPRIATe uSe OF nOn-COMPeTITIve OR RISky COnTRACTS And MAXIMuM uSe OF COMPeTITIOnSeCTIOn I: WHy IS THIS ISSue SIGnIFICAnT?Recent Administration contracting initiatives underscore government-wide use of competition and fixed-price contracts and require agencies to perform effective price analysis to mitigate risks for noncompetitive contract awards. However, the Department annu-ally awards over $1.8 billion using sole-source, cost-reimbursable, time-and-materials, and labor hours contracts, which represent the greatest risk to the Government because they are inefficient and subject to misuse. Most of these contracts are awarded by the Federal Aviation Administration (FAA) and the Federal Motor Carrier Safety Administration (FMCSA).
SeCTIOn II : ACTIOnS TAken In Fy 2011The agencies developed independent action plans for addressing their particular acquisition challenges.
In FY 2011 FMCSA:
Developed 9 acquisition management standard operating procedures;
Established an Acquisition Review Panel; and,
Formalized an acquisition quality assurance review program to ensure Federal acquisition regulations are followed throughout the contracting process.
FAA:
Continued training and education for Contracting Officers, Contracting Officer’s Technical Representatives and Program Managers;
Reviewed 225 awards to measure compliance with applicable policy; and,
Tracked trend data monthly on the value of procurements, competition and types of contracts awarded.
SeCTIOn III : ACTIOnS ReMAInInG And eXPeCTed COMPLeTIOn dATeBoth agencies have completed all the action items associated with this issue.
SeCTIOn Iv: ReSuLTS OR eXPeCTed ReSuLTSEstablishing new policies and procedures will help FMCSA improve pre-award, contract award, and contract administration. FAA has already seen improvement in its market analysis, acquisition planning and cost/price analysis as a result of the steps it took in FY 2011. The actions taken in both agencies will reduce the potential for loss and misuse due to risky contract awards.
ISSue 8b: STRenGTHenInG THe ACquISITIOn FunCTIOn And WORkFORCe TO PROvIde LeAdeRSHIP FOR THe dePARTMenT’S ACquISITIOnSSeCTIOn I: WHy IS THIS ISSue SIGnIFICAnT?Within the next five years it is estimated that 46% of the contract specialist in the Department will be eligible to retire. The Department needs to ensure that it has an appropriately sized and skilled acquisi-tion workforce to meet its needs. This becomes even more important during times of resource constraints. A highly skilled acquisition workforce will help ensure that the Department makes good business decisions and maximizes value for its contracting dollars.
SeCTIOn II : ACTIOnS TAken In Fy 2011The Office of the Secretary successfully recruited and filled a number of long term vacancies among its senior leadership positions in the Office of the Senior Procurement Executive (OSPE). These positions include the Senior Procurement Executive; the Associate Director of Acquisition Policy, Oversight, and Business Strategies; the Associated Director of Information Systems, Management and Reporting; and the Associate Director of Acquisition Services.
Under the leadership of the OSPE, the Office of the Secretary executed a memorandum of understanding among all the operat-ing administrations establishing a DOT Acquisition Rotational Exchange Program. The purpose of the program is to support the professional development of contracting staff through temporary rotational assignments between Operating Administrations.
In cooperation with the Office of Human Resources, the OSPE has developed a program guide for use by operating administrations to support the development of students in the contract specialist series.
ANNUAL PERFORMANCE REPORT FISCAL YEAR 2011U.S. DEPARTMENT OF TRANSPORTATION69
FAA’s procurement function operates seperately from the Department’s, so FAA has pursued its own action plan for strengthening its acquisition workforce. In FY 2011 FAA:
Developed an Acquisition Workforce Plan;
Developed recruiting strategies for identifying and hiring acquisition professionals;
Created an acquisition workforce community of practice portal on the agency intranet; and,
Enhanced existing acquisition courses.
FAA created an Acquisition Workforce Council which meets monthly to discuss the progress of its workforce initiatives.
SeCTIOn III : ACTIOnS ReMAInInG And eXPeCTed COMPLeTIOn dATeIn FY 2012, the Department’s Office of the Senior Procurement Executive will develop a strategy to increase the percentage of contracting officers and contracting officer’s technical repre-sentatives who have Federal Acquisition Certification. FAA will continue pursuing its workforce initiatives.
SeCTIOn Iv: ReSuLTS OR eXPeCTed ReSuLTSAll senior acquisition positions have been filled, laying the ground work for improved acquisition services, strengthened program stew-ardship, and organizational stability. The opportunities available through the DOT Acquisition Rotational Exchange Program will create a more highly skilled workforce. Through stable leadership and improved career development opportunities, the Department expects acquisition staff retention to improve.
ISSue 8C: MAInTAInInG PROGRAMS TO HeLP enSuRe HIGH eTHICAL STAndARdS AMOnG THe dePARTMenT’S COnTRACTORS And eMPLOyeeSSeCTIOn I: WHy IS THIS ISSue SIGnIFICAnT?Maintaining programs to ensure high ethical standards among contractors and employees is important as those employees have oversight of billions of dollars annually.
SeCTIOn II : ACTIOnS TAken In Fy 2011In 2011, the Office of the Chief Counsel, Acquisition and Commercial Law Division, created three separate training modules focused on Contract Fraud and Abuse, Controlling Contract Waste and Suspension and Debarment. The modules were created to target Acquisition personnel. In conjunction with the Electronic Learning Management Office (eLMS) the modules were placed into the training lists of all identifiable contracting officers, contracting specialists, contracting officer’s technical representatives and program managers. The training modules were made available to all targeted Agency personnel on August 5, 2011.
SeCTIOn III : ACTIOnS ReMAInInG And eXPeCTed COMPLeTIOn dATeThe Office of the Chief Counsel continues to respond to questions regarding the training material. All questions from the material are used to tweak and re-define the modules for future training sessions.
SeCTIOn Iv: ReSuLTS OR eXPeCTed ReSuLTSThe expected result is a more ethical and knowledgeable acquisition staff. With a clearer understanding of their ethical and legal respon-sibilities, over time, employees will be able to identify and prevent procurement fraud, waste and abuse.
mANAgemeNT chALLeNge 9: ImProvINg The dePArTmeNT’S cYBerSecUrITYISSue 9A: eSTAbLISHInG A RObuST InFORMATIOn SeCuRITy PROGRAMSeCTIOn I: WHy IS THIS ISSue SIGnIFICAnT?The DOT operates and oversees significant elements of the critical infrastructure of the United States. Much of the DOT framework relies upon, and is integrated with, computer networks, computer mediated communications, online databases, and a wide variety of other computer and computer network capabilities. Cybersecurity attacks against any piece of the infrastructure have the potential for serious consequences to critical operations, either in a direct failure of a system or in the compromise of information.
SeCTIOn II : ACTIOnS TAken In Fy 2011 Finalized Version 1 of the Cybersecurity Strategic Plan—
December 2010;
Deployed IT Vital Signs dashboard for performance manage-ment and monitoring across the department—April 2011;
Compliance review of all operating administration cybersecurity programs—June 2011;
Issuance of revised comprehensive Departmental Cybersecurity Policy—July 2011;
Plan for pilot to require use of DOT Personal Identity Verification (PIV) card as primary authenticator for network login—September 2011;
Increased PIV card issuance and provisioning for a total of 15,107 non-FAA cards. More than 90 percent of security configurations for DOT assets approved—October 2011;
Hiring of cybersecurity specialist for forensic analysis, and compliance assessment—October 2011; and,
In response to an idea posted on IdeaHub, a TIGER team was formed to execute a Password Reduction project that will reduce the burden of excessive usernames and passwords on employees.

ANNUAL PERFORMANCE REPORT FISCAL YEAR 2011U.S. DEPARTMENT OF TRANSPORTATION70
SeCTIOn III : ACTIOnS ReMAInInG And eXPeCTed COMPLeTIOn dATe
Develop standardized Departmental cybersecurity procedures (phase 1)—February 2012.
Implement secure DNS for third-level domains and below—March 2012.
Improve response to US-CERT security alerts to 100 percent—March 2012.
Consolidate external network connections to DHS-approved Trusted Internet Connections (TICs)—April 2012.
Complete hiring of cybersecurity vacancies—September 2012.
Pilot and select technology to support continuous monitoring—December 2012.
Complete issuance of PIV cards to all personnel— December 2012.
SeCTIOn Iv: ReSuLTS OR eXPeCTed ReSuLTSIt is expected that the establishment of strong Departmental cybersecurity policy will serve as the foundation for office and Agency programs to manage risk across the Federal network. Key among the controls to be implemented will be increased use of the PIV card to access DOT networks and systems, increased use of Federally approved secure standard configurations for systems and technology assets, and enhancement of the DOT CIO’s cyber-security workforce to provide improved expertise and coverage in development and operation of the Department’s program.
ISSue 9b: STRenGTHenInG AIR TRAFFIC COnTROL SySTeM PROTeCTIOnSSeCTIOn I: WHy IS THIS ISSue SIGnIFICAnT?FAA’s NextGen system relies on a number of new technologies to achieve its goal. As FAA develops NextGen, it must continue to protect its current air traffic control (ATC) systems. The Office of the Inspector General has stated that FAA has not established adequate Intrusion Detection System (IDS) capabilities to monitor and detect potential cybersecurity incidents at key ATC facilities. Additionally, FAA has not developed or identified a timetable for deploying IDS beyond specified TRACON facilities.
SeCTIOn II : ACTIOnS TAken In Fy 2011FAA is implementing a suite of cyber protection mechanisms for the National Airspace System that do not solely rely on static IDS signature-based detection mechanisms. The following is a summary of the protection mechanisms being implemented:
Modified ATO Notice 1370.44 to include policy that establishes formal security requirements derived from NIST 800-53, Recommended Security Controls for Federal Information Systems and Organizations (15 August 2011);
Began the Project Initiation Phase for a centralized NAS monitoring capability (30 August 2011);
Included policy statement for NAS Operational Contract Services to comply with defined security requirements. Vendor services that are contracted by the FAA to perform NAS functions must follow FAA security requirements (30 September 2011); and,
Coordinated Agency NAS Cyber Event Response steps: Completed draft of NAS Incident Response SOP (30 September 2011).
SeCTIOn III : ACTIOnS ReMAInInG And eXPeCTed COMPLeTIOn dATeAll planned actions to address this issue have been completed.
SeCTIOn Iv: ReSuLTS OR eXPeCTed ReSuLTS 2011 Impact: Formal NAS security requirements will be
levied on contractor-provided NAS services. Centralized NAS cyber event monitoring and agency-level response will be initiated.
Future Impact: NAS contract services will be secured at the same level as NAS-owned systems. NAS Cyber Operations will provide for fully centralized NAS cyber detection and response capability.
ISSue 9C: InCReASInG PROTeCTIOn OF PeRSOnALLy IdenTIFIAbLe InFORMATIOn (PII)SeCTIOn I: WHy IS THIS ISSue SIGnIFICAnT?The Department’s safety mission relies significantly on the trust relationship between the Department and the American people. If the public cannot trust the Department to collect, use, store, share, and dispose of PII in ways that do not unnecessarily erode individual privacy, then it is less likely to trust other activities conducted by the Department. Additionally, failure to appropriately assess privacy risk and protect PII creates unnecessary exposure and increases the potential for information to be lost, stolen, or used in an unauthorized manner, causing physical, financial and/or reputational harm to individuals as well as embarrassment, increased oversight, and loss of funding for the Department.
SeCTIOn II : ACTIOnS TAken In Fy 2011 Hiring of Departmental Chief Privacy Officer (CPO) to establish
program direction and operational oversight—February 2011.
Establishment of CPO oversight of incident response manage-ment for those incidents with a nexus to privacy—June 2011.
SeCTIOn III : ACTIOnS ReMAInInG And eXPeCTed COMPLeTIOn dATe
Initiate review of existing privacy documentation in accordance with Privacy Act and E-Government Act—January 2012.
Revamp compliance management program with focus on critical privacy risk analysis—January 2012.
Develop and deploy dedicated role-based privacy training for general staff, privacy officers, project managers, and executives—June 2012.
ANNUAL PERFORMANCE REPORT FISCAL YEAR 2011U.S. DEPARTMENT OF TRANSPORTATION71
Rationalize and appropriately reduce use of sensitive PII, including but not limited to social security numbers, throughout Department—January 2013.
Establish privacy program built on best practices endorsed by the CIO Council—June 2012.
SeCTIOn Iv: ReSuLTS OR eXPeCTed ReSuLTSThe Department currently faces significant risk of unauthorized collection, use, and exposure of PII. Implementing a robust privacy program allows for privacy controls to be injected into the business and system development lifecycles at the initial stages and increases staff awareness of their responsibility to protect PII and report unauthorized activity.
AmerIcAN recoverY ANd reINveSTmeNT AcT of 2009The American Recovery and Reinvestment Act of 2009 (Recovery Act) was an extraordinary response to a crisis unlike any since the Great Depression. This landmark legislation was the most sweeping and ambitious domestic aid package the Federal Government has implemented in generations. It reflected an unprecedented effort to jumpstart our economy, create or save millions of jobs, and put a down payment on addressing long-neglected challenges. Since the President signed this hallmark legislation on February 17, 2009, the Department of Transportation has worked hard to ensure that the Recovery Act was implemented quickly, wisely, and with un-precedented transparency and accountability to finance transportation projects throughout America.
STATuS AT THe CLOSe OF FISCAL yeAR 2011 Since the enactment of the Recovery Act, the Department of Transportation has:
Obligated $47. 6 billion (99%) of the $48. 1 billion in funds provided;
Disbursed over $-31. 8 billion from the U.S. Treasury to pay bills associated with Recovery Act activities; and,
Supported over 15,000 projects.
TRAnSIT — $8.8 bILLIOnThe Federal Transit Administration (FTA) obligated 100% of its $8.4 billion in Recovery Act funds before September 30, 2010. In doing so, the FTA awarded 983 ARRA grants to over 600 recipients for capital projects to improve the condition of the nation’s transit assets. In addition, the FTA obligated $443 million in FHWA Recovery Act funds (covering 89 projects) where States and localities chose to
“flex” highway resources to transit investments. More information is provided at: www.fta.dot.gov/about/12350_11887.html
HIGHWAyS — $26.6 bILLIOnA major portion of DOT’s Recovery Act resources was at work improving our highways and bridges. Of the $27.5 billion appropri-ated specifically to the FHWA, the States obligated $26.6 billion
ANNUAL PERFORMANCE REPORT FISCAL YEAR 2011U.S. DEPARTMENT OF TRANSPORTATION72
or 100% of their funding to support work on more than 12,900 projects as of September 30, 2010. $443 million of FHWA Recovery Act funding was ‘flexed’ to FTA for transit projects in some States while $500 million was obligated to the Department of the Interior for use on Federal lands. More information is provided at: www.fhwa.dot.gov/economicrecovery/index.htm
RAIL — $9. 3 bILLIOnHIGH-SPeed RAIL — $8 bILLIOn The Recovery Act provided $8 billion to the Federal Railroad Administration (FRA) to develop and expand high speed rail capability in the United States. By the end of FY 2011, FRA had obligated more than $8 billion for high-speed rail initiatives. Most of this investment is in seven large-scale service development programs. The remaining funds were to smaller corridor programs and individual construction projects that provided independent utility.
AMTRAk — $1.3 bILLIOn The Recovery Act provided $1.3 billion for Amtrak to improve and expand its fleet, track, bridges, tunnels, and signals, as well as improve the safety and security of its facilities. In FY 2009, FRA obligated 100% of the $450 million that was specifically designated for capital security grants to Amtrak. As of September 30, 2011, FRA has outlayed 100% of the remaining funds to Amtrak. More information is provided at: www.fra.dot.gov/us/content/2153
AvIATIOn — $1.3 bILLIOnAIRPORT GRAnTS—$1.1 bILLIOn The Federal Aviation Administration (FAA) provided $1.1 billion in funding for upgrades and improvements on runways and airport facilities in Fiscal Year 2009. These projects enhanced safety, capacity, and security at air-ports. They included construction or rehabilitation of new airports, runways, runway safety areas, taxiways, aprons, terminal buildings, and Aircraft Rescue and Fire Fighting buildings. Because many projects came in under budget, FAA was able to fund 372 projects, 72 more than originally anticipated. By the end of FY 2011, virtually every project was completed.
AIRPORT FACILITIeS And equIPMenT uPGRAdeS— $200 MILLIOn FAA’s Facilities and Equipment Upgrades program finances major capital investments related to modernizing and improving air traffic control and airway facilities, equipment, and systems. Of the $200 million provided for Facilities and Equipment Upgrades, $198.3 million was obligated at the end of FY 2010, supporting 398 infrastructure projects. By the end of FY 2011 nearly all of the facilities and equipment projects that were underway have been physically completed nationwide and outlays totaled $160 million at the end of FY 2011. More information is provided at: www.faa.gov/recovery
MARITIMe—$100 MILLIOnThe Recovery Act provided the Maritime Administration (MARAD) with $98 million in grant funding to make capital and infrastructure improvements at small shipyards. The grants provided to the shipyards will facilitate the efficiency, cost-effectiveness, and quality of domestic ship construction, conversion, or repair for commercial and government use. MARAD obligated 100% of the $100 million in Small Shipyard ARRA funding ($98 million in grant funding and $2 million in administrative funding) for 70 projects, of which all but one are underway or already completed. For more information, go to: www.marad.dot.gov/about_us_landing_page/marad_recovery_act/recovery.htm
GRAnTS FOR nATIOnAL SuRFACe TRAnSPORTATIOn SySTeMS—$1. 52 bILLIOnSuPPLeMenTAL dISCReTIOnARy GRAnTS FOR nATIOnAL SuRFACe TRAnSPORTATIOn SySTeM—$1.5 bILLIOn The Recovery Act provided the Office of the Secretary of Transportation $1.5 billion in grant funding for capital investments in surface transportation infrastructure projects that will have a significant impact on the Nation, a metropolitan area, or a region (including highway, bridge, public transportation, passenger rail, freight rail, and port infrastructure projects). On February 17, 2010, 51 awards were announced. In FY 2010 19 TIGER project grant agreements were executed, 10 TIGER project grant agreements were pending final negotiation, and 9 TIGER projects were under way across the country. All 51 projects are expected to be obligated before the September 30, 2011, obligation deadline.
jObS & PROjeCTSOne of the primary goals of the Recovery Act was to preserve and create jobs. The money appropriated to DOT by the Recovery Act is doing exactly what Congress intended it to do: it is creating jobs and reinvigorating our economy. On average, DOT created or saved more than 46,000 FTE per quarter throughout the past 4 reporting periods and had more than 67,500 FTE in the peak of construction (July–September 2010). In total, DOT obligated 15,061 projects Nationwide and more than 10,000 projects were completed at the end of FY 2011.
Throughout the course of the Recovery Act, the Department has carefully monitored job creation and retention and based on our analysis of the most recent 1201 (c) report to Congress determined that from the roughly 1,000 people DOTs programs directly employed in April 2009, jobs numbers grew to over 82,400 direct onsite or equipment manufacturing jobs in all of 2010. Also included in this 1201(c) report are indirect job numbers, which include more than 136,000 indirect jobs and nearly 279,000 total employment jobs (direct, indirect and induced) for 2010.
ACCOunTAbILITyThe Recovery Act has been implemented with an unprecedented level of transparency and accountability. A variety of reports on Recovery Act programs can be found at www.dot.gov/recovery.
mANAgemeNT’S dIScUSSIoN ANd ANALYSIS
ProgrAm evALUATIoNS
heAdLINeProgrAm evALUATIoNS
Performance measures show if intended outcomes are occurring and assess any trends. Program evaluation uses analytic techniques to assess the extent to which programs contribute to those outcomes and trends. As required by the Government Performance and Results Act of 1993, the Department’s FY 2006–2011 Strategic Plan includes a schedule of program evaluations by fiscal year.
74 U.S. DEPARTMENT OF TRANSPORTATION74 ANNUAL PERFORMANCE REPORT FISCAL YEAR 2011
INTrodUcTIoNTyPeS OF PROGRAM evALuATIOnSProgram evaluation is an assessment, through objective measurement and systematic analysis, of the manner and extent to which programs achieve intended outcomes. Evaluations are of the following types:
Impact Evaluations use empirical data to compare measurable program outcomes with what would have happened in the absence of the program. These represent the highest standard of program evaluations and are often the most difficult and expensive to construct and interpret.
Outcome Evaluations assess the extent to which programs achieve outcome-oriented objectives. These use quantitative methods to assess program effectiveness, but fall short of the rigorous causal analysis of impact evaluations.
Process Evaluations assess the extent to which a program operates as intended. While a true process evaluation will use objective measurement and analysis, it falls short of assessing the causal links between intervention and outcome.
�Cost-Benefit�and�Cost-Effectiveness�Analyses compare a program’s outputs or outcomes with the costs to produce them. These analyses conform to program evaluation when applied systematically to existing programs and when measurable outputs and outcomes are monetized.
PROGRAM evALuATIOn MAnAGeMenTThe programs selected for scheduled evaluations are vetted through the Department’s strategic planning process. Each modal administration nominates programs that are then reviewed by a strategic planning executive committee to ensure: 1) adequate breadth of program evaluations across modal administrations and
2) alignment to the strategic objectives. The Office of Inspector General and the Government Accountability Office pursue program evaluations independent of this schedule.
SAfeTYFRA Research and development ProgramPuRPOSeThe purpose of the Transportation Research Board’s (TRB) review of the Federal Railroad Administration’s (FRA) research, development, and demonstration program is to assess annually such topics as program management structure and approach, allocation of resources among program areas, and project selection criteria.
COnTRIbuTIOn TO GOAL PeRFORMAnCeThe TRB review helps ensure that the major directions and content of FRA’s research and development program serve the needs of customers and stakeholders internal and external to FRA.
MeTHOdOLOGyThe TRB committee for this project conducts an annual review and evaluation of FRA’s research, development, and demonstration program. FRA has three program objectives: support of FRA’s safety regulatory mandate; technology development and demonstration; and implementation of high-speed rail transportation. The committee reviews and assesses the effectiveness of FRA processes for setting program priorities, selecting projects, directing projects, and maxi-mizing and measuring the impact of its programs. The committee provides recommendations to FRA on how to improve its processes for selecting, executing, and delivering value from its research, development, and demonstration program.
STATuSTRB delivered its letter report to FRA on March 9, 2011
ANNUAL PERFORMANCE REPORT FISCAL YEAR 2011U.S. DEPARTMENT OF TRANSPORTATION75
PARTneRSFRA partners in this effort include TRB of the National Academies of Science
LISTed In dOT PLAnYes
TyPeProcess
SOuRCeExternal, TRB
FIndInGS“FRA’s research, development, and demonstration program has grown over the past 2 years in scope and management strength. The committee is impressed with the management team and believes that the senior staff and leadership of this program can facilitate the transition of rail research into the mainstream of U.S. transportation infrastructure development and strategy. ”
ReCOMMendATIOnS“The committee believes that projects should be organized and presented to research partners and stakeholders in a dozen or so groupings that correspond to key research objectives. More effort to engage private interests in the earliest phases of individual efforts and assessments of commercialization potential may help FRA in winnowing the long list of projects planned and under way. Finally, the committee believes that stakeholder outreach initiatives by FRA’s research arm should feature enhanced opportunities for dialogue and feedback on both past efforts and future directions to sustain support and proper targeting of scarce RD&D resources. ”
LInkSTRB Committee for Review of the FRA R&D Program: February 2011 www.fra.dot.gov/Pages/32.shtml
dIReCT LInkwww.trb.org/main/blurbs/165018.aspx
LOOkInG FORWARdTRB’s next review is planned for January 11–13, 2012
SAfeTYPHMSA Pipeline Safety State Grants ProgramPuRPOSeThe evaluation examined the Federal program, program outcomes, its processes and procedures, and the extent to which the core grant program is set up to effectively support, monitor, and guide State programs.
COnTRIbuTIOn TO GOAL PeRFORMAnCeState pipeline safety programs provide most of the inspection oversight for regulated pipelines in the U.S., including nearly all local distribution systems for natural gas—where most of
the safety risk has been concentrated. States provide about 80% of the pipeline inspection workforce. Their jurisdiction covers about 80% of pipeline mileage and about 80% of all pipeline incidents with death or major injury.
MeTHOdOLOGyThe evaluation traced program requirements and authorization (what’s required, what’s allowed) from legislation through the regulations and program guidance, to processes and procedures. It identified key assumptions. Then it looked at how these program elements worked in actual practice. Where there were differences, the evaluation explored why. The methodology included interviews with State program managers, agency management and staff; development of program logic models; examination of funding data over 15 years; review of annual reports, incident statistics, guidance, program documentation, grant applications, certifications, annual evaluations, and correspondence with States.
STATuSCompleted report was delivered to the PHMSA Administrator and the Associate Administrator for Pipeline Safety on June 27, 2011.
PARTneRSPipeline Safety State Programs.
LISTed In dOT PLAnYes (planned for 2009)
TyPeOutcome and process
SOuRCeInternal
FIndInGSThe program works effectively overall. This evaluation found many strengths with the program—including particularly the achievement of good safety outcomes, generally good working relationships, and an approach to managing the program that emphasizes continuous improvement. But the report also identifies and discusses several challenges and interrelated risks, including:
budget risks, particularly if States do not grow their programs more substantially;
program risks, particularly if states opt out of the program;
management risks, as some processes are inconsistent with broader requirements;
safety risks, with issues related to targeting funds and alignment of goals; and,
data quality risks, given our approaches to data collection and use.
ANNUAL PERFORMANCE REPORT FISCAL YEAR 2011U.S. DEPARTMENT OF TRANSPORTATION76
ReCOMMendATIOnSThe evaluation did not include any recommendations. However, several actions have been taken as a result of the evaluation, and it has been shared with all State Pipeline Safety program managers through the National Association of State Pipeline Safety Representatives.
LInkSThe report has not yet been posted, but will be available through www. phmsa. dot. gov.
LOOkInG FORWARdThe Office of Inspector General has planned a follow-on review of the program in response to a recommendation from the National Transportation Safety Board, in the aftermath of the pipeline accident at San Bruno, California in 2010.
SAfeTYFHWA & FTA: Program evaluation of FHWA Pedestrian & bicycle Safety ActivitiesPuRPOSeFHWA initiated a program evaluation of the overall effectiveness of the Agency’s Pedestrian and Bicycle Safety Program. The evalu-ation is intended to guide FHWA in making future enhancements to program delivery and best meet the needs of safety stakeholders.
COnTRIbuTIOn TO GOAL PeRFORMAnCeThe program develops guidance on processes to improve safety planning, develops and tests specific pedestrian and bicycle safety countermeasures and strategies, and provides training and technical assistance. FHWA may use the findings and recommendations from this evaluation to select a set of short- and long-term actions to im-prove the management of the Pedestrian and Bicycle Safety Program, specifically related to State and local government stakeholders.
MeTHOdOLOGyAn external consultant working with a cross-agency Evaluation Working Group (EWG) reviewed documents and data, and conducted 35 interviews with internal and external partners and stakeholders. The consultant reviewed program documents, analyzed pedestrian and bicycle data, and conducted interviews with federal, state, and local transportation agency staff involved in pedestrian and bicycle safety activities as well as pedestrian and bicycle safety advocates.
STATuSComplete with Actions Initiated
PARTneRSNone
LISTed In dOT PLAnNo. This study supports the DOT’s High Priority Performance Goal, which is to reduce transportation-related fatalities and injuries.
TyPeProcess
SOuRCeExternal, completed by a consultant evaluator
FIndInGSWhile the Pedestrian and Bicycle Safety Program has resulted in a wealth of countermeasures, strategies, training, and safety funding and activities available to every state, there are still some challenges to address, including the following:
Lack of broad support for safely accommodating pedestrians and bicycles in some Federal, state, and local transportation agencies; FHWA should work to fully implement policies and steps within the Agency that have been recommended for state and local agencies to enhance pedestrian and bicycle safety;
Safe accommodation of pedestrians and bicyclists is not fully incorporated as an integral part of each of FHWA’s core programs and some State Departments of Transportation do not have comprehensive pedestrian and bicycle safety programs; and
There is insufficient exposure and facility inventory data to effectively support decision making in the Pedestrian and Bicycle Safety Program.
ReCOMMendATIOnSIn all, FHWA received 6 recommendations and 15 suggested action items.
Focus efforts to foster a pedestrian and bicycle safety culture within FHWA, state, and local transportation agencies.
Implement FHWA and DOT policy recommendations to integrate pedestrian and bicycle safety activities throughout FHWA.
Mainstream and manage pedestrian and bicycle safety activities among the safety, planning, research, operations, infrastructure, and Division Offices in FHWA as a single program.
Promote and track effective Pedestrian and Bicycle Safety Program management strategies by state and local agencies.
Address safety data limitations to support management and evaluation of the Pedestrian and Bicycle Safety Program at the Federal, state, and local levels.
Create feedback loops in FHWA’s management of its Pedestrian and Bicycle Safety Programs, and use program output data to help guide decision making.
LInkSNone
ANNUAL PERFORMANCE REPORT FISCAL YEAR 2011U.S. DEPARTMENT OF TRANSPORTATION77
LOOkInG FORWARdThe following Quick Wins identified by the Agency were initiated:
Include a follow-up self-assessment a year later, as part of the training assessment by students in FHWA courses on pedestrian and bicycle safety.
Develop and deliver awareness training for transportation program managers, engineers, and specialists.
Establish a matrix group within FHWA with representatives from all program offices to oversee the Pedestrian and Bicycle Safety Program.
mANAgemeNT’S dIScUSSIoN ANd ANALYSIS
dATA deTAILS

ANNUAL PERFORMANCE REPORT FISCAL YEAR 2011U.S. DEPARTMENT OF TRANSPORTATION79
PerformANce dATA comPLeTeNeSS ANd reLIABILITY deTAILSEach table includes a description of a performance measure and associated data provided by the agencies in charge of the measure. The Scope statement gives an overview of the data collection strategy for the underlying data behind the performance measure. The Source statement identifies the data system(s) from which the data for each measure was taken. The Statistical Issues statement has comments, provided by the Bureau of Transportation Statistics (BTS) and the agency in charge of the measure, which discuss variability of the measure and other points. The Completeness statement indicates limitations due to missing data or availability of current measures, methods used to develop projections are also provided, as appropriate. The Reliability statement gives the reader a feel for how the performance data are used in program management decision making inside DOT.
For further information about the source and accuracy (S&A) of these data, and DOT’s data quality guidelines in accordance with Section 515 of the Treasury and General Government Appropriations Act for Fiscal Year 2001 (P.L.106-554), please refer to the BTS S&A compendium available at www.bts.gov/programs/ statistical_policy_and_research/source_and_accuracy_compendium/index. html.
deTAILS oN doT SAfeTY meASUreSPassenger vehicle Occupant Highway Fatality Rate (nHTSA / FHWA / FMSCA)MeASuRePassenger Vehicle Occupant Highway fatalities per 100 million passenger vehicle VMT (vehicle-miles traveled) are calculated for each calendar year (CY).
An occupant is any person inside or on top of a moving motor vehicle. This includes the driver, passengers, and all persons riding on the exterior of a motor vehicle. Passenger vehicle VMT (PVVMT) includes vehicle miles traveled by all types of passenger vehicles (e.g. passenger cars, vans, pickup trucks, and sport/utility vehicles) on public roads within the 50 States and the District of Columbia.
SCOPeThe number of fatalities is a count of passenger vehicle occupant deaths which occur within 30 days of a crash involving a motor vehicle traveling on a traffic-way customarily open to the public within the 50 States and the District of Columbia.
SOuRCeSMotor vehicle traffic fatality data is obtained from the National Highway Traffic Safety Administration’s Fatality Analysis Reporting System (FARS). The FARS database is based on police crash reports and other State data, containing data derived from a census of fatal traffic crashes within the 50 States, and the District of Columbia.
Vehicle miles traveled (VMT) is estimated from FHWA’s Traffic Volume Trends (TVT) report. TVT is a monthly report based on hourly traffic count data and annual data in the Highway Performance Monitoring System (HPMS), which is analyzed by FHWA Traffic Monitoring and Analysis System (TMAS). Passenger Vehicle VMT (PVVMT) is derived from the HPMS.
Fatality rates for CY 2011 were projected using recent passenger vehicle fatality rate trend data.
STATISTICAL ISSueSWhile based on historical data, the 2011 fatality rate projection depends on the continuation of individual and market behavior regarding highway safety policies, vehicle miles traveled, seat belt use, and alcohol related fatalities. The 2011 fatality rate projection does not reflect recent vehicle improvements. The assumptions inherent in these projections, together with the normal levels of uncertainty inherent in statistical evaluations, may influence the accuracy of the projection.
For HPMS, States provide annual average daily traffic (AADT) on all Federal-aid highway sections. These data are based on traffic counts taken at least once every three years on the National Highway System, Interstate, and Principal Arterials and at least once every six years on Minor Arterials and Collectors. Traffic counts are adjusted by the States to reflect day-of-week and seasonal variations, current year conditions, and axle corrections, as necessary. States provide summary data on the local and rural minor collector roads. The AADTs from HPMS are used as a baseline for the TVT report, which compiles data from about 4,000 automated traffic recorders (ATRFs) provided by the States on a monthly basis. Because both HPMS and TVT are based on samples of the traffic, there are associated sampling errors.
COMPLeTeneSSFARS has been in use since 1975 and is accepted as a complete measure for describing safety on the Nation’s highways. Total annual fatalities are available through CY 2009. The final PVVMT estimate for 2010 will be available in December 2011, and the final PVVMT estimate for CY 2011 will be available in December 2012.
ReLIAbILITyThis measure informs and guides the following programs for NHTSA, FHWA, and FMCSA:
highway safety policy
safety program planning
regulatory development
resource allocation
operational mission performance
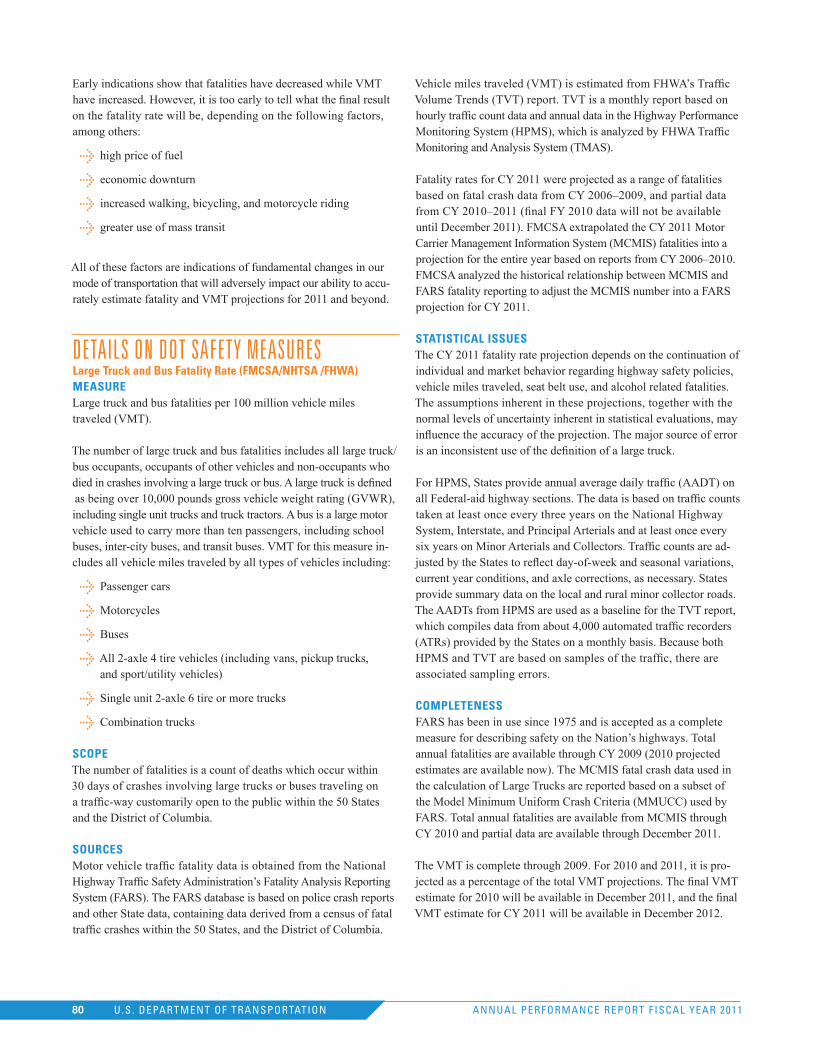
ANNUAL PERFORMANCE REPORT FISCAL YEAR 2011U.S. DEPARTMENT OF TRANSPORTATION80
Early indications show that fatalities have decreased while VMT have increased. However, it is too early to tell what the final result on the fatality rate will be, depending on the following factors, among others:
high price of fuel
economic downturn
increased walking, bicycling, and motorcycle riding
greater use of mass transit
All of these factors are indications of fundamental changes in our mode of transportation that will adversely impact our ability to accu-rately estimate fatality and VMT projections for 2011 and beyond.
deTAILS oN doT SAfeTY meASUreSLarge Truck and bus Fatality Rate (FMCSA/nHTSA /FHWA)MeASuReLarge truck and bus fatalities per 100 million vehicle miles traveled (VMT).
The number of large truck and bus fatalities includes all large truck/bus occupants, occupants of other vehicles and non-occupants who died in crashes involving a large truck or bus. A large truck is defined as being over 10,000 pounds gross vehicle weight rating (GVWR), including single unit trucks and truck tractors. A bus is a large motor vehicle used to carry more than ten passengers, including school buses, inter-city buses, and transit buses. VMT for this measure in-cludes all vehicle miles traveled by all types of vehicles including:
Passenger cars
Motorcycles
Buses
All 2-axle 4 tire vehicles (including vans, pickup trucks, and sport/utility vehicles)
Single unit 2-axle 6 tire or more trucks
Combination trucks
SCOPeThe number of fatalities is a count of deaths which occur within 30 days of crashes involving large trucks or buses traveling on a traffic-way customarily open to the public within the 50 States and the District of Columbia.
SOuRCeSMotor vehicle traffic fatality data is obtained from the National Highway Traffic Safety Administration’s Fatality Analysis Reporting System (FARS). The FARS database is based on police crash reports and other State data, containing data derived from a census of fatal traffic crashes within the 50 States, and the District of Columbia.
Vehicle miles traveled (VMT) is estimated from FHWA’s Traffic Volume Trends (TVT) report. TVT is a monthly report based on hourly traffic count data and annual data in the Highway Performance Monitoring System (HPMS), which is analyzed by FHWA Traffic Monitoring and Analysis System (TMAS).
Fatality rates for CY 2011 were projected as a range of fatalities based on fatal crash data from CY 2006–2009, and partial data from CY 2010–2011 (final FY 2010 data will not be available until December 2011). FMCSA extrapolated the CY 2011 Motor Carrier Management Information System (MCMIS) fatalities into a projection for the entire year based on reports from CY 2006–2010. FMCSA analyzed the historical relationship between MCMIS and FARS fatality reporting to adjust the MCMIS number into a FARS projection for CY 2011.
STATISTICAL ISSueSThe CY 2011 fatality rate projection depends on the continuation of individual and market behavior regarding highway safety policies, vehicle miles traveled, seat belt use, and alcohol related fatalities. The assumptions inherent in these projections, together with the normal levels of uncertainty inherent in statistical evaluations, may influence the accuracy of the projection. The major source of error is an inconsistent use of the definition of a large truck.
For HPMS, States provide annual average daily traffic (AADT) on all Federal-aid highway sections. The data is based on traffic counts taken at least once every three years on the National Highway System, Interstate, and Principal Arterials and at least once every six years on Minor Arterials and Collectors. Traffic counts are ad-justed by the States to reflect day-of-week and seasonal variations, current year conditions, and axle corrections, as necessary. States provide summary data on the local and rural minor collector roads. The AADTs from HPMS are used as a baseline for the TVT report, which compiles data from about 4,000 automated traffic recorders (ATRs) provided by the States on a monthly basis. Because both HPMS and TVT are based on samples of the traffic, there are associated sampling errors.
COMPLeTeneSSFARS has been in use since 1975 and is accepted as a complete measure for describing safety on the Nation’s highways. Total annual fatalities are available through CY 2009 (2010 projected estimates are available now). The MCMIS fatal crash data used in the calculation of Large Trucks are reported based on a subset of the Model Minimum Uniform Crash Criteria (MMUCC) used by FARS. Total annual fatalities are available from MCMIS through CY 2010 and partial data are available through December 2011.
The VMT is complete through 2009. For 2010 and 2011, it is pro-jected as a percentage of the total VMT projections. The final VMT estimate for 2010 will be available in December 2011, and the final VMT estimate for CY 2011 will be available in December 2012.
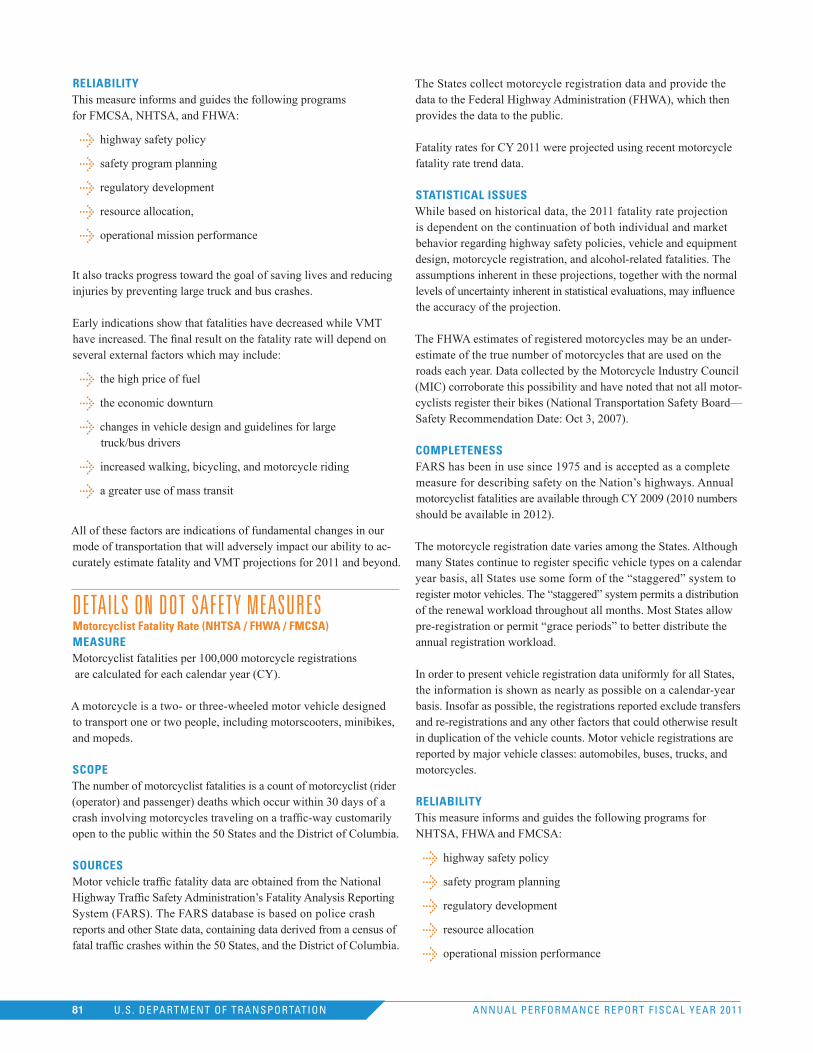
ANNUAL PERFORMANCE REPORT FISCAL YEAR 2011U.S. DEPARTMENT OF TRANSPORTATION81
ReLIAbILITyThis measure informs and guides the following programs for FMCSA, NHTSA, and FHWA:
highway safety policy
safety program planning
regulatory development
resource allocation,
operational mission performance
It also tracks progress toward the goal of saving lives and reducing injuries by preventing large truck and bus crashes.
Early indications show that fatalities have decreased while VMT have increased. The final result on the fatality rate will depend on several external factors which may include:
the high price of fuel
the economic downturn
changes in vehicle design and guidelines for large truck/bus drivers
increased walking, bicycling, and motorcycle riding
a greater use of mass transit
All of these factors are indications of fundamental changes in our mode of transportation that will adversely impact our ability to ac-curately estimate fatality and VMT projections for 2011 and beyond.
deTAILS oN doT SAfeTY meASUreSMotorcyclist Fatality Rate (nHTSA / FHWA / FMCSA)MeASuReMotorcyclist fatalities per 100,000 motorcycle registrations are calculated for each calendar year (CY).
A motorcycle is a two- or three-wheeled motor vehicle designed to transport one or two people, including motorscooters, minibikes, and mopeds.
SCOPeThe number of motorcyclist fatalities is a count of motorcyclist (rider (operator) and passenger) deaths which occur within 30 days of a crash involving motorcycles traveling on a traffic-way customarily open to the public within the 50 States and the District of Columbia.
SOuRCeSMotor vehicle traffic fatality data are obtained from the National Highway Traffic Safety Administration’s Fatality Analysis Reporting System (FARS). The FARS database is based on police crash reports and other State data, containing data derived from a census of fatal traffic crashes within the 50 States, and the District of Columbia.
The States collect motorcycle registration data and provide the data to the Federal Highway Administration (FHWA), which then provides the data to the public.
Fatality rates for CY 2011 were projected using recent motorcycle fatality rate trend data.
STATISTICAL ISSueSWhile based on historical data, the 2011 fatality rate projection is dependent on the continuation of both individual and market behavior regarding highway safety policies, vehicle and equipment design, motorcycle registration, and alcohol-related fatalities. The assumptions inherent in these projections, together with the normal levels of uncertainty inherent in statistical evaluations, may influence the accuracy of the projection.
The FHWA estimates of registered motorcycles may be an under-estimate of the true number of motorcycles that are used on the roads each year. Data collected by the Motorcycle Industry Council (MIC) corroborate this possibility and have noted that not all motor-cyclists register their bikes (National Transportation Safety Board—Safety Recommendation Date: Oct 3, 2007).
COMPLeTeneSSFARS has been in use since 1975 and is accepted as a complete measure for describing safety on the Nation’s highways. Annual motorcyclist fatalities are available through CY 2009 (2010 numbers should be available in 2012).
The motorcycle registration date varies among the States. Although many States continue to register specific vehicle types on a calendar year basis, all States use some form of the “staggered” system to register motor vehicles. The “staggered” system permits a distribution of the renewal workload throughout all months. Most States allow pre-registration or permit “grace periods” to better distribute the annual registration workload.
In order to present vehicle registration data uniformly for all States, the information is shown as nearly as possible on a calendar-year basis. Insofar as possible, the registrations reported exclude transfers and re-registrations and any other factors that could otherwise result in duplication of the vehicle counts. Motor vehicle registrations are reported by major vehicle classes: automobiles, buses, trucks, and motorcycles.
ReLIAbILITyThis measure informs and guides the following programs for NHTSA, FHWA and FMCSA:
highway safety policy
safety program planning
regulatory development
resource allocation
operational mission performance
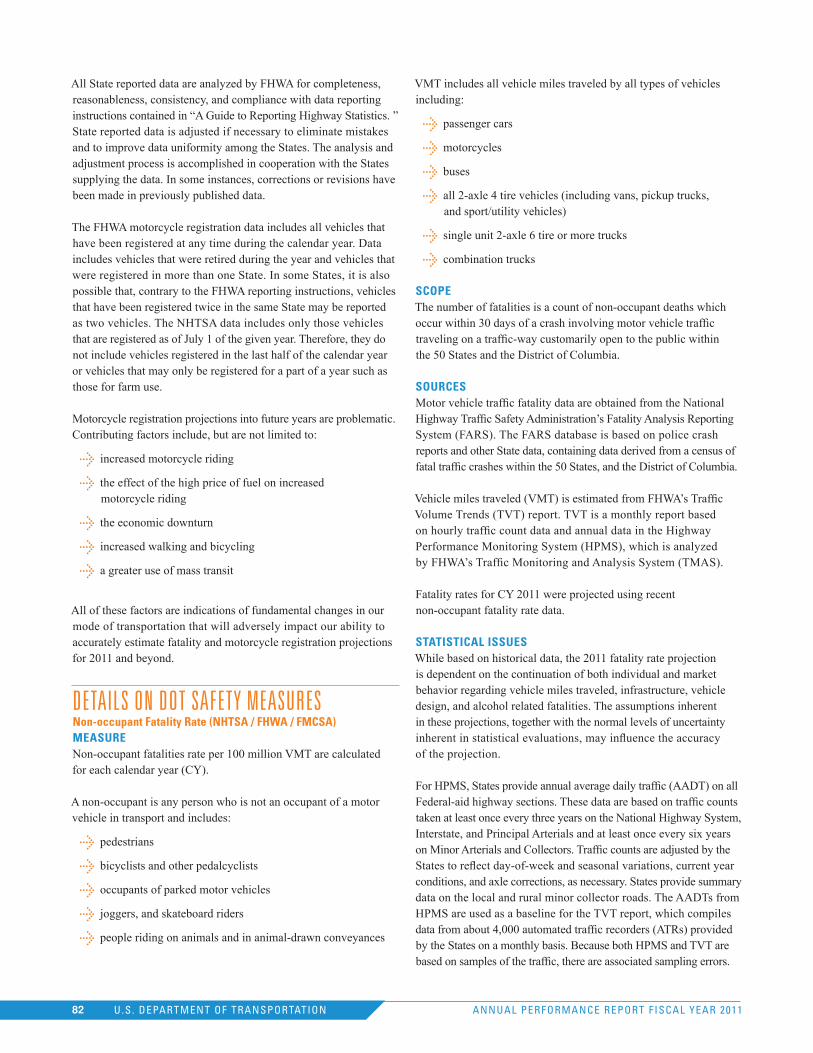
ANNUAL PERFORMANCE REPORT FISCAL YEAR 2011U.S. DEPARTMENT OF TRANSPORTATION82
All State reported data are analyzed by FHWA for completeness, reasonableness, consistency, and compliance with data reporting instructions contained in “A Guide to Reporting Highway Statistics. ” State reported data is adjusted if necessary to eliminate mistakes and to improve data uniformity among the States. The analysis and adjustment process is accomplished in cooperation with the States supplying the data. In some instances, corrections or revisions have been made in previously published data.
The FHWA motorcycle registration data includes all vehicles that have been registered at any time during the calendar year. Data includes vehicles that were retired during the year and vehicles that were registered in more than one State. In some States, it is also possible that, contrary to the FHWA reporting instructions, vehicles that have been registered twice in the same State may be reported as two vehicles. The NHTSA data includes only those vehicles that are registered as of July 1 of the given year. Therefore, they do not include vehicles registered in the last half of the calendar year or vehicles that may only be registered for a part of a year such as those for farm use.
Motorcycle registration projections into future years are problematic. Contributing factors include, but are not limited to:
increased motorcycle riding
the effect of the high price of fuel on increased motorcycle riding
the economic downturn
increased walking and bicycling
a greater use of mass transit
All of these factors are indications of fundamental changes in our mode of transportation that will adversely impact our ability to accurately estimate fatality and motorcycle registration projections for 2011 and beyond.
deTAILS oN doT SAfeTY meASUreSnon-occupant Fatality Rate (nHTSA / FHWA / FMCSA)MeASuReNon-occupant fatalities rate per 100 million VMT are calculated for each calendar year (CY).
A non-occupant is any person who is not an occupant of a motor vehicle in transport and includes:
pedestrians
bicyclists and other pedalcyclists
occupants of parked motor vehicles
joggers, and skateboard riders
people riding on animals and in animal-drawn conveyances
VMT includes all vehicle miles traveled by all types of vehicles including:
passenger cars
motorcycles
buses
all 2-axle 4 tire vehicles (including vans, pickup trucks, and sport/utility vehicles)
single unit 2-axle 6 tire or more trucks
combination trucks
SCOPeThe number of fatalities is a count of non-occupant deaths which occur within 30 days of a crash involving motor vehicle traffic traveling on a traffic-way customarily open to the public within the 50 States and the District of Columbia.
SOuRCeSMotor vehicle traffic fatality data are obtained from the National Highway Traffic Safety Administration’s Fatality Analysis Reporting System (FARS). The FARS database is based on police crash reports and other State data, containing data derived from a census of fatal traffic crashes within the 50 States, and the District of Columbia.
Vehicle miles traveled (VMT) is estimated from FHWA’s Traffic Volume Trends (TVT) report. TVT is a monthly report based on hourly traffic count data and annual data in the Highway Performance Monitoring System (HPMS), which is analyzed by FHWA’s Traffic Monitoring and Analysis System (TMAS).
Fatality rates for CY 2011 were projected using recent non-occupant fatality rate data.
STATISTICAL ISSueSWhile based on historical data, the 2011 fatality rate projection is dependent on the continuation of both individual and market behavior regarding vehicle miles traveled, infrastructure, vehicle design, and alcohol related fatalities. The assumptions inherent in these projections, together with the normal levels of uncertainty inherent in statistical evaluations, may influence the accuracy of the projection.
For HPMS, States provide annual average daily traffic (AADT) on all Federal-aid highway sections. These data are based on traffic counts taken at least once every three years on the National Highway System, Interstate, and Principal Arterials and at least once every six years on Minor Arterials and Collectors. Traffic counts are adjusted by the States to reflect day-of-week and seasonal variations, current year conditions, and axle corrections, as necessary. States provide summary data on the local and rural minor collector roads. The AADTs from HPMS are used as a baseline for the TVT report, which compiles data from about 4,000 automated traffic recorders (ATRs) provided by the States on a monthly basis. Because both HPMS and TVT are based on samples of the traffic, there are associated sampling errors.
ANNUAL PERFORMANCE REPORT FISCAL YEAR 2011U.S. DEPARTMENT OF TRANSPORTATION83
COMPLeTeneSSFARS has been in use since 1975 and is accepted as a complete measure for describing safety on the Nation’s highways. Annual non-occupant fatalities are available through CY 2009 (2010 numbers will be available in 2012).
VMT is complete through 2008. For 2010 and 2011, it is projected as a percentage of the total VMT projections. The final VMT estimate for 2010 will be available in December 2011, and the final VMT estimate for CY 2011 will be available in December 2012.
ReLIAbILITyThis measure informs and guides the following programs for NHTSA, FHWA and FMCSA:
highway safety policy
safety program planning
regulatory development
resource allocation
operational mission performance
Early indications show that fatalities have decreased while VMT have increased. However, it is too early to tell what the final result on the fatality rate will be, depending on the following factors, among others:
high price of fuel
economic downturn
increased walking, bicycling, and motorcycle riding
greater use of mass transit
All of these factors are indications of fundamental changes in our mode of transportation that will adversely impact our ability to ac-curately estimate fatality and VMT projections for 2011 and beyond.
deTAILS oN doT SAfeTY meASUreSCommercial Air Carrier Fatal Accident Rate (FAA)MeASuReNumber of commercial air carrier fatalities per 100 million persons onboard (FY)
SCOPeThis measure includes both scheduled and nonscheduled flights of U.S. passenger and cargo air carriers (14 CFR Part 121) and sched-uled flights of regional operators (14 CFR Part 135). It excludes on-demand (e.g. air taxi) service and general aviation. Fatal accidents involving passengers, crew, ground personnel, and the uninvolved public are all included.
Note: Part 121 and Part 135 define how airlines can operate. Part 121 allows companies to act as scheduled airlines where they are allowed to run and publish a scheduled service. Part 135 allows airlines to run as charter companies.
SOuRCeSThe data on commercial fatalities come from the National Transportation Safety Board’s (NTSB) Aviation Accident Database. All but a small share of the data for persons on board comes from the air carriers, who submit information for all passengers on board to the Bureau of Transportation Statistics (BTS). In addition, FAA estimates crew on board based on the distribution of aircraft departures by make and model, plus an average of 3. 5 persons on board per Part 121 cargo flight.
STATISTICAL ISSueSBoth accidents and passengers on board are censuses, having no sampling error. However, crew on board is an estimate. Crew staffing varies only within a very small range for any given aircraft make/model. Departure data and enplanements for Part 121 are from the BTS. The crew estimate is based on fleet makeup and crew require-ments per number of seats. For the current fleet, the number of crew is equal to about seven percent of all Part 121 enplanements. The average number of cargo crew on board is 3. 5 per departure, based on data from subscription services such as Air Claims, a proprietary database used by insurers to obtain information such as fleet mix, accidents and claims. Cargo crews typically include two flight crew members, and occasionally another pilot or company rep, or two deadheading passengers. Part 135 data also comes from BTS and Air Claims databases, but is not as complete. FAA contacts airline operators where BTS data have gaps. Based on previous accident and incident reports, the average Part 135 enplanement is five per depar-ture. Crew estimates for Part 135 are based on previous accident and incident data. Any error that might be introduced by estimating crew will be very small and will be overwhelmed by the passenger census. Also note that the fatality rate is small and could significantly fluctuate from year to year due to a single accident.
COMPLeTeneSSThe FAA does comparison checking of the departure data collected by BTS. This data is needed for crew estimates. However, FAA has no independent data sources against which to validate the numbers submitted to BTS. FAA compares its list of carriers to the DOT list to validate completeness and places the carriers in the appropriate category (e.g. Part 121 or Part 135).
The number of actual persons on board for any given period of time is considered preliminary for up to 18 months after the close of the reporting period. This is due to amended reports subsequently filed by the air carriers. Preliminary FAA estimates are based on projec-tions of the growth in departures. However, changes to the number of persons on board should rarely affect the annual fatality rate. NTSB and FAA’s Office of Accident Investigation meet regularly to validate the accident and fatality count. Accident data are consid-ered preliminary. NTSB usually completes investigations and issues reports on accidents that occur during any fiscal year by the end
ANNUAL PERFORMANCE REPORT FISCAL YEAR 2011U.S. DEPARTMENT OF TRANSPORTATION84
of the next fiscal year. Results are considered final when all those accidents have been reported in the NTSB press release (published by March 2013). FY 2011 results will therefore be final after the March 2013 NTSB press release. In general, however, fatal and seri-ous injury accident numbers are not likely to change significantly between the end of the fiscal year and the date they are finalized.
To overcome reporting delays of 60 to 90 days, FAA must rely on historical data, partial internal data sources, and Official Airline Guide (OAG) scheduling information to project at least part of the fiscal year activity data. FAA uses OAG data until official BTS data is available. The final result for the air carrier fatal accident rate is not considered reliable until BTS provides preliminary numbers. Due to reporting procedures in place, it is unlikely that calculation of future fiscal year departure data will be improved substantially. Lacking complete historical data on a monthly basis and independent sources of verification increases the risk of error in the activity data.
ReLIAbILITyResults are considered preliminary since they are based on projected activity data. FAA uses performance data extensively for program management, personnel evaluation, and accountability. Most ac-cident investigations are a joint undertaking. NTSB has the legal responsibility to determine probable cause, while FAA has separate authority to investigate accidents and incidents in order to ensure that FAA meets its broader responsibilities. FAA’s own accident investigators and other FAA employees participate in all accident investigations led by NTSB investigators.
deTAILS oN doT SAfeTY meASUreSGeneral Aviation Fatal Accident Rate (FAA)MeASuReNumber of general aviation fatal accidents per 100,000 flight hours (FY)
SCOPeThe measure includes on-demand (non-scheduled FAR Part 135) and general aviation flights. General aviation comprises a diverse range of aviation activities including:
single-seat homebuilt aircraft
helicopters
balloons
all other aircraft from single and multiple engine land and seaplanes to highly sophisticated extended range turbojets
SOuRCeSThe data on general aviation fatalities come from the National Transportation Safety Board’s (NTSB) Aviation Accident Database. With the assistance of the NTSB, aviation accident investigators develop the data used.
STATISTICAL ISSueSThe NTSB determines the actual number of general aviation fatal accidents. Since this is a simple count of accidents, there are no statistical issues relevant to this data.
The survey data for activity are highly accurate with a percent-standard error of less than one percent. The general aviation community and the General Aviation Joint Steering Committee (GAJSC) of the Safer Skies Initiative recommended development of a data collection program that will yield more accurate and relevant data on general aviation demographics and utilization. Improved survey and data collection methodologies have been developed.
As a result of these efforts, the FAA, working with the General Aviation Manufacturers Association, the NTSB, and other aviation industry associations, has made many improvements to the survey. First, the sample size has significantly increased. In addition, a report-ing form has been created to make it much easier for organizations with large fleets to report. Finally, the agency worked with the Aircraft Registry to improve the accuracy of contact information. As a result, a survey was completed in FY 2004 that, for the first time, creates a statistically valid report of activity on which the general aviation community agrees. Every year since 2004, significant improvements have been made which substantially improve the accuracy of the data.
The GAJSC General Aviation Data Improvement Team has worked closely with the general aviation community and industry to develop this performance measure and target. There is strong support and consensus for the measure and target.
COMPLeTeneSSThe number of general aviation fatal accidents, even when reported as preliminary, is very accurate. When final reports are issued, the number of fatal accidents does not change significantly. NTSB classifications are considered final when the Board issues their annual press release. Accidents during a fiscal year are addressed in the NTSB press release issued at the end of the following year.
GA Survey calendar hours are finalized by October 31 of the following year. As a result, the fatal accident rate for FY 2011 will not be considered final/complete until October 2012.
ReLIAbILITyFAA uses performance data extensively for program management and personnel evaluation and accountability. Most accident investigations are a joint undertaking between FAA and NTSB. NTSB has the legal responsibility; however, most of the accident investigations related to general aviation are conducted by FAA Aviation Safety Inspectors without NTSB’s direct involvement. FAA’s own accident investigators and other FAA employees participate in all accident investigations led by NTSB investigators.
As mentioned above, the large sample for FAA’s activity survey, along with the ease of data collection, produce highly accurate flight hour data. The low standard error which results ensures the reliability of these data.

ANNUAL PERFORMANCE REPORT FISCAL YEAR 2011U.S. DEPARTMENT OF TRANSPORTATION85
deTAILS oN doT SAfeTY meASUreSRail-related Accident and Incident Rate (FRA)MeASuReNumber of rail-related accidents and incidents per million train-miles. (FY)
SCOPeThe Railroad Safety Information System (RSIS) is FRA’s principal repository for data relating to:
railroad accidents and incidents
railroad inspections
highway-rail grade crossings
other rail safety-related information
The Railroad Accident/Incident Reporting Subsystem (RAIRS) compiles rail-related accidents andincident data that railroads submit as required under 49 CFRPart 225. This subsystem contains ap-proximately 35 years of data on railroad casualties, train accidents, highway-rail grade crossing collisions, and operating statistics.
A rail equipment (including train) accident is any collision, derailment, fire, explosion, act of God, or other event involving the operation of railroad on-track equipment (standing or moving), that results in damages greater than the current reporting threshold to railroad on-track equipment, signals, track, track structures, or roadbed. The reporting threshold for CY 2011 was $9,400. A reporting threshold for CY 2012 had not been set as of October 2011. Train accidents are reported on form FRA F6180. 54, “Rail Equipment Accident/Incident Report. ”
Operational data, including train-miles, are reported on form FRA F6180.55, “Railroad Injury and Illness Summary. ”
SOuRCeSFRA’s Railroad Accident/Incident Reporting Subsystem.
STATISTICAL ISSueSNone
COMPLeTeneSSRailroads are required by regulation (49 CFR Part 225) to file monthly reports to FRA of all train accidents that meet or exceed the specified calendar year dollar threshold ($9,400 in CY 2011). The railroads are also required to file monthly operations reports of train-miles, employee-hours, and passenger train-miles.
Accident/incident reports must be filed within 30 days after the end of the month in which the event occurred. Data must be updated if the costs of a particular accident are more than 10 percent higher or lower than the initially reported cost.
Railroad systems that do not connect with the general rail system are excluded from reporting to FRA. Examples include:
subway systems (e.g. , Washington, D.C. Metro, New York City Subway)
track existing inside an industrial compound
insular rail (e.g. , rail that is not connected to the general system and does not intersect with a public highway-rail grade crossing or go over a navigable waterway)
ReLIAbILITyFRA uses the data in prioritizing its inspections and safety reviews and for strategic management of its rail safety program.
FRA inspectors review the railroads’ reporting records and have authority to write violations if railroads are not reporting accurately and completely. Violations can result in monetary fines.
deTAILS oN doT SAfeTY meASUreSTransit Fatality Rate (FTA)MeASuReTransit fatalities per 100 million passenger-miles traveled. (CY)
SCOPeTransit fatality data includes passengers, revenue facility occupants, trespassers, employees, other transit workers (e.g. contractors) and others. A transit fatality is a death within 30 days of an incident related to transit revenue service
Previous to 2002, safety data was collected on a fiscal year, as opposed calendar year, basis.
SOuRCeSThese data are reported annually by operators to the FTA National Transit Database (NTD) and to the Federal Railroad Administration’s Rail Accident and Incident Reporting System (RAIRS). RAIRS data are used exclusively for commuter rail (CR) systems. NTD and RAIRS data are inputs to FTA’s Transit Safety and Security Statistics and Analysis Annual Report.
STATISTICAL ISSueSThe fatality counts in FTA’s Transit Safety and Security Statistics and Analysis are a census. The major source of uncertainty in the measure relates to passenger-miles traveled. Passenger-miles are an estimate typically derived from reported passenger trips and average trip length. Passenger-miles are the cumulative sum of the distances ridden on passenger trips.
An unlinked trip is recorded each time a passenger boards a transit vehicle, even though the rider may be on the same journey. Transit authorities do not routinely record trip length. To approximate passenger-miles, total unlinked trips are multiplied by average trip length. To obtain an average trip length for their bus routes, transit authorities use Automatic Passenger Counters (APCs) with GPS

ANNUAL PERFORMANCE REPORT FISCAL YEAR 2011U.S. DEPARTMENT OF TRANSPORTATION86
Technology or a FTA-approved sampling technique. To obtain passenger mile data on rail systems, ferry boats and paratransit, transit authorities often use computerized tracking systems, such as the Smart Card. In some cases, such as small fare-free systems or large free-transfer systems (e.g. the New York City subway), passenger miles are sampled directly since a 100% count of unlinked passenger trips is not available. Validation based on annual trend analysis is performed on the passenger mile inputs from the transit industry. The validation is performed by analysts at the NTD contractor (currently Savantage Solutions).
COMPLeTeneSSThe information for this measure comes from the FTA’s Transit Safety and Security Statistics and Analysis program, formerly FTA’s Safety Management Information System (SAMIS), which uses data reported by transit operators to the NTD. Many categories and definitions were added or changed in the new NTD in 2002, and have allowed for improvements and more timely analysis of trends and contributing factors. The 2010/2011 measure is an extrapolation of partial-year data, particularly of passenger-miles traveled.
ReLIAbILITyThe transit agency’s CEO certifies that data reported to the NTD are accurate. Submitted data are reviewed by analysts and compared to trend data for the transit system and to National benchmarks. The USDOT Volpe National Transportation Systems Center also compares current safety statistics with previous years, identifies any questionable trends, and seeks explanation from operators.
deTAILS oN doT SAfeTY meASUreSnatural Gas and Hazardous Liquid Pipeline Incidents (PHMSA)MeASuReThe number of pipeline incidents involving death or major injury. (CY)
SCOPeNatural gas pipeline incidents are reportable under 49 CFR 191.15, and hazardous liquid pipeline incidents are reportable under 49 CFR 195.50. Both interstate and intrastate pipelines are subject to incident reporting requirements.
An injury is reportable if it requires in-patient hospitalization resulting from a failure in a pipeline system in which there is a release of a hazardous liquid, CO2, or natural gas being transported. This includes operator employees, contractors working for the operator, other workers in the right of way, emergency responders, and the general public. If the person dies within 30 days of the incident date is it counted as a death, not as an injury. In-patient hospitalization means hospital admission and at least one overnight stay (detailed guidance is on the PHMSA website at www.phmsa.dot.gov).
SOuRCeSDOT/Pipeline and Hazardous Materials Safety Administration (PHMSA) incident data are used. These data are derived from pipeline operator reports submitted on PHMSA Form F-7100.1 and F-7000.1. Most incidents are reported online through the PHMSA website.
STATISTICAL ISSueSResults in any single year should be interpreted with caution. There is some normal annual variation in the number of reported incidents each year, particularly given the small number of these incidents, and this variation might not reflect real changes in the underlying risk.
Targets are presented as ranges to account for this variation. The target each year is set at one standard deviation from the trendline to account for normal variation year-to-year (which shows a decline of about 3.3% on average each year over the past 22 years (1989–2010). This provides about 80% probability of achieving the target if the risk continues to follow the trendline. An exponential trendline is used to reflect the concept of diminishing returns as the numbers decline.
The performance measure is not normalized for changes in exposure—external factors like changes in pipeline mileage, energy consumption, or U.S. population—that could affect the number of incidents with death or major injury.
COMPLeTeneSSCompliance in reporting is very high and most incidents that meet reporting requirements are submitted. Operators must submit reports within 30 days of an incident or face penalties for non-compliance. There may be a 30- to 60-day lag in reporting and compiling information in the database for analysis.
Projections from partial-year data include all months for which we have reliable data plus an estimated number for the missing months based on the historical fraction those months represent in the final totals over the past five years.
ReLIAbILITyPHMSA routinely cross-checks incident/accident reports against other sources of data, such as the telephonic reporting system for incidents requiring immediate notification provided to the National Response Center (NRC). PHMSA inspectors also regularly discuss incidents with operator personnel during routine inspections. PHMSA continues to work to improve Best Management Practices to ensure quality of the incident data.
ANNUAL PERFORMANCE REPORT FISCAL YEAR 2011U.S. DEPARTMENT OF TRANSPORTATION87
deTAILS oN doT SAfeTY meASUreSHazardous Materials Transportation Incidents (PHMSA)MeASuReThe number of hazardous materials transportation incidents involving death or major injury. (CY)
SCOPeHazardous materials transportation incidents are reportable under 49 CFR Parts 171.15 and 171.16. All modes of transportation (air, water, rail, and highway) except pipelines are covered. In maritime transportation, tank vessels (where the vessel itself is the container) are exempt from reporting. This measure is limited to transportation-related releases of hazardous materials that are in commerce.
An injury is reportable if a person receives an injury requiring admittance to a hospital as a direct result of a hazardous material—during the course of transportation in commerce (including loading, unloading, and temporary storage). This includes employees, emergency responders, and the general public. Hospitalization means admittance to a medical facility, not treated and released for a facility such as a hospital emergency room where the person was never admitted to the hospital proper (detailed guidance is on the PHMSA website at www.phmsa.dot.gov).
SOuRCeSDOT/Pipeline and Hazardous Materials Safety Administration (PHMSA) incident data are used. These data are derived from reports submitted on Form DOT F 5800.1 and maintained in the Hazardous Materials Information System (HMIS).
STATISTICAL ISSueSResults in any single year should be interpreted with caution. There is some normal annual variation in the number of reported incidents each year, particularly given the small number of these incidents, and this variation might not reflect real changes in the underlying risk.
Targets are presented as ranges to account for this variation. The target each year is set at one standard deviation from the trendline to account for normal variation year-to-year (which shows a decline of about 1.5% on average each year over the past 22 years (1989–2010)). This provides about 80% probability of achieving the target if the risk continues to follow the trendline. An exponential trendline is used to reflect the concept of diminishing returns as the numbers decline.
The performance measure is not normalized for changes in exposure—external factors like changes in the amount of hazmat shipped, number of shipments, or U.S. population—that could affect the number of incidents with death or major injury.
COMPLeTeneSSCompliance in reporting is very high and most incidents that resulted in death or major injury are reported. Each person in physical possession of a hazardous material at the time an incident occurs (loading, unloading, and temporary storage) during transportation
must submit a Hazardous Materials Incident Report on DOT Form F 5800.1 (01–2004) within 30 days of discovery of the incident. There may be a 30- to 60-day lag in reporting, verifying, validating and compiling information in the database for analysis.
Projections from partial-year data include all months for which we have reliable data plus an estimated number for the missing months based on the historical fraction those months represent in the final totals over the past five years.
ReLIAbILITyPHMSA routinely cross-checks incident data against other sources of data, including matching incident reports with reports made to the National Response Center (NRC) and the use of a news clipping service to provide information on significant hazmat incidents that might not be reported. If sufficient information exists, PHMSA follows up with carriers who may need to file an incident report.
Incidents with death or major injury are considered to be the most reliable of the incident data. These incidents have additional verifi-cation and validation procedures to include follow-up contact with the company or individual who made the report, contact with state and local law enforcement and/or emergency response officials, and matching data with initial reports made to the NRC.
deTAILS oN doT redUced coNgeSTIoN meASUreSHighway Infrastructure Condition (FHWA)MeASuReThe percent of travel on National Highway Systems (NHS) that meets pavement performance standards for a “good” rated ride. (CY)
SCOPeData include Vehicle-Miles Traveled (VMT) on the Highway Performance Monitoring System (HPMS), reported NHS sections and pavement ride quality data reported using the International Roughness Index (IRI). IRI is a quantitative measure of the ac-cumulated response of a quarter-car vehicle suspension experienced while traveling over pavement. An IRI of 95 inches per mile or less is necessary for a good rated ride. VMT represents the total number of vehicle-miles traveled by motor vehicles on public roadways within the 50 States, Washington, D.C., and Puerto Rico.
SOuRCeSData for this measure are collected by the State Highway Agencies us-ing measurement devices that meet industry set standards and reported to FHWA. Measurement procedures are included in the FHWA HPMS Field Manual. The VMT data are derived from the HPMS.
STATISTICAL ISSueSThe major source of error in the percentages is from data collection equipment error and differences in data collection methodologies between the States. Because the measure contains section data, it is sensitive to differences in section length from year to year and State to State.
ANNUAL PERFORMANCE REPORT FISCAL YEAR 2011U.S. DEPARTMENT OF TRANSPORTATION88
States provide annual average daily traffic (AADT) on all Federal-aid highway sections. These data are based on traffic counts taken at least once every three years on the National Highway System, Interstate, and Principal Arterials and at least once every six years on Minor Arterials and Collectors. Traffic counts are adjusted by the States to reflect day-of-week and seasonal variations, current year conditions, and axle corrections, as necessary. States provide summary data on the local and rural minor collector roads. VMT is calculated from this traffic data. Because HPMS is based on samples of the traffic, there are associated sampling errors.
COMPLeTeneSSThe 2011 actual results for this measure are reported based on available 2010 data, as of January 2012.
ReLIAbILITyThe HPMS data are collected by the 50 States, the District of Columbia, and Puerto Rico in cooperation with local governments. While many of the geometric data items, such as type of median, rarely change; other items, such as traffic volume, change yearly. Typically, the States maintain data inventories that are the reposi-tories of a wide variety of data. The HPMS data items are simply extracted from these inventories, although some data are collected just to meet Agency requirements.
The FHWA provides guidelines for data collection in the HPMS Field Manual. Adherence to these guidelines varies by State, depending on issues such as staff, resources, internal policies, and uses of the data at the data provider level. An annual review of reported data is conducted by the FHWA, both at the headquarters level and in the Division Offices in each State. The reported data are subjected to intense editing and comparison with previously reported data and reasonability checks. A written annual evalua-tion is provided to each State to document potential problems and to encourage corrective actions. Data re-submittal is requested in cases where major problems are identified.
deTAILS oN doT redUced coNgeSTIoN meASUreSHighway bridge Condition (FHWA)MeASuReSThe percent of deck area on expanded National Highway System Bridges rated structurally deficient. (CY)
SCOPeThe National Bridge Inspection Standards (NBIS) requires the inspection of all highway bridges located on public roads and the submission of the collected bridge inventory and inspection data to the FHWA for inclusion in the National Bridge Inventory (NBI). The FHWA maintains the NBI, which contains data on nearly 600,000 highway bridges. The information in the NBI contains 95 data items for each of the bridges as required by the Recording and Coding Guide for the Structure Inventory and Appraisal of the Nation’s Bridges. From the data provided, the FHWA monitors the condition of the Nation’s bridges, which includes identifying those bridges that are either Functionally Obsolete or Structurally Deficient.
SOuRCeSThe bridge information is collected by the State DOTs and other bridge owners and is provided to the FHWA at least annually. As part of the FHWA’s NBI, NBIS, and Highway Bridge Program monitoring and oversight responsibilities, the accuracy and reli-ability of the submitted NBI information is constantly evaluated through data checks and field reviews by both Headquarters and field office personnel.
STATISTICAL ISSueSAs with any very large dynamic database, there is always the potential for data quality issues. However, procedures are in-place to identify and correct data issues as part of the annual submittal process. Because the performance measure relies on data associated with nearly 116,000 NHS bridges, the impact of any localized data quality problem is minimized in the overall National analysis.
COMPLeTeneSSThe NBI is the world’s most comprehensive database of bridge information.
ReLIAbILITyThe bridge information is collected by the State DOTs and other bridge owners and is provided to the FHWA at least annually (Note: Some States provide data quarterly). As part of the FHWA’s NBI, NBIS and Highway Bridge Replacement and Rehabilitation Program the accuracy and reliability of the submitted NBI information is evaluated through data checks and field reviews by both Headquarters and field office personnel.
deTAILS oN doT redUced coNgeSTIoN meASUreSHighway Congestion (FHWA)MeASuReThe percent of total annual urban-area travel occurring in congested conditions. (FY)
SCOPeData are derived from approximately 400 urban areas. The data reflects travel conditions on freeway and principal arterial street networks. An urban area is a developed area with a density of greater than 1,000 persons per square mile. Congested conditions exist when travel occurs below the posted speed limit(s).
SOuRCeSData collected and provided by the State Departments of Transpor-tation from existing State or local government databases, including those of Metropolitan Planning Organizations. FHWA’s Highway Performance Monitoring System (HPMS) serves as the repository of the data. The Texas Transportation Institute utilizes HPMS data to derive the above measures.
STATISTICAL ISSueSThe methodology used to calculate performance measures has been developed by the Texas Transportation Institute (TTI) and reported in their annual Mobility Study. With sponsorship from the National
ANNUAL PERFORMANCE REPORT FISCAL YEAR 2011U.S. DEPARTMENT OF TRANSPORTATION89
Cooperative Highway Research Program of the Transportation Research Board, the methodology was significantly revised in both 2010 and 2011 to take advantage of new studies and detailed data sources that have not been previously available.
COMPLeTeneSSThe FY 2009 and prior measures are final. The FY 2010 and FY 2011 measures are preliminary as only partial 2010 HPMS data were available as of October 2011. HPMS data is compiled from the States and verified approximately 10 months from the base year. For example, FY 2011 actual numbers will not be available from HPMS until October 2012.
ReLIAbILITyThe HPMS data are collected by the 50 States, the District of Columbia, and Puerto Rico in cooperation with local governments. Most of the data items, such as type of median, rarely change between years. However, there are items such as traffic volume that change yearly. Typically, the States maintain data inventories that are warehouses for a wide variety of data.
The FHWA provides guidelines for data collection in the HPMS Field Manual. Adherence to these guidelines varies by State, depending on issues such as staff, resources, internal policies, and uses of the data at the data provider level. An annual review of reported data is conducted by the FHWA, both at the headquarters level and in the Division Offices in each State. All reported data is subjected to intense editing, comparison with previously-reported data and reasonability checks. A written annual evaluation is provided to each State to document potential problems and to encourage corrective actions. Data re-submittal is requested in cases where major problems are identified.
deTAILS oN doT redUced coNgeSTIoN meASUreSTransit Ridership (FTA)MeASuReThe average percent change in transit boardings per transit market (150 largest transit agencies).
SCOPeThis metric includes transit passengers at the 150 largest transit systems. These 150 systems account for over 95% of all transit boardings in the US.
SOuRCeSEach of the transit systems reports total boardings by transit mode to the Monthly Module of the National Transit Database within 30 days of the end of each month. This data is then aggregated by the 103 transit markets primarily served by the 150 largest agencies. The metric is the average increase in boardings across those 103 transit markets.
STATISTICAL ISSueSData is reported by the individual transit system. Transit systems with nine or more vehicles and who receive or benefit from FTA’s Urbanized Area Formula Grants are required to report to the NTD Monthly Module. The quality of this metric is largely reliant upon the quality of the data collected and submitted by the individual transit systems.
Although FTA requires a 100% count of boardings to be reported whenever it is available, not every system has a 100% count avail-able. In particular, several large subway systems with free transfers still rely on statistical sampling data to estimate the number of boardings each month.
The ranking of the 150 largest transit systems by transit boardings changes from year-to-year. FTA revises the list of 150 largest transit systems annually, which produces small variations each year in the number of transit markets included in the average.
COMPLeTeneSSThis measure only includes the 150 largest transit systems, as measured by ridership data available to FTA.
ReLIAbILITyFTA validates the submitted data against the historical data reported by each agency, but occasional reporting errors may remain undetected. As part of the validation process, changes to the data collection procedures by an individual transit system and identified by FTA are manually corrected in all calculations to ensure a consistent comparison of the ridership data.
deTAILS oN doT redUced coNgeSTIoN meASUreSTransportation Accessibility (FTA)MeASuReS1. Percentage of bus fleets compliant with the Americans with Disabilities Act (ADA). (CY)
2. Percent of key rail stations compliant with the Americans with Disabilities Act (ADA). (CY)
SCOPeADA compliance for bus fleet means that vehicles used in scheduled, fixed-route transit services are equipped with wheelchair lifts or ramps.
Accessibility for key rail facilities is determined by standards for ADA compliance. Transit systems were required to identify key stations. A key station is one at the end of a line, at a transfer point, or that has been designated as such by the operator.
All new rail stations are required to be ADA compliant upon completion and must meet standards for new rail stations, not key stations. Altered stations are also required to be ADA compliant upon completion and must meet standards for alterations of transportation facilities by public entities.

ANNUAL PERFORMANCE REPORT FISCAL YEAR 2011U.S. DEPARTMENT OF TRANSPORTATION90
SOuRCeSCompliant bus fleets: National Transit Database (NTD)
Compliant rail stations: Rail Station status reports to the FTA Office of Civil Rights
STATISTICAL ISSueSThe NTD collects data from all transit systems that receive or benefit from FTA’s Urbanized Area Formula Grants. It is believed that NTD Data covers over 99% of the Nation’s transit bus fleet. Information on the ADA key rail stations is reported to FTA by transit authorities.
COMPLeTeneSSData reported for key station accessibility excluded those stations for which time extensions had been granted under 49 CFR 37.47(c) (2) or 37.51(c) (2). There were 138 stations for which time extensions of various lengths were granted; some through 2020 the maximum permitted. These deadlines are now beginning to pass and the stations can no longer be excluded from the total key station accessibility figures. Currently, the total number of time extensions from 2010/2011 through 2020 stands at 14. The total number of key stations will increase and the percentage of compliant stations may decrease as they are added to the total key station count. Beginning in 2010/2011, the key station accessibility figures began reporting the total number of key stations, the total number that are accessible, and the number with outstanding time extensions.
ReLIAbILITyAll data in the NTD are self-reported by the transit industry. The transit agency’s Chief Executive Officer and an independent auditor for the transit agency certify the accuracy of this self-reported data. The data are also compared with fleet data reported in previous years and crosschecked with other related operating and financial data in the report. Fleet inventory is also reviewed as part of FTA’s Triennial Review, and a visual inspection is made at that time.
Information on ADA key rail stations is reported to FTA by transit authorities. The FTA’s Office of Civil Rights conducts oversight as-sessments to verify the information on key rail station accessibility. Quarterly rail station status reports and key rail station assessments have significantly increased the number of key rail stations that have come into compliance over the last several years.
deTAILS oN doT redUced coNgeSTIoN meASUreSnAS On-Time Arrivals (FAA)MeASuRePercent of all flights arriving no more than 15 minutes late.
SCOPeA flight is considered on-time if it arrives no later than 15 minutes after the published, scheduled arrival time. This definition is used in both the DOT Airline Service Quality Performance (ASQP), and Aviation System Performance Metrics (ASPM) reporting systems. Air carriers, however, also file up-to-date flight plans for their
services with the FAA that may differ from their published flight schedules. This metric measures on-time performance against the carriers’ filed flight plan rather than the published schedule, which may be dated.
The time of arrival of completed passenger flights to and from the 35 Core airports is compared to their flight plan scheduled time of arrival. For delayed flights, delay minutes are subtracted from the total min-utes of delay to determine lateness. Such delay minutes include:
delay minutes attributable to extreme weather
carrier caused delay
security delay
share of delay minutes due to a late arriving flight at the departure airport
If the flight is still late, it is counted as a delayed flight attributed to the National Aviation System (NAS) and the FAA.
SOuRCeSThe ASPM database, maintained by the FAA’s Office of Aviation Policy and Plans, and the DOT’s ASQP causation database, provides the data for this metric. By agreement with the DOT, certain major air carriers file ASQP flight data for all flights to and from most large and medium hubs. Flight records contained in the Traffic Flow Management System (TFMS) and flight movement times provided by Aeronautical Radio, Inc. (ARINC) supplement the flight data.
STATISTICAL ISSueSData are not reported for all carriers, only 20 carriers report monthly into the ASQP reporting system.
COMPLeTeneSSFiscal year data are finalized approximately 90 days after the close of the fiscal year.
ReLIAbILITyThe reliability of ASPM is verified on a daily basis by the execution of a number of audit checks, comparison to other published data met-rics, and through the use of ASPM by over 1500 registered users. ASQP data is filed monthly with DOT under 14 CFR 234, Airline Service Quality Performance Reports, which separately requires reporting by major air carriers on flights to and from all large hubs.
deTAILS oN doT gLoBAL coNNecTIvITY meASUreSdisadvantaged and Women-Owned Small businesses (OST S-40)MeASuRe1. Percent share of the total dollar value of DOT direct contracts that are awarded to women-owned businesses. (FY)
2. Percent share of the total dollar value of DOT direct contracts that are awarded to small disadvantaged businesses. (FY)
ANNUAL PERFORMANCE REPORT FISCAL YEAR 2011U.S. DEPARTMENT OF TRANSPORTATION91
SCOPeIncludes contracts awarded by DOT Operating Administrations through direct procurement. It does not include FAA contracts exempt from the Small Business Act.
SOuRCeSNew data reports will come directly from the Federal Procurement Data System (FPDS). Data are compiled by USDOT Contracting staff from Department contract documents. Selected information is either transmitted from the operating administration contract writing systems, or manually data-keyed into the FPDS database. The FPDS website can be queried to compute all needed statistics.
All USDOT contracts are itemized.
STATISTICAL ISSueSDOT is currently required to examine FPDS/NG data and resubmit it for validation. After re-verifying these data against internal sources, all known major errors in the data are eliminated. Business types are identified in the Central Contractor Registration (CCR) database. However, random variation in the number of DOT contracts as well as the number of women-owned and small disadvantaged businesses each year results in some random variation in these measures from year to year.
COMPLeTeneSSThe Federal Procurement Data System (FPDS) is prescribed by regulations as the official data collection mechanism for DOT acquisitions.
ReLIAbILITyThere is extensive regulatory coverage to ensure data reliability. The system is used to prepare many reports to Congress, the Small Business Administration (SBA), and others. Performance goals follow actual data, as finalized by the SBA, and is the only reliable basis for program evaluations as mandated by the Small Business Act, Section 644(g).
deTAILS oN doT gLoBAL coNNecTIvITY meASUreSSt. Lawrence Seaway System Availability (SLSdC)MeASuReThe percent of days in the shipping season that the U.S. portion of the St. Lawrence Seaway is available (FY).
SCOPeThe availability and reliability of the U.S. sectors of the St. Lawrence Seaway (including the two U.S. Seaway locks in Massena, NY) are critical to continuous commercial shipping during the navigation season (late March to late December). System downtime due to any condition (weather, vessel incidents, malfunctioning equipment) causes delays to shipping, affecting international trade to and from the Great Lakes region of North America. Downtime is measured by:
hours/minutes of delay for weather (visibility, fog, snow, ice)
vessel incidents (human error, electrical and/or mechanical failure)
water level and rate of flow regulation
lock equipment malfunction
SOuRCeSSaint Lawrence Seaway Development Corporation (SLSDC) Office of Lock Operations and Marine Services
STATISTICAL ISSueSNone
COMPLeTeneSSSLSDC is the agency responsible for the operation and maintenance of the U.S. portion of the St. Lawrence Seaway. Furthermore, SLSDC’s lock operations unit gathers primary data for all vessel transits through the U.S. Seaway sectors and locks, including any downtime in operations.
Data is collected on site, at the U.S. locks, as vessels are transiting or as operations are suspended. This information measuring the System’s reliability is compiled and delivered to SLSDC senior staff and stakeholders each month. In addition, SLSDC compiles annual System availability data for comparison purposes. Since SLSDC gathers data directly from observation, there are no limita-tions. Historically, the SLSDC has reported this performance metric for its entire navigation season (late March to late December). Unfortunately, due to reporting timelines, system availability data is only reported through September in this report.
ReLIAbILITySLSDC verifies and validates the accuracy of the data through review of 24-hour vessel traffic control computer records, radio communication between the two Seaway entities and vessel operators, and video and audiotapes of vessel incidents.
ANNUAL PERFORMANCE REPORT FISCAL YEAR 2011U.S. DEPARTMENT OF TRANSPORTATION92
deTAILS oN doT gLoBAL coNNecTIvITY meASUreSTravel in Freight Significant Corridors (FHWA)MeASuReNumber of freight corridors with an annual decrease in the average buffer index rating. (CY)
SCOPeTravel time reliability is a key indicator of transportation system performance. FHWA uses measured speed data to calculate a Buffer Index (BI) for each freight significant corridor. The BI is a measure of travel time reliability and variability that represents the extra time (or time cushion) that would have to be added to the average travel time to ensure on-time arrival 95 percent of the time.
SOuRCeSTravel time data for freight significant corridors is derived using time and location data from satellite communications equipment on-board mobile commercial vehicles. A Global Positioning System (GPS) or other communication devices in the vehicle transmits a continuous or periodic signal to an earth orbit satellite. This technology allows commercial vehicles to serve as probes and enables direct measurement of commercial vehicle average operat-ing speeds and travel rates and travel times. Selection of freight significant corridors and highway segments is largely based on the volume of freight moved on the segment.
STATISTICAL ISSueSThe key issues are long term viability of data source, sampling size of the commercial vehicle probes, and frequency of the time and position sampling. In FY 2009, FHWA made progress in addressing the issues of sample size and the frequency of sampling. By entering into arrange-ments with two additional technology partners, FHWA added more than 150,000 vehicles to the sample size and enabled more precise detection of a vehicle’s location, direction, and speed.
COMPLeTeneSSFHWA is partnering with vendors that collect automatic vehicle information from a customer base, primarily with interstate long-haul carriers. The data provides nationwide coverage from approximately 500,000 vehicles (trucks and trailers) in the United States, Canada and Mexico. The majority of the data is from fleets that have signals sent to vehicles with readings taken as often as every 15 minutes. The interval between probe readings depends on the subscription and which services the individual carriers have authorized. The intervals vary and may range from every two minutes to every two hours.
The following data is transmitted:
truck identification
latitude
longitude
date and time
interstate route
In FY 2009, FHWA enhanced the completeness of the data set by adding two additional vendors. This increases the percentage of local truckload carriers, increases the coverage area, and provides access to the data that more accurately pinpoints a vehicle’s loca-tion, direction and speed. FHWA processes and manages the data provided by the vendors to gather the information for this measure. On average the data set produces over 340,000,000 truck positions monthly and over 4,000,000,000 positions annually.
ReLIAbILITyProbe vehicle performance systems are designed to provide travel time and speed/delay information without traditional fixed-location traffic monitoring and data collection systems. Probe-based systems enable coverage of much larger geographic areas (e.g. entire roadway networks) without the cost of building fixed-location traffic data collection systems throughout those networks. This technique takes advantage of the significant reductions in the cost of GPS devices that report current location and time information with a high degree of accuracy. When placed in vehicles and combined with electronic map information, GPS devices are the primary component of excellent vehicle location systems. Storage and analysis of the GPS location data allow for very accurate roadway performance measurement. To provide reliable roadway performance estimates, a large enough number of vehicles must be equipped with GPS to provide an unbiased measure of roadway performance, and to provide the temporal and geographic diversity desired by the performance measurement system. A significant drawback to probe vehicle-based performance monitoring is that it does not provide information about the level of roadway use (e.g. vehicle volume), but only provides information about the speeds and travel times being experienced.
deTAILS oN doT gLoBAL coNNecTIvITY meASUreSborder Crossing Operation Reliability (FHWA)MeASuReNumber of National Highway System border crossings with a decrease in unexpected delay.
SCOPeU.S. Border Crossings with a decrease in unexpected delay, based on the average annual hours of unexpected delay, compares high-delay crossing times to average delay crossing times. The reliability measure, or Buffer Index, uses the 95th percentile crossing times to represent
ANNUAL PERFORMANCE REPORT FISCAL YEAR 2011U.S. DEPARTMENT OF TRANSPORTATION93
border crossing times during periods with the heaviest volumes and/ or most limited capacity and the average crossing time to represent the expected time for commercial vehicles to cross the border.
SOuRCeSData are collected from the following five U.S./Canada border crossings:
Blaine (Pacific Highway): Blaine, WA
Pembina: Pembina, ND
Ambassador Bridge: Detroit, MI
Peace Bridge: Buffalo, NY
Champlain: Champlain, NY
In addition, data collection efforts were initiated at two U.S./Mexico border crossings.
Data collection is satellite-based and uses automated vehicle location (AVL) and other technologies to obtain information. Using this method, the specific location of a vehicle can be determined at regular time intervals using latitude and longitude positioning. When collected, the locations are stamped with a time, date and vehicle identification number. This data makes it possible to compute the average crossing times.
To support data collection, FHWA has established contracts with third parties who arrange for access to data from technology vendors and commercial carriers.
STATISTICAL ISSueSThe key issues are long term viability of data source, sampling size of the commercial vehicle probes, and frequency of the time and position sampling. In FY 2010, FHWA made positive progress in addressing the issues of sample size and the frequency of sampling. By entering into arrangements with two additional technology part-ners, FHWA added more than 150,000 vehicles to the sample size and enabled more precise detection of a vehicle location, direction and speed.
COMPLeTeneSSTraffic travel time information is traditionally collected with fixed-location systems (e.g. detectors embedded in the roads and video cameras). While the border data collection methods used provide non-intrusive ways of measuring border delay, data are not collected on every commercial truck for a particular crossing. There is continuous sampling over time, but data are collected only for commercial vehicles equipped with the technology. There is also important information about the crossings that can significantly influence travel times that is not accounted for or explained by the data collection methods used. These include the number of inspec-tion/processing booths, the traffic volume and/or threat levels.
ReLIAbILITyProbe vehicle performance systems are designed to provide border crossing time and delay information without traditional fixed-location traffic monitoring and data collection systems. Probe-based systems enable coverage of much larger geographic areas (e.g. the entire Northern border) without the cost of building fixed-location traffic data collection systems throughout those networks. Storage and analysis of the GPS location data allow for very accurate border performance measurement. To provide reliable border performance estimates, a large enough number of vehicles must be equipped with GPS to provide an unbiased measure of the border transportation system.
deTAILS oN doT eNvIroNmeNTAL STewArdShIP meASUreSexemplary Human environment Initiatives (FHWA)MeASuReNumber of Exemplary Human Environment Initiatives undertaken (FY)
SCOPeThe FHWA seeks to recognize exemplary examples of transportation projects that either create or improve conditions for human activities. Projects are exemplary if they:
meet a specific documented need
are innovative
are significant
demonstrate results
offer the potential for transferability
demonstrate partnering and collaboration
provide specific benefits to human activity
are mainstreamed into transportation decision-making
benefit more than one project category
Each year a number of Exemplary Human Environment Initiatives (EHEI) will be selected for Nationwide recognition and promotion as models for other areas to consider implementing. Since 2008, projects can be recognized under both EHEI and the Exemplary Ecosystem Initiative to further demonstrate environmental stewardship.
SOuRCeSState DOT and FHWA field offices submit a list, including descriptions, of human environment initiatives for consideration to FHWA Headquarters.
STATISTICAL ISSueSThe data do not represent all ecosystem and habitat conservation initiatives underway. Submittals are made at the discretion of the States and FHWA field offices.
ANNUAL PERFORMANCE REPORT FISCAL YEAR 2011U.S. DEPARTMENT OF TRANSPORTATION94
COMPLeTeneSSAll recognized initiatives are included. However, there may be other potential qualifying initiatives that have not been identified.
ReLIAbILITyThe identification of Exemplary Human Environment Initiatives may not be consistent across all States and FHWA field offices. While the criteria are carefully defined and complete, they are still subject to interpretation.
deTAILS oN doT eNvIroNmeNTAL STewArdShIP meASUreSenvironmental Impact Statements (FHWA / FAA/ FTA)MeASuReMedian elapsed time in months to complete Environmental Impact Statements (EIS) for DOT funded infrastructure projects.
SCOPeThere are two purposes for an EIS. First, an EIS provides full and open evaluations of the human and natural environmental issues and alternatives. Secondly, an EIS is used to inform decision-makers and the public of reasonable alternatives that could avoid or minimize adverse impacts and enhance the quality of the environ-ment. EIS completion time covers the period from publication of the Notice of Intent (NOI) to publication of the Record of Decision (ROD) for DOT-funded infrastructure projects.
DOT modes have tools for measuring the agency’s performance in preparing and completing EISs for DOT funded infrastructure projects. Not only do they provide a measure of the time to complete an EIS and the intermediate steps, they will also help assess the suc-cess of environmental streamlining initiatives undertaken by DOT operating administrations.
SOuRCeSData are derived from FHWA, FTA, and FAA statistical compilations. FHWA data are collected primarily through the FHWA’s Environmen-tal Document Tracking System (EDTS). The EIS processing time is tracked from the NOI to the ROD. Frequent reports are an integral part of a National communication strategy for environmental stream-lining and are absolutely essential in responding to Congressional inquiries, periodic hearings, and mandated Congressional reports and annual reports to the Council on Environmental Quality.
FAA has developed and initiated a database maintained by the FAA’s Office of Environment and Energy. The database collects information on all agency EISs and all data not readily available. In addition the database provides information on agency Environ-mental Assessments, Endangered Species Expenditures, and EIS Cooperating Agency Information that are used to provide reports to DOT, Congress, and the White House. Start and completion dates of EISs are taken from published dates associated with the NOI to Prepare an EIS through Draft EIS, Final EIS, and ROD. Source materials are contained in the project files. The project
manager for the EIS maintains the files and records.
FHWA collects data for all projects primarily through the FHWA’s EDTS. The EIS processing time is tracked from the NOI to the ROD.
FTA maintains an EIS tracking database for EISs.
STATISTICAL ISSueSFor FAA data, the various lines-of-business are responsible for providing and updating the data on a regular basis. In most cases the data is recorded in the database by the EIS project manager. This is the sole source of the information for the database. Unanticipated requirements, such as additional funding for airport improvements or a split in the Airport Improvement Program, can have an effect on the timeliness of reporting.
The FHWA division offices are responsible for entering data into EDTS on a regular basis. EDTS also accounts for inactive periods in the processing of environmental documents. Delays can result from funding and/or to changes in State agency priorities.
FTA: None
COMPLeTeneSSProjects for which an NOI has been published in the Federal Register are entered into the FHWA EDTS. As the NEPA process progresses, the dates for the Draft EIS, Final EIS, and the ROD are also entered. FHWA reports out on the median time it takes to process an EIS from the NOI to the ROD.
For FAA, completeness and reliability of the data is the responsibility of the reporting lines-of-business. Unanticipated program changes can impact the timeliness of recording data and therefore the com-pleteness of the database and accuracy of the reported performance measure. After the start and completion of each EIS is recorded the total time until completion can be calculated. Then the mean time for completion can be computed for the total number of projects over the time period being considered.
ReLIAbILITyThere are no reliability issues. The data is submitted by States and Headquarters verifies those dates by the Federal Register Publication dates. This measure is reliable in the time it takes to complete the
“environmental process,” which satisfies environmental laws and permitting requirements that apply to a DOT-funded project after subtracting “down time. ”
deTAILS oN doT eNvIroNmeNTAL STewArdShIP meASUreSMobile Source emissions (FHWA / FTA)MeASuReA twelve-month moving average of the number of areas in conformity lapse. (FY)
ANNUAL PERFORMANCE REPORT FISCAL YEAR 2011U.S. DEPARTMENT OF TRANSPORTATION95
SCOPeThe transportation conformity process is intended to ensure that transportation plans, programs, and projects will not:
create new violations of the National Ambient Air Quality Standards (NAAQS)
increase the frequency or severity of existing NAAQS violations, or
delay the attainment of the NAAQS in designated non- attainment (or maintenance) areas
SOuRCeSThe FHWA and FTA jointly make conformity determinations within air quality non-attainment and maintenance areas. This is done to ensure that Federal actions conform to the purpose of State Imple-mentation Plans (SIP). With DOT support, the U.S. Environmental Protection Agency (EPA) has issued regulations pertaining to the criteria and procedures for transportation conformity, which were revised based on stakeholder comment.
STATISTICAL ISSueSNone
COMPLeTeneSSA 12-month conformity lapse grace period can be granted if:
compliance cannot be determined within 24 months after SIP actions
four years have passed since the last conformity determination
After the grace period, the consequences of a conformity lapse will apply.
During a conformity lapse, no new non-exempt projects may advance. This holds until a new determination for the plan and Transportation Improvement Program (TIP) can be made. This condition affects transit as well as highway projects. During a con-formity lapse, FHWA and FTA can only make approvals or grants for projects that are exempt from the conformity process (pursuant to Sections 93. 126 and 93. 127 of the conformity rule) such as a safety project and transportation control measures that are included in an approved SIP. Only those project phases that have received approval of the project agreement, and transit projects that have received a full funding grant agreement, or equivalent approvals, prior to the conformity lapse may proceed. This measure is current and has no missing data.
ReLIAbILITyThere are no reliability issues. FHWA and FTA jointly make confor-mity determinations within air quality non-attainment and mainte-nance areas to ensure that Federal actions conform to the purpose of the SIP.
deTAILS oN doT eNvIroNmeNTAL SUSTAINABILITY meASUreSHazardous Liquid Pipeline Spills (PHMSA)MeASuReThe number of hazardous liquid pipeline spills with environmental consequences. (CY)
SCOPeHazardous liquid pipeline incidents are reportable under 49 CFR 195.50. This measure tracks the number of spills, of five barrels or more, where the accident report noted any environmental consequences (fish, birds, terrestrial wildlife, soil, or water)— from hazardous liquid pipelines in the U.S.
SOuRCeSDOT/Pipeline and Hazardous Materials Safety Administration (PHMSA) incident data are used. These data are derived from pipe-line operator reports submitted on PHMSA Form F-7000.1. Most incidents are reported online through the PHMSA website.
STATISTICAL ISSueSResults in any single year should be interpreted with caution. There is some normal annual variation in the number of reported incidents each year, particularly given the small number of these incidents, and this variation might not reflect real changes in the underlying risk.
Targets are presented as ranges to account for this variation. The target each year is set at one standard deviation from the trendline to account for normal variation year-to-year (which shows a decline of about 5% on average each year over the 9-year period 2002–2010). This provides about 80% probability of achieving the target if the risk continues to follow the trendline. An exponential trendline is used to reflect the concept of diminishing returns as the numbers decline.
The performance measure is not normalized for changes in expo-sure—external factors like changes in pipeline mileage, petroleum consumption, or ton-miles moved through pipelines—that could affect the number of incidents with environmental consequences.
COMPLeTeneSSCompliance in reporting is very high and most or all incidents that meet reporting requirements are submitted. Operators must submit reports within 30 days of an incident or face penalties for non-compliance. There may be a 30- to 60-day lag in reporting and compiling information in the database for analysis.
Projections from partial-year data include all months for which we have reliable data plus an estimated number for the missing months based on the historical fraction those months represent in the final totals over the past five years.
ReLIAbILITyPHMSA routinely cross-checks incident/accident reports against other sources of data, such as the telephonic reporting system for incidents requiring immediate notification provided to the National
ANNUAL PERFORMANCE REPORT FISCAL YEAR 2011U.S. DEPARTMENT OF TRANSPORTATION96
Response Center (NRC). PHMSA inspectors also regularly discuss incidents with operator personnel during routine inspections. PHMSA continues to work to improve Best Management Practices to ensure quality of the incident data.
deTAILS oN doT SecUrITY meASUreSShipping Capacity (MARAd)MeASuRePercent of the Department of Defense (DOD) required shipping ca-pacity, complete with crews, available within mobilization timelines.
SCOPeThis measure is based on the availability of 48 ships in the Maritime Administration’s Ready Reserve Force (RRF) and approximately 132 ships enrolled in the Voluntary Intermodal Sealift Agreement (VISA) program. The VISA program includes 60 ships enrolled in the Maritime Security Program (MSP).
The performance measure represents the number of available ships (compared to the total number of ships in the RRF and VISA) that can be fully crewed within the established readiness timelines. Crewing of the RRF vessels is accomplished by commercial mariners employed by private sector companies under contract to the govern-ment. Currently there are more qualified mariners than jobs, even in the most under represented categories. However, due to the voluntary nature of this system, there is no guarantee that sufficient mariners will be available on time and as needed especially during a large, rapid activation.
SOuRCeSMaterial availability of ships: The Maritime Administration records (and information exchanged with the DOD) on the readiness/availability status of each ship by the Office of Sealift Support (MSP/VISA ships) and the Office of Ship Operations (RRF ships).
Typical reasons why a ship is not available include:
the ship is in drydock
the ship is undergoing a scheduled major overhaul
the ship is undergoing an unscheduled repair
The Maritime Administration and the DOD also maintain records of the sealift ships enrolled in the MSP and VISA and their crew requirements.
Availability of mariners: The Maritime Administration, through their Mariner Outreach System, extracts the number of qualified mariners from the data recorded in the U.S. Coast Guard’s Merchant Mariner Licensing and Documentation (MMLD) system. The willingness and availability of these mariners to sail is then estimated using all available information including total U.S. requirements for deep sea mariners, recent sea service, and mariner surveys.
STATISTICAL ISSueSNone
COMPLeTeneSSData are complete.
ReLIAbILITyThe data is reasonably reliable and useful in managing the reserve fleet readiness program.
deTAILS oN doT SecUrITY meASUreSdOd-designated Port Facilities (MARAd)MeASuRePercent of DOD-designated commercial strategic ports that are avail-able for military use within DOD established readiness timelines.
SCOPeThe measure consists of the total number of DOD-designated com-mercial strategic ports for military use. Ports must forecast their ability to able to meet DOD-readiness requirements within 48 hours of writ-ten notice from the Maritime Administration, expressed as a percent-age of the total number of DOD-designated commercial strategic ports. Presently, there are 15 DOD-designated commercial strategic ports. Port readiness is based on monthly forecasts submitted by the ports and semi-annual port readiness assessments by the Maritime Administration in cooperation with other National Port Readiness Network partners.
The semi-annual port assessments provide data or other information on a variety of factors, including the following:
the capabilities of channels, anchorages, berths, and pilots/tugboats to handle larger ships
rail access, rail restrictions, rail ramp offloading areas, and rail storage capacities
the availability of trained labor gangs and bosses
number and capabilities of available cranes
long-term leases and contracts for the port facility
distances from ports to key military installations
intermodal capabilities for handling containers
highway and rail access; number of port entry gates
available lighting for night operations; and number and capacity of covered storage areas
marshalling areas off the port
required security clearances and operational Secure Terminal Equipment (STE)
ANNUAL PERFORMANCE REPORT FISCAL YEAR 2011U.S. DEPARTMENT OF TRANSPORTATION97
SOuRCeSThe Maritime Administration’s data are derived from monthly reports submitted by the commercial strategic ports and from MARAD/DOD semi-annual port assessments.
STATISTICAL ISSueSNone
COMPLeTeneSSData are complete.
ReLIAbILITyThe data is reasonably reliable according to the Bureau of Transpor-tation Statistics and useful in managing its port readiness program.
deTAILS oN doT SecUrITY meASUreSemergency Management (OST)MeASuRePercent of DOT personnel with emergency management responsi-bilities who are prepared to respond to disasters or emergencies.
SCOPeDOT tracks participation in exercises conducted under the National Exercise Program as well as completion of training required under the National Security Professional Development Program.
SOuRCeSThe Department of Homeland Security establishes training requirements for the Department. For example, certain National Incident Management System courses are required. We notify staff of required courses and keep a list of all who are required to take the courses and those who have taken them. In addition, the Office of Intelligence, Security and Emergency Response leads the Department’s participation in four Principals Level Tabletop Exercises hosted by the White House Staff and in National Level Exercises that improve the Department’s abilities to respond to natural disasters and terrorist events. Further, the Office of Intelli-gence, Security and Emergency Response leads DOT participation in Tier II exercises and White House hosted tabletop exercises. A roster of participation is maintained which is matched against a list of staff required to participate in such exercises.
STATISTICAL ISSueSData collection is a manual process with self-reporting require-ments. This can lead to under-reporting of those required to take courses and an under reporting of those who have taken them.
COMPLeTeneSSThe data is as complete as can be obtained in a manual process. It is possible that the names of some participants are not captured. In addition, staff turnover makes it necessary to continually update the list of those required to participate in exercises or training. In addition, staff turnover makes it necessary to continually update the list of those required to take training. Similarly, the list of staff required to participate in exercises may not include all the required
staff because the Office of Intelligence, Security and Emergency Response may not have been notified of changes in staffing or responsibility.
ReLIAbILITyThe data is as reliable as can be expected for a system that requires participants to report their participation and where records are manually maintained.
deTAILS oN doT SecUrITY meASUreSemergency Management with exercises—Operating Administrations (OST)MeASuRePercent of Operating Administrations meeting annual response requirements.
SCOPeThis performance measure attempts to gauge the ability of the Department to effectively respond to emergencies affecting the transportation sector. Since it is not possible to measure actual response activities as each disaster has a unique set of response requirements, the Office of Intelligence, Security and Emergency Response maintains measures the capability of the department to respond to emergencies based on activities that would be required in a response.
SOuRCeSDOT establishes key response activities that are required of each of the Operating Administrations for operations of the Continuity of Operations sites, the Crisis Management center and the Regional Emergency transportation program and evaluate whether they have fulfilled the requirement for the activity. The results are then averaged for each of the Operating Administrations to determine the result for the Department.
STATISTICAL ISSueSData for this performance measure are taken by direct observation.
COMPLeTeneSSBecause of the lack of meaningful metrics, there are limits in what can be measured. To ensure preparedness, compliance with require-ments of the Continuity of Operations, Crisis Management Center and Response Programs there are a series of questions that are focused on. First, there are seven Continuity of Operation require-ments that are measured:
Did the Operating Administration continuity of operations site pass 95 percent of communications tests?
Was the Operating Administration continuity of operations plans 90% or more in line with the Continuity of Operations Evaluation Checklist?
Did the Operating Administration maintain a fully operational continuity of operations site?
Was the Operating Administration able to fully participate

ANNUAL PERFORMANCE REPORT FISCAL YEAR 2011U.S. DEPARTMENT OF TRANSPORTATION98
in exercises/events from their continuity of operations site?
Did the Operating Administration maintain adequate staffing to manage the continuity of operations program?
Did the Operating Administration have a redundant continuity communications program?
Did the Operating Administration ensure vital records were available at the continuity site?
In addition, three Crisis Management Center requirements are analyzed:
Did the Operating Administration meet staffing requirements?
Did the Operating Administration provide Emergency Coordinators when required?
Did the Operating Administration report incidents per reporting requirements?
Finally, four Response Program requirements are measured:
Did the Operating Administration provide the required Regional Emergency Transportation Coordinator?
Did the Regional Emergency Transportation Coordinator/ Regional Emergency Transportation Representative maintain an adequate and trained cadre?
Did the Operating Administration provide required financial support to the Regional Emergency Transportation Coordina-tor program?
Did the Operating Administration provide staffing to the Federal Emergency Management Agency National Response Coordination Center Care.
ReLIAbILITyThe data provide a reliable indicator of the Department’s preparedness to respond to disasters and man-made events.
deTAILS oN orgANIzATIoNAL exceLLeNce meASUreSCritical Acquisitions on budget (FAA)MeASuReFor major DOT aviation systems, percent of cost goals established in the acquisition project baseline that are met. (FY 2011)
SCOPeThe purpose of the Critical Acquisitions on Budget target is to encourage programs to stay on budget, identify significant projected budget variances early, and take corrective actions. FAA’s Air Traffic Organization (ATO) Service Units select specific programs that are determined to provide a capital asset to the NAS. For FY 2011, 34 acquisition programs were tracked and monitored. The designation of “critical acquisition programs” in the title of this performance
target expresses the critical value of the program to the NAS. The budget measure is set to the January 2011 CIP.
SOuRCeSATO tracks and reports the status of all cost performance targets using an automated database. ATO Service Units provide a monthly Red, Yellow, or Green assessment that indicates their confidence level in meeting their established milestones. To ensure milestones and cost are maintained within the established performance targets, comments are provided monthly that detail problems, issues, and corrective actions. The performance status is reported monthly to the FAA Administrator through FAA Flight Plan meetings.
STATISTICAL ISSueSThe programs that are selected each fiscal year represent a cross section of programs within the ATO. They include programs that have an Exhibit 300 as well as programs referred to as “variable quantity” programs. The latter are typically not required to undergo a standard acquisition life cycle process. The amount of equipment/systems procured or replaced with these programs is determined by the amount of funding available each fiscal year.
COMPLeTeneSSThis measure is current with no missing data. Each DOT organiza-tion maintains its own quality control checks for cost, schedule, and technical performance data of each major systems acquisition in accordance with OMB Circulars A-11, A-109, and A-130, Federal Acquisition Regulations, and Departmental orders implementing those directives and regulations.
ReLIAbILITyEach DOT organization having major system acquisitions uses the data during periodic acquisition program reviews, to determine resource requests. They are also used during the annual budget preparation process, for reporting progress made in the President’s Budget and for making key program management decisions. The monthly status is reported through the SPIRE database and included in monthly high-level management reviews. Once the pro-gram is selected and approved for tracking purposes it is reported with detailed commentary each month, and assigned a Red, Yellow, or Green confidence indicator when the cost is within the 10% threshold. These detailed reports are reviewed at all levels of the appropriate Service Unit, and Executive levels within the ATO, and the FAA Administrator.
deTAILS oN orgANIzATIoNAL exceLLeNce meASUreSCritical Acquisitions on Schedule (FAA)MeASuReFor major DOT aviation systems, percent of scheduled milestones established in acquisitions project baselines that are met. (FY 2011)
ANNUAL PERFORMANCE REPORT FISCAL YEAR 2011U.S. DEPARTMENT OF TRANSPORTATION99
SCOPeFAA’s Air Traffic Organization (ATO) Service Units select specific milestones and completion dates against programs that are determined to provide a capital asset to the NAS. For FY 2011, 54 selected critical milestones were to be tracked. However, four of the original 54 milestones that comprised this year’s target programs were approved to slip their planned September 2011 milestones into FY 2012 following the furlough of approximately 4,000 workers in August. The four programs would have completed their milestones originally scheduled for September 2011. Thus, the number of milestones included in this FY 2011 target was reduced from 54 to 50. Forty-five of the fifty milestones must meet their targeted date to be within 90 percent of the performance goal.
Most of the programs selected were FAA Acquisition Category 1 and 2. Those that did not provide Exhibit 300’s were included because they provided an asset to the NAS with a useful life of more than two years. The designation of “critical acquisition programs” in the title of the performance target expresses the critical value of the program to the NAS.
The schedule measure is set to only those milestones selected at the beginning of the current fiscal year. FY 2011 was an exception due to the unscheduled furlough. In FY 2009, the FAA National Airspace System Capital Investment Plan began assessing program performance against the total program acquisition baseline. These reports document the agency’s performance in compliance with the Federal Aviation Reauthorization Act of 1996, PL 104-264, Section 252—Air Traffic Control Modernization Reviews.
SOuRCeSATO tracks and reports the status of all schedule and cost performance targets using an automated database. ATO Service Units provide a monthly Red, Yellow, or Green assessment that indicates their confidence level in meeting their established milestones. Comments are provided monthly that detail problems, issues, and corrective actions to ensure milestones and cost are maintained within the established performance target. The performance status is reported monthly to the FAA Administrator through FAA Flight Plan meetings.
STATISTICAL ISSueSThe programs that are selected each fiscal year represent a cross section of programs within the ATO. They include programs that are referred to as “variable quantity” programs. The latter are typically not required to undergo a standard acquisition life cycle process. The amount of equipment/systems procured or replaced with these programs is determined by the amount of funding available each fiscal year. There is no bias with the selection of milestones. The milestones selected represent the program office’s determination as to what effort they deem “critical” or important enough to war-rant inclusion in the Acquisition Performance goal for the year. Typically there are anywhere from two to four milestones. Interim milestones are also tracked but not included in the final perfor-mance calculation.
COMPLeTeneSSThis measure is current with no missing data. Each DOT organization maintains its own quality control checks for cost, schedule, and technical performance data of each major systems acquisition in accordance with OMB Circulars A-11, A-109, and A-130, Federal Acquisition Regulations, and Departmental orders implementing those directives and regulations.
ReLIAbILITyEach DOT organization having major system acquisitions uses the data during periodic acquisition program reviews, for determining resource requests. They are also used during the annual budget preparation process, for reporting progress made in the President’s budget and for making key program management decisions. The monthly status is reported through the SPIRE database and included in monthly high-level management reviews. Since the Acquisition Performance target is a fiscal year performance measure the specific milestone and date selected is set at the beginning of each fiscal year and not changed. The ATO Executive Council must approve all requested changes. Once the milestone is approved it is reported on with detailed commentary each month and assigned a Red, Yellow, or Green confidence indicator that the milestone will be met on schedule. These detailed reports are reviewed at all levels of the appropriate Service Unit, Executive levels, within the ATO and up to FAA Administrator.
deTAILS oN doT orgANIzATIoNAL exceLLeNce meASUreSMajor dOT Infrastructure Project Cost and Schedule Performance (FHWA / FTA / FAA)MeASuRe1. Percentage of major federally funded transportation infrastructure projects with less than 2 percent growth in the project completion milestones as reported in the financial plan. (FY)
2. Percentage of finance plan cost estimates for major federally funded transportation infrastructure projects with less than 2 percent annual growth in project baselines that are met. (FY)
SCOPeThis measure addresses the following:
Active FTA New Starts projects with Full Funding Grant Agreements larger than $1 billion
FHWA projects with a total cost of $500 million or more, or projects approaching $500 million with a high level of public, Congress, or Administration interest
FAA runway projects with a total cost of $1 billion or more
SOuRCeSFAA—Project cost performance for each major project is measured from cost estimates submitted by the airport sponsor to support its letter of intent (LOI) and actual expenditure data sources (for
ANNUAL PERFORMANCE REPORT FISCAL YEAR 2011U.S. DEPARTMENT OF TRANSPORTATION100
grants) and airport sponsor submissions (for overall project cost). Project schedule performance is measured from the Runway Template Action Plan (RTAP), as specified in the NextGen Implementation Plan (formerly Operational Evolution Plan).
FHWA—The percent cost estimates and scheduled milestones for a FHWA Major Project are measured from when the Initial Financial Plan (IFP) is prepared and approved to the required Annual Project Update or from the previous Annual Update. The update contains the latest information about the cost and schedule for each of the Major Projects. Project Oversight Managers in FHWA Division Offices provide monthly status reports as a supplement to the Annual Update.
FTA—Oversight contractors and third-party risk assessment providers are used to validate the accuracy of project budgets and schedules before grantees are awarded Full Funding Grant Agreements. Project/Financial Management Oversight contractors review project budgets on a monthly basis and FTA assesses projected total project costs against baseline cost estimates and schedules.
STATISTICAL ISSueSFAA—Schedule completion performance is measured for two milestones: project design and project completion.
A project milestone is considered to meet the performance target if actual annual rate of completion is not more than two percent behind scheduled cumulative rate of completion, using the RTAP schedule as a base.
Cost performance is measured by comparing cumulative actual costs incurred at the end of each fiscal year with cumulative costs shown in the scheduled of costs submitted with the LOI application. A project will be considered to meet the cost performance target if annual costs are no more than two percent higher than projected costs in the cost schedule.
FHWA—A scheduled milestone is defined as being achieved upon completion of the project. Major Projects generally require six to ten years from an IFP to completion. Cost estimates are prepared by comparing the costs in the most recent Annual Update to the IFP estimate or the last Annual Update.
FTA—Scheduled milestone achievement is measured by the differ-ence between the actual Revenue Operations date and the date of the execution of the Full Funding Grant Agreement divided by the difference between the Revenue Operations date in the Full Funding Grant Agreement and the date of execution of the Full Funding Grant Agreement. Cost estimate achievement is measured by the actual Total Project Cost divided by the Total Project Cost in the Full Funding Grant Agreement.
COMPLeTeneSSFAA—Federal financial commitments to airport sponsors are tracked by two automated systems, the System of Airports Reporting (SOAR) and the Delphi financial system. These systems are updated immediately when a grant payment is made, amended or
closed-out. The FAA relies on the airport sponsor to report actual project costs on a quarterly basis. Project design and construction milestones (scheduled and actual) are contained in the RTAP and developed by all involved FAA lines of business, the airport sponsor and airlines. The RTAP is comprised of tasks that must be considered when commissioning the runway and assigns accountability to the airport, airline, and FAA allowing early identification and resolution of issues that might impact the runway schedule.
FHWA—The FHWA Major Projects Team maintains the project schedules and cost estimate information in a spreadsheet, which is updated when a Project IFP is approved and/or the Annual Update is received and accepted. The data is available and reported on a semi-annual basis.
FTA—This measure is current with no missing data. The informa-tion is currently tracked with an in-house database. The measures are calculated monthly by an FTA Headquarters Engineer, checked by the Team Leader and reviewed by the Office Director.
ReLIAbILITyFAA—Reporting of Federal financial commitments to airport spon-sors is done in accordance with FAA policy and guidance related to administering the Airport Improvement Program (AIP) and the authorizing statute. The FAA’s AIP Branch monitors FAA regional offices for compliance with policy and guidance, including input into SOAR and Delphi, and conducts periodic regional evaluations. Actual project costs reported by the airport sponsor are verified by an annual single audit required by OMB. Such audits cover the entire financial and compliance operation of the airport sponsor’s governing body. Status of the project design and construction schedule contained in the RTAP is updated quarterly, based on meetings held with the airport sponsor and airlines.
FHWA—Both the IFP and the Annual Update undergo a rigorous review by the Division Office and the Major Projects Team prior to approval and acceptance.
FTA—Calculations of schedule achievement are based on month of this report, and not on projected Revenue Operations Date. Re-calculations of schedule and cost baselines are made to reflect amendments to the Full Funding Grant Agreements. FTA uses oversight contractors and third-party risk assessment providers to validate the accuracy of project budgets and schedules before grantees’ are awarded Full Funding Grant Agreements. FTA continues to work to improve its rigorous oversight program and has made project cost and budget performance a core accountability of every senior manager in the agency.
ANNUAL PERFORMANCE REPORT FISCAL YEAR 2011U.S. DEPARTMENT OF TRANSPORTATION101
deTAILS oN doT orgANIzATIoNAL exceLLeNce meASUreSTransit Grant Process efficiency (FTA)MeASuReAverage number of days a grant is awarded after submission of a completed application. (FY)
SCOPeFTA grants obligated during a fiscal year period for major programs:
Urbanized area, non-Urbanized area, and Elderly/Persons with Disabilities formula grants
Capital grants
Job Access and Reverse Commute grants
Over-The-Road Bus grants
Planning grants
SOuRCeSFTA internal databases, including the Transportation Electronic Award Management (TEAM) system.
STATISTICAL ISSueSProcessing time is calculated from submission date to obligation date. Zero-dollar, non-funding grant amendments are excluded from analysis.
COMPLeTeneSSData are current with no missing data since FTA uses internal databases, including the TEAM system. All grants obligated during the fiscal year for the selected programs (see Scope) are included in the original data set. In rare cases where the submission date is omitted (which prevents processing time calculation), missing dates are researched and added to the database prior to reporting. The zero-dollar amendments are excluded because they are not representative of the grant processing action being tested.
ReLIAbILITyThe files that contain raw data from TEAM have been tested to ensure that all fiscal-year-to-date obligated grants are included and that data is current. Report programs screen various date fields to identify any missing or out-of-sequence dates that would skew aver-ages; dates are corrected prior to reporting. Reconciliation reports of TEAM data are produced monthly and anomalies are explored and resolved. Detailed monthly grant processing progress reports provide management tools to the Regional Administrators, who continue to make this goal a top priority.
Office of the Secretary of Transportation
Assistant Secretary for Budget & Program Performance
1200 New Jersey Avenue, SE Washington DC 20590