Embed Size (px)
Citation preview

ANNUAL PERFORMANCE PLAN FOR FISCAL YEAR 2014
AND REVISED FINAL PERFORMANCE PLAN FOR FISCAL YEAR 2013
APRIL 2013

Annual Performance Plan for FY 2014 and Revised Final Performance Plan for FY 2013
Social Security Administration | www.socialsecurity.gov | 1-800-772-1213 2
Our Values
Our Mission Deliver Social Security services that meet the changing needs of the public
Our Vision Provide the highest standard of considerate and thoughtful service for generations to come
Our Motto Social Security Benefits America
Our Service Principles We serve with empathy, creativity, integrity, and “an unbeatable determination to do the job
at hand” by following these service principles:
Adherence to the law
Clarity
Commitment to best demonstrated practices
Cultural sensitivity
Honesty
Prevention of waste, fraud, and abuse
Protection of privacy and personal information
Recruitment and training of the best public servants
Safety of the public and our employees

Annual Performance Plan for FY 2014 and Revised Final Performance Plan for FY 2013
Social Security Administration | www.socialsecurity.gov | 1-800-772-1213 3
Summary of Our Goals and Objectives
Deliver Quality Disability Decisions and Services Reduce the Wait Time for Hearing Decisions and Eliminate the Hearings Backlog
Improve Our Disability Policies, Procedures, and Tools
Expedite Cases for the Most Severely Disabled Individuals
Provide Quality Services to the Public Increase the Use of Our Online Services
Increase Public Satisfaction with Our Telephone Services
Expand the Use of Video Services
Improve the Clarity of Our Notices
Preserve the Public’s Trust in Our Programs Increase Efforts to Accurately Pay Benefits
Recover Improper Payments
Maintain Accurate Earnings Records
Make Our Administrative Operations Even More Efficient
Strengthen Our Workforce and Infrastructure Strengthen Our Workforce – Recruit, Train, Develop, and Retain Superior Employees
Maintain Secure and Reliable Information Technology Services
Increase Efficiency of Our Physical Infrastructure

Annual Performance Plan for FY 2014 and Revised Final Performance Plan for FY 2013
Social Security Administration | www.socialsecurity.gov | 1-800-772-1213 4
Our Organization Our current organization is comprised of over 80,000 Federal and State employees. We deliver services through a nationwide network of about 1,500 offices that include regional offices, field offices (including Social Security Card Centers), teleservice centers, processing centers, hearing offices (including satellite offices and National Hearing Centers), the Appeals Council, and our headquarters in Baltimore, Maryland. We also have a presence in several United States embassies around the globe.
Our field offices and Social Security Card Centers are the primary points of contact for in-person interaction with the public. Our teleservice centers primarily handle telephone calls to our National 800 Number. Employees in our processing centers primarily handle Social Security retirement, survivors, and disability payments, but also perform a wide range of other functions, which include answering telephone calls to our National 800 Number. We depend on State employees in 54 State and territorial Disability Determination Services (DDS) to make disability determinations. The administrative law judges (ALJ) in our hearing offices and the administrative appeals judges in our Appeals Council make decisions on appeals of denied Social Security and Supplemental Security Income (SSI) claims. The vast majority of our employees provide direct service to the public or provide support to those who do. For more information about our components and their functions, visit our current organizational structure webpage (www.socialsecurity.gov/org).

Annual Performance Plan for FY 2014 and Revised Final Performance Plan for FY 2013
Social Security Administration | www.socialsecurity.gov | 1-800-772-1213 5
Table of Contents and Revised Final Performance Plan for Fiscal Year 2013 ................................................. 1
April 2013 ....................................................................................................................... 1
Our Values ................................................................................................................................................. 2
Summary of Our Goals and Objectives ..................................................................................................... 3
Our Organization ....................................................................................................................................... 4
Table of Contents ...................................................................................................................................... 5
Performance Measures at a Glance .......................................................................................................... 6
STRATEGIC GOAL 1: Deliver Quality Disability Decisions and Services .................................................. 11
STRATEGIC GOAL 2: Provide Quality Services to the Public ................................................................... 27
STRATEGIC GOAL 3: Preserve the Public’s Trust in Our Programs ......................................................... 39
STRATEGIC GOAL 4: Strengthen Our Workforce and Infrastructure ..................................................... 54
Appendix A Priority Goals ...................................................................................................................... 64
Appendix B FY 2013 Major Evaluations ................................................................................................. 66
Appendix C How We Manage Performance .......................................................................................... 70
Appendix D Agency Challenges .............................................................................................................. 73
Appendix E Changes to Performance Measures, Data Definitions, and Data Sources ......................... 76
Appendix F Key Management Officials and Board Members ............................................................... 82
Summary of Key Management Officials’ Responsibilities....................................................................... 84
Appendix G Glossary of Acronyms ......................................................................................................... 86
April 2013 ......................................................................................................................89

Annual Performance Plan for FY 2014 and Revised Final Performance Plan for FY 2013
Social Security Administration | www.socialsecurity.gov | 1-800-772-1213 6
Performance Measures at a Glance
The following chart lists our performance measures and targets for fiscal years (FY) 2013 and 2014. We use these performance measures to gauge our progress in meeting our strategic goals and objectives outlined in our Agency Strategic Plan (ASP) (http://www.socialsecurity.gov/asp/plan-2013-2016.pdf).
STRATEGIC GOAL 1: Deliver Quality Disability Decisions and Services Strategic Objective 1.1: Reduce the Wait Time for Hearing Decisions and Eliminate the Hearings Backlog Performance Measure FY 2013 Target FY 2014 Target Responsible
Official Page
1.1a Complete the budgeted number of hearing requests
836,000 807,000 DCDAR 13
1.1b Achieve the budgeted goal for SSA hearing case production per workyear
112 114 DCDAR 14
1.1c Minimize average wait time from hearing request to decision
~380 days (September Only)
~387 days (September Only)
DCDAR 14
1.1d Eliminate the oldest pending hearing requests
Less than 0.5% of pending hearing requests 700 days or older
Less than 0.5% of pending hearing requests 675 days or older
DCDAR 15
1.1e Reduce the percentage of Appeals Council cases pending 365 days or over
19% or fewer 18% or fewer DCDAR 15

Annual Performance Plan for FY 2014 and Revised Final Performance Plan for FY 2013
Social Security Administration | www.socialsecurity.gov | 1-800-772-1213 7
STRATEGIC GOAL 1: Deliver Quality Disability Decisions and Services Strategic Objective 1.2: Improve Our Disability Policies, Procedures, and Tools Performance Measure FY 2013 Target FY 2014 Target Responsible
Official Page
1.2a Minimize average wait time for initial disability claims
107 days 120 days DCO 19
1.2b Complete the budgeted number of initial disability claims
2,970,000 2,851,000 DCO 20
1.2c Disability Determination Services (DDS) cases production per workyear
318 320 DCO 20
1.2d Complete the budgeted number of disability claims at the reconsideration level
803,000 725,000 DCO 21
1.2e Achieve the target number of initial disability claims pending
796,000 910,000 DCO 21
1.2f Achieve the target number of disability claims pending at the reconsideration level
179,000 208,000 DCO 22
1.2g NEW
Minimize average wait time for reconsideration disability claims
N/A TBD DCO 22
1.2h Update the medical Listing of Impairments Develop and submit at least five rules for public comment, three final rules, and three Social Security Rulings
Develop and submit at least five rules for public comment, five final rules, and three Social Security Rulings
DCRDP 23
1.2i Increase the percentage of disability cases evaluated using health Information Technology (IT)
200% above FY 2012 performance
200% above FY 2013 performance
DCS 23
1.2j Number of Disability Insurance and Supplemental Security Income disability beneficiaries, with Tickets assigned and in use, who work
136,401 139,129 DCRDP 24
1.2k DDS decisional accuracy rate for initial disability decisions
97% 97% DCO 24
Strategic Objective 1.3: Expedite Cases for the Most Severely Disabled Individuals Performance Measure FY 2013 Target FY 2014 Target Responsible
Official Page
1.3a Achieve the target percentage of initial disability cases identified as Quick Disability Determinations or Compassionate Allowances
6.0% (September Only)
6.1% (September Only)
DCRDP 26

Annual Performance Plan for FY 2014 and Revised Final Performance Plan for FY 2013
Social Security Administration | www.socialsecurity.gov | 1-800-772-1213 8
STRATEGIC GOAL 2: Provide Quality Services to the Public Strategic Objective 2.1: Increase the Use of Our Online Services Performance Measure FY 2013 Target FY 2014 Target Responsible
Official Page
2.1a Increase the percentage of claims filed online
48% (Last Quarter Only)
48% (Last Quarter Only)
DCO 30
2.1b Complete the budgeted number of retirement, survivors, and Medicare claims
5,269,000 5,402,000 DCO 31
Strategic Objective 2.2: Increase Public Satisfaction with Our Telephone Services Performance Measure FY 2013 Target FY 2014 Target Responsible
Official Page
2.2a Achieve the target speed in answering National 800 Number calls
455 seconds 482 seconds DCO 33
2.2b Achieve the target busy rate for National 800 Number calls
10% 10% DCO 34
2.2c Maintain the percent of people rating our services as “excellent,” “very good,” or “good”
83.5% 83.5% DCQP 35
Strategic Objective 2.3: Expand the Use of Video Services Performance Measure FY 2013 Target FY 2014 Target Responsible
Official Page
2.3a Complete the planned number of video hearings
154,000 169,000 DCDAR 37
Strategic Objective 2.4: Improve the Clarity of Our Notices There is no performance measure for this objective.

Annual Performance Plan for FY 2014 and Revised Final Performance Plan for FY 2013
Social Security Administration | www.socialsecurity.gov | 1-800-772-1213 9
STRATEGIC GOAL 3: Preserve the Public’s Trust in Our Programs Strategic Objective 3.1: Increase Efforts to Accurately Pay Benefits Performance Measure FY 2013 Target FY 2014 Target Responsible
Official Page
3.1a Complete the budgeted number of Supplemental Security Income (SSI) non-disability redeterminations
2,622,000 2,622,000 DCO 43
3.1b Complete the budgeted number of full medical continuing disability reviews
650,000 1,047,000 DCO DCQP
44
3.1c Percent of SSI payments free of overpayment (O/P) and underpayment error (U/P)
95.0% (O/P) 98.8% (U/P)
95.0% (O/P) 98.8% (U/P)
DCQP 45
3.1d Percent of Old-Age, Survivors, and Disability Insurance (OASDI) payments free of O/P and U/P error
99.8% (O/P) 99.8% (U/P)
99.8% (O/P) 99.8% (U/P)
DCQP 46
Strategic Objective 3.2: Recover Improper Payments Performance Measure FY 2013 Target FY 2014 Target Responsible
Official Page
3.2a Expand and enhance our debt collection tools
Send 180,000 OASDI and SSI External Collection Operation notices to debtors with debts 10 years or more delinquent
Send 180,000 OASDI and SSI External Collection Operation notices to debtors with debts 10 years or more delinquent
DCBFM 48
Strategic Objective 3.3: Maintain Accurate Earnings Records Performance Measure FY 2013 Target FY 2014 Target Responsible
Official Page
3.3a Reduce the percentage of paper Forms W-2 completed
13.0% 12.0% DCO 51
3.3b Achieve the target percentage for correctly assigning original Social Security numbers
99.0% 99.0% DCO 51
Strategic Objective 3.4: Make Our Administrative Operations Even More Efficient There is no performance measure for this objective.

Annual Performance Plan for FY 2014 and Revised Final Performance Plan for FY 2013
Social Security Administration | www.socialsecurity.gov | 1-800-772-1213 10
STRATEGIC GOAL 4: Strengthen Our Workforce and Infrastructure Strategic Objective 4.1: Strengthen Our Workforce – Recruit, Train, Develop, and Retain Superior Employees Performance Measure FY 2013 Target FY 2014 Target Responsible
Official Page
4.1a Recruit and hire veterans and disabled veterans
Veteran Hiring: 18% of total hiring
Disabled Veteran Hiring: 15% of total hiring
Veteran Hiring: 18% of total hiring
Disabled Veteran Hiring: 15% of total hiring
DCHR 57
4.1b Employ individuals with targeted disabilities
2.00% 2.00% DCHR 58
4.1c Conduct mandatory employee training on diffusing difficult encounters with the public
Complete development of the safety and security training curriculum and finalize training products
Train 100% of employees
DCBFM 58
Strategic Objective 4.2 Maintain Secure and Reliable Information Technology Services Performance Measure FY 2013 Target FY 2014 Target Responsible
Official Page
4.2a Percentage of enterprise-wide systems availability
99.50% 99.50% DCS 61
Strategic Objective 4.3 Increase Efficiency of Our Physical Infrastructure Performance Measure FY 2013 Target FY 2014 Target Responsible
Official Page
4.3a Reduce energy intensity by 30 percent by 2015
7% reduction from FY 2003
10% reduction from FY 2003
DCBFM 63

Annual Performance Plan for FY 2014 and Revised Final Performance Plan for FY 2013
Social Security Administration | www.socialsecurity.gov | 1-800-772-1213 11
STRATEGIC GOAL 1: Deliver Quality Disability
Decisions and Services
For over 50 years, we have helped disabled workers and their families replace income lost due to a severe disability. Over the last five years, our disability workloads have grown significantly, due in part to baby boomers reaching their disability-prone years and an economic downturn coupled with high unemployment.
Since fiscal year (FY) 2007, initial disability claim receipts have increased by 25 percent. In FY 2012, we received nearly 3.2 million initial disability applications. We anticipate receiving about 3 million initial disability applications in both FY 2013 and FY 2014.
In FY 2012, we received nearly 50 percent more hearing receipts than in FY 2007. Decreased funding forced us to cancel our plans to open eight new hearing offices in Alabama, California, Indiana, Michigan, Minnesota, Montana, New York, and Texas. We are doing what we can to compensate; however, we are concerned that despite our employees’ hard work, our progress in reducing the wait time for hearing decisions and eliminating the hearings backlog has stalled.
We plan to hire additional ALJs in FY 2014. In the meantime, we are using our reemployed annuitant authority to bring back experienced judges who have recently retired. We are maintaining an adequate support staff-to-ALJ ratio to ensure cases are ready for hearings. We will also allow hearing office employees to work overtime, as resources permit, to try to keep up with the surge in hearings.
The most important time consideration for claimants is how long they will have to wait for a hearing decision. Consequently, our primary goal is reducing average wait time, which is the average number of days it takes to get a hearing decision (from the date of the hearing request). In August 2008, claimants waited an average of 532 days. Since that time, we have steadily reduced the wait. In FY 2012, the average wait was 362 days. As of February 2013, the average wait time had increased to 382 days.
TO ACHIEVE THIS GOAL WE WILL
Ø Reduce the Wait Time for Hearing Decisions and Eliminate the Hearings Backlog
Ø Improve Our Disability Policies, Procedures, and Tools Ø Expedite Cases for the Most Severely Disabled Individuals

Annual Performance Plan for FY 2014 and Revised Final Performance Plan for FY 2013
Social Security Administration | www.socialsecurity.gov | 1-800-772-1213 12
Strategic Objective 1.1 Reduce the Wait Time for Hearing Decisions and
Eliminate the Hearings Backlog
In FY 2007, we began implementing our Plan to Eliminate the Hearings Backlog and Prevent Its Recurrence (www.socialsecurity.gov/appeals/Backlog_Reports/Annual_Backlog_Report_FY_2008-Jan.pdf). This plan outlines measures for improving hearing office procedures and business processes, increasing our ability to hear and decide cases, increasing efficiency through automation, and accelerating reviews of cases that are likely to result in a favorable decision.
The progress of backlog reduction has slowed in the last year, and we lost our margin for error when we canceled eight planned hearing office openings for budgetary reasons. Hearings receipts have been higher than we projected, and we have been unable to hire as many ALJs as we need to complete this work.
In September 2014, we expect a 387-day average wait time from hearing request to decision, a drop of almost 5 months from the all-time high average wait time of 532 days in August 2008. However, budget cuts in FY 2013 will jeopardize our plans. Until we can hire more ALJs, we may only be able to hold the average wait time steady.
Our efforts to reduce the average wait time for hearing decisions and eliminate our backlog include:
Ensuring an Adequate Supply of ALJs: Only ALJs can conduct hearings; therefore, they are an essential component of the hearings process. The Office of Personnel Management (OPM) is responsible for providing us with lists of qualified ALJ candidates. OPM is currently developing a new examination to assess potential ALJ candidates, and we are assisting by providing occupational analyses and input into core ALJ competencies and by participating in OPM-sponsored focus groups to develop the new examination. While we have hired over 850 ALJs since FY 2007, historically high ALJ attrition and dramatic workload growth leaves us short on adjudicatory capacity. OPM’s ALJ register is virtually exhausted, and we will end FY 2013 far short of our hiring target.
Expediting Hearing Decisions: Attorney adjudicators screen cases, and when appropriate, issue fully favorable decisions without the need for a hearing. In FY 2012, we completed over 37,000 fully favorable decisions under this initiative. We will continue to explore ways to maximize attorney adjudicator case screening to expedite hearing decisions.
Reducing the Backlog at the Appeals Council: As we decide more cases at the hearing level, the Appeals Council receives more requests for review. Over the past 3 years, the Appeals Council received 179,000 more requests for review than in the previous three-year period, a 60 percent increase. This influx of work resulted in an increase of 37 days in the average wait for an Appeals Council decision in FY 2012 compared to FY 2011. To address this increase, we added staff in the Office of Appellate Operations. We are now focusing on decreasing the percentage of cases pending over 365 days.
STRATEGIES
Ø Eliminate Our Oldest Cases First Ø Expedite Cases That Do Not Require a Hearing Ø Enhance Electronic Tools That Improve Productivity and Quality Ø Target Our National Resources to Meet Workload Demands

Annual Performance Plan for FY 2014 and Revised Final Performance Plan for FY 2013
Social Security Administration | www.socialsecurity.gov | 1-800-772-1213 13
Electronic Bench Book (eBB): eBB is a web-based application designed to assist adjudicators in documenting, analyzing, and deciding disability claims at the hearing level. Staff use eBB to review the case file, take notes at the hearing, and record their analysis as they work through the decision-making process and prepare hearing instructions. eBB walks adjudicators through every step of the sequential evaluation process to ensure that each step is fully addressed.
We expect that eBB will increase the quality and consistency of our decisions. Because eBB is a policy-compliant claims analysis tool, we also expect some reduction in the number of cases remanded from the Appeals Council.
In FY 2012, we implemented the web-application phase of this project that allows adjudicators to input their analysis from pre-hearing to post-hearing and provide instructions for the decision writers. In FY 2013, we plan to generate decisional notices using the combined data from eBB and other databases.
Auto-Scheduling: We are developing an automated application to schedule hearings based on the availability of the hearing site, equipment, ALJ, claimant, representative, and expert witnesses. This effort presents a great technological challenge, as each hearing can involve up to five participants from multiple locations using different communications equipment. In FY 2013, we will begin piloting Auto-Scheduling in five hearing offices.
Performance Measures – Strategic Objective 1.1
1.1a: Complete the budgeted number of hearing requests
Fiscal Year 2013 2014
Target 836,000 807,000
Historical Performance
Fiscal Year 2009 2010 2011 2012
Performance 660,842 737,616 795,424 820,484
Data definition: The number of hearing requests completed in the current fiscal year.
Data source: Case Processing and Management System

Annual Performance Plan for FY 2014 and Revised Final Performance Plan for FY 2013
Social Security Administration | www.socialsecurity.gov | 1-800-772-1213 14
1.1b: Achieve the budgeted goal for SSA hearing case production per workyear
Fiscal Year 2013 2014
Target 112 114
Historical Performance
Fiscal Year 2009 2010 2011 2012
Performance 105 105 109 111
Data definition: The average number of hearings completed per direct workyear used. A direct workyear represents actual time spent processing cases. It does not include time spent on training, ALJ travel, leave, holidays, etc.
Data source: Office of Disability Adjudication and Review‘s Monthly Activity Report, Case Processing and Management System, Payroll Analysis Recap Report, Travel Formula, and Training Reports (Regional reports on new staff training, ongoing training, and special training)
1.1c: Minimize average wait time from hearing request to decision
September 2013 2014
Target ~380 days ~387 days
Historical Performance
September 2009 2010 2011 2012
Performance 472 days 390 days 345 days 362 days
Data definition: The average wait time for hearing request dispositions is the cumulative wait time for all hearing requests completed during the last month of the fiscal year divided by the total number of hearing requests completed during the last month of the fiscal year.
Data source: Case Processing and Management System

Annual Performance Plan for FY 2014 and Revised Final Performance Plan for FY 2013
Social Security Administration | www.socialsecurity.gov | 1-800-772-1213 15
1.1d: Eliminate the oldest pending hearing requests
Fiscal Year 2013 2014
Target Less than 0.5% of pending hearing requests 700 days or older
Less than 0.5% of pending hearing requests 675 days or older
Historical Performance
Fiscal Year 2009 2010 2011 2012
Performance
228 of 166,838 cases remained
pending 850 days or older (.14%)
47 of 139,026 cases remained
pending 825 days or older (.03%)
103 of 111,792 cases remained
pending 775 days or older (.09%)
169 of 113,593 cases remained
pending 725 days or older
(.15%)
Data definition: The percentage of oldest hearing requests pending. The oldest hearing requests are those cases that are pending, or will be pending, 700 days or more at the end of the fiscal year. We derive the percentage by dividing the total number of hearing requests pending 700 days or more at the end of the fiscal year by the total number of oldest hearing requests identified at the beginning of the fiscal year.
Data source: Case Processing and Management System
1.1e: Reduce the percentage of Appeals Council cases pending 365 days or over
Fiscal Year 2013 2014
Target 19% or fewer 18% or fewer
Historical Performance
Fiscal Year 2012
Performance 12%
Data definition: The percentage of Appeals Council cases that are pending 365 days or over at the end of the fiscal year. The percentage is derived by dividing the total number of Appeals Council cases pending 365 days or over at the end of the fiscal year by the total number of Appeals Council cases pending at the end of the fiscal year.
Data source: Appeals Review Processing System

Annual Performance Plan for FY 2014 and Revised Final Performance Plan for FY 2013
Social Security Administration | www.socialsecurity.gov | 1-800-772-1213 16
Strategic Objective 1.2 Improve Our Disability Policies, Procedures,
and Tools
We continue to find ways to improve our disability process. We regularly update our disability policies, procedures, and tools to keep up with the continuous advances in medicine and technology. Over the years, testing for and treatment of impairments has changed. We are committed to modernizing our disability decision-making processes to provide better service to the public. We are making fundamental changes in the way we request and receive medical information to determine disability.
We continue to update the medical and vocational information we use to make disability determinations by revising our Listing of Impairments (Listings) and developing the Occupational Information System (OIS). In addition, we are developing automated systems to improve efficiency, such as the Disability Case Processing System (DCPS), which will unify separate DDS systems into one common system for the entire Nation. We will continue to use health Information Technology (health IT) in our disability process to help us obtain medical evidence almost instantaneously. We will also improve our employment support programs for people with disabilities who want to work.
Our efforts to improve our disability policies, procedures, and tools to provide better service to the public include:
Updating Our Listings: One of the most effective tools used to make disability decisions is the Listings. The Listings allow us to find a claimant disabled when his or her impairment meets specified medical criteria, without the need to consider age, education, or work experience. The Listings improve the consistency and accuracy of our decisions throughout all levels of the disability process.
Working with the Institute of Medicine, we have established a committee of medical experts to advise us on medical advancements that are relevant to our Listings. This committee will help ensure that our Listings are relevant, medically supportable, and technologically and scientifically current.
In calendar year 2012, we published an Advance Notice of Proposed Rulemaking for language and speech disorders and a Notice of Proposed Rulemaking for special senses (vision) in the Federal Register.
STRATEGIES
Ø Enhance and Expand Our Electronic Tools to Support Policy Compliant Determinations at All Levels of Decision-Making
Ø Replace the Outdated Dictionary of Occupational Titles with a New Occupational Information System to Aid in the Medical and Vocational Analysis of Disability Claims
Ø Develop and Implement a Common Disability Case Processing System for All 54 State Disability Determination Services
Ø Review Best Practices Learned from Our Prototype Test and Apply Them Nationwide for a More Consistent Disability Process
Ø Eliminate the Use of Paper Authorization to Request Medical Evidence Ø Regularly Update the Listing of Impairments, Which Describes Impairments
Severe Enough to Prevent an Individual from Working, to Reflect Current Medical Knowledge
Ø Develop and Test Proposals that Simplify Our Disability and Work Incentive Programs

Annual Performance Plan for FY 2014 and Revised Final Performance Plan for FY 2013
Social Security Administration | www.socialsecurity.gov | 1-800-772-1213 17
In calendar years 2013 and 2014, we plan to request public comment on a number of rules affecting body systems and disorders, submit several final rules, and publish several Social Security Rulings.
We publish final rules as the last step of the rulemaking process. In the rulemaking process, we respond to public comment on the Notice of Proposed Rulemaking and make appropriate revisions before publishing the final rule in the Federal Register. Social Security Rulings are a series of precedential decisions relating to the programs that we administer, and we publish them under the authority of the Commissioner of Social Security. The Rulings may be based on case decisions made at all administrative levels of adjudication, Federal court decisions, Commissioner's decisions, opinions of the Office of the General Counsel, and policy interpretations of the law and regulations.
Developing an Occupational Information System: We rely on the occupational information found in the Department of Labor’s (DoL), Dictionary of Occupational Titles (DOT) to determine whether claimants can do their past work or any other work in the United States economy. DoL no longer updates the DOT; consequently, we are working with the Bureau of Labor Statistics (BLS) to develop a long-term strategy to replace the DOT with a new OIS that addresses our specific needs for vocational information. We recently signed an interagency agreement with BLS to test the feasibility of using their National Compensation Survey platform as a means to gather the data we need for our OIS.
In FY 2013 and FY 2014, we will conduct the following activities in conjunction with our research partners:
· Develop and test the collection of occupational information; · Pending successful test results, collect data to be used in our disability programs; and · Evaluate integration of data into our program operations.
Simplifying the Disability Application Process: Beginning in FY 2012, adults filing online for disability benefits on their own behalf have the option to electronically sign and submit the Authorization to Disclose Information as part of the application and appeal processes. This improvement allows applicants to complete disability applications in a streamlined online session rather than printing, signing, and mailing paper authorization forms to us. In FY 2013, we plan to develop a fully electronic process for authorizations from adults filing by phone or in person. We will also conduct planning and analysis for a fully electronic process for individuals who file on behalf of others and for some childhood claims.
Developing the Disability Case Processing System: DCPS will replace five different legacy systems in the DDSs and Federal disability units with a unified system. DCPS will support consistent case processing, improved quality, and seamless workload sharing across State and Federal disability components. DCPS will also improve productivity by streamlining interactions with medical providers, copy services, and other vendors by using industry standards for electronic medical records.
In FY 2012, we implemented the initial (beta) version of DCPS in the Idaho DDS. In FY 2013 and FY 2014, we will release DCPS beta in the Illinois, Missouri, Nebraska, and New York DDSs. By the end of FY 2014, we plan to roll out DCPS to 25 percent of DDSs.
Employing the Electronic Claims Analysis Tool (eCAT): eCAT is a web-based application that guides adjudicators through the five-step sequential evaluation process for determining disability. eCAT produces a detailed policy-compliant case decision explanation and records the pertinent documentation and analysis necessary to support the determination. The explanation enables an independent reviewer to understand the decision maker’s actions and conclusions throughout the claim’s development and adjudication.

Annual Performance Plan for FY 2014 and Revised Final Performance Plan for FY 2013
Social Security Administration | www.socialsecurity.gov | 1-800-772-1213 18
In FY 2013, we will require that DDSs use eCAT on all initial and reconsideration level adult and child disability claims. Through cross-component collaboration and input from the user community, we continue to refine eCAT with increased functionality.
Using Health Information Technology to Expedite Disability Decisions: Obtaining medical records electronically plays a key role in streamlining the disability determination process. Each year, we request approximately 15 million medical records from almost 500,000 providers to help make decisions on over 3 million initial disability claims. Health IT gives us the potential to increase efficiencies in the disability program and dramatically improve service to the public by:
· Reducing the time to obtain medical records; · Decreasing the time to complete a disability claim; and · Helping offset increasing workloads and staffing constraints.
We exchange medical records with various medical networks and providers with facilities in 16 States using the eHealth Exchange (formerly known as the Nationwide Health Information Network). In FY 2012, we began the exchange of electronic health records with Kaiser Permanente. We will continue expanding to additional facilities with our current eHealth Exchange partners and add new organizations each year.
Expanding the Virtual Lifetime Electronic Record (VLER): In April 2009, the Department of Defense (DoD) and the Department of Veterans Affairs (VA) launched the VLER initiative to create a unified lifetime electronic health record for members of our Armed Services. For more information, please visit DoD’s website on VLER (www.prim.osd.mil/init/vler.html).
In FY 2012, SSA and DoD piloted and nationally rolled out a simplified process of requesting and receiving medical records using existing electronic data-sharing technologies to speed the processing of disability claims for veterans, service members, and Wounded Warriors. SSA and VA have had a similar process in place since 2006.
In FY 2013, we plan to pilot a fully automated exchange of information from the VLER initiative using the eHealth Exchange. In FY 2013 and FY 2014, we will also pursue complete deployment of the health IT solution to all Kaiser Permanente sites.
Improving Employment Support Programs: We continue to improve our efforts to advance the outcomes of our employment support programs. Disabled beneficiaries who want to work and attain self-sufficiency may receive services and support under the Ticket to Work and Self-Sufficiency Program, as well as under the Vocational Rehabilitation (VR) Cost Reimbursement Program. We began enhancing the quality of services and support provided by Employment Networks (EN) in FY 2011, and will continue enhancements in FY 2013 and beyond. These entities coordinate and deliver employment services under the Ticket to Work program.
In July 2011, we introduced language into the agreement signed by all ENs that enhanced accountability for providing timely and appropriate services. We hold ENs accountable at multiple points in the service delivery continuum. In addition to providing services and support to help beneficiaries obtain jobs, ENs are required to provide ongoing support to help beneficiaries stay employed, remain off the disability benefit rolls, and advance in their jobs.
As of FY 2012, we monitor the business practices of ENs to ensure they provide quality services that support beneficiaries returning to work. We have also set clear performance goals to ensure ENs support beneficiaries in gaining and sustaining long-term employment, economic security, and financial independence. We publish an annual online EN Report Card that enables beneficiaries to evaluate and

Annual Performance Plan for FY 2014 and Revised Final Performance Plan for FY 2013
Social Security Administration | www.socialsecurity.gov | 1-800-772-1213 19
select an EN that best meets their needs, interests, and employment goals. These changes are helping us better monitor EN performance and improve the value and results of the program.
We are improving our beneficiary outreach and education efforts by expanding the use of our Ticket to Work Call Center, the Internet, and social media tools (e.g., YouTube, Facebook, and Twitter). Similarly, to increase beneficiary access while reducing program costs, we are providing all Work Incentive Seminar Events via webinars.
In May 2008, we revised the Ticket program rules to allow effective partnerships between public and private providers and improve the payment structure to recognize the reality that entering the workforce or returning to work is an incremental and often episodic process. Since we made those revisions, the number of Tickets assigned or in use has increased 67 percent from over 200,000 on May 1, 2008, to over 340,000 in July 2012. During that same period, the number of beneficiaries with Tickets in use who had benefits suspended or terminated because they successfully returned to work increased 223 percent.
In FY 2012, Mathematica Policy Research, Inc. completed a report on the effects of the 2008 Ticket to Work regulations. We will use the results of the evaluation to identify ways we can continue to improve both the Ticket to Work and VR programs. While we currently do not have firm plans to conduct additional evaluation activities, we will maintain data necessary to conduct future evaluations.
Performance Measures – Strategic Objective 1.2
1.2a: Minimize average wait time for initial disability claims
Fiscal Year 2013 2014
Target 107 days 120 days
Historical Performance
Fiscal Year 2009 2010 2011 2012
Performance 101 days 111 days 109 days 102 days
Data definition: The average wait time is the overall cumulative number of elapsed days (including processing times for transit, technical determinations, medical determinations, and quality review) from the date of filing through the date payment is made or the denial notice is issued for all initial claims that require a medical determination. We divide the total number of days to complete all initial disability claims requiring a medical determination by the total number of initial disability claims requiring a medical determination that we complete during the fiscal year.
Data source: DENVision National Processing Time Tracker sourced by Social Security Unified Measurement System OASDI and SSI Processing Time

Annual Performance Plan for FY 2014 and Revised Final Performance Plan for FY 2013
Social Security Administration | www.socialsecurity.gov | 1-800-772-1213 20
1.2b: Complete the budgeted number of initial disability claims
Fiscal Year 2013 2014
Target 2,970,000 2,851,000
Historical Performance
Fiscal Year 2009 2010 2011 2012
Performance 2,812,918 3,161,314 3,390,936 3,206,869
Data definition: The number of Social Security and SSI initial disability claims that the State DDSs and other agency components complete in the current fiscal year up to the budgeted number.
Data source: National DDS System and Disability Operational Data Store
1.2c Disability Determination Services cases production per workyear
Fiscal Year 2013 2014
Target 318 320
Historical Performance
Fiscal Year 2009 2010 2011 2012
Performance 274 273 287 324
Data definition: The average number of all State DDS cases produced per workyear expended. A workyear represents both direct and indirect time, including overhead (time spent on training, travel, leave, holidays, etc.). It includes the time of staff on the DDS payroll, including doctors under contract to the DDS. The DDS case production per workyear is a national target.
Data source: National DDS System and Disability Operational Data Store

Annual Performance Plan for FY 2014 and Revised Final Performance Plan for FY 2013
Social Security Administration | www.socialsecurity.gov | 1-800-772-1213 21
1.2d: Complete the budgeted number of disability claims at the reconsideration level
Fiscal Year 2013 2014
Target 803,000 725,000
Historical Performance
Fiscal Year 2012
Performance 808,521
Data definition: The number of Social Security and SSI disability claims completed at the reconsideration level in the State DDSs and other agency components in the current fiscal year up to the budgeted number.
Data source: National DDS System and Disability Operational Data Store
1.2e: Achieve the target number of initial disability claims pending
Fiscal Year 2013 2014
Target 796,000 910,000
Historical Performance
Fiscal Year 2009 2010 2011 2012
Performance 779,854 842,192 759,023 707,700
Data definition: The number of Social Security and SSI initial disability claims pending in the State DDSs and other agency components at the end of the fiscal year.
Data source: National DDS System and Disability Operational Data Store

Annual Performance Plan for FY 2014 and Revised Final Performance Plan for FY 2013
Social Security Administration | www.socialsecurity.gov | 1-800-772-1213 22
1.2f: Achieve the target number of disability claims pending at the reconsideration level
Fiscal Year 2013 2014
Target 179,000 208,000
Historical Performance
Fiscal Year 2012
Performance 197,788
Data definition: The number of Social Security and SSI disability claims pending at the reconsideration level in the State DDSs and other agency components at the end of the fiscal year.
Data source: National DDS System and Disability Operational Data Store
1.2g: Minimize average wait time for reconsideration disability claims
Fiscal Year 2013 2014
Target N/A TBD
Data definition: The average wait time is the overall cumulative number of elapsed days (including processing times for transit, technical determinations, medical determinations, and quality review) from the date of filing the reconsideration through the date payment is made or the reconsideration denial notice is issued for all Disability Insurance (DI)-only, SSI disability, and combined DI and SSI disability reconsideration claims that require a medical determination. We divide the total number of days to complete all DI-only, SSI disability, and combined DI and SSI disability reconsideration claims that require a medical determination by the total number of DI-only, SSI disability, and combined DI and SSI disability reconsideration claims that require a medical determination that we complete during the fiscal year.
Data source: Appeals Operational Data Store
Note: This performance measure is new for FY 2013. We intend to provide an actual target for FY 2014 following completion of systems enhancements in FY 2013. These enhancements will help us accurately determine the average wait time for reconsiderations.

Annual Performance Plan for FY 2014 and Revised Final Performance Plan for FY 2013
Social Security Administration | www.socialsecurity.gov | 1-800-772-1213 23
1.2h: Update the medical Listing of Impairments
Fiscal Year 2013 2014
Target
Develop and submit at least five rules for public comment, three final
rules, and three Social Security Rulings
Develop and submit at least five rules for public comment, five final
rules, and three Social Security Rulings
Historical Performance
Fiscal Year 2009 2010 2011 2012
Performance Published
8 Social Security Rulings
Published 3 final regulations and
1 Notice of Proposed
Rulemaking
Published 2 regulatory actions and
1 Social Security Ruling
Published 3 rules for public comment
Data definition: We will develop regulatory actions or Social Security Rulings related to updating the medical Listings for publication in the Federal Register. Regulatory actions include Advance Notice of Proposed Rulemaking, Notice of Proposed Rulemaking, Final Rules, Social Security Ruling, or other Federal notice.
Data source: Office of Retirement and Disability Policy Workplan
1.2i: Increase the percentage of disability cases evaluated using health Information Technology
Fiscal Year 2013 2014
Target 200% above FY 2012 performance 200% above FY 2013 performance
Historical Performance
Fiscal Year 2010 2011 2012
Performance Established Baseline (3,000)
108% above FY 2010 baseline (6,235)
263% above FY 2011 performance (22,671)
Data definition: The percentage increase in the number of disability cases evaluated using medical evidence gathered through health IT over the prior year.
Data source: Health IT Management Information System

Annual Performance Plan for FY 2014 and Revised Final Performance Plan for FY 2013
Social Security Administration | www.socialsecurity.gov | 1-800-772-1213 24
1.2j: Number of Disability Insurance and Supplemental Security Income disability beneficiaries, with Tickets assigned and in use, who work
Fiscal Year 2013 2014
Target 136,401 139,129
Historical Performance
Fiscal Year 2009 2010 2011 2012
Performance 105,843 117,124 131,099 Available July 2013
Data definition: The total number of Social Security, SSI, and concurrent beneficiaries who used their Ticket to sign up with an EN or State VR agency and who have recorded earnings in the Disability Control File (DCF) in any month of the calendar year.
Data source: DCF “Verify Update Earnings Screen’s Work and Earnings Reports” data field
1.2k: Disability Determination Services decisional accuracy rate for initial disability decisions
Fiscal Year 2013 2014
Target 97% 97%
Historical Performance
Fiscal Year 2009 2010 2011 2012
Performance 97% 98% 98% 98%
Data definition: Net accuracy is the percentage of correct initial State disability determinations and is based on the net error rate (the number of corrected deficient cases with changed disability decisions), plus the number of deficient cases not corrected within 90 days from the end of the period covered by the report, divided by the number of cases reviewed.
Data source: Disability Quality Assurance Databases

Annual Performance Plan for FY 2014 and Revised Final Performance Plan for FY 2013
Social Security Administration | www.socialsecurity.gov | 1-800-772-1213 25
Strategic Objective 1.3 Expedite Cases for the Most Severely
Disabled Individuals
We are committed to quickly providing benefits to claimants whose medical conditions are so serious that they obviously meet our disability standards when we can obtain definitive medical evidence. Our two initiatives, Quick Disability Determinations (QDD) (www.socialsecurity.gov/disabilityresearch/qdd.htm) and Compassionate Allowances (CAL) (www.socialsecurity.gov/compassionateallowances/), use technology to identify claimants with the most severe disabilities and allow us to expedite decisions on their cases while maintaining accuracy. We can approve some cases in a matter of days instead of months or years. These fast-track initiatives have been two of our greatest successes in recent years.
We continue to refine our QDD predictive model and expand the number of CAL conditions used to identify claimants with the most severe disabilities. Additionally, we are working closely with the DoD to expedite decisions for Wounded Warriors.
Our efforts to expedite cases for the most severely disabled individuals include:
Advancing Quick Disability Determinations: The QDD process uses predictive modeling and computer-based screening tools to identify cases where favorable disability determinations are highly likely, and medical evidence is readily available. We are refining the QDD model to ensure it continues to select cases with high potential for allowance. In FY 2013, we will evaluate a reconfiguration of the QDD model, and if it proves to be an improvement over the existing model in efficiency and accuracy, we will implement the reconfigured model. With the refinements to the QDD model, we expect to maintain the high quality of cases selected while increasing the number of claimants served through QDD.
Advancing Compassionate Allowances: The CAL process allows us to quickly target the most obviously disabled applicants based on available objective medical information. We award benefits in nearly all CAL cases if we receive confirmation of the diagnosis with objective medical evidence, and the applicant meets our non-disability eligibility requirements. In FY 2012, we added 65 new conditions including neurological disorders, immune system disorders, cancers, and rare diseases. In December 2012, we added 35 more CAL conditions, bringing the total number of conditions in this expedited disability process to 200.
In FY 2013 and FY 2014, we plan to further expand our list of CAL conditions, so long as accuracy can be maintained, through consultations with medical, research, and advocacy communities. Additionally, since many CAL conditions are diseases that affect children or people in specific age ranges, we will enhance the accuracy of the CAL selection software by upgrading it to include an option for demographics based upon age.
STRATEGIES
Ø Expand the Number of Medical Conditions Included in the CAL Process, Allowing Us to Quickly Target the Most Obviously Disabled Individuals for Allowances Based on Objective Medical Evidence that We Can Obtain Quickly
Ø Refine the QDD Predictive Model to Maximize Its Capacity to Accurately Identify Cases, and Thereby Increase the Percentage of Individuals Served by the QDD Process
Ø Expand the Current Pilot to Further Improve Service for Wounded Warriors

Annual Performance Plan for FY 2014 and Revised Final Performance Plan for FY 2013
Social Security Administration | www.socialsecurity.gov | 1-800-772-1213 26
Performance Measures – Strategic Objective 1.3
1.3a: Achieve the target percentage of initial disability cases identified as Quick Disability Determinations or Compassionate Allowances
September 2013 2014
Target 6.0% 6.1%
Historical Performance
September 2009 2010 2011 2012
Performance 3.8% 4.6% 5.9% 5.8%
Data definition: We derive the percentage by dividing the total number of initial disability cases identified as QDD, CAL, or both by the total number of electronic initial disability cases filed in the last month of the fiscal year.
Data source: Management Information Disability

Annual Performance Plan for FY 2014 and Revised Final Performance Plan for FY 2013
Social Security Administration | www.socialsecurity.gov | 1-800-772-1213 27
STRATEGIC GOAL 2: Provide Quality Services to the Public
We touch the life of virtually every person in America, as well as the lives of many other people throughout the world. We offer a wide range of service options to the public. We provide face-to-face service through our community-based field offices and card centers. In various remote locations, we use video technology for face-to-face service. The public may also visit us online (www.socialsecurity.gov), call us toll-free at 1-800-772-1213 (TTY 1-800-325-0778), or write to us. These options save time and money as the public can conduct business without traveling to a local field office. We remain committed to maintaining personal interaction with the public, no matter which service method a customer chooses. Providing quality service is essential, especially today as the baby boomers move through their most disability-prone years before retiring.
Based on the most recent economic assumptions, we believe that we will continue to receive high numbers of retirement applications. In FY 2014, we estimate that retirement and survivor claims will be over 40 percent higher than in FY 2007. To enable us to better handle the significant increase in benefit applications and other demands for our services, we developed several new, easy-to-use online services. In FY 2012, we launched the online Social Security Statement, providing people age 18 and older the opportunity to review their estimated benefits and check their earnings history at any time. Our goal is to provide applicants and their representatives with a wide variety of online services, including the ability to apply for a range of benefits and update their records.
We are also committed to ensuring that our programs, activities, and facilities are accessible to everyone in accordance with Section 504 of the Rehabilitation Act of 1973. In FY 2012, we conducted a comprehensive self-evaluation of the accessibility of our programs, activities, and facilities. We identified recommendations for improving service to individuals with disabilities that we will implement in FY 2013 and beyond.
We continue to improve our field and hearing office telephone services, as well as our National 800 Number infrastructure. In addition, we are expanding our use of video technology and using plain language principles to simplify the letters we send to the public.
TO ACHIEVE THIS GOAL WE WILL
Ø Increase the Use of Our Online Services Ø Increase Public Satisfaction with Our Telephone Services Ø Expand the Use of Video Services Ø Improve the Clarity of Our Notices

Annual Performance Plan for FY 2014 and Revised Final Performance Plan for FY 2013
Social Security Administration | www.socialsecurity.gov | 1-800-772-1213 28
Strategic Objective 2.1 Increase the Use of Our Online Services
We strive to provide the best online services in government. We had the three highest rated electronic services in the Federal Government as measured by the American Customer Satisfaction Index (ACSI) in the fourth quarter of calendar year 2012:
· Retirement Estimator, with a rating of 91; · iClaim, our online benefit application, with a rating of 90; and · Application for Extra Help with Medicare Prescription Drug Plan Costs, with a rating of 89.
Our website provides helpful information about our programs and services to the public, employers, other government agencies, businesses, and stakeholders. For certain transactions, users can conduct business at their convenience and at their own pace, without traveling to a field office and waiting to meet with one of our representatives. Use of our online services continues to increase.
Online benefit applications reduce the average time our employees spend completing claims, freeing them to handle more complicated workloads. We expect our online filing rates to be 48 percent by the end of FY 2013.
We recently implemented a new, even more secure procedure to authenticate the identity of people interested in conducting business with us online through a new platform called my Social Security (http://www.ssa.gov/myaccount/). Social Security beneficiaries and SSI recipients now can access their benefit verification letters, payment histories, and earnings records instantly. Social Security beneficiaries also can change their address and start or change direct deposit information online. Others who successfully authenticate can verify their earnings history, receive notices, and request certain routine actions online.
my Social Security, which includes the online Social Security Statement, recently ranked in the top 10 in customer satisfaction for all Federal websites. Since its debut on May 1, 2012, approximately 67,000 respondents to the ACSI survey rated their online experience with an average score of 86.
We offer many of our online publications in up to 15 different languages. The majority of our online publications are also available in audio format. Additionally, most of our Internet documents are accessible to anyone who needs to use screen readers, screen magnifiers, or voice recognition software. We ensure all of our online applications fully comply with Section 508 of the Rehabilitation Act of 1973.
STRATEGIES
Ø Develop Creative Outreach Strategies to Market Online Services Ø Increase the Number of Electronic Services that Enable Individuals to File for
Any Benefit and Access and Update Personal Information Ø Enhance Usability and Continue to Incorporate Best-in-Business Features in Our
Existing Online Services Ø Explore Offering Online Services Through Mobile Devices Ø Explore Online Support Options, Including Click to Talk, Screen Sharing, and
Instant Messaging Ø Simplify Business Processes to Maximize the Benefits of Online Services

Annual Performance Plan for FY 2014 and Revised Final Performance Plan for FY 2013
Social Security Administration | www.socialsecurity.gov | 1-800-772-1213 29
We will enhance our online services with the following initiatives:
Improving Services to Our Spanish-Speaking Customers: The Census Bureau projects the U.S. Hispanic population will nearly triple, from 46.7 million to 132.8 million, between 2008 and 2050. We conduct approximately 5.4 percent of our National 800 Number calls in Spanish, and an increasing number of field office visitors expect to conduct their business with us in Spanish. Our website offers the following electronic services in Spanish:
· Spanish iClaim, which allows users to file retirement, Medicare, and disability applications; and · Spanish Medicare Extra Help Application, which allows Medicare beneficiaries to file for extra
help to pay for monthly premiums, annual deductibles, and co-payments related to the Medicare Prescription Drug program.
The ACSI score of 95 indicates that users are highly satisfied with Spanish iClaim, and the feedback is consistent with the overall satisfaction of the English application users. In FY 2013 and FY 2014, we will explore ways to expand the use of the Spanish iClaim to international users by including features to collect information related to foreign work, international direct deposit, and United States residency. As we continue to expand our online services, we will also offer those services in Spanish. Additionally, we plan to develop Spanish Forms W-2 online services.
Nationwide Marketing Campaign: We use public service announcements on television and radio, printed leaflets, billboards, bus posters, and displays in airport terminals to promote our online services. Additionally, we use social media and targeted relevant keyword searches on Google and Bing to more effectively direct web users to our online service options. At a local level, our offices find creative and cost-effective ways to inform the community about the advantages of using our online services.
We continue to work with a broad network of national organizations, advocacy groups, and other interested parties who represent the American public. Our audiences include aged individuals; people with disabilities; claimants’ representatives; financial planners; human resource managers; and our colleagues from other Federal agencies and State, local, and tribal governments. We also produce webinars and webcasts to promote online services and explain Social Security programs and services.
In FY 2013 and FY 2014, we will explore additional online marketing, such as Facebook advertising, while continuing to promote new and updated online services using strategies and products that have proven effective.
Electronic Services for Appointed Representatives: Representatives transact business with us on behalf of applicants who file for disability benefits. We provide appointed representatives access to their clients’ electronic disability folders at the hearing and Appeals Council levels. In FY 2012, more than 8,500 appointed representatives viewed their cases online. In addition, in FY 2012, we improved our online appeals application (iAppeals) by including more propagated fields, which reduces the requirement of representative to enter the same data multiple times. Representatives will also have the option to scan and submit forms and documents online. In FY 2013 and FY 2014, we will continue to improve the iAppeals application to provide appointed representatives with more features.
Social Security Statement: The Social Security Statement is a concise, easy-to-read personal record of workers’ earnings, the amount of Social Security taxes they paid, and a summary of the estimated benefits they and their families may receive. In recent years, we mailed annual Social Security Statements to more than 150 million people; however, in FY 2011 we suspended these mailings due to budget constraints.

Annual Performance Plan for FY 2014 and Revised Final Performance Plan for FY 2013
Social Security Administration | www.socialsecurity.gov | 1-800-772-1213 30
In February 2012, we resumed issuing the paper Social Security Statements to workers age 60 and older, and, in July 2012, we started a one-time mailing to workers as they turn age 25. In FY 2012, we mailed paper Social Security Statements to approximately 11.4 million workers nearing retirement age (age 60 and older) and to about 1 million workers who were turning age 25. At the start of FY 2013, we again suspended mailing any paper Social Security Statements due to budget constraints; however, we continue to offer the public the option of obtaining the information online. Both the mailed and online versions of the Social Security Statement include links to web information and services to help people plan for retirement.
Performance Measures – Strategic Objective 2.1
2.1a: Increase the percentage of claims filed online
Fourth Quarter FY 2013 2014
Target 48% 48%
Historical Performance
Fourth Quarter FY 2012
Performance 44%
Data definition: The percentage of initial Social Security disability, retirement, spouses, and Medicare claims filed online in the last quarter of the fiscal year. We derive the percentage by dividing the number of initial Social Security disability, retirement, spouses, and Medicare claims filed online in the last quarter of the fiscal year by the total number of initial Social Security disability, retirement, spouses, and Medicare claims that could be filed online in the last quarter of the fiscal year.
Data source: Social Security Unified Measurement System, MI Central, and Local Management Information Report
Note: Data from all four quarters of each year will be publicly available.

Annual Performance Plan for FY 2014 and Revised Final Performance Plan for FY 2013
Social Security Administration | www.socialsecurity.gov | 1-800-772-1213 31
2.1b: Complete the budgeted number of retirement, survivors, and Medicare claims
Fiscal Year 2013 2014
Target 5,269,000 5,402,000
Historical Performance
Fiscal Year 2009 2010 2011 2012
Performance 104% (4,742,218)
101% (4,700,990)
106% (4,877,955)
102% (5,001,092)
Data definition: The percent of retirement, survivors, and Medicare claims completed in the current fiscal year up to the budgeted number.
Data source: Work Measurement Transition Database

Annual Performance Plan for FY 2014 and Revised Final Performance Plan for FY 2013
Social Security Administration | www.socialsecurity.gov | 1-800-772-1213 32
Strategic Objective 2.2 Increase Public Satisfaction with
Our Telephone Services
Our telephone service remains the public’s most popular option for conducting business with us. We are taking advantage of additional technological advancements that will help us keep pace with industry standards and increase our efficiency. In FY 2012, we completed more than 56 million transactions through our National 800 Number. Callers can speak to an agent during business hours or use our automated services that are available 24 hours a day, 7 days a week.
We answer questions about Social Security benefits, schedule appointments to file claims, and, depending on the situation, take benefit applications by telephone. Beneficiaries also frequently call to change their address, request replacement Medicare cards, or request benefit verification statements.
We will continue to improve our telephone service and expand our efforts to increase public satisfaction. From FY 2009 through FY 2011, we significantly reduced both busy signals and average wait time to speak with an agent. Much of our improved performance was due to increased hiring of agents. However, with staffing losses over the last few years, we project time spent waiting for an agent will increase to an average of 455 seconds in FY 2013 from an average of 294 seconds in FY 2012. We conduct surveys to track trends in caller satisfaction with our National 800 Number and field office telephone service.
In FY 2013, we will continue improving our telephone services through the following:
Replacing Our National 800 Number Infrastructure: We will continue to enhance our telephone services so that more people can successfully complete their business with us by phone. We are converting to Citizens Access Routing Enterprise 2020 (CARE 2020) to replace our National 800 Number telecommunications infrastructure. We will enhance the menus, self-service features, and speech-recognition technology of our National 800 Number. The new system will have increased capacity to handle nearly all National 800 Number traffic, even on peak days. This increase in capacity will nearly eliminate busy signals for our callers. However, we expect wait times to speak to an agent to increase in the short-term due to the staffing losses over the last few years. CARE 2020 will enable callers to make a decision to wait for service, schedule a callback, or retry at a more convenient time. Based on trends in telephone service delivery methods and our research on customer satisfaction, we expect these options to reduce customer frustration and improve the overall caller experience.
The new CARE 2020 infrastructure will also provide technology to help us forecast call volumes, anticipate staffing needs, and better distribute incoming calls across the network so callers can more
STRATEGIES
Ø Develop and Implement Best-in-Business Features that Will Enhance the Caller’s Experience, Regardless of Whether the Caller Uses Automated Telephone Service or Speaks with an Employee
Ø Implement a New Post-Call Survey to Obtain Immediate Feedback on Our National 800 Number Service
Ø Develop and Evaluate Pilots to Allow Callers to Bypass Automated Phone Service
Ø Increase the Use of Management Information Tools to Redirect Calls from Field Offices to the National 800 Number to Reduce Delays

Annual Performance Plan for FY 2014 and Revised Final Performance Plan for FY 2013
Social Security Administration | www.socialsecurity.gov | 1-800-772-1213 33
quickly reach agents. CARE 2020 will also provide an option for our agents to place the key telephone functions on their computer screen (softphone), rather than using a traditional hardphone on their desks. In FY 2013, we will customize the placement of this softphone on agents’ computer screens via a customization feature. This customization will improve agents’ call handling efficiency through improved screen placement with other existing software tools and a single sign-on to use both the computer and telephone.
Providing Real-Time Assistance to Online Visitors: We are exploring the use of web-support technologies to improve the level of customer service we provide to our online users. As part of the Click-to-Communicate (C2C) initiative, we are considering using three web support technologies: Click-to-Talk, Screen Sharing, and Instant Messaging. In FY 2013, we will continue to pilot Network Online Web (NOW) support as a precursor to the C2C initiative. The NOW pilot will assist us in developing a strategy for incorporating web support technologies into our business process. We will begin planning and analysis for C2C in FY 2014.
Field Office Estimated Wait Time Messaging: In FY 2013, we plan to add a feature that will provide callers with the estimated amount of time it will take a field office representative to answer their calls.
Performance Measures – Strategic Objective 2.2
2.2a: Achieve the target speed in answering National 800 Number calls
Fiscal Year 2013 2014
Target 455 seconds 482 seconds
Historical Performance
Fiscal Year 2009 2010 2011 2012
Performance 245 seconds 203 seconds 180 seconds 294 seconds
Data definition: We calculate the speed of answering by dividing the wait time of all National 800 Number calls answered by agents by the number of all National 800 Number calls answered by agents in the fiscal year. Wait time begins from the time we transfer the caller to the agent queue (waiting for an agent) and continues until an agent answers the call.
Data source: Data generated by Cisco Intelligent Contact Management system

Annual Performance Plan for FY 2014 and Revised Final Performance Plan for FY 2013
Social Security Administration | www.socialsecurity.gov | 1-800-772-1213 34
2.2b: Achieve the target busy rate for National 800 Number calls
Fiscal Year 2013 2014
Target 10% 10%
Historical Performance
Fiscal Year 2009 2010 2011 2012
Performance 8% 5% 3% 5%
Data definition: We calculate the agent busy rate as the number of National 800 Number busy messages divided by the number of National 800 Number calls requesting agent service in the fiscal year. The caller receives a busy message when the number of calls offered exceeds the number of telephone lines available or when the agent queue has reached its maximum capacity of waiting calls.
Data source: Data generated by Cisco Intelligent Contact Management system
Note: We computed the agent busy rate using our current methodology to allow for comparability. We have not solidified the date for full implementation of CARE 2020, but we anticipate that our new state-of-the-art system will decrease the agent busy rate to 1 percent in FY 2014.

Annual Performance Plan for FY 2014 and Revised Final Performance Plan for FY 2013
Social Security Administration | www.socialsecurity.gov | 1-800-772-1213 35
2.2c: Maintain the percent of people rating our services as “excellent,” “very good,” or “good”
Fiscal Year 2013 2014
Target 83.5% 83.5%
Historical Performance
Fiscal Year 2009 2010 2011 2012
Performance 81% 78.2% 81.4% 80.9%
Data definition: The percent is derived by dividing the number of respondents who rate overall service as “excellent,” “very good,” or “good” on a six-point scale ranging from “excellent” to “very poor” in the fiscal year by the total number of respondents.
Data source: We base the overall satisfaction rating on service satisfaction surveys of National 800 Number callers; field office callers, visitors to field offices (including Social Security Card Centers beginning in FY 2011), and hearings offices, and individuals who used one of our transactional Internet services. The Internet Report Card Survey, which began in FY 2010 with iClaim and Medicare Part D subsidy applications, added online change of address and direct deposit actions to the types of transactions sampled in FY 2011. The FY 2012 Internet Report Card Survey added a sample of individuals who completed the online medical form for a disability initial claim or appeal. The FY 2013 survey will incorporate online requests for information, such as benefit verifications.
Note: In FY 2009, we measured satisfaction with Internet service in a special survey of iClaims. Beginning in FY 2010, we replaced this survey with the annual Internet Report Card Survey.

Annual Performance Plan for FY 2014 and Revised Final Performance Plan for FY 2013
Social Security Administration | www.socialsecurity.gov | 1-800-772-1213 36
Strategic Objective 2.3 Expand the Use of Video Services
Video technology is an important part of our efforts to reduce the hearings backlog. We use this technology to help balance workloads across the country, reduce travel for the public and our employees, and better serve remote areas. Our National Hearing Centers use video technology for all of their hearings, giving us the needed flexibility to quickly support the most backlogged hearing offices.
Video technology reduces the need for our staff to travel between offices and to remote hearing sites, saving travel costs and freeing up more time for our judges to decide cases. Surveys of people who have experienced the hearing process show they are equally satisfied whether their hearing was held in person or by video conference.
We will expand our video services with the following initiatives:
Expanding the Representative Video Project (RVP): RVP allows attorney and non-attorney claimants’ representatives to participate in hearings from their offices using their own video conferencing equipment. In FY 2012, 52 approved representatives held over 3,800 hearings using RVP. In FY 2013, we expect to add more RVP sites as we continue to close temporary remote hearing sites and reduce travel budgets.
Expanding Video Service Delivery (VSD): Some people experience difficulty visiting a field office because they are in rural locations or places without public transportation. VSD enables us to provide service to people at more convenient third-party sites, such as hospitals, libraries, community centers, American Indian Tribal centers, and homeless shelters. In FY 2012, we began piloting Video Remote Interpreting (VRI) services for hearing-impaired visitors in 37 field offices. Based on the success of this pilot, we expanded VRI services to 262 additional field offices, for a total of 299 locations as of December 2012. In January 2013, we provided 20 additional VSD units for DDSs, allowing them to conduct video disability hearings and video consultative exams. Additionally, we are expanding VSD to 20 Wounded Warrior locations, enabling us to assist veterans and reducing our dependence on travel funds.
STRATEGIES Ø Expand the Use of Video Services to Balance Our Workloads Ø Expand the Use of Third-Party Video Hearings

Annual Performance Plan for FY 2014 and Revised Final Performance Plan for FY 2013
Social Security Administration | www.socialsecurity.gov | 1-800-772-1213 37
Performance Measure – Strategic Objective 2.3
2.3a: Complete the planned number of video hearings
Fiscal Year 2013 2014
Target 154,000 169,000
Historical Performance
Fiscal Year 2009 2010 2011 2012
Performance 86,320 120,624 129,775 153,592
Data definition: The number of video hearings completed in the current fiscal year.
Data source: Case Processing and Management System

Annual Performance Plan for FY 2014 and Revised Final Performance Plan for FY 2013
Social Security Administration | www.socialsecurity.gov | 1-800-772-1213 38
Strategic Objective 2.4 Improve The Clarity Of Our Notices
Notices are one of our principal means of communicating with the public. Annually, we send approximately 250 million notices to the public explaining the programs that we administer. Our notices communicate decisions, payment, and other important information. The notices also inform claimants and beneficiaries of their rights and responsibilities under our programs, including their appeal rights.
Our notices must be accurate, easy-to-read, and clearly explain all necessary actions. Clear notices allow us to serve the public effectively and reduce unnecessary calls to our National 800 Number and visits to our field offices. We continue to assess and improve our notices. Our notice clearance process ensures all new notice language meets our notice standards and complies with the Plain Writing Act of 2010.
In FY 2013, we plan to improve the readability, clarity, and tone of SSI notices explaining payment changes and notices advising recipients their benefits will stop due to work. We also plan to improve language in our highest volume notices, such as the letter acknowledging our receipt of a hearing request.
We are also evaluating how we can use technology to generate notices more efficiently and effectively. For example, we will conduct planning and analysis on a new Enterprise Communication Architecture to determine if we can simplify notice production. We are also exploring technology that will allow us to produce notices in different formats to better serve our diverse public.
We apply the principles of open government—transparency, participation, and collaboration—to our notice development process. We also solicit feedback from advocates and other interested persons to provide input regarding the content and clarity of our notices.
STRATEGIES
Ø Improve the Readability, Clarity, and Tone of Our Supplemental Security Income Post-Eligibility Notices
Ø Revamp Our Title II Notice System to Make Notices More Complete and Easier to Understand
Ø Modernize Our Notice Architecture So That We Can Implement New or Revised Language More Efficiently and Effectively
Ø Incorporate Plain Language Principles in Our Notices

Annual Performance Plan for FY 2014 and Revised Final Performance Plan for FY 2013
Social Security Administration | www.socialsecurity.gov | 1-800-772-1213 39
STRATEGIC GOAL 3: Preserve the Public’s Trust in
Our Programs
We take our responsibility to be good stewards of the funds entrusted to us very seriously, and we have a well-deserved reputation for excellent financial management of our programs. We pay over $65 billion in benefits each month. Our most important responsibility is to pay these benefits accurately and promptly to the individuals who are entitled to receive them. Additionally, we operate very efficiently, holding our administrative expenses to about 1.4 percent of benefit expenses.
We are committed to preventing fraud and abuse. We collaborate with other Federal agencies to investigate and prosecute fraud, expand forensic computer crime detection capabilities, and strengthen fraud prevention by adding new checks and balances in our processes. In addition, we commit to continuing our long history of conducting analyses and providing data to the Administration, Congress, and stakeholders on proposals for Social Security reform.
This strategic goal aligns with the President’s challenge to Federal agencies to aggressively reduce improper payments government-wide. To preserve the public’s trust in our programs, we must continue to invest in enhanced program integrity activities. Together, our stewardship and service missions serve a common purpose—making our programs more effective and efficient. Visit our reducing improper payments website (www.socialsecurity.gov/improperpayments) for more information on our efforts to reduce improper payments.
TO ACHIEVE THIS GOAL WE WILL
Ø Increase Efforts to Accurately Pay Benefits Ø Recover Improper Payments Ø Maintain Accurate Earnings Records Ø Make Our Administrative Operations Even More Efficient

Annual Performance Plan for FY 2014 and Revised Final Performance Plan for FY 2013
Social Security Administration | www.socialsecurity.gov | 1-800-772-1213 40
Strategic Objective 3.1 Increase Efforts To Accurately Pay Benefits
Our program integrity activities are critical to ensuring well-run programs and accurate payments. Despite rising workloads, we have been steadily increasing our program integrity efforts. We intend to continue our commitment to our program integrity efforts to minimize improper payments. Our stewardship responsibilities include conducting periodic medical Continuing Disability Reviews (CDR) and non-medical SSI redeterminations. These reviews save significant program dollars by avoiding improper payments to beneficiaries. The FY 2014 President’s Budget includes a new legislative proposal that would replace discretionary cap adjustments with a dependable source of mandatory funding to significantly ramp up our program integrity work. In FY 2014, the proposed funding would allow us to handle significantly more CDRs.
We will further increase our efforts to pay benefits accurately by:
Conducting Continuing Disability Reviews (CDR): To ensure we pay disability benefits to only those who continue to meet our medical requirements, we conduct CDRs periodically for both DI beneficiaries and SSI recipients to determine if their disabling condition has improved and if they are still eligible for benefits. We use statistical modeling to identify beneficiaries’ probability of medical improvement.
We conduct two types of medical CDRs: questionnaires (mailers) and full medical reviews. Generally, we send mailers to beneficiaries and recipients who have a low probability of demonstrating medical improvement. We schedule a full medical CDR for those beneficiaries with a higher probability of medical improvement. Full medical CDRs require a new medical evaluation and disability determination by our DDS examiners.
Although most CDRs do not result in a cessation of benefits, our medical CDR process is cost effective. For FY 2014, we estimate that every dollar spent on CDRs will yield about $9 in program savings over 10 years, including Medicare and Medicaid program effects.
Conducting SSI Redeterminations: Because SSI is a means-tested program, changes in recipients’ living arrangements or the amount of their income and resources can affect their eligibility or the
STRATEGIES
Ø Explore New Business Processes for Completing Our Program Integrity Activities
Ø Develop New Tools and Automated Means for Beneficiaries to Report Changes that May Affect Their Payment Amount
Ø Automate Internal Business Processes to Make It Easier for Our Employees to Make Changes Quickly and Accurately
Ø Collaborate with Other Federal Agencies to Find Innovative Ways to Detect Fraud
Ø Pursue Additional Data Sharing Agreements with Private Industry and Government Agencies
Ø Enhance Predictive Models and Automation Tools to Help Identify Elements of Benefit Eligibility
Ø Explore Innovative Methods to Communicate Reporting Responsibilities to Beneficiaries

Annual Performance Plan for FY 2014 and Revised Final Performance Plan for FY 2013
Social Security Administration | www.socialsecurity.gov | 1-800-772-1213 41
amount of their payments. To ensure the accuracy of SSI payments, we conduct redeterminations, which are periodic reviews of non-medical factors of eligibility. For FY 2014, we estimate that every dollar spent on SSI redeterminations will yield about $5 in program savings over 10 years, including Medicaid program effects.
Using Predictive Modeling in the SSI Redetermination Process: We do not have the resources to conduct an annual redetermination on every SSI recipient, so we use a statistical scoring model to identify cases for redetermination that have a high likelihood of error. The statistical model uses various income, resource, and living arrangement variables to predict likely SSI overpayments.
Using this scoring model, we expect the cases we completed in FY 2012 to result in the prevention and recovery of $2.9 billion in total lifetime SSI overpayments. If we had relied on random case selection rather than using a predictive model, we project that we would have prevented and recovered only $2.1 billion in total lifetime savings in that year. In FY 2012, we began implementing an enhanced model with additional recipient living-arrangement information. This model enhancement will further improve our targeting of likely SSI overpayments by better identifying cases where recent changes in living arrangements have affected SSI payments.
Expanding the Access to Financial Institutions (AFI) Initiative: AFI is a web-based system that allows SSA to detect undisclosed assets in bank accounts. Detection of these assets prevents one of the most frequent causes of SSI erroneous payments. We completed the rollout of AFI to all 50 states, the District of Columbia, and the Northern Mariana Islands in FY 2011, and in FY 2012, we fully integrated the AFI process into our SSI Claims process. We plan to continue expanding its usage with a reduction in tolerance expected in FY 2013 pending available resources, and full implementation in the near future.
Promoting Use of the SSI Telephone Wage Reporting System (SSITWR): Wages continue to be a major source of payment error in the SSI program because we do not always receive accurate or timely monthly wage information. To facilitate timely reporting, we established a dedicated telephone number to allow recipients and their representative payees (i.e., organizations or persons who receive SSI payments on behalf of recipients who cannot manage their own benefits) to report monthly wages by calling and using a combination of touch-tone entry and voice-recognition software.
Our software system automatically enters the wage data into the SSI system. This process is more efficient than the recipient visiting a field office and having us manually enter the report of wages into our processing system. The improved efficiency of SSITWR allows us to process wage reports early enough to adjust the next SSI payment, thereby preventing improper payments.
As part of our ongoing efforts to promote monthly wage reporting, we are conducting a Payee Outreach Pilot. We mailed notices to a group of representative payees for working SSI recipients. The notices asked the payees to start using SSITWR to report the recipients’ wages to us. Based on the successful results of the pilot, we expanded the mailing to a larger group of representative payees for working SSI recipients. In FY 2013, we will continue to recruit new reporters to use SSITWR and post a webcast on our website that promotes the use of SSITWR. Future efforts to enhance this initiative will include the development of an Internet-based wage reporting application.
Expanding the Use of Electronic Death Data Exchange with Foreign Governments: We have expanded the use of electronic death data exchange with foreign governments to ensure we do not pay benefits to deceased people who resided outside of the United States. In FY 2012, we improved our exchange methodology with Australia, Sweden, and the Netherlands—our existing exchange partners. In FY 2012, we also implemented reciprocal exchanges with Germany and South Korea. In FY 2013, we

Annual Performance Plan for FY 2014 and Revised Final Performance Plan for FY 2013
Social Security Administration | www.socialsecurity.gov | 1-800-772-1213 42
expect to implement reciprocal exchanges with Belgium, Canada, and the United Kingdom and pursue new data exchanges with Japan, Poland, Switzerland, and other totalization partner countries.
Using Electronic Data Exchanges: We have over 1,400 data exchanges with a wide range of Federal, State, and local entities that provide us with information we need to stop benefits completely or to adjust the amount of benefits we pay. For example, States and jurisdictions provide us with notification of deceased persons, enabling us to timely administer programs for beneficiaries of decedents. We also have about 2,300 exchanges with prisons that allow us to suspend benefits to prisoners quickly and efficiently.
We will continue to explore opportunities to increase electronic data exchanges with the States and other government agencies to eliminate the need for online filers to provide us evidentiary documents, such as birth and death certificates, proof of citizenship, and Forms W-2. These exchanges make the online application process more accurate, efficient, and convenient.
One such exchange, the Internet Electronic Death Registration (EDR), is a web-based application designed to allow a State’s Bureau of Vital Statistics to verify decedents’ Social Security numbers using the Internet. EDR is currently active in 32 States, the District of Columbia, and New York City. Seven more states are tentatively scheduled to implement EDR in FY 2013.
Expanding Our Cooperative Disability Investigation (CDI) Program: We will continue to work collaboratively with the Office of the Inspector General (OIG), the DDSs, and with State and local law enforcement agencies through our CDI units to resolve allegations of fraud in our disability programs. Our CDI units help prevent payments to people who are not disabled and reduce improper payments to beneficiaries who have failed to report medical improvement or work activity. In FY 2012, CDI investigations led to the denial or termination of nearly 4,100 claims, saving approximately $340 million in our DI and SSI programs and approximately $235 million in non-SSA programs such as Medicare and Medicaid.
At the end of FY 2012, the CDI Program consisted of 25 CDI units operating in 21 States and the Commonwealth of Puerto Rico. Each unit consists of an OIG Special Agent who serves as the CDI Unit team leader, personnel from State or local law enforcement, and personnel from our agency and the State DDS. In FY 2013 and FY 2014, we will expand the program as funding permits.
Potential Entitlements Initiative: The law requires that we base a person's benefit amount on a number of factors including age, earnings history, and the type of benefit awarded. Inaccurate information or administrative mistakes can cause errors in calculating benefits. There are many causes for computation errors. From FY 2007 through FY 2011, approximately 53 percent of the computation errors resulted in underpayments, with the leading causes being the primary insurance amount, the Windfall Elimination Provision, and the recalculation of benefits due to updated and new information received after our initial calculation of an individual’s benefit amount.
The potential entitlements initiative is actively addressing improper underpayments and overpayments. In the OASDI program, we are correcting payments to young mothers who did not properly convert to widow’s benefits when they attained full retirement age. For the SSI program, we are referring some veterans receiving SSI to the VA when we determine they may be entitled to veteran’s benefits.

Annual Performance Plan for FY 2014 and Revised Final Performance Plan for FY 2013
Social Security Administration | www.socialsecurity.gov | 1-800-772-1213 43
Performance Measures – Strategic Objective 3.1
3.1a: Complete the budgeted number of Supplemental Security Income non-disability redeterminations
Fiscal Year 2013 2014
Target 2,622,000 2,622,000
Historical Performance
Fiscal Year 2009 2010 2011 2012
Performance 1,730,575 2,465,878 2,456,830 2,624,170
Data definition: The number of non-disability SSI redeterminations completed in the fiscal year up to the target. This number includes scheduled (i.e., identified for review through profiling) and unscheduled reviews (i.e., reviewed because of changes that may affect payment), as well as targeted redeterminations (i.e., limited issue reviews).
Data source: Integrated SSA Unified Measurement System Counts Report

Annual Performance Plan for FY 2014 and Revised Final Performance Plan for FY 2013
Social Security Administration | www.socialsecurity.gov | 1-800-772-1213 44
3.1b: Complete the budgeted number of full medical continuing disability reviews
Fiscal Year 2013 2014
Target 650,000 1,047,000
Historical Performance
Fiscal Year 2009 2010 2011 2012
Performance 316,960 324,567 345,492 443,233
Data definition: The number of full medical CDRs completed in the fiscal year up to the target. This number represents only full medical reviews completed by the State DDSs and other agency components and cases where we initiated a review but could not complete one because the individual failed to cooperate.
Data source: CDR Tracking Files
Note: Prior to FY 2012, performance included reviews completed by the State DDS and other agency components, reviews conducted by mailers that do not require a full medical review, and cases where we initiated a review but we did not conduct the review because the individual failed to cooperate. The table below provides additional historical information regarding the total number of full medical CDRs and mailers as reported in our FY 2012 Performance and Accountability Report.
Fiscal Year Performance 2009 2010 2011 2012
Full Medical 316,960 324,567 345,492 443,233
Mailers 785,023 631,615 1,063,405 961,069
Total CDRs 1,101,983 956,182 1,408,897 1,404,302

Annual Performance Plan for FY 2014 and Revised Final Performance Plan for FY 2013
Social Security Administration | www.socialsecurity.gov | 1-800-772-1213 45
3.1c: Percent of Supplemental Security Income payments free of overpayment and underpayment error
Overpayment Accuracy Rate
Fiscal Year 2013 2014
Target 95.0% 95.0%
Historical Performance
Fiscal Year 2009 2010 2011 2012
Performance 91.6% 93.3% 92.7% Available April 2013
Underpayment Accuracy Rate
Fiscal Year 2013 2014
Target 98.8% 98.8%
Historical Performance
Fiscal Year 2009 2010 2011 2012
Performance 98.4% 97.6% 98.2% Available April 2013
Data definition: We determine the SSI payment accuracy rate free of overpayment and underpayment error by an annual review of a statistically valid sample of the beneficiary rolls. We base the payment accuracy on a non-medical review of sampled individuals receiving SSI payments during the fiscal year. We determine the overpayment accuracy rate by dividing the total overpayment error dollars by the total dollars paid for the fiscal year and subtracting this percentage from 100 percent. We determine the underpayment accuracy rate by dividing the total underpayment error dollars by the total dollars paid for the fiscal year and subtracting this percentage from 100 percent.
Data source: SSI Stewardship Report

Annual Performance Plan for FY 2014 and Revised Final Performance Plan for FY 2013
Social Security Administration | www.socialsecurity.gov | 1-800-772-1213 46
3.1d: Percent of Old-Age, Survivors, and Disability Insurance payments free of overpayment and underpayment error
Overpayment Accuracy Rate
Fiscal Year 2013 2014
Target 99.8% 99.8%
Historical Performance
Fiscal Year 2009 2010 2011 2012
Performance 99.6% 99.6% 99.7% Available April 2013
Underpayment Accuracy Rate
Fiscal Year 2013 2014
Target 99.8% 99.8%
Historical Performance
Fiscal Year 2009 2010 2011 2012
Performance 99.9% 99.8% 99.9% Available April 2013
Data definition: We determine the OASDI payment accuracy rate free of overpayment and underpayment error by an annual review of a statistically valid sample of the beneficiary rolls. We base the payment accuracy on a non-medical review of sampled individuals receiving OASDI payments during the fiscal year. We determine the overpayment accuracy rate by dividing the total overpayment error dollars by the total dollars paid for the fiscal year and subtracting this percentage from 100 percent. We determine the underpayment accuracy rate by dividing the total underpayment error dollars by the total dollars paid for the fiscal year and subtracting this percentage from 100 percent.
Data source: OASDI Stewardship Report

Annual Performance Plan for FY 2014 and Revised Final Performance Plan for FY 2013
Social Security Administration | www.socialsecurity.gov | 1-800-772-1213 47
Strategic Objective 3.2 Recover Improper Payments
Although we strive to pay benefits accurately and timely, the complexity of our programs and dependence on beneficiaries to report payment-affecting changes can lead to improper payments. In FY 2012, we recovered $3.26 billion of Social Security and SSI overpayments. We use benefit withholding to recover overpayments from debtors currently receiving payments. When overpaid individuals are no longer receiving benefits, we offer them the opportunity to repay the debt by monthly installment payments. If the debtor does not agree to an acceptable repayment plan or defaults on an established agreement, we use our external collection techniques to recover the overpayments.
We have enhanced our debt collection program, focusing on the use of established external debt collection tools. These tools include Tax Refund Offset and Administrative Offset administered through the Treasury Offset Program (TOP) at the Department of the Treasury (Treasury). Our participation in TOP allows us to offset Federal tax refunds, Federal annuities, and Federal salaries to collect our delinquent debts. We also report delinquent debts to credit bureaus and use Administrative Wage Garnishment, which allows us to garnish a debtor’s private-sector wages.
We will continue improving our debt collection program by:
Maximizing Our Use of Proven Debt Collection Tools and Techniques: Referral of delinquent debts to TOP is an effective recovery method for individuals who are no longer entitled to our program benefits. From our initial implementation in FY 1992 through FY 2011, we have recovered approximately $2 billion dollars through TOP. In 2009, Treasury enhanced TOP by amending its regulations to allow collection of legally enforceable, non-tax debts beyond the prior 10-year statute of limitation. In FY 2011, we published regulatory changes authorizing us to refer delinquent debts over 10 years old to TOP. In May 2012, we implemented systems changes and began notifying our debtors. As a result of this enhancement, in August 2012, we began referring additional debts to Treasury for collection.
Implementing New Tools for Debt Collection: In FY 2011, we published the regulatory changes authorizing us to offset eligible State payments issued by participating States. We now have statutory authority to offset eligible State payments due to debtors as a way to collect delinquent debts. To offset the payment, the issuing State must have entered into a reciprocal agreement with Treasury. As resources permit, we will implement the required systems enhancements to employ State payment offset to increase our TOP collections.
STRATEGIES
Ø Maximize Our Use of Proven Debt Collection Tools and Techniques Ø Implement New Tools for Debt Collection Ø Develop Recommended Changes to Laws, Regulations, and Policies to Enhance
Our Ability to Collect Debt

Annual Performance Plan for FY 2014 and Revised Final Performance Plan for FY 2013
Social Security Administration | www.socialsecurity.gov | 1-800-772-1213 48
Performance Measure – Strategic Objective 3.2
3.2a: Expand and enhance our debt collection tools
Fiscal Year 2013 2014
Target
Send 180,000 OASDI and SSI External Collection Operation notices to debtors with debts 10 years or more delinquent
Send 180,000 OASDI and SSI External Collection Operation notices to debtors with debts 10 years or more delinquent
Historical Performance
Fiscal Year 2012
Performance Implemented Treasury Offset Program for programmatic delinquent debt over 10 years old
Data definition: Maximize our use of proven debt collection tools and techniques by continuing to notify debtors with delinquent debts over 10 years old of our ability to collect their debt through TOP. This indicator represents the number of notices sent to eligible beneficiaries as a result of this enhancement to our External Collection Operation system. Develop and implement internal processes to allow us to begin pursuing, through TOP, programmatic debts that have been delinquent for longer than 10 years.
Data source: External Collection Operation Master File

Annual Performance Plan for FY 2014 and Revised Final Performance Plan for FY 2013
Social Security Administration | www.socialsecurity.gov | 1-800-772-1213 49
Strategic Objective 3.3 Maintain Accurate Earnings Records
Enumeration is our process of assigning Social Security numbers (SSN) and issuing Social Security cards. Each year we receive approximately 17 million applications for original and replacement Social Security cards. We also verify SSNs more than one billion times a year through a variety of electronic exchanges with public and private organizations. The fundamental purposes of the SSN are to allow us to record a worker’s earnings history and monitor benefits paid under the Social Security program.
We base Social Security benefit amounts on a worker’s lifetime earnings, so it is critical that we maintain accurate earnings records and credit the correct amount of earnings to the right person. In FY 2012, we completed and posted more than 245 million items to workers’ records.
Maintaining accurate earnings records is resource-intensive and highly complex. We receive the majority of earnings reports electronically; however, we still receive nearly 30 million items on paper Forms W-2. In addition, the automated systems we use to process this workload are aging.
Our efforts to enhance our enumeration process include:
Strengthening the Social Security number Application Process (SSNAP): SSNAP is a web-based enumeration system used by our employees to record information and evidence submitted during the interview for an SSN. SSNAP is available in all field offices (including Social Security Card Centers), teleservice centers, and Foreign Service posts.
We are currently revising SSNAP to guide users through the mandatory in-person interview for applicants who are age 12 or older and applying for original SSNs. These revisions will help our employees determine whether we previously assigned an SSN to the applicant. As resources permit, we will continue to develop and implement enhancements that will help us enforce enumeration policy.
Expanding Enumeration-at-Entry (EAE): EAE is a collaborative effort among the Departments of State (DoS), Department of Homeland Security (DHS), and SSA. Initially, this program allowed immigrants age 18 or older to apply for an SSN with the DoS as part of their visa application. We expanded EAE in FY 2009 to handle requests for children under age 18 who apply for immigrant visas and SSNs. Upon an immigrant’s arrival in the United States, DHS forwards the data necessary for us to assign an SSN.
In FY 2012, we began proactively working with DoS and DHS to expand the EAE process to those persons applying for admission to the United States under certain non-immigrant visa classifications. In FY 2013 and FY 2014, we will continue working closely with DoS and DHS to identify potential categories of work-authorized non-immigrant visa holders we can enumerate through EAE and to enhance EAE’s management information. These improvements will reduce field office workloads, reduce costs, increase our capabilities to prevent the issuance of multiple SSNs, and improve the integrity of the enumeration process.
STRATEGIES
Ø Encourage More Employers to File W-2s Online Ø Work with the Internal Revenue Service to Improve Wage Reporting Ø Continue to Modernize Our Earnings Systems
Annual Performance Plan for FY 2014 and Revised Final Performance Plan for FY 2013
Social Security Administration | www.socialsecurity.gov | 1-800-772-1213 50
In addition to our efforts to improve the enumeration process, we are also striving to improve our ability to maintain accurate earnings records. Our initiatives include:
Continuing the Earnings Redesign Initiative: We are redesigning our systems to make our earnings process more efficient and accurate. In addition, we are working with the Internal Revenue Service (IRS) to enhance the earnings data exchanges for improved wage reporting.
In FY 2013, we will improve our detection and prevention capabilities for potential wage reporting fraud, retire outdated business processes, replace outdated technology, and automate our earnings reconciliation process. In FY 2014, we will improve our error-detection capabilities, retire obsolete system functionality, streamline automated business processes, continue to retire outdated business processes, and continue the automation of our earnings reconciliation process.
Expanding Use of Social Security number Verification Services (SSNVS): We can accurately post employee wages only when employers report employee wages under the correct name and SSN. SSNVS allows registered users (i.e., employers and their contractors) to determine, almost instantaneously, if the reported name and SSN of an employee matches our records. We will continue to work with the business community to encourage additional employers and third-party companies to use this service.
Increasing Electronic Wage Report (EWR) Filing: Annually, we receive over 3.3 million paper wage reports from employers that contain over 29 million paper Forms W-2. Paper wage reports are more error-prone, labor-intensive, and expensive to process; accordingly, we will continue to work toward eliminating paper wage reports while migrating to an electronic earnings record process.
In FY 2012, we implemented enhancements in our EWR suite of services to increase EWR filing. The number of registered EWR users has increased from 500,000 in tax year 2009 to over 734,000 in tax year 2012. In FY 2013, we will add functionality to our online Forms W-2 and implement user-friendly enhancements to make it easier for small businesses to use our EWR suite of services. We will also continue to encourage employers and third-party submitters to use EWR through promotional materials, articles in trade publications, and direct contact.

Annual Performance Plan for FY 2014 and Revised Final Performance Plan for FY 2013
Social Security Administration | www.socialsecurity.gov | 1-800-772-1213 51
Performance Measures – Strategic Objective 3.3
3.3a: Reduce the percentage of paper Forms W-2 completed
Fiscal Year 2013 2014
Target 13.0% 12.0%
Historical Performance
Fiscal Year 2009 2010 2011 2012
Performance 16% 15% 14.7% 13.5%
Data definition: The percentage of paper Forms W-2 processed to completion. We derive the percentage by dividing the number of paper Forms W-2 processed to completion by the total number of Forms W-2 processed to completion. We report data cumulatively for the current calendar year, as we process Forms W-2 for the prior tax year.
Data source: Earnings Modernization Operational Data Store Management Information Reports
3.3b: Achieve the target percentage for correctly assigning original Social Security numbers
Fiscal Year 2013 2014
Target 99.0% 99.0%
Historical Performance
Fiscal Year 2009 2010 2011 2012
Performance 99.9% 99.9% 99.9% Available May 2013
Data definition: We derive the percentage using a statistically valid sample of original SSNs assigned in the fiscal year. We divide the number of correctly assigned SSNs by the total number sampled. We consider the SSN assigned correctly when the individual:
· Did not receive an SSN that belongs to someone else; · Did not receive more than one SSN, except where permitted; and · Is eligible to receive an SSN based on supporting documentation.
Data source: Enumeration Quality Review
Annual Performance Plan for FY 2014 and Revised Final Performance Plan for FY 2013
Social Security Administration | www.socialsecurity.gov | 1-800-772-1213 52
Strategic Objective 3.4 Make Our Administrative Operations
Even More Efficient
We are committed to sound management practices. As responsible stewards, we continually review our business processes and use technology to make our operations more efficient. We continually seek new ways to efficiently use the approximately $1 billion we spend annually to obtain mission-essential goods and services. For example, we saved approximately $155 million in FY 2012 by negotiating with vendors and aggressively seeking discounts from contractors.
In accordance with Executive Order 13589, Promoting Efficient Spending, we:
· Identified ways to cut costs, where possible; · Eliminated practices that were outdated or unnecessary; and · Examined the key administrative areas targeted by the Executive Order.
Even prior to the issuance of the Executive Order, we took steps to reduce expenditures in many administrative areas and identified opportunities to promote efficient and effective spending.
We will continue to enhance the efficiency of our administrative operations by:
Increasing Use of Technology as an Alternative to Travel: We significantly increased the use of video hearings to reduce travel expenses, handle more hearings, transfer workloads between locations, and provide better service to claimants in remote areas.
We are also using technology to implement several new training methodologies, defined as Distance Learning, which allow training where space and time separate the students and instructor. Distance Learning can provide many training advantages, including:
· Increased timeliness; · More widespread availability; · Reduced travel cost; · Consistency of instruction; and · Fewer instructors.
In FY 2012, we reduced training travel costs through Distance Learning Technology, an initiative that replaced some face-to-face training with video training. In FY 2013 and FY 2014, we plan to offer Distance Learning training for employees, supervisors, and medical consultants through such technologies as Interactive Video Teletraining, Video on Demand (VOD), interactive simulations, and online lessons.
We continue to explore new technologies such as virtual conferences and video teleconferencing. Our Electronic Meeting Facility (EMF) facilitates workgroup sessions nationwide. Through both videoconferencing and FacilitatePro (a web-based collaborative meeting tool), participants are able to use the EMF virtually and face-to-face for training, workshops, presentations, brainstorming, etc. LiveMeeting, another technology, allows for training sessions or meetings for people who are not
STRATEGIES Ø Use Technology to Achieve Savings Ø Use Efficient Acquisition Strategies to Achieve Savings

Annual Performance Plan for FY 2014 and Revised Final Performance Plan for FY 2013
Social Security Administration | www.socialsecurity.gov | 1-800-772-1213 53
geographically co-located. In FYs 2013 and 2014, we will continue to enhance our LiveMeeting capabilities by upgrading from Office Communications Server 2007 to Lync 2010.
Ensuring the Integrity of Our Annual Financial Statements: The Chief Financial Officers Act of 1990 requires our OIG or an independent external auditor, as determined by OIG, to audit our financial statements in accordance with applicable standards. We strive to obtain an unqualified audit opinion, which attests to the fair presentation of our financial statements and demonstrates our commitment to sound financial management practices. FY 2012 marked the 19th consecutive year we received an unqualified opinion on our financial statements.
Conducting Onsite Security Control and Audit Reviews: We will continue to conduct ongoing Onsite Security Control and Audit Reviews (OSCAR) in our offices. OSCAR ensures our offices follow established security policies and procedures and that management controls are in place to deter and detect waste, fraud, and abuse. We require office managers to submit a corrective action plan providing details on the actions they will take to correct any deficiency cited during the review. We monitor these corrective plans to ensure we address and resolve each deficiency.
Open Government: We are using the Open Government principles of transparency, participation, and collaboration to increase public knowledge of and trust in our programs and operations. In April 2012, after a period of public and employee engagement, we published our refreshed Open Government Plan (www.socialsecurity.gov/open/story-2012-04-09-open-government-plan2.html). The plan describes major initiatives that we expect to accomplish from calendar year 2012 through 2014 and includes specific milestones. We will report on our accomplishments through our Open Government portal (www.socialsecurity.gov/open).
Annual Performance Plan for FY 2014 and Revised Final Performance Plan for FY 2013
Social Security Administration | www.socialsecurity.gov | 1-800-772-1213 54
STRATEGIC GOAL 4: Strengthen Our Workforce and
Infrastructure
We face many challenges in providing quality service to the public. Through the dedication and commitment of our employees and State partners, the DDSs, we have been able to sustain dedicated and compassionate public service. One of our challenges continues to be the loss of institutional knowledge due to the retirement of our employees. We must continue to find innovative ways to pass on institutional knowledge as our experienced employees leave.
Although we have a history of high productivity, process improvements alone cannot offset the significant increases in our workloads and loss of staff. To meet our service delivery challenge, we rely upon a large and complex information technology (IT) infrastructure, which includes very sensitive national databases, hundreds of software applications, large back-end computer platforms, and thousands of networked computers, printers, telephones, and other devices.
As the public we serve continues to become significantly more diverse, we are striving to ensure that our employees have the tools to work effectively with people of all age groups, educational levels, and cultural backgrounds. Our recruitment and retention efforts must attract a multi-generational, multi-cultural workforce with the competencies needed for our mission-critical positions. We must continue to make strategic investments in our employees for a strong and productive workforce that, when combined with investments in our IT and physical infrastructures, will equip our employees with the necessary tools to meet our challenges.
TO ACHIEVE THIS GOAL WE WILL
Ø Strengthen Our Workforce-Recruit, Train, Develop, and Retain Superior Employees
Ø Maintain Secure and Reliable Information Technology Services
Ø Increase Efficiency of Our Physical Infrastructure

Annual Performance Plan for FY 2014 and Revised Final Performance Plan for FY 2013
Social Security Administration | www.socialsecurity.gov | 1-800-772-1213 55
Strategic Objective 4.1 Strengthen Our Workforce-Recruit, Train, Develop, And Retain Superior Employees
The landscape of the Federal workplace and workforce continues to change, as do the needs of the public that we serve. We must be prepared to meet 21st century business demands by having a diverse, highly-skilled, and agile workplace. Technological advances have changed the way the public conducts business with us. Technology has not only changed our service delivery methods, but our physical workplace as well. The advent of portable electronic work is changing our traditional business models.
We continue to face the challenge of maintaining a workforce that provides exceptional customer service to the American public. In FY 2011 and FY 2012 combined, we lost over 7,600 permanent employees. We anticipate that this trend will continue. Most of our losses are due to retirements. By 2015, we project that over 30 percent of our current workforce will be eligible to retire; by FY 2020, this projection will increase to over 40 percent. Although we are beyond the peak of our retirement wave, we expect employees to continue to retire at a steady rate, even as our workloads continue to remain high.
We are committed to creating an environment that fosters learning and develops talent. We have expanded our development programs so that we can seamlessly pass the leadership of our agency to a well-prepared generation of new leaders. While continuing to provide excellent training opportunities, we will also leverage technology to develop tools and methodologies that facilitate learning and address the various learning styles of the four generations of employees currently working in the agency. We use a blended learning delivery approach that achieves effective training.
We place a high value on diversity and inclusion to foster a workplace that draws from everyone’s collective talents, respects individual differences, and leverages diversity throughout the agency. We seek to enable all employees to participate and contribute to their full potential while harnessing the innovation and creativity inherent to diversity. We will also continue to make special efforts to recruit a high-performing workforce that includes veterans and persons with disabilities, particularly our own beneficiaries in the Ticket to Work program.
We will strengthen our workforce through the following principles and activities:
Diversity and Inclusion (D&I): We have a long-standing record of being among the most diverse public sector Federal agencies. We continually strive to recruit, promote, and retain a highly-skilled, diverse workforce that draws from all segments of society. In FY 2012, we developed our D&I Strategic Plan that aligns with the government-wide D&I Strategic Plan and supports Executive Order 13583, Establishing a Coordinated Government-Wide Initiative to Promote Diversity and Inclusion in the Federal
STRATEGIES
Ø Recruit and Retain a Highly-Skilled, Multi-Generational, and Multi-Cultural Workforce, Including Veterans, Individuals with Disabilities, and Bilingual Employees
Ø Sustain a Positive Work Environment that Values Diversity and Inclusion and Encourages Employee Innovation and Input
Ø Offer High-Value Learning and Leadership Development Opportunities Ø Refresh Our Training and Technical Support Resources

Annual Performance Plan for FY 2014 and Revised Final Performance Plan for FY 2013
Social Security Administration | www.socialsecurity.gov | 1-800-772-1213 56
Workforce. Our D&I Strategic Plan highlights proven best practices for attracting, hiring, and retaining a diverse workforce. It also describes how we foster a work environment that draws on our collective talents, respects individual differences, and leverages diversity. As a means of further sustaining our D&I commitment, we instituted a D&I Council with representation from all levels of the agency, including visible senior leadership.
Employment of Veterans and Individuals with Disabilities: We have long recognized the rich talent pool that exists among veterans and people with disabilities.
To maintain our high level of veteran and disabled hiring and employment, we established two operational plans to help integrate proven practices for recruitment, development, support, and retention into our ongoing human capital strategies: the Veterans Employment Initiative Operational Plan and the Increasing the Employment of Individuals with Disabilities Operational Plan. Both plans outline our long-term leadership commitment, skill development and employment, marketing and outreach, and access to information through information gateways.
Career Development Programs: Our Strategic Human Capital Plan focuses on developing leaders at all levels through comprehensive succession management developmental programs and an extensive array of challenging opportunities. Our National Career Development Programs are the primary mechanisms we use to identify and develop employees who demonstrate potential for becoming future agency leaders.
An example of our commitment to maintain programs that enhance leadership opportunities is our Senior Executive Service Candidate Development Program (SES CDP). The SES CDP is a key element of our succession management strategy for filling future executive-level leadership vacancies by maintaining a pool of highly-qualified, diverse candidates for future vacancies. We designed the SES CDP to identify, develop, and support a mobile, highly-skilled, and diverse cadre of individuals to ensure the continuity of executive leadership in the agency.
Safety and Security: The safety of our employees and visitors to our offices has always been our top priority. Due to a recent increase in security-related incidents and the overall nature of our face-to-face business model, we regularly remind our employees of our physical security policies and procedures. This information:
· Educates our employees; · Encourages them to take an active role in making their work environment safe and secure; and · Helps them identify, assess, and react to potentially problematic situations.
We are developing training to educate employees (especially first-level managers) on how to address difficult and dangerous workplace situations.

Annual Performance Plan for FY 2014 and Revised Final Performance Plan for FY 2013
Social Security Administration | www.socialsecurity.gov | 1-800-772-1213 57
Performance Measures – Strategic Objective 4.1
4.1a: Recruit and hire veterans and disabled veterans
Veteran Hiring
Fiscal Year 2013 2014
Target 18% of total hiring 18% of total hiring
Historical Performance
Fiscal Year 2009 2010 2011 2012
Performance 15.07% 17.33% 26.72% 36.78%
Disabled Veteran Hiring
Fiscal Year 2013 2014
Target 15% of total hiring 15% of total hiring
Historical Performance
Fiscal Year 2009 2010 2011 2012
Performance 7.50% 8.72% 13.59% 15.49%
Data definition for Veteran Hiring: For a given fiscal year, the percentage of overall permanent hires who are veterans (e.g., an employee who has been discharged or released from active duty in the armed forces under honorable conditions and has a 5-point or 10-point veterans’ preference).
Data definition for Disabled Veteran Hiring: For a given fiscal year, the percentage of overall permanent hires who are disabled veterans (e.g., an employee who has been discharged or released from active duty in the armed forces under honorable conditions and has a 10-point preference due to a service-connected disability.) This category is a subset of the overall veterans hiring statistic.
Data includes full-time permanent and part-time permanent employees only.
Data source: Human Resources Operational Data Store
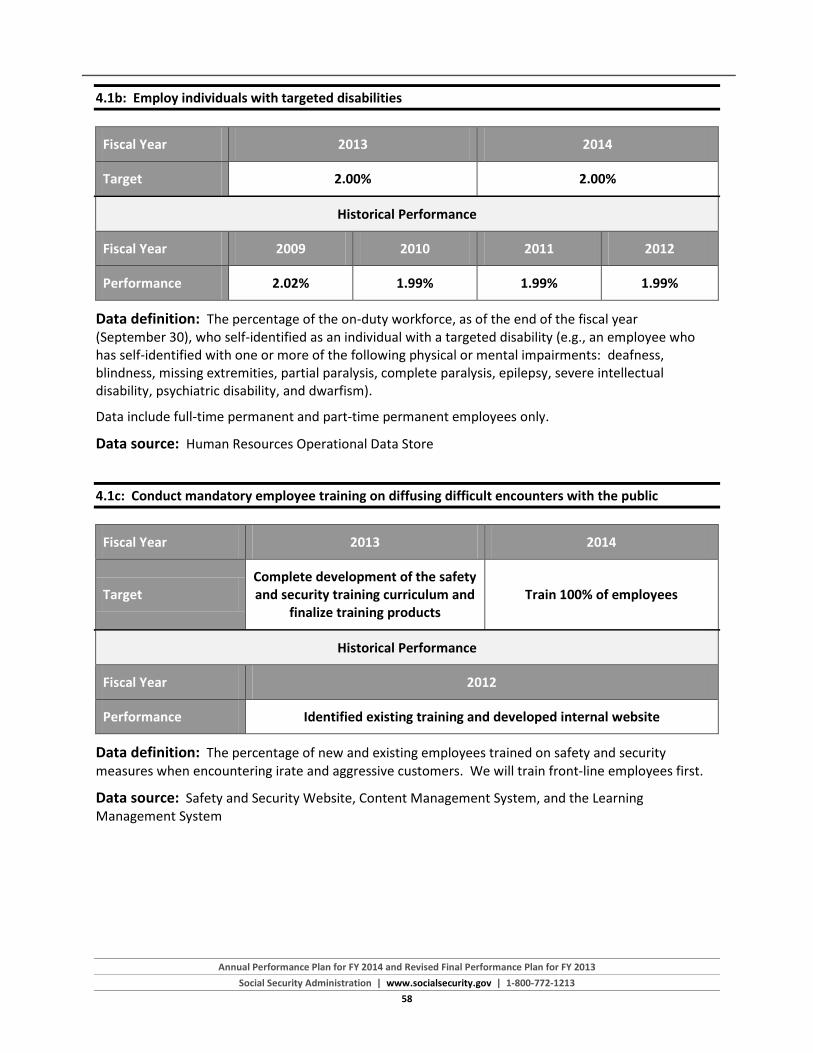
Annual Performance Plan for FY 2014 and Revised Final Performance Plan for FY 2013
Social Security Administration | www.socialsecurity.gov | 1-800-772-1213 58
4.1b: Employ individuals with targeted disabilities
Fiscal Year 2013 2014
Target 2.00% 2.00%
Historical Performance
Fiscal Year 2009 2010 2011 2012
Performance 2.02% 1.99% 1.99% 1.99%
Data definition: The percentage of the on-duty workforce, as of the end of the fiscal year (September 30), who self-identified as an individual with a targeted disability (e.g., an employee who has self-identified with one or more of the following physical or mental impairments: deafness, blindness, missing extremities, partial paralysis, complete paralysis, epilepsy, severe intellectual disability, psychiatric disability, and dwarfism).
Data include full-time permanent and part-time permanent employees only.
Data source: Human Resources Operational Data Store
4.1c: Conduct mandatory employee training on diffusing difficult encounters with the public
Fiscal Year 2013 2014
Target Complete development of the safety and security training curriculum and
finalize training products Train 100% of employees
Historical Performance
Fiscal Year 2012
Performance Identified existing training and developed internal website
Data definition: The percentage of new and existing employees trained on safety and security measures when encountering irate and aggressive customers. We will train front-line employees first.
Data source: Safety and Security Website, Content Management System, and the Learning Management System

Annual Performance Plan for FY 2014 and Revised Final Performance Plan for FY 2013
Social Security Administration | www.socialsecurity.gov | 1-800-772-1213 59
Strategic Objective 4.2 Maintain Secure and Reliable
Information Technology Services
Our IT infrastructure includes investments in computer hardware and software, telecommunications, data, and the processes by which we manage this technology. Our robust IT infrastructure enables high workforce productivity and public satisfaction in the services we offer. We design and implement cost-effective IT solutions in the face of budget constraints, growth in IT demand and services, cyber-security risks, and technology obsolescence that occurs as the technology industry changes.
Continued investments in our IT infrastructure will ensure that we will maintain secure and reliable technology services for our workforce and the public we serve. We will implement several strategies to strengthen both our day-to-day operations and ongoing technology modernization efforts.
We will maintain secure and reliable IT services by:
Enhancing Our Infrastructure: In FY 2012, we completed infrastructure changes to restore national IT operations within one day in the event of a disaster affecting either of our two data centers. We test our critical system recovery processes on an annual basis. We plan to continue to conduct disaster recovery exercises in accordance with Federal regulations.
Over the next several years, we will implement several technologies including high-speed disk replication, dynamic load balancing with high bandwidth connectivity between data centers, increased data center capacity, and automatic failover and staging systems.
Protecting Our Systems and Data: We will continue to strengthen our information security program to meet the standards and requirements of the 2002 Federal Information Security Management Act by training our employees and implementing effective cyber-security technologies. In FY 2012, we instituted agency-wide mandatory online systems security awareness training. In FY 2013 and FY 2014, we plan to expand and enrich the current cyber-security training curriculum and increase training opportunities.
We also continue to deploy new tools and techniques to enhance protection of our data, systems, and business processes. In FY 2013, we will complete deployment of a Data Loss Prevention tool to strengthen our systems protections. We will continue to mature our security processes and enhance our security posture.
STRATEGIES
Ø Complete Infrastructure Changes to Restore National IT Operations Within One Day in the Event of a Disaster Affecting Either of Our Two Data Centers
Ø Use Advanced Cyber-Security Tools and Techniques to Protect Our Data and Systems
Ø Utilize Proven New Technologies to Improve IT Cost, Performance, and Data Loss Risk
Ø Incrementally Modernize Our Older Software Applications Based on Business Opportunity and Technical Risk
Ø Maintain Systems Performance While Transitioning to Our New Data Center

Annual Performance Plan for FY 2014 and Revised Final Performance Plan for FY 2013
Social Security Administration | www.socialsecurity.gov | 1-800-772-1213 60
Improving IT Cost and Performance: We use proven new technologies to lower IT cost and improve performance. As part of our capital planning and investment control processes, we evaluate the cost of IT projects in terms of their return on investment. We appropriately adopt new technologies, which provide stable and high-performing environments. In FY 2012, we significantly upgraded the capacity and performance of our mainframe systems to cost effectively address rapidly increasing workload demands.
Concurrently, we continued virtualizing and consolidating our server-based open systems platform to reduce the number of physical servers being maintained in our data centers. Together, these initiatives increase our ability to manage cost-effectively current workloads, as well as projected increases in workload and service demands. These initiatives also contribute to reducing electrical power and cooling demands in the data centers. Finally, consolidation of the open systems infrastructure significantly improves our use of resources, reducing per-workload costs of the platform.
Modernizing Older Software Applications: We will continue to incrementally modernize our older software applications based on business opportunity and technical risks. We evaluate current software applications to ensure they meet strategic business goals and conform to our Enterprise Architecture plans. These evaluations identify applications to retire, renovate, or maintain. In FY 2012, we began modernizing our Visitor Intake Process (VIP) application, which tracks all field office appointments, monitors visitor information, tracks employee availability, and provides a wealth of statistical data. We began to rollout these enhancements in September 2012 and expect to complete rollout in FY 2013. We are also progressively increasing the number of open software applications in use. Open software uses industry standard protocols to ensure the software operates across all of our supported development environments.
We are committed to building systems that interoperate using standards-based services. Basing these systems on industry standard protocols ensures interoperability across all of our supported development environments. We will also look for opportunities to expand our set of sharable service components to support reusability and promote interoperability. In August 2012, we began piloting an Enterprise Social Media initiative to test a cloud-based shared services environment. Based on positive feedback, we plan to continue the pilot in FY 2013, provided funding is available. We also began implementation of a geospatial architecture shared service as a central resource for geospatial tools and common geospatial data.
Maintaining Systems Performance While Transitioning to Our New National Support Center (NSC): As we prepare for the move to our new NSC in 2015, our multi-year strategy to incorporate industry-standard storage technologies and architecture models to enhance the capacity, flexibility, and agility of our information storage infrastructure includes:
· Isolating our pre-production and network environments from our core computing environment; · Reducing the number of operating systems we support; · Implementing additional virtualization technologies wherever technically feasible and cost-
effective; and · Configuring tiered architectures to meet application cost and performance requirements.
Continued technological advancements and improvements required for the NSC’s completion will put us in a more favorable position to maintain world-class operations for the American public.

Annual Performance Plan for FY 2014 and Revised Final Performance Plan for FY 2013
Social Security Administration | www.socialsecurity.gov | 1-800-772-1213 61
Performance Measure – Strategic Objective 4.2
4.2a: Percentage of enterprise-wide systems availability
Fiscal Year 2013 2014
Target 99.50% 99.50%
Historical Performance
Fiscal Year 2010 2011 2012
Performance 99.84% 99.89% 99.95%
Data definition: We define enterprise availability as a weighted total availability of service channel mission-critical applications for all our customers. We consider an application available when the end user can perform all business functions within the application with reasonable response times. The weighting takes into account the relative impact that an outage could have on our customers, considering both the functionality and the service hours that are potentially affected. Six different service channels (online, DDS eDib, Internet, telephone, data exchange, and weekend online services) and accompanying applications are included.
Mission critical services in our Enterprise Availability include:
· Self-service Internet benefits applications; · Automated telephone menu data applications; · Email and case processing systems used by our direct support staff, or by our partnering State
DDS staff; and · Data exchange systems used by our governmental or business partners.
Data source: HP OpenView ServiceCenter (Data is limited to Critical Application Severity 1 outages.)
Note: Severity 1 outages are the highest priority for problem classification

Annual Performance Plan for FY 2014 and Revised Final Performance Plan for FY 2013
Social Security Administration | www.socialsecurity.gov | 1-800-772-1213 62
Strategic Objective 4.3 Increase Efficiency of Our Physical
Infrastructure
We strive to provide a professional, safe, and secure environment for our workforce and the public. We also have a responsibility to conduct business in an efficient, economical, and environmentally-responsible manner. We are analyzing opportunities to generate savings by minimizing waste and reducing energy consumption. To meet these responsibilities, we recycle and purchase energy-efficient lighting, electronics, and appliances. We also include sustainable acquisition language in agency contracts. We began these practices before the release of Executive Order 13423, Strengthening Federal Environment, Energy, and Transportation Management, which directed Federal agencies to improve their environmental, energy, and transportation processes. We continue to seek opportunities to generate savings by minimizing waste and reducing energy consumption.
In support of Executive Order 13423 and Executive Order 13514, Federal Leadership in Environmental, Energy, and Economic Performance, we replaced 100 percent of our gasoline vehicles eligible for replacement with alternative fuel or low greenhouse gas emissions vehicles. As a result, for FY 2011, the Department of Energy ranked us second among Federal agencies for alternative fuel consumption and fifth in reducing petroleum consumption.
We continue to find new and innovative ways to expand our “green” programs and use “green” solutions to improve our environment. Executive Orders 13423 and 13514 set forth ambitious energy and water conservation goals. We will track our progress using SSA’s Environmental Management System developed in August 2012.
We will increase the efficiency of our physical infrastructure by:
Greening Our Fleet: We developed a Greenhouse Gas Reduction Goal and Sustainability Performance Plan to meet the requirements of Executive Order 13514. To further our sustainable practices, we will increase our purchase of renewable energy. One hundred percent of our new vehicle purchases are alternative fuel vehicles. Nationwide, we converted over 70 percent of our light-duty vehicles to alternative fuel vehicles, and at our headquarters, we converted 94 percent of these vehicles.
We will continue to meet the Executive Order requirements to increase consumption of alternative fuels by 10 percent and reduce petroleum consumption by 2 percent annually. We continue to allow other Federal agencies to access alternative fuel pumps that we have installed. In FY 2013 and FY 2014, we plan to purchase additional “green” electric-powered utility trucks used for transporting materials between buildings at our headquarters complex.
STRATEGIES
Ø Implement Green Solutions that Improve Our Environment and Make Our Operations More Efficient
Ø Improve Real Property Management and Optimize Maintenance Costs Ø Increase Oversight of Space Acquisition Activities to Ensure Cost-Conscious
Decision Making, Taking Telework Opportunities into Consideration Ø Continue to Redesign and Equip Our Offices to Enhance Security and Privacy
and Foster Employee Satisfaction and Productivity

Annual Performance Plan for FY 2014 and Revised Final Performance Plan for FY 2013
Social Security Administration | www.socialsecurity.gov | 1-800-772-1213 63
Recycling and Redesign Waste: In FY 2012, we implemented single-stream recycling at our headquarters complex. We continue to conduct research and consider additional options for expanding our recycling program, such as deploying new recycling stations in high-visibility areas having more foot traffic.
Purchasing and Managing Environmentally-Sound Electronics: We purchase desktop computers, laptops, and monitors that the Electronic Product Environmental Assessment Tool rates as silver or better. We implemented power management on desktop and laptop computers, allowing computers to revert to the “sleep” mode during periods of inactivity, thereby reducing power usage and greenhouse gas emissions. In FY 2013 and FY 2014, we will continue our efforts to purchase and manage environmentally-friendly electronics.
Converting to Sustainable, “Green” Energy Sources: We will comply with General Services Administration guidelines by continuing to explore sustainable energy sources (e.g., solar, wind), and, where economically feasible, we will meet energy efficiency standards. For example, we are currently reviewing contracts for installation of electrical meters at our headquarters complex, which will allow us to determine the most effective use of power.
Performance Measure – Strategic Objective 4.3
4.3a: Reduce energy intensity by 30 percent by 2015
Fiscal Year 2013 2014
Target 7% reduction from FY 2003 10% reduction from FY 2003
Historical Performance
Fiscal Year 2010 2011 2012
Performance 5.6% 1.8% 13.3%
Data definition: Energy intensity is energy consumption per square foot of building space. Executive Order 13514 requires agencies to improve energy efficiency and reduce greenhouse gas emissions through reduction of energy intensity by 30 percent by the end of FY 2015 as it relates to the baseline of the agency’s energy use in FY 2003. We measure the decrease in energy consumption for each fiscal year against the FY 2003 usage baseline.
Data source: Department of Energy Federal Energy Management Program Greenhouse Gas Reduction Inventory
Note: The targets shown in the Annual Performance Plan (APP) may differ from the targets shown in the Strategic Sustainability Performance Plan (SSPP) due to the availability of updated information in the SSPP that revises projections found in the APP.
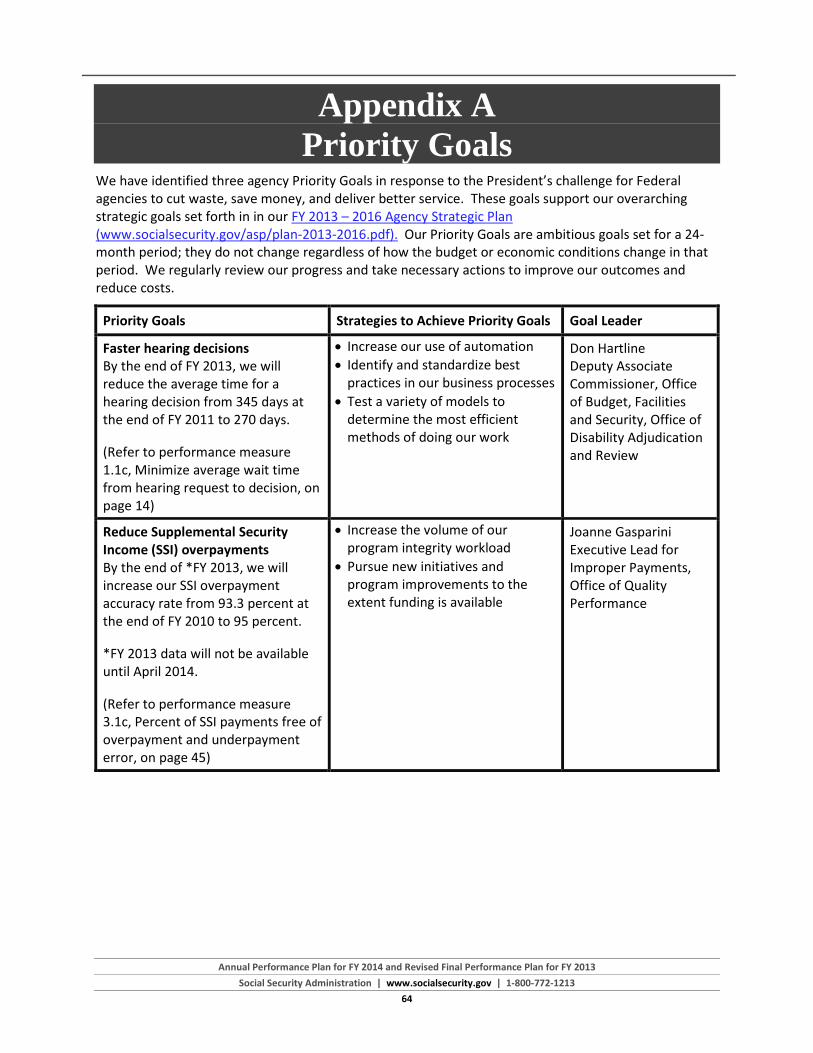
Annual Performance Plan for FY 2014 and Revised Final Performance Plan for FY 2013
Social Security Administration | www.socialsecurity.gov | 1-800-772-1213 64
Appendix A Priority Goals
We have identified three agency Priority Goals in response to the President’s challenge for Federal agencies to cut waste, save money, and deliver better service. These goals support our overarching strategic goals set forth in in our FY 2013 – 2016 Agency Strategic Plan (www.socialsecurity.gov/asp/plan-2013-2016.pdf). Our Priority Goals are ambitious goals set for a 24-month period; they do not change regardless of how the budget or economic conditions change in that period. We regularly review our progress and take necessary actions to improve our outcomes and reduce costs.
Priority Goals Strategies to Achieve Priority Goals Goal Leader
Faster hearing decisions By the end of FY 2013, we will reduce the average time for a hearing decision from 345 days at the end of FY 2011 to 270 days.
(Refer to performance measure 1.1c, Minimize average wait time from hearing request to decision, on page 14)
· Increase our use of automation · Identify and standardize best
practices in our business processes · Test a variety of models to
determine the most efficient methods of doing our work
Don Hartline Deputy Associate Commissioner, Office of Budget, Facilities and Security, Office of Disability Adjudication and Review
Reduce Supplemental Security Income (SSI) overpayments By the end of *FY 2013, we will increase our SSI overpayment accuracy rate from 93.3 percent at the end of FY 2010 to 95 percent.
*FY 2013 data will not be available until April 2014.
(Refer to performance measure 3.1c, Percent of SSI payments free of overpayment and underpayment error, on page 45)
· Increase the volume of our program integrity workload
· Pursue new initiatives and program improvements to the extent funding is available
Joanne Gasparini Executive Lead for Improper Payments, Office of Quality Performance

Annual Performance Plan for FY 2014 and Revised Final Performance Plan for FY 2013
Social Security Administration | www.socialsecurity.gov | 1-800-772-1213 65
Priority Goals Strategies to Achieve Priority Goals Goal Leader
Increase use of our online services By the end of FY 2013, we will increase our online filing rates from 36 percent at the end of FY 2011 to 48 percent.
(Refer to performance measure 2.1a, Increase the percentage of claims filed online, on page 30)
· Educate the public on the availability and ease of use of our online services. We will do this through: · Marketing · Public Outreach · Advocacy Discussions
· Incorporate public feedback to improve our online service delivery
· Increase the information available to the public online
· Implement new online services · Enhance existing online services to
make them easier and more user-friendly
Roy Snyder Associate Commissioner, Office of Electronic Services, Office of Operations
Further, in response to the President's challenge to create a more effective, efficient, innovative, and responsive Government, the Office of Management and Budget established Federal Priority Goals. These goals supplement Government-wide management improvement goals and agency Priority Goals. For information on Federal Priority Goals and our contributions to those goals, visit the Office of Management and Budget's performance portal (www.Performance.gov). The President’s Budget (www.whitehouse.gov/omb/budget) identifies the lower-priority program activities, as required under the Government Performance and Results Act Modernization Act of 2010, 31 U.S.C. 1115(b)(10).
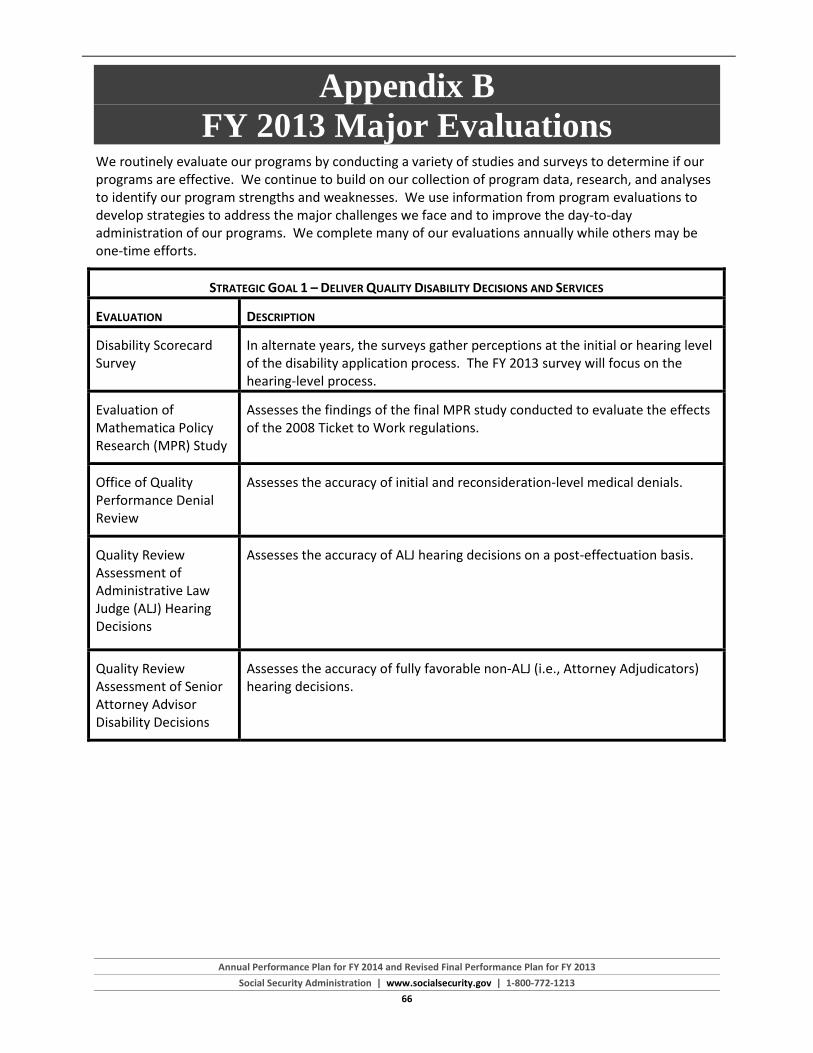
Annual Performance Plan for FY 2014 and Revised Final Performance Plan for FY 2013
Social Security Administration | www.socialsecurity.gov | 1-800-772-1213 66
Appendix B FY 2013 Major Evaluations
We routinely evaluate our programs by conducting a variety of studies and surveys to determine if our programs are effective. We continue to build on our collection of program data, research, and analyses to identify our program strengths and weaknesses. We use information from program evaluations to develop strategies to address the major challenges we face and to improve the day-to-day administration of our programs. We complete many of our evaluations annually while others may be one-time efforts.
STRATEGIC GOAL 1 – DELIVER QUALITY DISABILITY DECISIONS AND SERVICES
EVALUATION DESCRIPTION
Disability Scorecard Survey
In alternate years, the surveys gather perceptions at the initial or hearing level of the disability application process. The FY 2013 survey will focus on the hearing-level process.
Evaluation of Mathematica Policy Research (MPR) Study
Assesses the findings of the final MPR study conducted to evaluate the effects of the 2008 Ticket to Work regulations.
Office of Quality Performance Denial Review
Assesses the accuracy of initial and reconsideration-level medical denials.
Quality Review Assessment of Administrative Law Judge (ALJ) Hearing Decisions
Assesses the accuracy of ALJ hearing decisions on a post-effectuation basis.
Quality Review Assessment of Senior Attorney Advisor Disability Decisions
Assesses the accuracy of fully favorable non-ALJ (i.e., Attorney Adjudicators) hearing decisions.

Annual Performance Plan for FY 2014 and Revised Final Performance Plan for FY 2013
Social Security Administration | www.socialsecurity.gov | 1-800-772-1213 67
STRATEGIC GOAL 2 – PROVIDE QUALITY SERVICES TO THE PUBLIC
EVALUATION DESCRIPTION
Field Office Telephone Service Evaluation
Evaluates our accuracy in handling the publics’ calls to field offices.
National 800 Number Telephone Service Evaluation
Evaluates our accuracy in handling the publics’ calls to the National 800 Number.
Online Authentication Survey
Surveys people who visited a field office to authenticate for my Social Security services.
Overall Service Satisfaction Surveys
· Telephone Service Satisfaction Surveys evaluate callers’ satisfaction with our National 800 Number and field office telephone services;
· Office Visitor Surveys evaluate visitors’ satisfaction with our field offices (including Social Security Card Centers) and hearing offices; and
· Internet Transaction Surveys evaluate users’ satisfaction with online transactional services.
Prospective Client Survey
Surveys people between ages 50 and 64 to identify service expectations and preferences of the upcoming wave of retirees.
STRATEGIC GOAL 3 – PRESERVE THE PUBLIC’S TRUST IN OUR PROGRAMS
EVALUATION DESCRIPTION
Annual Report of the Board of Trustees of the Federal Old-Age and Survivors Insurance and Federal Disability Insurance Trust Funds
Reports annually to Congress on the financial and actuarial status of the two Social Security trust funds – the Old-Age and Survivors Insurance Trust Fund and the Disability Insurance Trust Fund.
Annual Report of the Supplemental Security Income (SSI) Program
Reports annually to the President and Congress on the status of the SSI program and provides 25-year projections of program participation and costs.

Annual Performance Plan for FY 2014 and Revised Final Performance Plan for FY 2013
Social Security Administration | www.socialsecurity.gov | 1-800-772-1213 68
STRATEGIC GOAL 3 – PRESERVE THE PUBLIC’S TRUST IN OUR PROGRAMS (CONTINUED)
EVALUATION DESCRIPTION
Annual Report to Congress on Continuing Disability Reviews (CDR)
A legislatively-mandated report that provides summary information on CDRs conducted for a completed fiscal year, including actuarial estimates of the lifetime savings in Old Age Survivors and Disability Insurance, SSI, Medicare, and Medicaid benefits resulting from the reviews conducted during that fiscal year.
Enumeration Quality Review
Assesses the accuracy of original Social Security numbers assigned during the fiscal year.
Pre-effectuation Review of Disability Determinations
Assesses the accuracy of disability initial and reconsideration allowances made by State DDSs as required in the Social Security Act.
Retirement, Survivors, and Disability Insurance Stewardship Review
Measures the accuracy of payments to persons receiving Social Security retirement, survivors, or disability benefits.
Safeguard Activity Report
Advises the Internal Revenue Service (IRS) of minor changes to procedures or safeguards described in the Safeguard Procedure Report.
Safeguard Review Evaluates the use of Federal tax information and the measures we employ to protect this information. This review is an onsite evaluation completed in collaboration with the IRS.
Safeguard Procedures Report
Details the security measures we are taking to ensure the confidentiality of the Federal tax information provided to us by the IRS.
SSI Stewardship Review
Measures the accuracy of payments to persons receiving SSI benefits.

Annual Performance Plan for FY 2014 and Revised Final Performance Plan for FY 2013
Social Security Administration | www.socialsecurity.gov | 1-800-772-1213 69
STRATEGIC GOAL 4 – STRENGTHEN OUR WORKFORCE AND INFRASTRUCTURE
EVALUATION DESCRIPTION
Federal Employee Viewpoint Survey
(Formerly the Annual Employee Survey/Federal Human Capital Survey)
Assesses employee perspectives of organizational performance across several major human capital areas: recruitment, development, performance culture, leadership, job satisfaction, and personal work experiences.
Federal Information Security Management Act Report
Reports to Congress whether our overall IT security programs and practices comply with the Federal Information Security Management Act of 2002.
Human Capital Accountability System
Monitors and evaluates the results of our human capital strategies, policies, and programs, as well as our adherence to merit system principles, including cyclical Human Resources Management and Delegated Examining Unit Assessments of components across the agency and an annual Human Capital Management Report.
Management Directive 715
Provides policy guidance and standards for establishing and maintaining effective affirmative action programs.
New Hire Survey Monitors employee perspectives on recruitment, hiring, on-boarding, and training activities.
Office of Civil Rights and Equal Opportunity Quality Assurance Program
Assesses the effectiveness of our Equal Employment Opportunity programs and our compliance with regulatory requirements, policy, and directives.

Annual Performance Plan for FY 2014 and Revised Final Performance Plan for FY 2013
Social Security Administration | www.socialsecurity.gov | 1-800-772-1213 70
Appendix C How We Manage Performance
The Government Performance and Results Act of 1993, as amended by the Government Performance and Results Act Modernization Act of 2010 (GPRAMA), provides a foundation for performance planning, reporting, and budgeting. GPRAMA requires each Federal agency to prepare an Annual Performance Plan (APP) outlining how it will use the budget to achieve its mission. In our APP, we established high-level, agency-wide performance measures and targets linked directly to the strategic goals in our Agency Strategic Plan (ASP):
· Goal 1 – Deliver Quality Disability Decisions and Services; · Goal 2 – Provide Quality Services to the Public; · Goal 3 – Preserve the Public’s Trust in Our Programs; and · Goal 4 – Strengthen Our Workforce and Infrastructure.
Our FY 2014 APP outlines our performance measures and targets. These measures provide a balanced view of overall agency performance, which we achieve through close coordination among our executive leadership and with local, State, and other Federal agencies and stakeholders. Previously, we have reported our actual performance each year in our Performance and Accountability Report (PAR). We will report our FY 2013 actual performance in the Annual Performance Report (APR) that we will publish in February 2014.
This APP, modeled after our ASP, conforms to the following hierarchy:
· Strategic Goal – Our four strategic goals reflect the Commissioner’s key priorities and provide a roadmap to achieving our mission.
· Strategies – Our strategies represent what we plan to achieve over the span of our ASP. · Strategic Objective – Our 14 strategic objectives articulate what we want to achieve. · Performance Measure – Our 35 performance measures gauge our progress towards achieving
our strategic objectives and goals. · Performance Target – Our targets indicate the level of performance we expect to achieve each
year.
To effectively and efficiently carry out our mission, we use a mixture of output and outcome-oriented performance measures to assist our executive leadership in their decision making. We consistently review progress, overall trend data, and the likelihood of meeting planned performance levels. Quarterly data-driven management reviews ensure that executives regularly assess agency performance on top priorities and make changes if necessary.
Our executive leadership receives an Agency Tracking Report monthly. The report uses a “stop light” approach to display the status of monthly progress towards achieving performance targets established at the beginning of the fiscal year. The report helps executives quickly diagnose potential problem areas and take corrective action. The executive responsible for an underperforming measure provides a brief explanation of why performance is below expectation and possible solutions for the underperformance. We will ensure the accuracy, credibility, and reliability of the data used to measure progress towards our performance goals.

Annual Performance Plan for FY 2014 and Revised Final Performance Plan for FY 2013
Social Security Administration | www.socialsecurity.gov | 1-800-772-1213 71
Social Security Administration Data Integrity Systems and Controls: We generate performance data for the APP’s quantifiable measures, including the budgeted output measures, through automated management information and workload measurement systems as a by-product of programmatic and administrative operations. The performance data for several accuracy and public satisfaction indicators comes from surveys and workload samples designed to achieve very high levels of statistical validity (usually 95 percent confidence level).
Our Office of Quality Performance (OQP) performs stewardship reviews, which are the primary measure of quality of the Old Age Survivors and Disability Insurance (OASDI) and Supplemental Security Income (SSI) programs. Review findings provide the basis for reports to Congress and other monitoring authorities. The reviews provide an overall accuracy measurement of payments to all beneficiaries currently on the rolls. We base the reviews on a monthly sample selection from the payment rolls consisting of beneficiaries or recipients receiving a payment in the sample month. For each sampled case, we interview the beneficiary, recipient, or representative payee, make collateral contacts as needed, and redevelop all non-medical factors of eligibility as of the sample month.
OQP’s transaction accuracy reviews (TAR) focus on field office (FO) and processing center quality and measure operational compliance with procedural requirements, as defined by the Program Operations Manual System (POMS). When we did not follow POMS instructions and the case needs further development, OQP completes the required development to bring the issue in question into compliance with POMS and determines whether the payment is affected. If an error is apparent and does not require further development, the OQP reviewer cites an error and determines whether the payment is affected.
We provide feedback about quality to the adjudicating FO in all cases. In fiscal year (FY) 2011, the TAR sample included approximately 3,850 OASDI cases and 8,300 SSI cases. These reviews produced national data on the adjudicative quality of OASDI claims and SSI claims, redeterminations, and limited issue reviews processed that year. Limited issue reviews develop only a specific issue or event, unlike a full redetermination that addresses all payment and eligibility factors. Please note that in FY 2011, we reduced the OASDI TAR sample to 3,850 cases from approximately 8,800 cases in FY 2010 and added a validation review of policy that streamlined issues such as proof of age, citizenship, and month of election. The results of this review will provide us with data to validate whether or not the new streamlined procedures achieve the desired outcome.
We issue an annual TAR report covering the entire fiscal year. We also generate analytical reports focusing on specific subject areas. Based on TAR findings, we perform targeted reviews focusing on specific problems that we identify and for which we test solutions at the national or regional level. Targeted samples may not be limited to a POMS compliance standard, depending on the nature of the issue.
Program Performance Report: Beginning in FY 2013, we will issue an APR to provide information on our progress in achieving the goals and objectives described in our ASP and APP, including progress on our Priority Goals. We will also issue an Annual Financial Report (AFR), which will contain highlights of our key performance goals and results. The AFR will also contain the results of our financial statement and internal controls audit by an independent accounting firm.
Role of SSA’s Office of the Inspector General (OIG): OIG improves our programs and operations and protects them against fraud, waste, and abuse by conducting independent and objective audits, evaluations, and investigations. OIG provides timely, useful, and reliable information and recommendations to Administration officials, Congress, and the public. OIG also oversees the financial statement audit performed by an independent accounting firm.

Annual Performance Plan for FY 2014 and Revised Final Performance Plan for FY 2013
Social Security Administration | www.socialsecurity.gov | 1-800-772-1213 72
In terms of data integrity, OIG completes audits of selected performance measures and the performance data that supports them. In FY 2012, OIG contracted with KPMG LLP, an independent auditing firm, to review the following three performance indicators (PI): SSI payments free of overpayment and underpayment error; OASDI payments free of overpayment and underpayment error; and individuals who do business with us rating our overall services. The objectives of the reviews were to:
· Comprehend and document the sources of data collected to report on the specified PIs. · Identify and test critical controls (both electronic data processing and manual) of systems from
which the specified performance data were gathered. · Test the adequacy, accuracy, reasonableness, completeness, and consistency of the underlying
data for each of the specified PIs. · Recalculate each measure to ascertain its accuracy.
For the three measures reviewed, KPMG did not identify any significant findings related to the internal controls, adequacy, accuracy, reasonableness, completeness, and consistency of the underlying data.

Annual Performance Plan for FY 2014 and Revised Final Performance Plan for FY 2013
Social Security Administration | www.socialsecurity.gov | 1-800-772-1213 73
Appendix D Agency Challenges
Our programs provide a safety net for the public and contribute to increased financial security for the elderly and disabled. Each month, we pay more than $65 billion in benefits to over 61 million beneficiaries. These benefits not only provide a lifeline to our beneficiaries and their families, but are also vital to the Nation's economy.
In the chart below, we show the major challenges we face as we look toward the future. We align the Commissioner’s priorities with the OIG identified top issues facing our management (http://oig.ssa.gov/audits-and-investigations/top-ssa-management-issues). In addition, we identify the performance measures that help us gauge progress toward resolving these challenges, as well as show our official responsible for resolving them. For a detailed description of how we address these challenges, see pages 11–63.
OIG Major Management Challenges
Strategic Goals and Performance Measures to Address Challenges with Responsible Official
Reduce the Hearings Backlog and Prevent Its Recurrence
Improve the Timeliness and Quality of the Disability Process
Strengthen Strategic and Tactical Planning
Strategic Goal 1 – Deliver Quality Disability Decisions and Services
Deputy Commissioner for Disability Adjudication and Review (DCDAR) · 1.1a Complete the budgeted number of hearing requests · 1.1b Achieve the budgeted goal for SSA hearing case production per workyear · 1.1c Minimize average wait time from hearing request to decision · 1.1d Eliminate the oldest pending hearing requests · 1.1e Reduce the percentage of Appeals Council cases pending 365 days or over
Deputy Commissioner for Operations (DCO) · 1.2a Minimize average wait time for initial disability claims · 1.2b Complete the budgeted number of initial disability claims · 1.2c Disability Determination Services cases production per workyear · 1.2d Complete the budgeted number of disability claims at the reconsideration level · 1.2e Achieve the target number of initial disability claims pending · 1.2f Achieve the target number of disability claims pending at the reconsideration level · 1.2g Minimize average wait time for reconsideration disability claims · 1.2k Disability Determination Services decisional accuracy rate for initial disability
decisions
Deputy Commissioner for Retirement and Disability Policy (DCRDP) · 1.2h Update the medical Listing of Impairments · 1.2j Number of Disability Insurance and Supplemental Security Income disability
beneficiaries, with Tickets assigned and in use, who work · 1.3a Achieve the target percentage of initial disability cases identified as Quick Disability
Determinations or Compassionate Allowances
Deputy Commissioner for Systems (DCS) · 1.2i Increase the percentage of disability cases evaluated using health Information
Technology

Annual Performance Plan for FY 2014 and Revised Final Performance Plan for FY 2013
Social Security Administration | www.socialsecurity.gov | 1-800-772-1213 74
OIG Major Management Challenges
Strategic Goals and Performance Measures to Address Challenges with Responsible Official
Improve Customer Service
Strategic Goal 2 – Provide Quality Services to the Public
DCO · 2.1a Increase the percentage of claims filed online · 2.1b Complete the budgeted number of retirement, survivors, and Medicare claims · 2.2a Achieve the target speed in answering National 800 Number calls · 2.2b Achieve the target busy rate for National 800 Number calls
Deputy Commissioner for Quality Performance (DCQP) · 2.2c Maintain the percent of people rating our services as “excellent,” “very good,” or
“good”
DCDAR · 2.3a Complete the planned number of video hearings
Reduce Improper Payments and Increase Overpayment Recoveries
Strengthen the Integrity and Protection of the Social Security number
Improve Transparency and Accountability
Strategic Goal 3 – Preserve the Public’s Trust in Our Programs
DCO · 3.1a Complete the budgeted number of Supplemental Security Income non-disability
redeterminations · 3.3a Reduce the percentage of paper Forms W-2 completed · 3.3b Achieve the target percentage for correctly assigning original Social Security
numbers
DCO and DCQP · 3.1b Complete the budgeted number of full medical continuing disability reviews
DCQP · 3.1c Percent of Supplemental Security Income payments free of overpayment and
underpayment error · 3.1d Percent of Old-Age, Survivors, and Disability Insurance payments free of
overpayment and underpayment error
Deputy Commissioner for Budget, Finance and Management (DCBFM) · 3.2a Expand and enhance our debt collection tools

Annual Performance Plan for FY 2014 and Revised Final Performance Plan for FY 2013
Social Security Administration | www.socialsecurity.gov | 1-800-772-1213 75
OIG Major Management Challenges
Strategic Goals and Performance Measures to Address Challenges with Responsible Official
Invest in Information Technology Infrastructure to Support Current and Future Workloads
Strategic Goal 4 – Strengthen our workforce and infrastructure
Deputy Commissioner for Human Resources (DCHR) · 4.1a Recruit and hire veterans and disabled veterans · 4.1b Employ individuals with targeted disabilities
DCS · 4.2a Percentage of enterprise-wide systems availability
DCBFM · 4.1c Conduct mandatory employee training on diffusing difficult encounters with the
public · 4.3a Reduce energy intensity by 30 percent by 2015

Annual Performance Plan for FY 2014 and Revised Final Performance Plan for FY 2013
Social Security Administration | www.socialsecurity.gov | 1-800-772-1213 76
Appendix E Changes to Performance Measures, Data Definitions, and Data Sources
PERFORMANCE MEASURE ESTABLISHED IN FY 2013
Number Performance Measure Title
1.2g Minimize average wait time for reconsideration disability claims
PERFORMANCE MEASURE ELIMINATED IN FY 2013
Receive an unqualified audit opinion on SSA’s financial statements
We discuss our commitment to ensuring the financial integrity of our annual financial
statements on page 53
CARRYOVER PERFORMANCE MEASURES WITH TITLE CHANGES
Number FY 2013 New Title FY 2012 Old Title
1.1b Achieve the budgeted goal for SSA hearing case production per workyear
Achieve the budgeted goal for SSA hearings case production per workyear
1.2a Minimize average wait time for initial disability claims
Minimize average processing time for initial disability claims
1.2j Number of Disability Insurance and Supplemental Security Income disability beneficiaries, with Tickets assigned and in use, who work
Number of Disability Insurance and Supplemental Security Income disability beneficiaries, with Tickets assigned who work
1.2k Disability Determination Services decisional accuracy rate for initial disability decisions
Improve Disability Determination Services decisional accuracy rate for initial disability decisions
3.1d Percent of Old-Age, Survivors, and Disability Insurance payments free of overpayment and underpayment error
Maintain percent of Old-Age, Survivors, and Disability Insurance payments free of overpayment and underpayment error

Annual Performance Plan for FY 2014 and Revised Final Performance Plan for FY 2013
Social Security Administration | www.socialsecurity.gov | 1-800-772-1213 77
CARRYOVER PERFORMANCE MEASURES WITH DATA SOURCE CHANGES
Number FY 2013 New Data Source FY 2012 Old Data Source
1.2a
DENVision National Processing Time Tracker sourced by Social Security Unified Measurement System Old-Age, Survivors, and Disability Insurance (OASDI) and SSI Processing Time
Chicago Claims Goals Report sourced by Social Security Unified Measurement System Title II and Title XVI Processing Time
1.3a Management Information Disability Executive and Management Information
System and Management Information Disability
2.2a Data generated by Cisco Intelligent Contact Management system
Report generated by Cisco router software
2.2b Data generated by Cisco Intelligent Contact Management system
Report generated by Cisco router software
4.1c Safety and Security Website, Content Management System, and the Learning Management System
Safety and Security Website and the Learning Management System
4.2a HP OpenView ServiceCenter (Data is limited to Critical Application Severity 1 outages.)
Change, Asset, and Problem Reporting System (Data is limited to Critical Application Severity 1 outages.)
CARRYOVER PERFORMANCE MEASURES WITH DATA DEFINITION CHANGES
Number FY 2013 New Data Definition FY 2012 Old Data Definition
1.1b
The average number of hearings completed per direct workyear used. A direct workyear represents actual time spent processing cases. It does not include time spent on training, ALJ travel, leave, holidays, etc.
This indicator represents the average number of hearings completed per direct workyear used. A direct workyear represents actual time spent processing cases. It does not include time spent on training, ALJ travel, leave, holidays, etc.
1.1c
The average wait time for hearing request dispositions is the cumulative wait time for all hearing requests completed during the last month of the fiscal year divided by the total number of hearing requests completed during the last month of the fiscal year.
The average processing time for hearing request dispositions is the cumulative processing time for all hearing requests completed during the last month of the fiscal year divided by the total number of hearing requests completed during the last month of the fiscal year.

Annual Performance Plan for FY 2014 and Revised Final Performance Plan for FY 2013
Social Security Administration | www.socialsecurity.gov | 1-800-772-1213 78
CARRYOVER PERFORMANCE MEASURES WITH DATA DEFINITION CHANGES
Number FY 2013 New Data Definition FY 2012 Old Data Definition
1.1e
The percentage of Appeals Council cases that are pending 365 days or over at the end of the fiscal year. The percentage is derived by dividing the total number of Appeals Council cases pending 365 days or over at the end of the fiscal year by the total number of Appeals Council cases pending at the end of the fiscal year.
The percentage of oldest Appeals Council cases pending. The oldest Appeals Council cases are those cases that are pending, or will be pending, 365 days or over at the end of the fiscal year. The percentage is derived by dividing the total number of Appeals Council cases pending 365 days or over at the end of the fiscal year by the total number of Appeals Council cases pending at the end of the fiscal year.
1.2a
The average wait time is the overall cumulative number of elapsed days (including processing times for transit, technical determinations, medical determinations, and quality review) from the date of filing through the date payment is made or the denial notice is issued for all initial claims that require a medical determination. We divide the total number of days to complete all initial disability claims requiring a medical determination by the total number of initial disability claims requiring a medical determination that we complete during the fiscal year.
The average processing time is the overall cumulative number of elapsed days (including processing times for transit, technical determinations, medical determinations, and quality review) from the date of filing through the date payment is made or the denial notice is issued for all initial claims that require a medical determination. The total number of days to process all initial disability claims requiring a medical determination is divided by the total number of initial disability claims requiring a medical determination that we process during the fiscal year.
1.2c
The average number of all State DDS cases produced per workyear expended. A workyear represents both direct and indirect time, including overhead (time spent on training, travel, leave, holidays, etc.). It includes the time of staff on the DDS payroll, including doctors under contract to the DDS. The DDS case production per workyear is a national target.
The average number of all State DDS cases produced per workyear expended. A workyear represents both direct and indirect time, including overhead (time spent on training, travel, leave, holidays, etc.). It is inclusive of all staff on the DDS payroll, including doctors under contract to the DDS. The DDS case production per workyear is a national target.
1.2e
The number of Social Security and SSI initial disability claims pending in the State DDS and other agency components at the end of the fiscal year.
The number of Social Security and SSI initial disability claims pending in the State DDS and other agency components in the current fiscal year.

Annual Performance Plan for FY 2014 and Revised Final Performance Plan for FY 2013
Social Security Administration | www.socialsecurity.gov | 1-800-772-1213 79
CARRYOVER PERFORMANCE MEASURES WITH DATA DEFINITION CHANGES
Number FY 2013 New Data Definition FY 2012 Old Data Definition
1.2f
The number of Social Security and SSI disability claims pending at the reconsideration level in the State DDS and other agency components at the end of the fiscal year.
The number of Social Security and SSI disability claims pending at the reconsideration level in the State DDS and other agency components in the current fiscal year.
3.1a
The number of non-disability SSI redeterminations completed in the fiscal year up to the target. This number includes scheduled (i.e., identified for review through profiling) and unscheduled reviews (i.e., reviewed because of changes that may affect payment), as well as targeted redeterminations (i.e., limited issue reviews).
The number of non-disability SSI redeterminations completed in the fiscal year up to the target. This number includes scheduled and unscheduled reviews, as well as targeted redeterminations.
3.2a
Maximize our use of proven debt collection tools and techniques by continuing to notify debtors with delinquent debts over 10 years old of our ability to collect their debt through TOP. This indicator represents the number of notices sent to eligible beneficiaries as a result of this enhancement to our External Collection Operation system. Develop and implement internal processes to allow us to begin pursuing, through TOP, programmatic debts that have been delinquent for longer than 10 years.
Develop and implement internal processes to allow us to begin pursuing, through the Department of Treasury Offset Program, programmatic debts that have been delinquent for longer than 10 years.
3.3a
The percentage of paper Forms W-2 processed to completion. We derive the percentage by dividing the number of paper Forms W-2 processed to completion by the total number of Forms W-2 processed to completion. We report data cumulatively for the current calendar year, as we process Forms W-2 for the prior tax year.
The percentage of paper Forms W-2 processed to completion. We derive the percentage by dividing the number of paper Forms W-2 processed to completion by the total number of Forms W-2 processed to completion. Data are reported cumulatively for the current calendar year, as we process Forms W-2 for the prior tax year.

Annual Performance Plan for FY 2014 and Revised Final Performance Plan for FY 2013
Social Security Administration | www.socialsecurity.gov | 1-800-772-1213 80
CARRYOVER PERFORMANCE MEASURES WITH DATA DEFINITION CHANGES
Number FY 2013 New Data Definition FY 2012 Old Data Definition
4.1b
The percentage of the on-duty workforce, as of the end of the fiscal year (September 30), who self-identified as an individual with a targeted disability (e.g., an employee who has self-identified with one or more of the following physical or mental impairments: deafness, blindness, missing extremities, partial paralysis, complete paralysis, epilepsy, severe intellectual disability, psychiatric disability, and dwarfism).
The percentage of the on-duty workforce, as of the end of the fiscal year (September 30), who self-identified as an individual with a targeted disability (e.g., an employee who has self-identified with the following physical and/or mental impairment: deafness, blindness, missing extremities, partial paralysis, complete paralysis, and other impairment such as epilepsy, severe intellectual disability, psychiatric disability, and dwarfism).
4.1c
The percentage of new and existing employees trained on safety and security measures when encountering irate and aggressive customers. We will train front-line employees first.
The number of new and existing employees trained on safety and security measures when encountering irate and aggressive customers. We will train front-line employees first.
4.2a
We define enterprise availability as a weighted total availability of service channel mission critical applications for all our customers. We consider an application available when the end user can perform all business functions within the application with reasonable response times. The weighting takes into account the relative impact that an outage could have on our customers, considering both the functionality and the service hours that are potentially impacted. Six different service channels (online, DDS eDib, Internet, telephone, data exchange, and weekend online services) and accompanying applications are included. Mission critical services in our Enterprise Availability include: · Self-service Internet benefits
applications; · Automated telephone menu data
applications; · Email and case processing systems
used by our direct support staff, or by our partnering State DDS staff; and
· Data exchange systems used by our governmental or business partners.
We define enterprise availability as a weighted total availability of service channel mission critical applications for all our customers. An application is considered available when the end user can perform all business functions within the application with reasonable response times. Six different service channels (online, DDS eDIB, Internet, telephone, data exchange, and weekend outage) and accompanying applications are included.
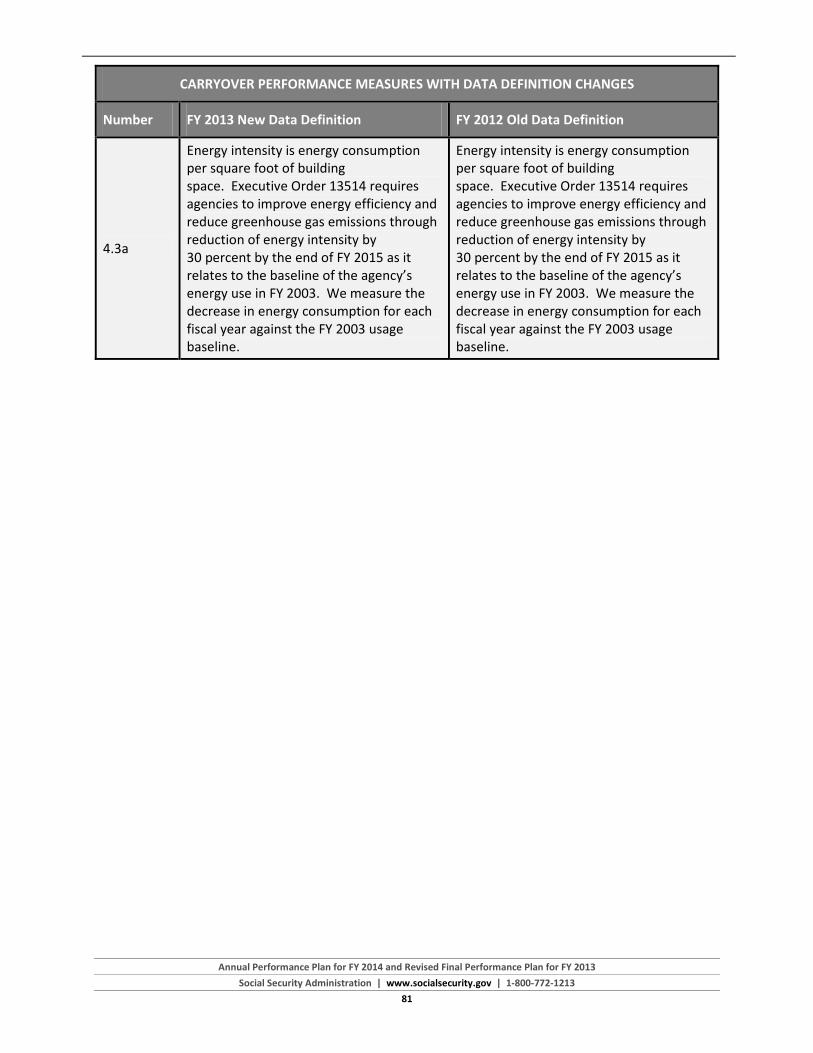
Annual Performance Plan for FY 2014 and Revised Final Performance Plan for FY 2013
Social Security Administration | www.socialsecurity.gov | 1-800-772-1213 81
CARRYOVER PERFORMANCE MEASURES WITH DATA DEFINITION CHANGES
Number FY 2013 New Data Definition FY 2012 Old Data Definition
4.3a
Energy intensity is energy consumption per square foot of building space. Executive Order 13514 requires agencies to improve energy efficiency and reduce greenhouse gas emissions through reduction of energy intensity by 30 percent by the end of FY 2015 as it relates to the baseline of the agency’s energy use in FY 2003. We measure the decrease in energy consumption for each fiscal year against the FY 2003 usage baseline.
Energy intensity is energy consumption per square foot of building space. Executive Order 13514 requires agencies to improve energy efficiency and reduce greenhouse gas emissions through reduction of energy intensity by 30 percent by the end of FY 2015 as it relates to the baseline of the agency’s energy use in FY 2003. We measure the decrease in energy consumption for each fiscal year against the FY 2003 usage baseline.

Annual Performance Plan for FY 2014 and Revised Final Performance Plan for FY 2013
Social Security Administration | www.socialsecurity.gov | 1-800-772-1213 82
Appendix F Key Management Officials and
Board Members Acting Commissioner Carolyn W. Colvin
Deputy Commissioner Vacant
Chief Actuary Stephen C. Goss
General Counsel David F. Black
Inspector General Patrick P. O’Carroll, Jr.
Deputy Commissioner, Budget, Finance, and Management Peter D. Spencer
Deputy Commissioner, Communications James J. Courtney
Deputy Commissioner, Disability Adjudication and Review Glenn E. Sklar
Deputy Commissioner, Human Resources Reginald F. Wells, Ph.D.
Deputy Commissioner, Legislation and Congressional Affairs Scott L. Frey
Acting Deputy Commissioner, Operations Nancy A. Berryhill
Deputy Commissioner, Quality Performance Stephanie J. Hall
Acting Deputy Commissioner, Retirement and Disability Policy Marianna LaCanfora
Acting Deputy Commissioner, Systems Debbi Russell
Annual Performance Plan for FY 2014 and Revised Final Performance Plan for FY 2013
Social Security Administration | www.socialsecurity.gov | 1-800-772-1213 83
Board of Trustees
Jacob J. Lew Secretary of the Treasury, and Managing Trustee of the Trust Funds
Seth D. Harris Secretary of Labor, and Trustee
Kathleen Sebelius Secretary of Health and Human Services, and Trustee
Carolyn W. Colvin Acting Commissioner of Social Security, and Trustee
Charles P. Blahous III Trustee
Robert D. Reischauer Trustee
Social Security Advisory Board
Barbara B. Kennelly, Acting Chair
Bernadette Franks-Ongoy
Jagadeesh Gokhale
Dorcas R. Hardy
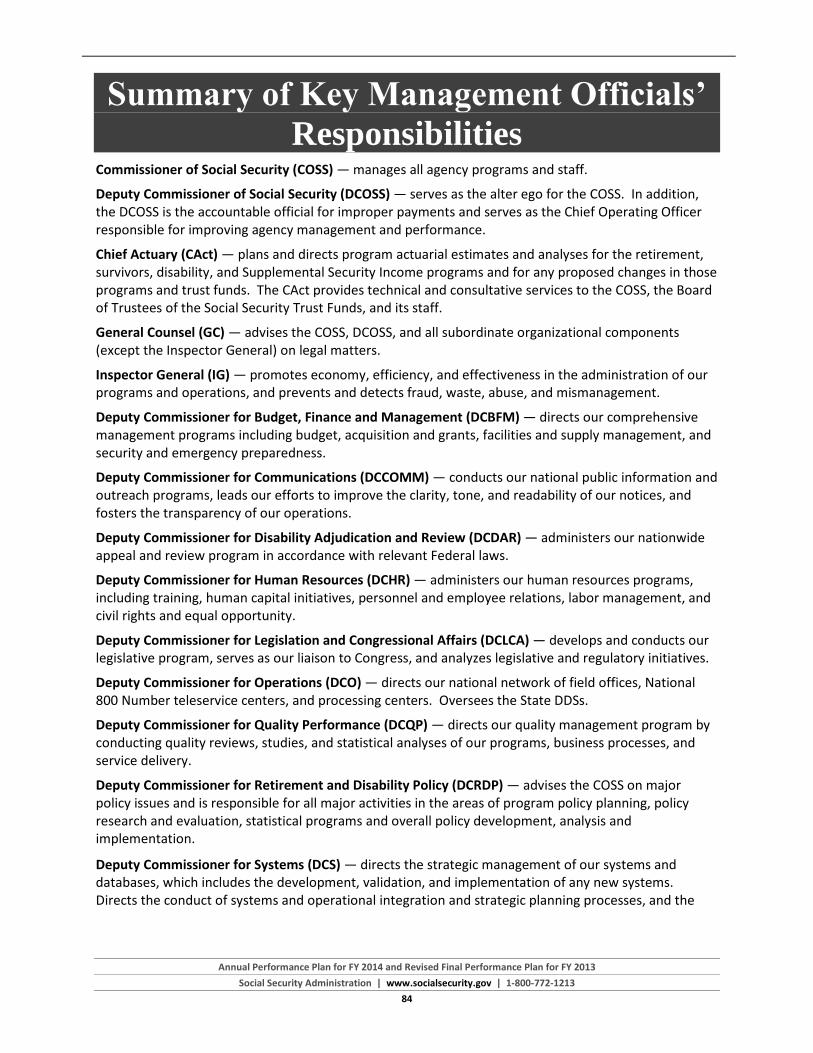
Annual Performance Plan for FY 2014 and Revised Final Performance Plan for FY 2013
Social Security Administration | www.socialsecurity.gov | 1-800-772-1213 84
Summary of Key Management Officials’ Responsibilities
Commissioner of Social Security (COSS) — manages all agency programs and staff.
Deputy Commissioner of Social Security (DCOSS) — serves as the alter ego for the COSS. In addition, the DCOSS is the accountable official for improper payments and serves as the Chief Operating Officer responsible for improving agency management and performance.
Chief Actuary (CAct) — plans and directs program actuarial estimates and analyses for the retirement, survivors, disability, and Supplemental Security Income programs and for any proposed changes in those programs and trust funds. The CAct provides technical and consultative services to the COSS, the Board of Trustees of the Social Security Trust Funds, and its staff.
General Counsel (GC) — advises the COSS, DCOSS, and all subordinate organizational components (except the Inspector General) on legal matters.
Inspector General (IG) — promotes economy, efficiency, and effectiveness in the administration of our programs and operations, and prevents and detects fraud, waste, abuse, and mismanagement.
Deputy Commissioner for Budget, Finance and Management (DCBFM) — directs our comprehensive management programs including budget, acquisition and grants, facilities and supply management, and security and emergency preparedness.
Deputy Commissioner for Communications (DCCOMM) — conducts our national public information and outreach programs, leads our efforts to improve the clarity, tone, and readability of our notices, and fosters the transparency of our operations.
Deputy Commissioner for Disability Adjudication and Review (DCDAR) — administers our nationwide appeal and review program in accordance with relevant Federal laws.
Deputy Commissioner for Human Resources (DCHR) — administers our human resources programs, including training, human capital initiatives, personnel and employee relations, labor management, and civil rights and equal opportunity.
Deputy Commissioner for Legislation and Congressional Affairs (DCLCA) — develops and conducts our legislative program, serves as our liaison to Congress, and analyzes legislative and regulatory initiatives.
Deputy Commissioner for Operations (DCO) — directs our national network of field offices, National 800 Number teleservice centers, and processing centers. Oversees the State DDSs.
Deputy Commissioner for Quality Performance (DCQP) — directs our quality management program by conducting quality reviews, studies, and statistical analyses of our programs, business processes, and service delivery.
Deputy Commissioner for Retirement and Disability Policy (DCRDP) — advises the COSS on major policy issues and is responsible for all major activities in the areas of program policy planning, policy research and evaluation, statistical programs and overall policy development, analysis and implementation.
Deputy Commissioner for Systems (DCS) — directs the strategic management of our systems and databases, which includes the development, validation, and implementation of any new systems. Directs the conduct of systems and operational integration and strategic planning processes, and the

Annual Performance Plan for FY 2014 and Revised Final Performance Plan for FY 2013
Social Security Administration | www.socialsecurity.gov | 1-800-772-1213 85
implementation of a comprehensive systems configuration management, database management, and data administration program. Serves as the Chief Information Officer.

Annual Performance Plan for FY 2014 and Revised Final Performance Plan for FY 2013
Social Security Administration | www.socialsecurity.gov | 1-800-772-1213 86
Appendix G Glossary of Acronyms
A ACSI ............................................ American Customer Satisfaction Index AFI .............................................. Access to Financial Institutions AFR ............................................. Annual Financial Report ALJ .............................................. Administrative Law Judge APP ............................................. Annual Performance Plan APR ............................................. Annual Performance Report ASP ............................................. Agency Strategic Plan
B BLS .............................................. Bureau of Labor Statistics
C C2C ............................................. Click-to-Communicate CAct ............................................ Chief Actuary CAL ............................................. Compassionate Allowances CARE 2020 .................................. Citizens Access Routing Enterprise CDI .............................................. Cooperative Disability Investigation CDR ............................................. Continuing Disability Review COSS ........................................... Commissioner of Social Security
D DCBFM ....................................... Deputy Commissioner for Budget, Finance and Management DCCOMM ................................... Deputy Commissioner for Communications DCDAR ........................................ Deputy Commissioner for Disability Adjudication and Review DCF ............................................. Disability Control File DCHR .......................................... Deputy Commissioner for Human Resources DCLCA ......................................... Deputy Commissioner for Legislation and Congressional Affairs DCO ............................................ Deputy Commissioner for Operations DCOSS ......................................... Deputy Commissioner of Social Security DCPS ........................................... Disability Case Processing System DCQP .......................................... Deputy Commissioner for Quality Performance DCRDP ........................................ Deputy Commissioner for Retirement and Disability Policy DCS ............................................. Deputy Commissioner for Systems DDS ............................................. Disability Determination Services DHS ............................................. Department of Homeland Security DI ................................................ Disability Insurance DoD ............................................ Department of Defense DoL ............................................. Department of Labor DoS ............................................. Department of State DOT ............................................ Dictionary of Occupational Titles D&I ............................................. Diversity and Inclusion

Annual Performance Plan for FY 2014 and Revised Final Performance Plan for FY 2013
Social Security Administration | www.socialsecurity.gov | 1-800-772-1213 87
E EAE ............................................. Enumeration-at-Entry eBB ............................................. Electronic Bench Book eCAT ........................................... Electronic Claims Analysis Tool eDib ............................................ Electronic Disability EDR ............................................. Electronic Death Registration EMF ............................................ Electronic Meeting Facility EN ............................................... Employment Network EWR ............................................ Electronic Wage Reporting
F FO ............................................... Field Office FY ................................................ Fiscal Year
G GC ............................................... General Counsel GPRAMA ..................................... Government Performance and Results Act Modernization Act
H health IT ..................................... Health Information Technology
I iAppeals ...................................... Internet Appeal Applications iClaim ......................................... Internet Benefit Application IG ................................................ Inspector General IRS .............................................. Internal Revenue Service IT ................................................ Information Technology
L Listings........................................ Listing of Impairments
M MPR ............................................ Mathematica Policy Research, Inc. my Social Security ...................... My Social Security Online Services
N NOW ........................................... Network Online Web NSC ............................................. National Support Center
O OASDI ......................................... Old-Age, Survivors, and Disability Insurance OIG ............................................. Office of the Inspector General OIS .............................................. Occupational Information System OPM ........................................... Office of Personnel Management OQP ............................................ Office of Quality Performance OSCAR ........................................ Onsite Security Control and Audit Reviews

Annual Performance Plan for FY 2014 and Revised Final Performance Plan for FY 2013
Social Security Administration | www.socialsecurity.gov | 1-800-772-1213 88
P PAR ............................................. Performance and Accountability Report PI ................................................ Performance Indicator POMS ......................................... Program Operations Manual System
Q QDD ............................................ Quick Disability Determination
R RVP ............................................. Representative Video Project
S SES CDP ...................................... Senior Executive Service Candidate Development Program SSA ............................................. Social Security Administration SSI ............................................... Supplemental Security Income SSITWR ....................................... SSI Telephone Wage Reporting System SSN ............................................. Social Security number SSNAP ......................................... Social Security number Application Process SSNVS ......................................... Social Security number Verification Services SSPP ............................................ Strategic Sustainability Performance Plan
T TAR ............................................. Transaction Accuracy Review TBD ............................................. To Be Determined Title II ......................................... Old-Age, Survivors, and Disability Insurance Title XVI ...................................... Supplemental Security Income TOP ............................................. Treasury Offset Program Treasury ..................................... Department of the Treasury
V VA ............................................... Department of Veterans Affairs VIP .............................................. Visitor Intake Process VLER ........................................... Virtual Lifetime Electronic Record VOD ............................................ Video on Demand VR ............................................... Vocational Rehabilitation VRI .............................................. Video Remote Interpreting VSD ............................................. Video Service Delivery

Annual Performance Plan for FY 2014 and Revised Final Performance Plan for FY 2013
Social Security Administration | www.socialsecurity.gov | 1-800-772-1213 89
APRIL 2013