Embed Size (px)
Citation preview

FY 2018 / FY 2016Annual Performance Plan and Report
(APP&R)
CARING FOR THOSE WHO HAVE BORNE THE BATTLE AND FOR THEIR FAMILIES
www.va.gov May 2017

2
FY 2018/FY 2016
Annual Performance Plan and Report

3
Message from the Secretary of Veterans Affairs
To the President of the United States, President of the Senate, Speaker of the House of Representatives,
and the President Pro Tempore.
This FY 2018 / FY 2016 Annual Performance Plan and Report (APPR) presents Department of Veterans
Affairs (VA) accomplishments and challenges in providing health care and benefits to those “who shall
have borne the battle,” and their eligible dependents. The APPR documents VA’s performance across its
full range of earned healthcare and benefits provided to millions of Veterans. Based on internal
evaluations, I can provide reasonable assurance that the performance information contained in this
report is complete, reliable and accurately describes VA results for FY 2016. The Agency Financial
Report, submitted in November 2016, contains financial details about VA’s FY 2016 activities.
The APPR documents VA’s performance achievements which demonstrate our commitment to
delivering effective and timely care and benefits to Veterans. Our emphasis is on outcomes: Veteran
satisfaction with their VA experiences and effective programs that are measured against our three
strategic goals—empowering Veterans to improve their well-being, enhancing and developing trusted
partnerships, and managing and improving VA operations so VA delivers seamless and integrated
support.
My overarching priority is providing Veterans access to high-quality care that meets their needs when
they need it, that is easy for them to understand, and that is simple to administer, whether care is
delivered in a VA facility or in their communities. So we have much work to do to build the kind of high-
performing, Veteran-centric, integrated enterprise Veterans deserve and need. That means modernizing
the entire Department. That means modernizing our health care system. It means modernizing
information technology. And it means modern facilities and modern programs and processes.
Incrementalism is not the answer to additional improvements VA and Veterans need. So VA will
compete and grow, simultaneously, becoming more and more focused on excellent execution of core
functions while modernizing with bold, rapid design and implementation.
We intend to build a VA that Veterans will choose. DAVID J. SHULKIN, M.D.
4
Table of Contents Mission Statement ...................................................................................................................................... 11
Overview ..................................................................................................................................................... 11
Organizational Chart for the Department of Veterans Affairs ................................................................... 12
Cross-Agency Priority Goals ........................................................................................................................ 12
Strategic Goals Overview ............................................................................................................................ 12
VA Priority Goals for FY 2016 – FY 2017 ..................................................................................................... 13
Performance Results and Plans .................................................................................................................. 18
Strategic Goal 1: Empower Veterans to Improve their Well-Being ........................................................... 18
Objective 1.1: Improve Veteran wellness and economic security ......................................................... 18
Homelessness...................................................................................................................................... 18
Percentage of Veterans reporting employment at discharge from VA homeless residential programs
(VHA #604) .......................................................................................................................................... 19
Percent of participants at risk for homelessness (Veterans and their households) served in
Supportive Services for Veteran Families (SSVF) that were prevented from becoming homeless
(VHA #606) .......................................................................................................................................... 20
Percent of Veterans discharged from VA-funded residential treatment programs (Grant and Per
Diem or Domiciliary Care Homeless Veterans) that discharge to permanent housing (#403). .......... 21
Percent of HUD-VASH vouchers allocated that have resulted in homeless Veterans obtaining
permanent housing (#535) ................................................................................................................. 21
Medical Benefits Package ........................................................................................................................... 22
Health Care ............................................................................................................................................. 22
Mental Health Balanced Scorecard (VHA #598) ................................................................................. 23
Percent of patients who responded ‘Yes’ on Patient Centered Medical Home survey questions that
contribute to the Self-Management Support Composite (“providers support you in taking care of
your own health”) (VHA #386) ............................................................................................................ 25
Patient Safety Indicator (PSI) 90 (#674) .............................................................................................. 25
Benefits ................................................................................................................................................... 26
Vocational Rehabilitation and Employment class success rate (VBA #600) ....................................... 27
Vocational Rehabilitation and Employment class persistence rate (VBA #601) ................................. 27
Vocational Rehabilitation and Employment outcome rate (VBA #602) ............................................. 28
Percent of Montgomery GI Bill or Post 9/11 GI Bill participants who successfully completed an
education or training program (VBA #494) ......................................................................................... 29
Default Resolution Rate (VBA #226) ................................................................................................... 29

5
Fiduciary Program: Average Days to Complete Initial Appointment Process (VBA 647).................... 30
Fiduciary Program: Average Days to Complete Follow-up Field Examinations (VBA 656) ................. 31
Loan Guaranty: Specially Adapted Housing grantees who believe adaptation obtained under the
program has helped them live more independently (VBA 653) ......................................................... 31
Objective Progress Update Summary ..................................................................................................... 32
Objective 1.2: Increase customer satisfaction through improvements in benefit and service delivery
policies, procedures, and interfaces ........................................................................................................... 36
Health care .............................................................................................................................................. 36
The average rating by patients of their recent VA hospitalization on a scale from 0 to 10 (inpatient)
(VHA #537) .......................................................................................................................................... 36
Percent of Primary Care patients who respond "Always" and "Usually" regarding their ability to get
an appointment for a routine checkup as soon as needed (VHA #677) ............................................. 37
Percent of Specialty Care patients who respond "Always" and "Usually" regarding their ability to get
an appointment for a routine checkup as soon as needed (VHA #683) ............................................. 37
Percent of Primary Care Patients who respond "Always" and "Usually" regarding their ability to get
an appointment for needed care right away (VHA #682) ................................................................... 37
Percent of Specialty Care Patients who respond "Always" and "Usually" regarding their ability to get
an appointment for needed care right away (VHA #680) ................................................................... 37
(Composite Measure) The average of the percent “Always” or “Usually” responses for four access
measures found in the Patient Centered Medical Home (PCMH) survey and the Specialty Care
Consumer Assessment of Health Providers and Systems (CAHPS) Survey. (#681) ............................ 38
The average patient rating VA primary care provider on a scale from 0 to 10 on the Patient
Centered Medical Home Survey (VHA #544) ...................................................................................... 39
The average patient rating of VA specialty care provider on a scale from 0 to 10 on the Specialty
Care Survey (VHA #673) ...................................................................................................................... 39
Veterans’ Experience with VA ................................................................................................................. 40
Trust in VA among America’s Veterans (VEO 30) (APG measure) ...................................................... 40
Benefits – Claims ..................................................................................................................................... 42
Percentage of VA Disability Rating Claims pending more than 125-days (VBA #308) ........................ 43
Percentage of Disability Compensation Rating Claims inventory pending more than 125-days (VBA
#576) ................................................................................................................................................... 43
National Accuracy Rate – Disability Compensation Rating Claims (VBA #303) .................................. 44
National Accuracy Rate – Disability Compensation Rating Claims – Issue Based (VBA #304) ............ 44
Percent of Disability Compensation Claims received virtually/electronically (VBA #444) ................. 45

6
Percentage of Dependency and Indemnity Compensation (DIC) Claims inventory pending more than
125 days (VBA #578) ........................................................................................................................... 46
Non-Rating Claims – Compensation Average Days Pending (ADP) (VBA #654) ................................. 47
Non-Rating Claims – Compensation Average Days to Complete (ADC) (VBA #686) .......................... 47
Dependency Claims Processing: Inventory (Claims Pending) (VBA 701) (thousands) ........................ 48
Dependency Claims Processing: Timeliness (Month-to-Date Average Days to Complete as of the last
month of the year) (VBA 670) ............................................................................................................. 48
Benefits – Appeals................................................................................................................................... 49
Appeals Processing – Notice of Disagreement (NODs) Pending Inventory (thousands) (VBA #514) . 51
Appeals processing – NODs average days pending (VBA #545) ......................................................... 51
Appeals Processing – Substantive Appeals to the Board (Form 9) Pending Inventory (thousands)
(VBA #607) .......................................................................................................................................... 51
Appeals Processing – Substantive Appeals to the Board (Form 9) Average Days to Complete (VBA
#685) ................................................................................................................................................... 52
Appeals Processing – Substantive Appeals to the Board (Form 9) Average Days Pending (VBA #655)
............................................................................................................................................................ 52
Appeals Dispositions – Average Days to Complete Returned Remands (measuring from date case is
received at the Board after remand until Board disposition date) (BVA #571).................................. 53
Appeals Dispositions – Average Days to Complete Original Appeals (from date of certification (Form
8) until Board disposition date) (BVA #573) ....................................................................................... 53
Benefits – Various ................................................................................................................................... 56
Compensation: Overall Customer Satisfaction Index Score (out of 1000) (VBA #491) ..................... 57
National Call Center Client Satisfaction Index Score (out of 1000) (VBA #485) ................................. 58
Number of Accredited Veterans Advocates Who Are Registered Users on the Stakeholder
Enterprise Portal (SEP) (VBA#446) ...................................................................................................... 59
Benefits – Pension ................................................................................................................................... 59
Average days to complete – original survivor’s pension claims (VBA #498) ...................................... 60
Percentage of original and reopened pension claims inventory pending more than 125-days (VBA
#577) ................................................................................................................................................... 60
Pension: Overall customer satisfaction index score (out of 1000) (VBA #490) .................................. 61
Pension call center client satisfaction index score (out of 1000) (VBA #484) .................................... 62
Benefits – Education ............................................................................................................................... 63
Average days to complete original education claims (VBA #218) ...................................................... 63
Average days to complete supplemental education claims (VBA #219) ............................................ 63
7
Education: Overall customer satisfaction index score (out of 1000) (VBA #489) .............................. 64
Education call center client satisfaction index score (out of 1000) (VBA #476) ................................. 64
Benefits – Loan Guaranty, Vocational Rehabilitation and Employment, Insurance ............................... 65
Veterans’ satisfaction level with the VA Loan Guaranty program (out of 1000) (VBA #487) ............. 65
Veterans’ satisfaction with the Vocational Rehabilitation and Employment program (out of 1,000)
(VBA #488) .......................................................................................................................................... 66
Rate of high client satisfaction ratings on insurance services delivered (VBA #214) ......................... 67
Memorial Services ................................................................................................................................... 68
Percent of Veterans served by a burial option within a reasonable distance (75 miles) of their
residence (NCA #234).......................................................................................................................... 68
Percent of respondents who rate the quality of service provided by the national cemeteries as
excellent (NCA #580) ........................................................................................................................... 69
Percent of respondents who rate national cemetery appearance as excellent (NCA #581).............. 69
Percent of respondents who would recommend the national cemetery to Veteran families during
their time of need (NCA #582) ............................................................................................................ 69
Percent of respondents who agree or strongly agree that the quality of the headstone or marker
received from VA was excellent (NCA #583) ...................................................................................... 70
Percent of respondents who agree or strongly agree that the quality of the Presidential Memorial
Certificate received from VA was excellent (NCA #584) ..................................................................... 70
Objective Progress Update Summary ..................................................................................................... 71
Strategic Goal 2: Enhance and Develop Trusted Partnerships .................................................................. 74
Objective 2.1 Enhance VA’s partnership with DoD ................................................................................. 74
Percent of Integrated Disability Evaluation System (IDES) participants who will receive VA benefit
notification letters within 30 days of discharge (Program Administered by VBA, but coordinated
with DoD via VA Office of Policy and Planning) (VBA #469) ............................................................... 74
Number of registered eBenefits users (VBA #443) ............................................................................. 75
Objective Progress Update Summary ..................................................................................................... 76
Objective 2.2: Enhance VA’s partnerships with Federal, state, private sector, academic affiliates,
Veteran Service Organizations, and non-profit organizations ................................................................ 77
Objective Progress Update Summary ..................................................................................................... 77
Objective 2.3: Amplify awareness of services and benefits available to Veterans through improved
communications and outreach ............................................................................................................... 79
Increase percentage of Veterans aware of using benefits, reached through advertising and
marketing effort (OPIA #536) .............................................................................................................. 79

8
Increase veteran traffic to and from the various VA content delivery platforms (OPIA #659) .......... 80
Objective Progress Update Summary ..................................................................................................... 81
Goal 3: Manage and Improve VA Operations to Deliver Seamless and Integrated Support ..................... 83
Percent of VA employees who are Veterans (HRA #278) ................................................................... 83
OPM Federal Employees Viewpoint Survey (FEVS) Employee Engagement Index Score (Percentage
of responses marked ‘positive’) (HRA #608) ....................................................................................... 84
My supervisor provides me with constructive suggestions to improve my job performance (HRA
695) (APG measure) ............................................................................................................................ 85
In my work unit, steps are taken to deal with a poor performer who cannot or will not improve
(HRA 696) (APG measure) ................................................................................................................... 85
Employees have a feeling of personal empowerment with respect to work processes (HRA 697)
(APG measure) .................................................................................................................................... 86
I feel encouraged to come up with new and better ways of doing things (HRA 698) (APG measure)
............................................................................................................................................................ 86
How satisfied are you with the information you receive from management on what’s going on in
your organization? (HRA 699) (APG measure) .................................................................................... 86
My organization’s leaders maintain high standards of honesty and integrity (HRA 700) (APG
measure) ............................................................................................................................................. 86
Objective Progress Update Summaries .................................................................................................. 88
Office of the Inspector General (OIG) ..................................................................................................... 95
Number of reports (audit, inspections, evaluation, contract review, Comprehensive Healthcare
Inspection Program (formerly known as Combined Assessment Program), and Community Based
Outpatient Clinic reports) issued that identify opportunities for improvement and provide
recommendations for corrective action (OIG #585) ........................................................................... 95
Number of arrests, indictments, convictions, criminal complaints, pretrial diversions, and
administrative sanctions (OIG #586) ................................................................................................... 95
Monetary benefits ($ in millions) from audits, investigations, contract reviews, inspections, and
other evaluations (OIG #587) .............................................................................................................. 96
Return on investment (monetary benefits divided by cost of operations in dollars) (OIG #588) ...... 96
Percentage of recommended recoveries achieved from post-award contract reviews (OIG #591) .. 97
Percent of full cases that result in criminal, civil, or administrative actions. (OIG 694) ..................... 98
VA OIG FY 2015 Major Management Challenges ................................................................................... 99
Government Accountability Office High Risk Areas ................................................................................ 99
Cross-Agency Collaborations ................................................................................................................ 105

9
Changes in Performance Measures ...................................................................................................... 108
Data Quality Review .............................................................................................................................. 112
Appendices ................................................................................................................................................ 113
Appendix 1 – Unmet Goals Provision.................................................................................................... 114
Appendix 2 – Annual Performance Plan ............................................................................................... 123
10
Transition at the Department of Veterans Affairs
FY 2017 is a year of transition for the Department of Veterans Affairs. Over the next six
months, we will draft a new strategic plan for fiscal year (FY) 2018 through FY 2024 that re-
defines our relationship with Veterans and how we serve them. The new plan will incorporate
the Administration’s vision and priorities.
Until the new plan is approved and published, however, we are presenting the Department’s
performance in FY 2016 in alignment with the current strategic plan. While the strategies for
serving Veterans will change over time, the reader will find a certain level of continuity
between strategic plans and reports that document the VA’s effort to provide Veterans the best
health care and the greatest access to benefits. In FY 2017 and 2018, Secretary Shulkin and VA will focus on five priorities: providing greater
choice for Veterans, modernizing our systems, focusing resources more efficiently, improving
timeliness of services, and preventing suicide. In the coming months, VA will develop robust
plans for implementing these management priorities.
11
Mission Statement President Lincoln’s immortal words – “To care for him who shall have borne the battle and for
his widow, and his orphan” delivered in his Second Inaugural Address more than 150 years ago
– best describe the VA’s mission. We care for Veterans, their families, and survivors – men and
women who have responded when their Nation needed help. Our mission is clear-cut, direct,
and historically significant. It is a mission that every employee is proud to fulfill.
The Department of Veterans Affairs (VA) fulfills these words by providing world-class benefits
and services to the millions of men and women who have served this country with honor in the
military. President Lincoln’s words guide all VA employees in their commitment to providing
the best medical care, benefits, social support, and lasting memorials that Veterans and their
beneficiaries deserve in recognition of Veterans’ service to this Nation.
Overview VA is comprised of three administrations that deliver services to Veterans and staff offices that
support the Department:
The Veterans Health Administration (VHA) provides a broad range of primary care, specialized care, and related medical and social support services that are uniquely related to Veterans’ health or special needs. VHA advances medical research and development in ways that support Veterans’ needs by pursuing medical research in areas that most directly address the diseases and conditions that affect Veterans.
The Veterans Benefits Administration (VBA) provides a variety of benefits to Veterans and their families. These benefits include compensation, pension, fiduciary services, educational opportunities, vocational rehabilitation and employment services, home ownership promotion, and life insurance benefits.
The National Cemetery Administration (NCA) provides burial and memorial benefits to Veterans and their eligible family members. These benefits include burial at national cemeteries, cemetery grants, headstones and markers and medallions and presidential memorial certificates.
The VA staff offices provide a variety of services to the Department, including information technology, human resources management, strategic planning, Veterans outreach and education, financial management, acquisition, and facilities management.

12
Organizational Chart for the Department of Veterans Affairs
Cross-Agency Priority Goals The Government Performance and Results Modernization Act requires each agency to address
Cross-Agency Priority (CAP) Goals in the agency strategic plan, the annual performance plan,
and the annual performance report. Please refer to www.Performance.gov for the
Department’s contribution to those goals and progress, where applicable. VA currently
contributes to the following CAP Goals: Servicemembers and Veterans Mental Health and
Smarter IT Delivery.
Strategic Goals Overview VA developed a strategic plan in FY 2013 to encompass the period from FY 2014 to
FY 2020. This plan, available at http://www.va.gov/op3/docs/StrategicPlanning/VA2014-
2020strategicPlan.PDF, identifies three strategic goals and 10 related objectives. The three
strategic goals are:
Strategic Goal 1: Empower Veterans to Improve Their Well-being
Strategic Goal 2: Enhance and Develop Trusted Partnerships
Strategic Goal 3: Manage and Improve VA Operations to Deliver Seamless and
Integrated Support

13
VA Priority Goals for FY 2016 – FY 2017
In FY 2016, VA identified four Agency Priority Goals (APG) focused on improving service to
Veterans and eligible beneficiaries over two fiscal years, FY 2016 – FY 2017. Achieving these
goals requires extensive collaboration across VA organizations and non-VA partners. In
addition to having long-term benefits for Veterans, each APG will result in short-term and high-
impact improvements in VA performance. The following sections provide a synopsis of the
activity under each goal. For more detailed information, please visit www.Performance.gov.
Improve Access to Health Care as Experienced by the Veteran: By September 30, 2017,
Veterans will experience significant improvement in the ability of VA to provide appointments
for needed care.
Overview: VA has experienced unprecedented growth in demand for its services as a result of
better recognition of service-connected conditions; innovative and favorable clinical offerings
for complex and costly health conditions; and the growing needs of an aging Veteran
population. VA is also embedded within the larger U.S. health system, which is similarly
experiencing increased demand for services and shortages of providers in key clinical
professions due to advances in technology and the aging of the population.
In FY 2015, a congressionally-mandated Independent Assessment of VA Healthcare Capabilities
as well as an Institute of Medicine report highlighted that VA access, while meeting timeliness
standards on average, still had unacceptable levels of variation across sites for specific services.
These independent reviews were candid in stating that highly specialized services required by
Veterans are frequently not available in their communities even from private sector providers.
Those independent reports interviewed many of U.S. medicine’s thought leaders, and these
experts highlighted the critical importance of addressing access challenges by taking a systems
approach, and recommended strategies such as modeling system supply and demand
relationships, exploring design and policy changes, and creating a culture of service excellence
that empowers the front line to experiment, identify limitations, and learn from trials.
The ultimate success of these strategies and programs must be evaluated through the eyes of
the Veteran, as a noticeable improvement in their self-reported ability to receive needed care.
Assessing access to health care through direct survey of patients is the only access measure
currently endorsed by the National Quality Forum. Using a survey-based approach to measure
access also provides additional advantages, such as 1) ability to benchmark with private sector
health systems and 2) avoiding the shortcomings of current VA scheduling software.
14
Progress Update: In November 2015, VA launched a multi-pronged effort (“MyVA Access”)
focused on improving the ability to provide same or next-day services in primary care and
mental health settings and reducing the backlog of specialty care consults. As a result, more VA
facilities now have same-day services, and our plan is to continue to expand that capability to
all VA sites. That is likely to have a major impact on our lowest performing component of the
Access APG, Urgent Access. In addition, we mounted a successful focused effort to address the
backlog in time-critical Specialty Care consultations (see http://catalyst.nejm.org/va-stand-
down-resolved-56000-plus-urgent-care-consults/ for a detailed case study). We are in the first
phases of deploying a web-based Veteran Appointment Request application that will allow
Veterans to directly select an open appointment slot that best matches their needs. Finally, VA
is poised to launch a new interactive website that will provide site-specific access results to the
public, with the intent of providing a transparent accounting of our performance and
information that will help Veterans select a clinic location that best meets their needs.
There are some risks associated with achieving this APG to note. Veteran reliance upon and
demand for VA services is dependent on many factors, including state of the economy;
availability of alternative coverage (employer health coverage and Medicaid expansion); out-of-
pocket costs for those alternatives; and technology advances (e.g., hepatitis C drugs; advances
in prosthetics, vision, and hearing aids). Critical shortages and maldistribution in primary care,
mental health, and other specialties make recruitment of clinical providers exceptionally
challenging in many markets. However, VA is implementing mitigation approaches for all of
these risks – for instance, redesigning our processes to simplify purchasing care in the
community; mounting efforts to expand recruitment of physicians and expand the practice
authority and autonomy of advance-practice nurses; and providing new modes of accessing
care such as telehealth that will reduce the need for office visits. All of these represent long-
term strategies, and so our success will be best gauged over years rather than months.
VA has developed a real-time Health Operations Dashboard and made it operational across all
VA facilities thus far. We continue to expand the site by working closely with Primary Care,
MyAccess and Access and Clinic Administration Program staff to develop a new leadership
report to assess Primary Care demand with capacity to identify staffing gaps. The newly formed
Office of Connected Care will continue to leverage advanced information technologies,
including Telehealth, mobile applications, secure messaging, and others, to provide alternatives
to face-to-face clinic visits. There will also be a new Clinical Practice Management curriculum,
intended to train all staff in a systems approach to managing supply and demand and optimize
the use of VA versus community resources, will be developed and rolled out in FY 2017.

15
Improve Veterans’ Experience with VA: Fulfilling our country’s commitment to Veterans, VA
will deliver effective and easy customer experiences in which Veterans feel valued. By
September 30, 2017, Veterans will reach 90 percent agreement with the statement: “I trust VA
to fulfill our country’s commitment to Veterans.”
Overview: VA currently offers an array of services and benefits to Veterans and eligible
dependents, but the experience has been disjointed and inconsistent for years. There are
hundreds of phone numbers and thousands of websites, each operating independently under
different standards. Similarly, there is a wide array of VA and non-VA resources at the Federal,
state, local, corporate, non-profit and tribal levels that are not coherently organized or
coordinated into a single source or reference point for the Veteran. Veterans deserve better
and so do VA staff, who care deeply about delivering the best possible outcome for Veterans.
The Veterans Experience team is leading a powerful effort to improve customer experiences
across VA, nationwide. The goal to deliver effective and easy customer experiences in which
Veterans feel valued is being achieved the same way the world’s most successful companies do:
by listening to our customers – Veterans, their families and supporters – when they describe
how they want things to work. Equally important, we are listening to our employees about
obstacles to excellence on-the-job. Employee empowerment is an essential part of the
equation. This is user-centered design. It puts Veterans and the employees who serve them
front and center.
Progress Update: VA’s Office of Veterans Experience (VE) continues to make significant
progress in the multiple areas of better serving the Veteran and their families. This year alone
VA was able to collect survey data from customers who used VA services between April 2016 –
June 2016, and we are now able to use the direct customer feedback to understand the
Veterans’ experience as a necessary step to prioritizing experience improvements. In
conjunction with the MyVA community expansion plans, we were able to establish a network of
MyVA communities through our first E-summit platform, which occurred on September 9, 2016.
This summit included 1,026 registered viewers, addressed over 100 stakeholder questions, and
received 34 social media impressions about the event.
VA will further improve the Veterans Experience by actively engaging in MyVA Communities
and the community Veterans engagement boards (CVEBs). The VE Office support will be
ongoing and the local District VE teams will be engaged in planning, implementing, and
monitoring local community efforts in all quarters throughout FY 2017. The role of the teams
in local communities is to be the conduit to building trusted relationships between VA and local
stakeholders, create a CVEB network across the districts through district-level summits, and

16
share best practices, knowledge, and lessons learned with other CVEBs. The teams will also
spark interest in other communities without a coordinated support system of resources,
compare/correlate Veteran data with CVEB activities, and provide support and customizable
tools to the CVEBs and local VA facility leaders who participate with the boards.
Improve VA’s employee experience by developing engaged leaders at all levels, which inspire
and empower all VA employees to deliver a seamless, integrated, and responsive VA customer
service experience. Success by September 30, 2017, will be measured by a 4-percent or more
increase in the “percent positive” responses by VA employees (over the FY 2015 baseline) to
the following statements:
1) My supervisor provides me with constructive suggestions to improve my job
performance.
2) In my work unit, steps are taken to deal with a poor performer who cannot or will not
improve.
3) Employees have a feeling of personal empowerment with respect to work processes.
4) I feel encouraged to come up with new and better ways of doing things.
5) How satisfied are you with the information you receive from management on what's
going on in your organization?
6) My organization's leaders maintain high standards of honesty and integrity.
Progress Update: VA is committed to creating a work environment which provides all
employees with a more consistent, positive employee experience, which ultimately improves
the Veteran’s experience with our organization. Each of VA’s indicators for improving the
employee experience under this APG showed significant increases, below are just a few of the
many accomplishments through the end of FY 2016:
• VA successfully conducted its third one-week residency session for Leadership VA (LVA)
in August 2016. LVA is VA’s flagship leadership development program for GS 13-15
employees. LVA creates opportunities to ensure continuity of leadership by
strengthening employees’ fundamental competencies in the areas of external
awareness, vision, entrepreneurship, accountability, conflict management, continued
learning, and creativity and innovation. LVA also focuses on customer service to better
serve Veterans. The LVA program is assisting in identifying and addressing potential
gaps in effective leadership and to design and maintain programs that capture
organizational knowledge and promote learning. The LVA Class of 2016 consists of 100
VA employees.

17
• VA’s Employment Engagement Council continues to address engagement issues
impacting VA’s workforce. Through Council members’ collaboration, VA established the
Employee Engagement Champions in July to connect each site to Human Resources and
Administration and to each other to help enhance employee engagement efforts.
Engagement Champions serve as a conduit for each site’s best practices through the
HRA Leading Practices site, enabling each site to benefit from how others have
successfully improved employee engagement. Additionally, as more Engagement
Champions utilize HRA tools, HRA will gather feedback to continuously improve
employee engagement efforts as a whole. HRA provided training, tools, and resources
to support the Engagement Champions in creating a local engagement action plans
based on 2016 Federal Employee Viewpoint Survey results.
• The end of the year VA Pulse Survey results reflect a truer picture of how VA employees
perceive their work experiences since the data were collected using a census
methodology and had a high response rate. The patterns across all four quarters of data
are similar, indicating that the “best” experiences are Constructive Performance
Feedback, Innovation, and Senior Leaders Ethics; while “lesser” experiences are
Accountability, Empowerment, and Information Sharing.
Improve access to benefits and the customer experience for Veterans who are entitled to
additional benefits for their dependents. By September 30, 2017, VA will reduce the overall
inventory of dependency claims to 100,000 (a 56 percent improvement from the FY 2015
baseline of 227,000) and improve the average days to complete dependency claims to 125 days
(a 43-percent improvement from the FY 2015 baseline of 221 days).
Progress Update: In FY 2016, VA reduced the inventory of pending dependency claims from
226,874 claims to 114,789 claims. This is a cumulative reduction of 49.4 percent. VA also
outperformed its end of fiscal year inventory target of 190,000 claims by 39.6 percent.
VA reduced the monthly average days to complete dependency claims from 207 days at the
end of FY 2015 to 197 days at the end of FY 2016. VA improved the overall age of the
dependency inventory, as average days pending fell from 359 days to 228 days.
VA continues to make progress on workstream projects to improve dependency claims
processing. These workstreams include utilization of the National Work Queue, improving call
center dependency resolutions, improving marketing for online dependency claims, and
enhancing automated processing.

18
Performance Results and Plans
Strategic Goal 1: Empower Veterans to Improve their Well-Being Military service provides Servicemembers with tremendous skills, experience, and honor, but
may also result in equally significant sacrifices and challenges. VA will work to ensure that
Veterans are empowered, independent, self-sustaining, and well equipped for civilian life.
Each Veteran is unique, yet, like all individuals, they are shaped by: their generation; the
conditions of their military service, including any war or conflict in which they served; their
gender; their ethnicity; and their support system of faith, family, friends, and caregivers. Each
Veteran has different needs and expectations, which may change many times between the time
he/she takes the induction oath and when the last survivor receives the last benefit.
VA will both directly, and with its partners, deliver benefits and services in an integrated, client-
centered portfolio that is personalized to meet each Veteran’s needs and situation. VA will
measure success in terms relevant to individual Veteran outcomes from VA benefits and
services.
Objective 1.1: Improve Veteran wellness and economic security VA is committed to improving Veterans’ wellness and economic security and made significant
strides towards achieving Objective 1.1. We leveraged strategic partnerships to support a
variety of Veteran programs such as ending homelessness and obtaining employment.
Numerous outreach efforts helped Veterans understand what VA offers and how to access the
benefits and services they earned. Education initiatives, such as the GI Bill Comparison Tool
and VetSuccess On Campus, made it easy for Veterans to find the right school and provided
counseling and support to help them succeed and achieve their education goals. Vocational
Rehabilitation and Employment Services supported the education and career goals of Veterans
with disabilities to promote their independence, and the Veterans Employment Center helped
Veterans and their families secure meaningful careers that provided economic security and
improved well-being.
Objective 1.1 Related Performance Measures
Homelessness
Tremendous progress is being made community by community since the launch of Opening
Doors, the Federal Strategic Plan to End Veteran Homeless in 2010. Since FY 2010, more than

19
480,000 Veterans and their family members have been permanently housed, rapidly rehoused,
or prevented from falling into homelessness as a result of VA’s homeless continuum of services
and targeted community resources. The ability to partner with the Department of Housing and
Urban Development (HUD), the United States Interagency Council on Homelessness (USICH),
other Federal agencies, state and local governments, and volunteer organizations contributed
to this significant accomplishment.
Homelessness is a local issue that has to be solved with partnership and solutions tailored to
each community. That is where partnerships like the Mayor’s Challenge and the 25 Cities
Initiative come into play and those are working. Hence, 859 local leaders (mayors, governors,
other community leaders) have signed on Obama Administration’s White House Challenge to
end Veteran Homelessness. As a result, in FY 2016, thirty-one communities and two states
(Commonwealth of Virginia and Connecticut) have declared an end to Veteran homelessness.
For the current listing, visit http://www.va.gov/HOMELESS/endingVetshomelessness.asp
Both independently and in tandem with other federal agencies, VA strives to meet the needs of
Veterans by providing various services that help Veterans secure permanent housing and
achieve their full potential. These include:
Health care
Housing solutions
Job training
Other various wraparound services
VA also partners with many other public and private entities to expand access to meaningful
employment, affordable housing and move-in essentials. Our work is guided by the Housing
First approach, which is based on the premise that when Veterans have a place to call home,
they’re best able to benefit from the supportive services they need.
Percentage of Veterans reporting employment at discharge from VA homeless residential
programs (VHA #604)
FY 2013 FY 2014 FY 2015 FY 2016 FY 2017 FY 2018
Target Not Available 30% 30% 45% 50% 50%
Actual Not Available 42% 45% 50%
Analysis of Results
VA exceeded the target. In FY 2016, 50 percent of Veterans reported employment at discharge
from VA homeless residential programs. Securing long-term, stable and fulfilling employment is

20
important for Veterans who are exiting homelessness or are at-risk of becoming
homeless. Homeless and at-risk Veterans need access to employment opportunities to support
their needs, improve the quality of their lives, and assist in their community reintegration
efforts. As part of our commitment to this critical component of eliminating homelessness, VA
introduced Community Employment Coordinators (CECs) at each VA Medical Center. Now it is
easier than ever for employers to find, interview and hire job-ready Veterans exiting
homelessness; we have hired more than 150 Community Employment Coordinators (CEC)
across the country who provide comprehensive vocational assessment, case management and
placement services for homeless Veterans. In addition they work with potential employers in
the community to identify opportunities for Veterans. Employers can visit
http://www.va.gov/HOMELESS/HVCES.asp.to contact to their local CEC and learn more about
the benefits of hiring Veterans who are exiting homelessness.
Plans for the Future
As CECs become better established at each VA Medical Center and build employment networks
with local employers, VA expects this employment rate to increase and exceed target.
Percent of participants at risk for homelessness (Veterans and their households) served in
Supportive Services for Veteran Families (SSVF) that were prevented from becoming
homeless (VHA #606)
FY 2013 FY 2014 FY 2015 FY 2016 FY 2017 FY 2018
Target 85% 90% 90% 85% 85% 85%
Actual 88% 90% 84% 92%
Analysis of Results
VA exceeded the target. In FY2016, 92 percent of participants at risk for homelessness
(Veterans and their households) served in SSVF that were prevented from becoming homeless.
Plans for the Future
In FY 2017 and FY 2018, VA will retain the target of 85 percent for “Percent of participants at
risk for homelessness (Veterans and their households) served in SSVF that were prevented from
becoming homeless”. A higher target would perhaps result in programs selecting the easiest to
serve, contradicting the program’s mission to serve the most vulnerable and in-need. Through
partnerships with HUD, USICH, other Federal agencies, state and local governments and
volunteer organizations, VA will also continue to accelerate its efforts to permanently house,
rapidly rehouse, or prevent Veterans and their families from falling into homelessness utilizing
VA’s homeless continuum of services and targeted community resources. Central to the
strategy is providing permanent supportive housing in the HUD-VA Supportive Housing (HUD-

21
VASH) program and rapid rehousing in the Supportive Services for Veteran Families (SSVF)
program. Both permanent supportive housing and rapid rehousing are proven practices that
enable Veterans to move quickly into permanent housing.
Percent of Veterans discharged from VA-funded residential treatment programs
(Grant and Per Diem or Domiciliary Care Homeless Veterans) that discharge to
permanent housing (#403).
FY 2013 FY 2014 FY 2015 FY 2016 FY 2017 FY 2018
Target Not Available 65% 65% 65% 65% 65%
Actual Not Available 69% 70% 71%
Analysis of Results
VA exceeded the target. In FY 2016, 71 percent of Veterans discharged from VA-funded
residential treatment programs (Grant and Per Diem or Domiciliary Care Homeless Veterans)
were discharged to permanent housing. Our success can be attributed to continued emphasis
on monitoring permanent housing outcomes with our community, Grant and Per Diem funded
partners and Domiciliary Care Homeless Veterans programs on a monthly basis to identify
opportunities for improvement.
Plans for the Future
In FY 2018, VA will continue to engage in a programmatic transformation with its homeless
Grant and Per Diem transitional housing program to lower barriers to entry, reduce lengths of
stay, and improve exits to permanent housing. This transformation will also provide VA greater
flexibility for resource allocation, the ability to remain agile to evolving best practices for
homeless services, and provide community providers the ability to also adapt and respond to
the most current needs of homeless Veterans. We will maintain targets of 65% in the future; we
recently brought our definition of permanent housing into alignment with the Department of
Housing and Urban Development’s more rigorous definition. As a result, we anticipate our
performance on this metric will decline for a year or two.
Percent of HUD-VASH vouchers allocated that have resulted in homeless Veterans obtaining
permanent housing (#535)
FY 2013 FY 2014 FY 2015 FY 2016 FY 2017 FY 2018
Target 88% 90% 90% 92% 92% 92%
Actual 92% 90% 92% 92%
Analysis of Results

22
VA met the target. In FY 2016, 92 percent of HUD-VASH vouchers allocated resulted in
homeless Veterans obtaining permanent housing.
Plans for the Future
In FY 2017, VA will continue to emphasize the importance of serving those with the greatest
need. Through partnerships with HUD, USICH, other Federal agencies, state and local
governments and volunteer organizations, VA will also continue to accelerate its efforts to
permanently house, rapidly rehouse, or prevent Veterans and their families from falling into
homelessness utilizing VA’s homeless continuum of services and targeted community
resources. Central to the strategy is providing permanent supportive housing in the HUD-VASH
program and rapid rehousing in the SSVF program. Both permanent supportive housing and
rapid rehousing are proven practices that enable Veterans to move quickly into permanent
housing.
Medical Benefits Package VA Health Benefits includes all the necessary inpatient hospital care and outpatient services to promote, preserve, or restore Veterans’ health. VHA medical facilities provide a wide range of services including traditional hospital-based services such as surgery, critical care, mental health, orthopedics, pharmacy, radiology and physical therapy. In addition, most of our medical facilities offer additional medical and surgical specialty services including audiology & speech pathology, dermatology, dental, geriatrics, neurology, oncology, podiatry, prosthetics, urology, and vision care. Some medical centers also offer advanced services such as organ transplants and plastic surgery.
Health Care
The Veterans Health Administration is America’s largest integrated health care system with
over 1,700 sites of care, serving 8.76 million Veterans each year.
VA provides mental health services at its medical centers and community-based outpatient
clinics. In addition, readjustment counseling services are available for Veterans and their
families at Vet Centers across the nation. All mental health care provided by VA supports
recovery, striving to enable people with mental health problems to live meaningful lives in their
communities and achieve their full potential. For more information about our mental health
services, please visit the VA Mental Health website at www.mentalhealth.va.gov or the Vet
Center website at www.vetcenter.va.gov.

23
Mental Health Balanced Scorecard (VHA #598)
FY 2013 FY 2014 FY 2015 FY 2016 FY 2017 FY 2018
Target Not
Available
Not
Available
Not
Available
(Baseline) 90% of
facilities
at/or
above
target
90% of
facilities
at/or
above
target
Actual Not
Available
Not
Available
Not
Available
91% above
target at
end of SAIL
performance
year
Analysis of Results
VA implemented use of the Mental Health Balanced Scorecard as part of a Mental Health
Management System to diagnose strengths and challenges and facilitate improvements in
mental health services at each facility. The scorecard evaluates the accessibility and quality of
the mental health services VA provides. One group of measures in the scorecard focuses on
how well we are covering the population that requires these services. In other words, is the
mental health program in each facility the right size, and can Veterans get into the type of care
they need when they need it? A second group of measures focuses on continuity of care. VA
understands it is not sufficient to only address a Veteran’s immediate mental health needs
when he or she is in crisis; most Veterans will require a course of treatment and consistent,
timely follow-up care to achieve and maintain recovery. The last group of measures in the
index monitors Veterans’ and practitioners’ experience of VA’s mental health care system, by
asking about the accessibility of care, its quality, and its perceived effectiveness. Holding these
three groups of measures in balance is critical to providing the best mental health care system
possible because over-emphasis in one area can lead to deficits in another area.
VA uses the scorecard to guide a management system which carefully monitors performance as
part of the Strategic Analytics for Improvement and Learning (SAIL) program. The management
system then investigates drivers of performance by examining scores in the context of
measures of wait time, operational efficiency, staffing, space, growth in demand, use of
innovative programming, etc., conducting deep dive analysis into scorecard components, and
engaging in quarterly guided discussions with local and regional mental health leadership. A
centralized technical assistance and action-planning program provides consultation and
assistance with identification and implementation of strong practices to address challenges,

24
proactively offering on-site or virtual intensive consultation and support to sites with below
average performance.
At the start of the SAIL performance measurement year, average scores are calibrated to zero,
with below average performers given negative scores, and above average performers given
positive scores, in units of standard deviation. The goal of the management program is to
improve performance in low performing facilities and maintain performance in high performing
facilities. The target is to have 90 percent of facilities scored within a normal range (i.e. above -
1) by the end of the performance year.
In the FY16 SAIL year (FY15Q4-FY16Q3), on average, facility performance improved by 0.34
standard deviations. Ninety-one percent of the facilities that were more than 1 standard
deviation below the mean on MH SAIL at the start of the year improved within four quarters,
and high performing facilities maintained high performance. By the end of the year, 91 percent
of facilities were above target (up from 83 percent at the start of the year), meeting
improvement goals.
Performance improvement was facilitated by quality and process improvement efforts aimed at
increasing access, filling gaps in services in underserved areas, improving productivity, and
disseminating strong practices and innovations across facilities. Changes in diagnostic coding
additionally boosted scores slightly, as diagnoses were updated to better reflect patient’s
current versus historic conditions. Performance gains were limited because growth in patient
need for mental health services outpaced growth in mental health staffing, and space
constraints slowed program expansion. Facilities also struggled to find available CHOICE
providers in locations where VHA experienced gaps.
Plans for the Future
For FY 2017, VA recalibrated start of year (FY16Q4) performance downward to zero, which
identified 25 facilities below the end of year target. VA will continue its intensive management,
technical assistance and action-planning system with a focus on these lower performing
facilities, in hopes of building on last year’s improvements. VA will also work to address staffing
and space shortages in some locations by (1) intensifying recruitment efforts, (2) recruiting
additional advanced practice providers and allied health service provider types (e.g. clinical
pharmacy specialists, clinical pharmacists, marriage and family therapists), (3) expanding
regional telemental health services to provide care via real-time video into underserved areas,
(4) increasing availability of mental health services in primary care settings, and (5) partnering
with community programs.

25
Percent of patients who responded ‘Yes’ on Patient Centered Medical Home survey questions
that contribute to the Self-Management Support Composite (“providers support you in
taking care of your own health”) (VHA #386)
FY 2013 FY 2014 FY 2015 FY 2016 FY 2017 FY 2018
Target Not Available 57% 58% 58% 58% 60%
Actual Not Available 57% 58% 58%
Analysis of Results
VA reached the target for “Percent of patients who responded ”yes” on Patient Centered
Medical Home survey questions that contribute to the Self-Management Support Composite” in
FY 2016. The Self-management Support composite measures the degree to which “providers
support you in taking care of your own health,” which is a principle component of the Patient
Centered Medical Home.
Plans for the Future
In order to continue its success with the self-management support index in FY 2018, VA intends
to continue to train primary care clinical staff to: utilize Veteran-centered communication and
health education skills to engage Veterans in care and care decisions; discuss healthcare goal-
setting and barriers with patients; and co-create self-management action plans. Self-
management support can be incorporated into daily practice in a variety of ways. These
include: Using all members of the care team; using each medical office visit to identify,
encourage, and track patients' behavior change efforts; incorporating self-management support
into shared medical appointments for chronic medical conditions; and supporting patients by
referring them to VHA and community-based Veteran-centered health education and self-
management support programs.
Patient Safety Indicator (PSI) 90 (#674)
FY 2013 FY 2014 FY 2015 FY 2016 FY 2017 FY 2018
Target Not
Available
Not
Available
Not
Available
Baseline Not
Available
TBD
Actual Not
Available
Not
Available
Not
Available
Not
Available
Analysis of Results
PSI 90 is defined by the Agency for Healthcare Quality and Research (AHRQ), which releases
software to calculate the measures. This measure is not currently available from AHRQ and
therefore cannot be reported.

26
Benefits
VA offers numerous significant benefits to our Nation’s Veterans. These benefits include access
to effective and convenient education through the Post 9/11 GI Bill and the Montgomery GI Bill,
sustainable employment opportunities through Vocational Rehabilitation and Employment
(VR&E), as well as special adaptations to housing through home loan guaranty. Additionally,
VA's Fiduciary program protects Veterans and other beneficiaries who, due to injury, disease, or
age, are unable to manage their VA financial affairs. Together, these benefits help promote
Veteran economic security and overall well-being.
Vocational Rehabilitation and Employment (VR&E) VR&E is for service-connected disabled Veterans with employment barriers who want to
overcome their disability-related challenges to become re-employed. VR&E Counselors
determine which of the following benefits a Veteran qualifies for:
A comprehensive rehabilitation evaluation to determine abilities, skills, and interests for
employment
Vocational counseling and rehabilitation planning for employment services
Employment services such as job-training, job-seeking skills, résumé development, and
other assistance that prepares individuals for work
Assistance finding and keeping a job, including the use of special employer incentives
and job accommodations
On-the-job training (OJT), apprenticeships, and non-paid work experiences
Post-secondary training at colleges, vocational, technical, or business schools
Supportive rehabilitation services including case management, counseling, and medical
referrals
Independent living services for those unable to work due to the severity of their
disabilities
In FY 2016, VA collected baseline data for new national performance measures for the VR&E
program.
VA leadership, the White House Policy Council, and the Office of Management and Budget
requested that VR&E Service evaluate its performance measures and develop new metrics. In a
January 2014 report, the U.S. Government Accountability Office recommended that VR&E
adopt a national model of Veteran success roughly similar to a college graduation rate. VR&E
Service recommended a six-year, as opposed to a four-year, completion model. This approach
aligned with the January 2014 GAO finding that 76 percent of the Veterans who completed the

27
VR&E program successfully did so within 6 years, based on the distribution of a VR&E cohort
studied by GAO.
The VR&E Class Success Model provides clearer and more intuitive accounting to stakeholders
on Veteran progress and employment outcomes. It also better reflects the program mission,
aligns with current graduation-rate reporting by institutes of higher learning, and reflects the
individualized needs of disabled Veterans.
To support overall Veteran success, in July 2015 VR&E implemented several new employee and
station-level measures. In FY 2016, VA collected baseline data for the new national
performance measures: Class Success Rate and Class Persistence Rate.
The Class Success Rate is the percentage of Veterans who achieve positive outcomes,
measured against all Veterans in their year group (cohort). Positive outcomes are a combined
measure of the number of Chapter 31 Employment Rehabilitations, Independent Living
Rehabilitations, Education Rehabilitations, Maximum Rehabilitation Gains, and Chapter 18 and
35 Rehabilitations achieved during a given fiscal year.
The Class Persistence Rate is the ratio of Veterans persisting in their enrollment who achieve
positive outcomes measured against all Veterans in their cohort.
Vocational Rehabilitation and Employment class success rate (VBA #600)
FY 2013 FY 2014 FY 2015 FY 2016 FY 2017 FY 2018
Target Not
Available
Not
Available
Not
Available
(Baseline) 55% 55%
Actual Not
Available
Not
Available
Not
Available
47%
Analysis of Results
The January 2014 GAO study found that 76 percent of the Veterans who successfully complete
the VR&E program and obtain suitable employment do so within 6 years.
Plans for the Future
VA continues to evaluate the targets for the National performance metrics as new data
becomes available. The targets for both FY 2017 and FY 2018 will be set at 55 percent.
Vocational Rehabilitation and Employment class persistence rate (VBA #601)
FY 2013 FY 2014 FY 2015 FY 2016 FY 2017 FY 2018
Target Not Not Not (Baseline) 70% 70%

28
Available Available Available
Actual Not
Available
Not
Available
Not
Available
72%
Analysis of Results
With roughly 72 percent of Veterans who entered plans of service in 2011 still persisting in
plans of service, these results are consistent with the finding that Veterans take an average of 6
years to successfully complete plans of service, to include the requisite education, training, and
ancillary services necessary to achieve employment, employability, or independence in daily
living. VA means to use the persistence measure in parallel with the success rate; the goal is to
complete the VR&E program in six years, but in many cases Veterans take longer due to
disability challenges.
Plans for the Future
VR&E Service will continue to monitor Class Persistence Rate across multiple class/cohort years
to re-validate baseline assumptions on Veteran participation, adjusting as necessary to provide
the most accurate depiction of Veteran participation possible.
Vocational Rehabilitation and Employment outcome rate (VBA #602)
FY 2013 FY 2014 FY 2015 FY 2016 FY 2017
Target Not Available Not Available Not Available (Baseline) 70%
Actual Not Available Not Available Not Available 69%
Analysis of Results
The Employment Outcome rate is the proportion of Veterans who VA determined to be ready
to seek employment (Job Ready) who actually achieved employment in a given fiscal year. The
Employment Outcome rate was initially intended to assess the efficacy of the Regional Office-
and Counselor-level Positive Outcomes Measure during the first year of its implementation (FY
2016).
Plans for the Future
Job Ready determinations are commensurate and proportionate with positive outcomes.
Therefore, VR&E Service is requesting to remove this essentially redundant measure for the FY
2018 Agency Performance Plan.
Other Elements of Economic Security

29
Percent of Montgomery GI Bill or Post 9/11 GI Bill participants who successfully completed
an education or training program (VBA #494)
FY 2013 FY 2014 FY 2015 FY 2016 FY 2017 FY 2018
Target Not
Available
Not
Available
Not
Available
Not
Available
Baseline TBD
Actual Not
Available
Not
Available
Not
Available
Not
Available
Analysis of Results
On August 10, 2016, VA provided draft graduation rates to four-year institutions of higher
learning (IHLs). VA received several requests from schools for more time to confirm their
graduation data. Absent this confirmation, VA decided to postpone the publication of four-year
IHL information.
Plans for the Future
VA is revising its current four-year IHL data and validation process to ensure the data is more
closely aligned with the school’s graduation rate. VA anticipates publishing four-year IHL data
in September 2017.
Default Resolution Rate (VBA #226)
FY 2013 FY 2014 FY 2015 FY 2016 FY 2017 FY 2018
Target 82% 83% 79% 80% 80% 81%
Actual 79% 80% 83% 84%
Analysis of Results
The default resolution rate measures the percentage of Veteran borrowers of VA-guaranteed
home loans that were able to avoid foreclosure and/or potential homelessness after becoming
delinquent on their mortgages. VA met and exceeded the target for the “Default Resolution
Rate” in FY 2016. Factors contributing to this success included improving economic conditions;
a sustained period of low-interest rates; and the ability of VA staff to leverage VA Loan
Electronic Reporting Interface (VALERI) to identify borrowers who initially default on their
mortgage payments. This proactive default intervention allows VA to identify suitable loss-
mitigation options, such as repayment plans, loan forbearance, loan modification, compromise
(short) sales, or deeds-in-lieu of foreclosure.
Plans for the Future
VA sets the default resolution rate targets based on national mortgage and economic trends in
the housing industry. VA continuously monitors these trends and adjusts performance targets
accordingly. VA will continue to leverage the web-based servicing application, VALERI, to track

30
data on VA-guaranteed home loans, and to provide proactive default and foreclosure avoidance
assistance to Veteran borrowers who are behind on their VA-guaranteed mortgage payment.
Fiduciary Program: Average Days to Complete Initial Appointment Process (VBA 647)
FY 2013 FY 2014 FY 2015 FY 2016 FY 2017 FY 2018
Target Not
Available
Not
Available
Not
Available
244 149 88
Actual Not
Available
Not
Available
Not
Available
287
*Prior to FY 2016, the initial appointment consisted of only the field examination. Starting in 2016, VBA expanded
the initial appointment process to also include the finalization of the incompetency decision and the release of
payment.
The fiduciary program’s mission is to protect beneficiaries who, as a result of injury, disease,
the infirmities of advanced age, or by reason of being less than age 18, are unable to manage
their VA benefits. When VA receives medical evidence that indicates the beneficiary can no
longer manage his or her VA benefits, VA may decide that the individual needs the assistance of
a fiduciary that is responsible for managing that VA benefit. VA conducts a field examination
prior to the initial appointment of a fiduciary, which includes a face-to-face interview with the
beneficiary and proposed fiduciary. Generally, an assessment of the fiduciary’s fitness to serve
will include a criminal background check and review of credit history.
Analysis of Results
VA did not reach the target for “Average Days to Complete Initial Appointment Process” in FY
2016. Prior to FY 2016, VA captured the average days to conduct the initial appointment field
examination and did not measure the entire initial appointment process. VA updated the
performance measure in FY 2016 to a Veteran-centric measure to capture timeliness of the
initial appointment process to include the finalization of the incompetency determination,
appointment of a fiduciary, and the release of any retroactive benefits. In FY 2016, VA
identified approximately 14,000 Veterans and survivors who had previously issued proposals
after VA found them unable to manage their VA benefits, but for whom VA did not finally
conclude the proposals. As a result, VA did not appoint fiduciaries for them. The addition of
the 14,000 Veterans and survivors significantly increased the existing inventory of cases
pending appointment of fiduciaries, which caused delays in the completion of the initial
appointments.
Plans for the Future
VA is developing technology enhancements and procedural changes to more efficiently
complete field examinations. We are also updating all policies and procedures in the Fiduciary
31
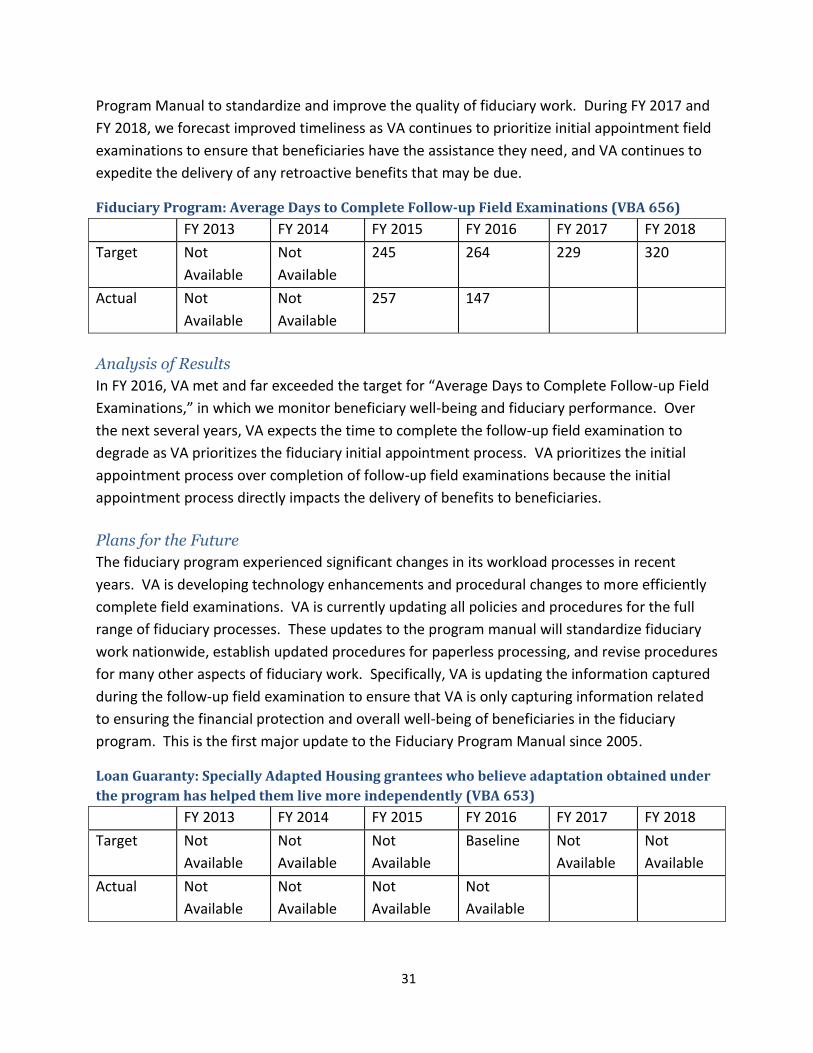
Program Manual to standardize and improve the quality of fiduciary work. During FY 2017 and
FY 2018, we forecast improved timeliness as VA continues to prioritize initial appointment field
examinations to ensure that beneficiaries have the assistance they need, and VA continues to
expedite the delivery of any retroactive benefits that may be due.
Fiduciary Program: Average Days to Complete Follow-up Field Examinations (VBA 656)
FY 2013 FY 2014 FY 2015 FY 2016 FY 2017 FY 2018
Target Not
Available
Not
Available
245 264 229 320
Actual Not
Available
Not
Available
257 147
Analysis of Results
In FY 2016, VA met and far exceeded the target for “Average Days to Complete Follow-up Field
Examinations,” in which we monitor beneficiary well-being and fiduciary performance. Over
the next several years, VA expects the time to complete the follow-up field examination to
degrade as VA prioritizes the fiduciary initial appointment process. VA prioritizes the initial
appointment process over completion of follow-up field examinations because the initial
appointment process directly impacts the delivery of benefits to beneficiaries.
Plans for the Future
The fiduciary program experienced significant changes in its workload processes in recent
years. VA is developing technology enhancements and procedural changes to more efficiently
complete field examinations. VA is currently updating all policies and procedures for the full
range of fiduciary processes. These updates to the program manual will standardize fiduciary
work nationwide, establish updated procedures for paperless processing, and revise procedures
for many other aspects of fiduciary work. Specifically, VA is updating the information captured
during the follow-up field examination to ensure that VA is only capturing information related
to ensuring the financial protection and overall well-being of beneficiaries in the fiduciary
program. This is the first major update to the Fiduciary Program Manual since 2005.
Loan Guaranty: Specially Adapted Housing grantees who believe adaptation obtained under
the program has helped them live more independently (VBA 653)
FY 2013 FY 2014 FY 2015 FY 2016 FY 2017 FY 2018
Target Not
Available
Not
Available
Not
Available
Baseline Not
Available
Not
Available
Actual Not
Available
Not
Available
Not
Available
Not
Available

32
The goal of the Specially Adapted Housing grant program is to provide Veterans with certain
severe service-connected disabilities the ability to live independently in their homes. This key
program outcome metric collects information directly from Veterans about their ability to live
independently. Data collected provides the program with the level of success realized in
meeting its mission. VA also uses these results as an indicator of whether it can identify ways
to enhance the program for greater levels of independent living.
Analysis of Results
The Specially Adapted Housing Survey was not administered during FY 2016, nor will it be
administered in FY 2017. The survey instrument was revised and otherwise refined to ensure
statistical validity. Revisions to this survey instrument have been submitted to the Office of
Management and Budget (OMB) under the Paperwork Reduction Act. Pending approval of the
revised survey instrument, development of a sound research design, and upon completion of
data collection, VA will use the survey results to develop a baseline target for subsequent fiscal
years.
Plans for the Future
VA intends to collect baseline data for this measure in FY 2018.
Objective Progress Update Summary
Access the VA FY 2014-2020 Strategic Plan for full Strategic Objective narratives.
Achievements:
Economic Security
Fiduciary program hubs:
o Completed over 89,000 field examinations in FY16 – a 6 percent increase from
FY15.
o Completed over 57,000 accountings in FY16 – nearly 28 percent more than FY15.
o Served more than 198,000 beneficiaries in FY16 – 8 percent more than FY15, to
protect beneficiaries who are unable to manage their VA benefits.
Concluded the Veterans Economic Communities Initiative (VECI) innovation pilot to
leverage data and create performance driven service offerings tailored by local
community champions. National VA data was made available at the local level to help
build understanding and improve each provider’s ability to respond to the needs of
Veterans in their community. VECI:
o Engaged over 190,000 community stakeholders, which included local government
leaders, businesses, educational institutions, and nonprofit organizations across
25 of the nation’s most populated metropolitan areas.
33
o Enabled more than 19,500 employers to post jobs, commit 1.2 million positions to
Veterans, and hire about 743,000 Veterans.
o Provided transitioning Servicemembers, Veterans, and their families access to an
array of services and tools worth approximately $1 billion at no cost to taxpayers
and VA saved tens of millions of dollars annually.
Education:
VA collaborated with interagency partners and launched the GI Bill Comparison Tool to
help Veterans and Servicemembers determine where to use their earned educational
benefits. Since its inception in 2014, the Comparison Tool has received over 5 million
unique page views and searched over 3 million schools.1
Launched the GI Bill Feedback System; a centralized online reporting system designed for
Veterans, Servicemembers, and eligible dependents to report negative experiences with
educational institutions that receive funding from Federal military and Veterans
educational benefits programs. Since the system was launched on January 30, 2014, VA
received over 78,942 landing-page views and resolved over 7,754 complaints, mostly
with financial issues (tuition/fees) and the quality of education. VA’s Education Service
continues to protect Veterans from predatory institutions of higher learning including
those that violate the law by using deceptive advertising.
The VetSuccess On Campus (VSOC) program provided counseling and coordinated on-
campus benefits and services to help Veterans adjust to college life. By the end of
February 2016, 79 VSOC counselors worked at 94 campuses and enabled nearly 80,000
Veterans, Servicemembers, and eligible dependents to achieve their education and
employment goals.
VA expanded eligibility criteria for the Marine Gunnery Sergeant John David Fry
Scholarship (Fry Scholarship) to include surviving spouses of Servicemembers who died in
the line of duty after September 10, 2001. This change entitled eligible spouses to the
maximum of 36 months of Post-9/11 GI Bill benefits which includes payments for tuition
and fees, a monthly housing allowance, and stipend for books and supplies. During
FY16, 2,024 children and 1,018 spouses received Post-9/11 GI Bill benefits under the Fry
Scholarship.
Education & Employment:
Vocational Rehabilitation and Employment (VR&E) Service case management of
wounded warriors and disabled Veterans grew to nearly 137,000 while increasing
positive outcomes. In FY 2016:
o 9,814 rehabilitated Veterans achieved suitable employment goals – a 7.5 percent
increase over FY15.
1 http://department-of-veterans-affairs.github.io/gi-bill-comparison-tool/

34
o 14,349 Veterans achieved positive outcomes – a 6.5 percent increase over FY15.
o 1,151 severely disabled Veterans achieved their independent living goals.
VR&E has also transformed itself to better support Veterans and their counselors with
new performance measures encouraging active casework; new online medical referrals
to all counselors; and new VR&E tele-counseling technology/procedures (the first VBA
tele-benefit).
According to the VR&E Longitudinal Study, 2016 Annual Report for FY 2015:
o Approximately 90 percent of all VR&E cohorts reported moderate to high
satisfaction with the VR&E program.
o For all cohorts, more than 90 percent of Veterans who received rehabilitation
from employment plans were employed in the past year, compared to less than
half of Veterans who discontinued their employment plans.
Employment:
Established the Veterans Employment Center (VEC) to connect Veterans and their
families with employment, career-development opportunities, economic programs and
employment services available from Federal agency partners like Departments of Labor,
Education, and Defense. Since April 2014 through September 2016, the VEC provided
links to 2.2 million jobs offered from over 1,500 committed employers and received more
than 28.8 million page-views.2
Implemented Homeless Veterans Community Employment Services (HVCES) at each VA
medical center to expand employment opportunities and provide a full range of
employment services to all homeless, chronically homeless, and Veterans at-risk for
homelessness.3
Housing:
Even though home ownership is at the lowest rate in over five decades, VA managed a
record setting home loan origination volume of over 705,000 valued at $179 billion
during FY 2016, and approved 1,914 Specially Adapted Housing grants, the highest in
program history, exceeding $100 million to adapt the homes of Veterans with severe
service-connected disabilities.
Assisted a record number (over 97,000) of Veterans, Servicemembers, and their families
avoid foreclosure, which saved approximately $3 billion in claim payments.
Homelessness:
2 https://www.vets.gov/
3 http://www.va.gov/HOMELESS/HVCES.asp
35
During FY16, two U.S. states (Commonwealth of Virginia and Connecticut) and 31
communities declared an end to Veteran homelessness,4 and 859 local leaders (Mayors,
Governors, other community leaders) signed on to end Veteran Homelessness.
VA’s Homeless Providers Grant and Grant Per Diem (GPD) Programs5 provided annual
funds for community agencies that serve homeless Veterans. During FY16, 71 percent of
Veterans discharged from VA funded residential treatment programs – Grant and Per
Diem (GPD) or Domiciliary Care for Homeless Veterans (DCHV) – moved to permanent
housing, and 92 percent of at risk Veterans and their families participating in Support
Services for Veteran Families were prevented from becoming homeless.
PenFed Foundation and VA partnered to provide emergency financial assistance for
Veterans experiencing financial setbacks and at risk for homeless.
VA received $750,000 from the Chrysler Liquidation Trust, which allowed VA to support
vulnerable homeless Veterans in Los Angeles, Detroit and Philadelphia.
The Benevolent and Protective Order of Elks of the United States of America (BPO Elks)
partnered with VA and committed $4 million over a 4-year period to help end Veteran
homelessness. The BPO Elks are calling on their 800,000 members to support homeless
Veteran efforts in their communities.
Challenges:
1. Information technology, compliance, and enforcement activities were significant
challenges for VA’s Education Service. During June 2016, the Department of Defense
implemented a massive update of over 1 million records, which changed military
service data in the VA/DoD Identity Repository (VADIR) database and reduced the
automation of Chapter 33 supplemental claims in the Long Term Solution (LTS). New
development is required to expand LTS automated processing and replace high-risk
legacy IT systems.
2. In August 2016, VA held a joint symposium on safeguarding the integrity of GI Bill
benefits that opened communication lines between Federal agencies and a large
variety of service organizations. This provided VA the opportunity to discuss how to
better assist Veteran students in the event schools abruptly closed.
3. In order to continue reducing homelessness, community help is needed to provide
affordable housing options for Veterans, opportunities for meaningful and
sustainable employment, and improved access to mainstream programs and
services.
4 http://www.va.gov/HOMELESS/endingVetshomelessness.asp
5 http://www.va.gov/homeless/GPD.asp
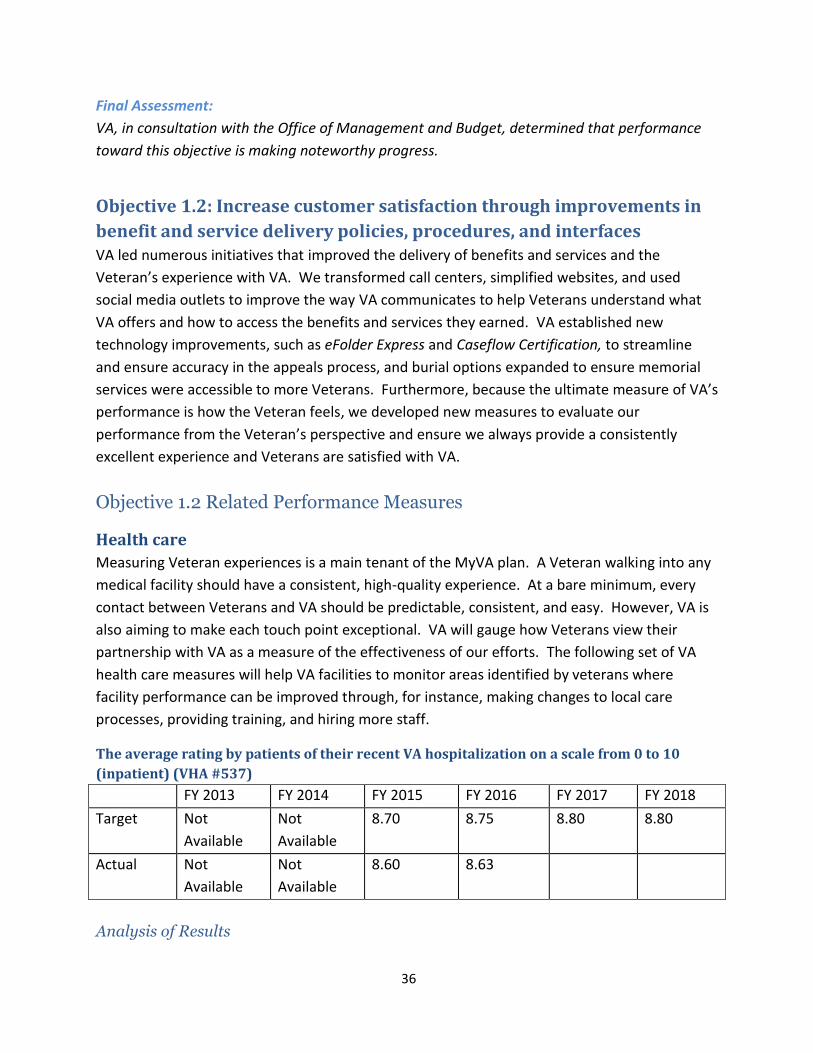
36
Final Assessment:
VA, in consultation with the Office of Management and Budget, determined that performance
toward this objective is making noteworthy progress.
Objective 1.2: Increase customer satisfaction through improvements in
benefit and service delivery policies, procedures, and interfaces VA led numerous initiatives that improved the delivery of benefits and services and the
Veteran’s experience with VA. We transformed call centers, simplified websites, and used
social media outlets to improve the way VA communicates to help Veterans understand what
VA offers and how to access the benefits and services they earned. VA established new
technology improvements, such as eFolder Express and Caseflow Certification, to streamline
and ensure accuracy in the appeals process, and burial options expanded to ensure memorial
services were accessible to more Veterans. Furthermore, because the ultimate measure of VA’s
performance is how the Veteran feels, we developed new measures to evaluate our
performance from the Veteran’s perspective and ensure we always provide a consistently
excellent experience and Veterans are satisfied with VA.
Objective 1.2 Related Performance Measures
Health care
Measuring Veteran experiences is a main tenant of the MyVA plan. A Veteran walking into any
medical facility should have a consistent, high-quality experience. At a bare minimum, every
contact between Veterans and VA should be predictable, consistent, and easy. However, VA is
also aiming to make each touch point exceptional. VA will gauge how Veterans view their
partnership with VA as a measure of the effectiveness of our efforts. The following set of VA
health care measures will help VA facilities to monitor areas identified by veterans where
facility performance can be improved through, for instance, making changes to local care
processes, providing training, and hiring more staff.
The average rating by patients of their recent VA hospitalization on a scale from 0 to 10
(inpatient) (VHA #537)
FY 2013 FY 2014 FY 2015 FY 2016 FY 2017 FY 2018
Target Not
Available
Not
Available
8.70 8.75 8.80 8.80
Actual Not
Available
Not
Available
8.60 8.63
Analysis of Results

37
VA essentially met the target for the “The average rating by patients of their recent VA
hospitalization on a scale from 0 to 10 (inpatient)” measure in FY 2016, and even improved
slightly compared to 2015. VA has invested considerable human and financial resources to
improve the patient experience for our Veterans, and will continue our efforts to affect
improvement in those experiences.
Percent of Primary Care patients who respond "Always" and "Usually" regarding their ability
to get an appointment for a routine checkup as soon as needed (VHA #677)
FY 2013 FY 2014 FY 2015 FY 2016 FY 2017** FY 2018**
Target Not
Available
Not
Available
Not
Available
(Baseline) 85% 87%
Actual Not
Available
Not
Available
Not
Available
84%
**Note: 89.3% is the 75th percentile
Percent of Specialty Care patients who respond "Always" and "Usually" regarding their
ability to get an appointment for a routine checkup as soon as needed (VHA #683)
FY 2013 FY 2014 FY 2015 FY 2016 FY 2017** FY 2018**
Target Not
Available
Not
Available
Not
Available
(Baseline) 83% 85%
Actual Not
Available
Not
Available
Not
Available
82%
**Note: 88.2% is the 75th percentile
Percent of Primary Care Patients who respond "Always" and "Usually" regarding their ability
to get an appointment for needed care right away (VHA #682)
FY 2013 FY 2014 FY 2015 FY 2016 FY 2017 FY 2018**
Target Not
Available
Not
Available
Not
Available
(Baseline) 73% 75%
Actual Not
Available
Not
Available
Not
Available
72%
**Note: 79.3% is the 75th percentile
Percent of Specialty Care Patients who respond "Always" and "Usually" regarding their
ability to get an appointment for needed care right away (VHA #680)
FY 2013 FY 2014 FY 2015 FY 2016 FY 2017** FY 2018**
Target Not
Available
Not
Available
Not
Available
(Baseline) 73% 75%
Actual Not
Available
Not
Available
Not
Available
72%
**Note: 79.6% is the 75th percentile

38
(Composite Measure) The average of the percent “Always” or “Usually” responses for four
access measures found in the Patient Centered Medical Home (PCMH) survey and the
Specialty Care Consumer Assessment of Health Providers and Systems (CAHPS) Survey.
(#681)
FY 2013 FY 2014 FY 2015 FY 2016 FY 2017** FY 2018**
Target Not
Available
Not
Available
Not
Available
(Baseline) 79.3% or
15% above
Baseline
Actual Not
Available
Not
Available
Not
Available
87%
**Note: 79.6% is the 75th percentile
Analysis of Results
Measures of access are being reported to VHA leadership, managers, and frontline staff at the
national, network, and facility levels. There is considerably more variation at the facility level
than there is nationally. The SHEP measures for urgent and routine access to primary care are
accurate indicators of facilities experiencing high patient growth, clinical turnover, difficulty in
hiring staff, or other factors that could adversely impact patient scheduling.
Both Urgent and Routine care measures of Access are higher in the Primary Care setting than
they are in the Specialty Care setting. Measures of Access to Routine care are higher than those
for Urgent care in both the Primary and Specialty care settings.
VHA has invested considerable human and financial resources to improve the patient
experience for our Veterans. VHA will continue the analysis of results to help understand what
impacts access and what can be done improve care for our nations Veterans.
Plans for the Future
Monthly reporting of these metrics will continue at national, network, and facility levels. VHA
will continue to provide reports that drill down into the data to understand what is creating
Veteran satisfaction and dissatisfaction. In addition, VHA will continue to analyze employee
engagement and other All Employee Survey data, as it relates to patient satisfaction. To help
facilitate understanding of the data, VHA has developed a Pyramid Analytics data cube to be
used by leadership, managers, and front-line staff alike. This new tool is will allow users to
easily select metrics of interest and plot them at the national, network, facility, and division
levels. This new tool should help VHA managers target those aspects of services provided to

39
Veterans that are not serving Veterans well. The Pyramid Analytics tool was released in January
2017 with local and national educational efforts continuing throughout the year.
The average patient rating VA primary care provider on a scale from 0 to 10 on the Patient
Centered Medical Home Survey (VHA #544)
FY 2013 FY 2014 FY 2015 FY 2016 FY 2017 FY 2018*
Target Not
Available
Not
Available
8.60 8.65 8.70 8.70
Actual Not
Available
Not
Available
8.46 8.54
*Note: 8.82 is the 75th percentile
Analysis of Results
VHA met the target score for this measure in FY 2016 when the 5 percent tolerance rule is
taken into account, and also had a significant improvement over FY 2015. This metric is being
reported to VHA leadership, managers, and frontline staff at the national, network, and facility
levels. Naturally, there is considerably more variation at the facility level than there is
nationally. VHA produces a Key Driver analysis for each facility to help managers understand
those aspects of care that drive the Veteran’s rating of their provider up or down. With that
knowledge and understanding, facility leadership can implement policies and practices that can
be used to improve the patient experience for our Veterans.
Plans for the Future
Like the four preceding measures, monthly reporting of this metric will continue at national,
network, and facility levels. VHA will continue to provide reports that drill down into the data
to understand what is creating Veteran satisfaction and dissatisfaction.
The average patient rating of VA specialty care provider on a scale from 0 to 10 on the
Specialty Care Survey (VHA #673)
FY 2013 FY 2014 FY 2015 FY 2016 FY 2017 FY 2018
Target Not
Available
Not
Available
Not
Available
(Baseline) 8.60 8.65
Actual Not
Available
Not
Available
Not
Available
8.54
*Note: 8.74 is the 75th percentile
Analysis of Results
The Average Patient Rating of VA Specialty Care Provider is a new metric for VHA in FY 2016 and
in-depth analysis is ongoing. The Specialty Care population is more complicated than Primary
Care in that it includes a wide array of clinic types, and a sicker and older patient population.

40
This metric is being reported to VHA leadership, managers, and frontline staff at the national,
network, and facility levels. Naturally, there is considerably more variation at the facility level
than there is nationally. VHA produces a Key Driver analysis for each facility to help managers
understand those aspects of care that drive the Veteran’s rating of their provider up or down.
With that knowledge and understanding, facility leadership can implement policies and
practices that can be used to improve the patient experience for our Veterans. The Specialty
Care population is more complicated than Primary Care in that it includes a wide array of clinic
types, and a sicker and older patient population. Additional analysis is underway to examine
these and other factors that drive Veteran experiences in the Specialty Care setting.
Plans for the Future
Like the five preceding measures, monthly reporting of this metric will continue at national,
network, and facility levels. VHA will continue to provide reports that drill down into the data
to understand what is creating Veteran satisfaction and dissatisfaction.
Veterans’ Experience with VA
The Veterans’ Experience Office (VEO) is leading a powerful effort to improve customer
experiences across VA, nationwide. The office’s goal: fostering the delivery of effective and
easy customer experiences in which Veterans feel valued. VA will achieve this goal the same
way the world’s most successful companies do: by listening to our customers – Veterans, their
families, and supporters – when they describe how they want things to work. To measure VA’s
progress in achieving the Veteran Experience Agency Priority Goal, the Department developed
and tested four new survey questions to ask every Veteran, for every line of business, and
across every channel of interaction. Veterans will be asked their level of agreement with four
statements, one assessing overall trust in VA, and three capturing specific aspects of their
experience with VA. The responses to these survey questions will measure VA’s ability to
progress toward achieving this goal.
Trust in VA among America’s Veterans (VEO 30) (APG measure)
FY 2013 FY 2014 FY 2015 FY 2016 FY 2017 FY 2018
Target Not
Available
Not
Available
Not
Available
(Baseline) 90% 90%
Actual Not
Available
Not
Available
Not
Available
60%
To build trust among our customers, VA must consistently deliver customer experiences
marked by effectiveness, ease, and emotion. To ensure comparability across VA’s disparate
service and product lines, the same measures of Trust and Customer Experience are applied.
VA has developed a baseline for this measure in FY 2016.

41
Analysis of Results
VA met its goal by collecting survey data from customers who used VA services from January
2016 – December 2016. The results indicate an observed increase in trust for FY16 reflecting
improvements in Veterans experience. This increase reflects a valid trend given the consistent
methodology over time. During FY17, VEO refined its survey methodology to include survey
questions that address Veteran customer experience and overall trust into one measurement in
support of VEO’s APG requirement. The four questions are:
“I trust VA to fulfill our country’s commitment with Veterans;”
“I got the service I needed;”
“It was easy to get the service I needed;” and
“I felt like a valued customer.”
These questions measure both trust and Veteran customer experience.
Plans for the Future
VA will deploy a real-time Veterans experience measurement tool to empower employees at all
VA levels with actionable insights that drive continuous Veterans experience improvements.
VA will collect three tiers of customer experience feedback:
Point of service feedback through Veterans Experience (VE) Feedback Tool: serves as an early
warning indicator that enables VA to resolve Veteran’s issues, concerns, and questions in the
moment at the point of service, thereby enhancing local customer recovery. Through the VE
Feedback tool, leaders can view actionable data at the local, VISN, and national levels to better
inform resource allocation, emergent priorities and manage customer expectations proactively
based on trend analysis.
The VE Feedback tool provides:
Digital comment card (Veterans submit voluntary feedback)
Case management

42
Workflow management and alerts
Facility and service-level data
Roles-based reporting
Customized dashboard
Identification of key experience drivers
Starting first at the Baltimore VA Medical Center in spring 2017 and thereafter at medical
centers across the country, the VA Feedback Tool will allow Veterans the ability to provide
feedback directly to Patient Advocates via secure web-link at a time and place of their choosing.
Patient Advocates will have the ability to instantly address this feedback, identify trends, and
support caregivers in the pursuit of providing a great VA experience to our nation’s Veterans.
VEO will collaborate with VHA to replace the Patient Advocate Tracking System (PATS) system
in the medical centers to introduce this real-time patient feedback capability.
Service-level patterns: drives daily business decisions by leveraging real time Veterans
feedback around their most impactful interactions with VA. This feedback allows VA to
determine how Veterans feel, and understand what is and is not working for Veterans at the
actionable service-level. Using this feedback, we can answer questions like:
What does VA need to continue to do?
What does VA need to improve on?
What does VA need to stop doing?
Enterprise trends: gauge strategic impact of daily operations and enables VA to monitor its
progress towards increasing Veterans trust. VEO will continue to monitor quarterly VA’s
progress towards 90 percent trust in VA.
Benefits – Claims
VA fundamentally redesigned and streamlined the delivery of benefits and services to Veterans,
their eligible dependents, and survivors. As of September 30, 2016, VA reduced the inventory
of disability claims requiring rating decisions by 57 percent, from 883,930 in July 2012 to
377,107. VA also reduced the number of disability claims pending more than 125 days by 88
percent, from 611,073 in March 2013 to 71,690. In FY 2016, VA completed 1.3 million claims
containing 5.76 million issues. Today, Veterans wait about 123 days for claims decisions, which
is 225 days fewer than the average waiting period in September 2013. The diagram on the next
page illustrates the most basic steps of processing claims for compensation or pension.

43
VBA Receives &
Establishes Control of
Claim
VBA Reviews Claim
and Gathers Evidence
As Needed
Involved in providing evidence are: -Veterans -Department of Defense -Private and/or VA Health-Care Providers
VBA Follows Up
with Evidence
Requests as
Needed
VBA Decides the Claim
VBA Notifies Veteran
of Claim Decision
Veteran May
Appeal if
Disagrees
Veterans Submits
Application
We used the following performance metrics to track our progress toward reducing the number
of disability rating claims pending more than 125 days, while providing highly accurate
decisions on ratings claims.
Percentage of VA Disability Rating Claims pending more than 125-days (VBA #308)
FY 2013 FY 2014 FY 2015 FY 2016 FY 2017 FY 2018
Target 40% 50% 0% 20% 15% 14%
Actual 58% 47% 20% 19%
Percentage of Disability Compensation Rating Claims inventory pending more than 125-days
(VBA #576)
FY 2013 FY 2014 FY 2015 FY 2016 FY 2017 FY 2018
Target 40% 50% 0% 20% 15% 14%
Actual 59% 48% 20% 20%
Analysis of Results
VA reached the targets for both “Percentage of VA Disability Rating Claims pending more than
125 days” and “Percentage of VA Disability Compensation Claims Inventory pending more than
125 days” in FY 2016. The following factors contributed to these successes:
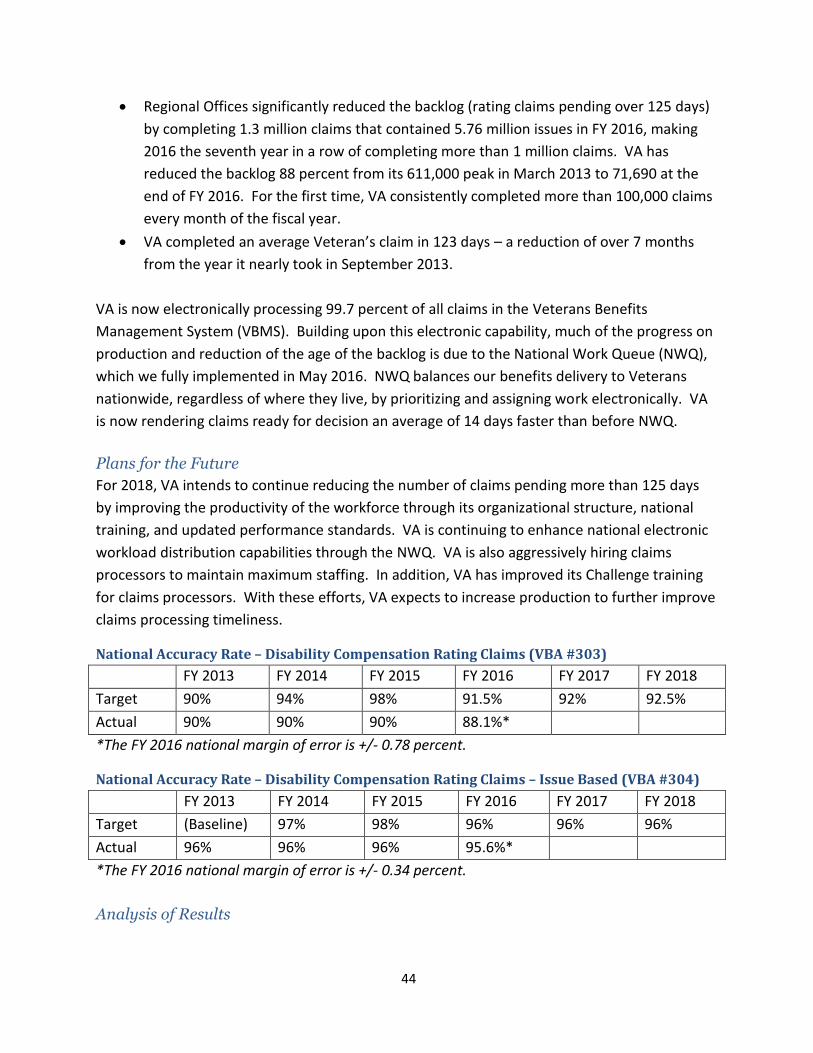
44
Regional Offices significantly reduced the backlog (rating claims pending over 125 days)
by completing 1.3 million claims that contained 5.76 million issues in FY 2016, making
2016 the seventh year in a row of completing more than 1 million claims. VA has
reduced the backlog 88 percent from its 611,000 peak in March 2013 to 71,690 at the
end of FY 2016. For the first time, VA consistently completed more than 100,000 claims
every month of the fiscal year.
VA completed an average Veteran’s claim in 123 days – a reduction of over 7 months
from the year it nearly took in September 2013.
VA is now electronically processing 99.7 percent of all claims in the Veterans Benefits
Management System (VBMS). Building upon this electronic capability, much of the progress on
production and reduction of the age of the backlog is due to the National Work Queue (NWQ),
which we fully implemented in May 2016. NWQ balances our benefits delivery to Veterans
nationwide, regardless of where they live, by prioritizing and assigning work electronically. VA
is now rendering claims ready for decision an average of 14 days faster than before NWQ.
Plans for the Future
For 2018, VA intends to continue reducing the number of claims pending more than 125 days
by improving the productivity of the workforce through its organizational structure, national
training, and updated performance standards. VA is continuing to enhance national electronic
workload distribution capabilities through the NWQ. VA is also aggressively hiring claims
processors to maintain maximum staffing. In addition, VA has improved its Challenge training
for claims processors. With these efforts, VA expects to increase production to further improve
claims processing timeliness.
National Accuracy Rate – Disability Compensation Rating Claims (VBA #303)
FY 2013 FY 2014 FY 2015 FY 2016 FY 2017 FY 2018
Target 90% 94% 98% 91.5% 92% 92.5%
Actual 90% 90% 90% 88.1%*
*The FY 2016 national margin of error is +/- 0.78 percent.
National Accuracy Rate – Disability Compensation Rating Claims – Issue Based (VBA #304)
FY 2013 FY 2014 FY 2015 FY 2016 FY 2017 FY 2018
Target (Baseline) 97% 98% 96% 96% 96%
Actual 96% 96% 96% 95.6%*
*The FY 2016 national margin of error is +/- 0.34 percent.
Analysis of Results
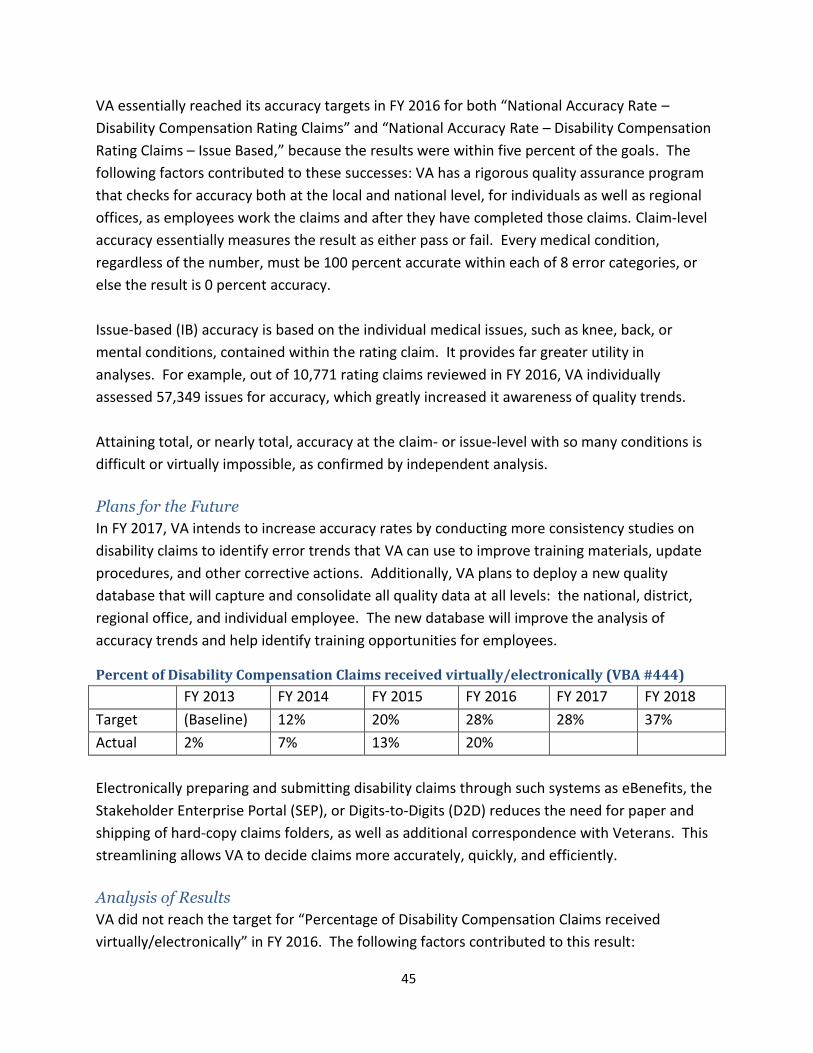
45
VA essentially reached its accuracy targets in FY 2016 for both “National Accuracy Rate –
Disability Compensation Rating Claims” and “National Accuracy Rate – Disability Compensation
Rating Claims – Issue Based,” because the results were within five percent of the goals. The
following factors contributed to these successes: VA has a rigorous quality assurance program
that checks for accuracy both at the local and national level, for individuals as well as regional
offices, as employees work the claims and after they have completed those claims. Claim-level
accuracy essentially measures the result as either pass or fail. Every medical condition,
regardless of the number, must be 100 percent accurate within each of 8 error categories, or
else the result is 0 percent accuracy.
Issue-based (IB) accuracy is based on the individual medical issues, such as knee, back, or
mental conditions, contained within the rating claim. It provides far greater utility in
analyses. For example, out of 10,771 rating claims reviewed in FY 2016, VA individually
assessed 57,349 issues for accuracy, which greatly increased it awareness of quality trends.
Attaining total, or nearly total, accuracy at the claim- or issue-level with so many conditions is
difficult or virtually impossible, as confirmed by independent analysis.
Plans for the Future
In FY 2017, VA intends to increase accuracy rates by conducting more consistency studies on
disability claims to identify error trends that VA can use to improve training materials, update
procedures, and other corrective actions. Additionally, VA plans to deploy a new quality
database that will capture and consolidate all quality data at all levels: the national, district,
regional office, and individual employee. The new database will improve the analysis of
accuracy trends and help identify training opportunities for employees.
Percent of Disability Compensation Claims received virtually/electronically (VBA #444)
FY 2013 FY 2014 FY 2015 FY 2016 FY 2017 FY 2018
Target (Baseline) 12% 20% 28% 28% 37%
Actual 2% 7% 13% 20%
Electronically preparing and submitting disability claims through such systems as eBenefits, the
Stakeholder Enterprise Portal (SEP), or Digits-to-Digits (D2D) reduces the need for paper and
shipping of hard-copy claims folders, as well as additional correspondence with Veterans. This
streamlining allows VA to decide claims more accurately, quickly, and efficiently.
Analysis of Results
VA did not reach the target for “Percentage of Disability Compensation Claims received
virtually/electronically” in FY 2016. The following factors contributed to this result:

46
The projected targets versus actual results attempt to compare data that is actually not
comparable. This discrepancy occurs because electronic claims submissions automatically
create tracking end-products, even when other claims may exist for the same claimant.
However, VA procedures typically require the consolidation of simultaneous pending claims
from the same Veteran, which is easily done with claims submitted on paper, but done less
easily with electronic claims. Therefore, VA has modified the target goal for FY17 to correlate
with the data that it can capture for paper claims vs. electronic claims.
Plans for the Future
For FY 2018, VA will continue to persuade new Veterans Service Organizations to use D2D,
which will allow direct data exchanges for claim submissions. VA will also continue to allow for
electronic claim submissions through Veterans Online Application (VONAPP) Direct Connect,
located in eBenefits and SEP. Additionally, starting in FY 2017, vets.gov will begin transmitting
electronic disability compensation claims. Vets.gov is a single portal that Veterans will use to
do business with VA. Electronic claim submission not only reduces the claim processing time by
eliminating the need for mail, but also provides immediate claim submission feedback, and
allows real-time viewing of the documents submitted in the user’s electronic eFolder.
Percentage of Dependency and Indemnity Compensation (DIC) Claims inventory pending
more than 125 days (VBA #578)
FY 2013 FY 2014 FY 2015 FY 2016 FY 2017 FY 2018
Target 38% 20% 0% 15% 9% 9%
Actual 26% 16% 15% 18%
Dependency and Indemnity Compensation (DIC) is a monthly benefit paid to eligible survivors
of: Servicemembers who died while on active duty, active duty for training, or inactive duty
training; Veterans whose death resulted from service-connected injury or disease; Veterans
whose death resulted from nonservice-connected injury or disease, and who were totally
disabled from their service-connected disability for certain minimal periods of time and
sometimes under certain situations, such as a former prisoner of war.
Analysis of Results
VA did not achieve the target for “Percentage of Dependency and Indemnity Compensation
Claims inventory pending more than 125 days.” VBA’s competing priorities have indirectly
contributed to technology limitations in VBMS, and Enterprise Veterans Self-Service for the
Pension Management Centers (PMCs). Claims processors currently must review, develop, and
promulgate benefit decisions in multiple systems. Delays in sunsetting older business systems
have led to less efficient claims processing as employees must access multiple systems.

47
PMCs nationwide diverted resources from processing DIC claims by also contributing to VBA
special missions in FY 2016, such as working 41,736 compensation dependency claims.
Plans for the Future
DIC claims processing will continue to transition to VBMS, with its electronic processing
fostering expedited completion of claims. Also, VA continues to look for opportunities to
automate claims processing to reduce the need for human intervention, resulting in increased
accuracy and efficiency.
Non-Rating Claims – Compensation Average Days Pending (ADP) (VBA #654)
FY 2013 FY 2014 FY 2015 FY 2016 FY 2017 FY 2018
Target Not
Available
Not
Available
Not
Available
290 320 318
Actual 274 338 350
(Baseline)
355
Non-Rating Claims – Compensation Average Days to Complete (ADC) (VBA #686)
FY 2013 FY 2014 FY 2015 FY 2016 FY 2017 FY 2018
Target Not
Available
Not
Available
Not
Available
232 143 144
Actual 112 129 160
(Baseline)
161
Analysis of Results
VA did not reach the target for “Non-Rating Claims – Compensation Average Days Pending”,
while it met and significantly exceeded the target for “Non-Rating Claims – Compensation
Average Days to Complete” in FY 2016. The successful reduction of ADC in FY 2016 was, in part,
a result of the Rules-Based Processing System (RBPS), which automatically processes claims
without user intervention, as well as increased automation of drill-pay adjustments.
Automation quickly reduces inventory, resulting in a lower ADC. However, without newer
claims to lower the average days pending, ADP increased by the end of FY 2016. VBA continues
to prioritize timely processing of non-rating inventory and serving first the Veterans waiting the
longest for non-rating claims decisions.
Plans for the Future
In FY 2017, VA is authorized to fill 300 additional positions to process non-rating claims. VA will
dedicate these resources to reducing the non-rating inventory and improving timeliness. The
National Work Queue will also distribute nationally the non-rating workload in FY 2017. VA will
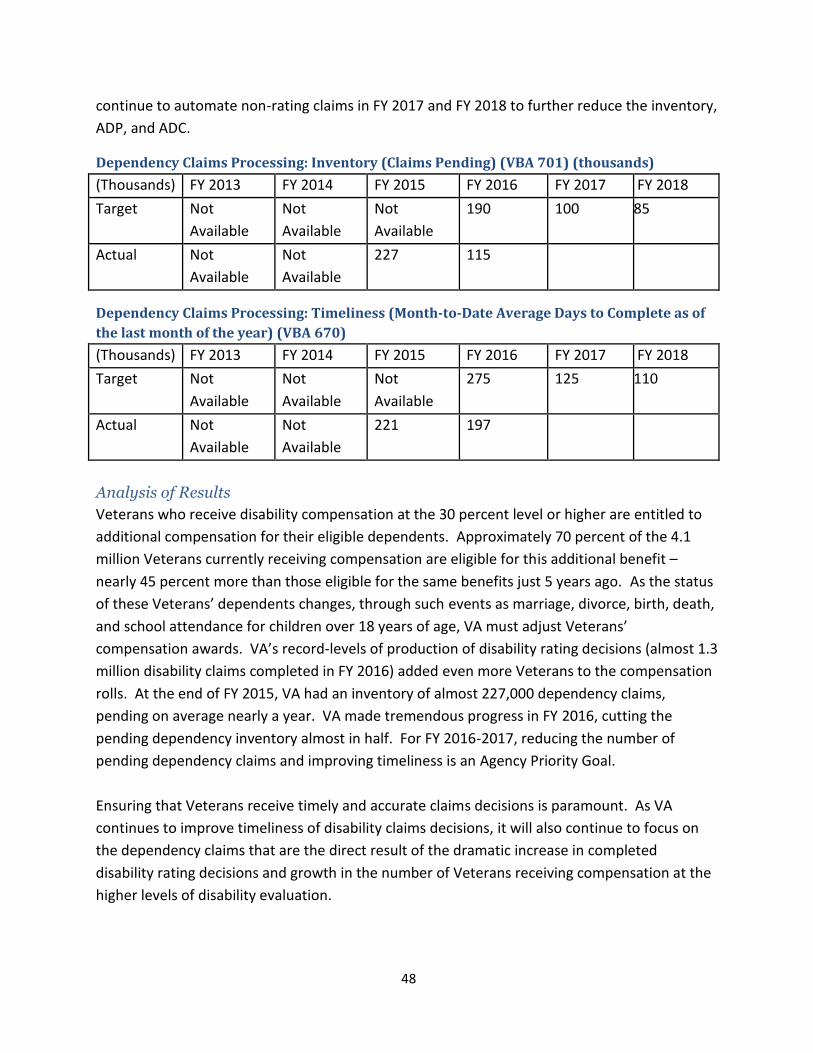
48
continue to automate non-rating claims in FY 2017 and FY 2018 to further reduce the inventory,
ADP, and ADC.
Dependency Claims Processing: Inventory (Claims Pending) (VBA 701) (thousands)
(Thousands) FY 2013 FY 2014 FY 2015 FY 2016 FY 2017 FY 2018
Target Not
Available
Not
Available
Not
Available
190 100 85
Actual Not
Available
Not
Available
227 115
Dependency Claims Processing: Timeliness (Month-to-Date Average Days to Complete as of
the last month of the year) (VBA 670)
(Thousands) FY 2013 FY 2014 FY 2015 FY 2016 FY 2017 FY 2018
Target Not
Available
Not
Available
Not
Available
275 125 110
Actual Not
Available
Not
Available
221 197
Analysis of Results
Veterans who receive disability compensation at the 30 percent level or higher are entitled to
additional compensation for their eligible dependents. Approximately 70 percent of the 4.1
million Veterans currently receiving compensation are eligible for this additional benefit –
nearly 45 percent more than those eligible for the same benefits just 5 years ago. As the status
of these Veterans’ dependents changes, through such events as marriage, divorce, birth, death,
and school attendance for children over 18 years of age, VA must adjust Veterans’
compensation awards. VA’s record-levels of production of disability rating decisions (almost 1.3
million disability claims completed in FY 2016) added even more Veterans to the compensation
rolls. At the end of FY 2015, VA had an inventory of almost 227,000 dependency claims,
pending on average nearly a year. VA made tremendous progress in FY 2016, cutting the
pending dependency inventory almost in half. For FY 2016-2017, reducing the number of
pending dependency claims and improving timeliness is an Agency Priority Goal.
Ensuring that Veterans receive timely and accurate claims decisions is paramount. As VA
continues to improve timeliness of disability claims decisions, it will also continue to focus on
the dependency claims that are the direct result of the dramatic increase in completed
disability rating decisions and growth in the number of Veterans receiving compensation at the
higher levels of disability evaluation.

49
VA is also completing an outreach campaign to increase online claim submissions by Veterans
to utilize the efficiencies of our automated, rules-based processing system (RBPS). We have
taken steps to expand our capability to address this growing inventory, which, as stated, is a
direct result of our record-breaking production. Veterans input data about their dependents
into an automated form in eBenefits, and the RBPS completes many dependency claims within
a day or two.
VA is prioritizing the oldest pending dependency claims for completion to ensure that Veterans
who have been waiting the longest receive their decisions as quickly as feasible. For this
reason, VA projected an initial increase in the average days to complete (ADC) in 2016 as VA
resolved the oldest pending dependency claims. The increase in RBPS usage and decreased
inventory of disability rating-related claims pending more than 125 days has allowed VA to
decrease the ADC for dependency claims by 24 days (as opposed to a projected 54-day
increase), as measured for the month of September 2016. With the continued efforts to reduce
the number of claims pending more than 125 days, VA projects the ADC will drop by 72 days at
the end of FY 2017.
Plans for the Future
VA’s strategy for reducing the inventory and timeliness of dependency claims will continue to
require further changes to processes and enhancements to RBPS. VA identified a set of
exceptions that prevent automated processing and is reviewing the costs and functional
requirements to eliminate them and expand Veterans’ self-service.
VA began using the National Work Queue for dependency claims in FY 2017 to increase
production capacity and efficiently distribute such work across the Nation.
Benefits – Appeals
The current VA appeals process, which is set in law, is broken and is providing Veterans a
frustrating experience. The VA appeals process consists of multiple steps, most of which occur
at the Agency of Original Jurisdiction (AOJ), which includes VBA, VHA, NCA, and the Office of
General Counsel; however, 98 percent of all appeals originate in VBA. If an appeal is not
resolved at the AOJ level, the Veteran (or Appellant) may formally continue that appeal to the
Board of Veterans’ Appeals (Board) for a de novo review (i.e., a new look) and the issuance of a
decision on behalf of the Secretary. In the current process, appeals have no defined endpoint
and require continuous evidence gathering and re-adjudication. The system is complex,
inefficient, ineffective, confusing, and splits jurisdiction of appeals processing between VBA and
the Board.
Current VA Appeals Process

50
The current process also takes too long. In FY 2016, on average, Veterans waited 3 years for a
resolution on their appeals. For those appeals that were decided by the Board in FY 2016, on
average, Veterans waited at least 6 years from filing of their Notice of Disagreement (NOD) until
the Board decision issued that year. Under the current process, Veterans can receive multiple
decisions by two organizations – the AOJ and the Board – contributing to lengthy appeals
processing times and confusion for Veterans. The current process features an open record
that, with only narrow exceptions, allows a Veteran or other appellant to submit new evidence
and/or make new arguments at any point from the beginning to the end of the appeals process.
Additionally, the statutory duty to assist throughout the appeals process requires VA to develop
further evidence on the Veteran’s behalf and pursue new arguments and theories of
entitlement. This continuous evidence gathering and re-adjudication delays a final decision.
VA continues to face rapid growth in its appeals workload. Since 1996, the annual appeal rate
has averaged 11 to 12 percent of all claims decisions. Looking back over FY 2010 through FY
2016, VBA completed more than 1 million claims annually. Growth in claims decision volume
has resulted in proportional appeals volume growth. From the end of FY 2013 to the end of FY
2016, the number of pending appeals climbed by 33 percent to more than 464,000.

51
To ensure full transparency in the current multi-step appeals process, VA adopted new metrics
in FY 2015 that track the amount of time it takes for VBA to process substantive appeals it must
certify to the Board and for the Board to process original and remanded appeals, the latter of
which are cases the Board returned to the AOJ to collect further evidence or for other
development. VA will use these metrics to identify barriers or obstacles in the appeals process
and to increase efficiency.
Appeals Processing – Notice of Disagreement (NODs) Pending Inventory (thousands) (VBA
#514)
FY 2013 FY 2014 FY 2015 FY 2016 FY 2017 FY 2018
Target Not
Available
Not
Available
(Baseline) 338 234 237
Actual Not
Available
Not
Available
228 231
Appeals processing – NODs average days pending (VBA #545)
FY 2013 FY 2014 FY 2015 FY 2016 FY 2017 FY 2018
Target Not
Available
Not
Available
(Baseline) 437 413 413
Actual Not
Available
Not
Available
394 413
Analysis of Results
VA has met and surpassed its target for the Notice of Disagreement (NOD) pending inventory
and NOD average days pending. The following factors contributed to this success: VA added
300 full-time equivalent (FTE) personnel and $10 million in overtime to appeals processing in FY
2016. These additional resources have greatly contributed to VA maintaining a static NOD
inventory compared to the previous year and meeting its projected target in FY 2016.
Appeals Processing – Substantive Appeals to the Board (Form 9) Pending Inventory
(thousands) (VBA #607)
FY 2013 FY 2014 FY 2015 FY 2016 FY 2017 FY 2018
Target Not
Available
Not
Available
(Baseline) 94 45 40
Actual Not
Available
Not
Available
56 50
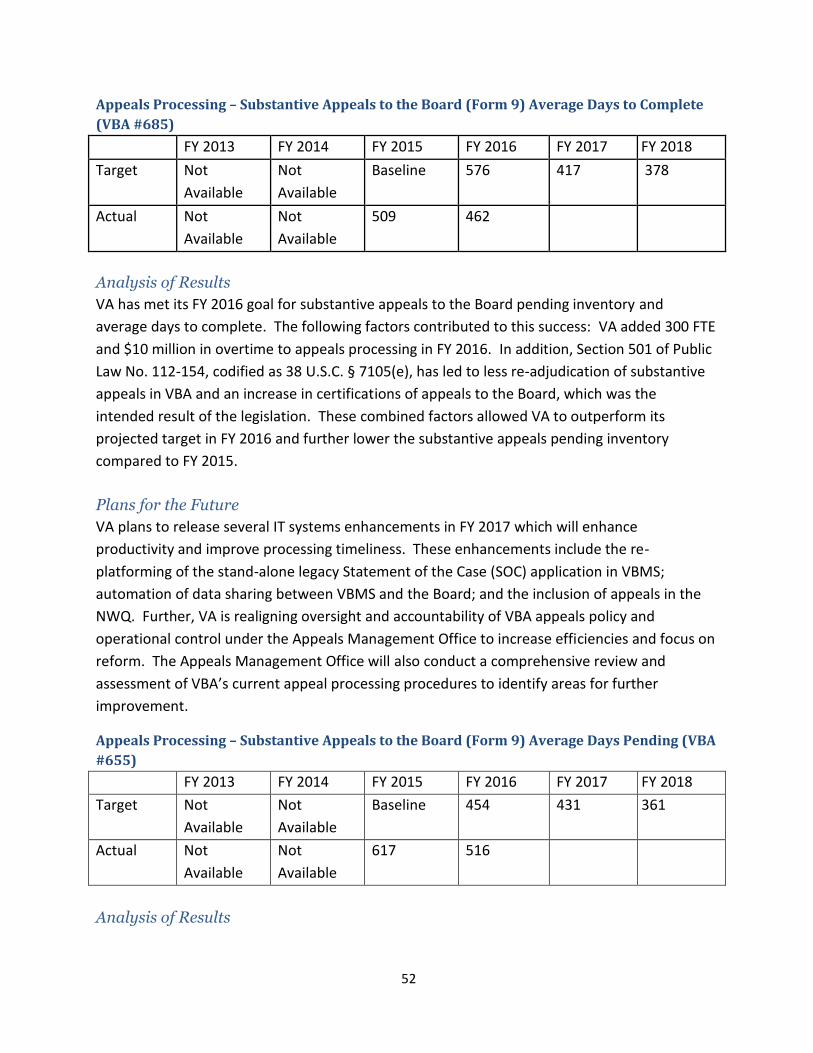
52
Appeals Processing – Substantive Appeals to the Board (Form 9) Average Days to Complete
(VBA #685)
FY 2013 FY 2014 FY 2015 FY 2016 FY 2017 FY 2018
Target Not
Available
Not
Available
Baseline 576 417 378
Actual Not
Available
Not
Available
509 462
Analysis of Results
VA has met its FY 2016 goal for substantive appeals to the Board pending inventory and
average days to complete. The following factors contributed to this success: VA added 300 FTE
and $10 million in overtime to appeals processing in FY 2016. In addition, Section 501 of Public
Law No. 112-154, codified as 38 U.S.C. § 7105(e), has led to less re-adjudication of substantive
appeals in VBA and an increase in certifications of appeals to the Board, which was the
intended result of the legislation. These combined factors allowed VA to outperform its
projected target in FY 2016 and further lower the substantive appeals pending inventory
compared to FY 2015.
Plans for the Future
VA plans to release several IT systems enhancements in FY 2017 which will enhance
productivity and improve processing timeliness. These enhancements include the re-
platforming of the stand-alone legacy Statement of the Case (SOC) application in VBMS;
automation of data sharing between VBMS and the Board; and the inclusion of appeals in the
NWQ. Further, VA is realigning oversight and accountability of VBA appeals policy and
operational control under the Appeals Management Office to increase efficiencies and focus on
reform. The Appeals Management Office will also conduct a comprehensive review and
assessment of VBA’s current appeal processing procedures to identify areas for further
improvement.
Appeals Processing – Substantive Appeals to the Board (Form 9) Average Days Pending (VBA
#655)
FY 2013 FY 2014 FY 2015 FY 2016 FY 2017 FY 2018
Target Not
Available
Not
Available
Baseline 454 431 361
Actual Not
Available
Not
Available
617 516
Analysis of Results

53
Although VA lowered the substantive appeals to the Board average days pending by 100 days in
FY 2016 compared to FY 2015, it still did not meet the FY 2016 target. The following factors
contributed to this result: Timeliness metrics are highly dependent on the age of the inventory
selected for processing. Our predictive modeling is based on historical trends and did not
account for the nuanced impact of legislative changes. Section 7105(e) has decreased re-
adjudication of appeals in VBA before certification to the Board, which was its intended
outcome. Nevertheless, while VA continues to focus on processing the oldest appeals first,
Section 7105(e) has also led to increased certification of newer substantive appeals to the
Board, resulting in a higher average days pending for the remaining inventory than projected;
which was an unintended consequence.
Plans for the Future
VA plans to release several IT systems enhancements in FY 2017 that will enhance productivity
and further improve processing timeliness. In addition, as a result of VA’s predictive modeling
for the appeals reform legislative proposal, VA has also reassessed its assumptions and vastly
improved its predictive modeling of its legacy workload. As a result, it has modified its appeal
targets goals for FY 2017 and FY 2018 consistent with improved data analytics efforts and
forecasting.
Appeals Dispositions – Average Days to Complete Returned Remands (measuring from date
case is received at the Board after remand until Board disposition date) (BVA #571)
FY 2013 FY 2014 FY 2015 FY 2016 FY 2017 FY 2018
Target Not
Available
Not
Available
(Baseline) 244 293 293
Actual Not
Available
Not
Available
244 264
Appeals Dispositions – Average Days to Complete Original Appeals (from date of certification
(Form 8) until Board disposition date) (BVA #573)
FY 2013 FY 2014 FY 2015 FY 2016 FY 2017 FY 2018
Target Not
Available
Not
Available
(Baseline) 531 694 694
Actual Not
Available
Not
Available
531 553
Note: By law, the Board considers and decides each case in regular order according to its place upon the
Board’s docket. The docket date of each case on appeal continues to derive from the date that VA
received the Substantive Appeal.
Analysis of Results

54
The average days to complete an appeal is largely contingent on the Board’s docket of appeals.
The Board is required by law (38 U.S.C. § 7107(a)) to review appeals in docket order unless
unusual hardship or other sufficient cause has been shown to advance a case on the docket. A
case may be advanced on the docket on the motion of the Chairman, the Vice Chairman, a
party to the case before the Board, or such party’s representative. Such a motion may be
granted only if sufficient cause is shown. Sufficient cause under 38 C.F.R. § 20.900(c) includes
serious illness, severe financial hardship, administrative error that resulted in a significant
delay in docketing the case, or the advanced age of the appellant, which is defined as 75 years
or more. Motions for advancement on the docket must be in writing and must identify the
specific reason(s) why advancement on the docket is sought. See 38 C.F.R. § 20.900(c).
Notably, the Board’s docket of appeals changes constantly because new appeals are received
from the AOJ and docketed and other appeals are dispatched on a daily basis. Additionally,
priority order in appeals adjudication is not based on the date the appeal arrives at the Board,
but rather, derives from the date the substantive appeal (VA Form 9) was received by VA.
Therefore, the priority order for deciding appeals in the Board’s active inventory is in constant
flux since appeals arrive at the Board in an order that is variable from the date that the
substantive appeal was received by VA. This impacts the average days to complete both
original and returned remand appeals.
Plans for the Future
FY 2016 marked the first year the Board established a target for the ‘Appeals dispositions –
average days to complete returned remands (measuring from the date the case is returned to
the Board after remand until Board disposition date)’ and ‘Appeals dispositions – average days
to complete original appeals (from date of certification (Form 8) until Board disposition date)’
measures. In FY 2017, the Board recharacterized this first measure as ‘Appeals dispositions –
average days to complete returned remands (measuring from the date the case is received at
the Board after remand until Board disposition date)’ for consistency with the way average days
to complete post-remand appeals is calculated in the Veterans Appeals Contact and Locator
System (VACOLS), the legacy system used to track and process appeals. The Board intends to
continue tracking these measures; however, the average days to complete original and post
remand appeals is largely contingent on the Board’s docket, which is constantly changing as
new appeals are received and appeals are dispatched.
Appeals – Moving Forward
VA appeals modernization is critically dependent on passage of legislation. VA is attempting to
make as many improvements to the existing appeals system as possible. These improvements
have focused on better leveraging people, process, and technology aspects of appeals
processing. These changes have resulted in a 42 percent increase in overall appeals actions

55
from FY13 to FY16, and a 34 percent increase in appeals resolutions from FY13 to FY16.
However, despite these positive changes, if substantial legislative reform does not occur,
additional resources will be required to meet performance targets.
In March 2016, VA sponsored an “Appeals Summit” – a series of meetings with VSOs, advocacy
groups, and congressional staff to design a new appeal process. The product of those meetings
was a new appeals framework developed collaboratively by VA and these stakeholder groups.
This New Framework, steps away from an appeals process that tries to do many unrelated
things inside a single process and replaces it with differentiated lanes, which give Veterans clear
options after receiving an initial decision on a claim. The New Framework provides an
understandable process, multiple options for Veterans instead of one, improved notice as to
which option might be best, early resolution of disagreements, each lane with clearly defined
start and end points, quality feedback loops to VBA, workload transparency for better
workload/resource projections, and efficient use of resources for long-term savings. This New
Framework also clearly defines VBA as the claims agency and the Board as the appeals agency.
The New Framework was described in Appeals Modernization legislation introduced during the
114th Congress and reintroduced in the 115th Congress.

56
Proposed New VA Appeals Process
Benefits – Various
VA developed the Voice of the Veteran (VOV) Customer Satisfaction Survey to obtain
measurable feedback from Veterans and beneficiaries regarding the benefits and services
provided by VA. The survey tracks overall satisfaction on a 1,000 point scale. The VOV program
currently conducts two studies: Call Center Satisfaction Research (CCSR) and Continuous
Measurement Satisfaction Research (CMSR), the latter focused on the lines of business, such as
compensation, pension, loan guaranty, etc.
The respondents to the call center survey provide their perceptions of the services and
information provided by VA’s call agents during phone interactions. The metrics from the
CMSR study represent the respondent's perception of the benefits, services, correspondence,
and interaction during both the claims process and the receipt of benefits from VA. While the

57
scale on all metrics is similar, the benefits and services offered by each business line are unique;
scores are designed to assist business lines with improvement to their programs and services
rather than to offer comparisons between the different business lines. Both studies seek to
determine what is most important to Veterans, and the customer satisfaction feedback allows
VA to identify process improvements in the delivery of benefits and services and key
performance indicators.
Compensation: Overall Customer Satisfaction Index Score (out of 1000) (VBA #491)
FY 2013 FY 2014 FY 2015 FY 2016 FY 2017 FY 2018
Target Not
Available
Not
Available
(Baseline) 650 680 685
Actual Not
Available
Not
Available
646 676
# Every VBA Program has a distinct mission, specific processes, Congressional mandates, and
technologies. Surveys were developed to measure the effectiveness of processes within a program.
Survey results cannot be compared between VBA programs.
Analysis of Results
VA exceeded the target for “Compensation: Overall Customer Satisfaction Index Score” in FY
2016. This measure gauges Veteran satisfaction with the overall processing of compensation
claims and receipt of benefits. The following factors contributed to this success: VA continued
to improve timely processing of claims, including additional automation of processes and
procedures. In FY 2016, VA released phase one of automatic adjustments of the awards of
fugitive felons, expanded to all regional offices the number of contracts to perform disability
examinations, and continued to frequently update policy and procedural information for
consistency between claims processors.
Plans for the Future
In FY 2017, VA has scheduled service enhancements to the eBenefits electronic platform, which
will allow Veterans additional access to evidence and claims status. VA will provide additional
education for Veterans and employees to explain Centralized Mail and electronic filing options
to support improved timeliness. VA is analyzing claims correspondence for opportunities to
enhance clarity and simplicity. VA also anticipates a modest increase in Veterans’ satisfaction as
a result of implementing enhancements in automation, clarity in communications, and
improvements in the examination process. VA will use the Veterans’ satisfaction data to
evaluate areas needing additional policy enhancements or technological improvements.

58
National Call Center Client Satisfaction Index Score (out of 1000) (VBA #485)
FY 2013 FY 2014 FY 2015 FY 2016 FY 2017 FY 2018
Target* 754 735 752 756 770 775
Actual 723 748 756 767
*VA’s recent targets and results exceed the current Government benchmark of 754 on a 1,000 point scale.
Analysis of Results
VA exceeded the target for the “National Call Center (NCC) client satisfaction index score” in FY
2016 with 767 out of a possible 1,000 points. The following factors contributed to this success:
VA hired over 400 new agents to decrease the call wait times to a FYTD17 average of 2 minutes
and reduced the blocked call to an average of 1 percent (less than 10 calls per month);
additional routing options helped reach the most skilled agent for caller needs; VA enhanced
speech recognition options; and call agents could access a consolidated view of Veteran
information.
Call agents now have auto-populated data, smart scripts, and increased integration with VA’s
Knowledge Management system, which allows them to search VA news, policies, procedures,
and crisis intervention. In addition, VBA has implemented multiple process improvements that
allow call agents to resolve more issues at the point of interaction, reducing wait time and
unnecessary organizational handoffs to improve the experience of the caller.
VA trained all newly hired employees in segments to quickly render them productive. The
strengthened training model, combined with advances in staffing/personnel and technology,
supports agent efficiencies, improves timeliness, increases access for callers, and increases the
accuracy of information provided to callers.
Plans for the Future
For FY 2018, VBA will continue to expand its first-call resolution options, which can support
claim completion and improve access for Veterans who contact VA through the NCC. In 2018,
VA anticipates sustaining current staffing levels and expects to further decrease call-wait times
and sustain current performance. VA will improve the Veteran experience by enhancing
technology, using other self-service tools (e.g., interactive voice recognition, online access
options), and live-chat access. Quality assurance and the monitoring of training requirements
will ensure accurate interactions. Nationally, VA is reviewing NCC processes to improve call
routing and timeliness. VA will use robust self-service models, e.g., interactive voice
recognition, enhanced functionality in eBenefits and the vets.gov website, etc., to better meet
the needs of its customers. The stated future targets assume that these improvements and
increased staffing levels will positively affect promptness to speaking to a person, which is a key

59
attribute in customer satisfaction. Additionally, VA expects continued customer service soft
skills training to increase the attribute for courtesy of the representative.
Number of Accredited Veterans Advocates Who Are Registered Users on the Stakeholder
Enterprise Portal (SEP) (VBA#446)
FY 2013 FY 2014 FY 2015 FY 2016 FY 2017 FY 2018
Target (Baseline) 2,000 3,500 4,200 4,900 SEP
replaced
by
Vets.gov
Actual 1,000 1,861 3,299 4,202
Part of the claims transformation plan was to change the way VA delivers benefits and services
to Veterans. As a result, VA now leverages the capabilities of electronic applications and
portals to streamline the application process.
The SEP https://www.sep.va.gov/sep/web/guest/sep), which resembles the eBenefits system
on va.gov, allows VA partners and Veterans Service Organizations to electronically file claims
for benefits and services on behalf of the Veterans they represent. Tools such as SEP support
VA’s efforts to improve the timeliness and accuracy of claims processing through technology.
Analysis of Results
VA reached the target for “Number of accredited Veterans’ advocates who are registered users
on the Stakeholder Enterprise Portal” in FY 2016. The major factor contributing to this success
was providing representatives with information about SEP whenever they asked about
resources available online, or about filing claims electronically.
Plans for the Future
In 2017, SEP capabilities will transition to the Vets.gov platform. Vets.gov is VA’s new Veteran-
facing platform that consolidates all content and interactive services. eBenefits capabilities are
in the process of transitioning to Vets.gov, and SEP will follow.
Benefits – Pension
Veterans’ pension is a needs-based benefit paid to wartime Veterans who meet certain age or
disability requirements. Survivors’ pension is a needs-based benefit paid to surviving spouses
and children of wartime Veterans.

60
Average days to complete – original survivor’s pension claims (VBA #498)
FY 2013 FY 2014 FY 2015 FY 2016 FY 2017 FY 2018
Target 230 150 150 80 75 75
Actual 251 193 89 130
Percentage of original and reopened pension claims inventory pending more than 125-days
(VBA #577)
FY 2013 FY 2014 FY 2015 FY 2016 FY 2017 FY 2018
Target 36% 20% 0% 3% 5% 5%
Actual 37% 5% 3% 4%
Analysis of Results
VA did not reach the target for “average days to complete (ADC) – original survivor’s pension
claims.” The following factors contributed to this result: VBA focused on processing the oldest
claims during FY 2016, which resulted in an increased ADC. While completing the oldest claims
resulted in increased ADC, it decreased the average days pending (ADP). The ADP for original
survivors’ pension claims improved from 88.6 days in FY 2015 to 72 days during FY 2016. ADP
measures the average age of claims that are currently awaiting decisions. ADC measures the
average time it took VA to issue decisions.
VA did not reach the target for “Percentage of original and reopened pension claims inventory
pending more than 125 days.” VA’s open-ended duty to assist Veterans in developing their
claims, established in law, prevents VA from deciding all claims within 125 days. VA will always
consider additional evidence or new medical conditions added – no matter how late in the
claims process VA receives them.
Plans for the Future
VA continues to aggressively pursue its Transformation Plan to improve accuracy and
productivity. Initiatives include shifting from a paper-based paradigm to a robust and
intelligent digital operating environment. Therefore, pension claims processing will continue to
transition to the electronic processing available in VBMS. VA also continues to look for
opportunities to automate pension claims with the goal of creating a true portal-to-payment
system.

61
Pension: Overall customer satisfaction index score (out of 1000) (VBA #490)
FY 2013 FY 2014 FY 2015 FY 2016 FY 2017 FY 2018
Target Not
Available
Not
Available
(Baseline) 688 668 672
Actual Not
Available
Not
Available
684 664
# Every VBA program has a distinct mission, specific processes, Congressional mandates, and
technologies. Surveys were developed to measure the effectiveness of processes within a program.
Survey results cannot be compared between VBA programs.
Analysis of Results
Pension customer service scores rely heavily on decisions regarding benefit entitlement.
Application processes, processing time, and time spent gathering information also impact the
claimant’s experience and satisfaction. VA is working to keep pace with Veterans’ expectations
and transform its customer services – soliciting regular customer feedback, streamlining
processes, and delivering consistent, high-quality service.
Plans for the Future
For FY 2018, VA will continue to improve customer satisfaction primarily through technological
improvements. VA will continue to develop the Rules-Based Processing System (RBPS) to
automate pension claims, which will relieve overburdened claims processors of some of their
workload. RBPS is part of a multi-pronged approach to create an automated, paperless claims
processing system. Utilizing business rules, the system will use data and information reported
electronically to make decisions without human intervention. The process includes
functionality to record data, generate award payments and correspondence, or refer benefit
claims for manual processing when the claim fails to pass all of the established rules. For
Veterans, rules-based processing will mean faster, higher-quality and more consistent decisions
on claims. For employees, the change will be a more user-friendly system that offers better
access to decision-level information, rules-based calculators, and automated tools that help
them process claims more consistently. Expansion and improvements to the Enterprise
Veterans Self-Service will increase the number of online benefit applications. VA will complete
site visits to the PMCs during FY 2017 to identify best practices and improve claim processing
accuracy.

62
Pension call center client satisfaction index score (out of 1000) (VBA #484)
FY 2013 FY 2014 FY 2015 FY 2016 FY 2017 FY 2018
Target Not
Available
735 770 770 780 782
Actual 732 766 770 778
Analysis of Results
VA reached the target for “Pension call center client satisfaction index score (out of 1,000)” in
FY 2016. The following on-going initiatives contributed to VA’s success: VA hired about 25 new
pension agents to decrease the call wait times to a FTYD17 average of 2 minutes, and reduced
the blocked call rate to an average of 1 percent per month. In addition, changes to new-hire
training curriculum have provided agents with skills in the first month to resolve basic
transactions during a first call from a Veteran. VA has developed additional routing options for
callers to reach the most skilled agent for their needs, enhanced speech recognition options,
created a consolidated view of Veteran information, auto-populated data, developed smart
scripts, and increased utilization of VA’s Knowledge Management system, which allows agents
to search for VA news, pension policies , procedures, and crisis intervention. This database,
with the increase in human capital, promoted efficiencies, improved timeliness, increased
Veteran access, and increased the accuracy of information provided to callers.
Plans for the Future
The National Pension Call Center (NPCC) will continue to monitor customer satisfaction. The
stated future targets assume increased staffing levels will positively affect promptness to
speaking to a person--a key attribute in the customer satisfaction index model. Additionally,
continued customer service soft skills training will increase representatives’ courtesy toward
Veterans, which is another key attribute in the customer satisfaction model The NPCC will
continue to implement best practices between VBA contact centers. J.D. Power, which
conducts this survey, will use industry standards to provide feedback and strategies to improve
customer service processes in the call center.
To further improve the Veteran’s experience, VA is optimizing its software containing
information about its customers and its own services. VA plans to better use robust self-service
models, e.g., interactive voice recognition, enhanced functionality in eBenefits and the vets.gov
website, etc., to better meet customer needs. Nationally, VA is continuing its review of the
NPCC processes to improve call routing and timeliness, and will implement workforce
management tools to better manage call volumes and operation hours.

63
Benefits – Education
VA provides timely and accurate delivery of education benefits to eligible active duty, National
Guard, and Reserve Servicemembers, Veterans, and eligible dependents. VA informs
Servicemembers of their educational benefits at various key points in their military career,
allowing them to use these benefits while still on active duty. VA also conducts outreach to
ensure Servicemembers and Veterans are well-informed regarding educational benefits as they
plan for the transition to civilian life, whether they need to learn a trade or obtain a degree.
VA education benefits may be used for licensing and certification examinations and on-the-job
training programs, as well as for study at institutions of higher learning (IHLs) or non-college
degree programs. VA provides resources to assist Veterans and Servicemembers in making
informed educational decisions so they may achieve their academic and career goals. VBA
makes these resources available online and has multiple avenues for Veterans and their
dependents to obtain information about their individual entitlement, including the GI Bill
Comparison Tool, the GI Bill Feedback System, the joint VA/DoD eBenefits portal, and the
Education Call Center, 1-888-GIBILL1 (1-888-442-4551).
Average days to complete original education claims (VBA #218)
FY 2013 FY 2014 FY 2015 FY 2016 FY 2017 FY 2018
Target 28 28 28 28 21 21
Actual 26 17 18 16.7
Average days to complete supplemental education claims (VBA #219)
FY 2013 FY 2014 FY 2015 FY 2016 FY 2017 FY 2018
Target 12 14 14 14 9 9
Actual 10 6 7 6.7
Analysis of Results
VA reached the target for “Average days to complete original education claims” and “Average
days to complete supplement education claims” in FY 2016. The following factors contributed
to these successes: VA has automated the processing of over 50 percent of all education
enrollment documents. VA automatically processes over 6,000 claims per day and continues to
broker cases between Regional Processing Offices. These factors significantly reduced
processing time for supplemental education claims from an average of 16.5 days in 2012 to 6.7
days in 2016.
Plans for the Future
The targets for FY 2017 and 20 18 do not reflect continued improvement from the actual results
for FY 2016. At the beginning of FY 2017, VA realigned over 100 education processors to
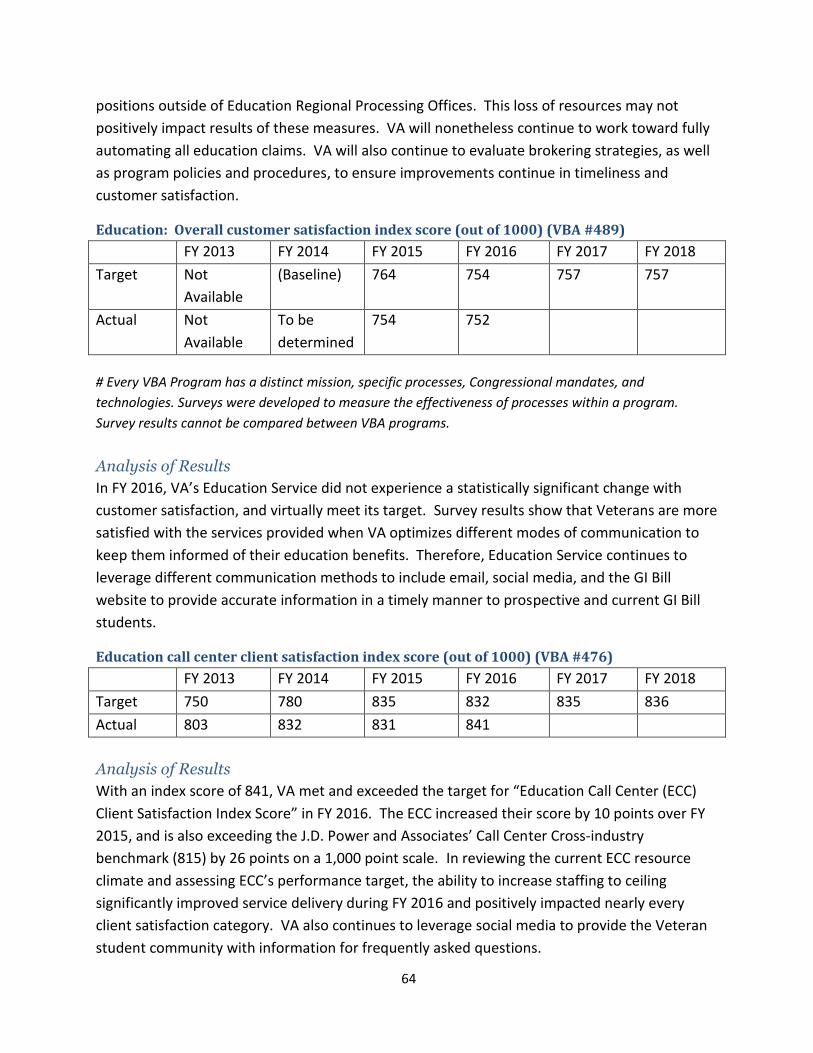
64
positions outside of Education Regional Processing Offices. This loss of resources may not
positively impact results of these measures. VA will nonetheless continue to work toward fully
automating all education claims. VA will also continue to evaluate brokering strategies, as well
as program policies and procedures, to ensure improvements continue in timeliness and
customer satisfaction.
Education: Overall customer satisfaction index score (out of 1000) (VBA #489)
FY 2013 FY 2014 FY 2015 FY 2016 FY 2017 FY 2018
Target Not
Available
(Baseline) 764 754 757 757
Actual Not
Available
To be
determined
754 752
# Every VBA Program has a distinct mission, specific processes, Congressional mandates, and
technologies. Surveys were developed to measure the effectiveness of processes within a program.
Survey results cannot be compared between VBA programs.
Analysis of Results
In FY 2016, VA’s Education Service did not experience a statistically significant change with
customer satisfaction, and virtually meet its target. Survey results show that Veterans are more
satisfied with the services provided when VA optimizes different modes of communication to
keep them informed of their education benefits. Therefore, Education Service continues to
leverage different communication methods to include email, social media, and the GI Bill
website to provide accurate information in a timely manner to prospective and current GI Bill
students.
Education call center client satisfaction index score (out of 1000) (VBA #476)
FY 2013 FY 2014 FY 2015 FY 2016 FY 2017 FY 2018
Target 750 780 835 832 835 836
Actual 803 832 831 841
Analysis of Results
With an index score of 841, VA met and exceeded the target for “Education Call Center (ECC)
Client Satisfaction Index Score” in FY 2016. The ECC increased their score by 10 points over FY
2015, and is also exceeding the J.D. Power and Associates’ Call Center Cross-industry
benchmark (815) by 26 points on a 1,000 point scale. In reviewing the current ECC resource
climate and assessing ECC’s performance target, the ability to increase staffing to ceiling
significantly improved service delivery during FY 2016 and positively impacted nearly every
client satisfaction category. VA also continues to leverage social media to provide the Veteran
student community with information for frequently asked questions.

65
Plans for the Future
The targets for FY 2017 and 2018 do not reflect continued improvement from the actual results
for FY 2016. At the beginning of FY 2017, VA realigned over 100 education processors to
positions outside of Education Regional Processing Offices. This loss of resources is not likely to
positively impact the results of these measures. However, for FY 2017, the Education Call
Center provides for staffing levels to remain at ceiling. These staffing levels will allow the ECC
to maintain ideal agent availability for callers, serving to further improve customer service
performance. The ECC has also continued to focus on its first-call resolution initiative, which
decreases the need for additional contacts. In addition, VA continues to implement
enhancements to technology within the ECC, to improve the efficiency and effectiveness of call
agents such as adding softphone technology and developing and improving the Customer
Relationship Management/Unified Desktop, to improve the efficiency and effectiveness of call
agents, and adding softphone technology. Robust self-service models, e.g., interactive voice
recognition, enhanced functionality in eBenefits and at the vets.gov website, etc., will also be
utilized to better meet the needs of our customers.
Benefits – Loan Guaranty, Vocational Rehabilitation and Employment,
Insurance
Veterans’ satisfaction level with the VA Loan Guaranty program (out of 1000) (VBA #487)
FY 2013 FY 2014 FY 2015 FY 2016 FY 2017 FY 2018
Target Not
Available
Not
Available
(Baseline) 822 825 830
Actual Not
Available
Not
Available
819 819
# Every VBA Program has a distinct mission, specific processes, Congressional mandates, and
technologies. Surveys were developed to measure the effectiveness of processes within a program.
Survey results cannot be compared between VBA programs.
Analysis of Results
VA helps Servicemembers, Veterans, and eligible surviving spouses become homeowners. VA
Home Loans are provided by private lenders, such as banks and mortgage companies. VA
guarantees a portion of the loan, enabling the lender to provide Veterans with more favorable
terms.
Through ongoing analysis of FY 2015 data, VA virtually met the Veteran’s satisfaction level
target in FY 2016. In an effort to maintain high Veteran satisfaction levels, the VA Home Loan
program continues to utilize best practices to ensure ongoing program efficiencies. In FY 2016,

66
VA established new processes to assign Certificates of Eligibility (COE) by distributing the
workload among VBA’s nine Regional Loan Centers across the country. VA implemented
additional processes to further reduce the blocked call rate, such as consolidating all Loan
Guaranty (LGY) incoming calls to a single toll-free number, with standardized interactive voice
response (IVR) messages. These two changes dropped the blocked call rate for overall LGY calls
by 68 percent nationwide, and reduced the average days to adjudicate a COE from 26 days to
the performance target of 5. Further, the overall volume of calls was reduced by over one
million, which enabled LGY to respond to incoming calls more rapidly, which enhances the
Veteran experience.
Plans for the Future
VA will use newly collected Veteran satisfaction data to assess areas of Loan Guaranty that
require additional automation or policy improvements to assure seamless program operations.
For example, the housing program systematically developed an eligibility process that correctly
determined and issued eligibility for home loans on approximately 65 percent of the over 1
million applications submitted during FY 2016. Analysis of Veteran experiences with the overall
COE determination process will allow VA to identify methods to increase the correct COE
issuance rate.
VA plans to implement a Customer Service Transformation system, which will help build out
customer service capability, training, internal/external communication, metrics, and any other
efficiencies. The Customer Service Transformation system will provide a clear, direct line of
communication for Veterans, Servicemembers, and other stakeholders to obtain information
regarding the VA Home Loan program.
Veterans’ satisfaction with the Vocational Rehabilitation and Employment program (out of
1,000) (VBA #488)
FY 2013 FY 2014 FY 2015 FY 2016 FY 2017 FY 2018
Target Not
Available
Not
Available
(Baseline) 658 674 682
Actual Not
Available
Not
Available
658 666
# Every VBA Program has a distinct mission, specific processes, Congressional mandates, and
technologies. Surveys were developed to measure the effectiveness of processes within a program.
Survey results cannot be compared between VBA programs.
Analysis of Results

67
VA reached the target for “Veterans’ satisfaction with the Vocational Rehabilitation and
Employment program.” VA implemented new individual-level performance standards to all
field staff. These standards focused on reducing allowance processing time and increasing
accuracy of payments.
In addition, to drive Veteran satisfaction, VR&E implemented telecounseling as an option for
Veterans who have busy schedules, live in rural locations, or have transportation challenges in
personally meeting with their counselors to discuss their rehabilitation goals. Telecounseling is
expected to reduce travel costs and time for Veterans and employees, and improve accessibility
to VR&E services.
Plans for the Future
The FY 2017 Briefing on 2016’s Voice of the Veteran (VOV) survey occurred in January 2017.
VR&E used the results to develop an action plan to address any issues that may be negatively
affecting Veteran’s experience with VR&E. VR&E Service will continue to collaborate with J.D.
Power & Associates to assess and interpret the VOV Survey results, to identify specific trends
and ways to improve service delivery that will increase Veteran’s satisfaction.
Rate of high client satisfaction ratings on insurance services delivered (VBA #214)
FY 2013 FY 2014 FY 2015 FY 2016 FY 2017 FY 2018
Target 95% 95% 95% 95% 95% 95%
Actual 93% 94% 94% 94%
Analysis of Results
VA effectively reached the target for “rate of high client satisfaction on insurance services
delivered” in FY 2016, as its results were within five percent of the target. In 2016, the
Insurance program paid approximately $2.3 billion for payments to Servicemembers, Veterans,
and their beneficiaries in the form of insurance death benefits, policy loans, and traumatic
injury protection payments. VBA Insurance completed 147,000 insurance disbursements
(death claims, loans, and cash surrenders) at 98.6 percent accuracy. Insurance answered an
average of 2,200 insurance-related calls per day with an average speed of answer of 31 seconds
and a 0.1 percent blocked call rate.
Plans for the Future
VA will implement the following strategies to continue achieving nearly 95 percent rate of high
client satisfaction on insurance services delivered: take action on customer survey responses to
the question “How can we improve our service,” improve processing as needed to increase
efficiency, and maintain appropriate staffing levels to provide services quickly and accurately.

68
Memorial Services
VA honors Veterans and their eligible family members with final resting places in national
shrines and with lasting tributes that commemorate their service and sacrifice to our Nation. In
2016, VA interred more than 131,000 Veterans and eligible family members and provided
perpetual care for more than 3.5 million gravesites at 135 national cemeteries and 33 other
cemetery installations in 40 states and Puerto Rico. VA has also funded the establishment,
expansion, and improvement of 104 state and tribal Veterans cemeteries in 44 states, Puerto
Rico, Guam, and the Northern Mariana Islands which interred more than 36,000 Veterans and
eligible family members in 2016. In 2016, VA furnished more than 365,000 headstones,
markers, and medallions for the graves of Veterans worldwide and furnished nearly 690,000
Presidential Memorial Certificates to the families and friends of Veterans commemorating their
service.
Percent of Veterans served by a burial option within a reasonable distance (75 miles) of
their residence (NCA #234)
FY 2013 FY 2014 FY 2015 FY 2016 FY 2017 FY 2018
Target 89.50% 89.60% 91.0% 91.5% 91.8% 92.0%
Actual 89.50% 89.80% 89.8% 91.7%
Analysis of Results
VA exceeded the target for the percent of veterans served by a burial option within a
reasonable distance (75 miles) of their residence in FY 2016. VA opened three new national
cemeteries (Tallahassee and Cape Canaveral, Florida and Omaha, Nebraska), five new VA-
funded state cemeteries (Flagstaff and Marana, Arizona; Goldsboro, North Carolina; Rayville,
Louisiana; and, Southeastern Minnesota;), and four new VA-funded tribal cemeteries (San
Carlos, Arizona; Auberry, California; Crow Agency, Montana; and, Ponca City, Oklahoma) in FY
16.
Plans for the Future
A new VA-funded state cemetery in Seaside, California has already opened in FY 17. Two more
VA-funded state cemeteries in Kilmichael, Mississippi and Fort Stanton, New Mexico will open
to interments later in FY 17. In FY 2018, VA plans to open the first new national cemetery
under the VA Urban Veterans Burial Initiative to enhance service in Indianapolis, Indiana. VA
also plans to open two more national cemeteries in Fargo, North Dakota and Rhinelander,
Wisconsin as part of the VA Rural Veterans Burial Initiative and a new VA-funded state Veterans
cemetery in Gallup, New Mexico. Combined, these cemeteries will serve nearly 80,000
Veterans who do not currently have access to a burial option within a reasonable distance (75
miles) of their residence.

69
Percent of respondents who rate the quality of service provided by the national cemeteries
as excellent (NCA #580)
FY 2013 FY 2014 FY 2015 FY 2016* FY 2017 FY 2018
Target 98% 98% 96% 97% 97% 97%
Actual 96% 96% 96% To be
determined
Percent of respondents who rate national cemetery appearance as excellent (NCA #581)
FY 2013 FY 2014 FY 2015 FY 2016* FY 2017 FY 2018
Target 99% 99% 99% 99% 99% 99%
Actual 99% 98% 99% To be
determined
Percent of respondents who would recommend the national cemetery to Veteran families
during their time of need (NCA #582)
FY 2013 FY 2014 FY 2015 FY 2016* FY 2017 FY 2018
Target 99% 99%** 99% 99% 99% 99%
Actual 99% 98% 98% To be
determined
* FY 2016 Survey results are not available due to unexpected delays in survey administration
** 98 percent was the 2014 actual for this measure. 99 percent was the 2014 target. (Source –
2014 PAR)
Analysis of Results
VA measures the percent of respondents who rate the quality of service provided by the
national cemeteries as excellent, the percent of respondents who rate national cemetery
appearance as excellent, and the percent of respondents who would recommend the national
cemetery to Veteran families during their time of need through an annual survey of Veterans,
Veteran next of kin, and funeral home directors who utilized VA burial and memorial benefits
during the year. While FY 2016 results were not available at the time of this report’s
publication, past results show VA’s continued focus on providing excellent customer service and
maintaining national cemeteries as national shrines. Through this continued focus, VA expects
FY 2016 results to demonstrate continued high levels of satisfaction with national cemeteries.
In FY 2016, VA’s National Cemetery Administration (NCA) was ranked first in an independent
customer satisfaction survey among the nation’s top corporations and federal agencies , which
was conducted by the CFI Group (Claes Fornell International) utilizing the science of the
American Customer Satisfaction Index (ACSI). The ACSI is the only national, cross-industry
measure of satisfaction with the quality of goods and services available in the United States.

70
For 2016, NCA achieved a customer satisfaction index of 96, currently the highest ACSI score in
either the private or public sector. The score is nearly 28 points above the 68 point average for
federal agencies. NCA participates in the ACSI every three years, previously in 2001, 2004, 2007,
2010 and 2013. This is the sixth time NCA participated and the sixth consecutive time NCA
received an overall customer satisfaction score of 96, the highest score received out of more
than 200 public and private sector the top rating among participating organizations. This result
further demonstrates VA’s continued commitment to customer satisfaction with national
cemeteries.
Plans for the Future
VA recognizes that high levels of client satisfaction cannot be assumed based on past history.
We will continue to collect client satisfaction data from our annual Survey of Satisfaction with
National Cemeteries to identify opportunities for improvement with the appearance and the
level of service provided by national cemeteries and the quality of memorials furnished for
Veterans worldwide. By FY 2018, VA plans to implement this survey on a quarterly basis in
order to collect more timely and relevant client feedback. VA will also continue to identify and
share best practices from high performing cemeteries throughout the national cemetery
system. These efforts will continue to support progress towards ensuring that VA continues to
meet the burial needs of Veterans and their eligible family members and to honor their service
and sacrifice to our Nation.
Percent of respondents who agree or strongly agree that the quality of the headstone or
marker received from VA was excellent (NCA #583)
FY 2013 FY 2014 FY 2015 FY 2016* FY 2017 FY 2018
Target 96% 91% 92% 92% 93% 93%
Actual 90% 90% 93% To be
determined
Percent of respondents who agree or strongly agree that the quality of the Presidential
Memorial Certificate received from VA was excellent (NCA #584)
FY 2013 FY 2014 FY 2015 FY 2016* FY 2017 FY 2018
Target 97% 90% 91% 91% 92% 92%
Actual 89% 87% 89% To be
determined
* FY 2016 Survey results are not available due to unexpected delays in survey administration
Analysis of Results
VA measures the percent of respondents who agree or strongly agree that the quality of the
headstone or marker received from VA was excellent and the percent of respondents who

71
agree or strongly agree that the quality of the Presidential Memorial Certificate received from
VA through an annual survey of Veteran next of kin and funeral home directors who utilized VA
burial and memorial benefits during the year. While FY 2016 results were not available at the
time of this report’s publication, past results show VA’s continued commitment to ensuring
high-quality memorials and providing excellent customer service to Veterans regardless of their
final resting place. Through this continued focus, VA expects FY 2016 results to demonstrate
continued high levels of satisfaction with VA memorial benefits.
Plans for the Future
VA recognizes that high levels of client satisfaction cannot be assumed based on past history.
VA will continue to collect client satisfaction data from our annual Memorial Products Survey to
identify opportunities for improvement with the appearance and the level of service provided
by national cemeteries and the quality of memorials furnished for Veterans worldwide. By FY
2018, VA plans to implement this survey on a quarterly basis in order to collect more timely and
relevant client feedback. VA will also continue to identify and share best practices from high
performing cemeteries throughout VA’s national cemetery system. These efforts will continue
to support progress towards ensuring that VA continues to meet the burial needs of Veterans
and their eligible family members and to honor their service and sacrifice to our Nation.
Objective Progress Update Summary
Achievements:
Customer Satisfaction:
Since implementing the Veterans Access, Choice, and Accountability Act of 2014, 1.2
million unique Veterans scheduled appointments under Choice, and Veterans
completed over 25.5 million community care appointments during FY16, an 18 percent
increase over FY15.
Created an easy to use VA orientation kit with two key components to help Veterans
understand VA’s products and services: a booklet that provides a tailored view of VA’s
benefits and services based on a Veteran’s life-stage, and a quick-start guide that
provides a checklist to apply for the three most popular benefits – disability
compensation; healthcare; and the GI Bill.
Improved Vets.gov by re-writing and reducing more than 500 pages of technical and
legal information into 112 pages of plain, easy-to-read language, and consolidated more
than 500 different VA websites into one, easy-to-use, high-performing, cloud-based
technology tool that enabled more than 45,000 Veterans to apply for health care on
line.
Launched MyVA311 to give Veterans, their families and caretakers a single phone
number and one-stop shop experience with VA while accessing their benefits and

72
services. Existing phone numbers will not be eliminated so Veterans may continue to
use any familiar numbers.
Launched a new user-friendly site with a live chat function for real time Question and
Answer sessions so Veterans can look up eligibility based on their address and find
providers in their area.
Created Veterans Choice Google Hangouts (live-streamed events) and mailed
information to raise awareness and encourage Veterans to use the Veterans Choice
Program, and instituted mandatory training to ensure all VA employees understood the
Veterans Choice Program and were capable of assisting Veterans.
Policies & Procedures:
Completed the rollout of Caseflow Certification to ensure accuracy during the transfer
of appeals from the Veterans Benefits Administration to the Board.
Collaborated with Veterans Service Organizations, advocacy groups, and congressional
staff to design a new appeals process. The new appeals framework legislative proposal
was introduced in several bills in the last Congress and has been reintroduced in the
115th Congress.
During FY2016, VA measured performance from the Veteran’s point of view:
o 60 percent of Veterans responded, “I trust VA to fulfill our country’s commitment to
Veterans,” up from 47 percent.
o 75 percent of Veterans responded, “I got the service I needed,” up from 65 percent.
o 66 percent of Veterans responded, “It was easy to get what I needed,” up from
46 percent.
o 68 percent of Veterans responded, “I felt like a valued customer,” up from 54
percent.
Benefits & Services Delivery:
Increased access to burial options in a national, state, or tribal Veterans cemetery for
nearly 420,000 Veterans who did not have reasonable access within 75 miles of their
residence.
91.7 percent of the U.S. Veteran population has a burial option in a national or state
Veterans cemetery within a reasonable distance (75 miles) of their residence.
Opened three new national cemeteries (Tallahassee and Cape Canaveral, Florida and
Omaha, Nebraska), five new VA-funded state cemeteries (Flagstaff and Marana,
Arizona; Goldsboro, North Carolina; Rayville, Louisiana; and, Southeastern Minnesota;),
and four new VA-funded tribal cemeteries (San Carlos, Arizona; Auberry, California;
Crow Agency, Montana; and, Ponca City, Oklahoma).
o Two additional new national cemeteries are in the design phase.
Since implementing the Veterans Access, Choice, and Accountability Act of 2014, 1.2
million unique Veterans scheduled appointments under Choice, and Veterans
73
completed over 25.5 million community care appointments during FY16, an 18 percent
increase over FY15.
Stood up eFolder Express to integrate with the Veterans Benefits Management System
(VBMS) and provide one-click downloads of Veterans' electronic folders. This improved
coordination and accuracy of support provided to Veterans such as fulfilling privacy
requests from Veterans and representatives and creating the Record Before the Agency.
In FY 2016, VA resolved 28 percent of appeals within one year of filing.
Challenges:
1. The current appeals process takes too long. During FY16, on average, Veterans waited 3
years for a resolution on their appeal. For those appeals that were decided by the
Board in FY 2016, on average, Veterans waited at least 6 years from filing of their NOD
until the Board decision issued that year. These long delays frustrate Veterans and may
even harm the trust between Veterans and VA. Unfortunately, legislative mandates
impede VA’s ability to implement many changes to improve the appeals process,
address the growing inventory, and positively impact the Veteran experience. As of
September 30, 2016, 464,008 appeals were pending at various stages in the multi-step
process. VA is seeking legislative reform to address the current lengthy, complex, and
confusing appeals process and replace it with a modernized framework that makes
sense and improves the experience for Veterans, their families and advocates, VA, and
other stakeholders.
Final Assessment:
VA, in consultation with the Office of Management and Budget, determined that performance
toward this objective is making noteworthy progress.

74
Strategic Goal 2: Enhance and Develop Trusted Partnerships VA is not the sole provider of benefits, services, and resources to Veterans and eligible
beneficiaries. We will improve our ability to partner and work with those who provide benefits,
services, and resources to our clients through improved collaboration, business practices, and
outreach. We will ensure that the necessary benefits, services, and resources are accessible
regardless of who provides them.
VA recognizes the importance of, and embraces, the opportunities to work with other Federal
agencies, state, and local governments, tribal organizations, Veteran Service Organizations,
Military Service Organizations, labor unions, nonprofits, and private industry to better serve
Veterans and eligible beneficiaries. DoD and VA, for example, are intimately joined, and VA will
build on this relationship to communicate with Servicemembers from the moment they enter
into service.
Objective 2.1 Enhance VA’s partnership with DoD
The partnership between VA and the Department of Defense (DoD) continued to grow and
strengthen during FY2016. VA and DoD jointly managed the Integrated Disability Evaluation
System (IDES) at 118 different sites to determine whether wounded, ill, and injured
Servicemembers referred to IDES are fit or unfit for duty, and provide them a single set of
medical exams and disability ratings upon completion of the IDES process. Additionally, VA and
DoD collaborated to provide military sexual trauma-related counseling, healthcare, and services
to active duty Servicemembers at Vet Centers without a referral from TRICARE or a military
treatment facility, and developed a plan to simplify and expand access to MST-related services
at VA Medical Centers.
Objective 2.1 Related Performance Measures
Percent of Integrated Disability Evaluation System (IDES) participants who will receive VA
benefit notification letters within 30 days of discharge (Program Administered by VBA, but
coordinated with DoD via VA Office of Policy and Planning) (VBA #469)
FY 2013 FY 2014 FY 2015 FY 2016 FY 2017 FY 2018
Target Not
Available
Not
Available
(Baseline) 80% 80% 80%
Actual Not
Available
Not
Available
55% 66%
The VA/DoD partnership is essential to the Integrated Disability Evaluation System (IDES). IDES
helps facilitate the transition for Servicemembers facing medical discharges by eliminating the
need for separate VA/DoD processes. Through this VA/DoD partnership, IDES participants

75
undergo a single set of examinations and receive single ratings, which both VA and the military
use to determine their respective benefits. As part of IDES, participants are awarded VA
benefits promptly upon their discharge from service.
Analysis of Results
VA did not reach the target for “Percent of Integrated Disability Evaluation System (IDES)
participants who will receive VA benefit notification letters within 30 days of discharge.” VA set
a very aggressive goal, and the IDES program grew 11 percent during 2016. Upon discharge or
retirement from the military, transitioning Servicemembers often face sudden changes in
income and financial uncertainty. Timely benefit notification is critical, confirming the VA
award and its imminent distribution. Currently, VBA is working with DoD on a DES Relook
project to see what timelines can be move and/or improved to achieve the target of 80
percent.
Plans for the Future
In 2017-2018, VA will continue to collaborate with DoD on improving IDES performance,
maintaining timeliness standards, and improving Servicemember satisfaction. VBA is working
with VBMS to integrate new requirements during 2017-2018. The new VBMS feature will allow
for proposed ratings to automatically become final ratings. This step will save RVSRs from
needing to rework ratings, improving performance and timeliness.
Number of registered eBenefits users (VBA #443)
FY 2013 FY 2014 FY 2015 FY 2016 FY 2017 FY 2018
Target 2.50M 3.80M 5M 5.7M 6.3M 6.8M
Actual 3.06M 4.14M 5.16M 6.1M
A goal of VA’s claims transformation plan was to change the way VA delivers benefits and
services to Veterans, leveraging the capabilities of electronic applications and portals. VA’s
extensive outreach efforts led more Veterans to interact with VA using the joint DoD/VA web
portal eBenefits (https://www.ebenefits.va.gov/ebenefits/homepage). This tool gives
immediate access to information on benefits and services, the status of any claims filed, and
the ability to submit claims for disabilities or to apply for health care benefits.
Analysis of Results
VA exceeded the target for “Number of registered eBenefits users” in FY 2016. The major
contributing factors for this success included: offering over 55 self-service features; continuing
to market videos, public service announcements, and web content regarding its advantages;
and targeting emails to promote online filing of claims and a better understanding of the claim
examination process.
76
Plans for the Future
VA will continue to increase the number of users of eBenefits or other self-service service
platforms by: developing new forms more suitable for electronic completion; maintaining
online application options in D2D; deploying new self-service capabilities within eBenefits (or
similar self-service platforms) for mobile devices to support a unified digital experience.
Additionally, VA will continue to collect customer feedback on the quality of VA services and/or
products and adjust its customer service based on that feedback.
Objective Progress Update Summary
Achievements:
Published the FY2016-2018 VA-DoD Joint Strategic Plan on October 28, 2016.
VA completed 4 Core Process Steps for the Integrated Disability Evaluation System
within the 100 day goal: Claim Development, Medical Examination & Administration,
Proposed Rating, and Benefits Notification.
During FY16:
o 29,437 Servicemembers were referred into IDES.
o 29,069 completed the IDES process.
o 24,542 completed IDES in an average of 225 days.
o 19,912, or 81 percent, completed the IDES process within the 295-day goal.
VA completed 10,796 exams in conjunction with the Separation Health Assessment
Initiative.
As of April 6, 2016, DoD and VA jointly certified the interoperability of electronic health
records and will deliver their modernized electronic health record systems to initial sites
by December 31, 2016.
The Veterans health and benefits portal, eBenefits, added nearly 717,505 new accounts
in FY2016 and now has a total of 6,085,160 million enrollees as of October 31, 2016.
In September 2016, co-chairs of the Joint Executive Committee (JEC) approved a new VA
and DoD concept, implementation strategy, and timeline to simplify and expand access
to MST-related services at VA Medical Centers. The implementation plan will be
finalized in the second quarter of FY 2017.
Challenges:
1. Continued process improvements are needed in order to meet and sustain the joint VA
– DoD IDES performance goal of processing 80 percent of all claims within 295 days.
2. The development of a DoD tracking tool would help VA verify that all Servicemembers
who are not filing a VA disability claim prior to separation receive a Separation Health
Assessment (SHA).

77
3. Another challenge is the continued evolution of baseline metrics into outcome-based
performance metrics for how both Departments will achieve the legal requirement for
interoperable electronic health record systems with integrated data displays.
Interoperability must comply with national standards and architectural requirements
identified by the DoD/VA Interagency Program Office (IPO) in collaboration with the
Office of the National Coordinator for Health Information Technology (ONC). The first
set of outcome-based performance metrics for interoperability must be established,
baselined, and measured on a quarterly basis.
Final Assessment:
VA, in consultation with the OMB, highlighted this objective as a focus area for improvement
for three consecutive fiscal years. VA’s mitigation strategy to improve the performance of
Objective 2.1 Enhance VA’s Partnership with DoD, is provided in Appendix 1.
Objective 2.2: Enhance VA’s partnerships with Federal, state, private sector,
academic affiliates, Veteran Service Organizations, and non-profit
organizations
During FY2016, VA made great strides in enhancing partnerships with federal, state, and local
organizations to promote best outcomes for Veterans and ensure the efficient use of resources.
The Veterans Experience Office worked with local VA leadership to build Community Veterans
Engagement Boards (also known as MyVA Communities) and maximize the collective impact of
local services, stakeholders, and federal/state agencies working together to improve Veteran
outcomes. Organizations such as Walgreens, National Association for Stock Car Auto Racing
(NASCAR), and the Young Men’s Christian Association (YMCA) pledged resources and/or
services to support the health and welfare of Veterans. The Department of Agriculture (USDA)
and VA plan to collaborate to manage foreclosed property assets and save taxpayer dollars.
Objective 2.2 Related Performance Measures VA does not currently have any performance measures tied to this strategic objective.
Objective Progress Update Summary
Achievements:
USDA and VA forged a new partnership to manage, market, and sell the foreclosed
properties VA acquired from lenders. This interagency partnership will create efficiency
by eliminating the private sector contractor support normally used and generate an
annual savings to taxpayers of over $9 million.
78
VA helped to develop and participated in 90 Community Veteran Engagement Boards
(CVEB) located throughout the United States: North Atlantic – 29 CVEB; Midwest – 20
CVEB; Southeast – 15 CVEB; Pacific – 15 CVEB, and the Continental – 11 CVEB.6
Established or expanded more than 50 strategic partnerships that collectively
contributed over $155 million in donations or commitments to Veterans services such as
homelessness, employment, adaptive sports, benefits, caregiver support, health, mental
health, and many more.
Strategic partnerships enabled VA to leverage more than $275,000 in private sector
donations to fully fund two Pathway to InnoVAtions events. These events brought
together more than 600 national leaders and experts in research, clinical services,
government, sports, and other industries along with Veterans, their families, Caregivers,
Survivors, and other beneficiaries to highlight key Veteran issues around brain injury,
mental health, and caregiver support for military families.
More than 10 partnerships were established to support Pathway to InnoVAtions events.
Partners include: Amazon, Booz Allen Hamilton, Comcast, Disabled Sports USA, General
Electric, IBM, Philips, Johnson & Johnson, Optum Health Care, Elizabeth Dole
Foundation, and First Quality Enterprises.
VA established and sustained partnerships to help with critical needs for Veterans and
their families. A few examples include:
o Walgreens offered free flu shots to Veterans at 8,200 locations, which increased
access to flu shot vaccinations to more than 72,000 Veterans.
o NASCAR allowed VA staff to attend races which enabled VA to provide
information about VA benefits and services to over 7,000 Veterans,
Servicemembers, and families during the 2016 race season.
o YMCA of USA (Y-USA) expanded their existing partnership to promote and
enhance the health and well-being of Veterans and their families and made it
easier to connect Veterans to needed community resources and opportunities
for employment, homelessness, healthy lifestyle programming, and reintegration
into the local community.
o Warrior Care Network, comprised of Wounded Warrior Project and four
academic medical centers (Emory, Massachusetts General, UCLA, Rush), pledged
$100 million over the next three years to provide intensive mental health care
treatment at the four medical centers to post 9/11 Veterans and their families.
VA partnered with the Warrior Care Network to assist with the smooth transition
of eligible Veterans from these programs back to the VA. Since its launch in
6 The full list can be found at: http://www.va.gov/nace/myVA/state.asp?STATE=All

79
February 2016, VA social workers provided more than 300 consultations to
Veterans and facilitated over 90 referrals to VA health care.
Challenges:
None identified.
Final Assessment:
VA, in consultation with the Office of Management and Budget, determined that this objective
is maintaining progress.
Objective 2.3: Amplify awareness of services and benefits available to
Veterans through improved communications and outreach
The benefits, services, and resources available to our current and future clients, and the means
and mechanisms for delivering them, must be widely-known and well understood. We will
expand the ways in which we connect to our clients to amplify awareness of the services and
benefits available to Veterans and eligible beneficiaries. We will connect with Veterans and
eligible beneficiaries, our partners, and the Nation through clear, aligned, and proactive
interactions.
Objective 2.3 Related Performance Measures
Increase percentage of Veterans aware of using benefits, reached through advertising and
marketing effort (OPIA #536)
FY 2013 FY 2014 FY 2015 FY 2016 FY 2017 FY 2018
Target 10% 10% 15% 15% 15% 15%
Actual 15% 26% 19.8% 14.35%
Analysis of Results
In FY 2016, VA did not reach the target for “Increase percentage of Veterans aware of using
benefits, reached through advertising and marketing effort” measure. The actual performance
result was 14.35 percent. No single causal factor has been identified that lead to the lower
result. Due to competing demands for limited resources, less advertising was purchased in FY
2016. This resulted in lower media purchases, equaling a reduced advertising impact.
Secondly, the contract in place had reduced capacity for the number of digital outreach events
– only 8 for the base year versus monthly. In turn, we have vigorously increased the planning
and targeted execution associated with ExploreVA, OPIA’s digital outreach campaign launched
in 2013. This campaign is supported by an ongoing contract for digital outreach; increased
flexibility to adjust digital outreach tactics using key word search optimization measures;
increasing coordination and integration of all VA administrations outreach efforts to maximize

80
use of VA.gov for outreach programs and resources; monthly use of digital outreach platforms
such as twitter chats and Facebook Live events featuring subject matter experts by benefit line;
closely reviewing the assessment of monthly performance measures to determine what is and
is not performing; and finally, we have increased the frequent interface with Veteran Service
and non-government organizations to amplify the ExploreVA homepage as a benefit and
services resource too. VA constantly reviews performance metrics to shape campaign
messages for greatest reach and impact.
Plans for the Future
In FY 2017, the Office of Public Affairs will continue this successful program with the National
Veterans Outreach Office sustaining the monthly performance analysis requirement. A new
contract for digital outreach is in place. VA will spend funds on digital advertising such as key
word purchase, banner ads, and remarketing. Additional funding will support website
maintenance and updates to ensure accuracy in VA communication, partnership engagement,
digital outreach materials and monthly outreach engagement. Continued partnership with
VSOs and NGOs will increase effectiveness of VA’s communication reach.
Increase veteran traffic to and from the various VA content delivery platforms (OPIA #659)
FY 2013 FY 2014 FY 2015 FY 2016 FY 2017 FY 2018
Target Not
Available
Not
Available
Not
Available
(Baseline) 586,358 To be
determined
Actual Not
Available
Not
Available
Not
Available
488,632
Analysis of Results
FY 2016 – FY 2017 is the baseline year for measuring the average number of views to VA’s
primary content delivery platform, the VAntage Point blog. On average at the end of FY FY2016,
there were 488,000 page views per month to the blog. *Measurement data from mid-May 2016
through mid-July 2017 is estimated based on an error in reporting by Google Analytics.
Plans for the Future
In FY 2017, OPIA and its Digital Media Engagement program will evaluate traffic to the primary
content delivery platforms, as well as means by which visitors are encouraged to visit the site.
Depending on results, options for increased engagement on complementary social and digital
media platforms will be considered.

81
Objective Progress Update Summary
Achievements: VA’s Vantage Point blog serves as the bridge between VA’s social content
andVA.gov. Vantage Point’s site was redesigned in 2015 in order to make it mobile responsive,
so that users could easily view the content on mobile devices as well as traditional computers.
Additional enhancements to meet Section 508 accessibility standards and responsiveness have
been implemented in the last 12 months. In FY 2016, overall traffic increased 38 percent from
FY 2015, with more than 1.2 billion page views across va.gov. From October 2015 to September
2016, VAntage Point had 3.5M unique page views.
The Explore VA7 campaign remains on-going. The Explore.VA.gov site continues to
improve information on VA services and benefits and how to apply. Explore VA includes
dozens of testimonial videos by Veterans discussing how VA benefits and services
improve their lives. Explore VA also works in partnership with Veteran Service
Organizations and Non-Governmental Organizations to circulate social media outreach
and execute monthly digital media events such as Facebook Live events, Twitter and
Facebook chats, to specifically discuss a VA service or benefit in focus. Subscriber email
is also an effective digital outreach tool. Social media events and outreach increase
subscriber base, which in turn allow VA to reach a growing audience of Veterans hungry
for information. The objective of these tools is to drive Veterans and family members to
Explore.VA.gov to increase awareness and access.
Additionally, in the last two fiscal years, VA’s primary Facebook page gained nearly
631,000 new subscribers, bringing its total to 1.1M subscribers. VA has more than 464K
followers and has posted nearly 500 new Veteran-centric videos on the Department’s
YouTube channel. In all, VA has more than 1,600 videos available on a range of topics,
with more than 6 million views.
VA published more than 32,100 VA-related photos on the Department’s Flickr page that
were viewed more than 17.5 million times. The @DeptVetAffairs Instagram audience
has grown to 45.2K followers and has posted nearly 1200 images.
In FY 2016, a newly created “This Week at VA” email newsletter, a summary of content
generated on the VAntage Point blog, is distributed each week to 1.5 million
subscribers. VA also launched in late FY 2016 a “This Week at VA” podcast to highlight
Veteran engagement and VA stories.
Challenges: With additional message distribution methods, such as GovDelivery,
integrating messaging opportunities across administration, program office and facility
7 http://explore.va.gov/

82
accounts continue to be a work-in-progress. Converting email opens to website “click
thrus” will increase message delivery and outreach. Cultivating and promoting quality
content and executing sustained messaging from the field level up will continue to be a
focus of efforts going forward.
Final Assessment: VA, in consultation with the Office of Management and Budget,
determined that performance toward this objective is making noteworthy progress.

83
Goal 3: Manage and Improve VA Operations to Deliver Seamless and
Integrated Support VA will strengthen its business operations in targeted areas to ensure it is able to optimally and
effectively serve Veterans and eligible beneficiaries. We are in a prolonged period of rapid
technological and cultural change, as well as economic and emerging National Security threats.
We must become nimble and responsive to change, giving ourselves maneuverability, space,
and options in our response to shifting conditions. Our policies, processes, and approaches
must allow us to expand and contract rapidly with minimal disruption to our business, benefits,
services, and resources.
We must focus on developing cost-effective and integrated solutions to increase productivity
and look for opportunities to divest, eliminate redundancies, and improve efficiency. VA must
integrate business support processes, Veteran-facing services, and technology Department-
wide.
Veteran Hiring
Percent of VA employees who are Veterans (HRA #278)
FY 2013 FY 2014 FY 2015 FY 2016* FY 2017 FY 2018
Target 35% 35% 33.5% 33.8% 35% 35%
Actual 32.20% 32.66% 32.74% 32.53%
* The FY 2016 target was previously reset to 33.8% from 34.3%. Future stretch targets were also adjusted last year to 35% for
FY 2017 and beyond to align expectations with current circumstances.
Analysis of Results
This measure assesses the degree to which VA’s workforce reflects customers we serve, which
is considered to enhance VA’s ability to execute its mission. During FY 2016, VA hired 16,737
Veterans, and proudly ranks first among non-Defense agencies in hiring Veterans. The
Department intends to increase the percentage of VA employees who are Veterans to 35
percent in FY 2017 and beyond. As of September 30, 2016, VA had a total of 120,912 Veterans
on board, which accounts for 32.53 percent of the total workforce. Although the results are
within the acceptable variance, there is one factor that may continue to constrain the hiring of
Veterans: an increased emphasis on hiring for health care positions within VHA, i.e., positions
that require civilian credentials that the military service does not require in their medical
capacity and, therefore, most transitioning Veterans do not possess. Despite these
circumstances, VA did see a net increase of 2,312 Veterans into the VA workforce since the end
of FY 2015.
Plans for the Future

84
While VA is committed to Veteran hiring, it will place increased emphasis on Veteran retention.
There are three primary areas of focus for the benefit of Veterans already employed at VA: the
first is to collaborate with VA Administrations to develop best practices for retaining Veterans;
the second is to develop and sustain a platform for VA Veteran employees and managers to
interact and find solutions to internal VA workforce issues and concerns; and the third is to
promote a support system offering VA Veteran employees a sense of community, camaraderie
and connection to the department. This last area supports VA’s Agency Priority Goal to
“Improve the Employee Experience.”
Employee Engagement
OPM Federal Employees Viewpoint Survey (FEVS) Employee Engagement Index Score
(Percentage of responses marked ‘positive’) (HRA #608)
FY 2013 FY 2014 FY 2015 FY 2016 FY 2017 FY 2018
Target 63% 61% 62% 63% 64% 65%
Actual 63% 61% 61% 62%
Analysis of Results
The Federal Employee Viewpoint Survey (FEVS) is a confidential survey that measures
government employees’ perceptions of whether, and to what extent, conditions that
characterize successful organizations are present in an agency. The survey was administered
electronically to a sample of full-time and part-time permanent employees from May to June
2016. OPM then collects and verifies responses from the more than two hundred federal
agencies before releasing the data. VA’s FEVS employee engagement index score increased for
the second year in a row, and FY 2016 scores improved on 66 of 71 questions. Other areas of
improvement between 2015 and 2016 included:
• Arbitrary action, personal favoritism and coercion for partisan political purposes are not
tolerated
• Senior leaders demonstrate support for Work/Life programs
• My organization has prepared employees for potential security threats
• Employees are recognized for providing high quality products and services
• Creativity and innovation are rewarded
The Partnership for Public Service uses a subset of the data to create the Best Places to Work
(BPTW) Index rankings for federal government agencies. This year, VA ranked 17th out of 18
large federal agencies, maintaining the same position it held in 2015. While our ranking stayed
the same, our BPTW Index Score improved 1.6 points, to 56.7, exceeding the government-wide
increase of 1.3 points.
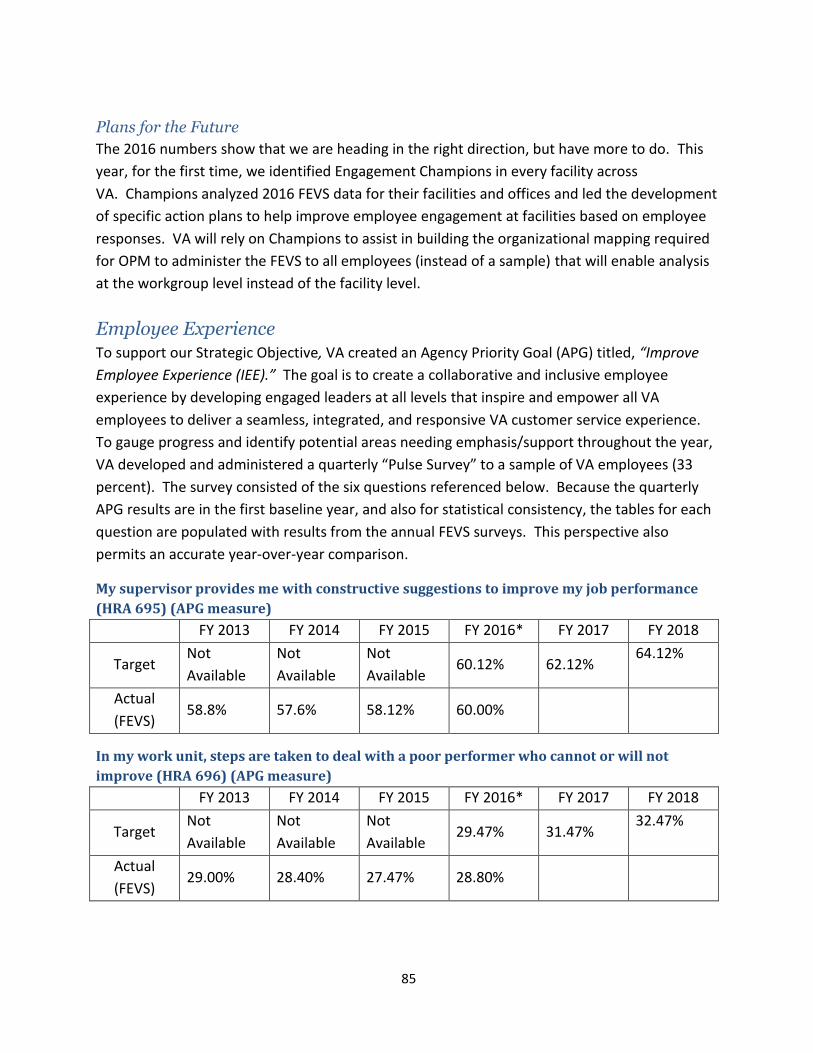
85
Plans for the Future
The 2016 numbers show that we are heading in the right direction, but have more to do. This
year, for the first time, we identified Engagement Champions in every facility across
VA. Champions analyzed 2016 FEVS data for their facilities and offices and led the development
of specific action plans to help improve employee engagement at facilities based on employee
responses. VA will rely on Champions to assist in building the organizational mapping required
for OPM to administer the FEVS to all employees (instead of a sample) that will enable analysis
at the workgroup level instead of the facility level.
Employee Experience To support our Strategic Objective, VA created an Agency Priority Goal (APG) titled, “Improve
Employee Experience (IEE).” The goal is to create a collaborative and inclusive employee
experience by developing engaged leaders at all levels that inspire and empower all VA
employees to deliver a seamless, integrated, and responsive VA customer service experience.
To gauge progress and identify potential areas needing emphasis/support throughout the year,
VA developed and administered a quarterly “Pulse Survey” to a sample of VA employees (33
percent). The survey consisted of the six questions referenced below. Because the quarterly
APG results are in the first baseline year, and also for statistical consistency, the tables for each
question are populated with results from the annual FEVS surveys. This perspective also
permits an accurate year-over-year comparison.
My supervisor provides me with constructive suggestions to improve my job performance
(HRA 695) (APG measure)
FY 2013 FY 2014 FY 2015 FY 2016* FY 2017 FY 2018
Target Not
Available
Not
Available
Not
Available 60.12% 62.12%
64.12%
Actual
(FEVS) 58.8% 57.6% 58.12% 60.00%
In my work unit, steps are taken to deal with a poor performer who cannot or will not
improve (HRA 696) (APG measure)
FY 2013 FY 2014 FY 2015 FY 2016* FY 2017 FY 2018
Target Not
Available
Not
Available
Not
Available 29.47% 31.47%
32.47%
Actual
(FEVS) 29.00% 28.40% 27.47% 28.80%

86
Employees have a feeling of personal empowerment with respect to work processes (HRA
697) (APG measure)
FY 2013 FY 2014 FY 2015 FY 2016* FY 2017 FY 2018
Target Not
Available
Not
Available
Not
Available 41.51% 43.51%
45.51%
Actual
(FEVS) 41.30% 39.80% 39.51% 41.40%
I feel encouraged to come up with new and better ways of doing things (HRA 698) (APG
measure)
FY 2013 FY 2014 FY 2015 FY 2016* FY 2017 FY 2018
Target Not
Available
Not
Available
Not
Available 55.40% 57.40%
59.40%
Actual
(FEVS) 54.70% 52.80% 53.40% 54.30%
How satisfied are you with the information you receive from management on what’s going
on in your organization? (HRA 699) (APG measure)
FY 2013 FY 2014 FY 2015 FY 2016* FY 2017 FY 2018
Target Not
Available
Not
Available
Not
Available 45.05% 47.05%
49.05%
Actual
(FEVS) 45.60% 42.90% 43.05% 44.30%
My organization’s leaders maintain high standards of honesty and integrity (HRA 700) (APG
measure)
FY 2013 FY 2014 FY 2015 FY 2016* FY 2017 FY 2018
Target Not
Available
Not
Available
Not
Available 45.50% 47.50%
49.50%
Actual
(FEVS) 49.3% 43.9% 43.50% 44.80%
* Targets posted in FY 2016 for all six questions were based on tentative APG Pulse Survey projections. Targets were
subsequently modified to reflect projected results from the annual Federal Employee Viewpoint Survey (FEVS) – a more reliable
tool for making year-over-year comparisons.
Analysis of Results
In addition to conducting the quarterly “Pulse Survey,” as previously mentioned, VA also uses
the responses to the same six questions included within OPM’s Annual Federal Employee
Viewpoint Survey (FEVS) to assess annual progress. Compared to FY 2015, as measured by the
FY 2016 FEVS results within the tables above, VA saw at least a 1 percent point increase in each
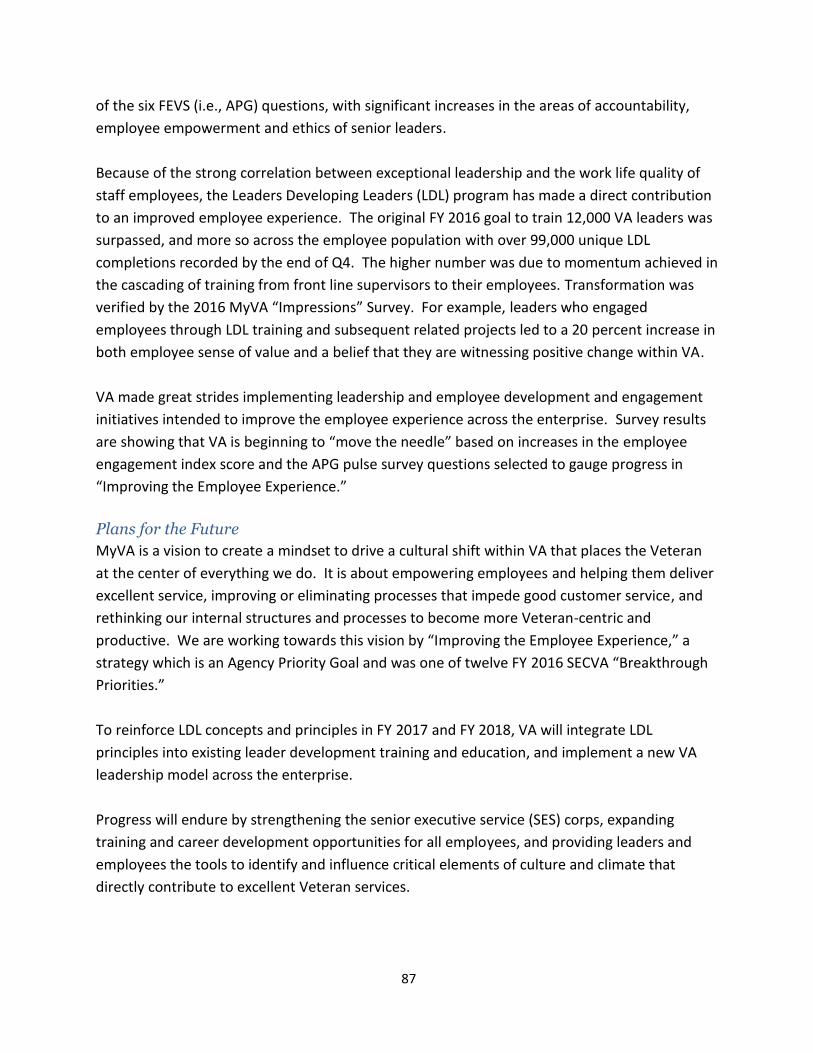
87
of the six FEVS (i.e., APG) questions, with significant increases in the areas of accountability,
employee empowerment and ethics of senior leaders.
Because of the strong correlation between exceptional leadership and the work life quality of
staff employees, the Leaders Developing Leaders (LDL) program has made a direct contribution
to an improved employee experience. The original FY 2016 goal to train 12,000 VA leaders was
surpassed, and more so across the employee population with over 99,000 unique LDL
completions recorded by the end of Q4. The higher number was due to momentum achieved in
the cascading of training from front line supervisors to their employees. Transformation was
verified by the 2016 MyVA “Impressions” Survey. For example, leaders who engaged
employees through LDL training and subsequent related projects led to a 20 percent increase in
both employee sense of value and a belief that they are witnessing positive change within VA.
VA made great strides implementing leadership and employee development and engagement
initiatives intended to improve the employee experience across the enterprise. Survey results
are showing that VA is beginning to “move the needle” based on increases in the employee
engagement index score and the APG pulse survey questions selected to gauge progress in
“Improving the Employee Experience.”
Plans for the Future
MyVA is a vision to create a mindset to drive a cultural shift within VA that places the Veteran
at the center of everything we do. It is about empowering employees and helping them deliver
excellent service, improving or eliminating processes that impede good customer service, and
rethinking our internal structures and processes to become more Veteran-centric and
productive. We are working towards this vision by “Improving the Employee Experience,” a
strategy which is an Agency Priority Goal and was one of twelve FY 2016 SECVA “Breakthrough
Priorities.”
To reinforce LDL concepts and principles in FY 2017 and FY 2018, VA will integrate LDL
principles into existing leader development training and education, and implement a new VA
leadership model across the enterprise.
Progress will endure by strengthening the senior executive service (SES) corps, expanding
training and career development opportunities for all employees, and providing leaders and
employees the tools to identify and influence critical elements of culture and climate that
directly contribute to excellent Veteran services.

88
Objective Progress Update Summaries
3.1 Make VA a Place People Want to Serve
VA made significant strides towards understanding the employee’s viewpoint and achieving
Objective 3.1. VA’s Leaders Developing Leaders (LDL) program provided training on developing
leadership judgement, analyzing the enterprise, teambuilding and team feedback, and
managing change that cascaded throughout VA and enabled participants to directly apply these
new skills to address current challenges. Internal and external surveys were used to gauge
progress and identify problem areas that required immediate action and other areas that VA
should monitor. VA used OPM’s Federal Employee Viewpoint Survey (FEVS) to evaluate
employee engagement and VA’s annual All Employee Survey and quarterly Pulse survey to
evaluate six measured categories: constructive performance feedback, accountability,
employee empowerment, innovation, customer experience and ethics. Although VA made
significant progress towards understanding employee attitudes and experiences, we still have
work to do to improve hiring for Veterans and the capabilities, engagement and experience of
VA employees.
Objective Progress Update Summary Achievements:
OPM’s Annual Federal Employee Viewpoint Survey (FEVS) showed the Employee
Engagement Index increased for the second year in a row, and FY16 scores improved on
66 of 71 questions. Even though VA did not achieve its FY16 Employee Engagement
Index target score of 63 percent, scores improved one full percentage point and OPM
cited VA as one of five agencies that made a “remarkable turnaround.”
The annual FEVS also showed a one percentage point increase in each of the six Agency
Priority Goal questions with significant increases in the areas of accountability,
employee empowerment, and senior leader ethics.
VA developed and administered a quarterly “Pulse Survey” to a sample (33 percent) of
VA employees to gauge progress and identify potential areas needing special/ focused
support throughout the year.
VA created an Agency Priority Goal (APG) titled, “Improving the Employee Experience
(IEE).” The goal was to create a collaborative and inclusive employee experience by
developing engaged leaders at all levels that inspire and empower all VA employees to
deliver a seamless, integrated, and responsive VA customer service experience.
Due to the momentum achieved in cascading training from front line supervisors to
employees, the FY 2016 Leaders Developing Leaders (LDL) goal to train 12,000 VA

89
leaders was significantly surpassed with over 99,000 unique LDL completions recorded
by the end of Q4.
VA streamlined the Strategic Leadership Course (SLC) curriculum to integrate
components of the LDL program and I LEAD philosophy, and instituted shorter panel
discussions to replace longer individual presentations. Emphasis was placed on
knowledge of critical points of contact across VA and the importance of building internal
networks. Within their first 90 days of employment, 87 percent of VA’s newly assigned
senior executives completed Strategic Leadership Course.
As of September 30, 2016, the number of Veterans employed at VA increased by
120,912, and the percentage of employees who are Veterans reached 32.53percent.
While VA fell short of its 33.8 percent goal for FY 2016, more than 100,000 (~ 33
percent) of VA’s 365,000 employees are Veterans and 49,000 (~13 percent) are disabled
Veterans.
VA proudly ranked first among non-Defense agencies in hiring Veterans and used a
combination of all authorities to hire 16,737 Veterans during fiscal year 2016.
Challenge:
1. VA must adapt its medical positions to meet the evolving health care needs of Veterans.
However, the lack of qualified/licensed Veterans to fill those positions, combined with
significant reductions in resources to recruit Veterans, impacts VA’s ability to achieve
annual targets for the percentage of VA employees who are Veterans.
Final Assessment:
VA, in consultation with the Office of Management and Budget, determined that this objective
is maintaining progress.
3.2 Evolve VA Information Technology Capabilities to Meet Emerging Customer Service/
Empowerment Expectations of Both VA Customers and Employees
VA made significant progress during 2016 to promote accessibility; information security, and
data and infrastructure interoperability at the enterprise level. The Office of Information and
Technology (OI&T) launched the Transformation Plan which resulted in new mission and vision
statements, guiding principles, and strategic goals for information technology throughout the
Department. This Plan stabilized and streamlined core processes and platforms, eliminated the
material weakness, and institutionalized a new set of capabilities to improve outcomes. VA
must continue this progress while increasing efforts to eliminate ineffective and efficient legacy
systems and aid in the development of a mobile workforce and secure data environment.

90
Objective Progress Update Summary Achievements:
Adopted a customer-centric mindset and collaborative engagement with all key
stakeholders.
Institutionalized a “buy-first” strategy that leveraged existing commercial solutions first
before building internally and incorporated best practices from the public and private
sector to spur agility, efficiency, effectiveness, and innovation in service delivery.
Established the Enterprise Program Management Office (EPMO) as the control tower for
all IT projects and created a single release process to streamline the timing of IT
projects.
Developed Interoperability Metrics & Milestones that detailed efforts to standardize
terminology, content, exchange methods, and access to shared health information for
the seven technical objectives and the four use cases in the DoD/VA Joint
Interoperability Plan.
Published the Enterprise Cybersecurity Strategy and established eight domains to address the material weakness findings, and fully funded all Continuous Readiness in Information Security Program (CRISP) efforts.
Identified the new Chief Information Security Officer and conducted extensive
penetration testing of VA’s networks with multiple parties. OI&T and customers can
now track over 600 VA IT systems and associated technical, business and stakeholder
attributes in the VA Systems Inventory.
Challenges:
1. Constantly shifting needs and the diversity of customers increases the complexity of IT
support.
2. The persistent risk of cyber-attacks combined with continuing digitization of health care
increases exposure, vulnerability, and potential consequences of a data breach.
3. External IT delivery models are constantly changing with the adoption of more
commercial-style services and techniques (e.g., learning by doing).
Final Assessment:
VA, in consultation with the Office of Management and Budget, determined that this objective
is maintaining progress.

91
3.3 Build a Flexible and Scalable Infrastructure through Improved Organizational Design and
Enhanced Capital Planning
VA developed Managing for Results to establish a more agile organization that is capable of
adapting to meet the needs of a diverse Veteran population. Managing for Results is a process
to coordinate the development of mission requirements and program performance standards
that serve as the basis to identify risks and align multi-year resource planning and budgets.
Objective Progress Update Summary Achievements:
Completed the FY17 Strategic Capital Investment Planning (SCIP) process and delivered
the budget on time containing both the current year funding request and Long-Range
(10-year) capital requirements to address VA’s infrastructure deficiencies.
VA is developing and integrating of the Department’s Enterprise Risk Management
(ERM) system within the Managing for Results construct.
VA expects to award 160 million in energy performance-based contracts by the end of
calendar year 2016.
Challenges:
1. Accomplishing Strategic Objective 3.3 is dependent upon funding to implement capital
plans developed through the Strategic Capital Investment Planning (SCIP) process.
Funding for capital initiatives contained in SCIP remain significantly well below the rates
required to address the Long-Range (10-year) plan requirements to achieve full gap
closure.
Final Assessment:
VA, in consultation with the Office of Management and Budget, determined that this objective
is maintaining progress.
3.4 Enhance Productivity and Improve the Efficiency of the Provision of Veterans Benefits and
Services
VA established partnerships with other federal agencies and encouraged smaller VA offices to
partner and share best practices. These partnerships resulted in recommendations from
numerous internal and independent third-party organizations that helped VA strengthen a
major construction program, increase efficiencies and preserve resources while ensuring
Veterans received the benefits and services they earned.
Objective Progress Update Summary

92
Achievements:
VA and DoD assumed co-ownership and co-leadership of one of the ten OMB sponsored
federal category management centers of excellence, the Medical Products and Services
Category Management Center of Excellence, to leverage federal buying power for this
large federal spend category and improve federal procurement practices in assigned
categories.
VA’s Technology Acquisition Center awarded an Enterprise Multi-Function Device (MFD)
Contract, which is an enterprise contractual solution to acquire latest technology MFDs
ranging from desktop size to small duty, medium duty, heavy duty, and extra heavy duty
configurations. All VA Contracting Officers will have the ability to compete and place
orders for MFDs under this contract.
VHA and VBA partnered with the Office of Acquisitions, Logistics, and Construction’s
Strategic Acquisition Center to implement medical-surgical, medical disability
examinations, and prosthetic strategic sourcing solutions to better leverage the
Department’s buying power in FY16 and beyond.
VA achieved relatively high levels of maturity in measured categories using the OMB
Category Spend Under Management (SUM) Maturity Tracking Model, and especially
high ratings in terms of aligning cost avoidance tracking methodologies with approved
Strategic Sourcing Leadership Council methodologies. Sixty-five (65 percent) of OMB
surveyed category spend was at Tier 1 or higher maturity (OMB defines Tier 1 as
“excellence”). These achievements helped VA obtain better prices and represent a
commitment to ensuring good stewardship of taxpayer dollars.
Implemented recommendations from numerous internal and independent third-party
organizations to strengthen the major construction program with 48 major construction
projects in various planning, design, or construction phases. This included 14 projects
that are, or will be, managed in conjunction with the U.S. Army Corps of Engineers. VA
recently briefed the program improvements to the Association of General Contracts
2016 Federal Contractors Conference, and industry representatives lauded the
improved interactions with the major construction program.
VA’s Technology Acquisition Center (TAC) awarded a major 5-year Multi-Agency IDIQ
contract, Transformation Twenty-One Total Technology Next Generation (T4NG), with a
program ceiling of $22.3 billion. T4NG covers a wide range of IT and Health IT services
including program management, strategic planning, systems and software engineering,
enterprise networks, cyber security, operations and maintenance.
VA’s Value Engineering Resource Center (systems engineering) staff developed a web-
based analytics support tool, Pricing Opportunities Analysis Tool – Suite (POAT), that
provides robust analytical capabilities to support better requirements planning and
acquisition decision making. This capability improved the decision cycle time.

93
Challenges:
1. VHA commodity management infrastructure is evolving too slowly to see rapid,
significant strategic sourcing benefits in terms of reduced cost, process efficiencies, and
improved customer satisfaction.
Final Assessment:
VA, in consultation with the Office of Management and Budget, determined that this objective
is maintaining progress.
3.5 Ensure Preparedness to Provide Services and Protect People and Assets Continuously and
in Time of Crisis
VA strengthened security practices and procedures during 2016 and prepared personnel to
ensure Veterans and their families continued receiving the benefits and services they earned
even during emergencies. The Operations, Security, and Preparedness (OSP) office worked
with multiple VA offices and other federal agencies to share knowledge and experience and
prevent unauthorized access to facilities, systems, and equipment. VA updated and launched
an Insider Threat Program and enforced a multistep authentication process to protect VA
networks and associated software applications.
Objective Progress Update Summary Achievements:
Performed a USAccess planning offsite at Hines, Illinois OIT Field Office with 30
stakeholders from OSP Executive Office of Personnel Security and Identity Management,
Office of Management (OM), General Services Administration, US Treasury, OIT
(National Security Operations Center (NSOC), Office of Information Security (OIS),
Enterprise Program Management Office (EPMO) and Service Delivery and Engineering
(SDE). This collaboration enabled all stakeholders to:
o Obtain a baseline understanding of the technical, process, and policy challenges
of the current VA PIV system.
o Obtain an overview of the “NextGen” systems and capabilities that will be
piloted at the VA.
o Develop a multi-phased VA-USAccess pilot approach that takes into account key
considerations, requirements, and activities.
The Homeland Security Presidential Directive 12 (HSPD-12) Program Management Office
issued Personal Identity Verification (PIV) cards for approximately 98 percent of the VA’s
workforce to include contractors, affiliates and government employees.

94
Ensured the use of multifactor authentication to access the VA network and associated
software applications for 85.5 percent; 398,951 of 467,000 employees.
VA’s Insider Threat Program reached full operational capability in accordance with
Executive Order 13587 Structural Reforms to Improve the Security of Classified Networks
and the Responsible Sharing and Safeguarding of Classified Information. VA began
resourcing the requirement to establish a defensive Counter Intelligence Capability in
accordance with the 2016 National Counter Intelligence Strategy.
OSP agreed to support the Intelligence Community and Department of Homeland
Security (DHS) and provided User Activity Monitoring (UAM) for VA’s 2nd classified
networks (i.e. Joint Worldwide Intelligence Communications System (JWICS) and
Homeland Secure Data Network (HSDN)).
Challenges:
1. The current VA PIV system is nearing the end of its expected life cycle and encountering
technology issues that make it cost-prohibitive to maintain and enhance. VA risks falling
behind and complying with Federal policy requirements to accommodate emerging
security requirements. VA PIV system outages and process issues negatively impact
productivity and the employee experience, particularly given PIV enforcement
requirements.
2. VA’s emergency management portfolio covers several Administrations and Staff Offices.
As such, it is difficult to appropriately align mission responsibilities, personnel, and
resources from an enterprise perspective.
Final Assessment:
VA, in consultation with the Office of Management and Budget, determined that this objective
is maintaining progress.
95
Office of the Inspector General (OIG)
Number of reports (audit, inspections, evaluation, contract review, Comprehensive
Healthcare Inspection Program (formerly known as Combined Assessment Program), and
Community Based Outpatient Clinic reports) issued that identify opportunities for
improvement and provide recommendations for corrective action (OIG #585)
FY 2013 FY 2014 FY 2015 FY 2016 FY 2017 FY 2018
Target 300 320 330 330
Actual 349 310 390 304
Analysis of Results
OIG achieved the FY 2016 target (tolerance of 5 percent) for the number of reports (audit,
inspections, evaluation, contract review, Comprehensive Healthcare Inspection Program
(formerly known as Combined Assessment Program) and Community-Based Outpatient Clinic
reports) issued that identify opportunities for improvement and provide recommendations for
corrective action. This accomplishment reflects the impact of additional budgetary resources
provided over the last couple of fiscal years, which has allowed OIG to hire and train additional
auditors, criminal investigators, health care inspectors, and other professionals.
Plans for the Future
OIG anticipates increased performance levels for this measure as new employees are hired,
trained and positioned across the country to address the increased demand for oversight of VA
programs and services, on par with appropriated resources.
Number of arrests, indictments, convictions, criminal complaints, pretrial diversions, and
administrative sanctions (OIG #586)
FY 2013 FY 2014 FY 2015 FY 2016 FY 2017 FY 2018
Target 2,200 2,300 2,400 2,400
Actual 2,491 2,537 2,536 2,425
Analysis of Results
OIG exceeded the FY 2016 target for the number of arrests, indictments, convictions, criminal
complaints, pretrial diversions, and administrative sanctions achieved. This accomplishment
reflects the impact of additional budgetary resources provided over the last couple of fiscal
years, which has allowed OIG to hire and train additional auditors, criminal investigators, health
care inspectors, and other professionals.

96
Plans for the Future
OIG anticipates increased performance levels for this measure as new employees are hired and
positioned across the country to address the increased demand for oversight of VA programs
and services, on par with appropriated resources.
Monetary benefits ($ in millions) from audits, investigations, contract reviews, inspections,
and other evaluations (OIG #587)
FY 2013 FY 2014 FY 2015 FY 2016 FY 2017 FY 2018
Target $2,000 $2,100 $3,100 $3,100
Actual $3,589 $2,300 $2,167 $4,093
Analysis of Results
OIG surpassed the 2016 target for monetary benefits ($ in millions) from audits, investigations,
contract reviews, inspections, and other evaluations realized. This accomplishment reflects the
impact of additional budgetary resources provided over the last couple of fiscal years, which
has allowed OIG to hire and train additional auditors, criminal investigators, health care
inspectors, and other professionals.
Plans for the Future
OIG anticipates increased performance levels for this measure as new employees are hired,
trained, and positioned across the country to address the increased demand for oversight of VA
programs and services on par with appropriated resources.
Return on investment (monetary benefits divided by cost of operations in dollars) (OIG
#588)
FY 2013 FY 2014 FY 2015 FY 2016 FY 2017 FY 2018
Target 18 to 1 18 to 1 22 to 1 22 to 1
Actual 36 to 1 22 to 1 20 to 1 34 to 1
Analysis of Results
OIG surpassed the 2016 target for return on investment (monetary benefits divided by cost of
operations in dollars). This accomplishment reflects the impact of additional budgetary
resources provided over the last couple of fiscal years, which has allowed OIG to hire and train
additional auditors, criminal investigators, health care inspectors, and other professionals.
Plans for the Future
OIG anticipates increased performance levels for this measure as new employees are hired and
positioned across the country to address the increased demand for oversight of VA programs
and services, on par with appropriated resources.

97
Percentage of recommendations implemented within 1 year to improve efficiencies in operations
through legislative, regulatory, policy, practices, and procedural changes in VA (OIG #590)
FY 2013 FY 2014 FY 2015 FY 2016 FY 2017 FY 2018
Target 85% 85% 85% To be
determined
Actual 81% 85% 89% 83%
Analysis of Results
OIG achieved the FY 2016 target (tolerance of 5 percent) for the percentage of
recommendations implemented within 1 year to improve efficiencies in operations through
legislative, regulatory, policy, practices, and procedural changes in VA.
Plans for the Future
OIG’s strategy to meet future targets is to continue to track and coordinate VA’s progress
towards report recommendations implemented on a quarterly basis and mitigate issues when
noted through communication and collaboration with VA senior officials to the extent allowable
within appropriated resources.
Percentage of recommended recoveries achieved from post-award contract reviews (OIG
#591)
FY 2013 FY 2014 FY 2015 FY 2016 FY 2017 FY 2018
Target 96% 96% 98% To be
determined
Actual 100% 100% 100% 100%
Analysis of Results
OIG surpassed the FY 2016 target for the percentage of recommended recoveries achieved
from post-award contract reviews. The primary factor that led to this accomplishment was the
quality of analysis and review conducted by trained contract review teams.
Plans for the Future
OIG’s strategy to meet future targets for this measure is to hire, train, and deploy sufficient
numbers of auditors and other professionals on par with the growth in demand for oversight of
VA programs and services at facilities nationwide and to the extent allowable within budgeted
resources.

98
Percent of full cases that result in criminal, civil, or administrative actions. (OIG 694)
FY 2013 FY 2014 FY 2015 FY 2016 FY 2017 FY 2018
Target Not
Available
Not
Available
Not
Available
Not
Available
72% 72%
Actual Not
Available
Not
Available
Not
Available
Not
Available
Analysis of Results
This measure is new for FY 2017.
Plans for the Future
To meet the target in FY 2018, the OIG Investigative Division will carefully assess each allegation
to determine the level of risk it presents to VA programs and personnel. Where facts and
circumstances reasonably indicate the possibility of criminal activity or administrative
misconduct, the OIG will initiate a full investigation and submit its findings to the Department
of Justice, state or local law enforcement office, or VA Office of Administrative Responsibility, as
appropriate. The decision to prosecute or invoke administrative action rests with the receiving
authority. Where an allegation does not reasonably indicate the possibility criminal or
administrative malfeasance, the OIG’s Investigative Division may open a preliminary inquiry or
developmental case to determine whether additional investigative resources are warranted.

99
VA OIG FY 2015 Major Management Challenges
The Inspector General’s statements regarding major management challenges and VA’s
response can be found in the Agency Financial Report:
https://www.va.gov/finance/docs/afr/2016VAafrFullWeb.pdf, starting on page 226.
Government Accountability Office High Risk Areas
VA Health Care High Risk Area
Since 1990, the Government Accountability Office (GAO) has produced a report every two years
highlighting “high-risk” areas across the Federal government. GAO defines “high-risk” areas as:
Government operations that are high risk due to their greater vulnerability to fraud,
waste, abuse and mismanagement or that are in need of transformation to address
economy, efficiency, or effectiveness challenges.
In its 2015 High Risk List Update, GAO added “Managing Risks and Improving VA Health Care”
as a Department of Veterans Affairs (VA) high-risk area and identified five associated high-risk
issues: (1) ambiguous policies and inconsistent processes; (2) Inadequate oversight and
accountability; (3) Information technology (IT) challenges; (4) Inadequate training for VA staff;
and, (5) Unclear resource needs and allocation priorities.
On April 29, 2016, VA met with Comptroller General Dodaro and the Office of Management and
Budget to address its plans for addressing its health care high-risk area. At that meeting,
Comptroller General Dodaro rated VA as partially met for Leadership Commitment. GAO
evaluates five criteria to evaluate a department or agencies readiness to come off the High-Risk
List. The five criteria are leadership commitment, agency capacity, an action plan, monitoring
efforts, and demonstrated progress. There are three possible ratings for each criterion, fully
met, partially met, and not met. Fully meeting these criteria, implementing GAO’s
recommended solutions and action by Congress are all essential to achieving progress.
Throughout 2016, VA expressed its commitment to GAO for addressing the health care High-
Risk List designation, and has taken actions such as establishing a task force, working groups,
and a governance structure for addressing the issues contributing to the designation. For
example, in July 2016, VA chartered the GAO High-Risk List Area Task Force for Managing Risk
and Improving VA Health Care to develop and oversee implementation of VA’s plan to address
the root causes of the five high-risk issues. VHA’s Deputy Under Secretary for Health for
Organizational Excellence serves as the executive agent for the task force, with support from a
combination of permanent and temporary staff. VA created this senior VHA position in 2015
and they are responsible for overseeing offices focused on assessing and improving health care
100
quality and safety, providing VA leadership with analytics to assess VHA’s performance, and
addressing issues related to public trust and integrity. For each of the five areas of concern, VA
has established a working group with two senior-level VA officials as leaders. These
workgroups and officials are responsible for developing and executing VA’s high-risk mitigation
plan for each of the five high-risk issues. In addition, VA senior leadership increased its focus on
implementing GAO recommendations.
VA also developed a strategy for addressing its high-risk area and five high-risk issues, and
provided the strategy to GAO in August 2016. The strategy acknowledged the significant scope
of work required to remove VA health care from the GAO High-Risk List, and identified the
Secretary’s priority transformation efforts (i.e., MyVA), and the actions VA would take over the
next several years to address the specific high-risk issues. VA provided its first update to the
strategy in December 2016, summarizing the relationship of the health care high risk area to
the President’s September 1, 2016, report to Congress on the Commission on Care
recommendations, and the next steps VA is taking to address integrating high-risk area
management into its management practices.
The initial focus for the Task Force is to complete the root cause analysis; identify and prioritize
the root cause management issues; and implement and monitor the corrective action plans for
the root cause management issues. VA began the root cause analysis in 2016 and will complete
it in 2017.
The efforts to fully manage VA’s high-risks are an enormous undertaking. No Executive Branch
department or agency has satisfied all the criteria for removal from the GAO High-Risk List in
less than four years. VA leadership and employees are committed it the VA mission and equally
committed to taking the actions required to ensure VA is providing Veterans with timely, cost-
effective, safe and high quality health care.
VA efforts will build upon each other across a period of years to develop a sustainable solution
to each high-risk issue, as well as to put in place systems that dramatically reduces the chance
that this high-risk area and its high-risk issues will reemerge.
VA High-Risk Area: Improving and Modernizing Federal Disability Programs
GAO - Why Area Is High Risk
An estimated one in six working-age Americans reported that they had a disability in 2010;
many of them may require assistance finding or retaining employment, or rely on cash benefits
if they cannot work. Nevertheless, disability programs across the federal government face

101
significant challenges in addressing the needs of Americans with disabilities. In particular, 3 of
the largest federal disability programs—2 managed by the Social Security Administration (SSA)
and 1 by the Department of Veterans Affairs (VA), which together dispensed about $256 billion
in cash benefits to over 20 million people in fiscal year 2015—are grappling with large
workloads and have struggled to make timely decisions on who is eligible for cash benefits.
These issues are most evident when individuals appeal their decisions, as the number of
pending appeals increased 30 and 34 percent respectively at SSA and VA when comparing fiscal
years 2012 and 2015. Workloads for these agencies are likely to remain a challenge as the
population ages and large numbers of Servicemembers are expected to transition out of the
military in the next several years. In addition, SSA and VA rely on outdated criteria to determine
whether individuals qualify for benefits. While these agencies reported efforts underway to
update their rules, they continue to emphasize individuals’ medical conditions without
sufficiently considering whether they could work because of improvements in workplace
accommodations and assistive technologies. In addition to these 3 cash assistance programs,
we found that there are 45 programs managed by 9 different federal agencies that provide a
patchwork of employment supports to people with disabilities. Although programs that
support employment can divert individuals from the disability rolls, these programs lack a
unified vision, strategy, or set of goals to guide their outcomes. We first designated improving
and modernizing federal disability programs as high risk in 2003.
What GAO Found
The federal government’s progress in improving and modernizing disability programs remains
mixed. GAO assessed VA’s progress under five criteria across two broad areas: VA’s actions to
manage their disability claims workloads, and VA’s progress to modernize their criteria for
deciding who is eligible for disability benefits.
GAO Criteria for Removal from the High-Risk List
• Leadership Commitment - Demonstrated strong commitment and top leadership support.
• Capacity - Agency has the capacity (i.e., people and resources) to resolve the risk(s).
• Action Plan - A corrective action plan exists that defines the root cause, solutions, and
provides for substantially completing corrective measures, including steps necessary to
implement solutions we recommended.
• Monitoring - A program has been instituted to monitor and independently validate the
effectiveness and sustainability of corrective measures.
• Demonstrated Progress - Ability to demonstrate progress in implementing corrective
measures and in resolving the high-risk area.
GAO rates progress on the criteria using the following definitions:

102
• Met - Actions have been taken that meet the criterion. There are no significant actions that
need to be taken to further address this criterion.
• Partially Met - Some, but not all, actions necessary to meet the criterion have been taken.
• Not Met - Few, if any, actions towards meeting the criterion have been taken.
Managing VA Disability Claims Workload
Per GAO, since the 2015 high-risk update, VA has demonstrated mixed progress in addressing
its workload challenges. Progress is evident in regards to VA’s efforts to reduce the Veterans
Benefits Administration’s (VBA’s) compensation claims backlog. However, VA’s appeals
workload continued to grow, and several efforts to address this challenge are still underway. In
particular, VA’s proposed framework to reform the appeals process—developed by VBA and
the Board of Veterans’ Appeals (Board)—requires legislative authority to pursue. We have
ongoing work related to VA’s efforts to address appeals workloads and timeliness that we plan
to issue in the first quarter of 2017.
GAO Criteria Status
Leadership Commitment Status: Met
Capacity Status: Partially Met
Action Plan Status: Partially Met
Monitoring Status: Partially Met
Demonstrated Progress Status: Partially Met
GAO - What Remains to Be Done
Predicting growth in both disability compensation claims and appeals, VA should maintain focus
on (1) managing its workloads at both levels; (2) ensuring that it has detailed plans in place for
creating capacity and reforming its appeals process; and (3) collecting and reporting
appropriate data and metrics to fully understand factors influencing timeliness under both its
legacy and proposed appeals process, and transparently reporting progress.
VA Program Response
VBA is committed to providing Veterans with the benefits and services they have earned and
deserve. Many of the recent changes VBA has experienced in the disability claims process are
attributable to the full implementation of the National Work Queue (NWQ). The shift to a
national workload management strategy marked a major departure from the historical
disability claims process, and fundamentally changed how VBA distributes and processes claims
in the regional offices (ROs).
103
Additionally, in fiscal year (FY) 2017, VBA successfully issued new performance standards to
Veterans Service Representatives. These standards better support VA’s agency goals and
leverage NWQ’s functionality by focusing on the entire claim development process, rather than
a final production target.
The current VA appeals process, which is set in law, is broken and is providing Veterans a
frustrating experience. Developing a simplified appeals process is one of VA’s top priorities. In
the current process, appeals have no defined endpoint and require continuous evidence
gathering and re-adjudication. The system is complex, inefficient, ineffective, confusing, and
splits jurisdiction of appeals processing between the Board and VBA.
Looking back over FY 2010 through FY 2016, VBA completed more than 1 million claims
annually, with nearly 1.3 million claims completed in FY 2016 alone. This reflects a record level
of production. As VA has increased claims decision output over the past 6 years, appeals
volume has grown proportionately. Since 1996, the appeals rate has averaged 11 to 12 percent
of all claims decisions. The dramatic increase in the volume of appeals is directly proportional
to the dramatic increase in claims decisions being produced, as the rate of appeals has held
steady over decades.
While legislative reform is necessary to fix the broken appeals system, VA is doing as much as
possible to improve appeals processing in the interim. As part of an effort to streamline and
improve appeals processing and demonstrate its commitment to appeals reform, in January
2017, VBA realigned its administrative appeals program under the Appeals Management Office
(AMO). The realignment identifies a single accountable official within VBA, the AMO Director,
who is responsible for overseeing VBA’s appeals. This allows VBA to increase oversight and
management attention in its appeals program, while also allowing greater focus on the complex
and challenging non-appeals workload and policy issues that arise in VBA’s business lines.
Following realignment, AMO developed a resource allocation model (RAM) for appeals staffing.
AMO has provided this RAM to VBA ROs with instructions that the ROs must ensure that their
appeals teams are fully staffed to the RAM. Moreover, AMO directed that employees assigned
to appeals teams must work exclusively on appeals and cannot be used to perform non-appeals
tasks. AMO is providing overarching guidance to the ROs that provide a focused effort to
reduce both inventory and timeliness.
In addition to the staffing requirements, AMO has authorized $7.5 million in overtime funds for
appeals processing. With this overtime funding and staffing allocation, VBA has already seen
the growth of the appeals inventory slow.

104
Updating VA Disability Benefit Eligibility Criteria
Per GAO, VA continued to make progress toward updating the medical criteria that it uses to
determine eligibility for disability compensation, and has now improved to meet for action plan
and monitoring. However, VA has experienced delays, and officials told us that VA will not
meet its prior target for completing this effort by March 2017.
GAO Criteria Status
Leadership Commitment Status: Met
Capacity Status: Partially Met
Action Plan Status: Met
Monitoring Status: Met
Demonstrated Progress Status: Partially Met
GAO - What Remains to Be Done
VA made steady progress updating its disability criteria. However, given that only a third of the
initial round of updates are complete and the remainder were delayed, VA should maintain
leadership focus and continue monitoring its progress against its project plans to ensure that
sufficient resources are dedicated to this effort and that its plans to subsequently revisit its
criteria at least once every 10 years thereafter continue to be realistic.
VA Program Response
VA is committed to implementing the VA Schedule for Rating Disabilities (VASRD) Project
Management Plan. VBA has published proposed regulations for notice and comment in the
Federal Register for the following six body systems:
(1) The Hemic and Lymphatic System
(2) Gynecological Conditions and Disorders of the Breast,
(3) The Organs of Special Sense (Eye),
(4) The Endocrine System,
(5) Dental and Oral Conditions, and
(6) Skin Conditions.
VBA expects to publish the remaining nine proposed regulations for notice and comment in the
Federal Register by the end of FY 2017.
Additionally, VBA intends to publish final regulations for five of the six proposed regulations
referenced above by the end of FY 2017. Because of the need for significant revisions, the final

105
regulation for the Hemic and Lymphatic System will not be released until FY 2018. VBA is on
track to publish final rulemakings for all VASRD body systems by the end of FY 2018.
Cross-Agency Collaborations
Veterans Health Administration
VHA works with a number of organizations on a wide range of issues related to Veterans’
health. Here are some examples:
Federal Interagency Health Equity Team (FIHET): VHA continues to represent Veteran health
equity issues on the FIHET. The mission of FIHET is to bring together leaders across federal
departments to address and end health disparities through capacity building, strategic
partnerships, and dissemination of best practices.
Native American Veteran Access to Care: Indian Health Service (IHS) and VA signed a
Memorandum of Understanding (MOU) on October 1, 2010 “to improve the health status of
American Indian and Alaska Native (AI/AN) Veterans.” Under the MOU, VHA and IHS
collaborate through joint workgroups on access to care, clinical processes, care coordination
and workforce development.
Hospital Compare: In September 2016, VA entered into a new Inter-Agency Agreement (IAA)
with the Department of Health and Human Services, Centers for Medicare and Medicaid
Services (CMS) to publish VA Performance Measures on the CMS Hospital Compare website.
The agreement is part of a congressional mandate under Section 206c of the Veterans Choice
Act.
100 Million Healthier Lives: The VA partnered with the Institute for Healthcare Improvement as
part of the 100 Million Healthier Lives Initiative Veterans Hub to improve the lives of 20 million
Veterans by the year 2020 by addressing the social determinants of health. This goal will be
achieved through unprecedented collaborations. In addition to collaborating with the
Department of Defense, National Defense University, Uniformed Services University of the
Health Sciences, Department of Health and Human Services, and Center for Medicare and
Medicaid Innovation, the Veterans Hub also includes nongovernmental members Samueli
Institute, Community Solutions, American Red Cross, Points of Light, and Easter Seals, Inc. The
number of Veterans Hub partners continues to grow.
National Research Action Plan for Mental Health: Since August 2012, Federal agencies have
worked together to address the mental health needs of Veterans through the National
Research Action Plan (NRAP). The plan was developed by VA, DoD, the Department of Health

106
and Human Services, and the Department of Education in response to Executive Order 13625.
It outlines a vision for research on posttraumatic stress disorder (PTSD), traumatic brain injury
(TBI), and suicide prevention, and describes a goal-driven vision to improve treatment for PTSD
and TBI.
Veterans Benefits Administration
VBA continues to leverage public and private partnerships to improve the Veteran
experience. VBA collaborates with other Federal and state agencies, Veteran Service
Organizations (VSOs), and educational institutions to improve benefits delivered as
demonstrated by the following examples:
The VA/DoD Self-Service Logon enabled Veterans, Servicemembers, and eligible
dependents to utilize over 55 self-service features online through eBenefits, which now
has over 6 million registered users. Through eBenefits, there were over 14 million claim
status views in FY 2016 and over 4.2 million self-service letter requests. Since its initial
rollout in 2009, there have been over 69 million claim status views and over 12.5 million
self-service letters generated resulting in greater time resource efficiencies for both
users and the agency. VA continues to work closely with VSOs and state and county
service officers to encourage the submission of Fully Developed Claims. In FY 2016, 48
percent of receipts from VSOs were fully developed claims, a significant increased from
3 percent in FY 2012.
In an effort to expand available on-campus services, VetSuccess on Campus counselors
are coordinating with host institutions to establish and enhance peer-to-peer Veteran
mentoring programs to address military-to-college transition issues.
VA partnered with the U.S. Department of Agriculture to develop a process by which
Loan Guaranty will begin managing U.S. Department of Agriculture foreclosed
properties. VBA is currently responsible for all accounting supporting 7,745 foreclosed
properties valued at $85 million.
National Cemetery Administration
VA’s Veterans Cemetery Grants Program (VCGP) assists states, territories and Federally-
recognized tribal governments in providing gravesites for Veterans in those areas where VA’s
national cemeteries cannot fully satisfy their burial needs. The VCGP provides grants for the
purpose of establishing, expanding, or improving Veterans cemeteries that are owned and
operated by a state, Federally recognized tribal government, or U.S. territory. Cemeteries
established or assisted by a VA grant must be also maintained and operated according to the
operational standards and measures of NCA. In 2016 VA awarded 15 grants totaling more than

107
$49 million. Since 1980, VA has awarded nearly 400 grants for the establishment, expansion, or
improvement of 105 state and tribal Veterans cemeteries totaling more than $714 million.
NCA continued a joint working group with the Army National Military Cemeteries (ANMC) that
was originally formed in 2013. In 2016, the American Battle Monuments Commission joined as
a formal member of the working group. A representative of the National Park Service
(Department of Interior) also participates in the joint working group. This Joint Working Group,
which provides a forum for senior level interaction between the two agencies, seeks to
collectively identify potential improvements, share lessons learned, avoid potential duplication,
and develop solutions to common problems to ensure high-quality service and benefit delivery
to our Nation’s Veterans.
NCA is working closely with the American Battle Monuments Commission and the Library of
Congress, Veterans History Project, to share Veterans’ and Servicemember stories, which are
preserved by these Federal agencies as part of NCA’s Legacy Initiative. This initiative is
designed to memorialize Veterans' service and sacrifice through educational products and
programming using the rich resources found throughout VA national cemeteries, soldier’s lots,
and monument sites. The partnership with the American Battle Monuments Commission
(ABMC) has resulted in NCA’s first professional development program focused on the
educational community. The two-year partnership provides opportunities for 19 selected
teachers to create lesson plans to share with other educators about American World War II
service members buried in national cemeteries. NCA is also working with the Library of
Congress, Veterans History Project to provide college students the opportunity to develop
public-facing blog postings about Veterans buried in VA national cemeteries using the Library’s
extensive records.

108
Changes in Performance Measures
Org. Measure name
and number
Change
type
Original measure
in FY 2015 PAR
Proposed
measure change
Reason for
change
VBA Percent of
Disability
Compensation
Claims received
virtually/electronic
ally (VBA #444)
Revised
Target
Same FY17 Target: 28% Modified the FY
2017 target to
reflect a more
realistic number
VBA Non-Rating Claims
– Compensation
Average Days
Pending (ADP)
(VBA #xxx)
Revised
targets
Same FY 17 Target: 320 Automation of
some claims
removed short
duration claims
causing ADP of
claims to be higher.
VBA Non-Rating Claims
– Compensation
Average Days to
Complete (ADC)
(VBA #xxx)
Revised
target
and
results
Same FY 17 Target: 143 VBA
Original FY 2017
target was higher
than FY 2016
actual. Target
changed to reflect
greater efficiency in
completing claims
VBA Number of
registered
eBenefits users
(VBA #443)
Delete Same Delete measure The projections for
eBenefits users will
decrease as the
Veterans
population declines
and user saturation
increases.
Additionally, as the
agency pursues
other self-service
platforms and
other types of
credentials, VA
expects declining
use of eBenefits

109
credentials (DS
Logons). This
measure is not a
true gauge of self-
service success and
should be retired in
FY 2017.
VBA Number of
accredited
Veterans advocates
who are registered
users on the
Stakeholder
Enterprise Portal
(SEP) (VBA#446)
Delete Same Delete measure SEP capabilities
will transition to
the Vets.gov
platform.
BVA Appeals
dispositions –
average days to
complete
returned
remands
(measuring from
date case is
returned to the
Board after
remand until
Board disposition
date) (BVA #571)
Revised
target
Same FY17 Target:
293
The target was
previously 244.
We have revised
the target to be
293, consistent
with the monthly
actual average
number of days
to complete
returned remands
in September
2016.
BVA Appeals
dispositions –
average days to
complete original
appeals (from
date of
certification
(Form 8) until
Board disposition
Revised
target
Same FY17 Target:
694
The target was
previously 531.
We have revised
the target to be
694, consistent
with the monthly
actual average
number of days
to complete

110
date) (BVA #573) original appeals in
September 2016.
VBA Appeals
processing –
Notice of
Disagreement
(NODs) pending
inventory
(thousands) (VBA
#514)
Revised
target
Same FY17 Target: 234 The target was
previously 405K;
we have revised
the target to
234K, based on
processing gains
by the additional
300 FTE.
VBA Appeals
processing –
NODs average
days pending
(VBA #545)
Revised
target
Same FY17 Target: 413 The target was
previously 459;
we have revised
the target to 413,
based on
historical
timeliness of
inventory
selected.
VBA Appeals
processing –
substantive
appeals to the
Board (Form 9)
pending
inventory
(thousands) (VBA
#607)
Revised
target
Same FY17 Target: 45 The target was
previously 138;
we have revised
the target to 45,
based on
processing gains
by the additional
300 FTE.
VBA Appeals processing – substantive appeals to the Board (Form 9) Average Days to
Revised
target
Same FY17 Target: 417 The target was
previously 664;
we have revised
the target to 417,
based on

111
Complete (VBA ###)
historical
timeliness of
inventory
selected
VBA Appeals
processing –
substantive
appeals to the
Board (Form 9)
Average Days
Pending (VBA
###)
Revised
target
Same FY17 Target: 431 The target was
previously 225;
we have revised
the target to 361,
based on
historical
timeliness of
inventory
selected.
VBA Employment
Outcome Rate
(VBA #602)
Delete Same Delete in FY 18 Measures
proportion of
Veterans deemed
“job-ready” and
actually
employed over
the entire cycle of
the VR&E
experience, which
is typically six
years. VR&E is
requesting to
delete this
measure while it
retains such
positive outcome
measures as
Veteran
satisfaction, class
persistence, and
class success.

112
Data Quality Review
VA uses the metrics reported in this document to assist in monitoring programs for Veterans
and their stakeholders. VA Senior Leaders and managers rely on these measures to help
improve operations purposes, and the measure results serve the essential requirements for our
public accountability reporting. The quality of VA’s data was called into question during the
patient access crisis in 2014, and VA has worked to restore trust in our numbers. During 2015,
VA initiated data quality reviews to independently validate performance measures and verify
the results of those measures. Metrics “owners” and VA leaders received training in the
principles of data quality, and have begun the lengthy process of fully documenting
performance metrics so reported data can be verified in a systematic and on-going way. When
methodological weaknesses are discovered in metrics they are improved, replaced or
discontinued depending on the Administrations’ focus for a particular year. In fiscal years 2016
and 2017 VA moved to the use of metrics that reflect Veteran and stakeholder satisfaction with
VA services and their experiences in service delivery and the effectiveness of administration.
VA uses established data quality & validation processes that include External Peer Review
Program (EPRP) and the Survey of Healthcare Experience of Patients (SHEP), both of which
follow Medicare protocols. In 2015, the Office of Performance Management (OPM), formerly
located in the Office of Management (OM), conducted a Pilot study on Data Verification and
Validation. Although the study revealed areas where Administrations and Staff Offices were
compliant to the laws and regulations in which they were governed, several deficiencies were
identified. As a result, OPM created a plan to ensure the risks associated with the deficiencies
were mitigated. In 2016, after relocating to the Office of Enterprise Integration (OEI), formerly
the Office of Policy and Planning (OPP), OPM continued supporting the Pilot by Leading a
Community of Practice (CoP), responsible for documenting and mapping business processes,
identifying areas to improve business processes for their organization, and making
recommendations to management. OEI developed a plan to establish an on-going data quality
effort within VA in 2017 and the plan was briefed to the leadership for resource consideration.
After the 2017 Presidential transition, this effort was put on hold while the agency reevaluated
how to meet the demands for the new Administration’s priorities and policies.

113
Appendices

114
Appendix 1 – Unmet Goals Provision Agency FY 2016 Annual Performance Plan and Report
VA Strategic Objective 2.1 - Improving VA’s Partnership with DoD Strategic Objective:
The Department of Veterans Affairs, in consultation with the Office of Management and
Budget, highlighted this objective as a focus area for improvement for three consecutive fiscal
years.
Over the past three fiscal years, VA has worked towards achieving these objectives with DoD
and many military service partners. Through the VA-DoD Joint Executive Committee (JEC), VA
and DoD collaborated to improve the access, quality, effectiveness, and efficiency of health
care, benefits, and services provided to Service members, Veterans, and other beneficiaries.
1. Performance Goal: Increase the percentage of active duty, National Guard, and Reserve
Servicemembers with an eBenefits log-on by the end of FY 2015.
Performance Analysis:
The joint VA/DoD “eBenefits” web portal exceeded targets set for the Agency Priority
Goals (APGs) in fiscal years 2014, 2015, and 2016 due to efforts by VA and DoD to drive
Servicemembers, Veterans, and other potential users to enroll in eBenefits.
Key Successes:
Since November 2010, DoD required mandatory enrollment in eBenefits for all new
Servicemembers and VA proactively conducted outreach and enrollment efforts with
various strategic partners throughout the nation. These efforts increased the use of
eBenefits self-service letters for employment and benefit verification by 119 percent and
resulted in improved efficiencies in the claims adjudication process that benefitted both VA
as well as Veterans.
Key Challenges:
1. Coordination and communication among partners and support activities within the
eBenefits web portal community remains the biggest challenge.
Performance Improvement Recommendations/Next Steps:
Performance will continue at current levels until the eBenefits portal has migrated to the
newly improved Vets.gov site. Vets.gov is currently under development and designed to
improve the Veterans experience. Many of the current features in eBenefits will migrate
115
to Vets.gov along with features from other VA portals. This will improve the overall
experience by allowing users to log-on to one site and perform numerous self-service tasks
related benefits, healthcare, and services.
2. Performance Goal: Increase the percentage of Servicemembers receiving a separation
health assessment prior to separation from active duty.
Performance Analysis:
VA and DoD collaborated to establish a mechanism to provide Servicemembers a
Separation Health Assessment (SHA) prior to discharge or retirement and ensure the SHA is
added to the Service Treatment Record (STR). DoD will complete the SHA for
Servicemembers who do not file a claim for disability benefits prior to separation and VA
will use the Benefits Delivery at Discharge (BDD) program to complete the SHA for
Servicemembers who file a claim for disability benefits prior to separation or retirement.
Initially, both Departments committed to full implementation of the SHA by December
2014 but the Departments did not develop a coordinated plan to implement the
mandatory SHA requirements. As a result, VA fully implemented the SHA initiative in early
2015 while DoD rolled it out with a more phased approach. During this process, multiple
issues surfaced that proved difficult to resolve.
Initial VA and DoD agreements regarding SHA were based on the assumption that the
Departments would have access to the same records and conduct standardized exams.
This logic has been challenged by the following realities:
VA and DoD have inherently different business needs for conducting SHA exams.
DoD needs a medical evaluation at the end of a Servicemembers’ service to identify
fitness for separation as well as any new diagnosis for treatment and/or trend
analysis. VA needs a medical evaluation suitable to adjudicate a disability claim,
which requires access to the most complete STR as possible.
VA and DoD have different access to medical records. DoD owns the STR and VA
cannot access the full STR through current electronic interfaces which creates the
need for a paper process.
VA and DoD are continuing to test new strategies in the SHA pilot program to facilitate the
claims process and eliminate the need for Servicemembers to function as couriers for their
STRs. In FY 2016, the Departments developed critical requirements for the IT capability to
eliminate paper copies of DoD STRs and VA exam reports through existing medical record

116
sharing systems. Building and implementation of the corresponding functionality from
those requirements is still in progress.
Key Successes:
In June 2016, combined detailed work flow analysis with health IT system expertise
to develop detailed requirements for system modifications that will result in
greater efficiency of pre-separation claims processing, including electronic upload
of service treatment records (STRs).
In January 2016, modifications to VA’s Veterans Benefits Management System
(VBMS) enabled manual activation of a “subscription” (“notification of interest”) to
provide a tool to VBA users for facilitating retrieval of the electronic STR.
In July 2016, deployment of new Joint Legacy Viewer (JLV) capabilities, specifically,
the ability to access and retrieve archived record artifacts and create and save an
excerpt of the record containing all items viewed during a review session.
o Operational testing began in June 2016 of the STR Processing Operations
Reporting Tracking System (SPORTS), which is an upgrade to DoD’s artifact
management system. This system improves the efficiency of artifact upload
and greatly increases the ability to monitor record completion times.
o DoD awarded a contract in July 2016 that enabled reserve component
members to obtain a separation exam as they demobilize from a period of
active service.
In June 2016, VA and DoD agreed on the requirements to support the development of
automated system functionality to eliminate the burden on Servicemembers required to
hand-carry their record to VA for filing a benefits claim. The new work flow will effectively
engage Servicemembers in transition planning and provide confidence that the records
maintained by DoD and shared with VA are complete and available when needed. This
system functionality will also reduce the time necessary to complete the VA exam. In
addition, more Servicemembers will be able to take advantage of the process and obtain
benefits delivery at discharge. The planned modifications to VA and DoD systems will
enable feedback loops to improve both Departments’ ability to perform exams to standard
and track completion rates. These improvements will also include automation of the
return of exam reports performed by VA to the DoD for inclusion in the STR and improve
the integrity of that record for the lifetime of the Veteran.
Key Challenges:
The major challenges identified prior to SHA piloting include the manual process of utilizing
shared lists between departments, DoD sharing required STRs within the separation

117
timeline, providing access to required systems (specifically, Joint Legacy Viewer) to VBA
contract examiners, as well as ensuring copies of VBA contractor examination reports are
provided to DoD. Below are additional details on some of the identified key challenges:
1. Joint Legacy Viewer (JLV) Access: Access to electronic health records is governed by
the Privacy Act of 1974 and the Health Insurance Portability and Accountability Act
(HIPAA) of 1996, Public Law 104-191, as well as VA enterprise security and privacy
mandates and Veterans Health Administration (VHA) policy for approving and
providing access to personally identifiable information (PII), including personal
health information (PHI) in VA Information Technology (IT) systems.
To be granted JLV access a user must meet the aforementioned requirements and
receive a VA-issued Personal Identity Verification (PIV) card and personal
identification number and either Computerized Patient Record System access
credentials (specificially, VistA Veterans Health Administration access) or
Compensation and Pension Records Interchange access. Access to these systems
and a PIV card are not normally issued to VBA examination contractors. Options
are being explored to address this challenge. For example, VA IT system users may
be granted a PIV exemption at the enterprise level and use alternate identifying
verification options. As of April 2017, JLV is able to honor a PIV exemption.
2. Possible Claims Processing Delays: DoD currently has 45 days to provide VA with
scanned copies of the paper STRs in their possession. This can create critical time
delays in ensuring an examination is conducted while the Servicemember is
currently on active duty. This can also cause delays in providing a decision to the
Servicemember on their claim timely upon discharge.
Performance Improvement Recommendations/Next Steps:
A proposed timeline was briefed to VA and DoD leadership indicating a March 1, 2017,
start date for the SHA pilot. The objective of the pilot is to demonstrate a process to
eliminate the requirement of the Servicemember providing a copy of the STRs to VA by
testing the JLV functionality to upload the available STRs to VBMS. After piloting for a
minimum of three months, the SHA working group and leadership will make a decision on
future automation efforts based on the timeline provided by VA and DoD’s Information
Technology offices.
Continued coordination with VBA Office of Information and Technology (OI&T) and DoD
will be required to develop and implement functionality to establish an automated process

118
where all electronic and paper STR documents from DoD will be provided to VA upon
establishment of a Pre-Discharge/Integrated Disability Evaluation System (IDES) claim. This
long term goal will require further functionality development with Data Access Service
(DAS) to facilitate a method to bypass the current requirements to provide VA with all
currently available electronic STRs. Reduction of the 45 day timeframe for DoD to scan and
upload paper STR documents in their possession is an additional long term goal being
developed by DoD and VA.
3. Performance Goal: Increase the percentage of IDES discharges that meet VA-DoD goal of
80 percent of cases completed within 295 days.
Performance Analysis:
The vision for the Integrated Disability Evaluation System (IDES) is to create a disability
evaluation that is “Servicemember Centric,” seamless, transparent, and administered
jointly by DoD and VA. To date, DoD and VA accomplished the following goals to improve
the IDES Program and provide Servicemembers a:
Simplified process that is non-adversarial for the Servicemember.
Single set of comprehensive medical examinations.
Single-source disability rating that eliminates the potential for DoD and VA to
independently develop disability ratings that conflict.
Continuum of care and advocacy for the IDES participant.
Faster and more consistent disability evaluation.
Streamlined experience that eliminates the benefits gap and delivers benefits
faster.
Key Successes:
The information depicted below clearly shows VA’s progress in administering its part of the
IDES Program. To rate VA’s effort solely on the metric of 80 percent of participants
meeting the 295 day goal is to ignore improvements to IDES that have been accomplished
in the last three years. Since September 2013, VA reduced the time to complete its four
core process steps from 256 days to 88 days, an improvement of 65 percent, while
increasing the overall completion rate within 295 days from 29 percent to 77 percent.
Overall IDES Performance
Sep 2013 Sep 2014 Sep 2015 Sep 2016
VA Total Days 256 143 91 88
IDES Total Days 391 342 235 238
% Within 295 Days 29% 43% 80% 77%
Note: Goal for VA Total Days = 100 days

119
Note: Goal for IDES Total Days = 295 days
The information below clearly depicts the improvements VA has made over the past three
years in its four core process steps, especially with the steps of Proposed Rating and
Benefits Notification.
VA IDES Core Process Performance
VA Core Process Step Sep 2013 Sep 2014 Sep 2015 Sep 2016
VA Claim Development 4 / 98% 4 / 98% 4 / 97% 5 / 93%
VA Medical Examination 38 / 77% 35 / 81% 42 / 67% 37 / 75%
VA Proposed Rating 134 / 12% 58 / 24% 19 / 62% 21 / 60%
VA Benefit Notification 80 / 19% 45 / 30% 27 / 67% 25 / 72%
Note: Depicted are average days per stage and percent within goal
Note: Goal for VA Claim Development = 10 days
Note: Goal for VA Medical Examination = 45 days
Note: Goal for VA Proposed Rating = 15 days
Note: Goal for VA Benefit Notification = 30 days
A measure of whether or not DoD and VA are administering IDES correctly and successfully
is customer satisfaction. DoD conducted customer satisfaction surveys and the results
show DoD and VA are doing an excellent job with the IDES Program:
Overall IDES Customer Satisfaction
Apr - Sep 2016 86%
Jan - Jun 2016 87%
Jul - Dec 2015 87%
Jul - Dec 2014 86%
Note: Goal = 80%
Key Challenges:
1. Veterans Tracking Application (VTA) is the information technology system used to
gather IDES performance data and track Servicemembers’ cases as they move
through the IDES Program. In recent years, many improvements have been made
in VTA but manual duplicative data entry still exists. An interface between Veterans
Benefit Management System (VBMS) and VTA is needed so when a transaction is
completed in VBMS a data entry is made in VTA. This data interface would
eliminate manual duplicative data entries and reduce the occurrence of missing
data and data entry errors.

120
Performance Improvement Recommendations/Next Steps:
History has shown the current goal of 15 days to complete the VA Proposed Rating
is not realistic. A proposal to increase the goal to 20 days has been made and is
awaiting approval by DoD.
Funding and manpower needs to be dedicated in FY2017 to accomplish the data
interface between VTA and VBMS and any processing system used by the Military
Services to process their steps within IDES.
4. Create clinical and technical standards profile and processes to ensure seamless
integration of health data between VA and DoD and private health care providers.
Performance Analysis:
While additional work remains, VA and DoD have made significant interoperability
progress during the past three fiscal years. Today, the electronic health record systems of
DoD and VA have an integrated display of data for clinician use based upon the national
standards and architectural requirements identified by the DoD/VA Interagency Program
Office (IPO) in collaboration with the Office of the National Coordinator for Health
Information Technology.
Key Successes:
During this time and as prioritized by the Interagency Clinical Informatics Board, national
standards have been created for 25 of the 38 data domains with structured data and
approximately 80 percent of clinical data has been mapped between the two Departments.
During this same timeframe, the Joint Legacy Viewer (JLV) deployed to additional users. By
the end of 2016, over 75,000 DoD and 200,000 VA clinicians and claims adjudicators have
access to JLV. Various releases of JLV brought numerous new functionalities for users.
Release 4 established an interface with DoD’s Healthcare Artifact Imaging and
Management System (HAIMS) for all documents not stored according to Digital Imaging
and Communications in Medicine (DICOM) standards. Essentially, this means more than
12 million images of radiographs, clinical photographs, electrocardiograms, etc. are now
available to both DoD and VA clinicians.
In addition, as of March 2017, VLER Health has reached the milestones of connecting with
over 100 Community Care Partners for both the Exchange and Direct Messaging programs
respectively. Now over 1,000,000 unique VA-enrolled Veterans have Community Care
Partner records available for bi-directional exchange with VA.

121
Key Challenges:
1. Complete interoperability for healthcare data exchange between the Departments
remains a significant challenge. Often, these issues reside in how each Department
captures data. For example, blood pressure may be recorded as a data entry
(systolic over diastolic) in one Department and two separate data entries in the
other. These clinical process issues are addressed as encountered even while both
Departments modernize their electronic health records but the volume of medical
information that requires collaboration and consensus is significant.
2. As VLER Health continues to grow in the number of Community Care Partners
connected to VA via the eHealth Exchange and Direct Messaging programs, the
required resources and IT capabilities to execute and sustain such an upsurge
become a substantial challenge.
Performance Improvement Recommendations/Next Steps:
Significant progress has been made to create health care interoperability between DoD
and VA. Both Departments recognize the need to continue these efforts and ensure health
data compiled during military service is shared with VA for continuity of care and disability
claims adjudication.
5. Increase the percentage of VA and DoD providers trained in the use of consistent models
of evidence-based practice for PTSD, depression, and other psychological health
conditions.
Performance Analysis:
VA and DoD worked together to increase the percentage of providers trained in the use of
consistent models of evidence-based practice for PTSD, depression, and other
psychological health conditions.
Key Successes:
Close collaboration between DoD and VA training program staff to disseminate
comparable clinician training programs in evidence-based psychotherapies for the
treatment of PTSD and other psychological health (PH) conditions.
Joint VA/DoD Provider Portal ensures comparable training and treatment information
is shared and widely disseminated across both Departments.

122
FY 2014: VA trained > 630 clinicians in the delivery of Cognitive Processing Therapy
(CPT) and/or Prolonged Exposure Therapy (PE) for PTSD and > 580 clinicians in EBP for
other conditions. DoD trained 514 clinicians in EBPs for PTSD and 629 clinicians in EBPs
for other PH conditions.
FY 2015: VA trained > 550 clinicians in PTSD treatments and more than 1400 clinicians
in EBP for other conditions. DoD trained 360 clinicians in PTSD EBPs and > 580 clinicians
in EBPs for other PH conditions.
FY 2016: VA trained > 760 clinicians in PTSD treatments and more than 830 clinicians in
EBPs for other conditions. DoD trained >360 clinicians in PTSD treatments and more
than 320 clinicians in EBPs for other conditions.
Key Challenges:
1. Advocacy and consultation are necessary elements for increasing the utilization of
evidence-based practice, but advocacy and consultation alone are insufficient to
create systemic changes in practice. Clinic operations need to be optimized in
order to create an environment where EBPs can be utilized to a degree that will
have a meaningful impact to Veterans.
2. Variability in leadership support across sites impacted implementation of evidence
based psychotherapy practices.
Performance Improvement Recommendations/Next Steps:
VA and DoD continue training programs for dissemination and implementation of
evidence-based practice for PTSD, depression and other psychological health conditions
and ongoing consultation programs are available to clinicians. VA will continue to develop,
refine, and sustain decentralized training and consultation models and DoD will assess the
impact of local champions on EBP implementation. No reauthorization or statutory
changes are needed in order to continue these activities into the future.
123
Appendix 2 – Annual Performance Plan
The following table provides a snapshot of the measures VA will use to track its performance
for FY 2018, along with historical data on established measures.

Department of Veteran Affairs FY 2018 Annual Performance Plan
Performance Indicators, Historical
Milestones & Agency Priority
Goals
Historical Results Fiscal Year Targets Strategic
Target
2012 2013 2014 2015 2016 2017 2018 2019 2022
(Target)
Veterans Health Administration (VHA) Medical Care - Existing Measures Percentage of Veterans reporting employment at a discharge from VA
homeless residential programs (#604)
N/Av N/Av 42% 45% 50% 50% 50% 50% 50%
Percent of participants at risk for
homelessness (Veterans and their
households) served in SSVF that were prevented from
becoming homeless (#606)
90% 88% 90% 84% 92% 85% 85% 85% 85%
Percent of Veterans discharged from VA-
funded residential treatment programs
N/Av N/Av 69% 70% 71% 65% 65% 65% 65%

2
(Grant and Per Diem or Domiciliary Care
Homeless Veterans) who discharge to
permanent housing (#403)
Percent of HUD-VASH vouchers allocated that
have resulted in homeless Veterans
obtaining permanent housing (#535)
92% 90% 92% 92% 92% 92% 92% 92%
Percent of patients who responded “yes” on
Patient Centered Medical Home survey
questions that contribute to the Self-Management Support Composite (providers support you in taking
care of your own health) (#386)
N/Av N/Av 57% 58% 58% 58% 60% 60% 62%
The average patients rating VA health care on a scale from 0 to 10
(Inpatient) (#537)
N/Av N/Av N/Av 8.6 8.63 8.8 8.8 8.8 8.9
Percent of patients who responded "Always"
regarding their ability to get an appointment
N/Av N/Av 44% 44% 47% 48% 49% TBD TBD

3
for needed care right away (Patient Centered
Medical Home Survey)(#539)
Percent of patients who respond "Always"
regarding their ability to get an appointment for a routine checkup
as soon as needed (Patient Centered
Medical Home Survey)(#543)
N/Av N/Av 53% 52% 56% 57% 58% TBD TBD
The average patients rating VA primary care
provider on a scale from 0 to 10 on the Patient Centered
Medical Home Survey (#544)
N/Av N/Av N/Av 8.46 8.54 8.7 8.7 8.7 8.9
Mental Health Balanced Scorecard
(#598)
N/Av N/Av N/Av N/Av
91% above target at end
of SAIL performance
year
90% of facilities
at/or above target
90% of facilities
at/or above target
90% of facilities
at/or above target
90% of facilities
at/or above target
The average patients rating of VA specialty
care provider on a scale from 0 to 10 on
the Specialty Care Survey #673)
N/Av N/Av N/Av N/Av 8.54 8.60 8.65 8.60 8.90
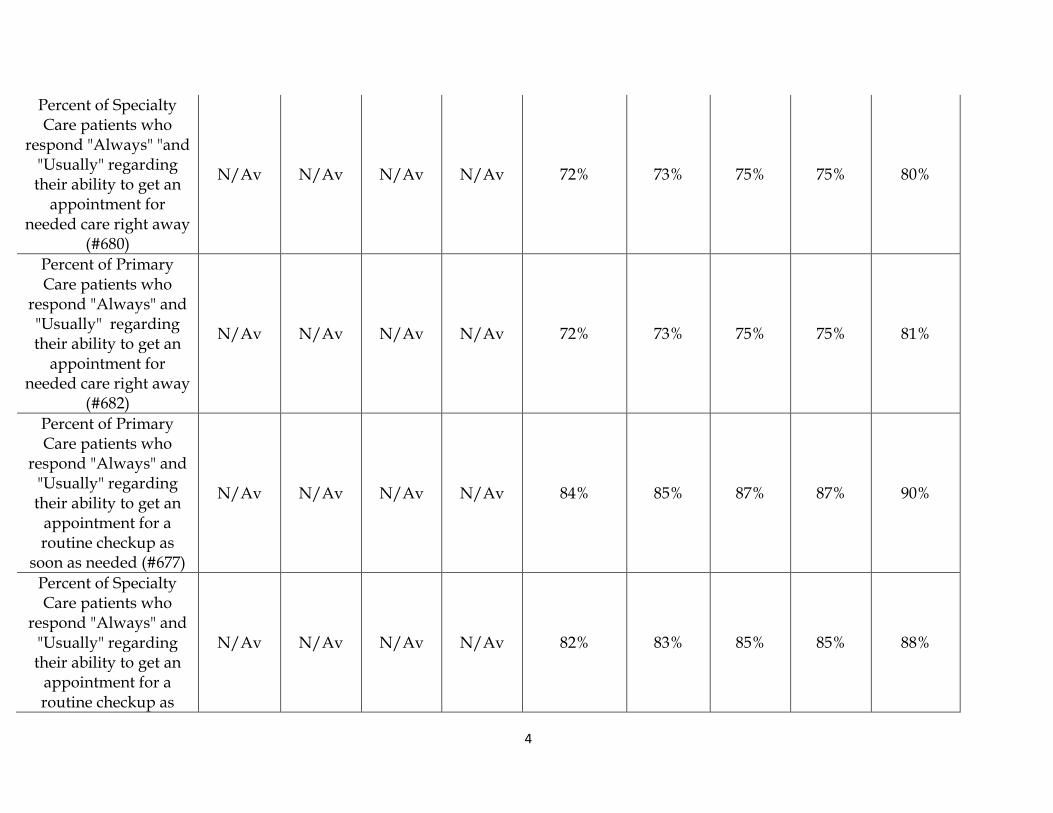
4
Percent of Specialty Care patients who
respond "Always" "and "Usually" regarding their ability to get an
appointment for needed care right away
(#680)
N/Av N/Av N/Av N/Av 72% 73% 75% 75% 80%
Percent of Primary Care patients who
respond "Always" and "Usually" regarding their ability to get an
appointment for needed care right away
(#682)
N/Av N/Av N/Av N/Av 72% 73% 75% 75% 81%
Percent of Primary Care patients who
respond "Always" and "Usually" regarding their ability to get an
appointment for a routine checkup as
soon as needed (#677)
N/Av N/Av N/Av N/Av 84% 85% 87% 87% 90%
Percent of Specialty Care patients who
respond "Always" and "Usually" regarding their ability to get an
appointment for a routine checkup as
N/Av N/Av N/Av N/Av 82% 83% 85% 85% 88%

5
soon as needed (#683)
Patient Safety Indicator (PSI) 90 (#674)
N/Av N/Av N/Av N/Av N/Av (baseline) TBD TBD TBD
VHA New Measure (Composite Measure) The average of the percent “Always” or “Usually” responses for four access measures found in the Patient Centered Medical Home (PCMH) survey and the Specialty Care Consumer Assessment of Health Providers and Systems (CAHPS) Survey. (#681)
81 82 84
Veterans Benefit Administration (VBA) Compensation
National Accuracy Rate - Disability
Compensation Rating Claims (#303)
86% 90% 90% 90% 88.1% 92% 92.50% 93%
Percentage of VA Disability Rating
Claims Pending More Than 125 Days Old
(#308)
66% 58% 47% 20% 19% 15% 14% 10%

6
National Accuracy Rate - Disability
Compensation Rating Claims - Issue Based
(#304)
(baseline) 96% 96% 96% 96% 96% 96% 97%
Number of registered eBenefits users
(Millions) (#443)
1.93 3.06 4.14 5.16 6.1 6.3 6.8 7.5
Percent of disability compensation claims
received virtually/electronically
(#444)
N/Av 2% 7% 13% 20% 28% 37% 55%
Number of accredited Veterans advocates who are registered
users on the Stakeholder Enterprise
Portal (SEP) (#446)
N/Av 1000 1861 3299 4202 4900
SEP replaced
by Vets.gov
N/A
National Call Center Client Satisfaction Index Score (out of
1000) (#485)
731 723 748 756 767 770 775 795
Overall Customer Satisfaction Index Score (out of 1000)
(Compensation) (#491)
N/Av N/Av N/Av 646 676 680 685 690
Percentage of Disability
Compensation Rating Claims Inventory
67% 59% 48% 20% 20% 15% 14% 10%

7
Pending Over 125 Days (#576)
Appeals Processing - Notices of
Disagreement (NODs) Average Days Pending
(#545)
N/Av N/Av N/Av 394 413 413 413 398
Appeals Processing - Substantive Appeals to
the Board (Form 9) Pending Inventory (Thousands) (#607)
N/Av N/Av N/Av 56 50 45 40 32
Appeals Processing - Notices of
Disagreement (NODs) Pending Inventory (Thousands) (#514)
N/Av N/Av N/Av 228 231 234 237 249
Percent of IDES participants who will
receive VA Benefit notification letters within 30 days of discharge (#469)
N/Av N/Av N/Av 55% 66% 80% 80% 90%
Non-Rating Claims, Compensation
Average Days Pending (#654)
219 274 338 350 355 320 318 237
Non-Rating Claims, Compensation
Average Days to Complete #686)
90 112 129 160 161 143 144 101

8
Dependency Claims Processing: Claims Pending Inventory
(#701)
N/Av N/Av N/Av 227 115 100 85 69
Dependency Claims Processing: Timeliness
(Month-to-Date Average Days to
Complete as of the last month of the year)
(#670)
N/Av N/Av N/Av 221 197 125 110 96
Appeals Processing - Substantive Appeals to
the Board (Form 9) Average Days Pending
(#655)
N/Av N/Av N/Av 617 516 431 361 230
Appeals Processing - Substantive Appeals to
the Board (Form 9) Average Days to Complete (#685)
N/Av N/Av N/Av 509 462 417 378 305
Pension and Fiduciary Pension Call Center Client Satisfaction Index Score (out of
1000) (#484)
N/Av 732 766 770 778 780 782 785
Overall Customer Satisfaction Index Score (out of 1000) (Pension) (#490)
N/Av N/Av N/Av 684 664 668 672 688
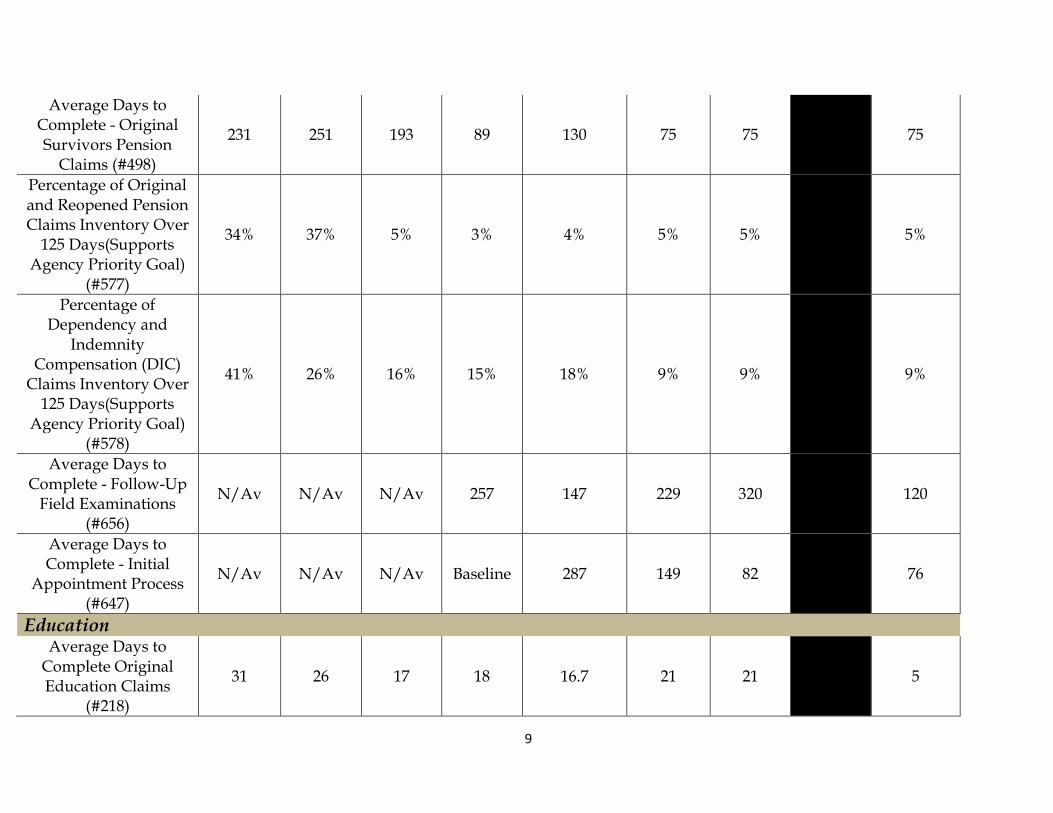
9
Average Days to Complete - Original Survivors Pension
Claims (#498)
231 251 193 89 130 75 75 75
Percentage of Original and Reopened Pension Claims Inventory Over
125 Days(Supports Agency Priority Goal)
(#577)
34% 37% 5% 3% 4% 5% 5% 5%
Percentage of Dependency and
Indemnity Compensation (DIC)
Claims Inventory Over 125 Days(Supports
Agency Priority Goal) (#578)
41% 26% 16% 15% 18% 9% 9% 9%
Average Days to Complete - Follow-Up
Field Examinations (#656)
N/Av N/Av N/Av 257 147 229 320 120
Average Days to Complete - Initial
Appointment Process (#647)
N/Av N/Av N/Av Baseline 287 149 82 76
Education Average Days to
Complete Original Education Claims
(#218)
31 26 17 18 16.7 21 21 5

10
Average Days to Complete
Supplemental Education Claims
(#219)
17 10 6 7 6.7 9 9 5
Education Call Center Client Satisfaction Index Score (out of
1000) (#476)
760 803 832 831 841 835 836 845
Overall Customer Satisfaction Index Score (out of 1000) (Education) (#489)
N/Av N/Av N/Av 754 752 757 757 755
Percent of Montgomery GI Bill or
Post 9/11 GI Bill participants who
successfully completed an education or
training program (#494)
N/Av N/Av N/Av N/Av (Baseline) (Baseline) TBD TBD
Vocational Rehabilitation and Employment (VR&E) Veterans’ Satisfaction with the Vocational Rehabilitation and
Employment Program (out of 1000) (#488)
N/Av N/Av N/Av 658 666 674 682 714
VR&E Class Persistence Rate (#601)
N/Av N/Av N/Av N/Av 72% 70% 70% 70%
VR&E Class Success Rate (#600)
N/Av N/Av N/Av N/Av 47% 55% 55% 60%

11
New VR&E Measure VR&E Employment
Outcome Rate (#602) N/Av N/Av N/Av N/Av baseline 70%
Loan Guaranty Default Resolution Rate (DRR) (#226)
81% 79% 80% 83% 84% 80% 81% 85%
Veterans’ Satisfaction Level with the VA
Loan Guaranty Program (out of 1000)
(#487)
N/Av N/Av N/Av 819 819 825 830 834
Specially Adapted Housing (SAH)
grantees who believe adaptation obtained
under the program has helped them live more independently (#TBD)
N/Av N/Av N/Av N/Av (Baseline) TBD TBD TBD
Insurance Rate of High Client
Satisfaction Ratings on Insurance Services Delivered (#214)
95% 93% 94% 94% 94% 95% 95% 95%
National Cemetery Administration (NCA) Memorial Services
Percent of Veterans served by a burial
option within a reasonable distance (75
89.6% 89.5% 89.8% 89.8% 91.7% 91.8% 92.0% 93.2%
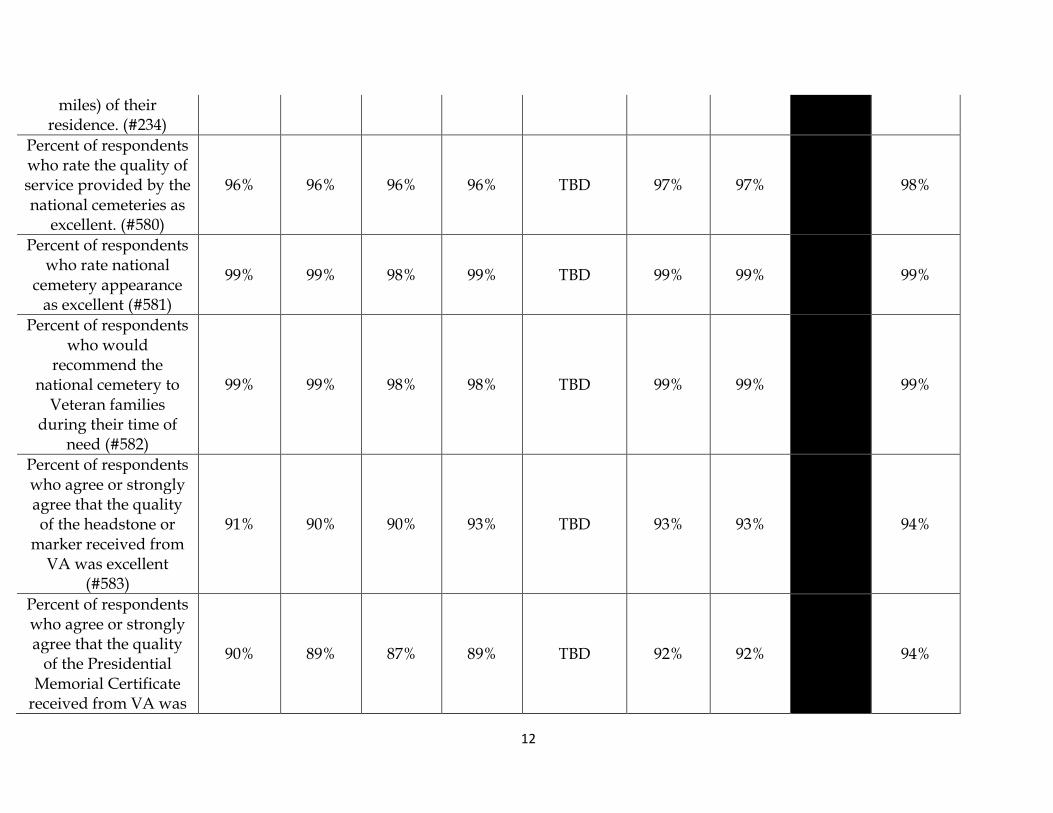
12
miles) of their residence. (#234)
Percent of respondents who rate the quality of service provided by the national cemeteries as
excellent. (#580)
96% 96% 96% 96% TBD 97% 97% 98%
Percent of respondents who rate national
cemetery appearance as excellent (#581)
99% 99% 98% 99% TBD 99% 99% 99%
Percent of respondents who would
recommend the national cemetery to
Veteran families during their time of
need (#582)
99% 99% 98% 98% TBD 99% 99% 99%
Percent of respondents who agree or strongly agree that the quality of the headstone or
marker received from VA was excellent
(#583)
91% 90% 90% 93% TBD 93% 93% 94%
Percent of respondents who agree or strongly agree that the quality
of the Presidential Memorial Certificate
received from VA was
90% 89% 87% 89% TBD 92% 92% 94%

13
excellent (#584)
Board of Veterans Appeals (BVA) BVA
Access: Appeals Dispositions – Average
Days to Complete Returned Remands
(Measuring from Date Case is Received at the
Board after Remand until Board Disposition
Date) (#571)
N/Av N/Av N/Av 244 264 293 293 TBD
Backlog: Appeals Dispositions - Average
Days to Complete Original Appeals
(From Date of Certification (Form 8)
until Board Disposition Date) (#573)
N/Av N/Av N/Av 531 553 694 694 TBD
Office of Public and Intergovernmental Affairs (OPIA) OPIA - Existing Measures Increase percentage of
Veterans aware of using benefits, reached
through advertising and marketing efforts
(#536)
5% 15% 26% 19.80% 15% 15% 15% 15%
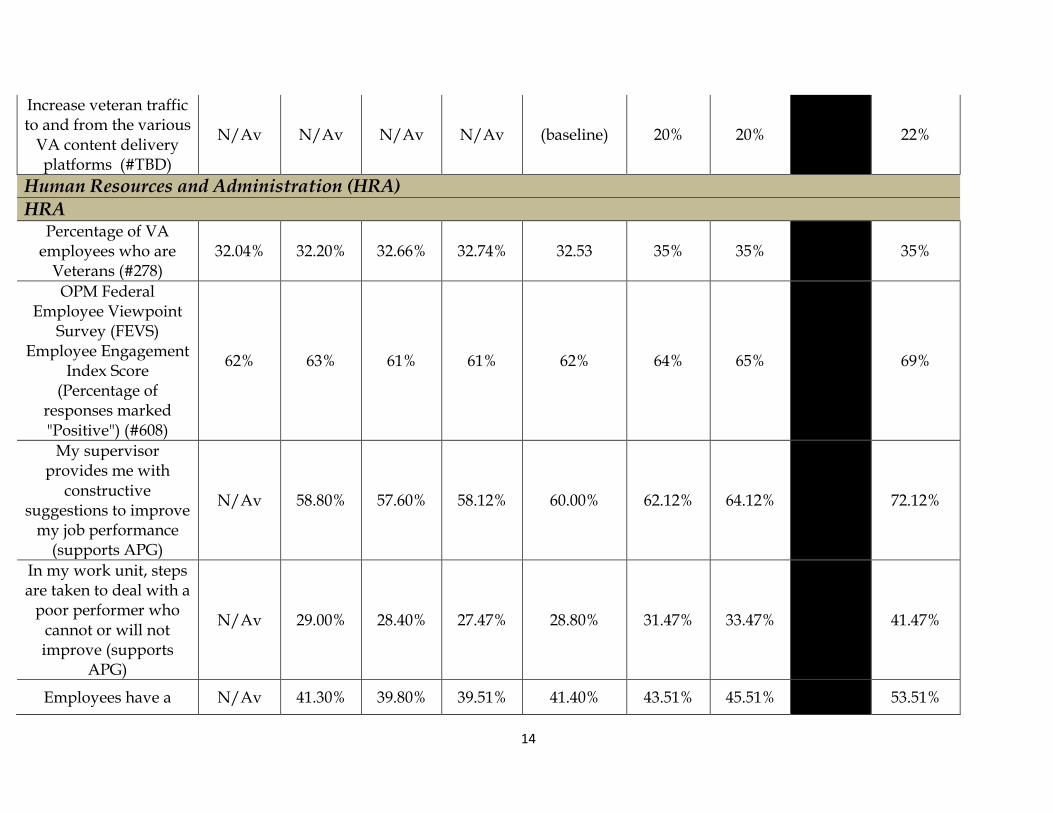
14
Increase veteran traffic to and from the various
VA content delivery platforms (#TBD)
N/Av N/Av N/Av N/Av (baseline) 20% 20% 22%
Human Resources and Administration (HRA) HRA
Percentage of VA employees who are
Veterans (#278) 32.04% 32.20% 32.66% 32.74% 32.53 35% 35% 35%
OPM Federal Employee Viewpoint
Survey (FEVS) Employee Engagement
Index Score (Percentage of
responses marked "Positive") (#608)
62% 63% 61% 61% 62% 64% 65% 69%
My supervisor provides me with
constructive suggestions to improve
my job performance (supports APG)
N/Av 58.80% 57.60% 58.12% 60.00% 62.12% 64.12% 72.12%
In my work unit, steps are taken to deal with a
poor performer who cannot or will not improve (supports
APG)
N/Av 29.00% 28.40% 27.47% 28.80% 31.47% 33.47% 41.47%
Employees have a N/Av 41.30% 39.80% 39.51% 41.40% 43.51% 45.51% 53.51%

15
feeling of personal empowerment with
respect to work processes (supports
APG)
I feel encouraged to come up with new and
better ways of doing things (supports APG)
N/Av 54.70% 52.80% 53.40% 54.30% 57.40% 59.40% 67.40%
How satisfied are you with the information
you receive from management on what's
going on in your organization?
(supports APG)
N/Av 45.60% 42.90% 43.05% 44.30% 47.05% 49.05% 57.05%
My organization's leaders maintain high standards of honesty
and integrity (supports APG)
N/Av 49.30% 43.90% 43.50% 44.80% 47.50% 49.50% 57.50%
Veterans' Experience Office (VEO) Trust in VA among America's Veterans (Supports VE APG)
N/Av N/Av N/Av N/Av 60% 90% 90% 90%
Office of Inspector General (OIG) Number of reports (audit, inspection,
evaluation, contract review, and
299 349 310 390 304 330 330 340
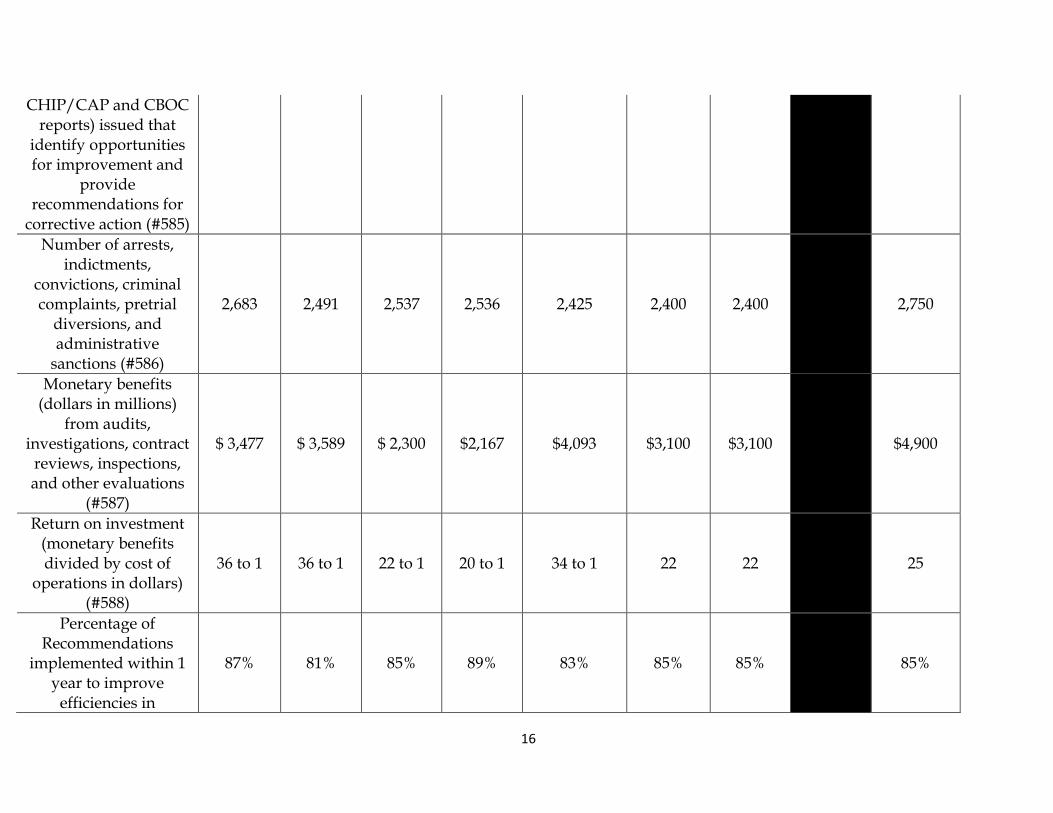
16
CHIP/CAP and CBOC reports) issued that
identify opportunities for improvement and
provide recommendations for
corrective action (#585)
Number of arrests, indictments,
convictions, criminal complaints, pretrial
diversions, and administrative
sanctions (#586)
2,683 2,491 2,537 2,536 2,425 2,400 2,400 2,750
Monetary benefits (dollars in millions)
from audits, investigations, contract
reviews, inspections, and other evaluations
(#587)
$ 3,477 $ 3,589 $ 2,300 $2,167 $4,093 $3,100 $3,100 $4,900
Return on investment (monetary benefits divided by cost of
operations in dollars) (#588)
36 to 1 36 to 1 22 to 1 20 to 1 34 to 1 22 22 25
Percentage of Recommendations
implemented within 1 year to improve
efficiencies in
87% 81% 85% 89% 83% 85% 85% 85%

17
operations through legislative, regulatory, policy, practices, and procedural changes in
VA (#590)
Percentage of Recommended
recoveries achieved from post-award
contract reviews (#591)
100% 100% 100% 100% 100% 98% 98% 98%
Percent of full cases that result in criminal, civil, or administrative
actions (#694)
72% 72% 85%