Embed Size (px)
Citation preview
ANNUAL REPORT 2017 CAPE TOWN CENTRAL CITY IMPROVEMENT DISTRICT20
FOR THE YEAR ENDED 30 JUNE 2017 AUDITED(Registration number: 1999/009132/08)
ANNUAL FINANCIAL STATEMENTS

ANNUAL REPORT 2017 21CAPE TOWN CENTRAL CITY IMPROVEMENT DISTRICT
The directors are responsible for the preparation and fair presentation of the annual financial statements of Cape Town Central City Improvement District NPC comprising the statement of financial position at 30 June 2017, and the statements of comprehensive income, changes in equity and cash flows for the year then ended, and the notes to the financial statements, which include a summary of significant accounting policies and other explanatory notes, in accordance with International Financial Reporting Standards and the requirements of the Companies Act of South Africa. In addition, the directors are responsible for preparing the directors’ report.
The directors are also responsible for such internal control as the directors determine is necessary to enable the preparation of financial statements that are free from material misstatement, whether due to fraud or error, and for maintaining adequate accounting records and an effective system of risk management, as well as the preparation of the supplementary schedules included in these annual financial statements.
The directors have made an assessment of the company’s ability to continue as a going concern and have no reason to believe the business will not be a going concern in the year ahead.
The auditor is responsible for reporting on whether the financial statements are fairly presented in accordance with the applicable financial reporting framework.
APPROVAL OF THE ANNUAL FINANCIAL STATEMENTS
The annual financial statements of Cape Town Central City Improvement District, as identified in the first paragraph, were approved by board of directors on 28 August 2017 and signed by:
R KaneChairman (Authorised Director)
JM RipponAuthorised Director
DIRECTORS’ RESPONSIBILITY STATEMENT
FINANCIALS

ANNUAL REPORT 2017 CAPE TOWN CENTRAL CITY IMPROVEMENT DISTRICT22
The directors have pleasure in presenting their report for the year ended 30 June 2017.
BUSINESS ACTIVITIESThe company provides additional security, cleansing, maintenance services, marketing and social development in the Cape Town City area.
GENERAL REVIEW OF OPERATIONSDuring the year under review the company operated independently of any shared services. The main business and operations of the company during the year under review has continued as in the past year and we have nothing further to report thereon. The financial statements adequately reflect the results of the operations of the company for the year under review and no further explanations are considered necessary.
DIRECTORSThe following directors held office during the year and at the date of this report:
Name Name
R Kane (Chairperson) J van Rooyen
D Stoll L Robinson
CEP Keefer G Elliot
RN Harris JD Leibman
R van Wyk JM Rippon
T Capstick-Dale HC Truter
NK Ramasar F Jacobs (Resigned on 14 November 2016)
BUSINESS ADDRESS: POSTAL ADDRESS:13th Floor PO Box 75171 Thibault Square RoggebaaiCnr Long St & Hans Strijdom Ave South AfricaCape Town 8012
8001
SUBSEQUENT EVENTSThere have been no facts or circumstances of a material nature that have occurred between the accounting date and the date of this report, which would have a material impact on the statement of financial position at the reporting date.
AUDITORSKPMG Inc. will continue in office in accordance with section 90 of the Companies Act of South Africa.
GOING CONCERNAs at 30 June 2017 and up to the date of signing these financials no events or conditions have occurred that would impact the entity’s ability to continue to as a going concern.
DIRECTORS’ REPORT
FINANCIALS
FOR THE YEAR ENDED 30 JUNE 2017

ANNUAL REPORT 2017 23CAPE TOWN CENTRAL CITY IMPROVEMENT DISTRICT
OPINIONWe have audited the financial statements of Cape Town Central City Improvement District NPC, which comprise the statement of financial position at 30 June 2017 and the statements of comprehensive income, changes in equity and cash flows for the year then ended, and the notes to the financial statements, which include a summary of significant accounting policies and other explanatory notes, as set out on pages 24 to 37.
In our opinion, the financial statements present fairly, in all material respects, the financial position of Cape Town Central City Improvement District NPC at 30 June 2017, and its financial performance and cash flows for the year then ended in accordance with International Financial Reporting Standards and the requirements of the Companies Act of South Africa.
BASIS FOR OPINIONWe conducted our audit in accordance with International Standards on Auditing (ISAs). Our responsibilities under those standards are further described in the Auditor’s Responsibilities for the Audit of the Financial Statements section of our report. We are independent of the company in accordance with the Independent Regulatory Board for Auditors Code of Professional Conduct for Registered Auditors (IRBA Code) and other independence requirements applicable to performing audits of financial statements in South Africa. We have fulfilled our other ethical responsibilities in accordance with the IRBA Code and in accordance with other ethical requirements applicable to performing audits in South Africa. The IRBA Code is consistent with the International Ethics Standards Board for Accountants Code of Ethics for Professional Accountants (Parts A and B). We believe that the audit evidence we have obtained is sufficient and appropriate to provide a basis for our opinion.
OTHER INFORMATIONThe directors are responsible for the other information. The other information comprises the Directors’ Report as required by the Companies Act of South Africa, the Directors’ Responsibility Statement and the supplementary information as set out on pages 38 and 39. The other information does not include the Financial Statements and our auditor’s report thereon.
Our opinion on the Financial Statements does not cover the other information and we do not express an audit opinion or any form of assurance conclusion thereon.
In connection with our audit of the Financial Statements, our responsibility is to read the other information and, in doing so, consider whether the other information is materially inconsistent with the Financial Statements or our knowledge obtained in the audit, or otherwise appears to be materially misstated. If, based on the work we have performed, we conclude that there is a material misstatement of this other information, we are required to report that fact. We have nothing to report in this regard.
RESPONSIBILITIES OF THE DIRECTORS FOR THE FINANCIAL STATEMENTSThe directors are responsible for the preparation and fair presentation of the Financial Statements in accordance with International Financial Reporting Standards and the requirements of the Companies Act of South Africa, and for such internal control as the directors determine is necessary to enable the preparation of Financial Statements that are free from material misstatement, whether due to fraud or error.
In preparing the Financial Statements, the directors are responsible for assessing the company’s ability to continue as a going concern, disclosing, as applicable, matters related to going concern and using
the going concern basis of accounting unless the directors either intend to liquidate the company or to cease operations, or have no realistic alternative but to do so.
AUDITOR’S RESPONSIBILITIES FOR THE AUDIT OF THE FINANCIAL STATEMENTSOur objectives are to obtain reasonable assurance about whether the Financial Statements as a whole are free from material misstatement, whether due to fraud or error, and to issue an auditor’s report that includes our opinion. Reasonable assurance is a high level of assurance, but is not a guarantee that an audit conducted in accordance with ISAs will always detect a material misstatement when it exists. Misstatements can arise from fraud or error and are considered material if, individually or in the aggregate, they could reasonably be expected to influence the economic decisions of users taken on the basis of these Financial Statements.
As part of an audit in accordance with ISAs, we exercise professional judgement and maintain professional scepticism throughout the audit. We also:
• Identify and assess the risks of material misstatement of the Financial Statements, whether due to fraud or error, design and perform audit procedures responsive to those risks, and obtain audit evidence that is sufficient and appropriate to provide a basis for our opinion. The risk of not detecting a material misstatement resulting from fraud is higher than for one resulting from error, as fraud may involve collusion, forgery, intentional omissions, misrepresentations, or the override of internal control.
• Obtain an understanding of internal control relevant to the audit in order to design audit procedures that are appropriate in the circumstances, but not for the purpose of expressing an opinion on the effectiveness of the company’s internal control.
• Evaluate the appropriateness of accounting policies used and the reasonableness of accounting estimates and related disclosures made by the directors.
• Conclude on the appropriateness of the directors’ use of the going concern basis of accounting and based on the audit evidence obtained, whether a material uncertainty exists related to events or conditions that may cast significant doubt on the company’s ability to continue as a going concern. If we conclude that a material uncertainty exists, we are required to draw attention in our auditor’s report to the related disclosures in the Financial Statements or, if such disclosures are inadequate, to modify our opinion. Our conclusions are based on the audit evidence obtained up to the date of our auditor’s report. However, future events or conditions may cause the company to cease to continue as a going concern.
• Evaluate the overall presentation, structure and content of the Financial Statements, including the disclosures, and whether the Financial Statements represent the underlying transactions and events in a manner that achieves fair presentation.
We communicate with the directors regarding, among other matters, the planned scope and timing of the audit and significant audit findings, including any significant deficiencies in internal control that we identify during our audit.
KPMG Inc.
Per: Ivan EngelsChartered Accountant (SA)Registered AuditorDirector
_______________________________
Date: 28 August 2017
INDEPENDENT AUDITOR’S REPORTTO THE MEMBERS OF CAPE TOWN CENTRAL CITY IMPROVEMENT DISTRICT NPC
FINANCIALS

ANNUAL REPORT 2017 CAPE TOWN CENTRAL CITY IMPROVEMENT DISTRICT24
STATEMENT OF COMPREHENSIVE INCOMEFOR THE YEAR ENDED 30 JUNE 2017
FINANCIALS
Note 2017 2016
R R
Revenue 54 817 527 50 715 242
Other income 2 317 364 27 000
Expenditure (52 732 659) (46 663 858)
Surplus from operations 3 2 402 232 4 078 384
Finance income 4 1 320 048 1 020 077
Surplus for the year 3 722 280 5 098 461
Other comprehensive income for the year - -
Total comprehensive income for the year 3 722 280 5 098 461

ANNUAL REPORT 2017 25CAPE TOWN CENTRAL CITY IMPROVEMENT DISTRICT
STATEMENT OF FINANCIAL POSITIONFOR THE YEAR ENDED 30 JUNE 2017
Note 2017 2016
R R
Non‑current assets
Plant and equipment 6 1 619 313 1 739 311
Current assets 21 228 119 17 230 543
Trade and other receivables 7 319 814 99 744
Cash and cash equivalents 8 20 908 305 17 130 799
Retention 12.2 13 183 165 11 665 965
Projects – existing 2 340 000 780 000
– future 5 385 140 4 684 835
Total assets 22 847 432 18 969 854
RESERVES AND LIABILITIES
Reserves
Accumulated surplus 21 177 020 17 454 740
Current liabilities
Trade and other payables 9 1 552 582 1 400 995
Non‑current liabilities
Operating lease obligation 117 830 114 119
Total reserves and liabilities 22 847 432 18 969 854
FINANCIALS
ASSETS

ANNUAL REPORT 2017 CAPE TOWN CENTRAL CITY IMPROVEMENT DISTRICT26
STATEMENT OF CHANGES IN EQUITYFOR THE YEAR ENDED 30 JUNE 2017
FINANCIALS
Accumulated surplus
R
Balance at 1 July 2015 12 356 279
Total comprehensive income for the year 5 098 461
Balance at 30 June 2016 17 454 740
Balance at 1 July 2016 17 454 740
Total comprehensive income for the year 3 722 280
Balance at 30 June 2017 21 177 020

ANNUAL REPORT 2017 27CAPE TOWN CENTRAL CITY IMPROVEMENT DISTRICT
STATEMENT OF CASH FLOWSFOR THE YEAR ENDED 30 JUNE 2017
Note 2017 2016
R R
Cash generated by operations 10 2 743 474 4 224 574
Finance income 4 1 320 048 1 020 077
Net cash inflow from operating activities 4 063 522 5 244 651
CASH FLOWS FROM INVESTING ACTIVITIES
Acquisition of plant and equipment 6 (436 016) (388 558)
Proceeds from disposals of plant and equipment 6 150 000 ‑
Net cash outflow from investing activities (286 016) (388 558)
Net increase in cash and cash equivalents 3 777 506 4 856 093
Cash and cash equivalents at beginning of year 8 17 130 799 12 274 706
Cash and cash equivalents at end of year 20 908 305 17 130 799
FINANCIALS
CASH FLOWS FROM OPERATING ACTIVITIES

ANNUAL REPORT 2017 CAPE TOWN CENTRAL CITY IMPROVEMENT DISTRICT28
1. REPORTING ENTITY Cape Town Central City Improvement District NPC (the "Company") is a company domiciled in South Africa. The address of the Company’s registered office is 1 Thibault Square, cnr Long St & Hans Strijdom Ave, Cape Town.
1.1 BASIS OF PREPARATION
1.1.1 Statement of compliance
The financial statements have been prepared in accordance with International Financial Reporting Standards (IFRS) and the requirements of the Companies Act of South Africa.
1.1.2 Basis of measurement
The financial statements are presented in South African rand, which is the company’s functional currency. These financial statements have been prepared on the historical cost basis unless otherwise indicated, and on the going concern principle.
1.1.3 Use of estimates and judgements
The preparation of financial statements requires management to make judgements, estimates and assumptions that affect the application of accounting policies and the reported amounts of assets, liabilities, income and expenses. Actual results may differ from these estimates.
Estimates and underlying assumptions are reviewed on an ongoing basis. Revisions to accounting estimates are recognised in the period in which the estimate is revised and in any future periods affected.
1.2 SIGNIFICANT ACCOUNTING POLICIES
1.2.1 PLANT AND EQUIPMENT
Plant and equipment are stated historical cost less accumulated depreciation and accumulated impairment losses.
When parts of an item of plant and equipment have different useful lives, they are accounted for as separate items of plant and equipment.
Subsequent costs
The company recognises in the carrying amount of an item of plant and equipment the cost of replacing part of such an item when that cost is incurred if it is probable that the future economic benefits embodied with the item will flow to the Company and the cost of the item can be measured reliably. All other costs are recognised in profit or loss as an expense when incurred.
NOTES TO THE FINANCIAL STATEMENTSFOR THE YEAR ENDED 30 JUNE 2017
FINANCIALS

ANNUAL REPORT 2017 29CAPE TOWN CENTRAL CITY IMPROVEMENT DISTRICT
NOTES TO THE FINANCIAL STATEMENTS (CONT)FOR THE YEAR ENDED 30 JUNE 2017
1.2 SIGNIFICANT ACCOUNTING POLICIES (CONTINUED)
1.2.1 PLANT AND EQUIPMENT (CONTINUED) Depreciation
Depreciation is charged to profit or loss on a straight-line basis over the estimated useful lives of each part of an item of plant and equipment.
The estimated useful lives for the current and comparative periods are as follows:
Motor vehicle 5 years
Furniture 6 years
Fittings 3 years
Office equipment 6 years
Computer hardware 3 years
Computer software 2 years
Leasehold improvements shorter of lease term and useful life
Residual values, if significant, are reassessed annually.
1.2.2 IMPAIRMENT
The carrying amounts of the company’s assets are reviewed at each reporting date to determine whether there is any indication of impairment. If any such indication exists, the asset’s recoverable amount is estimated.
An impairment loss is recognised whenever the carrying amount of an asset or its cash-generating unit exceeds its recoverable amount. Impairment losses are recognised in the statement of comprehensive income.
(i) Calculation of recoverable amount
The recoverable amount of other assets is the greater of their net selling price and value in use. In assessing value in use, the estimated future cash flows are discounted to their present value using a pre-tax discount rate that reflects current market assessments of the time value of money and the risks specific to the asset. For an asset that does not generate largely independent cash inflows, the recoverable amount is determined for the cash-generating unit to which the asset belongs.
(ii) Reversals of impairments
An impairment loss is reversed if there has been a change in the estimates used to determine the recoverable amount.
An impairment loss is reversed only to the extent that the asset’s carrying amount does not exceed the carrying amount that would have been determined, net of depreciation or amortisation, if no impairment loss had been recognised.
FINANCIALS

ANNUAL REPORT 2017 CAPE TOWN CENTRAL CITY IMPROVEMENT DISTRICT30
NOTES TO THE FINANCIAL STATEMENTS (CONT)FOR THE YEAR ENDED 30 JUNE 2017
FINANCIALS
1.2 SIGNIFICANT ACCOUNTING POLICIES (CONTINUED)
1.2.3 FINANCIAL INSTRUMENTS Measurement Non-derivative financial instruments
Non-derivative financial instruments comprise receivables, cash and cash equivalents and payables.
Non-derivative financial instruments are recognised initially at fair value plus any directly attributable transaction costs. Subsequent to initial recognition non-derivative financial instruments are measured as described below.
A financial instrument is recognised if the company becomes party to the contractual provisions of the instrument. Financial assets are derecognised if the company’s contractual rights to the cash flows from the financial assets expire or if the company transfers the financial asset to another party without retaining control or substantially all risks and rewards of the asset. Financial liabilities are derecognised if the company’s obligations specified in the contract expire or are discharged or cancelled.
Non-derivative financial instruments are measured at amortised cost using the effective interest method, less any impairment losses. Subsequent to initial recognition these instruments are measured as set out below. Trade and other receivables Trade and other receivables originated by the company are stated at amortised cost less allowance for doubtful debts.
Cash and cash equivalents For the purpose of the statement of cash flows, cash and cash equivalents comprise cash on hand which are available for use by the company unless otherwise stated. Subsequent to initial recognition cash and cash equivalents are measured at amortised cost. Trade and other payables Payables are recognised at amortised cost.
1.2.4 REVENUE
Revenue comprises levy income from ratepayers which is collected by the City of Cape Town on the entity’s behalf, net of retention levy retained.
1.2.5 FINANCE INCOME
Finance income comprises interest income on funds invested. Interest income is recognised as it accrues, using the effective interest method.
1.2.6 OTHER INCOME
Other income includes management fee income and sundry income. Management fee income consists of various dedicated projects funded externally.
1.2.7 LEASE PAYMENTS
Payments made under operating leases are recognised in profit or loss on a straight-line basis over the term of the lease. Lease incentives received are recognised as an integral part of the total lease expense, over the term of the lease.
1.2.8 COMPARATIVE FIGURES
Where material, comparative figures are reclassified to conform with the current year presentation.

ANNUAL REPORT 2017 31CAPE TOWN CENTRAL CITY IMPROVEMENT DISTRICT
NOTES TO THE FINANCIAL STATEMENTS (CONT)FOR THE YEAR ENDED 30 JUNE 2017
2017 2016
R R
Sundry income 167 364 27 000
Profit of sale of asset 150 000 -
317 364 27 000
3. SURPLUS FROM OPERATIONS is arrived at after taking into account:
Operating lease payments - equipment 40 104 40 104
Operating lease payments - premises 117 830 114 119
Security expense 24 118 271 22 470 670
Social services 3 992 888 3 614 936
Salaries 10 033 333 8 774 597
Cleaning 6 954 771 6 702 180
Marketing expense 2 451 020 2 525 445
Auditor’s remuneration 87 273 80 425
Depreciation 556 014 560 589
3.1 OPERATING LEASE COMMITMENTS The company leases premises and equipment under operating leases. The lease agreements for the majority of the premises and equipment utilised are for the minimum annual payments under non-cancellable operating leases.
Not later than 1 year 342 620 323 594
Between 1 and 5 years 757 524 991 224
More than 5 years - -
1 100 144 1 314 818
The rentals escalation for the premises and equipment is 7.5% and 0% per annum respectively.
4. FINANCE INCOME
Interest received on bank balance 1 320 048 1 020 077
FINANCIALS
2. OTHER INCOME

ANNUAL REPORT 2017 CAPE TOWN CENTRAL CITY IMPROVEMENT DISTRICT32
NOTES TO THE FINANCIAL STATEMENTS (CONT)FOR THE YEAR ENDED 30 JUNE 2017
FINANCIALS
5. INCOME TAX EXPENSE Provision has not been made for current taxation, or deferred taxation as the Company is an approved Public Benefit Organisation in terms of Section 30 of the Income Tax Act and is exempt from income tax in terms of section 10(1)(cN) of the Income Tax Act.
6. PLANT AND EQUIPMENT
Cost Accumulated Carrying depreciation amount R R R
2017
Motor vehicles 1 191 933 (499 485) 692 448
Furniture 332 931 (118 087) 214 844
Fittings 54 759 (54 609) 150
Office equipment 135 916 (43 825) 92 091
Computer hardware 534 372 (347 611) 186 761
Leasehold improvements 780 658 (347 805) 432 853
Computer software 48 100 (47 934) 166
3 078 669 (1 459 356) 1 619 313
2016
Motor vehicles 1 100 658 (605 377) 495 281
Furniture 326 881 (62 918) 263 963
Fittings 54 759 (53 427) 1 332
Office equipment 101 095 (24 429) 76 666
Computer hardware 499 227 (188 308) 310 919
Leasehold improvements 780 658 (191 674) 588 984
Computer software 48 100 (45 934) 2 166
2 911 378 (1 172 067) 1 739 311

ANNUAL REPORT 2017 33CAPE TOWN CENTRAL CITY IMPROVEMENT DISTRICT
NOTES TO THE FINANCIAL STATEMENTS (CONT)FOR THE YEAR ENDED 30 JUNE 2017
Carrying amount Additions Disposals Depreciation Carrying amount R R R R R
2017
Motor vehicles 495 281 360 000 ‑ (162 833) 692 448
Furniture 263 963 6 050 ‑ (55 169) 214 844
Fittings 1 332 ‑ ‑ (1 182) 150
Office equipment 76 666 34 821 ‑ (19 396) 92 091
Computer hardware 310 919 35 145 ‑ (159 303) 186 761
Leasehold improvements 588 984 ‑ ‑ (156 131) 432 853
Computer software 2 166 ‑ ‑ (2 000) 166
1 739 311 436 016 ‑ (556 014) 1 619 313
2016
Motor vehicles 526 843 138 593 - (170 155) 495 281
Furniture 280 912 36 781 (238) (53 492) 263 963
Fittings 3 150 - - (1 818) 1 332
Office equipment 89 797 4 680 (1 141) (16 670) 76 666
Computer hardware 298 625 175 346 (19 569) (143 483) 310 919
Leasehold improvements 715 470 29 160 - (155 646) 588 984
Computer software 17 493 3 998 - (19 325) 2 166
1 932 290 388 558 (20 948) (560 589) 1 739 311
Assets with book value of R0 was sold for R150 000 during the current year, refer note 2.
FINANCIALS

ANNUAL REPORT 2017 CAPE TOWN CENTRAL CITY IMPROVEMENT DISTRICT34
NOTES TO THE FINANCIAL STATEMENTS (CONT)FOR THE YEAR ENDED 30 JUNE 2017
FINANCIALS
2017 2016
R R
7. TRADE AND OTHER RECEIVABLES
Trade receivables 12 972 907 10 153 892
Other receivables 184 897 -
Prepayments 134 917 99 744
13 292 721 10 253 636
Less: Allowance for doubtful debts (12 972 907) (10 153 892)
319 814 99 744
The Company receives levy income from the City of Cape Town (“the City”), which the City collects from ratepayers. In terms of the agreement, the City retains a reserve of 3% of all payments due to the CID. This reserve covers any short fall which may be suffered by the City as a result of non-payment or short payment of the CID levy by property owners.
Reconciliation of allowance for doubtful debts
Opening balance (10 153 892) (10 634 730)
Movement for the year (4 450 374) (2 494 604)
Retention levy refunded 1 631 359 2 975 442
Closing balance (12 972 907) (10 153 892)
8. CASH AND CASH EQUIVALENTS
Cash Management 19 931 073 16 208 058
Operational 977 232 922 741
20 908 305 17 130 799
9. TRADE AND OTHER PAYABLES
Accruals 153 401 43 643
Other payables 782 203 621 688
Project income received in advance 217 659 313 454
Tenant inducement allowance 246 483 319 901
Value Added Tax (VAT) payable 152 836 102 309
1 552 582 1 400 995
ANNUAL REPORT 2017 35CAPE TOWN CENTRAL CITY IMPROVEMENT DISTRICT
NOTES TO THE FINANCIAL STATEMENTS (CONT)FOR THE YEAR ENDED 30 JUNE 2017
2017 2016
R R
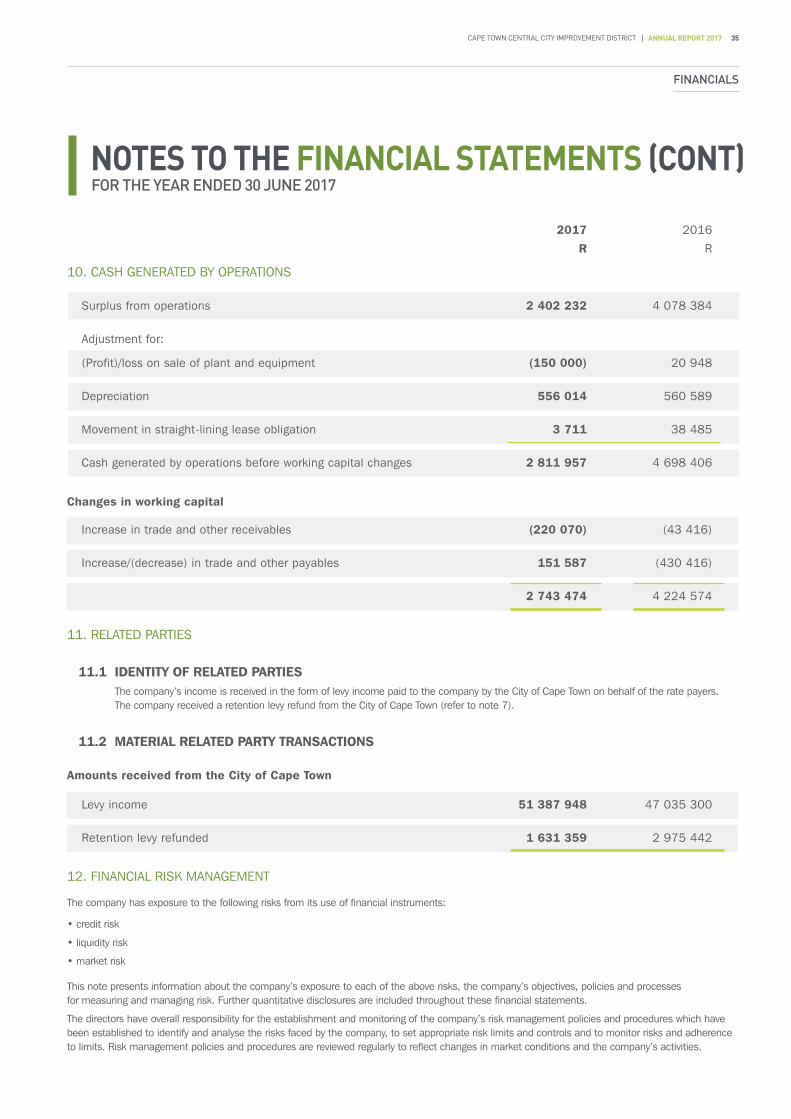
10. CASH GENERATED BY OPERATIONS
Surplus from operations 2 402 232 4 078 384
Adjustment for:
(Profit)/loss on sale of plant and equipment (150 000) 20 948
Depreciation 556 014 560 589
Movement in straight-lining lease obligation 3 711 38 485
Cash generated by operations before working capital changes 2 811 957 4 698 406
Changes in working capital
Increase in trade and other receivables (220 070) (43 416)
Increase/(decrease) in trade and other payables 151 587 (430 416)
2 743 474 4 224 574
11. RELATED PARTIES
11.1 IDENTITY OF RELATED PARTIES The company’s income is received in the form of levy income paid to the company by the City of Cape Town on behalf of the rate payers. The company received a retention levy refund from the City of Cape Town (refer to note 7).
11.2 MATERIAL RELATED PARTY TRANSACTIONS
Amounts received from the City of Cape Town
Levy income 51 387 948 47 035 300
Retention levy refunded 1 631 359 2 975 442
12. FINANCIAL RISK MANAGEMENT
The company has exposure to the following risks from its use of financial instruments:
• credit risk
• liquidity risk
• market risk
This note presents information about the company’s exposure to each of the above risks, the company’s objectives, policies and processes for measuring and managing risk. Further quantitative disclosures are included throughout these financial statements.
The directors have overall responsibility for the establishment and monitoring of the company’s risk management policies and procedures which have been established to identify and analyse the risks faced by the company, to set appropriate risk limits and controls and to monitor risks and adherence to limits. Risk management policies and procedures are reviewed regularly to reflect changes in market conditions and the company’s activities.
FINANCIALS

ANNUAL REPORT 2017 CAPE TOWN CENTRAL CITY IMPROVEMENT DISTRICT36
NOTES TO THE FINANCIAL STATEMENTS (CONT)FOR THE YEAR ENDED 30 JUNE 2017
FINANCIALS
12. FINANCIAL RISK MANAGEMENT (CONTINUED)
Credit risk
Credit risk is the risk of financial loss to the company if a counterparty to a financial instrument fails to meet its contractual obligations, and arises principally from the company’s receivables and cash and cash equivalents.
An allowance for impairment is established based on managements’ estimate of identified incurred losses in respect of specific trade and other receivables. Bad debts identified are written off as they occur.
Reputable financial institutions are used for investing and cash handling purposes. Concentration of credit risk exists as R14 244 175 (2016: R13 184 056) is invested with Investec Bank Limited.
Liquidity risk
Liquidity risk is the risk that the company will not be able to meet its financial obligations as they fall due. The company’s approach to managing liquidity is to ensure, as far as possible, that it will always have sufficient liquidity to meet its liabilities when due, under normal and stressed conditions, without incurring unacceptable losses or risking damage to the company’s reputation.
Market risk
Market risk is the risk that changes in market prices, such as interest rates will affect the company's income. The entity is not exposed to foreign exchange risk at the reporting date.
Fair value of financial instruments
The company’s financial instruments consist mainly of cash at the bank and cash equivalents, trade and other receivables and trade and other payables.
The estimated net fair value at which financial instruments are carried on the statement of financial position at 30 June 2017 have been determined using available market information and is considered to approximate its carrying values.
12.1 CREDIT RISK
At reporting date there were no significant concentrations of credit risk other than the majority of its cash and cash equivalents being kept at a single financial institution.
The maximum exposure to credit risk is represented by the carrying amount of each financial asset in the statement of financial position.
The maximum exposure to credit risk at the reporting date is:
The Company receives levy income from the City of Cape Town (“the City”), which the City collects from ratepayers. In terms of the agreement, the City of Cape Town retains a reserve of 3% of all payments due to the CID. This reserve covers any short fall which may be suffered by the City of Cape Town as a result of non-payment or short payment of the CID levy by property owners.
Note 2017 2016
R R
Trade and other receivables 7 184 897 -
Cash and cash equivalents 8 20 908 305 17 130 799
21 093 202 17 130 799

ANNUAL REPORT 2017 37CAPE TOWN CENTRAL CITY IMPROVEMENT DISTRICT
NOTES TO THE FINANCIAL STATEMENTS (CONT)FOR THE YEAR ENDED 30 JUNE 2017
12. FINANCIAL RISK MANAGEMENT (CONTINUED)
12.2 LIQUIDITY RISK The following are contractual maturities of financial liabilities, including interest payments and excluding the impact of netting agreements:
Carrying Contractual Less than 1 – 5 Over amount cash flows 1 year years 5 years
30 June 2017
Non‑derivative financial liabilities
Trade and other payables* (153 401) (153 401) (153 401) - -
30 June 2016
Non-derivative financial liabilities
Trade and other payables* (43 643) (43 643) (43 643) - -
* Includes other payables, accruals, contract creditors and other financial liabilities as defined in IAS32: Financial Instruments.
As approved by the Board the company maintains a Retention cash position of R13 183 165 (2016: R11 665 965) as contingency to meet liabilities in the unlikely event of winding up and committed R2 340 000 (2016: R780 000) to existing projects.
12.2 MARKET RATE RISK The entity's only exposure to interest rate risk is on its cash and cash equivalents which earns interest at a variable interest rate.
The impact of a 1% increase in variable interest rates will result in an increase in interest income of R209 083 (2016: R171 308). A 1% decrease in interest rates will have an equal but opposite impact.
13. STANDARDS AND INTERPRETATIONS NOT YET EFFECTIVEThere are new or revised Accounting Standards and Interpretations in issue that are not yet effective. These include the following Standards and Interpretations that are applicable to the business of the entity and may have an impact on future financial statements:
Management is evaluating the impact that the adoption of these amendments may have on the financial statements.
14. SUBSEQUENT EVENTS TO THE REPORTING DATE There have been no facts or circumstances of a material nature that have occurred between the reporting date and the date of this report that have a material impact on the financial position of the company at the reporting date.
15. GOING CONCERNAs at 30 June 2017 and up to the date of signing these financials no events or conditions have occurred that would impact the entity’s ability to continue to as a going concern.
Standard/Interpretation Effective date
IFRS 15 Revenue from contracts with customers Periods beginning on or after 1 January 2018
IFRS 9 Financial Instruments Periods beginning on or after 1 January 2018
IFRS 16 Leases Periods beginning on or after 1 January 2019
FINANCIALS

ANNUAL REPORT 2017 CAPE TOWN CENTRAL CITY IMPROVEMENT DISTRICT38
DETAILED STATEMENT OF INCOME AND EXPENSESFOR THE YEAR ENDED 30 JUNE 2017
FINANCIALS
2017 2016
R R
Revenue
Levy income 51 387 948 47 035 300
Retention levy refunded 1 631 359 2 975 442
Safe Spaces project 277 340 276 000
Public space management project 1 000 000 428 500
Long steet association project 520 880 -
54 817 527 50 715 242
Other income 1 637 412 1 047 077
Finance income 1 320 048 1 020 077
Other income 317 364 27 000
56 454 939 51 762 319
Expenditure (refer to page 39) (52 732 659) (46 663 858)
Surplus for the year 3 722 280 5 098 461

ANNUAL REPORT 2017 39CAPE TOWN CENTRAL CITY IMPROVEMENT DISTRICT
DETAILED STATEMENT OF INCOME AND EXPENSESFOR THE YEAR ENDED 30 JUNE 2017
2017 2016
R R
Expenditure (52 732 659) (46 663 858)
Auditor’s remuneration 87 273 80 425
Bank charges 33 871 25 639
Cellphone costs 171 488 177 381
Cleaning 6 954 771 6 702 180
Computer expenses 357 083 330 679
Courier 2 541 4 112
Depreciation 556 014 560 589
Entertainment 56 329 67 949
General expenses 38 325 26 530
Insurance 119 567 94 970
Legal fees 173 927 -
Loss on sale of plant and equipment - 20 948
Marketing 2 737 871 2 526 345
Printing and stationary 118 627 108 450
Project Expenditure 1 957 368 141 448
- Safe Spaces Project 277 341 58 032
- Public Space Management Project 1 159 055 83 416
- Long Street Association Project 520 972 -
Rent expense – straight lined 678 576 687 656
Salaries 10 033 333 8 689 544
Social services 3 992 888 3 614 936
Staff costs 205 774 85 053
Subscriptions 55 075 50 501
Security expense 24 118 271 22 470 670
Telephone and fax 2 147 12 237
Travel 281 540 185 616
FINANCIALS