Embed Size (px)
Citation preview
Annual Financial Statements 2016
CHARTING A NEW COURSE

Contents
Annual financial statements
Directors’ responsibility statement 2
Secretarial certification 2
Independent auditors’ report 3
Directors’ report 4
Directors’ interest in shares 6
Audit Committee report 7
Group statement of financial position 8
Group statement of comprehensive income 9
Group statement of changes in equity 10
Group statement of cash flows 11
Significant accounting policies 12
Notes to the Group annual financial statements 21
Company annual financial statements 50
Annexure 1 – Related parties 58
Annexure 2 – Details of land and buildings 59
Analysis of shareholders 60
General information IBC
Shareholders’ diary IBC
Astrapak Annual Financial Statements 2016 1
Directors’ responsibility statementfor the year ended 29 February 2016
safeguard, verify and maintain accountability of assets, and to prevent and detect material misstatement and loss. The systems are implemented and monitored by suitably trained personnel with an appropriate segregation of authority and duties. Nothing has come to the attention of the directors to indicate that any material breakdown in the functioning of these controls, procedures and systems has occurred during the year under review.
The consolidated and separate financial statements are prepared on a going-concern basis. Nothing has come to the attention of the directors to indicate that the Group and Company will not remain going concerns for the foreseeable future.
These consolidated and separate financial statements were prepared by Salome Ratlhagane CA(SA) (Group Financial Manager) under the supervision of Manley Diedloff (Group Managing Director and Chief Financial Officer).
The directors of the Company are responsible for the maintenance of adequate accounting records and the preparation and integrity of the annual financial statements and related information. The annual financial statements have been prepared in accordance with the Companies Act of South Africa, International Financial Reporting Standards of the International Accounting Standards Board, SAICA Financial Reporting Guide as issued by the Accounting Practices Committee and the Interpretations issued by the IFRS Interpretations Committee.
The Group’s independent auditors, Deloitte & Touche, have audited the annual financial statements and their unmodified report appears on page 3.
The directors are also responsible for the systems of internal control. These are designed to provide reasonable, but not absolute, assurance as to the reliability of the annual financial statements, and to adequately
These financial statements were audited in compliance with section 29(1)(e)(i)(aa) of the Companies Act, No 71 of 2008.
The financial statements set out on pages 8 to 57 were approved by the Board of Directors and are signed on its behalf by:
M DiedloffGroup Managing Director and Chief Financial Officer
R MooreChief Executive Officer
Denver19 April 2016
In accordance with section 88(2)(e) of the Companies Act, No 71 of 2008, it is hereby certified that, to the best of my knowledge, the Company has lodged with the Registrar of Companies all such returns as are required of a public company in terms of the Act and that such returns are true and correct for the financial period ended 29 February 2016.
Salome RatlhaganeCompany Secretary
Denver19 April 2016
Secretarial certificationfor the year ended 29 February 2016
2 Astrapak Annual Financial Statements 2016
Independent auditors’ report for the year ended 29 February 2016
material misstatement of the financial statements, whether due to fraud or error. In making those risk assessments, the auditor considers internal control relevant to the entity’s preparation and fair presentation of the financial statements in order to design audit procedures that are appropriate in the circumstances, but not for the purpose of expressing an opinion on the effectiveness of the entity’s internal control. An audit also includes evaluating the appropriateness of accounting policies used and the reasonableness of accounting estimates made by management, as well as evaluating the overall presentation of the financial statements.
We believe that the audit evidence we have obtained is sufficient and appropriate to provide a basis for our audit opinion.
OpinionIn our opinion, the consolidated and separate financial statements present fairly, in all material respects, the consolidated and separate financial position of Astrapak Limited as at 29 February 2016, and its consolidated and separate financial performance and consolidated and separate cash flows for the year then ended in accordance with International Financial Reporting Standards and the requirements of the Companies Act of South Africa.
Other reports required by the Companies ActAs part of our audit of the consolidated and separate financial statements for the year ended 29 February 2016, we have read the directors’ report, the Audit Committee’s report and secretarial certification for the purpose of identifying whether there are material inconsistencies between these reports and the audited consolidated and separate financial statements.
TO THE SHAREHOLDERS OF ASTRAPAK LIMITEDWe have audited the consolidated and separate financial statements of Astrapak Limited as set out on pages 8 to 57 which comprise the statements of financial position as at 29 February 2016, and the statements of comprehensive income, the statements of changes in equity, the statements of cash flows for the year then ended, and the notes which include a summary of significant accounting policies and other explanatory information.
Directors’ responsibility for the consolidated financial statements The Company’s directors are responsible for the preparation and fair presentation of these consolidated and separate financial statements in accordance with International Financial Reporting Standards and the requirements of the Companies Act of South Africa, and for such internal control as the directors determine is necessary to enable the preparation of consolidated and separate financial statements that are free from material misstatement, whether due to fraud or error.
Auditors’ responsibilityOur responsibility is to express an opinion on the consolidated and separate financial statements based on our audit. We conducted our audit in accordance with International Standards on Auditing. Those standards require that we comply with ethical requirements and plan and perform the audit to obtain reasonable assurance about whether the financial statements are free from material misstatement.
An audit involves performing procedures to obtain audit evidence about the amounts and disclosures in the financial statements. The procedures selected depend on the auditor’s judgement, including the assessment of the risks of
These reports are the responsibility of the respective preparers. Based on reading these reports, we have not identified material inconsistencies between these reports and the audited consolidated and separate financial statements. However, we have not audited these reports and accordingly do not express an opinion on these reports.
Report on other legal and regulatory requirementsIn terms of the Independent Regulatory Board for Auditors (“IRBA”) Rule published in Government Gazette Number 39475 dated 4 December 2015, we report that Deloitte & Touche has been the auditor of Astrapak Limited for 21 years.
Deloitte & ToucheRegistered AuditorsPer Corinne RingwoodPartner
19 April 2016
National executive: *LL Bam (Chief Executive),*AE Swiegers (Chief Operating Officer), *GM Pinnock (Audit), *N Sing (Risk Advisory), *NB Kader (Tax), TP Pillay (Consulting), S Gwala (BPaaS), *K Black (Clients and Industries), *JK Mazzocco (Talent and Transformation), *MJ Jarvis (Finance), *M Jordan (Strategy), *MJ Comber (Reputation and Risk), *TJ Brown (Chairman of the Board)*Partner and Registered Auditor
A full list of partners and directors is available on request.
B-BBEE rating: Level 2 contributor in terms of Chartered Accountancy Profession Sector Code
Associate of Deloitte Africa, a member of Deloitte Touche Tohmatsu Limited
Astrapak Annual Financial Statements 2016 3
Directors’ reportfor the year ended 29 February 2016
plastic packaging products. The Group has manufacturing facilities in all main centres of South Africa and has annualised revenues of R1,348 million. The operations are grouped into various
DirectorsThe names of directors of Astrapak are listed on page IBC of these annual financial statements.
Directors’ remunerationThe aggregate remuneration and benefits paid to the executive and non-executive directors of the Group for the year ended 29 February 2016 are set out in note 36 of these financial statements.
Astrapak Limited Share Option SchemeFurther details on the Astrapak Limited Share Option Scheme (“the scheme”) and the number of options issued to executive directors in terms of such scheme are set out in note 36 of these annual financial statements.
Property, plant and equipmentDuring the year, the Group acquired property, plant and equipment to the value of R132,4 million (2015: R158,0 million).
Nature of businessAstrapak Limited and its subsidiaries (“Astrapak” or the “Company” or the “Group”) are manufactures and distributors of an extensive range of
Authorised and issued share capitalDetails of the authorised share capital are given in note 11 to the financial statements. No changes occurred during the year.
Preference sharesThe non-redeemable, non-participating, cumulative preference shareholders will receive, if declared, dividends which are payable by 31 March and 30 September each year. Dividends are calculated based on 88,89% of the average daily prime rate which prevailed in respect of the relevant period for which the dividend is calculated.
SubsidiariesThe list of all parties related to the Company during the year ended 29 February 2016 is disclosed in Annexure 1 to the financial statements.
A number of special resolutions were passed by subsidiary companies. None of these resolutions are of significance to the shareholders in assessing the state of affairs of the Group.
business segments and service mainly the food, beverage, personal care, pharmaceutical, agricultural, industrial and retail markets.
Plant and machinery were not impaired in the current year and prior year impairments were R38,6 million.
Directors’ service contractsAll executive directors and prescribed officers have service level agreements in place.
Distribution to ordinary shareholdersAstrapak has not declared an ordinary dividend in respect of the financial year ended 29 February 2016 (2015: Rnil).
Litigation statementIn terms of the JSE Listings Requirements, the directors, whose names appear on page IBC of these financial statements, have confirmed that they are not aware of any legal or arbitration proceedings, including proceedings that are pending or threatened, that may have or have had in the recent past, being at least the previous 12 months, a material effect on the Group’s financial position.
Trading results2016
R’0002015R’000
Revenue 1 348,4 1 388,6Profit from operations before exceptional items 44,3 61,5Profit/(loss) for the year 21,2 (122,3)Loss attributable to ordinary shareholders (3,3) (138,5)Attributable to preference shareholders of the parent 12,7 10,9Loss per ordinary share (cents) (2,7) (114,4)Headline loss per ordinary share (cents) (14,1) (71,5)
4 Astrapak Annual Financial Statements 2016
As at 29 February 2016, entities included in discontinued operations and assets classified as held-for-sale are as follows:
Flexible › Barrier Film Converters Proprietary
Limited (held-for-sale). › Coralline Investment Proprietary
Limited (held-for-sale).
Flexible divisions which are divisions of Astrapak Manufacturing Holdings Proprietary Limited › Peninsula Packaging (held-for-sale).
Rigids divisions which are divisions of Astrapak Manufacturing Holdings Proprietary Limited › Cinqplast Denver (discontinued).
Plastop Bronkhorstspruit (discontinued).
Going concernThe directors report that, after having considered a wide range of factors, they have reasonable expectation that the Group and Company have adequate resources and facilities available to continue in operation for the foreseeable future. For this reason, the Group continues to adopt the going-concern basis in preparing its financial statements.
Discontinued operationsDuring the 29 February 2016 financial year, the following entities were disposed of: › Cinqpet. › East Rand Plastics. › Knilam Packaging.
Events after the reporting periodNo material fact or circumstance has come to light between 29 February 2016 and date of signature of these financial statements that would require adjustment to or disclosure in these financial statements.
Astrapak Annual Financial Statements 2016 5
DirectorBeneficial
direct
Non-beneficial
indirectUnit
holding %
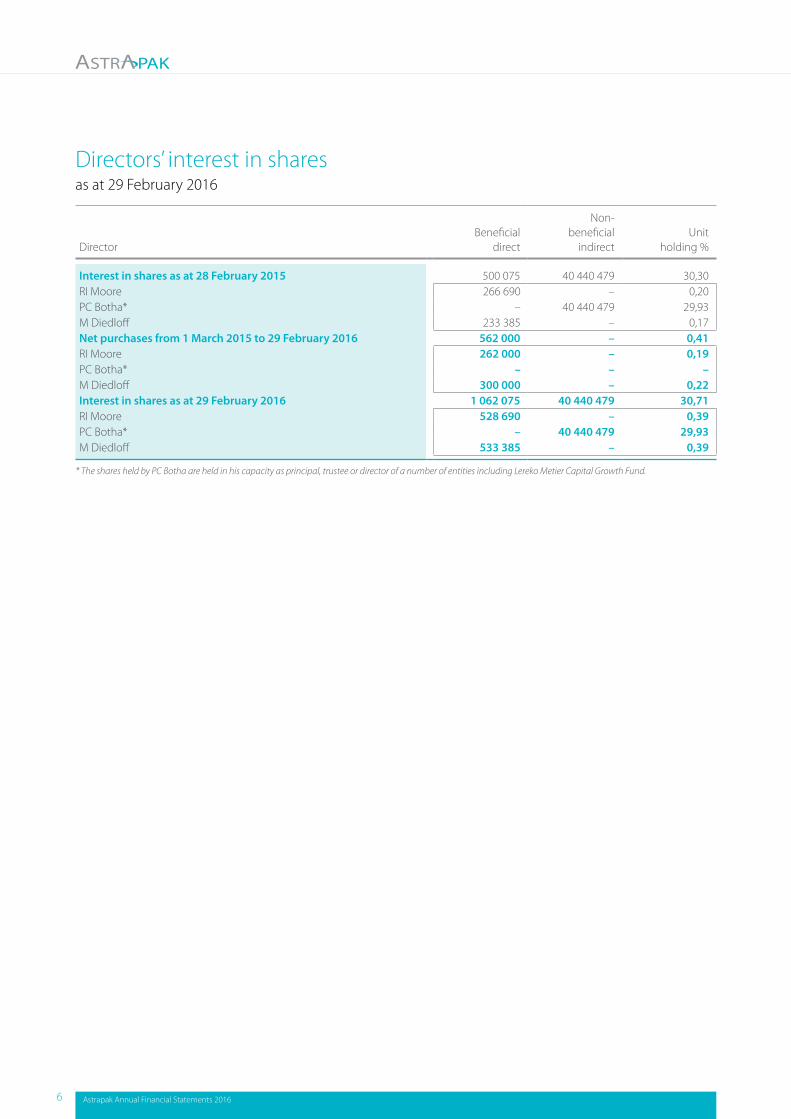
Interest in shares as at 28 February 2015 500 075 40 440 479 30,30RI Moore 266 690 – 0,20PC Botha* – 40 440 479 29,93M Diedloff 233 385 – 0,17Net purchases from 1 March 2015 to 29 February 2016 562 000 – 0,41RI Moore 262 000 – 0,19PC Botha* – – –M Diedloff 300 000 – 0,22Interest in shares as at 29 February 2016 1 062 075 40 440 479 30,71RI Moore 528 690 – 0,39PC Botha* – 40 440 479 29,93M Diedloff 533 385 – 0,39
* The shares held by PC Botha are held in his capacity as principal, trustee or director of a number of entities including Lereko Metier Capital Growth Fund.
Directors’ interest in sharesas at 29 February 2016
6 Astrapak Annual Financial Statements 2016
Audit Committee reportfor the year ended 29 February 2016
› evaluated the effectiveness of risk management, control and various governance processes;
› verified the independence of the external auditors;
› nominated Deloitte & Touche as auditor and noted the appointment of Mrs Corinne Ringwood as the designated auditor;
› reviewed and approved audit fees and engagement terms of the external auditor;
› considered and determined the nature and extent of non-audit services;
› considered and satisfied itself that the Chief Financial Officer has appropriate expertise and experience and that the composition, experience and skills set of the finance function met the Group’s requirements;
› considered and reviewed the appropriateness of IT risks and controls;
› reviewed and monitored the appropriateness of the Group’s combined assurance model and ensuring that significant risks facing the business were adequately addressed; and
› received and dealt appropriately with any complaints, from within or outside the Company, relating to the accounting practices and internal audit of the Company, to the content or auditing of its financial statements, or any related matter.
The Audit Committee has discharged all its responsibilities and carried out all the functions assigned to it in terms of section 94(7) of the Companies Act, No 71 of 2008 (“the Act”).
The Audit Committee has adopted formal terms of reference, as delegated to it by the Board of Directors (“the Board”), as its Audit Committee Charter.
The Audit Committee herewith confirms that it has discharged the functions in terms of its charter and ascribed to it in terms of the Act in the following manner: › reviewed the interim and year-end
financial results as published and recommended the adoption thereof to the Board;
› reviewed external audit reports on the annual financial statements;
› reviewed the Board-approved internal audit and risk charters;
› reviewed and approved the internal audit plan;
› assessed the independence of the internal audit function;
› reviewed and approved the adopted approach to risk management and the risk registers produced via the risk assessment process;
› reviewed all internal audit and risk management reports;
› reviewed the internal audit and risk management plans and where required made recommendations to the Board on remedial actions to be taken;
In the course of its reviews, the Audit Committee took appropriate steps to ensure that the financial statements were prepared in accordance with International Financial Reporting Standards and in the manner required by the Act. It further considered and made recommendations on internal financial controls, dealt with any concerns or queries of matters financial, audit or risk-related and reviewed and considered all legal matters that could significantly impact on the organisation and the financial results reported or to be reported.
The Audit Committee determined that, during the financial year under review, it had discharged its legal, regulatory and all other responsibilities, as might be defined in its charter and terms of reference. The Board concurs with this assessment.
TV MokgatlhaChairman: Audit Committee
19 April 2016
Astrapak Annual Financial Statements 2016 7
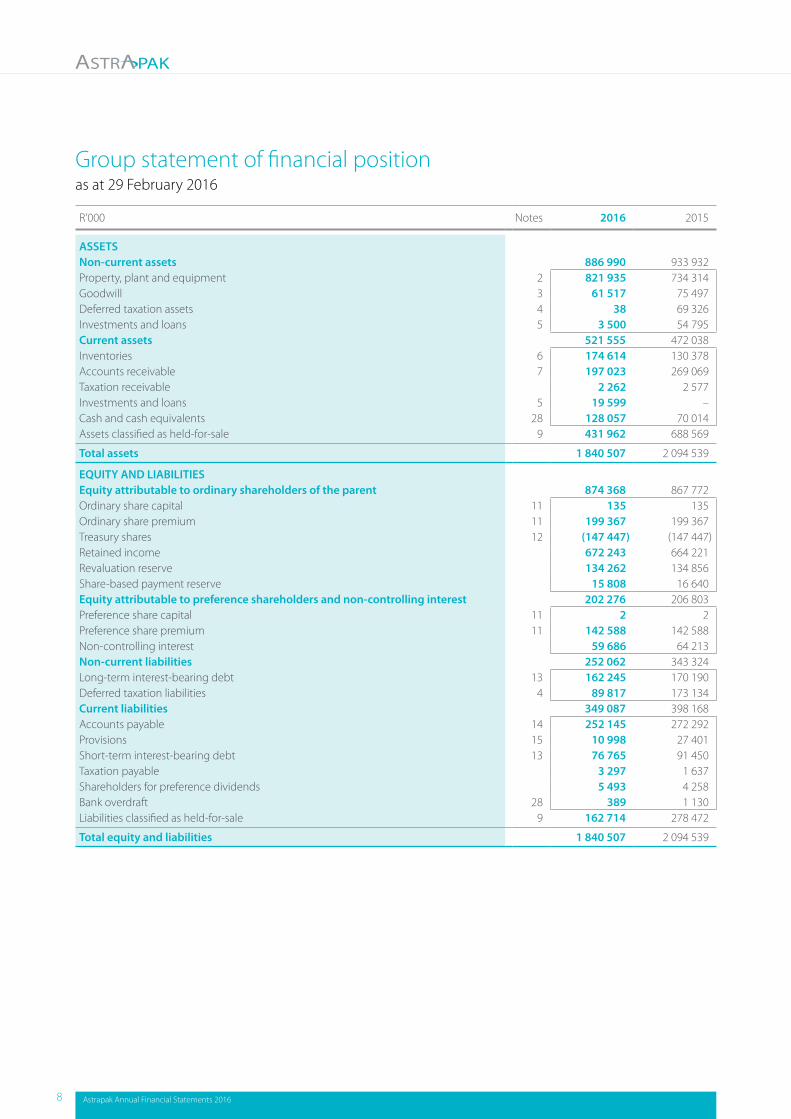
Group statement of financial positionas at 29 February 2016
R’000 Notes 2016 2015
ASSETSNon-current assets 886 990 933 932Property, plant and equipment 2 821 935 734 314 Goodwill 3 61 517 75 497 Deferred taxation assets 4 38 69 326 Investments and loans 5 3 500 54 795 Current assets 521 555 472 038Inventories 6 174 614 130 378 Accounts receivable 7 197 023 269 069 Taxation receivable 2 262 2 577Investments and loans 5 19 599 –Cash and cash equivalents 28 128 057 70 014Assets classified as held-for-sale 9 431 962 688 569
Total assets 1 840 507 2 094 539
EQUITY AND LIABILITIESEquity attributable to ordinary shareholders of the parent 874 368 867 772 Ordinary share capital 11 135 135 Ordinary share premium 11 199 367 199 367 Treasury shares 12 (147 447) (147 447)Retained income 672 243 664 221 Revaluation reserve 134 262 134 856 Share-based payment reserve 15 808 16 640Equity attributable to preference shareholders and non-controlling interest 202 276 206 803 Preference share capital 11 2 2 Preference share premium 11 142 588 142 588 Non-controlling interest 59 686 64 213 Non-current liabilities 252 062 343 324Long-term interest-bearing debt 13 162 245 170 190Deferred taxation liabilities 4 89 817 173 134Current liabilities 349 087 398 168Accounts payable 14 252 145 272 292 Provisions 15 10 998 27 401 Short-term interest-bearing debt 13 76 765 91 450 Taxation payable 3 297 1 637 Shareholders for preference dividends 5 493 4 258 Bank overdraft 28 389 1 130 Liabilities classified as held-for-sale 9 162 714 278 472
Total equity and liabilities 1 840 507 2 094 539
8 Astrapak Annual Financial Statements 2016
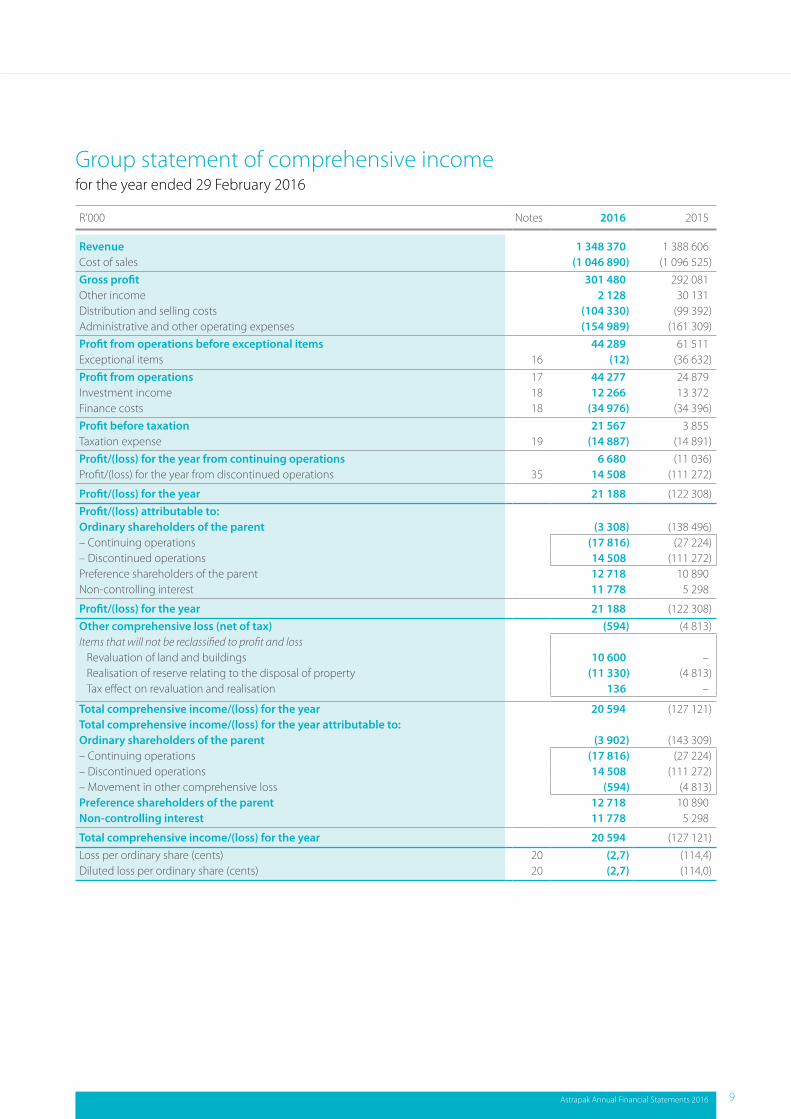
Group statement of comprehensive incomefor the year ended 29 February 2016
R’000 Notes 2016 2015
Revenue 1 348 370 1 388 606 Cost of sales (1 046 890) (1 096 525)Gross profit 301 480 292 081 Other income 2 128 30 131 Distribution and selling costs (104 330) (99 392)Administrative and other operating expenses (154 989) (161 309)Profit from operations before exceptional items 44 289 61 511 Exceptional items 16 (12) (36 632)Profit from operations 17 44 277 24 879 Investment income 18 12 266 13 372 Finance costs 18 (34 976) (34 396)Profit before taxation 21 567 3 855 Taxation expense 19 (14 887) (14 891)Profit/(loss) for the year from continuing operations 6 680 (11 036)Profit/(loss) for the year from discontinued operations 35 14 508 (111 272)
Profit/(loss) for the year 21 188 (122 308)Profit/(loss) attributable to: Ordinary shareholders of the parent (3 308) (138 496)– Continuing operations (17 816) (27 224)– Discontinued operations 14 508 (111 272)Preference shareholders of the parent 12 718 10 890 Non-controlling interest 11 778 5 298
Profit/(loss) for the year 21 188 (122 308)Other comprehensive loss (net of tax) (594) (4 813)Items that will not be reclassified to profit and loss
Revaluation of land and buildings 10 600 –Realisation of reserve relating to the disposal of property (11 330) (4 813)Tax effect on revaluation and realisation 136 –
Total comprehensive income/(loss) for the year 20 594 (127 121)Total comprehensive income/(loss) for the year attributable to:Ordinary shareholders of the parent (3 902) (143 309)– Continuing operations (17 816) (27 224)– Discontinued operations 14 508 (111 272)– Movement in other comprehensive loss (594) (4 813)Preference shareholders of the parent 12 718 10 890 Non-controlling interest 11 778 5 298
Total comprehensive income/(loss) for the year 20 594 (127 121)Loss per ordinary share (cents) 20 (2,7) (114,4)Diluted loss per ordinary share (cents) 20 (2,7) (114,0)
Astrapak Annual Financial Statements 2016 9
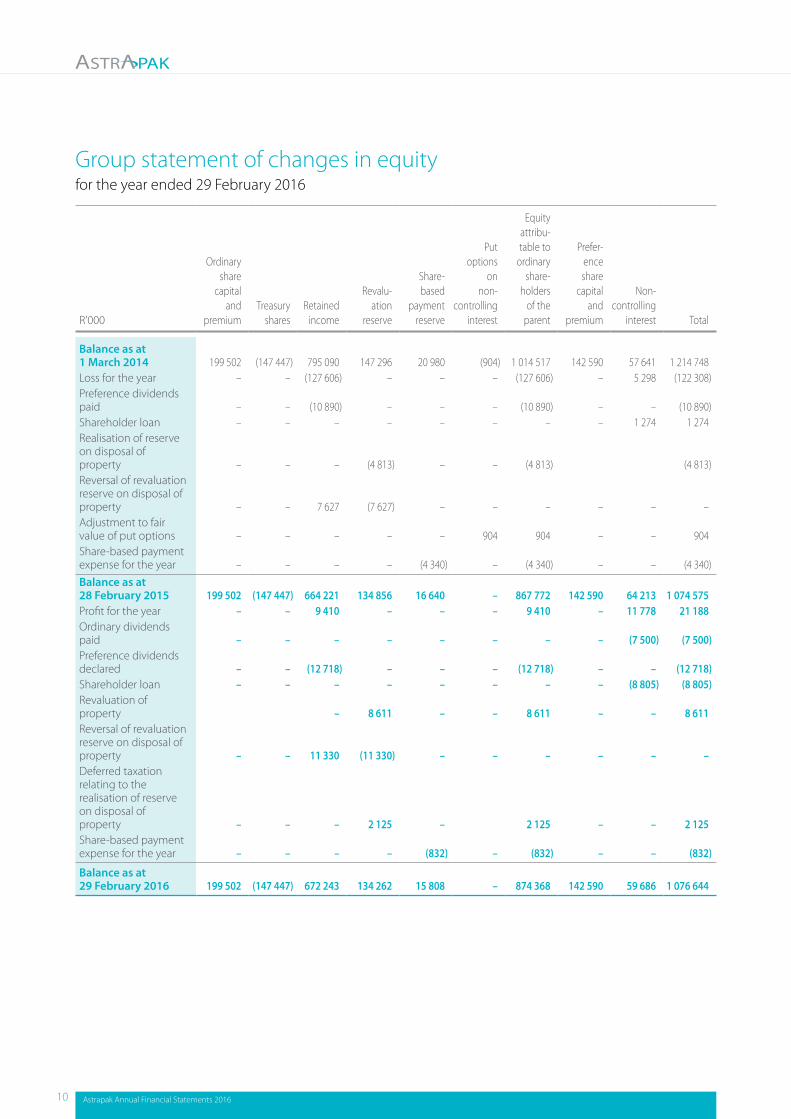
Group statement of changes in equityfor the year ended 29 February 2016
R’000
Ordinary share
capital and
premiumTreasury
sharesRetained
income
Revalu-ation
reserve
Share-based
payment reserve
Put options
on non-
controlling interest
Equity attribu-table to
ordinary share-
holders of the
parent
Prefer-ence share
capital and
premium
Non-controlling
interest Total
Balance as at 1 March 2014 199 502 (147 447) 795 090 147 296 20 980 (904) 1 014 517 142 590 57 641 1 214 748 Loss for the year – – (127 606) – – – (127 606) – 5 298 (122 308)Preference dividends paid – – (10 890) – – – (10 890) – – (10 890)Shareholder loan – – – – – – – – 1 274 1 274 Realisation of reserve on disposal of property – – – (4 813) – – (4 813) (4 813)Reversal of revaluation reserve on disposal of property – – 7 627 (7 627) – – – – – –Adjustment to fair value of put options – – – – – 904 904 – – 904 Share-based payment expense for the year – – – – (4 340) – (4 340) – – (4 340)Balance as at 28 February 2015 199 502 (147 447) 664 221 134 856 16 640 – 867 772 142 590 64 213 1 074 575 Profit for the year – – 9 410 – – – 9 410 – 11 778 21 188 Ordinary dividends paid – – – – – – – – (7 500) (7 500)Preference dividends declared – – (12 718) – – – (12 718) – – (12 718)Shareholder loan – – – – – – – – (8 805) (8 805)Revaluation of property – 8 611 – – 8 611 – – 8 611 Reversal of revaluation reserve on disposal of property – – 11 330 (11 330) – – – – – –Deferred taxation relating to the realisation of reserve on disposal of property – – – 2 125 – 2 125 – – 2 125 Share-based payment expense for the year – – – – (832) – (832) – – (832)
Balance as at 29 February 2016 199 502 (147 447) 672 243 134 262 15 808 – 874 368 142 590 59 686 1 076 644
10 Astrapak Annual Financial Statements 2016
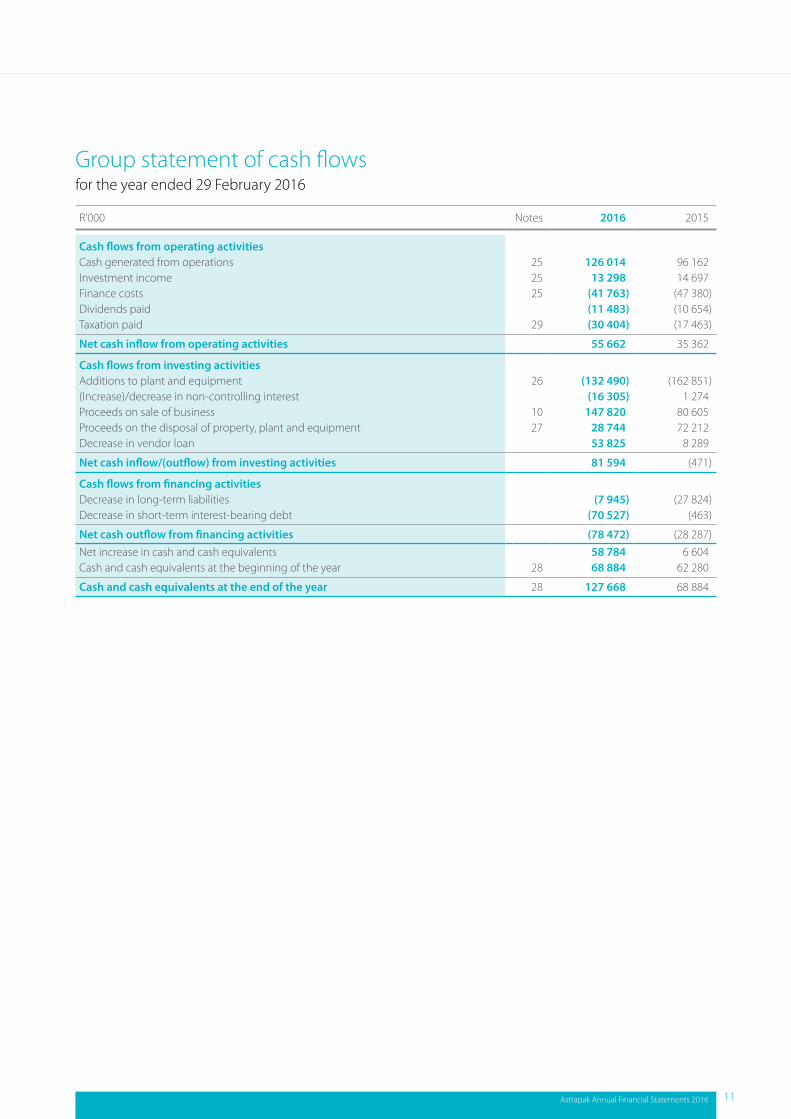
Group statement of cash flowsfor the year ended 29 February 2016
R’000 Notes 2016 2015
Cash flows from operating activitiesCash generated from operations 25 126 014 96 162 Investment income 25 13 298 14 697 Finance costs 25 (41 763) (47 380)Dividends paid (11 483) (10 654)Taxation paid 29 (30 404) (17 463)
Net cash inflow from operating activities 55 662 35 362
Cash flows from investing activitiesAdditions to plant and equipment 26 (132 490) (162 851)(Increase)/decrease in non-controlling interest (16 305) 1 274 Proceeds on sale of business 10 147 820 80 605 Proceeds on the disposal of property, plant and equipment 27 28 744 72 212 Decrease in vendor loan 53 825 8 289
Net cash inflow/(outflow) from investing activities 81 594 (471)
Cash flows from financing activitiesDecrease in long-term liabilities (7 945) (27 824)Decrease in short-term interest-bearing debt (70 527) (463)
Net cash outflow from financing activities (78 472) (28 287)Net increase in cash and cash equivalents 58 784 6 604 Cash and cash equivalents at the beginning of the year 28 68 884 62 280
Cash and cash equivalents at the end of the year 28 127 668 68 884
Astrapak Annual Financial Statements 2016 11
Significant accounting policiesfor the year ended 29 February 2016
1. General information Astrapak Limited and its subsidiaries is a company incorporated under the Companies Act of South Africa. The address of the
registered office is given on page IBC. The principal business of the Group is described in the directors’ report.
These financial statements are presented in South African Rand because that is the currency of the primary economic environment in which the Group operates.
Statement of compliance The annual financial statements have been prepared in accordance with the Companies Act of South Africa, International
Financial Reporting Standards and SAICA Financial Reporting Guide as issued by the Accounting Practices Committee and Financial Pronouncements issued by the Financial Reporting Standards Board.
The financial statements have been prepared in a manner that is consistent with the prior year. The historical cost basis has been applied to the preparation of the financial statements except for the revaluation of certain properties and financial instruments to fair value as explained in the accounting policies below.
1.1 Basis of consolidation The consolidated financial statements incorporate the financial statements of the Astrapak Limited Group (“the Company”) and
entities controlled by the Company (its subsidiaries) as at 28 February each year. Control is achieved where the Company has the power to govern the financial and operating polices of an investee entity so as to obtain benefits from its activities.
On acquisition, the assets and liabilities and contingent liabilities of a subsidiary are measured at their fair values at the date of acquisition. The acquisition of subsidiaries is accounted for using the purchase method. Any excess of the cost of acquisition over the fair values of the identifiable net assets acquired is recognised as goodwill. Any deficiency of the cost of acquisition below the fair values of the identifiable net assets acquired (that is discount on acquisition) is credited to profit or loss in the period of acquisition.
The results of subsidiaries acquired or disposed of during the year are included in the consolidated statement of comprehensive income from the effective date of acquisition or up to the effective date of disposal, as appropriate. Total comprehensive income of subsidiaries is attributed to the owner of the Company and to the non-controlling interests even if this results in the non-controlling interest having a deficit balance.
If the subsidiary uses accounting policies other than those adopted in the consolidated financial statements for like transactions and events in similar circumstances, appropriate adjustments are made to its financial statements in preparing the consolidated financial statements.
All intra-group transactions, balances, income and expenses are eliminated in full on consolidation.
Transactions with non-controlling interests The Group treats transactions with non-controlling interests as transactions with equity owners of the Group. For purchases from
non-controlling interests, the difference between any consideration paid and the relevant share acquired of the carrying value of net assets of the subsidiary is recorded in equity. Gains or losses on disposals to non-controlling interests are also recorded in equity. Any increase or decrease in ownership interest in subsidiaries without a change in control is recognised as equity transactions in the consolidated financial statements. Accordingly, any premium or discount on subsequent purchases of equity instruments from or sales of equity instruments to non-controlling interests are recognised directly in equity of the parent shareholder.
Put options on non-controlling interests Changes in fair value of put options on non-controlling interests are reflected through equity.
1.2 Goodwill Goodwill arising on consolidation represents the excess of the cost of acquisition over the Group’s interest in the fair value of the
identifiable assets and liabilities of a subsidiary, or jointly controlled entity, at the date of acquisition.
Goodwill arising on an acquisition of a business is carried at cost as established at the date of acquisition of the business less accumulated impairment losses, if any.
Whenever negative goodwill arises, the identification and measurement of the acquired identifiable assets, liabilities and contingent liabilities are reassessed. If negative goodwill still remains, it is recognised in profit or loss immediately.
12 Astrapak Annual Financial Statements 2016
Goodwill is not amortised. For the purposes of impairment testing, goodwill is allocated to each of the Group’s cash-generating units (or groups of cash-generating units) that is expected to benefit from the synergies of the combination.
A cash-generating unit to which goodwill has been allocated is tested for impairment annually, or more frequently when there is indication that the unit may be impaired. If the recoverable amount of the cash-generating unit is less than its carrying amount, the impairment loss is allocated first to reduce the carrying amount of any goodwill allocated to the unit and then to the other assets of the unit on a pro rata basis based on the carrying amount of each asset in the unit. Any impairment loss for goodwill is recognised directly in profit or loss in the consolidated statement of comprehensive income/income statement. An impairment loss recognised for goodwill is not reversed in subsequent periods.
On disposal of the relevant cash-generating unit, the attributable amount of goodwill is included in the determination of the profit or loss on disposal. The same principle is applicable for partial disposals where there is a change in ownership, in other words, a portion of the goodwill is expensed as part of the cost of disposal. For partial disposals and acquisitions with no change in ownership, goodwill is recognised as a transaction with equity holders.
1.3 Non-controlling interests The Group presents non-controlling interests in its consolidated statement of financial position within equity, separately from
the equity of the owners of the parent and attributes the profit or loss and each component of other comprehensive income to the owners of the parent and to the non-controlling interests. The proportion allocated to the parent and non-controlling interests is determined on the basis of present ownership interests.
1.4 Revenue recognition Revenue is measured at the fair value of the consideration received or receivable and represents amounts receivable for goods
and services provided in the normal course of business, net of trade discounts, rebates and other sales-related taxes.
Sales of goods are recognised when goods are delivered and title has passed.
Interest income is accrued on a time basis, by reference to the principal outstanding and at the effective interest rate applicable.
1.5 Leasing Leases are classified as finance leases whenever the terms of the lease transfer substantially all the risks and rewards of ownership
to the lessee. Finance leases are capitalised. All other leases are classified as operating leases.
Assets held under finance leases are recognised as assets of the Group at their fair value or, if lower, at the present value of the minimum lease payments, each determined at the inception of the lease. The corresponding liability to the lessor is included in the statement of financial position as a finance lease obligation. Lease payments are apportioned between finance charges and reduction of the lease obligation so as to achieve a constant rate of interest on the remaining balance of the liability. Finance charges are charged directly against income, unless they are directly attributable to qualifying assets, in which case they are capitalised in accordance with the Group’s general policy on borrowing costs.
Rentals payable under operating leases are charged to income on a straight-line basis over the term of the relevant lease.
Benefits received and receivable as an incentive to enter into an operating lease are also spread on a straight-line basis over the lease term.
1.6 Foreign currencies Transactions in currencies other than South African Rand are recorded at the rates of exchange prevailing on the dates of the
transactions. At each year-end date, monetary assets and liabilities that are denominated in foreign currencies are translated at the rates prevailing on the year-end date. Non-monetary assets and liabilities carried at fair value that are denominated in foreign currencies are translated at the rates prevailing at the date when the fair value was determined. Gains and losses arising on translation are included in net profit or loss for the period, except for exchange differences arising on non-monetary assets and liabilities where the changes in fair value are recognised directly in equity.
To hedge its exposure to certain foreign exchange risks, the Group enters into forward contracts and options.
Astrapak Annual Financial Statements 2016 13
Significant accounting policies continued
for the year ended 29 February 2016
1.7 Borrowing costs Borrowing costs directly attributable to the acquisition, construction or production of qualifying assets, which are assets that
necessarily take a substantial period of time to prepare for their intended use or sale, are added to the cost of those assets, until such time as the assets are substantially ready for their intended use or sale. Investment income earned on the temporary investment of specific borrowings, pending their expenditure on qualifying assets, is deducted from the borrowing costs eligible for capitalisation.
All other borrowing costs are recognised in profit or loss in the period in which they are incurred.
1.8 Government grants Government grants are recognised at their fair value where there is reasonable assurance that the grant will be received and all
attaching conditions will be complied with.
Government grants are recognised as income over the periods necessary to match them with the costs they are intended to compensate on a systematic basis.
1.9 Exceptional items Exceptional items are material items which derive from events or transactions that fall outside the ordinary trading activities of
the Group and which individually or, if of a similar type, in aggregate, need to be disclosed by virtue of their size or incidence, if the financial statements are to give a true and fair view.
1.10 Retirement benefit costs Under defined contribution plans, the Group’s legal or constructive obligation is limited to the amount that it agrees to contribute
to the fund. Consequently, the actuarial risk that benefits will be less than expected and the investment risk that assets invested will be insufficient to meet expected benefits is borne by the employee.
Payments to defined contribution retirement benefit schemes are charged as an expense as they fall due.
1.11 Impairment of assets, excluding goodwill At the end of each reporting period, the Group reviews the carrying amounts of its tangible and intangible assets to determine
whether there is any indication that those assets have suffered an impairment loss. If any such indication exists, the recoverable amount of the asset is estimated in order to determine the extent of the impairment loss (if any). Where it is not possible to estimate the recoverable amount of an individual asset, the Group estimates the recoverable amount of the cash-generating unit to which the asset belongs. Where a reasonable and consistent basis of allocation can be identified, corporate assets are also allocated to individual cash-generating units, or otherwise they are allocated to the smallest group of cash-generating units for which a reasonable and consistent allocation basis can be identified.
Intangible assets with indefinite useful lives and intangible assets not yet available for use are tested for impairment at least annually, and whenever there is an indication that the asset may be impaired.
Recoverable amount is the higher of fair value less costs to sell and value-in-use. In assessing value-in-use, the estimated future cash flows are discounted to their present value using a pre-tax discount rate that reflects current market assessments of the time value of money and the risks specific to the asset for which the estimates of future cash flows have not been adjusted.
If the recoverable amount of an asset (or a cash-generating unit) is estimated to be less than its carrying amount, the carrying amount of the asset (or the cash-generating unit) is reduced to its recoverable amount. An impairment loss is recognised immediately in profit or loss, unless the relevant asset is carried at a revalued amount, in which case the impairment loss is treated as a revaluation decrease.
Where an impairment loss subsequently reverses, the carrying amount of the asset (or a cash-generating unit) is increased to the revised estimate of its recoverable amount, but so that the increased carrying amount does not exceed the carrying amount that would have been determined had no impairment loss been recognised for the asset (or the cash-generating unit) in prior years. A reversal of an impairment loss is recognised immediately in profit or loss, unless the relevant asset is carried at a revalued amount, in which case the reversal of the impairment loss is treated as a revaluation increase.
14 Astrapak Annual Financial Statements 2016
1.12 Taxation The taxation expense represents the sum of the taxation currently payable and deferred taxation.
The taxation currently payable is based on taxable profit for the year. Taxable profit differs from profit as reported in the statement of comprehensive income because it excludes items of income or expense that are taxable or deductible in other years and it further excludes items that are never taxable or deductible. The Group’s liability for current taxation is calculated using taxation rates that have been enacted or substantively enacted by the statement of financial position date.
Deferred taxation is the taxation expected to be payable or recoverable on differences between the carrying amounts of assets and liabilities in the financial statements and the corresponding taxation bases used in the computation of taxable profit, and is accounted for using the statement of financial position liability method.
Deferred taxation liabilities are generally recognised for all taxable temporary differences and deferred taxation assets are recognised to the extent that it is probable that taxable profits will be available against which deductible temporary differences can be utilised. Such assets and liabilities are not recognised if the temporary difference arises from goodwill or from the initial recognition (other than in a business combination) of other assets and liabilities in a transaction that affects neither the taxation profit nor the accounting profit.
Deferred taxation liabilities are recognised for taxable temporary differences arising on investments in subsidiaries and associates, and interests in joint ventures, except where the Group is able to control the reversal of the temporary difference and it is probable that the temporary difference will not reverse in the foreseeable future.
The carrying amount of deferred taxation assets is reviewed at each reporting date and reduced to the extent that it is no longer probable that sufficient taxable profits will be available to allow all or part of the asset to be recovered.
Deferred taxation is calculated at the taxation rates that are expected to apply in the period when the liability is settled or the asset is realised. Deferred taxation is charged or credited in the statement of comprehensive income, except when it relates to items charged or credited directly to equity, in which case the deferred taxation is also dealt with in equity.
Deferred taxation assets and liabilities are offset when there is a legal enforceable right to offset current taxation assets against liabilities and when the deferred taxation relates to the same fiscal authority.
Additional income taxes that arise from the distribution of dividends are recognised at the same time as the liability to pay the related dividend is recognised.
1.13 Property, plant and equipment Plant and equipment is accounted for at cost less accumulated depreciation and any accumulated impairment. All direct costs,
including finance costs relating to major capital projects, are capitalised up to the date of commissioning.
Property is accounted for using the revaluation model.
Under the revaluation model, property is carried at the revalued amount, being its fair value at the date of the revaluation less subsequent depreciation and impairment.
Increases are value credited to other comprehensive income and accumulated in equity and reversal of a revaluation decrease previously recognised as an expense should be recognised as income.
Decreases arising from the revaluation are recognised as an expense to the extent that it exceeds the amount previously credited to the revaluation surplus.
The cost of replacing part of an item of property, plant and equipment is recognised in the carrying amount of the item if it is probable that the future economic benefits embodied within the part will flow to the Group and its cost can be measured reliably. The costs of day-to-day servicing of property, plant and equipment are recognised in profit or loss as incurred.
Depreciation is charged so as to write off the cost of assets, other than freehold land, over their estimated economic useful lives, using the straight-line method. Depreciation is not provided for on freehold land.
Residual values and estimated useful lives are assessed on an annual basis and, if expectations differ from previous estimates, adjusted prospectively as a change in accounting estimate.
Astrapak Annual Financial Statements 2016 15
Significant accounting policies continued
for the year ended 29 February 2016
1.14 Inventories Inventories are stated at the lower of cost and net realisable value. Cost comprises direct materials and, where applicable, direct
labour costs and those overheads that have been incurred in bringing the inventories to their present location and condition. Cost is calculated using the first-in first-out method. Net realisable value represents the estimated selling price less all estimated costs of completion and costs to be incurred in marketing, selling and distribution.
1.15 Financial instruments Financial assets and financial liabilities are recognised on the Group’s statement of financial position when the Group has become
a party to contractual provisions of the instruments.
Financial assets and financial liabilities are initially measured at fair value. Transaction costs are directly attributable to the acquisition or issue of financial assets and liabilities (other than financial assets and financial liabilities at fair value through profit or loss) are added to or deducted from the fair value of financial assets or financial liabilities, as appropriate, on initial recognition. Transaction costs directly attributable to the acquisition of financial assets or financial liabilities at fair value through profit or loss or recognised immediately in profit or loss.
Financial assets are fair value through profit or loss (“FVTPL”) Financial assets are classified at FVTPL when the asset is either held-for-trading or does not satisfy the criteria for hedge
accounting or is designated at FVTPL.
A financial asset is designated at FVTPL on initial recognition if this designation provides more useful information because: › such designation eliminates or significantly reduces a measurement or recognition inconsistency that would otherwise arise; or › the financial asset is part of a group of financial assets, financial liabilities or both, that is managed and its performance
evaluated on a fair value basis in accordance with a documented risk/investment management strategy, and the information regarding this grouping is reported internally to key management on this basis; or
› it forms part of a contract containing one or more embedded derivatives, and IAS 39 permits the entire combined contract to be designated as at FVTPL.
Financial assets measured at FVTPL are recognised at fair value. Any subsequent gains or losses are recognised in profit or loss.
Trade receivables and payables are measured at initial recognition at fair value, and are subsequently measured at amortised cost using the effective interest rate method. Appropriate allowances for estimated irrecoverable trade receivables are recognised in profit or loss when there is objective evidence that the asset is impaired.
Appropriate allowances for estimated irrecoverable trade receivables are recognised in profit or loss when there is objective evidence that the asset is impaired.
Cash and cash equivalents comprise the net of cash on hand and overdrafts, demand deposits, and other short-term highly liquid investments that are readily convertible to a known amount of cash and are subject to an insignificant risk of changes in value. Interest-bearing bank loans and overdrafts are recorded at the proceeds received, net of direct issue costs. Finance charges, including premiums payable on settlement or redemption, are accounted for on an accrual basis to the statement of comprehensive income using the effective interest rate method and are added to the carrying amount of the instrument to the extent they are not settled in the period in which they arise.
Equity instruments are recorded at the proceeds received, net of direct issue costs. The Group uses derivative financial instruments, primarily foreign currency forward contracts, to hedge its risks associated with foreign currency. The Group does not use derivative financial instruments for speculative purposes. The fair value of these derivatives is recorded and remeasured at each reporting date. Changes in fair value of derivative financial instruments that are designated and effective as hedges of future cash flows relating to firm commitments and forecast transactions are recognised directly in equity. If the hedged firm commitment or forecast transaction results in the recognition of an asset or a liability, then, at the time the asset or liability is recognised, the associated gain or loss on the derivative that had previously been recognised in equity is included in the initial measurement of the asset or liability.
Hedge accounting is discontinued when the hedging instrument expires or is sold, terminated, exercised or no longer qualifies for hedge accounting. At that time, any cumulative gain or loss on the hedging instrument recognised in equity is retained in equity until the forecast transaction occurs. If a hedged transaction is no longer expected to occur, the net cumulative gain or loss recognised in equity is transferred to net profit or loss for the period.
Changes in fair value of derivative financial instruments that do not qualify for hedge accounting are recognised in the statement of comprehensive income as they arise.
16 Astrapak Annual Financial Statements 2016
1.16 Provisions and contingencies Provisions are recognised when the Group has a present obligation (legal or constructive) as a result of a past event, it is probable
that the Group will be required to settle the obligation, and a reliable estimate can be made of the amount of the obligation.
The amount recognised as a provision is the best estimate of the consideration required to settle the present obligation at the end of the reporting period, taking into account the risks and uncertainties surrounding the obligation. When a provision is measured using the cash flows estimated to settle the present obligation, its carrying amount is the present value of those cash flows (where the effect of the time value of money is material).
When some or all of the economic benefits required to settle a provision are expected to be recovered from a third party, a receivable is recognised as an asset if it is virtually certain that reimbursement will be received and the amount of the receivable can be measured reliably.
Onerous contracts Present obligations arising under onerous contracts are recognised and measured as provisions. An onerous contract is
considered to exist where the Group has a contract under which the unavoidable costs of meeting the obligations under the contract exceed the economic benefits expected to be received from the contract.
Contingent liabilities A contingent liability is a possible obligation that arises from past events and whose existence will be confirmed only by the
occurrence or non-occurrence of one or more uncertain future events not wholly within the control of the Group, or a present obligation that arises from past events but is not recognised because it is not probable that an outflow of resources embodying economic benefits will be required to settle the obligation; or the amount of the obligation cannot be measured with sufficient reliability. If the likelihood of an outflow of resources is remote, the possible obligation is neither a provision nor a contingent liability and no disclosure is made.
Contingent assets A contingent asset is a possible asset that arises from past events and whose existence will be confirmed only by the occurrence
or non-occurrence of one or more uncertain future events not wholly within the control of the Group. Such contingent assets are only recognised in the financial statements where the realisation of income is virtually certain. If the inflow of economic benefits is only probable, the contingent asset is disclosed as a claim in favour of the Group but not recognised in the statement of financial position.
Provisions for royalties, distribution commissions and credit notes Provisions for royalties, distribution commissions and credit notes are recognised when the Group has a present obligation (legal
or constructive) as a result of a past event and when it is probable that the Group will be required to settle the obligation, and a reliable estimate can be made of the amount of the obligation.
1.17 Share-based payments The Group has applied the requirements of IFRS 2 Share-based Payments.
An expense is recognised where the Group receives goods or services in exchange for shares or rights over shares (equity-settled transactions).
Employees, including directors, of the Group receive remuneration in the form of share-based payment transactions, whereby employees render services in exchange for shares or rights over shares (equity-settled transactions).
The cost of equity-settled transactions with employees is measured by reference to the fair value at the date at which they are granted. The fair value is determined by an external value using the binomial model. In valuing equity-settled transactions, no account is taken of any performance conditions, other than conditions linked to the price of the shares of the Group (market conditions). The expected life used in the model has been adjusted, based on management’s best estimate, for the effects of non-transferability, exercise restrictions and behavioural considerations.
The cost of equity-settled transactions is recognised, together with a corresponding increase in equity, on a straight-line basis over the period in which the non-market performance conditions are fulfilled, ending on the date on which the relevant employees become fully entitled to the award (vesting date).
Astrapak Annual Financial Statements 2016 17
Significant accounting policies continued
for the year ended 29 February 2016
No expense is recognised for awards that do not ultimately vest, except for awards where vesting is conditional upon a market condition, which are treated as vesting irrespective of whether or not the market condition is satisfied, provided that all other performance conditions are satisfied.
Where the terms of an equity-settled award are modified, as a minimum, an expense is recognised as if the terms had not been modified. In addition, an expense is recognised for any increase in the value of the transaction as a result of the modification, as measured at the date of modification. Where an equity-settled award is cancelled, it is treated as if it had vested on the date of cancellation, and any expense not yet recognised for the award is recognised immediately. However, if a new award is substituted for the cancelled award, and designated as a replacement award on the date that it is granted, the cancelled and new awards are treated as if they were a modification of the original award. The dilutive effect of outstanding options is reflected as additional share dilution in the computation of diluted earnings per share.
1.18 Non-current assets held-for-sale and discontinued operations Assets (or disposal groups) that are classified as held-for-sale are measured in accordance with IFRS 5 Non-current Assets Held-for-
sale and Discontinued Operations. Non-current assets and disposal groups are classified as held-for sale if the carrying amount will be recovered principally through a sale transaction rather than through continuing use. This condition is regarded as met only when the asset is available for immediate sale in its present condition subject only to terms that are usual and customary for sales of such assets and its sale is highly probable. The directors must be committed to the sale, which should be expected to qualify for recognition as a completed sale within one year from the date of classification.
IFRS 5 requires that the sale must be highly probable within 12 months of classification as held-for-sale. For the sale to be highly probable, management must be committed to selling the asset and must be actively looking for a buyer. It is possible that the sale may not be completed within one year, but the delay effectively must be caused by events beyond the entity’s control and the entity must still be committed to selling the asset.
1.19 Segmental reporting The Group’s reportable segments are strategic business units that offer different types of products. They are managed separately,
because these units require different technology and address different market segments.
Flexible The Flexible segment is a manufacturer of blown and cast mono and multilayer polyolefin films for bags, sheet, tubing, shrink,
stretch and barrier applications. Products also include stand-up pouches and modified atmospheric packaging (“MAP”).
Rigids The Rigids segment is a manufacturer of a range of closures, jars, bottles, tottles, tubes, trays, cups, tubs, and other plastic
containers up to a size of 5 litres through the processes of extrusion blow moulding (“EBM”), injection stretch blow moulding (“ISBM”), injection blow moulding (“IBM”), injection moulding (“IM”), sheet extrusion and thermoforming.
1.20 Headline earnings per share The Group has followed the recommendation contained in Circular 2/2015 Headline Earnings issued by SAICA and has published
headline earnings per share in addition to attributable earnings per share. Headline earnings per share has been calculated in accordance with the requirements of Circular 2/2015. Attributable profit per share has been based on earnings attributable, including interest, to ordinary shareholders.
1.21 Judgements and estimates In the application of the Group’s accounting policies, which are described above, the directors are required to make judgements,
estimates and assumptions about the carrying amounts of assets and liabilities that are not readily apparent from other sources. The estimates and associated assumptions are based on historic experience and other factors that are considered to be relevant. Actual results may differ from these estimates.
The estimates and underlying assumptions are reviewed on an ongoing basis. Revisions to accounting estimates are recognised in the period in which the estimate is revised if the revision affects only that period, or in the period of the revision and future periods if the revision affects both current and future periods.
Property, plant and equipment Property valuations In determining the fair value of the property, given it is owner occupied and unencumbered by a lease, an income capitalisation
rate ranging from 10,25% to 12,00%.
18 Astrapak Annual Financial Statements 2016
The method requires a market derived projection of economic net annual income for the property, which is then capitalised into perpetuity using a market-related capitalisation rate to determine the market value estimate.
It was further assumed that the improvements at the property can be utilised by an alternate user with minimal repair and conversion costs.
The level of rental income achievable from the property is limited by its age, condition and design. We are of the opinion that good demand exists for premises of this nature.
For the purposes of this valuation, an average gross monthly rental of R30,48/m2 was applied on a through rate basis, which is in line with statistics and opinions canvassed from brokers.
The following property expense elements were taken into account in the valuation: › Rates and taxes. › Insurance. › Repairs and maintenance. › Sundry expenses of 2,0% of gross income, which includes audit fees and leasing commission management fee of 1,0% of
gross income. This fee would be paid to an external management company to manage the property on the owner’s behalf.
Impairment of property, plant and equipment The Group evaluates its non-current assets for impairment annually whenever events or changes in circumstances indicate that
the carrying amount of the asset may not be recoverable. Judgements regarding the existence of impairment indicators are based on market conditions and operational performance of the business. Future events could cause management to conclude that impairment indicators exist.
Residual values The Group is required to measure the residual value of an item of property, plant and equipment. An estimation is made of the
amount it would receive currently for the asset if the asset was already of the age and condition expected at the end of its useful life.
The residual value of an asset is the estimated amount that an entity would currently obtain from the disposal of the asset after deducting the estimated costs of disposal, if the asset was already of the age and in the condition expected at the end of its useful life.
IAS 16 requires residual values (if material) to be estimated first at the date of acquisition and thereafter to be reviewed at each reporting date. If these change from the prior period, the depreciation charge is adjusted prospectively.
Useful life The useful life of an asset is the period over which the Group expects to use the asset, and not necessarily the asset’s economic life.
Useful lives of assets are reviewed annually. If these change from the prior period, the depreciation charge is adjusted prospectively.
The Group uses the following indicators to determine useful lives: › Expected usage of assets. › Expected physical wear and tear. › Technical or commercial obsolescence.
Impairment of goodwill Determining whether goodwill is impaired requires an estimation of the value-in-use of the cash-generating units to which
goodwill has been allocated. The value-in-use calculation is based on an estimate or the future cash flows expected to arise from the cash-generating units discounted at a suitable pre-tax rate in order to calculate the present value of the cash-generating units.
Provisions Provisions are required to be recorded when the Group has a present legal or constructive obligation as a result of past events,
for which it is probable that an outflow of economic benefits will occur, and where a reliable estimate can be made of the amount of the obligation.
Astrapak Annual Financial Statements 2016 19
Significant accounting policies continued
for the year ended 29 February 2016
Best estimates, being the amount that the Group would rationally pay to settle the obligation, are recognised as provisions at statement of financial position date. Risks, uncertainties and future events are taken into account by management in determining the best estimates. Provisions are discounted where the effect of discounting is material. The discount rate used is the rate that reflects current market assessments of the time value of money and, where appropriate, the risks specific to the liability, all of which requires management’s judgement. All provisions are reviewed at each statement of financial position date.
Various uncertainties can result in obligations not being considered probable or estimable for significant periods of time. As a consequence, potentially material obligations may have no provisions and a change in facts or circumstances that result in an obligation becoming probable or estimable can lead to a need for the establishment of material provisions. In addition, where estimated amounts vary from initial estimates the provisions may be revised materially, up or down.
The Group is required to record provisions for legal contingencies when the occurrence of the contingency is probable and the amount of the loss can be reasonably estimated. Liabilities provided for legal matters require judgements regarding projected outcomes and ranges of losses based on historical experience and recommendations of legal counsel. Litigation is, however, unpredictable and actual costs incurred could differ materially from those estimated at the statement of financial position date.
Doubtful debts A debtor or group of debtors is regarded as doubtful if there is objective evidence, as a result of one or more events that occurred
after initial recognition. The Group assesses at each statement of reporting date whether there is objective evidence for doubtful debts.
Deferred taxation assets The carrying amount of deferred taxation assets is reviewed at each reporting date and is adjusted to the extent that it is no
longer probable that sufficient taxable profit will be available to allow all or part of the asset to be recovered.
1.22 Accounting standards and interpretations adopted impacting the annual financial statements The Group did not adopt any new or revised accounting standards or interpretations in the current year that have had a
significant impact on the amounts or disclosures reported in these annual financial statements.
1.23 Impact of standards and interpretations not yet adopted At the reporting date or signing date, the following new and/or revised accounting standards and interpretations were in issue
but not yet effective: › IFRS 1 First-time Adoption of International Financial Reporting Standards (amended) › IFRS 5 Non-current Assets Held-for-sale and Discontinued Operations (amended) › IFRS 7 Financial Instruments: Disclosures (amended) › IFRS 8 Operating Segments (amended) › IFRS 9 Financial Instruments › IFRS 10 Consolidated Financial Statements (amended) › IFRS 12 Disclosure of interests in Other Entities (amended) › IFRS 14 Regulatory Deferral Accounts (amended) › IFRS 16 Leases › IAS 1 Presentation of Financial Statements (amended) › IFRS 15 Revenue from Contracts with Customers › IAS 16 Property, Plant and Equipment (revised) › IAS 19 Employee Benefits (amended) › IAS 24 Related Party Disclosures (amended) › IAS 27 Separate Financial Statements (amended) › IAS 38 Intangible Assets (amended) › IAS 39 Financial Instruments: Recognition and Measurement (amended) › IAS 40 Investment Property (amended).
The Group did not early adopt any new, revised or amended accounting standards or interpretations. The accounting standards, amendments to issued accounting standards and interpretations, which are relevant to the Group but not yet effective at 29 February 2016, are being evaluated for the impact of these pronouncements.
20 Astrapak Annual Financial Statements 2016
Notes to the Group annual financial statementsfor the year ended 29 February 2016
R’000Land and buildings
Plant and machinery
Motor vehicles
Leasehold improve-
ments Total
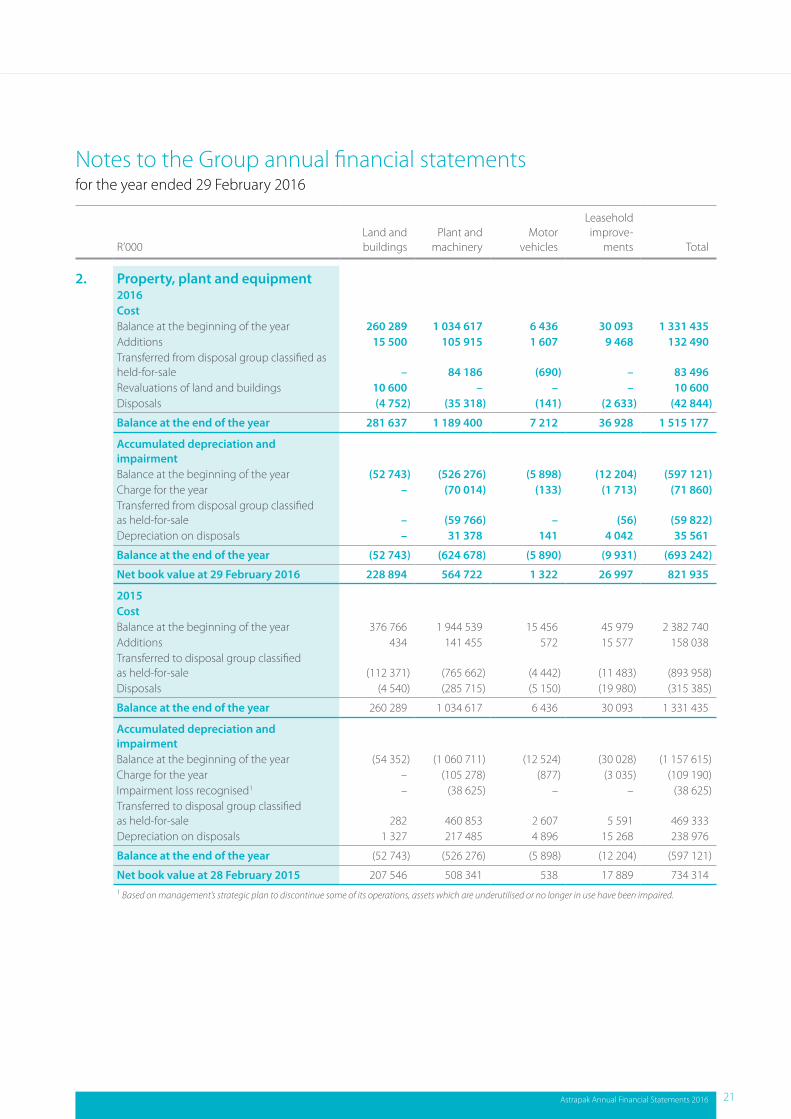
2. Property, plant and equipment2016CostBalance at the beginning of the year 260 289 1 034 617 6 436 30 093 1 331 435 Additions 15 500 105 915 1 607 9 468 132 490 Transferred from disposal group classified as held-for-sale – 84 186 (690) – 83 496 Revaluations of land and buildings 10 600 – – – 10 600 Disposals (4 752) (35 318) (141) (2 633) (42 844)
Balance at the end of the year 281 637 1 189 400 7 212 36 928 1 515 177
Accumulated depreciation and impairmentBalance at the beginning of the year (52 743) (526 276) (5 898) (12 204) (597 121)Charge for the year – (70 014) (133) (1 713) (71 860)Transferred from disposal group classified as held-for-sale – (59 766) – (56) (59 822)Depreciation on disposals – 31 378 141 4 042 35 561
Balance at the end of the year (52 743) (624 678) (5 890) (9 931) (693 242)
Net book value at 29 February 2016 228 894 564 722 1 322 26 997 821 935
2015CostBalance at the beginning of the year 376 766 1 944 539 15 456 45 979 2 382 740 Additions 434 141 455 572 15 577 158 038 Transferred to disposal group classified as held-for-sale (112 371) (765 662) (4 442) (11 483) (893 958)Disposals (4 540) (285 715) (5 150) (19 980) (315 385)
Balance at the end of the year 260 289 1 034 617 6 436 30 093 1 331 435
Accumulated depreciation and impairmentBalance at the beginning of the year (54 352) (1 060 711) (12 524) (30 028) (1 157 615)Charge for the year – (105 278) (877) (3 035) (109 190)Impairment loss recognised1 – (38 625) – – (38 625)Transferred to disposal group classified as held-for-sale 282 460 853 2 607 5 591 469 333 Depreciation on disposals 1 327 217 485 4 896 15 268 238 976
Balance at the end of the year (52 743) (526 276) (5 898) (12 204) (597 121)
Net book value at 28 February 2015 207 546 508 341 538 17 889 734 3141 Based on management’s strategic plan to discontinue some of its operations, assets which are underutilised or no longer in use have been impaired.
Astrapak Annual Financial Statements 2016 21
Notes to the Group annual financial statements continued
for the year ended 29 February 2016
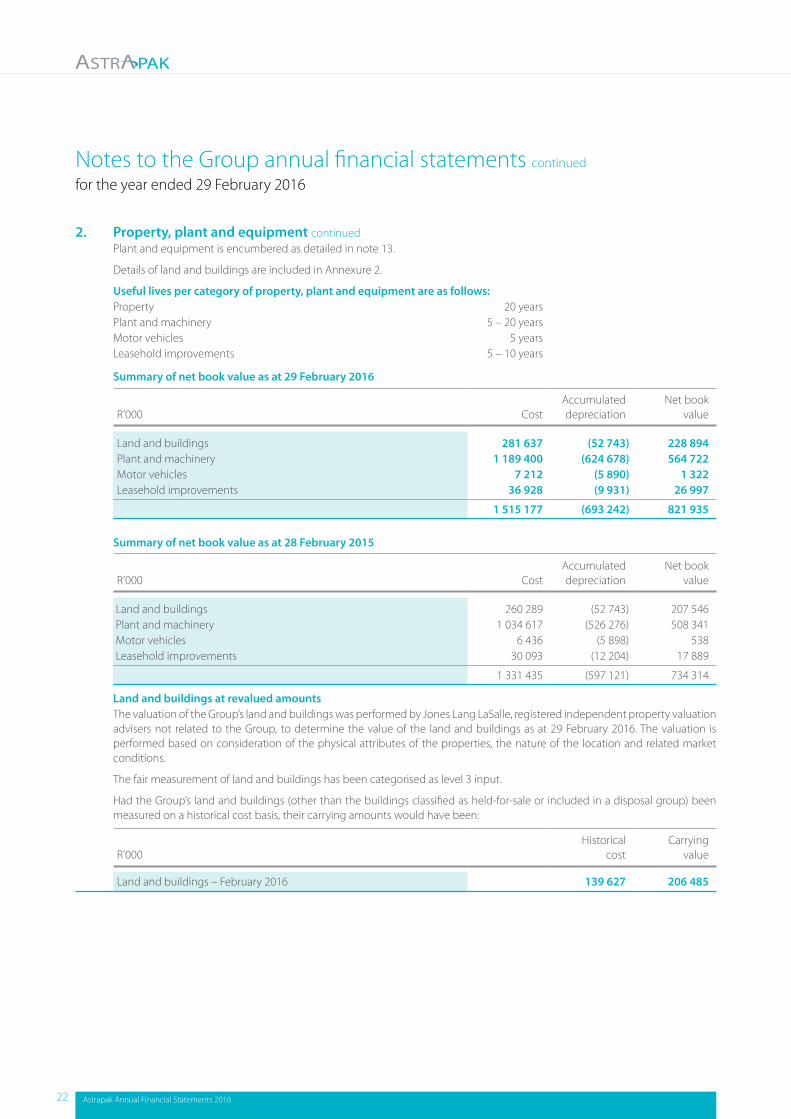
2. Property, plant and equipment continuedPlant and equipment is encumbered as detailed in note 13.
Details of land and buildings are included in Annexure 2.
Useful lives per category of property, plant and equipment are as follows: Property 20 years Plant and machinery 5 – 20 years Motor vehicles 5 years Leasehold improvements 5 – 10 years
Summary of net book value as at 29 February 2016
R’000 Cost Accumulated
depreciation Net book
value
Land and buildings 281 637 (52 743) 228 894Plant and machinery 1 189 400 (624 678) 564 722Motor vehicles 7 212 (5 890) 1 322 Leasehold improvements 36 928 (9 931) 26 997
1 515 177 (693 242) 821 935
Summary of net book value as at 28 February 2015
R’000 Cost Accumulated
depreciation Net book
value
Land and buildings 260 289 (52 743) 207 546 Plant and machinery 1 034 617 (526 276) 508 341 Motor vehicles 6 436 (5 898) 538 Leasehold improvements 30 093 (12 204) 17 889
1 331 435 (597 121) 734 314
Land and buildings at revalued amounts The valuation of the Group’s land and buildings was performed by Jones Lang LaSalle, registered independent property valuation advisers not related to the Group, to determine the value of the land and buildings as at 29 February 2016. The valuation is performed based on consideration of the physical attributes of the properties, the nature of the location and related market conditions.
The fair measurement of land and buildings has been categorised as level 3 input.
Had the Group’s land and buildings (other than the buildings classified as held-for-sale or included in a disposal group) been measured on a historical cost basis, their carrying amounts would have been:
R’000Historical
costCarrying
value
Land and buildings – February 2016 139 627 206 485
22 Astrapak Annual Financial Statements 2016
R’000 2016 2015
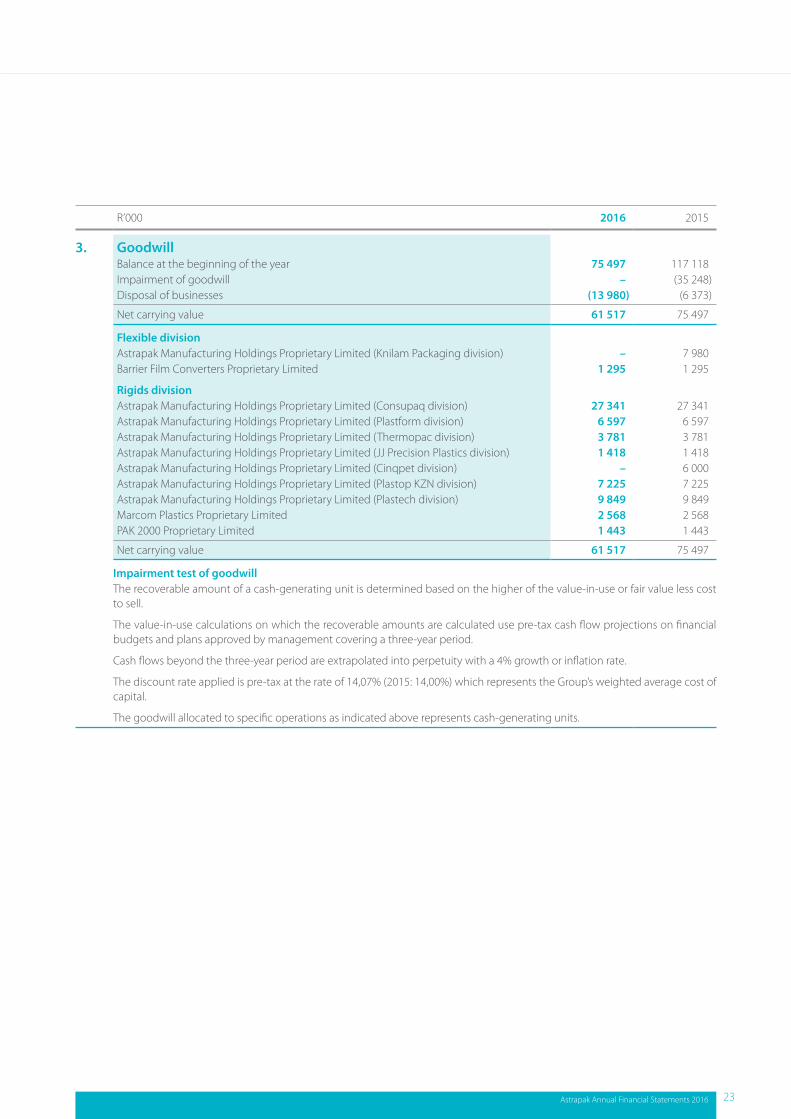
3. GoodwillBalance at the beginning of the year 75 497 117 118 Impairment of goodwill – (35 248)Disposal of businesses (13 980) (6 373)
Net carrying value 61 517 75 497
Flexible division Astrapak Manufacturing Holdings Proprietary Limited (Knilam Packaging division) – 7 980 Barrier Film Converters Proprietary Limited 1 295 1 295
Rigids divisionAstrapak Manufacturing Holdings Proprietary Limited (Consupaq division) 27 341 27 341 Astrapak Manufacturing Holdings Proprietary Limited (Plastform division) 6 597 6 597 Astrapak Manufacturing Holdings Proprietary Limited (Thermopac division) 3 781 3 781 Astrapak Manufacturing Holdings Proprietary Limited (JJ Precision Plastics division) 1 418 1 418 Astrapak Manufacturing Holdings Proprietary Limited (Cinqpet division) – 6 000 Astrapak Manufacturing Holdings Proprietary Limited (Plastop KZN division) 7 225 7 225 Astrapak Manufacturing Holdings Proprietary Limited (Plastech division) 9 849 9 849 Marcom Plastics Proprietary Limited 2 568 2 568 PAK 2000 Proprietary Limited 1 443 1 443
Net carrying value 61 517 75 497
Impairment test of goodwillThe recoverable amount of a cash-generating unit is determined based on the higher of the value-in-use or fair value less cost to sell.
The value-in-use calculations on which the recoverable amounts are calculated use pre-tax cash flow projections on financial budgets and plans approved by management covering a three-year period.
Cash flows beyond the three-year period are extrapolated into perpetuity with a 4% growth or inflation rate.
The discount rate applied is pre-tax at the rate of 14,07% (2015: 14,00%) which represents the Group’s weighted average cost of capital.
The goodwill allocated to specific operations as indicated above represents cash-generating units.
Astrapak Annual Financial Statements 2016 23
Notes to the Group annual financial statements continued
for the year ended 29 February 2016
R’000 2016 2015
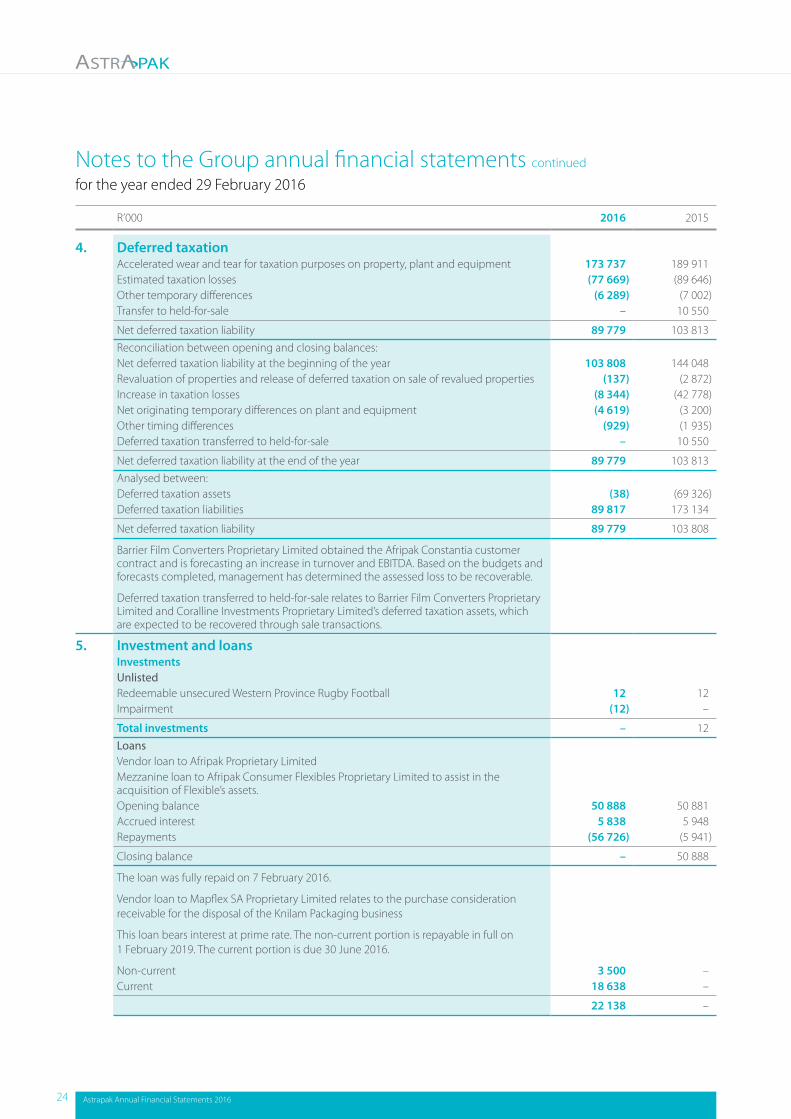
4. Deferred taxation Accelerated wear and tear for taxation purposes on property, plant and equipment 173 737 189 911 Estimated taxation losses (77 669) (89 646)Other temporary differences (6 289) (7 002)Transfer to held-for-sale – 10 550
Net deferred taxation liability 89 779 103 813 Reconciliation between opening and closing balances:Net deferred taxation liability at the beginning of the year 103 808 144 048 Revaluation of properties and release of deferred taxation on sale of revalued properties (137) (2 872)Increase in taxation losses (8 344) (42 778)Net originating temporary differences on plant and equipment (4 619) (3 200)Other timing differences (929) (1 935)Deferred taxation transferred to held-for-sale – 10 550
Net deferred taxation liability at the end of the year 89 779 103 813 Analysed between:Deferred taxation assets (38) (69 326)Deferred taxation liabilities 89 817 173 134
Net deferred taxation liability 89 779 103 808
Barrier Film Converters Proprietary Limited obtained the Afripak Constantia customer contract and is forecasting an increase in turnover and EBITDA. Based on the budgets and forecasts completed, management has determined the assessed loss to be recoverable.
Deferred taxation transferred to held-for-sale relates to Barrier Film Converters Proprietary Limited and Coralline Investments Proprietary Limited’s deferred taxation assets, which are expected to be recovered through sale transactions.
5. Investment and loans Investments Unlisted Redeemable unsecured Western Province Rugby Football 12 12 Impairment (12) –
Total investments – 12 Loans Vendor loan to Afripak Proprietary Limited Mezzanine loan to Afripak Consumer Flexibles Proprietary Limited to assist in the acquisition of Flexible’s assets. Opening balance 50 888 50 881 Accrued interest 5 838 5 948 Repayments (56 726) (5 941)
Closing balance – 50 888
The loan was fully repaid on 7 February 2016.
Vendor loan to Mapflex SA Proprietary Limited relates to the purchase consideration receivable for the disposal of the Knilam Packaging business
This loan bears interest at prime rate. The non-current portion is repayable in full on 1 February 2019. The current portion is due 30 June 2016.
Non-current 3 500 –Current 18 638 –
22 138 –
24 Astrapak Annual Financial Statements 2016
R’000 2016 2015
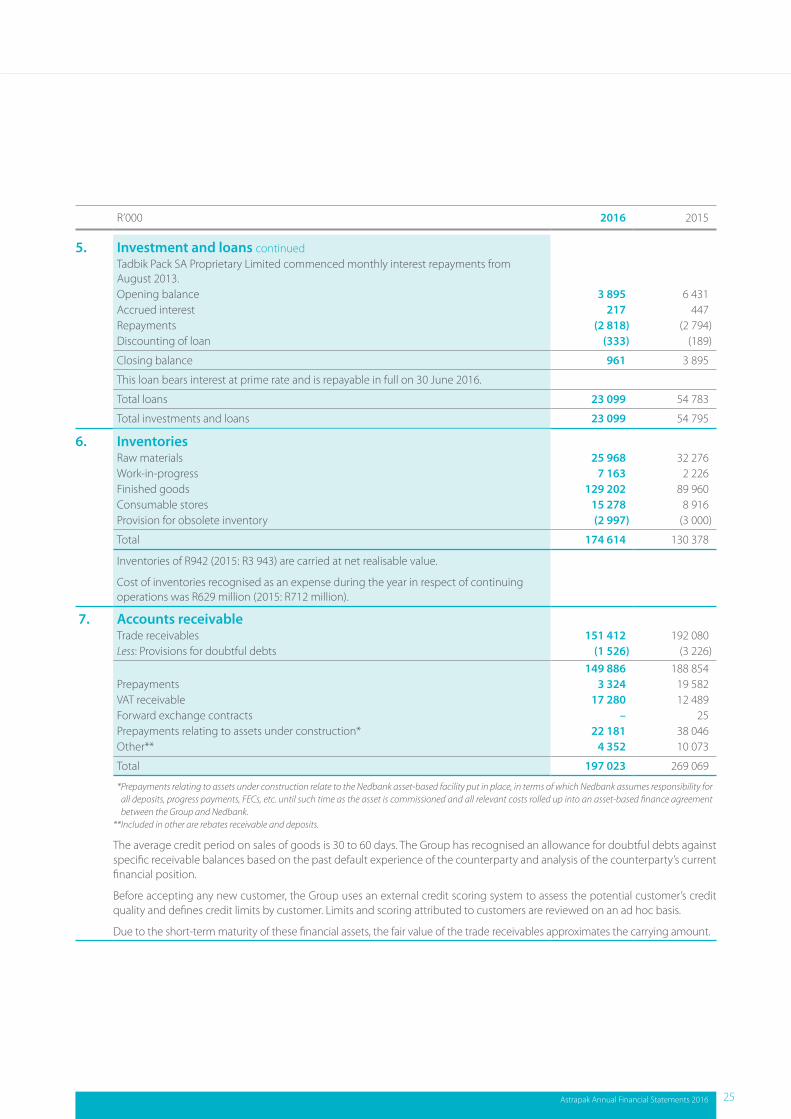
5. Investment and loans continuedTadbik Pack SA Proprietary Limited commenced monthly interest repayments from August 2013.Opening balance 3 895 6 431 Accrued interest 217 447 Repayments (2 818) (2 794)Discounting of loan (333) (189)
Closing balance 961 3 895
This loan bears interest at prime rate and is repayable in full on 30 June 2016.
Total loans 23 099 54 783
Total investments and loans 23 099 54 795
6. Inventories Raw materials 25 968 32 276 Work-in-progress 7 163 2 226 Finished goods 129 202 89 960 Consumable stores 15 278 8 916 Provision for obsolete inventory (2 997) (3 000)
Total 174 614 130 378
Inventories of R942 (2015: R3 943) are carried at net realisable value.
Cost of inventories recognised as an expense during the year in respect of continuing operations was R629 million (2015: R712 million).
7. Accounts receivable Trade receivables 151 412 192 080 Less: Provisions for doubtful debts (1 526) (3 226)
149 886 188 854 Prepayments 3 324 19 582 VAT receivable 17 280 12 489 Forward exchange contracts – 25 Prepayments relating to assets under construction* 22 181 38 046 Other** 4 352 10 073
Total 197 023 269 069
* Prepayments relating to assets under construction relate to the Nedbank asset-based facility put in place, in terms of which Nedbank assumes responsibility for all deposits, progress payments, FECs, etc. until such time as the asset is commissioned and all relevant costs rolled up into an asset-based finance agreement between the Group and Nedbank.
**Included in other are rebates receivable and deposits.
The average credit period on sales of goods is 30 to 60 days. The Group has recognised an allowance for doubtful debts against specific receivable balances based on the past default experience of the counterparty and analysis of the counterparty’s current financial position.
Before accepting any new customer, the Group uses an external credit scoring system to assess the potential customer’s credit quality and defines credit limits by customer. Limits and scoring attributed to customers are reviewed on an ad hoc basis.
Due to the short-term maturity of these financial assets, the fair value of the trade receivables approximates the carrying amount.
Astrapak Annual Financial Statements 2016 25
Notes to the Group annual financial statements continued
for the year ended 29 February 2016
R’000 2016 2015
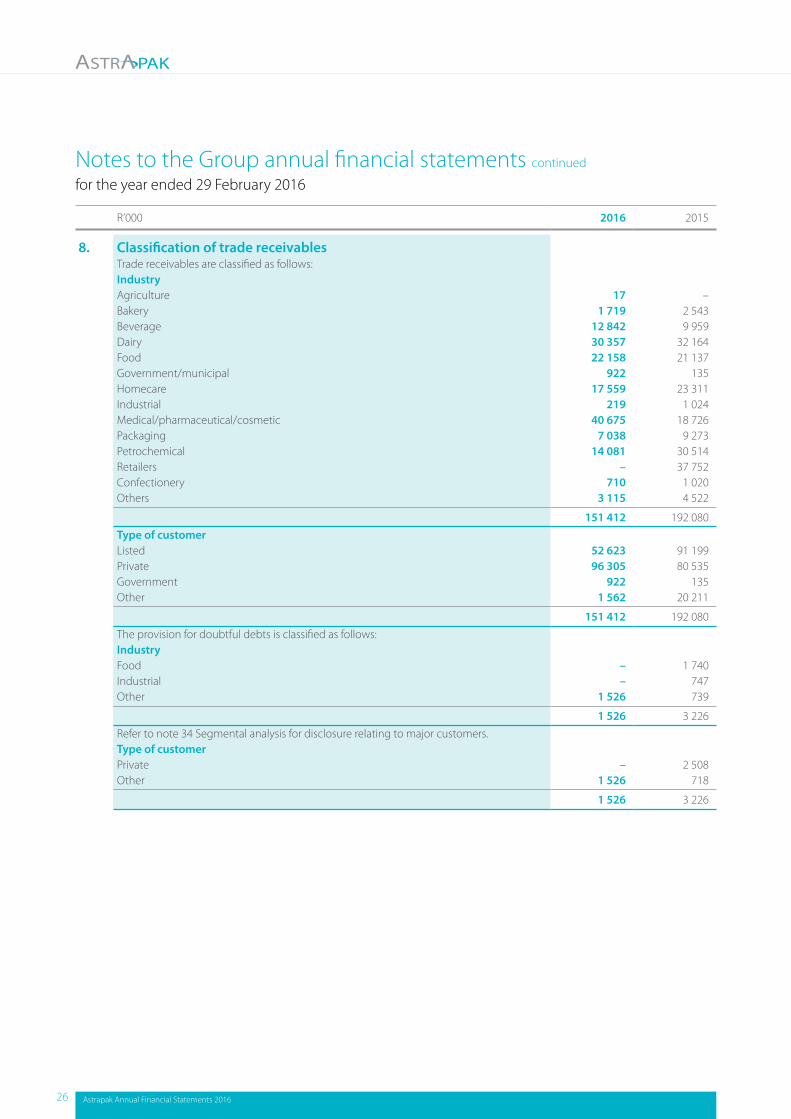
8. Classification of trade receivables Trade receivables are classified as follows: Industry Agriculture 17 –Bakery 1 719 2 543 Beverage 12 842 9 959 Dairy 30 357 32 164 Food 22 158 21 137 Government/municipal 922 135 Homecare 17 559 23 311 Industrial 219 1 024 Medical/pharmaceutical/cosmetic 40 675 18 726 Packaging 7 038 9 273 Petrochemical 14 081 30 514 Retailers – 37 752 Confectionery 710 1 020 Others 3 115 4 522
151 412 192 080 Type of customer Listed 52 623 91 199 Private 96 305 80 535 Government 922 135 Other 1 562 20 211
151 412 192 080 The provision for doubtful debts is classified as follows: Industry Food – 1 740 Industrial – 747 Other 1 526 739
1 526 3 226 Refer to note 34 Segmental analysis for disclosure relating to major customers. Type of customer Private – 2 508 Other 1 526 718
1 526 3 226
26 Astrapak Annual Financial Statements 2016
R’000 2016 2015
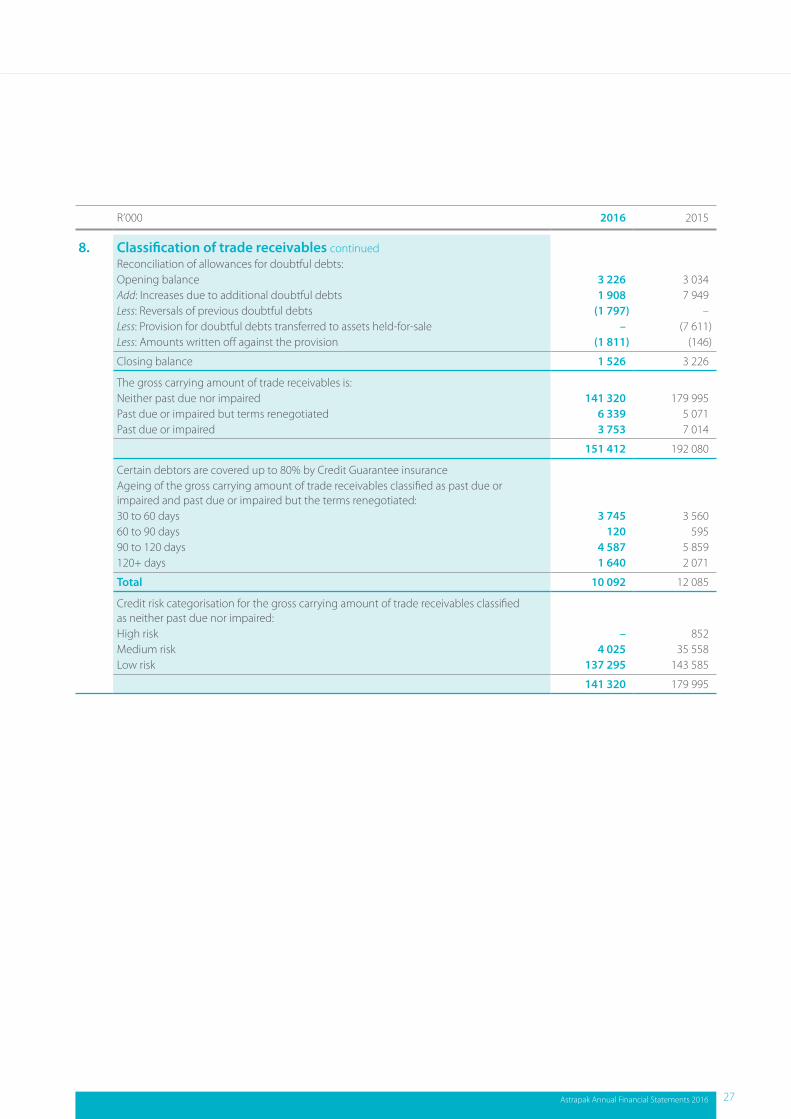
8. Classification of trade receivables continuedReconciliation of allowances for doubtful debts: Opening balance 3 226 3 034 Add: Increases due to additional doubtful debts 1 908 7 949 Less: Reversals of previous doubtful debts (1 797) –Less: Provision for doubtful debts transferred to assets held-for-sale – (7 611)Less: Amounts written off against the provision (1 811) (146)
Closing balance 1 526 3 226
The gross carrying amount of trade receivables is: Neither past due nor impaired 141 320 179 995 Past due or impaired but terms renegotiated 6 339 5 071 Past due or impaired 3 753 7 014
151 412 192 080
Certain debtors are covered up to 80% by Credit Guarantee insurance Ageing of the gross carrying amount of trade receivables classified as past due or impaired and past due or impaired but the terms renegotiated: 30 to 60 days 3 745 3 560 60 to 90 days 120 595 90 to 120 days 4 587 5 859 120+ days 1 640 2 071
Total 10 092 12 085
Credit risk categorisation for the gross carrying amount of trade receivables classified as neither past due nor impaired: High risk – 852 Medium risk 4 025 35 558 Low risk 137 295 143 585
141 320 179 995
Astrapak Annual Financial Statements 2016 27
Notes to the Group annual financial statements continued
for the year ended 29 February 2016
R’000 2016 2015
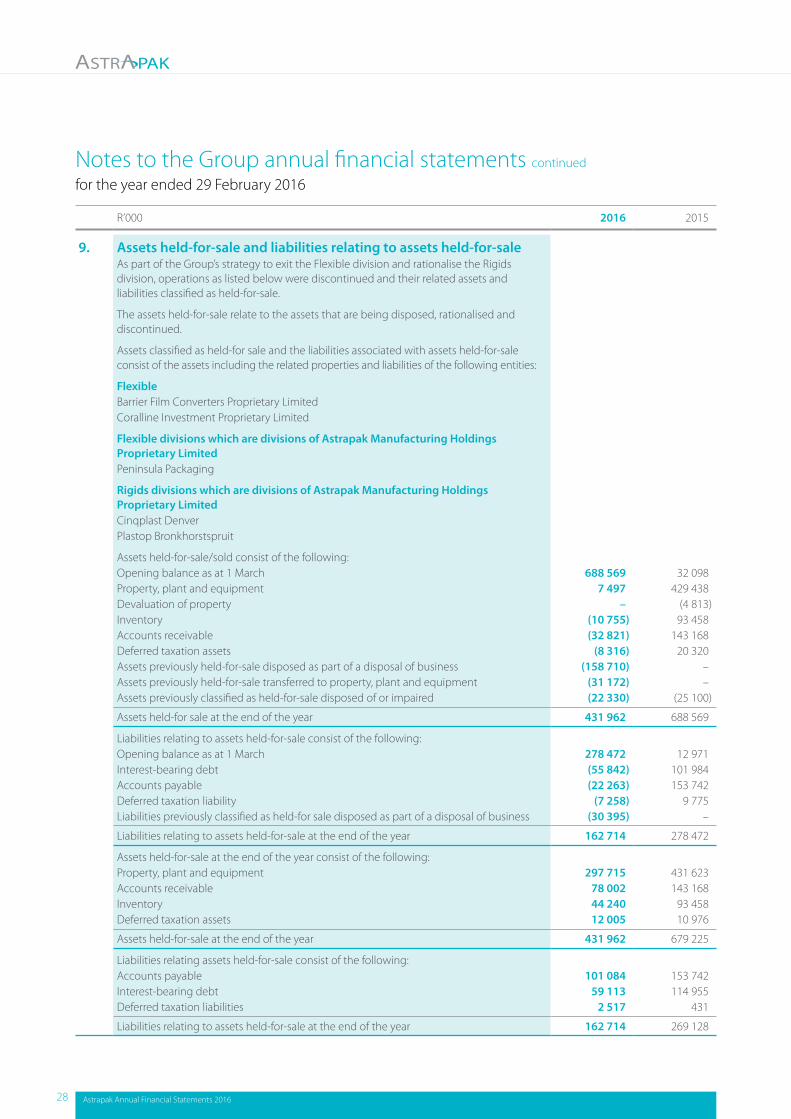
9. Assets held-for-sale and liabilities relating to assets held-for-sale As part of the Group’s strategy to exit the Flexible division and rationalise the Rigids division, operations as listed below were discontinued and their related assets and liabilities classified as held-for-sale.
The assets held-for-sale relate to the assets that are being disposed, rationalised and discontinued.
Assets classified as held-for sale and the liabilities associated with assets held-for-sale consist of the assets including the related properties and liabilities of the following entities:
FlexibleBarrier Film Converters Proprietary LimitedCoralline Investment Proprietary Limited
Flexible divisions which are divisions of Astrapak Manufacturing Holdings Proprietary LimitedPeninsula Packaging
Rigids divisions which are divisions of Astrapak Manufacturing Holdings Proprietary LimitedCinqplast Denver Plastop Bronkhorstspruit
Assets held-for-sale/sold consist of the following: Opening balance as at 1 March 688 569 32 098 Property, plant and equipment 7 497 429 438 Devaluation of property – (4 813)Inventory (10 755) 93 458 Accounts receivable (32 821) 143 168 Deferred taxation assets (8 316) 20 320 Assets previously held-for-sale disposed as part of a disposal of business (158 710) –Assets previously held-for-sale transferred to property, plant and equipment (31 172) –Assets previously classified as held-for-sale disposed of or impaired (22 330) (25 100)
Assets held-for sale at the end of the year 431 962 688 569
Liabilities relating to assets held-for-sale consist of the following: Opening balance as at 1 March 278 472 12 971 Interest-bearing debt (55 842) 101 984 Accounts payable (22 263) 153 742 Deferred taxation liability (7 258) 9 775 Liabilities previously classified as held-for sale disposed as part of a disposal of business (30 395) –
Liabilities relating to assets held-for-sale at the end of the year 162 714 278 472
Assets held-for-sale at the end of the year consist of the following:Property, plant and equipment 297 715 431 623 Accounts receivable 78 002 143 168 Inventory 44 240 93 458 Deferred taxation assets 12 005 10 976
Assets held-for-sale at the end of the year 431 962 679 225
Liabilities relating assets held-for-sale consist of the following:Accounts payable 101 084 153 742 Interest-bearing debt 59 113 114 955 Deferred taxation liabilities 2 517 431
Liabilities relating to assets held-for-sale at the end of the year 162 714 269 128
28 Astrapak Annual Financial Statements 2016
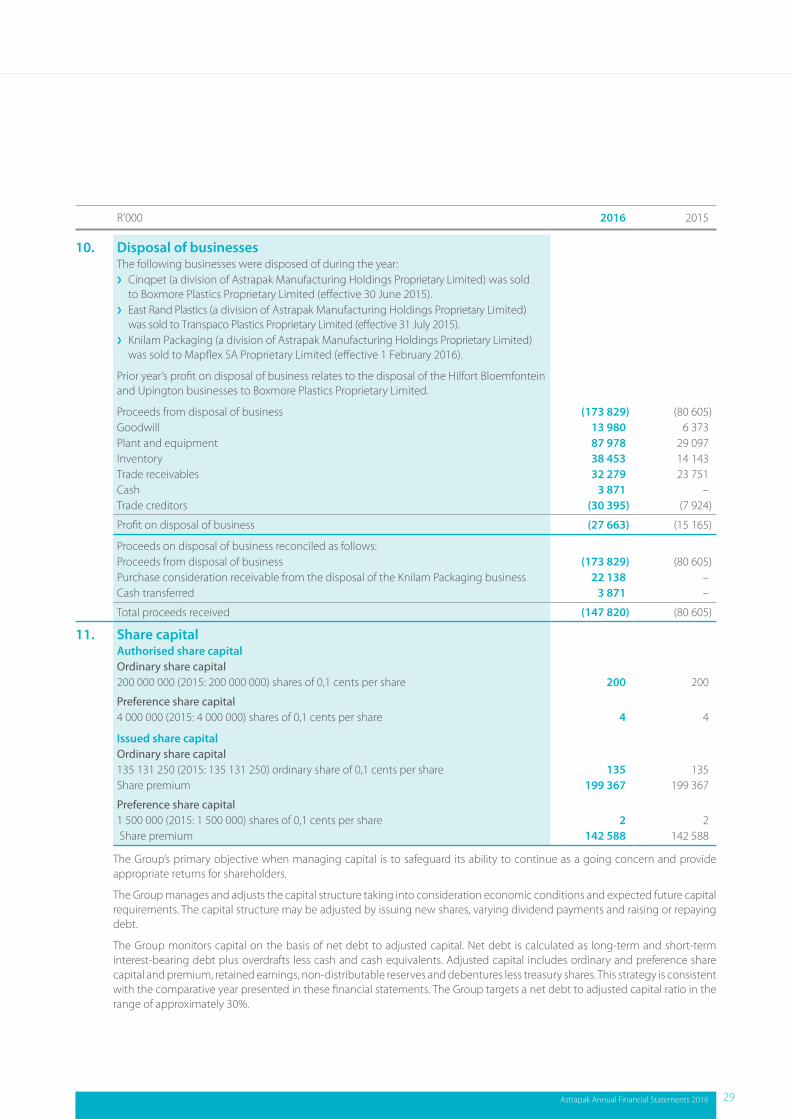
R’000 2016 2015
10. Disposal of businesses The following businesses were disposed of during the year: › Cinqpet (a division of Astrapak Manufacturing Holdings Proprietary Limited) was sold
to Boxmore Plastics Proprietary Limited (effective 30 June 2015). › East Rand Plastics (a division of Astrapak Manufacturing Holdings Proprietary Limited)
was sold to Transpaco Plastics Proprietary Limited (effective 31 July 2015). › Knilam Packaging (a division of Astrapak Manufacturing Holdings Proprietary Limited)
was sold to Mapflex SA Proprietary Limited (effective 1 February 2016).
Prior year’s profit on disposal of business relates to the disposal of the Hilfort Bloemfontein and Upington businesses to Boxmore Plastics Proprietary Limited.
Proceeds from disposal of business (173 829) (80 605)Goodwill 13 980 6 373 Plant and equipment 87 978 29 097 Inventory 38 453 14 143 Trade receivables 32 279 23 751 Cash 3 871 –Trade creditors (30 395) (7 924)
Profit on disposal of business (27 663) (15 165)
Proceeds on disposal of business reconciled as follows:Proceeds from disposal of business (173 829) (80 605)Purchase consideration receivable from the disposal of the Knilam Packaging business 22 138 –Cash transferred 3 871 –
Total proceeds received (147 820) (80 605)
11. Share capital Authorised share capital Ordinary share capital 200 000 000 (2015: 200 000 000) shares of 0,1 cents per share 200 200
Preference share capital 4 000 000 (2015: 4 000 000) shares of 0,1 cents per share 4 4
Issued share capital Ordinary share capital 135 131 250 (2015: 135 131 250) ordinary share of 0,1 cents per share 135 135 Share premium 199 367 199 367
Preference share capital 1 500 000 (2015: 1 500 000) shares of 0,1 cents per share 2 2 Share premium 142 588 142 588
The Group’s primary objective when managing capital is to safeguard its ability to continue as a going concern and provide appropriate returns for shareholders.
The Group manages and adjusts the capital structure taking into consideration economic conditions and expected future capital requirements. The capital structure may be adjusted by issuing new shares, varying dividend payments and raising or repaying debt.
The Group monitors capital on the basis of net debt to adjusted capital. Net debt is calculated as long-term and short-term interest-bearing debt plus overdrafts less cash and cash equivalents. Adjusted capital includes ordinary and preference share capital and premium, retained earnings, non-distributable reserves and debentures less treasury shares. This strategy is consistent with the comparative year presented in these financial statements. The Group targets a net debt to adjusted capital ratio in the range of approximately 30%.
Astrapak Annual Financial Statements 2016 29
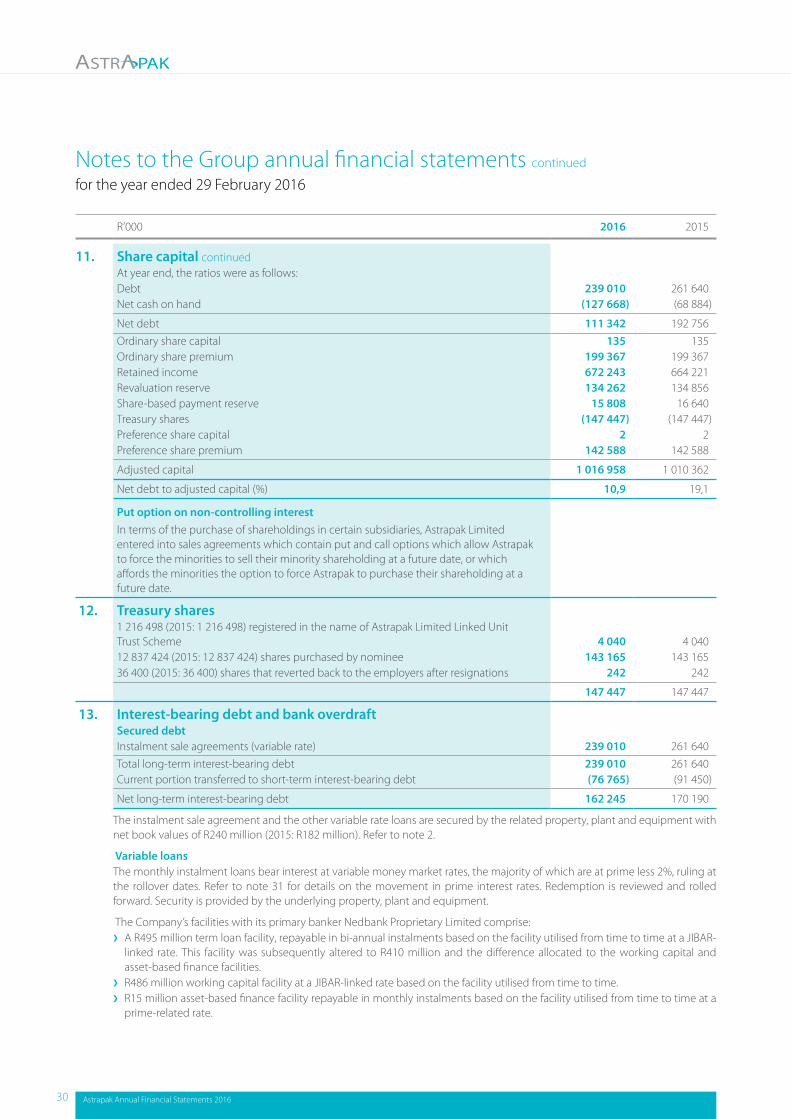
Notes to the Group annual financial statements continued
for the year ended 29 February 2016
R’000 2016 2015
11. Share capital continuedAt year end, the ratios were as follows: Debt 239 010 261 640 Net cash on hand (127 668) (68 884)
Net debt 111 342 192 756 Ordinary share capital 135 135 Ordinary share premium 199 367 199 367 Retained income 672 243 664 221 Revaluation reserve 134 262 134 856 Share-based payment reserve 15 808 16 640 Treasury shares (147 447) (147 447)Preference share capital 2 2 Preference share premium 142 588 142 588
Adjusted capital 1 016 958 1 010 362
Net debt to adjusted capital (%) 10,9 19,1
Put option on non-controlling interestIn terms of the purchase of shareholdings in certain subsidiaries, Astrapak Limited entered into sales agreements which contain put and call options which allow Astrapak to force the minorities to sell their minority shareholding at a future date, or which affords the minorities the option to force Astrapak to purchase their shareholding at a future date.
12. Treasury shares 1 216 498 (2015: 1 216 498) registered in the name of Astrapak Limited Linked Unit Trust Scheme 4 040 4 040 12 837 424 (2015: 12 837 424) shares purchased by nominee 143 165 143 165 36 400 (2015: 36 400) shares that reverted back to the employers after resignations 242 242
147 447 147 447
13. Interest-bearing debt and bank overdraft Secured debt Instalment sale agreements (variable rate) 239 010 261 640 Total long-term interest-bearing debt 239 010 261 640 Current portion transferred to short-term interest-bearing debt (76 765) (91 450)
Net long-term interest-bearing debt 162 245 170 190
The instalment sale agreement and the other variable rate loans are secured by the related property, plant and equipment with net book values of R240 million (2015: R182 million). Refer to note 2.
Variable loans The monthly instalment loans bear interest at variable money market rates, the majority of which are at prime less 2%, ruling at the rollover dates. Refer to note 31 for details on the movement in prime interest rates. Redemption is reviewed and rolled forward. Security is provided by the underlying property, plant and equipment.
The Company’s facilities with its primary banker Nedbank Proprietary Limited comprise: › A R495 million term loan facility, repayable in bi-annual instalments based on the facility utilised from time to time at a JIBAR-
linked rate. This facility was subsequently altered to R410 million and the difference allocated to the working capital and asset-based finance facilities.
› R486 million working capital facility at a JIBAR-linked rate based on the facility utilised from time to time. › R15 million asset-based finance facility repayable in monthly instalments based on the facility utilised from time to time at a
prime-related rate.
30 Astrapak Annual Financial Statements 2016
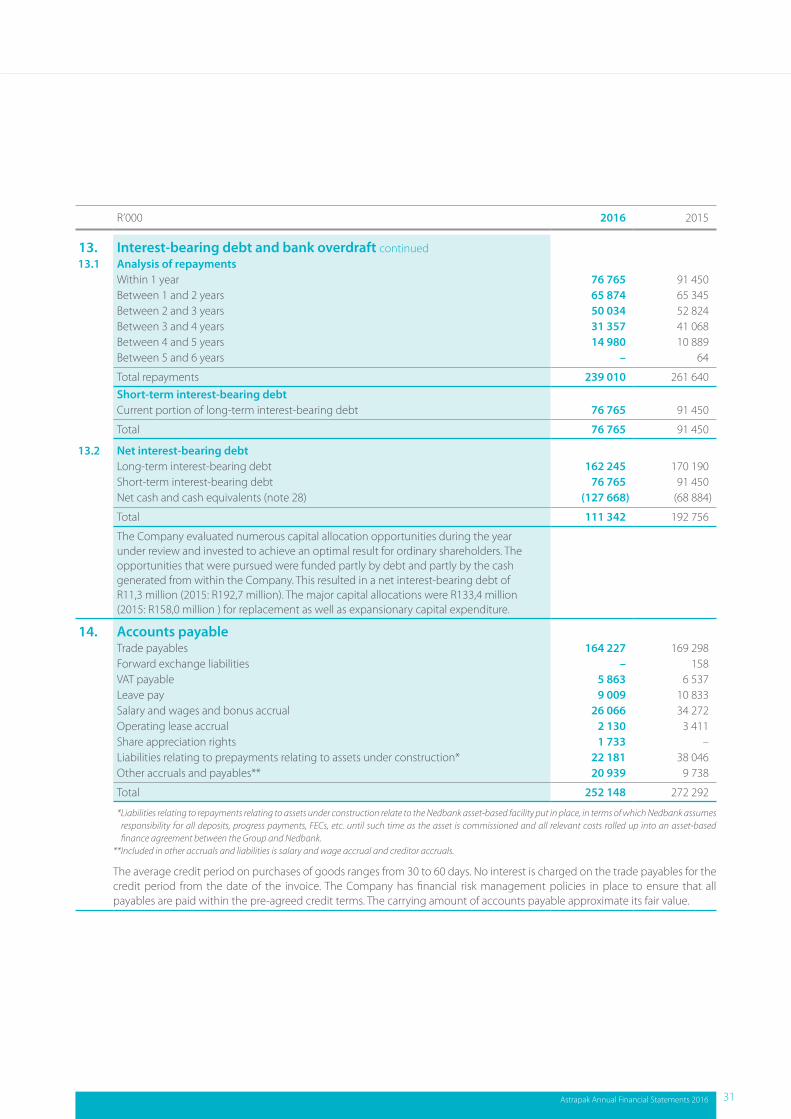
R’000 2016 2015
13. Interest-bearing debt and bank overdraft continued 13.1 Analysis of repayments
Within 1 year 76 765 91 450 Between 1 and 2 years 65 874 65 345 Between 2 and 3 years 50 034 52 824 Between 3 and 4 years 31 357 41 068 Between 4 and 5 years 14 980 10 889 Between 5 and 6 years – 64
Total repayments 239 010 261 640 Short-term interest-bearing debt Current portion of long-term interest-bearing debt 76 765 91 450
Total 76 765 91 450
13.2 Net interest-bearing debt Long-term interest-bearing debt 162 245 170 190 Short-term interest-bearing debt 76 765 91 450 Net cash and cash equivalents (note 28) (127 668) (68 884)
Total 111 342 192 756
The Company evaluated numerous capital allocation opportunities during the year under review and invested to achieve an optimal result for ordinary shareholders. The opportunities that were pursued were funded partly by debt and partly by the cash generated from within the Company. This resulted in a net interest-bearing debt of R11,3 million (2015: R192,7 million). The major capital allocations were R133,4 million (2015: R158,0 million ) for replacement as well as expansionary capital expenditure.
14. Accounts payable Trade payables 164 227 169 298 Forward exchange liabilities – 158 VAT payable 5 863 6 537 Leave pay 9 009 10 833 Salary and wages and bonus accrual 26 066 34 272 Operating lease accrual 2 130 3 411 Share appreciation rights 1 733 –Liabilities relating to prepayments relating to assets under construction* 22 181 38 046 Other accruals and payables** 20 939 9 738
Total 252 148 272 292
* Liabilities relating to repayments relating to assets under construction relate to the Nedbank asset-based facility put in place, in terms of which Nedbank assumes responsibility for all deposits, progress payments, FECs, etc. until such time as the asset is commissioned and all relevant costs rolled up into an asset-based finance agreement between the Group and Nedbank.
**Included in other accruals and liabilities is salary and wage accrual and creditor accruals.
The average credit period on purchases of goods ranges from 30 to 60 days. No interest is charged on the trade payables for the credit period from the date of the invoice. The Company has financial risk management policies in place to ensure that all payables are paid within the pre-agreed credit terms. The carrying amount of accounts payable approximate its fair value.
Astrapak Annual Financial Statements 2016 31
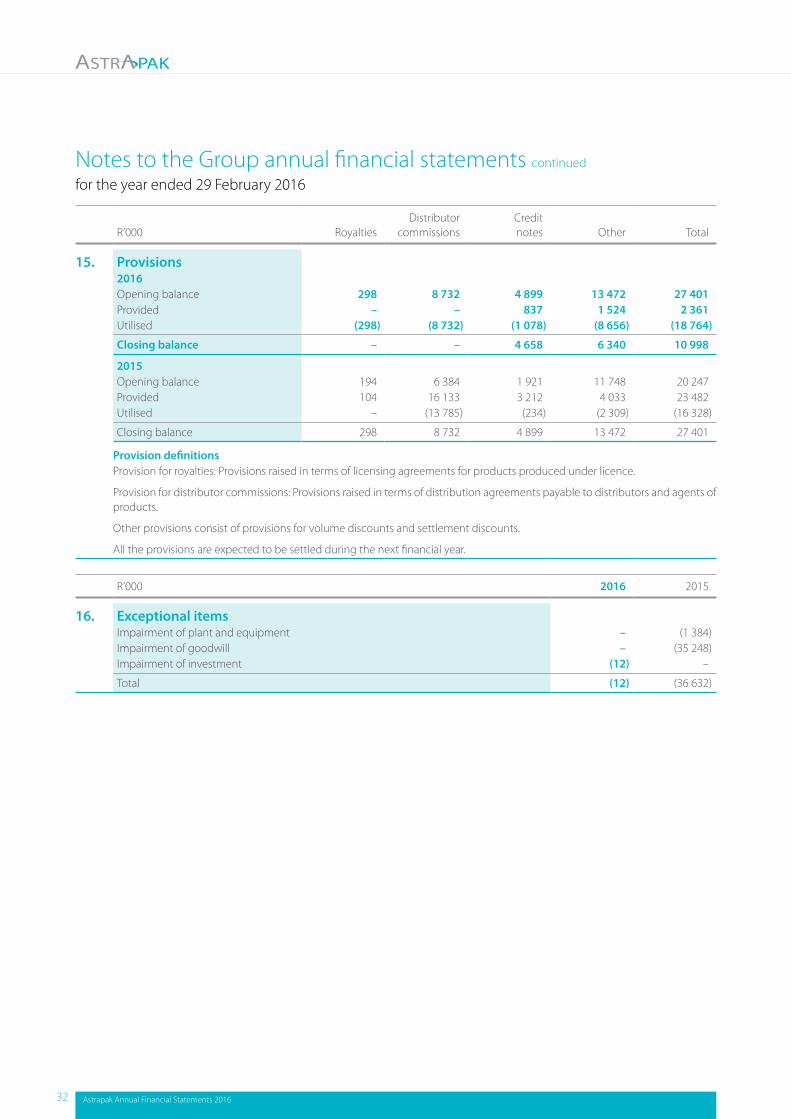
Notes to the Group annual financial statements continued
for the year ended 29 February 2016
R’000 Royalties Distributor
commissions Credit notes Other Total
15. Provisions2016Opening balance 298 8 732 4 899 13 472 27 401 Provided – – 837 1 524 2 361 Utilised (298) (8 732) (1 078) (8 656) (18 764)
Closing balance – – 4 658 6 340 10 998
2015Opening balance 194 6 384 1 921 11 748 20 247 Provided 104 16 133 3 212 4 033 23 482 Utilised – (13 785) (234) (2 309) (16 328)
Closing balance 298 8 732 4 899 13 472 27 401
Provision definitionsProvision for royalties: Provisions raised in terms of licensing agreements for products produced under licence.
Provision for distributor commissions: Provisions raised in terms of distribution agreements payable to distributors and agents of products.
Other provisions consist of provisions for volume discounts and settlement discounts.
All the provisions are expected to be settled during the next financial year.
R’000 2016 2015
16. Exceptional itemsImpairment of plant and equipment – (1 384)Impairment of goodwill – (35 248)Impairment of investment (12) –
Total (12) (36 632)
32 Astrapak Annual Financial Statements 2016
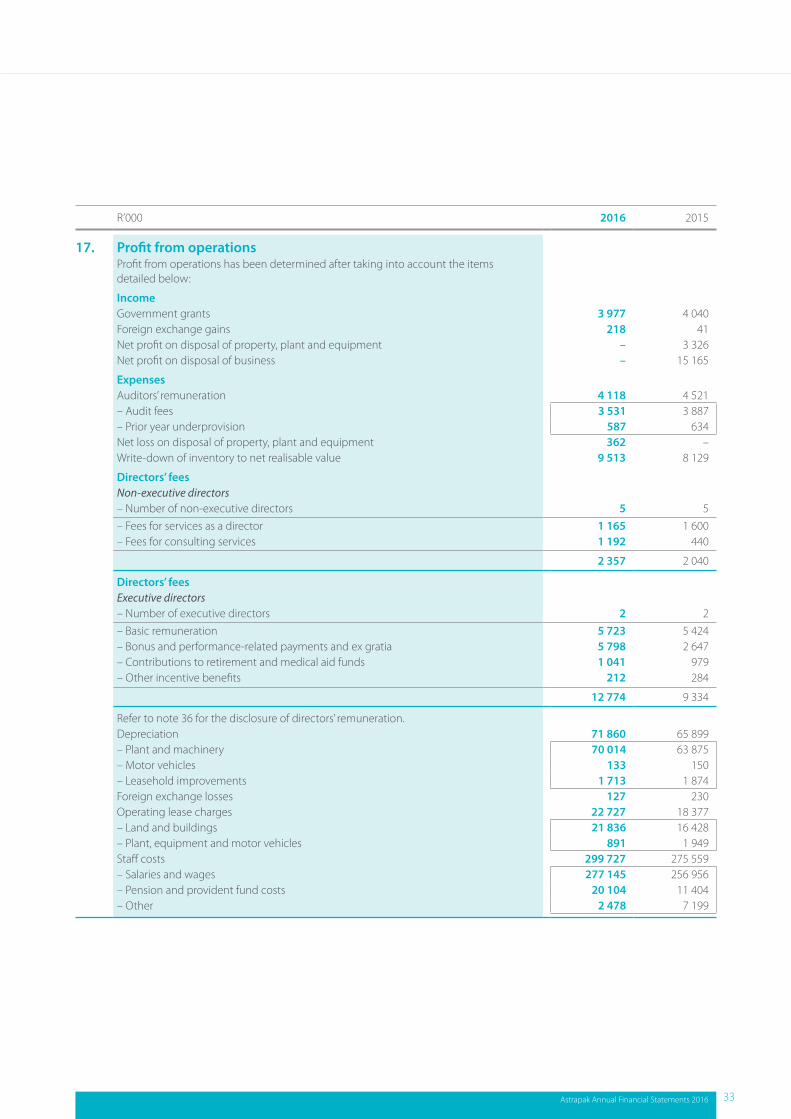
R’000 2016 2015
17. Profit from operationsProfit from operations has been determined after taking into account the items detailed below:
IncomeGovernment grants 3 977 4 040 Foreign exchange gains 218 41 Net profit on disposal of property, plant and equipment – 3 326 Net profit on disposal of business – 15 165
ExpensesAuditors’ remuneration 4 118 4 521 – Audit fees 3 531 3 887 – Prior year underprovision 587 634 Net loss on disposal of property, plant and equipment 362 –Write-down of inventory to net realisable value 9 513 8 129
Directors’ feesNon-executive directors– Number of non-executive directors 5 5 – Fees for services as a director 1 165 1 600 – Fees for consulting services 1 192 440
2 357 2 040
Directors’ feesExecutive directors– Number of executive directors 2 2 – Basic remuneration 5 723 5 424 – Bonus and performance-related payments and ex gratia 5 798 2 647 – Contributions to retirement and medical aid funds 1 041 979 – Other incentive benefits 212 284
12 774 9 334
Refer to note 36 for the disclosure of directors’ remuneration.Depreciation 71 860 65 899 – Plant and machinery 70 014 63 875 – Motor vehicles 133 150 – Leasehold improvements 1 713 1 874 Foreign exchange losses 127 230 Operating lease charges 22 727 18 377 – Land and buildings 21 836 16 428 – Plant, equipment and motor vehicles 891 1 949 Staff costs 299 727 275 559 – Salaries and wages 277 145 256 956 – Pension and provident fund costs 20 104 11 404 – Other 2 478 7 199
Astrapak Annual Financial Statements 2016 33
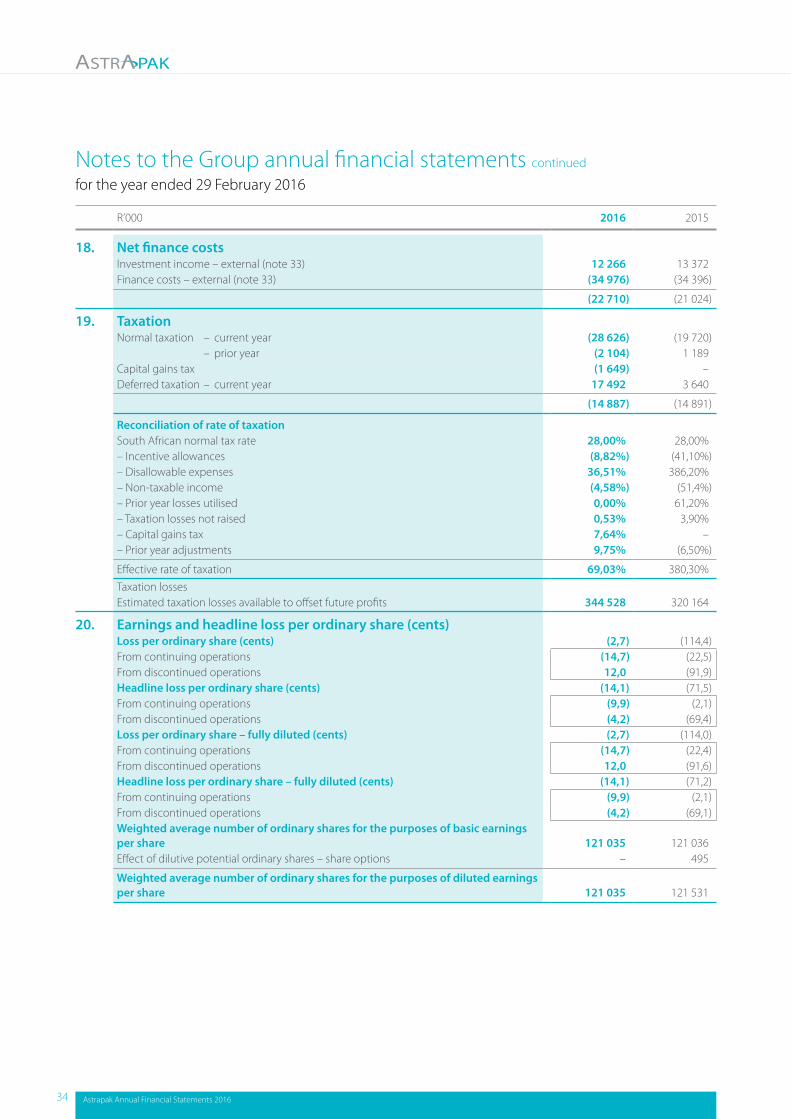
Notes to the Group annual financial statements continued
for the year ended 29 February 2016
R’000 2016 2015
18. Net finance costsInvestment income – external (note 33) 12 266 13 372 Finance costs – external (note 33) (34 976) (34 396)
(22 710) (21 024)
19. Taxation Normal taxation – current year (28 626) (19 720) – prior year (2 104) 1 189 Capital gains tax (1 649) –Deferred taxation – current year 17 492 3 640
(14 887) (14 891)
Reconciliation of rate of taxation South African normal tax rate 28,00% 28,00%– Incentive allowances (8,82%) (41,10%)– Disallowable expenses 36,51% 386,20%– Non-taxable income (4,58%) (51,4%)– Prior year losses utilised 0,00% 61,20%– Taxation losses not raised 0,53% 3,90%– Capital gains tax 7,64% –– Prior year adjustments 9,75% (6,50%)
Effective rate of taxation 69,03% 380,30%Taxation losses Estimated taxation losses available to offset future profits 344 528 320 164
20. Earnings and headline loss per ordinary share (cents)Loss per ordinary share (cents) (2,7) (114,4)From continuing operations (14,7) (22,5)From discontinued operations 12,0 (91,9)Headline loss per ordinary share (cents) (14,1) (71,5)From continuing operations (9,9) (2,1)From discontinued operations (4,2) (69,4)Loss per ordinary share – fully diluted (cents) (2,7) (114,0)From continuing operations (14,7) (22,4)From discontinued operations 12,0 (91,6)Headline loss per ordinary share – fully diluted (cents) (14,1) (71,2)From continuing operations (9,9) (2,1)From discontinued operations (4,2) (69,1)Weighted average number of ordinary shares for the purposes of basic earnings per share 121 035 121 036 Effect of dilutive potential ordinary shares – share options – 495
Weighted average number of ordinary shares for the purposes of diluted earnings per share 121 035 121 531
34 Astrapak Annual Financial Statements 2016
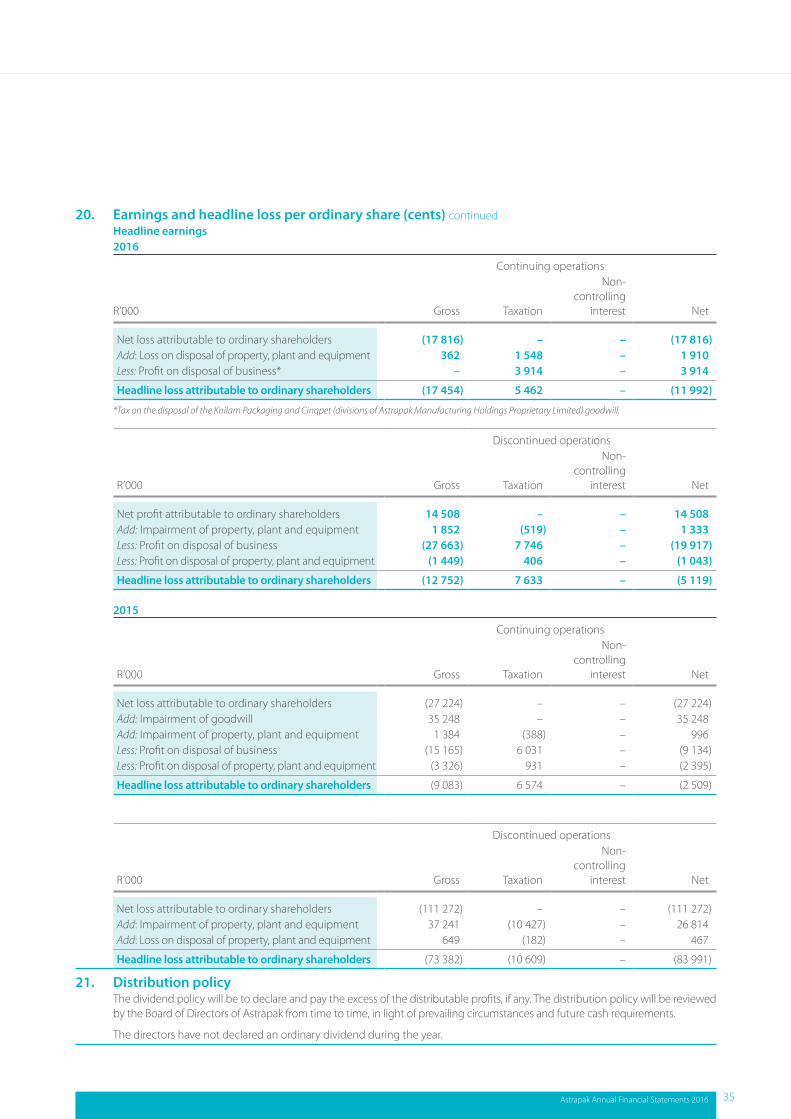
20. Earnings and headline loss per ordinary share (cents) continuedHeadline earnings2016
Continuing operations
R’000 Gross Taxation
Non-controlling
interest Net
Net loss attributable to ordinary shareholders (17 816) – – (17 816)Add: Loss on disposal of property, plant and equipment 362 1 548 – 1 910 Less: Profit on disposal of business* – 3 914 – 3 914
Headline loss attributable to ordinary shareholders (17 454) 5 462 – (11 992)
*Tax on the disposal of the Knilam Packaging and Cinqpet (divisions of Astrapak Manufacturing Holdings Proprietary Limited) goodwill.
Discontinued operations
R’000 Gross Taxation
Non-controlling
interest Net
Net profit attributable to ordinary shareholders 14 508 – – 14 508 Add: Impairment of property, plant and equipment 1 852 (519) – 1 333 Less: Profit on disposal of business (27 663) 7 746 – (19 917)Less: Profit on disposal of property, plant and equipment (1 449) 406 – (1 043)
Headline loss attributable to ordinary shareholders (12 752) 7 633 – (5 119)
2015
Continuing operations
R’000 Gross Taxation
Non-controlling
interest Net
Net loss attributable to ordinary shareholders (27 224) – – (27 224)Add: Impairment of goodwill 35 248 – – 35 248 Add: Impairment of property, plant and equipment 1 384 (388) – 996 Less: Profit on disposal of business (15 165) 6 031 – (9 134)Less: Profit on disposal of property, plant and equipment (3 326) 931 – (2 395)
Headline loss attributable to ordinary shareholders (9 083) 6 574 – (2 509)
Discontinued operations
R’000 Gross Taxation
Non-controlling
interest Net
Net loss attributable to ordinary shareholders (111 272) – – (111 272)Add: Impairment of property, plant and equipment 37 241 (10 427) – 26 814 Add: Loss on disposal of property, plant and equipment 649 (182) – 467
Headline loss attributable to ordinary shareholders (73 382) (10 609) – (83 991)
21. Distribution policyThe dividend policy will be to declare and pay the excess of the distributable profits, if any. The distribution policy will be reviewed by the Board of Directors of Astrapak from time to time, in light of prevailing circumstances and future cash requirements.
The directors have not declared an ordinary dividend during the year.
Astrapak Annual Financial Statements 2016 35
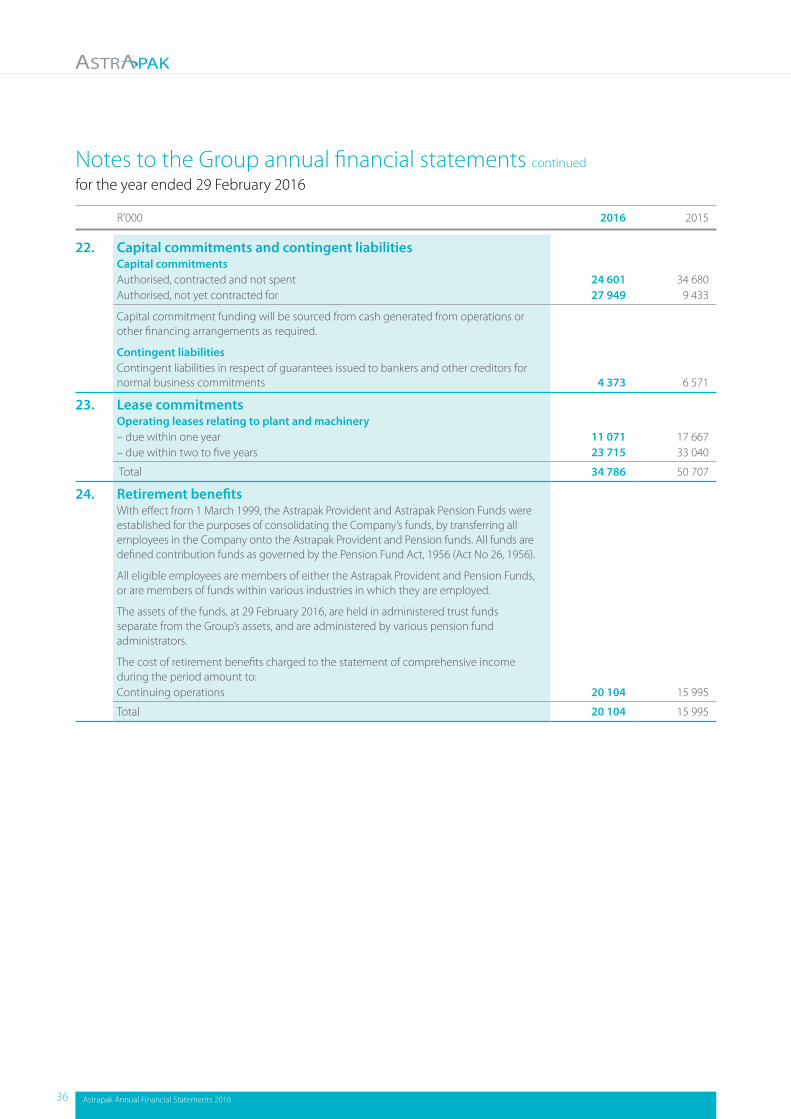
Notes to the Group annual financial statements continued
for the year ended 29 February 2016
R’000 2016 2015
22. Capital commitments and contingent liabilities Capital commitments Authorised, contracted and not spent 24 601 34 680 Authorised, not yet contracted for 27 949 9 433
Capital commitment funding will be sourced from cash generated from operations or other financing arrangements as required.
Contingent liabilities Contingent liabilities in respect of guarantees issued to bankers and other creditors for normal business commitments 4 373 6 571
23. Lease commitments Operating leases relating to plant and machinery – due within one year 11 071 17 667 – due within two to five years 23 715 33 040
Total 34 786 50 707
24. Retirement benefits With effect from 1 March 1999, the Astrapak Provident and Astrapak Pension Funds were established for the purposes of consolidating the Company’s funds, by transferring all employees in the Company onto the Astrapak Provident and Pension funds. All funds are defined contribution funds as governed by the Pension Fund Act, 1956 (Act No 26, 1956).
All eligible employees are members of either the Astrapak Provident and Pension Funds, or are members of funds within various industries in which they are employed.
The assets of the funds, at 29 February 2016, are held in administered trust funds separate from the Group’s assets, and are administered by various pension fund administrators.
The cost of retirement benefits charged to the statement of comprehensive income during the period amount to: Continuing operations 20 104 15 995
Total 20 104 15 995
36 Astrapak Annual Financial Statements 2016
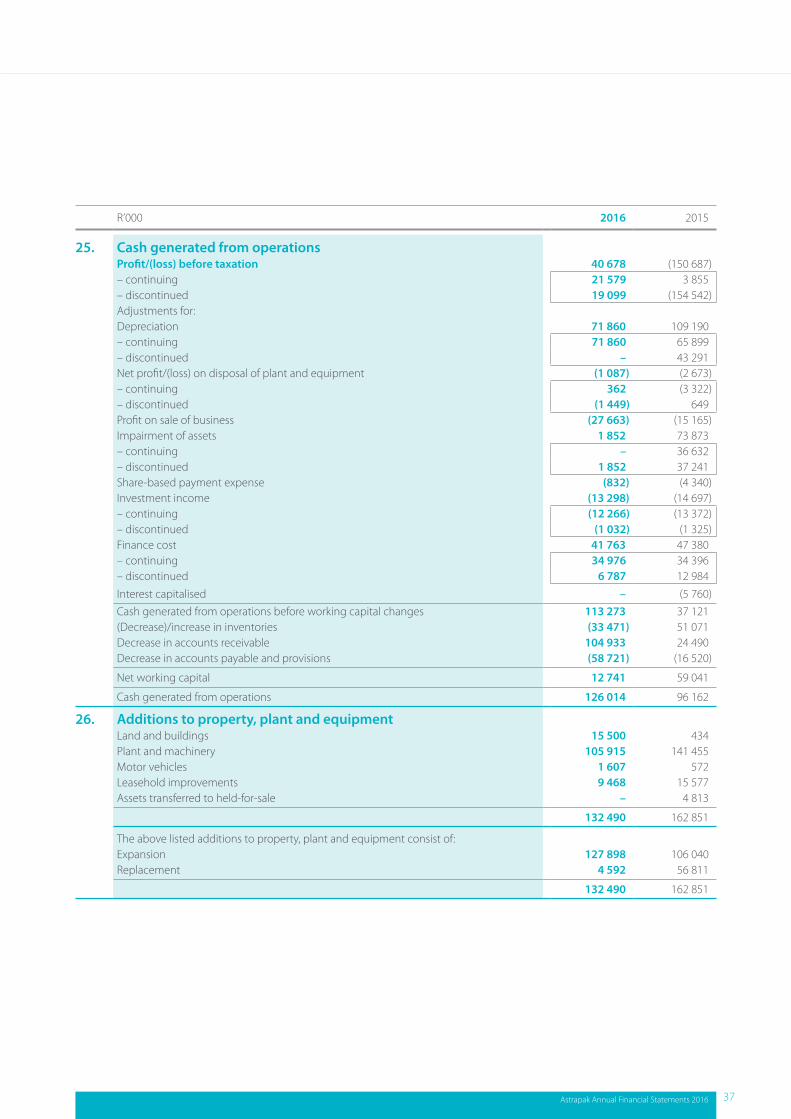
R’000 2016 2015
25. Cash generated from operationsProfit/(loss) before taxation 40 678 (150 687)– continuing 21 579 3 855 – discontinued 19 099 (154 542)Adjustments for:Depreciation 71 860 109 190 – continuing 71 860 65 899 – discontinued – 43 291 Net profit/(loss) on disposal of plant and equipment (1 087) (2 673)– continuing 362 (3 322)– discontinued (1 449) 649 Profit on sale of business (27 663) (15 165)Impairment of assets 1 852 73 873 – continuing – 36 632 – discontinued 1 852 37 241 Share-based payment expense (832) (4 340)Investment income (13 298) (14 697)– continuing (12 266) (13 372)– discontinued (1 032) (1 325)Finance cost 41 763 47 380 – continuing 34 976 34 396 – discontinued 6 787 12 984
Interest capitalised – (5 760)Cash generated from operations before working capital changes 113 273 37 121 (Decrease)/increase in inventories (33 471) 51 071 Decrease in accounts receivable 104 933 24 490 Decrease in accounts payable and provisions (58 721) (16 520)
Net working capital 12 741 59 041
Cash generated from operations 126 014 96 162
26. Additions to property, plant and equipmentLand and buildings 15 500 434 Plant and machinery 105 915 141 455 Motor vehicles 1 607 572 Leasehold improvements 9 468 15 577 Assets transferred to held-for-sale – 4 813
132 490 162 851
The above listed additions to property, plant and equipment consist of:Expansion 127 898 106 040 Replacement 4 592 56 811
132 490 162 851
Astrapak Annual Financial Statements 2016 37
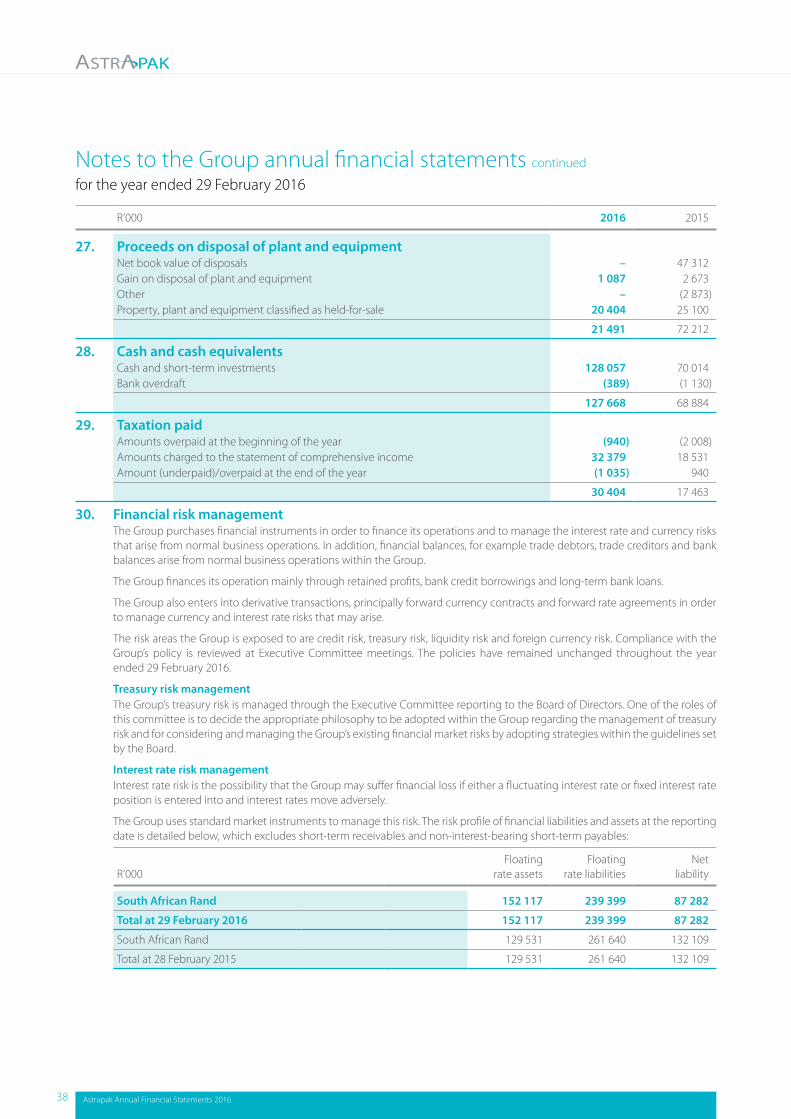
Notes to the Group annual financial statements continued
for the year ended 29 February 2016
R’000 2016 2015
27. Proceeds on disposal of plant and equipmentNet book value of disposals – 47 312 Gain on disposal of plant and equipment 1 087 2 673 Other – (2 873)Property, plant and equipment classified as held-for-sale 20 404 25 100
21 491 72 212
28. Cash and cash equivalentsCash and short-term investments 128 057 70 014 Bank overdraft (389) (1 130)
127 668 68 884
29. Taxation paidAmounts overpaid at the beginning of the year (940) (2 008)Amounts charged to the statement of comprehensive income 32 379 18 531 Amount (underpaid)/overpaid at the end of the year (1 035) 940
30 404 17 463
30. Financial risk managementThe Group purchases financial instruments in order to finance its operations and to manage the interest rate and currency risks that arise from normal business operations. In addition, financial balances, for example trade debtors, trade creditors and bank balances arise from normal business operations within the Group.
The Group finances its operation mainly through retained profits, bank credit borrowings and long-term bank loans.
The Group also enters into derivative transactions, principally forward currency contracts and forward rate agreements in order to manage currency and interest rate risks that may arise.
The risk areas the Group is exposed to are credit risk, treasury risk, liquidity risk and foreign currency risk. Compliance with the Group’s policy is reviewed at Executive Committee meetings. The policies have remained unchanged throughout the year ended 29 February 2016.
Treasury risk managementThe Group’s treasury risk is managed through the Executive Committee reporting to the Board of Directors. One of the roles of this committee is to decide the appropriate philosophy to be adopted within the Group regarding the management of treasury risk and for considering and managing the Group’s existing financial market risks by adopting strategies within the guidelines set by the Board.
Interest rate risk managementInterest rate risk is the possibility that the Group may suffer financial loss if either a fluctuating interest rate or fixed interest rate position is entered into and interest rates move adversely.
The Group uses standard market instruments to manage this risk. The risk profile of financial liabilities and assets at the reporting date is detailed below, which excludes short-term receivables and non-interest-bearing short-term payables:
R’000Floating
rate assetsFloating
rate liabilitiesNet
liability
South African Rand 152 117 239 399 87 282
Total at 29 February 2016 152 117 239 399 87 282
South African Rand 129 531 261 640 132 109
Total at 28 February 2015 129 531 261 640 132 109
38 Astrapak Annual Financial Statements 2016
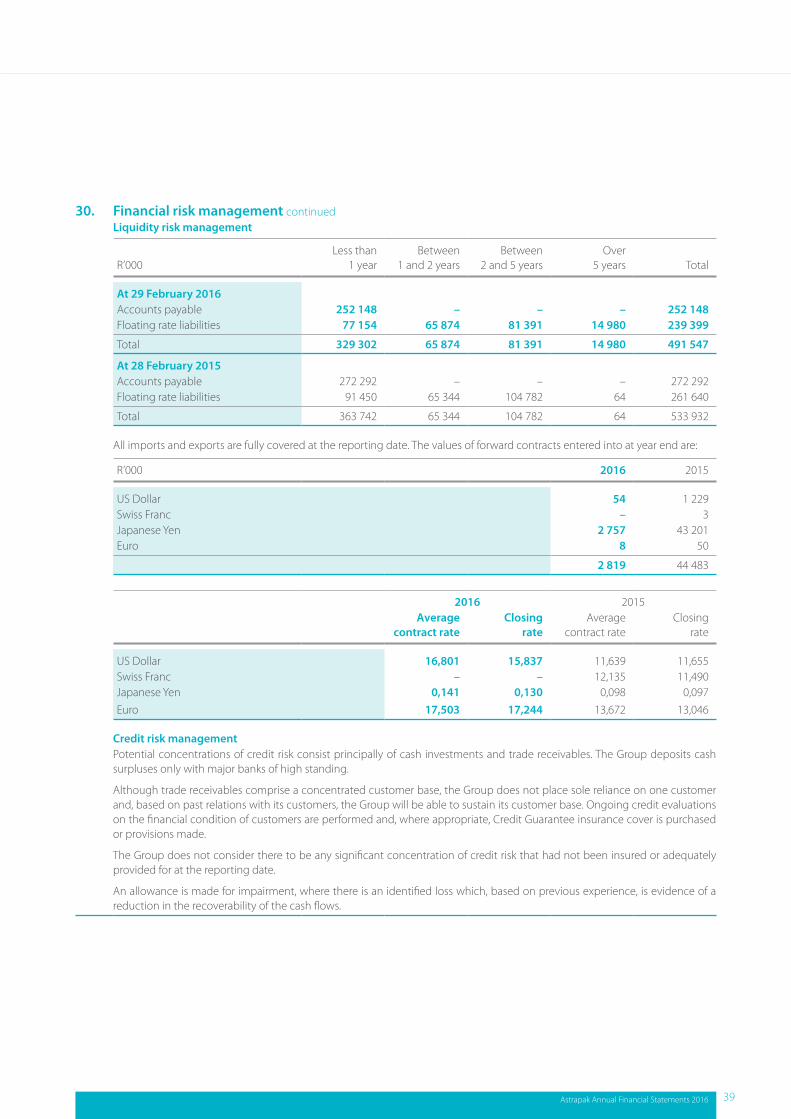
30. Financial risk management continuedLiquidity risk management
R’000Less than
1 yearBetween
1 and 2 yearsBetween
2 and 5 yearsOver
5 years Total
At 29 February 2016Accounts payable 252 148 – – – 252 148 Floating rate liabilities 77 154 65 874 81 391 14 980 239 399
Total 329 302 65 874 81 391 14 980 491 547
At 28 February 2015Accounts payable 272 292 – – – 272 292 Floating rate liabilities 91 450 65 344 104 782 64 261 640
Total 363 742 65 344 104 782 64 533 932
All imports and exports are fully covered at the reporting date. The values of forward contracts entered into at year end are:
R’000 2016 2015
US Dollar 54 1 229 Swiss Franc – 3 Japanese Yen 2 757 43 201 Euro 8 50
2 819 44 483
2016 2015Average
contract rateClosing
rateAverage
contract rateClosing
rate
US Dollar 16,801 15,837 11,639 11,655Swiss Franc – – 12,135 11,490Japanese Yen 0,141 0,130 0,098 0,097 Euro 17,503 17,244 13,672 13,046
Credit risk managementPotential concentrations of credit risk consist principally of cash investments and trade receivables. The Group deposits cash surpluses only with major banks of high standing.
Although trade receivables comprise a concentrated customer base, the Group does not place sole reliance on one customer and, based on past relations with its customers, the Group will be able to sustain its customer base. Ongoing credit evaluations on the financial condition of customers are performed and, where appropriate, Credit Guarantee insurance cover is purchased or provisions made.
The Group does not consider there to be any significant concentration of credit risk that had not been insured or adequately provided for at the reporting date.
An allowance is made for impairment, where there is an identified loss which, based on previous experience, is evidence of a reduction in the recoverability of the cash flows.
Astrapak Annual Financial Statements 2016 39
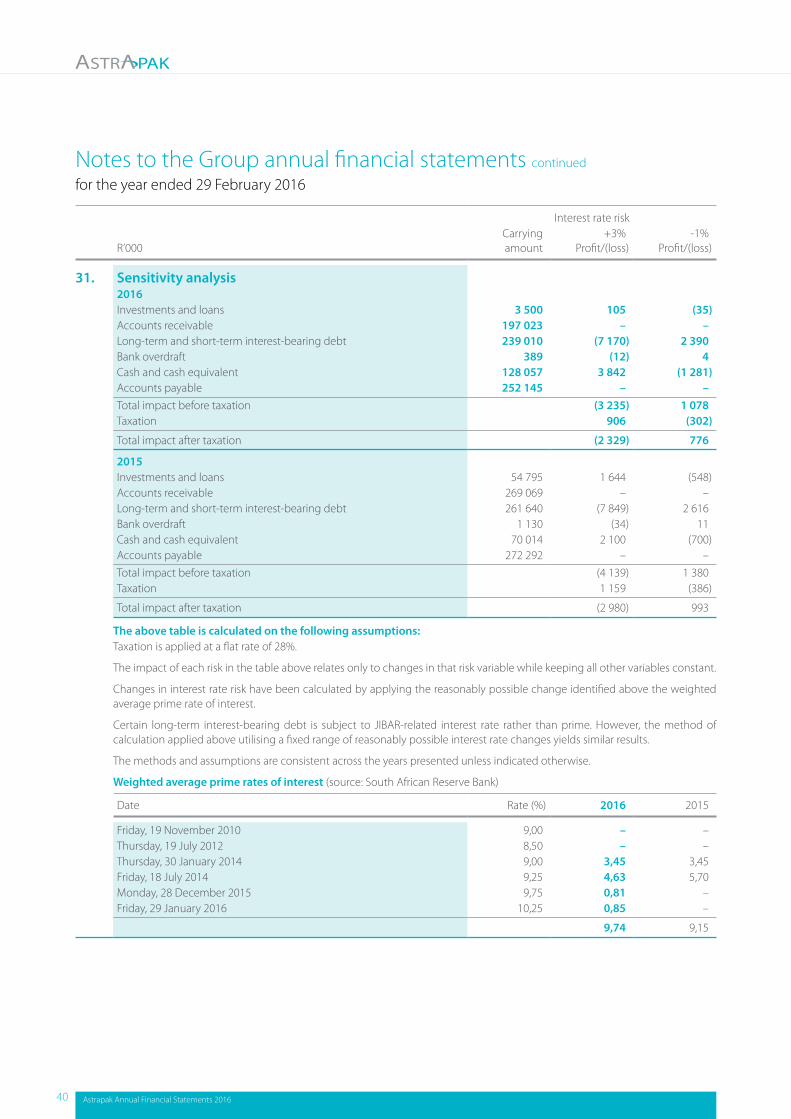
Notes to the Group annual financial statements continued
for the year ended 29 February 2016
Interest rate risk
R’000 Carrying amount
+3%Profit/(loss)
-1%Profit/(loss)
31. Sensitivity analysis2016Investments and loans 3 500 105 (35)Accounts receivable 197 023 – –Long-term and short-term interest-bearing debt 239 010 (7 170) 2 390 Bank overdraft 389 (12) 4 Cash and cash equivalent 128 057 3 842 (1 281)Accounts payable 252 145 – –Total impact before taxation (3 235) 1 078 Taxation 906 (302)
Total impact after taxation (2 329) 776
2015Investments and loans 54 795 1 644 (548)Accounts receivable 269 069 – –Long-term and short-term interest-bearing debt 261 640 (7 849) 2 616 Bank overdraft 1 130 (34) 11 Cash and cash equivalent 70 014 2 100 (700)Accounts payable 272 292 – –Total impact before taxation (4 139) 1 380 Taxation 1 159 (386)
Total impact after taxation (2 980) 993
The above table is calculated on the following assumptions:Taxation is applied at a flat rate of 28%.
The impact of each risk in the table above relates only to changes in that risk variable while keeping all other variables constant.
Changes in interest rate risk have been calculated by applying the reasonably possible change identified above the weighted average prime rate of interest.
Certain long-term interest-bearing debt is subject to JIBAR-related interest rate rather than prime. However, the method of calculation applied above utilising a fixed range of reasonably possible interest rate changes yields similar results.
The methods and assumptions are consistent across the years presented unless indicated otherwise.
Weighted average prime rates of interest (source: South African Reserve Bank)
Date Rate (%) 2016 2015
Friday, 19 November 2010 9,00 – –Thursday, 19 July 2012 8,50 – –Thursday, 30 January 2014 9,00 3,45 3,45 Friday, 18 July 2014 9,25 4,63 5,70 Monday, 28 December 2015 9,75 0,81 –Friday, 29 January 2016 10,25 0,85 –
9,74 9,15
40 Astrapak Annual Financial Statements 2016
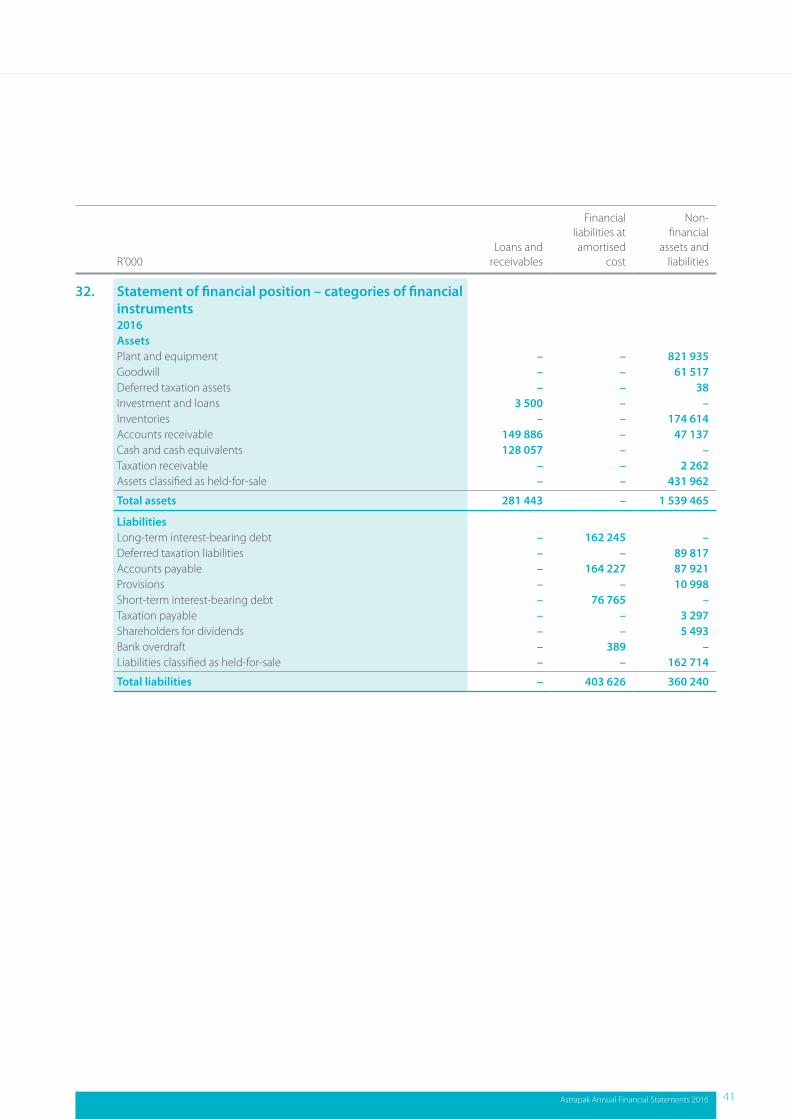
R’000Loans and
receivables
Financial liabilities at amortised
cost
Non-financial
assets and liabilities
32. Statement of financial position – categories of financial instruments2016AssetsPlant and equipment – – 821 935 Goodwill – – 61 517 Deferred taxation assets – – 38 Investment and loans 3 500 – –Inventories – – 174 614 Accounts receivable 149 886 – 47 137 Cash and cash equivalents 128 057 – –Taxation receivable – – 2 262 Assets classified as held-for-sale – – 431 962
Total assets 281 443 – 1 539 465
Liabilities Long-term interest-bearing debt – 162 245 –Deferred taxation liabilities – – 89 817 Accounts payable – 164 227 87 921 Provisions – – 10 998 Short-term interest-bearing debt – 76 765 –Taxation payable – – 3 297 Shareholders for dividends – – 5 493 Bank overdraft – 389 –Liabilities classified as held-for-sale – – 162 714
Total liabilities – 403 626 360 240
Astrapak Annual Financial Statements 2016 41
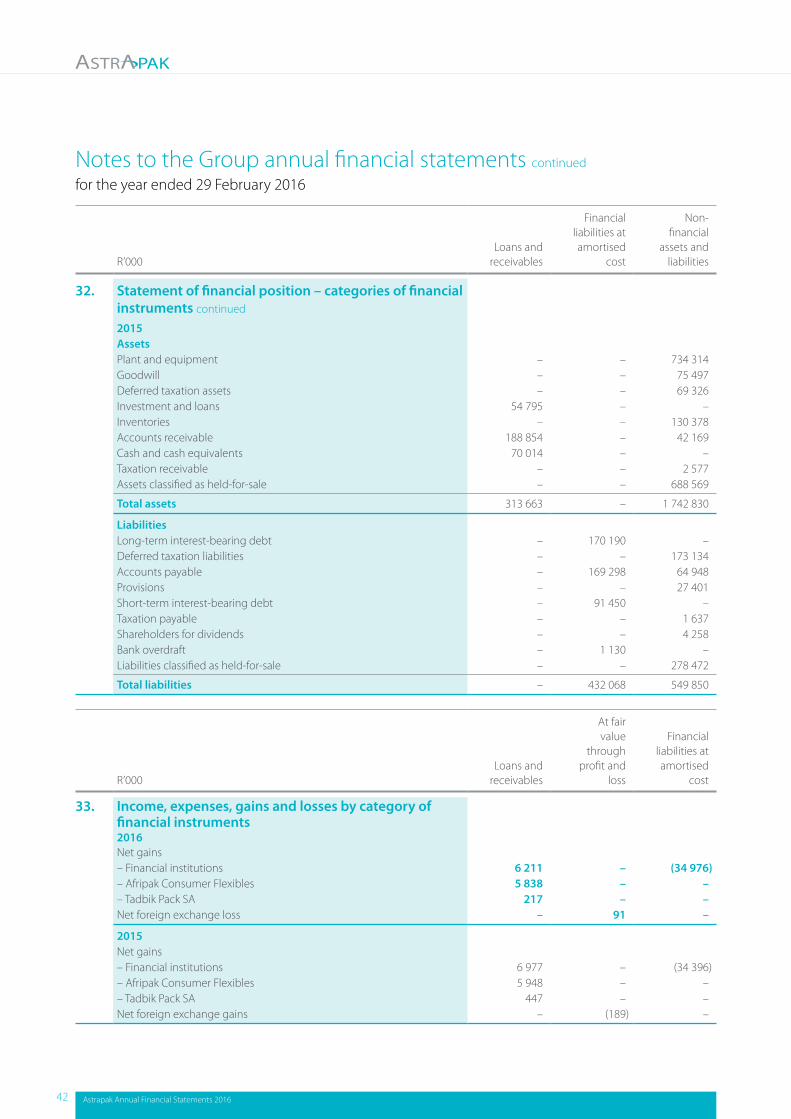
Notes to the Group annual financial statements continued
for the year ended 29 February 2016
R’000Loans and
receivables
Financial liabilities at amortised
cost
Non-financial
assets and liabilities
32. Statement of financial position – categories of financial instruments continued
2015AssetsPlant and equipment – – 734 314 Goodwill – – 75 497 Deferred taxation assets – – 69 326 Investment and loans 54 795 – –Inventories – – 130 378 Accounts receivable 188 854 – 42 169 Cash and cash equivalents 70 014 – –Taxation receivable – – 2 577 Assets classified as held-for-sale – – 688 569
Total assets 313 663 – 1 742 830
LiabilitiesLong-term interest-bearing debt – 170 190 –Deferred taxation liabilities – – 173 134 Accounts payable – 169 298 64 948 Provisions – – 27 401 Short-term interest-bearing debt – 91 450 –Taxation payable – – 1 637 Shareholders for dividends – – 4 258 Bank overdraft – 1 130 –Liabilities classified as held-for-sale – – 278 472
Total liabilities – 432 068 549 850
R’000Loans and
receivables
At fair value
through profit and
loss
Financial liabilities at amortised
cost
33. Income, expenses, gains and losses by category of financial instruments2016Net gains– Financial institutions 6 211 – (34 976)– Afripak Consumer Flexibles 5 838 – –– Tadbik Pack SA 217 – –Net foreign exchange loss – 91 –
2015Net gains– Financial institutions 6 977 – (34 396)– Afripak Consumer Flexibles 5 948 – –– Tadbik Pack SA 447 – –Net foreign exchange gains – (189) –
42 Astrapak Annual Financial Statements 2016
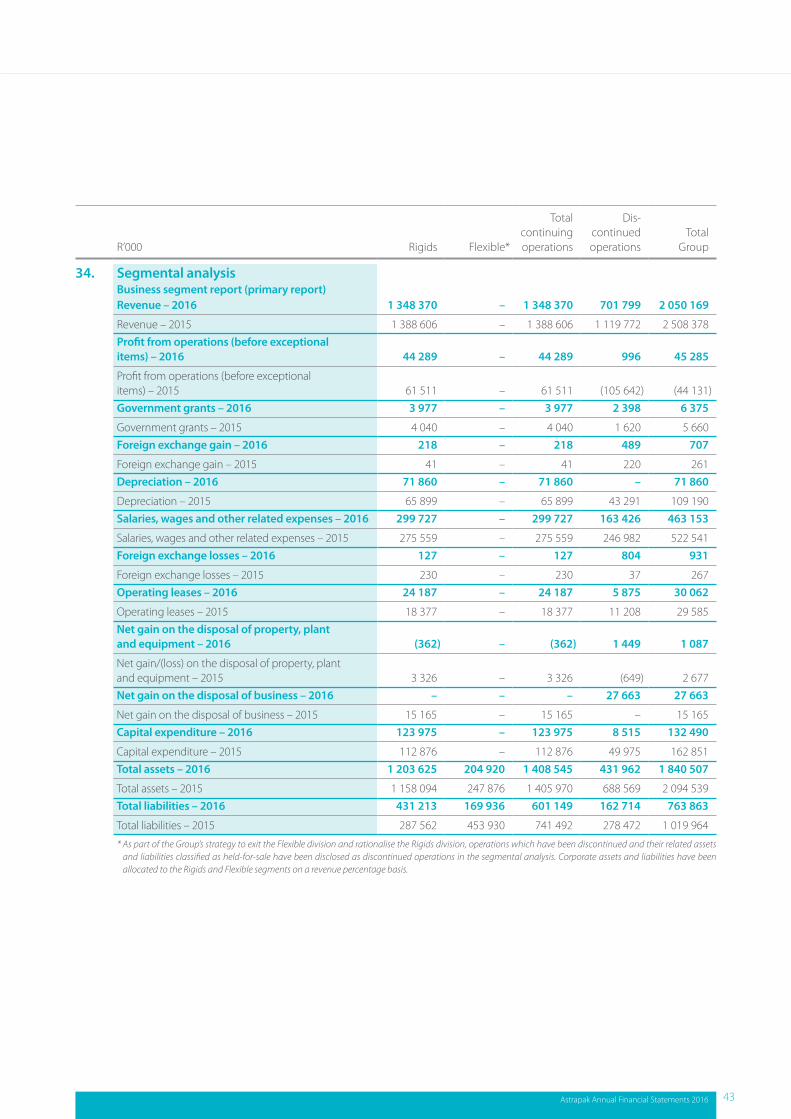
R’000 Rigids Flexible*
Total continuingoperations
Dis-continuedoperations
Total Group
34. Segmental analysisBusiness segment report (primary report)Revenue – 2016 1 348 370 – 1 348 370 701 799 2 050 169
Revenue – 2015 1 388 606 – 1 388 606 1 119 772 2 508 378 Profit from operations (before exceptional items) – 2016 44 289 – 44 289 996 45 285
Profit from operations (before exceptional items) – 2015 61 511 – 61 511 (105 642) (44 131)Government grants – 2016 3 977 – 3 977 2 398 6 375
Government grants – 2015 4 040 – 4 040 1 620 5 660 Foreign exchange gain – 2016 218 – 218 489 707
Foreign exchange gain – 2015 41 – 41 220 261 Depreciation – 2016 71 860 – 71 860 – 71 860
Depreciation – 2015 65 899 – 65 899 43 291 109 190 Salaries, wages and other related expenses – 2016 299 727 – 299 727 163 426 463 153
Salaries, wages and other related expenses – 2015 275 559 – 275 559 246 982 522 541 Foreign exchange losses – 2016 127 – 127 804 931
Foreign exchange losses – 2015 230 – 230 37 267 Operating leases – 2016 24 187 – 24 187 5 875 30 062
Operating leases – 2015 18 377 – 18 377 11 208 29 585 Net gain on the disposal of property, plant and equipment – 2016 (362) – (362) 1 449 1 087
Net gain/(loss) on the disposal of property, plant and equipment – 2015 3 326 – 3 326 (649) 2 677 Net gain on the disposal of business – 2016 – – – 27 663 27 663
Net gain on the disposal of business – 2015 15 165 – 15 165 – 15 165 Capital expenditure – 2016 123 975 – 123 975 8 515 132 490
Capital expenditure – 2015 112 876 – 112 876 49 975 162 851 Total assets – 2016 1 203 625 204 920 1 408 545 431 962 1 840 507
Total assets – 2015 1 158 094 247 876 1 405 970 688 569 2 094 539 Total liabilities – 2016 431 213 169 936 601 149 162 714 763 863
Total liabilities – 2015 287 562 453 930 741 492 278 472 1 019 964
* As part of the Group’s strategy to exit the Flexible division and rationalise the Rigids division, operations which have been discontinued and their related assets and liabilities classified as held-for-sale have been disclosed as discontinued operations in the segmental analysis. Corporate assets and liabilities have been allocated to the Rigids and Flexible segments on a revenue percentage basis.
Astrapak Annual Financial Statements 2016 43
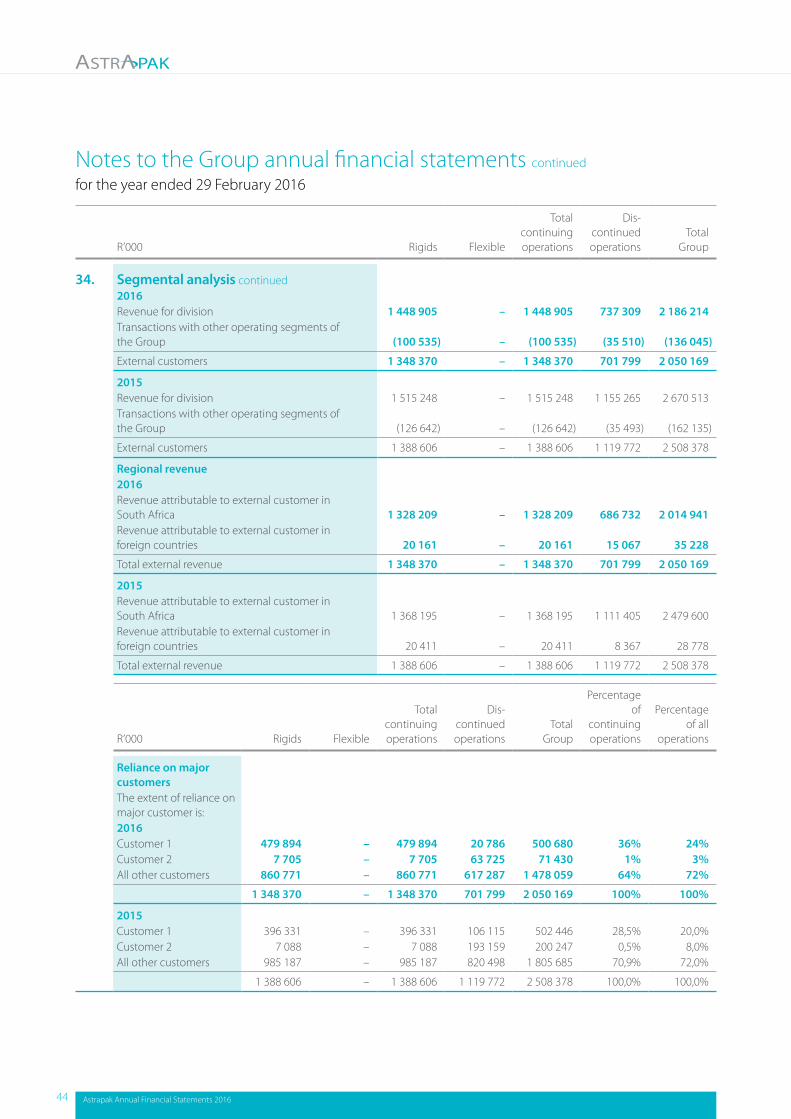
Notes to the Group annual financial statements continued
for the year ended 29 February 2016
R’000 Rigids Flexible
Total continuing operations
Dis-continued operations
Total Group
34. Segmental analysis continued2016Revenue for division 1 448 905 – 1 448 905 737 309 2 186 214 Transactions with other operating segments of the Group (100 535) – (100 535) (35 510) (136 045)
External customers 1 348 370 – 1 348 370 701 799 2 050 169
2015Revenue for division 1 515 248 – 1 515 248 1 155 265 2 670 513 Transactions with other operating segments of the Group (126 642) – (126 642) (35 493) (162 135)
External customers 1 388 606 – 1 388 606 1 119 772 2 508 378
Regional revenue2016Revenue attributable to external customer in South Africa 1 328 209 – 1 328 209 686 732 2 014 941 Revenue attributable to external customer in foreign countries 20 161 – 20 161 15 067 35 228
Total external revenue 1 348 370 – 1 348 370 701 799 2 050 169
2015Revenue attributable to external customer in South Africa 1 368 195 – 1 368 195 1 111 405 2 479 600 Revenue attributable to external customer in foreign countries 20 411 – 20 411 8 367 28 778
Total external revenue 1 388 606 – 1 388 606 1 119 772 2 508 378
R’000 Rigids Flexible
Total continuing operations
Dis-continuedoperations
Total Group
Percentage of
continuingoperations
Percentage of all
operations
Reliance on major customersThe extent of reliance on major customer is:2016Customer 1 479 894 – 479 894 20 786 500 680 36% 24%Customer 2 7 705 – 7 705 63 725 71 430 1% 3%All other customers 860 771 – 860 771 617 287 1 478 059 64% 72%
1 348 370 – 1 348 370 701 799 2 050 169 100% 100%
2015Customer 1 396 331 – 396 331 106 115 502 446 28,5% 20,0%Customer 2 7 088 – 7 088 193 159 200 247 0,5% 8,0%All other customers 985 187 – 985 187 820 498 1 805 685 70,9% 72,0%
1 388 606 – 1 388 606 1 119 772 2 508 378 100,0% 100,0%
44 Astrapak Annual Financial Statements 2016
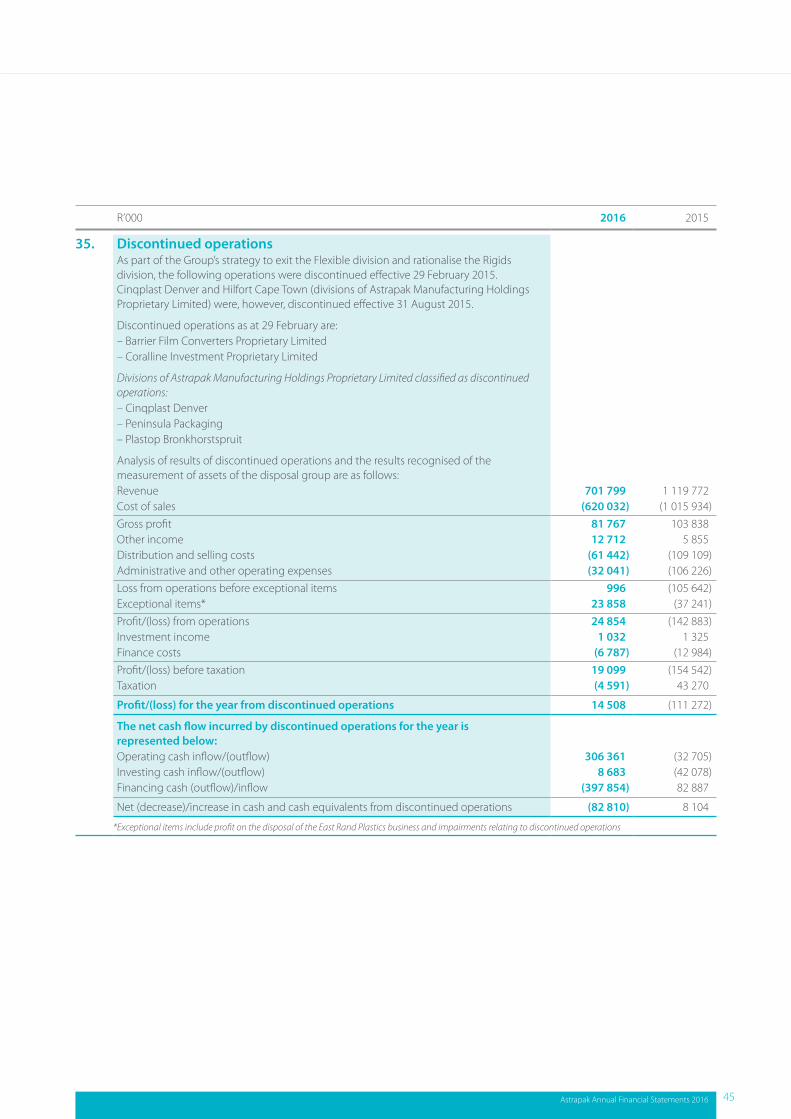
R’000 2016 2015
35. Discontinued operationsAs part of the Group’s strategy to exit the Flexible division and rationalise the Rigids division, the following operations were discontinued effective 29 February 2015. Cinqplast Denver and Hilfort Cape Town (divisions of Astrapak Manufacturing Holdings Proprietary Limited) were, however, discontinued effective 31 August 2015.
Discontinued operations as at 29 February are:– Barrier Film Converters Proprietary Limited– Coralline Investment Proprietary Limited
Divisions of Astrapak Manufacturing Holdings Proprietary Limited classified as discontinued operations:– Cinqplast Denver – Peninsula Packaging– Plastop Bronkhorstspruit
Analysis of results of discontinued operations and the results recognised of the measurement of assets of the disposal group are as follows:Revenue 701 799 1 119 772 Cost of sales (620 032) (1 015 934)Gross profit 81 767 103 838 Other income 12 712 5 855 Distribution and selling costs (61 442) (109 109)Administrative and other operating expenses (32 041) (106 226)Loss from operations before exceptional items 996 (105 642)Exceptional items* 23 858 (37 241)Profit/(loss) from operations 24 854 (142 883)Investment income 1 032 1 325 Finance costs (6 787) (12 984)Profit/(loss) before taxation 19 099 (154 542)Taxation (4 591) 43 270
Profit/(loss) for the year from discontinued operations 14 508 (111 272)
The net cash flow incurred by discontinued operations for the year is represented below:Operating cash inflow/(outflow) 306 361 (32 705)Investing cash inflow/(outflow) 8 683 (42 078)Financing cash (outflow)/inflow (397 854) 82 887
Net (decrease)/increase in cash and cash equivalents from discontinued operations (82 810) 8 104
*Exceptional items include profit on the disposal of the East Rand Plastics business and impairments relating to discontinued operations
Astrapak Annual Financial Statements 2016 45
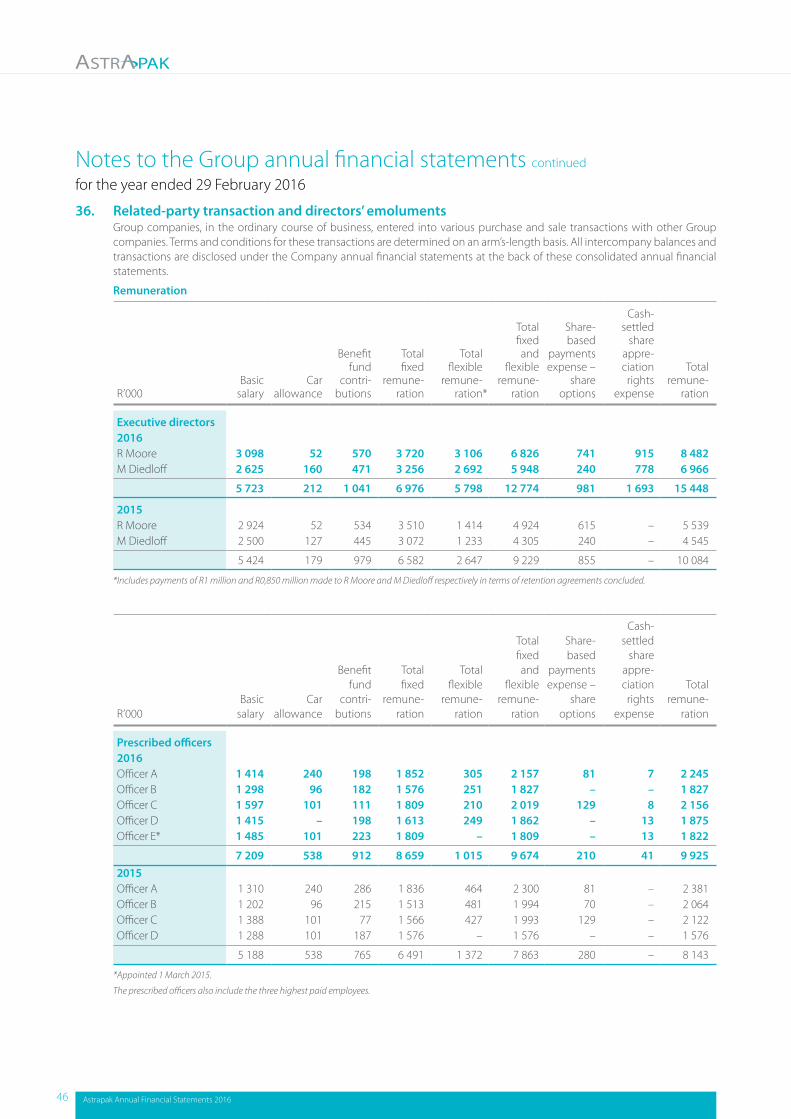
Notes to the Group annual financial statements continued
for the year ended 29 February 2016
36. Related-party transaction and directors’ emoluments Group companies, in the ordinary course of business, entered into various purchase and sale transactions with other Group companies. Terms and conditions for these transactions are determined on an arm’s-length basis. All intercompany balances and transactions are disclosed under the Company annual financial statements at the back of these consolidated annual financial statements.
Remuneration
R’000Basic
salaryCar
allowance
Benefit fund
contri-butions
Total fixed
remune-ration
Total flexible
remune-ration*
Total fixed and
flexible remune-
ration
Share-based
payments expense –
share options
Cash- settled
share appre-ciation rights
expense
Total remune-
ration
Executive directors2016R Moore 3 098 52 570 3 720 3 106 6 826 741 915 8 482 M Diedloff 2 625 160 471 3 256 2 692 5 948 240 778 6 966
5 723 212 1 041 6 976 5 798 12 774 981 1 693 15 448
2015R Moore 2 924 52 534 3 510 1 414 4 924 615 – 5 539 M Diedloff 2 500 127 445 3 072 1 233 4 305 240 – 4 545
5 424 179 979 6 582 2 647 9 229 855 – 10 084
*Includes payments of R1 million and R0,850 million made to R Moore and M Diedloff respectively in terms of retention agreements concluded.
R’000Basic
salaryCar
allowance
Benefit fund
contri-butions
Total fixed
remune-ration
Total flexible
remune-ration
Total fixed and
flexible remune-
ration
Share-based
paymentsexpense –
share options
Cash- settled
share appre-ciation rights
expense
Total remune-
ration
Prescribed officers2016Officer A 1 414 240 198 1 852 305 2 157 81 7 2 245 Officer B 1 298 96 182 1 576 251 1 827 – – 1 827 Officer C 1 597 101 111 1 809 210 2 019 129 8 2 156 Officer D 1 415 – 198 1 613 249 1 862 – 13 1 875 Officer E* 1 485 101 223 1 809 – 1 809 – 13 1 822
7 209 538 912 8 659 1 015 9 674 210 41 9 925 2015Officer A 1 310 240 286 1 836 464 2 300 81 – 2 381 Officer B 1 202 96 215 1 513 481 1 994 70 – 2 064 Officer C 1 388 101 77 1 566 427 1 993 129 – 2 122 Officer D 1 288 101 187 1 576 – 1 576 – – 1 576
5 188 538 765 6 491 1 372 7 863 280 – 8 143
*Appointed 1 March 2015.
The prescribed officers also include the three highest paid employees.
46 Astrapak Annual Financial Statements 2016
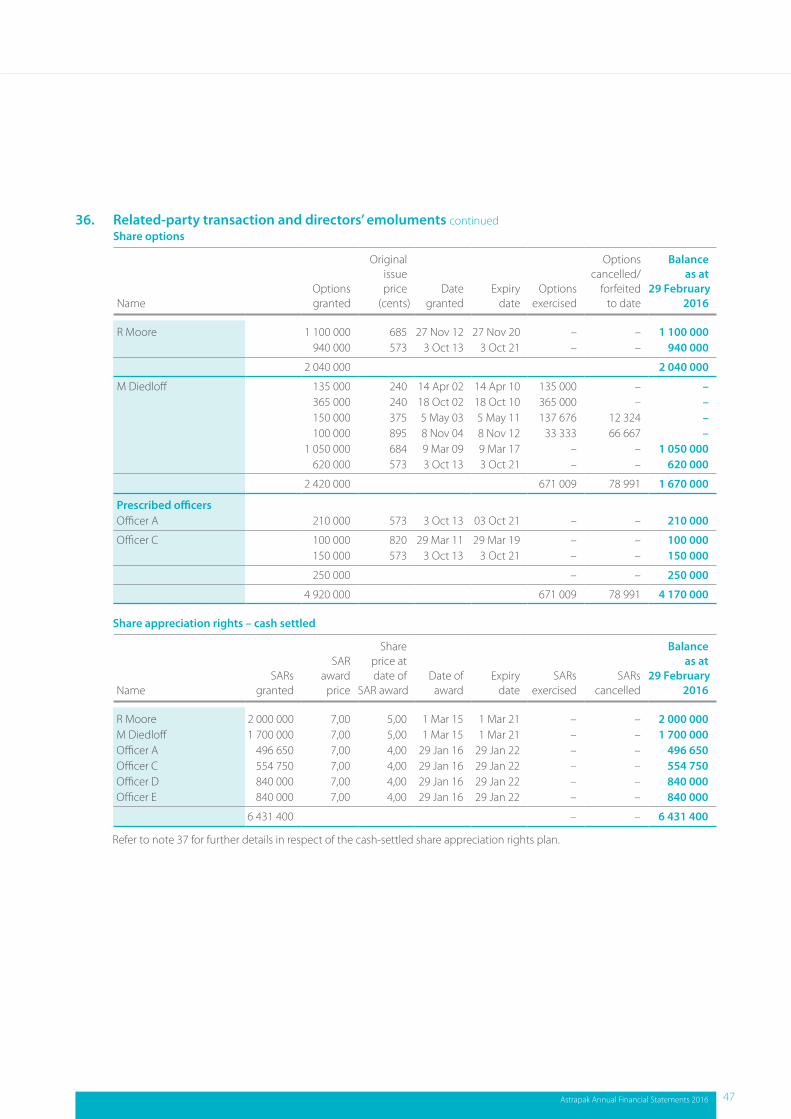
36. Related-party transaction and directors’ emoluments continuedShare options
NameOptions granted
Original issue price
(cents)Date
grantedExpiry
date Options
exercised
Options cancelled/
forfeited to date
Balance as at
29 February 2016
R Moore 1 100 000 685 27 Nov 12 27 Nov 20 – – 1 100 000 940 000 573 3 Oct 13 3 Oct 21 – – 940 000
2 040 000 2 040 000
M Diedloff 135 000 240 14 Apr 02 14 Apr 10 135 000 – – 365 000 240 18 Oct 02 18 Oct 10 365 000 – – 150 000 375 5 May 03 5 May 11 137 676 12 324 – 100 000 895 8 Nov 04 8 Nov 12 33 333 66 667 –
1 050 000 684 9 Mar 09 9 Mar 17 – – 1 050 000 620 000 573 3 Oct 13 3 Oct 21 – – 620 000
2 420 000 671 009 78 991 1 670 000
Prescribed officersOfficer A 210 000 573 3 Oct 13 03 Oct 21 – – 210 000
Officer C 100 000 820 29 Mar 11 29 Mar 19 – – 100 000 150 000 573 3 Oct 13 3 Oct 21 – – 150 000
250 000 – – 250 000
4 920 000 671 009 78 991 4 170 000
Share appreciation rights – cash settled
NameSARs
granted
SAR award
price
Share price at date of
SAR awardDate of
awardExpiry
date SARs
exercised SARs
cancelled
Balance as at
29 February 2016
R Moore 2 000 000 7,00 5,00 1 Mar 15 1 Mar 21 – – 2 000 000 M Diedloff 1 700 000 7,00 5,00 1 Mar 15 1 Mar 21 – – 1 700 000 Officer A 496 650 7,00 4,00 29 Jan 16 29 Jan 22 – – 496 650 Officer C 554 750 7,00 4,00 29 Jan 16 29 Jan 22 – – 554 750 Officer D 840 000 7,00 4,00 29 Jan 16 29 Jan 22 – – 840 000 Officer E 840 000 7,00 4,00 29 Jan 16 29 Jan 22 – – 840 000
6 431 400 – – 6 431 400
Refer to note 37 for further details in respect of the cash-settled share appreciation rights plan.
Astrapak Annual Financial Statements 2016 47
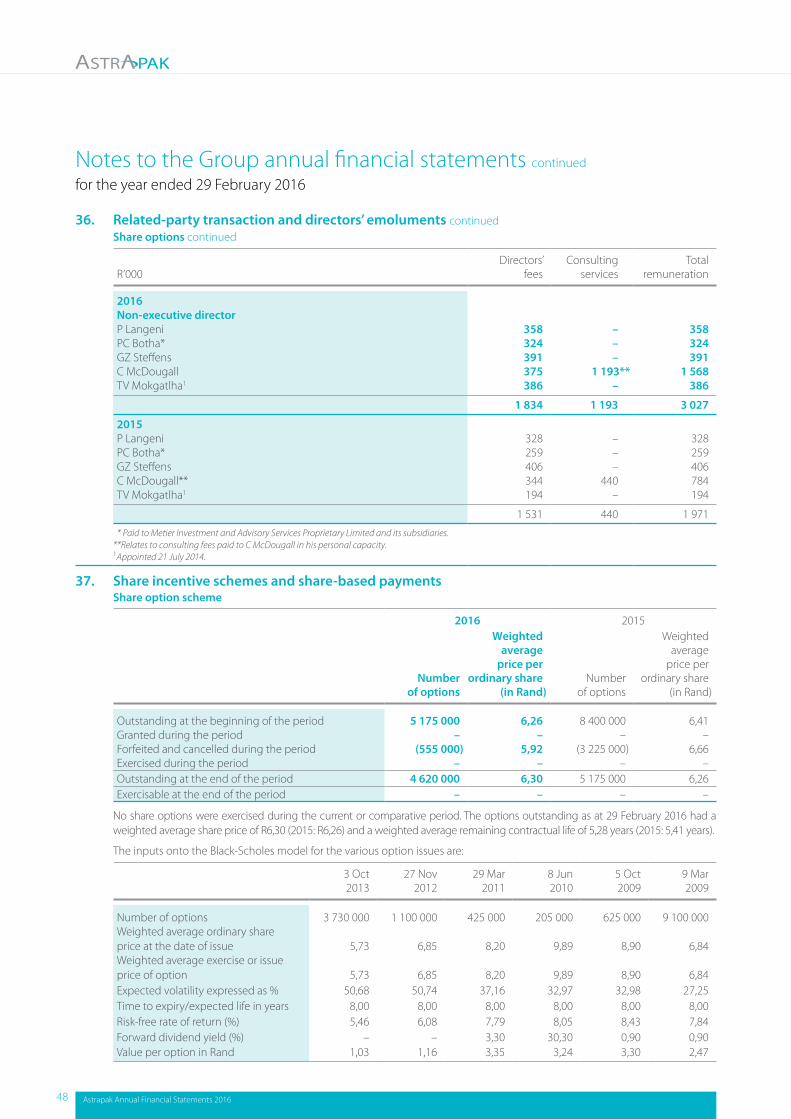
Notes to the Group annual financial statements continued
for the year ended 29 February 2016
36. Related-party transaction and directors’ emoluments continuedShare options continued
R’000 Directors’
fees Consulting
servicesTotal
remuneration
2016Non-executive directorP Langeni 358 – 358 PC Botha* 324 – 324 GZ Steffens 391 – 391 C McDougall 375 1 193** 1 568 TV Mokgatlha1 386 – 386
1 834 1 193 3 027
2015P Langeni 328 – 328PC Botha* 259 – 259GZ Steffens 406 – 406C McDougall** 344 440 784TV Mokgatlha1 194 – 194
1 531 440 1 971
* Paid to Metier Investment and Advisory Services Proprietary Limited and its subsidiaries. **Relates to consulting fees paid to C McDougall in his personal capacity.1Appointed 21 July 2014.
37. Share incentive schemes and share-based paymentsShare option scheme
2016 2015
Number of options
Weighted average
price per ordinary share
(in Rand)Number
of options
Weighted average
price per ordinary share
(in Rand)
Outstanding at the beginning of the period 5 175 000 6,26 8 400 000 6,41 Granted during the period – – – –Forfeited and cancelled during the period (555 000) 5,92 (3 225 000) 6,66 Exercised during the period – – – –Outstanding at the end of the period 4 620 000 6,30 5 175 000 6,26 Exercisable at the end of the period – – – –
No share options were exercised during the current or comparative period. The options outstanding as at 29 February 2016 had a weighted average share price of R6,30 (2015: R6,26) and a weighted average remaining contractual life of 5,28 years (2015: 5,41 years).
The inputs onto the Black-Scholes model for the various option issues are:
3 Oct 2013
27 Nov 2012
29 Mar 2011
8 Jun 2010
5 Oct 2009
9 Mar 2009
Number of options 3 730 000 1 100 000 425 000 205 000 625 000 9 100 000 Weighted average ordinary share price at the date of issue 5,73 6,85 8,20 9,89 8,90 6,84 Weighted average exercise or issue price of option 5,73 6,85 8,20 9,89 8,90 6,84 Expected volatility expressed as % 50,68 50,74 37,16 32,97 32,98 27,25 Time to expiry/expected life in years 8,00 8,00 8,00 8,00 8,00 8,00 Risk-free rate of return (%) 5,46 6,08 7,79 8,05 8,43 7,84 Forward dividend yield (%) – – 3,30 30,30 0,90 0,90 Value per option in Rand 1,03 1,16 3,35 3,24 3,30 2,47
48 Astrapak Annual Financial Statements 2016
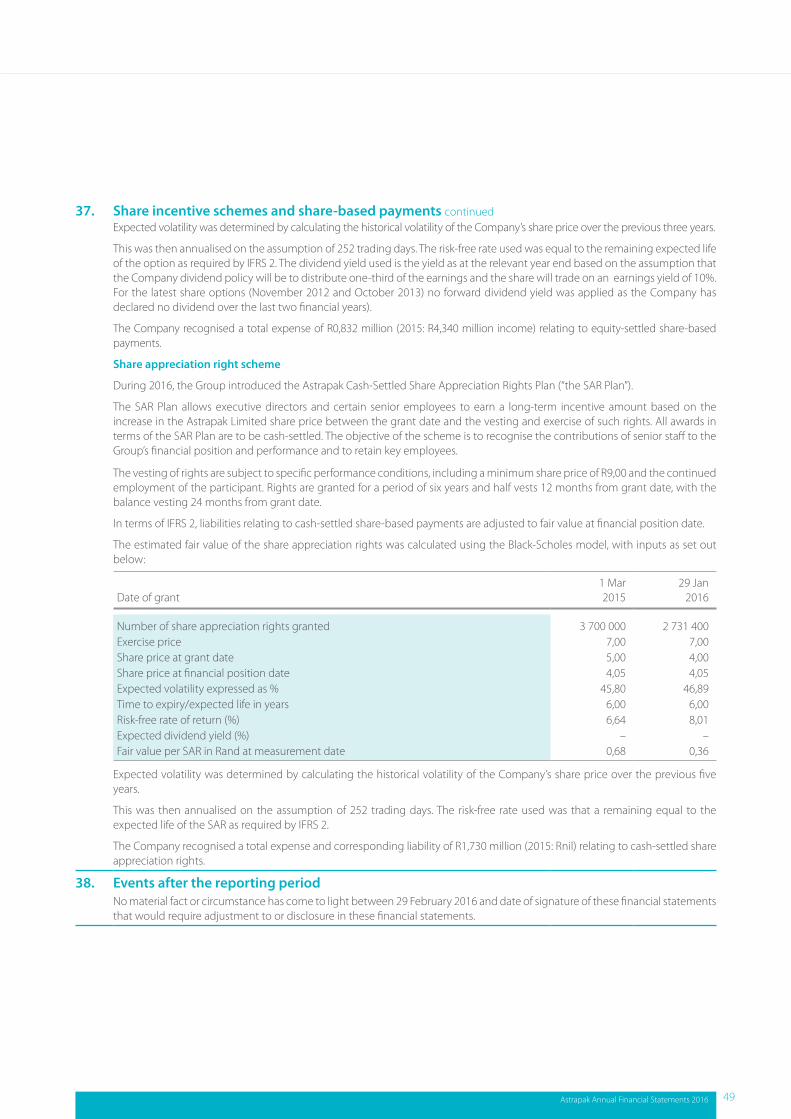
37. Share incentive schemes and share-based payments continuedExpected volatility was determined by calculating the historical volatility of the Company’s share price over the previous three years.
This was then annualised on the assumption of 252 trading days. The risk-free rate used was equal to the remaining expected life of the option as required by IFRS 2. The dividend yield used is the yield as at the relevant year end based on the assumption that the Company dividend policy will be to distribute one-third of the earnings and the share will trade on an earnings yield of 10%. For the latest share options (November 2012 and October 2013) no forward dividend yield was applied as the Company has declared no dividend over the last two financial years).
The Company recognised a total expense of R0,832 million (2015: R4,340 million income) relating to equity-settled share-based payments.
Share appreciation right scheme
During 2016, the Group introduced the Astrapak Cash-Settled Share Appreciation Rights Plan (“the SAR Plan”).
The SAR Plan allows executive directors and certain senior employees to earn a long-term incentive amount based on the increase in the Astrapak Limited share price between the grant date and the vesting and exercise of such rights. All awards in terms of the SAR Plan are to be cash-settled. The objective of the scheme is to recognise the contributions of senior staff to the Group’s financial position and performance and to retain key employees.
The vesting of rights are subject to specific performance conditions, including a minimum share price of R9,00 and the continued employment of the participant. Rights are granted for a period of six years and half vests 12 months from grant date, with the balance vesting 24 months from grant date.
In terms of IFRS 2, liabilities relating to cash-settled share-based payments are adjusted to fair value at financial position date.
The estimated fair value of the share appreciation rights was calculated using the Black-Scholes model, with inputs as set out below:
Date of grant1 Mar2015
29 Jan2016
Number of share appreciation rights granted 3 700 000 2 731 400 Exercise price 7,00 7,00 Share price at grant date 5,00 4,00 Share price at financial position date 4,05 4,05 Expected volatility expressed as % 45,80 46,89 Time to expiry/expected life in years 6,00 6,00 Risk-free rate of return (%) 6,64 8,01 Expected dividend yield (%) – –Fair value per SAR in Rand at measurement date 0,68 0,36
Expected volatility was determined by calculating the historical volatility of the Company’s share price over the previous five years.
This was then annualised on the assumption of 252 trading days. The risk-free rate used was that a remaining equal to the expected life of the SAR as required by IFRS 2.
The Company recognised a total expense and corresponding liability of R1,730 million (2015: Rnil) relating to cash-settled share appreciation rights.
38. Events after the reporting periodNo material fact or circumstance has come to light between 29 February 2016 and date of signature of these financial statements that would require adjustment to or disclosure in these financial statements.
Astrapak Annual Financial Statements 2016 49
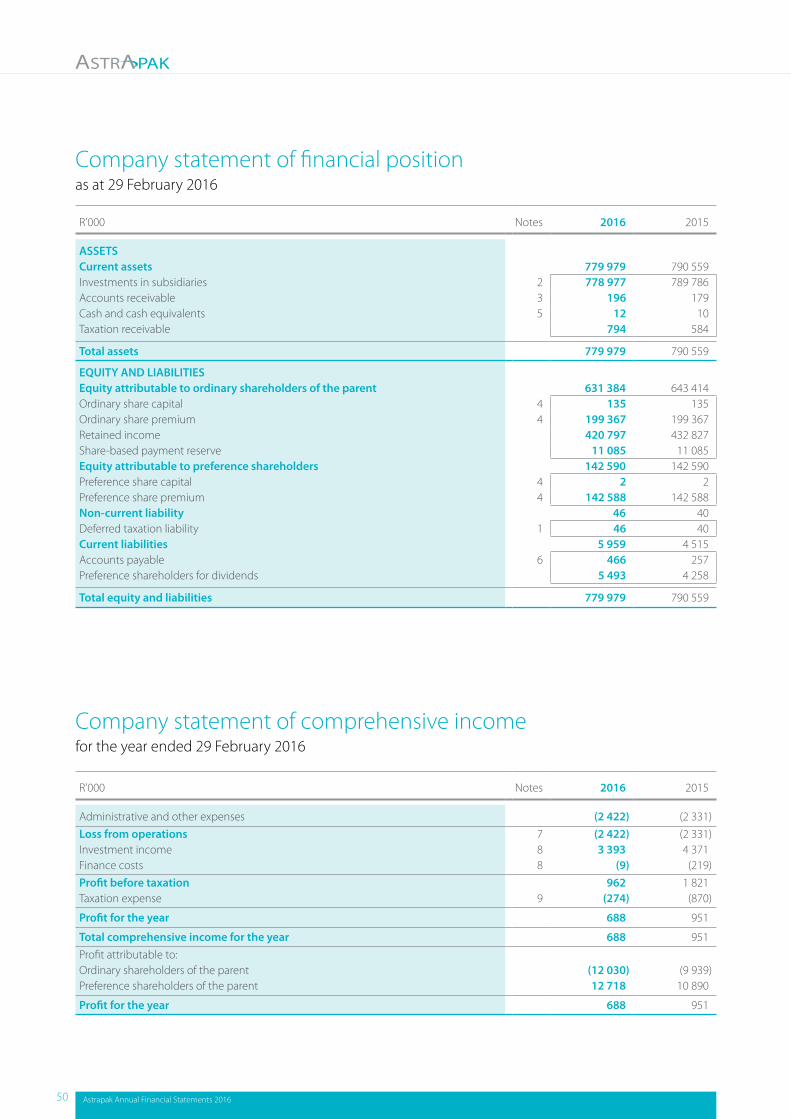
Company statement of financial positionas at 29 February 2016
R’000 Notes 2016 2015
ASSETSCurrent assets 779 979 790 559 Investments in subsidiaries 2 778 977 789 786 Accounts receivable 3 196 179 Cash and cash equivalents 5 12 10 Taxation receivable 794 584
Total assets 779 979 790 559
EQUITY AND LIABILITIESEquity attributable to ordinary shareholders of the parent 631 384 643 414 Ordinary share capital 4 135 135 Ordinary share premium 4 199 367 199 367 Retained income 420 797 432 827 Share-based payment reserve 11 085 11 085 Equity attributable to preference shareholders 142 590 142 590 Preference share capital 4 2 2 Preference share premium 4 142 588 142 588 Non-current liability 46 40 Deferred taxation liability 1 46 40 Current liabilities 5 959 4 515 Accounts payable 6 466 257 Preference shareholders for dividends 5 493 4 258
Total equity and liabilities 779 979 790 559
R’000 Notes 2016 2015
Administrative and other expenses (2 422) (2 331)Loss from operations 7 (2 422) (2 331)Investment income 8 3 393 4 371 Finance costs 8 (9) (219)Profit before taxation 962 1 821 Taxation expense 9 (274) (870)
Profit for the year 688 951
Total comprehensive income for the year 688 951 Profit attributable to:Ordinary shareholders of the parent (12 030) (9 939)Preference shareholders of the parent 12 718 10 890
Profit for the year 688 951
Company statement of comprehensive incomefor the year ended 29 February 2016
50 Astrapak Annual Financial Statements 2016
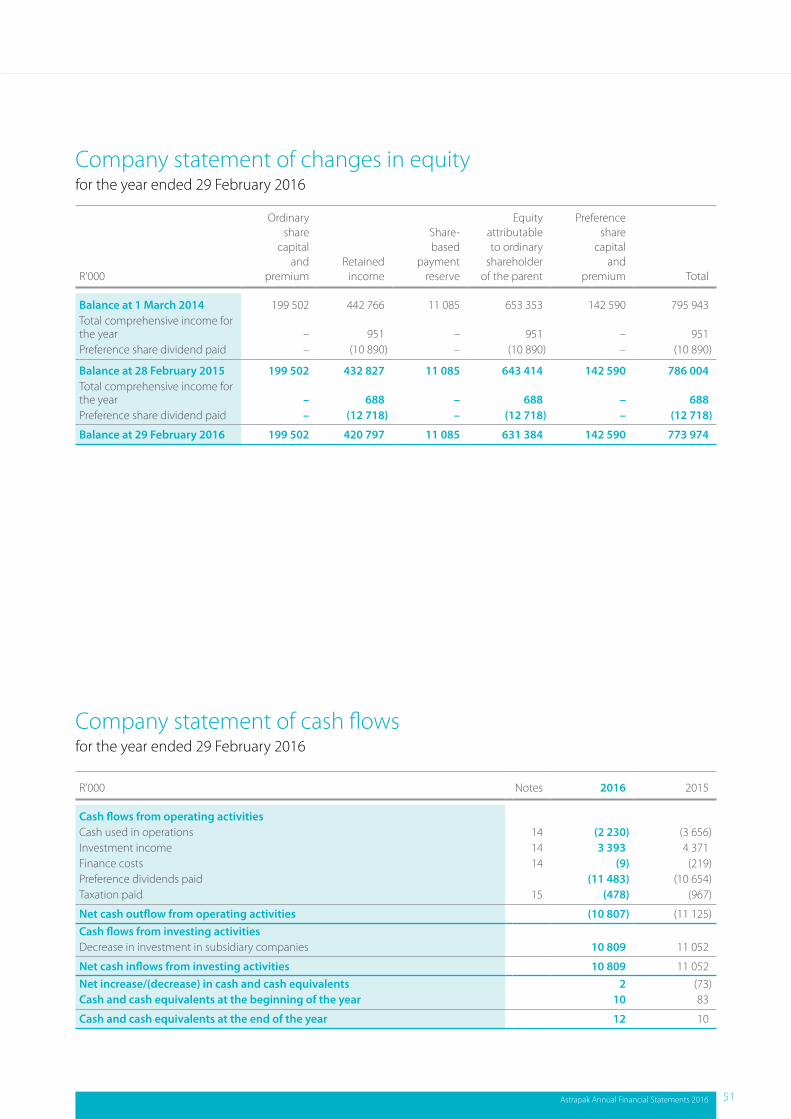
R’000
Ordinary share
capital and
premiumRetained
income
Share-based
payment reserve
Equity attributable to ordinary
shareholder of the parent
Preference share
capital and
premium Total
Balance at 1 March 2014 199 502 442 766 11 085 653 353 142 590 795 943 Total comprehensive income for the year – 951 – 951 – 951 Preference share dividend paid – (10 890) – (10 890) – (10 890)
Balance at 28 February 2015 199 502 432 827 11 085 643 414 142 590 786 004Total comprehensive income for the year – 688 – 688 – 688 Preference share dividend paid – (12 718) – (12 718) – (12 718)
Balance at 29 February 2016 199 502 420 797 11 085 631 384 142 590 773 974
R’000 Notes 2016 2015
Cash flows from operating activitiesCash used in operations 14 (2 230) (3 656)Investment income 14 3 393 4 371 Finance costs 14 (9) (219)Preference dividends paid (11 483) (10 654)Taxation paid 15 (478) (967)
Net cash outflow from operating activities (10 807) (11 125)Cash flows from investing activitiesDecrease in investment in subsidiary companies 10 809 11 052
Net cash inflows from investing activities 10 809 11 052 Net increase/(decrease) in cash and cash equivalents 2 (73)Cash and cash equivalents at the beginning of the year 10 83
Cash and cash equivalents at the end of the year 12 10
Company statement of cash flowsfor the year ended 29 February 2016
Company statement of changes in equityfor the year ended 29 February 2016
Astrapak Annual Financial Statements 2016 51
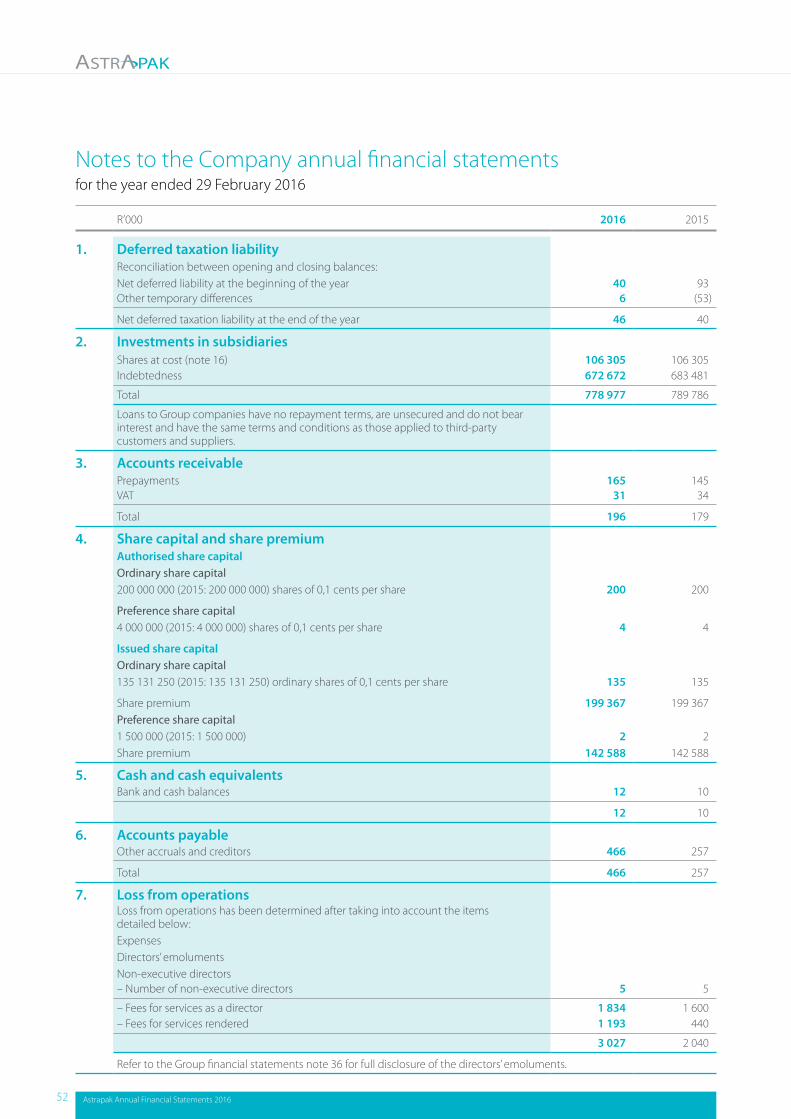
Notes to the Company annual financial statementsfor the year ended 29 February 2016
R’000 2016 2015
1. Deferred taxation liabilityReconciliation between opening and closing balances:Net deferred liability at the beginning of the year 40 93 Other temporary differences 6 (53)
Net deferred taxation liability at the end of the year 46 40
2. Investments in subsidiariesShares at cost (note 16) 106 305 106 305 Indebtedness 672 672 683 481
Total 778 977 789 786
Loans to Group companies have no repayment terms, are unsecured and do not bear interest and have the same terms and conditions as those applied to third-party customers and suppliers.
3. Accounts receivablePrepayments 165 145 VAT 31 34
Total 196 179
4. Share capital and share premiumAuthorised share capitalOrdinary share capital200 000 000 (2015: 200 000 000) shares of 0,1 cents per share 200 200
Preference share capital4 000 000 (2015: 4 000 000) shares of 0,1 cents per share 4 4
Issued share capitalOrdinary share capital135 131 250 (2015: 135 131 250) ordinary shares of 0,1 cents per share 135 135
Share premium 199 367 199 367 Preference share capital1 500 000 (2015: 1 500 000) 2 2 Share premium 142 588 142 588
5. Cash and cash equivalentsBank and cash balances 12 10
12 10
6. Accounts payableOther accruals and creditors 466 257
Total 466 257
7. Loss from operationsLoss from operations has been determined after taking into account the items detailed below:ExpensesDirectors’ emolumentsNon-executive directors– Number of non-executive directors 5 5
– Fees for services as a director 1 834 1 600– Fees for services rendered 1 193 440
3 027 2 040
Refer to the Group financial statements note 36 for full disclosure of the directors’ emoluments.
52 Astrapak Annual Financial Statements 2016
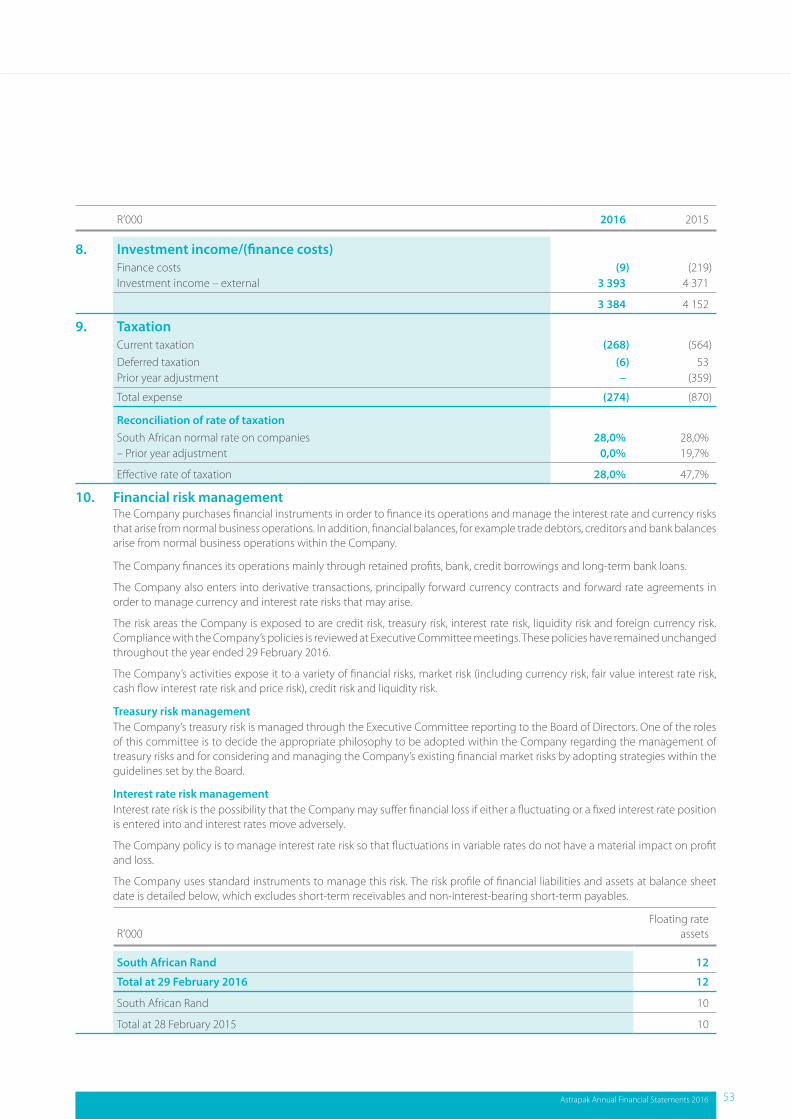
R’000 2016 2015
8. Investment income/(finance costs)Finance costs (9) (219)Investment income – external 3 393 4 371
3 384 4 152
9. TaxationCurrent taxation (268) (564)Deferred taxation (6) 53 Prior year adjustment – (359)
Total expense (274) (870)
Reconciliation of rate of taxationSouth African normal rate on companies 28,0% 28,0%– Prior year adjustment 0,0% 19,7%
Effective rate of taxation 28,0% 47,7%
10. Financial risk managementThe Company purchases financial instruments in order to finance its operations and manage the interest rate and currency risks that arise from normal business operations. In addition, financial balances, for example trade debtors, creditors and bank balances arise from normal business operations within the Company.
The Company finances its operations mainly through retained profits, bank, credit borrowings and long-term bank loans.
The Company also enters into derivative transactions, principally forward currency contracts and forward rate agreements in order to manage currency and interest rate risks that may arise.
The risk areas the Company is exposed to are credit risk, treasury risk, interest rate risk, liquidity risk and foreign currency risk. Compliance with the Company’s policies is reviewed at Executive Committee meetings. These policies have remained unchanged throughout the year ended 29 February 2016.
The Company’s activities expose it to a variety of financial risks, market risk (including currency risk, fair value interest rate risk, cash flow interest rate risk and price risk), credit risk and liquidity risk.
Treasury risk managementThe Company’s treasury risk is managed through the Executive Committee reporting to the Board of Directors. One of the roles of this committee is to decide the appropriate philosophy to be adopted within the Company regarding the management of treasury risks and for considering and managing the Company’s existing financial market risks by adopting strategies within the guidelines set by the Board.
Interest rate risk managementInterest rate risk is the possibility that the Company may suffer financial loss if either a fluctuating or a fixed interest rate position is entered into and interest rates move adversely.
The Company policy is to manage interest rate risk so that fluctuations in variable rates do not have a material impact on profit and loss.
The Company uses standard instruments to manage this risk. The risk profile of financial liabilities and assets at balance sheet date is detailed below, which excludes short-term receivables and non-interest-bearing short-term payables.
R’000 Floating rate
assets
South African Rand 12
Total at 29 February 2016 12
South African Rand 10
Total at 28 February 2015 10
Astrapak Annual Financial Statements 2016 53
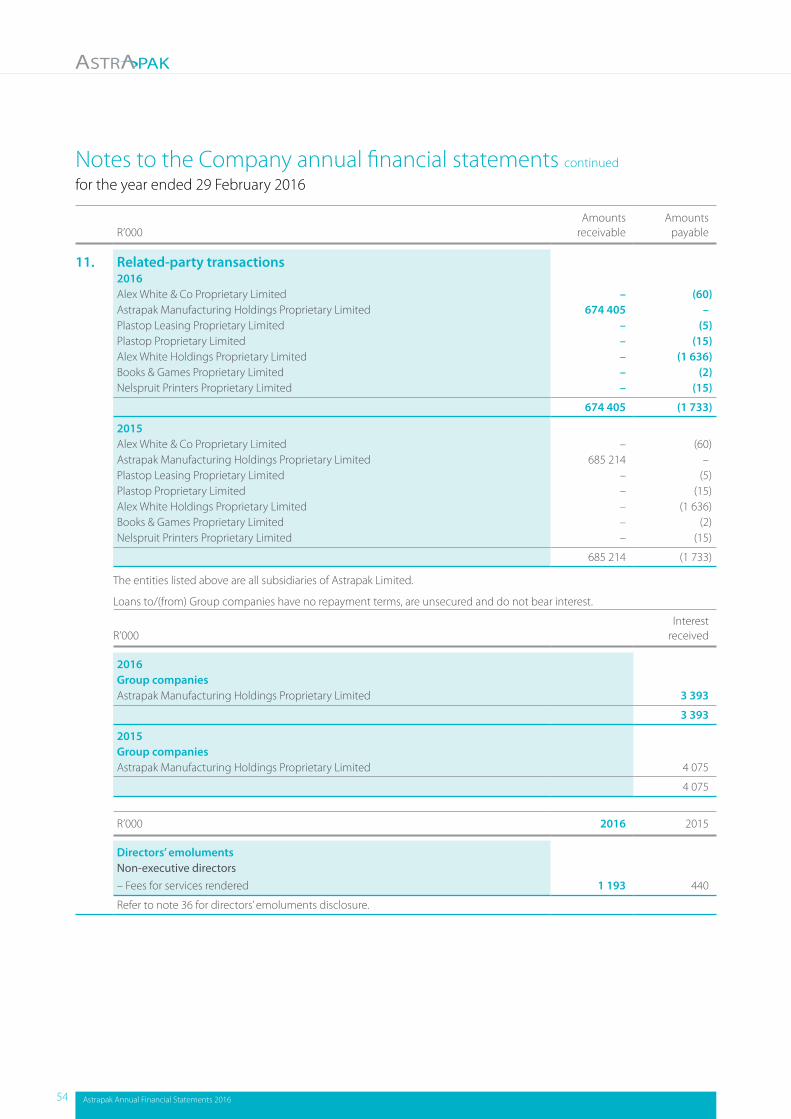
Notes to the Company annual financial statements continued
for the year ended 29 February 2016
R’000Amounts
receivableAmounts
payable
11. Related-party transactions 2016Alex White & Co Proprietary Limited – (60)Astrapak Manufacturing Holdings Proprietary Limited 674 405 –Plastop Leasing Proprietary Limited – (5)Plastop Proprietary Limited – (15)Alex White Holdings Proprietary Limited – (1 636)Books & Games Proprietary Limited – (2)Nelspruit Printers Proprietary Limited – (15)
674 405 (1 733)
2015Alex White & Co Proprietary Limited – (60)Astrapak Manufacturing Holdings Proprietary Limited 685 214 –Plastop Leasing Proprietary Limited – (5)Plastop Proprietary Limited – (15)Alex White Holdings Proprietary Limited – (1 636)Books & Games Proprietary Limited – (2)Nelspruit Printers Proprietary Limited – (15)
685 214 (1 733)
The entities listed above are all subsidiaries of Astrapak Limited.
Loans to/(from) Group companies have no repayment terms, are unsecured and do not bear interest.
R’000Interest
received
2016Group companies Astrapak Manufacturing Holdings Proprietary Limited 3 393
3 393
2015Group companies Astrapak Manufacturing Holdings Proprietary Limited 4 075
4 075
R’000 2016 2015
Directors’ emolumentsNon-executive directors– Fees for services rendered 1 193 440
Refer to note 36 for directors’ emoluments disclosure.
54 Astrapak Annual Financial Statements 2016
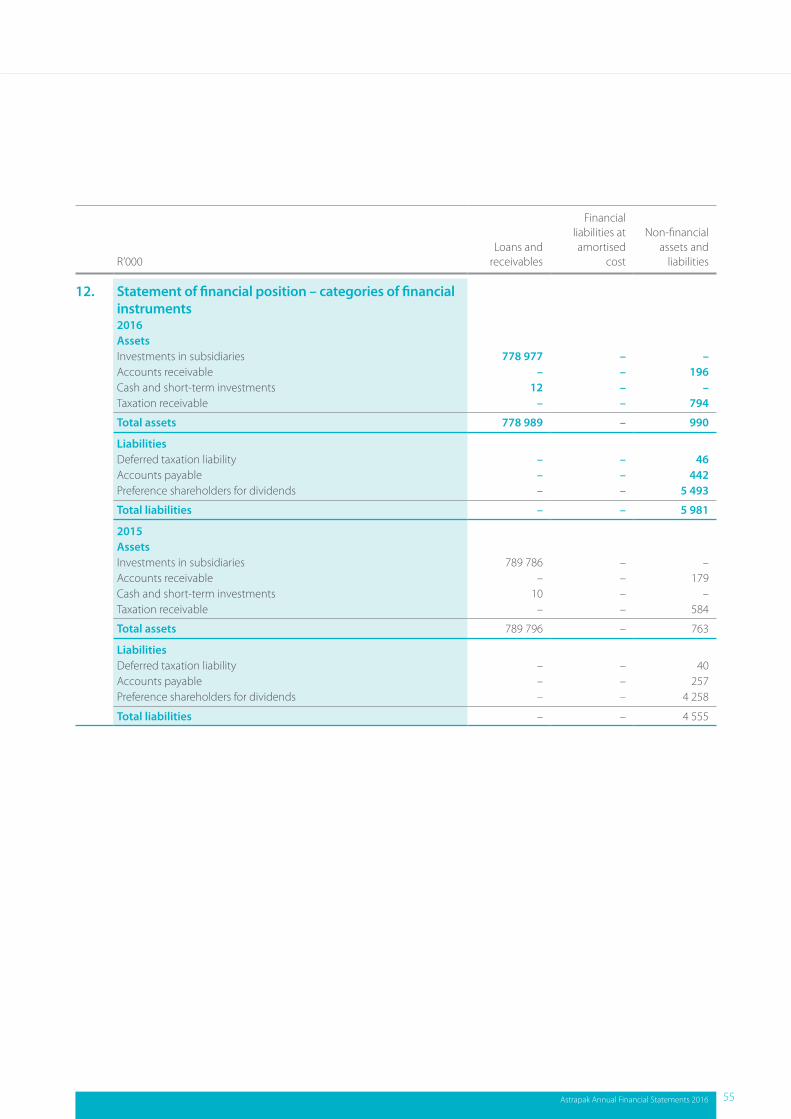
R’000Loans and
receivables
Financial liabilities at amortised
cost
Non-financial assets and
liabilities
12. Statement of financial position – categories of financial instruments2016AssetsInvestments in subsidiaries 778 977 – –Accounts receivable – – 196 Cash and short-term investments 12 – –Taxation receivable – – 794
Total assets 778 989 – 990
LiabilitiesDeferred taxation liability – – 46 Accounts payable – – 442 Preference shareholders for dividends – – 5 493
Total liabilities – – 5 981
2015AssetsInvestments in subsidiaries 789 786 – –Accounts receivable – – 179 Cash and short-term investments 10 – –Taxation receivable – – 584
Total assets 789 796 – 763
LiabilitiesDeferred taxation liability – – 40 Accounts payable – – 257 Preference shareholders for dividends – – 4 258
Total liabilities – – 4 555
Astrapak Annual Financial Statements 2016 55
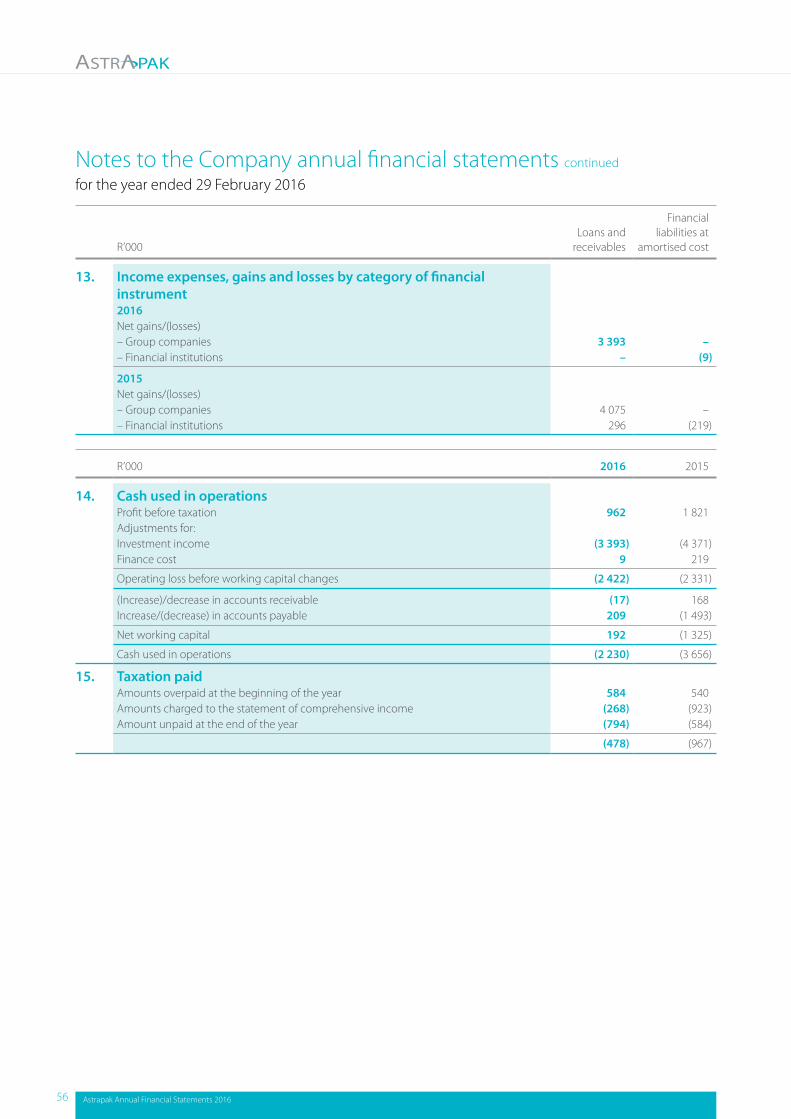
Notes to the Company annual financial statements continued
for the year ended 29 February 2016
R’000Loans and
receivables
Financial liabilities at
amortised cost
13. Income expenses, gains and losses by category of financial instrument2016Net gains/(losses)– Group companies 3 393 –– Financial institutions – (9)
2015Net gains/(losses)– Group companies 4 075 –– Financial institutions 296 (219)
R’000 2016 2015
14. Cash used in operationsProfit before taxation 962 1 821 Adjustments for:Investment income (3 393) (4 371)Finance cost 9 219
Operating loss before working capital changes (2 422) (2 331)
(Increase)/decrease in accounts receivable (17) 168 Increase/(decrease) in accounts payable 209 (1 493)
Net working capital 192 (1 325)
Cash used in operations (2 230) (3 656)
15. Taxation paidAmounts overpaid at the beginning of the year 584 540 Amounts charged to the statement of comprehensive income (268) (923)Amount unpaid at the end of the year (794) (584)
(478) (967)
56 Astrapak Annual Financial Statements 2016
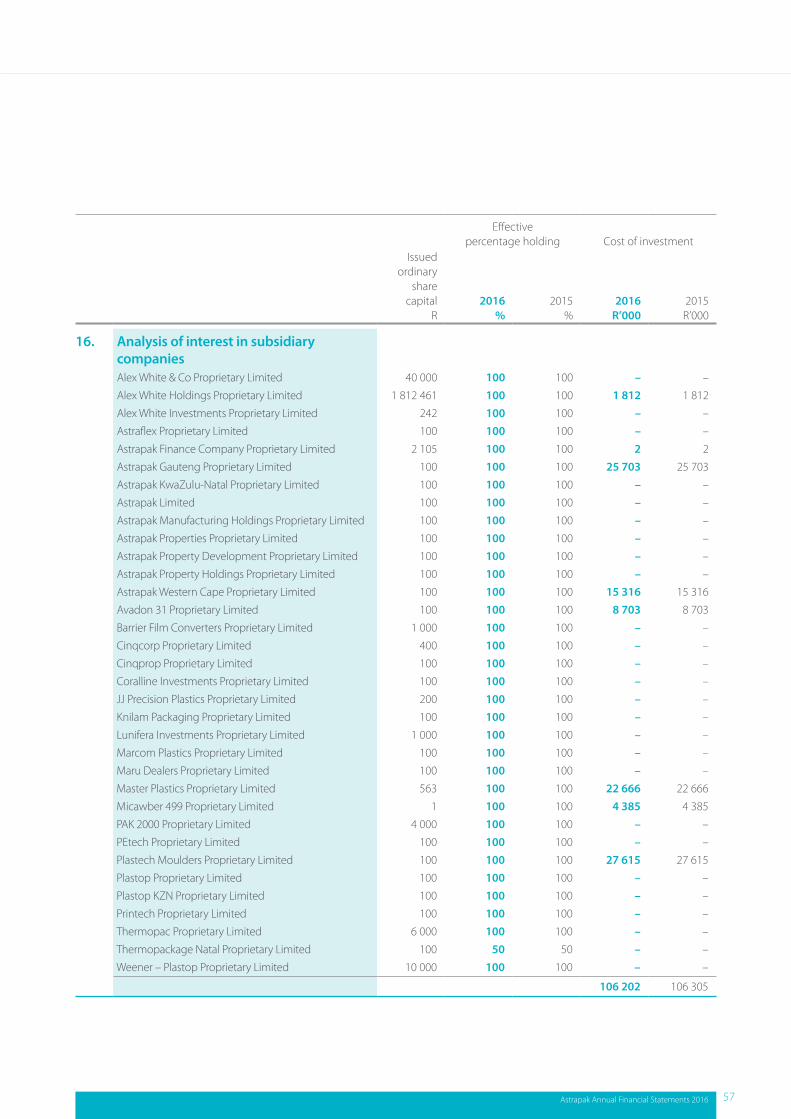
Effective percentage holding Cost of investment
Issued ordinary
share capital
R2016
%2015
%2016
R’0002015R’000
16. Analysis of interest in subsidiary companies Alex White & Co Proprietary Limited 40 000 100 100 – –
Alex White Holdings Proprietary Limited 1 812 461 100 100 1 812 1 812
Alex White Investments Proprietary Limited 242 100 100 – –
Astraflex Proprietary Limited 100 100 100 – –
Astrapak Finance Company Proprietary Limited 2 105 100 100 2 2
Astrapak Gauteng Proprietary Limited 100 100 100 25 703 25 703
Astrapak KwaZulu-Natal Proprietary Limited 100 100 100 – –
Astrapak Limited 100 100 100 – –
Astrapak Manufacturing Holdings Proprietary Limited 100 100 100 – –
Astrapak Properties Proprietary Limited 100 100 100 – –
Astrapak Property Development Proprietary Limited 100 100 100 – –
Astrapak Property Holdings Proprietary Limited 100 100 100 – –
Astrapak Western Cape Proprietary Limited 100 100 100 15 316 15 316
Avadon 31 Proprietary Limited 100 100 100 8 703 8 703
Barrier Film Converters Proprietary Limited 1 000 100 100 – –
Cinqcorp Proprietary Limited 400 100 100 – –
Cinqprop Proprietary Limited 100 100 100 – –
Coralline Investments Proprietary Limited 100 100 100 – –
JJ Precision Plastics Proprietary Limited 200 100 100 – –
Knilam Packaging Proprietary Limited 100 100 100 – –
Lunifera Investments Proprietary Limited 1 000 100 100 – –
Marcom Plastics Proprietary Limited 100 100 100 – –
Maru Dealers Proprietary Limited 100 100 100 – –
Master Plastics Proprietary Limited 563 100 100 22 666 22 666
Micawber 499 Proprietary Limited 1 100 100 4 385 4 385
PAK 2000 Proprietary Limited 4 000 100 100 – –
PEtech Proprietary Limited 100 100 100 – –
Plastech Moulders Proprietary Limited 100 100 100 27 615 27 615
Plastop Proprietary Limited 100 100 100 – –
Plastop KZN Proprietary Limited 100 100 100 – –
Printech Proprietary Limited 100 100 100 – –
Thermopac Proprietary Limited 6 000 100 100 – –
Thermopackage Natal Proprietary Limited 100 50 50 – –
Weener – Plastop Proprietary Limited 10 000 100 100 – –
106 202 106 305
Astrapak Annual Financial Statements 2016 57
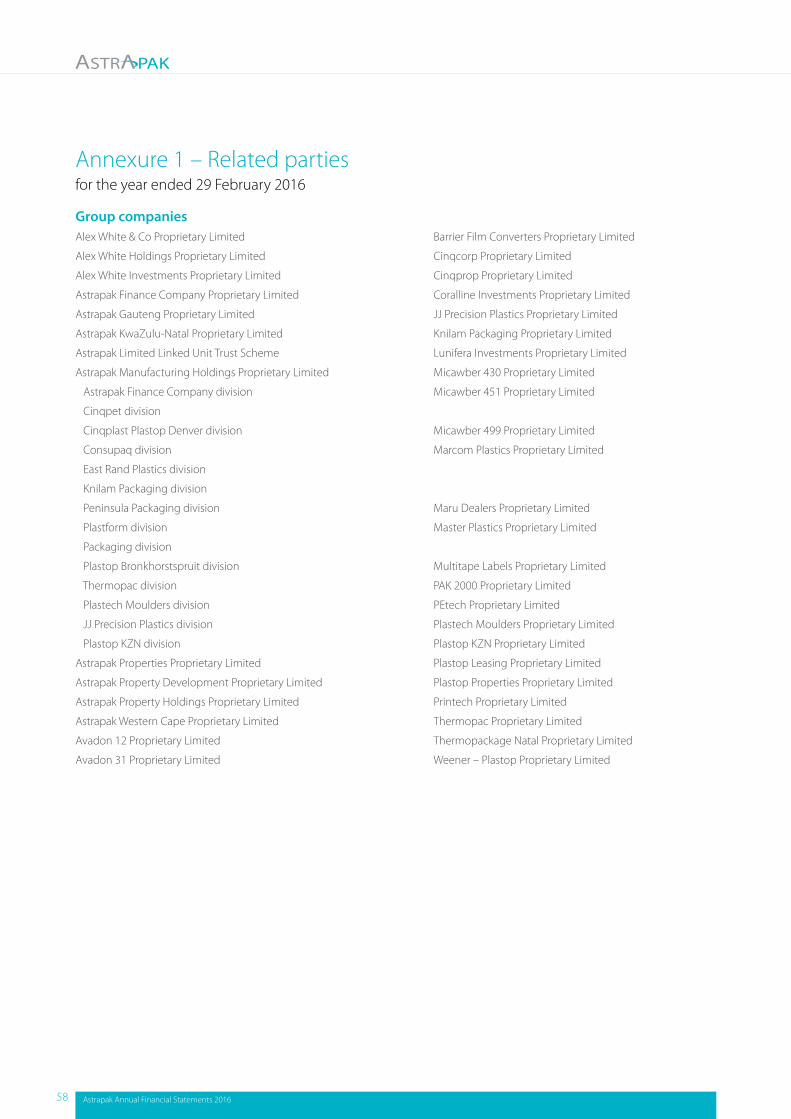
Annexure 1 – Related partiesfor the year ended 29 February 2016
Group companiesAlex White & Co Proprietary Limited Barrier Film Converters Proprietary Limited
Alex White Holdings Proprietary Limited Cinqcorp Proprietary Limited
Alex White Investments Proprietary Limited Cinqprop Proprietary Limited
Astrapak Finance Company Proprietary Limited Coralline Investments Proprietary Limited
Astrapak Gauteng Proprietary Limited JJ Precision Plastics Proprietary Limited
Astrapak KwaZulu-Natal Proprietary Limited Knilam Packaging Proprietary Limited
Astrapak Limited Linked Unit Trust Scheme Lunifera Investments Proprietary Limited
Astrapak Manufacturing Holdings Proprietary Limited Micawber 430 Proprietary Limited
Astrapak Finance Company division Micawber 451 Proprietary Limited
Cinqpet division
Cinqplast Plastop Denver division Micawber 499 Proprietary Limited
Consupaq division Marcom Plastics Proprietary Limited
East Rand Plastics division
Knilam Packaging division
Peninsula Packaging division Maru Dealers Proprietary Limited
Plastform division Master Plastics Proprietary Limited
Packaging division
Plastop Bronkhorstspruit division Multitape Labels Proprietary Limited
Thermopac division PAK 2000 Proprietary Limited
Plastech Moulders division PEtech Proprietary Limited
JJ Precision Plastics division Plastech Moulders Proprietary Limited
Plastop KZN division Plastop KZN Proprietary Limited
Astrapak Properties Proprietary Limited Plastop Leasing Proprietary Limited
Astrapak Property Development Proprietary Limited Plastop Properties Proprietary Limited
Astrapak Property Holdings Proprietary Limited Printech Proprietary Limited
Astrapak Western Cape Proprietary Limited Thermopac Proprietary Limited
Avadon 12 Proprietary Limited Thermopackage Natal Proprietary Limited
Avadon 31 Proprietary Limited Weener – Plastop Proprietary Limited
58 Astrapak Annual Financial Statements 2016
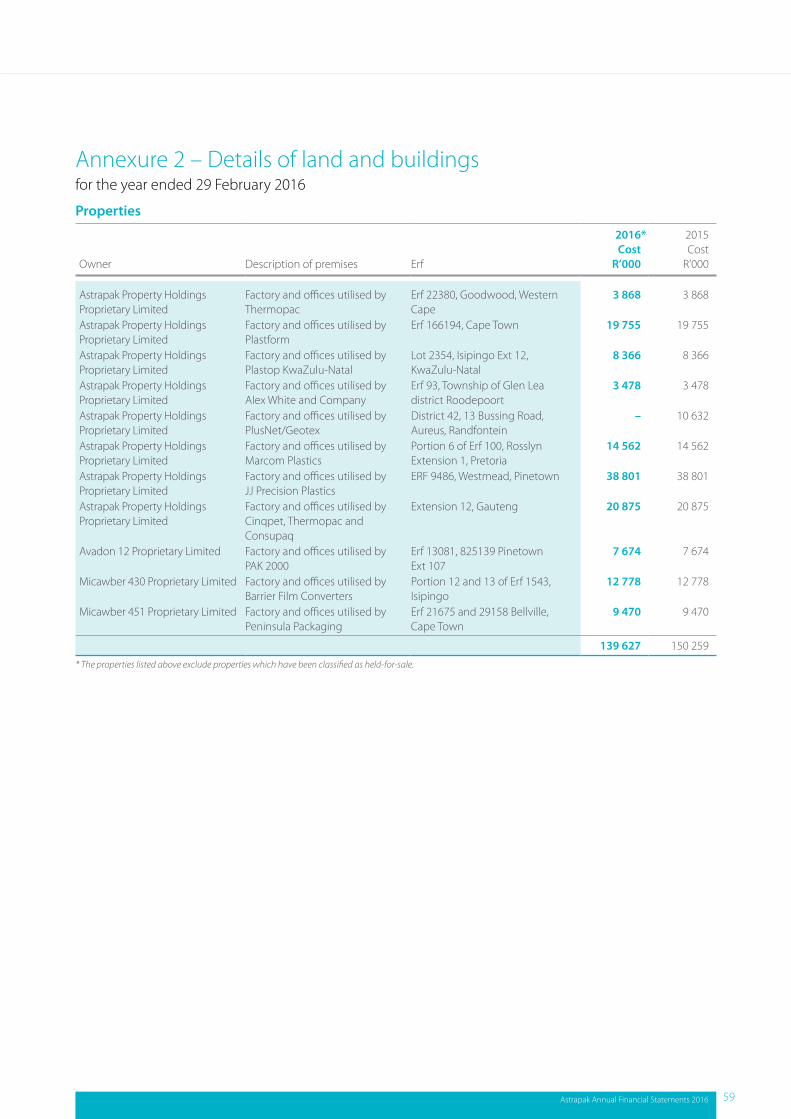
Annexure 2 – Details of land and buildingsfor the year ended 29 February 2016
Properties
Owner Description of premises Erf
2016*Cost
R’000
2015Cost
R’000
Astrapak Property Holdings Proprietary Limited
Factory and offices utilised by Thermopac
Erf 22380, Goodwood, Western Cape
3 868 3 868
Astrapak Property Holdings Proprietary Limited
Factory and offices utilised by Plastform
Erf 166194, Cape Town 19 755 19 755
Astrapak Property Holdings Proprietary Limited
Factory and offices utilised by Plastop KwaZulu-Natal
Lot 2354, Isipingo Ext 12, KwaZulu-Natal
8 366 8 366
Astrapak Property Holdings Proprietary Limited
Factory and offices utilised by Alex White and Company
Erf 93, Township of Glen Lea district Roodepoort
3 478 3 478
Astrapak Property Holdings Proprietary Limited
Factory and offices utilised by PlusNet/Geotex
District 42, 13 Bussing Road, Aureus, Randfontein
– 10 632
Astrapak Property Holdings Proprietary Limited
Factory and offices utilised by Marcom Plastics
Portion 6 of Erf 100, Rosslyn Extension 1, Pretoria
14 562 14 562
Astrapak Property Holdings Proprietary Limited
Factory and offices utilised by JJ Precision Plastics
ERF 9486, Westmead, Pinetown 38 801 38 801
Astrapak Property Holdings Proprietary Limited
Factory and offices utilised by Cinqpet, Thermopac and Consupaq
Extension 12, Gauteng 20 875 20 875
Avadon 12 Proprietary Limited Factory and offices utilised by PAK 2000
Erf 13081, 825139 Pinetown Ext 107
7 674 7 674
Micawber 430 Proprietary Limited Factory and offices utilised by Barrier Film Converters
Portion 12 and 13 of Erf 1543, Isipingo
12 778 12 778
Micawber 451 Proprietary Limited Factory and offices utilised by Peninsula Packaging
Erf 21675 and 29158 Bellville, Cape Town
9 470 9 470
139 627 150 259
* The properties listed above exclude properties which have been classified as held-for-sale.
Astrapak Annual Financial Statements 2016 59
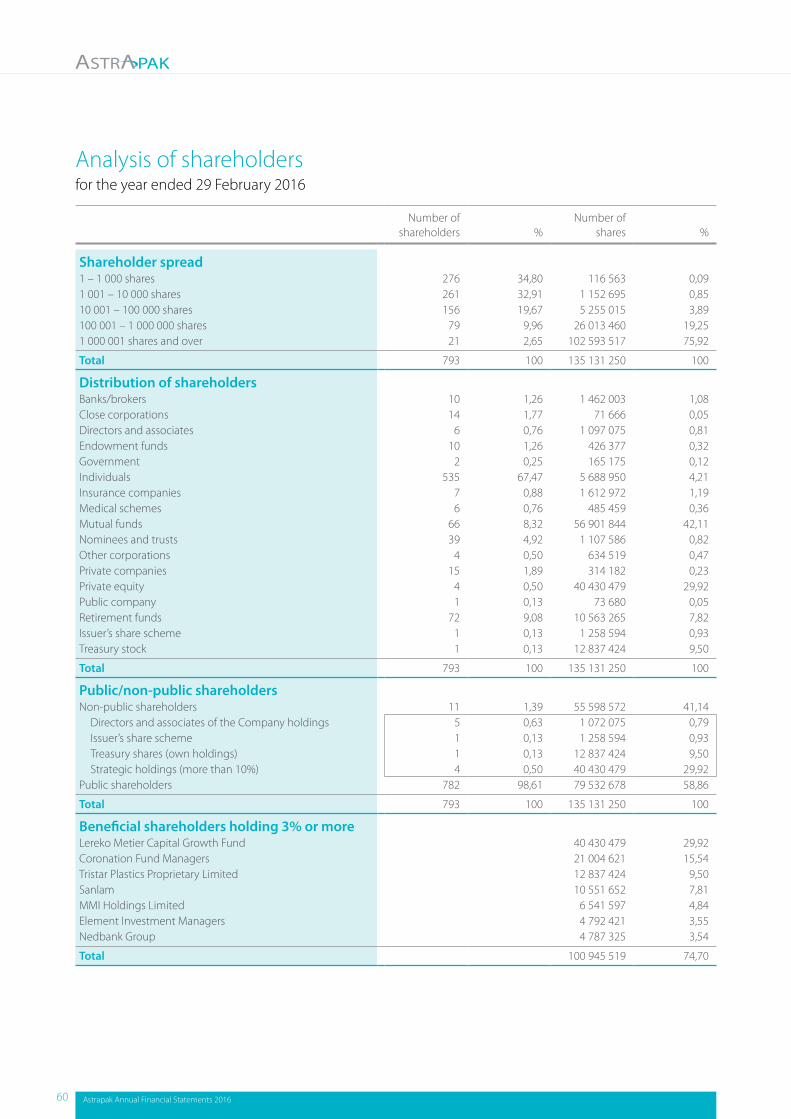
Analysis of shareholdersfor the year ended 29 February 2016
Number of shareholders %
Number of shares %
Shareholder spread1 – 1 000 shares 276 34,80 116 563 0,091 001 – 10 000 shares 261 32,91 1 152 695 0,8510 001 – 100 000 shares 156 19,67 5 255 015 3,89100 001 – 1 000 000 shares 79 9,96 26 013 460 19,251 000 001 shares and over 21 2,65 102 593 517 75,92
Total 793 100 135 131 250 100
Distribution of shareholdersBanks/brokers 10 1,26 1 462 003 1,08Close corporations 14 1,77 71 666 0,05Directors and associates 6 0,76 1 097 075 0,81Endowment funds 10 1,26 426 377 0,32Government 2 0,25 165 175 0,12Individuals 535 67,47 5 688 950 4,21Insurance companies 7 0,88 1 612 972 1,19Medical schemes 6 0,76 485 459 0,36Mutual funds 66 8,32 56 901 844 42,11Nominees and trusts 39 4,92 1 107 586 0,82Other corporations 4 0,50 634 519 0,47Private companies 15 1,89 314 182 0,23Private equity 4 0,50 40 430 479 29,92Public company 1 0,13 73 680 0,05Retirement funds 72 9,08 10 563 265 7,82Issuer’s share scheme 1 0,13 1 258 594 0,93Treasury stock 1 0,13 12 837 424 9,50
Total 793 100 135 131 250 100
Public/non-public shareholdersNon-public shareholders 11 1,39 55 598 572 41,14
Directors and associates of the Company holdings 5 0,63 1 072 075 0,79Issuer’s share scheme 1 0,13 1 258 594 0,93Treasury shares (own holdings) 1 0,13 12 837 424 9,50Strategic holdings (more than 10%) 4 0,50 40 430 479 29,92
Public shareholders 782 98,61 79 532 678 58,86
Total 793 100 135 131 250 100
Beneficial shareholders holding 3% or moreLereko Metier Capital Growth Fund 40 430 479 29,92Coronation Fund Managers 21 004 621 15,54Tristar Plastics Proprietary Limited 12 837 424 9,50Sanlam 10 551 652 7,81MMI Holdings Limited 6 541 597 4,84Element Investment Managers 4 792 421 3,55Nedbank Group 4 787 325 3,54
Total 100 945 519 74,70
60 Astrapak Annual Financial Statements 2016
General information
Nature of the business and principal activitiesAstrapak Limited and its subsidiaries are manufacturers and distributors of an extensive range of plastic packaging products. The Company manufactures and operates principally in South Africa.
DirectorsPhumzile Langeni Paul Botha Günter Steffens Craig McDougall Thabo Vincent Mokgatlha Robin MooreManley Diedloff
Registered office5 Kruger StreetDenverJohannesburg2001
Business address5 Kruger StreetDenverJohannesburg2001
Postal addressPO Box 75769Gardenview2047
BankersNedbank Group Limited
AuditorsDeloitte & Touche
Company secretaryVashnee Mahadeo (resigned 18 December 2015)Salome Ratlhagane (appointed 18 December 2015)
Company registration number1995/009169/06
Shareholders’ diary
February Financial year endApril Preliminary results announcement for the year ended 29 February 2016July Integrated annual report publishedAugust Annual General MeetingSeptember Interim results announcement for the period ended 31 August 2016
Directions from OR Tambo (Airport) to Melrose Arch, SandtonAfter leaving the airport, follow the R24 Johannesburg highway.
At Gillooly’s Interchange, follow the N3 Pretoria signs until you reach the Marlboro off-ramp. Take the Marlboro off-ramp and continue until you get to the M1 on-ramp. Take the M1 South, pass Grayston Drive and take the off-ramp on to Corlett Drive. At the traffic lights, turn right into Corlett Drive. Cross one set of traffic lights and turn left into Melrose Arch.
Directions from Sandton CBD to Melrose Arch, SandtonFrom Grayston Drive take the M1 South and off-ramp on Corlett Drive. At the traffic lights, take a right turn into Corlett Drive. Pass one set of traffic lights and take a left turn into Melrose Arch.

www.astrapak.co.za5 Kruger StreetDenver2011South Africa