Embed Size (px)
Citation preview

ANNUAL FINANCIAL STATEMENTS 2012
These annual financial statements were prepared by the finance department of the Truworths International Ltd Group acting under the supervision of MJV Sardi CA (SA), the Chief Financial Officer of the Group.
CoNTENTS
Group annual financial statements independent auditor’s report 1approval of annual financial statements 2certificate by company secretary 2Directors’ report 3audit committee report 4Group statements of financial position 8Group statements of comprehensive income 9Group statements of changes in equity 10Group statements of cash flows 11notes to the group annual financial statements 12
Corporate information 12Statement of compliance 12Glossary of financial reporting terms 121 Principal accounting policies 172 Property, plant and equipment 303 Goodwill 314 Intangible assets 325 Derivative financial assets 336 Available-for-sale assets 357 Loans and receivables 368 Interest in subsidiaries and associates 379 Inventories 3810 Trade and other receivables 3811 Cash and cash equivalents 3912 Share capital 3913 Share premium 3914 Treasury shares 4015 Non-distributable reserves 4116 Deferred tax 4217 Post-retirement medical benefit obligation 4318 Leases 4519 Trade and other payables 4620 Derivative financial liability 4721 Provisions 4722 Capital commitments 4823 Contingent liabilities 4824 Financial risk management 4925 Revenue 5826 Trading profit 5827 Directors and employees 6028 Tax expense 6729 Dividends 6830 Earnings and cash flow per share 6831 Related party disclosures 7032 Notes to the statements of cash flows 7233 Comparative information 7334 Segment information 7435 Events after the end of the reporting period 75
company annual financial statements 76
annexure one Details of subsidiary companies 89
annexure two Details of directors’ holdings of shares and options 91
shareholDer information 100
T r u w o r t h s I n t e r n a t i o n a l L i m i t e d A n n u a l F i n a n c i a l S t a t e m e n t s 2 0 1 2
INDEPENDENT AUDIToR’S REPoRT To ThE ShAREhoLDERS oF TRUwoRThS INTERNATIoNAL LIMITED
report on the financial statementswe have audited the consolidated and separate financial statements of Truworths International Limited set out on pages 3 to 99, which comprise the statements of financial position as at 1 July 2012, and the statements of comprehensive income, statements of changes in equity and statements of cash flows for the period then ended, and the notes, comprising a summary of significant accounting policies and other explanatory information.
Directors’ responsibility for the financial statementsThe company’s directors are responsible for the preparation and fair presentation of these consolidated and separate financial statements in accordance with International Financial Reporting Standards and the requirements of the Companies Act of South Africa, and for such internal control as the directors determine is necessary to enable the preparation of financial statements that are free from material misstatement, whether due to fraud or error.
auDitor’s responsibilityour responsibility is to express an opinion on these consolidated and separate financial statements based on our audit. we conducted our audit in accordance with International Standards on Auditing. Those standards require that we comply with ethical requirements and plan and perform the audit to obtain reasonable assurance about whether the financial statements are free from material misstatement.
An audit involves performing procedures to obtain audit evidence about the amounts and disclosures in the financial statements. The procedures selected depend on the auditor’s judgement, including the assessment of the risks of material misstatement of the financial statements, whether due to fraud or error. In making those risk assessments, the auditor considers internal control relevant to the entity’s preparation and fair presentation of the financial statements in order to design audit procedures that are appropriate in the circumstances, but not for the purpose of expressing an opinion on the effectiveness of the entity’s internal control. An audit also includes evaluating the appropriateness of accounting policies used and the reasonableness of accounting estimates made by management, as well as evaluating the overall presentation of the financial statements.
we believe that the audit evidence we have obtained is sufficient and appropriate to provide a basis for our audit opinion.
opinionIn our opinion, the consolidated and separate financial statements present fairly, in all material respects, the consolidated and separate financial position of Truworths International Limited as at 1 July 2012, and its consolidated and separate financial performance and consolidated and separate cash flows for the period then ended in accordance with International Financial Reporting Standards and the requirements of the Companies Act of South Africa.
other reports requireD by the companies actAs part of our audit of the consolidated and separate financial statements for the period ended 1 July 2012, we have read the Directors’ Report, the Audit Committee’s Report and the Company Secretary’s Certificate for the purpose of identifying whether there are material inconsistencies between these reports and the audited consolidated and separate financial statements. These reports are the responsibility of the respective preparers. Based on reading these reports we have not identified material inconsistencies between these reports and the audited financial statements. however, we have not audited these reports and accordingly do not express an opinion on these reports.
James newlandsDirectorRegistered Auditor (RA)Chartered Accountant (SA)
15 August 2012Cape Town
T r u w o r t h s I n t e r n a t i o n a l L i m i t e d A n n u a l F i n a n c i a l S t a t e m e n t s 2 0 1 2 1
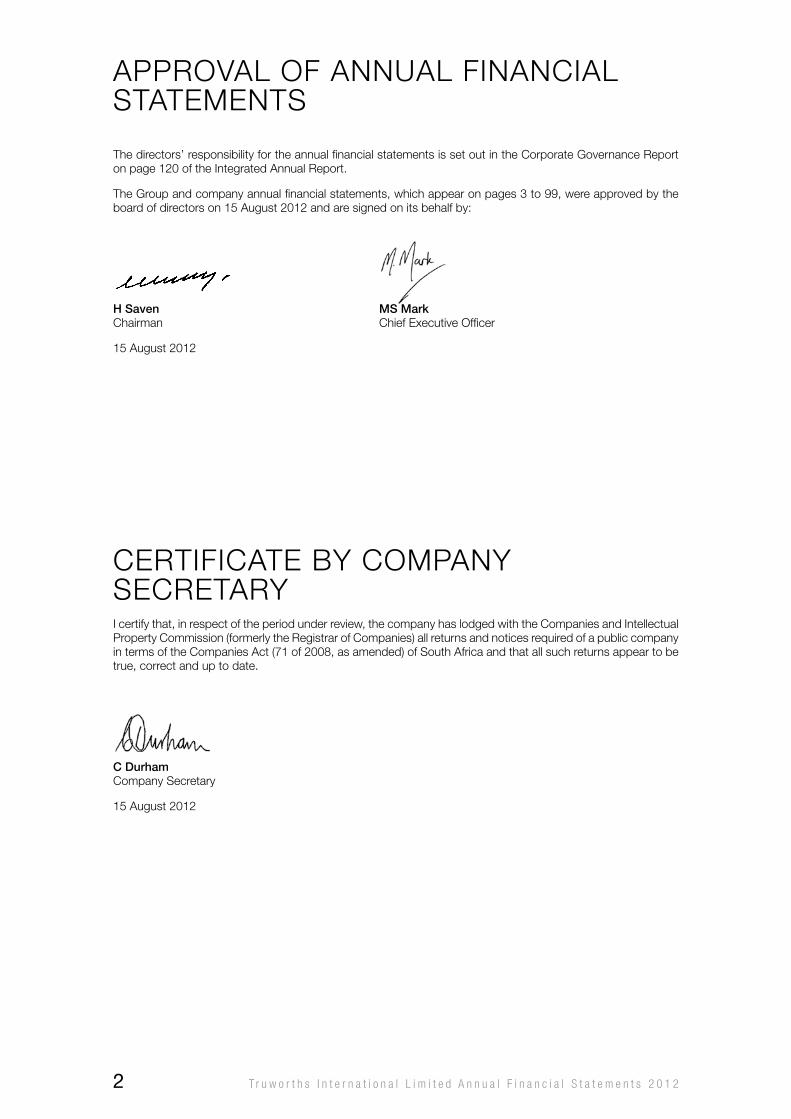
APPRovAL oF ANNUAL FINANCIAL STATEMENTS
The directors’ responsibility for the annual financial statements is set out in the Corporate Governance Report on page 120 of the Integrated Annual Report.
The Group and company annual financial statements, which appear on pages 3 to 99, were approved by the board of directors on 15 August 2012 and are signed on its behalf by:
h saven ms markChairman Chief Executive officer
15 August 2012
CERTIFICATE By CoMPANy SECRETARyI certify that, in respect of the period under review, the company has lodged with the Companies and Intellectual Property Commission (formerly the Registrar of Companies) all returns and notices required of a public company in terms of the Companies Act (71 of 2008, as amended) of South Africa and that all such returns appear to be true, correct and up to date.
c DurhamCompany Secretary
15 August 2012
T r u w o r t h s I n t e r n a t i o n a l L i m i t e d A n n u a l F i n a n c i a l S t a t e m e n t s 2 0 1 22
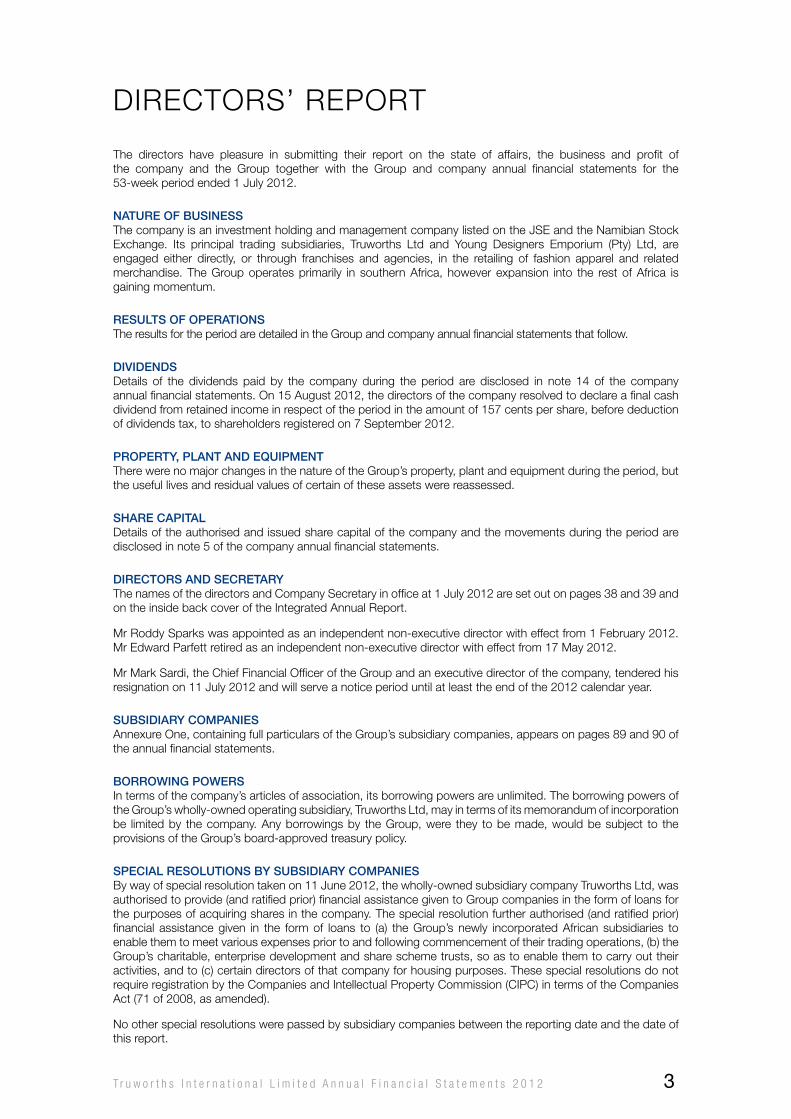
DIRECToRS’ REPoRT
The directors have pleasure in submitting their report on the state of affairs, the business and profit of the company and the Group together with the Group and company annual financial statements for the 53-week period ended 1 July 2012.
nature of businessThe company is an investment holding and management company listed on the JSE and the Namibian Stock Exchange. Its principal trading subsidiaries, Truworths Ltd and young Designers Emporium (Pty) Ltd, are engaged either directly, or through franchises and agencies, in the retailing of fashion apparel and related merchandise. The Group operates primarily in southern Africa, however expansion into the rest of Africa is gaining momentum.
results of operationsThe results for the period are detailed in the Group and company annual financial statements that follow.
DiviDenDsDetails of the dividends paid by the company during the period are disclosed in note 14 of the company annual financial statements. on 15 August 2012, the directors of the company resolved to declare a final cash dividend from retained income in respect of the period in the amount of 157 cents per share, before deduction of dividends tax, to shareholders registered on 7 September 2012.
property, plant anD equipmentThere were no major changes in the nature of the Group’s property, plant and equipment during the period, but the useful lives and residual values of certain of these assets were reassessed.
share capitalDetails of the authorised and issued share capital of the company and the movements during the period are disclosed in note 5 of the company annual financial statements.
Directors anD secretaryThe names of the directors and Company Secretary in office at 1 July 2012 are set out on pages 38 and 39 and on the inside back cover of the Integrated Annual Report.
Mr Roddy Sparks was appointed as an independent non-executive director with effect from 1 February 2012. Mr Edward Parfett retired as an independent non-executive director with effect from 17 May 2012.
Mr Mark Sardi, the Chief Financial officer of the Group and an executive director of the company, tendered his resignation on 11 July 2012 and will serve a notice period until at least the end of the 2012 calendar year.
subsiDiary companiesAnnexure one, containing full particulars of the Group’s subsidiary companies, appears on pages 89 and 90 of the annual financial statements.
borrowinG powersIn terms of the company’s articles of association, its borrowing powers are unlimited. The borrowing powers of the Group’s wholly-owned operating subsidiary, Truworths Ltd, may in terms of its memorandum of incorporation be limited by the company. Any borrowings by the Group, were they to be made, would be subject to the provisions of the Group’s board-approved treasury policy.
special resolutions by subsiDiary companiesBy way of special resolution taken on 11 June 2012, the wholly-owned subsidiary company Truworths Ltd, was authorised to provide (and ratified prior) financial assistance given to Group companies in the form of loans for the purposes of acquiring shares in the company. The special resolution further authorised (and ratified prior) financial assistance given in the form of loans to (a) the Group’s newly incorporated African subsidiaries to enable them to meet various expenses prior to and following commencement of their trading operations, (b) the Group’s charitable, enterprise development and share scheme trusts, so as to enable them to carry out their activities, and to (c) certain directors of that company for housing purposes. These special resolutions do not require registration by the Companies and Intellectual Property Commission (CIPC) in terms of the Companies Act (71 of 2008, as amended).
No other special resolutions were passed by subsidiary companies between the reporting date and the date of this report.
T r u w o r t h s I n t e r n a t i o n a l L i m i t e d A n n u a l F i n a n c i a l S t a t e m e n t s 2 0 1 2 3
AUDIT CoMMITTEE REPoRT
The Audit Committee (the committee) of the Truworths International Ltd board complies with relevant legislation, regulation and governance practices. The responsibilities of the committee are outlined in its written charter, which was reviewed and updated by the board during the reporting period. This update took into account changes brought about by the recent coming into force of the Companies Act (71 of 2008, as amended) as well as to reflect changed practices arising from recent amendments to the JSE Listings Requirements.
This report of the committee is presented to shareholders in compliance with the requirements of the Companies Act (71 of 2008, as amended) of South Africa.
role of the committeeThe objectives and functions of the committee are set out in its charter. In summary the committee:
• aimstoensurethemaintenanceofadequateaccountingrecordsandeffectivefinancialreportingandinternalcontrol systems;
• aimstoensurecomplianceofpublishedfinancialreportswithrelevantlegislation,reportingstandardsandgood governance;
• aimstoensureGroupassetsaresafeguarded;
• hasoversightoffraudandinformationtechnologyrisksinsofarastheseimpactonthefinancialreportingprocess;
• confirmsthenominationandappointmentoftheexternalauditor,ensuringsuchappointmentislegislativelycompliant;
• approvesthetermsofengagementandfeesoftheexternalauditor,asrecommendedbymanagement;
• definesandconsidersthenon-auditservicesthatmayberenderedbytheexternalauditor;
• considerstheexternalauditor’sfindingsarisingfromtheannualfinancialstatementaudit;
• monitorsthefunctioningandapprovesthecoverageplanoftheinternalauditdepartment;
• reviewsriskmanagementandtaxcomplianceprogrammesandinitiatives;
• fulfilsthefunctionofauditcommitteetoGroupsubsidiariesthatarepubliccompaniesandcharitabletrusts;
• reviews the expertise, resources and experience of the Group’s finance function and the expertise andexperience of the Chief Financial officer; and
• reviewsandrecommendstotheboardtheapprovaloftheGroup’sIntegratedAnnualReport,InterimReportand published results announcements.
structure of the committeeThe committee comprises three independent non-executive directors, and the chairman of the committee is not the chairman of the board of the company. The following directors served on the committee during the reporting period:
• MichaelThompson(Chairman)
• RobDow
• RoddySparks(appointedascommitteememberwitheffectfrom7May2012)
• HiltonSaven(resignedascommitteememberwitheffectfrom17May2012)
Biographical details of the committee members appear on pages 38 and 39 of the Integrated Annual Report. Fees paid to the committee members are outlined in note 27.1 of the Group annual financial statements.
The Chairman of the board, Chief Financial officer, Company Secretary, Internal Audit Manager, Finance Executive, Chairman of the Risk Committee and external auditor also attend meetings of the committee as invitees.
The chairman of the committee periodically meets separately with the external auditor and the internal audit staff without members of executive management being present.
internal auDitThe internal audit function provides assurance to the Truworths International board, via the committee, on the adequacy and effectiveness of the Group’s internal control and risk management practices, and the integrity of financial reporting systems. Internal audit also assists management by making recommendations for improvements to the control and risk management environment.
T r u w o r t h s I n t e r n a t i o n a l L i m i t e d A n n u a l F i n a n c i a l S t a t e m e n t s 2 0 1 24
The principle of independence of the internal audit department is upheld and the Internal Audit Manager reports on operational matters to the Chief Executive officer and on administrative matters to the Chief Financial officer.
The scope of the internal audit department work includes:
• reviewing,appraisingandreportingontheadequacyandeffectivenessofthesystemofinternalcontrol;
• reviewingtheprocessesandsystemswhicharedesignedtoensureintegrity inreportingoffinancialandoperating information; and
• reviewingtheadequacyofcompliancewithapplicablepolicies,plans,procedures,lawsandregulations.
Specific focus is placed on the system of internal control that ensures that assets and information are protected against loss, theft or misuse, as well as on those controls that ensure key transactional information is of high integrity. Internal audit also provides consultation and other services to management such as due diligence services, forensic audit services, systems auditing services, risk management services and special reviews or audits.
internal controlsThe Group aims to maintain a high standard of internal control. The sound control environment in the Group is founded on:
• strongresponsibilityforcontrolsbyexecutives;
• executivecommitmenttointegrityandethicalvalues;and
• theskillsandcompetenceofexecutives.
The soundness of the Group’s control environment is illustrated through:
• management’shands-onoperatingstyle;
• clearcommunicationthroughstaffpolicies;
• assignmentofauthorityandresponsibilitytoappropriatelevelsofmanagement;and
• acontrolconsciousnessthroughouttheGroup.
The Truworths International board is ultimately responsible for the system of internal control, which is designed to ensure:
• effectivenessandefficiencyofoperations;
• safeguarding,verificationandaccountabilityofassets;
• detectionandminimisationoffraudandlosses;
• reliabilityoffinancialandoperationalinformationandreporting;and
• compliancewithapplicablelaws,regulations,policiesandprocedures.
The Truworths International board delegates responsibility for the implementation and maintenance of the control framework to management. The committee, together with the Risk Committee and the internal and external auditors, assist the board in monitoring the effectiveness and adequacy of the control environment.
The committee reports that during the period under review:
• internalcontrolprocedureswererepresentedbymanagementashavingbeensubstantiallyeffectiveandappropriate;
• nomaterialbreachofinternalcontrolsandprocedureswasbroughttoitsattention;
• key risks appeared to be adequately documented by management and appropriately monitored andreported on by the Risk Committee;
• policiesandauthoritylevelswererepresentedbymanagementashavingbeenenforcedandadheredto;and
• nomaterialbreachesofanylawsaffectingtheGroupwerebroughttoitsattention.
external auDitThe Group’s external auditor is Ernst & young Inc. Fees paid to the auditor are detailed in note 26.5 of the Group annual financial statements.
The external auditor’s annual audit plan, which incorporates the identification of significant risks and how they are to be addressed during the audit, is presented and approved at a meeting of the committee before the commencement of audit fieldwork.
T r u w o r t h s I n t e r n a t i o n a l L i m i t e d A n n u a l F i n a n c i a l S t a t e m e n t s 2 0 1 2 5
AUDIT CoMMITTEE REPoRT
The external auditor has unrestricted access to the Group’s records and management. The auditor furnishes a written report to the committee on significant findings arising from the annual audit and is able to raise matters of concern directly with the chairman of the committee.
auDitor inDepenDenceThe committee is satisfied that the external auditor Ernst & young Inc. and the designated audit partner are independent of the Group and management and are therefore able to express an independent opinion on the fair presentation of the Group’s annual financial statements.
This conclusion is inter alia based on the following:
• theGroup’spolicylimitingthenon-auditservicesprovidedbytheexternalauditor;
• auditingprofessionstandardsthatprecludetheexternalauditor’spersonnelfromholdingsharesinorhavingother business relationships with the Group;
• theexternalauditormaynotprovideservicesthatcouldbeseenasparticipatinginthemanagementoftheGroup’s affairs; and
• assurancewasprovidedbytheexternalauditor that internalgovernanceprocesseswithintheauditfirmsupport the claim to independence.
The committee has a policy which limits the provision of non-audit services by the auditors. The auditor is restricted from rendering accounting, company secretarial, internal audit, legal, valuation, financial information system design, actuarial, management, human resource and investment services.
Furthermore, the provision of non-restricted non-audit services by the external auditor is subject to prior approval by the committee if the fees exceed R100 000 (currently less than 5% of the annual audit fee) and requires appropriate disclosure in the financial statements. Details of non-audit services for the reporting period are presented and approved at committee meetings. During the period the external auditor received R386 000 (2011: R107 000) for non-audit services relating to taxation and other services to the Group, equivalent to 10% (2011: 4%) of the annual audit fee. (Refer to note 26.5 of the Group annual financial statements.)
committee functioninGDuring the reporting period, three committee meetings were held. Meetings are scheduled to coincide with the key dates in the financial reporting and audit cycle.
Reports routinely considered by the committee at these meetings included the Chief Financial officer’s Report, the report of the internal audit department (including its coverage plan), the Risk Committee Report, minutes and board Risk Status Report, the Group Tax Report and the Company Secretary’s regulatory update.
In addition, the chairman of the committee is a member of the Risk Committee, attends its quarterly meetings and is able to provide feedback to the Audit Committee on its activities and recommendations.
The committee also considered the draft interim and annual financial reports and announcements prepared by management, and recommended their adoption by the board subject to identified amendments. The committee further considered the external auditor’s audit plan and the appropriateness of the responses of management to the comments raised by the auditor in relation to the prior period audit.
During the reporting period the committee undertook the following:
• nominatedforappointmenttheexternalauditor;
• notedwhichauditpartnerhadbeenassignedtotheannualauditengagement;
• consideredandapprovedtheexternalauditor’sfeesandtermsofengagementthathadbeennegotiatedbymanagement;
• obtainedassurancefrommanagementthattheauditor’sappointmentcompliedwithlegislativerequirements;and
• reviewedtheapplicabilityofthenewCompaniesAct(71of2008,asamended),theKingIIICodeandtheJSE Listings Requirements to the composition and functioning of the committee, and to accounting and external and internal auditing matters.
The committee was not required to deal with any complaints relating to accounting practices or internal audit, nor to the content or audit of the Group’s annual financial statements.
The committee carried out its other responsibilities as set out in its board-approved charter, including those relating to the audit and financial reporting obligations of the Group’s subsidiary companies and charitable
T r u w o r t h s I n t e r n a t i o n a l L i m i t e d A n n u a l F i n a n c i a l S t a t e m e n t s 2 0 1 26
trusts, during the reporting period by way of a consideration of annual and interim financial statements, and audit and management reports at its scheduled meetings.
Following each meeting of the committee, the chairman of the committee submits a written report to the directors on the committee’s activities, findings and recommendations, and presents and invites questions on this report at the board meeting immediately following the committee meeting.
The chairman of the committee attends the annual general meeting of shareholders to answer any questions relating to the committee’s activities.
chief financial officer expertise anD experienceThe committee reports in terms of the JSE Listings Requirements that it was satisfied as to the appropriateness of the expertise and experience of the Group’s Chief Financial officer during the reporting period.
finance function expertise, resources anD experienceBased on a consideration of the qualifications, participation in continuing professional education and the nature, duration and relevance of the experience of key managers in the Group’s finance department, as well as a review of the staff complement, functional responsibilities and information systems of the department, the committee reportsintermsoftheKingIIICodethatitissatisfiedastotheappropriatenessofthecollectiveexpertiseandexperience of the Group’s finance function and the adequacy of its human and technological resources.
annual financial statements anD inteGrateD annual reportThe committee has recommended the annual financial statements (of which this report forms part) and the Integrated Annual Report to the board for approval.
approval of the reportThe committee confirms that it has functioned in accordance with its charter for the reporting period and that its report to shareholders was approved by the board on 15 August 2012.
ma thompsonChairmanAudit Committee
T r u w o r t h s I n t e r n a t i o n a l L i m i t e d A n n u a l F i n a n c i a l S t a t e m e n t s 2 0 1 2 7
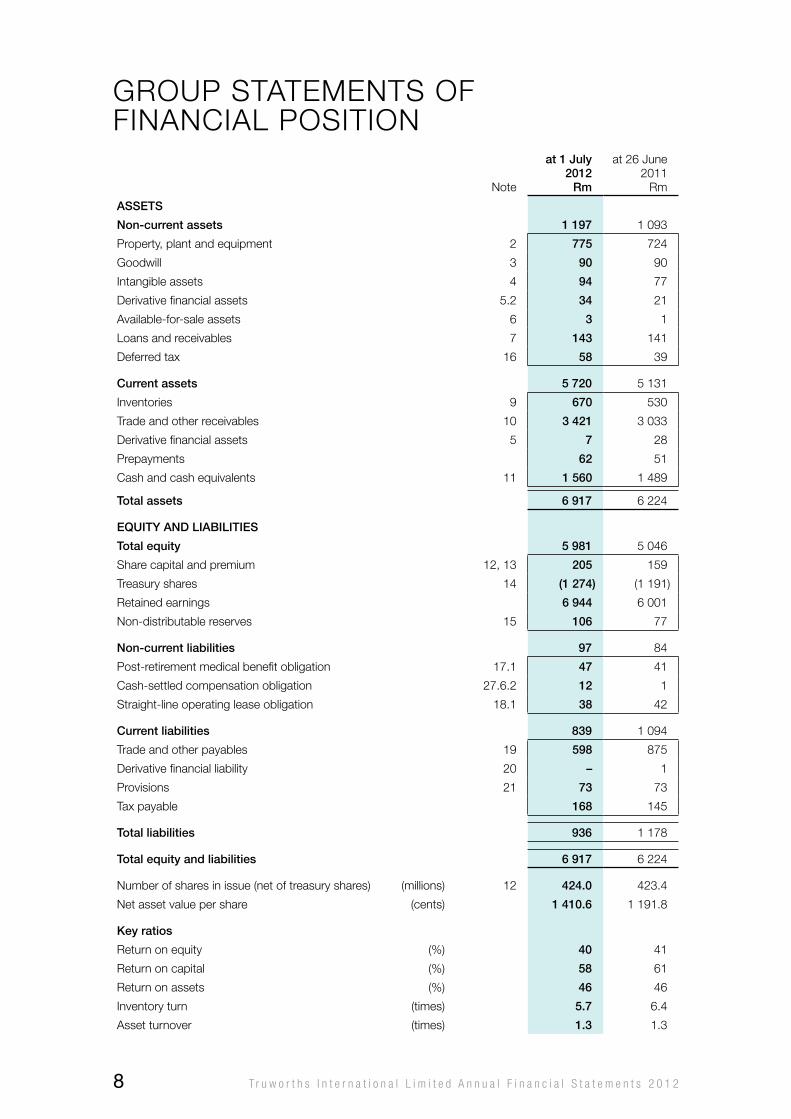
GRoUP STATEMENTS oF FINANCIAL PoSITIoN
Note
at 1 July 2012
rm
at 26 June 2011
Rm
assets
non-current assets 1 197 1 093
Property, plant and equipment 2 775 724
Goodwill 3 90 90
Intangible assets 4 94 77
Derivative financial assets 5.2 34 21
Available-for-sale assets 6 3 1
Loans and receivables 7 143 141
Deferred tax 16 58 39
current assets 5 720 5 131
Inventories 9 670 530
Trade and other receivables 10 3 421 3 033
Derivative financial assets 5 7 28
Prepayments 62 51
Cash and cash equivalents 11 1 560 1 489
total assets 6 917 6 224
equity anD liabilities
total equity 5 981 5 046
Share capital and premium 12, 13 205 159
Treasury shares 14 (1 274) (1 191)
Retained earnings 6 944 6 001
Non-distributable reserves 15 106 77
non-current liabilities 97 84
Post-retirement medical benefit obligation 17.1 47 41
Cash-settled compensation obligation 27.6.2 12 1
Straight-line operating lease obligation 18.1 38 42
current liabilities 839 1 094
Trade and other payables 19 598 875
Derivative financial liability 20 – 1
Provisions 21 73 73
Tax payable 168 145
total liabilities 936 1 178
total equity and liabilities 6 917 6 224
Number of shares in issue (net of treasury shares) (millions) 12 424.0 423.4
Net asset value per share (cents) 1 410.6 1 191.8
Key ratios
Return on equity (%) 40 41
Return on capital (%) 58 61
Return on assets (%) 46 46
Inventory turn (times) 5.7 6.4
Asset turnover (times) 1.3 1.3
T r u w o r t h s I n t e r n a t i o n a l L i m i t e d A n n u a l F i n a n c i a l S t a t e m e n t s 2 0 1 28
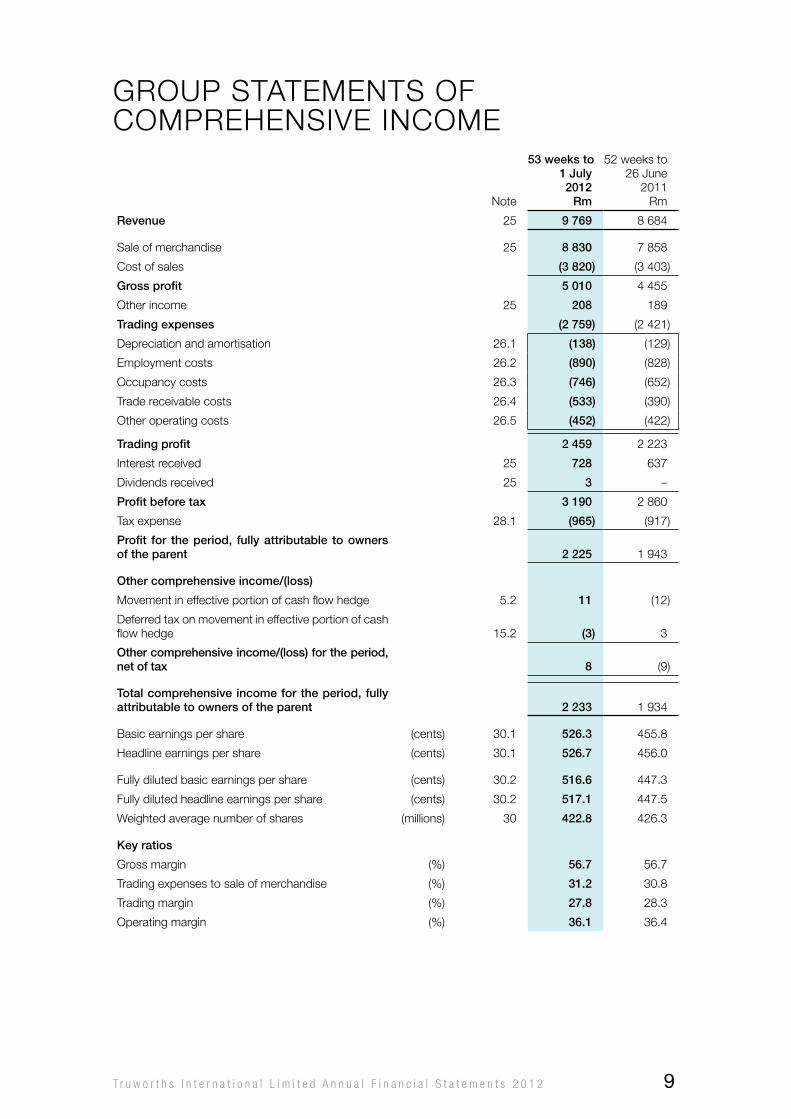
GRoUP STATEMENTS oF CoMPREhENSIvE INCoME
Note
53 weeks to1 July 2012
rm
52 weeks to26 June
2011Rm
revenue 25 9 769 8 684
Sale of merchandise 25 8 830 7 858
Cost of sales (3 820) (3 403)
Gross profit 5 010 4 455
other income 25 208 189
trading expenses (2 759) (2 421)
Depreciation and amortisation 26.1 (138) (129)
Employment costs 26.2 (890) (828)
occupancy costs 26.3 (746) (652)
Trade receivable costs 26.4 (533) (390)
other operating costs 26.5 (452) (422)
trading profit 2 459 2 223
Interest received 25 728 637
Dividends received 25 3 –
profit before tax 3 190 2 860
Tax expense 28.1 (965) (917)
profit for the period, fully attributable to owners of the parent 2 225 1 943
other comprehensive income/(loss)
Movement in effective portion of cash flow hedge 5.2 11 (12)
Deferred tax on movement in effective portion of cash flow hedge 15.2 (3) 3
other comprehensive income/(loss) for the period, net of tax 8 (9)
total comprehensive income for the period, fully attributable to owners of the parent 2 233 1 934
Basic earnings per share (cents) 30.1 526.3 455.8
headline earnings per share (cents) 30.1 526.7 456.0
Fully diluted basic earnings per share (cents) 30.2 516.6 447.3
Fully diluted headline earnings per share (cents) 30.2 517.1 447.5
weighted average number of shares (millions) 30 422.8 426.3
Key ratios
Gross margin (%) 56.7 56.7
Trading expenses to sale of merchandise (%) 31.2 30.8
Trading margin (%) 27.8 28.3
operating margin (%) 36.1 36.4
T r u w o r t h s I n t e r n a t i o n a l L i m i t e d A n n u a l F i n a n c i a l S t a t e m e n t s 2 0 1 2 9
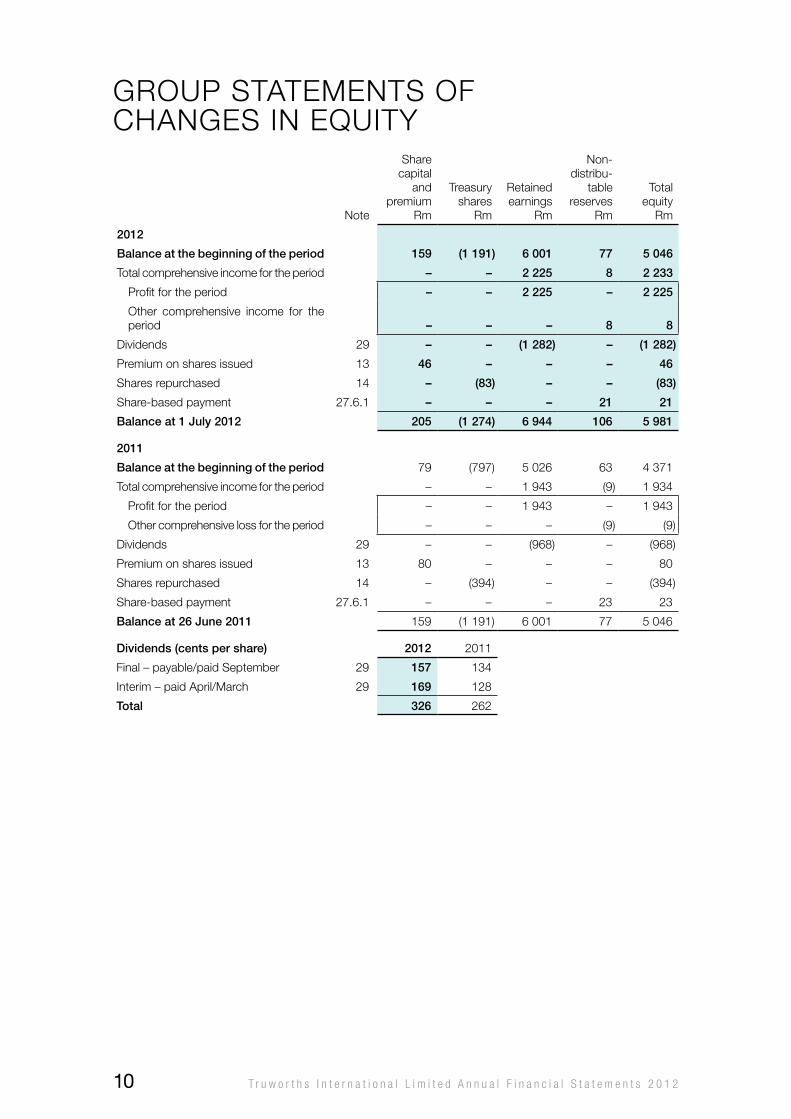
GRoUP STATEMENTS oF ChANGES IN EQUITy
Note
Share capital
and premium
Rm
Treasury shares
Rm
Retained earnings
Rm
Non-distribu-
table reserves
Rm
Total equity
Rm
2012
balance at the beginning of the period 159 (1 191) 6 001 77 5 046
Total comprehensive income for the period – – 2 225 8 2 233
Profit for the period – – 2 225 – 2 225
other comprehensive income for the period – – – 8 8
Dividends 29 – – (1 282) – (1 282)
Premium on shares issued 13 46 – – – 46
Shares repurchased 14 – (83) – – (83)
Share-based payment 27.6.1 – – – 21 21
balance at 1 July 2012 205 (1 274) 6 944 106 5 981
2011
balance at the beginning of the period 79 (797) 5 026 63 4 371
Total comprehensive income for the period – – 1 943 (9) 1 934
Profit for the period – – 1 943 – 1 943
other comprehensive loss for the period – – – (9) (9)
Dividends 29 – – (968) – (968)
Premium on shares issued 13 80 – – – 80
Shares repurchased 14 – (394) – – (394)
Share-based payment 27.6.1 – – – 23 23
balance at 26 June 2011 159 (1 191) 6 001 77 5 046
Dividends (cents per share) 2012 2011
Final – payable/paid September 29 157 134
Interim – paid April/March 29 169 128
total 326 262
T r u w o r t h s I n t e r n a t i o n a l L i m i t e d A n n u a l F i n a n c i a l S t a t e m e n t s 2 0 1 210
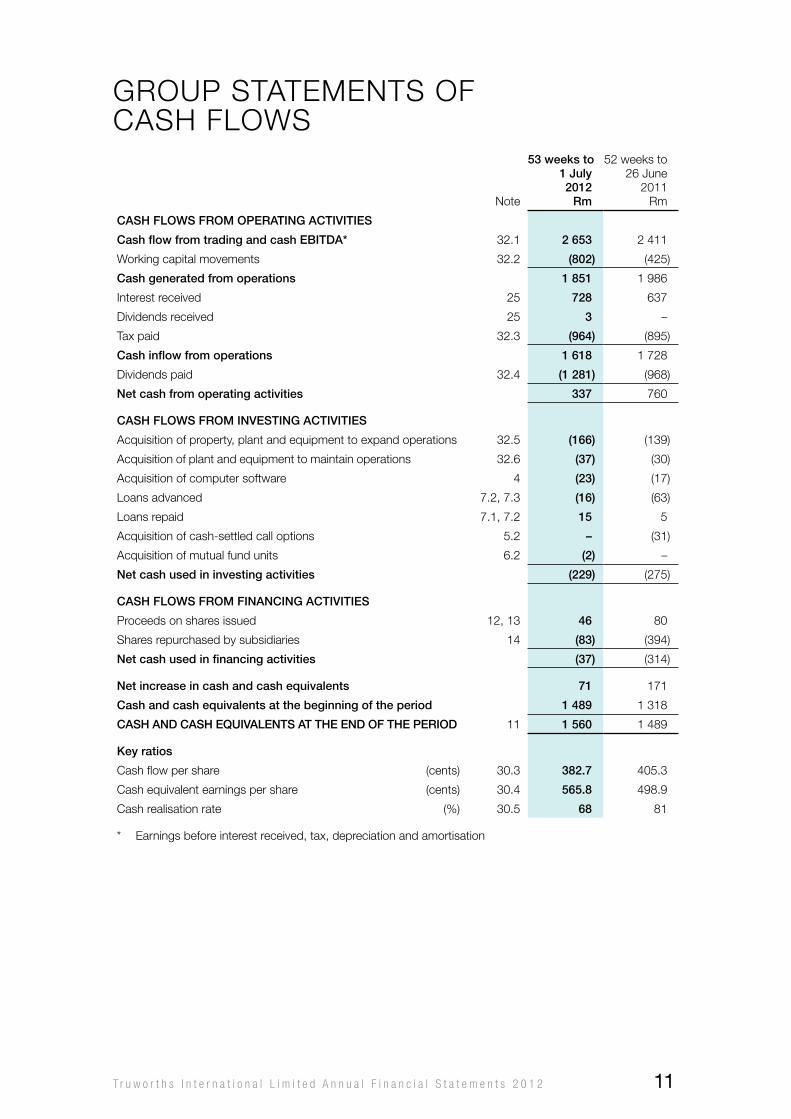
GRoUP STATEMENTS oF CASh FLowS
Note
53 weeks to 1 July
2012rm
52 weeks to 26 June
2011Rm
cash flows from operatinG activities
cash flow from trading and cash ebitDa* 32.1 2 653 2 411
working capital movements 32.2 (802) (425)
cash generated from operations 1 851 1 986
Interest received 25 728 637
Dividends received 25 3 –
Tax paid 32.3 (964) (895)
cash inflow from operations 1 618 1 728
Dividends paid 32.4 (1 281) (968)
net cash from operating activities 337 760
cash flows from investinG activities
Acquisition of property, plant and equipment to expand operations 32.5 (166) (139)
Acquisition of plant and equipment to maintain operations 32.6 (37) (30)
Acquisition of computer software 4 (23) (17)
Loans advanced 7.2, 7.3 (16) (63)
Loans repaid 7.1, 7.2 15 5
Acquisition of cash-settled call options 5.2 – (31)
Acquisition of mutual fund units 6.2 (2) –
net cash used in investing activities (229) (275)
cash flows from financinG activities
Proceeds on shares issued 12, 13 46 80
Shares repurchased by subsidiaries 14 (83) (394)
net cash used in financing activities (37) (314)
net increase in cash and cash equivalents 71 171
cash and cash equivalents at the beginning of the period 1 489 1 318
cash anD cash equivalents at the enD of the perioD 11 1 560 1 489
Key ratios
Cash flow per share (cents) 30.3 382.7 405.3
Cash equivalent earnings per share (cents) 30.4 565.8 498.9
Cash realisation rate (%) 30.5 68 81
* Earnings before interest received, tax, depreciation and amortisation
T r u w o r t h s I n t e r n a t i o n a l L i m i t e d A n n u a l F i n a n c i a l S t a t e m e n t s 2 0 1 2 11
NoTES To ThE GRoUP ANNUAL FINANCIAL STATEMENTScorporate informationThe consolidated financial statements of Truworths International Ltd and its subsidiaries (the Group) for the 53 weeks ended 1 July 2012 were authorised for issue in accordance with a resolution of the directors taken on 15 August 2012. Truworths International Ltd, the holding company of the Group, is incorporated and domiciled in the Republic of South Africa, and its shareholders have limited liability.
statement of complianceThe annual financial statements have been prepared in compliance with International Financial Reporting Standards (IFRS), the AC 500 Standards as issued by the Accounting Practices Board, the Companies Act (71 of 2008, as amended) of South Africa and the JSE Listings Requirements.
Glossary of financial reportinG termsThis glossary of financial reporting terms is provided to ensure clarity of meaning, as certain terms may not always have the same meaning or interpretation as in other countries.
Group structurescompanyTruworths International Ltd
entityThe company or any one of its subsidiaries or, where the context requires, an entity outside of the Group.
subsidiaryAny entity over which the Group has the power to exercise control (including the Truworths International Limited Share Trust).
associateAn entity over which the Group has significant influence and that is neither a subsidiary nor a joint venture.
accountinGacquisition dateThe date on which an entity (the acquirer) obtains control of the acquiree.
acquisition method of accountingThe method of accounting for business combinations whereby the acquiring entity recognises, on the acquisition date, the identifiable assets acquired, the liabilities assumed, any non-controlling interest in the acquiree and the related goodwill (or gain from a bargain purchase).
allowanceAn estimate of the reduction or diminution in the cost or initial amount of current assets, such as inventories and trade receivables, attributable to factors such as obsolescence, shrinkage and irrecoverability.
business combinationA transaction or other event in which an entity (the acquirer) obtains control of one or more businesses.
cash-generating unitThe smallest identifiable group of assets that generates cash inflows that are largely independent of the cash inflows from other assets or groups of assets.
contingent liability(a) a possible obligation that arises from past events, the existence of which will be confirmed only by the
occurrence or non-occurrence of one or more uncertain future events not wholly within the control of an entity; or
(b) a present obligation that arises from past events but is not recognised because:
(i) it is not probable that an outflow of resources embodying economic benefits will be required to settle the obligation; or
(ii) the amount of the obligation cannot be measured with sufficient reliability.
controlThe power to govern the financial and operating policies of an entity so as to obtain benefits from its activities.
T r u w o r t h s I n t e r n a t i o n a l L i m i t e d A n n u a l F i n a n c i a l S t a t e m e n t s 2 0 1 212
Defined contribution planPost-employment benefit plans under which an entity pays fixed contributions to a separate entity (such as a fund or an insurer), and in respect of which that entity will have no legal or constructive obligation to pay further contributions if the other entity does not hold sufficient assets to pay all employee benefits relating to the service of such employees during the current and prior periods.
Discount rateThe pre-tax interest rate that reflects current market assessments of the time value of money and the risks specific to the asset for which future cash flow estimates have not been adjusted. It is the return that investors would require if they were to choose an investment that would generate cash flows of amounts, timing and risk profile equivalent to those that the entity expects to derive from the asset.
fair valueThe amount for which an asset could be exchanged or a liability settled, between knowledgeable, willing parties in an arm’s length transaction.
foreign currencyA currency other than the functional currency of the entity.
functional currencyThe currency of the primary economic environment in which the entity operates.
Key management personnelKeymanagementpersonnelarethosepersonshavingauthorityandresponsibilityforplanning,directingandcontrolling the activities of an entity, directly or indirectly, including any director (executive and non-executive) of that entity.
operating segmentAn operating segment is a component of the Group that engages in business activities from which it may earn revenue and incur expenses (including revenue and expenses relating to transactions with other components of the Group), whose operating results are regularly reviewed by the entity’s or the company’s board to make decisions about resource allocation and assess segmental performance, and for which separate financial information is available.
pooling of interest method of accountingA method of accounting for business combinations involving entities under common control, whereby those entities combine their net assets and operations at their carrying amounts and the financial statements are presented as if the entities had always been combined.
presentation currencyThe currency in which the financial statements are presented.
projected unit credit methodAn actuarial valuation method used to determine the present value of an entity’s defined benefit obligations and the related current, and where applicable, past service cost. The method treats each period of service as giving rise to an additional unit of benefit entitlement and measures each unit separately to build up the final obligation.
provisionA liability of uncertain timing or amount.
recoverable amountFor an asset or a cash-generating unit, this is the higher of its fair value less costs to sell, and its value in use.
related partyA related party is a person or an entity that is related to the entity that is preparing its financial statements (referred to as the ‘reporting entity’).
(a) A person or a close member of that person’s family is related to a reporting entity if that person:
(i) has control or joint control over the reporting entity;
(ii) has significant influence over the reporting entity; or
(iii) is a member of the key management personnel of the reporting entity or of the parent of the reporting entity.
T r u w o r t h s I n t e r n a t i o n a l L i m i t e d A n n u a l F i n a n c i a l S t a t e m e n t s 2 0 1 2 13
NoTES To ThE GRoUP ANNUAL FINANCIAL STATEMENTSaccountinG (continued)
related party (continued)(b) An entity is related to a reporting entity if any of the following conditions apply:
(i) the entity and the reporting entity are members of a Group (which means that the parent, and each subsidiary and fellow subsidiary is related to the others);
(ii) one entity is an associate or joint venture of the other entity (or an associate or joint venture of a member of a group of which the other entity is a member);
(iii) both entities are joint ventures of the same third party;
(iv) one entity is a joint venture of a third entity and the other entity is an associate of the third entity;
(v) the entity is a post-employment benefit plan for the benefit of employees of either the reporting entity or an entity related to the reporting entity. If the reporting entity is itself such a plan, the sponsoring employers are also related to the reporting entity;
(vi) the entity is controlled or jointly controlled by a person identified in (a); or
(vii) a person identified in (a)(i) has significant influence over the entity or is a member of the key management personnel of the entity (or of the parent of the entity).
residual valueThe estimated amount that an entity would currently obtain from disposal of an asset, after deducting the estimated costs of disposal, if the asset were already of the age and in the condition expected at the end of its useful life.
value in useThe present value of the future cash flows expected to be derived from an asset or a cash-generating unit.
financial instrumentsamortised costThe amount at which a financial asset or financial liability is measured at initial recognition, minus principal repayments, plus or minus the cumulative amortisation (using the effective interest method) of any difference between that initial amount and the maturity amount, and minus any reduction (directly or through the use of an allowance account) for impairment or uncollectibility.
available-for-sale financial assetA non-derivative financial asset that is designated as available-for-sale or is not classified as:
• Loansandreceivables;
• Held-to-maturityinvestments;or
• Financialassetsatfairvaluethroughprofitorloss.
cash flow hedgeA hedge of the exposure to variability in cash flows that:
• isattributabletoaparticularriskassociatedwitharecognisedassetorliabilityorahighlyprobableforecasttransaction; and
• couldaffectprofitorloss.
credit riskThe risk that a counterparty to a financial instrument will cause a financial loss for the Group by failing to discharge an obligation.
currency riskThe risk that the fair value or future cash flows of a financial instrument will fluctuate because of changes in foreign exchange rates.
Derivative financial instrumentA financial instrument:
• the value of which changes in response to movements in a specified interest rate, financial instrumentprice, commodity price, foreign exchange rate, index of prices or rates, credit rating or credit index, or other variable; provided that, in the case of a non-financial variable, the variable is not specific to a party to the contract;
T r u w o r t h s I n t e r n a t i o n a l L i m i t e d A n n u a l F i n a n c i a l S t a t e m e n t s 2 0 1 214
• thatrequiresnoinitialnetinvestmentoraninitialnetinvestmentthatissmallerthanwouldberequiredforother types of contracts that would be expected to respond similarly to changes in market factors; and
• thatissettledatafuturedate.
effective interest rateThe interest rate that exactly discounts estimated future cash payments or receipts during the expected life of the financial instrument, or, when appropriate, a shorter period, to the net carrying amount of the financial asset or financial liability.
equity instrumentA contract that evidences a residual interest in the assets of an entity after deducting all of its liabilities.
fair value hedgeA hedge of the exposure to changes in fair value of a recognised asset or liability or an unrecognised firm commitment that is attributable to a particular risk and could affect profit or loss.
financial assetAny asset that is:
• cash;
• anequityinstrumentofanotherentity;
• acontractualright:
(i) to receive cash or another financial asset from another entity; or
(ii) to exchange financial instruments with another entity under conditions that are potentially favourable; or
• acontractthatwillormaybesettledinanentity’sownequityinstrumentsandis:
(i) a non-derivative financial instrument for which the entity is or may be obliged to receive a variable number of its own equity instruments; or
(ii) a derivative financial instrument that will or may be settled, other than by the exchange of a fixed amount of cash or another financial asset, for a fixed number of its own equity instruments. For this purpose the entity’s own equity instruments do not include instruments that are themselves contracts for the future receipt or delivery of the entity’s own equity instruments.
financial asset or financial liability at fair value through profit or lossA financial asset or financial liability that meets either of the following conditions:
• itisclassifiedasheld-for-trading;or
• uponinitialrecognition,itisdesignatedbytheentityasatfairvaluethroughprofitorloss.Anentitymayusethis designation only when permitted, or when doing so would result in more relevant information because either:
(i) it eliminates or significantly reduces a measurement or recognition inconsistency that would otherwise arise from measuring assets or liabilities or from recognising the gains and losses on them on different bases; or
(ii) a group of financial assets, financial liabilities or both, is managed and its performance is evaluated on a fair value basis, in accordance with a documented risk management or investment strategy, and information about such group is provided internally on that basis to the entity’s key management personnel.
financial instrumentA contract giving rise to a financial asset of one entity and a financial liability or equity instrument of another entity.
financial liabilityAny liability that is:
• acontractualobligation:
(i) to deliver cash or another financial asset to another entity; or
T r u w o r t h s I n t e r n a t i o n a l L i m i t e d A n n u a l F i n a n c i a l S t a t e m e n t s 2 0 1 2 15
NoTES To ThE GRoUP ANNUAL FINANCIAL STATEMENTSfinancial instruments (continued)
financial liability (continued)
(ii) to exchange financial assets or financial liabilities with another entity under conditions that are potentially unfavourable to the entity; or
• acontractthatwillormaybesettledinanentity’sownequityinstrumentsandis:
(i) a non-derivative financial instrument for which the entity is or may be obliged to deliver a variable number of its own equity instruments; or
(ii) a derivative financial instrument that will or may be settled, other than by the exchange of a fixed amount of cash or another financial asset, for a fixed number of the entity’s own equity instruments. For this purpose the entity’s own equity instruments do not include instruments that are themselves contracts for the future receipt or delivery of the entity’s own equity instruments.
forecast transactionAn uncommitted but anticipated future transaction.
hedge effectivenessThe degree to which changes in the fair value or cash flows of the hedged item that are attributable to a hedged risk are off-set by changes in the fair value or cash flows of the hedging instrument.
hedged itemAn asset, liability, firm commitment, highly probable forecast transaction or net investment in a foreign operation that exposes the entity to risk of changes in fair value or future cash flows and is designated as being hedged.
hedging instrumentA designated derivative financial instrument or, for a hedge against changes in foreign currency exchange rates only a designated non-derivative financial asset or non-derivative financial liability, for which fair value or cash flows are expected to off-set changes in the fair value or cash flows of a designated hedged item.
interest rate riskThe risk that the fair value or future cash flows of a financial instrument will fluctuate because of changes in market rates of interest.
liquidity riskThe risk that an entity will encounter difficulty in meeting obligations associated with financial liabilities that are to be settled by delivering cash or another financial asset.
loans and receivablesNon-derivative financial assets with fixed or determinable payments that are not quoted in an active market, other than those:
• thatanentityintendstosellimmediatelyorinthenearterm,whichareclassifiedasheld-for-trading,andthose that the entity upon initial recognition designates as at fair value through profit or loss;
• thattheentityuponinitialrecognitiondesignatesasavailable-for-sale;or
• forwhichtheholdermaynotrecoversubstantiallyallofitsinitialinvestment,otherthanasaresultofcreditdeterioration, and which are classified as available-for-sale.
market riskThe risk that the fair value or future cash flows of a financial instrument will fluctuate because of changes in market prices. Market risk comprises currency risk, interest rate risk and other price risk.
monetary itemsUnits of currency held and assets and liabilities to be received or paid in a fixed or determinable number of units of currency.
other price riskThe risk that the fair value or future cash flows of a financial instrument will fluctuate because of changes in market prices (other than those arising from interest rate or currency risk), whether those changes are caused by factors specific to the instrument or its issuer, or factors affecting all similar financial instruments traded in the market.
regular way purchase or saleA purchase or sale of a financial asset under a contract whose terms require delivery of the asset within the time frame established generally by regulation or convention in the marketplace concerned.
T r u w o r t h s I n t e r n a t i o n a l L i m i t e d A n n u a l F i n a n c i a l S t a t e m e n t s 2 0 1 216
1. principal accountinG policies1.1 basis of preparation of financial results
The annual financial statements are prepared in accordance with the going concern and historical cost bases except where otherwise indicated. The accounting policies are applied consistently throughout the Group. The presentation and functional currency used in the preparation of the Group and company financial statements is the South African Rand [ZAR] (Rand) and all amounts are rounded to the nearest million, except where otherwise indicated.
Accounting policies and methods of computationThe accounting policies and methods of computation applied in the preparation of these financial statements are consistent with those applied in the preparation of the Group’s annual financial statements for the period ended 26 June 2011, except for the adoption of the improvements to IFRS issued in May 2010.
The adoption of the said improvements has had the following consequences for the accounting policies, financial position or performance of the Group:
Annual improvements to IFRS (issued May 2010)In May 2010, the International Accounting Standards Board (IASB) issued an omnibus of amendments to its standards, affecting six standards and one interpretation. The amendments that are effective for periods beginning on or after 1 January 2011 have been adopted by the Group in the current reporting period, to the extent that they are applicable to its activities.
In some instances, the adoption of these amendments has resulted in minor revisions to accounting policies and disclosures, but has not had any impact on the financial position or performance of the Group.
IFRS, amendments and International Financial Reporting Interpretations Committee (IFRIC) interpretations not applicable to Group activitiesvarious other new and amended IFRS and IFRIC interpretations that have been issued and are effective, have not been adopted by the Group as they are not applicable to its activities.
1.2 basis of consolidation of financial resultsThe Group consolidated annual financial statements comprise the annual financial statements of the company and its subsidiaries and are prepared using uniform accounting policies for like transactions and other events in similar circumstances.
SubsidiariesThe results of subsidiaries are consolidated from the effective acquisition date to the effective date of loss of control. Acquisitions from outside the Group are included in the Group financial statements using the acquisition method of accounting, whilst the acquisition of entities under common control is accounted for using the pooling of interest method.
In the course of such consolidation intra-group balances and transactions, as well as unrealised gains and losses resulting from intra-group transactions and dividends are eliminated in full.
The company carries its investments in subsidiaries at fair value. The financial statements of subsidiaries are prepared for the same reporting period as the company, using consistent accounting policies.
All dividends received from subsidiaries are recognised in profit or loss in the financial statements of the company. when such dividends are received, the company considers whether this indicates an impairment of the investment.
1.3 use of estimates and judgements in the preparation of annual financial statementsIn the preparation of the annual financial statements, management is required to make estimates and assumptions that affect reported income, expenses, assets, liabilities and disclosure of contingent assets and liabilities. Use of available information and the application of judgement are inherent in the formation of estimates. Actual results in the future could differ from these estimates and these differences may be material to the financial statements within the next reporting period. The key assumptions concerning estimation uncertainties at the reporting date are discussed below.
Property, plant and equipmentThe Group assesses the depreciation methods, and estimates the useful lives and residual values of these assets at each reporting date. These estimates take cognisance of current market and trading conditions for the Group’s specific assets. In addition, the useful life estimates take into account the risk of obsolescence due to advances in technology. (Refer to note 2 for further detail.)
T r u w o r t h s I n t e r n a t i o n a l L i m i t e d A n n u a l F i n a n c i a l S t a t e m e n t s 2 0 1 2 17
NoTES To ThE GRoUP ANNUAL FINANCIAL STATEMENTS1. principal accountinG policies (continued)
1.3 use of estimates and judgements in the preparation of annual financial statements (continued)
TrademarksThe Group’s acquired trademark is adjudged to have an indefinite useful life. The useful life is assessed at each reporting date. This judgement is based on the market and trading conditions applicable to the Group and management’s expectations and strategy for the use of the trademark. (Refer to note 4 for further detail.)
Impairment of goodwill and trademarksThe Group assesses whether goodwill and trademarks are impaired at each reporting date or more frequently if events or changes in circumstances indicate that their carrying amounts may be impaired. This assessment involves a discounted cash flow calculation and key assumptions made in determining future earnings relate to the sales growth rate, operating margin, return on investment, reinvestment of profits, working capital requirements and capital expenditure. The growth rate used to extrapolate cash flows beyond the most recent budget period is also estimated. In determining the discount rate applied to calculate the present value of future earnings, the Group estimates the market risk return. (Refer to notes 3 and 4 for further detail.)
Allowances for inventoriesThe allowances for markdown, obsolescence and shrinkage of inventory take into account historic information related to sales trends and represent the expected markdown between the original cost and the estimated net realisable value. The net realisable value assigned to this inventory is the net selling price in the ordinary course of business less the estimated costs of completion (where applicable) less the estimated costs to make the sale. (Refer to note 9 for further detail.)
Doubtful debt allowanceTheGroupassesses its doubtful debt allowanceat each reportingdate.Key assumptions applied inthis calculation are the estimated debt recovery rates within the Group’s debtors’ book, as well as an estimation or view on current and future market conditions that could affect the debt recovery rates. (Refer to note 10 for further detail.)
Post-retirement medical benefitsThe Group provides limited post-retirement medical benefits and obtains an actuarial valuation annually of its net obligation in this regard. The key assumptions applied in arriving at the net obligation include mortality rates, medical inflation rates, investment return, the discount rate and current market conditions. (Refer to note 17 for further detail.)
Fair value of equity- and cash-settled share options grantedThe fair value attached to share incentive scheme options granted is determined with the use of a binomial option pricing model. The key assumptions used in the calculation include estimates of the company’s share’s expected volatility, dividend yield, risk-free interest rate and, for equity-settled share options, the forfeiture rate. (Refer to note 27.6 for further detail.)
Fair value of subsidiariesThe fair value of subsidiaries in the company annual financial statements is determined with reference to relative subsidiary profit performance and company market capitalisation (in the case of trading subsidiaries) and net asset value (in the case of non-trading subsidiaries). (Refer to note 2 of the company annual financial statements for further detail.)
TaxationIn determining the liability for taxation (including indirect and withholding taxes) management makes certain assumptions regarding the interpretation of the relevant taxing legislation and its practical application by the relevant revenue authorities.
1.4 foreign currency translationThe Group and company financial statements are presented in Rand, the functional currency of the company. Each entity in the Group determines its own functional currency and items included in the financial statements of each entity are measured in that currency.
Translation of foreign currency transactions and balancesTransactions in foreign currencies are translated to the company’s functional currency at exchange rates prevailing at the date of the transaction. Subsequent to initial measurement, monetary assets and liabilities are translated at exchange rates prevailing at the reporting date. Non-monetary items carried at cost are translated using the exchange rate at the date of the transaction, whilst assets carried at fair value are translated at the exchange rate when the fair value was determined.
T r u w o r t h s I n t e r n a t i o n a l L i m i t e d A n n u a l F i n a n c i a l S t a t e m e n t s 2 0 1 218
Exchange differences arising on the settlement of monetary items or on translation of monetary items at rates different from those at which they were translated at initial recognition are recognised in profit or loss. Exchange differences on non-monetary items carried at fair value are recognised in profit or loss, except where the fair value adjustments are recognised in other comprehensive income, in which case the translation differences arising are recognised in other comprehensive income.
Translation for consolidationFor consolidation purposes, the assets and liabilities of entities with a functional currency other than the Rand are translated into Rand at the exchange rates prevailing at the reporting date and their statements of comprehensive income at the average exchange rates of each retail month of the reporting period. Exchange differences arising on translation for consolidation are recognised in other comprehensive income in a separate foreign currency translation reserve (FCTR). on disposal of a foreign operation, the component of the FCTR relating to that particular foreign operation would be recognised in profit or loss.
1.5 property, plant and equipmentInitial recognition and measurementEach item of property, plant and equipment is initially recognised as an asset if it is probable that future economic benefits associated with the item will flow to the entity, and the cost of the item can be reliably measured. Each item that qualifies for recognition is initially measured at cost, being the cash equivalent of the purchase price and any costs directly attributable to bringing the asset to the location and condition necessary for it to be capable of operating in the manner intended by management.
Subsequent measurementBuildings owned by the Group are classified as owner-occupied property and carried at cost less accumulated depreciation and/or accumulated impairment losses, if any. Land is carried at cost less accumulated impairment losses, if any, and is not depreciated. Motor vehicles, plant, equipment, furniture and fittings, and computer equipment are carried at cost less accumulated depreciation and/or accumulated impairment losses, if any. when these assets comprise major components with different useful lives, these components are accounted for as separate items. Expenditure incurred to replace or modify a significant component of these assets is capitalised if it is probable that future economic benefits associated with the item will flow to the entity and the cost of the item can be reliably measured. Any remaining carrying amount of the component replaced is written off in profit or loss or derecognised on disposal. All other expenditure is recognised in profit or loss.
DepreciationBuildings, motor vehicles, plant, equipment, furniture and fittings and computer equipment are depreciated to their estimated residual values on a straight-line basis over their expected useful lives. The depreciation methods, estimated remaining useful lives and residual values are reviewed at each reporting date, taking into account technological innovations and asset maintenance programmes. A change resulting from the review is treated as a change in accounting estimate. The depreciation expense is recognised in profit or loss in the depreciation and amortisation expense category.
Depreciation commences when an asset is available for its intended use and ceases temporarily if the residual value exceeds or is equal to the carrying amount. Depreciation ceases permanently at the earlier of the date the asset is classified as held for sale in accordance with IFRS 5 and the date that the asset is derecognised. The following estimated useful lives apply:
Buildings 10 – 15 yearsMotor vehicles 4 yearsPlant, equipment, furniture and fittings 5 – 10 yearsComputer equipment 5 years
DerecognitionAn item of property, plant and equipment is derecognised on disposal or when no future economic benefits are expected from its use or disposal. Gains or losses arising on derecognition are included in profit or loss in the period of derecognition. The gain or loss is calculated as the difference between the net disposal proceeds and the carrying amount of the item at the date of derecognition.
ImpairmentProperty, plant and equipment is assessed for impairment in terms of the accounting policy set out in note 1.9.
T r u w o r t h s I n t e r n a t i o n a l L i m i t e d A n n u a l F i n a n c i a l S t a t e m e n t s 2 0 1 2 19
NoTES To ThE GRoUP ANNUAL FINANCIAL STATEMENTS1. principal accountinG policies (continued)
1.6 GoodwillInitial recognition and measurementGoodwill arising from a business combination is initially measured at cost, being the excess of the aggregate of the consideration transferred and the amount (if any) recognised for the non-controlling interest over the net identifiable assets acquired and liabilities assumed. If this consideration is lower than the fair value of the net assets of the subsidiary acquired, the difference is recognised in profit or loss.
At the acquisition date, any goodwill acquired is allocated to each of the cash-generating units expected to benefit from the acquisition, irrespective of whether other assets or liabilities of the acquiree are assigned to those units.
Subsequent measurementGoodwill is stated at cost less accumulated impairment losses, if any.
Derecognitionwhere goodwill forms part of a cash-generating unit and part of the operation within that unit is disposed of, the goodwill associated with the operation disposed of is included in the carrying amount of such part when determining the gain or loss on disposal of that part. Goodwill disposed of in this circumstance is measured based on the relative values of the part disposed of and the portion of the cash-generating unit retained.
ImpairmentGoodwill is not amortised but tested for impairment at each reporting date, or more frequently if events or changes in circumstances indicate that the carrying amount may be impaired.
Cash-generating units to which goodwill has been allocated are tested for impairment annually by assessing the recoverable amount of the cash-generating unit, which is the higher of fair value (less costs to sell) and value in use. The value in use is calculated as the present value of the future cash flows expected to be derived from the cash-generating unit.
where the recoverable amount of the unit is less than the carrying amount, an impairment loss is recognised. The impairment loss is applied firstly to the carrying amount of any goodwill in the unit assessed. Thereafter, any remaining impairment is allocated to the other assets of the unit on a pro-rata basis, based on the carrying amount of each asset. Losses arising from the impairment of goodwill cannot be reversed.
1.7 trademarksThe Group’s acquired trademark is classified as an intangible asset with an indefinite useful life.
Initial recognition and measurementwhere payments are made for the acquisition of trademarks, the amounts are capitalised at cost. Trademarks acquired through an acquisition of an entity are initially recognised at fair value.
Subsequent measurementTrademarks are stated at cost less accumulated impairment losses, if any. Subsequent expenditure incurred is capitalised if it is probable that future economic benefits associated with the trademark will flow to the entity and its cost can be reliably measured. Trademarks are considered to have an indefinite useful life, based on an analysis of all relevant factors, if there is no foreseeable limit to the period over which they are expected to generate net cash flows for the entity. The useful lives are reviewed at each reporting date to determine whether events or circumstances continue to support an indefinite useful life assessment. A change resulting from the review is accounted for as a change in accounting estimate.
DerecognitionTrademarks are derecognised on disposal or when no future economic benefits are expected from their use or disposal. Gains or losses which arise on derecognition are included in profit or loss in the period of derecognition. The gain or loss is calculated as the difference between the net disposal proceeds and the carrying amount of the item at the date of derecognition.
ImpairmentTrademarks are tested for impairment annually or more frequently if events or changes in circumstances indicate that the carrying amounts may be impaired. The impairment recognised in profit or loss is the excess of the carrying amount over the recoverable amount. Recoverable amounts are estimated for individual trademarks or, when an individual trademark cannot generate cash flows independently, the recoverable amount is determined for the larger cash-generating unit to which the trademark has been assigned. A previously recognised impairment will be reversed in so far as estimates change as a result of an event occurring after the impairment was recognised. An impairment is reversed only to the extent that
T r u w o r t h s I n t e r n a t i o n a l L i m i t e d A n n u a l F i n a n c i a l S t a t e m e n t s 2 0 1 220
the trademark’s carrying amount does not exceed the carrying amount that would have been determined had no impairment been recognised. A reversal of an impairment is recognised in profit or loss.
1.8 computer softwareComputer software is classified as an intangible asset with a finite useful life.
Initial recognition and measurementPurchased software and the direct costs associated with the customisation and installation thereof are capitalised. Expenditure on software developed internally is capitalised if the following criteria are satisfied:
• itcanbedemonstratedthattheintangibleassetwillgenerateprobablefutureeconomicbenefits;
• itistechnicallyfeasibletocompletetheasset;
• theintentionandabilitytocompleteandusetheassetexists;
• adequatefinancial,technicalandotherresourcestocompletethedevelopmentareavailable;and
• thecostsattributabletotheprocessorproductcanbeseparatelyidentifiedandreliablymeasured.
Subsequent measurementComputer software is stated at cost less accumulated amortisation and accumulated impairment losses, if any. Expenditure incurred to restore or maintain the originally assessed future economic benefits of existing software is recognised in profit or loss. Expenditure incurred to replace or modify software is capitalised if it is probable that future economic benefits associated therewith will flow to the entity and the cost thereof can be reliably measured.
AmortisationComputer software is amortised to its estimated residual value on a straight-line basis over its expected useful life of five years. Amortisation commences when the computer software is available for its intended use and ceases temporarily if the residual value exceeds or is equal to the carrying amount. Amortisation ceases permanently at the earlier of the date the asset is classified as held for sale in accordance with IFRS 5 and the date that the asset is derecognised. The amortisation period, amortisation method and residual values are reviewed at each reporting date. A change resulting from the review is treated as a change in accounting estimate. The amortisation expense is recognised in profit or loss in the depreciation and amortisation expense category.
DerecognitionComputer software is derecognised on disposal or when no future economic benefits are expected from its use or disposal. Gains or losses which arise on derecognition are included in profit or loss in the period of derecognition. The gain or loss is calculated as the difference between the net disposal proceeds and the carrying amount of the item at the date of derecognition.
ImpairmentComputer software is assessed for impairment in terms of the accounting policy set out in note 1.9.
1.9 impairment of property, plant and equipment and computer softwareThe Group’s property, plant and equipment (including property, motor vehicles, plant, equipment, furniture and fittings and computer equipment) and computer software are reviewed at each reporting date to determine whether there is any indication of impairment. whenever events or changes in circumstances indicate that the carrying amount may not be recoverable, the recoverable amount of the asset is estimated.
Recoverable amounts are estimated for individual assets or, where an individual asset cannot generate cash flows independently, for the larger cash-generating unit to which the asset belongs. If the recoverable amount of the asset or cash-generating unit is estimated to be less than its carrying amount, the carrying amount of the asset or cash-generating unit is reduced to the recoverable amount. The impairment is recognised in profit or loss as an expense. where an impairment loss is recognised for a cash-generating unit, it is firstly allocated to any goodwill belonging to that unit and thereafter to the other assets of the unit, pro-rata based on their carrying amounts.
A previously recognised impairment will be reversed in so far as estimates change as a result of an event occurring after the impairment was recognised. An impairment is reversed only to the extent that the asset’s carrying amount does not exceed the carrying amount that would have been determined at the reversal date, had no impairment been recognised. A reversal of an impairment is recognised in profit or loss.
After recognition of an impairment loss, the depreciation or amortisation charge for the asset is adjusted in future periods to allocate the asset’s revised carrying amount, less its residual value, on a straight-line basis over its remaining useful life.
Impairment policies for goodwill, trademarks, inventories and deferred tax are described within their respective accounting policies.
T r u w o r t h s I n t e r n a t i o n a l L i m i t e d A n n u a l F i n a n c i a l S t a t e m e n t s 2 0 1 2 21
NoTES To ThE GRoUP ANNUAL FINANCIAL STATEMENTS1. principal accountinG policies (continued)
1.10 financial instrumentsFinancial instruments recognised in the statement of financial position include available-for-sale assets, derivative financial instruments, loans, trade and other receivables, cash and cash equivalents and trade and other payables. Financial instruments are recognised only when the Group becomes party to the contractual provisions of the instrument.
Initial recognition and measurementThe Group determines the classification of its financial assets and liabilities at initial recognition and, where allowed and appropriate in limited instances, re-evaluates this designation at each reporting date. Financial instruments are initially measured at fair value plus, in the case of a financial asset or financial liability not at fair value through profit or loss, transaction costs directly attributable to the acquisition or issue of the financial asset or financial liability. Subsequent measurement and impairment for each category is specified below.
All regular way purchases and sales of financial assets are recognised on the trade date, which is the date that the Group commits to purchase or sell the asset.
Fair valueThe fair value of financial instruments traded in active financial markets is determined with reference to quoted prices at the close of business on the reporting date. For financial instruments where there is no active market, fair value is determined using valuation techniques. Such techniques include reference to the quoted market capitalisation of the Group, quoted market prices, relative entity profit performance, recent arm’s length transactions and other recognised valuation methodologies. Equity securities for which fair values cannot be measured reliably are recognised at cost less impairment losses.
Categories of financial instruments and subsequent measurementFinancial assets and liabilities at fair value through profit or lossThe Group classifies its derivatives in the form of forward exchange contracts as held-for-trading financial assets or liabilities. The Group has not elected to designate any other financial instruments in this category. The Group’s purchased cash-settled call options are designated hedging instruments. (Refer to note 1.12 for further detail.)
The fair value of forward exchange contracts is calculated with reference to current forward exchange contracts traded in the open market with similar maturity profiles at the reporting date. Gains and losses arising from changes in the fair value of forward exchange contracts are recognised under other operating expenses, with a corresponding current asset (in the event of a gain) or current liability (in the event of a loss) in the statement of financial position.
Available-for-sale financial assetsShares in subsidiaries, the Group’s mutual fund units and unlisted investment are classified as available-for-sale financial assets.
Subsequent to initial measurement, available-for-sale financial assets are measured at fair value. Gains or losses arising on the change in fair value of available-for-sale financial assets are recognised in other comprehensive income.
The fair value of the shares held in subsidiaries in the company annual financial statements is determined with reference to relative subsidiary profit performance and company market capitalisation (in the case of trading subsidiaries) and net asset value (in the case of non-trading subsidiaries).
The fair value of the Group’s mutual fund units and unlisted investment is determined annually with reference to the quoted unit prices at the close of business on the reporting date and the most recently traded share price respectively.
Loans and receivablesThe export partnership participation, various other amounts owing to the Group, trade and other receivables and cash and cash equivalents are classified as loans and receivables.
Subsequent to initial measurement, loans and receivables are carried at amortised cost using the effective interest method. Gains and losses are recognised in profit or loss when the loans and receivables are derecognised or impaired, as well as through the amortisation process.
where credit sales are made on a six-month interest-free basis, the related receivables are recognised at the fair value on transaction date and notional interest is recognised over the interest-free period.
T r u w o r t h s I n t e r n a t i o n a l L i m i t e d A n n u a l F i n a n c i a l S t a t e m e n t s 2 0 1 222
Subsequently, such receivables are measured at amortised cost using the effective interest method, less an allowance for uncollectible amounts.
Financial liabilities measured at amortised costAmounts owing for trade and other payables are classified as financial liabilities and are subsequently measured at amortised cost. Gains and losses are recognised in profit or loss when the financial liabilities are derecognised or impaired, as well as through the amortisation process.
offsetFinancial assets and liabilities are off-set and the net amount reported in the statement of financial position when there is a current legally enforceable right to off-set the recognised amounts and there is an intention to settle on a net basis, or realise the asset and settle the liability simultaneously.
Derecognition of financial assets and liabilitiesA financial asset, or a portion of a financial asset, is derecognised where:
• therightstoreceivecashflowsfromtheassethaveexpired;
• theGroupretainstherighttoreceivecashflowsfromtheasset,buthasassumedanobligationtopaythem in full without material delay to a third party under a ‘pass-through’ arrangement; or
• theGrouphastransferreditsrightstoreceivecashflowsfromtheassetandeither:
(i) has transferred substantially all the risks and rewards of the asset; or
(ii) has neither transferred nor retained substantially all the risks and rewards of the asset, but has transferred control of the asset.
A financial liability is derecognised when the obligation under the liability is discharged, cancelled or has expired.
1.11 impairment of financial assetsThe Group’s financial assets are reviewed at each reporting date, or whenever events or changes in circumstances indicate that the carrying amount may not be recoverable, to determine whether there is any indication of impairment.
The Group first assesses whether objective evidence of impairment exists for financial assets that are individually significant, and collectively for financial assets that are not individually significant. If no objective evidence of impairment exists for an individually assessed financial asset, whether significant or not, the asset is included in a group of financial assets with similar credit risk characteristics and that group of financial assets is collectively assessed for impairment. Assets that are individually assessed for impairment, and for which an impairment loss is or continues to be recognised, are not included in a collective assessment of impairment.
Available-for-sale financial assetswhen an available-for-sale financial asset is impaired (such as when there has been a significant or prolonged decline in the fair value of the investment below its cost), an amount comprising the difference between its cost and its current fair value, less any impairment loss previously recognised, is reclassified from other comprehensive income to profit or loss.
If, in a subsequent period, the amount of the impairment loss decreases and the decrease can be related objectively to an event occurring after the impairment was recognised, the previously recognised impairment loss is reversed. The reversal of any such impairment loss is recognised in other comprehensive income.
Loans and receivablesIf there is objective evidence that an impairment loss has been incurred (such as the probability of insolvency or significant financial difficulties of the debtor), it is measured as the difference between the asset’s carrying amount and the present value of the estimated future cash flows discounted at the financial asset’s original effective interest rate. The carrying amount of the asset is reduced using an allowance account and the loss is recognised in profit or loss. Loans and receivables are written off, and, if previously impaired, the doubtful debt allowance utilised, when there is no realistic prospect of future recovery and all collateral (where applicable) has been realised or transferred to the Group.
If, in a subsequent period, the amount of the impairment loss decreases and the decrease can be related objectively to an event occurring after the impairment was recognised, the previously recognised impairment loss is reversed. Any subsequent reversal of an impairment loss is recognised in profit or loss, to the extent that the carrying amount of the asset does not exceed its amortised cost at the reversal date had no impairment been recognised.
T r u w o r t h s I n t e r n a t i o n a l L i m i t e d A n n u a l F i n a n c i a l S t a t e m e n t s 2 0 1 2 23
NoTES To ThE GRoUP ANNUAL FINANCIAL STATEMENTS1. principal accountinG policies (continued)
1.12 Derivative financial instruments and hedge accountingThe Group is exposed to fluctuations in the share price of the company as a result of having issued cash-settled call options to certain employees. The Group uses derivative instruments in the form of purchased cash-settled call options to hedge this exposure. The purchased options have been designated as cash flow hedges. There are no other instances of hedge accounting.
Initial recognition and measurementThe hedging instrument is initially measured at fair value. The Group’s criteria for the application of cash flow hedge accounting require that:
• attheinceptionofthehedgerelationship,thereisformaldesignationanddocumentationofthehedgingrelationship, the risk management objective and the strategy for undertaking the hedge;
• thehedgetransactionisexpectedtobehighlyeffectiveinachievingoffsetinchangesincashflowsattributable to the hedged risk;
• theeffectivenessofthehedgecanbereliablymeasured;
• theforecasttransactionthatisthesubjectofthecashflowhedgemustbehighlyprobable;and
• thehedge isassessedonanongoingbasisanddeterminedactually tohavebeenhighlyeffectivethroughout the financial reporting periods for which the hedge was designated.
Subsequent measurementThe fair value of the cash-settled call options issued by the Group is obtained from a valuation performed by a financial institution at the close of business on the reporting date. The effective part of any gain or loss arising on the purchased cash-settled call options is recognised in other comprehensive income and held in a separate cash flow hedging reserve in the statement of changes in equity until the hedged transaction affects profit or loss. The ineffective part of any gain or loss is recognised in profit or loss.
DerecognitionIf a forecast transaction is no longer expected to occur, amounts previously recognised in other comprehensive income are reclassified to profit or loss. If the hedging instrument expires or is sold, terminated or exercised without replacement or rollover, or if its designation as a hedge is revoked, amounts previously recognised in other comprehensive income remain in equity until the forecast transaction occurs. If the forecast transaction is not expected to occur, the amount is recognised in profit or loss.
1.13 inventoriesFinished goods are valued at the lower of cost and net realisable value. The cost is calculated using the First-In- First-out (FIFo) method. Adjustments are made for any allowances for markdown, obsolescence and shrinkage, where appropriate. write-downs to net realisable value and inventory losses are recognised in profit or loss in the reporting period in which the write-downs occur. Net realisable value is the estimated selling price in the ordinary course of business, less the estimated costs of completion (where applicable) less the estimated costs to make the sale.
Inventories are physically verified at least once a year through the performance of inventory counts, and shortages identified are written off immediately. An allowance is made at the reporting date, based on historical trends, for inventory losses incurred between the last physical count and the reporting date.
1.14 share capital and share premiumIssued share capital and share premium are stated as the amount of the proceeds received on the issue of shares less directly attributable issue costs.
1.15 treasury sharesShares in the company held by Group subsidiaries are classified as treasury shares. The cost price of these shares, together with related transaction costs, is deducted from equity. The issued and weighted average number of shares is reduced by the treasury shares for the purposes of the basic and headline earnings per share calculations. Dividends received on treasury shares are eliminated on consolidation.
when treasury shares are cancelled, the treasury share balance is reduced by the cost of the cancelled shares. Share capital is then reduced by the par value of these cancelled treasury shares. when shares are repurchased from parties outside the Group and subsequently cancelled, the company’s share premium is reduced by the excess of the repurchase price over the par value of the shares cancelled. when shares are repurchased from subsidiary companies and subsequently cancelled, retained income of the Group is reduced by the excess of the repurchase price over the par value of the shares cancelled. In the company, the non-distributable reserve is reduced by the excess of the repurchase price over the par value of the shares cancelled.
T r u w o r t h s I n t e r n a t i o n a l L i m i t e d A n n u a l F i n a n c i a l S t a t e m e n t s 2 0 1 224
1.16 employee benefitsThe Group remunerates its employees with short-term employee benefits and participates in six defined contribution retirement funds and one defined benefit healthcare fund. In addition, certain employees are remunerated with share-based payments.
Short-term employee benefitsRemuneration to employees is recognised in profit or loss as the services are rendered, except for non-accumulating benefits that are only recognised when the specified event occurs. Provision is made for accumulated and incentive bonuses.
Defined contribution plansThe Group’s contributions to the defined contribution retirement funds are based on a percentage of the pensionable payroll and are recognised as an expense in profit or loss in the reporting period in which the services are rendered by the relevant employees.
Defined benefit plansThe Group has an obligation to provide certain post-retirement medical benefits to eligible employees and pensioners who entered into the Group’s employment prior to 30 June 2000.
The net defined benefit liability is the aggregate of the present value of the defined benefit obligation and unrecognised actuarial gains and losses, reduced by unrecognised past service costs and the fair value of plan assets. The present value of the defined benefit obligation, the related current service costs and, where applicable, past service costs, are calculated using the projected unit credit method, incorporating actuarial assumptions and a discount rate based on high quality corporate bonds.
Unrecognised actuarial gains and losses, in excess of the greater of 10% of the fair value of plan assets or the present value of the obligation at the beginning of the period, are recognised in profit or loss over the average expected remaining working lives of employees who qualify for the benefits.
Past service costs are recognised as an expense on a straight-line basis over the average period until the benefits become vested. Any curtailment benefits or settlement amounts are recognised in profit or loss when they are incurred.
Share-based paymentsEquity-settled share optionsEmployees of the Group, including executive directors (and in prior periods, certain of the non-executive directors) receive remuneration in the form of equity-settled share options, whereby they render services in exchange for rights over the company’s listed shares.
The cost of the services to be received from employees and the corresponding increase in the equity-settled compensation reserve are measured with reference to the fair value of the shares on the date on which the share options are granted. The fair value of the share options is determined using an actuarial binomial model (refer to note 27.6.1 for further detail). Non-vesting conditions and vesting conditions, to the extent that they are conditions linked to the price of the company’s shares (i.e. market conditions), if any, are taken into account in determining the fair value of the share options granted. No account is taken of any other vesting conditions.
The cost of share options is recognised in profit or loss, together with a corresponding increase in total equity under the equity-settled compensation reserve, over the vesting period. The cumulative expense recognised for share options granted at each reporting date until the vesting date reflects the extent to which the vesting period has expired, as well as the Group’s best estimate of the number of share options that will ultimately vest. The estimate is revised if subsequent information indicates that the number of share options expected to vest differs from previous estimates. No expense is recognised for share options that do not ultimately vest.
where the terms of an award are modified, as a minimum an expense is recognised as if the terms had not been modified. In addition, an expense is recognised for any modification that increases the total fair value of the share option arrangement, or is otherwise beneficial to the employee as measured at the date of modification. where an award is cancelled, it is treated as if it had vested on the date of cancellation and any expense not yet recognised for the award is recognised immediately. however, if a new award is substituted for the cancelled award and designated as a replacement award on the date that it is granted, the cancelled and new awards are treated as if they were a modification of the original award, as described above.
The effect of outstanding share options is reflected in the computation of diluted earnings per share. (Refer to note 30.2 for further detail.)
T r u w o r t h s I n t e r n a t i o n a l L i m i t e d A n n u a l F i n a n c i a l S t a t e m e n t s 2 0 1 2 25
NoTES To ThE GRoUP ANNUAL FINANCIAL STATEMENTS1. principal accountinG policies (continued)
1.16 employee benefits (continued)
Cash-settled share optionsEmployees of the Group, including executive directors receive remuneration in the form of cash-settled share options, whereby they render services in exchange for remuneration based on the company’s share price.
The cost of the services to be rendered by employees and the corresponding cash-settled compensation liability is recognised over the vesting period and is initially measured at fair value. The liability is re-measured at each reporting date up to and including the settlement date, and changes in the fair value are recognised in profit or loss.
1.17 taxesThe tax expense consists of current South African and foreign tax, deferred tax and secondary tax on companies (STC).
Current South African and foreign taxThe current tax charge is the expected tax payable on the taxable income for the reporting period. The tax rates and tax laws used to compute this amount are those that are enacted or substantively enacted at the reporting date.
Deferred taxThe provision for deferred tax assets and liabilities reflects the tax consequences that would follow from the expected recovery or settlement of the carrying amount of the Group’s assets and liabilities. Deferred tax is provided, using the liability method, for all temporary differences at the reporting date between the tax bases of assets or liabilities and their respective carrying amounts.
A deferred tax liability is recognised except to the extent that it arises from:
• theinitialrecognitionofgoodwill;or
• theinitialrecognitionofanassetorliabilityinatransactionthatisnotabusinesscombinationand,atthe time of the transaction, affects neither accounting profit (or loss) nor taxable income (or tax loss).
A deferred tax liability is recognised for all taxable temporary differences associated with investments in subsidiaries, except to the extent that both of the following conditions are satisfied:
• theentityisabletocontrolthetimingofthereversalofthetemporarydifference;and
• itisprobablethatthetemporarydifferencewillnotreverseintheforeseeablefuture.
A deferred tax asset is recognised where it is probable that, in the foreseeable future, taxable income will be available against which the deferred tax asset can be realised. A deferred tax asset is not recognised where:
• itarisesfromatransactionthatisnotpartofabusinesscombination;and
• atthetimeofthetransaction,ithasnotaffectedaccountingprofit(orloss)ortaxableincome(ortaxloss).
The carrying amount of deferred tax assets is reviewed at the reporting date and reduced to the extent that it is no longer probable that sufficient future taxable income will be available to allow all or part of the deferred tax asset to be utilised. Unrecognised deferred tax assets are reassessed at each reporting date and are recognised to the extent that it has become probable that future taxable income will allow the deferred tax assets to be recovered.
Deferred tax assets and liabilities are measured at the tax rates that are expected to apply when the asset is realised or the liability is settled, based on tax rates and tax laws that have been enacted or substantively enacted at the reporting date. The related deferred tax charge is accounted for in profit or loss, other comprehensive income or equity depending on the underlying transaction. Deferred tax assets and deferred tax liabilities are off-set, if the Group has a legally enforceable right to set off current tax assets against current tax liabilities and the deferred taxes relate to the same taxable entity and the same taxation authority.
T r u w o r t h s I n t e r n a t i o n a l L i m i t e d A n n u a l F i n a n c i a l S t a t e m e n t s 2 0 1 226
Secondary tax on companiesFor all dividends declared prior to 1 April 2012, STC was recognised as part of the tax expense in the statement of comprehensive income when the related dividend was paid.
Dividends taxSTC was abolished with effect from 1 April 2012 and replaced by a dividends tax, which is not levied on the company but on the beneficial owner of the share and accordingly does not require recognition in profit or loss. Dividends tax withheld by the company on dividends paid to its shareholders (who do not qualify for an exemption from dividends tax) and payable at the reporting date to the South African Revenue Service (where applicable) is included in trade and other payables in the statement of financial position.
1.18 leasesLeases are classified as operating leases, where substantially all the risks and rewards associated with ownership of the asset are not transferred from the lessor to the lessee. operating lease rentals with fixed or minimum rental escalation clauses are recognised in profit or loss on a straight-line basis over the lease term. The resulting difference between the lease expenses arising from the application of the straight-line basis and the contractual amounts actually paid or accrued is recognised as an operating lease obligation or asset.
Contingent rental income and expenses are recognised when accrued or incurred.
1.19 provisions and contingent liabilitiesA provision is recognised when the Group has a present legal or constructive obligation as a result of a past event, it is probable that an outflow of economic benefits will be required to settle the obligation and a reliable estimate can be made of the amount of the obligation. The expense related to any provision is recognised in profit or loss. If the effect of the time value of money is material, a discount rate is applied to determine the present value of the provision. where discounting is applied, the annual increase in the provision due to the passage of time is recognised as an interest expense in profit or loss.
Contingent liabilities are not recognised as liabilities in the Group financial statements but are disclosed separately in the notes.
1.20 DividendsDividends payable (and up to 1 April 2012 the STC thereon) are recognised as liabilities in the reporting period in which the dividends are declared. A dividend declared subsequent to the reporting date is not charged against total equity at the reporting date, as no liability exists at that date.
1.21 revenueRevenue is measured at the fair value of the consideration received or receivable. Revenue is recognised when the amount of revenue can be reliably measured and it is probable that the economic benefits associated with the transaction will flow to the entity. Revenue transactions are recognised on the following bases:
Sale of merchandiseRevenue from the sale of merchandise through retail outlets and to franchisees is recognised when the risks and rewards of ownership have passed to the customer or franchisee. Such income represents the net invoice value of merchandise provided to such third parties – excluding discounts, value-added and general sales tax.
Sales made on six-month interest-free deferred settlement terms effectively contain a financing element. The difference between the purchase price under market-related conditions and the amount actually paid is recognised as notional interest income over the six-month financing period.
InterestInterest is recognised using the effective interest method.
CommissionCommission, through the sale of merchandise on behalf of third parties, is recognised in the reporting period in which it is earned, according to the applicable contractual arrangements. where the Group acts as an agent, all payments collected from customers and passed on to third parties are excluded from both revenue and expenses.
T r u w o r t h s I n t e r n a t i o n a l L i m i t e d A n n u a l F i n a n c i a l S t a t e m e n t s 2 0 1 2 27
NoTES To ThE GRoUP ANNUAL FINANCIAL STATEMENTS1. principal accountinG policies (continued)
1.21 revenue (continued)
Display fees and financial services incomeDisplay fees and financial services income, comprising commissions on insurance products and account service fees, are recognised in the reporting period in which they are earned, according to the applicable contractual arrangements.
Lease rental incomeLease rental income is recognised in the reporting period in which it is earned, based on the straight-line method.
RoyaltiesRoyalties, based on the sale of merchandise to franchisees, are recognised in the reporting period in which they are earned, according to the applicable contractual arrangements.
Management feesManagement fees are recognised when the services contracted for are rendered.
DividendsDividends are recognised when the Group’s right to receive the payment is established.
1.22 cost of salesCost of sales includes all costs of purchase, costs of conversion and other costs incurred in bringing inventories to their present location and condition. Costs of purchase include the purchase price, royalties paid, import duties and other taxes (to the extent that they are not recoverable), transport and distribution costs. Inventory write-downs are included in cost of sales when recognised. Trade discounts, settlement discounts and other similar items are deducted in determining the costs of purchase.
Cost of sales is recognised as an expense when the risks and rewards of ownership related to the sale of merchandise pass to the customer or franchisee.
1.23 segment informationThe reportable segments of the Group have been identified as the Truworths and young Designers Emporium (yDE) business units with reference to the internal management structure. This basis is representative of management’s review processes and the Group’s internal financial reporting structures. The source and nature of business risks and returns are segmented on the same basis.
The Group’s main geographical regions, being South Africa, Namibia, Swaziland, Botswana and other African countries, are based on the location of the Group’s customers. Transfer prices between operating segments are at arm’s length, in a manner similar to transactions with third parties.
1.24 events after the reporting dateThe financial statements are adjusted to reflect events that occurred between the reporting date and the date when the financial statements are authorised for issue, provided they give evidence of conditions that existed at the reporting date. Events that are indicative of conditions that arose after the reporting date are disclosed, but do not result in an adjustment of the financial statements themselves.
1.25 ifrs, amendments and ifric interpretations issued but not yet effectiveThe following IFRS and amendments, that are relevant to the Group, have been issued but are not yet effective for the period under review. The Group will adopt these no later than their effective dates, to the extent that they are applicable to its activities:
• IFRS9:FinancialInstruments Phase One – Classification and measurement of financial assets and liabilities Effective for annual periods beginning on or after 1 January 2015 The Group is still determining the expected impact of IFRS 9. The standard released to date is the first
phase of a larger project to replace IAS 39: Financial Instruments – Recognition and Measurement. The second and third phases of the project will deal with impairment of financial instruments and hedge accounting respectively. The impact of the new standard could be significant for the Group.
T r u w o r t h s I n t e r n a t i o n a l L i m i t e d A n n u a l F i n a n c i a l S t a t e m e n t s 2 0 1 228
• IFRS10:ConsolidatedFinancialStatements Presentation and preparation of consolidated financial statements Effective for annual periods beginning on or after 1 January 2013 The new standard establishes control as the only basis for consolidation of all entities, regardless of
the nature of the investee. It amends the definition of control to include three elements, namely power over an investee, exposure or rights to variable returns of the investee and the ability to use power over the investee to affect the investor’s returns. The new standard will replace IAS 27: Consolidated and Separate Financial Statements and SIC-12: Consolidation – Special Purpose Entities. The Group is still determining the expected impact of IFRS 10.
• IFRS12:DisclosureofInterestsinOtherEntities Disclosure of interests in subsidiaries, joint arrangements, associates and unconsolidated structured
entities Effective for annual periods beginning on or after 1 January 2013 The objective of the new standard is to increase transparency in financial reporting where the reporting
entity has an interest in subsidiaries, joint arrangements, associates and/or unconsolidated structured entities. The new standard requires disclosure of information to enable users of financial statements to evaluate the nature of, and risks associated with, its interests in other entities and the effects of those interests on its financial position, financial performance and cash flows. The Group expects that the adoption of IFRS 12 will have no material financial impact on its financial statements in the period of initial application. however, the Group will comply with the additional disclosure requirements resulting from such initial application.
• IFRS13:FairValueMeasurement Framework for measuring fair value and disclosure requirements for fair value measurements Effective for annual periods beginning on or after 1 January 2013 The objective of the new standard is to reduce the complexity and improve the consistency of fair
value measurements and is part of the IASB’s IFRS and US GAAP convergence project. The new standard consolidates and clarifies the requirements for measuring fair value and includes disclosure enhancements to assist users of financial statements to better assess the valuation techniques and inputs used to measure fair value. The Group is still determining the expected impact of IFRS 13.
• IAS1:PresentationofFinancialStatements(Amended) Amendments to presentation of items recognised in other comprehensive income Effective for annual periods beginning on or after 1 July 2012 The amendments to IAS 1 require items that are recognised in other comprehensive income, that may
in a future period be reclassified to profit or loss, to be presented separately from those items that may never be reclassified to profit or loss. The Group expects that the adoption of IAS 1 (Amended) will have no material financial impact on its financial statements in the period of initial application. however, the Group will comply with the additional disclosure requirements resulting from such initial application.
• IAS19:EmployeeBenefits(Amended) Amendments to accounting for employee benefits, particularly pension and post-retirement benefit plans Effective for annual periods beginning on or after 1 January 2013 Amendments to IAS 19 include significant changes to the accounting for pension and post-retirement
benefit plans and various other minor changes. of these changes, the most fundamental is the removal of the corridor mechanism for recognising actuarial gains and losses, which will result in full balance sheet recognition of plan surpluses and deficits. The Group is still determining the expected impact of IAS 19 (Amended).
various other IFRS, amendments and IFRIC interpretations that have been issued and are not yet effective have not been disclosed by the Group, as they are not applicable to its activities.
T r u w o r t h s I n t e r n a t i o n a l L i m i t e d A n n u a l F i n a n c i a l S t a t e m e n t s 2 0 1 2 29
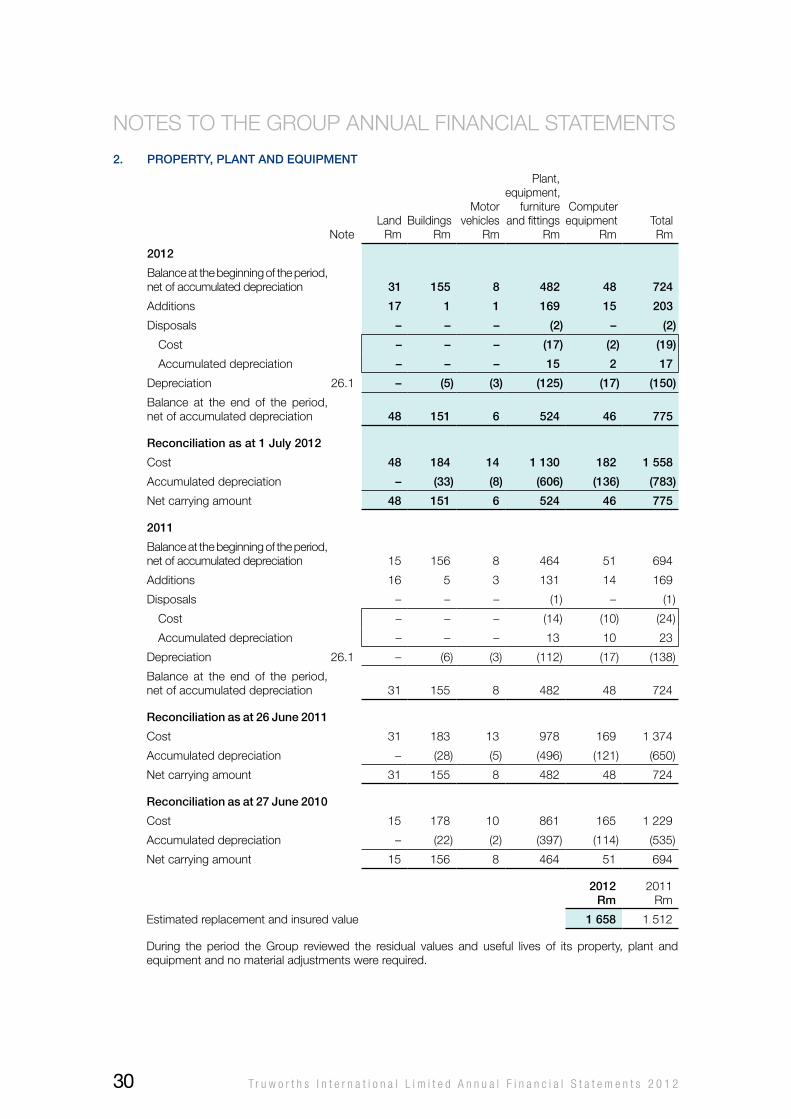
NoTES To ThE GRoUP ANNUAL FINANCIAL STATEMENTS
2. property, plant anD equipment
Note Land
RmBuildings
Rm
Motor vehicles
Rm
Plant, equipment,
furniture and fittings
Rm
Computer equipment
Rm Total
Rm
2012
Balance at the beginning of the period, net of accumulated depreciation 31 155 8 482 48 724
Additions 17 1 1 169 15 203
Disposals – – – (2) – (2)
Cost – – – (17) (2) (19)
Accumulated depreciation – – – 15 2 17
Depreciation 26.1 – (5) (3) (125) (17) (150)
Balance at the end of the period, net of accumulated depreciation 48 151 6 524 46 775
reconciliation as at 1 July 2012
Cost 48 184 14 1 130 182 1 558
Accumulated depreciation – (33) (8) (606) (136) (783)
Net carrying amount 48 151 6 524 46 775
2011
Balance at the beginning of the period, net of accumulated depreciation 15 156 8 464 51 694
Additions 16 5 3 131 14 169
Disposals – – – (1) – (1)
Cost – – – (14) (10) (24)
Accumulated depreciation – – – 13 10 23
Depreciation 26.1 – (6) (3) (112) (17) (138)
Balance at the end of the period, net of accumulated depreciation 31 155 8 482 48 724
reconciliation as at 26 June 2011
Cost 31 183 13 978 169 1 374
Accumulated depreciation – (28) (5) (496) (121) (650)
Net carrying amount 31 155 8 482 48 724
reconciliation as at 27 June 2010
Cost 15 178 10 861 165 1 229
Accumulated depreciation – (22) (2) (397) (114) (535)
Net carrying amount 15 156 8 464 51 694
2012rm
2011Rm
Estimated replacement and insured value 1 658 1 512
During the period the Group reviewed the residual values and useful lives of its property, plant and equipment and no material adjustments were required.
T r u w o r t h s I n t e r n a t i o n a l L i m i t e d A n n u a l F i n a n c i a l S t a t e m e n t s 2 0 1 230
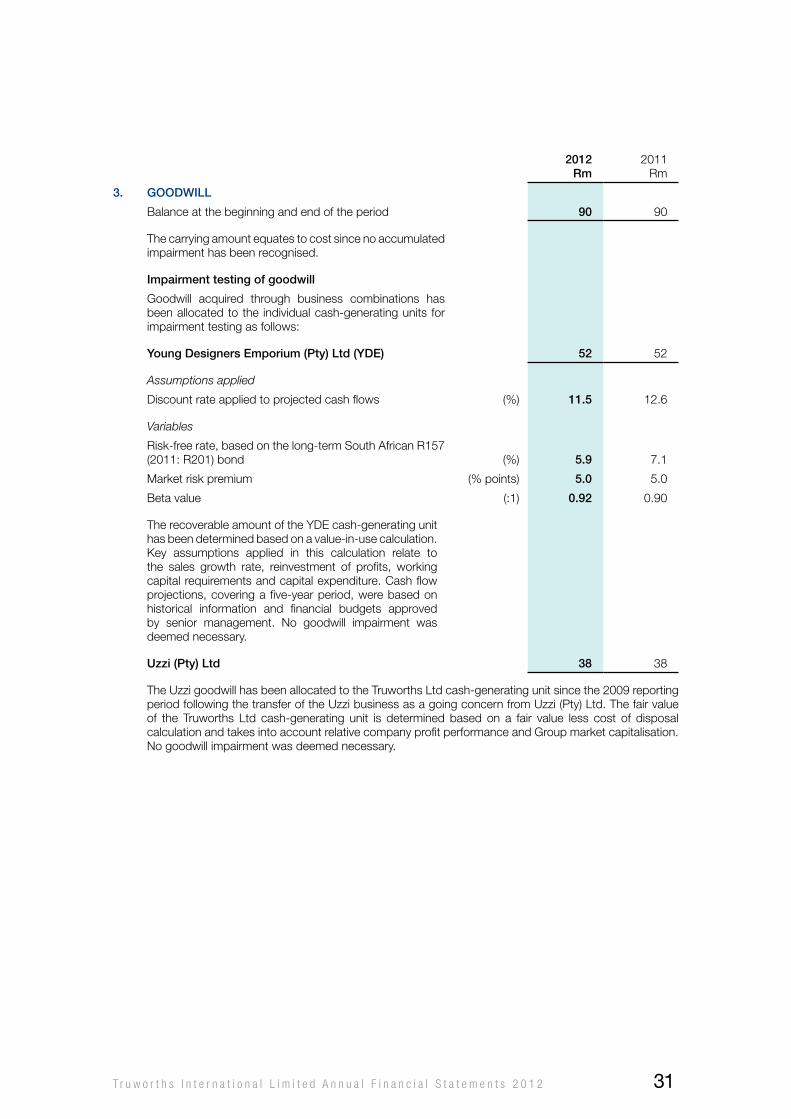
2012rm
2011Rm
3. GooDwill
Balance at the beginning and end of the period 90 90
The carrying amount equates to cost since no accumulated impairment has been recognised.
impairment testing of goodwill
Goodwill acquired through business combinations has been allocated to the individual cash-generating units for impairment testing as follows:
young Designers emporium (pty) ltd (yDe) 52 52
Assumptions applied
Discount rate applied to projected cash flows (%) 11.5 12.6
Variables
Risk-free rate, based on the long-term South African R157 (2011: R201) bond (%) 5.9 7.1
Market risk premium (% points) 5.0 5.0
Beta value (:1) 0.92 0.90
The recoverable amount of the yDE cash-generating unit has been determined based on a value-in-use calculation. Key assumptions applied in this calculation relate tothe sales growth rate, reinvestment of profits, working capital requirements and capital expenditure. Cash flow projections, covering a five-year period, were based on historical information and financial budgets approved by senior management. No goodwill impairment was deemed necessary.
uzzi (pty) ltd 38 38
The Uzzi goodwill has been allocated to the Truworths Ltd cash-generating unit since the 2009 reporting period following the transfer of the Uzzi business as a going concern from Uzzi (Pty) Ltd. The fair value of the Truworths Ltd cash-generating unit is determined based on a fair value less cost of disposal calculation and takes into account relative company profit performance and Group market capitalisation. No goodwill impairment was deemed necessary.
T r u w o r t h s I n t e r n a t i o n a l L i m i t e d A n n u a l F i n a n c i a l S t a t e m e n t s 2 0 1 2 31
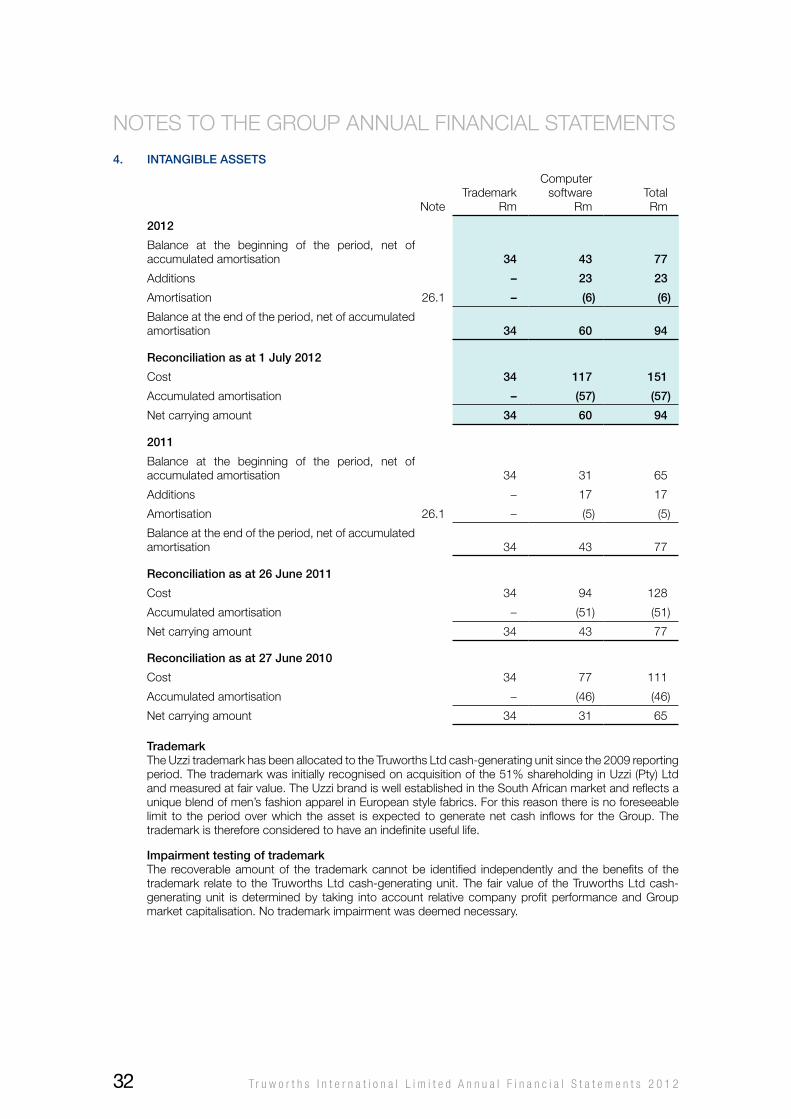
NoTES To ThE GRoUP ANNUAL FINANCIAL STATEMENTS
4. intanGible assets
NoteTrademark
Rm
Computer software
RmTotalRm
2012
Balance at the beginning of the period, net of accumulated amortisation 34 43 77
Additions – 23 23
Amortisation 26.1 – (6) (6)
Balance at the end of the period, net of accumulated amortisation 34 60 94
reconciliation as at 1 July 2012
Cost 34 117 151
Accumulated amortisation – (57) (57)
Net carrying amount 34 60 94
2011
Balance at the beginning of the period, net of accumulated amortisation 34 31 65
Additions – 17 17
Amortisation 26.1 – (5) (5)
Balance at the end of the period, net of accumulated amortisation 34 43 77
reconciliation as at 26 June 2011
Cost 34 94 128
Accumulated amortisation – (51) (51)
Net carrying amount 34 43 77
reconciliation as at 27 June 2010
Cost 34 77 111
Accumulated amortisation – (46) (46)
Net carrying amount 34 31 65
trademarkThe Uzzi trademark has been allocated to the Truworths Ltd cash-generating unit since the 2009 reporting period. The trademark was initially recognised on acquisition of the 51% shareholding in Uzzi (Pty) Ltd and measured at fair value. The Uzzi brand is well established in the South African market and reflects a unique blend of men’s fashion apparel in European style fabrics. For this reason there is no foreseeable limit to the period over which the asset is expected to generate net cash inflows for the Group. The trademark is therefore considered to have an indefinite useful life.
impairment testing of trademarkThe recoverable amount of the trademark cannot be identified independently and the benefits of the trademark relate to the Truworths Ltd cash-generating unit. The fair value of the Truworths Ltd cash-generating unit is determined by taking into account relative company profit performance and Group market capitalisation. No trademark impairment was deemed necessary.
T r u w o r t h s I n t e r n a t i o n a l L i m i t e d A n n u a l F i n a n c i a l S t a t e m e n t s 2 0 1 232
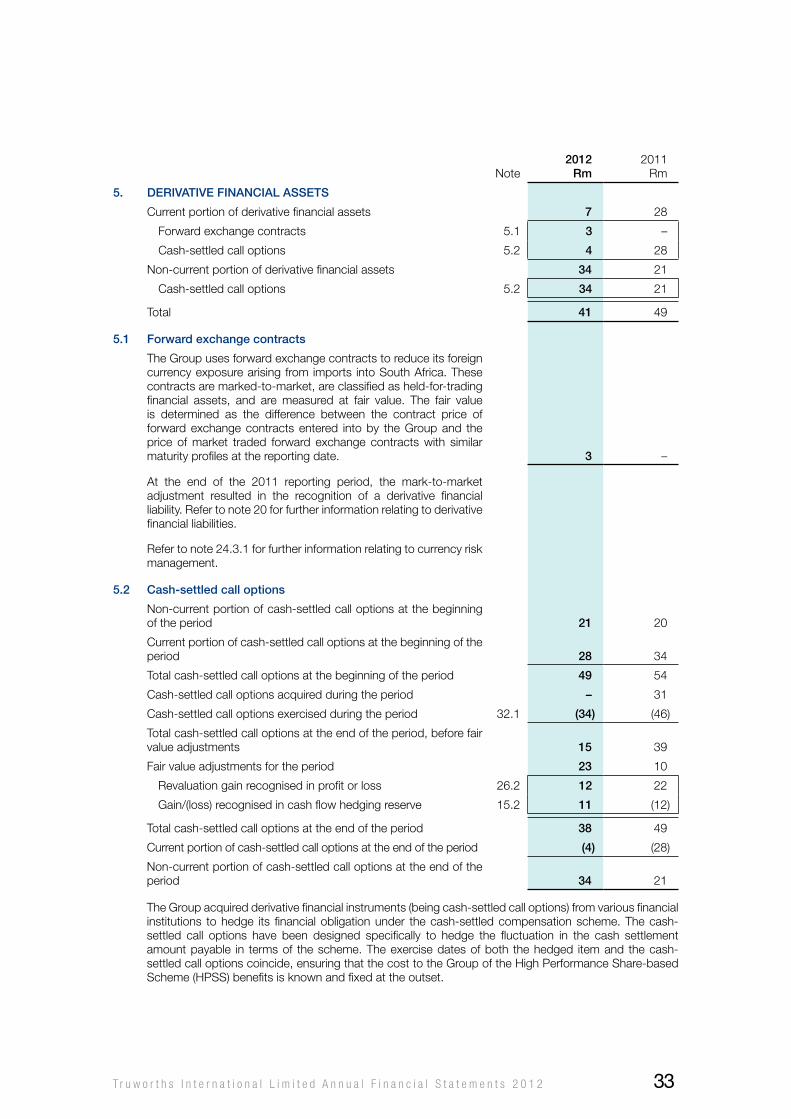
Note2012
rm2011
Rm
5. Derivative financial assets
Current portion of derivative financial assets 7 28
Forward exchange contracts 5.1 3 –
Cash-settled call options 5.2 4 28
Non-current portion of derivative financial assets 34 21
Cash-settled call options 5.2 34 21
Total 41 49
5.1 forward exchange contracts
The Group uses forward exchange contracts to reduce its foreign currency exposure arising from imports into South Africa. These contracts are marked-to-market, are classified as held-for-trading financial assets, and are measured at fair value. The fair value is determined as the difference between the contract price of forward exchange contracts entered into by the Group and the price of market traded forward exchange contracts with similar maturity profiles at the reporting date. 3 –
At the end of the 2011 reporting period, the mark-to-market adjustment resulted in the recognition of a derivative financial liability. Refer to note 20 for further information relating to derivative financial liabilities.
Refer to note 24.3.1 for further information relating to currency risk management.
5.2 cash-settled call options
Non-current portion of cash-settled call options at the beginning of the period 21 20
Current portion of cash-settled call options at the beginning of the period 28 34
Total cash-settled call options at the beginning of the period 49 54
Cash-settled call options acquired during the period – 31
Cash-settled call options exercised during the period 32.1 (34) (46)
Total cash-settled call options at the end of the period, before fair value adjustments 15 39
Fair value adjustments for the period 23 10
Revaluation gain recognised in profit or loss 26.2 12 22
Gain/(loss) recognised in cash flow hedging reserve 15.2 11 (12)
Total cash-settled call options at the end of the period 38 49
Current portion of cash-settled call options at the end of the period (4) (28)
Non-current portion of cash-settled call options at the end of the period 34 21
The Group acquired derivative financial instruments (being cash-settled call options) from various financial institutions to hedge its financial obligation under the cash-settled compensation scheme. The cash-settled call options have been designed specifically to hedge the fluctuation in the cash settlement amount payable in terms of the scheme. The exercise dates of both the hedged item and the cash-settled call options coincide, ensuring that the cost to the Group of the high Performance Share-based Scheme (hPSS) benefits is known and fixed at the outset.
T r u w o r t h s I n t e r n a t i o n a l L i m i t e d A n n u a l F i n a n c i a l S t a t e m e n t s 2 0 1 2 33
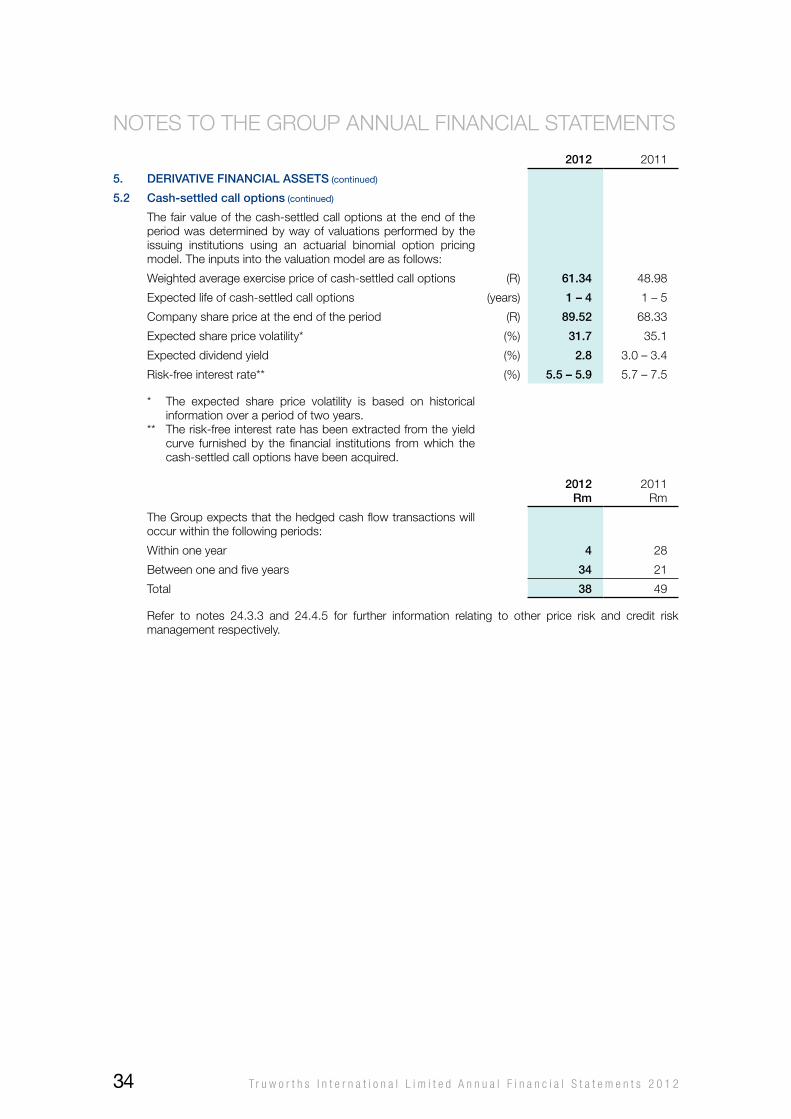
NoTES To ThE GRoUP ANNUAL FINANCIAL STATEMENTS
2012 2011
5. Derivative financial assets (continued)
5.2 cash-settled call options (continued)
The fair value of the cash-settled call options at the end of the period was determined by way of valuations performed by the issuing institutions using an actuarial binomial option pricing model. The inputs into the valuation model are as follows:
weighted average exercise price of cash-settled call options (R) 61.34 48.98
Expected life of cash-settled call options (years) 1 – 4 1 – 5
Company share price at the end of the period (R) 89.52 68.33
Expected share price volatility* (%) 31.7 35.1
Expected dividend yield (%) 2.8 3.0 – 3.4
Risk-free interest rate** (%) 5.5 – 5.9 5.7 – 7.5
* The expected share price volatility is based on historical information over a period of two years.
** The risk-free interest rate has been extracted from the yield curve furnished by the financial institutions from which the cash-settled call options have been acquired.
2012rm
2011Rm
The Group expects that the hedged cash flow transactions will occur within the following periods:
within one year 4 28
Between one and five years 34 21
Total 38 49
Refer to notes 24.3.3 and 24.4.5 for further information relating to other price risk and credit risk management respectively.
T r u w o r t h s I n t e r n a t i o n a l L i m i t e d A n n u a l F i n a n c i a l S t a t e m e n t s 2 0 1 234
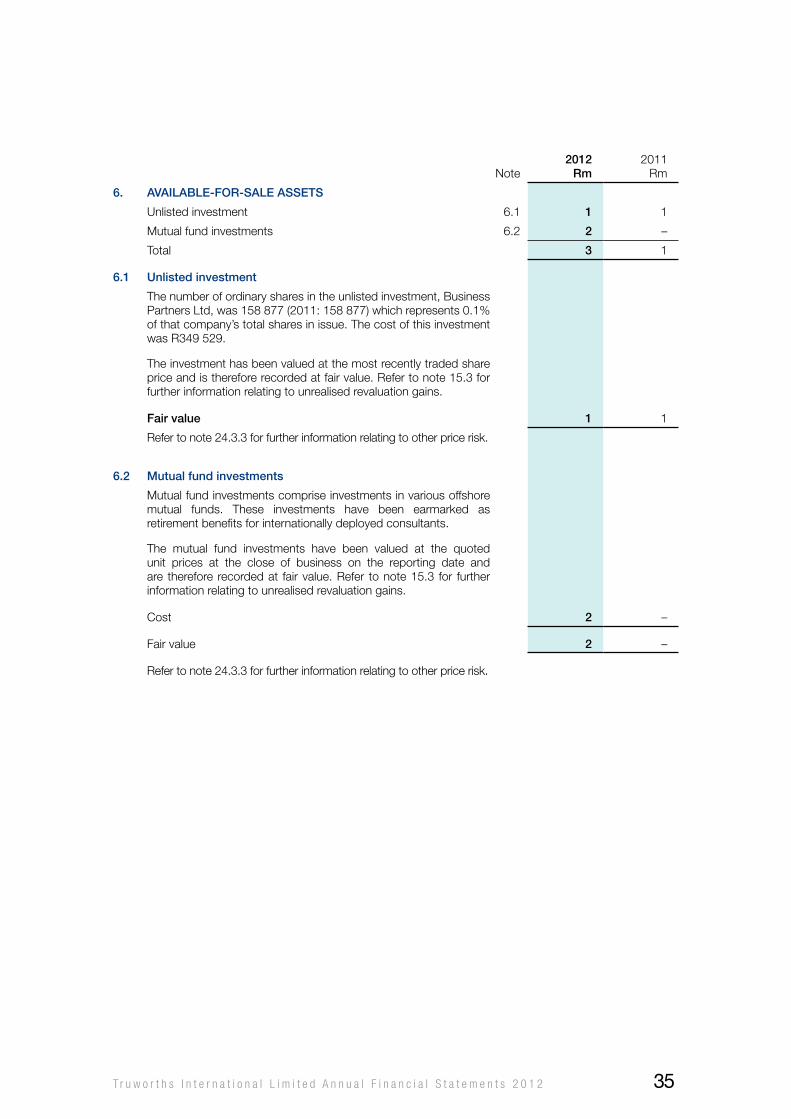
Note2012
rm2011
Rm
6. available-for-sale assets
Unlisted investment 6.1 1 1
Mutual fund investments 6.2 2 –
Total 3 1
6.1 unlisted investment
The number of ordinary shares in the unlisted investment, Business Partners Ltd, was 158 877 (2011: 158 877) which represents 0.1% of that company’s total shares in issue. The cost of this investment was R349 529.
The investment has been valued at the most recently traded share price and is therefore recorded at fair value. Refer to note 15.3 for further information relating to unrealised revaluation gains.
fair value 1 1
Refer to note 24.3.3 for further information relating to other price risk.
6.2 mutual fund investments
Mutual fund investments comprise investments in various offshore mutual funds. These investments have been earmarked as retirement benefits for internationally deployed consultants.
The mutual fund investments have been valued at the quoted unit prices at the close of business on the reporting date and are therefore recorded at fair value. Refer to note 15.3 for further information relating to unrealised revaluation gains.
Cost 2 –
Fair value 2 –
Refer to note 24.3.3 for further information relating to other price risk.
T r u w o r t h s I n t e r n a t i o n a l L i m i t e d A n n u a l F i n a n c i a l S t a t e m e n t s 2 0 1 2 35
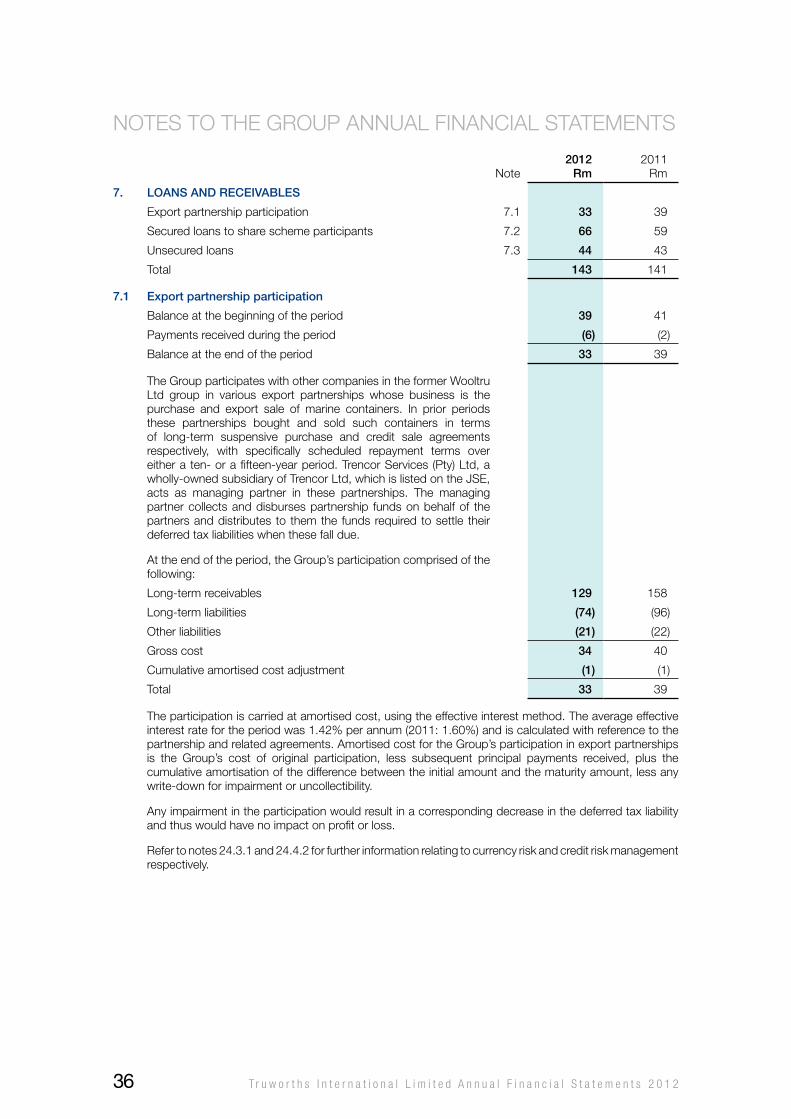
NoTES To ThE GRoUP ANNUAL FINANCIAL STATEMENTS
Note2012
rm2011
Rm
7. loans anD receivables
Export partnership participation 7.1 33 39
Secured loans to share scheme participants 7.2 66 59
Unsecured loans 7.3 44 43
Total 143 141
7.1 export partnership participation
Balance at the beginning of the period 39 41
Payments received during the period (6) (2)
Balance at the end of the period 33 39
The Group participates with other companies in the former wooltru Ltd group in various export partnerships whose business is the purchase and export sale of marine containers. In prior periods these partnerships bought and sold such containers in terms of long-term suspensive purchase and credit sale agreements respectively, with specifically scheduled repayment terms over either a ten- or a fifteen-year period. Trencor Services (Pty) Ltd, a wholly-owned subsidiary of Trencor Ltd, which is listed on the JSE, acts as managing partner in these partnerships. The managing partner collects and disburses partnership funds on behalf of the partners and distributes to them the funds required to settle their deferred tax liabilities when these fall due.
At the end of the period, the Group’s participation comprised of the following:
Long-term receivables 129 158
Long-term liabilities (74) (96)
other liabilities (21) (22)
Gross cost 34 40
Cumulative amortised cost adjustment (1) (1)
Total 33 39
The participation is carried at amortised cost, using the effective interest method. The average effective interest rate for the period was 1.42% per annum (2011: 1.60%) and is calculated with reference to the partnership and related agreements. Amortised cost for the Group’s participation in export partnerships is the Group’s cost of original participation, less subsequent principal payments received, plus the cumulative amortisation of the difference between the initial amount and the maturity amount, less any write-down for impairment or uncollectibility.
Any impairment in the participation would result in a corresponding decrease in the deferred tax liability and thus would have no impact on profit or loss.
Refer to notes 24.3.1 and 24.4.2 for further information relating to currency risk and credit risk management respectively.
T r u w o r t h s I n t e r n a t i o n a l L i m i t e d A n n u a l F i n a n c i a l S t a t e m e n t s 2 0 1 236
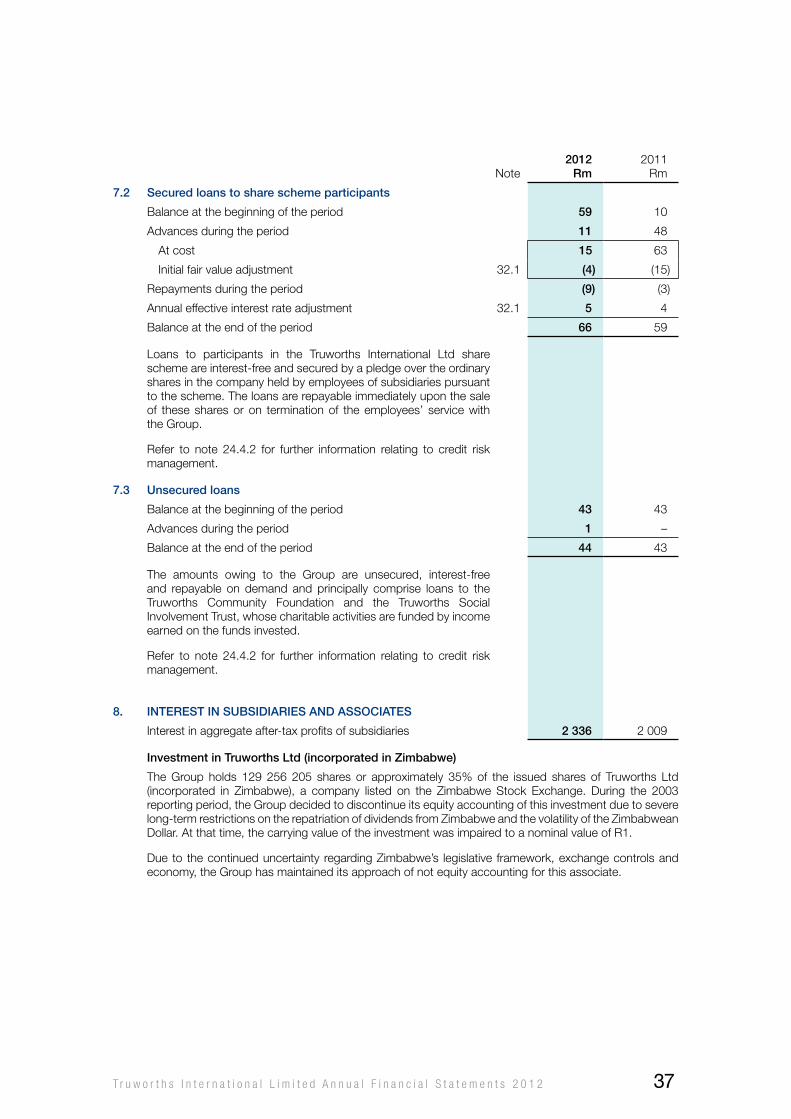
Note2012
rm2011
Rm
7.2 secured loans to share scheme participants
Balance at the beginning of the period 59 10
Advances during the period 11 48
At cost 15 63
Initial fair value adjustment 32.1 (4) (15)
Repayments during the period (9) (3)
Annual effective interest rate adjustment 32.1 5 4
Balance at the end of the period 66 59
Loans to participants in the Truworths International Ltd share scheme are interest-free and secured by a pledge over the ordinary shares in the company held by employees of subsidiaries pursuant to the scheme. The loans are repayable immediately upon the sale of these shares or on termination of the employees’ service with the Group.
Refer to note 24.4.2 for further information relating to credit risk management.
7.3 unsecured loans
Balance at the beginning of the period 43 43
Advances during the period 1 –
Balance at the end of the period 44 43
The amounts owing to the Group are unsecured, interest-free and repayable on demand and principally comprise loans to the Truworths Community Foundation and the Truworths Social Involvement Trust, whose charitable activities are funded by income earned on the funds invested.
Refer to note 24.4.2 for further information relating to credit risk management.
8. interest in subsiDiaries anD associates
Interest in aggregate after-tax profits of subsidiaries 2 336 2 009
investment in truworths ltd (incorporated in Zimbabwe)
The Group holds 129 256 205 shares or approximately 35% of the issued shares of Truworths Ltd (incorporated in Zimbabwe), a company listed on the Zimbabwe Stock Exchange. During the 2003 reporting period, the Group decided to discontinue its equity accounting of this investment due to severe long-term restrictions on the repatriation of dividends from Zimbabwe and the volatility of the Zimbabwean Dollar. At that time, the carrying value of the investment was impaired to a nominal value of R1.
Due to the continued uncertainty regarding Zimbabwe’s legislative framework, exchange controls and economy, the Group has maintained its approach of not equity accounting for this associate.
T r u w o r t h s I n t e r n a t i o n a l L i m i t e d A n n u a l F i n a n c i a l S t a t e m e n t s 2 0 1 2 37
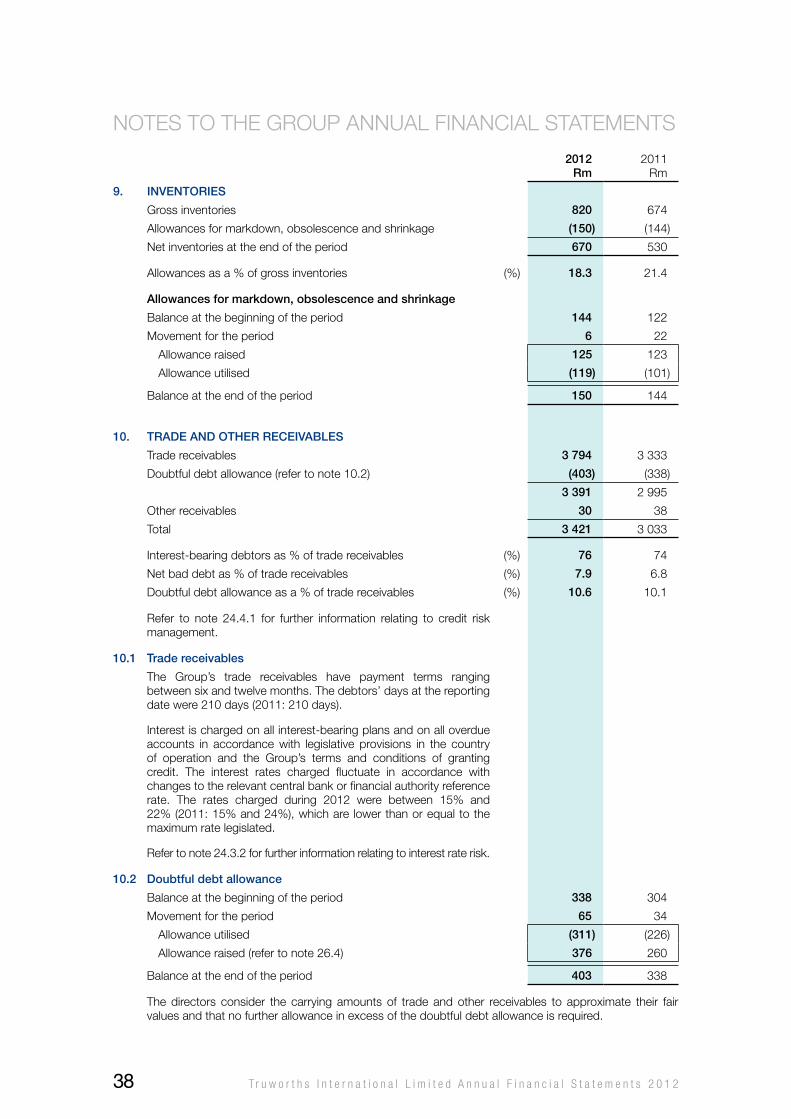
NoTES To ThE GRoUP ANNUAL FINANCIAL STATEMENTS
2012rm
2011Rm
9. inventories
Gross inventories 820 674
Allowances for markdown, obsolescence and shrinkage (150) (144)
Net inventories at the end of the period 670 530
Allowances as a % of gross inventories (%) 18.3 21.4
allowances for markdown, obsolescence and shrinkage
Balance at the beginning of the period 144 122
Movement for the period 6 22
Allowance raised 125 123
Allowance utilised (119) (101)
Balance at the end of the period 150 144
10. traDe anD other receivables
Trade receivables 3 794 3 333
Doubtful debt allowance (refer to note 10.2) (403) (338)
3 391 2 995
other receivables 30 38
Total 3 421 3 033
Interest-bearing debtors as % of trade receivables (%) 76 74
Net bad debt as % of trade receivables (%) 7.9 6.8
Doubtful debt allowance as a % of trade receivables (%) 10.6 10.1
Refer to note 24.4.1 for further information relating to credit risk management.
10.1 trade receivables
The Group’s trade receivables have payment terms ranging between six and twelve months. The debtors’ days at the reporting date were 210 days (2011: 210 days).
Interest is charged on all interest-bearing plans and on all overdue accounts in accordance with legislative provisions in the country of operation and the Group’s terms and conditions of granting credit. The interest rates charged fluctuate in accordance with changes to the relevant central bank or financial authority reference rate. The rates charged during 2012 were between 15% and 22% (2011: 15% and 24%), which are lower than or equal to the maximum rate legislated.
Refer to note 24.3.2 for further information relating to interest rate risk.
10.2 Doubtful debt allowance
Balance at the beginning of the period 338 304
Movement for the period 65 34
Allowance utilised (311) (226)
Allowance raised (refer to note 26.4) 376 260
Balance at the end of the period 403 338
The directors consider the carrying amounts of trade and other receivables to approximate their fair values and that no further allowance in excess of the doubtful debt allowance is required.
T r u w o r t h s I n t e r n a t i o n a l L i m i t e d A n n u a l F i n a n c i a l S t a t e m e n t s 2 0 1 238
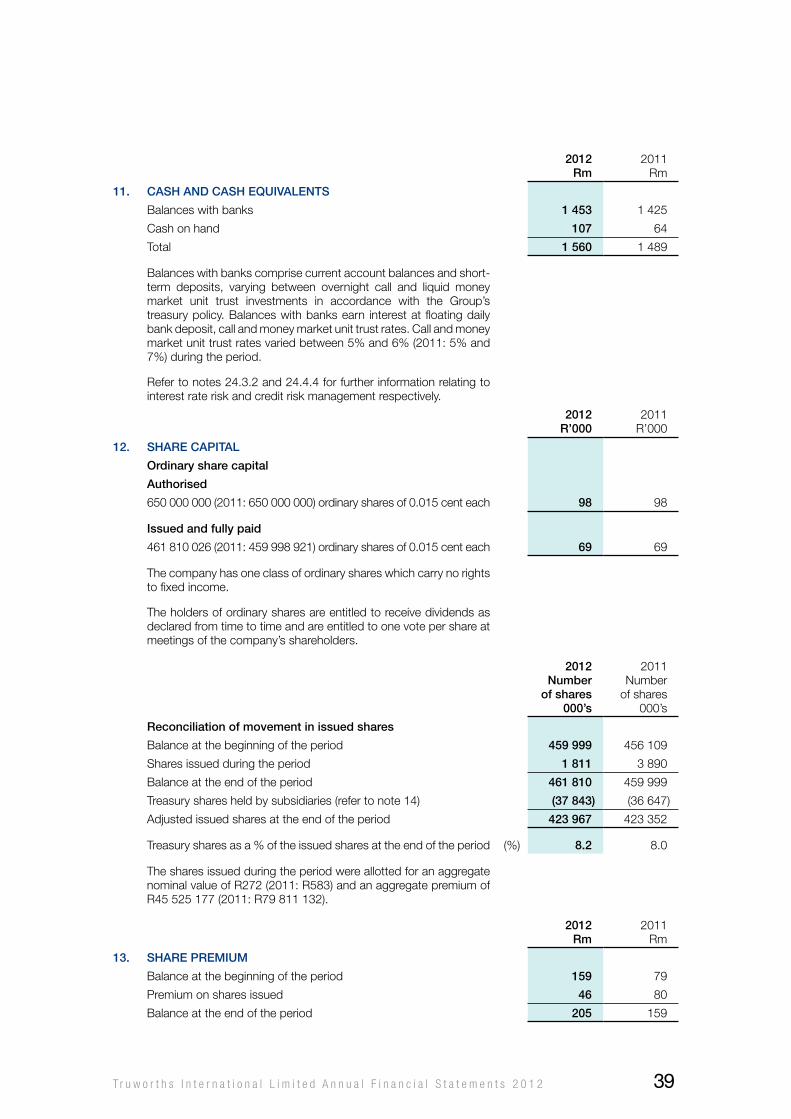
2012rm
2011Rm
11. cash anD cash equivalents
Balances with banks 1 453 1 425
Cash on hand 107 64
Total 1 560 1 489
Balances with banks comprise current account balances and short-term deposits, varying between overnight call and liquid money market unit trust investments in accordance with the Group’s treasury policy. Balances with banks earn interest at floating daily bank deposit, call and money market unit trust rates. Call and money market unit trust rates varied between 5% and 6% (2011: 5% and 7%) during the period.
Refer to notes 24.3.2 and 24.4.4 for further information relating to interest rate risk and credit risk management respectively.
2012r’000
2011R’000
12. share capital
ordinary share capital
authorised
650 000 000 (2011: 650 000 000) ordinary shares of 0.015 cent each 98 98
issued and fully paid
461 810 026 (2011: 459 998 921) ordinary shares of 0.015 cent each 69 69
The company has one class of ordinary shares which carry no rights to fixed income.
The holders of ordinary shares are entitled to receive dividends as declared from time to time and are entitled to one vote per share at meetings of the company’s shareholders.
2012number
of shares000’s
2011Number
of shares000’s
reconciliation of movement in issued shares
Balance at the beginning of the period 459 999 456 109
Shares issued during the period 1 811 3 890
Balance at the end of the period 461 810 459 999
Treasury shares held by subsidiaries (refer to note 14) (37 843) (36 647)
Adjusted issued shares at the end of the period 423 967 423 352
Treasury shares as a % of the issued shares at the end of the period (%) 8.2 8.0
The shares issued during the period were allotted for an aggregate nominal value of R272 (2011: R583) and an aggregate premium of R45 525 177 (2011: R79 811 132).
2012rm
2011Rm
13. share premium
Balance at the beginning of the period 159 79
Premium on shares issued 46 80
Balance at the end of the period 205 159
T r u w o r t h s I n t e r n a t i o n a l L i m i t e d A n n u a l F i n a n c i a l S t a t e m e n t s 2 0 1 2 39
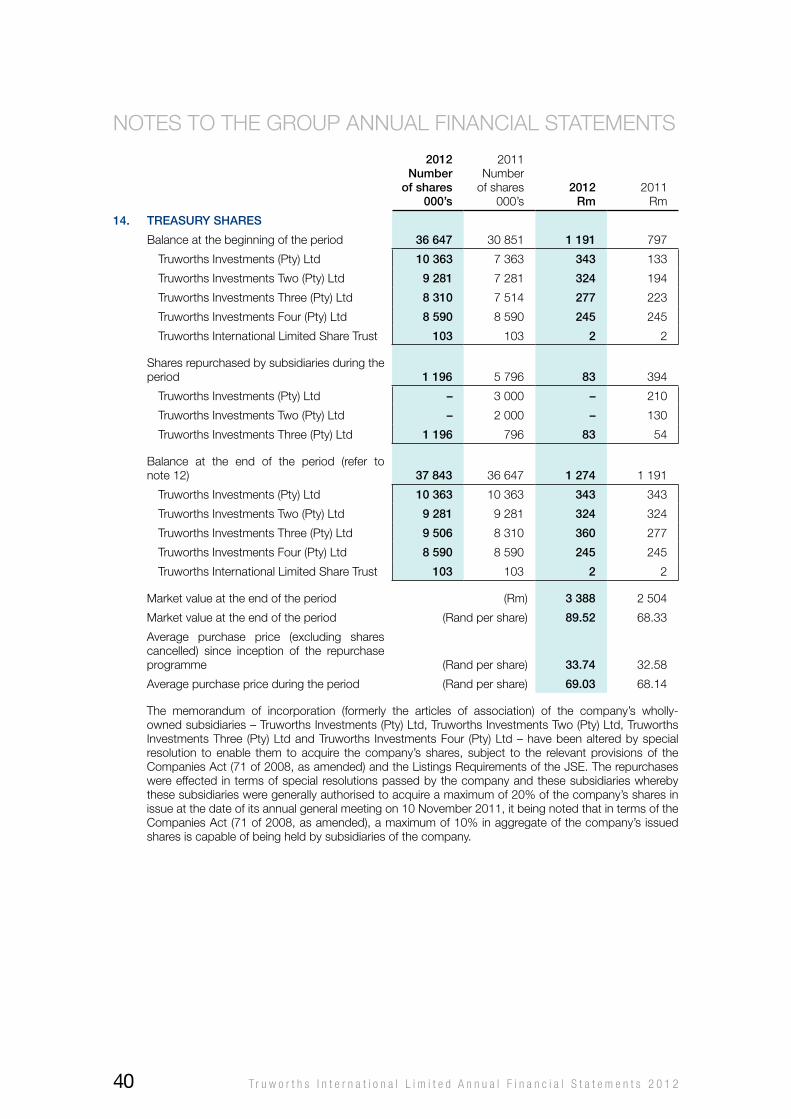
NoTES To ThE GRoUP ANNUAL FINANCIAL STATEMENTS
2012number
of shares000’s
2011Number
of shares000’s
2012rm
2011Rm
14. treasury shares
Balance at the beginning of the period 36 647 30 851 1 191 797
Truworths Investments (Pty) Ltd 10 363 7 363 343 133
Truworths Investments Two (Pty) Ltd 9 281 7 281 324 194
Truworths Investments Three (Pty) Ltd 8 310 7 514 277 223
Truworths Investments Four (Pty) Ltd 8 590 8 590 245 245
Truworths International Limited Share Trust 103 103 2 2
Shares repurchased by subsidiaries during the period 1 196 5 796 83 394
Truworths Investments (Pty) Ltd – 3 000 – 210
Truworths Investments Two (Pty) Ltd – 2 000 – 130
Truworths Investments Three (Pty) Ltd 1 196 796 83 54
Balance at the end of the period (refer to note 12) 37 843 36 647 1 274 1 191
Truworths Investments (Pty) Ltd 10 363 10 363 343 343
Truworths Investments Two (Pty) Ltd 9 281 9 281 324 324
Truworths Investments Three (Pty) Ltd 9 506 8 310 360 277
Truworths Investments Four (Pty) Ltd 8 590 8 590 245 245
Truworths International Limited Share Trust 103 103 2 2
Market value at the end of the period (Rm) 3 388 2 504
Market value at the end of the period (Rand per share) 89.52 68.33
Average purchase price (excluding shares cancelled) since inception of the repurchase programme (Rand per share) 33.74 32.58
Average purchase price during the period (Rand per share) 69.03 68.14
The memorandum of incorporation (formerly the articles of association) of the company’s wholly-owned subsidiaries – Truworths Investments (Pty) Ltd, Truworths Investments Two (Pty) Ltd, Truworths Investments Three (Pty) Ltd and Truworths Investments Four (Pty) Ltd – have been altered by special resolution to enable them to acquire the company’s shares, subject to the relevant provisions of the Companies Act (71 of 2008, as amended) and the Listings Requirements of the JSE. The repurchases were effected in terms of special resolutions passed by the company and these subsidiaries whereby these subsidiaries were generally authorised to acquire a maximum of 20% of the company’s shares in issue at the date of its annual general meeting on 10 November 2011, it being noted that in terms of the Companies Act (71 of 2008, as amended), a maximum of 10% in aggregate of the company’s issued shares is capable of being held by subsidiaries of the company.
T r u w o r t h s I n t e r n a t i o n a l L i m i t e d A n n u a l F i n a n c i a l S t a t e m e n t s 2 0 1 240
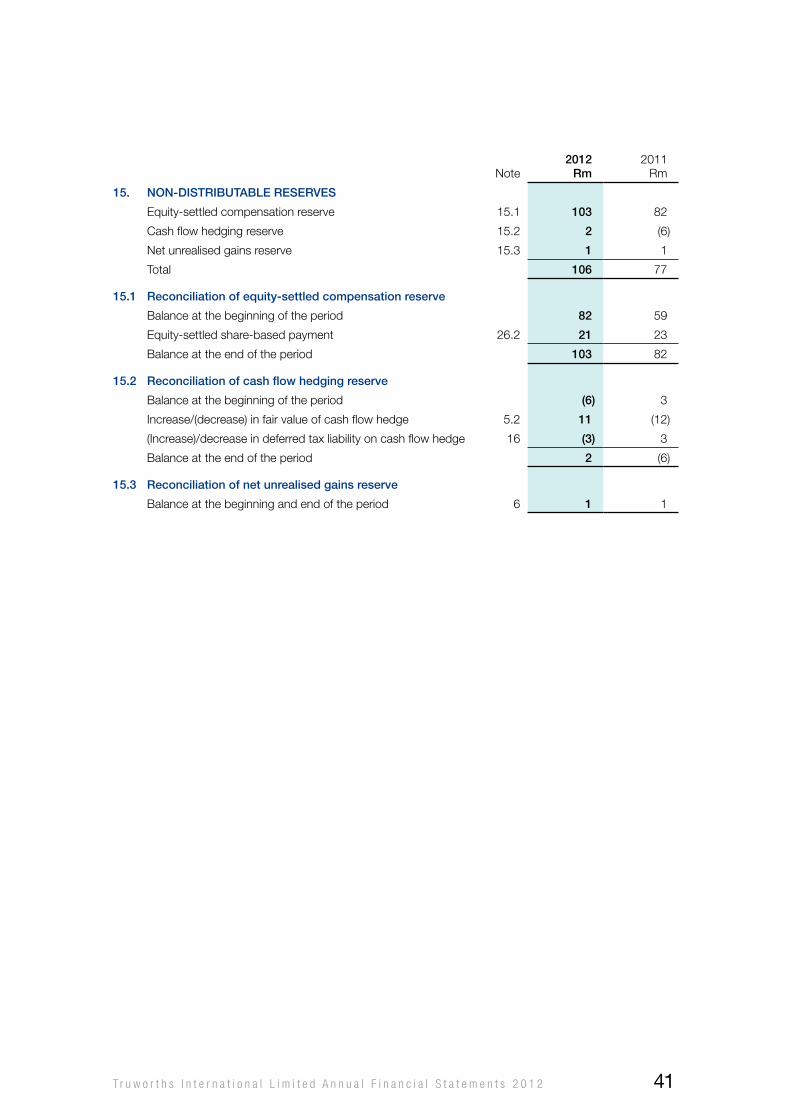
Note2012
rm2011
Rm
15. non-Distributable reserves
Equity-settled compensation reserve 15.1 103 82
Cash flow hedging reserve 15.2 2 (6)
Net unrealised gains reserve 15.3 1 1
Total 106 77
15.1 reconciliation of equity-settled compensation reserve
Balance at the beginning of the period 82 59
Equity-settled share-based payment 26.2 21 23
Balance at the end of the period 103 82
15.2 reconciliation of cash flow hedging reserve
Balance at the beginning of the period (6) 3
Increase/(decrease) in fair value of cash flow hedge 5.2 11 (12)
(Increase)/decrease in deferred tax liability on cash flow hedge 16 (3) 3
Balance at the end of the period 2 (6)
15.3 reconciliation of net unrealised gains reserve
Balance at the beginning and end of the period 6 1 1
T r u w o r t h s I n t e r n a t i o n a l L i m i t e d A n n u a l F i n a n c i a l S t a t e m e n t s 2 0 1 2 41
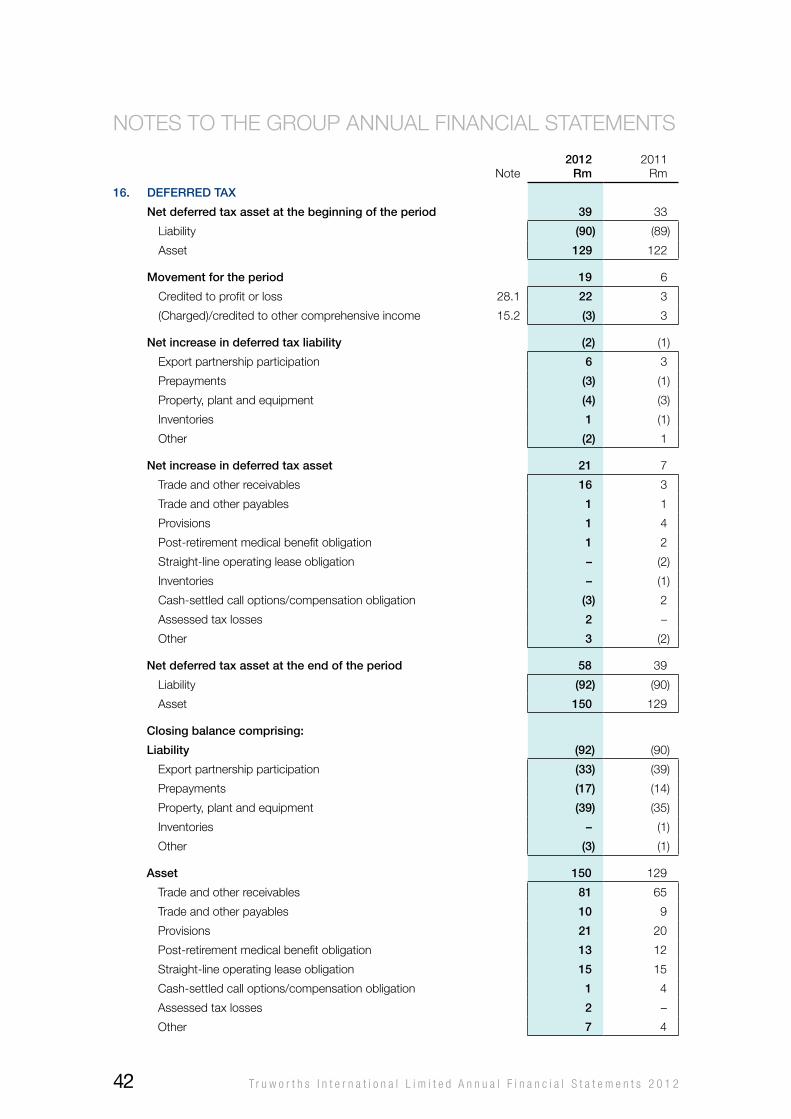
Note2012
rm2011
Rm
16. DeferreD tax
net deferred tax asset at the beginning of the period 39 33
Liability (90) (89)
Asset 129 122
movement for the period 19 6
Credited to profit or loss 28.1 22 3
(Charged)/credited to other comprehensive income 15.2 (3) 3
net increase in deferred tax liability (2) (1)
Export partnership participation 6 3
Prepayments (3) (1)
Property, plant and equipment (4) (3)
Inventories 1 (1)
other (2) 1
net increase in deferred tax asset 21 7
Trade and other receivables 16 3
Trade and other payables 1 1
Provisions 1 4
Post-retirement medical benefit obligation 1 2
Straight-line operating lease obligation – (2)
Inventories – (1)
Cash-settled call options/compensation obligation (3) 2
Assessed tax losses 2 –
other 3 (2)
net deferred tax asset at the end of the period 58 39
Liability (92) (90)
Asset 150 129
closing balance comprising:
liability (92) (90)
Export partnership participation (33) (39)
Prepayments (17) (14)
Property, plant and equipment (39) (35)
Inventories – (1)
other (3) (1)
asset 150 129
Trade and other receivables 81 65
Trade and other payables 10 9
Provisions 21 20
Post-retirement medical benefit obligation 13 12
Straight-line operating lease obligation 15 15
Cash-settled call options/compensation obligation 1 4
Assessed tax losses 2 –
other 7 4
NoTES To ThE GRoUP ANNUAL FINANCIAL STATEMENTS
T r u w o r t h s I n t e r n a t i o n a l L i m i t e d A n n u a l F i n a n c i a l S t a t e m e n t s 2 0 1 242
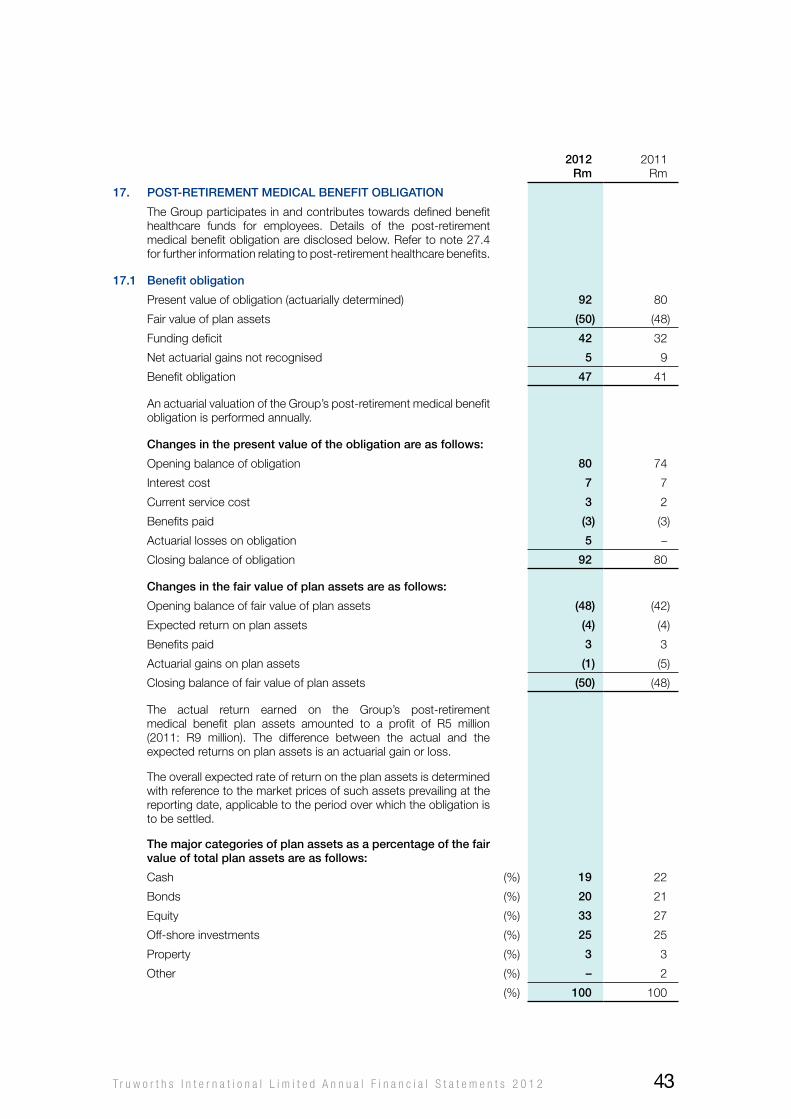
2012rm
2011Rm
17. post-retirement meDical benefit obliGation
The Group participates in and contributes towards defined benefit healthcare funds for employees. Details of the post-retirement medical benefit obligation are disclosed below. Refer to note 27.4 for further information relating to post-retirement healthcare benefits.
17.1 benefit obligation
Present value of obligation (actuarially determined) 92 80
Fair value of plan assets (50) (48)
Funding deficit 42 32
Net actuarial gains not recognised 5 9
Benefit obligation 47 41
An actuarial valuation of the Group’s post-retirement medical benefit obligation is performed annually.
changes in the present value of the obligation are as follows:
opening balance of obligation 80 74
Interest cost 7 7
Current service cost 3 2
Benefits paid (3) (3)
Actuarial losses on obligation 5 –
Closing balance of obligation 92 80
changes in the fair value of plan assets are as follows:
opening balance of fair value of plan assets (48) (42)
Expected return on plan assets (4) (4)
Benefits paid 3 3
Actuarial gains on plan assets (1) (5)
Closing balance of fair value of plan assets (50) (48)
The actual return earned on the Group’s post-retirement medical benefit plan assets amounted to a profit of R5 million (2011: R9 million). The difference between the actual and the expected returns on plan assets is an actuarial gain or loss.
The overall expected rate of return on the plan assets is determined with reference to the market prices of such assets prevailing at the reporting date, applicable to the period over which the obligation is to be settled.
the major categories of plan assets as a percentage of the fair value of total plan assets are as follows:
Cash (%) 19 22
Bonds (%) 20 21
Equity (%) 33 27
off-shore investments (%) 25 25
Property (%) 3 3
other (%) – 2
(%) 100 100
T r u w o r t h s I n t e r n a t i o n a l L i m i t e d A n n u a l F i n a n c i a l S t a t e m e n t s 2 0 1 2 43
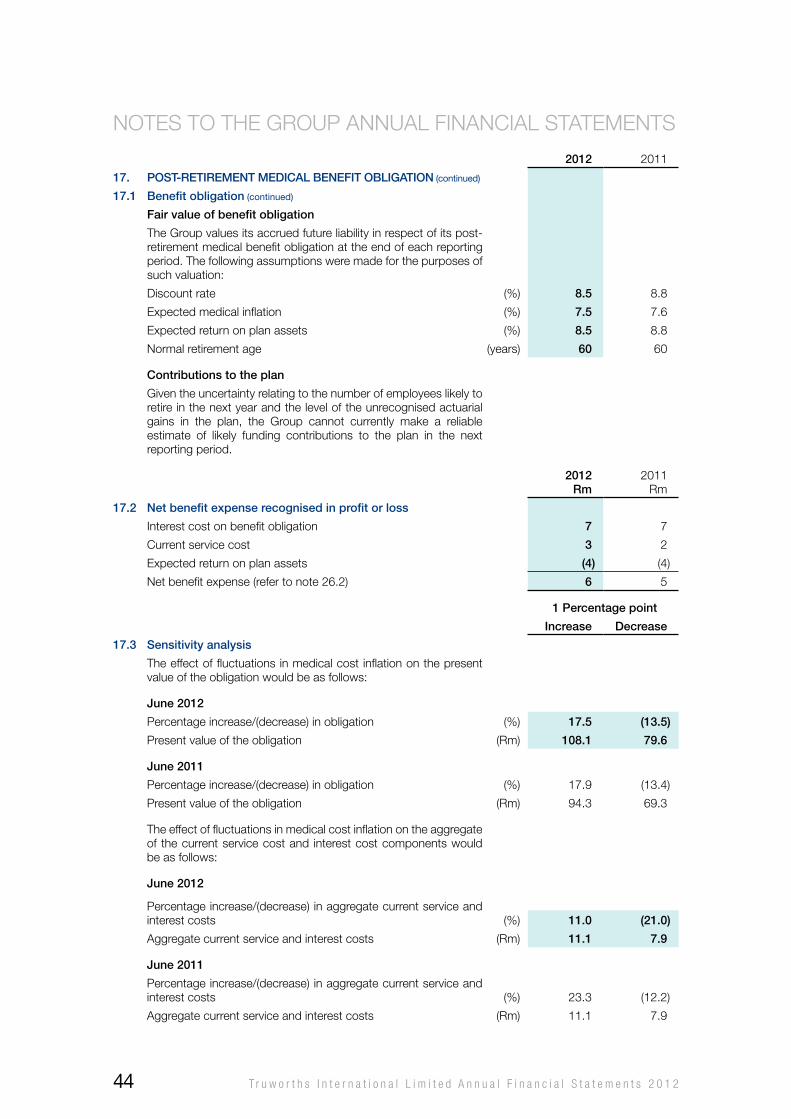
2012 2011
17. post-retirement meDical benefit obliGation (continued)
17.1 benefit obligation (continued)
fair value of benefit obligation
The Group values its accrued future liability in respect of its post-retirement medical benefit obligation at the end of each reporting period. The following assumptions were made for the purposes of such valuation:
Discount rate (%) 8.5 8.8
Expected medical inflation (%) 7.5 7.6
Expected return on plan assets (%) 8.5 8.8
Normal retirement age (years) 60 60
contributions to the plan
Given the uncertainty relating to the number of employees likely to retire in the next year and the level of the unrecognised actuarial gains in the plan, the Group cannot currently make a reliable estimate of likely funding contributions to the plan in the next reporting period.
2012rm
2011Rm
17.2 net benefit expense recognised in profit or loss
Interest cost on benefit obligation 7 7
Current service cost 3 2
Expected return on plan assets (4) (4)
Net benefit expense (refer to note 26.2) 6 5
1 percentage point
increase Decrease
17.3 sensitivity analysis
The effect of fluctuations in medical cost inflation on the present value of the obligation would be as follows:
June 2012
Percentage increase/(decrease) in obligation (%) 17.5 (13.5)
Present value of the obligation (Rm) 108.1 79.6
June 2011
Percentage increase/(decrease) in obligation (%) 17.9 (13.4)
Present value of the obligation (Rm) 94.3 69.3
The effect of fluctuations in medical cost inflation on the aggregate of the current service cost and interest cost components would be as follows:
June 2012
Percentage increase/(decrease) in aggregate current service andinterest costs (%) 11.0 (21.0)
Aggregate current service and interest costs (Rm) 11.1 7.9
June 2011
Percentage increase/(decrease) in aggregate current service and interest costs (%) 23.3 (12.2)
Aggregate current service and interest costs (Rm) 11.1 7.9
NoTES To ThE GRoUP ANNUAL FINANCIAL STATEMENTS
T r u w o r t h s I n t e r n a t i o n a l L i m i t e d A n n u a l F i n a n c i a l S t a t e m e n t s 2 0 1 244
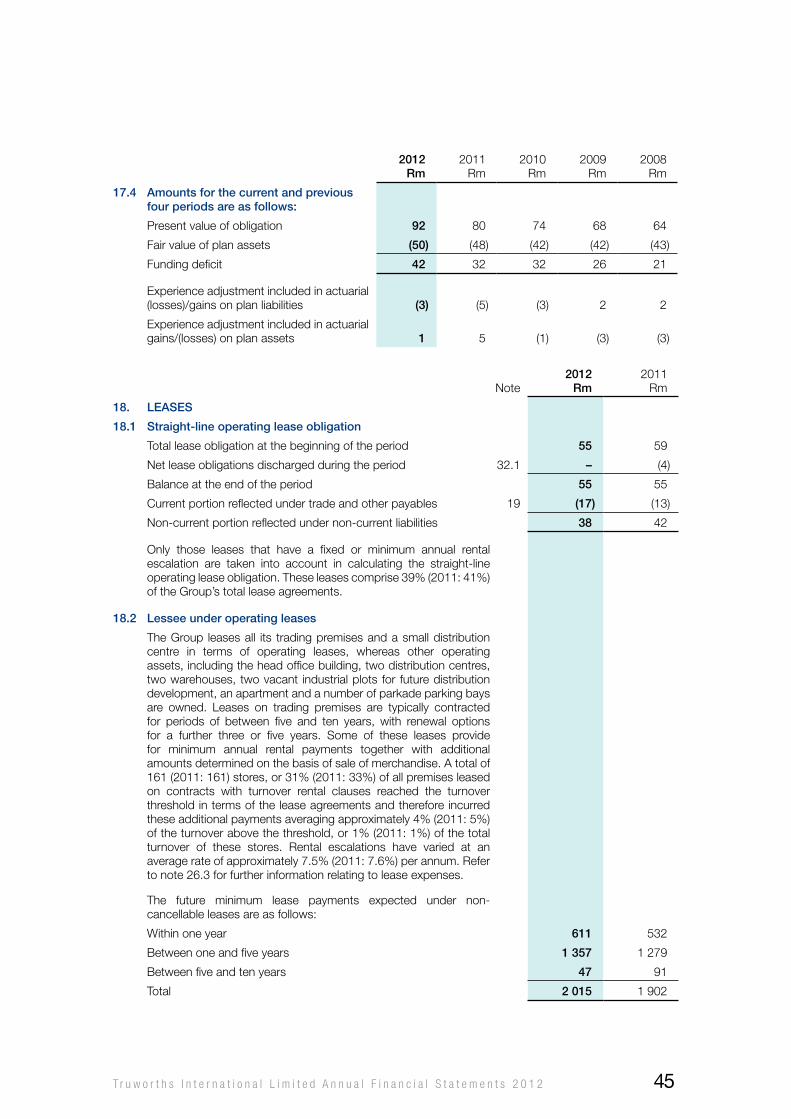
2012rm
2011Rm
2010Rm
2009Rm
2008Rm
17.4 amounts for the current and previous four periods are as follows:
Present value of obligation 92 80 74 68 64
Fair value of plan assets (50) (48) (42) (42) (43)
Funding deficit 42 32 32 26 21
Experience adjustment included in actuarial (losses)/gains on plan liabilities (3) (5) (3) 2 2
Experience adjustment included in actuarial gains/(losses) on plan assets 1 5 (1) (3) (3)
Note2012
rm2011
Rm
18. leases
18.1 straight-line operating lease obligation
Total lease obligation at the beginning of the period 55 59
Net lease obligations discharged during the period 32.1 – (4)
Balance at the end of the period 55 55
Current portion reflected under trade and other payables 19 (17) (13)
Non-current portion reflected under non-current liabilities 38 42
only those leases that have a fixed or minimum annual rental escalation are taken into account in calculating the straight-line operating lease obligation. These leases comprise 39% (2011: 41%) of the Group’s total lease agreements.
18.2 lessee under operating leases
The Group leases all its trading premises and a small distribution centre in terms of operating leases, whereas other operating assets, including the head office building, two distribution centres, two warehouses, two vacant industrial plots for future distribution development, an apartment and a number of parkade parking bays are owned. Leases on trading premises are typically contracted for periods of between five and ten years, with renewal options for a further three or five years. Some of these leases provide for minimum annual rental payments together with additional amounts determined on the basis of sale of merchandise. A total of 161 (2011: 161) stores, or 31% (2011: 33%) of all premises leased on contracts with turnover rental clauses reached the turnover threshold in terms of the lease agreements and therefore incurred these additional payments averaging approximately 4% (2011: 5%) of the turnover above the threshold, or 1% (2011: 1%) of the total turnover of these stores. Rental escalations have varied at an average rate of approximately 7.5% (2011: 7.6%) per annum. Refer to note 26.3 for further information relating to lease expenses.
The future minimum lease payments expected under non-cancellable leases are as follows:
within one year 611 532
Between one and five years 1 357 1 279
Between five and ten years 47 91
Total 2 015 1 902
T r u w o r t h s I n t e r n a t i o n a l L i m i t e d A n n u a l F i n a n c i a l S t a t e m e n t s 2 0 1 2 45
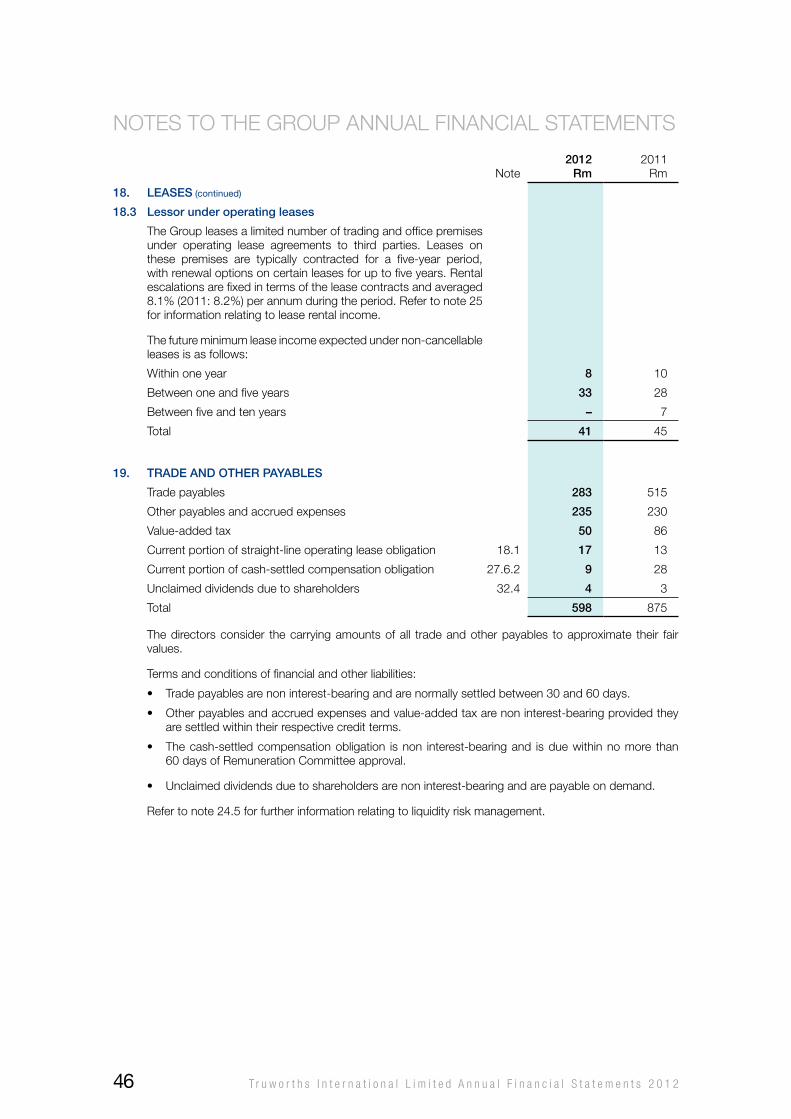
Note2012
rm2011
Rm
18. leases (continued)
18.3 lessor under operating leases
The Group leases a limited number of trading and office premises under operating lease agreements to third parties. Leases on these premises are typically contracted for a five-year period, with renewal options on certain leases for up to five years. Rental escalations are fixed in terms of the lease contracts and averaged 8.1% (2011: 8.2%) per annum during the period. Refer to note 25 for information relating to lease rental income.
The future minimum lease income expected under non-cancellable leases is as follows:
within one year 8 10
Between one and five years 33 28
Between five and ten years – 7
Total 41 45
19. traDe anD other payables
Trade payables 283 515
other payables and accrued expenses 235 230
value-added tax 50 86
Current portion of straight-line operating lease obligation 18.1 17 13
Current portion of cash-settled compensation obligation 27.6.2 9 28
Unclaimed dividends due to shareholders 32.4 4 3
Total 598 875
The directors consider the carrying amounts of all trade and other payables to approximate their fair values.
Terms and conditions of financial and other liabilities:
• Tradepayablesarenoninterest-bearingandarenormallysettledbetween30and60days.
• Otherpayablesandaccruedexpensesandvalue-addedtaxarenoninterest-bearingprovidedtheyare settled within their respective credit terms.
• Thecash-settledcompensationobligation isnon interest-bearingand isduewithinnomore than60 days of Remuneration Committee approval.
• Unclaimeddividendsduetoshareholdersarenoninterest-bearingandarepayableondemand.
Refer to note 24.5 for further information relating to liquidity risk management.
NoTES To ThE GRoUP ANNUAL FINANCIAL STATEMENTS
T r u w o r t h s I n t e r n a t i o n a l L i m i t e d A n n u a l F i n a n c i a l S t a t e m e n t s 2 0 1 246
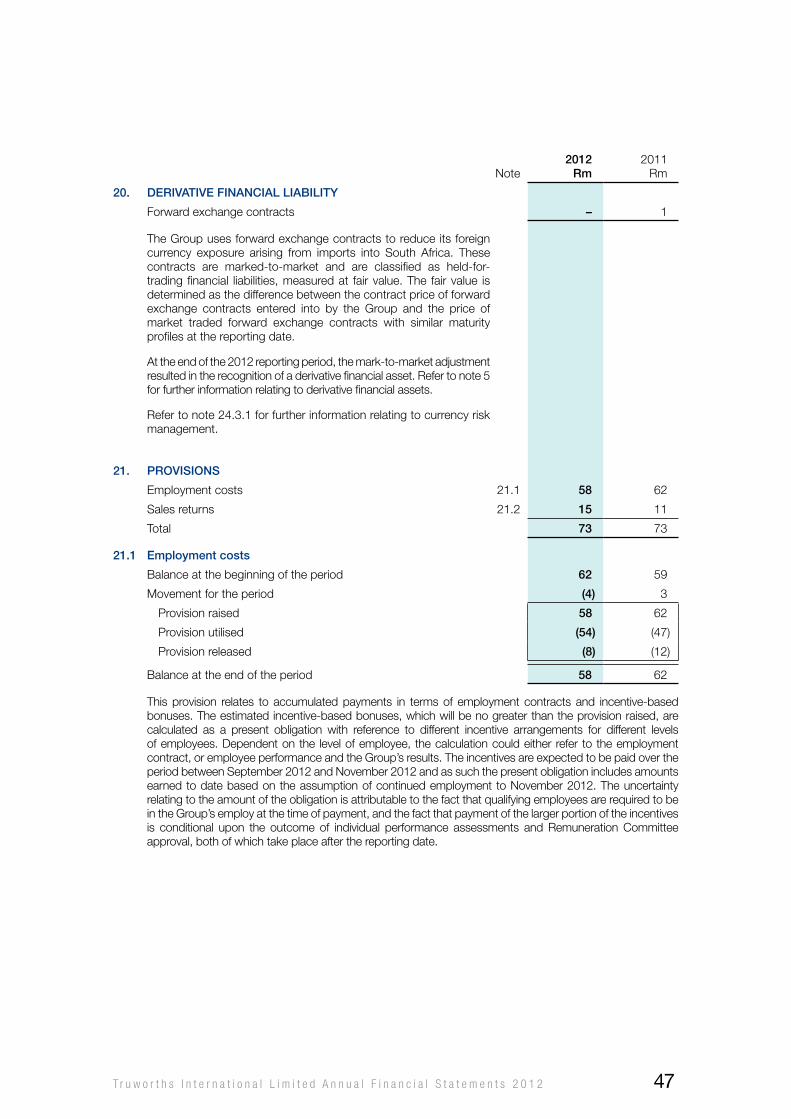
Note2012
rm2011
Rm
20. Derivative financial liability
Forward exchange contracts – 1
The Group uses forward exchange contracts to reduce its foreign currency exposure arising from imports into South Africa. These contracts are marked-to-market and are classified as held-for-trading financial liabilities, measured at fair value. The fair value is determined as the difference between the contract price of forward exchange contracts entered into by the Group and the price of market traded forward exchange contracts with similar maturity profiles at the reporting date.
At the end of the 2012 reporting period, the mark-to-market adjustment resulted in the recognition of a derivative financial asset. Refer to note 5 for further information relating to derivative financial assets.
Refer to note 24.3.1 for further information relating to currency risk management.
21. provisions
Employment costs 21.1 58 62
Sales returns 21.2 15 11
Total 73 73
21.1 employment costs
Balance at the beginning of the period 62 59
Movement for the period (4) 3
Provision raised 58 62
Provision utilised (54) (47)
Provision released (8) (12)
Balance at the end of the period 58 62
This provision relates to accumulated payments in terms of employment contracts and incentive-based bonuses. The estimated incentive-based bonuses, which will be no greater than the provision raised, are calculated as a present obligation with reference to different incentive arrangements for different levels of employees. Dependent on the level of employee, the calculation could either refer to the employment contract, or employee performance and the Group’s results. The incentives are expected to be paid over the period between September 2012 and November 2012 and as such the present obligation includes amounts earned to date based on the assumption of continued employment to November 2012. The uncertainty relating to the amount of the obligation is attributable to the fact that qualifying employees are required to be in the Group’s employ at the time of payment, and the fact that payment of the larger portion of the incentives is conditional upon the outcome of individual performance assessments and Remuneration Committee approval, both of which take place after the reporting date.
T r u w o r t h s I n t e r n a t i o n a l L i m i t e d A n n u a l F i n a n c i a l S t a t e m e n t s 2 0 1 2 47
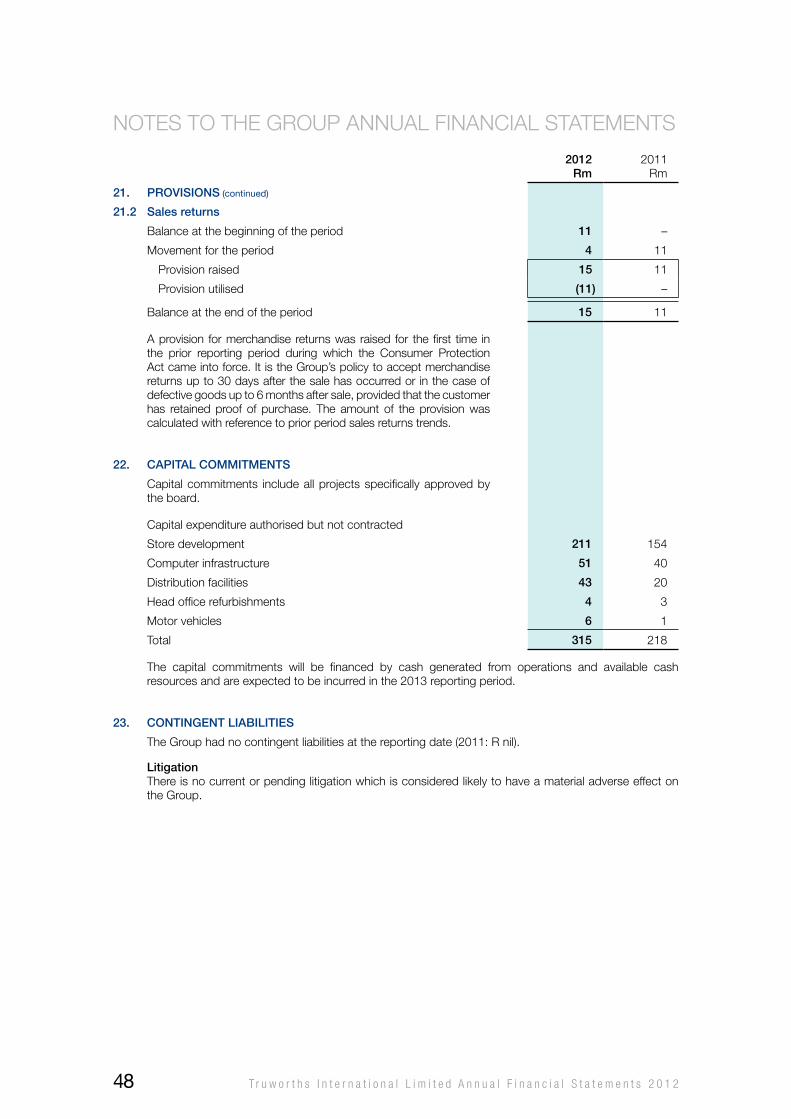
2012rm
2011Rm
21. provisions (continued)
21.2 sales returns
Balance at the beginning of the period 11 –
Movement for the period 4 11
Provision raised 15 11
Provision utilised (11) –
Balance at the end of the period 15 11
A provision for merchandise returns was raised for the first time in the prior reporting period during which the Consumer Protection Act came into force. It is the Group’s policy to accept merchandise returns up to 30 days after the sale has occurred or in the case of defective goods up to 6 months after sale, provided that the customer has retained proof of purchase. The amount of the provision was calculated with reference to prior period sales returns trends.
22. capital commitments
Capital commitments include all projects specifically approved by the board.
Capital expenditure authorised but not contracted
Store development 211 154
Computer infrastructure 51 40
Distribution facilities 43 20
head office refurbishments 4 3
Motor vehicles 6 1
Total 315 218
The capital commitments will be financed by cash generated from operations and available cash resources and are expected to be incurred in the 2013 reporting period.
23. continGent liabilities
The Group had no contingent liabilities at the reporting date (2011: R nil).
litigationThere is no current or pending litigation which is considered likely to have a material adverse effect on the Group.
NoTES To ThE GRoUP ANNUAL FINANCIAL STATEMENTS
T r u w o r t h s I n t e r n a t i o n a l L i m i t e d A n n u a l F i n a n c i a l S t a t e m e n t s 2 0 1 248
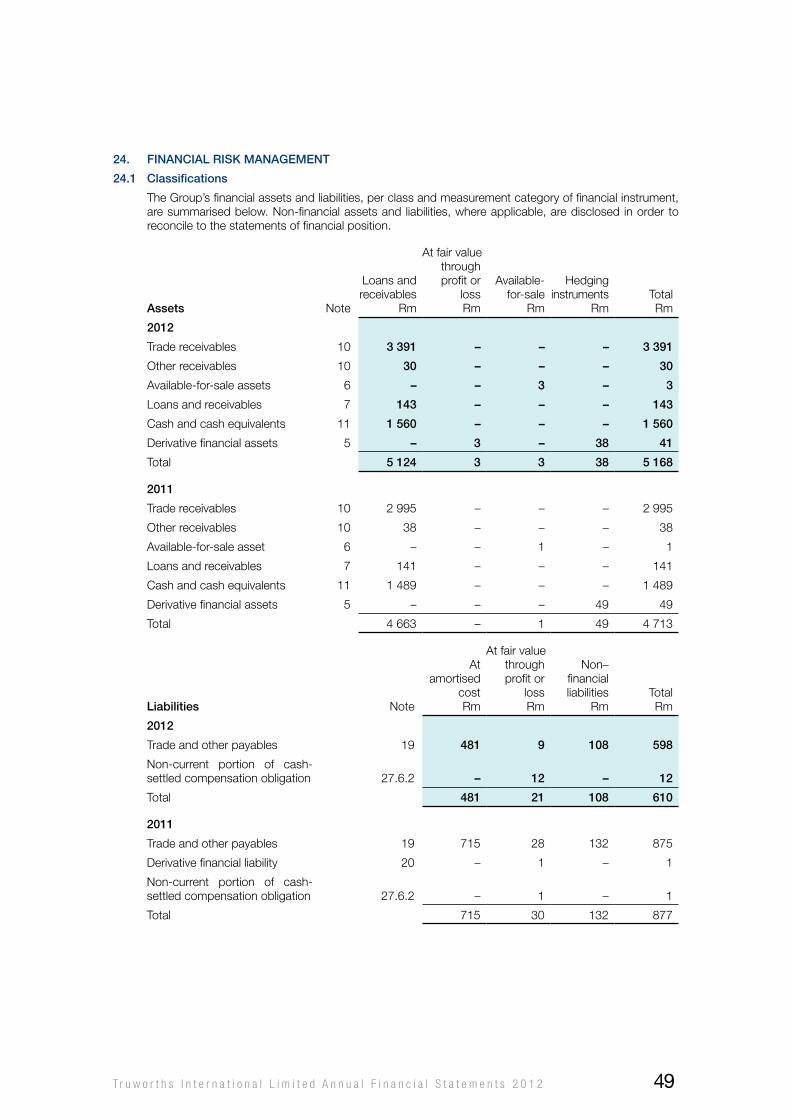
24. financial risK manaGement
24.1 classifications
The Group’s financial assets and liabilities, per class and measurement category of financial instrument, are summarised below. Non-financial assets and liabilities, where applicable, are disclosed in order to reconcile to the statements of financial position.
assets Note
Loans and receivables
Rm
At fair value through profit or
lossRm
Available-for-sale
Rm
hedging instruments
RmTotalRm
2012
Trade receivables 10 3 391 – – – 3 391
other receivables 10 30 – – – 30
Available-for-sale assets 6 – – 3 – 3
Loans and receivables 7 143 – – – 143
Cash and cash equivalents 11 1 560 – – – 1 560
Derivative financial assets 5 – 3 – 38 41
Total 5 124 3 3 38 5 168
2011
Trade receivables 10 2 995 – – – 2 995
other receivables 10 38 – – – 38
Available-for-sale asset 6 – – 1 – 1
Loans and receivables 7 141 – – – 141
Cash and cash equivalents 11 1 489 – – – 1 489
Derivative financial assets 5 – – – 49 49
Total 4 663 – 1 49 4 713
liabilities Note
At amortised
costRm
At fair value through profit or
lossRm
Non–financial liabilities
RmTotalRm
2012
Trade and other payables 19 481 9 108 598
Non-current portion of cash-settled compensation obligation 27.6.2 – 12 – 12
Total 481 21 108 610
2011
Trade and other payables 19 715 28 132 875
Derivative financial liability 20 – 1 – 1
Non-current portion of cash-settled compensation obligation 27.6.2 – 1 – 1
Total 715 30 132 877
T r u w o r t h s I n t e r n a t i o n a l L i m i t e d A n n u a l F i n a n c i a l S t a t e m e n t s 2 0 1 2 49
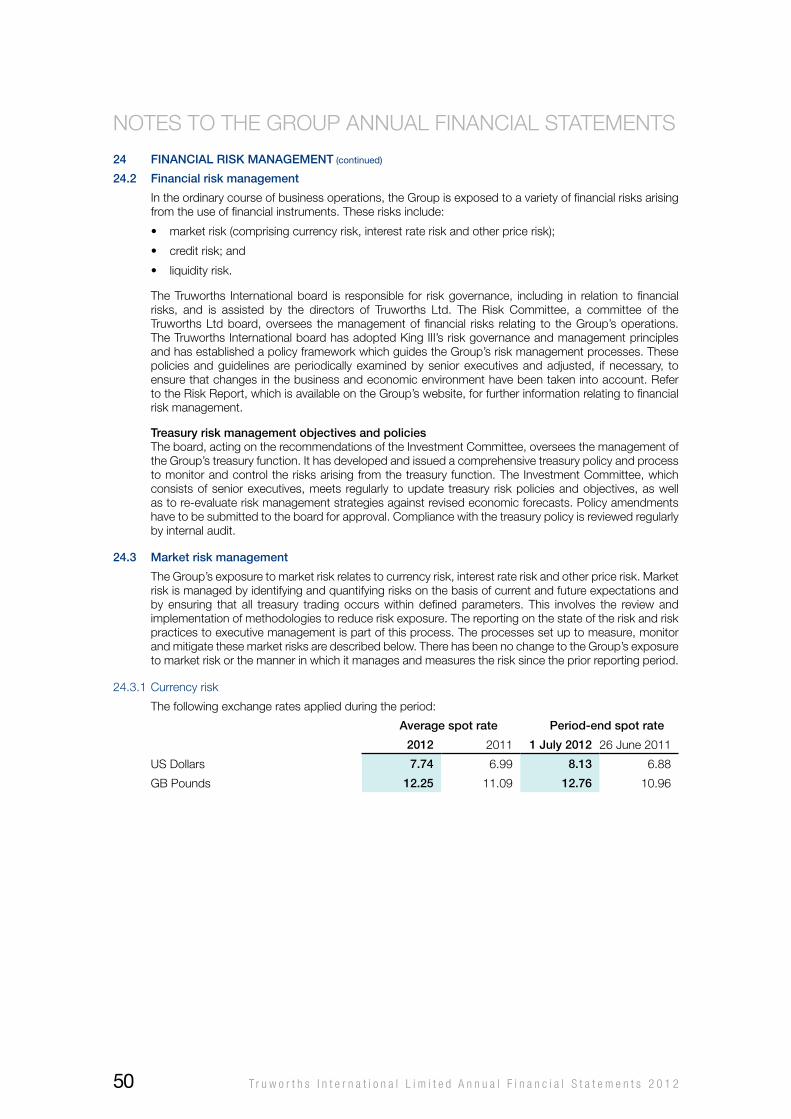
24 financial risK manaGement (continued)
24.2 financial risk management
In the ordinary course of business operations, the Group is exposed to a variety of financial risks arising from the use of financial instruments. These risks include:
• marketrisk(comprisingcurrencyrisk,interestrateriskandotherpricerisk);
• creditrisk;and
• liquidityrisk.
The Truworths International board is responsible for risk governance, including in relation to financial risks, and is assisted by the directors of Truworths Ltd. The Risk Committee, a committee of the Truworths Ltd board, oversees the management of financial risks relating to the Group’s operations. TheTruworthsInternationalboardhasadoptedKingIII’sriskgovernanceandmanagementprinciplesand has established a policy framework which guides the Group’s risk management processes. These policies and guidelines are periodically examined by senior executives and adjusted, if necessary, to ensure that changes in the business and economic environment have been taken into account. Refer to the Risk Report, which is available on the Group’s website, for further information relating to financial risk management.
treasury risk management objectives and policiesThe board, acting on the recommendations of the Investment Committee, oversees the management of the Group’s treasury function. It has developed and issued a comprehensive treasury policy and process to monitor and control the risks arising from the treasury function. The Investment Committee, which consists of senior executives, meets regularly to update treasury risk policies and objectives, as well as to re-evaluate risk management strategies against revised economic forecasts. Policy amendments have to be submitted to the board for approval. Compliance with the treasury policy is reviewed regularly by internal audit.
24.3 market risk management
The Group’s exposure to market risk relates to currency risk, interest rate risk and other price risk. Market risk is managed by identifying and quantifying risks on the basis of current and future expectations and by ensuring that all treasury trading occurs within defined parameters. This involves the review and implementation of methodologies to reduce risk exposure. The reporting on the state of the risk and risk practices to executive management is part of this process. The processes set up to measure, monitor and mitigate these market risks are described below. There has been no change to the Group’s exposure to market risk or the manner in which it manages and measures the risk since the prior reporting period.
24.3.1 Currency risk
The following exchange rates applied during the period:
average spot rate period-end spot rate
2012 2011 1 July 2012 26 June 2011
US Dollars 7.74 6.99 8.13 6.88
GB Pounds 12.25 11.09 12.76 10.96
NoTES To ThE GRoUP ANNUAL FINANCIAL STATEMENTS
T r u w o r t h s I n t e r n a t i o n a l L i m i t e d A n n u a l F i n a n c i a l S t a t e m e n t s 2 0 1 250
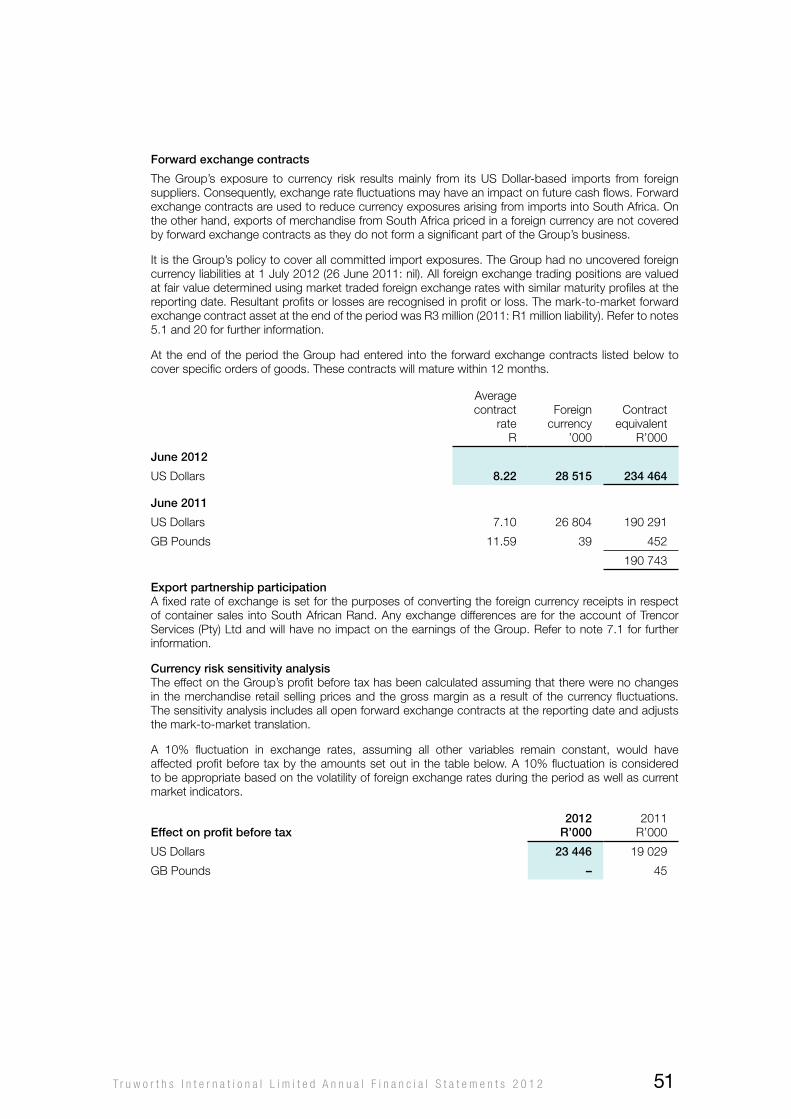
forward exchange contracts
The Group’s exposure to currency risk results mainly from its US Dollar-based imports from foreign suppliers. Consequently, exchange rate fluctuations may have an impact on future cash flows. Forward exchange contracts are used to reduce currency exposures arising from imports into South Africa. on the other hand, exports of merchandise from South Africa priced in a foreign currency are not covered by forward exchange contracts as they do not form a significant part of the Group’s business.
It is the Group’s policy to cover all committed import exposures. The Group had no uncovered foreign currency liabilities at 1 July 2012 (26 June 2011: nil). All foreign exchange trading positions are valued at fair value determined using market traded foreign exchange rates with similar maturity profiles at the reporting date. Resultant profits or losses are recognised in profit or loss. The mark-to-market forward exchange contract asset at the end of the period was R3 million (2011: R1 million liability). Refer to notes 5.1 and 20 for further information.
At the end of the period the Group had entered into the forward exchange contracts listed below to cover specific orders of goods. These contracts will mature within 12 months.
Average contract
rateR
Foreign currency
’000
Contract equivalent
R’000
June 2012
US Dollars 8.22 28 515 234 464
June 2011
US Dollars 7.10 26 804 190 291
GB Pounds 11.59 39 452
190 743
export partnership participationA fixed rate of exchange is set for the purposes of converting the foreign currency receipts in respect of container sales into South African Rand. Any exchange differences are for the account of Trencor Services (Pty) Ltd and will have no impact on the earnings of the Group. Refer to note 7.1 for further information.
currency risk sensitivity analysisThe effect on the Group’s profit before tax has been calculated assuming that there were no changes in the merchandise retail selling prices and the gross margin as a result of the currency fluctuations. The sensitivity analysis includes all open forward exchange contracts at the reporting date and adjusts the mark-to-market translation.
A 10% fluctuation in exchange rates, assuming all other variables remain constant, would have affected profit before tax by the amounts set out in the table below. A 10% fluctuation is considered to be appropriate based on the volatility of foreign exchange rates during the period as well as current market indicators.
effect on profit before tax2012
r’0002011
R’000
US Dollars 23 446 19 029
GB Pounds – 45
T r u w o r t h s I n t e r n a t i o n a l L i m i t e d A n n u a l F i n a n c i a l S t a t e m e n t s 2 0 1 2 51
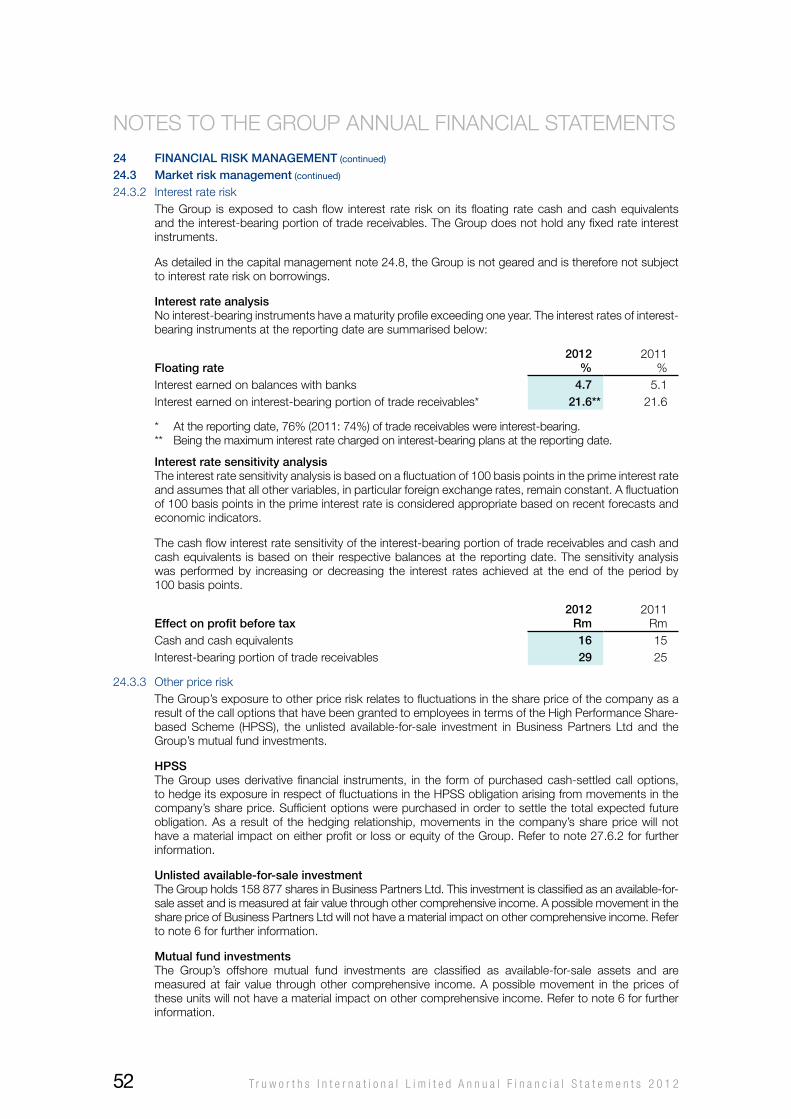
24 financial risK manaGement (continued)
24.3 market risk management (continued)
24.3.2 Interest rate riskThe Group is exposed to cash flow interest rate risk on its floating rate cash and cash equivalents and the interest-bearing portion of trade receivables. The Group does not hold any fixed rate interest instruments.
As detailed in the capital management note 24.8, the Group is not geared and is therefore not subject to interest rate risk on borrowings.
interest rate analysisNo interest-bearing instruments have a maturity profile exceeding one year. The interest rates of interest-bearing instruments at the reporting date are summarised below:
floating rate2012
%2011
%Interest earned on balances with banks 4.7 5.1 Interest earned on interest-bearing portion of trade receivables* 21.6** 21.6
* At the reporting date, 76% (2011: 74%) of trade receivables were interest-bearing.** Being the maximum interest rate charged on interest-bearing plans at the reporting date.
interest rate sensitivity analysisThe interest rate sensitivity analysis is based on a fluctuation of 100 basis points in the prime interest rate and assumes that all other variables, in particular foreign exchange rates, remain constant. A fluctuation of 100 basis points in the prime interest rate is considered appropriate based on recent forecasts and economic indicators.
The cash flow interest rate sensitivity of the interest-bearing portion of trade receivables and cash and cash equivalents is based on their respective balances at the reporting date. The sensitivity analysis was performed by increasing or decreasing the interest rates achieved at the end of the period by 100 basis points.
effect on profit before tax2012
rm2011
RmCash and cash equivalents 16 15 Interest-bearing portion of trade receivables 29 25
24.3.3 other price riskThe Group’s exposure to other price risk relates to fluctuations in the share price of the company as a result of the call options that have been granted to employees in terms of the high Performance Share-based Scheme (hPSS), the unlisted available-for-sale investment in Business Partners Ltd and the Group’s mutual fund investments.
hpssThe Group uses derivative financial instruments, in the form of purchased cash-settled call options, to hedge its exposure in respect of fluctuations in the hPSS obligation arising from movements in the company’s share price. Sufficient options were purchased in order to settle the total expected future obligation. As a result of the hedging relationship, movements in the company’s share price will not have a material impact on either profit or loss or equity of the Group. Refer to note 27.6.2 for further information.
unlisted available-for-sale investmentThe Group holds 158 877 shares in Business Partners Ltd. This investment is classified as an available-for-sale asset and is measured at fair value through other comprehensive income. A possible movement in the share price of Business Partners Ltd will not have a material impact on other comprehensive income. Refer to note 6 for further information.
mutual fund investmentsThe Group’s offshore mutual fund investments are classified as available-for-sale assets and are measured at fair value through other comprehensive income. A possible movement in the prices of these units will not have a material impact on other comprehensive income. Refer to note 6 for further information.
NoTES To ThE GRoUP ANNUAL FINANCIAL STATEMENTS
T r u w o r t h s I n t e r n a t i o n a l L i m i t e d A n n u a l F i n a n c i a l S t a t e m e n t s 2 0 1 252
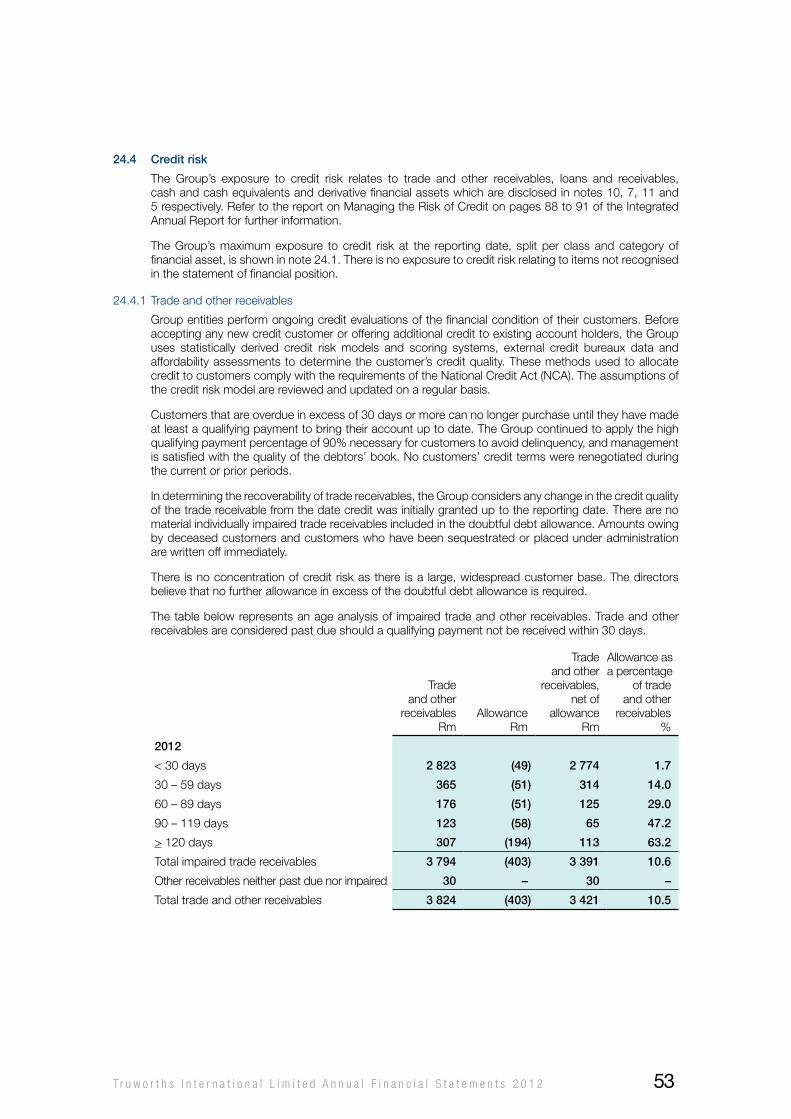
24.4 credit risk
The Group’s exposure to credit risk relates to trade and other receivables, loans and receivables, cash and cash equivalents and derivative financial assets which are disclosed in notes 10, 7, 11 and 5 respectively. Refer to the report on Managing the Risk of Credit on pages 88 to 91 of the Integrated Annual Report for further information.
The Group’s maximum exposure to credit risk at the reporting date, split per class and category of financial asset, is shown in note 24.1. There is no exposure to credit risk relating to items not recognised in the statement of financial position.
24.4.1 Trade and other receivables
Group entities perform ongoing credit evaluations of the financial condition of their customers. Before accepting any new credit customer or offering additional credit to existing account holders, the Group uses statistically derived credit risk models and scoring systems, external credit bureaux data and affordability assessments to determine the customer’s credit quality. These methods used to allocate credit to customers comply with the requirements of the National Credit Act (NCA). The assumptions of the credit risk model are reviewed and updated on a regular basis.
Customers that are overdue in excess of 30 days or more can no longer purchase until they have made at least a qualifying payment to bring their account up to date. The Group continued to apply the high qualifying payment percentage of 90% necessary for customers to avoid delinquency, and management is satisfied with the quality of the debtors’ book. No customers’ credit terms were renegotiated during the current or prior periods.
In determining the recoverability of trade receivables, the Group considers any change in the credit quality of the trade receivable from the date credit was initially granted up to the reporting date. There are no material individually impaired trade receivables included in the doubtful debt allowance. Amounts owing by deceased customers and customers who have been sequestrated or placed under administration are written off immediately.
There is no concentration of credit risk as there is a large, widespread customer base. The directors believe that no further allowance in excess of the doubtful debt allowance is required.
The table below represents an age analysis of impaired trade and other receivables. Trade and other receivables are considered past due should a qualifying payment not be received within 30 days.
Trade and other
receivablesRm
AllowanceRm
Trade and other
receivables, net of
allowanceRm
Allowance as a percentage
of trade and other
receivables%
2012
< 30 days 2 823 (49) 2 774 1.7
30 – 59 days 365 (51) 314 14.0
60 – 89 days 176 (51) 125 29.0
90 – 119 days 123 (58) 65 47.2
> 120 days 307 (194) 113 63.2
Total impaired trade receivables 3 794 (403) 3 391 10.6
other receivables neither past due nor impaired 30 – 30 –
Total trade and other receivables 3 824 (403) 3 421 10.5
T r u w o r t h s I n t e r n a t i o n a l L i m i t e d A n n u a l F i n a n c i a l S t a t e m e n t s 2 0 1 2 53
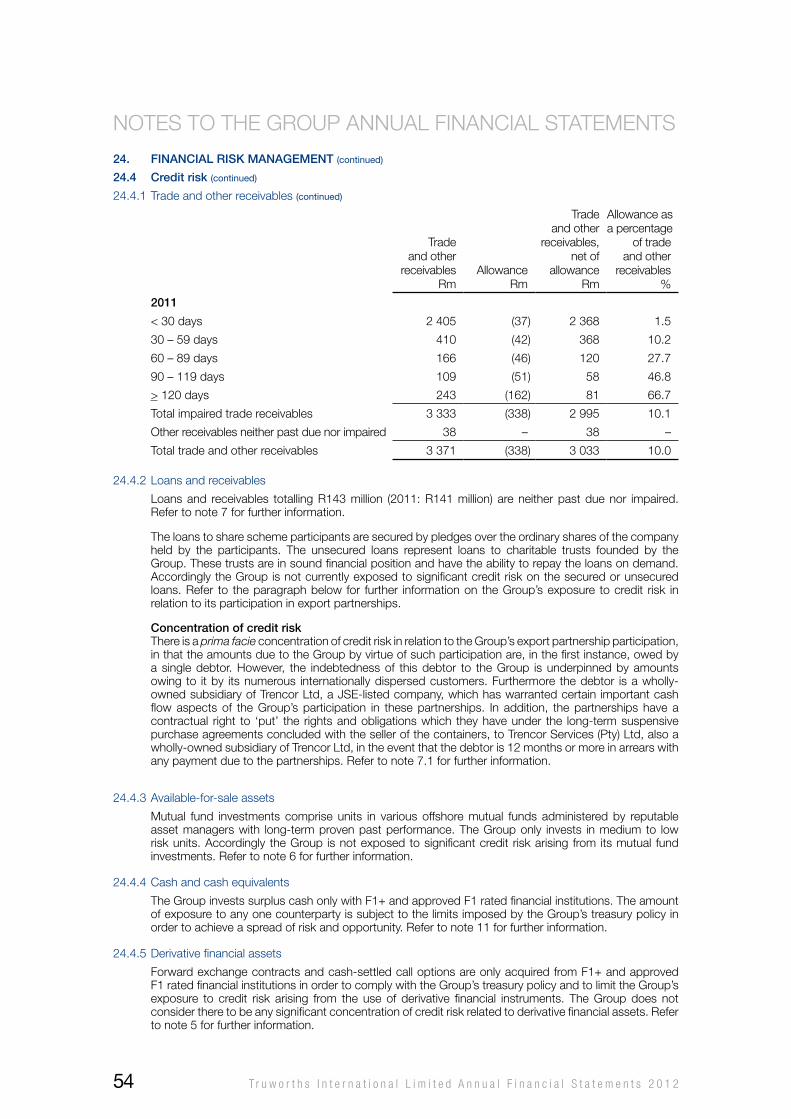
24. financial risK manaGement (continued)
24.4 credit risk (continued)
24.4.1 Trade and other receivables (continued)
Trade and other
receivablesRm
AllowanceRm
Trade and other
receivables, net of
allowanceRm
Allowance as a percentage
of trade and other
receivables%
2011
< 30 days 2 405 (37) 2 368 1.5
30 – 59 days 410 (42) 368 10.2
60 – 89 days 166 (46) 120 27.7
90 – 119 days 109 (51) 58 46.8
> 120 days 243 (162) 81 66.7
Total impaired trade receivables 3 333 (338) 2 995 10.1
other receivables neither past due nor impaired 38 – 38 –
Total trade and other receivables 3 371 (338) 3 033 10.0
24.4.2 Loans and receivables
Loans and receivables totalling R143 million (2011: R141 million) are neither past due nor impaired. Refer to note 7 for further information.
The loans to share scheme participants are secured by pledges over the ordinary shares of the company held by the participants. The unsecured loans represent loans to charitable trusts founded by the Group. These trusts are in sound financial position and have the ability to repay the loans on demand. Accordingly the Group is not currently exposed to significant credit risk on the secured or unsecured loans. Refer to the paragraph below for further information on the Group’s exposure to credit risk in relation to its participation in export partnerships.
concentration of credit riskThere is a prima facie concentration of credit risk in relation to the Group’s export partnership participation, in that the amounts due to the Group by virtue of such participation are, in the first instance, owed by a single debtor. however, the indebtedness of this debtor to the Group is underpinned by amounts owing to it by its numerous internationally dispersed customers. Furthermore the debtor is a wholly-owned subsidiary of Trencor Ltd, a JSE-listed company, which has warranted certain important cash flow aspects of the Group’s participation in these partnerships. In addition, the partnerships have a contractual right to ‘put’ the rights and obligations which they have under the long-term suspensive purchase agreements concluded with the seller of the containers, to Trencor Services (Pty) Ltd, also a wholly-owned subsidiary of Trencor Ltd, in the event that the debtor is 12 months or more in arrears with any payment due to the partnerships. Refer to note 7.1 for further information.
24.4.3 Available-for-sale assets
Mutual fund investments comprise units in various offshore mutual funds administered by reputable asset managers with long-term proven past performance. The Group only invests in medium to low risk units. Accordingly the Group is not exposed to significant credit risk arising from its mutual fund investments. Refer to note 6 for further information.
24.4.4 Cash and cash equivalents
The Group invests surplus cash only with F1+ and approved F1 rated financial institutions. The amount of exposure to any one counterparty is subject to the limits imposed by the Group’s treasury policy in order to achieve a spread of risk and opportunity. Refer to note 11 for further information.
24.4.5 Derivative financial assets
Forward exchange contracts and cash-settled call options are only acquired from F1+ and approved F1 rated financial institutions in order to comply with the Group’s treasury policy and to limit the Group’s exposure to credit risk arising from the use of derivative financial instruments. The Group does not consider there to be any significant concentration of credit risk related to derivative financial assets. Refer to note 5 for further information.
NoTES To ThE GRoUP ANNUAL FINANCIAL STATEMENTS
T r u w o r t h s I n t e r n a t i o n a l L i m i t e d A n n u a l F i n a n c i a l S t a t e m e n t s 2 0 1 254
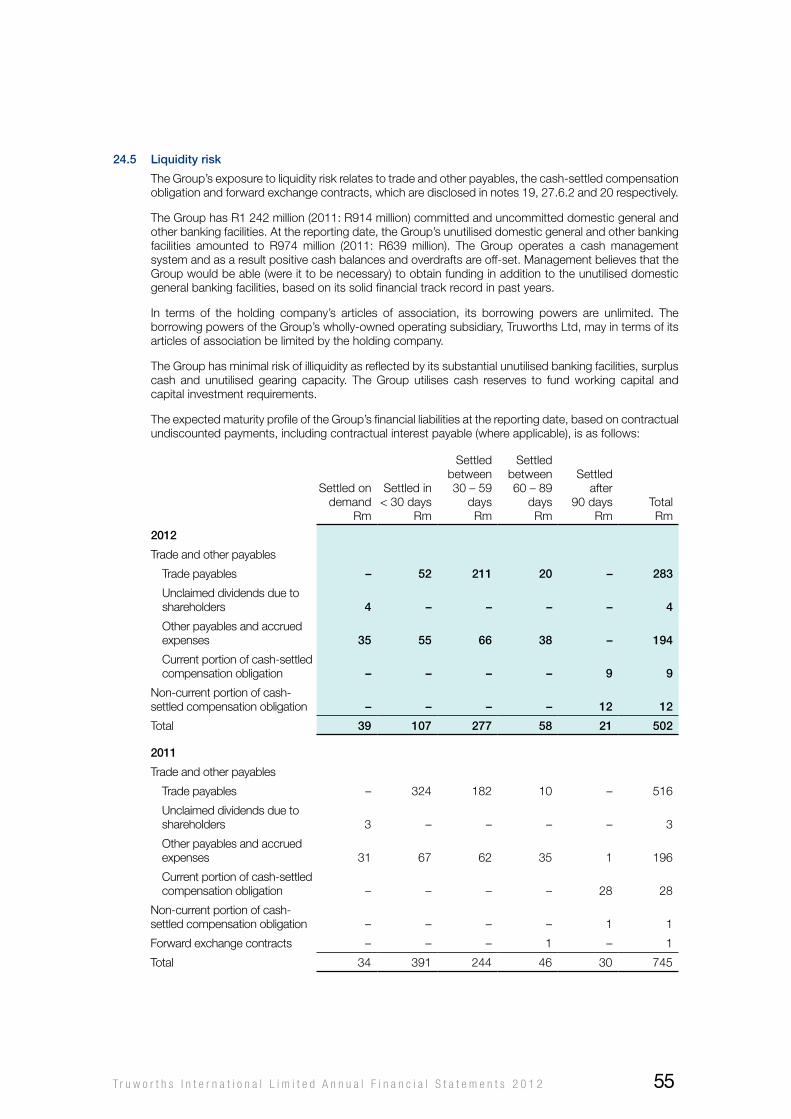
24.5 liquidity risk
The Group’s exposure to liquidity risk relates to trade and other payables, the cash-settled compensation obligation and forward exchange contracts, which are disclosed in notes 19, 27.6.2 and 20 respectively.
The Group has R1 242 million (2011: R914 million) committed and uncommitted domestic general and other banking facilities. At the reporting date, the Group’s unutilised domestic general and other banking facilities amounted to R974 million (2011: R639 million). The Group operates a cash management system and as a result positive cash balances and overdrafts are off-set. Management believes that the Group would be able (were it to be necessary) to obtain funding in addition to the unutilised domestic general banking facilities, based on its solid financial track record in past years.
In terms of the holding company’s articles of association, its borrowing powers are unlimited. The borrowing powers of the Group’s wholly-owned operating subsidiary, Truworths Ltd, may in terms of its articles of association be limited by the holding company.
The Group has minimal risk of illiquidity as reflected by its substantial unutilised banking facilities, surplus cash and unutilised gearing capacity. The Group utilises cash reserves to fund working capital and capital investment requirements.
The expected maturity profile of the Group’s financial liabilities at the reporting date, based on contractual undiscounted payments, including contractual interest payable (where applicable), is as follows:
Settled on demand
Rm
Settled in < 30 days
Rm
Settled between
30 – 59 days
Rm
Settled between
60 – 89 days
Rm
Settled after
90 daysRm
TotalRm
2012
Trade and other payables
Trade payables – 52 211 20 – 283
Unclaimed dividends due to shareholders 4 – – – – 4
other payables and accrued expenses 35 55 66 38 – 194
Current portion of cash-settled compensation obligation – – – – 9 9
Non-current portion of cash-settled compensation obligation – – – – 12 12
Total 39 107 277 58 21 502
2011
Trade and other payables
Trade payables – 324 182 10 – 516
Unclaimed dividends due to shareholders 3 – – – – 3
other payables and accrued expenses 31 67 62 35 1 196
Current portion of cash-settled compensation obligation – – – – 28 28
Non-current portion of cash-settled compensation obligation – – – – 1 1
Forward exchange contracts – – – 1 – 1
Total 34 391 244 46 30 745
T r u w o r t h s I n t e r n a t i o n a l L i m i t e d A n n u a l F i n a n c i a l S t a t e m e n t s 2 0 1 2 55
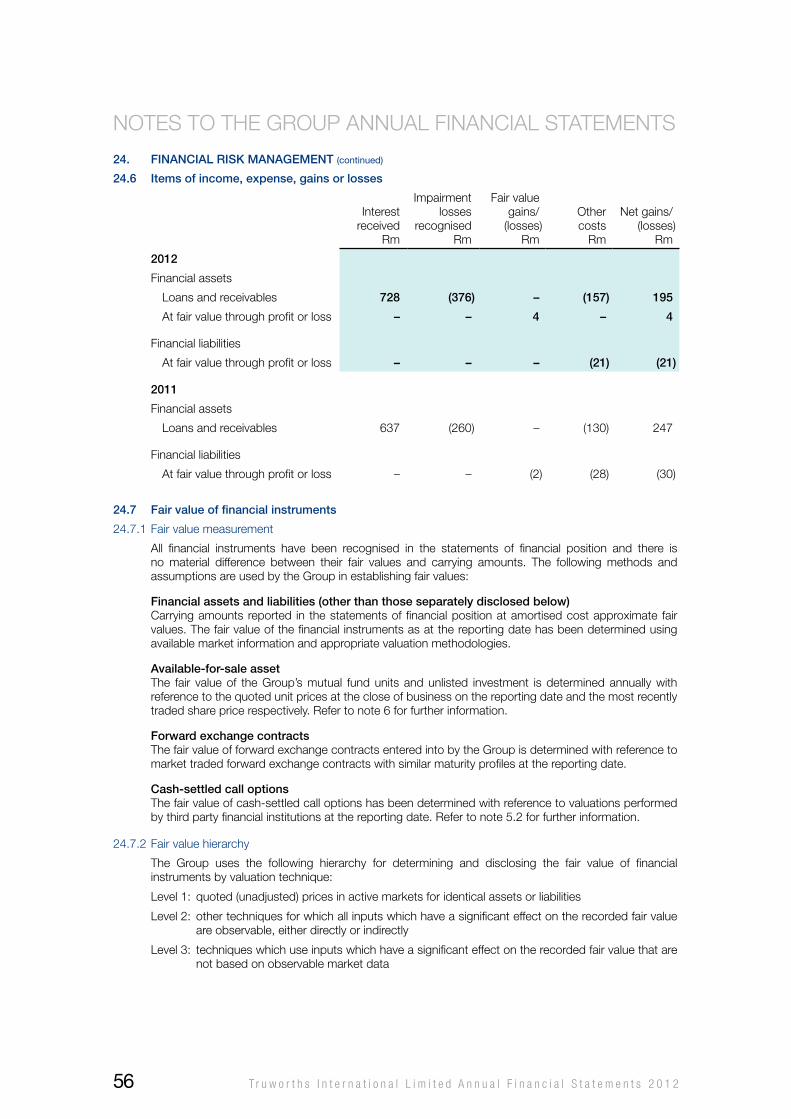
24. financial risK manaGement (continued)
24.6 items of income, expense, gains or losses
Interest received
Rm
Impairment losses
recognisedRm
Fair value gains/
(losses)Rm
other costs
Rm
Net gains/ (losses)
Rm
2012
Financial assets
Loans and receivables 728 (376) – (157) 195
At fair value through profit or loss – – 4 – 4
Financial liabilities
At fair value through profit or loss – – – (21) (21)
2011
Financial assets
Loans and receivables 637 (260) – (130) 247
Financial liabilities
At fair value through profit or loss – – (2) (28) (30)
24.7 fair value of financial instruments
24.7.1 Fair value measurement
All financial instruments have been recognised in the statements of financial position and there is no material difference between their fair values and carrying amounts. The following methods and assumptions are used by the Group in establishing fair values:
financial assets and liabilities (other than those separately disclosed below)Carrying amounts reported in the statements of financial position at amortised cost approximate fair values. The fair value of the financial instruments as at the reporting date has been determined using available market information and appropriate valuation methodologies.
available-for-sale assetThe fair value of the Group’s mutual fund units and unlisted investment is determined annually with reference to the quoted unit prices at the close of business on the reporting date and the most recently traded share price respectively. Refer to note 6 for further information.
forward exchange contractsThe fair value of forward exchange contracts entered into by the Group is determined with reference to market traded forward exchange contracts with similar maturity profiles at the reporting date.
cash-settled call optionsThe fair value of cash-settled call options has been determined with reference to valuations performed by third party financial institutions at the reporting date. Refer to note 5.2 for further information.
24.7.2 Fair value hierarchy
The Group uses the following hierarchy for determining and disclosing the fair value of financial instruments by valuation technique:
Level 1: quoted (unadjusted) prices in active markets for identical assets or liabilities
Level 2: other techniques for which all inputs which have a significant effect on the recorded fair value are observable, either directly or indirectly
Level 3: techniques which use inputs which have a significant effect on the recorded fair value that are not based on observable market data
NoTES To ThE GRoUP ANNUAL FINANCIAL STATEMENTS
T r u w o r t h s I n t e r n a t i o n a l L i m i t e d A n n u a l F i n a n c i a l S t a t e m e n t s 2 0 1 256
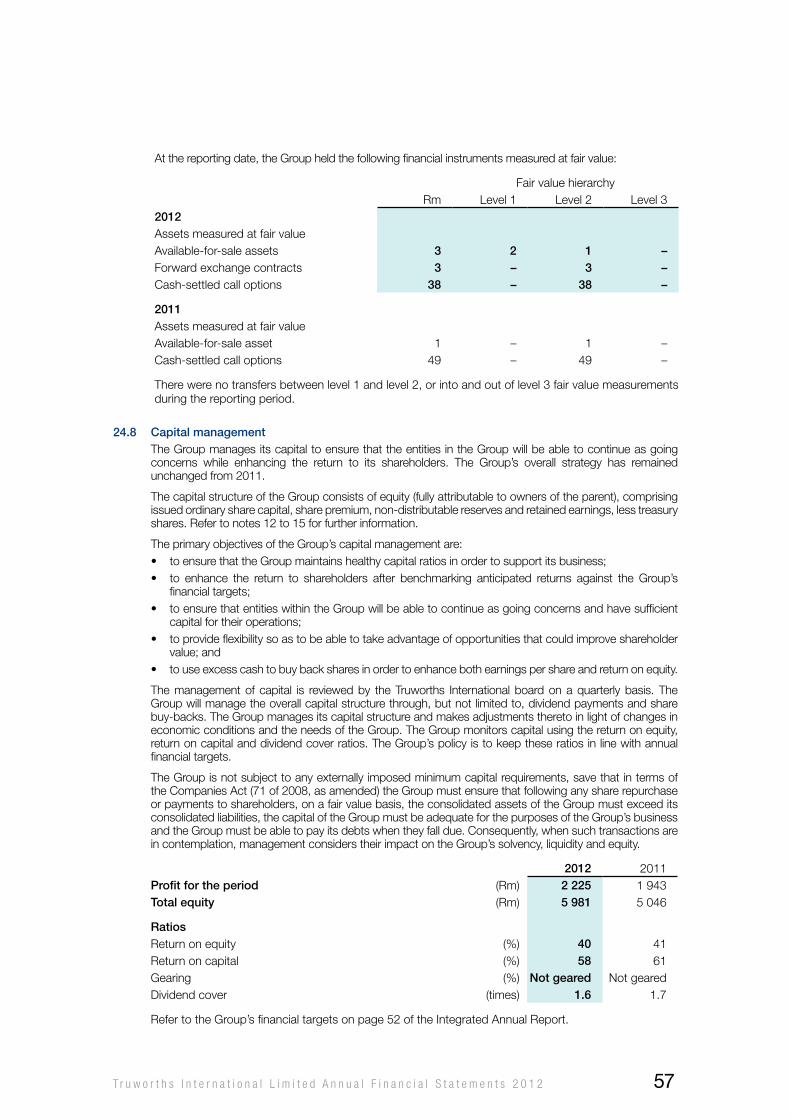
At the reporting date, the Group held the following financial instruments measured at fair value:
RmFair value hierarchy
Level 1 Level 2 Level 32012Assets measured at fair valueAvailable-for-sale assets 3 2 1 – Forward exchange contracts 3 – 3 – Cash-settled call options 38 – 38 –
2011Assets measured at fair valueAvailable-for-sale asset 1 – 1 – Cash-settled call options 49 – 49 –
There were no transfers between level 1 and level 2, or into and out of level 3 fair value measurements during the reporting period.
24.8 capital managementThe Group manages its capital to ensure that the entities in the Group will be able to continue as going concerns while enhancing the return to its shareholders. The Group’s overall strategy has remained unchanged from 2011.
The capital structure of the Group consists of equity (fully attributable to owners of the parent), comprising issued ordinary share capital, share premium, non-distributable reserves and retained earnings, less treasury shares. Refer to notes 12 to 15 for further information.
The primary objectives of the Group’s capital management are: • toensurethattheGroupmaintainshealthycapitalratiosinordertosupportitsbusiness;• to enhance the return to shareholders after benchmarking anticipated returns against the Group’s
financial targets;• toensurethatentitieswithintheGroupwillbeabletocontinueasgoingconcernsandhavesufficient
capital for their operations;• toprovideflexibilitysoastobeabletotakeadvantageofopportunitiesthatcouldimproveshareholder
value; and• touseexcesscashtobuybacksharesinordertoenhancebothearningspershareandreturnonequity.
The management of capital is reviewed by the Truworths International board on a quarterly basis. The Group will manage the overall capital structure through, but not limited to, dividend payments and share buy-backs. The Group manages its capital structure and makes adjustments thereto in light of changes in economic conditions and the needs of the Group. The Group monitors capital using the return on equity, return on capital and dividend cover ratios. The Group’s policy is to keep these ratios in line with annual financial targets.
The Group is not subject to any externally imposed minimum capital requirements, save that in terms of the Companies Act (71 of 2008, as amended) the Group must ensure that following any share repurchase or payments to shareholders, on a fair value basis, the consolidated assets of the Group must exceed its consolidated liabilities, the capital of the Group must be adequate for the purposes of the Group’s business and the Group must be able to pay its debts when they fall due. Consequently, when such transactions are in contemplation, management considers their impact on the Group’s solvency, liquidity and equity.
2012 2011profit for the period (Rm) 2 225 1 943 total equity (Rm) 5 981 5 046
ratiosReturn on equity (%) 40 41 Return on capital (%) 58 61 Gearing (%) not geared Not gearedDividend cover (times) 1.6 1.7
Refer to the Group’s financial targets on page 52 of the Integrated Annual Report.
T r u w o r t h s I n t e r n a t i o n a l L i m i t e d A n n u a l F i n a n c i a l S t a t e m e n t s 2 0 1 2 57
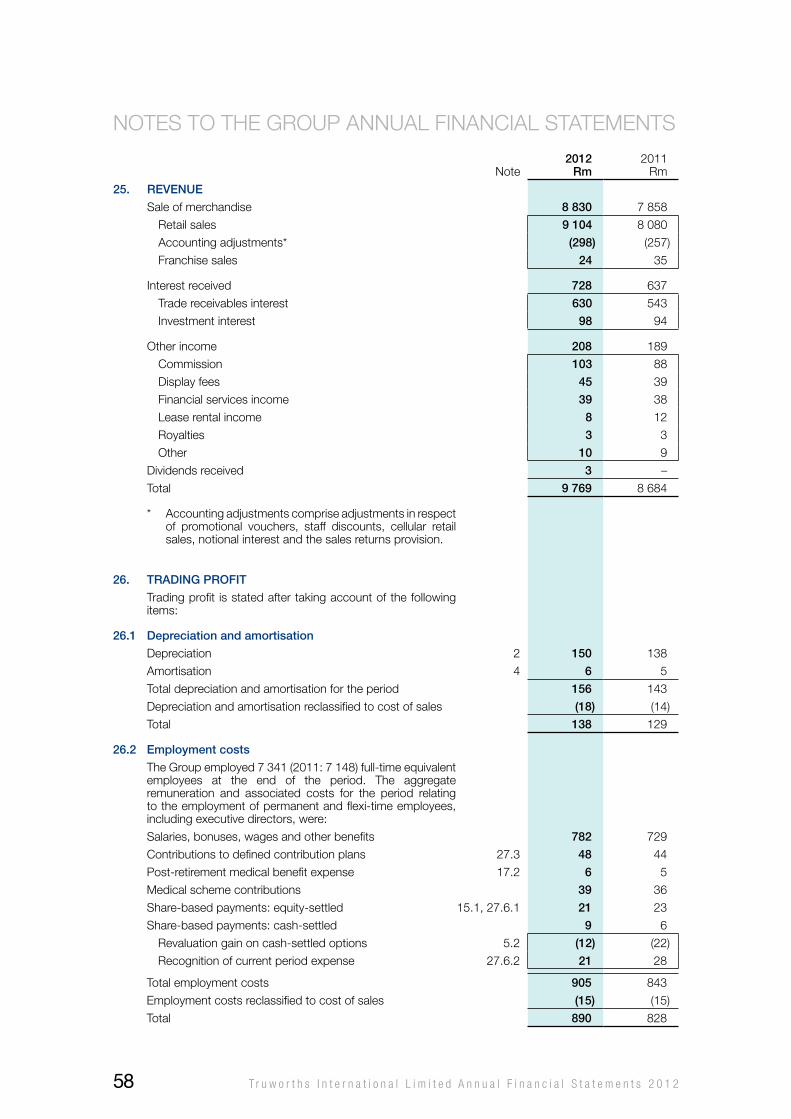
Note2012
rm2011
Rm
25. revenue
Sale of merchandise 8 830 7 858
Retail sales 9 104 8 080
Accounting adjustments* (298) (257)
Franchise sales 24 35
Interest received 728 637
Trade receivables interest 630 543
Investment interest 98 94
other income 208 189
Commission 103 88
Display fees 45 39
Financial services income 39 38
Lease rental income 8 12
Royalties 3 3
other 10 9
Dividends received 3 –
Total 9 769 8 684
* Accounting adjustments comprise adjustments in respect of promotional vouchers, staff discounts, cellular retail sales, notional interest and the sales returns provision.
26. traDinG profit
Trading profit is stated after taking account of the following items:
26.1 Depreciation and amortisation
Depreciation 2 150 138
Amortisation 4 6 5
Total depreciation and amortisation for the period 156 143
Depreciation and amortisation reclassified to cost of sales (18) (14)
Total 138 129
26.2 employment costs
The Group employed 7 341 (2011: 7 148) full-time equivalent employees at the end of the period. The aggregate remuneration and associated costs for the period relating to the employment of permanent and flexi-time employees, including executive directors, were:
Salaries, bonuses, wages and other benefits 782 729
Contributions to defined contribution plans 27.3 48 44
Post-retirement medical benefit expense 17.2 6 5
Medical scheme contributions 39 36
Share-based payments: equity-settled 15.1, 27.6.1 21 23
Share-based payments: cash-settled 9 6
Revaluation gain on cash-settled options 5.2 (12) (22)
Recognition of current period expense 27.6.2 21 28
Total employment costs 905 843
Employment costs reclassified to cost of sales (15) (15)
Total 890 828
NoTES To ThE GRoUP ANNUAL FINANCIAL STATEMENTS
T r u w o r t h s I n t e r n a t i o n a l L i m i t e d A n n u a l F i n a n c i a l S t a t e m e n t s 2 0 1 258
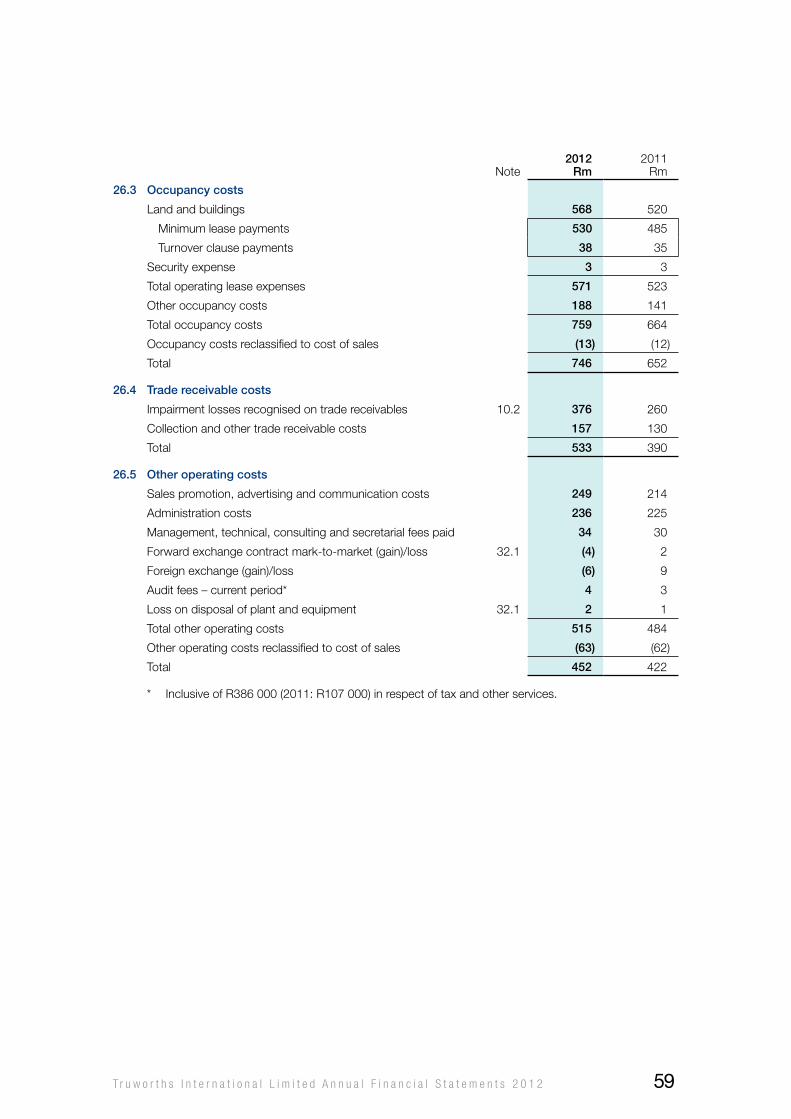
Note2012
rm2011
Rm
26.3 occupancy costs
Land and buildings 568 520
Minimum lease payments 530 485
Turnover clause payments 38 35
Security expense 3 3
Total operating lease expenses 571 523
other occupancy costs 188 141
Total occupancy costs 759 664
occupancy costs reclassified to cost of sales (13) (12)
Total 746 652
26.4 trade receivable costs
Impairment losses recognised on trade receivables 10.2 376 260
Collection and other trade receivable costs 157 130
Total 533 390
26.5 other operating costs
Sales promotion, advertising and communication costs 249 214
Administration costs 236 225
Management, technical, consulting and secretarial fees paid 34 30
Forward exchange contract mark-to-market (gain)/loss 32.1 (4) 2
Foreign exchange (gain)/loss (6) 9
Audit fees – current period* 4 3
Loss on disposal of plant and equipment 32.1 2 1
Total other operating costs 515 484
other operating costs reclassified to cost of sales (63) (62)
Total 452 422
* Inclusive of R386 000 (2011: R107 000) in respect of tax and other services.
T r u w o r t h s I n t e r n a t i o n a l L i m i t e d A n n u a l F i n a n c i a l S t a t e m e n t s 2 0 1 2 59
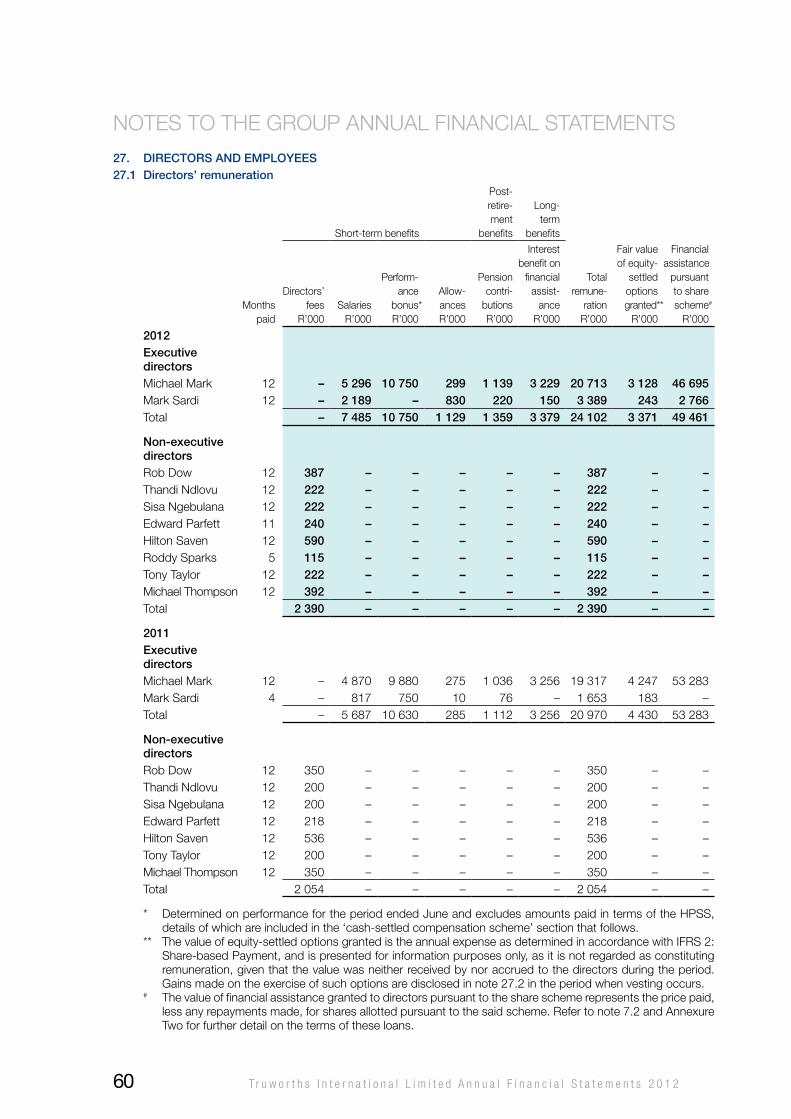
27. Directors anD employees27.1 Directors’ remuneration
Months paid
Short-term benefits
Post-retire-ment
benefits
Long-term
benefits
Total remune-
ration R’000
Fair value of equity-
settled options granted**
R’000
Financial assistance
pursuant to share scheme#
R’000
Directors’ fees
R’000Salaries
R’000
Perform-ance
bonus* R’000
Allow-ances R’000
Pension contri-
butions R’000
Interest benefit on
financial assist-
ance R’000
2012executive directorsMichael Mark 12 – 5 296 10 750 299 1 139 3 229 20 713 3 128 46 695Mark Sardi 12 – 2 189 – 830 220 150 3 389 243 2 766Total – 7 485 10 750 1 129 1 359 3 379 24 102 3 371 49 461
non-executive directorsRob Dow 12 387 – – – – – 387 – – Thandi Ndlovu 12 222 – – – – – 222 – – Sisa Ngebulana 12 222 – – – – – 222 – – Edward Parfett 11 240 – – – – – 240 – – hilton Saven 12 590 – – – – – 590 – – Roddy Sparks 5 115 – – – – – 115 – – Tony Taylor 12 222 – – – – – 222 – – Michael Thompson 12 392 – – – – – 392 – – Total 2 390 – – – – – 2 390 – –
2011executive directorsMichael Mark 12 – 4 870 9 880 275 1 036 3 256 19 317 4 247 53 283 Mark Sardi 4 – 817 750 10 76 – 1 653 183 – Total – 5 687 10 630 285 1 112 3 256 20 970 4 430 53 283
non-executive directorsRob Dow 12 350 – – – – – 350 – – Thandi Ndlovu 12 200 – – – – – 200 – – Sisa Ngebulana 12 200 – – – – – 200 – – Edward Parfett 12 218 – – – – – 218 – – hilton Saven 12 536 – – – – – 536 – – Tony Taylor 12 200 – – – – – 200 – – Michael Thompson 12 350 – – – – – 350 – – Total 2 054 – – – – – 2 054 – –
* Determined on performance for the period ended June and excludes amounts paid in terms of the hPSS, details of which are included in the ‘cash-settled compensation scheme’ section that follows.
** The value of equity-settled options granted is the annual expense as determined in accordance with IFRS 2: Share-based Payment, and is presented for information purposes only, as it is not regarded as constituting remuneration, given that the value was neither received by nor accrued to the directors during the period. Gains made on the exercise of such options are disclosed in note 27.2 in the period when vesting occurs.
# The value of financial assistance granted to directors pursuant to the share scheme represents the price paid, less any repayments made, for shares allotted pursuant to the said scheme. Refer to note 7.2 and Annexure Two for further detail on the terms of these loans.
NoTES To ThE GRoUP ANNUAL FINANCIAL STATEMENTS
T r u w o r t h s I n t e r n a t i o n a l L i m i t e d A n n u a l F i n a n c i a l S t a t e m e n t s 2 0 1 260
executive directorsAll amounts received by the executives, while being directors of the company, were in respect of services rendered to, and in connection with the carrying on of the affairs of the Group’s subsidiaries. These amounts were paid by the subsidiaries.
Mr Michael Mark, the Chief Executive officer, entered into a further three-year contract with the Group effective from 1 July 2010. In terms of his contract, he is entitled to a guaranteed remuneration package and to participate in the Group’s various cash and share schemes. Both parties have the right to terminate the contract on a nine-month notice period but should the Group do so for reasons other than improper conduct prior to the conclusion of the three-year period, the balance of the remuneration package owing in terms of his contract would become payable. The contract requires a nine-month notice period to be provided except in the case of permanent disability/incapacitation.
Mr Mark Sardi, the Chief Financial officer of the Group, was appointed as an executive director of the company with effect from 21 February 2011. In terms of his contract, he is entitled to a guaranteed remuneration package and to participate in the Group’s various cash and share schemes. The contract requires a nine-month notice period to be provided except in the case of permanent disability/incapacitation. Mr Sardi tendered his resignation on 11 July 2012 and will serve a notice period until at least the end of the 2012 calendar year.
non-executive directorsAll amounts received by the non-executive directors were for services rendered as directors of the company. These amounts, which were approved by the shareholders at the company’s annual general meeting held on 10 November 2011, were paid by the company. None of the non-executive directors has service contracts with the company.
Mr Roddy Sparks was appointed as an independent non-executive director with effect from 1 February 2012. Mr Edward Parfett retired as an independent non-executive director with effect from 17 May 2012.
consultancy feesThere were no consultancy fees paid to executive and non-executive directors during the period (2011: nil).
cash-settled compensation schemeDuring the period an amount totalling R29 million (2011: R45 million) was paid to participants pursuant to the hPSS on successful attainment of Group and individual performance targets. Mr Mark, in his capacity as an executive director of the company, received R6.4 million (2011: R10.8 million) in terms of the hPSS during the period.
2012rm
2011Rm
27.2 Directors’ equity-settled share option gains
Executive directors 20 20
Non-executive directors 3 –
Total 23 20
The share incentive scheme participants (including the directors) may exercise their equity-settled share options at any date subsequent to the offer date. The shares acquired on exercise of the options are, however, only eligible for sale after the vesting date, when ownership passes to the directors (subject to repayment of any financial assistance) who are then able to dispose of the shares. The share option gain for disclosure purposes is therefore the difference between the exercise price and the company’s share price on the vesting date, or exercise date if later. Refer to Annexure 2 for details of directors’ equity-settled share options.
T r u w o r t h s I n t e r n a t i o n a l L i m i t e d A n n u a l F i n a n c i a l S t a t e m e n t s 2 0 1 2 61
27. Directors anD employees (continued)
27.3 Defined contribution retirement fundsalexander forbes retirement fund: Defined contribution planThis is a defined contribution arrangement whereby the members pay 7.5% of their pensionable salary as contributions towards retirement benefits. The Group contributes 10.5% towards retirement benefits, life insurance, disability benefits, funeral benefits and administration costs. The fund’s retirement age is 60. Membership of either this fund or the SACCAwU National Provident Fund is compulsory for all full-time or part-time permanent South African employees (excluding flexi-time employees) under normal retirement age. The member’s pension entitlement at retirement age is determined by his/her share of the fund. on retirement, the member is entitled to elect up to one-third of the share as a cash lump sum payout and receive the balance in the form of a monthly pension. The plan is registered under the Pension Funds Act (1956, as amended).
the pension fund (formerly the investment solutions pension fund): Defined contribution planAll senior employees can structure additional voluntary contributions in multiples of 2.5%, with a maximum of 10% into this fund, which is an umbrella retirement funding arrangement. The member’s pension entitlement at retirement age is determined by his/her share of the fund. The fund’s retirement age is 60 and retirement from this fund must coincide with retirement from the Alexander Forbes Retirement Fund. The plan is registered under the Pension Funds Act (1956, as amended). The Group also contributes at a rate of 2.5% of pensionable salaries in respect of employees who are on two-year contracts.
saccawu national provident fund: Defined contribution planThe SACCAwU National Provident Fund is an umbrella money purchase arrangement administered by old Mutual. Members pay 7.5% of their pensionable salary towards retirement benefits. The Group contributes 10.0% of pensionable salaries towards retirement benefits, life insurance, disability benefits and administration costs. Membership of either the Alexander Forbes Retirement Fund or of the SACCAwU National Provident Fund is compulsory for all permanent full-time and part-time South African employees (excluding flexi-time employees) under normal retirement age. The member’s pension entitlement at retirement age is determined by his/her share of the fund. The plan is registered under the Pension Funds Act (1956, as amended).
namflex pension fund: Defined contribution planThe Namflex Pension Fund is a money purchase arrangement whereby the members pay 7.5% of their pensionable salary as contributions towards retirement benefits. The Group contributes 7.5% to retirement benefits and an additional 3.5% of pensionable salaries towards life insurance, disability benefits and administration costs. The fund’s retirement age is 60. Membership of the fund is compulsory for all Namibian permanent employees under normal retirement age. The member’s pension entitlement at retirement age is determined by his/her share of the fund. on retirement, the member is entitled to elect up to one-third of the share as a cash lump sum payout and receive the balance in the form of a monthly pension. The plan is registered under the Namibian Pension Funds Act.
swaziland national provident fund: Defined contribution planThe Swaziland National Provident Fund is an arrangement whereby the members and the Group pay a statutory contribution based on members’ earnings on a 50/50 basis with a maximum monthly contribution of E150 (2011: E140) based on a maximum monthly wage of E1 500 (2011: E1 400). The fund provides for a retirement benefit at or after age 45 and an age benefit at or after age 50. The fund also provides for a disability benefit, immigration benefit and a survivor’s benefit. The employer is registered under the provisions of the Registration of Contributing Employers Regulations 1975, and Section 8 of the Swaziland National Provident Fund order 1974. Membership of the fund is compulsory for all Swaziland-based permanent employees under normal retirement age. The member’s pension entitlement at retirement age is determined by his/her share of the fund.
swaziland retirement fund: Defined contribution planUntil 31 December 2011 all Swaziland-based permanent employees of the Group were members of the Alexander Forbes Retirement Fund. with effect from 1 January 2012, these members were transferred to the Swaziland Retirement Fund.
This fund is a defined contribution arrangement whereby the members pay 7.5% of their pensionable salary as contributions towards retirement benefits. The Group contributes 10.5% of pensionable salaries towards retirement benefits, life insurance, disability benefits, funeral benefits and administration costs. The fund’s retirement age is 60. The member’s pension entitlement at retirement age is determined by his/her share of the fund. on retirement, the member is entitled to elect up to one-third of the share as a cash lump sum payout and receive the balance in the form of a monthly pension.
NoTES To ThE GRoUP ANNUAL FINANCIAL STATEMENTS
T r u w o r t h s I n t e r n a t i o n a l L i m i t e d A n n u a l F i n a n c i a l S t a t e m e n t s 2 0 1 262
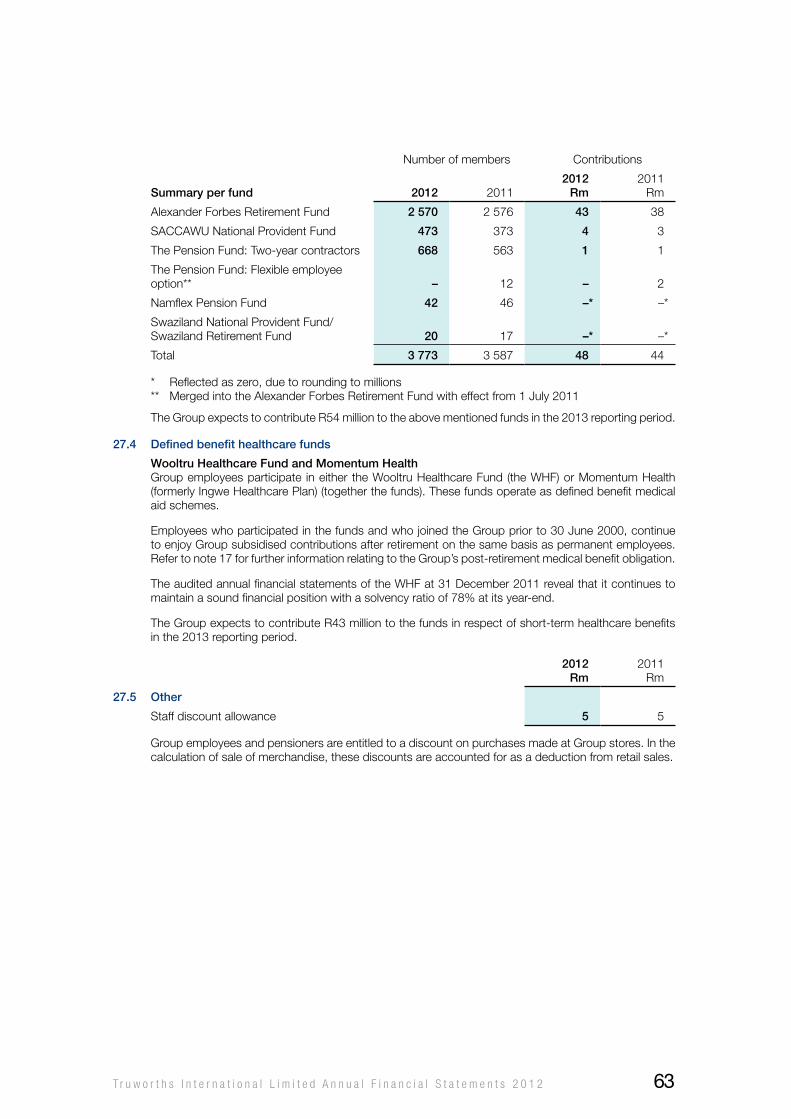
Number of members Contributions
summary per fund 2012 20112012
rm2011
Rm
Alexander Forbes Retirement Fund 2 570 2 576 43 38
SACCAwU National Provident Fund 473 373 4 3
The Pension Fund: Two-year contractors 668 563 1 1
The Pension Fund: Flexible employee option** – 12 – 2
Namflex Pension Fund 42 46 –* –*
Swaziland National Provident Fund/Swaziland Retirement Fund 20 17 –* –*
Total 3 773 3 587 48 44
* Reflected as zero, due to rounding to millions** Merged into the Alexander Forbes Retirement Fund with effect from 1 July 2011
The Group expects to contribute R54 million to the above mentioned funds in the 2013 reporting period.
27.4 Defined benefit healthcare funds
wooltru healthcare fund and momentum healthGroup employees participate in either the wooltru healthcare Fund (the whF) or Momentum health (formerly Ingwe healthcare Plan) (together the funds). These funds operate as defined benefit medical aid schemes.
Employees who participated in the funds and who joined the Group prior to 30 June 2000, continue to enjoy Group subsidised contributions after retirement on the same basis as permanent employees. Refer to note 17 for further information relating to the Group’s post-retirement medical benefit obligation.
The audited annual financial statements of the whF at 31 December 2011 reveal that it continues to maintain a sound financial position with a solvency ratio of 78% at its year-end.
The Group expects to contribute R43 million to the funds in respect of short-term healthcare benefits in the 2013 reporting period.
2012rm
2011Rm
27.5 other
Staff discount allowance 5 5
Group employees and pensioners are entitled to a discount on purchases made at Group stores. In the calculation of sale of merchandise, these discounts are accounted for as a deduction from retail sales.
T r u w o r t h s I n t e r n a t i o n a l L i m i t e d A n n u a l F i n a n c i a l S t a t e m e n t s 2 0 1 2 63
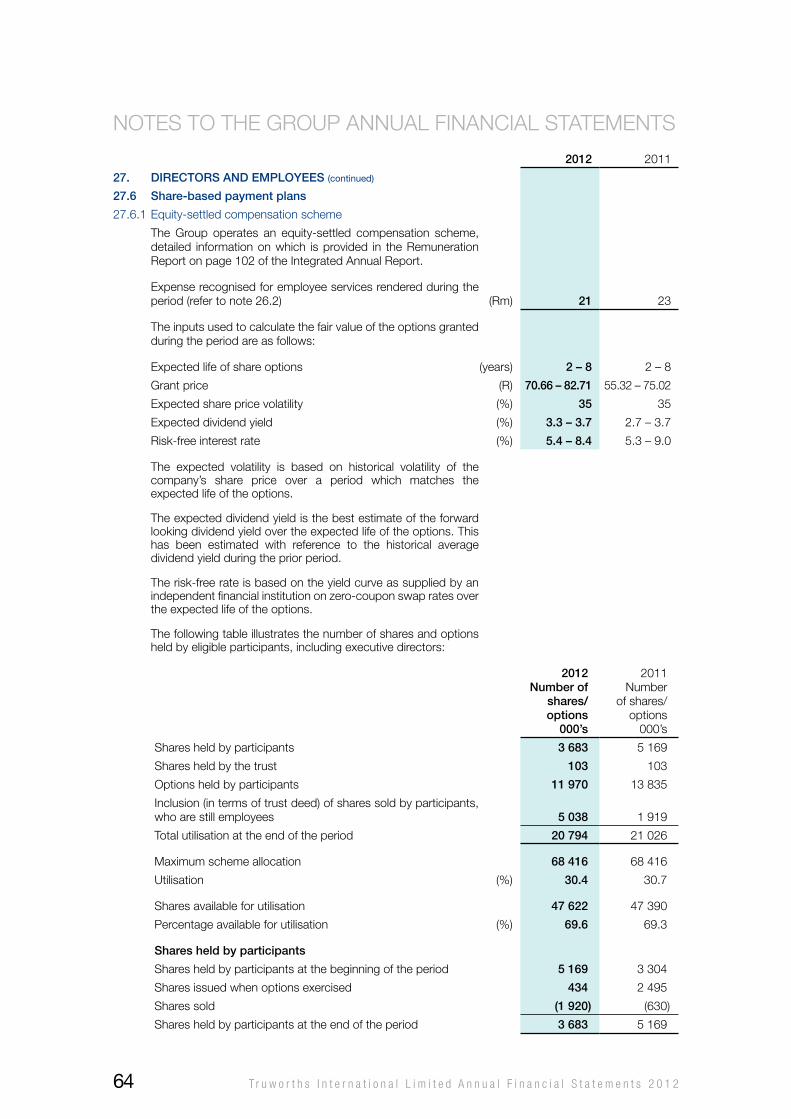
2012 2011
27. Directors anD employees (continued)
27.6 share-based payment plans
27.6.1 Equity-settled compensation scheme
The Group operates an equity-settled compensation scheme, detailed information on which is provided in the Remuneration Report on page 102 of the Integrated Annual Report.
Expense recognised for employee services rendered during the period (refer to note 26.2) (Rm) 21 23
The inputs used to calculate the fair value of the options granted during the period are as follows:
Expected life of share options (years) 2 – 8 2 – 8
Grant price (R) 70.66 – 82.71 55.32 – 75.02
Expected share price volatility (%) 35 35
Expected dividend yield (%) 3.3 – 3.7 2.7 – 3.7
Risk-free interest rate (%) 5.4 – 8.4 5.3 – 9.0
The expected volatility is based on historical volatility of the company’s share price over a period which matches the expected life of the options.
The expected dividend yield is the best estimate of the forward looking dividend yield over the expected life of the options. This has been estimated with reference to the historical average dividend yield during the prior period.
The risk-free rate is based on the yield curve as supplied by an independent financial institution on zero-coupon swap rates over the expected life of the options.
The following table illustrates the number of shares and options held by eligible participants, including executive directors:
2012number of
shares/options
000’s
2011Number
of shares/options
000’s
Shares held by participants 3 683 5 169
Shares held by the trust 103 103
options held by participants 11 970 13 835
Inclusion (in terms of trust deed) of shares sold by participants, who are still employees 5 038 1 919
Total utilisation at the end of the period 20 794 21 026
Maximum scheme allocation 68 416 68 416
Utilisation (%) 30.4 30.7
Shares available for utilisation 47 622 47 390
Percentage available for utilisation (%) 69.6 69.3
shares held by participants
Shares held by participants at the beginning of the period 5 169 3 304
Shares issued when options exercised 434 2 495
Shares sold (1 920) (630)
Shares held by participants at the end of the period 3 683 5 169
NoTES To ThE GRoUP ANNUAL FINANCIAL STATEMENTS
T r u w o r t h s I n t e r n a t i o n a l L i m i t e d A n n u a l F i n a n c i a l S t a t e m e n t s 2 0 1 264
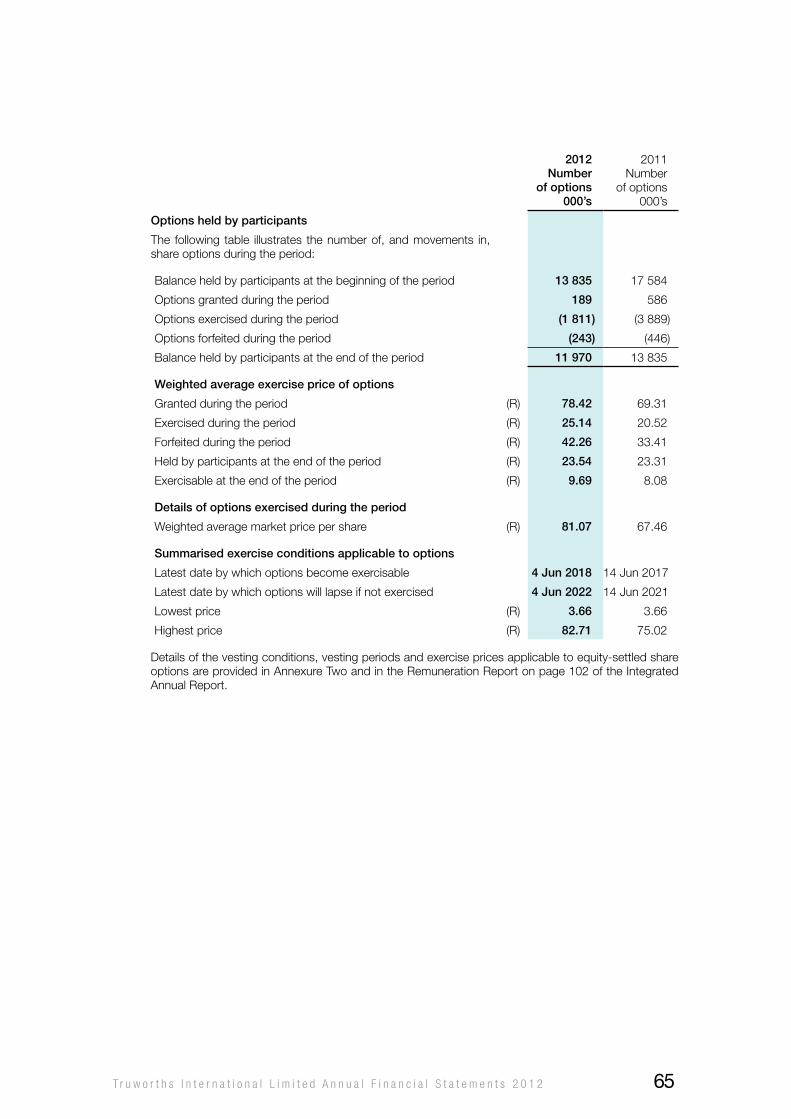
2012number
of options000’s
2011Number
of options000’s
options held by participants
The following table illustrates the number of, and movements in, share options during the period:
Balance held by participants at the beginning of the period 13 835 17 584
options granted during the period 189 586
options exercised during the period (1 811) (3 889)
options forfeited during the period (243) (446)
Balance held by participants at the end of the period 11 970 13 835
weighted average exercise price of options
Granted during the period (R) 78.42 69.31
Exercised during the period (R) 25.14 20.52
Forfeited during the period (R) 42.26 33.41
held by participants at the end of the period (R) 23.54 23.31
Exercisable at the end of the period (R) 9.69 8.08
Details of options exercised during the period
weighted average market price per share (R) 81.07 67.46
summarised exercise conditions applicable to options
Latest date by which options become exercisable 4 Jun 2018 14 Jun 2017
Latest date by which options will lapse if not exercised 4 Jun 2022 14 Jun 2021
Lowest price (R) 3.66 3.66
highest price (R) 82.71 75.02
Details of the vesting conditions, vesting periods and exercise prices applicable to equity-settled share options are provided in Annexure Two and in the Remuneration Report on page 102 of the Integrated Annual Report.
T r u w o r t h s I n t e r n a t i o n a l L i m i t e d A n n u a l F i n a n c i a l S t a t e m e n t s 2 0 1 2 65
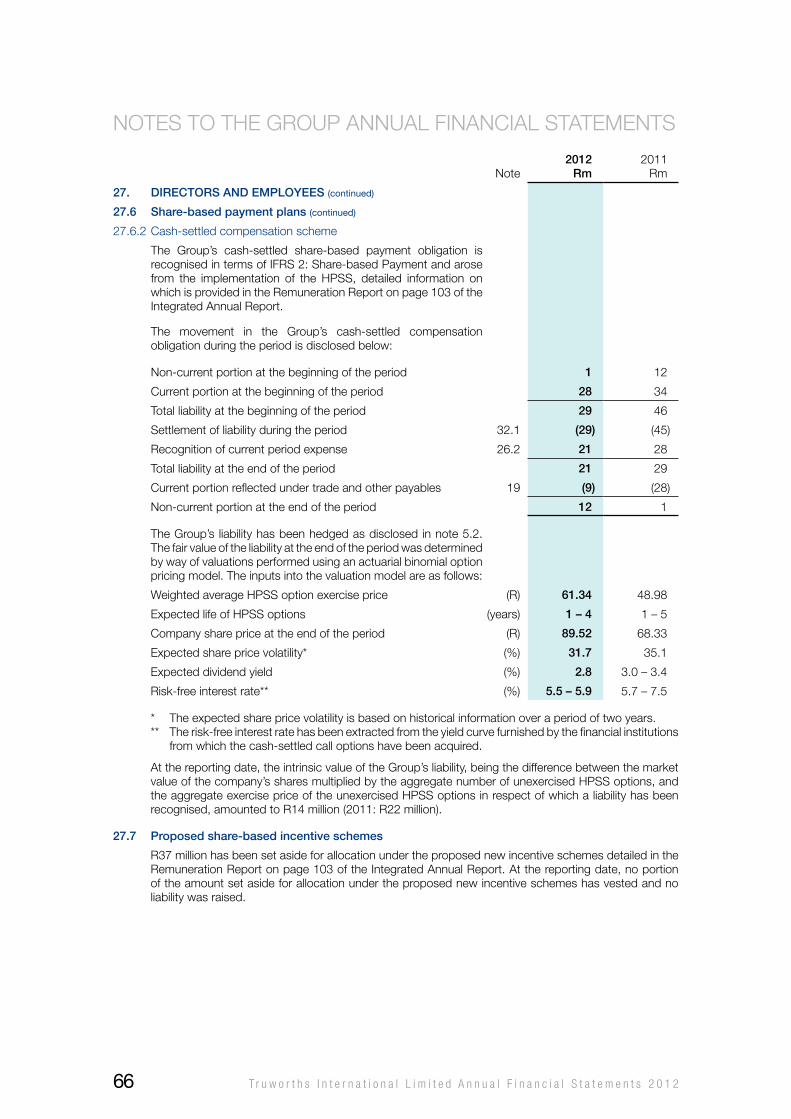
Note2012
rm2011
Rm
27. Directors anD employees (continued)
27.6 share-based payment plans (continued)
27.6.2 Cash-settled compensation scheme
The Group’s cash-settled share-based payment obligation is recognised in terms of IFRS 2: Share-based Payment and arose from the implementation of the hPSS, detailed information on which is provided in the Remuneration Report on page 103 of the Integrated Annual Report.
The movement in the Group’s cash-settled compensation obligation during the period is disclosed below:
Non-current portion at the beginning of the period 1 12
Current portion at the beginning of the period 28 34
Total liability at the beginning of the period 29 46
Settlement of liability during the period 32.1 (29) (45)
Recognition of current period expense 26.2 21 28
Total liability at the end of the period 21 29
Current portion reflected under trade and other payables 19 (9) (28)
Non-current portion at the end of the period 12 1
The Group’s liability has been hedged as disclosed in note 5.2. The fair value of the liability at the end of the period was determined by way of valuations performed using an actuarial binomial option pricing model. The inputs into the valuation model are as follows:
weighted average hPSS option exercise price (R) 61.34 48.98
Expected life of hPSS options (years) 1 – 4 1 – 5
Company share price at the end of the period (R) 89.52 68.33
Expected share price volatility* (%) 31.7 35.1
Expected dividend yield (%) 2.8 3.0 – 3.4
Risk-free interest rate** (%) 5.5 – 5.9 5.7 – 7.5
* The expected share price volatility is based on historical information over a period of two years.** The risk-free interest rate has been extracted from the yield curve furnished by the financial institutions
from which the cash-settled call options have been acquired.
At the reporting date, the intrinsic value of the Group’s liability, being the difference between the market value of the company’s shares multiplied by the aggregate number of unexercised hPSS options, and the aggregate exercise price of the unexercised hPSS options in respect of which a liability has been recognised, amounted to R14 million (2011: R22 million).
27.7 proposed share-based incentive schemes
R37 million has been set aside for allocation under the proposed new incentive schemes detailed in the Remuneration Report on page 103 of the Integrated Annual Report. At the reporting date, no portion of the amount set aside for allocation under the proposed new incentive schemes has vested and no liability was raised.
NoTES To ThE GRoUP ANNUAL FINANCIAL STATEMENTS
T r u w o r t h s I n t e r n a t i o n a l L i m i t e d A n n u a l F i n a n c i a l S t a t e m e n t s 2 0 1 266
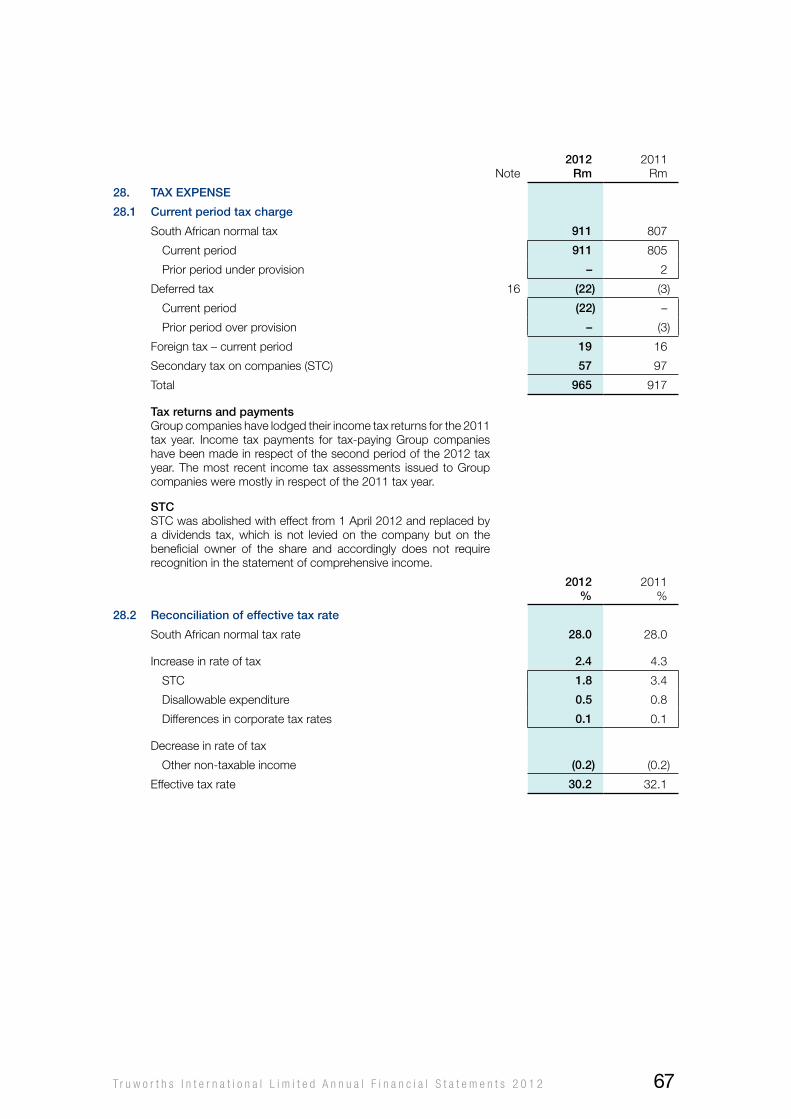
Note2012
rm2011
Rm
28. tax expense
28.1 current period tax charge
South African normal tax 911 807
Current period 911 805
Prior period under provision – 2
Deferred tax 16 (22) (3)
Current period (22) –
Prior period over provision – (3)
Foreign tax – current period 19 16
Secondary tax on companies (STC) 57 97
Total 965 917
tax returns and paymentsGroup companies have lodged their income tax returns for the 2011 tax year. Income tax payments for tax-paying Group companies have been made in respect of the second period of the 2012 tax year. The most recent income tax assessments issued to Group companies were mostly in respect of the 2011 tax year.
stcSTC was abolished with effect from 1 April 2012 and replaced by a dividends tax, which is not levied on the company but on the beneficial owner of the share and accordingly does not require recognition in the statement of comprehensive income.
2012%
2011%
28.2 reconciliation of effective tax rate
South African normal tax rate 28.0 28.0
Increase in rate of tax 2.4 4.3
STC 1.8 3.4
Disallowable expenditure 0.5 0.8
Differences in corporate tax rates 0.1 0.1
Decrease in rate of tax
other non-taxable income (0.2) (0.2)
Effective tax rate 30.2 32.1
T r u w o r t h s I n t e r n a t i o n a l L i m i t e d A n n u a l F i n a n c i a l S t a t e m e n t s 2 0 1 2 67
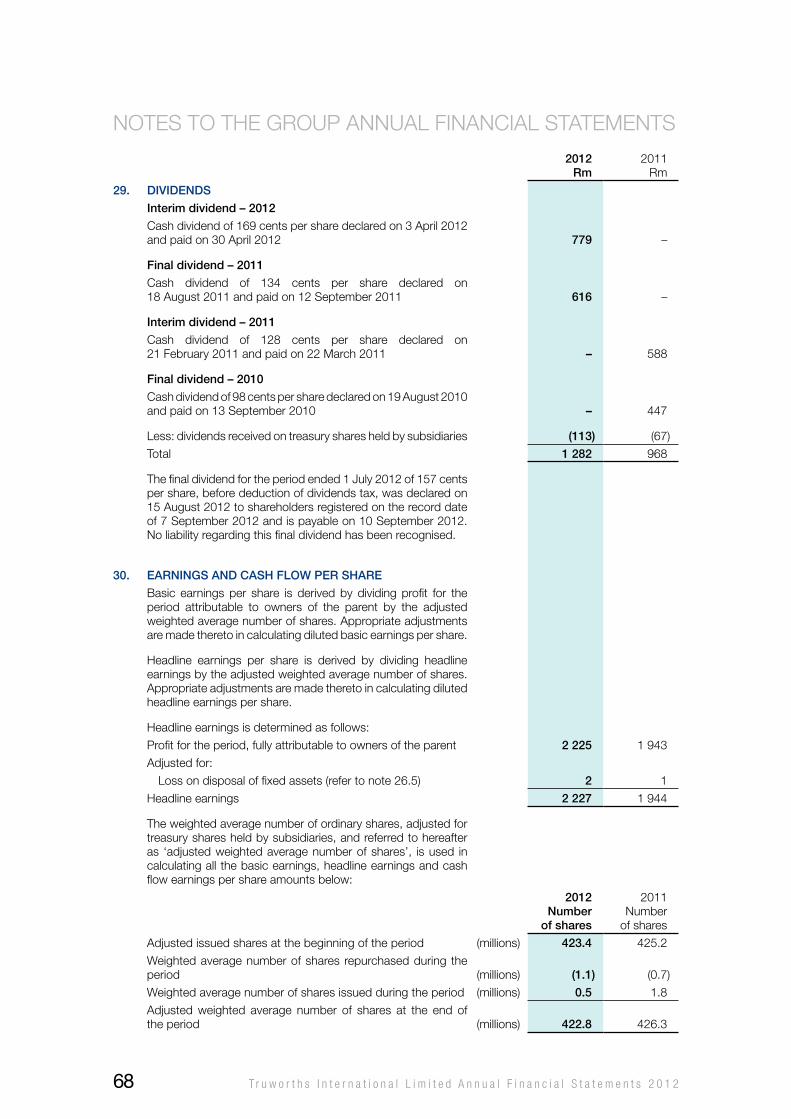
2012rm
2011Rm
29. DiviDenDs
interim dividend – 2012
Cash dividend of 169 cents per share declared on 3 April 2012 and paid on 30 April 2012 779 –
final dividend – 2011
Cash dividend of 134 cents per share declared on 18 August 2011 and paid on 12 September 2011 616 –
interim dividend – 2011
Cash dividend of 128 cents per share declared on 21 February 2011 and paid on 22 March 2011 – 588
final dividend – 2010
Cash dividend of 98 cents per share declared on 19 August 2010 and paid on 13 September 2010 – 447
Less: dividends received on treasury shares held by subsidiaries (113) (67)
Total 1 282 968
The final dividend for the period ended 1 July 2012 of 157 cents per share, before deduction of dividends tax, was declared on 15 August 2012 to shareholders registered on the record date of 7 September 2012 and is payable on 10 September 2012. No liability regarding this final dividend has been recognised.
30. earninGs anD cash flow per share
Basic earnings per share is derived by dividing profit for the period attributable to owners of the parent by the adjusted weighted average number of shares. Appropriate adjustments are made thereto in calculating diluted basic earnings per share.
headline earnings per share is derived by dividing headline earnings by the adjusted weighted average number of shares. Appropriate adjustments are made thereto in calculating diluted headline earnings per share.
headline earnings is determined as follows:
Profit for the period, fully attributable to owners of the parent 2 225 1 943
Adjusted for:
Loss on disposal of fixed assets (refer to note 26.5) 2 1
headline earnings 2 227 1 944
The weighted average number of ordinary shares, adjusted for treasury shares held by subsidiaries, and referred to hereafter as ‘adjusted weighted average number of shares’, is used in calculating all the basic earnings, headline earnings and cash flow earnings per share amounts below:
2012number
of shares
2011Number
of shares
Adjusted issued shares at the beginning of the period (millions) 423.4 425.2
weighted average number of shares repurchased during the period (millions) (1.1) (0.7)
weighted average number of shares issued during the period (millions) 0.5 1.8
Adjusted weighted average number of shares at the end of the period (millions) 422.8 426.3
NoTES To ThE GRoUP ANNUAL FINANCIAL STATEMENTS
T r u w o r t h s I n t e r n a t i o n a l L i m i t e d A n n u a l F i n a n c i a l S t a t e m e n t s 2 0 1 268
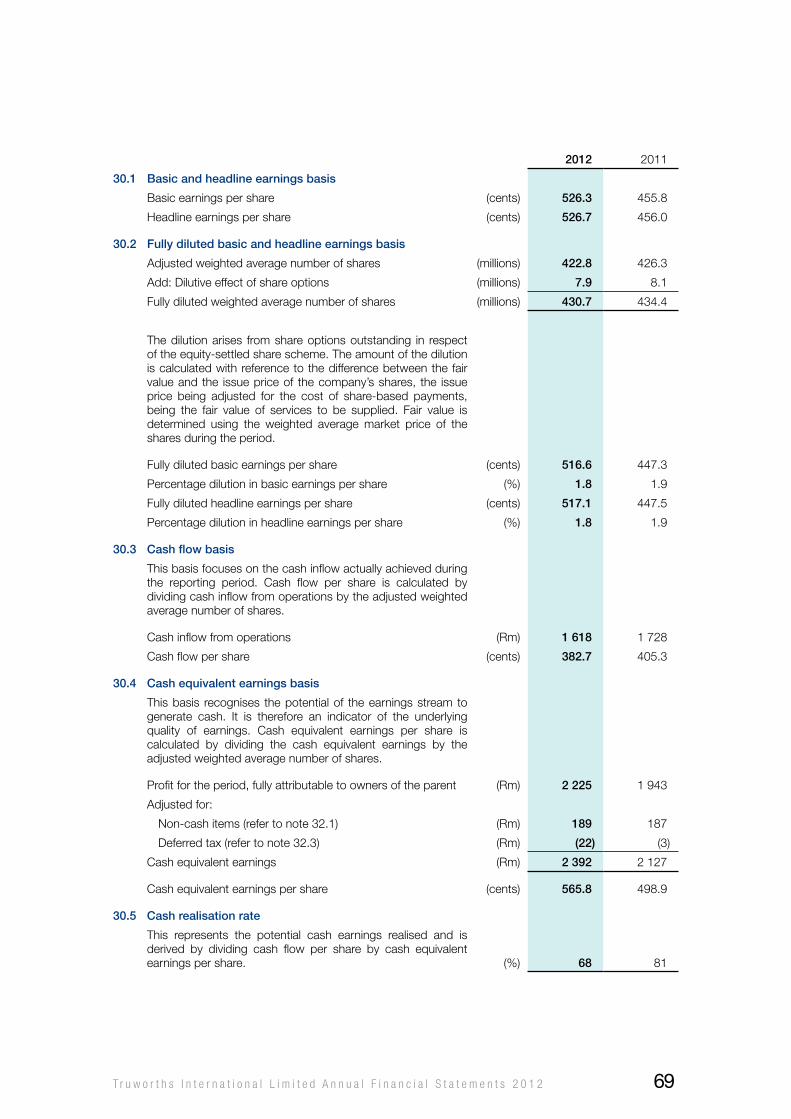
2012 2011
30.1 basic and headline earnings basis
Basic earnings per share (cents) 526.3 455.8
headline earnings per share (cents) 526.7 456.0
30.2 fully diluted basic and headline earnings basis
Adjusted weighted average number of shares (millions) 422.8 426.3
Add: Dilutive effect of share options (millions) 7.9 8.1
Fully diluted weighted average number of shares (millions) 430.7 434.4
The dilution arises from share options outstanding in respect of the equity-settled share scheme. The amount of the dilution is calculated with reference to the difference between the fair value and the issue price of the company’s shares, the issue price being adjusted for the cost of share-based payments, being the fair value of services to be supplied. Fair value is determined using the weighted average market price of the shares during the period.
Fully diluted basic earnings per share (cents) 516.6 447.3
Percentage dilution in basic earnings per share (%) 1.8 1.9
Fully diluted headline earnings per share (cents) 517.1 447.5
Percentage dilution in headline earnings per share (%) 1.8 1.9
30.3 cash flow basis
This basis focuses on the cash inflow actually achieved during the reporting period. Cash flow per share is calculated by dividing cash inflow from operations by the adjusted weighted average number of shares.
Cash inflow from operations (Rm) 1 618 1 728
Cash flow per share (cents) 382.7 405.3
30.4 cash equivalent earnings basis
This basis recognises the potential of the earnings stream to generate cash. It is therefore an indicator of the underlying quality of earnings. Cash equivalent earnings per share is calculated by dividing the cash equivalent earnings by the adjusted weighted average number of shares.
Profit for the period, fully attributable to owners of the parent (Rm) 2 225 1 943
Adjusted for:
Non-cash items (refer to note 32.1) (Rm) 189 187
Deferred tax (refer to note 32.3) (Rm) (22) (3)
Cash equivalent earnings (Rm) 2 392 2 127
Cash equivalent earnings per share (cents) 565.8 498.9
30.5 cash realisation rate
This represents the potential cash earnings realised and is derived by dividing cash flow per share by cash equivalent earnings per share. (%) 68 81
T r u w o r t h s I n t e r n a t i o n a l L i m i t e d A n n u a l F i n a n c i a l S t a t e m e n t s 2 0 1 2 69
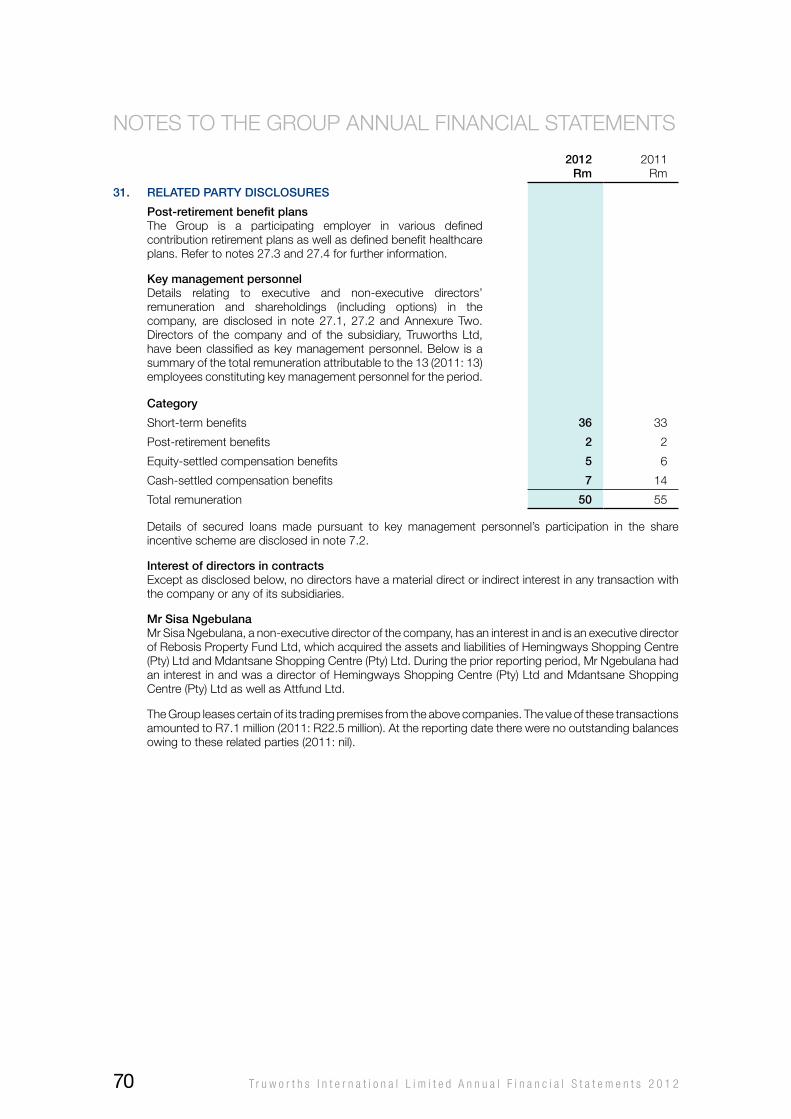
2012rm
2011Rm
31. relateD party Disclosures
post-retirement benefit plansThe Group is a participating employer in various defined contribution retirement plans as well as defined benefit healthcare plans. Refer to notes 27.3 and 27.4 for further information.
Key management personnelDetails relating to executive and non-executive directors’ remuneration and shareholdings (including options) in the company, are disclosed in note 27.1, 27.2 and Annexure Two. Directors of the company and of the subsidiary, Truworths Ltd, have been classified as key management personnel. Below is a summary of the total remuneration attributable to the 13 (2011: 13) employees constituting key management personnel for the period.
category
Short-term benefits 36 33
Post-retirement benefits 2 2
Equity-settled compensation benefits 5 6
Cash-settled compensation benefits 7 14
Total remuneration 50 55
Details of secured loans made pursuant to key management personnel’s participation in the share incentive scheme are disclosed in note 7.2.
interest of directors in contractsExcept as disclosed below, no directors have a material direct or indirect interest in any transaction with the company or any of its subsidiaries.
mr sisa ngebulanaMr Sisa Ngebulana, a non-executive director of the company, has an interest in and is an executive director of Rebosis Property Fund Ltd, which acquired the assets and liabilities of hemingways Shopping Centre (Pty) Ltd and Mdantsane Shopping Centre (Pty) Ltd. During the prior reporting period, Mr Ngebulana had an interest in and was a director of hemingways Shopping Centre (Pty) Ltd and Mdantsane Shopping Centre (Pty) Ltd as well as Attfund Ltd.
The Group leases certain of its trading premises from the above companies. The value of these transactions amounted to R7.1 million (2011: R22.5 million). At the reporting date there were no outstanding balances owing to these related parties (2011: nil).
NoTES To ThE GRoUP ANNUAL FINANCIAL STATEMENTS
T r u w o r t h s I n t e r n a t i o n a l L i m i t e d A n n u a l F i n a n c i a l S t a t e m e n t s 2 0 1 270
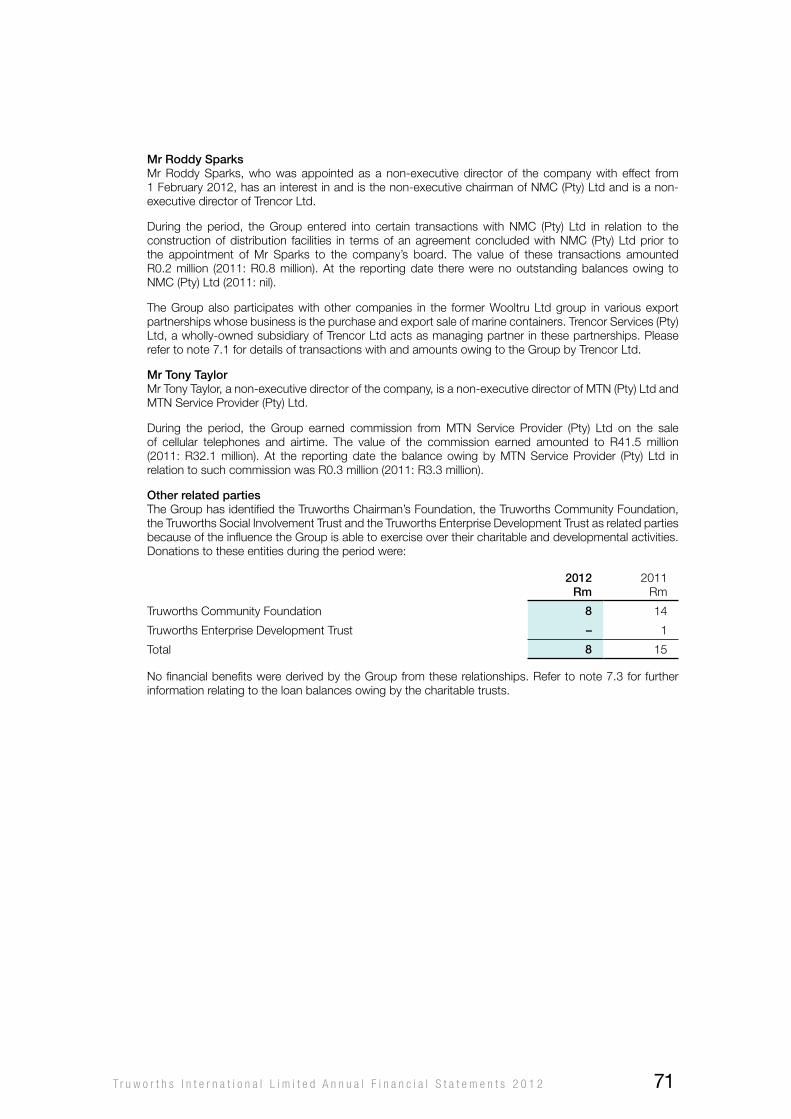
mr roddy sparksMr Roddy Sparks, who was appointed as a non-executive director of the company with effect from 1 February 2012, has an interest in and is the non-executive chairman of NMC (Pty) Ltd and is a non-executive director of Trencor Ltd.
During the period, the Group entered into certain transactions with NMC (Pty) Ltd in relation to the construction of distribution facilities in terms of an agreement concluded with NMC (Pty) Ltd prior to the appointment of Mr Sparks to the company’s board. The value of these transactions amounted R0.2 million (2011: R0.8 million). At the reporting date there were no outstanding balances owing to NMC (Pty) Ltd (2011: nil).
The Group also participates with other companies in the former wooltru Ltd group in various export partnerships whose business is the purchase and export sale of marine containers. Trencor Services (Pty) Ltd, a wholly-owned subsidiary of Trencor Ltd acts as managing partner in these partnerships. Please refer to note 7.1 for details of transactions with and amounts owing to the Group by Trencor Ltd.
mr tony taylorMr Tony Taylor, a non-executive director of the company, is a non-executive director of MTN (Pty) Ltd and MTN Service Provider (Pty) Ltd.
During the period, the Group earned commission from MTN Service Provider (Pty) Ltd on the sale of cellular telephones and airtime. The value of the commission earned amounted to R41.5 million (2011: R32.1 million). At the reporting date the balance owing by MTN Service Provider (Pty) Ltd in relation to such commission was R0.3 million (2011: R3.3 million).
other related partiesThe Group has identified the Truworths Chairman’s Foundation, the Truworths Community Foundation, the Truworths Social Involvement Trust and the Truworths Enterprise Development Trust as related parties because of the influence the Group is able to exercise over their charitable and developmental activities. Donations to these entities during the period were:
2012rm
2011Rm
Truworths Community Foundation 8 14
Truworths Enterprise Development Trust – 1
Total 8 15
No financial benefits were derived by the Group from these relationships. Refer to note 7.3 for further information relating to the loan balances owing by the charitable trusts.
T r u w o r t h s I n t e r n a t i o n a l L i m i t e d A n n u a l F i n a n c i a l S t a t e m e n t s 2 0 1 2 71
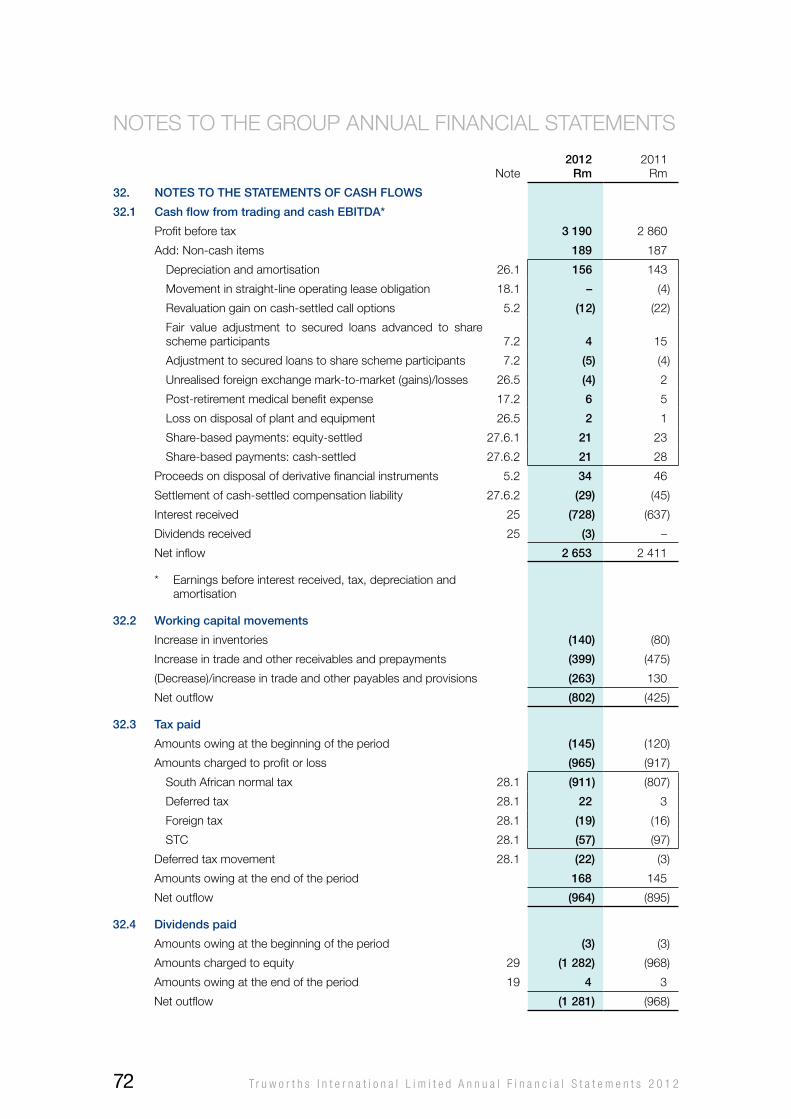
Note2012
rm2011
Rm
32. notes to the statements of cash flows
32.1 cash flow from trading and cash ebitDa*
Profit before tax 3 190 2 860
Add: Non-cash items 189 187
Depreciation and amortisation 26.1 156 143
Movement in straight-line operating lease obligation 18.1 – (4)
Revaluation gain on cash-settled call options 5.2 (12) (22)
Fair value adjustment to secured loans advanced to share scheme participants 7.2 4 15
Adjustment to secured loans to share scheme participants 7.2 (5) (4)
Unrealised foreign exchange mark-to-market (gains)/losses 26.5 (4) 2
Post-retirement medical benefit expense 17.2 6 5
Loss on disposal of plant and equipment 26.5 2 1
Share-based payments: equity-settled 27.6.1 21 23
Share-based payments: cash-settled 27.6.2 21 28
Proceeds on disposal of derivative financial instruments 5.2 34 46
Settlement of cash-settled compensation liability 27.6.2 (29) (45)
Interest received 25 (728) (637)
Dividends received 25 (3) –
Net inflow 2 653 2 411
* Earnings before interest received, tax, depreciation and amortisation
32.2 working capital movements
Increase in inventories (140) (80)
Increase in trade and other receivables and prepayments (399) (475)
(Decrease)/increase in trade and other payables and provisions (263) 130
Net outflow (802) (425)
32.3 tax paid
Amounts owing at the beginning of the period (145) (120)
Amounts charged to profit or loss (965) (917)
South African normal tax 28.1 (911) (807)
Deferred tax 28.1 22 3
Foreign tax 28.1 (19) (16)
STC 28.1 (57) (97)
Deferred tax movement 28.1 (22) (3)
Amounts owing at the end of the period 168 145
Net outflow (964) (895)
32.4 Dividends paid
Amounts owing at the beginning of the period (3) (3)
Amounts charged to equity 29 (1 282) (968)
Amounts owing at the end of the period 19 4 3
Net outflow (1 281) (968)
NoTES To ThE GRoUP ANNUAL FINANCIAL STATEMENTS
T r u w o r t h s I n t e r n a t i o n a l L i m i t e d A n n u a l F i n a n c i a l S t a t e m e n t s 2 0 1 272
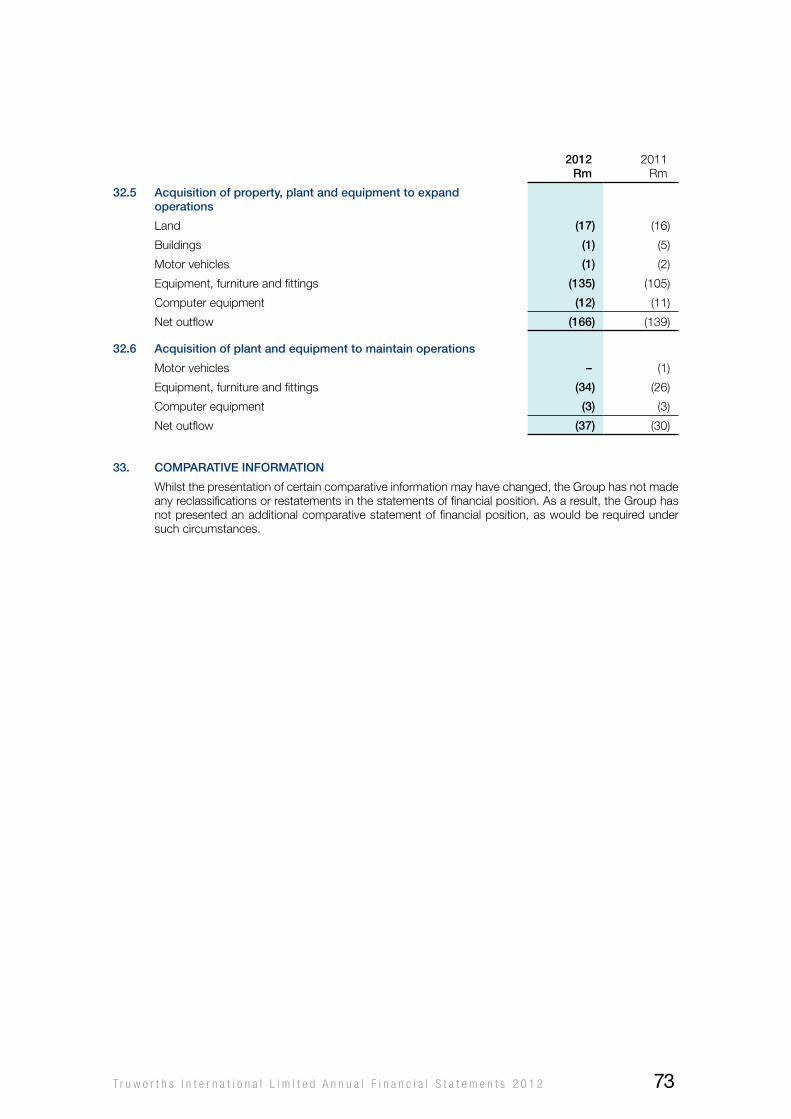
2012rm
2011Rm
32.5 acquisition of property, plant and equipment to expand operations
Land (17) (16)
Buildings (1) (5)
Motor vehicles (1) (2)
Equipment, furniture and fittings (135) (105)
Computer equipment (12) (11)
Net outflow (166) (139)
32.6 acquisition of plant and equipment to maintain operations
Motor vehicles – (1)
Equipment, furniture and fittings (34) (26)
Computer equipment (3) (3)
Net outflow (37) (30)
33. comparative information
whilst the presentation of certain comparative information may have changed, the Group has not made any reclassifications or restatements in the statements of financial position. As a result, the Group has not presented an additional comparative statement of financial position, as would be required under such circumstances.
T r u w o r t h s I n t e r n a t i o n a l L i m i t e d A n n u a l F i n a n c i a l S t a t e m e n t s 2 0 1 2 73
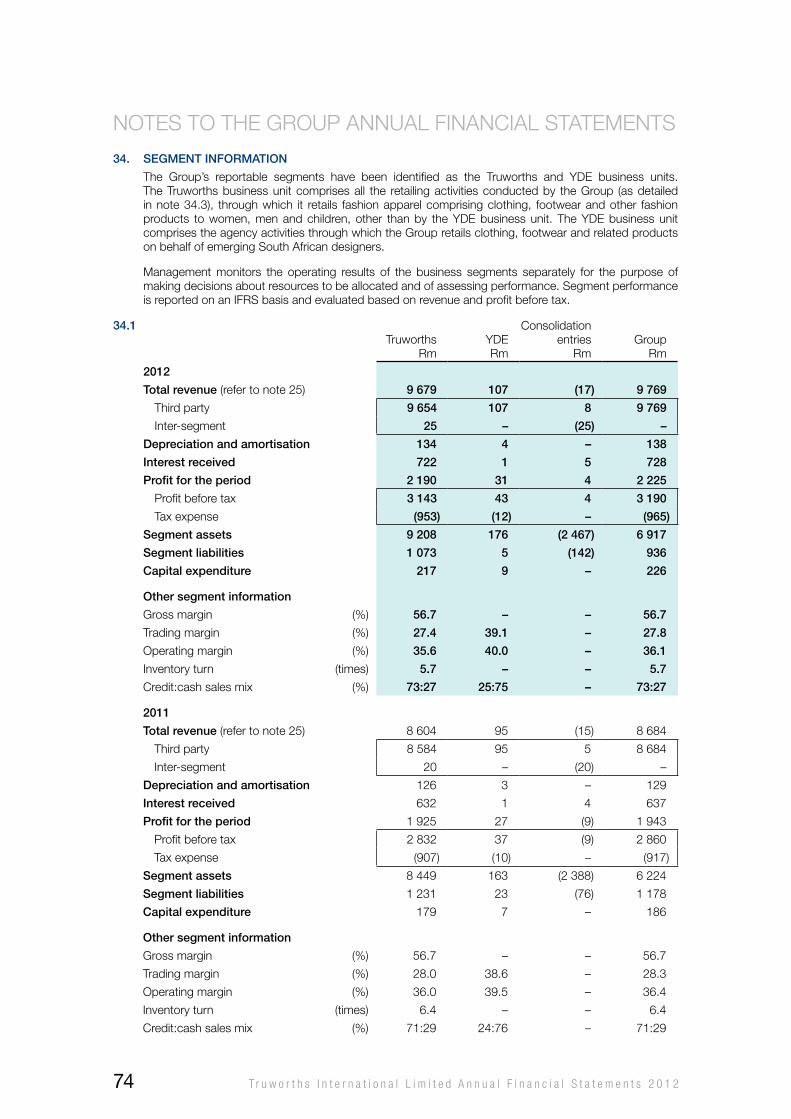
34. seGment information
The Group’s reportable segments have been identified as the Truworths and yDE business units. The Truworths business unit comprises all the retailing activities conducted by the Group (as detailed in note 34.3), through which it retails fashion apparel comprising clothing, footwear and other fashion products to women, men and children, other than by the yDE business unit. The yDE business unit comprises the agency activities through which the Group retails clothing, footwear and related products on behalf of emerging South African designers.
Management monitors the operating results of the business segments separately for the purpose of making decisions about resources to be allocated and of assessing performance. Segment performance is reported on an IFRS basis and evaluated based on revenue and profit before tax.
34.1Truworths
RmyDERm
Consolidation entries
RmGroup
Rm
2012
total revenue (refer to note 25) 9 679 107 (17) 9 769
Third party 9 654 107 8 9 769
Inter-segment 25 – (25) –
Depreciation and amortisation 134 4 – 138
interest received 722 1 5 728
profit for the period 2 190 31 4 2 225
Profit before tax 3 143 43 4 3 190
Tax expense (953) (12) – (965)
segment assets 9 208 176 (2 467) 6 917
segment liabilities 1 073 5 (142) 936
capital expenditure 217 9 – 226
other segment information
Gross margin (%) 56.7 – – 56.7
Trading margin (%) 27.4 39.1 – 27.8
operating margin (%) 35.6 40.0 – 36.1
Inventory turn (times) 5.7 – – 5.7
Credit:cash sales mix (%) 73:27 25:75 – 73:27
2011
total revenue (refer to note 25) 8 604 95 (15) 8 684
Third party 8 584 95 5 8 684
Inter-segment 20 – (20) –
Depreciation and amortisation 126 3 – 129
interest received 632 1 4 637
profit for the period 1 925 27 (9) 1 943
Profit before tax 2 832 37 (9) 2 860
Tax expense (907) (10) – (917)
segment assets 8 449 163 (2 388) 6 224
segment liabilities 1 231 23 (76) 1 178
capital expenditure 179 7 – 186
other segment information
Gross margin (%) 56.7 – – 56.7
Trading margin (%) 28.0 38.6 – 28.3
operating margin (%) 36.0 39.5 – 36.4
Inventory turn (times) 6.4 – – 6.4
Credit:cash sales mix (%) 71:29 24:76 – 71:29
NoTES To ThE GRoUP ANNUAL FINANCIAL STATEMENTS
T r u w o r t h s I n t e r n a t i o n a l L i m i t e d A n n u a l F i n a n c i a l S t a t e m e n t s 2 0 1 274
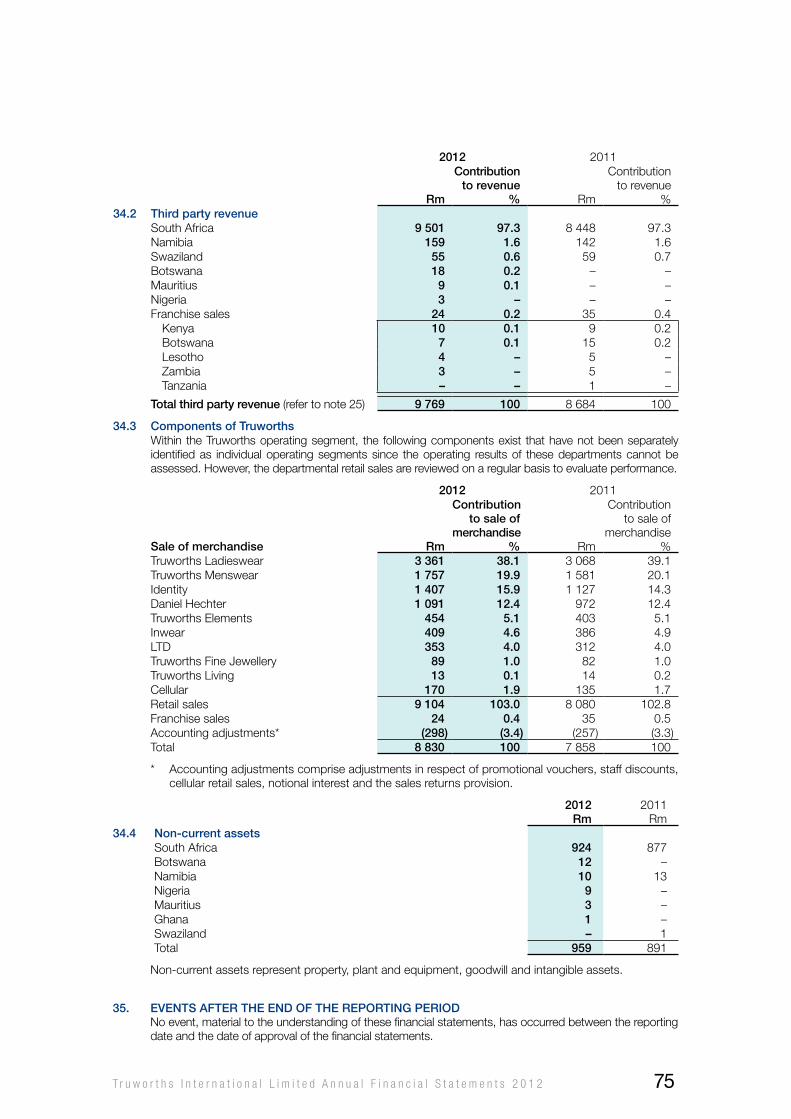
2012 2011
rm
contribution to revenue
% Rm
Contribution to revenue
%34.2 third party revenue
South Africa 9 501 97.3 8 448 97.3 Namibia 159 1.6 142 1.6 Swaziland 55 0.6 59 0.7 Botswana 18 0.2 – – Mauritius 9 0.1 – – Nigeria 3 – – – Franchise sales 24 0.2 35 0.4
Kenya 10 0.1 9 0.2 Botswana 7 0.1 15 0.2 Lesotho 4 – 5 – Zambia 3 – 5 – Tanzania – – 1 –
total third party revenue (refer to note 25) 9 769 100 8 684 100
34.3 components of truworthswithin the Truworths operating segment, the following components exist that have not been separately identified as individual operating segments since the operating results of these departments cannot be assessed. however, the departmental retail sales are reviewed on a regular basis to evaluate performance.
2012 2011
sale of merchandise rm
contribution to sale of
merchandise% Rm
Contribution to sale of
merchandise%
Truworths Ladieswear 3 361 38.1 3 068 39.1 Truworths Menswear 1 757 19.9 1 581 20.1 Identity 1 407 15.9 1 127 14.3 Daniel hechter 1 091 12.4 972 12.4 Truworths Elements 454 5.1 403 5.1 Inwear 409 4.6 386 4.9 LTD 353 4.0 312 4.0 Truworths Fine Jewellery 89 1.0 82 1.0 Truworths Living 13 0.1 14 0.2 Cellular 170 1.9 135 1.7 Retail sales 9 104 103.0 8 080 102.8 Franchise sales 24 0.4 35 0.5 Accounting adjustments* (298) (3.4) (257) (3.3)Total 8 830 100 7 858 100
* Accounting adjustments comprise adjustments in respect of promotional vouchers, staff discounts, cellular retail sales, notional interest and the sales returns provision.
2012rm
2011Rm
34.4 non-current assetsSouth Africa 924 877 Botswana 12 – Namibia 10 13 Nigeria 9 – Mauritius 3 – Ghana 1 – Swaziland – 1 Total 959 891
Non-current assets represent property, plant and equipment, goodwill and intangible assets.
35. events after the enD of the reportinG perioDNo event, material to the understanding of these financial statements, has occurred between the reporting date and the date of approval of the financial statements.
T r u w o r t h s I n t e r n a t i o n a l L i m i t e d A n n u a l F i n a n c i a l S t a t e m e n t s 2 0 1 2 75
CoMPANy ANNUAL FINANCIAL STATEMENTS CoNTENTS
company statements of financial position 77
company statements of comprehensive income 77
company statements of changes in equity 78
company statements of cash flows 79
notes to the company annual financial statements
1 Principal accounting policies – refer to note 1 to the Group annual financial statements 17
2 Available-for-sale assets 80
3 Loans and receivables 80
4 Cash and cash equivalents 80
5 Share capital 81
6 Share premium 81
7 Non-distributable reserves 81
8 Deferred tax 82
9 Trade and other payables 82
10 Financial risk management 82
11 Revenue 86
12 Trading profit 86
13 Tax expense 86
14 Dividends 87
15 Notes to the statements of cash flows 87
16 Related party disclosures 88
17 Comparative information 88
18 Events after the end of the reporting period 88
T r u w o r t h s I n t e r n a t i o n a l L i m i t e d A n n u a l F i n a n c i a l S t a t e m e n t s 2 0 1 276
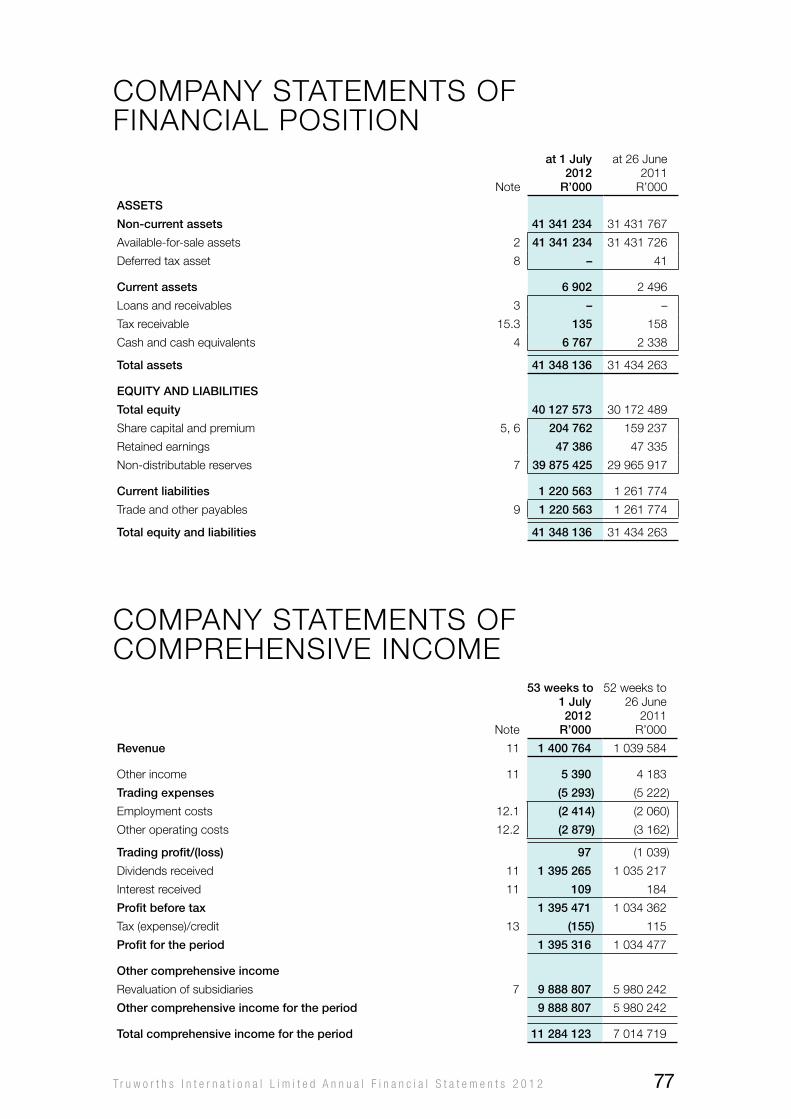
Note
at 1 July 2012
r’000
at 26 June 2011
R’000
assets
non-current assets 41 341 234 31 431 767
Available-for-sale assets 2 41 341 234 31 431 726
Deferred tax asset 8 – 41
current assets 6 902 2 496
Loans and receivables 3 – –
Tax receivable 15.3 135 158
Cash and cash equivalents 4 6 767 2 338
total assets 41 348 136 31 434 263
equity anD liabilities
total equity 40 127 573 30 172 489
Share capital and premium 5, 6 204 762 159 237
Retained earnings 47 386 47 335
Non-distributable reserves 7 39 875 425 29 965 917
current liabilities 1 220 563 1 261 774
Trade and other payables 9 1 220 563 1 261 774
total equity and liabilities 41 348 136 31 434 263
CoMPANy STATEMENTS oF FINANCIAL PoSITIoN
Note
53 weeks to 1 July
2012r’000
52 weeks to 26 June
2011R’000
revenue 11 1 400 764 1 039 584
other income 11 5 390 4 183
trading expenses (5 293) (5 222)
Employment costs 12.1 (2 414) (2 060)
other operating costs 12.2 (2 879) (3 162)
trading profit/(loss) 97 (1 039)
Dividends received 11 1 395 265 1 035 217
Interest received 11 109 184
profit before tax 1 395 471 1 034 362
Tax (expense)/credit 13 (155) 115
profit for the period 1 395 316 1 034 477
other comprehensive income
Revaluation of subsidiaries 7 9 888 807 5 980 242
other comprehensive income for the period 9 888 807 5 980 242
total comprehensive income for the period 11 284 123 7 014 719
CoMPANy STATEMENTS oF CoMPREhENSIvE INCoME
T r u w o r t h s I n t e r n a t i o n a l L i m i t e d A n n u a l F i n a n c i a l S t a t e m e n t s 2 0 1 2 77
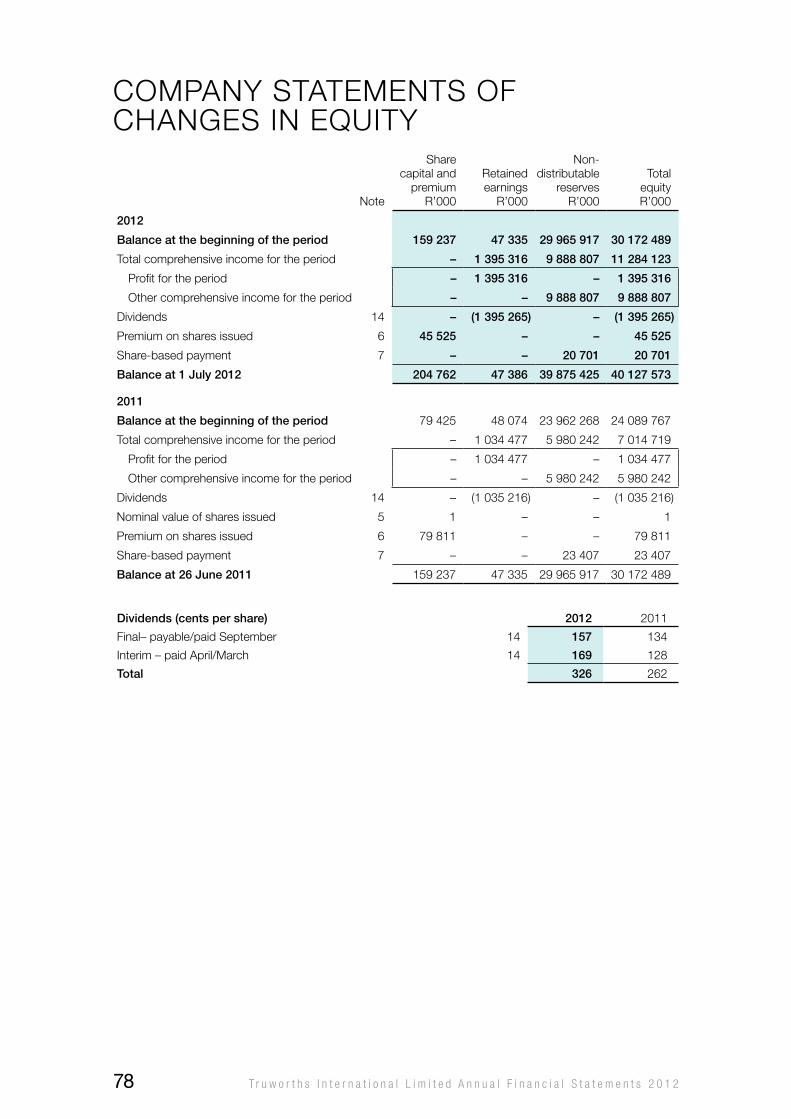
Note
Share capital and
premiumR’000
Retained earnings
R’000
Non-distributable
reservesR’000
Total equity R’000
2012
balance at the beginning of the period 159 237 47 335 29 965 917 30 172 489
Total comprehensive income for the period – 1 395 316 9 888 807 11 284 123
Profit for the period – 1 395 316 – 1 395 316
other comprehensive income for the period – – 9 888 807 9 888 807
Dividends 14 – (1 395 265) – (1 395 265)
Premium on shares issued 6 45 525 – – 45 525
Share-based payment 7 – – 20 701 20 701
balance at 1 July 2012 204 762 47 386 39 875 425 40 127 573
2011
balance at the beginning of the period 79 425 48 074 23 962 268 24 089 767
Total comprehensive income for the period – 1 034 477 5 980 242 7 014 719
Profit for the period – 1 034 477 – 1 034 477
other comprehensive income for the period – – 5 980 242 5 980 242
Dividends 14 – (1 035 216) – (1 035 216)
Nominal value of shares issued 5 1 – – 1
Premium on shares issued 6 79 811 – – 79 811
Share-based payment 7 – – 23 407 23 407
balance at 26 June 2011 159 237 47 335 29 965 917 30 172 489
Dividends (cents per share) 2012 2011
Final– payable/paid September 14 157 134
Interim – paid April/March 14 169 128
total 326 262
CoMPANy STATEMENTS oF ChANGES IN EQUITy
T r u w o r t h s I n t e r n a t i o n a l L i m i t e d A n n u a l F i n a n c i a l S t a t e m e n t s 2 0 1 278
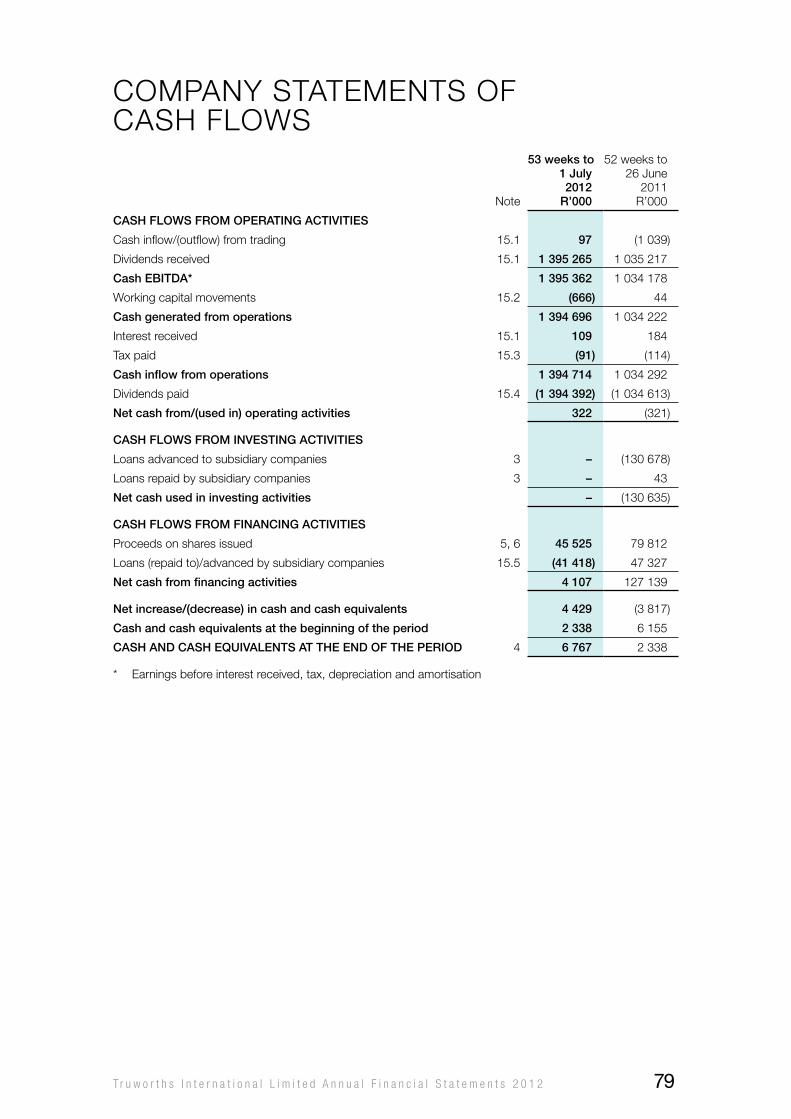
Note
53 weeks to 1 July 2012
r’000
52 weeks to 26 June
2011R’000
cash flows from operatinG activities
Cash inflow/(outflow) from trading 15.1 97 (1 039)
Dividends received 15.1 1 395 265 1 035 217
cash ebitDa* 1 395 362 1 034 178
working capital movements 15.2 (666) 44
cash generated from operations 1 394 696 1 034 222
Interest received 15.1 109 184
Tax paid 15.3 (91) (114)
cash inflow from operations 1 394 714 1 034 292
Dividends paid 15.4 (1 394 392) (1 034 613)
net cash from/(used in) operating activities 322 (321)
cash flows from investinG activities
Loans advanced to subsidiary companies 3 – (130 678)
Loans repaid by subsidiary companies 3 – 43
net cash used in investing activities – (130 635)
cash flows from financinG activities
Proceeds on shares issued 5, 6 45 525 79 812
Loans (repaid to)/advanced by subsidiary companies 15.5 (41 418) 47 327
net cash from financing activities 4 107 127 139
net increase/(decrease) in cash and cash equivalents 4 429 (3 817)
cash and cash equivalents at the beginning of the period 2 338 6 155
cash anD cash equivalents at the enD of the perioD 4 6 767 2 338
* Earnings before interest received, tax, depreciation and amortisation
CoMPANy STATEMENTS oF CASh FLowS
T r u w o r t h s I n t e r n a t i o n a l L i m i t e d A n n u a l F i n a n c i a l S t a t e m e n t s 2 0 1 2 79
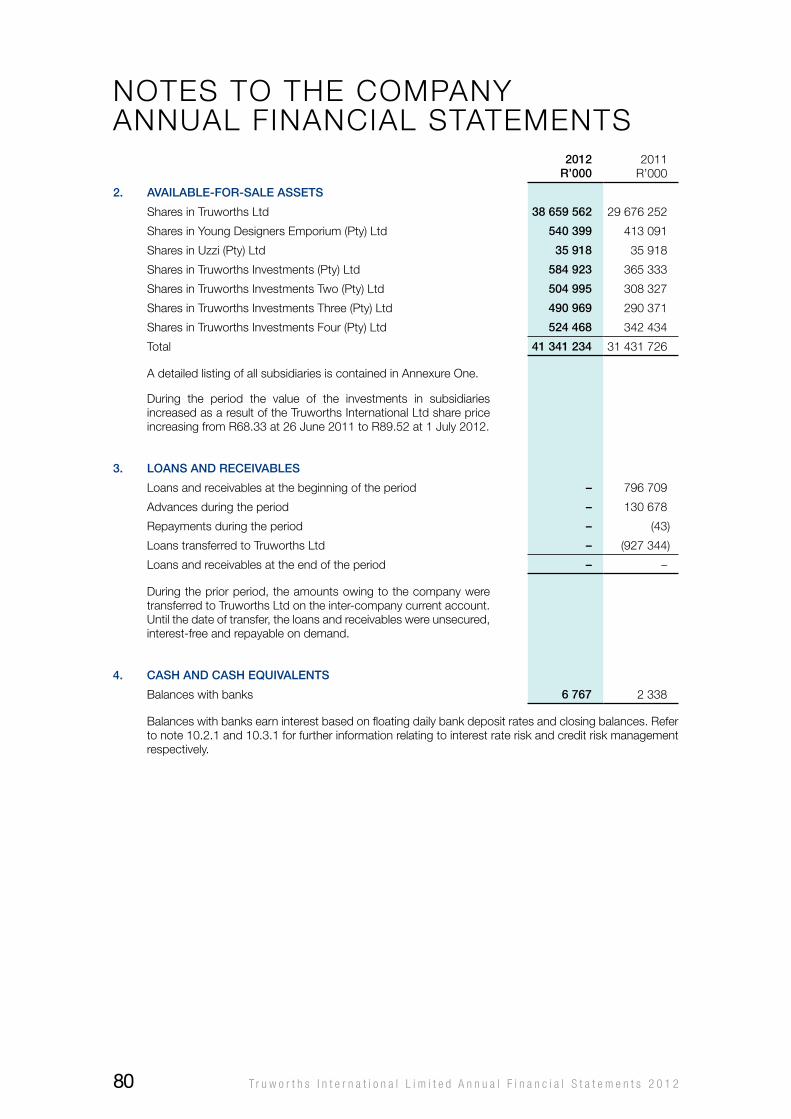
2012r’000
2011R’000
2. available-for-sale assets
Shares in Truworths Ltd 38 659 562 29 676 252
Shares in young Designers Emporium (Pty) Ltd 540 399 413 091
Shares in Uzzi (Pty) Ltd 35 918 35 918
Shares in Truworths Investments (Pty) Ltd 584 923 365 333
Shares in Truworths Investments Two (Pty) Ltd 504 995 308 327
Shares in Truworths Investments Three (Pty) Ltd 490 969 290 371
Shares in Truworths Investments Four (Pty) Ltd 524 468 342 434
Total 41 341 234 31 431 726
A detailed listing of all subsidiaries is contained in Annexure one.
During the period the value of the investments in subsidiaries increased as a result of the Truworths International Ltd share price increasing from R68.33 at 26 June 2011 to R89.52 at 1 July 2012.
3. loans anD receivables
Loans and receivables at the beginning of the period – 796 709
Advances during the period – 130 678
Repayments during the period – (43)
Loans transferred to Truworths Ltd – (927 344)
Loans and receivables at the end of the period – –
During the prior period, the amounts owing to the company were transferred to Truworths Ltd on the inter-company current account. Until the date of transfer, the loans and receivables were unsecured, interest-free and repayable on demand.
4. cash anD cash equivalents
Balances with banks 6 767 2 338
Balances with banks earn interest based on floating daily bank deposit rates and closing balances. Refer to note 10.2.1 and 10.3.1 for further information relating to interest rate risk and credit risk management respectively.
NoTES To ThE CoMPANy ANNUAL FINANCIAL STATEMENTS
T r u w o r t h s I n t e r n a t i o n a l L i m i t e d A n n u a l F i n a n c i a l S t a t e m e n t s 2 0 1 280
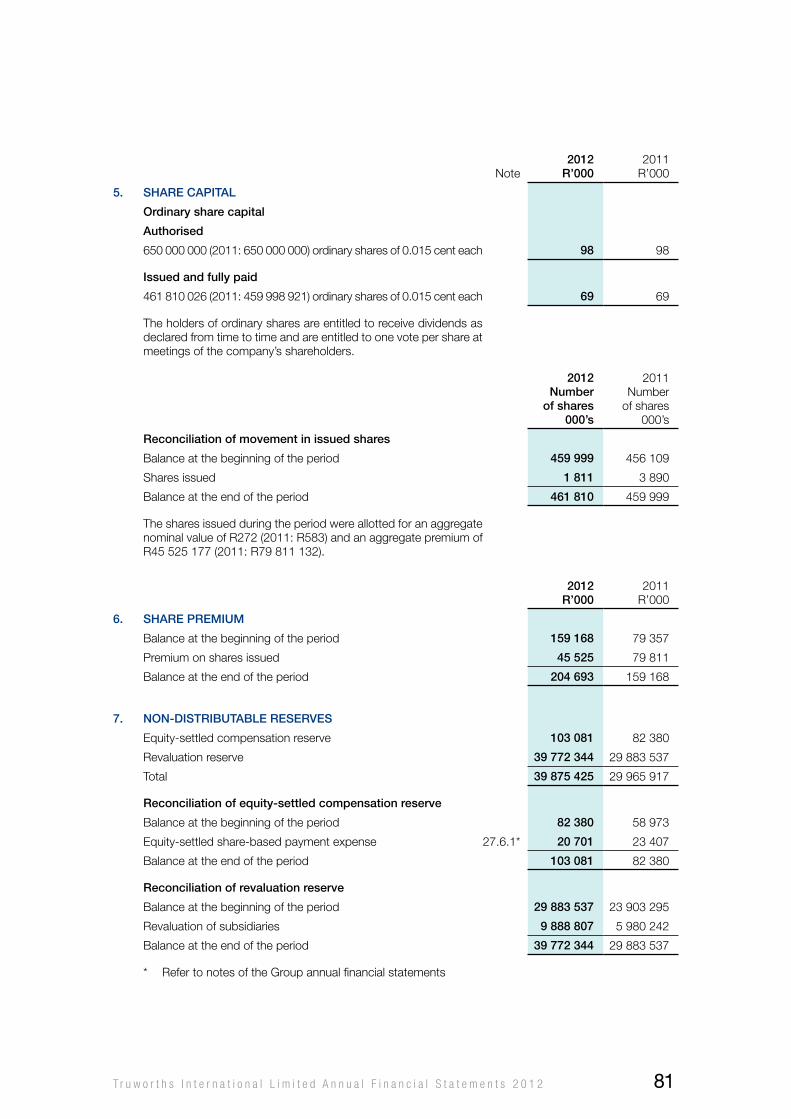
Note2012
r’0002011
R’000
5. share capital
ordinary share capital
authorised
650 000 000 (2011: 650 000 000) ordinary shares of 0.015 cent each 98 98
issued and fully paid
461 810 026 (2011: 459 998 921) ordinary shares of 0.015 cent each 69 69
The holders of ordinary shares are entitled to receive dividends as declared from time to time and are entitled to one vote per share at meetings of the company’s shareholders.
2012number
of shares000’s
2011Number
of shares000’s
reconciliation of movement in issued shares
Balance at the beginning of the period 459 999 456 109
Shares issued 1 811 3 890
Balance at the end of the period 461 810 459 999
The shares issued during the period were allotted for an aggregate nominal value of R272 (2011: R583) and an aggregate premium of R45 525 177 (2011: R79 811 132).
2012r’000
2011R’000
6. share premium
Balance at the beginning of the period 159 168 79 357
Premium on shares issued 45 525 79 811
Balance at the end of the period 204 693 159 168
7. non-Distributable reserves
Equity-settled compensation reserve 103 081 82 380
Revaluation reserve 39 772 344 29 883 537
Total 39 875 425 29 965 917
reconciliation of equity-settled compensation reserve
Balance at the beginning of the period 82 380 58 973
Equity-settled share-based payment expense 27.6.1* 20 701 23 407
Balance at the end of the period 103 081 82 380
reconciliation of revaluation reserve
Balance at the beginning of the period 29 883 537 23 903 295
Revaluation of subsidiaries 9 888 807 5 980 242
Balance at the end of the period 39 772 344 29 883 537
* Refer to notes of the Group annual financial statements
T r u w o r t h s I n t e r n a t i o n a l L i m i t e d A n n u a l F i n a n c i a l S t a t e m e n t s 2 0 1 2 81
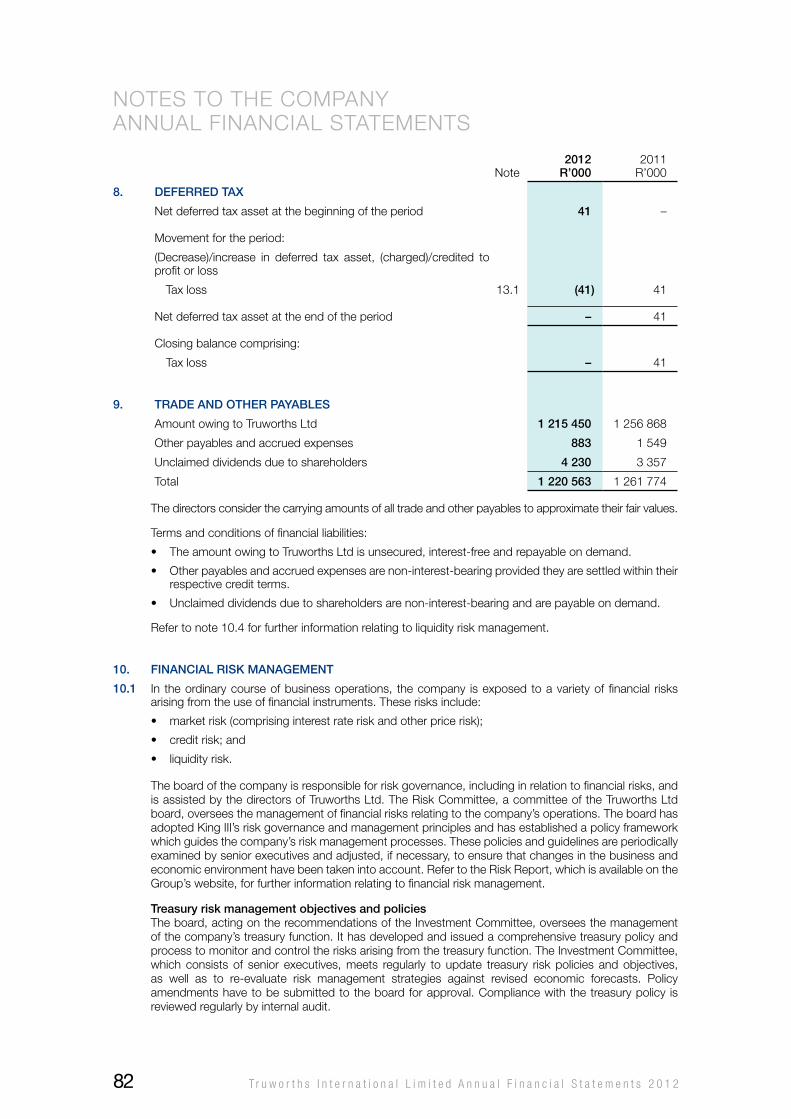
Note2012
r’0002011
R’000
8. DeferreD tax
Net deferred tax asset at the beginning of the period 41 –
Movement for the period:
(Decrease)/increase in deferred tax asset, (charged)/credited to profit or loss
Tax loss 13.1 (41) 41
Net deferred tax asset at the end of the period – 41
Closing balance comprising:
Tax loss – 41
9. traDe anD other payables
Amount owing to Truworths Ltd 1 215 450 1 256 868
other payables and accrued expenses 883 1 549
Unclaimed dividends due to shareholders 4 230 3 357
Total 1 220 563 1 261 774
The directors consider the carrying amounts of all trade and other payables to approximate their fair values.
Terms and conditions of financial liabilities:
• TheamountowingtoTruworthsLtdisunsecured,interest-freeandrepayableondemand.
• Otherpayablesandaccruedexpensesarenon-interest-bearingprovidedtheyaresettledwithintheirrespective credit terms.
• Unclaimeddividendsduetoshareholdersarenon-interest-bearingandarepayableondemand.
Refer to note 10.4 for further information relating to liquidity risk management.
10. financial risK manaGement
10.1 In the ordinary course of business operations, the company is exposed to a variety of financial risks arising from the use of financial instruments. These risks include:
• marketrisk(comprisinginterestrateriskandotherpricerisk);
• creditrisk;and
• liquidityrisk.
The board of the company is responsible for risk governance, including in relation to financial risks, and is assisted by the directors of Truworths Ltd. The Risk Committee, a committee of the Truworths Ltd board, oversees the management of financial risks relating to the company’s operations. The board has adoptedKingIII’sriskgovernanceandmanagementprinciplesandhasestablishedapolicyframeworkwhich guides the company’s risk management processes. These policies and guidelines are periodically examined by senior executives and adjusted, if necessary, to ensure that changes in the business and economic environment have been taken into account. Refer to the Risk Report, which is available on the Group’s website, for further information relating to financial risk management.
treasury risk management objectives and policiesThe board, acting on the recommendations of the Investment Committee, oversees the management of the company’s treasury function. It has developed and issued a comprehensive treasury policy and process to monitor and control the risks arising from the treasury function. The Investment Committee, which consists of senior executives, meets regularly to update treasury risk policies and objectives, as well as to re-evaluate risk management strategies against revised economic forecasts. Policy amendments have to be submitted to the board for approval. Compliance with the treasury policy is reviewed regularly by internal audit.
NoTES To ThE CoMPANy ANNUAL FINANCIAL STATEMENTS
T r u w o r t h s I n t e r n a t i o n a l L i m i t e d A n n u a l F i n a n c i a l S t a t e m e n t s 2 0 1 282
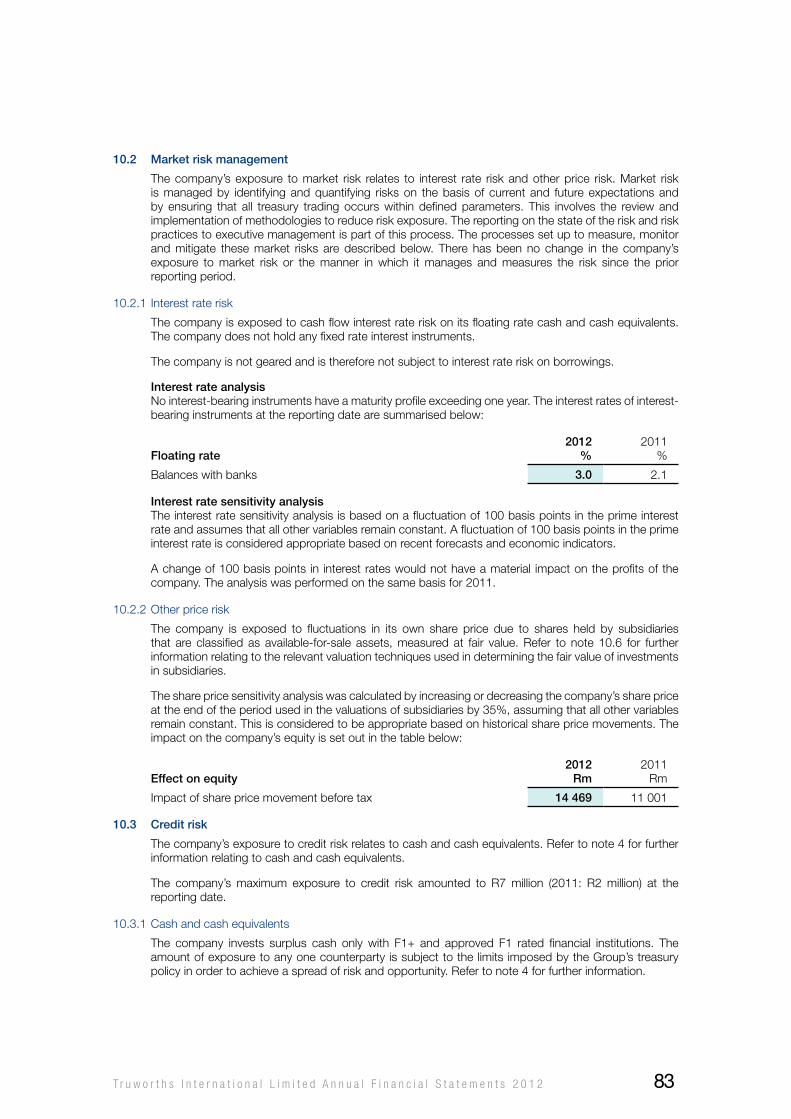
10.2 market risk management
The company’s exposure to market risk relates to interest rate risk and other price risk. Market risk is managed by identifying and quantifying risks on the basis of current and future expectations and by ensuring that all treasury trading occurs within defined parameters. This involves the review and implementation of methodologies to reduce risk exposure. The reporting on the state of the risk and risk practices to executive management is part of this process. The processes set up to measure, monitor and mitigate these market risks are described below. There has been no change in the company’s exposure to market risk or the manner in which it manages and measures the risk since the prior reporting period.
10.2.1 Interest rate risk
The company is exposed to cash flow interest rate risk on its floating rate cash and cash equivalents. The company does not hold any fixed rate interest instruments.
The company is not geared and is therefore not subject to interest rate risk on borrowings.
interest rate analysisNo interest-bearing instruments have a maturity profile exceeding one year. The interest rates of interest-bearing instruments at the reporting date are summarised below:
floating rate2012
%2011
%
Balances with banks 3.0 2.1
interest rate sensitivity analysisThe interest rate sensitivity analysis is based on a fluctuation of 100 basis points in the prime interest rate and assumes that all other variables remain constant. A fluctuation of 100 basis points in the prime interest rate is considered appropriate based on recent forecasts and economic indicators.
A change of 100 basis points in interest rates would not have a material impact on the profits of the company. The analysis was performed on the same basis for 2011.
10.2.2 other price risk
The company is exposed to fluctuations in its own share price due to shares held by subsidiaries that are classified as available-for-sale assets, measured at fair value. Refer to note 10.6 for further information relating to the relevant valuation techniques used in determining the fair value of investments in subsidiaries.
The share price sensitivity analysis was calculated by increasing or decreasing the company’s share price at the end of the period used in the valuations of subsidiaries by 35%, assuming that all other variables remain constant. This is considered to be appropriate based on historical share price movements. The impact on the company’s equity is set out in the table below:
effect on equity2012
rm2011
Rm
Impact of share price movement before tax 14 469 11 001
10.3 credit risk
The company’s exposure to credit risk relates to cash and cash equivalents. Refer to note 4 for further information relating to cash and cash equivalents.
The company’s maximum exposure to credit risk amounted to R7 million (2011: R2 million) at the reporting date.
10.3.1 Cash and cash equivalents
The company invests surplus cash only with F1+ and approved F1 rated financial institutions. The amount of exposure to any one counterparty is subject to the limits imposed by the Group’s treasury policy in order to achieve a spread of risk and opportunity. Refer to note 4 for further information.
T r u w o r t h s I n t e r n a t i o n a l L i m i t e d A n n u a l F i n a n c i a l S t a t e m e n t s 2 0 1 2 83
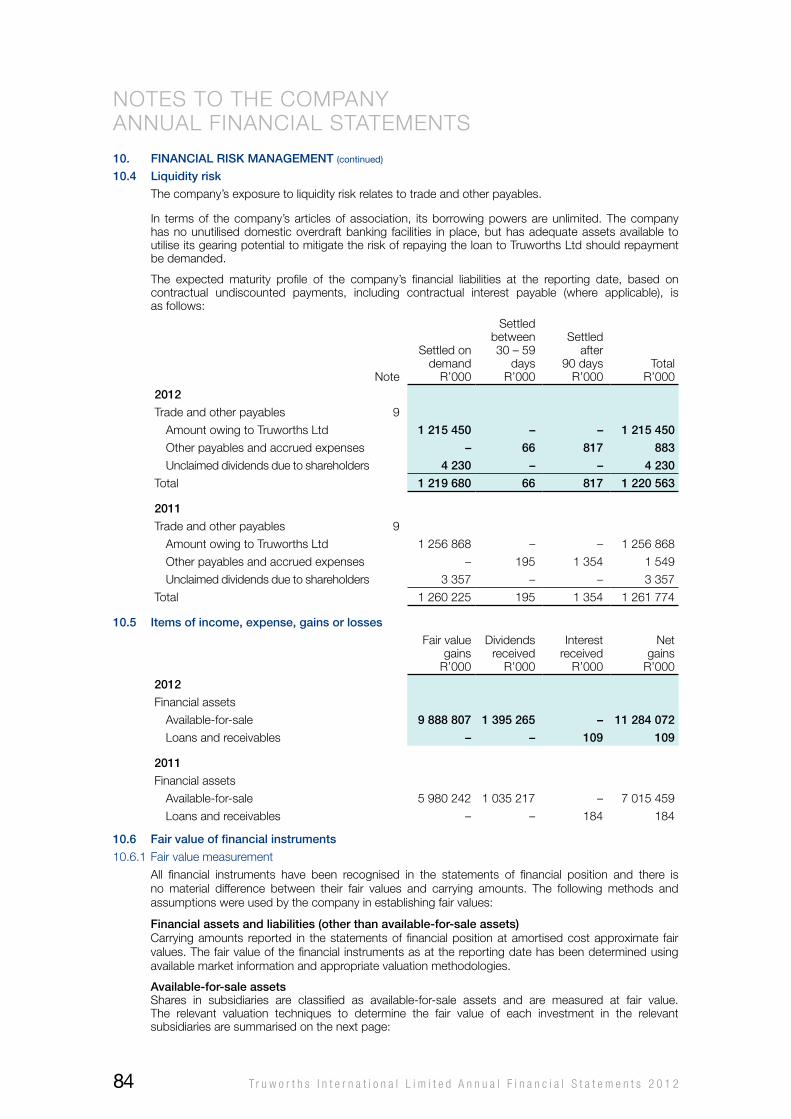
10. financial risK manaGement (continued)
10.4 liquidity risk
The company’s exposure to liquidity risk relates to trade and other payables.
In terms of the company’s articles of association, its borrowing powers are unlimited. The company has no unutilised domestic overdraft banking facilities in place, but has adequate assets available to utilise its gearing potential to mitigate the risk of repaying the loan to Truworths Ltd should repayment be demanded.
The expected maturity profile of the company’s financial liabilities at the reporting date, based on contractual undiscounted payments, including contractual interest payable (where applicable), is as follows:
Note
Settled on demand
R’000
Settled between
30 – 59 days
R’000
Settled after
90 daysR’000
TotalR’000
2012
Trade and other payables 9
Amount owing to Truworths Ltd 1 215 450 – – 1 215 450
other payables and accrued expenses – 66 817 883
Unclaimed dividends due to shareholders 4 230 – – 4 230
Total 1 219 680 66 817 1 220 563
2011
Trade and other payables 9
Amount owing to Truworths Ltd 1 256 868 – – 1 256 868
other payables and accrued expenses – 195 1 354 1 549
Unclaimed dividends due to shareholders 3 357 – – 3 357
Total 1 260 225 195 1 354 1 261 774
10.5 items of income, expense, gains or losses
Fair value gainsR’000
Dividends received
R’000
Interest received
R’000
Net gains
R’000
2012
Financial assets
Available-for-sale 9 888 807 1 395 265 – 11 284 072
Loans and receivables – – 109 109
2011
Financial assets
Available-for-sale 5 980 242 1 035 217 – 7 015 459
Loans and receivables – – 184 184
10.6 fair value of financial instruments
10.6.1 Fair value measurement
All financial instruments have been recognised in the statements of financial position and there is no material difference between their fair values and carrying amounts. The following methods and assumptions were used by the company in establishing fair values:
financial assets and liabilities (other than available-for-sale assets)Carrying amounts reported in the statements of financial position at amortised cost approximate fair values. The fair value of the financial instruments as at the reporting date has been determined using available market information and appropriate valuation methodologies.
available-for-sale assetsShares in subsidiaries are classified as available-for-sale assets and are measured at fair value. The relevant valuation techniques to determine the fair value of each investment in the relevant subsidiaries are summarised on the next page:
NoTES To ThE CoMPANy ANNUAL FINANCIAL STATEMENTS
T r u w o r t h s I n t e r n a t i o n a l L i m i t e d A n n u a l F i n a n c i a l S t a t e m e n t s 2 0 1 284
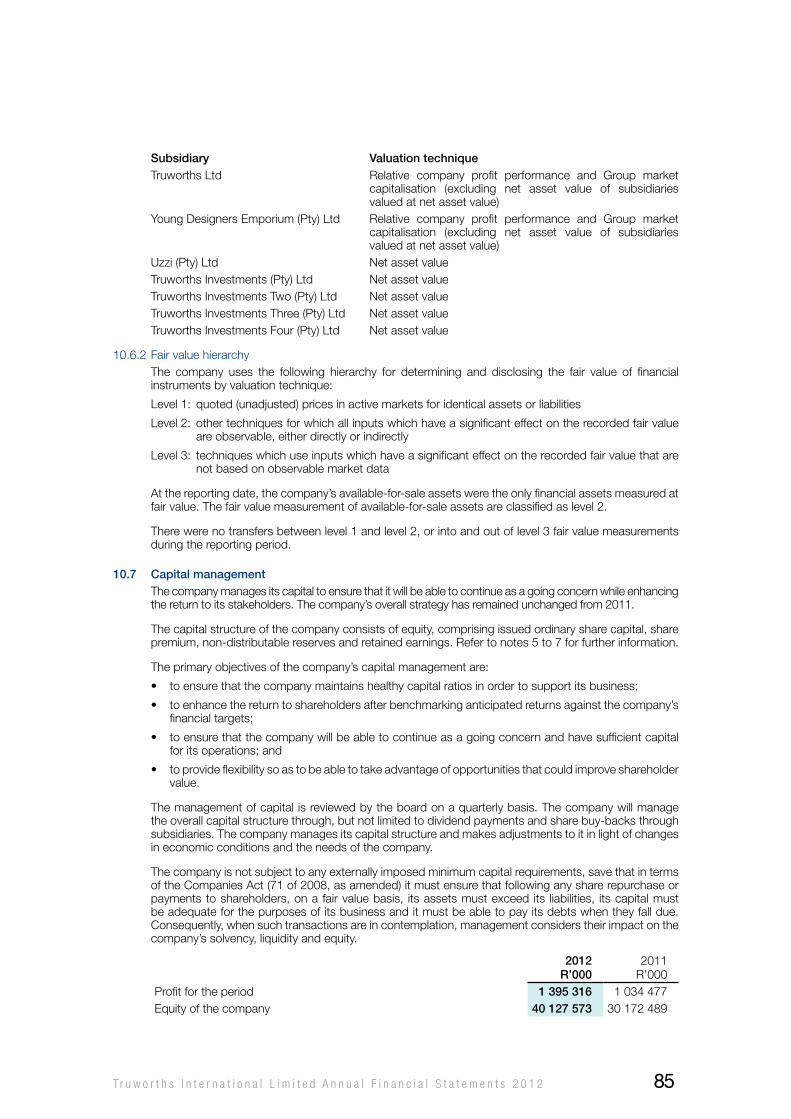
subsidiary valuation techniqueTruworths Ltd Relative company profit performance and Group market
capitalisation (excluding net asset value of subsidiaries valued at net asset value)
young Designers Emporium (Pty) Ltd Relative company profit performance and Group market capitalisation (excluding net asset value of subsidiaries valued at net asset value)
Uzzi (Pty) Ltd Net asset valueTruworths Investments (Pty) Ltd Net asset valueTruworths Investments Two (Pty) Ltd Net asset valueTruworths Investments Three (Pty) Ltd Net asset valueTruworths Investments Four (Pty) Ltd Net asset value
10.6.2 Fair value hierarchyThe company uses the following hierarchy for determining and disclosing the fair value of financial instruments by valuation technique:
Level 1: quoted (unadjusted) prices in active markets for identical assets or liabilities
Level 2: other techniques for which all inputs which have a significant effect on the recorded fair value are observable, either directly or indirectly
Level 3: techniques which use inputs which have a significant effect on the recorded fair value that are not based on observable market data
At the reporting date, the company’s available-for-sale assets were the only financial assets measured at fair value. The fair value measurement of available-for-sale assets are classified as level 2.
There were no transfers between level 1 and level 2, or into and out of level 3 fair value measurements during the reporting period.
10.7 capital managementThe company manages its capital to ensure that it will be able to continue as a going concern while enhancing the return to its stakeholders. The company’s overall strategy has remained unchanged from 2011.
The capital structure of the company consists of equity, comprising issued ordinary share capital, share premium, non-distributable reserves and retained earnings. Refer to notes 5 to 7 for further information.
The primary objectives of the company’s capital management are:
• toensurethatthecompanymaintainshealthycapitalratiosinordertosupportitsbusiness;
• toenhancethereturntoshareholdersafterbenchmarkinganticipatedreturnsagainstthecompany’sfinancial targets;
• toensurethatthecompanywillbeabletocontinueasagoingconcernandhavesufficientcapitalfor its operations; and
• toprovideflexibilitysoastobeabletotakeadvantageofopportunitiesthatcouldimproveshareholdervalue.
The management of capital is reviewed by the board on a quarterly basis. The company will manage the overall capital structure through, but not limited to dividend payments and share buy-backs through subsidiaries. The company manages its capital structure and makes adjustments to it in light of changes in economic conditions and the needs of the company.
The company is not subject to any externally imposed minimum capital requirements, save that in terms of the Companies Act (71 of 2008, as amended) it must ensure that following any share repurchase or payments to shareholders, on a fair value basis, its assets must exceed its liabilities, its capital must be adequate for the purposes of its business and it must be able to pay its debts when they fall due. Consequently, when such transactions are in contemplation, management considers their impact on the company’s solvency, liquidity and equity.
2012r’000
2011R’000
Profit for the period 1 395 316 1 034 477 Equity of the company 40 127 573 30 172 489
T r u w o r t h s I n t e r n a t i o n a l L i m i t e d A n n u a l F i n a n c i a l S t a t e m e n t s 2 0 1 2 85
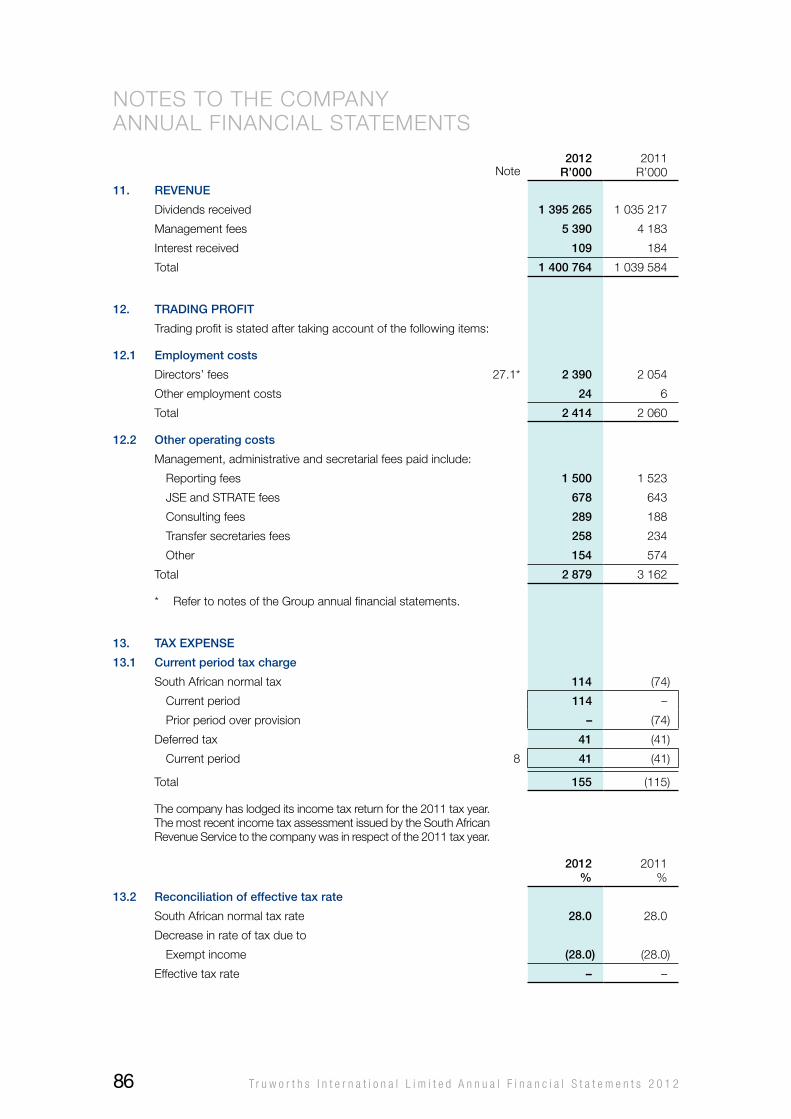
Note2012
r’0002011
R’000
11. revenue
Dividends received 1 395 265 1 035 217
Management fees 5 390 4 183
Interest received 109 184
Total 1 400 764 1 039 584
12. traDinG profit
Trading profit is stated after taking account of the following items:
12.1 employment costs
Directors’ fees 27.1* 2 390 2 054
other employment costs 24 6
Total 2 414 2 060
12.2 other operating costs
Management, administrative and secretarial fees paid include:
Reporting fees 1 500 1 523
JSE and STRATE fees 678 643
Consulting fees 289 188
Transfer secretaries fees 258 234
other 154 574
Total 2 879 3 162
* Refer to notes of the Group annual financial statements.
13. tax expense
13.1 current period tax charge
South African normal tax 114 (74)
Current period 114 –
Prior period over provision – (74)
Deferred tax 41 (41)
Current period 8 41 (41)
Total 155 (115)
The company has lodged its income tax return for the 2011 tax year. The most recent income tax assessment issued by the South African Revenue Service to the company was in respect of the 2011 tax year.
2012%
2011%
13.2 reconciliation of effective tax rate
South African normal tax rate 28.0 28.0
Decrease in rate of tax due to
Exempt income (28.0) (28.0)
Effective tax rate – –
NoTES To ThE CoMPANy ANNUAL FINANCIAL STATEMENTS
T r u w o r t h s I n t e r n a t i o n a l L i m i t e d A n n u a l F i n a n c i a l S t a t e m e n t s 2 0 1 286
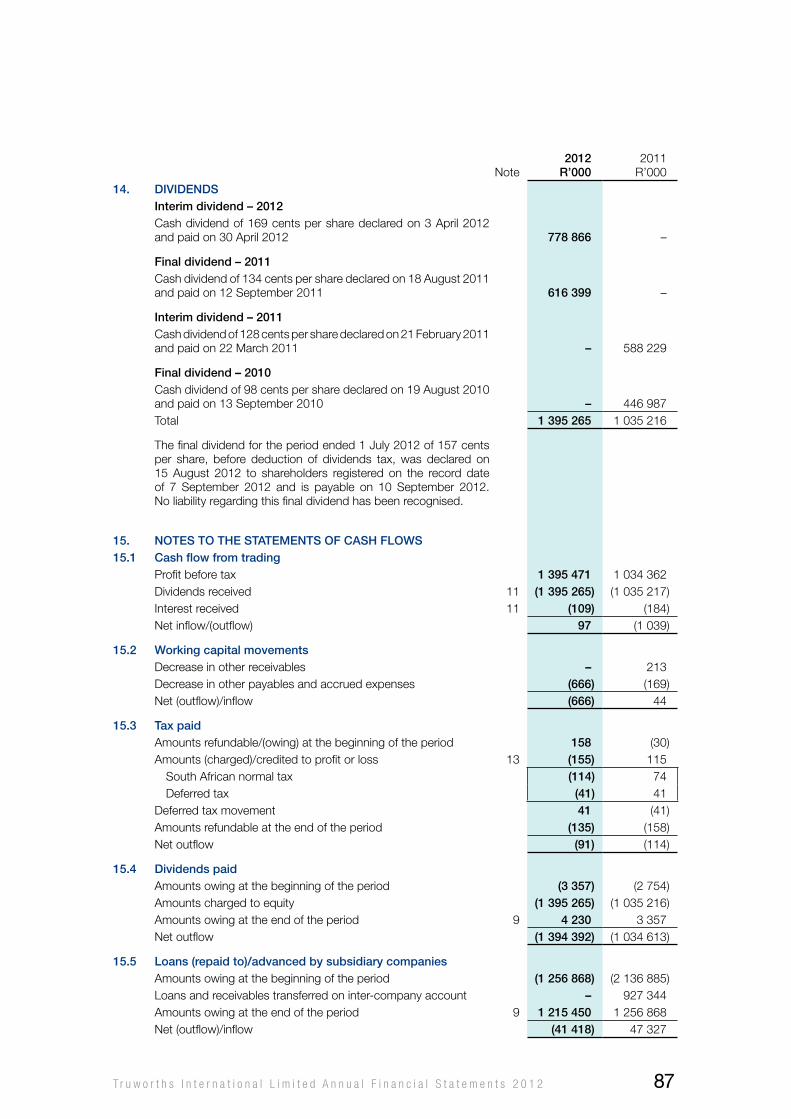
Note2012
r’0002011
R’00014. DiviDenDs
interim dividend – 2012Cash dividend of 169 cents per share declared on 3 April 2012 and paid on 30 April 2012 778 866 –
final dividend – 2011Cash dividend of 134 cents per share declared on 18 August 2011 and paid on 12 September 2011 616 399 –
interim dividend – 2011Cash dividend of 128 cents per share declared on 21 February 2011 and paid on 22 March 2011 – 588 229
final dividend – 2010Cash dividend of 98 cents per share declared on 19 August 2010 and paid on 13 September 2010 – 446 987 Total 1 395 265 1 035 216
The final dividend for the period ended 1 July 2012 of 157 cents per share, before deduction of dividends tax, was declared on 15 August 2012 to shareholders registered on the record date of 7 September 2012 and is payable on 10 September 2012. No liability regarding this final dividend has been recognised.
15. notes to the statements of cash flows15.1 cash flow from trading
Profit before tax 1 395 471 1 034 362 Dividends received 11 (1 395 265) (1 035 217)Interest received 11 (109) (184)Net inflow/(outflow) 97 (1 039)
15.2 working capital movements Decrease in other receivables – 213 Decrease in other payables and accrued expenses (666) (169)Net (outflow)/inflow (666) 44
15.3 tax paidAmounts refundable/(owing) at the beginning of the period 158 (30)Amounts (charged)/credited to profit or loss 13 (155) 115
South African normal tax (114) 74 Deferred tax (41) 41
Deferred tax movement 41 (41)Amounts refundable at the end of the period (135) (158)Net outflow (91) (114)
15.4 Dividends paidAmounts owing at the beginning of the period (3 357) (2 754)Amounts charged to equity (1 395 265) (1 035 216)Amounts owing at the end of the period 9 4 230 3 357 Net outflow (1 394 392) (1 034 613)
15.5 loans (repaid to)/advanced by subsidiary companiesAmounts owing at the beginning of the period (1 256 868) (2 136 885)Loans and receivables transferred on inter-company account – 927 344 Amounts owing at the end of the period 9 1 215 450 1 256 868 Net (outflow)/inflow (41 418) 47 327
T r u w o r t h s I n t e r n a t i o n a l L i m i t e d A n n u a l F i n a n c i a l S t a t e m e n t s 2 0 1 2 87
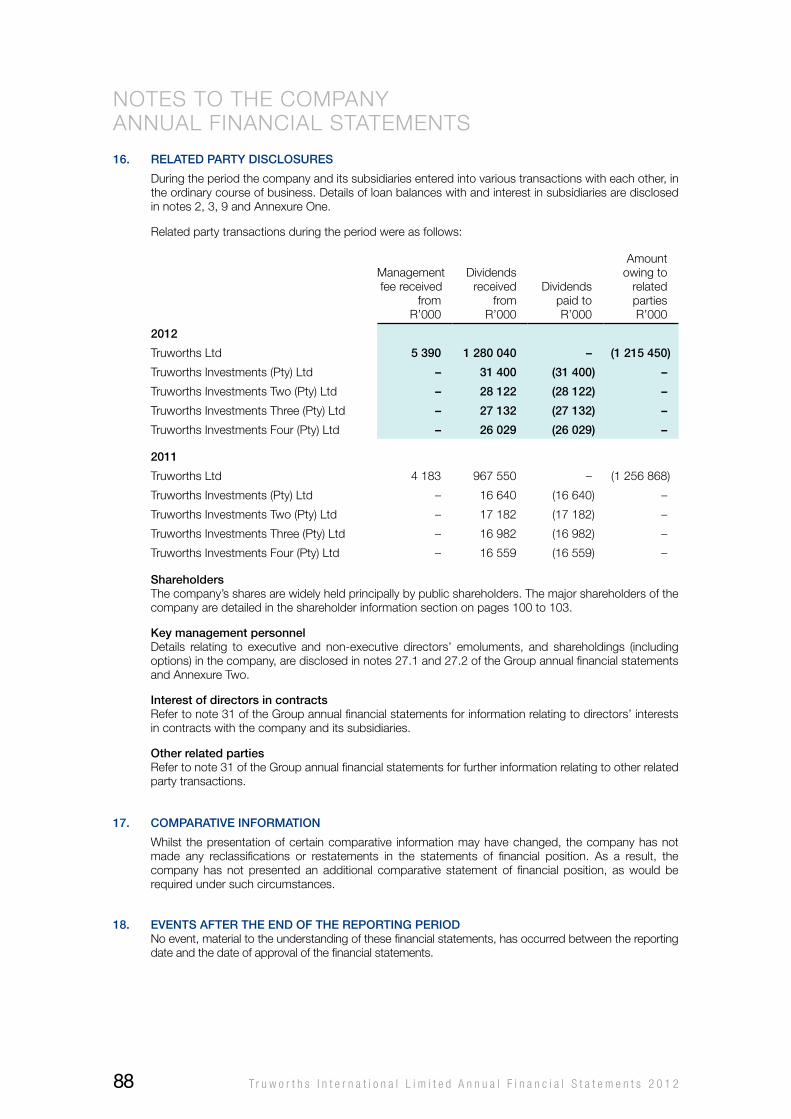
16. relateD party Disclosures
During the period the company and its subsidiaries entered into various transactions with each other, in the ordinary course of business. Details of loan balances with and interest in subsidiaries are disclosed in notes 2, 3, 9 and Annexure one.
Related party transactions during the period were as follows:
Management fee received
from R’000
Dividends received
from R’000
Dividends paid to R’000
Amount owing to related parties R’000
2012
Truworths Ltd 5 390 1 280 040 – (1 215 450)
Truworths Investments (Pty) Ltd – 31 400 (31 400) –
Truworths Investments Two (Pty) Ltd – 28 122 (28 122) –
Truworths Investments Three (Pty) Ltd – 27 132 (27 132) –
Truworths Investments Four (Pty) Ltd – 26 029 (26 029) –
2011
Truworths Ltd 4 183 967 550 – (1 256 868)
Truworths Investments (Pty) Ltd – 16 640 (16 640) –
Truworths Investments Two (Pty) Ltd – 17 182 (17 182) –
Truworths Investments Three (Pty) Ltd – 16 982 (16 982) –
Truworths Investments Four (Pty) Ltd – 16 559 (16 559) –
shareholdersThe company’s shares are widely held principally by public shareholders. The major shareholders of the company are detailed in the shareholder information section on pages 100 to 103.
Key management personnelDetails relating to executive and non-executive directors’ emoluments, and shareholdings (including options) in the company, are disclosed in notes 27.1 and 27.2 of the Group annual financial statements and Annexure Two.
interest of directors in contractsRefer to note 31 of the Group annual financial statements for information relating to directors’ interests in contracts with the company and its subsidiaries.
other related partiesRefer to note 31 of the Group annual financial statements for further information relating to other related party transactions.
17. comparative information
whilst the presentation of certain comparative information may have changed, the company has not made any reclassifications or restatements in the statements of financial position. As a result, the company has not presented an additional comparative statement of financial position, as would be required under such circumstances.
18. events after the enD of the reportinG perioDNo event, material to the understanding of these financial statements, has occurred between the reporting date and the date of approval of the financial statements.
NoTES To ThE CoMPANy ANNUAL FINANCIAL STATEMENTS
T r u w o r t h s I n t e r n a t i o n a l L i m i t e d A n n u a l F i n a n c i a l S t a t e m e n t s 2 0 1 288
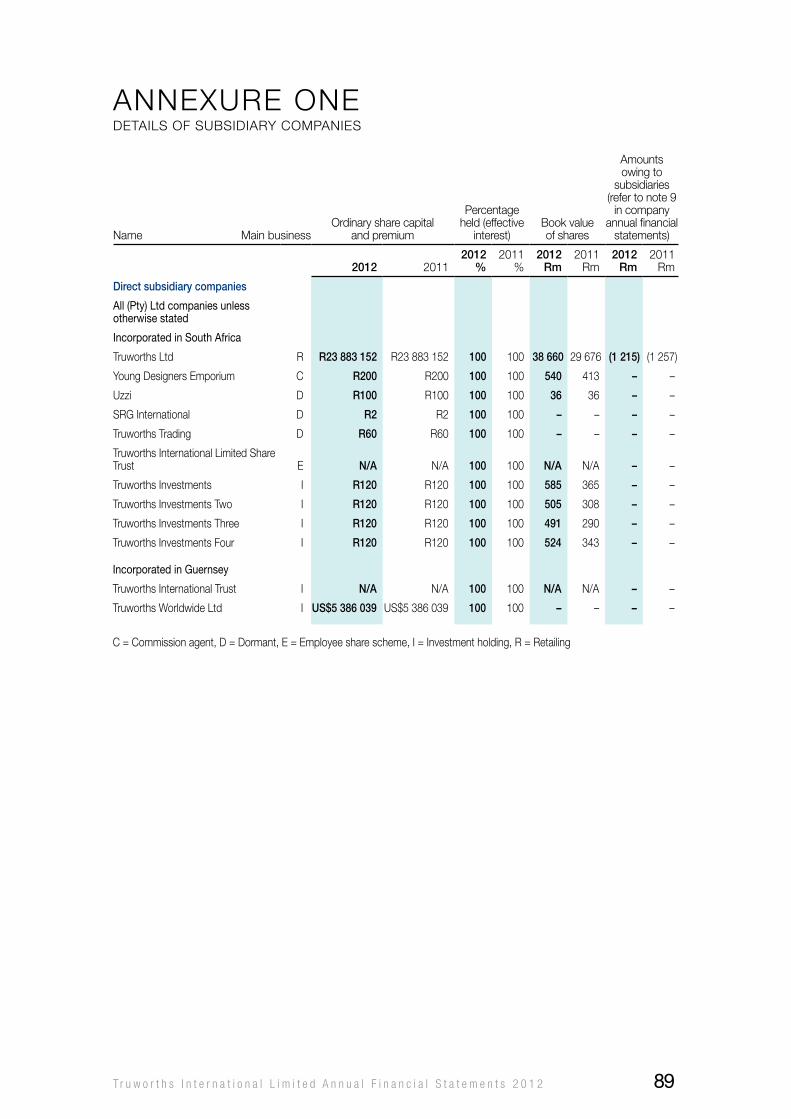
Name Main businessordinary share capital
and premium
Percentage held (effective
interest)Book value of shares
Amounts owing to
subsidiaries (refer to note 9
in company annual financial
statements)
2012 20112012
%2011
%2012
rm2011
Rm2012
rm2011
Rm
Direct subsidiary companies
All (Pty) Ltd companies unless otherwise stated
Incorporated in South Africa
Truworths Ltd R r23 883 152 R23 883 152 100 100 38 660 29 676 (1 215) (1 257)
young Designers Emporium C r200 R200 100 100 540 413 – –
Uzzi D r100 R100 100 100 36 36 – –
SRG International D r2 R2 100 100 – – – –
Truworths Trading D r60 R60 100 100 – – – –
Truworths International Limited Share Trust E n/a N/A 100 100 n/a N/A – –
Truworths Investments I r120 R120 100 100 585 365 – –
Truworths Investments Two I r120 R120 100 100 505 308 – –
Truworths Investments Three I r120 R120 100 100 491 290 – –
Truworths Investments Four I r120 R120 100 100 524 343 – –
Incorporated in Guernsey
Truworths International Trust I n/a N/A 100 100 n/a N/A – –
Truworths worldwide Ltd I us$5 386 039 US$5 386 039 100 100 – – – –
C = Commission agent, D = Dormant, E = Employee share scheme, I = Investment holding, R = Retailing
ANNExURE oNEDETAILS oF SUBSIDIARy CoMPANIES
T r u w o r t h s I n t e r n a t i o n a l L i m i t e d A n n u a l F i n a n c i a l S t a t e m e n t s 2 0 1 2 89
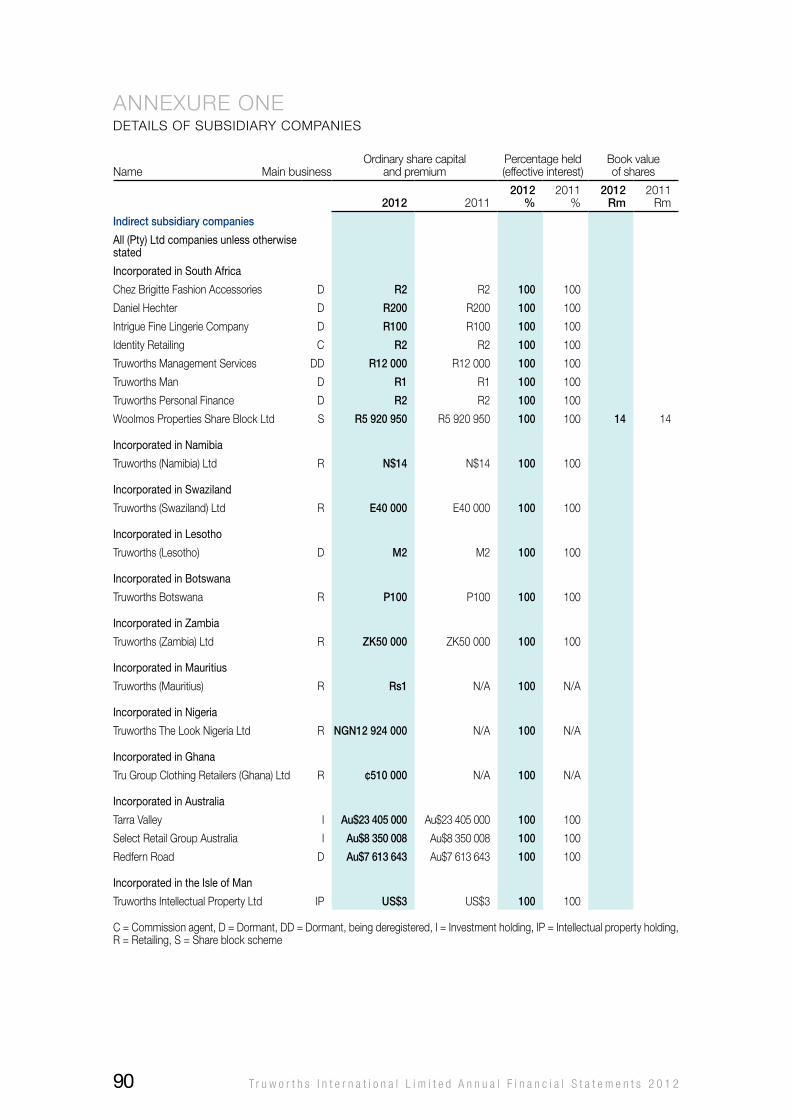
Name Main businessordinary share capital
and premiumPercentage held (effective interest)
Book value of shares
2012 20112012
%2011
%2012
rm2011
Rm
indirect subsidiary companies
All (Pty) Ltd companies unless otherwise stated
Incorporated in South Africa
Chez Brigitte Fashion Accessories D r2 R2 100 100
Daniel hechter D r200 R200 100 100
Intrigue Fine Lingerie Company D r100 R100 100 100
Identity Retailing C r2 R2 100 100
Truworths Management Services DD r12 000 R12 000 100 100
Truworths Man D r1 R1 100 100
Truworths Personal Finance D r2 R2 100 100
woolmos Properties Share Block Ltd S r5 920 950 R5 920 950 100 100 14 14
Incorporated in Namibia
Truworths (Namibia) Ltd R n$14 N$14 100 100
Incorporated in Swaziland
Truworths (Swaziland) Ltd R e40 000 E40 000 100 100
Incorporated in Lesotho
Truworths (Lesotho) D m2 M2 100 100
Incorporated in Botswana
Truworths Botswana R p100 P100 100 100
Incorporated in Zambia
Truworths (Zambia) Ltd R ZK50 000 ZK50000 100 100
Incorporated in Mauritius
Truworths (Mauritius) R rs1 N/A 100 N/A
Incorporated in Nigeria
Truworths The Look Nigeria Ltd R nGn12 924 000 N/A 100 N/A
Incorporated in Ghana
Tru Group Clothing Retailers (Ghana) Ltd R ¢510 000 N/A 100 N/A
Incorporated in Australia
Tarra valley I au$23 405 000 Au$23 405 000 100 100
Select Retail Group Australia I au$8 350 008 Au$8 350 008 100 100
Redfern Road D au$7 613 643 Au$7 613 643 100 100
Incorporated in the Isle of Man
Truworths Intellectual Property Ltd IP us$3 US$3 100 100
C = Commission agent, D = Dormant, DD = Dormant, being deregistered, I = Investment holding, IP = Intellectual property holding, R = Retailing, S = Share block scheme
ANNExURE oNEDETAILS oF SUBSIDIARy CoMPANIES
T r u w o r t h s I n t e r n a t i o n a l L i m i t e d A n n u a l F i n a n c i a l S t a t e m e n t s 2 0 1 290
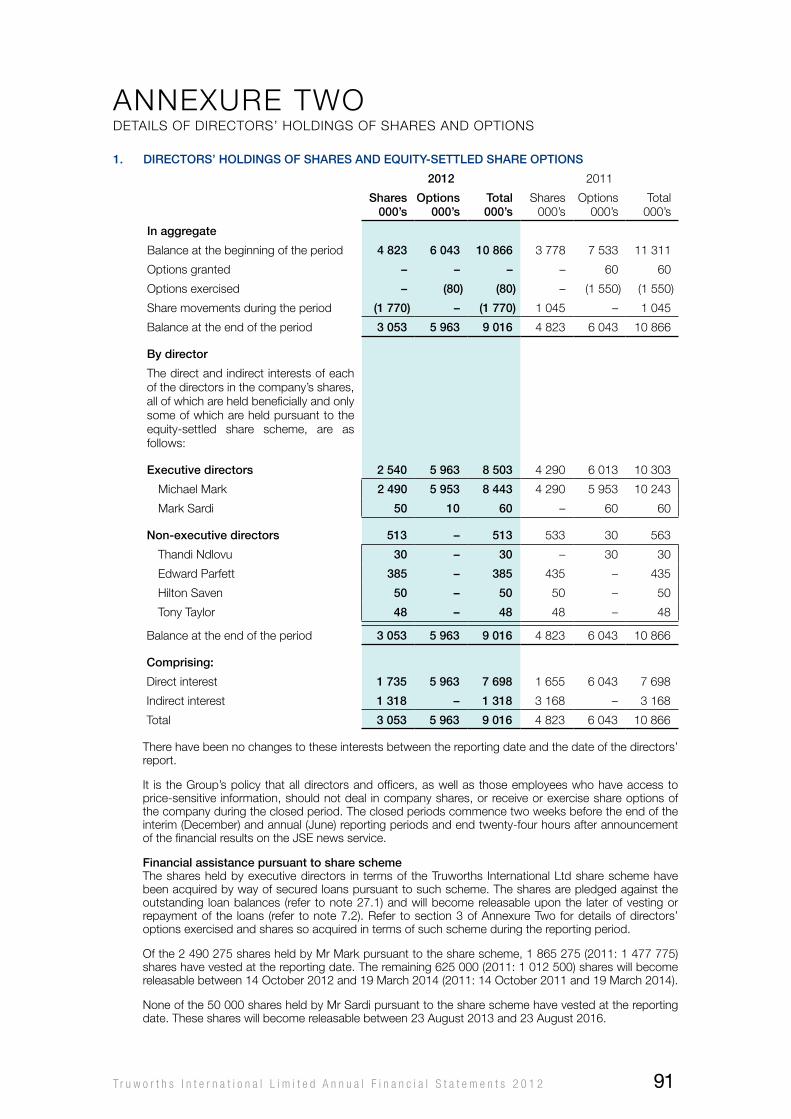
1. Directors’ holDinGs of shares anD equity-settleD share options
2012 2011
shares000’s
options000’s
total 000’s
Shares000’s
options000’s
Total 000’s
in aggregate
Balance at the beginning of the period 4 823 6 043 10 866 3 778 7 533 11 311
options granted – – – – 60 60
options exercised – (80) (80) – (1 550) (1 550)
Share movements during the period (1 770) – (1 770) 1 045 – 1 045
Balance at the end of the period 3 053 5 963 9 016 4 823 6 043 10 866
by director
The direct and indirect interests of each of the directors in the company’s shares, all of which are held beneficially and only some of which are held pursuant to the equity-settled share scheme, are as follows:
executive directors 2 540 5 963 8 503 4 290 6 013 10 303
Michael Mark 2 490 5 953 8 443 4 290 5 953 10 243
Mark Sardi 50 10 60 – 60 60
non-executive directors 513 – 513 533 30 563
Thandi Ndlovu 30 – 30 – 30 30
Edward Parfett 385 – 385 435 – 435
hilton Saven 50 – 50 50 – 50
Tony Taylor 48 – 48 48 – 48
Balance at the end of the period 3 053 5 963 9 016 4 823 6 043 10 866
comprising:
Direct interest 1 735 5 963 7 698 1 655 6 043 7 698
Indirect interest 1 318 – 1 318 3 168 – 3 168
Total 3 053 5 963 9 016 4 823 6 043 10 866
There have been no changes to these interests between the reporting date and the date of the directors’ report.
It is the Group’s policy that all directors and officers, as well as those employees who have access to price-sensitive information, should not deal in company shares, or receive or exercise share options of the company during the closed period. The closed periods commence two weeks before the end of the interim (December) and annual (June) reporting periods and end twenty-four hours after announcement of the financial results on the JSE news service.
financial assistance pursuant to share schemeThe shares held by executive directors in terms of the Truworths International Ltd share scheme have been acquired by way of secured loans pursuant to such scheme. The shares are pledged against the outstanding loan balances (refer to note 27.1) and will become releasable upon the later of vesting or repayment of the loans (refer to note 7.2). Refer to section 3 of Annexure Two for details of directors’ options exercised and shares so acquired in terms of such scheme during the reporting period.
of the 2 490 275 shares held by Mr Mark pursuant to the share scheme, 1 865 275 (2011: 1 477 775) shares have vested at the reporting date. The remaining 625 000 (2011: 1 012 500) shares will become releasable between 14 october 2012 and 19 March 2014 (2011: 14 october 2011 and 19 March 2014).
None of the 50 000 shares held by Mr Sardi pursuant to the share scheme have vested at the reporting date. These shares will become releasable between 23 August 2013 and 23 August 2016.
ANNExURE TwoDETAILS oF DIRECToRS’ hoLDINGS oF ShARES AND oPTIoNS
T r u w o r t h s I n t e r n a t i o n a l L i m i t e d A n n u a l F i n a n c i a l S t a t e m e n t s 2 0 1 2 91
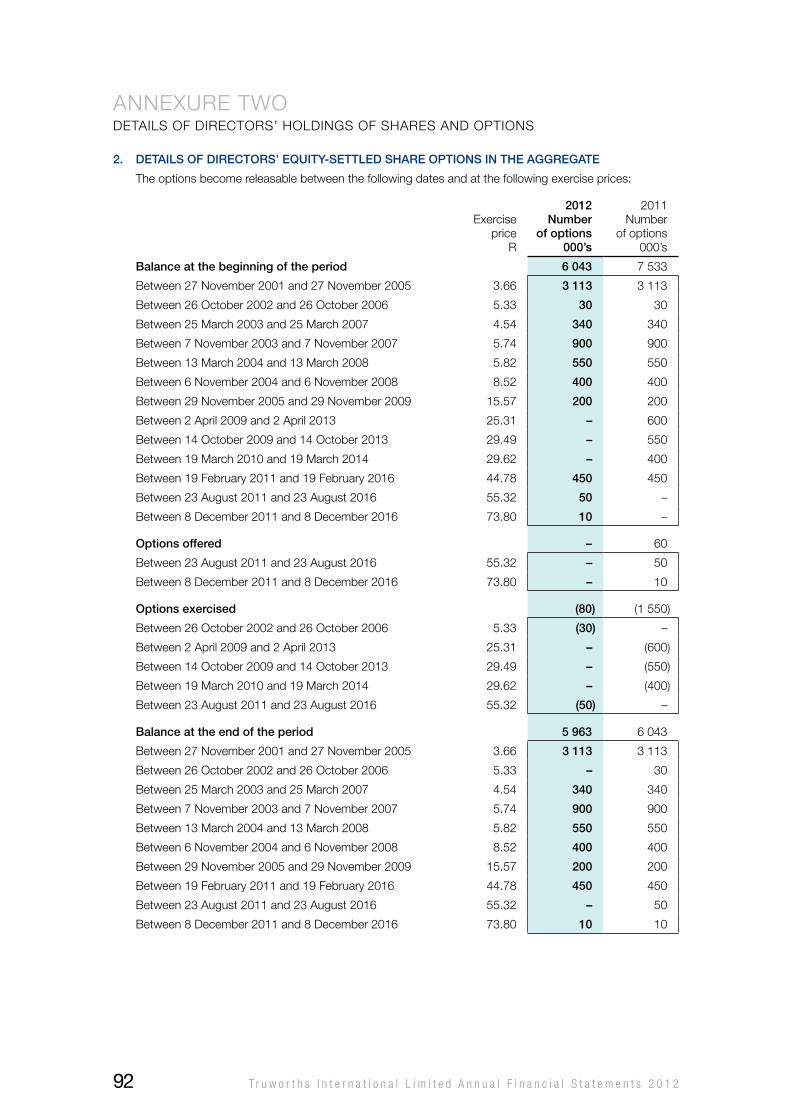
2. Details of Directors’ equity-settleD share options in the aGGreGate
The options become releasable between the following dates and at the following exercise prices:
Exercise price
R
2012number
of options000’s
2011Number
of options000’s
balance at the beginning of the period 6 043 7 533
Between 27 November 2001 and 27 November 2005 3.66 3 113 3 113
Between 26 october 2002 and 26 october 2006 5.33 30 30
Between 25 March 2003 and 25 March 2007 4.54 340 340
Between 7 November 2003 and 7 November 2007 5.74 900 900
Between 13 March 2004 and 13 March 2008 5.82 550 550
Between 6 November 2004 and 6 November 2008 8.52 400 400
Between 29 November 2005 and 29 November 2009 15.57 200 200
Between 2 April 2009 and 2 April 2013 25.31 – 600
Between 14 october 2009 and 14 october 2013 29.49 – 550
Between 19 March 2010 and 19 March 2014 29.62 – 400
Between 19 February 2011 and 19 February 2016 44.78 450 450
Between 23 August 2011 and 23 August 2016 55.32 50 –
Between 8 December 2011 and 8 December 2016 73.80 10 –
options offered – 60
Between 23 August 2011 and 23 August 2016 55.32 – 50
Between 8 December 2011 and 8 December 2016 73.80 – 10
options exercised (80) (1 550)
Between 26 october 2002 and 26 october 2006 5.33 (30) –
Between 2 April 2009 and 2 April 2013 25.31 – (600)
Between 14 october 2009 and 14 october 2013 29.49 – (550)
Between 19 March 2010 and 19 March 2014 29.62 – (400)
Between 23 August 2011 and 23 August 2016 55.32 (50) –
balance at the end of the period 5 963 6 043
Between 27 November 2001 and 27 November 2005 3.66 3 113 3 113
Between 26 october 2002 and 26 october 2006 5.33 – 30
Between 25 March 2003 and 25 March 2007 4.54 340 340
Between 7 November 2003 and 7 November 2007 5.74 900 900
Between 13 March 2004 and 13 March 2008 5.82 550 550
Between 6 November 2004 and 6 November 2008 8.52 400 400
Between 29 November 2005 and 29 November 2009 15.57 200 200
Between 19 February 2011 and 19 February 2016 44.78 450 450
Between 23 August 2011 and 23 August 2016 55.32 – 50
Between 8 December 2011 and 8 December 2016 73.80 10 10
ANNExURE TwoDETAILS oF DIRECToRS’ hoLDINGS oF ShARES AND oPTIoNS
T r u w o r t h s I n t e r n a t i o n a l L i m i t e d A n n u a l F i n a n c i a l S t a t e m e n t s 2 0 1 292
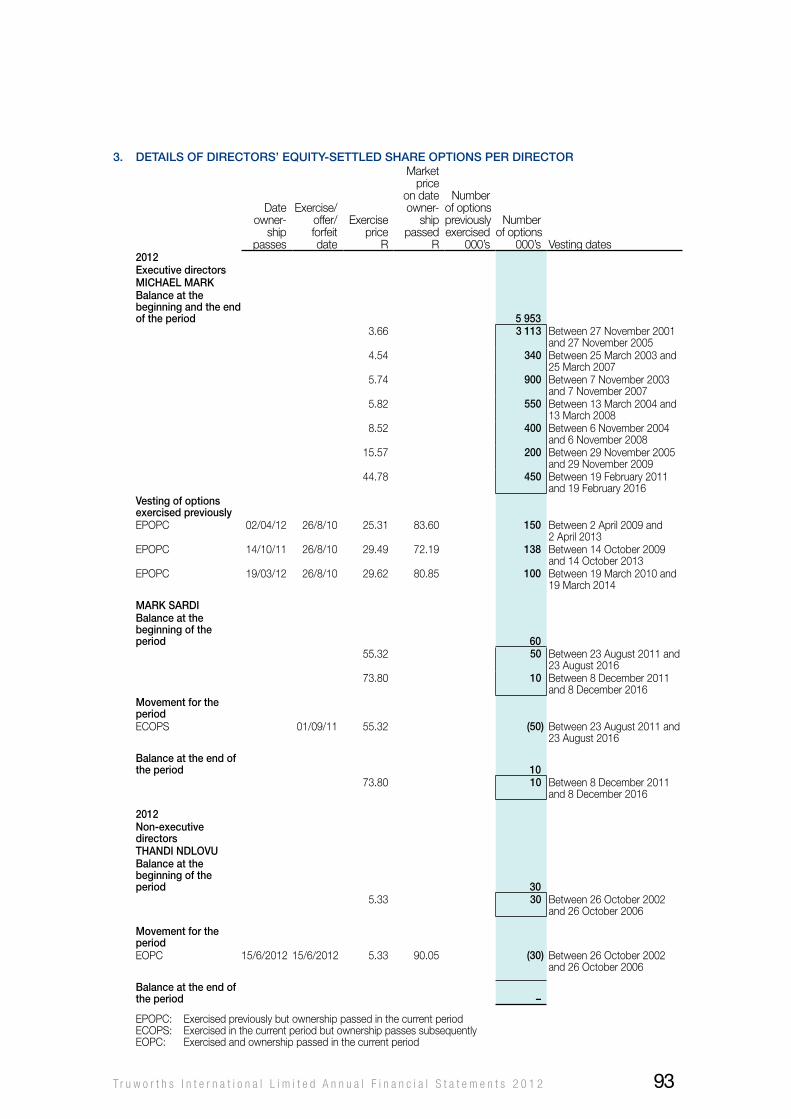
3. Details of Directors’ equity-settleD share options per Director
Date owner-
ship passes
Exercise/offer/forfeit date
Exercise price
R
Market price
on date owner-
ship passed
R
Number of options previously exercised
000’s
Number of options
000’s vesting dates2012executive directorsmichael marKbalance at the beginning and the end of the period 5 953
3.66 3 113 Between 27 November 2001 and 27 November 2005
4.54 340 Between 25 March 2003 and 25 March 2007
5.74 900 Between 7 November 2003 and 7 November 2007
5.82 550 Between 13 March 2004 and 13 March 2008
8.52 400 Between 6 November 2004 and 6 November 2008
15.57 200 Between 29 November 2005 and 29 November 2009
44.78 450 Between 19 February 2011 and 19 February 2016
vesting of options exercised previouslyEPoPC 02/04/12 26/8/10 25.31 83.60 150 Between 2 April 2009 and
2 April 2013EPoPC 14/10/11 26/8/10 29.49 72.19 138 Between 14 october 2009
and 14 october 2013EPoPC 19/03/12 26/8/10 29.62 80.85 100 Between 19 March 2010 and
19 March 2014
marK sarDibalance at the beginning of the period 60
55.32 50 Between 23 August 2011 and 23 August 2016
73.80 10 Between 8 December 2011 and 8 December 2016
movement for the periodECoPS 01/09/11 55.32 (50) Between 23 August 2011 and
23 August 2016
balance at the end of the period 10
73.80 10 Between 8 December 2011 and 8 December 2016
2012non-executive directorsthanDi nDlovubalance at the beginning of the period 30
5.33 30 Between 26 october 2002 and 26 october 2006
movement for the periodEoPC 15/6/2012 15/6/2012 5.33 90.05 (30) Between 26 october 2002
and 26 october 2006
balance at the end of the period –
EPoPC: Exercised previously but ownership passed in the current periodECoPS: Exercised in the current period but ownership passes subsequentlyEoPC: Exercised and ownership passed in the current period
T r u w o r t h s I n t e r n a t i o n a l L i m i t e d A n n u a l F i n a n c i a l S t a t e m e n t s 2 0 1 2 93
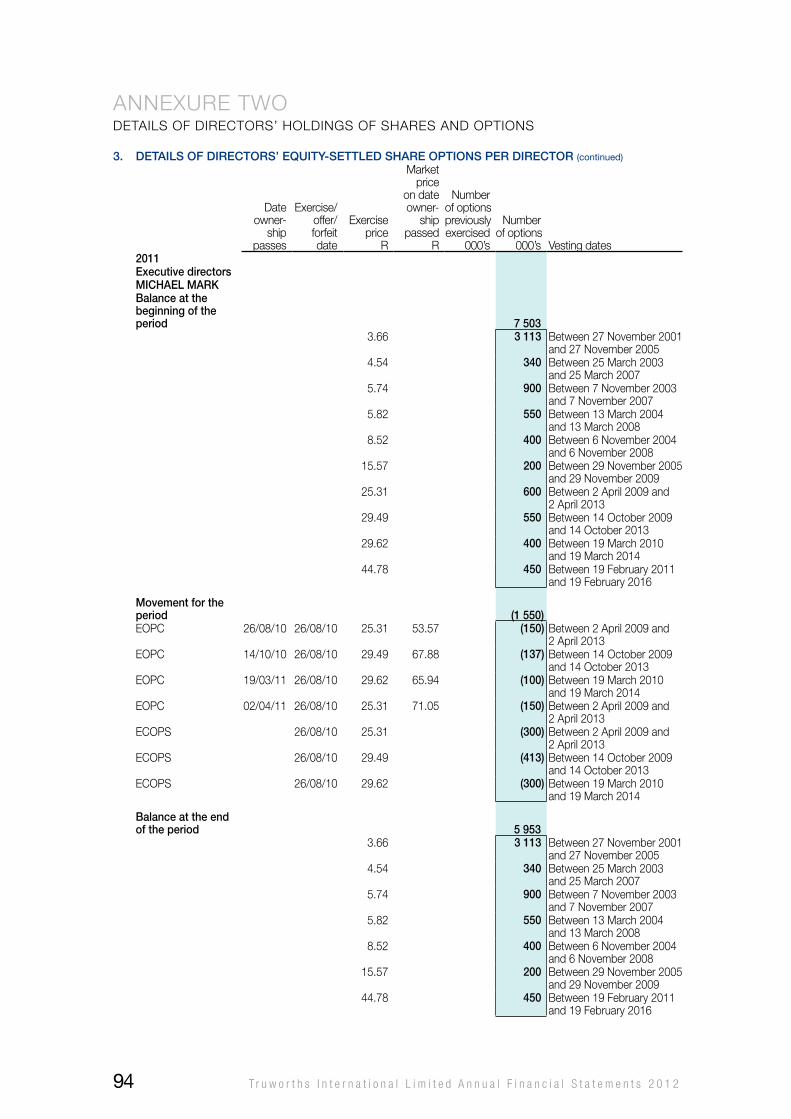
3. Details of Directors’ equity-settleD share options per Director (continued)
Date owner-
ship passes
Exercise/offer/forfeit date
Exercise price
R
Market price
on date owner-
ship passed
R
Number of options previously exercised
000’s
Number of options
000’s vesting dates2011executive directorsmichael marKbalance at the beginning of the period 7 503
3.66 3 113 Between 27 November 2001 and 27 November 2005
4.54 340 Between 25 March 2003 and 25 March 2007
5.74 900 Between 7 November 2003 and 7 November 2007
5.82 550 Between 13 March 2004 and 13 March 2008
8.52 400 Between 6 November 2004 and 6 November 2008
15.57 200 Between 29 November 2005 and 29 November 2009
25.31 600 Between 2 April 2009 and 2 April 2013
29.49 550 Between 14 october 2009 and 14 october 2013
29.62 400 Between 19 March 2010 and 19 March 2014
44.78 450 Between 19 February 2011 and 19 February 2016
movement for the period (1 550)EoPC 26/08/10 26/08/10 25.31 53.57 (150) Between 2 April 2009 and
2 April 2013EoPC 14/10/10 26/08/10 29.49 67.88 (137) Between 14 october 2009
and 14 october 2013EoPC 19/03/11 26/08/10 29.62 65.94 (100) Between 19 March 2010
and 19 March 2014EoPC 02/04/11 26/08/10 25.31 71.05 (150) Between 2 April 2009 and
2 April 2013ECoPS 26/08/10 25.31 (300) Between 2 April 2009 and
2 April 2013ECoPS 26/08/10 29.49 (413) Between 14 october 2009
and 14 october 2013ECoPS 26/08/10 29.62 (300) Between 19 March 2010
and 19 March 2014
balance at the end of the period 5 953
3.66 3 113 Between 27 November 2001 and 27 November 2005
4.54 340 Between 25 March 2003 and 25 March 2007
5.74 900 Between 7 November 2003 and 7 November 2007
5.82 550 Between 13 March 2004 and 13 March 2008
8.52 400 Between 6 November 2004 and 6 November 2008
15.57 200 Between 29 November 2005 and 29 November 2009
44.78 450 Between 19 February 2011 and 19 February 2016
ANNExURE TwoDETAILS oF DIRECToRS’ hoLDINGS oF ShARES AND oPTIoNS
T r u w o r t h s I n t e r n a t i o n a l L i m i t e d A n n u a l F i n a n c i a l S t a t e m e n t s 2 0 1 294
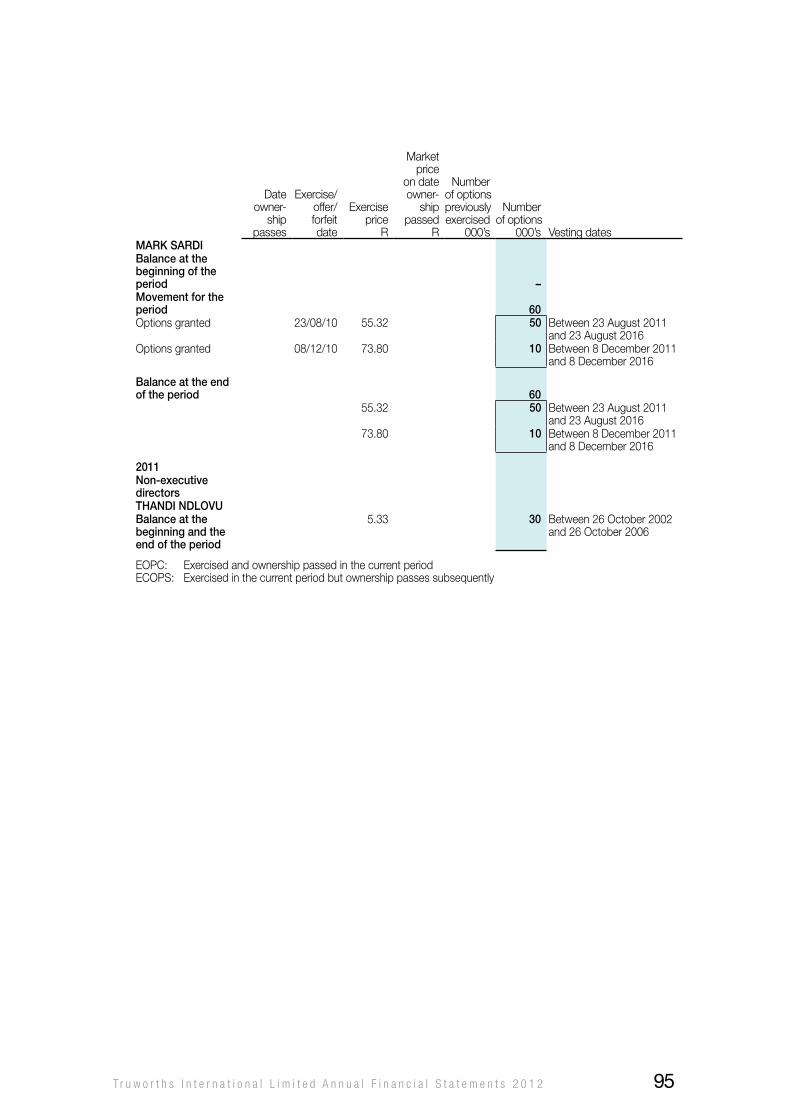
Date owner-
ship passes
Exercise/offer/forfeit date
Exercise price
R
Market price
on date owner-
ship passed
R
Number of options previously exercised
000’s
Number of options
000’s vesting datesmarK sarDibalance at the beginning of the period –movement for the period 60 options granted 23/08/10 55.32 50 Between 23 August 2011
and 23 August 2016options granted 08/12/10 73.80 10 Between 8 December 2011
and 8 December 2016
balance at the end of the period 60
55.32 50 Between 23 August 2011 and 23 August 2016
73.80 10 Between 8 December 2011 and 8 December 2016
2011non-executive directorsthanDi nDlovubalance at the beginning and the end of the period
5.33 30 Between 26 october 2002 and 26 october 2006
EoPC: Exercised and ownership passed in the current periodECoPS: Exercised in the current period but ownership passes subsequently
T r u w o r t h s I n t e r n a t i o n a l L i m i t e d A n n u a l F i n a n c i a l S t a t e m e n t s 2 0 1 2 95
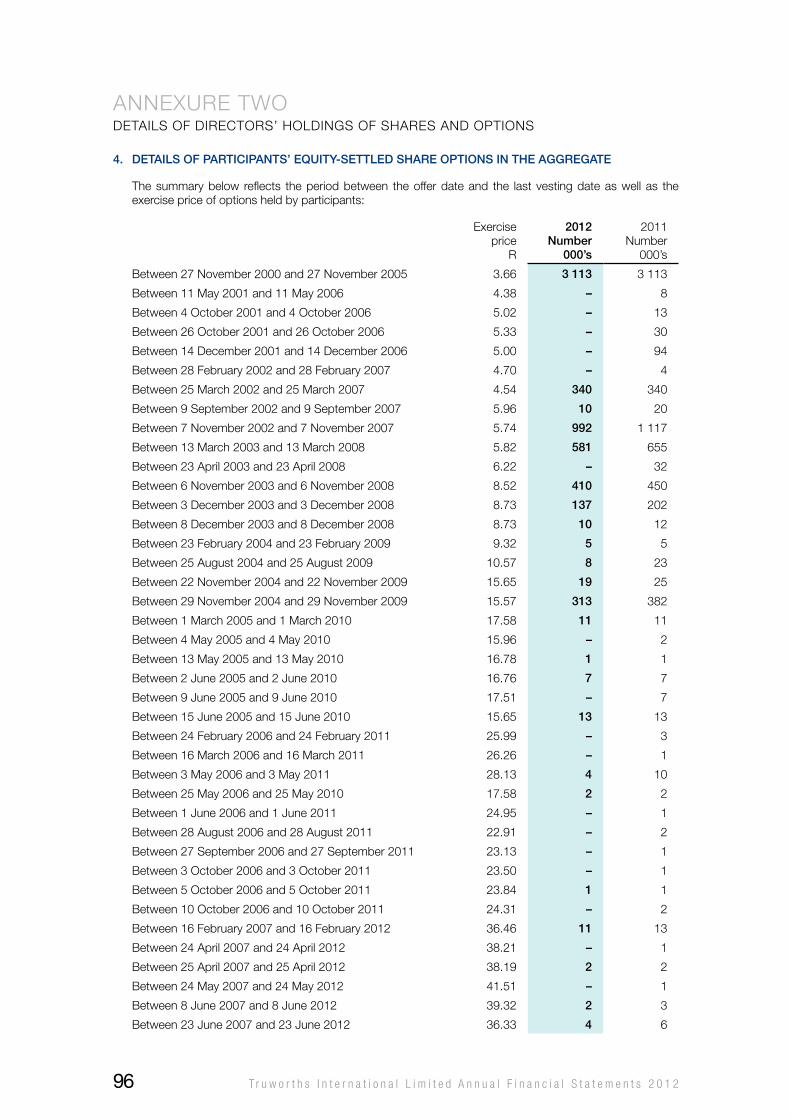
4. Details of participants’ equity-settleD share options in the aGGreGate
The summary below reflects the period between the offer date and the last vesting date as well as the exercise price of options held by participants:
Exercise price
R
2012number
000’s
2011Number
000’s
Between 27 November 2000 and 27 November 2005 3.66 3 113 3 113
Between 11 May 2001 and 11 May 2006 4.38 – 8
Between 4 october 2001 and 4 october 2006 5.02 – 13
Between 26 october 2001 and 26 october 2006 5.33 – 30
Between 14 December 2001 and 14 December 2006 5.00 – 94
Between 28 February 2002 and 28 February 2007 4.70 – 4
Between 25 March 2002 and 25 March 2007 4.54 340 340
Between 9 September 2002 and 9 September 2007 5.96 10 20
Between 7 November 2002 and 7 November 2007 5.74 992 1 117
Between 13 March 2003 and 13 March 2008 5.82 581 655
Between 23 April 2003 and 23 April 2008 6.22 – 32
Between 6 November 2003 and 6 November 2008 8.52 410 450
Between 3 December 2003 and 3 December 2008 8.73 137 202
Between 8 December 2003 and 8 December 2008 8.73 10 12
Between 23 February 2004 and 23 February 2009 9.32 5 5
Between 25 August 2004 and 25 August 2009 10.57 8 23
Between 22 November 2004 and 22 November 2009 15.65 19 25
Between 29 November 2004 and 29 November 2009 15.57 313 382
Between 1 March 2005 and 1 March 2010 17.58 11 11
Between 4 May 2005 and 4 May 2010 15.96 – 2
Between 13 May 2005 and 13 May 2010 16.78 1 1
Between 2 June 2005 and 2 June 2010 16.76 7 7
Between 9 June 2005 and 9 June 2010 17.51 – 7
Between 15 June 2005 and 15 June 2010 15.65 13 13
Between 24 February 2006 and 24 February 2011 25.99 – 3
Between 16 March 2006 and 16 March 2011 26.26 – 1
Between 3 May 2006 and 3 May 2011 28.13 4 10
Between 25 May 2006 and 25 May 2010 17.58 2 2
Between 1 June 2006 and 1 June 2011 24.95 – 1
Between 28 August 2006 and 28 August 2011 22.91 – 2
Between 27 September 2006 and 27 September 2011 23.13 – 1
Between 3 october 2006 and 3 october 2011 23.50 – 1
Between 5 october 2006 and 5 october 2011 23.84 1 1
Between 10 october 2006 and 10 october 2011 24.31 – 2
Between 16 February 2007 and 16 February 2012 36.46 11 13
Between 24 April 2007 and 24 April 2012 38.21 – 1
Between 25 April 2007 and 25 April 2012 38.19 2 2
Between 24 May 2007 and 24 May 2012 41.51 – 1
Between 8 June 2007 and 8 June 2012 39.32 2 3
Between 23 June 2007 and 23 June 2012 36.33 4 6
ANNExURE TwoDETAILS oF DIRECToRS’ hoLDINGS oF ShARES AND oPTIoNS
T r u w o r t h s I n t e r n a t i o n a l L i m i t e d A n n u a l F i n a n c i a l S t a t e m e n t s 2 0 1 296
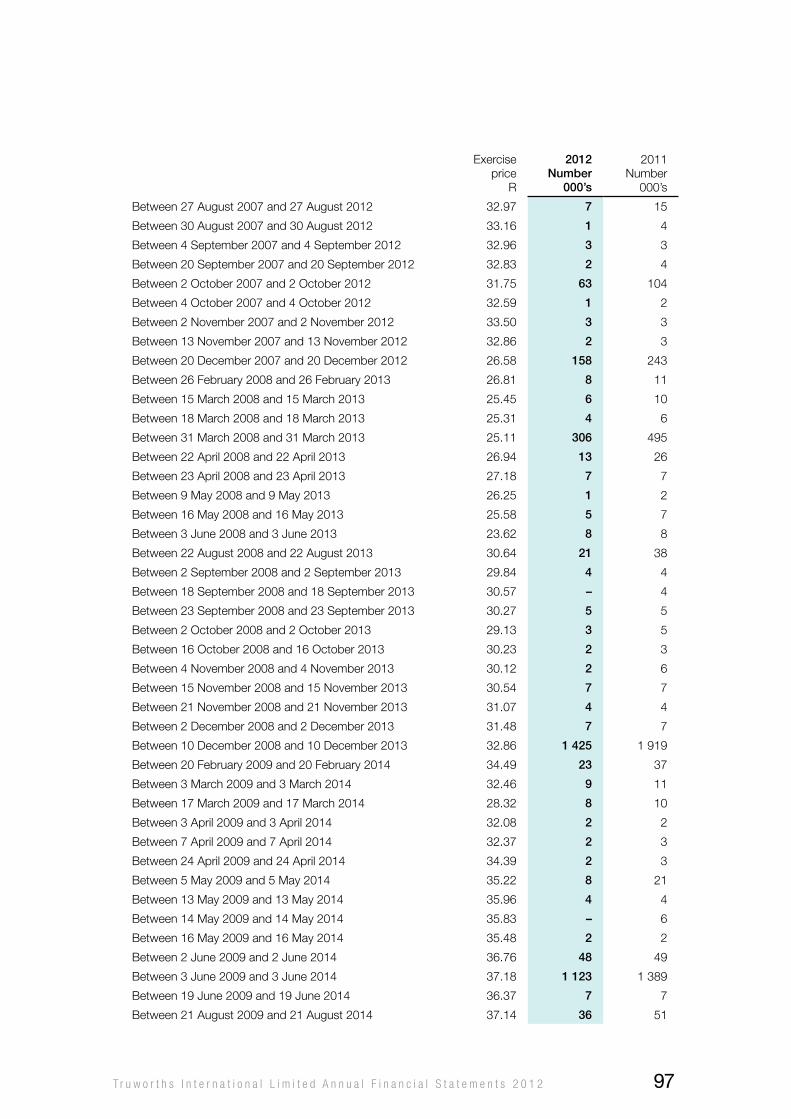
Exercise price
R
2012number
000’s
2011Number
000’s
Between 27 August 2007 and 27 August 2012 32.97 7 15
Between 30 August 2007 and 30 August 2012 33.16 1 4
Between 4 September 2007 and 4 September 2012 32.96 3 3
Between 20 September 2007 and 20 September 2012 32.83 2 4
Between 2 october 2007 and 2 october 2012 31.75 63 104
Between 4 october 2007 and 4 october 2012 32.59 1 2
Between 2 November 2007 and 2 November 2012 33.50 3 3
Between 13 November 2007 and 13 November 2012 32.86 2 3
Between 20 December 2007 and 20 December 2012 26.58 158 243
Between 26 February 2008 and 26 February 2013 26.81 8 11
Between 15 March 2008 and 15 March 2013 25.45 6 10
Between 18 March 2008 and 18 March 2013 25.31 4 6
Between 31 March 2008 and 31 March 2013 25.11 306 495
Between 22 April 2008 and 22 April 2013 26.94 13 26
Between 23 April 2008 and 23 April 2013 27.18 7 7
Between 9 May 2008 and 9 May 2013 26.25 1 2
Between 16 May 2008 and 16 May 2013 25.58 5 7
Between 3 June 2008 and 3 June 2013 23.62 8 8
Between 22 August 2008 and 22 August 2013 30.64 21 38
Between 2 September 2008 and 2 September 2013 29.84 4 4
Between 18 September 2008 and 18 September 2013 30.57 – 4
Between 23 September 2008 and 23 September 2013 30.27 5 5
Between 2 october 2008 and 2 october 2013 29.13 3 5
Between 16 october 2008 and 16 october 2013 30.23 2 3
Between 4 November 2008 and 4 November 2013 30.12 2 6
Between 15 November 2008 and 15 November 2013 30.54 7 7
Between 21 November 2008 and 21 November 2013 31.07 4 4
Between 2 December 2008 and 2 December 2013 31.48 7 7
Between 10 December 2008 and 10 December 2013 32.86 1 425 1 919
Between 20 February 2009 and 20 February 2014 34.49 23 37
Between 3 March 2009 and 3 March 2014 32.46 9 11
Between 17 March 2009 and 17 March 2014 28.32 8 10
Between 3 April 2009 and 3 April 2014 32.08 2 2
Between 7 April 2009 and 7 April 2014 32.37 2 3
Between 24 April 2009 and 24 April 2014 34.39 2 3
Between 5 May 2009 and 5 May 2014 35.22 8 21
Between 13 May 2009 and 13 May 2014 35.96 4 4
Between 14 May 2009 and 14 May 2014 35.83 – 6
Between 16 May 2009 and 16 May 2014 35.48 2 2
Between 2 June 2009 and 2 June 2014 36.76 48 49
Between 3 June 2009 and 3 June 2014 37.18 1 123 1 389
Between 19 June 2009 and 19 June 2014 36.37 7 7
Between 21 August 2009 and 21 August 2014 37.14 36 51
T r u w o r t h s I n t e r n a t i o n a l L i m i t e d A n n u a l F i n a n c i a l S t a t e m e n t s 2 0 1 2 97
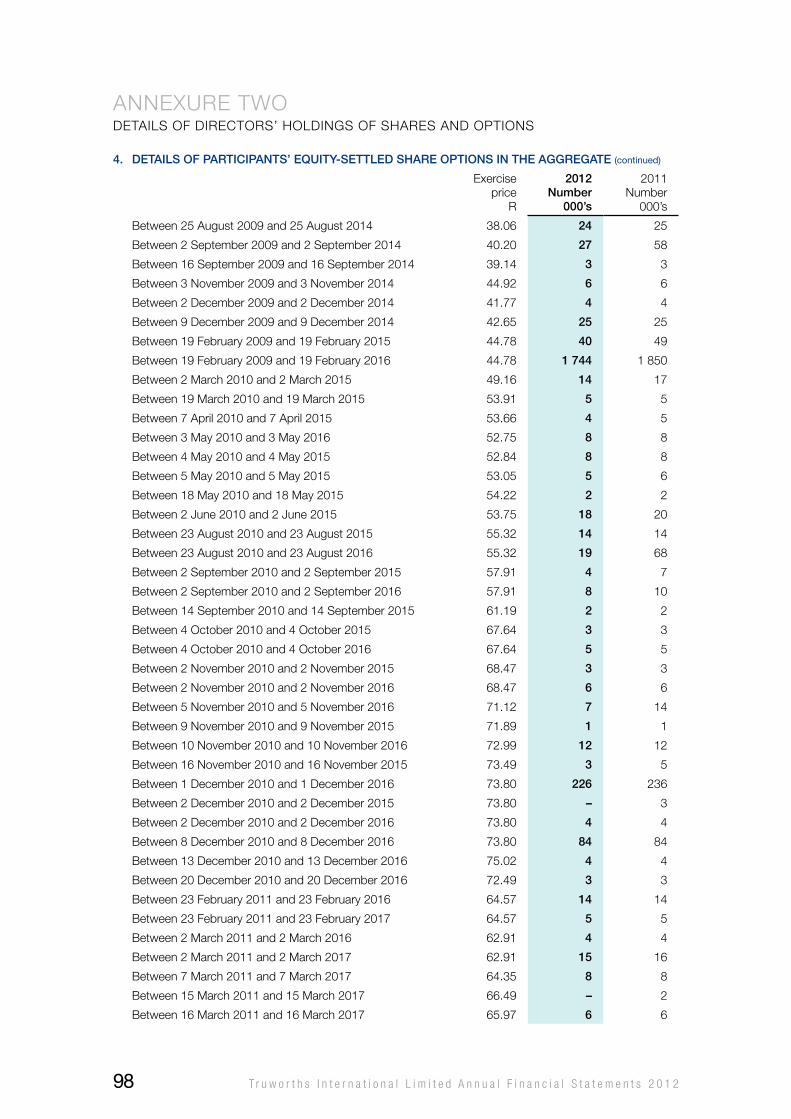
4. Details of participants’ equity-settleD share options in the aGGreGate (continued)
Exercise price
R
2012number
000’s
2011Number
000’s
Between 25 August 2009 and 25 August 2014 38.06 24 25
Between 2 September 2009 and 2 September 2014 40.20 27 58
Between 16 September 2009 and 16 September 2014 39.14 3 3
Between 3 November 2009 and 3 November 2014 44.92 6 6
Between 2 December 2009 and 2 December 2014 41.77 4 4
Between 9 December 2009 and 9 December 2014 42.65 25 25
Between 19 February 2009 and 19 February 2015 44.78 40 49
Between 19 February 2009 and 19 February 2016 44.78 1 744 1 850
Between 2 March 2010 and 2 March 2015 49.16 14 17
Between 19 March 2010 and 19 March 2015 53.91 5 5
Between 7 April 2010 and 7 April 2015 53.66 4 5
Between 3 May 2010 and 3 May 2016 52.75 8 8
Between 4 May 2010 and 4 May 2015 52.84 8 8
Between 5 May 2010 and 5 May 2015 53.05 5 6
Between 18 May 2010 and 18 May 2015 54.22 2 2
Between 2 June 2010 and 2 June 2015 53.75 18 20
Between 23 August 2010 and 23 August 2015 55.32 14 14
Between 23 August 2010 and 23 August 2016 55.32 19 68
Between 2 September 2010 and 2 September 2015 57.91 4 7
Between 2 September 2010 and 2 September 2016 57.91 8 10
Between 14 September 2010 and 14 September 2015 61.19 2 2
Between 4 october 2010 and 4 october 2015 67.64 3 3
Between 4 october 2010 and 4 october 2016 67.64 5 5
Between 2 November 2010 and 2 November 2015 68.47 3 3
Between 2 November 2010 and 2 November 2016 68.47 6 6
Between 5 November 2010 and 5 November 2016 71.12 7 14
Between 9 November 2010 and 9 November 2015 71.89 1 1
Between 10 November 2010 and 10 November 2016 72.99 12 12
Between 16 November 2010 and 16 November 2015 73.49 3 5
Between 1 December 2010 and 1 December 2016 73.80 226 236
Between 2 December 2010 and 2 December 2015 73.80 – 3
Between 2 December 2010 and 2 December 2016 73.80 4 4
Between 8 December 2010 and 8 December 2016 73.80 84 84
Between 13 December 2010 and 13 December 2016 75.02 4 4
Between 20 December 2010 and 20 December 2016 72.49 3 3
Between 23 February 2011 and 23 February 2016 64.57 14 14
Between 23 February 2011 and 23 February 2017 64.57 5 5
Between 2 March 2011 and 2 March 2016 62.91 4 4
Between 2 March 2011 and 2 March 2017 62.91 15 16
Between 7 March 2011 and 7 March 2017 64.35 8 8
Between 15 March 2011 and 15 March 2017 66.49 – 2
Between 16 March 2011 and 16 March 2017 65.97 6 6
ANNExURE TwoDETAILS oF DIRECToRS’ hoLDINGS oF ShARES AND oPTIoNS
T r u w o r t h s I n t e r n a t i o n a l L i m i t e d A n n u a l F i n a n c i a l S t a t e m e n t s 2 0 1 298
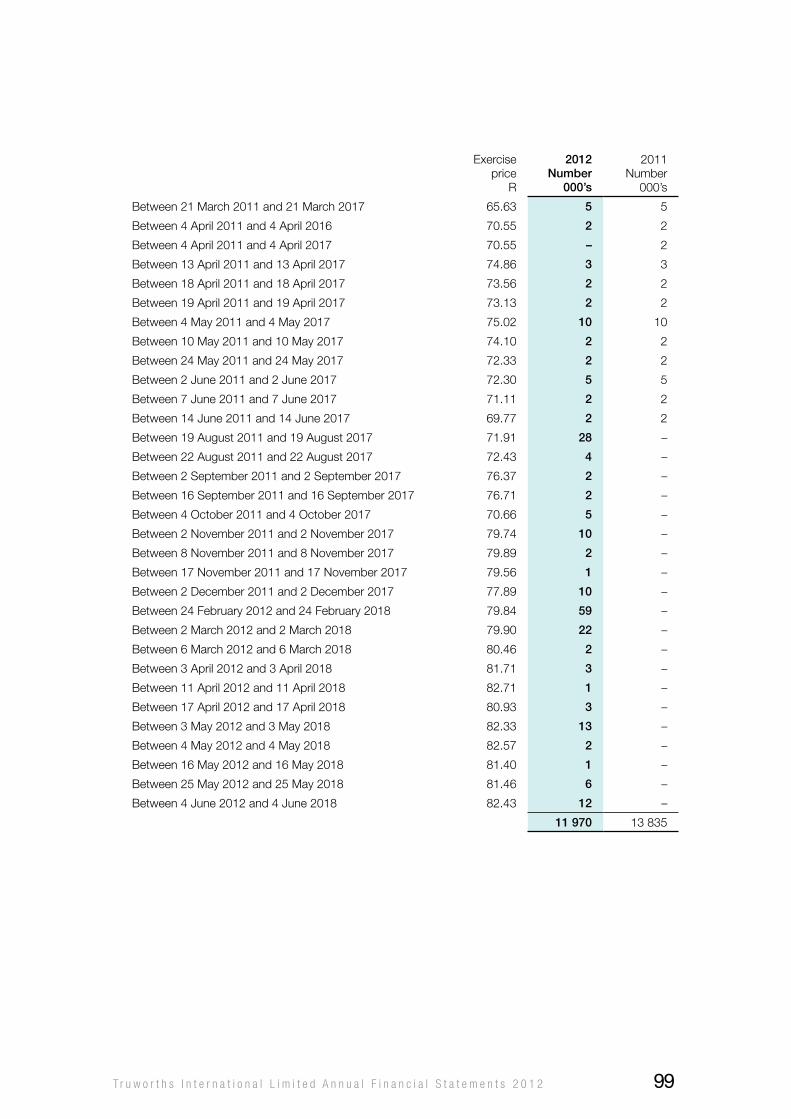
Exercise price
R
2012number
000’s
2011Number
000’s
Between 21 March 2011 and 21 March 2017 65.63 5 5
Between 4 April 2011 and 4 April 2016 70.55 2 2
Between 4 April 2011 and 4 April 2017 70.55 – 2
Between 13 April 2011 and 13 April 2017 74.86 3 3
Between 18 April 2011 and 18 April 2017 73.56 2 2
Between 19 April 2011 and 19 April 2017 73.13 2 2
Between 4 May 2011 and 4 May 2017 75.02 10 10
Between 10 May 2011 and 10 May 2017 74.10 2 2
Between 24 May 2011 and 24 May 2017 72.33 2 2
Between 2 June 2011 and 2 June 2017 72.30 5 5
Between 7 June 2011 and 7 June 2017 71.11 2 2
Between 14 June 2011 and 14 June 2017 69.77 2 2
Between 19 August 2011 and 19 August 2017 71.91 28 –
Between 22 August 2011 and 22 August 2017 72.43 4 –
Between 2 September 2011 and 2 September 2017 76.37 2 –
Between 16 September 2011 and 16 September 2017 76.71 2 –
Between 4 october 2011 and 4 october 2017 70.66 5 –
Between 2 November 2011 and 2 November 2017 79.74 10 –
Between 8 November 2011 and 8 November 2017 79.89 2 –
Between 17 November 2011 and 17 November 2017 79.56 1 –
Between 2 December 2011 and 2 December 2017 77.89 10 –
Between 24 February 2012 and 24 February 2018 79.84 59 –
Between 2 March 2012 and 2 March 2018 79.90 22 –
Between 6 March 2012 and 6 March 2018 80.46 2 –
Between 3 April 2012 and 3 April 2018 81.71 3 –
Between 11 April 2012 and 11 April 2018 82.71 1 –
Between 17 April 2012 and 17 April 2018 80.93 3 –
Between 3 May 2012 and 3 May 2018 82.33 13 –
Between 4 May 2012 and 4 May 2018 82.57 2 –
Between 16 May 2012 and 16 May 2018 81.40 1 –
Between 25 May 2012 and 25 May 2018 81.46 6 –
Between 4 June 2012 and 4 June 2018 82.43 12 –
11 970 13 835
T r u w o r t h s I n t e r n a t i o n a l L i m i t e d A n n u a l F i n a n c i a l S t a t e m e n t s 2 0 1 2 99
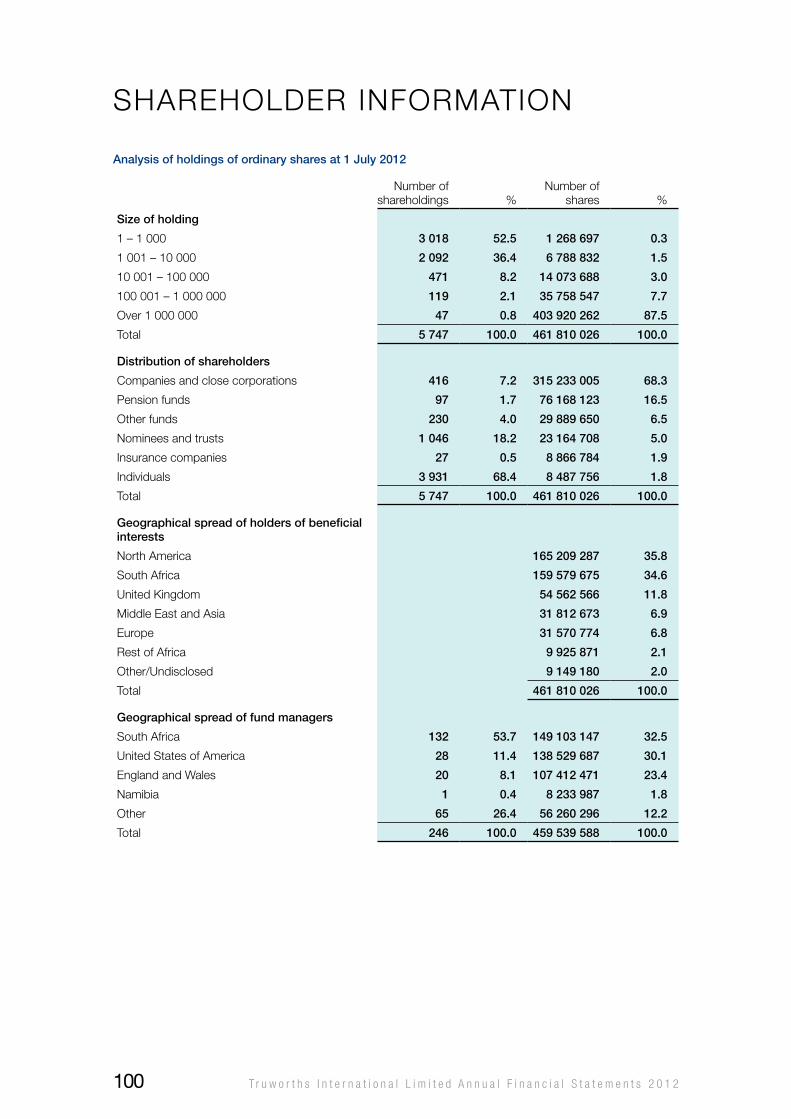
analysis of holdings of ordinary shares at 1 July 2012
Number of shareholdings %
Number of shares %
size of holding
1 – 1 000 3 018 52.5 1 268 697 0.3
1 001 – 10 000 2 092 36.4 6 788 832 1.5
10 001 – 100 000 471 8.2 14 073 688 3.0
100 001 – 1 000 000 119 2.1 35 758 547 7.7
over 1 000 000 47 0.8 403 920 262 87.5
Total 5 747 100.0 461 810 026 100.0
Distribution of shareholders
Companies and close corporations 416 7.2 315 233 005 68.3
Pension funds 97 1.7 76 168 123 16.5
other funds 230 4.0 29 889 650 6.5
Nominees and trusts 1 046 18.2 23 164 708 5.0
Insurance companies 27 0.5 8 866 784 1.9
Individuals 3 931 68.4 8 487 756 1.8
Total 5 747 100.0 461 810 026 100.0
Geographical spread of holders of beneficial interests
North America 165 209 287 35.8
South Africa 159 579 675 34.6
UnitedKingdom 54 562 566 11.8
Middle East and Asia 31 812 673 6.9
Europe 31 570 774 6.8
Rest of Africa 9 925 871 2.1
other/Undisclosed 9 149 180 2.0
Total 461 810 026 100.0
Geographical spread of fund managers
South Africa 132 53.7 149 103 147 32.5
United States of America 28 11.4 138 529 687 30.1
England and wales 20 8.1 107 412 471 23.4
Namibia 1 0.4 8 233 987 1.8
other 65 26.4 56 260 296 12.2
Total 246 100.0 459 539 588 100.0
ShAREhoLDER INFoRMATIoN
T r u w o r t h s I n t e r n a t i o n a l L i m i t e d A n n u a l F i n a n c i a l S t a t e m e n t s 2 0 1 2100
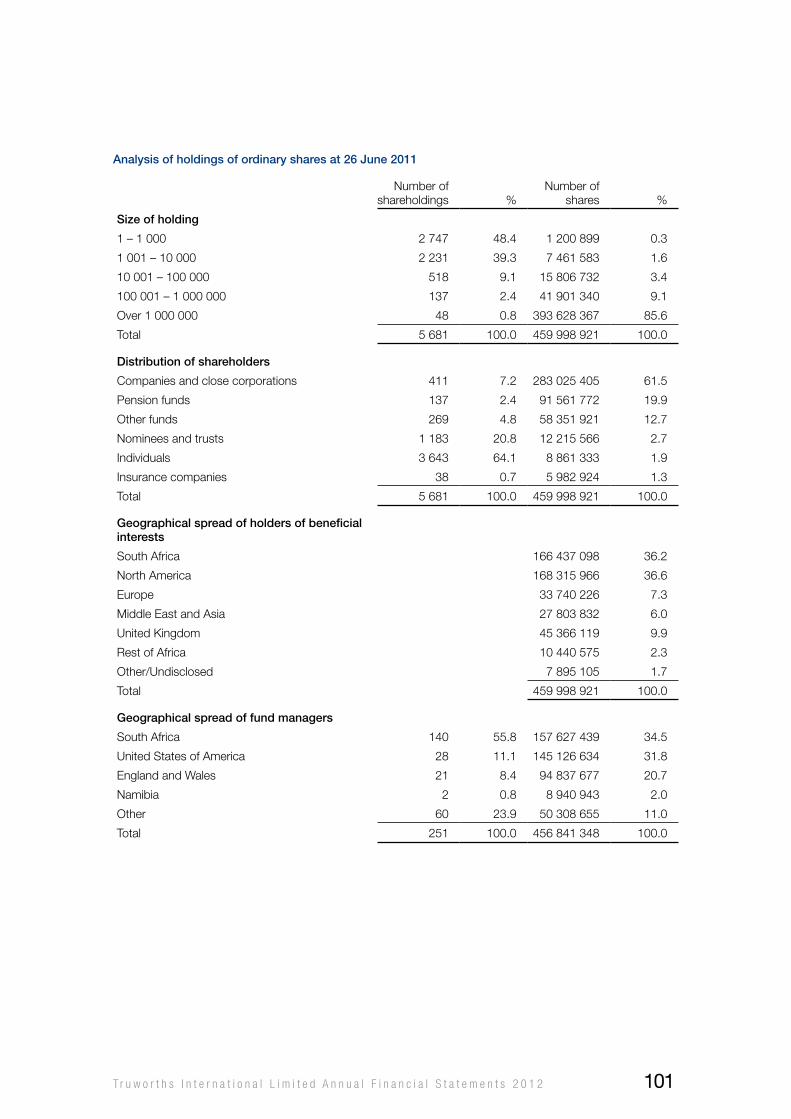
analysis of holdings of ordinary shares at 26 June 2011
Number of shareholdings %
Number of shares %
size of holding
1 – 1 000 2 747 48.4 1 200 899 0.3
1 001 – 10 000 2 231 39.3 7 461 583 1.6
10 001 – 100 000 518 9.1 15 806 732 3.4
100 001 – 1 000 000 137 2.4 41 901 340 9.1
over 1 000 000 48 0.8 393 628 367 85.6
Total 5 681 100.0 459 998 921 100.0
Distribution of shareholders
Companies and close corporations 411 7.2 283 025 405 61.5
Pension funds 137 2.4 91 561 772 19.9
other funds 269 4.8 58 351 921 12.7
Nominees and trusts 1 183 20.8 12 215 566 2.7
Individuals 3 643 64.1 8 861 333 1.9
Insurance companies 38 0.7 5 982 924 1.3
Total 5 681 100.0 459 998 921 100.0
Geographical spread of holders of beneficial interests
South Africa 166 437 098 36.2
North America 168 315 966 36.6
Europe 33 740 226 7.3
Middle East and Asia 27 803 832 6.0
UnitedKingdom 45 366 119 9.9
Rest of Africa 10 440 575 2.3
other/Undisclosed 7 895 105 1.7
Total 459 998 921 100.0
Geographical spread of fund managers
South Africa 140 55.8 157 627 439 34.5
United States of America 28 11.1 145 126 634 31.8
England and wales 21 8.4 94 837 677 20.7
Namibia 2 0.8 8 940 943 2.0
other 60 23.9 50 308 655 11.0
Total 251 100.0 456 841 348 100.0
T r u w o r t h s I n t e r n a t i o n a l L i m i t e d A n n u a l F i n a n c i a l S t a t e m e n t s 2 0 1 2 101
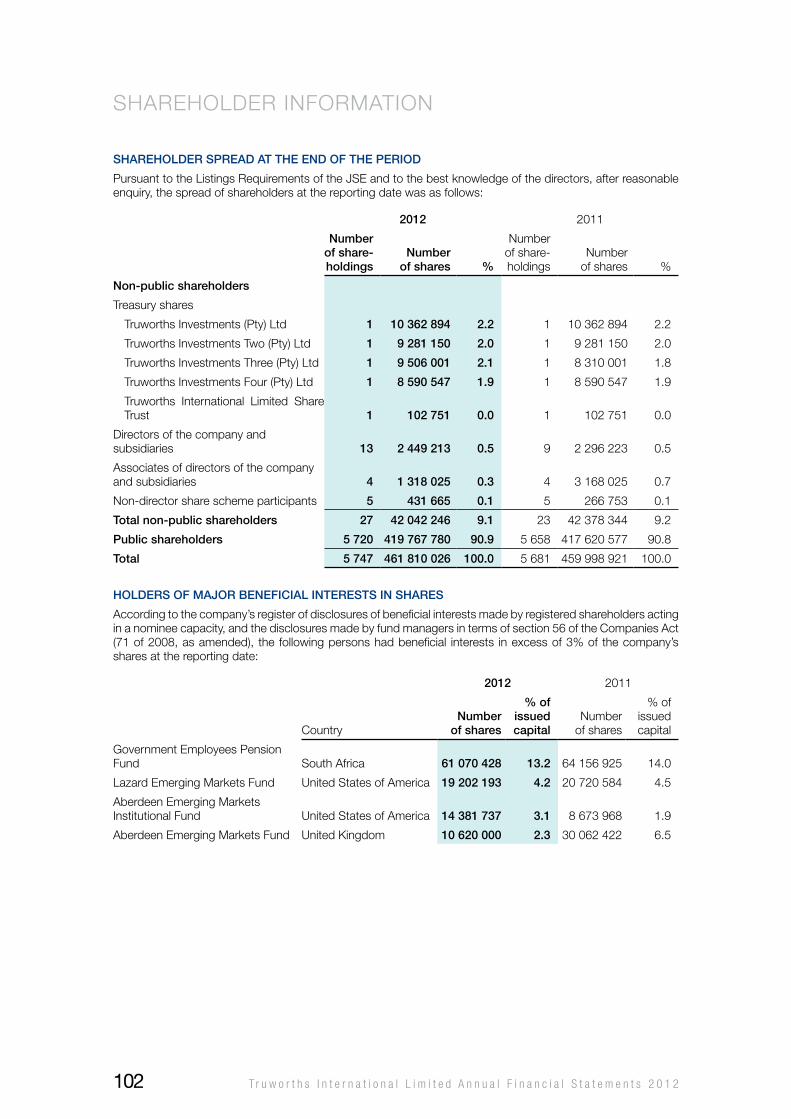
ShAREhoLDER INFoRMATIoN
shareholDer spreaD at the enD of the perioD
Pursuant to the Listings Requirements of the JSE and to the best knowledge of the directors, after reasonable enquiry, the spread of shareholders at the reporting date was as follows:
2012 2011
number of share-holdings
number of shares %
Number of share-holdings
Number of shares %
non-public shareholders
Treasury shares
Truworths Investments (Pty) Ltd 1 10 362 894 2.2 1 10 362 894 2.2
Truworths Investments Two (Pty) Ltd 1 9 281 150 2.0 1 9 281 150 2.0
Truworths Investments Three (Pty) Ltd 1 9 506 001 2.1 1 8 310 001 1.8
Truworths Investments Four (Pty) Ltd 1 8 590 547 1.9 1 8 590 547 1.9
Truworths International Limited Share Trust 1 102 751 0.0 1 102 751 0.0
Directors of the company and subsidiaries 13 2 449 213 0.5 9 2 296 223 0.5
Associates of directors of the company and subsidiaries 4 1 318 025 0.3 4 3 168 025 0.7
Non-director share scheme participants 5 431 665 0.1 5 266 753 0.1
total non-public shareholders 27 42 042 246 9.1 23 42 378 344 9.2
public shareholders 5 720 419 767 780 90.9 5 658 417 620 577 90.8
total 5 747 461 810 026 100.0 5 681 459 998 921 100.0
holDers of maJor beneficial interests in shares
According to the company’s register of disclosures of beneficial interests made by registered shareholders acting in a nominee capacity, and the disclosures made by fund managers in terms of section 56 of the Companies Act (71 of 2008, as amended), the following persons had beneficial interests in excess of 3% of the company’s shares at the reporting date:
2012 2011
Countrynumber
of shares
% of issued capital
Number of shares
% of issued capital
Government Employees Pension Fund South Africa 61 070 428 13.2 64 156 925 14.0
Lazard Emerging Markets Fund United States of America 19 202 193 4.2 20 720 584 4.5
Aberdeen Emerging Markets Institutional Fund United States of America 14 381 737 3.1 8 673 968 1.9
Aberdeen Emerging Markets Fund UnitedKingdom 10 620 000 2.3 30 062 422 6.5
T r u w o r t h s I n t e r n a t i o n a l L i m i t e d A n n u a l F i n a n c i a l S t a t e m e n t s 2 0 1 2102
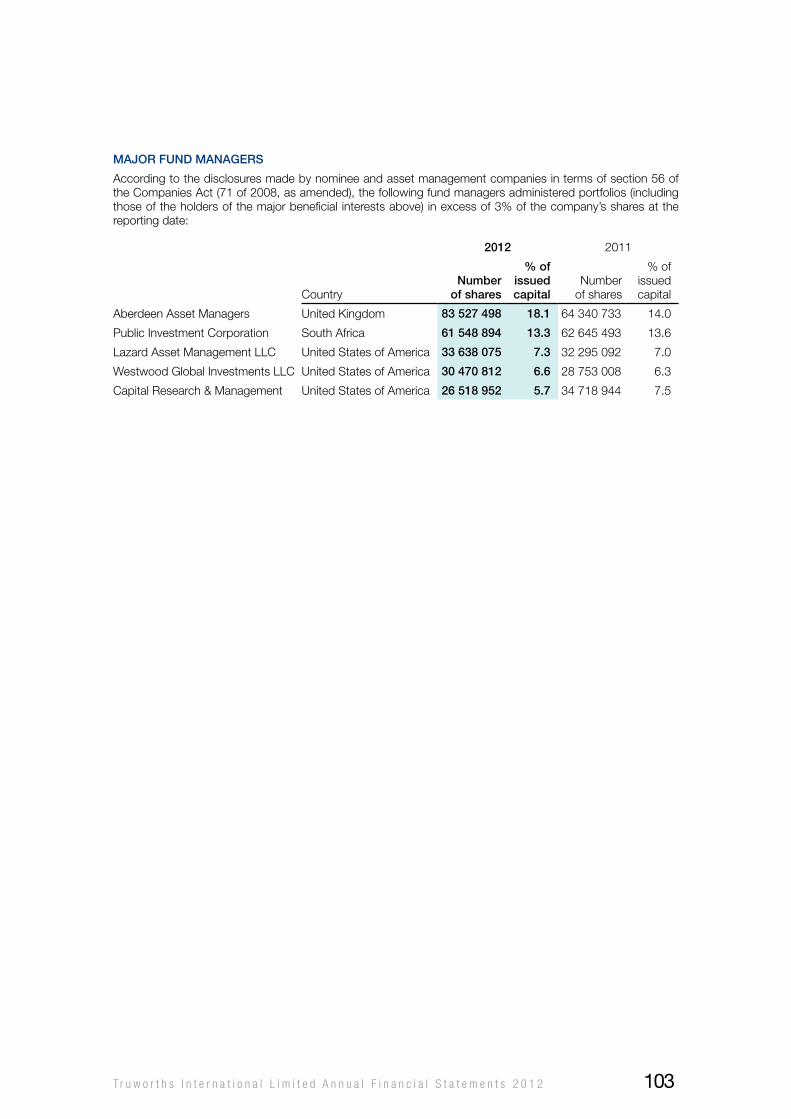
maJor funD manaGers
According to the disclosures made by nominee and asset management companies in terms of section 56 of the Companies Act (71 of 2008, as amended), the following fund managers administered portfolios (including those of the holders of the major beneficial interests above) in excess of 3% of the company’s shares at the reporting date:
2012 2011
Countrynumber
of shares
% of issued capital
Number of shares
% of issued capital
Aberdeen Asset Managers UnitedKingdom 83 527 498 18.1 64 340 733 14.0
Public Investment Corporation South Africa 61 548 894 13.3 62 645 493 13.6
Lazard Asset Management LLC United States of America 33 638 075 7.3 32 295 092 7.0
westwood Global Investments LLC United States of America 30 470 812 6.6 28 753 008 6.3
Capital Research & Management United States of America 26 518 952 5.7 34 718 944 7.5
T r u w o r t h s I n t e r n a t i o n a l L i m i t e d A n n u a l F i n a n c i a l S t a t e m e n t s 2 0 1 2 103

www.truworths.co.za