Embed Size (px)
Citation preview

www.eia.govU.S. Energy Information Administration Independent Statistics & Analysis
Annual Energy Outlook 2018
Johns Hopkins University School of Advanced International Studies (SAIS)February 6, 2018 | Washington, DC
Dr. Linda Capuano, AdministratorU.S. Energy Information Administration
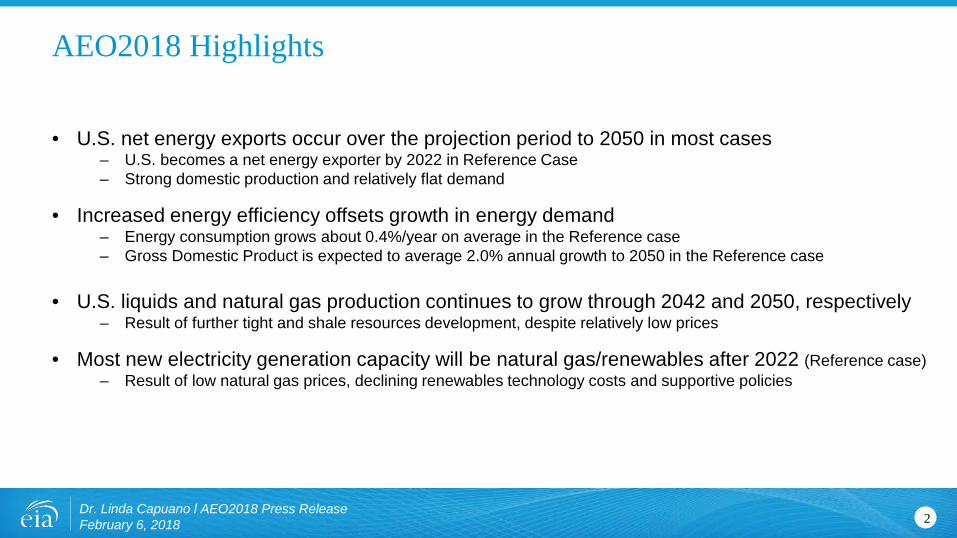
AEO2018 Highlights
• U.S. net energy exports occur over the projection period to 2050 in most cases– U.S. becomes a net energy exporter by 2022 in Reference Case – Strong domestic production and relatively flat demand
• Increased energy efficiency offsets growth in energy demand– Energy consumption grows about 0.4%/year on average in the Reference case – Gross Domestic Product is expected to average 2.0% annual growth to 2050 in the Reference case
• U.S. liquids and natural gas production continues to grow through 2042 and 2050, respectively– Result of further tight and shale resources development, despite relatively low prices
• Most new electricity generation capacity will be natural gas/renewables after 2022 (Reference case)– Result of low natural gas prices, declining renewables technology costs and supportive policies
Dr. Linda Capuano l AEO2018 Press Release February 6, 2018 2
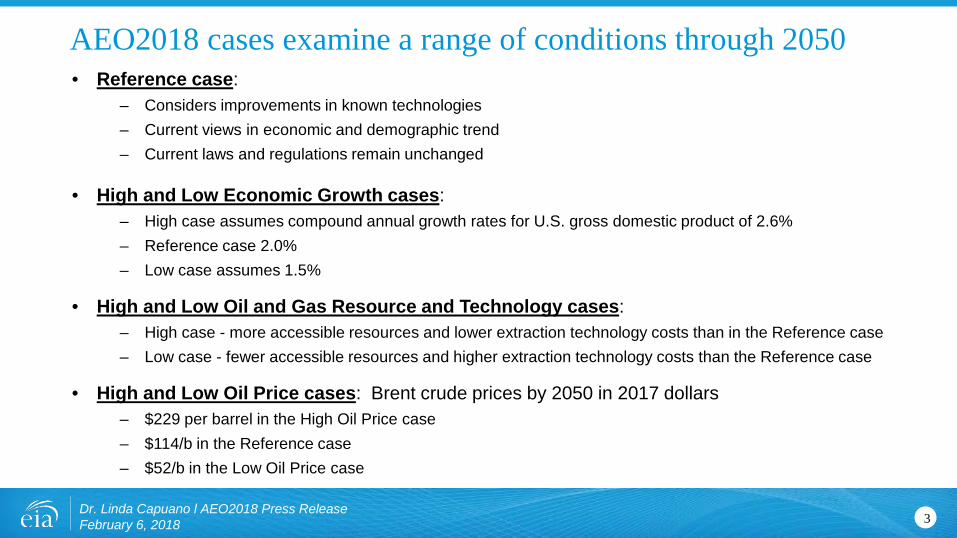
AEO2018 cases examine a range of conditions through 2050• Reference case:
– Considers improvements in known technologies– Current views in economic and demographic trend– Current laws and regulations remain unchanged
• High and Low Economic Growth cases: – High case assumes compound annual growth rates for U.S. gross domestic product of 2.6% – Reference case 2.0%– Low case assumes 1.5%
• High and Low Oil and Gas Resource and Technology cases:– High case - more accessible resources and lower extraction technology costs than in the Reference case– Low case - fewer accessible resources and higher extraction technology costs than the Reference case
• High and Low Oil Price cases: Brent crude prices by 2050 in 2017 dollars– $229 per barrel in the High Oil Price case– $114/b in the Reference case– $52/b in the Low Oil Price case
Dr. Linda Capuano l AEO2018 Press Release February 6, 2018 3
0
50
100
150
200
250
2010 2020 2030 2040 2050
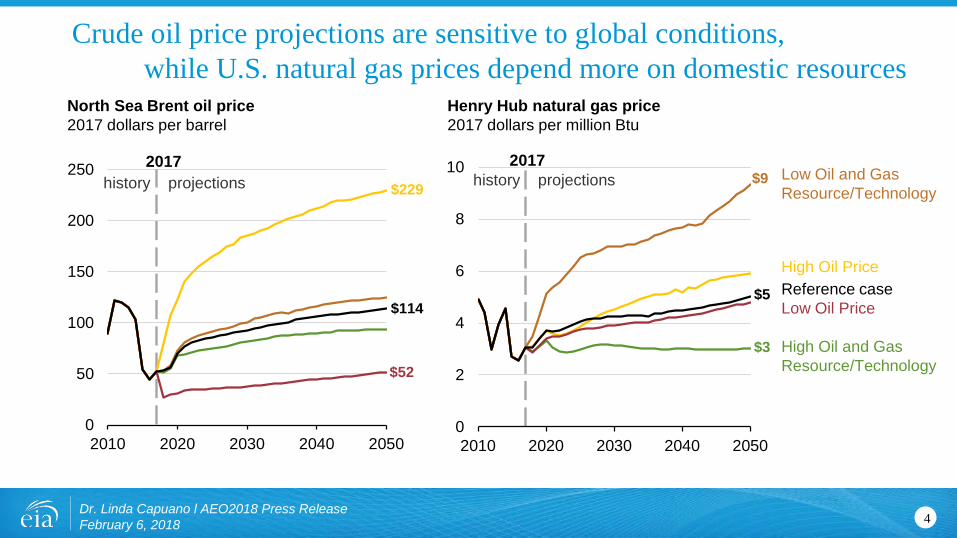
North Sea Brent oil price2017 dollars per barrel
2017history projections $229
$52
$114
0
2
4
6
8
10
2010 2020 2030 2040 2050
Henry Hub natural gas price2017 dollars per million Btu
2017history projections Low Oil and Gas
Resource/Technology
High Oil PriceReference caseLow Oil Price
High Oil and Gas Resource/Technology
$9
$5
$3
Crude oil price projections are sensitive to global conditions,while U.S. natural gas prices depend more on domestic resources
4Dr. Linda Capuano l AEO2018 Press Release February 6, 2018
0
5
10
15
20
25
2010 2020 2030 2040 2050
2017history projections
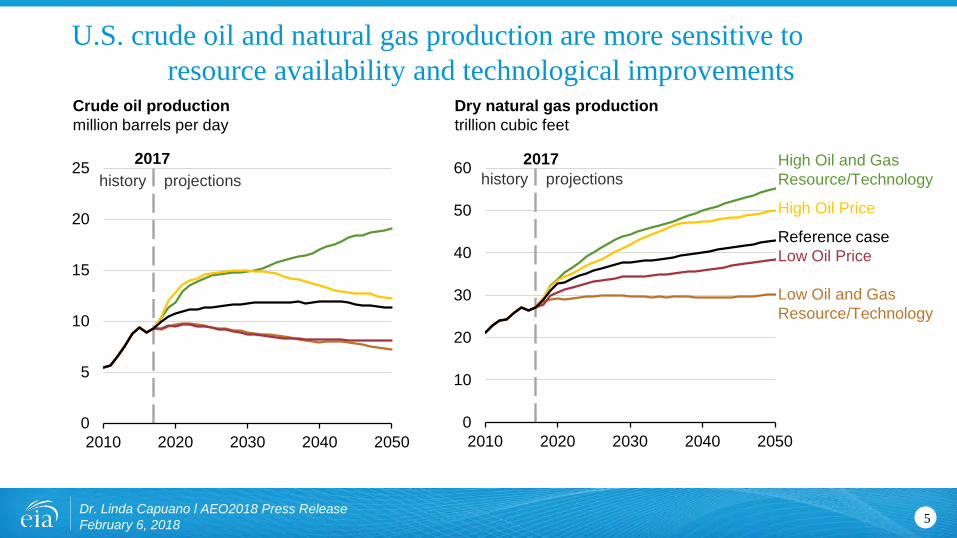
Crude oil productionmillion barrels per day
0
10
20
30
40
50
60
2010 2020 2030 2040 2050
2017
Dry natural gas productiontrillion cubic feet
history projectionsHigh Oil and Gas Resource/Technology
High Oil Price
Reference case Low Oil Price
Low Oil and Gas Resource/Technology
U.S. crude oil and natural gas production are more sensitive to resource availability and technological improvements
5Dr. Linda Capuano l AEO2018 Press Release February 6, 2018
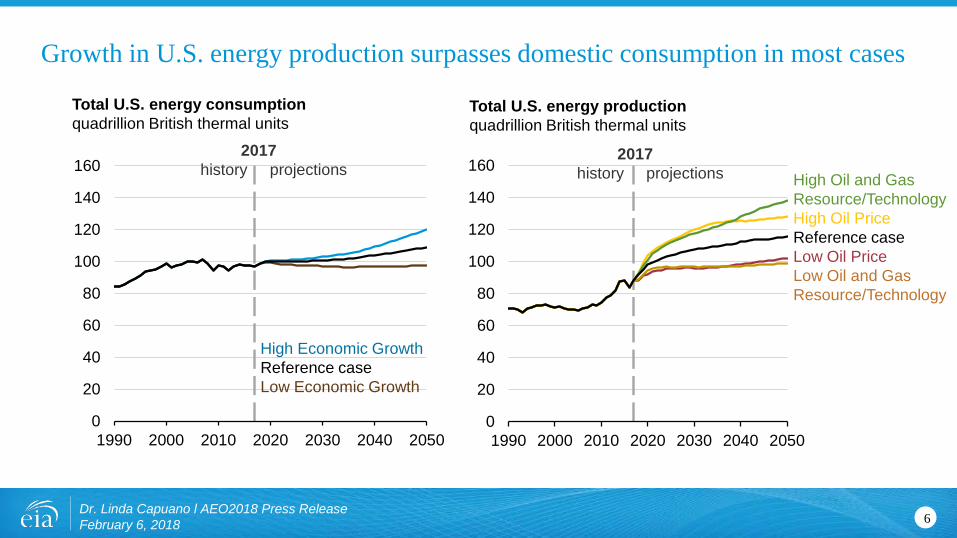
0
20
40
60
80
100
120
140
160
1990 2000 2010 2020 2030 2040 2050
2017history projections
High Economic GrowthReference case Low Economic Growth
Growth in U.S. energy production surpasses domestic consumption in most cases
6Dr. Linda Capuano l AEO2018 Press Release February 6, 2018
Total U.S. energy consumptionquadrillion British thermal units
Total U.S. energy productionquadrillion British thermal units
0
20
40
60
80
100
120
140
160
1990 2000 2010 2020 2030 2040 2050
2017history projections High Oil and Gas
Resource/Technology High Oil PriceReference case Low Oil PriceLow Oil and Gas Resource/Technology
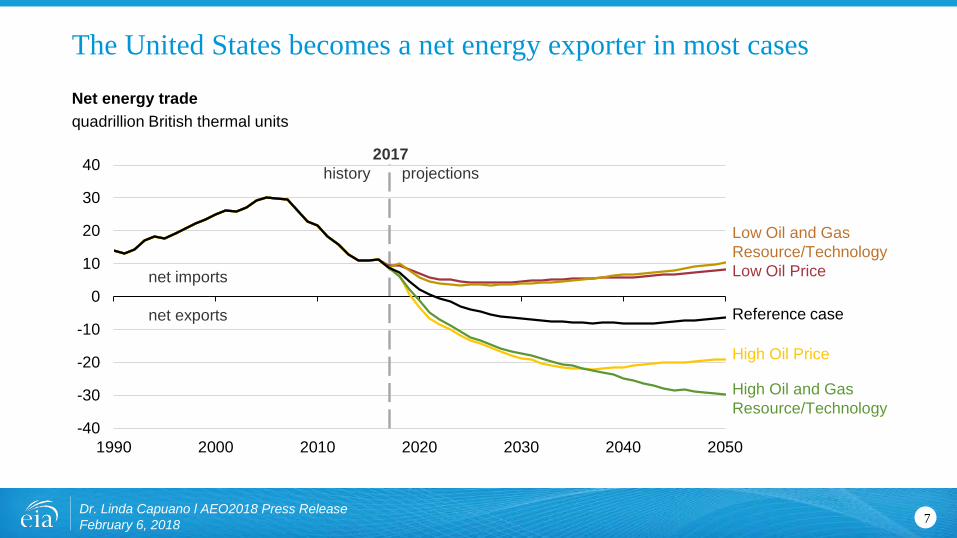
-40
-30
-20
-10
0
10
20
30
40
1990 2000 2010 2020 2030 2040 2050
2017history projections
net imports
net exports
Low Oil and Gas Resource/Technology Low Oil Price
Reference case
High Oil Price
High Oil and Gas Resource/Technology
Net energy tradequadrillion British thermal units
The United States becomes a net energy exporter in most cases
7Dr. Linda Capuano l AEO2018 Press Release February 6, 2018
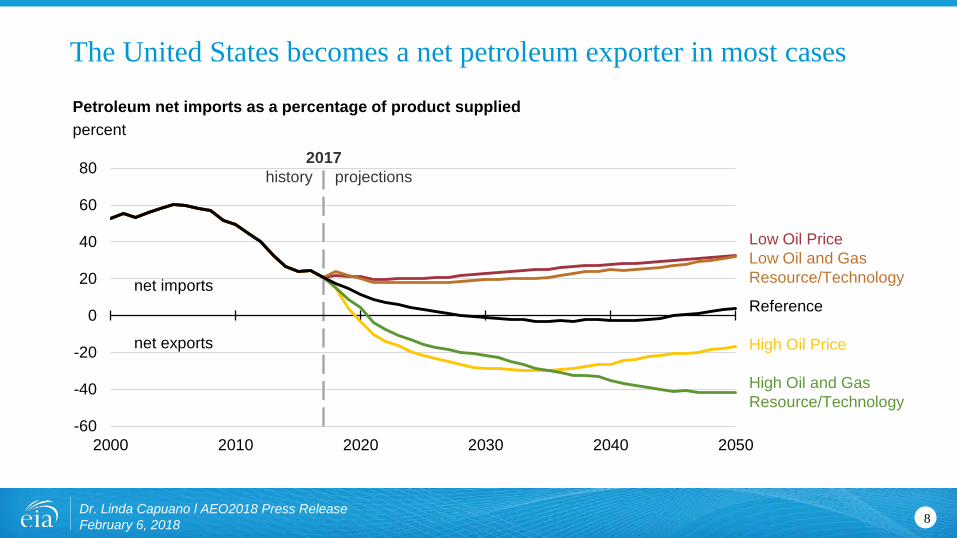
-60
-40
-20
0
20
40
60
80
2000 2010 2020 2030 2040 2050
2017history projections
Low Oil PriceLow Oil and GasResource/Technology
Reference
High Oil Price
High Oil and GasResource/Technology
net imports
net exports
Petroleum net imports as a percentage of product suppliedpercent
The United States becomes a net petroleum exporter in most cases
8Dr. Linda Capuano l AEO2018 Press Release February 6, 2018
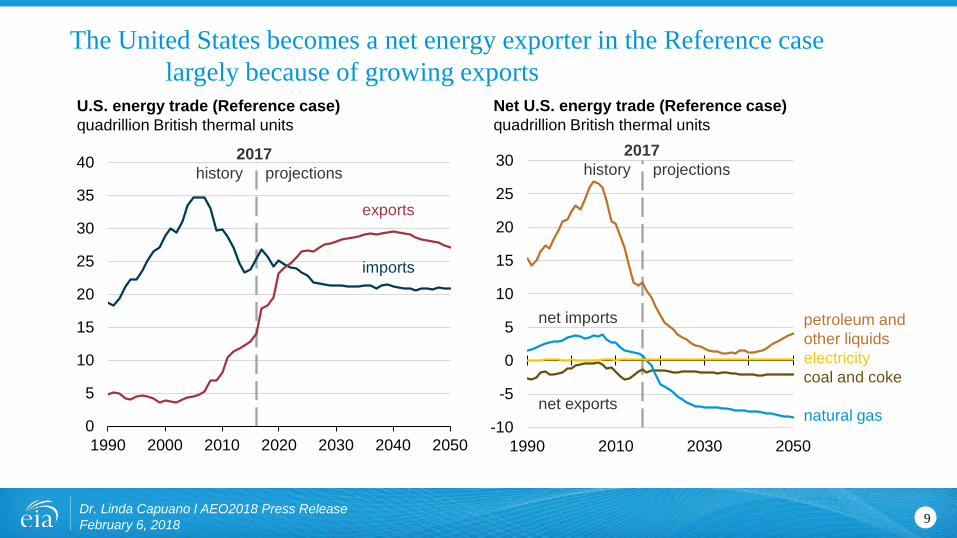
0
5
10
15
20
25
30
35
40
1990 2000 2010 2020 2030 2040 2050
U.S. energy trade (Reference case)quadrillion British thermal units
exports
imports
2017history projections
-10
-5
0
5
10
15
20
25
30
1990 2010 2030 2050
Net U.S. energy trade (Reference case)quadrillion British thermal units
petroleum and other liquidselectricitycoal and coke
natural gas
2017history projections
net imports
net exports
The United States becomes a net energy exporter in the Reference caselargely because of growing exports
9Dr. Linda Capuano l AEO2018 Press Release February 6, 2018
0
5
10
15
20
25
30
35
40
45
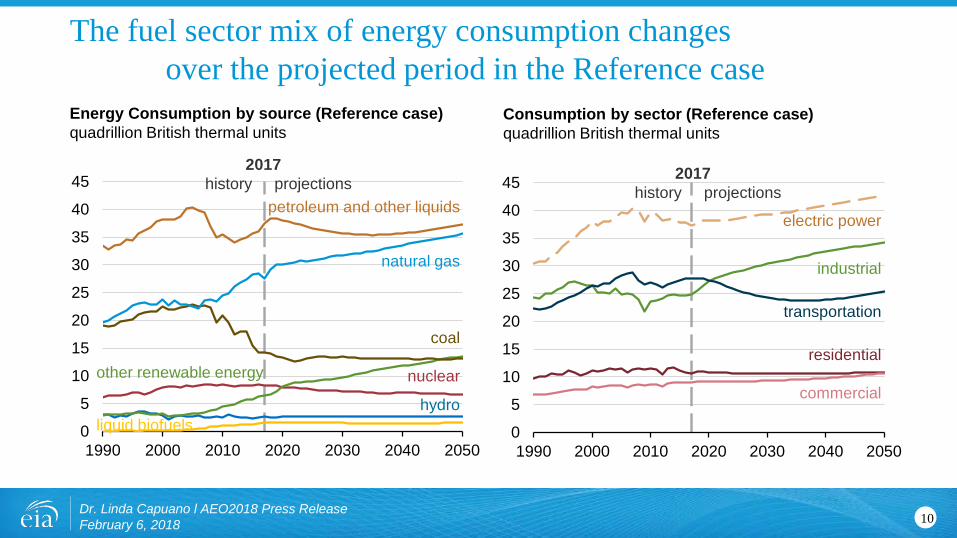
1990 2000 2010 2020 2030 2040 2050
2017history projections
Energy Consumption by source (Reference case)quadrillion British thermal units
petroleum and other liquids
natural gas
coal
nuclear
hydro
other renewable energy
liquid biofuels
The fuel sector mix of energy consumption changesover the projected period in the Reference case
10Dr. Linda Capuano l AEO2018 Press Release February 6, 2018
0
5
10
15
20
25
30
35
40
45
1990 2000 2010 2020 2030 2040 2050
electric power
industrial
transportation
residential
commercial
Consumption by sector (Reference case)quadrillion British thermal units
2017history projections
0
5
10
15
20
25
30
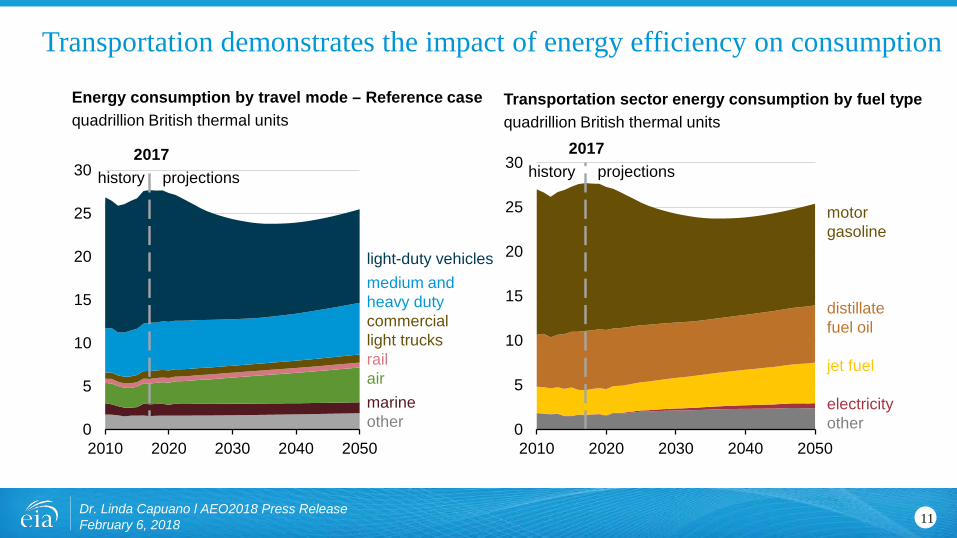
2010 2020 2030 2040 2050
2017history projections
light-duty vehiclesmedium and heavy dutycommerciallight trucksrailairmarineother 0
5
10
15
20
25
30
2010 2020 2030 2040 2050
2017history projections
motorgasoline
distillate fuel oil
jet fuel
electricityother
Transportation sector energy consumption by fuel typequadrillion British thermal units
Transportation demonstrates the impact of energy efficiency on consumption
11Dr. Linda Capuano l AEO2018 Press Release February 6, 2018
Energy consumption by travel mode – Reference casequadrillion British thermal units
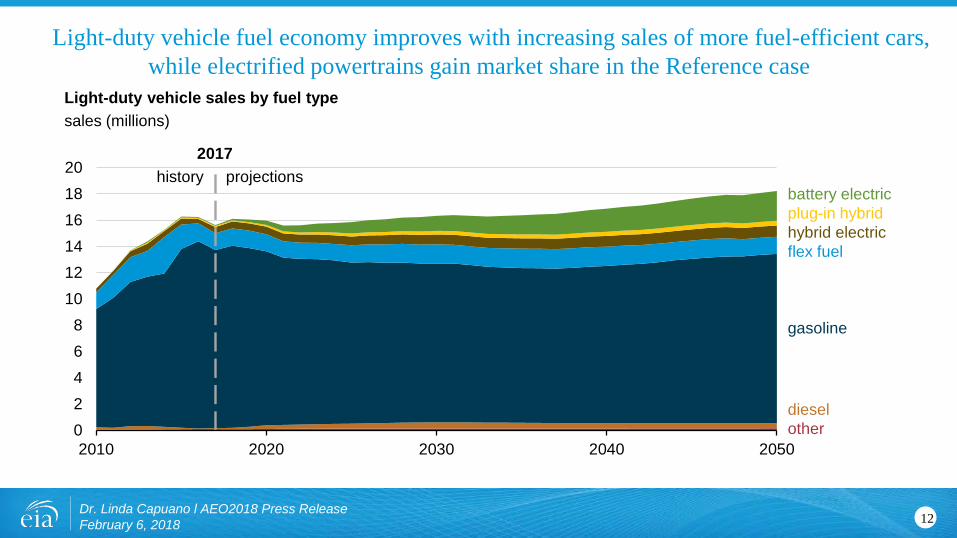
02468
101214161820
2010 2020 2030 2040 2050
2017history projections
battery electricplug-in hybridhybrid electricflex fuel
gasoline
dieselother
Light-duty vehicle sales by fuel typesales (millions)
Light-duty vehicle fuel economy improves with increasing sales of more fuel-efficient cars, while electrified powertrains gain market share in the Reference case
12Dr. Linda Capuano l AEO2018 Press Release February 6, 2018

0
5
10
15
20
25
2010 2020 2030 2040 2050
2017projections
Low Oil and Gas Resource and Technology
2010 2020 2030 2040 2050
2017projections
High Oil and Gas Resource and Technology
0
5
10
15
20
25
2000 2010 2020 2030 2040 2050
tight oil
2017history projections
Reference case
other
Crude oil production million barrels per day
U.S. crude oil production growth led by tight oil
13Dr. Linda Capuano l AEO2018 Press Release February 6, 2018
0
20
40
60
80
100
120
140
160
0
10
20
30
40
50
60
2000 2010 2020 2030 2040 2050
2017history projections High Oil and Gas
Resource/TechnologyHigh Oil PriceReferenceLow Oil PriceLow Oil and Gas Resource/Technology
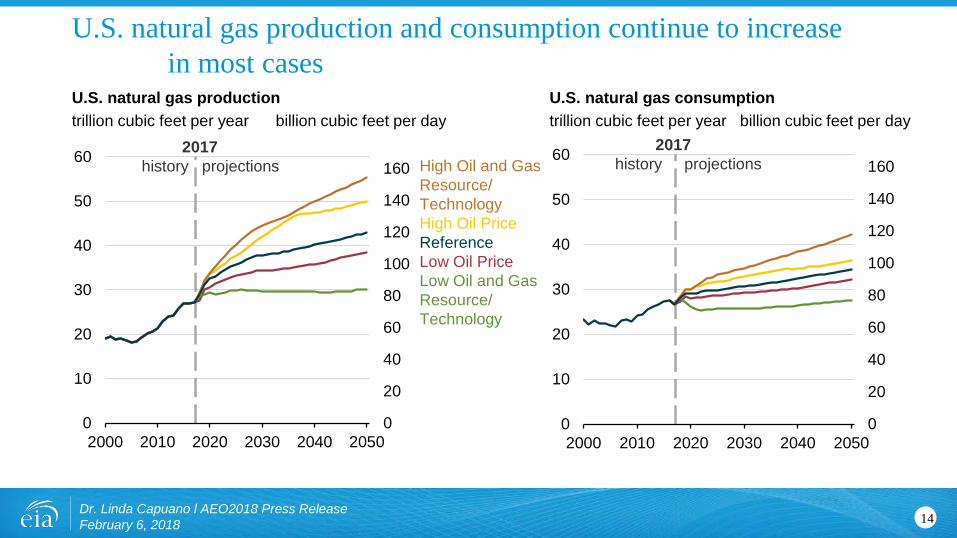
0
20
40
60
80
100
120
140
160
0
10
20
30
40
50
60
2000 2010 2020 2030 2040 2050
2017history projections
U.S. natural gas productiontrillion cubic feet per year billion cubic feet per day
U.S. natural gas consumptiontrillion cubic feet per year billion cubic feet per day
U.S. natural gas production and consumption continue to increasein most cases
14Dr. Linda Capuano l AEO2018 Press Release February 6, 2018

0
5
10
15
20
25
30
35
0
2
4
6
8
10
12
14
2000 2010 2020 2030 2040 2050
2017history projections
High Oil Price
High Oil and Gas Resource/Technology
ReferenceLow Oil and Gas Resource/Technology
Low Oil Price
Liquefied natural gas exportstrillion cubic feet per year billion cubic feet per day
The United States becomes a net exporter of natural gas before 2020, although the level of LNG exports is uncertain
15Dr. Linda Capuano l AEO2018 Press Release February 6, 2018
-14
-7
0
7
14
21
28
-5
0
5
10
2000 2010 2020 2030 2040 2050
2017history projections
?
Canada pipeline imports
LNG imports
LNG exports
Mexico pipeline export
Canada pipeline export
Natural gas tradetrillion cubic feet per year billion cubic feet per day
0
2
4
6
8
10
12
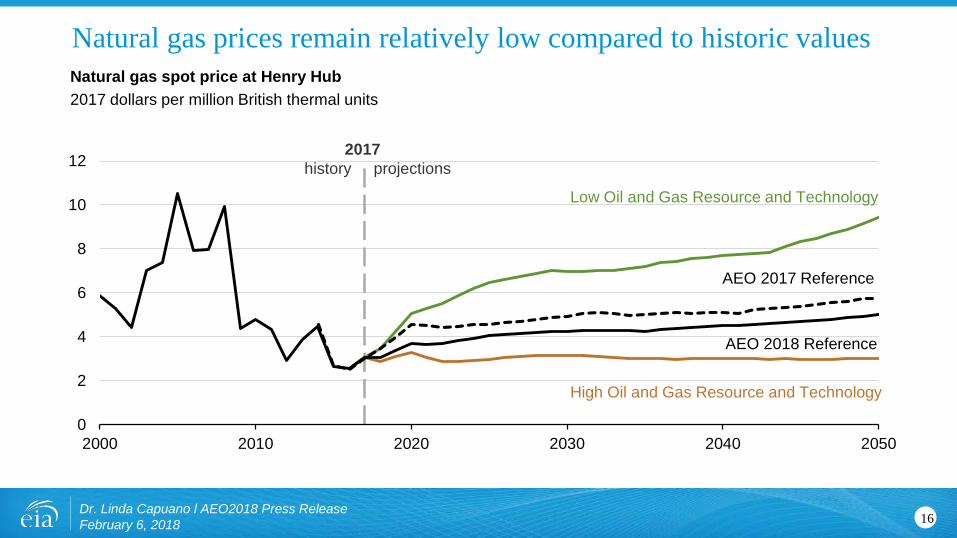
2000 2010 2020 2030 2040 2050
2017history projections
Low Oil and Gas Resource and Technology
AEO 2018 Reference
High Oil and Gas Resource and Technology
AEO 2017 Reference
Natural gas spot price at Henry Hub 2017 dollars per million British thermal units
Natural gas prices remain relatively low compared to historic values
16Dr. Linda Capuano l AEO2018 Press Release February 6, 2018
-1
0
1
2
3
4
5
1990 2000 2010 2020 2030 2040 2050
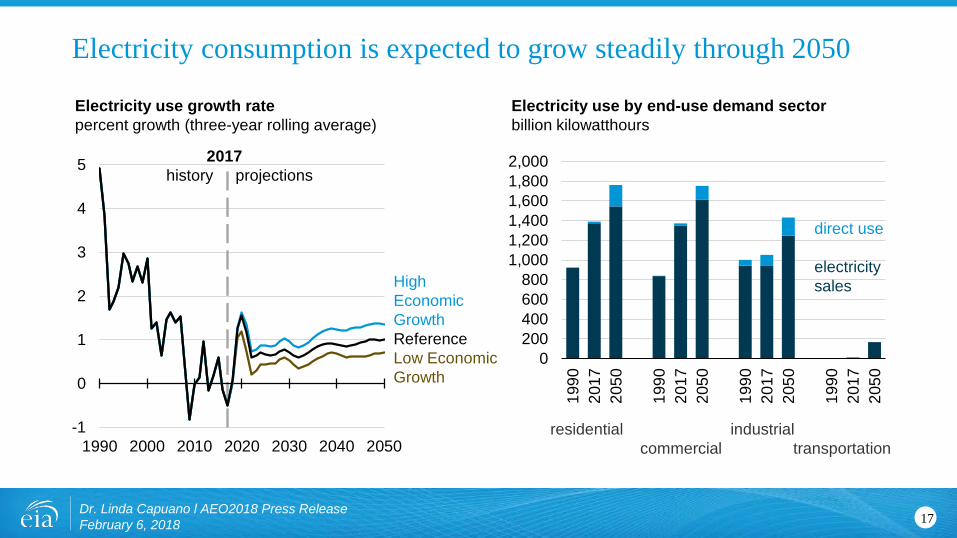
Electricity use growth rate percent growth (three-year rolling average)
2017history projections
High Economic GrowthReference Low Economic Growth
0200400600800
1,0001,2001,4001,6001,8002,000
1990
2017
2050
1990
2017
2050
1990
2017
2050
1990
2017
2050
Electricity use by end-use demand sector billion kilowatthours
direct use
electricity sales
residential industrialcommercial transportation
Electricity consumption is expected to grow steadily through 2050
17Dr. Linda Capuano l AEO2018 Press Release February 6, 2018
0
500
1000
1500
2000
2500
3000
2010 2020 2030 2040 2050
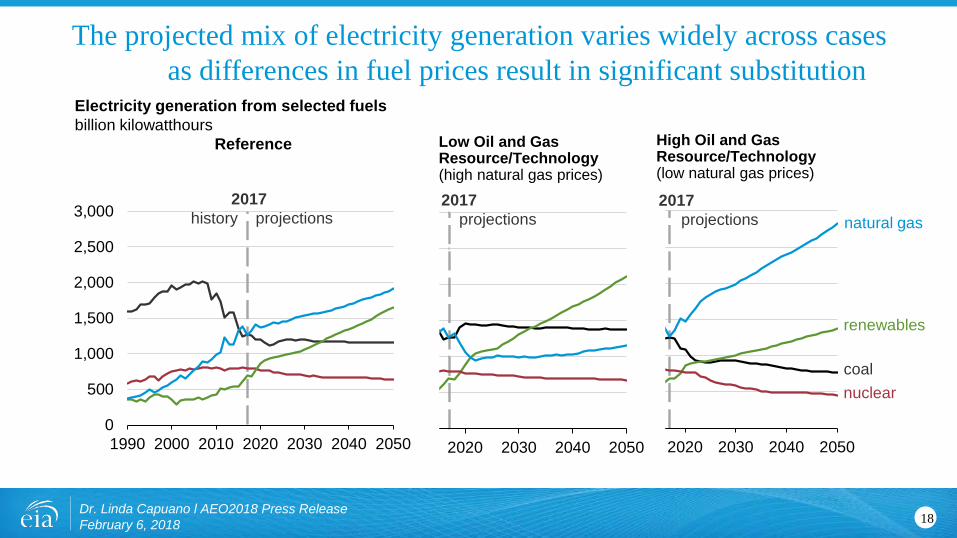
2017projections
High Oil and Gas Resource/Technology(low natural gas prices)
0
500
1000
1500
2000
2500
3000
2010 2020 2030 2040 2050
2017projections
Low Oil and Gas Resource/Technology(high natural gas prices)
0
500
1,000
1,500
2,000
2,500
3,000
1990 2000 2010 2020 2030 2040 2050
2017history projections
Electricity generation from selected fuelsbillion kilowatthours
Reference
The projected mix of electricity generation varies widely across casesas differences in fuel prices result in significant substitution
18Dr. Linda Capuano l AEO2018 Press Release February 6, 2018
natural gas
renewables
coalnuclear
-30
-20
-10
0
10
20
30
40
50
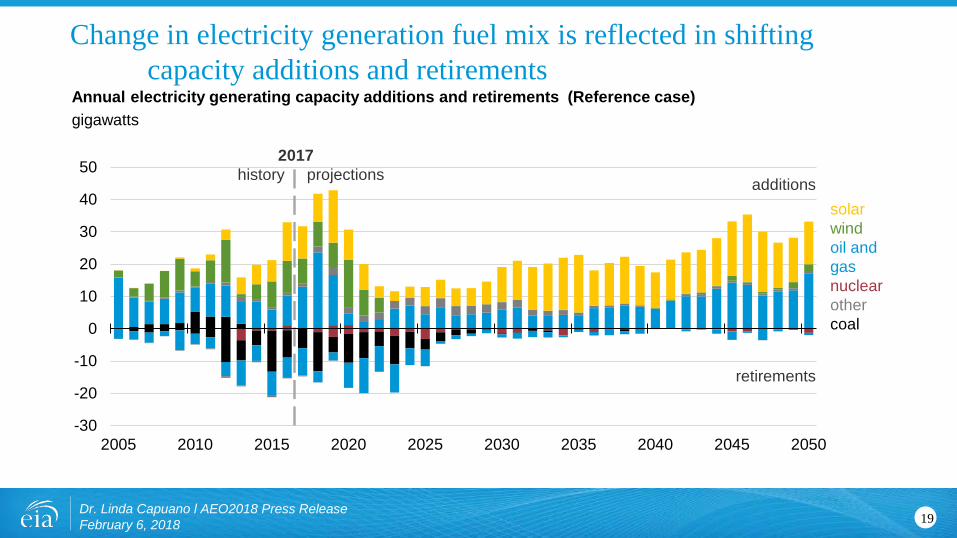
2005 2010 2015 2020 2025 2030 2035 2040 2045 2050
2017history projections
solarwindoil and gasnuclearothercoal
additions
retirements
Annual electricity generating capacity additions and retirements (Reference case) gigawatts
Change in electricity generation fuel mix is reflected in shiftingcapacity additions and retirements
19Dr. Linda Capuano l AEO2018 Press Release February 6, 2018
0
200
400
600
800
1,000
1,200
1,400
2000 2010 2020 2030 2040 2050
2017history projections
Reference case Reference with Clean Power Plan
Total
WestInteriorAppalachia
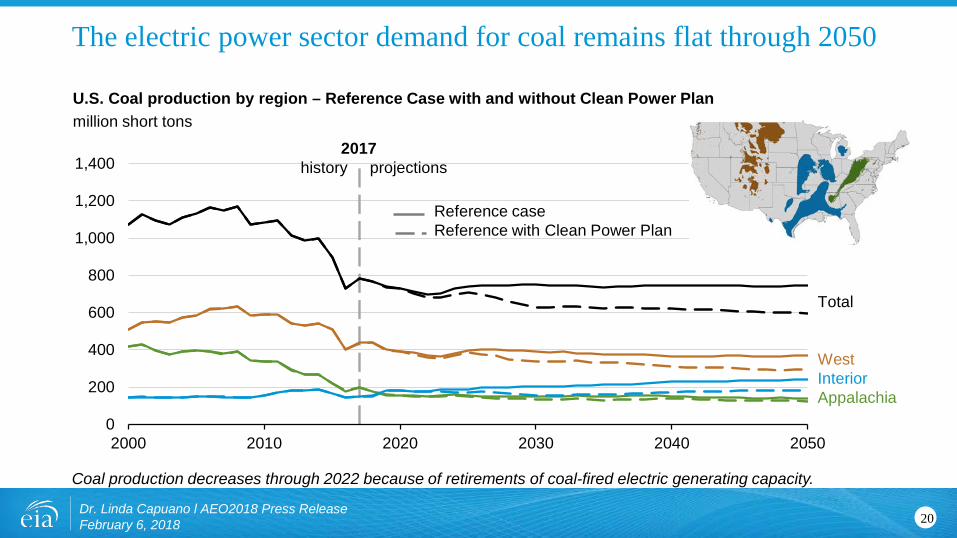
U.S. Coal production by region – Reference Case with and without Clean Power Planmillion short tons .
The electric power sector demand for coal remains flat through 2050
Coal production decreases through 2022 because of retirements of coal-fired electric generating capacity.
20Dr. Linda Capuano l AEO2018 Press Release February 6, 2018
0
1
2
3
4
5
6
1980 1990 2000 2010 2020 2030 2040 2050
2017history projections
0
1
2
3
4
5
6
1980 1990 2000 2010 2020 2030 2040 2050
2017history projections
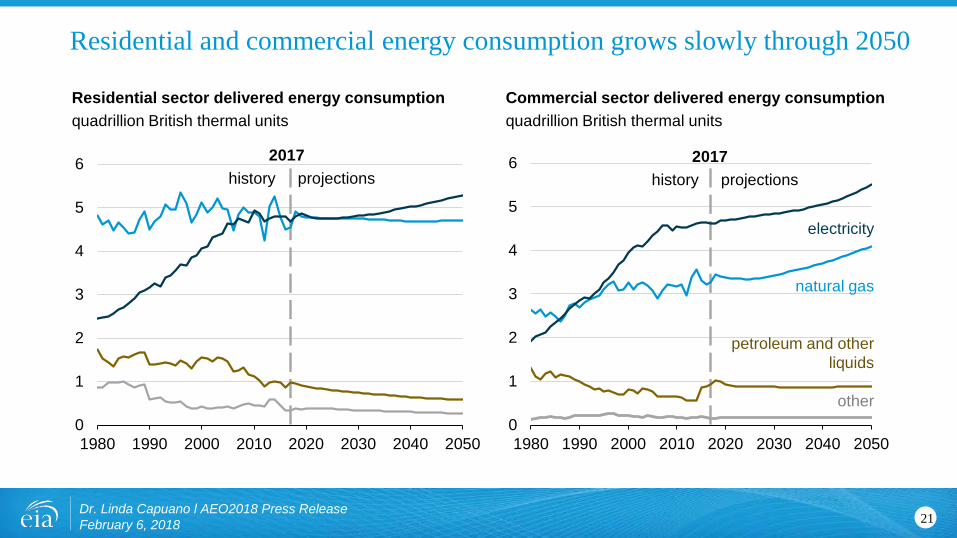
Residential sector delivered energy consumption quadrillion British thermal units
Commercial sector delivered energy consumption quadrillion British thermal units
Residential and commercial energy consumption grows slowly through 2050
21
electricity
natural gas
petroleum and other liquids
other
Dr. Linda Capuano l AEO2018 Press Release February 6, 2018
Dr. Linda Capuano l AEO2018 Press Release February 6, 2018
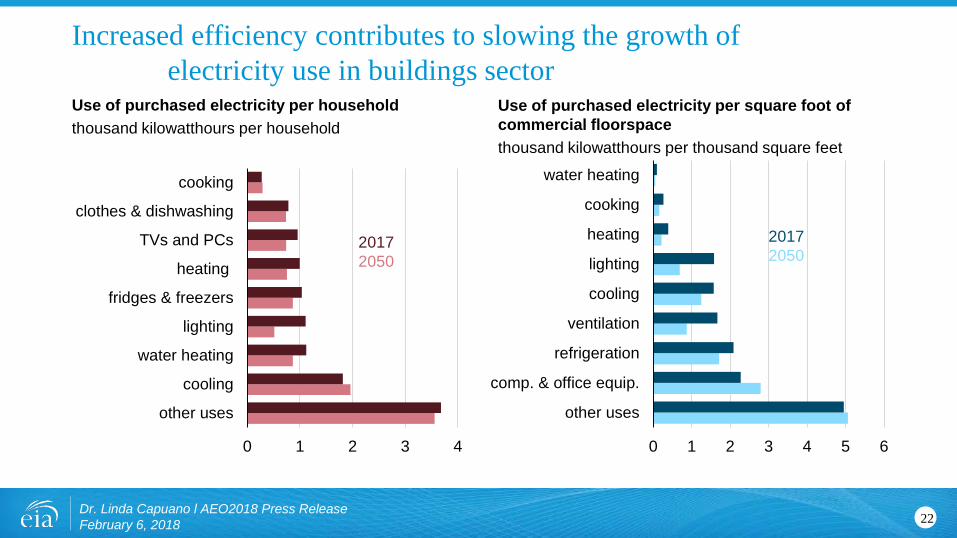
Increased efficiency contributes to slowing the growth of electricity use in buildings sector
22
0 1 2 3 4
other uses
cooling
water heating
lighting
fridges & freezers
heating
TVs and PCs
clothes & dishwashing
cooking
20172050
Use of purchased electricity per householdthousand kilowatthours per household
0 1 2 3 4 5 6
other uses
comp. & office equip.
refrigeration
ventilation
cooling
lighting
heating
cooking
water heating
20172050
Use of purchased electricity per square foot of commercial floorspacethousand kilowatthours per thousand square feet
15
20
25
30
35
40
45
50
2000 2010 2020 2030 2040 2050
\\
2017history projections
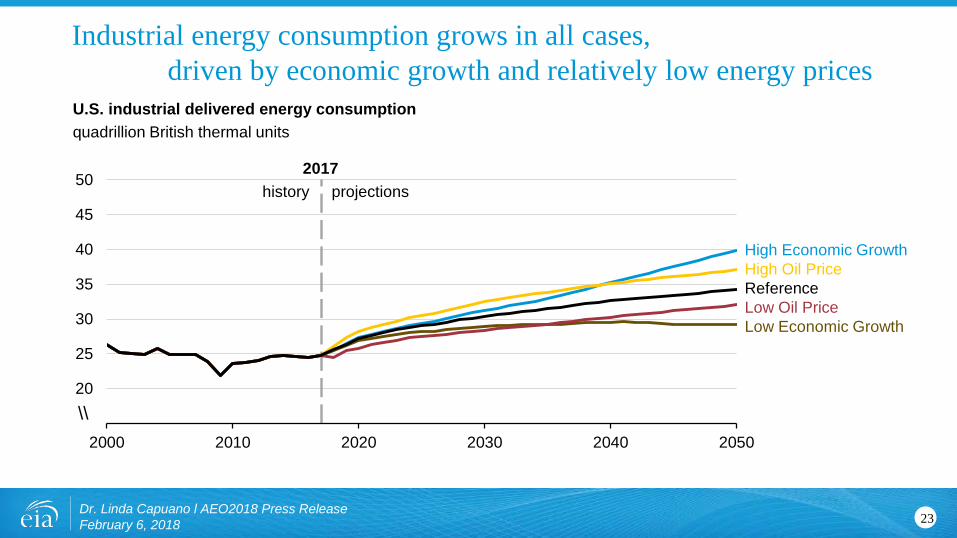
High Economic GrowthHigh Oil PriceReference Low Oil PriceLow Economic Growth
U.S. industrial delivered energy consumption quadrillion British thermal units
Industrial energy consumption grows in all cases, driven by economic growth and relatively low energy prices
23Dr. Linda Capuano l AEO2018 Press Release February 6, 2018
0
5
10
15
20
25
30
35
40
45
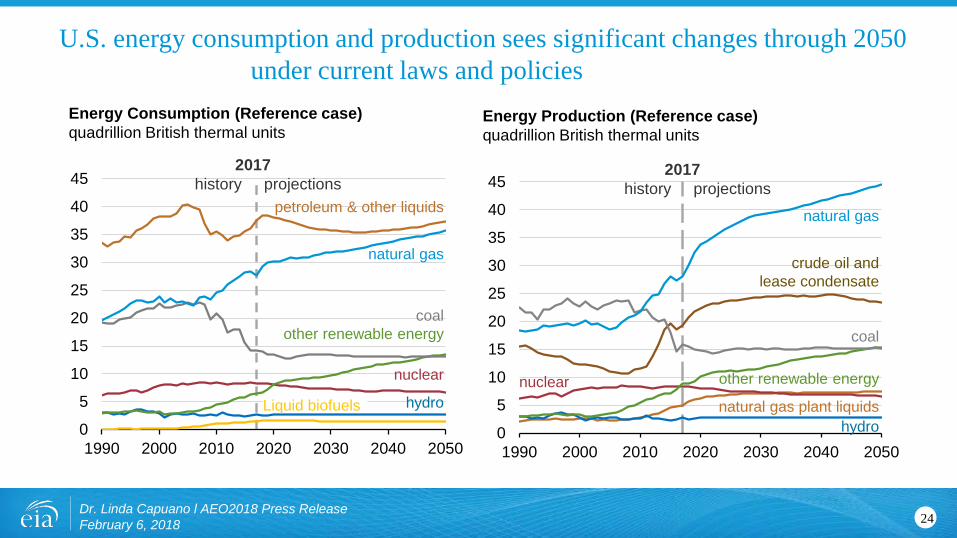
1990 2000 2010 2020 2030 2040 2050
2017history projections
petroleum & other liquids
natural gas
coalother renewable energy
nuclear
hydro
Energy Consumption (Reference case)quadrillion British thermal units
Liquid biofuels
U.S. energy consumption and production sees significant changes through 2050 under current laws and policies
24
0
5
10
15
20
25
30
35
40
45
1990 2000 2010 2020 2030 2040 2050
natural gas
crude oil and lease condensate
coal
other renewable energy
natural gas plant liquidshydro
2017history projections
Energy Production (Reference case)quadrillion British thermal units
Dr. Linda Capuano l AEO2018 Press Release February 6, 2018
nuclear

AEO2018 Highlights
• U.S. net energy exports occur over the projection period to 2050 in most cases– U.S. becomes a net energy exporter by 2022 in Reference Case – Strong domestic production and relatively flat demand
• Increased energy efficiency offsets growth in energy demand– Energy consumption grows about 0.4%/year on average in the Reference case – Gross Domestic Product is expected to average 2.0% annual growth to 2050 in the Reference case
• U.S. liquids and natural gas production continues to grow through 2042 and 2050, respectively– Result of further tight and shale resources development, despite relatively low prices
• Most new electricity generation capacity will be natural gas/renewables after 2022 (Reference case)– Result of low natural gas prices, declining renewables technology costs and supportive policies
Dr. Linda Capuano l AEO2018 Press Release February 6, 2018 25