Embed Size (px)
Citation preview
U.S. Energy Information Administration www.eia.govIndependent Statistics & Analysis
Annual Energy Outlook 2018
ForOil and Gas Supply, Natural Gas Markets, & Liquid Fuels Markets Working GroupJuly 26, 2017 | Washington, DC http://www.eia.gov/forecasts/aeo/workinggroup/
ByOffice of Petroleum, Natural Gas, & Biofuels Analysis
Modeling updates in oil, natural gas, & liquid fuels
WORKING GROUP PRESENTATION FOR DISCUSSION PURPOSESDO NOT QUOTE OR CITE AS RESULTS ARE SUBJECT TO CHANGE
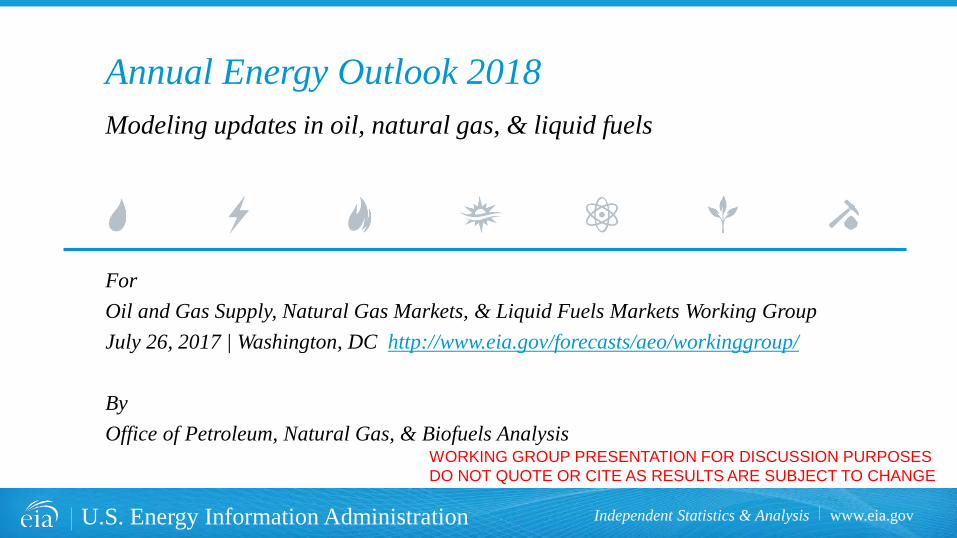
• Introductions & AEO2018 overview (2:00-2:10)
• Liquid fuels markets (2:10-2:40)– World oil prices – Petroleum and biofuel updates
• Natural gas markets (2:40-3:15)– New model NGMM
• Design: granularity, bi-directional flows
• Improvements: prices, Mexico, LNG
• Oil & gas supply (3:15-3:45)– EURs and TRRs
– Changes to accommodate new NGMM model
– NGPL and API gravity characteristics
– Canada representation
– Supply response
• Wrap-up (3:45-4:00)
Agenda
2Office of Petroleum, Gas, and Biofuels Analysis Working Group Presentation for Discussion Purposes Washington, DC, July 26, 2017 DO NOT QUOTE OR CITE as results are subject to change
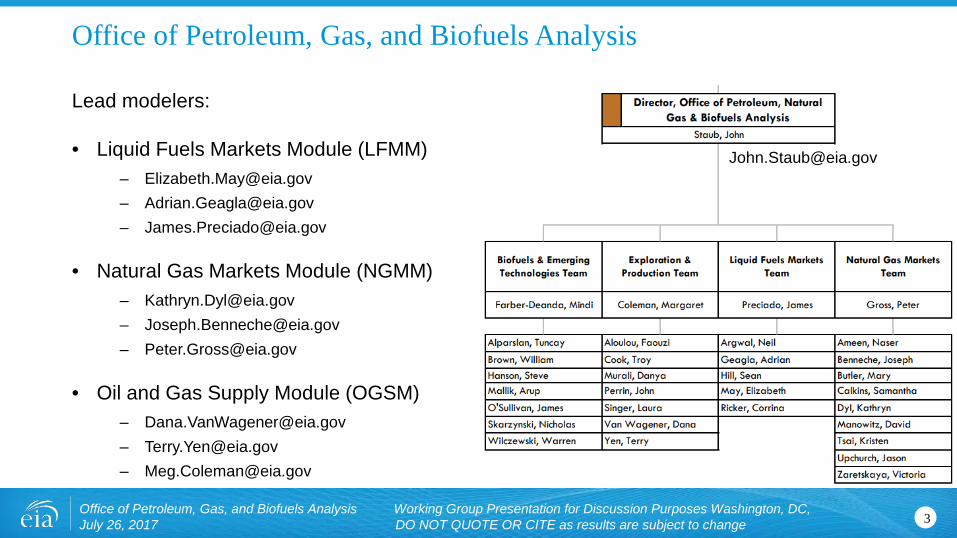
Office of Petroleum, Gas, and Biofuels Analysis
Lead modelers:
• Liquid Fuels Markets Module (LFMM)– [email protected]– [email protected]– [email protected]
• Natural Gas Markets Module (NGMM)– [email protected]– [email protected]– [email protected]
• Oil and Gas Supply Module (OGSM)– [email protected]– [email protected]– [email protected]
3Office of Petroleum, Gas, and Biofuels Analysis Working Group Presentation for Discussion Purposes Washington, DC, July 26, 2017 DO NOT QUOTE OR CITE as results are subject to change
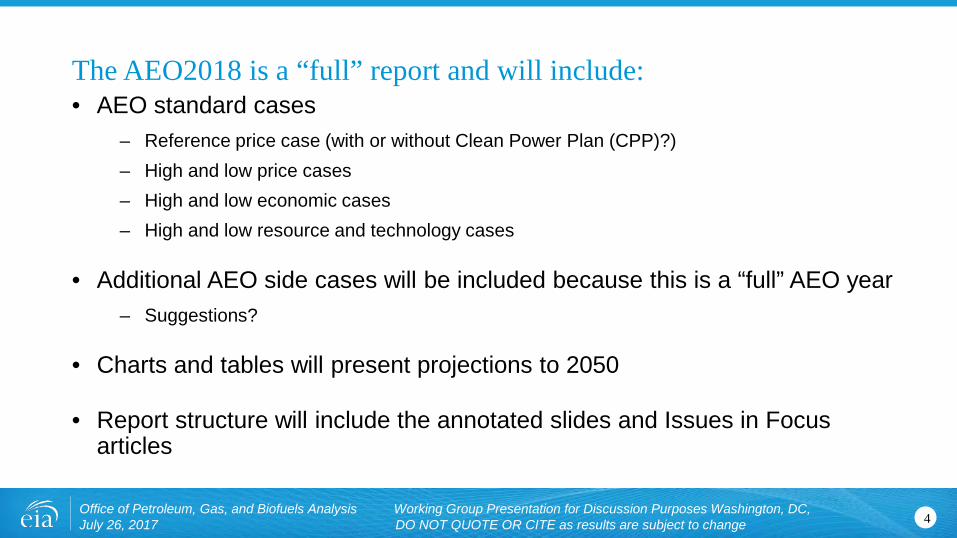
The AEO2018 is a “full” report and will include:• AEO standard cases
– Reference price case (with or without Clean Power Plan (CPP)?)– High and low price cases– High and low economic cases– High and low resource and technology cases
• Additional AEO side cases will be included because this is a “full” AEO year– Suggestions?
• Charts and tables will present projections to 2050
• Report structure will include the annotated slides and Issues in Focus articles
4Office of Petroleum, Gas, and Biofuels Analysis Working Group Presentation for Discussion Purposes Washington, DC, July 26, 2017 DO NOT QUOTE OR CITE as results are subject to change
Liquid Fuels Markets &
world oil prices
5Office of Petroleum, Gas, and Biofuels Analysis Working Group Presentation for Discussion Purposes Washington, DC, July 26, 2017 DO NOT QUOTE OR CITE as results are subject to change
Discussion topics• Lower World Oil Price compared to AEO 2017
• General crude oil and petroleum product model updates
• Reduced sulfur specification for marine bunker fuel in 2020
• Revised existing and planned biofuel production capacity and select biofuel feedstock supply curves
6Office of Petroleum, Gas, and Biofuels Analysis Working Group Presentation for Discussion Purposes Washington, DC, July 26, 2017 DO NOT QUOTE OR CITE as results are subject to change
0
50
100
150
200
250
300
1990 1995 2000 2005 2010 2015 2020 2025 2030 2035 2040 2045 2050
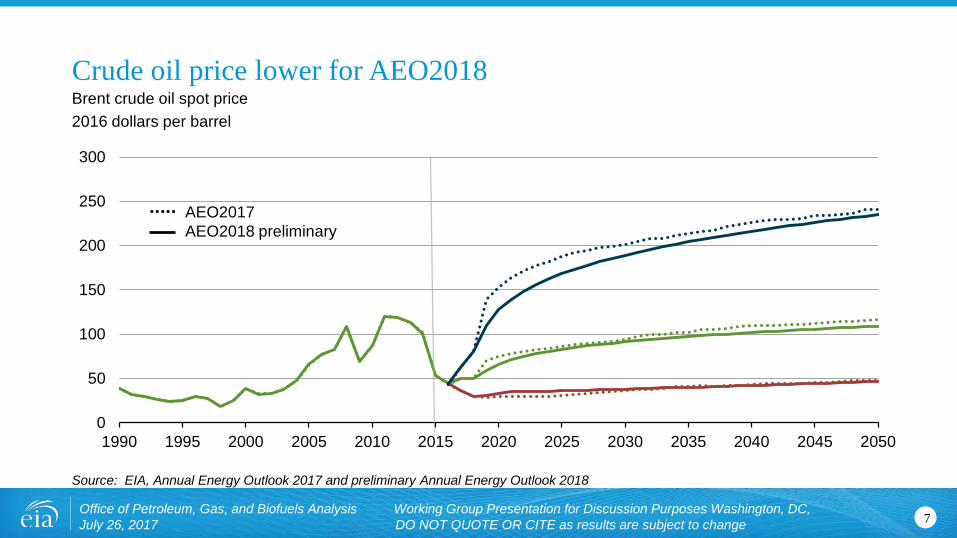
Brent crude oil spot price2016 dollars per barrel
Crude oil price lower for AEO2018
Source: EIA, Annual Energy Outlook 2017 and preliminary Annual Energy Outlook 2018
7Office of Petroleum, Gas, and Biofuels Analysis Working Group Presentation for Discussion Purposes Washington, DC, July 26, 2017 DO NOT QUOTE OR CITE as results are subject to change
AEO2017AEO2018 preliminary
Lower World Oil Price compared with AEO 2017 • The outlook for global liquids supply is relatively unchanged from last year,
with slightly higher OPEC production largely offset by slightly lower non-OPEC production.
• Expectations for global liquids demand are lower compared with AEO 2017, with lower GDP growth in OECD and non-OECD contributing to the reduced outlook for demand.
8Office of Petroleum, Gas, and Biofuels Analysis Working Group Presentation for Discussion Purposes Washington, DC, July 26, 2017 DO NOT QUOTE OR CITE as results are subject to change
General crude oil and petroleum product model updates• Import and export levels of petroleum products better reflect global and
domestic demand trends
• Availability and price of international crude oils are more aligned with the global refinery complex
• Octane rating for gasoline better incorporates demands for premium and mid-grades
• Distribution and marketing costs from the refinery to end-users were updated for all petroleum products
• Expected results include a reduced diesel-gasoline price spread and higher refinery utilization throughout the projection
9Office of Petroleum, Gas, and Biofuels Analysis Working Group Presentation for Discussion Purposes Washington, DC, July 26, 2017 DO NOT QUOTE OR CITE as results are subject to change
General crude oil and petroleum product model updates (cont’d)• Existing US refinery capacity updated using EIA’s Petroleum Supply Annual
(PSA)
• Existing Canadian and Caribbean refinery capacity updated using Oil and Gas Journal
• U.S. crude oil pipeline capacities updated– Dakota Access pipeline will be included in the model starting in 2017
– Expanded pipeline capacity from the Permian to the Gulf Coast refining region
10Office of Petroleum, Gas, and Biofuels Analysis Working Group Presentation for Discussion Purposes Washington, DC, July 26, 2017 DO NOT QUOTE OR CITE as results are subject to change
Reduced sulfur specification for marine bunker fuel in 2020• The AEO will represent the International Maritime Organizations planned
implementation of a 0.5% limit on sulfur content for marine bunker fuel in 2020
• Effects on the volume of U.S. domestic consumption of marine bunker fuel will be relatively small
• Updated international supply/demand curves for petroleum products resulted in a larger low-high sulfur residual fuel oil spread compared to AEO 2017
11Office of Petroleum, Gas, and Biofuels Analysis Working Group Presentation for Discussion Purposes Washington, DC, July 26, 2017 DO NOT QUOTE OR CITE as results are subject to change
Revised existing and planned biofuel production capacity and biofuel feedstock supply curves• Based on EIA’s market research, updated existing and planned capacity for
various biofuel production facilities
• Using information from a new version of Polysys, updated corn starch, seed oil, and cellulosic biomass feedstock supply curves
• Key assumptions maintained from AEO2017– GTL, CTL, BTL (xTL Fischer-Tropsch) expansion are restricted until 2025 at the earliest
– No changes to California low carbon fuel standards (LCFS) representation
12Office of Petroleum, Gas, and Biofuels Analysis Working Group Presentation for Discussion Purposes Washington, DC, July 26, 2017 DO NOT QUOTE OR CITE as results are subject to change
Contacts for Liquid Fuels Markets including biofuels
13Office of Petroleum, Gas, and Biofuels Analysis Working Group Presentation for Discussion Purposes Washington, DC, July 26, 2017 DO NOT QUOTE OR CITE as results are subject to change
For questions about the Liquid Fuels Market Module contact:Elizabeth May: [email protected]
For questions about the International Energy Module contact:Adrian Geagla: [email protected]
For questions about Biofuels contact:Steve Hanson: [email protected]
Liquid Fuels Markets Team Lead: James Preciado: [email protected]
Biofuels and Emerging Technologies Team Lead: Mindi Farber-DeAnda: [email protected]
Natural Gas Markets
14Office of Petroleum, Gas, and Biofuels Analysis Working Group Presentation for Discussion Purposes Washington, DC, July 26, 2017 DO NOT QUOTE OR CITE as results are subject to change
AEO2018 Natural Gas Model Updates• Implementation of new Natural Gas Market Module (NGMM)
– Changes between Natural Gas Transmission and Distribution Module (NGTDM) and NGMM
– Model structure and design
– Major changes in how natural gas markets are modeled
15Office of Petroleum, Gas, and Biofuels Analysis Working Group Presentation for Discussion Purposes Washington, DC, July 26, 2017 DO NOT QUOTE OR CITE as results are subject to change
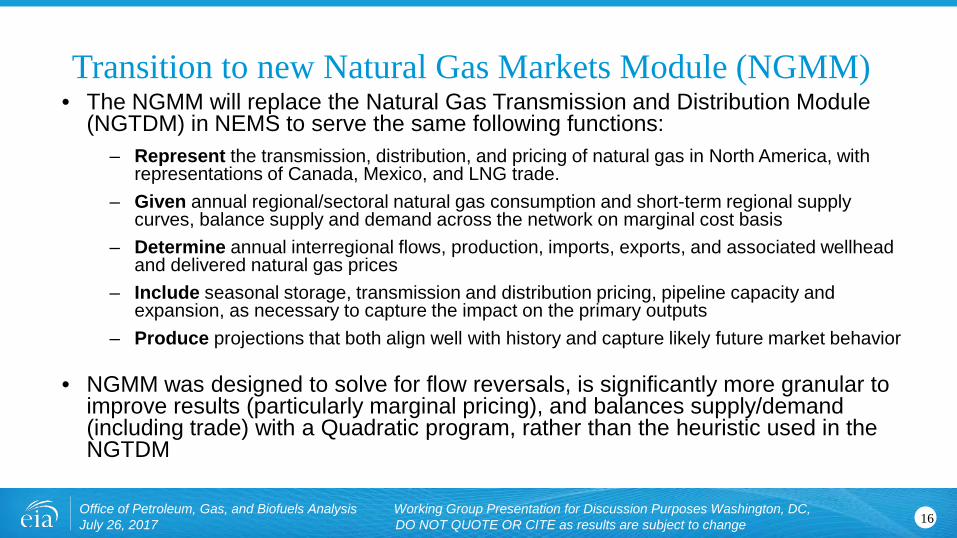
Transition to new Natural Gas Markets Module (NGMM)• The NGMM will replace the Natural Gas Transmission and Distribution Module
(NGTDM) in NEMS to serve the same following functions:– Represent the transmission, distribution, and pricing of natural gas in North America, with
representations of Canada, Mexico, and LNG trade.– Given annual regional/sectoral natural gas consumption and short-term regional supply
curves, balance supply and demand across the network on marginal cost basis– Determine annual interregional flows, production, imports, exports, and associated wellhead
and delivered natural gas prices– Include seasonal storage, transmission and distribution pricing, pipeline capacity and
expansion, as necessary to capture the impact on the primary outputs– Produce projections that both align well with history and capture likely future market behavior
• NGMM was designed to solve for flow reversals, is significantly more granular to improve results (particularly marginal pricing), and balances supply/demand (including trade) with a Quadratic program, rather than the heuristic used in the NGTDM
16Office of Petroleum, Gas, and Biofuels Analysis Working Group Presentation for Discussion Purposes Washington, DC, July 26, 2017 DO NOT QUOTE OR CITE as results are subject to change
Decision to redesign NGTDM• Being too constrained to previous year, limits ability to respond to larger
annual changes in the market
• Limitations in modeling flows, capacities, and pricing at such an aggregate level ‒ some calibration factors too large
• Heuristic algorithm limited in ability to represent bidirectional flows and changing primary flows
• Model has become difficult to modify and update after many incremental code and data changes, complicating the need for it to be managed by new people
17Office of Petroleum, Gas, and Biofuels Analysis Working Group Presentation for Discussion Purposes Washington, DC, July 26, 2017 DO NOT QUOTE OR CITE as results are subject to change
NGMM model requirements• Project delivered, wellhead, import, and export prices given delivered
volumes and regional short-term supply curves
• Balance market and establish production, imports, and exports, as well as lease, plant, and pipeline fuel, and supplemental supplies
• Project region-to-region flows and pipeline capacity
• Produce reasonable projections, align well with history, but capture likely future market behavior (such as under different scenarios)
• Be easier to maintain, update, debug, and learn
18Office of Petroleum, Gas, and Biofuels Analysis Working Group Presentation for Discussion Purposes Washington, DC, July 26, 2017 DO NOT QUOTE OR CITE as results are subject to change
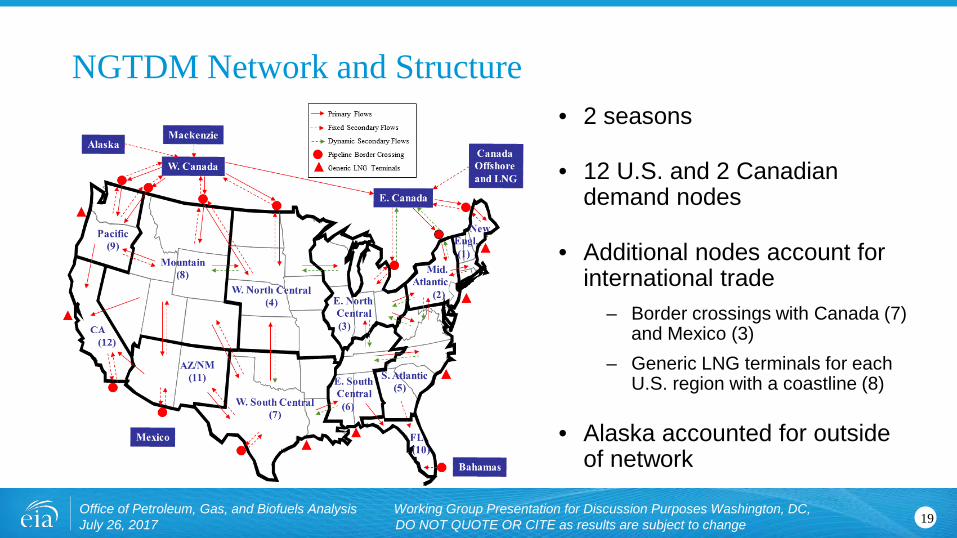
NGTDM Network and Structure• 2 seasons
• 12 U.S. and 2 Canadian demand nodes
• Additional nodes account for international trade
– Border crossings with Canada (7) and Mexico (3)
– Generic LNG terminals for each U.S. region with a coastline (8)
• Alaska accounted for outside of network
19Office of Petroleum, Gas, and Biofuels Analysis Working Group Presentation for Discussion Purposes Washington, DC, July 26, 2017 DO NOT QUOTE OR CITE as results are subject to change
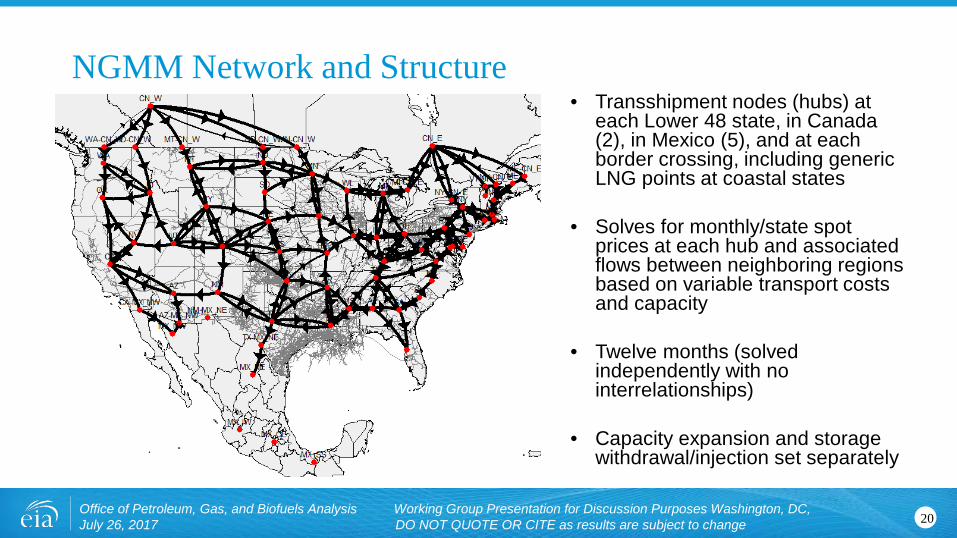
NGMM Network and Structure
20
• Transshipment nodes (hubs) at each Lower 48 state, in Canada (2), in Mexico (5), and at each border crossing, including generic LNG points at coastal states
• Solves for monthly/state spot prices at each hub and associated flows between neighboring regions based on variable transport costs and capacity
• Twelve months (solved independently with no interrelationships)
• Capacity expansion and storage withdrawal/injection set separately
Office of Petroleum, Gas, and Biofuels Analysis Working Group Presentation for Discussion Purposes Washington, DC, July 26, 2017 DO NOT QUOTE OR CITE as results are subject to change
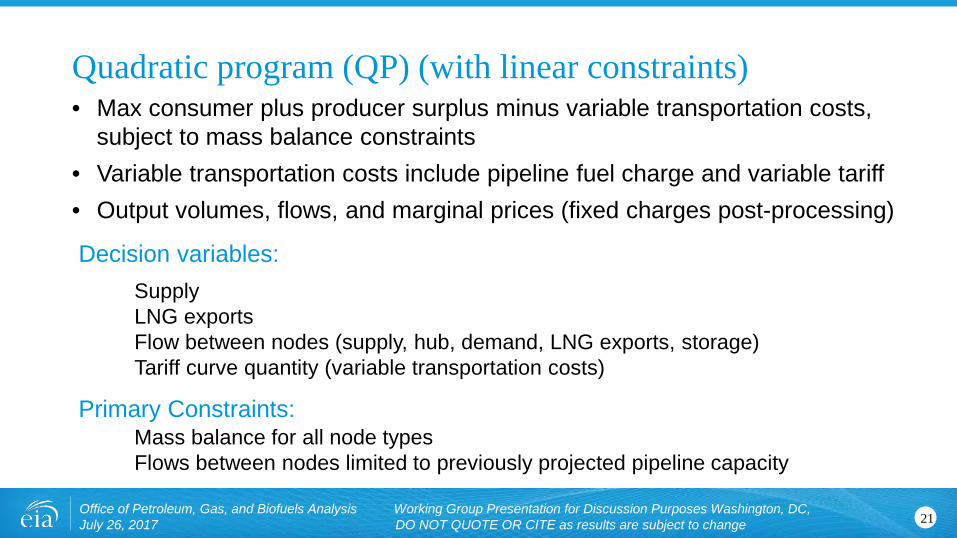
Quadratic program (QP) (with linear constraints)• Max consumer plus producer surplus minus variable transportation costs,
subject to mass balance constraints• Variable transportation costs include pipeline fuel charge and variable tariff• Output volumes, flows, and marginal prices (fixed charges post-processing)
21
SupplyLNG exportsFlow between nodes (supply, hub, demand, LNG exports, storage)Tariff curve quantity (variable transportation costs)
Mass balance for all node typesFlows between nodes limited to previously projected pipeline capacity
Decision variables:
Primary Constraints:
Office of Petroleum, Gas, and Biofuels Analysis Working Group Presentation for Discussion Purposes Washington, DC, July 26, 2017 DO NOT QUOTE OR CITE as results are subject to change
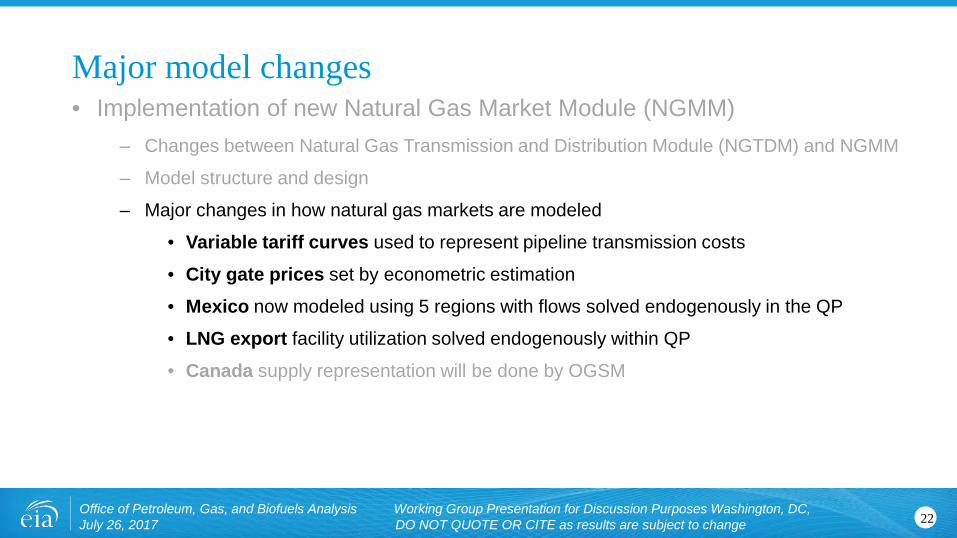
Major model changes• Implementation of new Natural Gas Market Module (NGMM)
– Changes between Natural Gas Transmission and Distribution Module (NGTDM) and NGMM
– Model structure and design
– Major changes in how natural gas markets are modeled
• Variable tariff curves used to represent pipeline transmission costs
• City gate prices set by econometric estimation
• Mexico now modeled using 5 regions with flows solved endogenously in the QP
• LNG export facility utilization solved endogenously within QP
• Canada supply representation will be done by OGSM
Office of Petroleum, Gas, and Biofuels Analysis Working Group Presentation for Discussion Purposes Washington, DC, July 26, 2017 DO NOT QUOTE OR CITE as results are subject to change 22
Variable tariff curves• Based on difference between region/state spot prices• Components of basis differentials
– Pipeline fuel charge– Variable Tariff
• Assumptions– Differences in spot prices are pipeline fuel and variable charges– Difference between spot and city gate prices are the fixed charges
• Variable tariff set in a QP using a curve for each arc, function of utilization• Curves are used as a basis for calibrating the model to history and are held
constant throughout forecast, unless assumed otherwise• Tariff curves based on flow one direction will be assumed to be the same for
flow in opposite direction• Extended beyond existing capacity when projecting capacity expansion,
reflecting the consideration of reservation fees
23Office of Petroleum, Gas, and Biofuels Analysis Working Group Presentation for Discussion Purposes Washington, DC, July 26, 2017 DO NOT QUOTE OR CITE as results are subject to change
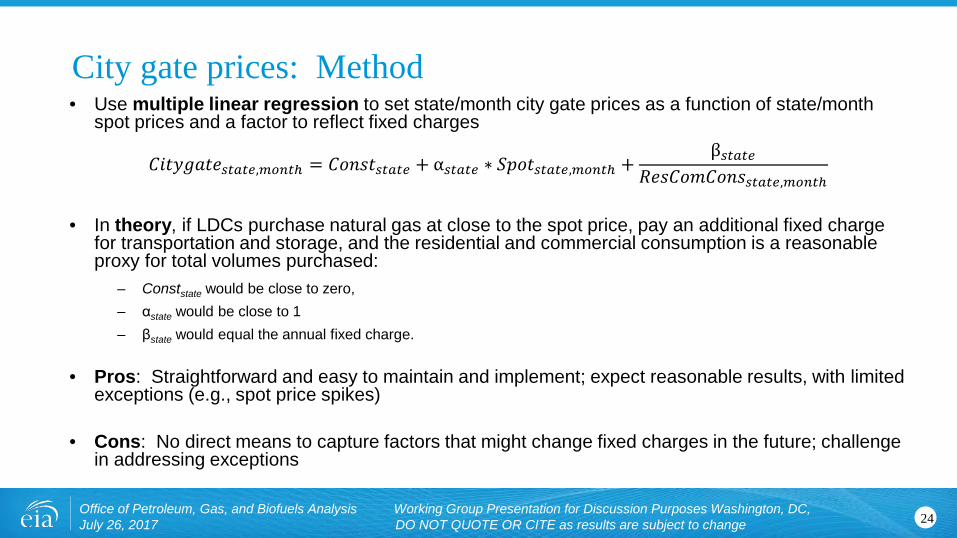
City gate prices: Method• Use multiple linear regression to set state/month city gate prices as a function of state/month
spot prices and a factor to reflect fixed charges
𝐶𝐶𝐶𝐶𝐶𝐶𝐶𝐶𝐶𝐶𝐶𝐶𝐶𝐶𝐶𝐶𝑠𝑠𝑠𝑠𝑠𝑠𝑠𝑠𝑠𝑠,𝑚𝑚𝑚𝑚𝑚𝑚𝑠𝑠𝑚 = 𝐶𝐶𝑜𝑜𝑜𝑜𝑜𝑜𝐶𝐶𝑠𝑠𝑠𝑠𝑠𝑠𝑠𝑠𝑠𝑠 + α𝑠𝑠𝑠𝑠𝑠𝑠𝑠𝑠𝑠𝑠 ∗ 𝑆𝑆𝑆𝑆𝑜𝑜𝐶𝐶𝑠𝑠𝑠𝑠𝑠𝑠𝑠𝑠𝑠𝑠,𝑚𝑚𝑚𝑚𝑚𝑚𝑠𝑠𝑚 +β𝑠𝑠𝑠𝑠𝑠𝑠𝑠𝑠𝑠𝑠
𝑅𝑅𝐶𝐶𝑜𝑜𝐶𝐶𝑜𝑜𝑅𝑅𝐶𝐶𝑜𝑜𝑜𝑜𝑜𝑜𝑠𝑠𝑠𝑠𝑠𝑠𝑠𝑠𝑠𝑠,𝑚𝑚𝑚𝑚𝑚𝑚𝑠𝑠𝑚
• In theory, if LDCs purchase natural gas at close to the spot price, pay an additional fixed charge for transportation and storage, and the residential and commercial consumption is a reasonable proxy for total volumes purchased:
– Conststate would be close to zero, – αstate would be close to 1– βstate would equal the annual fixed charge.
• Pros: Straightforward and easy to maintain and implement; expect reasonable results, with limited exceptions (e.g., spot price spikes)
• Cons: No direct means to capture factors that might change fixed charges in the future; challenge in addressing exceptions
24Office of Petroleum, Gas, and Biofuels Analysis Working Group Presentation for Discussion Purposes Washington, DC, July 26, 2017 DO NOT QUOTE OR CITE as results are subject to change
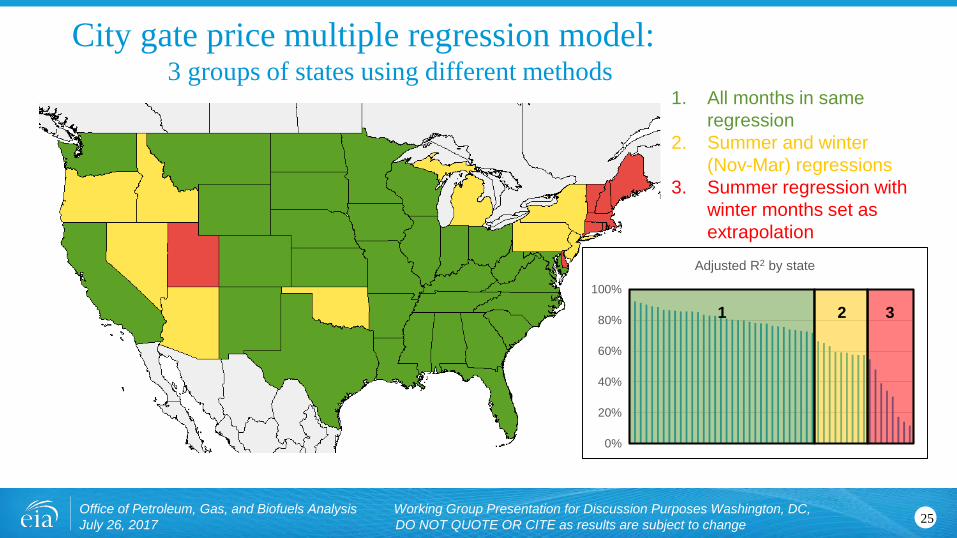
City gate price multiple regression model: 3 groups of states using different methods
25
0%
20%
40%
60%
80%
100%
Adjusted R2 by state
1. All months in same regression
2. Summer and winter (Nov-Mar) regressions
3. Summer regression with winter months set as extrapolation
1 2 3
Office of Petroleum, Gas, and Biofuels Analysis Working Group Presentation for Discussion Purposes Washington, DC, July 26, 2017 DO NOT QUOTE OR CITE as results are subject to change
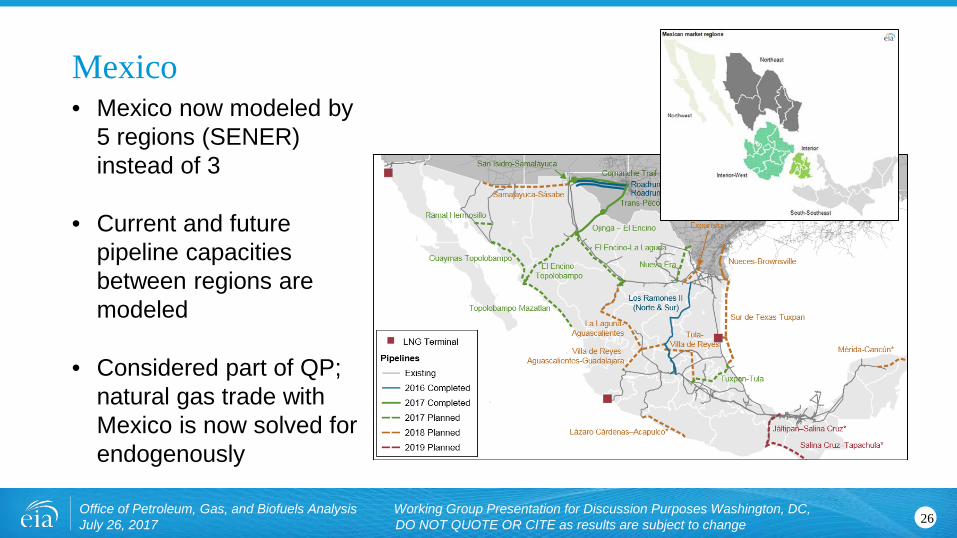
Mexico • Mexico now modeled by
5 regions (SENER) instead of 3
• Current and future pipeline capacities between regions are modeled
• Considered part of QP; natural gas trade with Mexico is now solved for endogenously
26Office of Petroleum, Gas, and Biofuels Analysis Working Group Presentation for Discussion Purposes Washington, DC, July 26, 2017 DO NOT QUOTE OR CITE as results are subject to change
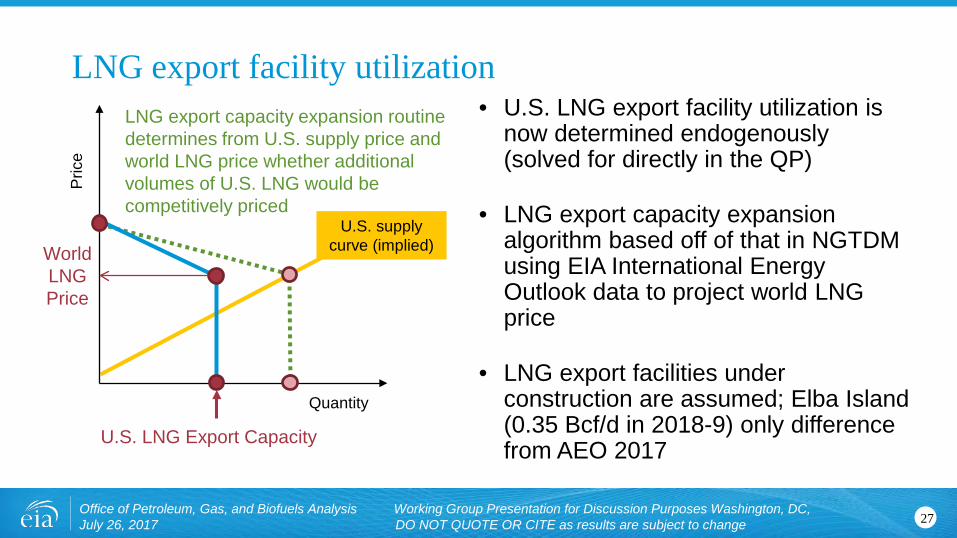
U.S. supply curve (implied)
LNG export facility utilization
27
Quantity
Pric
e
U.S. LNG Export Capacity
World LNG Price
LNG export capacity expansion routine determines from U.S. supply price and world LNG price whether additional volumes of U.S. LNG would be competitively priced
• U.S. LNG export facility utilization is now determined endogenously (solved for directly in the QP)
• LNG export capacity expansion algorithm based off of that in NGTDM using EIA International Energy Outlook data to project world LNG price
• LNG export facilities under construction are assumed; Elba Island (0.35 Bcf/d in 2018-9) only difference from AEO 2017
Office of Petroleum, Gas, and Biofuels Analysis Working Group Presentation for Discussion Purposes Washington, DC, July 26, 2017 DO NOT QUOTE OR CITE as results are subject to change
For questions about NGTDM, NGMM design, and comparisons between models:
Joe Benneche: [email protected]
For questions pertaining to NGMM, design in AIMMS, suggestions for improvements to new model:
Katie Dyl: [email protected]
Natural Gas Markets Team Lead:
Peter Gross: [email protected]
Contacts for Natural Gas Markets
28Office of Petroleum, Gas, and Biofuels Analysis Working Group Presentation for Discussion Purposes Washington, DC, July 26, 2017 DO NOT QUOTE OR CITE as results are subject to change
OGSM / Upstream
29Office of Petroleum, Gas, and Biofuels Analysis Working Group Presentation for Discussion Purposes Washington, DC, July 26, 2017 DO NOT QUOTE OR CITE as results are subject to change
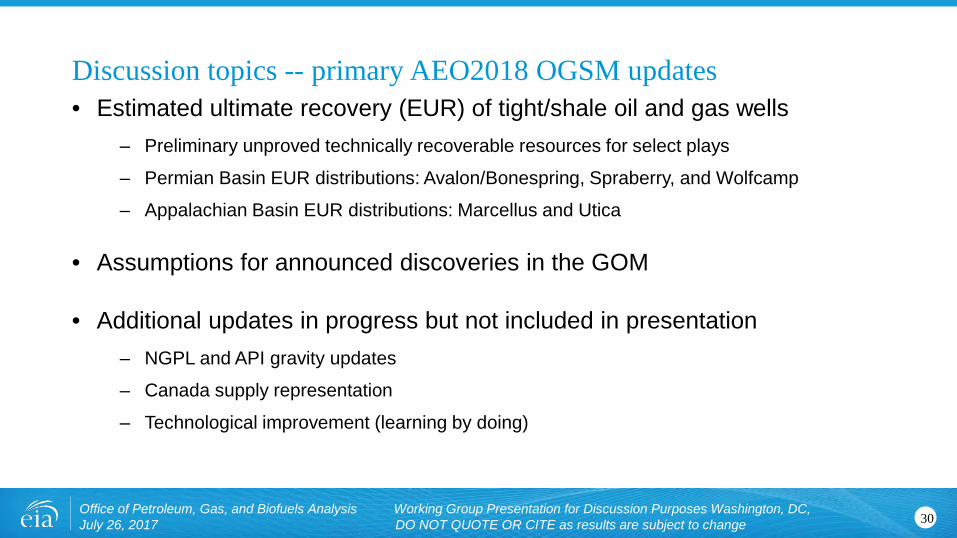
Discussion topics -- primary AEO2018 OGSM updates• Estimated ultimate recovery (EUR) of tight/shale oil and gas wells
– Preliminary unproved technically recoverable resources for select plays
– Permian Basin EUR distributions: Avalon/Bonespring, Spraberry, and Wolfcamp
– Appalachian Basin EUR distributions: Marcellus and Utica
• Assumptions for announced discoveries in the GOM
• Additional updates in progress but not included in presentation– NGPL and API gravity updates
– Canada supply representation
– Technological improvement (learning by doing)
30Office of Petroleum, Gas, and Biofuels Analysis Working Group Presentation for Discussion Purposes Washington, DC, July 26, 2017 DO NOT QUOTE OR CITE as results are subject to change
0
500
1,000
1,500
2,000
2,500
3,00020
0020
0120
0220
0320
0420
0520
0620
0720
0820
0920
1020
1120
1220
1320
1420
1520
1620
17
Edition of the Annual Energy Outlook
0
100
200
300
400
500
2000
2001
2002
2003
2004
2005
2006
2007
2008
2009
2010
2011
2012
2013
2014
2015
2016
2017
Edition of the Annual Energy Outlook
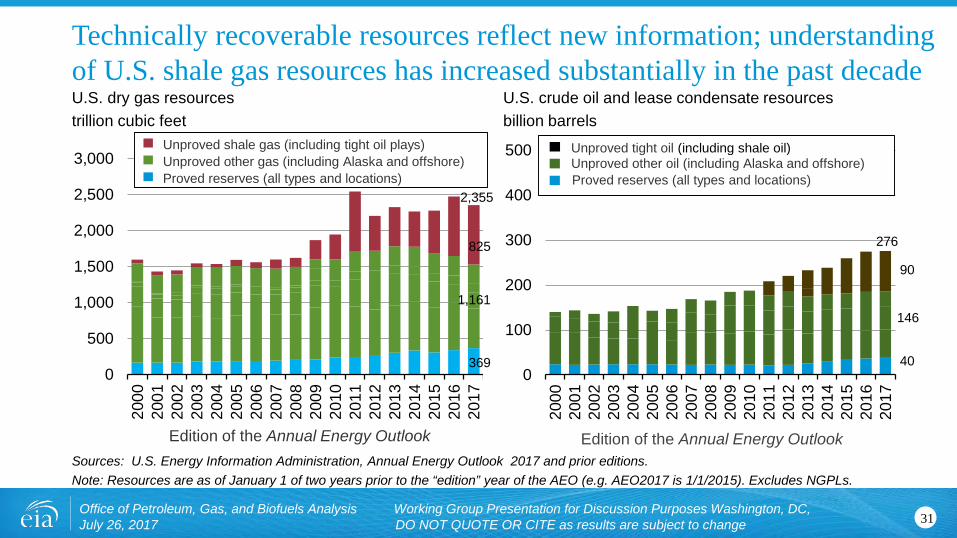
Unproved tight oil (including shale oil)Unproved other oil (including Alaska and offshore)Proved reserves (all types and locations)
U.S. dry gas resourcestrillion cubic feet
U.S. crude oil and lease condensate resourcesbillion barrels
Office of Petroleum, Gas, and Biofuels Analysis Working Group Presentation for Discussion Purposes Washington, DC, July 26, 2017 DO NOT QUOTE OR CITE as results are subject to change
Technically recoverable resources reflect new information; understanding of U.S. shale gas resources has increased substantially in the past decade
Sources: U.S. Energy Information Administration, Annual Energy Outlook 2017 and prior editions.Note: Resources are as of January 1 of two years prior to the “edition” year of the AEO (e.g. AEO2017 is 1/1/2015). Excludes NGPLs.
31
Unproved shale gas (including tight oil plays)Unproved other gas (including Alaska and offshore)Proved reserves (all types and locations)
369
825
1,161
2,355
90
146
40
276
0.0
0.5
1.0
1.5
2.0
2.5
3.0
3.5
4.0
4.5
5.0
2003 2005 2007 2009 2011 2013 2015 2017
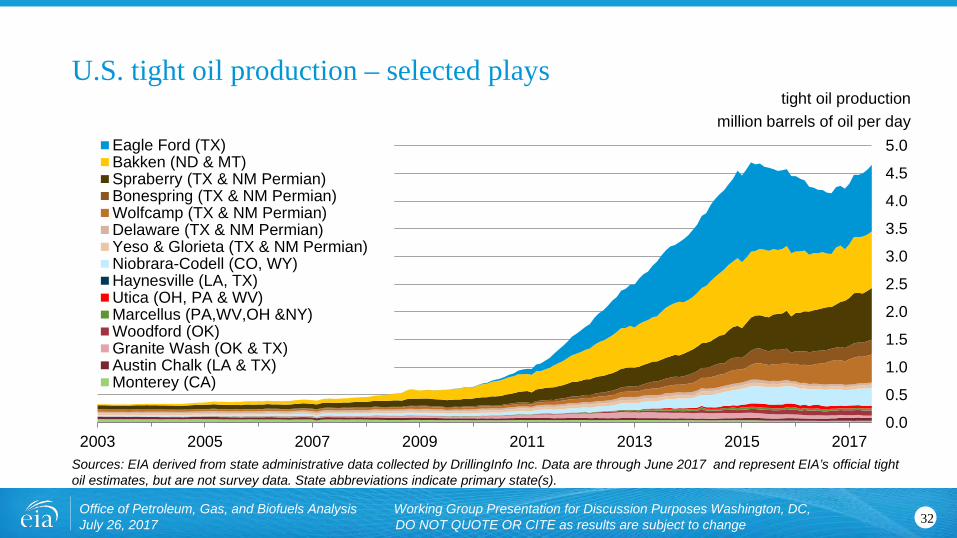
Eagle Ford (TX)Bakken (ND & MT)Spraberry (TX & NM Permian)Bonespring (TX & NM Permian)Wolfcamp (TX & NM Permian)Delaware (TX & NM Permian)Yeso & Glorieta (TX & NM Permian)Niobrara-Codell (CO, WY)Haynesville (LA, TX)Utica (OH, PA & WV)Marcellus (PA,WV,OH &NY)Woodford (OK)Granite Wash (OK & TX)Austin Chalk (LA & TX)Monterey (CA)
tight oil productionmillion barrels of oil per day
U.S. tight oil production – selected plays
Sources: EIA derived from state administrative data collected by DrillingInfo Inc. Data are through June 2017 and represent EIA’s official tight oil estimates, but are not survey data. State abbreviations indicate primary state(s).
32Office of Petroleum, Gas, and Biofuels Analysis Working Group Presentation for Discussion Purposes Washington, DC, July 26, 2017 DO NOT QUOTE OR CITE as results are subject to change
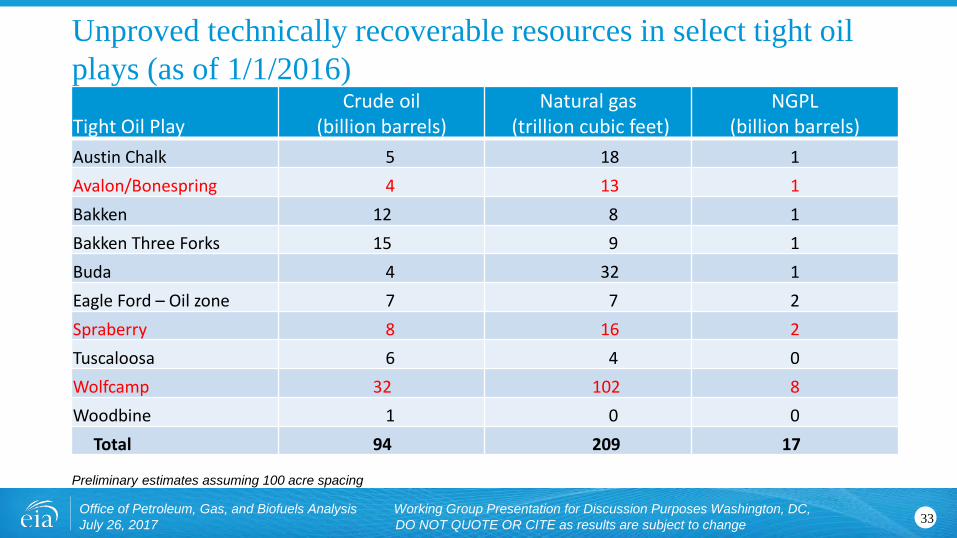
Unproved technically recoverable resources in select tight oil plays (as of 1/1/2016)
Preliminary estimates assuming 100 acre spacing
33Office of Petroleum, Gas, and Biofuels Analysis Working Group Presentation for Discussion Purposes Washington, DC, July 26, 2017 DO NOT QUOTE OR CITE as results are subject to change
Tight Oil PlayCrude oil
(billion barrels)Natural gas
(trillion cubic feet)NGPL
(billion barrels)Austin Chalk 5 18 1 Avalon/Bonespring 4 13 1 Bakken 12 8 1 Bakken Three Forks 15 9 1 Buda 4 32 1 Eagle Ford – Oil zone 7 7 2 Spraberry 8 16 2 Tuscaloosa 6 4 0 Wolfcamp 32 102 8 Woodbine 1 0 0
Total 94 209 17
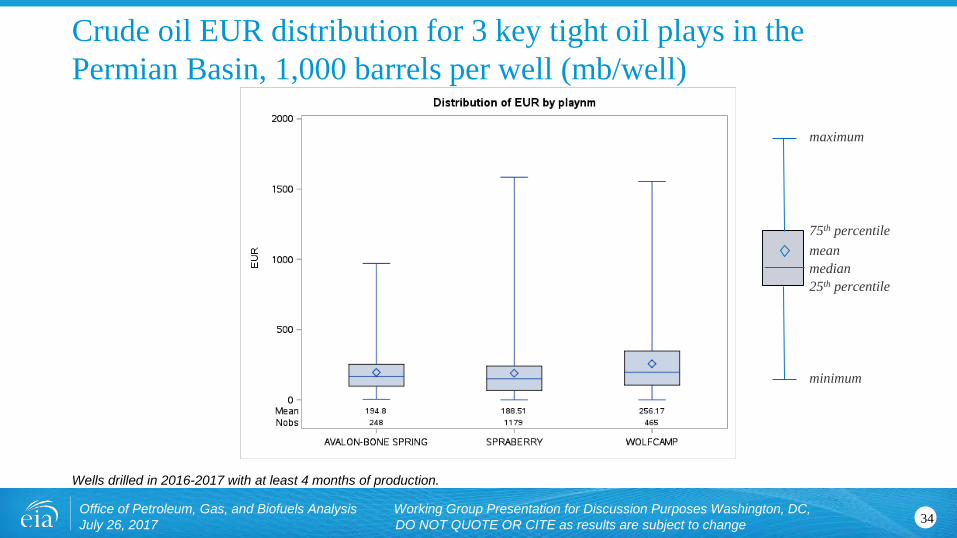
Crude oil EUR distribution for 3 key tight oil plays in the Permian Basin, 1,000 barrels per well (mb/well)
Wells drilled in 2016-2017 with at least 4 months of production.
34Office of Petroleum, Gas, and Biofuels Analysis Working Group Presentation for Discussion Purposes Washington, DC, July 26, 2017 DO NOT QUOTE OR CITE as results are subject to change
minimum
maximum
25th percentile
meanmedian
75th percentile
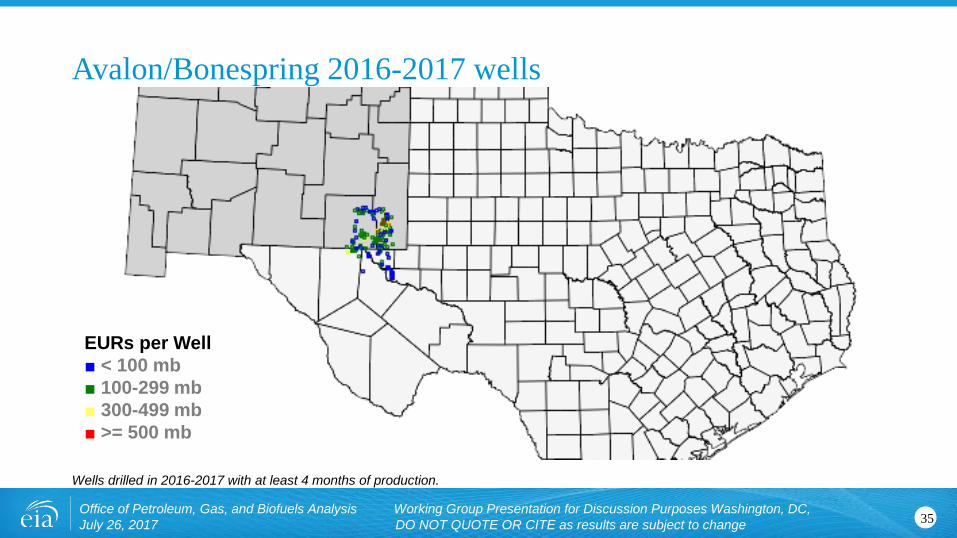
Avalon/Bonespring 2016-2017 wells
Wells drilled in 2016-2017 with at least 4 months of production.
35Office of Petroleum, Gas, and Biofuels Analysis Working Group Presentation for Discussion Purposes Washington, DC, July 26, 2017 DO NOT QUOTE OR CITE as results are subject to change
EURs per Well■ < 100 mb■ 100-299 mb■ 300-499 mb■ >= 500 mb
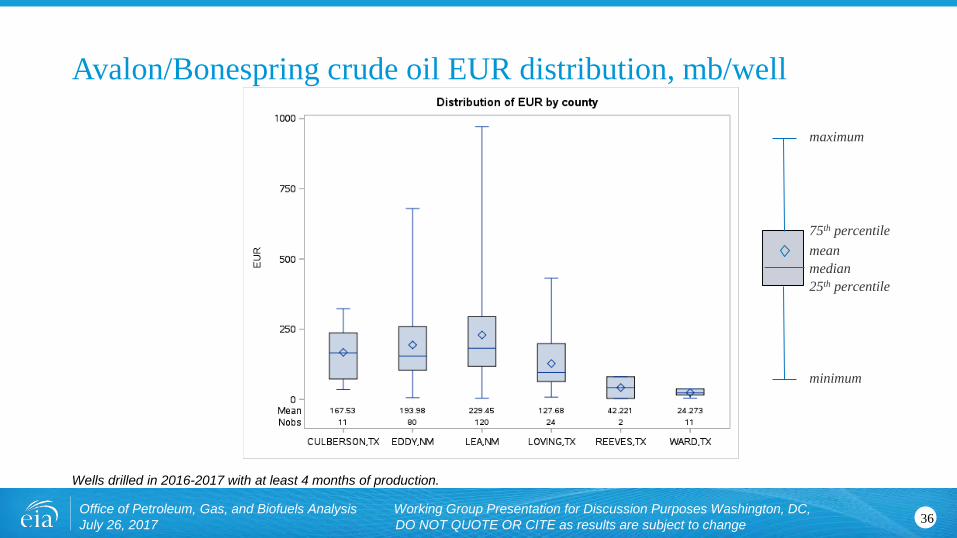
Avalon/Bonespring crude oil EUR distribution, mb/well
Wells drilled in 2016-2017 with at least 4 months of production.
36Office of Petroleum, Gas, and Biofuels Analysis Working Group Presentation for Discussion Purposes Washington, DC, July 26, 2017 DO NOT QUOTE OR CITE as results are subject to change
minimum
maximum
25th percentile
meanmedian
75th percentile
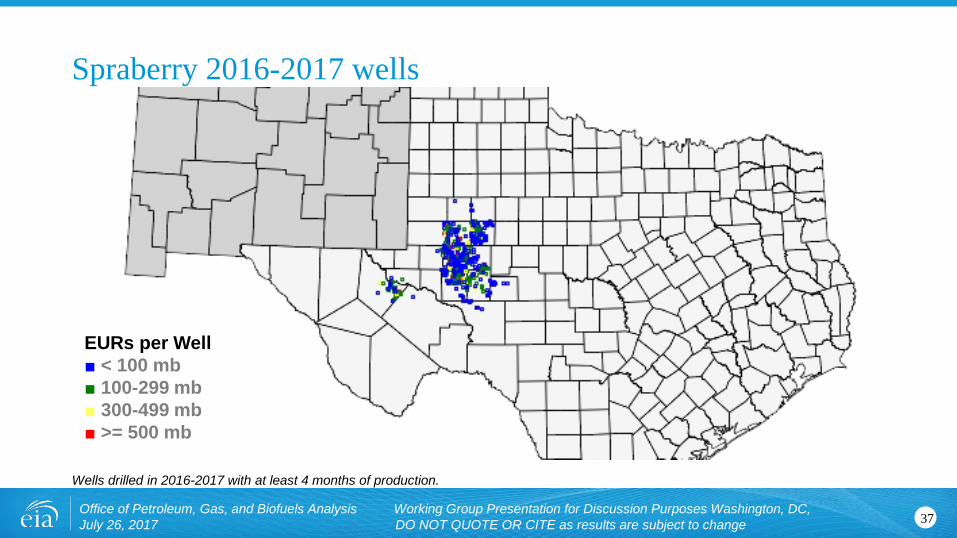
Spraberry 2016-2017 wells
Wells drilled in 2016-2017 with at least 4 months of production.
37Office of Petroleum, Gas, and Biofuels Analysis Working Group Presentation for Discussion Purposes Washington, DC, July 26, 2017 DO NOT QUOTE OR CITE as results are subject to change
EURs per Well■ < 100 mb■ 100-299 mb■ 300-499 mb■ >= 500 mb
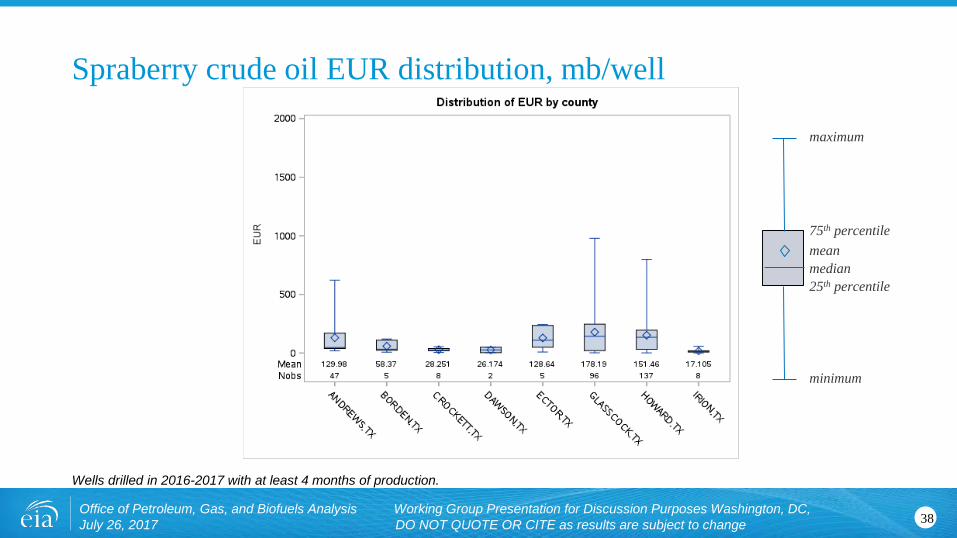
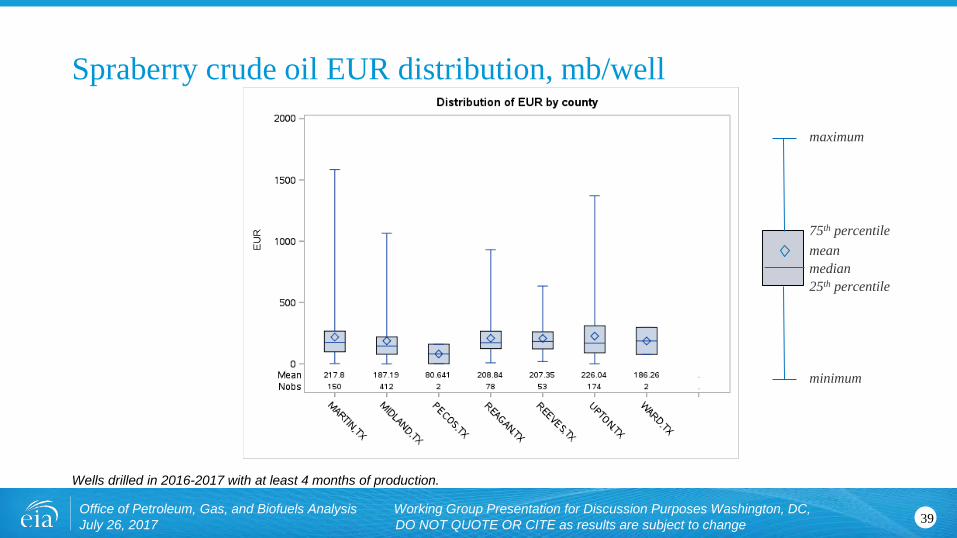
Spraberry crude oil EUR distribution, mb/well
Wells drilled in 2016-2017 with at least 4 months of production.
38Office of Petroleum, Gas, and Biofuels Analysis Working Group Presentation for Discussion Purposes Washington, DC, July 26, 2017 DO NOT QUOTE OR CITE as results are subject to change
minimum
maximum
25th percentile
meanmedian
75th percentile
Spraberry crude oil EUR distribution, mb/well
Wells drilled in 2016-2017 with at least 4 months of production.
39Office of Petroleum, Gas, and Biofuels Analysis Working Group Presentation for Discussion Purposes Washington, DC, July 26, 2017 DO NOT QUOTE OR CITE as results are subject to change
minimum
maximum
25th percentile
meanmedian
75th percentile
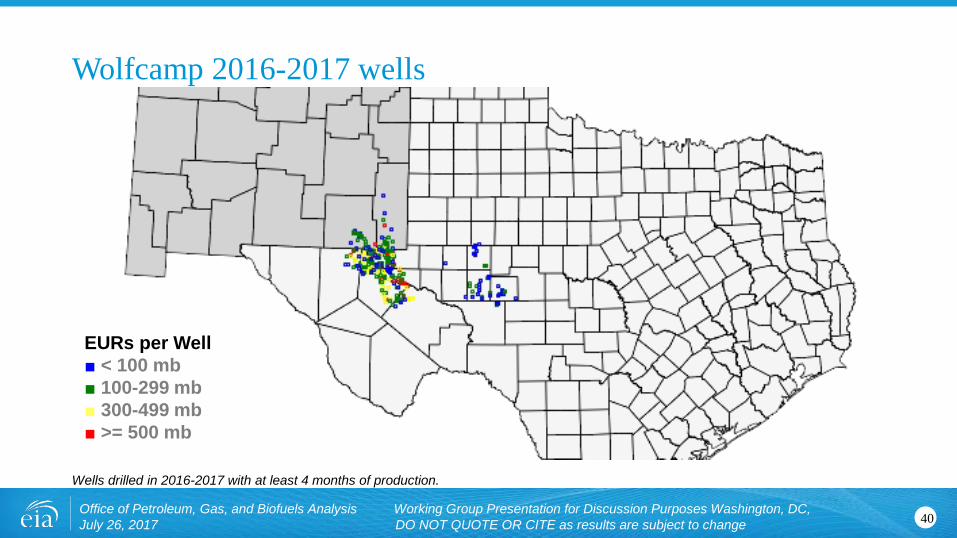
Wolfcamp 2016-2017 wells
Wells drilled in 2016-2017 with at least 4 months of production.
40Office of Petroleum, Gas, and Biofuels Analysis Working Group Presentation for Discussion Purposes Washington, DC, July 26, 2017 DO NOT QUOTE OR CITE as results are subject to change
EURs per Well■ < 100 mb■ 100-299 mb■ 300-499 mb■ >= 500 mb
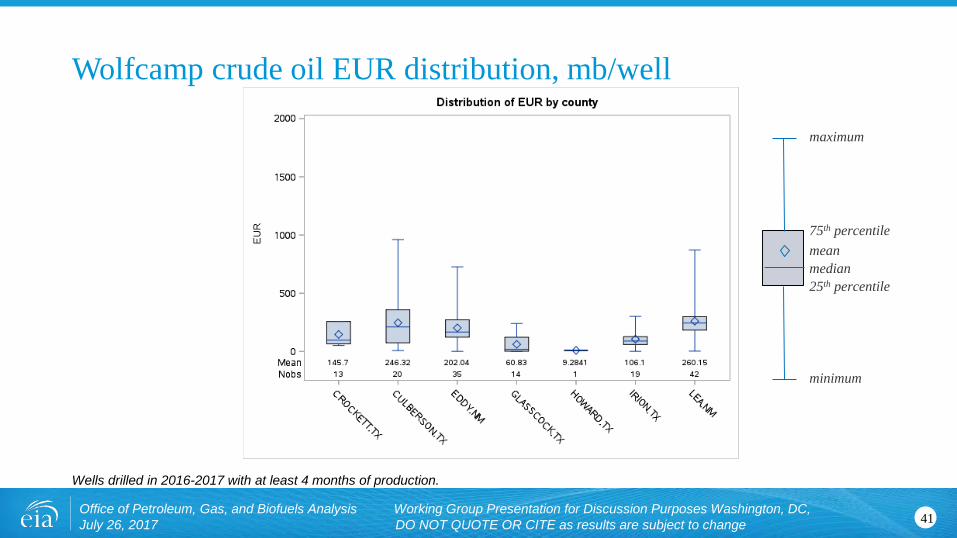
Wolfcamp crude oil EUR distribution, mb/well
Wells drilled in 2016-2017 with at least 4 months of production.
41Office of Petroleum, Gas, and Biofuels Analysis Working Group Presentation for Discussion Purposes Washington, DC, July 26, 2017 DO NOT QUOTE OR CITE as results are subject to change
minimum
maximum
25th percentile
meanmedian
75th percentile
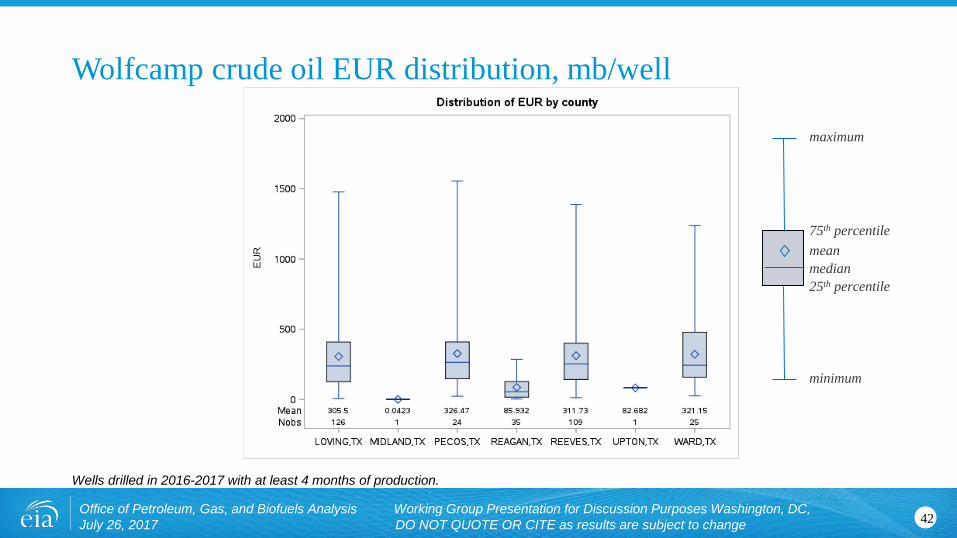
Wolfcamp crude oil EUR distribution, mb/well
Wells drilled in 2016-2017 with at least 4 months of production.
42Office of Petroleum, Gas, and Biofuels Analysis Working Group Presentation for Discussion Purposes Washington, DC, July 26, 2017 DO NOT QUOTE OR CITE as results are subject to change
minimum
maximum
25th percentile
meanmedian
75th percentile
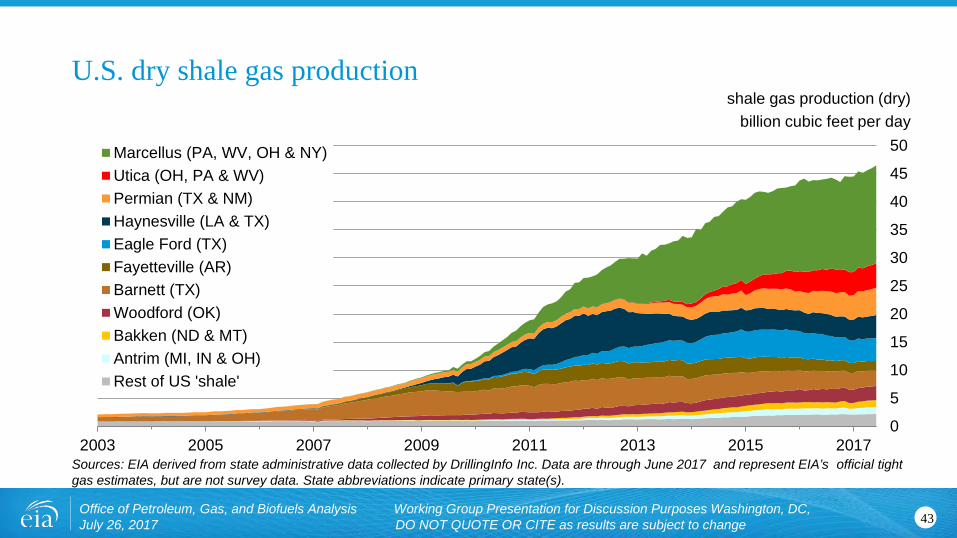
shale gas production (dry)billion cubic feet per day
U.S. dry shale gas production
Sources: EIA derived from state administrative data collected by DrillingInfo Inc. Data are through June 2017 and represent EIA’s official tight gas estimates, but are not survey data. State abbreviations indicate primary state(s).
43Office of Petroleum, Gas, and Biofuels Analysis Working Group Presentation for Discussion Purposes Washington, DC, July 26, 2017 DO NOT QUOTE OR CITE as results are subject to change
0
5
10
15
20
25
30
35
40
45
50
2003 2005 2007 2009 2011 2013 2015 2017
Marcellus (PA, WV, OH & NY)Utica (OH, PA & WV)Permian (TX & NM)Haynesville (LA & TX)Eagle Ford (TX)Fayetteville (AR)Barnett (TX)Woodford (OK)Bakken (ND & MT)Antrim (MI, IN & OH)Rest of US 'shale'
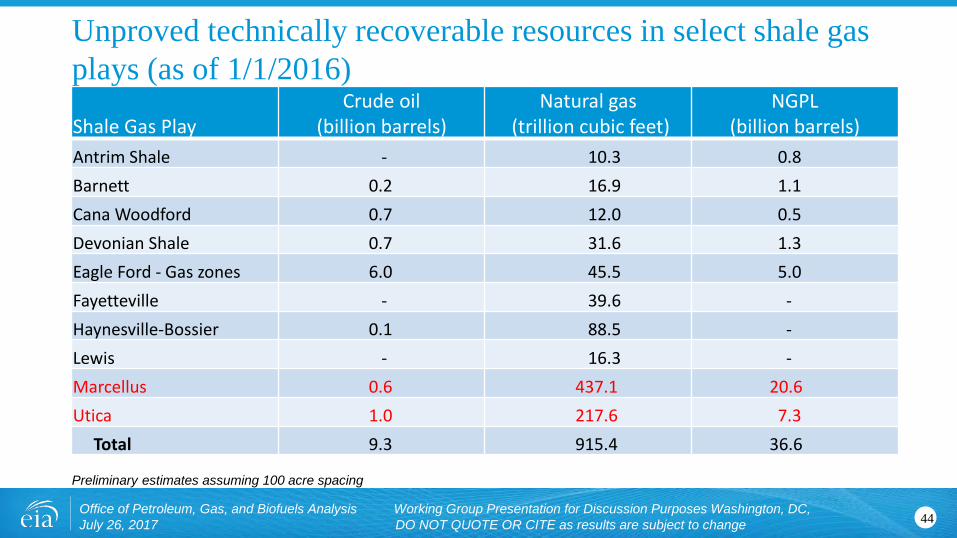
Unproved technically recoverable resources in select shale gas plays (as of 1/1/2016)
Preliminary estimates assuming 100 acre spacing
44Office of Petroleum, Gas, and Biofuels Analysis Working Group Presentation for Discussion Purposes Washington, DC, July 26, 2017 DO NOT QUOTE OR CITE as results are subject to change
Shale Gas PlayCrude oil
(billion barrels)Natural gas
(trillion cubic feet)NGPL
(billion barrels)Antrim Shale - 10.3 0.8 Barnett 0.2 16.9 1.1 Cana Woodford 0.7 12.0 0.5 Devonian Shale 0.7 31.6 1.3 Eagle Ford - Gas zones 6.0 45.5 5.0 Fayetteville - 39.6 -Haynesville-Bossier 0.1 88.5 -Lewis - 16.3 -Marcellus 0.6 437.1 20.6 Utica 1.0 217.6 7.3
Total 9.3 915.4 36.6
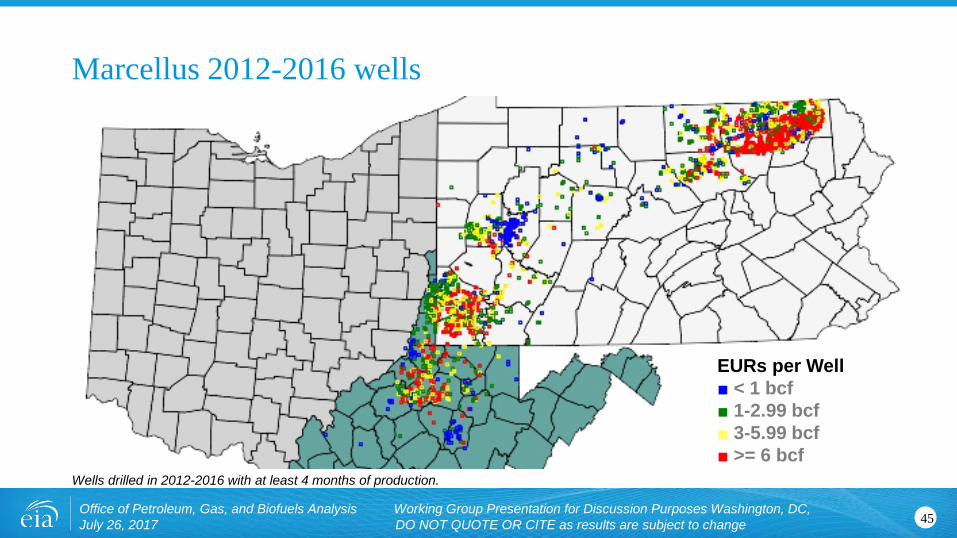
Marcellus 2012-2016 wells
Wells drilled in 2012-2016 with at least 4 months of production.
45Office of Petroleum, Gas, and Biofuels Analysis Working Group Presentation for Discussion Purposes Washington, DC, July 26, 2017 DO NOT QUOTE OR CITE as results are subject to change
EURs per Well■ < 1 bcf■ 1-2.99 bcf■ 3-5.99 bcf■ >= 6 bcf
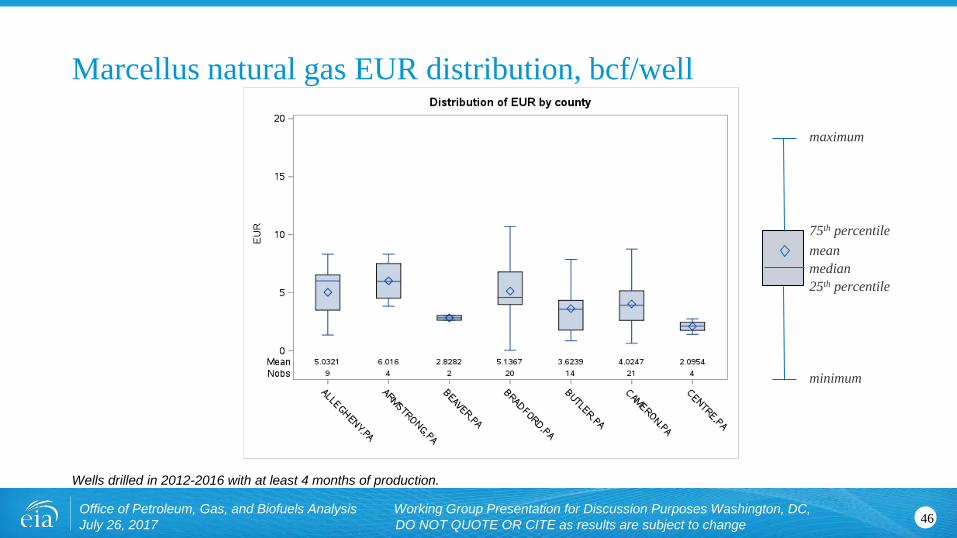
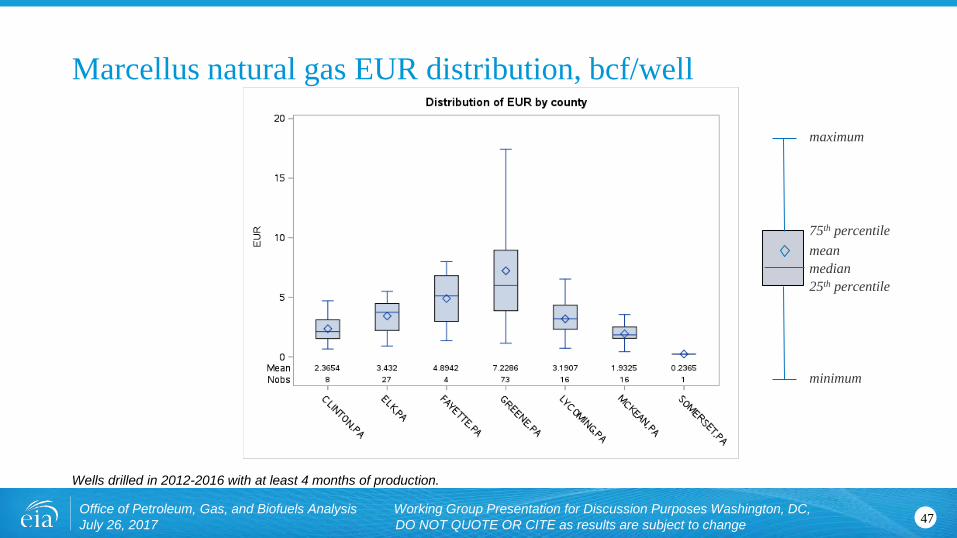
Marcellus natural gas EUR distribution, bcf/well
Wells drilled in 2012-2016 with at least 4 months of production.
46Office of Petroleum, Gas, and Biofuels Analysis Working Group Presentation for Discussion Purposes Washington, DC, July 26, 2017 DO NOT QUOTE OR CITE as results are subject to change
minimum
maximum
25th percentile
meanmedian
75th percentile
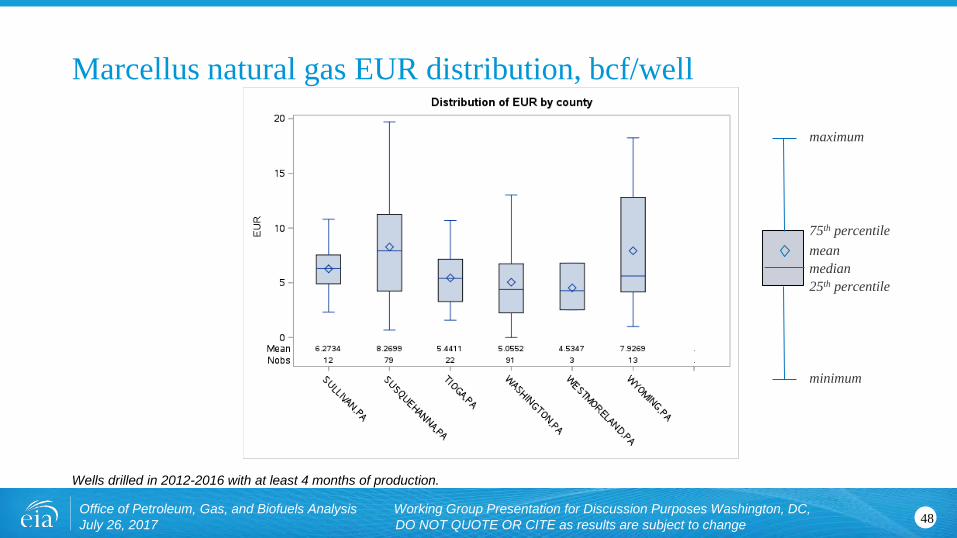
Marcellus natural gas EUR distribution, bcf/well
Wells drilled in 2012-2016 with at least 4 months of production.
47Office of Petroleum, Gas, and Biofuels Analysis Working Group Presentation for Discussion Purposes Washington, DC, July 26, 2017 DO NOT QUOTE OR CITE as results are subject to change
minimum
maximum
25th percentile
meanmedian
75th percentile
Marcellus natural gas EUR distribution, bcf/well
Wells drilled in 2012-2016 with at least 4 months of production.
48Office of Petroleum, Gas, and Biofuels Analysis Working Group Presentation for Discussion Purposes Washington, DC, July 26, 2017 DO NOT QUOTE OR CITE as results are subject to change
minimum
maximum
25th percentile
meanmedian
75th percentile
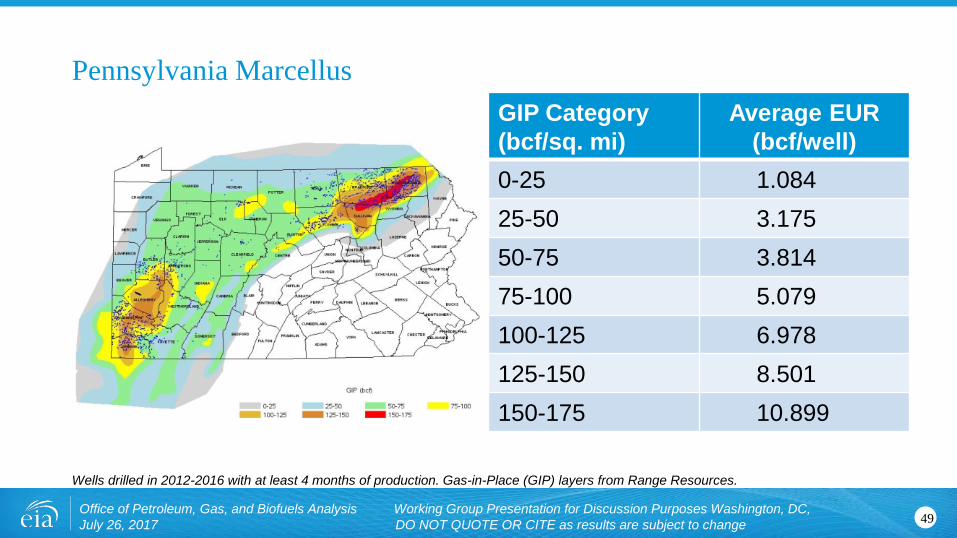
GIP Category (bcf/sq. mi)
Average EUR (bcf/well)
0-25 1.08425-50 3.17550-75 3.81475-100 5.079100-125 6.978125-150 8.501150-175 10.899
Wells drilled in 2012-2016 with at least 4 months of production. Gas-in-Place (GIP) layers from Range Resources.
Pennsylvania Marcellus
49Office of Petroleum, Gas, and Biofuels Analysis Working Group Presentation for Discussion Purposes Washington, DC, July 26, 2017 DO NOT QUOTE OR CITE as results are subject to change
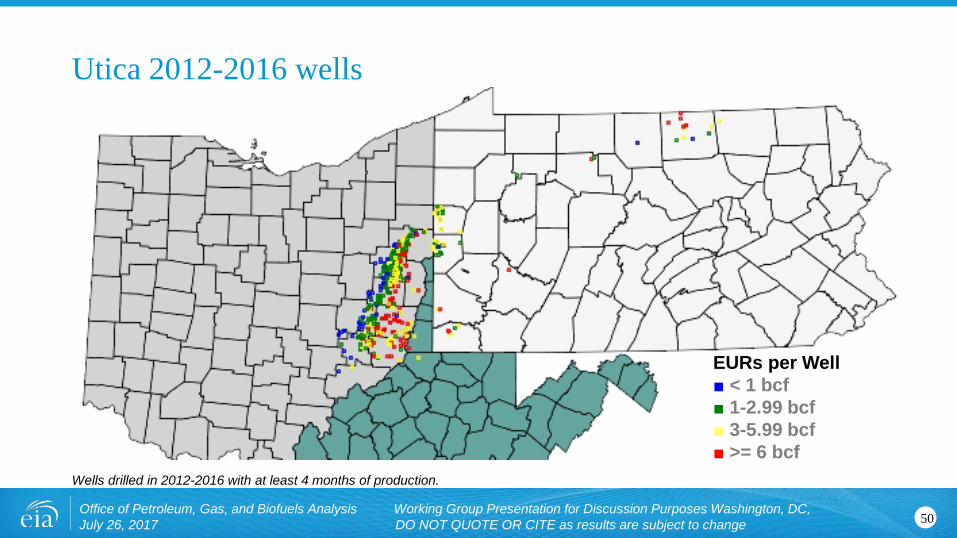
Utica 2012-2016 wells
Wells drilled in 2012-2016 with at least 4 months of production.
50Office of Petroleum, Gas, and Biofuels Analysis Working Group Presentation for Discussion Purposes Washington, DC, July 26, 2017 DO NOT QUOTE OR CITE as results are subject to change
EURs per Well■ < 1 bcf■ 1-2.99 bcf■ 3-5.99 bcf■ >= 6 bcf
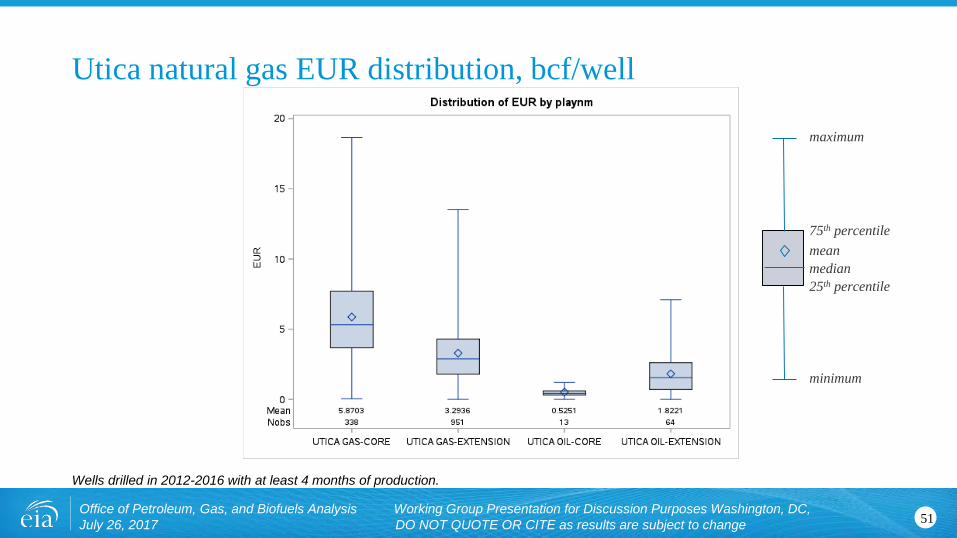
Utica natural gas EUR distribution, bcf/well
Wells drilled in 2012-2016 with at least 4 months of production.
51Office of Petroleum, Gas, and Biofuels Analysis Working Group Presentation for Discussion Purposes Washington, DC, July 26, 2017 DO NOT QUOTE OR CITE as results are subject to change
minimum
maximum
25th percentile
meanmedian
75th percentile
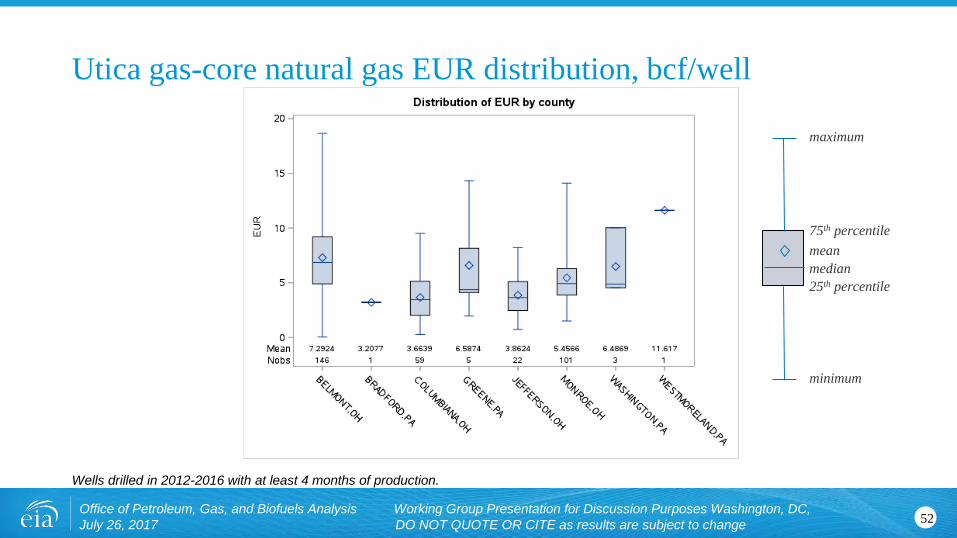
Utica gas-core natural gas EUR distribution, bcf/well
Wells drilled in 2012-2016 with at least 4 months of production.
52Office of Petroleum, Gas, and Biofuels Analysis Working Group Presentation for Discussion Purposes Washington, DC, July 26, 2017 DO NOT QUOTE OR CITE as results are subject to change
minimum
maximum
25th percentile
meanmedian
75th percentile
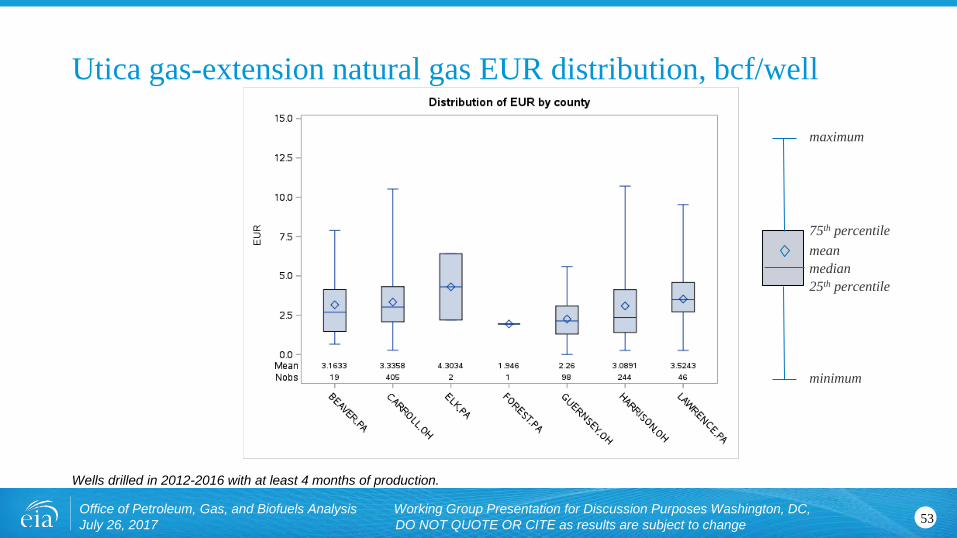
Utica gas-extension natural gas EUR distribution, bcf/well
Wells drilled in 2012-2016 with at least 4 months of production.
53Office of Petroleum, Gas, and Biofuels Analysis Working Group Presentation for Discussion Purposes Washington, DC, July 26, 2017 DO NOT QUOTE OR CITE as results are subject to change
minimum
maximum
25th percentile
meanmedian
75th percentile
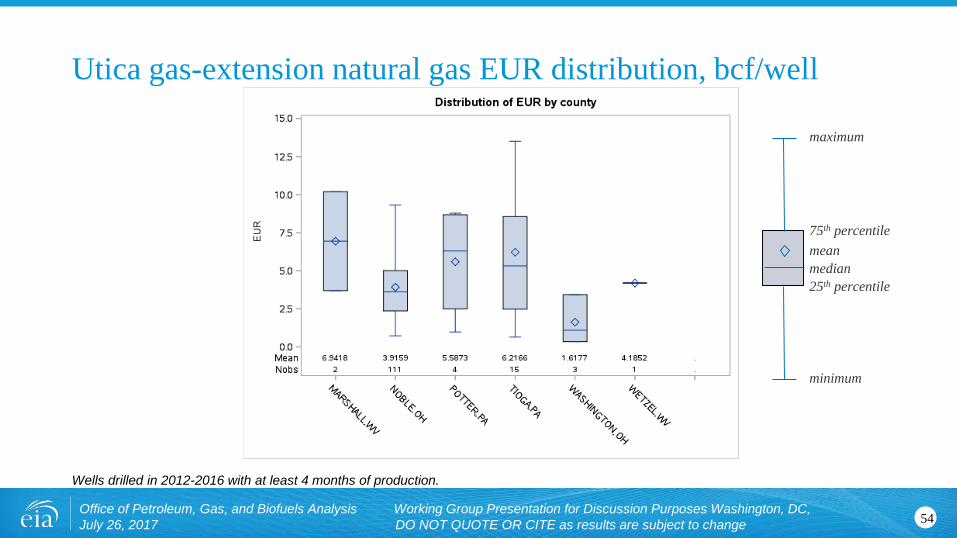
Utica gas-extension natural gas EUR distribution, bcf/well
Wells drilled in 2012-2016 with at least 4 months of production.
54Office of Petroleum, Gas, and Biofuels Analysis Working Group Presentation for Discussion Purposes Washington, DC, July 26, 2017 DO NOT QUOTE OR CITE as results are subject to change
minimum
maximum
25th percentile
meanmedian
75th percentile
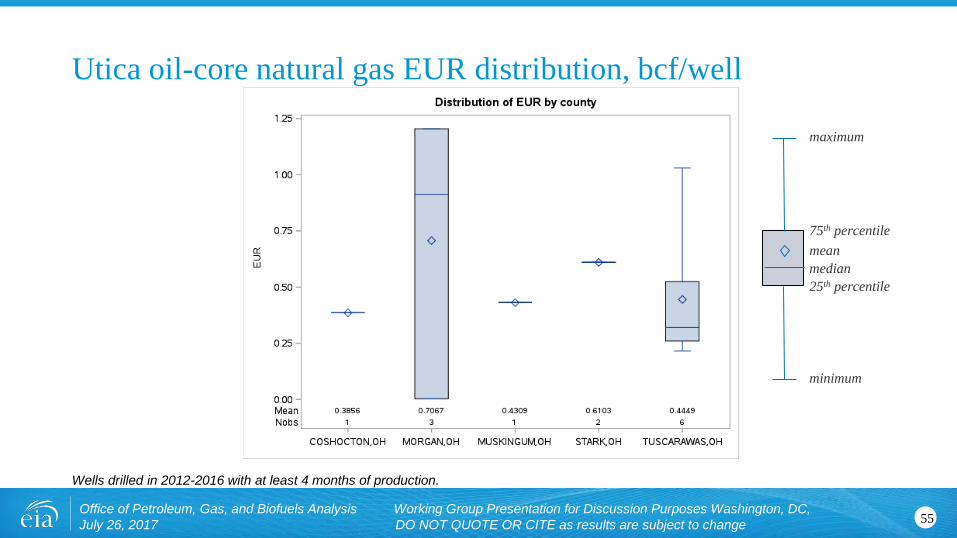
Utica oil-core natural gas EUR distribution, bcf/well
Wells drilled in 2012-2016 with at least 4 months of production.
55Office of Petroleum, Gas, and Biofuels Analysis Working Group Presentation for Discussion Purposes Washington, DC, July 26, 2017 DO NOT QUOTE OR CITE as results are subject to change
minimum
maximum
25th percentile
meanmedian
75th percentile
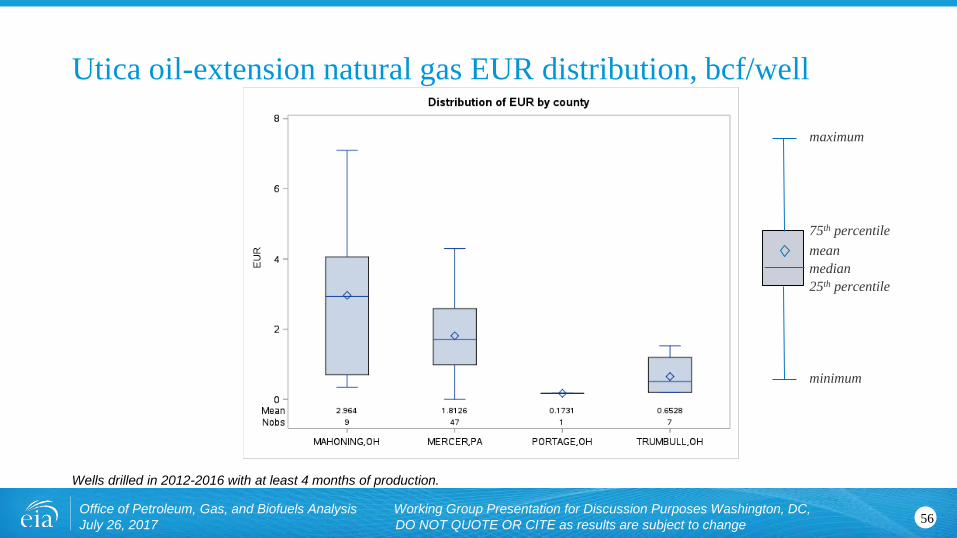
Utica oil-extension natural gas EUR distribution, bcf/well
Wells drilled in 2012-2016 with at least 4 months of production.
56Office of Petroleum, Gas, and Biofuels Analysis Working Group Presentation for Discussion Purposes Washington, DC, July 26, 2017 DO NOT QUOTE OR CITE as results are subject to change
minimum
maximum
25th percentile
meanmedian
75th percentile
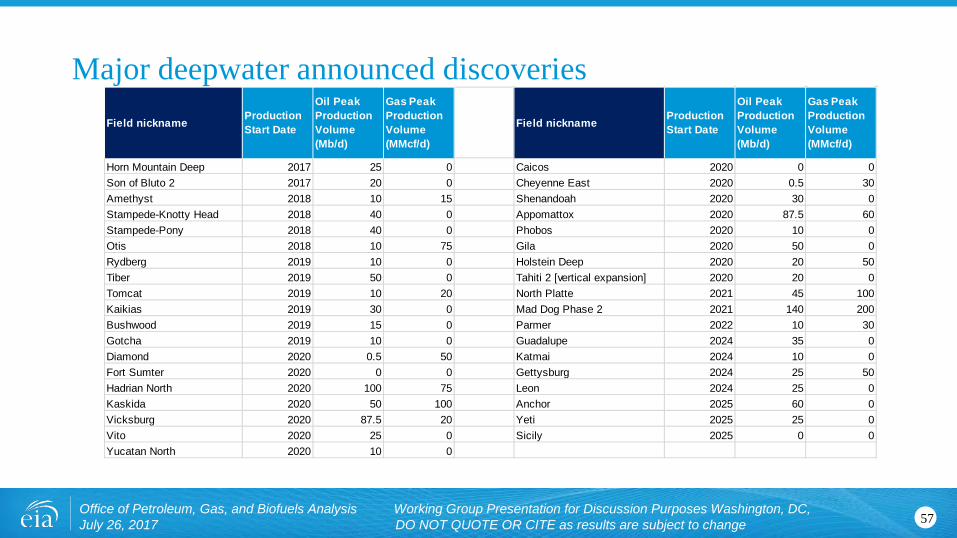
Major deepwater announced discoveries
57Office of Petroleum, Gas, and Biofuels Analysis Working Group Presentation for Discussion Purposes Washington, DC, July 26, 2017 DO NOT QUOTE OR CITE as results are subject to change
Field nickname Production Start Date
Oil Peak Production Volume (Mb/d)
Gas Peak Production Volume (MMcf/d)
Field nickname Production Start Date
Oil Peak Production Volume (Mb/d)
Gas Peak Production Volume (MMcf/d)
Horn Mountain Deep 2017 25 0 Caicos 2020 0 0Son of Bluto 2 2017 20 0 Cheyenne East 2020 0.5 30Amethyst 2018 10 15 Shenandoah 2020 30 0Stampede-Knotty Head 2018 40 0 Appomattox 2020 87.5 60Stampede-Pony 2018 40 0 Phobos 2020 10 0Otis 2018 10 75 Gila 2020 50 0Rydberg 2019 10 0 Holstein Deep 2020 20 50Tiber 2019 50 0 Tahiti 2 [vertical expansion] 2020 20 0Tomcat 2019 10 20 North Platte 2021 45 100Kaikias 2019 30 0 Mad Dog Phase 2 2021 140 200Bushwood 2019 15 0 Parmer 2022 10 30Gotcha 2019 10 0 Guadalupe 2024 35 0Diamond 2020 0.5 50 Katmai 2024 10 0Fort Sumter 2020 0 0 Gettysburg 2024 25 50Hadrian North 2020 100 75 Leon 2024 25 0Kaskida 2020 50 100 Anchor 2025 60 0Vicksburg 2020 87.5 20 Yeti 2025 25 0Vito 2020 25 0 Sicily 2025 0 0Yucatan North 2020 10 0
Contacts for OGSM
58Office of Petroleum, Gas, and Biofuels Analysis Working Group Presentation for Discussion Purposes Washington, DC, July 26, 2017 DO NOT QUOTE OR CITE as results are subject to change
Lower 48 onshore
Dana Van Wagener: [email protected]
Lower 48 offshore and Alaska
Terry Yen: [email protected]
Exploration and Production Team Lead
Meg Coleman: [email protected]
We welcome feedback on our assumptions and documentation• Working group meetings http://www.eia.gov/forecasts/aeo/workinggroup/
• The AEO Assumptions report http://www.eia.gov/forecasts/aeo/assumptions/
• NEMS Model Documentation– Oil and gas supply
https://www.eia.gov/outlooks/aeo/nems/documentation/ogsm/pdf/m063(2017).pdf
– Natural gas transmission and distribution http://www.eia.gov/forecasts/aeo/nems/documentation/ngtdm/pdf/m062(2014).pdf
– LFMM https://www.eia.gov/outlooks/aeo/nems/documentation/lfmm/pdf/m059(2014).pdf
• Working papers series http://www.eia.gov/workingpapers/
59Office of Petroleum, Gas, and Biofuels Analysis Working Group Presentation for Discussion Purposes Washington, DC, July 26, 2017 DO NOT QUOTE OR CITE as results are subject to change
Thank you
60Office of Petroleum, Gas, and Biofuels Analysis Working Group Presentation for Discussion Purposes Washington, DC, July 26, 2017 DO NOT QUOTE OR CITE as results are subject to change
Next Working Group MeetingTentatively planned for September 2017.
Will present preliminary results for AEO2018.