Embed Size (px)
Citation preview
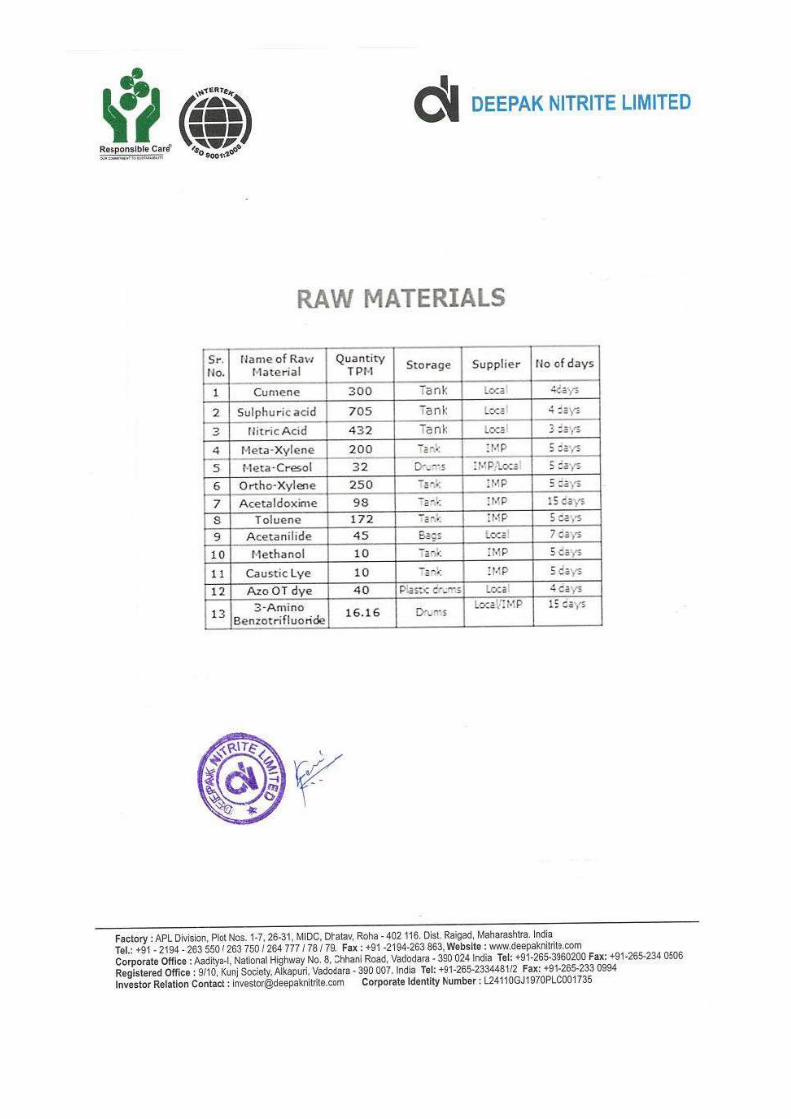
Annexure –I
Risk assessment to be done by 3D Model
Risk assessment study by 3D model is under process and it
will take another 6-7 days for completion. Hence, risk
assessment report by 3D model will be submitted at the
time of presentation.
Annexure-II
Report on Prediction of Ground Level Concentrations of Air Pollutants
PREDICTION OF GROUND LEVEL
CONCENTRATION
OF
AIR POLLUTANTS
OPERATION OF
Deepak Nitrite Ltd.
Plot No. 1-7 & 26-31, Dhatav MIDC – Roha-402116
Dist – Raigad, Maharashtra state
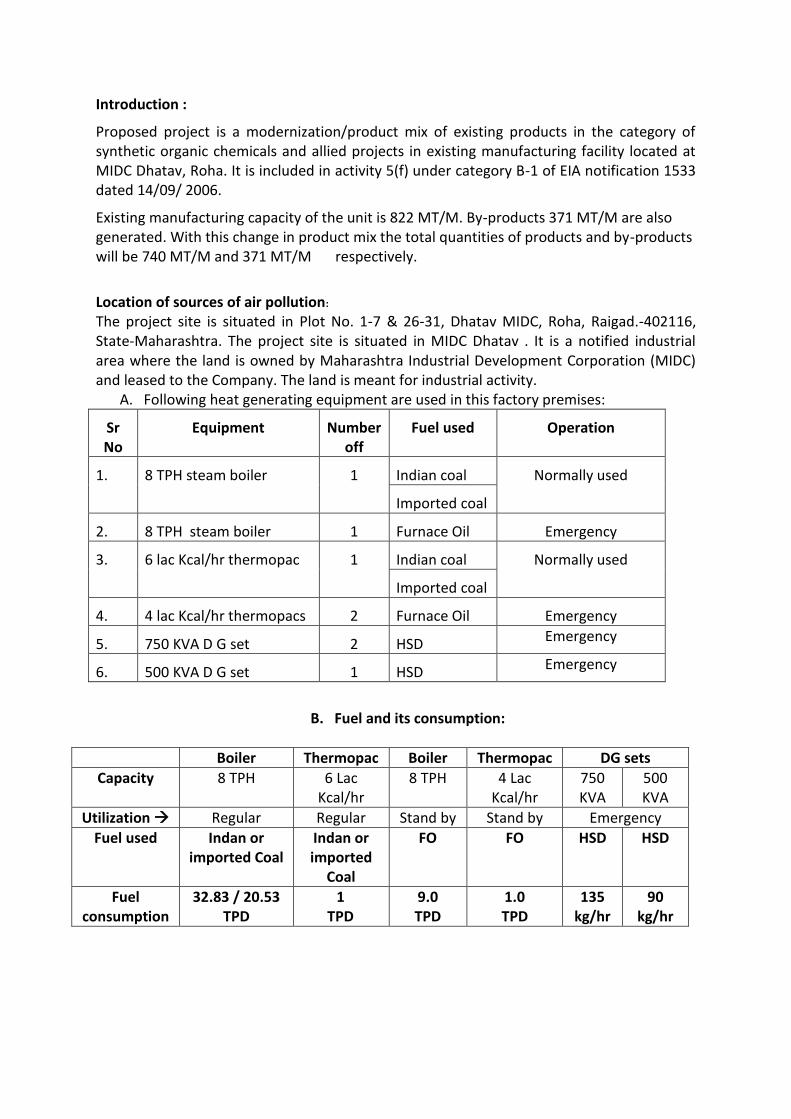
Introduction :
Proposed project is a modernization/product mix of existing products in the category of synthetic organic chemicals and allied projects in existing manufacturing facility located at MIDC Dhatav, Roha. It is included in activity 5(f) under category B-1 of EIA notification 1533 dated 14/09/ 2006.
Existing manufacturing capacity of the unit is 822 MT/M. By-products 371 MT/M are also generated. With this change in product mix the total quantities of products and by-products will be 740 MT/M and 371 MT/M respectively.
Location of sources of air pollution: The project site is situated in Plot No. 1-7 & 26-31, Dhatav MIDC, Roha, Raigad.-402116, State-Maharashtra. The project site is situated in MIDC Dhatav . It is a notified industrial area where the land is owned by Maharashtra Industrial Development Corporation (MIDC) and leased to the Company. The land is meant for industrial activity.
A. Following heat generating equipment are used in this factory premises:
Sr No
Equipment Number off
Fuel used Operation
1. 8 TPH steam boiler 1 Indian coal Normally used
Imported coal
2. 8 TPH steam boiler 1 Furnace Oil Emergency
3. 6 lac Kcal/hr thermopac 1 Indian coal Normally used
Imported coal
4. 4 lac Kcal/hr thermopacs 2 Furnace Oil Emergency
5. 750 KVA D G set 2 HSD Emergency
6. 500 KVA D G set 1 HSD Emergency
B. Fuel and its consumption:
Boiler Thermopac Boiler Thermopac DG sets
Capacity 8 TPH 6 Lac Kcal/hr
8 TPH 4 Lac Kcal/hr
750 KVA
500 KVA
Utilization Regular Regular Stand by Stand by Emergency
Fuel used Indan or imported Coal
Indan or imported
Coal
FO FO HSD HSD
Fuel consumption
32.83 / 20.53 TPD
1 TPD
9.0 TPD
1.0 TPD
135 kg/hr
90 kg/hr
Stack details:
Boiler Thermopac Boiler Thermopac DG sets
Capacity 8 TPH 6 Lac Kcal/hr 8 TPH 4 Lac Kcal/hr
750 KVA 500 KVA
Stack Height 34 m. 24.50 m. 20 m. 11 m. 4.50 m.
Stack dia. 1.20 m. 1.20 m. 1.0 m. 0.20 m. 0.20 m.
Stack gas Temp.
1620C 1600C 1600C 1550C 2070C 1900C
Flue gas Velocity
5.30 m/s 2.50 m/s 3.0 m/s 3.0 m/s 15.70 14.60
Flue gas rate 14746 Nm3/hr
10178 Nm3/hr
12214 m3/hr
8490 m3/hr
1140 Nm3/hr
1075 Nm3/hr
D. Expected Emission:.
D-1 : 8 TPH Boiler -- (Regular use)
8 TPH Boiler
Fuel used Imported Coal Indian Coal
Fuel consumption 20.52TPD (855kg / hr) 32.53TPD ( 1355 kg / hr)
Fuel analysis 10 % ash 1 % Sulfur
38 % ash 1 % Sulfur
Total ash generated 2.05 TPD or 85.50 kg/hr 12.36 TPD or 515 kg/hr
Bottom ash (20 %) 0.410 TPD 2.47 TPD
Fly ash (80 %) 1.64 TPD ( 0.068 T/hr ) 9.88 TPD ( 0.411 T/hr )
Fly Ash going after APC of 90% efficiency
0.164 TPD ( 0.0068 T/hr )
0.988 TPD ( 0.0411 T/hr )
PM 10 25%
0.041 TPD
0.247 TPD
PM2.5 30%
0.049 TPD
0.296 TPD
Stack height 34 m.
Total SO2 emission rate 17.10 kg/hr or 0. 41 TPD
27.10 kg/hr or 0. 65 TPD
Total NOx emission rate 6.10 kg/hr or 0.146 TPD 9.48 kg/hr or 0.22 TPD
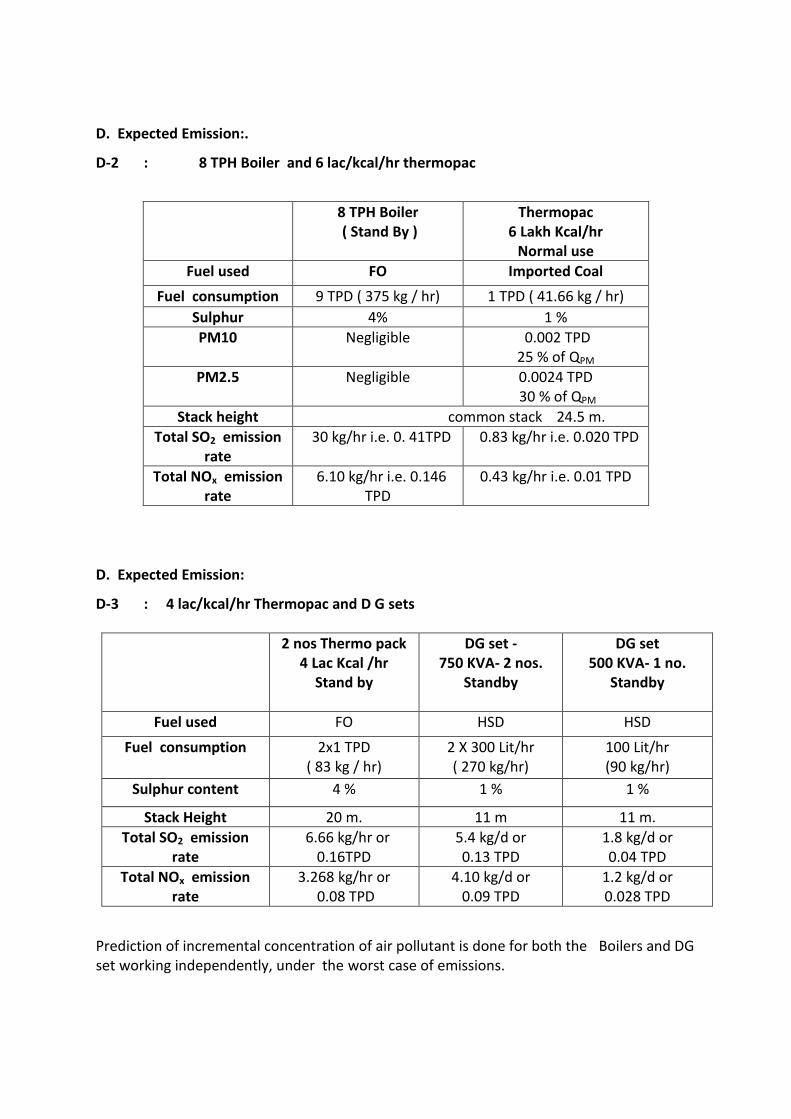
D. Expected Emission:.
D-2 : 8 TPH Boiler and 6 lac/kcal/hr thermopac
8 TPH Boiler
( Stand By ) Thermopac
6 Lakh Kcal/hr Normal use
Fuel used FO Imported Coal
Fuel consumption 9 TPD ( 375 kg / hr) 1 TPD ( 41.66 kg / hr)
Sulphur 4% 1 %
PM10 Negligible 0.002 TPD 25 % of QPM
PM2.5 Negligible 0.0024 TPD 30 % of QPM
Stack height common stack 24.5 m.
Total SO2 emission rate
30 kg/hr i.e. 0. 41TPD 0.83 kg/hr i.e. 0.020 TPD
Total NOx emission rate
6.10 kg/hr i.e. 0.146 TPD
0.43 kg/hr i.e. 0.01 TPD
D. Expected Emission:
D-3 : 4 lac/kcal/hr Thermopac and D G sets
2 nos Thermo pack 4 Lac Kcal /hr
Stand by
DG set - 750 KVA- 2 nos.
Standby
DG set 500 KVA- 1 no.
Standby
Fuel used FO HSD HSD
Fuel consumption 2x1 TPD ( 83 kg / hr)
2 X 300 Lit/hr ( 270 kg/hr)
100 Lit/hr (90 kg/hr)
Sulphur content 4 % 1 % 1 %
Stack Height 20 m. 11 m 11 m.
Total SO2 emission rate
6.66 kg/hr or 0.16TPD
5.4 kg/d or 0.13 TPD
1.8 kg/d or 0.04 TPD
Total NOx emission rate
3.268 kg/hr or 0.08 TPD
4.10 kg/d or 0.09 TPD
1.2 kg/d or 0.028 TPD
Prediction of incremental concentration of air pollutant is done for both the Boilers and DG set working independently, under the worst case of emissions.
E. Air estimation : Air quality estimation is done with Plausibility approach using Gaussian Plume Model. Prediction of air quality under given emission conditions is needed to check whether the actual concentrations of PM2.5 & PM10, SO2 and NOx shall not be exceeding the Ambient Air Quality Standards prescribed by CPCB. E.1. Plausibility approach using Gaussian Plume Model ( GPM )
Prediction of pollutant concentrations can be made by suitable air quality model. Application of such model require in addition to emission data, proper meteorological data ie. Simultaneous wind speed, direction and cloudiness data
Under such condition it is possible to use plausibility approach model to obtain maximum possible impact from the unit. This impact level can be used in the design and also for setting operating limits.
Input parameters are so chosen by taking into consideration their plausibility of occurrence such that the model gives the maximum impact.
Steps : a. Determination of critical wind speed – Wind speed affects the GLC in two ways in the model, one directly and other through plume rise. One hour average GLC values are determined for standard distances ( 100 m.to 20 km ), for six stability classes ( A- F ).
From these values Critical wind speeds for each stability classes are determined which gives maximum concentration value for that wind speed.
b. Use of critical wind speeds to determination of max. GLC- Based on the maximum one hour GLC values estimated with these critical wind speed for six stability classes and selecting worst condition, ie. assuming plausibility of occurrence of different stability conditions in hours, during day time and night time, 24 hour average values are worked out. c. This value represents the maximum under worst condition which shall not exceed at
any time.
E.2. One hour average Centre line GLC of pollutant :
Gaussian Plume Model : ( GPM ) For determining one hour average concentration values Gaussian Plume Model (GPM ) is used.
The model is based on four basic assumptions:
The solution is time variant;
Wind speed is not a function of position;
Diffusivities are not a function of position
Diffusion in downwind direction is insignificant;
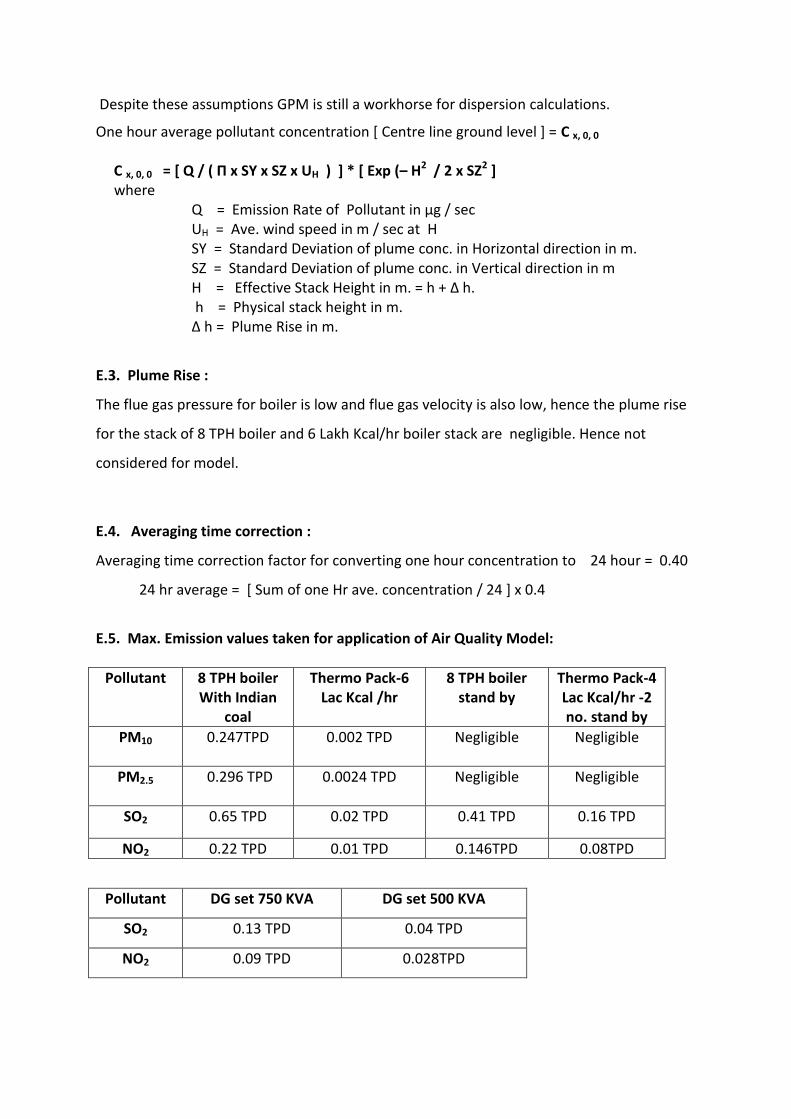
Despite these assumptions GPM is still a workhorse for dispersion calculations.
One hour average pollutant concentration [ Centre line ground level ] = C x, 0, 0 C x, 0, 0 = [ Q / ( Π x SY x SZ x UH ) ] * [ Exp (– H2 / 2 x SZ2 ]
where Q = Emission Rate of Pollutant in μg / sec UH = Ave. wind speed in m / sec at H SY = Standard Deviation of plume conc. in Horizontal direction in m. SZ = Standard Deviation of plume conc. in Vertical direction in m H = Effective Stack Height in m. = h + ∆ h. h = Physical stack height in m. ∆ h = Plume Rise in m.
E.3. Plume Rise :
The flue gas pressure for boiler is low and flue gas velocity is also low, hence the plume rise
for the stack of 8 TPH boiler and 6 Lakh Kcal/hr boiler stack are negligible. Hence not
considered for model.
E.4. Averaging time correction :
Averaging time correction factor for converting one hour concentration to 24 hour = 0.40
24 hr average = [ Sum of one Hr ave. concentration / 24 ] x 0.4
E.5. Max. Emission values taken for application of Air Quality Model:
Pollutant 8 TPH boiler With Indian
coal
Thermo Pack-6 Lac Kcal /hr
8 TPH boiler stand by
Thermo Pack-4 Lac Kcal/hr -2 no. stand by
PM10 0.247TPD
0.002 TPD Negligible Negligible
PM2.5 0.296 TPD
0.0024 TPD Negligible Negligible
SO2 0.65 TPD 0.02 TPD 0.41 TPD 0.16 TPD
NO2 0.22 TPD 0.01 TPD 0.146TPD 0.08TPD
Pollutant DG set 750 KVA DG set 500 KVA
SO2 0.13 TPD 0.04 TPD
NO2 0.09 TPD 0.028TPD
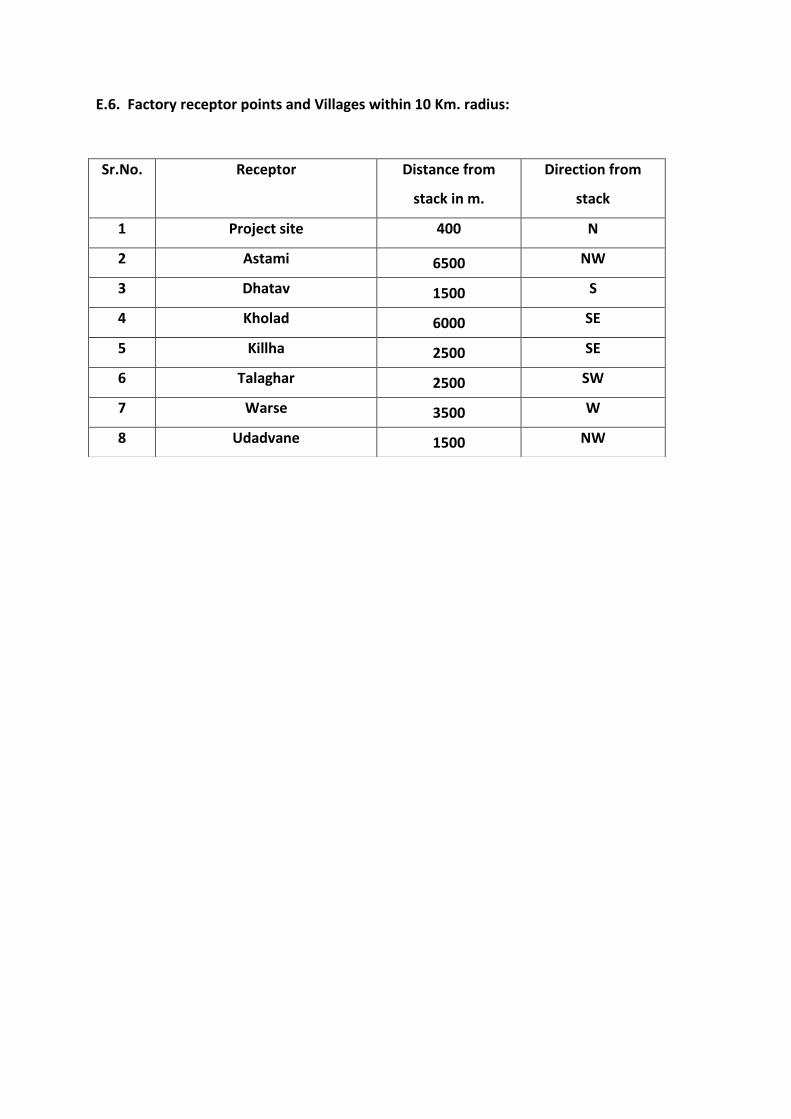
E.6. Factory receptor points and Villages within 10 Km. radius:
Sr.No. Receptor Distance from
stack in m.
Direction from
stack
1 Project site 400 N
2 Astami 6500 NW
3 Dhatav 1500 S
4 Kholad 6000 SE
5 Killha 2500 SE
6 Talaghar 2500 SW
7 Warse 3500 W
8 Udadvane 1500 NW
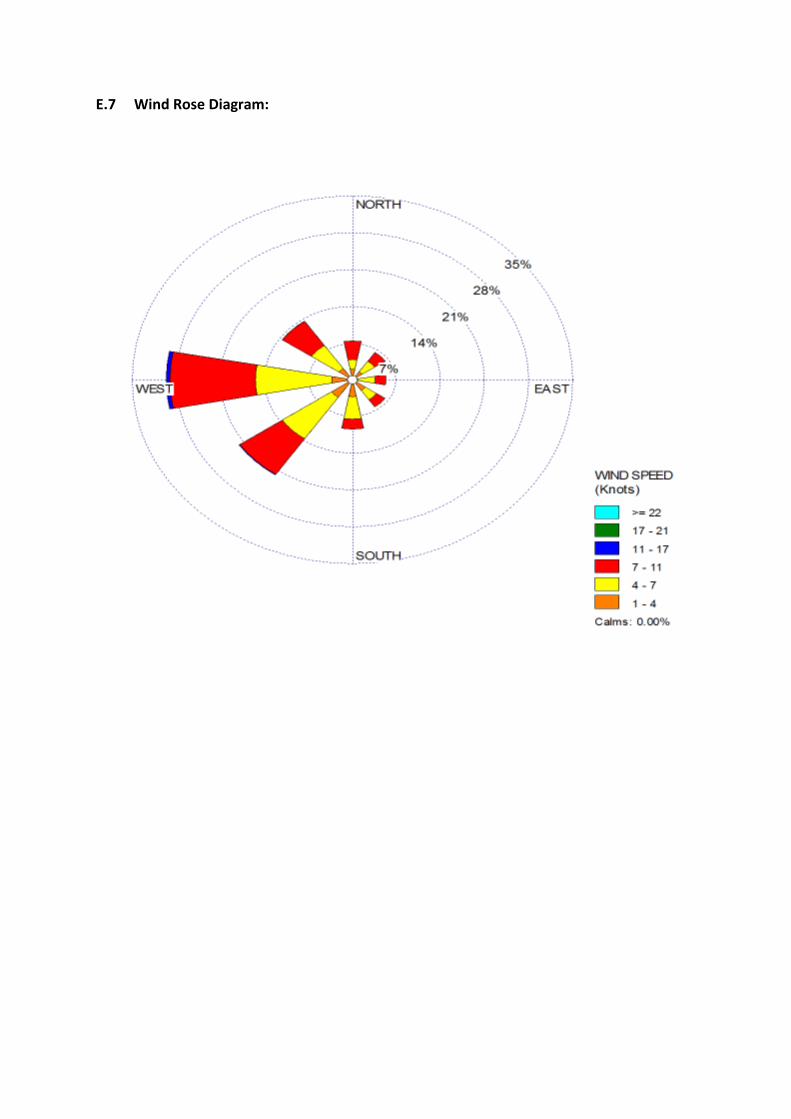
E.7 Wind Rose Diagram:
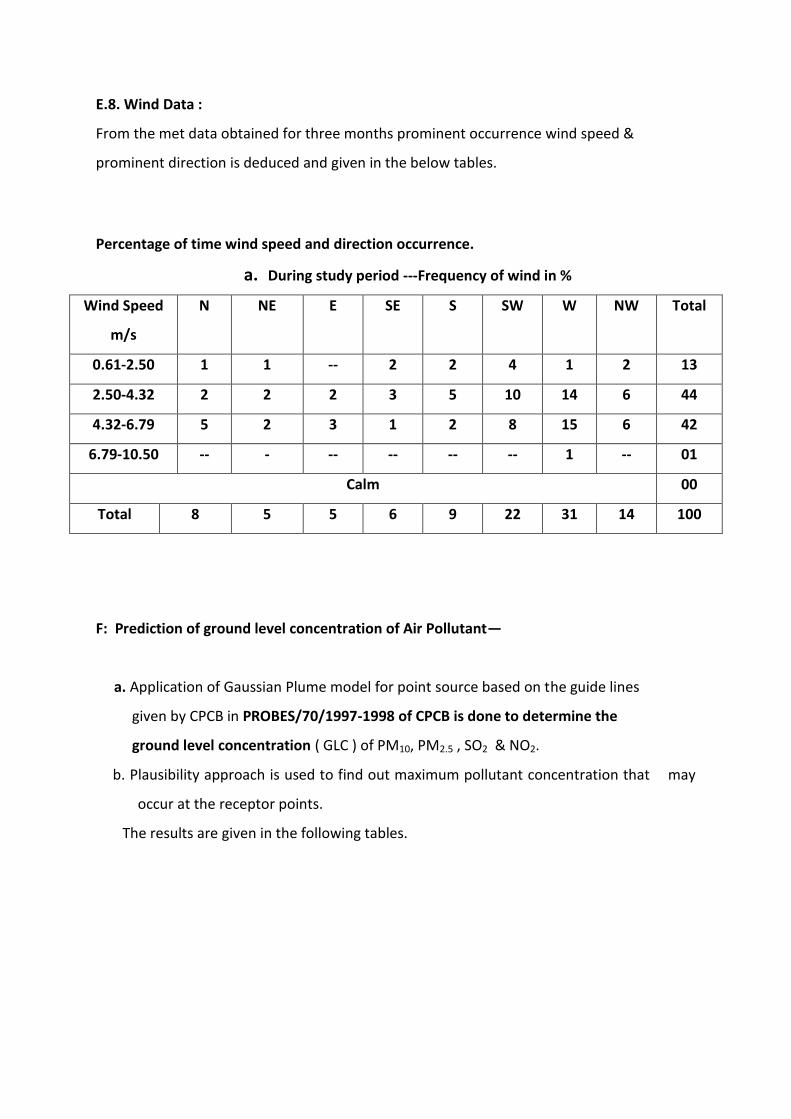
E.8. Wind Data : From the met data obtained for three months prominent occurrence wind speed &
prominent direction is deduced and given in the below tables.
Percentage of time wind speed and direction occurrence.
a. During study period ---Frequency of wind in %
Wind Speed
m/s
N NE E SE S SW W NW Total
0.61-2.50 1 1 -- 2 2 4 1 2 13
2.50-4.32 2 2 2 3 5 10 14 6 44
4.32-6.79 5 2 3 1 2 8 15 6 42
6.79-10.50 -- - -- -- -- -- 1 -- 01
Calm 00
Total 8 5 5 6 9 22 31 14 100
F: Prediction of ground level concentration of Air Pollutant—
a. Application of Gaussian Plume model for point source based on the guide lines
given by CPCB in PROBES/70/1997-1998 of CPCB is done to determine the
ground level concentration ( GLC ) of PM10, PM2.5 , SO2 & NO2.
b. Plausibility approach is used to find out maximum pollutant concentration that may
occur at the receptor points.
The results are given in the following tables.
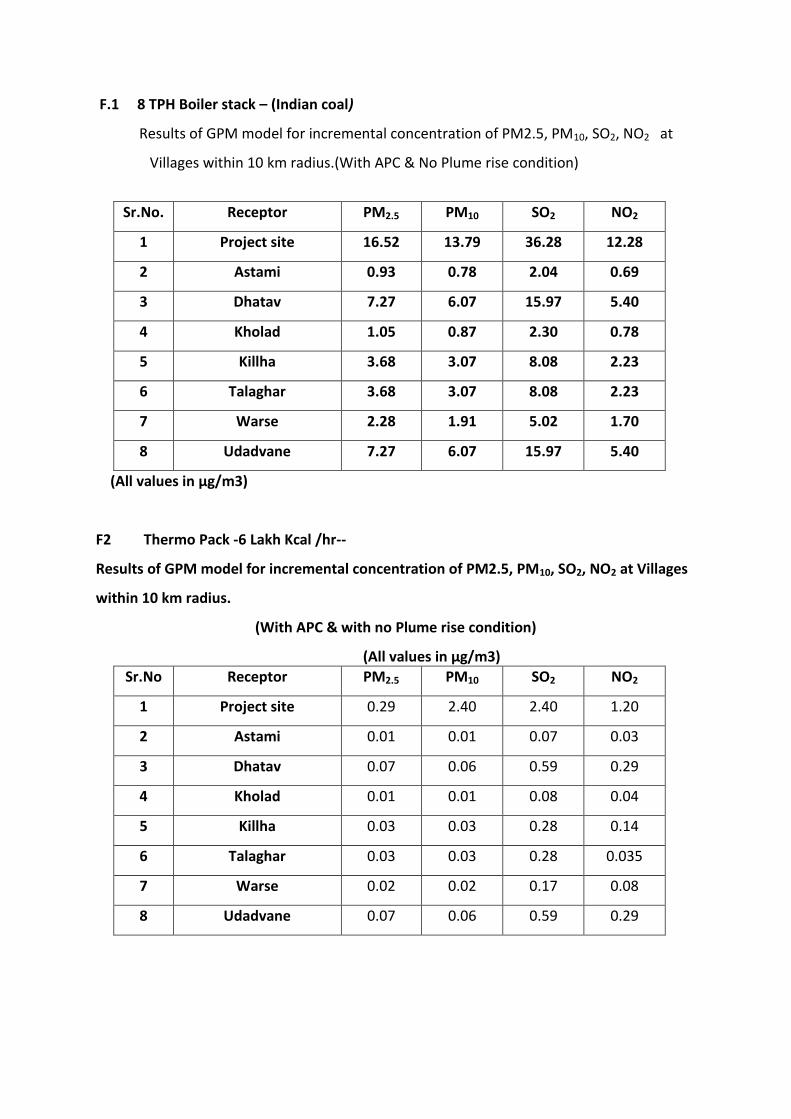
F.1 8 TPH Boiler stack – (Indian coal)
Results of GPM model for incremental concentration of PM2.5, PM10, SO2, NO2 at
Villages within 10 km radius.(With APC & No Plume rise condition)
Sr.No. Receptor PM2.5 PM10 SO2 NO2
1 Project site 16.52 13.79 36.28 12.28
2 Astami 0.93 0.78 2.04 0.69
3 Dhatav 7.27 6.07 15.97 5.40
4 Kholad 1.05 0.87 2.30 0.78
5 Killha 3.68 3.07 8.08 2.23
6 Talaghar 3.68 3.07 8.08 2.23
7 Warse 2.28 1.91 5.02 1.70
8 Udadvane 7.27 6.07 15.97 5.40
(All values in µg/m3)
F2 Thermo Pack -6 Lakh Kcal /hr--
Results of GPM model for incremental concentration of PM2.5, PM10, SO2, NO2 at Villages
within 10 km radius.
(With APC & with no Plume rise condition)
(All values in µg/m3)
Sr.No Receptor PM2.5 PM10 SO2 NO2
1 Project site 0.29 2.40 2.40 1.20
2 Astami 0.01 0.01 0.07 0.03
3 Dhatav 0.07 0.06 0.59 0.29
4 Kholad 0.01 0.01 0.08 0.04
5 Killha 0.03 0.03 0.28 0.14
6 Talaghar 0.03 0.03 0.28 0.035
7 Warse 0.02 0.02 0.17 0.08
8 Udadvane 0.07 0.06 0.59 0.29
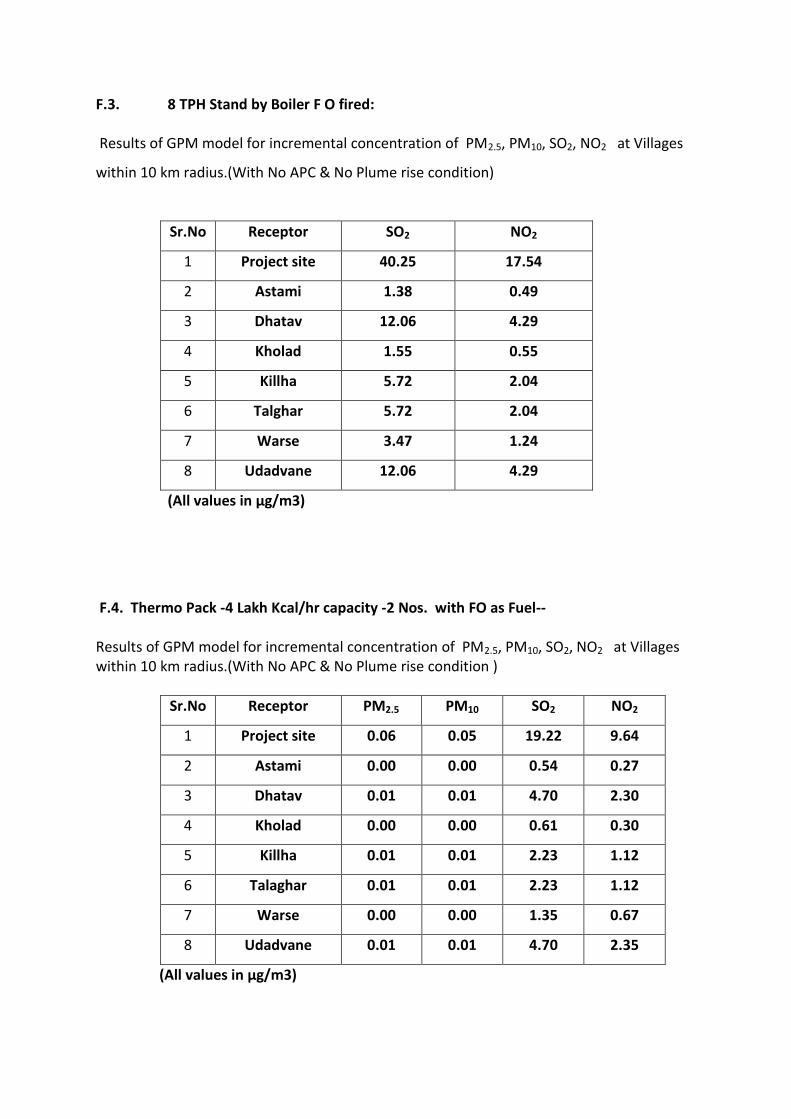
F.3. 8 TPH Stand by Boiler F O fired: Results of GPM model for incremental concentration of PM2.5, PM10, SO2, NO2 at Villages
within 10 km radius.(With No APC & No Plume rise condition)
Sr.No Receptor SO2 NO2
1 Project site 40.25 17.54
2 Astami 1.38 0.49
3 Dhatav 12.06 4.29
4 Kholad 1.55 0.55
5 Killha 5.72 2.04
6 Talghar 5.72 2.04
7 Warse 3.47 1.24
8 Udadvane 12.06 4.29
(All values in µg/m3)
F.4. Thermo Pack -4 Lakh Kcal/hr capacity -2 Nos. with FO as Fuel-- Results of GPM model for incremental concentration of PM2.5, PM10, SO2, NO2 at Villages within 10 km radius.(With No APC & No Plume rise condition )
Sr.No Receptor PM2.5 PM10 SO2 NO2
1 Project site 0.06 0.05 19.22 9.64
2 Astami 0.00 0.00 0.54 0.27
3 Dhatav 0.01 0.01 4.70 2.30
4 Kholad 0.00 0.00 0.61 0.30
5 Killha 0.01 0.01 2.23 1.12
6 Talaghar 0.01 0.01 2.23 1.12
7 Warse 0.00 0.00 1.35 0.67
8 Udadvane 0.01 0.01 4.70 2.35
(All values in µg/m3)
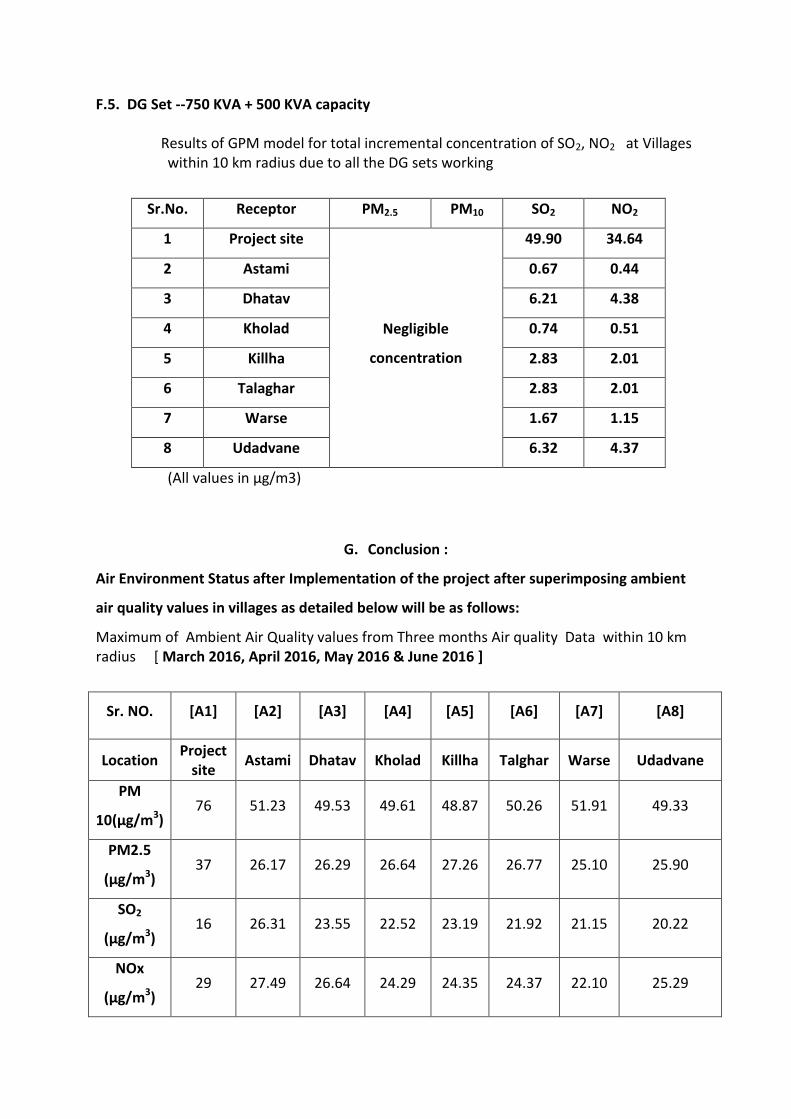
F.5. DG Set --750 KVA + 500 KVA capacity Results of GPM model for total incremental concentration of SO2, NO2 at Villages
within 10 km radius due to all the DG sets working
Sr.No. Receptor PM2.5 PM10 SO2 NO2
1 Project site
Negligible
concentration
49.90 34.64
2 Astami 0.67 0.44
3 Dhatav 6.21 4.38
4 Kholad 0.74 0.51
5 Killha 2.83 2.01
6 Talaghar 2.83 2.01
7 Warse 1.67 1.15
8 Udadvane 6.32 4.37
(All values in µg/m3)
G. Conclusion :
Air Environment Status after Implementation of the project after superimposing ambient
air quality values in villages as detailed below will be as follows:
Maximum of Ambient Air Quality values from Three months Air quality Data within 10 km radius [ March 2016, April 2016, May 2016 & June 2016 ]
Sr. NO. [A1] [A2] [A3] [A4] [A5] [A6] [A7] [A8]
Location Project
site Astami Dhatav Kholad Killha Talghar Warse Udadvane
PM
10(µg/m3) 76 51.23 49.53 49.61 48.87 50.26 51.91 49.33
PM2.5
(µg/m3) 37 26.17 26.29 26.64 27.26 26.77 25.10 25.90
SO2
(µg/m3) 16 26.31 23.55 22.52 23.19 21.92 21.15 20.22
NOx
(µg/m3) 29 27.49 26.64 24.29 24.35 24.37 22.10 25.29
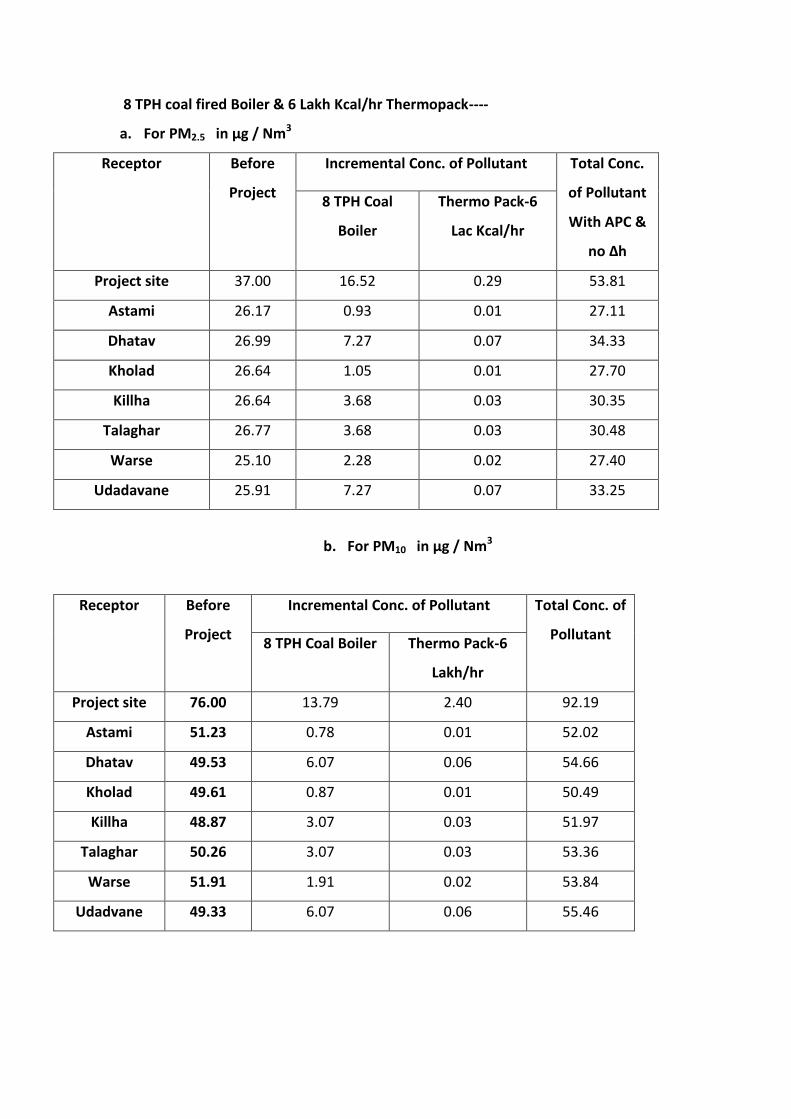
8 TPH coal fired Boiler & 6 Lakh Kcal/hr Thermopack----
a. For PM2.5 in µg / Nm3
Receptor Before
Project
Incremental Conc. of Pollutant Total Conc.
of Pollutant
With APC &
no ∆h
8 TPH Coal
Boiler
Thermo Pack-6
Lac Kcal/hr
Project site 37.00 16.52 0.29 53.81
Astami 26.17 0.93 0.01 27.11
Dhatav 26.99 7.27 0.07 34.33
Kholad 26.64 1.05 0.01 27.70
Killha 26.64 3.68 0.03 30.35
Talaghar 26.77 3.68 0.03 30.48
Warse 25.10 2.28 0.02 27.40
Udadavane 25.91 7.27 0.07 33.25
b. For PM10 in µg / Nm3
Receptor Before
Project
Incremental Conc. of Pollutant Total Conc. of
Pollutant
8 TPH Coal Boiler Thermo Pack-6
Lakh/hr
Project site 76.00 13.79 2.40 92.19
Astami 51.23 0.78 0.01 52.02
Dhatav 49.53 6.07 0.06 54.66
Kholad 49.61 0.87 0.01 50.49
Killha 48.87 3.07 0.03 51.97
Talaghar 50.26 3.07 0.03 53.36
Warse 51.91 1.91 0.02 53.84
Udadvane 49.33 6.07 0.06 55.46
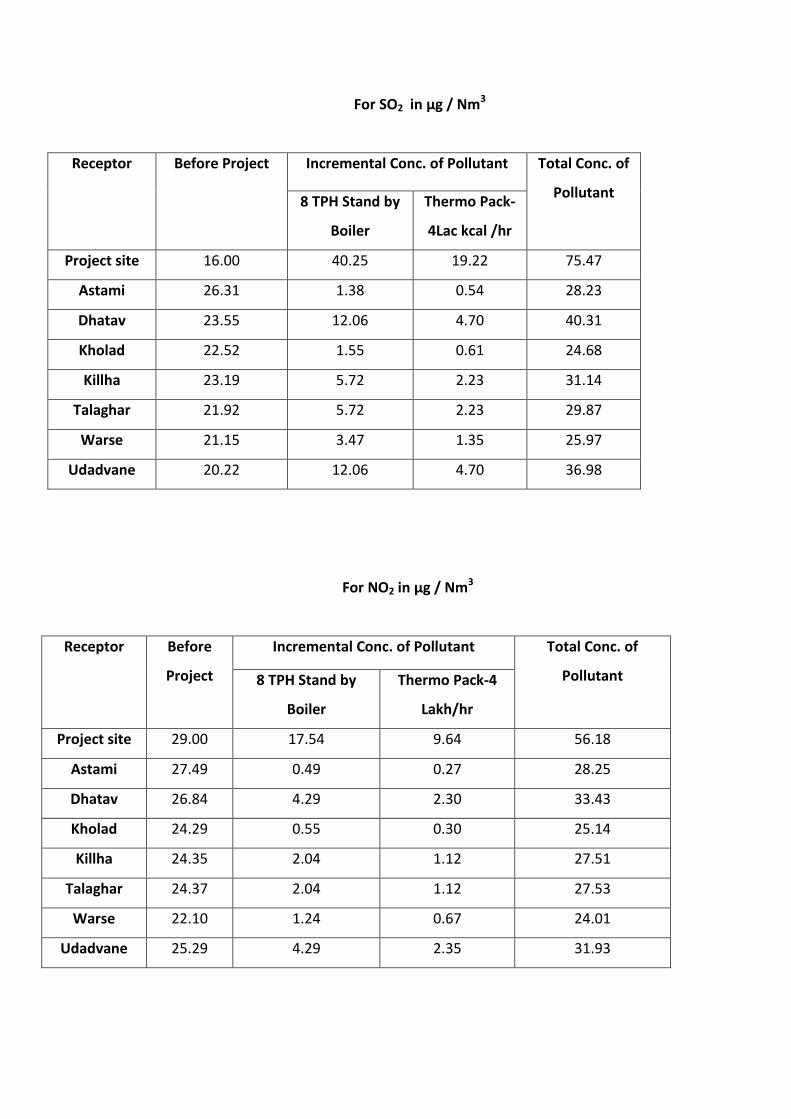
For SO2 in µg / Nm3
Receptor Before Project Incremental Conc. of Pollutant Total Conc. of
Pollutant
8 TPH Stand by
Boiler
Thermo Pack-
4Lac kcal /hr
Project site 16.00 40.25 19.22 75.47
Astami 26.31 1.38 0.54 28.23
Dhatav 23.55 12.06 4.70 40.31
Kholad 22.52 1.55 0.61 24.68
Killha 23.19 5.72 2.23 31.14
Talaghar 21.92 5.72 2.23 29.87
Warse 21.15 3.47 1.35 25.97
Udadvane 20.22 12.06 4.70 36.98
For NO2 in µg / Nm3
Receptor Before
Project
Incremental Conc. of Pollutant Total Conc. of
Pollutant
8 TPH Stand by
Boiler
Thermo Pack-4
Lakh/hr
Project site 29.00 17.54 9.64 56.18
Astami 27.49 0.49 0.27 28.25
Dhatav 26.84 4.29 2.30 33.43
Kholad 24.29 0.55 0.30 25.14
Killha 24.35 2.04 1.12 27.51
Talaghar 24.37 2.04 1.12 27.53
Warse 22.10 1.24 0.67 24.01
Udadvane 25.29 4.29 2.35 31.93
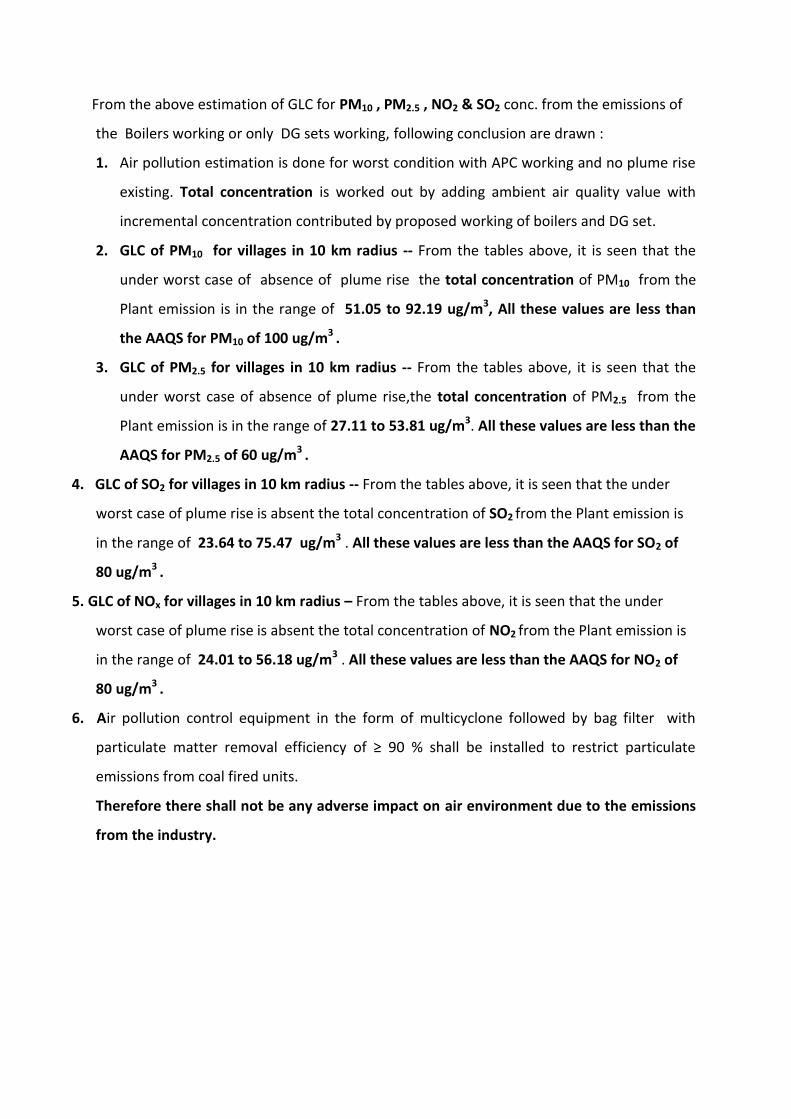
From the above estimation of GLC for PM10 , PM2.5 , NO2 & SO2 conc. from the emissions of
the Boilers working or only DG sets working, following conclusion are drawn :
1. Air pollution estimation is done for worst condition with APC working and no plume rise
existing. Total concentration is worked out by adding ambient air quality value with
incremental concentration contributed by proposed working of boilers and DG set.
2. GLC of PM10 for villages in 10 km radius -- From the tables above, it is seen that the
under worst case of absence of plume rise the total concentration of PM10 from the
Plant emission is in the range of 51.05 to 92.19 ug/m3, All these values are less than
the AAQS for PM10 of 100 ug/m3 .
3. GLC of PM2.5 for villages in 10 km radius -- From the tables above, it is seen that the
under worst case of absence of plume rise,the total concentration of PM2.5 from the
Plant emission is in the range of 27.11 to 53.81 ug/m3. All these values are less than the
AAQS for PM2.5 of 60 ug/m3 .
4. GLC of SO2 for villages in 10 km radius -- From the tables above, it is seen that the under
worst case of plume rise is absent the total concentration of SO2 from the Plant emission is
in the range of 23.64 to 75.47 ug/m3 . All these values are less than the AAQS for SO2 of
80 ug/m3 .
5. GLC of NOx for villages in 10 km radius – From the tables above, it is seen that the under
worst case of plume rise is absent the total concentration of NO2 from the Plant emission is
in the range of 24.01 to 56.18 ug/m3 . All these values are less than the AAQS for NO2 of
80 ug/m3 .
6. Air pollution control equipment in the form of multicyclone followed by bag filter with
particulate matter removal efficiency of ≥ 90 % shall be installed to restrict particulate
emissions from coal fired units.
Therefore there shall not be any adverse impact on air environment due to the emissions
from the industry.
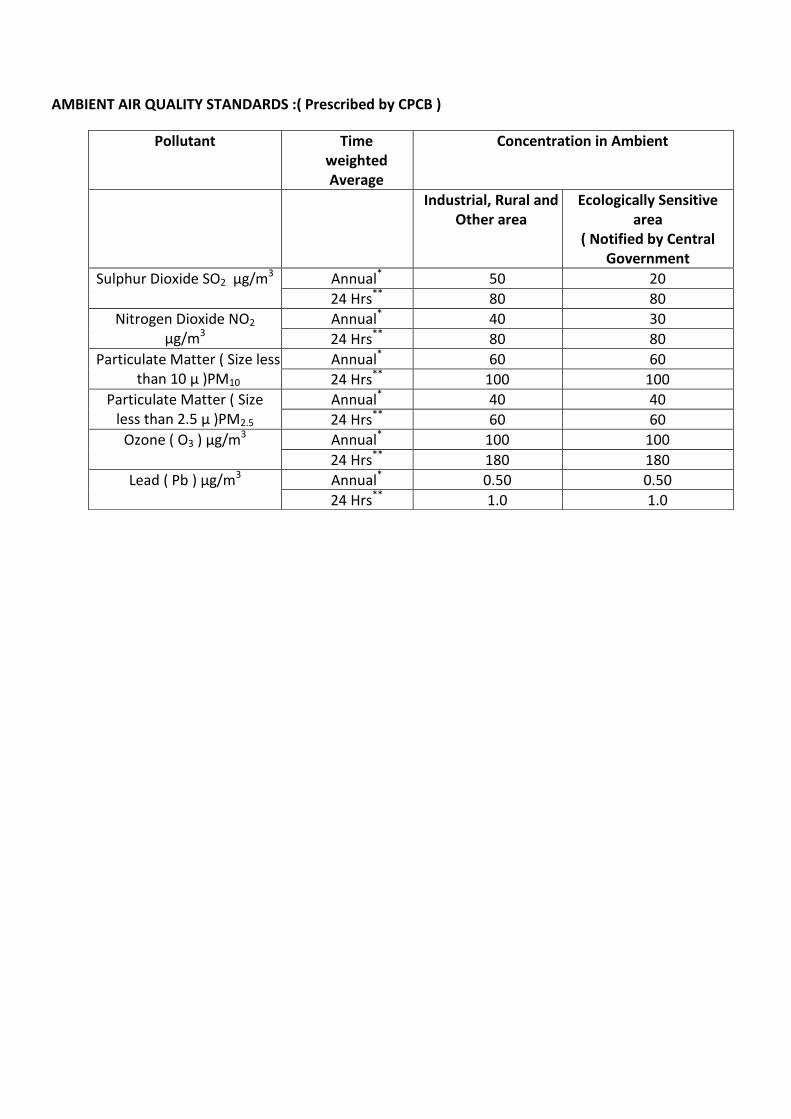
AMBIENT AIR QUALITY STANDARDS :( Prescribed by CPCB )
Pollutant Time weighted Average
Concentration in Ambient
Industrial, Rural and Other area
Ecologically Sensitive area
( Notified by Central Government
Sulphur Dioxide SO2 µg/m3 Annual* 50 20
24 Hrs** 80 80
Nitrogen Dioxide NO2 µg/m3
Annual* 40 30
24 Hrs** 80 80
Particulate Matter ( Size less than 10 µ )PM10
Annual* 60 60
24 Hrs** 100 100
Particulate Matter ( Size less than 2.5 µ )PM2.5
Annual* 40 40
24 Hrs** 60 60
Ozone ( O3 ) µg/m3 Annual* 100 100
24 Hrs** 180 180
Lead ( Pb ) µg/m3 Annual* 0.50 0.50
24 Hrs** 1.0 1.0
Annexure- III
List of pollution control equipments w.r.t.
each pollution source
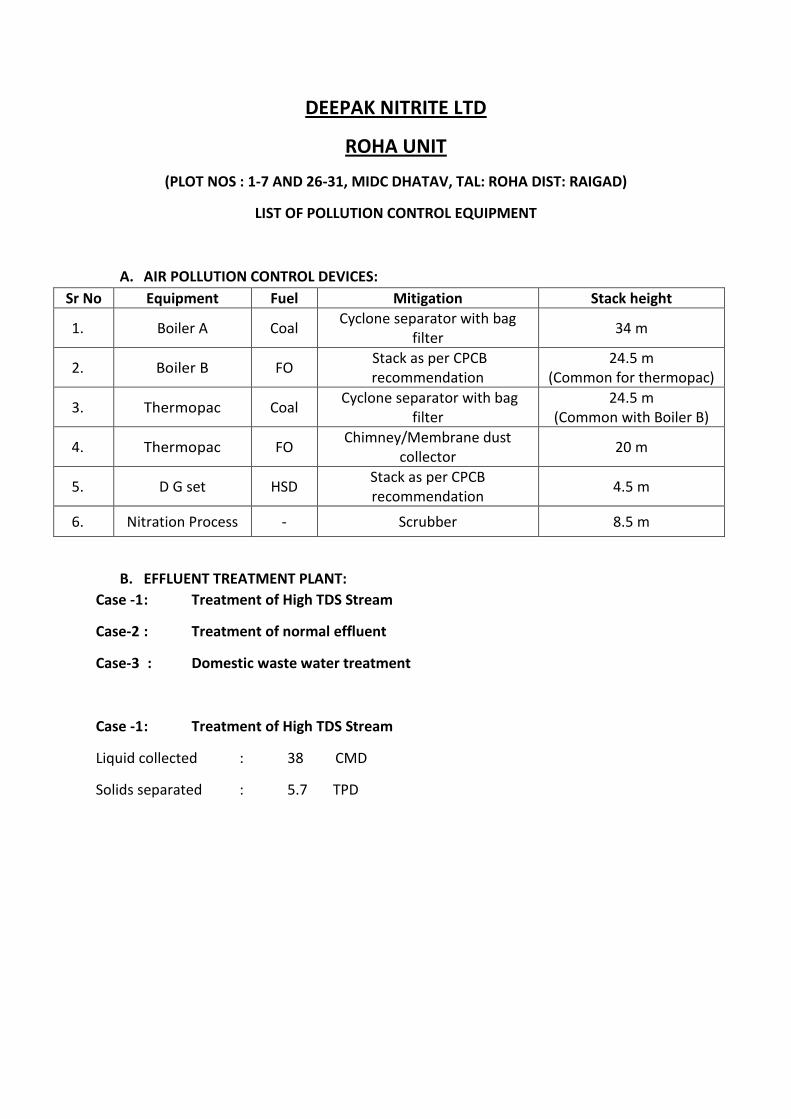
DEEPAK NITRITE LTD
ROHA UNIT
(PLOT NOS : 1-7 AND 26-31, MIDC DHATAV, TAL: ROHA DIST: RAIGAD)
LIST OF POLLUTION CONTROL EQUIPMENT
A. AIR POLLUTION CONTROL DEVICES:
Sr No Equipment Fuel Mitigation Stack height
1. Boiler A Coal Cyclone separator with bag
filter 34 m
2. Boiler B FO Stack as per CPCB recommendation
24.5 m (Common for thermopac)
3. Thermopac Coal Cyclone separator with bag
filter 24.5 m
(Common with Boiler B)
4. Thermopac FO Chimney/Membrane dust
collector 20 m
5. D G set HSD Stack as per CPCB recommendation
4.5 m
6. Nitration Process - Scrubber 8.5 m
B. EFFLUENT TREATMENT PLANT:
Case -1 : Treatment of High TDS Stream
Case-2 : Treatment of normal effluent
Case-3 : Domestic waste water treatment
Case -1 : Treatment of High TDS Stream
Liquid collected : 38 CMD
Solids separated : 5.7 TPD
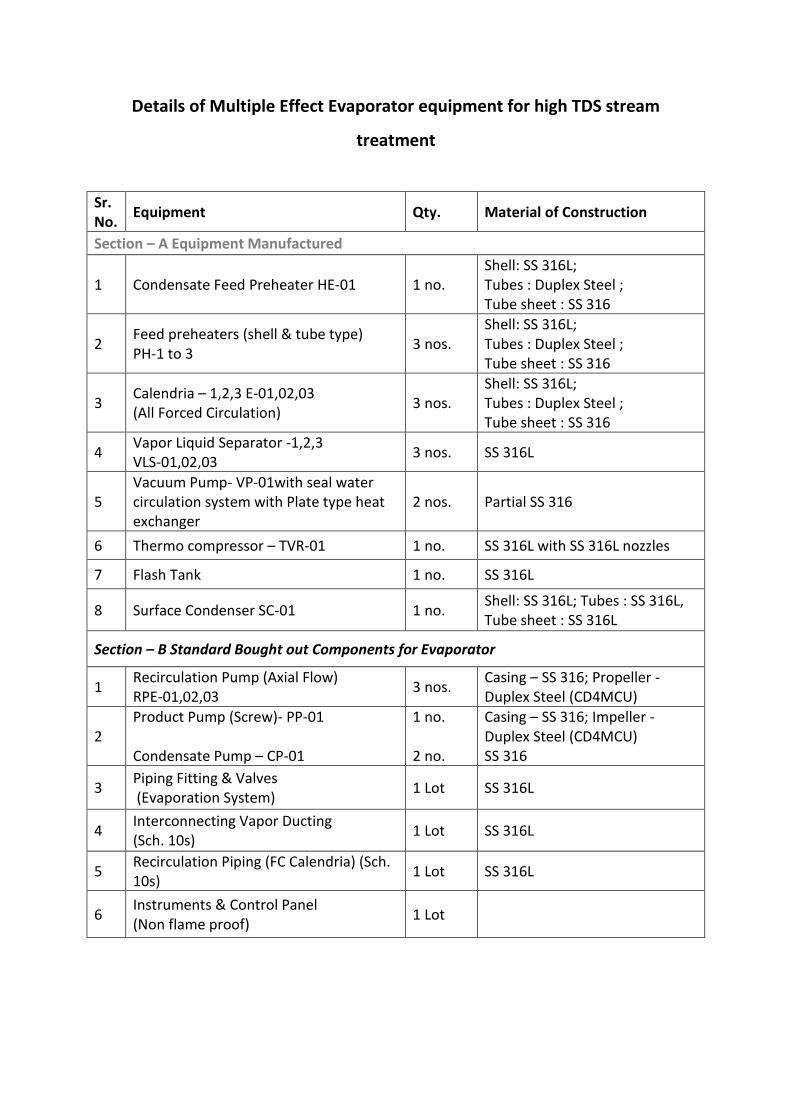
Details of Multiple Effect Evaporator equipment for high TDS stream
treatment
Sr. No.
Equipment Qty. Material of Construction
Section – A Equipment Manufactured
1 Condensate Feed Preheater HE-01 1 no. Shell: SS 316L; Tubes : Duplex Steel ; Tube sheet : SS 316
2 Feed preheaters (shell & tube type) PH-1 to 3
3 nos. Shell: SS 316L; Tubes : Duplex Steel ; Tube sheet : SS 316
3 Calendria – 1,2,3 E-01,02,03 (All Forced Circulation)
3 nos. Shell: SS 316L; Tubes : Duplex Steel ; Tube sheet : SS 316
4 Vapor Liquid Separator -1,2,3 VLS-01,02,03
3 nos. SS 316L
5 Vacuum Pump- VP-01with seal water circulation system with Plate type heat exchanger
2 nos. Partial SS 316
6 Thermo compressor – TVR-01 1 no. SS 316L with SS 316L nozzles
7 Flash Tank 1 no. SS 316L
8 Surface Condenser SC-01 1 no. Shell: SS 316L; Tubes : SS 316L, Tube sheet : SS 316L
Section – B Standard Bought out Components for Evaporator
1 Recirculation Pump (Axial Flow) RPE-01,02,03
3 nos. Casing – SS 316; Propeller - Duplex Steel (CD4MCU)
2 Product Pump (Screw)- PP-01 Condensate Pump – CP-01
1 no. 2 no.
Casing – SS 316; Impeller - Duplex Steel (CD4MCU) SS 316
3 Piping Fitting & Valves (Evaporation System)
1 Lot SS 316L
4 Interconnecting Vapor Ducting (Sch. 10s)
1 Lot SS 316L
5 Recirculation Piping (FC Calendria) (Sch. 10s)
1 Lot SS 316L
6 Instruments & Control Panel (Non flame proof)
1 Lot
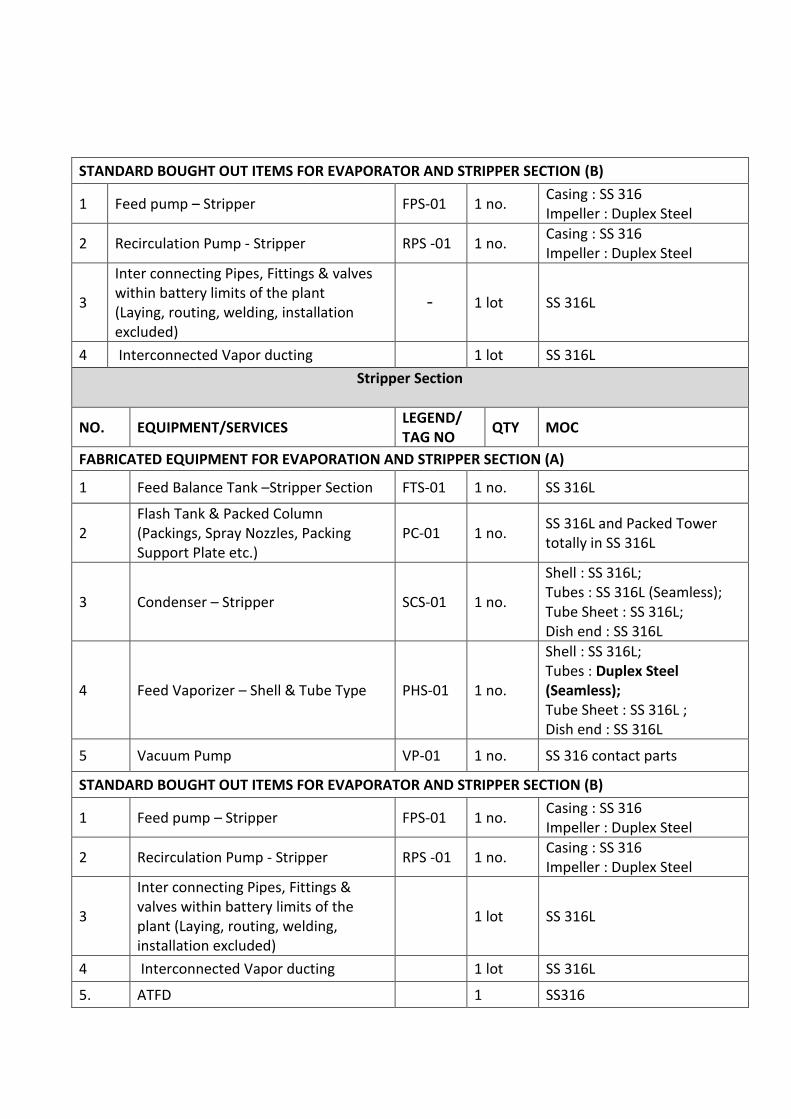
STANDARD BOUGHT OUT ITEMS FOR EVAPORATOR AND STRIPPER SECTION (B)
1 Feed pump – Stripper FPS-01 1 no. Casing : SS 316 Impeller : Duplex Steel
2 Recirculation Pump - Stripper RPS -01 1 no. Casing : SS 316 Impeller : Duplex Steel
3
Inter connecting Pipes, Fittings & valves within battery limits of the plant (Laying, routing, welding, installation excluded)
- 1 lot SS 316L
4 Interconnected Vapor ducting 1 lot SS 316L
Stripper Section
NO. EQUIPMENT/SERVICES LEGEND/ TAG NO
QTY MOC
FABRICATED EQUIPMENT FOR EVAPORATION AND STRIPPER SECTION (A)
1 Feed Balance Tank –Stripper Section FTS-01 1 no. SS 316L
2 Flash Tank & Packed Column (Packings, Spray Nozzles, Packing Support Plate etc.)
PC-01 1 no. SS 316L and Packed Tower totally in SS 316L
3 Condenser – Stripper SCS-01 1 no.
Shell : SS 316L; Tubes : SS 316L (Seamless); Tube Sheet : SS 316L; Dish end : SS 316L
4 Feed Vaporizer – Shell & Tube Type PHS-01 1 no.
Shell : SS 316L; Tubes : Duplex Steel (Seamless); Tube Sheet : SS 316L ; Dish end : SS 316L
5 Vacuum Pump VP-01 1 no. SS 316 contact parts
STANDARD BOUGHT OUT ITEMS FOR EVAPORATOR AND STRIPPER SECTION (B)
1 Feed pump – Stripper FPS-01 1 no. Casing : SS 316 Impeller : Duplex Steel
2 Recirculation Pump - Stripper RPS -01 1 no. Casing : SS 316 Impeller : Duplex Steel
3
Inter connecting Pipes, Fittings & valves within battery limits of the plant (Laying, routing, welding, installation excluded)
1 lot SS 316L
4 Interconnected Vapor ducting 1 lot SS 316L
5. ATFD 1 SS316
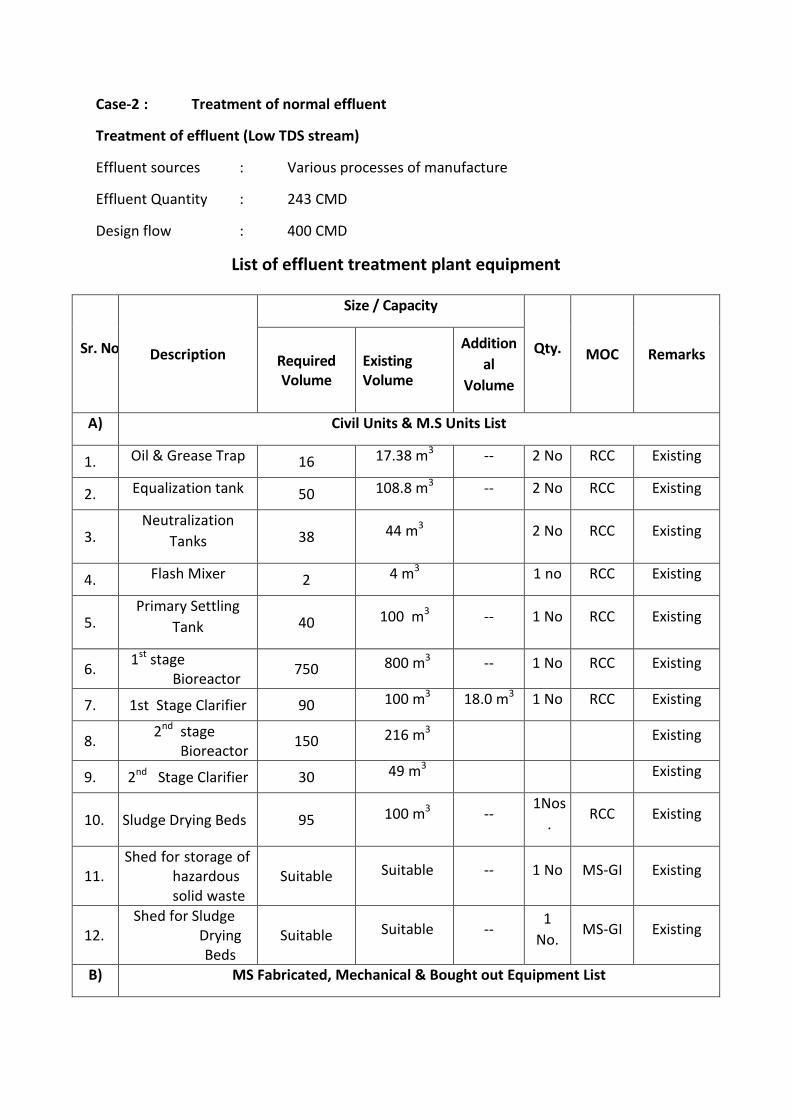
Case-2 : Treatment of normal effluent
Treatment of effluent (Low TDS stream)
Effluent sources : Various processes of manufacture
Effluent Quantity : 243 CMD
Design flow : 400 CMD
List of effluent treatment plant equipment
Sr. No Description
Size / Capacity
Qty. MOC Remarks Required Volume
Existing Volume
Addition
al
Volume
A) Civil Units & M.S Units List
1. Oil & Grease Trap 16 17.38 m3 -- 2 No RCC Existing
2. Equalization tank 50 108.8 m3 -- 2 No RCC Existing
3. Neutralization
Tanks 38 44 m3 2 No RCC Existing
4. Flash Mixer 2 4 m3 1 no RCC Existing
5. Primary Settling
Tank 40 100 m3 -- 1 No RCC Existing
6. 1st stage
Bioreactor 750 800 m3 -- 1 No RCC Existing
7. 1st Stage Clarifier 90 100 m3 18.0 m3 1 No RCC Existing
8. 2nd stage
Bioreactor 150 216 m3 Existing
9. 2nd Stage Clarifier 30 49 m3 Existing
10. Sludge Drying Beds 95 100 m3 -- 1Nos
. RCC Existing
11. Shed for storage of
hazardous solid waste
Suitable Suitable -- 1 No MS-GI Existing
12. Shed for Sludge
Drying Beds
Suitable Suitable -- 1
No. MS-GI Existing
B) MS Fabricated, Mechanical & Bought out Equipment List
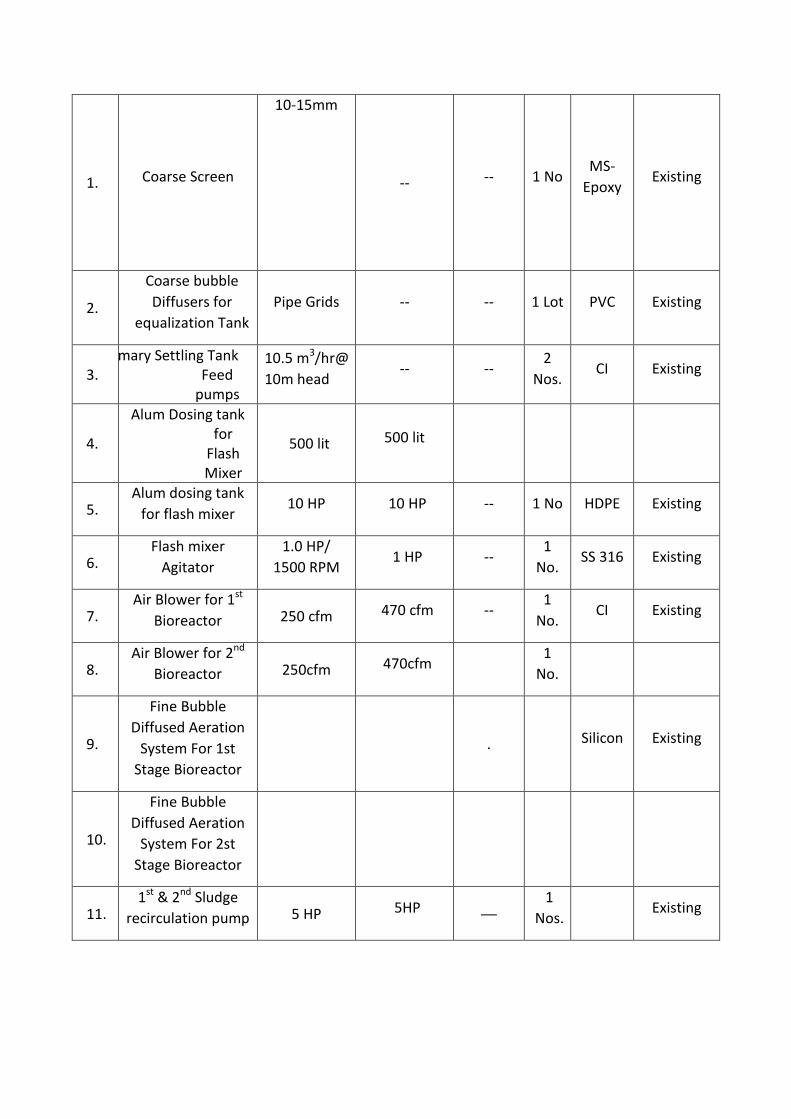
1. Coarse Screen
10-15mm openings
-- -- 1 No MS-
Epoxy Existing
2.
Coarse bubble
Diffusers for
equalization Tank
Pipe Grids -- -- 1 Lot PVC Existing
3. Primary Settling Tank
Feed pumps
10.5 m3/hr@
10m head -- --
2
Nos. CI Existing
4.
Alum Dosing tank for
Flash Mixer
500 lit 500 lit
5. Alum dosing tank
for flash mixer 10 HP 10 HP -- 1 No HDPE Existing
6. Flash mixer
Agitator
1.0 HP/
1500 RPM 1 HP --
1
No. SS 316 Existing
7. Air Blower for 1st
Bioreactor 250 cfm 470 cfm -- 1
No. CI Existing
8. Air Blower for 2nd
Bioreactor 250cfm 470cfm 1
No.
9.
Fine Bubble
Diffused Aeration
System For 1st
Stage Bioreactor
. Silicon Existing
10.
Fine Bubble
Diffused Aeration
System For 2st
Stage Bioreactor
11. 1st & 2nd Sludge
recirculation pump 5 HP 5HP __ 1
Nos. Existing

Case : 3 SEWAGE TREATMENT PLANT
Capacity : 35 KLD
Sewage : 31 KLD
List of Equipment
Sr. No.
Description Capacity/ Size MOC Qty.
A) Civil
1 Bar Screen Chamber 0.35 m3 RCC 1 No
2 Oil & Grease Trap 2.5 m3 RCC 1 No.
3 Collection cum Equalization Tank 10 m3 RCC 1 No.
4 Equipment & Pump Foundations Suitable RCC 1 No.
B) Mechanical & Fabricated Equipment Skid
1 Coarse Screen in Bar Screen Chamber 15-20 mm opening MS- Epoxy 1 No
2 Bioreactor Feed (Submersible) Pump 2.0 m3/hr @ 10 meter CI 1 No.
3 Air blower 45 m3/hr @ 4 meter CI 1 No.
4 Coarse Bubble Diffuser 1800 mm Long x 90 mm
Dia. PVC 1 No.
5 Fine bubble diffusers 600 m Long x 65 mm Dia. EPDM 4 No.
6 Bioreactor Tank 12.5 m3
MS- Epoxy coating External
MS-FRP lining Internal
1 No.
7 Secondary Settling Tank (Hopper Bottom)
10.0 m3
MS- Epoxy coating External
MS-FRP lining Internal
1 No
8 Sludge Recirculation Pump 2 m3/hr @ 6 meter CI 1 No.
9 Intermediate Tank 1000 Lit. HDPE 1 No
10 PSF Feed Pump 2.5 m3/hr @ 15 meter CI 1 No.
11 Hypo Dosing Tank 250 Lit. HDPE 1 No
12 Hypo dosing pump 12.5 LPH @ 2 kg / cm2 PP 1 No.
13 Pressure Sand Filter ( PSF ) with sand media
0.5 m Dia. X 1.2 m Ht. MS-Epoxy 1 No
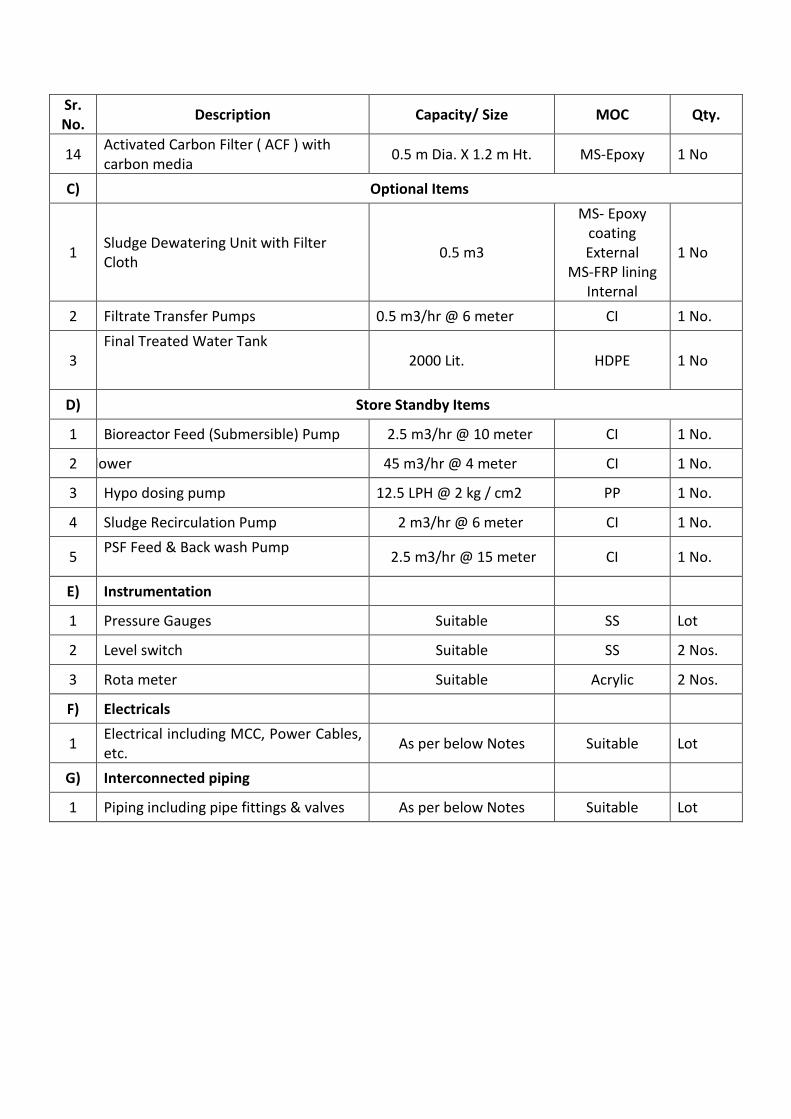
Sr. No.
Description Capacity/ Size MOC Qty.
14 Activated Carbon Filter ( ACF ) with carbon media
0.5 m Dia. X 1.2 m Ht. MS-Epoxy 1 No
C) Optional Items
1 Sludge Dewatering Unit with Filter Cloth
0.5 m3
MS- Epoxy coating External
MS-FRP lining Internal
1 No
2 Filtrate Transfer Pumps 0.5 m3/hr @ 6 meter CI 1 No.
3 Final Treated Water Tank
2000 Lit. HDPE 1 No
D) Store Standby Items
1 Bioreactor Feed (Submersible) Pump 2.5 m3/hr @ 10 meter CI 1 No.
2 Air blower 45 m3/hr @ 4 meter CI 1 No.
3 Hypo dosing pump 12.5 LPH @ 2 kg / cm2 PP 1 No.
4 Sludge Recirculation Pump 2 m3/hr @ 6 meter CI 1 No.
5 PSF Feed & Back wash Pump
2.5 m3/hr @ 15 meter CI 1 No.
E) Instrumentation
1 Pressure Gauges Suitable SS Lot
2 Level switch Suitable SS 2 Nos.
3 Rota meter Suitable Acrylic 2 Nos.
F) Electricals
1 Electrical including MCC, Power Cables, etc.
As per below Notes Suitable Lot
G) Interconnected piping
1 Piping including pipe fittings & valves As per below Notes Suitable Lot
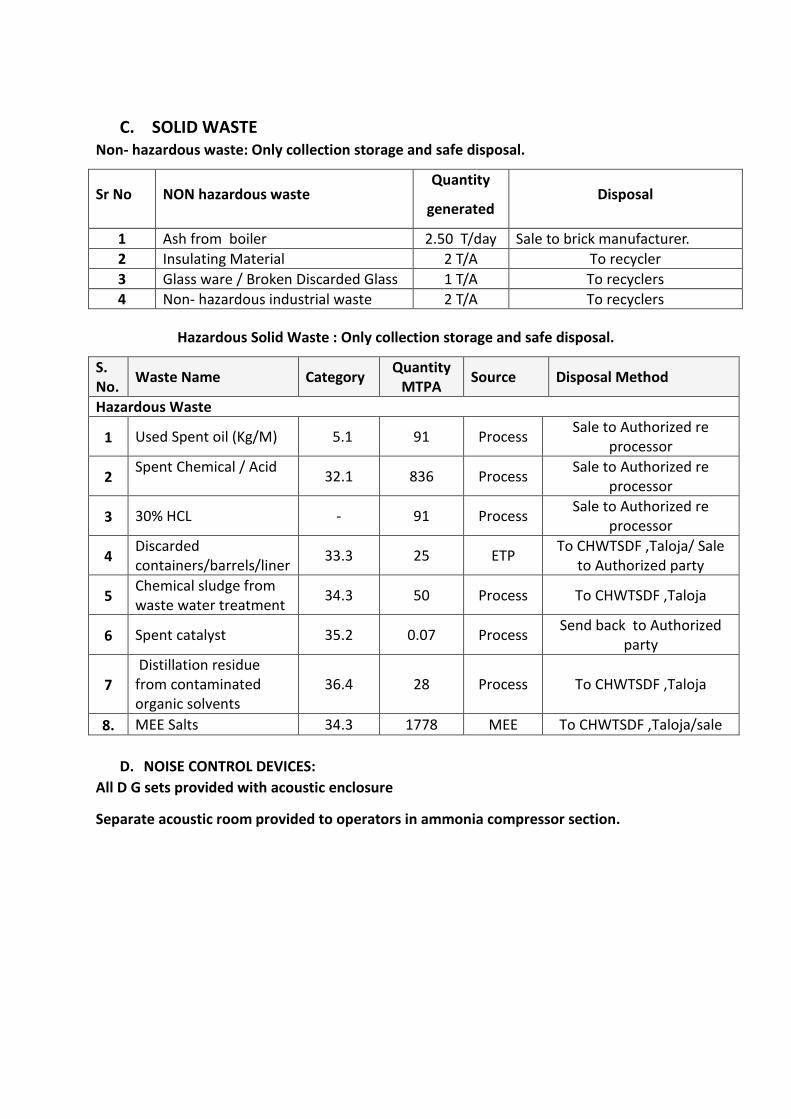
C. SOLID WASTE Non- hazardous waste: Only collection storage and safe disposal.
Sr No NON hazardous waste Quantity
generated Disposal
1 Ash from boiler 2.50 T/day Sale to brick manufacturer.
2 Insulating Material 2 T/A To recycler
3 Glass ware / Broken Discarded Glass 1 T/A To recyclers
4 Non- hazardous industrial waste 2 T/A To recyclers
Hazardous Solid Waste : Only collection storage and safe disposal.
S. No.
Waste Name Category Quantity
MTPA Source Disposal Method
Hazardous Waste
1 Used Spent oil (Kg/M) 5.1 91 Process Sale to Authorized re
processor
2 Spent Chemical / Acid
32.1 836 Process Sale to Authorized re
processor
3 30% HCL - 91 Process Sale to Authorized re
processor
4 Discarded containers/barrels/liner
33.3 25 ETP To CHWTSDF ,Taloja/ Sale
to Authorized party
5 Chemical sludge from waste water treatment
34.3 50 Process To CHWTSDF ,Taloja
6 Spent catalyst 35.2 0.07 Process Send back to Authorized
party
7
Distillation residue from contaminated organic solvents
36.4 28 Process To CHWTSDF ,Taloja
8. MEE Salts 34.3 1778 MEE To CHWTSDF ,Taloja/sale
D. NOISE CONTROL DEVICES:
All D G sets provided with acoustic enclosure
Separate acoustic room provided to operators in ammonia compressor section.

Annexure-IV
Commitment to not store locally available
raw materials more Than 3 days.
Annexure-V
An ESR plan for 5 years @ 5 % of the project cost with the consultation of nearby
villagers.
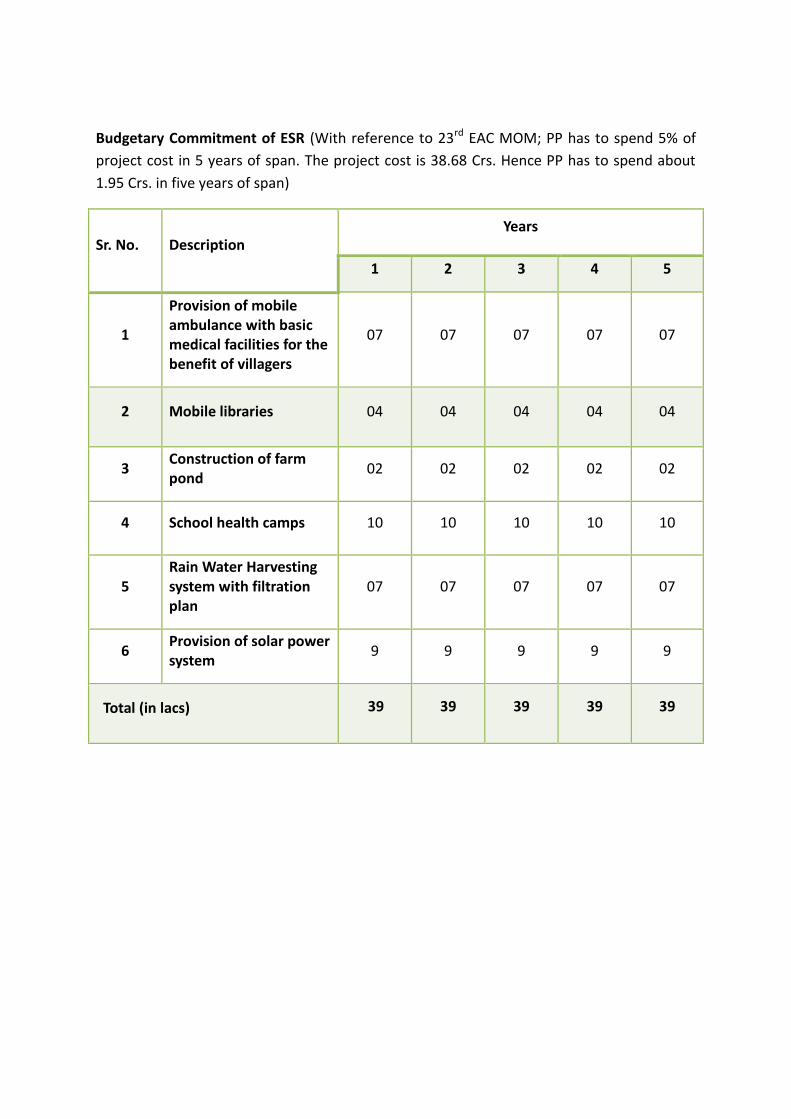
Budgetary Commitment of ESR (With reference to 23rd EAC MOM; PP has to spend 5% of
project cost in 5 years of span. The project cost is 38.68 Crs. Hence PP has to spend about
1.95 Crs. in five years of span)
Sr. No. Description Years
1 2 3 4 5
1
Provision of mobile ambulance with basic medical facilities for the benefit of villagers
07 07 07 07 07
2 Mobile libraries 04 04 04 04 04
3 Construction of farm pond
02 02 02 02 02
4 School health camps 10 10 10 10 10
5 Rain Water Harvesting system with filtration plan
07 07 07 07 07
6 Provision of solar power system
9 9 9 9 9
Total (in lacs) 39 39 39 39 39
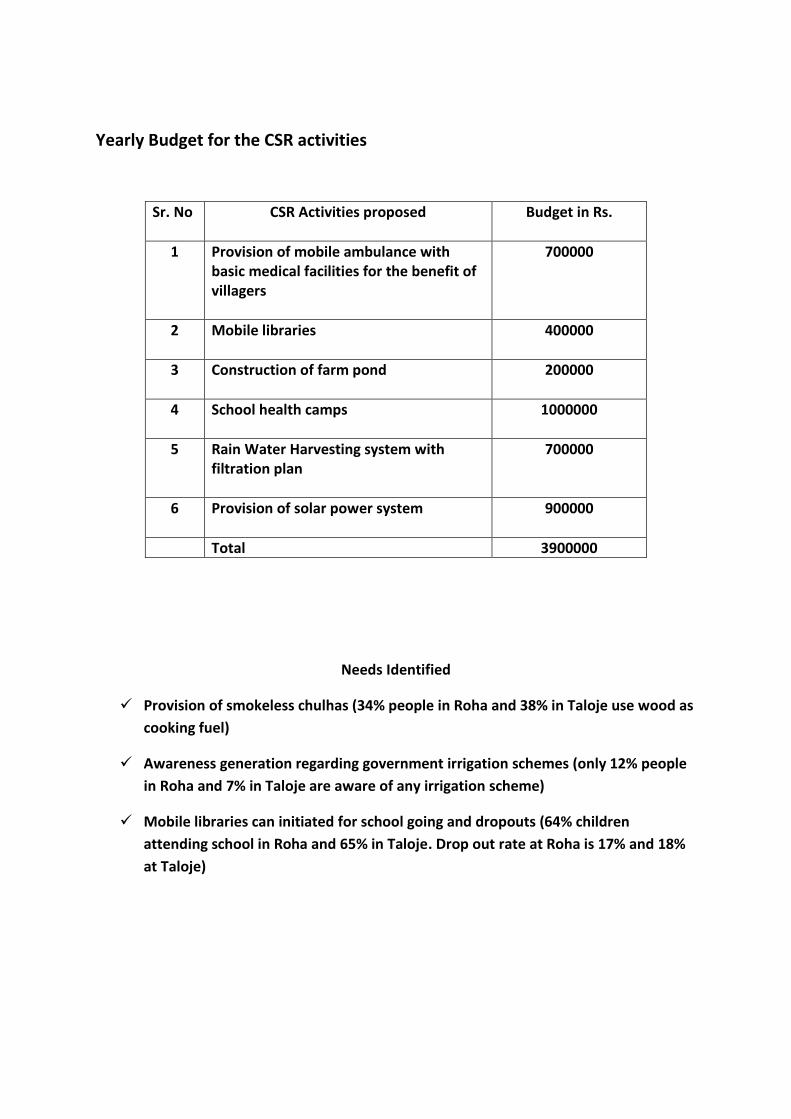
Yearly Budget for the CSR activities
Sr. No
CSR Activities proposed
Budget in Rs.
1 Provision of mobile ambulance with basic medical facilities for the benefit of villagers
700000
2 Mobile libraries
400000
3 Construction of farm pond
200000
4 School health camps
1000000
5 Rain Water Harvesting system with filtration plan
700000
6 Provision of solar power system
900000
Total 3900000
Needs Identified
Provision of smokeless chulhas (34% people in Roha and 38% in Taloje use wood as
cooking fuel)
Awareness generation regarding government irrigation schemes (only 12% people
in Roha and 7% in Taloje are aware of any irrigation scheme)
Mobile libraries can initiated for school going and dropouts (64% children
attending school in Roha and 65% in Taloje. Drop out rate at Roha is 17% and 18%
at Taloje)

Grant Activity Chart for MHU activity for the Year 2017 – 2018
S.
No.
Activities Apr May June July Aug Sep Oct Nov Dec Jan Feb Mar
1 Regular
OPDs
2 Counseling
Sessions
3 Operational
use of MIS
4 Anemia/HB
Testing
5 School
Health Camp
6 Identification
of
Underweight
Children
7 Blood Group
check up
Camp
8 Eye Check Up
camp
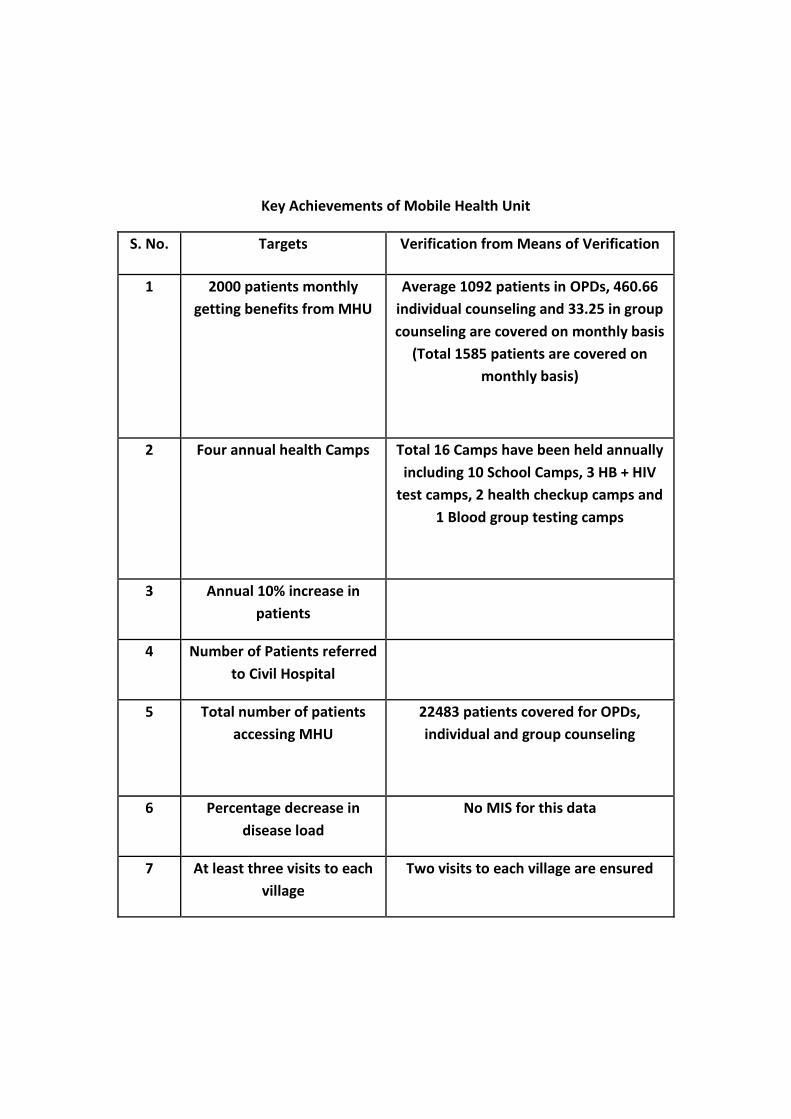
Key Achievements of Mobile Health Unit
S. No. Targets Verification from Means of Verification
1 2000 patients monthly
getting benefits from MHU
Average 1092 patients in OPDs, 460.66
individual counseling and 33.25 in group
counseling are covered on monthly basis
(Total 1585 patients are covered on
monthly basis)
2 Four annual health Camps Total 16 Camps have been held annually
including 10 School Camps, 3 HB + HIV
test camps, 2 health checkup camps and
1 Blood group testing camps
3 Annual 10% increase in
patients
4 Number of Patients referred
to Civil Hospital
5 Total number of patients
accessing MHU
22483 patients covered for OPDs,
individual and group counseling
6 Percentage decrease in
disease load
No MIS for this data
7 At least three visits to each
village
Two visits to each village are ensured

Grant chart for Mobile Library Activity for 2017-2018
S.
No.
Activities Apr May June Jul Aug Sep Oct Nov Dec Jan Feb Mar
1 Story
Session
2 Counseling
Session
3 Operational
Use of MIS
4 Monthly
Meeting
5 Story telling
Competition
6 Mid Line
Assessment

Key Achievements of Mobile Library
S. No. Objectives/Expected Out comes Status
1 50% of the primary school children utilize mobile
library facilities
Average monthly
membership is 537 till now
as against 935 school
children
2 80% of regular readers clear the test for reading
& writing in local language
3 60% of children clear aptitude test expected in
age 6 to 15 years
4 Providing a library experience to more than 4500
children across Roha annually
We do not have month wise
membership data till now
but have started it from
January 2016
5 Over 4000 books read/explored over one year
period
Do not have budget for such
a high stock we currently
have 175 books in 3 kits
6 Improving reading levels literacy in the
community
50% of regular readers are
able to improve reading
levels
7 Improving learning for life
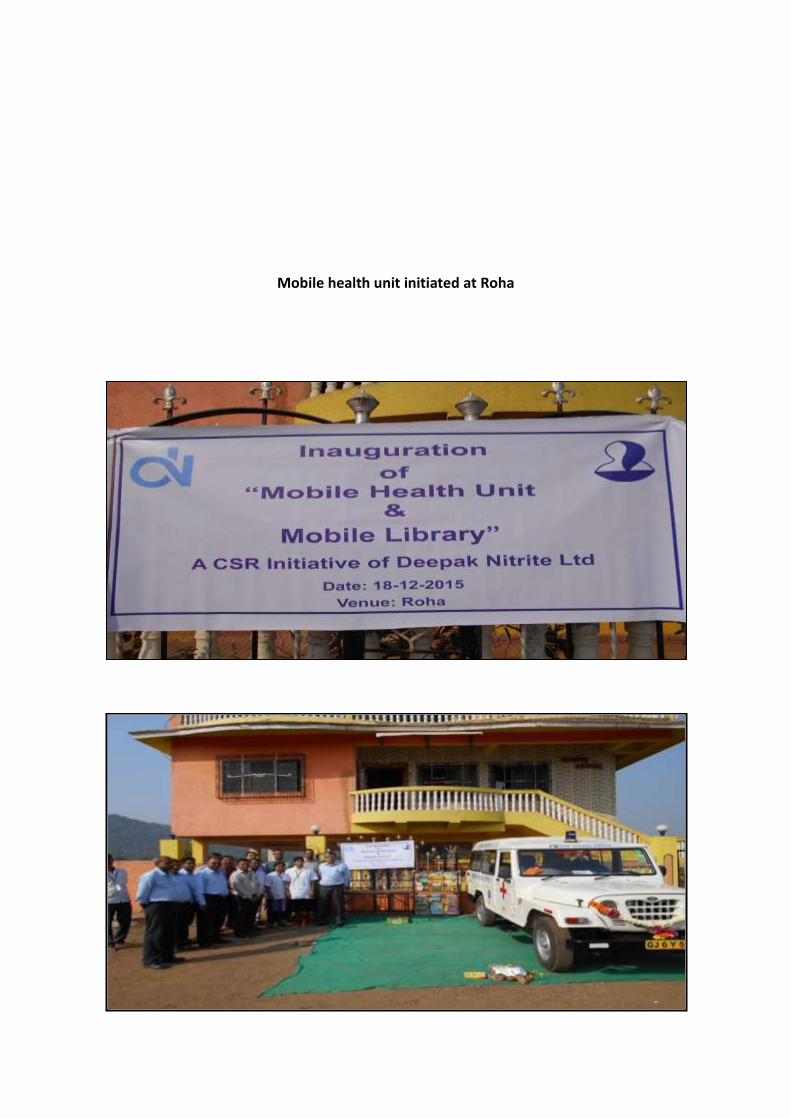
Mobile health unit initiated at Roha
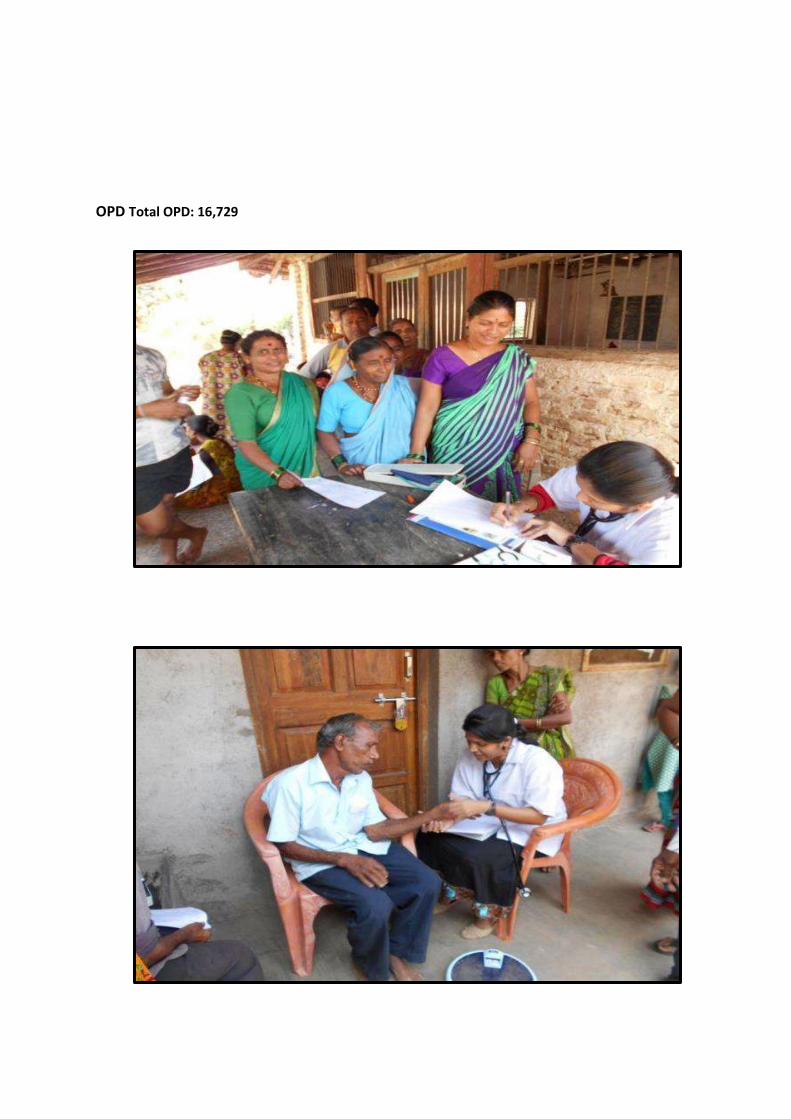
OPD Total OPD: 16,729
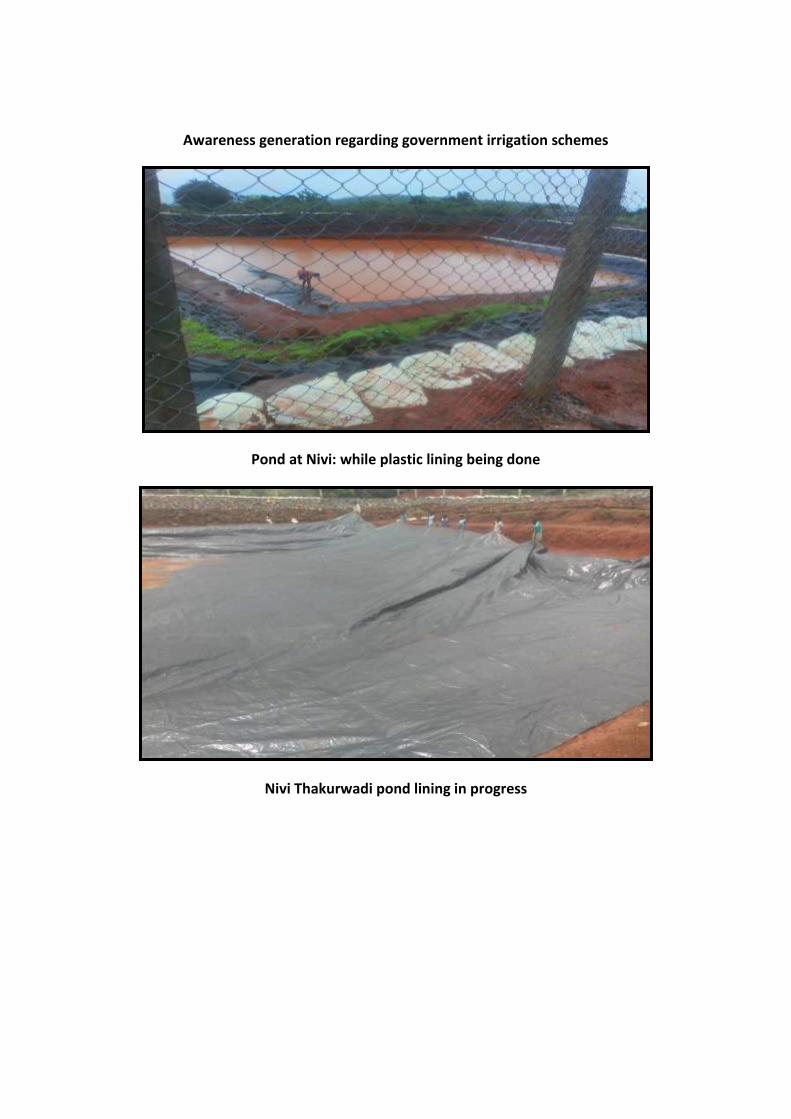
Awareness generation regarding government irrigation schemes
Pond at Nivi: while plastic lining being done
Nivi Thakurwadi pond lining in progress