Embed Size (px)
Citation preview
ANN prediction of impact toughness of ship steel/stainless steel plates produced by explosive welding266
ANN prediction of impact toughness of ship steel/stainless steel plates produced by explosive welding
Yakup Kaya*, Ali Kalyon and Nizamettin Kahraman
Department of Manufacturing Engineering, Technology Faculty, Karabük University, Karabük 78050, Turkey*Corresponding Author: [email protected]
Submitted: 09/04/2018 Revised: 17/07/2019 Accepted: 21/10/2019
ABSTRACTIn this study, ship steel/stainless steel plates were produced by joining ship steel with stainless steel using explosive
welding process. The characterization of the joining interface of the plates was carried out by optical microscopic examination. Charpy impact tests were conducted at different temperatures to determine the impact toughness of the ship steel/stainless steel plates and the effect of the rolling on the impact toughness. In addition, after the Charpy impact test, the fractured surfaces of the specimens were investigated via scanning electron microscopy (SEM). Using the data obtained as a result of the impact toughness tests, an artificial neural network (ANN) model was improved for the prediction of the impact toughness. Five different material types, two different rolling directions, and eight different temperatures were used as the input parameters of the Charpy impact tests. The impact toughness values obtained at the end of the tests were used as the output parameters of the generated prediction model. The high R2 value obtained in the developed prediction model demonstrated that it could be successfully used for predicting impact toughness.
Keywords: ANN; explosive welding/cladding; impact toughness; ship steel plate; stainless steel.
INTRODUCTIONToday’s ship and offshore construction designers face complex problems in selecting materials that provide
minimization of topside weight and protection against marine corrosion-all within a reasonable budget (Kaya & Kahraman, 2013). With the development of modern industry, applications of single metallic constituents are unable to meet these requirements. Instead, with the respective merits of two metallic components, the cladded plate can achieve the performance that single metal constituents fail to provide. The usual solution to this problem is to employ a variety of metals throughout the structure, each being selected for features appropriate for the specific component (Kaya, 2018).
A cladded plate is a ship steel/stainless steel plate obtained by joining stainless steel (cladding metal), etc., to a carbon or low alloy steel (base metal). The most important advantage is that not only is it less costly than similar steels that are made entirely of cladding materials, but it also provides other features including good mechanical strength and good resistance to heat and corrosion. The explosive welding is utilized for many industrial processing applications, including those for refineries and chemical plants as well as in the ship-building industry. In the shipbuilding and marine industries, cladded plates are one of the oldest applications for explosive welding (Kaya et al., 2017).
The explosive welding is becoming an increasingly popular process of joining, as it provides many advantages such as high joint strength and the ability to join unweldable metals or those difficult to weld by other processes. Additionally, when combining materials characterized by large surfaces or materials of different thicknesses, the explosive welding enables their properties to be preserved after joining (Fronczek et al., 2016).
267Yakup Kaya, Ali Kalyon and Nizamettin Kahraman
New industrial application design requires the investigation of innovative construction materials, including multilayer materials such as bimetals. The explosive welding is one of the most widely employed processes for bimetal surface modification. This process offers the possibility of combining the properties of two or more metals or alloys (Nieslony et al., 2016). The explosive welding method has been successfully shown for varied similar steel/steel plate (Acarer et al., 2003) and Al/Al plate (Gülenç et al., 2016) and dissimilar aluminium/steel plate (Findik, 2011, Corigliano et al., 2018; Corigliano et al., 2018; Kaya, 2018), titanium/steel plate (Xie et al., 2018), and inconel 625/Ti6Al4V plate (Topolski et al., 2016) materials.
Using mathematical models in experimental studies provides savings in both time and cost. Experimental studies can be modeled using many mathematical and experimental design processes (Benyounis & Olabi 2008). Previous studies have demonstrated the successful modeling of arc welding using artificial neural networks (ANNs) (Nagesh & Datta, 2002; Chan et al., 1999; Mirapeix et al., 2007). Moreover, other studies in the literature have used ANNs and other prediction models successfully to model the laser welding process (Casalino & Minutolo, 2004; Luo et al., 2005; Olabi et al., 2006), while a number of studies have obtained positive results using ANNs for other welding processes (Martin et al., 2007; Dutta & Prahitar, 2007; Shojaeefard et al., 2013).
Recently, a research has been carried out on the fatigue life (Prazmowski et al., 2017), numerical simulation (Chu et al., 2017), and physical/experimental modeling (Wang et al., 2016) of explosive-cladded plates. Reinforcement of these bimetallic composites with wire (Gülenç et al., 2016), their production from shape-memory alloys (Belyaev et al., 2016), and multilayer material production (Lazurenko et al., 2016) has also been studied. Much research has been carried out on the production and on the investigation of various aspects of explosive-cladded plates. However, the influences of distance from the explosion zone on the joining interface microstructure of these cladded plates have not been dealt with in those studies. Neither has any work been seen to deal with the impact transition temperature of these cladded plates nor to deal with the influence of the rolling direction of the base material on the impact transition temperature. In addition, no study found in the literature to date has employed ANNs to model the explosive welding.
Compared to the ship steels, the stainless steels provide much better mechanical and corrosion properties in sea water. Using entirely the stainless steel significantly increases the cost of shipbuilding. Instead, using the stainless steel on the surfaces exposed to corrosive effects (i.e., the outer surfaces) and normal shipbuilding steel on the less exposed surfaces may significantly decrease the cost. The aim of this study was to produce the ship steel/stainless steel plates for use in the offshore and shipbuilding industries by employing the explosive welding process to clad the ship steel plate widely used in shipbuilding with different types of the stainless steel (ferritic, austenitic, martensitic, and duplex). Based on the distance from the explosion zone, the effect of the rolling direction on the impact toughness of the resulting the ship steel/stainless steel plates was examined via microstructure studies. In addition, an ANN model was developed to evaluate the effect of the material type, the rolling direction, and temperature on the impact toughness.
MATERIAL AND METHODS
Material ProductionFor the ship steel/stainless steel plates production, the ship steel plates in dimensions of 500×250×10 mm were
used as the base material and ferritic (AISI 430), austenitic (AISI 316L), martensitic (AISI 420), and duplex (AISI 2304). The stainless steel plates in dimensions of 500×250×1 mm were used as the cladding materials (flyer plate). The chemical compositions of the materials used in the ship steel/stainless steel plates are given in Table 1.
ANN prediction of impact toughness of ship steel/stainless steel plates produced by explosive welding268
Table 1. Chemical compositions of the base and cladding materials (by weight %).
C Mn P S Si Al Cu Cr Ni Mo Fe
Ship steel 0.149 0.70 0.015 0.012 0.166 0.028 0.049 0.022 0.052 0.002 Balance
AISI 430 0.039 0.340 0.029 0.002 0.39 - - 16.07 0.15 - Balance
AISI 316L 0.008 1.75 0.045 0.003 0.95 - - 17.8 12 2.7 Balance
AISI 420 0.20 0.70 0.002 0.003 0.20 0.006 0.13 12.7 0.15 - Balance
AISI 2304 0.02 0.10 - - - - - 23 4.8 0.3 Balance
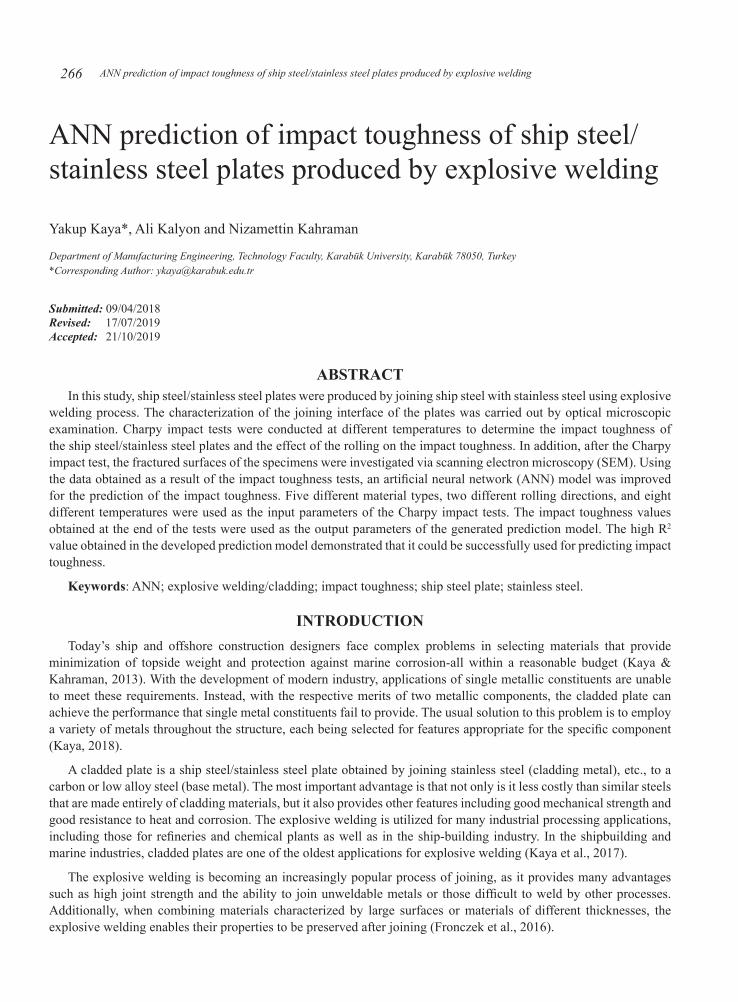
The production of the ship steel/stainless steel plates using the explosive welding/cladding process was carried out using the parallel setup shown in Figure 1. Preliminary tests were conducted to determine the optimum welding parameters, which are given in Table 2. 92% ammonium nitrate, 5% diesel fuel, and min 3% TNT (Elbar-5) powder produced by Mechanical and Chemical Industry Company (MKE, Turkey) were used as the explosive in the welding processes. The specimens joined via the explosion could cool in the open air after the procedure.
Fig. 1. Parallel arrangement of experimental setup for welding process.
Table 2. Welding parameters used in experimental studies.
Base Plate Flyer Plate Explosive Material
Stand-off Distance ((s) mm)
Explosive Rate (R)
Explosive Amount (m × R) (g)
Ship steel
AISI430
Elbar-5 2 t 2.5 2.500AISI316L
AISI420
AISI2304
Metallographic Examination The specimens were cut from the ship steel/stainless steel plates using the wire electric discharge machining
(EDM) process for the microstructure examination and Charpy impact test. The microstructure specimens were classified according to their distance from the explosion zone (Zones 1-4) and the Charpy impact specimens were classified depending on the rolling direction (Fig. 2).

269Yakup Kaya, Ali Kalyon and Nizamettin Kahraman
Fig. 2. Wire EDM-cut specimens.
The specimens for microstructure examinations were classified into four zones depending on the distance from the explosion zone and were cut, mounted in bakelite, and embedded in epoxy resin. Standard metallographic specimen preparation procedures (ground and polished) were then applied. The polished specimens were etched with 3% nitric acid-97% ethanol solution. Microstructure examinations were then performed using a Leica DM 4000M optical microscope.
Charpy Impact Toughness TestsThe base material (the ship steel plate) and the ship steel/stainless steel plates (four different cladding) were prepared
in accordance with the Charpy impact test specimen standard (ASTM E 23-98) schematically shown in Figure 3. The specimens were cut from the plates in directions parallel and perpendicular to the rolling direction. In order to see the effect of the four different types of the stainless steel claddings (flyer plate) on the impact toughness of the ship steel base material, only the ship steel surface was notched. Tests were performed at eight different temperatures (between -50 °C and 50 °C) to determine the impact transition temperature of the specimens. Three specimens were tested at each temperature and the results averaged. The Charpy impact test specimens were brought to the test temperature using a HUBER CC 805 cooler/heater with a capacity of -80°C/+150°C. Charpy impact tests were applied to the prepared specimens using a computer-controlled 450 J capacity ZWICK ROELL RKP 450 device. After the tests, the fracture surface images (-50 °C, -40 °C, and -30 °C) on the impact transition temperature of the ship steel and the ship steel/stainless steel plate specimens parallel to the rolling direction were examined with the ZEISS EVO LS10 scanning electron microscope (SEM).
Fig. 3. Charpy impact test specimen.
ANN prediction of impact toughness of ship steel/stainless steel plates produced by explosive welding270
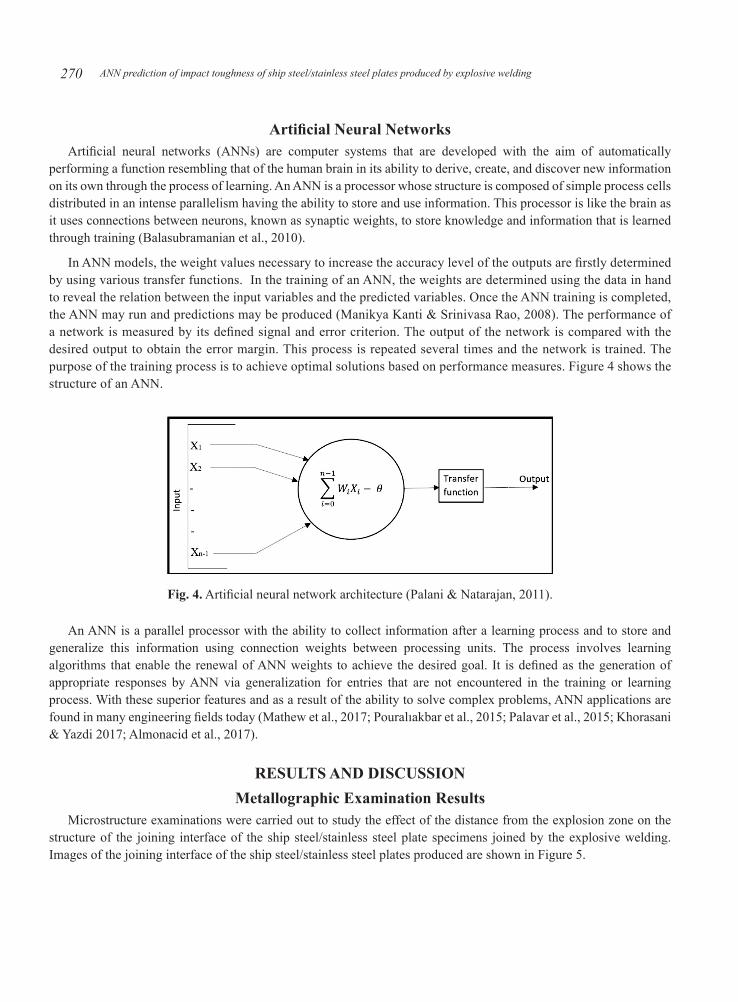
Artificial Neural NetworksArtificial neural networks (ANNs) are computer systems that are developed with the aim of automatically
performing a function resembling that of the human brain in its ability to derive, create, and discover new information on its own through the process of learning. An ANN is a processor whose structure is composed of simple process cells distributed in an intense parallelism having the ability to store and use information. This processor is like the brain as it uses connections between neurons, known as synaptic weights, to store knowledge and information that is learned through training (Balasubramanian et al., 2010).
In ANN models, the weight values necessary to increase the accuracy level of the outputs are firstly determined by using various transfer functions. In the training of an ANN, the weights are determined using the data in hand to reveal the relation between the input variables and the predicted variables. Once the ANN training is completed, the ANN may run and predictions may be produced (Manikya Kanti & Srinivasa Rao, 2008). The performance of a network is measured by its defined signal and error criterion. The output of the network is compared with the desired output to obtain the error margin. This process is repeated several times and the network is trained. The purpose of the training process is to achieve optimal solutions based on performance measures. Figure 4 shows the structure of an ANN.
Fig. 4. Artificial neural network architecture (Palani & Natarajan, 2011).
An ANN is a parallel processor with the ability to collect information after a learning process and to store and generalize this information using connection weights between processing units. The process involves learning algorithms that enable the renewal of ANN weights to achieve the desired goal. It is defined as the generation of appropriate responses by ANN via generalization for entries that are not encountered in the training or learning process. With these superior features and as a result of the ability to solve complex problems, ANN applications are found in many engineering fields today (Mathew et al., 2017; Pouraliakbar et al., 2015; Palavar et al., 2015; Khorasani & Yazdi 2017; Almonacid et al., 2017).
RESULTS AND DISCUSSION Metallographic Examination Results
Microstructure examinations were carried out to study the effect of the distance from the explosion zone on the structure of the joining interface of the ship steel/stainless steel plate specimens joined by the explosive welding. Images of the joining interface of the ship steel/stainless steel plates produced are shown in Figure 5.
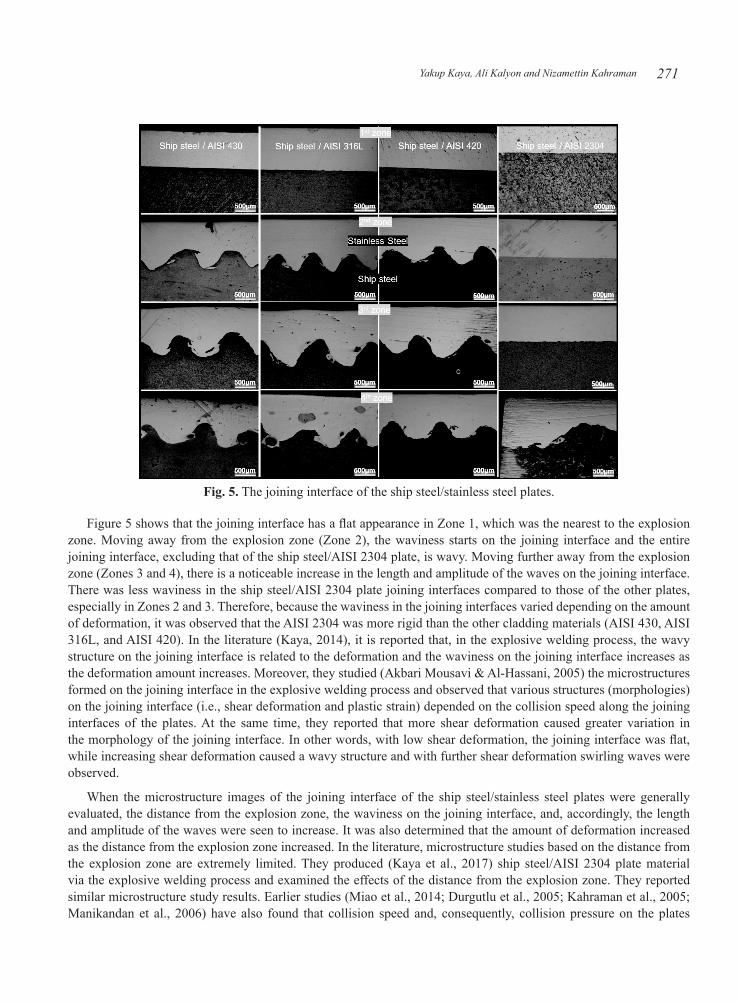
271Yakup Kaya, Ali Kalyon and Nizamettin Kahraman
Fig. 5. The joining interface of the ship steel/stainless steel plates.
Figure 5 shows that the joining interface has a flat appearance in Zone 1, which was the nearest to the explosion zone. Moving away from the explosion zone (Zone 2), the waviness starts on the joining interface and the entire joining interface, excluding that of the ship steel/AISI 2304 plate, is wavy. Moving further away from the explosion zone (Zones 3 and 4), there is a noticeable increase in the length and amplitude of the waves on the joining interface. There was less waviness in the ship steel/AISI 2304 plate joining interfaces compared to those of the other plates, especially in Zones 2 and 3. Therefore, because the waviness in the joining interfaces varied depending on the amount of deformation, it was observed that the AISI 2304 was more rigid than the other cladding materials (AISI 430, AISI 316L, and AISI 420). In the literature (Kaya, 2014), it is reported that, in the explosive welding process, the wavy structure on the joining interface is related to the deformation and the waviness on the joining interface increases as the deformation amount increases. Moreover, they studied (Akbari Mousavi & Al-Hassani, 2005) the microstructures formed on the joining interface in the explosive welding process and observed that various structures (morphologies) on the joining interface (i.e., shear deformation and plastic strain) depended on the collision speed along the joining interfaces of the plates. At the same time, they reported that more shear deformation caused greater variation in the morphology of the joining interface. In other words, with low shear deformation, the joining interface was flat, while increasing shear deformation caused a wavy structure and with further shear deformation swirling waves were observed.
When the microstructure images of the joining interface of the ship steel/stainless steel plates were generally evaluated, the distance from the explosion zone, the waviness on the joining interface, and, accordingly, the length and amplitude of the waves were seen to increase. It was also determined that the amount of deformation increased as the distance from the explosion zone increased. In the literature, microstructure studies based on the distance from the explosion zone are extremely limited. They produced (Kaya et al., 2017) ship steel/AISI 2304 plate material via the explosive welding process and examined the effects of the distance from the explosion zone. They reported similar microstructure study results. Earlier studies (Miao et al., 2014; Durgutlu et al., 2005; Kahraman et al., 2005; Manikandan et al., 2006) have also found that collision speed and, consequently, collision pressure on the plates
ANN prediction of impact toughness of ship steel/stainless steel plates produced by explosive welding272
increased due to the energy of the explosion on the joining interface of cladded plates produced via the explosive welding using different explosive ratios. These studies also found that deformation increased with the increase of this pressure and the waviness increased in parallel with it. In addition, the effects shown by moving further from the explosion zone were like those shown by increasing the explosive ratio.
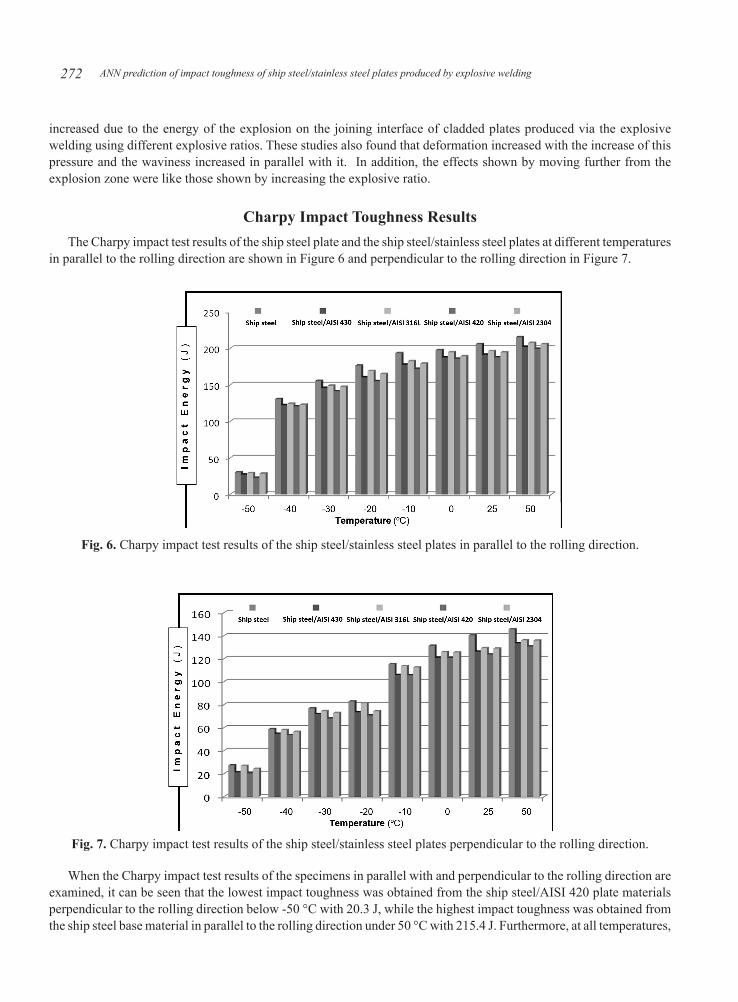
Charpy Impact Toughness ResultsThe Charpy impact test results of the ship steel plate and the ship steel/stainless steel plates at different temperatures
in parallel to the rolling direction are shown in Figure 6 and perpendicular to the rolling direction in Figure 7.
Fig. 6. Charpy impact test results of the ship steel/stainless steel plates in parallel to the rolling direction.
Fig. 7. Charpy impact test results of the ship steel/stainless steel plates perpendicular to the rolling direction.
When the Charpy impact test results of the specimens in parallel with and perpendicular to the rolling direction are examined, it can be seen that the lowest impact toughness was obtained from the ship steel/AISI 420 plate materials perpendicular to the rolling direction below -50 °C with 20.3 J, while the highest impact toughness was obtained from the ship steel base material in parallel to the rolling direction under 50 °C with 215.4 J. Furthermore, at all temperatures,
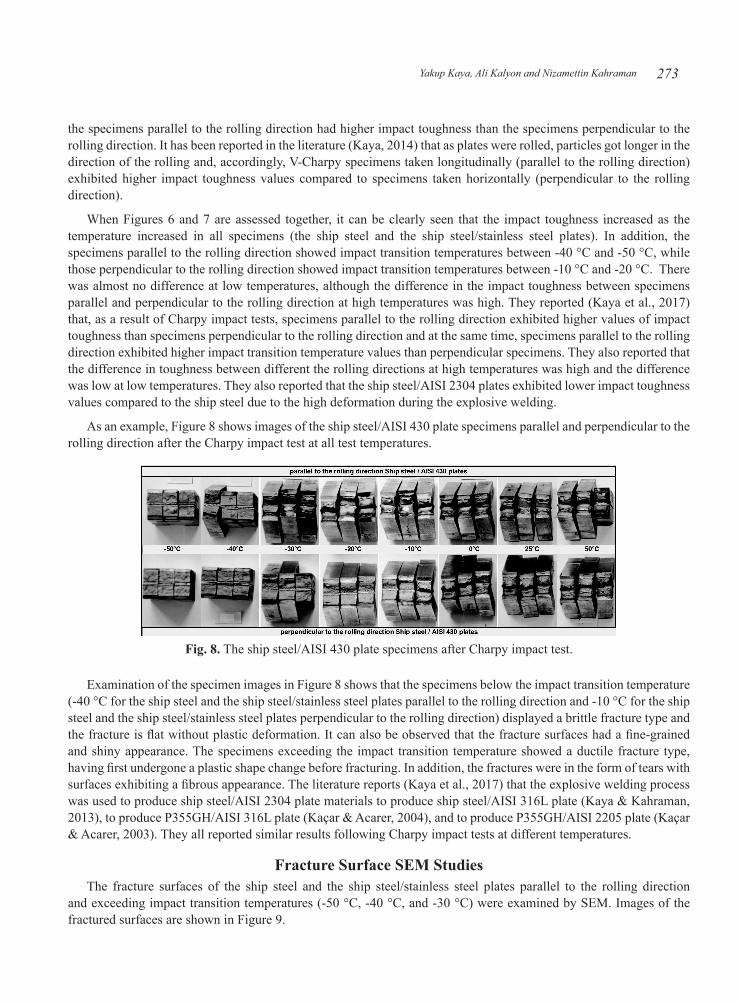
273Yakup Kaya, Ali Kalyon and Nizamettin Kahraman
the specimens parallel to the rolling direction had higher impact toughness than the specimens perpendicular to the rolling direction. It has been reported in the literature (Kaya, 2014) that as plates were rolled, particles got longer in the direction of the rolling and, accordingly, V-Charpy specimens taken longitudinally (parallel to the rolling direction) exhibited higher impact toughness values compared to specimens taken horizontally (perpendicular to the rolling direction).
When Figures 6 and 7 are assessed together, it can be clearly seen that the impact toughness increased as the temperature increased in all specimens (the ship steel and the ship steel/stainless steel plates). In addition, the specimens parallel to the rolling direction showed impact transition temperatures between -40 °C and -50 °C, while those perpendicular to the rolling direction showed impact transition temperatures between -10 °C and -20 °C. There was almost no difference at low temperatures, although the difference in the impact toughness between specimens parallel and perpendicular to the rolling direction at high temperatures was high. They reported (Kaya et al., 2017) that, as a result of Charpy impact tests, specimens parallel to the rolling direction exhibited higher values of impact toughness than specimens perpendicular to the rolling direction and at the same time, specimens parallel to the rolling direction exhibited higher impact transition temperature values than perpendicular specimens. They also reported that the difference in toughness between different the rolling directions at high temperatures was high and the difference was low at low temperatures. They also reported that the ship steel/AISI 2304 plates exhibited lower impact toughness values compared to the ship steel due to the high deformation during the explosive welding.
As an example, Figure 8 shows images of the ship steel/AISI 430 plate specimens parallel and perpendicular to the rolling direction after the Charpy impact test at all test temperatures.
Fig. 8. The ship steel/AISI 430 plate specimens after Charpy impact test.
Examination of the specimen images in Figure 8 shows that the specimens below the impact transition temperature (-40 °C for the ship steel and the ship steel/stainless steel plates parallel to the rolling direction and -10 °C for the ship steel and the ship steel/stainless steel plates perpendicular to the rolling direction) displayed a brittle fracture type and the fracture is flat without plastic deformation. It can also be observed that the fracture surfaces had a fine-grained and shiny appearance. The specimens exceeding the impact transition temperature showed a ductile fracture type, having first undergone a plastic shape change before fracturing. In addition, the fractures were in the form of tears with surfaces exhibiting a fibrous appearance. The literature reports (Kaya et al., 2017) that the explosive welding process was used to produce ship steel/AISI 2304 plate materials to produce ship steel/AISI 316L plate (Kaya & Kahraman, 2013), to produce P355GH/AISI 316L plate (Kaçar & Acarer, 2004), and to produce P355GH/AISI 2205 plate (Kaçar & Acarer, 2003). They all reported similar results following Charpy impact tests at different temperatures.
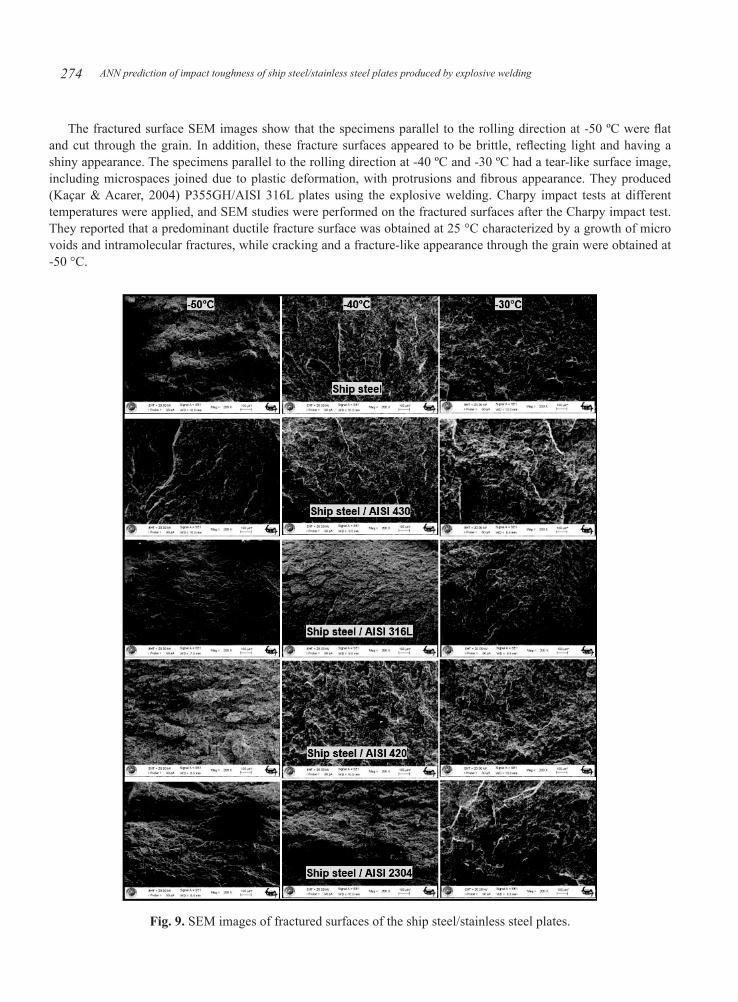
Fracture Surface SEM StudiesThe fracture surfaces of the ship steel and the ship steel/stainless steel plates parallel to the rolling direction
and exceeding impact transition temperatures (-50 °C, -40 °C, and -30 °C) were examined by SEM. Images of the fractured surfaces are shown in Figure 9.
ANN prediction of impact toughness of ship steel/stainless steel plates produced by explosive welding274
The fractured surface SEM images show that the specimens parallel to the rolling direction at -50 ºC were flat and cut through the grain. In addition, these fracture surfaces appeared to be brittle, reflecting light and having a shiny appearance. The specimens parallel to the rolling direction at -40 ºC and -30 ºC had a tear-like surface image, including microspaces joined due to plastic deformation, with protrusions and fibrous appearance. They produced (Kaçar & Acarer, 2004) P355GH/AISI 316L plates using the explosive welding. Charpy impact tests at different temperatures were applied, and SEM studies were performed on the fractured surfaces after the Charpy impact test. They reported that a predominant ductile fracture surface was obtained at 25 °C characterized by a growth of micro voids and intramolecular fractures, while cracking and a fracture-like appearance through the grain were obtained at -50 °C.
Fig. 9. SEM images of fractured surfaces of the ship steel/stainless steel plates.
275Yakup Kaya, Ali Kalyon and Nizamettin Kahraman
In addition, using the explosive welding process, they produced the ship steel/AISI 2304 (Kaya et al., 2017) and P355GH/AISI 2205 (Kaçar & Acarer 2003) plates. They applied Charpy impact tests at different temperatures and then performed SEM studies on the surfaces of the fractured specimens and reported similar results above and below the impact transition temperature.
ANN ApplicationArtificial neural networks are an estimation model that is created by using the data contained in the experimental
set. The learning of the ANN model is performed by using the values in the experiment set. After learning is performed, the model is tested. The more the inputs used in learning the model, the more successful the model. The purpose of testing the model is to evaluate the predictability of the model. When testing the ANN model, experimental parameters that are not used in learning the model are used. Prediction and evaluation results are compared to determine whether the model is successful. Experimental results can be estimated without the need for an experimental set using the ANN model, which has been successfully created. This saves time and costs for experimental work. Using the ANN model, which is obtained with high estimation results, it is provided to estimate the impact toughness results for the material under the desired properties and conditions. The fact that the model can only work in the range of data used in learning causes the system to work in a limited way.
In this study, the Levenberg-Marquardt (LM) algorithm based on a backpropagation multilayered ANN model was used due to its widespread usage and application in ANNs. The LM learning algorithm is a very successful optimization process and backpropagation learning technique based on the idea of multiple neighborhoods and the least squares approach. One of the most important advantages of the LM algorithm is its fast convergence. The prediction performance of the ANN model developed in this experimental study was established by applying the determination coefficient (R2), root of mean square error (RMSE), and mean absolute percentage error (MAPE) processes. Equations (1), (2), and (3) below were used in the calculations.
(1)
(2)
(3)
Pythia software was used to develop the ANN model. Training was given by using the Fermi function as the Pythia software transfer function. The Fermi transfer function can be calculated by Equation (4), where VN represents the normalization value of the input, and wi represents the weight value and (I = 1,2,3 ..., n).
(4)
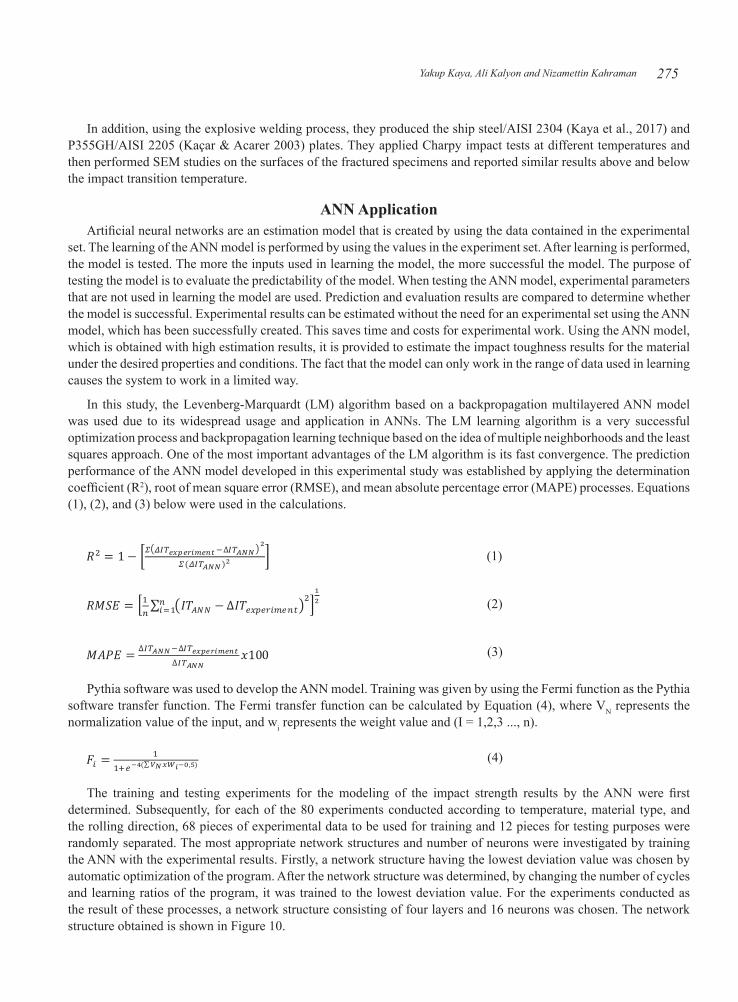
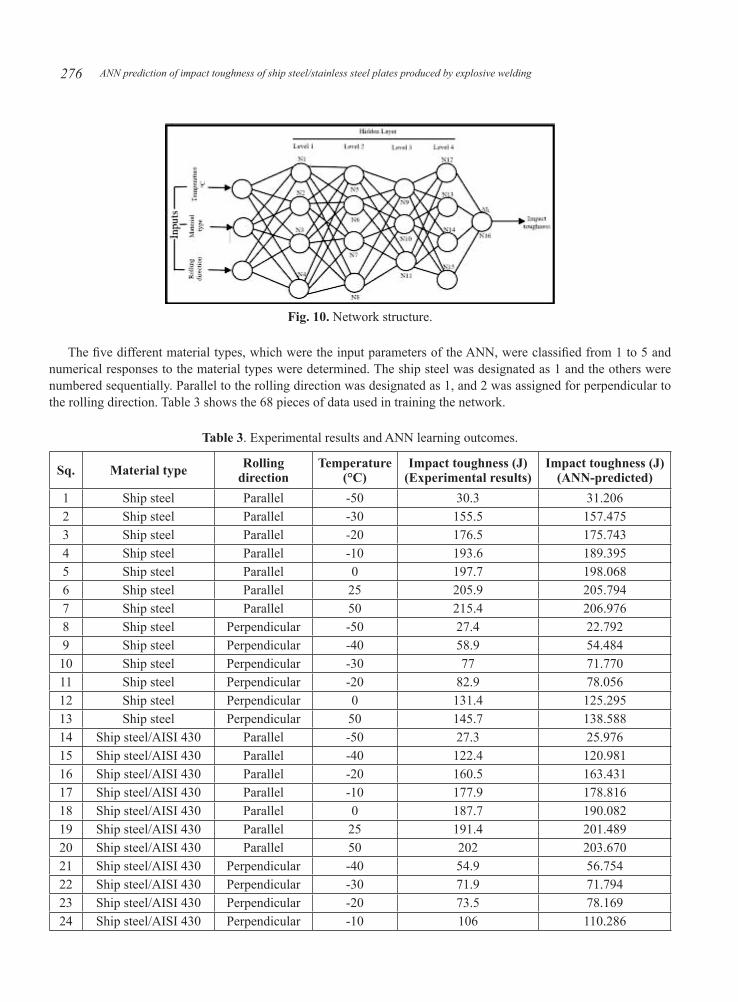
The training and testing experiments for the modeling of the impact strength results by the ANN were first determined. Subsequently, for each of the 80 experiments conducted according to temperature, material type, and the rolling direction, 68 pieces of experimental data to be used for training and 12 pieces for testing purposes were randomly separated. The most appropriate network structures and number of neurons were investigated by training the ANN with the experimental results. Firstly, a network structure having the lowest deviation value was chosen by automatic optimization of the program. After the network structure was determined, by changing the number of cycles and learning ratios of the program, it was trained to the lowest deviation value. For the experiments conducted as the result of these processes, a network structure consisting of four layers and 16 neurons was chosen. The network structure obtained is shown in Figure 10.
ANN prediction of impact toughness of ship steel/stainless steel plates produced by explosive welding276
Fig. 10. Network structure.
The five different material types, which were the input parameters of the ANN, were classified from 1 to 5 and numerical responses to the material types were determined. The ship steel was designated as 1 and the others were numbered sequentially. Parallel to the rolling direction was designated as 1, and 2 was assigned for perpendicular to the rolling direction. Table 3 shows the 68 pieces of data used in training the network.
Table 3. Experimental results and ANN learning outcomes.
Sq. Material type Rollingdirection
Temperature(°C)
Impact toughness (J)(Experimental results)
Impact toughness (J)(ANN-predicted)
1 Ship steel Parallel -50 30.3 31.2062 Ship steel Parallel -30 155.5 157.4753 Ship steel Parallel -20 176.5 175.7434 Ship steel Parallel -10 193.6 189.3955 Ship steel Parallel 0 197.7 198.0686 Ship steel Parallel 25 205.9 205.7947 Ship steel Parallel 50 215.4 206.9768 Ship steel Perpendicular -50 27.4 22.7929 Ship steel Perpendicular -40 58.9 54.48410 Ship steel Perpendicular -30 77 71.77011 Ship steel Perpendicular -20 82.9 78.05612 Ship steel Perpendicular 0 131.4 125.29513 Ship steel Perpendicular 50 145.7 138.58814 Ship steel/AISI 430 Parallel -50 27.3 25.97615 Ship steel/AISI 430 Parallel -40 122.4 120.98116 Ship steel/AISI 430 Parallel -20 160.5 163.43117 Ship steel/AISI 430 Parallel -10 177.9 178.81618 Ship steel/AISI 430 Parallel 0 187.7 190.08219 Ship steel/AISI 430 Parallel 25 191.4 201.48920 Ship steel/AISI 430 Parallel 50 202 203.67021 Ship steel/AISI 430 Perpendicular -40 54.9 56.75422 Ship steel/AISI 430 Perpendicular -30 71.9 71.79423 Ship steel/AISI 430 Perpendicular -20 73.5 78.16924 Ship steel/AISI 430 Perpendicular -10 106 110.286
277Yakup Kaya, Ali Kalyon and Nizamettin Kahraman
25 Ship steel/AISI 430 Perpendicular 0 120.9 124.27326 Ship steel/AISI 430 Perpendicular 25 126.3 133.20427 Ship steel/AISI 316L Parallel -50 29.2 25.59228 Ship steel/AISI 316L Parallel -40 124.2 120.76729 Ship steel/AISI 316L Parallel -30 149 144.35630 Ship steel/AISI 316L Parallel -20 169 161.36731 Ship steel/AISI 316L Parallel -10 182.6 176.57132 Ship steel/AISI 316L Parallel 0 194.8 187.81233 Ship steel/AISI 316L Parallel 50 207.6 202.01534 Ship steel/AISI 316L Perpendicular -50 26.9 24.87035 Ship steel/AISI 316L Perpendicular -40 58.1 58.46036 Ship steel/AISI 316L Perpendicular -30 74.5 71.81137 Ship steel/AISI 316L Perpendicular -20 81.3 78.24238 Ship steel/AISI 316L Perpendicular -10 113.7 110.04439 Ship steel/AISI 316L Perpendicular 0 125.9 123.33340 Ship steel/AISI 316L Perpendicular 25 129.4 131.84941 Ship steel/AISI 420 Parallel -50 22.8 26.26742 Ship steel/AISI 420 Parallel -40 120.6 123.62343 Ship steel/AISI 420 Parallel -30 141.5 146.44844 Ship steel/AISI 420 Parallel -20 155.1 163.34145 Ship steel/AISI 420 Parallel -10 172.1 178.00546 Ship steel/AISI 420 Parallel 25 187.8 199.04547 Ship steel/AISI 420 Parallel 50 199.5 201.40148 Ship steel/AISI 420 Perpendicular -50 20.3 25.75749 Ship steel/AISI 420 Perpendicular -40 53.8 59.22550 Ship steel/AISI 420 Perpendicular -30 68.1 71.81851 Ship steel/AISI 420 Perpendicular -20 70.7 78.42352 Ship steel/AISI 420 Perpendicular 0 120.7 122.81353 Ship steel/AISI 420 Perpendicular 25 123.8 130.93954 Ship steel/AISI 420 Perpendicular 50 130.7 135.17655 Ship steel/AISI 2304 Parallel -50 28.5 27.68656 Ship steel/AISI 2304 Parallel -40 122.9 127.48657 Ship steel/AISI 2304 Parallel -30 147.3 149.78258 Ship steel/AISI 2304 Parallel -10 179.2 180.51259 Ship steel/AISI 2304 Parallel 0 189.3 189.81560 Ship steel/AISI 2304 Parallel 25 194.6 199.10061 Ship steel/AISI 2304 Parallel 50 205.9 201.21062 Ship steel/AISI 2304 Perpendicular -50 24.4 27.68663 Ship steel/AISI 2304 Perpendicular -40 56.5 58.00664 Ship steel/AISI 2304 Perpendicular -20 74.4 79.13265 Ship steel/AISI 2304 Perpendicular -10 112.5 111.68766 Ship steel/AISI 2304 Perpendicular 0 125.6 123.46867 Ship steel/AISI 2304 Perpendicular 25 128.9 131.21068 Ship steel/AISI 2304 Perpendicular 50 135.9 135.883
ANN prediction of impact toughness of ship steel/stainless steel plates produced by explosive welding278
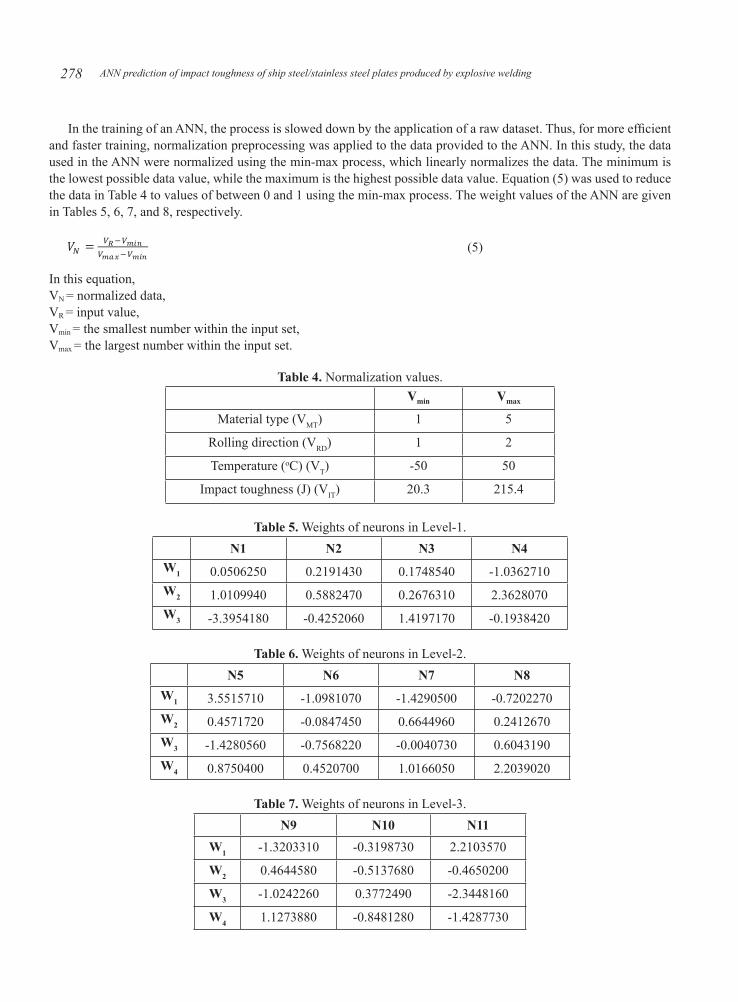
In the training of an ANN, the process is slowed down by the application of a raw dataset. Thus, for more efficient and faster training, normalization preprocessing was applied to the data provided to the ANN. In this study, the data used in the ANN were normalized using the min-max process, which linearly normalizes the data. The minimum is the lowest possible data value, while the maximum is the highest possible data value. Equation (5) was used to reduce the data in Table 4 to values of between 0 and 1 using the min-max process. The weight values of the ANN are given in Tables 5, 6, 7, and 8, respectively.
(5)
In this equation,VN = normalized data,VR = input value,Vmin = the smallest number within the input set,Vmax = the largest number within the input set.
Table 4. Normalization values.Vmin Vmax
Material type (VMT) 1 5
Rolling direction (VRD) 1 2
Temperature (oC) (VT) -50 50
Impact toughness (J) (VIT) 20.3 215.4
Table 5. Weights of neurons in Level-1.N1 N2 N3 N4
W1 0.0506250 0.2191430 0.1748540 -1.0362710W2 1.0109940 0.5882470 0.2676310 2.3628070W3 -3.3954180 -0.4252060 1.4197170 -0.1938420
Table 6. Weights of neurons in Level-2.N5 N6 N7 N8
W1 3.5515710 -1.0981070 -1.4290500 -0.7202270W2 0.4571720 -0.0847450 0.6644960 0.2412670W3 -1.4280560 -0.7568220 -0.0040730 0.6043190W4 0.8750400 0.4520700 1.0166050 2.2039020
Table 7. Weights of neurons in Level-3.N9 N10 N11
W1 -1.3203310 -0.3198730 2.2103570
W2 0.4644580 -0.5137680 -0.4650200
W3 -1.0242260 0.3772490 -2.3448160
W4 1.1273880 -0.8481280 -1.4287730

279Yakup Kaya, Ali Kalyon and Nizamettin Kahraman
Table 8. Weights of neurons in Level-4 and output.N12 N13 N14 N15 Output
W1 -1.0730750 0.3549820 -1.5653750 0.5261540 -0.594484
W2 0.6896290 -0.6594090 -0.2935870 1.2950210 1.489708
W3 0.9386280 -0.7053140 1.1983560 -1.4338800 -1.447591
W4 2.547669
The performance of the ANN was evaluated by using the R2, the RMSE, and the MAPE specified in Equations (1), (2), and (3). High R2 and low RMSE values indicated that the prediction model was successful.
The ANN created was constructed using sixteen neurons, feedforward, and the backpropagation algorithm. The model was formulated using the widely applied Fermi transfer function in ANN training (Eq. 4). At the end of the calculations, the net output value was calculated using Equation (6).
Vann= fi (Vmax-Vmin)+Vmin (6)
where fi (i = 1,2,3 ..., n), Vmax is the maximum output value of the experimental data, and Vmin is the minimum output value.
Once the learning part of the network was successfully completed, the network performance was tested using the experimental data not used in the learning. The output of the fifteen-neuron network structure generated for the prediction of impact toughness is given in Equations (7-11). These equations were used to calculate the impact toughness value by using material type, the rolling direction, and temperature input values.
(7)
(8)
(9)
(10)
(11)
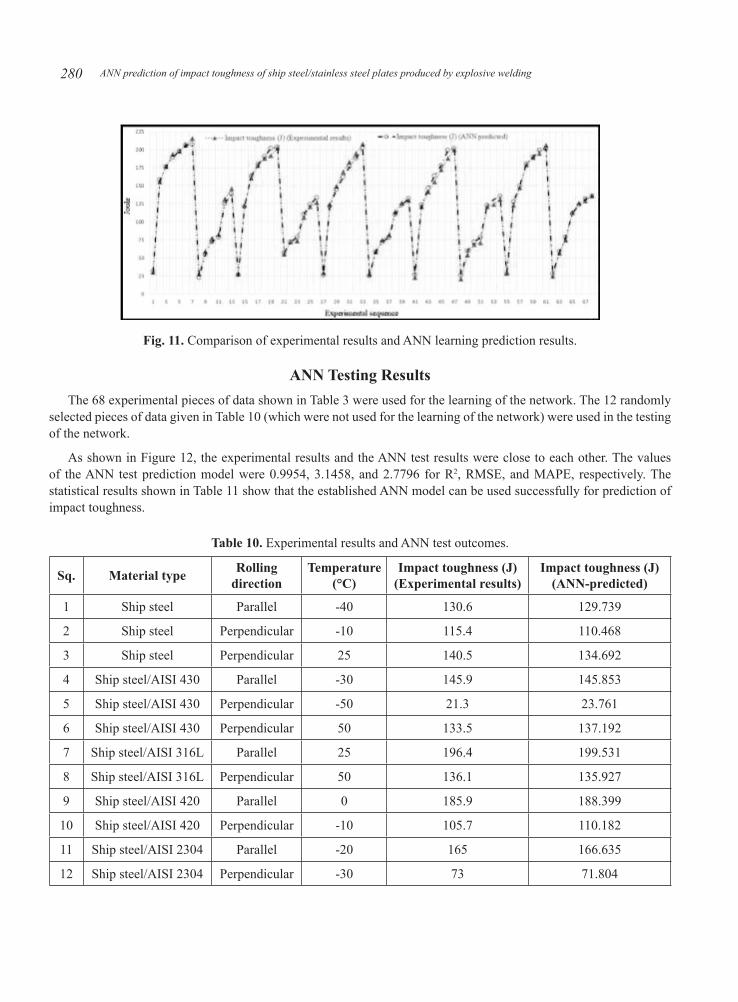
A comparison of the data obtained in the experimental studies and the impact toughness prediction values obtained by using the ANN prediction model is given in Figure 11. The ANN and the experimental results were very close to each other. Table 9 gives the R2, RMSE, and MAPE results of the ANN learning prediction results. The ANN learning model R2 value was 0.9941, the RMSE value was 4.4920, and the MAPE value was 4.2965. The high R2 value and the low RMSE and MAPE values obtained indicated that the learning of the prediction model was successful.
Table 9. Statistical data of ANN model learning established for impact toughness prediction.
R2 RMSE MAPE
∆ IT 0.9941 4.4920 4.2965
ANN prediction of impact toughness of ship steel/stainless steel plates produced by explosive welding280
Fig. 11. Comparison of experimental results and ANN learning prediction results.
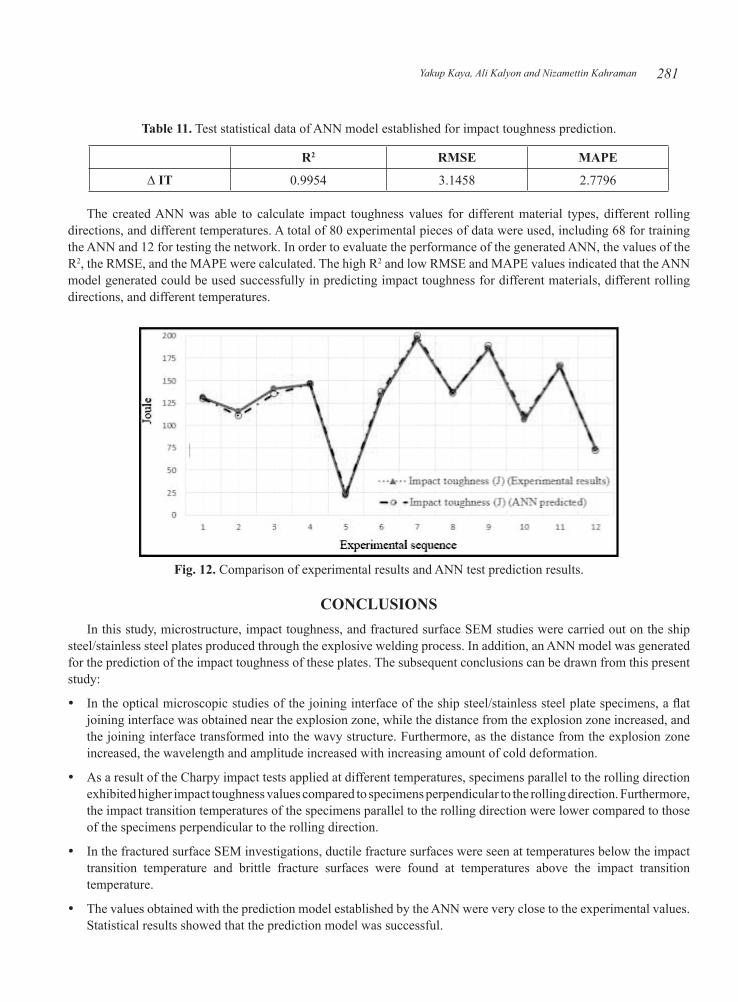
ANN Testing ResultsThe 68 experimental pieces of data shown in Table 3 were used for the learning of the network. The 12 randomly
selected pieces of data given in Table 10 (which were not used for the learning of the network) were used in the testing of the network.
As shown in Figure 12, the experimental results and the ANN test results were close to each other. The values of the ANN test prediction model were 0.9954, 3.1458, and 2.7796 for R2, RMSE, and MAPE, respectively. The statistical results shown in Table 11 show that the established ANN model can be used successfully for prediction of impact toughness.
Table 10. Experimental results and ANN test outcomes.
Sq. Material type Rollingdirection
Temperature(°C)
Impact toughness (J)(Experimental results)
Impact toughness (J)(ANN-predicted)
1 Ship steel Parallel -40 130.6 129.739
2 Ship steel Perpendicular -10 115.4 110.468
3 Ship steel Perpendicular 25 140.5 134.692
4 Ship steel/AISI 430 Parallel -30 145.9 145.853
5 Ship steel/AISI 430 Perpendicular -50 21.3 23.761
6 Ship steel/AISI 430 Perpendicular 50 133.5 137.192
7 Ship steel/AISI 316L Parallel 25 196.4 199.531
8 Ship steel/AISI 316L Perpendicular 50 136.1 135.927
9 Ship steel/AISI 420 Parallel 0 185.9 188.399
10 Ship steel/AISI 420 Perpendicular -10 105.7 110.182
11 Ship steel/AISI 2304 Parallel -20 165 166.635
12 Ship steel/AISI 2304 Perpendicular -30 73 71.804
281Yakup Kaya, Ali Kalyon and Nizamettin Kahraman
Table 11. Test statistical data of ANN model established for impact toughness prediction.
R2 RMSE MAPE
∆ IT 0.9954 3.1458 2.7796
The created ANN was able to calculate impact toughness values for different material types, different rolling directions, and different temperatures. A total of 80 experimental pieces of data were used, including 68 for training the ANN and 12 for testing the network. In order to evaluate the performance of the generated ANN, the values of the R2, the RMSE, and the MAPE were calculated. The high R2 and low RMSE and MAPE values indicated that the ANN model generated could be used successfully in predicting impact toughness for different materials, different rolling directions, and different temperatures.
Fig. 12. Comparison of experimental results and ANN test prediction results.
CONCLUSIONSIn this study, microstructure, impact toughness, and fractured surface SEM studies were carried out on the ship
steel/stainless steel plates produced through the explosive welding process. In addition, an ANN model was generated for the prediction of the impact toughness of these plates. The subsequent conclusions can be drawn from this present study:
In the optical microscopic studies of the joining interface of the ship steel/stainless steel plate specimens, a flat �joining interface was obtained near the explosion zone, while the distance from the explosion zone increased, and the joining interface transformed into the wavy structure. Furthermore, as the distance from the explosion zone increased, the wavelength and amplitude increased with increasing amount of cold deformation.
As a result of the Charpy impact tests applied at different temperatures, specimens parallel to the rolling direction �exhibited higher impact toughness values compared to specimens perpendicular to the rolling direction. Furthermore, the impact transition temperatures of the specimens parallel to the rolling direction were lower compared to those of the specimens perpendicular to the rolling direction.
In the fractured surface SEM investigations, ductile fracture surfaces were seen at temperatures below the impact �transition temperature and brittle fracture surfaces were found at temperatures above the impact transition temperature.
The values obtained with the prediction model established by the ANN were very close to the experimental values. �Statistical results showed that the prediction model was successful.
ANN prediction of impact toughness of ship steel/stainless steel plates produced by explosive welding282
By using a prediction model in experimental work, less time would be spent, and costs reduced. The desired data �could be obtained without the need for an experimental environment. Moreover, the generated prediction model would provide a quick solution without the need to decide on experimental working conditions.
ACKNOWLEDGMENTThe authors are pleased to acknowledge the financial support for this study from Karabük University scientific
research projects department (KBÜ-BAP-13/1-DR-012). We would also like to thank to Mechanical and Chemical Industry Company (MKE, Turkey) for the facilities they provide.
REFERENCESAcarer, M., Gülenç, B. & Findik, F. 2003. Investigation of explosive welding parameters and their effects on microhardness and
shear strength. Materials & Design 24:659-664. https://doi.org/10.1016/S0261-3069(03)00066-9
Akbari, Mousavi, A.A. & Al-Hassani, S.T.S. 2005. Numerical and experimental studies of the mechanism of the wavy interface formations in explosive/impact welding. Journal of the Mechanis and Physics of Solids 53:2501-2528. https://doi.org/10.1016/j.jmps.2005.06.001
Almonacid, F., Fernandez, E.F., Mellit, A. & Kalogirou, S. 2017. Review of techniques based on artificial neural networks for the electrical characterization of concentrator photovoltaic technology. Renewable & Sustainable Energy Reviews 75:938-953. https://doi.org/10.1016/j.rser.2016.11.075
Balasubramanian, K.R., Buvanashekaran, G. & Sankaranarayanasamy, K. 2010. Modeling of laser beam welding of stainless steel sheet butt joint using neural networks, CIRP Journal of Manufacturing Science and Technology 3:80-84. https://doi.org/10.1016/j.cirpj.2010.07.001
Belyaev, S., Rubanik, V., Resnina, N., Rubanik, Jr. V., Demidova, E. & Lomakin, I. 2016. Bimetallic shape memory alloy composites produced by explosion welding: Structure and martensitic transformation. Journal of Materials Processing Technology 234:323-331. https://doi.org/10.1016/j.jmatprotec.2016.04.004
Benyounis, K.Y. & Olabi, A.G. 2008. Optimization of different welding processes using statistical and numerical approaches–A reference guide. Advances in Engineering Software 39:483-496. https://doi.org/10.1016/j.advengsoft.2007.03.012
Casalino, G. & Minutolo, F.M.C. 2004. A model for evaluation of laser welding efficiency and quality using an artificial neural network and fuzzy logic. Proceedings of the Institution of Mechanical Engineers, Part B: Journal of Engineering Manufacture 218:641-646. https://doi.org/10.1243/0954405041167112
Chan, B., Pacey, J. & Bibby, M. 1999. Modelling gas metal arc weld geometry using artificial neural network technology. Canadian Metallurgical Quarterly 38: 43-51. https://doi.org/10.1016/S0008-4433(98)00037-8
Chu, Q., Zhang, M., Li, J. & Yan, C. 2017. Experimental and numerical investigation of microstructure and mechanical behavior of titanium/steel interfaces prepared by explosive welding. Materials Science and Engineering: A 689:323-331. https://doi.org/10.1016/j.msea.2017.02.075
Corigliano, P., Crupi, V., Guglielmino, E. & Sili, A.M. 2018. Full-field analysis of Al/Fe explosive welded joints for shipbuilding applications. Marine Structures 57:207-218. https://doi.org/10.1016/j.marstruc.2017.10.004
Corigliano, P., Crupi, V. & Guglielmino, E. 2018. Non linear finite element simulation of explosive welded joints of dissimilar metals for shipbuilding applications. Ocean Engineering 160:346-353. https://doi.org/10.1016/j.oceaneng.2018.04.070
Durgutlu, A., Gülenç, B. & Findik, F. 2005. Examination of copper/stainless steel joints formed by explosive welding. Materials & Design 26:497-507. https://doi.org/10.1016/j.matdes.2004.07.021
Dutta, P. & Pratihar, D. K. 2007. Modeling of TIG welding process using conventional regression analysis and neural network-based approaches. Journal of Materials Processing Technology 184:56-68. https://doi.org/10.1016/j.jmatprotec.2006.11.004
Findik, F. 2011. Recent developments in explosive welding. Materials & Design 32(3):1081-1093. https://doi.org/10.1016/j.matdes.2010.10.017
Fronczek, D.M., Wojewoda-Budka, J., Chulist, R., Sypien, A., Korneva A., Szulc, Z., Schell, N. & Zieba, P. 2016. Structural
283Yakup Kaya, Ali Kalyon and Nizamettin Kahraman
properties of Ti/Al clads manufactured by explosive welding and annealing. Materials & Design 91:80-89. https://doi.org/10.1016/j.matdes.2015.11.087
Gülenç, B., Kaya, Y., Durgutlu, A., Gülenç, İ.T., Yildirim, M.S. & Kahraman, N. 2016. Production of wire reinforced composite materials through explosive welding. Archives Civil Mechanical Engineering 16:1-8. https://doi.org/10.1016/j.acme.2015.09.006
Kaçar, R. & Acarer, M. 2003. Microstructure-property relationship in explosively welded duplex stainless steel-steel, Materials Science and Engineering: A 363:290-296. https://doi.org/10.1016/S0921-5093(03)00643-9
Kaçar, R. & Acarer, M. 2004. An investigation on the explosive cladding of 316L stainless steel-DIN-P355GH steel. Journal of Materials Processing Technology 52:91-96. https://doi.org/10.1016/j.jmatprotec.2004.03.012
Kahraman, N., Gülenç, B. & Findik, F. 2005. Joining of titanium/stainless steel by explosive welding and effect on interface. Journal of Materials Processing Technology 169:127-133. https://doi.org/10.1016/j.jmatprotec.2005.06.045
Kaya, Y. 2014. An investigation into the microstructure, mechanical and corrosion properties of Grade A ship steel-stainless steel composites produced by explosive welding method. Ph D Thesis Karabük University.
Kaya, Y. 2018. Microstructural, mechanical and corrosion investigations of ship steel-aluminum bimetal composites produced by explosive welding. Metals 8(7):544. https://doi.org/10.3390/met8070544
Kaya,Y. & Kahraman, N. 2013. An investigation into the explosive welding/cladding of Grade A ship steel/AISI 316L austenitic stainless steel. Materials & Design 52:367-372. https://doi.org/10.1016/j.matdes.2013.05.033
Kaya, Y., Kahraman, N., Durgutlu, A. & Gülenç, B. 2017. Investigation of the microstructural, mechanical and corrosion properties of Grade A ship steel-duplex stainless steel composites produced via explosive welding. Metallurgical and Materials Transactions A 48(8):3721-3733. https://doi.org/10.1007/s11661-017-4161-3
Khorasani, A. & Yazdi, M.R.S. 2017. Development of a dynamic surface roughness monitoring system based on artificial neural networks (ANN) in milling operation. The International Journal of Advanced Manufacturing Technology 93(1-4):141-151. https://doi.org/10.1007/s00170-015-7922-4
Lazurenko, D.V., Bataev, I.A., Mali, V.I., Bataev, A.A., Maliutina, I.N., Lozhkin, V.S., Esikov, M.A. & Jorge A.M.J. 2016. Explosively welded multilayer Ti-Al composites: Structure and transformation during heat treatment. Materials & Design 102:122-130.
Luo, H., Zeng, H., Hu, L., Hu, X. & Zhou, Z. 2005. Application of artificial neural network in laser welding defect diagnosis. Journal of Materials Processing Technology 170:403-411. https://doi.org/10.1016/j.jmatprotec.2005.06.008
Manikandan, P., Hokamoto, K., Deribaş, A.A., Raghukandan, K. & Tomoshige, R. 2006. Explosive welding of titanium/stainless steel by controlling energetic conditions. Materials Transactions 47(8):2049-2055. https://doi.org/10.2320/matertrans.47.2049
Manikya, Kanti, K. & Srinivasa, Rao, P. 2008. Prediction of bead geometry in pulsed GMA welding using back propagation neural network. Journal of Materials Processing Technology 200:300-305. https://doi.org/10.1016/j.jmatprotec.2007.09.034
Martín, O., López, M. & Martín, F. 2007. Artificial neural networks for quality control by ultrasonic testing in resistance spot welding. Journal of Materials Processing Technology 183:226-233. https://doi.org/10.1016/j.jmatprotec.2006.10.011
Mathew, J., Moat, R.J., Paddea, S., Fitzpatrick, M.E. & Bouchard, P.J. 2017. Prediction of residual stresses in girth welded pipes using an artificial neural network approach. International Journal of Pressure Vessels and Piping 150:89-95. https://doi.org/10.1016/j.ijpvp.2017.01.002
Miao, G., Ma, H., Shen, Z. & Yu, Y. 2014. Research on honeycomb structure explosives and double sided explosive cladding. Materials & Design 63:538-543. https://doi.org/10.1016/j.matdes.2014.06.050
Mirapeix, J., García-Allende, P.B., Cobo, A., Conde, O.M. & López-Higuera, J.M. 2007. Real-time arc-welding defect detection and classification with principal component analysis and artificial neural networks. NDT & E International 40:315-323. https://doi.org/10.1016/j.ndteint.2006.12.001
Nagesh, D.S. & Datta, G.L. 2002. Prediction of weld bead geometry and penetration in shielded metal-arc welding using artificial neural networks. Journal of Materials Processing Technology 123:303-312. https://doi.org/10.1016/S0924-0136(02)00101-2
ANN prediction of impact toughness of ship steel/stainless steel plates produced by explosive welding284
Nieslony, P., Cichosz, P., Krolczyk, G.M., Legutko, S., Smyczek, D. & Kolodziej, M. 2016. Experimental studies of the cutting force and surface morphology of explosively clad Ti-steel plates. Measurement 78:129-137. https://doi.org/10.1016/j.measurement.2015.10.005
Olabi, A.G., Casalino, G., Benyounis, K.Y. & Hashmi, M.S.J. 2006. An ANN and taguchi algorithms integrated approach to the optimization of CO2 laser welding. Advances in Engineering Software 37:643-648. https://doi.org/10.1016/j.advengsoft.2006.02.002
Palani. S. & Natarajan, U. 2011. Prediction of surface roughness in CNC end milling by machine vision system using artificial neural network based on 2D fourier transform. The International Journal of Advanced Manufacturing Technology 54:1033-1042. https://doi.org/10.1007/s00170-010-3018-3
Palavar, O., Özyürek, D. & Kalyon, A. 2015. Artificial neural network prediction of aging effects on the wear behavior of IN706 superalloy. Materials & Design 82:164-172. https://doi.org/10.1016/j.matdes.2015.05.055
Pouraliakbar, H., Khalaj, M., Nazerfakhari, M. & Khalaj, G. 2015. Artificial neural networks for hardness prediction of HAZ with chemical composition and tensile test of X70 pipeline steels. Journal of Iron and Steel Research, International 22:446-450. https://doi.org/10.1016/S1006-706X(15)30025-X
Prazmowski, M., Rozumek, D. & Paul, H. 2017. Static and fatigue tests of bimetal Zr-steel made by explosive welding. Engineering Failure Analysis 75:71-81. https://doi.org/10.1016/j.engfailanal.2016.12.022
Shojaeefard, M.H., Behnagh, R.A., Akbari, M., Givi, M.K.B. & Farhani, F. 2013. Modelling and pareto optimization of mechanical properties of friction stir welded AA7075/AA5083 butt joints using neural network and particle swarm algorithm. Materials & Design 44:190-198. https://doi.org/10.1016/j.matdes.2012.07.025
Topolski, K., Szulc, Z. & Garbacz, H. 2016. Microstructure and properties of the Ti6Al4V/Inconel 625 bimetal obtained by explosive joining. Journal of Materials Engineering and Performance 25(8): 3231-3237. https://doi.org/10.1007/s11665-016-2080-x
Wang, B., Xie, F., Luo, X. & Zhou, J. 2016. Experimental and physical model of the melting zone in the interface of the explosive cladding bar. Journal of Materials Research and Technology 5(4):333-338. https://doi.org/10.1016/j.jmrt.2016.04.001
Xie, M.X., Shang, X.T., Zhang, L.J., Bai, Q.L. & Xu, T.T. 2018. Interface characteristic of explosive-welded and hot-rolled TA1/X65 bimetallic plate. Metals 8(3):159. https://doi.org/10.3390/met8030159