Embed Size (px)
Citation preview
SSC-248
FRACTURE TOUGHNESS CHARACTERIZATIONOF SHIPBUILDING STEELS
This document has been approved forpublic release and sale; its
distribution is unlimited.
SHIP STRUCTURE COMMITTEE
1975
—
.
MEMBER AGENCIES:
Un, !ed $totes Coast Guard
Naval Sea Systems Command
Milttory Seolift Command
Maritime Administration
American Bureau of Shipping
SHIP STRUCTURE COMMIl”rEEAN INTERAGENCY ADVISORY
COMMITTEE DEDICATED TO IMPROVING
THE 5TRUCTURE OF SHIPS
ADDRESS CORRESPONDENCE TO.
Secretary
Ship Structure Commlttec
U.S. Coast Guard Heodquorters
Washington, DC. 20590
SR-220
.$./.,
Material requirements to avoid catastrophic’fractures ofship hull structures continue to be of great concern. The Ship Struc-ture Committee has undertaken a program to define, formulate, andvalidate fracture toughness criteria to cover steels up to 100,000 psiyield strength and their associated weldments. A critical review andassessment of current knowledge has been completed and appears inSSC-244.
The enclosed report covers an exploratory experimentalproject to test currently employed ship steels to determine theirmaterial characteristics in response to toughness requirements proposedby SSC-244.
Comments on this report and suggestions for additionalresearch topics will be most welcome.
W. M. BENKERTRear Admiral, U. S. Coast GuardChairman, Ship Structure Committee
.—— —
SSC-248
Final Report
on
Project SR-220, “Dynamic Tear (DT) Test Characterizat~on
Of Shipbuilding Steels”
FRACTURE TOUGHNESS CHARACTERIZATION OF SHIPBUILDING STEELS
by
J. R. Hawthorne and F. J. Loss
Naval Research Laboratory
under
Department of the tiavyNRL Project No. 63 MO1-25
RR 022-01-46-5432
This document has been approved for public ?elease and sale;its distribution is udirnited.
U. S. Coast Guard HeadquartersWashington, D.C.
1974
ABSTRAC?
New fracture control guidelines for welded ship hullshave been proposed as a result of an investigation. sponsored bythe Ship Structure Committee. These guidelines include fracturetoughness requirements in terms of the Drop Weight-NDT tempera-ture and Dynamic Tear (DT) energy. To aid the implemehtatiOtI
of these criteria an exploratory program was undertaken to char-acterize the dynamic fracture toughness of ordinary-strengthshipbuilding steels, namely, ABS Grades A, B, C, D, E, and CS.Test materials (plate) were obtained at random from several ship-yards and steel mills in an effort to characterize the productsof current steel making practice. Fracture toughness trends weredefined by means of Drop Weight-NOT, l-in. DT and standard CharpyV-notch tests and the observed toughnes~ characteristics werecompared with the proposed toughness criteria. Non-heat treatedplates of ABS Grades A, B, and C were found to have insufficienttoughness to meet reasonable fracture toughness requirements. Onthe other hand, normalized plates of ABS Grades C, D, E, and CSwere found to exhibit improved toughness trends that could meetthe proposed requirements in most cases.
-ii-
CONTENTS
INTRODUCTION . . . . . . . . . . . . . . . . . . . . . . . . . . . . . . . . . . . . . . . . 1
PROGRAM SCOPE . . . . . . . . . . . . . . . . . . . . . . . . . . . . . . . . . . . . . . . . 2
MATERIALS . . . . . . . . . . . . . . . . . . . . . . . . . . . . . . . . . . . . . . . . . . . . 2
TEST SPECIMENS ANDPROCEDURES . . . . . . . . . . . . . . . . . . . . . . 5
DROP WEIGHT NDT RESULTS . . . . . . . . . . . . . . . . . . . . . . . . . . . . 8
GENERALIZED INTERPRETATION OFDTENERGY . . . . . . . . . . 10
DTTEST RESULTS . . . . . . . . . . . . . . . . . . . . . . . . . . . . . . . . . . . . . . 14
CHARPY-V RESULTS . . . . . . . . . . . . . . . . . . . . . . . . . . . . . . . . . . . . ,21
GRADE AH AND EH ASSESSMENTS . . . . . . . . . . . . . . . . . . . . . . . . 27
RELATIONSHIP OF MEASURED NOTCH TOUGHNESSTRENDS TO RECOMMENDED FRACTURECONTROL GUIDELINES . . . . . . . . . . . . . . . . . . . . . . . . . . . . . . . . 27
NDT Criterion . . . . . . . . . . . . . . . . . . . . . . . . . . . . . . . . . . . . . . . . 27Toughness atMinirnum Service Temperature . . . . . . . . . . . . . . . . 28DT Energy Criteria . . . . . . . . . . . . . . . . . . . . . . . . . . . . . . . . . . . . 29
RECOMMENDATION FORFOLLOW-ON RESEARCH . . . . . . . . . . . . 30
Crack Arrester Materials . . . . . . . . . . . . . . . . . . . . . . . . . . . . . . . . 30Thickness Effects . . . . . . . . . . . . . . . . . . . . . . . . . . . . . . . . . . . . 31Metallurgical Effects . . . . . . . . . . . . . . . . . . . . . . . . . . . . . . . . . . 31Higher Strength (H) Grades... . . . . . . . . . . . . . . . . . . . . . . . . . . . 32KId Trends . . . . . . . . . . . . . . . . . . . . . . . . . . . . . . . . . . . . . . . . . . 32
SUMMARY AND CONCLUSIONS . . . . . . . . . . . . . . . . . . . . . . . . . . . . 32
ACKNOWLEDGMENTS . . . . . . . . . . . . . . . . . . . . . . . . . . . . . . . . . . . . 34
REFERENCES . . . . . . . . . . . . . . . . . . . . . . . . . . . . . . . . . . . . . . . . . . 34
ABBREVIATIONS AND SYMBOLS . .. . . . . . . . . . . . . . . . . . . . . . . . . 36
-iii-
LIST OF FIGURES
NO.
1
2345678910
11
12131415
16171819202122
NO.—
Comparison of Test Results from Modified (4-in. wide) andReference Standard (4-3/4-in. wide) DT Specimens
Summary of NDT TemperaturesComparison of NDT Temperature DistributionsThe Ratio Analysis Diagram (RAD)The Characteristic KId vs Temperature Transition CurveExample of Toughness Indexing ProceduresSummary of DT Test Performance of the ABS Grade A PlatesSummary of DT Test Performance of the ABS Grade B PlatesSuinmary of DT Test Performance of the ABS Grade C PlatesSummary of DT Test Performance of Heat-Treated (Normalized)
ABS Grade C PlatesSummary of DT Test Performance of Heat-Treated (Normalized)
ABS Grade D PlatesSummary of DT Test Performance of ABS Grade E PlatesSummary of DT Test Performance of ABS Grade CS PlatesDT Midenergy TransitionSummary of DT Midenergy
the Test PlatesCharpy-V Performance ofCharpy-V Performance ofCharpy-V Performance ofCharpy-V Performance ofCharpy-V Performance ofCharpy-V Performance ofCharpy-V Performance of
Temperatures Relative to NDT TemperaturesTransition Temperatures Determined for
Two ABS Grade A PlatesTwo ABS Grade B PlatesTwo ABS Grade C Platesa Heat-Treated (Normalized) ABS Grade C Platesa Heat-Treated (Normalized) ABS Grade D PlatesTwo Ai3SGrade E PlatesOne ABS Grade CS Plate
LIST OF TABLES
PAGE
6
8911131415161617
17
18
;;20
23232424252526
PAGE
I Identification, Source, and Chemical Composition of Test PlatesII Mechanical Properties of Test Plates :III NRL-ABS Comparison Study of Drop !deiht NDT Performancea
7
Iv DT Energy of Test Plates at 75°F (24 C) and at 32°F (O°C) 22
-iv-
SHIP STRUCTURE COMMITTEE
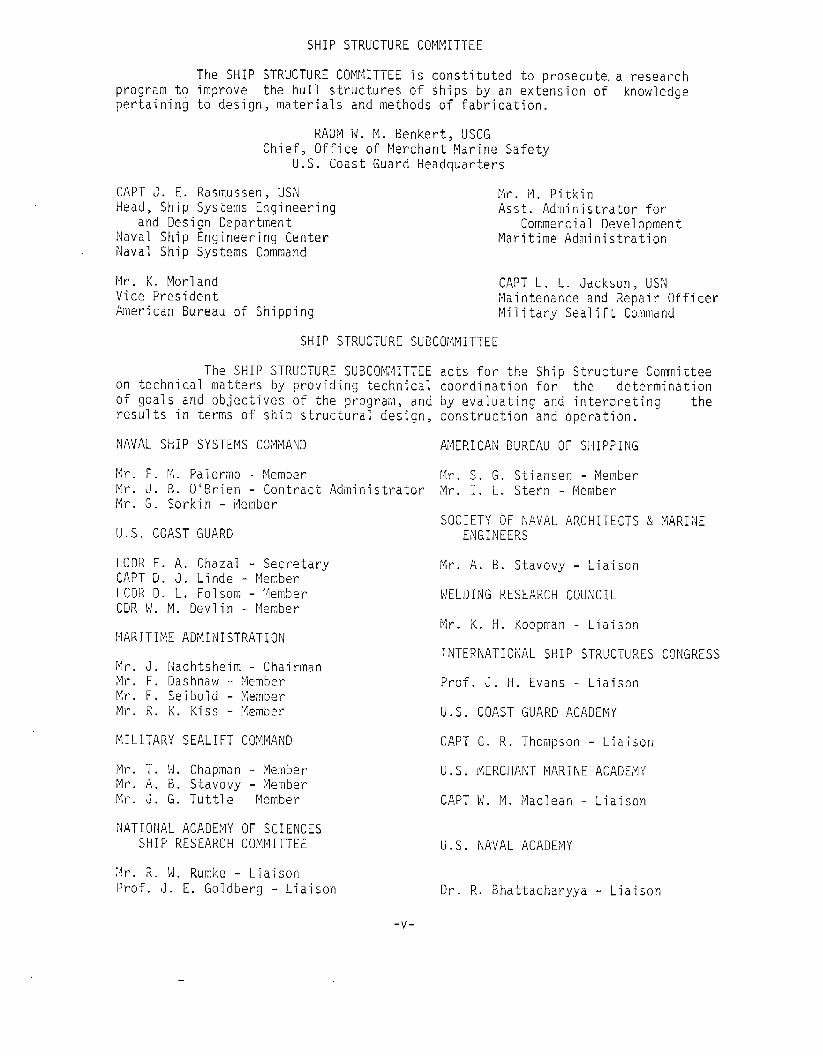
The SHIP STRUCTURE COMMITTEE is constituted to prosecute. a researchprogram to improve the hull structures of ships by an extension of knowledgepertaining to design, materials and methods of fabrication.
RADM W. M. Benkert, USCGChief, Office of Merchant Marine Safety
U.S. Coast Guard Headquarters
CAPT J. E. Rasmussen, USN Mr. i~. PitkinHead, Ship Systems Engineering Asst. Administrator for
and Design Department Commercial DevelopmentNaval Ship Engineering Center Maritime Administration]Naval Ship Systems Command
Mr. K. Morland CAPT L. L. Jackson, USNVice President Maintenance and Repair OfficerAmerican Bureau of Shipping Military Sealift Command
SHIP STRUCTURE SUi3COMMITTEE
The SHIP STRUCTURE SUBCOMMITTEE acts for the Ship Structure Committ?eon technical matters by providing technical coordination for the determinationof goals and objectives of the program, and by evaluating and interpreting theresults in terms of ship structural design, construction and operation.
NAVAL SHIP SYSTEMS COMMAND AMERICAN BUREAU OF SHIPPING
Mr. P. ~fl.Palermo - Member ~~r.S. G. Stiansen - MemberMr. J. B. O’Brien - Contract Adininistrator Mr. I, L. Stern - ~flemberMr. G. Sorkin - Member
U.S. COAST GUARD
LCDR E. A. Chazal - SecretaryCAPT D. J. Linde - MemberLCDR D. L. Folsom - l~emberCDR W. M. Devlin - Member
MARITIME ADMINISTRATION
Mr. J, Iiachtshejm - ChairmanMr. F. Dashnaw - MemberMr. F. Seibold - MemberMr. R. K. Kiss - Member
MILITARY SEALIFT COMMAND
iqr.T. W, Chap]man - MemberMr. A. B. Stavovy - MemberMr. J. G. Tuttle - Member
NATIONAL ACADEPIY OF SCIENCESSHIP RESEARCH COMMITTEE
;Ir. R. W. Rumke - LiaisonProf. J. E. Goldberg - Liaison
-v-
SOCIETY OF p;AVALARCHITECTS & MARINEENGINEERS
Mr. A. B. Stavovy - Liaison
WELDING RESEARCH COUNCIL
Mr. K. H. Koopman - Liaison
INTERNATIONAL SHIP STRUCTURES CONGRESS
Prof. J. H. Evans - Liaison
Us.
CAPT
Us.
CAPT
Us.
COAST GUARD ACADEMY
C. R. Thompson - Liaison
lMERCHANT MARINE ACADEIIY
W. M. Placlean - Liaison
NAVAL ACADEMY
Dr. R. Bhattacharyya - Liaison

NOTES
FRACTURE TOUGHNESS CHARACTERIZATIONOF SHIPBUILDING STEELS
INTRODUCTION
With the advent of the supertanker and of ships carrying liquefied natural gas (LNG),questions of the fracture safety assurance of the ship’s hull have assumed increased im-portance. In the United States commercial shipbuilding steels have been classified by theAmerican Bureau of Shipping (ABS) according to chemistry, strength level, and heat treat-ment. The ABS steel grades for ordinary-strength hull applications are A, B, C, D, E, andCS. Specific fracture toughness requirements for these steels, as related to service perfor-mance, are not included in existing specifications but are under consideration by ABS.In current applications, adequate toughness is inferred through controls on chemistry,deoxidation practice, and heat treatment. The past record of good fracture-safe performanceof ships has been achieved through experience with the individual grades coupled withknow ledgeable ship design and fabrication practices. Nevertheless, occasional catastrophicfractures have occurred to suggest a need for improvement in fracture-safe assuranceprocedures.
Recognizing the above, the Ship Structure Committee (SSC ) recently commissioned astudy by Rolfe and coworkers [1 ] to develop fracture control guidelines for welded steel shiphulls based on existing technology. In their report to the Committee, Rolfe and coworkersstated a need to define the toughness of shipbuilding steels directly by means of a fracturetoughness test rather than indirectly through specification of chemistry and heat treatment.Specifically, they recommended that all steels and weldments used in primary load-cmryingmembers in the main stress regions of ships should exhibit a maximum Drop Weight-NilDuctility Transition (NDT) temperature of 0° F (–18” C) as measured by ASTM StandardTest Method E-208. Furthermore, they recommended the requirement of fixed 5/S-in.Dynamic Tear (DT) test [2, 3] energy levels at room temperature. This requirement wasformulated to assure an increase in tou~hness with rising temperature above the 0° F NDTcriterion so that acceptable toughness is exhibited at a minimum service temperature of 32° F(O°C). The DT test is currently a military standard, Mil Std 1601 SHIPS, arid is beingactively investigated by ASTM Committee E-24 on Fracture Tcs~ing of Metals for the purposeof defining a standard DT test method.
The DT test procedure provides a means for rational interpretation of fracture tough-ness trends whereby structural performance can be projected. This structural translationgenerally is not possible using the Charpy V-notch (Cv ) test of long standing. Charpy energyminima presently are required by ABS specifications for Grades D and E, but the valuesare considered by the authors to provide only limited assurance of a consistent qualitysteel; the CV numbers themselves cannot be related to fracture-safe performance in aconsistent manner.
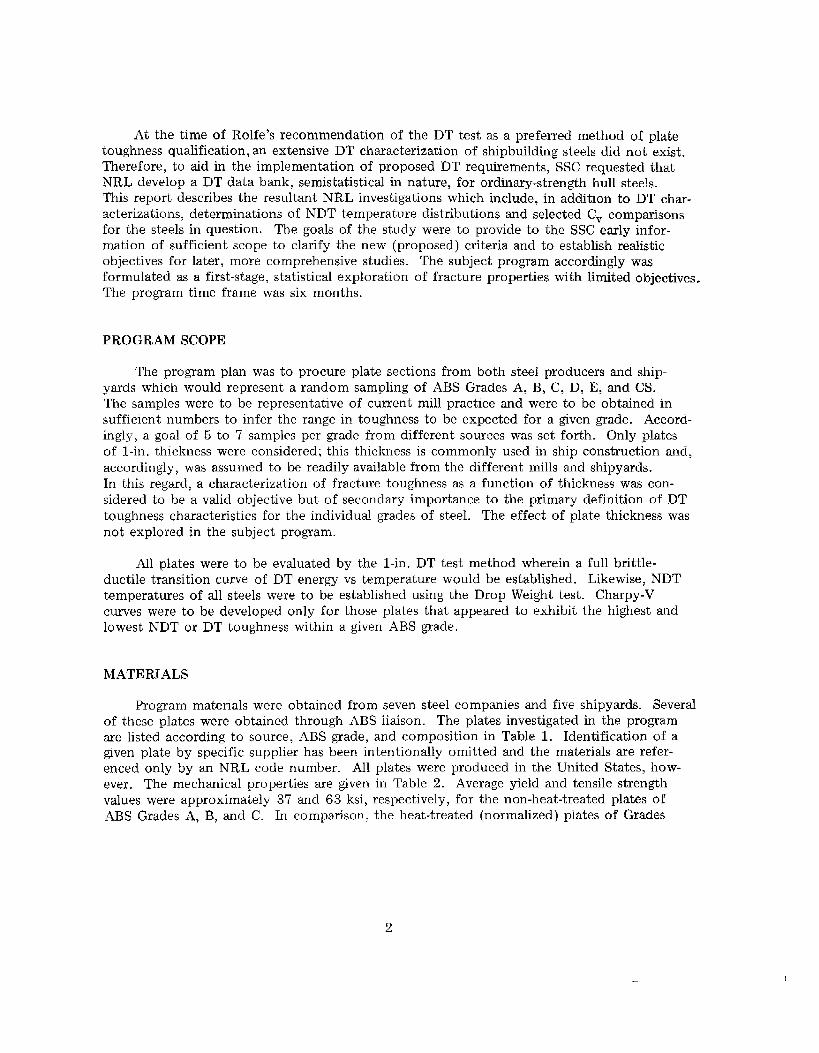
At the time of Rolfe’s recommendation of the DT test as a preferred method of platetoughness qualification, an extensive DT characterization of shipbuilding steels did not exist.Therefore, to aid in the implementation of proposed DT requirements, SSC requested thatNRL develop a DT data bank, sernistatistical in nature, for ordinary-strength hull steels.This report describes the resultant NRL investigations which include, in addition to 13T char-acterizations, determinations of NDT temperature distributions and selected CV comparisonsfor the steels in question. The goals of the study were to provide to the SSC eaxly infor-mation of sufficient scope to clarify the new (proposed) criteria and to establish realisticobjectives for later, more comprehensive studies. The subject program accordingly wasformulated as a first-stage, statistical exploration of fracture propetiies with limited objectives.The program time frame was six months.
PROGRAM SCOPE
The program plan was to procure plate sections from both steel producers and ship-yards which would represent a random sampling of ABS Grades A, B, C, D, E, and CS.The samples were to be representative of current mill practice and were to be obtained insufficient numbers to infer the range in toughness to be expected for a given grade. Accord-ingly, a goal of 5 to 7 samples per grade from different sources was set forth. Only platesof 1-in. thickness were considered; this thickness is commonly used in ship construction and,accordingly, was assumed to be readily available from the different mills and shipyards.In this regard, a characterization of fracture toughness as a function of thickness was con-sidered to be a valid objective but of secondary importance to the primary definition of DTtoughness characteristics for the individual grades of steel. The effect of plate thickness wasnot explored in the subject program.
All plates were to be evaluated by the l-in. DT test method wherein a full brittle-ductile transition curve of DT energy vs temperature would be established. Likewise, NDTtemperatures of all steels were to be established using the Drop Weight test. Charpy-Vcurves were to be developed only for those plates that appeared to exhibit the highest andlowest NDT or DT toughness within a given ABS grade.
MATERIALS
Program materials were obtained from seven steel companies and five shipyards. Severalof these plates were obtained through A13S liaison. The plates investigated in the programare listed according to source, ABS grade, and composition in Table 1. Identification of agiven plate by specific supplier has been intentionally omitted and the materials are refer-enced only by an NRL code number. All plates were produced in the United States, how-ever. The mechanical properties are given in Table 2. Average yield and tensile strengthvalues were approximately 37 and 63 ksi, respectively, for the non-heat-treated plates ofABS Grades A, B, and C. In comparison, the heat-treated (normalized) plates of Grades
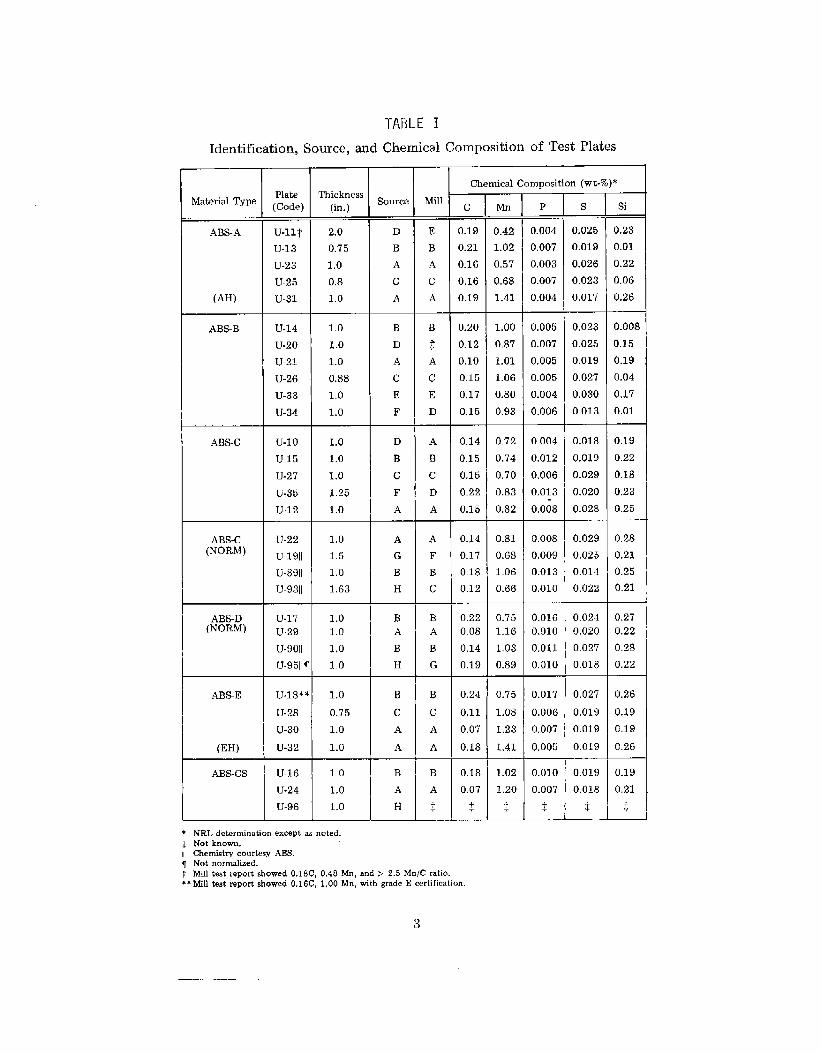
TABLE I
Identification, Source, and Chemical Composition of Test Plates
MillMaterial Type
ABS-A
(AH)
ABS-B
ABS-C
Chemical Composition (wt-%)*Plate(Code)
Thickness(in.) 3P
0.004
0.007
0.003
0.007
0.004
SiSourcec Mn s
_
0.025
0.019
0.026
0.023
0.017
U-llT
U-13
U-23
U-25
U-31
2.0
0.75
1.0
0.8
1.0
1.0
1.0
1.0
0,88
1.0
1.0
D
B
A
c
A
E
B
A
c
A
B+.}
A
c
E
D
0.19
0.21
0.16
0.16
0.19
0.20
0.12
0.10
0.15
0.17
0.15
0.14
0.15
0.15
0,22
0.15
0.14
0.11
0.18
0.12
0.220.08
0.14
0.19
0.24
0.11
0.07
0.18
0.18
0.07
$
0.42
1.02
0.57
0.68
1.41
0.23
0.01
0.22
0.06
0.26
0.008
0.15
0.19
0.04
0.17
0.01
U-14
U-20
U-21
W-26
u-33
u-34
B
D
A
c
E
1?
1.00
0,87
1.01
1.06
0.80
0.93
0.005
0.007
0.005
0.005
0.004
0.006
0.02.3
0.025
0.019
0.027
0.030
0.013
0.72
0.74
0.70
0.83
0.82
0.004
0.012
0.006
0.013
0.0~8
0.008
0.009
0.013
0.010—.
0.0160.010
0.011
0,010
0.018
0.019
0.029
0.020
0.028
0.029
0.025
0.014
0.022
0.19
0.22
0.18
0.23
0.25
0.28
0.21
0.25
0.21
0.270.22
0.28
0.22
0.26
0.19
0.19
0.26
u-lo
U-15
U-27
u-35
U-12
u-22
U-1911
U-8911
U-9311
U-17
U-29
U-901[
U-95114
1.0
1.0
1.0
1.25
1.0
D
B
c
F
A
A
B
c
D
A
ABS-C(NORM)
ABS-D(NORM)
1.01.5
1.0
1.63
A
G
B
H
A
F
B
c
0.81
0.68
1.06
0.66
0.0240.020
0.027
0.018
1.01,0
1,0
1.0
BA
B
H
B
A
B
G
0.751.16
1.03
0.89
0.027
0.019
0.019
0.019
0.019
0.018
$
AB%E
(EH)
u.18*~
u-28
LJ-30
U-32
1.0
0.75
1.0
1.0
B
c
A
A
B
c
A
A
0.75
1.08
1.23
1.41
0.017
0.006
0.007
0.005
U-16
U-24
U-96
1.0
1.0
1.0
B
A
H
1.02
1.20
t
0.010
0.007
t
0.19
0.21
t
ABs-cs
● NRL determination excevt u notedt Not known.II Chemistry courtesy ABS.~ Not normalized.~ Mill test report showed 0.18C, 0,48 Mn, and > 2.5 Mn/Cratio.● * WII tiBt report showed 0.16C, 1.00 Mn, with grade E certification.
3
—.—. -—..-—
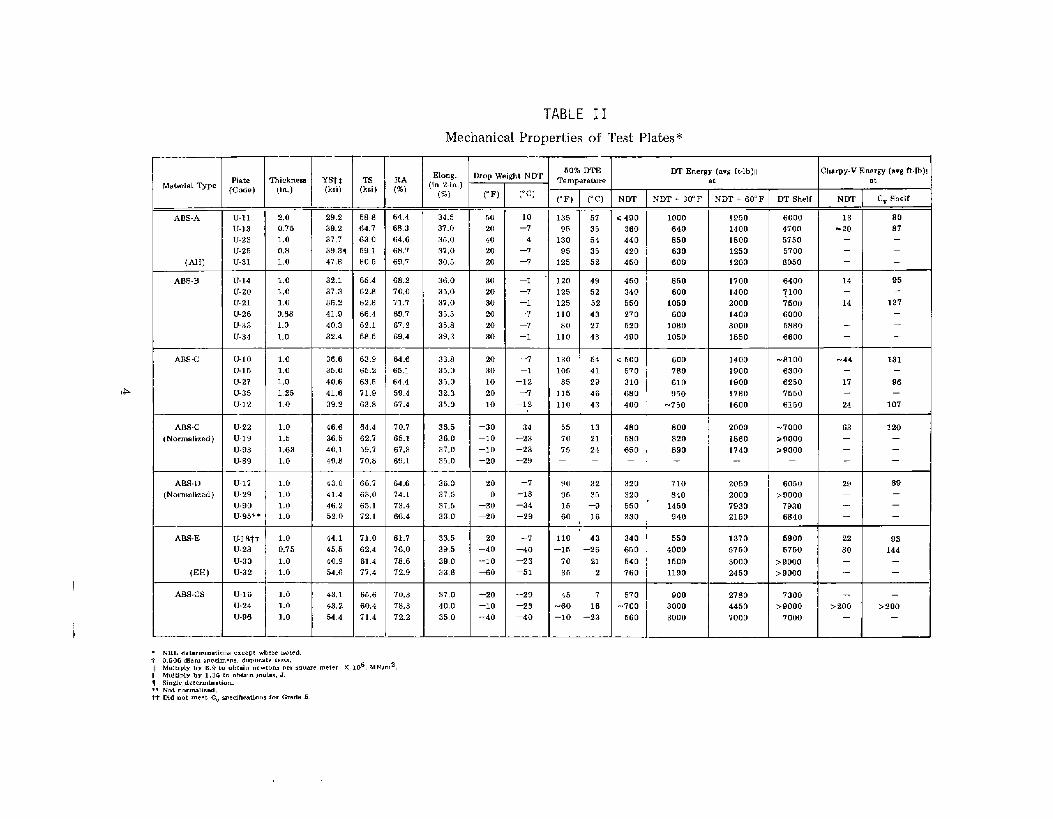
TABLE 11
Mechanical Properties of Test Plates*
Elong.in 2-in, )
(%)
50% DTE
TemperatureFiate[Code)
Yst *(ksi)
DT Energy (avg ft.lb)]lat
Iclwpy-vwrgy(m, win,l%icknem
(in. ) (Ri )
kopu
~F)
50
20
40
20
20
M8terid ‘&p@
NDT+ 60”F Cv Shelf
80
87—
—
—
95—
137—
—
—
(“c) Film
< 490
360
440
420
450
NOT+ 30’F DT Shelf I NDT
ABS-A
(AH)
U.11
U.S3
U.23
U.25
U.31
U-14
U-20
U-21
U-26
u-33
U-34
2.0
0.75
1.0
0.8
1.0
29.2
39.2
37,7
39.31
47,8
32.1
37.3
36.2
41.9
40.3
32.4
36.6
35.0
40.6
56.8
64.7
63,0
59,1
00,5
65.4
62.8
62.8
66,4
62.1
58.5
63.9
65.2
63.5
64.4
6S.3
64.6
66.7
69.7
34.5
37.0
35,0
37,0
30,5
10
–7
4
–7
–7
135
95
130
95
125
57
36
54
35
52
1000
640
650
630
600
1950
1400
1600
1250
1200
6000 13
4700 -20
5750 —
5700 —
6050 —
6400 14
?100 —
7600 14
6000 —
5680 —
6600 —
-8100 -44
6300 —
6250 17
7550 —
6150 24
-7000 63
>9000 —
>9000 —
— —
+
6050 29
>9000 —
7930 —
6840 —
5900 22
5750 80
>9000 —
>9000 —
68.2
70.0
71.7
69.7
67.2
69,4
64.6
65.1
64,4
59.4
36,0
35.0
37.0
35.5
35.8
39.3
33.8
35.0
35.0
37..3
ABS-B 1.01.0
1.0
0.68
1.0
1.0
30
20
30
20
20
30
20
30
10
20
10
–1
–7
–1
–7
–7
–1
–7
–1
–12
–7
–12
120
125
125
110
80
110
49
52
52
43
27
43
450
340
550
270
520
490
<500
570
310
660
400
850
600
1050
600
1080
1050
1700
1.400
2000
1400
3000
1850
AES.C u-lo 1.0
1.0
1.0
130
105
85
115
110
54
41
29
46
43
600
780
610
950
-750
1400
1900
1900
1780
1600
131—
96—
107
U-15
U-27
u-35
U-12— .—
U.22
U.19
U-93
U-89
U.17
U.29
U.90
U.95*,
U18tj
U-28
U-30
U-32
f
1,25
1,0
1.0
1.5
, :: f
41.6
39.2
46,6
36,5
40,1
E
49.8
43.0
41,4
46,2
52,0
44.1
45.5
40.9
54.6
43.1
43,2
54,4
71.9
63.8
—
64.4
62.7
59,7
70.8
66.7
63.0
65.1
72.1
71.0
62,4
61,4
77,4
85.6
60.4
71,4
:
67.4
10.7
85.1
67.8
89.1
64.6
74.1
73.4
66.4
61.7
76.0
78.6
72.9
35.0
36.5
36.0
37.0
35.0
36.0
37.5
37.5
33.0
33.5
39.5
39,0
33,8
37,0
40,0
35,0
A6SC
(Notmslized)
–3 o
—lo
–lo
–20
20
0
–30
–20
20
–40
—lo
-60
–20
–lo
–4 o
–34
–23
–23
–29
55
70
75—
90
95
15
60
110
-15
70
35
45
-60
-lo
13
21
24—
32
35
-8
16
460
560
650—
800
820
89o—
2000
1860
1740—
2050
2000
‘7930
2150
120—
—
—
ASS.D
(Normalized)
I 1.0
+
1.0
1.0* 1.0
1.0
0.75
L
1.0
1.0
1.0
1.0
1.0
–7
–18
–34
–29
320
320
550
330
710
840
1450
940
89—
—
—
93
144—
—
MS-E
(EH)
43
-26
21
2
7
16
-23
340
650
540
760
570
-700
580
550
4000
1500
1190
900
3000
3000
1370
5750
3000
2450
2780
4450
7000
–7
–40
–23
–51
–29
–23
–40 J_7300 —
>9000 >200
7000 —
AM-m U-16
U-24
U-96
70.3
76.3
72.2
—>200
—
- NRL detmm.tiom excew where IiOLed.
* 0.505 diem emeamens dwb..Le Ie.k.
~ MulhPIY by 6.9 to obti. .ewkm! Per swam meter X 106. MNlru2
II MuJtiPIY by 1.36 m obtain Joules. J.1 S.0. delermin,tion.
●* Not normalized,
‘H Did not meet Cv specibcmlons for Grade E.
C, D, E, and CS exhibited somewhat higher average yield strengths than the non-heat-treatedplates but essentially the same tensile strength. *_/
Cornposition limits, tensile properties, and heat-treatment procedures for ship hull steelsare defined” by ABS Rules [4] . The data in Tables 1 and 2 confirm that the program platesmet these requirements with only one exception, as discussed below. Additional test requirements, i.e., CV test, are set forth by ABS Rules for Grade D (35 ft-lb and 23 ft-lb at 32° F0° C, longitudinal and transverse orientations, respectively) and for Grade E (45 ft-lb and 30ft-lb at 14° F – 10° C, longitudinal and transverse orientations, respectively. ) All plates, ac-cording to mill test evaluations, satisfied the additional Cv energy requirements. AlthoughPlate U-18 was obtained directly from a mill and was mill-certified as Grade E, NRL resultsfor this plate indicated a below-specification Cv energy level and carbon content.
In this report, Grade C plates are treated separately according to heat treatment received.The designation, Grade C, will refer to as-rolled plates; the designation, Grade C-norm willdenote heat-treated (normalized ) plates. Grade D plates are not treated separately accordingto heat treatment received; the designation Grade D will refer to as-rolled plate while thedesignation, Grade D-norm, will denote heat-treated plate. The Grade D specification doesnot require heat treatment.
TEST SPECIMENS AND PROCEDURES
The size** of the DT test specimen employed was 4 in. (width) by 18 in. (length) by fullplate thickness. The specimen contained a I-in .-deep machined notch $ and an unbrokenligament of 3 in. For plates thinner or thicker than the nominal 1 in., these planar dimen-sions were maintained. The specimen notch tip was sharpened by pressing-in a knife blade(40-degree included angle) approximately 0.010 in. Notch acuity was confirmed using a60 X shadowgraph. A minimum of six specimens was used to establish the full curve of DTenergy versus temperature for a material. The single pendulum impact machine used forthe tests was of 10,000 ft-lb capacity.
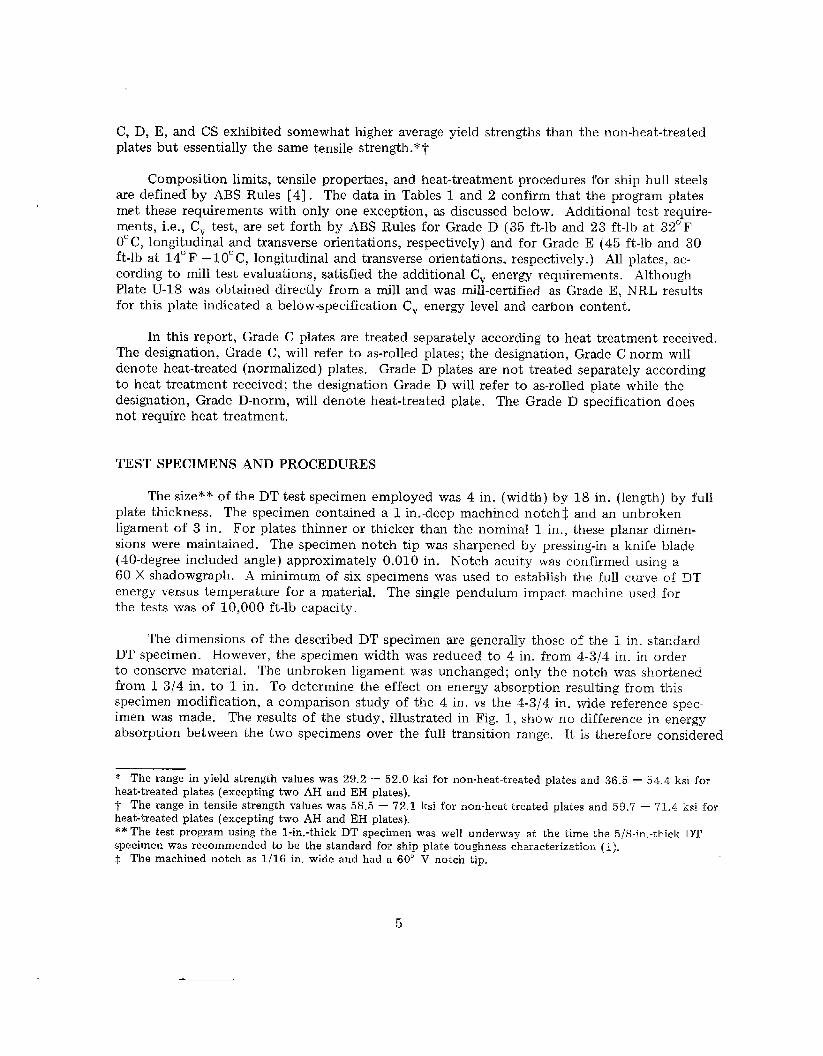
The dimensions of the described DT specimen am generally those of the 1 in. standard.DT sp~cimen. However, the specimen width was reduced to 4 in. from 4.3/4 in. in orderto conserve material. The unbroken ligament was unchanged; only the notch was shortenedfrom 1-3/4 in. to 1 in. To determine the effect on energy absorption resulting from thisspecimen modification, a comparison study of the 4 in. vs the 4-3/4 in. wide refere~ce spec-imen was made. The results of the study, illustrated in Fig. 1, show no difference in energyabsorption between the two specimens over the full transition range. It is therefore considered
* The range in yield strength values was 29.2 — 52.0 ksi for non-heat-treated plates and 36.5 — 54.4 ksi forheat-treated plates (excepting two AH and EI-I plates).~ The range in ‘censiIe strength values was 58.5 — 72.1 ksi for non-heat-treated plates and 59,7 – 71.4 ksi for
heat-treated plates (excepting two AH and EH plates).
** The test program u5ing the I-in+ -thick DT specimen was well underway at the time the 5/8-in. -thi& DT
specimen was recommended to be the standard for ship plat~ toughness characterization [1 ).~ The machined notch as 1/16 in. wide and had a 60° V notch tip,
5
‘~_,o// J-.,----- 1 --–.1... I-20 100 180 200 250 350 “F
L_. ..l .-L——. I .-.–-–.L. –-—J~ +-50 -25 0 25 50 75 175 “c
TEMPERATURE
Fig. 1 —Comparison of test results from modified (4-in. wide) and reference standard(4-3/4 in. wide) IY1’specimens (filled vs open points, respectively). The change inspec-imen notch depth (1 in. vs the 1-3/4 in. of the reference standard) is shown not to havean effect on DT performance over the f~dl transition range.
that results from this DT characterization of hull steels may be compared directly with published results for other steels that were characterized with the standard 4-3/4-in. -wide DTspecimen.
The Type P-2 ASTM Drop Weight specimen (2 in. by 5 in. by 3/4 in. thick) was usedfor determinations of NDT temperatures as per ASTM Standard Procedure E-208. Testswere conducted using a 60-lb falling weight released from a 5-ft drop height. The anvil ofthe tester had a 4-in. span and allowed 0.060-in. (max) specimen deflection. The crackstinter weld was applied to the specimen saw-cut surface in this study rather than to theas-rolled surface (required in the ASTM specification) to avoid any surfiace effects and tobest determine bulk NDT properties for planned 13T data comparisons. As is discussedlater in this report, test comparisons conducted by NRL and by the AEW Moratory usingseveral program plates indicated that the choice of surface for the crack starter weld wasnot critical for the types of materials investigated here.
TWO tensile specimens (0.505-in. diam by 2.0 in. gage len@h) were taken from eachplate, Yield strengths were determined from ‘extensorne~er traces. Standard Cvwere normally taken from two plates per grade which depicted the extremes ofform~ce or, secondarily, of chemistry variation. The C, specimens were taken
6
specimensNDT per-adjacent
to the plate surface and in the same orientation as the DT specimens. The impact testeremployed was of 264 ft-lb capacity and was calibrated in advance with standard specimensobtained from the Army Materials and Mechanics Research Center, Watertown, Massachusetts.
In all cases the standard specimen orientation was the RW orientation (longi-tudinal, parallel to the primary plate rolling direction). This orientation was selectedas best approximating the most likely potential fracture path in a hull. The rolling direc-tion of each test plate was verified by NRL using macroetching procedures. It should benoted that test-plate sizes, as received, were nominally on the order of 2 ft by 3 ft; there-fore, it is considered that any m~tallurgical variations would be small and so all test resultsfor a given plate can be compared directly. Experimental results from all impact tests aresummarized in Tables 2 and 3.
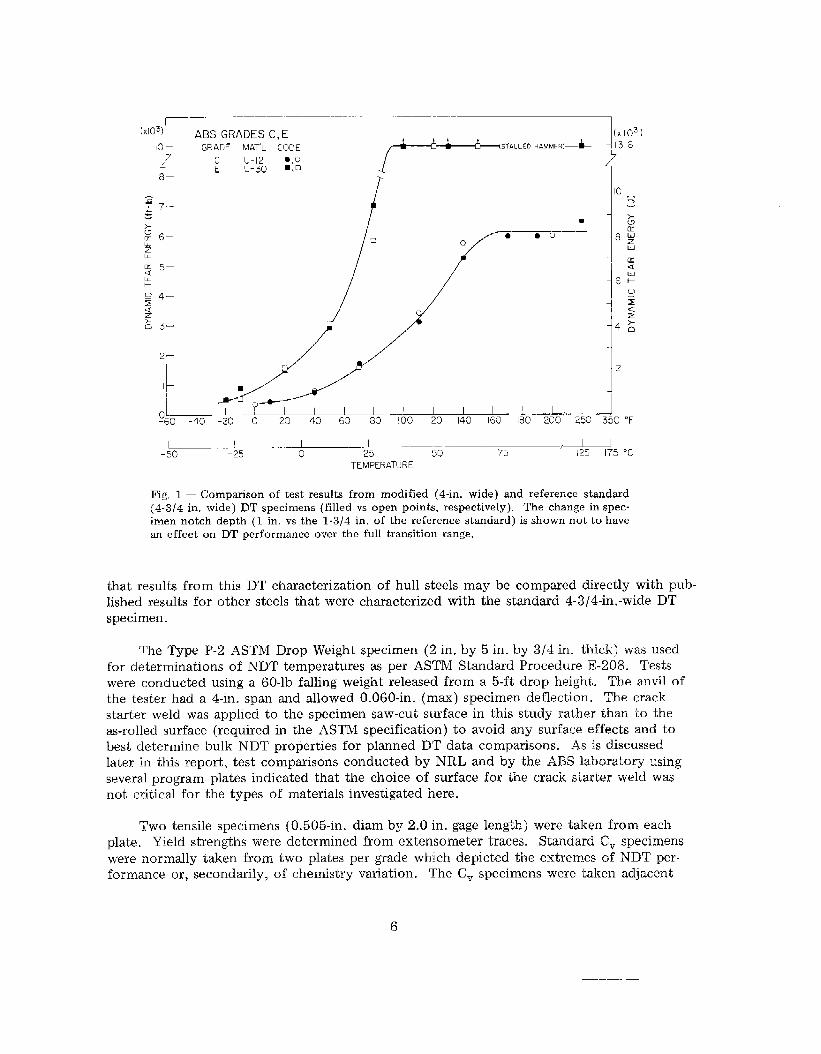
TABLE IIINRL-ABS Comparison Study of Dr ] Weight NDT Performance*
SpecimenGroup
1
2
3
4*
Welded TestedPlate
U-23
ABSGrade
A
c
WeldSurface$
~DT (0F)
Sc
Sc
AR
AR
NRL
NRL
ABS
NRL
NRL
NRL
ABS
NRL
ABS
ABS
NRL
NRL
ABS
ABS
40
40
10
40
10
10
10
20
20
10
U-12
U-17
U-16
1
2
3
Sc
Sc
AR
D
NORM
1
2
3
Sc
Sc
AR
NRL
NRL
ABS
NRL
NRL
ABS
NRL
NRL
NRL
AJ3S
ABS
Cs
A
1
2
3
11
Sc
Sc
AR
AR
Sc
NRL
ABS
ABS
–20
–30
–30
U-n NRL
NRL
50
50
* All specimens were Type P-2,T SC = saw cut. AR = as rolled.
clarification of group 3 anomolous results.j; Additional specimen group forI Not part of comparison study.
7
DROP WEIGHT NDT RESULTS
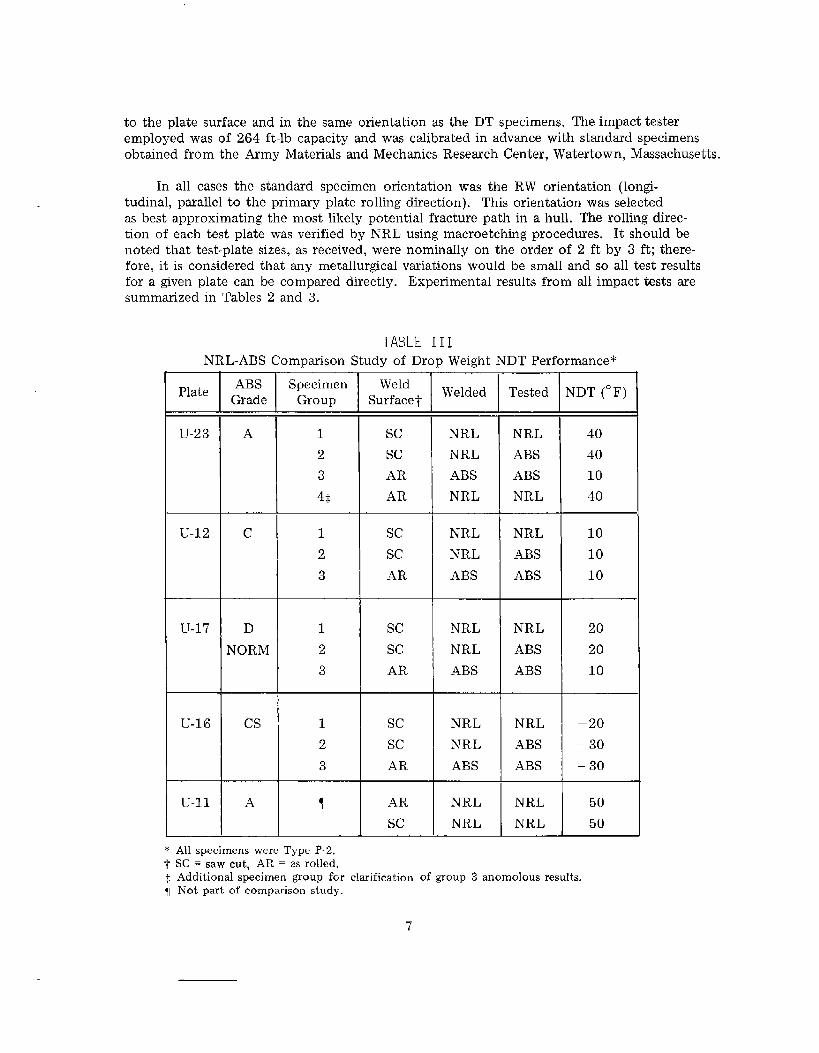
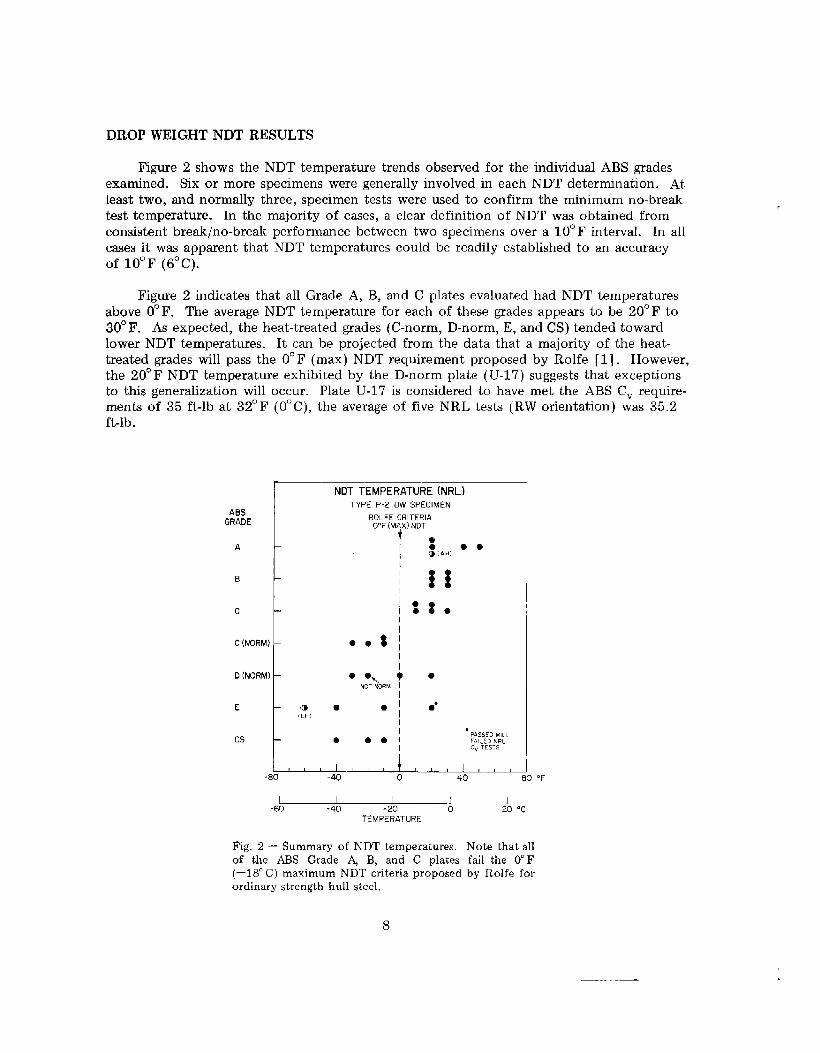
Figure 2 shows the NDT temperature trends observed for the individual ABS gradesexamined. Six or more specimens were generally involved in each NDT determination. Atleast two, and normally three, specimen tests were used to confirm the minimum no-breaktest temperature. In the majority of cases, a clear definition of NDT was obtained fromconsistent break/no-break performance between two specimens over a 10° F interval. In allcases it was apparent that NDT temperatures could be readily established to an accuracyof 10° F (6° C).
Figure 2 indicates that all Grade A, B, and C plates evaluated had NDT temperaturesabove 0° F. The average NDT temperature for each of these grades appears to be 20° F to30° F. As expected, the heat-treated grades (C-norm, D-norm, E, and CS) tended towardlower NDT temperatures. It can be projected from the data that a majority of the heat-treated grades will pass the 0° F (max) NDT requirement proposed by Rolfe [1]. However,the 20° F NDT temperature exhibited by the D-norm plate (U-17) suggests that exceptionsto this generalization will occur. Plate U-17 is considered to have met the ABS Cv require-ments of 35 ft-lb at 32° F (0° C), the average of five NRL tests (RW orientation ) was 35.2ft-lb.
ABSGRADE
A
B
c
C (NORM) –
D (NORM) –
E
Cs
NDT TEMPERATURE (NRL)TYPE P-z DW SPECIMEN
ROLFE CRITERIAO“F (MA,X) NDT
I
● ● *I
● m
*PASSED M,L1.,FAIILEONRLCv TESTS
&--—Lu. L.-—,-L-40 0 40 (
I I I I 1-m -40 -20 0 20 “c
TEMPERATURE
) “F
Fig. 2 – Summary of NDT temperatures. Note that allof the ABS Grade ~ B, and C plates fail tho 0° F(–180 C) maximum NDT criteria proposed by Rolfe forordinary-strength hull steel.
8
—-.. . -.—
NDT TEMPERATURE
● NRL@Q) NRL-ABS RESULTS
(SAME PLATE)
~ ABS NDT SURVEY Rol FF CRITERIAABS
GRADE
A
B
c
C (NORM)
D (NORM)
E
Cs
-i
o SHIP FRACTURE O;F ~MAX) Ni)T
(- 1970 cONSTRUCTION) ~
m ● OSABS hlVG
NOT NORM
-e ●I
I
-*@@*; * PASSED MILL
IFAILED NRlCv TESTS
I ( 1 I I 1 1 I 1 1 1 t 1 ! 1 I 1
) -Bo -40 0 40 80 ‘F
~~.u.~o ~c80
TEMPERATURE
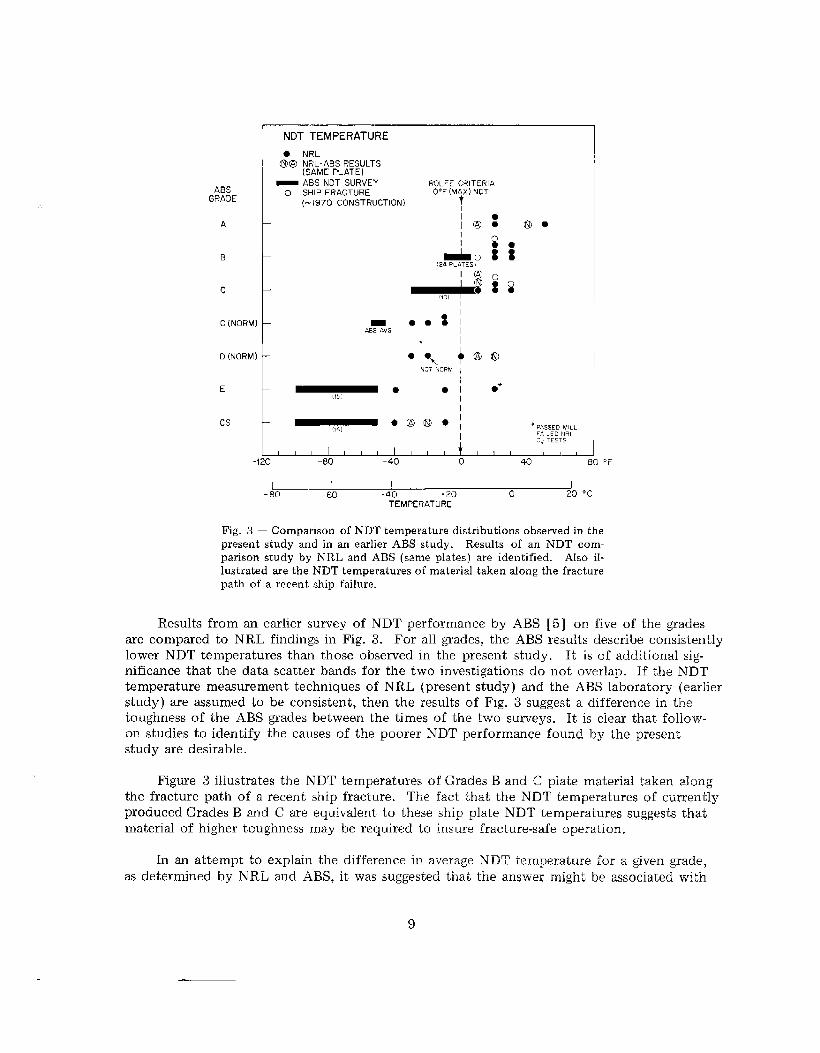
Fig. 3 — Comparison of NDT temperature distributions observed in thepresent study and in an earlier ABS study. Results of an NDT com-parison study by NRL and ABS (same plates) are identified. Also il-lustrated are the NDT temperatures of material taken along the fracturepath of a recent ship failure.
Results from an earlier survey of NDT performance by ABS [5] on five of the grades
are compared to NRL findings in Fig. 3. For all grades, the ABS results describe consistentlylower NDT temperatures than those observed in the present study. It is of additional sig-nificance that the data scatter hands for the two investigations do not overlap. If the NDTtemperature measurement techniques of NRL (present study) and the ABS laboratory (earlierstudy ) are assumed to be consistent, then the results of Fig. 3 suggest a difference in thetoughness of the ABS grades between the times of the two surveys. It is clear that follow-on studies to identify the causes of the poorer NDT performance found by the presentstudy are desirable.
Figure 3 illustrates the NDT temperatures of Grades B and C plat~ material talwn alongthe fracture path of a recent ship fracture. The fact that the NDT temperatures of currentlyproduced Grades B and C are equivalent to these ship plate ND’T temperatures suggests thatmaterial of higher toughness may be required to insure fracture-safe operation.
In an attempt to explain the difference in average N13T temperature for a given grade,
as determined by NRL and ABS, it was suggested that the answer might be associated with
9
the location of the weld bead (i.e., on the saw-cut swface w employed by NRL as opposedto the as-rolled surface as employed by the ABS laboratory in accordance with the ASTMspecification ). However, for the types of steels being considered, one would not expect theplacement of the weld bead with respect to either of the specimen surfaces to be significant.*Nevertheless, two groups of Drop Weight specimens from a 2-in. -thick Grade A steel (U-11)were tested by NRL. One group had the weld bead on the as-rolled surface and the othergroup had the weld on the saw-cut surface. The results from both sets of specimens wereidentical, thereby confirming the above assumption. Finally, a comparison NDT study usingcommon material was undertaken between NRL and the ABS laboratory. The variables. con-sidered in the study were (a) weld-bead placement with respect to as-rolled vs saw-cut surface,(b) weld-bead deposit technique, and (c) test technique. The exchange involved three groupsof Type P-2 specimens cut from four materials, namely, ABS Grades A, C, D-norm, and CS.Group 1 specimens were welded by NRL on the saw-cut surface and tested by NRL. Group2 specimens were also welded on the saw-cut surface by NRL but tested by ABS, whereasGroup 3 specimens were welded by ABS on the as-rolled surface and subsequently tested byABS. Results of this study are summarized in Table 3 and Fig. 3.
Correspondence within 10° F is noted between NDT temperatures determined from Group1 and Group 2 specimens, thereby suggesting no significant differences in test technique be-tween the two laboratories. A good correlation is also noted between groups 2 and 3 (oneapparent exception ), all of which were tested by ABS. This correlation suggests that thereexists no difference attributable to the surface on which the weld bead was placed or theweld deposit technique. An apparently anomalous difference of 30° F in NDT temperaturebetween Groups 2 and 3 was observed for the Grade A material (U-23). Noting that sincethe Group 1 vs Group 2 comparison for this plate gave identical results, the 30° F difference,if significant, would suggest an effect of weld bead location. However, this hypothesis couldbe dismissed at the outset for two reasons: (a) the NRL study of weld-bead location onanother heat of Grade A steel (U-11) discussed above showed no change in NDT temperaturewith weld-bead location, and (b) the Grade A steels evaluated had uniform microstructureso there would be no metallurgical reason to suspect that the weld-bead location would in-fluence the NDT temperature. In confirmation, subsequent NRL tests of a fourth group ofspecimens from the U-23 plate welded on the as-rolled surface by NRL showed no differencein NDT temperature from that first established.
GENERALIZED INTERPRETATION OF DTENERGY
Previous reports [6, ‘i] have described the structural significance of the curve of DTenergy vs temperature for steels, such as shipbuilding steels, which exhibit a micromodefracture transition (i.e., cleavage to dimpled rupture) as a function of temperature. To aidin the understanding of DT results presented here, highlights of DT interpretative proceduresare next summarized.
*l’he AIM grades do not exhibit a variation in microstructure through the thickness as is the case withhigher strength, quenched and tempered steels.
10
60 53 100 120 I40 160 180 200 220 240 260 (kg/mmz )I —~’—r
11,000
10,000/
9000
8000
wINTERPRETATIONSFOR I O-IN PLATE
I
-001
- 200
60:
‘t- [20 .–m
80 ‘iU.
- 40 y
L- I..__~—._— .-.. 1080 100 120 140 160 180 200 220 240 260 280 300 320 340 (KSI)
YIELD STRENGTH
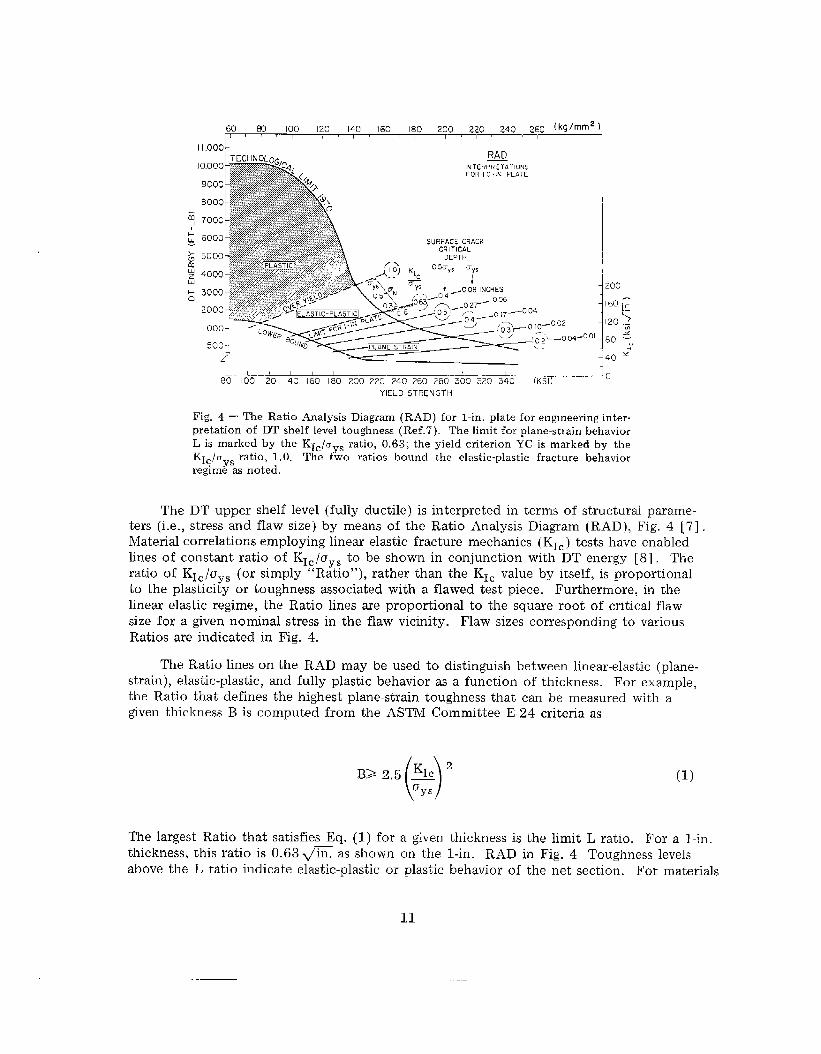
Fig. 4 — The Ratio Analysis Diagram (RAD) for l-in, plate for engineering inter-pretation of DT shelf level toughness (Ref.7 ). The limit for plane-strain behaviorL is marked by the K1c/oys ratio, 0.63; the yield criterion YC is marked by the
‘IC/UyS ratio, 1.0. The two ratios bound the elastic-plastic fracture behaviorregime as noted.
The DT upper shelf level (fully ductile) is interpreted in terms of structural parame-ters (i.e., stress and flaw size) by means of the Ratio Analysis Diagram (RAD), Fig. 4 [7] .Material correlations employing linear elastic fracture mechanics (KIC ) tests have enabledlines of constant ratio of KIc/uy S to be shown in conjunction with DT energy [8] . Theratio of KIC/uY. (or simply “Ratio”), rather than the KIC value by itself, is proportionalto the plasticity or toughness associated with a flawed test piece. Furthermore, in thelinear elastic regime, the Ratio lines are proportional to the square root of critical flawsize for a given nominal stress in the flaw vicinity. Flaw sizes corresponding to variousRatios are indicated in Fig. 4.
The Ratio lines on the RAI) may be used to distinguish between linear-elastic (plane-strain ), elastic-plastic, and fully plastic behavior as a function of thickness. For example,the Ratio that defines the highest plane-strain toughness that can be measured with agiven thickness B is computed from the ASTM Committee E-24 criteria as
The largest Ratio that satisfies Eq. (1) for a given thickness is the limit L ratio. For a l-in.thickness, this ratio is 0.63@ as shown on the l-in. RA13 in Fig. 4 Toughness levelsabove the L ratio indicate elastic-plastic or plastic behavior of the net section. For materials
11
—-
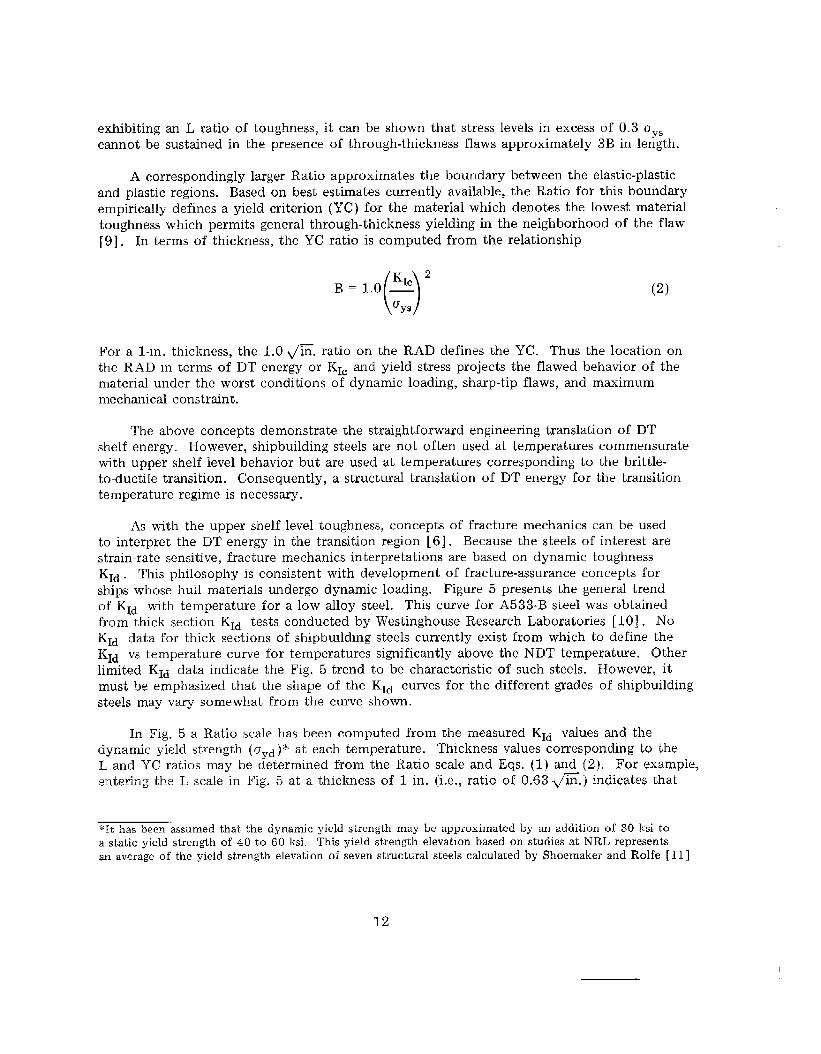
exhibiting an L ratio of toughness, it can be shown that stress levels in excess of 0.3 uY~cannot be sustained in the presence of through-thickness flaws approximately 3B in length.
A correspondingly larger Ratio approximates the boundary between the elastic-plasticand plastic regions. Based on best estimates currently available, the Ratio for this boundaryempirically defines a yield criterion (YC ) for the material which denotes the lowest materialtoughness which permits general through-thickness yielding in the neighborhood of the flaw[9]. In terms of thickness, the YC ratio is computed from the relationship
(-)KIC 2
B = 1.0
~ys(2)
For a l-in. thickness, the 1.0@. ratio on the RAD defines the YC. Thus the location onthe RAD in terms of DT energy or KIC and yield stress projects the flawed behavior of the
material under the worst conditions of dynamic loading, sharp-tip flaws, and maximummechanical constraint.
The above concepts demonstrate the straightforward engineering translation of 13Tshelf energy. However, shipbuilding steels are not often used at temperatures commensuratewith upper shelf level behavior but are used at temperatures corresponding to the brittle-to-ductile transition. Consequently, a structural translation of 13T energy for the transitiontemperature regime is necessary.
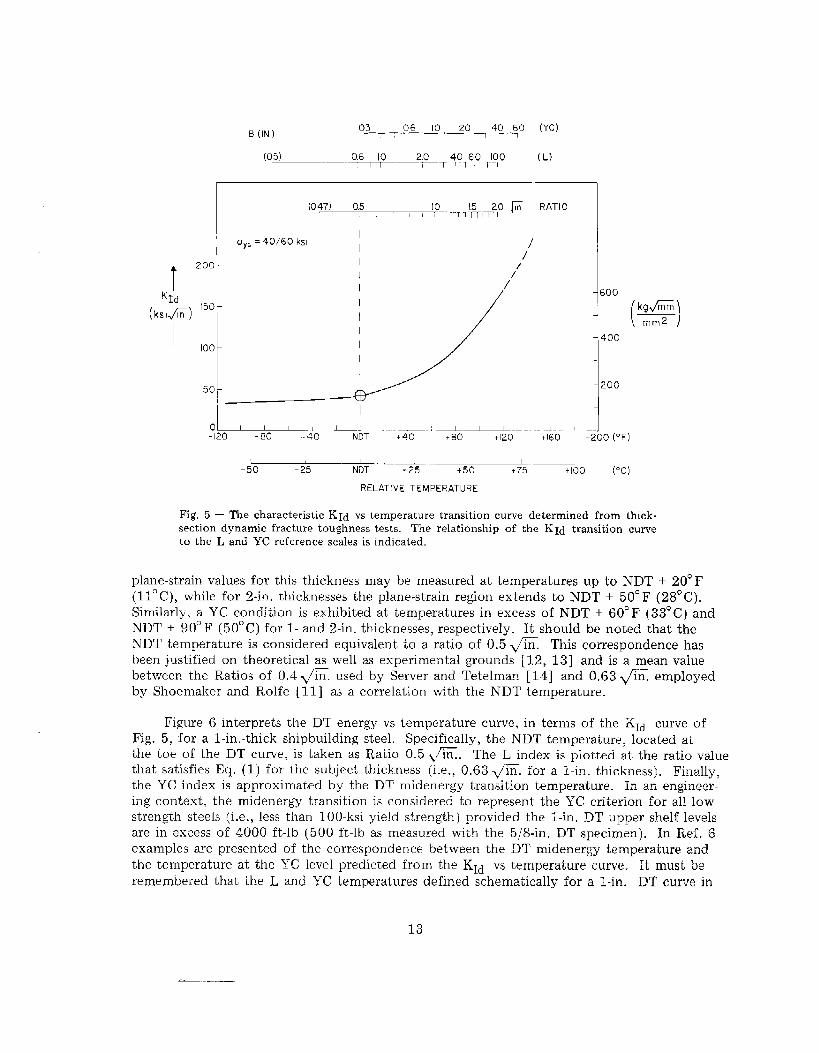
As with the upper shelf level toughness, concepts of fracture mechanics can be usedto interpret the DT energy in the transition region [6]. Because the steels of interest arestrain-rate sensitive, fracture mechanics interpretations are based on dynamic toughnessK1d . This philosophy is consistent with development of fracture-assurance concepts forships whose hull materials undergo dynamic loading. Figure 5 presents the general trendof I<Id with temperature for a low alloy steel. This curve for A5 33-B steel was obtainedfrom thick section KId tests conducted by Westinghouse Research Laboratories [10]. NoKId data for thick sections of shipbuilding steels currently exist from which to define theK1d vs temperature curve fOr temperatures significantly above the NDT temperature. Otherlimited KId data indicate the Fig. 5 trend to be characteristic of such steels. However, itmust be emphasized that the shape of the KId curves for the different grades of shipbuilding
steels may vary somewhat from the curve shown.
In Fig. 5 a Ratio scale has been computed from the measured KId values and thedynamic yield strength (o ~ )‘~ at each temperature.
JThickness values corresponding to the
L and YC ratios may be etermined from the Ratio scale and Eqs. (1) and (2). For example.,entering the L scale in Fig. 5 at a thickness of 1 in. (i.e., ratio of 0.63 fi. ) indicates that
‘iIt has been =sumec2 that the dynamic yield strength may be approximated by an addition of 30 ksi toa static yield strength of 40 to 60 ksi. This yield strength elevation based on studies at NRL representsan average of the yield strength elevation of seven structural steels calculated by Shoemaker and Rolfe [111
12
B (IN )03 06 10 20
r—~ -.. — - .-, —141g ,.:0 (Ye)
(05) ,0.6 10 —7—T flol 6,0 1002.0 (L),...,
(047) 0.5 1,07. ~Lr ., j:;rmf,o ~. RATl O,,,
my~ =40/60 kslII /
I /
t200
//II I I /l.- / 1600
“Id
(kslfi) ’50 -II
()
kgfi
mm2I
I- 400
100 --
I
I
50 -- 200
_y2~-- , L—1 J._... _. i .J— ~J----- d. .- ..1.... 1 ...!--40 NDT +40 +80 +120 +160 +200 (“F)
~~ ,-.-—. ...~. —-50 -25 NDT T 25 +50 +75 +100 (“C)
RELATIVE TEMPERATURE
Fig. 5 — The characterisi,ic KId vs temperature transition curve determined from ~hick-section dynamic fracture toughness tests. The relationship of the KId transition curveto the L and YC reference scales is indicated.
plane-strain values for this thickness may be measured at temperatures up to NDT + 20° F
(11° C), while for 2-in. thicknesses the plane-strain region extends to NDT + 50° F (28°C).
Similarly, a YC condition is exhibited at temperatures in excess of NDT + 60° F (33° C) andNDT + 90° F (50” C) for 1- and 2-in. thicknesses, respectively. It should be noted that theNDT temperature is considered equivalent to a ratio of 0.5 @. This correspondence hasbeen justified on theoretical as well as experimental grounds [1,2, 13] and is a mean valuebetween the Ratios of 0.4 <F. used by Server and Tetelman [14] and 0.63@. employedby Shoemaker and Rolfe [11] as a correlation with the NDT temperature.
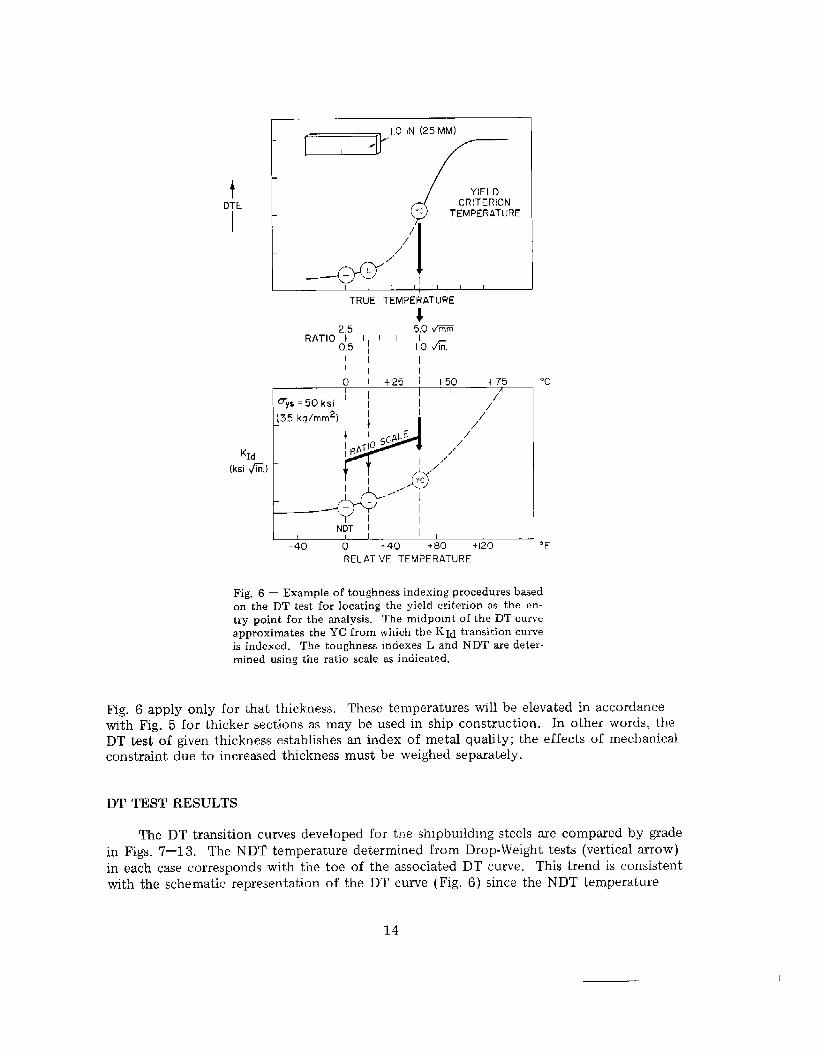
Figure 6 interprets the DT energy vs temperature curve, in terms of the KId curve ofFig. 5, for a I-in. -thick shipbuilding steel. Specifically, the NDT temperature, located atthe toe of the DT curve, is taken as Ratio 0.5 ~. The L index is plotted at the ratio valuethat satisfies Eq. (1) for the subject thickness (i.e., 0.63 @. for a l-in. thickness). Finally,the YC index is approximated by the DT rnidenergy transition temperature. In an engineer-ing context, the rnidenergy transition is considered to represent the YC criterion for all lowstrength steels (i.e., less than 100-ksi yield strength) provided the l-in. DT upper shelf levelsare in excess of 4000 ft-lb (500 ft-lb as measured with the 5/8-in. DT specimen). In Ref. 6examples me presented of the correspondence between the DT midenergy temperature andthe temperature at the YC level predicted from the KId vs temperature curve. It must beremembered that the L and YC tempera~ures defined schematically for a l-in. DT curve in
13
-... ..—
tDTE
t
=“0’” “’MM)rd YIELD
cRITERIONYc TEMPERATURE
/
1,,~:’l! ,
TRUE TEMPERATURE
+
2.5 5,0 mRATIO
0.5 / Io&,
II I1,
01 +25 ) +50 +75 “c
UY$.sc)k~i I
(35 kglrnrn2)
+
‘Id
(ksi 6.)
NDT I1 1 I I 1 1
-40 0 +40 +80 +120 “F
RELATIVE TEMPERATURE
Fig. 6— Example oftoughness indexing procedures basedon the DT test for locating the yield criterion w the en-Lry point for the analysis. The midpoint of the DT curveapproximates the YC from which the ~ Id transition curveis indexed. The toughness indexes L and NDT are deter-mined using the ralio scale as indicated.
Fig. 6 apply only for that thickness. These temperatures will be elevated in accordancewith Fig. 5 for thicker sections as may be used in ship construction. In other words, theDT test of given thickness establishes an index of metal quality; the effects of mechanicalconstraint due to increased thickness must be weighed sepwately.
DT TEST RESULTS
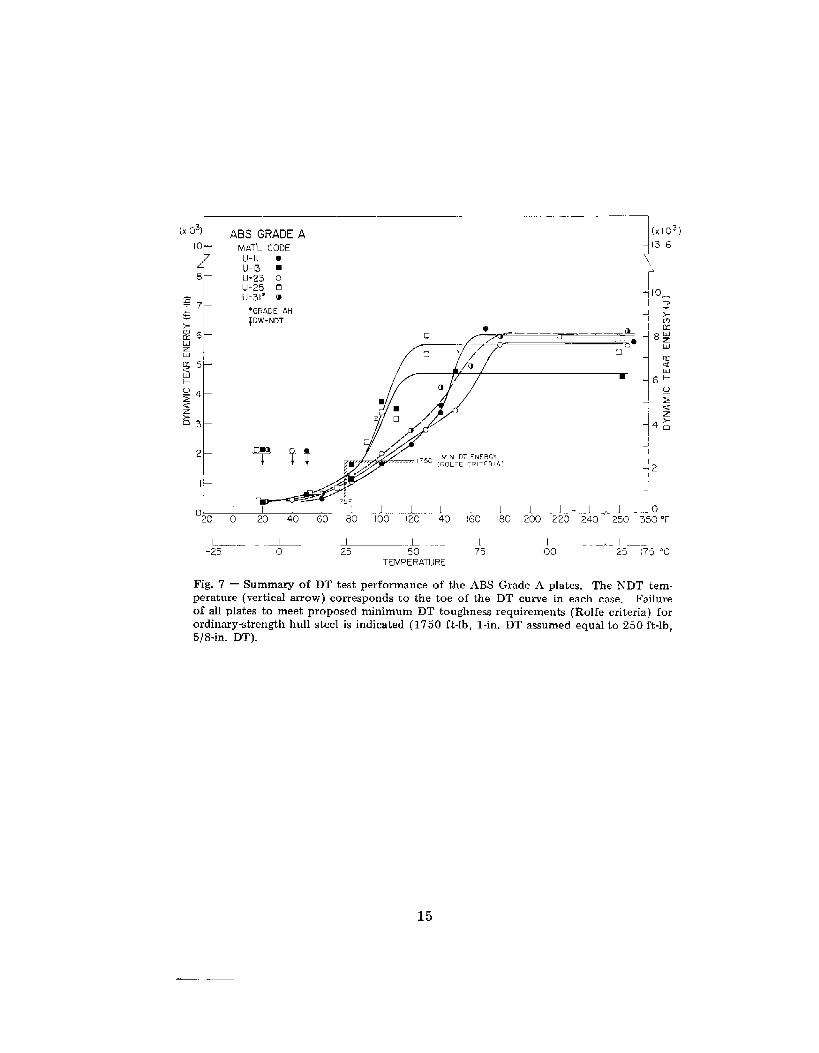
The DT transition curves developed for the shipbuilding steels are compared by gradein Figs. 7—13. The NDT temperature determined from Drop-Weight tests (vertical arrow)in each case corresponds with the toe of the associated DT curve. This trend is consistentwith the schematic representation of the DT curve (Fig. 6) since the NDT temperature
14
-.““-–”” T
(,103) ABS GRADEA
7L
4
(xl OS)
10 — MAT’L CODEU-11 ●
13.6
U-13 ■
8 – U-23 OU-25 ❑ (
~ U-31’ m~lo_
7 -“GRADE AH
4
2~
JDw-NDT L
&6 —●
c!/“ /::
.—— ——— —.— m
wu
.]
8;
z O* wu u
%5 —a<
w+ -6Eg4 — J:az>
!:
D3 —I
4g
_!2 –
T 7T MIN DT ENERGY1750 (ROLFE <R IT CR IA) ‘2-,
I —J
I I 1 .i;o.. ....(.3. 1 I ,;O ;OO .2:0 - .2;0 Jo ~;; ~~2O 0 20 40 6h”- 8i I40 160 .
L-- .. . . -. ..+.. .4–— —....L-25
--~~-4- ;5.–;5 ~c25 50 ;5 1:0
TEMPERATURE
Fig. 7 — Summary of DT test performance of the ABS Grade A plates. The NDT tem-perature (vertical arrow) corresponds to the toe of the IX’ curve in each case. Failureof all plates to meet proposed minimum DT toughness requirements (Rolfe criteria) forordinary-strength hull steel is indicated (1750 ft-lb, l-in. DT assumed equal to 250 ft-lb,5/8-in. DT).
15
— .,_
r —.-.(XI03) ABS GRADE B
‘0> H c:’
+ U-20 ■
U-21 o 0
I(xl OS)
13.6
\
L L_~...-;i... ....~-25 0 175 “c
TEMPERATURE
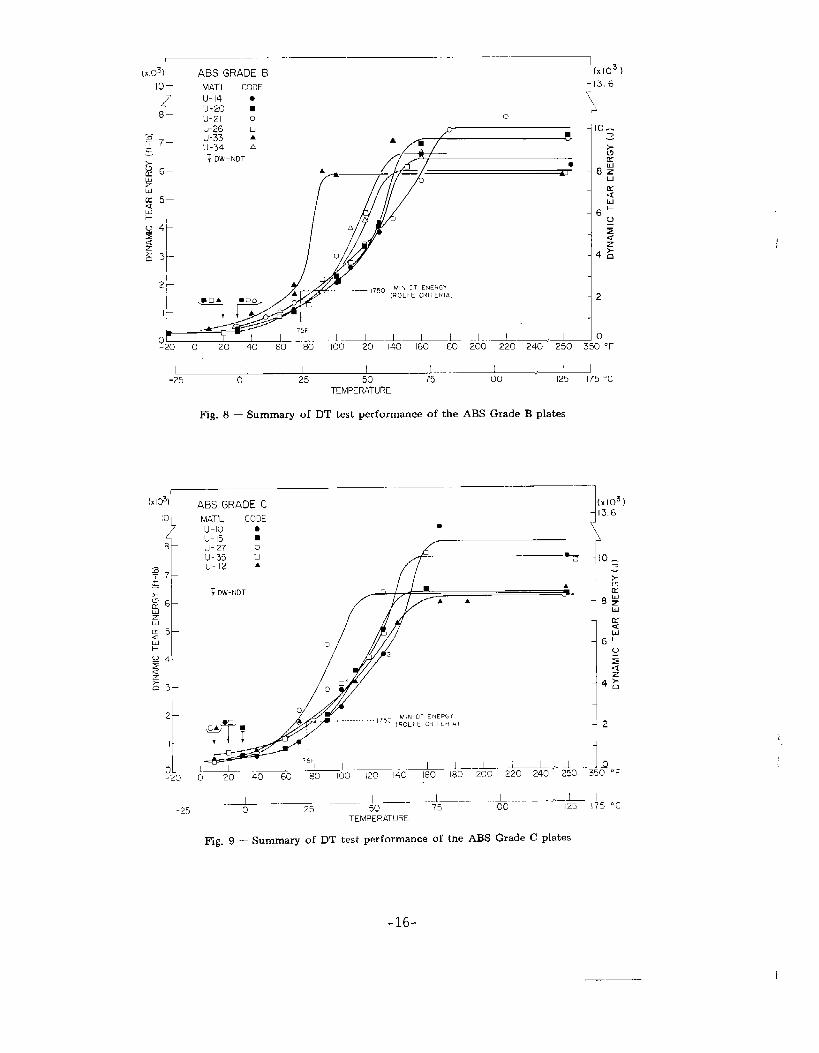
Fig. 8 — Summary of DT test performance of the AIM Grade B plates
—. —..—...,..—.—
(XI03)
10’>
3B-
‘1o 1-20
ABS GRADE C
MAT’L CODE
u-lo ●
U-15 ■
U-27 o
u-35 u
U-1? A+’
~ DW-NDT n If.A
AA
o
0
.----------,,50 ,~;~Fy&yfi:A,
21
! .J–. ..l~ .~. I .+ h+- ,~o—–L. -L-.--.-J---- J- -.
0 20 40 60 80 100 200 220 240 250
L... do--- ....._l ] ___ .+------ .*O ----- JL I
-25 25 50 175 “c
Fig. 9 – Summary of DT
TEMPERATURE
test performance of the ABS Grade C plates
-16-
1
— .— “—”~
ABS GRADE C (NORtVl)
● ,+(STALLLD lHAMMER)~
MAT’L CODE
u-22
1(,,.3)
i136
Y,
r
+2
110
350” F
.~o-.-——.:j:------------*–.——.25–—–. -+ __ l.-–.–.. Id—-.75 125 175 ‘r
TEMPERATURE
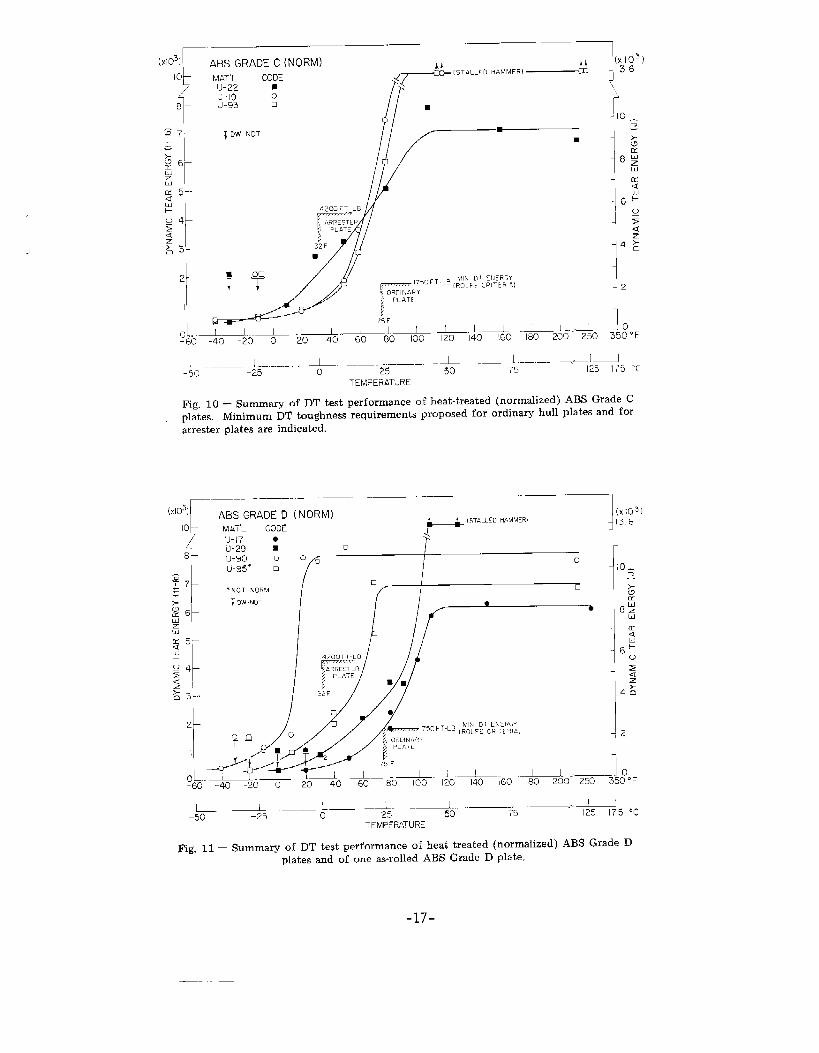
J?ig. 10– Summary of DT test performance of heat-treated (normalized) ABS Grade Cplates. Minimum DT toughness requirements proposed for ordinary hull plates and forarrester plates are indicated.
F-.
(xlo~) ABS GRADED (NORM))
(xlOf)
10 - MAT’L CODE.?
(%TLLLLD HAMMER) 13.6
U-)7 ●
U-29 9 0:
i
U-90 o 0u-95” ❑ -- lo_
E17
❑2
‘NOT NORM=
f DW -NDT
; 6}1~ J
‘~J&g.,,MIER ‘~
_5~”-”+5 -—-— ~..—__+5 ..+.. _)5 .—a. ~
125 175 ‘C
TEMPERATURE
Fig. 11 – Summary of DT test performance of heat treated (normalized) ABS Grade Dplates and of one as-rolled ABS Grade D plate.
-17-
—— ..—
—(Xlo(
1o:-
{8
.—.ABS GRADE E
MAT’L CODE f tf
r
C- 15TALLLDHAMMER)1
J(x 103)
U-18’/.
~13,6
U-28 :~<
/lU-30 oU-32” a PI
“GRADE EH,/’ /
- lo_{DW-NDT 2
/’■
/
I-—.. .+ I—!-50
.-+. -*0 __—.. I__o
-.. -+. J75
TEMPERATURE175 “c
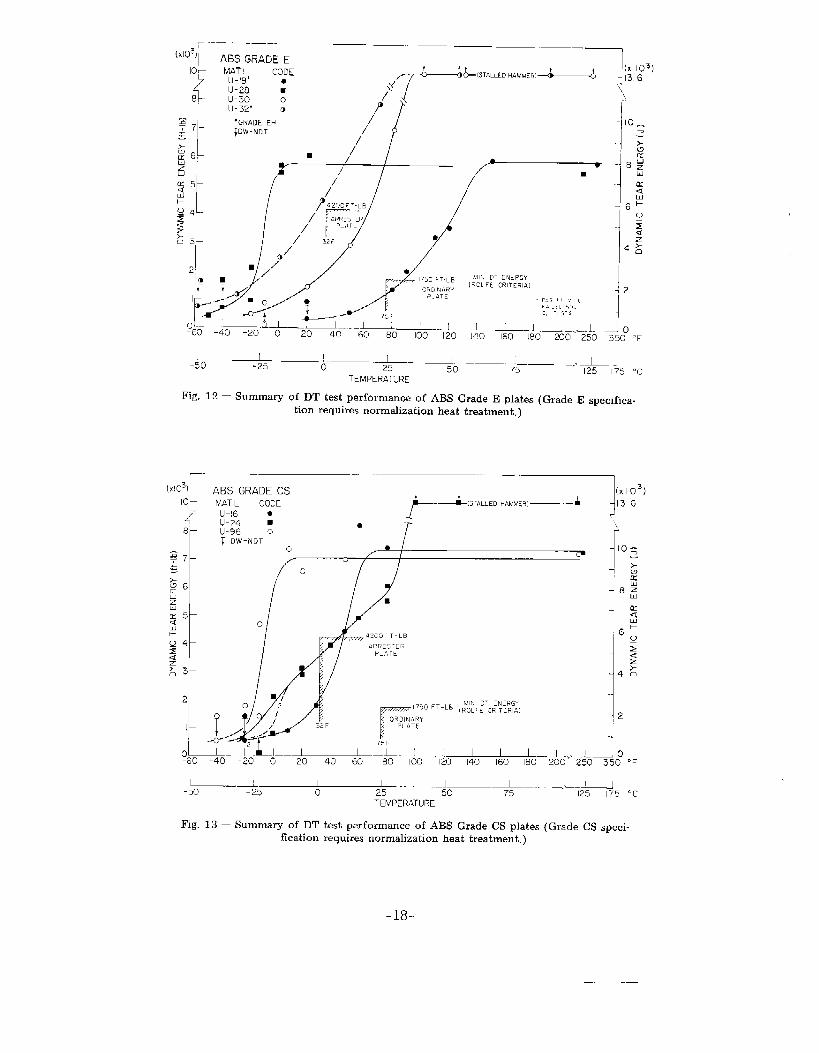
Fig. 12 — Summary of DT test performance of ABS Grade E plates (Grade E specifica-tion requires normalization heat treatment. )
.—
ABS GRADE CSMAT’L CODE
U-!6 ● &“*LLEDHAMMER)-’U-24 ■
u-96 o●
r
‘Dw-NDT~o
/h“
~6&_&– _;o.L~__ ~ —:.–- 1 1.—L+.-. 1 .* .1...J o100 120 140 180 200 250 350 “F
L–._.J~__ —J—–., _LT2+J-50 -25 0 25 io 75 17’5 “c
TEMPERATURE
Fig. 13 — Summary of DT test performance of ABS Grade CS plates (Grade CS speci-
fication requires normalization heat treatment. )
physically denotes the beginning of the temperature region of sharply increasing notch tough-ness (DT energy) with temperature. Accordingly, the DT curves substantiate the validity ofthe NDT performance patterns discussed above.
In most cases the l-in. DT upper shelf energy values exceed 6000 ft-lb considered equiva-lent to 750 ft-lb, 5/8-in. DT energy as discussed later (Table 2). This upper shelf energylevel, as seen from the RAD (Fig. 4), denotes a high level of toughness for the “plastic” re-gime. In cases where the plate (and specimen) thickness is somewhat thicker or thinner thanthe nominal 1 in. thickness, the shelf energy equivalent for a l-in. DT specimen can be com-puted from the relationship [15] *
E = Rp Qa2B1/2, (3)
where E is 13T energy (ft-lb), RP is a material constant, Aa is the original unbroken ligament(3 in.), and B is the specimen thickness (in.). Since the thickness term appears to the one-half power, energy corrections due to the small thickness variations encountered are negli-gible. Note from Figs, 7—13 that the temperature region for shelf level behavior is on theorder of 120° F to 180° F for most Grade A, B, and C plates; shelf temperatures are lowerfor the normalized plates (C-norm, D-norm, CS, and E), and the spread is larger (0° to 120° F).It is apparent from these data that ordinary shipbuilding steels typically will not exhibit shelflevel behavior at any temperature of normal operation. This general characteristic is notnecessarily detrimental to the application of these steels since the high toughness levels asso-ciated with upper shelf temperatures may not be required for satisfactory behavior in shipstructures.
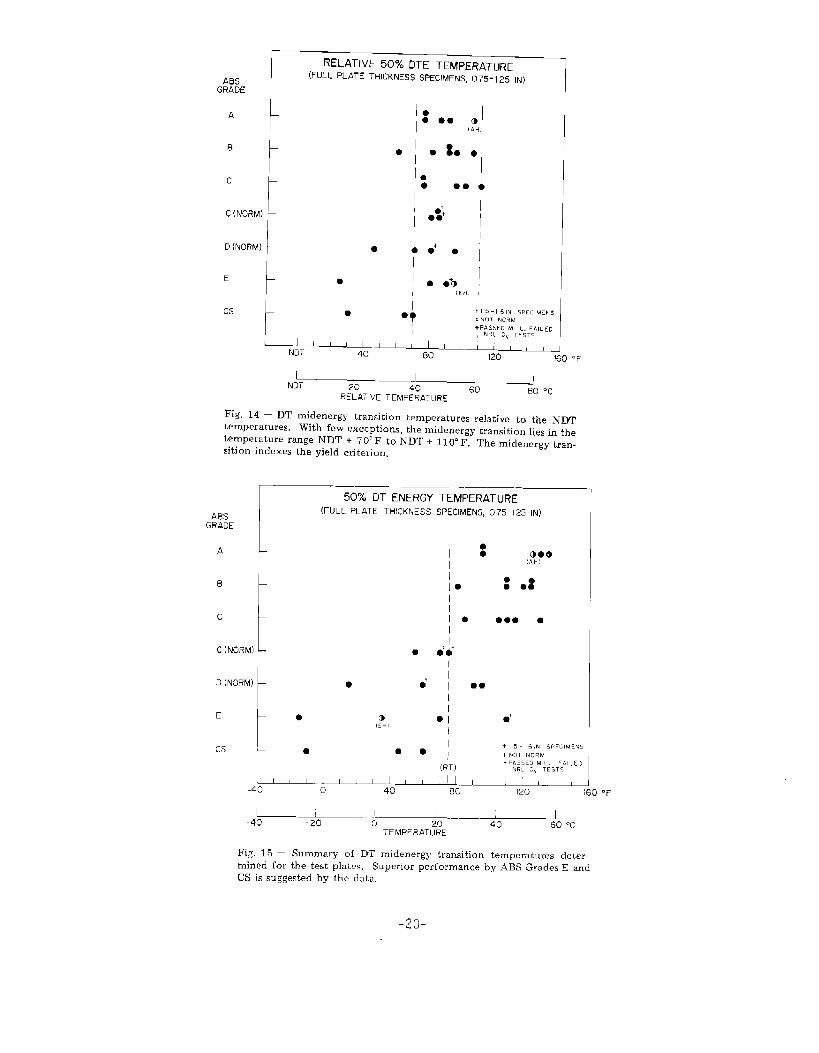
Most of the materials exhibit a YC index (DT midenergy transition) at temperatures70° to 110° F above the NDT temperature (Fig. 14). In terms of absolute temperature,the YC indexes of the as-rolled plates (Grades A, B, and C) generally lie between 80° and135° F (Fig. 15). For the heat-treated plates (Grades C-norm, D-norm, E, and CS) the YCindex temperatures show a larger variation (i.e., —15° to 95° F) but, for the most part, liebelow the range for as-rolled grades.
The results suggest that, in general, none of the ordinary hull steels will consistentlyexhibit a YC level of toughness at the minimum service temperature. It follows that thesesteels will be in the elastic-plastic toughness regime in service. Nonetheless, it is believedthat fracture-safe performance can be achieved with these steels through application ofknowledgeable ship design practices that restrict plastic deformation and by the inclusionof crack arresters that limit the extent of a fracture.
When the DT curves from all grades are considered together, it k apparent that littledifference exists among the as-rolled grades (A, B, and C). Further, a considerable improvem-ent in toughness is found with heat treatment. Of the heat-treated grades, Grades E and
_CS are clearly the best. Unfortunately, the preliminary data reported here indicate a large
*A least-squares fit of the data forming the basis for this equation results in exponents of 1.8 and 0.7 forthe factors a and B, respectively. Equation (3) also fits the data reasonably well and k set forth for corr-putational ease.
-19-
ABSGRADE
A
B
c
C (NORM)
D (NORM)
E
Cs
I
RELATIVE 50% DTE TEMPERATURE I(FULL PLATE THICKNESS SPECIMENS, 075-125 IN)
I*● emm
(AH I
ream*●
● ● m+
●% I
I I● ● O%.
I
● I● ●b
I
(EM)
●
+tPAL:>k D MlLL, F41LED\ Nt<L C , ltSTS
.-~NDT
~.ti..~d. , , ,40
-J80 120 160 “F
~D~L —.L.~ -
R~LOATIVE TEMP%ATURE60 80 “c
Fig. 14 – DT midenergy transition temperatures relative to the NDTtemperatures. With fewexccptions, themidener~ transition liesin thetempemture range NDT + 70” F to NDT+ llO”l?. The midenergy b-an-sition indexes the yield criterion.
ABSGRADE
A
B
c
c (tdORM)
D (NORM)
E
Cs
— .——50% DT-ENERGY TEM-PERATuRE
(FuLL PLATE THICKNESS SPECIMENS, 075-125 IN)
1:I
I
I*I
● d
● m ●[EM)
a ● m1
(RT)
O**[AH)
: ●S
● ** ●
● m
●“
+ 5-1 SIN 5P FCIMEN51 N(11 NO!+MHPA;5ED Mll 1 F&n. fl)
NRL c, TESTS
Fig. 15 — Summary of DT rnidener~ transition temperatures d~ter-
mined for the test plates. Superior performance by ABS Grades E and
CS is suggested by the data.
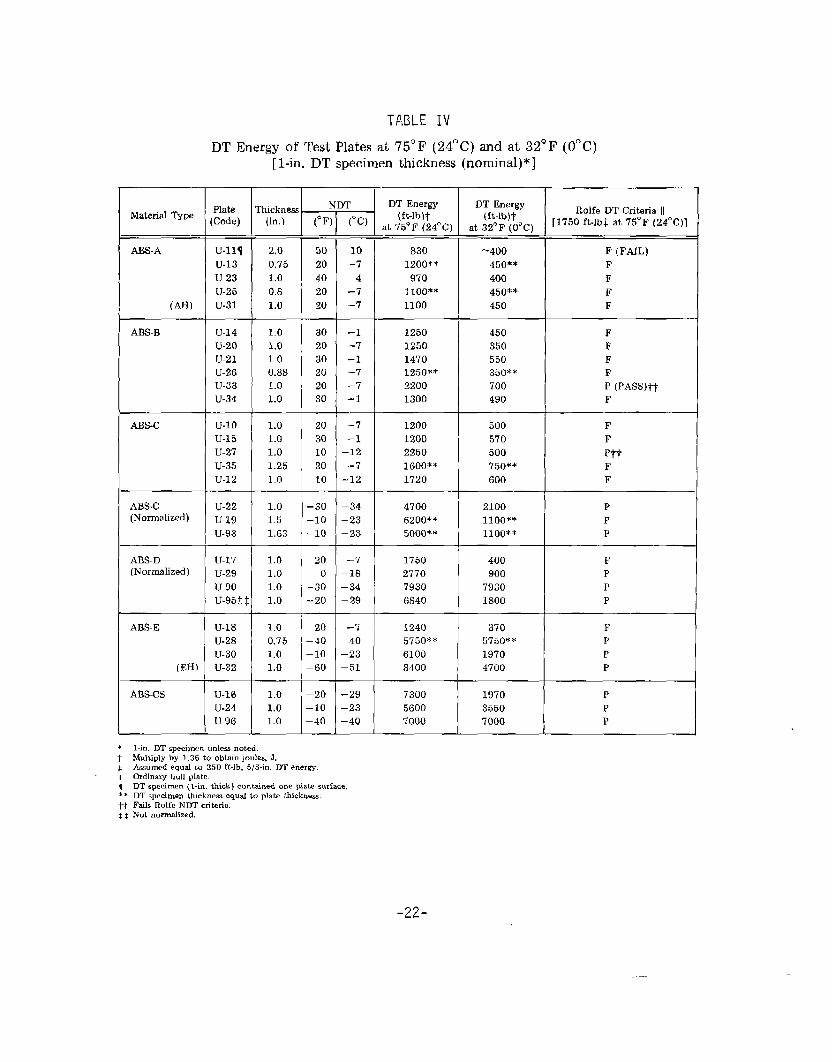
temperature variation in the brittle-ductile transition for the normalized plates. Consequently,the specification of normalization by itself cannot assure a consistent level of toughness at theminimum ship service temperate. For example, the normalized plates in Figs. 10-13 havingNDT temperatures of 0° F or less exhibit an order of magnitude variation in DT energy at30” F i.e., from 900 to 7930 ft-lb (Table 4).
CHARPY-V RESULTS
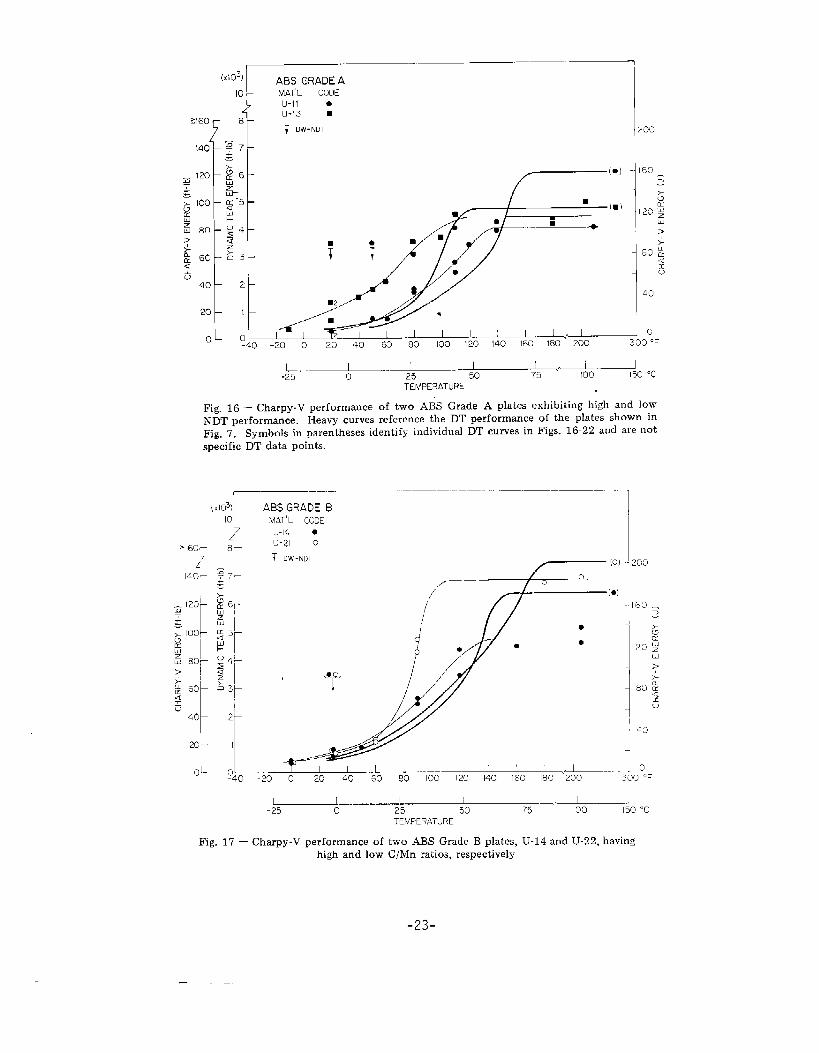
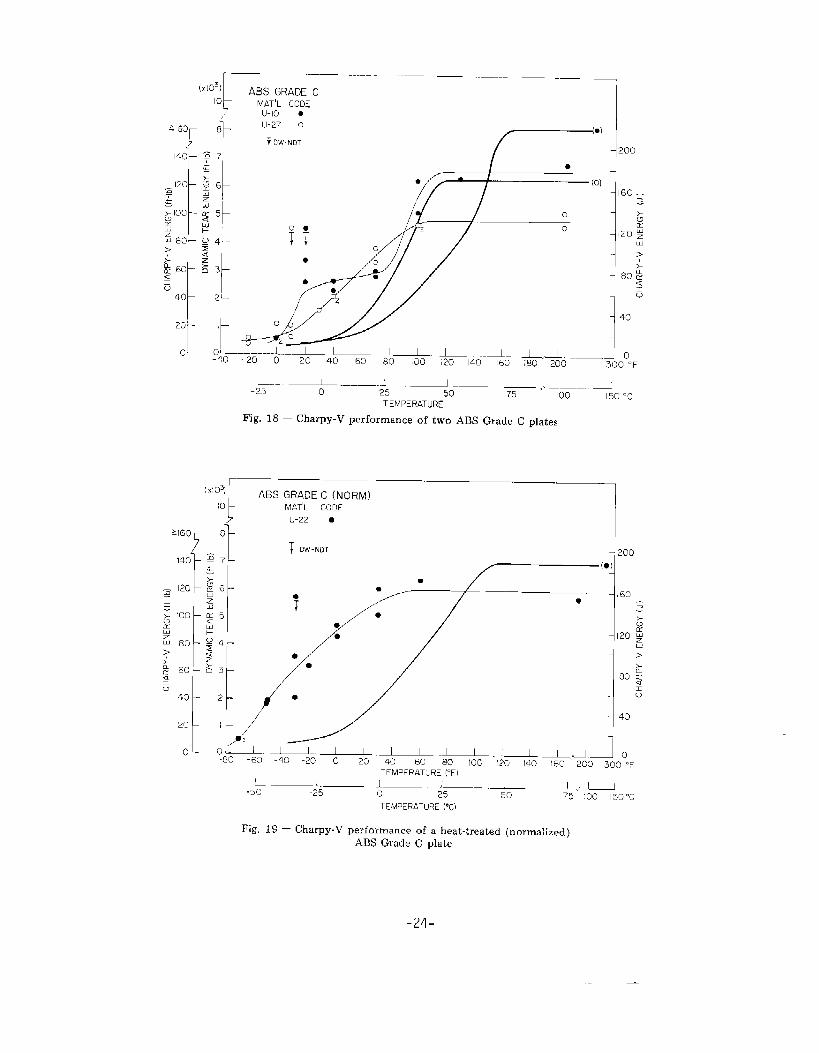
The CV results for selected plates are compared to the DT performance in Figs. 16–22;curve features are summarized in Table 2. Plates from Grades A, C, and E were selected fortesting on the basis of the highest and lowest NDT temperatures for a given grade. Since allthe Grade B plates had compm-able NDT temperatures, plate selection for this grade was onthe basis of high and low values of Mn/C ratio. Only one plate each of Grades C-norm, D,and CS was characterized.
The results indicate a lack of correlation of C,, energy with either the NDT temperatureor with a given DT energy in the DT transition retime. The variationnot only among the different grades but also among the plates withinthe following examples:
. The non-heat-treated grades exhibited a CV energy variation at
in CV energy i; largea given grade. Consider
the NDT temperatureOf 13 to 44 ft-lb.
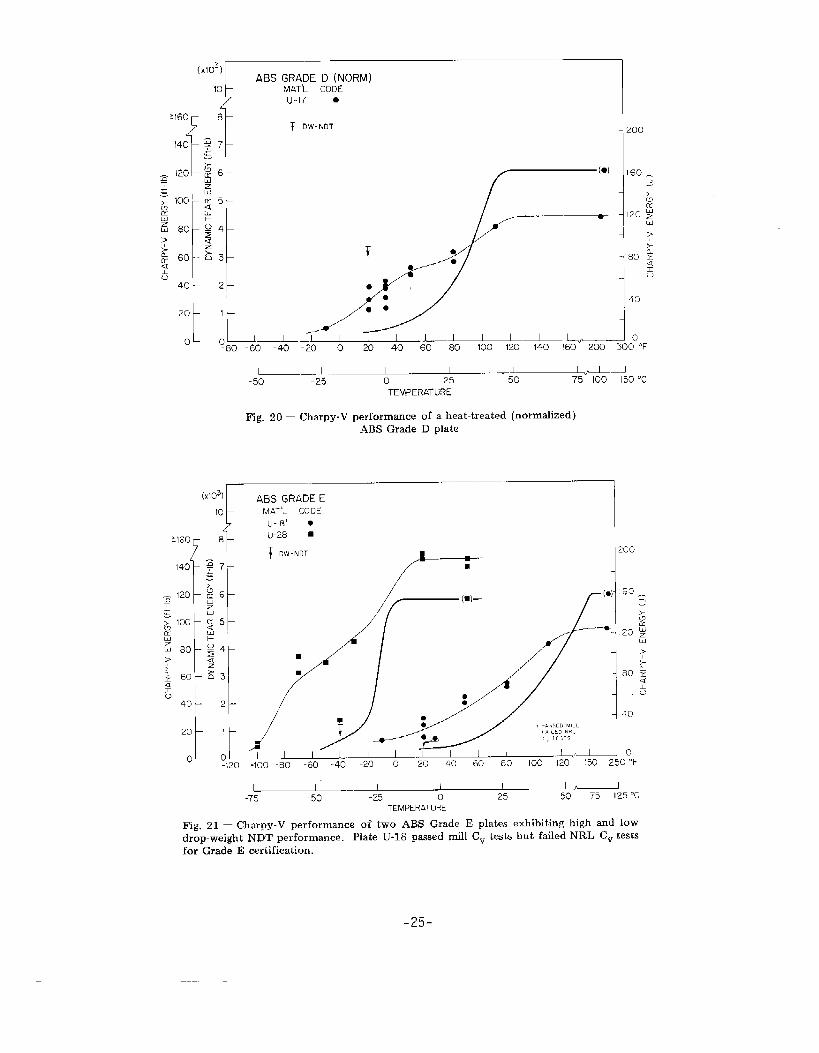
. The normalized grades exhibited an order of magnitudethe NDT temperature, extending from about 20 to 200 ft-lb.
. Heat-to-heat differences in plates of Grade E resulted inenergy at the NDT temperature of about 60 ft-lb.
variation in CV energy at
a variation in average Cv
It is evident that such variations preclude the establishment of a meaningful C, “fix”energy level with which to approximate the NDT temperature in the absence of Drop-Weight tests.
By comparison, differences in DT energy at the NDT temperature were small for allthe grades, i.e., only about 5% 01 the DT upper shelf energy. In Table 2 NDT ‘temperaturesare shown to correspond to a l-in. DT energy of 300 to 600 ft-lb. It follows that, unlikeCv results, DT determinations by themselves can be used to approximate~y fix the NDTtemperature in the absence of Drop-Weight tests. Moreover, it is apparent that an empiricalcorrelation of CV and DT energy in the transition region is not likely.
It was noted above that Grades D and E include Cv energy as part of their materialspecifications (35 ft-lb at 32° F for Grade D and 45 ft-lb at 14° F for Grade E). From thescatter in the CV data observed here, it is evident that it would be most difficult to relatethe Cv specifications to structural performance at the service temperatu~e. The specifi-cation of minimum Cv values for C~rades D and E, however, may be useful as a means ofinsuring consistent quality steel once the possible variation in Cv energy level is known.The significance of the inferred quality level, then, must be judged from past experiencewith the steel grade.
-21-
TP,BLE IV
DT Energy of Test Plates at 75° F (24° C) and at 32° F (O°C)‘~1-in. DT specimen thickness (~ominal)*]
DT Energy(ft-lb)~
at 75° F (24°C)
830
1200**
97011OO**
1100
1250
1250
14701250**
2200
1300
K
(0 F)
IT
(“c)
DT Energy(ft-lb)~
at 32° F (O° C)
-400
450**
400
450**
450
450
350550
350**
700
490
500
570
500
750**
600
2100
11OO**
11OO**
400
900
7930
1800
rhickness(in.)
Rolfe DT Criteria [1[1750 ft.lb~ at 75°F (24°C)]
F (FAIL)FFFF
FFFFP (PASS)~~F
1ABS-A U-111
U-13U-23U-25
(AH) U-31
2<0
0.75
1.0
0.8
1.0
1.0
1.0
1.00.88
1.0
1.0
50
20
40
20
20
30
20
30
20
2030
10–7
4-7–7
-1-7-1–7–7-1
Af3S-B U-14U-20U-21U-26U-23U-34
I
1ABs-c u-lo
U-15U-27u-35U-12
1.01.01.01.25
1.0
20
30
10
20
10
–7–1
–12-7
-12
–34–23–23
1200
1200
2250
1600**
1720
4700
6200**
5000**
1.0
1.51.63
-30
-lo
-lo
P
PP
ABS-D(Normalized)
u-17U-29U-90
u-95i j
1.01.01.0
1.0
1.0
0.75
1.01.0
1.0
1.01.0
200
-30
-20
–7
–18
– 34
–29
1750
2770
7930
6840
12405750**
6100
8400
FPPP
A13S-E
(EH)
U-18U-28U-30U-32
20
-40
-10
-60
-7
–40
–23–51
3705750**
1970
4700
1970
35507000
I
ABS-CS U-16U-24U-96
-20
-lo
-40
–29-23–40
7300
56007000
I
* l-in. DT specimen unless noted.$ Multiply by 1.36 to obtain joules, J.k kumed equal to 250 ft-lb, 5/8-in. DT energyII Ordinary hull plate.q DT specimen (1-in. thick) contained one plate surface.* * DT s~ccimen thickness equal 10 ulati thickmw.
~~ Fails“Rolfc ND’r CritCIifl. “ “
~ ~ Not normalized.
-22-
r“.,.——.
(xlOS) ABS GRADEA10 MAT’L CODE
U-II ●
U-13 ■
Z16058 ; DW-NDT ?00
[~ :~::~
I 1-40 -20 0 20 40 @3 80 100 I20 140 160 5!30 “F
L“ ..— +.-+. ..~ “..+50 .C-25
TEMPERATURE
Fig. 16— Charpy-V performance of two ABS Grade A plates exhibiting high and lowNDT performance. 1-Ieavy curves reference the DT performance of the plates shown inFig. 7. Symbols in parentheses identify individual DT curves in Figs. 16-22 and are notspecific DT data points.
(xl&) ABSGRADE B
o
‘1
MAT’L CODE
U-14 ●
~160T 8U-21 o
~> 100 IuKuzw Bor>1
201-
~ EW-NC)T
(0)
//
I
I
1 ..–
-20 0 20 40 Go 80
160 .....:
1‘-” -Jo!r
~—--L...—--L –. —L..—J-25 0 25 50 75 100 150 “c
TEMPERATURE
Fig. 17 – Charpy-V per~ormance of two ABS Grade B plates, U-14 and U-22, havinghigh and low C/Mn ratios, respectively
-23-
—
2o1-
o!-
(,103)
1- ‘-- “--- ‘----- “--‘-““
ABS GRADE C10 MAT’L CODE
u-lo ●/
8
r
U-27 O
+ Dw-NDT
E 7+—
●I
—
o—
o
/ 1
O*TT
~1c4.-
&
++>,
~ /
z
I
● (c&3
●●
●
21--
‘1 -
2
0
0
oL—-:~E------;:.._. ~ l~.. i~. I .-J.. *,.&o-_–-40 20 40 60 80 100 140 160 3(
40
20
c I
[X103:
10
‘8
2
0-f
L..-. ~. ..1-25
1 ––— L— .. —L–.. Jo 25 ““ 50 75 100
TEMPERATuRE150 “c
Fig. 18 — Charpy-V performance of two ABS Grade C plates
.—. —ABS GRADEC (NORM)
MAT’L CODE
U-22 ●
~ DW-NDT
7
200
● ~(”)
-. b-.~-60 -40 -2o 0 PO
L ._ l._-50 -25
40
.~ .-~. 1~.L”._. J o40 60 SO 100 170 1~ 160 200 300 ‘F
TEMPERATuRE PF)
[ J_ – .~.~ + ..I.Jo 25 50 75 100 150”C
TEMPERATURE (“c)
Fig. 19– Charpy-V performance of a heat-treated (normalized)
ABS Grade C plate
-24-
.
L——.. I ..~.~... . .. ..o~..50 “c-50 -25 0 25
TEMPERATURE
Fig. 20– Charpy-Vperformmce of a heat-treated (normalized)AJ3S Grade D plate
o L
ABS GRADE EMAT’L COOE
u-18’ ●
U-28 ■
j DW-NDT
t 1
200---
■
-~~~-75 -50 -2.5 0 25 50 75 125 “c
TEMPERATURE
Fig. 21 — Charpy-V performance of two AIM Grade E plates exhibiting high and lowdrop-weight NDT performance. Plate U-18 passed mill Cv test-s but failed NRL Cv testsfor Grade E certification.
-——.
20
t t
2218
/ /. J -:..
,Y./’ .p’ i 40
oL d-.~ 1~...._~_~__ ~..T2& J o-60 -40 -20 0 20 40 60 80 100 150 250 ‘F
_7~~~ I I-50
Io 25 50 75 125 “C
TEMPERATuRE
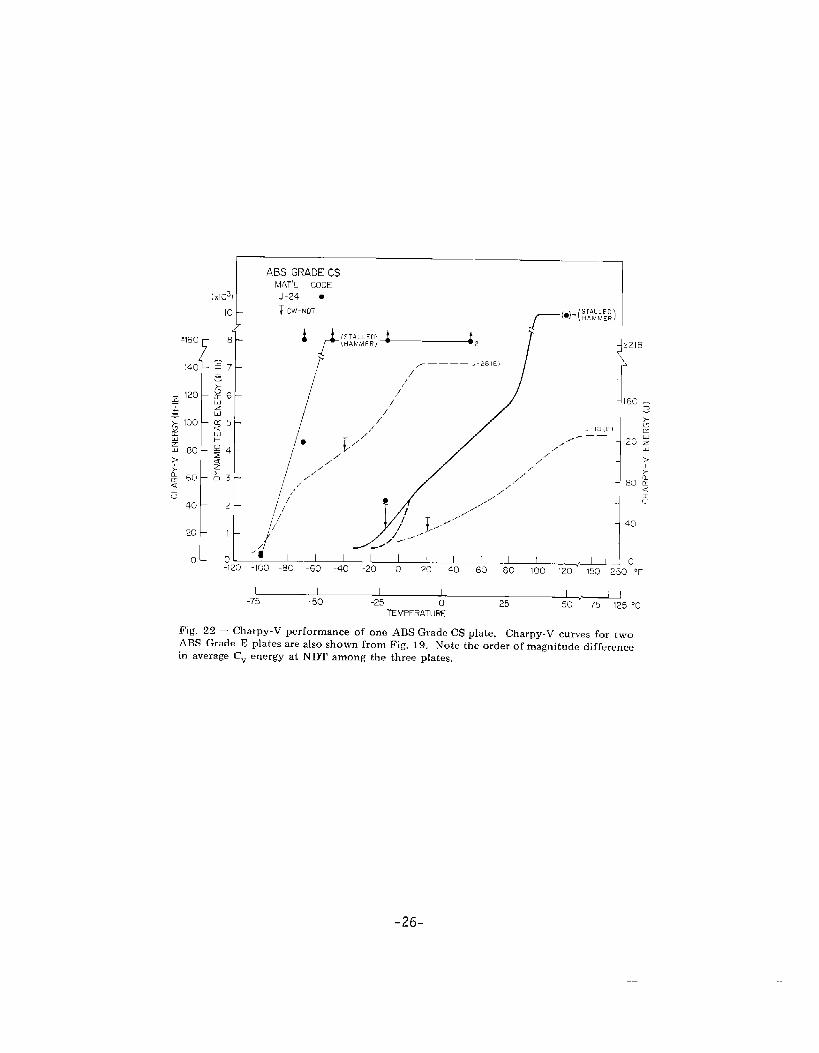
Fig. 22 — Charpy-V performance of one ABSGrado CS plate. Charpy-V curves for LWOA13S Grade E plates are also shown from Fig. 19. Note the order ofmagnitudc difference
in average Cv energy ai NDT among the three plates.
.26-
GRADE AH AND EH ASSESSMENTS
An investigation of the H grades (higher yield strength) was not included in the originalprogram scope; however, an exploratory investigation was conducted with one plate each ofGrades AH and EH. .& Seen from Table 2, the plates exhibited a yield strength approximately20 to 30% higher than that of ordinary Grade A and E plates. The DT curves determined forthe Grade AH and EH plates have been included in Figs. 7 and 12, respectively (dashed curves).It can be seen that the toughness transitions for these plates are within the scatterbamds fortheir lower strength counterparts. In the case of the Grade AH plate, its DT transition curvefollows closely the curves for two Grade A plates. Its NDT temperature is some 20” F to 30° Flower than the NDT temperatures of these plates but within the range of NDT temperature ofall Grade A plates. The YC index temperature for the Grade AH plate lies at NDT + 105” F, orslightly higher than the range NDT + 75° F to 90° F found for the YC index of the Grade A plates(Fig. 14). The Grade EH plate exhibits a somewhat lower NDT temperature than the Grade Eplates; however, its DT curve falls within the DT curve distribution for Grade E. The YC tem-perature relative to NDT is NDr + 100° F, comparable to the high end of the range observedfor Grade E.
Overall, no major difference in NDT or DT performance by H-grade plates was indicatedby the limited evaluations.
RELATIONSHIP OF MEASURED NOTCH TOUGHNESSTRENDS TO RECOMMENDED FRACTURECONTROL GUIDELINES
As discussed, fracture control guidelines for welded ship hulls have been recommendedby Rolfe and coworkers (1). Prior to implementing these guidelines it was necessmy toascertain the ability of current shipbuilding steels to meet the proposed criteria. Basically,a minimum toughness level of K1d/OYd = 0.9 fi at the minimum service temperature (32° 1?,0° C) has been recommended. Since this toughness exceeds that which can be determinedwith 13q. (1 ) using linear elwtic fracture mechanics specimens of l-in. thickness, other tough-ness criteria based on Drop Weight and DT testi have been proposed. This proposed levelof toughness is not intended, nor sufficient, to guarantee a complete absence of brittle frac-ture but is set forth as reasonable for economic reasons. A fail-safe philosophy neverthelessis intended through the use of crack arresters that limit the extent of brittle fractures.
NDT Criterion
A maximum NDT temperature of 0° F has been proposed to give assurance that thetoughness transition from brittle to ductile behavior begins at a temperature below the minim-um service temperature. To compare the actual materials performance with this criterion,the NDT data evolved in the present study are considered to represent average v~ues. How-ever, a final specification of mean NDT temperatures must be based on a strict statisticalanalysis involving many more heats than were evaluated here. The NDT trends evolved inthe present study suggest that there will be a high rejection rate of as-rolled plates, GradesA, B, and C, when tested against a 0° F NDT criterion. If the observed trends are verifiedthrough further statistical sampling, it is readily apparent that ship construction in accordance
-27-
with the proposed criterion will gravitate to the use of only normalized plates for important(critical) strength members.
1Toughness At Minimum Service Temperature
For the case of a 0° F NDT temperature, Rolfe and coworkers estimate the toughnessat 32° F tO be K1d/Oyd = ().9 @. However, existing data are insufficient to define KIdtrends exactly for shipbuilding steels. This area requires further investigation before it willbe possible to state with certainty that a Ratio of 0.9@ or higher will be attained atNDT + 32° F. The KId curve in Fig. 5, for example, indicates that this value will not beattained at temperatures below NDT + 55° F for material exhibiting plane-strain constraint.Also of interest here is the authors’ estimate of an NDT “equivahmce” Ratio, 0.5 @,compared with Rolfe’s estimate [1] of 0.6 ~. It is felt that this difference is academicand that the toughness at NDT cannot be established using an engineering test procedureto within 0.1 ~. ratio value.
The KId curve of Fig. 5 suggests that a ratio lower than 0.9@ (i.e., 0.75 ~.) maybe exhibited by some steels at NDT + 32° F. With this level of toughness, plates of 1.4-in.thickness will exhibit plane-strain behavior (Eq. (1)) and surface flaws on the order of 0.2-in,deep will be critical stress loading. At one-quarter yield-stress loading a critical flaw lengthfor a through-thickness flaw in a tension plate of this toughness level would be approximately6 in..* Flaw sizes of this magnitude are not uncommon in cargo ships, Thus, it is readilyapparent that higher toughness levels would be required of hull steels to assure a completeabsence of running cracks. It follows that KId vs temperature curves should be establishedfor the steels of interest.
The DT trends determined in this study suggest caution in associating a given Ratio witha fixed temperature increment above the NDT temperature. For example, the KId curve ofFig. 5 locates the YC index of a l-in. plate (equivalent to a ratio of 1.0 ~) at NDT +60° F. On the other hand, for a large number of the shipbuilding steels examined, the YCindex was attained only at temperatures in excess of NDT + 70° F to 110° F. This trendand the K1d curve both suggest that the Ratio requirement of 0.9-. (since it is close tothe YC ratio of 1.0 ~) may not be achieved at the minimum service temperature, 32° F(0° C), for the ordinarystrength shipbuilding steels, except for some plates of the Grades Eand CS. Additional research is required to ascertain the conservatism in the YC index asdefined by NRL. Hopefully, it will be found that the toughness corresponding to the DTmidenergy level actually exceeds a ratio of 1.0 @.. This would imply that a 0.9 @.ratio toughness would be attained at temperatures closer to the NDT temperature thanto NDT + 70° to llO” F.
* These calculations assume plane-strain behavior, i.e., that the thickness satisfies Eq. ( 1). For smallerthicknesses, valid ftId values cannot be established using current techniques. The resulting lack ofthickness-induced constraint may lead to elastic-plastic behavior. For this ewe, a higher effective tough-ness is exhibited and flaw size calculations, such as those above, can lead to quite consemative estimates.
-28-
DT Energy Criteria
Rolfe’s proposed toughness criteria include minimum 5/8-in. DT energy requirementsat 75° F (24° C) for ordinary-strength hull plates and at 32° F (0° C) for crack arrester mater-ials. The 75° F (24° C) test temperature rather than the minimum service temperature of32° F (O°C) was chosen for the hull plates because it would be difficult to establish a sig-nificant increase in DT energy between the O“F NDT temperature, where the DT energy islow by definition, and the 32° F service temperature. Tables of increasing DT energy require-ments for hull materials and arrester materials, as a function of increasing yield strength,are provided in Ref. 1. Considering a 40-ksi static yield strength material, which is repre-sefitative of the majority of plates described here, the 5/8-in. DT requirement is 250 ft-lbfor ordinary-strength hull plates and 600 ft-lb for arrester materials. To compare the presentresults with these minimum values, an approximate relationship between 5/8-in. and l-in.DT energy values, noted below, is available:
At the time this program was initiated, the recommendation of 5/8-in. DT energy valueshad not yet been made and this size specimen* was not included in the program scope.However, it is expected that follow-on studies, using the 5/8-in. DT specimens cut fromthe same plates characterized here, will be undertaken by the ABS laboratory. NRL hasdemonstrated [3] that the proportionality factor between upper shelf energies obtainedwith l-in. and 5/8-in. I)T specimens is 8:1. In the transition temperature region, the pro-portionality factor appears to be somewhat less than 8:1. Insufficient comparisons havebeen made to permit an exact determination in this region; however, preliminary datasuggest that a factor of 7 provides a good data fit and that a ‘factor of 8, as defined forthe upper shelf correspondence, is also reasonable for the transition temperature region.For the present analysis, the 250 ft-lb 5/8-in. DT criterion will be considered equivalent to1750-ft-lb l-in. DT energy. Similarly, the 600 ft-lb 5/8-in. DT requirement for arrestermaterial will be considered equal to 4200 ft-lb l-in. DT energy.
Tk,e l-in. DT values, equivalent to the above 5/8-in. DT criteria, are compared in Figs.7—13 with the DT trends of both the as-rolled and normalized grades; a summary ispresented in Table 4. These comparisons lead to the following conclusions:
. For ordinary-strength hull plates, it is predicted that the as-rolled ~ades (~, ~, ~)
generally will not meet a 5/8-in. DT requirement of 250 ft-lb at 75° F (assumed equal to1750 ft-lb l-in. DT energy).
● For the normalized grades (C-norm, D-norm, E, and CS) it is concluded that a250 ft-lb requirement at 75° F can be met in most cases,
. A 5/8-in. DT requirement of 600 ft-lb at 32° F (4200 ft-lb l-in. .DT energy) forarrester materials of 40-ksi yield strength will not be met by a majority of the ordinary-strength hull grades. For example, the data show only some of Grades E and CS plates
* The 5/8-in. -thick DT specimen has planar deminsions of 1 5/8 in. (width) x ‘7.0 in. (length) andfeatures a 0.5-in. -deep machined notch (sharpened by knife-edge technique).
-29-
offering l-in. DT energies above 4200 ft-lb at 32° F. A significant rejection rate for arrestermaterial produced to either of these grades probably would be exhibited. Of the Grade C-normand Grade D-norm plates, only one plate met the requirement for arrester material.
Finally, it is observed from Table 4 that all of the steels which met the proposed 0° FNDT requirement also satisfied the (1-in. equivalent) 13T energy requirement at 75° F. Theconverse, however, is not true; some plates (e.g., U-33, Grade B and U-17, Grade D) exhi-bited an NDT temperature above 0° F but still satisfied the DT toughness requirement at75° F. From these variations in shape of the DT curves it can be concluded that the devel-opment of toughness between 0° F and 75° F is not a unique function. Further research isrequired to establish the resultant variation in DT energy and in Ratio value at 32° F whenthe proposed criteria at 0° F and 75° F have been met.
RECOMMENDATIONS FOR FOLLOW-ONRESEARCH
Crack Arrester Materials
Steels used as crack arresters must, by definition, exhibit a high level of toughness. Thisrequirement could be interpreted to mean upper shelf behavior at the minimum service temp-erature. From the DT trends exhibited by each of the ordinary-strength hull grades invest-igated here, it can be inferred that (a) the non-heat-treated plates exhibit insufficient toughnessat a minimum service temperature of 32° F (0° C ) to be used as crack arresters, and (b) theheat-treated plates at 32° F (0° C) will be in the middle to lower third of their DT transitionregime on the average and will not consistently offer upper shelf toughness protection. Thesesteels at or below the toughness level associated with YC performance will, when subjectedto a certain degree of plastic deformation within the transition regime, exhibit a partialcleavage (brittle) mode of fracture. The possibility exists, therefore, that a crack arrestersatisfying the above requirements could fail in a brittle manner after sustaining a certainamount of plastic deformation if this deformation is insufficient to absorb the energy re-leased by a fracture originating in a brittle hull plate.
Past experience with ship fractures and with crack arrest tests, sum as the Robertsontest, indicates that arrest will occur at toughness levels less than upper shelf toughness fornormal plate loading levels. On the basis of those results, a YC level of toughness has beendeemed sufficient for crack arrest. Certainly, the toughness requirements for arrester mak-nal, as proposed by Rolfe, will lead to a YC performance level. On the other hand, knowingthat arrester material can exhibit unstable fracture following plastic deformation impliesthat crack arrest, a priori, cannot be guaranteed solely by an energy criterion unless uppershelf level behavior is, in fact, also required.
Crack arrest behavior appears to be related to the driving force available from the struc-ture which, in turn, is related to the configuration of the structure in the neighborhood ofthe fracture. On the basis of this hypothesis it is possible that a future requirement ofdifferent toughness levels for arresters may be necessary for different types of ships. Thesupertanker, for example, can subject the hull to significant lateral bending stresses whichare of second-order importance in smaller ships, It is recommended that structural tests be
-30-
conducted to simulate the driving forces associated with different ship designs on postulatedbrittle cracks in hull plates. Such tests would allow positive conclusions to be reached con-cerning proper arrester toughness requirements for individual service conditions.
Thickness Effects
It is known that the mechanical constraint associated with increasing thickness inhibitsplastic flow in the neighborhood of a flaw. This phenomenon serves to decrease the fracturetoughness of thick sections in comparison with thin sections at a giv~n temperature withinthe transition region. In effect, increased thickness elevates the temperature regime of appli-cability of linear elastic fracture mechanics. At sufficiently high temperatures, nonetheless,the metallurgical micromode transition (cleavage to dimpled rupture) overshadows the effectsof mechanical constraint and a “constraint transition” to high toughness evolves, just as forthin sections.
This report has considered primarily the toughness trends exhibited by steels of 1 in.thickness. It is recommended that both a DT and K1~ specimen testing program be under-taken to define toughness trends with thicknesses in excess of 1 in. as they may be used inship construction. From past experience with other steels one would expect a constraintelevation of the YC temperature on the order of 25° to 40° F (14° to 22° C) for thicknesseson the order of 2 in.. While this temperature increment is not large, it nevertheless is feltto be significant. Specifically, a 25° to 40° F constraint elevation is noted to be of the sameorder of magnitude as the 32” 1? temperature increment above the NDT temperature forwhich the recommended toughness criteria [1] stipulate the evolution of sufficient toughnessfor fracture-safe operation. The suggested research program would establish what, if any,upward adjustment in the proposed DT energy levels is required for hull plates and arrestermaterials thicker than 1 in.. Also, full-thickness DT tests are of interest to assess possiblemetallurgical changes affecting toughness in thicknesses exceeding 1 in..
Metallurgical Effects
It is appaxent from the toughness characterizations evolved in the subject program thatthe currently produced grades of ordinary-strength hull steels do not consistently exhibitsufficient toughness to sustain any but the smallest flaws (several inches) for quarter-yieldstress loading at the minimum service temperature. It is assumed that this level of perfor-mance h= been responsible for numerous cases of cracking in ship plate which were repairedwithout incident. The absence of numerous catastrophic ship failures, on the other hand,is a reflection of good design practice.
A characterization of steel processing techniques and of other metallurgical factors isobviously needed if specifications for a consistent quality hull steel of high toughness areto be established. Most of these factors probably have been well researched by the steelcompanies. However, development of rational criteria for purchase specifications is still re-quired. For example, a plate of Grade E (U-30) exhibits similar DT performance to platesof Grade C-norm (U-19 and U-93). Yet another Grade E plate (U-28) exhibits superiorperformance to the other three. The deoxidation practice and heat treatment specified for
-31-
these grades are identical. Also the specified chemical composition is identical, except for Cand Mn. It is readily apparent that variations in C and Mn among the four cited plates doesnot explain the superior performance of plate U-28. Characterization of weld deposits bydifferent weld processes is also felt necessary for the forementioned reasons.
Finally, the DT trends described here show that different plates within a grade can haveDT curves of significantly different shape. Some curves exhibit a sharply rising toughnesslevel within 25° to 50° F above the NDT temperature while others reach this same level oftoughness only at 100° F or more above the NDT. Differences in transition behavior may bedue in part to heat treatment, deoxidation practice, or residual element levels. Once thecauses for such differences are established, a large payoff in structural reliability can be ach-ieved through specifications insuring steels of the former toughness characteristics.
Higher Strength (H) Grades
It is reco remended that a DT characterization program, similm to that described herefor the ordinarystrength hull steels, be undertaken for the higher strength hull steels (GradesAH, DH, and EH). This study is important if full toughness comparisons are to be estab-lished with the ordinary ABS hull grades and if any toughness tradeoffs with a higher yieldstrength are to be defined.
K1d Trends
If structural performance criteria are to be based on the existence of a given KId /u@ratio at the minimum service temperature as proposed by Rolfe, then the KId vs tempera-ture trends must be established for the hull steels, as discussed. Application of nonlinearfracture mechanics techniques, such as the J integral, are appropriate for this research,
SUMMARY AND CONCLUSIONS
A program of limited scope to characterize the toughness of ordinary-strength ship-building steels has been completed. Random plate samples of production heats of ABSGrades A, B, C, C-norm, D-norm, E, and CS were obtained from various shipyards and steelmills. It is considered that sufficient plates of each grade were investigated to define aver-age properties. However, a more extensive program, statistically based, would be requiredto define the full extent of properties variation for each grade of steel. The data werepresented in the form of NDT temperature, and 13T and Cv energy vs temperature curves.Interpretations of the DT curves were expressed in terms of L and YC index valu~s thatdefine, respectively, the upper temperature limit of plane-strain behatior for a given thick-ness and a yield criterion whereby significant plastic deformation (through-thickness yield-ing) in the neighborhood of a flaw is required for fracture propagation. Finally, data trendswere assessed for the ability of currently produced steels ‘m meet toughness criteria proposedby Rolfe and coworkers in a related Ship Structure Committee project. The principal obser-vations and conclusions made in this investigation were as follows:
-32-
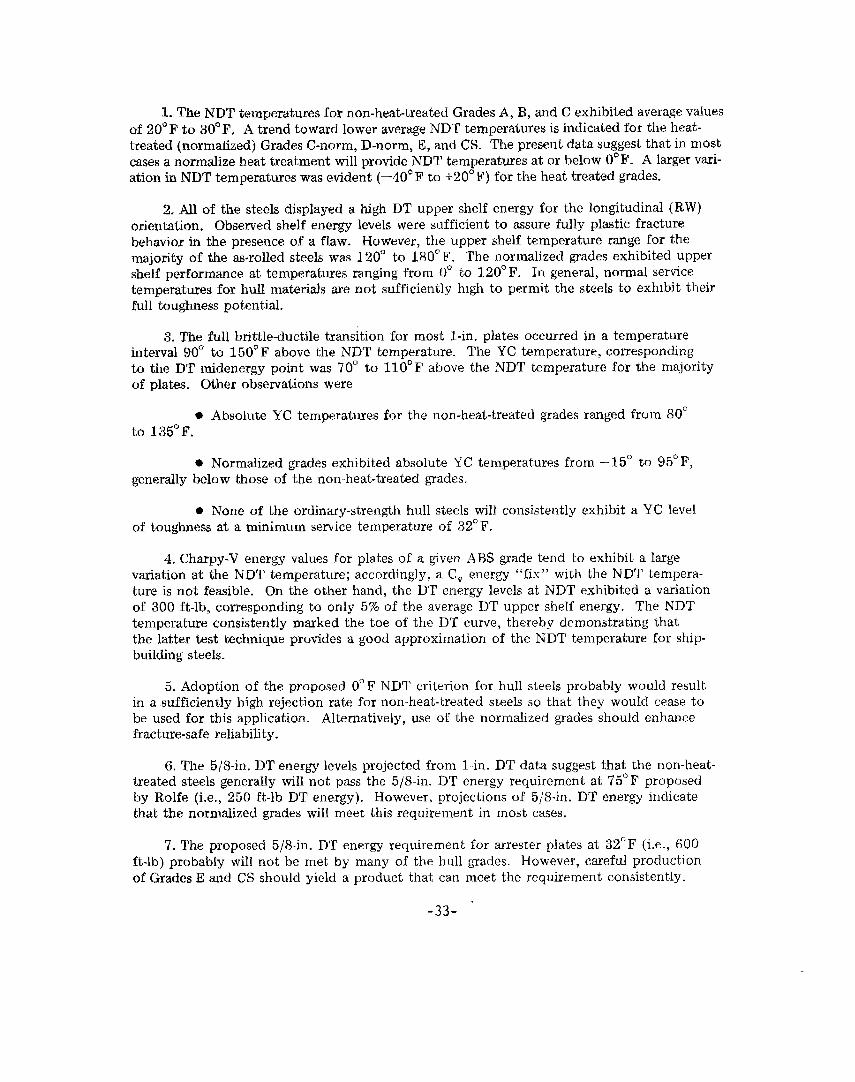
1. The NDT temperatures for non-heat-treated Grades A, B, and C exhibited average valuesof 20° F to 30° F, A trend toward lower average NDT temperatmes is indicated for the heat-treated (normalized) Grades C-norm, D-norm, E, and CS. The present data suggest that in mostcases a normalize heat treatment will provide NDT temperatures at or below 0° F. A larger vari-ation in NDT temperatures was evident (—40° F to i-20° F) for the heat treated grades.
2. All of the steels displayed a high DT upper shelf energy for the longitudinal (RW)orientation. Observed shelf energy levels were sufficient to assure fully plastic fracturebehavior in the presence of a flaw. However, the upper shelf temperature range for themajority of the as-rolled steels was 120° to 180° F. The normalized grades exhibited uppershelf performance at temperatures ranging from 0° to 120° F. In general, normal servicetemperatures for hull materials are not sufficiently high to permit the steels to exhibit theirfull toughness potential.
3. The full brittle-ductile transition for most l-in. plates occurred in a temperatureinterval 90° to 150° F above the NDT temperature. The YC temperature, correspondingto the DT midenergy point was 70° to 110° F above the NDT temperature for the majorityof plates. Other observations were
● Absolute YC temperatures for the non-heat-treated grades ranged from 80°to 135° F.
. Normalized grades exhibited absolute YC temperatures from – 15° to 95° F,generally below those of the non-heat-treated grades.
● None of the ordinmy-strength hull steels will consistently exhibit a YC levelof toughness at a minimum service temperature of 32° F.
4. Charpy-V energy values for plates of a given ABS grade t-end to exhibit a largevariation at the NDT temperature; accordingly, a CV energy “fix” with the NDT temperat-ure is not fe~ible. On the other hand, the DT energy levels at NDT exhibited a variationof 300 ft-lb, corresponding to only 5% of the average DT upper shelf energy. The NDTtemperature consistently mmked the toe of the DT curve, thereby demonstrating thatthe latter test technique provides a good approximation of the NDT temperature for ship-building steels.
5. Adoption of the proposed 0° F NDT criterion for hull steels probably would resultin a ,sufficiently high rejection Me for non-heat-treated steels so that they would cease tobe used for this application. Alternatively, use of the normalized grades should enhancefracture-safe reliability.
6. The 5/8-in. DT energy levels projected from l-in. DT data suggest that the non-heat-treated steels generally will not pass the 5/8-in. DT energy requirement at 75° F proposedby Rolfe (i.e., 250 ft-lb DT energy). However, projections of 5/S-in. DT energy indicatethat the normalized grades will meet this requirement in most cases.
7.The proposed 5/8-in. DT energy requirement for arrester plates at 32°F (i.e., 600ft-lb) probably will not be met by many of the hull grades. However, careful productionof Grades E and CS should yield a product that can meet the requirement consistently.
-33-
8. A specification requiring only a 0° 1? (max) NDT temperature does not infer a con-sistent level of toughness at a fixed service temperature; the additional requirement of DTenergy at the service temperature (or some related temperature) is necessary.
Finally, the DT data trends indicate that 32° F (0° C) generally lies in the transitiontemperature regime of the ordinary hull steels. Arrester materials, in this elastic-plastictoughness regime, may exhibit unstable fracture following a certain degree of plastic defor-mation. For the newer ship designs it will be of value to demonstrate that the strain toler-ance of the arrester material at 32° F (0° C) is greater than that which would allow a post-ulated fracture of the hull.
ACKNOWLEDGMENTS
The authors express their sincere appreciation to Mr. W. E. Hagel and Mr. M. Martinfor conducting the extensive tests and to Mr. H. E. Watson for his helpful assistance inmany other experimental aspects of the investigation.
REFERENCES
1.
2.
3.
4.
5.
6.
7.
8.
9.
S.T. Rolfe, D.M. Rhea, and B.O. Kuzmanovic, “Fracture Control Guidelines for WeldedShip Hulls,” SSC Report 244. Ship Structure Committee, Washington, D.C., pendingpublication.
“Method for 5/8 Inch Dynamic Tear Testing of Metallic Materials,” MIL STD-1601(SHIPS), 8 May 1973.
E.A. Lange; P.P, Puzak, and L.A. Cooley, “Standard Method for the 5/8 Inch DynamicTear Test,” NRL Report 7159, Aug. 27, 1970.
Rules for Building and Classing of Steel Vessels 1972, American Bureau of Shipping,45 Broad St., New York, N.Y. 10004.
“ABS Project No. G77,” revised September 1972, (private communication fromMr. Prakash, ABS, New York, to Mr. Hawthorne, NRL).
W.S. Pellini, “Design Options for Selection of Fracture Control Procedures in theModernization of Codes, Rules, and Standards,” Welding Res. Council Bull. 186,Aug. 1973.
W.S. Pellini, “Evolution of Engineering Principles for Fracture-Safe Design of SteelStructures,” NRL Report 6957, Sep. 23, 1969.
W.S. Pellini, “Advances in Fracture Toughness Characterization Procedures and inQuantitative Interpretations to Fracture-Safe Design for Structural Steels,” NRLReport 6713, April 1968.
F.J. Loss, J.R. Hawthorne, and W.S. Pellini, “Generalized Procedures for the Use ofPlane Strain and Elastic-Plastic Fracture Mechanics Options in the Modernization ofNuclear Standards,” NRL Report 7603, Sf?pt. 18, 1973.
-34-
10. W.O. Shabbits, “Dynamic Fracture Toughness Properties of Heavy Section A533Grade B Class 1 Steel Plate,” Westinghouse R & D Report WCAP-7623, Pittsburgh,Pa., Dec. 1970.
11. A.K. Shoemaker, S.T. Rolfe, “The Static and Dynamic Low-Temperature Crack-Toughness Performance of Seven Structural Steels,” Engrg. Fracture Mechan. 2,No. 4, 319-339 June 1971.
12. F.J. Loss, and W.S. Pellini, “Coupling of Fracture Mechanics and Transition Temper-ature Approaches to Fracture-Safe Design, ‘‘ in Practical Fracture Mechanics forStructural Steels, Chapman and Hall, London, 1969 pp. J1-J35; also NRL Report6913, Apr. 14, 1969.
13. F.J. Loss, “Engineering Significance of Statistical and Temperature-Induced FractureMechanics Toughness Variations of Fracture-Safe Assurance,” Trans. ASME, J. Eng.Ind. 95, Series B, No. 1, pp. 137-144 (Feb. 1973); also NRL Report 7253, Dec. 2, 1971.
14, W.L. Server, A.S. Tetelrnan, “The Use of Precracked Charpy Specimens to DetermineDynamic Fracture Toughness,” UCLA Report Eng. 7153, University of Californiaat Los Angeles, July 1971.
15. R.W. tJudy, Jr., and R.J, Goode, “Ductile Fracture Equation for High-Strength StructuralMetals,” NRL Report 7557, Apr. 3, 1973.
-35-
ABBREVIATIONS AND SYMBOLS
SSC – Ship Structure Committee
A13S – American Bureau of Shipping
NRL — Naval Research Laboratory
ASTM — American Society for Testing and Materials
DW – Drop Weight Test (see ASTM Standard Method E208-69)
NDT – Nil Ductility Transition temperature as determined by the Drop Weight Test
DT – Dynamic Tear Test (see MIL STD – 1601 [Ships])
DTE – Dynamic Tear Energy Absorption (ft-lb, J)
50% DTE – Dynalmic Tear Transition Energy corresponding to 50 percent of mmimurnDT (upper shelf) energy absorption
c“ – Charpy V-notch test (see ASTM Standard Method E23-72)
KIC – Plane Strain Fracture Toughness, static (psi . in.llz, N . m–z - ml/z)
K1d – Plane Strain Fracture Toughness, dynamic (psi - in. 1/2, N - m–2 . m112 )
Uys – Yield Strength, static (psi, N ‘ m-2)
~Yd — Yield Strength, dynamic (psi, N - m–2)
RW – Longitudinal ‘rest Orientation, long dimension of specimen is parallel to primaryplate rolling direction
RAD — Ratio Analysis Diagram
L — Limit for plane strain (brittle) behavior
L Ratio – KIc/oy~ ratio corresponding to L index
Yc – Yield Criterion, describes the lowest material toughness which permits through-thickness yielding in the neighborhood of a flaw
YC Ratio – KIC/ay~ ratio corresponding to YC index
-36-
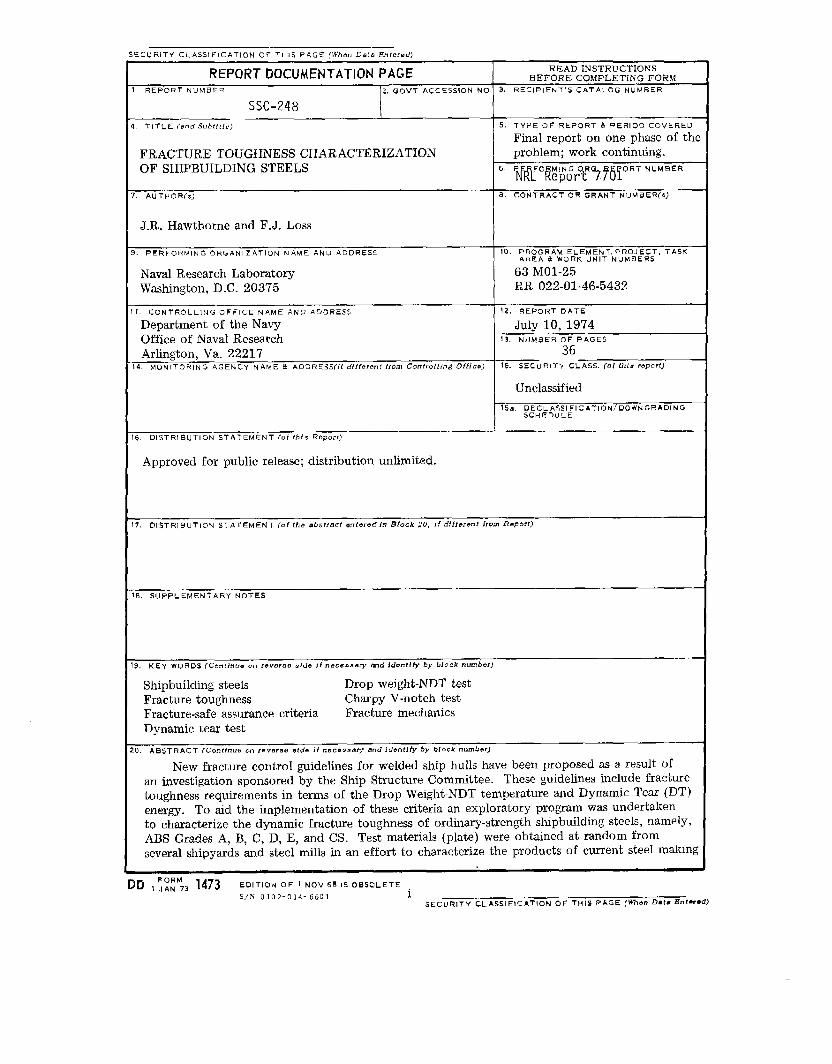
<C URITY CLASSIFICATION OF THIS PAGE (When Data Enrermd}
REPORT DOCUMENTATION PAGE READ INSTRUCTIONSBEFORE COMPLETING FORM
REPoRT NL!MBER 2, GOVT ACCESSION NO, 3. RFclPIENT’5 CATALOG NUMBER
SSC-248—,
TITLE (end Sub fir/r) 5, TYPEoF REPORT & PERIOD COVERED
Final reporton one phase ofthiFRACTURE TOUGHNESS CHARACTERIZATION problem; work continuing.OF SHIPBUILDING STEELS I“ iiwORY&TmYRT‘u”’”
AuTHOR(S) a, CONTRACT OR GRANT MU MB ER(Oj
J. Il. Hawthorne and F.J. Loss IPERFORMING ORGANIZATION NAME AND ADDRESS 10, PROGRAM EL EM EN T. PROJECT, TASK
AREA & WORK UNIT NuMBERS
Naval Res~arch Laboratory 63 MO1-25Washington, D.C. 20375 RR 022-01-46-5432
1. CONTROLLING oFFICE KIAME AND ADDRESS 17, REPoRT DATE
Department of the Navy July 10, 1974Office of Naval Research !3. NUMBER OF PAGES
Arlington, Va. 22217 364. MONITORING AGENCY N AME & AODRES5(if dlf{erenf from Corrtrollln# Of ftco) IS. SE CUBIT-, CLASS. (oI thin report)
] Unclassified
t-==lsa. DE CLASSIFICATION/DOWNGRADING
!
6. DISTRIBUTION sTATEMENT (o1 this Report)
Approved for public release; distribution unlimited.
7. DISTRIBUTION STATEMENT (of the abafract entar8d In Black 20, If dlffemnt from I+%porr)
B, SUPPLEMENTARY NoTES
3. KEY WORDS (Corillnu- 011 revar.e .Ide if nocecimary imd idantlfy by block numbar)
Shipbuilding steels Drop weight-NDT testFracture toughness Charpy V-notch testFracture-safe assurance criteria Fracture mechanicsDynamic tear test
D. ABSTRACT (ContlrIUe on reve,,e alda if fiec. aamy and Identify by block number)
New fracture control guidelines for welded ship hulk have been proposed as a result ofan investigation sponsored by the Ship Structure Committee. These guiddines include fracture
toughness requirements in terms of the Drop Weight-NDT temperature and Dynamic Tear (DT)energy. TO aid the implementation of these criteria an exploratory program was undertakento characterize the dynamic fracture toughness of ordinary-strength shipbuilding steels, namely,ABS Grades A, B, C, D, E, and CS. Test materials (plate) were obtained at random fromseveral shipyards and steel mills in an effort to characterize the products of current steel making
-----
S/N 0102-014-6601 1
SECURITY CLASSIFICATION OF THIS PAGE (When Dafz Enf=,@
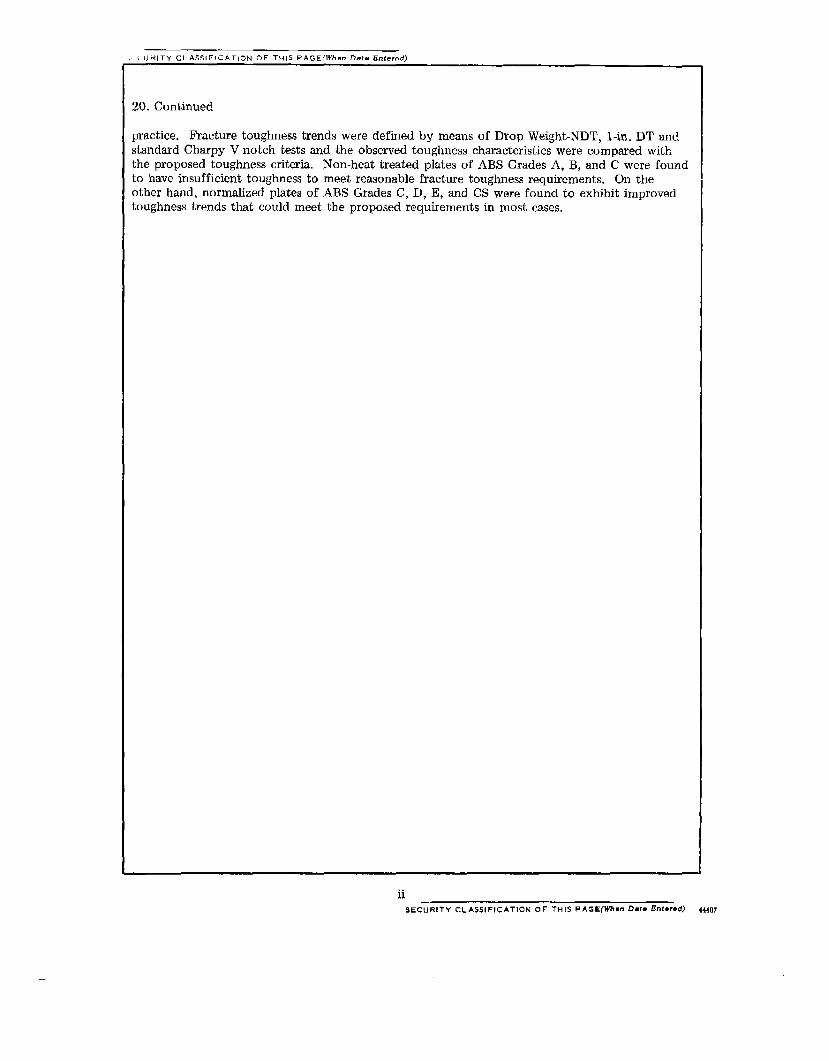
~LIJWITY CLASSIFICATION OF THIS PA GE(Wh.n Dda .Enrdfd)
20. Continued
practice. Fracture toughness trends were defined by means of Drop Weight-NDT, l-in. DT andstandard Charpy V-notch tests and the observed toughness characteristics were compared withthe proposed toughness criteria. Non-heat treated plates of ABS Grades A, B, and C were foundto have insufficient toughness to meet reasonable fracture toughness requirements. On theother hand, normalized plates of A13S Grades C, D, E, and CS were found to exhibit improvedtoughness trends that could meet the proposed requirements in most cases.
SECURITY CLASSIFICATION OF THIS PA GE(Whmn Data Ent.r.d) 44407
SHIP RESEARCH COMMITTEEMaritime Transportation Research Board
National Academy of Sciences-National Research Council
The Ship Research Committee has technical cognizance of the inter-agency Ship Structure Committee’s research program:
PROF. J. E. GOLDBERG, Chairman, School of Ciuil Eng$nQeting, ~P~e un~v~~~ityPROF. R. W. CLOUGH, Prof. of Civ-izEngineering, University of CaliforniaDR. S. R. ilELLER,Jr., C’man, Civil & Mech. &g. Dept., The Catholic Univ. ?f~erie~
MR. G. E. KAWSCWHER, Jr., MmugeF, Techn<caz Semiees, ARMcosteez cow~at~o~MR. W. W. OFFNER, Consulting Engzkee~, San FranciscoMR. D. P. ROSEMAN, Chief Naval Arcl-zitieet,Bydronautiics,Inc.MR. H. S. TOWNSEND, Vic~ Presidmt, U.S. Sa2vag& Association, Inc.DR. S. YUKA!4A,Consulting Enginee~, General Electric CompanyMR. R. N. RUMKE, Exeeutioe See~etaPy, 5’hipResea~ch Corrunitke
Advisory Group 111, “Materials, Fabrication, and Inspection”, preparedthe project prospectus and evaluated the proposals for this project:
MR. G. E. KAMP.SCHAEFER,Jr., Chairman, Manager, Tech. Services, ARMCQ Steel COFP.DR. J. M. BARSOM, Research Consultant, U.S. Steel Cmporuz%onPROF. J. R. FREDERICK, Dept. ofMech. Engineering, The Univers$ky of MichiganMR. S. GOLDSPIEL, Mechanica2 Enginem, Board of Water Supply, fleuYoFkMR. T. E. KOSTER, NavaZ Architect, AMOCO International Oil CompanyDR. J. M. KRAFFT, Head, Ocean Mate.risk Criteria Branch, Naval Reseamh Lab.MR. G. E. LINNERT, flopth American Representative, The WeZding InstitutePROF. H. W. LIU, tiofessor of Materials Science, Syracuse UniversityPROF. W. 1-1.MUNSE, Dept. of Civil Engineering, University of IllinoisMR. Il.W. OFFNER, Consulting Engineer, San FranciscoPROF. H. C. ROGERS, College of .t?ngineering,Drexel UniversityDR. W. F. SAVAGE, Professo~ of Metallurgy, Renssehe~ PoZytechnie InstituteDR. W. K. WILSON, Analytical Mechanics, Westinghouse Electric Corporation
The SR-220 Project Advisory Comrili-tteeprovided the liaison technicalguidance, and reviewed the project reports with the investigator:
PROF. A. W. PENSE, Chairman, Professo~ of M@tallu~gy, Lehigh UfliversibyMR. T. KOSTER, NavaL Axchiteek, AMOCO International Oil CompanyPROF. W. H. MUNSE, Dept. Of Civil Engineering, University oJ.Illinois
SHIP STRUCTURE COMMITTEE PUBLICATIONS
These documents ape distributed by the National TechnicalInformation Service, Springfield, Vu. 22151. These doc-uments have been announced in the Cleminghouse journalU.S. Government Research & Development Repo~ts (USGRDR)under the indicated AD numbw.s.
SSC-240, Load Criteria for Ship StrueturaZ Design by E. V. Lewis, R. van Hooff,D. Hoffman, R. B. Zubaly, and W. M. Maclean. 1973. AD 767389.
SSC-241, TherinoeZast<c ModeZ Studies of Cryogenic Tanker Stm.mhwes byH. Becker and A. Colao. 1973. AD 771217.
Y3C-242, Fast .FractiureResistance and C~aek Arrest in StructuyaZ SteeZs byG. T. Hahn, R. G. Hoagland, M. F. Kanninen, A. R. Rosenfield andR. Sejnoha. 1973; AD 775018.
SSC-243, Struetu~aZ AnaZysis ofSL-7 Containezwhip Unde~ “CombinedLoading ofVertical, Lateral and Toz%iona~ Moments Vying Finite Ezement Techniquesby A. M. Elbatouti, D. Liu and H. Y. Jan. 1974. AD AO02620
SSC-244, Fraeture<ontpoz Guidelines for We2ded Steel Ship Hu12s by S. T. Rolfe,D. M. Rhea, and B. O. Kuzmanovic. 1974. AD AO04553
SSC-245, A Guide for Inspection of High-Strength Steel Vekhents by The MeldFlaw Evaluation Committee. (To be published),
SSC-246, TheoxwticaZ Est-i-maties of Wave Loads On the SL-7 Coztainersh{p InRegulm and ImwguZar Seas by P. Kaplan, T. P. Sargent and J. Cilmi.1974. AD-AO04554
SSC-247, FZame Straightening Quenclzed-And-TernperedSte@ls in Ship Constructionby R, L. Rothman. 1974. ADA 002621
SL-7 PUBLICATIONS TO DATE
S1-7-1, (SSC-238) - Design and Installation of a Ship Response InstrumentationSystem Aboard the SL-7 C’ZassContainership S.S. SEA-LAND McLEAflby R. A. Fain. 1973. AD 780090.
SL-7-2, (SSC-239) - Maoe Loads in a Mode2 of the SL-7 Containership Running atUbZique Headings ix ReguZa~ Vaves by J. F. Dalzell and M. J. Chiocco.1973. AD 780065
SL-7-3, (SSC-243) - Structural AnaZysis ofSL-7 Containership Unde~ CombinedLoadings of Verkica2, Late~aL and Torsional Moments Using Finite ElementTechniques by A. M. Elbatouti, D, Liu and H. Y. Jan. 1974.
SL-7-4, (SSC-246) - Theo~eticaZ Estimates of Wave Loads on the SL-7 Containershipin Regular and Imegular Seas by P. Kaplan, T. P. Sargent and J. Cilmi.1974.