Embed Size (px)
Citation preview
Running head: GREEN PRODUCT PLACEMENT
Green versus Conventional Product Placement and Disclosures:
The Positive Effect of Greenness
Anja Krafczyk
University of Amsterdam
Master’s Thesis
Graduate School of Communication
Master’s program Communication Science
Supervisor: Dr. Marijn Meijers
Anja Krafczyk
Student no.: 10965718
June 24, 2016
GREEN PRODUCT PLACEMENT 2
Abstract
This study examined the influence of green brands compared to conventional brands in
product placement on warmth, persuasion knowledge, resistance and brand attitude.
Additionally, the effect of sponsorship disclosures was studied. An experiment (N = 155) was
executed and showed that a green product placement compared to conventional product
placement positively affects brand attitudes, which is mediated by an increase in brand
warmth. Besides, no support was found that green product placement activates less persuasion
knowledge than conventional product placement. However, it could be confirmed that
attitudinal persuasion knowledge, but not conceptual persuasion knowledge, is positively
associated with resistance. Despite finding this association, less resistance did not positively
affect brand attitudes. In addition, no support was found for the assumed negative effect of
disclosure on brand attitude through a higher activation of persuasion knowledge and
resistance. As this study is the first that examined the effect of green product placement, it is a
great contribution to product placement research and green advertising literature in general.
Keywords: product placement, green brands, disclosures, warmth, persuasion
knowledge, resistance
GREEN PRODUCT PLACEMENT 3
Green versus Conventional Product Placement and Disclosures:
The Positive Effect of Greenness
Imagine you are sitting in front of your television watching the television series House of
Cards and you notice Zoe Barnes (one of the characters) eating Ben & Jerry’s. The just
described setting is called product placement: the placement of a brand in non-commercial
content such as a television series or movie (Karrh, 1998). Marketers use this technique for
the purpose of advertising brands in a more natural fashion, hoping to avoid the activation of
persuasion knowledge and as such influencing brand attitudes positively (Karrh, 1998; Avery
& Ferraro, 2000; Russel, 2002). The point of interest in the just mentioned example lies on the
brand (Ben & Jerry’s) which is a green brand. Green brands mainly differ from conventional
brands such as Heineken in their connection to environmental friendliness and sustainability
(Hartmann, Ibáñez & Sainz, 2006). Does it therefore work different when a green brand is
used in product placement instead of a conventional brand? Until now, no previous study has
investigated the effects of green product placement. Based on that, the present study tries to
fill a research gap focusing on green product placement.
It is expected that the placement of green brands works better (i.e. more persuasive)
than the placement of conventional brands. On one hand, because research has shown that
people have a more positive attitude towards green brands than conventional brands
(Schuhwerk & Lefkoff-Hagius, 1995; Kong & Zhang, 2013). People perceive green brands as
more ethical, trustworthy and warmer than conventional brands due to their association with
goodwill (Chernev & Blair, 2015). Therefore, a similar positive effect for green brands
compared to conventional brands is expected when using them in product placement.
On the other hand, green product placement may also work due to a different
underlying process that concerns the perception of advertising. In 2012 the company “Green
Product Placement” integrated green brands into movies for the first time (Green Product
Placement, 2015). Due to the novelty of green product placement, people rarely know this
GREEN PRODUCT PLACEMENT 4
type of advertising and are therefore probably less aware of its persuasive intent (Friestad &
Wright, 1994; Tutaj & van Reijmersdal, 2012). As a result, it may be argued that people show
less resistance towards green product placement than towards conventional product placement
which benefits subsequent evaluations (Friestad & Wright, 1994; Campbell & Kirmani, 2008;
Fransen, Smit & Verlegh, 2015). Taken together this may lead to more positive brand
attitudes with green product placement than with conventional product placement.
However, in the last years, programs have to disclose when using product placement
(Avery & Ferrao, 2000; Cain, 2011). The inclusion of disclosures in television series or
movies has shown to make the persuasive intent of the product placement more apparent
(Boerman, van Reijmersdal & Neijens, 2012). If this is translated to the current situation, the
positive effect of green product placement compared to conventional product placement due
to a lower perception of the persuasive intent might disappear with disclosures.
Based on these processes, it is expected that green product placement works better due
to brand warmth on one side and a lower activation of persuasion knowledge and resistance
on the other. However, when the product placement will be disclosed, green product
placement will only profit from brand warmth and no longer from a lower activation of
persuasion knowledge and resistance. Nevertheless, green product placement will still be
evaluated as more positive than conventional product placement, the effect will only be less
pronounced when the product placement is disclosed.
The research gap around green product placement provides relevance to address this
topic in the present study. Furthermore, enhancing the awareness for green brands and
increasing more positive attitudes towards green brands underlies the societal relevance of the
present study. When this can be achieved, green behavior probably increases which can help
conquering global warming which is a great issue. For this purpose the following research
question will be addressed:
GREEN PRODUCT PLACEMENT 5
RQ: What is the influence of green product placement versus conventional product
placement on consumer’s attitude towards the brand? How do warmth, persuasion
knowledge, and resistance mediate this relationship? And how does sponsorship
disclosure moderate the effect of the mediators persuasion knowledge and resistance
on consumer’s attitude towards the brand?
Theoretical Background
Product Placement of Conventional versus Green Brands
Product placement is a more unobtrusive form of advertising brands and its products
than traditional print and television advertising (Balasubramanian, 1994; Hackley, Tiwsakul
& Preuss, 2008). It is originally and more correctly called brand placement which refers to its
definition: the placement of a brand in a mass media program that can be a television series or
movie (Karrh, 1998; Russel, 2002). More and more companies use the product placement
technique instead of traditional forms of advertising (Hackley et al., 2008). The huge hype
around product placement is based on the idea that it is perceived less as advertising, because
the brand is embedded in non-advertising content (Hackley et al., 2008). With this advantage
of native advertising, companies try to increase the awareness of their brands while breaking
through the clutter of traditional advertising and overcoming consumers’ avoidance behavior
towards advertising (Roehm, Roehm & Boone, 2004; Rotfeld, 2006; Wojdinski, 2016).
Researchers have paid attention to product placement for more than two decades and
have studied its effects on factors such as memory and evaluations of the brand placed
(Nebenzahl & Secunda, 1993; Karrh, 1998; Russel, 2002; van Reijmersdal, Neijens & Smit,
2007; Verhellen, Dens & de Pelsmacker, 2015). Up to date the brands that are part of these
studies belong to the category conventional brands, which may be explained by the fact that
GREEN PRODUCT PLACEMENT 6
conventional brands are commonly used in product placement (Nelson & McLeod, 2005;
Sutherland et al., 2010). An example for the use of conventional brands in product placement
would be James Bond drinking Heineken in the movie Skyfall. Consumers are already more
or less used to seeing conventional brands such as Heineken, Coca Cola, or Pepsi in movies
nowadays.
Next to the category of conventional brands, another type of brands exists: green
brands. Organic and biological brands such as the ice-cream brand Ben & Jerry’s, the Dutch
chocolate brand Tony’s Chocolonely, or the German refreshment drink brand Bionade are
green brands. Product placement of green brands, so called green product placement, first
emerged in 2012 when Beth Bell, the founder of the company “Green Product Placement”,
started integrating green brands into films (Green Product Placement, 2015). Due to the
novelty of green product placement, there is a lack of research regarding this practice. The
necessity to study the effects of green product placement besides conventional product
placement is supported by van Reijmersdal et al. (2007). The authors emphasize that the
results concerning product placement are always related to the specific brand used that leads
to the assumption that green product placement probably shows different effects than
conventional product placement does.
There are two main differences between conventional product placement and green
product placement that could explain the hypothesized differential effects: firstly, green
product placement is a more novel practice than conventional product placement and
secondly, green product placement has a greater connection to environmental friendliness and
sustainability than conventional product placement. Concerning the novelty of green product
placement, research has shown that novel advertising techniques are evaluated more
positively than well-known advertising techniques (Stafford & Stafford, 2002; Dahlén 2005;
Dahlén & Edenius, 2007; Sheinin, Varki & Ashley, 2011). People are less likely to perceive
communication as advertising when they see or hear it for the first time compared to
GREEN PRODUCT PLACEMENT 7
communication they encounter several times per day. In consequence the overall negative
associations people have with advertising, such as the negative feeling towards a persuasive
attempt, are less likely to get activated with novel advertising techniques (Dahlén & Edenius,
2007; Tutaj & van Reijmersdal, 2012). As green product placement is a more novel technique
compared to conventional product placement, it can be expected that green product placement
profits from its novelty factor and will therefore be perceived as more positive than
conventional product placement.
The second distinction that can be made between green product placement and
conventional product placement refers to the brands connection with environmental
friendliness and sustainability. Whereas the company’s goal of a conventional brand is to
reach a high return on investment (ROI), the company’s ultimate goal of a green brand is to
take responsibility for the society (Davis, 1960; Perrow, 1961; Chernev & Blair, 2015). The
contribution to social and environmental well-being can be expressed in various ways: the
reduction of CO2 emission, the use of recyclable packaging, the use of natural or organic
materials from local farmers, the investment in projects or initiatives that strive to stop global
warming et cetera (Dennis, Neck & Goldsby, 1998; Newell & Paterson, 2010). All these
actions express the so-called Corporate Social Responsibility (CSR) of a company (Dennis et
al., 1998). CSR is an important part of a company that markets green brands, but not of a
company that deals with conventional brands. The connection of green brands with CSR
could exhibit an advantage compared to conventional brands, because most people appreciate
when organizations take responsibility for society (Chernev & Blair, 2015; Juwaheer,
Pudaruth & Noyaux, 2012). Consumer’s positive attitude towards CSR was even strengthened
by the issue of global warming, because CSR is one form of taking a much needed step
towards slowing down global warming (Grimmer & Woolley, 2014).
The association of green brands along with a company’s goodwill is likely to lead to a
positive evaluation of the brand itself. As conventional brands lack this association, green
GREEN PRODUCT PLACEMENT 8
brands are likely to be evaluated as more positive than conventional brands. This view is
supported by research that compared print advertising of green brands with print advertising
of conventional brands (Schuhwerk & Lefkoff-Hagius, 1995; Kong & Zhang, 2013). Most of
the time, print advertising of a green brands is evaluated as more positive than print
advertising of a conventional brands. Print advertising research showed that people have a
more positive brand attitude towards green brands than towards conventional brands and that
green advertising in general elicits positive effects (Schuhwerk & Lefkoff-Hagius, 1995;
Kong & Zhang, 2013; Hartmann et al., 2006; Grimmer & Woolley, 2014; Huang, Yang &
Wang, 2014; Nagar, 2015). Based on the preceding reasoning concerning the novelty factor of
product placement using green brands as well as its association with CSR the following
hypothesis will be tested:
H1: Green product placement will lead to a more positive brand attitude than
conventional product placement.
The fact that green brands are expected to be evaluated more positively than
conventional brands when used in product placement could be explained by brand warmth. As
such, this might be an important mediator if the expected effect of green product placement
versus conventional product placement on brand attitude can be confirmed.
Brand Warmth
Warmth is defined as a positive, mild, volatile emotion (Aaker, Stayman & Hagerty,
1986). The emotion warmth is often used to describe a person such as referring to someone as
a “warm person” (Kervyn, Fiske and Malone, 2012). Besides using the term to describe a
person, warmth is also used to describe entities such as brands: brand warmth. The fact that
people can perceive brands as warm and that warmth is actually commonly used to express
GREEN PRODUCT PLACEMENT 9
ones feelings towards a brand is discussed by Kervyn et al. (2012). The authors developed a
framework to illustrate with which attributes people express ones evaluation of a certain
brand: The Brands as Intentional Agents Framework (BIAF). The BIAF is based on the
assumption that people rate a brand according to its good intentions (besides rating a brand on
its ability to realize its intention, i.e. competence); a brand can have a good intention (i.e.
well-intentioned) such as protecting the environment or a bad intention (i.e. ill-intentioned)
such as making profit. Kervyn et al. (2012) showed that well-intentioned brands are perceived
as warmer than ill-intentioned brands. As a green brand is more likely to be perceived as a
well-intentioned brand than a conventional brand, because of the company’s motive to do
something that benefits society as a whole or at least does not damage, it can be expected that
a green brand will be perceived as warmer than a conventional brand.
Besides illustrating the different relations between distinct brand types (green versus
conventional) and brand warmth with the BIAF, the expectation that green brands are
perceived as warmer than conventional brands can also be explained by means of the spillover
effect. The spillover or halo effect is basically a bias of evaluations (Thorndike, 1920;
Beckwith & Lehmann, 1975). For example, cookies labelled “organic” are evaluated as
healthier than conventional cookies. The reason for this misperception is that people infer
from the organic label to the caloric content of the cookies (Schuldt & Schwarz, 2010;
Schuldt & Hannahan, 2013). In other words: the overall positive impression of an object (i.e.
organic cookies) is transferred to subsequent evaluations related with the object (i.e. caloric
content) (Thorndike, 1920; Schuldt & Hannahan, 2013).
Earlier in this paper it was discussed that a company promoting green brands engages
in CSR, while a company promoting conventional brands lacks this engagement. A company
that engages in CSR is evaluated more positively than a company that does not engage in
CSR in the sense that it is rated as more trustworthy, more ethical and warmer (Chernev &
Blair, 2015). If we look at the perception of warmth towards a company that engages in CSR
GREEN PRODUCT PLACEMENT 10
activities and the concept brand warmth, it seems likely that these are interconnected: the
feeling of warmth towards a company (that engages in CSR) probably spills over to the
company’s brands (i.e. green brands) which leads to the perception of warmth towards green
brands. To summarize, it is likely that green brands will be perceived as warm, but
conventional brands will not be perceived as warm. When using green brands versus
conventional brands in product placement, the following is expected:
H2: Green brands that use product placement will be perceived as warmer than
conventional brands that use product placement.
In consequence, it can be expected that the perception of brand warmth has a positive
effect on brand attitudes, as brand warmth depicts a positive evaluation of a brand. Bernritter,
Verlegh and Smit (2016) showed in a social media study that non-profit brands are perceived
as warmer than for-profit brands. The perception of warmth subsequently influenced the
consumer’s behavior which was shown in an increase in “likes” on the social media platform
Facebook (Bernritter et al., 2016). A beneficial effect due to a perception of brand warmth is
also expected in the present study:
H3: Brand warmth will mediate the positive effect of green product placement versus
conventional product placement on brand attitude.
After discussing the positive path from product placement via brand warmth to brand
attitude, in the next section another path will be sketched that takes a critical look on the
effectiveness (i.e. persuasiveness) of product placement.
GREEN PRODUCT PLACEMENT 11
Persuasion Knowledge
The persuasiveness of communication strongly depends on the extent to which the
receiver perceives it to be intended to be persuasive (Friestad & Wright, 1994). Persuasion
knowledge helps the receiver to recognize whether communication is meant to persuade and
subsequently helps the receiver to cope with the persuasive attempt. Friestad & Wright (1994)
define persuasion knowledge as an overall comprehension of persuasion and an expertise in
coping with persuasive attempts. When persuasion knowledge is activated, the effect of
advertising is weakened. This process is consolidated in the Persuasion Knowledge Model
(Friestad & Wright, 1994).
When looking at research concerning product placement (of conventional brands), one
can see that the native advertising technique product placement can activate persuasion
knowledge (Russel, 2002; Verhellen et al., 2015; Wojdinski, 2016). For example, Russel
(2002) showed that product placement is perceived as a persuasive attempt when the brand is
not perfectly integrated in the movie and therefore appears unnatural. Furthermore, Verhellen
et al. (2015) showed that a prominent product placement decreases its persuasiveness. The
effect of green product placement on persuasion knowledge has not yet been researched.
Based on research concerning conventional product placement, a possible effect of green
product placement will be discussed. This will be done by comparing conventional to green
product placement.
As mentioned before, the persuasion knowledge of a person is of great relevance for
the effectiveness of communication, such as product placement, and it develops with
experience. It can be expected that people have quite some experience with conventional
product placement, because it has been practiced by marketers for approximately 35 years and
the amount of brands placed since then is quite substantial (Babin, 1996). For example, just in
the last year, 430 brands were placed in the 31 top movies of 2015 in the United States (Sauer,
2016). The opposite (i.e. low experience) is probably true for green product placement, as it is
GREEN PRODUCT PLACEMENT 12
a novel technique that has been practiced for no longer than 4 years and counts 170
productions and 65 brands in total (Green Product Placement, 2015). Based on these facts, it
can be expected that people have more persuasion knowledge about conventional product
placement than about green product placement. In summary, it can be expected that a person
will less likely perceive the placement of a green brand as a persuasive attempt, than the
placement of a conventional brand. Based on the previous section the following hypothesis
will be tested:
H4: Green product placement will lead to a lower activation of persuasion knowledge
than conventional product placement.
As shortly mentioned, the perception of a persuasive attempt elicits a reaction (i.e.
coping behavior). This reaction can be a form of resistance, which will be discussed in the
following section.
Resistance
The Persuasion Knowledge Model argues that the activation of persuasion knowledge
consequently exhibits a reaction towards the persuasive attempt which is in general of
negative valence (Friestad & Wright, 1994; Campbell & Kirmani, 2008). This (negative)
reaction is a behavior that helps the person dealing with the persuasive attack (i.e. coping
behavior) and is most commonly a type of resistance (Friestad & Wright, 1994; Campbell &
Kirmani, 2008). Reactance theory argues that people respond negatively when they perceive a
threat of freedom, which can be caused by a persuasive attempt. They do this to restore their
natural desire for freedom (Brehm & Brehm, 1981). Furthermore, resistance can also be
triggered by a concern of deception, which is likely to occur with advertising (Fransen et al.,
2015). Alongside the framework of Fransen et al. (2015) these two motives for resistance (i.e.
GREEN PRODUCT PLACEMENT 13
threat of freedom and concern for deception) make people to contest communications. This
negative reaction to persuasive communication (i.e. product placement) will probably lead to
negative evaluations of the advertising.
Until now, the factor resistance has not been studied in product placement research
and therefore adding to the field of product placement. So far, only a direct relation between
persuasion knowledge and brand attitude has been investigated. Gibson, Redker and
Zimmerman (2013) showed that the activation of persuasion knowledge negatively affects
brand attitudes. However, the mediating role of resistance is shown in research concerning
advertising in general and native advertising specifically (Wei, 2009; van Reijmersdal et al.,
2016). In addition and based on abundant research into the Persuasion Knowledge Model
(Friestad & Wright, 1994; Campbell & Kirmani, 2008; Fransen et al., 2015), the following
hypotheses were formulated:
H5: A high activation of persuasion knowledge will lead to a higher activation of
resistance than a low activation of persuasion knowledge.
H6: A high activation of resistance will lead to a lower evaluation (i.e. more negative)
of the brand (i.e. brand attitude) than a low activation of resistance.
The persuasive attempt of product placement might become more salient due to a
sponsorship disclosure, which is becoming more and more common. Therefore, the
moderating effect of disclosures will be examined.
Sponsorship Disclosures
The Federal Communications Commission (FCC) that regulates communications by
television and other devices expressed their concern about product placement (Avery &
Ferraro, 2000). They argue that product placement is an unethical technique, because
GREEN PRODUCT PLACEMENT 14
consumers are unaware of its persuasive attempt. Therefore, the FCC strives to inform
consumers about the incorporation of brands (i.e. commercial content) in movies, television
series and shows (i.e. non-commercial content) by placing a logo (mostly an illustration of the
letter “P”) and/ or text (such as “This program contains advertising by […]”) in the upper right
or left corner of the screen. This indication of product placement is called sponsorship
disclosure (Cain, 2011).
Based on the Persuasion Knowledge Model, the recognition of communication as a
persuasive attempt activates the message receiver’s persuasion knowledge which in turn
influences subsequent processes. The disclosure of product placement that is basically directly
pointing to advertising will probably lead to the activation of persuasion knowledge, as it
acknowledges the persuasive attempt of product placement. Research about sponsorship
disclosures of (conventional) product placement confirms that indeed disclosures can lead to
the activation of persuasion knowledge (Boerman et al., 2012; Boerman, van Reijmersdal &
Neijens, 2015; Matthes & Naderer, 2016). For example, Boerman et al. (2012) showed that a
disclosure of six seconds compared to a shorter or no disclosure leads to the activation of
persuasion knowledge.
For green product placement without a sponsorship disclosure it was argued that the
probability that persuasion knowledge gets activated is very low, because people do not
perceive it as advertising. However, when people are made aware of the persuasive intent of
green product placement due to a sponsorship disclosure, it can be expected that they will be
more likely to perceive product placement as advertising. As such activation of their
persuasion knowledge will be more likely. Subsequently, people will resist the persuasive
attempt more which will lead to a lower brand attitude. That process is shown in a study about
online native advertising by van Reijmersdal et al. (2016). The authors demonstrated that
disclosing sponsored content in a blog evokes persuasion knowledge that in turn activates
GREEN PRODUCT PLACEMENT 15
resistance and consequently degrades evaluations (i.e. brand attitude). This leads to the
following hypothesis:
H7: Green product placement will lead to a lower activation of persuasion knowledge
than conventional product placement without a disclosure, but with a disclosure green
product placement will activate as much persuasion knowledge as conventional
product placement.
Study overview
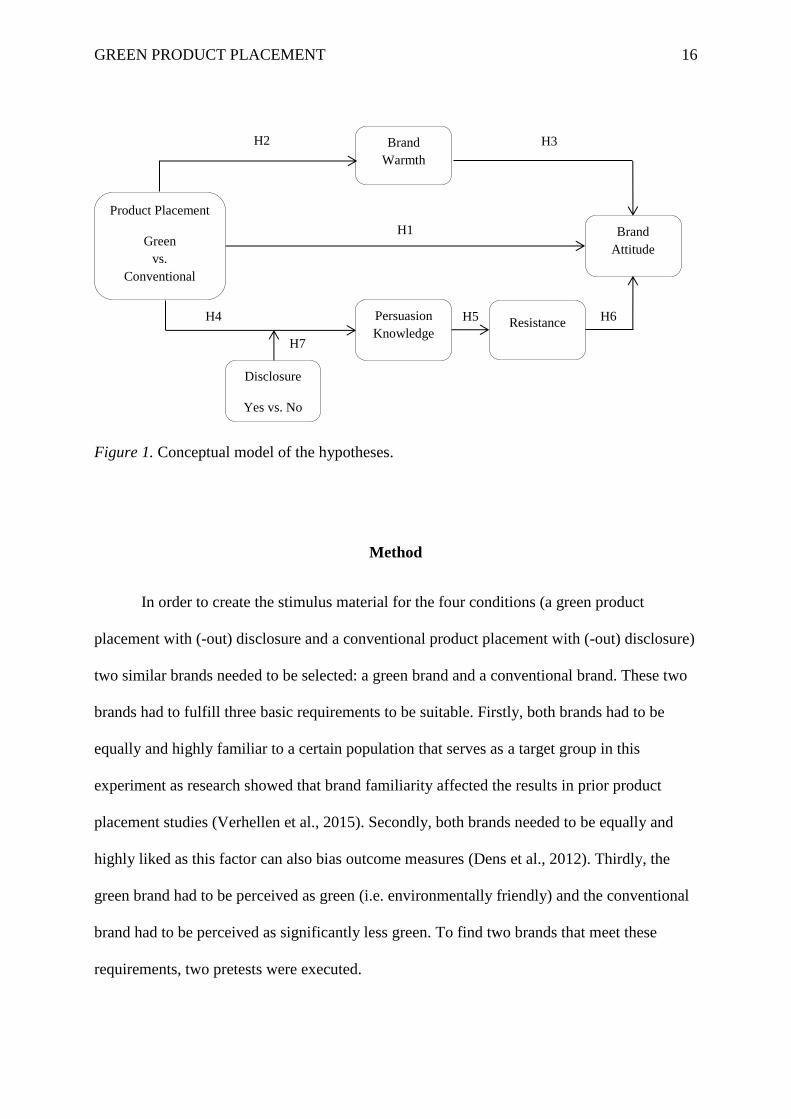
It is assumed that the effect of green product placement versus conventional product
placement on brand attitude takes place via two underlying processes, see Figure 1. On one
hand, green product placement might benefit from a perception of brand warmth in
comparison to conventional product placement. On the other hand, green product placement
might profit from a lower activation of persuasion knowledge, due to the novelty of this
advertising technique and thus evoke less resistance. When a disclosure is incorporated in the
product placement, it is expected that green product placement will activate as much
persuasion knowledge as conventional product placement. However, the perception of brand
warmth will still lead to a higher attitude towards the green brand than the conventional
brand.
GREEN PRODUCT PLACEMENT 16
Figure 1. Conceptual model of the hypotheses.
Method
In order to create the stimulus material for the four conditions (a green product
placement with (-out) disclosure and a conventional product placement with (-out) disclosure)
two similar brands needed to be selected: a green brand and a conventional brand. These two
brands had to fulfill three basic requirements to be suitable. Firstly, both brands had to be
equally and highly familiar to a certain population that serves as a target group in this
experiment as research showed that brand familiarity affected the results in prior product
placement studies (Verhellen et al., 2015). Secondly, both brands needed to be equally and
highly liked as this factor can also bias outcome measures (Dens et al., 2012). Thirdly, the
green brand had to be perceived as green (i.e. environmentally friendly) and the conventional
brand had to be perceived as significantly less green. To find two brands that meet these
requirements, two pretests were executed.
H6 H5
H7
H4
H3 H2
H1
Product Placement
Green
vs.
Conventional
Disclosure
Yes vs. No
Brand
Warmth
Brand
Attitude
Persuasion
Knowledge Resistance
GREEN PRODUCT PLACEMENT 17
Pretest 1
The first pretest had a within-subject design with Brand Type: Green vs. Conventional
as conditions. A sample of 17 participants (Mage = 24.65, SD = 2.09, 82.4% female, 70.6%
German, 29,4% other nationality) was randomly exposed (online) to 20 green and
conventional brands such as beverage brands, cosmetic brands, and grocery store brands.
Participants were asked to answer the following three questions regarding every brand: “Do
you like the brand?”, “Is the brand familiar to you?” and “Do you perceive the brand as
green (environmentally friendly)?” on a 7-point Likert-scale (1 = “Strongly disagree”; 7 =
“Strongly agree”). The results showed that the German refreshment drink brand Bionade
(Mliking = 5.81, SD = 1.05; Mfamiliar = 5.69, SD = 1.92; Mgreen = 5.44, SD = 0.89) and the
German grocery store brand Alnatura (Mliking = 5.35, SD = 1.22; Mfamiliar = 5.88, SD = 2.03;
Mgreen = 6.06, SD = 1.09) scored high on familiarity, liking and greenness within the German
participants. However, none of the other researched brands of the categories refreshment
drink and grocery store scored equally high on familiarity and liking and significantly lower
on greenness (see Table 1). The brands Bionade and Alnatura fulfilled the requirements to
function as a green brand in this present research. However, a second pretest needed to be
done to find a matching conventional brand. It was also decided to restrict the experiment to
German participants, as differences between brands and countries were too big.
Pretest 2
The second pretest also had a within-subject design with Brand Type: Green vs.
Conventional as conditions. The sample consisted of 21 German participants (Mage = 33.24,
SD = 14.63, 66.7% female). Participants were exposed to a selection of 10 brands (five
refreshment drink brands and five German grocery store brands) with the same procedure as
GREEN PRODUCT PLACEMENT 18
in the first pretest. The results of a paired-sample t-test indicated that the refreshment drink
brand Coca Cola (M = 6.19, SD = 1.33) was as familiar as Bionade (M = 6.19, SD = 0.93).
This is shown by a non-significant result, t (20) < .01, p = 1.000, 95% CI [-0.68, 0.68]. The
results also showed that Coca Cola (M = 2.67, SD = 1.28) scored significantly lower on
greenness than Bionade (M = 5.57, SD = 0.93). This is reflected in a significant difference
with a large effect size, t (20) = 7.23, p < .001, 95% CI [2.07, 3.74], d = 2.60. Furthermore, a
non-significant result showed that Coca Cola (M = 5.19, SD = 1.60) scored equally high on
liking as Bionade did (M = 5.67, SD = 0.86), t (20) = 1.39, p = .180, 95% CI [-0.24, 1.19].
The brands Coca Cola and Bionade provided the best match concerning the requirements (see
Table 2) and it was decided to use the brand Coca Cola for the conventional product
placement conditions and Bionade for the green product placement conditions. To increase
the comparability of these two chosen brands to a maximum, liking will be measured in order
to be able to control for it, if necessary.
Stimulus Development
For the purpose of developing the four product placement conditions, a short scene (2
minutes 14 seconds) of the German movie Vaterfreuden was chosen. In the scene a discussion
takes place while some people are sitting around a table. One of the beer bottles standing on
the table was replaced by a Bionade bottle (green conditions) or a Coca Cola bottle
(conventional conditions), see Figure 2. The editing was done by a professional. In the
disclosure conditions the sponsorship disclosure (text and logo) used on German television
was placed in the upper right corner of the screen for 6 seconds, see Figure 3. The
effectiveness of a sponsorship disclosure that consists out of a text and logo and fades in for 6
seconds is supported by product placement research (van Reijmersdal et al., 2012). To
establish stimuli for the four conditions that are highly comparable, it was decided to
GREEN PRODUCT PLACEMENT 19
manipulate one scene instead of using existing scenes with product placement. While using
this method, the factors modality, plot connection and displaying stay equal in all conditions,
which is of great importance as previous research has shown that these influence the effects of
product placement (Russel, 2002; Verhellen et al., 2015). The brands are presented only
visually (modality), were congruent with the plot (plot connection) and showed up 14 times
(displaying frequency).
Previous research showed that people are not always aware of the disclosure, but being
aware is necessary for the disclosure to work as intended (Boerman et al., 2012). Therefore,
the participants in the disclosure conditions were, additionally to the disclosure in the scene,
informed about the sponsored content in the scene with the use of a short text and were
exposed to the sponsorship disclosure logo before watching the scene.
Main Experiment
Participants, Design and Procedure
The design of this research represented a 2 factor (Brand Type: Green vs.
Conventional condition) × (Disclosure: Yes vs. No) between-subject design. Participants (N =
435) were recruited via e-mail or Facebook to take part in the online experiment on the
website Qualtrics. After excluding not completed responses (n = 193), the sample comprised
242 participants (Mage = 41.23, SD = 15.55, 55.8% female).
After opening the link to the experiment, participants were provided with general
information about the experiment and had to give consent to be able to continue. Firstly,
brand liking towards the green and conventional brand was measured to be able to control for
differences. Thereupon, the participants were randomly assigned to one of the four conditions
(green product placement without disclosure vs. conventional product placement without
disclosure vs. green product placement with disclosure vs. conventional product placement
GREEN PRODUCT PLACEMENT 20
with disclosure) and exposed to the corresponding scene. Right after the exposure it was
checked whether participants remembered the placed brand by measuring brand recall and
brand recognition as a manipulation check. Thereupon, participants were asked to rate their
attitude towards the brand (dependent variable). The rating of the dependent variable was
followed by the scales of the expected mediating variables brand warmth, persuasion
knowledge, and resistance. Subsequently, the appropriateness of the manipulation was
checked and participants were asked some questions concerning the scene, so that potential
confounding factors could be controlled for in later analyses if deemed necessary. Finally,
participants were requested to fill in demographics and rate their environmental self-identity
(control variable). Environmental self-identity was taken into account as previous research
showed that this may have a large influence on the effectiveness of green communication
(Nelson & McLeod, 2005). In case randomization was not successful, this could be controlled
for. At the very end, participants received a debriefing in which the purpose of the study was
explained.
Measurements
Brand Liking. First of all, brand liking towards the green brand Bionade and the
conventional brand Coca Cola was measured to be able to control for the small difference in
brand liking that was observed in Pretest 2. To prevent that this measure influenced further
research, 13 filler items were used. This measure included in total 15 items such as “I like the
brand Bionade.” and “I like the brand Haribo.”. Participants were asked to rate the 15 food
brands on a 7-point Likert-scale (1 = “Strongly disagree; 7 = “Strongly agree”). High scores
of brand liking corresponded to more brand liking, whereas low scores corresponded to less
brand liking (M = 4.40; SD = 1.87).
GREEN PRODUCT PLACEMENT 21
Brand Recall. In order to check if participants saw the brand placed in the movie
scene (manipulation check), first of all, brand recall was measured by asking participants to
list every brand that they remembered seeing in the movie scene of Vaterfreuden (Russel,
2002; Boerman et al., 2012). The item was coded with 0 (not recalled) and 1 (correctly
recalled). 81.4% of the participants recalled the brand correctly.
Brand Recognition. Secondly, brand recognition was measured to check if
participants recognized the placed brand in the case they were not able to recall it
(manipulation check) (Russel, 2002). For this purpose participants were exposed to a list of 10
brands (Bionade, Coca Cola and eight filler items) and asked to check the brands they
remembered seeing in the movie scene Vaterfreuden (0 = “No”; 1 = “Yes”). 82.6% of the
participants recognized the brand correctly.
Brand Attitude. The dependent variable was the participant’s attitude towards the
brand (brand attitude) that was placed in the movie scene and was measured with a six 7-point
differential scale: unpleasant/ pleasant, bad/ good, negative/ positive, unfavorable/ favorable,
poor quality/ high quality and dislike/ like (Bruner, 2009). A principal component analysis
(PCA) showed that the six items loaded on 1 factor (eigenvalue 5.07) that explained 84 per
cent of the variance. The reliability of the scale was good, Cronbach’s alpha = .96. Therefore,
the average score of the six items was used to measure this concept (M = 4.44; SD =
1.62).The scale showed to measure brand attitude as intended: the higher participants scored
on brand attitude, the more positive was their attitude toward the brand.
Brand Warmth. The mediator brand warmth is defined as a positive, warm feeling
towards a brand (Aaker et al., 1986) and was measured on a 7-point Likert-scale (1 =
“Strongly disagree”; 7 = “Strongly agree”). The scale which was adapted from Aaker, Vohs
and Mogilner (2010) consisted out of the three following items: “I find that the brand Coca
Cola/ Bionade is warm/ generous/ kind”. A PCA showed that the three items form a uni-
GREEN PRODUCT PLACEMENT 22
dimensional scale, because they all load on 1 factor (eigenvalue 2.43; explained variance =
81.08%). Furthermore, the scale proved to be reliable, Cronbach’s alpha = .88. The average of
the three items formed the index measure for brand warmth (M = 3.47, SD = 1.37): a high
score reflected more brand warmth than a low score.
Persuasion Knowledge. Persuasion knowledge was measured as a mediator. The
concept persuasion knowledge consists of two dimensions: conceptual persuasion knowledge
and attitudinal persuasion knowledge (Rozendaal et al., 2011). The former one is defined as
people’s perception of communication (i.e. product placement) as advertising and can be
measured with a single item: “To what extend was the item about Coca Cola/ Bionade in the
scene of the movie Vaterfreuden advertising?” on a 7-point Likert-scale (1 = “Strongly
disagree”; 7 = “Strongly agree”) (Boerman et al., 2012). A high score on conceptual
persuasion knowledge depicted a greater perception of communication as advertising (M =
5.61; SD = 1.61).
The latter dimension, attitudinal persuasion knowledge, is defined as people’s critical
feelings toward communication (Rozendaal et al., 2011). The following three items formed
the measure for attitudinal persuasion knowledge in this study: “I think the item about Coca
Cola/ Bionade in the scene of the movie Vaterfreuden is honest (reversed)/ trustworthy
(reversed)/ convincing (reversed) and were rated on a 7-point Liker-scale (1 = “Strongly
disagree”; 7 = “Strongly agree) (Boerman et al., 2012). The original scale to measure this
dimension which consisted out of five items was reduced to these three items based on the
results of a PCA: two components were extracted and only by leaving out two items a reliable
scale could be composed The composed scale loaded on 1 factor (eigenvalue 2.46; explained
variance = 81.83%) with a high reliability (Cronbach’s alpha = .89). Participants who reported
a high score on attitudinal persuasion knowledge felt highly critical towards the product
placement (M = 4.55; SD = 1.27).
GREEN PRODUCT PLACEMENT 23
Resistance. The mediator resistance consists of two dimensions: cognitive resistance,
which can be defined as negative cognitions and affective resistance which can be described
as negative feelings (Zuwernik & Cameron, 2003; Knowles & Linn, 2004). Both types of
resistance were measured on a 7-point Likert-scale (1 = “Strongly disagree”; 7 = “Strongly
agree”). The former, cognitive resistance, included the following four items: “While viewing,
I contested/ refuted/ doubted/ countered the information in the scene of the movie
Vaterfreuden.” (Zuwernik & Cameron, 2003). Based on a PCA, it could be concluded that the
scale was unidimensional (eigenvalue 3.43; explained variance = 85.75). Besides that, it was
reliable, Cronbach’s alpha = .94. Participants who scored high showed more cognitive
resistance towards the product placement than participants that scored low (M = 3.21, SD =
1.48).
The latter, affective resistance, was measured as well with four items: “While watching
the scene of the movie Vaterfreuden I felt angry/ enraged/ irritated/ annoyed.” (Zuwernik &
Cameron, 2003). By executing a PCA, one component was extracted (eigenvalue 3.41) that
explained 85 per cent of the variance. Reliability of this scale was also good, Cronbach’s
alpha = .94. Participants who reported a high affective resistance were reflected by a higher
score on this variable (M = 2.62, SD = 1.50). Because of a strong positive association between
these two components (r = 0.52, p < .001) the average score of cognitive resistance and
affective resistance was used to measure the concept resistance (M = 2.89, SD = 1.30).
Greenness of the Brand. It was measured whether participants who were in the green
product placement conditions perceived the green brand (Bionade) as green and whether
participants who were in the conventional product placement conditions perceived the
conventional brand (Coca Cola) as less green: on a 7-point Likert-scale (1 = “Not green”; 7 =
“Green”). The perceived greenness of the brands was measured to check for the manipulation
of the factor brand type. A high score reflected the perception of a brand as green (M= 3.72,
SD = 1.89).

GREEN PRODUCT PLACEMENT 24
Disclosure. Furthermore, the manipulation of the factor disclosure was checked. This
was done to ensure that participants who were in the disclosure conditions also recognized
seeing the disclosure. For this purpose participants were asked if they saw the particular
sponsorship disclosure in the movie scene Vaterfreuden (1 = “Yes”, 2 = “No” and 3 = “No
idea”).
Movie Liking. Because prior research showed that context variables such as how
much one likes the movie scene can bias participants’ responses (van Reijmersdal, Smit &
Neijens, 2010), movie liking was measured with the following scale (out of seven items): “I
enjoyed watching the scene of the movie Vaterfreuden”, “I don’t regret watching [… ]”, “I’m
glad I saw […]”, “I like the story of […]”, “The acting in […] is good”, “[…] is a good movie
scene” (Dens et al., 2012). Participants were asked to rate these items on a 7-point Likert-
scale (1 = “Strongly disagree”; 7 = “Strongly agree”). The seven items formed a reliable scale
(eigenvalue 4.89; extracted variance = 69.83%; Cronbach’s alpha = .93). A high average
score on the scale represented a great liking of the movie scene of Vaterfreuden (M = 4.23;
SD = 1.34).
Movie Seen Before. Also a prior exposure to the movie and thereby to the movie
scene could influence the participant’s responses (Russel, 2002). Therefore, participants were
asked if they had seen the movie before (1 = “Yes”, 2 = “No” and 3 = “No idea”).
Movie Mood. A third factor concerning the movie scene itself that could affect other
measures is the genre of the movie (Van Reijmersdal et al., 2010). For this reason participants
were asked to rate how they perceived the mood of the movie scene (1 = “Sad”; 5 = “Funny”).
A low rating reflected the perception of a tragedy and a high rating reflected the perception of
a comedy (M = 2.92; SD = 1.05).
GREEN PRODUCT PLACEMENT 25
Demographics. The standard demographic variables gender, age, nationality and
education were recorded as well.
Environmental Self-Identity. By reason of prior research about green brands that
showed a possible influence of how environmentally conscious a person is, the concept
environmental self-identity was included (do Paço & Reis, 2012; Grimmer & Woolley, 2014).
This last scale of this experiment consisted of the three following items: “Acting
environmentally friendly is an important part of who I am.”, “I am the type of person who acts
environmentally friendly.”, “I see myself as an environmentally friendly person.” on a 7-point
Likert-scale (1 = “Strongly disagree”; 7 = “Strongly agree”). This scale was used in research
by van der Werff, Steg and Keizer (2013) and showed to be a reliable measure of the concept
environmental self-identity (eigenvalue 2.35; explained variance = 78.23; Cronbach’s alpha =
.84). The scores on the three items were thus taken together: the higher the score, the higher
the participants’ environmental self-identity (M = 5.09, SD = 0.88).
Results
Manipulation Checks
Brand memory. Seventeen percent of the participants (n = 42) who were exposed to
one of the four conditions did not recognized the brand placed in the movie scene. As brand
recognition and recall were significantly and very strongly correlated (r = 0.90, p < .001), it
was decided that the results of brand recognition will function as an indicator for brand
memory in this study (Russel, 2002). Based on the aim of the present study to compare
different brands (green versus conventional) in product placement, it was decided to exclude
all participants that did not recognized the brand correctly (following Boerman et al., 2012).
Therefore, a sample of N = 200 participants was included.
GREEN PRODUCT PLACEMENT 26
Greenness of the Brand. A one-way analysis of variance was carried out to see if the
brand type was perceived as intended. A large significant effect was found, F (1, 194) =
142.46, p < .001, η² = .423 indicating that participants in the green product placement
conditions were more likely to perceive the brand as green (M = 4.97, SD = 1.42) than
participants in the conventional product placement conditions (M = 2.52, SD = 1.45). Thus the
manipulation of the brand type was successful.
Disclosure. Despite the implementation of an explicit disclosure, 38,5% of the
participants (n = 45) who were assigned to one of the two disclosure conditions stated not to
have seen a disclosure. As the recognition of the disclosure is critical for the effects, it was
decided to exclude these participants in the analyses which left a sample of N = 155
participants (following Boerman et al., 2012).
Confounding Variable Analyses
To check for confounding variables the measured control variables were correlated
with the mediators and dependent variable, see Table 3. Brand liking was positively correlated
with brand warmth (r = 0.52, p < .001), negatively correlated with attitudinal persuasion
knowledge (r = -0.24, p = .003), and positively correlated with brand attitude (r = 0.79, p <
.001). Next, results showed that movie liking was negatively correlated with attitudinal
persuasion knowledge (r = -0.29, p < .001) and with resistance (r = -0.45, p < .001). Whether
people have seen the movie before was negatively correlate with brand warmth (r = -0.18, p =
.029). Furthermore, movie mood showed to be negatively correlated with attitudinal
persuasion knowledge (r = -0.19, p = .025), and positively correlated with brand warmth (r =
0.17, p = .041). The results also showed that the older the participants were, the lower the
participants scored on brand warmth (r = -0.20, p = .014) and brand attitude (r = -0.17, p =
GREEN PRODUCT PLACEMENT 27
.035). Lastly, a negative correlation between environmental self-identity and brand attitude
was found (r = -0.16, p = .049).
Randomization Check
For the control variables that correlated significantly with the dependent variable or
mediators, a randomization check was executed to test if they need to be controlled for in the
main analyses. A two-way analysis of variance was conducted to check if the brands were
equally liked in all conditions. The analysis showed that the brands were not equally liked in
the two product placement conditions (green versus conventional), indicated by a small
significant effect F (1, 149) = 6.99, p = .009, η2 = .05. No significant difference was found for
the disclosure conditions, F (1, 149) = 0.82, p = .367 and the interaction was not significant
either, F (1, 149) = 0.07, p = .798. Participants who were exposed to the green product
placement were already more likely to indicate that they like the brand (Bionade) upfront
more (M = 4.88, SD = 1.43) than participants who were exposed to the conventional product
placement (Coca Cola) (M = 4.08, SD = 2.10). Whether participants were exposed to a
product placement with disclosure (M = 4.65, SD = 1.87) or without disclosure (M = 4.32, SD
= 1.81) was not affected by brand liking. In the following analyses brand liking will be used
as a covariate to control for the difference between conditions concerning brand type.
A two-way analysis of variance for movie liking showed no significant effects
between conditions. There was no significant effect of brand type, F (1, 149) = 0.42, p = .520,
nor of disclosure, F (1, 149) = 0.19, p = .664. The interaction between brand type and
disclosure was marginally significant, F (2, 149) = 3.41, p = .067, η2 = .02. The effect was
small. The participants liked the movie equally in all conditions (green product placement (M
= 4.08, SD = 1.24), conventional product placement (M = 4.21, SD = 1.41), with disclosure
GREEN PRODUCT PLACEMENT 28
(M = 4.09, SD = 1.43), without disclosure (M = 4.20, SD = 1.32)), thus there was no need to
control for movie liking.
To check if there was need to control for whether participants had seen the movie
before or not, a chi-square test was executed. The results showed that out of 74 participants in
the green product placement condition, 10 (11.8%) had seen the movie before and out of 76
participants in the conventional product placement condition 18 (13.5%) had seen the movie
before which reflects no significant difference between the brand type conditions, χ² (1) =
0.67, p = .412. A second chi-square test for the disclosure conditions showed that out of 70
participants in the disclosure condition 11 (11.2%) had seen the movie before and out of 80
participants in the non-disclosure condition 13 (12,8%) had seen the movie before. This was
also reflected in a non-significant result, χ² (1) = 0.01, p = .929. As these two analyses
showed, there was no need to control for a possible prior exposure to the movie.
A second variable that needed to be checked for randomization regarding the movie
was movie mood. Therefore, a two-way analysis of variance for movie mood with brand type
and disclosure as independent variables was executed. The results indicated no significant
effects for brand type, F (1, 145) = 0.07, p = .791, nor for disclosure, F (1, 145) = 1.44, p =
.232, nor for the interaction, F (2, 145) = 0.42, p = .518. Thus, in both brand type conditions
(green (M = 2.97, SD = 1.05) versus conventional (M = 2.93, SD = 1.10)) and in both
disclosure conditions (yes (M = 2.84, SD = 1.09) versus no (M = 3.05, SD = 1.06)) the
perception of movie mood did not differ significantly, which indicated that there was no need
to control for movie mood.
Furthermore, the results of a two-way analysis of variance for age revealed no
significant effects for brand type, F (1, 146) = 0.08, p = .773, and disclosure, F (1, 146) =
2.21, p = .140, nor for the interaction, F (2, 146) = 1.33, p = .250. As for the green product
placement conditions (M = 39.27, SD = 15.15), conventional product placement conditions (M
= 40.05, SD = 14.38), disclosure conditions (M = 37.75, SD = 14.29), and no disclosure
GREEN PRODUCT PLACEMENT 29
conditions (M = 41.38, SD = 14.72) was the average age the same, there was no need to
control for the variable age.
The last randomization check was aimed to check for the variable environmental self-
identity. The results of a two-way analysis of variance showed that brand type had a
significant effect (small) on environmental self-identity, F (1, 149) = 5.04, p = .026, η2 = .03.
The effect of disclosure was not significant, F (1, 149) = 0.33, p = .566, neither the interaction
effect, F (2, 149) = 0.19, p = .663. By evaluating the mean scores, one could see that
participants who were exposed to a green product placement had a higher rating of
environmental self-identity (M = 5.19, SD = 0.75) compared to participants who were exposed
to a conventional product placement (M = 4.90, SD = 0.90). There was no difference between
in scores, depending on the disclosure conditions (yes (M = 5.01, SD = 0.88) versus no (M =
5.07, SD = 0.80)). The former difference could be due to a priming effect: participants saw
themselves as more green, because they had seen a green brand (Bionade). In addition to this
alternative explanation for the effect of brand type on environmental self-identity, a former
test showed that environmental self-identity is only correlated with the dependent variable
brand attitude, but not with the assumed mediators. These aspects led to the decision, that
there is no need to control for environmental self-identity.
To sum up, the randomization check showed that there is a need to control for brand
liking, but none of the other variables. While controlling for brand liking the upfront more
positive evaluation of a green brand in comparison to a conventional brand will not explain
the results of the main analyses. Therefore, the results can be ascribed to the effect of using
different brand types (green versus conventional) in product placement.
GREEN PRODUCT PLACEMENT 30
Main Analyses
Brand Type on Brand Attitude. In order to test Hypothesis 1 which stated the
hypothesized main effect of brand type in product placement on brand attitude, a one-way
analysis of covariance was conducted. The results indicated that brand type has a medium
strong significant effect on brand attitude, F (1, 149) = 27.98, p <.001, ηp2 = .16. The
covariate brand liking also significantly influenced participants’ brand attitude, F (1, 149) =
240.55, p < .001, ηp2 = .62. This effect was large. Due to the results, Hypothesis 1 was
supported: the placement of a green brand (Bionade) (M = 4.85, SD = 0.11) led to a higher
(i.e. more positive) brand attitude than the placement of a conventional brand (Coca Cola) (M
= 4.06, SD = 0.10).
Brand Type on Brand Warmth. Furthermore, a one-way analysis of covariance was
executed to test whether distinct brand types in product placement lead to distinct perceptions
of brand warmth (Hypothesis 2). The results showed a significant (small) effect on brand
warmth, F (1,150) = 6.93, p = .009, ηp2 = .04, and a significant (medium) effect on the
covariate brand liking, F (1, 150) = 46.03, p < .001, ηp2 = .24. As expected, green brands in
product placement are perceived as warmer (M = 3.76, SD = 0.13) than conventional brands
in product placement (M = 3.28, SD = 0.13).
Brand Warmth on Brand Attitude. It was further hypothesized that the perception
of brand warmth directly influences the attitude towards the brand (Hypothesis 3). To assess if
this is indeed the case, a multiple linear regression analysis was computed with brand warmth
and brand liking as predictors and brand attitude as dependent measure. Indicated by
significant results, F (2, 149) = 168.75, p < .001, 69 per cent of the variation in brand attitude
(R² = 0.69) could be predicted by brand warmth (β = 0.31, t = 5.82, p < .001, 95% CI [0.24,
0.50]) and brand liking (β = 0.63, t = 11.88, p < .001, 95% CI [0.45, 0.63]). Thus, Hypothesis
3 was supported: a higher brand warmth is associated with a more positive brand attitude.
GREEN PRODUCT PLACEMENT 31
Brand Warmth Mediation. Hypothesis 3 also entailed that the influence of distinct
brand types in product placement on brand attitude is mediated by brand warmth. Therefore, a
mediation analysis was performed and computed three regression equations. A bootstrapping
analyses with 1000 samples (Preacher & Hayes, 2004) confirmed mediation through brand
warmth (indirect effect = -0.15, SE = 0.07, 95% confidence interval [-0.3355, -0.0401]. Based
on the PROCESS analysis that extracted a significant indirect effect of brand warmth, it could
be concluded that brand warmth mediates the influence of brand type on brand attitude.
Brand Type and Disclosure on Persuasion Knowledge. By the execution of a two-
way analysis of covariance with brand type and disclosure as independent variables,
persuasion knowledge as dependent variable and brand liking as covariate, Hypotheses 4 and
7 were tested. As the concept persuasion knowledge was measured with two distinct scales to
extract attitudinal as well as cognitive persuasion knowledge that were not correlated with one
another (r = 0.13, p = .123), the analysis concerning persuasion knowledge had to be
computed twice.
The first analysis with attitudinal persuasion knowledge as dependent measure
revealed no significant effects of brand type, F (1, 147) = 1.58, p = .211, nor of disclosure, F
(1, 147) = 0.75, p = .387, nor of the interaction between brand type and disclosure, F (2, 147)
= 0.01, p = .907. Solely the covariate brand liking showed to have a significant (small) effect,
F (1, 147) = 6.45, p = .012, ηp2 = .04. Based on these results, Hypotheses 4 and 7 could not be
confirmed with attitudinal persuasion knowledge as dependent measure. Green product
placement did not lead to a lower activation of attitudinal persuasion knowledge (M = 4.46,
SD = 0.15), than conventional product placement (M = 4.72; SD = 0.15) (Hypothesis 4).
Furthermore, the activation of attitudinal persuasion knowledge was not higher when the
product placement was disclosed (M = 4.50; SD = 0.15), than when the product placement
was not disclosed (M = 4.68; SD = 0.14) (Hypothesis 7).
GREEN PRODUCT PLACEMENT 32
The second analysis with conceptual persuasion knowledge as dependent measure
instead of attitudinal persuasion knowledge showed similar results. There was no significant
effect of brand type, F (1, 148) = 0.99, p = .322, nor of disclosure, F (1, 148) = 1.19, p = .278.
Also brand liking did not influence conceptual persuasion knowledge, F (1, 148) = 0.78, p =
.379. However, there was a marginally significant (small) interaction effect, F (2, 1478) =
3.46, p = .065, ηp2 = .02. There were no differences in the activation of conceptual persuasion
knowledge between the four conditions (green product placement (M = 5.67, SD = 0.18),
conventional product placement (M = 5.92; SD = 0.18), disclosure (M = 5.66; SD = 0.18), and
no disclosure (M = 5.93; SD = 0.17).
In sum, the results of these two analysis concerning persuasion knowledge did not
confirm the hypothesized effect that green product placement will lead to a lower activation
of persuasion knowledge than conventional product placement (Hypothesis 4). In addition, the
hypothesized effect that due to a disclosure green product placement will activate a similar
amount of persuasion knowledge than conventional product placement could also not be
confirmed (Hypothesis 7).
Persuasion Knowledge and Resistance. It was predicted that the activation of
persuasion knowledge subsequently leads to resistance (Hypothesis 5). This prediction was
tested with a multiple linear regression analysis. Firstly, attitudinal persuasion knowledge and
brand liking were used as predictors for resistance. The model was significant, F (2,149) =
4.10, p = .018, but explained only 5 per cent of the variance (R² = 0.05). Attitudinal
persuasion knowledge predicted resistance, β = 0.24, t = 2.86, p = .005, 95% CI [0.07, 0.39],
but brand liking did not, β = 0.04, t = 0.53, p = .597. Thus, Hypothesis 5 can be supported (for
attitudinal persuasion knowledge): a higher activation of attitudinal persuasion knowledge
leads to more resistance among participants than a lower activation of attitudinal persuasion
knowledge.
GREEN PRODUCT PLACEMENT 33
Secondly, the same analysis was performed, but instead of using attitudinal persuasion
knowledge as a predictor, conceptual persuasion knowledge was used as a predictor for
resistance. The model was not significant, F (2,150) = 0.46, p = .630, so resistance could not
be predicted by conceptual persuasion knowledge, β = 0.08, t = 0.95, p = .346, and also not by
brand liking, β = -0.02, t = -0.22, p = .828.
To sum up, attitudinal persuasion knowledge led to resistance, but conceptual
persuasion knowledge did not. Hypothesis 5 could only be partly confirmed.
Resistance and Brand Attitude. As a consequence of a higher degree of resistance, it
was hypothesized that the evaluation of brand attitudes would decrease (Hypothesis 6). To
test Hypothesis 6, a multiple linear regression analysis was executed. The results of the
analysis showed that the model was significant, F (2, 149) = 125.57, p < .001 and explained
63 per cent of the variance (R² = 0.63). Surprisingly, the variation could not be explained by
resistance, β = -0.06, t = -1.17, p = .245, but by brand liking, β = 0.79, t = 15.79, p < .001,
95% CI [0.60, 0.77]. Based on these results, Hypothesis 6 was rejected: more resistance did
not lead to a lower brand attitude than less resistance.
Conclusion and Discussion
The present study aimed answering the following research question: What is the
influence of green product placement versus conventional product placement on consumer’s
attitude towards the brand? How do warmth, persuasion knowledge, and resistance mediate
this relationship? And how does sponsorship disclosure moderate the effect of the mediators
persuasion knowledge and resistance on consumer’s attitude towards the brand? In order to
answer these questions seven hypotheses were formulated and tested in an experiment.
Firstly, the results of the main effect and the first path of the model concerning the mediation
GREEN PRODUCT PLACEMENT 34
of brand warmth will be discussed. After that the second path of the model, which predicted a
mediation by persuasion knowledge and resistance and a moderation by disclosure, will be
discussed.
The first hypothesized path of the model was fully supported by the results of the
current study. This regards Hypotheses 1 to 3. The results showed that green product
placement indeed leads to a higher brand attitude than conventional product placement
(Hypothesis 1). The green brand Bionade was better liked than the conventional brand Coca
Cola after being exposed to these brands in a product placement. This is in line with green
advertising research that showed a positive brand attitude towards green brands that use
advertising (Schuhwerk & Lefkoff-Hagius, 1995; Kong & Zhang, 2013; Hartmann et al.,
2006; Grimmer & Woolley, 2014; Huang et al., 2014; Nagar, 2015). The present study reveals
that the positive effect of green brands versus conventional brands that is found in traditional
advertising can be extended to the native advertising type of product placement.
Besides the fact that the placement of green brands led to a more positive brand
attitude, the study also showed that green brands are perceived to be warmer than
conventional brands when used in product placement (Hypothesis 2). As hypothesized, the
perception of warmth leads to an increase in brand attitude which confirms Hypothesis 3 that
predicted brand warmth would mediate the effect of brand type on brand attitude. Related to
theory and prior research, the perception of a company as warm due to its engagement in CSR
indeed spills over to the brand and leads to a higher brand warmth of green brands than
conventional brands which is in line with research by Chernev and Blair (2015). The authors
showed that the perception of a company’s goodwill influences consumer’s product
evaluations. Consumers evaluated products of companies that engage in CSR more positively
(i.e. better performing) than products of companies that do not engage in CSR (Chernev &
Blair, 2015). Also Bernritter et al. (2016) showed a similar effect of brand warmth which
indicated to mediate the effect of brand type on behavior. In a social media study they showed
GREEN PRODUCT PLACEMENT 35
that non-profit brands are perceived as warmer than for-profit brands and therefore are more
often “liked” on the social media platform Facebook (Bernritter et al., 2016). To summarize,
the results of the present study regarding the effect of brand type on brand attitude mediated
by brand warmth are in line with prior research and add the insight that this effect also occurs
in the context of product placement.
Concerning the second (lower) path of the assumed model, the hypotheses could be
only partly confirmed by the results. To start, Hypothesis 4 assumed that the use of green
brands in product placement leads to a lower activation of persuasion knowledge than the use
of conventional brands in product placement. The present study showed no support for this
hypothesis. Based on the results, this hypothesized effect was rejected. An explanation for this
contradicting effect might be that the placement of the brand was perceived as very obvious
and therefore also in the green product placement condition persuasion knowledge was
activated. Verhellen et al. (2015) defined a visual placement that is frequently repeated as a
prominent placement that leads to the activation of persuasion knowledge. So, even within the
green product placement conditions, participants did not perceive the product placement as
trustworthy, honest, and convincing and noticed the persuasive attempt. The factor novelty of
the green product placement was thus of less relevance. However, this might be more relevant
when using a placement that is less frequently repeated and therefore unobtrusive.
Subsequently, it was tested if persuasion knowledge and resistance have a positive
relationship and this was indeed the case which supported Hypothesis 5. A higher activation
of attitudinal persuasion knowledge led to more resistance than a lower activation of
attitudinal persuasion knowledge. This result matches with the Persuasion Knowledge Model
that assumes that due to an activation of persuasion knowledge coping behaviors such as
resistance are activated (Friestad & Wright, 1994; Campbell & Kirmani, 2008).
Interestingly, conceptual persuasion knowledge was not related to resistance, nor to
attitudinal persuasion knowledge - which was tested in an additional correlation analysis. The
GREEN PRODUCT PLACEMENT 36
lacking relation of conceptual persuasion knowledge with resistance and attitudinal
persuasion knowledge could be due to how people define advertisement. In the experiment
participants were asked to what extend they perceive the item about the brand (Coca Cola or
Bionade) as advertising. As product placement is native advertising and not a common type of
advertising such as traditional print advertising, participants might not have defined product
placement as adverting as they rather associate traditional types of advertising with the word
advertising. Dahlén and Edenius (2007) support this reasoning by a study that compared
traditional advertising with non-traditional types of advertising such as advertorials. The
enhanced persuasiveness of non-traditional advertising was explained by the fact that non-
traditional types of advertising is less perceived as advertising compared to traditional types
of advertising because the boundaries with the surrounding content are less clear (Dahlén &
Edenius, 2007).
Hypothesis 6 was rejected based on the results: more resistance did not lead to a more
negative brand attitude than less resistance. An explanation for this effect could be the
influence of brand warmth on brand attitude. The upper path of the model, as well as the
lower path of the model, influence both attitudes towards the brand. Due to a green product
placement and therefore the perception of brand warmth, the green brand was evaluated
positively. The positive brand attitude due to the process of the upper path might have
extinguished the expected negative effect of resistance on brand attitude (lower path).
Lastly, the hypothesized effect concerning a moderation of disclosure was not
confirmed (Hypothesis 7). It was assumed that green product placement leads to a lower
activation of persuasion knowledge than conventional product placement, when there is no
implementation of disclosures. However, the integration of disclosures will offset the benefit
of green product placement compared to conventional product placement, due to its novelty.
And this will lead to a similar activation of persuasion knowledge not matter whether the
brand used in product placement is a green brand or a conventional brand. This expected
GREEN PRODUCT PLACEMENT 37
moderation effect of disclosure was not found. There was no difference in persuasion
knowledge when the product placement was disclosed or not. Here, the same explanation as
for the lacking effect of an influence of brand type on persuasion knowledge could serve: due
to the frequency of displaying the brand, the persuasive attempt was highly obvious to the
participants. Therefore, participants also perceived the scene as highly persuasive when it was
not disclosed. This result is not in line with the research by van Reijmersdal et al. (2016)
where an effect of disclosure on persuasion knowledge in online native advertising was found.
These contradicting effects of the prior study and the study by van Reijmersdal et al. (2016)
could be explained by the difference in advertising types. Product placement, as well as online
advertising in a blog belongs to the category native advertising. Nevertheless, this does not
mean that these two types of advertising are the same in all aspects. In the online native
advertising, the brand was only mentioned once in the blog post, while in the product
placement of the present study the brand was shown 14 times. The difference in prominence,
with online native advertising as less obtrusive than product placement, could serve as an
explanation for the different results.
Managerial Implications
The present study provides some managerial implications. To start, the results of this
study can add some value to the discussion about sponsorship disclosures. The FCC strives
for disclosing product placement to protect the consumer against subtle persuasion attempts.
As the effects did not vary based on a disclosure in the sense that product placement activated
the same amount of persuasion knowledge regardless of disclosures, it can be assumed that a
consumer is already aware of the persuasive attempt. Thus, when a brand is frequently placed
there is no need for a disclosure. The concern about disclosing product placement might be
more relevant for subtle forms of product placement.
GREEN PRODUCT PLACEMENT 38
Secondly, the investigation of the perception of warmth towards green brands when
used in product placement and the subsequent increase in brand attitude shows that green
product placement might have the power to trigger changes in our society. With the
advertising technique green product placement positive attitudes towards green brands can be
achieved. One can assume that this is a first step into the right direction that aims at more
positive evaluation of green products compared to conventional products. As a positive
attitude towards a brand is a requirement for subsequent behavior such as purchase behavior,
one can conclude that green product placement strengthens environmental conscious
behavior.
Limitations and Future Research
Every study has its limitations such as the present study. Due to a great difference
between countries and familiarity with certain green and conventional brands, this study was
executed within the German population. However, the results might be different for example
within the United States and United Kingdom, as product placement is in these countries more
common than in Germany (Sauer, 2016). Therefore, it is suggested to replicate the study
among other populations, especially in the United States and United Kingdom.
Furthermore, the study was conducted in an experimental setting. Experimental
settings have the disadvantage that participants know that they are participating in an
experiment and could be therefore more aware of the purpose of the study. This awareness
could affect the responses, thus the results could be biased. In comparison to experimental
settings, natural settings are less vulnerable for these disadvantages. The theatre methodology
is a technique to create natural circumstances when studying product placement (Russel,
2002). Accordingly, it is recommended to study the effects of green product placement by
applying the theatre methodology in future research.
GREEN PRODUCT PLACEMENT 39
With regard to the promotion of environmental friendly behavior as a contribution to
slow down global warming and improve other environmental issues, it is suggested to study
the effect of green product placement on behavioral intentions and actual behavior. A positive
mindset towards green brands is a first step in the right direction, but what counts at the end
are actions.
Lastly, due to no evidence for the expected moderating role of disclosure, besides the
absence of differential effects of green versus conventional product placement on persuasion
knowledge, more insights are needed here. Therefore, it is suggested to compare a more subtle
green product placement (for example a product placement that is displayed less frequently)
with a more obtrusive green product placement.
These suggestions for future research depict only a small selection. As this study was
the first focusing on green product placement, future research can go into many directions.
With this study a great contribution to the literature about green advertising and specifically
for product placement is made as it was shown that green product placement works not only
differently from conventional product placement, but more positively.
Product placement might be a great chance to combine a company’s need for positive
brand attitudes as well as society’s need for an increased use of green products that might be a
way of stopping or at least slowing down the many negative effects of consumption.
GREEN PRODUCT PLACEMENT 40
References
Aaker, D. A., Stayman, D. M., & Hagerty, M. R. (1986). Warmth in advertising:
measurement, impact, and sequence effects. Journal of Consumer Research, 12, 365-
381.
Aaker, J. L., Vohs, K. D., & Mogilner, C. (2010). Nonprofits are seen as warm and for-profits
as competent: firm stereotypes matter. Journal of Consumer Research, 37, 224-237.
Avery, R. J., & Ferraro, R. (2000). Verisimilitude or advertising? Brand appearances on
prime-time television. The Journal of Consumer Affairs, 34, 217-244.
Babin, L. A. (1996). Advertising via the box office: is product placement effective?. Journal
of Promotion Management, 3, 31-52.
Balasubramanian, S. K. (1994). Beyond advertising and publicity: hybrid messages and public
policy issues. Journal of Advertising, 23, 29-46.
Beckwith, N. E., & Lehmann, D. R. (1975). The importance of halo effects in multi-attribute
models. Journal of Marketing Research, 12, 265-275.
Bernritter, S. F., Verlegh, P. W. J., & Smit, E. G. (2016). Why nonprofits are easier to endorse
on social media: the roles of warmth and brand symbolism. Journal of Interactive
Marketing, 33, 27-42.
Boerman, S. C., van Reijmersdal, E. A., & Neijens, P. C. (2012). Sponsorship disclosure:
effects of duration on persuasion knowledge and brand responses. Journal of
Communication, 62, 1047-1064.
Boerman, S. C., van Reijmersdal, E. A., & Neijens, P. C. (2015). Using eye tracking to
understand the effects of brand placement disclosure types in television programs.
Journal of Advertising, 44, 196-207.
Brehm, S. S., & Brehm, J. W. (1981). Psychological Reactance: A Theory of Freedom and
Control. New York: Academic Press.
Bruner, G. C. I. (2009). Marketing scales handbook: a compilation of multi-item measures for
GREEN PRODUCT PLACEMENT 41
consumer behavior & advertising research (5th ed.). Carbondale, IL: GCBII
Productions.
Cain, R. M. (2011). Embedded advertising on television: disclosure, deception and free
speech rights. Journal of Public Policy & Marketing, 30, 226-238.
Campbell, M. C., & Kirmani, A. (2008). I know what you’re doing and why you’re doing it:
the use of the persuasion knowledge model in consumer research. Handbook of
Consumer Psychology, 549-575.
Chernev, A., & Blair, S. (2015). Doing well by doing good: the benevolent halo of corporate
social responsibility. Journal of Consumer Research, 41, 1412-1425.
Dahlén, M. (2005). The medium as contextual cue: effects of creative media choice. Journal
of Advertising, 34, 89-98.
Dahlén, M., & Edenius, M. (2007). When is advertising advertising? Comparing responses to
non-traditional and traditional advertising media. Journal of Current Issues &
Research in Advertising, 29, 33-42.
Davis, K. (1960). Can business afford to ignore social responsibilities?. California
Management Review, 2, 70-76.
Dennis, B., Neck, C. P., & Goldsby, M. (1998). Body shop international: an exploration of
corporate social responsibility. Management Decision, 36, 649-653.
Dens, N., de Pelsmacker, P., Wouters, M., & Purnawirawan, N. (2012). Do you like what you
recognize? Journal of Advertising, 41, 35-54.
Fransen, M. L., Smit, E. G., & Verlegh, P. W. J. (2015). Strategies and motives for resistance
to persuasion: an integrative framework. Frontiers in Psychology, 6, 1-12.
Friestad, M., & Wright, P. (1994). The persuasion knowledge model: how people cope with
persuasive attempts. Journal of Consumer Research, 21, 1-31.
Gibson, B., Redker, C., & Zimmerman, I. (2013). Conscious and nonconscious effects of
product placement: brand recall and active persuasion knowledge affect brand
GREEN PRODUCT PLACEMENT 42
attitudes and brand self-identification differently. Psychology of Popular Media
Culture. Advanced online publication. doi: 10.1037/a0032594
Green Product Placement (2015). 2013 Summer into autumn report: green product placement.
Retrieved from http://www.greenproductplacement.com/us/2013-summer-into-
autumn-report-green-product-placement/
Grimmer, M., & Woolley, M. (2014). Green marketing messages and consumers’ purchase
intentions: promoting personal versus environmental benefits. Journal of Marketing
Communications, 20, 231-250.
Hackley, C., Tiwsakul, R. A., & Preuss, L. (2008). An ethical evaluation of product
placement: a deceptive practice? Business Ethics: A European Review, 17, 109-120.
Hartmann, P., Ibáñez, V. A., & Sainz, F. J. F. (2006). Green branding effects on attitude:
functional versus emotional positioning strategies. Marketing Intelligence & Planning,
23, 9-29.
Huang, Y., Yang, M., & Wang, Y. (2014). Effects of green brand on green purchase intention.
Marketing Intelligence & Planning, 32, 250-268.
Juwaheer, T. D., Pudaruth, S., & Noyaux, M. M. E. (2012). Analysing the impact of green
marketing strategies on consumer purchasing patterns in Mauritius. World Journal of
Entrepreneurship, Management and Sustainable Development, 8, 36-59.
Karrh, J. A. (1998). Brand placement: a review. Journal of Current Issues & Research in
Advertising, 20, 31-49.
Kervyn, N., Fiske, S. T., & Malone, C. (2012). Brands as intentional agents framework: how
perceived intentions and ability can map brand perception. Journal of Consumer
Psychology, 22, 166-176.
Knowles, E. S., & Linn, J. A. (2004). The importance of resistance to persuasion. In E. S.
Knowles, & J. A. Linn (Eds.), Resistance and persuasion (pp. 3-9). Mahwah, New
Jersey: Lawrence Erlbaum Associates.
GREEN PRODUCT PLACEMENT 43
Kong, Y., & Zhang, A. (2013). Consumer response to green advertising: the influence of
product involvement. Asian Journal of Communication, 23,428-447.
Matthes, J., & Naderer, B. (2016). Product placement disclosures: exploring the moderating
effect of placement frequency on brand responses via persuasion knowledge.
International Journal of Advertising: The Review of Marketing Communication, 35,
185-199.
Nagar, K. (2015). Modeling the effects of green advertising on brand image: investigating the
moderation effects of product involvement using structural equation. Journal of
Global Marketing, 28, 152-171.
Nebenzahl, I. D., & Secunda, E. (1993). Consumer’s attitudes toward product placement in
movies. International Journal of Advertising, 12, 1-11.
Nelson, M. R., & McLeod, L. E. (2005). Adolescent brand consciousness and product
placements: awareness, liking ad perceived effects on self and others. International
Journal of Consumer Studies, 29, 515-528.
Newell, P. & Paterson, M. (2010). Climate capitalism: global warming and the
transformation of the global economy. New York: Cambridge University Press.
Do Paço, A. M. F., & Reis, R. (2012). Factors affecting skepticism toward green advertising.
Journal of Advertising, 41, 147-155.
Perrow, C. (1961). The analysis of goals in complex organizations. American Sociological
Review, 26, 854-866.
Van Reijmersdal, E. A. et al. (2016). Effect of disclosing sponsored content in blogs: how the
use of resistance strategies mediates effects on persuasion. (Not published)
Van Reijmersdal, E. A., Neijens, P. C., & Smit, E. G. (2007). Effects of television brand
placement on brand image. Psychology & Marketing, 24, 403-420.
Van Reijmersdal, E. A., Smit, E., & Neijens, P. (2010). How media factors effect audience
responses to brand placement. International Journal of Advertising, 29, 279-302.
GREEN PRODUCT PLACEMENT 44
Roehm, M. L., Roehm, H. A., & Boone, D. S. (2004). Plugs versus placements: a comparison
of alternatives for within-program brand exposure. Psychology & Marketing, 21, 17-
28.
Rotfeld, H. J. (2006). Understandig advertising clutter and the real solution to declining
audience attention to mass media commercial messages. Journal of Consumer
Marketing, 23, 180-181.
Rozendaal, E., Lapierre, M. A., Van Reijmersdal, E. A., & Buijzen, R. E. (2011).
Reconsidering advertising literacy as a defense against advertising effects. Media
Psychology, 14, 333-354.
Russel, C. A. (2002). Investigating the effectiveness of product placements in television
shows: the role of modality and plot connection congruence on brand memory and
attitude. Journal of Consumer Research, 29, 306-318.
Sauer, A. (2016, February 24th
). Announcing the 2016 brandcameo product placement
awards. Retrieved from http://brandchannel.com/2016/02/24/2016-brandcameo-
product-placement-awards-022416/
Schuhwerk, M. E., & Lefkoff-Hagius, R. (1995). Green or non-green? Does type of appeal
matter when advertising a green product?. Journal of Advertising, 24, 45-54.
Schuldt, J. P., & Hannahan, M. (2013). When good deeds leave a bad taste. Negative
inferences from ethical food claims. Appetite, 62, 76-83.
Schuldt, J. P., & Schwarz, N. (2010). The „organic“ path to obesity? Organic claims influence
caloric judgment and exercise recommendations. Judgment and Decision Marketing,
5, 144-150.
Sheinin, D. A., Varki, S., & Ashley, C. (2011). The differential effect of ad novelty and
message usefulness on brand judgments. Journal of Advertising, 40, 5-18.
Stafford, T. F., & Stafford, M. R. (2002). The advantaged of atypical advertisements for
stereotyped product categories. Journal of Current Issues & Research in Advertising,
GREEN PRODUCT PLACEMENT 45
24, 25-37.
Sutherland, L. A., MacKenzie, T., Purvis, L. A., & Dalton, M. (2010). Prevalence of food and
beverage brands in movies: 1996-2005. Pediatrics, 125, 468-474.
Thorndike, E. L. (1920). A constant error in psychological ratings. Journal of Applied
Psychology, 4, 25-29.
Tutaj, K., & van Reijmersdal, E. A. (2012). Effects of online advertising formats and
persuasion knowledge on audience reactions. Journal of Marketing
Communication,18, 5-18.
Verhellen, Y., Dens, N., & de Pelsmacker, P. (2015). Do I know you? How brand familiarity
and perceived fit affect consumers’ attitudes towards brands placed in movies.
Marketing Letters, 1-11.
Van der Werff, E., Steg, L., & Keizer, K. (2013). It is a moral issue: the relationship between
environmental self-identity, obligation-based intrinsic motivation and pro-
environmental behavior. Global Environmental Change, 23, 1258-1265.
Wei, M. (2009). The influence of persuasion knowledge on consumer response to brands: the
roles of reactance, brand familiarity and self-brand connection. Humanities and Social
Sciences, 70, 262 (Dissertation Abstract)
Wojdynski, B. W. (2016). Native advertising: engagement, deception and implications for
theory. In R. Brown, V. K. Jones & B. M. Wang (Eds.), The new advertising:
Branding, content and consumer relationships in a data-driven, social media era.
Santa Barbara, CA: Praeger/ABC Clio.
Zuwernik, J. J., & Cameron, K. A. (2003). Strategies for resisting persuasion. Basic and
Applied Psychology, 25, 145-161.
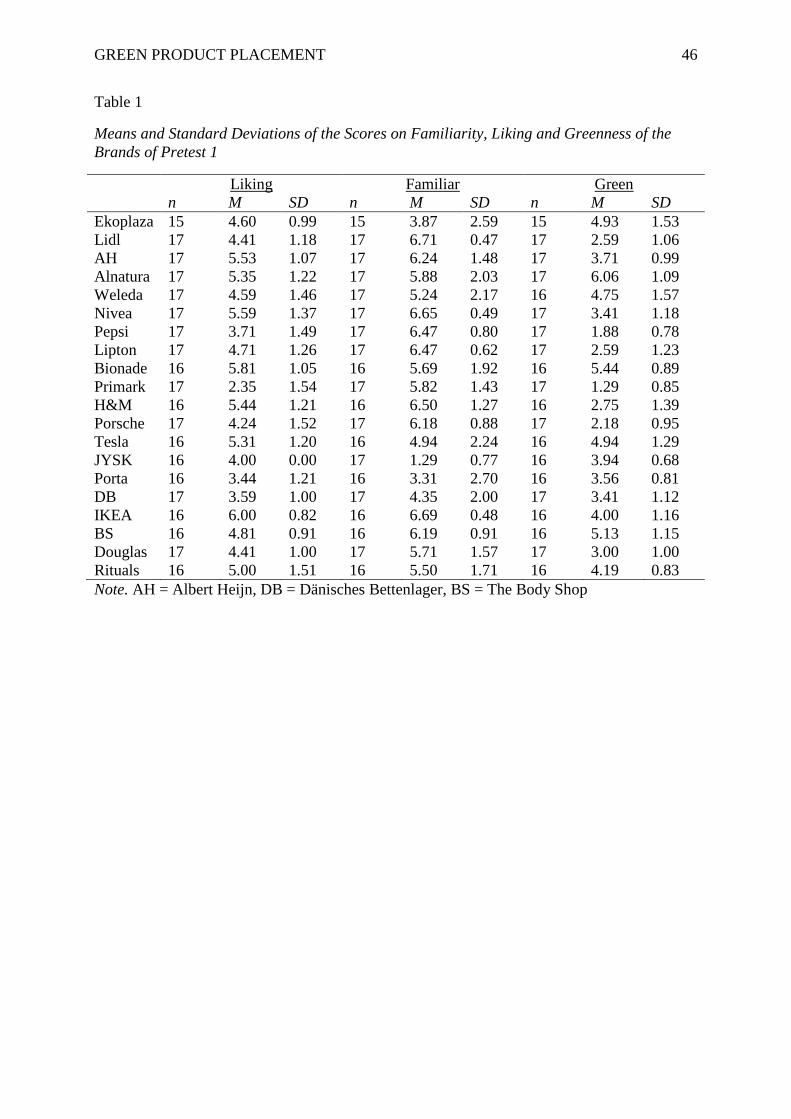
GREEN PRODUCT PLACEMENT 46
Table 1
Means and Standard Deviations of the Scores on Familiarity, Liking and Greenness of the
Brands of Pretest 1
Liking Familiar Green
n M SD n M SD n M SD
Ekoplaza 15 4.60 0.99 15 3.87 2.59 15 4.93 1.53
Lidl 17 4.41 1.18 17 6.71 0.47 17 2.59 1.06
AH 17 5.53 1.07 17 6.24 1.48 17 3.71 0.99
Alnatura 17 5.35 1.22 17 5.88 2.03 17 6.06 1.09
Weleda 17 4.59 1.46 17 5.24 2.17 16 4.75 1.57
Nivea 17 5.59 1.37 17 6.65 0.49 17 3.41 1.18
Pepsi 17 3.71 1.49 17 6.47 0.80 17 1.88 0.78
Lipton 17 4.71 1.26 17 6.47 0.62 17 2.59 1.23
Bionade 16 5.81 1.05 16 5.69 1.92 16 5.44 0.89
Primark 17 2.35 1.54 17 5.82 1.43 17 1.29 0.85
H&M 16 5.44 1.21 16 6.50 1.27 16 2.75 1.39
Porsche 17 4.24 1.52 17 6.18 0.88 17 2.18 0.95
Tesla 16 5.31 1.20 16 4.94 2.24 16 4.94 1.29
JYSK 16 4.00 0.00 17 1.29 0.77 16 3.94 0.68
Porta 16 3.44 1.21 16 3.31 2.70 16 3.56 0.81
DB 17 3.59 1.00 17 4.35 2.00 17 3.41 1.12
IKEA 16 6.00 0.82 16 6.69 0.48 16 4.00 1.16
BS 16 4.81 0.91 16 6.19 0.91 16 5.13 1.15
Douglas 17 4.41 1.00 17 5.71 1.57 17 3.00 1.00
Rituals 16 5.00 1.51 16 5.50 1.71 16 4.19 0.83
Note. AH = Albert Heijn, DB = Dänisches Bettenlager, BS = The Body Shop
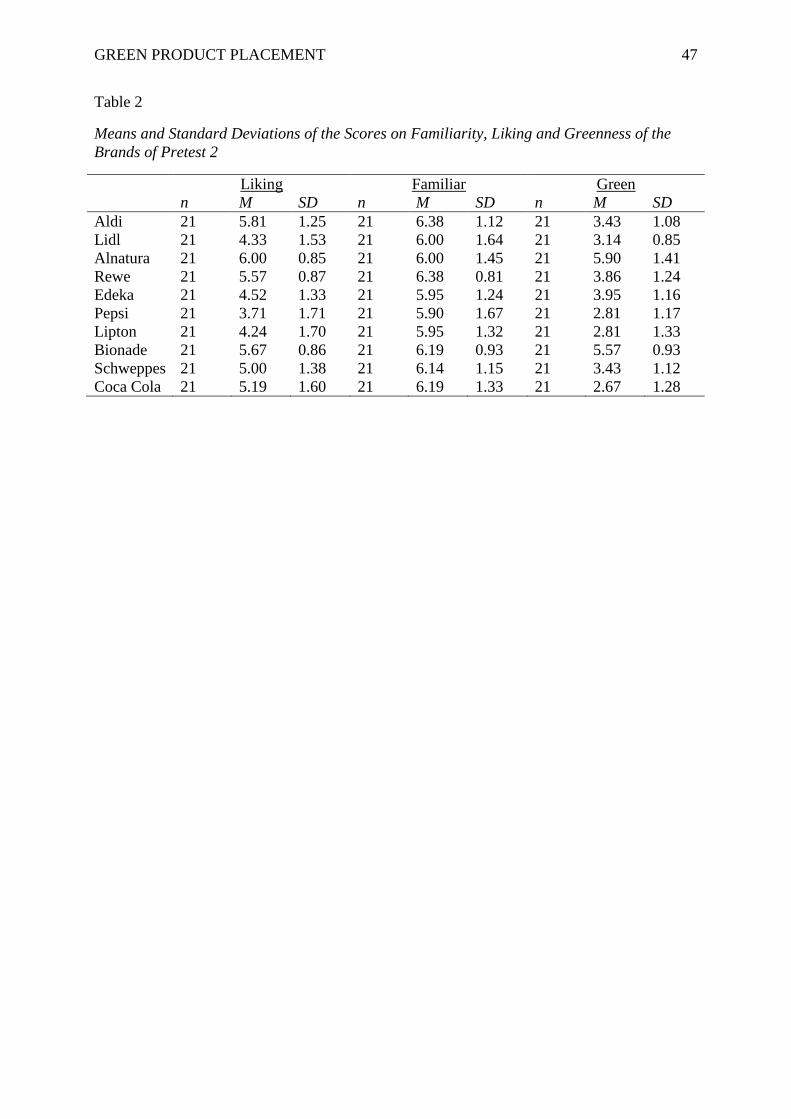
GREEN PRODUCT PLACEMENT 47
Table 2
Means and Standard Deviations of the Scores on Familiarity, Liking and Greenness of the
Brands of Pretest 2
Liking Familiar Green
n M SD n M SD n M SD
Aldi 21 5.81 1.25 21 6.38 1.12 21 3.43 1.08
Lidl 21 4.33 1.53 21 6.00 1.64 21 3.14 0.85
Alnatura 21 6.00 0.85 21 6.00 1.45 21 5.90 1.41
Rewe 21 5.57 0.87 21 6.38 0.81 21 3.86 1.24
Edeka 21 4.52 1.33 21 5.95 1.24 21 3.95 1.16
Pepsi 21 3.71 1.71 21 5.90 1.67 21 2.81 1.17
Lipton 21 4.24 1.70 21 5.95 1.32 21 2.81 1.33
Bionade 21 5.67 0.86 21 6.19 0.93 21 5.57 0.93
Schweppes 21 5.00 1.38 21 6.14 1.15 21 3.43 1.12
Coca Cola 21 5.19 1.60 21 6.19 1.33 21 2.67 1.28
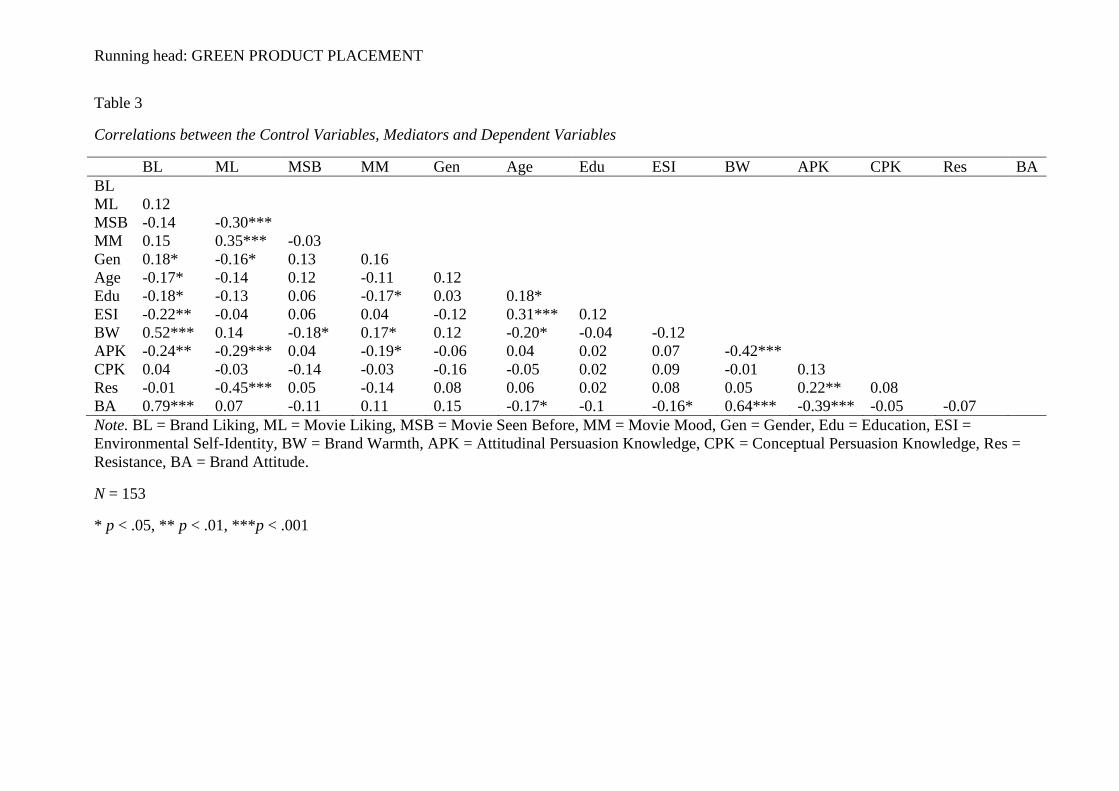
Running head: GREEN PRODUCT PLACEMENT
Table 3
Correlations between the Control Variables, Mediators and Dependent Variables
BL ML MSB MM Gen Age Edu ESI BW APK CPK Res BA
BL
ML 0.12
MSB -0.14 -0.30***
MM 0.15 0.35*** -0.03
Gen 0.18* -0.16* 0.13 0.16
Age -0.17* -0.14 0.12 -0.11 0.12
Edu -0.18* -0.13 0.06 -0.17* 0.03 0.18*
ESI -0.22** -0.04 0.06 0.04 -0.12 0.31*** 0.12
BW 0.52*** 0.14 -0.18* 0.17* 0.12 -0.20* -0.04 -0.12
APK -0.24** -0.29*** 0.04 -0.19* -0.06 0.04 0.02 0.07 -0.42***
CPK 0.04 -0.03 -0.14 -0.03 -0.16 -0.05 0.02 0.09 -0.01 0.13
Res -0.01 -0.45*** 0.05 -0.14 0.08 0.06 0.02 0.08 0.05 0.22** 0.08
BA 0.79*** 0.07 -0.11 0.11 0.15 -0.17* -0.1 -0.16* 0.64*** -0.39*** -0.05 -0.07
Note. BL = Brand Liking, ML = Movie Liking, MSB = Movie Seen Before, MM = Movie Mood, Gen = Gender, Edu = Education, ESI =
Environmental Self-Identity, BW = Brand Warmth, APK = Attitudinal Persuasion Knowledge, CPK = Conceptual Persuasion Knowledge, Res =
Resistance, BA = Brand Attitude.
N = 153
* p < .05, ** p < .01, ***p < .001
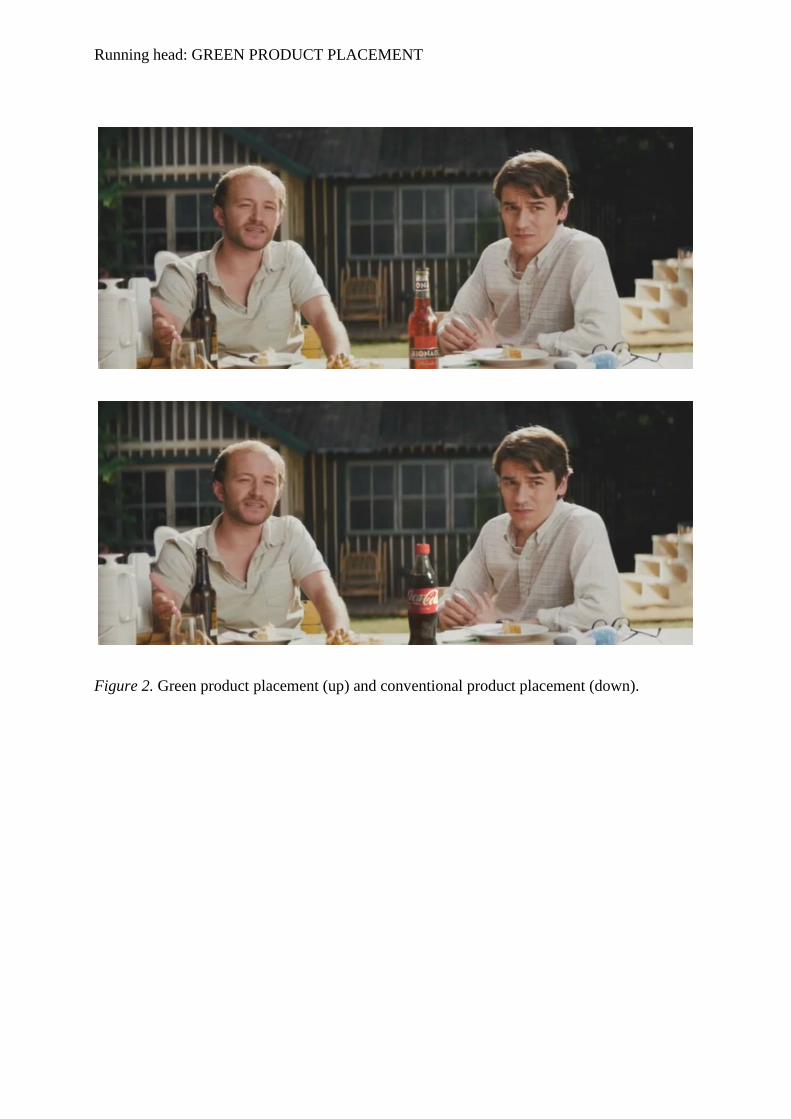
Running head: GREEN PRODUCT PLACEMENT
Figure 2. Green product placement (up) and conventional product placement (down).
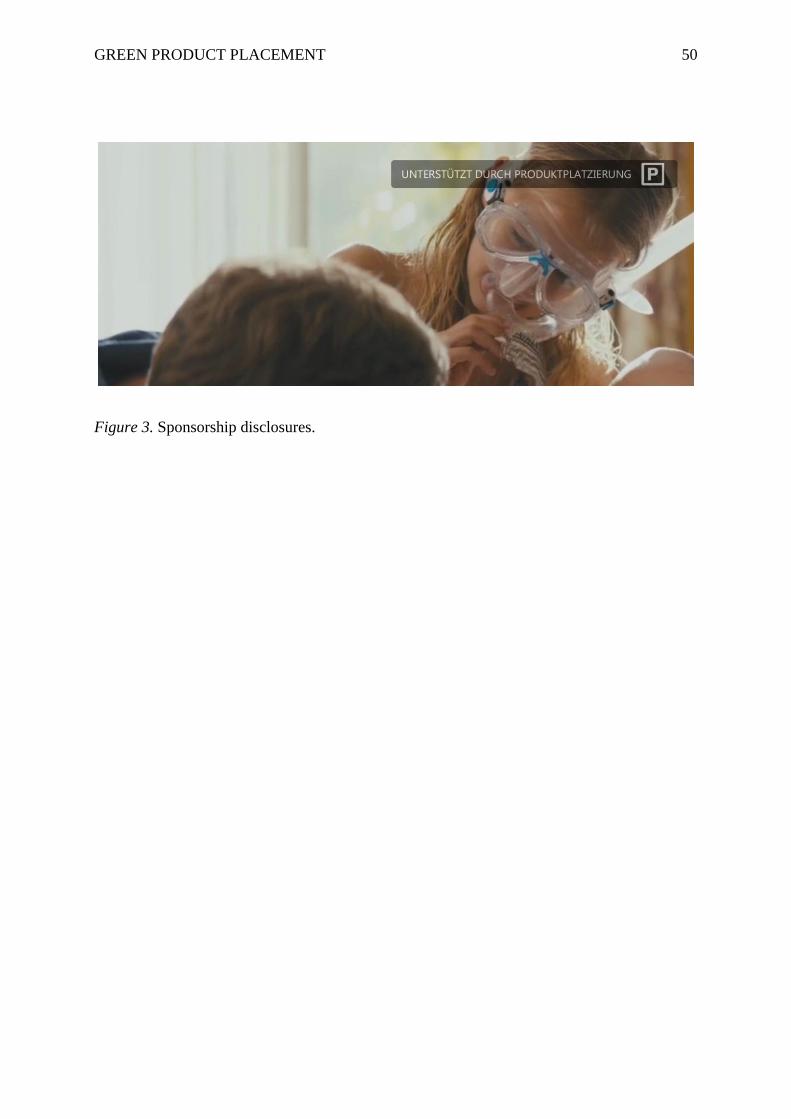
GREEN PRODUCT PLACEMENT 50
Figure 3. Sponsorship disclosures.
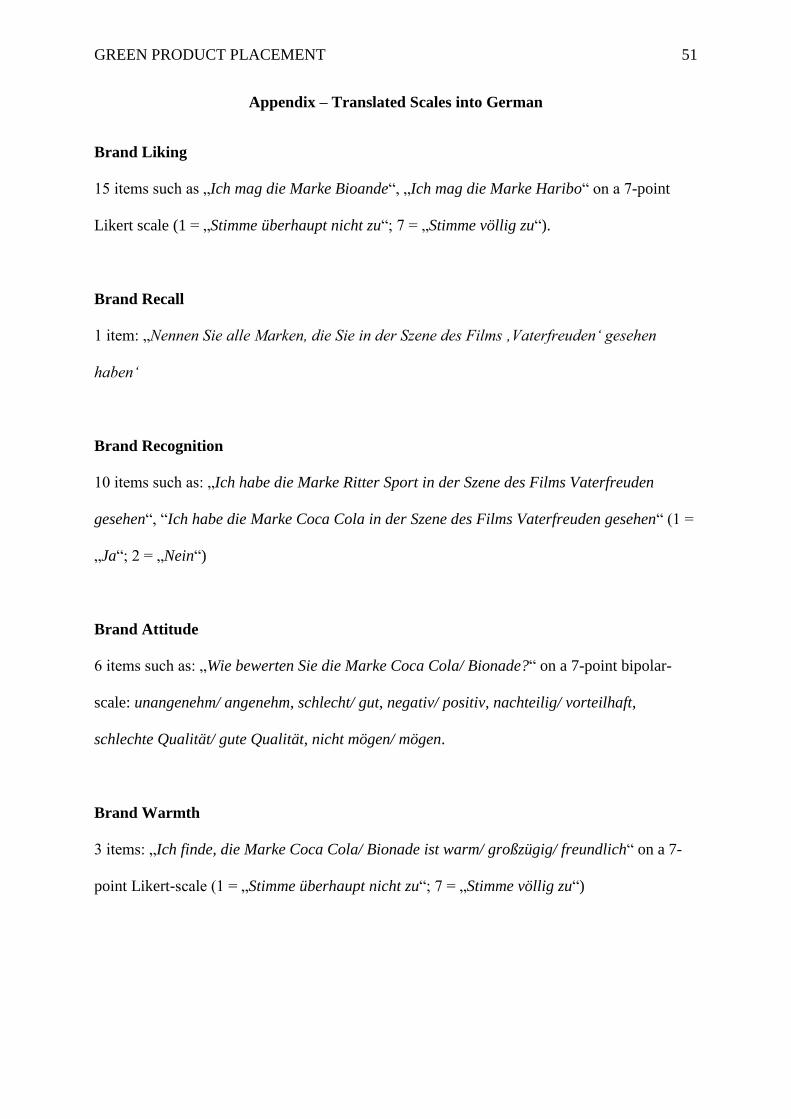
GREEN PRODUCT PLACEMENT 51
Appendix – Translated Scales into German
Brand Liking
15 items such as „Ich mag die Marke Bioande“, „Ich mag die Marke Haribo“ on a 7-point
Likert scale (1 = „Stimme überhaupt nicht zu“; 7 = „Stimme völlig zu“).
Brand Recall
1 item: „Nennen Sie alle Marken, die Sie in der Szene des Films ‚Vaterfreuden‘ gesehen
haben‘
Brand Recognition
10 items such as: „Ich habe die Marke Ritter Sport in der Szene des Films Vaterfreuden
gesehen“, “Ich habe die Marke Coca Cola in der Szene des Films Vaterfreuden gesehen“ (1 =
„Ja“; 2 = „Nein“)
Brand Attitude
6 items such as: „Wie bewerten Sie die Marke Coca Cola/ Bionade?“ on a 7-point bipolar-
scale: unangenehm/ angenehm, schlecht/ gut, negativ/ positiv, nachteilig/ vorteilhaft,
schlechte Qualität/ gute Qualität, nicht mögen/ mögen.
Brand Warmth
3 items: „Ich finde, die Marke Coca Cola/ Bionade ist warm/ großzügig/ freundlich“ on a 7-
point Likert-scale (1 = „Stimme überhaupt nicht zu“; 7 = „Stimme völlig zu“)
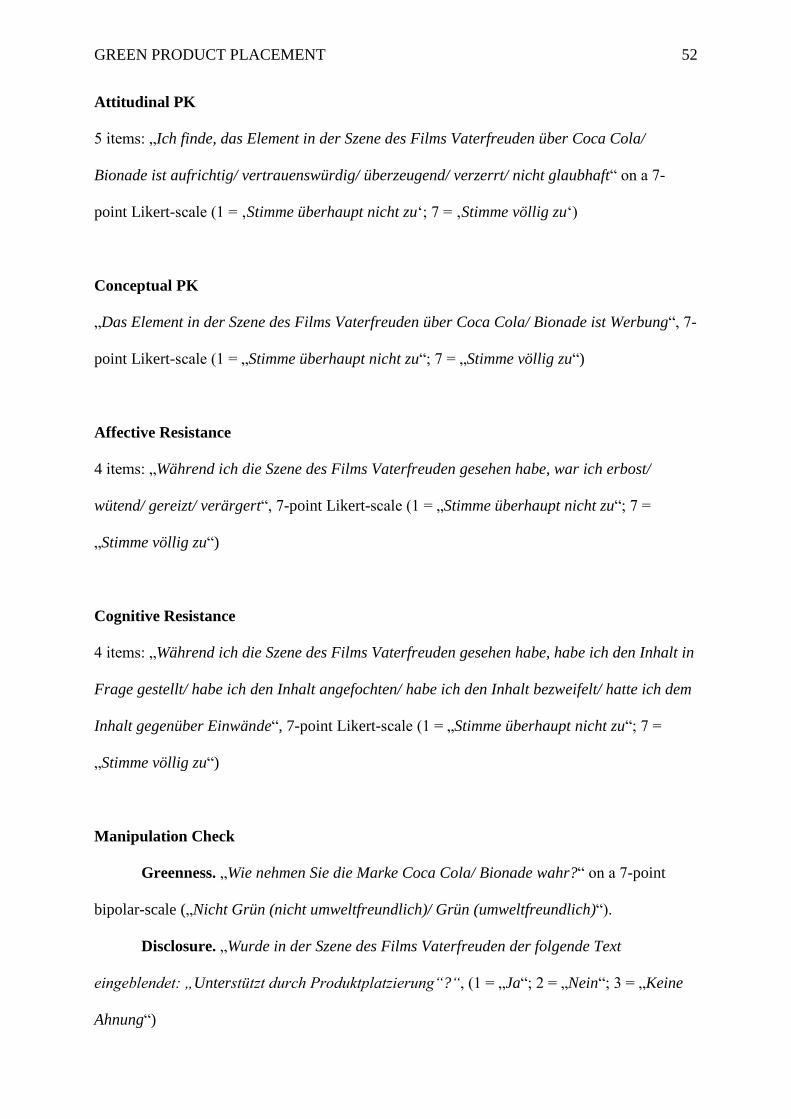
GREEN PRODUCT PLACEMENT 52
Attitudinal PK
5 items: „Ich finde, das Element in der Szene des Films Vaterfreuden über Coca Cola/
Bionade ist aufrichtig/ vertrauenswürdig/ überzeugend/ verzerrt/ nicht glaubhaft“ on a 7-
point Likert-scale (1 = ‚Stimme überhaupt nicht zu‘; 7 = ‚Stimme völlig zu‘)
Conceptual PK
„Das Element in der Szene des Films Vaterfreuden über Coca Cola/ Bionade ist Werbung“, 7-
point Likert-scale (1 = „Stimme überhaupt nicht zu“; 7 = „Stimme völlig zu“)
Affective Resistance
4 items: „Während ich die Szene des Films Vaterfreuden gesehen habe, war ich erbost/
wütend/ gereizt/ verärgert“, 7-point Likert-scale (1 = „Stimme überhaupt nicht zu“; 7 =
„Stimme völlig zu“)
Cognitive Resistance
4 items: „Während ich die Szene des Films Vaterfreuden gesehen habe, habe ich den Inhalt in
Frage gestellt/ habe ich den Inhalt angefochten/ habe ich den Inhalt bezweifelt/ hatte ich dem
Inhalt gegenüber Einwände“, 7-point Likert-scale (1 = „Stimme überhaupt nicht zu“; 7 =
„Stimme völlig zu“)
Manipulation Check
Greenness. „Wie nehmen Sie die Marke Coca Cola/ Bionade wahr?“ on a 7-point
bipolar-scale („Nicht Grün (nicht umweltfreundlich)/ Grün (umweltfreundlich)“).
Disclosure. „Wurde in der Szene des Films Vaterfreuden der folgende Text
eingeblendet: „Unterstützt durch Produktplatzierung“?“, (1 = „Ja“; 2 = „Nein“; 3 = „Keine
Ahnung“)
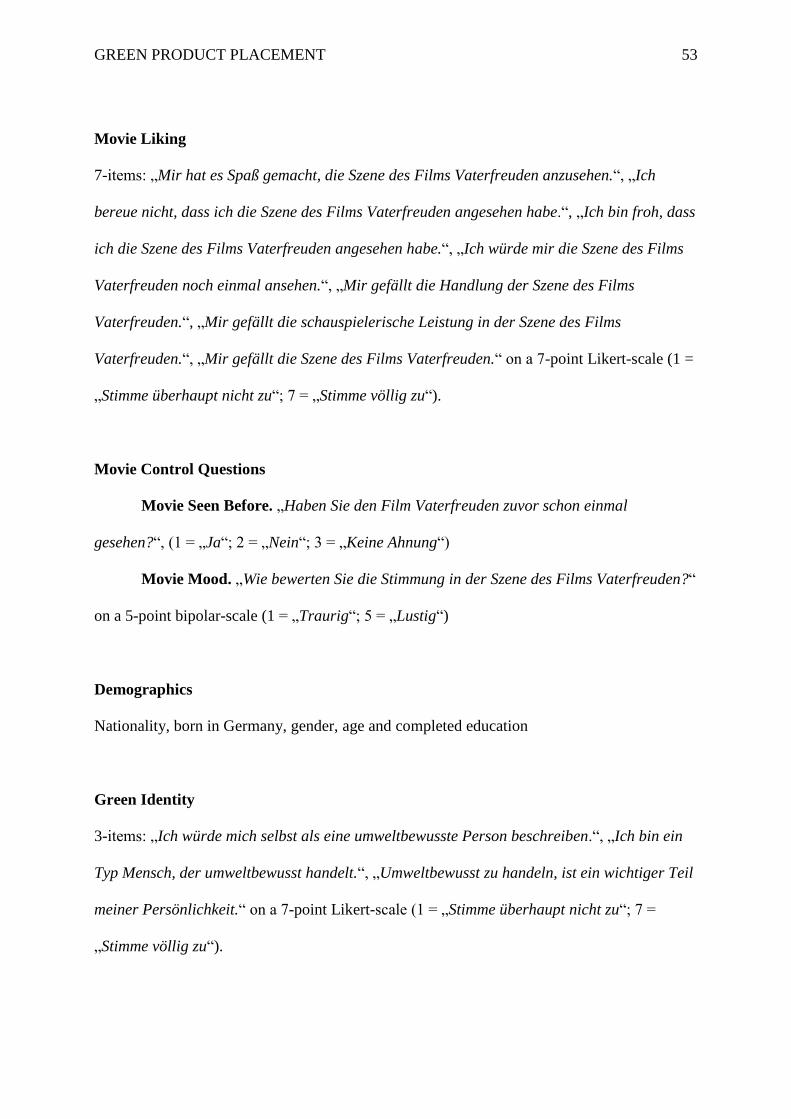
GREEN PRODUCT PLACEMENT 53
Movie Liking
7-items: „Mir hat es Spaß gemacht, die Szene des Films Vaterfreuden anzusehen.“, „Ich
bereue nicht, dass ich die Szene des Films Vaterfreuden angesehen habe.“, „Ich bin froh, dass
ich die Szene des Films Vaterfreuden angesehen habe.“, „Ich würde mir die Szene des Films
Vaterfreuden noch einmal ansehen.“, „Mir gefällt die Handlung der Szene des Films
Vaterfreuden.“, „Mir gefällt die schauspielerische Leistung in der Szene des Films
Vaterfreuden.“, „Mir gefällt die Szene des Films Vaterfreuden.“ on a 7-point Likert-scale (1 =
„Stimme überhaupt nicht zu“; 7 = „Stimme völlig zu“).
Movie Control Questions
Movie Seen Before. „Haben Sie den Film Vaterfreuden zuvor schon einmal
gesehen?“, (1 = „Ja“; 2 = „Nein“; 3 = „Keine Ahnung“)
Movie Mood. „Wie bewerten Sie die Stimmung in der Szene des Films Vaterfreuden?“
on a 5-point bipolar-scale (1 = „Traurig“; 5 = „Lustig“)
Demographics
Nationality, born in Germany, gender, age and completed education
Green Identity
3-items: „Ich würde mich selbst als eine umweltbewusste Person beschreiben.“, „Ich bin ein
Typ Mensch, der umweltbewusst handelt.“, „Umweltbewusst zu handeln, ist ein wichtiger Teil
meiner Persönlichkeit.“ on a 7-point Likert-scale (1 = „Stimme überhaupt nicht zu“; 7 =
„Stimme völlig zu“).