Embed Size (px)
Citation preview
able at ScienceDirect
Journal of Rock Mechanics and Geotechnical Engineering 6 (2014) 156e164
Contents lists avail
Journal of Rock Mechanics andGeotechnical Engineering
journal homepage: www.rockgeotech.org
Anisotropy of strength and deformability of fractured rocks
Majid Noorian Bidgoli*, Lanru JingDepartment of Land and Water Resources Engineering, Engineering Geology and Geophysics Research Group, Royal Institute of Technology (KTH),11423 Stockholm, Sweden
a r t i c l e i n f o
Article history:Received 20 November 2013Received in revised form15 January 2014Accepted 22 January 2014Available online 3 February 2014
Keywords:AnisotropyStrength criterionDeformation behaviorNumerical experimentsFractured rock massDiscrete element method (DEM)Discrete fracture network (DFN)
* Corresponding author. Tel.: þ46 8 790 8661.E-mail address: [email protected] (M. Noorian Bid
Peer review under responsibility of Institute of RockAcademy of Sciences.
Production and hosting by El
1674-7755 � 2014 Institute of Rock and Soil MecSciences. Production and hosting by Elsevier B.V. Ahttp://dx.doi.org/10.1016/j.jrmge.2014.01.009
a b s t r a c t
Anisotropy of the strength and deformation behaviors of fractured rock masses is a crucial issue fordesign and stability assessments of rock engineering structures, due mainly to the non-uniform and non-regular geometries of the fracture systems. However, no adequate efforts have been made to study thisissue due to the current practical impossibility of laboratory tests with samples of large volumes con-taining many fractures, and the difficulty for controlling reliable initial and boundary conditions forlarge-scale in situ tests. Therefore, a reliable numerical predicting approach for evaluating anisotropy offractured rock masses is needed. The objective of this study is to systematically investigate anisotropy ofstrength and deformability of fractured rocks, which has not been conducted in the past, using a nu-merical modeling method. A series of realistic two-dimensional (2D) discrete fracture network (DFN)models were established based on site investigation data, which were then loaded in different directions,using the code UDEC of discrete element method (DEM), with changing confining pressures. Numericalresults show that strength envelopes and elastic deformability parameters of tested numerical modelsare significantly anisotropic, and vary with changing axial loading and confining pressures. The resultsindicate that for design and safety assessments of rock engineering projects, the directional variations ofstrength and deformability of the fractured rock mass concerned must be treated properly with respectto the directions of in situ stresses. Traditional practice for simply positioning axial orientation of tunnelsin association with principal stress directions only may not be adequate for safety requirements.Outstanding issues of the present study and suggestions for future study are also presented.� 2014 Institute of Rock and Soil Mechanics, Chinese Academy of Sciences. Production and hosting by
Elsevier B.V. All rights reserved.
1. Introduction
It is well-known that rock masses are very complex materials innature, due to the existence of fractures of varying sizes, orienta-tions andmechanical properties, so that their mechanical behaviorsare discontinuous, inhomogeneous, anisotropic, and not linearlyelastic (DIANE). Anisotropy is defined as variations of propertieswith respect to the directions concerned in design and analysis ofrock structures. A rock mass is often considered as anisotropicbecause mainly it contains the fracture system geometry that isusually not uniformly or regularly distributed, and its behavior may
goli).and Soil Mechanics, Chinese
sevier
hanics, Chinese Academy ofll rights reserved.
change with loading directions. However, how significant suchchange may become has not received adequate research and ourbasic understanding about this important issue remains unclear.Therefore, the objective of this research is quantitative demon-stration and representation of the anisotropy of strength anddeformability of fractured rocks due to its impact on design, safetyand performance assessment of rock engineering projects.
Concept of anisotropy is well-known in the field of rock me-chanics and engineering. Morland (1976) investigated elasticanisotropy of regularly jointed rockmass during a theoretical study,which was an initial effort on the influence of joint on the elasticanisotropy. Amadei and Savage (1989) and Amadei (1996) pointedout the importance of anisotropy of rock masses and discussed theinteraction existing between rock anisotropy and stress, deform-ability and strength of a rock mass containing a regular single jointset. Experimental researches based on standard laboratory testswith small sample sizes were reported in literature about anisot-ropy of strength and deformability of the different rock materials,such as those given by Reik and Zacas (1978), Broch (1983), Chenet al. (1998, 2011), Yang et al. (1998), Ajalloeian and Lashkaripour(2000), Nasseri et al. (2003), Gonzaga et al. (2008), and Cho et al.(2012). Given the fact that small rock samples cannot containfractures with varying sizes, orientations and locations at largerscales, the obtained results from such laboratory tests cannot be
M. Noorian Bidgoli, L. Jing / Journal of Rock Mechanics and Geotechnical Engineering 6 (2014) 156e164 157
representative of fractured rockmasses. Sun et al. (2012) performednumerical research on anisotropy of mechanical parameters of amoderately large volume fractured rock mass, but the testing andmodeling considered only the uniaxial compressive test conditionswithout confining pressure, so that a proper understanding on thestrength and deformability of the rock mass sample concernedcould not be obtained. Therefore, one of the remaining challengingissues for rock mechanics and engineering now is how to evaluateanisotropic nature of fractured rocks of realistic fracture systemgeometry. Since laboratory and in situ tests for fractured rocksamples of large volumes are not practically possible, a compre-hensive predictive numerical study is necessary for establishingconceptual understanding on the anisotropy of deformationbehavior and strength of fractured rock masses.
Basedon the abovemotivation, themainobjective of this researchis to predict numerically how deformability and strength of a typicalfractured rock sample may vary in different loading directions ofrotational computational models of fracture systems at its repre-sentative elementary volume (REV) size, since such a systematicnumerical testing is rarely reported. In the context, the Young’smodulus and Poisson’s ratio were selected as equivalent elasticdeformability. The friction angle and cohesion for MohreCoulomb(MeC) and parametersm and s for HoekeBrown (HeB) criteriawereselected as equivalent strength parameters, respectively. A series offractured rockmodelswere used to evaluate thedirectional variationof these parameters representing deformability and strength of thecomputationalmodels, since they aremost commonly applied in thefield of rock mechanics and engineering.
2. Approaches of research by numerical experiments
2.1. Model establishment
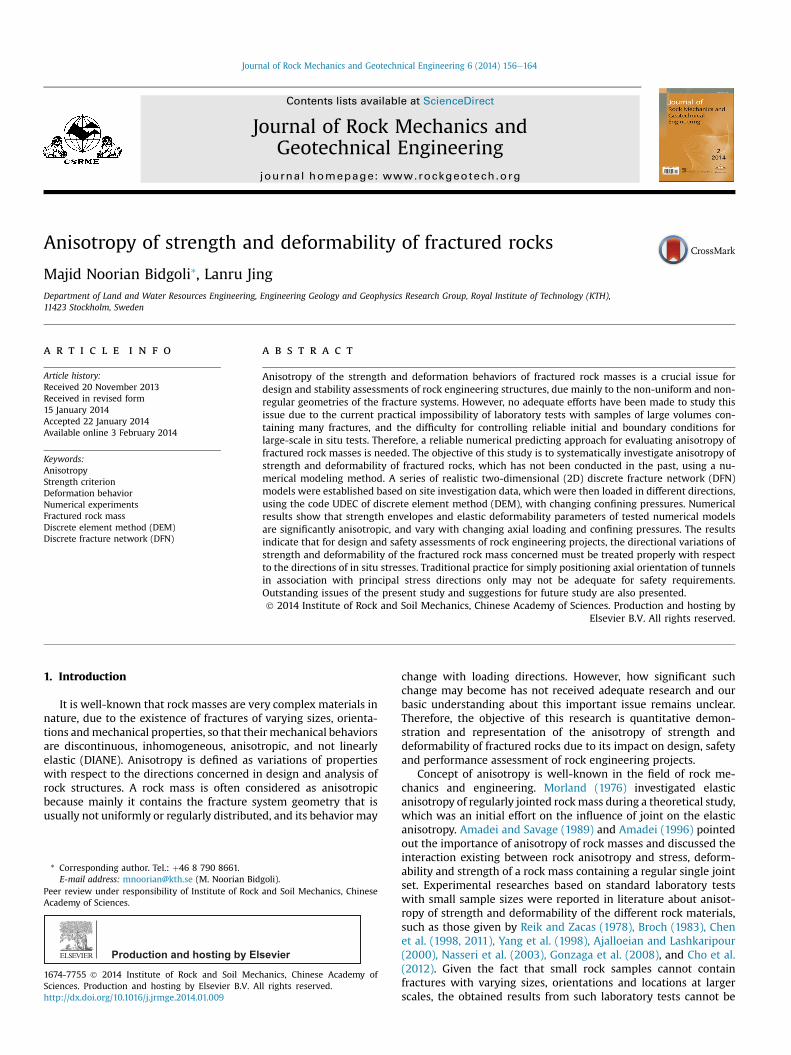
As a general research approach, a systematic numerical uniaxialand biaxial test procedure was developed for observing the aniso-tropic behaviors of the rotated fractured rock models containing alarge number of fractures of varying sizes, created using the sto-chastic discrete fracture network (DFN) method, based on therealistic fracture system information from field mapping, as re-ported in Noorian Bidgoli et al. (2013). The stress-deformationanalysis was performed using the discrete element method(DEM) (Fig. 1). The obtained stresses and strains from thesenumerical experiments were used to fit the well-known MeC andHeB failure criteria, represented by equivalent material properties
Fig. 1. Flowchart for the process of numerical experiments on strength and deform-ability of fractured rock models using rotational DFN models.
to define these two criteria. The equivalent Young’s modulus andPoisson’s ratio were derived by the stressestrain curves during theelastic deformation ranges of the whole stressestrain curves.
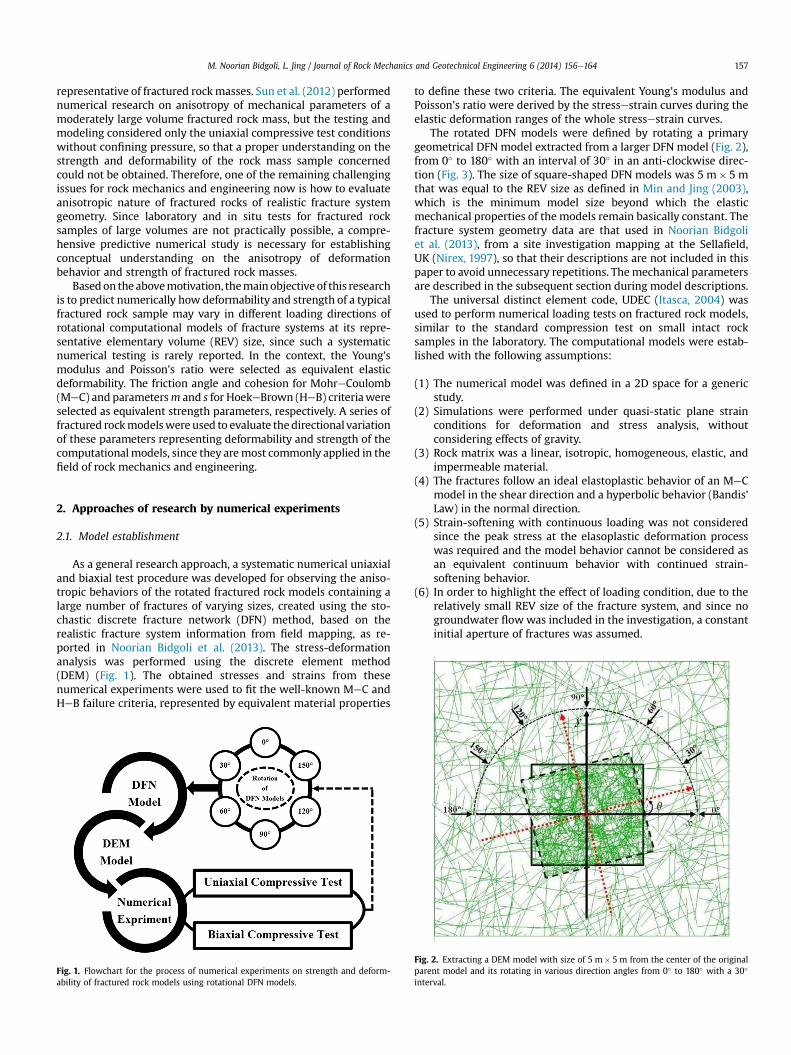
The rotated DFN models were defined by rotating a primarygeometrical DFN model extracted from a larger DFN model (Fig. 2),from 0� to 180� with an interval of 30� in an anti-clockwise direc-tion (Fig. 3). The size of square-shaped DFN models was 5 m� 5 mthat was equal to the REV size as defined in Min and Jing (2003),which is the minimum model size beyond which the elasticmechanical properties of the models remain basically constant. Thefracture system geometry data are that used in Noorian Bidgoliet al. (2013), from a site investigation mapping at the Sellafield,UK (Nirex, 1997), so that their descriptions are not included in thispaper to avoid unnecessary repetitions. Themechanical parametersare described in the subsequent section during model descriptions.
The universal distinct element code, UDEC (Itasca, 2004) wasused to perform numerical loading tests on fractured rock models,similar to the standard compression test on small intact rocksamples in the laboratory. The computational models were estab-lished with the following assumptions:
(1) The numerical model was defined in a 2D space for a genericstudy.
(2) Simulations were performed under quasi-static plane strainconditions for deformation and stress analysis, withoutconsidering effects of gravity.
(3) Rock matrix was a linear, isotropic, homogeneous, elastic, andimpermeable material.
(4) The fractures follow an ideal elastoplastic behavior of an MeCmodel in the shear direction and a hyperbolic behavior (Bandis’Law) in the normal direction.
(5) Strain-softening with continuous loading was not consideredsince the peak stress at the elasoplastic deformation processwas required and the model behavior cannot be considered asan equivalent continuum behavior with continued strain-softening behavior.
(6) In order to highlight the effect of loading condition, due to therelatively small REV size of the fracture system, and since nogroundwater flowwas included in the investigation, a constantinitial aperture of fractures was assumed.
Fig. 2. Extracting a DEM model with size of 5 m� 5 m from the center of the originalparent model and its rotating in various direction angles from 0� to 180� with a 30�
interval.
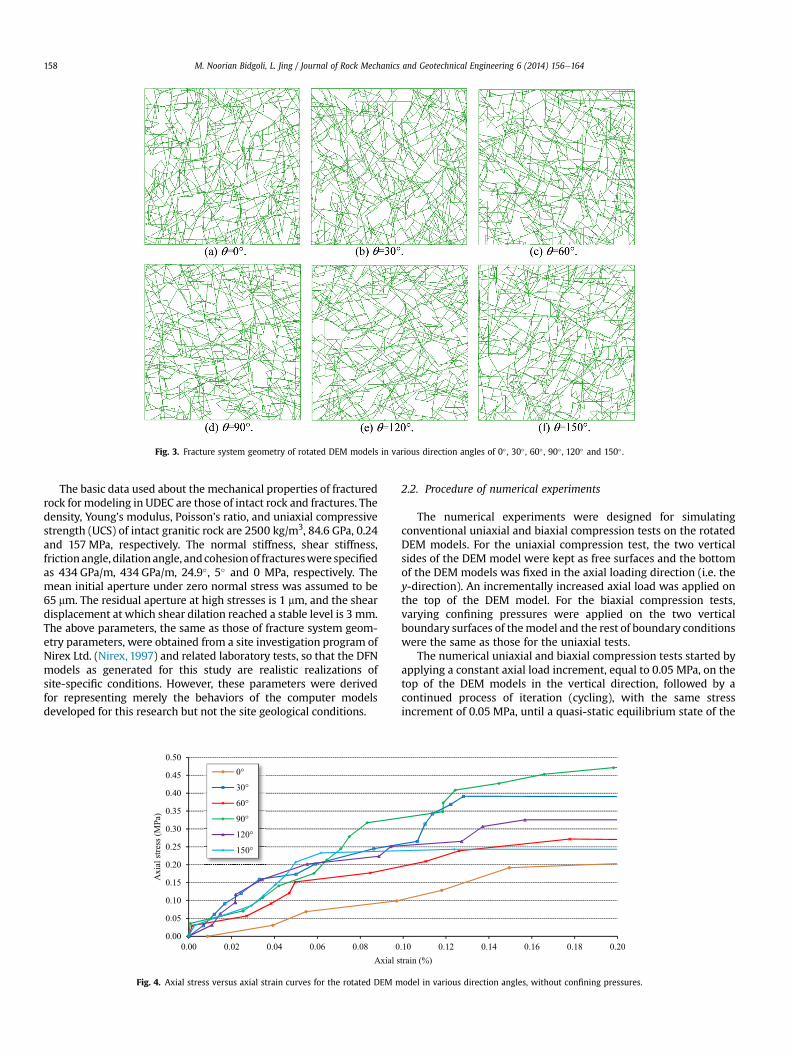
Fig. 3. Fracture system geometry of rotated DEM models in various direction angles of 0� , 30� , 60� , 90� , 120� and 150� .
M. Noorian Bidgoli, L. Jing / Journal of Rock Mechanics and Geotechnical Engineering 6 (2014) 156e164158
The basic data used about the mechanical properties of fracturedrock for modeling in UDEC are those of intact rock and fractures. Thedensity, Young’s modulus, Poisson’s ratio, and uniaxial compressivestrength (UCS) of intact granitic rock are 2500 kg/m3, 84.6 GPa, 0.24and 157 MPa, respectively. The normal stiffness, shear stiffness,frictionangle, dilationangle, andcohesionof fractureswere specifiedas 434 GPa/m, 434 GPa/m, 24.9�, 5� and 0 MPa, respectively. Themean initial aperture under zero normal stress was assumed to be65 mm. The residual aperture at high stresses is 1 mm, and the sheardisplacement at which shear dilation reached a stable level is 3 mm.The above parameters, the same as those of fracture system geom-etry parameters, were obtained from a site investigation program ofNirex Ltd. (Nirex, 1997) and related laboratory tests, so that the DFNmodels as generated for this study are realistic realizations ofsite-specific conditions. However, these parameters were derivedfor representing merely the behaviors of the computer modelsdeveloped for this research but not the site geological conditions.
Fig. 4. Axial stress versus axial strain curves for the rotated DEM m
2.2. Procedure of numerical experiments
The numerical experiments were designed for simulatingconventional uniaxial and biaxial compression tests on the rotatedDEM models. For the uniaxial compression test, the two verticalsides of the DEM model were kept as free surfaces and the bottomof the DEM models was fixed in the axial loading direction (i.e. they-direction). An incrementally increased axial load was applied onthe top of the DEM model. For the biaxial compression tests,varying confining pressures were applied on the two verticalboundary surfaces of themodel and the rest of boundary conditionswere the same as those for the uniaxial tests.
The numerical uniaxial and biaxial compression tests started byapplying a constant axial load increment, equal to 0.05 MPa, on thetop of the DEM models in the vertical direction, followed by acontinued process of iteration (cycling), with the same stressincrement of 0.05 MPa, until a quasi-static equilibrium state of the
odel in various direction angles, without confining pressures.
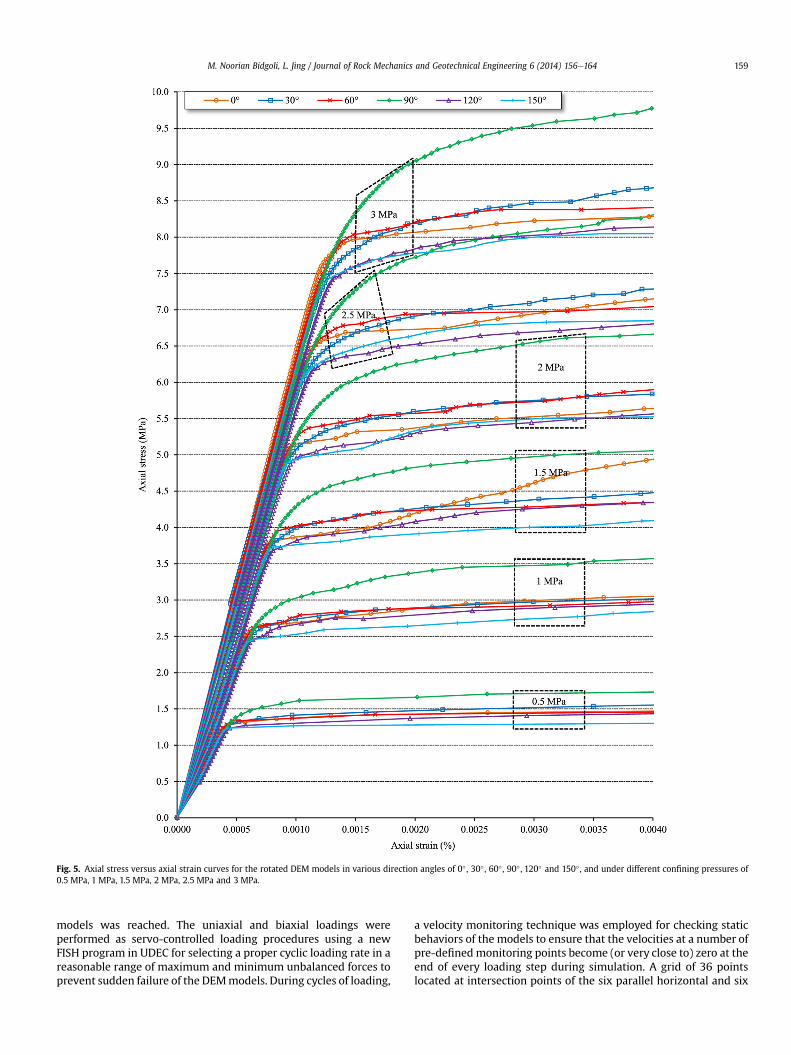
Fig. 5. Axial stress versus axial strain curves for the rotated DEM models in various direction angles of 0� , 30� , 60� , 90� , 120� and 150� , and under different confining pressures of0.5 MPa, 1 MPa, 1.5 MPa, 2 MPa, 2.5 MPa and 3 MPa.
M. Noorian Bidgoli, L. Jing / Journal of Rock Mechanics and Geotechnical Engineering 6 (2014) 156e164 159
models was reached. The uniaxial and biaxial loadings wereperformed as servo-controlled loading procedures using a newFISH program in UDEC for selecting a proper cyclic loading rate in areasonable range of maximum and minimum unbalanced forces toprevent sudden failure of the DEMmodels. During cycles of loading,
a velocity monitoring technique was employed for checking staticbehaviors of the models to ensure that the velocities at a number ofpre-definedmonitoring points become (or very close to) zero at theend of every loading step during simulation. A grid of 36 pointslocated at intersection points of the six parallel horizontal and six
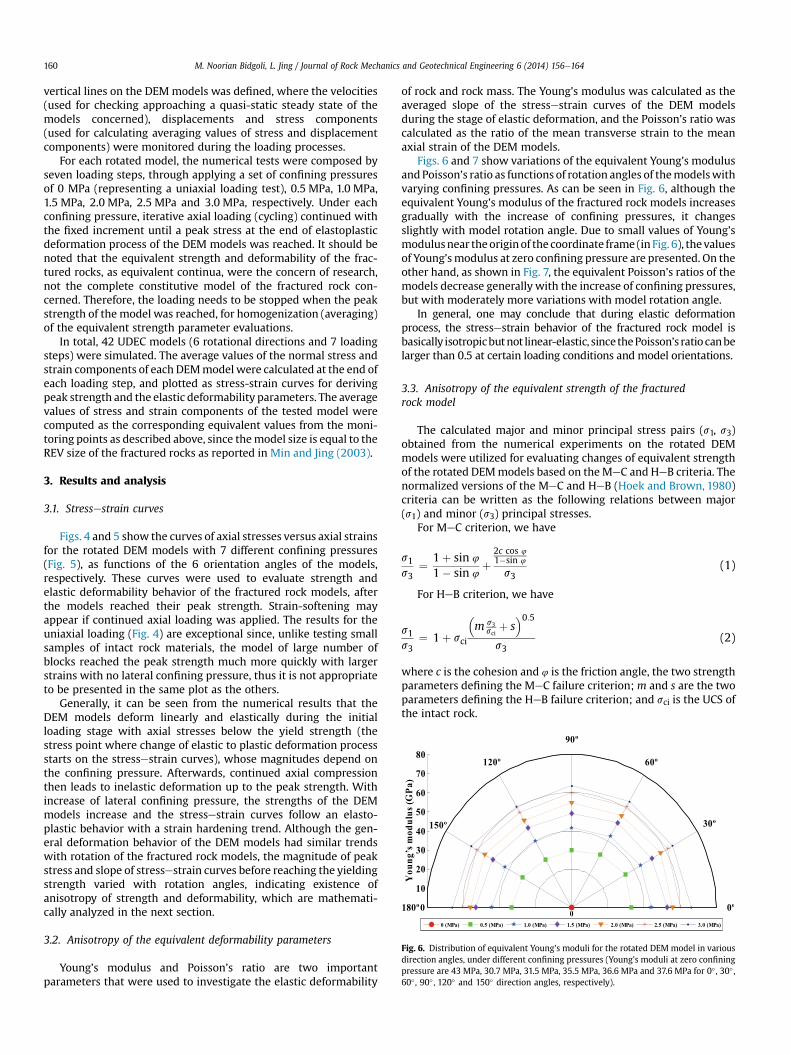
Fig. 6. Distribution of equivalent Young’s moduli for the rotated DEM model in variousdirection angles, under different confining pressures (Young’s moduli at zero confiningpressure are 43 MPa, 30.7 MPa, 31.5 MPa, 35.5 MPa, 36.6 MPa and 37.6 MPa for 0� , 30� ,60� , 90� , 120� and 150� direction angles, respectively).
M. Noorian Bidgoli, L. Jing / Journal of Rock Mechanics and Geotechnical Engineering 6 (2014) 156e164160
vertical lines on the DEMmodels was defined, where the velocities(used for checking approaching a quasi-static steady state of themodels concerned), displacements and stress components(used for calculating averaging values of stress and displacementcomponents) were monitored during the loading processes.
For each rotated model, the numerical tests were composed byseven loading steps, through applying a set of confining pressuresof 0 MPa (representing a uniaxial loading test), 0.5 MPa, 1.0 MPa,1.5 MPa, 2.0 MPa, 2.5 MPa and 3.0 MPa, respectively. Under eachconfining pressure, iterative axial loading (cycling) continued withthe fixed increment until a peak stress at the end of elastoplasticdeformation process of the DEM models was reached. It should benoted that the equivalent strength and deformability of the frac-tured rocks, as equivalent continua, were the concern of research,not the complete constitutive model of the fractured rock con-cerned. Therefore, the loading needs to be stopped when the peakstrength of the model was reached, for homogenization (averaging)of the equivalent strength parameter evaluations.
In total, 42 UDEC models (6 rotational directions and 7 loadingsteps) were simulated. The average values of the normal stress andstrain components of each DEMmodel were calculated at the end ofeach loading step, and plotted as stress-strain curves for derivingpeak strength and the elastic deformability parameters. The averagevalues of stress and strain components of the tested model werecomputed as the corresponding equivalent values from the moni-toring points as described above, since themodel size is equal to theREV size of the fractured rocks as reported in Min and Jing (2003).
3. Results and analysis
3.1. Stressestrain curves
Figs. 4 and 5 show the curves of axial stresses versus axial strainsfor the rotated DEM models with 7 different confining pressures(Fig. 5), as functions of the 6 orientation angles of the models,respectively. These curves were used to evaluate strength andelastic deformability behavior of the fractured rock models, afterthe models reached their peak strength. Strain-softening mayappear if continued axial loading was applied. The results for theuniaxial loading (Fig. 4) are exceptional since, unlike testing smallsamples of intact rock materials, the model of large number ofblocks reached the peak strength much more quickly with largerstrains with no lateral confining pressure, thus it is not appropriateto be presented in the same plot as the others.
Generally, it can be seen from the numerical results that theDEM models deform linearly and elastically during the initialloading stage with axial stresses below the yield strength (thestress point where change of elastic to plastic deformation processstarts on the stressestrain curves), whose magnitudes depend onthe confining pressure. Afterwards, continued axial compressionthen leads to inelastic deformation up to the peak strength. Withincrease of lateral confining pressure, the strengths of the DEMmodels increase and the stressestrain curves follow an elasto-plastic behavior with a strain hardening trend. Although the gen-eral deformation behavior of the DEM models had similar trendswith rotation of the fractured rock models, the magnitude of peakstress and slope of stressestrain curves before reaching the yieldingstrength varied with rotation angles, indicating existence ofanisotropy of strength and deformability, which are mathemati-cally analyzed in the next section.
3.2. Anisotropy of the equivalent deformability parameters
Young’s modulus and Poisson’s ratio are two importantparameters that were used to investigate the elastic deformability
of rock and rock mass. The Young’s modulus was calculated as theaveraged slope of the stressestrain curves of the DEM modelsduring the stage of elastic deformation, and the Poisson’s ratio wascalculated as the ratio of the mean transverse strain to the meanaxial strain of the DEM models.
Figs. 6 and 7 show variations of the equivalent Young’s modulusandPoisson’s ratio as functions of rotation angles of themodelswithvarying confining pressures. As can be seen in Fig. 6, although theequivalent Young’s modulus of the fractured rock models increasesgradually with the increase of confining pressures, it changesslightly with model rotation angle. Due to small values of Young’smodulusnear theoriginof the coordinate frame (in Fig. 6), thevaluesof Young’smodulus at zero confining pressure are presented. On theother hand, as shown in Fig. 7, the equivalent Poisson’s ratios of themodels decrease generally with the increase of confining pressures,but with moderately more variations with model rotation angle.
In general, one may conclude that during elastic deformationprocess, the stressestrain behavior of the fractured rock model isbasically isotropicbutnot linear-elastic, sincethePoisson’s ratiocanbelarger than 0.5 at certain loading conditions and model orientations.
3.3. Anisotropy of the equivalent strength of the fracturedrock model
The calculated major and minor principal stress pairs (s1, s3)obtained from the numerical experiments on the rotated DEMmodels were utilized for evaluating changes of equivalent strengthof the rotated DEMmodels based on theMeC and HeB criteria. Thenormalized versions of the MeC and HeB (Hoek and Brown, 1980)criteria can be written as the following relations between major(s1) and minor (s3) principal stresses.
For MeC criterion, we have
s1s3
¼ 1þ sin 4
1� sin 4þ
2c cos 41�sin 4
s3(1)
For HeB criterion, we have
s1s3
¼ 1þ sci
�m s3
sciþ s
�0:5
s3(2)
where c is the cohesion and 4 is the friction angle, the two strengthparameters defining the MeC failure criterion;m and s are the twoparameters defining the HeB failure criterion; and sci is the UCS ofthe intact rock.
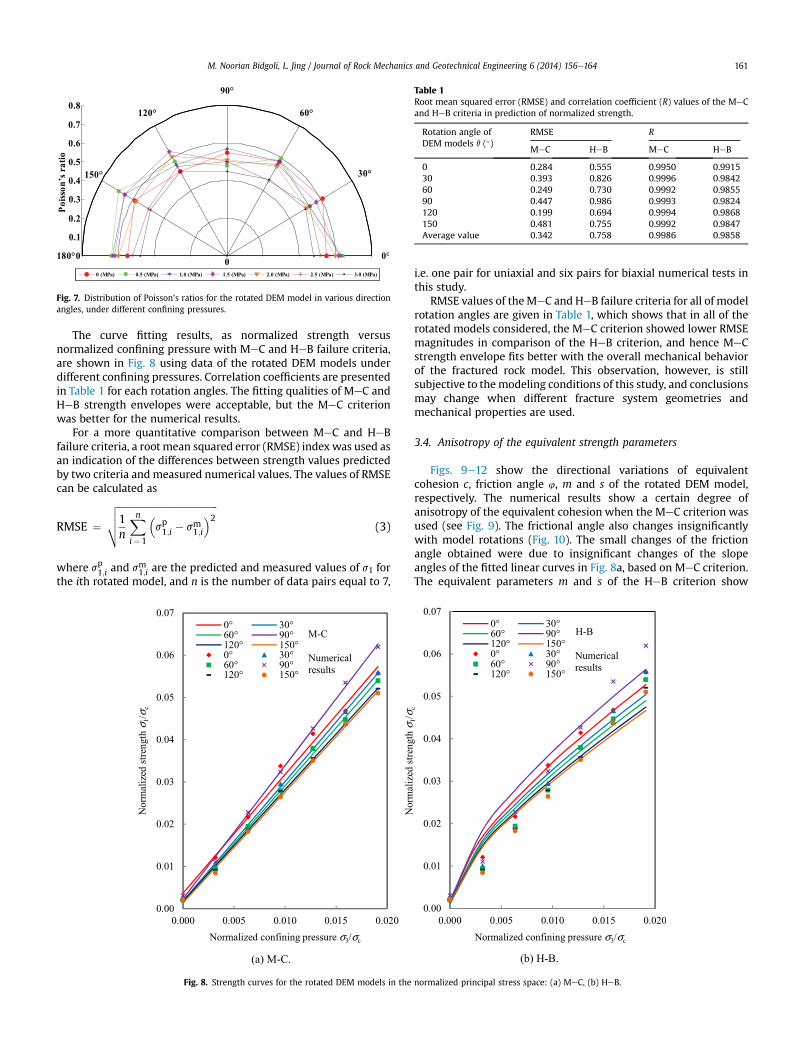
Fig. 7. Distribution of Poisson’s ratios for the rotated DEM model in various directionangles, under different confining pressures.
Table 1Root mean squared error (RMSE) and correlation coefficient (R) values of the MeCand HeB criteria in prediction of normalized strength.
Rotation angle ofDEM models q (�)
RMSE R
MeC HeB MeC HeB
0 0.284 0.555 0.9950 0.991530 0.393 0.826 0.9996 0.984260 0.249 0.730 0.9992 0.985590 0.447 0.986 0.9993 0.9824120 0.199 0.694 0.9994 0.9868150 0.481 0.755 0.9992 0.9847Average value 0.342 0.758 0.9986 0.9858
M. Noorian Bidgoli, L. Jing / Journal of Rock Mechanics and Geotechnical Engineering 6 (2014) 156e164 161
The curve fitting results, as normalized strength versusnormalized confining pressure with MeC and HeB failure criteria,are shown in Fig. 8 using data of the rotated DEM models underdifferent confining pressures. Correlation coefficients are presentedin Table 1 for each rotation angles. The fitting qualities of MeC andHeB strength envelopes were acceptable, but the MeC criterionwas better for the numerical results.
For a more quantitative comparison between MeC and HeBfailure criteria, a root mean squared error (RMSE) indexwas used asan indication of the differences between strength values predictedby two criteria andmeasured numerical values. The values of RMSEcan be calculated as
RMSE ¼ffiffiffiffiffiffiffiffiffiffiffiffiffiffiffiffiffiffiffiffiffiffiffiffiffiffiffiffiffiffiffiffiffiffiffiffiffiffiffiffiffi1n
Xn
i¼1
�sp1;i � sm1;i
�2vuut (3)
where sp1;i and sm1;i are the predicted and measured values of s1 forthe ith rotated model, and n is the number of data pairs equal to 7,
Fig. 8. Strength curves for the rotated DEM models in the
i.e. one pair for uniaxial and six pairs for biaxial numerical tests inthis study.
RMSE values of theMeC and HeB failure criteria for all of modelrotation angles are given in Table 1, which shows that in all of therotated models considered, the MeC criterion showed lower RMSEmagnitudes in comparison of the HeB criterion, and hence MeCstrength envelope fits better with the overall mechanical behaviorof the fractured rock model. This observation, however, is stillsubjective to themodeling conditions of this study, and conclusionsmay change when different fracture system geometries andmechanical properties are used.
3.4. Anisotropy of the equivalent strength parameters
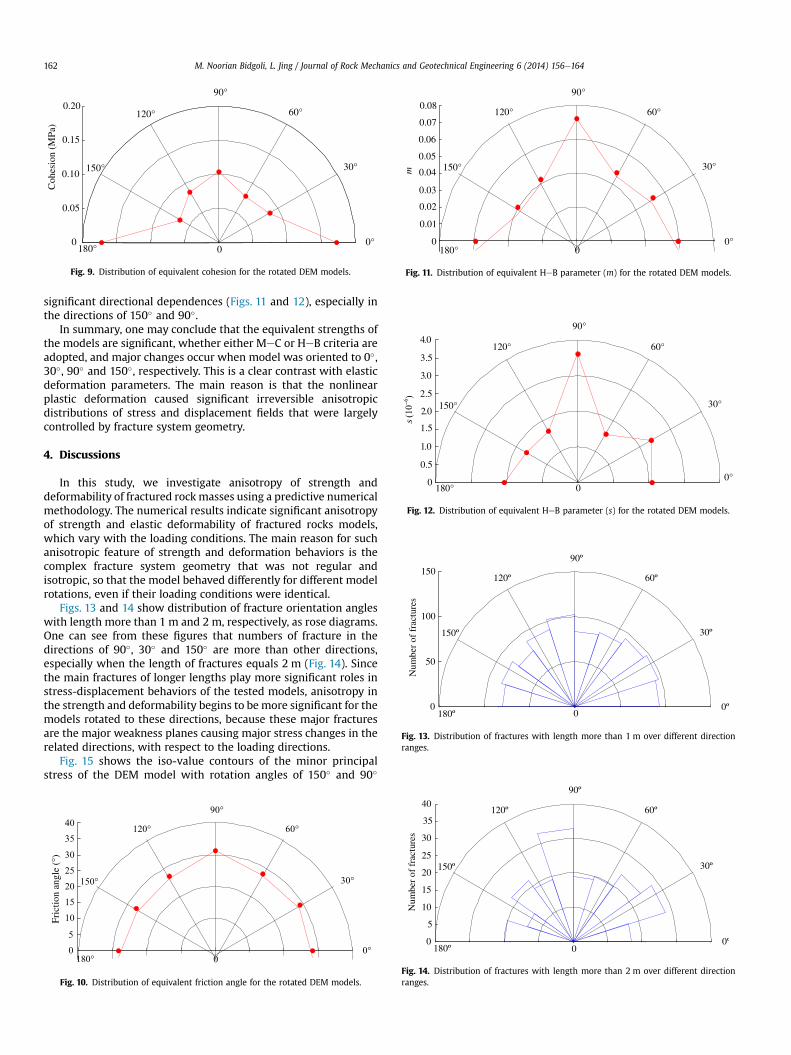
Figs. 9e12 show the directional variations of equivalentcohesion c, friction angle 4, m and s of the rotated DEM model,respectively. The numerical results show a certain degree ofanisotropy of the equivalent cohesion when the MeC criterion wasused (see Fig. 9). The frictional angle also changes insignificantlywith model rotations (Fig. 10). The small changes of the frictionangle obtained were due to insignificant changes of the slopeangles of the fitted linear curves in Fig. 8a, based on MeC criterion.The equivalent parameters m and s of the HeB criterion show
normalized principal stress space: (a) MeC, (b) HeB.
0180°
0°
0.05
0.10
0.15
0.20
30°
60°
90°
120°
150°
Coh
esio
n (M
Pa)
0
Fig. 9. Distribution of equivalent cohesion for the rotated DEM models.
00
0.01
0.02
0.03
0.04
0.05
0.06
0.07
0.08
30°
60°
90°
120°
150°
180°0°
m
Fig. 11. Distribution of equivalent HeB parameter (m) for the rotated DEM models.
00
0.5
1.0
1.5
2.0
2.5
3.0
3.5
4.0
30°
60°
90°
120°
150°
180°0°
Fig. 12. Distribution of equivalent HeB parameter (s) for the rotated DEM models.
00
50
100
150
30º
60º
90º
120º
150º
180º0º
Num
ber
of f
ract
ures
Fig. 13. Distribution of fractures with length more than 1 m over different directionranges.
M. Noorian Bidgoli, L. Jing / Journal of Rock Mechanics and Geotechnical Engineering 6 (2014) 156e164162
significant directional dependences (Figs. 11 and 12), especially inthe directions of 150� and 90�.
In summary, one may conclude that the equivalent strengths ofthe models are significant, whether either MeC or HeB criteria areadopted, and major changes occur when model was oriented to 0�,30�, 90� and 150�, respectively. This is a clear contrast with elasticdeformation parameters. The main reason is that the nonlinearplastic deformation caused significant irreversible anisotropicdistributions of stress and displacement fields that were largelycontrolled by fracture system geometry.
4. Discussions
In this study, we investigate anisotropy of strength anddeformability of fractured rockmasses using a predictive numericalmethodology. The numerical results indicate significant anisotropyof strength and elastic deformability of fractured rocks models,which vary with the loading conditions. The main reason for suchanisotropic feature of strength and deformation behaviors is thecomplex fracture system geometry that was not regular andisotropic, so that the model behaved differently for different modelrotations, even if their loading conditions were identical.
Figs. 13 and 14 show distribution of fracture orientation angleswith length more than 1 m and 2 m, respectively, as rose diagrams.One can see from these figures that numbers of fracture in thedirections of 90�, 30� and 150� are more than other directions,especially when the length of fractures equals 2 m (Fig. 14). Sincethe main fractures of longer lengths play more significant roles instress-displacement behaviors of the tested models, anisotropy inthe strength and deformability begins to be more significant for themodels rotated to these directions, because these major fracturesare the major weakness planes causing major stress changes in therelated directions, with respect to the loading directions.
Fig. 15 shows the iso-value contours of the minor principalstress of the DEM model with rotation angles of 150� and 90�
00
5
10
1520
25
30
3540
30°
60°
90°
120°
150°
180°0°
Fric
tion
angl
e (°
)
Fig. 10. Distribution of equivalent friction angle for the rotated DEM models.
00
5
10
15
20
25
30
35
40
30º
60º
90º
120º
150º
180º0º
Num
ber
of f
ract
ures
Fig. 14. Distribution of fractures with length more than 2 m over different directionranges.
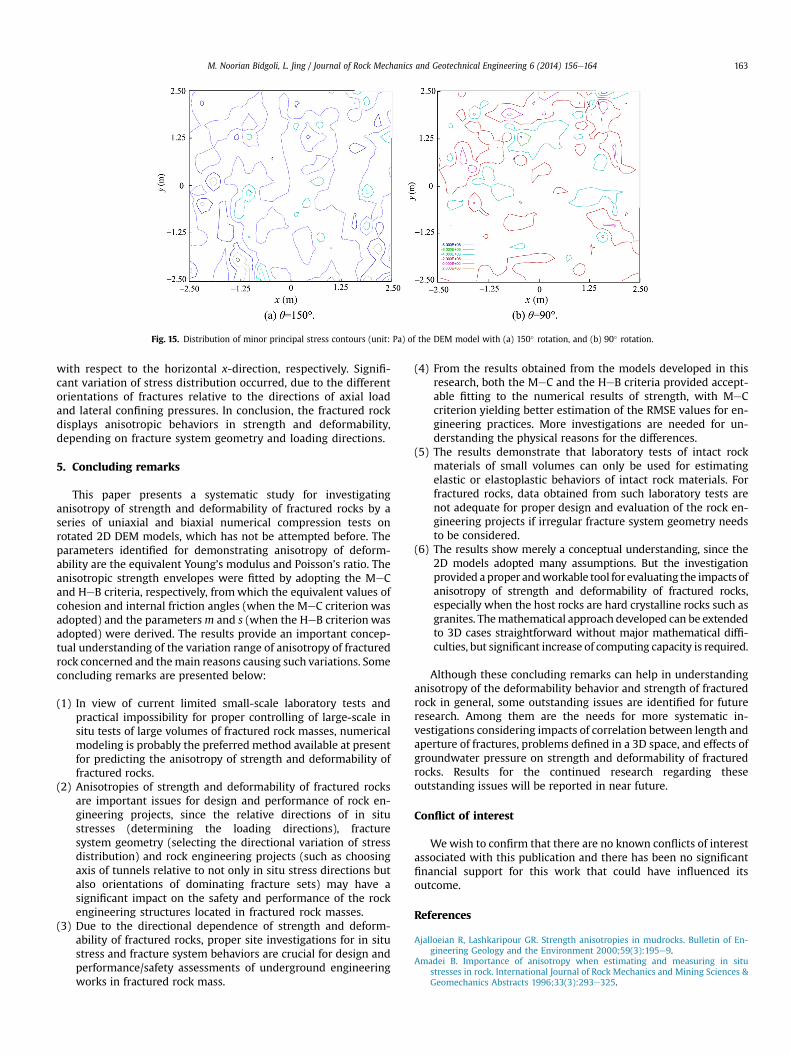
Fig. 15. Distribution of minor principal stress contours (unit: Pa) of the DEM model with (a) 150� rotation, and (b) 90� rotation.
M. Noorian Bidgoli, L. Jing / Journal of Rock Mechanics and Geotechnical Engineering 6 (2014) 156e164 163
with respect to the horizontal x-direction, respectively. Signifi-cant variation of stress distribution occurred, due to the differentorientations of fractures relative to the directions of axial loadand lateral confining pressures. In conclusion, the fractured rockdisplays anisotropic behaviors in strength and deformability,depending on fracture system geometry and loading directions.
5. Concluding remarks
This paper presents a systematic study for investigatinganisotropy of strength and deformability of fractured rocks by aseries of uniaxial and biaxial numerical compression tests onrotated 2D DEM models, which has not be attempted before. Theparameters identified for demonstrating anisotropy of deform-ability are the equivalent Young’s modulus and Poisson’s ratio. Theanisotropic strength envelopes were fitted by adopting the MeCand HeB criteria, respectively, fromwhich the equivalent values ofcohesion and internal friction angles (when the MeC criterion wasadopted) and the parametersm and s (when the HeB criterion wasadopted) were derived. The results provide an important concep-tual understanding of the variation range of anisotropy of fracturedrock concerned and themain reasons causing such variations. Someconcluding remarks are presented below:
(1) In view of current limited small-scale laboratory tests andpractical impossibility for proper controlling of large-scale insitu tests of large volumes of fractured rock masses, numericalmodeling is probably the preferred method available at presentfor predicting the anisotropy of strength and deformability offractured rocks.
(2) Anisotropies of strength and deformability of fractured rocksare important issues for design and performance of rock en-gineering projects, since the relative directions of in situstresses (determining the loading directions), fracturesystem geometry (selecting the directional variation of stressdistribution) and rock engineering projects (such as choosingaxis of tunnels relative to not only in situ stress directions butalso orientations of dominating fracture sets) may have asignificant impact on the safety and performance of the rockengineering structures located in fractured rock masses.
(3) Due to the directional dependence of strength and deform-ability of fractured rocks, proper site investigations for in situstress and fracture system behaviors are crucial for design andperformance/safety assessments of underground engineeringworks in fractured rock mass.
(4) From the results obtained from the models developed in thisresearch, both the MeC and the HeB criteria provided accept-able fitting to the numerical results of strength, with MeCcriterion yielding better estimation of the RMSE values for en-gineering practices. More investigations are needed for un-derstanding the physical reasons for the differences.
(5) The results demonstrate that laboratory tests of intact rockmaterials of small volumes can only be used for estimatingelastic or elastoplastic behaviors of intact rock materials. Forfractured rocks, data obtained from such laboratory tests arenot adequate for proper design and evaluation of the rock en-gineering projects if irregular fracture system geometry needsto be considered.
(6) The results show merely a conceptual understanding, since the2D models adopted many assumptions. But the investigationprovided aproper andworkable tool for evaluating the impacts ofanisotropy of strength and deformability of fractured rocks,especially when the host rocks are hard crystalline rocks such asgranites. Themathematical approach developed can be extendedto 3D cases straightforward without major mathematical diffi-culties, but significant increase of computing capacity is required.
Although these concluding remarks can help in understandinganisotropy of the deformability behavior and strength of fracturedrock in general, some outstanding issues are identified for futureresearch. Among them are the needs for more systematic in-vestigations considering impacts of correlation between length andaperture of fractures, problems defined in a 3D space, and effects ofgroundwater pressure on strength and deformability of fracturedrocks. Results for the continued research regarding theseoutstanding issues will be reported in near future.
Conflict of interest
Wewish to confirm that there are no known conflicts of interestassociated with this publication and there has been no significantfinancial support for this work that could have influenced itsoutcome.
References
Ajalloeian R, Lashkaripour GR. Strength anisotropies in mudrocks. Bulletin of En-gineering Geology and the Environment 2000;59(3):195e9.
Amadei B. Importance of anisotropy when estimating and measuring in situstresses in rock. International Journal of Rock Mechanics and Mining Sciences &Geomechanics Abstracts 1996;33(3):293e325.
M. Noorian Bidgoli, L. Jing / Journal of Rock Mechanics and Geotechnical Engineering 6 (2014) 156e164164
Amadei B, Savage WZ. Anisotropic nature of jointed rock mass strength. Journal ofEngineering Mechanics 1989;115(3):525e42.
Broch E. Estimation of strength anisotropy using the point-load test. InternationalJournal of Rock Mechanics and Mining Sciences & Geomechanics Abstracts1983;20(4):181e7.
Chen CS, Pan E, Amadei B. Determination of deformability and tensile strength ofanisotropic rock using Brazilian tests. International Journal of Rock Mechanicsand Mining Sciences 1998;35(1):43e61.
Chen W, Yang J, Tan X, Yu H. Study on mechanical parameters of fractured rockmasses. Science China Technological Sciences 2011;54(1):140e6.
Cho JW, Kim H, Jeon S, Min KB. Deformation and strength anisotropy of Asangneiss, Boryeong shale, and Yeoncheon schist. International Journal of RockMechanics and Mining Sciences 2012;50:158e69.
Gonzaga GG, Leite MH, Corthesy R. Determination of anisotropic deformabilityparameters from a single standard rock specimen. International Journal of RockMechanics and Mining Sciences 2008;45(8):1420e38.
Hoek E, Brown ET. Empirical strength criterion for rock masses. Journal of theGeotechnical Engineering Division ASCE 1980;106:1013e35.
Itasca Consulting Group, Inc.. UDEC 4.0 user’s guide. Minneapolis, Minnesota: ItascaConsulting Group, Inc.; 2004.
Min KB, Jing L. Numerical determination of the equivalent elastic compliance tensorfor fractured rock masses using the distinct element method. InternationalJournal of Rock Mechanics and Mining Sciences 2003;40(6):795e816.
Morland LW. Elastic anisotropy of regularly jointed media. Rock Mechanics1976;8(1):35e48.
Nirex (United Kingdom Nirex Limited). Data summary sheets in support of grossgeotechnical predictions. Harwell, UK: Nirex report SA/97/052; 1997.
Nasseri MHB, Rao KS, Ramamurthy T. Anisotropic strength and deformationalbehavior of Himalayan schists. International Journal of Rock Mechanics andMining Sciences 2003;40(1):3e23.
Noorian Bidgoli M, Zhao Z, Jing L. Numerical evaluation of strength and deform-ability of fractured rocks. Journal of Rock Mechanics and Geotechnical Engi-neering 2013;5(6):419e30.
Reik G, Zacas M. Strength and deformation characteristics of jointed media in truetriaxial compression. International Journal of RockMechanics andMining Sciences& Geomechanics Abstracts 1978;15(6):295e303.
Sun PF, Yu QL, Yang TH, Shen W. Numerical research on anisotropy mechanicalparameters of fractured rock mass. Advanced Materials Research 2012;5(24):310e6.
Yang ZY, Chen JM, Huang TH. Effect of joint sets on the strength and deformation ofrock mass models. International Journal of Rock Mechanics and Mining Sciences1998;35(1):75e84.
Majid Noorian Bidgoli currently is a PhD student in theDepartment of Land and Water Resources Engineering,Engineering Geology and Geophysics Research Group,Royal Institute of Technology (KTH), Stockholm, Sweden,supervised by Professor Lanru Jing. His research focuses onnumerical modeling of fractured rock masses usingdiscrete fracture network (DFN) method and discreteelement method (DEM) to investigate strength anddeformability of fractured rocks. His interests are studyingabout coupled thermo-hydro-mechanical (THM) processesanalysis in fractured rock masses, and also design, perfor-mance and safety assessments of slopes, foundations andunderground excavations located in rock and fracturedrock mass.