Embed Size (px)
Citation preview
Journal of X-Ray Science and Technology 16 (2008) 171–187 171IOS Press
An in vitro evaluation of cone-beam breastCT methods
Kai Zenga, Laurie L. Fajardob, Simon Kaob, Edmund A. Frankenb, Jeong Mi Parkb,Zhenxue Jingc, Er-wei Baid and Ge Wange,∗aBiomedical Engineering Department, The University of Iowa, Iowa city, IA 52242, USAbRadiology Department, The University of Iowa, Iowa city, IA 52242, USAcHologic Inc., Bedford, MA 01730, USAdElectrical and Computer Engineering Department, The University of Iowa, Iowa City, IA 52242, USAeVT-WFU School of Biomedical Engineering & Science, Virginia Polytechnic Institute & StateUniversity, VA 24061, USA
Received 17 December 2007
Revised 18 May 2008
Accepted 20 June 2008
Abstract. Tomosynthesis was developed for mammography, especially breast cancer detection. However, its limited-angularrange scan and resultant data incompleteness causes strong image artifacts and distortions. To address this problem, a hybridimaging method was proposed in our previous work, which combines tomosynthesis and low-resolution CT into a single systemto produce fewer artifacts and distortions at a similar dose level. The purpose of this paper is to evaluate the images reconstructedusing the proposed method as compared with that using the conventional tomosynthesis method (ML-convex). For that purpose,the projection datasets are acquired in both numerical simulation and phantom experiments on our breast imaging platform.Three kinds of phantoms are used in our work, including a numerical phantom, a physical phantom and 8in vitro phantomsmade of breast specimens. In addition to visual comparison of the reconstructed images, we employ spatial resolution, imagecontrast, reconstruction error, and convergence rate to evaluate the results quantitatively. It is observed that the results from ourmethod can achieve significantly higher spatial resolution, higher contrast, smaller reconstruction error and faster convergencerate. Besides, a reader study using 8in vitro phantoms of breast specimens demonstrates the clinical potential of our method,which significantly outperforms the conventional tomosynthesis.
Keywords: Cone-beam CT, tomosynthesis, mammography, breast imaging, image quality
1. Introduction
Breast malignancy is ranked as the second leading cause of cancer death in women in the United States.It has been recognized that mass screening and early treatment are extremely important to improve thecancer prognosis and minimize the healthcare burden, which can reduce the breast cancer mortality about48 percent. Due to its specificity and sensitivity, x-ray mammography has been the method of choicefor screening and diagnosis [17,20]. However, x-ray mammography is far from being perfect becauseup to 17% of breast cancers are not identified with mammography, it also produces a large number of
∗Corresponding author. E-mail: [email protected].
0895-3996/08/$17.00 2008 – IOS Press and the authors. All rights reserved
172 K. Zeng et al. / An in vitro evaluation of cone-beam breast CT methods
false positive findings [19]. A major limitation of mammography is its 2D projective nature, while thereal anatomy and pathology is truly 3D. To address this problem, X-ray tomosynthesis was introducedto improve mammography with more 3D information.
Tomosynthesis is a 3D imaging technique to reconstruct a series of images from a limited number ofprojections [8]. Since its introduction in 1972, the area of tomosynthesis has been significantly advancedlargely due to the development of the area detectors [4]. A primary application of tomosynthesis isfor breast imaging [21–23]. The tomosynthetic algorithms are either analytic or iterative. The analyticalgorithms are straightforward and efficient, such as self-masking [3], selective plane removal [5], andmatrix inversion tomosynthesis [6]. The iterative algorithms are robust with noisy data and flexible toincorporate a priori knowledge, such as algebraic reconstruction techniques (ART) [1,7], expectation-maximization (EM) [25]. However, none of these algorithms can avoid the inherent drawback oftomosynthesis, namel, data incompleteness. Therefore, additional information is desirable to improvethe image quality fundamentally. In our previous work [12], a hybrid imaging scheme was proposed,which combines a low-resolution CT scan with a tomosynthesis scan. The results showed a promisingimprovement as compared with the conventional tomosynthesis method.
The purpose of this paper is to evaluate our low-dose CT-based tomosynthesis method against thetraditional tomosynthesis methods using three kinds of phantoms including a numerical phantom, aphysical phantom and eightin vitro phantoms made of breast specimens. In the following section,our method and the traditional tomosynthesis method will be briefly reviewed. Also, the experimentalplatform, phantoms and evaluation criteria are explained in detail. In the third section, the reconstructionand evaluation results are presented and analyzed. In the last section, we discuss relevant issues andconclude the paper.
2. Materials and methods
2.1. Conventional tomosynthesis method
In our evaluation, the transmission EM algorithm [16] was chosen for tomosynthesis [24]. This EMalgorithm is based on the Poisson model of the photon count. For each projection indexed byi, let W i
be the total number of photons from the source to the detector, andY i the actual number of photons
detected. The initial photons reach the detector with a probabilitye−
∑j∈Ii
lijµj
, wherej is the voxel index,Ijrepresents the set of voxels contributing to the ith x-ray path, andlij gives the equivalent length of theline along the projection linei that intersects voxelj. Therefore, the log-likelihood over all projectionsis given by:
ln g(Y, µ) =∑
i
−die
−∑
j∈Ij
lijµj
− Yi
∑j∈Ii
lijµj + Yi ln di − lnYi!
. (1)
whereY andµ are vectors whose components areY i andµj respectively,diis the x-ray dose per raywhich is equal to∆tiαi = I0, ∆ti the time interval over which theith projection is collected, andαi thesource intensity (tube flux). The projection data can be computed asp i = ln(di/Yi) = ln(I0/Yi). As itwas formulated in [15], the updating scheme can be written as:
µ(n+1)j = µ
(n)j + ∆µ
(n)j ,
K. Zeng et al. / An in vitro evaluation of cone-beam breast CT methods 173
∆µ(n)j =
µ(n)j
∑i lij(Die
−〈l,µ(n)〉i − Yi)
∑i (lij
⟨l, µ(n)
⟩iDie
−〈l,µ(n)〉i)
. (2)
WhereDi is the photon count for that dector pixel when no object presents.
2.2. Proposed hybrid cone-beam method
As described in [13], our work incorporates two imaging methods. A priori knowledge can beincorporated into the EM framework by adding regularization terms, choosing a proper initial guess, etc.As the optimization with regularization terms is not very effective and increases the computational timesignificantly, we proposed to use a low-dose/low-resolution CT image as the initial guess (fCT ). Dueto the data incompleteness, the final tomosynthetic result of the EM algorithm is not unique. As such,setting the initial value tofCT gives the tomosynthesis process an unbiased starting point. That is, wecan use the following formulas:
µ(0)j = fCT,j,
µ(n+1)j = µ
(n)j + ∆µ
(n)j ,
∆µ(n)j =
µ(n)j
∑i lij(Die
−〈l,µ(n)〉i − Yi)
∑i (lij
⟨l, µ(n)
⟩iDie
−〈l,µ(n)〉i)
. (3)
Our method does not require higher dose than conventional method. As the radiation dose from oneview is inversely proportion to the detector size, if with same SNR and same geometry [12]. Therefore, thedose from conventional tomosynthesis is redistributed to a low-resolution CT scan and a tomosyntheticscan so that the overall dose is the same as before.
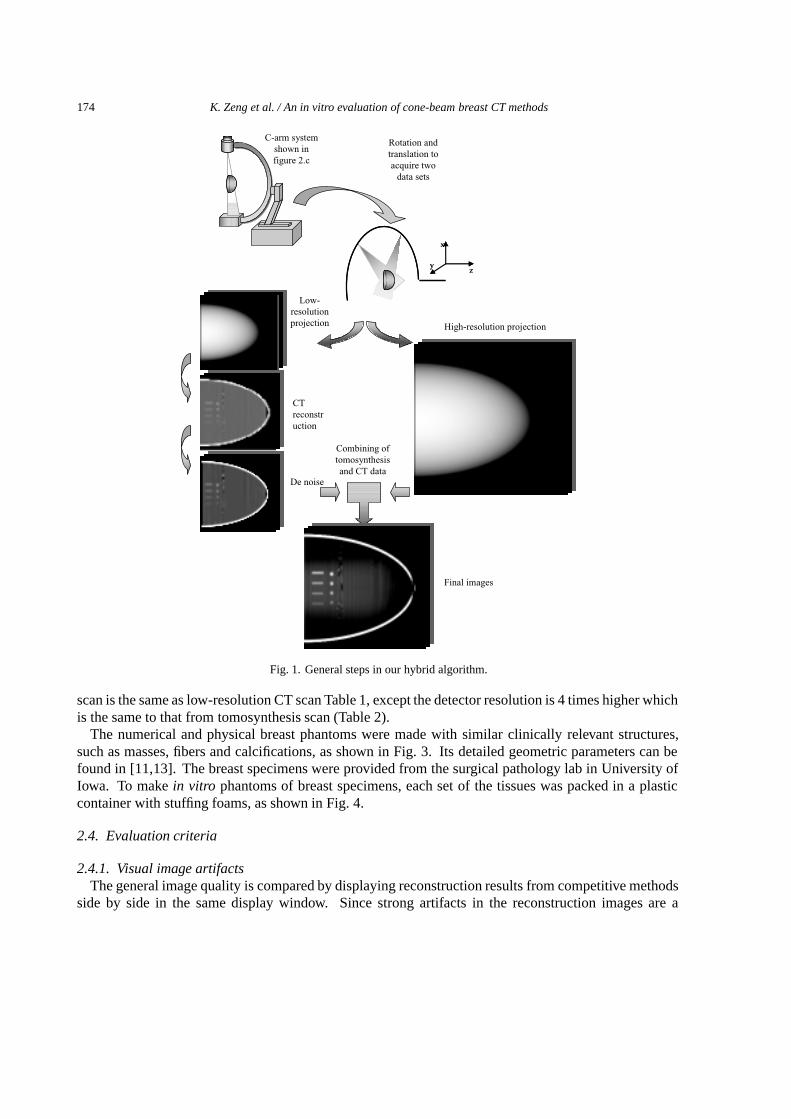
Generally speaking, our algorithm consists of the following steps (Fig. 1):
(1) Acquire a low-resolution CT (for example, 4 fold degradation in image resolution relative to whatis actually used for the tomosynthesis);
(2) Acquire a high-resolution tomosynthetic scan (for example,30 projections over a 60 degree angularrange);
(3) Reconstruct an image volume from a low resolution CT dataset using the CT algorithm. As theradiation dose is very low, some de-noising method can be used;
(4) Perform tomosynthesis from high resolution projections based on the low-resolution CT resultusing the transmission EM algorithm. Its update formulas are given in (3) with the initial valuebeing the low resolution CT reconstruction.
2.3. System setup and phantom design
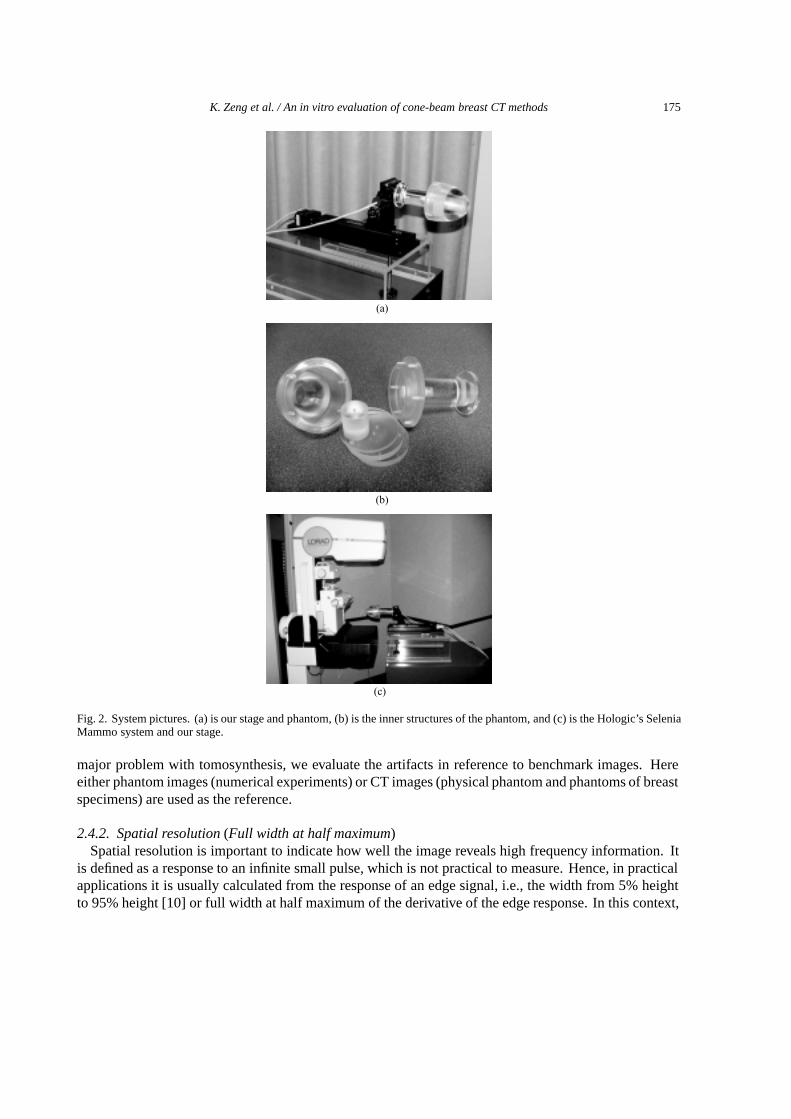
The experimental system was setup as shown in Fig. 2. The experimental platform was based on acommercial digital mammography system (Selenia system, Hologic Company, Fig. 2c). A translation-rotation stage was built in our laboratory to simulate scans around the phantom for both low-resolutionCT and tomosynthesis. The geometric parameters are shown in Tables 1–2, which are used for all theexperiments. And CT scan is also used as a reference method for the evaluation, the geometry of CT
174 K. Zeng et al. / An in vitro evaluation of cone-beam breast CT methods
High-resolution projection
Rotation and translation to acquire two
data sets
y
x
zy
x
z
Low-resolution projection
C-arm system shown in figure 2.c
De noise
CT reconstruction
Combining of tomosynthesis and CT data
Final images
Fig. 1. General steps in our hybrid algorithm.
scan is the same as low-resolution CT scan Table 1, except the detector resolution is 4 times higher whichis the same to that from tomosynthesis scan (Table 2).
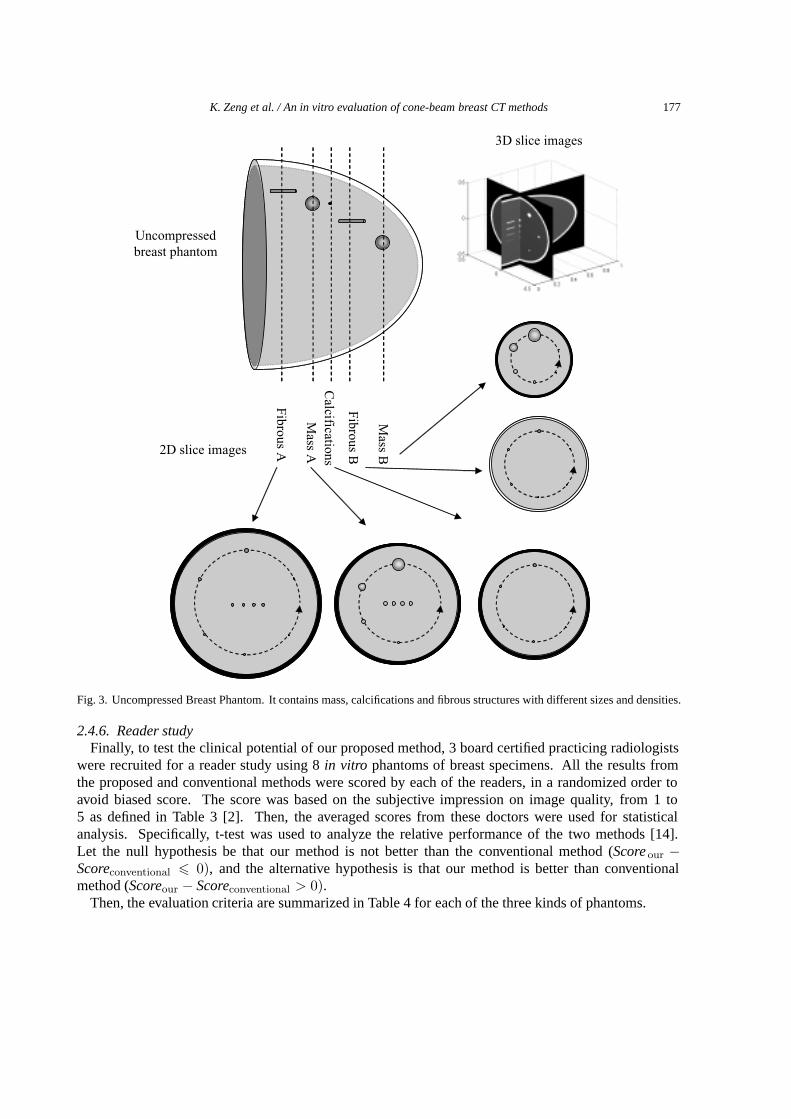
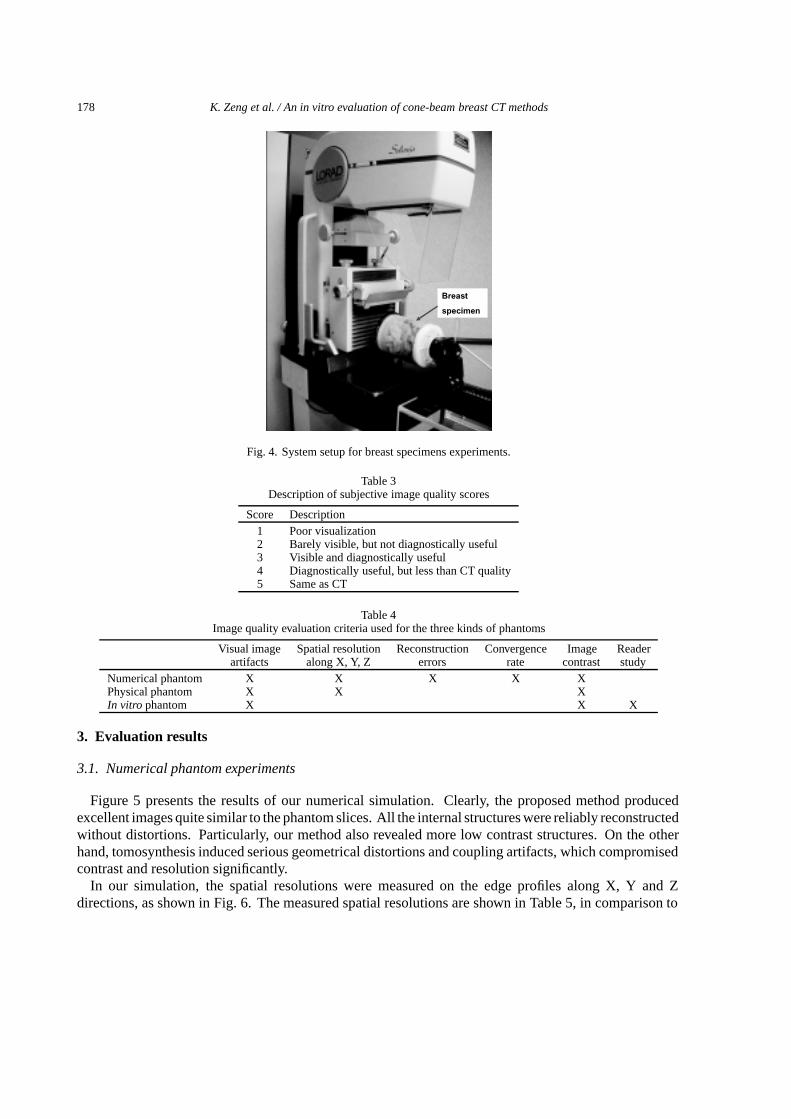
The numerical and physical breast phantoms were made with similar clinically relevant structures,such as masses, fibers and calcifications, as shown in Fig. 3. Its detailed geometric parameters can befound in [11,13]. The breast specimens were provided from the surgical pathology lab in University ofIowa. To makein vitro phantoms of breast specimens, each set of the tissues was packed in a plasticcontainer with stuffing foams, as shown in Fig. 4.
2.4. Evaluation criteria
2.4.1. Visual image artifactsThe general image quality is compared by displaying reconstruction results from competitive methods
side by side in the same display window. Since strong artifacts in the reconstruction images are a
K. Zeng et al. / An in vitro evaluation of cone-beam breast CT methods 175
(c)
(a)
(b)
Fig. 2. System pictures. (a) is our stage and phantom, (b) is the inner structures of the phantom, and (c) is the Hologic’s SeleniaMammo system and our stage.
major problem with tomosynthesis, we evaluate the artifacts in reference to benchmark images. Hereeither phantom images (numerical experiments) or CT images (physical phantom and phantoms of breastspecimens) are used as the reference.
2.4.2. Spatial resolution (Full width at half maximum)Spatial resolution is important to indicate how well the image reveals high frequency information. It
is defined as a response to an infinite small pulse, which is not practical to measure. Hence, in practicalapplications it is usually calculated from the response of an edge signal, i.e., the width from 5% heightto 95% height [10] or full width at half maximum of the derivative of the edge response. In this context,
176 K. Zeng et al. / An in vitro evaluation of cone-beam breast CT methods
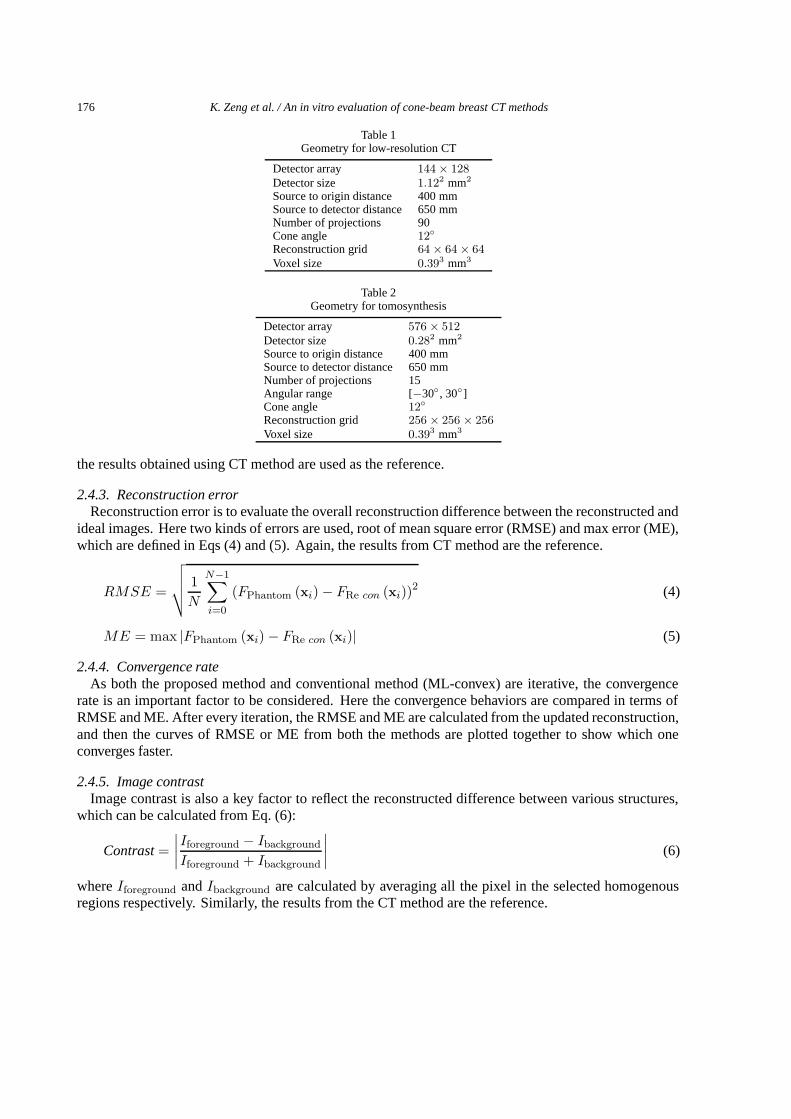
Table 1Geometry for low-resolution CT
Detector array 144 × 128Detector size 1.122 mm2
Source to origin distance 400 mmSource to detector distance 650 mmNumber of projections 90Cone angle 12◦
Reconstruction grid 64 × 64 × 64Voxel size 0.393 mm3
Table 2Geometry for tomosynthesis
Detector array 576 × 512Detector size 0.282 mm2
Source to origin distance 400 mmSource to detector distance 650 mmNumber of projections 15Angular range [−30◦, 30◦]Cone angle 12◦
Reconstruction grid 256 × 256 × 256Voxel size 0.393 mm3
the results obtained using CT method are used as the reference.
2.4.3. Reconstruction errorReconstruction error is to evaluate the overall reconstruction difference between the reconstructed and
ideal images. Here two kinds of errors are used, root of mean square error (RMSE) and max error (ME),which are defined in Eqs (4) and (5). Again, the results from CT method are the reference.
RMSE =
√√√√ 1N
N−1∑i=0
(FPhantom (xi) − FRe con (xi))2 (4)
ME = max |FPhantom (xi) − FRe con (xi)| (5)
2.4.4. Convergence rateAs both the proposed method and conventional method (ML-convex) are iterative, the convergence
rate is an important factor to be considered. Here the convergence behaviors are compared in terms ofRMSE and ME. After every iteration, the RMSE and ME are calculated from the updated reconstruction,and then the curves of RMSE or ME from both the methods are plotted together to show which oneconverges faster.
2.4.5. Image contrastImage contrast is also a key factor to reflect the reconstructed difference between various structures,
which can be calculated from Eq. (6):
Contrast =∣∣∣∣Iforeground − Ibackground
Iforeground + Ibackground
∣∣∣∣ (6)
whereIforeground andIbackground are calculated by averaging all the pixel in the selected homogenousregions respectively. Similarly, the results from the CT method are the reference.
K. Zeng et al. / An in vitro evaluation of cone-beam breast CT methods 177
Fib
rous B
Fib
rous A
Calcificatio
ns
Mass A
Mass B
3D slice images
2D slice images
Uncompressed breast phantom
Fig. 3. Uncompressed Breast Phantom. It contains mass, calcifications and fibrous structures with different sizes and densities.
2.4.6. Reader studyFinally, to test the clinical potential of our proposed method, 3 board certified practicing radiologists
were recruited for a reader study using 8in vitro phantoms of breast specimens. All the results fromthe proposed and conventional methods were scored by each of the readers, in a randomized order toavoid biased score. The score was based on the subjective impression on image quality, from 1 to5 as defined in Table 3 [2]. Then, the averaged scores from these doctors were used for statisticalanalysis. Specifically, t-test was used to analyze the relative performance of the two methods [14].Let the null hypothesis be that our method is not better than the conventional method (Score our −Scoreconventional � 0), and the alternative hypothesis is that our method is better than conventionalmethod (Scoreour − Scoreconventional > 0).
Then, the evaluation criteria are summarized in Table 4 for each of the three kinds of phantoms.
178 K. Zeng et al. / An in vitro evaluation of cone-beam breast CT methods
Breast
specimen
Fig. 4. System setup for breast specimens experiments.
Table 3Description of subjective image quality scores
Score Description1 Poor visualization2 Barely visible, but not diagnostically useful3 Visible and diagnostically useful4 Diagnostically useful, but less than CT quality5 Same as CT
Table 4Image quality evaluation criteria used for the three kinds of phantoms
Visual image Spatial resolution Reconstruction Convergence Image Readerartifacts along X, Y, Z errors rate contrast study
Numerical phantom X X X X XPhysical phantom X X XIn vitro phantom X X X
3. Evaluation results
3.1. Numerical phantom experiments
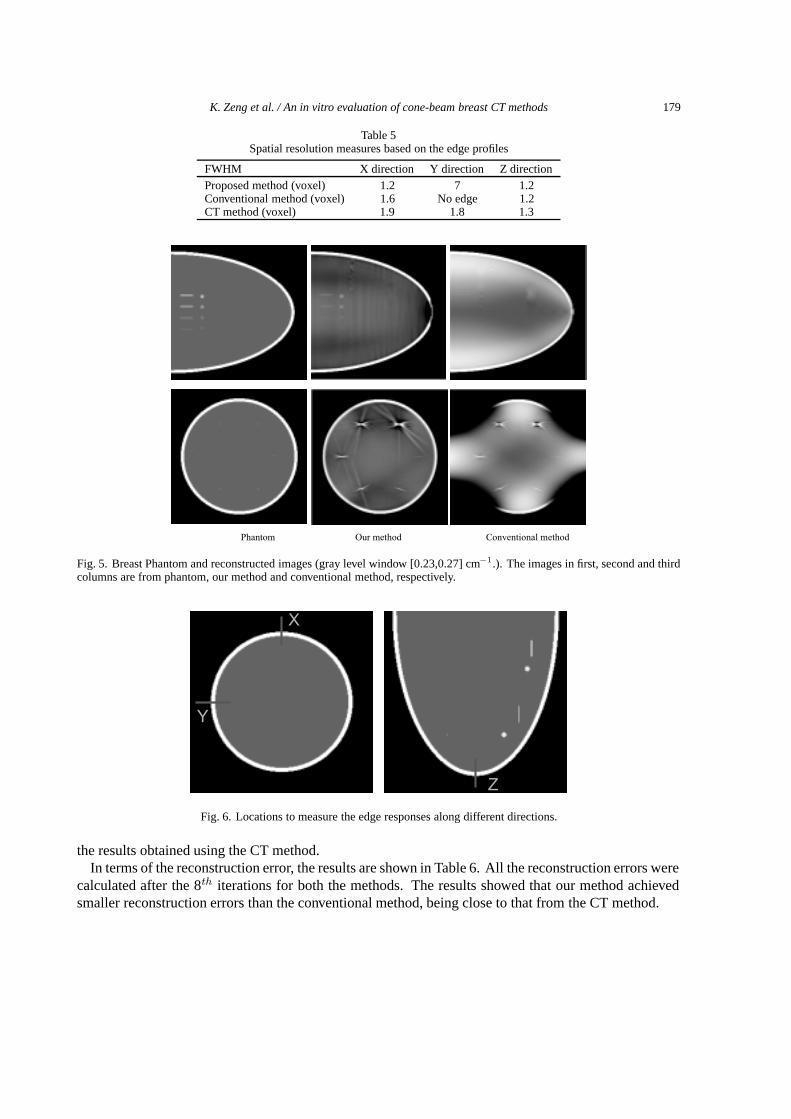
Figure 5 presents the results of our numerical simulation. Clearly, the proposed method producedexcellent images quite similar to the phantom slices. All the internal structures were reliably reconstructedwithout distortions. Particularly, our method also revealed more low contrast structures. On the otherhand, tomosynthesis induced serious geometrical distortions and coupling artifacts, which compromisedcontrast and resolution significantly.
In our simulation, the spatial resolutions were measured on the edge profiles along X, Y and Zdirections, as shown in Fig. 6. The measured spatial resolutions are shown in Table 5, in comparison to
K. Zeng et al. / An in vitro evaluation of cone-beam breast CT methods 179
Table 5Spatial resolution measures based on the edge profiles
FWHM X direction Y direction Z directionProposed method (voxel) 1.2 7 1.2Conventional method (voxel) 1.6 No edge 1.2CT method (voxel) 1.9 1.8 1.3
(a)(b)
(c)
Phantom Our method Conventional method
Fig. 5. Breast Phantom and reconstructed images (gray level window [0.23,0.27] cm−1.). The images in first, second and thirdcolumns are from phantom, our method and conventional method, respectively.
Y
X
Z
Fig. 6. Locations to measure the edge responses along different directions.
the results obtained using the CT method.In terms of the reconstruction error, the results are shown in Table 6. All the reconstruction errors were
calculated after the 8th iterations for both the methods. The results showed that our method achievedsmaller reconstruction errors than the conventional method, being close to that from the CT method.
180 K. Zeng et al. / An in vitro evaluation of cone-beam breast CT methods
Table 6Reconstruction error in terms of RMSE and ME
RMSE MEProposed method 0.016 2.73Conventional method 0.053 2.81CT method 0.012 2.69
RM
SE
RM
SE
Max
Err
orM
ax E
rror
(a)
(b)
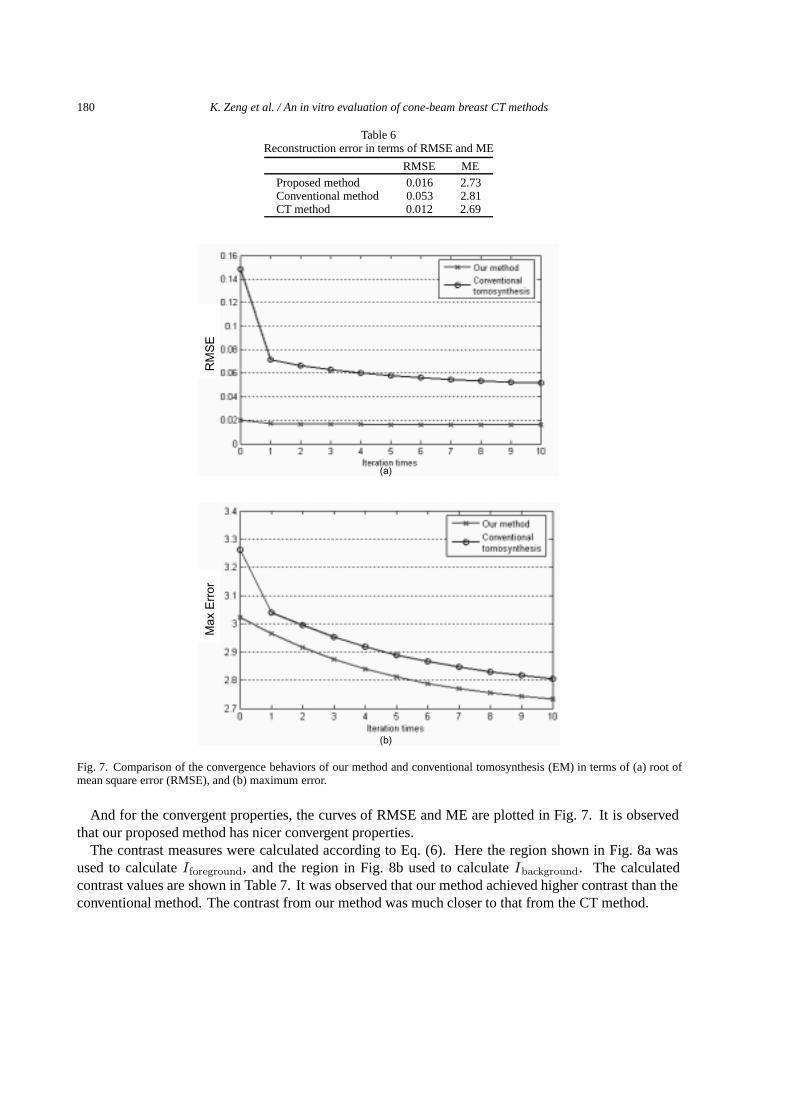
Fig. 7. Comparison of the convergence behaviors of our method and conventional tomosynthesis (EM) in terms of (a) root ofmean square error (RMSE), and (b) maximum error.
And for the convergent properties, the curves of RMSE and ME are plotted in Fig. 7. It is observedthat our proposed method has nicer convergent properties.
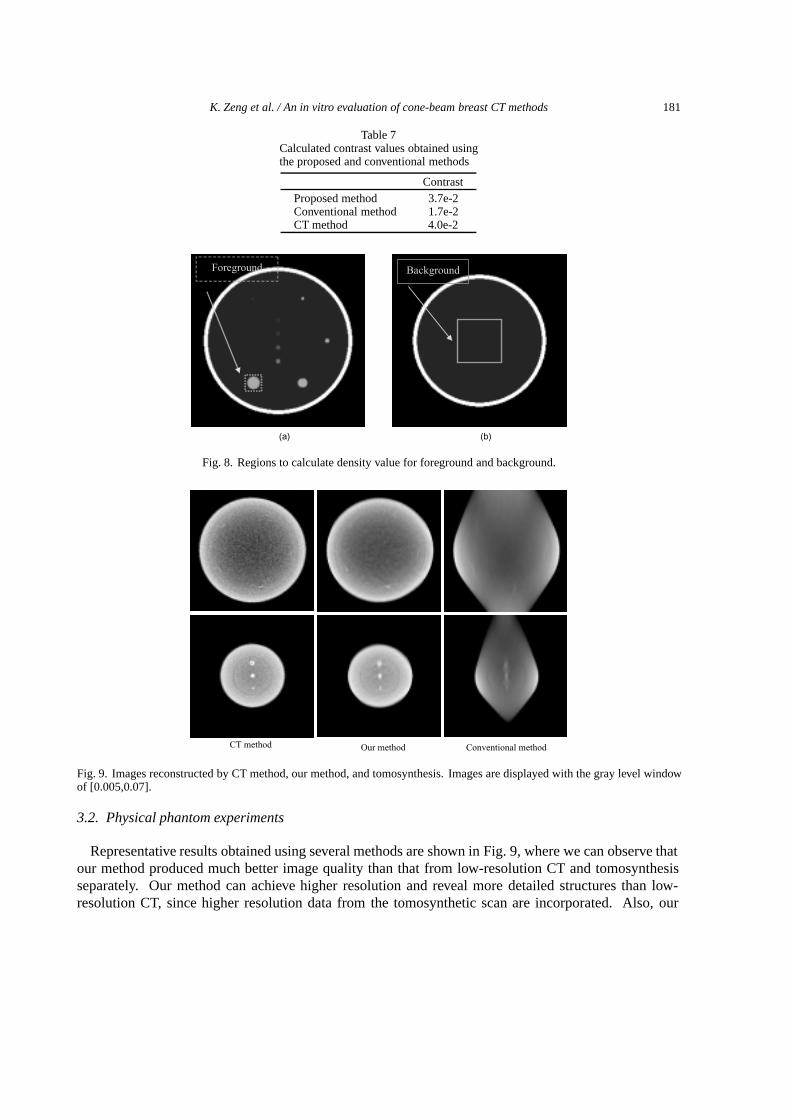
The contrast measures were calculated according to Eq. (6). Here the region shown in Fig. 8a wasused to calculateIforeground, and the region in Fig. 8b used to calculateIbackground. The calculatedcontrast values are shown in Table 7. It was observed that our method achieved higher contrast than theconventional method. The contrast from our method was much closer to that from the CT method.
K. Zeng et al. / An in vitro evaluation of cone-beam breast CT methods 181
Table 7Calculated contrast values obtained usingthe proposed and conventional methods
ContrastProposed method 3.7e-2Conventional method 1.7e-2CT method 4.0e-2
(a) (b)
BackgroundForeground
Fig. 8. Regions to calculate density value for foreground and background.
CT method Our method Conventional method
Fig. 9. Images reconstructed by CT method, our method, and tomosynthesis. Images are displayed with the gray level windowof [0.005,0.07].
3.2. Physical phantom experiments
Representative results obtained using several methods are shown in Fig. 9, where we can observe thatour method produced much better image quality than that from low-resolution CT and tomosynthesisseparately. Our method can achieve higher resolution and reveal more detailed structures than low-resolution CT, since higher resolution data from the tomosynthetic scan are incorporated. Also, our
182 K. Zeng et al. / An in vitro evaluation of cone-beam breast CT methods
Table 8Spatial resolution comparison based edge profiles in Fig. 10
FWHM X direction Y direction Z directionProposed method (voxel) 1.0 8 1.1Conventional method (voxel) 1.8 No edge 1.0CT method (voxel) 1.9 1.8 1.4
Y
X
Z
Fig. 10. Locations to measure the edge responses along different directions.
BackgroundForeground
(a) (b)
Fig. 11. Regions to calculate density value for foreground and background.
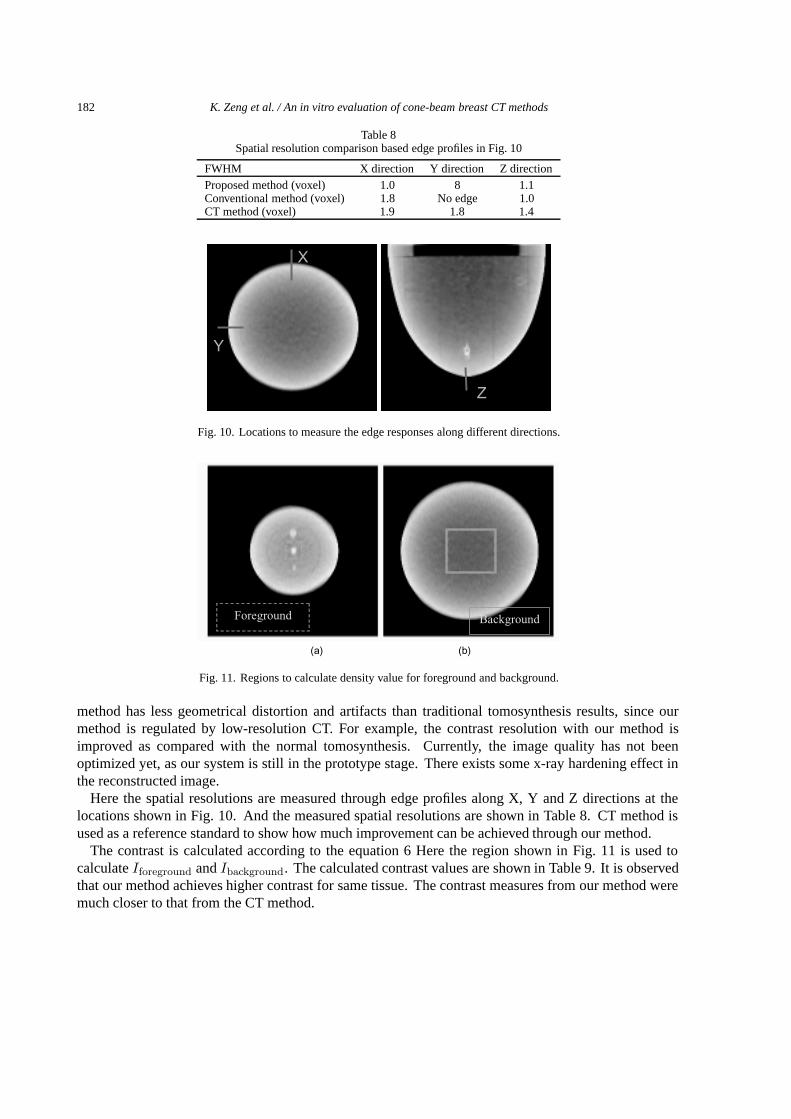
method has less geometrical distortion and artifacts than traditional tomosynthesis results, since ourmethod is regulated by low-resolution CT. For example, the contrast resolution with our method isimproved as compared with the normal tomosynthesis. Currently, the image quality has not beenoptimized yet, as our system is still in the prototype stage. There exists some x-ray hardening effect inthe reconstructed image.
Here the spatial resolutions are measured through edge profiles along X, Y and Z directions at thelocations shown in Fig. 10. And the measured spatial resolutions are shown in Table 8. CT method isused as a reference standard to show how much improvement can be achieved through our method.
The contrast is calculated according to the equation 6 Here the region shown in Fig. 11 is used tocalculateIforeground andIbackground. The calculated contrast values are shown in Table 9. It is observedthat our method achieves higher contrast for same tissue. The contrast measures from our method weremuch closer to that from the CT method.
K. Zeng et al. / An in vitro evaluation of cone-beam breast CT methods 183
Table 9Calculated contrast values obtained usingthe proposed and conventional methods
ContrastProposed method 0.29Conventional method 0.14CT method 0.31
(a)
(b)
(c)
Conventional method
Proposed method
CT method
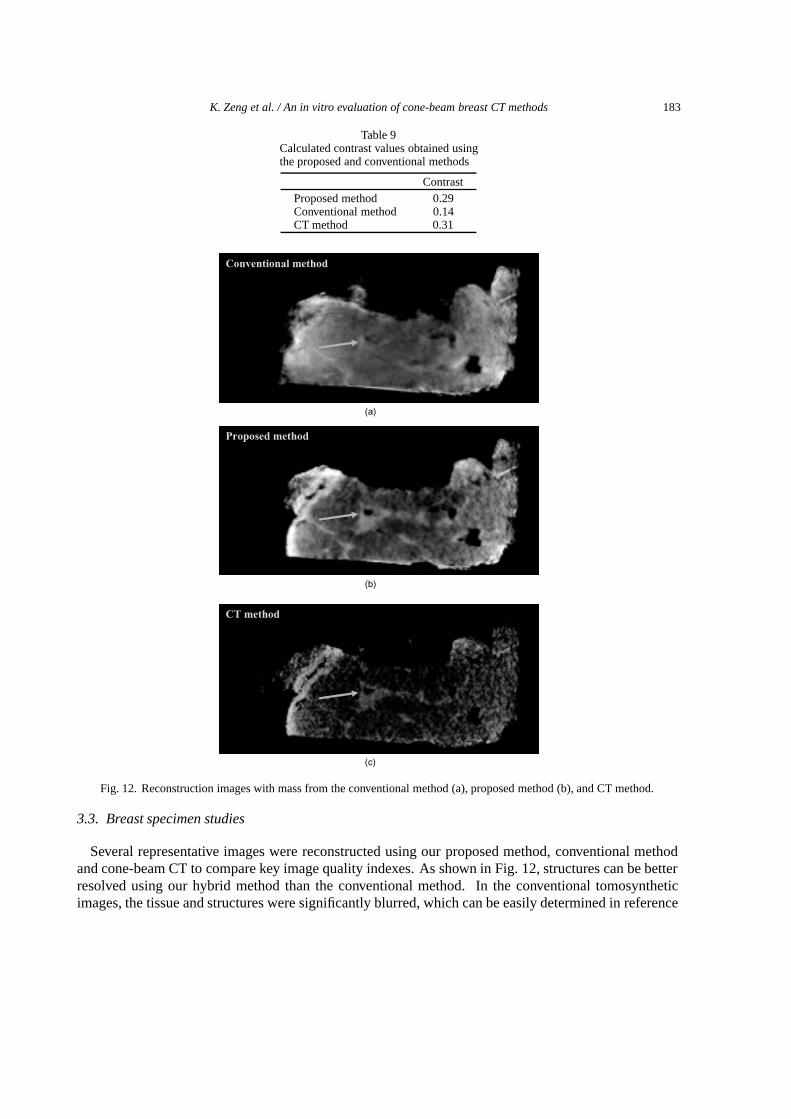
Fig. 12. Reconstruction images with mass from the conventional method (a), proposed method (b), and CT method.
3.3. Breast specimen studies
Several representative images were reconstructed using our proposed method, conventional methodand cone-beam CT to compare key image quality indexes. As shown in Fig. 12, structures can be betterresolved using our hybrid method than the conventional method. In the conventional tomosyntheticimages, the tissue and structures were significantly blurred, which can be easily determined in reference
184 K. Zeng et al. / An in vitro evaluation of cone-beam breast CT methods
Table 10Calculated contrast values obtained usingthe proposed and conventional methods
ContrastProposed method 0.162Conventional method 0.074CT method 0.17
ForegroundBackground
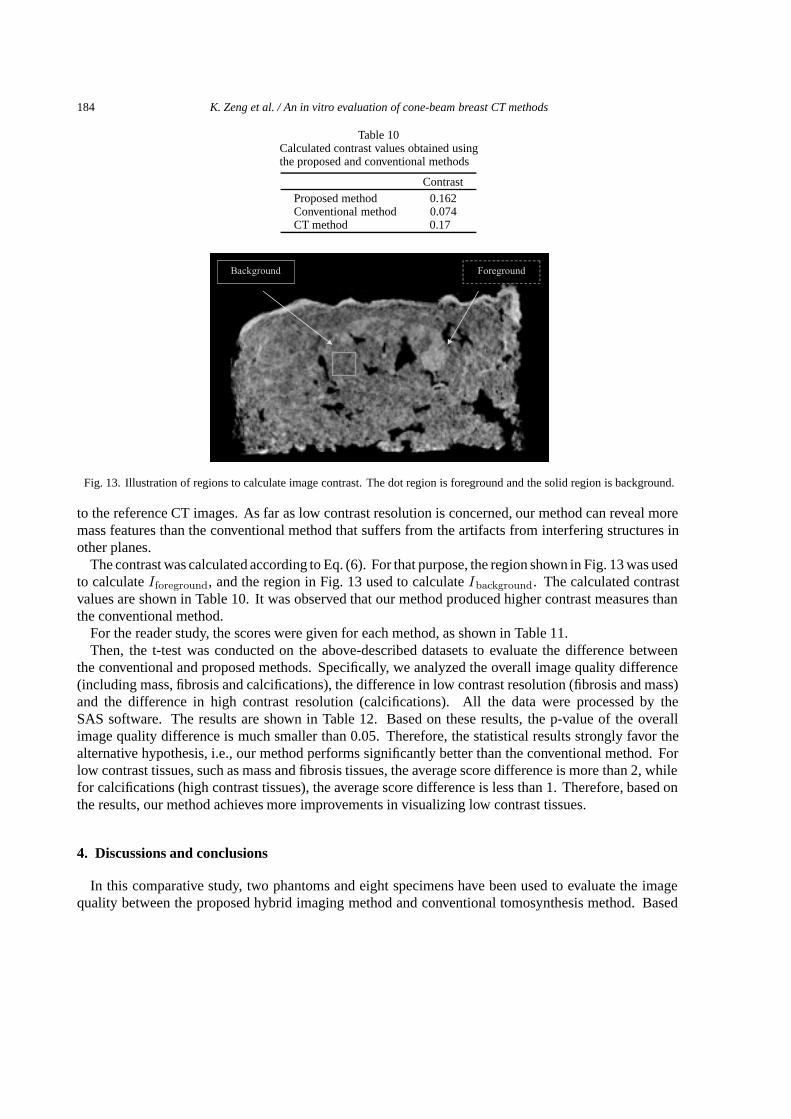
Fig. 13. Illustration of regions to calculate image contrast. The dot region is foreground and the solid region is background.
to the reference CT images. As far as low contrast resolution is concerned, our method can reveal moremass features than the conventional method that suffers from the artifacts from interfering structures inother planes.
The contrast was calculated according to Eq. (6). For that purpose, the region shown in Fig. 13 was usedto calculateIforeground, and the region in Fig. 13 used to calculateIbackground. The calculated contrastvalues are shown in Table 10. It was observed that our method produced higher contrast measures thanthe conventional method.
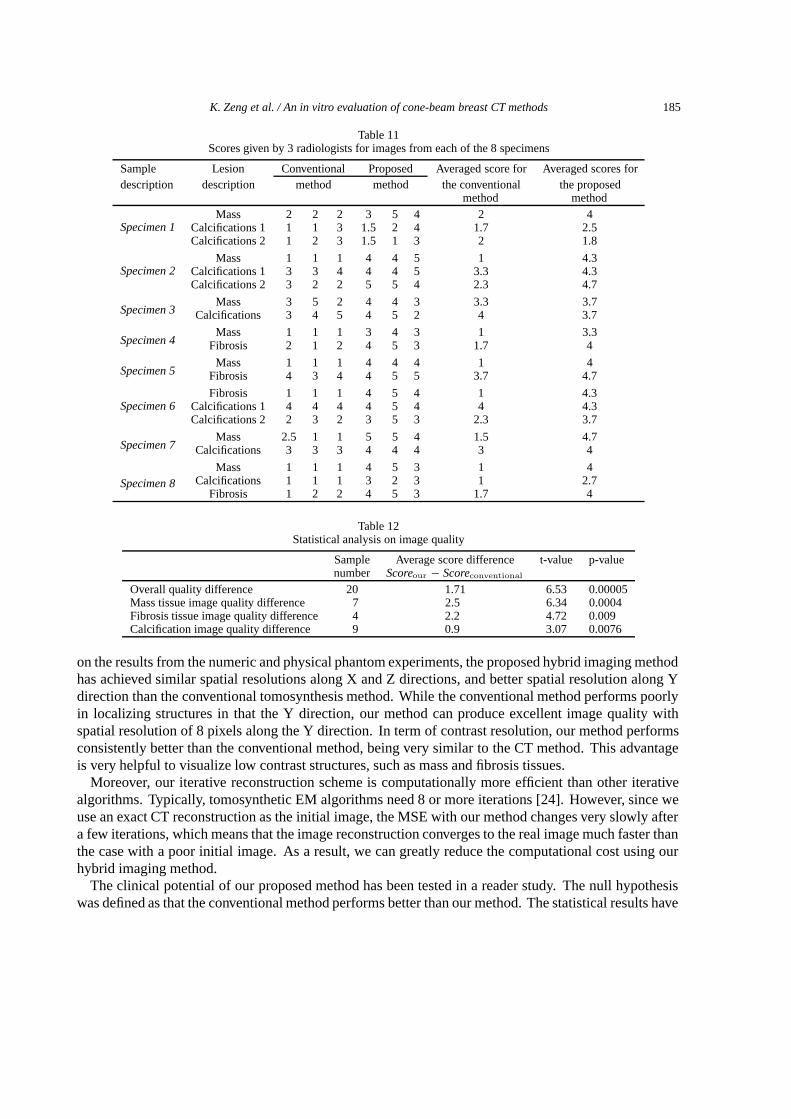
For the reader study, the scores were given for each method, as shown in Table 11.Then, the t-test was conducted on the above-described datasets to evaluate the difference between
the conventional and proposed methods. Specifically, we analyzed the overall image quality difference(including mass, fibrosis and calcifications), the difference in low contrast resolution (fibrosis and mass)and the difference in high contrast resolution (calcifications). All the data were processed by theSAS software. The results are shown in Table 12. Based on these results, the p-value of the overallimage quality difference is much smaller than 0.05. Therefore, the statistical results strongly favor thealternative hypothesis, i.e., our method performs significantly better than the conventional method. Forlow contrast tissues, such as mass and fibrosis tissues, the average score difference is more than 2, whilefor calcifications (high contrast tissues), the average score difference is less than 1. Therefore, based onthe results, our method achieves more improvements in visualizing low contrast tissues.
4. Discussions and conclusions
In this comparative study, two phantoms and eight specimens have been used to evaluate the imagequality between the proposed hybrid imaging method and conventional tomosynthesis method. Based
K. Zeng et al. / An in vitro evaluation of cone-beam breast CT methods 185
Table 11Scores given by 3 radiologists for images from each of the 8 specimens
Sample Lesion Conventional Proposed Averaged score for Averaged scores fordescription description method method the conventional the proposed
method method
Specimen 1Mass 2 2 2 3 5 4 2 4
Calcifications 1 1 1 3 1.5 2 4 1.7 2.5Calcifications 2 1 2 3 1.5 1 3 2 1.8
Specimen 2Mass 1 1 1 4 4 5 1 4.3
Calcifications 1 3 3 4 4 4 5 3.3 4.3Calcifications 2 3 2 2 5 5 4 2.3 4.7
Specimen 3Mass 3 5 2 4 4 3 3.3 3.7
Calcifications 3 4 5 4 5 2 4 3.7
Specimen 4Mass 1 1 1 3 4 3 1 3.3
Fibrosis 2 1 2 4 5 3 1.7 4
Specimen 5Mass 1 1 1 4 4 4 1 4
Fibrosis 4 3 4 4 5 5 3.7 4.7
Specimen 6Fibrosis 1 1 1 4 5 4 1 4.3
Calcifications 1 4 4 4 4 5 4 4 4.3Calcifications 2 2 3 2 3 5 3 2.3 3.7
Specimen 7Mass 2.5 1 1 5 5 4 1.5 4.7
Calcifications 3 3 3 4 4 4 3 4
Specimen 8Mass 1 1 1 4 5 3 1 4
Calcifications 1 1 1 3 2 3 1 2.7Fibrosis 1 2 2 4 5 3 1.7 4
Table 12Statistical analysis on image quality
Sample Average score difference t-value p-valuenumber Scoreour − Scoreconventional
Overall quality difference 20 1.71 6.53 0.00005Mass tissue image quality difference 7 2.5 6.34 0.0004Fibrosis tissue image quality difference 4 2.2 4.72 0.009Calcification image quality difference 9 0.9 3.07 0.0076
on the results from the numeric and physical phantom experiments, the proposed hybrid imaging methodhas achieved similar spatial resolutions along X and Z directions, and better spatial resolution along Ydirection than the conventional tomosynthesis method. While the conventional method performs poorlyin localizing structures in that the Y direction, our method can produce excellent image quality withspatial resolution of 8 pixels along the Y direction. In term of contrast resolution, our method performsconsistently better than the conventional method, being very similar to the CT method. This advantageis very helpful to visualize low contrast structures, such as mass and fibrosis tissues.
Moreover, our iterative reconstruction scheme is computationally more efficient than other iterativealgorithms. Typically, tomosynthetic EM algorithms need 8 or more iterations [24]. However, since weuse an exact CT reconstruction as the initial image, the MSE with our method changes very slowly aftera few iterations, which means that the image reconstruction converges to the real image much faster thanthe case with a poor initial image. As a result, we can greatly reduce the computational cost using ourhybrid imaging method.
The clinical potential of our proposed method has been tested in a reader study. The null hypothesiswas defined as that the conventional method performs better than our method. The statistical results have
186 K. Zeng et al. / An in vitro evaluation of cone-beam breast CT methods
favored the alternative hypothesis that our method performs better than the conventional method.Our hybrid imaging method has more requirements on the imaging hardware, such as a gantry needed
to rotate over a much larger angular range to acquire projection data. However, it can be implementedin the current C-arm digital mammography framework with little modification. Also, the two scans(low-resolution/high-noise CT scan and high-resolution tomosynthetic scan) can be physically realizedin a single scan with the mA modulation technique, i.e., low mA for a global CT dataset and normal mAfor tomosynthesis. Nevertheless, the advantages in image quality with our proposed method have beenshown to be so clear that can justify the additional hardware cost.
An enlarged scanning range will increases the data acquisition time a little bit than a conventionaltomosynthetic scan. Thus, the patient motion could be more involved. Nevertheless, temporal resolutioncan be improved using a faster C-arm rotational speed. More importantly, in our scheme the low-dose CT scan is not sensitive to small motion because of its low resolution. The tomosynthetic scanis still performed within a very short scan, which will reveal detailed structures at uncompromisedtemporal resolution. Therefore, the overall temporal resolution is still quite comparable to that with theconventional tomosynthetic scan.
In conclusion, we have evaluated our hybrid imaging scheme in comparison with the conventionaltomosynthesis method. It has been observed that the results from our method performs significantlybetter than the conventional method in terms of spatial resolution, contrast resolution, reconstructionerror, convergence rate, and scores in the reader study. These data, especially scores from the-readerstudy, have demonstrated the clinical potential of our method. In future, more systematic clinicalexperiments will be used to explore the its clinical impact and our scheme may be further improved byrecent cone-beam reconstruction results in ref [9,18].
Acknowledgement
This work is supported by the NIH/NIBIB grants EB002667, EB004287, and NSF/ECS grant 055394.The authors express their appreciation for Sandra Maxwell’s and Allen McGruder’s technical assistancein acquiring datasets using the Selenia mammo system. The authors are also grateful for Dr. BarryDeYoung and Katie Nelson with the Surgical Pathological Lab, University of Iowa, who acquired the 8breast specimens for this project.
References
[1] P. Bleuet et al., An adapted fan volume sampling scheme for 3-D algebraic reconstruction in linear tomosynthesis,IEEETransactions on Nuclear Science 49 I(5) (2002), 2366–2372.
[2] D.T. Boll et al., Comparison of MR imaging sequences for liver and head and neck interventions: Is there a single optimalsequence for all purposes,Academic Radiology 11(5) (2004), 506.
[3] D.P. Chakraborty et al., Self-masking subtraction tomosynthesis,Radiology 150(1) (1984), 225–229.[4] J.T. Dobbins 3rd and D.J. Godfrey, Digital x-ray tomosynthesis: current state of the art and clinical potential,Phys Med
Biol 48(19) (2003), R65–R106.[5] D.N. Ghosh Roy et al., Selective plane removal in limited angle tomographic imaging,Med Phys 12(1) (1985), 65–70.[6] D.J. Godfrey, A. Rader and J.T. Dobbins III, Practical strategies for the clinical implementation of matrix inversion
tomosynthesis (MITS). in Medical Imaging 2003: Physics of Medical Imaging, Feb 16–18 2003. 2003. San Diego, CA,United States: The International Society for Optical Engineering.
[7] R. Gordon, R. Bender and G.T. Herman, Algebraic reconstruction techniques (ART) for three-dimensional electronmicroscopy and x-ray photography,J Theor Biol 29(3) (1970), 471–481.
[8] D.G. Grant, Tomosynthesis: a three-dimensional radiographic imaging technique,IEEE Trans Biomed Eng 19(1) (1972),20–28.
K. Zeng et al. / An in vitro evaluation of cone-beam breast CT methods 187
[9] J. Zhao, Y. Lu, Y. Jin, E. Bai and G. Wang, Feldkamp-type reconstruction algorithms for spiral cone-beam CT withvariable pitch,Journal of X-Ray Science and Technology 15 (2007), 177–196.
[10] K. Zeng, H.Y., Er-Wei Bai and G. Wang, Numerical studies on Palamodov and generalized Feldkamp algorithm forgeneral cone-beam scanning (To be appeared),Journal of X-ray Science and Technology (2007).
[11] K. Zeng, H.Y., Laurie L. Fajardo M.D. and G. Wang, Cone-beam mammo-computed tomography from data along twotilting arcs,Medical Physics 33(10) (2006), 3621–3633.
[12] K. Zeng, H.Y., S. Zhao, L.L. Fajardo, C. Ruth, Z. Jing and G. Wang, Digital tomosynthesis aided by low resolution exactCT, Jounal of Computer Assisted Tomography (2006), (to be published).
[13] K. Zeng, H.Y., S. Zhao, L.L. Fajardo, C. Ruth, Z. Jing and G. Wang, Digital tomosynthesis aided by low resolution exactCT, Jounal of Computer Assisted Tomography (2007), (to be published).
[14] M.P. Kimberlee Gauvreau,Principles of Biostatistics, (2nd ed.), Thomson Learning College, 2000.[15] k. Lange and J.A. Fessler, Globally convergent algorithms for maximum a posteriori transmission tomography,4(10)
(1995), 1430.[16] K. Lange and R. Carson, EM reconstruction algorithms for emission and transmission tomography,J Comput Assist
Tomogr 8(2) (1984), 306–316.[17] J.M. Lewin, C.J. D’Orsi and R.E. Hendrick, Digital mammography,Radiol Clin North Am 42(5) (2004), 871–884, vi.[18] L. Li, K. Kang, Z. Chen, L. Zhang, Y. Xing and G. Wang, The FDK algorithm with an expanded definition domain
for cone-beam reconstruction preserving oblique line integrals,Journal of X-Ray Science and Technology 14 (2006),217–233.
[19] A.I. Mushlin, R.W. Kouides and D.E. Shapiro, Estimating the accuracy of screening mammography: a meta-analysis,Am J Prev Med 14(2) (1998), 143–153.
[20] L.T. Niklason, Current and future developments in digital mammography,European Journal of Cancer 38 (2002),S14–S15.
[21] L.T. Niklason et al., Digital tomosynthesis in breast imaging,Radiology 205(2) (1997), 399–406.[22] E.D. Pisano and C.A. Parham, Digital mammography, sestamibi breast scintigraphy, and positron emission tomography
breast imaging,Radiol Clin North Am 38(4) (2000), 861–869, x.[23] G.M. Stevens et al., Circular tomosynthesis: potential in imaging of breast and upper cervical spine – preliminary
phantom andin vitro study,Radiology 228(2) (2003), 569–575.[24] T. Wu et al. Digital tomosynthesis mammography using a parallel maximum likelihood reconstruction method. in Medical
Imaging 2004: Physics of Medical Imaging, Feb 15–17 2004. 2004. San Diego, CA, United States: The InternationalSociety for Optical Engineering, Bellingham, United States.
[25] T. Wu et al., A comparison of reconstruction algorithms for breast tomosynthesis,Med Phys 31(9) (2004), 2636–2647.