Embed Size (px)
Citation preview
Angular reconstruction of high energy airshowers using the radio signal spectrum
S Nonis2, A Leisos1, A Tsirigotis1, G Bourlis1, K Papageorgiou2,I Gkialas2, I Manthos3 and Spyros Tzamarias3
1 Physics Laboratory, School of Science and Technology,Hellenic Open University, Patras 26222, Greece
2 School of Engineering, Department of Financial andManagement Engineering, University of the Aegean, Chios
82100, Greece3 Department of Physics, Aristotle University of Thessaloniki,
Thessaloniki 54124, Greece
Abstract
The Hellenic Open University extensive air shower array (alsoknown as Astroneu array) is a small scale hybrid detection systemoperating in an area with high levels of electromagnetic noise fromanthropogenic activity. In the present study we report the latest resultsof the data analysis concerning the estimation of the shower directionusing the spectrum of the RF system. In a recent layout of the array,4 RF antennas were operating receiving a common trigger from anautonomous detection station of 3 particle detectors. The directionsestimated with the RF system are in very good agreement with thecorresponding estimations using the particle detectors demonstratingthat a single antenna has the potential for reconstructing the showeraxis angular direction.
Keywords: Cosmic rays, Astroneu, radio detection of extensive air showers,RF spectrum
1
arX
iv:2
005.
0068
6v1
[ph
ysic
s.in
s-de
t] 2
May
202
0
1 Introduction
The detection of high energetic cosmic particles (above 1014 eV) is tra-ditionally made by well-established techniques which use ground particledetectors or detectors recording Cherenkov and fluorescent light emission.Another method of detection relies on the measurement of the electromagneticradiation emitted by high energy showers in the radio frequency (RF) regime.The first RF signal detection from air showers was made during the 1960’s[1], but the lack of fast digital electronics has soon sidelined this method.Since 2002 the RF detection has been regenerated from various experiments(such as LOPES [2], CODALEMA [3], LOFAR [4], AERA [5] and Tunka-Rex[6]) that measure the electric field strength at frequency range [30-80] MHz(or up to the band [110-200] MHz). Nowadays, the RF detection allowsthe measurements of properties of primary cosmic particles, such as theirarrival direction, energy and chemical composition with accuracy similar tothose obtained by particle detectors or fluorescence telescopes. Among theadvantages of the RF method is the small dependence on the atmosphericconditions (weather, light and transparency), as well as the low cost of theantennas (and their electronics) compared to large scintillator detectors.
The radio emission in air showers is attributed to two different physical pro-cesses. The more dominant is of geomagnetic origin, producing a time-varyingtransverse (with respect to the shower axis) current, due to the (opposite)deflection of shower’s electrons and positrons by the Earth’s magnetic field[7]. The RF signal generated by this mechanism is linearly polarized in the
direction of the Lorentz force (~v × ~B). A secondary contribution to the radiosignal comes from the excess of electrons at the front of the shower (Askaryaneffect) [8], which generates a time depended current collateral to the showeraxis direction. The resulting signal is radially polarized, pointing towards theshower axis. The RF electric field measured at the ground is the sum of bothcontributions.
The Hellenic Open University (HOU) extensive air shower array (Astroneu[9]) is a hybrid small scale array, operating in urban environment, on theoutskirts of the city of Patras in Greece. During the first pilot phase (2014-2017) the array consisted of 3 stations each comprising 3 large scintillatordetectors and 1 RF antenna. Since 2017 (second phase) 4 RF antennas weredeployed at station A, receiving a common trigger from the 3 scintillatordetectors. In former studies, we demonstrated the performance of the Astroneuarray with emphasis on the detection and reconstruction of EAS using the
2
charged particle detectors [9] indicating also the capability of detecting RFsignals from showers by imposing the appropriate selection criteria to theRF signals [10]. We have also studied the timing and the amplitude strengthof the RF signals by comparing the antenna data with the particle detectordata, as well as with the simulation predictions [11]. Furthermore, we havepresented the first studies on a complete Voltage Response Model (VRM)for the RF system using the antenna’s Vector Effective Length (VEL) [12]and the measured electric field (actually the RF spectra) at the antenna’sposition in order to estimate the primary particle arrival direction.
In this work we extend this study using a specific geometrical layout andwe compare our RF measurements to independent measurements obtained bythe particle detectors as well as to the simulation predictions. In Section 2we outline the components and performance of the Astroneu array, while inSection 3 the simulation framework is presented. In Section 4 we describethe method for reconstructing the direction of the shower axis using the RFspectrum and evaluate its performance using Monte Carlo (MC) simulation.In Section 5 we apply the method to shower data collected by the Astroneuarray and we compare the estimations of the angular shower axis directionusing the RF spectrum with the independent measurements of the particledetectors. Finally, in Section 6 the conclusions are drawn.
2 The Astroneu array
The Astroneu array is a small scale hybrid detection system comprising9 scintillator detectors and 6 RF antennas. The detector components arearranged in three independent autonomous stations (A, B and C) separatedby few hundred meters, while the inter-station distances between the particledetectors is about 27 meters. Each station includes three Scintillator DetectorModules (SDM) [9] forming a triangle with one RF Antenna (RFA) [13] inthe middle. It is also equipped with trigger, digitization and Data Acquisition(DAQ) electronics along with slow control and monitor electronics and aGPS-based timing system. Since 2017 station A comprises 3 more antennas(4 RFAs in total) covering an area roughly 120 m in diameter. The data usedin this analysis were collected by station A of which the geometrical layout isdepicted in Figure 1 (left).
The SDM consists of 160 scintillating tiles covering an area of approxi-mately 1m2. The light which is generated during the interaction of shower
3
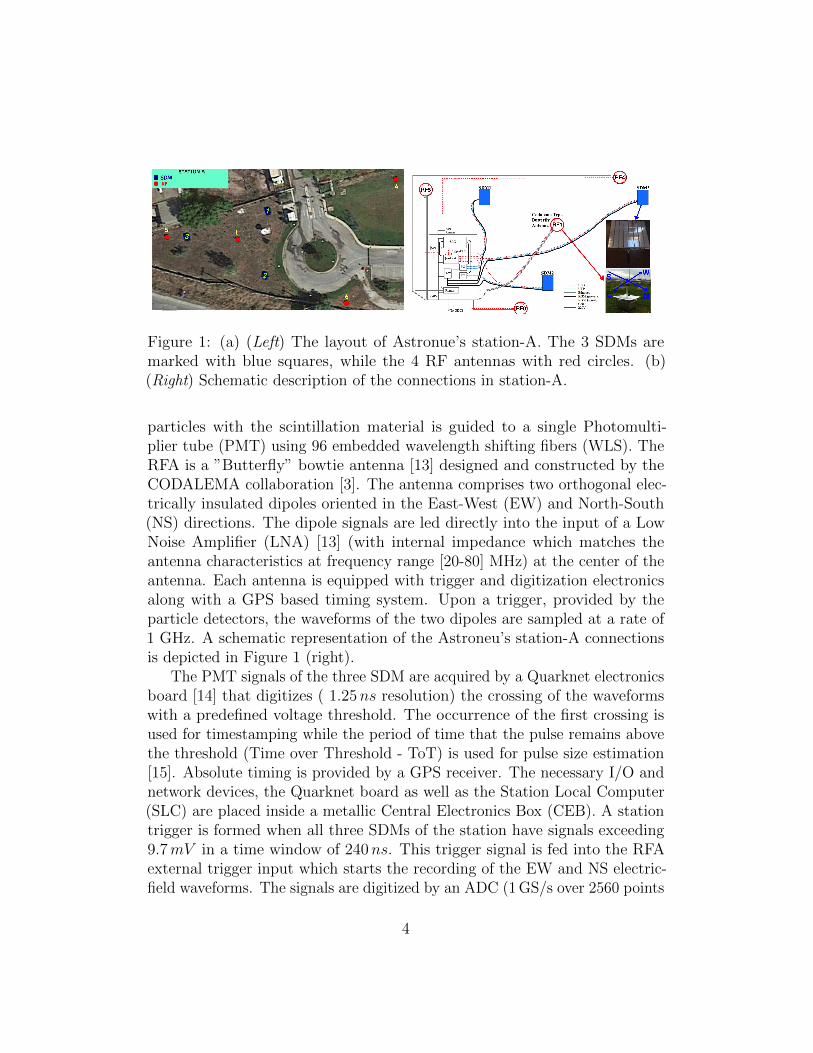
Figure 1: (a) (Left) The layout of Astronue’s station-A. The 3 SDMs aremarked with blue squares, while the 4 RF antennas with red circles. (b)(Right) Schematic description of the connections in station-A.
particles with the scintillation material is guided to a single Photomulti-plier tube (PMT) using 96 embedded wavelength shifting fibers (WLS). TheRFA is a ”Butterfly” bowtie antenna [13] designed and constructed by theCODALEMA collaboration [3]. The antenna comprises two orthogonal elec-trically insulated dipoles oriented in the East-West (EW) and North-South(NS) directions. The dipole signals are led directly into the input of a LowNoise Amplifier (LNA) [13] (with internal impedance which matches theantenna characteristics at frequency range [20-80] MHz) at the center of theantenna. Each antenna is equipped with trigger and digitization electronicsalong with a GPS based timing system. Upon a trigger, provided by theparticle detectors, the waveforms of the two dipoles are sampled at a rate of1 GHz. A schematic representation of the Astroneu’s station-A connectionsis depicted in Figure 1 (right).
The PMT signals of the three SDM are acquired by a Quarknet electronicsboard [14] that digitizes ( 1.25ns resolution) the crossing of the waveformswith a predefined voltage threshold. The occurrence of the first crossing isused for timestamping while the period of time that the pulse remains abovethe threshold (Time over Threshold - ToT) is used for pulse size estimation[15]. Absolute timing is provided by a GPS receiver. The necessary I/O andnetwork devices, the Quarknet board as well as the Station Local Computer(SLC) are placed inside a metallic Central Electronics Box (CEB). A stationtrigger is formed when all three SDMs of the station have signals exceeding9.7mV in a time window of 240ns. This trigger signal is fed into the RFAexternal trigger input which starts the recording of the EW and NS electric-field waveforms. The signals are digitized by an ADC (1 GS/s over 2560 points
4
for 2.56 s record) and timestamped using GPS. The experimental data fromboth the SDMs and the RFAs of the station are transferred to the GlobalData and Control Server (GDCS), where the event building is carried outoffline using the GPS time-tags.
Each autonomous station of the Astroneu array can potentially reconstructextensive air showers of energy more than 10TeV with a typical resolutionof 3.5 degrees at a rate of 17h−1. The efficiency of the Astroneu array indetecting and reconstructing EAS using the data from the charged particledetectors of one station (single station operation) or by combining the datainformation from two stations (multiple station operation) is reported in [9].The RF component of the EAS has been studied using noise filters, timingand signal polarization [10]. Further studies including the correlation of theRF signals with the particle detector data as well as the comparison of theelectric field measurements with the MC prediction have also been reported[11].
3 Simulation framework
The simulation procedure can be divided into three main parts. In the firstsimulation step we produced high energy shower events (corresponding to348000 hours of experimental time) with the CORSIKA simulation package[16]. The energy varied between 1015eV and 1018eV with primary relativeabundances and spectral index according to the latest measurements [17]. TheQGSJET-II-04 [18] package has been utilized for the hadronic interactionsand the EGS4 Code system [19] for the electromagnetic interactions. Thesimulations sample was selected to cover a wide range of arrival directions(0o ≤ θ ≤ 90o, 0 ≤ φ ≤ 360o) and showers cores inside a large enoughcircular area of radius R = 418m around the center of station-A. Duringthe second part of the simulation process, the Hellenic Open UniversityReconstruction and Simulation (HOURS) package [20] was applied to simulatethe response of the SDM to shower particles (scintillating material, opticalfibers, photomultipliers and cable effects) and the functionality of the triggerand data acquisition system.
The final stage in the simulation process is the RF signal development.For the simulation of the RF signals the Simulation of Electric Field from AirShowers (SELFAS) package [21] was used, which calculates the electric fieldof the RF generated signal during the shower development in the atmosphere.
5
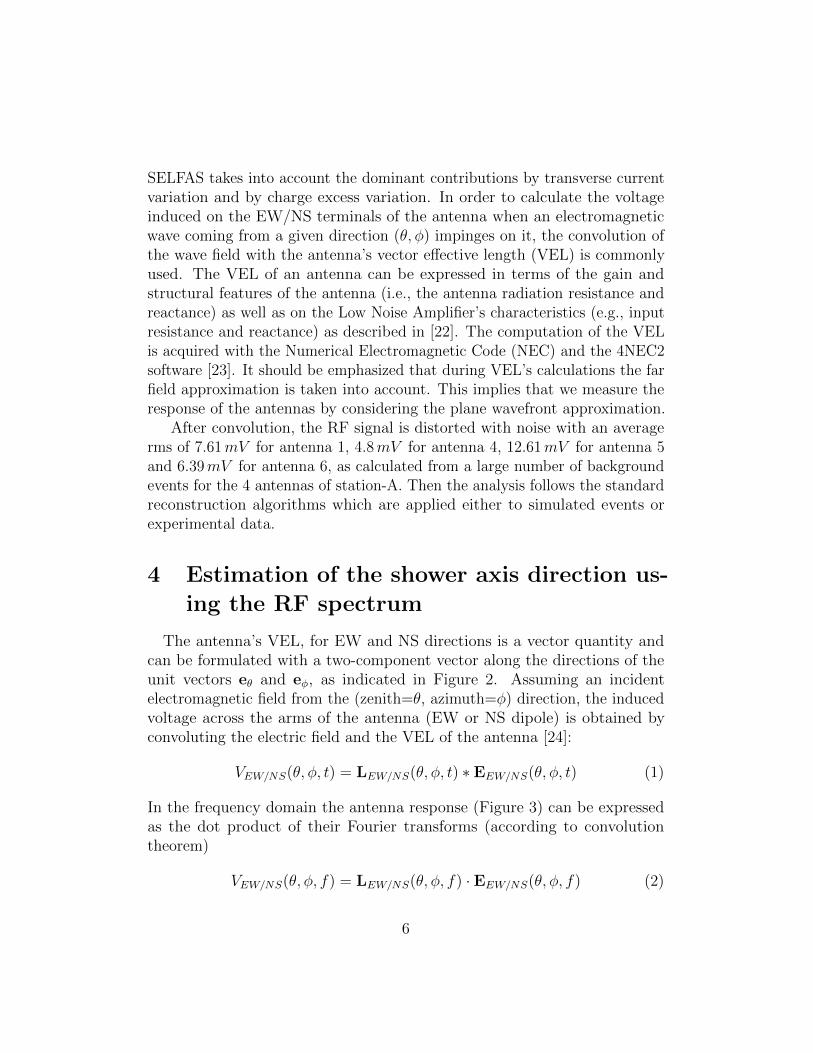
SELFAS takes into account the dominant contributions by transverse currentvariation and by charge excess variation. In order to calculate the voltageinduced on the EW/NS terminals of the antenna when an electromagneticwave coming from a given direction (θ, φ) impinges on it, the convolution ofthe wave field with the antenna’s vector effective length (VEL) is commonlyused. The VEL of an antenna can be expressed in terms of the gain andstructural features of the antenna (i.e., the antenna radiation resistance andreactance) as well as on the Low Noise Amplifier’s characteristics (e.g., inputresistance and reactance) as described in [22]. The computation of the VELis acquired with the Numerical Electromagnetic Code (NEC) and the 4NEC2software [23]. It should be emphasized that during VEL’s calculations the farfield approximation is taken into account. This implies that we measure theresponse of the antennas by considering the plane wavefront approximation.
After convolution, the RF signal is distorted with noise with an averagerms of 7.61mV for antenna 1, 4.8mV for antenna 4, 12.61mV for antenna 5and 6.39mV for antenna 6, as calculated from a large number of backgroundevents for the 4 antennas of station-A. Then the analysis follows the standardreconstruction algorithms which are applied either to simulated events orexperimental data.
4 Estimation of the shower axis direction us-
ing the RF spectrum
The antenna’s VEL, for EW and NS directions is a vector quantity andcan be formulated with a two-component vector along the directions of theunit vectors eθ and eφ, as indicated in Figure 2. Assuming an incidentelectromagnetic field from the (zenith=θ, azimuth=φ) direction, the inducedvoltage across the arms of the antenna (EW or NS dipole) is obtained byconvoluting the electric field and the VEL of the antenna [24]:
VEW/NS(θ, φ, t) = LEW/NS(θ, φ, t) ∗ EEW/NS(θ, φ, t) (1)
In the frequency domain the antenna response (Figure 3) can be expressedas the dot product of their Fourier transforms (according to convolutiontheorem)
VEW/NS(θ, φ, f) = LEW/NS(θ, φ, f) · EEW/NS(θ, φ, f) (2)
6
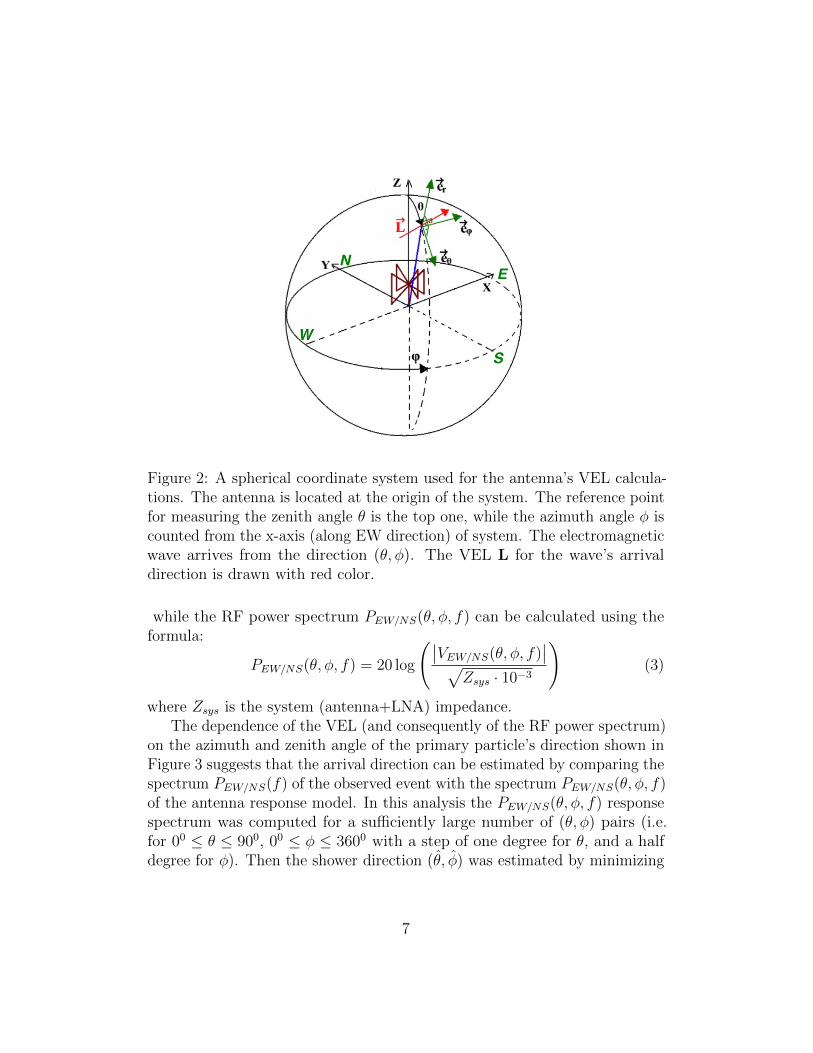
Figure 2: A spherical coordinate system used for the antenna’s VEL calcula-tions. The antenna is located at the origin of the system. The reference pointfor measuring the zenith angle θ is the top one, while the azimuth angle φ iscounted from the x-axis (along EW direction) of system. The electromagneticwave arrives from the direction (θ, φ). The VEL L for the wave’s arrivaldirection is drawn with red color.
while the RF power spectrum PEW/NS(θ, φ, f) can be calculated using theformula:
PEW/NS(θ, φ, f) = 20 log
(∣∣VEW/NS(θ, φ, f)∣∣√
Zsys · 10−3
)(3)
where Zsys is the system (antenna+LNA) impedance.The dependence of the VEL (and consequently of the RF power spectrum)
on the azimuth and zenith angle of the primary particle’s direction shown inFigure 3 suggests that the arrival direction can be estimated by comparing thespectrum PEW/NS(f) of the observed event with the spectrum PEW/NS(θ, φ, f)of the antenna response model. In this analysis the PEW/NS(θ, φ, f) responsespectrum was computed for a sufficiently large number of (θ, φ) pairs (i.e.for 00 ≤ θ ≤ 900, 00 ≤ φ ≤ 3600 with a step of one degree for θ, and a halfdegree for φ). Then the shower direction (θ̂, φ̂) was estimated by minimizing
7
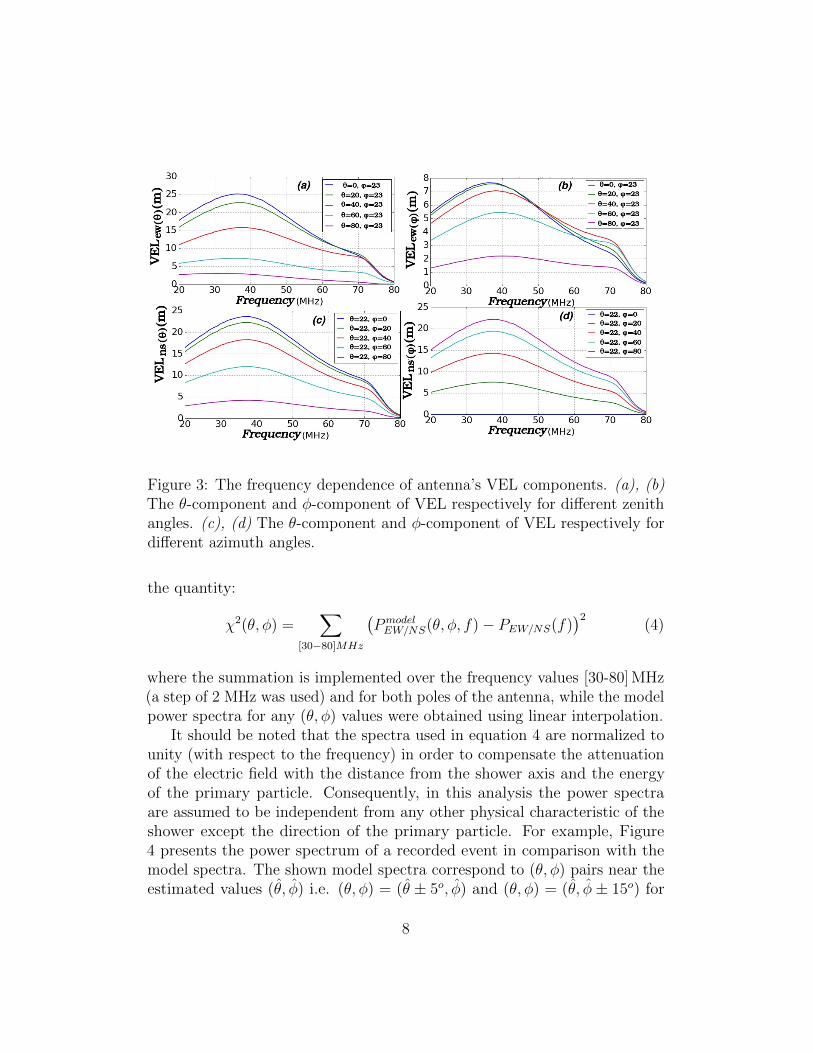
Figure 3: The frequency dependence of antenna’s VEL components. (a), (b)The θ-component and φ-component of VEL respectively for different zenithangles. (c), (d) The θ-component and φ-component of VEL respectively fordifferent azimuth angles.
the quantity:
χ2(θ, φ) =∑
[30−80]MHz
(PmodelEW/NS(θ, φ, f)− PEW/NS(f)
)2(4)
where the summation is implemented over the frequency values [30-80] MHz(a step of 2 MHz was used) and for both poles of the antenna, while the modelpower spectra for any (θ, φ) values were obtained using linear interpolation.
It should be noted that the spectra used in equation 4 are normalized tounity (with respect to the frequency) in order to compensate the attenuationof the electric field with the distance from the shower axis and the energyof the primary particle. Consequently, in this analysis the power spectraare assumed to be independent from any other physical characteristic of theshower except the direction of the primary particle. For example, Figure4 presents the power spectrum of a recorded event in comparison with themodel spectra. The shown model spectra correspond to (θ, φ) pairs near theestimated values (θ̂, φ̂) i.e. (θ, φ) = (θ̂ ± 5o, φ̂) and (θ, φ) = (θ̂, φ̂ ± 15o) for
8
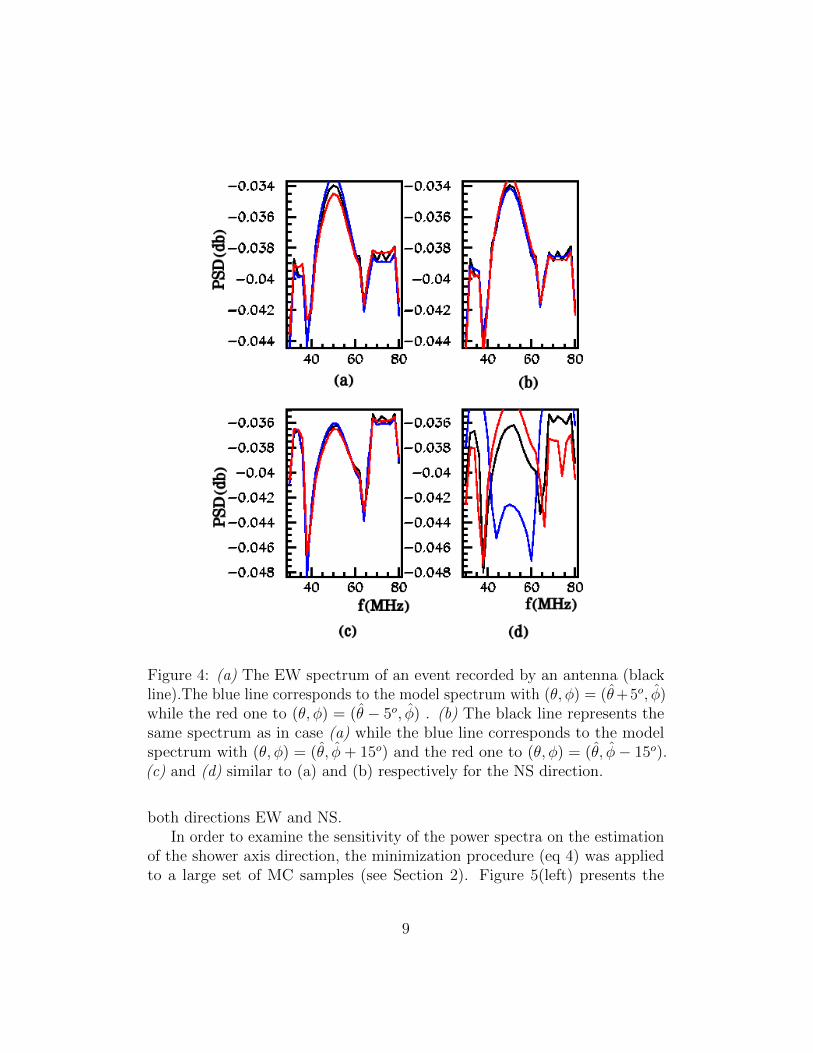
Figure 4: (a) The EW spectrum of an event recorded by an antenna (blackline).The blue line corresponds to the model spectrum with (θ, φ) = (θ̂+5o, φ̂)while the red one to (θ, φ) = (θ̂ − 5o, φ̂) . (b) The black line represents thesame spectrum as in case (a) while the blue line corresponds to the modelspectrum with (θ, φ) = (θ̂, φ̂+ 15o) and the red one to (θ, φ) = (θ̂, φ̂− 15o).(c) and (d) similar to (a) and (b) respectively for the NS direction.
both directions EW and NS.In order to examine the sensitivity of the power spectra on the estimation
of the shower axis direction, the minimization procedure (eq 4) was appliedto a large set of MC samples (see Section 2). Figure 5(left) presents the
9
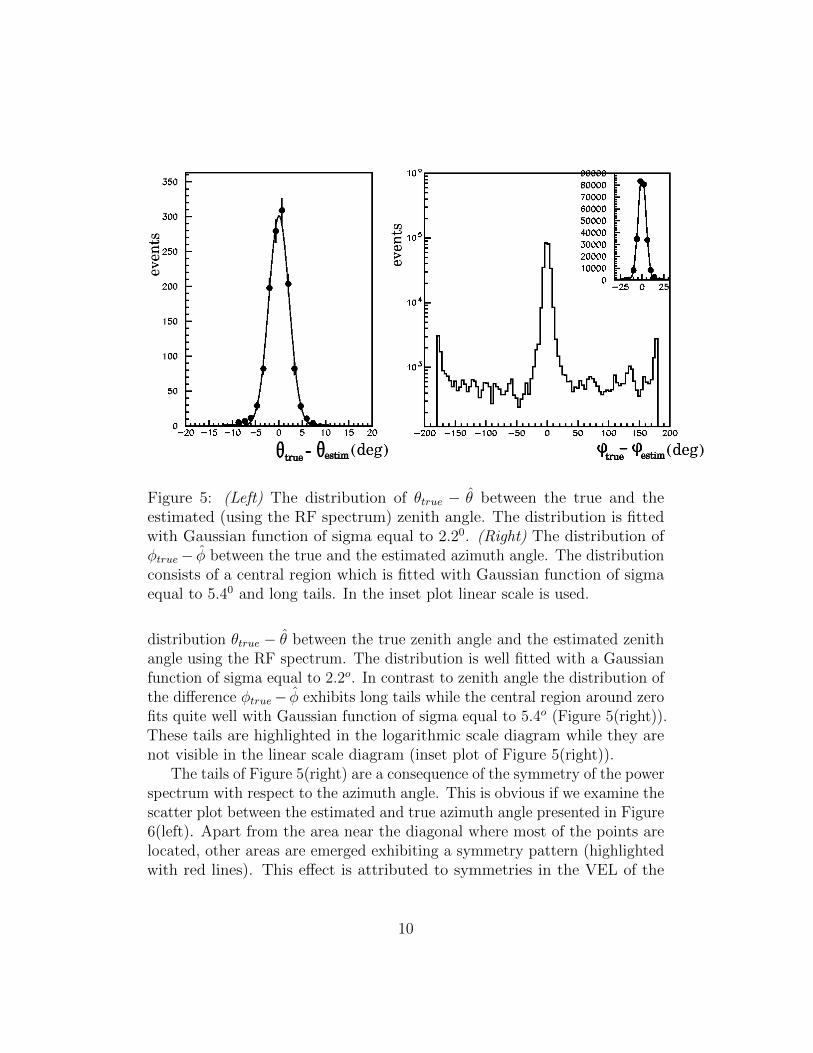
Figure 5: (Left) The distribution of θtrue − θ̂ between the true and theestimated (using the RF spectrum) zenith angle. The distribution is fittedwith Gaussian function of sigma equal to 2.20. (Right) The distribution ofφtrue− φ̂ between the true and the estimated azimuth angle. The distributionconsists of a central region which is fitted with Gaussian function of sigmaequal to 5.40 and long tails. In the inset plot linear scale is used.
distribution θtrue − θ̂ between the true zenith angle and the estimated zenithangle using the RF spectrum. The distribution is well fitted with a Gaussianfunction of sigma equal to 2.2o. In contrast to zenith angle the distribution ofthe difference φtrue− φ̂ exhibits long tails while the central region around zerofits quite well with Gaussian function of sigma equal to 5.4o (Figure 5(right)).These tails are highlighted in the logarithmic scale diagram while they arenot visible in the linear scale diagram (inset plot of Figure 5(right)).
The tails of Figure 5(right) are a consequence of the symmetry of the powerspectrum with respect to the azimuth angle. This is obvious if we examine thescatter plot between the estimated and true azimuth angle presented in Figure6(left). Apart from the area near the diagonal where most of the points arelocated, other areas are emerged exhibiting a symmetry pattern (highlightedwith red lines). This effect is attributed to symmetries in the VEL of the
10
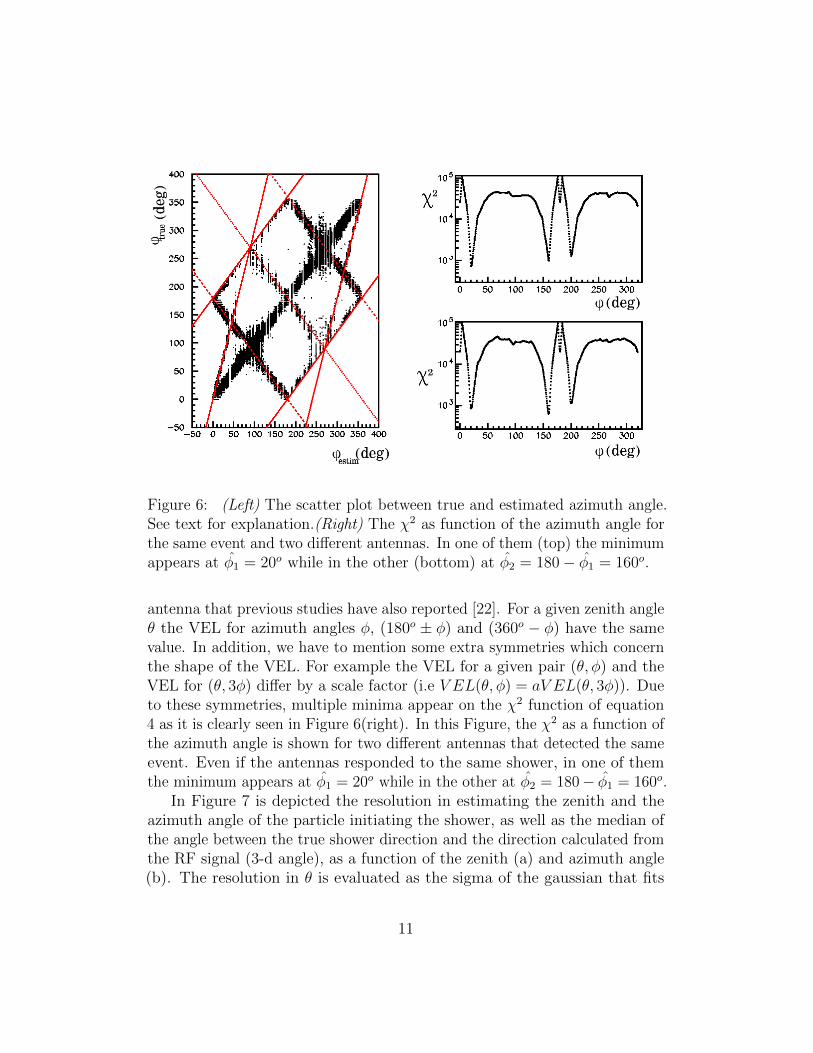
Figure 6: (Left) The scatter plot between true and estimated azimuth angle.See text for explanation.(Right) The χ2 as function of the azimuth angle forthe same event and two different antennas. In one of them (top) the minimumappears at φ̂1 = 20o while in the other (bottom) at φ̂2 = 180− φ̂1 = 160o.
antenna that previous studies have also reported [22]. For a given zenith angleθ the VEL for azimuth angles φ, (180o ± φ) and (360o − φ) have the samevalue. In addition, we have to mention some extra symmetries which concernthe shape of the VEL. For example the VEL for a given pair (θ, φ) and theVEL for (θ, 3φ) differ by a scale factor (i.e V EL(θ, φ) = aV EL(θ, 3φ)). Dueto these symmetries, multiple minima appear on the χ2 function of equation4 as it is clearly seen in Figure 6(right). In this Figure, the χ2 as a function ofthe azimuth angle is shown for two different antennas that detected the sameevent. Even if the antennas responded to the same shower, in one of themthe minimum appears at φ̂1 = 20o while in the other at φ̂2 = 180− φ̂1 = 160o.
In Figure 7 is depicted the resolution in estimating the zenith and theazimuth angle of the particle initiating the shower, as well as the median ofthe angle between the true shower direction and the direction calculated fromthe RF signal (3-d angle), as a function of the zenith (a) and azimuth angle(b). The resolution in θ is evaluated as the sigma of the gaussian that fits
11
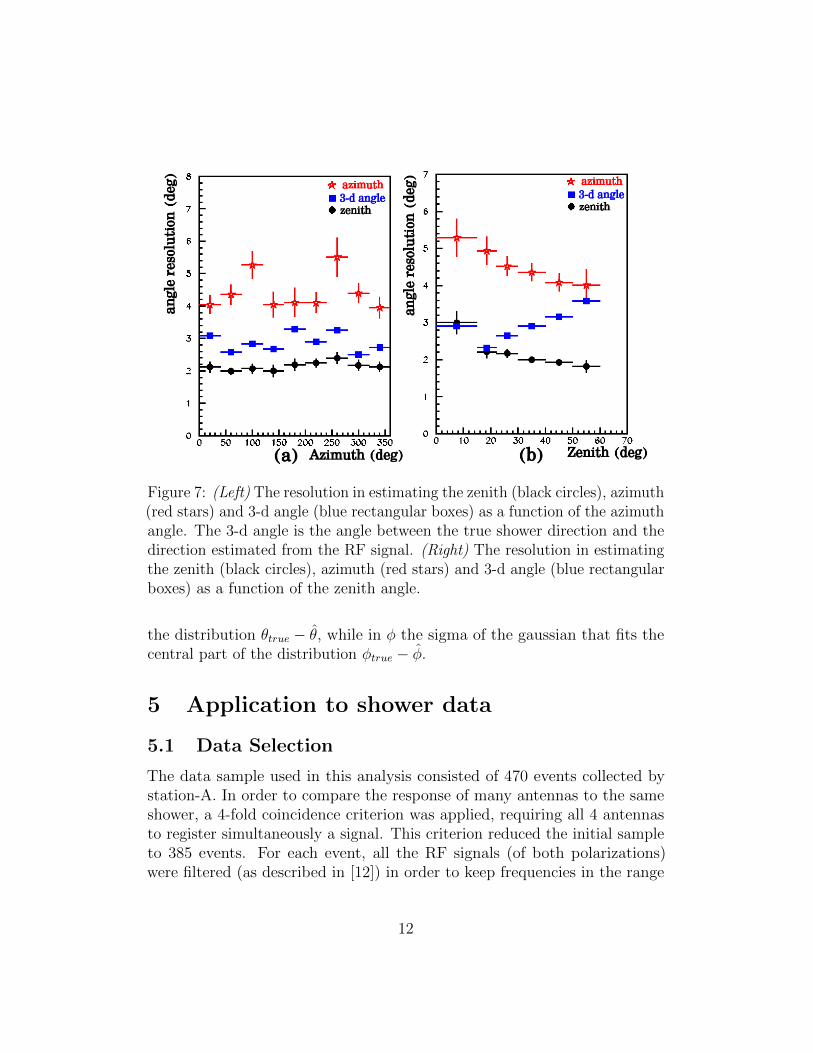
Figure 7: (Left) The resolution in estimating the zenith (black circles), azimuth(red stars) and 3-d angle (blue rectangular boxes) as a function of the azimuthangle. The 3-d angle is the angle between the true shower direction and thedirection estimated from the RF signal. (Right) The resolution in estimatingthe zenith (black circles), azimuth (red stars) and 3-d angle (blue rectangularboxes) as a function of the zenith angle.
the distribution θtrue − θ̂, while in φ the sigma of the gaussian that fits thecentral part of the distribution φtrue − φ̂.
5 Application to shower data
5.1 Data Selection
The data sample used in this analysis consisted of 470 events collected bystation-A. In order to compare the response of many antennas to the sameshower, a 4-fold coincidence criterion was applied, requiring all 4 antennasto register simultaneously a signal. This criterion reduced the initial sampleto 385 events. For each event, all the RF signals (of both polarizations)were filtered (as described in [12]) in order to keep frequencies in the range
12
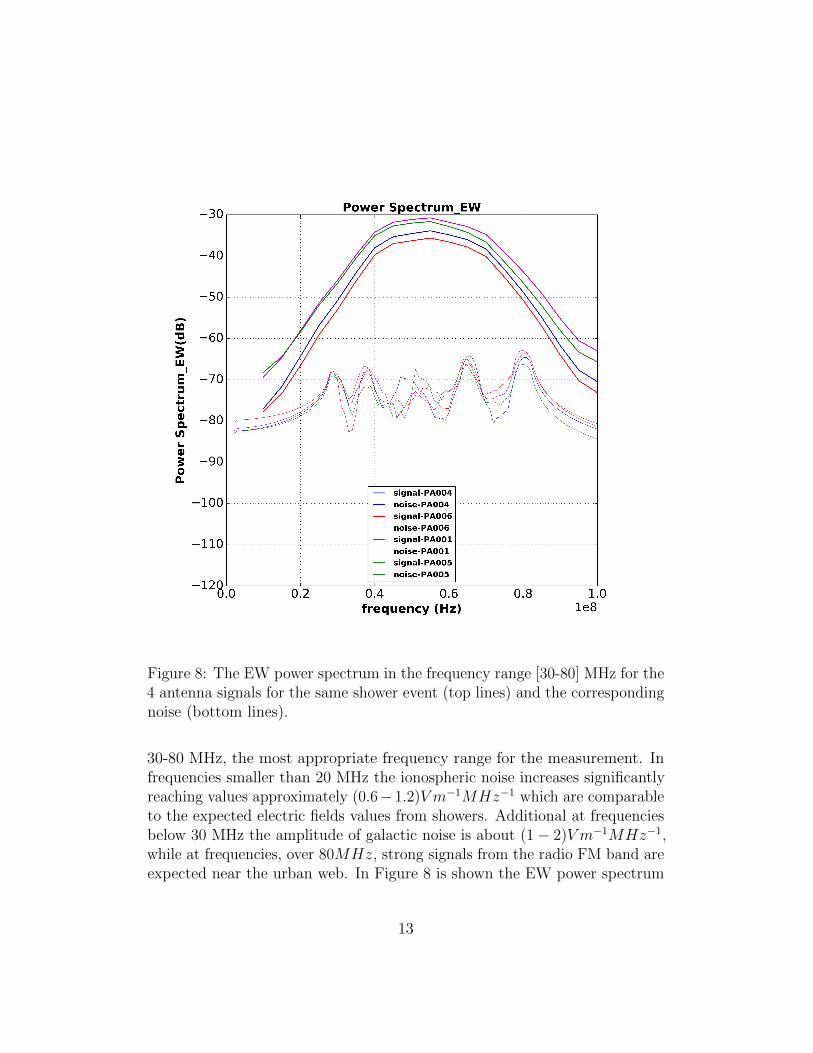
Figure 8: The EW power spectrum in the frequency range [30-80] MHz for the4 antenna signals for the same shower event (top lines) and the correspondingnoise (bottom lines).
30-80 MHz, the most appropriate frequency range for the measurement. Infrequencies smaller than 20 MHz the ionospheric noise increases significantlyreaching values approximately (0.6−1.2)V m−1MHz−1 which are comparableto the expected electric fields values from showers. Additional at frequenciesbelow 30 MHz the amplitude of galactic noise is about (1− 2)V m−1MHz−1,while at frequencies, over 80MHz, strong signals from the radio FM band areexpected near the urban web. In Figure 8 is shown the EW power spectrum
13
in the frequency range [30-80] MHz for an event detected by all four antennas.
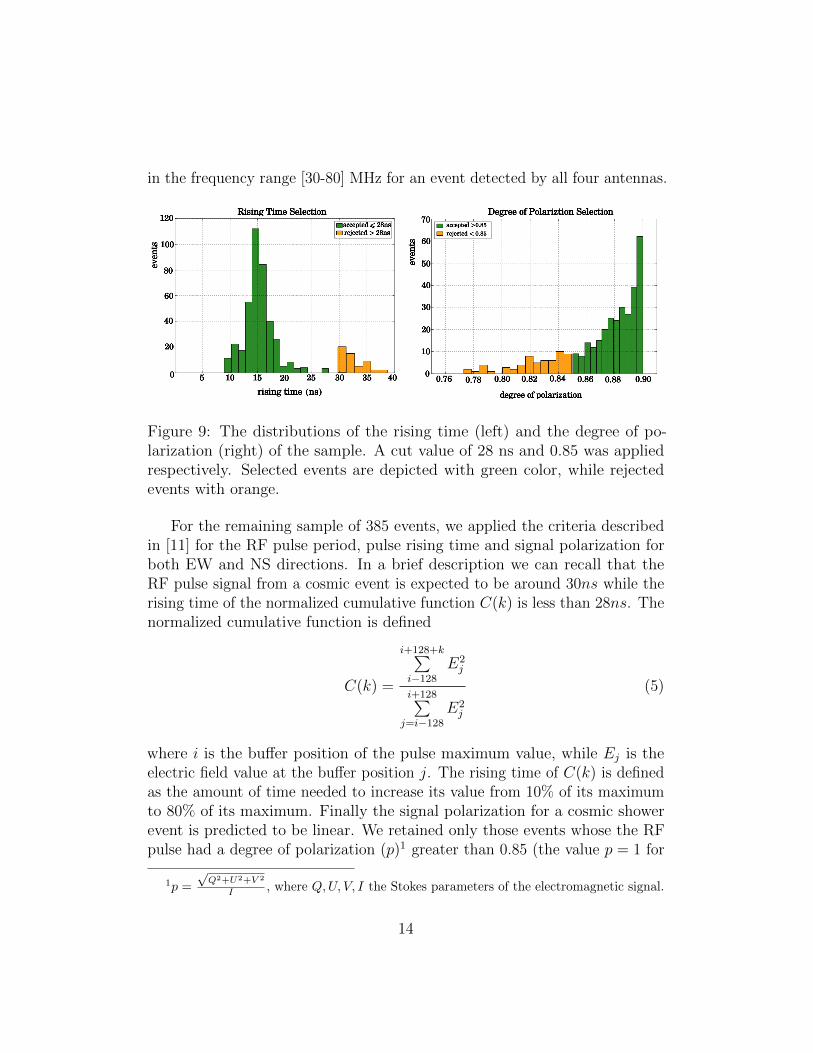
Figure 9: The distributions of the rising time (left) and the degree of po-larization (right) of the sample. A cut value of 28 ns and 0.85 was appliedrespectively. Selected events are depicted with green color, while rejectedevents with orange.
For the remaining sample of 385 events, we applied the criteria describedin [11] for the RF pulse period, pulse rising time and signal polarization forboth EW and NS directions. In a brief description we can recall that theRF pulse signal from a cosmic event is expected to be around 30ns while therising time of the normalized cumulative function C(k) is less than 28ns. Thenormalized cumulative function is defined
C(k) =
i+128+k∑i−128
E2j
i+128∑j=i−128
E2j
(5)
where i is the buffer position of the pulse maximum value, while Ej is theelectric field value at the buffer position j. The rising time of C(k) is definedas the amount of time needed to increase its value from 10% of its maximumto 80% of its maximum. Finally the signal polarization for a cosmic showerevent is predicted to be linear. We retained only those events whose the RFpulse had a degree of polarization (p)1 greater than 0.85 (the value p = 1 for
1p =
√Q2+U2+V 2
I , where Q,U, V, I the Stokes parameters of the electromagnetic signal.
14
perfectly linear polarized wave). After all these selection criteria our finalsample consisted of 274 events for the next steps of the analysis. In Figure9 is presented the distributions of the rising time and degree of polarisationbefore the application of the above criteria.
5.2 Correlation with the particle detector data
The reconstruction of the shower axis direction (zenith and azimuth angle)from the particle detectors was performed using the triangulation method [9].Furthermore, as described in the previous sections, we calculated the showeraxis direction using the power spectra of the 4 antennas. In order to increasethe resolution of the RF system, the data from the 4 antennas were combinedi.e. that χ2 function that was minimized was:
χ2(θ, φ) =∑i=1,4
∑[30−80]MHz
(PmodelEW/NS(θ, φ, f)− P i
EW/NS(f))2
(6)
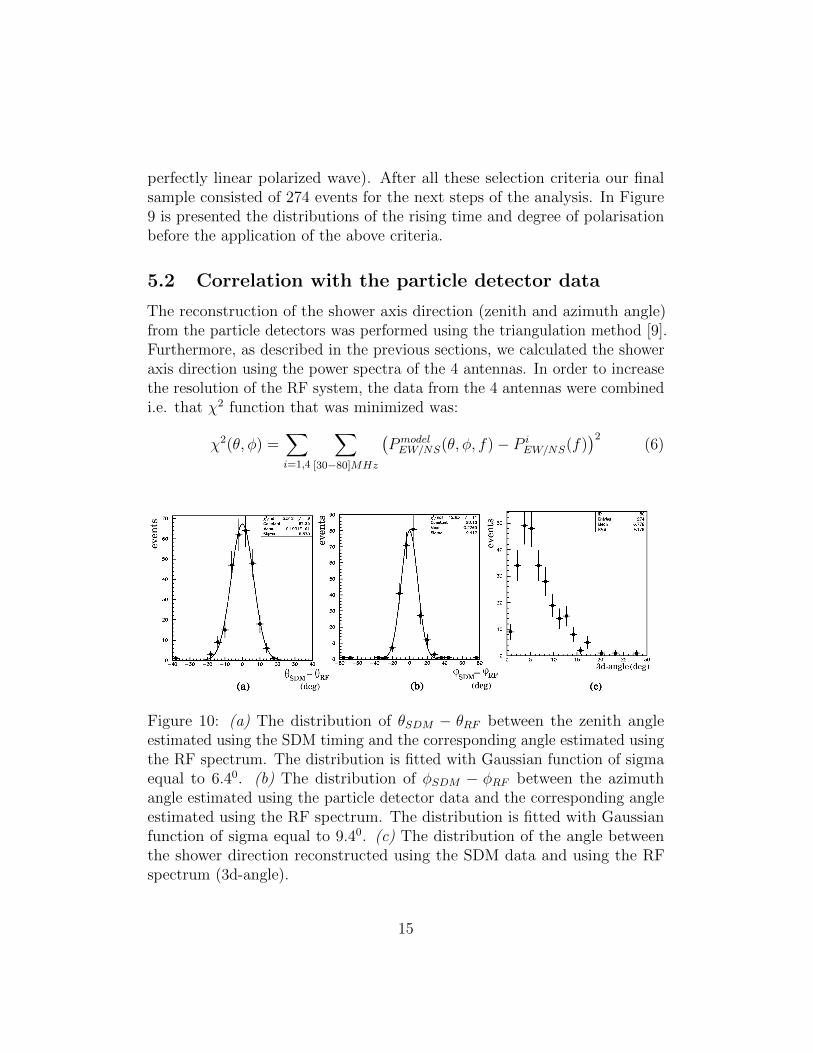
Figure 10: (a) The distribution of θSDM − θRF between the zenith angleestimated using the SDM timing and the corresponding angle estimated usingthe RF spectrum. The distribution is fitted with Gaussian function of sigmaequal to 6.40. (b) The distribution of φSDM − φRF between the azimuthangle estimated using the particle detector data and the corresponding angleestimated using the RF spectrum. The distribution is fitted with Gaussianfunction of sigma equal to 9.40. (c) The distribution of the angle betweenthe shower direction reconstructed using the SDM data and using the RFspectrum (3d-angle).
15
The difference between the direction estimated using the RF spectrumand the SDM timing is shown in Figure 10. The difference of the zenithangles (a) and azimuth angles (b) are well described by Gaussian functionscentered near zero. The corresponding sigmas of the Gaussian function areσ∆θ ' 6.3o and σ∆φ ' 9.4o. In Figure 10(c) the distribution of the anglebetween the shower direction reconstructed using the SDM data and using theRF spectrum (3-d angle) is also presented. The median of this distribution is5.8o.
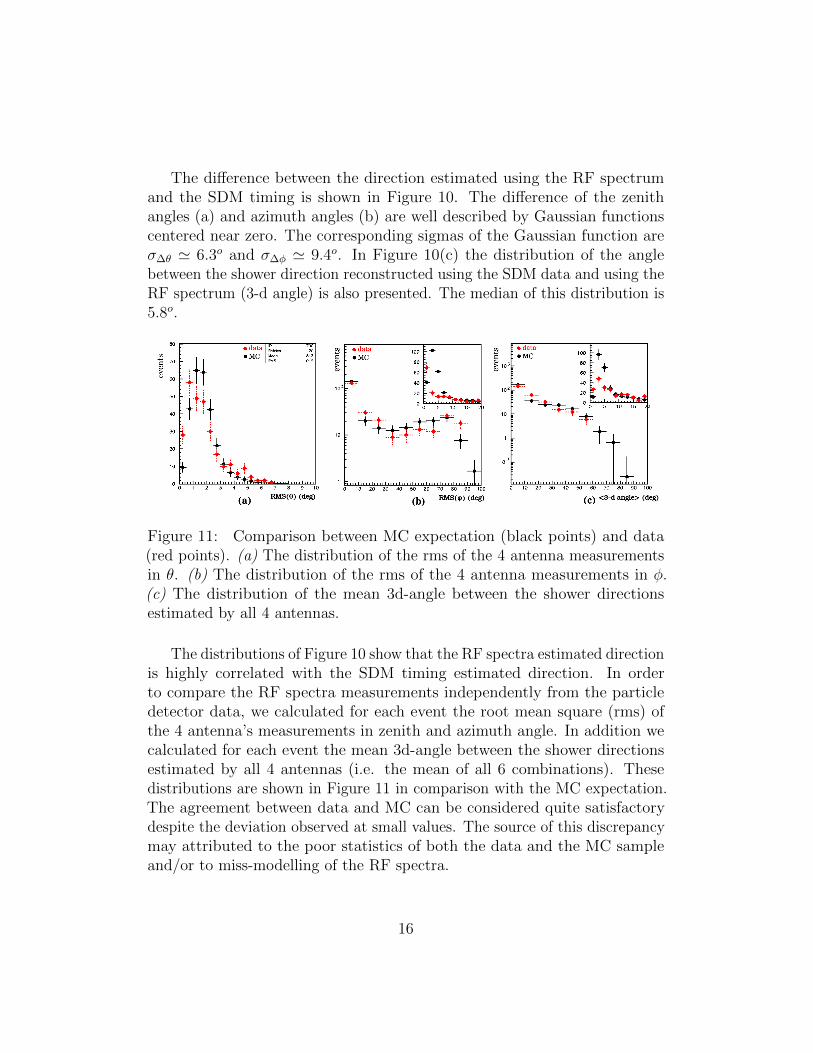
Figure 11: Comparison between MC expectation (black points) and data(red points). (a) The distribution of the rms of the 4 antenna measurementsin θ. (b) The distribution of the rms of the 4 antenna measurements in φ.(c) The distribution of the mean 3d-angle between the shower directionsestimated by all 4 antennas.
The distributions of Figure 10 show that the RF spectra estimated directionis highly correlated with the SDM timing estimated direction. In orderto compare the RF spectra measurements independently from the particledetector data, we calculated for each event the root mean square (rms) ofthe 4 antenna’s measurements in zenith and azimuth angle. In addition wecalculated for each event the mean 3d-angle between the shower directionsestimated by all 4 antennas (i.e. the mean of all 6 combinations). Thesedistributions are shown in Figure 11 in comparison with the MC expectation.The agreement between data and MC can be considered quite satisfactorydespite the deviation observed at small values. The source of this discrepancymay attributed to the poor statistics of both the data and the MC sampleand/or to miss-modelling of the RF spectra.
16
6 Conclusions
We have presented a method to reconstruct the shower axis of high energyshowers using the spectrum of the radio signal. The reconstructed directionswere compared on event by event basis with the corresponding directioncalculated using the timing of the particle detectors and triangulation. Forthe comparison we used a sample of 274 shower events collected by station-Aof the Astroneu array, where 4 RF antennas are triggered when a showerevent is detected by the particle detectors. The comparison showed that thereconstructed directions of the 2 systems coincide within a sigma of 6.3o and9.4o for the zenith and azimuth angle respectively. In addition, the simulationsanalysis highlighted the problems in estimating the azimuth angle with theantenna’s spectrum due to the symmetries appearing in VEL. The presentedresults demonstrate that the RF spectrum method is efficient and applicableeven in sites with strong electromagnetic noise present.
Acknowledgments
This research was funded by the Hellenic Open University Grant No. ΦK228: “Development of technological applications and experimental methodsin Particle and Astroparticle Physics”
References
[1] J. V. Jelley et al. 1965 Nature 205 327
[2] H. Falcke et al. - LOPES collaboration 2005 Nature 435 313-316
[3] L. Martin et al., Proc.35th ICRC (2017)
[4] P. Schellart et al. 2015 Astron. Astrophys. 66 31
[5] The Pierre Auger Coll. 2016 Phys. Rev. D 93 122
[6] W.D. Apel et al. 2016 Phys. Lett. B 763 179
[7] O. Scholten, K. Werner, F. Rusydi 2008 Astropart.Phys. 29 94-103
[8] G.A.Askaryan 1962 Phys. JETP 14 441
17
[9] T. Avgitas et al, JINST 15 T03003
[10] I. Manthos et al. 2017 Cosmic Ray RF detection with the ASTRONEUarray arXiv:1702.05794
[11] A. Leisos et al. 2019 Universe 5 3
[12] S. Nonis et al. 2019 EPJ Web of Conferences 210 05010
[13] D. Charrier, 2012 Nucl. Instrum. Methods Phys. Res., Sect. A 662142-145
[14] S. Hansen et al. 2004 IEEE Transactions on Nuclear Science 51 926-930
[15] T. Avgitas et al. 2017 Deployment and calibration procedures for accu-rate timing and directional reconstruction of EAS particle-fronts withHELYCON stations arXiv:1702.04902
[16] D. Heck et al. 1998 Forschungszentrum Karlsruhe Report FZKA 6019
[17] Thomas K. Gaisser, Todor Stanev, Serap Tilav, CosmicRay Energy Spectrum from Measurements of Air Showers,https://arxiv.org/abs/1303.3565;
[18] S. Ostapchenko 2011 Phys. Rev. D 83 014018
[19] H. Fesefeldt 1985 Report PITHA 85 02
[20] A.G. Tsirigotis et al. 2011 Nucl. Instrum. Methods Phys. Res. Sect. A626 185-187
[21] V. Marin et al 2012 Astropart. Phys. 35 733
[22] D. Charrier 2012 Nucl. Instrum. Methods Phys. Res. Sect. A 662 142-145
[23] Burke G and Poggio A 1983 Numerical Electromagnetics Code (NEC)Method of Moments, Parts I, II, III (USA: Lawrence Livermore NationalLaboratory CA) p 223-289
[24] Abreu P 2013 Nucl. Instrum. Methods Phys. Res. B 521 65-72
18