Embed Size (px)
Citation preview
Distribution Category: UC-601
ANL-93/43
ARGONNE NATIONAL LABORATORY
9700 South Cass Avenue
Argonne, IL 60439
RADIOLYTIC AND RADIOLYTICALLY INDUCED GENERATION OF
GASES FROM SYNTHETIC WASTES
FINAL REPORT
D. Meisel, C. D. Jonah, S. Kapoor, M. S. Matheson, and M. C. Sauer, Jr.
Chemistry Division
October 1993
Work performed for Westinghouse Hanford Company in accordance with PO M652408.

ii
TABLE OF CONTENTS
Page
AB STRA CT B...........................................................ST-C............................... . 1
SUMMARY......................................................2
A. INTRODUCTION..............................................4
B. RADIOLYTIC YIELDS OF GASES...............................................................4
1. Introduction..................................................................................... 4
2. Experimental.................................................5
a. Radiation Sources and Dosimetry.................................. 5
b. G as M easurem ents .......................................................................... 5
c. Solutions and Slurry Preparation .......................................................... 5
3. Results and Discussion.........................................7
a. H2 Yields from Homogeneous Solutions...............................................7
b. N20 Yields from Homogeneous Solutions..............................................9
c. Origin of Nitrogen in Radiolytic N20.....................................................9
d. H2 and N20 Yields from Slurries ......................................................... 16
e. Yields of Other Gases....................................... 16
f. Effects of Carbonate, Sulfide, Formate, and Oxalate on Radiolytic Yields........ 20
g. Comparison with Modeling Calculations .............................................. 21
4. Conclusions....................................................................................23
C. RADIOLYTIC DEGRADATION OF ORGANICS AND THERMAL GENERATION..... 24
1. Introduction..................................................................................... 24
2. Experim ental..................................................................................... 25
3. Results and Discussion.........................................25
a. Effect of Degradation on H2 Thermal Generation.................................................25
b. Effect of Degradation on Thermal Generation of N20.................................. 27
c. Effect of Degradation Products on Thermal Generation Rates ....................... 37
d. Role of Hydroxylamine...................................................................37
4. C onclusions......................................................................................37
D. THE FORMALDEHYDE REACION..................................................... .. 39
1. Introduction..................................................................................... 39
2. Experim ental..................................................................................... 39
a. Procedures................................................................................... 39
b. Effect of Formaldehyde Polymers......................................................40
Gee
3. Results and Discussion........................................................................40
a. Formaldehyde in Simulated Waste Solutions .......................................... 40
b. Formaldehyde in Aqueous Solutions....................................................44
c. Computer Modeling ...................................................................... 58
d. Effect of 02 on the Thermal Generation of H2................................ .. . . .. . .. . .. . . .. .. . . . 61
e. Source of the Hydrogen Atoms.........................................................61
f. Effect of "Minor" Components on H2 Generation from Formaldehyde.......... 65
4. Conclusions....................................................................................65
E. EFFECT OF MINOR COMPONENTS ......................................................... 65
1. Introduction..................................................................................... 65
2. Experimental...................................................................................67
3. Results and Discussion........................................................................68
a Effect of "Minor" Components on Radiolytic Yields.................................68
b. Effect of "Minor" Components on Thermal Generation Rates ....................... 73
4. Conclusions....................................................................................74
F. GAS RETENTION................................................................................74
1. Introduction.....................................................................................74
2. Experimental...................................................................................74
3. Results and Discussion........................................................................81
4. Conclusions....................................................................................83
G. MECHANISMS OF GAS GENERATION................................................... 84
1. Radiolytic Mechanisms........................................................................84
2. Thermal Mechanisms .......................................................................... 86
3. Integrated View.................................................................................86
REFERENCES.............................................................................................. 91
IV
LIST OF FIGURESNo. Pape
B3-1. The yield, G(H2), from slurry SYl-SIM-91A (composition given in Table B3-4)containing 0.3 M EDTA at 30 OC as a function of total dose delivered to theslurry. Dose rates are shown in the figure.................................................11
B3-2. The yield, G(H2), as a function of dose rate for slurry SY1-SIM-91A containing0.3 M ED TA at 30 0C . ....................................................................... 11
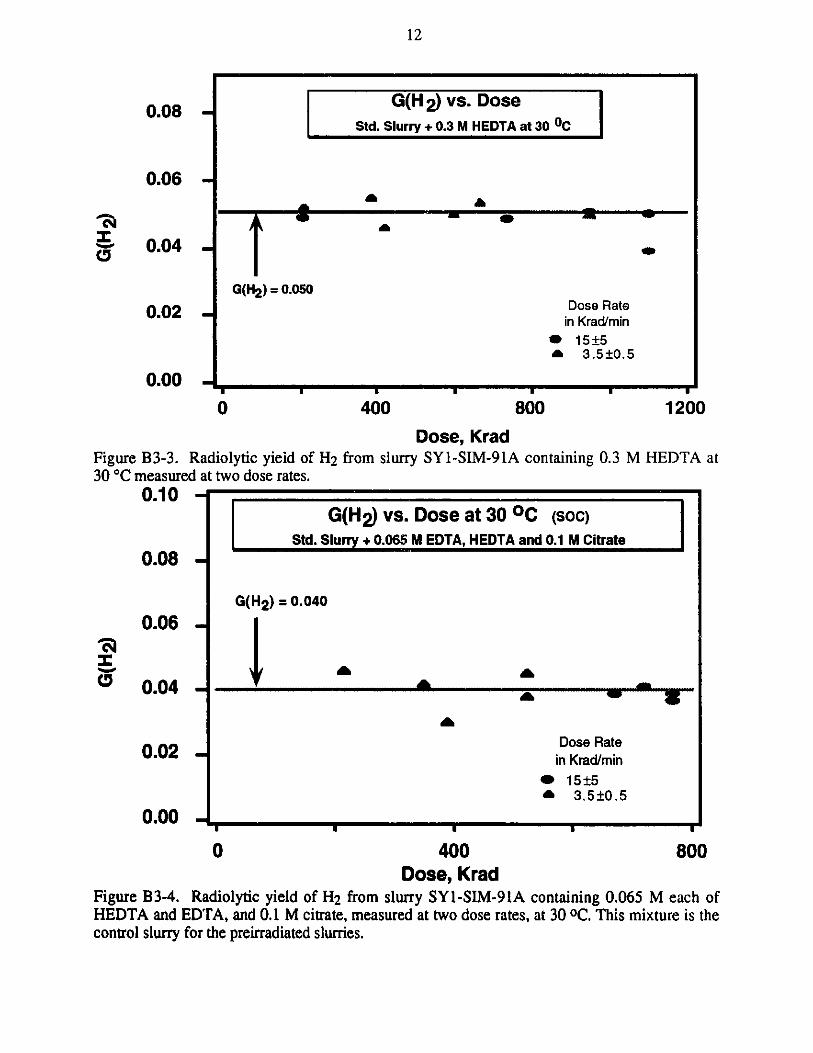
B3-3. Radiolytic yield of H2 from slurry SY1-SIM-91A containing 0.3 M HEDTA at30 *C measured at two dose rates. ........................................................ 12
B3-4. Radiolytic yield of H2 from slurry SYl-SIM-91A containing 0.065 M each ofHEDTA and EDTA, and 0.1 M citrate, measured at two dose rates, at 30 0C. Thismixture is the control slurry for the preirradiated slurries. ................................ 12
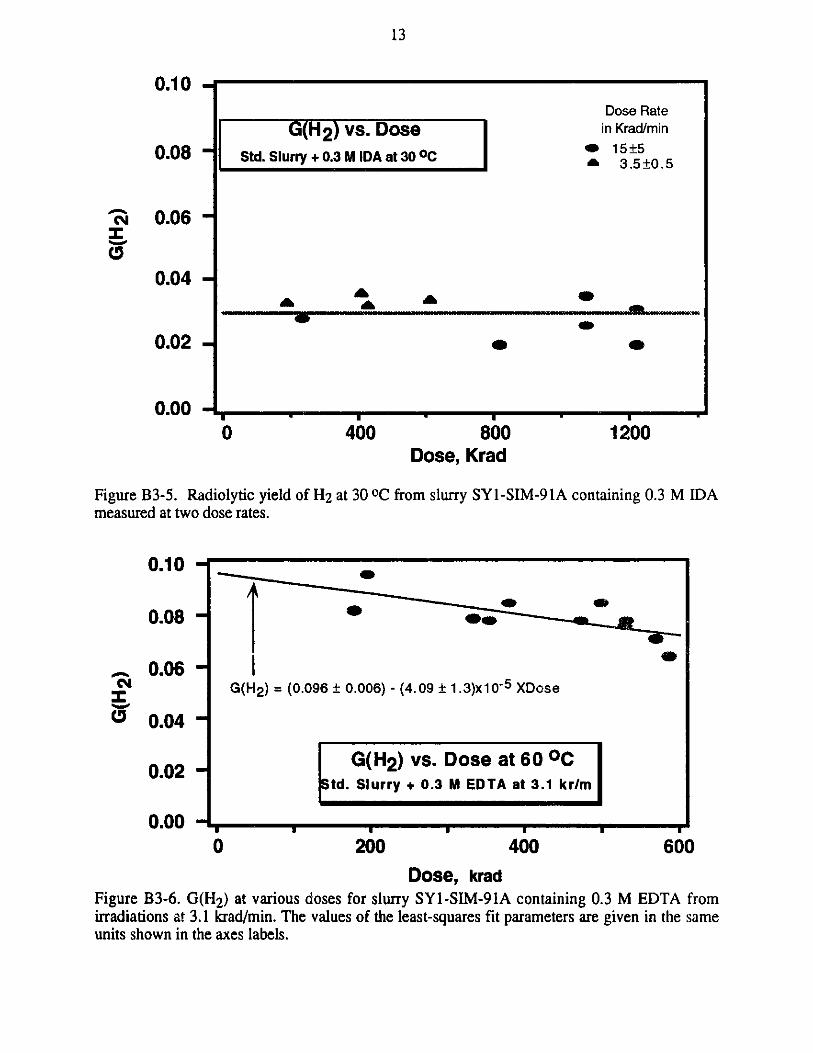
B3-5. Radiolytic yield of H2 at 30 OC from slurry SY-SIM-91A containing 0.3 M IDAm easured at two dose rates..................................................................... 13
B3-6. G(H2 ) at various doses for slurry SYl-SIM-91A containing 0.3 M EDTA fromirradiations at 3.1 krad/min. The values of the least-squares fit parameters aregiven in the same units shown in the axes labels..........................................13
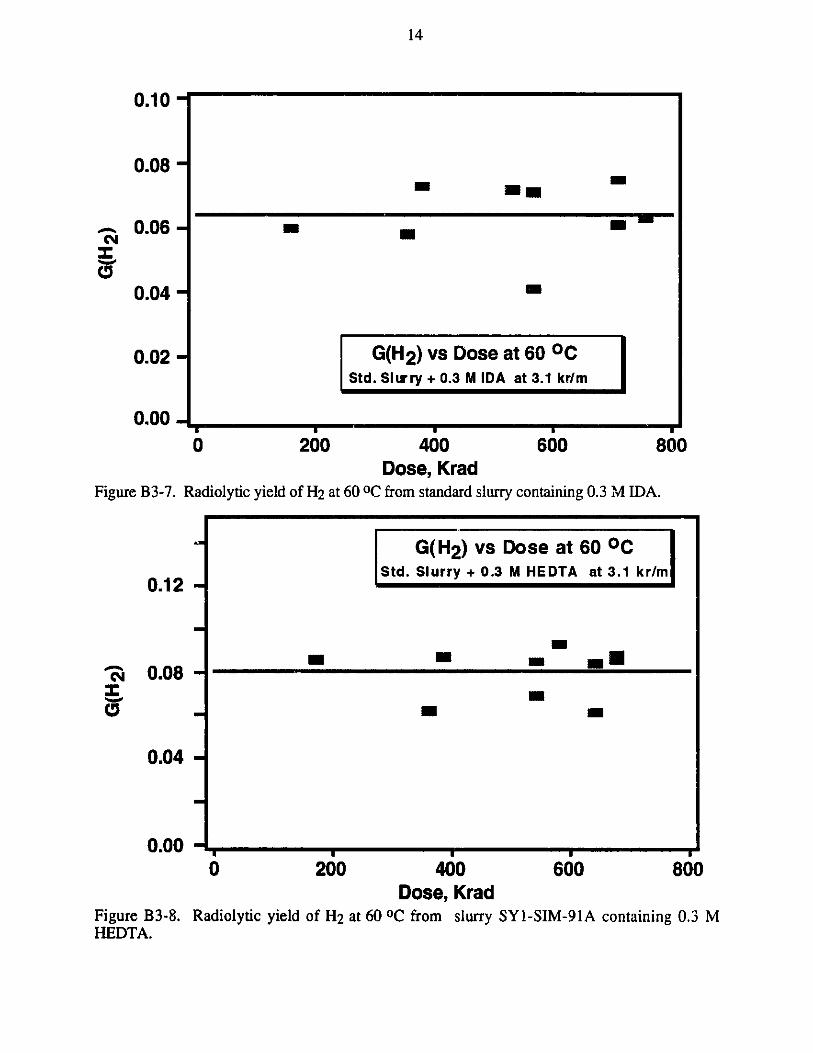
B3-7. Radiolytic yield of H2 at 60 OC from standard slurry containing 0.3 M IDA ........... 14
B3-8. Radiolytic yield of H2 at 60 OC from slurry SY1-SIM-91A containing 0.3 MH E D T A ........................................................................................... 14
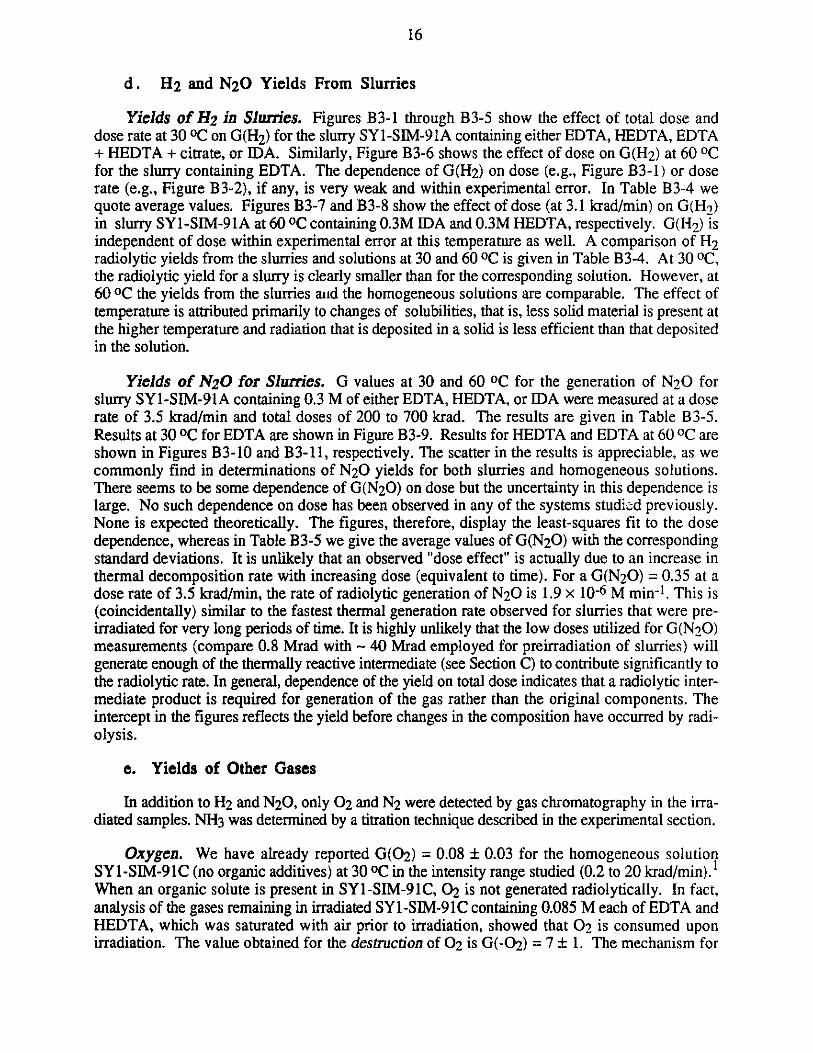
B3-9. The yield of N20, G(N 20), at 30 0 C vs. dose and for a range of dose rates forslurry SY1-SIM-91A containing 0.3 M EDTA. "Feed solution" (triangles) is thesolution used in the preparation of the slurry prior to the 30%-v water distillation(labeled SY 1-SIM -91B)...................................................................... 17
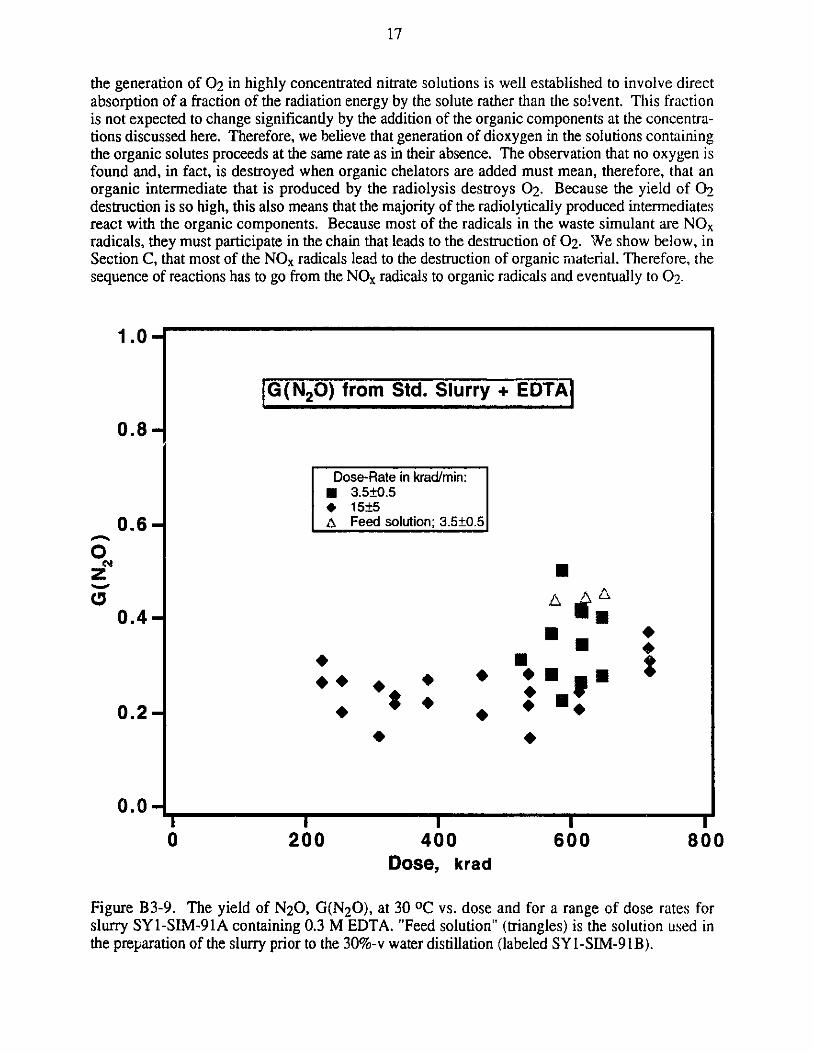
B3-10. The yield of N20 at 60 OC vs. dose at a dose rate of 3.5 krad/min for slurry SYl-SIM-91A containing 0.3 M HEDTA. ...................................................... 18
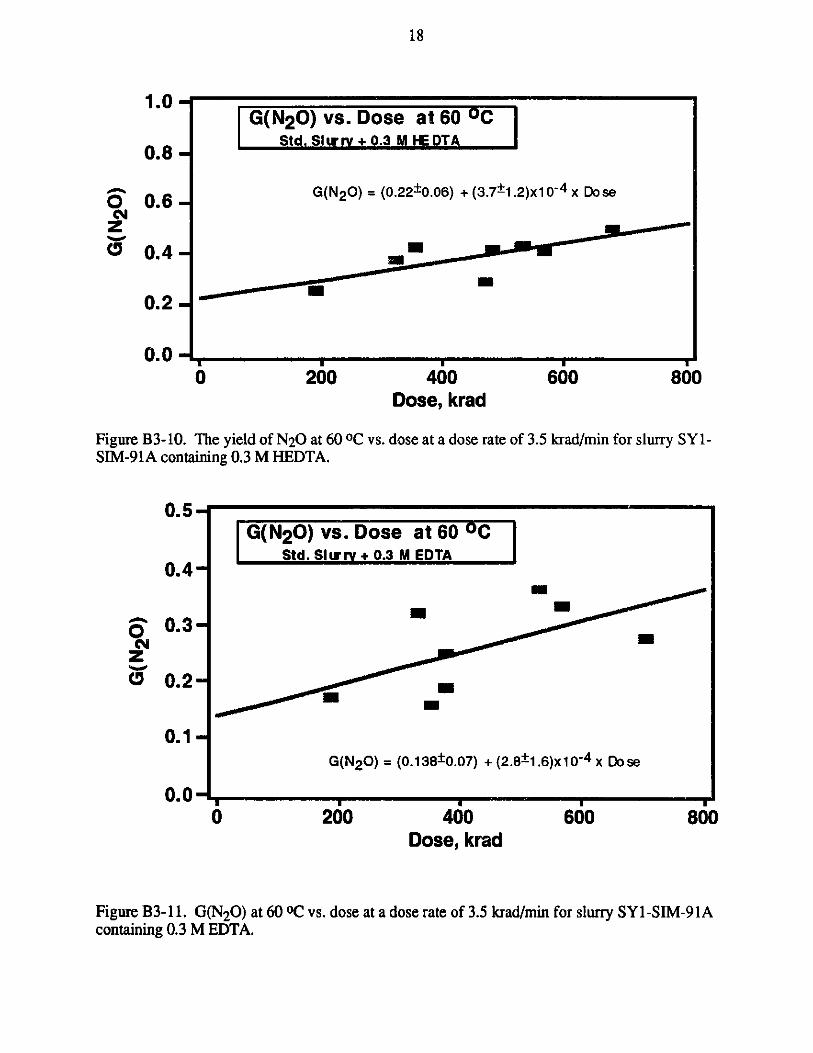
B3-1 1. G(N2 0) at 60 OC vs. dose at a dose rate of 3.5 krad/min for slurry SY1-SIM-91Acontaining 0.3 M EDTA. .................................................................... 18
B3-12. Yields of ammonia from solution SY1-SIM-91C containing the organic additivesshown as a function of dose................................................................ 22
C3- 1. Thermal generation of H2 at 60 OC from preirradiated (dose of 35 Mrad) solutionSYl-SIM-91C (solution P) originally containing 0.065 M EDTA. Shown are therates measured 5 and 46 days after termination of the preirradiation. .................... 28
V
LIST OF FIGURES (Cont'd.)No. Pae
C3-2. The dependence of the (initial) rate of thermal generation of H2 and N20 at 60 OCon total dose of preirradiation for solution SYl-SIM-91C containing 0.065 MEDTA, 0.065 M HEDTA, and 0.1 M citrate (POI). Experimental details aregiven in Table C3-2. The dashed line is the estimated rate for 101-SY..................30
C3-3. Thermal generation of H2 at 60 OC following 16 Mrad preirradiation of SY 1-SIM-91C containing (sodium salts) 0.065 M EDTA, 0.065 M HEDTA, and 0.1 Mcitrate. ............................................................................................ 32
C3-4. Thermal generation of H2 at 60 0C following 24 Mrad preirradiation of solutionSY1-SIM-91C containing (sodium salts) 0.065 M EDTA, 0.065 M HEDTA, and0.1 M citrate. .................................................................................. 33
C3-5. Thermal generation of H2 at 60 OC from preirradiated slurry SY1-SIM-91A with(sodium salts) 0.065 M EDTA, 0.065 M HEDTA, and 0.1 M sodium citrate....... 34
C3-6. Thermal generation of H2 at 60 0C from preirradiated slurry SY1-SIM-91A with0.065 M EDTA, 0.065 M HEDTA, and 0.1 M citrate (SOI). The slurry wasdissolved prior to degassing and running the reaction. The dissolution dilutes allconcentrations to -55% of their original value; [H2 ] is back-calculated to correctfor this dilution.................................................................................. 35
C3-7. Thermal generation of H2 at 60 OC from control slurry SYI-SIM-91A with(sodium salts) 0.065 M EDTA, 0.065 M HEDTA, and 0.1 M sodium citrate.Dissolved and "not dissolved", aged and fresh slurries were used as shown in thelegend. The dissolution dilutes all concentrations to ~ 55% of their original value;[H2 ] is back-calculated to correct for this dilution...................... 36
C3-8. The ratio of initial rates of N20 and H2 generation from solution SY-SIM-91Ccontaining 0.065 M each of EDTA and HEDTA, and 0.1 M citrate (sodium salts),as a function of preirradiation dose. ................ ,....................................... 38
C3-9. Rate and yield of N20 generation at 60 OC from SYl-SIM-91C (solution P)containing 0.01 M NH2 OH.................................................................. 41
D2- 1. Test for leakage of H2 in/out of the modified Erlenmeyer vessels during the timeof a thermal decomposition experiment. 50 jl of H2 was injected into 10 ml of2.3 M NaOH at 60 OC and the amount of H2 in the gas phase determined atvarious tim es.................................................................................. 42
D2-2. The rate of generation of H2 from 1.67 mM trioxane in 2.3 M NaOH at 60 0 C......... 43
D3-1. Thermal generation of H2 from solution SYl-SIM-91C containing 0.065 Mformaldehyde at 23, 45, and 60 OC. ......................................................... 45
D3-2. Determination of the activation energy for the reaction assumed to be as shown inthe title.......................................................................................... 46
vi
LIST OF FIGURES (Cont'd.)No. Pae
D3-3. Activation energy for the H2 generation reaction from glyoxylate in SY 1-SIM-91C. The reaction is assumed to be as shown in the title.................. 47
D3-4. Rate of H2 generation at 60 OC from 2.3 M NaOH (no NOx or aluminate) solutionat various HCHO concentrations.............................................................. 48
D3-5. Rate of H2 generation at 60 OC from 5 mM HCHO (no NOx or aluminate)solution at various NaOH concentrations .................................................... 49
D3-6. Rate of H2 generation from 0.065 M HCHO and 2.3 M NaOH (no NOx oraluminate) solution at three temperatures...................................................50
D3-7. Arrhenius plot for the rate constant of the H2 generation reaction in aqueoussolution containing 2.3 M NaOH and 0.065 M HCHO .................................... 51
D3-8. Generation of H2 from 5 mM HCHO in aqueous solutions at three NaOHconcentrations, at 60 0C........................................................................ 53
D3-9. Generation of H2 from aqueous solutions of 0.065 M HCHO and 2.3 M NaOH,at 60 0 C ........................................................................................... 54
D3-10. Generation of H2 from aqueous solutions of 0.5 mM HCHO and 2.3 M NaOH,at 60 0 C ........................................................................................... 55
D3-1 1. The dependence of the initial rate of H2 generation in aqueous solution on[HCHO] (circles; at 2.3 M NaOH) and on [NaOH] (squares; at 5 mM HCHO)........ 56
D3-12. Log of the initial rate of H2 generation from formaldehyde in aqueous solution at60 OC as a function of log([OH-]). The slope, n, represents the order of thereaction in [O H -1.j ............................................................................... 57
D3-13. Computation of the generation of H2 from solution P (SY-SIM-91C) containingvarious concentrations of HCHO and OH- at 60 OC. Curves are calculated usingthe parameters given in Table D3-3 as Fit 1. Points are experimental data.............. 60
D3-14. Effect of oxygen concentration on the rate of generation of H2 from 0.065 MHCHO in solution SYI-SIM-91C .......................................................... 62
D3-15. Effect of oxygen concentration on the rate of generation of H2 from 0.065 MHCHO in 2.3 M NaOH ...................................................................... 63
D3-16. The effect of the "minor" components (shown in title to the figure) on the rate ofH2 generation from solution SYl-SIM-91C containing formaldehyde at theconcentrations indicated at 60 0 C........................................................... 66
vii
LIST OF FIGURES (Cont'd.)No. Page
E3- 1. The rate of thermal generation of H2 from preirradiated (16 Mrad) solutions SY1-SIM-91C containing organics (designated POI) and "minor" components at 60OC. Solid circles: all minor components except Pd(IV). Open squares: all minorcom ponents including Pd .................................................................... 75
E3-2. The rate of thermal generation of N2 0 from preirradiated (35.8 Mrad) solutionsSYl-SIM-91C containing organics and minor components at 60 0 C. Solidtriangles: all minor components. Open circles: all minor components exceptC r(III) ........................................................................................ . . 76
E3-3. The rate of thermal generation of N20 from control SYl-SIM-91C containingorganics and all minor components, but not preirradiated, at 60 0C....................77
E3-4. The rate of thermal generation of N2 0 from solution SY 1-SIM-9 1 C containing0.01 M NH2OH and 5 mM Cr(N03)3 at 60 0C. The rate is an order of magnitudesmaller than in the absence of Cr(III)....................................................... 78
F2- 1. Pressurization cell and extraction vessel inside the housing. The internal cell wasalso used for gas bubbling.......................................80
F2-2. Extraction vessel of retained gas and related connections ................................. 82
viii
LIST OF TABLES
No. Page
B2-1. Composition of standard solutions and slurries ............................................. 6
B3-1. Yields, G(H2), and efficiencies, Rx, at 30 and 60 0 C-.........----------------.............. 8
B3-2. Rate constants, ki, and activation energies, Ea, for the hydrogen abstraction reaction:H + R H -- H 2 + R .............................................................................. 8
B3-3. G(N20) from irradiation of solution SY1-SIM-91C containing various additives at 30and 60 0 C -----------.--------------.. ................................................ 10
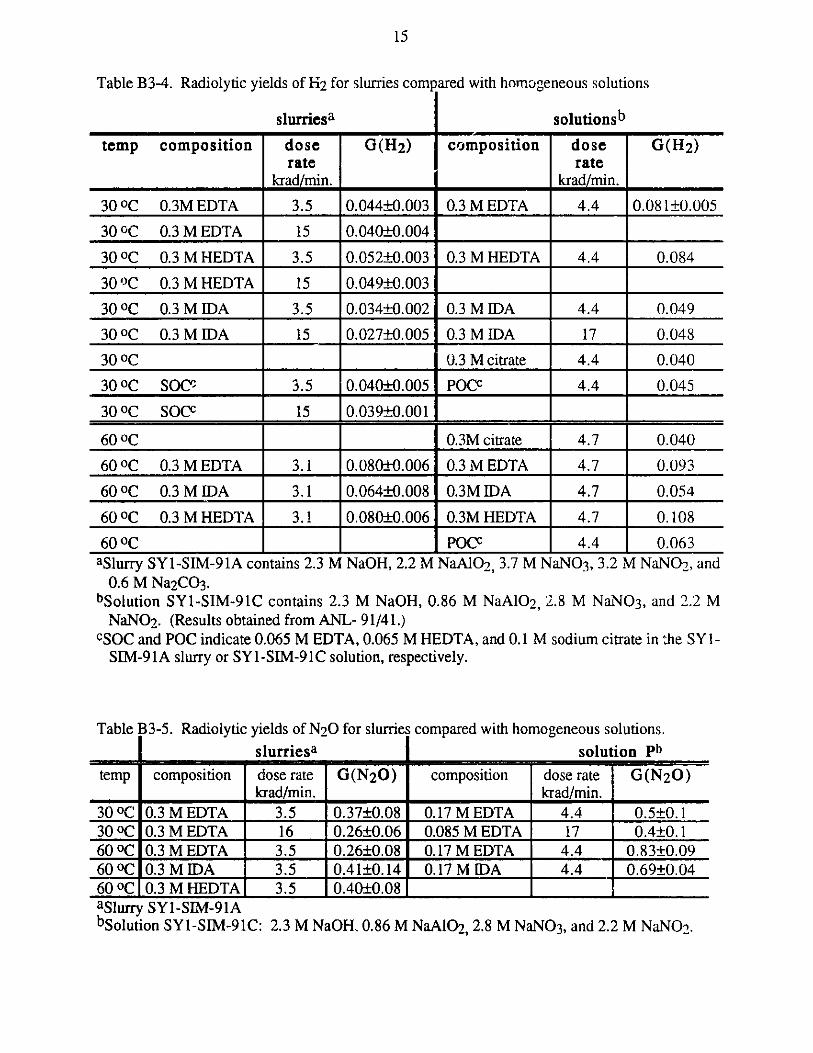
B3-4. Radiolytic yields of H2 for slurries compared with homogeneous solutions.......... 15
B3-5. Radiolytic yields of N20 for slurries compared with homogeneous solutions......... 15
B3-6. G(N2) from solution SYL-SIIM-91C under various experimental conditions............19
B3-7. Effect of formate and oxalate on G(H2) in SYl-SIM-91C. .............................. 21
C3- 1. Rates of thermal generation of H2 and N20 at 60 OC from slurries and homogeneoussolutions. Numbers in parenthesis are days elapsed from end of preirradiation tomeasurement of the thermal reaction........................................................... 29
C3-2. Rates of thermal generation of H2 and N20 at 60 'C from solution SY1-SIM-91Ccontaining 0.065 M of EDTA, HEDTA and 0.1 M citrate following various doses ofpreirradiation................................................................................... 31
D3-1. H2 production vs. [NaOH] and [HCHOJ in aqueous solution................ 52
D3-2. H2 production vs. [NaOH] and [HCHO] in aqueous solution at 60 0C.................52
D3-3. Parameters obtained from the model calculations...........................................59
D3-4. Isotopic composition of the dihydrogen generated from formaldehyde or glyoxylate inbasic solutions of various isotopic compositions..........................................64
E2- 1. Composition of homogeneous solution and slurry used to measure the effect of"m inor" com ponents ............................................................................ 67
E3- 1. The effect of minor components on G(H2) in solution SY1-SIM-91C containing0.065 M HEDTA, 0.065M EDTA, and 0.1 M citrate........................................ 69
E3-2. The effect of Pd(IV) in SY1-SIM-91C solution containing 0.065 H MEDTA,0.065 M EDTA, and 0.1 M citrate on H2 yields..............................................70
ix
LIST OF TABLES (Cont'd.)
No. Pag<
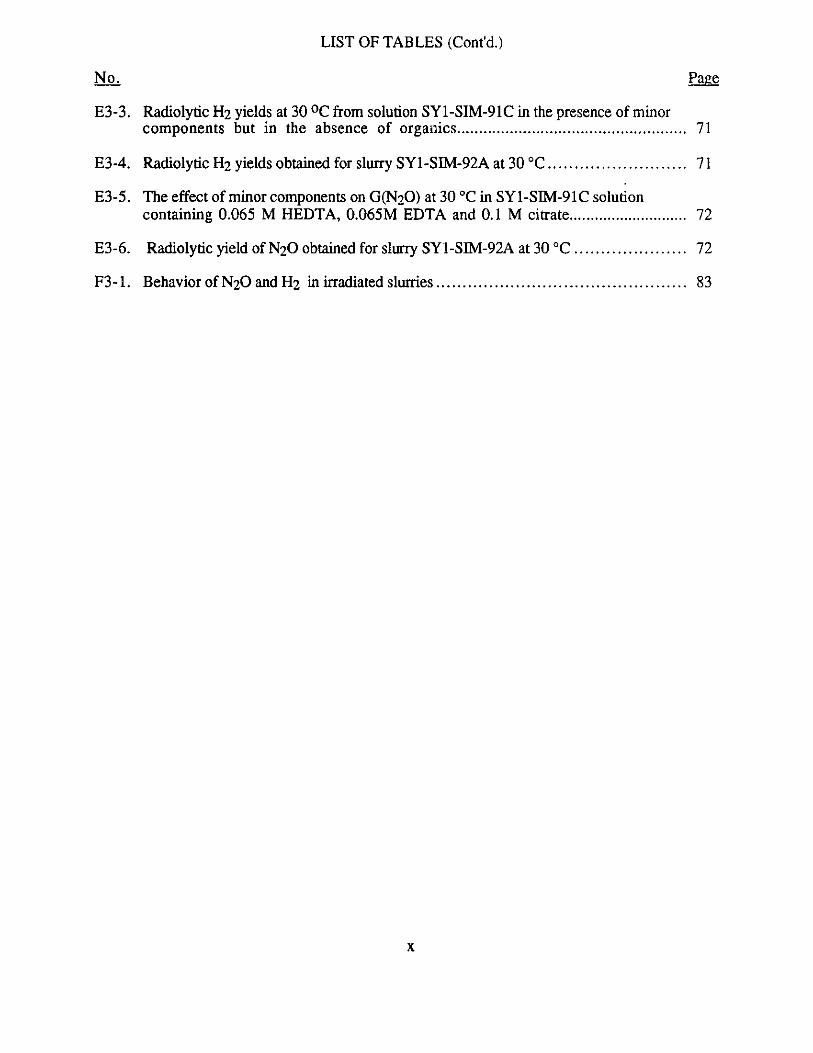
E3-3. Radiolytic H2 yields at 30 OC from solution SYl-SIM-91C in the presence of minorcomponents but in the absence of organics................................................. 71
E3-4. Radiolytic H2 yields obtained for slurry SY1-SIM-92A at 30 *C ...................... 71
E3-5. The effect of minor components on G(N 20) at 30 *C in SY1-SIM-91C solutioncontaining 0.065 M HEDTA, 0.065M EDTA and 0.1 M citrate................72
E3-6. Radiolytic yield of N20 obtained for slurry SY1-SIM-92A at 30 C.............72
F3-1. Behavior of N20 and H2 in irradiated slurries............................................ 83
x
RADIOLYTIC AND RADIOLYTICALLY INDUCED GENERATION OF
GASES FROM SYNTHETIC WASTES
FINAL REPORT
D. Meisel, C. D. Jonah, S. Kapoor, M. S. Matheson, and M. C. Sauer, Jr.
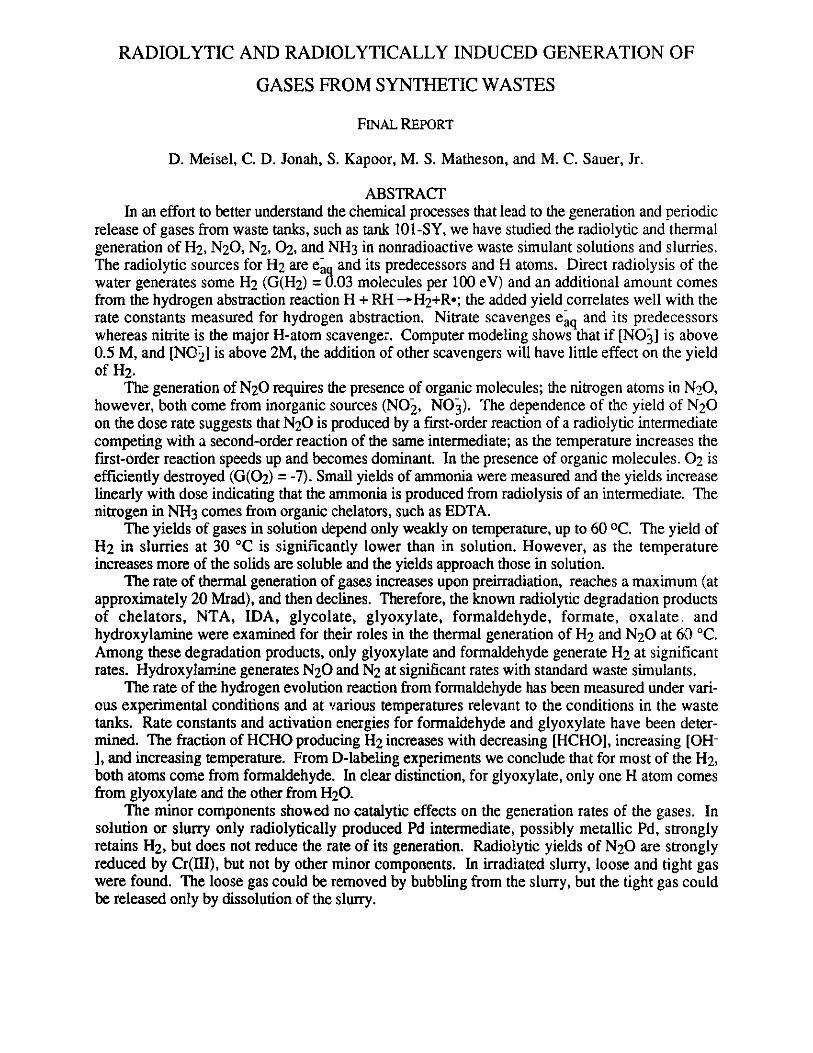
ABSTRACTIn an effort to better understand the chemical processes that lead to the generation and periodic
release of gases from waste tanks, such as tank 101-SY, we have studied the radiolytic and thermalgeneration of H2, N20, N2, 02, and NH3 in nonradioactive waste simulant solutions and slurries.The radiolytic sources for H2 are e, and its predecessors and H atoms. Direct radiolysis of thewater generates some H2 (G(H2) = 3.03 molecules per 100 eV) and an additional amount comesfrom the hydrogen abstraction reaction H + RH -+H 2 +R.; the added yield correlates well with therate constants measured for hydrogen abstraction. Nitrate scavenges eq and its predecessorswhereas nitrite is the major H-atom scavenger. Computer modeling shows that if [N0~] is above0.5 M, and [NO2 is above 2M, the addition of other scavengers will have little effect on the yieldof H2.
The generation of N20 requires the presence of organic molecules; the nitrogen atoms in N20,however, both come from inorganic sources (N02, N03). The dependence of the yield of N20on the dose rate suggests that N20 is produced by a first-order reaction of a radiolytic intermediatecompeting with a second-order reaction of the same intermediate; as the temperature increases thefirst-order reaction speeds up and becomes dominant. In the presence of organic molecules. 02 isefficiently destroyed (G(02) = -7). Small yields of ammonia were measured and the yields increaselinearly with dose indicating that the ammonia is produced from radiolysis of an intermediate. Thenitrogen in NH3 comes from organic chelators, such as EDTA.
The yields of gases in solution depend only weakly on temperature, up to 60 OC. The yield ofH2 in slurries at 30 *C is significantly lower than in solution. However, as the temperatureincreases more of the solids are soluble and the yields approach those in solution.
The rate of thermal generation of gases increases upon preirradiation, reaches a maximum (atapproximately 20 Mrad), and then declines. Therefore, the known radiolytic degradation productsof chelators, NTA, IDA, glycolate, glyoxylate, formaldehyde, formate, oxalate andhydroxylamine were examined for their roles in the thermal generation of H2 and N20 at 60 *C.Among these degradation products, only glyoxylate and formaldehyde generate H2 at significantrates. Hydroxylamine generates N20 and N2 at significant rates with standard waste simulants.
The rate of the hydrogen evolution reaction from formaldehyde has been measured under vari-ous experimental conditions and at various temperatures relevant to the conditions in the wastetanks. Rate constants and activation energies for formaldehyde and glyoxylate have been deter-mined. The fraction of HCHO producing H2 increases with decreasing [HCHOJ, increasing [OH-1, and increasing temperature. From D-labeling experiments we conclude that for most of the H2,both atoms come from formaldehyde. In clear distinction, for glyoxylate, only one H atom comesfrom glyoxylate and the other from H20.
The minor components showed no catalytic effects on the generation rates of the gases. Insolution or slurry only radiolytically produced Pd intermediate, possibly metallic Pd, stronglyretains H2 , but does not reduce the rate of its generation. Radiolytic yields of N 20 are stronglyreduced by Cr(III), but not by other minor components. In irradiated slurry, loose and tight gaswere found. The loose gas could be removed by bubbling from the slurry, but the tight gas couldbe released only by dissolution of the slurry.
2
SUMMARY
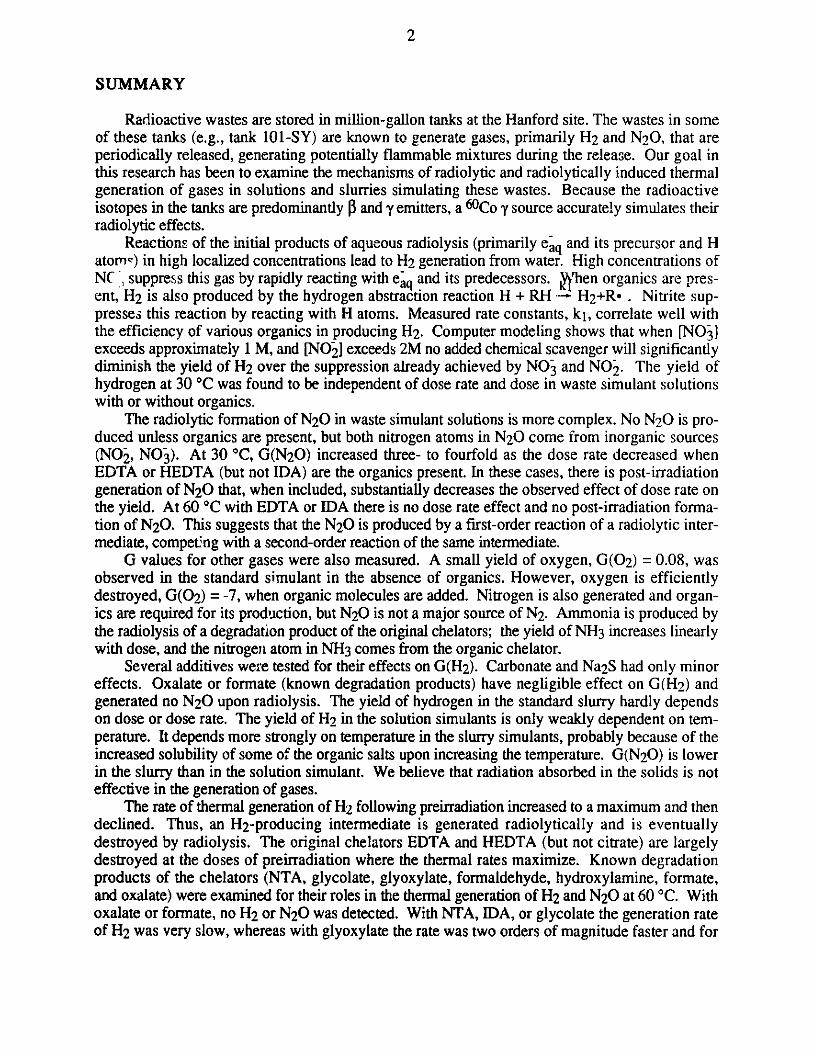
Radioactive wastes are stored in million-gallon tanks at the Hanford site. The wastes in someof these tanks (e.g., tank 101-SY) are known to generate gases, primarily H2 and N20, that areperiodically released, generating potentially flammable mixtures during the release. Our goal inthis research has been to examine the mechanisms of radiolytic and radiolytically induced thermalgeneration of gases in solutions and slurries simulating these wastes. Because the radioactiveisotopes in the tanks are predominantly $ and y emitters, a 6Co y source accurately simulates theirradiolytic effects.
Reactions of the initial products of aqueous radiolysis (primarily eaq and its precursor and Hatomz) in high localized concentrations lead to H2 generation from water. High concentrations ofNC, suppress this gas by rapidly reacting with eaq and its predecessors. yhen organics are pres-ent, H2 is also produced by the hydrogen abstraction reaction H + RH -- H2+R. . Nitrite sup-presses this reaction by reacting with H atoms. Measured rate constants, ki, correlate well withthe efficiency of various organics in producing H2. Computer modeling shows that when [NOexceeds approximately 1 M, and [N02] exceeds 2M no added chemical scavenger will significantlydiminish the yield of H2 over the suppression already achieved by NO and NO2. The yield ofhydrogen at 30 *C was found to be independent of dose rate and dose in waste simulant solutionswith or without organics.
The radiolytic formation of N20 in waste simulant solutions is more complex. No N20 is pro-duced unless organics are present, but both nitrogen atoms in N20 come from inorganic sources(N2, NO3). At 30 *C, G(N20) increased three- to fourfold as the dose rate decreased whenEDTA or HEDTA (but not IDA) are the organics present. In these cases, there is post-irradiationgeneration of N20 that, when included, substantially decreases the observed effect of dose rate onthe yield. At 60 *C with EDTA or IDA there is no dose rate effect and no post-irradiation forma-tion of N20. This suggests that the N20 is produced by a first-order reaction of a radiolytic inter-mediate, competing with a second-order reaction of the same intermediate.
G values for other gases were also measured. A small yield of oxygen, G(02) = 0.08, wasobserved in the standard simulant in the absence of organics. However, oxygen is efficientlydestroyed, G(02) = -7, when organic molecules are added. Nitrogen is also generated and organ-ics are required for its production, but N20 is not a major source of N2. Ammonia is produced bythe radiolysis of a degradation product of the original chelators; the yield of NH3 increases linearlywith dose, and the nitrogen atom in NH3 comes from the organic chelator.
Several additives were tested for their effects on G(H2 ). Carbonate and Na2S had only minoreffects. Oxalate or formate (known degradation products) have negligible effect on G(H2) andgenerated no N20 upon radiolysis. The yield of hydrogen in the standard slurry hardly dependson dose or dose rate. The yield of H2 in the solution simulants is only weakly dependent on tem-perature. It depends more strongly on temperature in the slurry simulants, probably because of theincreased solubility of some of the organic salts upon increasing the temperature. G(N20) is lowerin the slurry than in the solution simulant. We believe that radiation absorbed in the solids is noteffective in the generation of gases.
The rate of thermal generation of H2 following preirradiation increased to a maximum and thendeclined. Thus, an H2-producing intermediate is generated radiolytically and is eventuallydestroyed by radiolysis. The original chelators EDTA and HEDTA (but not citrate) are largelydestroyed at the doses of preirradiation where the thermal rates maximize. Known degradationproducts of the chelators (NTA, glycolate, glyoxylate, formaldehyde, hydroxylamine, formate,and oxalate) were examined for their roles in the thermal generation of H2 and N20 at 60 "C. Withoxalate or formate, no H2 or N20 was detected. With NTA, IDA, or glycolate the generation rateof H2 was very slow, whereas with glyoxylate the rate was two orders of magnitude faster and for
3
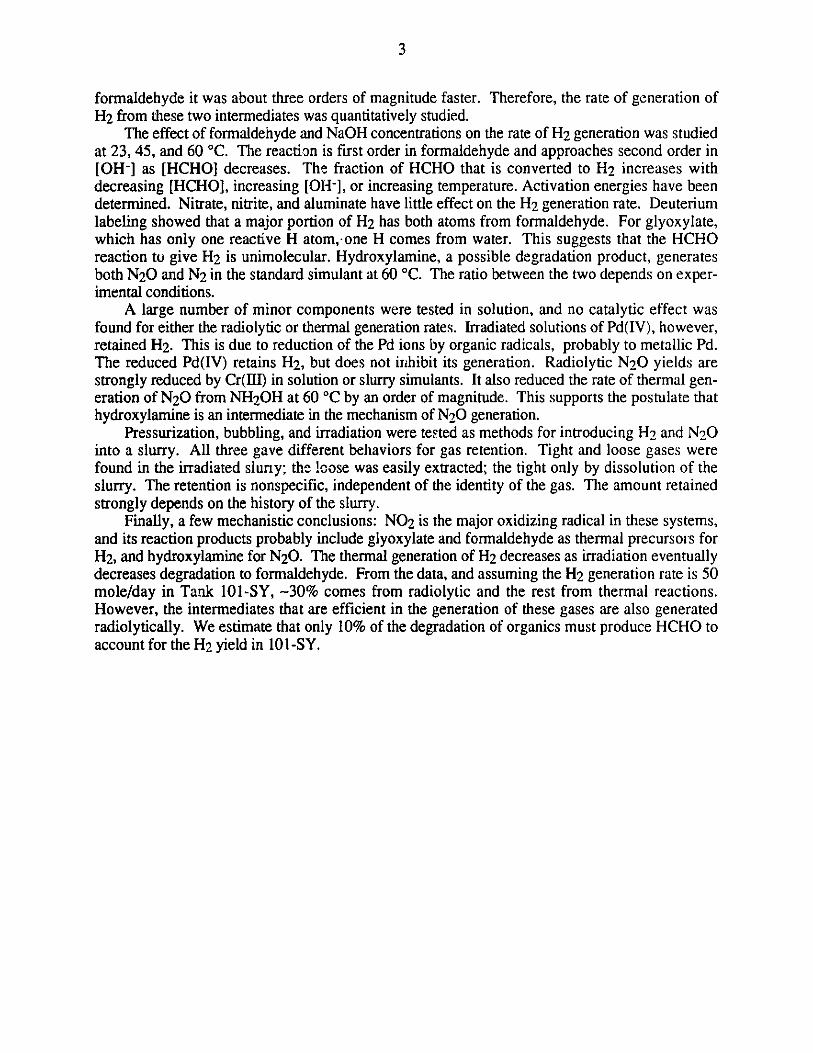
formaldehyde it was about three orders of magnitude faster. Therefore, the rate of generation ofH2 from these two intermediates was quantitatively studied.
The effect of formaldehyde and NaOH concentrations on the rate of H2 generation was studiedat 23, 45, and 60 *C. The reaction is first order in formaldehyde and approaches second order in[OH-] as [HCHO] decreases. The fraction of HCHO that is converted to H2 increases withdecreasing [HCHO], increasing [OH-], or increasing temperature. Activation energies have beendetermined. Nitrate, nitrite, and aluminate have little effect on the H2 generation rate. Deuteriumlabeling showed that a major portion of H2 has both atoms from formaldehyde. For glyoxylate,which has only one reactive H atom,-one H comes from water. This suggests that the HCHOreaction to give H2 is unimolecular. Hydroxylamine, a possible degradation product, generatesboth N20 and N2 in the standard simulant at 60 *C. The ratio between the two depends on exper-imental conditions.
A large number of minor components were tested in solution, and no catalytic effect wasfound for either the radiolytic or thermal generation rates. Irradiated solutions of Pd(IV), however,retained H2. This is due to reduction of the Pd ions by organic radicals, probably to metallic Pd.The reduced Pd(IV) retains H2, but does not inhibit its generation. Radiolytic N20 yields arestrongly reduced by Cr(III) in solution or slurry simulants. It also reduced the rate of thermal gen-eration of N20 from NH2 OH at 60 *C by an order of magnitude. This supports the postulate thathydroxylamine is an intermediate in the mechanism of N20 generation.
Pressurization, bubbling, and irradiation were tested as methods for introducing H2 and N20into a slurry. All three gave different behaviors for gas retention. Tight and loose gases werefound in the irradiated sluny; the loose was easily extracted; the tight only by dissolution of theslurry. The retention is nonspecific, independent of the identity of the gas. The amount retainedstrongly depends on the history of the slurry.
Finally, a few mechanistic conclusions: NO2 is the major oxidizing radical in these systems,and its reaction products probably include glyoxylate and formaldehyde as thermal precursors forH2, and hydroxylamine for N20. The thermal generation of H2 decreases as irradiation eventuallydecreases degradation to formaldehyde. From the data, and assuming the H2 generation rate is 50mole/day in Tank 101-SY, ~30% comes from radiolytic and the rest from thermal reactions.However, the intermediates that are efficient in the generation of these gases are also generatedradiolytically. We estimate that only 10% of the degradation of organics must produce HCHO toaccount for the H2 yield in 101-SY.
4
A. INTRODUCTION
Some of the mixed radioactive wastes in temporary storage tanks at the Hanford site areknown to generate mixtures of gases (primarily H2 ,nd N20, but also N2, NH3, and small quanti-ties of other gases). Of particular concern is tank 241-SY-101, where potentially flammable mix-tures of H2 and N20 are released periodically. During the last two years, we attempted to deter-mine the role of radiation in the production of H2 and the other gases in the waste tanks. With suf-ficient information, one could then propose strategies to substantially decrease the buildup ofhazardous gas mixtures.- This report summarizes the sults and conclusions of this effort. Interimreports have been issued,1'2 including a literature report, 3 and these will be frequently referred tohere.
The yields of the radiolytic generation of gases in homogeneous aqueous solutions, similar incomposition to the waste in tank 101-SY were first studied; the yields in a heterogeneous simulantwere then determined and compared to the yields of the homogeneous solutions. These are sum-marized in Section B. It was then discovered that the rate of thermal generation of gases from thesimulants is much faster after exposure to irradiation than i its absence. Therefore, the effect ofpreirradiation on the rate of thermal generation was investigated (Section C). It became clear thatthe most efficient product to generate hydrogen in the irradiated waste simulants is formaldehydeand its analogs; quantitative determination of the rate of its reaction to thermally generate H2 fol-lowed (Section D). The presence of a large number of compounds in the waste, at relatively lowconcentrations (thus labeled "minor components"), raised the concern of a possible catalytic effect;none was found, and the results of these studies are given i1i Section E. Whereas prevention ofgas generation will completely alleviate any possible flammability concerns, prevention of theretention of gas in the tank will stabilize the situation and remove most such concerns as well. Thephenomenon of gas retention was addressed (Section F); the interaction between gas bubbles andsolid particles seems to depend strongly on the particles and the mode of generation of the gas.Extracting conclusions from our studies and applying them to the actual conditions in the tanks ishampered by a lack of information on the chemical composition of the organic compounds in thetank. Nonetheless, we attempt to draw such conclusions in Section G.
B. RADIOLYTIC YIELDS OF GASES
1. Introduction
Over several decades liquid and solid radioactive wastes have accumulated at the Hanford,Washington site. Liquid waste is stored in large tanks containing up to a million gallons. In addi-tion to radioactive isotopes (largely 0- or y-emitting fission products), the solutions contain highconcentrations of NaOH, NaNO3, NaNO2, NaAlO2, and medium concentrations of dissolvedorganic complexants (EDTA, HEDTA, NTA, etc.); the fate and present status of the latter are notknown. In this section, we focus on the direct role of radiolysis in the generation of gases that areevolved in simulated waste solutions. A literature search3 revealed that much of the detailed infor-mation collected on radiolytic processes that generate the gases is inadequate to describe the chem-istry in the highly basic and complex solutions and slurries similar to those in 101-SY. Ourresearch has closely defined the mechanism for radiolytic H2 production. This includes: (1) aportion of the yield that comes directly from water radiolysis; (2) an additional yield, proportionalto the rate of H + RH -- H2 +R. (where RH is a hydrogen-containing organic compound),accounts for the effect of organic compounds.
Significant knowledge about N20 formation has been gained, but the mechanism that candescribe its generation remains on a qualitative level. We have shown that: (1) organic compoundsare necessary for N 20 formation (and the destruction of 02); (2) the nitrogen in the radiolytically
5
generated N 20 comes from N02 and/or NO3, but not from Lfe organic components, and (3)hydroxylamine is a likely intermediate.
2. Experimental
Details of the experimental techniques used for the studies reported here have been given in aprevious report.1 Below is a brief description of these techniques and some details of additionalprocedures that were not given in earlier reports.
a. Radiation Sources and Dosimetry
A 60 Co source was used to irradiate the samples in syringes (or in stainless steel beakers forpreirradiation; see Section C). Dosimetry was done by measuring the production of Fe+3 spectro-photometrically in Fricke dosimeter solutions containing 1 mM NaCl. Details were given previ-ously. 1 '4
b. Gas Measurements
The yields of all gases, except ammonia, were determined by gas chromatography. Emphasiswas placed on H2, N20, N2, and 02 in the irradiated solutions. For the homogeneous solutions,irradiations were carried out in syringes; the gases generated, then, were all below their solubilityat 1 atm partial pressure of the gas in the solution. The Van Slyke manometric apparatus was usedto extract the gases from these solutions. An Infotronics Model 15C-3 gas chromatographequipped with a dual column flow system, a thermal conductivity detector, and a recorder-integra-tor ("ChromJet Integrator," Spectra Physics, Inc.) was used for these measurements. The separat-ing columns were homemade 1/4-inch-diameter, several feet long copper tubing filled with theappropriate separating material (13X molecular sieve for most experiments). Argon was used as acarrier gas for most experiments and the flow rate was adjusted to about 60 cc/min. For H2 andN20, the column temperature was maintained at 23 or 158 OC, respectively. Air (21% oxygen and78% nitrogen), pure hydrogen, and pure N20 samples were used to calibrate the apparatus for itsresponse to the corresponding gases. Further details of the Van Slyke apparatus and the gas chro-matograph are given in previous reports."5
Yields of ammonia were determined by back titration of a standard HCl solution with a stan-dard sodium carbonate solution after bubbling the ammonia through the HC1 solution.6 Details ofthe procedure are given in Section B3e below. Mass spectrometry was used primarily to determinethe isotopic composition of gases. A differentially pumped 30 cm radius 900 sector magneticdeflection mass spectrometer from Vg-Micromass (MM3001) of 7500 maximum resolving powerand 10 kV maximum accelerating voltage was used for these studies. The sensitivity for N2 is2.0 x 10-4 ampere/mbar at 8 kV and for H2 and its isotopes it is smaller by a factor of two.
c. Solutions and Slurry Preparation
Unless otherwise specified, all chemicals were obtained from Aldrich and used as received.For long-time thermal reactions, NaAIO2 (from ICN) was baked at ~ 900 OC for 6 hrs to removetraces of organic impurities. Concentrations of aluminum in stock solutions of the processed alu-minate samples were determined by ICP. The standard waste solution, designated SY I -SIM-9 1C(at times labeled solution P), was used for most of the studies of homogeneous simulants. Its com-position is given in Table B2-1. Other additives, such as organics, transition metals, halide ions,and noble metals were added as needed for the experiment after the SY I -SIM-9 1C preparation.
6
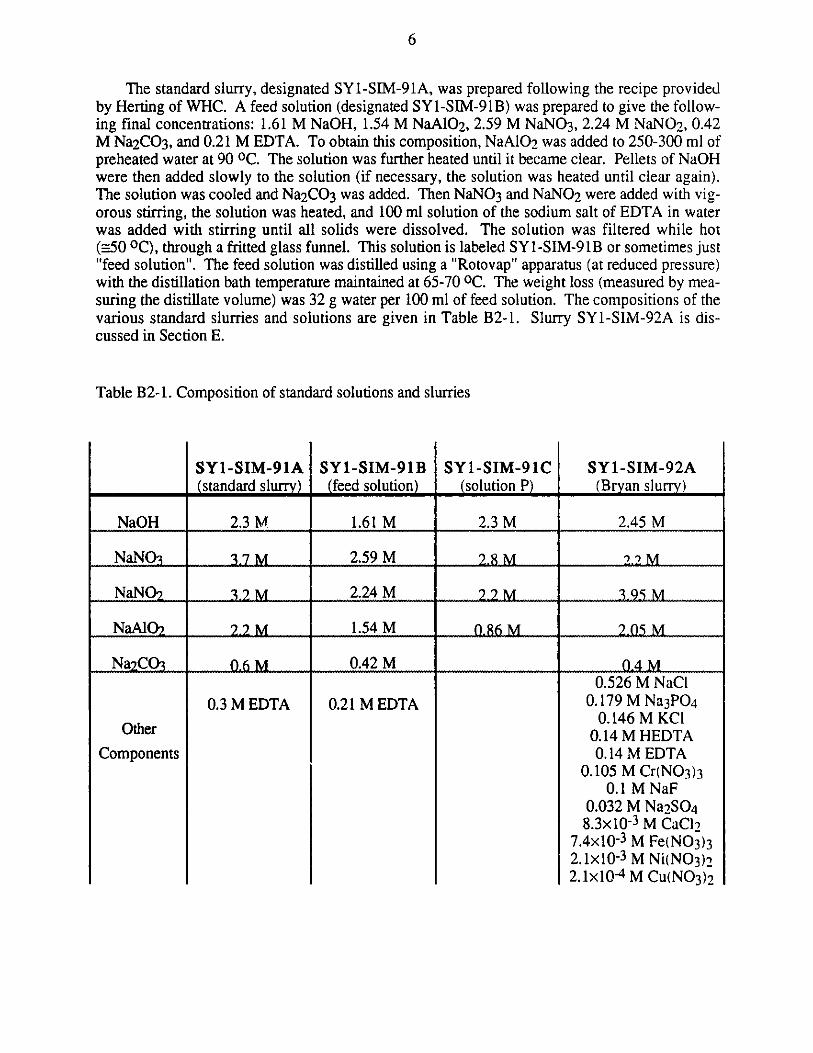
The standard slurry, designated SY1-SIM-91A, was prepared following the recipe providedby Herting of WHC. A feed solution (designated SYl-SIM-91B) was prepared to give the follow-ing final concentrations: 1.61 M NaOH, 1.54 M NaAlO2, 2.59 M NaNO3, 2.24 M NaNO2, 0.42M Na2CO3, and 0.21 M EDTA. To obtain this composition, NaAlO2 was added to 250-300 ml ofpreheated water at 90 OC. The solution was further heated until it became clear. Pellets of NaOHwere then added slowly to the solution (if necessary, the solution was heated until clear again).The solution was cooled and Na2CO3 was added. Then NaNO3 and NaNO2 were added with vig-orous stirring, the solution was heated, and 100 ml solution of the sodium salt of EDTA in waterwas added with stirring until all solids were dissolved. The solution was filtered while hot(=50 OC), through a fitted glass funnel. This solution is labeled SYI-SIM-91B or sometimes just"feed solution". The feed solution was distilled using a "Rotovap" apparatus (at reduced pressure)with the distillation bath temperature maintained at 65-70 OC. The weight loss (measured by mea-suring the distillate volume) was 32 g water per 100 ml of feed solution. The compositions of thevarious standard slurries and solutions are given in Table B2-1. Slurry SYl-SIM-92A is dis-cussed in Section E.
Table B2-1. Composition of standard solutions and slurries
SY1-SIM-91A(standard slurry)
SY1-SIM-91B(feed solution)
SY1-SIM-91C(solution P)
SY 1-SIM-92A(Bryan slurry)
NaOH 2.3 M 1.61 M 2.3 M 2.45 M
NaO2 M 2.59 M -. 86 M 2.25M
Na2O-- - .-2M -2.24M -. 4mM
NaCO3Q6M 0.42 M ______ OggM
Other
Components
0.3 M EDTA 0.21 M EDTA0.526 M NaCl
0.179 M Na3PO 40.146 M KCl
0.14 M HEDTA0.14 M EDTA
0.105 M Cr(N03)30.1 M NaF
0.032 M Na2SO48.3x10-3 M CaCl2
7.4x10⁻³ M Fe(N03)32.1xO- 3 M Ni(N0 3)22.1x10⁻⁴ M Cu(N0 3)2
7
3. Results and Discussion
a. H2 Yields From Homogeneous Solutions
The G(H2) at 30 OC from SYI-SIM-91C was determined to be independent of dose (30-1000krad) and dose rate (0.15-20 krad/min). Likewise, over the same dose range, no effect of dose ordose rate was observed on G(H2 ) at 30 OC when solution SY1-SIM-91C contained organic solutes(see Figures 2-7 of reference 1).
G(H2) at 30 OC increases linearly with concentration of the organic in SY 1-SIM-9 1C (Figures8-12, reference 1), as is expected from the mechanism for H2 production that includes thehydrogen abstraction reaction: k
H+RH -L H2 +R., (B-1)
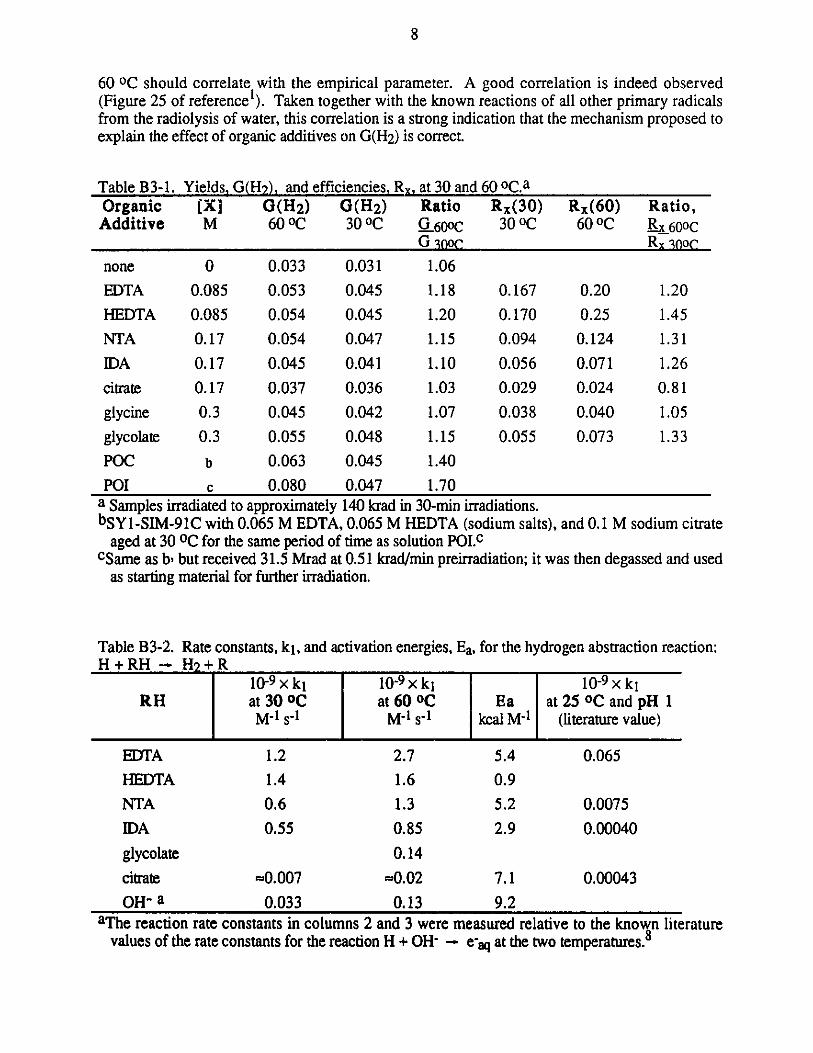
and as predicted by model calculations (Figure 33 in reference 1). From measurements of G(H2 )with and without organic solutes, the efficiencies, R, of several organics, x = RH, weredetermined at 30 and 60 0C. These Rx values, when multiplied by the molar concentration of theorganic, give the increase in G(H2) by the organic compound above the yield in the same solutionwithout the organic. A summary of the G(H2) results and the Rx values at 30 and 60 OC is givenin Table B3-1. The Rx values at 30 OC are based on results from a series of concentrations oforganic additive; the Rx values at 60 OC are based on results with only one concentration of organicadditive and are therefore likely to be less accurate. Thus, to a good approximation, G(H2) can becalculated from eq. B-2.
G(H2) = G(H2)[RH]=0 + Rx x [RH] (B-2)
For compounds not measured, and therefore not listed in Table B3- 1, some prediction couldbe made on their effect on the yield of H2. A correlation between the Rx values and the number ofC-H and N-H bonds, E1x-H, in the organic has been noted (Figure 14 of reference 1). The Rxvalues at 30 OC are given by:
Rx = 0.013 X x-H , (B-3)
and thus the yield of hydrogen, for a compound of a known formula but whose effect on G(H2 )has not been measured, can be described by eq. B-4.
G(H2 ) = 0.031 + 0.013 XTEx-H X [RHI . (B-4)
This correlation is not exact, but it does provide some predictive capability for a broad rangeof organic additives. It should be emphasized that this equation is only of empirical value; it willbe followed only for a background solution of the same composition as SY1-SIM-91C. Such anapproximate correlation is to be expected from the mechanism of abstraction of H from the organicsolute by radiolytically produced H atoms to yield H2.
Table B3-1 indicates that the efficiency, Rx, of H2 production by the organic solutes is largerat 60 OC than at 30 OC for all solutes except citrate. In the framework of the mechanism for radio-lytic hydrogen production (hydrogen abstraction by H atoms from the organic solute), this resultindicates that the rate of hydrogen abstraction reaction increases more upon increasing temperaturethan increase in the rate of the other reactions with H atoms (most dominating is the reaction withnitrite) that do not produce H2. This is reflected in the rate constants that we have determined forreaction of hydrogen atoms with organics. The method for these determinations is described inreference 1, and the rate constants for reaction B-I under conditions similar to those in solutionSYl-SIM-91C are summarized in Table B3-2.
Further verification of the impact of reaction B-I on the yield of H2 comes from the correlationbetween ki and Rx. If the presence of the organics in SYI-SIM-91C causes an increase in the H2yield because of the hydrogen abstraction reaction, the values of the rate constants, ki, at 30 and
8
60 OC should correlate with the empirical parameter. A good correlation is indeed observed(Figure 25 of reference1 ). Taken together with the known reactions of all other primary radicalsfrom the radiolysis of water, this correlation is a strong indication that the mechanism proposed toexplain the effect of organic additives on G(H2) is correct.
Table B3-1. Yields, G(H2), and efficiencies, R, at 30 and 60 oC.aOrganic [X] G(H2) G(H2) Ratio Rx(30) Rx(60) Ratio,Additive M 60 OC 30 OC .G.600C 30 0C 60 OC R_600C
G 300C R200C
none
EDTA
0
0.085
HEDTA 0.085
NTA
IDA
citrate
glycine
glycolate
POC
0.17
0.17
0.17
0.3
0.3
b
0.033
0.05 30.054
0.054
0.045
0.037
0.045
0.055
0.063
0.031
0.045
0.045
0.047
0.041
0.036
0.042
0.048
0.045
1.06
1.18
1.20
1.15
1.10
1.03
1.07
1.15
1.40
0.167
0.170
0.094
0.056
0.029
0.038
0.055
0.20
0.25
0.124
0.071
0.024
0.040
0.07 3
1.20
1.45
1.31
1.26
0.81
1.05
1.33
POI C 0.080 0.047 1.70a Samples irradiated to approximately 140 krad in 30-min irradiations.bSy1 -SIM-.91C with 0.065 M EDTA, 0.065 M HEDTA (sodium salts), and 0.1 M sodium citrate
aged at 30 OC for the same period of time as solution POI.ccSame as b, but received 31.5 Mrad at 0.51 krad/min preirradiation; it was then degassed and used
as starting material for further irradiation.
Table B3-2. Rate constants, ki, and activation energies, Ea, for the hydrogen abstraction reaction:H + RH -- H2+ R
10- 9 x ki 10-9 x ki 10-9 x kIRH at 30 OC at 60 OC Ea at 25 OC and pH 1
M-1s-1 M-1 s-1 kcalM-1 (literature value)
EDTA 1.2 2.7 5.4 0.065HEDTA 1.4 1.6 0.9NTA 0.6 1.3 5.2 0.0075IDA 0.55 0.85 2.9 0.00040
glycolate 0.14
citrate =0.007 =0.02 7.1 0.00043OH- a 0.033 0.13 9.2
aThe reaction rate constants in columns 2 and 3 were measured relative to the known literaturevalues of the rate constants for the reaction H + OH -- e-aq at the two temperatures. 8
I
9
b. N20 Yields From Homogeneous Solutions
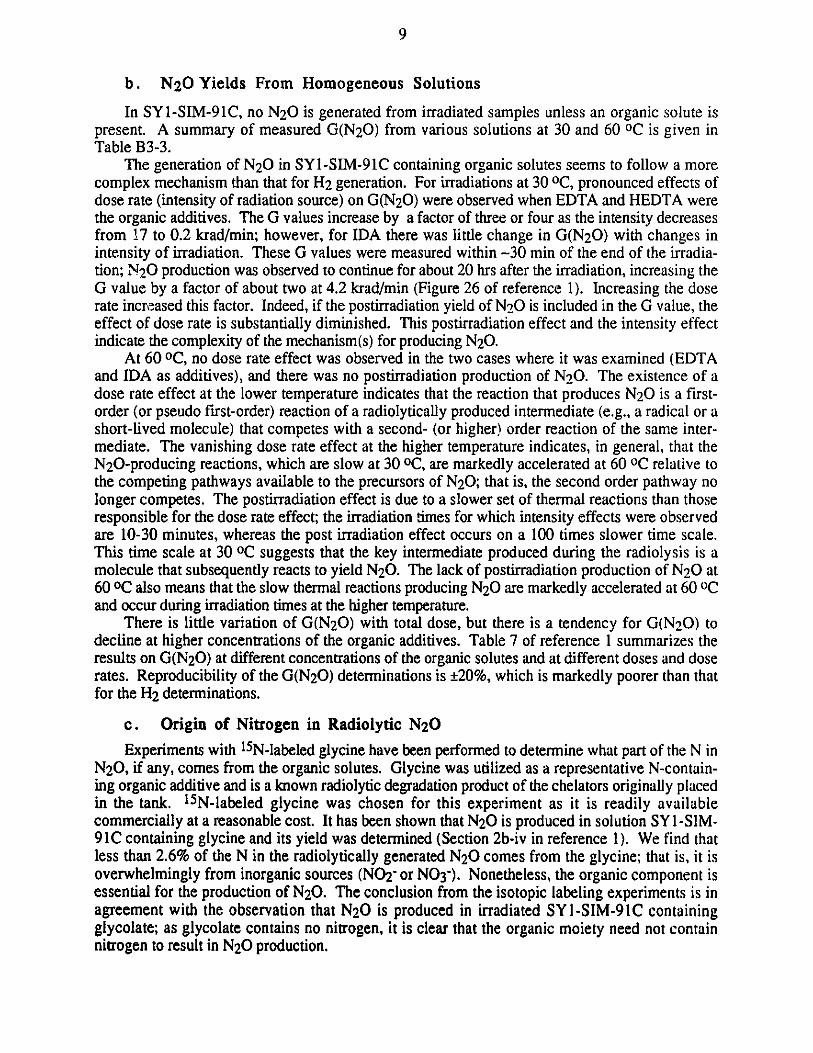
In SYl-SIM-91C, no N20 is generated from irradiated samples unless an organic solute ispresent. A summary of measured G(N20) from various solutions at 30 and 60 OC is given inTable B3-3.
The generation of N2 0 in SYl-SIM-91C containing organic solutes seems to follow a morecomplex mechanism than that for H2 generation. For irradiations at 30 OC, pronounced effects ofdose rate (intensity of radiation source) on G(N20) were observed when EDTA and HEDTA werethe organic additives. The G values increase by a factor of three or four as the intensity decreasesfrom 17 to 0.2 krad/min; however, for IDA there was little change in G(N20) with changes inintensity of irradiation. These G values were measured within ~30 min of the end of the irradia-tion; N 20 production was observed to continue for about 20 hrs after the irradiation, increasing theG value by a factor of about two at 4.2 krad/min (Figure 26 of reference 1). Increasing the doserate increased this factor. Indeed, if the postirradiation yield of N20 is included in the G value, theeffect of dose rate is substantially diminished. This postirradiation effect and the intensity effectindicate the complexity of the mechanism(s) for producing N20.
At 60 OC, no dose rate effect was observed in the two cases where it was examined (EDTAand IDA as additives), and there was no postirradiation production of N20. The existence of adose rate effect at the lower temperature indicates that the reaction that produces N20 is a first-order (or pseudo first-order) reaction of a radiolytically produced intermediate (e.g., a radical or ashort-lived molecule) that competes with a second- (or higher) order reaction of the same inter-mediate. The vanishing dose rate effect at the higher temperature indicates, in general, that theN20-producing reactions, which are slow at 30 OC, are markedly accelerated at 60 OC relative tothe competing pathways available to the precursors of N 20; that is, the second order pathway nolonger competes. The postirradiation effect is due to a slower set of thermal reactions than thoseresponsible for the dose rate effect; the irradiation times for which intensity effects were observedare 10-30 minutes, whereas the post irradiation effect occurs on a 100 times slower time scale.This time scale at 30 OC suggests that the key intermediate produced during the radiolysis is amolecule that subsequently reacts to yield N 20. The lack of postirradiation production of N 20 at60 OC also means that the slow thermal reactions producing N20 are markedly accelerated at 60 OCand occur during irradiation times at the higher temperature.
There is little variation of G(N20) with total dose, but there is a tendency for G(N20) todecline at higher concentrations of the organic additives. Table 7 of reference 1 summarizes theresults on G(N20) at different concentrations of the organic solutes and at different doses and doserates. Reproducibility of the G(N20) determinations is 20%, which is markedly poorer than thatfor the H2 determinations.
c. Origin of Nitrogen in Radiolytic N20Experiments with 15N-labeled glycine have been performed to determine what part of the N in
N20, if any, comes from the organic solutes. Glycine was utilized as a representative N-contain-ing organic additive and is a known radiolytic degradation product of the chelators originally placedin the tank. 1 5 N-labeled glycine was chosen for this experiment as it is readily availablecommercially at a reasonable cost. It has been shown that N20 is produced in solution SY 1-SIM-91C containing glycine and its yield was determined (Section 2b-iv in reference 1). We find thatless than 2.6% of the N in the radiolytically generated N20 comes from the glycine; that is, it isoverwhelmingly from inorganic sources (NO2- or N03-). Nonetheless, the organic component isessential for the production of N20. The conclusion from the isotopic labeling experiments is inagreement with the observation that N20 is produced in irradiated SYl-SIM-91C containingglycolate; as glycolate contains no nitrogen, it is clear that the organic moiety need not containnitrogen to result in N20 production.
10
Table B3-3. G(N20) from irradiation of solution SY1-SIM-91C containing various additives at 30and 60 oC.a
Additive [RH] G(N20) G(N20) RatioM at 60 C at 30 C G600 C
G30 *Cnone 0 0 0 --
EDTA 0.085 1.10 0.60 1.8HEDTA 0.085 0.77 0.50 1.43NTA 0.17 0.48 0.56 0.86IDA 0.17 0.94 0.76 1.24citrate 0.17 0.064 0.045 1.42glycine 0.3 0.47 0.15 3.1glycolate 0.3 0.86 0.42 2.0POC b 0.87 0.49 1.8POI c 1.06 0.48 2.2aAJ1 samples irradiated to 125 krad in 30-min irradiations.
bSolution SY-SIM-91C with 0.065 M EDTA, 0.065 M HEDTA (sodium salts), and 0.1 Msodium citrate aged at 30 OC for the same period of time as solution POI.cCSame as b, but preirradiated to 31.5 Mrad at 0.51 krad/min; it was then degassed and used asstarting material for further irradiation.
9
11
,
0 200 400 600
Dose, krad
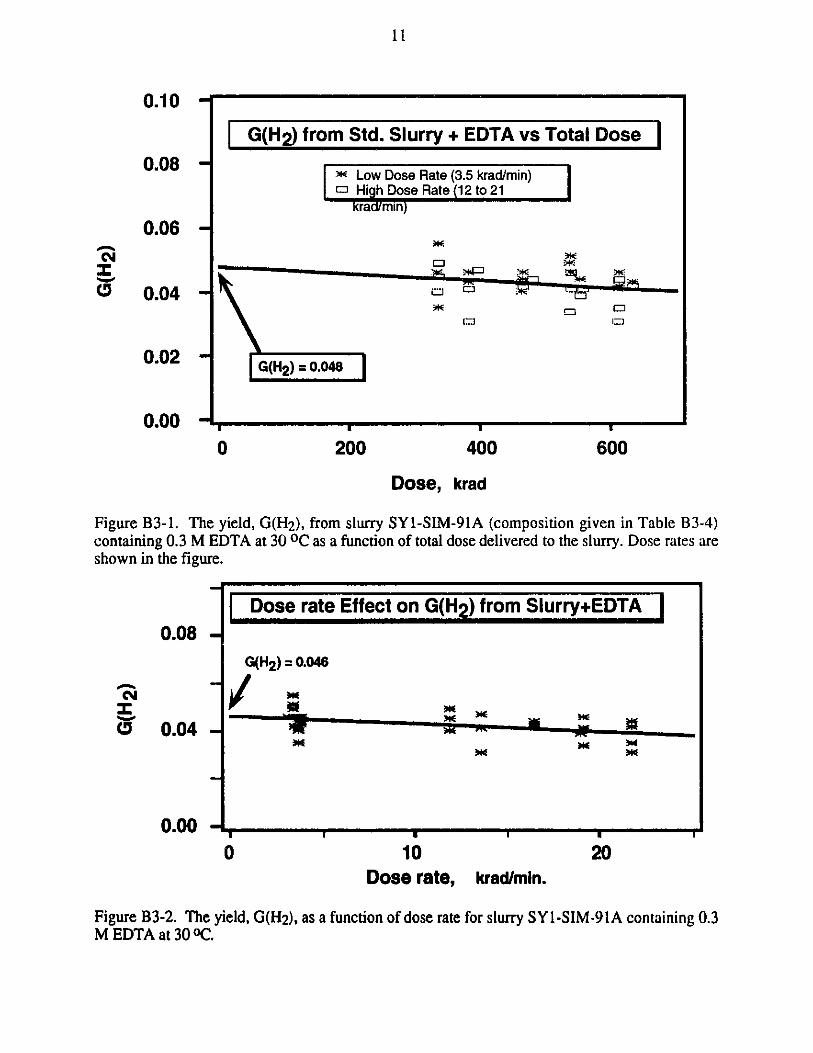
Figure B3-1. The yield, G(H2 ), from slurry SY1-SIM-91A (composition given in Table B3-4)containing 0.3 M EDTA at 30 OC as a function of total dose delivered to the slurry. Dose rates areshown in the figure.
0.08 -
0.04 -
0.00 -J
0 10Dose rate, krad/min.
20
Figure B3-2. The yield, G(H2), as a function of dose rate for slurry SYl-SIM-91A containing 0.3M EDTA at 30 OC.
0.10
0.08
0.06
G(H 2) from Std. Slurry + EDTA vs Total Dose
* Low Dose Rate (3.5 krad/min)M3 High Dose Rate (12 to 21kradmin)
*o
-DC-
- G(H2) =.0.048
N
(I0.04
0.02
0.00
NzNM
Dose rate Effect on G(H2) from Slurry+EDTA
G(H2) = 0.046
I I I r
12
0.08 G(H 2) vs. DoseStd. Slurry + 0.3 M HEDTA at 30 0C
0.06
0.04 4G(H2) = 0.050
0.02 Dose Ratein Krad/min
* 15 5" 3.5 0.5
0.00-0 400 800 1200
Dose, KradFigure B3-3. Radiolytic yield of H2 from slurry SY1-SIM-91A containing 0.3 M HEDTA at30 *C measured at two dose rates.
0 .1 0 -
0.08
0.06
0.04
0.02
0.00
0 400 800Dose, Krad
Figure B3-4. Radiolytic yield of H2 from slurry SYI-SIM-91A containing 0.065 M each ofHEDTA and EDTA, and 0.1 M citrate, measured at two dose rates, at 30 OC. This mixture is thecontrol slurry for the preirradiated slurries.
G(H2) vs. Dose at 30 OC (soC)
Std.Slurry +0.065 M EDTA, HEDTA and 0.1 M Citrate
G(H2 ) =0.040
Dose Ratein Krad/min
" 15 5" 3.510.5
9F
13
G(H 2) vs. DoseStd. Slurry +0.3 M IDA at 3 0 C
a
- -
-U
400
Dose Ratein Krad/min
* 15 5A 3.5 0.5
a
800Dose, Krad
1200
Figure B3-5. Radiolytic yield of H2 at 30 OC from slurry SYI-SIM-91A containing 0.3 M IDAmeasured at two dose rates.
N4
0
0.10 -
0.08 -
0.06 -
0.04 -
0.02 -
0.00 -0 200 400 600
Dose, kradFigure B3-6. G(H2) at various doses for slurry SY1-SIM-91A containing 0.3 M EDTA fromirradiations at 3.1 krad/min. The values of the least-squares fit parameters are given in the sameunits shown in the axes labels.
0.10 -
0.08 -
'N 0.06 -
0.04
0.02
0.00
0
G(H 2 ) = (0.096 0.006) - (4.09 1.3)x10- 5 XDose
G(H2 ) vs. Dose at 60 Ctd. Slurry + 0.3 M EDTA at 3.1 kr/m
-
AL
14
CD
0.06 -
0.04 -
0.02 -
0.00 -0 200 400 600 800
Dose, KradFigure B3-7. Radiolytic yield of H2 at 60 OC from standard slurry containing 0.3 M IDA.
G(H 2) vs Dose at 60 C
0.12 Std. Slurry + 0.3 M HEDTA at 3.1 kr/m
CMi 0.08
0.04
0.00 -0
Figure B3-8. Radiolytic yieldHEDTA.
200 400 600 800Dose, Krad
of H2 at 60 OC from slurry SY1-SIM-91A containing 0.3 M
m U
G(H2 ) vs Dose at 60 0 CStd. SIrry + 0.3 M IDA at 3.1 kr/m
0.10-
0.08
.-
15
Table B3-4. Radiolytic yields of H2 for slurries compared with homogeneous solutions
slurriesa solutionsb
temp composition dose G(H 2 ) composition dose G(H2)rate rate
kirad/min. krad/min.
30 OC 0.3M EDTA 3.5 0.044 0.003 0.3 M EDTA 4.4 0.081 0.005
30 OC 0.3 M EDTA 15 0.040 0.004
30 0C 0.3 M HEDTA 3.5 0.052 0.003 0.3 M HEDTA 4.4 0.084
30 OC 0.3 M HEDTA 15 0.049 0.003
30 0 C 0.3 M IDA 3.5 0.034 0.002 0.3 M IDA 4.4 0.049
30 OC 0.3 M IDA 15 0.027 0.005 0.3 M IDA 17 0.048
30 OC 0.3 M citrate 4.4 0.040
30 0C SOC C 3.5 0.040 0.005 POCc 4.4 0.045
30 OC SOCc 15 0.039 0.001
60 OC 0.3M citrate 4.7 0.040
60 0C 0.3 M EDTA 3.1 0.080 0.006 0.3 M EDTA 4.7 0.093
60 OC 0.3 M IDA 3.1 0.064 0.008 0.3M IDA 4.7 0.054
60 OC 0.3 M HEDTA 3.1 0.080 0.006 0.3M HEDTA 4.7 0.108
60 0C IPOCC 4.4 0.063aSlurry SYl-SIM-91A contains 2.3 M NaOH, 2.2 M NaA1O2, 3.7 M NaNO 3, 3.2 M NaNO2, and
0.6 M Na2CO3.bSolution SYl-SIM-91C contains 2.3 M NaOH, 0.86 M NaAlO, 2.8 M NaNO3, and 2.2 M
NaNO2. (Results obtained from ANL- 91/4 1.)cSOC and POC indicate 0.065 M EDTA, 0.065 M HEDTA, and 0.1 M sodium citrate in the SYL-
SIM-91A slurry or SYl-SIM-91C solution, respectively.
Table B3-5. Radiolytic yields of N20 for slurries compared with homogeneous solutions.
slurriesa solution pb
temp composition dose rate G(N20) composition dose rate G(N20)krad/min.I_ krad/min.
30 OC 0.3 M EDTA 3.5 0. 37 0.08 0.17 M EDTA 4.4 0.5 0.130 OC 0.3 M EDTA 16 0.26 0.06 0.085 M EDTA 17 0.4 0.160 OC 0.3 M EDTA 3.5 0.26 0.08 0.17 M EDTA 4.4 0.83 0.0960 OC 0.3 M IDA 3.5 0.41 0.14 0.17 M IDA 4.4 0.69 0.0460 OC 0.3 M HEDTA 3.5 0.40 0.081aSlurry SY1-SIM-91AbSolution SY1-SIM-91C: 2.3 M NaOH, 0.86 M NaAIO2, 2.8 M NaN03, and 2.2 M NaNO2.
16
d. H2 and N20 Yields From Slurries
Yields of H2 in Slurries. Figures B3-l through B3-5 show the effect of total dose anddose rate at 30 0C on G(H2 ) for the slurry SYl-SIM-91A containing either EDTA, HEDTA, EDTA+ HEDTA + citrate, or IDA. Similarly, Figure B3-6 shows the effect of dose on G(H2) at 60 0Cfor the slurry containing EDTA. The dependence of G(H2) on dose (e.g., Figure B3-1) or doserate (e.g., Figure B3-2), if any, is very weak and within experimental error. In Table B3-4 wequote average values. Figures B3-7 and B3-8 show the effect of dose (at 3.1 krad/min) on G(H2)in slurry SYl-SIM-91A at 60 0C containing 0.3M IDA and 0.3M HEDTA, respectively. G(H2) isindependent of dose within experimental error at this temperature as well. A comparison of H2radiolytic yields from the slurries and solutions at 30 and 60 0C is given in Table B3-4. At 30 0 C,the radiolytic yield for a slurry is clearly smaller than for the corresponding solution. However, at60 OC the yields from the slurries and the homogeneous solutions are comparable. The effect oftemperature is attributed primarily to changes of solubilities, that is, less solid material is present atthe higher temperature and radiation that is deposited in a solid is less efficient than that depositedin the solution.
Yields of N20 for Slurries. G values at 30 and 60 OC for the generation of N20 forslurry SYl-SIM-91A containing 0.3 M of either EDTA, HEDTA, or IDA were measured at a doserate of 3.5 krad/min and total doses of 200 to 700 krad. The results are given in Table B3-5.Results at 30 0C for EDTA are shown in Figure B3-9. Results for HEDTA and EDTA at 60 0C areshown in Figures B3-10 and B3-1, respectively. The scatter in the results is appreciable, as wecommonly find in determinations of N20 yields for both slurries and homogeneous solutions.There seems to be some dependence of G(N20) on dose but the uncertainty in this dependence islarge. No such dependence on dose has been observed in any of the systems studied previously.None is expected theoretically. The figures, therefore, display the least-squares fit to the dosedependence, whereas in Table B3-5 we give the average values of G(N20) with the correspondingstandard deviations. It is unlikely that an observed "dose effect" is actually due to an increase inthermal decomposition rate with increasing dose (equivalent to time). For a G(N 20) = 0.35 at adose rate of 3.5 krad/min, the rate of radiolytic generation of N20 is 1.9 x 10⁻⁶ M min-1. This is(coincidentally) similar to the fastest thermal generation rate observed for slurries that were pre-irradiated for very long periods of time. It is highly unlikely that the low doses utilized for G(N 2O)measurements (compare 0.8 Mrad with ~ 40 Mrad employed for preirradiation of slurries) willgenerate enough of the thermally reactive intermediate (see Section C) to contribute significantly tothe radiolytic rate. In general, dependence of the yield on total dose indicates that a radiolytic inter-mediate product is required for generation of the gas rather than the original components. Theintercept in the figures reflects the yield before changes in the composition have occurred by radi-olysis.
e. Yields of Other Gases
In addition to H2 and N20, only 02 and N2 were detected by gas chromatography in the irra-diated samples. NH3 was determined by a titration technique described in the experimental section.
Oxygen. We have already reported G(02) = 0.08 0.03 for the homogeneous solutionSYl-SIM-91C (no organic additives) at 30 0 C in the intensity range studied (0.2 to 20 krad/min).IWhen an organic solute is present in SYl-SIM-91C, 02 is not generated radiolytically. In fact,analysis of the gases remaining in irradiated SYI-SIM-91C containing 0.085 M each of EDTA andHEDTA, which was saturated with air prior to irradiation, showed that 02 is consumed uponirradiation. The value obtained for the destruction of 02 is G(-02) = 7 + 1. The mechanism for
17
the generation of 02 in highly concentrated nitrate solutions is well established to involve directabsorption of a fraction of the radiation energy by the solute rather than the solvent. This fractionis not expected to change significantly by the addition of the organic components at the concentra-tions discussed here. Therefore, we believe that generation of dioxygen in the solutions containingthe organic solutes proceeds at the same rate as in their absence. The observation that no oxygen isfound and, in fact, is destroyed when organic chelators are added must mean, therefore, that anorganic intermediate that is produced by the radiolysis destroys 02. Because the yield of 02destruction is so high, this also means that the majority of the radiolytically produced intermediatesreact with the organic components. Because most of the radicals in the waste simulant are NOxradicals, they must participate in the chain that leads to the destruction of 02. We show below, inSection C, that most of the NOx radicals lead to the destruction of organic material. Therefore, thesequence of reactions has to go from the NOx radicals to organic radicals and eventually to 02.
IG(N 20) from Std. Slurry + EDTA
Dose-Rate in krad/min:M 3.5 0.5* 15 5A Feed solution; 3.5 0.5
+
L G.E.
0 200
Ak
400 600 800Dose, krad
Figure B3-9. The yield of N20, G(N2 0), at 30 OC vs. dose and for a range of dose rates forslurry SY1-SIM-91A containing 0.3 M EDTA. "Feed solution" (triangles) is the solution used inthe preparation of the slurry prior to the 30%-v water distillation (labeled SYL-SIM-91B).
1.0-
0.8 -
0.6-
0.4-
0.2
0.0-
18
1.0
-
0.8 -
0.6-
0.4-
0.2-
0.0-0 200 400 600 800
Dose, krad
Figure B3-10. The yield of N20 at 60 OC vs. dose at a dose rate of 3.5 krad/min for slurry SYl-SIM-91A containing 0.3 M HEDTA.
0.5-
0.4
0.3
0.2
0.1
0.00 200 400
Dose, krad600 800
Figure B3-11. G(N20) at 60 OC vs. dose at a dose rate of 3.5 krad/min for slurry SY1-SIM-91Acontaining 0.3 M EDTA.
Z
C'3
G(N20) vs. Dose at6O0 C IStd. Sliurr +0.3 M HEDTA
G(N2 0) = (0.2210.06) + (3.7 1.2)x10"4 x Dose
ON%z
IG(N 20)vs.Dose at 60 0 CStd. Sliry + 0.3 M EDTA
G(N 2 0) = (0.138 0.07) + (2.8 1.6)x10"4 x Dose
19
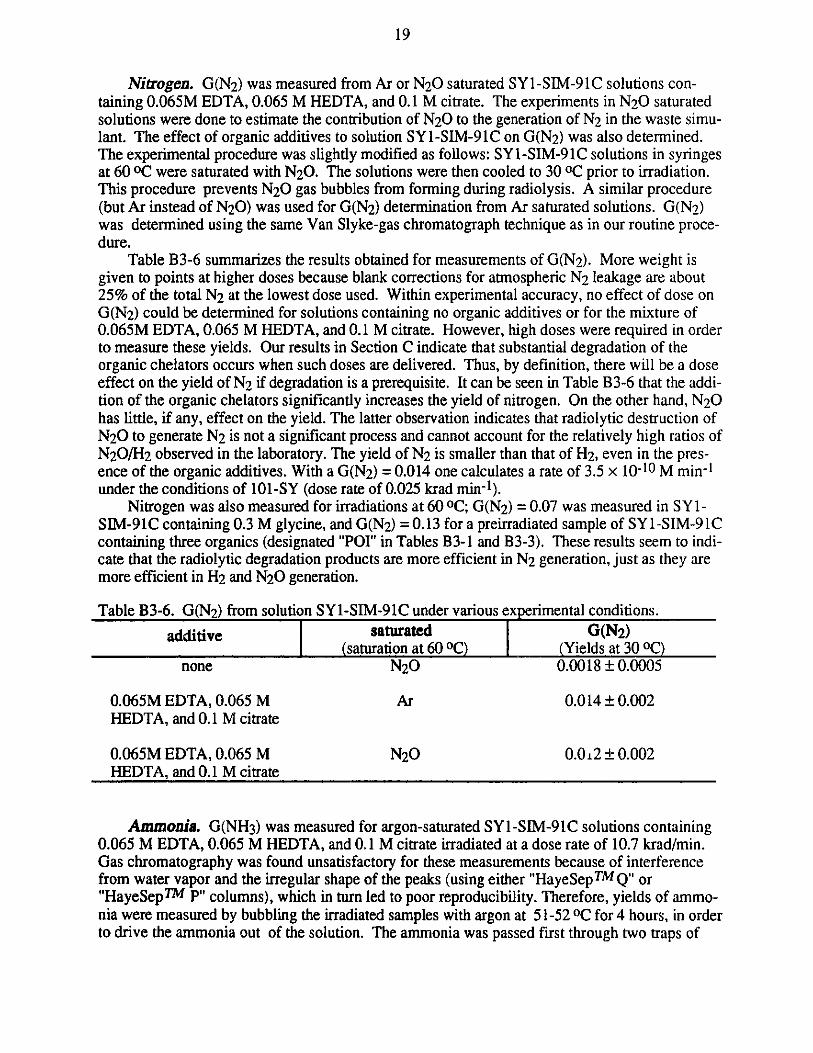
Nitrogen. G(N2 ) was measured from Ar or N2 0 saturated SYl-SIM-91C solutions con-taining 0.065M EDTA, 0.065 M HEDTA, and 0.1 M citrate. The experiments in N20 saturatedsolutions were done to estimate the contribution of N20 to the generation of N2 in the waste simu-lant. The effect of organic additives to solution SY1-SIM-91C on G(N2) was also determined.The experimental procedure was slightly modified as follows: SYl-SIM-91C solutions in syringesat 60 OC were saturated with N2 0. The solutions were then cooled to 30 OC prior to irradiation.This procedure prevents N20 gas bubbles from forming during radiolysis. A similar procedure(but Ar instead of N20) was used for G(N2) determination from Ar saturated solutions. G(N2)was determined using the same Van Slyke-gas chromatograph technique as in our routine proce-dure.
Table B3-6 summarizes the results obtained for measurements of G(N2). More weight isgiven to points at higher doses because blank corrections for atmospheric N2 leakage are about25% of the total N2 at the lowest dose used. Within experimental accuracy, no effect of dose onG(N2) could be determined for solutions containing no organic additives or for the mixture of0.065M EDTA, 0.065 M HEDTA, and 0.1 M citrate. However, high doses were required in orderto measure these yields. Our results in Section C indicate that substantial degradation of theorganic chelators occurs when such doses are delivered. Thus, by definition, there will be a doseeffect on the yield of N2 if degradation is a prerequisite. It can be seen in Table B3-6 that the addi-tion of the organic chelators significantly increases the yield of nitrogen. On the other hand, N20has little, if any, effect on the yield. The latter observation indicates that radiolytic destruction ofN20 to generate N2 is not a significant process and cannot account for the relatively high ratios ofN20/H2 observed in the laboratory. The yield of N2 is smaller than that of H2, even in the pres-ence of the organic additives. With a G(N2) = 0.014 one calculates a rate of 3.5 x 10⁻¹⁰ M min-'under the conditions of 101-SY (dose rate of 0.025 krad min-1).
Nitrogen was also measured for irradiations at 60 OC; G(N2 ) = 0.07 was measured in SYI1-SIM-91C containing 0.3 M glycine, and G(N2) =0.13 for a preirradiated sample of SY1-SIM-91Ccontaining three organics (designated "POI" in Tables B3-1 and B3-3). These results seem to indi-cate that the radiolytic degradation products are more efficient in N2 generation, just as they aremore efficient in H2 and N20 generation.
Table B3-6. G(N2 ) from solution SYl-SIM-91C under various experimental conditions.
additive saturated G(N2)(saturation at 60 OC) (Yields at 30 OC)
none N20 0.0018 0.0005
0.065M EDTA, 0.065 M Ar 0.014 0.002HEDTA, and 0.1 M citrate
0.065M EDTA, 0.065 M N20 0.012 0.002HEDTA, and 0.1 M citrate
Ammonia. G(NH3) was measured for argon-saturated SY1-SIM-91C solutions containing0.065 M EDTA, 0.065 M HEDTA, and 0.1 M citrate irradiated at a dose rate of 10.7 krad/min.Gas chromatography was found unsatisfactory for these measurements because of interferencefrom water vapor and the irregular shape of the peaks (using either "HayeSepTMQ" or"HayeSepTM P" columns), which in turn led to poor reproducibility. Therefore, yields of ammo-nia were measured by bubbling the irradiated samples with argon at 51-52 0C for 4 hours, in orderto drive the ammonia out of the solution. The ammonia was passed first through two traps of
20
glass wool to prevent any aerosol containing NaOH from reaching the acid standard solution. TheNH3 flowed into an HCl solution of known molarity, and the HCl remaining, after absorption ofthe ammonia, was back titrated with standard Na2CO3. An identical unirradiated solution, whichunderwent an identical procedure, was used as a blank for these determinations. The concentrationof NH3 was calculated from the amount of HCl consumed and the G value was calculated from theconcentration of ammonia and the dose.
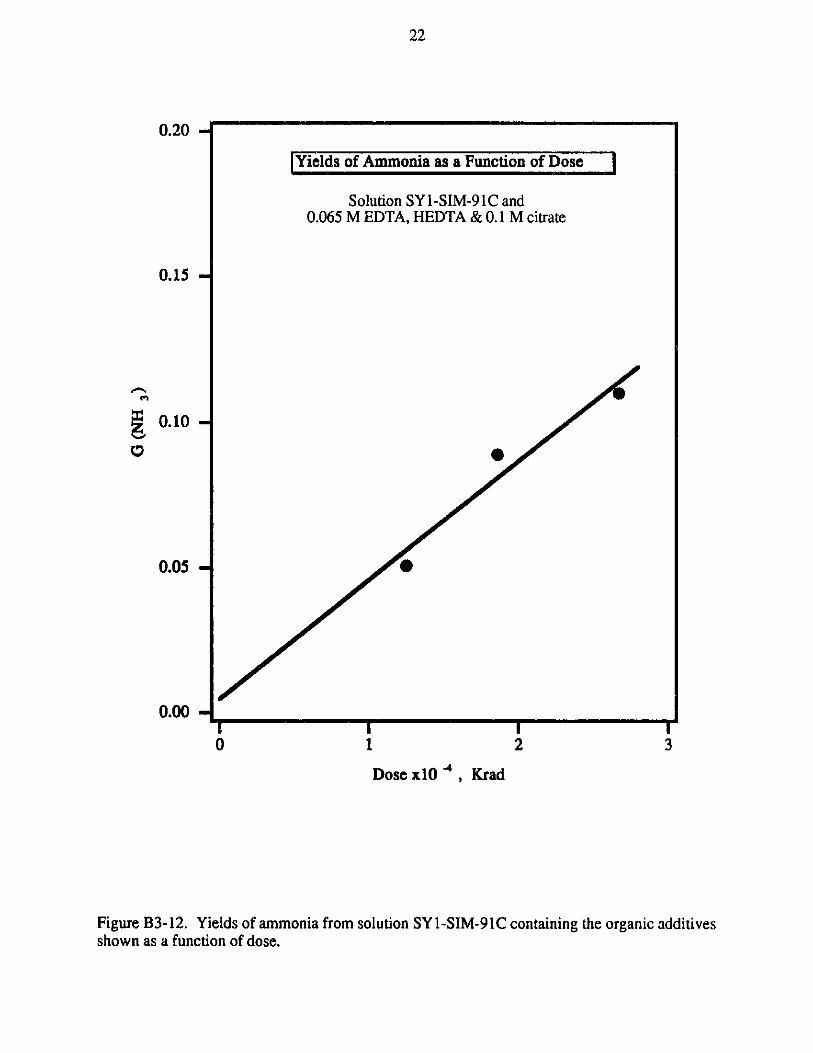
Figure B3-12 shows the results for G(NH 3) from the solutions mentioned above at three dif-ferent doses. It can be seen from this figure that G(NH3) increases linearly with dose. No particu-lar significance is attached to the linear dependence on dose (clearly, the yield will start to decreaseat sufficiently high doses). However, the increase in yield with increasing dose indicates that theammonia is produced from a degradation product whose concentration increases with dose. Toobtain some information on the source of NH3 in the above solutions (organic or inorganic), theexperiment was repeated using SYL-SIM-91C solution containing 0.1 M citrate and 0.13 M glyco-late. The solutions were again irradiated at a dose rate of 10.7 krad/min up to a maximum of 26.7Mrad. No ammonia was detected. Based on results obtained by back titrating HCl after reactionwith genuine ammonia solutions, we estimate the upper limit of G(NH3) at the highest dose stud-ied to be G(NH 3) 5 6 x 10⁻³. These results seem to indicate that the nitrogen in the radiolyticallyproduced ammonia comes from the organic nitrogen in EDTA and HEDTA. From information inthe literature, the mechanism for radiolytic generation of ammonia is probably similar to the mech-anism of the radiolytic generation of glyoxylate or formaldehyde. Oxidation, probably by NO2radicals, of EDTA, for example, at the N-C bond will initially yield glyoxylate on one side andHN<R on the other. Repetitive oxidations will eventually yield the ammonia. Such a mechanismwould predict an S-shaped dependence of G(NH3) on dose; the range of doses delivered in theexperiments shown in Figure B3-12 were apparently insufficient to obtain the expected curvature.
f. Effects of Carbonate, Sulfide, Formate, and Oxalate on Radiolytic Yields
The effects of Na2CO3 and Na2S on the yield of H2 from SY1-SIM-91C were determined.The former is present in 101-SY and in the SYI-SIM-91B standard waste solution but is absent inSYl-SIM-91C; the latter was of interest as a source for radical scavengers. To check the effect ofcarbonate, 0.4 M Na2CO3 was added to SYl-SIM-91C containing 0.17 M EDTA. This solutionwas irradiated at 30 and 60 OC at 4.2 krad/min to a dose of 150 krad. The values of G(H2)obtained are 0.047 at 30 OC and 0.059 at 60 OC. These are somewhat lower than the values foridentical solutions without the added carbonate (0.059 at 30 OC and 0.066 at 60 0 C). The apparentsmall inhibition effect is unexpected because Na2CO3 does not react with hydrogen atoms.Carbonate may, however, affect solubility of the organic component and thereby reduce the yield.
Sulfur has been considered (Seimer, private communication, 1991) as a possible additive toinhibit H2 formation. In basic solutions H2S will autooxidize to polysulfide and will have a similareffect; the relative ratio of S to S2- in the solutions used has not been determined. We measured H2yields in solutions of 0. 17 M EDTA in SYl-SIM-91C containing 0.01 and 0.1 M Na2S, irradiatedat 4.2 krad/min to a dose of 130 krad. The results show that 0.1 M Na2S increases the yield of H2by about 20% at both 30 and 60 OC. A possible explanation is the hydrogen abstraction reaction:
H+HS- -- H2 +S-.
The effects of formate and oxalate on the yields of H2 and N20 in solution SY 1-SIM-9 1Cwere determined. Both of these additives are known radiolytic degradation products of the chela-tors originally present in tank SY-101. G(H2) was measured for SYl-SIM-91C containing either=0.001 M oxalate (the solubility limit of oxalate in this solution) or 0.13 M formate. The resultsare shown in Table B3-7. The effect of either one of these on G(H2 ) is negligible. From informa-
21
tion in the literature, no effect is expected. The yields for the oxalate and formate containing solu-tions are similar to those from SY 1 -SIM-91 C solutions containing citrate.
Measurements on N20 yields from solutions of the same compositions indicate that N20 isnot radiolytically generated in the presence of formate or oxalate. Organic components are requiredfor radiolytic generation of N20, but in this regard, oxalate and formate resemble "inorganic" ions.As we have concluded previously,I organic radicals are responsible for the radiolytic generation ofN20. In the case of formate and oxalate, no organic radicals that can form N20 are produced.
Table B3-7. Effect of formate and oxalate on G(H2) in SY1-SIM-91C.a
solution G(H2)SYl-SIiM-91C 3.1 x 10.2b
SY1-SIM-91C +0.13 M formate 3.4 x 10⁻²
SY1-SIM-91C + 0.001 M oxalate 3.2 x 10⁻²
a Irradiations at 30 OC at a dose rate of 3.3 krad/min to a total dose of 130 krad. SYl-SIM-91C contains 2.3 M NaOH, 0.86 M NaAlO2, 2.8 M NaNO3, 2.2 M NaNO2-
b From reference 1.
g. Comparison with Modeling Calculations
Because the precise composition of the waste solutions is presently unknown, it is difficult todefine a simulant for experimental studies that will perfectly match the waste solutions in the tanks.Furthermore, tanks other than SY- 101 may have varying compositions and correspondingly differ-ent rates of excess gas generation. It is obvious that a model that could predict the rate of gas gen-eration and its dependence on composition would be very beneficial in many practical applications.In this subsection we try to apply known computer modeling procedures of radiation chemicalprocesses and test their predictive capabilities for the waste solutions. Because the energy isdeposited nonhomogeneously, and because there are a large number of interrelated reactions takingplace, it is not simple to predict how different chemical species will alter the rate of generation ofhydrogen. To address this complexity, we utilize a computer program to:
1) compare the predictions with the experimental results and possibly adjust the parameters ofthe model to obtain better agreement with experiments; and
2) predict the consequence of changes in various parameters, in particular changes in concen-tration of various species.
The calculations were not intended to simulate quantitatively the experimental data obtained inthe laboratory. Even more, they were not intended to simulate conditions in tank SY-101. Instead,they were to provide guidance to the experimental program and to define the importance of differ-ent mechanisms. Nonetheless, the calculations did reproduce the experimental trends and predicthydrogen yields to within a factor of two of the experimental observations.
The specific questions that the theoretical effort is addressing are:(1) What are the mechanisms of hydrogen production from radiolytic reactions? How do the
concentrations of the various components in the system (primarily nitrate, nitrite and organics)affect the yield of H2? What chemistry affects the production mechanisms?
(2) How much hydrogen peroxide will be formed from radiolytic processes?(3) What possible mechanisms exist for the production of N20?The results are summarized below; detailed data are given in reference 1.
22
0.20 -
0.15 -
0.10-
0.05 -
0.00-I0
11
22
33
Dose xlO -a, Krad
Figure B3-12. Yields of ammonia from solution SYI-SIM-91C containing the organic additivesshown as a function of dose.
Yields of Ammonia as a Function of Dose
Solution SY1-SIM-91C and0.065 M EDTA, HEDTA & 0.1 M citrate
0
0
23
Hydrogen-Production Mechanisms and Yields. There are two dominant radiolyticH2-forming pathways that occur in the waste storage tanks: a) the formation of hydrogen from thedirect excitation of water, and b) the abstraction of a hydrogen atom from an organic molecule inthe solution by a hydrogen atom formed in the radiolysis of water. The high concentrations ofscavengers for electrons (eaq and its precursors), H atoms and OH radicals eliminate all other pos-sible major pathways - the various reactions among radicals formed in the radiolysis of water.
A key result of these calculations is the observation that the yield of H2 will depend directlyon ki x [RH], the product of the concentration and the rate constant of the organic moleculestoward the H atoms. The results of these calculations were given in Figure 33 of reference 1.Furthermore, these calculations show that the G(H2) calculated at high concentrations of organicsis within a factor of two of the experimental results. Thus, both theory and experiment show thatto predict the H2 production raLo by radiolysis, the concentration and identity of the organic com-pounds must be known. It is not sufficient to know the initial concentrations, for, as is well estab-lished, radiolysis will change both the concentration and identity of the initial species over time.
The dependencies of G(H2) on INO31 and [N021 were also computed (Figure 31 of refer-ence 1). Whereas the yield of H2 is virtually independent of the NO3 concentration over the rangeof 0.5-3.0 M, it varies by nearly a factor of two over the same concentration range for NO. Thusit is of importance to know the concentration of nitrite in the tank and maintain it at high levels.
Yields of Hydrogen Peroxide Formadon. It has been suggested that hydrogen per-oxide, a known product of the radiolysis of aqueous solutions, is a precursor to hydrogen. Upperlimits to the hydrogen peroxide yields have been estimated (Figure 34 of reference 1). The resultsare an upper limit because we have assumed that all of the oxidizing radicals produced by the ioniz-ing radiation are OH radicals. Because of the high salt concentration, considerable direct ionizationof nitrite and nitrate would occur. The products of these events are unlikely to be OH radicals.Furthermore, the yield of hydrogen peroxide will be inversely proportional to the concentration oforganic molecules. Experimentally, we observe that H2 yield is directly proportional to the concen-tration of organics, suggesting that the peroxide pathway to H2 generation is unlikely to be thedominant one. Under the high concentrations of base and in the presence of metal ions, the non-productive (for H2 generation) destruction of hydrogen peroxide is expected to be fast. In sum-mary, it is unlikely that the peroxide pathway is important in radiolytic production of hydrogen.
N20 Producdon Mechanisms. Because several stable, but reactive, intermediates areformed in the radiolysis of the waste simulants, the chemistry of the NOx system is highly com-plex. Most of the reactions of the various NOx radicals are not sufficiently fast to compete effec-tively with the initial reactions that occur in the spurs. Therefore, the modeling was done usinghomogeneous kinetics rather than nonhomogeneous kinetics as was done for the hydrogen forma-tion. The mechanism that was used to describe the chemistry is described in detail in reference 1.No reactions of the organics with NOx radicals were included in the mechanism, because noquantitative data on these reactions are available in the literature. No N20 was formed in the calcu-lations under such conditions. These results are consistent with the experimental data; in theabsence of organics, no N20 was obtained experimentally.
4. Conclusions
In this section we have described the determination of the radiolytic yields of H2, N20, N2,02, and NH3 in various waste simulants, homogeneous solutions, and slurries. Hydrogen is gen-erated from direct radiolysis of water, but its yield is further increased by the presence of organiccompounds (RH) due to the reaction of hydrogen atoms with the organic (reaction B- I); the
24
increased efficiency correlates well with the rate constants for that reaction. The efficiency of pro-ducing H2 is roughly proportional to the total number of C-H and N-H bonds in RH, and is gen-erally higher at 60 *C than at 30 *C. The yield of hydrogen decreases on increasing the fraction ofsolids in the slurry.
No N20 is generated by radiolysis unless organics are present. Yet, the nitrogen in N20comes exclusively from inorganic components of the waste simulant. The pathways for N 2 0 gen-eration are quite complex and a mechanism that is consistent with the observations reported in thissection is proposed in Scheme IV of Section G. Oxygen is produced by well understood processesknown to occur during the radiolysis of concentrated nitrate solutions; it is efficiently consumed,however, in the presence of organics. Nitrogen gas is generated from N-containing organics andnot from N20. Ammonia yields increase with dose and come from degradation products of N-containing chelators. Neither oxalate nor formate contribute to the yield of H2, and neither enablesN20 production.
The calculations subtask of this program reproduced the trends observed experimentally andverified the primary mechanisms for hydrogen production in the waste simulants. The yield ofhydrogen could be semiquantitatively determined to within a factor of two of the experimentallydetermined yield of H2 and its dependence on organic reactivity and concentration is well repro-duced. No N20 production in the absence of organic compounds is predicted by the calculations,in agreement with the experimental measurement. The calculations show that the concentrations ofNO and NO2 will not appreciably change over long periods (decades) of storage and they suggestthat no chemical scavenger will significantly diminish the yield of H2 at the high nitrate and nitriteconcentrations that exist in tank 101-SY.
C. RADIOLYTIC DEGRADATION OF ORGANICS AND THERMAL GENERATION
1. Introduction
The following significant observations were made by Campbell of PNL.9 In a preirradiated(31.5 Mrad) SYl-SIM-91C solution (see Table B2-1 for composition) containing 0.065 M EDTA,0.065 M HEDTA, and 0.1 M citrate, the concentration of EDTA and HEDTA after the irradiationis less than ~l% that of an unirradiated identical control solution. In contradistinction, the concen-tration of citrate was only slightly reduced by the preirradiation. Hence, EDTA, HEDTA and, to amuch smaller extent, citrate, will be degraded under the irradiation field in the storage tanks. Ayield of G(-RH)> 2.6 molecules per 100 eV has been estimated for the destruction of these chela-tors from Campbell's analytical result. Thus, the concentration of EDTA or HEDTA will dropfrom 0.1 M to half its original concentration within less than 1.5 years under the field of radiationin tank 101-SY (assumed to be 25 rad/min). From this observation one may conclude that thefocus on the original chelators iaay be unjustified; very little of these will survive several years ofstorage in the waste tank. Indeed, to the best of our knowledge, less than 10% of the TOC can beidentified as EDTA and HEDTA in 101-SY core samples. The question, therefore, arises as to theeffect of the degradation products (and the reduction in concentration of the original components)on the rate of generation of the gases, thermal or radiolytic.
The effect of preirradiation on the radiolytic yields has already been given in the previous sec-tion (e.g., entries designated POI in Tables B3-1 and B3-3). The effect of various degradationproducts on G values has also been discussed in Section B. In the following, we describe studiesof the rates for thermal generation of gases from preirradiated SY1-SIM-91C solutions containingeither HEDTA, EDTA, or citrate and their mixture. The degradation of the above mentionedchelators will undoubtedly depend on the dose delivered to the solution. Therefore, we studied indetail the effect of the preirradiation dose on the thermal generation rate.
25
Campbell also found NTA and glycolate in the analysis of the preirradiated SY1-SIM-91Csolution mentioned above, and in analyses of core samples from tank SY-101. Both are knownradiolytic degradation products of the chelators. Glyoxylate and formaldehyde are also knownradiolytic products, further down the degradation chain (scheme III in reference 3); they were alsoconsidered as possible intermediates, along with NTA and glycolate, for the thermal generation ofH2 . The possible role of hydroxylamine, formate, and oxalate in the thermal generation of H2 andN20 was also examined.
2. Experimental
Preirradiations were performed in covered (but not gas tight) stainless steel beakers. It wasobserved that during irradiation the temperature of the solutions increased from 24 OC to 38 OC forall doses utilized, except for the dose of 10.2 Mrad where the temperature increased only to 32 OC.An aqueous solution of NaClO4 (density identical to SYl-SIM-91C to ensure absorption of thesame amount of radiation) was also irradiated under identical conditions. A similar increase intemperature was observed for this solution as well. Therefore, the increase in temperature duringirradiation is attributed to the absorption of radiation energy by the solution and not to any possibleexothermic chemical reaction.
After the preirradiation, 10 ml aliquots of the solution were put into Erlenmeyer flasks anddeaerated by bubbling argon, at room temperature, using a needle-septum arrangement. Thesevessels were then put into a water bath at 600GC. At various time intervals, just before samplingfor gas analysis, 0.5 ml of argon-saturated water was injected into the vessel through the septum.This was done in order to ensure no air leakage into the vessels when the samples were withdrawnfrom the vessels, that is, to create slight over-pressure in the vessel. The small dilution introducedby this injection was factored into the calculation. The solution was then stirred for 5 min., and 4ml of the gas phase above the sample were withdrawn and injected into the gas chromatograph foranalysis. The amounts of gas calculated from these measurements were converted to concentra-tions (i.e., moles of gas generated per liter of solution) and plotted against the time since the initia-tion of the thermal reaction. The rates for thermal generation were obtained from the slopes ofsuch plots at the early stages of the reaction and refer, therefore, to initial rates. For measuring thethermal generation rates in solution SY I-SM4-9 IC containing NTA or glycolate (not preirradiated),the reaction was performed in syringes placed in the 60 OC bath. For glyoxylate and formalde-hyde, experiments were done using the Erlenmeyers as described above for preirradiated solu-tions. However, the required glyoxylate or formaldehyde solution was injected after deaeration toinitiate the thermal reaction. These experiments are described in Section D.
The preparation of slurries is reported in Section B2c. After preirradiation, slurries weretransferred to the Erlenmeyers and were deaerated by bubbling with argon at ambient temperature.The slurries were then placed in the water bath held at 60 OC to study the thermal production of thegases. For analysis at various time intervals, the slurries were dissolved by injecting an appropri-ate amount of water (usually 4 ml water per 10 ml of slurry), and then proceeding as describedabove for the homogeneous solutions. The dissolution of the slurry prior to analysis was neces-sary to minimize significant retention of the gases by particles in the slurry.
3. Results and Discussion
a. Effect of Degradation on H2 Thermal Generation
The rate of thermal generation of H2 as a function of preirradiation dose was measured forseveral different solutions. An example is shown in Figure C3- 1. The results from the preirradi-
26
ated homogeneous solutions of SYl-SIM-91C containing either EDTA, HEDTA, or citrate aretabulated in Table C3- 1. It can be seen from the table that the rates of thermal H2 generationdepend markedly on the identity of the organic molecules present in the solution. The solution thatoriginally contained citrate shows the slowest rate of H2 generation among those studied. The rateof generation in this solution is similar to the one in non-preirradiated solutions. This agrees wellwith the observation of Campbell that citrate is degraded only to a minor degree by the preirradia-tion.
Figure C3-1 also shows the effect of "aging" on the thermal generation of H2 for a solution ofSYI-SIM-91C containing 0.065 M EDTA. It can be seen that the H2 generation rate decreased byabout 50% upon aging the preirradiated solution at ambient temperature for 46 days. Therefore,the preirradiated solution probably generated H2 at a slow rate while standing at room temperaturebefore the measurement at 60 OC. From the decrease in the rate of thermal generation upon aging,we also infer that the intermediate that efficiently produces H2 is consumed upon this aging at roomtemperature. For this reason, the time elapsed between termination of preirradiation and the mea-surement of the generation rate is also shown (in parentheses) in Table C3- 1. From Table C3-Ione notes a similar aging effect for HEDTA and for EDTA. However, for the SYl-SIM-91C/citrate solution, little effect of this time interval was observed, consistent with our earlierconclusions that citrate is not an important precursor of the reactive intermediate. Thus, we mayconclude that the major source of the intermediate is EDTA, and the order of efficiency of its pro-duction is EDTA > HEDTA >> citrate.
To determine the effect of dose and dose rate on the rates of thermal generation of H2, SYI1-SIM-91C containing all three organics was preirradiated for various doses and dose rates. Tominimize the thermal deterioration of the intermediate produced by the irradiation on standing atroom temperature, all measurements were performed on the sample the same day that the preirra-diation was terminated. The results are tabulated in Table C3-2, where it can be seen that the ratesfor thermal generation of H2 are independent of dose rate. Table C3-2 also contains the rates forthermal generation of H2 when the solutions were aged for two weeks after the preirradiation.
Figure C3-2 shows the variation of the rate for thermal generation of H2 with the total dose ofpreirradiation. The rate passes through a maximum and then declines. As is mentioned above,following irradiation to 31.5 Mrad, almost all of the EDTA and HEDTA is destroyed. Therefore, itis not surprising that the radiation degrades products of the original starting compounds at thesehigh doses. The decrease in the rate of H2 generation indicates that the reactive intermediate (or asecondary precursor) is destroyed to produce a product that is less effective in the generation ofH2. Two pathways to this destruction may exist: radiolytic destruction or thermal destruction.That is, some thermal reaction may occur for higher doses (at the same dose rate) because of thelonger periods of irradiation (see Table C3-2). Therefore, the decrease in H2 generation rate couldbe due to the increase in dose and/or the longer time elapsed. On the other hand, the time of irra-diation for the samples receiving 37 Mrad (dose rate = 9.47 krad/min) and 58.5 Mrad (dose rate =14.9 krad/min) was identical. The decrease in the rate in that case must be due to greater dose, thatis, to radiolytic destruction.
Figure C3-2 shows that the rates for thermal generation of H2 for preirradiation doses in therange of 10-24 Mrad do not vary significantly. The thermal generation of H2 was determined inthis dose range for extended periods of time. Figures C3-3 and C3-4 show these results. Theplateau value for H2 is similar for the two doses used (as are the generation rates). One can calcu-late from the values shown in these results that only a small fraction of the total original concentra-tion of HEDTA and EDTA (0.13 M combined) can be converted to H2. This may result from com-petitive pathways in the radiolytic degradation of the chelators or from competitive, non-hydrogenproducing, pathways for the disappearance of the reactive intermediate.
27
The rates of thermal generation of H2 in preirradiated slurries are also given in Table C3- 1.An example of the thermal generation of H2 is shown in Figure C3-5. As can be seen in this fig-ure, even at zero time of thermal reaction there is an observable amount of H2 in the preirradiatedslurry. This is because the gas produced during the preirradiation is tightly held by the slurm,, andcannot completely be removed by bubbling argon through the slurry. As described in the experi-mental section, the slurries were dissolved after the thermal reaction period, but before the gasextraction. Dissolution of the particulate matter releases any adsorbed H2. Hence, the intercept inFigure C3-5 reflects this adsorbed gas. Several experiments were done in unsuccessful attempts toremove the adsorbed H2 (bubbling at ambient temperature, bubbling at 60 0C, bubbling overnight,bubbling with water-saturated argon to avoid extensive loss of water, all with vigorous stirring).None was particularly efficient. It was noticed that extensive argon bubbling for several hoursleads to appreciable thickening of the slurry because of water loss. On the other hand, bubblingwith water saturated argon leads to water uptake by the slurry (thinning). An attempt was made toestimate the amount of gas accumulated on the particles during preirradiation. This was done bymeasuring the amount of gas that could be released prior to bubbling Ar through the slurry. Theresults indicate that the bubbling procedure removes only about half of the H2 generated during theirradiation.
The large scatter in the experimental results (see Figure C3-5) obtained in studies of the ther-mal generation of H2 from the preirradiated slurries is attributed to sample-to-sample variations inthe amount of H2 retained by the slurry after the bubbling procedure. This problem was eliminatedif the preirradiated slurry was dissolved prior to the thermal generation studies, thus releasing theadsorbed gas . Because of the difficulties involved in the removal of the gases generated by thelong-term preirradiations of slurries, several experiments were conducted where the preirradiatedslurry was dissolved prior to the bubbling and before thermal generation rates were measured. Thedissolution leads to dilution of all the slurry components to 55% of their original concentrate.However, in calculating the concentration of gases, correction was made to account for this dilu-tion. Such a correction arbitrarily assumes that the reaction is first order in the significantreactants. Results from these experiments are given in Figure C3-6. As can be seen in this figure,and as was expected, the bubbling procedure now removes all residual gases that were generatedby the preirradiation.
Results from dissolved and "undissolved" slurries are shown in Figure C3-7 and also inTable C3-1. It is clear that the rate of generation is much slower in the dissolved slurries than inthose that were not dissolved. However, it should be recognized that the significant dilution ofnearly a factor of two in the concentrations of all components will also cause a reduction in rate.Therefore, it cannot be concluded that the effect is necessarily a catalytic effect of the solids in theslurry. To conclude this section, it is clear that radiolytic degradation products are significantlymore efficient in the thermal generation of H2 than the original chelators, whether the gases aregenerated from a homogeneous solution or from a slurry.
b. Effect of Degradation on Thermal Generation of N20
The rate of thermal generation of N 20 was measured for solution SY 1 -SIM-9 1C containingeither EDTA, HEDTA, or citrate. Unlike H2, the rate of N20 generation is markedly enhanced inthe citrate solution following the preirradiation. Therefore, we conclude that some degradationdoes occur in the citrate-containing solution and the rate of N20 generation is much more sensitiveto the presence of the degradation product than is the rate of H2 generation. The rate of thermalgeneration of N20 from preirradiated solution SY 1-SIM-9 IC containing 0.1 M citrate levels off attimes of about 25 hrs. The total amount of N20 produced at this time is ca. 7 x 10⁻⁵ M, that is,<0.1% of the initial concentration of citrate.
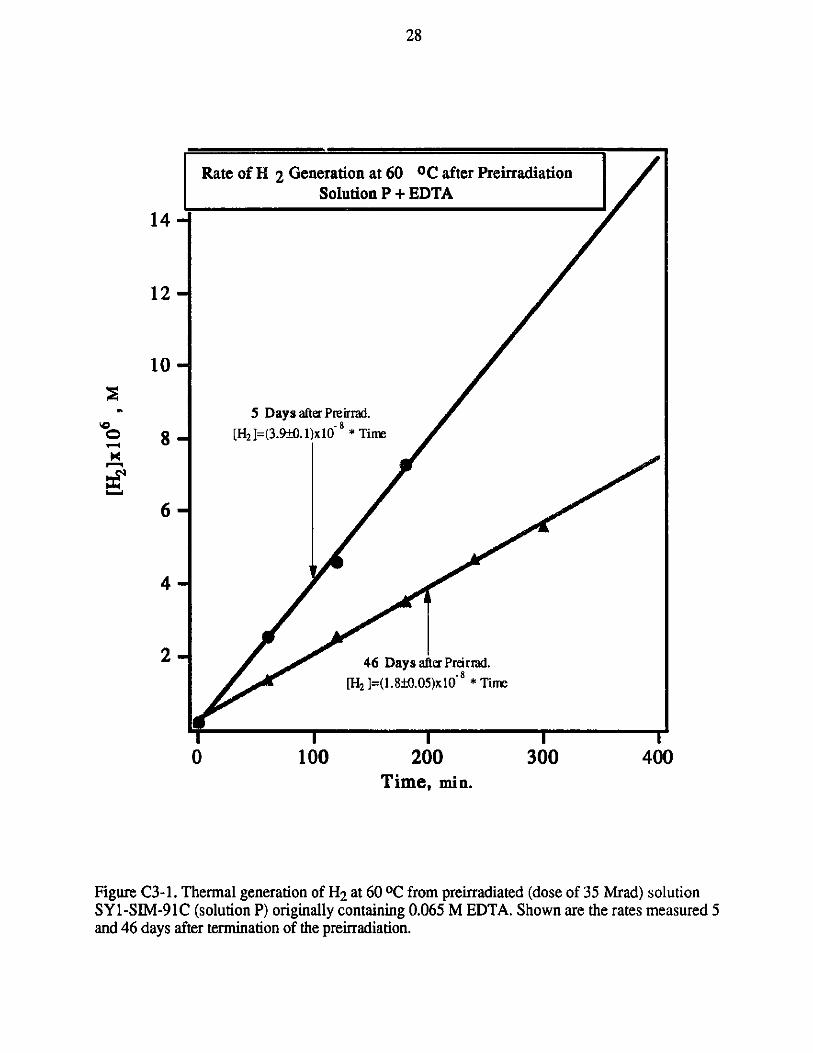
28
Lz1SRate
of H 2 Ge 14-
12
10
8-
64-
4 -
5 Days aft
[H 2 ]=(3.9 0.1)
aeration at 60 0C after PreirradiationSolution P + EDTA
er Preirrad.
xlO,8 * Time
46 Days after Preirrad.
[H2 ]=(1.810.05)x10 * Time
I
0 100 200 300I
400Time, min.
Figure C3-1. Thermal generation of H2 at 60 OC from preirradiated (dose of 35 Mrad) solutionSY1-SIM-91C (solution P) originally containing 0.065 M EDTA. Shown are the rates measured 5and 46 days after termination of the preirradiation.
0Nl
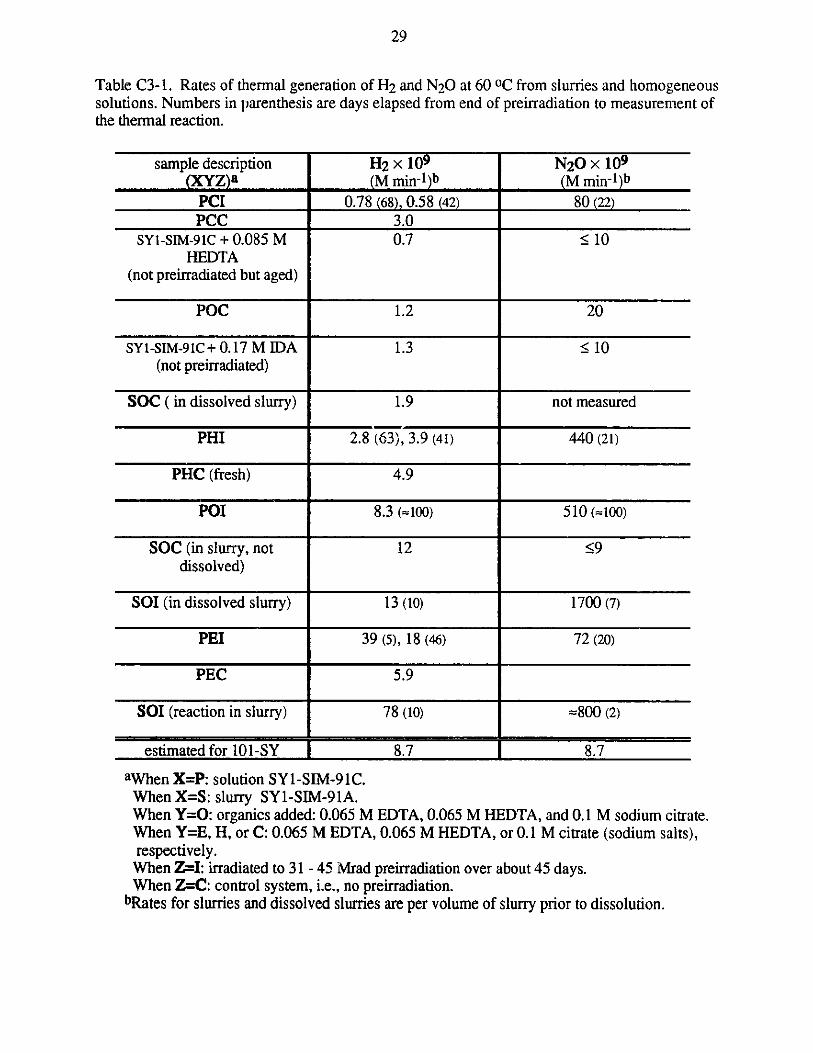
29
Table C3- 1. Rates of thermal generation of H2 and N 20 at 60 OC from slurries and homogeneoussolutions. Numbers in parenthesis are days elapsed from end of preirradiation to measurement ofthe thermal reaction.
sample description H2 x 109 N20 x 109
(XYZ)a (M min-I)b (M min-l)bPCI 0.78 (68), 0.58 (42) 80 (22)PCC 3.0
SY1-SIM-91C + 0.085 M 0.7 10HEDTA
(not preirradiated but aged)
POC 1.2 20
SY1-SIM-91C+ 0.17 MJIDA 1.3 510(not preirradiated)
SOC ( in dissolved slurry) 1.9 not measured
PHI 2.8 (63), 3.9 (41) 440 (21)
PHC (fresh) 4.9
POI 8.3 (=100) 510 (=100)
SOC (in slurry, not 12 59dissolved)
SOI (in dissolved slurry) 13 (10) 1700 (7)
PEI 39 (5), 18 (46) 72 (20)
PEC 5.9
SOI (reaction in slurry) 78 (10) ~800 (2)
estimated for101-SY 8.7 8.7
aWhen X=P: solution SY1-SIM-91C.When X=S: slurry SY1-SIM-91A.When Y=O: organics added: 0.065 M EDTA, 0.065 M HEDTA, and 0.1 M sodium citrate.When Y=E, H, or C: 0.065 M EDTA, 0.065 M HEDTA, or 0.1 M citrate (sodium salts),respectively.
When Z=I: irradiated to 31 -45 Mrad preirradiation over about 45 days.When Z=C: control system, i.e., no preirradiation.
bRates for slurries and dissolved slurries are per volume of slurry prior to dissolution.
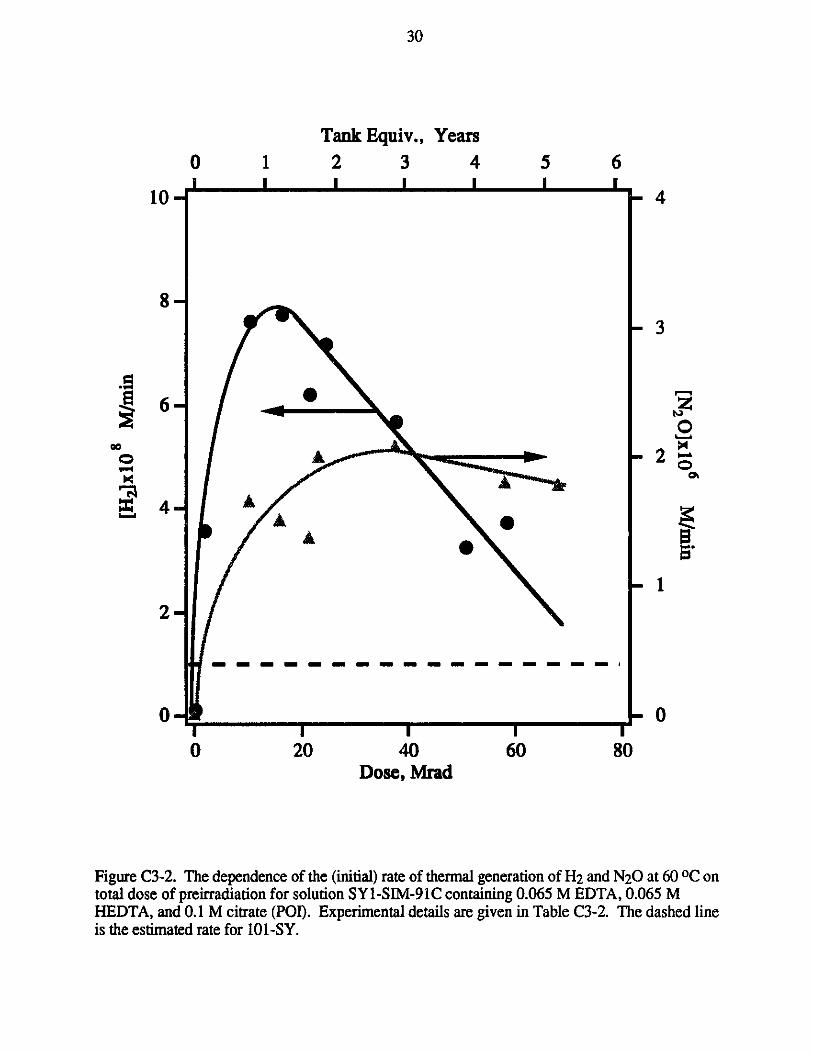
30
1I
Tank Equiv.,2 3I I
20
Years
4I
I
40Dose, Mrad
5I
6I
I
60I
80
108-
Figure C3-2. The dependence of the (initial) rate of thermal generation of H2 and N20 at 60 0C ontotal dose of preirradiation for solution SY1-SIM-91C containing 0.065 M EDTA, 0.065 MHEDTA, and 0.1 M citrate (POI). Experimental details are given in Table C3-2. The dashed lineis the estimated rate for 101-SY.
0I
00
O
K
e
xu
6-
4-
0
AA
AA
2-
0-
0
- 4
-3
-1
-0
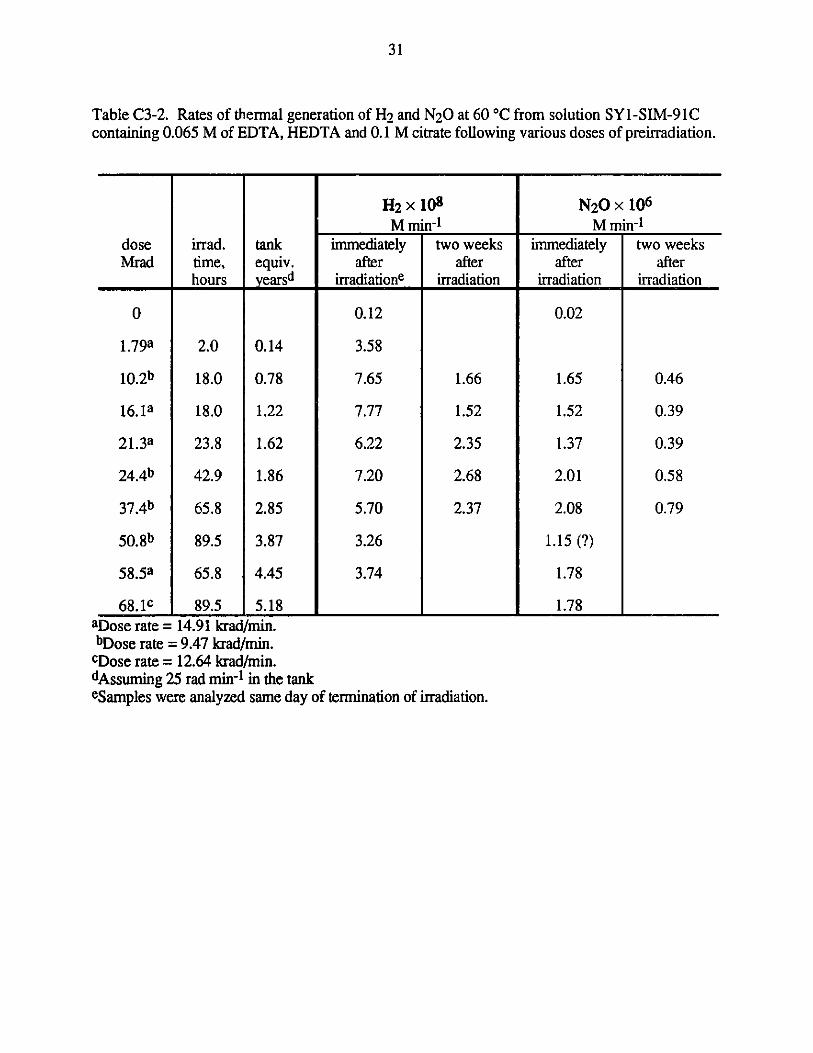
31
Table C3-2. Rates of thermal generation of H2 and N20 at 60 *C from solution SYl-SIM-91Ccontaining 0.065 M of EDTA, HEDTA and 0.1 M citrate following various doses of preirradiation.
H2 x 108 N20x 106M mn-' M min-
dose irrad. tank immediately two weeks immediately two weeksMrad time, equiv. after after after after
hours years irradiatione irradiation irradiation irradiation
0 0.12 0.02
1.79a 2.0 0.14 3.58
10.2b 18.0 0.78 7.65 1.66 1.65 0.46
16.1a 18.0 1.22 7.77 1.52 1.52 0.39
21.3a 23.8 1.62 6.22 2.35 1.37 0.39
24.4b 42.9 1.86 7.20 2.68 2.01 0.58
37.4b 65.8 2.85 5.70 2.37 2.08 0.79
50.8b 89.5 3.87 3.26 1.15 (?)
58.5a 65.8 4.45 3.74 1.78
68.1c 89.5 5.18 1.78 _1
aDose rate = 14.91 krad/min.bDose rate = 9.47 krad/min.
cDose rate = 12.64 krad/min.dAssuming 25 rad min- in the tankeSamples were analyzed same day of termination of irradiation.
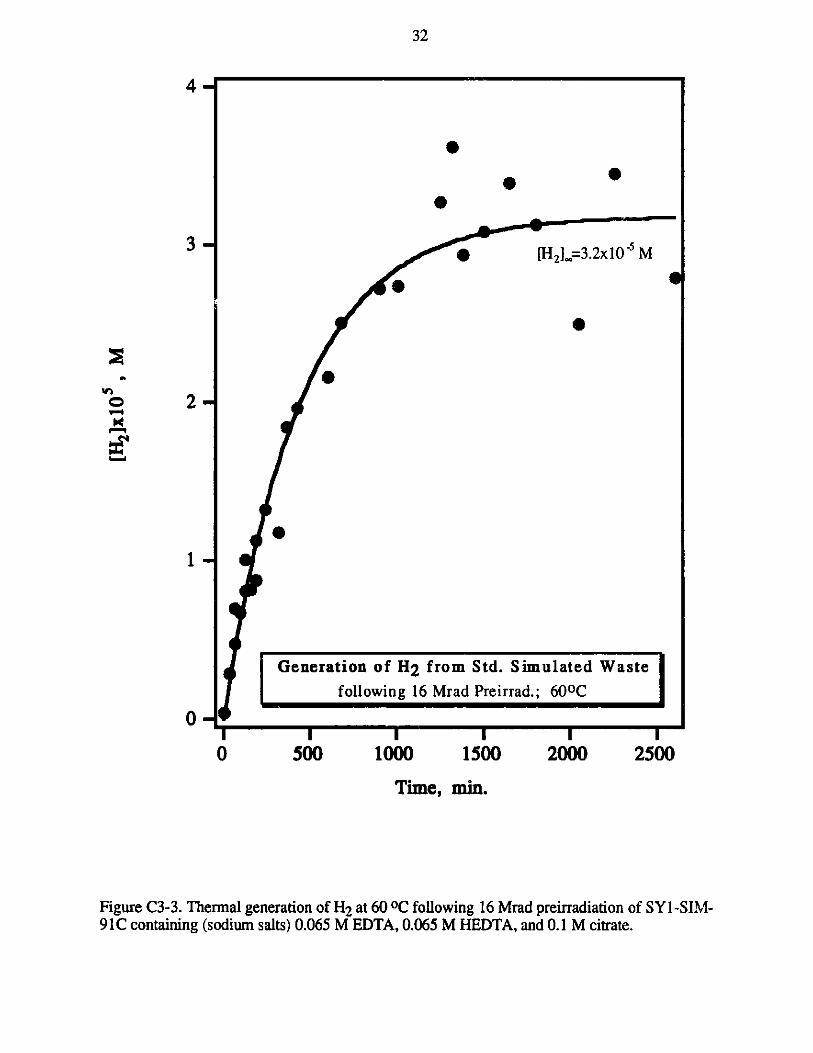
32
4
3
0 2
1
n -
0
0
s [H2L.=3.2x10 5 M
"e
Generation of H 2 from Std. Simulated Waste
following 16 Mrad Preirrad.; 600 C
Iv
0 500 1000 1500 2000 2500
Time, mi.
Figure C3-3. Thermal generation of H2 at 60 OC following 16 Mrad preirradiation of SYl-SIM-91C containing (sodium salts) 0.065 M EDTA, 0.065 M HEDTA, and 0.1 M citrate.
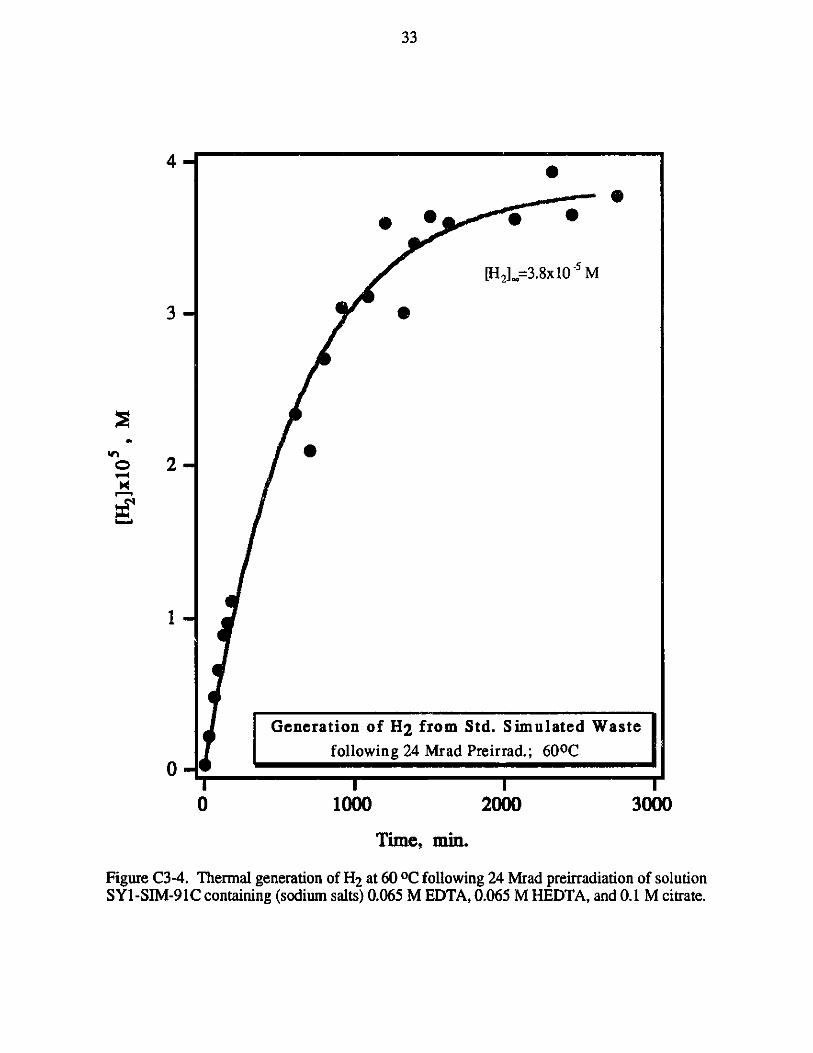
33
4 0
[H2 .=3.8x10 M
3
In2
Generation of H2 from Std. Simulated Waste
following 24 Mrad Preirrad.; 600 C0-
0 1000 2000 3000
Time, mi.
Figure C3-4. Thermal generation of H2 at 60 OC following 24 Mrad preirradiation of solutionSYI-SIM-91C containing (sodium salts) 0.065 M EDTA, 0.065 M HEDTA, and 0.1 M citrate.
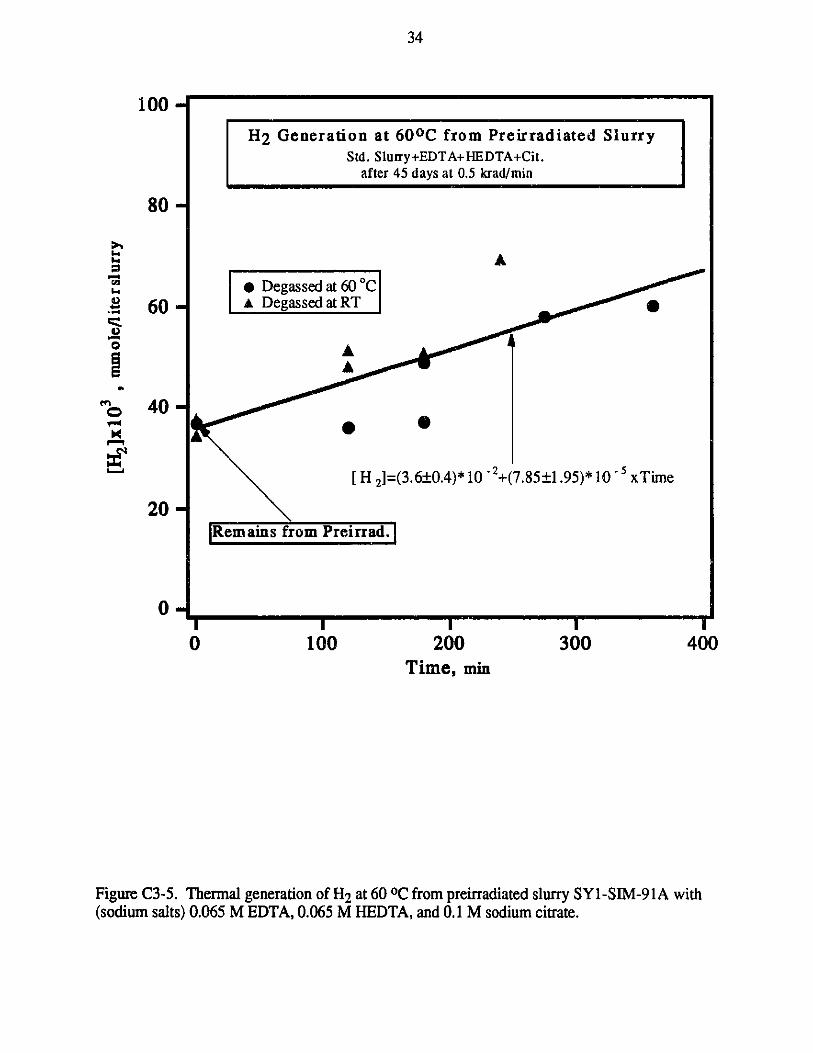
34
100-
80-
WH
U" r
ii
60-
40-
20-
0-I0
I1100
I200
I300
Time, mi
Figure C3-5. Thermal generation of H2 at 60 OC from preirradiated slurry SYl-SIM-91A with(sodium salts) 0.065 M EDTA, 0.065 M HEDTA, and 0.1 M sodium citrate.
H2 Generation at 600 C from Preirradiated SlurryStd. Slurry+EDTA+HEDTA+Cit.
after 45 days at 0.5 krad/min
AA" Degassed at 60 *C
f Degassed at RTg
[ H 2]=(3.6+0.4)*10 -2+(7.85 1.95)*10 ~5 xTime
Remains from Preirrad.
400
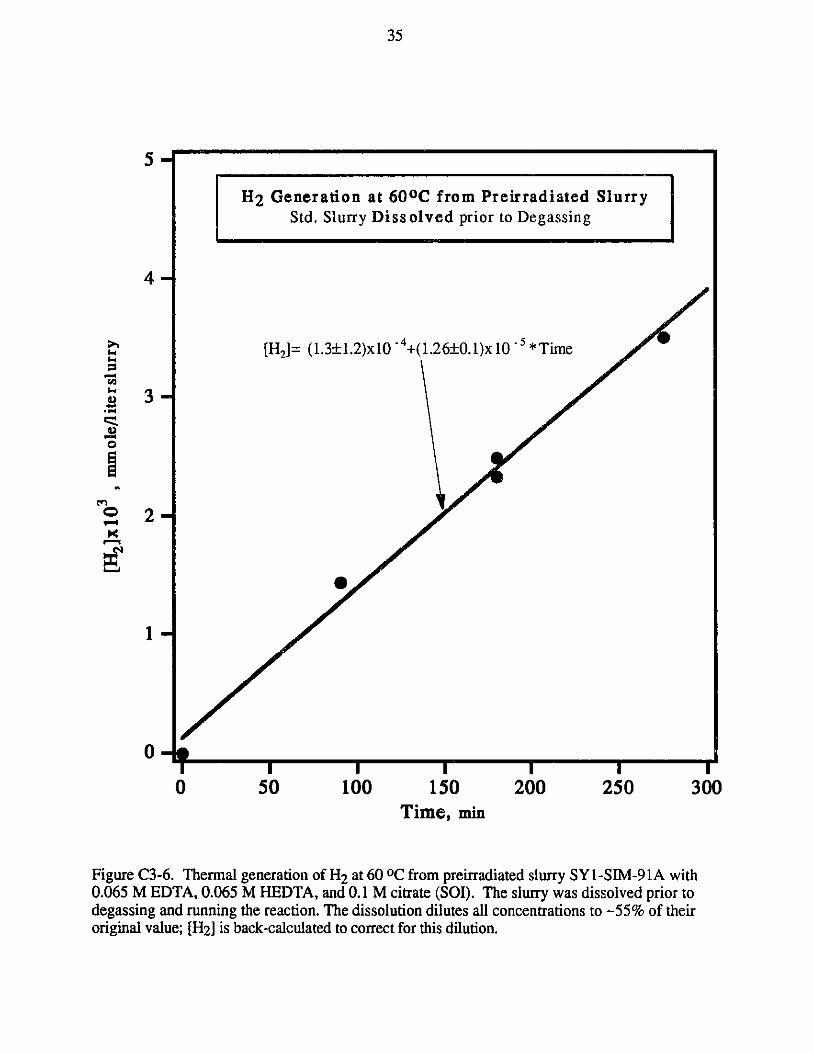
35
5
H2 Generation at 600 C from Preirradiated SlurryStd. Slurry Dissolved prior to Degassing
4
[H2 ]= (1.3 l.2)xlO +(1.26 0.1)x*10 Time
3-
1
04-I I I I I I I
0 50 100 150 200 250 300Time, min
Figure C3-6. Thermal generation of H2 at 60 OC from preirradiated slurry SYl-SIM-91A with0.065 M EDTA, 0.065 M HEDTA, and 0.1 M citrate (SOI). The slurry was dissolved prior todegassing and running the reaction. The dissolution dilutes all concentrations to -55% of theiroriginal value; [H2] is back-calculated to correct for this dilution.
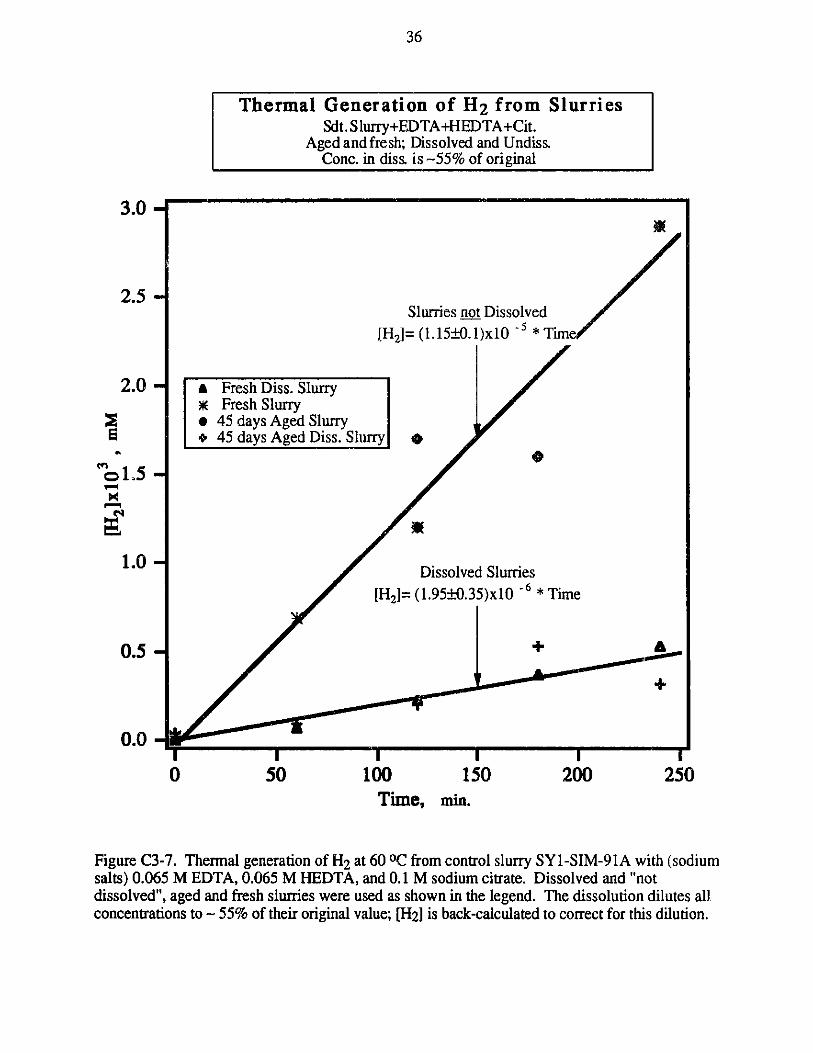
36
Thermal Generation of H2 from SlurriesSdt.Slurry+FDTA+HEDTA+Cit.
Aged and fresh; Dissolved and Undiss.Conc. in diss. is -55% of original
3.0
2.5Slurries not Dissolved
[H2]= (1.15 0O.I)x10 ~ 5 *Time/
2.0- a Fresh Diss. SlurryK Fresh Slurry* 45 days Aged Slurry+ 45 days Aged Diss. Slurry *
c1L5 -01.-
1.0- Dissolved Slurries
[H2]= (1.95 0.35)xlO 6 * Time
0.5
+
0.0-SI I I
0 50 100 150 200 250Time, mie.
Figure C3-7. Thermal generation of H2 at 60 0C from control slurry SYl-SIM-91A with (sodiumsalts) 0.065 M EDTA, 0.065 M HEDTA, and 0.1 M sodium citrate. Dissolved and "notdissolved", aged and fresh slurries were used as shown in the legend. The dissolution dilutes allconcentrations to ~ 55% of their original value; [H2] is back-calculated to correct for this dilution.
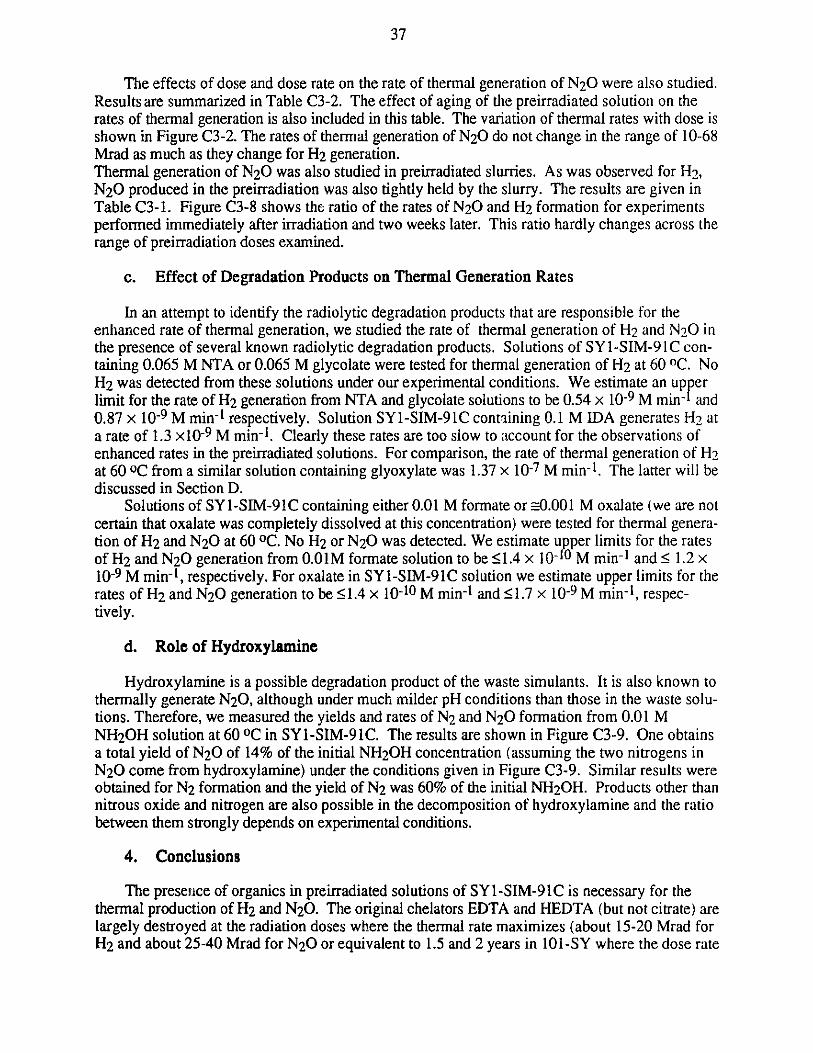
37
The effects of dose and dose rate on the rate of thermal generation of N 20 were also studied.Results are summarized in Table C3-2. The effect of aging of the preirradiated solution on therates of thermal generation is also included in this table. The variation of thermal rates with dose isshown in Figure C3-2. The rates of thermal generation of N20 do not change in the range of 10-68Mrad as much as they change for H2 generation.Thermal generation of N20 was also studied in preirradiated slurries. As was observed for H?2,N20 produced in the preirradiation was also tightly held by the slurry. The results are given inTable C3-1. Figure C3-8 shows the ratio of the rates of N20 and H2 formation for experimentsperformed immediately after irradiation and two weeks later. This ratio hardly changes across therange of preirradiation doses examined.
c. Effect of Degradation Products on Thermal Generation Rates
In an attempt to identify the radiolytic degradation products that are responsible for theenhanced rate of thermal generation, we studied the rate of thermal generation of H2 and N2 0 inthe presence of several known radiolytic degradation products. Solutions of SY1-SIM-91C con-taining 0.065 M NTA or 0.065 M glycolate were tested for thermal generation of H2 at 60 0 C. NoH2 was detected from these solutions under our experimental conditions. We estimate an upperlimit for the rate of H2 generation from NTA and glycolate solutions to be 0.54 x 10⁻⁹ M min- 1 and0.87 x 10-9 M min-1 respectively. Solution SY1-SIM-91C containing 0.1 M IDA generates H2 ata rate of 1.3 x10⁻⁹ M min-1. Clearly these rates are too slow to account for the observations ofenhanced rates in the preirradiated solutions. For comparison, the rate of thermal generation of H2at 60 OC from a similar solution containing glyoxylate was 1.37 x 10⁻⁷ M min-1. The latter will bediscussed in Section D.
Solutions of SY1-SIIM-91C containing either 0.01 M formate or ~0.001 M oxalate (we are notcertain that oxalate was completely dissolved at this concentration) were tested for thermal genera-tion of H2 and N20 at 60 OC. No H2 or N20 was detected. We estimate upper limits for the ratesof H2 and N20 generation from 0.01M formate solution to be 51.4 x 10⁻¹⁰ M min-, and 1.2 x10⁻⁹ M min-1 , respectively. For oxalate in SY1-SIM-91C solution we estimate upper limits for therates of H2 and N20 generation to be 51.4 x 10⁻¹⁰ M min-1 and 51.7 x 10⁻⁹ M min-, respec-tively.
d. Role of Hydroxylamine
Hydroxylamine is a possible degradation product of the waste simulants. It is also known tothermally generate N20, although under much milder pH conditions than those in the waste solu-tions. Therefore, we measured the yields and rates of N2 and N20 formation from 0.01 MNH2OH solution at 60 0C in SY1-SIM-91C. The results are shown in Figure C3-9. One obtainsa total yield of N 20 of 14% of the initial NH2OH concentration (assuming the two nitrogens inN20 come from hydroxylamine) under the conditions given in Figure C3-9. Similar results wereobtained for N2 formation and the yield of N2 was 60% of the initial NH20H. Products other thannitrous oxide and nitrogen are also possible in the decomposition of hydroxylamine and the ratiobetween them strongly depends on experimental conditions.
4. Conclusions
The presence of organics in preirradiated solutions of SY1-SIM-91C is necessary for thethermal production of H2 and N20. The original chelators EDTA and HEDTA (but not citrate) arelargely destroyed at the radiation doses where the thermal rate maximizes (about 15-20 Mrad forH2 and about 25-40 Mrad for N 20 or equivalent to 1.5 and 2 years in 101-SY where the dose rate
38
Ratio N 20/H2 Thermal Generation Ratesvs. Preirrad. Dose
4
1
4
J
Immediately after Irrad.I 2 Weeks later
a
I10
I20
I30
I440
Preirrad. Dose, Mrad
Figure C3-8. The ratio of initial rates of N20 and H2 generation from solution SY 1-SIM-9 1Ccontaining 0.065 M each of EDTA and of HEDTA, and 0.1 M citrate (sodium salts), as a functionof preirradiation dose.
40-
a-t
O
0z0
20-
0-I0
I50
-I
1
I
39
is believed to be 25 rad/min). The half-life for EDTA and HEDTA would be less than 1.5 years inTank 101-SY from the analytical results of PNL. It seems that radiolytic degradation of the organ-ics produces intermediates responsible for efficient thermal generation of H2 and N20.Experimental evidence suggests that these intermediates are HCHO and glyoxylate for H2 andNH2 OH for N20 (and N2). The ratio between N20 and N2 that is obtained from this precursor isknown to be strongly dependent on experimental details. NTA, IDA, glycolate, formate, and oxa-late are not effective thermal generators of H2. Formate and oxalate are not thermal generators ofN20. Citrate in a preirradiated solution does produce an intermediate that enhances the thermalgeneration of N20 but not of H2. Tangential, but important to the issue of gas retention in 101-SY, we notice in preirradiated slurries that a large fraction of the gases produced during the pre-irradiation is tightly held by the slurry particulate after irradiation (see also Section F).
D. THE FORMALDEHYDE REACTION
1. Introduction
Formaldehyde is a well-documented radiolytic degradation product of the original chelatorsthat were placed in the waste tanks. It has been shown that formaldehyde in basic aqueous solu-tions will generate dihydrogen.10,11 Efforts at Georgia Tech have established that formaldehydeand similar aldehydes may quantitatively be converted to hydrogen at extremely high concentra-tions of hydroxide.12, 13 In this section we provide quantitative descriptions of the reactions offormaldehyde and glyoxylate and attempt to shed further light on the mechanism of their hydrogen-generating reaction. We provide effective rate constants and activation energies for the H2 produc-tion reaction of these two substrates. We further verify that the mechanism for this reaction utilizesone water proton in the case of glyoxylate, as proposed earlier, 12 ,13 but not in the case GIformaldehyde.
2. Experimental
a. Procedures
Because of the volatility of formaldehyde, the experimental procedure for the measurement ofproducts of its thermal decomposition was modified from that described in the previous section.Solution SYL-SIM-91C was first bubbled with argon at room temperature in Erlenmeyer vessels.The sample was then put into a thermostated water bath held at the desired temperature.Formaldehyde or glyoxylate was then injected from another syringe into the Erlenmeyer vessel.Gas samples were withdrawn for chromatographic analysis at various time intervals following theinjection. For measurements of the rate from formaldehyde, the time of initiation of the reaction issomewhat uncertain because the rate of H2 generation is fast on the time scale required for manipu-lation of the samples for analysis.
To examine the possibility of leakage of gases to/from the vessels during long thermal reactiontimes, several control experiments were performed. 50 kl of H2 was injected into 10 ml of anargon-saturated solution of 2.3 M NaOH. The solution was kept at 60 0 C and the concentration ofH2, N2, and 02 (from possible air leaks) was measured as a function of time. Equilibriumbetween the solution and the gas phase was maintained by stirring, and the concentration of thegases in the liquid phase was calculated from the ratio of volumes of the two phases, as was theprocedure in all our experiments with these vessels. The results for H2 are shown in Figure D2- 1.We conclude that the loss of H2 by leakage in our experiments at the longest times used is not morethan ~10%. The maximum leakage of air into the vessel resulted in a concentration of 0 in theliquid of less than 2% of the concentration that would result from 1 atm of air in equilibrium with
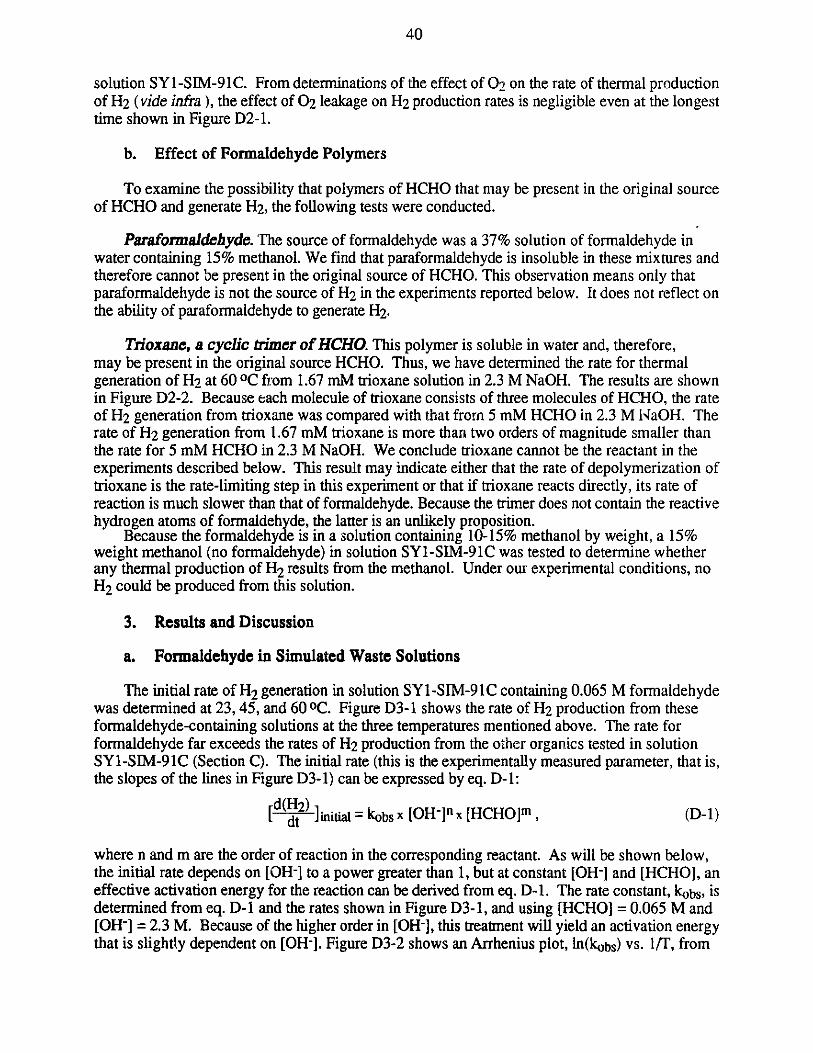
40
solution SYl-SIM-91C. From determinations of the effect of 02 on the rate of thermal productionof H2 (vide infra ), the effect of 02 leakage on H2 production rates is negligible even at the longesttime shown in Figure D2-1.
b. Effect of Formaldehyde Polymers
To examine the possibility that polymers of HCHO that may be present in the original sourceof HCHO and generate H2, the following tests were conducted.
Paraformaldehyde. The source of formaldehyde was a 37% solution of formaldehyde inwater containing 15% methanol. We find that paraformaldehyde is insoluble in these mixtures andtherefore cannot be present in the original source of HCHO. This observation means only thatparaformaldehyde is not the source of H2 in the experiments reported below. It does not reflect onthe ability of paraformaldehyde to generate H2.
Trioxane, a cyclic trimer of HCHO. This polymer is soluble in water and, therefore,may be present in the original source HCHO. Thus, we have determined the rate for thermalgeneration of H2 at 60 OC from 1.67 mM trioxane solution in 2.3 M NaOH. The results are shownin Figure D2-2. Because each molecule of trioxane consists of three molecules of HCHO, the rateof H2 generation from trioxane was compared with that from 5 mM HCHO in 2.3 M NaOH. Therate of H2 generation from 1.67 mM trioxane is more than two orders of magnitude smaller thanthe rate for 5 mM HCHO in 2.3 M NaOH. We conclude trioxane cannot be the reactant in theexperiments described below. This result may indicate either that the rate of depolymerization oftrioxane is the rate-limiting step in this experiment or that if trioxane reacts directly, its rate ofreaction is much slower than that of formaldehyde. Because the trimer does not contain the reactivehydrogen atoms of formaldehyde, the latter is an unlikely proposition.
Because the formaldehyde is in a solution containing 10-15% methanol by weight, a 15%weight methanol (no formaldehyde) in solution SYl-SIM-91C was tested to determine whetherany thermal production of H2 results from the methanol. Under our experimental conditions, noH2 could be produced from this solution.
3. Results and Discussion
a. Formaldehyde in Simulated Waste Solutions
The initial rate of H2 generation in solution SY1-SIM-91C containing 0.065 M formaldehydewas determined at 23, 45, and 60 OC. Figure D3-1 shows the rate of H2 production from theseformaldehyde-containing solutions at the three temperatures mentioned above. The rate forformaldehyde far exceeds the rates of H2 production from the other organics tested in solutionSY1-SIM-91C (Section C). The initial rate (this is the experimentally measured parameter, that is,the slopes of the lines in Figure D3- 1) can be expressed by eq. D- 1:
d(H2) -nx[COm(-1[dHt2 ]initial = kobs x [OH-]n x [HCHOI, (D-l)
where n and m are the order of reaction in the corresponding reactant. As will be shown below,the initial rate depends on [OH-] to a power greater than 1, but at constant [OH-] and [HCHOJ, aneffective activation energy for the reaction can be derived from eq. D-1. The rate constant, kobs, isdetermined from eq. D- 1 and the rates shown in Figure D3- 1, and using [HCHO] = 0.065 M and[OH-] = 2.3 M. Because of the higher order in [OH-], this treatment will yield an activation energythat is slightly dependent on [OH-]. Figure D3-2 shows an Arrhenius plot, ln(kobs) vs. 1f/, from
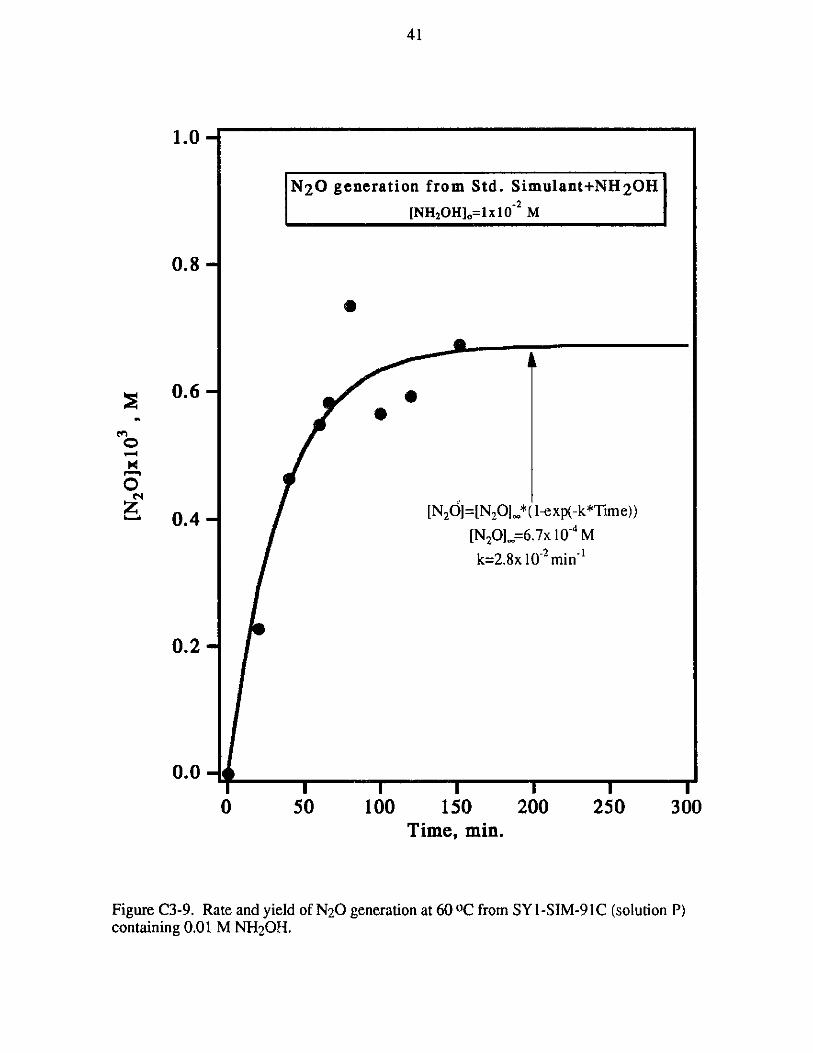
41
N2 0 generation from Std. Simulant+NH2OH
[NH2OH]0=1x10⁻² M
1.0-
0.8-
0.6 - 00
[N2 0]=[N2 OL*(1-exp(-k*Time))
[N20]L=6.7x 10⁴ M
k=2.8x 10 2min
I50
I1100
I150 200 250
I300
Time, min.
Figure C3-9. Rate and yield of N20 generation at 60 0C from SY1-SIM-91C (solution P)containing 0.01 M NH2OH.
0
0
0
0.4-
0.2-
0.0-I0
MOWN
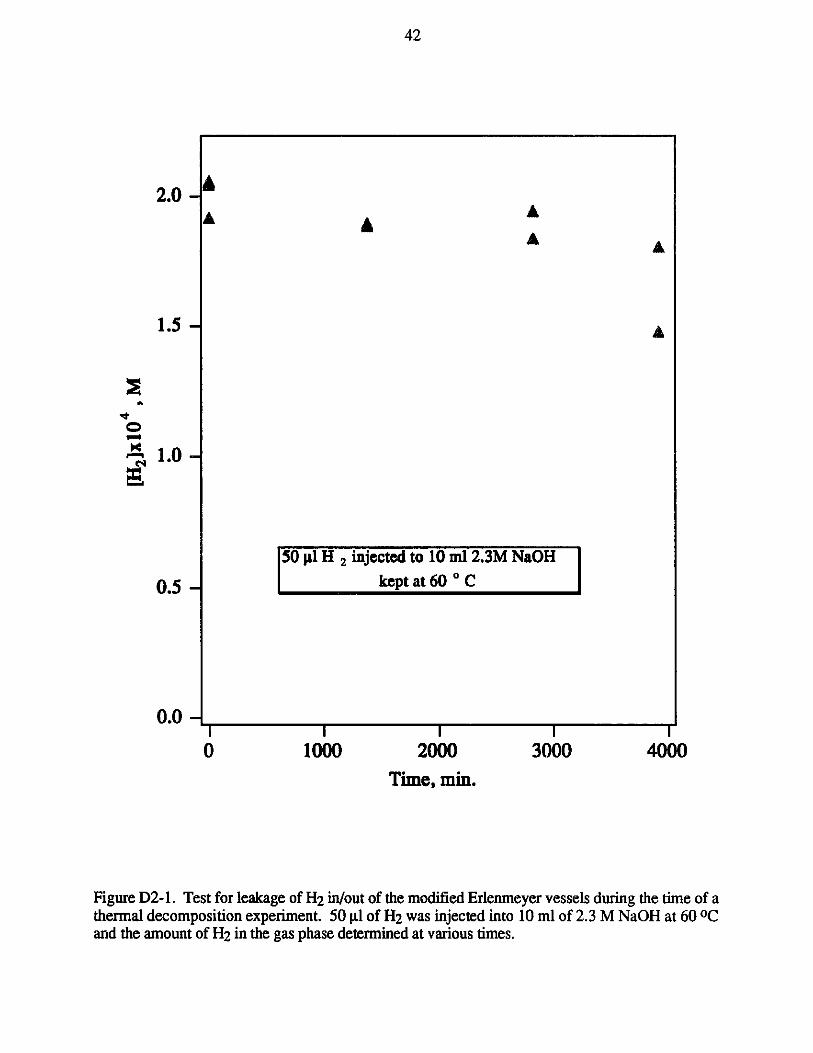
2.0-
1.5 -
01.O -
0.5-_0
0.0 -
0
Time, min.
Figure D2-1. Test for leakage of H2 in/out of the modified Erlenmeyer vessels during the time of athermal decomposition experiment. 50 l of H2 was injected into 10 ml of 2.3 M NaOH at 60 OCand the amount of H2 in the gas phase determined at various times.
42
A
A A
A
50 l H i njected to 10 ml2.3M NaOH
kept at 60 0 C
1000I
2000 3000 4000
m 0 0 N mmmr
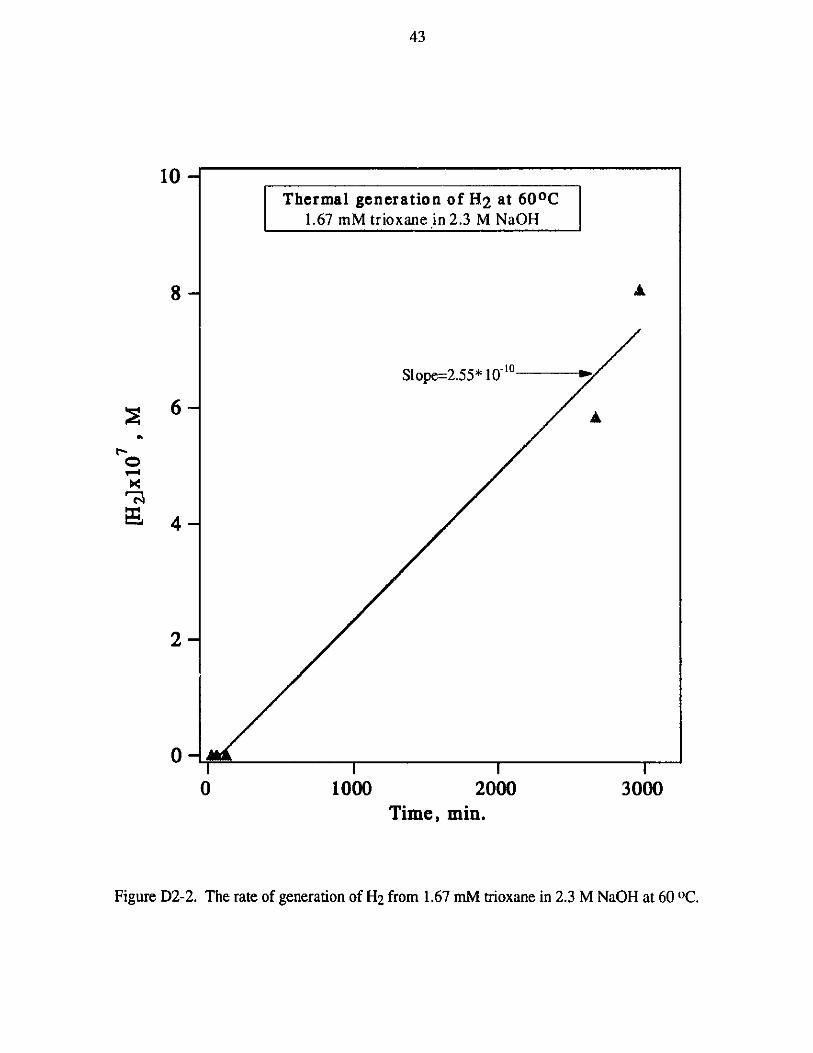
43
10-Thermal generation of H2 at 600C
1.67 mM trioxane .in 2.3 M NaOH
8 -A
Slope=2.55*10~1 0
2-
0-I I I
0 1000 2000 3000Time, min.
Figure D2-2. The rate of generation of H2 from 1.67 mM trioxane in 2.3 M NaOH at 60 OC.
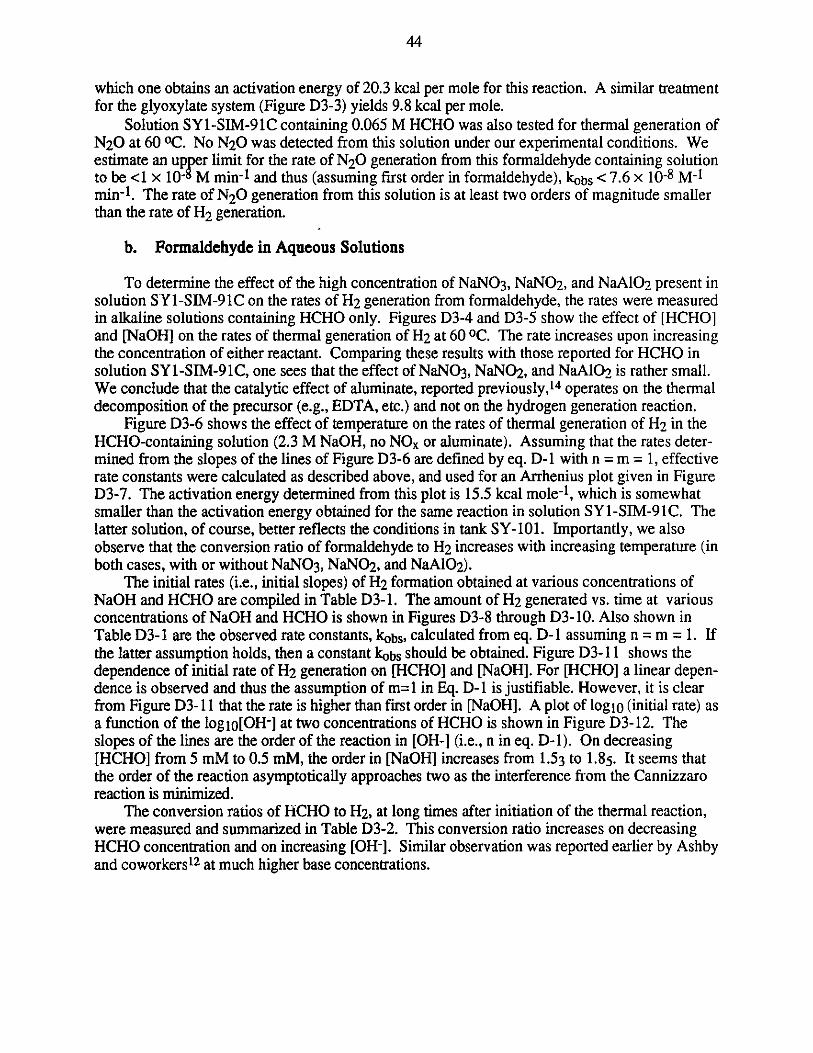
44
which one obtains an activation energy of 20.3 kcal per mole for this reaction. A similar treatmentfor the glyoxylate system (Figure D3-3) yields 9.8 kcal per mole.
Solution SYl-SIM-91C containing 0.065 M HCHO was also tested for thermal generation ofN20 at 60 0C. No N20 was detected from this solution under our experimental conditions. Weestimate an upper limit for the rate of N20 generation from this formaldehyde containing solutionto be <1 x 10⁻⁸ M min-1 and thus (assuming first order in formaldehyde), kobs < 7.6 x 10⁻⁸ M-1
min-1. The rate of N20 generation from this solution is at least two orders of magnitude smallerthan the rate of H2 generation.
b. Formaldehyde in Aqueous Solutions
To determine the effect of the high concentration of NaNO3, NaNO2, and NaAlO2 present insolution SY1-SIM-91C on the rates of H2 generation from formaldehyde, the rates were measuredin alkaline solutions containing HCHO only. Figures D3-4 and D3-5 show the effect of [HCHO]and [NaOH] on the rates of thermal generation of H2 at 60 0C. The rate increases upon increasingthe concentration of either reactant. Comparing these results with those reported for HCHO insolution SY 1-SIM-91C, one sees that the effect of NaNO3, NaNO2, and NaAlO2 is rather small.We conclude that the catalytic effect of aluminate, reported previously,1 4 operates on the thermaldecomposition of the precursor (e.g., EDTA, etc.) and not on the hydrogen generation reaction.
Figure D3-6 shows the effect of temperature on the rates of thermal generation of H2 in theHCHO-containing solution (2.3 M NaOH, no NOx or aluminate). Assuming that the rates deter-mined from the slopes of the lines of Figure D3-6 are defined by eq. D- 1 with n = m = 1, effectiverate constants were calculated as described above, and used for an Arrhenius plot given in FigureD3-7. The activation energy determined from this plot is 15.5 kcal mole-1, which is somewhatsmaller than the activation energy obtained for the same reaction in solution SYl-S[M-91C. Thelatter solution, of course, better reflects the conditions in tank SY-101. Importantly, we alsoobserve that the conversion ratio of formaldehyde to H2 increases with increasing temperature (inboth cases, with or without NaNO3, NaNO2, and NaAlO2).
The initial rates (i.e., initial slopes) of H2 formation obtained at various concentrations ofNaOH and HCHO are compiled in Table D3-1. The amount of H2 generated vs. time at variousconcentrations of NaOH and HCHO is shown in Figures D3-8 through D3- 10. Also shown inTable D3-1 are the observed rate constants, kobs, calculated from eq. D-1 assuming n = m = 1. Ifthe latter assumption holds, then a constant kobs should be obtained. Figure D3-11 shows thedependence of initial rate of H2 generation on [HCHO] and [NaOH]. For [HCHO] a linear depen-dence is observed and thus the assumption of m= 1 in Eq. D- 1 is justifiable. However, it is clearfrom Figure D3-11 that the rate is higher than first order in [NaOH]. A plot of logo (initial rate) asa function of the logli[OH-] at two concentrations of HCHO is shown in Figure D3-12. Theslopes of the lines are the order of the reaction in [OH-] (i.e., n in eq. D-1). On decreasing[HCHOJ from 5 mM to 0.5 mM, the order in [NaOH] increases from 1.53 to 1.85. It seems thatthe order of the reaction asymptotically approaches two as the interference from the Cannizzaroreaction is minimized.
The conversion ratios of HCHO to H2, at long times after initiation of the thermal reaction,were measured and summarized in Table D3-2. This conversion ratio increases on decreasingHCHO concentration and on increasing [OH-]. Similar observation was reported earlier by Ashbyand coworkers 12 at much higher base concentrations.
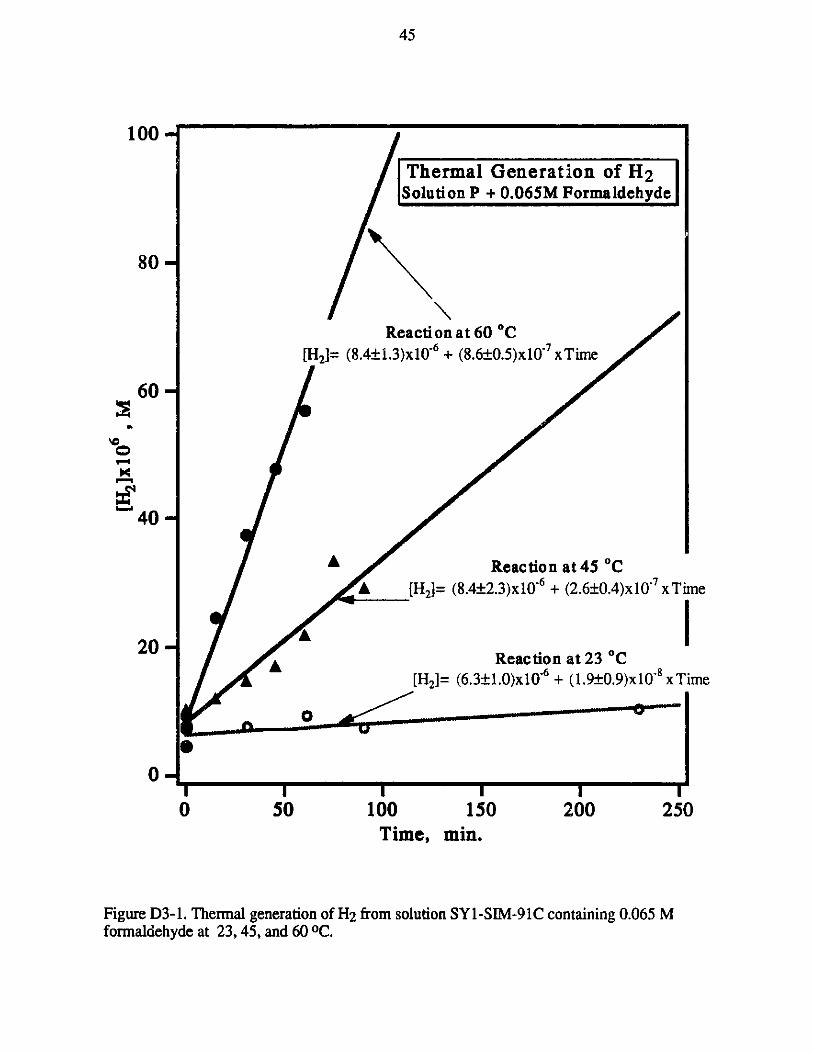
45
100
Thermal Generation of H 2Solution P + 0.065M Formaldehyde
80-
Reaction at 60 C[H6 107
[H2]= (8.4+1.3)x10- + (8.6 0.5)x10 xTime
60-
40-
A Reaction at 45 *CA [H2]= (8.4 2.3)x10-6 + (2.6 0.4)x107 xTime
20 A20-Reaction at 23 *C
[H2]= (6.3 1.0)x10~6 + (1.9 0.9)x10~8 xTime
0-I I I
0 50 100 150 200 250Time, min.
Figure D3-1. Thermal generation of H2 from solution SY-SIM-91C containing 0.065 Mformaldehyde at 23, 45, and 60 OC.
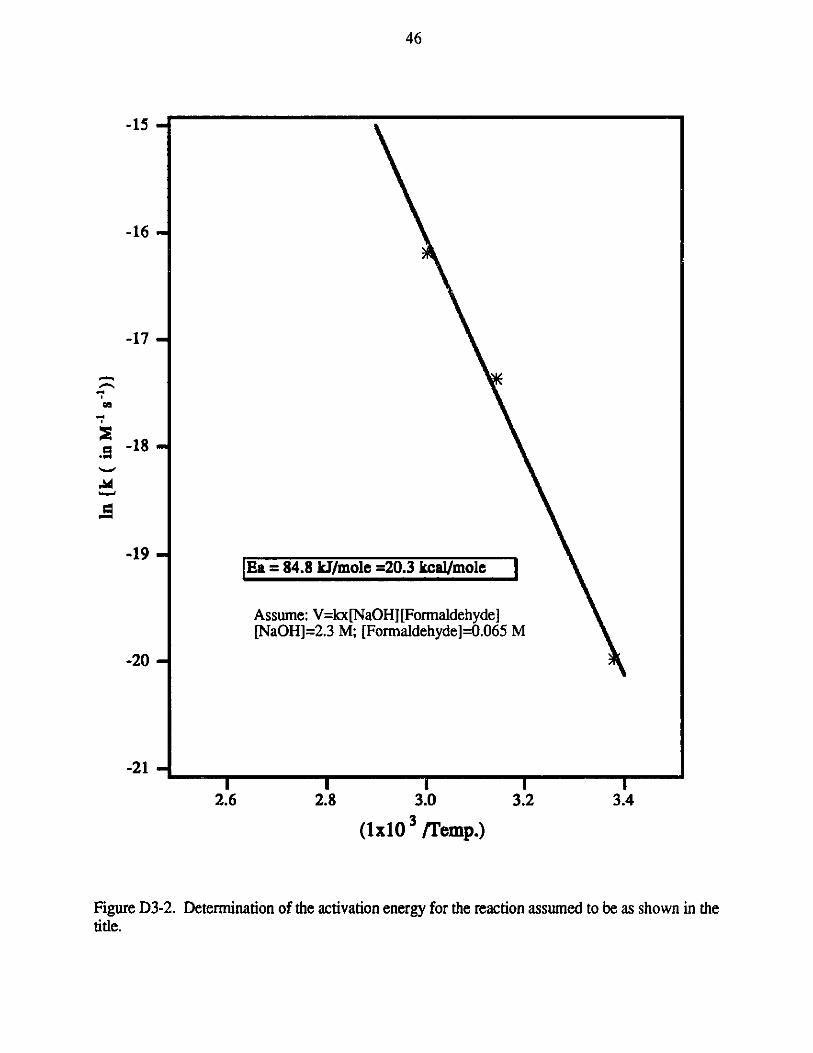
46
-15 -
-16 -
-17 -
-18 -
-19 -
-20 -
-21 -I
2.8
=20.3 kcal/mole
OH] [Formaldehyde]Formaldehyde]=0.065 M
I3.0
I3.2
(1x10 3 /Temp.)
Figure D3-2. Determination of the activation energy for the reaction assumed to be as shown in thetitle.
a= 4.8 mole
Assume: V=kx[Na[NaOH]=2.3 M; [I
I2.6
I3.4
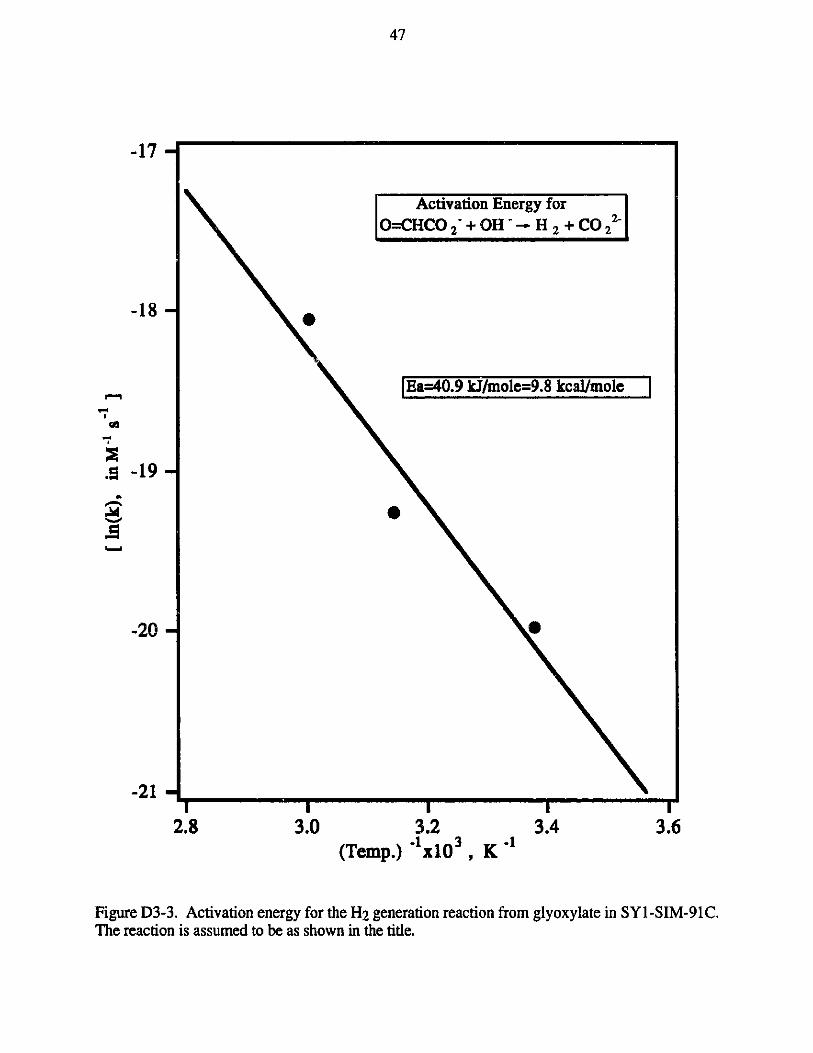
47
-17-
-18-
. -19-
-20-
-21-
3.2(Temp.) ~1x10³
3.4 3.6
Figure D3-3. Activation energy for the H2 generation reaction from glyoxylate in SY1-SIM-91C.The reaction is assumed to be as shown in the title.
Activation Energy for
O=CHCO2-+OH--H2 + CO 22 -
IEa=40.9 kJ/mole=9.8 kcal/mole I
e0
2.8 3.0
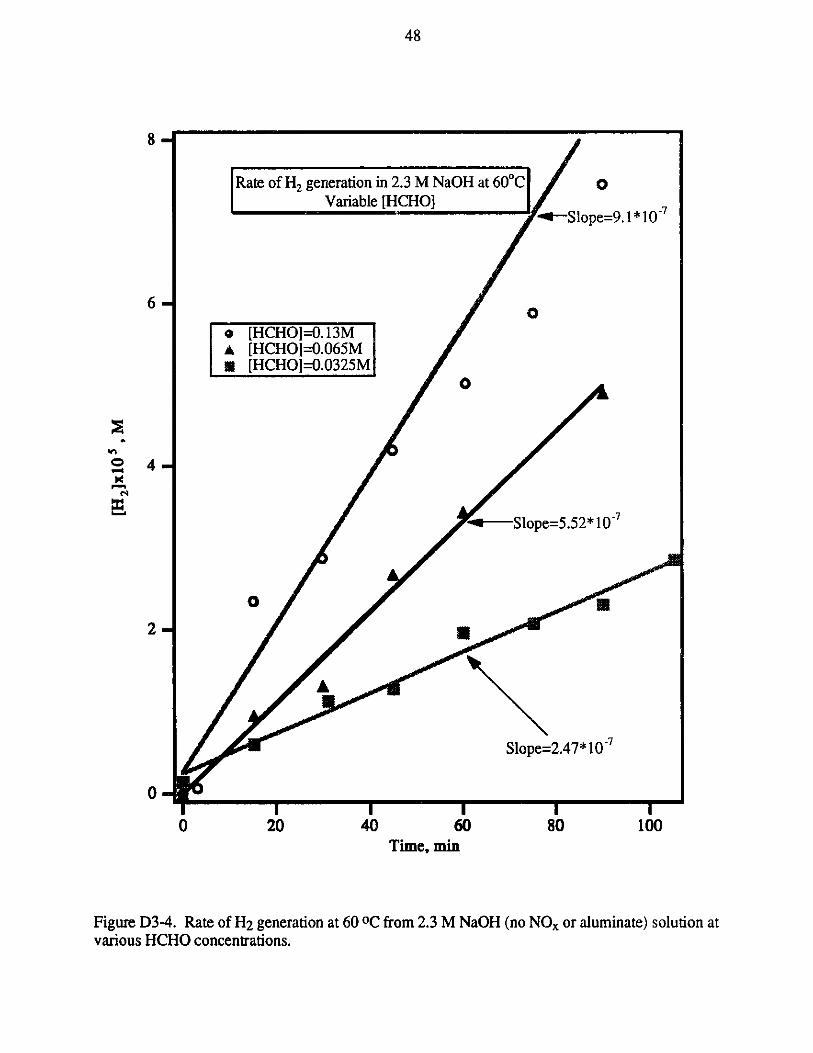
48
Rate of H2 generation in 2.3 M NaOH at 60*CVariable [iHH
0
8-
6-
204
40 60Time, min
80 100
Figure D3-4. Rate of H2 generation at 60 0C from 2.3 M NaOH (no NOx or aluminate) solution atvarious HCHO concentrations.
q*-Slope=9.1* 10~7
o [HCHOJ=O.13MA [HCHOJ=0.065M* [HCHOJ=0.0325M
0
WSlope=5.52* 10
Slope=2.47 *10~-7
V1
N
2-
0-
0
4-
I
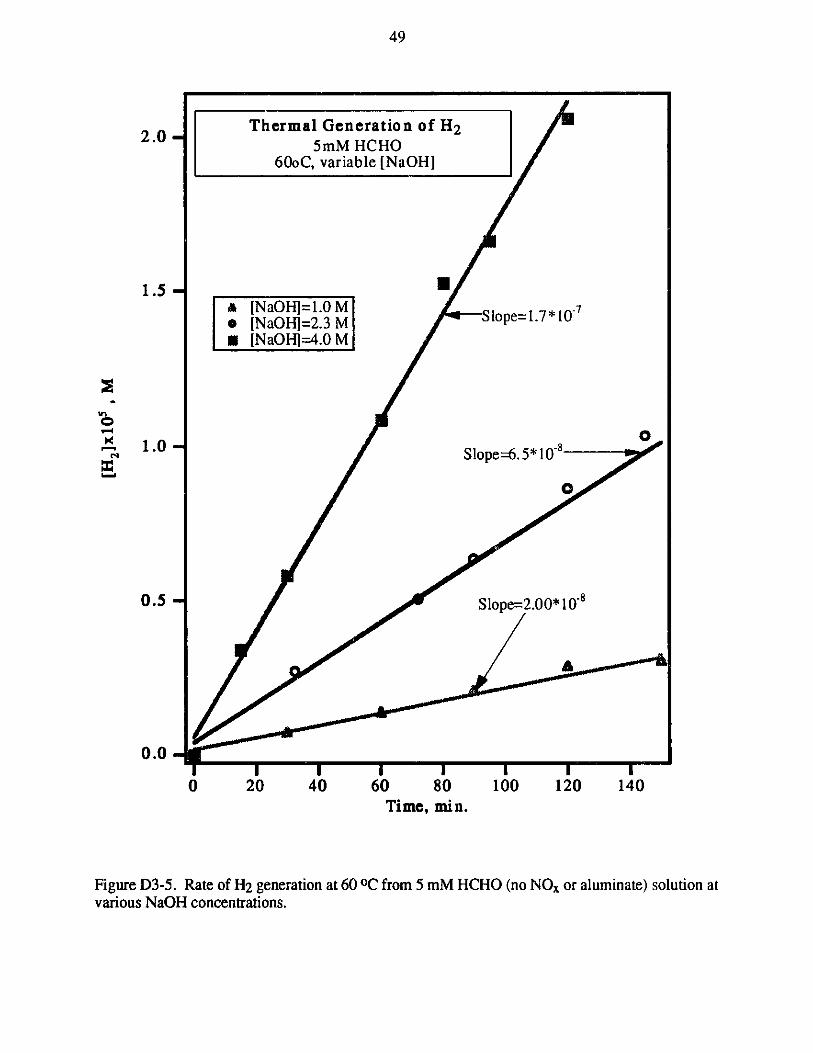
49
2.0-
1 5-
Thermal Generation of H2
5mM HCHO60oC, variable [NaOH]
UA[NaOHi=1.0 M Slope=1.7*10 7
*[NaOH]=2.3 MS[NaOH]=4.0
46
0
1.0 -Slope=6. 5* 10-
0.5 Slope=2.00*108
0.0
0 20 40 60 80 100 120 140Time, mn.
Figure D3-5. Rate of H2 generation at 60 0 C from 5 mM HCHO (no NOx or aluminate) solution atvarious NaOH concentrations.
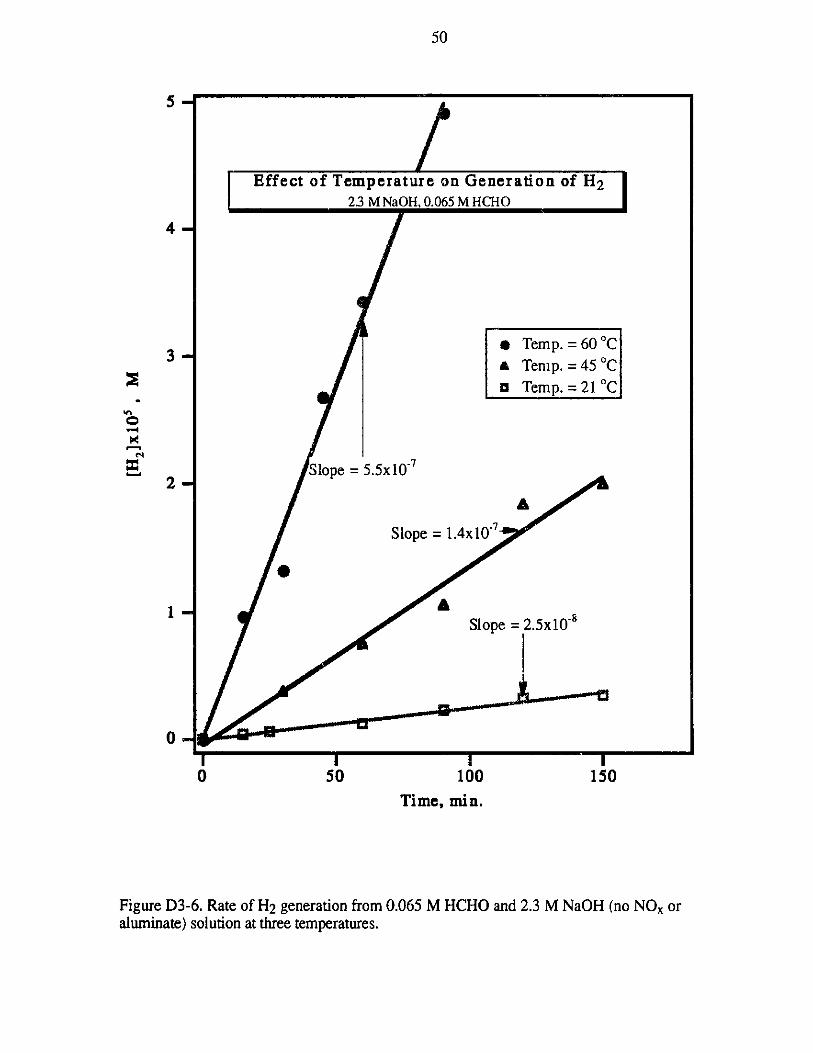
50
Effect of Temperature on Generation of H 223 M NaOH, 0.065 M HCHO I
4 -
3-
2-
1-
0-I
50I-
100 150Time, min.
Figure D3-6. Rate of H2 generation from 0.065 M HCHO and 2.3 M NaOH (no NOx oraluminate) solution at three temperatures.
0
* Temp.=60'CA Tenip.=45'Ca Temp. = 21 *C
Slope = 5.5x10~7
Slope = 1.4x10~7
Slope = 2.5x10~
I0
5 -
|
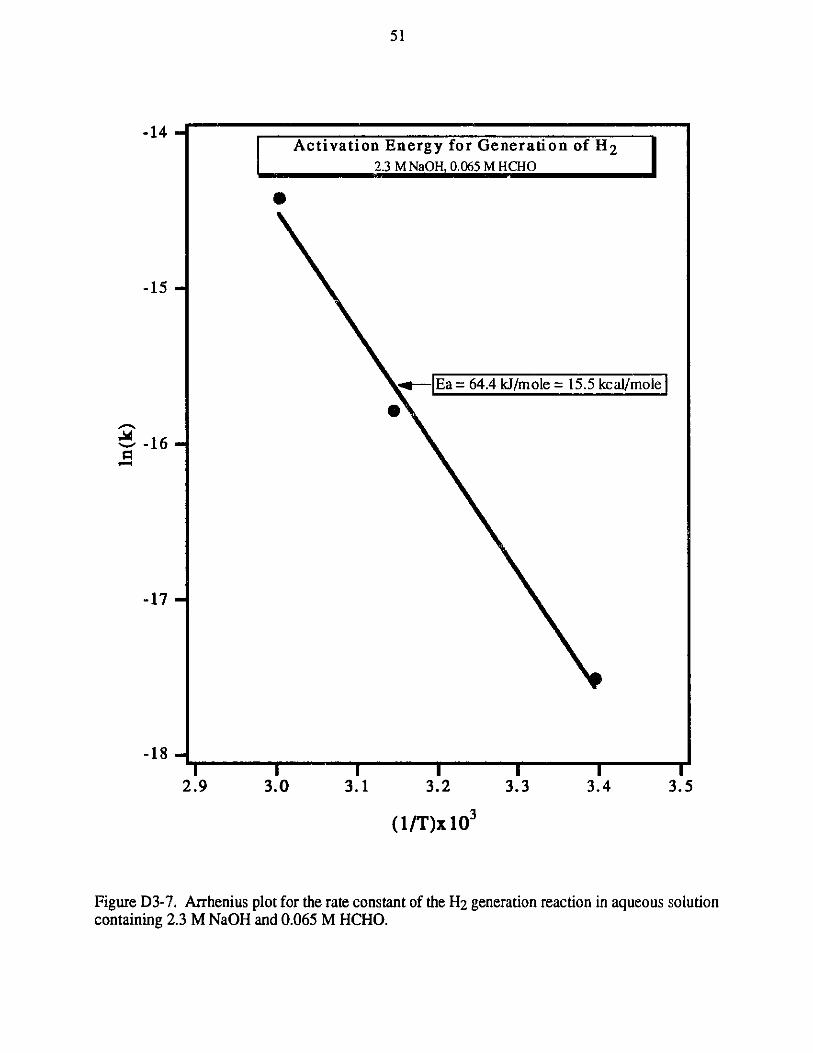
51
-14Activation Energy for Generation of H 2
2.3 M NaOH, 0.065 M HCHO
-15
Ea= 64.4 kJ/mole = 15.5 kcal/mole
0
-16-
-17
-18 -SI I I I I I
2.9 3.0 3.1 3.2 3.3 3.4 3.5
(1/T)x 10 3
Figure D3-7. Arrhenius plot for the rate constant of the H2 generation reaction in aqueous solutioncontaining 2.3 M NaOH and 0.065 M HCHO.
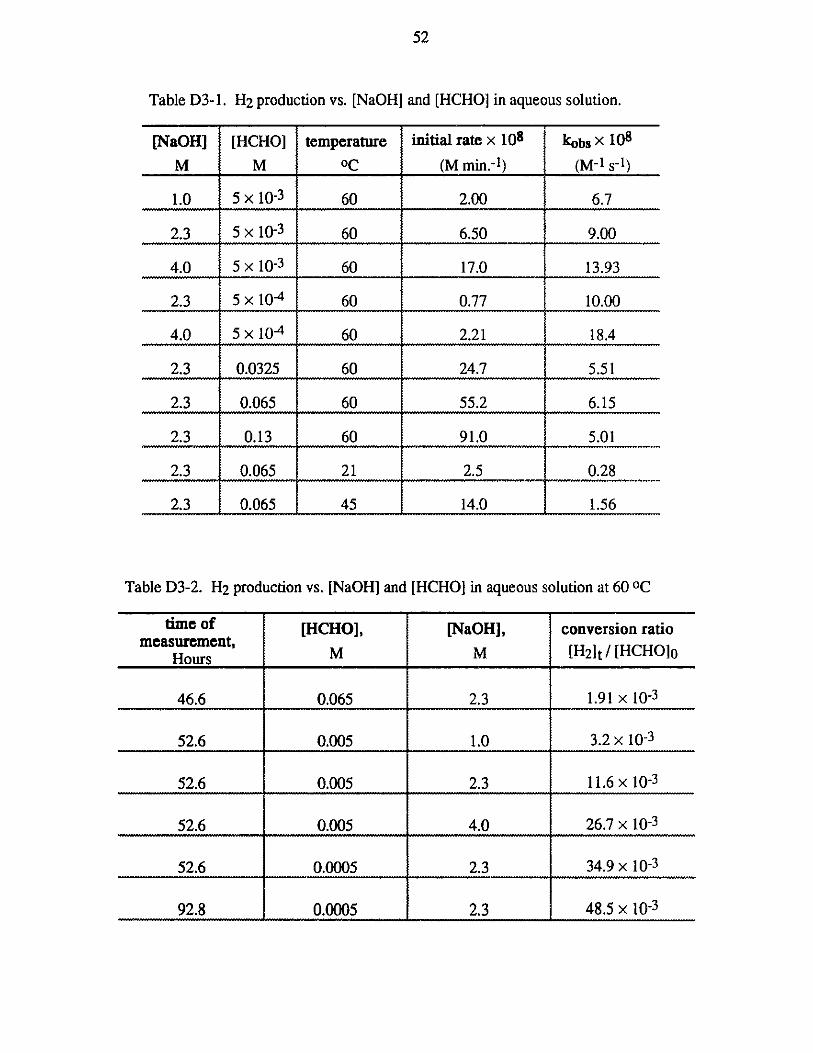
52
Table D3- 1. H2 production vs. [NaOH] and [HCHO] in aqueous solution.
[NaOH] [HCHO] temperature initial rate x 108 kobs x 108
M M 0C(M min.- 1) (M-1 s- 1)
1.0 5 x 10⁻³ 60 2.00 6.7
2.3 5 x 10⁻³ 60 6.50 9.00
4.0 5 x 10⁻³ 60 17.0 13.93
2.3 5 x 10⁴ 60 0.77 10.00
4.0 -5x-104 60 2.21 18.4
2.3 0.0325 60 24.7 5.51
2.3 0.065 60 55.2 6.15
2.3 0.13 60 91.0 5.01
2.3 0.065 21 2.5 0.28
2.3 0.065 45 14.0 1.56
Table D3-2. H2 production vs. [NaOH] and [HCHO] in aqueous solution at 60 OC
time of [HCHO], [NaOH], conversion ratioM M [H2lt / [HCHOJo
Hours
46.6 0.065 2.3 1.91 x 10⁻³
52.6 0.005 1.0 3.2 x 10⁻³
52.6 0.005 2.3 11.6 x 10⁻³
52.6 0.005 4.0 26.7 x 10⁻³
52.6 0.0005 2.3 34.9 x 10⁻³
92.8 0.0005 2.3 48.5 x 10⁻³
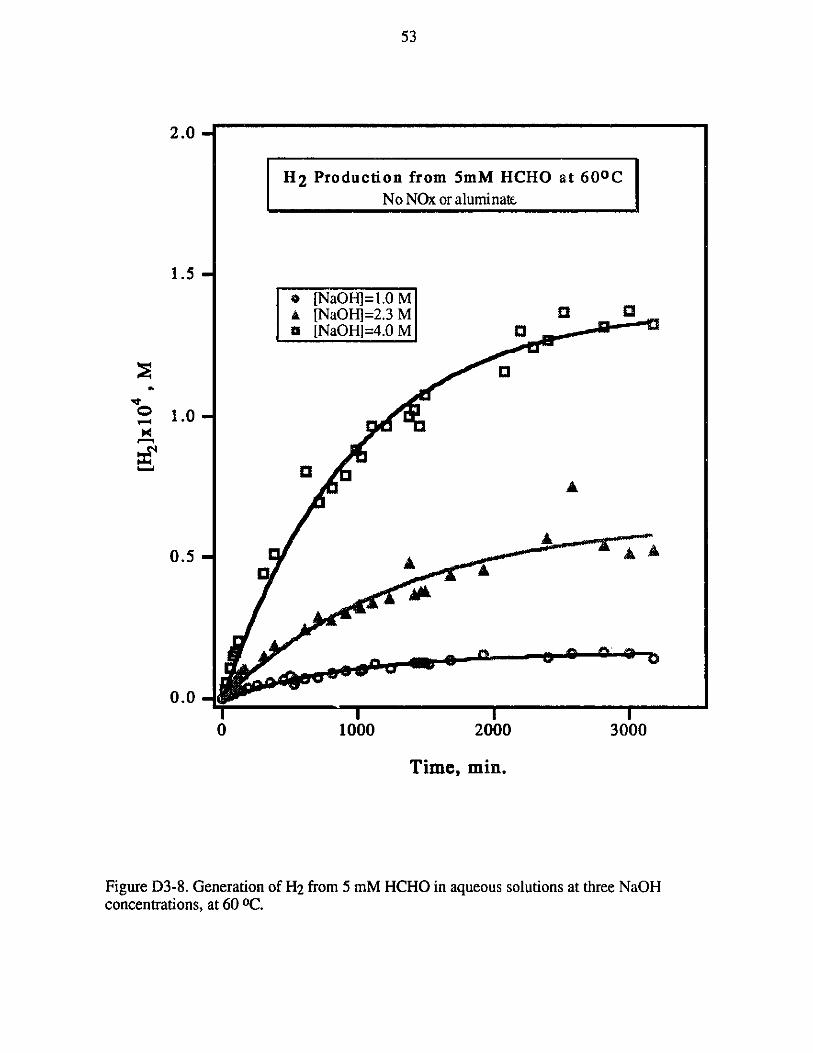
53
2.0
H2 Production from 5mM HCHO at 600 CNo NOx or aluminate
1.5 -
l [NaOH]=1.0 [NO]23M
S[NaOH] =4.0 M
1.0
A
AA
0.5-AAAA
0.0I I I I0 1000 2000 3000
Time, min.
Figure D3-8. Generation of H2 from 5 mM HCHO in aqueous solutions at three NaOHconcentrations, at 60 OC.
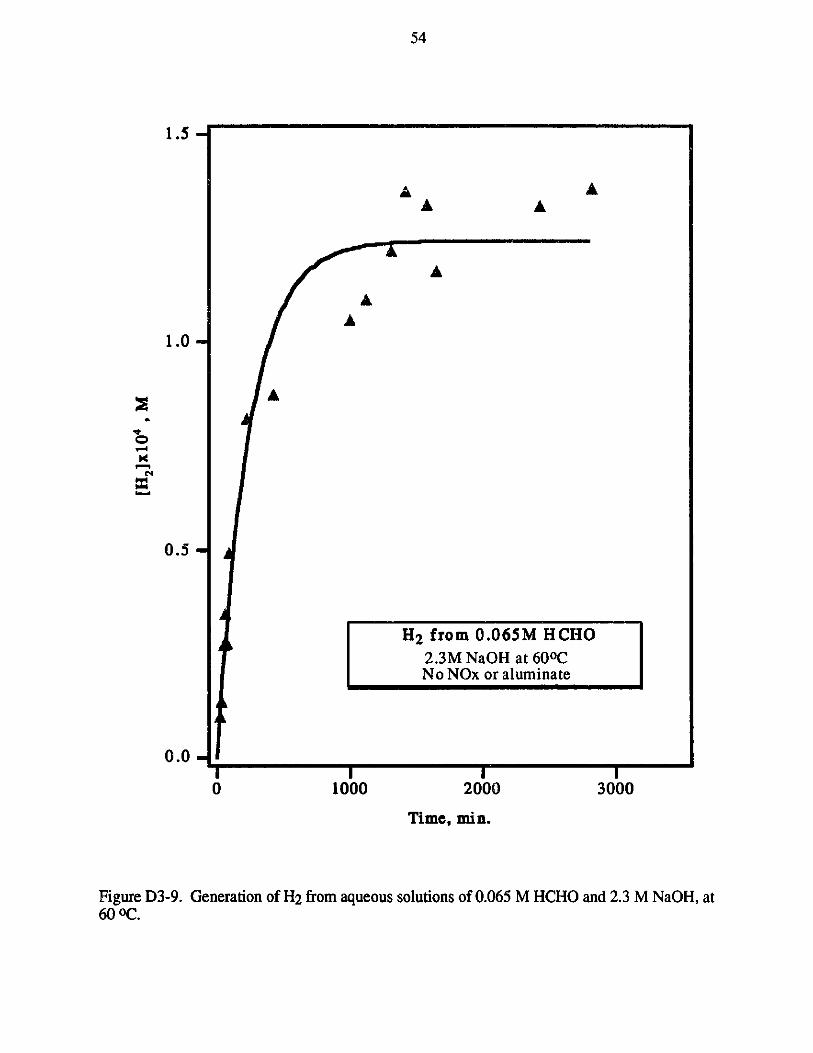
54
AA
AA
1.5-
1.0-
A
1000
H 2 from 0.065M HCHO2.3M NaOH at 600CNo NOx or aluminate
2000
Time, min.
Figure D3-9. Generation of H2 from aqueous solutions of 0.065 M HCHO and 2.3 M NaOH, at60 OC.
A
0
C4Nl
0.5-
0.0-I0 3000
------- ------ -
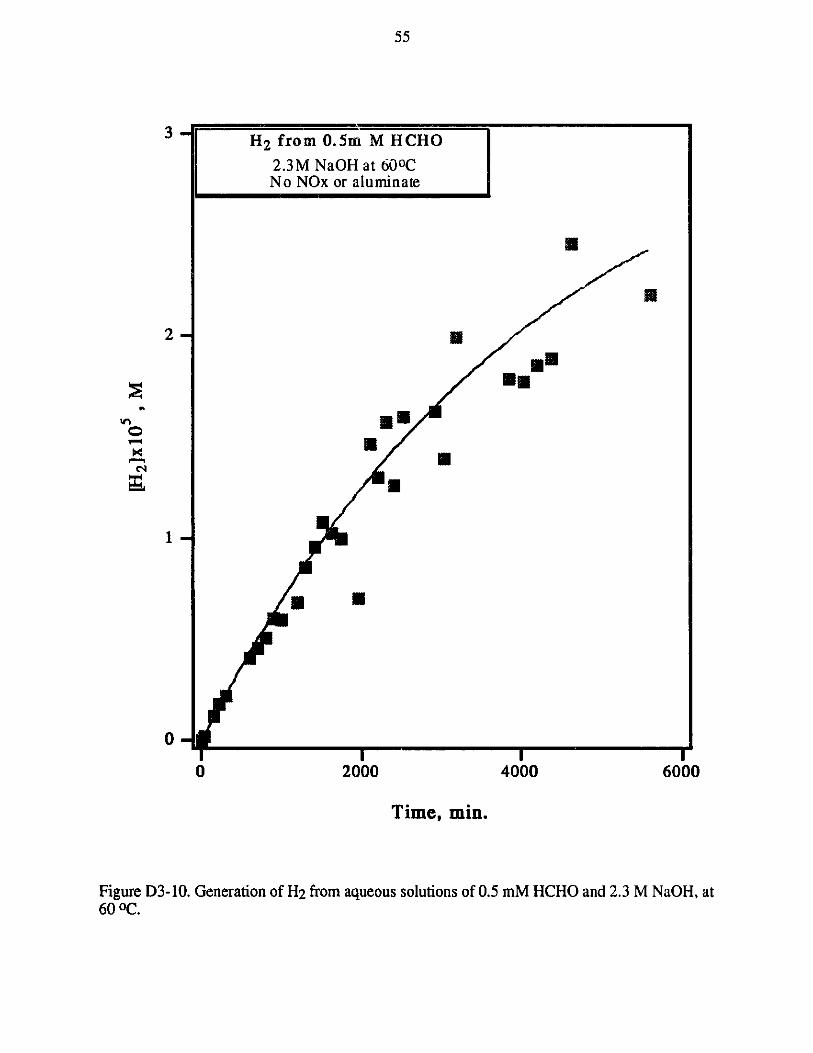
55
3 H2 from 0.5m M HCHO
2.3M NaOH at 600CNo NOx or aluminate
2-
Em
0
- Uo
1-
0-
0 2000 4000 6000
Time, min.
Figure D3-10. Generation of H2 from aqueous solutions of 0.5 mM HCHO and 2.3 M NaOH, at60 0C.
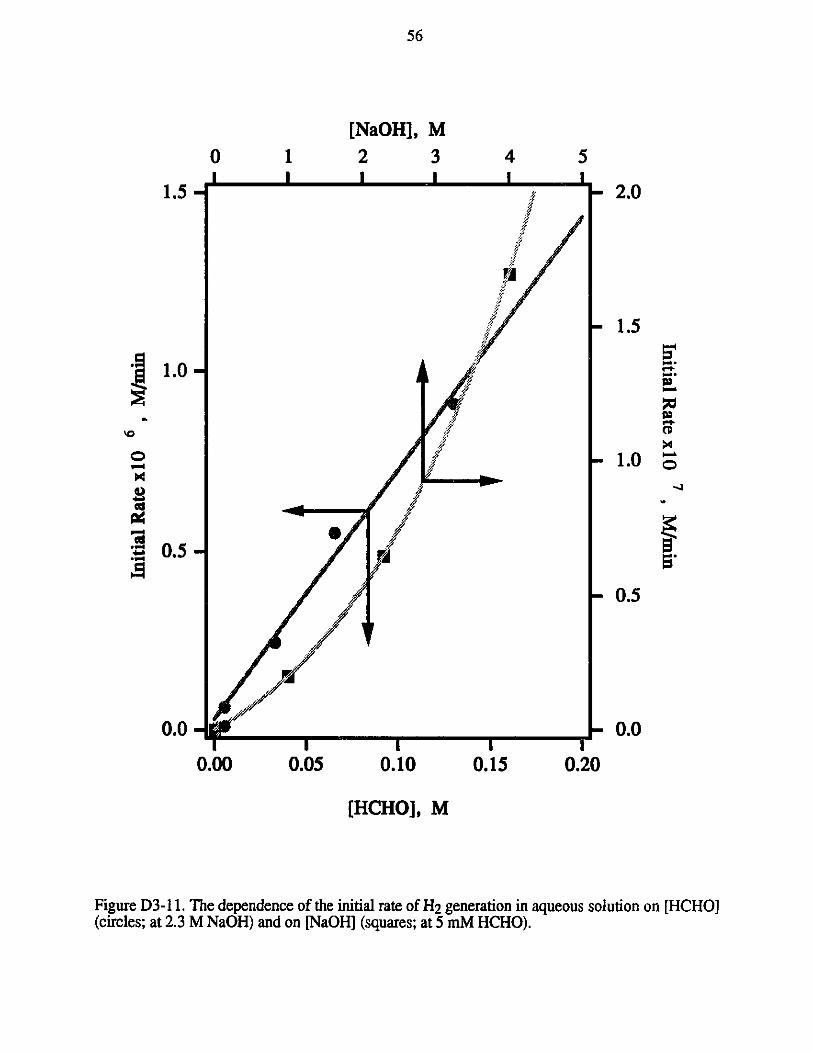
[NaOH], M2 3 5
U
I0.20
1.5 -
[HCHO], M
Figure D3-1 1. The dependence of the initial rate of H2 generation in aqueous solution on [HCHO](circles; at 2.3 M NaOH) and on [NaOH] (squares; at 5 mM HCHO).
56
0U
1I
'7o
I I4I
I1
0
0=1
1.0-
0.5-
0.0-
- 2.0
- 1.5
-1.0
- 0.5
- 0.0
0.00 0.05 0.10I0
0.15
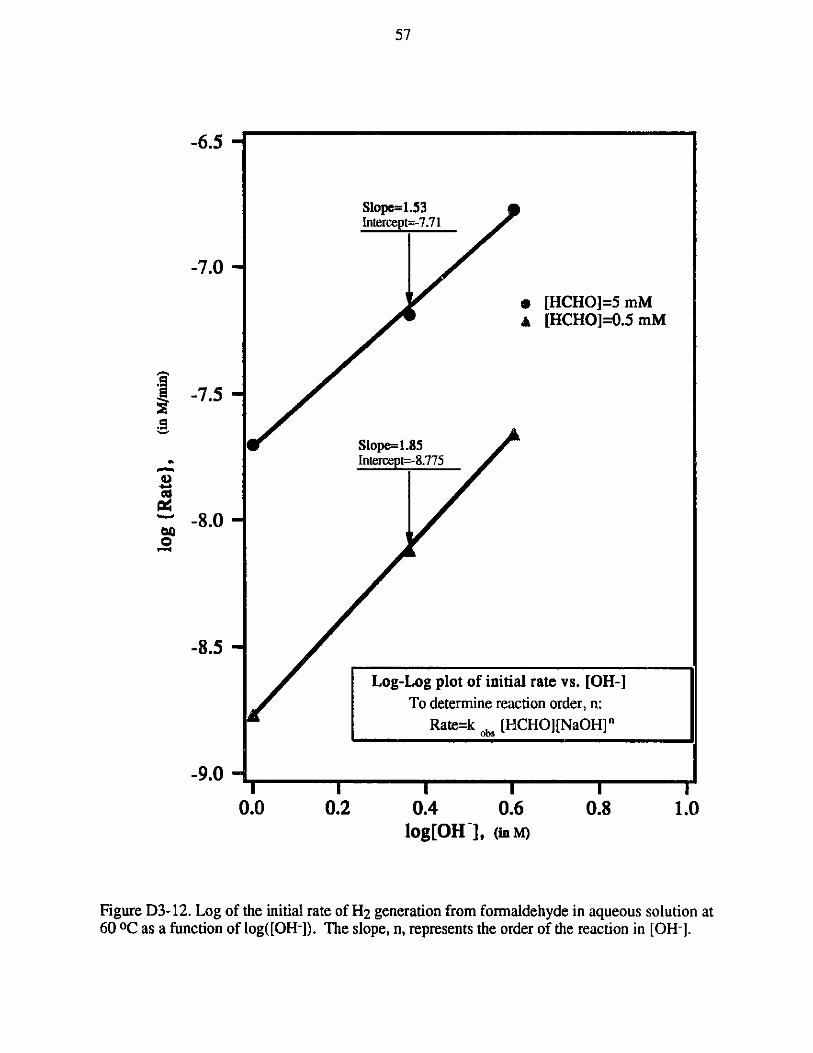
57
-6.5 -
-7.0 -
-7.5 -
I I0.4 0.6
log[OH], (inM)
* [HCHO]=5 mM& [HCHO]=0.5 mM
Slope=1.53Intercept=-7.71
Slope=1.85Intercept=-8.775
Log-Log plot of initialTo determine reac
Rate=k obs [HC
I00.8
Figure D3-12. Log of the initial rate of H2 generation from formaldehyde in aqueous solution at60 OC as a function of log([OH-]). The slope, n, represents the order of the reaction in [OH-].
1 rate vs. [OH-]ion order, n:
HO][NaOH]"
0 -8.0 -
-8.5 -
-9.0 -I0
0.0 0.2I
1.0
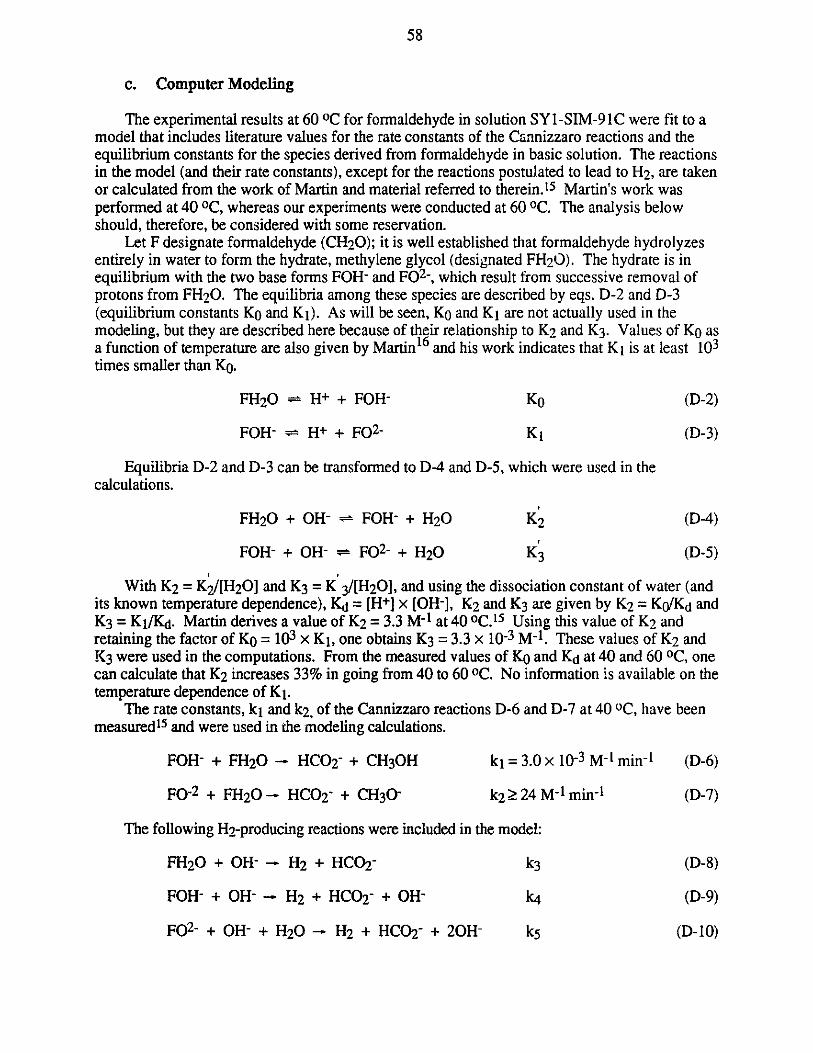
58
c. Computer Modeling
The experimental results at 60 0C for formaldehyde in solution SY1-SIM-91C were fit to amodel that includes literature values for the rate constants of the Cannizzaro reactions and theequilibrium constants for the species derived from formaldehyde in basic solution. The reactionsin the model (and their rate constants), except for the reactions postulated to lead to H2 , are takenor calculated from the work of Martin and material referred to therein. 15 Martin's work wasperformed at 40 OC, whereas our experiments were conducted at 60OC. The analysis belowshould, therefore, be considered with some reservation.
Let F designate formaldehyde (CH20); it is well established that formaldehyde hydrolyzesentirely in water to form the hydrate, methylene glycol (designated FH20). The hydrate is inequilibrium with the two base forms FOH- and F02-, which result from successive removal ofprotons from FH20. The equilibria among these species are described by eqs. D-2 and D-3(equilibrium constants K and K1 ). As will be seen, K0 and Ki are not actually used in themodeling, but they are described here because of their relationship to K2 and K3. Values of K asa function of temperature are also given by Martin1 6 and his work indicates that KI is at least 103times smaller than K0.
FH20 - H+ + FOH- K0 (D-2)
FOH- H+ + F02- KI (D-3)
Equilibria D-2 and D-3 can be transformed to D-4 and D-5, which were used in thecalculations.
FH20 + OH- FOH- + H20 K2 (D-4)
FOH- + OH- F02 - + H20 K3 (D-5)
With K2 = K/[H20J and K3 = K'3/[H 2 0], and using the dissociation constant of water (andits known temperature dependence), Kj = [H+J x [OH-], K2 and K3 are given by K2 = KO/Kd andK3 = Ki/Kd. Martin derives a value of K2 = 3.3 M-1 at 400C.15 Using this value of K2 andretaining the factor of KO = 103 x KI, one obtains K3 = 3.3 x 10⁻³ M-1 . These values of K2 andK3 were used in the computations. From the measured values of K0 and Kd at 40 and 60 0C, onecan calculate that K2 increases 33% in going from 40 to 60 0C. No information is available on thetemperature dependence of KI.
The rate constants, ki and k2, of the Cannizzaro reactions D-6 and D-7 at 40 OC, have beenmeasured1 5 and were used in the modeling calculations.
FOH- + FH20 - HC02- + CH30H kI = 3.0 x 10⁻³ M-1 min-I (D-6)
FO-2 + FH20 - HCO2- + CH30- k2> 24 M-1 min- (D-7)
The following H2-producing reactions were included in the model:
FH20 + OH- - H2 + HCO2 - k3 (D-8)
FOH- + OH- - H2 + HCO2 - + OH- k4 (D-9)
F02- + OH- + H2O-R H2 + HCO 2- +2OH- (D-10)
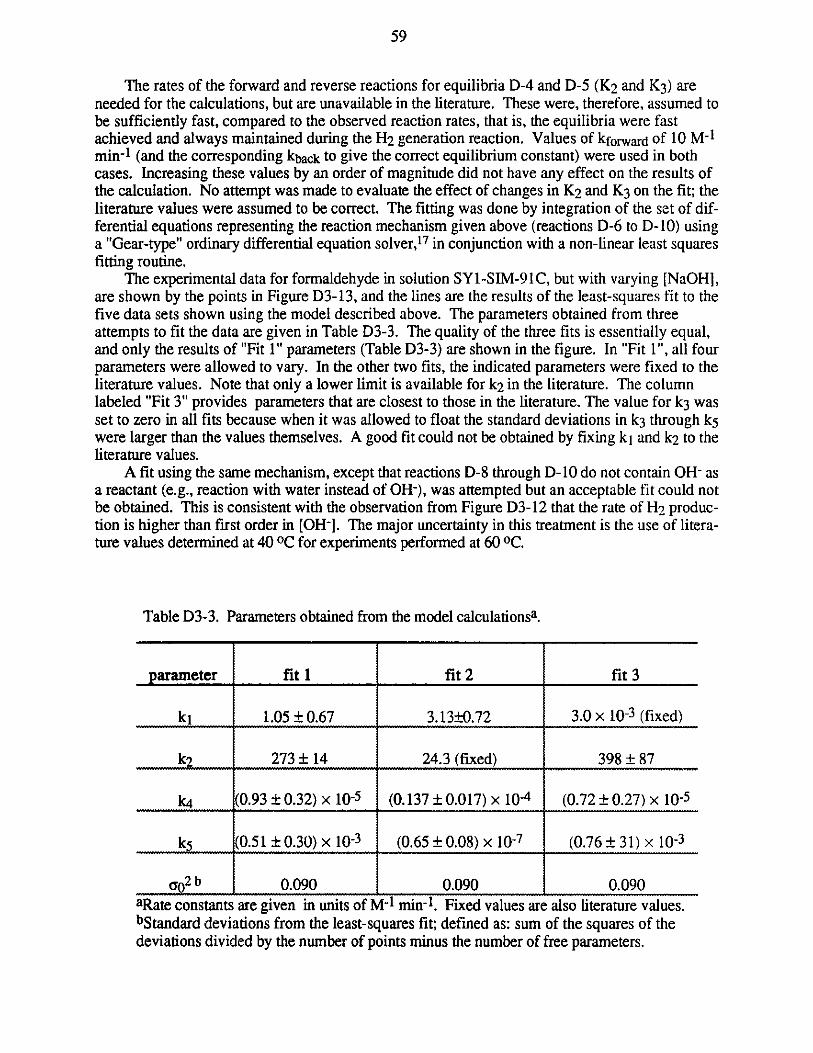
59
The rates of the forward and reverse reactions for equilibria D-4 and D-5 (K 2 and K3) areneeded for the calculations, but are unavailable in the literature. These were, therefore, assumed tobe sufficiently fast, compared to the observed reaction rates, that is, the equilibria were fastachieved and always maintained during the H2 generation reaction. Values of kforward of 10 M- 1
min-1 (and the corresponding kback to give the correct equilibrium constant) were used in bothcases. Increasing these values by an order of magnitude did not have any effect on the results ofthe calculation. No attempt was made to evaluate the effect of changes in K2 and K3 on the fit; theliterature values were assumed to be correct. The fitting was done by integration of the set of dif-ferential equations representing the reaction mechanism given above (reactions D-6 to D- 10) usinga "Gear-type" ordinary differential equation solver,17 in conjunction with a non-linear least squaresfitting routine.
The experimental data for formaldehyde in solution SY1-SIM-91C, but with varying [NaOHJ,are shown by the points in Figure D3-13, and the lines are the results of the least-squares fit to thefive data sets shown using the model described above. The parameters obtained from threeattempts to fit the data are given in Table D3-3. The quality of the three fits is essentially equal,and only the results of "Fit 1" parameters (Table D3-3) are shown in the figure. In "Fit 1", all fourparameters were allowed to vary. In the other two fits, the indicated parameters were fixed to theliterature values. Note that only a lower limit is available for k2 in the literature. The columnlabeled "Fit 3" provides parameters that are closest to those in the literature. The value for k3 wasset to zero in all fits because when it was allowed to float the standard deviations in k3 through k5were larger than the values themselves. A good fit could not be obtained by fixing k and k2 to theliterature values.
A fit using the same mechanism, except that reactions D-8 through D- 10 do not contain OH- asa reactant (e.g., reaction with water instead of OH-), was attempted but an acceptable fit could notbe obtained. This is consistent with the observation from Figure D3-12 that the rate of H2 produc-tion is higher than first order in [OH-]. The major uncertainty in this treatment is the use of litera-ture values determined at 40 0C for experiments performed at 60 OC.
Table D3-3. Parameters obtained from the model calculationsa.
parameter fit 1 fit 2 fit 3
ki 1.05 0.67 3.13 0.72 3.0 x 10⁻³ (fixed)
273 14 24.3 (fixed) 398 87
k4_(0.93 0.32) x 10-5 (0.137 0.017) x 10-4 (0.72 0.27) x 10-5
k5 (0.51 0.30) x 10-3 (0.65 0.08) x 10-7 (0.76 31) x 10-3
a02 b 0.090 0.090 0.090
aRate constants are given in units of M-1 min-1. Fixed values are also literature values.bStandard deviations from the least-squares fit; defined as: sum of the squares of thedeviations divided by the number of points minus the number of free parameters.
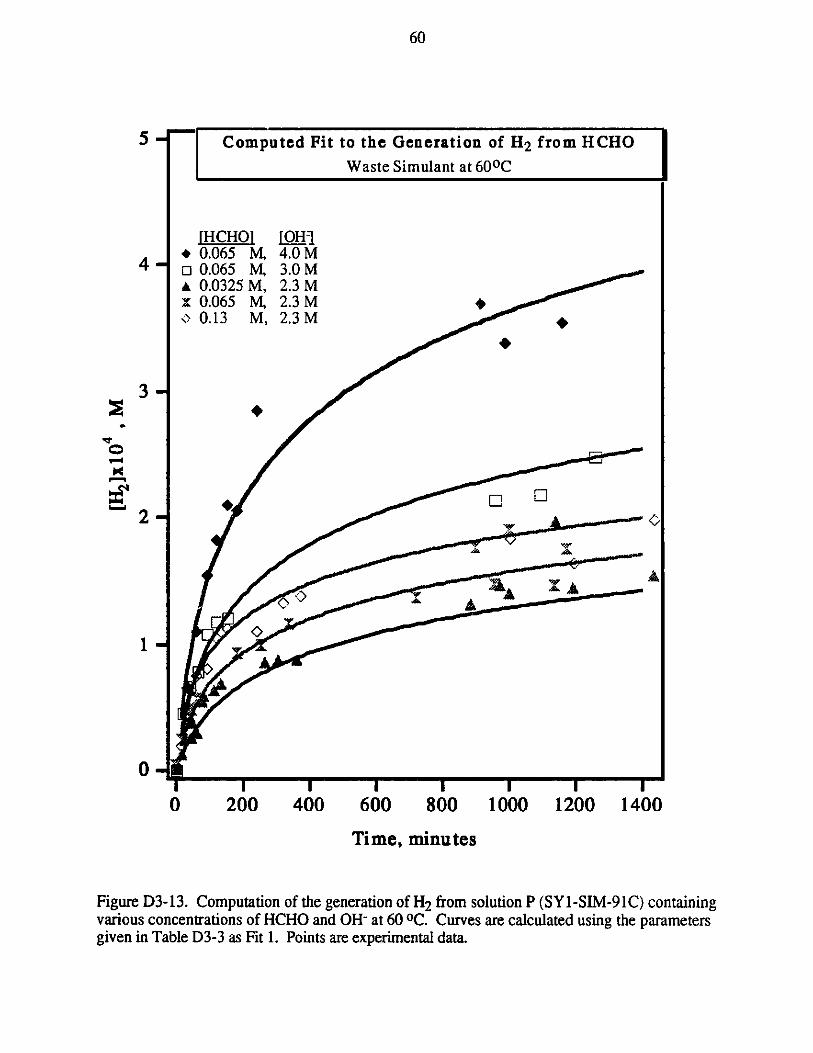
60
5 Computed Fit to the Generation of H2 from HCHO
Waste Simulant at 600 C
[HCHO1 [OH]+*0.065 M, 4.0 M
4 o 0.065 M, 3.0 MA 0.0325 M, 2.3 Mx 0.065 M, 2.3 MC 0.13 M, 2.3 M
3
20
AA
0-
0 200 400 600 800 1000 1200 1400
Time, minutes
Figure D3-13. Computation of the generation of H2 from solution P (SY1-SIM-91C) containingvarious concentrations of HCHO and OH- at 600GC. Curves are calculated using the parametersgiven in Table D3-3 as Fit 1. Points are experimental data.
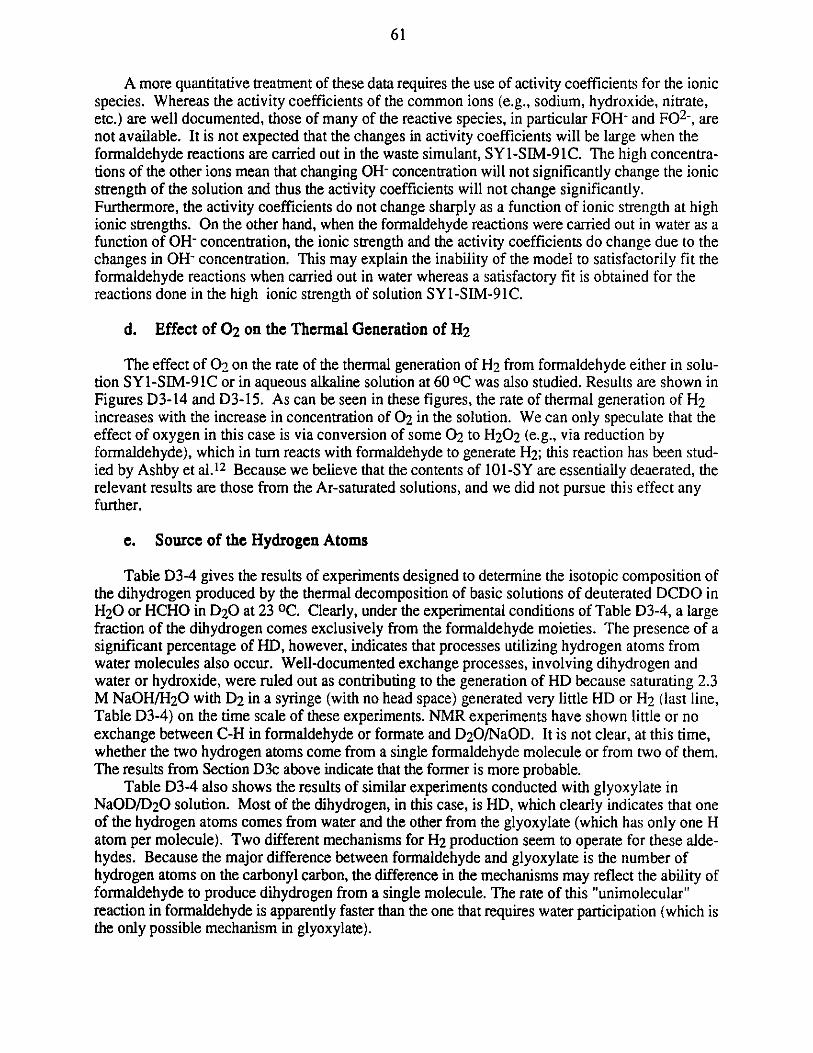
61
A more quantitative treatment of these data requires the use of activity coefficients for the ionicspecies. Whereas the activity coefficients of the common ions (e.g., sodium, hydroxide, nitrate,etc.) are well documented, those of many of the reactive species, in particular FOH- and F0 2-, arenot available. It is not expected that the changes in activity coefficients will be large when theformaldehyde reactions are carried out in the waste simulant, SY1-SIM-91C. The high concentra-tions of the other ions mean that changing OH- concentration will not significantly change the ionicstrength of the solution and thus the activity coefficients will not change significantly.Furthermore, the activity coefficients do not change sharply as a function of ionic strength at highionic strengths. On the other hand, when the formaldehyde reactions were carried out in water as afunction of OH- concentration, the ionic strength and the activity coefficients do change due to thechanges in OH- concentration. This may explain the inability of the model to satisfactorily fit theformaldehyde reactions when carried out in water whereas a satisfactory fit is obtained for thereactions done in the high ionic strength of solution SYL-SIM-91C.
d. Effect of 02 on the Thermal Generation of H2
The effect of 02 on the rate of the thermal generation of H2 from formaldehyde either in solu-tion SY1-SIM-91C or in aqueous alkaline solution at 60 OC was also studied. Results are shown inFigures D3-14 and D3-15. As can be seen in these figures, the rate of thermal generation of H2increases with the increase in concentration of 02 in the solution. We can only speculate that theeffect of oxygen in this case is via conversion of some 02 to H202 (e.g., via reduction byformaldehyde), which in turn reacts with formaldehyde to generate H2; this reaction has been stud-ied by Ashby et al.12 Because we believe that the contents of 101-SY are essentially deaerated, therelevant results are those from the Ar-saturated solutions, and we did not pursue this effect anyfurther.
e. Source of the Hydrogen Atoms
Table D3-4 gives the results of experiments designed to determine the isotopic composition ofthe dihydrogen produced by the thermal decomposition of basic solutions of deuterated DCDO inH20 or HCHO in D 20 at 23 OC. Clearly, under the experimental conditions of Table D3-4, a largefraction of the dihydrogen comes exclusively from the formaldehyde moieties. The presence of asignificant percentage of HD, however, indicates that processes utilizing hydrogen atoms fromwater molecules also occur. Well-documented exchange processes, involving dihydrogen andwater or hydroxide, were ruled out as contributing to the generation of HD because saturating 2.3M NaOH/H20 with D2 in a syringe (with no head space) generated very little HD or H2 (last line,Table D3-4) on the time scale of these experiments. NMR experiments have shown little or noexchange between C-H in formaldehyde or formate and D20/NaOD. It is not clear, at this time,whether the two hydrogen atoms come from a single formaldehyde molecule or from two of them.The results from Section D3c above indicate that the former is more probable.
Table D3-4 also shows the results of similar experiments conducted with glyoxylate inNaOD/D20 solution. Most of the dihydrogen, in this case, is HD, which clearly indicates that oneof the hydrogen atoms comes from water and the other from the glyoxylate (which has only one Hatom per molecule). Two different mechanisms for H2 production seem to operate for these alde-hydes. Because the major difference between formaldehyde and glyoxylate is the number ofhydrogen atoms on the carbonyl carbon, the difference in the mechanisms may reflect the ability offormaldehyde to produce dihydrogen from a single molecule. The rate of this "unimolecular"reaction in formaldehyde is apparently faster than the one that requires water participation (which isthe only possible mechanism in glyoxylate).
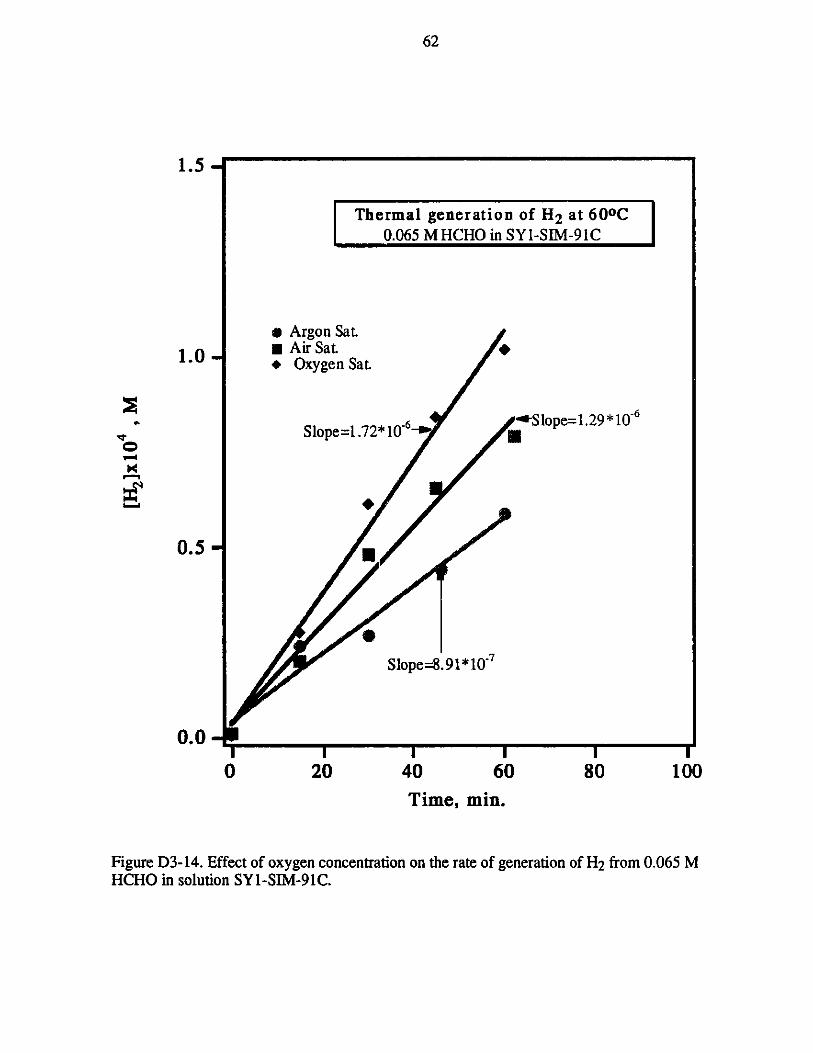
62
1.5
Thermal generation of H2 at 600C0.065 M HCHO in SYl-SIM-91C
* Argon Sat.
1.0 *mAir Sat.- ' + Oxygen Sat.
6
Sl 172*l06 * Slope=1.29*106
0.5 U
Slope=8.91*10~7
0.0I I I I I
0 20 40 60 80 100
Time, min.
Figure D3-14. Effect of oxygen concentration on the rate of generation of H2 from 0.065 MHCHO in solution SY1-SIM-91C.
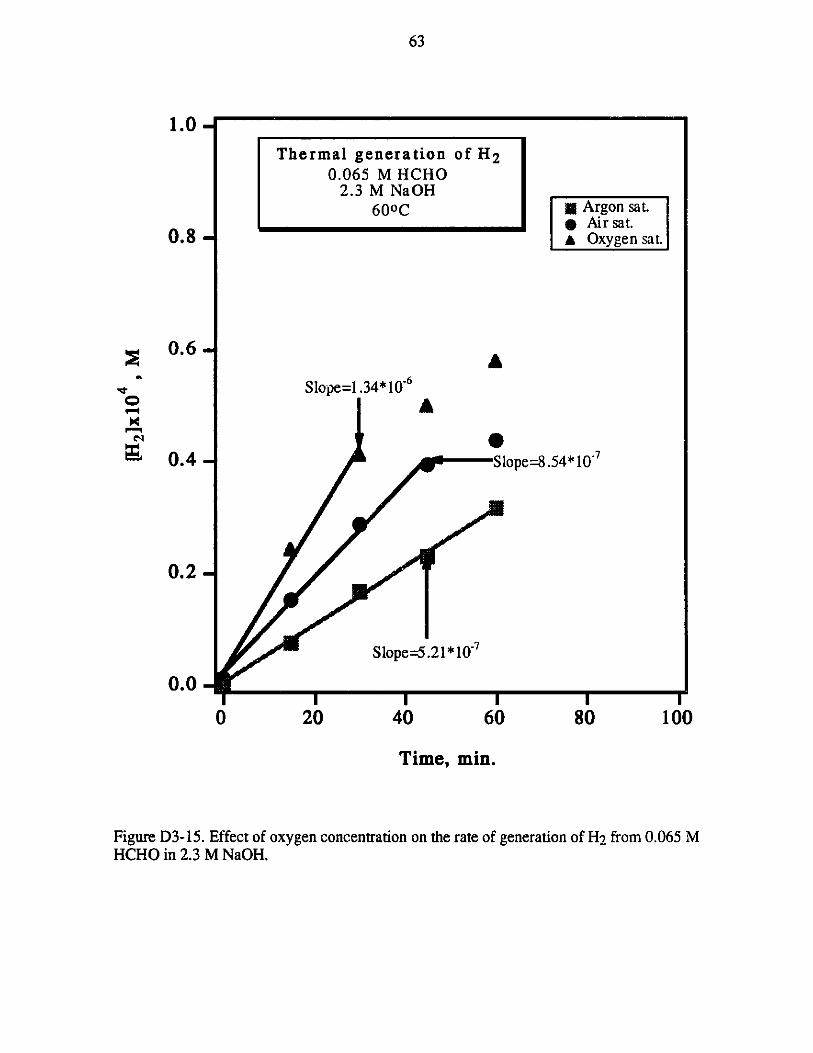
63
1.0
Thermal generation of H20.065 M HCHO
2.3 M NaOH600C M Argon sat.
1 1 Air sat.0.8 A Oxygen sat.
0.6 A
Slope=1.34*10-6A
0.4 Slope=8.54*10 4
0.2
Slope=5.21*107
0.0
0 20 40 60 80 100
Time, min.
Figure D3-15. Effect of oxygen concentration on the rate of generation of H2 from 0.065 MHCHO in 2.3 M NaOH.
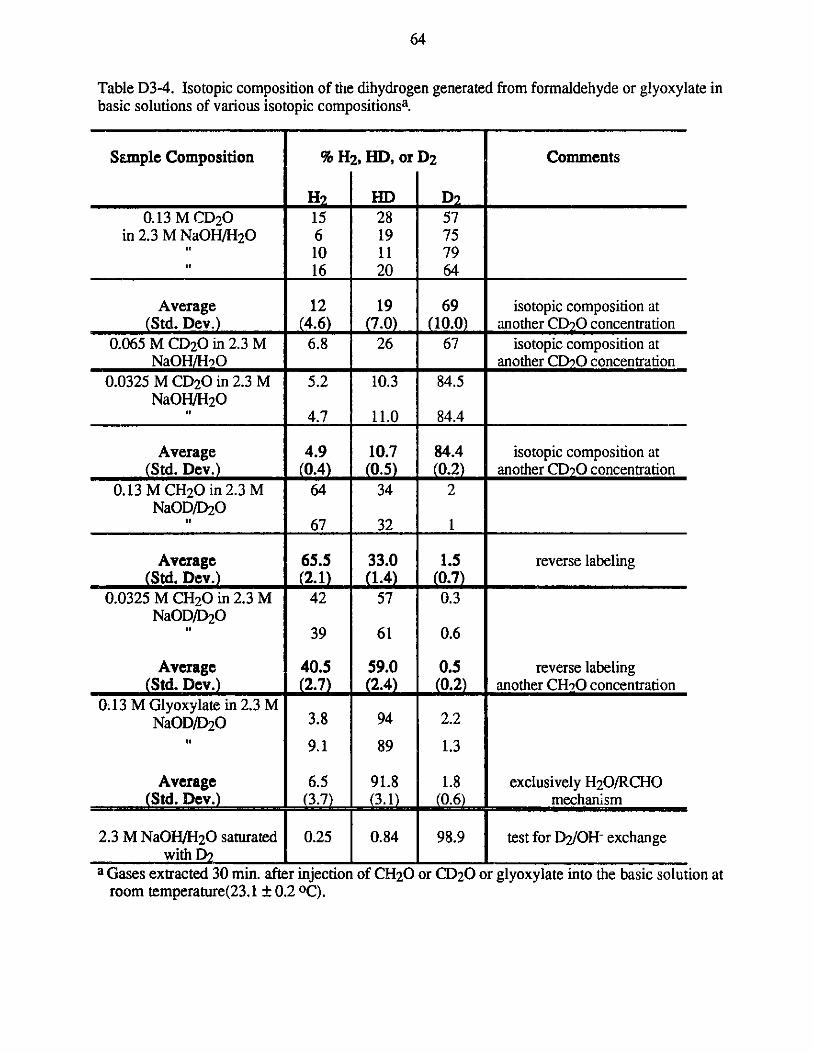
64
Table D3-4. Isotopic composition of the dihydrogen generated from formaldehyde or glyoxylate inbasic solutions of various isotopic compositionsa.
Sample Composition % H2, HD, or D2 Comments
H2 HD D2
0.13 M CD20 15 28 57in 2.3 M NaOH/H20 6 19 75
10 11 79"_16 20 64
Average 12 19 69 isotopic composition at(Std. Dev.) (4.6) (7.0) (10.0) another CD2O concentration
0.065 M CD2O in 2.3 M 6.8 26 67 isotopic composition atNaOH/H20 another CD2O concentration
0.0325 M CD20 in 2.3 M 5.2 10.3 84.5NaOH/H20
"1 _4.7 11.0 84.4
Average 4.9 10.7 84.4 isotopic composition at(Std. Dev.) (0.4) (0.5) (0.2) another CD2O concentration
0.13 M CH20 in 2.3 M 64 34 2NaOD/D20
"t _67 32 1
Average 65.5 33.0 1.5 reverse labeling(Std. Dev.) (2.1) (1.4) (0.7)
0.0325 M CH20 in 2.3 M 42 57 0.3NaOD/D20
"o39 61 0.6
Average 40.5 59.0 0.5 reverse labeling(Std. Dev.) (2.7) (2.4) (0.2) another CH20 concentration
0.13 M Glyoxylate in 2.3 MNaOD/D20 3.8 94 2.2
"f9.1 89 1.3
Average 6.5 91.8 1.8 exclusively H20/RCHO(Std. Dev.) (3.7) (3.1) (0.6) mechanism
2.3 M NaOH/H20 saturated 0.25 0.84 98.9 test for D2/OH- exchangewith 2j___
a Gases extracted 30 min. after injection of CH20 or CD20 or glyoxylate into the basic solution atroom temperature(23.1 0.2 OC).
65
f. Effect of "Minor" Components on H2 Generation From Formaldehyde
Figure D3-16 shows the rates of thermal generation of H2 from SY1-SIM-91C solutionscontaining formaldehyde and 5.0 mM Cr(N03)3, 1.0 mM K2PtC16, 1.0 mM K2PdC16 , 0.25 MNaCl, 0.05 M NaF. The effects of these minor components on the radiolytic generation of H2 isdiscussed in detail in Section E. The rates are quite comparable to the rates obtained above forSY1-SIM-91C solution containing formaldehyde only and no unusual behavior was encountered inthe extraction procedure. This supports the conclusion reached in Section E that the "retention" ofH2 observed in irradiated solutions results from the radiolytic reduction of the Pd(IV) ions.
4. Conclusions
Formaldehyde is a well-documented degradation product of the original chelators that wereplaced in the tank. Formaldehyde does not affect the thermal generation of N20, but it doesthermally generate H2 in the waste simulants and in concentrated NaOH solutions. Rate laws forthe direct generation of H2 from formaldehyde were derived along with their corresponding rateconstants and their temperature dependencies (i.e., activation energies) were determined. Isotopiccomposition studies show that a major source of both H atoms in the hydrogen molecule is theformaldehyde (i.e., little from the water). The observation that the reaction is first order informaldehyde suggests that a single formaldehyde molecule is involved in the generation of oneH2 molecule. In clear distinction to the formaldehyde reaction, one H atom comes from water andthe other from glyoxylate, in the case of glyoxalate.
Oxygen enhances H2 generation from formaldehyde, but Tank 101-SY is presumed to beessentially deaerated. The minor components (Cr(III), Pt(IV), Pd(IV), Cl-, and F-) do not affectthe thermal generation of H2 from formaldehyde in the standard solution, neither do the highconcentrations of nitrate, nitrite, and aluminate. Since paraformaldehyde is absent from thesystems under study, and trioxane is very slow in H2 generation, these two formaldehydepolymers are not important in that reaction.
E. EFFECT OF MINOR COMPONENTS
1. Introduction
Studies at PNL18 indicate that components of the waste that were considered relatively inertmay have a significant effect on the composition of the gases generated. These components includetransition metal ions, in particular Cr(III), Fe(III), Pd(IV), and Pt(IV), as well as halide ions (Cl-,F-). In this section we explore the effect of these "minor" components on the radiolytic yields ofH2 and N20. Our studies so far have established that radiolytic degradation products are veryefficient in the thermal generation of H2 and N20. These thermal processes, induced by radiolyticdegradation products, may be significantly affected by the presence of small quantities of the minorcomponents as these thermal processes occur on time scales that are longer than those consideredin the pure radiolytic mechanisms. It is possible, therefore, that the presence of the above-mentioned minor components in the nuclear waste may change the course of degradation processes(e.g., via complexation with the chelators). We have, therefore, studied the effects of the minorcomponents on the thermal rate of H2 and N20 generation as well.
We find no catalytic enhancement of either the radiolytic or thermal generation rates. Perhapssurprisingly, we observe that H2 is retained in the solution or slurry by a degradation product ofPd ions (probably metallic Pd). Cr(III) ions reduce the radiolytic yield of N20 but not the rate ofthermal generation of N20.
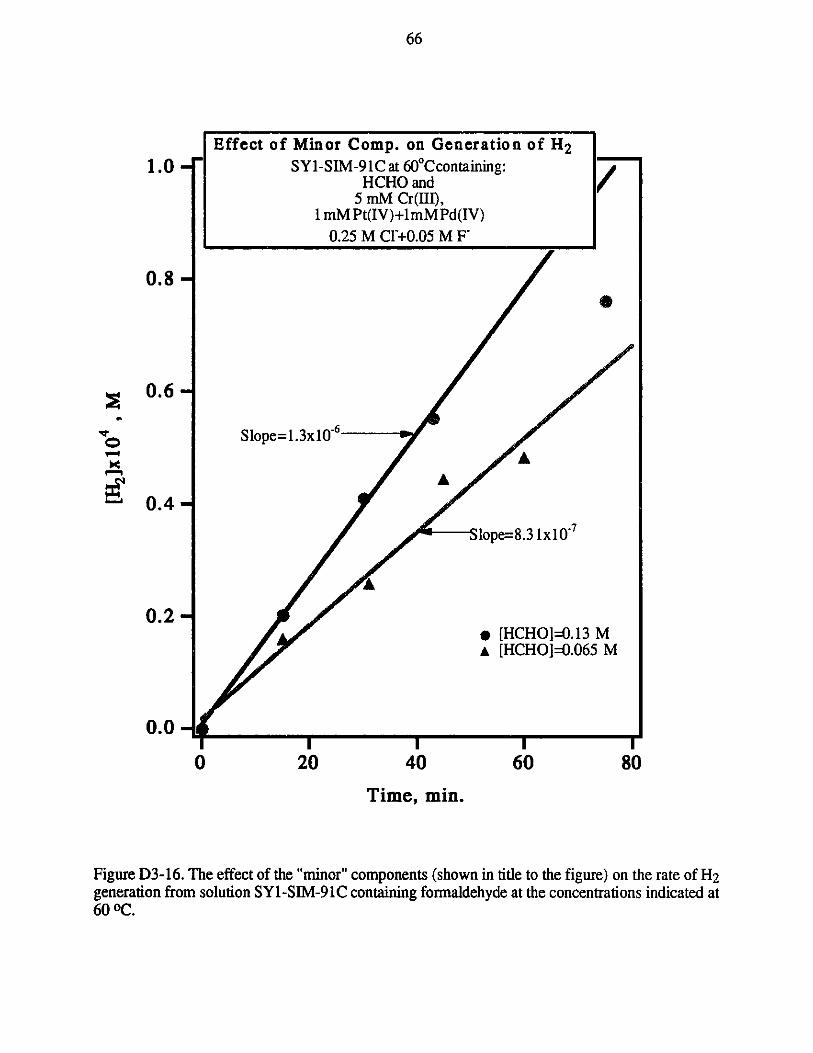
66
Effect of Minor Comp. on Generation of H2
1.0 - SY1-SIM-91C at 60*Ccontaining:H CHO and
5 mM Cr(III),1mM Pt(IV)+lmMPd(IV)
0.25 M C1+0.05 M F
0.8
0.6
Slope=1.3x10⁻⁶
0.4
lope=8.3 1x10⁷
0.2* [HCHO]=0.13 M
A [HCHO=0.065 M
0.0
0 20 40 60 80
Time, min.
Figure D3-16. The effect of the "minor" components (shown in title to the figure) on the rate of H2generation from solution SYl-SIM-91C containing formaldehyde at the concentrations indicated at60 0C.
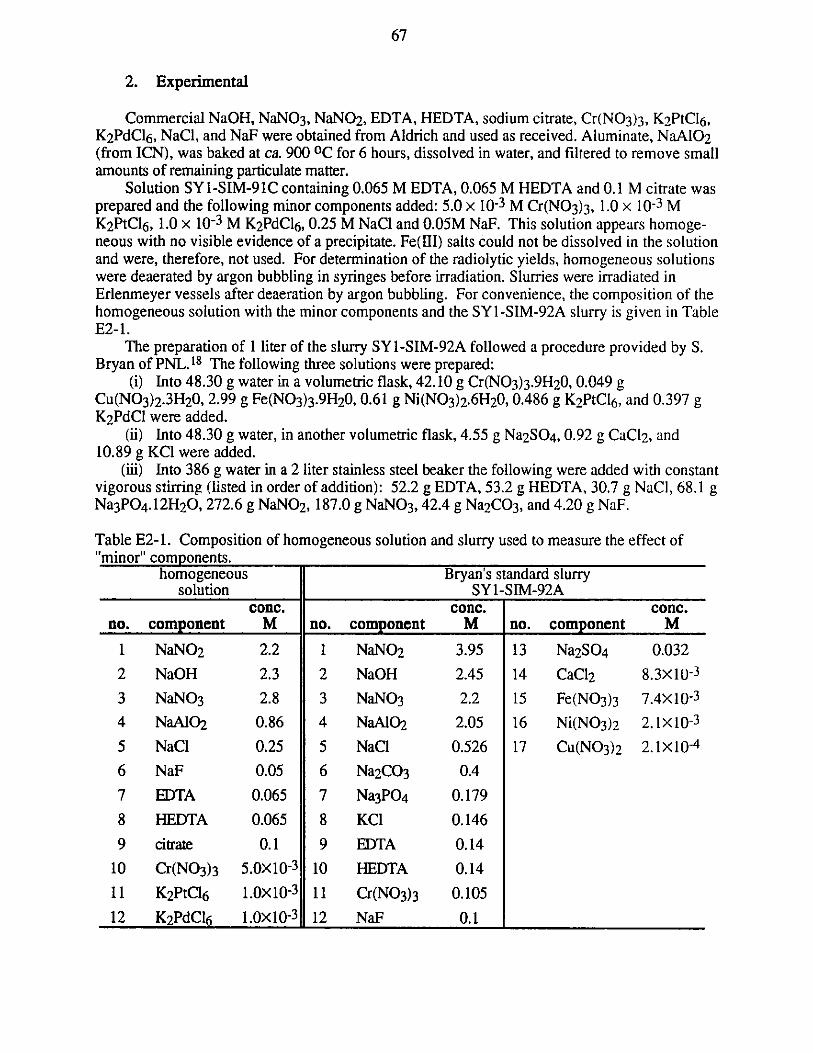
67
2. Experimental
Commercial NaOH, NaNO3, NaNO2, EDTA, HEDTA, sodium citrate, Cr(N03)3, K2PtCl6,K2PdCl6 , NaCl, and NaF were obtained from Aldrich and used as received. Aluminate, NaAlO2(from ICN), was baked at ca. 900 OC for 6 hours, dissolved in water, and filtered to remove smallamounts of remaining particulate matter.
Solution SY1-SIM-91C containing 0.065 M EDTA, 0.065 M HEDTA and 0.1 M citrate wasprepared and the following minor components added: 5.0 x 10- 3 M Cr(N0 3 )3 , 1.0 x 10⁻³ MK2PtCl6 , 1.0 X 10⁻³ M K2PdCl6, 0.25 M NaCi and 0.05M NaF. This solution appears homoge-neous with no visible evidence of a precipitate. Fe(III) salts could not be dissolved in the solutionand were, therefore, not used. For determination of the radiolytic yields, homogeneous solutionswere deaerated by argon bubbling in syringes before irradiation. Slurries were irradiated inErlenmeyer vessels after deaeration by argon bubbling. For convenience, the composition of thehomogeneous solution with the minor components and the SY1-SIM-92A slurry is given in TableE2-1.
The preparation of 1 liter of the slurry SY1-SIM-92A followed a procedure provided by S.Bryan of PNL. 18 The following three solutions were prepared:
(i) Into 48.30 g water in a volumetric flask, 42.10 g Cr(N03)3.9H 20, 0.049 gCu(N0 3)2.3H 20, 2.99 g Fe(N0 3)3 .9H20, 0.61 g Ni(N0 3)2.6H20, 0.486 g K2 PtCl6, and 0.397 gK2 PdCl were added.
(ii) Into 48.30 g water, in another volumetric flask, 4.55 g Na2SO4, 0.92 g CaCl2, and10.89 g KCl were added.
(iii) Into 386 g water in a 2 liter stainless steel beaker the following were added with constantvigorous stirring (listed in order of addition): 52.2 g EDTA, 53.2 g HEDTA, 30.7 g NaCl, 68.1 gNa3PO4.12H 20, 272.6 g NaNO2, 187.0 g NaNO 3, 42.4 g Na2CO3, and 4.20 g NaF.
Table E2- 1. Composition of homogeneous solution"minor" components.
and slurry used to measure the effect of
homogeneous Bryan's standard slurrysolution SY 1-SIM-92A
conc. conc. conc.no. component M no. component M no. component M
1 NaNO2 2.2 1 NaNO2 3.95 13 Na2SO4 0.032
2 NaOH 2.3 2 NaOH 2.45 14 CaCl2 8.3X10- 3
3 NaNO3 2.8 3 NaNO3 2.2 15 Fe(N03) 3 7.4X10⁻³
4 NaA1O2 0.86 4 NaA1O2 2.05 16 Ni(N0 3)2 2.1x10⁻³
5 NaCl 0.25 5 NaCl 0.526 17 Cu(N0 3)2 2.1x10⁻⁴
6 NaF 0.05 6 Na2CO3 0.4
7 EDTA 0.065 7 Na3PO4 0.179
8 HEDTA 0.065 8 KCl 0.146
9 citrate 0.1 9 EDTA 0.14
10 Cr(N03)3 5.0X10⁻³ 10 HEDTA 0.14
11 K2PtC16 1.0X10⁻³ 11 Cr(N03)3 0.105
12 K2PdC16 1.0X10⁻³ 12 NaF 0.1
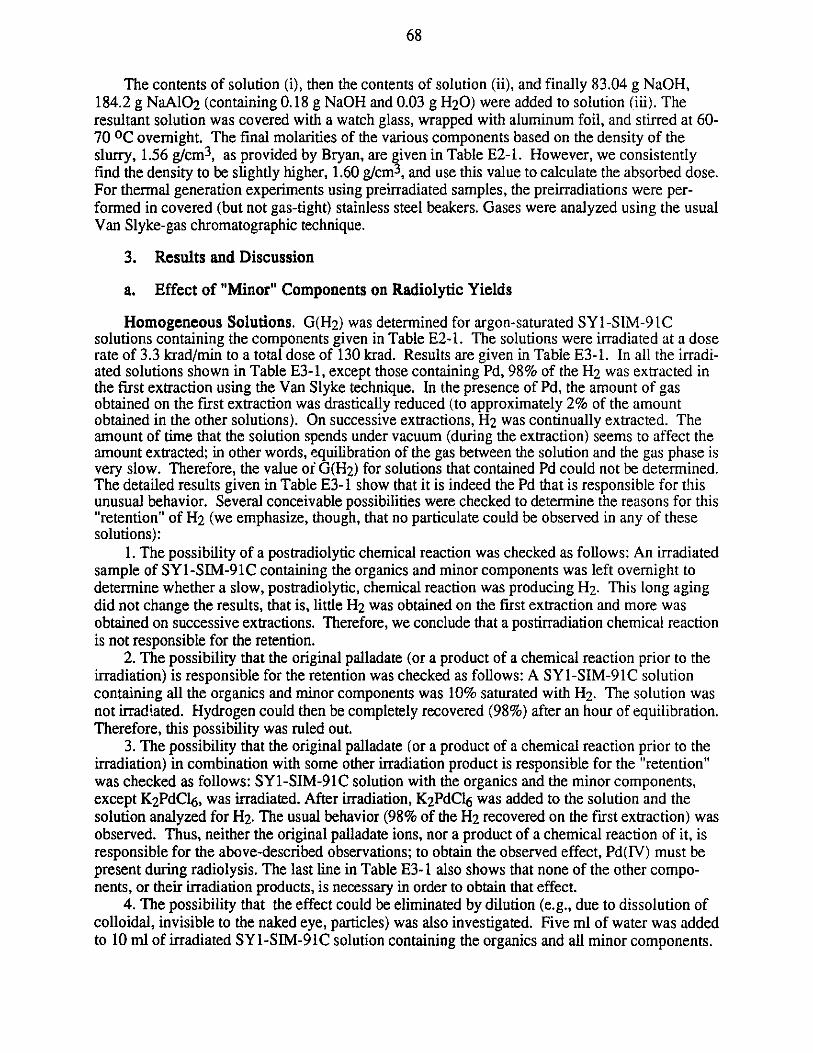
68
The contents of solution (i), then the contents of solution (ii), and finally 83.04 g NaOH,184.2 g NaAlO2 (containing 0.18 g NaOH and 0.03 g H20) were added to solution (iii). Theresultant solution was covered with a watch glass, wrapped with aluminum foil, and stirred at 60-70 0 C overnight. The final molarities of the various components based on the density of theslurry, 1.56 g/cm3, as provided by Bryan, are given in Table E2-1. However, we consistentlyfind the density to be slightly higher, 1.60 g/cm3 , and use this value to calculate the absorbed dose.For thermal generation experiments using preirradiated samples, the preirradiations were per-formed in covered (but not gas-tight) stainless steel beakers. Gases were analyzed using the usualVan Slyke-gas chromatographic technique.
3. Results and Discussion
a. Effect of "Minor" Components on Radiolytic Yields
Homogeneous Solutions. G(H2) was determined for argon-saturated SYl-SIM-91Csolutions containing the components given in Table E2-1. The solutions were irradiated at a doserate of 3.3 krad/min to a total dose of 130 krad. Results are given in Table E3-1. In all the irradi-ated solutions shown in Table E3-1, except those containing Pd, 98% of the H2 was extracted inthe first extraction using the Van Slyke technique. In the presence of Pd, the amount of gasobtained on the first extraction was drastically reduced (to approximately 2% of the amountobtained in the other solutions). On successive extractions, H2 was continually extracted. Theamount of time that the solution spends under vacuum (during the extraction) seems to affect theamount extracted; in other words, equilibration of the gas between the solution and the gas phase isvery slow. Therefore, the value of G(H2) for solutions that contained Pd could not be determined.The detailed results given in Table E3-1 show that it is indeed the Pd that is responsible for thisunusual behavior. Several conceivable possibilities were checked to determine the reasons for this"retention" of H2 (we emphasize, though, that no particulate could be observed in any of thesesolutions):
1. The possibility of a postradiolytic chemical reaction was checked as follows: An irradiatedsample of SY1-SIM-91C containing the organics and minor components was left overnight todetermine whether a slow, postradiolytic, chemical reaction was producing H2. This long agingdid not change the results, that is, little H2 was obtained on the first extraction and more wasobtained on successive extractions. Therefore, we conclude that a postirradiation chemical reactionis not responsible for the retention.
2. The possibility that the original palladate (or a product of a chemical reaction prior to theirradiation) is responsible for the retention was checked as follows: A SY1-SIM-9 IC solutioncontaining all the organics and minor components was 10% saturated with H2. The solution wasnot irradiated. Hydrogen could then be completely recovered (98%) after an hour of equilibration.Therefore, this possibility was ruled out.
3. The possibility that the original palladate (or a product of a chemical reaction prior to theirradiation) in combination with some other irradiation product is responsible for the "retention"was checked as follows: SYI-SIM-91C solution with the organics and the minor components,except K2 PdCL6, was irradiated. After irradiation, K2 PdCl6 was added to the solution and thesolution analyzed for H2. The usual behavior (98% of the H2 recovered on the first extraction) wasobserved. Thus, neither the original palladate ions, nor a product of a chemical reaction of it, isresponsible for the above-described observations; to obtain the observed effect, Pd(IV) must bepresent during radiolysis. The last line in Table E3-1 also shows that none of the other compo-nents, or their irradiation products, is necessary in order to obtain that effect.
4. The possibility that the effect could be eliminated by dilution (e.g., due to dissolution ofcolloidal, invisible to the naked eye, particles) was also investigated. Five ml of water was addedto 10 ml of irradiated SY1-SIM-91C solution containing the organics and all minor components.
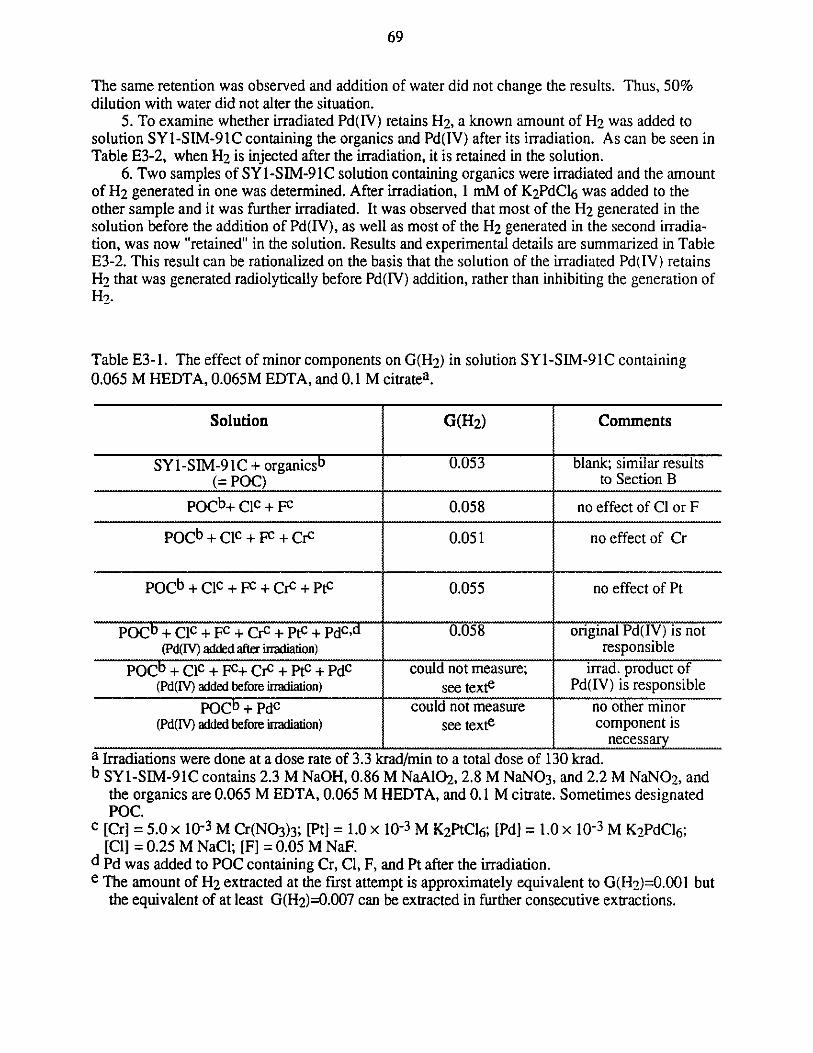
69
The same retention was observed and addition of water did not change the results. Thus, 50%dilution with water did not alter the situation.
5. To examine whether irradiated Pd(IV) retains H2, a known amount of H2 was added tosolution SY1-SIM-91C containing the organics and Pd(IV) after its irradiation. As can be seen inTable E3-2, when H2 is injected after the irradiation, it is retained in the solution.
6. Two samples of SYI-SIM-91C solution containing organics were irradiated and the amountof H2 generated in one was determined. After irradiation, 1 mM of K2PdCl6 was added to theother sample and it was further irradiated. It was observed that most of the H2 generated in thesolution before the addition of Pd(IV), as well as most of the H2 generated in the second irradia-tion, was now "retained" in the solution. Results and experimental details are summarized in TableE3-2. This result can be rationalized on the basis that the solution of the irradiated Pd(IV) retainsH2 that was generated radiolytically before Pd(IV) addition, rather than inhibiting the generation ofH 2.
Table E3-1. The effect of minor components on G(H2 ) in solution SYl-SIN4-91C containing0.065 M HEDTA, 0.065M EDTA, and 0.1 M citratea.
Solution G(H2) Comments
SY1-SIM-91C + organicsb 0.053 blank; similar results(= POC) to Section B
POCb+ Clc + FC 0.058 no effect of Cl or F
pOCb + Cic + FC + Crc 0.051 no effect of Cr
pOCb + Clc + FC + Crc + Ptc 0.055 no effect of Pt
Pocb + .c. + F + Crc + Ptc + pdcd 0.058 original Pd(IV) is not(Pd(IV) added after irradiation) responsible
pOCb + Clc + Fc+ Crc + Ptc + Pdc could not measure; irrad. product of(Pd(IV) added before irradiation) see texte Pd(IV) is responsible
POCb+ Pdc could not measure no other minor(Pd(IV) added before irradiation) see texte component is
---------------- _-----------_I-------_....ne c e ssa rya Irradiations were done at a dose rate of 3.3 krad/min to a total dose of 130 krad.b SY1-SIM-91C contains 2.3 M NaOH, 0.86 M NaA1O2, 2.8 M NaNO3, and 2.2 M NaNO2, and
the organics are 0.065 M EDTA, 0.065 M HEDTA, and 0.1 M citrate. Sometimes designatedPOC.
c [Cr] = 5.0 x 10⁻³ M Cr(N03)3; [Pt] = 1.0 x 10⁻³ M K2PtCl6; [Pd] = 1.0 x 10⁻³ M K2PdCl6 ;[Cl] = 0.25 M NaCl; [F] = 0.05 M NaF.
d Pd was added to POC containing Cr, Cl, F, and Pt after the irradiation.e The amount of H2 extracted at the first attempt is approximately equivalent to G(H2 )=0.001 but
the equivalent of at least G(H2 )=0.007 can be extracted in further consecutive extractions.
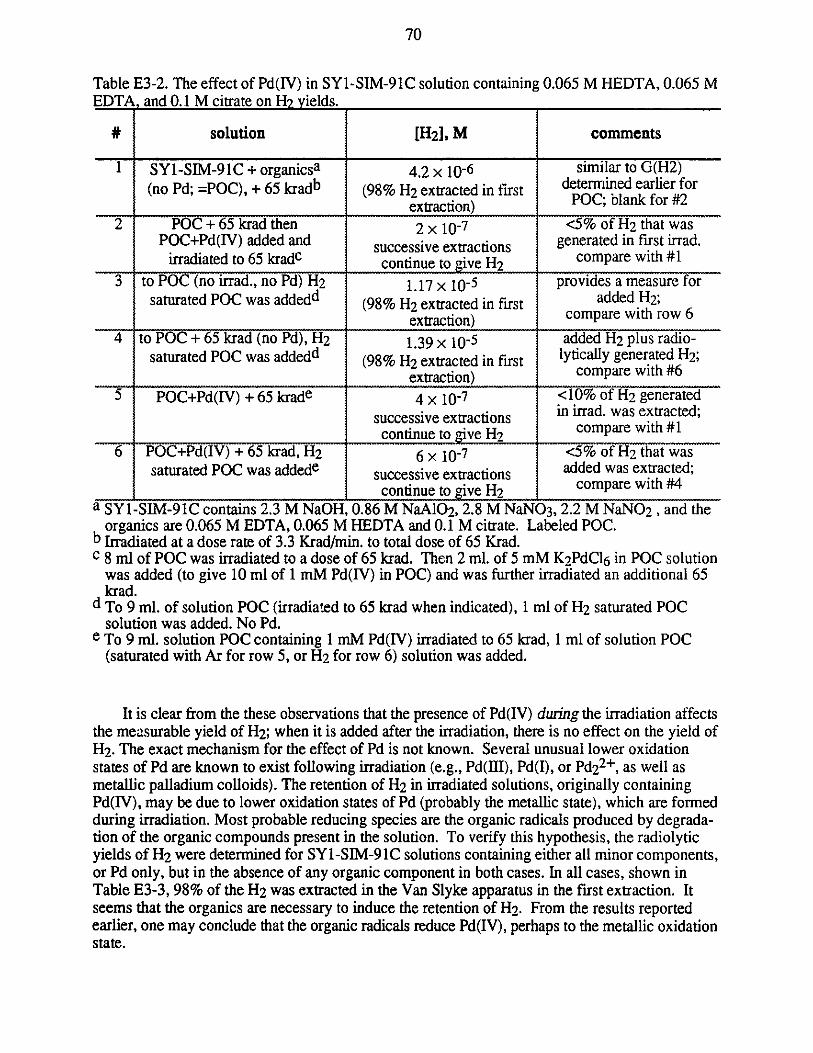
70
Table E3-2. The effect of Pd(IV) in SY1-SIM-91C solution containing 0.065 M HEDTA, 0.065 MEDTA, and 0.1 M citrate on H2 yields.
# solution [H2], M comments
I SY1-SIM-91C + organicsa 4.2 x 10⁻⁶ similar to G(H2)(no Pd; =POC), + 65 kradb (98% H2 extracted in first determined earlier for
extraction)(POC; blank for #2
2 POC + 65 krad then 2 x 10⁻⁷ <5% of H2 that wasPOC+Pd(IV) added and successive extractions generated in first irrad.
irradiated to 65 kradc continue to give H2 compare with #1
3 to POC (no irrad., no Pd) H2 1.17 x 10⁻⁵ provides a measure forsaturated POC was addedd (98% H2 extracted in first added H2;
extraction) compare with row 6
4 to POC + 65 krad (no Pd), H2 1.39 x 10⁻⁵ added H2 plus radio-saturated POC was addedd (98% H2 extracted in first lytically generated H2;
extraction) compare with #6
5 POC+Pd(IV) +65 krade 4 x 10⁻⁷ <10% of H2 generatedsuccessive extractions in irrad. was extracted;continueto___ _H2_----continu to-i---H2 compare with #1
6 P C+Pd(IV) + 65 krad, H2 6 x 10⁻⁷ <5% of H2 that wassaturated POC was addede successive extractions added was extracted;
J continue to giveH2compare with #4a SY1-SIM-91C contains 2.3 M NaOH, 0.86 M NaAlO2, 2.8 M NaNO3, 2.2 M NaNO2 , and the
organics are 0.065 M EDTA, 0.065 M HEDTA and 0.1 M citrate. Labeled POC.b Irradiated at a dose rate of 3.3 Krad/min. to total dose of 65 Krad.c 8 ml of POC was irradiated to a dose of 65 krad. Then 2 ml. of 5 mM K2PdCl6 in POC solution
was added (to give 10 ml of 1 mM Pd(IV) in POC) and was further irradiated an additional 65krad.
d To 9 ml. of solution POC (irradiated to 65 krad when indicated), 1 ml of H2 saturated POCsolution was added. No Pd.
e To 9 ml. solution POC containing 1 mM Pd(IV) irradiated to 65 krad, 1 ml of solution POC(saturated with Ar for row 5, or H2 for row 6) solution was added.
It is clear from the these observations that the presence of Pd(IV) during the irradiation affectsthe measurable yield of H2; when it is added after the irradiation, there is no effect on the yield ofH2. The exact mechanism for the effect of Pd is not known. Several unusual lower oxidationstates of Pd are known to exist following irradiation (e.g., Pd(III), Pd(I), or Pd22+, as well asmetallic palladium colloids). The retention of H2 in irradiated solutions, originally containingPd(IV), may be due to lower oxidation states of Pd (probably the metallic state), which are formedduring irradiation. Most probable reducing species are the organic radicals produced by degrada-tion of the organic compounds present in the solution. To verify this hypothesis, the radiolyticyields of H2 were determined for SY1-SIM-91C solutions containing either all minor components,or Pd only, but in the absence of any organic component in both cases. In all cases, shown inTable E3-3, 98% of the H2 was extracted in the Van Slyke apparatus in the first extraction. Itseems that the organics are necessary to induce the retention of H2. From the results reportedearlier, one may conclude that the organic radicals reduce Pd(IV), perhaps to the metallic oxidationstate.
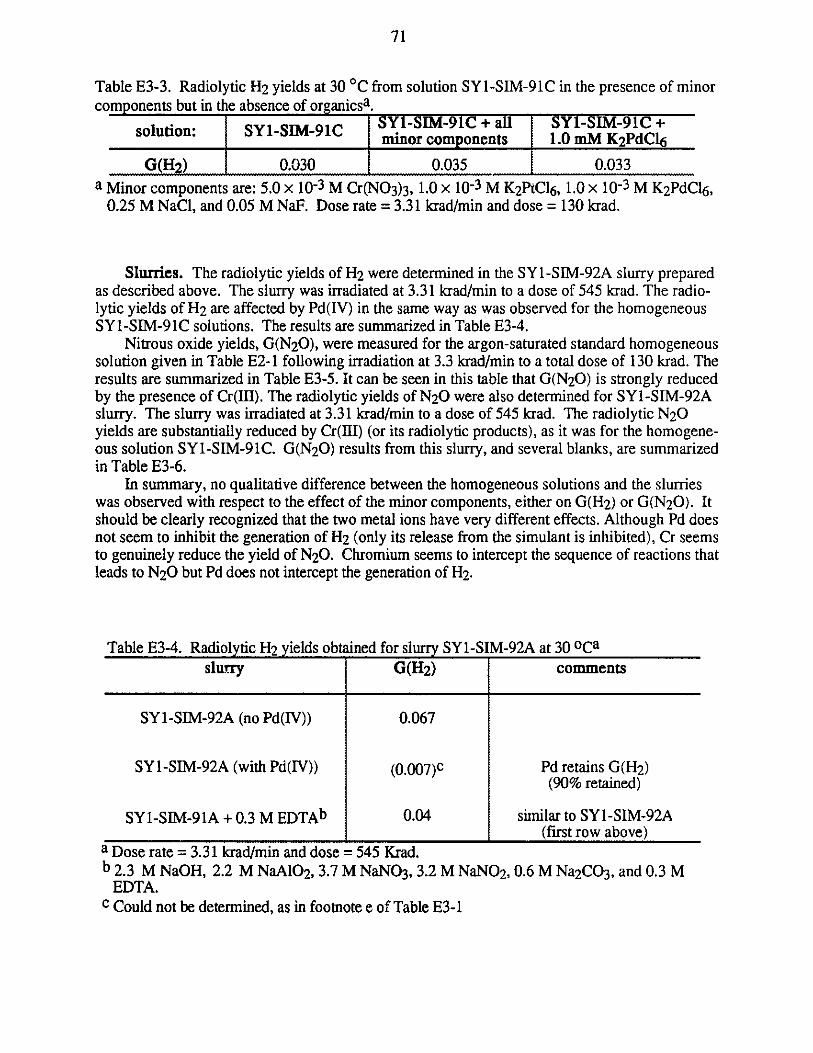
71
Table E3-3. Radiolytic H2 yields at 30 *C from solution SYl-SIM-91C in the presence of minorcomponents but in the absence of organicsa.
solution: SY1-SIM-91C SYI-SIM-91C + all SY1-SIM-91C +minor components 1.0 mM K2PdCl6
G(H2) 0.030 0.035 0.033a Minor components are: 5.0 x 10⁻³ M Cr(N03)3, 1.0 X 10⁻³ M K2PtC16, 1.0 X 10⁻³ M K2PdCl 6,
0.25 M NaCl, and 0.05 M NaF. Dose rate = 3.31 krad/min and dose = 130 krad.
Slurries. The radiolytic yields of H2 were determined in the SY1-SIM-92A slurry preparedas described above. The slurry was irradiated at 3.31 krad/min to a dose of 545 kad. The radio-lytic yields of H2 are affected by Pd(IV) in the same way as was observed for the homogeneousSYL-SIiM-91C solutions. The results are summarized in Table E3-4.
Nitrous oxide yields, G(N2 0), were measured for the argon-saturated standard homogeneoussolution given in Table E2-1 following irradiation at 3.3 krad/min to a total dose of 130 krad. Theresults are summarized in Table E3-5. It can be seen in this table that G(N20) is strongly reducedby the presence of Cr(II). The radiolytic yields of N20 were also determined for SY 1-SIM-92Aslurry. The slurry was irradiated at 3.31 krad/min to a dose of 545 krad. The radiolytic N20yields are substantially reduced by Cr(llI) (or its radiolytic products), as it was for the homogene-ous solution SY1-SIM-91C. G(N 20) results from this slurry, and several blanks, are summarizedin Table E3-6.
In summary, no qualitative difference between the homogeneous solutions and the slurrieswas observed with respect to the effect of the minor components, either on G(H2) or G(N20). Itshould be clearly recognized that the two metal ions have very different effects. Although Pd doesnot seem to inhibit the generation of H2 (only its release from the simulant is inhibited), Cr seemsto genuinely reduce the yield of N20. Chromium seems to intercept the sequence of reactions thatleads to N20 but Pd does not intercept the generation of H2.
Table E3-4. Radiolytic H2 yields obtained for slurry SY1-SIM-92A at 30 oCaslurry G(H2) comments
SY1-SIM-92A (no Pd(IV)) 0.067
SYL-SIM-92A (with Pd(IV)) (0.007)c Pd retains G(H2)(90% retained)
SYL-SIM-91A + 0.3 M EDTAb 0.04 similar to SY-SIM-92A(first row above)
a Dose rate = 3.31 krad/min and dose = 545 Krad.b 2.3 M NaOH, 2.2 M NaAlO2, 3.7 M NaNO3, 3.2 M NaNO2, 0.6 M Na2CO3, and 0.3 M
EDTA.c Could not be determined, as in footnote e of Table E3-1
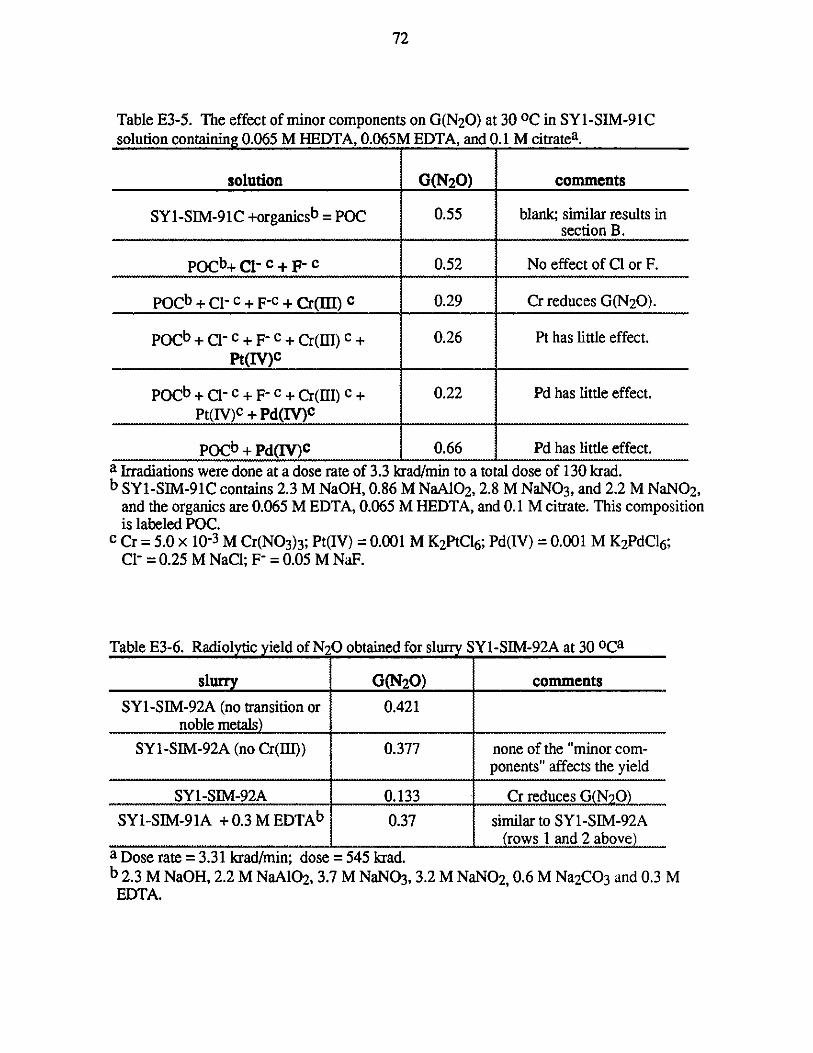
72
Table E3-5. The effect of minor components on G(N 20) at 30 OC in SYl-SIM-91Csolution containing 0.065 M HEDTA, 0.065M EDTA, and 0.1 M citratea.
solution G(N20) comments
SY1-SIM-91C +organicsb = POC 0.55 blank; similar results insection B.
POCb+ Cl- c + F- c 0.52 No effect of Cl or F.
pOCb + Cl- c + F-c + Cr(fI) C 0.29 Cr reduces G(N20).
POCb + Cl- c + F- c + Cr(III) c + 0.26 Pt has little effect.Pt(IV)C
POCb + Cl- c + F- c + Cr(III) c + 0.22 Pd has little effect.Pt(IV)c + Pd(IV)c
POCb + Pd(IV)c 0.66 Pd has little effect.
a Irradiations were done at a dose rate of 3.3 krad/min to a total dose of 130 krad.b SYl-SIM-91C contains 2.3 M NaOH, 0.86 M NaAl02, 2.8 M NaNO3, and 2.2 M NaNO2,
and the organics are 0.065 M EDTA, 0.065 M HEDTA, and 0.1 M citrate. This compositionis labeled POC.
c Cr = 5.0 x 10⁻³ M Cr(N03)3; Pt(IV) = 0.001 M K2 PtC16 ; Pd(IV) = 0.001 M K2PdC16 ;Cl- =0.25 M NaCl; F- = 0.05 M NaF.
Table E3-6. Radiolytic yield of N20 obtained for slurry SY1-SIM-92A at 30 oCa
slurry G(N20) comments
SYl-SIM-92A (no transition or 0.421noble metals)
SYl-SIM-92A (no Cr(III)) 0.377 none of the "minor com-ponents" affects the yield
SY1-SIM-92A 0.133 Cr reduces G(N2 0)
SY1-SIM-91A + 0.3 M EDTAb 0.37 similar to SYI-SIM-92A-- -- - -- -- -- - ---- -- ----- - ---- -(row s 1 and 2 above)a Dose rate = 3.31 krad/min; dose = 545 krad.b 2.3 M NaOH, 2.2 M NaAlO2, 3.7 M NaNO3, 3.2 M NaN02, 0.6 M Na2CO3 and 0.3 MEDTA.
73
b. Effect of "Minor" Components on Thermal Generation Rates
The rate of thermal generation of H2 from preirradiated solutions SY 1-SIM-9 1C containing0.065 M EDTA ,0.065 M HEDTA, 0.1 M citrate and the minor components given in Table E2- 1,was measured. The solution was preirradiated to 16 Mrad, a dose that gave the maximum rate forthermal generation of gases as described in Section C (see Figure C3-2).
Figure E3-1 shows the thermal production of H2 from samples of this preirradiated solution(note that the samples were degassed after the preirradiation and used as starting material for thethermal studies). It can be seen that the presence Pd(IV) in the original solution leads to the sameretention of H2 as discussed above. Hydrogen is retained, as in the case of the radiolytic studies,that is, successive extractions of gas result in further release of hydrogen. This effect was notobserved when Pd(IV) was absent from the preirradiated solution (solid circles in Figure E3- 1).The rate of thermal generation of H2 for the solutions containing organics and minor components,except Pd(IV), is roughly the same as was observed earlier for SY1-SIM-91C solution containingthe organics only (Section C of this report). A blank experiment, where the rate of the thermalgeneration of H2 was determined for identical, but not preirradiated, SY1-SIM-91C solutions con-taining the organics and all the minor components (including Pd) was also performed. No H2 wasdetected under these experimental conditions. We estimate an upper limit for the rate of H2 pro-duction from this solution to be <2.1 x 10⁻¹⁰ M min-.
Rates of thermal generation of N20 from preirradiated SYl-SIM-91C solutions of the com-position shown in Table E2-1 were measured. As for H2, the solutions were preirradiated to adose that gave the maximum rate for thermal generation of gases. Figure E3-2 shows the thermalproduction of N20 from preirradiated (35.8 Mrad) solution of SY 1-SIM-91C containing the com-ponents listed above. As can be seen in Figure E3-2, the presence of Cr(III) does not affect ther-mal generation of N20. A control experiment was also performed in which the rates of the thermalgeneration of N20 were determined for identical but unirradiated solutions. Thermal generation ofN20 from this control solution is shown in Figure E3-3. On comparing Figures E3-2 and E3-3 itseems that the preirradiation enhances the rate of N20 generation by approximately a factor offive, regardless of the presence of the minor components (including Cr(III)).
In both Figures E3-2 and E3-3 one observes an induction period. This is an indication that theN20 is a secondary product resulting from degradation of a predecessor degradation product. Forthe solutions that were not preirradiated, this degradation product must be thermally generated. Itcan also be seen that an induction period is shorter for the preirradiated solutions than for the con-trol solutions, by approximately the same factor that the rate is enhanced.
The radiolytic yields of N20 for homogeneous solutions, as well as for slurries, decreasewhen Cr(III) is present, as is shown above. Hydroxylamine has been proposed as an intermediatein the mechanism of N20 generation. We, therefore, studied the effect of Cr(IlI) on the rate ofthermal generation of N20 from solution SY1-SIM-91C containing 5 mM Cr(III) and 0.01 MNH2OH at 60 OC (no organics nor other minor component). The rate of N20 generation from asimilar solution that did not contain Cr(III) is described in Section C3d. Figure E3-4 shows thegeneration of N20 from the solution containing Cr(I). The rate is an order of magnitude slowerthan that obtained for the same solution without Cr(III) (8.8 x 10⁻⁶ M min-1 , as can be calculatedfrom Figure C3-9). This observation is compatible with the mechanism that invokes NH2OH asan intermediate. In distinction to the effect of chromium ions on the radiolytic yields, no effect wasobserved on the thermal generation rate. A possible explanation for this difference would invokedifferent mechanisms for N20 generation radiolytically and thermally.
74
4. Conclusions
Among the minor components, Pd(IV), after irradiation in the presence of organics, stronglyretains hydrogen, but does not inhibit its formation. The other minor components (Cr(III), Pt(IV),Cl-, and F-) have little effect on either H2 yields or its retention. The retention is attributed to areduced form of Pd, probably metallic Pd produced by a reaction of organic radicals with the origi-nal ion. The effect of Pd(IV) is similar in both homogeneous solutions and slurries.
In the radiolysis of solution or slurry simulants, the yield of N20 is strongly reduced byCr(III), but is not affected by the other minor components. The thermal rates of N 20 generationfrom these simulated waste solutions are not affected by Cr(IlI). However, in SYI-SIM-91C withhydroxylamine (a degradation product intermediate), the thermal rate of N20 generation is reducedby an order of magnitude upon the addition of Cr(III).
F. GAS RETENTION
1. Introduction
The problems of gas generation and retention couple to create the potentially flammable condi-tions in tank 101-SY. The rate of hydrogen generation is low and would not present a seriousproblem if the gases were released continuously. However, much of each gas is retained withinthe tank and then released periodically. During such an episodic release of gas, the concentrationof hydrogen in the oxidizing atmosphere of nitrous oxide is within the flammability limits. Toshed some light on the mechanisms of retention, we measured the retention of H2 and N2 0 in afew simulant slurries.
2. Experimental
The slurry used for these experiments was the standard SYl-SIM-91A slurry to which 0.3 MEDTA was added. The first problem addressed was the method of supersaturating the slurry in amanner consistent with the conditions in 101-SY. Three approaches were undertaken - bubblingthe sample, pressurizing the sample, and irradiation. Irradiation would simulate the generation andretention of gas in tank 101-SY best; the former two were explored because they would have beeneasier to perform and would have been quicker. However, the behavior of the gas retention in theirradiated samples was different from either of the other two techniques and it became evident thatthe results depend strongly on the method utilized for supersaturation. Therefore, only the resultsfrom the irradiation experiments will be discussed in detail.
Methods of Supersaturation. To measure the amount of gases retained by a slurry, pro-visions were made to introduce the gas into the slurry in a manner similar to gas formation in thetank and to measure it with minimum manipulation. Three methods of addition of the gas to theslurry were tested: 1) bubbling, 2) pressurization, and 3) radiolytic generation of the gases. For allthree methods, identical vessels were utilized in the measurements. However, the pressure celldescribed below was utilized only for method 2. Each method gave different results, indicatingstrong dependence of the total gas retained on the slurry pretreatment, age of the slurry, and timethat the gases were in contact with the slurry particles. Method 3 is believed to best simulate gasgeneration in the tank.
Method 1: The gas was bubbled in the glass vessel described in Figure F2- 1. Extraction ofthe gas using the Van Slyke gas apparatus was discussed previously.'
Method 2: To simulate the gas formed in the nonconvective layer of the tank, the slurry wasput in a glass vessel inside a pressurization cell housing (Figure F2- 1) under gas pressure andallowed to equilibrate. After a preset time, the excess gas was released slowly, and the glass ves-sel was removed from the pressurization cell and connected to the Van Slyke apparatus for gasextraction (Figure F2-2).
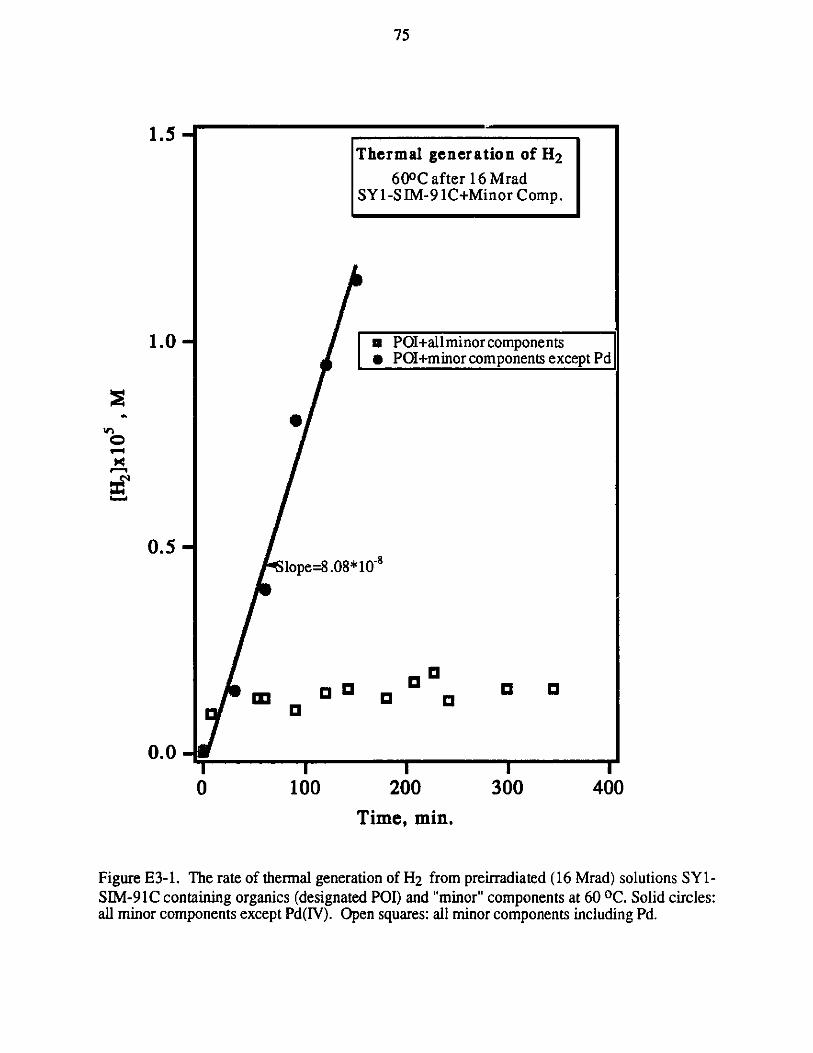
75
POI+all minor componentsPOI+minor components except Pd
lope =8.08* 108
pO
100
aa
I2200
a a
I300
I400
Time, min.
Figure E3- 1. The rate of thermal generation of H2 from preirradiated (16 Mrad) solutions SY1-SIM-91C containing organics (designated POI) and "minor" components at 60 0C. Solid circles:all minor components except Pd(IV). Open squares: all minor components including Pd.
Thermal generation of H2
600C after 16 MradSY1-SIM-9 1C+Minor Comp.
1.5-
0
0.5 -
0.0 -I
0
1.0 -
r
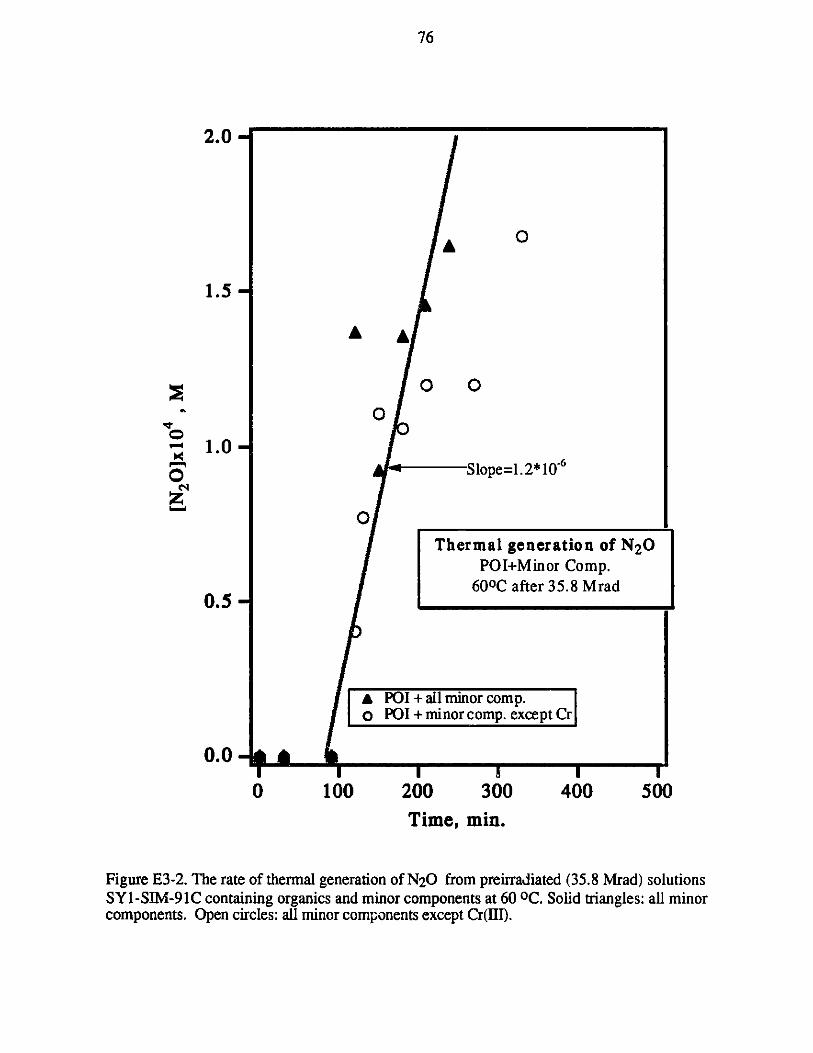
76
2.0 -
1.5 -
I100
I200 300
A A
0 0
0
Slope=l.2*10 6
0
Thermal generatPOI+Minor
600 C after 35.
SA POI+ all minor comp.POI+ minor comp. except C r
I400
I500
Time, min.
Figure E3-2. The rate of thermal generation of N20 from preirradiated (35.8 Mrad) solutionsSY1-SIM-91C containing organics and minor components at 60 0OC. Solid triangles: all minorcomponents. Open circles: all minor components except Cr(III).
ion of N2 0Comp.8 Mrad
0
0.0-I0
-
1.0-
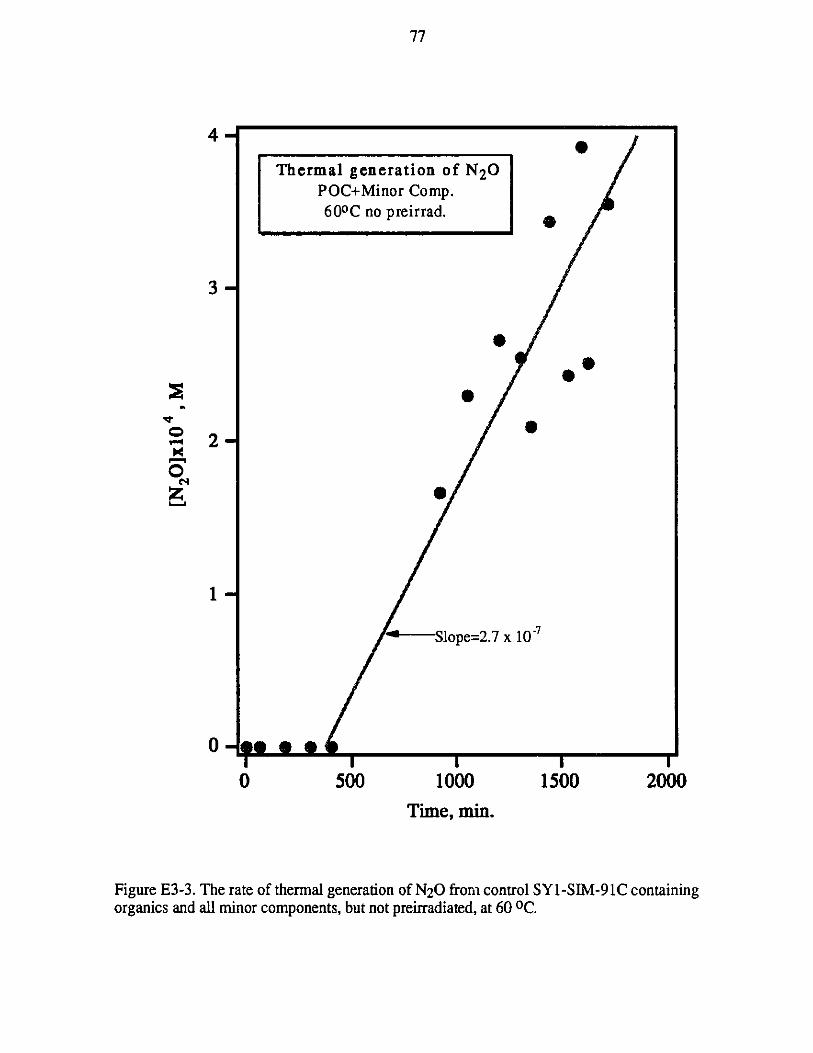
77
3-
I0
I500
I01000
I01500
I2000
Time, min.
Figure E3-3. The rate of thermal generation of N20 from control SYl-SIM-91C containingorganics and all minor components, but not preirradiated, at 600C.
Thermal generation of N 20POC+Minor Comp.600C no preirrad.
40
Slope=2.7 x 10~7
2w
0
r1
O
N
z
2-
0-
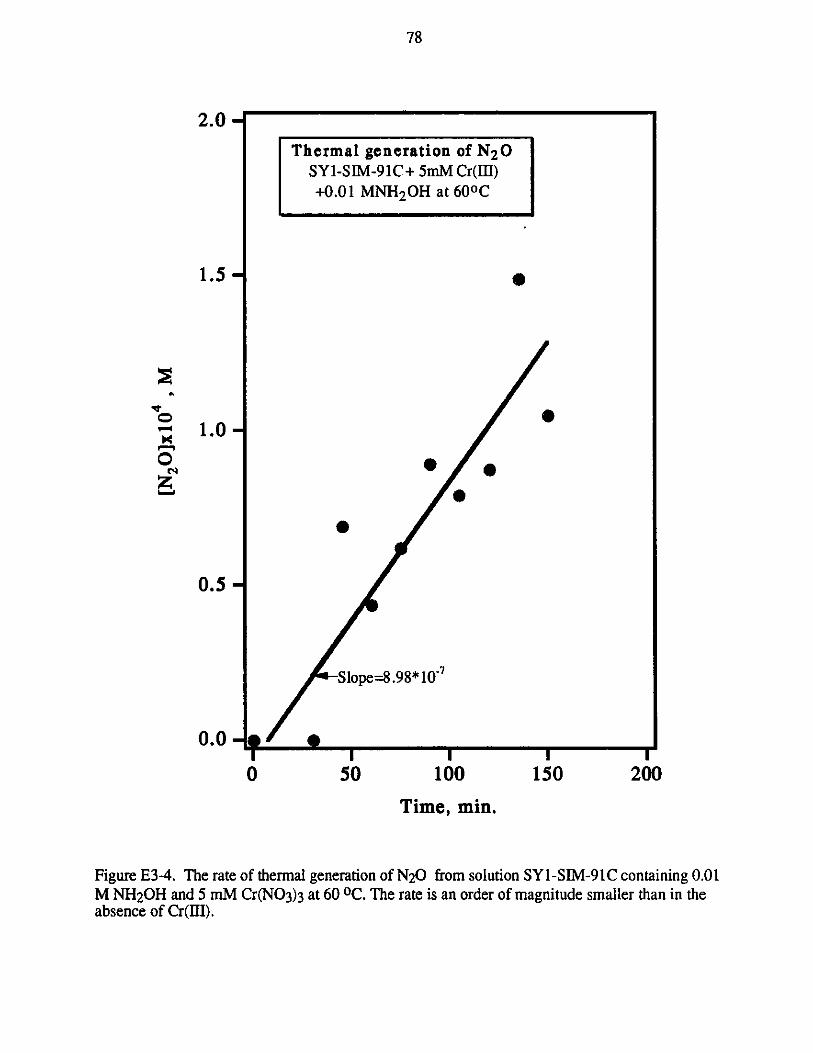
78
2.0
Thermal generation of N2 0SYl-SIM-91C+ 5mM Cr(III)+0.0 1 MNH2 OH at 600 C
1.5-
1.0
0.5-
Slope=8.98*10 7
0.0 -
0 50 100 150 200
Time, min.
Figure E3-4. The rate of thermal generation of N20 from solution SYL-SIM-91C containing 0.01M NH20H and 5 mM Cr(N03)3 at 60 0C. The rate is an order of magnitude smaller than in theabsence of Cr(III).
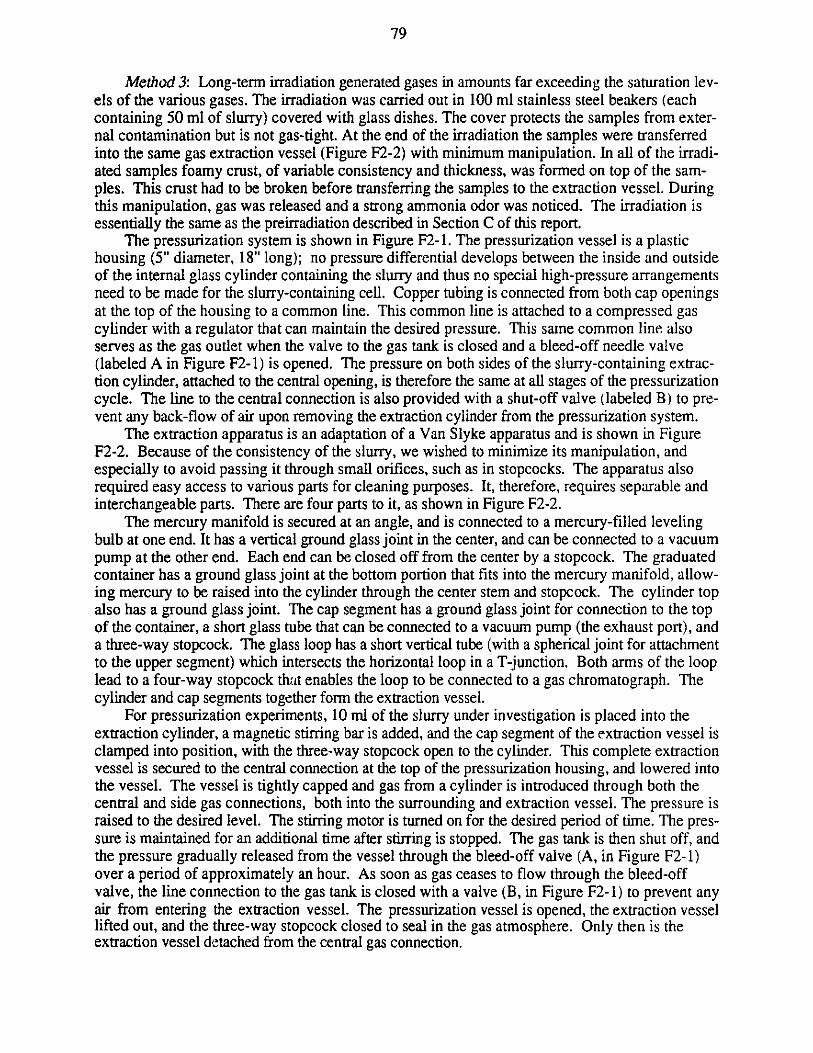
79
Method 3: Long-term irradiation generated gases in amounts far exceeding the saturation lev-els of the various gases. The irradiation was carried out in 100 ml stainless steel beakers (eachcontaining 50 ml of slurry) covered with glass dishes. The cover protects the samples from exter-nal contamination but is not gas-tight. At the end of the irradiation the samples were transferredinto the same gas extraction vessel (Figure F2-2) with minimum manipulation. In all of the irradi-ated samples foamy crust, of variable consistency and thickness, was formed on top of the sam-ples. This crust had to be broken before transferring the samples to the extraction vessel. Duringthis manipulation, gas was released and a strong ammonia odor was noticed. The irradiation isessentially the same as the preirradiation described in Section C of this report.
The pressurization system is shown in Figure F2-1. The pressurization vessel is a plastichousing (5" diameter, 18" long); no pressure differential develops between the inside and outsideof the internal glass cylinder containing the slurry and thus no special high-pressure arrangementsneed to be made for the slurry-containing cell. Copper tubing is connected from both cap openingsat the top of the housing to a common line. This common line is attached to a compressed gascylinder with a regulator that can maintain the desired pressure. This same common line alsoserves as the gas outlet when the valve to the gas tank is closed and a bleed-off needle valve(labeled A in Figure F2-1) is opened. The pressure on both sides of the slurry-containing extrac-tion cylinder, attached to the central opening, is therefore the same at all stages of the pressurizationcycle. The line to the central connection is also provided with a shut-off valve (labeled B) to pre-vent any back-flow of air upon removing the extraction cylinder from the pressurization system.
The extraction apparatus is an adaptation of a Van Slyke apparatus and is shown in FigureF2-2. Because of the consistency of the slurry, we wished to minimize its manipulation, andespecially to avoid passing it through small orifices, such as in stopcocks. The apparatus alsorequired easy access to various parts for cleaning purposes. It, therefore, requires separable andinterchangeable parts. There are four parts to it, as shown in Figure F2-2.
The mercury manifold is secured at an angle, and is connected to a mercury-filled levelingbulb at one end. It has a vertical ground glass joint in the center, and can be connected to a vacuumpump at the other end. Each end can be closed off from the center by a stopcock. The graduatedcontainer has a ground glass joint at the bottom portion that fits into the mercury manifold, allow-ing mercury to be raised into the cylinder through the center stem and stopcock. The cylinder topalso has a ground glass joint. The cap segment has a ground glass joint for connection to the topof the container, a short glass tube that can be connected to a vacuum pump (the exhaust port), anda three-way stopcock. The glass loop has a short vertical tube (with a spherical joint for attachmentto the upper segment) which intersects the horizontal loop in a T-junction. Both arms of the looplead to a four-way stopcock that enables the loop to be connected to a gas chromatograph. Thecylinder and cap segments together form the extraction vessel.
For pressurization experiments, 10 ml of the slurry under investigation is placed into theextraction cylinder, a magnetic stirring bar is added, and the cap segment of the extraction vessel isclamped into position, with the three-way stopcock open to the cylinder. This complete extractionvessel is secured to the central connection at the top of the pressurization housing, and lowered intothe vessel. The vessel is tightly capped and gas from a cylinder is introduced through both thecentral and side gas connections, both into the surrounding and extraction vessel. The pressure israised to the desired level. The stirring motor is turned on for the desired period of time. The pres-sure is maintained for an additional time after stirring is stopped. The gas tank is then shut off, andthe pressure gradually released from the vessel through the bleed-off valve (A, in Figure F2- 1)over a period of approximately an hour. As soon as gas ceases to flow through the bleed-offvalve, the line connection to the gas tank is closed with a valve (B, in Figure F2- 1) to prevent anyair from entering the extraction vessel. The pressurization vessel is opened, the extraction vessellifted out, and the three-way stopcock closed to seal in the gas atmosphere. Only then is theextraction vessel detached from the central gas connection.
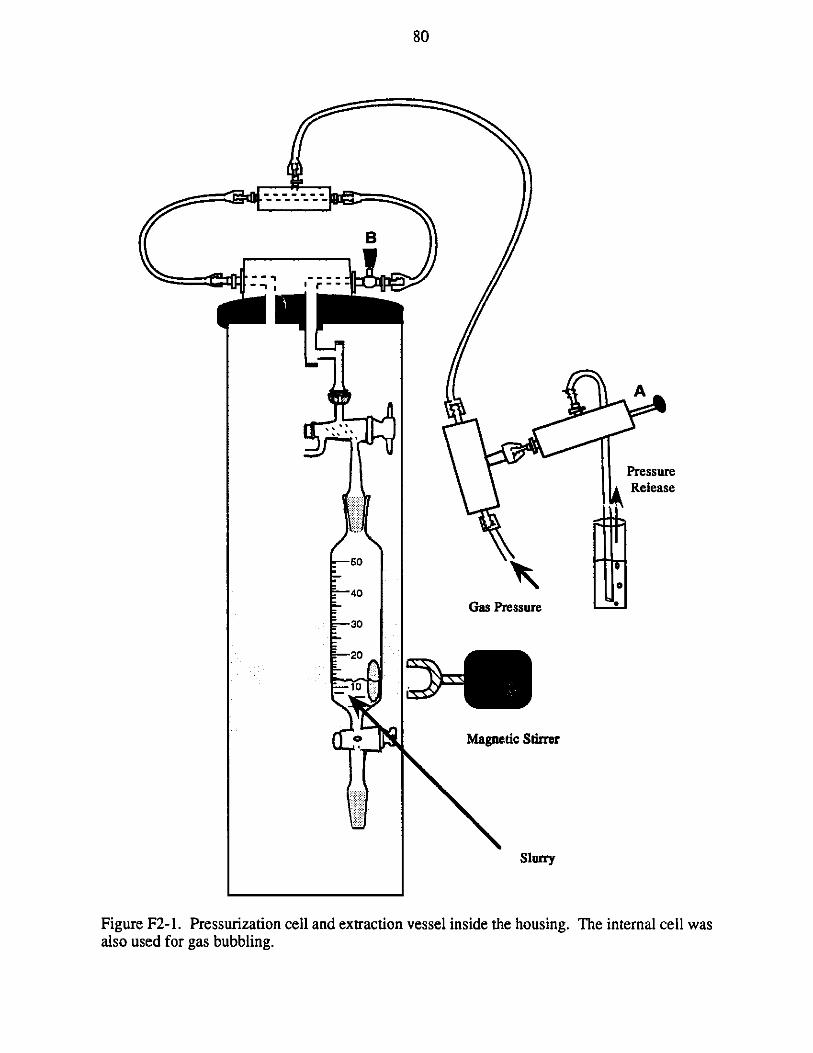
80
B
A
PressureRelease
so
40
Gas Pressure -
30
20
Magnetic Stirfer
Slurry
Figure F2-1. Pressurization cell and extraction vessel inside the housing. The internal cell wasalso used for gas bubbling.
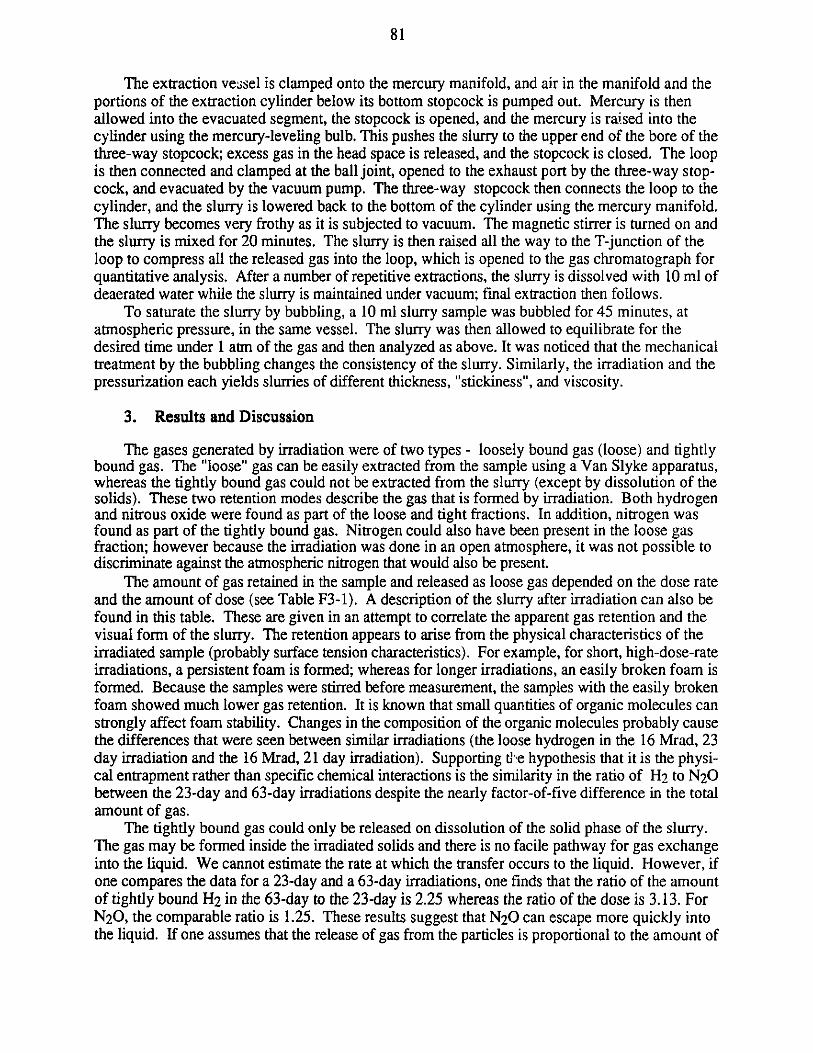
81
The extraction vessel is clamped onto the mercury manifold, and air in the manifold and theportions of the extraction cylinder below its bottom stopcock is pumped out. Mercury is thenallowed into the evacuated segment, the stopcock is opened, and the mercury is raised into thecylinder using the mercury-leveling bulb. This pushes the slurry to the upper end of the bore of thethree-way stopcock; excess gas in the head space is released, and the stopcock is closed. The loopis then connected and clamped at the ball joint, opened to the exhaust port by the three-way stop-cock, and evacuated by the vacuum pump. The three-way stopcock then connects the loop to thecylinder, and the slurry is lowered back to the bottom of the cylinder using the mercury manifold.The slurry becomes very frothy as it is subjected to vacuum. The magnetic stirrer is turned on andthe slurry is mixed for 20 minutes. The slurry is then raised all the way to the T-junction of theloop to compress all the released gas into the loop, which is opened to the gas chromatograph forquantitative analysis. After a number of repetitive extractions, the slurry is dissolved with 10 ml ofdeaerated water while the slurry is maintained under vacuum; final extraction then follows.
To saturate the slurry by bubbling, a 10 ml slurry sample was bubbled for 45 minutes, atatmospheric pressure, in the same vessel. The slurry was then allowed to equilibrate for thedesired time under 1 atm of the gas and then analyzed as above. It was noticed that the mechanicaltreatment by the bubbling changes the consistency of the slurry. Similarly, the irradiation and thepressurization each yields slurries of different thickness, "stickiness", and viscosity.
3. Results and Discussion
The gases generated by irradiation were of two types - loosely bound gas (loose) and tightlybound gas. The "loose" gas can be easily extracted from the sample using a Van Slyke apparatus,whereas the tightly bound gas could not be extracted from the slurry (except by dissolution of thesolids). These two retention modes describe the gas that is formed by irradiation. Both hydrogenand nitrous oxide were found as part of the loose and tight fractions. In addition, nitrogen wasfound as part of the tightly bound gas. Nitrogen could also have been present in the loose gasfraction; however because the irradiation was done in an open atmosphere, it was not possible todiscriminate against the atmospheric nitrogen that would also be present.
The amount of gas retained in the sample and released as loose gas depended on the dose rateand the amount of dose (see Table F3-1). A description of the slurry after irradiation can also befound in this table. These are given in an attempt to correlate the apparent gas retention and thevisual form of the slurry. The retention appears to arise from the physical characteristics of theirradiated sample (probably surface tension characteristics). For example, for short, high-dose-rateirradiations, a persistent foam is formed; whereas for longer irradiations, an easily broken foam isformed. Because the samples were stirred before measurement, the samples with the easily brokenfoam showed much lower gas retention. It is known that small quantities of organic molecules canstrongly affect foam stability. Changes in the composition of the organic molecules probably causethe differences that were seen between similar irradiations (the loose hydrogen in the 16 Mrad, 23day irradiation and the 16 Mrad, 21 day irradiation). Supporting the hypothesis that it is the physi-cal entrapment rather than specific chemical interactions is the similarity in the ratio of H2 to N20between the 23-day and 63-day irradiations despite the nearly factor-of-five difference in the totalamount of gas.
The tightly bound gas could only be released on dissolution of the solid phase of the slurry.The gas may be formed inside the irradiated solids and there is no facile pathway for gas exchangeinto the liquid. We cannot estimate the rate at which the transfer occurs to the liquid. However, ifone compares the data for a 23-day and a 63-day irradiations, one finds that the ratio of the amountof tightly bound H2 in the 63-day to the 23-day is 2.25 whereas the ratio of the dose is 3.13. ForN20, the comparable ratio is 1.25. These results suggest that N20 can escape more quickly intothe liquid. If one assumes that the release of gas from the particles is proportional to the amount of
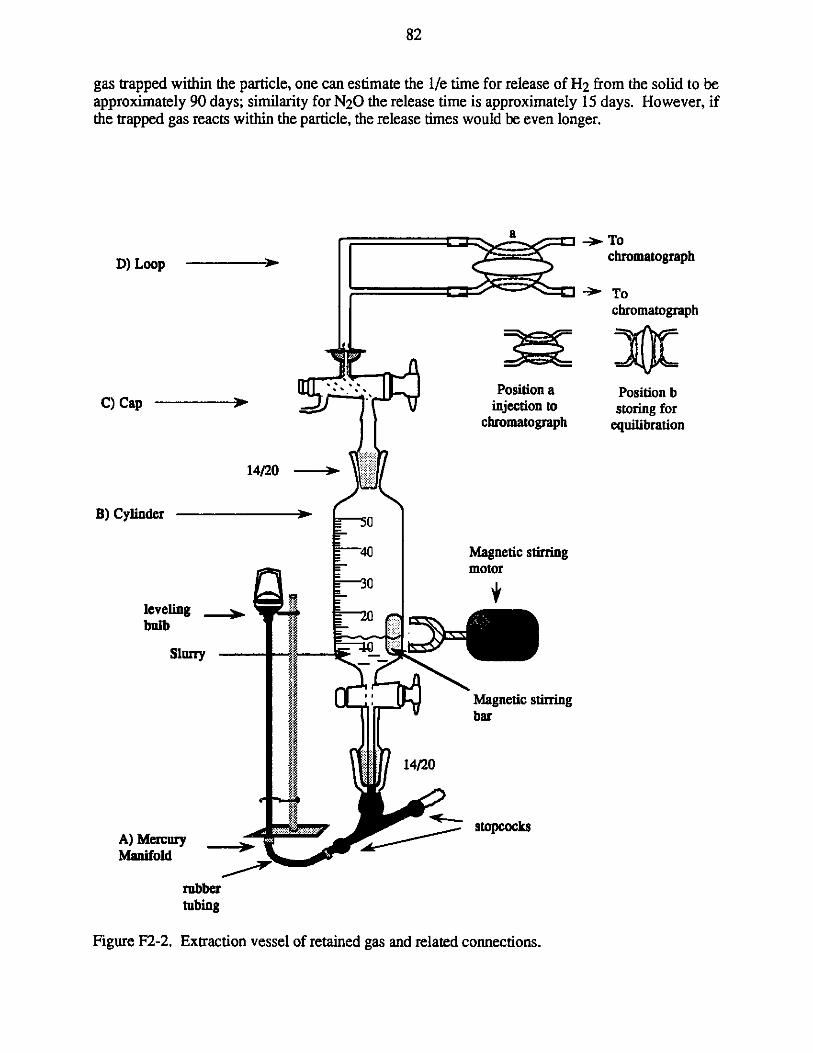
82
gas trapped within the particle, one can estimate the l/e time for release of H2 from the solid to beapproximately 90 days; similarity for N20 the release time is approximately 15 days. However, ifthe trapped gas reacts within the particle, the release times would be even longer.
D) Loop
C) Cap
B) Cylinder -
levelingbulb
Slurry
A) MercuryManifold
rubitubi
a
Positi(injection
chromato
14/20 ---
> 0
40 Magnetic simotor
0
4 0
Magneticsbar
14/20
stopcocks
berIng
on a)n tograph
-. To
chromatograph
-> To
chromatograph
Position bstoring for
equilibration
stirring
stirring
Figure F2-2. Extraction vessel of retained gas and related connections.
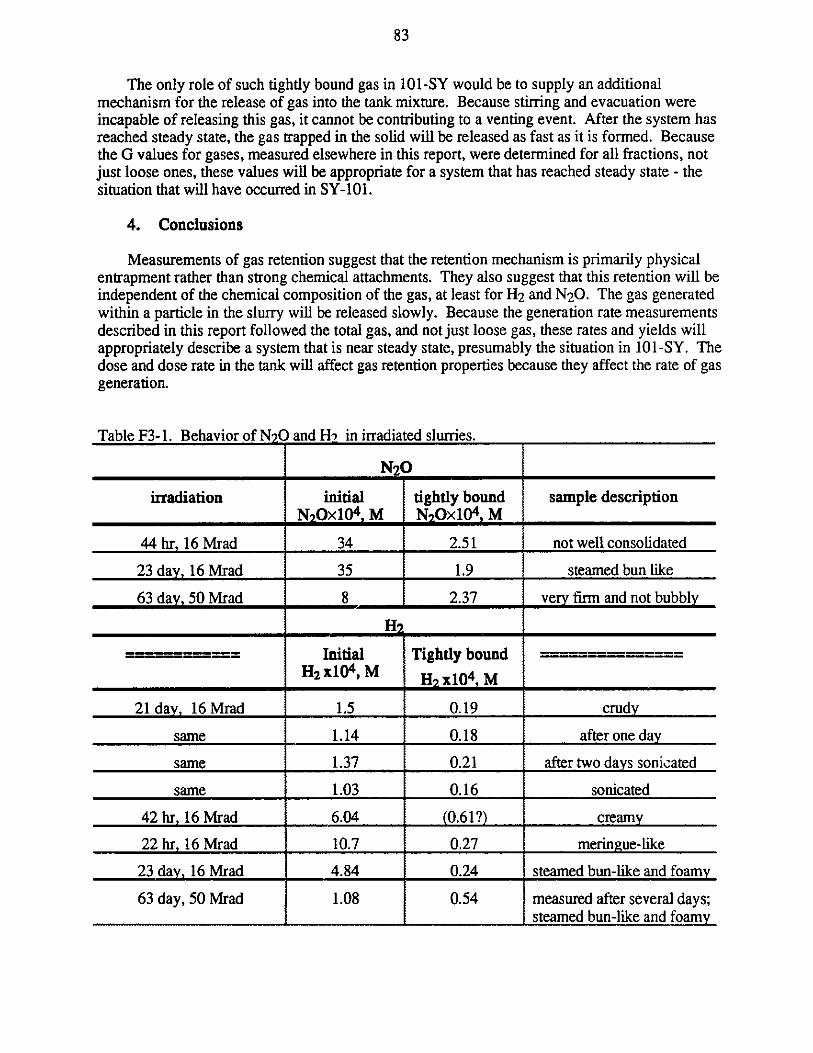
83
The only role of such tightly bound gas in 101-SY would be to supply an additionalmechanism for the release of gas into the tank mixture. Because stirring and evacuation wereincapable of releasing this gas, it cannot be contributing to a venting event. After the system hasreached steady state, the gas trapped in the solid will be released as fast as it is formed. Becausethe G values for gases, measured elsewhere in this report, were determined for all fractions, notjust loose ones, these values will be appropriate for a system that has reached steady state - thesituation that will have occurred in SY-101.
4. Conclusions
Measurements of gas retention suggest that the retention mechanism is primarily physicalentrapment rather than strong chemical attachments. They also suggest that this retention will beindependent of the chemical composition of the gas, at least for H2 and N 20. The gas generatedwithin a particle in the slurry will be released slowly. Because the generation rate measurementsdescribed in this report followed the total gas, and not just loose gas, these rates and yields willappropriately describe a system that is near steady state, presumably the situation in 101 -SY. Thedose and dose rate in the tank will affect gas retention properties because they affect the rate of gasgeneration.
Table F3- 1. Behavior of N20 and H2 in irradiated slurries.
N20
irradiation initial tightly bound sample descriptionNOx1O 4 , M N2Ox10 4 , M
44 hr, 16 Mrad 34 2.51 not well consolidated
23 day, 16 Mrad 35 1.9 steamed bun like
63 day, 50 Mrad 8 - 2.37 very firm and not bubbly
H
Initial Tightly boundH2 x10 4 , M H2 x10 4 , M
21 day, 16 Mrad 1.5 0.19 crudy
same 1.14 0.18 after one day
same 1.37 0.21 after two days sonicated
same 1.03 0.16 sonicated
42 hr, 16 Mrad 6.04 (0.61?) creamy
22 hr, 16 Mrad 10.7 0.27 meringue-like
23 day, 16 Mrad 4.84 0.24 steamed bun-like and foamy
63 day, 50 Mrad 1.08 0.54 measured after several days;steamed bun-like and foamy
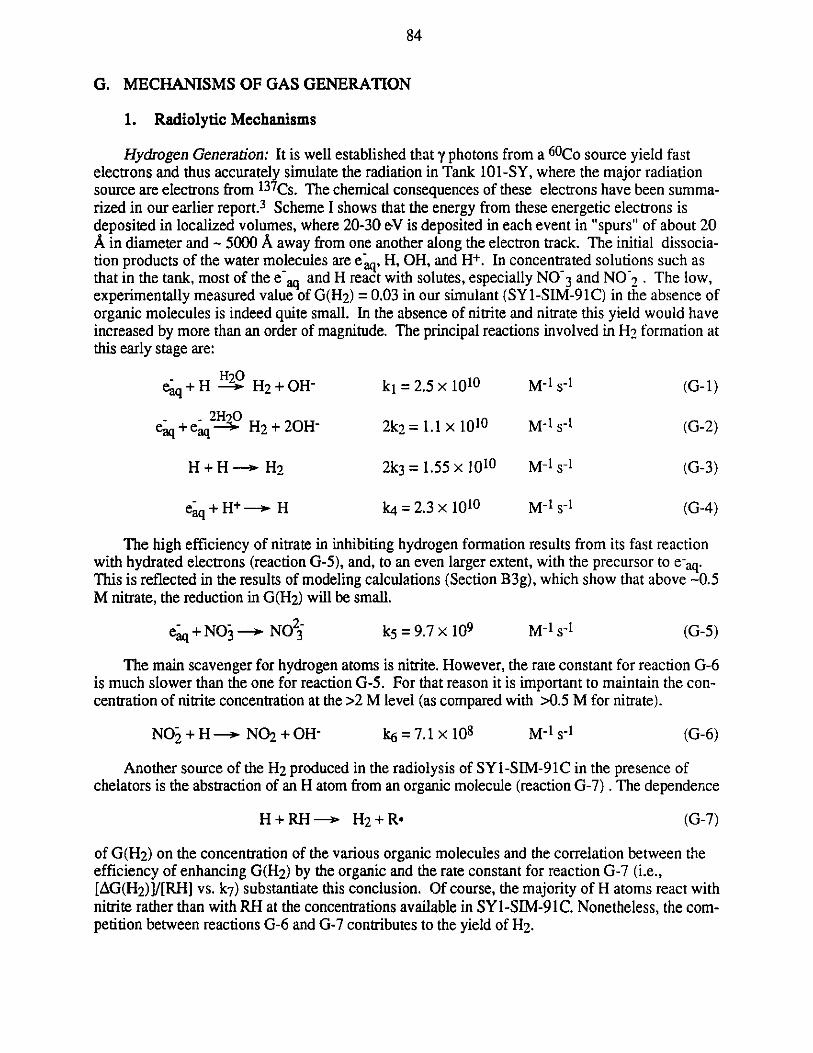
84
G. MECHANISMS OF GAS GENERATION
1. Radiolytic Mechanisms
Hydrogen Generation: It is well established that y photons from a 60Co source yield fastelectrons and thus accurately simulate the radiation in Tank 101-SY, where the major radiationsource are electrons from 137Cs. The chemical consequences of these electrons have been summa-rized in our earlier report.3 Scheme I shows that the energy from these energetic electrons isdeposited in localized volumes, where 20-30 eV is deposited in each event in "spurs" of about 20A in diameter and~ 5000 A away from one another along the electron track. The initial dissocia-tion products of the water molecules are eaq, H, OH, and H+. In concentrated solutions such asthat in the tank, most of the e&aq and H react with solutes, especially NO 3 and NO 2 . The low,experimentally measured value of G(H2 ) = 0.03 in our simulant (SYl-SIM-91C) in the absence oforganic molecules is indeed quite small. In the absence of nitrite and nitrate this yield would haveincreased by more than an order of magnitude. The principal reactions involved in H) formation atthis early stage are:
H20M-S1eaq+H H2+ OH- k1 = 2.5 x 10¹⁰ M 1 s 1 (G-1)
eaq+e~ 2 H2+ 20H- 2k2= 1.1 x 10¹⁰ M-1 s-1 (G-2)
H + H -- H2 2k3 = 1.55 x 10¹⁰ M-1 s-1 (G-3)
eaq + H+- H k4 = 2.3 x 10¹⁰ M-1 s-1 (G-4)
The high efficiency of nitrate in inhibiting hydrogen formation results from its fast reactionwith hydrated electrons (reaction G-5), and, to an even larger extent, with the precursor to eaq.This is reflected in the results of modeling calculations (Section B3g), which show that above -0.5M nitrate, the reduction in G(H2) will be small.
e-q+ NO- NO2 k5 = 9.7 x 10⁹ M-1 s-1 (G-5)
The main scavenger for hydrogen atoms is nitrite. However, the rate constant for reaction G-6is much slower than the one for reaction G-5. For that reason it is important to maintain the con-centration of nitrite concentration at the >2 M level (as compared with >0.5 M for nitrate).
NO~ + H -o NO2 + OH- k6 = 7.1 x 10⁸ M- 1 s-1 (G-6)
Another source of the H2 produced in the radiolysis of SY-SIM-91C in the presence ofchelators is the abstraction of an H atom from an organic molecule (reaction G-7) . The dependence
H + RH-- H2+ Re (G-7)
of G(H2) on the concentration of the various organic molecules and the correlation between theefficiency of enhancing G(H2) by the organic and the rate constant for reaction G-7 (i.e.,[AG(H2)]/[RH] vs. k7) substantiate this conclusion. Of course, the majority of H atoms react withnitrite rather than with RH at the concentrations available in SYl-SIM-91C. Nonetheless, the com-petition between reactions G-6 and G-7 contributes to the yield of H2.
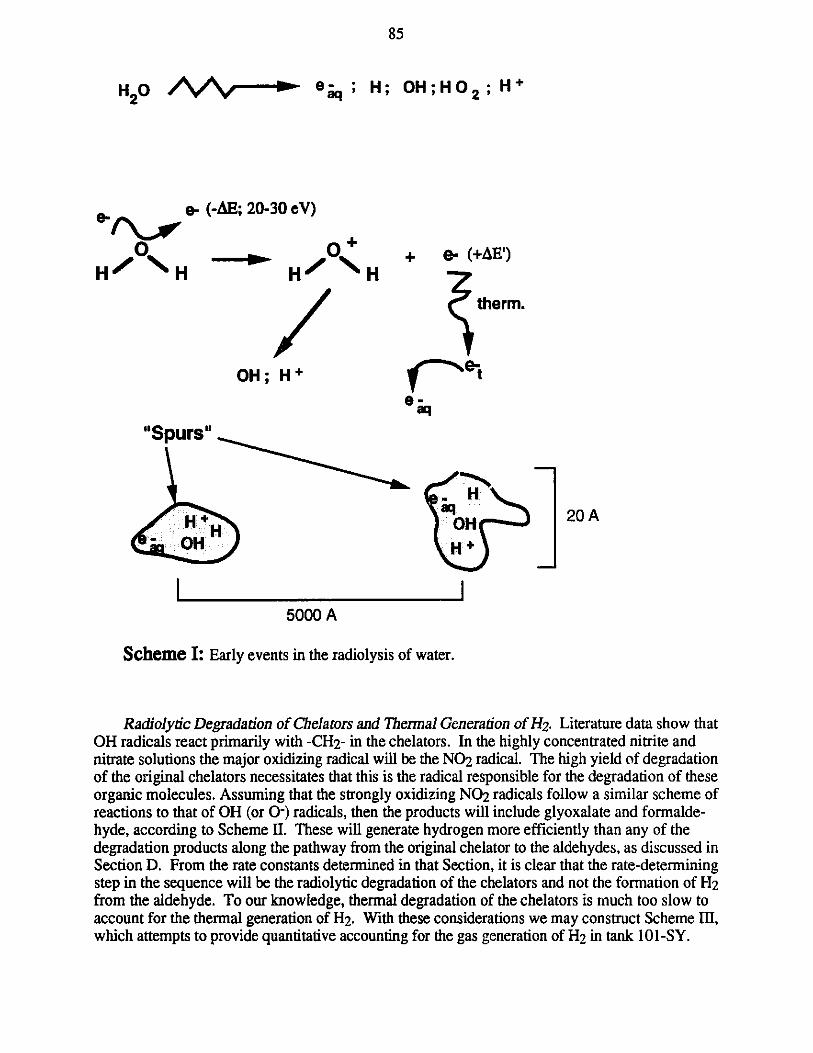
85
H 20 / e"; H;
E
0.
H' N H
OH;HO 2 ; H+
3- (-AE; 20-30 eV)
H NH
OH; H+
+. e- (+AE')
therm.
0t
e-
aq
OH
H +
"Spurs"
0H H
5000 A
Scheme I: Early events in the radiolysis of water.
Radiolytic Degradation of Chelators and Thermal Generation of H2. Literature data show thatOH radicals react primarily with -CH2- in the chelators. In the highly concentrated nitrite andnitrate solutions the major oxidizing radical will be the N02 radical. The high yield of degradationof the original chelators necessitates that this is the radical responsible for the degradation of theseorganic molecules. Assuming that the strongly oxidizing N02 radicals follow a similar scheme ofreactions to that of OH (or O-) radicals, then the products will include glyoxalate and formalde-hyde, according to Scheme II. These will generate hydrogen more efficiently than any of thedegradation products along the pathway from the original chelator to the aldehydes, as discussed inSection D. From the rate constants determined in that Section, it is clear that the rate-determiningstep in the sequence will be the radiolytic degradation of the chelators and not the formation of H2from the aldehyde. To our knowledge, thermal degradation of the chelators is much too slow toaccount for the thermal generation of H2 . With these considerations we may construct Scheme III,which attempts to provide quantitative accounting for the gas generation of H2 in tank 101-SY.
20 AI
86
Scheme II also shows a probable pathway to the generation of ammonia that is consistent withour experimental observations. The circular arrow in that scheme indicates repetition of the samepathway to replace all the organic moieties on N by hydrogen atoms. Because the quantities ofammonia generated in 101-SY are unknown to us, it is difficult to estimate whether this mechanismfor ammonia formation could operate in the tank. Because the source of NH3 is entirely organic inthis scheme, one could estimate the amount of organic that will be degraded in the tank from such amechanism.
N20 Generation. We have shown that organics must be present for the radiolytic formation ofN20, although both nitrogen atoms in N20 come from inorganic sources (nitrate and nitrite). Ourmodeling results also show that in the absence of organics no N2O will be radiolytically generated.Hydroxylamine is a likely intermediate in the generation of N20 and N2. We indeed observe thatthe same inhibitor (Cr(I)) that reduces the rate of the hydroxylamine reaction will also reduce theyield of N20. Hydroxylamine can be produced radiolytically via the documented mechanismshown in Scheme IV. The mechanism in this scheme fulfills the requirement for participation of anorganic; the source of nitrogen is entirely inorganic and it will show slight dose-rate dependencebecause of the participation of two radicals (NO and R). Bonner et al.1 find that NO reacts withNH2 OH to give equal amounts of N2 and N20 at room temperature above pH 13, and this reactionmay provide another mechanism to N 20 formation.
2. Thermal Mechanisms
Among the radiolytic intermediates that we have identified, only formaldehyde and glyoxalatecould generate hydrogen fast enough in SYI-SIM-91C at 60 *C to account for the amounts ofgases released in 101-SY. As was shown in Section D, the reactions of formaldehyde in basicsolutions to give hydrogen in competition with the Cannizzaro reaction can be quantitativelymodeled. As the irradiation persists, the rate of thermal generation of H2 will decrease as the rateof degradation of the organics to give formaldehyde is reduced.
Formaldehyde is not involved in the thermal generation of N20; hydroxylamine, however, is alikely intermediate. Our experiments have shown that thermal generation of N20 and N2 fromhydroxylamine does not require organics. Therefore, it is the generation of the hydroxylamine thatnecessitates the intervention of organic radicals as shown in the top of Scheme IV. With the addi-tion of minor components to SY1-SIM-91C containing chelators, we find that radiolyticallyreduced Pd(IV) retains hydrogen, whereas Cr(III) in its original oxidation state (i.e., with or with-out irradiation) reduces the rate of N20 formation.
3. Integrated View
The original solution SY 1-SIM-91C containing the chelators EDTA, HEDTA and citrate doesnot generate hydrogen appreciably prior to irradiation. On irradiation, a small amount of H2(G(H2) = 0.03) is generated by the direct radiolysis of water. Little can be done to eliminate thissource of hydrogen short of extraction of the irradiation source (mostly 137Cs). This small hydro-gen yield corresponds to a rate of generation of approximately 4.4 mole of hydrogen per day in a4 x 106 liter tank that absorbs 25 rad min-1 of irradiation. This yield could be more than doubledwhen the hydrogen abstraction reaction is taken into account. The latter can be eliminated bycomplete destruction of the or anic contents in the waste. Assuming that the rate of generation ofH2 in 101-SY is 50 mole day-', the direct radiolytic pathways will account then for up to 30% ofthe total generation rate; the remainder has to come from thermal reactions. The right hand side ofScheme III provides this accounting.
The rate of thermal H2 formation is appreciably augmented by radiolytic degradation of theoriginal chelators. Such degradation can proceed through NTA, IDA, glycine (and other chelating
87
intermediates) to glyoxylate and in parallel to produce formaldehyde (Scheme II). Because theyield for degradation of the original chelators is G(-RH) 2.9, the rate of generation of anydegradation product, and specifically formaldehyde, cannot exceed this rate. As shown in SchemeIII, this yield corresponds to 415 mole per day per 4 x 10⁶ liter of waste. From the rate c - wantsdetermined in Section D, if all of the degradation leads to formaldehyde, the rate of H2 generationwill exceed that observed in 101-SY by an order of magnitude. Therefore, if only 10% of thedegradation leads to formaldehyde (a very reasonable estimate), a full accounting of the sources forhydrogen in 101-SY is obtained.
- Of the minor components, only Cr(III) and the radiolytic product of Pd(IV) seem to affect therate of generation of N20 and H2, respectively. The Cr(llI) reduces the rate of N20 productionradiolytically and thermally from hydroxylamine. Reduced Pd(IV), perhaps Pd particles, stronglyretain H2 . In 101-SY, considering the long period of irradiation and small amount of Pd, retentionby Pd has long reached saturation, and this bound hydrogen is insignificant. The importantobservation, however, is the lack of any significant catalytic effect by any of the minorcomponents.
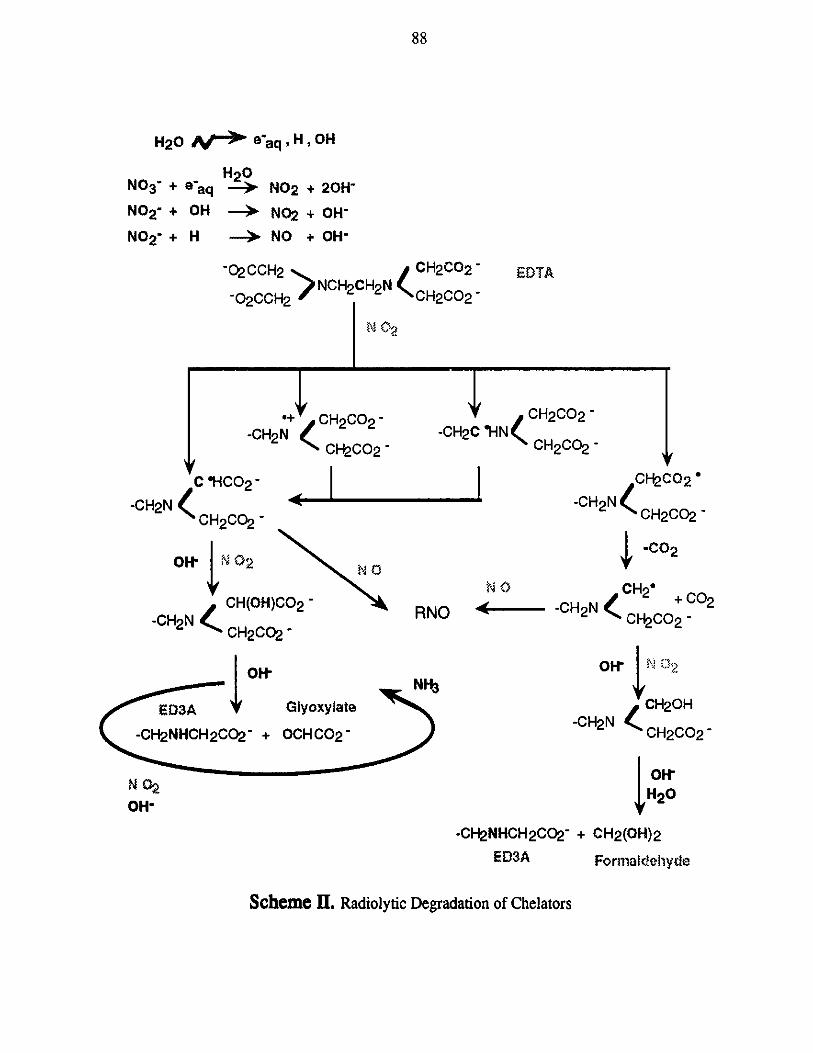
88
H2O O o e'aq ,H ,OH
NO3 + e q
NO2 - + OH
NO2 + H
H 2 0-- > NO2 + 2OH-
'-> NO2 + OH-
--> NO + OH-
-02CCH2 CH2CO2~-
-02CCH2 NCH2 CH2N CH2CO2-
NO
-+ CH2CO2 --CH2N
CH2CC2H-
C HCO2 --CH2N
(CH2CO2 -
Ol N 02 NO
CH(OH)CO 2 -
-CH2 N (0CH2CO2 -
ED3A Glyoxylate
-CH2NHCH2CO2- + OCH C02 _
N 02
OH-
CH2CO2 --CH2C HN
CH2CO2 -
CH2C02 '
-CH 2N(CH2CO2
41-Co2
y OCH2'
RNO --- -CH 2 N ( +002CH2CO2
0H20CH2OH
-CH2N CH2CO2 -
OWH2 0
-CH2NHCH2CO2~ + CH2(OH)2
ED3A Formaldehyde
Scheme II. Radiolytic Degradation of Chelators
EDTA
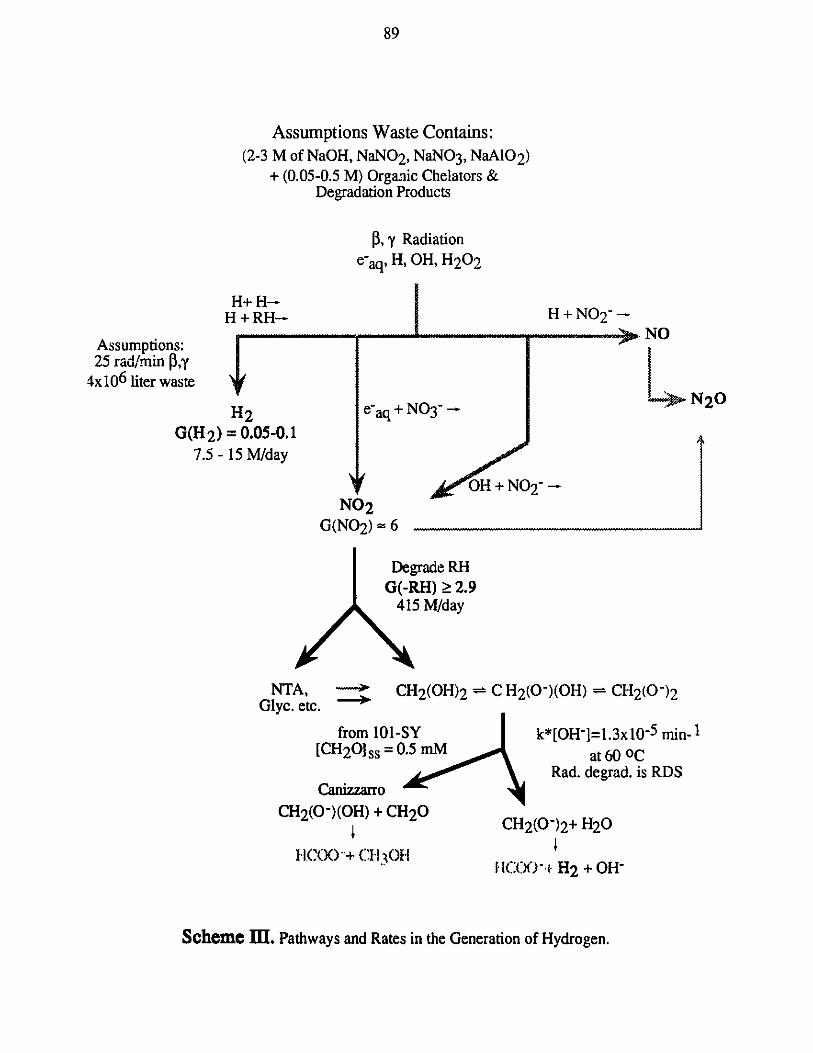
89
Assumptions Waste Contains:(2-3 M of NaOH, NaNO2 , NaNO3 , NaALO2 )
+ (0.05-0.5 M) Organic Chelators &Degradation Products
0, y Radiatione-aq, H, OH, H2 02
H+RH-H + RH-
Assumptions:25 rad/min $,y
4x10⁶ liter waste
H 2G(H2) = 0.05-0.1
7.5 - 15 M/day
"m m----.."-----Ie-aq+NO3-~'
OH + N02 -
NO2
G(N0 2 ) ~ 6
Degrade RHG(-RH) > 2.9
415 M/day
NTA,Glyc. etc.
CH2 (OH)2 ^ C H 2 (0-)(OH) - CH2(0-)2
from 101-SY[CH2 0]ss = 0.5 mM
CH2 (0-)(OH) + CH2 O
k*[OH-]=1.3x 10⁻⁵ min- Iat 60 OC
Rad. degrad. is RDS
CH2 (0-)2 + H2 0
fICOO-- H2 + OH-
Scheme III. Pathways and Rates in the Generation of Hydrogen.
H + N02 ~
--------------- - op - 0% - - - - - - - - -- - - - - ----- -- - - - --------- - - - - -- - -- --- - --- - - - - - - - -
.. NO
N20
".C O-+ C11h3 01'
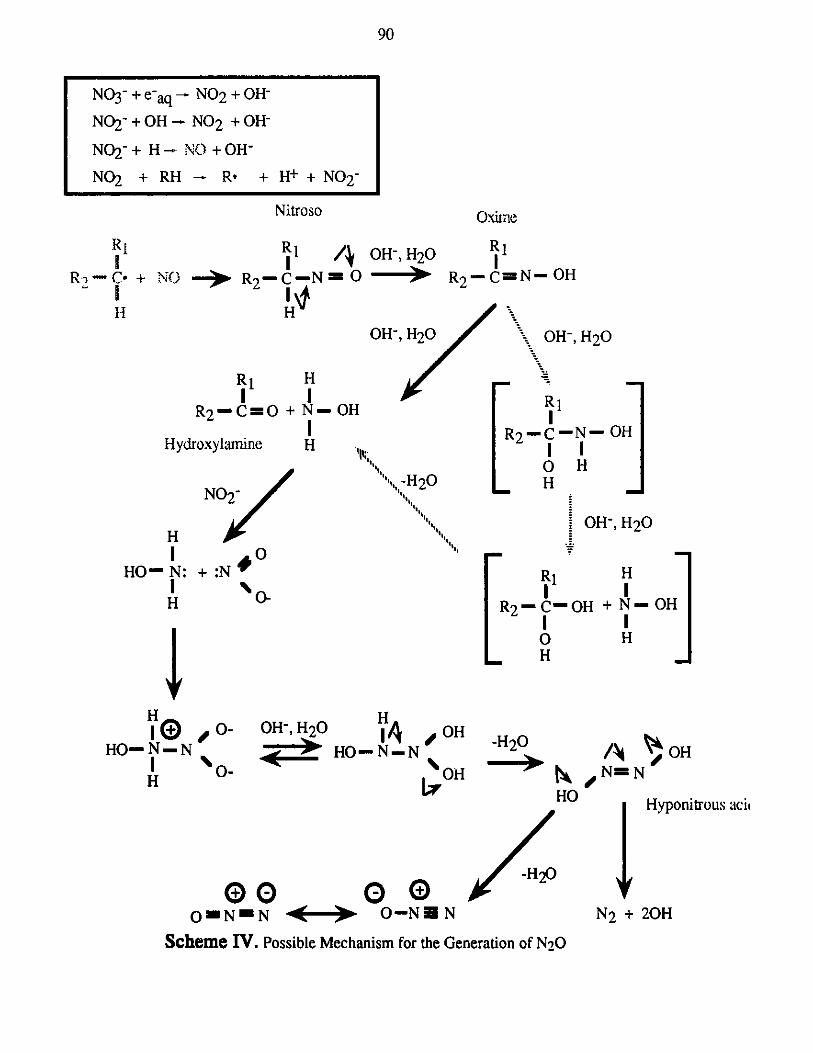
NO3- + e'aq- NO2 + OH-N2- + OH- NO2 +OH'
N2-+ H - NO + OH-
NO2 + RH - R" + H+ + NO 2 ~
Nitroso
R -- C- +
HINO -R 2 - C-N(
OH-, H20D
R1i
IR2 -C=N- OH
R1IR2 -C=Co
Hydroxylanine
HI
H
NO2
0
e :N
OH-, H2 0
-H 2 0
t '',, _______
OH-, H2 0
IR2 -C-N-
I IO HH
OH
OH-, H2 0
i
R2 - C- OHI0H
HI
+ N- OHIH
HiO
HO- N-N
H
,0-
% o-
OH-, H2 0
00ONMN
H14
HO-N-NOH
.OH
000 -NEM N
-H 20
HO
-H 20
Ay OHNON
Hyponitrous aci
N2 + 20H
Scheme IV. Possible Mechanism for the Generation of N20
90
Oxime
HI
HO- N:IH
I
91
REFERENCES
(1) Meisel, D.; Diamond, H.; Horwitz, E. P.; Jonah, C. D.; Matheson, M. S.; Sauer, Jr., M.C.; Sullivan, J. C.; Barnabas, F.; Cerny, E.; Cheng, Y. D. "Radiolytic Generation ofGases from Synthetic Waste," ANL report -91/41, 1991.
(2) Meisel, D.; Diamond, H.; Jonah, C. D.; Sauer, Jr., M. C; Sullivan, J. C.; Barnabas, F.;Cerny, E.; Cheng, Y. D., "Radiolytic and Radiolytically Induced Generation of Gases inSimulated Mixed Waste Solutions", In "Waste Management 92", ; R. G. Post and M. E.Wacks, Ed.; Am. Nuc. Soc. & IAEA: 1992; Vol. 1; p. 859.
(3) Meisel, D.; Diamond, H.; Horwitz, E. P.; Jonah, C. D.; Matheson, M. S.; Sauer, Jr., M.C; Sullivan, J. C., "Radiation Chemistry of Synthetic Waste," ANL report -91/40, 1991.
(4) Spinks, J. W.; Woods, R. J., "An Introduction to Radiation Chemistry" J. Wiley & Sons:New York, 1976.
(5) Hart, E. J.; Thomas, J. K., "Application of the Van Slyke Manometric Apparatus toRadiation Chemistry," ANL report 7856, 1971.
(6) Vogel, A. I. "Quantitative Inorganic Analysis", 3rd Edition, Longmans, 1961; p. 254.(7) Herting, D. L., Letter of May 1, 1991.(8) Han, P.; Bartels, D. M., "Reevaluation of Arrhenius parameters for H + OH- -- e-a+
H20 and the enthalpy and entropy of hydrated electrons." J. Phys. Chem., 1990,94,7294.
(9) Campbell, J. A., Appendix K in "Minutes of the Tank Waste Science Panel MeetingMarch 25-27, 1992" Compiled by W. W. Schultz and D. M Strachan," PNL report PNL-8278/AD-940, 1992.
(10) Loew, Ber., 1887, 20, 144.(11) Siemer, D. D., INEL Letter DDS-27-90 of December 7, 1990.(12) Ashby, E. C., Appendix H in "Minutes of the Tank Waste Science Panel Meeting March
25-27, 1992" Compiled by W. W. Schultz and D. M Strachan," 1992.(13) Ashby, E. C.; Doctorovich, F.; Liotta, C. L.; Neumann, H. M.; Barefield, E. K.; Konda,
A.; Zhang, K.; Hurley, J.; Siemer, D. D., "Concerning the Formation of Hydrogen inNuclear Waste. Quantitative Generation of Hydrogen via a Cannizzaro Intermediate." J.Am. Chem. Soc., 1993, 115, 1171.
(14) Delegard, C., "Laboratory Studies of Complexed Waste Slurry Volume Growth in Tank241-SY-101," Rockwell Hanford Operations, 1980.
(15) Martin, R. J. L., Australian J. Chem., 1954, 7, 335.(16) Martin, R. J. L., Aust. J. Chem., 1954, 7, 400.(17) A. C. Hindmarsh, "Instruction for LSODE. Installation of ODEPACK", LLNL Report M-
4162, May 1983.(18) Bryan, S. A.; Pederson, L. R.; Scheele, R. D.; Adami, S. R. In "Proceedings 4th Annual
International Conference on High Level Radioactive Waste Management;" Am. NuclearSoc.: Las Vegas, Nevada, 1993; Vol. 2, p. 1348.
(19) Bonner, F. T.; Dzelzkalns, L. S.; Bonucci, J. A., "Properties of Nitroxyl as Intermediatein the Nitric Oxide - Hydroxylamine Reaction in Trioxodinitrate Decomposition." Inorg.Chem., 1978, 9, 2487.
92
Distribution for ANL 93/43
Internal:
F. A. CafassoE. P. HorwitzC. D. JonahS. KapoorM. S. Matheson
D. Meisel (36)M. C. Sauer, Jr.L. M. StockTIS Files
External:
DOE-OSTI for distribution per (UC-601) (12)ANL-E Library (2)ANL-W LibraryManager, Chicago Operations Office, DOEG. D. Johnson, Westinghouse Hanford Company (40)


![FLOW TUBE STUDIES OF REACTIONS OF CYANOGEN ...218 electron-induced radiolytic polymerization of C,N, at ca. 1 Torr [3]. Here, we report the application of the selected-ion flow tube](https://img.pdfslide.us/doc/110x75/61199c2f7e80f668ef2f68bd/flow-tube-studies-of-reactions-of-cyanogen-218-electron-induced-radiolytic-polymerization.jpg)