Embed Size (px)
Citation preview

UNIVERSITY OF MANCHESTER
The Radiolytic Steady-State and Factors
Controlling H2 Production
School of Chemistry
Thomas Donoclift
2016
A thesis submitted to the University of Manchester for the degree of Doctor of Philosophy in the Faculty of Engineering and Physical Science
1
Table of Contents
Table of Contents 1
List of Figures 4
List of Tables 9
List of Acronyms and Initialisms 11
Abstract 13
Declaration 14
Copyright Statement 15
Dedications 16
Acknowledgements 17
Chapter 1 Introduction 18
Overview of Sellafield 18
Radiation Chemistry 21
Alpha α Radiation 23
Beta β Radiation 23
Gamma γ Radiation 24
Radiation interactions with matter 25
Radiolysis of Water 29
The Hydrated Electron eaq- 32
The Hydrogen Atom H˙ 32
The Hydroxyl Radical bullOH 33
Computational Applications in Radiation Chemistry 35
Deliverables and Project Aims 36
Table of Contents
2
Chapter 2 Experimental Methods 40
Source of Radiation and Dosimetry 40
Water Purification for Radiolysis Experiments 49
Determination of H2O2 ndash Photometric Analysis 50
Analytical Procedure 52
Determination of H2 - Gas Chromatography 55
Method development 55
The Crush Tube Sampling Method 56
Detection of H2 and Calibration 61
Method Validation 64
Sources of Error 66
Sources of Error in the Determination of H2O2 66
Sources of Error in the Determination of H2 68
Chapter 3 Computational Methodology 69
Production of Primary Species 70
Factors Affecting Primary Yields 72
Temperature 72
pH 77
Linear Energy Transfer (LET) 83
Mass Transfer of Volatile Species 86
Water Radiolysis Reaction Set 90
Computational Assumptions and Error 95
Chapter 4 The Radiolysis of Aqueous Solutions at High pH 97
Preliminary Radiolysis Studies of Pure Water 97
Discussion 99
Measurements of H2O2 in the Radiolysis of High pH Solutions 105
Results 105
Measurements of H2 in the Radiolysis of High pH Solutions 107
Results 108
Discussion 112
Table of Contents
3
Chapter 5 Radiolysis of Magnesium Hydroxide 122
Context 122
Method 123
Results 124
Discussion 128
Chapter 6 Radiolysis of Methanol Solutions 135
Context 135
Experimental Method 135
Results 136
Discussion 139
Chapter 7 Radiolysis of Iron Oxide-Water Systems 148
Context 148
Method 148
Results 149
Discussion 151
Chapter 8 Conclusions and Further Work 154
Further High pH Investigations 154
Further Methanol Radiolysis Investigations 156
Future Development of a Multi-Scale Radiolysis Model 157
Closing Remarks Relevant to Sellafield Ltd 158
References 160
Appendix 172
Radiolysis Model Code 172
Radiolysis Model Full Reaction Scheme 189
List of Figures
4
List of Figures
Figure 1 An aerial view of the Sellafield Site which covers approximately 6 km2 Image
provided by Sellafield Ltd Press Office 19
Figure 2 On the left is The First Generation Magnox Storage Pond (FGMSP) and on the right
are the Magnox Swarf Storage Silos (MSSS) Images provided by Sellafield Ltd Press Office 20
Figure 3 A representation demonstrating the uniform excitations and ionisations of UV
radiation compared to the structured tracks of alpha radiation 22
Figure 4 A representation of the photoelectric effect Image recreated from Spinks and Wood2
25
Figure 5 A representation of the Compton Effect Image recreated from Spinks and Wood 26
Figure 6 A representation of pair production and positron annihilation Image recreated from
Spinks and Wood2 27
Figure 7 A scheme showing the early stages of water radiolysis and the production of primary
species 29
Figure 8 A decay scheme for cobalt-60 41
Figure 9 Image on the left shows the Model-812 Irradiator On the right is the inside of the
irradiator showing the three guide rods that contain the cobalt-60 source during irradiation 42
Figure 10 Sample holding devices for use in the Model-812 Left is the 4x8 rack with its
schematic below On the right is the inverter rig again with its schematic below 46
Figure 11 A diagram of the purification system that provides the ultra-pure water used
throughout this work Image was taken from the ELGA PURELAB user manual 50
Figure 12 Structure of Potassium phthalate monobasic (C8H5KO4) 51
Figure 13 Scanned absorption spectra of a 625 μM H2O2 solution 53
Figure 14 A calibration curve of H2O2 photometric absorption to determine the molar
extinction coefficient 54
Figure 15 The modified SRI 8610C Gas chromatograph with inline ldquocrush tuberdquo setup The
sample can be seen inside the silicone tubing 56
Figure 16 Image on the left shows a schematic for the sampling apparatus on the right are the
vials used which are flame sealed at the midway neck 57
List of Figures
5
Figure 17 A schematic of the original setup for the 10-port sampling valve in both off (top
image) and on (bottom image) positions 58
Figure 18 A schematic for the modified 10-port sampling valve including the removal of the
silica gel column 59
Figure 19 Image on the left shows the bespoke frac14 inch OD 13x molecular sieve column On the
right the rotameter is connected to calibrate gas flow rates 60
Figure 20 A calibration curve to provide a conversion to determine carrier gas flow rate 61
Figure 21 A schematic of a Wheatstone bridge circuit used in the TCD 62
Figure 22 A calibration curve for quantifying hydrogen gas from chromatograms 63
Figure 23 Method validation by the determination of the well-established primary yield of H2
through hydroxyl scavenging by bromide 65
Figure 24 Collected data from literature showing measured primary yields as a function of
temperature Provided by Elliot and Bartels 2008 75
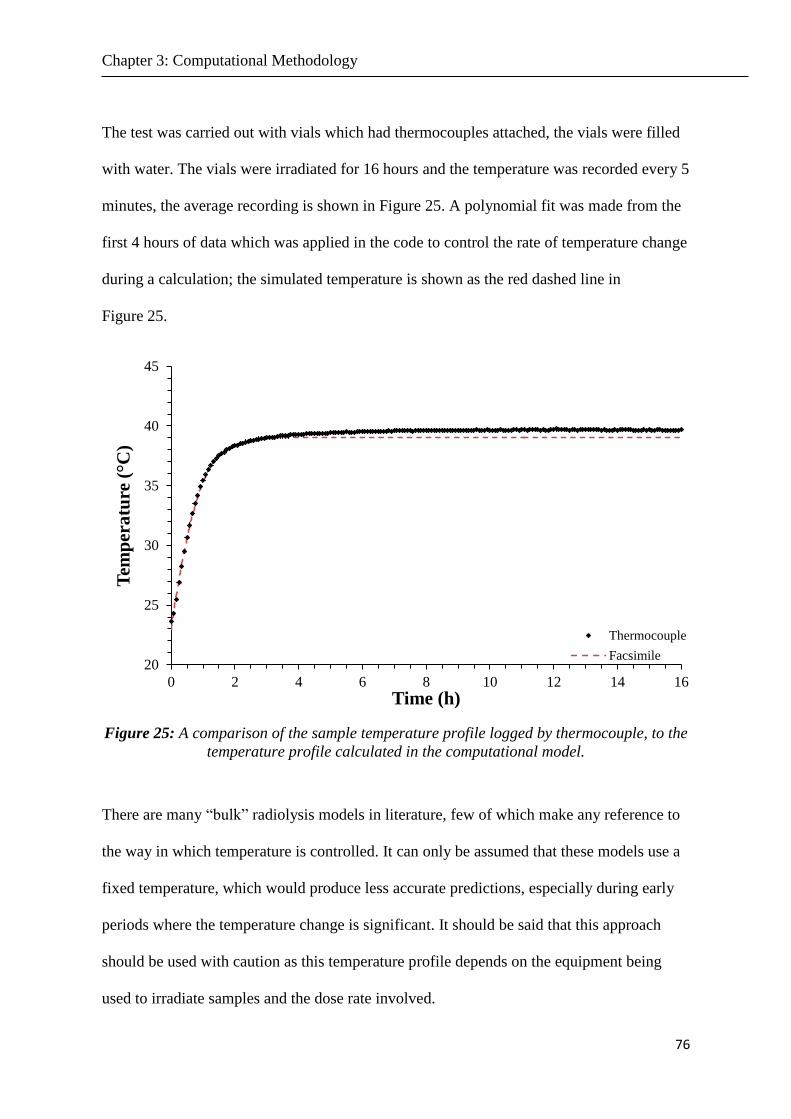
Figure 25 A comparison of the sample temperature profile logged by thermocouple to the
temperature profile calculated in the computational model 76
Figure 26 A reproduction of data provided by Hayon 82
Figure 27 An example of a Bragg peak Energy loss of alphas of 549 MeV in Air Image
released to public domain 83
Figure 28 A schematic representation of how linear energy transfer (LET) alters the
distribution of spurs along a radiation track Image was recreated from Allen AO 84
Figure 29 Simulation data showing the effects of increasing linear energy transfer on the
primary yields of water radiolysis Image was recreated from Allen AO 85
Figure 30 A representation of the stagnant two-film model used to calculate the partitioning of
volatile species 87
Figure 31 The diffusivity of O2 and H2 in both water and air as a function of temperature88
Figure 32 Measurements of H2O2 concentration as a function of dose for aerated water (diams) and
deaerated water (diams) Vertical error bars show the standard deviation between replicates while
horizontal error bars show the dose range for replicates 98
List of Figures
6
Figure 33 Measurements of H2 as a function of dose in aerated (diams) and deaerated (diams) samples
Vertical error bars show the standard deviation of replicates while horizontal error bars show the
dose range for replicates 99
Figure 34 Predicted concentrations of H2O2 as calculated by the radiolysis model for both
aerated () and deaerated () conditions 102
Figure 35 Predicted concentrations of H2 gas as calculated by the radiolysis model for both
aerated () and deaerated () conditions 102
Figure 36 Calculated concentrations of the major oxidising and reducing water radiolysis
species as a function of dose Solid lines represent aerated conditions while broken lines
represent deaerated conditions 103
Figure 37 Measurements of H2O2 concentrations as a function of dose for samples initially at
pH 7 (diams) pH 104 (diams) pH 11 (diams) pH 123 (diams) and pH 127 (diams) All samples were aerated
Vertical error bars are the standard deviation between replicates while horizontal error bars
show the dose range for replicates 106
Figure 38 Measurements of H2 gas as a function of dose at pH 7 (diams) pH 106 (diams) pH 123 (diams)
and pH 13 (diams) Dashed lines are provided to clarify the data trends all samples were deaerated
Vertical error bars show the standard deviation between replicates while horizontal error bars
show the dose range for replicates 108
Figure 39 Model calculations to show the predicted concentrations of H2O2 as a function of
dose at various pH 109
Figure 40 Model calculations to show the predicted concentrations of H2 gas as a function of
dose at various pH 110
Figure 41 Model calculations showing the concentrations of aqueous oxygen and hydrogen gas
from deaerated water after 80 kGy at 280 Gy min-1
to show the related behaviour between the
two 114
Figure 42 Model predictions of the steady-state reaction rates of R21 R50 and R32 at various
pH for γ radiolysis of deaerated water at a dose rate of 280 Gy min-1
115
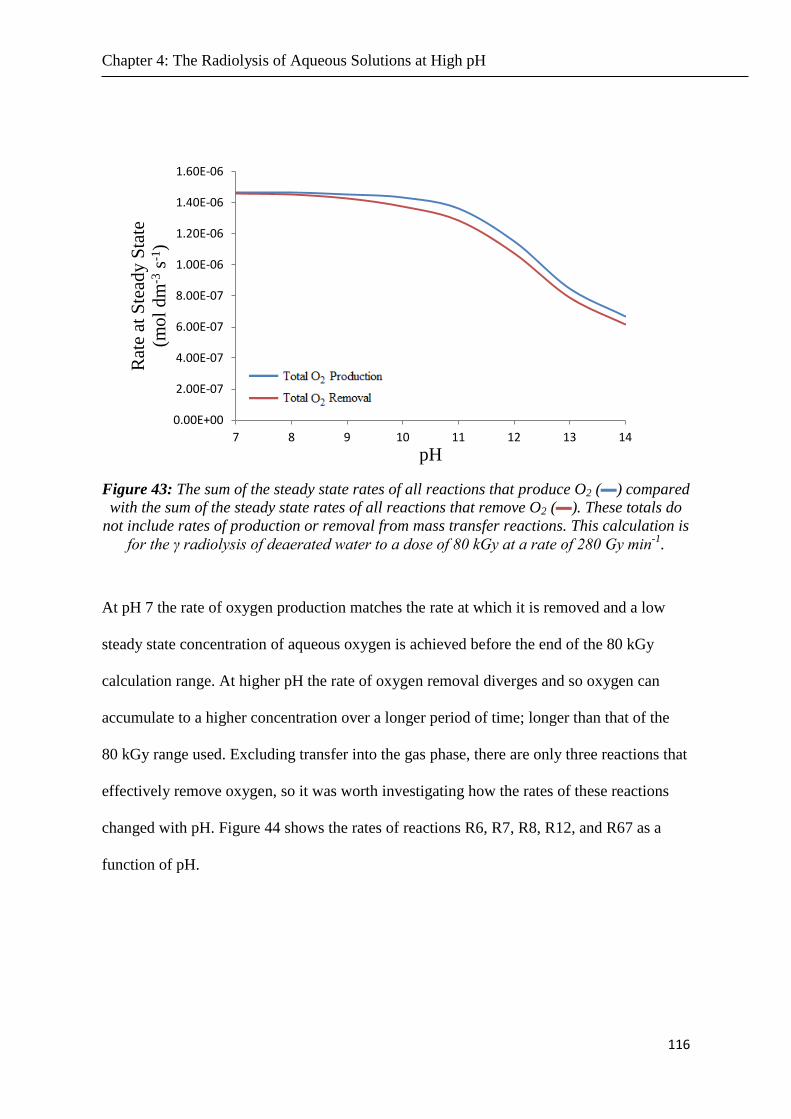
Figure 43 The sum of the steady state rates of all reactions that produce O2 () compared with
the sum of the steady state rates of all reactions that remove O2 () These totals do not include
rates of production or removal from mass transfer reactions This calculation is for the γ
radiolysis of deaerated water to a dose of 80 kGy at a rate of 280 Gy min-1
116
Figure 44 Model predictions of the steady-state reaction rates of R7 R12 and R67 at various
pH This calculation is for the γ radiolysis of deaerated water to a dose of 80 kGy at a rate of
280 Gy min-1
117
List of Figures
7
Figure 45 Dashed lines show the original prediction where k50 = 60 times108 M
-1 s
-1 while solid
lines show the predictions with the increased k50 = 48 times109 M
-1 s
-1 120
Figure 46 Measurements of H2 gas as a function of dose All samples here are aerated with
vertical error bars showing the standard deviation between replicates123
Figure 47 Measurements of H2O2 concentrations in aerated samples of saturated magnesium
hydroxide solution as a function of dose 126
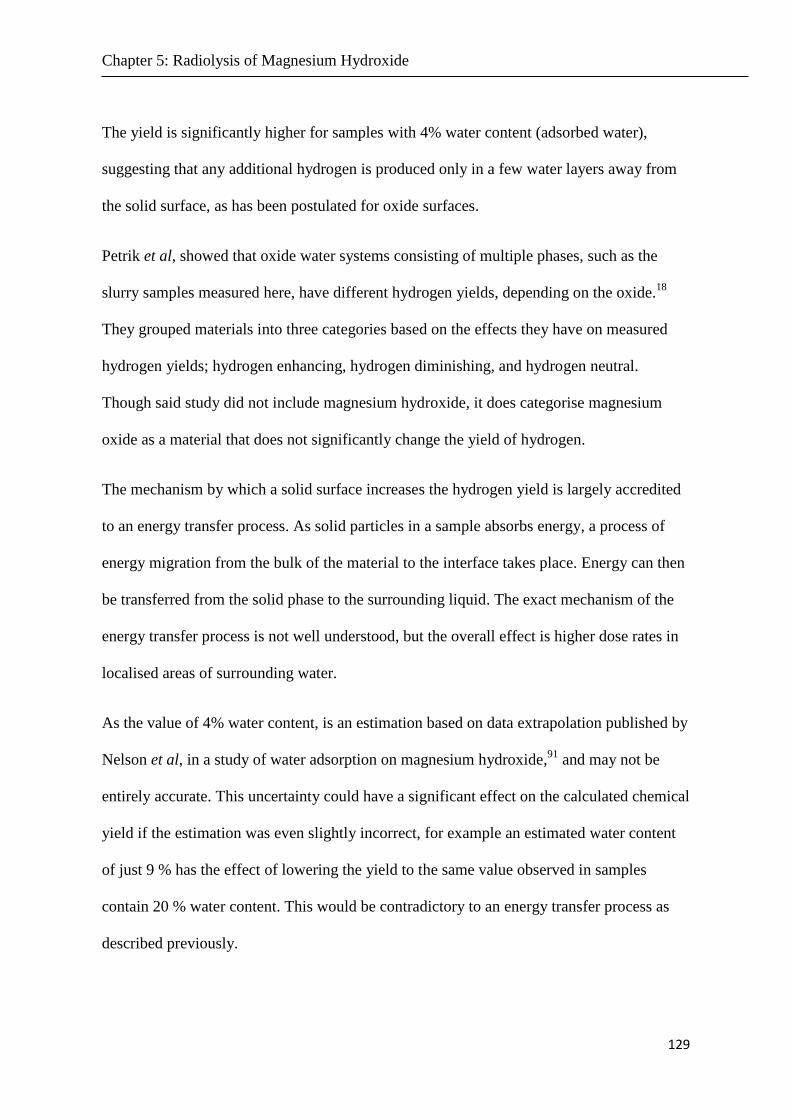
Figure 48 Measurements of hydrogen yields from magnesium hydroxide samples with various
solid ndash aqueous ratios All samples were irradiated to a total dose of ~52 kGy to the aqueous
phase at a dose rate of 3041 Gy min-1
128
Figure 49 Model predictions for the yield of H2 from a solution containing various
concentrations of carbonate anions 133
Figure 50 Measurements of H2O2 concentrations as a function of dose in samples containing
1 mM methanol (diams) and water as a control (diams) All samples were aerated and a dashed line is
included to highlight the data trend The dose rate was 1638 Gy min-1
for methanol solutions
and 2839 Gy min-1
for the aerated water 136
Figure 51 Measurements of H2 gas as a function of dose from deaerated samples containing
1 mM methanol deaerated water is also shown as a control Dashed lines are included to
highlight the data trend The dose rate was 1755 Gy min-1
for the methanol solutions and
2851 Gy min-1
for the deaerated water 137
Figure 52 Chemical yields of hydrogen peroxide measured from an aerated solution of
1 mM methanol as a function of dose 138
Figure 53 Chemical yields of hydrogen gas measured from a deaerated solution of 1 mM
methanol as a function of dose 139
Figure 54 Model prediction of H2O2 concentrations as a function of dose in a solution of
1 mM methanol 142
Figure 55 Calculations of hydrogen peroxide concentrations with and without modification to
the mass transfer routine142
Figure 56 Model prediction of H2 gas as a function of dose in a solution of 1 mM
methanol144
Figure 57 Model predictions of the concentrations of various stable organic products formed as
a result of using the proposed reaction scheme in table 23 146
List of Figures
8
Figure 58 Measurements of H2O2 concentrations from heterogeneous samples of 05g Fe2O3
and 10 mL aerated water The dose rate for the haematite samples was 3052 Gy min-1
and for
the aerated water the dose rate was 2839 Gy min-1
149
Figure 59 Measurements of H2O2 concentrations from heterogeneous samples of 05g Fe3O4
and 10 mL aerated water The dose rate for the magnetite samples was 1625 Gy min-1
and for
the aerated water the dose rate was 2839 Gy min-1
150
List of Tables
9
List of Tables
Table 1 Dose rates of the front most two rows of the 4x8 irradiation rack determined by Fricke
analysis The error indicates the percentage of uncertainty of the obtained gradient 47
Table 2 Dose rates of the four positions of the inverter rig determined by Fricke analysis The
error indicates the percentage of uncertainty of the obtained gradient 48
Table 3 Thermal conductivity of commonly used gases Values taken from the Handbook of
Tables for Applied Engineering Science 62
Table 4 Optimised parameters used for the analysis of H2 gas 64
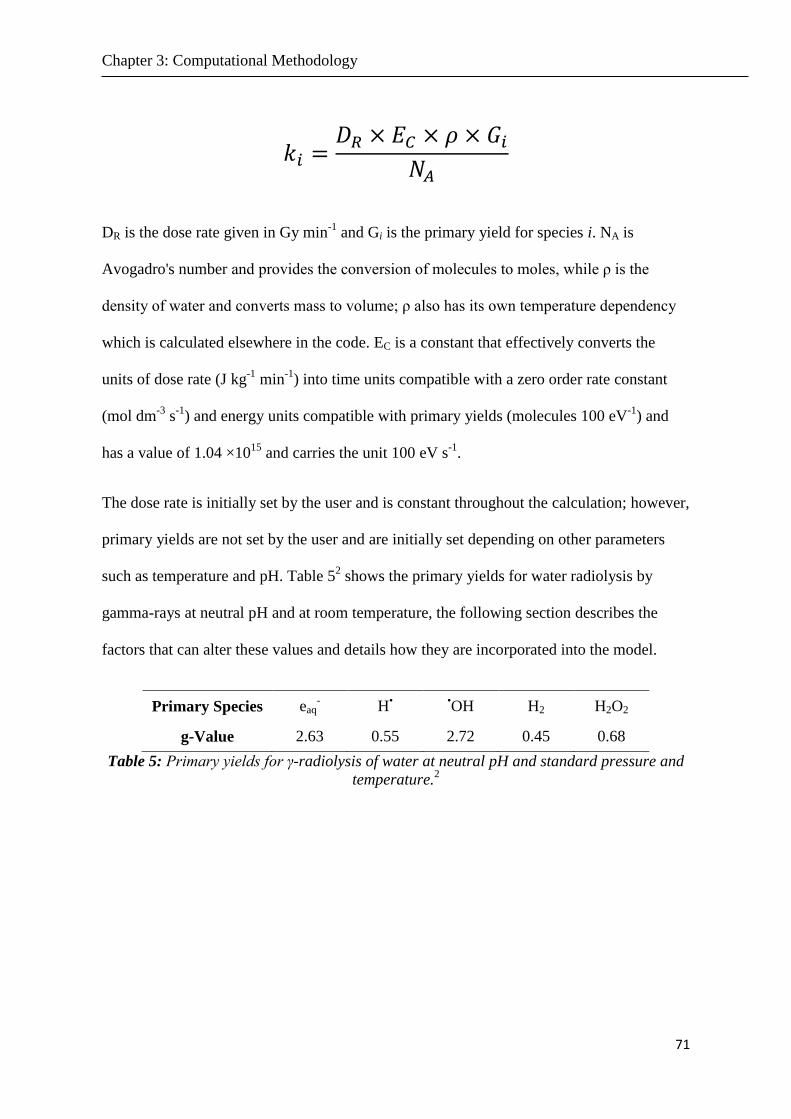
Table 5 Primary yields for γ-radiolysis of water at neutral pH and standard pressure and
temperature2 71
Table 6 Temperature effects on the primary yields of water radiolysis49
72
Table 7 Polynomial equations for estimating temperature effects on primary yields44
75
Table 8 A collection of measurements of primary yields made in 04 M solution of sulphuric
acid (pH = 046)56
77
Table 9 A collection of primary yields measured in alkali solutions (pH asymp 135)56
79
Table 10 Multiple regression polynomials used to estimate the combined effect of temperature
and pH on the primary yields of water radiolysis 82
Table 11 Polynomial equations used to estimate the temperature effects on the diffusivity of O2
and H2 in both gas and aqueous phases where t = temperature (Cdeg) 90
Table 12 A list of Primary Species used to model water radiolysis helliphelliphelliphelliphelliphelliphelliphelliphellip90
Table 13 A list of reactions used to model water radiolysis 93
Table 14 A list of equilibria used to model the radiolysis of water 94
Table 15 Statistical information concerning the estimation of primary yields used to model the
radiolysis of water 95
Table 16 Parameters used to describe interfacial surface area (Aint) and boundary thicknesses
(δ) for sample vials of different geometry 96
Table 17 Conditions of samples used to investigate hydrogen peroxide in high pH radiolysis
105
List of Tables
10
Table 18 A list of important equilibria and their associated pKa values 107
Table 19 Conditions of samples used to investigate hydrogen gas in high pH radiolysis 108
Table 20 Obtained results from the measurements of H2 gas 124
Table 21 Conditions of samples containing Mg(OH)2 for measurements of H2
a ndash Powder sample with no added water estimated adsorbed water content is based on data from
Nelson et al89
b ndash Sample is a saturated solution of Mg(OH)2 ie contains no solid 127
Table 22 A reaction scheme to estimate the effect of carbonate in water radiolysis 132
Table 23 A reaction scheme to estimate the effect of methanol in water radiolysis
a ndash Rate constant for gas phase reaction
b ndash Estimated rate constant
c ndash Rate constant based on reaction of acetic acid and hydroxyl
d ndash Assumed reaction 141
Table 24 A reaction scheme to estimate the effects of dissolved iron in water radiolysis 153
List of Acronyms and Initialisms
11
List of Acronyms and Initialisms
AES - Atomic Emission Spectroscopy
AVIDAC - Argonne Version of the Institutes Digital Automatic Computer
CANDU - Canada Deuterium-Uranium
DCF - Dalton Cumbrian Facility
EDTA - Ethylenediaminetetraacetic acid
EPSRC - Engineering and Physical Sciences Research Council
FGMSP - First Generation Magnox Storage Pond
GC - Gas Chromatography
HDEHP - Di-(2-ethylhexyl)phosphoric acid
HPLC - High Performance Liquid Chromatography
ICP - Inductively Coupled Plasma
ISO - International Organization for Standardization
LET - Linear Energy Transfer
MOX - Mixed Oxide
MSSS - Magnox Swarf Storage Silo
NNL - National Nuclear Laboratory
ODE - Ordinary Differential Equation
PUREX - Plutonium Uranium Redox Extraction
PWR - Pressurised Water Reactor
SHE - Standard Hydrogen Electrode
SI - International System
TCD - Thermal Conductivity Detector
TGA - Thermogravimetric Analysis
TOC - Total Organic Carbon
UV - Ultra Violet
VIS - Visible
Word count - 42500
Abstract
13
Abstract
Sellafield is home to the UKrsquos largest repository of nuclear waste including reprocessed
uranium and plutonium as well as a backlog of unprocessed used fuel and waste kept in
outdated storage facilities commonly referred to as ldquolegacy wasterdquo For this reason
Sellafield has often been called the most hazardous place in Western Europe and as such is
currently undergoing a multi-billion pound decommissioning and clean-up operation Each
on-site facility has unique challenges associated with it many of them presenting situations
where the radiation chemistry aspects of the material degradation are not well understood
The key factors that can affect water radiolysis processes in the Sellafield challenges are a
high pH environment the presence of magnesium hydroxide the presence of iron oxide
and the presence of organic materials This work examines the effect each of these factors
has on H2 and H2O2 production in water radiolysis as well as developing a computational
model to offer some understanding to the kinetic behaviour of water radiolysis under such
conditions
The computational model was able to replicate experimental measurements of radiolytic H2
and H2O2 production in both aerated and deaerated water at neutral pH and provide a
further understanding of the role of dissolved oxygen in water radiolysis Measurements of
H2O2 from solutions containing NaOH have shown that an increase in pH generally results
in a higher steady state of H2O2 while measurements of H2 show a similar increase with a
maximum production rate at pH ~11 The model was also able to closely replicate these
experimental measurements with some over prediction which highlights a gap in our
understanding of high pH radiolysis and also brings into question the validity of the
estimated rate constant for the reaction
119926minus + 119926120784minus119919120784119926rarr 120784119926119919minus +119926120784 119948 = 120788 120782 times 120783120782
120790 119924minus120783119956minus120783
which was originally determined from kinetic model calculations designed to describe the
decay of ozonide (O3ˉ) during pulse-radiolysis studies of high pH solutions conducted by
K Sehested et al in 1982
The radiolysis of magnesium hydroxide slurry also resulted in an increased yield of
hydrogen gas but had little effect on the yield of hydrogen peroxide The hydrogen yield
was 052 molecules per 100eV while a NaOH solution of equivalent pH gave a yield of
027 however interference from carbonate may be the cause of the increased yield A
surface effect was also estimated to contribute 005 molecules per 100 eV to the hydrogen
gas yield
Hydrogen gas and hydrogen peroxide was measured from the radiolysis of aqueous
methanol This was modelled with a near agreement but modifications to the model were
necessary highlighting areas of the model that need improvement as well as providing a
reaction scheme from which a more comprehensive model for aqueous methanol radiolysis
could be developed
Declaration
14
Declaration
No portion of the work referred to in the thesis has been submitted in support of an
application for another degree or qualification of this or any other university or other
institute of learning
Thomas A Donoclift August 2016
Copyright Statement
15
Copyright Statement
The author of this thesis (including any appendices andor schedules to this thesis) owns
certain copyright or related rights in it (the ldquoCopyrightrdquo) and he has given The University
of Manchester certain rights to use such Copyright including for administrative purposes
Copies of this thesis either in full or in extracts and whether in hard or electronic copy
may be made only in accordance with the Copyright Designs and Patents Act 1988 (as
amended) and regulations issued under it or where appropriate in accordance with
licensing agreements which the University has from time to time This page must form part
of any such copies made
The ownership of certain Copyright patents designs trademarks and other intellectual
property (the ldquoIntellectual Propertyrdquo) and any reproductions of copyright works in the
thesis for example graphs and tables (ldquoReproductionsrdquo) which may be described in this
thesis may not be owned by the author and may be owned by third parties Such
Intellectual Property and Reproductions cannot and must not be made available for use
without the prior written permission of the owner(s) of the relevant Intellectual Property
andor Reproductions
Further information on the conditions under which disclosure publication and
commercialisation of this thesis the Copyright and any Intellectual Property andor
Reproductions described in it may take place is available in the University IP Policy (see
httpdocumentsmanchesteracukDocuInfoaspxDocID=487) in any relevant Thesis
restriction declarations deposited in the University Library The University Libraryrsquos
regulations (see httpwwwmanchesteracuklibraryaboutusregulations) and in The
Universityrsquos policy on Presentation of Theses
Dedications
16
Dedications
Mum
For the strength and freedom to explore
and the support and security to return
Dad
For the support and encouragement
exceeded only by pride
Acknowledgements
17
Acknowledgements
I would like to take this opportunity to thank some of the people who have made this work
possible My supervisor Simon Pimblott even with the busy work schedule that comes with
managing an entire research facility he is still able to provide support and put the well-
being of his students and staff above all else My unofficial but very much appreciated
industrial supervisors from the National Nuclear Laboratory (NNL) Howard Sims and
Robin Orr who both take a personal interest in the work going on at the Dalton Cumbrian
Facility (DCF) and dedicate much of their own time to helping the researchers in their
work
I would like to acknowledge the EPSRC and Sellafield Ltd for providing the funding that
supported this research
A special thanks to all the members of the Dalton Cumbrian Facility especially to all the
staff who work immeasurably hard and with profound dedication to the values
management and research carried out at the Dalton Cumbrian Facility Acknowledgements
to the academic staff Ruth Edge Aliaksandr Baidak and Sven Koehler for always
providing a useful and meaningful insight to almost any situation and for providing
valuable guidance in practical radiation chemistry as well as the inspiration and
encouragement to pursue potentially interesting avenues of research
Thank you to the research team at the Dalton Cumbrian Facility for their friendship and for
making the workplace an enjoyable place to conduct research
Chapter 1 Introduction
18
Chapter 1 Introduction
Overview of Sellafield
Sellafield shown in Figure 1 is the largest nuclear facility in the UK and has played a key
role in the UK nuclear industry for over 60 years Sellafield began as a Royal Ordinance
Factory producing weapons propellant for use in the Second World War Soon after the
war ended Sellafield was renamed to Windscale and was repurposed to produce plutonium
for the development of nuclear weapons in order to secure the UKrsquos position in the nuclear
arms race
Several years later the focus on acquiring nuclear weapons shifted towards the development
of new reactors for civil energy production with Magnox reactors built on a neighbouring
site known as Calder Hall The two sites were later combined and were once again named
Sellafield Previous operations carried out at Sellafield meant the site was also in a good
position to conduct fuel reprocessing operations alongside energy production Spent fuel is
separated from its now contaminated cladding and dissolved in nitric acid uranium and
plutonium are separated by solvent extraction while the cladding is treated independently
At Sellafield this industrial process meant storing the contaminated cladding swarf in
underwater silos
The fuel reprocessing process most commonly used is the Plutonium Uranium Redox
Extraction method (PUREX) and produces a number of product streams including
plutonium uranium and other highly active liquors
Chapter 1 Introduction
19
The separated uranium can be re-enriched to produce reusable uranium fuel or mixed with
plutonium to produce mixed oxide (MOX) fuel although much of the reclaimed uranium
and plutonium remains unused and is stored at Sellafield The remaining fission products
classified as high level waste are treated in various ways including vitrification and are
also stored at Sellafield
Figure 1 An aerial view of the Sellafield Site which covers approximately 6 km2
Image provided by Sellafield Ltd Press Office
Magnox reactors are now an obsolete design of reactors that use unenriched uranium fuel
which was clad in an alloy comprising almost entirely of magnesium with small amounts
of aluminium Spent fuel from Magnox reactors was briefly stored in a cooling pond before
having the cladding removed for reprocessing of the fuel pellets
Chapter 1 Introduction
20
The facilities used for this storage shown in Figure 2 were called the First Generation
Magnox Storage Pond (FGMSP) and the Magnox Swarf Storage Silos (MSSS) both of
these facilities are now considered to be ldquoLegacyrdquo facilities
Figure 2 On the left is The First Generation Magnox Storage Pond (FGMSP) and on the
right are the Magnox Swarf Storage Silos (MSSS)
Images provided by Sellafield Ltd Press Office
An extended shut down of reprocessing in the first generation reprocessing plant meant that
fuel being stored in the Magnox pond was left far longer than intended resulting in
corrosion and a backlog of spent fuel The Magnox Storage Pond now contains
approximately 14000 m3
of contaminated water which includes roughly 1200 m3 of sludge
consisting mainly of magnesium hydroxide and iron oxide1 Later technological
advancements rendered the wet storage of Magnox fuel cladding to be an obsolete method
and operations moved towards dry storage However the construction of a new facility and
the huge backlog of material stored in the silo also resulted in corrosion of stored fuel and
eventually a state of disrepair for the Magnox Swarf Storage Silos Both of these legacy
facilities present a huge challenge for decommissioning operations as well as a unique
opportunity for scientific research
Chapter 1 Introduction
21
Radiation Chemistry
Radiation chemistry is the study of chemical change driven by the absorption of energy
capable of causing ionisation This ionising radiation can be of a particulate nature
including but not limited to alpha (He2+
) and beta (eˉ) radiation or non-particulate such as
gamma (γ) or X-ray radiation Radiation chemistry and its experimental methods parallel in
many ways to photochemistry but the differences between the fields are well defined The
fundamental difference between the two fields of study is the quantity of energy involved in
the initiation of reactions In radiation chemistry this energy is provided by the atomic
decay of radioactive nuclei and is far higher than energy used in photochemistry typically
UV radiation The lower initial energies used in photochemistry tend to only produce
molecular excitations rather than direct ionisations These lower incident energies also
mean that each photon will usually only interact once and produce a uniform distribution of
excited species in any plane perpendicular to the incident beam The higher initial energies
used in radiation chemistry often provided by atomic decay can produce both excitations
and ionisations directly Interactions between ionising radiation and a substance is not
necessarily limited to only one interaction a single high energy photon or particle may
interact a number of times This behaviour gives rise to a non-uniform track-like structure
of interactions unlike the uniform distributions found in photochemistry2
Chapter 1 Introduction
22
Figure 3 A representation demonstrating the uniform excitations and ionisations of UV
radiation compared to the structured tracks of alpha radiation
To fully appreciate the chemical changes initiated by ionising radiation it is important to
have some knowledge of the different types of ionising radiation and the ways in which
they interacts with matter There are two main ways in which radiation chemists provide a
source of ionising radiation for experiments The first involves taking advantage of the
atomic decay of radioactive nuclei this may be a naturally occurring radioisotope or an
artificially created isotope The second involves specialised equipment to directly generate
radiation usually by accelerating particles to a high energy The major types of ionising
radiation are alpha beta and gamma however in the field of radiation chemistry one may
also come across the use of X-rays fast neutron radiation proton radiation and other heavy
charged particle radiation This study utilises cobalt-60 as a source of gamma radiation
other types of radiation were not investigated during this work however it is necessary to
understand some fundamental features of alpha and beta decay to fully appreciate gamma
decay
Chapter 1 Introduction
23
Alpha α Radiation
Alpha radiation occurs when an unstable atomic nuclei spontaneously ejects an alpha
particle Elements with an atomic number greater than 83 will decay by this mechanism3
Alpha particles are fully ionised helium nuclei they consist of two protons and two
neutrons and have no electrons which gives them a charge of +2 Alpha particles are
mono-energetic this means that every alpha particle emitted from a given radioactive
element will have the same energy characteristic of that element These energy values
typically range between 4 and 10 MeV This quality means that research facilities capable
of artificially producing alpha radiation by ionising and accelerating helium atoms can
select the particle energy required to effectively mimic alpha decay of any radioactive
element
Beta β Radiation
Beta decay involves the conversion of a neutron to a proton or vice versa in order to create
a more favourable proton to neutron ratio This conversion process is accompanied by the
ejection of fundamental particles directly from the atomic nucleus In the case of a neutron
converting to a proton the ejected particles are an anti-neutrino and a high energy electron
while in the reverse case the ejected particles are a neutrino and a positron (the antimatter
equivalent of an electron) Unlike alpha particles beta particles are not mono-energetic
The energy lost through beta decay is shared between the ejected particles and the recoil of
the decaying atom this means beta particle energy ranges from zero up to a maximum
energy characteristic of that element
Chapter 1 Introduction
24
Gamma γ Radiation
Gamma radiation is not a particle like the previously mentioned types of radiation but is a
photon with a short wavelength in the region of 3 x10⁻⁹
to 3 x10-11
cm or approximately 40
KeV to 4 MeV when converted to energy A gamma ray is emitted when a nucleus in an
excited state relaxes to a lower nuclear energy level there is no change in the number of
protons or neutrons during gamma decay Gamma rays like alpha particles are mono-
energetic however a nucleus may emit several photons as a cascade of energy loss As
gamma emission starts with an excited nucleus some prior process must take place to result
in a nucleus with an elevated energy level For most gamma emitters the process is
initiated with either alpha or beta decay and the resulting atomic nucleus is left in an
excited state For example ceasium-137 undergoes beta decay by emission of a beta
particle of 1174 MeV to form stable barium-137 This only happens 54 of the time and
the more common decay mechanism is the emission of a beta particle of 0512 MeV to
form and excited barium-137 nucleus this then emits a photon of 0662 MeV to relax the
nucleus to the stable barium-137
Chapter 1 Introduction
25
Radiation interactions with matter
In order for radiation to induce a chemical change it must interact with matter in some way
There are many mechanisms by which radiation can interact with matter as this project
focuses on the use of gamma rays a brief description of the interactions of gamma rays
with matter is given below
In the photoelectric effect the entire energy of an incident gamma photon is transferred to
an electron of some absorbing matter This electron is ejected from the absorbing atom with
energy equal to the incident photon minus the binding energy of that electron The electrons
ejected are often K-shell electrons which have the highest binding energy As momentum
and energy must be conserved it is necessary for the absorbing atom to recoil As this
mechanism involves the recoil of a parent atom it would not be possible for the
photoelectric effect to be the mechanism of interaction with free electrons that do not have
a parent nucleus to recoil In the photoelectric effect ejected electrons will leave a hole as
this hole is filled by electrons from higher energy levels characteristic X-rays are emitted
Figure 4 A representation of the photoelectric effect
Image recreated from Spinks and Wood2
Chapter 1 Introduction
26
Although photons cannot interact with free electrons by means of the photoelectric effect
they may interact with free and loosely bound electrons through the Compton Effect In this
mechanism a photon accelerates an electron thereby reducing its own energy The photon
is scattered now with reduced energy while the electron recoils with increased energy
Figure 5 A representation of the Compton Effect
Image recreated from Spinks and Wood2
Another mechanism by which a gamma ray may interact with matter is through pair-
production This is only a viable mechanism for photons with energy larger than 102 MeV
A photon is completely absorbed by an atomic nucleus and from that nucleus two particles
are produced an electron and a positron The energy of the incident photon is shared
between the rest energy of the two new particles and the kinetic energy of these particles as
they move away from the nucleus a negligible amount of energy is also used as the nucleus
recoils The positron behaves much the same way as the electron until it annihilates with an
electron from the medium to produce two 051 MeV gamma rays travelling at 180deg from
each other
Chapter 1 Introduction
27
Figure 6 A representation of pair production and positron annihilation
Image recreated from Spinks and Wood2
Generally the interactions of gamma rays with matter result in fast moving electrons these
are often referred to as secondary electrons or delta-rays and have the same interactions
with matter as beta particles It is these secondary electrons that are predominantly
responsible for producing the excited states and ionisations in an absorbing material that
will initiate chemical changes in said material4 For this reason it is necessary to also
understand the interactions with matter these secondary electrons may have Fast moving
electrons lose energy through three main mechanisms electromagnetic radiation elastic
scattering and inelastic scattering When a fast electron greater than 100 KeV passes close
to an atomic nucleus it is decelerated and slightly deflected This event is accompanied by
emission of electromagnetic radiation commonly known as Bremsstrahlung radiation and
is required for the conservation of energy
Chapter 1 Introduction
28
At energies below 100 keV Bremsstrahlung emission becomes negligible instead electrons
tend to lose energy through scattering Fast moving electrons interact with the bound
electrons of a molecule predominantly through inelastic collisions This interaction
transfers energy from the incident electron to the bound molecular electron which can result
in ionisation and excitation (and often with production of radical species) If there is an
ionisation event the tertiary electrons produced can cause more ionisation events in the
same manner These events tend to lie closer together as the electron that caused them has a
much lower energy than the primary electron that passed by This engenders a radiation
track structure that consists of small groups of ionisation events These groups are often
referred to as spurs
Fast moving electrons may also interact elastically with matter this interaction causes the
electrons to be deflected by a wide range of angles This means that a fast moving electron
may have moved a significant total distance but may have not travelled particularly far into
the absorbing material
Chapter 1 Introduction
29
Radiolysis of Water
As mentioned earlier it is the secondary and tertiary electrons produced from gamma ray
interactions that predominantly lead to the formation of ions and radical species that drives
chemical change in substances exposed to radiation Below is a diagram outlining the
sequence of events and the different stages of water radiolysis
Figure 7 A scheme showing the early stages of water radiolysis and the production of
primary species
In water this initial interaction between a gamma ray and a water molecule produces either
an excited state of water or a water cation accompanied by an electron this is achieved in
less than ten femtoseconds (10-14
s) Molecules in an excited state may break apart to form
hydrogen atoms and hydroxyl radicals or molecular hydrogen and oxygen atoms in a
singlet or triplet state while water cations will quickly react with nearby water molecules to
produce hydronium ions and hydroxyl radicals
Chapter 1 Introduction
30
The electron produced begins a thermalisation process eventually resulting in a solvated
electron however at this stage the electron exists as a potentially reactive precursor
intermediate This happens in a time frame of less than 1 picosecond and occurs before
diffusion of the spur During the non-homogeneous stage the produced radicals and ions
may react within the spur to produce molecular products such as H2 and H2O2 Eventually
the spur species diffuse into the bulk water and these ldquoprimaryrdquo species produced are said
to be homogeneously distributed from this point onwards The yield at which these primary
species are produced are known as primary yields and are often expressed as G-values
which have units of micromoles per Joule (SI unit) or molecules produced per 100 eV of
energy absorbed (conventional historic units)
119866 = 119873119900 119900119891 119898119900119897119890119888119906119897119890119904 119891119900119903119898119890119889
100 119890119881
This should not be confused with a ldquochemicalrdquo yield which are the yields of chemical
species sometime after homogeneous chemistry has taken place and is also often expressed
as a G-value During the homogeneous stage reactions between primary species occur
often altering the observed production rates of these species through back reactions To
avoid confusion between the two types of yield a notation system can be used to discern the
two Two notation systems are commonly used throughout the radiation chemistry
literature the first denotes primary yields with the species of interest in subscript whilst the
chemical yield is often expressed with the species of interest in parenthesis For example
the primary and chemical yield of H2 would be written as GH2 and G(H2) respectively The
second system simply uses a lowercase ldquogrdquo to denote primary yields and uppercase ldquoGrdquo for
chemical yields This study will use the latter system
Chapter 1 Introduction
31
Most often it is the chemical yield that is measured during an experiment but it is possible
to measure a primary yield with the use of scavengers A scavenger is a chemical species
that can quickly react with a targeted primary species before it is able to diffuse into the
bulk solution effectively removing it and its associated chemistry from the homogeneous
stage of radiolysis The effectiveness of a scavenger is often referred to as the ldquoscavenging
capacityrdquo and is quoted as the pseudo-first order rate of reaction between a scavenger (S)
and a radical (R) which depends only on the rate constant for said reaction and the
concentration of the scavenger In other words the scavenging capacity is equal to kS+R[S]5
A well-documented example of this is the use of bromide ions to prevent the reaction of
hydroxyl radicals with molecular hydrogen allowing for the room temperature primary
yield of H2 to be measured this has been done extensively throughout the literature and the
g-value is quoted to be 045 molecules100eV6 Without the use of the bromide scavenger
hydroxyl radicals would react with H2 reducing the observed yield this reduced yield is
what is meant by the term chemical yield
The following summarises some of the properties of the more important primary radicals
Chapter 1 Introduction
32
The Hydrated Electron eaq-
One of the most reactive primary species of water radiolysis is the hydrated electron It is a
chemical entity that can be thought of as being a single electron somewhat stabilised by a
cage of orientated water molecules Hydrated electrons typically have reaction rate
constants close to the diffusion controlled limit with low activation energies Reactions of
hydrated electrons are typically represented as single electron transfer processes and with a
reduction potential of -29 V vs the standard hydrogen electrode (SHE) the hydrated
electron will react with most other species78
119890119886119902minus + 119878119899 rarr 119878119899minus1
In the presence of organic compounds the hydrated electron will act as a nucleophile with
enhanced reactivity towards areas adjacent to electron withdrawing groups Halogenated
organics also show enhanced reactivity towards elimination of the halide ion9
119890119886119902minus + 119877119883 rarr 119877119883minus rarr 119877bull+ 119883minus
The Hydrogen Atom H˙
In terms of BroslashnstedndashLowry acidndashbase theory the hydrogen atom is the conjugate acid of
the hydrated electron with a pKa of 9679
119890119886119902minus + 119867(119886119902)
+ 119867bull
The hydrogen atom has a reduction potential of -23 V78
similar to that of the hydrated
electron however its chemistry is seldom the same
Chapter 1 Introduction
33
Inorganic ions are reduced by the hydrogen atom at slower rates than reduction by the
hydrated electron In certain circumstances such as in low pH environments hydrogen
atoms can act as an oxidant reacting with inorganic ions to form a hydride intermediate
that soon decomposes to form the oxidised ion and molecular hydrogen10
119867bull + 1198651198902+ rarr 1198651198903+119867minus119867+
rarr 1198651198903+ + 1198672
Organic molecules are also subject to oxidation reactions with the hydrogen atom
Saturated organics tend to react by hydrogen abstraction to form molecular hydrogen and a
carbon centered organic radical Unsaturated organics will react by hydrogen addition to the
center of unsaturation again forming a carbon centered organic radical9
119867bull+ 1198621198673119874119867 rarr bull1198621198672119874119867 + 1198672
119867bull+ 11986211986721198621198672 rarr bull11986211986721198621198673
The Hydroxyl Radical bullOH
Unlike the previously mentioned primary radicals the hydroxyl radical has a positive
reduction potential of 18 V in neutral solution making it a powerful oxidising species11
Reactions of hydroxyl radicals with inorganic ions are often said to be simple electron
transfer processes however it has been suggested that the mechanism actually proceeds
through an intermediate adduct12
Reactions with inorganic ions have been observed to
proceed at rates close to the diffusion limit however this is not the case with many metal
cations Reaction rates between the hydroxyl radical and metal cations tend to be slower
with rate constants of the order ~30 x108 M
-1 s
-19
Chapter 1 Introduction
34
One explanation for this is that the mechanism for metal cation oxidation involves the
addition of the hydroxyl radical to the metal cation increasing its coordination number and
allowing for inner-sphere oxidation to take place
[119872(1198672119874)119909]119899+ + ∙119874119867 [(1198672119874)119909119872-119874119867]
119899+ rarr [119872(1198672119874)119909](119899+1)+ + 119874119867minus
The intermediate species Mn+
OH has actually been observed in cases where M = Tl+ Ag
+
Cu2+
Sn2+
Fe2+
and Mn2+
12
As is the case with the hydrated electron and the hydrogen atom the hydroxyl radical also
exists in an acid-base equilibrium with the oxide radical anion bullOˉ
bull119874119867 + 119874119867minus bull119874minus + 1198672119874
With a pKa of 119 the reactions of bullOˉ only become important at high pH With a few
exceptions reactions of bullOˉ are typically slower than those of
bullOH The two species also
have different reactivity towards organic molecules Hydroxyl radicals tend to add to
unsaturated bonds as an electrophile while the conjugate base bullOˉ acts more like a
nucleophile and will abstract hydrogen from a hydrocarbon bond
Chapter 1 Introduction
35
Computational Applications in Radiation Chemistry
Early computational studies in the field of radiation chemistry were focused largely on
developing the radical diffusion theory and the non-homogeneous stage of water radiolysis
to help rationalise experimental observations One of the earliest water models used
coupled differential equations with terms for the competing diffusion and reacting
processes to represent the evolution of a spur containing six radical pairs as a function of
time13-15
Although the predicted primary yields from this type of model agree well with
experimental data there are problems associated with this type of approach the main
problems arising from the application of classical chemical kinetics to a system of
diminutive volume and extremely fast reactions occurring between only a few reactive
species Such deterministic models often use a typical spur to represent a whole system
fixing the average number of radical pairs as a single integer or in some cases a range of
integers This means that in deterministic models the long-running average value for the
number of reactive species is neglected This small difference can lead to inaccuracies in
deterministic calculations of this kind and so a stochastic approach became the preferred
method to these types of non-homogeneous radiolysis calculations16
Deterministic models however are still the preferred technique for the longer term
homogeneous stage calculations for water radiolysis Once a suitable set of primary yields
has been established it is possible to model the subsequent chemistry in much the same way
as any other chemical kinetics simulation
Chapter 1 Introduction
36
By describing a reaction set in terms of a series of simultaneous differential equations and
by including details of physical parameters such as temperature it is possible to predict
chemical yields of radiolysis and highlight important chemical pathways This is the
general methodology implemented in this study and will be discussed in further detail in
subsequent chapters
Deliverables and Project Aims
Given the technical challenges associated with the Sellafield site and the pressing
conditions of legacy facilities such as the First Generation Magnox Storage Pond and
Magnox Swarf Storage Silos there has been a renewed interest in water radiolysis
especially with respects to high pH and slurry systems Previous radiolysis studies of high
pH solutions have been contradictory and difficult to reproduce There are very few
situations in industry where knowledge of high pH water radiolysis is required as most
situations where water radiolysis may occur are in acidic media with the exception of
Pressurised water reactors (PWRs) and CANDU reactor technology which run under alkali
conditions due to added LiOH17
As mentioned previously the Magnox Swarf Storage Silos at Sellafield Ltd contains large
quantities of contaminated magnesium alloy produced from the de-cladding process of
spent nuclear fuel The material contaminated with uranium oxide is stored under water
and over time has corroded to produce large amounts of magnesium hydroxide To prevent
further corrosion some of the 22 silos at the facility dose the water with sodium hydroxide
Although alleviating some corrosion this addition increases the pH
Chapter 1 Introduction
37
One of the aims of this project is to try and obtain a better understanding of water radiolysis
at high pH Using cobalt-60 as a source of gamma radiation and a range of analytical
techniques to determine the production rates of H2 and H2O2 as a function of absorbed dose
it is hoped that the effects of high pH on water radiolysis can be experimentally quantified
Deterministic computational modelling is then used to investigate the experimentally
observed effects of high pH in order to extract a better mechanistic understanding of water
radiolysis at high pH
While there were a number of early water radiolysis studies concerning the effects of
various metal oxides and their surface interactions18
this is also a subject which has
received a renewed scientific interest as there are many situations in the nuclear industry
where an understanding of the effects of metal oxides on water radiolysis are significant
These areas include preventing corrosion within operational facilities to extend their
lifetime controlling radiolytic products associated with stored nuclear material preventing
incidences of unexpected gas build up and managing already heavily corroded facilities
such as the legacy ponds and silos at Sellafield Ltd
In addition to sodium hydroxide the Magnox Swarf Storage Silos also contain large
quantities of magnesium hydroxide the hydrated form of magnesium oxide Radiolysis
studies concerned with magnesium hydroxide solutions slurries and solids are scarce119
despite the obvious need for further investigation The slight solubility of magnesium
hydroxide in water compels a prior understanding of high pH water radiolysis to facilitate
understanding the effects of magnesium hydroxide and the presence of a surface Data
collected from experiments involving magnesium hydroxide are therefore also included in
this project
Chapter 1 Introduction
38
Up until now the discussed aims of this project have been targeted at the issues associated
with the Magnox Swarf Storage Silo rather than with the First Generation Magnox Storage
Ponds These legacy ponds are outdoor open air ponds that have been used to store spent
nuclear fuel for extended periods (far longer than ever intended) As the ponds are open air
they are susceptible to the introduction of natural debris mostly falling leaves and other
biological matter
This has led to an interest in the effects of organic substances on radiolysis processes in
water with the focus being on some of the decomposition products of decaying organic
matter substances such as humic acids The complexity of these substances requires
general underpinning by first understanding simple organic substances In this work the
radiolysis of aqueous methanol was studied
The extended storage of spent fuel in the First Generation Magnox Storage Pond has led to
various challenges concerning corrosion products and their effects on water radiolysis In
the past spent fuel rods were often grouped into small bundles and placed into steel skips
which were then submerged in the pond These skips might also contain other contaminated
material and the exact content of any given skip is largely unknown Over time much of
the steel has corroded resulting in a large build-up of what can only be described as
ldquosludgerdquo The exact composition of this sludge is fairly unknown but the major constituent
is iron oxide present as both red haematite (Fe2O3) and black magnetite (Fe3O4) Research
involving iron oxides and radiolytic processes have mostly been focused on corrosion
mechanisms predominantly adopting an electrochemical approach with very few studies
measuring chemical yields of radiolytically produced H2 and no studies measuring H2O2 in
the presence of iron oxide
Chapter 1 Introduction
39
There are studies that have demonstrated decomposition of H2O2 over iron oxide in the
absence of a radiation source but as H2O2 is a primary product of water radiolysis it is
continuously being generated and the implications of this production are largely unknown
Other studies involving metal oxides have also investigated radiation induced dissolution
With both these processes in mind this project investigates some of the effects of iron
oxide on the steady-state concentrations of the molecular radiolysis products H2 and H2O2
Chapter 2 Experimental Methods
40
Chapter 2 Experimental Methods
Source of Radiation and Dosimetry
This project uses cobalt-60 as a source of gamma radiation Cobalt-60 is an artificial
isotope with a half-life of 527 years2 As cobalt-60 is not a naturally occurring isotope it
must be manufactured This is normally done through neutron bombardment of the non-
radioactive isotope cobalt-59 Stainless steel control rods within a nuclear reactor core are
substituted with cobalt rods and the neutron flux present is enough to transmute cobalt-59
to cobalt-6020
The overall reaction for the production and decay of cobalt-60 is shown
below
1198621199002759 + 119899 rarr 11986211990027
60 rarr 119873119894lowast2860 + 119890minus + 119890 + 120574
The decay mechanism for cobalt-60 was similar to that of Caesium-137 in that it is initiated
by beta decay Unlike Caesium-137 however there is no direct route to a stable isotope
Subsequently the decay of cobalt-60 follows one of two paths both of which begin with the
ejection of a beta particle Cobalt-60 may emit two photons of gamma radiation but will
always emit at least one photon A cobalt-60 nucleus may eject a beta particle with energy
up to 148 MeV this is followed by emission of a photon with energy of 133 MeV
however there is only a 012 chance that this happens The more common decay path for
cobalt-60 is to eject a beta particle with energy up to 031 MeV followed by the emission of
two photons with energies of 117 MeV and 133 MeV
Chapter 2 Experimental Methods
41
Figure 8 A decay scheme for cobalt-60
Cobalt-60 is a popular source of gamma radiation used by radiation scientists High dose
rates can be achieved with fairly little material21
Facilities that conduct experiments using
cobalt-60 as a source of radiation use a variety of systems to shield operators from
radiation Older systems can be as rudimental as a water filled hole with cobalt-60 resting at
the bottom samples are lowered in a container and held at a given distance from the source
to accumulate dose More advanced systems involve mechanically lifting cobalt-60 from
some shielded well into an experimental area This area may be a dedicated room for
irradiating samples or it may be a shielded chamber in which samples are placed The latter
example is known as a self-contained irradiator and is the type of irradiator used in this
work
Chapter 2 Experimental Methods
42
All irradiations reported here were carried out using the Foss Therapy Model-812 Self-
Contained Cobalt-60 Irraditor located at the University of Manchesterrsquos Dalton Cumbrian
Facility (DCF) The Model-812 Irradiator contains three independent housings where
cobalt-60 sources may reside named A B and C Currently only A and C contain
cobalt-60 and had a total activity of 5281 TBq on the original date of measurement
(2nd
May 2012) Source B is due to be filled after one half-life from the original date to
bring the total activity back to a similar level Both A and C sources are used at the same
time for every irradiation throughout this work
Figure 9 Image on the left shows the Model-812 Irradiator On the right is the inside of
the irradiator showing the three guide rods that contain the cobalt-60 source during
irradiation
Chapter 2 Experimental Methods
43
Samples are placed within the irradiator and are exposed to gamma emission from the
cobalt-60 for calculated periods of time to allow samples to accumulate the desired dose
Radiation doses are defined as the amount of energy deposited per kilogram of sample
material and are often quoted as the SI derived unit Gray (Gy) which has the unit J kg-1
In
order to calculate how long a sample should be exposed for requires knowledge of the rate
at which radiation energy is deposited into the sample This is known as a dose rate and is
often quoted as Gy min-1
The practice of dose rate determination is known as ldquodosimetryrdquo
and there are a number of physical and chemical methods for determining the dose rate
from a given source Physical methods often deploy tools such as calorimeters and
scintillation chambers to directly measure energy while chemical methods depend on
measuring some chemical change that occurs during exposure to radiation that responds
linearly with increasing dose There are many chemical dosimeters available depending on
the kind of work being undertaken For example vapour phase experiments often measure
the condensation of acetylene into benzene to determine a dose rate22
For this work the
dosimeter used was a ferrous sulphate solution known as the Fricke dosimeter The Fricke
dosimeter was first described in 1927 by Hugo Fricke and has become the most adopted
chemical dosimeter among radiation scientists23
The standard recipe to make a Fricke
dosimeter used in this work is as follows
Fricke Dosimeter Dissolve 04 grams FeSO4∙7H2O (99 assay Fisher Chemicals) 006
grams NaCl (gt9999 Assay Calbiochem) and 22 mL concentrated H2SO4 (95-98
Sigma Aldrich) Dilute with distilled water to make 1 litre of Fricke solution24
Chapter 2 Experimental Methods
44
This solution will slowly oxidise and must be used within a few days by preventing light
from interacting with the solution it is possible to extend the shelf life of the Fricke
solution to three months The Fricke dosimeter relies on the oxidation of FeII to Fe
III by
species produced during the radiolysis of water
119867(119886119902)+ + 119890(119886119902)
minus rarr 119867bull
119867bull + 1198742 rarr 1198671198742bull
119865119890119868119868 + 1198671198742bull rarr 119865119890119868119868119868 + 1198671198742
minus
1198671198742minus + 119867(119886119902)
+ rarr 11986721198742
119865119890119868119868 + 11986721198742 rarr 119865119890119868119868119868 + bull119874119867 + 119874119867minus
119865119890119868119868 + bull119874119867 rarr 119865119890119868119868119868 + 119874119867minus
The extent of oxidation responds in a linear fashion to ionising radiation until dissolved
oxygen is exhausted this can be up to 500 Gy but in practice doses are usually kept
between 40 and 400 Gy to ensure measurements are made within the range in which FeIII
is
of a measurable concentration but FeII is not fully depleted
2 With a strong absorbance at
304 nm Fe3+
can be quantified by spectrophotometric analysis and an absorbed dose can be
calculated from the following equation
119863119866119910 = 9647 times 106 times
∆119860
∆휀119897120588119866(1198651198903+)
Chapter 2 Experimental Methods
45
where DGy is the absorbed dose in Grays ΔA is the difference between the optical
absorbance before and after irradiation and Δε is difference between the molar extinction
coefficient of Fe2+
and Fe3+
at 304 nm which has an established value of
2201 mol-1
cm-1
24
G(Fe3+
) is the chemical yield of Fe3+
and a value of 155 is
recommended when using cobalt-60 by the International Commission on Radiation Units
and Measurements Path length and solution density are represented by the terms l and ρ
respectively
Irradiations throughout this work were conducted using two sample holding devices each
with a number of different positions The first device consists of a standard 4x8 test tube
rack that has been fixed to an irradiation base plate The base plate allows the device to be
locked in exactly the same position within the Model-812 every time it is used
This device holds a number of 20 mL headspace vials during irradiations of samples which
are then analysed for H2O2 content the details of which will be discussed later
The second device is somewhat more complex and is used to hold samples that are
analysed for H2 content again the details of which are discussed later This device is
designed to keep samples mixed by slowly rotating them along a horizontal axis thus
continually inverting samples throughout the irradiation period it is hence referred to as the
ldquoinverter rigrdquo The construction consists of a high torque motor with a top speed of 2 rpm
Chapter 2 Experimental Methods
46
Figure 10 Sample holding devices for use in the Model-812 Left is the 4x8 rack with its
schematic below On the right is the inverter rig again with its schematic below
Dosimetry measurements were carried out in each of these devices and the results are
shown below Table 1 shows the dosimetry for the 4x8 test tube rack each position was
measured at four time intervals each of which with three replicates Measurements were
carried out in 20 mL headspace vials which were filled with 10 mL of Fricke solution
Chapter 2 Experimental Methods
47
Experiments carried out in this device only occupied positions in the first two rows hence
only these results are shown Table 2 shows the dosimetry of the inverter rig again each
position was measured at four time intervals each with three replicates The inverter rig
only has four positions which were measured with no rotation mixing Initially
experiments were to be conducted under stationary conditions before moving on to mixed
conditions however time limitations prevented progression to mixed samples and all
samples are conducted with no rotational mixing From the data obtained absorbance units
were converted to an absorbed dose by use of equation 1 and dose rates are then extracted
as the gradient of absorbed dose plotted as a function of time
Date of Original Measurement 07022014
Position Dose Rate on Date of
Measurement (Gy min-1
) plusmn Error
A1 29435 75
B1 34827 23
C1 32352 41
D1 27358 89
A2 15845 24
B2 18519 62
C2 18176 26
D2 15248 17
Table 1 Dose rates of the front most two rows of the 4x8 irradiation rack determined by
Fricke analysis The error indicates the percentage of uncertainty of the obtained gradient
Chapter 2 Experimental Methods
48
Date of Original Measurement 13012015
Position Dose Rate on Date of
Measurement (Gy min-1
) plusmn Error
A 29379 46
B 31708 46
C 30208 87
D 30616 46
Table 2 Dose rates of the four positions of the inverter rig determined by Fricke analysis
The error indicates the percentage of uncertainty of the obtained gradient
As cobalt-60 decays dose rates are subject to change with time however they change in a
predictable manner The decay of cobalt-60 follows first order kinetics it is therefore
possible to adjust dose rates to account for the decay of the source simply by multiplying
the dose rate by the ratio of initial radiation intensity and the intensity after a given time2
This can be written as
119863119877119860119889119895 = 119863119877 times1198681199051198680
Where
1198681199051198680= 119890minus120582119905
And
120582 =ln 2
11990512
Chapter 2 Experimental Methods
49
DRAdj is the decay adjusted dose rate after time t λ is the decay constant and tfrac12 is the half-
life which for cobalt-60 is 527 years The use of this equation depends on knowing how
much time has passed since the original dose rate (DR) was calculated hence the inclusion
of the date on which these measurements were made in Tables 1 and 2
Water Purification for Radiolysis Experiments
Radiation breaks water molecules into reactive radicals which can react quickly with any
impurity present in a sample It is therefore of high importance to ensure that any water
used in radiolysis experiments is of the highest purity During the early days of radiation
chemistry high purity water was often obtained through a triple distillation process Water
was distilled firstly through standard means before being distilled again from an acid
dichromate solution and finally a third time from an alkaline permanganate solution before
being stored in a fused silica container4 Advancements in modern self-contained
purification systems have significantly simplified the process of obtaining ultra-pure water
for radiolysis experiments All experiments carried out throughout this work use ultra-pure
water dispensed from the ELGA PURELAB Classic the feed water of which is provided
by the ELGA PURELAB Option-SR 715 Through the use of duel bank reverse osmosis
units two independent UV lamp purifiers and deionisation cartridges the final resistivity of
output water is measured to be 182 MΩ cm-1
Chapter 2 Experimental Methods
50
Figure 11 A diagram of the purification system that provides the ultra-pure water used
throughout this work Image was taken from the ELGA PURELAB user manual
Determination of H2O2 ndash Photometric Analysis
Throughout this work the determination of hydrogen peroxide is carried out using a
photometric technique known as the Ghormley Tri-iodide method25
This method takes
advantage of the redox reaction between hydrogen peroxide and iodide to produce iodine in
a 11 stoichiometric ratio with hydrogen peroxide This reaction takes place under acidic
conditions and is catalysed by the presence of ammonium molybdate tetrahydrate Acid is
also required to force the resulting equilibrium between iodine and tri-iodide completely
towards the production of tri-iodide which can then be measured by photometric analysis
this is achieved using potassium phthalate monobasic A general reaction scheme for this is
shown below
Chapter 2 Experimental Methods
51
11986721198742 + 2119868minus + 2119867+ rarr 1198682 + 21198672119874
1198682 + 119868minus 1198683
minus
This is a popular method for the determination of hydrogen peroxide in radiolysis studies26-
29 It is favoured for its relative simplicity over previous methods which typically involved
complicated titrations with potassium permanganate Furthermore it is also extremely
sensitive enabling accurate measurements of low concentrations of hydrogen peroxide with
a lower limit of 1 μM30
The reagent used to reduce hydrogen peroxide is susceptible to self-oxidation and has a
very short shelf life To prevent self-oxidation and prolong the shelf life the reagent is
prepared as two reagents designated ldquopart Ardquo and ldquopart Brdquo and are only mixed during
analysis One reagent contains potassium iodide under slightly alkali conditions while the
other contains an organic acid salt potassium phthalate monobasic Both reagents are
prepared according to the recipe originally described by Ghormley25
Part A Dissolve 1 gram NaOH (ge98 Sigma Aldrich) 33 grams KI (995 Assay
Fisher Scientific) and 01 gram (NH4)6Mo7O24∙4H2O (ge99 AppliChem) in 500 mL
deionised water
Part B Dissolve 10 g C8H5KO4 (ge9995 Sigma Aldrich) in 500 mL deionised water
Figure 12 Structure of Potassium phthalate monobasic (C8H5KO4)
Chapter 2 Experimental Methods
52
Analytical Procedure
The redox reaction between H2O2 and I ˉ is carried out on a 2 mL aliquot of sample
solution To this 1 mL of Part A and 1 mL of Part B are added a few seconds are required
for development before transfer to a quartz cuvette for analysis in a Cray 5000 UVVisNIR
photospectrometer Samples that contain solid material are filtered through syringe filters
before analysis to remove any solid particles Samples of elevated pH often required
additional acid to reduce the pH to the conditions required for analysis the quantity of
additional acid is determined by testing a blank sample with litmus paper the quantity is
then recorded and the dilution factor accounted for Utilisation of the Beer-Lambert law
allows for the calculation of hydrogen peroxide concentration from an absorbance within
the linear range of the technique
119860 = 휀119897119888
Where A is the optical absorbance ε is the molar extinction coefficient in M-1
cm-1
l is the
path length (always 1 cm during this work) and c is the concentration in mol dm-3
Determination of the optimum wavelength of absorption was carried out by a scanning
analysis of a 625 μM solution of hydrogen peroxide prepared by serial dilution of a 1 M
standard which itself was prepared from a 3wt stock solution of hydrogen peroxide in
water purchased from Sigma-Aldrich
Chapter 2 Experimental Methods
53
Figure 13 Scanned absorption spectra of a 625 μM H2O2 solution
The maximum absorbance was determined to be 351 nm which is consistent with values
described in literature3031
A series of standard solutions were made ranging in
concentration from 1-300 microM to determine the molar extinction coefficient shown in
Figure 14
Chapter 2 Experimental Methods
54
Figure 14 A calibration curve of H2O2 photometric absorption to determine the molar
extinction coefficient
Addition of the tri-iodide reagents dilutes the standard to half the quoted concentration A
dilution factor of 2 is used to correct for this hence the calibration curve covers the
concentration range 05-150 microM hydrogen peroxide The determined molar extinction
coefficient was 25631 M-1
cm-1
this again is consistent with values quoted in
literature263132
y = 25631x - 00012
0
05
1
15
2
25
3
35
4
45
00E+00 20E-05 40E-05 60E-05 80E-05 10E-04 12E-04 14E-04 16E-04
Ab
sorb
ance
[H2O2] (mol dm-3)
Slope Error = plusmn35548
Chapter 2 Experimental Methods
55
Determination of H2 - Gas Chromatography
Method development
Measurements of hydrogen gas are usually carried out using gas chromatography
frequently paired with mass spectroscopy3334
This work uses only gas chromatography to
measure hydrogen gas produced during the radiolysis of samples The standard technique
for gas analysis is to use a gas tight syringe and needle to extract a portion of headspace
from a sealed sample The samples are typically sealed in air tight vials with a rubber
septum to allow gas extraction however due to the effects of radiation on plastics and
rubbers the reliability of this technique remains debatable and often alternative methods are
sought One argument against the use of rubber septa in a radiation field is that they are
known to radiolytically produce their own hydrogen which would contribute to any
measurements Although some preliminary laboratory tests indicate that the production of
hydrogen from septa seems predictable and can be subtracted from any hydrogen produced
from samples this information was obtained from a single batch of septa and the
production rate of hydrogen will most likely vary between batches as nothing is known
about the manufacturersquos quality control tolerances Another important argument is
concerned with the concentration ranges of hydrogen that will be measured Aqueous
samples that contain no radical scavengers often have low chemical yields for hydrogen
and sampling with a syringe reduces the sample volume to a maximum of 100 microL
attempting to extract a larger volume leads to sampling problems associated with negative
pressure within the sealed sample
The portion of hydrogen entering the gas chromatograph may be reduced even further for
samples containing slurries as much of the hydrogen may remain trapped in the aqueous
phase even after agitation
Chapter 2 Experimental Methods
56
Headspace injections may be a viable technique for samples that are known to produce
large quantities of hydrogen but generally measurements made with this technique are
often close to or below the detection limits of the gas chromatograph Many radiation
chemists have adopted a variety of techniques for measuring small quantities of
radiolytically produced hydrogen that do not rely on the use of rubber septa One such
technique is the ldquoCrush Tuberdquo method described in references3536
This method is used for
all hydrogen analysis in this work
The Crush Tube Sampling Method
The crush tube method of gas chromatography uses a modified SRI Model 8610C Gas
Chromatograph (GC) with a bespoke sampling device that contains a section of Tygonreg
tubing that allows for a glass sample vial to be crushed by an external force such as a pair
of wrench pliers Originally the tubing was a standard silicone tube however Tygonreg
tubing proved to be more durable and less prone to leaks Figure 15 and 16 show the
general schematic for the apparatus as well as the specially made sample vials for this
method
Figure 15 The modified SRI 8610C Gas chromatograph with inline ldquocrush tuberdquo setup
The sample can be seen inside the silicone tubing
Chapter 2 Experimental Methods
57
Figure 16 Image on the left shows a schematic for the sampling apparatus on the right
are the vials used which are flame sealed at the midway neck
In order for this technique to work several modifications must be made to the GC hence
the selection of the highly modular SRI Model 8610C The first modification was made to
the 10-port gas sampling valve to enable carrier gas to flow through the bespoke sampling
device during analysis The unmodified 10-port valve contains a sample loop that connects
to the ldquoINrdquo and ldquoOUTrdquo ports on the external of the GC during sample loading When the
port is rotated to the ldquoINJECTrdquo position the loop is included in the carrier gas path and the
external ports are isolated
Chapter 2 Experimental Methods
58
Figure 17 A schematic of the original setup for the 10-port sampling valve in both off (top
image) and on (bottom image) positions
It is essential that carrier gas is allowed to continually flow through the system during both
sample loading and sample injecting As the bespoke sampling device creates a closed loop
between the external ports it is possible to swap the connections of ports 1 and 10 without
disrupting the flow of carrier gas
This modification isolates the external ports during sample loading but includes them
during sample injection and allows sample gas to be carried through the GC
Chapter 2 Experimental Methods
59
Figure 18 A schematic for the modified 10-port sampling valve including the removal of
the silica gel column
Figure 18 also depicts the removal of the silica gel column this is part of the second
modification The bespoke sampling device contains a large volume of gas that requires a
relatively fast carrier gas flow rate to achieve acceptably narrow peaks This flow rate is
quoted in literature as being around 50 mLmin35
The Packed silica gel column and the
default molecular sieve column simply did not allow for this high flow rate without
significant back pressure that can cause damage to equipment for this reason they were
removed A bespoke column was made from frac14 inch copper tubing and 13x molecular sieve
beads The new column had a total length of 4 m and allowed sufficient flow rates with
adequate separation of gasses
Chapter 2 Experimental Methods
60
Figure 19 Image on the left shows the bespoke frac14 inch OD 13x molecular sieve column
On the right the rotameter is connected to calibrate gas flow rates
The SRI Model 8610C is not equipped with a digital rotameter as such it cannot display
flow rate information and instead can only display information about the carrier gas inlet
pressure which requires a conversion formula to obtain a meaningful flow rate The user
manual includes conversion factors but these are column specific and as the column has
been custom built it is necessary to manually determine a conversion formula to obtain a
flow rate This was done using a rotameter connected to the external GC ports by adjusting
the inlet pressure and noting the rotameter value a calibration curve was obtained
Chapter 2 Experimental Methods
61
Figure 20 A calibration curve to provide a conversion to determine carrier gas flow rate
Detection of H2 and Calibration
The SRI Model 8610C is equipped with a thermal conductivity detector (TCD) for the
measurement of eluted gas The TCD consists of a Wheatstone bridge circuit with tungsten-
rhenium filaments serving as resistors (Figure 21) Carrier gas containing eluted sample
passes over one of the filaments while a second path is reserved for carrier gas only to
serve as a reverence The filaments are electrically heated and the temperature of the whole
unit is carefully controlled As carrier gas passes over the filaments it conducts heat away
from the filament to the detector body when a sample component flows over the filament
the conductivity changes causing the filament to change temperature relative to the
reference filament This change in temperature changes the resistivity of the filament and a
change in voltage is recorded
Chapter 2 Experimental Methods
62
Figure 21 A schematic of a Wheatstone bridge circuit used in the TCD
To achieve a good sensitivity towards a given analyte it is important to have a large
difference in thermal conductivity between said analyte and the carrier gas Table 3 shows
the thermal conductivity values for some common gases The carrier gas most often used is
helium which has a thermal conductivity of 36036times106 cal s
-1 cm
-1 degC
-1 As many other
gases have much lower thermal conductivities helium often performs well however
hydrogen is a special case as it also has a high thermal conductivity of
44632times106 cal s
-1 cm
-1 degC
-1 For this reason the carrier gas selected for hydrogen
measurement was argon which has a much lower thermal conductivity of
4257times106 cal s
-1 cm
-1 degC
-1
Gas Thermal Conductivity (cal s-1
cm-1
degC-1
x106)
267degC
H2 44632
O2 6364
N2 6240
Ar 4257
He 36036
Table 3 Thermal conductivity of commonly used gases
Values taken from the Handbook of Tables for Applied Engineering Science
Chapter 2 Experimental Methods
63
Measurements made by the TCD are expressed as a voltage plotted as a function of time
The peaks produced in this plot are integrated and the final result is expressed as the peak
area As the peak area unit is largely arbitrary a calibration curve must be obtained to relate
the peak area to a meaningful quantity of hydrogen Calibration is carried out by replacing
the bespoke sampling device with a simple T-section fitted with a rubber septum Known
quantities of hydrogen gas are injected into the T-section which is then carried through the
GC Figure 22 shows a calibration curve for the linear range of 1 ndash 500 microL of pure
hydrogen at standard room temperature and pressure
Figure 22 A calibration curve for quantifying hydrogen gas from chromatograms
Samples of airhydrogen mixtures were also injected to make sure there was adequate
separation between the gases good separation between hydrogen and oxygen is observed
but the separation of oxygen and nitrogen is not adequate for analysis of those gases when
both are present in large quantities
Chapter 2 Experimental Methods
64
Machine parameters were adjusted for optimum performance these are shown in Table 4
These parameters were used for every experiment throughout this work
Parameter Value
Valve Temperature 70 Cdeg
Column Temperature 40 Cdeg
TCD Temperature 220 Cdeg
Flow Rate 50 mLmin
Carrier Gas Ar
Table 4 Optimised parameters used for the analysis of H2 gas
Method Validation
It was mentioned previously that the bromide ion is an excellent scavenger of hydroxyl
radicals during radiolysis
bull119874119867 + 119861119903minus [119867119874119861119903]minus119867(119886119902)+
rarr 119861119903bull + 1198672119874119861119903minus
rarr 1198611199032bullminus
Radiolysis of an aqueous solution of 1 mM bromide results in the elimination of the
reaction between the hydroxyl radical and molecular hydrogen in solution37
Other than
diffusion to the gas phase a reaction with hydroxyl radicals is the only significant removal
path of hydrogen at neutral pH The removal of dissolved oxygen by argon sparging also
simplifies much of the radiolysis chemistry allowing for a more reproducible experiment
This means that the hydrogen measured from the radiolysis of a deaerated 1 mM bromide
solution is in fact a primary yield and is quoted throughout the literature as being
GH2 = 045 this is an average value from a range of studies
2453839
Chapter 2 Experimental Methods
65
In order to secure confidence in this technique a validation experiment was carried out in
which a 1 mM solution of potassium bromide was used to determine the primary yield of
hydrogen which was then compared to the literature value
Figure 23 Method validation by the determination of the well-established primary yield of
H2 through hydroxyl scavenging by bromide
As expected the hydrogen concentration increased linearly with absorbed dose over the
experimental range When the number of hydrogen molecules is plotted as a function of
absorbed energy in sets of 100 eV the gradient gives GH2 = 0456 plusmn0025 matching well to
the average value quoted in literature
Chapter 2 Experimental Methods
66
Sources of Error
The majority of experiments carried out in this work use the absorbed energy or dose as
the independent variable and using one of the analytic techniques discussed above either a
photometric absorption value or the integrated response to hydrogen gas detection as the
dependant variable Both the dependant and independent variable have errors associated
with them which are discussed below
Determining the quantity of absorbed energy to the sample relies on the procedure of
dosimetry discussed earlier in this chapter The errors reported in Tables 1 and 2 are the
percent error of the gradient obtained from the measurement of Fe3+
as a function of time
As the experiments carried out in this work are plotted as a function absorbed dose and
there is an element of uncertainty associated with the dose rates the uncertainty of the
calculated absorbed dose increases with increasing dose This uncertainty in the absorbed
dose is included in many of graphs showing experimental data and is represented by
horizontal error bars
Sources of Error in the Determination of H2O2
The determination of H2O2 relies mainly on the calibration curve to yield a molar extinction
coefficient determined to be 25631 M-1
cm-1
with an uncertainty of plusmn 355 M-1
cm-1
The
molar extinction coefficient is used to convert the measured absorbance of a sample to a
concentration of H2O2 however this value has a dependence on temperature The ambient
temperature of the laboratory fluctuates slightly but it was decided that the effects were too
minor to consider The irradiation of samples on the other hand resulted in samples
heating slightly to a temperature that would be significant
Chapter 2 Experimental Methods
67
This was largely mitigated by leaving samples to cool for a few minutes until they reached
room temperature however an increase in temperature may affect the radiation chemistry
Solutions used to calibrate and reagents used to analyse samples also carry an associated
uncertainty in their concentrations The standards used to produce the calibration curve
were prepared from a stock solution of 3 wt H2O2 (Sigma Aldrich) From this the
0882 M solution was diluted to 1 mM which was used in a serial dilution to create the
standards ranging from 1 ndash 300 μM Uncertainty in the concentrations will have been
introduced by the tolerances of the pipettes and volumetric flasks used The pipettes used
were the Gilson Pipetman P1000 and P20 which are certified to comply with ISO 8655 that
imposes maximum allowable systematic errors of plusmn 80 μL and plusmn 02 μL for the P1000 and
P20 respectively The maximum allowable random error for the P1000 is quoted to be
le 30 μL and le 01 μL for the P20 The volumetric flasks used were class A Glassco brand
flask that conform to ISO 1042 Of the range of flasks used the largest error was 00025
Any uncertainty in the concentrations of the analytical reagents used to reduce H2O2 is
largely irrelevant as the chemicals used to perform the analysis are provided in a large
excess Stoichiometrically speaking as long as the concentration of iodide is at least three
times that of H2O2 the analysis should work in reality the concentration of iodide is
several times higher than this ensuring all H2O2 is reduced The sum of the above errors are
assumed to contribute to less than 1 of the total uncertainty of any measurements of
H2O2
Chapter 2 Experimental Methods
68
Sources of Error in the Determination of H2
The experimental technique provides a means to quantify hydrogen gas by volume In order
to make a comparison to predictions made by the computational model it was necessary to
convert this value to a concentration (mol dm-3
) This means knowing the volume of the
headspace in the crush tube vials As these vials are flame sealed they naturally have an
irregular shape and calculating a precise volume is difficult for this reason the conversion
uses an estimated headspace volume of 2 mL
Hydrogen gas is quantified by the integration of a change in voltage with respects to time
however the voltage response measured can be affected by a number of factors Factors
such as temperature and pressure are controlled automatically by the machine Moisture can
also affect the response of the TCD and this is controlled by running a ldquobake outrdquo cycle
prior to running any analysis One factor that cannot be prevented is the slow oxidation of
the tungsten-ruthenium filament which lowers the sensitivity of gas detection This can be
accounted for by performing regular calibrations often 3 or 4 point calibrations that are
compared to the original calibration curve If there is any deviance from the original curve
then a full calibration is performed and this is then used for the following analyses The
calibration curve shown in Figure 22 was the first full calibration performed throughout the
duration of this project the gradient of this curve gradually decreased this was accounted
for using the calibration process mentioned above As calibrations are performed by hand
with a gas tight syringe most of the error is likely introduced at this point The average
error of calibration points was plusmn 25 in the calibration curve given in Figure 22 for other
calibrations not shown in this work the average error was always less than 5
Chapter 3 Computational Methodology
69
Chapter 3 Computational Methodology
The earliest recorded computational approaches to solving problems in the field of radiation
chemistry date back to 1958 when the AVIDAC computer in Chicago was used to model
radical diffusion kinetics40
Since then different mathematical techniques have found use in
modelling problems found in the field of radiation chemistry and with ever increasing
computational power complicated calculations can be performed in seconds rather than
days In the early days of computational radiation chemistry primary yields were calculated
by deterministic methods involving the diffusion of a single spur However it became
apparent that a Monte Carlo approach held several advantages over deterministic methods
for the description of early stage radiolysis Such advantages include the ability to
incorporate the effects of a variety of different spur sizes and other entities arising from
secondary electrons41
For this reason modern radiolysis models usually fall into two
categories depending on what stage of radiolysis is being modelled Monte Carlo
calculations often concern the non-homogeneous early stages of radiolysis due to the
stochastic nature of energy deposition into a medium as mentioned earlier these
calculations often predict the primary yields of radiolysis products42
If the primary yields
are already known a deterministic approach is often employed to model the resulting
homogeneous chemistry in a similar way to most other chemical kinetics models through
the use of simultaneous ordinary differential equations (ODE)2743-46
Newer radiolysis
models are moving towards a multi-scale approach in which the output of the stochastic
stage is fed directly into the deterministic stage47
In this project a deterministic kinetic model for homogeneous chemical stage radiolysis has
been developed using a software package called FACSIMILE developed by MCPA
software Ltd
Chapter 3 Computational Methodology
70
FACSIMILE utilises Gear methodology for auto-adaptive time step control coupled with
Newton-Raphson iterations for prediction correction to deliver a robust simultaneous
ordinary differential equation solver The FACSIMILE language is largely based on the
Fortran language but is tailored for use by the scientific community and includes its own
high level notations for simplifying ODE construction48
The chemical model developed
here is largely based on the rate coefficient compilation by Elliot and Bartels 46
as well as
other literature sources27434549
This chapter gives a detailed description of how the model in this project works In essence
the model functions by producing primary radiolysis species at rates determined by their
primary yields and a dose rate parameter while simultaneously solving a set of ODEs that
represent the chemical reactions that describe the radiolysis chemistry At the same time
the model is also bound by framework calculations that describe various physical
parameters including but not limited to temperature effects and species volatility Each of
these concepts is described in detail in the following sections as well as the core radiolysis
reaction set
Production of Primary Species
As this model is only concerned with the homogeneous radiolysis chemistry that occurs
after diffusion of the primary species away from any kind of track structure the effect of
radiation can be represented by a series of zero order production equations with rate
constants derived from the dose rate and the species primary yield Each primary radiolysis
species has its own equation that defines its rate of production the general form of this
equation is shown below
Chapter 3 Computational Methodology
71
119896119894 =119863119877 times 119864119862 times 120588 times 119866119894
119873119860
DR is the dose rate given in Gy min-1
and Gi is the primary yield for species i NA is
Avogadros number and provides the conversion of molecules to moles while ρ is the
density of water and converts mass to volume ρ also has its own temperature dependency
which is calculated elsewhere in the code EC is a constant that effectively converts the
units of dose rate (J kg-1
min-1
) into time units compatible with a zero order rate constant
(mol dm-3
s-1
) and energy units compatible with primary yields (molecules 100 eV-1
) and
has a value of 104 times1015
and carries the unit 100 eV s-1
The dose rate is initially set by the user and is constant throughout the calculation however
primary yields are not set by the user and are initially set depending on other parameters
such as temperature and pH Table 52 shows the primary yields for water radiolysis by
gamma-rays at neutral pH and at room temperature the following section describes the
factors that can alter these values and details how they are incorporated into the model
Primary Species eaq- H
bull
bullOH H2 H2O2
g-Value 263 055 272 045 068
Table 5 Primary yields for γ-radiolysis of water at neutral pH and standard pressure and
temperature2
Chapter 3 Computational Methodology
72
Factors Affecting Primary Yields
Temperature
The rate of diffusion of primary species away from spurs created by ionising radiation is
affected by temperature As the temperature is increased the rate of diffusion of radical
species increases as does the rate of recombination reactions The yields obtained at high
temperature are determined by this competition between diffusion and recombination rates
Experiments carried out by Hochanadel and Ghormley (Table 6)50
first show this effect
over a temperature range of 2 ndash 65 degC in which higher temperatures favour increased
radical yields and decreased molecular yields
Primary Species g-Value Temperature
coefficient degC-1
2degC 23degC 65degC
Hbull + eaqˉ 359 367 382 +010plusmn003
bullOH 280 291 313 +018plusmn004
H2 038 037 036 -006plusmn003
H2O2 078 075 070 -015plusmn003
-H2O 435 441 454 +007plusmn003
Table 6 Temperature effects on the primary yields of water radiolysis50
A recent extensive compilation by Elliot and Bartels includes measurements of primary
yields at temperatures from 20 ndash 350degC from multiple sources and collates this data to
provide fitted equations for use in computational models The primary yield of the hydrated
electron was determined by product analysis of nitrogen formation from samples containing
nitrous oxide51-54
The chemical yield of nitrogen is equal to the primary yield of the
hydrated electron due to the following scavenging reaction
119890(119886119902)minus + 1198732119874 rarr 1198732119874
minus rarr 1198732 + 119874minus
Chapter 3 Computational Methodology
73
Organic compounds were also added to scavenge hydroxyl radicals and prevent them from
reacting with hydrated electrons Pulse radiolysis studies were also included55
but only the
data from nitrogen yield measurements were recommended for use
For the determination of the hydroxyl primary yield pulse radiolysis was the primary
method used The method described used bicarbonate to effectively convert hydroxyl
radicals to the carbonate radical which is more easily measured
The temperature dependency of the extinction coefficient for the carbonate radical was
estimated by integrating normalised absorption spectra as a function of temperature
originally collected by Elliot et al53
The resulting temperature dependency of the hydroxyl
radical primary yield is in agreement with an independent pulse radiolysis study that used a
ferrocyanide ion solution to measure the temperature dependency of the hydroxyl yield up
to 105degC53
The temperature dependence of the hydrogen peroxide primary yield was determined by
three independent studies Measurements in acrylamide solutions provided the temperature
dependency up to 100degC53
Further measurements made in deaerated solutions containing
nitrate and methanol extended this range to 150degC56
Estimations of the peroxide primary
yield to high temperatures were made based on the assumption that it was equivalent to the
chemical yield of oxygen in an alkali solution containing nitrous oxide or iodine this
approach expanded the temperature range to 270degC54
The primary yield of molecular hydrogen as a function of temperature has been measured
by three laboratories In each case hydrogen was directly measured from solutions
containing either a nitrous oxide and organic mix or nitrite ions In both cases the
measurements agreed well across all three laboratories515354
Chapter 3 Computational Methodology
74
Several attempts at measuring the primary yield of the hydrogen atom as a function of
temperature have been made however only two data sets are considered reliable as others
do not agree with the established yield at room temperature although all data sets show an
increase in yield with temperature
The chemical yield of molecular hydrogen from deaerated solutions containing nitrate and
phosphite ions is said to be equal to the sum of the primary yields of molecular hydrogen
and the hydrogen atom subtracting the already established primary yield of molecular
hydrogen from these measurements should give the primary yield of the hydrogen atom
These measurements agreed well with the established room temperature value and gave a
temperature dependence up to 200degC53
The temperature dependence was expanded to
350degC based on estimations of the ratio between the hydrogen atom primary yield and
hydrated electron primary yield which was calculated from data obtained during other
experiments performed in alkali solutions Unfortunately this data is described as archived
and unpublished The collated data from the experiments described above are shown in
Figure 24 with polynomial fits overlain the equations for these polynomials are given in
Table 7 and are used in the modelling calculations reported
Chapter 3 Computational Methodology
75
Figure 24 Collected data from literature showing measured primary yields as a function
of temperature Provided by Elliot and Bartels 200845
Primary Yield
Polynomial
g(eaq-) 2641 + 4162times10
-3 t + 9093times10
-6 t
2 ndash 4717 times10
-8 t
3
g(H2O2) 0752 ndash 1620times10-3
t
g(H2) 0419 + 8721times10-4
t ndash 4971times10-6
t2 + 1503times10
-8 t3
g(bullOH) 2531 +1134times10
-2 t ndash 1269times10
-5 t2 + 3513times10
-8 t3
g(Hbull) 0556 + 2198times10
-3 t ndash 1184times10
-5 t2 + 5223times10
-8 t3
Table 7 Polynomial equations for estimating temperature effects on primary yields45
Where t is the temperature in degC
Incorporation of any kind of temperature dependence into a prediction that will be
compared with experimental data requires knowledge of the experimental temperature This
is especially important in chemical kinetic models such as this as almost all the reaction
rate constants are temperature dependent For this reason a test was conducted to measure
the temperatures experienced by samples during irradiation
Chapter 3 Computational Methodology
76
The test was carried out with vials which had thermocouples attached the vials were filled
with water The vials were irradiated for 16 hours and the temperature was recorded every 5
minutes the average recording is shown in Figure 25 A polynomial fit was made from the
first 4 hours of data which was applied in the code to control the rate of temperature change
during a calculation the simulated temperature is shown as the red dashed line in
Figure 25
Figure 25 A comparison of the sample temperature profile logged by thermocouple to the
temperature profile calculated in the computational model
There are many ldquobulkrdquo radiolysis models in literature few of which make any reference to
the way in which temperature is controlled It can only be assumed that these models use a
fixed temperature which would produce less accurate predictions especially during early
periods where the temperature change is significant It should be said that this approach
should be used with caution as this temperature profile depends on the equipment being
used to irradiate samples and the dose rate involved
20
25
30
35
40
45
0 2 4 6 8 10 12 14 16
Tem
per
atu
re (degC
)
Time (h)
Thermocouple
Facsimile
Chapter 3 Computational Methodology
77
The majority of energy from the radioactive sources ends up being deposited into the
shielding material of the irradiation unit This heats the surrounding air within the
irradiation chamber which is often not circulated
pH
The effect of pH on the primary yields of water radiolysis has been a subject of discussion
for many decades yet experimental data on the subject is relatively sparse at high and low
pH Early radiolysis experiments often took place in acidic medium and so acidity became
one of the first variables considered for investigations into the effects of pH on primary
yields Table 857
shows primary yields data from 04 M sulfuric acid samples where the
pH = 046 the values shown are averages over multiple sources
Reference g(eaq-) + g(H
bull)
g(
bullOH) g(H2) g(H2O2) g(-H2O) Ref
Ferradini C et al 370 280 045 090 460 58
Allen AO
Lefort M 365 295 045 080 455
459
Sworski T J 370 292 039 078 448 60
Hochanadel C J et al 370 290 040 080 450 61
Mahlman H A et al 368 296 045 081 458 62
Hayon E et al 366 297 040 076 450 6364
Sehested K et al 362 289 039 076 441 65
Spinks amp Wood 365 290 040 078 445 2
Table 8 A collection of measurements of primary yields made in 04 M solution of
sulphuric acid (pH = 046)57
The noticeable changes to the primary yields when compared with those at neutral pH are
consistent throughout the literature including further sources not included in Table 8
Chapter 3 Computational Methodology
78
The change in primary yields is not massive in the pH range 046 ndash 7 but neither is it
insignificant With the exception of the molecular hydrogen yield all primary yields
increase slightly at low pH The main explanation for this involves the conversion of
hydrated electrons to hydrogen atoms within the radiation spurs In neutral solutions the
hydrated electron readily reacts with the hydroxyl radical to form hydroxide but when the
hydrated electrons are converted to hydrogen atoms the reaction with hydroxyl radicals is
suppressed
The hydrogen atoms do not react with hydroxyl radicals as quickly as hydrated electrons
and so the hydroxyl radicals become effectively ldquoprotectedrdquo at low pH This explains the
increase in primary yield of the reducing species (hydrated electron plus the hydrogen
atom) and the increase in the hydroxyl radical yield With an increase in hydroxyl radicals
comes an increase in the peroxide primary yield via the dimerisation of hydroxyl radicals
The decrease of the molecular hydrogen primary yield is due to the dimerisation of
hydrogen atoms having a slower coefficient than the reaction between two hydrated
electrons
119890119886119902minus + 119867(119886119902)
+ rarr 119867bull k = 210 times1010
M-1
s-1
119890119886119902minus + bull119874119867 rarr 119874119867minus k = 302 times10
10 M
-1 s
-1
119867bull + bull119874119867 rarr 1198672119874 k = 153 times10
10 M
-1 s
-1
The effect high pH has on the primary radiolysis yields of water is not as well documented
The number of studies is fewer than those conducted in acidic medium and the data from
said studies do not always agree Table 957
shows a collection of primary yields measured
in alkali samples where the pH asymp 135
Chapter 3 Computational Methodology
79
Reference g(eaq
-) +
g(Hbull)
g(
bullOH) +
g(bullOˉ)
g(H2) g(H2O2) +
g(HO2ˉ) g(-H2O) Ref
Draganić et al 318 272 045 068 409
538
Hayon E 327 304 043 053 412
66
Haissinsky M 334 301 04 056 414
67
Dainton F S et al 385 34 036 058 457
6869
Cheek C H et al 28 21 045 084 37
70
Fielden E M et al 357 28 - - -
71
Czapski G et al 33 - - 056 -
72
Table 9 A collection of primary yields measured in alkali solutions (pH asymp 135)57
At high pH the hydroxide ion can react with the hydroxyl radical within the spur forming
the oxide radical anion bullOˉ in the following equilibrium
bull119874119867 + 119874119867minus bull119874minus + 1198672119874 pKa = 119
At high concentrations of hydroxide the hydroxyl radical may be completely replaced by
the oxide radical anion A consequence of this shift is the decrease in the peroxide primary
yield as it is thought that the dimerisation of the oxide radical anion to form peroxide is
slower than the neutral equivalent dimerisation of hydroxyl radicals This is something that
is observed across almost all the studies conducted at high pH The reaction between the
hydrated electron and the oxide radical anion is also slower than the corresponding neutral
equivalent reaction It is therefore expected that the primary yield of oxidising radicals
G(bullOH) + G(
bullOˉ) would increase with increasing pH as would the total primary yield of
reducing radicals G(e(aq)
-) + G(
bullH) The primary yield of molecular hydrogen is mostly
unaffected by the increased pH this would suggest that the net decomposition yield of
water must increase in order to satisfy the material balance equation
Chapter 3 Computational Methodology
80
119892(minus1198672119874) = 119892(119890119886119902minus ) + 119892(119867bull) + 2119892(1198672) = 119892(119874119867
bull) + 119892(119874bullminus) + 2(119892(11986721198742) + 119892(1198671198742minus))
Despite the difficulty in deriving quantitative agreement across the available data there are
studies that offer qualitative agreement with the expected changes to primary yields at high
pH66-69
There are also studies that do not agree and propose that the primary yields are
largely unaffected by pH5387073
Despite the oxide radical anion being the main radiation produced oxidising radical in
aqueous alkali medium and therefore having a significant effect on the chemistry reaction
rate coefficients associated with it are largely unknown and rely on estimation The lack of
reliable rate coefficients for the reactions of the oxide radical anion is an important factor to
consider when attempting to model the radiolysis of water at high pH
It has been shown using stochastic simulations that the chemistry of the oxide radical
anion can have a significant impact on the prediction of primary yields Initial predictions
of the stochastic model by Pimblott et al74
showed an increase in the peroxide primary
yield at high pH This is counter to the accepted trend observed experimentally of a
decreasing peroxide primary yields at high pH In order to match the observed decrease in
peroxide primary yield a single rate constant was changed from 20 times1010
M-1
s-1
to 65
times109 M
-1 s
-1 for the reaction below
119874bullminus + bull119874119867 rarr 1198671198742minus
Chapter 3 Computational Methodology
81
This change had the effect of reversing the trends of the primary yield predictions at high
pH resulting in agreement with experimental data Soon after this the rate constant for the
reaction between the oxide radical anion and the hydroxyl radical was measured to be 74
times109 M
-1 s
-1 which is much closer to the adjusted rate constant used in the stochastic
simulation than the original estimate49
Figure 26 shows literature values for the measured primary yields as a function of pH from
this polynomial equations were fitted which were combined in a multiple regression
analysis with the equations fitted to temperature analysis data Table 10 shows the resulting
equations While this approach gives an estimate of the primary yields as a function of both
temperature and pH it is not an ideal solution This type of estimation is better suited to a
stochastic type track chemistry calculation
A stochastic approach could also account for the effects of different linear energy transfer
(LET) values which are discussed in the next section A multi-scale approach could even
procedurally produce stochastically calculated primary yields that feed into a deterministic
chemical kinetic simulation
Chapter 3 Computational Methodology
82
Figure 26 A reproduction of data provided by Hayon75
showing the effect of pH on
primary radiolysis yields
Primary Yield
Multiple Regression Equation
g(eaq-) 28 + 285times10
-3 times t ndash 251times10
-2 times pH
g(H2O2) 845times10-1
ndash 151times10-3
times t ndash 17times10-2
times pH
g(H2) 388times10-1
+ 829times10-4
times t + 599times10-4
times pH
g(˙OH) 243 + 111times10-2
times t ndash 12times10-3
times pH
g(H˙) 444times10-1
+ 367times10-3
times t ndash 24times10-4
times pH
Table 10 Multiple regression polynomials used to estimate the combined effect of
temperature and pH on the primary yields of water radiolysis
0
05
1
15
2
25
3
35
0 1 2 3 4 5 6 7 8 9 10 11 12 13 14
Pri
ma
ry Y
ield
(M
ole
cule
s 1
00
eV
-1)
pH
g(OH)
g(e-)
g(H2O2)
g(H2)
Chapter 3 Computational Methodology
83
Linear Energy Transfer (LET)
Linear energy transfer is a way of expressing the rate at which an ionising particle loses
energy through a medium Sometimes referred to as ldquostopping powerrdquo linear energy
transfer is quoted as the average energy loss divided by a fixed path length usually micro
meters or nano meters (keV μm-1
or eV nm-1
) This parameter is frequently expressed as an
average rate of energy loss across the entire particlersquos track this is because the energy loss
rate of an ionising particle is not uniform As a high energy ionising particle begins its
journey through a material energy loss events are sparse and only small quantities of
energy are transferred so the particle continues largely un-deflected As this energy lost to
these small transfers accumulates and the energy of the charged particle decreases the
cross section of interactions increases This means that there are more energy loss events
for a given linear distance as the particles path becomes less linear A true linear energy
transfer profile of a particle would take the form of a Bragg curve such as the example
shown below
Figure 27 An example of a Bragg peak Energy loss of alphas of 549 MeV in Air
Image released to public domain
Chapter 3 Computational Methodology
84
For ease of comparison this profile is usually averaged to give a single LET parameter
Ionising particles of higher mass andor lower energy have higher LET values The
implications of linear energy transfer are manifested in the radiation track structure
Increasing LET values have the effect of increasing the spur distribution density as
illustrated in the diagram below
Figure 28 A schematic representation of how linear energy transfer (LET) alters the
distribution of spurs along a radiation track Image was recreated from Allen AO4
The distribution of spurs along a track has an effect on the diffusion of primary radiolysis
species and ultimately alters the primary yields Experiments carried out using 210
Po to
irradiate solutions of iron sulphate through various thicknesses of mica have shown the
effects of changing LET on the yield of oxidation of Fe2+
76
From this subsequent studies
using cyclotron accelerated protons have measured the effects of LET on the primary yields
of water radiolysis77
Compiling the data from these studies gives a general picture of the
effects of LET on water radiolysis primary yields which is shown below
Chapter 3 Computational Methodology
85
Figure 29 Simulation data showing the effects of increasing linear energy transfer on the
primary yields of water radiolysis Image was recreated from Allen AO4
The general trend shows an increase in the formation of molecular products at higher LET
at the expense of radical species (with the exception of hydroperoxyl radical (˙HO2)) at very
high LET values whilst lower LET values favour the radical species Currently there is no
clear agreed explanation as to how the hydroperoxyl radical is formed at high LET Gamma
rays from cobalt-60 fall in the low LET range and have an average value of
023 keV μm-1
78
As the experiments conducted throughout this project used only cobalt-60 as a source of
radiation it was not necessary to incorporate the effects of linear energy transfer into this
radiolysis model nor was it necessary to include the primary yield of hydroperoxyl radicals
into this model as the yield is negligible at the LET value of cobalt-60 Future iterations of
this model would need to include the effects of linear energy transfer as well as better
methods for coping with the effects of temperature and pH this is discussed in more detail
in Chapter 8
Chapter 3 Computational Methodology
86
Mass Transfer of Volatile Species
The transfer of volatile species is not something that affects radiolysis primary yields but it
is important to include as the aqueous reactions of volatile species namely molecular
hydrogen and oxygen will partition into the gas phase This mass transfer is described
within the model as two equations
1198672(119886119902) 1198672(119892)
1198742(119886119902) 1198742(119892)
These equations take the form of first order rate equations with the rate constant substituted
for a time dependant net mass transfer coefficient (kapp) which includes an interfacial mass
transfer coefficient (νint) and the Henryrsquos equilibrium partition coefficient (Kp)27
119889119862(119886119902)119894
119889119905= minus119896119886119901119901
119894 (119905) times 119862(119886119902)119894 (119905)
119896119886119901119901119894 = 120592119894119899119905
119894 times119860119894119899119905119881119886119902
(1 minus 119870119901119894119862119892119894(119905)
119862119886119902119894 (119905)
)
Ci refers to the concentration of species i in either the gas phase or the aqueous phase Aint
and Vaq are used to describe some of the geometry of the radiolysis vessels used in
experiments Aint is the interfacial surface area between the two phases while V is the
volume of the aqueous or gas phase denoted by its subscript As experiments were
conducted in different sized vials depending on the analysis technique used different values
of Aint and V were used when comparing model predictions to experimental data
Chapter 3 Computational Methodology
87
This method assumes that the volume of liquid and covering gas is the same which was
true for all the experiments conducted during this work If the liquid to gas volume ratio
was anything other than 1 then the above differential should be adjusted to account for this
ratio by the following modification
minus119881119897119881119892times119889119862(119886119902)
119894
119889119905= 119896119886119901119901
119894 (119905) times 119862(119886119902)119894 (119905)
The interfacial mass transfer coefficient (νint) incorporates the use of the stagnant two-film
model which provides a description of resistance to diffusion through un-mixed boundary
layers (see Figure 3079
)
Figure 30 A representation of the stagnant two-film model used to calculate the
partitioning of volatile species79
The stagnant two-film model is incorporated into the mass transfer coefficient by relating
the species diffusivity coefficients (D) the boundary thickness (δ) and the Henryrsquos
equilibrium partition coefficient (Kp)
Chapter 3 Computational Methodology
88
1
120592119894119899119905119894=
1
(119863119886119902119894
120575119886119902)
+119870119901119894
(119863119892119894
120575119892)
119870119901119894 =
119862119886119902119894 (119890119902)
119862119892119894(119890119902)
The diffusivity of volatile species is a temperature dependant coefficient which is included
in the model through the use of polynomial fits to data obtained from literature and is
shown in figure 3180-83
Henryrsquos coefficients were taken from literature which included
equations for describing the temperature dependence so a polynomial fit was not
necessary84
The Henryrsquos equilibrium partition coefficient is a dimensionless ratio between
the aqueous and gas phase concentrations of a volatile species at equilibrium This value is
related to the Henryrsquos law constant (kH) by the following relationship
119879 times 119896119867119894 = 122 times 119870119901
119894
The value 122 is used to convert between the Henryrsquos law coefficient in mol maq-3
Pa-1
and
the dimensionless Henryrsquos law coefficient While T represents the temperature in Kelvin
the Henryrsquos law constant also has its own temperature dependency built in this is described
by the following relationship
119896119867 = 119896119867120579 times 119864119883119875 (
∆119867119904119900119897119899119877
(1
119879minus1
119879120579))
Chapter 3 Computational Methodology
89
The Henryrsquos constant at standard temperature (29815 K) (kHθ) is quoted in the literature as
being 13times10-3
mol dm-3
atm-1
for oxygen and 78times10-4
mol dm-3
atm-1
for hydrogen ΔHsoln
is the enthalpy of solution and R is the gas constant the average ratios are quoted in the
literature as 1650 for oxygen and 543 for hydrogen84
This gives values for the Henryrsquos equilibrium partition coefficient (Kpi) of 0019 and 0031
for hydrogen and oxygen respectively at 25degC and smaller values at higher temperatures
Figure 31 The diffusivity of O2 and H2 in both water and air as a function of temperature
000
050
100
150
200
250
300
350
000E+00
100E-05
200E-05
300E-05
400E-05
500E-05
600E-05
700E-05
800E-05
900E-05
0 100 200 300 400
Dif
fusi
vit
y i
n A
ir (
cm2 s
-1)
Dif
fusi
vit
y i
n H
2O
(cm
2 s
-1)
Temperature (degC)
O2aq
H2aq
H2g
O2g
Chapter 3 Computational Methodology
90
Diffusivity
Polynomial
O2(aq) 20times10-9
times t2
+ 40times10-7
times t + 10times10-5
O2(g) 10times10-6
times t2
+ 12times10-3
times t + 02073
H2(aq) 10times10-8
times t2 + 40times10
-7 times t + 30times10
-5
H2(g) 50times10-6
times t2 + 47times10
-3 times t + 07719
Table 11 Polynomial equations used to estimate the temperature effects on the diffusivity
of O2 and H2 in both gas and aqueous phases where t = temperature (Cdeg)
Water Radiolysis Reaction Set
The radiolysis model simulates the chemical kinetics of homogeneous radiolysis through
the use of simultaneous differential equations that represent the independent chemical
reactions taking place The model therefore includes a set of reactions accompanied by
reaction rate constants Tables 12 - 14 gives a summary of the reaction set used with a full
description of the reaction set including the associated temperature dependences is given in
appendix A The reaction rate coefficients are taken from multiple sources with the
majority from the compilation of A J Elliot and D M Bartels45
Chapter 3 Computational Methodology
91
Reaction Number Primary Species
Production
G-value
(Molecules100eV) Ref
G0 H2O 119890(119886119902)minus 271 45
G1 H2O Hbull 054 45
G2 H2O H2 041 45
G3 H2O bullOH 270 45
G4 H2O H2O2 068 45
G5 H2O H(aq)+ 271 45
Table 12 A list of Primary Species used to model water radiolysis
Reaction
Number
Chemical Reactions Rate Constant k
(M-1
s-1
25degC)
Ref
R0 emacraq + emacraq rarr H2 + 2OHmacr 726 times109
45
R1 emacraq + Hbull rarr H2 + OHmacr 276 times10
10
45
R2 emacraq + bullOH rarr OHmacr 355 times10
10
45
R3 emacraq + bullOmacr rarr 2OHmacr 231 times10
10
49
R4 emacraq + H2O2 rarr OHmacr + bullOH 136 times10
10
45
R5 emacraq + HO2bull rarr HO2macr 130 times10
10
45
R6 emacraq + HO2macr rarr Obullmacr + OHmacr 351 times10
9
49
R7 emacraq + O2 rarr O2bullmacr 225 times10
10
45
R8 emacraq + O2bullmacr rarr O2
2macr + H2O 130times10
10
4349
R9 Hbull + H
bull rarr H2 514 times10
9
45
R10 Hbull +
bullOH rarr H2O 109 times10
10
45
R11 Hbull + H2O2 rarr
bullOH + H2O 365 times10
7
45
R12 Hbull + O2 rarr HO2
bull 130 times10
10
45
R13 Hbull + O2
bullmacr rarr HO2macr 114 times10
10
45
R14 Hbull + HO2
bull rarr 2
bullOH 114 times10
10
45
R15 Hbull + HO2macr rarr
bullOH + OHmacr 137times10
9
85
Chapter 3 Computational Methodology
92
R16 Hbull + O3 rarr
bullOH + O2 220 times10
10
43
R17 bullOH +
bullOH rarr H2O2 481 times10
9
45
R18 bullOH + H2O2 rarr H2O + HO2
bull 292 times10
7
45
R19 bullOH + HO2macr rarr OHmacr + HO2
bull 813 times10
9
45
R20 bullOH + HO2
bull rarr H2O + O2 884 times10
9
45
R21 bullOH + O2
bullmacr rarr OHmacr + O2 110 times10
10
45
R22 bullOH + O3 rarr HO2
bull + O2 110 times10
8
43
R23 bullO3macr + H2O2 rarr O2
bullmacr + O2 + H2O 159 times10
6
43
R24 bullO3macr + HO2macr rarr O2
bullmacr + O2 + OHmacr 887 times10
5
43
R25 bullO3macr + H2 rarr O2 + H
bull + OHmacr 249times10
5
46
R26 bullO3macr +
bullOH rarr HO2
bull + O2
bullmacr 6000 times10
9
43
R27 bullO3macr +
bullOH rarr HOmacr + O3 250 times10
9
43
R28 bullO3macr + H
+(aq) rarr O2 +
bullOH 900 times10
10
43
R29 O2bullmacr + O2
bullmacr +1198672119874rarr
O2 + O22macr 299times10
-1
43
R30 O2bullmacr + HO2macr rarr
O2 + bullOmacr + OHmacr 823 times10
-2
43
R31 O2bullmacr + H2O2 rarr
O2 +
bullOH + OHmacr 130 times10
-1
43
R32 O2bullmacr + HO2
bull rarr O2 + HO2macr 760times10
7
43
R33 O2bullmacr +
bullO3macr rarr
O2macr+ 2O2 100 times10
4
43
R34 O2bullmacr + O3 rarr
bullO3macr + O2 150 times10
9
43
R35 HO2bull + HO2
bull rarr H2O2 + O2 840 times10
5
45
R36 HO2bull + H2O2 rarr O2 + H2O +
bullOH 500 times10
-1
49
R37 HO2bull + O3 rarr
bullOH + 2O2 500 times10
8
43
R38 H2O2 + HO2macr rarr O2 + H2O + OHmacr 450times10-4
43
R39 O3 + OHmacr rarr HO2macr + O2 480 times101
43
R40 O3 + HO2macr rarr bullOH + O2 + O2
bullmacr 550 times10
6
43
R41 O3 + H2O2 rarr bullOH + O2 + HO2
bull 371 times10
-2
43
R42 Hbull +
bullOmacr rarr OHmacr 200times10
10
43
Chapter 3 Computational Methodology
93
R43 bullO3macr + emacraq rarr 2OHmacr
+
O2 160times10
10
43
R44 O3 + emacraq rarr bullO3macr 360 times10
10
43
R45 H2O2 rarr 2bullOH 230 times10
-7
86
R46 O2macr + H2O rarr 2OHmacr
100 times10
10
43
R47 bullOmacr + H2 rarr
bullH + OHmacr 128 times10
8
45
R48 bullOmacr + H2O2 rarr O2
bullmacr + H2O 555 times10
8
49
R49 bullOmacr + HO2macr rarr O2
bullmacr + OHmacr 786 times10
8
45
R50 bullOmacr + O2
bullmacr rarr O
2macr + O2 600 times10
8
43
R51 bullOmacr +
bullOmacr rarr O2
2macr 100times10
8
43
R52 bullOmacr +
bullOH rarr HO2macr 761 times10
9
49
R53 bullOmacr + O3macr rarr 2O2
bullmacr 700times10
8
43
R54 bullOmacr + O3 rarr O2
bullmacr + O2 100 times10
9
43
Table 13 A list of reactions used to model water radiolysis
Chapter 3 Computational Methodology
94
Equilibria kf
(M-1
s-1
25degC)
kb
(M-1
s-1
25degC) Ref
R5556 H2O H+
(aq) + OHmacr 117 times10-3
118times1011
45
R5758 H2O2 H+
(aq) + HO2macr 890 times10-2
478times1010
45
R5960 H2O2 + OHmacr HO2macr + H2O 127 times1010
140 times106
45
R6162 HO2macr + OHmacr
O22macr + H2O 351 times10
5 110 times10
6
43
R6364 bullOH H
+(aq) +
bullOmacr 890 times10
-2 478times10
10
45
R6566 bullOH + OHmacr
bullOmacr + H2O 127 times10
10 140 times10
6
45
R6768 bullOmacr + O2
bullO3macr 375 times10
9 262 times10
3
45
R6970 HO2bull H
+(aq) + O2
bullmacr 478 times10
10 735 times10
5
45
R7172 HO2bull + OHmacr O2
bullmacr+ H2O 127 times10
10 163 times10
-1
45
R7374 Hbull emacraq + H
+(aq) 583 210times10
10
45
R7576 Hbull + OHmacr emacraq + H2O 244 times10
7 174 times10
1
45
R7778 Hbull + H2O H2 +
bullOH 458 times10
-5 395 times10
7
45
R79 H2(aq) H2(g) 269times10-3
R80 O2(aq) O2(g) 103times10-4
Table 14 A list of equilibria used to model the radiolysis of water
Chapter 3 Computational Methodology
95
Computational Assumptions and Error
The first assumption this model makes is that radiolysis does not occur in the gas phase In
reality this is not the case however the density of the gas phase is so small compared to that
of the aqueous phase that any contribution from gas phase radiolysis will be negligible
There are several reactions that do not include any kind of temperature dependence for their
associated rate constants This is due to a lack of information available in the literature
many of the species involved in these reactions are notoriously difficult to measure reaction
rate constants for thus these reactions have a fixed rate constant across all temperatures
The method for estimating the primary yields to account for both temperature and pH
effects is not an ideal method Multiple linear regression analysis is often used to
empirically predict the value of a single dependant variable based on the contributions of
multiple independent variables In the case of this model the independent variables are
temperature and pH a full model would also include LET as a third independent variable
The number of observations considered for the regression analysis is less than ideal due to
the scarcity of available data coupled with the difficulty of relating non-linear variables
means that predictions of primary yields are loose estimates at best The coefficient of
determination (R2) gives information about how well the multiple regressions fit the data
and is shown in Table 15 where μ denotes the estimated standard deviation of the error
Primary Yield
R2 μ
g(eaq-) 0612 0249
g(H2O2) 0934 0045
g(H2) 0907 0032
g(bullOH) 0950 0265
g(Hbull) 0925 0108
Table 15 Statistical information concerning the estimation of primary yields used to model
the radiolysis of water
Chapter 3 Computational Methodology
96
The partition of volatile species depends on a number of parameters some of which are
dependent on geometry Although H2O2 is not a volatile species its concentration is
strongly affected by the concentration of aqueous O2 it is therefore necessary to include gas
partitioning methods in both H2 and H2O2 model calculations The interfacial surface area
(Aint) is one such parameter although this can be roughly determined by measuring the
geometry of the vials being used Other parameters such as the boundary thicknesses (δ) are
not so easily measured and are parameter fitted This is done using the parameter fitting
functionality built into FACSIMILE Experimental data is supplied to FACSIMILE and the
desired parameters to fit are declared the calculation is then performed a number of times
slightly varying the declared parameters each time until the predicted values better match
the provided experimental data For this work the data provided to FACSIMILE was the
concentration of H2 and H2O2 in aerated water as a function of dose (Figures 32-33) Vials
of different geometry have different boundary thicknesses the values used throughout this
work are shown in Table 16
Parameter
Vial Used for H2 Analysis Vial Used for H2O2 Analysis
Aint (m2) 502 times10
-5 284 times10
-4
δaq (m) 580 times10-4
510 times10-4
δg (m) 260 times10-2
260 times10-2
Table 16 Parameters used to describe interfacial surface area (Aint) and boundary
thicknesses (δ) for sample vials of different geometry
Chapter 4 The Radiolysis of Aqueous Solutions at High pH
97
Chapter 4 The Radiolysis of Aqueous Solutions at High pH
Preliminary Radiolysis Studies of Pure Water
Preliminary experiments to measure hydrogen peroxide and hydrogen gas concentrations
from the radiolysis of aerated and deaerated water at neutral pH were carried out as a
control to which other measurements may be compared Computational modelling of these
pure water systems were performed with the radiolysis model described in Chapter 3 to
validate the models performance
Measurements of hydrogen peroxide were made using the Ghormley Tri-iodide method
described in Chapter 2 The pH of the stock was measured using a Mettler Toledo
SevenMultitrade pH meter equipped with a probe capable of measuring pH in the range 0-14
and was found to be 699 Aliquots of 10 mL from the pure water stock were sealed in
20 mL headspace vials so that the liquid to headspace ratio was 11 and were irradiated in
row 1 of the 4x8 sample rack the average dose rate was 2839 Gy min-1
The experiment
was run twice prior to irradiation samples used in the first run were sealed but left aerated
while samples used in the second run were sealed in gas tight vials equipped with rubber
septa and were sparged for 20 minutes with zero grade argon gas to remove all dissolved
oxygen The results of the two experimental runs are shown in Figure 32
Preliminary measurements of hydrogen gas production were also carried out using pure
water 2 mL aliquots of pure water stock were flame sealed in 4 mL glass vials which were
then secured in the inverter rig and irradiated for various periods of time the average dose
rate was 2851 Gy min-1
Post irradiation analysis was carried out by the previously
described crush tube method of gas chromatography
Chapter 4 The Radiolysis of Aqueous Solutions at High pH
98
As flame sealing introduces slight irregularity in the volume of headspace an assumption
was made that the headspace of the sealed vial was 2 mL
This allows the conversion of measured quantities (microL) of hydrogen to a concentration
(mol dm-3
) Once again the experiment was run twice with the second experimental run
using samples that have been deaerated with argon and the results are shown in Figure 33
Figure 32 Measurements of H2O2 concentration as a function of dose for aerated water
(diams) and deaerated water (diams) Vertical error bars show the standard deviation between
replicates while horizontal error bars show the dose range for replicates
000E+00
100E-06
200E-06
300E-06
400E-06
500E-06
600E-06
700E-06
800E-06
000E+00
200E-05
400E-05
600E-05
800E-05
100E-04
120E-04
140E-04
0 10 20 30 40
[H2O
2]
(mo
l d
m-3
) D
eaer
ated
[H2O
2]
(mo
l d
m-3
) A
erat
ed
Dose (kGy)
Aerated Water
Deaerated Water
Chapter 4 The Radiolysis of Aqueous Solutions at High pH
99
Figure 33 Measurements of H2 as a function of dose in aerated (diams) and deaerated (diams)
samples Vertical error bars show the standard deviation of replicates while horizontal
error bars show the dose range for replicates
Discussion
Aerated samples resulted in a steady-state concentration of hydrogen peroxide at
approximately 11 times10-4
mol dm-3
while molecular hydrogen continues to form with
absorbed dose over the range considered In order to satisfy the mass balance requirements
some other species must be formed after the achievement of the peroxide steady-state that
is also proportional to hydrogen formation The most likely candidate for this is molecular
oxygen which would have to be formed at half the rate of hydrogen
Samples that did not contain any dissolved oxygen failed to produce significant quantities
of hydrogen peroxide or hydrogen gas with a very low steady state eventually achieved at
approximately 40 times10-6
mol dm-3
This may be attributed to the radiolytic production of
oxygen required to satisfy mass balance Using the radiolysis model a predicted chemical
yield can be obtained after the establishment of the hydrogen peroxide steady state to show
that mass balance is satisfied by oxygen production The predicted chemical yields were
calculated between doses of 15 kGy to 30 kGy
000E+00
100E-04
200E-04
300E-04
400E-04
500E-04
600E-04
700E-04
800E-04
0 10 20 30 40 50 60
[H2]
(mo
l d
m-3
)
Dose (kGy)
Aerated Water
Deaerated Water
Chapter 4 The Radiolysis of Aqueous Solutions at High pH
100
For oxygen gas the predicted chemical yield was G(O2) = 0011 while the predicted yield
of hydrogen gas formation in deaerated water was G(H2) = 0022 In both cases samples
that were aerated produced much larger quantities of hydrogen and hydrogen peroxide than
their deaerated equivalents This was somewhat expected as it has long been considered
that dissolved oxygen is reduced and the reduction products are able to react with hydroxyl
radicals preventing them from removing hydrogen peroxide and hydrogen87
The general
scheme first proposed in 1954 for this protection mechanism is initiated by the reaction of
hydrogen atoms with oxygen to produce hydroperoxyl radicals these then react with
hydroxyl radicals to reform water and oxygen or with itself to form hydrogen peroxide and
oxygen4
119867bull + 1198742 rarr 1198671198742bull
(R12)
bull119874119867 + 11986721198742 rarr 1198672119874 + 1198671198742bull
(R18)
1198671198742bull + 1198671198742
bull rarr 11986721198742 + 1198742 (R35)
bull119874119867 + 1198671198742bull rarr 1198672119874 + 1198742 (R20)
More recent studies by the research group led by Clara Wren have deployed computational
methods to investigate further the effects of dissolved oxygen on the steady-state
concentration of both hydrogen peroxide and molecular hydrogen86
The calculations
performed in this study also supported the idea that dissolved oxygen is reduced and it is
the reduction products that scavenge hydroxyl radicals resulting in the protection of
hydrogen peroxide and molecular hydrogen The calculations revealed that oxygen is
mainly reduced by the hydrated electron and that the superoxide formed is responsible for
the scavenging of hydroxyl radicals This process serves as a catalytic mechanism for the
overall reaction between the solvated electron and hydroxyl radicals
Chapter 4 The Radiolysis of Aqueous Solutions at High pH
101
119890119886119902minus + 1198742 rarr 1198742
minus (R7)
1198742minus + bull119874119867 rarr 119874119867minus + 1198742 (R21)
Overall Reaction 119890119886119902minus + bull119874119867 rarr 119874119867minus (R2)
This scavenging of hydroxyl radicals has a larger impact on protecting hydrogen as the
reaction between hydrogen and the hydroxyl radical is the only significant removal path of
hydrogen in neutral conditions
Wren proposes that high concentrations of hydrogen peroxide seen in aerated solutions can
be attributed to a change in the production pathway for hydrogen peroxide in the presence
of oxygen The reaction between both the reduction products of oxygen becomes the
dominant production pathway for hydrogen peroxide
1198671198742bull + 1198742
minus rarr 1198671198742minus + 1198742 (R32)
119867(119886119902)+ + 1198742
minus 1198671198742bull (R6970)
119867(119886119902)+ + 1198671198742
minus 11986721198742 (R5758)
Similar calculations were performed in this work using the computational method described
in Chapter 3 The computational predictions shown in figures 34 and 35 serve as a baseline
to demonstrate that the computational model performs well at least at a fundamental level
before building up to more complex systems
Chapter 4 The Radiolysis of Aqueous Solutions at High pH
102
Figure 34 Predicted concentrations of H2O2 as calculated by the radiolysis model for both
aerated () and deaerated () conditions
Figure 35 Predicted concentrations of H2 gas as calculated by the radiolysis model for
both aerated () and deaerated () conditions
000E+00
100E-06
200E-06
300E-06
400E-06
500E-06
600E-06
700E-06
800E-06
000E+00
200E-05
400E-05
600E-05
800E-05
100E-04
120E-04
140E-04
0 10 20 30 40
[H2O
2]
(mo
l d
m-3
) D
eaer
ated
[H2O
2]
(mo
l d
m-3
) A
erat
ed
Dose (kGy)
Aerated Water
FACSIMILE Aerated
Deaerated Water
FACSIMILE Deaerated
000E+00
100E-04
200E-04
300E-04
400E-04
500E-04
600E-04
700E-04
800E-04
0 10 20 30 40 50 60
H2 (
mo
l d
m-3
)
Dose (kGy)
Aerated Water
Deaerated Water
FACSIMILE Aerated
FACSIMILE Deaerated
Chapter 4 The Radiolysis of Aqueous Solutions at High pH
103
The predictions made for the concentrations of hydrogen peroxide and hydrogen gas in pure
water match well with the observed measurements especially for the concentration of
hydrogen peroxide produced in aerated water The most obvious discrepancy is the
disparity between the early predictions of hydrogen peroxide concentration and the
measured concentration for deaerated samples which is most likely due to imperfect
oxygen removal from the samples As the predictions are in generally good agreement with
the experimental measurements it is not unreasonable to assume that steady state
concentrations of other species which cannot or were not determined experimentally
during this work can be estimated by the model
Figure 36 Calculated concentrations of the major oxidising and reducing water radiolysis
species as a function of dose Solid lines represent aerated conditions while broken lines
represent deaerated conditions
Figure 36 shows the predicted concentrations of various radical species in both aerated and
deaerated water The calculated concentrations agree with previously published calculations
by Wren and co-workers86
100E-14
100E-12
100E-10
100E-08
100E-06
0 10 20 30 40 50
Co
nce
ntr
atio
n (
mo
l d
m-3
)
Dose (kGy)
˙OH
O2˙-
H˙
eaq-
HO2˙
Chapter 4 The Radiolysis of Aqueous Solutions at High pH
104
Under aerated conditions reducing species H˙ and eaq- have significantly lower
concentrations than in deaerated conditions due to scavenging by oxygen The resulting
reduction products of oxygen are superoxide and hydroperoxyl radicals and both show an
increased concentration in aerated conditions
The experiments in the following sections concerning the measurement of hydrogen
peroxide were all performed in aerated conditions to resemble the conditions at the
Sellafield site Measurements of hydrogen were for the most part carried out under
deaerated conditions
Chapter 4 The Radiolysis of Aqueous Solutions at High pH
105
Measurements of H2O2 in the Radiolysis of High pH Solutions
Stock solutions of various pH were prepared using NaOH dissolved in ultra-pure water
From each stock sample sets were prepared from 10 mL aliquots of stock solution and
sealed in 20 mL glass vials with aluminium crimp caps The pH of the remaining sample
stocks were measured and recorded Irradiation dose rates were calculated from original
measurements using the Fricke dosimetry method described previously Sample sets were
loaded into row 1 of the 4x8 irradiation rack and irradiated using the Model-812 cobalt-60
irradiator until they reached the desired dose Table 17 summarises the dose rates and pH of
the sample batches examined
Sample Batch ID Average Dose Rate for Row 1 (Gy min-1
) Measured pH
H2O2-PH00 28512 699
H2O2-PH01 27497 1041
H2O2-PH02 27407 1108
H2O2-PH03 28364 1230
H2O2-PH04 27467 1274
Table 17 Conditions of samples used to investigate hydrogen peroxide in high pH
radiolysis
Results
Post irradiation analysis for H2O2 was carried out immediately after irradiation using the
previously described tri-iodide method Analysis of high pH samples required additional
acid to lower the pH to the conditions required by the analytical method the quantities of
acid used were recorded and the dilution effects have been accounted for The results of this
study are shown in Figure 37
Chapter 4 The Radiolysis of Aqueous Solutions at High pH
106
Figure 37 Measurements of H2O2 concentrations as a function of dose for samples
initially at pH 7 (diams) pH 104 (diams) pH 11 (diams) pH 123 (diams) and pH 127 (diams)
All samples were aerated Vertical error bars are the standard deviation between
replicates while horizontal error bars show the dose range for replicates
The steady state concentration of hydrogen peroxide is fairly consistent at about
115 x10-4
mol dm-3
within the pH range 7-11 each attaining steady state after roughly
5 kGy At higher pH values both the steady state concentration and the dose at which
steady state is achieved increase
Samples at pH 123 required roughly 10 kGy to obtain a peak steady-state concentration of
195 x10-4
mol dm-3
of hydrogen peroxide while samples at pH 127 required even higher
doses almost 20 kGy to reach a steady concentration of 238 x10-4
mol dm-3
The data set
from samples at pH 123 shows an apparent decrease in hydrogen peroxide concentration of
~18 at 35 kGy A similar decrease in hydrogen peroxide concentration is also observed in
samples of pH 11
000E+00
500E-05
100E-04
150E-04
200E-04
250E-04
300E-04
0 10 20 30 40
[H2O
2]
(mo
l d
m-3
)
Dose (kGy)
pH 127
pH 123
pH 11
pH 104
pH 7
Chapter 4 The Radiolysis of Aqueous Solutions at High pH
107
Measurements of H2 in the Radiolysis of High pH Solutions
Stock solutions of various pH were prepared using NaOH to match the pH range used in
the measurement of hydrogen peroxide Many of the acid-base equilibria used in the
description of water radiolysis have pKa values in the pH range investigated by this study
The behaviour of H2 production observed at high pH may be influenced by a change in
chemistry brought about by a shift in one or more of the acid-base equilibria Table 18
shows the equilibria of interest and their associated pKa value while Table 19 includes the
measured pH of the stock solutions
Equilibrium pKa
bull119926119919 119919(119938119954)+ + bull119926minus 1184
119919120784119926120784 119919(119938119954)+ +119919119926120784
minus 1168
119919bull 119919(119938119954)+ + 119942119938119954
minus 974
119919119926120784bull 119919(119938119954)
+ + 119926120784minus 483
Table 18 A list of important equilibria and their associated pKa values
For the measurement of hydrogen sample sets were prepared from 2 mL aliquots of stock
solution which were transferred to glass ldquocrush tuberdquo vials described in chapter two The
vials were connected to a glass manifold via stainless steel needles and sparged with zero
grade argon for 20 minutes to remove any dissolved oxygen before samples were flame
sealed under argon
Irradiation dose rates were calculated from original Fricke dosimetry study described
previously Samples were loaded into the four positions available in the inverter rig and
irradiated until they reached the desired dose
Chapter 4 The Radiolysis of Aqueous Solutions at High pH
108
Results
After irradiation samples were analysed for hydrogen gas by gas chromatography using the
ldquocrush tuberdquo technique described in Chapter 2 Figure 38 shows the amounts of H2
produced as a function of radiation dose As production rates of hydrogen gas are linear as a
function of absorbed dose chemical yields can be identified as the gradient expressed in
terms of molecules per 100 eV of absorbed energy These results are summarised in Table
19 while the data is shown in Figure 38
Table 19 Conditions of samples used to investigate hydrogen gas in high pH radiolysis
Figure 38 Measurements of H2 gas as a function of dose at pH 7 (diams) pH 106 (diams) pH 123
(diams) and pH 13 (diams) Dashed lines are provided to clarify the data trends all samples were
deaerated Vertical error bars show the standard deviation between replicates while
horizontal error bars show the dose range for replicates
000E+00
500E-04
100E-03
150E-03
200E-03
250E-03
0 20 40 60 80
H2 (
mo
l d
m-3
)
Dose (kGy)
pH 13
pH 123
pH 106
pH 7
Sample
Batch ID
Average Dose Rate for
Inverter Rig (Gy min-1
) Measured pH G(H2) Error plusmn
H2-PH00 28385 699 0021 0002
H2-PH01 28408 1063 0071 0018
H2-PH02 29039 1232 0352 0005
H2-PH03 28634 1307 0176 0010
Chapter 4 The Radiolysis of Aqueous Solutions at High pH
109
Increasing the pH has the effect of increasing the chemical yield for hydrogen over the pH
range 7 to 123 however the data set for pH 13 shows that the chemical yield for hydrogen
is less than samples at pH 123 The results of the calculations using the reaction scheme
given in Tables 12 - 14 for both hydrogen peroxide and hydrogen gas production are
shown in Figures 39 and 40 respectively
Figure 39 Model calculations to show the predicted concentrations of H2O2 as a function
of dose at various pH
000E+00
500E-05
100E-04
150E-04
200E-04
250E-04
300E-04
350E-04
0 10 20 30 40 50
[H2O
2]
(mo
l d
m-3
)
Dose (kGy)
pH 127
pH 123
pH 11
pH 104
pH 7
Chapter 4 The Radiolysis of Aqueous Solutions at High pH
110
Figure 40 Model calculations to show the predicted concentrations of H2 gas as a function
of dose at various pH
Calculated concentrations of hydrogen peroxide show the same trends as the data The
predictions at pH 104 and 11 take slightly longer to reach steady state than what the
experimental data shows Higher pH calculations follow the same trend as the experimental
data but overestimate the steady state concentrations of hydrogen peroxide especially in the
calculations at pH 127
Calculated concentrations of molecular hydrogen follow a slightly more unexpected trend
Predictions made for pH 106 massively overestimate hydrogen production rates this is
symptomatic of a misunderstanding of the mechanistic chemistry A similar error has also
been noted by Wren when performing calculations at this pH a suggested fix was to
increase the reaction rate between ozinide and molecular hydrogen by a factor of 886
000E+00
500E-04
100E-03
150E-03
200E-03
250E-03
300E-03
0 20 40 60 80
[H2]
(mo
l d
m-3
)
Dose (kGy)
pH 13
pH 123
pH 106
pH 7
Chapter 4 The Radiolysis of Aqueous Solutions at High pH
111
Even with this higher rate the over prediction of hydrogen is still large at pH 106 while
predictions for pH 123 agree reasonably well with experimental data This information at
least helps to narrow the pH range at which this misunderstanding manifests The pH range
afflicted by over prediction of hydrogen falls close to the pKa of the dissociation of the
hydrogen atom at 974
119867bull 119867(119886119902)+ + 119890(119886119902)
minus pKa = 974
The reverse reaction rate for the above equilibrium has been measured with good agreement
over a number of laboratories however the forward reaction rate is calculated based on the
relationship between the reverse reaction rate and the equilibrium constant45
This
equilibrium constant is derived from the Gibbs free energy of formation of Hbull in the gas
phase combined with an estimated value for the free energy of solvation of Hbull This
estimation is a value between those for the free energy of solvation of He atoms and H2
molecules888
Both computational and experimental data show the same trend at pH 13 in that the
production rate of hydrogen is less than that observed at lower pH however the
calculations once again overestimate the rate shown by the experimental data Some more
features of this discrepancy are discussed further in the following section
Chapter 4 The Radiolysis of Aqueous Solutions at High pH
112
Discussion
The radiolytic removal of hydrogen from solution by the hydroxyl radical has long been
referred to as the Allen chain25
In this mechanism the hydroxyl radical reacts with
molecular hydrogen to reform water and a hydrogen atom the chain is then extended by the
reaction of the hydrogen atom with hydrogen peroxide to reform the hydroxyl radical with
the net effect being the removal of H2 and H2O2
Propagation Steps
bull119874119867 + 1198672 rarr 119867bull + 1198672119874 k78 = 40 times10
7 M
-1 s
-1
119867bull + 11986721198742 rarr bull119874119867 + 1198672119874 k11 = 365times107 M
-1 s
-1
Termination 119867bull + bull119874119867 rarr 1198672119874 k10 = 109times1010
M-1
s-1
Aside from transference into the gas phase this chain is the only removal path for hydrogen
under neutral pH conditions At higher pH radical species are converted into their base
forms and a new chain is established43
119867bull + 119874119867minus 119890119886119902minus + 1198672119874 (R7576)
bull119874119867 + 119874119867minus 119874bullminus + 1198672119874 (R6566)
Propagation Steps
119874bullminus + 1198672 rarr 119890119886119902minus + 1198672119874 k47 = 128 times10
8 M
-1 s
-1
119890119886119902minus + 1198671198742
minus rarr 119874bullminus + 119874119867minus k49 = 786times108 M
-1 s
-1
Termination 119890119886119902minus + 119874bullminus rarr 2119874119867minus k3 = 231times10
10 M
-1 s
-1
Chapter 4 The Radiolysis of Aqueous Solutions at High pH
113
Given the higher rate constants involved in the alkali chain it would seem that the chain
reaction established in the basic form has a higher efficiency than its neutral equivalent yet
observations show a higher chemical yield of hydrogen at high pH and would suggest
otherwise This can largely be resolved by considering the effects of oxygen on these chain
reactions Oxygen acts as a poison to both the chain reactions removing hydrogen causing
an increase in hydrogen yield The mechanism by which oxygen disrupts the chain is
through reactions with solvated electrons to produce superoxide which in turn reacts with
OH radicals or in the case of alkali solutions bullOˉ preventing them from reacting with
hydrogen as well as reforming oxygen
119890119886119902minus + 1198742 rarr 1198742
bullminus (R7)
bull119874119867 + 1198742bullminus rarr 119874119867minus + 1198742 (R21)
bull119874minus + 1198742bullminus + 1198672119874 rarr 2119874119867
minus + 1198742 (R50)
In alkali solution bullOˉ is also susceptible to a direct reaction with oxygen to form ozonide
ions while a neutral equivalent reaction between hydroxyl radicals and oxygen does not
exist As the experimental measurements of hydrogen gas from solutions of sodium
hydroxide were carried out in deaerated conditions there should be no initial dissolved
oxygen and any oxygen present would have been radiolytically formed Figure 41 shows
the calculated steady state concentration of aqueous oxygen compared to hydrogen gas
formation as a function of pH from this it is clear that an increase in pH leads to a rise in
radiolytically produced oxygen which is proportional to the amount of hydrogen generated
Chapter 4 The Radiolysis of Aqueous Solutions at High pH
114
Figure 41 Model calculations showing the concentrations of aqueous oxygen and
hydrogen gas from deaerated water after 80 kGy at 280 Gy min-1
to show the related
behaviour between the two
Analysis of the calculated reaction rates gives an insight to why the concentration of
radiolytic oxygen first rises with pH and then falls after pH 12 and may help to reveal the
source of the over-prediction at pH 106 All the following reaction rates are taken from the
end of the experimental range ie 80 kGy with a dose rate of 280 Gy min-1
At neutral pH
it is the reaction between the superoxide ion and the hydroxyl radical (R21) that is the main
source of radiolytic oxygen but as the pH rises beyond pH 10 the rate of this reaction
begins to fall from ~140 times10-6
mol dm-3
s-1
to 886 times10-8
mol dm-3
s-1
at pH 14 This drop
is mainly due to the equilibrium between the hydroxyl radical and its basic form bullOˉ which
has a pKa of 119 As one would expect the reaction rate of the equivalent base reaction
(R50) rises as the pH increases although this increase does not fully compensate for the
decrease in rate of R21
100E-06
100E-05
100E-04
100E-03
100E-02
7 8 9 10 11 12 13 14
Lo
g C
on
cen
trat
ion (
mo
l d
m-3
)
pH
[H2] g
[O2] aq
Chapter 4 The Radiolysis of Aqueous Solutions at High pH
115
This is because the reaction between the solvated electron and superoxide (R8) has a larger
rate constant than R50 and with the conversion of hydrogen atoms to solvated electrons at
high pH R8 out competes R50
In principal many other reactions produce oxygen but the rates of these reactions are often
negligible Only the rate of oxygen production through the reaction of superoxide and
hydroperoxyl (R32) sees an increase over the pH range 10-12 which may be significant to
radiolytic oxygen production Figure 42 shows the rates of the three main molecular oxygen
producing reactions (R21 R50 and R32) as well as the reaction rate for R8 and the
combined reaction rates for R8 and R50 as a function of pH When the combined reaction
rates of R8 and R50 are compared with the reaction rate of R21 it becomes obvious that
there is a transition from the removal of super oxide by R21 to removal by both R8 and
R50 this is the main cause of a decrease in oxygen concentration after pH 12 Figure 43
shows the sum of reaction rates that lead to oxygen formation and removal as a function of
pH
Figure 42 Model predictions of the steady-state reaction rates of R21 R50 and R32 at
various pH for γ radiolysis of deaerated water at a dose rate of 280 Gy min-1
000E+00
200E-07
400E-07
600E-07
800E-07
100E-06
120E-06
140E-06
160E-06
7 8 9 10 11 12 13 14
Rea
ctio
n R
ate
at S
tead
y S
tate
(mo
l d
m-3
s-1
)
pH
Chapter 4 The Radiolysis of Aqueous Solutions at High pH
116
Figure 43 The sum of the steady state rates of all reactions that produce O2 () compared
with the sum of the steady state rates of all reactions that remove O2 () These totals do
not include rates of production or removal from mass transfer reactions This calculation is
for the γ radiolysis of deaerated water to a dose of 80 kGy at a rate of 280 Gy min-1
At pH 7 the rate of oxygen production matches the rate at which it is removed and a low
steady state concentration of aqueous oxygen is achieved before the end of the 80 kGy
calculation range At higher pH the rate of oxygen removal diverges and so oxygen can
accumulate to a higher concentration over a longer period of time longer than that of the
80 kGy range used Excluding transfer into the gas phase there are only three reactions that
effectively remove oxygen so it was worth investigating how the rates of these reactions
changed with pH Figure 44 shows the rates of reactions R6 R7 R8 R12 and R67 as a
function of pH
000E+00
200E-07
400E-07
600E-07
800E-07
100E-06
120E-06
140E-06
160E-06
7 8 9 10 11 12 13 14
Rat
e at
Ste
ady S
tate
(mo
l d
m-3
s-1
)
pH
Chapter 4 The Radiolysis of Aqueous Solutions at High pH
117
Figure 44 Model predictions of the steady-state reaction rates of R7 R12 and R67 at
various pH This calculation is for the γ radiolysis of deaerated water to a dose of 80 kGy
at a rate of 280 Gy min-1
The first removal path of oxygen is the reaction between the solvated electron and oxygen
to produce superoxide (R7) this reaction does not see a significant change in rate below
pH 11 after which the rate begins to fall The second reaction is the reduction of oxygen by
the hydrogen atom (R12) the rate of this reaction falls steadily as pH increases this is due
to the conversion of hydrogen atoms to solvated electrons by hydroxide which has a pKa of
96 The decline in rate of this reaction accompanied by no significant increase in the rate
of oxygen removal by solvated electrons may be the main contribution to the increased
concentrations of oxygen at pH gt 9 It was thought that this might also be the cause of the
over prediction but any attempt to increase this rate constant is largely negated by an
accompanying increase in the rate of reaction R32 The final removal path of oxygen is the
reaction with O˙- to form ozonide (R67)
000E+00
200E-07
400E-07
600E-07
800E-07
100E-06
120E-06
7 8 9 10 11 12 13 14
Rea
ctio
n R
ate
at S
tead
y S
tate
(mo
l d
m-3
s-1
)
pH
Chapter 4 The Radiolysis of Aqueous Solutions at High pH
118
The rate of this reaction increases rapidly with pH from 194 times10-8
mol dm-3
s-1
at pH 9
to 146 times10-6
mol dm-3
s-1
at pH 14 however ozonide is unstable and decomposes to reform
oxygen at a rate not much lower than its formation
Subtracting the rate of oxygen reformation from the decomposition of ozonide gives the
actual rate of oxygen removal by bullOˉ of 110 times10
-9 mol dm
-3 s
-1 at pH 9 and
600 times10-8
mol dm-3
s-1
at pH 14 It should be noted that the decomposition rate of ozonide
was excluded from the total rate of oxygen formation in figure 44 while the rate of oxygen
removal by ozonide formation was the subtracted values quoted above
The main removal mechanism of hydrogen peroxide is by reaction with solvated electrons
In the presence of oxygen the removal of hydrogen peroxide by solvated electrons is
largely out competed by reactions between the solvated electrons and oxygen or
superoxide The rate constant for the reaction between oxygen and the solvated electron
(R7) is 225 times1010
dm3 mol
-1 s
-1 while for the reaction of hydrogen peroxide and the
solvated electron (R4) is only 136 times1010
dm3 mol
-1 s
-1 and so hydrogen peroxide is initially
protected from reactions with the solvated electron as long as oxygen or superoxide is
available In alkali conditions where the pH is larger than 116 the conjugate base of
hydrogen peroxide HO2- becomes the dominant peroxide species This reacts even slower
with the solvated electron with a rate constant of 365 times109
dm3 mol
-1 s
-1 so the protection
effect is even stronger It was mentioned earlier that beyond pH 11 the rate of reaction R21
falls significantly as bullOH is converted to its basic form and the equivalent base reaction
(R50) does not see a sufficient equivalent increase in rate The reason given was that R50
was out competed by the reaction between superoxide and the solvated electron (R8)
Chapter 4 The Radiolysis of Aqueous Solutions at High pH
119
This not only serves to protect hydrogen peroxide by competing with solvated electrons but
also contributes to the increased concentration of hydrogen peroxide as the product of R8 is
in fact hydrogen peroxide
119890119886119902minus + 1198742
bullminus rarr 11987422minus (R8)
11987422minus + 1198672119874 1198671198742
minus + 119874119867minus (R6162)
Although this may account for the increased steady state of hydrogen peroxide at high pH
Figure 39 still shows a slight over prediction for calculations made at pH 123 and 127 As
the equilibrium between the hydroxyl radical and the oxygen anion has a pKa of 1184 it
was thought that the over prediction could be a result of the estimations used for the rate
constants of the reactions involving the oxide radical anion There is little data available for
the rate constants of reactions involving bullOˉ As reaction R51 and R52 both lead to the
formation of peroxide it initially was thought that these reactions may have rate constants
that are too high however removing these reactions from the model made no significant
difference to the predicted production of H2O2
119874bullminus + 119874bullminus rarr 11987422minus
1198672119874rarr 1198671198742
minus + 119874119867minus (R51)
119874bullminus + bull119874119867 rarr 1198671198742minus (R52)
It was instead found that other oxide radical anion reactions had an effect on the predicted
value for H2O2 A total of four oxide radical anion reactions influence the predicted values
with two of them making a significant difference Reducing the rate constant for the
reactions R47 and R48 made a slight improvement to the prediction of H2O2 a more
significant effect can be seen by altering the rate constants for R49 and R50
Chapter 4 The Radiolysis of Aqueous Solutions at High pH
120
119874bullminus + 1198671198742minus rarr 1198742
minus + 119874119867minus (R49)
119874bullminus + 1198742minus rarr 1198742minus
1198672119874rarr 2119874119867minus + 1198742 (R50)
Originally the rate constant for R49 was an estimation reported by Buxton et al in 19889
with a value of 40 times108 M
-1 s
-1 Since then this rate constant has been measured by
C R Stuart and D C Ouellette and is reported as being 786 times108
M-1
s-1
at 25degC45
The
value for the rate constant for R50 was originally estimated by Sehested et al in 198289
to
be 60 times108 M
-1 s
-1 This estimation was made by adjusting the rate constant for R50 and
R53 in a kinetic model to produce a prediction that agreed with the decay of ozonide
measured experimentally by pulse radiolysis By increasing the rate constant for R50 from
60 times108 M
-1 s
-1 to 48 times10
9 M
-1 s
-1 an improved agreement to the predicted steady state
concentration of H2O2 is found This is shown in Figure 45
Figure 45 Dashed lines show the original prediction where k50 = 60 times108 M
-1 s
-1 while
solid lines show the predictions with the increased k50 = 48 times109 M
-1 s
-1
000E+00
500E-05
100E-04
150E-04
200E-04
250E-04
300E-04
350E-04
0 10 20 30 40 50
[H2O
2]
(mo
l d
m-3
)
Dose (kGy)
Chapter 4 The Radiolysis of Aqueous Solutions at High pH
121
With the modified reaction rate constant for R50 the predictions for the steady state
concentrations of H2O2 are closer to the experimental values at high pH
Although this calculation improves the prediction for the steady state concentration it also
appears to increase the rate at which the steady state is achieved moving the prediction
away from the experimental data The cause of this discrepancy may have something to do
with the way in which some of the equilibria have been implemented in the model and
should be investigated in the future This modification also has little effect on the over
prediction of hydrogen gas at pH 104
Chapter 5 Radiolysis of Magnesium Hydroxide
122
Chapter 5 Radiolysis of Magnesium Hydroxide
Context
The Magnox Swarf Storage Silo contains 22 silos used to store magnesium alloy cladding
that has been removed from spent Magnox fuel elements The magnesium fuel cladding is
stored underwater where it readily corrodes to form magnesium hydroxide and hydrogen
gas by the following reaction90
119872119892 + 21198672119874 rarr 119872119892(119874119867)2 +1198672
Hydrogen gas poses an obvious hazard and is closely monitored however production rates
are not predictable Much of the magnox fuel cladding is contaminated with uranium and
other fission products contributing an additional supply of hydrogen through water
radiolysis Dose rates are often further increased as some of the silos were used to dispose
of other beta and gamma emitting waste The presence of the magnesium hydroxide
complicates the radiolysis processes as (a low) solubility in water drives up the pH while
undissolved magnesium hydroxide provides additional surfaces where radiolysis processes
are poorly understood
Experiments were conducted to investigate the effects of magnesium hydroxide on the
radiolytic production yields of hydrogen gas and hydrogen peroxide The investigation
began by measuring hydrogen yields in solutions of magnesium hydroxide and comparing
hydrogen yields to solutions containing sodium hydroxide solution with the same pH Pure
water is also included as a control and the magnesium hydroxide samples included both
homogeneous saturated solutions of aqueous magnesium hydroxide and heterogeneous
slurries containing undissolved magnesium hydroxide
Chapter 5 Radiolysis of Magnesium Hydroxide
123
Method
The saturated solution was prepared in bulk using magnesium hydroxide (Sigma Aldrich
BioUltra ge 990) and ultra-pure water solids were separated by centrifuge as filters may
introduce organic contamination 2 mL aliquots of saturated magnesium hydroxide solution
were transferred to sample tubes and flame sealed under air The pH of the remainder of the
saturated solution was measured to be 106 Slurry samples were prepared by weighing
01 g of magnesium hydroxide into a glass vial before adding 2 mL of ultra-pure water
Samples were also flame sealed under air before being mechanically mixed by agitation
Samples were irradiated using the inverter rig however the samples were left stationary and
were not inverted during irradiation Samples were irradiated at an average dose rate
of 281 Gy min-1
until the desired dose was reached samples were then analysed for
hydrogen by the ldquocrush tuberdquo gas chromatography method previously described Figure 46
shows the production of hydrogen as a function of dose for both saturated solutions and
solid containing slurries of magnesium hydroxide This is compared with measurements
obtained from pure water and an aqueous solution of sodium hydroxide with a similar pH
to that of the magnesium hydroxide samples
Chapter 5 Radiolysis of Magnesium Hydroxide
124
Results
Figure 46 Measurements of H2 gas as a function of dose All samples here are aerated
with vertical error bars showing the standard deviation between replicates
It should be noted that all the samples used to produce figure 46 are aerated The chemical
yield of hydrogen for each sample set is given in Table 20
Table 20 Obtained results from the measurements of H2 gas
000E+00
200E-04
400E-04
600E-04
800E-04
100E-03
120E-03
140E-03
160E-03
180E-03
200E-03
0 10 20 30 40 50 60
[H2]
(mo
l d
m-3
)
Dose (kGy)
Sample ID Average Dose Rate for
Inverter Rig (Gy min-1
)
Measured
pH G(H2)
(Molecules 100 eV-1
) Error
plusmn
Mg(OH)2(s) 2814 1062 052 003
Mg(OH)2(aq) 2814 1057 047 002
NaOH 2845 1063 027 002
H2O 1732 699 016 001
Chapter 5 Radiolysis of Magnesium Hydroxide
125
The dose rate for the pure water samples is much lower than the other dose rates quoted as
this measurement was performed before the construction of the inverter rig and so the
samples were held further away from the source during irradiation
This data shows that the presence of magnesium hydroxide appears to increase the
hydrogen yield beyond what one would expect if the yield was controlled by pH alone
There is very little difference in hydrogen yield between samples that contain solid
magnesium hydroxide and samples that contain only dissolved magnesium hydroxide This
suggests that surface effects contribute to the hydrogen yield only a very small amount or
not at all This data is discussed further in the following section
A second set of experiments was conducted to measure the concentration of hydrogen
peroxide in irradiated saturated solutions of magnesium hydroxide 10 mL aliquots of
aerated saturated solution were transferred in to 20 mL glass headspace vials the vials were
sealed with an aluminium crimp cap and irradiated in the front row of the 4 x 8 rack the
average dose rate was 2831 Gy min-1
After irradiation the samples were analysed for
hydrogen peroxide by the Ghormley tri-iodide method described in Chapter 2 Figure 47
compares the obtained data from this experiment with data obtained from measurements
made in pure water
Chapter 5 Radiolysis of Magnesium Hydroxide
126
Figure 47 Measurements of H2O2 concentrations in aerated samples of saturated
magnesium hydroxide solution as a function of dose
The steady state concentration of hydrogen peroxide in a saturated solution of magnesium
hydroxide is almost the same as in a neutral sample of pure water as is expected given the
pH of the saturated solution was measured to be 106 which is below the 118 threshold
that is associated with an increased steady state of hydrogen peroxide observed in the
previous chapter
A further experiment was conducted to investigate the effects of the solid magnesium
hydroxide surface on the production of hydrogen Batches of samples were prepared with
various ratios of magnesium hydroxide to water each sample had a total mass of
approximately 2 g Table 21 summarises the sample ratios used Samples were irradiated
using the inverter rig which was left stationary throughout the irradiation the average dose
rate was 3042 Gy min-1
All samples were irradiated to approximately 525 kGy so that any
difference in the amount of hydrogen produced is independent of absorbed dose
000E+00
200E-05
400E-05
600E-05
800E-05
100E-04
120E-04
140E-04
0 5 10 15 20 25 30 35 40
[H2O
2]
mo
l d
m-3
Dose kGy
Aerated Water
Mg(OH)2 Saturated SolutionMg(OH)2 Aerated Saturated Solution
Chapter 5 Radiolysis of Magnesium Hydroxide
127
As the dose rate was determined by Fricke dosimetry which is a liquid phase dosimeter
with a density close to that of water the quoted dose of 525 kGy is what was received by
the aqueous phase The solid phase magnesium hydroxide has a slightly higher density and
will have received a slightly higher dose Figure 48 shows the chemical yields of hydrogen
as a function of water content percentage The results have been normalised to reflect the
amount of hydrogen produced per gram of water and the yields were calculated based on
the radiation dose absorbed by the whole system this makes the data from samples that
contain large quantities of water comparable to those with lower water content
Table 21 Conditions of samples containing Mg(OH)2 for measurements of H2
a ndash Powder sample with no added water estimated adsorbed water content is based on
data from Nelson et al91
b ndash Sample is a saturated solution of Mg(OH)2 ie contains no solid
H2O Average Mg(OH)2
Mass (g)
Average H2O
Mass (g)
Average
Dose (kGy)
4a 5303 plusmn 111
20 161 plusmn 002 040 plusmn 001 5245 plusmn 146
40 122 plusmn 002 082 plusmn 001 5255 plusmn 146
60 081 plusmn 001 122 plusmn 001 5255 plusmn 145
80 040 plusmn 001 162 plusmn 002 5245 plusmn 145
100b 5239 plusmn 145
Chapter 5 Radiolysis of Magnesium Hydroxide
128
Figure 48 Measurements of hydrogen yields from magnesium hydroxide samples with
various solid ndash aqueous ratios All samples were irradiated to a total dose of ~52 kGy to
the aqueous phase at a dose rate of 3041 Gy min-1
Discussion
The data shown in Figure 46 suggests that the presence of dissolved magnesium hydroxide
increases the chemical yield of hydrogen significantly more than if pH was the only
controlling factor Data shown in Figure 48 suggests that the presence of the solid surface
increases the hydrogen yield slightly above that for saturated solutions but it would seem
that the main contribution to the increased H2 yields in magnesium hydroxide samples
when compared to a solution of NaOH of equivalent pH is a factor present in both slurries
and saturated solutions of magnesium hydroxide The yield of H2 between 20 and 80
percent water content is not affected by changing the solid solution ratio suggesting that
there is little interaction between the solid magnesium hydroxide and the bulk water
00
02
04
06
08
10
12
14
16
0 20 40 60 80 100
G(H
2)
(Mo
lecu
les
10
0 e
V-1
)
H2O
Chapter 5 Radiolysis of Magnesium Hydroxide
129
The yield is significantly higher for samples with 4 water content (adsorbed water)
suggesting that any additional hydrogen is produced only in a few water layers away from
the solid surface as has been postulated for oxide surfaces
Petrik et al showed that oxide water systems consisting of multiple phases such as the
slurry samples measured here have different hydrogen yields depending on the oxide18
They grouped materials into three categories based on the effects they have on measured
hydrogen yields hydrogen enhancing hydrogen diminishing and hydrogen neutral
Though said study did not include magnesium hydroxide it does categorise magnesium
oxide as a material that does not significantly change the yield of hydrogen
The mechanism by which a solid surface increases the hydrogen yield is largely accredited
to an energy transfer process As solid particles in a sample absorbs energy a process of
energy migration from the bulk of the material to the interface takes place Energy can then
be transferred from the solid phase to the surrounding liquid The exact mechanism of the
energy transfer process is not well understood but the overall effect is higher dose rates in
localised areas of surrounding water
As the value of 4 water content is an estimation based on data extrapolation published by
Nelson et al in a study of water adsorption on magnesium hydroxide91
and may not be
entirely accurate This uncertainty could have a significant effect on the calculated chemical
yield if the estimation was even slightly incorrect for example an estimated water content
of just 9 has the effect of lowering the yield to the same value observed in samples
contain 20 water content This would be contradictory to an energy transfer process as
described previously
Chapter 5 Radiolysis of Magnesium Hydroxide
130
A study by Jay La Verne et al published measurements of hydrogen yields from the
gamma radiolysis of magnesium hydroxide to be 005119
This measurement was made
using magnesium hydroxide that had been dried to remove all excess water while
remaining hydroxylated The difference between the measured yields of saturated
magnesium hydroxide solution (G(H2) = 047) and a slurry sample (G(H2) = 052) given in
Table 20 is 005
This value is very close to the quoted value from dry magnesium hydroxide although it is
an average value and errors can be high with small differences between large numbers such
as this Little information is given to explain the mechanism contributing to this yield of
hydrogen from dry magnesium hydroxide other that the radiation induced conversion of
magnesium hydroxide to magnesium oxide92
A comparison was made to yields obtained
from calcium hydroxide and found that the yield of hydrogen was four times higher from
calcium hydroxide than from magnesium hydroxide This was explained in terms of the
tendency to form water during radiolysis being greater in magnesium hydroxide than in
calcium hydroxide meaning that a smaller portion of the hydroxide generates hydrogen
directly If the yield measured from the dry powder (0051) by La Verne et al is the result
of direct hydrogen production from magnesium hydroxide converting to the oxide then it
would make sense that the difference in yield between samples containing solid magnesium
hydroxide and only aqueous magnesium hydroxide would be close to this value
This does not explain why the yields of both samples are far higher than samples of sodium
hydroxide at the same pH as the magnesium hydroxide samples The chemical yield of
hydrogen from samples of sodium hydroxide with a pH of 1063 was 027 while yields
from both magnesium hydroxide systems were a little less than double this value
Chapter 5 Radiolysis of Magnesium Hydroxide
131
As this can be seen in both aqueous only samples and those containing solid magnesium
hydroxide the cause of this increased yield must be attributed to a factor present in both
aqueous only samples and samples containing solid magnesium hydroxide Magnesium
hydroxide is often discussed in literature concerning environmental science for its
properties and reactivity towards carbon dioxide9394
As the samples used in these experiments did not undergo any purification processes prior
to use they were most likely subject to carbonation reactions with atmospheric carbon
dioxide and water Magnesium hydroxide can be carbonated on exposed surfaces although
slow at standard room conditions it can be increased in the presence of water95
119872119892(119874119867)2(119904) + 1198621198742(119892) rarr 1198721198921198621198743(119904) + 1198672119874(119892)
Magnesium hydroxide can also take on intercalated carbon dioxide which can be converted
to carbonate either by reaction with water or if released into solution with hydroxide to
form bicarbonate9697
1198621198742(119860119894119903) 1198621198742(119894119899119905119890119903119897119886119910119890119903)
1198621198742(119894119899119905119890119903119897119886119910119890119903) + 1198672119874(119894119899119905119890119903119897119886119910119890119903) 2119867(119894119899119905119890119903119897119886119910119890119903)+ + 1198621198743(119894119899119905119890119903119897119886119910119890119903)
2minus
1198621198742(119886119902) + 119874119867(119886119902)minus 1198671198621198743(119886119902)
minus
Both carbonate and bicarbonate are known to be hydroxyl radical scavengers in the
radiolysis of aqueous solutions998
Using the Facsimile model described in Chapter 3 it
was possible to insert a set of reactions concerning carbonate radiolysis to estimate the
effects that small quantities of carbonate might have on hydrogen yields
Chapter 5 Radiolysis of Magnesium Hydroxide
132
The reaction set used is described in Table 22 and represents a simplified reaction scheme
of carbonate in aqueous radiolysis Initial concentrations of carbonate were set ranging
from 10 μM to 10 mM a yield of hydrogen was calculated for each initial concentration
these calculations have been graphed in Figure 49
In each case the calculated production of hydrogen was linear over the dose range used
which would be a necessary feature if carbonate is to be a valid explanation for the
increased yields observed in magnesium hydroxide experiments The calculated yield of
hydrogen increases rapidly with only small quantities of initial carbonate before reaching a
plateau at about G(H2) = 03 with an initial carbonate concentration of 50 μM The
hydrogen yield did not change much more than this increasing to just G(H2) = 036 with an
initial carbonate concentration of 10 mM The effect is almost the same in calculations for
both aerated and deaerated solutions It should be noted that these calculations were done at
pH 7 due to the systematic error of over prediction when the pH is close to 10 it would be
unadvisable to trust such calculations without first solving the error (see previous chapter)
Table 22 A reaction scheme to estimate the effect of carbonate in water radiolysis
Reaction Rate Constant Reference
CO32macr +
bullOH rarr CO3macr + OHmacr 39 times10
8
9
CO32macr + emacraq rarr products 39 times10
5
99
CO3bullmacr +
bullOH rarr products 30 times10
9
100
CO3bullmacr + H2O2 rarr HCO3macr + HO2
bull 43 times10
5
101
CO3bullmacr + HO2macr rarr HCO3macr + O2
bullmacr 30 times10
7
101
CO3bullmacr + O2
bullmacr rarr O2 + CO3
2macr 65 times10
8
102
HCO3macr + emacraq rarr products 10 times106
103
HCO3macr + bullOH rarr H2O + CO3
bullmacr 85 times10
6
9
HCO3macr + Hbull rarr products 44 times10
4
104
Chapter 5 Radiolysis of Magnesium Hydroxide
133
Figure 49 Model predictions for the yield of H2 from a solution containing various
concentrations of carbonate anions
Reaction rate analysis of the calculations reveals that the main mechanism for hydrogen
protection is through a cooperative effect of scavenging of the hydroxyl radical to form a
carbonate radical The majority of carbonate radicals are converted back to carbonate by
reaction with superoxide A secondary process of carbonate radical reactions with hydrogen
peroxide contributes slightly to regeneration of superoxide as well as forming bicarbonate
which itself contributes to hydrogen protection by scavenging hydroxyl radicals once again
forming a carbonate radical As these calculations were performed at pH 7 it is uncertain
what effect an elevated pH would have on the predicted hydrogen yield It should also be
remembered that many of the rate constants used are estimations and the reaction set is a
simplification and is not a comprehensive description
0
005
01
015
02
025
03
035
04
0 1 2 3 4 5 6 7 8 9 10 11
G(H
2)
[CO32-] mM
Aerated
Deaerated
134
With these factors in mind the predicted behaviour of hydrogen production is a reasonable
representation of the behaviour observed in experiments This could easily be investigated
further by experiments in a number of ways
Attempts could be made to measure carbonate directly from the magnesium hydroxide
used either by thermogravimetric analysis (TGA) or by total organic carbon analysis
(TOC) Radiolysis experiments of other carbonates could also be carried out to further
investigate the effect of carbonate
Chapter 6 Radiolysis of Methanol Solutions
135
Chapter 6 Radiolysis of Methanol Solutions
Context
Many of the waste storage ponds at Sellafield Ltd are open to the air and are subject to
organic matter falling in and decomposing to a range of organic products One particular
group of compounds known as humic acids and how they might affect radiolysis processes
in the ponds are of particular interest Humic acids are ill-defined but complex organic
acids with several different functional groups which will have many effects on radiolysis
The best approach to investigating this chemistry is to understand the effects of each
functional group independently before building up to a full humic acid analogue This study
takes the first steps towards this investigation through experimentation on aqueous
solutions of methanol
Experimental Method
A stock aqueous solution of 1 mM methanol was made and was used to prepare aerated
samples of 10 mL sealed by crimp cap in 20 mL headspace vials so that the liquid to
headspace ratio was 11 Samples were irradiated in row 2 of the 4x8 irradiation rack for
various periods of time The average dose rate was 1638 Gy min-1
The samples were
analysed for hydrogen peroxide immediately after irradiation using the Ghormley tri-iodide
method described in Chapter 2 A separate batch of aerated samples was prepared from the
1 mM methanol stock solution for analysis of hydrogen generation These were samples of
2 mL of 1 mM methanol and were deaerated using zero grade argon gas before being sealed
in glass tubes designed for use by the crush tube analysis method described in Chapter 2
Again the samples had a liquid to headspace ratio of 11
Chapter 6 Radiolysis of Methanol Solutions
136
These samples were irradiated in the centre positions of row 2 in the 4x8 rack where the
average dose rate was 1755 Gy min-1
Results
Figure 50 Measurements of H2O2 concentrations as a function of dose in samples
containing 1 mM methanol (diams) and water as a control (diams) All samples were aerated and a
dashed line is included to highlight the data trend The dose rate was 1638 Gy min-1
for
methanol solutions and 2839 Gy min-1
for the aerated water
000E+00
500E-05
100E-04
150E-04
200E-04
250E-04
0 5 10 15 20 25
[H2O
2]
(mo
l d
m-3
)
Dose (kGy)
Aerated Water
Methanol 1 mM
Chapter 6 Radiolysis of Methanol Solutions
137
Figure 51 Measurements of H2 gas as a function of dose from deaerated samples
containing 1 mM methanol deaerated water is also shown as a control Dashed lines are
included to highlight the data trend The dose rate was 1755 Gy min-1
for the methanol
solutions and 2851 Gy min-1
for the deaerated water
Figure 50 shows the measured concentrations of hydrogen peroxide from the 1 mM
methanol solution compared with the measured concentrations from pure aerated water At
low doses the concentration of hydrogen peroxide increases rapidly to approximately
20 times10-4
mol dm-3
at approximately 1 kGy which is almost double the steady state
concentration observed in pure water As the dose increases further the concentration
begins to fall to a steady state value at approximately 33 times10-5
mol dm-3
Figure 51 shows the measured hydrogen concentrations from the 1 mM methanol solutions
compared with hydrogen measurements from aerated water
000E+00
500E-04
100E-03
150E-03
200E-03
250E-03
300E-03
0 5 10 15 20 25 30
H2 (
mo
l d
m-3
)
Dose (kGy)
Methanol Solution 1mM Deaerated
Dearated Water
Chapter 6 Radiolysis of Methanol Solutions
138
Hydrogen concentrations measured in a deaerated 1 mM methanol solution are significantly
higher than those measured in deaerated water the initial production rate is higher in the
methanol solution but production is not linear and the rate of hydrogen production with
dose soon falls The change in production rate of hydrogen and hydrogen peroxide with
dose can be shown by converting the experimental measurements to G-values and plotting
them as a function of dose Figures 52 and 53 show the chemical yields determined by
converting the gradients between 0 and each data point to units of molecules 100 eV-1
Figure 52 Chemical yields of hydrogen peroxide measured from an aerated solution of
1 mM methanol as a function of dose
00
05
10
15
20
25
30
35
40
0 5 10 15 20
G(H
2O
2)
(mo
lecu
les
10
0eV
-1)
Dose (kGy)
Chapter 6 Radiolysis of Methanol Solutions
139
Figure 53 Chemical yields of hydrogen gas measured from a deaerated solution of 1 mM
methanol as a function of dose
Discussion
Most alcohols are effective scavengers of hydroxyl radicals and hydrogen atoms The
reactions between methanol and hydroxyl radicals or hydrogen atoms result in hydrogen
abstraction from methanol to form water or molecular hydrogen respectively and in both
cases form the hydroxymethyl radical105106
bull119874119867 + 1198621198673119874119867 rarr 1198672119874 + bull1198621198672119874119867 119896 = 83 times 108 119872minus1119904minus1
119867bull + 1198621198673119874119867 rarr 1198672 + bull1198621198672119874119867 119896 = 28 times 106 119872minus1119904minus1
Although the second order rate constant for the reaction between methanol and the solvated
electron is faster than that for the solvated electron and water the reaction rate does not
compete with the rate of reaction between the solvated electron and water until the
concentration of methanol is greater than 10-2
M2107
00
02
04
06
08
10
12
14
16
18
0 5 10 15 20
G(H
2)
(mo
lecu
les
10
0eV
-1)
Dose (kGy)
Chapter 6 Radiolysis of Methanol Solutions
140
In deaerated water methanol radicals may dimerise to form ethylene glycol or
disproportionate to form formaldehyde and reform methanol108
They may also react with
hydrogen peroxide to form formaldehyde
2bull1198621198672119874119867 rarr (1198621198672119874119867)2
2bull1198621198672119874119867 rarr 1198621198673119874119867 + 119867119862119867119874
bull1198621198672119874119867 + 11986721198742 rarr 119867119862119867119874 + 1198672119874 + bull119874119867
In solutions that contain dissolved oxygen such as those used in the measurements of
hydrogen peroxide (Figure 50) methanol radicals rapidly react with oxygen to form an
organic peroxyl radical which reacts by second-order processes resulting in the formation
of formaldehyde hydrogen peroxide and oxygen109
bull1198621198672119874119867 + 1198742 rarr bull11987421198621198672119874119867
An additional set of reactions were included in the water radiolysis model described in
Chapter 3 in an attempt to model the radiolysis chemistry of an aqueous solution of 1 mM
methanol This reaction scheme is shown in Table 23
Chapter 6 Radiolysis of Methanol Solutions
141
Reaction
Number Reaction
Rate Constant at 25degC (M
-1 s
-1)
Ref
M1 CH3OH + bullOH rarr H2O +
bullCH2OH 83times10
8
110
M2 CH3OH + Hbull rarr H2 +
bullCH2OH 28times10
6
106
M3 bullCH2OH + O2 rarr
bullO2CH2OH 49times10
9
111
M4 bullCH2OH + H2O2 rarr H2O + H2CO +
bullOH 18times10
5
112
M5 bullCH2OH +
bullCH2OH rarr CH3OH + H2CO 12times10
9
2113
M6 bullCH2OH +
bullCH2OH rarr HOCH2CH2OH 12times10
9
2113
M7 bullCH2OH +
bullOH rarr H2CO + H2O
a24times10
10
114
M8 bullO2CH2OH +
bullO2CH2OH rarr 2H2CO + H2O2 + O2 74times10
8
115
M9 bullO2CH2OH +
bullHO2 rarr H2CO + H2O2 + O2
b50times10
8
2
M10 bullO2CH2OH + O2macr rarr H2CO + HO2macr + O2
b50times10
7
2
M11 HOCH2CH2OH + bullOH rarr
bullHOCHCH2OH + H2O 24times10
9
116
M12 HOCH2CH2OH + Hbull rarr
bullHOCHCH2OH + H2 14times10
7
9
M13 bullHOCHCH2OH + O2 rarr
bullO2HOCHCH2OH 32times10
9
111
M14 bullO2HOCHCH2OH rarr HOCH2CHO + H
+ + O2macr 19times10
2 s
-1
117
M15 bullHOCHCH2OH +
bullHOCHCH2OH rarr HOCH2CH2OH +
HOCH2CHO 96times10
8
118
M16 HOCH2CHO + bullOH rarr H2O +
bullHOCHCHO
c92times10
6
119
M17 bullHOCHCHO +
bullHOCHCHO rarr HOCH2CHO + OCHCHO
d50times10
4 -
M18 OCHCHO + bullOH rarr H2O +
bullOCCHO 14times10
6
120
M19 bullOCCHO rarr CO + HCO
bull
a35times10
7 s
-1
121
M20 H2CO + emacraq rarr bullCH2OH + OHmacr 10times10
6
2
M21 H2CO + Hbull rarr H2 + HCO
bull 50times10
6
2
M22 H2CO + bullOH rarr H2O + HCO
bull 20times10
9
2
M23 HCObull + H
bull rarr H2 + CO
a68times10
10
122
M24 HCObull +
bullOH rarr CO + H2O
a11times10
11
123
M25 HCObull + O2 rarr CO + HO2
bull
a31times10
9
124
M26 HCObull + HCO
bull rarr 2CO + H2
a22times10
10
125
Table 23 A reaction scheme to estimate the effect of methanol in water radiolysis
a ndash Rate constant for gas phase reaction
b ndash Estimated rate constant
c ndash Rate constant based on reaction of acetic acid and hydroxyl
d ndash Assumed reaction
Figure 54 shows the predicted hydrogen peroxide concentration with the above chemistry
included in the calculation and compares it with the experimental data In order to achieve
the agreement shown a modification to the mass transfer routine was required
Chapter 6 Radiolysis of Methanol Solutions
142
The current implementation of the mass transfer routine does not cope with a rapid
depletion of dissolved oxygen and responds by increasing the rate of oxygen transfer from
the gas phase to the aqueous phase to an unrealistic value A temporary fix can be made by
reducing the mass transfer rate of oxygen (for instance by a factor of 15) but a more
appropriate correction to the routine should be sought in future implementations Figure 55
shows the original calculation with the un-modified mass transfer routine compared with
the modified mass transfer routine
Figure 54 Model prediction of H2O2 concentrations as a function of dose in a solution of
1 mM methanol
000E+00
500E-05
100E-04
150E-04
200E-04
250E-04
0 5 10 15 20 25
[H2O
2]
mo
l d
m-3
Dose kGy
Methanol 1 mM
Model
Chapter 6 Radiolysis of Methanol Solutions
143
Figure 55 Calculations of hydrogen peroxide concentrations with and without
modification to the mass transfer routine
Analyses of the evolution of the calculated reaction rates reveal a possible explanation for
the behaviour of hydrogen peroxide in the presence of a low concentration of methanol
Initially the most important methanol reactions are the formation of the methanol radical
by scavenging hydroxyl radicals (M1) and the formation of an organic peroxide by the
reaction between the aforementioned methanol radical and oxygen (M3)
1198621198673119874119867 + bull119874119867 rarr bull1198621198672119874119867 + 1198672119874
bull1198621198672119874119867 + 1198742 rarr bull11987421198621198672119874119867
With the formation of the organic peroxide comes an increase in the rate of the formation of
formaldehyde mainly through self-reaction or to a lesser degree through reaction with
superoxide
000E+00
100E-04
200E-04
300E-04
400E-04
500E-04
600E-04
700E-04
0 5 10 15 20 25 30 35 40 45
[H2O
2]
(mo
l d
m-3
)
Dose (kGy)
Original Calculation
Modified Calculation
Chapter 6 Radiolysis of Methanol Solutions
144
2bull11987421198621198672119874119867 rarr 21198672119862119874 + 11986721198742 + 1198742
bull11987421198621198672119874119867 + 1198742bullminus rarr 1198672119862119874 + 1198671198742
minus + 1198742
These reactions not only contribute to the production of hydrogen peroxide but also return
oxygen to the system which can scavenge solvated electrons and protect hydrogen peroxide
from the rapid reaction between the solvated electron and hydrogen peroxide
(R4 k = 136times1010
M-1
s-1
) The total rate of oxygen consumption by methanol radicals and
solvated electrons is still greater than the rate of return from the reactions of the organic
peroxide After about 11 kGy oxygen concentrations are reduced to an insignificant value
As the concentration of oxygen falls the reaction rate between hydrogen peroxide and the
solvated electron increases As mentioned in Chapter 4 oxygen plays a vital role in the
formation and protection of hydrogen peroxide The model prediction shows the
concentration of hydrogen peroxide beginning to rise again after about 8 kGy this is due to
the mass transfer of oxygen gas into the aqueous phase slowly re-establishing equilibrium
and effectively allowing a build-up of hydrogen peroxide As mentioned earlier the mass
transfer routine has been modified for this calculation and is non-representative of the real
mass transfer flux nevertheless it is reasonable to assume that after the depletion of
dissolved oxygen and the methanol has been converted to glycol or formaldehyde
equilibrium of aqueous and gaseous oxygen would eventually be re-established This could
be supported by further analysis at higher doses which may show an increase in hydrogen
peroxide concentrations
Chapter 6 Radiolysis of Methanol Solutions
145
The formation of hydrogen gas is enhanced by the presence of methanol however
hydrogen gas production is not linear with dose Figure 56 shows the model predictions for
hydrogen gas production compared to the experimentally obtained data
The calculations show a higher production rate of hydrogen gas can be attributed to the
scavenging of hydroxyl radicals by methanol and a number of methanol radiolysis
products
Figure 56 Model prediction of H2 gas as a function of dose in a solution of 1 mM
methanol
Although the model prediction somewhat overestimates the quantity of hydrogen formed
the slope is close to what is observed experimentally Many of the rate constants used in the
reaction scheme could not be found in the literature and are therefore estimations The
reaction scheme used protects molecular hydrogen from reacting with the hydroxyl radical
in a number of reactions Throughout the radiolysis of methanol a number of intermediary
organic products are formed such as ethylene glycol and formaldehyde each of which is an
effective hydroxyl scavenger
000E+00
500E-04
100E-03
150E-03
200E-03
250E-03
300E-03
0 5 10 15 20 25 30
H2 (
mo
l d
m-3
)
Dose (kGy)
Methanol 1 mM Dearated
Model
Chapter 6 Radiolysis of Methanol Solutions
146
After reacting with the hydroxyl radical the newly formed organic radical will usually form
an organic peroxide however in the absence of oxygen the radicals will tend towards
disproportionation to reform the original organic product at well as a new stable organic
usually an aldehyde Eventually the only stable product is carbon monoxide which does not
have any further reactions within this scheme Figure 57 shows the calculated
concentrations of each of the stable organic products as a function of dose in an aerated
system
Figure 57 Model predictions of the concentrations of various stable organic products
formed as a result of using the proposed reaction scheme in Table 23
Kinetic models of aqueous methanol have previously been presented in literature one such
model by Sunaryo and Domae126
was developed for calculating the effects of aqueous
methanol in light water reactors
000E+00
200E-04
400E-04
600E-04
800E-04
100E-03
120E-03
0 10 20 30 40
Co
nce
ntr
ati
on
(m
ol
dm
-3)
Dose (kGy)
Methanol
Formaldehyde
Ethylene Glycol
Glycolaldehyde
Glyoxal
Carbon Monoxide
Chapter 6 Radiolysis of Methanol Solutions
147
The reaction scheme for methanol radiolysis used in that publication is not a complete
scheme in that ldquoimaginary productsrdquo are implemented to terminate certain reaction
pathways This is still a valid approach as their interest was focused on the initial reaction
paths when delivering a maximum dose of 500 Gy and not the long term radiolysis of
methanol over several kGy
It was noted that an understanding of the radiolysis of the transient organic products is
needed they concluded that methanol is converted into ethylene glycol which may have the
same effect as methanol itself The formation of ethylene glycol and formaldehyde from
methanol radiolysis is well known and has been measured in previous studies127
The
radiolysis of ethylene glycol has also been discussed in literature128
and it has been
described that under aerated conditions the main organic product of radiolysis is
glycolaldehyde129
The reaction scheme for methanol radiolysis in this work assumes the
formation of a radical species by the reaction between glycolaldehyde and the hydroxyl
radical however this is most likely not the major radiolysis path for glycolaldehyde In
aqueous solutions glycolaldehyde exists in a number of different forms with the aldehyde
form usually being the minor component130
The existence of multiple forms of
glycolaldehyde in solution and the large number of unknown rate constants makes creating
a complete reaction scheme for methanol radiolysis difficult Furthermore the publications
mentioned above also report the formation of small amounts of methane along with carbon
monoxide The radiolysis of ethylene glycol under deaerated conditions can also lead to the
production of ethyl aldehyde Both of these points highlight gaps in the reaction scheme
that should be included in a comprehensive description of methanol radiolysis Suggestions
for an improved radiolysis scheme are given in Chapter 8
Chapter 7 Radiolysis of Iron Oxide-Water Systems
148
Chapter 7 Radiolysis of Iron Oxide-Water Systems
Context
Large quantities of iron oxide have been reported to be present in the First Generation
Magnox Storage Pond where iron skips containing spent fuel have corroded to form a layer
of haematite (Fe2O3) and magnetite (Fe3O4) several meters below the water level
Documented investigations into the effects of iron oxide on water radiolysis are sparse the
most recent of which focusing on the formation of molecular hydrogen from the radiolysis
of water-iron oxide systems131
Preliminary experiments have been carried out to
investigate the effects iron oxide may have on radiolytic production of hydrogen peroxide
from water-oxide slurries
Method
Iron oxide powders were washed with ultra-pure water to remove any soluble
contamination Excess water was decanted before the powders were washed a further two
times After the third decanting the powders were dried in a vacuum oven at 40degC
overnight Haematite samples were prepared by weighing 05 g quantities of haematite into
20 mL headspace vials to which 10 mL of ultra-pure water was added before sealing with a
crimp cap Samples of magnetite were prepared in the same way Samples were agitated
and then left to settle before irradiation The irradiations of haematite samples were carried
out in row 1 of the 4x8 irradiation rack with an average dose rate of 30518 Gy min-1
while
irradiations of magnetite samples were carried out in row 2 of the 4x8 rack with an average
dose rate of 16252 Gy min-1
After irradiation aliquots of the water from the samples were
removed by syringe and pushed through a syringe filter to remove any solid particles
Chapter 7 Radiolysis of Iron Oxide-Water Systems
149
The filtered aliquot was then analysed for hydrogen peroxide using the Ghormley tri-iodide
method described in Chapter 2
Results
Figure 58 shows the obtained results for the haematite system compared to concentrations
of hydrogen peroxide measured in aerated water Figure 59 shows the obtained results from
magnetite samples again they are compared with measurements obtained from pure water
Figure 58 Measurements of H2O2 concentrations from heterogeneous samples of 05g
Fe2O3 and 10 mL aerated water The dose rate for the haematite samples was
3052 Gy min-1
and for the aerated water the dose rate was 2839 Gy min-1
000E+00
200E-05
400E-05
600E-05
800E-05
100E-04
120E-04
140E-04
0 2 4 6 8 10 12 14
[H2O
2]
(mo
l d
m-3
)
Dose (kGy)
Haematite
Pure Water
Chapter 7 Radiolysis of Iron Oxide-Water Systems
150
Figure 59 Measurements of H2O2 concentrations from heterogeneous samples of 05g
Fe3O4 and 10 mL aerated water The dose rate for the magnetite samples was
1625 Gy min-1
and for the aerated water the dose rate was 2839 Gy min-1
The steady state concentration of hydrogen peroxide achieved in the presence of haematite
is close to that of pure water however the initial production rate is slightly higher An
increased initial production rate is also observed in samples containing magnetite but after
approximately 500 Gy the concentration of hydrogen peroxide falls dramatically and
achieves a low steady state of approximately 15 times10-5
mol dm-3
000E+00
200E-05
400E-05
600E-05
800E-05
100E-04
120E-04
140E-04
0 2 4 6 8 10 12 14 16 18 20 22
[H2O
2]
(mo
l d
m-3
)
Dose (kGy)
Magnetite
Pure Water
Chapter 7 Radiolysis of Iron Oxide-Water Systems
151
Discussion
Hydrogen peroxide undergoes surface decomposition over both haematite and
magnetite28132
The estimated second-order rate constants for the surface decomposition of
hydrogen peroxide are quoted as 30 times10-9
M-1
s-1
for haematite132
and 45 times10-10
M-1
s-1
for
magnetite28
Calculations using the water radiolysis model including a hypothetical reaction
that removes hydrogen peroxide at these rates makes no significant difference to the
predicted concentrations of hydrogen peroxide in water over the time scale of the
experiment However as the aforementioned rate constants are second-order they not only
depend on the concentration of hydrogen peroxide but the surface area of the metal oxide as
well which is unknown for the metal oxides used in this study
Furthermore the experiments carried out in the aforementioned publications to determine
these rate constants were well mixed throughout the reaction time while in this work the
samples were static with the iron powder settled at the bottom of the reaction vessel This
means that the rate of surface decomposition is greatly hindered due to the need for
hydrogen peroxide to diffuse a large distance to the iron oxide surface nevertheless a
significant difference in hydrogen peroxide concentrations were observed in samples
containing magnetite The behaviour of hydrogen peroxide observed in samples containing
magnetite is most likely due to homogeneous chemistry initiated by dissolved iron ions
The chemistry initiated by dissolved iron could serve to remove hydrogen peroxide through
a Haber-Weiss mechanism133
1198651198903+ + 1198742bullminus rarr 1198651198902+ + 1198742 k = Unknown
1198651198902+ + 11986721198742 rarr 1198651198903+ + 119874119867minus + bull119874119867 k = 10 times10
7 M
-1 s
-1
1198651198902+ + bull119874119867 rarr 1198651198903+ + 119874119867minus k = 32 times108
M-1
s-1
1198651198902+ + 1198671198742bull rarr 1198651198903+ + 1198671198742
minus k = 12 times10
6 M
-1 s
-1
Chapter 7 Radiolysis of Iron Oxide-Water Systems
152
Experiments discussed in publications by Mats Jonsson28
focus largely on the reactivity of
hydrogen peroxide and various metal oxides including iron oxide It was found that many
metal oxide surfaces show reactivity towards hydrogen peroxide and that rate of removal of
hydrogen peroxide can be calculated in heterogeneous systems based on properties such as
particle size As mentioned previously the model suggests that the rate of this surface
reactivity does not seem to be able to compete with the rate of radiolytic hydrogen peroxide
production The studies by Jonsson concerning iron oxide were met with difficulty in
discriminating between surface reactions and aqueous chemistry initiated by dissolved iron
Through the use of ICP-AES it was shown that iron can be found in water with a
concentration of 23 times10-6
mol dm-3
after just 30 minutes of mixing magnetite with distilled
water28
Even with this measurement by Jonsson the quantity of dissolved iron is difficult to
estimate for samples used in this work as they were washed with water whereas the
literature measurements were made with unwashed or EDTA treated samples More
information about the dissolution of iron from magnetite could be used to attempt to model
this behaviour using the reaction scheme in table 24 In addition to this it would also be
useful to investigate the dissolution of iron as a function of radiation dose to see what
effect if any radiation has on dissolution rates Analysis techniques such as inductively
coupled plasma mass spectroscopy (ICP-MS) can be used to determine concentrations of
dissolved iron in very low concentrations however due to the nature of the plasma used it
can often be difficult to distinguish between Fe2+
and Fe3+
as further ionization may cause
interference It is possible to chemically separate the two oxidation states of iron by solvent
extraction with n-heptane containing 01 M Di-(2-ethylhexyl)phosphoric acid (HDEHP)
before performing an analysis for iron134
Chapter 7 Radiolysis of Iron Oxide-Water Systems
153
This reaction scheme would be initiated by a production of aqueous iron based on the
dissolution behaviour observed from future experiments As mentioned earlier the
experiments conducted in this work are only preliminary and there is much more work to
be done on the subject
If a computational model could be made to accurately simulate the aqueous iron chemistry
coupled with a more detailed understanding of radiation induced iron dissolution it may be
possible to determine the surface effects of iron oxide by comparison of experimental and
calculated data and effectively subtracting the difference
Reaction
Number
Reaction Rate Constant at
25degC (M-1
s-1
)
Ref
F1 Fe2+
+ H2O2 rarr Fe3+
+ OHmacr + bullOH 100 times10
7
135
F2 Fe2+
+ bullOH rarr Fe
3+ + OHmacr 32 times10
8
136
F3 Fe2+
+ bullHO2 rarr Fe
3+HO2macr 12 times10
6
133
F45 Fe3+
HO2macr + Fe2+ Fe
3+HO2macrFe
2+ K = 27 M
-1
133
F6 Fe3+
HO2macr rarr Fe3+
+ HO2macr 18times103
s-1
133
F7 Fe3+
HO2macrFe2+
rarr Fe3+
+ Fe2+
HO2macr 25 times104
133
F8 Fe2+
HO2macr + H+
(aq) rarr Fe2+
+ H2O2 Unknown 133
F9 Fe3+
+ O2macr rarr Fe2+
+ O2 Unknown 137
F10 Fe2+
+ O2macr + H2O rarr HO2macr + Fe
3+ + OHmacr 10 times10
7
133
F11 Fe3+
+ Hbull rarr Fe
2+ + H
+(aq) 20 times10
6
138
F12 Fe3+
+ emacraq rarr Fe2+
60 times1010
139
F13 Fe2+
+ Hbull + H
+(aq)
rarr Fe
3+ + H2 75 times10
6
10
Table 24 A reaction scheme to estimate the effects of dissolved iron in water radiolysis
Chapter 8 Conclusions and Further Work
154
Chapter 8 Conclusions and Further Work
Further High pH Investigations
Experiments have shown that the radiolytic production of hydrogen gas and hydrogen
peroxide is strongly influenced by high pH Hydrogen peroxide tends to reach higher steady
state concentrations with increasing pH as well as taking longer to reach this steady state
Hydrogen gas production rates appear to also increase with increasing pH up to
approximately pH 11 where thereafter they decrease The development of a computational
model for water radiolysis has provided a mechanistic understanding to explain the
observed effects of high pH on water radiolysis Calculations suggest that an increase in
radiolytically produced oxygen could explain the behaviour of hydrogen gas at high pH
Dissolved oxygen acts as a poison to the Allen chain which normally serves to remove
dissolved hydrogen through reactions with the hydroxyl radical or the alkali equivalent the
oxide radical anion The steady state concentration of dissolved oxygen increases with pH
up to approximately pH 115 This can be attributed to the decline in the rate at which
dissolved oxygen is reduced by hydrogen atoms as the equilibrium between the hydrogen
atom and the solvated electron shifts to favour the solvated electron The reaction rate of
the equivalent alkali reaction to remove dissolved oxygen through reduction by the solvated
electron does not increase to compensate resulting in a net increase in the steady state
concentration of dissolved oxygen The model calculations also show that increasing the
pH further results in a decline in the hydrogen gas production rate This is due to the shift in
the equilibrium between the hydroxyl radical and the oxide radical anion (R6364) which
has a pKa of 119 The main pathway for the radiolytic production of dissolved oxygen is
the reaction between the hydroxyl radical and super oxide (R21)
Chapter 8 Conclusions and Further Work
155
The rate of this reaction falls at high pH as the hydroxyl radical is converted to the oxide
radical anion The alkali equivalent of this reaction (R50) has a much lower rate constant
and is out competed by the solvated electron (R8) Further experiments to measure the
concentration of radiolytically produced oxygen at high pH could help to support the model
predictions or confirm a misunderstanding in the model An inline gas chromatography
technique similar to the ldquocrush tuberdquo described in Chapter 2 may be used only instead of
crushing a sealed glass vial within the carrier gas flow a specially designed cell is
connected to the in and out ports of the carrier gas flow This cell would contain a high pH
solution and would sit inside the irradiator from here multiple analyses can be run on a
single sample The carrier gas would have to be changed from argon to helium to increase
the sensitivity towards oxygen running the carrier gas through the cell prior to irradiation
will serve to remove the initial dissolved oxygen from the sample from this point onward
any measurements of oxygen would be radiolytically produced
These experiments would help to better understand high pH water radiolysis and hopefully
help to improve the radiolysis model and understand why there is an over prediction at
pH 106 A comprehensive water radiolysis model that can accurately predict
concentrations of radiolysis products under a wide range of conditions is of high
importance to the nuclear industry and would have applications in decommissioning
maintenance of current nuclear systems and designing new nuclear technology
Chapter 8 Conclusions and Further Work
156
Further Methanol Radiolysis Investigations
The reaction scheme used to model the radiolysis of aqueous methanol results in the
temporary formation of several stable organic species before they themselves are oxidised
by hydroxyl radicals This scheme eventually converts all organic substances to carbon
monoxide however in reality this is not the case It has been reported in literature that one
of the stable products formed is methane gas a substance not included in the current
reaction scheme The gas chromatography techniques used in this work are not suitable for
the detection of small quantities of carbon monoxide or indeed other potential radiolysis
products such as methane A more sophisticated approach would be to use a gas
chromatography mass spectroscopy technique (GC-MS) This technique would allow for
the detection of carbon monoxide carbon dioxide methane and any other volatile
hydrocarbons that may be formed during radiolysis Other transient products of methanol
radiolysis such as formaldehyde ethylene glycol glycolaldehyde and glyoxal may be
analysed by high performance liquid chromatography (HPLC) It was mentioned in Chapter
6 that the reaction scheme does not accurately represent the radiolysis of the transient
product glycolaldehyde A publication by Yaylayan et al130
discusses some measurements
made by nuclear magnetic resonance spectroscopy of glycolaldehyde in deuterated water
and it was found that it exists mostly as the hydrated aldehyde 112-ethanetriol (~70) A
complete reaction scheme for the radiolysis of methanol should include the radiolysis
reactions of all the transient species of which there are potentially many
However if the major component of a glycolaldehyde solution is 112-ethanetriol an
acceptable compromise may be to include only the radiolysis reactions of this species and
ignore the radiolysis paths of minor products
Chapter 8 Conclusions and Further Work
157
Experimental analysis of aqueous methanol to determine the major transient species would
be valuable for determining which radiolysis paths have the most significant roles in
methanol radiolysis
Future Development of a Multi-Scale Radiolysis Model
As discussed in Chapter 3 the model developed in this work is a deterministic model for the
calculation of long term homogeneous phase radiolysis This calculation depends on a
series of primary values that represent the production rates of the primary species of water
radiolysis which in turn depend on a number of physical and chemical factors It is
possible to calculate these primary yields using stochastic methods which can then be fed
into the deterministic calculation to obtain predictions of chemical species concentrations
This technique has been successfully used recently to demonstrate some of the effects of
high capacity scavengers47
This technique assumes that there are no changes to the
physiochemical conditions during the radiolysis period for example if a calculation was to
be performed where the temperature were to change the primary yields would need to be
recalculated at the new temperature The model developed in this work attempts to
overcome this by estimating primary yields as a multiple regression fit of temperature and
pH however this estimation is not adequately accurate and does not include any effects that
linear energy transfer has on the primary yields A more suitable approach to the
development of a comprehensive multi-scale radiolysis model may be to utilise a stochastic
calculation of the primary yields that includes the effects of temperature pH LET and
chemical scavengers which can be called from within the deterministic calculation
whenever a significant change to one of these factors is initiated
Chapter 8 Conclusions and Further Work
158
Further work concerning the deterministic model presented in this work include an
investigation into the partitioning of gaseous species The method used is one that has been
successfully used by other research groups to model the radiolysis of water and the effect of
available headspace This implementation of the stagnant two-film model was never
intended to cope with rapid changes in aqueous oxygen concentrations Further efforts
should be made to better incorporate this gas partitioning method in a way that can more
realistically represent oxygen partitioning during the radiolysis of aqueous methanol
Closing Remarks Relevant to Sellafield Ltd
The experimental data presented in Chapters 4 and 5 are pertinent to the situations and
conditions currently found within the Magnox Swarf Storage Silos at Sellafield In the case
of elevated pH due to sodium hydroxide both the experimental and computational data
show increased rates of hydrogen gas production and an increased steady-state
concentration of hydrogen peroxide Despite some minor quantitative disagreements
between the experimental data and the computational data the qualitative trend is in
general agreement One could therefore expect to observe increased production of hydrogen
gas in the MSSS with increasing pH especially within the pH region of approximately
105 to 125 An important aspect of the situation at the MSSS is the aerated nature of the
system The obvious consideration being the increased amounts of dissolved oxygen
present which although such effects were also discussed in Chapter 4 the experimental
data shown was only for water at neutral pH Nevertheless it was discussed in Chapter 4
that dissolved oxygen acts a poison to the chain reaction that normally removes molecular
hydrogen A less obvious consideration and one that was largely overlooked in Chapter 4
is the inclusion of gas to liquid carbon dioxide exchange and its aqueous conversion to
carbonate
Chapter 8 Conclusions and Further Work
159
At high pH the concentration of aqueous CO2 and therefore CO32-
becomes significant
With CO32-
being known to react with the hydroxyl radical and given the difficulty in its
removal future research and industrial models involving high pH aqueous radiolysis would
benefit from including a description of the radiolysis chemistry of aqueous carbonate
systems Chapter 5 begins to address the concept of including carbonate chemistry into a
radiolysis model This came about from the realisation that magnesium hydroxide can be
easily carbonated on contact with CO2 and is also known to be an effective carbon trapping
material In this case not only the additional chemistry brought about carbonate should be
considered but also the effects of the magnesium compounds that can be formed for
example magnesium carbonate magnesium bicarbonate magnesium oxide and
magnesium hydroxide Similarly consideration should be given to the multitude of iron
phases that can exist in conditions comparable to those of the First Generation Magnox
Storage Ponds Although it was not considered in Chapter 7 it is likely that the corroded
iron found in the FGMSP also exists as a number of iron hydroxides and hydrated oxides
Given the open air nature of the FGMSP hydrogen gas build-up is not a major concern
however the interactions of the various iron oxide phases in a radiolysis system may affect
concentrations of oxidising species such as H2O2 which may alter corrosion rates The
results shown in Chapter 7 suggest little effect on H2O2 concentration in the presence of
haematite but the presence of magnetite had a significant effect in removing H2O2 To gain
a better understanding further work would need to be done that also investigated the other
possible phases of iron oxide and also gives consideration to the proportions in which they
can be found in the FGMSP
References
160
References
1 Pitois A Ivanov P I Abrahamsen L G Bryan N D Taylor R J amp Sims H E Magnesium Hydroxide Bulk and Colloid-Associated 152Eu in an Alkaline Environment Colloid Characterisation and Sorption Properties in the Presence and Absence of Carbonate J Environ Monit 10 315-324 (2008)
2 Spinks J W T amp Woods R J An Introduction to Radiation Chemistry (1990)
3 Loveland W D Morrissey D J amp Seaborg G T Modern Nuclear Chemistry (2005)
4 Allen A O The Radiation Chemistry of Water and Aqueous Solutions (1961)
5 Draganić I G amp Draganić Z D The Radiation Chemistry of Water (1971)
6 Schwarz H A Losee J P amp Allen A O Hydrogen Yields in the Radiolysis of Aqueous
Solutions Journal of the American Chemical Society 76 4693-4694 (1954)
7 Swallow A J Radiation Chemistry An Introduction (1973)
8 Schwarz H A Free Radicals Generated by Radiolysis of Aqueous Solutions Journal of
Chemical Education 58 101 (1981)
9 Buxton G V Clive L Greenstock W Helman P amp Ross A B Critical Review of Rate
Constants for Reactions of Hydrated Electrons Hydrogen Atoms and Hydroxyl Radicals (˙OHO˙-) in Aqueous Solution J Phys Chem Ref Data 17 513-886 (1988)
10 Jayson G G Keene J P Stirling D A amp Swallow A J Pulse-Radiolysis Study of Some
Unstable Complexes of Iron Transactions of the Faraday Society 65 2453-2464 (1969)
11 Koppenol W H amp Liebman J F The Oxidizing Nature of the Hydroxyl Radical A
Comparison with the Ferryl Ion (FeO2+) The Journal of Physical Chemistry 88 99-101 (1984)
12 Meyerstein D Complexes of Cations in Unstable Oxidation States in Aqueous Solutions as
Studied by Pulse Radiolysis Accounts of Chemical Research 11 43-48 (1978)
13 Schwarz H A Applications of the spur diffusion model to the radiation chemistry of
aqueous solutions The Journal of Physical Chemistry 73 1928-1937 (1969)
References
161
14 Dyne P J amp Kennedy J M The Kinetics of Radical Reactions in the Tracks of Fast Electrons A Detailed Study of the SamuelndashMagee Model for the Radiation Chemisty of Water Canadian Journal of Chemistry 36 1518-1536 (1958)
15 Burns W G Sims H E amp Goodall J A B Special Issue Dedicated to The Memory of the
Late John Hodson Baxendale Radiation chemical diffusion kinetic calculations with prescribed and non-prescribed diffusionmdashI Radiation Physics and Chemistry (1977) 23 143-180 (1984)
16 Pimblott S M amp LaVerne J A Comparison of Stochastic and Deterministic Methods for
Modeling Spur Kinetics Radiation Research 122 12-23 (1990)
17 Tapping R L Corrosion Issues in Pressurized Heavy Water Reactor (PHWRCANDUreg)
Systems A2 in Nuclear Corrosion Science and Engineering 581-633 (2012)
18 Petrik N G Alexandrov A B amp Vall A I Interfacial Energy Transfer During Gamma
Radiolysis of Water on the Surface of ZrO2 and Some Other Oxides The Journal of Physical Chemistry B 105 5935-5944 (2001)
19 LaVerne J A amp Tandon L H2 and Cl2 Production in the Radiolysis of Calcium and
Magnesium Chlorides and Hydroxides The Journal of Physical Chemistry A 109 2861-2865 (2005)
20 Slack J Norton J L amp Malkoske G R Cobalt-60 Production in CANDU Power Reactors
21 Unterweger M P Hoppes D D amp Schima F J New and Revised Half-Life Measurements
Results Nuclear Instruments and Methods in Physics Research Section A Accelerators Spectrometers Detectors and Associated Equipment 312 349-352 (1992)
22 Weiss J A Survey of Chemical Dosimetric Systems The International Journal of Applied
Radiation and Isotopes 4 89-95 (1958)
23 Fricke H amp Morse S The Chemical Action of Roumlntgen Rays on Dilute Ferrosulfate Solutions
as a Measure of Dose Am J Roentgenology and Radium Therapy 18 430-432 (1927)
24 Weiss J Allen A O amp Schwarz H A Fricke Ferrous Sulfate Dosimeter for γ-rays in the
Range 4 to 40 Kiloroumlntgens Proceedings of the International Conference on the Peaceful Uses of Atomic Energy 14 179-181 (1956)
25 Allen A O Hochanadel C J Ghormley J A amp Davis T W Decomposition of Water and
Aqueous Solutions under Mixed Fast Neutron and Gamma Radiation American Chemical Society (1952)
References
162
26 Hiroki A Pimblott S M amp LaVerne J A Hydrogen Peroxide Production in the Radiolysis of
Water with High Radical Scavenger Concentrations The Journal of Physical Chemistry A 106 9352-9358 (2002)
27 Yakabuskie P A Joseph J M amp Wren C J The Effect of Interfacial Mass Transfer on
Steady-State Water Radiolysis Radiation Physics and Chemistry 79 777-785 (2010)
28 Nejad M A amp Jonsson M Reactivity of Hydrogen Peroxide towards Fe3O4 Fe2CoO4 and
Fe2NiO4 Journal of Nuclear Materials 334 28-34 (2004)
29 Pastina B amp LaVerne J A Effect of Molecular Hydrogen on Hydrogen Peroxide in Water
Radiolysis The Journal of Physical Chemistry A 105 9316-9322 (2001)
30 Klassen N V Marchington D amp McGowan H C E H2O2 Determination by the I3
- Method and by KMnO4 Titration Analytical Chemistry 66 2921-2925 (1994)
31 Roth O amp LaVerne J A Effect of pH on H2O2 Production in the Radiolysis of Water J Phys
Chem A 115 700-708 (2011)
32 Wasselin-Trupin V Baldacchino G Bouffard S amp Hickel B Hydrogen Peroxide Yields in
Water Radiolysis by High-Energy Ion Beams at Constant LET Radiation Physics and Chemistry 65 53-61 (2002)
33 Essehli R Crumiegravere F Blain G Vandenborre J Pottier F Grambow B et al H2
Production by γ and He Ions Water Radiolysis Effect of Presence TiO2 Nanoparticles International Journal of Hydrogen Energy 36 14342-14348 (2011)
34 Faraggi M Zehavi D amp Anbar M Effect of Thallous Ions on the Yields of Hydrogen and
Hydrogen Peroxide in Radiolyzed Aqueous Solutions Transactions of the Faraday Society 67 2057-2067 (1971)
35 Lousada C M LaVerne J A amp Jonsson M Enhanced Hydrogen Formation During the
Catalytic Decomposition of H2O2 on Metal Oxide Surfaces in the Presence of ˙OH Radical Scavengers Phys Chem Chem Phys 15 12674-12679 (2013)
36 Schofield J Reiff S C Pimblott S M amp LaVerne J A Radiolytic Hydrogen Generation at
Silicon CarbidendashWater Interfaces Journal of Nuclear Materials 469 43-50 (2016)
37 LaVerne J A Ryan M R amp Mu T Hydrogen Production in the Radiolysis of Bromide
Solutions Radiation Physics and Chemistry 78 1148-1152 (2009)
References
163
38 Draganic I Nenadovic M T amp Draganic Z D Radiolysis of HCOOH + O2 at pH 13-13 and
the Yields of Primary Products in γ Radiolysis of Water Journal of Physical Chemistry 73 2564-2571 (1969)
39 Hart E J γ-Ray Induced Oxidation of Aqueous Formic Acid-Oxygen Solutions Effect of pH
Journal of the American Chemical Society 76 4198-4201 (1954)
40 Flanders D A amp Fricke H Application of a High-Speed Electronic Computer in Diffusion
Kinetics The Journal of Chemical Physics 28 1126-1129 (1958)
41 Burns W G Sims H E amp Goodall J A B Radiation Chemical Diffusion Kinetic Calculations
with Prescribed and Non-Prescribed DiffusionmdashI Spherical and Cylindrical Cases Radiation Physics and Chemistry 23 143-180 (1984)
42 Green N J B Pilling M J Pimblott S M amp Clifford P Stochastic Modeling of Fast Kinetics
in a Radiation Track The Journal of Physical Chemistry 94 251-258 (1990)
43 Bouniol P amp Bjergbakke E A Comprehensive Model to Describe Radiolytic Processes in
Cement Medium Journal of Nuclear Materials 372 1-15 (2008)
44 Ershov B G amp Gordeev A V A Model for Radiolysis of Water and Aqueous Solutions of H2
H2O2 and O2 Radiation Physics and Chemistry 77 928-935 (2008)
45 Elliot A J amp Bartels D M The Reaction Set Rate Constants and g-Values for the Simulation
of the Radiolysis of Light Water over the range 20degC to 350degC Based on Information Available in 2008 (Atomic Energy of Canada Limited Mississauga Ontario (Canada) 2009)
46 Wren J C amp Ball J M LIRIC 32 an Updated Model for Iodine Behaviour in the Presence of
Organic Impurities Radiation Physics and Chemistry 60 577-596 (2001)
47 Gregory P Horne Thomas A Donoclift Howard E Sims Robin M Orr amp Simon M
Pimblott Multi-Scale Modelling of the Radiolysis of Nitrate Solutions The Journal of Physical Chemistry B 120 (45) 11781 - 11789 (2016)
48 Chance E M Curtis A R Jones I P amp Kirby C R FACSIMILE A Computer Program for
Flow and Chemistry Simulation and General Initial Value Problems Report No 0436-9734 148 pp (Univ Coll 1977)
49 Elliot A J Rate Constants and G-Values for the Simulation of the Radiolysis of Light Water
Over the Range 0 - 300degC AECL-11073 COG-94-167 (1994)
References
164
50 Hochanadel C J amp Ghormley J A Effect of Temperature on the Decomposition of Water
by γ-Rays Radiat Res 16 635-660 (1962)
51 Janik D Janik I amp Bartels D M Neutron and βγ Radiolysis of Water up to Supercritical
Conditions βγ Yields for H2 Hbull Atom and Hydrated Electron The Journal of Physical
Chemistry A 111 7777-7786 (2007)
52 Jha K N Ryan T G amp Freeman G R Radiolysis of H2O and D2O between 0 and 300degC J
Phys Chem 79 868-870 (1974)
53 Elliot A J Chenier M P amp Ouellette D C Temperature Dependence of g Values for H2O
and D2O Irradiated with Low Linear Energy Transfer Radiation Journal of the Chemical Society Faraday Transactions 89 1193-1197 (1993)
54 Kent M C amp Sims H E The Yield of γ-Radiolysis Products from Water at Temperatures up
to 270degC Harwell Report AEA-RS-2301 (1992)
55 Lin M Katsumura Y Muroya Y He H Wu G Han Z et al Pulse Radiolysis Study on the
Estimation of Radiolytic Yields of Water Decomposition Products in High-Temperature and Supercritical Waterthinsp Use of Methyl Viologen as a Scavenger The Journal of Physical Chemistry A 108 8287-8295 (2004)
56 Štefanić I amp LaVerne J A Temperature Dependence of the Hydrogen Peroxide Production
in the γ-Radiolysis of Water The Journal of Physical Chemistry A 106 447-452 (2002)
57 Ferradini C amp Jay-Gerin J-P The Effect of pH on Water Radiolysis A Still Open Question mdash
A Minireview Research on Chemical Intermediates 26 549-565 (2000)
58 Ferradini C Kinetic Behavior of the Radiolysis Products of Water in Advances in Inorganic
Chemistry and Radiochemistry Vol Volume 3 (eds H J Emeleus amp A G Sharpe) 171-205 (1961)
59 Lefort M Radiation Chemistry Annual Review of Physical Chemistry 9 123-156 (1958)
60 Sworski T J Yields of Hydrogen Peroxide in the Decomposition of Water by Cobalt γ-
Rradiation I Effect of Bromide Ion Journal of the American Chemical Society 76 4687 (1954)
61 Hochanadel C J amp Lind S C Radiation Chemistry Annual Review of Physical Chemistry 7
83-106 (1956)
References
165
62 Mahlman H A amp Boyle J W Primary Cobalt-60 Radiolysis Yields in Heavy Water Journal
of the American Chemical Society 80 773 (1958)
63 Hayon E amp Stein G Radiation Chemistry of Aqueous Systems (1968)
64 Hayon E Effect of Solute Concentration on the Recombination of H˙ and ˙OH in γ-Irradiated
Aqueous Solutions Journal of Physical Chemistry 65 1502-1505 (1961)
65 Sehested K Bjergbakke E amp Fricke H The Primary Species Yields in the 60Co γ-Ray
Radiolysis of Aqueous Solutions of H2SO4 between pH 7 and 046 Radiation Research 56 385-399 (1973)
66 Hayon E Radiolysis of Heavy Water in the pD Range 0-14 Journal of Physical Chemistry 69
2628-2632 (1965)
67 Haissinsky M γ-Radiolysis of Alkaline and Neutral Solutions I Alkaline Solutions of Sodium
Phosphite Journal de Chimie Physique et de Physico-Chimie 62 1141-1148 (1965)
68 Dainton F S amp Watt W S The Effect of pH on the Radical Yields in the γ-Radiolysis of
Aqueous Systems Nature 195 1294-1296 (1962)
69 Dainton F S amp Rumfeldt R Radical and Molecular Yields in the γ-Radiolysis of Water III
The Nitrous Oxide-Sodium Tellurite System Proceedings of the Royal Society of London A Mathematical Physical and Engineering Sciences 287 444-456 (1965)
70 Cheek C H amp Linnenbom V J The Radiation Chemistry of Alkaline Hypobromite Solutions
The Journal of Physical Chemistry 67 1856-1860 (1963)
71 Fielden E M amp Hart E J Primary Radical Yields in Pulse-Irradiated Alkaline Aqueous
Solution Radiation Research 32 564-580 (1967)
72 Czapski G amp Peled E On the pH-Dependence of Greducing in the Radiation Chemistry of
Aqueous Solutions Israel Journal of Chemistry 6 421-436 (1968)
73 Balkas T Dainton F S Dishman J K amp Smithies D Radiation Chemistry of Aqueous
Solutions Containing Carbon Monoxide and Oxygen Between pH 04 and 12 Transactions of the Faraday Society 62 81-87 (1966)
References
166
74 Pimblott S M Pilling M J amp Green N J B Stochastic Models of Spur Kinetics in Water International Journal of Radiation Applications and Instrumentation Part C Radiation Physics and Chemistry 37 377-388 (1991)
75 Hayon E Radical and Molecular Yields in the Radiolysis of Alkaline Aqueous Solutions
Transactions of the Faraday Society 61 734-743 (1965)
76 Gordon S amp Hart E J Chemical Yields of Ionizing Radiations in Aqueous Solutions Effect of
Energy of Alpha Particles Radiation Research 15 440-451 (1961)
77 Kochanny G L Timnick A Hochanadel C J amp Goodman C D Radiation Chemistry Studies
of Water as Related to the Initial Linear Energy Transfer of 11-MeV to 23-MeV Protons Radiation Research 19 462-473 (1963)
78 ICRU Report 16 - Linear Energy Transfer (ICRU Washington USA 1970)
79 Schwarzenbach R P Gschwend P M amp Imboden D M Environmental Organic Chemistry
(Wiley 2005)
80 Ferrell R T amp Himmelblau D M Diffusion Coefficients of Hydrogen and Helium in Water
American Institute of Chemical Engineers 13 702-708 (1967)
81 Han P amp Bartels D M Temperature Dependence of Oxygen Diffusion in H2O and D2O The
Journal of Physical Chemistry 100 5597-5602 (1996)
82 Marrero T R amp Mason E A Gaseous Diffusion Coefficients Journal of Physical and
Chemical Reference Data 1 3-118 (1972)
83 Kestin J Knierim K Mason E A Najafi B Ro S T amp Waldman M Equilibrium and
Transport Properties of the Noble Gases and Their Mixtures at Low Density Journal of Physical and Chemical Reference Data 13 229-303 (1984)
84 Sander R Compilation of Henryrsquos Law Constants for Inorganic and Organic Species of
Potential Importance in Environmental Chemistry (1999)
85 Mezyk Stephen P amp Bartels David M Direct EPR Measurement of Arrhenius Parameters
for the Reactions of Hmiddot Atoms with H2O2 and Dmiddot Atoms with D2O2 in Aqueous Solution Journal of the Chemical Society Faraday Transactions 91 3127-3132 (1995)
References
167
86 Joseph Jiju M Seon Choi Byung Yakabuskie Pam amp Wren Clara J A Combined Experimental and Model Analysis on the Effect of pH and O2(aq) on γ-Radiolytically Produced H2 and H2O2 Radiation Physics and Chemistry 77 1009-1020 (2008)
87 Allen A O The Yields of Free H˙ and ˙OH in the Irradiation of Water Radiation Research 1
85-96 (1954)
88 Jortner J amp Noyes R M Some Thermodynamic Properties of the Hydrated Electron The
Journal of Physical Chemistry 70 770-774 (1966)
89 Sehested K Holcman J Bjergbakke E amp Hart Edwin J Ultraviolet Spectrum and Decay of
the Ozonide Ion Radical O3- in Strong Alkaline Solution Journal of Physical Chemistry 86
2066-2069 (1982)
90 Jones T Development of an Effluent Treatment Process for the Silos Direct Encapsulation
Plant IChemE Sustainable Nuclear Energy Conference (2014)
91 Nelson S M Newman A C D Tomlinson T E amp Sutton L E A Dielectric Study of the
Adsorption of Water by Magnesium Hydroxide Transactions of the Faraday Society 55 2186-2202 (1959)
92 Shpak P A Kalinichenko A E Lytovchenko S A Kalinichenko A I Legkova V G amp
Bagmut N N The Effect of γ-Irradiation on the Structure and Subsequent Thermal Decomposition of Brucite Physics and Chemistry of Minerals 30 59-68 (2003)
93 Maroto-Valer M M Developments and Innovation in Carbon Dioxide (CO2) Capture and
Storage Technology Volume One Carbon Dioxide (CO2) Capture Transport and Industrial Applications (Woodhead Publishing 2010)
94 Siriwardane R V amp Stevens R W Novel Regenerable Magnesium Hydroxide Sorbents for
CO2 Capture at Warm Gas Temperatures Industrial amp Engineering Chemistry Research 48 2135-2141 (2009)
95 Fricker Kyle J amp Park A Alissa Effect of H2O on Mg(OH)2 Carbonation Pathways for
Combined CO2 Capture and Storage Chemical Engineering Science 100 332-341 (2013)
96 Sahoo P Ishihara S Yamada K Deguchi K Ohki S Tansho M et al Rapid Exchange
between Atmospheric CO2 and Carbonate Anion Intercalated within Magnesium Rich Layered Double Hydroxide ACS Applied Materials amp Interfaces 6 18352-18359 (2014)
97 Stirling A HCO3
- Formation from CO2 at High pH Ab Initio Molecular Dynamics Study The Journal of Physical Chemistry B 115 14683-14687 (2011)
References
168
98 Shah Noor S Khan Javed Ali Al-Muhtaseb Alarsquoa H Sayed Murtaza amp Khan Hasan M
Gamma Radiolytic Decomposition of Endosulfan in Aerated Solution The Role of Carbonate Radical Environmental Science and Pollution Research 1-10 (2016)
99 Nash K Mulac W Noon M Fried S amp Sullivan J C Pulse Radiolysis Studies of U(VI)
Complexes in Aqueous Media Journal of Inorganic and Nuclear Chemistry 43 897-899 (1981)
100 Holcman J Bjergbakke E amp Sehested K The Importance of Radical-Rradical Reactions in
Pulse Radiolysis of Aqueous CarbonateBicarbonate Proceedings of the Tihany Symposium on Radiation Chemistry 6 149-153 (1987)
101 Draganic Z D Negron-Mendoza A Sehested K Vujosevic S I Navarro-Gonzales R
Albarran-Sanchez M G et al Radiolysis of Aqueous Solutions of Ammonium Bicarbonate Over a Large Dose Range Radiation Physics and Chemistry 38 317-321 (1991)
102 Eriksen T E Lind J amp Mereacutenyi G On the Acid-Base Equilibrium of the Carbonate Radical
Radiation Physics and Chemistry 26 197-199 (1985)
103 Thomas J K Gordon Sheffield amp Hart Edwin J The Rates of Reaction of the Hydrated
Electron in Aqueous Inorganic Solutions Journal of Physical Chemistry 68 1524-1527 (1964)
104 Nehari Shlomo amp Rabani Joseph The Reaction of H˙ Atoms with OH- in the Radiation
Chemistry of Aqueous Solutions Journal of Physical Chemistry 67 1609-1613 (1963)
105 Neta P amp Dorfman L M Pulse Radiolysis Studies XIII Rate Constants for the Reaction of
Hydroxyl Radicals with Aromatic Compounds in Aqueous Solutions in Radiation Chemistry Vol 81 Advances in Chemistry Ch 15 222-230 (American Chemical Society 1968)
106 Mezyk S P amp Bartels D M Rate Constant and Activation Energy Measurement for the
Reaction of Atomic Hydrogen with Methanol Iodomethane Iodoethane and 1-Iodopropane in Aqueous Solution The Journal of Physical Chemistry 98 10578-10583 (1994)
107 Anbar M amp Hart E J The Reactivity of Aromatic Compounds toward Hydrated Electrons
Journal of the American Chemical Society 86 5633-5637 (1964)
108 Theard Leslie M amp Burton Milton Radiolysis of Liquid Methanol and some Methanolic Salt
Solutions Journal of Physical Chemistry 67 59-64 (1963)
References
169
109 Porter Raymond P Noyes W amp Albert Jr Photochemical Studies LIV Methanol Vapor Journal of the American Chemical Society 81 2307-2311 (1959)
110 Motohashi N amp Saito Y Competitive Measurement of Rate Constants for Hydroxyl Radical
Reactions Using Radiolytic Hydroxylation of Benzoate Chemical amp pharmaceutical bulletin 41 1842-1845 (1993)
111 Adams G E amp Willson R L Pulse Radiolysis Studies on the Oxidation of Organic Radicals in
Aqueous Solution Transactions of the Faraday Society 65 2981-2987 (1969)
112 Kishore K Moorthy P N amp Rao K N Reactivity of H2O2 with Radiation Produced Free
Radicals Steady State Radiolysis Methods for Estimating the Rate Constants International Journal of Radiation Applications and Instrumentation Part C Radiation Physics and Chemistry 29 309-313 (1987)
113 Simic M Neta P amp Hayon E Pulse Radiolysis Study of Alcohols in Aqueous Solution The
Journal of Physical Chemistry 73 3794-3800 (1969)
114 Tsang W Chemical Kinetic Data Base for Combustion Chemistry Part 2 Methanol Journal
of Physical and Chemical Reference Data 16 471-508 (1987)
115 Huie R E amp Clifton C L Kinetics of the Self-Reaction of Hydroxymethylperoxyl Radicals
Chemical Physics Letters 205 163-167 (1993)
116 Schuchmann M N amp Von Sonntag C The Rapid Hydration of the Acetyl Radical A Pulse
Radiolysis Study of Acetaldehyde in Aqueous Solution Journal of the American Chemical Society 110 5698-5701 (1988)
117 Bothe E Schulte-Frohlinde D amp von Sonntag C Radiation Chemistry of Carbohydrates
Part 16 Kinetics of HO2˙ Elimination from Peroxyl Radicals Derived from Glucose and Polyhydric Alcohols Journal of the Chemical Society Perkin Transactions 2 416-420 (1978)
118 Zimina GM amp Bakh NA Pulse Radiolysis of Ethylene Glycol Absorption Spectra of the
Short-Lived Radicals High Energy Chem 13 187-190 (1979)
119 Thomas J K Rates of Reaction of the Hydroxyl Radical Transactions of the Faraday Society
61 702-707 (1965)
120 Draganic I amp Marcovic V Unpublished data (NIST Squib 1968DRAMARB) (1968)
References
170
121 Orlando J J amp Tyndall G S The Atmospheric Chemistry of the HC(O)CO Radical International Journal of Chemical Kinetics 33 149-156 (2001)
122 Ziemer H Doacutebeacute S Wagner H G Olzman M Viskolcz B amp Temps F Kinetics of the
Reactions of HCO with H˙ and D˙ Atoms Berichte der Bunsengesellschaft fuumlr physikalische Chemie 102 897-905 (1998)
123 Temps F amp Wagner H G Rate Constants for the Reactions of ˙OH Radicals with CH2O˙ and
HCO˙ Berichte der Bunsengesellschaft fuumlr physikalische Chemie 88 415-418 (1984)
124 Atkinson R Baulch D L Cox R A Hampson R F Kerr J A Rossi M J et al Evaluated
Kinetic and Photochemical Data for Atmospheric Chemistry Supplement VI IUPAC Subcommittee on Gas Kinetic Data Evaluation for Atmospheric Chemistry Journal of Physical and Chemical Reference Data 26 1329-1499 (1997)
125 Yee Quee M J amp Thynne J C J The Photolysis of Organic Esters Berichte der
Bunsengesellschaft fuumlr physikalische Chemie 72 211-217 (1968)
126 Sunaryoy G R amp Domae M Numerical Simulation on Effect of Methanol Addition on
Coolant Radiolysis in Pressurized Water Reactor Journal of Nuclear Science and Technology 45 1261-1274 (2008)
127 Baxendale J H amp Mellows F W The γ-Radiolysis of Methanol and Methanol Solutions
Journal of the American Chemical Society 83 4720-4726 (1961)
128 Pikaev A K amp Kartasheva L I Radiolysis of Aqueous Solutions of Ethylene Glycol
International Journal for Radiation Physics and Chemistry 7 395-415 (1975)
129 Ahmad M Awan M H amp Mohammad D γ-Radiolysis of Ethylene Glycol Aqueous
Solutions Journal of the Chemical Society B Physical Organic 945-946 (1968)
130 Yaylayan V A Harty-Majors S amp Ismail A A Investigation of the Mechanism of
Dissociation of Glycolaldehyde Dimer (25-dihydroxy-14-dioxane) by FTIR Spectroscopy Carbohydrate Research 309 31-38 (1998)
131 Reiff S C amp LaVerne J A Radiation-Induced Chemical Changes to Iron Oxides The Journal
of Physical Chemistry B 119 7358-7365 (2015)
132 Lousada C M Yang M Nilsson K amp Jonsson M Catalytic Decomposition of Hydrogen
Peroxide on Transition Metal and Lanthanide Oxides Journal of Molecular Catalysis A Chemical 379 178-184 (2013)
References
171
133 Rush J D B Benon H J Pulse Radiolytic Studies of the Reaction of Perhydroxyl
Superoxide O2- with Iron(II)Iron(III) Ions The Reactivity of HO2O2
- with Ferric Ions and its Implication on the Occurrence of the Haber-Weiss Reaction Journal of Physical Chemistry 89 5062-5066 (1985)
134 Pepper S E Borkowski M Richmann M K amp Reed D T Determination of Ferrous and
Ferric Iron in Aqueous Biological Solutions Analytica Chimica Acta 663 172-177 (2010)
135 Barb W G Baxendale J H George P amp Hargrave K R Reactions of Ferrous and Ferric
Ions with Hydrogen Peroxide Part II-The Ferric Ion Reaction Transactions of the Faraday Society 47 591-616 (1951)
136 Stuglik Z amp PawełZagoacuterski Z Pulse Radiolysis of Neutral Iron(II) Solutions Oxidation of
Ferrous Ions by ˙OH Radicals Radiation Physics and Chemistry (1977) 17 229-233 (1981)
137 Fong K-L McCay P B Poyer J L Misra H P amp Keele B B Evidence for Superoxide-
Dependent Reduction of Fe3+ and its role in Enzyme-Generated Hydroxyl Radical Formation Chemico-Biological Interactions 15 77-89 (1976)
138 Baxendale J H Dixon R S amp Stott D A Reactivity of Hydrogen Atoms with Fe3+ FeOH2+
and Cu2+ in Aqueous Solutions Transactions of the Faraday Society 64 2398-2401 (1968)
139 Jonah C D M John R Matheson Max S The Reaction of the Precursor of the Hydrated
Electron with Electron Scavengers Journal of Physical Chemistry 81 1618-1622 (1977)
Appendix
172
Appendix
Radiolysis Model Code
All computational calculations were performed with the software package Facsimile by
MCPA Software The following is a print out of the core water radiolysis model and only
includes the reactions of water other reaction schemes documented in this work can be
found on the included CD as well as the setup files containing initial parameters and
associated Python scripts used to manage output data
Appendix
173
--------------------------------------------------------------------
_ _ ___ ____ _____ _ _ _ _
| | | |__ __ | __ | (_) | | (_)
| |__| | ) | | | | | |__) |__ _ __| |_ ___ | |_ _ ___ _ ___
| __ | | | | | | _ _` | _` | | _ | | | | __| __|
| | | | _| |__| | | | | (_| | (_| | | (_) | | |_| __ | __
|_| |_|____|____ |_| ____|___|_|___|_|__ |___|_|___
__ |
|___
--------------------------------------------------------------------
-----Radiolysis Model for the Radiolysis of Pure Water--------------
----------------------Thomas Donoclift------------------------------
Rate constants mainly are from
A J Elliot Rate constants and G-values
for the simulation of the radiolysis of
light water over the range 0 - 300 C
AECL-11073 COG-94-167 19942008
P Bouniol amp E Bjergbakke ldquoA Comprehensive
Model to Describe Radiolytic processes
in Cement Mediumrdquo J Nuclear Materials 372 1-15 2008
JC Wren JM Ball ldquoLIRIC 32 an Updated model for
Iodine behaviour in the presence of organic impuritiesrdquo
Radiation Physics and Chemistry 60 577-596 2001
EXECUTE OPEN 1 RadMout UNKNOWN
EXECUTE OPEN 2 Reportout UNKNOWN
EXECUTE OPEN 3 SetUptxt OLD
EXECUTE OPEN 4 Flux_Atxt UNKNOWN
EXECUTE OPEN 7 Flux_Btxt UNKNOWN
EXECUTE OPEN 8 Flux_Ctxt UNKNOWN
EXECUTE OPEN 9 Flux_Dtxt UNKNOWN
EXECUTE OPEN 10 Flux_Etxt UNKNOWN
EXECUTE OPEN 11 FireCount_Atxt UNKNOWN
EXECUTE OPEN 12 FireCount_Btxt UNKNOWN
EXECUTE OPEN 14 TIMEtxt UNKNOWN
EXECUTE OPEN 15 FireCount_Ctxt UNKNOWN
EXECUTE OPEN 16 FireCount_Dtxt UNKNOWN
EXECUTE OPEN 17 FireCount_Etxt UNKNOWN
EXECUTE OPEN 19 TRACEtxt UNKNOWN
PERMIT +-
------------------------
Appendix
174
These variables are the concentrations of radiolysis
species Edit initial values in COMPILE INSTANT and
COMPILE INITIAL routines or SetUptxt
---------DEFINE-VARIABLES--------------
----CHEMICAL-SPECIES-FOR-H2O-RADIOLYSIS---------------
VARIABLE
H2O H2O+ H3O+ OH H H2 H2g H2O2 H2O2+ O2 O2g H+
OH- Eaq- O2- O2-- HO2 HO2- O- O-- O3- O Rx O3
---------------------------------------
------REACTION-COUNTERS-----------------------
VARIABLE
R0 R1 R2 R3 R4 R5 R6 R7 R8 R9 R10 R11 R12 R13 R14 R15 R16
R17 R18 R19 R20 R21 R22 R23 R24 R25 R26 R27 R28 R29 R30
R31 R32 R33 R34 R35 R36 R37 R38 R39 R40 R41 R42 R43 R44
R45 R46 R47 R48 R49 R50 R51 R52 R53 R54 R55 R56 R57 R58
R59 R60 R61 R62 R63 R64 R65 R66 R67 R68 R69 R70 R71 R72
R73 R74 R75 R76 R77 R78 R79 R80 R81 R82 R83
G0 G1 G2 G3 G4 G5 G6 G7 G8
---------DEFINE-PARAMETERS-------------
PARAMETER
T TK RT TAB DOSER ADOSE
DOSE EVDOSE GEaq- GH GH2 GOH GH2O2 GH+ GOH- G-H2O G+H2O GO2 GO2-
kappH2 kappO2 GHO2 GHO2-
kappO2g H2tot EA MB1 MB2 H2O2T
INTEGER RUNt
-------------------------
This set of perameters concerns radiolysis rates
G-Values are converted to rates in COMPILE INITIAL
Rate constants are given the prefix K
Arrhenius Pre-exponentials are given the prefix A
Activation Energies (-EaR) are given the prefix E
followed by letters representing reacting species ie
KAB = Rate constant of A+B
-------------------------
A=Eaq- B=H C=OH D=O-
E=O3- F=HO2 G=H2O2 H=H2O2+
I=H2O J=H+ K=OH- L=HO2-
M=O2 N=O2- O=O2-- P=H2O+
Q=O3 R=H2 S=O
-------------------------
PARAMETER
DW GREaq- GRH GRH2 GROH GRH2O2 GRH+ GROH- GR-H2O GR+H2O
GRO2 GRO2- GRHO2 GRHO2- KAA KAB KAC KAD KAG KAF KAL KAM KAN KBB KBC
KBG KBM KBN KBF KBF2 KBL KCC KCD KCG KCL KCF KCN KDR KDG KDL
KDN KEG KEL KER KEC KED KNN KFN KFNI KFF KFG KI KJK KG
KJL KGK KLI KC KJD KCK KDI KDM KE KF KJN KFK KNI KB KJA
KBK KAI KBI KRC KJNb KCKb KLK KLKb KDD KEJ KBQ KDQ
KCL2 KCQ KNQ KFQ KNG KNE KKQ KLQ KGQ KLG KLN KEC2 KAN2 KAN3
-------------------------
Appendix
175
----PRE-EXPONENTIAL-FACTORS-------------------
PARAMETER AAB AAF AAG AAM AAN ABB ABC ABG
ABN ABF ACG ACF ACN ACL ADR ADL AFNI
AFF ADM AE AG AAN2 AGQ AFN ANN ACL2 ABF2
ABL AAD AAL ADG AEG AEL AER AFG AAN3 ACD ALKb
-----------------------------------
-------ACTIVATION-ENERGIES--------------
PARAMETER EAB EAF EAG EAM EAN EBB EBC EBG
EBN EBF ECG ECF ECN ECL EDR EDL EFNI
EFF EDM EE EG EAN2 EGQ EFN ENN ECL2 EBF2
EBL EAD EAL EDG EEG EEL EER EFG EAN3 ECD ELKb
---------------------------------------
PARAMETER
pH pHreal pKw pKH2O2 pKOH pKHO2 pKH pKH2O pKHO2- KpH KpO
KfH KrH KfO KrO CONV PcH PcO O2in xO2 Kprot Khydx
TPrint pHsweep Tstart Tend DecTime
---------------------------------------------------------
Below are arrays for storing reaction flux These are limited to 20
as the output length max is 250 characters To overcome this clunky
artefact of Facsimile the arrays can be fed into Facssemblepy to
concatenate them into a single output file
----------------------------------------------------------
PARAMETER lt20gt Ra Stores Water Reaction Flux Part A
PARAMETER lt20gt Rb Stores Water Reaction Flux Part B
PARAMETER lt20gt Rc Stores Water Reaction Flux Part C
PARAMETER lt20gt Rd Stores Water Reaction Flux Part D
PARAMETER lt10gt Re Stores Water Reaction Flux Part E
PARAMETER lt2gt GR Stores Gas Partition Flux
-------------------------
--PARAMETERS-FOR-GAS-PARTITION--------------
PARAMETER
DaqH2 DgH2 DaqO2 DgO2 daq dg
vaqH2 vgH2 vaqO2 vgO2 vintH2 vintO2
KpH2 KpO2 vtot
Aint Vl Vg Vr Dose EqR
---------------INITIALISE-PARAMETERS--------
Concentrations of specis are given as Moll
T is Temp in C - TK is Temp in K
pHin is the initial pH xO2 is the fraction of O2
pHreal is the calculated pH at any given time
DW is density of water depending on temperature
DS is the density of the whole solution
Vl and Vg is the Volume of liqud and gas phases in L
DOSER is the dose rate in Gymin
ADOSE is the conversion of dose rate to sets of 100eVls
Appendix
176
COMPILE INSTANT
----PARAMETERS-FROM-SETUP-FILE-----
READ 3 DOSER
READ 3 RUNt
READ 3 Tstart
READ 3 Tend
READ 3 pH
READ 3 xO2
READ 3 Vl
READ 3 Vg
READ 3 Aint
READ 3 DaqH2
READ 3 DgH2
READ 3 DaqO2
READ 3 DgO2
READ 3 daq
READ 3 dg
READ 3 KpH2
READ 3 KpO2
---ADDITIONAL-PARAMETERS----
T = Tstart
TK = T + 27315
TAB = 1TK
RT = 8314TK
DW = (0999 + 1094E-4 T - 7397E-6 T2
+ 2693E-8 T3 - 4714E-11 T4)
ADOSE = ((DOSER 62415E16) 60) DW 100 eVsl for use with Gymin
TPrint = (FLOAT(RUNt) - 1) 60
EA = EXP(18800((129815-1TK)8314))
WRITE 2 = 4
WRITE 3 = 7
WRITE 4 = 8
WRITE 7 = 10
WRITE 8 = 9
WRITE 12 = 14
WRITE 1 = 2 WATER RADIOLYSIS MODEL - DEBUG REPORT
------INITIAL-SPECIES-CONCENTRATIONS-----
READ 3 Eaq-
READ 3 H2
READ 3 O2
READ 3 H2O2
H2O = 553DW
O2g = 101320 xO2 (1000 RT)
H2g = 1E-22 mass transfer - zero will cause floating point overflow
H+ = 10(-1pH) H+ Activity (Effective concentration)
OH- = 10(-1(14-pH))
Appendix
177
------------ARRHENIUS-PARAMETERS-----------------------------
----PRE-EXPONENTIAL-FACTORS-------------------
AAB = 114E13
AAF = 24636E12
AAG = 77E12
AAM = 2479E12
AAN = 24636E12
ABB = 27E12
ABC = 426E11
ABG = 179E11
ABN = 517E12
ABF = 517E12
ACG = 768E9
ACF = 129E11
ACN = 877E11
ACL = 100E12
ADR = 232E10
ADL = 145E13
AFNI = 263E9
AFF = 278E9
ADM = 341E11
AE = 320E11
AG = 3171E4
AAN2 = 31E12
AGQ = 28E11
AFN = 244E9
ANN = 489E8
ACL2 = 45E12
ABF2 = 72E11
ABL = 42E13
AAD = 56E11
AAL = 175E12
ADG = 300E11
AEG = 159E6
AEL = 887E5
AER = 249E5
AFG = 37
AAN3 = 2567E13
ACD = 17E11
ALKb = 295E8
------------------------------
------ACTIVATION-ENERGIES-EaR----
EAB = 17957
EAF = 15636
EAG = 18896
EAM = 14015
EAN = 15636
EBB = 18675
EBC = 10919
EBG = 25336
EBN = 18242
EBF = 18242
ECG = 16614
ECF = 7992
ECN = 13062
ECL = 14346
EDR = 15505
EDL = 29285
Appendix
178
EFNI = 9743
EFF = 24164
EDM = 13449
EE = 55521
EG = 78181
------ACTIVATION-ENERGIES---Ea-J--
EAN2 = 136000
EGQ = 735000
EFN = 86000
ENN = 525900
ECL2 = 156000
EBF2 = 106000
EBL = 256000
EAD = 79000
EAL = 154000
EDG = 156000
EEG = 188400
EEL = 188400
EER = 188400
EFG = 200000
EAN3 = 188000
ECD = 77000
ELKb = 142000
--------------------------------
---------OTHER-LITERATURE-RATE-CONSTANTS--------------------------
KLG = 45E-4 FRDuke TWHaas 1961
KLQ = 55E6 JStaehelin J Hoigne 1982
KKQ = 48E1 LForni EJ Hart 1982
KFQ = 50E8 Pastina La Verne 2001
KNQ = 15E9 EJ Hart 1983
KNE = 10E4 Pastina La Verne 2001
KNG = 13E-1 JWeinstein BBielski 1979
KLN = 823E-2 PBouniol EBjergbakke 2008
KCQ = 11E8 K Sehested EJ Hart 1984
KEC2 = 25E9 K Sehested EJ Hart 1984
KDQ = 10E9 E Bjergbakke H Christensen
KBQ = 22E10 EJ Hart 1983
KCD = 20E10
KDN = 600E8
KEC = 60E9 Sehested Holcman Hart 1984
(269)
KEC = 850E9 P Bouniol E Bjergbakke
KDD = 84E9 Adams GE Boag JW
KDD = 10E8
KED = 70E8 Hart EJ 1984
KEJ = 90E10 Hart EJ
KLK = 3506E5
KLKb = 961E5
-GENERAL-ROUTINE-CONTINUALLY-ITTERATES-THROUGHOUT-CALCULATION-
Appendix
179
COMPILE GENERAL
------TEMPERATURE-RAMPING-ROUTINE----------------
TK = T + 27315
TAB = 1TK
RT = 8314TK
DecTime = TIME 3600
T = (11414 DecTime3 - 80383 DecTime2
+ 19256 DecTime + 22918)
IF(T - Tend)211
LABEL 1
T = Tend
LABEL 2
----------------------
H2O2T = H2O2 + HO2- + O2-- Total peroxide for output use
------------------SETUP-OF-EQUILIBRIA---------------------------------
pKw = (14947 - 4273E-2 T + 2115E-4 T2
- 5786E-7 T3 + 7529E-10 T4)
pKH2O2 = (12383 - 3020E-2 T + 170E-4 T2
- 5151E-7 T3 + 696E-10 T4)
pKOH = (12383 - 3020E-2 T + 170E-4 T2
- 5151E-7 T3 + 696E-10 T4)
pKHO2 = (4943 - 623E-3 T + 4125E-5 T2
- 8182E-9 T3)
pKH = (10551 - 443E-2 T + 1902E-4 T2
- 4661E-7 T3 + 598E-10 T4)
pKH2O = (1669 - 443E-2 T + 2071E-4 T2
- 5594E-7 T3 + 7161E-10 T4)
Kprot = (341E10 + 275E8 T + 124E7 T2
- 623E4 T3 + 131E2 T4)
Khydx = (722E9 + 162E8 T + 24E6 T2
- 781E3 T3 + 106 T4)
pKHO2- = 165 see Bouniol 2001
--------------------PARTITION-OF-O2-AND-H2---------------------
It should be noted that this routine is only valid for
a liquid to gas ratio of 1 See Chapter 3 for details
---------DIFFUSIVITY-WITH-TEMPERATURE---------
DaqO2 = (2E-9 T2 + 4E-7 T + 1E-5)
DaqH2 = (1E-8 T2 + 4E-7 T + 3E-5)
DgO2 = (1E-6 T2 + 12E-3 T + 02073)
DgH2 = (5E-6 T2 + 47E-3 T + 07719)
-----HENRYS-COEFFICIENT-WITH-TEMPERATURE--------------------
KpH2 = (TK (78E-4 EXP(543((1TK) - (129815))))) 122
KpO2 = (TK (13E-3 EXP(1650((1TK) - (129815))))) 122
---H2----
vgH2 = DgH2dg
vaqH2 = DaqH2daq
vintH2 = 1(1vaqH2 + KpH2vgH2)
H2tot = H2 + H2g
Appendix
180
---O2----
vgO2 = DgO2dg
vaqO2 = DaqO2daq
vintO2 = 1(1vaqO2 + KpO2vgO2)
vtot = 1((1(vaqO2))+(1(vgO2KpO2)))
--------PARAMETER-EVOLUTION--------------
kappH2 = vintH2(AintVl)(1 - KpH2(H2gH2))
kappO2 = vintO2(AintVl)(1 - KpO2(O2gO2))
Dose = DOSER (TIME 60)
pHreal = -LOG10( H+ )
--------------------G-VALUES------------------------
G-Values with temperature dependency ONLY
G-Values are initially obtained from literature molec 100eV
G-Values are converted to rates later
GEaq- = 2641 + 4162E-3 T + 9093E-6 T2 - 4717E-8 T3
GH2 = 0419 + 872E-4 T - 4971E-6 T2 + 1503E-8 T3
GOH = 2531 + 1134E-2 T - 1269E-5 T2 + 3513E-8 T3
GH2O2 = 0752 - 162E-3 T
GH = 0556 + 2198E-3 T - 1184E-5 T2 + 5223E-8 T3
GH+ = GEaq-
G-H2O = GOH + 2GH2O2
-----------------------------------------------------
------------G-VALUES-FROM-MULTIPLE-POLYNOMIAL-REGRESSION-----
Multiple polynomial regression was used to combine data that measured
primary yields as a function of temperature AND as a function of pH
GEaq- = 2798 + 285E-3 T - 2514E-2 pHreal
GH2 = 38781E-1 + 8288E-4 T + 5988E-4 pHreal
GOH = 243146 + 1111E-2 T - 12E-3 pHreal
GH = 4444E-1 + 367E-3 T - 2378E-4 pHreal
GH+ = GEaq-
GH2O2 = 05(GH + GEaq- + (2 GH2) - GOH) Material Balance
G-H2O = GOH + 2GH2O2
MB1 = GH + GEaq- + (2 GH2) Diagnostic Material Balance Variables
MB2 = GOH + (2 GH2O2)
-------------------G-VALUES--AS--RATES--------------
GREaq- = (ADOSE GEaq-)6022E23
GRH = (ADOSE GH)6022E23
GRH2 = (ADOSE GH2)6022E23
GROH = (ADOSE GOH)6022E23
GRH2O2 =(ADOSE GH2O2)6022E23
GRH+ = (ADOSE GH+)6022E23
GROH- = (ADOSE GOH-)6022E23
GR-H2O = (ADOSE G-H2O)6022E23
GRO2 = (ADOSE GO2)6022E23
GRO2- = (ADOSE GO2-)6022E23
GRHO2 = (ADOSE GHO2)6022E23
GRHO2- = (ADOSE GHO2-)6022E23
Appendix
181
------REACTION-RATES-WITH-TEMP-DEPENDENCY--
--------POLYNOMIAL-EQUATIONS----------------
KAA = 10(12281 - 3768E2 TAB - 6673E4 TAB2 - 1075E7 TAB3)
KAC = 10(13123 - 1023E3 TAB + 7634E4 TAB2)
KBM = 10(10704 + 2840E2 TAB - 137E5 TAB2)
KCC = 10(8054 + 2193E3 TAB - 7395E5 TAB2 + 687E7 TAB3)
KJK = 10(20934 - 1236E4 TAB + 6364E6 TAB2
- 1475E9 TAB3 + 1237E11 TAB4)
KJN = 10(1641 - 4888E3 TAB + 1622E6 TAB2 - 2004E8 TAB3)
KCK = 10(13339 - 222E3 TAB + 7333E5 TAB2 - 1065E8 TAB3)
KJA = 10(39127 - 3888E4 TAB + 2054E7 TAB2 - 4899E9 TAB3
+ 4376E11 TAB4)
KBK = 10(22970 - 1971E4 TAB + 1137E7 TAB2 - 2991E9 TAB3
+ 2803E11 TAB4)
KBI = 10(9408 - 2827E3 TAB - 3792E5 TAB2)
KRC = 10(-11556 + 32546E4 TAB - 18623E7 TAB2
+ 45543E9 TAB3 - 41364E11 TAB4)
------------ARRHENIUS-EQUATIONS------------------
----------EaR-------------------
KAB = AAB(EXP(-EABTK))
KAF = AAF(EXP(-EAFTK))
KAG = AAG(EXP(-EAGTK))
KAM = AAM(EXP(-EAMTK))
KAN = AAN(EXP(-EANTK))
KBB = ABB(EXP(-EBBTK))
KBC = ABC(EXP(-EBCTK))
KBG = ABG(EXP(-EBGTK))
KBN = ABN(EXP(-EBNTK))
KBF = ABF(EXP(-EBFTK))
KCG = ACG(EXP(-ECGTK))
KCF = ACF(EXP(-ECFTK))
KCN = ACN(EXP(-ECNTK))
KCL = ACL(EXP(-ECLTK))
KDR = ADR(EXP(-EDRTK))
KDL = ADL(EXP(-EDLTK))
KFNI = AFNI(EXP(-EFNITK))
KFF = AFF(EXP(-EFFTK))
KDM = ADM(EXP(-EDMTK))
KE = AE(EXP(-EETK))
KG = AG(EXP(-EGTK))
---------Ea-----------------
KAN2 = AAN2EXP(-EAN2RT)
KGQ = AGQEXP(-EGQRT) KSehested EJ Hart1992
KFN = AFNEXP(-EFNRT) BBielski ARoss 1985
KNN = ANNEXP(-ENNRT) Eliot
KCL2 = ACL2EXP(-ECL2RT) Eliot
KBF2 = ABF2EXP(-EBF2RT) Eliot
KBL = ABLEXP(-EBLRT) SP Mezyk DM Bartels
KAD = AADEXP(-EADRT) Eliot
KAL = AALEXP(-EALRT)
KDG = ADGEXP(-EDGRT)
KEG = AEGEA Wren amp Ball
Appendix
182
KEL = AELEA Wren amp Ball
KER = (AEREA) Wren (Suggests 8 correction)
KFG = 50E-1
KAN3 = AAN3EXP(-EAN3RT)
KCD = ACDEXP(-ECDRT)
-----------EQUILIBRIA---------------------------------------
KCKb = KCK ((10(-pKH2O))(10(-pKOH)))
KI = KJK(10-pKw)
KF = KJN (10-pKHO2)
KJL = KJN
KGK = KCK
KDI = KCK((10-pKH2O)(10-pKOH))
KLI = KCK((10-pKH2O)(10-pKH2O2))
KJD = KJN
KC = KJD(10-pKOH)
KFK = KCK
KNI = KFK((10-pKH2O)(10-pKHO2))
KB = KJA(10-pKH)
KAI = KBK((10-pKH2O)(10-pKH))
KJNb = KJN(10-pKH2O2)((10(-pKw))(10(-pKHO2)))
GENERAL
-------EQUATIONS-ROUTINE-CONTAINS-RADIOLYSIS-CHEMISTRY--------
COMPILE EQUATIONS
------INITIAL-SPECIES-GENERATION----------------------------
Ralt0gtGREaq- = Eaq- + G0
Ralt1gtGRH = H + G1
Ralt2gtGRH2 = H2 + G2
Ralt3gtGROH = OH + G3
Ralt4gtGRH2O2 = H2O2 + G4
Ralt5gtGRH+ = H+ + G5
Ralt6gtGROH- = OH- + G6
Ralt7gtGR-H2OH2O H2O = G7
----------REACTIONS------------------------
Ralt8gtKAA(H2OH2O) Eaq- + Eaq- + H2O + H2O = H2 + OH- + OH- + R0
Ralt9gtKABH2O Eaq- + H + H2O = H2 + OH- + R1
Ralt10gtKAC Eaq- + OH = OH- + R2
Ralt11gtKADH2O Eaq- + H2O + O- = OH- + OH- + R3
Ralt12gtKAG Eaq- + H2O2 = OH- + OH + R4
Ralt13gtKAF Eaq- + HO2 = HO2- + R5
Ralt14gtKAL Eaq- + HO2- = O- + OH- + R6
Ralt15gtKAM Eaq- + O2 = O2- + R7
Ralt16gtKAN Eaq- + O2- = O2-- + R8
Ralt17gtKBB H + H = H2 + R9
Ralt18gtKBC H + OH = H2O + R10
Ralt19gtKBG H + H2O2 = OH + H2O + R11
Rblt0gtKBM H + O2 = HO2 + R12
Rblt1gtKBN H + O2- = HO2- + R13
Rblt2gtKBF H + HO2 = OH + OH + R14
Rblt3gtKBL H + HO2- = OH + OH- + R15
Rblt4gtKBQ H + O3 = OH + O2 + R16
Rblt5gtKCC OH + OH = H2O2 + R17
Rblt6gtKCG OH + H2O2 = H2O + HO2 + R18
Rblt7gtKCL OH + HO2- = OH- + HO2 + R19
Rblt8gtKCF OH + HO2 = H2O + O2 + R20
Appendix
183
Rblt9gtKCN OH + O2- = OH- + O2 + R21
Rblt10gtKCQ OH + O3 = O2 + HO2 + R22
Rblt11gtKEG O3- + H2O2 = O2- + O2 + H2O + R23
Rblt12gtKEL O3- + HO2- = O2- + O2 + OH- + R24
Rblt13gtKER O3- + H2 = O2 + H + OH- + R25
Rblt14gtKEC O3- + OH = HO2 + O2- + R26
Rblt15gtKEC2 O3- + OH = OH- + O3 + R27
Rblt16gtKEJ O3- + H+ = OH + O2 + R28
Rblt17gtKNN O2- + O2- = O2 + O2-- + R29
Rblt18gtKLN O2- + HO2- = O2 + OH- + O- + R30
Rblt19gtKNG O2- + H2O2 = O2 + OH + OH- + R31
Rclt1gtKFN O2- + HO2 = O2 + HO2- + R32
Rclt2gtKNE O2- + O3- = O-- + O2 + O2 + R33
Rclt3gtKNQ O2- + O3 = O2 + O3- + R34
Rclt4gtKFF HO2 + HO2 = H2O2 + O2 + R35
Rclt5gtKFG HO2 + H2O2 = O2 + H2O + OH + R36
Rclt6gtKFQ HO2 + O3 = OH + O2 + O2 + R37
Rclt7gtKLG H2O2 + HO2- = H2O + O2 + OH- + R38
Rclt8gtKKQ O3 + OH- = O2 + HO2- + R39
Rclt9gtKLQ O3 + HO2- = O2 + OH + O2- + R40
Rclt10gtKGQ O3 + H2O2 = O2 + OH + HO2 + R41
------------------ADDITIONAL-WATER-CHEMISTRY------------------------
Rclt12gt200E10 H + O- = OH- + R42 Bjergbakke Draganic
Sehested
Rclt13gt16E10 O3- + Eaq- = OH- + OH- + O2 + R43 Pastina amp La
Verne
Rclt14gt36E10 O3 + Eaq- = O3- + R44 NIST
Rclt16gt23E-7 H2O2 = OH + OH + R45 Yakabuskie et al
Rclt17gt10E10H2O O-- + H2O = OH- + OH- + R46
Bouniol and Bjergbakke 2008
----------------ALKALI-REACTIONS------------------
Relt2gtKDR O- + H2 = H + OH- + R47
Relt3gtKDG O- + H2O2 = OH- + HO2 + R48
Relt4gtKDL O- + HO2- = O2- + OH- + R49
Relt5gtKDN O- + O2- = O-- + O2 + R50
Relt6gtKDD O- + O- = O2-- + R51
Relt7gtKCD O- + OH = HO2- + R52
Relt8gtKED O- + O3- = O2- + O2- + R53
Relt9gtKDQ O- + O3 = O2- + O2 + R54
----------EQUILIBRIUM-REACTIONS--------------------
Rclt18gtKIH2O H2O = H+ + OH- + R55
Rclt19gtKJK H+ + OH- = H2O + R56
Rdlt0gtKJN10(-pKH2O2) H2O2 = H+ + HO2- + R57
Rdlt1gtKJN H+ + HO2- = H2O2 + R58
Rdlt2gtKCK H2O2 + OH- = HO2- + H2O + R59
Rdlt3gtKLIH2O HO2- + H2O = H2O2 + OH- + R60
Rdlt4gtKLK HO2- + OH- = O2-- + H2O + R61
Rdlt5gtKLKbH2O O2-- + H2O = HO2- + OH- + R62
Rdlt6gtKJN10(-pKOH) OH = H+ + O- + R63
Rdlt7gtKJN H+ + O- = OH + R64
Appendix
184
Rdlt8gtKCK OH + OH- = O- + H2O + R65
Rdlt9gtKCKbH2O O- + H2O = OH + OH- + R66
Rdlt10gtKDM O- + O2 = O3- + R67
Rdlt11gtKE O3- = O- + O2 + R68
Rdlt12gtKF HO2 = H+ + O2- + R69
Rdlt13gtKJN H+ + O2- = HO2 + R70
Rdlt14gtKFK HO2 + OH- = O2- + H2O + R71
Rdlt15gtKNIH2O O2- + H2O = HO2 + OH- + R72
Rdlt16gtKB H = H+ + Eaq- + R73
Rdlt17gtKJA H+ + Eaq- = H + R74
Rdlt18gtKBK H + OH- = Eaq- + H2O + R75
Rdlt19gtKAIH2O Eaq- + H2O = H + OH- + R76
Relt0gtKBIH2O H + H2O = H2 + OH + R77
Relt1gtKRC H2 + OH = H + H2O + R78
---------------MASS-TRANSFER----------------------
GRlt0gtkappH2 H2 = H2g + R79
GRlt1gtkappO2 O2 = O2g + R80
-------OUTPUTS-ROUTINE-------
SETPSTREAM 3 1 20
OH H H2 H2g H2O2 O2 O2g H+ OH- Eaq-
O2- O2-- HO2 HO2- O- O-- O3- O O3
SETPSTREAM 4 11 20
R0 R1 R2 R3 R4 R5 R6 R7 R8 R9 R10 R11 R12 R13 R14 R15 R16
R17 R18 R19
SETPSTREAM 5 12 20
R20 R21 R22 R23 R24 R25 R26 R27 R28 R29 R30
R31 R32 R33 R34 R35 R36 R37 R38 R39
SETPSTREAM 6 15 20
R40 R41 R42 R43 R44 R45 R46 R47 R48 R49
R50 R51 R52 R53 R54 R55 R56 R57 R58 R59
SETPSTREAM 7 16 20
R60 R61 R62 R63 R64 R65 R66 R67 R68 R69
R70 R71 R72 R73 R74 R75 R76 R77 R78 R79
Appendix
185
SETPSTREAM 8 17 20
R80 R81 R82 R83 G1 G2 G3
G4 G5 G6 G7 G8
COMPILE OUT
PSTREAM 3
PSTREAM 4
PSTREAM 5
PSTREAM 6
PSTREAM 7
PSTREAM 8
WRITE 2 250 (N20 E10 2) Ra
WRITE 3 250 (N20 E10 2) Rb
WRITE 4 250 (N20 E10 2) Rc
WRITE 8 250 (N20 E10 2) Rd
WRITE 7 250 (N10 E10 2) Re
WRITE 10 (N2 E10 2) GR
WRITE 12 (E10 2) TIME
WHENEVER
TIME = TPrint Call Report
TIME = 0 + 600 RUNt CALL OUT
------------DEBUG-REPORT---------------
-Contains a list of all parameters to
confirm that values are correct-
COMPILE Report
WRITE 1 THIS REPORT IS GENERATED AT TPrint SECONDS
WRITE 1 RUNt = RUNt
WRITE 1 KpH2 = (E12 3) KpH2
WRITE 1 KpO2 = (E12 3) KpO2
WRITE 1 pH = (F6 1) pH
WRITE 1 Temperature = (F6 1) T C
WRITE 1 Dose Rate = (F6 1) DOSER Gymin
WRITE 1 VgVl Ratio = (F6 2) Vr
WRITE 1 Run Time = (F12 2) RUNt Mins
WRITE 1 Oxygen Fraction = (F6 3) xO2
WRITE 1 G-VALUES
WRITE 1 G(Eaq-) = (F6 3) GEaq-
WRITE 1 G(H) = (F6 3) GH
WRITE 1 G(H2) = (F6 3) GH2
WRITE 1 G(OH) = (F6 3) GOH
WRITE 1 G(H2O2) = (F6 3) GH2O2
WRITE 1 G(H+) = (F6 3) GH+
WRITE 1 G(-H2O) = (F6 3) G-H2O
WRITE 1 G-VALUES AS RATES MOLLS
WRITE 1 GREaq- = (E12 3) GREaq-
WRITE 1 GRH = (E12 3) GRH
WRITE 1 GRH2 = (E12 3) GRH2
WRITE 1 GROH = (E12 3) GROH
WRITE 1 GRH2O2 = (E12 3) GRH2O2
WRITE 1 GRH+ = (E12 3) GRH+
WRITE 1 GR-H2O = (E12 3) GR-H2O
WRITE 1 RATE CONSTANTS
WRITE 1 KAA = (E12 3) KAA
WRITE 1 KAB = (E12 3) KAB
Appendix
186
WRITE 1 KAC = (E12 3) KAC
WRITE 1 KAD = (E12 3) KAD
WRITE 1 KAG = (E12 3) KAG
WRITE 1 KAF = (E12 3) KAF
WRITE 1 KAL = (E12 3) KAL
WRITE 1 KAM = (E12 3) KAM
WRITE 1 KAN = (E12 3) KAN
WRITE 1 KBB = (E12 3) KBB
WRITE 1 KBC = (E12 3) KBC
WRITE 1 KBG = (E12 3) KBG
WRITE 1 KBM = (E12 3) KBM
WRITE 1 KBN = (E12 3) KBN
WRITE 1 KBF = (E12 3) KBF
WRITE 1 KBF2 = (E12 3) KBF2
WRITE 1 KBL = (E12 3) KBL
WRITE 1 KBQ = (E12 3) KBQ
WRITE 1 KCC = (E12 3) KCC
WRITE 1 KCD = (E12 3) KCD
WRITE 1 KCG = (E12 3) KCG
WRITE 1 KCL = (E12 3) KCL
WRITE 1 KCF = (E12 3) KCF
WRITE 1 KCN = (E12 3) KCN
WRITE 1 KCQ = (E12 3) KCQ
WRITE 1 KDR = (E12 3) KDR
WRITE 1 KDG = (E12 3) KDG
WRITE 1 KDL = (E12 3) KDL
WRITE 1 KDN = (E12 3) KDN
WRITE 1 KEG = (E12 3) KEG
WRITE 1 KEL = (E12 3) KEL
WRITE 1 KER = (E12 3) KER
WRITE 1 KEC = (E12 3) KEC
WRITE 1 KED = (E12 3) KED
WRITE 1 KNN = (E12 3) KNN
WRITE 1 KFN = (E12 3) KFN
WRITE 1 KFNI = (E12 3) KFNI
WRITE 1 KFF = (E12 3) KFF
WRITE 1 KFG = (E12 3) KFG
WRITE 1 KI = (E12 3) KI
WRITE 1 KJK = (E12 3) KJK
WRITE 1 KG = (E12 3) KG
WRITE 1 KJL = (E12 3) KJL
WRITE 1 KGK = (E12 3) KGK
WRITE 1 KLI = (E12 3) KLI
WRITE 1 KC = (E12 3) KC
WRITE 1 KJD = (E12 3) KJD
WRITE 1 KCK = (E12 3) KCK
WRITE 1 KDI = (E12 3) KDI
WRITE 1 KDM = (E12 3) KDM
WRITE 1 KE = (E12 3) KE
WRITE 1 KF = (E12 3) KF
WRITE 1 KJN = (E12 3) KJN
WRITE 1 KFK = (E12 3) KFK
WRITE 1 KNI = (E12 3) KNI
WRITE 1 KB = (E12 3) KB
WRITE 1 KJA = (E12 3) KJA
WRITE 1 KBK = (E12 3) KBK
WRITE 1 KAI = (E12 3) KAI
WRITE 1 KBI = (E12 3) KBI
WRITE 1 KRC = (E12 3) KRC
Appendix
187
WRITE 1 KJNb = (E12 3) KJNB
WRITE 1 KCKb = (E12 3) KCKb
WRITE 1 KLK = (E12 3) KLK
WRITE 1 KLKb = (E12 3) KLKb
WRITE 1 KDD = (E12 3) KDD
WRITE 1 KEJ = (E12 3) KEJ
WRITE 1 KBQ = (E12 3) KBQ
WRITE 1 KDQ = (E12 3) KDQ
WRITE 1 KCL2 = (E12 3) KCL2
WRITE 1 KCQ = (E12 3) KCQ
WRITE 1 KNQ = (E12 3) KNQ
WRITE 1 KFQ = (E12 3) KFQ
WRITE 1 KNG = (E12 3) KNG
WRITE 1 KNE = (E12 3) KNE
WRITE 1 KKQ = (E12 3) KKQ
WRITE 1 KLQ = (E12 3) KLQ
WRITE 1 KGQ = (E12 3) KGQ
WRITE 1 KLG = (E12 3) KLG
WRITE 1 KLN = (E12 3) KLN
WRITE 1 KEC2 = (E12 3) KEC2
WRITE 1 KAN2 = (E12 3) KAN2
WRITE 1 KRC = (E12 3) KRC
WRITE 1 ----PRE-EXPONENTIAL-FACTORS----
WRITE 1 AAB = (E12 3) AAB
WRITE 1 AAF = (E12 3) AAF
WRITE 1 AAG = (E12 3) AAG
WRITE 1 AAM = (E12 3) AAM
WRITE 1 AAN = (E12 3) AAN
WRITE 1 ABB = (E12 3) ABB
WRITE 1 ABC = (E12 3) ABC
WRITE 1 ABG = (E12 3) ABG
WRITE 1 ABN = (E12 3) ABN
WRITE 1 ABF = (E12 3) ABF
WRITE 1 ACF = (E12 3) ACF
WRITE 1 ACL = (E12 3) ACL
WRITE 1 ACG = (E12 3) ACG
WRITE 1 ACN = (E12 3) ACN
WRITE 1 ADR = (E12 3) ADR
WRITE 1 ADL = (E12 3) ADL
WRITE 1 AFNI = (E12 3) AFNI
WRITE 1 AFF = (E12 3) AFF
WRITE 1 ADM = (E12 3) ADM
WRITE 1 AG = (E12 3) AG
WRITE 1 AAN2 = (E12 3) AAN2
WRITE 1 AGQ = (E12 3) AGQ
WRITE 1 AFN = (E12 3) AFN
WRITE 1 ANN = (E12 3) ANN
WRITE 1 ACL2 = (E12 3) ACL2
WRITE 1 ABF2 = (E12 3) ABF2
WRITE 1 ABL = (E12 3) ABL
WRITE 1 AAD = (E12 3) AAD
WRITE 1 AAL = (E12 3) AAL
WRITE 1 ADG = (E12 3) ADG
WRITE 1 AEG = (E12 3) AEG
WRITE 1 AEL = (E12 3) AEL
WRITE 1 AER = (E12 3) AER
WRITE 1 AFG = (E12 3) AFG
WRITE 1 ----ACTIVATION ENERGIES----
WRITE 1 EAG = (E12 3) EAG
Appendix
188
WRITE 1 EAM = (E12 3) EAM
WRITE 1 EAN = (E12 3) EAN
WRITE 1 EBG = (E12 3) EBG
WRITE 1 ECG = (E12 3) ECG
WRITE 1 ECL = (E12 3) ECL
WRITE 1 ECF = (E12 3) ECF
WRITE 1 ECN = (E12 3) ECN
WRITE 1 EFN = (E12 3) EFN
WRITE 1 EFNI = (E12 3) EFNI
WRITE 1 ECL2 = (E12 3) ECL2
WRITE 1 EAN2 = (E12 3) EAN2
WRITE 1 ---pKa----
WRITE 1 pKw = (E12 3) pKw
WRITE 1 pKH2O2 = (E12 3) pKH2O2
WRITE 1 pKHO2 = (E12 3) pKHO2
WRITE 1 pKOH = (E12 3) pKOH
WRITE 1 pKH = (E12 3) pKH
WRITE 1 pKH2O = (E12 3) pKH2O
WRITE 1 Kprot = (E12 3) Kprot
WRITE 1 Khydx = (E12 3) Khydx
WRITE 1 KappO2 = (E12 3) kappO2
WRITE 1 KappH2 = (E12 3) kappH2
WRITE 1 H2O2 Equ rate = (E12 3) EqR
SETHMAX 1
BEGIN
STOP
Appendix
189
Radiolysis Model Full Reaction Scheme
Primary Reaction G-value
(Molecules100eV) Temperature Dependency Ref
G0 H2O emacraq 271 2641 + 416210-3
t + 909310-6 t2
ndash 471710-8 t3 45
G1 H2O H 054 0556 + 219810-3 t ndash 118410-5 t2 + 522310-8 t3 45
G2 H2O H2 041 0419 + 872110-4 t - 497110-6 t2 + 150310-8 t3 45
G3 H2O OH 270 2531 + 113410-2 t ndash 126910-5 t2 + 351310-8 t3 45
G4 H2O H2O2 068 0752 ndash 162010-3 t 45
G5 H2O H+ 271 2641 + 416210-3
t + 909310-6 t2
ndash 471710-8 t3 45
Chemical Reaction Rate Constant
k (M-1 s-1 25degC) Arrhenius Activation Energy Ea
(kJ) Ref
R0 emacraq + emacr
aq rarr H2 + 2OHmacr 7260 times109 Log kR7 = 12281 ndash 3768102T ndash 6673104T2 - 1075107T3 45
R1 emacraq + H rarr H2 + OHmacr 2762 times1010
114 times1013 14929 45
R2 emacraq + OH rarr OHmacr 3553 times1010
Log kR9 = 13123 ndash 1023103T + 7634104T2 45
R3 emacraq + Omacr rarr 2OHmacr 2313 times1010
56 times1011 79 49
R4 emacraq + H2O2 rarr OHmacr + OH 1362 times1010
77 times1012 1571 45
R5 emacraq + HO2 rarr HO2
macr 1300 times1010 246 times1012 130 45
R6 emacraq + HO2
macr rarr Omacr + OHmacr 3507 times109 175 times1012 154 49
R7 emacraq + O2 rarr O2
macr 2253 times1010 252 times1012 11652 45
R8 emacraq + O2
macr rarr O22macr + H2O 1300times1010
31 times1012 136 4349
R9 H + H rarr H2 5142 times109 27 times1012 15526 45
R10 H + OH rarr H2O 1094 times1010 426 times1011 9078 45
R11 H + H2O2 rarr OH + H2O 3650 times107 179 times1011 21064 45
R12 H + O2 rarr HO2 1304 times1010
Log kR23 = 10704 + 2840102T - 1369105T2 45
R13 H + O2
macr rarr HO2macr 1138 times1010
517 times1012 15166 45
R14 H + HO2 rarr 2OH 1138 times1010 517 times1012 15166 45
R15 H + HO2macr rarr OH + OHmacr 1374times109
42 times1013 256 85
R16 H + O3 rarr OH + O2 2200 times1010 No temperature dependence available 43
R17 OH + OH rarr H2O2 4814 times109 Log kR25 = 8054 + 2193103T ndash 7395105T2 + 6870107T3
45
R18 OH + H2O2 rarr H2O + HO2 2920 times107 768times109 13813 45
R19 OH + HO2macr rarr OHmacr + HO2 8134 times109
100 times1012 11927 45
R20 OH + HO2 rarr H2O + O2 8840 times109
129 times1011 6645 45
Appendix
190
R21 OH + O2
macr rarr OHmacr + O2 1097 times1010 877 times1011 10860 45
R22 OH + O3 rarr HO2 + O2 1100 times108
No temperature dependence available 43
R23 O3macr + H2O2 rarr O2
macr + O2 + H2O 1590 times106 xEXP(188times103 (129815 ndash 1TK)R) 43
R24 O3macr + HO2
macr rarr O2macr + O2 + OHmacr 8870 times105
xEXP(188times103 (129815 ndash 1TK)R) 43
R25 O3macr + H2 rarr O2 + H + OHmacr 2490times105
xEXP(188times103 (129815 ndash 1TK)R) 46
R26 O3
macr + OH rarr HO2 + O2macr 6000 times109 No temperature dependence
available 46 43
R27 O3
macr + OH rarr HOmacr + O3 2500 times109 No temperature dependence available
46 43
R28 O3
macr + H+ rarr O2 + OH 9000 times1010 No temperature dependence available
4 43
R29 O2
macr + O2macr rarr O2 + O2
2macr 2988times10-1 489 times108 5259 43
R30 O2
macr + HO2macr rarr O2 + Omacr + OHmacr 8230 times10-2 No temperature dependence
available 4 43
R31 O2
macr + H2O2 rarr O2 + OH + OHmacr 1300 times10-1 No temperature dependence
available 4 43
R32 O2
macr + HO2 rarr O2 + HO2macr 7597times107
244 times109 86 43
R33 O2
macr + O3macr rarr O2-
+ 2O2 1000 times104 No temperature dependence available
47 43
R34 O2
macr + O3 rarr O3macr + O2 1500 times109 No temperature dependence
available 4 43
R35 HO2 + HO2 rarr H2O2 + O2 8399 times105
278 times109 201 45
R36 HO2 + H2O2 rarr O2 + H2O + OH 5000 times10-1 No temperature dependence
available 4 49
R37 HO2 + O3 rarr OH + 2O2 5000 times108 No temperature dependence
available 4 43
R38 H2O2 + HO2
macr rarr O2 + H2O + OHmacr 450times10-4 No temperature dependence available
4 43
R39 O3 + OHmacr rarr HO2
macr + O2 4800 times101 No temperature dependence available
4 43
R40 O3 + HO2
macr rarr OH + O2 + O2macr 5500 times106 No temperature dependence
available 4 43
R41 O3 + H2O2 rarr OH + O2 + HO2 3714 times10-2
28 times1011 735 43
R42 H +Omacr rarr OHmacr 2000times1010 No temperature dependence
available 4 43
R43 O3
macr + emacraq rarr 2OHmacr + O2 1600times1010 No temperature dependence
available 47 43
R44 O3 + emacr
aq rarr O3macr 3600 times1010 No temperature dependence
available 4 43
R45 H2O2 rarr 2OH 2300 times10-7 No temperature dependence
available - 86
R46 O2- + H2O rarr 2OH- 1000 times1010 No temperature dependence
available - 43
R47 Omacr + H2 rarr H + OHmacr 1279 times108
232 times1010 12891 45
R48 Omacr + H2O2 rarr O2
macr + H2O 5546 times108 30 times1011 156 49
R49 Omacr + HO2
macr rarr O2macr + OHmacr 7864 times108
145 times1013 24348 45
R50 Omacr + O2
macr rarr O2macr + O2 6000 times108 No temperature dependence available
46 43
R51 Omacr + Omacr rarr O2
2macr 1000times108 No temperature dependence available
4 43
R52 Omacr + OH rarr HO2
macr 7610 times109 17 times1011 77 49
Appendix
191
R53 Omacr + O3macr rarr 2O2
macr 7000times108 No temperature dependence available
46 43
R54 Omacr
+ O3 rarr O2macr + O2 1000 times109 No temperature dependence
available 4 43
Equilibria
kf
(M-1 s-1)
kb
(M-1 s-1) Temperature Dependence pKa
(25degC)
R5556 H2O H+ + OHmacr 1172 times10-3 1178times1011 Log kR67 = 20934 - 1236x104T + 6364x106T2 ndash 1475x109T3 +
1237x1011T4 1575 45
R5758 H2O2 H+ + HO2macr 8900 times10-2 4780times1010 Log kR68 = 16410 ndash 4888x10
3T + 1622x10
6T
2 ndash 2004x10
8T
3 1173 45
R5960 H2O2 + OHmacr HO2
macr + H2O
1265 times1010 1403 times106 Log kR75 = 13339 ndash 2220x103T + 7333x10
5T
2 ndash 1065x10
8T
3
1198701198672119874
11987011986721198742 45
R6162 HO2macr + OHmacr O2
2macr + H2O 3506 times105 1103 times106 339times108 142 165 43
R6364 OH H+ + Omacr 8900 times10-2 4780times1010 Log kR66 = 16410 ndash 4888x103T + 1622x106T2 ndash 2004x108T3 1173 45
R6566 OH + OHmacr Omacr + H2O 1265 times1010 1403 times106 Log kR72 = 13339 ndash 2220x103T + 7333x105T2 ndash 1065x108T3 1198701198672119874
119870119874119867 45
R6768 Omacr + O2 O3macr 3747 times109 2617 times103 341 times1011 11182 Forward 45
320 times1011 4616 Reverse 45
R6970 HO2 H+ + O2macr 4780 times1010 7354 times105 Log kR69 = 16410 ndash 4888x103T + 1622x106T2 ndash 2004x108T3 481 45
R7172 HO2 + OHmacr O2macr + H2O 1265 times1010 1628 times10-1 Log kR75 = 13339 ndash 2220x103T + 7333x105T2 ndash 1065x108T3
1198701198672119874
1198701198671198742 45
R7374 H emacraq + H+ 5832 2095times1010
Log kR74 = 39127 - 3888E4T + 2054E7T2 - 4899E9T3 + 4376E11T4
955 45
R7576 H + OHmacr emacraq + H2O 2440 times107 1735 times101
Log kR70 = 22970 ndash1971x104T + 1137x107T2 ndash 2991x109T3 + 2803x1011T4
1198701198672119874
119870119867 45
R7778 H + H2O H2 + OH 4575 times10-5 3954 times107
Log kR71f = 9408 ndash 2827x103 Tndash 3792x105T2 45
Log kR71b = -11556 + 32546x104T - 18623x107T2 + 45543x109T3 - 41364x1011T4
45
R79 H2(aq) H2(g) 2687times10-3 See Chapter 3
R80 O2(aq) O2(g) 1033times10-4 See Chapter 3

1
Table of Contents
Table of Contents 1
List of Figures 4
List of Tables 9
List of Acronyms and Initialisms 11
Abstract 13
Declaration 14
Copyright Statement 15
Dedications 16
Acknowledgements 17
Chapter 1 Introduction 18
Overview of Sellafield 18
Radiation Chemistry 21
Alpha α Radiation 23
Beta β Radiation 23
Gamma γ Radiation 24
Radiation interactions with matter 25
Radiolysis of Water 29
The Hydrated Electron eaq- 32
The Hydrogen Atom H˙ 32
The Hydroxyl Radical bullOH 33
Computational Applications in Radiation Chemistry 35
Deliverables and Project Aims 36
Table of Contents
2
Chapter 2 Experimental Methods 40
Source of Radiation and Dosimetry 40
Water Purification for Radiolysis Experiments 49
Determination of H2O2 ndash Photometric Analysis 50
Analytical Procedure 52
Determination of H2 - Gas Chromatography 55
Method development 55
The Crush Tube Sampling Method 56
Detection of H2 and Calibration 61
Method Validation 64
Sources of Error 66
Sources of Error in the Determination of H2O2 66
Sources of Error in the Determination of H2 68
Chapter 3 Computational Methodology 69
Production of Primary Species 70
Factors Affecting Primary Yields 72
Temperature 72
pH 77
Linear Energy Transfer (LET) 83
Mass Transfer of Volatile Species 86
Water Radiolysis Reaction Set 90
Computational Assumptions and Error 95
Chapter 4 The Radiolysis of Aqueous Solutions at High pH 97
Preliminary Radiolysis Studies of Pure Water 97
Discussion 99
Measurements of H2O2 in the Radiolysis of High pH Solutions 105
Results 105
Measurements of H2 in the Radiolysis of High pH Solutions 107
Results 108
Discussion 112
Table of Contents
3
Chapter 5 Radiolysis of Magnesium Hydroxide 122
Context 122
Method 123
Results 124
Discussion 128
Chapter 6 Radiolysis of Methanol Solutions 135
Context 135
Experimental Method 135
Results 136
Discussion 139
Chapter 7 Radiolysis of Iron Oxide-Water Systems 148
Context 148
Method 148
Results 149
Discussion 151
Chapter 8 Conclusions and Further Work 154
Further High pH Investigations 154
Further Methanol Radiolysis Investigations 156
Future Development of a Multi-Scale Radiolysis Model 157
Closing Remarks Relevant to Sellafield Ltd 158
References 160
Appendix 172
Radiolysis Model Code 172
Radiolysis Model Full Reaction Scheme 189
List of Figures
4
List of Figures
Figure 1 An aerial view of the Sellafield Site which covers approximately 6 km2 Image
provided by Sellafield Ltd Press Office 19
Figure 2 On the left is The First Generation Magnox Storage Pond (FGMSP) and on the right
are the Magnox Swarf Storage Silos (MSSS) Images provided by Sellafield Ltd Press Office 20
Figure 3 A representation demonstrating the uniform excitations and ionisations of UV
radiation compared to the structured tracks of alpha radiation 22
Figure 4 A representation of the photoelectric effect Image recreated from Spinks and Wood2
25
Figure 5 A representation of the Compton Effect Image recreated from Spinks and Wood 26
Figure 6 A representation of pair production and positron annihilation Image recreated from
Spinks and Wood2 27
Figure 7 A scheme showing the early stages of water radiolysis and the production of primary
species 29
Figure 8 A decay scheme for cobalt-60 41
Figure 9 Image on the left shows the Model-812 Irradiator On the right is the inside of the
irradiator showing the three guide rods that contain the cobalt-60 source during irradiation 42
Figure 10 Sample holding devices for use in the Model-812 Left is the 4x8 rack with its
schematic below On the right is the inverter rig again with its schematic below 46
Figure 11 A diagram of the purification system that provides the ultra-pure water used
throughout this work Image was taken from the ELGA PURELAB user manual 50
Figure 12 Structure of Potassium phthalate monobasic (C8H5KO4) 51
Figure 13 Scanned absorption spectra of a 625 μM H2O2 solution 53
Figure 14 A calibration curve of H2O2 photometric absorption to determine the molar
extinction coefficient 54
Figure 15 The modified SRI 8610C Gas chromatograph with inline ldquocrush tuberdquo setup The
sample can be seen inside the silicone tubing 56
Figure 16 Image on the left shows a schematic for the sampling apparatus on the right are the
vials used which are flame sealed at the midway neck 57
List of Figures
5
Figure 17 A schematic of the original setup for the 10-port sampling valve in both off (top
image) and on (bottom image) positions 58
Figure 18 A schematic for the modified 10-port sampling valve including the removal of the
silica gel column 59
Figure 19 Image on the left shows the bespoke frac14 inch OD 13x molecular sieve column On the
right the rotameter is connected to calibrate gas flow rates 60
Figure 20 A calibration curve to provide a conversion to determine carrier gas flow rate 61
Figure 21 A schematic of a Wheatstone bridge circuit used in the TCD 62
Figure 22 A calibration curve for quantifying hydrogen gas from chromatograms 63
Figure 23 Method validation by the determination of the well-established primary yield of H2
through hydroxyl scavenging by bromide 65
Figure 24 Collected data from literature showing measured primary yields as a function of
temperature Provided by Elliot and Bartels 2008 75
Figure 25 A comparison of the sample temperature profile logged by thermocouple to the
temperature profile calculated in the computational model 76
Figure 26 A reproduction of data provided by Hayon 82
Figure 27 An example of a Bragg peak Energy loss of alphas of 549 MeV in Air Image
released to public domain 83
Figure 28 A schematic representation of how linear energy transfer (LET) alters the
distribution of spurs along a radiation track Image was recreated from Allen AO 84
Figure 29 Simulation data showing the effects of increasing linear energy transfer on the
primary yields of water radiolysis Image was recreated from Allen AO 85
Figure 30 A representation of the stagnant two-film model used to calculate the partitioning of
volatile species 87
Figure 31 The diffusivity of O2 and H2 in both water and air as a function of temperature88
Figure 32 Measurements of H2O2 concentration as a function of dose for aerated water (diams) and
deaerated water (diams) Vertical error bars show the standard deviation between replicates while
horizontal error bars show the dose range for replicates 98
List of Figures
6
Figure 33 Measurements of H2 as a function of dose in aerated (diams) and deaerated (diams) samples
Vertical error bars show the standard deviation of replicates while horizontal error bars show the
dose range for replicates 99
Figure 34 Predicted concentrations of H2O2 as calculated by the radiolysis model for both
aerated () and deaerated () conditions 102
Figure 35 Predicted concentrations of H2 gas as calculated by the radiolysis model for both
aerated () and deaerated () conditions 102
Figure 36 Calculated concentrations of the major oxidising and reducing water radiolysis
species as a function of dose Solid lines represent aerated conditions while broken lines
represent deaerated conditions 103
Figure 37 Measurements of H2O2 concentrations as a function of dose for samples initially at
pH 7 (diams) pH 104 (diams) pH 11 (diams) pH 123 (diams) and pH 127 (diams) All samples were aerated
Vertical error bars are the standard deviation between replicates while horizontal error bars
show the dose range for replicates 106
Figure 38 Measurements of H2 gas as a function of dose at pH 7 (diams) pH 106 (diams) pH 123 (diams)
and pH 13 (diams) Dashed lines are provided to clarify the data trends all samples were deaerated
Vertical error bars show the standard deviation between replicates while horizontal error bars
show the dose range for replicates 108
Figure 39 Model calculations to show the predicted concentrations of H2O2 as a function of
dose at various pH 109
Figure 40 Model calculations to show the predicted concentrations of H2 gas as a function of
dose at various pH 110
Figure 41 Model calculations showing the concentrations of aqueous oxygen and hydrogen gas
from deaerated water after 80 kGy at 280 Gy min-1
to show the related behaviour between the
two 114
Figure 42 Model predictions of the steady-state reaction rates of R21 R50 and R32 at various
pH for γ radiolysis of deaerated water at a dose rate of 280 Gy min-1
115
Figure 43 The sum of the steady state rates of all reactions that produce O2 () compared with
the sum of the steady state rates of all reactions that remove O2 () These totals do not include
rates of production or removal from mass transfer reactions This calculation is for the γ
radiolysis of deaerated water to a dose of 80 kGy at a rate of 280 Gy min-1
116
Figure 44 Model predictions of the steady-state reaction rates of R7 R12 and R67 at various
pH This calculation is for the γ radiolysis of deaerated water to a dose of 80 kGy at a rate of
280 Gy min-1
117
List of Figures
7
Figure 45 Dashed lines show the original prediction where k50 = 60 times108 M
-1 s
-1 while solid
lines show the predictions with the increased k50 = 48 times109 M
-1 s
-1 120
Figure 46 Measurements of H2 gas as a function of dose All samples here are aerated with
vertical error bars showing the standard deviation between replicates123
Figure 47 Measurements of H2O2 concentrations in aerated samples of saturated magnesium
hydroxide solution as a function of dose 126
Figure 48 Measurements of hydrogen yields from magnesium hydroxide samples with various
solid ndash aqueous ratios All samples were irradiated to a total dose of ~52 kGy to the aqueous
phase at a dose rate of 3041 Gy min-1
128
Figure 49 Model predictions for the yield of H2 from a solution containing various
concentrations of carbonate anions 133
Figure 50 Measurements of H2O2 concentrations as a function of dose in samples containing
1 mM methanol (diams) and water as a control (diams) All samples were aerated and a dashed line is
included to highlight the data trend The dose rate was 1638 Gy min-1
for methanol solutions
and 2839 Gy min-1
for the aerated water 136
Figure 51 Measurements of H2 gas as a function of dose from deaerated samples containing
1 mM methanol deaerated water is also shown as a control Dashed lines are included to
highlight the data trend The dose rate was 1755 Gy min-1
for the methanol solutions and
2851 Gy min-1
for the deaerated water 137
Figure 52 Chemical yields of hydrogen peroxide measured from an aerated solution of
1 mM methanol as a function of dose 138
Figure 53 Chemical yields of hydrogen gas measured from a deaerated solution of 1 mM
methanol as a function of dose 139
Figure 54 Model prediction of H2O2 concentrations as a function of dose in a solution of
1 mM methanol 142
Figure 55 Calculations of hydrogen peroxide concentrations with and without modification to
the mass transfer routine142
Figure 56 Model prediction of H2 gas as a function of dose in a solution of 1 mM
methanol144
Figure 57 Model predictions of the concentrations of various stable organic products formed as
a result of using the proposed reaction scheme in table 23 146
List of Figures
8
Figure 58 Measurements of H2O2 concentrations from heterogeneous samples of 05g Fe2O3
and 10 mL aerated water The dose rate for the haematite samples was 3052 Gy min-1
and for
the aerated water the dose rate was 2839 Gy min-1
149
Figure 59 Measurements of H2O2 concentrations from heterogeneous samples of 05g Fe3O4
and 10 mL aerated water The dose rate for the magnetite samples was 1625 Gy min-1
and for
the aerated water the dose rate was 2839 Gy min-1
150
List of Tables
9
List of Tables
Table 1 Dose rates of the front most two rows of the 4x8 irradiation rack determined by Fricke
analysis The error indicates the percentage of uncertainty of the obtained gradient 47
Table 2 Dose rates of the four positions of the inverter rig determined by Fricke analysis The
error indicates the percentage of uncertainty of the obtained gradient 48
Table 3 Thermal conductivity of commonly used gases Values taken from the Handbook of
Tables for Applied Engineering Science 62
Table 4 Optimised parameters used for the analysis of H2 gas 64
Table 5 Primary yields for γ-radiolysis of water at neutral pH and standard pressure and
temperature2 71
Table 6 Temperature effects on the primary yields of water radiolysis49
72
Table 7 Polynomial equations for estimating temperature effects on primary yields44
75
Table 8 A collection of measurements of primary yields made in 04 M solution of sulphuric
acid (pH = 046)56
77
Table 9 A collection of primary yields measured in alkali solutions (pH asymp 135)56
79
Table 10 Multiple regression polynomials used to estimate the combined effect of temperature
and pH on the primary yields of water radiolysis 82
Table 11 Polynomial equations used to estimate the temperature effects on the diffusivity of O2
and H2 in both gas and aqueous phases where t = temperature (Cdeg) 90
Table 12 A list of Primary Species used to model water radiolysis helliphelliphelliphelliphelliphelliphelliphelliphellip90
Table 13 A list of reactions used to model water radiolysis 93
Table 14 A list of equilibria used to model the radiolysis of water 94
Table 15 Statistical information concerning the estimation of primary yields used to model the
radiolysis of water 95
Table 16 Parameters used to describe interfacial surface area (Aint) and boundary thicknesses
(δ) for sample vials of different geometry 96
Table 17 Conditions of samples used to investigate hydrogen peroxide in high pH radiolysis
105
List of Tables
10
Table 18 A list of important equilibria and their associated pKa values 107
Table 19 Conditions of samples used to investigate hydrogen gas in high pH radiolysis 108
Table 20 Obtained results from the measurements of H2 gas 124
Table 21 Conditions of samples containing Mg(OH)2 for measurements of H2
a ndash Powder sample with no added water estimated adsorbed water content is based on data from
Nelson et al89
b ndash Sample is a saturated solution of Mg(OH)2 ie contains no solid 127
Table 22 A reaction scheme to estimate the effect of carbonate in water radiolysis 132
Table 23 A reaction scheme to estimate the effect of methanol in water radiolysis
a ndash Rate constant for gas phase reaction
b ndash Estimated rate constant
c ndash Rate constant based on reaction of acetic acid and hydroxyl
d ndash Assumed reaction 141
Table 24 A reaction scheme to estimate the effects of dissolved iron in water radiolysis 153
List of Acronyms and Initialisms
11
List of Acronyms and Initialisms
AES - Atomic Emission Spectroscopy
AVIDAC - Argonne Version of the Institutes Digital Automatic Computer
CANDU - Canada Deuterium-Uranium
DCF - Dalton Cumbrian Facility
EDTA - Ethylenediaminetetraacetic acid
EPSRC - Engineering and Physical Sciences Research Council
FGMSP - First Generation Magnox Storage Pond
GC - Gas Chromatography
HDEHP - Di-(2-ethylhexyl)phosphoric acid
HPLC - High Performance Liquid Chromatography
ICP - Inductively Coupled Plasma
ISO - International Organization for Standardization
LET - Linear Energy Transfer
MOX - Mixed Oxide
MSSS - Magnox Swarf Storage Silo
NNL - National Nuclear Laboratory
ODE - Ordinary Differential Equation
PUREX - Plutonium Uranium Redox Extraction
PWR - Pressurised Water Reactor
SHE - Standard Hydrogen Electrode
SI - International System
TCD - Thermal Conductivity Detector
TGA - Thermogravimetric Analysis
TOC - Total Organic Carbon
UV - Ultra Violet
VIS - Visible
Word count - 42500
Abstract
13
Abstract
Sellafield is home to the UKrsquos largest repository of nuclear waste including reprocessed
uranium and plutonium as well as a backlog of unprocessed used fuel and waste kept in
outdated storage facilities commonly referred to as ldquolegacy wasterdquo For this reason
Sellafield has often been called the most hazardous place in Western Europe and as such is
currently undergoing a multi-billion pound decommissioning and clean-up operation Each
on-site facility has unique challenges associated with it many of them presenting situations
where the radiation chemistry aspects of the material degradation are not well understood
The key factors that can affect water radiolysis processes in the Sellafield challenges are a
high pH environment the presence of magnesium hydroxide the presence of iron oxide
and the presence of organic materials This work examines the effect each of these factors
has on H2 and H2O2 production in water radiolysis as well as developing a computational
model to offer some understanding to the kinetic behaviour of water radiolysis under such
conditions
The computational model was able to replicate experimental measurements of radiolytic H2
and H2O2 production in both aerated and deaerated water at neutral pH and provide a
further understanding of the role of dissolved oxygen in water radiolysis Measurements of
H2O2 from solutions containing NaOH have shown that an increase in pH generally results
in a higher steady state of H2O2 while measurements of H2 show a similar increase with a
maximum production rate at pH ~11 The model was also able to closely replicate these
experimental measurements with some over prediction which highlights a gap in our
understanding of high pH radiolysis and also brings into question the validity of the
estimated rate constant for the reaction
119926minus + 119926120784minus119919120784119926rarr 120784119926119919minus +119926120784 119948 = 120788 120782 times 120783120782
120790 119924minus120783119956minus120783
which was originally determined from kinetic model calculations designed to describe the
decay of ozonide (O3ˉ) during pulse-radiolysis studies of high pH solutions conducted by
K Sehested et al in 1982
The radiolysis of magnesium hydroxide slurry also resulted in an increased yield of
hydrogen gas but had little effect on the yield of hydrogen peroxide The hydrogen yield
was 052 molecules per 100eV while a NaOH solution of equivalent pH gave a yield of
027 however interference from carbonate may be the cause of the increased yield A
surface effect was also estimated to contribute 005 molecules per 100 eV to the hydrogen
gas yield
Hydrogen gas and hydrogen peroxide was measured from the radiolysis of aqueous
methanol This was modelled with a near agreement but modifications to the model were
necessary highlighting areas of the model that need improvement as well as providing a
reaction scheme from which a more comprehensive model for aqueous methanol radiolysis
could be developed
Declaration
14
Declaration
No portion of the work referred to in the thesis has been submitted in support of an
application for another degree or qualification of this or any other university or other
institute of learning
Thomas A Donoclift August 2016
Copyright Statement
15
Copyright Statement
The author of this thesis (including any appendices andor schedules to this thesis) owns
certain copyright or related rights in it (the ldquoCopyrightrdquo) and he has given The University
of Manchester certain rights to use such Copyright including for administrative purposes
Copies of this thesis either in full or in extracts and whether in hard or electronic copy
may be made only in accordance with the Copyright Designs and Patents Act 1988 (as
amended) and regulations issued under it or where appropriate in accordance with
licensing agreements which the University has from time to time This page must form part
of any such copies made
The ownership of certain Copyright patents designs trademarks and other intellectual
property (the ldquoIntellectual Propertyrdquo) and any reproductions of copyright works in the
thesis for example graphs and tables (ldquoReproductionsrdquo) which may be described in this
thesis may not be owned by the author and may be owned by third parties Such
Intellectual Property and Reproductions cannot and must not be made available for use
without the prior written permission of the owner(s) of the relevant Intellectual Property
andor Reproductions
Further information on the conditions under which disclosure publication and
commercialisation of this thesis the Copyright and any Intellectual Property andor
Reproductions described in it may take place is available in the University IP Policy (see
httpdocumentsmanchesteracukDocuInfoaspxDocID=487) in any relevant Thesis
restriction declarations deposited in the University Library The University Libraryrsquos
regulations (see httpwwwmanchesteracuklibraryaboutusregulations) and in The
Universityrsquos policy on Presentation of Theses
Dedications
16
Dedications
Mum
For the strength and freedom to explore
and the support and security to return
Dad
For the support and encouragement
exceeded only by pride
Acknowledgements
17
Acknowledgements
I would like to take this opportunity to thank some of the people who have made this work
possible My supervisor Simon Pimblott even with the busy work schedule that comes with
managing an entire research facility he is still able to provide support and put the well-
being of his students and staff above all else My unofficial but very much appreciated
industrial supervisors from the National Nuclear Laboratory (NNL) Howard Sims and
Robin Orr who both take a personal interest in the work going on at the Dalton Cumbrian
Facility (DCF) and dedicate much of their own time to helping the researchers in their
work
I would like to acknowledge the EPSRC and Sellafield Ltd for providing the funding that
supported this research
A special thanks to all the members of the Dalton Cumbrian Facility especially to all the
staff who work immeasurably hard and with profound dedication to the values
management and research carried out at the Dalton Cumbrian Facility Acknowledgements
to the academic staff Ruth Edge Aliaksandr Baidak and Sven Koehler for always
providing a useful and meaningful insight to almost any situation and for providing
valuable guidance in practical radiation chemistry as well as the inspiration and
encouragement to pursue potentially interesting avenues of research
Thank you to the research team at the Dalton Cumbrian Facility for their friendship and for
making the workplace an enjoyable place to conduct research
Chapter 1 Introduction
18
Chapter 1 Introduction
Overview of Sellafield
Sellafield shown in Figure 1 is the largest nuclear facility in the UK and has played a key
role in the UK nuclear industry for over 60 years Sellafield began as a Royal Ordinance
Factory producing weapons propellant for use in the Second World War Soon after the
war ended Sellafield was renamed to Windscale and was repurposed to produce plutonium
for the development of nuclear weapons in order to secure the UKrsquos position in the nuclear
arms race
Several years later the focus on acquiring nuclear weapons shifted towards the development
of new reactors for civil energy production with Magnox reactors built on a neighbouring
site known as Calder Hall The two sites were later combined and were once again named
Sellafield Previous operations carried out at Sellafield meant the site was also in a good
position to conduct fuel reprocessing operations alongside energy production Spent fuel is
separated from its now contaminated cladding and dissolved in nitric acid uranium and
plutonium are separated by solvent extraction while the cladding is treated independently
At Sellafield this industrial process meant storing the contaminated cladding swarf in
underwater silos
The fuel reprocessing process most commonly used is the Plutonium Uranium Redox
Extraction method (PUREX) and produces a number of product streams including
plutonium uranium and other highly active liquors
Chapter 1 Introduction
19
The separated uranium can be re-enriched to produce reusable uranium fuel or mixed with
plutonium to produce mixed oxide (MOX) fuel although much of the reclaimed uranium
and plutonium remains unused and is stored at Sellafield The remaining fission products
classified as high level waste are treated in various ways including vitrification and are
also stored at Sellafield
Figure 1 An aerial view of the Sellafield Site which covers approximately 6 km2
Image provided by Sellafield Ltd Press Office
Magnox reactors are now an obsolete design of reactors that use unenriched uranium fuel
which was clad in an alloy comprising almost entirely of magnesium with small amounts
of aluminium Spent fuel from Magnox reactors was briefly stored in a cooling pond before
having the cladding removed for reprocessing of the fuel pellets
Chapter 1 Introduction
20
The facilities used for this storage shown in Figure 2 were called the First Generation
Magnox Storage Pond (FGMSP) and the Magnox Swarf Storage Silos (MSSS) both of
these facilities are now considered to be ldquoLegacyrdquo facilities
Figure 2 On the left is The First Generation Magnox Storage Pond (FGMSP) and on the
right are the Magnox Swarf Storage Silos (MSSS)
Images provided by Sellafield Ltd Press Office
An extended shut down of reprocessing in the first generation reprocessing plant meant that
fuel being stored in the Magnox pond was left far longer than intended resulting in
corrosion and a backlog of spent fuel The Magnox Storage Pond now contains
approximately 14000 m3
of contaminated water which includes roughly 1200 m3 of sludge
consisting mainly of magnesium hydroxide and iron oxide1 Later technological
advancements rendered the wet storage of Magnox fuel cladding to be an obsolete method
and operations moved towards dry storage However the construction of a new facility and
the huge backlog of material stored in the silo also resulted in corrosion of stored fuel and
eventually a state of disrepair for the Magnox Swarf Storage Silos Both of these legacy
facilities present a huge challenge for decommissioning operations as well as a unique
opportunity for scientific research
Chapter 1 Introduction
21
Radiation Chemistry
Radiation chemistry is the study of chemical change driven by the absorption of energy
capable of causing ionisation This ionising radiation can be of a particulate nature
including but not limited to alpha (He2+
) and beta (eˉ) radiation or non-particulate such as
gamma (γ) or X-ray radiation Radiation chemistry and its experimental methods parallel in
many ways to photochemistry but the differences between the fields are well defined The
fundamental difference between the two fields of study is the quantity of energy involved in
the initiation of reactions In radiation chemistry this energy is provided by the atomic
decay of radioactive nuclei and is far higher than energy used in photochemistry typically
UV radiation The lower initial energies used in photochemistry tend to only produce
molecular excitations rather than direct ionisations These lower incident energies also
mean that each photon will usually only interact once and produce a uniform distribution of
excited species in any plane perpendicular to the incident beam The higher initial energies
used in radiation chemistry often provided by atomic decay can produce both excitations
and ionisations directly Interactions between ionising radiation and a substance is not
necessarily limited to only one interaction a single high energy photon or particle may
interact a number of times This behaviour gives rise to a non-uniform track-like structure
of interactions unlike the uniform distributions found in photochemistry2
Chapter 1 Introduction
22
Figure 3 A representation demonstrating the uniform excitations and ionisations of UV
radiation compared to the structured tracks of alpha radiation
To fully appreciate the chemical changes initiated by ionising radiation it is important to
have some knowledge of the different types of ionising radiation and the ways in which
they interacts with matter There are two main ways in which radiation chemists provide a
source of ionising radiation for experiments The first involves taking advantage of the
atomic decay of radioactive nuclei this may be a naturally occurring radioisotope or an
artificially created isotope The second involves specialised equipment to directly generate
radiation usually by accelerating particles to a high energy The major types of ionising
radiation are alpha beta and gamma however in the field of radiation chemistry one may
also come across the use of X-rays fast neutron radiation proton radiation and other heavy
charged particle radiation This study utilises cobalt-60 as a source of gamma radiation
other types of radiation were not investigated during this work however it is necessary to
understand some fundamental features of alpha and beta decay to fully appreciate gamma
decay
Chapter 1 Introduction
23
Alpha α Radiation
Alpha radiation occurs when an unstable atomic nuclei spontaneously ejects an alpha
particle Elements with an atomic number greater than 83 will decay by this mechanism3
Alpha particles are fully ionised helium nuclei they consist of two protons and two
neutrons and have no electrons which gives them a charge of +2 Alpha particles are
mono-energetic this means that every alpha particle emitted from a given radioactive
element will have the same energy characteristic of that element These energy values
typically range between 4 and 10 MeV This quality means that research facilities capable
of artificially producing alpha radiation by ionising and accelerating helium atoms can
select the particle energy required to effectively mimic alpha decay of any radioactive
element
Beta β Radiation
Beta decay involves the conversion of a neutron to a proton or vice versa in order to create
a more favourable proton to neutron ratio This conversion process is accompanied by the
ejection of fundamental particles directly from the atomic nucleus In the case of a neutron
converting to a proton the ejected particles are an anti-neutrino and a high energy electron
while in the reverse case the ejected particles are a neutrino and a positron (the antimatter
equivalent of an electron) Unlike alpha particles beta particles are not mono-energetic
The energy lost through beta decay is shared between the ejected particles and the recoil of
the decaying atom this means beta particle energy ranges from zero up to a maximum
energy characteristic of that element
Chapter 1 Introduction
24
Gamma γ Radiation
Gamma radiation is not a particle like the previously mentioned types of radiation but is a
photon with a short wavelength in the region of 3 x10⁻⁹
to 3 x10-11
cm or approximately 40
KeV to 4 MeV when converted to energy A gamma ray is emitted when a nucleus in an
excited state relaxes to a lower nuclear energy level there is no change in the number of
protons or neutrons during gamma decay Gamma rays like alpha particles are mono-
energetic however a nucleus may emit several photons as a cascade of energy loss As
gamma emission starts with an excited nucleus some prior process must take place to result
in a nucleus with an elevated energy level For most gamma emitters the process is
initiated with either alpha or beta decay and the resulting atomic nucleus is left in an
excited state For example ceasium-137 undergoes beta decay by emission of a beta
particle of 1174 MeV to form stable barium-137 This only happens 54 of the time and
the more common decay mechanism is the emission of a beta particle of 0512 MeV to
form and excited barium-137 nucleus this then emits a photon of 0662 MeV to relax the
nucleus to the stable barium-137
Chapter 1 Introduction
25
Radiation interactions with matter
In order for radiation to induce a chemical change it must interact with matter in some way
There are many mechanisms by which radiation can interact with matter as this project
focuses on the use of gamma rays a brief description of the interactions of gamma rays
with matter is given below
In the photoelectric effect the entire energy of an incident gamma photon is transferred to
an electron of some absorbing matter This electron is ejected from the absorbing atom with
energy equal to the incident photon minus the binding energy of that electron The electrons
ejected are often K-shell electrons which have the highest binding energy As momentum
and energy must be conserved it is necessary for the absorbing atom to recoil As this
mechanism involves the recoil of a parent atom it would not be possible for the
photoelectric effect to be the mechanism of interaction with free electrons that do not have
a parent nucleus to recoil In the photoelectric effect ejected electrons will leave a hole as
this hole is filled by electrons from higher energy levels characteristic X-rays are emitted
Figure 4 A representation of the photoelectric effect
Image recreated from Spinks and Wood2
Chapter 1 Introduction
26
Although photons cannot interact with free electrons by means of the photoelectric effect
they may interact with free and loosely bound electrons through the Compton Effect In this
mechanism a photon accelerates an electron thereby reducing its own energy The photon
is scattered now with reduced energy while the electron recoils with increased energy
Figure 5 A representation of the Compton Effect
Image recreated from Spinks and Wood2
Another mechanism by which a gamma ray may interact with matter is through pair-
production This is only a viable mechanism for photons with energy larger than 102 MeV
A photon is completely absorbed by an atomic nucleus and from that nucleus two particles
are produced an electron and a positron The energy of the incident photon is shared
between the rest energy of the two new particles and the kinetic energy of these particles as
they move away from the nucleus a negligible amount of energy is also used as the nucleus
recoils The positron behaves much the same way as the electron until it annihilates with an
electron from the medium to produce two 051 MeV gamma rays travelling at 180deg from
each other
Chapter 1 Introduction
27
Figure 6 A representation of pair production and positron annihilation
Image recreated from Spinks and Wood2
Generally the interactions of gamma rays with matter result in fast moving electrons these
are often referred to as secondary electrons or delta-rays and have the same interactions
with matter as beta particles It is these secondary electrons that are predominantly
responsible for producing the excited states and ionisations in an absorbing material that
will initiate chemical changes in said material4 For this reason it is necessary to also
understand the interactions with matter these secondary electrons may have Fast moving
electrons lose energy through three main mechanisms electromagnetic radiation elastic
scattering and inelastic scattering When a fast electron greater than 100 KeV passes close
to an atomic nucleus it is decelerated and slightly deflected This event is accompanied by
emission of electromagnetic radiation commonly known as Bremsstrahlung radiation and
is required for the conservation of energy
Chapter 1 Introduction
28
At energies below 100 keV Bremsstrahlung emission becomes negligible instead electrons
tend to lose energy through scattering Fast moving electrons interact with the bound
electrons of a molecule predominantly through inelastic collisions This interaction
transfers energy from the incident electron to the bound molecular electron which can result
in ionisation and excitation (and often with production of radical species) If there is an
ionisation event the tertiary electrons produced can cause more ionisation events in the
same manner These events tend to lie closer together as the electron that caused them has a
much lower energy than the primary electron that passed by This engenders a radiation
track structure that consists of small groups of ionisation events These groups are often
referred to as spurs
Fast moving electrons may also interact elastically with matter this interaction causes the
electrons to be deflected by a wide range of angles This means that a fast moving electron
may have moved a significant total distance but may have not travelled particularly far into
the absorbing material
Chapter 1 Introduction
29
Radiolysis of Water
As mentioned earlier it is the secondary and tertiary electrons produced from gamma ray
interactions that predominantly lead to the formation of ions and radical species that drives
chemical change in substances exposed to radiation Below is a diagram outlining the
sequence of events and the different stages of water radiolysis
Figure 7 A scheme showing the early stages of water radiolysis and the production of
primary species
In water this initial interaction between a gamma ray and a water molecule produces either
an excited state of water or a water cation accompanied by an electron this is achieved in
less than ten femtoseconds (10-14
s) Molecules in an excited state may break apart to form
hydrogen atoms and hydroxyl radicals or molecular hydrogen and oxygen atoms in a
singlet or triplet state while water cations will quickly react with nearby water molecules to
produce hydronium ions and hydroxyl radicals
Chapter 1 Introduction
30
The electron produced begins a thermalisation process eventually resulting in a solvated
electron however at this stage the electron exists as a potentially reactive precursor
intermediate This happens in a time frame of less than 1 picosecond and occurs before
diffusion of the spur During the non-homogeneous stage the produced radicals and ions
may react within the spur to produce molecular products such as H2 and H2O2 Eventually
the spur species diffuse into the bulk water and these ldquoprimaryrdquo species produced are said
to be homogeneously distributed from this point onwards The yield at which these primary
species are produced are known as primary yields and are often expressed as G-values
which have units of micromoles per Joule (SI unit) or molecules produced per 100 eV of
energy absorbed (conventional historic units)
119866 = 119873119900 119900119891 119898119900119897119890119888119906119897119890119904 119891119900119903119898119890119889
100 119890119881
This should not be confused with a ldquochemicalrdquo yield which are the yields of chemical
species sometime after homogeneous chemistry has taken place and is also often expressed
as a G-value During the homogeneous stage reactions between primary species occur
often altering the observed production rates of these species through back reactions To
avoid confusion between the two types of yield a notation system can be used to discern the
two Two notation systems are commonly used throughout the radiation chemistry
literature the first denotes primary yields with the species of interest in subscript whilst the
chemical yield is often expressed with the species of interest in parenthesis For example
the primary and chemical yield of H2 would be written as GH2 and G(H2) respectively The
second system simply uses a lowercase ldquogrdquo to denote primary yields and uppercase ldquoGrdquo for
chemical yields This study will use the latter system
Chapter 1 Introduction
31
Most often it is the chemical yield that is measured during an experiment but it is possible
to measure a primary yield with the use of scavengers A scavenger is a chemical species
that can quickly react with a targeted primary species before it is able to diffuse into the
bulk solution effectively removing it and its associated chemistry from the homogeneous
stage of radiolysis The effectiveness of a scavenger is often referred to as the ldquoscavenging
capacityrdquo and is quoted as the pseudo-first order rate of reaction between a scavenger (S)
and a radical (R) which depends only on the rate constant for said reaction and the
concentration of the scavenger In other words the scavenging capacity is equal to kS+R[S]5
A well-documented example of this is the use of bromide ions to prevent the reaction of
hydroxyl radicals with molecular hydrogen allowing for the room temperature primary
yield of H2 to be measured this has been done extensively throughout the literature and the
g-value is quoted to be 045 molecules100eV6 Without the use of the bromide scavenger
hydroxyl radicals would react with H2 reducing the observed yield this reduced yield is
what is meant by the term chemical yield
The following summarises some of the properties of the more important primary radicals
Chapter 1 Introduction
32
The Hydrated Electron eaq-
One of the most reactive primary species of water radiolysis is the hydrated electron It is a
chemical entity that can be thought of as being a single electron somewhat stabilised by a
cage of orientated water molecules Hydrated electrons typically have reaction rate
constants close to the diffusion controlled limit with low activation energies Reactions of
hydrated electrons are typically represented as single electron transfer processes and with a
reduction potential of -29 V vs the standard hydrogen electrode (SHE) the hydrated
electron will react with most other species78
119890119886119902minus + 119878119899 rarr 119878119899minus1
In the presence of organic compounds the hydrated electron will act as a nucleophile with
enhanced reactivity towards areas adjacent to electron withdrawing groups Halogenated
organics also show enhanced reactivity towards elimination of the halide ion9
119890119886119902minus + 119877119883 rarr 119877119883minus rarr 119877bull+ 119883minus
The Hydrogen Atom H˙
In terms of BroslashnstedndashLowry acidndashbase theory the hydrogen atom is the conjugate acid of
the hydrated electron with a pKa of 9679
119890119886119902minus + 119867(119886119902)
+ 119867bull
The hydrogen atom has a reduction potential of -23 V78
similar to that of the hydrated
electron however its chemistry is seldom the same
Chapter 1 Introduction
33
Inorganic ions are reduced by the hydrogen atom at slower rates than reduction by the
hydrated electron In certain circumstances such as in low pH environments hydrogen
atoms can act as an oxidant reacting with inorganic ions to form a hydride intermediate
that soon decomposes to form the oxidised ion and molecular hydrogen10
119867bull + 1198651198902+ rarr 1198651198903+119867minus119867+
rarr 1198651198903+ + 1198672
Organic molecules are also subject to oxidation reactions with the hydrogen atom
Saturated organics tend to react by hydrogen abstraction to form molecular hydrogen and a
carbon centered organic radical Unsaturated organics will react by hydrogen addition to the
center of unsaturation again forming a carbon centered organic radical9
119867bull+ 1198621198673119874119867 rarr bull1198621198672119874119867 + 1198672
119867bull+ 11986211986721198621198672 rarr bull11986211986721198621198673
The Hydroxyl Radical bullOH
Unlike the previously mentioned primary radicals the hydroxyl radical has a positive
reduction potential of 18 V in neutral solution making it a powerful oxidising species11
Reactions of hydroxyl radicals with inorganic ions are often said to be simple electron
transfer processes however it has been suggested that the mechanism actually proceeds
through an intermediate adduct12
Reactions with inorganic ions have been observed to
proceed at rates close to the diffusion limit however this is not the case with many metal
cations Reaction rates between the hydroxyl radical and metal cations tend to be slower
with rate constants of the order ~30 x108 M
-1 s
-19
Chapter 1 Introduction
34
One explanation for this is that the mechanism for metal cation oxidation involves the
addition of the hydroxyl radical to the metal cation increasing its coordination number and
allowing for inner-sphere oxidation to take place
[119872(1198672119874)119909]119899+ + ∙119874119867 [(1198672119874)119909119872-119874119867]
119899+ rarr [119872(1198672119874)119909](119899+1)+ + 119874119867minus
The intermediate species Mn+
OH has actually been observed in cases where M = Tl+ Ag
+
Cu2+
Sn2+
Fe2+
and Mn2+
12
As is the case with the hydrated electron and the hydrogen atom the hydroxyl radical also
exists in an acid-base equilibrium with the oxide radical anion bullOˉ
bull119874119867 + 119874119867minus bull119874minus + 1198672119874
With a pKa of 119 the reactions of bullOˉ only become important at high pH With a few
exceptions reactions of bullOˉ are typically slower than those of
bullOH The two species also
have different reactivity towards organic molecules Hydroxyl radicals tend to add to
unsaturated bonds as an electrophile while the conjugate base bullOˉ acts more like a
nucleophile and will abstract hydrogen from a hydrocarbon bond
Chapter 1 Introduction
35
Computational Applications in Radiation Chemistry
Early computational studies in the field of radiation chemistry were focused largely on
developing the radical diffusion theory and the non-homogeneous stage of water radiolysis
to help rationalise experimental observations One of the earliest water models used
coupled differential equations with terms for the competing diffusion and reacting
processes to represent the evolution of a spur containing six radical pairs as a function of
time13-15
Although the predicted primary yields from this type of model agree well with
experimental data there are problems associated with this type of approach the main
problems arising from the application of classical chemical kinetics to a system of
diminutive volume and extremely fast reactions occurring between only a few reactive
species Such deterministic models often use a typical spur to represent a whole system
fixing the average number of radical pairs as a single integer or in some cases a range of
integers This means that in deterministic models the long-running average value for the
number of reactive species is neglected This small difference can lead to inaccuracies in
deterministic calculations of this kind and so a stochastic approach became the preferred
method to these types of non-homogeneous radiolysis calculations16
Deterministic models however are still the preferred technique for the longer term
homogeneous stage calculations for water radiolysis Once a suitable set of primary yields
has been established it is possible to model the subsequent chemistry in much the same way
as any other chemical kinetics simulation
Chapter 1 Introduction
36
By describing a reaction set in terms of a series of simultaneous differential equations and
by including details of physical parameters such as temperature it is possible to predict
chemical yields of radiolysis and highlight important chemical pathways This is the
general methodology implemented in this study and will be discussed in further detail in
subsequent chapters
Deliverables and Project Aims
Given the technical challenges associated with the Sellafield site and the pressing
conditions of legacy facilities such as the First Generation Magnox Storage Pond and
Magnox Swarf Storage Silos there has been a renewed interest in water radiolysis
especially with respects to high pH and slurry systems Previous radiolysis studies of high
pH solutions have been contradictory and difficult to reproduce There are very few
situations in industry where knowledge of high pH water radiolysis is required as most
situations where water radiolysis may occur are in acidic media with the exception of
Pressurised water reactors (PWRs) and CANDU reactor technology which run under alkali
conditions due to added LiOH17
As mentioned previously the Magnox Swarf Storage Silos at Sellafield Ltd contains large
quantities of contaminated magnesium alloy produced from the de-cladding process of
spent nuclear fuel The material contaminated with uranium oxide is stored under water
and over time has corroded to produce large amounts of magnesium hydroxide To prevent
further corrosion some of the 22 silos at the facility dose the water with sodium hydroxide
Although alleviating some corrosion this addition increases the pH
Chapter 1 Introduction
37
One of the aims of this project is to try and obtain a better understanding of water radiolysis
at high pH Using cobalt-60 as a source of gamma radiation and a range of analytical
techniques to determine the production rates of H2 and H2O2 as a function of absorbed dose
it is hoped that the effects of high pH on water radiolysis can be experimentally quantified
Deterministic computational modelling is then used to investigate the experimentally
observed effects of high pH in order to extract a better mechanistic understanding of water
radiolysis at high pH
While there were a number of early water radiolysis studies concerning the effects of
various metal oxides and their surface interactions18
this is also a subject which has
received a renewed scientific interest as there are many situations in the nuclear industry
where an understanding of the effects of metal oxides on water radiolysis are significant
These areas include preventing corrosion within operational facilities to extend their
lifetime controlling radiolytic products associated with stored nuclear material preventing
incidences of unexpected gas build up and managing already heavily corroded facilities
such as the legacy ponds and silos at Sellafield Ltd
In addition to sodium hydroxide the Magnox Swarf Storage Silos also contain large
quantities of magnesium hydroxide the hydrated form of magnesium oxide Radiolysis
studies concerned with magnesium hydroxide solutions slurries and solids are scarce119
despite the obvious need for further investigation The slight solubility of magnesium
hydroxide in water compels a prior understanding of high pH water radiolysis to facilitate
understanding the effects of magnesium hydroxide and the presence of a surface Data
collected from experiments involving magnesium hydroxide are therefore also included in
this project
Chapter 1 Introduction
38
Up until now the discussed aims of this project have been targeted at the issues associated
with the Magnox Swarf Storage Silo rather than with the First Generation Magnox Storage
Ponds These legacy ponds are outdoor open air ponds that have been used to store spent
nuclear fuel for extended periods (far longer than ever intended) As the ponds are open air
they are susceptible to the introduction of natural debris mostly falling leaves and other
biological matter
This has led to an interest in the effects of organic substances on radiolysis processes in
water with the focus being on some of the decomposition products of decaying organic
matter substances such as humic acids The complexity of these substances requires
general underpinning by first understanding simple organic substances In this work the
radiolysis of aqueous methanol was studied
The extended storage of spent fuel in the First Generation Magnox Storage Pond has led to
various challenges concerning corrosion products and their effects on water radiolysis In
the past spent fuel rods were often grouped into small bundles and placed into steel skips
which were then submerged in the pond These skips might also contain other contaminated
material and the exact content of any given skip is largely unknown Over time much of
the steel has corroded resulting in a large build-up of what can only be described as
ldquosludgerdquo The exact composition of this sludge is fairly unknown but the major constituent
is iron oxide present as both red haematite (Fe2O3) and black magnetite (Fe3O4) Research
involving iron oxides and radiolytic processes have mostly been focused on corrosion
mechanisms predominantly adopting an electrochemical approach with very few studies
measuring chemical yields of radiolytically produced H2 and no studies measuring H2O2 in
the presence of iron oxide
Chapter 1 Introduction
39
There are studies that have demonstrated decomposition of H2O2 over iron oxide in the
absence of a radiation source but as H2O2 is a primary product of water radiolysis it is
continuously being generated and the implications of this production are largely unknown
Other studies involving metal oxides have also investigated radiation induced dissolution
With both these processes in mind this project investigates some of the effects of iron
oxide on the steady-state concentrations of the molecular radiolysis products H2 and H2O2
Chapter 2 Experimental Methods
40
Chapter 2 Experimental Methods
Source of Radiation and Dosimetry
This project uses cobalt-60 as a source of gamma radiation Cobalt-60 is an artificial
isotope with a half-life of 527 years2 As cobalt-60 is not a naturally occurring isotope it
must be manufactured This is normally done through neutron bombardment of the non-
radioactive isotope cobalt-59 Stainless steel control rods within a nuclear reactor core are
substituted with cobalt rods and the neutron flux present is enough to transmute cobalt-59
to cobalt-6020
The overall reaction for the production and decay of cobalt-60 is shown
below
1198621199002759 + 119899 rarr 11986211990027
60 rarr 119873119894lowast2860 + 119890minus + 119890 + 120574
The decay mechanism for cobalt-60 was similar to that of Caesium-137 in that it is initiated
by beta decay Unlike Caesium-137 however there is no direct route to a stable isotope
Subsequently the decay of cobalt-60 follows one of two paths both of which begin with the
ejection of a beta particle Cobalt-60 may emit two photons of gamma radiation but will
always emit at least one photon A cobalt-60 nucleus may eject a beta particle with energy
up to 148 MeV this is followed by emission of a photon with energy of 133 MeV
however there is only a 012 chance that this happens The more common decay path for
cobalt-60 is to eject a beta particle with energy up to 031 MeV followed by the emission of
two photons with energies of 117 MeV and 133 MeV
Chapter 2 Experimental Methods
41
Figure 8 A decay scheme for cobalt-60
Cobalt-60 is a popular source of gamma radiation used by radiation scientists High dose
rates can be achieved with fairly little material21
Facilities that conduct experiments using
cobalt-60 as a source of radiation use a variety of systems to shield operators from
radiation Older systems can be as rudimental as a water filled hole with cobalt-60 resting at
the bottom samples are lowered in a container and held at a given distance from the source
to accumulate dose More advanced systems involve mechanically lifting cobalt-60 from
some shielded well into an experimental area This area may be a dedicated room for
irradiating samples or it may be a shielded chamber in which samples are placed The latter
example is known as a self-contained irradiator and is the type of irradiator used in this
work
Chapter 2 Experimental Methods
42
All irradiations reported here were carried out using the Foss Therapy Model-812 Self-
Contained Cobalt-60 Irraditor located at the University of Manchesterrsquos Dalton Cumbrian
Facility (DCF) The Model-812 Irradiator contains three independent housings where
cobalt-60 sources may reside named A B and C Currently only A and C contain
cobalt-60 and had a total activity of 5281 TBq on the original date of measurement
(2nd
May 2012) Source B is due to be filled after one half-life from the original date to
bring the total activity back to a similar level Both A and C sources are used at the same
time for every irradiation throughout this work
Figure 9 Image on the left shows the Model-812 Irradiator On the right is the inside of
the irradiator showing the three guide rods that contain the cobalt-60 source during
irradiation
Chapter 2 Experimental Methods
43
Samples are placed within the irradiator and are exposed to gamma emission from the
cobalt-60 for calculated periods of time to allow samples to accumulate the desired dose
Radiation doses are defined as the amount of energy deposited per kilogram of sample
material and are often quoted as the SI derived unit Gray (Gy) which has the unit J kg-1
In
order to calculate how long a sample should be exposed for requires knowledge of the rate
at which radiation energy is deposited into the sample This is known as a dose rate and is
often quoted as Gy min-1
The practice of dose rate determination is known as ldquodosimetryrdquo
and there are a number of physical and chemical methods for determining the dose rate
from a given source Physical methods often deploy tools such as calorimeters and
scintillation chambers to directly measure energy while chemical methods depend on
measuring some chemical change that occurs during exposure to radiation that responds
linearly with increasing dose There are many chemical dosimeters available depending on
the kind of work being undertaken For example vapour phase experiments often measure
the condensation of acetylene into benzene to determine a dose rate22
For this work the
dosimeter used was a ferrous sulphate solution known as the Fricke dosimeter The Fricke
dosimeter was first described in 1927 by Hugo Fricke and has become the most adopted
chemical dosimeter among radiation scientists23
The standard recipe to make a Fricke
dosimeter used in this work is as follows
Fricke Dosimeter Dissolve 04 grams FeSO4∙7H2O (99 assay Fisher Chemicals) 006
grams NaCl (gt9999 Assay Calbiochem) and 22 mL concentrated H2SO4 (95-98
Sigma Aldrich) Dilute with distilled water to make 1 litre of Fricke solution24
Chapter 2 Experimental Methods
44
This solution will slowly oxidise and must be used within a few days by preventing light
from interacting with the solution it is possible to extend the shelf life of the Fricke
solution to three months The Fricke dosimeter relies on the oxidation of FeII to Fe
III by
species produced during the radiolysis of water
119867(119886119902)+ + 119890(119886119902)
minus rarr 119867bull
119867bull + 1198742 rarr 1198671198742bull
119865119890119868119868 + 1198671198742bull rarr 119865119890119868119868119868 + 1198671198742
minus
1198671198742minus + 119867(119886119902)
+ rarr 11986721198742
119865119890119868119868 + 11986721198742 rarr 119865119890119868119868119868 + bull119874119867 + 119874119867minus
119865119890119868119868 + bull119874119867 rarr 119865119890119868119868119868 + 119874119867minus
The extent of oxidation responds in a linear fashion to ionising radiation until dissolved
oxygen is exhausted this can be up to 500 Gy but in practice doses are usually kept
between 40 and 400 Gy to ensure measurements are made within the range in which FeIII
is
of a measurable concentration but FeII is not fully depleted
2 With a strong absorbance at
304 nm Fe3+
can be quantified by spectrophotometric analysis and an absorbed dose can be
calculated from the following equation
119863119866119910 = 9647 times 106 times
∆119860
∆휀119897120588119866(1198651198903+)
Chapter 2 Experimental Methods
45
where DGy is the absorbed dose in Grays ΔA is the difference between the optical
absorbance before and after irradiation and Δε is difference between the molar extinction
coefficient of Fe2+
and Fe3+
at 304 nm which has an established value of
2201 mol-1
cm-1
24
G(Fe3+
) is the chemical yield of Fe3+
and a value of 155 is
recommended when using cobalt-60 by the International Commission on Radiation Units
and Measurements Path length and solution density are represented by the terms l and ρ
respectively
Irradiations throughout this work were conducted using two sample holding devices each
with a number of different positions The first device consists of a standard 4x8 test tube
rack that has been fixed to an irradiation base plate The base plate allows the device to be
locked in exactly the same position within the Model-812 every time it is used
This device holds a number of 20 mL headspace vials during irradiations of samples which
are then analysed for H2O2 content the details of which will be discussed later
The second device is somewhat more complex and is used to hold samples that are
analysed for H2 content again the details of which are discussed later This device is
designed to keep samples mixed by slowly rotating them along a horizontal axis thus
continually inverting samples throughout the irradiation period it is hence referred to as the
ldquoinverter rigrdquo The construction consists of a high torque motor with a top speed of 2 rpm
Chapter 2 Experimental Methods
46
Figure 10 Sample holding devices for use in the Model-812 Left is the 4x8 rack with its
schematic below On the right is the inverter rig again with its schematic below
Dosimetry measurements were carried out in each of these devices and the results are
shown below Table 1 shows the dosimetry for the 4x8 test tube rack each position was
measured at four time intervals each of which with three replicates Measurements were
carried out in 20 mL headspace vials which were filled with 10 mL of Fricke solution
Chapter 2 Experimental Methods
47
Experiments carried out in this device only occupied positions in the first two rows hence
only these results are shown Table 2 shows the dosimetry of the inverter rig again each
position was measured at four time intervals each with three replicates The inverter rig
only has four positions which were measured with no rotation mixing Initially
experiments were to be conducted under stationary conditions before moving on to mixed
conditions however time limitations prevented progression to mixed samples and all
samples are conducted with no rotational mixing From the data obtained absorbance units
were converted to an absorbed dose by use of equation 1 and dose rates are then extracted
as the gradient of absorbed dose plotted as a function of time
Date of Original Measurement 07022014
Position Dose Rate on Date of
Measurement (Gy min-1
) plusmn Error
A1 29435 75
B1 34827 23
C1 32352 41
D1 27358 89
A2 15845 24
B2 18519 62
C2 18176 26
D2 15248 17
Table 1 Dose rates of the front most two rows of the 4x8 irradiation rack determined by
Fricke analysis The error indicates the percentage of uncertainty of the obtained gradient
Chapter 2 Experimental Methods
48
Date of Original Measurement 13012015
Position Dose Rate on Date of
Measurement (Gy min-1
) plusmn Error
A 29379 46
B 31708 46
C 30208 87
D 30616 46
Table 2 Dose rates of the four positions of the inverter rig determined by Fricke analysis
The error indicates the percentage of uncertainty of the obtained gradient
As cobalt-60 decays dose rates are subject to change with time however they change in a
predictable manner The decay of cobalt-60 follows first order kinetics it is therefore
possible to adjust dose rates to account for the decay of the source simply by multiplying
the dose rate by the ratio of initial radiation intensity and the intensity after a given time2
This can be written as
119863119877119860119889119895 = 119863119877 times1198681199051198680
Where
1198681199051198680= 119890minus120582119905
And
120582 =ln 2
11990512
Chapter 2 Experimental Methods
49
DRAdj is the decay adjusted dose rate after time t λ is the decay constant and tfrac12 is the half-
life which for cobalt-60 is 527 years The use of this equation depends on knowing how
much time has passed since the original dose rate (DR) was calculated hence the inclusion
of the date on which these measurements were made in Tables 1 and 2
Water Purification for Radiolysis Experiments
Radiation breaks water molecules into reactive radicals which can react quickly with any
impurity present in a sample It is therefore of high importance to ensure that any water
used in radiolysis experiments is of the highest purity During the early days of radiation
chemistry high purity water was often obtained through a triple distillation process Water
was distilled firstly through standard means before being distilled again from an acid
dichromate solution and finally a third time from an alkaline permanganate solution before
being stored in a fused silica container4 Advancements in modern self-contained
purification systems have significantly simplified the process of obtaining ultra-pure water
for radiolysis experiments All experiments carried out throughout this work use ultra-pure
water dispensed from the ELGA PURELAB Classic the feed water of which is provided
by the ELGA PURELAB Option-SR 715 Through the use of duel bank reverse osmosis
units two independent UV lamp purifiers and deionisation cartridges the final resistivity of
output water is measured to be 182 MΩ cm-1
Chapter 2 Experimental Methods
50
Figure 11 A diagram of the purification system that provides the ultra-pure water used
throughout this work Image was taken from the ELGA PURELAB user manual
Determination of H2O2 ndash Photometric Analysis
Throughout this work the determination of hydrogen peroxide is carried out using a
photometric technique known as the Ghormley Tri-iodide method25
This method takes
advantage of the redox reaction between hydrogen peroxide and iodide to produce iodine in
a 11 stoichiometric ratio with hydrogen peroxide This reaction takes place under acidic
conditions and is catalysed by the presence of ammonium molybdate tetrahydrate Acid is
also required to force the resulting equilibrium between iodine and tri-iodide completely
towards the production of tri-iodide which can then be measured by photometric analysis
this is achieved using potassium phthalate monobasic A general reaction scheme for this is
shown below
Chapter 2 Experimental Methods
51
11986721198742 + 2119868minus + 2119867+ rarr 1198682 + 21198672119874
1198682 + 119868minus 1198683
minus
This is a popular method for the determination of hydrogen peroxide in radiolysis studies26-
29 It is favoured for its relative simplicity over previous methods which typically involved
complicated titrations with potassium permanganate Furthermore it is also extremely
sensitive enabling accurate measurements of low concentrations of hydrogen peroxide with
a lower limit of 1 μM30
The reagent used to reduce hydrogen peroxide is susceptible to self-oxidation and has a
very short shelf life To prevent self-oxidation and prolong the shelf life the reagent is
prepared as two reagents designated ldquopart Ardquo and ldquopart Brdquo and are only mixed during
analysis One reagent contains potassium iodide under slightly alkali conditions while the
other contains an organic acid salt potassium phthalate monobasic Both reagents are
prepared according to the recipe originally described by Ghormley25
Part A Dissolve 1 gram NaOH (ge98 Sigma Aldrich) 33 grams KI (995 Assay
Fisher Scientific) and 01 gram (NH4)6Mo7O24∙4H2O (ge99 AppliChem) in 500 mL
deionised water
Part B Dissolve 10 g C8H5KO4 (ge9995 Sigma Aldrich) in 500 mL deionised water
Figure 12 Structure of Potassium phthalate monobasic (C8H5KO4)
Chapter 2 Experimental Methods
52
Analytical Procedure
The redox reaction between H2O2 and I ˉ is carried out on a 2 mL aliquot of sample
solution To this 1 mL of Part A and 1 mL of Part B are added a few seconds are required
for development before transfer to a quartz cuvette for analysis in a Cray 5000 UVVisNIR
photospectrometer Samples that contain solid material are filtered through syringe filters
before analysis to remove any solid particles Samples of elevated pH often required
additional acid to reduce the pH to the conditions required for analysis the quantity of
additional acid is determined by testing a blank sample with litmus paper the quantity is
then recorded and the dilution factor accounted for Utilisation of the Beer-Lambert law
allows for the calculation of hydrogen peroxide concentration from an absorbance within
the linear range of the technique
119860 = 휀119897119888
Where A is the optical absorbance ε is the molar extinction coefficient in M-1
cm-1
l is the
path length (always 1 cm during this work) and c is the concentration in mol dm-3
Determination of the optimum wavelength of absorption was carried out by a scanning
analysis of a 625 μM solution of hydrogen peroxide prepared by serial dilution of a 1 M
standard which itself was prepared from a 3wt stock solution of hydrogen peroxide in
water purchased from Sigma-Aldrich
Chapter 2 Experimental Methods
53
Figure 13 Scanned absorption spectra of a 625 μM H2O2 solution
The maximum absorbance was determined to be 351 nm which is consistent with values
described in literature3031
A series of standard solutions were made ranging in
concentration from 1-300 microM to determine the molar extinction coefficient shown in
Figure 14
Chapter 2 Experimental Methods
54
Figure 14 A calibration curve of H2O2 photometric absorption to determine the molar
extinction coefficient
Addition of the tri-iodide reagents dilutes the standard to half the quoted concentration A
dilution factor of 2 is used to correct for this hence the calibration curve covers the
concentration range 05-150 microM hydrogen peroxide The determined molar extinction
coefficient was 25631 M-1
cm-1
this again is consistent with values quoted in
literature263132
y = 25631x - 00012
0
05
1
15
2
25
3
35
4
45
00E+00 20E-05 40E-05 60E-05 80E-05 10E-04 12E-04 14E-04 16E-04
Ab
sorb
ance
[H2O2] (mol dm-3)
Slope Error = plusmn35548
Chapter 2 Experimental Methods
55
Determination of H2 - Gas Chromatography
Method development
Measurements of hydrogen gas are usually carried out using gas chromatography
frequently paired with mass spectroscopy3334
This work uses only gas chromatography to
measure hydrogen gas produced during the radiolysis of samples The standard technique
for gas analysis is to use a gas tight syringe and needle to extract a portion of headspace
from a sealed sample The samples are typically sealed in air tight vials with a rubber
septum to allow gas extraction however due to the effects of radiation on plastics and
rubbers the reliability of this technique remains debatable and often alternative methods are
sought One argument against the use of rubber septa in a radiation field is that they are
known to radiolytically produce their own hydrogen which would contribute to any
measurements Although some preliminary laboratory tests indicate that the production of
hydrogen from septa seems predictable and can be subtracted from any hydrogen produced
from samples this information was obtained from a single batch of septa and the
production rate of hydrogen will most likely vary between batches as nothing is known
about the manufacturersquos quality control tolerances Another important argument is
concerned with the concentration ranges of hydrogen that will be measured Aqueous
samples that contain no radical scavengers often have low chemical yields for hydrogen
and sampling with a syringe reduces the sample volume to a maximum of 100 microL
attempting to extract a larger volume leads to sampling problems associated with negative
pressure within the sealed sample
The portion of hydrogen entering the gas chromatograph may be reduced even further for
samples containing slurries as much of the hydrogen may remain trapped in the aqueous
phase even after agitation
Chapter 2 Experimental Methods
56
Headspace injections may be a viable technique for samples that are known to produce
large quantities of hydrogen but generally measurements made with this technique are
often close to or below the detection limits of the gas chromatograph Many radiation
chemists have adopted a variety of techniques for measuring small quantities of
radiolytically produced hydrogen that do not rely on the use of rubber septa One such
technique is the ldquoCrush Tuberdquo method described in references3536
This method is used for
all hydrogen analysis in this work
The Crush Tube Sampling Method
The crush tube method of gas chromatography uses a modified SRI Model 8610C Gas
Chromatograph (GC) with a bespoke sampling device that contains a section of Tygonreg
tubing that allows for a glass sample vial to be crushed by an external force such as a pair
of wrench pliers Originally the tubing was a standard silicone tube however Tygonreg
tubing proved to be more durable and less prone to leaks Figure 15 and 16 show the
general schematic for the apparatus as well as the specially made sample vials for this
method
Figure 15 The modified SRI 8610C Gas chromatograph with inline ldquocrush tuberdquo setup
The sample can be seen inside the silicone tubing
Chapter 2 Experimental Methods
57
Figure 16 Image on the left shows a schematic for the sampling apparatus on the right
are the vials used which are flame sealed at the midway neck
In order for this technique to work several modifications must be made to the GC hence
the selection of the highly modular SRI Model 8610C The first modification was made to
the 10-port gas sampling valve to enable carrier gas to flow through the bespoke sampling
device during analysis The unmodified 10-port valve contains a sample loop that connects
to the ldquoINrdquo and ldquoOUTrdquo ports on the external of the GC during sample loading When the
port is rotated to the ldquoINJECTrdquo position the loop is included in the carrier gas path and the
external ports are isolated
Chapter 2 Experimental Methods
58
Figure 17 A schematic of the original setup for the 10-port sampling valve in both off (top
image) and on (bottom image) positions
It is essential that carrier gas is allowed to continually flow through the system during both
sample loading and sample injecting As the bespoke sampling device creates a closed loop
between the external ports it is possible to swap the connections of ports 1 and 10 without
disrupting the flow of carrier gas
This modification isolates the external ports during sample loading but includes them
during sample injection and allows sample gas to be carried through the GC
Chapter 2 Experimental Methods
59
Figure 18 A schematic for the modified 10-port sampling valve including the removal of
the silica gel column
Figure 18 also depicts the removal of the silica gel column this is part of the second
modification The bespoke sampling device contains a large volume of gas that requires a
relatively fast carrier gas flow rate to achieve acceptably narrow peaks This flow rate is
quoted in literature as being around 50 mLmin35
The Packed silica gel column and the
default molecular sieve column simply did not allow for this high flow rate without
significant back pressure that can cause damage to equipment for this reason they were
removed A bespoke column was made from frac14 inch copper tubing and 13x molecular sieve
beads The new column had a total length of 4 m and allowed sufficient flow rates with
adequate separation of gasses
Chapter 2 Experimental Methods
60
Figure 19 Image on the left shows the bespoke frac14 inch OD 13x molecular sieve column
On the right the rotameter is connected to calibrate gas flow rates
The SRI Model 8610C is not equipped with a digital rotameter as such it cannot display
flow rate information and instead can only display information about the carrier gas inlet
pressure which requires a conversion formula to obtain a meaningful flow rate The user
manual includes conversion factors but these are column specific and as the column has
been custom built it is necessary to manually determine a conversion formula to obtain a
flow rate This was done using a rotameter connected to the external GC ports by adjusting
the inlet pressure and noting the rotameter value a calibration curve was obtained
Chapter 2 Experimental Methods
61
Figure 20 A calibration curve to provide a conversion to determine carrier gas flow rate
Detection of H2 and Calibration
The SRI Model 8610C is equipped with a thermal conductivity detector (TCD) for the
measurement of eluted gas The TCD consists of a Wheatstone bridge circuit with tungsten-
rhenium filaments serving as resistors (Figure 21) Carrier gas containing eluted sample
passes over one of the filaments while a second path is reserved for carrier gas only to
serve as a reverence The filaments are electrically heated and the temperature of the whole
unit is carefully controlled As carrier gas passes over the filaments it conducts heat away
from the filament to the detector body when a sample component flows over the filament
the conductivity changes causing the filament to change temperature relative to the
reference filament This change in temperature changes the resistivity of the filament and a
change in voltage is recorded
Chapter 2 Experimental Methods
62
Figure 21 A schematic of a Wheatstone bridge circuit used in the TCD
To achieve a good sensitivity towards a given analyte it is important to have a large
difference in thermal conductivity between said analyte and the carrier gas Table 3 shows
the thermal conductivity values for some common gases The carrier gas most often used is
helium which has a thermal conductivity of 36036times106 cal s
-1 cm
-1 degC
-1 As many other
gases have much lower thermal conductivities helium often performs well however
hydrogen is a special case as it also has a high thermal conductivity of
44632times106 cal s
-1 cm
-1 degC
-1 For this reason the carrier gas selected for hydrogen
measurement was argon which has a much lower thermal conductivity of
4257times106 cal s
-1 cm
-1 degC
-1
Gas Thermal Conductivity (cal s-1
cm-1
degC-1
x106)
267degC
H2 44632
O2 6364
N2 6240
Ar 4257
He 36036
Table 3 Thermal conductivity of commonly used gases
Values taken from the Handbook of Tables for Applied Engineering Science
Chapter 2 Experimental Methods
63
Measurements made by the TCD are expressed as a voltage plotted as a function of time
The peaks produced in this plot are integrated and the final result is expressed as the peak
area As the peak area unit is largely arbitrary a calibration curve must be obtained to relate
the peak area to a meaningful quantity of hydrogen Calibration is carried out by replacing
the bespoke sampling device with a simple T-section fitted with a rubber septum Known
quantities of hydrogen gas are injected into the T-section which is then carried through the
GC Figure 22 shows a calibration curve for the linear range of 1 ndash 500 microL of pure
hydrogen at standard room temperature and pressure
Figure 22 A calibration curve for quantifying hydrogen gas from chromatograms
Samples of airhydrogen mixtures were also injected to make sure there was adequate
separation between the gases good separation between hydrogen and oxygen is observed
but the separation of oxygen and nitrogen is not adequate for analysis of those gases when
both are present in large quantities
Chapter 2 Experimental Methods
64
Machine parameters were adjusted for optimum performance these are shown in Table 4
These parameters were used for every experiment throughout this work
Parameter Value
Valve Temperature 70 Cdeg
Column Temperature 40 Cdeg
TCD Temperature 220 Cdeg
Flow Rate 50 mLmin
Carrier Gas Ar
Table 4 Optimised parameters used for the analysis of H2 gas
Method Validation
It was mentioned previously that the bromide ion is an excellent scavenger of hydroxyl
radicals during radiolysis
bull119874119867 + 119861119903minus [119867119874119861119903]minus119867(119886119902)+
rarr 119861119903bull + 1198672119874119861119903minus
rarr 1198611199032bullminus
Radiolysis of an aqueous solution of 1 mM bromide results in the elimination of the
reaction between the hydroxyl radical and molecular hydrogen in solution37
Other than
diffusion to the gas phase a reaction with hydroxyl radicals is the only significant removal
path of hydrogen at neutral pH The removal of dissolved oxygen by argon sparging also
simplifies much of the radiolysis chemistry allowing for a more reproducible experiment
This means that the hydrogen measured from the radiolysis of a deaerated 1 mM bromide
solution is in fact a primary yield and is quoted throughout the literature as being
GH2 = 045 this is an average value from a range of studies
2453839
Chapter 2 Experimental Methods
65
In order to secure confidence in this technique a validation experiment was carried out in
which a 1 mM solution of potassium bromide was used to determine the primary yield of
hydrogen which was then compared to the literature value
Figure 23 Method validation by the determination of the well-established primary yield of
H2 through hydroxyl scavenging by bromide
As expected the hydrogen concentration increased linearly with absorbed dose over the
experimental range When the number of hydrogen molecules is plotted as a function of
absorbed energy in sets of 100 eV the gradient gives GH2 = 0456 plusmn0025 matching well to
the average value quoted in literature
Chapter 2 Experimental Methods
66
Sources of Error
The majority of experiments carried out in this work use the absorbed energy or dose as
the independent variable and using one of the analytic techniques discussed above either a
photometric absorption value or the integrated response to hydrogen gas detection as the
dependant variable Both the dependant and independent variable have errors associated
with them which are discussed below
Determining the quantity of absorbed energy to the sample relies on the procedure of
dosimetry discussed earlier in this chapter The errors reported in Tables 1 and 2 are the
percent error of the gradient obtained from the measurement of Fe3+
as a function of time
As the experiments carried out in this work are plotted as a function absorbed dose and
there is an element of uncertainty associated with the dose rates the uncertainty of the
calculated absorbed dose increases with increasing dose This uncertainty in the absorbed
dose is included in many of graphs showing experimental data and is represented by
horizontal error bars
Sources of Error in the Determination of H2O2
The determination of H2O2 relies mainly on the calibration curve to yield a molar extinction
coefficient determined to be 25631 M-1
cm-1
with an uncertainty of plusmn 355 M-1
cm-1
The
molar extinction coefficient is used to convert the measured absorbance of a sample to a
concentration of H2O2 however this value has a dependence on temperature The ambient
temperature of the laboratory fluctuates slightly but it was decided that the effects were too
minor to consider The irradiation of samples on the other hand resulted in samples
heating slightly to a temperature that would be significant
Chapter 2 Experimental Methods
67
This was largely mitigated by leaving samples to cool for a few minutes until they reached
room temperature however an increase in temperature may affect the radiation chemistry
Solutions used to calibrate and reagents used to analyse samples also carry an associated
uncertainty in their concentrations The standards used to produce the calibration curve
were prepared from a stock solution of 3 wt H2O2 (Sigma Aldrich) From this the
0882 M solution was diluted to 1 mM which was used in a serial dilution to create the
standards ranging from 1 ndash 300 μM Uncertainty in the concentrations will have been
introduced by the tolerances of the pipettes and volumetric flasks used The pipettes used
were the Gilson Pipetman P1000 and P20 which are certified to comply with ISO 8655 that
imposes maximum allowable systematic errors of plusmn 80 μL and plusmn 02 μL for the P1000 and
P20 respectively The maximum allowable random error for the P1000 is quoted to be
le 30 μL and le 01 μL for the P20 The volumetric flasks used were class A Glassco brand
flask that conform to ISO 1042 Of the range of flasks used the largest error was 00025
Any uncertainty in the concentrations of the analytical reagents used to reduce H2O2 is
largely irrelevant as the chemicals used to perform the analysis are provided in a large
excess Stoichiometrically speaking as long as the concentration of iodide is at least three
times that of H2O2 the analysis should work in reality the concentration of iodide is
several times higher than this ensuring all H2O2 is reduced The sum of the above errors are
assumed to contribute to less than 1 of the total uncertainty of any measurements of
H2O2
Chapter 2 Experimental Methods
68
Sources of Error in the Determination of H2
The experimental technique provides a means to quantify hydrogen gas by volume In order
to make a comparison to predictions made by the computational model it was necessary to
convert this value to a concentration (mol dm-3
) This means knowing the volume of the
headspace in the crush tube vials As these vials are flame sealed they naturally have an
irregular shape and calculating a precise volume is difficult for this reason the conversion
uses an estimated headspace volume of 2 mL
Hydrogen gas is quantified by the integration of a change in voltage with respects to time
however the voltage response measured can be affected by a number of factors Factors
such as temperature and pressure are controlled automatically by the machine Moisture can
also affect the response of the TCD and this is controlled by running a ldquobake outrdquo cycle
prior to running any analysis One factor that cannot be prevented is the slow oxidation of
the tungsten-ruthenium filament which lowers the sensitivity of gas detection This can be
accounted for by performing regular calibrations often 3 or 4 point calibrations that are
compared to the original calibration curve If there is any deviance from the original curve
then a full calibration is performed and this is then used for the following analyses The
calibration curve shown in Figure 22 was the first full calibration performed throughout the
duration of this project the gradient of this curve gradually decreased this was accounted
for using the calibration process mentioned above As calibrations are performed by hand
with a gas tight syringe most of the error is likely introduced at this point The average
error of calibration points was plusmn 25 in the calibration curve given in Figure 22 for other
calibrations not shown in this work the average error was always less than 5
Chapter 3 Computational Methodology
69
Chapter 3 Computational Methodology
The earliest recorded computational approaches to solving problems in the field of radiation
chemistry date back to 1958 when the AVIDAC computer in Chicago was used to model
radical diffusion kinetics40
Since then different mathematical techniques have found use in
modelling problems found in the field of radiation chemistry and with ever increasing
computational power complicated calculations can be performed in seconds rather than
days In the early days of computational radiation chemistry primary yields were calculated
by deterministic methods involving the diffusion of a single spur However it became
apparent that a Monte Carlo approach held several advantages over deterministic methods
for the description of early stage radiolysis Such advantages include the ability to
incorporate the effects of a variety of different spur sizes and other entities arising from
secondary electrons41
For this reason modern radiolysis models usually fall into two
categories depending on what stage of radiolysis is being modelled Monte Carlo
calculations often concern the non-homogeneous early stages of radiolysis due to the
stochastic nature of energy deposition into a medium as mentioned earlier these
calculations often predict the primary yields of radiolysis products42
If the primary yields
are already known a deterministic approach is often employed to model the resulting
homogeneous chemistry in a similar way to most other chemical kinetics models through
the use of simultaneous ordinary differential equations (ODE)2743-46
Newer radiolysis
models are moving towards a multi-scale approach in which the output of the stochastic
stage is fed directly into the deterministic stage47
In this project a deterministic kinetic model for homogeneous chemical stage radiolysis has
been developed using a software package called FACSIMILE developed by MCPA
software Ltd
Chapter 3 Computational Methodology
70
FACSIMILE utilises Gear methodology for auto-adaptive time step control coupled with
Newton-Raphson iterations for prediction correction to deliver a robust simultaneous
ordinary differential equation solver The FACSIMILE language is largely based on the
Fortran language but is tailored for use by the scientific community and includes its own
high level notations for simplifying ODE construction48
The chemical model developed
here is largely based on the rate coefficient compilation by Elliot and Bartels 46
as well as
other literature sources27434549
This chapter gives a detailed description of how the model in this project works In essence
the model functions by producing primary radiolysis species at rates determined by their
primary yields and a dose rate parameter while simultaneously solving a set of ODEs that
represent the chemical reactions that describe the radiolysis chemistry At the same time
the model is also bound by framework calculations that describe various physical
parameters including but not limited to temperature effects and species volatility Each of
these concepts is described in detail in the following sections as well as the core radiolysis
reaction set
Production of Primary Species
As this model is only concerned with the homogeneous radiolysis chemistry that occurs
after diffusion of the primary species away from any kind of track structure the effect of
radiation can be represented by a series of zero order production equations with rate
constants derived from the dose rate and the species primary yield Each primary radiolysis
species has its own equation that defines its rate of production the general form of this
equation is shown below
Chapter 3 Computational Methodology
71
119896119894 =119863119877 times 119864119862 times 120588 times 119866119894
119873119860
DR is the dose rate given in Gy min-1
and Gi is the primary yield for species i NA is
Avogadros number and provides the conversion of molecules to moles while ρ is the
density of water and converts mass to volume ρ also has its own temperature dependency
which is calculated elsewhere in the code EC is a constant that effectively converts the
units of dose rate (J kg-1
min-1
) into time units compatible with a zero order rate constant
(mol dm-3
s-1
) and energy units compatible with primary yields (molecules 100 eV-1
) and
has a value of 104 times1015
and carries the unit 100 eV s-1
The dose rate is initially set by the user and is constant throughout the calculation however
primary yields are not set by the user and are initially set depending on other parameters
such as temperature and pH Table 52 shows the primary yields for water radiolysis by
gamma-rays at neutral pH and at room temperature the following section describes the
factors that can alter these values and details how they are incorporated into the model
Primary Species eaq- H
bull
bullOH H2 H2O2
g-Value 263 055 272 045 068
Table 5 Primary yields for γ-radiolysis of water at neutral pH and standard pressure and
temperature2
Chapter 3 Computational Methodology
72
Factors Affecting Primary Yields
Temperature
The rate of diffusion of primary species away from spurs created by ionising radiation is
affected by temperature As the temperature is increased the rate of diffusion of radical
species increases as does the rate of recombination reactions The yields obtained at high
temperature are determined by this competition between diffusion and recombination rates
Experiments carried out by Hochanadel and Ghormley (Table 6)50
first show this effect
over a temperature range of 2 ndash 65 degC in which higher temperatures favour increased
radical yields and decreased molecular yields
Primary Species g-Value Temperature
coefficient degC-1
2degC 23degC 65degC
Hbull + eaqˉ 359 367 382 +010plusmn003
bullOH 280 291 313 +018plusmn004
H2 038 037 036 -006plusmn003
H2O2 078 075 070 -015plusmn003
-H2O 435 441 454 +007plusmn003
Table 6 Temperature effects on the primary yields of water radiolysis50
A recent extensive compilation by Elliot and Bartels includes measurements of primary
yields at temperatures from 20 ndash 350degC from multiple sources and collates this data to
provide fitted equations for use in computational models The primary yield of the hydrated
electron was determined by product analysis of nitrogen formation from samples containing
nitrous oxide51-54
The chemical yield of nitrogen is equal to the primary yield of the
hydrated electron due to the following scavenging reaction
119890(119886119902)minus + 1198732119874 rarr 1198732119874
minus rarr 1198732 + 119874minus
Chapter 3 Computational Methodology
73
Organic compounds were also added to scavenge hydroxyl radicals and prevent them from
reacting with hydrated electrons Pulse radiolysis studies were also included55
but only the
data from nitrogen yield measurements were recommended for use
For the determination of the hydroxyl primary yield pulse radiolysis was the primary
method used The method described used bicarbonate to effectively convert hydroxyl
radicals to the carbonate radical which is more easily measured
The temperature dependency of the extinction coefficient for the carbonate radical was
estimated by integrating normalised absorption spectra as a function of temperature
originally collected by Elliot et al53
The resulting temperature dependency of the hydroxyl
radical primary yield is in agreement with an independent pulse radiolysis study that used a
ferrocyanide ion solution to measure the temperature dependency of the hydroxyl yield up
to 105degC53
The temperature dependence of the hydrogen peroxide primary yield was determined by
three independent studies Measurements in acrylamide solutions provided the temperature
dependency up to 100degC53
Further measurements made in deaerated solutions containing
nitrate and methanol extended this range to 150degC56
Estimations of the peroxide primary
yield to high temperatures were made based on the assumption that it was equivalent to the
chemical yield of oxygen in an alkali solution containing nitrous oxide or iodine this
approach expanded the temperature range to 270degC54
The primary yield of molecular hydrogen as a function of temperature has been measured
by three laboratories In each case hydrogen was directly measured from solutions
containing either a nitrous oxide and organic mix or nitrite ions In both cases the
measurements agreed well across all three laboratories515354
Chapter 3 Computational Methodology
74
Several attempts at measuring the primary yield of the hydrogen atom as a function of
temperature have been made however only two data sets are considered reliable as others
do not agree with the established yield at room temperature although all data sets show an
increase in yield with temperature
The chemical yield of molecular hydrogen from deaerated solutions containing nitrate and
phosphite ions is said to be equal to the sum of the primary yields of molecular hydrogen
and the hydrogen atom subtracting the already established primary yield of molecular
hydrogen from these measurements should give the primary yield of the hydrogen atom
These measurements agreed well with the established room temperature value and gave a
temperature dependence up to 200degC53
The temperature dependence was expanded to
350degC based on estimations of the ratio between the hydrogen atom primary yield and
hydrated electron primary yield which was calculated from data obtained during other
experiments performed in alkali solutions Unfortunately this data is described as archived
and unpublished The collated data from the experiments described above are shown in
Figure 24 with polynomial fits overlain the equations for these polynomials are given in
Table 7 and are used in the modelling calculations reported
Chapter 3 Computational Methodology
75
Figure 24 Collected data from literature showing measured primary yields as a function
of temperature Provided by Elliot and Bartels 200845
Primary Yield
Polynomial
g(eaq-) 2641 + 4162times10
-3 t + 9093times10
-6 t
2 ndash 4717 times10
-8 t
3
g(H2O2) 0752 ndash 1620times10-3
t
g(H2) 0419 + 8721times10-4
t ndash 4971times10-6
t2 + 1503times10
-8 t3
g(bullOH) 2531 +1134times10
-2 t ndash 1269times10
-5 t2 + 3513times10
-8 t3
g(Hbull) 0556 + 2198times10
-3 t ndash 1184times10
-5 t2 + 5223times10
-8 t3
Table 7 Polynomial equations for estimating temperature effects on primary yields45
Where t is the temperature in degC
Incorporation of any kind of temperature dependence into a prediction that will be
compared with experimental data requires knowledge of the experimental temperature This
is especially important in chemical kinetic models such as this as almost all the reaction
rate constants are temperature dependent For this reason a test was conducted to measure
the temperatures experienced by samples during irradiation
Chapter 3 Computational Methodology
76
The test was carried out with vials which had thermocouples attached the vials were filled
with water The vials were irradiated for 16 hours and the temperature was recorded every 5
minutes the average recording is shown in Figure 25 A polynomial fit was made from the
first 4 hours of data which was applied in the code to control the rate of temperature change
during a calculation the simulated temperature is shown as the red dashed line in
Figure 25
Figure 25 A comparison of the sample temperature profile logged by thermocouple to the
temperature profile calculated in the computational model
There are many ldquobulkrdquo radiolysis models in literature few of which make any reference to
the way in which temperature is controlled It can only be assumed that these models use a
fixed temperature which would produce less accurate predictions especially during early
periods where the temperature change is significant It should be said that this approach
should be used with caution as this temperature profile depends on the equipment being
used to irradiate samples and the dose rate involved
20
25
30
35
40
45
0 2 4 6 8 10 12 14 16
Tem
per
atu
re (degC
)
Time (h)
Thermocouple
Facsimile
Chapter 3 Computational Methodology
77
The majority of energy from the radioactive sources ends up being deposited into the
shielding material of the irradiation unit This heats the surrounding air within the
irradiation chamber which is often not circulated
pH
The effect of pH on the primary yields of water radiolysis has been a subject of discussion
for many decades yet experimental data on the subject is relatively sparse at high and low
pH Early radiolysis experiments often took place in acidic medium and so acidity became
one of the first variables considered for investigations into the effects of pH on primary
yields Table 857
shows primary yields data from 04 M sulfuric acid samples where the
pH = 046 the values shown are averages over multiple sources
Reference g(eaq-) + g(H
bull)
g(
bullOH) g(H2) g(H2O2) g(-H2O) Ref
Ferradini C et al 370 280 045 090 460 58
Allen AO
Lefort M 365 295 045 080 455
459
Sworski T J 370 292 039 078 448 60
Hochanadel C J et al 370 290 040 080 450 61
Mahlman H A et al 368 296 045 081 458 62
Hayon E et al 366 297 040 076 450 6364
Sehested K et al 362 289 039 076 441 65
Spinks amp Wood 365 290 040 078 445 2
Table 8 A collection of measurements of primary yields made in 04 M solution of
sulphuric acid (pH = 046)57
The noticeable changes to the primary yields when compared with those at neutral pH are
consistent throughout the literature including further sources not included in Table 8
Chapter 3 Computational Methodology
78
The change in primary yields is not massive in the pH range 046 ndash 7 but neither is it
insignificant With the exception of the molecular hydrogen yield all primary yields
increase slightly at low pH The main explanation for this involves the conversion of
hydrated electrons to hydrogen atoms within the radiation spurs In neutral solutions the
hydrated electron readily reacts with the hydroxyl radical to form hydroxide but when the
hydrated electrons are converted to hydrogen atoms the reaction with hydroxyl radicals is
suppressed
The hydrogen atoms do not react with hydroxyl radicals as quickly as hydrated electrons
and so the hydroxyl radicals become effectively ldquoprotectedrdquo at low pH This explains the
increase in primary yield of the reducing species (hydrated electron plus the hydrogen
atom) and the increase in the hydroxyl radical yield With an increase in hydroxyl radicals
comes an increase in the peroxide primary yield via the dimerisation of hydroxyl radicals
The decrease of the molecular hydrogen primary yield is due to the dimerisation of
hydrogen atoms having a slower coefficient than the reaction between two hydrated
electrons
119890119886119902minus + 119867(119886119902)
+ rarr 119867bull k = 210 times1010
M-1
s-1
119890119886119902minus + bull119874119867 rarr 119874119867minus k = 302 times10
10 M
-1 s
-1
119867bull + bull119874119867 rarr 1198672119874 k = 153 times10
10 M
-1 s
-1
The effect high pH has on the primary radiolysis yields of water is not as well documented
The number of studies is fewer than those conducted in acidic medium and the data from
said studies do not always agree Table 957
shows a collection of primary yields measured
in alkali samples where the pH asymp 135
Chapter 3 Computational Methodology
79
Reference g(eaq
-) +
g(Hbull)
g(
bullOH) +
g(bullOˉ)
g(H2) g(H2O2) +
g(HO2ˉ) g(-H2O) Ref
Draganić et al 318 272 045 068 409
538
Hayon E 327 304 043 053 412
66
Haissinsky M 334 301 04 056 414
67
Dainton F S et al 385 34 036 058 457
6869
Cheek C H et al 28 21 045 084 37
70
Fielden E M et al 357 28 - - -
71
Czapski G et al 33 - - 056 -
72
Table 9 A collection of primary yields measured in alkali solutions (pH asymp 135)57
At high pH the hydroxide ion can react with the hydroxyl radical within the spur forming
the oxide radical anion bullOˉ in the following equilibrium
bull119874119867 + 119874119867minus bull119874minus + 1198672119874 pKa = 119
At high concentrations of hydroxide the hydroxyl radical may be completely replaced by
the oxide radical anion A consequence of this shift is the decrease in the peroxide primary
yield as it is thought that the dimerisation of the oxide radical anion to form peroxide is
slower than the neutral equivalent dimerisation of hydroxyl radicals This is something that
is observed across almost all the studies conducted at high pH The reaction between the
hydrated electron and the oxide radical anion is also slower than the corresponding neutral
equivalent reaction It is therefore expected that the primary yield of oxidising radicals
G(bullOH) + G(
bullOˉ) would increase with increasing pH as would the total primary yield of
reducing radicals G(e(aq)
-) + G(
bullH) The primary yield of molecular hydrogen is mostly
unaffected by the increased pH this would suggest that the net decomposition yield of
water must increase in order to satisfy the material balance equation
Chapter 3 Computational Methodology
80
119892(minus1198672119874) = 119892(119890119886119902minus ) + 119892(119867bull) + 2119892(1198672) = 119892(119874119867
bull) + 119892(119874bullminus) + 2(119892(11986721198742) + 119892(1198671198742minus))
Despite the difficulty in deriving quantitative agreement across the available data there are
studies that offer qualitative agreement with the expected changes to primary yields at high
pH66-69
There are also studies that do not agree and propose that the primary yields are
largely unaffected by pH5387073
Despite the oxide radical anion being the main radiation produced oxidising radical in
aqueous alkali medium and therefore having a significant effect on the chemistry reaction
rate coefficients associated with it are largely unknown and rely on estimation The lack of
reliable rate coefficients for the reactions of the oxide radical anion is an important factor to
consider when attempting to model the radiolysis of water at high pH
It has been shown using stochastic simulations that the chemistry of the oxide radical
anion can have a significant impact on the prediction of primary yields Initial predictions
of the stochastic model by Pimblott et al74
showed an increase in the peroxide primary
yield at high pH This is counter to the accepted trend observed experimentally of a
decreasing peroxide primary yields at high pH In order to match the observed decrease in
peroxide primary yield a single rate constant was changed from 20 times1010
M-1
s-1
to 65
times109 M
-1 s
-1 for the reaction below
119874bullminus + bull119874119867 rarr 1198671198742minus
Chapter 3 Computational Methodology
81
This change had the effect of reversing the trends of the primary yield predictions at high
pH resulting in agreement with experimental data Soon after this the rate constant for the
reaction between the oxide radical anion and the hydroxyl radical was measured to be 74
times109 M
-1 s
-1 which is much closer to the adjusted rate constant used in the stochastic
simulation than the original estimate49
Figure 26 shows literature values for the measured primary yields as a function of pH from
this polynomial equations were fitted which were combined in a multiple regression
analysis with the equations fitted to temperature analysis data Table 10 shows the resulting
equations While this approach gives an estimate of the primary yields as a function of both
temperature and pH it is not an ideal solution This type of estimation is better suited to a
stochastic type track chemistry calculation
A stochastic approach could also account for the effects of different linear energy transfer
(LET) values which are discussed in the next section A multi-scale approach could even
procedurally produce stochastically calculated primary yields that feed into a deterministic
chemical kinetic simulation
Chapter 3 Computational Methodology
82
Figure 26 A reproduction of data provided by Hayon75
showing the effect of pH on
primary radiolysis yields
Primary Yield
Multiple Regression Equation
g(eaq-) 28 + 285times10
-3 times t ndash 251times10
-2 times pH
g(H2O2) 845times10-1
ndash 151times10-3
times t ndash 17times10-2
times pH
g(H2) 388times10-1
+ 829times10-4
times t + 599times10-4
times pH
g(˙OH) 243 + 111times10-2
times t ndash 12times10-3
times pH
g(H˙) 444times10-1
+ 367times10-3
times t ndash 24times10-4
times pH
Table 10 Multiple regression polynomials used to estimate the combined effect of
temperature and pH on the primary yields of water radiolysis
0
05
1
15
2
25
3
35
0 1 2 3 4 5 6 7 8 9 10 11 12 13 14
Pri
ma
ry Y
ield
(M
ole
cule
s 1
00
eV
-1)
pH
g(OH)
g(e-)
g(H2O2)
g(H2)
Chapter 3 Computational Methodology
83
Linear Energy Transfer (LET)
Linear energy transfer is a way of expressing the rate at which an ionising particle loses
energy through a medium Sometimes referred to as ldquostopping powerrdquo linear energy
transfer is quoted as the average energy loss divided by a fixed path length usually micro
meters or nano meters (keV μm-1
or eV nm-1
) This parameter is frequently expressed as an
average rate of energy loss across the entire particlersquos track this is because the energy loss
rate of an ionising particle is not uniform As a high energy ionising particle begins its
journey through a material energy loss events are sparse and only small quantities of
energy are transferred so the particle continues largely un-deflected As this energy lost to
these small transfers accumulates and the energy of the charged particle decreases the
cross section of interactions increases This means that there are more energy loss events
for a given linear distance as the particles path becomes less linear A true linear energy
transfer profile of a particle would take the form of a Bragg curve such as the example
shown below
Figure 27 An example of a Bragg peak Energy loss of alphas of 549 MeV in Air
Image released to public domain
Chapter 3 Computational Methodology
84
For ease of comparison this profile is usually averaged to give a single LET parameter
Ionising particles of higher mass andor lower energy have higher LET values The
implications of linear energy transfer are manifested in the radiation track structure
Increasing LET values have the effect of increasing the spur distribution density as
illustrated in the diagram below
Figure 28 A schematic representation of how linear energy transfer (LET) alters the
distribution of spurs along a radiation track Image was recreated from Allen AO4
The distribution of spurs along a track has an effect on the diffusion of primary radiolysis
species and ultimately alters the primary yields Experiments carried out using 210
Po to
irradiate solutions of iron sulphate through various thicknesses of mica have shown the
effects of changing LET on the yield of oxidation of Fe2+
76
From this subsequent studies
using cyclotron accelerated protons have measured the effects of LET on the primary yields
of water radiolysis77
Compiling the data from these studies gives a general picture of the
effects of LET on water radiolysis primary yields which is shown below
Chapter 3 Computational Methodology
85
Figure 29 Simulation data showing the effects of increasing linear energy transfer on the
primary yields of water radiolysis Image was recreated from Allen AO4
The general trend shows an increase in the formation of molecular products at higher LET
at the expense of radical species (with the exception of hydroperoxyl radical (˙HO2)) at very
high LET values whilst lower LET values favour the radical species Currently there is no
clear agreed explanation as to how the hydroperoxyl radical is formed at high LET Gamma
rays from cobalt-60 fall in the low LET range and have an average value of
023 keV μm-1
78
As the experiments conducted throughout this project used only cobalt-60 as a source of
radiation it was not necessary to incorporate the effects of linear energy transfer into this
radiolysis model nor was it necessary to include the primary yield of hydroperoxyl radicals
into this model as the yield is negligible at the LET value of cobalt-60 Future iterations of
this model would need to include the effects of linear energy transfer as well as better
methods for coping with the effects of temperature and pH this is discussed in more detail
in Chapter 8
Chapter 3 Computational Methodology
86
Mass Transfer of Volatile Species
The transfer of volatile species is not something that affects radiolysis primary yields but it
is important to include as the aqueous reactions of volatile species namely molecular
hydrogen and oxygen will partition into the gas phase This mass transfer is described
within the model as two equations
1198672(119886119902) 1198672(119892)
1198742(119886119902) 1198742(119892)
These equations take the form of first order rate equations with the rate constant substituted
for a time dependant net mass transfer coefficient (kapp) which includes an interfacial mass
transfer coefficient (νint) and the Henryrsquos equilibrium partition coefficient (Kp)27
119889119862(119886119902)119894
119889119905= minus119896119886119901119901
119894 (119905) times 119862(119886119902)119894 (119905)
119896119886119901119901119894 = 120592119894119899119905
119894 times119860119894119899119905119881119886119902
(1 minus 119870119901119894119862119892119894(119905)
119862119886119902119894 (119905)
)
Ci refers to the concentration of species i in either the gas phase or the aqueous phase Aint
and Vaq are used to describe some of the geometry of the radiolysis vessels used in
experiments Aint is the interfacial surface area between the two phases while V is the
volume of the aqueous or gas phase denoted by its subscript As experiments were
conducted in different sized vials depending on the analysis technique used different values
of Aint and V were used when comparing model predictions to experimental data
Chapter 3 Computational Methodology
87
This method assumes that the volume of liquid and covering gas is the same which was
true for all the experiments conducted during this work If the liquid to gas volume ratio
was anything other than 1 then the above differential should be adjusted to account for this
ratio by the following modification
minus119881119897119881119892times119889119862(119886119902)
119894
119889119905= 119896119886119901119901
119894 (119905) times 119862(119886119902)119894 (119905)
The interfacial mass transfer coefficient (νint) incorporates the use of the stagnant two-film
model which provides a description of resistance to diffusion through un-mixed boundary
layers (see Figure 3079
)
Figure 30 A representation of the stagnant two-film model used to calculate the
partitioning of volatile species79
The stagnant two-film model is incorporated into the mass transfer coefficient by relating
the species diffusivity coefficients (D) the boundary thickness (δ) and the Henryrsquos
equilibrium partition coefficient (Kp)
Chapter 3 Computational Methodology
88
1
120592119894119899119905119894=
1
(119863119886119902119894
120575119886119902)
+119870119901119894
(119863119892119894
120575119892)
119870119901119894 =
119862119886119902119894 (119890119902)
119862119892119894(119890119902)
The diffusivity of volatile species is a temperature dependant coefficient which is included
in the model through the use of polynomial fits to data obtained from literature and is
shown in figure 3180-83
Henryrsquos coefficients were taken from literature which included
equations for describing the temperature dependence so a polynomial fit was not
necessary84
The Henryrsquos equilibrium partition coefficient is a dimensionless ratio between
the aqueous and gas phase concentrations of a volatile species at equilibrium This value is
related to the Henryrsquos law constant (kH) by the following relationship
119879 times 119896119867119894 = 122 times 119870119901
119894
The value 122 is used to convert between the Henryrsquos law coefficient in mol maq-3
Pa-1
and
the dimensionless Henryrsquos law coefficient While T represents the temperature in Kelvin
the Henryrsquos law constant also has its own temperature dependency built in this is described
by the following relationship
119896119867 = 119896119867120579 times 119864119883119875 (
∆119867119904119900119897119899119877
(1
119879minus1
119879120579))
Chapter 3 Computational Methodology
89
The Henryrsquos constant at standard temperature (29815 K) (kHθ) is quoted in the literature as
being 13times10-3
mol dm-3
atm-1
for oxygen and 78times10-4
mol dm-3
atm-1
for hydrogen ΔHsoln
is the enthalpy of solution and R is the gas constant the average ratios are quoted in the
literature as 1650 for oxygen and 543 for hydrogen84
This gives values for the Henryrsquos equilibrium partition coefficient (Kpi) of 0019 and 0031
for hydrogen and oxygen respectively at 25degC and smaller values at higher temperatures
Figure 31 The diffusivity of O2 and H2 in both water and air as a function of temperature
000
050
100
150
200
250
300
350
000E+00
100E-05
200E-05
300E-05
400E-05
500E-05
600E-05
700E-05
800E-05
900E-05
0 100 200 300 400
Dif
fusi
vit
y i
n A
ir (
cm2 s
-1)
Dif
fusi
vit
y i
n H
2O
(cm
2 s
-1)
Temperature (degC)
O2aq
H2aq
H2g
O2g
Chapter 3 Computational Methodology
90
Diffusivity
Polynomial
O2(aq) 20times10-9
times t2
+ 40times10-7
times t + 10times10-5
O2(g) 10times10-6
times t2
+ 12times10-3
times t + 02073
H2(aq) 10times10-8
times t2 + 40times10
-7 times t + 30times10
-5
H2(g) 50times10-6
times t2 + 47times10
-3 times t + 07719
Table 11 Polynomial equations used to estimate the temperature effects on the diffusivity
of O2 and H2 in both gas and aqueous phases where t = temperature (Cdeg)
Water Radiolysis Reaction Set
The radiolysis model simulates the chemical kinetics of homogeneous radiolysis through
the use of simultaneous differential equations that represent the independent chemical
reactions taking place The model therefore includes a set of reactions accompanied by
reaction rate constants Tables 12 - 14 gives a summary of the reaction set used with a full
description of the reaction set including the associated temperature dependences is given in
appendix A The reaction rate coefficients are taken from multiple sources with the
majority from the compilation of A J Elliot and D M Bartels45
Chapter 3 Computational Methodology
91
Reaction Number Primary Species
Production
G-value
(Molecules100eV) Ref
G0 H2O 119890(119886119902)minus 271 45
G1 H2O Hbull 054 45
G2 H2O H2 041 45
G3 H2O bullOH 270 45
G4 H2O H2O2 068 45
G5 H2O H(aq)+ 271 45
Table 12 A list of Primary Species used to model water radiolysis
Reaction
Number
Chemical Reactions Rate Constant k
(M-1
s-1
25degC)
Ref
R0 emacraq + emacraq rarr H2 + 2OHmacr 726 times109
45
R1 emacraq + Hbull rarr H2 + OHmacr 276 times10
10
45
R2 emacraq + bullOH rarr OHmacr 355 times10
10
45
R3 emacraq + bullOmacr rarr 2OHmacr 231 times10
10
49
R4 emacraq + H2O2 rarr OHmacr + bullOH 136 times10
10
45
R5 emacraq + HO2bull rarr HO2macr 130 times10
10
45
R6 emacraq + HO2macr rarr Obullmacr + OHmacr 351 times10
9
49
R7 emacraq + O2 rarr O2bullmacr 225 times10
10
45
R8 emacraq + O2bullmacr rarr O2
2macr + H2O 130times10
10
4349
R9 Hbull + H
bull rarr H2 514 times10
9
45
R10 Hbull +
bullOH rarr H2O 109 times10
10
45
R11 Hbull + H2O2 rarr
bullOH + H2O 365 times10
7
45
R12 Hbull + O2 rarr HO2
bull 130 times10
10
45
R13 Hbull + O2
bullmacr rarr HO2macr 114 times10
10
45
R14 Hbull + HO2
bull rarr 2
bullOH 114 times10
10
45
R15 Hbull + HO2macr rarr
bullOH + OHmacr 137times10
9
85
Chapter 3 Computational Methodology
92
R16 Hbull + O3 rarr
bullOH + O2 220 times10
10
43
R17 bullOH +
bullOH rarr H2O2 481 times10
9
45
R18 bullOH + H2O2 rarr H2O + HO2
bull 292 times10
7
45
R19 bullOH + HO2macr rarr OHmacr + HO2
bull 813 times10
9
45
R20 bullOH + HO2
bull rarr H2O + O2 884 times10
9
45
R21 bullOH + O2
bullmacr rarr OHmacr + O2 110 times10
10
45
R22 bullOH + O3 rarr HO2
bull + O2 110 times10
8
43
R23 bullO3macr + H2O2 rarr O2
bullmacr + O2 + H2O 159 times10
6
43
R24 bullO3macr + HO2macr rarr O2
bullmacr + O2 + OHmacr 887 times10
5
43
R25 bullO3macr + H2 rarr O2 + H
bull + OHmacr 249times10
5
46
R26 bullO3macr +
bullOH rarr HO2
bull + O2
bullmacr 6000 times10
9
43
R27 bullO3macr +
bullOH rarr HOmacr + O3 250 times10
9
43
R28 bullO3macr + H
+(aq) rarr O2 +
bullOH 900 times10
10
43
R29 O2bullmacr + O2
bullmacr +1198672119874rarr
O2 + O22macr 299times10
-1
43
R30 O2bullmacr + HO2macr rarr
O2 + bullOmacr + OHmacr 823 times10
-2
43
R31 O2bullmacr + H2O2 rarr
O2 +
bullOH + OHmacr 130 times10
-1
43
R32 O2bullmacr + HO2
bull rarr O2 + HO2macr 760times10
7
43
R33 O2bullmacr +
bullO3macr rarr
O2macr+ 2O2 100 times10
4
43
R34 O2bullmacr + O3 rarr
bullO3macr + O2 150 times10
9
43
R35 HO2bull + HO2
bull rarr H2O2 + O2 840 times10
5
45
R36 HO2bull + H2O2 rarr O2 + H2O +
bullOH 500 times10
-1
49
R37 HO2bull + O3 rarr
bullOH + 2O2 500 times10
8
43
R38 H2O2 + HO2macr rarr O2 + H2O + OHmacr 450times10-4
43
R39 O3 + OHmacr rarr HO2macr + O2 480 times101
43
R40 O3 + HO2macr rarr bullOH + O2 + O2
bullmacr 550 times10
6
43
R41 O3 + H2O2 rarr bullOH + O2 + HO2
bull 371 times10
-2
43
R42 Hbull +
bullOmacr rarr OHmacr 200times10
10
43
Chapter 3 Computational Methodology
93
R43 bullO3macr + emacraq rarr 2OHmacr
+
O2 160times10
10
43
R44 O3 + emacraq rarr bullO3macr 360 times10
10
43
R45 H2O2 rarr 2bullOH 230 times10
-7
86
R46 O2macr + H2O rarr 2OHmacr
100 times10
10
43
R47 bullOmacr + H2 rarr
bullH + OHmacr 128 times10
8
45
R48 bullOmacr + H2O2 rarr O2
bullmacr + H2O 555 times10
8
49
R49 bullOmacr + HO2macr rarr O2
bullmacr + OHmacr 786 times10
8
45
R50 bullOmacr + O2
bullmacr rarr O
2macr + O2 600 times10
8
43
R51 bullOmacr +
bullOmacr rarr O2
2macr 100times10
8
43
R52 bullOmacr +
bullOH rarr HO2macr 761 times10
9
49
R53 bullOmacr + O3macr rarr 2O2
bullmacr 700times10
8
43
R54 bullOmacr + O3 rarr O2
bullmacr + O2 100 times10
9
43
Table 13 A list of reactions used to model water radiolysis
Chapter 3 Computational Methodology
94
Equilibria kf
(M-1
s-1
25degC)
kb
(M-1
s-1
25degC) Ref
R5556 H2O H+
(aq) + OHmacr 117 times10-3
118times1011
45
R5758 H2O2 H+
(aq) + HO2macr 890 times10-2
478times1010
45
R5960 H2O2 + OHmacr HO2macr + H2O 127 times1010
140 times106
45
R6162 HO2macr + OHmacr
O22macr + H2O 351 times10
5 110 times10
6
43
R6364 bullOH H
+(aq) +
bullOmacr 890 times10
-2 478times10
10
45
R6566 bullOH + OHmacr
bullOmacr + H2O 127 times10
10 140 times10
6
45
R6768 bullOmacr + O2
bullO3macr 375 times10
9 262 times10
3
45
R6970 HO2bull H
+(aq) + O2
bullmacr 478 times10
10 735 times10
5
45
R7172 HO2bull + OHmacr O2
bullmacr+ H2O 127 times10
10 163 times10
-1
45
R7374 Hbull emacraq + H
+(aq) 583 210times10
10
45
R7576 Hbull + OHmacr emacraq + H2O 244 times10
7 174 times10
1
45
R7778 Hbull + H2O H2 +
bullOH 458 times10
-5 395 times10
7
45
R79 H2(aq) H2(g) 269times10-3
R80 O2(aq) O2(g) 103times10-4
Table 14 A list of equilibria used to model the radiolysis of water
Chapter 3 Computational Methodology
95
Computational Assumptions and Error
The first assumption this model makes is that radiolysis does not occur in the gas phase In
reality this is not the case however the density of the gas phase is so small compared to that
of the aqueous phase that any contribution from gas phase radiolysis will be negligible
There are several reactions that do not include any kind of temperature dependence for their
associated rate constants This is due to a lack of information available in the literature
many of the species involved in these reactions are notoriously difficult to measure reaction
rate constants for thus these reactions have a fixed rate constant across all temperatures
The method for estimating the primary yields to account for both temperature and pH
effects is not an ideal method Multiple linear regression analysis is often used to
empirically predict the value of a single dependant variable based on the contributions of
multiple independent variables In the case of this model the independent variables are
temperature and pH a full model would also include LET as a third independent variable
The number of observations considered for the regression analysis is less than ideal due to
the scarcity of available data coupled with the difficulty of relating non-linear variables
means that predictions of primary yields are loose estimates at best The coefficient of
determination (R2) gives information about how well the multiple regressions fit the data
and is shown in Table 15 where μ denotes the estimated standard deviation of the error
Primary Yield
R2 μ
g(eaq-) 0612 0249
g(H2O2) 0934 0045
g(H2) 0907 0032
g(bullOH) 0950 0265
g(Hbull) 0925 0108
Table 15 Statistical information concerning the estimation of primary yields used to model
the radiolysis of water
Chapter 3 Computational Methodology
96
The partition of volatile species depends on a number of parameters some of which are
dependent on geometry Although H2O2 is not a volatile species its concentration is
strongly affected by the concentration of aqueous O2 it is therefore necessary to include gas
partitioning methods in both H2 and H2O2 model calculations The interfacial surface area
(Aint) is one such parameter although this can be roughly determined by measuring the
geometry of the vials being used Other parameters such as the boundary thicknesses (δ) are
not so easily measured and are parameter fitted This is done using the parameter fitting
functionality built into FACSIMILE Experimental data is supplied to FACSIMILE and the
desired parameters to fit are declared the calculation is then performed a number of times
slightly varying the declared parameters each time until the predicted values better match
the provided experimental data For this work the data provided to FACSIMILE was the
concentration of H2 and H2O2 in aerated water as a function of dose (Figures 32-33) Vials
of different geometry have different boundary thicknesses the values used throughout this
work are shown in Table 16
Parameter
Vial Used for H2 Analysis Vial Used for H2O2 Analysis
Aint (m2) 502 times10
-5 284 times10
-4
δaq (m) 580 times10-4
510 times10-4
δg (m) 260 times10-2
260 times10-2
Table 16 Parameters used to describe interfacial surface area (Aint) and boundary
thicknesses (δ) for sample vials of different geometry
Chapter 4 The Radiolysis of Aqueous Solutions at High pH
97
Chapter 4 The Radiolysis of Aqueous Solutions at High pH
Preliminary Radiolysis Studies of Pure Water
Preliminary experiments to measure hydrogen peroxide and hydrogen gas concentrations
from the radiolysis of aerated and deaerated water at neutral pH were carried out as a
control to which other measurements may be compared Computational modelling of these
pure water systems were performed with the radiolysis model described in Chapter 3 to
validate the models performance
Measurements of hydrogen peroxide were made using the Ghormley Tri-iodide method
described in Chapter 2 The pH of the stock was measured using a Mettler Toledo
SevenMultitrade pH meter equipped with a probe capable of measuring pH in the range 0-14
and was found to be 699 Aliquots of 10 mL from the pure water stock were sealed in
20 mL headspace vials so that the liquid to headspace ratio was 11 and were irradiated in
row 1 of the 4x8 sample rack the average dose rate was 2839 Gy min-1
The experiment
was run twice prior to irradiation samples used in the first run were sealed but left aerated
while samples used in the second run were sealed in gas tight vials equipped with rubber
septa and were sparged for 20 minutes with zero grade argon gas to remove all dissolved
oxygen The results of the two experimental runs are shown in Figure 32
Preliminary measurements of hydrogen gas production were also carried out using pure
water 2 mL aliquots of pure water stock were flame sealed in 4 mL glass vials which were
then secured in the inverter rig and irradiated for various periods of time the average dose
rate was 2851 Gy min-1
Post irradiation analysis was carried out by the previously
described crush tube method of gas chromatography
Chapter 4 The Radiolysis of Aqueous Solutions at High pH
98
As flame sealing introduces slight irregularity in the volume of headspace an assumption
was made that the headspace of the sealed vial was 2 mL
This allows the conversion of measured quantities (microL) of hydrogen to a concentration
(mol dm-3
) Once again the experiment was run twice with the second experimental run
using samples that have been deaerated with argon and the results are shown in Figure 33
Figure 32 Measurements of H2O2 concentration as a function of dose for aerated water
(diams) and deaerated water (diams) Vertical error bars show the standard deviation between
replicates while horizontal error bars show the dose range for replicates
000E+00
100E-06
200E-06
300E-06
400E-06
500E-06
600E-06
700E-06
800E-06
000E+00
200E-05
400E-05
600E-05
800E-05
100E-04
120E-04
140E-04
0 10 20 30 40
[H2O
2]
(mo
l d
m-3
) D
eaer
ated
[H2O
2]
(mo
l d
m-3
) A
erat
ed
Dose (kGy)
Aerated Water
Deaerated Water
Chapter 4 The Radiolysis of Aqueous Solutions at High pH
99
Figure 33 Measurements of H2 as a function of dose in aerated (diams) and deaerated (diams)
samples Vertical error bars show the standard deviation of replicates while horizontal
error bars show the dose range for replicates
Discussion
Aerated samples resulted in a steady-state concentration of hydrogen peroxide at
approximately 11 times10-4
mol dm-3
while molecular hydrogen continues to form with
absorbed dose over the range considered In order to satisfy the mass balance requirements
some other species must be formed after the achievement of the peroxide steady-state that
is also proportional to hydrogen formation The most likely candidate for this is molecular
oxygen which would have to be formed at half the rate of hydrogen
Samples that did not contain any dissolved oxygen failed to produce significant quantities
of hydrogen peroxide or hydrogen gas with a very low steady state eventually achieved at
approximately 40 times10-6
mol dm-3
This may be attributed to the radiolytic production of
oxygen required to satisfy mass balance Using the radiolysis model a predicted chemical
yield can be obtained after the establishment of the hydrogen peroxide steady state to show
that mass balance is satisfied by oxygen production The predicted chemical yields were
calculated between doses of 15 kGy to 30 kGy
000E+00
100E-04
200E-04
300E-04
400E-04
500E-04
600E-04
700E-04
800E-04
0 10 20 30 40 50 60
[H2]
(mo
l d
m-3
)
Dose (kGy)
Aerated Water
Deaerated Water
Chapter 4 The Radiolysis of Aqueous Solutions at High pH
100
For oxygen gas the predicted chemical yield was G(O2) = 0011 while the predicted yield
of hydrogen gas formation in deaerated water was G(H2) = 0022 In both cases samples
that were aerated produced much larger quantities of hydrogen and hydrogen peroxide than
their deaerated equivalents This was somewhat expected as it has long been considered
that dissolved oxygen is reduced and the reduction products are able to react with hydroxyl
radicals preventing them from removing hydrogen peroxide and hydrogen87
The general
scheme first proposed in 1954 for this protection mechanism is initiated by the reaction of
hydrogen atoms with oxygen to produce hydroperoxyl radicals these then react with
hydroxyl radicals to reform water and oxygen or with itself to form hydrogen peroxide and
oxygen4
119867bull + 1198742 rarr 1198671198742bull
(R12)
bull119874119867 + 11986721198742 rarr 1198672119874 + 1198671198742bull
(R18)
1198671198742bull + 1198671198742
bull rarr 11986721198742 + 1198742 (R35)
bull119874119867 + 1198671198742bull rarr 1198672119874 + 1198742 (R20)
More recent studies by the research group led by Clara Wren have deployed computational
methods to investigate further the effects of dissolved oxygen on the steady-state
concentration of both hydrogen peroxide and molecular hydrogen86
The calculations
performed in this study also supported the idea that dissolved oxygen is reduced and it is
the reduction products that scavenge hydroxyl radicals resulting in the protection of
hydrogen peroxide and molecular hydrogen The calculations revealed that oxygen is
mainly reduced by the hydrated electron and that the superoxide formed is responsible for
the scavenging of hydroxyl radicals This process serves as a catalytic mechanism for the
overall reaction between the solvated electron and hydroxyl radicals
Chapter 4 The Radiolysis of Aqueous Solutions at High pH
101
119890119886119902minus + 1198742 rarr 1198742
minus (R7)
1198742minus + bull119874119867 rarr 119874119867minus + 1198742 (R21)
Overall Reaction 119890119886119902minus + bull119874119867 rarr 119874119867minus (R2)
This scavenging of hydroxyl radicals has a larger impact on protecting hydrogen as the
reaction between hydrogen and the hydroxyl radical is the only significant removal path of
hydrogen in neutral conditions
Wren proposes that high concentrations of hydrogen peroxide seen in aerated solutions can
be attributed to a change in the production pathway for hydrogen peroxide in the presence
of oxygen The reaction between both the reduction products of oxygen becomes the
dominant production pathway for hydrogen peroxide
1198671198742bull + 1198742
minus rarr 1198671198742minus + 1198742 (R32)
119867(119886119902)+ + 1198742
minus 1198671198742bull (R6970)
119867(119886119902)+ + 1198671198742
minus 11986721198742 (R5758)
Similar calculations were performed in this work using the computational method described
in Chapter 3 The computational predictions shown in figures 34 and 35 serve as a baseline
to demonstrate that the computational model performs well at least at a fundamental level
before building up to more complex systems
Chapter 4 The Radiolysis of Aqueous Solutions at High pH
102
Figure 34 Predicted concentrations of H2O2 as calculated by the radiolysis model for both
aerated () and deaerated () conditions
Figure 35 Predicted concentrations of H2 gas as calculated by the radiolysis model for
both aerated () and deaerated () conditions
000E+00
100E-06
200E-06
300E-06
400E-06
500E-06
600E-06
700E-06
800E-06
000E+00
200E-05
400E-05
600E-05
800E-05
100E-04
120E-04
140E-04
0 10 20 30 40
[H2O
2]
(mo
l d
m-3
) D
eaer
ated
[H2O
2]
(mo
l d
m-3
) A
erat
ed
Dose (kGy)
Aerated Water
FACSIMILE Aerated
Deaerated Water
FACSIMILE Deaerated
000E+00
100E-04
200E-04
300E-04
400E-04
500E-04
600E-04
700E-04
800E-04
0 10 20 30 40 50 60
H2 (
mo
l d
m-3
)
Dose (kGy)
Aerated Water
Deaerated Water
FACSIMILE Aerated
FACSIMILE Deaerated
Chapter 4 The Radiolysis of Aqueous Solutions at High pH
103
The predictions made for the concentrations of hydrogen peroxide and hydrogen gas in pure
water match well with the observed measurements especially for the concentration of
hydrogen peroxide produced in aerated water The most obvious discrepancy is the
disparity between the early predictions of hydrogen peroxide concentration and the
measured concentration for deaerated samples which is most likely due to imperfect
oxygen removal from the samples As the predictions are in generally good agreement with
the experimental measurements it is not unreasonable to assume that steady state
concentrations of other species which cannot or were not determined experimentally
during this work can be estimated by the model
Figure 36 Calculated concentrations of the major oxidising and reducing water radiolysis
species as a function of dose Solid lines represent aerated conditions while broken lines
represent deaerated conditions
Figure 36 shows the predicted concentrations of various radical species in both aerated and
deaerated water The calculated concentrations agree with previously published calculations
by Wren and co-workers86
100E-14
100E-12
100E-10
100E-08
100E-06
0 10 20 30 40 50
Co
nce
ntr
atio
n (
mo
l d
m-3
)
Dose (kGy)
˙OH
O2˙-
H˙
eaq-
HO2˙
Chapter 4 The Radiolysis of Aqueous Solutions at High pH
104
Under aerated conditions reducing species H˙ and eaq- have significantly lower
concentrations than in deaerated conditions due to scavenging by oxygen The resulting
reduction products of oxygen are superoxide and hydroperoxyl radicals and both show an
increased concentration in aerated conditions
The experiments in the following sections concerning the measurement of hydrogen
peroxide were all performed in aerated conditions to resemble the conditions at the
Sellafield site Measurements of hydrogen were for the most part carried out under
deaerated conditions
Chapter 4 The Radiolysis of Aqueous Solutions at High pH
105
Measurements of H2O2 in the Radiolysis of High pH Solutions
Stock solutions of various pH were prepared using NaOH dissolved in ultra-pure water
From each stock sample sets were prepared from 10 mL aliquots of stock solution and
sealed in 20 mL glass vials with aluminium crimp caps The pH of the remaining sample
stocks were measured and recorded Irradiation dose rates were calculated from original
measurements using the Fricke dosimetry method described previously Sample sets were
loaded into row 1 of the 4x8 irradiation rack and irradiated using the Model-812 cobalt-60
irradiator until they reached the desired dose Table 17 summarises the dose rates and pH of
the sample batches examined
Sample Batch ID Average Dose Rate for Row 1 (Gy min-1
) Measured pH
H2O2-PH00 28512 699
H2O2-PH01 27497 1041
H2O2-PH02 27407 1108
H2O2-PH03 28364 1230
H2O2-PH04 27467 1274
Table 17 Conditions of samples used to investigate hydrogen peroxide in high pH
radiolysis
Results
Post irradiation analysis for H2O2 was carried out immediately after irradiation using the
previously described tri-iodide method Analysis of high pH samples required additional
acid to lower the pH to the conditions required by the analytical method the quantities of
acid used were recorded and the dilution effects have been accounted for The results of this
study are shown in Figure 37
Chapter 4 The Radiolysis of Aqueous Solutions at High pH
106
Figure 37 Measurements of H2O2 concentrations as a function of dose for samples
initially at pH 7 (diams) pH 104 (diams) pH 11 (diams) pH 123 (diams) and pH 127 (diams)
All samples were aerated Vertical error bars are the standard deviation between
replicates while horizontal error bars show the dose range for replicates
The steady state concentration of hydrogen peroxide is fairly consistent at about
115 x10-4
mol dm-3
within the pH range 7-11 each attaining steady state after roughly
5 kGy At higher pH values both the steady state concentration and the dose at which
steady state is achieved increase
Samples at pH 123 required roughly 10 kGy to obtain a peak steady-state concentration of
195 x10-4
mol dm-3
of hydrogen peroxide while samples at pH 127 required even higher
doses almost 20 kGy to reach a steady concentration of 238 x10-4
mol dm-3
The data set
from samples at pH 123 shows an apparent decrease in hydrogen peroxide concentration of
~18 at 35 kGy A similar decrease in hydrogen peroxide concentration is also observed in
samples of pH 11
000E+00
500E-05
100E-04
150E-04
200E-04
250E-04
300E-04
0 10 20 30 40
[H2O
2]
(mo
l d
m-3
)
Dose (kGy)
pH 127
pH 123
pH 11
pH 104
pH 7
Chapter 4 The Radiolysis of Aqueous Solutions at High pH
107
Measurements of H2 in the Radiolysis of High pH Solutions
Stock solutions of various pH were prepared using NaOH to match the pH range used in
the measurement of hydrogen peroxide Many of the acid-base equilibria used in the
description of water radiolysis have pKa values in the pH range investigated by this study
The behaviour of H2 production observed at high pH may be influenced by a change in
chemistry brought about by a shift in one or more of the acid-base equilibria Table 18
shows the equilibria of interest and their associated pKa value while Table 19 includes the
measured pH of the stock solutions
Equilibrium pKa
bull119926119919 119919(119938119954)+ + bull119926minus 1184
119919120784119926120784 119919(119938119954)+ +119919119926120784
minus 1168
119919bull 119919(119938119954)+ + 119942119938119954
minus 974
119919119926120784bull 119919(119938119954)
+ + 119926120784minus 483
Table 18 A list of important equilibria and their associated pKa values
For the measurement of hydrogen sample sets were prepared from 2 mL aliquots of stock
solution which were transferred to glass ldquocrush tuberdquo vials described in chapter two The
vials were connected to a glass manifold via stainless steel needles and sparged with zero
grade argon for 20 minutes to remove any dissolved oxygen before samples were flame
sealed under argon
Irradiation dose rates were calculated from original Fricke dosimetry study described
previously Samples were loaded into the four positions available in the inverter rig and
irradiated until they reached the desired dose
Chapter 4 The Radiolysis of Aqueous Solutions at High pH
108
Results
After irradiation samples were analysed for hydrogen gas by gas chromatography using the
ldquocrush tuberdquo technique described in Chapter 2 Figure 38 shows the amounts of H2
produced as a function of radiation dose As production rates of hydrogen gas are linear as a
function of absorbed dose chemical yields can be identified as the gradient expressed in
terms of molecules per 100 eV of absorbed energy These results are summarised in Table
19 while the data is shown in Figure 38
Table 19 Conditions of samples used to investigate hydrogen gas in high pH radiolysis
Figure 38 Measurements of H2 gas as a function of dose at pH 7 (diams) pH 106 (diams) pH 123
(diams) and pH 13 (diams) Dashed lines are provided to clarify the data trends all samples were
deaerated Vertical error bars show the standard deviation between replicates while
horizontal error bars show the dose range for replicates
000E+00
500E-04
100E-03
150E-03
200E-03
250E-03
0 20 40 60 80
H2 (
mo
l d
m-3
)
Dose (kGy)
pH 13
pH 123
pH 106
pH 7
Sample
Batch ID
Average Dose Rate for
Inverter Rig (Gy min-1
) Measured pH G(H2) Error plusmn
H2-PH00 28385 699 0021 0002
H2-PH01 28408 1063 0071 0018
H2-PH02 29039 1232 0352 0005
H2-PH03 28634 1307 0176 0010
Chapter 4 The Radiolysis of Aqueous Solutions at High pH
109
Increasing the pH has the effect of increasing the chemical yield for hydrogen over the pH
range 7 to 123 however the data set for pH 13 shows that the chemical yield for hydrogen
is less than samples at pH 123 The results of the calculations using the reaction scheme
given in Tables 12 - 14 for both hydrogen peroxide and hydrogen gas production are
shown in Figures 39 and 40 respectively
Figure 39 Model calculations to show the predicted concentrations of H2O2 as a function
of dose at various pH
000E+00
500E-05
100E-04
150E-04
200E-04
250E-04
300E-04
350E-04
0 10 20 30 40 50
[H2O
2]
(mo
l d
m-3
)
Dose (kGy)
pH 127
pH 123
pH 11
pH 104
pH 7
Chapter 4 The Radiolysis of Aqueous Solutions at High pH
110
Figure 40 Model calculations to show the predicted concentrations of H2 gas as a function
of dose at various pH
Calculated concentrations of hydrogen peroxide show the same trends as the data The
predictions at pH 104 and 11 take slightly longer to reach steady state than what the
experimental data shows Higher pH calculations follow the same trend as the experimental
data but overestimate the steady state concentrations of hydrogen peroxide especially in the
calculations at pH 127
Calculated concentrations of molecular hydrogen follow a slightly more unexpected trend
Predictions made for pH 106 massively overestimate hydrogen production rates this is
symptomatic of a misunderstanding of the mechanistic chemistry A similar error has also
been noted by Wren when performing calculations at this pH a suggested fix was to
increase the reaction rate between ozinide and molecular hydrogen by a factor of 886
000E+00
500E-04
100E-03
150E-03
200E-03
250E-03
300E-03
0 20 40 60 80
[H2]
(mo
l d
m-3
)
Dose (kGy)
pH 13
pH 123
pH 106
pH 7
Chapter 4 The Radiolysis of Aqueous Solutions at High pH
111
Even with this higher rate the over prediction of hydrogen is still large at pH 106 while
predictions for pH 123 agree reasonably well with experimental data This information at
least helps to narrow the pH range at which this misunderstanding manifests The pH range
afflicted by over prediction of hydrogen falls close to the pKa of the dissociation of the
hydrogen atom at 974
119867bull 119867(119886119902)+ + 119890(119886119902)
minus pKa = 974
The reverse reaction rate for the above equilibrium has been measured with good agreement
over a number of laboratories however the forward reaction rate is calculated based on the
relationship between the reverse reaction rate and the equilibrium constant45
This
equilibrium constant is derived from the Gibbs free energy of formation of Hbull in the gas
phase combined with an estimated value for the free energy of solvation of Hbull This
estimation is a value between those for the free energy of solvation of He atoms and H2
molecules888
Both computational and experimental data show the same trend at pH 13 in that the
production rate of hydrogen is less than that observed at lower pH however the
calculations once again overestimate the rate shown by the experimental data Some more
features of this discrepancy are discussed further in the following section
Chapter 4 The Radiolysis of Aqueous Solutions at High pH
112
Discussion
The radiolytic removal of hydrogen from solution by the hydroxyl radical has long been
referred to as the Allen chain25
In this mechanism the hydroxyl radical reacts with
molecular hydrogen to reform water and a hydrogen atom the chain is then extended by the
reaction of the hydrogen atom with hydrogen peroxide to reform the hydroxyl radical with
the net effect being the removal of H2 and H2O2
Propagation Steps
bull119874119867 + 1198672 rarr 119867bull + 1198672119874 k78 = 40 times10
7 M
-1 s
-1
119867bull + 11986721198742 rarr bull119874119867 + 1198672119874 k11 = 365times107 M
-1 s
-1
Termination 119867bull + bull119874119867 rarr 1198672119874 k10 = 109times1010
M-1
s-1
Aside from transference into the gas phase this chain is the only removal path for hydrogen
under neutral pH conditions At higher pH radical species are converted into their base
forms and a new chain is established43
119867bull + 119874119867minus 119890119886119902minus + 1198672119874 (R7576)
bull119874119867 + 119874119867minus 119874bullminus + 1198672119874 (R6566)
Propagation Steps
119874bullminus + 1198672 rarr 119890119886119902minus + 1198672119874 k47 = 128 times10
8 M
-1 s
-1
119890119886119902minus + 1198671198742
minus rarr 119874bullminus + 119874119867minus k49 = 786times108 M
-1 s
-1
Termination 119890119886119902minus + 119874bullminus rarr 2119874119867minus k3 = 231times10
10 M
-1 s
-1
Chapter 4 The Radiolysis of Aqueous Solutions at High pH
113
Given the higher rate constants involved in the alkali chain it would seem that the chain
reaction established in the basic form has a higher efficiency than its neutral equivalent yet
observations show a higher chemical yield of hydrogen at high pH and would suggest
otherwise This can largely be resolved by considering the effects of oxygen on these chain
reactions Oxygen acts as a poison to both the chain reactions removing hydrogen causing
an increase in hydrogen yield The mechanism by which oxygen disrupts the chain is
through reactions with solvated electrons to produce superoxide which in turn reacts with
OH radicals or in the case of alkali solutions bullOˉ preventing them from reacting with
hydrogen as well as reforming oxygen
119890119886119902minus + 1198742 rarr 1198742
bullminus (R7)
bull119874119867 + 1198742bullminus rarr 119874119867minus + 1198742 (R21)
bull119874minus + 1198742bullminus + 1198672119874 rarr 2119874119867
minus + 1198742 (R50)
In alkali solution bullOˉ is also susceptible to a direct reaction with oxygen to form ozonide
ions while a neutral equivalent reaction between hydroxyl radicals and oxygen does not
exist As the experimental measurements of hydrogen gas from solutions of sodium
hydroxide were carried out in deaerated conditions there should be no initial dissolved
oxygen and any oxygen present would have been radiolytically formed Figure 41 shows
the calculated steady state concentration of aqueous oxygen compared to hydrogen gas
formation as a function of pH from this it is clear that an increase in pH leads to a rise in
radiolytically produced oxygen which is proportional to the amount of hydrogen generated
Chapter 4 The Radiolysis of Aqueous Solutions at High pH
114
Figure 41 Model calculations showing the concentrations of aqueous oxygen and
hydrogen gas from deaerated water after 80 kGy at 280 Gy min-1
to show the related
behaviour between the two
Analysis of the calculated reaction rates gives an insight to why the concentration of
radiolytic oxygen first rises with pH and then falls after pH 12 and may help to reveal the
source of the over-prediction at pH 106 All the following reaction rates are taken from the
end of the experimental range ie 80 kGy with a dose rate of 280 Gy min-1
At neutral pH
it is the reaction between the superoxide ion and the hydroxyl radical (R21) that is the main
source of radiolytic oxygen but as the pH rises beyond pH 10 the rate of this reaction
begins to fall from ~140 times10-6
mol dm-3
s-1
to 886 times10-8
mol dm-3
s-1
at pH 14 This drop
is mainly due to the equilibrium between the hydroxyl radical and its basic form bullOˉ which
has a pKa of 119 As one would expect the reaction rate of the equivalent base reaction
(R50) rises as the pH increases although this increase does not fully compensate for the
decrease in rate of R21
100E-06
100E-05
100E-04
100E-03
100E-02
7 8 9 10 11 12 13 14
Lo
g C
on
cen
trat
ion (
mo
l d
m-3
)
pH
[H2] g
[O2] aq
Chapter 4 The Radiolysis of Aqueous Solutions at High pH
115
This is because the reaction between the solvated electron and superoxide (R8) has a larger
rate constant than R50 and with the conversion of hydrogen atoms to solvated electrons at
high pH R8 out competes R50
In principal many other reactions produce oxygen but the rates of these reactions are often
negligible Only the rate of oxygen production through the reaction of superoxide and
hydroperoxyl (R32) sees an increase over the pH range 10-12 which may be significant to
radiolytic oxygen production Figure 42 shows the rates of the three main molecular oxygen
producing reactions (R21 R50 and R32) as well as the reaction rate for R8 and the
combined reaction rates for R8 and R50 as a function of pH When the combined reaction
rates of R8 and R50 are compared with the reaction rate of R21 it becomes obvious that
there is a transition from the removal of super oxide by R21 to removal by both R8 and
R50 this is the main cause of a decrease in oxygen concentration after pH 12 Figure 43
shows the sum of reaction rates that lead to oxygen formation and removal as a function of
pH
Figure 42 Model predictions of the steady-state reaction rates of R21 R50 and R32 at
various pH for γ radiolysis of deaerated water at a dose rate of 280 Gy min-1
000E+00
200E-07
400E-07
600E-07
800E-07
100E-06
120E-06
140E-06
160E-06
7 8 9 10 11 12 13 14
Rea
ctio
n R
ate
at S
tead
y S
tate
(mo
l d
m-3
s-1
)
pH
Chapter 4 The Radiolysis of Aqueous Solutions at High pH
116
Figure 43 The sum of the steady state rates of all reactions that produce O2 () compared
with the sum of the steady state rates of all reactions that remove O2 () These totals do
not include rates of production or removal from mass transfer reactions This calculation is
for the γ radiolysis of deaerated water to a dose of 80 kGy at a rate of 280 Gy min-1
At pH 7 the rate of oxygen production matches the rate at which it is removed and a low
steady state concentration of aqueous oxygen is achieved before the end of the 80 kGy
calculation range At higher pH the rate of oxygen removal diverges and so oxygen can
accumulate to a higher concentration over a longer period of time longer than that of the
80 kGy range used Excluding transfer into the gas phase there are only three reactions that
effectively remove oxygen so it was worth investigating how the rates of these reactions
changed with pH Figure 44 shows the rates of reactions R6 R7 R8 R12 and R67 as a
function of pH
000E+00
200E-07
400E-07
600E-07
800E-07
100E-06
120E-06
140E-06
160E-06
7 8 9 10 11 12 13 14
Rat
e at
Ste
ady S
tate
(mo
l d
m-3
s-1
)
pH
Chapter 4 The Radiolysis of Aqueous Solutions at High pH
117
Figure 44 Model predictions of the steady-state reaction rates of R7 R12 and R67 at
various pH This calculation is for the γ radiolysis of deaerated water to a dose of 80 kGy
at a rate of 280 Gy min-1
The first removal path of oxygen is the reaction between the solvated electron and oxygen
to produce superoxide (R7) this reaction does not see a significant change in rate below
pH 11 after which the rate begins to fall The second reaction is the reduction of oxygen by
the hydrogen atom (R12) the rate of this reaction falls steadily as pH increases this is due
to the conversion of hydrogen atoms to solvated electrons by hydroxide which has a pKa of
96 The decline in rate of this reaction accompanied by no significant increase in the rate
of oxygen removal by solvated electrons may be the main contribution to the increased
concentrations of oxygen at pH gt 9 It was thought that this might also be the cause of the
over prediction but any attempt to increase this rate constant is largely negated by an
accompanying increase in the rate of reaction R32 The final removal path of oxygen is the
reaction with O˙- to form ozonide (R67)
000E+00
200E-07
400E-07
600E-07
800E-07
100E-06
120E-06
7 8 9 10 11 12 13 14
Rea
ctio
n R
ate
at S
tead
y S
tate
(mo
l d
m-3
s-1
)
pH
Chapter 4 The Radiolysis of Aqueous Solutions at High pH
118
The rate of this reaction increases rapidly with pH from 194 times10-8
mol dm-3
s-1
at pH 9
to 146 times10-6
mol dm-3
s-1
at pH 14 however ozonide is unstable and decomposes to reform
oxygen at a rate not much lower than its formation
Subtracting the rate of oxygen reformation from the decomposition of ozonide gives the
actual rate of oxygen removal by bullOˉ of 110 times10
-9 mol dm
-3 s
-1 at pH 9 and
600 times10-8
mol dm-3
s-1
at pH 14 It should be noted that the decomposition rate of ozonide
was excluded from the total rate of oxygen formation in figure 44 while the rate of oxygen
removal by ozonide formation was the subtracted values quoted above
The main removal mechanism of hydrogen peroxide is by reaction with solvated electrons
In the presence of oxygen the removal of hydrogen peroxide by solvated electrons is
largely out competed by reactions between the solvated electrons and oxygen or
superoxide The rate constant for the reaction between oxygen and the solvated electron
(R7) is 225 times1010
dm3 mol
-1 s
-1 while for the reaction of hydrogen peroxide and the
solvated electron (R4) is only 136 times1010
dm3 mol
-1 s
-1 and so hydrogen peroxide is initially
protected from reactions with the solvated electron as long as oxygen or superoxide is
available In alkali conditions where the pH is larger than 116 the conjugate base of
hydrogen peroxide HO2- becomes the dominant peroxide species This reacts even slower
with the solvated electron with a rate constant of 365 times109
dm3 mol
-1 s
-1 so the protection
effect is even stronger It was mentioned earlier that beyond pH 11 the rate of reaction R21
falls significantly as bullOH is converted to its basic form and the equivalent base reaction
(R50) does not see a sufficient equivalent increase in rate The reason given was that R50
was out competed by the reaction between superoxide and the solvated electron (R8)
Chapter 4 The Radiolysis of Aqueous Solutions at High pH
119
This not only serves to protect hydrogen peroxide by competing with solvated electrons but
also contributes to the increased concentration of hydrogen peroxide as the product of R8 is
in fact hydrogen peroxide
119890119886119902minus + 1198742
bullminus rarr 11987422minus (R8)
11987422minus + 1198672119874 1198671198742
minus + 119874119867minus (R6162)
Although this may account for the increased steady state of hydrogen peroxide at high pH
Figure 39 still shows a slight over prediction for calculations made at pH 123 and 127 As
the equilibrium between the hydroxyl radical and the oxygen anion has a pKa of 1184 it
was thought that the over prediction could be a result of the estimations used for the rate
constants of the reactions involving the oxide radical anion There is little data available for
the rate constants of reactions involving bullOˉ As reaction R51 and R52 both lead to the
formation of peroxide it initially was thought that these reactions may have rate constants
that are too high however removing these reactions from the model made no significant
difference to the predicted production of H2O2
119874bullminus + 119874bullminus rarr 11987422minus
1198672119874rarr 1198671198742
minus + 119874119867minus (R51)
119874bullminus + bull119874119867 rarr 1198671198742minus (R52)
It was instead found that other oxide radical anion reactions had an effect on the predicted
value for H2O2 A total of four oxide radical anion reactions influence the predicted values
with two of them making a significant difference Reducing the rate constant for the
reactions R47 and R48 made a slight improvement to the prediction of H2O2 a more
significant effect can be seen by altering the rate constants for R49 and R50
Chapter 4 The Radiolysis of Aqueous Solutions at High pH
120
119874bullminus + 1198671198742minus rarr 1198742
minus + 119874119867minus (R49)
119874bullminus + 1198742minus rarr 1198742minus
1198672119874rarr 2119874119867minus + 1198742 (R50)
Originally the rate constant for R49 was an estimation reported by Buxton et al in 19889
with a value of 40 times108 M
-1 s
-1 Since then this rate constant has been measured by
C R Stuart and D C Ouellette and is reported as being 786 times108
M-1
s-1
at 25degC45
The
value for the rate constant for R50 was originally estimated by Sehested et al in 198289
to
be 60 times108 M
-1 s
-1 This estimation was made by adjusting the rate constant for R50 and
R53 in a kinetic model to produce a prediction that agreed with the decay of ozonide
measured experimentally by pulse radiolysis By increasing the rate constant for R50 from
60 times108 M
-1 s
-1 to 48 times10
9 M
-1 s
-1 an improved agreement to the predicted steady state
concentration of H2O2 is found This is shown in Figure 45
Figure 45 Dashed lines show the original prediction where k50 = 60 times108 M
-1 s
-1 while
solid lines show the predictions with the increased k50 = 48 times109 M
-1 s
-1
000E+00
500E-05
100E-04
150E-04
200E-04
250E-04
300E-04
350E-04
0 10 20 30 40 50
[H2O
2]
(mo
l d
m-3
)
Dose (kGy)
Chapter 4 The Radiolysis of Aqueous Solutions at High pH
121
With the modified reaction rate constant for R50 the predictions for the steady state
concentrations of H2O2 are closer to the experimental values at high pH
Although this calculation improves the prediction for the steady state concentration it also
appears to increase the rate at which the steady state is achieved moving the prediction
away from the experimental data The cause of this discrepancy may have something to do
with the way in which some of the equilibria have been implemented in the model and
should be investigated in the future This modification also has little effect on the over
prediction of hydrogen gas at pH 104
Chapter 5 Radiolysis of Magnesium Hydroxide
122
Chapter 5 Radiolysis of Magnesium Hydroxide
Context
The Magnox Swarf Storage Silo contains 22 silos used to store magnesium alloy cladding
that has been removed from spent Magnox fuel elements The magnesium fuel cladding is
stored underwater where it readily corrodes to form magnesium hydroxide and hydrogen
gas by the following reaction90
119872119892 + 21198672119874 rarr 119872119892(119874119867)2 +1198672
Hydrogen gas poses an obvious hazard and is closely monitored however production rates
are not predictable Much of the magnox fuel cladding is contaminated with uranium and
other fission products contributing an additional supply of hydrogen through water
radiolysis Dose rates are often further increased as some of the silos were used to dispose
of other beta and gamma emitting waste The presence of the magnesium hydroxide
complicates the radiolysis processes as (a low) solubility in water drives up the pH while
undissolved magnesium hydroxide provides additional surfaces where radiolysis processes
are poorly understood
Experiments were conducted to investigate the effects of magnesium hydroxide on the
radiolytic production yields of hydrogen gas and hydrogen peroxide The investigation
began by measuring hydrogen yields in solutions of magnesium hydroxide and comparing
hydrogen yields to solutions containing sodium hydroxide solution with the same pH Pure
water is also included as a control and the magnesium hydroxide samples included both
homogeneous saturated solutions of aqueous magnesium hydroxide and heterogeneous
slurries containing undissolved magnesium hydroxide
Chapter 5 Radiolysis of Magnesium Hydroxide
123
Method
The saturated solution was prepared in bulk using magnesium hydroxide (Sigma Aldrich
BioUltra ge 990) and ultra-pure water solids were separated by centrifuge as filters may
introduce organic contamination 2 mL aliquots of saturated magnesium hydroxide solution
were transferred to sample tubes and flame sealed under air The pH of the remainder of the
saturated solution was measured to be 106 Slurry samples were prepared by weighing
01 g of magnesium hydroxide into a glass vial before adding 2 mL of ultra-pure water
Samples were also flame sealed under air before being mechanically mixed by agitation
Samples were irradiated using the inverter rig however the samples were left stationary and
were not inverted during irradiation Samples were irradiated at an average dose rate
of 281 Gy min-1
until the desired dose was reached samples were then analysed for
hydrogen by the ldquocrush tuberdquo gas chromatography method previously described Figure 46
shows the production of hydrogen as a function of dose for both saturated solutions and
solid containing slurries of magnesium hydroxide This is compared with measurements
obtained from pure water and an aqueous solution of sodium hydroxide with a similar pH
to that of the magnesium hydroxide samples
Chapter 5 Radiolysis of Magnesium Hydroxide
124
Results
Figure 46 Measurements of H2 gas as a function of dose All samples here are aerated
with vertical error bars showing the standard deviation between replicates
It should be noted that all the samples used to produce figure 46 are aerated The chemical
yield of hydrogen for each sample set is given in Table 20
Table 20 Obtained results from the measurements of H2 gas
000E+00
200E-04
400E-04
600E-04
800E-04
100E-03
120E-03
140E-03
160E-03
180E-03
200E-03
0 10 20 30 40 50 60
[H2]
(mo
l d
m-3
)
Dose (kGy)
Sample ID Average Dose Rate for
Inverter Rig (Gy min-1
)
Measured
pH G(H2)
(Molecules 100 eV-1
) Error
plusmn
Mg(OH)2(s) 2814 1062 052 003
Mg(OH)2(aq) 2814 1057 047 002
NaOH 2845 1063 027 002
H2O 1732 699 016 001
Chapter 5 Radiolysis of Magnesium Hydroxide
125
The dose rate for the pure water samples is much lower than the other dose rates quoted as
this measurement was performed before the construction of the inverter rig and so the
samples were held further away from the source during irradiation
This data shows that the presence of magnesium hydroxide appears to increase the
hydrogen yield beyond what one would expect if the yield was controlled by pH alone
There is very little difference in hydrogen yield between samples that contain solid
magnesium hydroxide and samples that contain only dissolved magnesium hydroxide This
suggests that surface effects contribute to the hydrogen yield only a very small amount or
not at all This data is discussed further in the following section
A second set of experiments was conducted to measure the concentration of hydrogen
peroxide in irradiated saturated solutions of magnesium hydroxide 10 mL aliquots of
aerated saturated solution were transferred in to 20 mL glass headspace vials the vials were
sealed with an aluminium crimp cap and irradiated in the front row of the 4 x 8 rack the
average dose rate was 2831 Gy min-1
After irradiation the samples were analysed for
hydrogen peroxide by the Ghormley tri-iodide method described in Chapter 2 Figure 47
compares the obtained data from this experiment with data obtained from measurements
made in pure water
Chapter 5 Radiolysis of Magnesium Hydroxide
126
Figure 47 Measurements of H2O2 concentrations in aerated samples of saturated
magnesium hydroxide solution as a function of dose
The steady state concentration of hydrogen peroxide in a saturated solution of magnesium
hydroxide is almost the same as in a neutral sample of pure water as is expected given the
pH of the saturated solution was measured to be 106 which is below the 118 threshold
that is associated with an increased steady state of hydrogen peroxide observed in the
previous chapter
A further experiment was conducted to investigate the effects of the solid magnesium
hydroxide surface on the production of hydrogen Batches of samples were prepared with
various ratios of magnesium hydroxide to water each sample had a total mass of
approximately 2 g Table 21 summarises the sample ratios used Samples were irradiated
using the inverter rig which was left stationary throughout the irradiation the average dose
rate was 3042 Gy min-1
All samples were irradiated to approximately 525 kGy so that any
difference in the amount of hydrogen produced is independent of absorbed dose
000E+00
200E-05
400E-05
600E-05
800E-05
100E-04
120E-04
140E-04
0 5 10 15 20 25 30 35 40
[H2O
2]
mo
l d
m-3
Dose kGy
Aerated Water
Mg(OH)2 Saturated SolutionMg(OH)2 Aerated Saturated Solution
Chapter 5 Radiolysis of Magnesium Hydroxide
127
As the dose rate was determined by Fricke dosimetry which is a liquid phase dosimeter
with a density close to that of water the quoted dose of 525 kGy is what was received by
the aqueous phase The solid phase magnesium hydroxide has a slightly higher density and
will have received a slightly higher dose Figure 48 shows the chemical yields of hydrogen
as a function of water content percentage The results have been normalised to reflect the
amount of hydrogen produced per gram of water and the yields were calculated based on
the radiation dose absorbed by the whole system this makes the data from samples that
contain large quantities of water comparable to those with lower water content
Table 21 Conditions of samples containing Mg(OH)2 for measurements of H2
a ndash Powder sample with no added water estimated adsorbed water content is based on
data from Nelson et al91
b ndash Sample is a saturated solution of Mg(OH)2 ie contains no solid
H2O Average Mg(OH)2
Mass (g)
Average H2O
Mass (g)
Average
Dose (kGy)
4a 5303 plusmn 111
20 161 plusmn 002 040 plusmn 001 5245 plusmn 146
40 122 plusmn 002 082 plusmn 001 5255 plusmn 146
60 081 plusmn 001 122 plusmn 001 5255 plusmn 145
80 040 plusmn 001 162 plusmn 002 5245 plusmn 145
100b 5239 plusmn 145
Chapter 5 Radiolysis of Magnesium Hydroxide
128
Figure 48 Measurements of hydrogen yields from magnesium hydroxide samples with
various solid ndash aqueous ratios All samples were irradiated to a total dose of ~52 kGy to
the aqueous phase at a dose rate of 3041 Gy min-1
Discussion
The data shown in Figure 46 suggests that the presence of dissolved magnesium hydroxide
increases the chemical yield of hydrogen significantly more than if pH was the only
controlling factor Data shown in Figure 48 suggests that the presence of the solid surface
increases the hydrogen yield slightly above that for saturated solutions but it would seem
that the main contribution to the increased H2 yields in magnesium hydroxide samples
when compared to a solution of NaOH of equivalent pH is a factor present in both slurries
and saturated solutions of magnesium hydroxide The yield of H2 between 20 and 80
percent water content is not affected by changing the solid solution ratio suggesting that
there is little interaction between the solid magnesium hydroxide and the bulk water
00
02
04
06
08
10
12
14
16
0 20 40 60 80 100
G(H
2)
(Mo
lecu
les
10
0 e
V-1
)
H2O
Chapter 5 Radiolysis of Magnesium Hydroxide
129
The yield is significantly higher for samples with 4 water content (adsorbed water)
suggesting that any additional hydrogen is produced only in a few water layers away from
the solid surface as has been postulated for oxide surfaces
Petrik et al showed that oxide water systems consisting of multiple phases such as the
slurry samples measured here have different hydrogen yields depending on the oxide18
They grouped materials into three categories based on the effects they have on measured
hydrogen yields hydrogen enhancing hydrogen diminishing and hydrogen neutral
Though said study did not include magnesium hydroxide it does categorise magnesium
oxide as a material that does not significantly change the yield of hydrogen
The mechanism by which a solid surface increases the hydrogen yield is largely accredited
to an energy transfer process As solid particles in a sample absorbs energy a process of
energy migration from the bulk of the material to the interface takes place Energy can then
be transferred from the solid phase to the surrounding liquid The exact mechanism of the
energy transfer process is not well understood but the overall effect is higher dose rates in
localised areas of surrounding water
As the value of 4 water content is an estimation based on data extrapolation published by
Nelson et al in a study of water adsorption on magnesium hydroxide91
and may not be
entirely accurate This uncertainty could have a significant effect on the calculated chemical
yield if the estimation was even slightly incorrect for example an estimated water content
of just 9 has the effect of lowering the yield to the same value observed in samples
contain 20 water content This would be contradictory to an energy transfer process as
described previously
Chapter 5 Radiolysis of Magnesium Hydroxide
130
A study by Jay La Verne et al published measurements of hydrogen yields from the
gamma radiolysis of magnesium hydroxide to be 005119
This measurement was made
using magnesium hydroxide that had been dried to remove all excess water while
remaining hydroxylated The difference between the measured yields of saturated
magnesium hydroxide solution (G(H2) = 047) and a slurry sample (G(H2) = 052) given in
Table 20 is 005
This value is very close to the quoted value from dry magnesium hydroxide although it is
an average value and errors can be high with small differences between large numbers such
as this Little information is given to explain the mechanism contributing to this yield of
hydrogen from dry magnesium hydroxide other that the radiation induced conversion of
magnesium hydroxide to magnesium oxide92
A comparison was made to yields obtained
from calcium hydroxide and found that the yield of hydrogen was four times higher from
calcium hydroxide than from magnesium hydroxide This was explained in terms of the
tendency to form water during radiolysis being greater in magnesium hydroxide than in
calcium hydroxide meaning that a smaller portion of the hydroxide generates hydrogen
directly If the yield measured from the dry powder (0051) by La Verne et al is the result
of direct hydrogen production from magnesium hydroxide converting to the oxide then it
would make sense that the difference in yield between samples containing solid magnesium
hydroxide and only aqueous magnesium hydroxide would be close to this value
This does not explain why the yields of both samples are far higher than samples of sodium
hydroxide at the same pH as the magnesium hydroxide samples The chemical yield of
hydrogen from samples of sodium hydroxide with a pH of 1063 was 027 while yields
from both magnesium hydroxide systems were a little less than double this value
Chapter 5 Radiolysis of Magnesium Hydroxide
131
As this can be seen in both aqueous only samples and those containing solid magnesium
hydroxide the cause of this increased yield must be attributed to a factor present in both
aqueous only samples and samples containing solid magnesium hydroxide Magnesium
hydroxide is often discussed in literature concerning environmental science for its
properties and reactivity towards carbon dioxide9394
As the samples used in these experiments did not undergo any purification processes prior
to use they were most likely subject to carbonation reactions with atmospheric carbon
dioxide and water Magnesium hydroxide can be carbonated on exposed surfaces although
slow at standard room conditions it can be increased in the presence of water95
119872119892(119874119867)2(119904) + 1198621198742(119892) rarr 1198721198921198621198743(119904) + 1198672119874(119892)
Magnesium hydroxide can also take on intercalated carbon dioxide which can be converted
to carbonate either by reaction with water or if released into solution with hydroxide to
form bicarbonate9697
1198621198742(119860119894119903) 1198621198742(119894119899119905119890119903119897119886119910119890119903)
1198621198742(119894119899119905119890119903119897119886119910119890119903) + 1198672119874(119894119899119905119890119903119897119886119910119890119903) 2119867(119894119899119905119890119903119897119886119910119890119903)+ + 1198621198743(119894119899119905119890119903119897119886119910119890119903)
2minus
1198621198742(119886119902) + 119874119867(119886119902)minus 1198671198621198743(119886119902)
minus
Both carbonate and bicarbonate are known to be hydroxyl radical scavengers in the
radiolysis of aqueous solutions998
Using the Facsimile model described in Chapter 3 it
was possible to insert a set of reactions concerning carbonate radiolysis to estimate the
effects that small quantities of carbonate might have on hydrogen yields
Chapter 5 Radiolysis of Magnesium Hydroxide
132
The reaction set used is described in Table 22 and represents a simplified reaction scheme
of carbonate in aqueous radiolysis Initial concentrations of carbonate were set ranging
from 10 μM to 10 mM a yield of hydrogen was calculated for each initial concentration
these calculations have been graphed in Figure 49
In each case the calculated production of hydrogen was linear over the dose range used
which would be a necessary feature if carbonate is to be a valid explanation for the
increased yields observed in magnesium hydroxide experiments The calculated yield of
hydrogen increases rapidly with only small quantities of initial carbonate before reaching a
plateau at about G(H2) = 03 with an initial carbonate concentration of 50 μM The
hydrogen yield did not change much more than this increasing to just G(H2) = 036 with an
initial carbonate concentration of 10 mM The effect is almost the same in calculations for
both aerated and deaerated solutions It should be noted that these calculations were done at
pH 7 due to the systematic error of over prediction when the pH is close to 10 it would be
unadvisable to trust such calculations without first solving the error (see previous chapter)
Table 22 A reaction scheme to estimate the effect of carbonate in water radiolysis
Reaction Rate Constant Reference
CO32macr +
bullOH rarr CO3macr + OHmacr 39 times10
8
9
CO32macr + emacraq rarr products 39 times10
5
99
CO3bullmacr +
bullOH rarr products 30 times10
9
100
CO3bullmacr + H2O2 rarr HCO3macr + HO2
bull 43 times10
5
101
CO3bullmacr + HO2macr rarr HCO3macr + O2
bullmacr 30 times10
7
101
CO3bullmacr + O2
bullmacr rarr O2 + CO3
2macr 65 times10
8
102
HCO3macr + emacraq rarr products 10 times106
103
HCO3macr + bullOH rarr H2O + CO3
bullmacr 85 times10
6
9
HCO3macr + Hbull rarr products 44 times10
4
104
Chapter 5 Radiolysis of Magnesium Hydroxide
133
Figure 49 Model predictions for the yield of H2 from a solution containing various
concentrations of carbonate anions
Reaction rate analysis of the calculations reveals that the main mechanism for hydrogen
protection is through a cooperative effect of scavenging of the hydroxyl radical to form a
carbonate radical The majority of carbonate radicals are converted back to carbonate by
reaction with superoxide A secondary process of carbonate radical reactions with hydrogen
peroxide contributes slightly to regeneration of superoxide as well as forming bicarbonate
which itself contributes to hydrogen protection by scavenging hydroxyl radicals once again
forming a carbonate radical As these calculations were performed at pH 7 it is uncertain
what effect an elevated pH would have on the predicted hydrogen yield It should also be
remembered that many of the rate constants used are estimations and the reaction set is a
simplification and is not a comprehensive description
0
005
01
015
02
025
03
035
04
0 1 2 3 4 5 6 7 8 9 10 11
G(H
2)
[CO32-] mM
Aerated
Deaerated
134
With these factors in mind the predicted behaviour of hydrogen production is a reasonable
representation of the behaviour observed in experiments This could easily be investigated
further by experiments in a number of ways
Attempts could be made to measure carbonate directly from the magnesium hydroxide
used either by thermogravimetric analysis (TGA) or by total organic carbon analysis
(TOC) Radiolysis experiments of other carbonates could also be carried out to further
investigate the effect of carbonate
Chapter 6 Radiolysis of Methanol Solutions
135
Chapter 6 Radiolysis of Methanol Solutions
Context
Many of the waste storage ponds at Sellafield Ltd are open to the air and are subject to
organic matter falling in and decomposing to a range of organic products One particular
group of compounds known as humic acids and how they might affect radiolysis processes
in the ponds are of particular interest Humic acids are ill-defined but complex organic
acids with several different functional groups which will have many effects on radiolysis
The best approach to investigating this chemistry is to understand the effects of each
functional group independently before building up to a full humic acid analogue This study
takes the first steps towards this investigation through experimentation on aqueous
solutions of methanol
Experimental Method
A stock aqueous solution of 1 mM methanol was made and was used to prepare aerated
samples of 10 mL sealed by crimp cap in 20 mL headspace vials so that the liquid to
headspace ratio was 11 Samples were irradiated in row 2 of the 4x8 irradiation rack for
various periods of time The average dose rate was 1638 Gy min-1
The samples were
analysed for hydrogen peroxide immediately after irradiation using the Ghormley tri-iodide
method described in Chapter 2 A separate batch of aerated samples was prepared from the
1 mM methanol stock solution for analysis of hydrogen generation These were samples of
2 mL of 1 mM methanol and were deaerated using zero grade argon gas before being sealed
in glass tubes designed for use by the crush tube analysis method described in Chapter 2
Again the samples had a liquid to headspace ratio of 11
Chapter 6 Radiolysis of Methanol Solutions
136
These samples were irradiated in the centre positions of row 2 in the 4x8 rack where the
average dose rate was 1755 Gy min-1
Results
Figure 50 Measurements of H2O2 concentrations as a function of dose in samples
containing 1 mM methanol (diams) and water as a control (diams) All samples were aerated and a
dashed line is included to highlight the data trend The dose rate was 1638 Gy min-1
for
methanol solutions and 2839 Gy min-1
for the aerated water
000E+00
500E-05
100E-04
150E-04
200E-04
250E-04
0 5 10 15 20 25
[H2O
2]
(mo
l d
m-3
)
Dose (kGy)
Aerated Water
Methanol 1 mM
Chapter 6 Radiolysis of Methanol Solutions
137
Figure 51 Measurements of H2 gas as a function of dose from deaerated samples
containing 1 mM methanol deaerated water is also shown as a control Dashed lines are
included to highlight the data trend The dose rate was 1755 Gy min-1
for the methanol
solutions and 2851 Gy min-1
for the deaerated water
Figure 50 shows the measured concentrations of hydrogen peroxide from the 1 mM
methanol solution compared with the measured concentrations from pure aerated water At
low doses the concentration of hydrogen peroxide increases rapidly to approximately
20 times10-4
mol dm-3
at approximately 1 kGy which is almost double the steady state
concentration observed in pure water As the dose increases further the concentration
begins to fall to a steady state value at approximately 33 times10-5
mol dm-3
Figure 51 shows the measured hydrogen concentrations from the 1 mM methanol solutions
compared with hydrogen measurements from aerated water
000E+00
500E-04
100E-03
150E-03
200E-03
250E-03
300E-03
0 5 10 15 20 25 30
H2 (
mo
l d
m-3
)
Dose (kGy)
Methanol Solution 1mM Deaerated
Dearated Water
Chapter 6 Radiolysis of Methanol Solutions
138
Hydrogen concentrations measured in a deaerated 1 mM methanol solution are significantly
higher than those measured in deaerated water the initial production rate is higher in the
methanol solution but production is not linear and the rate of hydrogen production with
dose soon falls The change in production rate of hydrogen and hydrogen peroxide with
dose can be shown by converting the experimental measurements to G-values and plotting
them as a function of dose Figures 52 and 53 show the chemical yields determined by
converting the gradients between 0 and each data point to units of molecules 100 eV-1
Figure 52 Chemical yields of hydrogen peroxide measured from an aerated solution of
1 mM methanol as a function of dose
00
05
10
15
20
25
30
35
40
0 5 10 15 20
G(H
2O
2)
(mo
lecu
les
10
0eV
-1)
Dose (kGy)
Chapter 6 Radiolysis of Methanol Solutions
139
Figure 53 Chemical yields of hydrogen gas measured from a deaerated solution of 1 mM
methanol as a function of dose
Discussion
Most alcohols are effective scavengers of hydroxyl radicals and hydrogen atoms The
reactions between methanol and hydroxyl radicals or hydrogen atoms result in hydrogen
abstraction from methanol to form water or molecular hydrogen respectively and in both
cases form the hydroxymethyl radical105106
bull119874119867 + 1198621198673119874119867 rarr 1198672119874 + bull1198621198672119874119867 119896 = 83 times 108 119872minus1119904minus1
119867bull + 1198621198673119874119867 rarr 1198672 + bull1198621198672119874119867 119896 = 28 times 106 119872minus1119904minus1
Although the second order rate constant for the reaction between methanol and the solvated
electron is faster than that for the solvated electron and water the reaction rate does not
compete with the rate of reaction between the solvated electron and water until the
concentration of methanol is greater than 10-2
M2107
00
02
04
06
08
10
12
14
16
18
0 5 10 15 20
G(H
2)
(mo
lecu
les
10
0eV
-1)
Dose (kGy)
Chapter 6 Radiolysis of Methanol Solutions
140
In deaerated water methanol radicals may dimerise to form ethylene glycol or
disproportionate to form formaldehyde and reform methanol108
They may also react with
hydrogen peroxide to form formaldehyde
2bull1198621198672119874119867 rarr (1198621198672119874119867)2
2bull1198621198672119874119867 rarr 1198621198673119874119867 + 119867119862119867119874
bull1198621198672119874119867 + 11986721198742 rarr 119867119862119867119874 + 1198672119874 + bull119874119867
In solutions that contain dissolved oxygen such as those used in the measurements of
hydrogen peroxide (Figure 50) methanol radicals rapidly react with oxygen to form an
organic peroxyl radical which reacts by second-order processes resulting in the formation
of formaldehyde hydrogen peroxide and oxygen109
bull1198621198672119874119867 + 1198742 rarr bull11987421198621198672119874119867
An additional set of reactions were included in the water radiolysis model described in
Chapter 3 in an attempt to model the radiolysis chemistry of an aqueous solution of 1 mM
methanol This reaction scheme is shown in Table 23
Chapter 6 Radiolysis of Methanol Solutions
141
Reaction
Number Reaction
Rate Constant at 25degC (M
-1 s
-1)
Ref
M1 CH3OH + bullOH rarr H2O +
bullCH2OH 83times10
8
110
M2 CH3OH + Hbull rarr H2 +
bullCH2OH 28times10
6
106
M3 bullCH2OH + O2 rarr
bullO2CH2OH 49times10
9
111
M4 bullCH2OH + H2O2 rarr H2O + H2CO +
bullOH 18times10
5
112
M5 bullCH2OH +
bullCH2OH rarr CH3OH + H2CO 12times10
9
2113
M6 bullCH2OH +
bullCH2OH rarr HOCH2CH2OH 12times10
9
2113
M7 bullCH2OH +
bullOH rarr H2CO + H2O
a24times10
10
114
M8 bullO2CH2OH +
bullO2CH2OH rarr 2H2CO + H2O2 + O2 74times10
8
115
M9 bullO2CH2OH +
bullHO2 rarr H2CO + H2O2 + O2
b50times10
8
2
M10 bullO2CH2OH + O2macr rarr H2CO + HO2macr + O2
b50times10
7
2
M11 HOCH2CH2OH + bullOH rarr
bullHOCHCH2OH + H2O 24times10
9
116
M12 HOCH2CH2OH + Hbull rarr
bullHOCHCH2OH + H2 14times10
7
9
M13 bullHOCHCH2OH + O2 rarr
bullO2HOCHCH2OH 32times10
9
111
M14 bullO2HOCHCH2OH rarr HOCH2CHO + H
+ + O2macr 19times10
2 s
-1
117
M15 bullHOCHCH2OH +
bullHOCHCH2OH rarr HOCH2CH2OH +
HOCH2CHO 96times10
8
118
M16 HOCH2CHO + bullOH rarr H2O +
bullHOCHCHO
c92times10
6
119
M17 bullHOCHCHO +
bullHOCHCHO rarr HOCH2CHO + OCHCHO
d50times10
4 -
M18 OCHCHO + bullOH rarr H2O +
bullOCCHO 14times10
6
120
M19 bullOCCHO rarr CO + HCO
bull
a35times10
7 s
-1
121
M20 H2CO + emacraq rarr bullCH2OH + OHmacr 10times10
6
2
M21 H2CO + Hbull rarr H2 + HCO
bull 50times10
6
2
M22 H2CO + bullOH rarr H2O + HCO
bull 20times10
9
2
M23 HCObull + H
bull rarr H2 + CO
a68times10
10
122
M24 HCObull +
bullOH rarr CO + H2O
a11times10
11
123
M25 HCObull + O2 rarr CO + HO2
bull
a31times10
9
124
M26 HCObull + HCO
bull rarr 2CO + H2
a22times10
10
125
Table 23 A reaction scheme to estimate the effect of methanol in water radiolysis
a ndash Rate constant for gas phase reaction
b ndash Estimated rate constant
c ndash Rate constant based on reaction of acetic acid and hydroxyl
d ndash Assumed reaction
Figure 54 shows the predicted hydrogen peroxide concentration with the above chemistry
included in the calculation and compares it with the experimental data In order to achieve
the agreement shown a modification to the mass transfer routine was required
Chapter 6 Radiolysis of Methanol Solutions
142
The current implementation of the mass transfer routine does not cope with a rapid
depletion of dissolved oxygen and responds by increasing the rate of oxygen transfer from
the gas phase to the aqueous phase to an unrealistic value A temporary fix can be made by
reducing the mass transfer rate of oxygen (for instance by a factor of 15) but a more
appropriate correction to the routine should be sought in future implementations Figure 55
shows the original calculation with the un-modified mass transfer routine compared with
the modified mass transfer routine
Figure 54 Model prediction of H2O2 concentrations as a function of dose in a solution of
1 mM methanol
000E+00
500E-05
100E-04
150E-04
200E-04
250E-04
0 5 10 15 20 25
[H2O
2]
mo
l d
m-3
Dose kGy
Methanol 1 mM
Model
Chapter 6 Radiolysis of Methanol Solutions
143
Figure 55 Calculations of hydrogen peroxide concentrations with and without
modification to the mass transfer routine
Analyses of the evolution of the calculated reaction rates reveal a possible explanation for
the behaviour of hydrogen peroxide in the presence of a low concentration of methanol
Initially the most important methanol reactions are the formation of the methanol radical
by scavenging hydroxyl radicals (M1) and the formation of an organic peroxide by the
reaction between the aforementioned methanol radical and oxygen (M3)
1198621198673119874119867 + bull119874119867 rarr bull1198621198672119874119867 + 1198672119874
bull1198621198672119874119867 + 1198742 rarr bull11987421198621198672119874119867
With the formation of the organic peroxide comes an increase in the rate of the formation of
formaldehyde mainly through self-reaction or to a lesser degree through reaction with
superoxide
000E+00
100E-04
200E-04
300E-04
400E-04
500E-04
600E-04
700E-04
0 5 10 15 20 25 30 35 40 45
[H2O
2]
(mo
l d
m-3
)
Dose (kGy)
Original Calculation
Modified Calculation
Chapter 6 Radiolysis of Methanol Solutions
144
2bull11987421198621198672119874119867 rarr 21198672119862119874 + 11986721198742 + 1198742
bull11987421198621198672119874119867 + 1198742bullminus rarr 1198672119862119874 + 1198671198742
minus + 1198742
These reactions not only contribute to the production of hydrogen peroxide but also return
oxygen to the system which can scavenge solvated electrons and protect hydrogen peroxide
from the rapid reaction between the solvated electron and hydrogen peroxide
(R4 k = 136times1010
M-1
s-1
) The total rate of oxygen consumption by methanol radicals and
solvated electrons is still greater than the rate of return from the reactions of the organic
peroxide After about 11 kGy oxygen concentrations are reduced to an insignificant value
As the concentration of oxygen falls the reaction rate between hydrogen peroxide and the
solvated electron increases As mentioned in Chapter 4 oxygen plays a vital role in the
formation and protection of hydrogen peroxide The model prediction shows the
concentration of hydrogen peroxide beginning to rise again after about 8 kGy this is due to
the mass transfer of oxygen gas into the aqueous phase slowly re-establishing equilibrium
and effectively allowing a build-up of hydrogen peroxide As mentioned earlier the mass
transfer routine has been modified for this calculation and is non-representative of the real
mass transfer flux nevertheless it is reasonable to assume that after the depletion of
dissolved oxygen and the methanol has been converted to glycol or formaldehyde
equilibrium of aqueous and gaseous oxygen would eventually be re-established This could
be supported by further analysis at higher doses which may show an increase in hydrogen
peroxide concentrations
Chapter 6 Radiolysis of Methanol Solutions
145
The formation of hydrogen gas is enhanced by the presence of methanol however
hydrogen gas production is not linear with dose Figure 56 shows the model predictions for
hydrogen gas production compared to the experimentally obtained data
The calculations show a higher production rate of hydrogen gas can be attributed to the
scavenging of hydroxyl radicals by methanol and a number of methanol radiolysis
products
Figure 56 Model prediction of H2 gas as a function of dose in a solution of 1 mM
methanol
Although the model prediction somewhat overestimates the quantity of hydrogen formed
the slope is close to what is observed experimentally Many of the rate constants used in the
reaction scheme could not be found in the literature and are therefore estimations The
reaction scheme used protects molecular hydrogen from reacting with the hydroxyl radical
in a number of reactions Throughout the radiolysis of methanol a number of intermediary
organic products are formed such as ethylene glycol and formaldehyde each of which is an
effective hydroxyl scavenger
000E+00
500E-04
100E-03
150E-03
200E-03
250E-03
300E-03
0 5 10 15 20 25 30
H2 (
mo
l d
m-3
)
Dose (kGy)
Methanol 1 mM Dearated
Model
Chapter 6 Radiolysis of Methanol Solutions
146
After reacting with the hydroxyl radical the newly formed organic radical will usually form
an organic peroxide however in the absence of oxygen the radicals will tend towards
disproportionation to reform the original organic product at well as a new stable organic
usually an aldehyde Eventually the only stable product is carbon monoxide which does not
have any further reactions within this scheme Figure 57 shows the calculated
concentrations of each of the stable organic products as a function of dose in an aerated
system
Figure 57 Model predictions of the concentrations of various stable organic products
formed as a result of using the proposed reaction scheme in Table 23
Kinetic models of aqueous methanol have previously been presented in literature one such
model by Sunaryo and Domae126
was developed for calculating the effects of aqueous
methanol in light water reactors
000E+00
200E-04
400E-04
600E-04
800E-04
100E-03
120E-03
0 10 20 30 40
Co
nce
ntr
ati
on
(m
ol
dm
-3)
Dose (kGy)
Methanol
Formaldehyde
Ethylene Glycol
Glycolaldehyde
Glyoxal
Carbon Monoxide
Chapter 6 Radiolysis of Methanol Solutions
147
The reaction scheme for methanol radiolysis used in that publication is not a complete
scheme in that ldquoimaginary productsrdquo are implemented to terminate certain reaction
pathways This is still a valid approach as their interest was focused on the initial reaction
paths when delivering a maximum dose of 500 Gy and not the long term radiolysis of
methanol over several kGy
It was noted that an understanding of the radiolysis of the transient organic products is
needed they concluded that methanol is converted into ethylene glycol which may have the
same effect as methanol itself The formation of ethylene glycol and formaldehyde from
methanol radiolysis is well known and has been measured in previous studies127
The
radiolysis of ethylene glycol has also been discussed in literature128
and it has been
described that under aerated conditions the main organic product of radiolysis is
glycolaldehyde129
The reaction scheme for methanol radiolysis in this work assumes the
formation of a radical species by the reaction between glycolaldehyde and the hydroxyl
radical however this is most likely not the major radiolysis path for glycolaldehyde In
aqueous solutions glycolaldehyde exists in a number of different forms with the aldehyde
form usually being the minor component130
The existence of multiple forms of
glycolaldehyde in solution and the large number of unknown rate constants makes creating
a complete reaction scheme for methanol radiolysis difficult Furthermore the publications
mentioned above also report the formation of small amounts of methane along with carbon
monoxide The radiolysis of ethylene glycol under deaerated conditions can also lead to the
production of ethyl aldehyde Both of these points highlight gaps in the reaction scheme
that should be included in a comprehensive description of methanol radiolysis Suggestions
for an improved radiolysis scheme are given in Chapter 8
Chapter 7 Radiolysis of Iron Oxide-Water Systems
148
Chapter 7 Radiolysis of Iron Oxide-Water Systems
Context
Large quantities of iron oxide have been reported to be present in the First Generation
Magnox Storage Pond where iron skips containing spent fuel have corroded to form a layer
of haematite (Fe2O3) and magnetite (Fe3O4) several meters below the water level
Documented investigations into the effects of iron oxide on water radiolysis are sparse the
most recent of which focusing on the formation of molecular hydrogen from the radiolysis
of water-iron oxide systems131
Preliminary experiments have been carried out to
investigate the effects iron oxide may have on radiolytic production of hydrogen peroxide
from water-oxide slurries
Method
Iron oxide powders were washed with ultra-pure water to remove any soluble
contamination Excess water was decanted before the powders were washed a further two
times After the third decanting the powders were dried in a vacuum oven at 40degC
overnight Haematite samples were prepared by weighing 05 g quantities of haematite into
20 mL headspace vials to which 10 mL of ultra-pure water was added before sealing with a
crimp cap Samples of magnetite were prepared in the same way Samples were agitated
and then left to settle before irradiation The irradiations of haematite samples were carried
out in row 1 of the 4x8 irradiation rack with an average dose rate of 30518 Gy min-1
while
irradiations of magnetite samples were carried out in row 2 of the 4x8 rack with an average
dose rate of 16252 Gy min-1
After irradiation aliquots of the water from the samples were
removed by syringe and pushed through a syringe filter to remove any solid particles
Chapter 7 Radiolysis of Iron Oxide-Water Systems
149
The filtered aliquot was then analysed for hydrogen peroxide using the Ghormley tri-iodide
method described in Chapter 2
Results
Figure 58 shows the obtained results for the haematite system compared to concentrations
of hydrogen peroxide measured in aerated water Figure 59 shows the obtained results from
magnetite samples again they are compared with measurements obtained from pure water
Figure 58 Measurements of H2O2 concentrations from heterogeneous samples of 05g
Fe2O3 and 10 mL aerated water The dose rate for the haematite samples was
3052 Gy min-1
and for the aerated water the dose rate was 2839 Gy min-1
000E+00
200E-05
400E-05
600E-05
800E-05
100E-04
120E-04
140E-04
0 2 4 6 8 10 12 14
[H2O
2]
(mo
l d
m-3
)
Dose (kGy)
Haematite
Pure Water
Chapter 7 Radiolysis of Iron Oxide-Water Systems
150
Figure 59 Measurements of H2O2 concentrations from heterogeneous samples of 05g
Fe3O4 and 10 mL aerated water The dose rate for the magnetite samples was
1625 Gy min-1
and for the aerated water the dose rate was 2839 Gy min-1
The steady state concentration of hydrogen peroxide achieved in the presence of haematite
is close to that of pure water however the initial production rate is slightly higher An
increased initial production rate is also observed in samples containing magnetite but after
approximately 500 Gy the concentration of hydrogen peroxide falls dramatically and
achieves a low steady state of approximately 15 times10-5
mol dm-3
000E+00
200E-05
400E-05
600E-05
800E-05
100E-04
120E-04
140E-04
0 2 4 6 8 10 12 14 16 18 20 22
[H2O
2]
(mo
l d
m-3
)
Dose (kGy)
Magnetite
Pure Water
Chapter 7 Radiolysis of Iron Oxide-Water Systems
151
Discussion
Hydrogen peroxide undergoes surface decomposition over both haematite and
magnetite28132
The estimated second-order rate constants for the surface decomposition of
hydrogen peroxide are quoted as 30 times10-9
M-1
s-1
for haematite132
and 45 times10-10
M-1
s-1
for
magnetite28
Calculations using the water radiolysis model including a hypothetical reaction
that removes hydrogen peroxide at these rates makes no significant difference to the
predicted concentrations of hydrogen peroxide in water over the time scale of the
experiment However as the aforementioned rate constants are second-order they not only
depend on the concentration of hydrogen peroxide but the surface area of the metal oxide as
well which is unknown for the metal oxides used in this study
Furthermore the experiments carried out in the aforementioned publications to determine
these rate constants were well mixed throughout the reaction time while in this work the
samples were static with the iron powder settled at the bottom of the reaction vessel This
means that the rate of surface decomposition is greatly hindered due to the need for
hydrogen peroxide to diffuse a large distance to the iron oxide surface nevertheless a
significant difference in hydrogen peroxide concentrations were observed in samples
containing magnetite The behaviour of hydrogen peroxide observed in samples containing
magnetite is most likely due to homogeneous chemistry initiated by dissolved iron ions
The chemistry initiated by dissolved iron could serve to remove hydrogen peroxide through
a Haber-Weiss mechanism133
1198651198903+ + 1198742bullminus rarr 1198651198902+ + 1198742 k = Unknown
1198651198902+ + 11986721198742 rarr 1198651198903+ + 119874119867minus + bull119874119867 k = 10 times10
7 M
-1 s
-1
1198651198902+ + bull119874119867 rarr 1198651198903+ + 119874119867minus k = 32 times108
M-1
s-1
1198651198902+ + 1198671198742bull rarr 1198651198903+ + 1198671198742
minus k = 12 times10
6 M
-1 s
-1
Chapter 7 Radiolysis of Iron Oxide-Water Systems
152
Experiments discussed in publications by Mats Jonsson28
focus largely on the reactivity of
hydrogen peroxide and various metal oxides including iron oxide It was found that many
metal oxide surfaces show reactivity towards hydrogen peroxide and that rate of removal of
hydrogen peroxide can be calculated in heterogeneous systems based on properties such as
particle size As mentioned previously the model suggests that the rate of this surface
reactivity does not seem to be able to compete with the rate of radiolytic hydrogen peroxide
production The studies by Jonsson concerning iron oxide were met with difficulty in
discriminating between surface reactions and aqueous chemistry initiated by dissolved iron
Through the use of ICP-AES it was shown that iron can be found in water with a
concentration of 23 times10-6
mol dm-3
after just 30 minutes of mixing magnetite with distilled
water28
Even with this measurement by Jonsson the quantity of dissolved iron is difficult to
estimate for samples used in this work as they were washed with water whereas the
literature measurements were made with unwashed or EDTA treated samples More
information about the dissolution of iron from magnetite could be used to attempt to model
this behaviour using the reaction scheme in table 24 In addition to this it would also be
useful to investigate the dissolution of iron as a function of radiation dose to see what
effect if any radiation has on dissolution rates Analysis techniques such as inductively
coupled plasma mass spectroscopy (ICP-MS) can be used to determine concentrations of
dissolved iron in very low concentrations however due to the nature of the plasma used it
can often be difficult to distinguish between Fe2+
and Fe3+
as further ionization may cause
interference It is possible to chemically separate the two oxidation states of iron by solvent
extraction with n-heptane containing 01 M Di-(2-ethylhexyl)phosphoric acid (HDEHP)
before performing an analysis for iron134
Chapter 7 Radiolysis of Iron Oxide-Water Systems
153
This reaction scheme would be initiated by a production of aqueous iron based on the
dissolution behaviour observed from future experiments As mentioned earlier the
experiments conducted in this work are only preliminary and there is much more work to
be done on the subject
If a computational model could be made to accurately simulate the aqueous iron chemistry
coupled with a more detailed understanding of radiation induced iron dissolution it may be
possible to determine the surface effects of iron oxide by comparison of experimental and
calculated data and effectively subtracting the difference
Reaction
Number
Reaction Rate Constant at
25degC (M-1
s-1
)
Ref
F1 Fe2+
+ H2O2 rarr Fe3+
+ OHmacr + bullOH 100 times10
7
135
F2 Fe2+
+ bullOH rarr Fe
3+ + OHmacr 32 times10
8
136
F3 Fe2+
+ bullHO2 rarr Fe
3+HO2macr 12 times10
6
133
F45 Fe3+
HO2macr + Fe2+ Fe
3+HO2macrFe
2+ K = 27 M
-1
133
F6 Fe3+
HO2macr rarr Fe3+
+ HO2macr 18times103
s-1
133
F7 Fe3+
HO2macrFe2+
rarr Fe3+
+ Fe2+
HO2macr 25 times104
133
F8 Fe2+
HO2macr + H+
(aq) rarr Fe2+
+ H2O2 Unknown 133
F9 Fe3+
+ O2macr rarr Fe2+
+ O2 Unknown 137
F10 Fe2+
+ O2macr + H2O rarr HO2macr + Fe
3+ + OHmacr 10 times10
7
133
F11 Fe3+
+ Hbull rarr Fe
2+ + H
+(aq) 20 times10
6
138
F12 Fe3+
+ emacraq rarr Fe2+
60 times1010
139
F13 Fe2+
+ Hbull + H
+(aq)
rarr Fe
3+ + H2 75 times10
6
10
Table 24 A reaction scheme to estimate the effects of dissolved iron in water radiolysis
Chapter 8 Conclusions and Further Work
154
Chapter 8 Conclusions and Further Work
Further High pH Investigations
Experiments have shown that the radiolytic production of hydrogen gas and hydrogen
peroxide is strongly influenced by high pH Hydrogen peroxide tends to reach higher steady
state concentrations with increasing pH as well as taking longer to reach this steady state
Hydrogen gas production rates appear to also increase with increasing pH up to
approximately pH 11 where thereafter they decrease The development of a computational
model for water radiolysis has provided a mechanistic understanding to explain the
observed effects of high pH on water radiolysis Calculations suggest that an increase in
radiolytically produced oxygen could explain the behaviour of hydrogen gas at high pH
Dissolved oxygen acts as a poison to the Allen chain which normally serves to remove
dissolved hydrogen through reactions with the hydroxyl radical or the alkali equivalent the
oxide radical anion The steady state concentration of dissolved oxygen increases with pH
up to approximately pH 115 This can be attributed to the decline in the rate at which
dissolved oxygen is reduced by hydrogen atoms as the equilibrium between the hydrogen
atom and the solvated electron shifts to favour the solvated electron The reaction rate of
the equivalent alkali reaction to remove dissolved oxygen through reduction by the solvated
electron does not increase to compensate resulting in a net increase in the steady state
concentration of dissolved oxygen The model calculations also show that increasing the
pH further results in a decline in the hydrogen gas production rate This is due to the shift in
the equilibrium between the hydroxyl radical and the oxide radical anion (R6364) which
has a pKa of 119 The main pathway for the radiolytic production of dissolved oxygen is
the reaction between the hydroxyl radical and super oxide (R21)
Chapter 8 Conclusions and Further Work
155
The rate of this reaction falls at high pH as the hydroxyl radical is converted to the oxide
radical anion The alkali equivalent of this reaction (R50) has a much lower rate constant
and is out competed by the solvated electron (R8) Further experiments to measure the
concentration of radiolytically produced oxygen at high pH could help to support the model
predictions or confirm a misunderstanding in the model An inline gas chromatography
technique similar to the ldquocrush tuberdquo described in Chapter 2 may be used only instead of
crushing a sealed glass vial within the carrier gas flow a specially designed cell is
connected to the in and out ports of the carrier gas flow This cell would contain a high pH
solution and would sit inside the irradiator from here multiple analyses can be run on a
single sample The carrier gas would have to be changed from argon to helium to increase
the sensitivity towards oxygen running the carrier gas through the cell prior to irradiation
will serve to remove the initial dissolved oxygen from the sample from this point onward
any measurements of oxygen would be radiolytically produced
These experiments would help to better understand high pH water radiolysis and hopefully
help to improve the radiolysis model and understand why there is an over prediction at
pH 106 A comprehensive water radiolysis model that can accurately predict
concentrations of radiolysis products under a wide range of conditions is of high
importance to the nuclear industry and would have applications in decommissioning
maintenance of current nuclear systems and designing new nuclear technology
Chapter 8 Conclusions and Further Work
156
Further Methanol Radiolysis Investigations
The reaction scheme used to model the radiolysis of aqueous methanol results in the
temporary formation of several stable organic species before they themselves are oxidised
by hydroxyl radicals This scheme eventually converts all organic substances to carbon
monoxide however in reality this is not the case It has been reported in literature that one
of the stable products formed is methane gas a substance not included in the current
reaction scheme The gas chromatography techniques used in this work are not suitable for
the detection of small quantities of carbon monoxide or indeed other potential radiolysis
products such as methane A more sophisticated approach would be to use a gas
chromatography mass spectroscopy technique (GC-MS) This technique would allow for
the detection of carbon monoxide carbon dioxide methane and any other volatile
hydrocarbons that may be formed during radiolysis Other transient products of methanol
radiolysis such as formaldehyde ethylene glycol glycolaldehyde and glyoxal may be
analysed by high performance liquid chromatography (HPLC) It was mentioned in Chapter
6 that the reaction scheme does not accurately represent the radiolysis of the transient
product glycolaldehyde A publication by Yaylayan et al130
discusses some measurements
made by nuclear magnetic resonance spectroscopy of glycolaldehyde in deuterated water
and it was found that it exists mostly as the hydrated aldehyde 112-ethanetriol (~70) A
complete reaction scheme for the radiolysis of methanol should include the radiolysis
reactions of all the transient species of which there are potentially many
However if the major component of a glycolaldehyde solution is 112-ethanetriol an
acceptable compromise may be to include only the radiolysis reactions of this species and
ignore the radiolysis paths of minor products
Chapter 8 Conclusions and Further Work
157
Experimental analysis of aqueous methanol to determine the major transient species would
be valuable for determining which radiolysis paths have the most significant roles in
methanol radiolysis
Future Development of a Multi-Scale Radiolysis Model
As discussed in Chapter 3 the model developed in this work is a deterministic model for the
calculation of long term homogeneous phase radiolysis This calculation depends on a
series of primary values that represent the production rates of the primary species of water
radiolysis which in turn depend on a number of physical and chemical factors It is
possible to calculate these primary yields using stochastic methods which can then be fed
into the deterministic calculation to obtain predictions of chemical species concentrations
This technique has been successfully used recently to demonstrate some of the effects of
high capacity scavengers47
This technique assumes that there are no changes to the
physiochemical conditions during the radiolysis period for example if a calculation was to
be performed where the temperature were to change the primary yields would need to be
recalculated at the new temperature The model developed in this work attempts to
overcome this by estimating primary yields as a multiple regression fit of temperature and
pH however this estimation is not adequately accurate and does not include any effects that
linear energy transfer has on the primary yields A more suitable approach to the
development of a comprehensive multi-scale radiolysis model may be to utilise a stochastic
calculation of the primary yields that includes the effects of temperature pH LET and
chemical scavengers which can be called from within the deterministic calculation
whenever a significant change to one of these factors is initiated
Chapter 8 Conclusions and Further Work
158
Further work concerning the deterministic model presented in this work include an
investigation into the partitioning of gaseous species The method used is one that has been
successfully used by other research groups to model the radiolysis of water and the effect of
available headspace This implementation of the stagnant two-film model was never
intended to cope with rapid changes in aqueous oxygen concentrations Further efforts
should be made to better incorporate this gas partitioning method in a way that can more
realistically represent oxygen partitioning during the radiolysis of aqueous methanol
Closing Remarks Relevant to Sellafield Ltd
The experimental data presented in Chapters 4 and 5 are pertinent to the situations and
conditions currently found within the Magnox Swarf Storage Silos at Sellafield In the case
of elevated pH due to sodium hydroxide both the experimental and computational data
show increased rates of hydrogen gas production and an increased steady-state
concentration of hydrogen peroxide Despite some minor quantitative disagreements
between the experimental data and the computational data the qualitative trend is in
general agreement One could therefore expect to observe increased production of hydrogen
gas in the MSSS with increasing pH especially within the pH region of approximately
105 to 125 An important aspect of the situation at the MSSS is the aerated nature of the
system The obvious consideration being the increased amounts of dissolved oxygen
present which although such effects were also discussed in Chapter 4 the experimental
data shown was only for water at neutral pH Nevertheless it was discussed in Chapter 4
that dissolved oxygen acts a poison to the chain reaction that normally removes molecular
hydrogen A less obvious consideration and one that was largely overlooked in Chapter 4
is the inclusion of gas to liquid carbon dioxide exchange and its aqueous conversion to
carbonate
Chapter 8 Conclusions and Further Work
159
At high pH the concentration of aqueous CO2 and therefore CO32-
becomes significant
With CO32-
being known to react with the hydroxyl radical and given the difficulty in its
removal future research and industrial models involving high pH aqueous radiolysis would
benefit from including a description of the radiolysis chemistry of aqueous carbonate
systems Chapter 5 begins to address the concept of including carbonate chemistry into a
radiolysis model This came about from the realisation that magnesium hydroxide can be
easily carbonated on contact with CO2 and is also known to be an effective carbon trapping
material In this case not only the additional chemistry brought about carbonate should be
considered but also the effects of the magnesium compounds that can be formed for
example magnesium carbonate magnesium bicarbonate magnesium oxide and
magnesium hydroxide Similarly consideration should be given to the multitude of iron
phases that can exist in conditions comparable to those of the First Generation Magnox
Storage Ponds Although it was not considered in Chapter 7 it is likely that the corroded
iron found in the FGMSP also exists as a number of iron hydroxides and hydrated oxides
Given the open air nature of the FGMSP hydrogen gas build-up is not a major concern
however the interactions of the various iron oxide phases in a radiolysis system may affect
concentrations of oxidising species such as H2O2 which may alter corrosion rates The
results shown in Chapter 7 suggest little effect on H2O2 concentration in the presence of
haematite but the presence of magnetite had a significant effect in removing H2O2 To gain
a better understanding further work would need to be done that also investigated the other
possible phases of iron oxide and also gives consideration to the proportions in which they
can be found in the FGMSP
References
160
References
1 Pitois A Ivanov P I Abrahamsen L G Bryan N D Taylor R J amp Sims H E Magnesium Hydroxide Bulk and Colloid-Associated 152Eu in an Alkaline Environment Colloid Characterisation and Sorption Properties in the Presence and Absence of Carbonate J Environ Monit 10 315-324 (2008)
2 Spinks J W T amp Woods R J An Introduction to Radiation Chemistry (1990)
3 Loveland W D Morrissey D J amp Seaborg G T Modern Nuclear Chemistry (2005)
4 Allen A O The Radiation Chemistry of Water and Aqueous Solutions (1961)
5 Draganić I G amp Draganić Z D The Radiation Chemistry of Water (1971)
6 Schwarz H A Losee J P amp Allen A O Hydrogen Yields in the Radiolysis of Aqueous
Solutions Journal of the American Chemical Society 76 4693-4694 (1954)
7 Swallow A J Radiation Chemistry An Introduction (1973)
8 Schwarz H A Free Radicals Generated by Radiolysis of Aqueous Solutions Journal of
Chemical Education 58 101 (1981)
9 Buxton G V Clive L Greenstock W Helman P amp Ross A B Critical Review of Rate
Constants for Reactions of Hydrated Electrons Hydrogen Atoms and Hydroxyl Radicals (˙OHO˙-) in Aqueous Solution J Phys Chem Ref Data 17 513-886 (1988)
10 Jayson G G Keene J P Stirling D A amp Swallow A J Pulse-Radiolysis Study of Some
Unstable Complexes of Iron Transactions of the Faraday Society 65 2453-2464 (1969)
11 Koppenol W H amp Liebman J F The Oxidizing Nature of the Hydroxyl Radical A
Comparison with the Ferryl Ion (FeO2+) The Journal of Physical Chemistry 88 99-101 (1984)
12 Meyerstein D Complexes of Cations in Unstable Oxidation States in Aqueous Solutions as
Studied by Pulse Radiolysis Accounts of Chemical Research 11 43-48 (1978)
13 Schwarz H A Applications of the spur diffusion model to the radiation chemistry of
aqueous solutions The Journal of Physical Chemistry 73 1928-1937 (1969)
References
161
14 Dyne P J amp Kennedy J M The Kinetics of Radical Reactions in the Tracks of Fast Electrons A Detailed Study of the SamuelndashMagee Model for the Radiation Chemisty of Water Canadian Journal of Chemistry 36 1518-1536 (1958)
15 Burns W G Sims H E amp Goodall J A B Special Issue Dedicated to The Memory of the
Late John Hodson Baxendale Radiation chemical diffusion kinetic calculations with prescribed and non-prescribed diffusionmdashI Radiation Physics and Chemistry (1977) 23 143-180 (1984)
16 Pimblott S M amp LaVerne J A Comparison of Stochastic and Deterministic Methods for
Modeling Spur Kinetics Radiation Research 122 12-23 (1990)
17 Tapping R L Corrosion Issues in Pressurized Heavy Water Reactor (PHWRCANDUreg)
Systems A2 in Nuclear Corrosion Science and Engineering 581-633 (2012)
18 Petrik N G Alexandrov A B amp Vall A I Interfacial Energy Transfer During Gamma
Radiolysis of Water on the Surface of ZrO2 and Some Other Oxides The Journal of Physical Chemistry B 105 5935-5944 (2001)
19 LaVerne J A amp Tandon L H2 and Cl2 Production in the Radiolysis of Calcium and
Magnesium Chlorides and Hydroxides The Journal of Physical Chemistry A 109 2861-2865 (2005)
20 Slack J Norton J L amp Malkoske G R Cobalt-60 Production in CANDU Power Reactors
21 Unterweger M P Hoppes D D amp Schima F J New and Revised Half-Life Measurements
Results Nuclear Instruments and Methods in Physics Research Section A Accelerators Spectrometers Detectors and Associated Equipment 312 349-352 (1992)
22 Weiss J A Survey of Chemical Dosimetric Systems The International Journal of Applied
Radiation and Isotopes 4 89-95 (1958)
23 Fricke H amp Morse S The Chemical Action of Roumlntgen Rays on Dilute Ferrosulfate Solutions
as a Measure of Dose Am J Roentgenology and Radium Therapy 18 430-432 (1927)
24 Weiss J Allen A O amp Schwarz H A Fricke Ferrous Sulfate Dosimeter for γ-rays in the
Range 4 to 40 Kiloroumlntgens Proceedings of the International Conference on the Peaceful Uses of Atomic Energy 14 179-181 (1956)
25 Allen A O Hochanadel C J Ghormley J A amp Davis T W Decomposition of Water and
Aqueous Solutions under Mixed Fast Neutron and Gamma Radiation American Chemical Society (1952)
References
162
26 Hiroki A Pimblott S M amp LaVerne J A Hydrogen Peroxide Production in the Radiolysis of
Water with High Radical Scavenger Concentrations The Journal of Physical Chemistry A 106 9352-9358 (2002)
27 Yakabuskie P A Joseph J M amp Wren C J The Effect of Interfacial Mass Transfer on
Steady-State Water Radiolysis Radiation Physics and Chemistry 79 777-785 (2010)
28 Nejad M A amp Jonsson M Reactivity of Hydrogen Peroxide towards Fe3O4 Fe2CoO4 and
Fe2NiO4 Journal of Nuclear Materials 334 28-34 (2004)
29 Pastina B amp LaVerne J A Effect of Molecular Hydrogen on Hydrogen Peroxide in Water
Radiolysis The Journal of Physical Chemistry A 105 9316-9322 (2001)
30 Klassen N V Marchington D amp McGowan H C E H2O2 Determination by the I3
- Method and by KMnO4 Titration Analytical Chemistry 66 2921-2925 (1994)
31 Roth O amp LaVerne J A Effect of pH on H2O2 Production in the Radiolysis of Water J Phys
Chem A 115 700-708 (2011)
32 Wasselin-Trupin V Baldacchino G Bouffard S amp Hickel B Hydrogen Peroxide Yields in
Water Radiolysis by High-Energy Ion Beams at Constant LET Radiation Physics and Chemistry 65 53-61 (2002)
33 Essehli R Crumiegravere F Blain G Vandenborre J Pottier F Grambow B et al H2
Production by γ and He Ions Water Radiolysis Effect of Presence TiO2 Nanoparticles International Journal of Hydrogen Energy 36 14342-14348 (2011)
34 Faraggi M Zehavi D amp Anbar M Effect of Thallous Ions on the Yields of Hydrogen and
Hydrogen Peroxide in Radiolyzed Aqueous Solutions Transactions of the Faraday Society 67 2057-2067 (1971)
35 Lousada C M LaVerne J A amp Jonsson M Enhanced Hydrogen Formation During the
Catalytic Decomposition of H2O2 on Metal Oxide Surfaces in the Presence of ˙OH Radical Scavengers Phys Chem Chem Phys 15 12674-12679 (2013)
36 Schofield J Reiff S C Pimblott S M amp LaVerne J A Radiolytic Hydrogen Generation at
Silicon CarbidendashWater Interfaces Journal of Nuclear Materials 469 43-50 (2016)
37 LaVerne J A Ryan M R amp Mu T Hydrogen Production in the Radiolysis of Bromide
Solutions Radiation Physics and Chemistry 78 1148-1152 (2009)
References
163
38 Draganic I Nenadovic M T amp Draganic Z D Radiolysis of HCOOH + O2 at pH 13-13 and
the Yields of Primary Products in γ Radiolysis of Water Journal of Physical Chemistry 73 2564-2571 (1969)
39 Hart E J γ-Ray Induced Oxidation of Aqueous Formic Acid-Oxygen Solutions Effect of pH
Journal of the American Chemical Society 76 4198-4201 (1954)
40 Flanders D A amp Fricke H Application of a High-Speed Electronic Computer in Diffusion
Kinetics The Journal of Chemical Physics 28 1126-1129 (1958)
41 Burns W G Sims H E amp Goodall J A B Radiation Chemical Diffusion Kinetic Calculations
with Prescribed and Non-Prescribed DiffusionmdashI Spherical and Cylindrical Cases Radiation Physics and Chemistry 23 143-180 (1984)
42 Green N J B Pilling M J Pimblott S M amp Clifford P Stochastic Modeling of Fast Kinetics
in a Radiation Track The Journal of Physical Chemistry 94 251-258 (1990)
43 Bouniol P amp Bjergbakke E A Comprehensive Model to Describe Radiolytic Processes in
Cement Medium Journal of Nuclear Materials 372 1-15 (2008)
44 Ershov B G amp Gordeev A V A Model for Radiolysis of Water and Aqueous Solutions of H2
H2O2 and O2 Radiation Physics and Chemistry 77 928-935 (2008)
45 Elliot A J amp Bartels D M The Reaction Set Rate Constants and g-Values for the Simulation
of the Radiolysis of Light Water over the range 20degC to 350degC Based on Information Available in 2008 (Atomic Energy of Canada Limited Mississauga Ontario (Canada) 2009)
46 Wren J C amp Ball J M LIRIC 32 an Updated Model for Iodine Behaviour in the Presence of
Organic Impurities Radiation Physics and Chemistry 60 577-596 (2001)
47 Gregory P Horne Thomas A Donoclift Howard E Sims Robin M Orr amp Simon M
Pimblott Multi-Scale Modelling of the Radiolysis of Nitrate Solutions The Journal of Physical Chemistry B 120 (45) 11781 - 11789 (2016)
48 Chance E M Curtis A R Jones I P amp Kirby C R FACSIMILE A Computer Program for
Flow and Chemistry Simulation and General Initial Value Problems Report No 0436-9734 148 pp (Univ Coll 1977)
49 Elliot A J Rate Constants and G-Values for the Simulation of the Radiolysis of Light Water
Over the Range 0 - 300degC AECL-11073 COG-94-167 (1994)
References
164
50 Hochanadel C J amp Ghormley J A Effect of Temperature on the Decomposition of Water
by γ-Rays Radiat Res 16 635-660 (1962)
51 Janik D Janik I amp Bartels D M Neutron and βγ Radiolysis of Water up to Supercritical
Conditions βγ Yields for H2 Hbull Atom and Hydrated Electron The Journal of Physical
Chemistry A 111 7777-7786 (2007)
52 Jha K N Ryan T G amp Freeman G R Radiolysis of H2O and D2O between 0 and 300degC J
Phys Chem 79 868-870 (1974)
53 Elliot A J Chenier M P amp Ouellette D C Temperature Dependence of g Values for H2O
and D2O Irradiated with Low Linear Energy Transfer Radiation Journal of the Chemical Society Faraday Transactions 89 1193-1197 (1993)
54 Kent M C amp Sims H E The Yield of γ-Radiolysis Products from Water at Temperatures up
to 270degC Harwell Report AEA-RS-2301 (1992)
55 Lin M Katsumura Y Muroya Y He H Wu G Han Z et al Pulse Radiolysis Study on the
Estimation of Radiolytic Yields of Water Decomposition Products in High-Temperature and Supercritical Waterthinsp Use of Methyl Viologen as a Scavenger The Journal of Physical Chemistry A 108 8287-8295 (2004)
56 Štefanić I amp LaVerne J A Temperature Dependence of the Hydrogen Peroxide Production
in the γ-Radiolysis of Water The Journal of Physical Chemistry A 106 447-452 (2002)
57 Ferradini C amp Jay-Gerin J-P The Effect of pH on Water Radiolysis A Still Open Question mdash
A Minireview Research on Chemical Intermediates 26 549-565 (2000)
58 Ferradini C Kinetic Behavior of the Radiolysis Products of Water in Advances in Inorganic
Chemistry and Radiochemistry Vol Volume 3 (eds H J Emeleus amp A G Sharpe) 171-205 (1961)
59 Lefort M Radiation Chemistry Annual Review of Physical Chemistry 9 123-156 (1958)
60 Sworski T J Yields of Hydrogen Peroxide in the Decomposition of Water by Cobalt γ-
Rradiation I Effect of Bromide Ion Journal of the American Chemical Society 76 4687 (1954)
61 Hochanadel C J amp Lind S C Radiation Chemistry Annual Review of Physical Chemistry 7
83-106 (1956)
References
165
62 Mahlman H A amp Boyle J W Primary Cobalt-60 Radiolysis Yields in Heavy Water Journal
of the American Chemical Society 80 773 (1958)
63 Hayon E amp Stein G Radiation Chemistry of Aqueous Systems (1968)
64 Hayon E Effect of Solute Concentration on the Recombination of H˙ and ˙OH in γ-Irradiated
Aqueous Solutions Journal of Physical Chemistry 65 1502-1505 (1961)
65 Sehested K Bjergbakke E amp Fricke H The Primary Species Yields in the 60Co γ-Ray
Radiolysis of Aqueous Solutions of H2SO4 between pH 7 and 046 Radiation Research 56 385-399 (1973)
66 Hayon E Radiolysis of Heavy Water in the pD Range 0-14 Journal of Physical Chemistry 69
2628-2632 (1965)
67 Haissinsky M γ-Radiolysis of Alkaline and Neutral Solutions I Alkaline Solutions of Sodium
Phosphite Journal de Chimie Physique et de Physico-Chimie 62 1141-1148 (1965)
68 Dainton F S amp Watt W S The Effect of pH on the Radical Yields in the γ-Radiolysis of
Aqueous Systems Nature 195 1294-1296 (1962)
69 Dainton F S amp Rumfeldt R Radical and Molecular Yields in the γ-Radiolysis of Water III
The Nitrous Oxide-Sodium Tellurite System Proceedings of the Royal Society of London A Mathematical Physical and Engineering Sciences 287 444-456 (1965)
70 Cheek C H amp Linnenbom V J The Radiation Chemistry of Alkaline Hypobromite Solutions
The Journal of Physical Chemistry 67 1856-1860 (1963)
71 Fielden E M amp Hart E J Primary Radical Yields in Pulse-Irradiated Alkaline Aqueous
Solution Radiation Research 32 564-580 (1967)
72 Czapski G amp Peled E On the pH-Dependence of Greducing in the Radiation Chemistry of
Aqueous Solutions Israel Journal of Chemistry 6 421-436 (1968)
73 Balkas T Dainton F S Dishman J K amp Smithies D Radiation Chemistry of Aqueous
Solutions Containing Carbon Monoxide and Oxygen Between pH 04 and 12 Transactions of the Faraday Society 62 81-87 (1966)
References
166
74 Pimblott S M Pilling M J amp Green N J B Stochastic Models of Spur Kinetics in Water International Journal of Radiation Applications and Instrumentation Part C Radiation Physics and Chemistry 37 377-388 (1991)
75 Hayon E Radical and Molecular Yields in the Radiolysis of Alkaline Aqueous Solutions
Transactions of the Faraday Society 61 734-743 (1965)
76 Gordon S amp Hart E J Chemical Yields of Ionizing Radiations in Aqueous Solutions Effect of
Energy of Alpha Particles Radiation Research 15 440-451 (1961)
77 Kochanny G L Timnick A Hochanadel C J amp Goodman C D Radiation Chemistry Studies
of Water as Related to the Initial Linear Energy Transfer of 11-MeV to 23-MeV Protons Radiation Research 19 462-473 (1963)
78 ICRU Report 16 - Linear Energy Transfer (ICRU Washington USA 1970)
79 Schwarzenbach R P Gschwend P M amp Imboden D M Environmental Organic Chemistry
(Wiley 2005)
80 Ferrell R T amp Himmelblau D M Diffusion Coefficients of Hydrogen and Helium in Water
American Institute of Chemical Engineers 13 702-708 (1967)
81 Han P amp Bartels D M Temperature Dependence of Oxygen Diffusion in H2O and D2O The
Journal of Physical Chemistry 100 5597-5602 (1996)
82 Marrero T R amp Mason E A Gaseous Diffusion Coefficients Journal of Physical and
Chemical Reference Data 1 3-118 (1972)
83 Kestin J Knierim K Mason E A Najafi B Ro S T amp Waldman M Equilibrium and
Transport Properties of the Noble Gases and Their Mixtures at Low Density Journal of Physical and Chemical Reference Data 13 229-303 (1984)
84 Sander R Compilation of Henryrsquos Law Constants for Inorganic and Organic Species of
Potential Importance in Environmental Chemistry (1999)
85 Mezyk Stephen P amp Bartels David M Direct EPR Measurement of Arrhenius Parameters
for the Reactions of Hmiddot Atoms with H2O2 and Dmiddot Atoms with D2O2 in Aqueous Solution Journal of the Chemical Society Faraday Transactions 91 3127-3132 (1995)
References
167
86 Joseph Jiju M Seon Choi Byung Yakabuskie Pam amp Wren Clara J A Combined Experimental and Model Analysis on the Effect of pH and O2(aq) on γ-Radiolytically Produced H2 and H2O2 Radiation Physics and Chemistry 77 1009-1020 (2008)
87 Allen A O The Yields of Free H˙ and ˙OH in the Irradiation of Water Radiation Research 1
85-96 (1954)
88 Jortner J amp Noyes R M Some Thermodynamic Properties of the Hydrated Electron The
Journal of Physical Chemistry 70 770-774 (1966)
89 Sehested K Holcman J Bjergbakke E amp Hart Edwin J Ultraviolet Spectrum and Decay of
the Ozonide Ion Radical O3- in Strong Alkaline Solution Journal of Physical Chemistry 86
2066-2069 (1982)
90 Jones T Development of an Effluent Treatment Process for the Silos Direct Encapsulation
Plant IChemE Sustainable Nuclear Energy Conference (2014)
91 Nelson S M Newman A C D Tomlinson T E amp Sutton L E A Dielectric Study of the
Adsorption of Water by Magnesium Hydroxide Transactions of the Faraday Society 55 2186-2202 (1959)
92 Shpak P A Kalinichenko A E Lytovchenko S A Kalinichenko A I Legkova V G amp
Bagmut N N The Effect of γ-Irradiation on the Structure and Subsequent Thermal Decomposition of Brucite Physics and Chemistry of Minerals 30 59-68 (2003)
93 Maroto-Valer M M Developments and Innovation in Carbon Dioxide (CO2) Capture and
Storage Technology Volume One Carbon Dioxide (CO2) Capture Transport and Industrial Applications (Woodhead Publishing 2010)
94 Siriwardane R V amp Stevens R W Novel Regenerable Magnesium Hydroxide Sorbents for
CO2 Capture at Warm Gas Temperatures Industrial amp Engineering Chemistry Research 48 2135-2141 (2009)
95 Fricker Kyle J amp Park A Alissa Effect of H2O on Mg(OH)2 Carbonation Pathways for
Combined CO2 Capture and Storage Chemical Engineering Science 100 332-341 (2013)
96 Sahoo P Ishihara S Yamada K Deguchi K Ohki S Tansho M et al Rapid Exchange
between Atmospheric CO2 and Carbonate Anion Intercalated within Magnesium Rich Layered Double Hydroxide ACS Applied Materials amp Interfaces 6 18352-18359 (2014)
97 Stirling A HCO3
- Formation from CO2 at High pH Ab Initio Molecular Dynamics Study The Journal of Physical Chemistry B 115 14683-14687 (2011)
References
168
98 Shah Noor S Khan Javed Ali Al-Muhtaseb Alarsquoa H Sayed Murtaza amp Khan Hasan M
Gamma Radiolytic Decomposition of Endosulfan in Aerated Solution The Role of Carbonate Radical Environmental Science and Pollution Research 1-10 (2016)
99 Nash K Mulac W Noon M Fried S amp Sullivan J C Pulse Radiolysis Studies of U(VI)
Complexes in Aqueous Media Journal of Inorganic and Nuclear Chemistry 43 897-899 (1981)
100 Holcman J Bjergbakke E amp Sehested K The Importance of Radical-Rradical Reactions in
Pulse Radiolysis of Aqueous CarbonateBicarbonate Proceedings of the Tihany Symposium on Radiation Chemistry 6 149-153 (1987)
101 Draganic Z D Negron-Mendoza A Sehested K Vujosevic S I Navarro-Gonzales R
Albarran-Sanchez M G et al Radiolysis of Aqueous Solutions of Ammonium Bicarbonate Over a Large Dose Range Radiation Physics and Chemistry 38 317-321 (1991)
102 Eriksen T E Lind J amp Mereacutenyi G On the Acid-Base Equilibrium of the Carbonate Radical
Radiation Physics and Chemistry 26 197-199 (1985)
103 Thomas J K Gordon Sheffield amp Hart Edwin J The Rates of Reaction of the Hydrated
Electron in Aqueous Inorganic Solutions Journal of Physical Chemistry 68 1524-1527 (1964)
104 Nehari Shlomo amp Rabani Joseph The Reaction of H˙ Atoms with OH- in the Radiation
Chemistry of Aqueous Solutions Journal of Physical Chemistry 67 1609-1613 (1963)
105 Neta P amp Dorfman L M Pulse Radiolysis Studies XIII Rate Constants for the Reaction of
Hydroxyl Radicals with Aromatic Compounds in Aqueous Solutions in Radiation Chemistry Vol 81 Advances in Chemistry Ch 15 222-230 (American Chemical Society 1968)
106 Mezyk S P amp Bartels D M Rate Constant and Activation Energy Measurement for the
Reaction of Atomic Hydrogen with Methanol Iodomethane Iodoethane and 1-Iodopropane in Aqueous Solution The Journal of Physical Chemistry 98 10578-10583 (1994)
107 Anbar M amp Hart E J The Reactivity of Aromatic Compounds toward Hydrated Electrons
Journal of the American Chemical Society 86 5633-5637 (1964)
108 Theard Leslie M amp Burton Milton Radiolysis of Liquid Methanol and some Methanolic Salt
Solutions Journal of Physical Chemistry 67 59-64 (1963)
References
169
109 Porter Raymond P Noyes W amp Albert Jr Photochemical Studies LIV Methanol Vapor Journal of the American Chemical Society 81 2307-2311 (1959)
110 Motohashi N amp Saito Y Competitive Measurement of Rate Constants for Hydroxyl Radical
Reactions Using Radiolytic Hydroxylation of Benzoate Chemical amp pharmaceutical bulletin 41 1842-1845 (1993)
111 Adams G E amp Willson R L Pulse Radiolysis Studies on the Oxidation of Organic Radicals in
Aqueous Solution Transactions of the Faraday Society 65 2981-2987 (1969)
112 Kishore K Moorthy P N amp Rao K N Reactivity of H2O2 with Radiation Produced Free
Radicals Steady State Radiolysis Methods for Estimating the Rate Constants International Journal of Radiation Applications and Instrumentation Part C Radiation Physics and Chemistry 29 309-313 (1987)
113 Simic M Neta P amp Hayon E Pulse Radiolysis Study of Alcohols in Aqueous Solution The
Journal of Physical Chemistry 73 3794-3800 (1969)
114 Tsang W Chemical Kinetic Data Base for Combustion Chemistry Part 2 Methanol Journal
of Physical and Chemical Reference Data 16 471-508 (1987)
115 Huie R E amp Clifton C L Kinetics of the Self-Reaction of Hydroxymethylperoxyl Radicals
Chemical Physics Letters 205 163-167 (1993)
116 Schuchmann M N amp Von Sonntag C The Rapid Hydration of the Acetyl Radical A Pulse
Radiolysis Study of Acetaldehyde in Aqueous Solution Journal of the American Chemical Society 110 5698-5701 (1988)
117 Bothe E Schulte-Frohlinde D amp von Sonntag C Radiation Chemistry of Carbohydrates
Part 16 Kinetics of HO2˙ Elimination from Peroxyl Radicals Derived from Glucose and Polyhydric Alcohols Journal of the Chemical Society Perkin Transactions 2 416-420 (1978)
118 Zimina GM amp Bakh NA Pulse Radiolysis of Ethylene Glycol Absorption Spectra of the
Short-Lived Radicals High Energy Chem 13 187-190 (1979)
119 Thomas J K Rates of Reaction of the Hydroxyl Radical Transactions of the Faraday Society
61 702-707 (1965)
120 Draganic I amp Marcovic V Unpublished data (NIST Squib 1968DRAMARB) (1968)
References
170
121 Orlando J J amp Tyndall G S The Atmospheric Chemistry of the HC(O)CO Radical International Journal of Chemical Kinetics 33 149-156 (2001)
122 Ziemer H Doacutebeacute S Wagner H G Olzman M Viskolcz B amp Temps F Kinetics of the
Reactions of HCO with H˙ and D˙ Atoms Berichte der Bunsengesellschaft fuumlr physikalische Chemie 102 897-905 (1998)
123 Temps F amp Wagner H G Rate Constants for the Reactions of ˙OH Radicals with CH2O˙ and
HCO˙ Berichte der Bunsengesellschaft fuumlr physikalische Chemie 88 415-418 (1984)
124 Atkinson R Baulch D L Cox R A Hampson R F Kerr J A Rossi M J et al Evaluated
Kinetic and Photochemical Data for Atmospheric Chemistry Supplement VI IUPAC Subcommittee on Gas Kinetic Data Evaluation for Atmospheric Chemistry Journal of Physical and Chemical Reference Data 26 1329-1499 (1997)
125 Yee Quee M J amp Thynne J C J The Photolysis of Organic Esters Berichte der
Bunsengesellschaft fuumlr physikalische Chemie 72 211-217 (1968)
126 Sunaryoy G R amp Domae M Numerical Simulation on Effect of Methanol Addition on
Coolant Radiolysis in Pressurized Water Reactor Journal of Nuclear Science and Technology 45 1261-1274 (2008)
127 Baxendale J H amp Mellows F W The γ-Radiolysis of Methanol and Methanol Solutions
Journal of the American Chemical Society 83 4720-4726 (1961)
128 Pikaev A K amp Kartasheva L I Radiolysis of Aqueous Solutions of Ethylene Glycol
International Journal for Radiation Physics and Chemistry 7 395-415 (1975)
129 Ahmad M Awan M H amp Mohammad D γ-Radiolysis of Ethylene Glycol Aqueous
Solutions Journal of the Chemical Society B Physical Organic 945-946 (1968)
130 Yaylayan V A Harty-Majors S amp Ismail A A Investigation of the Mechanism of
Dissociation of Glycolaldehyde Dimer (25-dihydroxy-14-dioxane) by FTIR Spectroscopy Carbohydrate Research 309 31-38 (1998)
131 Reiff S C amp LaVerne J A Radiation-Induced Chemical Changes to Iron Oxides The Journal
of Physical Chemistry B 119 7358-7365 (2015)
132 Lousada C M Yang M Nilsson K amp Jonsson M Catalytic Decomposition of Hydrogen
Peroxide on Transition Metal and Lanthanide Oxides Journal of Molecular Catalysis A Chemical 379 178-184 (2013)
References
171
133 Rush J D B Benon H J Pulse Radiolytic Studies of the Reaction of Perhydroxyl
Superoxide O2- with Iron(II)Iron(III) Ions The Reactivity of HO2O2
- with Ferric Ions and its Implication on the Occurrence of the Haber-Weiss Reaction Journal of Physical Chemistry 89 5062-5066 (1985)
134 Pepper S E Borkowski M Richmann M K amp Reed D T Determination of Ferrous and
Ferric Iron in Aqueous Biological Solutions Analytica Chimica Acta 663 172-177 (2010)
135 Barb W G Baxendale J H George P amp Hargrave K R Reactions of Ferrous and Ferric
Ions with Hydrogen Peroxide Part II-The Ferric Ion Reaction Transactions of the Faraday Society 47 591-616 (1951)
136 Stuglik Z amp PawełZagoacuterski Z Pulse Radiolysis of Neutral Iron(II) Solutions Oxidation of
Ferrous Ions by ˙OH Radicals Radiation Physics and Chemistry (1977) 17 229-233 (1981)
137 Fong K-L McCay P B Poyer J L Misra H P amp Keele B B Evidence for Superoxide-
Dependent Reduction of Fe3+ and its role in Enzyme-Generated Hydroxyl Radical Formation Chemico-Biological Interactions 15 77-89 (1976)
138 Baxendale J H Dixon R S amp Stott D A Reactivity of Hydrogen Atoms with Fe3+ FeOH2+
and Cu2+ in Aqueous Solutions Transactions of the Faraday Society 64 2398-2401 (1968)
139 Jonah C D M John R Matheson Max S The Reaction of the Precursor of the Hydrated
Electron with Electron Scavengers Journal of Physical Chemistry 81 1618-1622 (1977)
Appendix
172
Appendix
Radiolysis Model Code
All computational calculations were performed with the software package Facsimile by
MCPA Software The following is a print out of the core water radiolysis model and only
includes the reactions of water other reaction schemes documented in this work can be
found on the included CD as well as the setup files containing initial parameters and
associated Python scripts used to manage output data
Appendix
173
--------------------------------------------------------------------
_ _ ___ ____ _____ _ _ _ _
| | | |__ __ | __ | (_) | | (_)
| |__| | ) | | | | | |__) |__ _ __| |_ ___ | |_ _ ___ _ ___
| __ | | | | | | _ _` | _` | | _ | | | | __| __|
| | | | _| |__| | | | | (_| | (_| | | (_) | | |_| __ | __
|_| |_|____|____ |_| ____|___|_|___|_|__ |___|_|___
__ |
|___
--------------------------------------------------------------------
-----Radiolysis Model for the Radiolysis of Pure Water--------------
----------------------Thomas Donoclift------------------------------
Rate constants mainly are from
A J Elliot Rate constants and G-values
for the simulation of the radiolysis of
light water over the range 0 - 300 C
AECL-11073 COG-94-167 19942008
P Bouniol amp E Bjergbakke ldquoA Comprehensive
Model to Describe Radiolytic processes
in Cement Mediumrdquo J Nuclear Materials 372 1-15 2008
JC Wren JM Ball ldquoLIRIC 32 an Updated model for
Iodine behaviour in the presence of organic impuritiesrdquo
Radiation Physics and Chemistry 60 577-596 2001
EXECUTE OPEN 1 RadMout UNKNOWN
EXECUTE OPEN 2 Reportout UNKNOWN
EXECUTE OPEN 3 SetUptxt OLD
EXECUTE OPEN 4 Flux_Atxt UNKNOWN
EXECUTE OPEN 7 Flux_Btxt UNKNOWN
EXECUTE OPEN 8 Flux_Ctxt UNKNOWN
EXECUTE OPEN 9 Flux_Dtxt UNKNOWN
EXECUTE OPEN 10 Flux_Etxt UNKNOWN
EXECUTE OPEN 11 FireCount_Atxt UNKNOWN
EXECUTE OPEN 12 FireCount_Btxt UNKNOWN
EXECUTE OPEN 14 TIMEtxt UNKNOWN
EXECUTE OPEN 15 FireCount_Ctxt UNKNOWN
EXECUTE OPEN 16 FireCount_Dtxt UNKNOWN
EXECUTE OPEN 17 FireCount_Etxt UNKNOWN
EXECUTE OPEN 19 TRACEtxt UNKNOWN
PERMIT +-
------------------------
Appendix
174
These variables are the concentrations of radiolysis
species Edit initial values in COMPILE INSTANT and
COMPILE INITIAL routines or SetUptxt
---------DEFINE-VARIABLES--------------
----CHEMICAL-SPECIES-FOR-H2O-RADIOLYSIS---------------
VARIABLE
H2O H2O+ H3O+ OH H H2 H2g H2O2 H2O2+ O2 O2g H+
OH- Eaq- O2- O2-- HO2 HO2- O- O-- O3- O Rx O3
---------------------------------------
------REACTION-COUNTERS-----------------------
VARIABLE
R0 R1 R2 R3 R4 R5 R6 R7 R8 R9 R10 R11 R12 R13 R14 R15 R16
R17 R18 R19 R20 R21 R22 R23 R24 R25 R26 R27 R28 R29 R30
R31 R32 R33 R34 R35 R36 R37 R38 R39 R40 R41 R42 R43 R44
R45 R46 R47 R48 R49 R50 R51 R52 R53 R54 R55 R56 R57 R58
R59 R60 R61 R62 R63 R64 R65 R66 R67 R68 R69 R70 R71 R72
R73 R74 R75 R76 R77 R78 R79 R80 R81 R82 R83
G0 G1 G2 G3 G4 G5 G6 G7 G8
---------DEFINE-PARAMETERS-------------
PARAMETER
T TK RT TAB DOSER ADOSE
DOSE EVDOSE GEaq- GH GH2 GOH GH2O2 GH+ GOH- G-H2O G+H2O GO2 GO2-
kappH2 kappO2 GHO2 GHO2-
kappO2g H2tot EA MB1 MB2 H2O2T
INTEGER RUNt
-------------------------
This set of perameters concerns radiolysis rates
G-Values are converted to rates in COMPILE INITIAL
Rate constants are given the prefix K
Arrhenius Pre-exponentials are given the prefix A
Activation Energies (-EaR) are given the prefix E
followed by letters representing reacting species ie
KAB = Rate constant of A+B
-------------------------
A=Eaq- B=H C=OH D=O-
E=O3- F=HO2 G=H2O2 H=H2O2+
I=H2O J=H+ K=OH- L=HO2-
M=O2 N=O2- O=O2-- P=H2O+
Q=O3 R=H2 S=O
-------------------------
PARAMETER
DW GREaq- GRH GRH2 GROH GRH2O2 GRH+ GROH- GR-H2O GR+H2O
GRO2 GRO2- GRHO2 GRHO2- KAA KAB KAC KAD KAG KAF KAL KAM KAN KBB KBC
KBG KBM KBN KBF KBF2 KBL KCC KCD KCG KCL KCF KCN KDR KDG KDL
KDN KEG KEL KER KEC KED KNN KFN KFNI KFF KFG KI KJK KG
KJL KGK KLI KC KJD KCK KDI KDM KE KF KJN KFK KNI KB KJA
KBK KAI KBI KRC KJNb KCKb KLK KLKb KDD KEJ KBQ KDQ
KCL2 KCQ KNQ KFQ KNG KNE KKQ KLQ KGQ KLG KLN KEC2 KAN2 KAN3
-------------------------
Appendix
175
----PRE-EXPONENTIAL-FACTORS-------------------
PARAMETER AAB AAF AAG AAM AAN ABB ABC ABG
ABN ABF ACG ACF ACN ACL ADR ADL AFNI
AFF ADM AE AG AAN2 AGQ AFN ANN ACL2 ABF2
ABL AAD AAL ADG AEG AEL AER AFG AAN3 ACD ALKb
-----------------------------------
-------ACTIVATION-ENERGIES--------------
PARAMETER EAB EAF EAG EAM EAN EBB EBC EBG
EBN EBF ECG ECF ECN ECL EDR EDL EFNI
EFF EDM EE EG EAN2 EGQ EFN ENN ECL2 EBF2
EBL EAD EAL EDG EEG EEL EER EFG EAN3 ECD ELKb
---------------------------------------
PARAMETER
pH pHreal pKw pKH2O2 pKOH pKHO2 pKH pKH2O pKHO2- KpH KpO
KfH KrH KfO KrO CONV PcH PcO O2in xO2 Kprot Khydx
TPrint pHsweep Tstart Tend DecTime
---------------------------------------------------------
Below are arrays for storing reaction flux These are limited to 20
as the output length max is 250 characters To overcome this clunky
artefact of Facsimile the arrays can be fed into Facssemblepy to
concatenate them into a single output file
----------------------------------------------------------
PARAMETER lt20gt Ra Stores Water Reaction Flux Part A
PARAMETER lt20gt Rb Stores Water Reaction Flux Part B
PARAMETER lt20gt Rc Stores Water Reaction Flux Part C
PARAMETER lt20gt Rd Stores Water Reaction Flux Part D
PARAMETER lt10gt Re Stores Water Reaction Flux Part E
PARAMETER lt2gt GR Stores Gas Partition Flux
-------------------------
--PARAMETERS-FOR-GAS-PARTITION--------------
PARAMETER
DaqH2 DgH2 DaqO2 DgO2 daq dg
vaqH2 vgH2 vaqO2 vgO2 vintH2 vintO2
KpH2 KpO2 vtot
Aint Vl Vg Vr Dose EqR
---------------INITIALISE-PARAMETERS--------
Concentrations of specis are given as Moll
T is Temp in C - TK is Temp in K
pHin is the initial pH xO2 is the fraction of O2
pHreal is the calculated pH at any given time
DW is density of water depending on temperature
DS is the density of the whole solution
Vl and Vg is the Volume of liqud and gas phases in L
DOSER is the dose rate in Gymin
ADOSE is the conversion of dose rate to sets of 100eVls
Appendix
176
COMPILE INSTANT
----PARAMETERS-FROM-SETUP-FILE-----
READ 3 DOSER
READ 3 RUNt
READ 3 Tstart
READ 3 Tend
READ 3 pH
READ 3 xO2
READ 3 Vl
READ 3 Vg
READ 3 Aint
READ 3 DaqH2
READ 3 DgH2
READ 3 DaqO2
READ 3 DgO2
READ 3 daq
READ 3 dg
READ 3 KpH2
READ 3 KpO2
---ADDITIONAL-PARAMETERS----
T = Tstart
TK = T + 27315
TAB = 1TK
RT = 8314TK
DW = (0999 + 1094E-4 T - 7397E-6 T2
+ 2693E-8 T3 - 4714E-11 T4)
ADOSE = ((DOSER 62415E16) 60) DW 100 eVsl for use with Gymin
TPrint = (FLOAT(RUNt) - 1) 60
EA = EXP(18800((129815-1TK)8314))
WRITE 2 = 4
WRITE 3 = 7
WRITE 4 = 8
WRITE 7 = 10
WRITE 8 = 9
WRITE 12 = 14
WRITE 1 = 2 WATER RADIOLYSIS MODEL - DEBUG REPORT
------INITIAL-SPECIES-CONCENTRATIONS-----
READ 3 Eaq-
READ 3 H2
READ 3 O2
READ 3 H2O2
H2O = 553DW
O2g = 101320 xO2 (1000 RT)
H2g = 1E-22 mass transfer - zero will cause floating point overflow
H+ = 10(-1pH) H+ Activity (Effective concentration)
OH- = 10(-1(14-pH))
Appendix
177
------------ARRHENIUS-PARAMETERS-----------------------------
----PRE-EXPONENTIAL-FACTORS-------------------
AAB = 114E13
AAF = 24636E12
AAG = 77E12
AAM = 2479E12
AAN = 24636E12
ABB = 27E12
ABC = 426E11
ABG = 179E11
ABN = 517E12
ABF = 517E12
ACG = 768E9
ACF = 129E11
ACN = 877E11
ACL = 100E12
ADR = 232E10
ADL = 145E13
AFNI = 263E9
AFF = 278E9
ADM = 341E11
AE = 320E11
AG = 3171E4
AAN2 = 31E12
AGQ = 28E11
AFN = 244E9
ANN = 489E8
ACL2 = 45E12
ABF2 = 72E11
ABL = 42E13
AAD = 56E11
AAL = 175E12
ADG = 300E11
AEG = 159E6
AEL = 887E5
AER = 249E5
AFG = 37
AAN3 = 2567E13
ACD = 17E11
ALKb = 295E8
------------------------------
------ACTIVATION-ENERGIES-EaR----
EAB = 17957
EAF = 15636
EAG = 18896
EAM = 14015
EAN = 15636
EBB = 18675
EBC = 10919
EBG = 25336
EBN = 18242
EBF = 18242
ECG = 16614
ECF = 7992
ECN = 13062
ECL = 14346
EDR = 15505
EDL = 29285
Appendix
178
EFNI = 9743
EFF = 24164
EDM = 13449
EE = 55521
EG = 78181
------ACTIVATION-ENERGIES---Ea-J--
EAN2 = 136000
EGQ = 735000
EFN = 86000
ENN = 525900
ECL2 = 156000
EBF2 = 106000
EBL = 256000
EAD = 79000
EAL = 154000
EDG = 156000
EEG = 188400
EEL = 188400
EER = 188400
EFG = 200000
EAN3 = 188000
ECD = 77000
ELKb = 142000
--------------------------------
---------OTHER-LITERATURE-RATE-CONSTANTS--------------------------
KLG = 45E-4 FRDuke TWHaas 1961
KLQ = 55E6 JStaehelin J Hoigne 1982
KKQ = 48E1 LForni EJ Hart 1982
KFQ = 50E8 Pastina La Verne 2001
KNQ = 15E9 EJ Hart 1983
KNE = 10E4 Pastina La Verne 2001
KNG = 13E-1 JWeinstein BBielski 1979
KLN = 823E-2 PBouniol EBjergbakke 2008
KCQ = 11E8 K Sehested EJ Hart 1984
KEC2 = 25E9 K Sehested EJ Hart 1984
KDQ = 10E9 E Bjergbakke H Christensen
KBQ = 22E10 EJ Hart 1983
KCD = 20E10
KDN = 600E8
KEC = 60E9 Sehested Holcman Hart 1984
(269)
KEC = 850E9 P Bouniol E Bjergbakke
KDD = 84E9 Adams GE Boag JW
KDD = 10E8
KED = 70E8 Hart EJ 1984
KEJ = 90E10 Hart EJ
KLK = 3506E5
KLKb = 961E5
-GENERAL-ROUTINE-CONTINUALLY-ITTERATES-THROUGHOUT-CALCULATION-
Appendix
179
COMPILE GENERAL
------TEMPERATURE-RAMPING-ROUTINE----------------
TK = T + 27315
TAB = 1TK
RT = 8314TK
DecTime = TIME 3600
T = (11414 DecTime3 - 80383 DecTime2
+ 19256 DecTime + 22918)
IF(T - Tend)211
LABEL 1
T = Tend
LABEL 2
----------------------
H2O2T = H2O2 + HO2- + O2-- Total peroxide for output use
------------------SETUP-OF-EQUILIBRIA---------------------------------
pKw = (14947 - 4273E-2 T + 2115E-4 T2
- 5786E-7 T3 + 7529E-10 T4)
pKH2O2 = (12383 - 3020E-2 T + 170E-4 T2
- 5151E-7 T3 + 696E-10 T4)
pKOH = (12383 - 3020E-2 T + 170E-4 T2
- 5151E-7 T3 + 696E-10 T4)
pKHO2 = (4943 - 623E-3 T + 4125E-5 T2
- 8182E-9 T3)
pKH = (10551 - 443E-2 T + 1902E-4 T2
- 4661E-7 T3 + 598E-10 T4)
pKH2O = (1669 - 443E-2 T + 2071E-4 T2
- 5594E-7 T3 + 7161E-10 T4)
Kprot = (341E10 + 275E8 T + 124E7 T2
- 623E4 T3 + 131E2 T4)
Khydx = (722E9 + 162E8 T + 24E6 T2
- 781E3 T3 + 106 T4)
pKHO2- = 165 see Bouniol 2001
--------------------PARTITION-OF-O2-AND-H2---------------------
It should be noted that this routine is only valid for
a liquid to gas ratio of 1 See Chapter 3 for details
---------DIFFUSIVITY-WITH-TEMPERATURE---------
DaqO2 = (2E-9 T2 + 4E-7 T + 1E-5)
DaqH2 = (1E-8 T2 + 4E-7 T + 3E-5)
DgO2 = (1E-6 T2 + 12E-3 T + 02073)
DgH2 = (5E-6 T2 + 47E-3 T + 07719)
-----HENRYS-COEFFICIENT-WITH-TEMPERATURE--------------------
KpH2 = (TK (78E-4 EXP(543((1TK) - (129815))))) 122
KpO2 = (TK (13E-3 EXP(1650((1TK) - (129815))))) 122
---H2----
vgH2 = DgH2dg
vaqH2 = DaqH2daq
vintH2 = 1(1vaqH2 + KpH2vgH2)
H2tot = H2 + H2g
Appendix
180
---O2----
vgO2 = DgO2dg
vaqO2 = DaqO2daq
vintO2 = 1(1vaqO2 + KpO2vgO2)
vtot = 1((1(vaqO2))+(1(vgO2KpO2)))
--------PARAMETER-EVOLUTION--------------
kappH2 = vintH2(AintVl)(1 - KpH2(H2gH2))
kappO2 = vintO2(AintVl)(1 - KpO2(O2gO2))
Dose = DOSER (TIME 60)
pHreal = -LOG10( H+ )
--------------------G-VALUES------------------------
G-Values with temperature dependency ONLY
G-Values are initially obtained from literature molec 100eV
G-Values are converted to rates later
GEaq- = 2641 + 4162E-3 T + 9093E-6 T2 - 4717E-8 T3
GH2 = 0419 + 872E-4 T - 4971E-6 T2 + 1503E-8 T3
GOH = 2531 + 1134E-2 T - 1269E-5 T2 + 3513E-8 T3
GH2O2 = 0752 - 162E-3 T
GH = 0556 + 2198E-3 T - 1184E-5 T2 + 5223E-8 T3
GH+ = GEaq-
G-H2O = GOH + 2GH2O2
-----------------------------------------------------
------------G-VALUES-FROM-MULTIPLE-POLYNOMIAL-REGRESSION-----
Multiple polynomial regression was used to combine data that measured
primary yields as a function of temperature AND as a function of pH
GEaq- = 2798 + 285E-3 T - 2514E-2 pHreal
GH2 = 38781E-1 + 8288E-4 T + 5988E-4 pHreal
GOH = 243146 + 1111E-2 T - 12E-3 pHreal
GH = 4444E-1 + 367E-3 T - 2378E-4 pHreal
GH+ = GEaq-
GH2O2 = 05(GH + GEaq- + (2 GH2) - GOH) Material Balance
G-H2O = GOH + 2GH2O2
MB1 = GH + GEaq- + (2 GH2) Diagnostic Material Balance Variables
MB2 = GOH + (2 GH2O2)
-------------------G-VALUES--AS--RATES--------------
GREaq- = (ADOSE GEaq-)6022E23
GRH = (ADOSE GH)6022E23
GRH2 = (ADOSE GH2)6022E23
GROH = (ADOSE GOH)6022E23
GRH2O2 =(ADOSE GH2O2)6022E23
GRH+ = (ADOSE GH+)6022E23
GROH- = (ADOSE GOH-)6022E23
GR-H2O = (ADOSE G-H2O)6022E23
GRO2 = (ADOSE GO2)6022E23
GRO2- = (ADOSE GO2-)6022E23
GRHO2 = (ADOSE GHO2)6022E23
GRHO2- = (ADOSE GHO2-)6022E23
Appendix
181
------REACTION-RATES-WITH-TEMP-DEPENDENCY--
--------POLYNOMIAL-EQUATIONS----------------
KAA = 10(12281 - 3768E2 TAB - 6673E4 TAB2 - 1075E7 TAB3)
KAC = 10(13123 - 1023E3 TAB + 7634E4 TAB2)
KBM = 10(10704 + 2840E2 TAB - 137E5 TAB2)
KCC = 10(8054 + 2193E3 TAB - 7395E5 TAB2 + 687E7 TAB3)
KJK = 10(20934 - 1236E4 TAB + 6364E6 TAB2
- 1475E9 TAB3 + 1237E11 TAB4)
KJN = 10(1641 - 4888E3 TAB + 1622E6 TAB2 - 2004E8 TAB3)
KCK = 10(13339 - 222E3 TAB + 7333E5 TAB2 - 1065E8 TAB3)
KJA = 10(39127 - 3888E4 TAB + 2054E7 TAB2 - 4899E9 TAB3
+ 4376E11 TAB4)
KBK = 10(22970 - 1971E4 TAB + 1137E7 TAB2 - 2991E9 TAB3
+ 2803E11 TAB4)
KBI = 10(9408 - 2827E3 TAB - 3792E5 TAB2)
KRC = 10(-11556 + 32546E4 TAB - 18623E7 TAB2
+ 45543E9 TAB3 - 41364E11 TAB4)
------------ARRHENIUS-EQUATIONS------------------
----------EaR-------------------
KAB = AAB(EXP(-EABTK))
KAF = AAF(EXP(-EAFTK))
KAG = AAG(EXP(-EAGTK))
KAM = AAM(EXP(-EAMTK))
KAN = AAN(EXP(-EANTK))
KBB = ABB(EXP(-EBBTK))
KBC = ABC(EXP(-EBCTK))
KBG = ABG(EXP(-EBGTK))
KBN = ABN(EXP(-EBNTK))
KBF = ABF(EXP(-EBFTK))
KCG = ACG(EXP(-ECGTK))
KCF = ACF(EXP(-ECFTK))
KCN = ACN(EXP(-ECNTK))
KCL = ACL(EXP(-ECLTK))
KDR = ADR(EXP(-EDRTK))
KDL = ADL(EXP(-EDLTK))
KFNI = AFNI(EXP(-EFNITK))
KFF = AFF(EXP(-EFFTK))
KDM = ADM(EXP(-EDMTK))
KE = AE(EXP(-EETK))
KG = AG(EXP(-EGTK))
---------Ea-----------------
KAN2 = AAN2EXP(-EAN2RT)
KGQ = AGQEXP(-EGQRT) KSehested EJ Hart1992
KFN = AFNEXP(-EFNRT) BBielski ARoss 1985
KNN = ANNEXP(-ENNRT) Eliot
KCL2 = ACL2EXP(-ECL2RT) Eliot
KBF2 = ABF2EXP(-EBF2RT) Eliot
KBL = ABLEXP(-EBLRT) SP Mezyk DM Bartels
KAD = AADEXP(-EADRT) Eliot
KAL = AALEXP(-EALRT)
KDG = ADGEXP(-EDGRT)
KEG = AEGEA Wren amp Ball
Appendix
182
KEL = AELEA Wren amp Ball
KER = (AEREA) Wren (Suggests 8 correction)
KFG = 50E-1
KAN3 = AAN3EXP(-EAN3RT)
KCD = ACDEXP(-ECDRT)
-----------EQUILIBRIA---------------------------------------
KCKb = KCK ((10(-pKH2O))(10(-pKOH)))
KI = KJK(10-pKw)
KF = KJN (10-pKHO2)
KJL = KJN
KGK = KCK
KDI = KCK((10-pKH2O)(10-pKOH))
KLI = KCK((10-pKH2O)(10-pKH2O2))
KJD = KJN
KC = KJD(10-pKOH)
KFK = KCK
KNI = KFK((10-pKH2O)(10-pKHO2))
KB = KJA(10-pKH)
KAI = KBK((10-pKH2O)(10-pKH))
KJNb = KJN(10-pKH2O2)((10(-pKw))(10(-pKHO2)))
GENERAL
-------EQUATIONS-ROUTINE-CONTAINS-RADIOLYSIS-CHEMISTRY--------
COMPILE EQUATIONS
------INITIAL-SPECIES-GENERATION----------------------------
Ralt0gtGREaq- = Eaq- + G0
Ralt1gtGRH = H + G1
Ralt2gtGRH2 = H2 + G2
Ralt3gtGROH = OH + G3
Ralt4gtGRH2O2 = H2O2 + G4
Ralt5gtGRH+ = H+ + G5
Ralt6gtGROH- = OH- + G6
Ralt7gtGR-H2OH2O H2O = G7
----------REACTIONS------------------------
Ralt8gtKAA(H2OH2O) Eaq- + Eaq- + H2O + H2O = H2 + OH- + OH- + R0
Ralt9gtKABH2O Eaq- + H + H2O = H2 + OH- + R1
Ralt10gtKAC Eaq- + OH = OH- + R2
Ralt11gtKADH2O Eaq- + H2O + O- = OH- + OH- + R3
Ralt12gtKAG Eaq- + H2O2 = OH- + OH + R4
Ralt13gtKAF Eaq- + HO2 = HO2- + R5
Ralt14gtKAL Eaq- + HO2- = O- + OH- + R6
Ralt15gtKAM Eaq- + O2 = O2- + R7
Ralt16gtKAN Eaq- + O2- = O2-- + R8
Ralt17gtKBB H + H = H2 + R9
Ralt18gtKBC H + OH = H2O + R10
Ralt19gtKBG H + H2O2 = OH + H2O + R11
Rblt0gtKBM H + O2 = HO2 + R12
Rblt1gtKBN H + O2- = HO2- + R13
Rblt2gtKBF H + HO2 = OH + OH + R14
Rblt3gtKBL H + HO2- = OH + OH- + R15
Rblt4gtKBQ H + O3 = OH + O2 + R16
Rblt5gtKCC OH + OH = H2O2 + R17
Rblt6gtKCG OH + H2O2 = H2O + HO2 + R18
Rblt7gtKCL OH + HO2- = OH- + HO2 + R19
Rblt8gtKCF OH + HO2 = H2O + O2 + R20
Appendix
183
Rblt9gtKCN OH + O2- = OH- + O2 + R21
Rblt10gtKCQ OH + O3 = O2 + HO2 + R22
Rblt11gtKEG O3- + H2O2 = O2- + O2 + H2O + R23
Rblt12gtKEL O3- + HO2- = O2- + O2 + OH- + R24
Rblt13gtKER O3- + H2 = O2 + H + OH- + R25
Rblt14gtKEC O3- + OH = HO2 + O2- + R26
Rblt15gtKEC2 O3- + OH = OH- + O3 + R27
Rblt16gtKEJ O3- + H+ = OH + O2 + R28
Rblt17gtKNN O2- + O2- = O2 + O2-- + R29
Rblt18gtKLN O2- + HO2- = O2 + OH- + O- + R30
Rblt19gtKNG O2- + H2O2 = O2 + OH + OH- + R31
Rclt1gtKFN O2- + HO2 = O2 + HO2- + R32
Rclt2gtKNE O2- + O3- = O-- + O2 + O2 + R33
Rclt3gtKNQ O2- + O3 = O2 + O3- + R34
Rclt4gtKFF HO2 + HO2 = H2O2 + O2 + R35
Rclt5gtKFG HO2 + H2O2 = O2 + H2O + OH + R36
Rclt6gtKFQ HO2 + O3 = OH + O2 + O2 + R37
Rclt7gtKLG H2O2 + HO2- = H2O + O2 + OH- + R38
Rclt8gtKKQ O3 + OH- = O2 + HO2- + R39
Rclt9gtKLQ O3 + HO2- = O2 + OH + O2- + R40
Rclt10gtKGQ O3 + H2O2 = O2 + OH + HO2 + R41
------------------ADDITIONAL-WATER-CHEMISTRY------------------------
Rclt12gt200E10 H + O- = OH- + R42 Bjergbakke Draganic
Sehested
Rclt13gt16E10 O3- + Eaq- = OH- + OH- + O2 + R43 Pastina amp La
Verne
Rclt14gt36E10 O3 + Eaq- = O3- + R44 NIST
Rclt16gt23E-7 H2O2 = OH + OH + R45 Yakabuskie et al
Rclt17gt10E10H2O O-- + H2O = OH- + OH- + R46
Bouniol and Bjergbakke 2008
----------------ALKALI-REACTIONS------------------
Relt2gtKDR O- + H2 = H + OH- + R47
Relt3gtKDG O- + H2O2 = OH- + HO2 + R48
Relt4gtKDL O- + HO2- = O2- + OH- + R49
Relt5gtKDN O- + O2- = O-- + O2 + R50
Relt6gtKDD O- + O- = O2-- + R51
Relt7gtKCD O- + OH = HO2- + R52
Relt8gtKED O- + O3- = O2- + O2- + R53
Relt9gtKDQ O- + O3 = O2- + O2 + R54
----------EQUILIBRIUM-REACTIONS--------------------
Rclt18gtKIH2O H2O = H+ + OH- + R55
Rclt19gtKJK H+ + OH- = H2O + R56
Rdlt0gtKJN10(-pKH2O2) H2O2 = H+ + HO2- + R57
Rdlt1gtKJN H+ + HO2- = H2O2 + R58
Rdlt2gtKCK H2O2 + OH- = HO2- + H2O + R59
Rdlt3gtKLIH2O HO2- + H2O = H2O2 + OH- + R60
Rdlt4gtKLK HO2- + OH- = O2-- + H2O + R61
Rdlt5gtKLKbH2O O2-- + H2O = HO2- + OH- + R62
Rdlt6gtKJN10(-pKOH) OH = H+ + O- + R63
Rdlt7gtKJN H+ + O- = OH + R64
Appendix
184
Rdlt8gtKCK OH + OH- = O- + H2O + R65
Rdlt9gtKCKbH2O O- + H2O = OH + OH- + R66
Rdlt10gtKDM O- + O2 = O3- + R67
Rdlt11gtKE O3- = O- + O2 + R68
Rdlt12gtKF HO2 = H+ + O2- + R69
Rdlt13gtKJN H+ + O2- = HO2 + R70
Rdlt14gtKFK HO2 + OH- = O2- + H2O + R71
Rdlt15gtKNIH2O O2- + H2O = HO2 + OH- + R72
Rdlt16gtKB H = H+ + Eaq- + R73
Rdlt17gtKJA H+ + Eaq- = H + R74
Rdlt18gtKBK H + OH- = Eaq- + H2O + R75
Rdlt19gtKAIH2O Eaq- + H2O = H + OH- + R76
Relt0gtKBIH2O H + H2O = H2 + OH + R77
Relt1gtKRC H2 + OH = H + H2O + R78
---------------MASS-TRANSFER----------------------
GRlt0gtkappH2 H2 = H2g + R79
GRlt1gtkappO2 O2 = O2g + R80
-------OUTPUTS-ROUTINE-------
SETPSTREAM 3 1 20
OH H H2 H2g H2O2 O2 O2g H+ OH- Eaq-
O2- O2-- HO2 HO2- O- O-- O3- O O3
SETPSTREAM 4 11 20
R0 R1 R2 R3 R4 R5 R6 R7 R8 R9 R10 R11 R12 R13 R14 R15 R16
R17 R18 R19
SETPSTREAM 5 12 20
R20 R21 R22 R23 R24 R25 R26 R27 R28 R29 R30
R31 R32 R33 R34 R35 R36 R37 R38 R39
SETPSTREAM 6 15 20
R40 R41 R42 R43 R44 R45 R46 R47 R48 R49
R50 R51 R52 R53 R54 R55 R56 R57 R58 R59
SETPSTREAM 7 16 20
R60 R61 R62 R63 R64 R65 R66 R67 R68 R69
R70 R71 R72 R73 R74 R75 R76 R77 R78 R79
Appendix
185
SETPSTREAM 8 17 20
R80 R81 R82 R83 G1 G2 G3
G4 G5 G6 G7 G8
COMPILE OUT
PSTREAM 3
PSTREAM 4
PSTREAM 5
PSTREAM 6
PSTREAM 7
PSTREAM 8
WRITE 2 250 (N20 E10 2) Ra
WRITE 3 250 (N20 E10 2) Rb
WRITE 4 250 (N20 E10 2) Rc
WRITE 8 250 (N20 E10 2) Rd
WRITE 7 250 (N10 E10 2) Re
WRITE 10 (N2 E10 2) GR
WRITE 12 (E10 2) TIME
WHENEVER
TIME = TPrint Call Report
TIME = 0 + 600 RUNt CALL OUT
------------DEBUG-REPORT---------------
-Contains a list of all parameters to
confirm that values are correct-
COMPILE Report
WRITE 1 THIS REPORT IS GENERATED AT TPrint SECONDS
WRITE 1 RUNt = RUNt
WRITE 1 KpH2 = (E12 3) KpH2
WRITE 1 KpO2 = (E12 3) KpO2
WRITE 1 pH = (F6 1) pH
WRITE 1 Temperature = (F6 1) T C
WRITE 1 Dose Rate = (F6 1) DOSER Gymin
WRITE 1 VgVl Ratio = (F6 2) Vr
WRITE 1 Run Time = (F12 2) RUNt Mins
WRITE 1 Oxygen Fraction = (F6 3) xO2
WRITE 1 G-VALUES
WRITE 1 G(Eaq-) = (F6 3) GEaq-
WRITE 1 G(H) = (F6 3) GH
WRITE 1 G(H2) = (F6 3) GH2
WRITE 1 G(OH) = (F6 3) GOH
WRITE 1 G(H2O2) = (F6 3) GH2O2
WRITE 1 G(H+) = (F6 3) GH+
WRITE 1 G(-H2O) = (F6 3) G-H2O
WRITE 1 G-VALUES AS RATES MOLLS
WRITE 1 GREaq- = (E12 3) GREaq-
WRITE 1 GRH = (E12 3) GRH
WRITE 1 GRH2 = (E12 3) GRH2
WRITE 1 GROH = (E12 3) GROH
WRITE 1 GRH2O2 = (E12 3) GRH2O2
WRITE 1 GRH+ = (E12 3) GRH+
WRITE 1 GR-H2O = (E12 3) GR-H2O
WRITE 1 RATE CONSTANTS
WRITE 1 KAA = (E12 3) KAA
WRITE 1 KAB = (E12 3) KAB
Appendix
186
WRITE 1 KAC = (E12 3) KAC
WRITE 1 KAD = (E12 3) KAD
WRITE 1 KAG = (E12 3) KAG
WRITE 1 KAF = (E12 3) KAF
WRITE 1 KAL = (E12 3) KAL
WRITE 1 KAM = (E12 3) KAM
WRITE 1 KAN = (E12 3) KAN
WRITE 1 KBB = (E12 3) KBB
WRITE 1 KBC = (E12 3) KBC
WRITE 1 KBG = (E12 3) KBG
WRITE 1 KBM = (E12 3) KBM
WRITE 1 KBN = (E12 3) KBN
WRITE 1 KBF = (E12 3) KBF
WRITE 1 KBF2 = (E12 3) KBF2
WRITE 1 KBL = (E12 3) KBL
WRITE 1 KBQ = (E12 3) KBQ
WRITE 1 KCC = (E12 3) KCC
WRITE 1 KCD = (E12 3) KCD
WRITE 1 KCG = (E12 3) KCG
WRITE 1 KCL = (E12 3) KCL
WRITE 1 KCF = (E12 3) KCF
WRITE 1 KCN = (E12 3) KCN
WRITE 1 KCQ = (E12 3) KCQ
WRITE 1 KDR = (E12 3) KDR
WRITE 1 KDG = (E12 3) KDG
WRITE 1 KDL = (E12 3) KDL
WRITE 1 KDN = (E12 3) KDN
WRITE 1 KEG = (E12 3) KEG
WRITE 1 KEL = (E12 3) KEL
WRITE 1 KER = (E12 3) KER
WRITE 1 KEC = (E12 3) KEC
WRITE 1 KED = (E12 3) KED
WRITE 1 KNN = (E12 3) KNN
WRITE 1 KFN = (E12 3) KFN
WRITE 1 KFNI = (E12 3) KFNI
WRITE 1 KFF = (E12 3) KFF
WRITE 1 KFG = (E12 3) KFG
WRITE 1 KI = (E12 3) KI
WRITE 1 KJK = (E12 3) KJK
WRITE 1 KG = (E12 3) KG
WRITE 1 KJL = (E12 3) KJL
WRITE 1 KGK = (E12 3) KGK
WRITE 1 KLI = (E12 3) KLI
WRITE 1 KC = (E12 3) KC
WRITE 1 KJD = (E12 3) KJD
WRITE 1 KCK = (E12 3) KCK
WRITE 1 KDI = (E12 3) KDI
WRITE 1 KDM = (E12 3) KDM
WRITE 1 KE = (E12 3) KE
WRITE 1 KF = (E12 3) KF
WRITE 1 KJN = (E12 3) KJN
WRITE 1 KFK = (E12 3) KFK
WRITE 1 KNI = (E12 3) KNI
WRITE 1 KB = (E12 3) KB
WRITE 1 KJA = (E12 3) KJA
WRITE 1 KBK = (E12 3) KBK
WRITE 1 KAI = (E12 3) KAI
WRITE 1 KBI = (E12 3) KBI
WRITE 1 KRC = (E12 3) KRC
Appendix
187
WRITE 1 KJNb = (E12 3) KJNB
WRITE 1 KCKb = (E12 3) KCKb
WRITE 1 KLK = (E12 3) KLK
WRITE 1 KLKb = (E12 3) KLKb
WRITE 1 KDD = (E12 3) KDD
WRITE 1 KEJ = (E12 3) KEJ
WRITE 1 KBQ = (E12 3) KBQ
WRITE 1 KDQ = (E12 3) KDQ
WRITE 1 KCL2 = (E12 3) KCL2
WRITE 1 KCQ = (E12 3) KCQ
WRITE 1 KNQ = (E12 3) KNQ
WRITE 1 KFQ = (E12 3) KFQ
WRITE 1 KNG = (E12 3) KNG
WRITE 1 KNE = (E12 3) KNE
WRITE 1 KKQ = (E12 3) KKQ
WRITE 1 KLQ = (E12 3) KLQ
WRITE 1 KGQ = (E12 3) KGQ
WRITE 1 KLG = (E12 3) KLG
WRITE 1 KLN = (E12 3) KLN
WRITE 1 KEC2 = (E12 3) KEC2
WRITE 1 KAN2 = (E12 3) KAN2
WRITE 1 KRC = (E12 3) KRC
WRITE 1 ----PRE-EXPONENTIAL-FACTORS----
WRITE 1 AAB = (E12 3) AAB
WRITE 1 AAF = (E12 3) AAF
WRITE 1 AAG = (E12 3) AAG
WRITE 1 AAM = (E12 3) AAM
WRITE 1 AAN = (E12 3) AAN
WRITE 1 ABB = (E12 3) ABB
WRITE 1 ABC = (E12 3) ABC
WRITE 1 ABG = (E12 3) ABG
WRITE 1 ABN = (E12 3) ABN
WRITE 1 ABF = (E12 3) ABF
WRITE 1 ACF = (E12 3) ACF
WRITE 1 ACL = (E12 3) ACL
WRITE 1 ACG = (E12 3) ACG
WRITE 1 ACN = (E12 3) ACN
WRITE 1 ADR = (E12 3) ADR
WRITE 1 ADL = (E12 3) ADL
WRITE 1 AFNI = (E12 3) AFNI
WRITE 1 AFF = (E12 3) AFF
WRITE 1 ADM = (E12 3) ADM
WRITE 1 AG = (E12 3) AG
WRITE 1 AAN2 = (E12 3) AAN2
WRITE 1 AGQ = (E12 3) AGQ
WRITE 1 AFN = (E12 3) AFN
WRITE 1 ANN = (E12 3) ANN
WRITE 1 ACL2 = (E12 3) ACL2
WRITE 1 ABF2 = (E12 3) ABF2
WRITE 1 ABL = (E12 3) ABL
WRITE 1 AAD = (E12 3) AAD
WRITE 1 AAL = (E12 3) AAL
WRITE 1 ADG = (E12 3) ADG
WRITE 1 AEG = (E12 3) AEG
WRITE 1 AEL = (E12 3) AEL
WRITE 1 AER = (E12 3) AER
WRITE 1 AFG = (E12 3) AFG
WRITE 1 ----ACTIVATION ENERGIES----
WRITE 1 EAG = (E12 3) EAG
Appendix
188
WRITE 1 EAM = (E12 3) EAM
WRITE 1 EAN = (E12 3) EAN
WRITE 1 EBG = (E12 3) EBG
WRITE 1 ECG = (E12 3) ECG
WRITE 1 ECL = (E12 3) ECL
WRITE 1 ECF = (E12 3) ECF
WRITE 1 ECN = (E12 3) ECN
WRITE 1 EFN = (E12 3) EFN
WRITE 1 EFNI = (E12 3) EFNI
WRITE 1 ECL2 = (E12 3) ECL2
WRITE 1 EAN2 = (E12 3) EAN2
WRITE 1 ---pKa----
WRITE 1 pKw = (E12 3) pKw
WRITE 1 pKH2O2 = (E12 3) pKH2O2
WRITE 1 pKHO2 = (E12 3) pKHO2
WRITE 1 pKOH = (E12 3) pKOH
WRITE 1 pKH = (E12 3) pKH
WRITE 1 pKH2O = (E12 3) pKH2O
WRITE 1 Kprot = (E12 3) Kprot
WRITE 1 Khydx = (E12 3) Khydx
WRITE 1 KappO2 = (E12 3) kappO2
WRITE 1 KappH2 = (E12 3) kappH2
WRITE 1 H2O2 Equ rate = (E12 3) EqR
SETHMAX 1
BEGIN
STOP
Appendix
189
Radiolysis Model Full Reaction Scheme
Primary Reaction G-value
(Molecules100eV) Temperature Dependency Ref
G0 H2O emacraq 271 2641 + 416210-3
t + 909310-6 t2
ndash 471710-8 t3 45
G1 H2O H 054 0556 + 219810-3 t ndash 118410-5 t2 + 522310-8 t3 45
G2 H2O H2 041 0419 + 872110-4 t - 497110-6 t2 + 150310-8 t3 45
G3 H2O OH 270 2531 + 113410-2 t ndash 126910-5 t2 + 351310-8 t3 45
G4 H2O H2O2 068 0752 ndash 162010-3 t 45
G5 H2O H+ 271 2641 + 416210-3
t + 909310-6 t2
ndash 471710-8 t3 45
Chemical Reaction Rate Constant
k (M-1 s-1 25degC) Arrhenius Activation Energy Ea
(kJ) Ref
R0 emacraq + emacr
aq rarr H2 + 2OHmacr 7260 times109 Log kR7 = 12281 ndash 3768102T ndash 6673104T2 - 1075107T3 45
R1 emacraq + H rarr H2 + OHmacr 2762 times1010
114 times1013 14929 45
R2 emacraq + OH rarr OHmacr 3553 times1010
Log kR9 = 13123 ndash 1023103T + 7634104T2 45
R3 emacraq + Omacr rarr 2OHmacr 2313 times1010
56 times1011 79 49
R4 emacraq + H2O2 rarr OHmacr + OH 1362 times1010
77 times1012 1571 45
R5 emacraq + HO2 rarr HO2
macr 1300 times1010 246 times1012 130 45
R6 emacraq + HO2
macr rarr Omacr + OHmacr 3507 times109 175 times1012 154 49
R7 emacraq + O2 rarr O2
macr 2253 times1010 252 times1012 11652 45
R8 emacraq + O2
macr rarr O22macr + H2O 1300times1010
31 times1012 136 4349
R9 H + H rarr H2 5142 times109 27 times1012 15526 45
R10 H + OH rarr H2O 1094 times1010 426 times1011 9078 45
R11 H + H2O2 rarr OH + H2O 3650 times107 179 times1011 21064 45
R12 H + O2 rarr HO2 1304 times1010
Log kR23 = 10704 + 2840102T - 1369105T2 45
R13 H + O2
macr rarr HO2macr 1138 times1010
517 times1012 15166 45
R14 H + HO2 rarr 2OH 1138 times1010 517 times1012 15166 45
R15 H + HO2macr rarr OH + OHmacr 1374times109
42 times1013 256 85
R16 H + O3 rarr OH + O2 2200 times1010 No temperature dependence available 43
R17 OH + OH rarr H2O2 4814 times109 Log kR25 = 8054 + 2193103T ndash 7395105T2 + 6870107T3
45
R18 OH + H2O2 rarr H2O + HO2 2920 times107 768times109 13813 45
R19 OH + HO2macr rarr OHmacr + HO2 8134 times109
100 times1012 11927 45
R20 OH + HO2 rarr H2O + O2 8840 times109
129 times1011 6645 45
Appendix
190
R21 OH + O2
macr rarr OHmacr + O2 1097 times1010 877 times1011 10860 45
R22 OH + O3 rarr HO2 + O2 1100 times108
No temperature dependence available 43
R23 O3macr + H2O2 rarr O2
macr + O2 + H2O 1590 times106 xEXP(188times103 (129815 ndash 1TK)R) 43
R24 O3macr + HO2
macr rarr O2macr + O2 + OHmacr 8870 times105
xEXP(188times103 (129815 ndash 1TK)R) 43
R25 O3macr + H2 rarr O2 + H + OHmacr 2490times105
xEXP(188times103 (129815 ndash 1TK)R) 46
R26 O3
macr + OH rarr HO2 + O2macr 6000 times109 No temperature dependence
available 46 43
R27 O3
macr + OH rarr HOmacr + O3 2500 times109 No temperature dependence available
46 43
R28 O3
macr + H+ rarr O2 + OH 9000 times1010 No temperature dependence available
4 43
R29 O2
macr + O2macr rarr O2 + O2
2macr 2988times10-1 489 times108 5259 43
R30 O2
macr + HO2macr rarr O2 + Omacr + OHmacr 8230 times10-2 No temperature dependence
available 4 43
R31 O2
macr + H2O2 rarr O2 + OH + OHmacr 1300 times10-1 No temperature dependence
available 4 43
R32 O2
macr + HO2 rarr O2 + HO2macr 7597times107
244 times109 86 43
R33 O2
macr + O3macr rarr O2-
+ 2O2 1000 times104 No temperature dependence available
47 43
R34 O2
macr + O3 rarr O3macr + O2 1500 times109 No temperature dependence
available 4 43
R35 HO2 + HO2 rarr H2O2 + O2 8399 times105
278 times109 201 45
R36 HO2 + H2O2 rarr O2 + H2O + OH 5000 times10-1 No temperature dependence
available 4 49
R37 HO2 + O3 rarr OH + 2O2 5000 times108 No temperature dependence
available 4 43
R38 H2O2 + HO2
macr rarr O2 + H2O + OHmacr 450times10-4 No temperature dependence available
4 43
R39 O3 + OHmacr rarr HO2
macr + O2 4800 times101 No temperature dependence available
4 43
R40 O3 + HO2
macr rarr OH + O2 + O2macr 5500 times106 No temperature dependence
available 4 43
R41 O3 + H2O2 rarr OH + O2 + HO2 3714 times10-2
28 times1011 735 43
R42 H +Omacr rarr OHmacr 2000times1010 No temperature dependence
available 4 43
R43 O3
macr + emacraq rarr 2OHmacr + O2 1600times1010 No temperature dependence
available 47 43
R44 O3 + emacr
aq rarr O3macr 3600 times1010 No temperature dependence
available 4 43
R45 H2O2 rarr 2OH 2300 times10-7 No temperature dependence
available - 86
R46 O2- + H2O rarr 2OH- 1000 times1010 No temperature dependence
available - 43
R47 Omacr + H2 rarr H + OHmacr 1279 times108
232 times1010 12891 45
R48 Omacr + H2O2 rarr O2
macr + H2O 5546 times108 30 times1011 156 49
R49 Omacr + HO2
macr rarr O2macr + OHmacr 7864 times108
145 times1013 24348 45
R50 Omacr + O2
macr rarr O2macr + O2 6000 times108 No temperature dependence available
46 43
R51 Omacr + Omacr rarr O2
2macr 1000times108 No temperature dependence available
4 43
R52 Omacr + OH rarr HO2
macr 7610 times109 17 times1011 77 49
Appendix
191
R53 Omacr + O3macr rarr 2O2
macr 7000times108 No temperature dependence available
46 43
R54 Omacr
+ O3 rarr O2macr + O2 1000 times109 No temperature dependence
available 4 43
Equilibria
kf
(M-1 s-1)
kb
(M-1 s-1) Temperature Dependence pKa
(25degC)
R5556 H2O H+ + OHmacr 1172 times10-3 1178times1011 Log kR67 = 20934 - 1236x104T + 6364x106T2 ndash 1475x109T3 +
1237x1011T4 1575 45
R5758 H2O2 H+ + HO2macr 8900 times10-2 4780times1010 Log kR68 = 16410 ndash 4888x10
3T + 1622x10
6T
2 ndash 2004x10
8T
3 1173 45
R5960 H2O2 + OHmacr HO2
macr + H2O
1265 times1010 1403 times106 Log kR75 = 13339 ndash 2220x103T + 7333x10
5T
2 ndash 1065x10
8T
3
1198701198672119874
11987011986721198742 45
R6162 HO2macr + OHmacr O2
2macr + H2O 3506 times105 1103 times106 339times108 142 165 43
R6364 OH H+ + Omacr 8900 times10-2 4780times1010 Log kR66 = 16410 ndash 4888x103T + 1622x106T2 ndash 2004x108T3 1173 45
R6566 OH + OHmacr Omacr + H2O 1265 times1010 1403 times106 Log kR72 = 13339 ndash 2220x103T + 7333x105T2 ndash 1065x108T3 1198701198672119874
119870119874119867 45
R6768 Omacr + O2 O3macr 3747 times109 2617 times103 341 times1011 11182 Forward 45
320 times1011 4616 Reverse 45
R6970 HO2 H+ + O2macr 4780 times1010 7354 times105 Log kR69 = 16410 ndash 4888x103T + 1622x106T2 ndash 2004x108T3 481 45
R7172 HO2 + OHmacr O2macr + H2O 1265 times1010 1628 times10-1 Log kR75 = 13339 ndash 2220x103T + 7333x105T2 ndash 1065x108T3
1198701198672119874
1198701198671198742 45
R7374 H emacraq + H+ 5832 2095times1010
Log kR74 = 39127 - 3888E4T + 2054E7T2 - 4899E9T3 + 4376E11T4
955 45
R7576 H + OHmacr emacraq + H2O 2440 times107 1735 times101
Log kR70 = 22970 ndash1971x104T + 1137x107T2 ndash 2991x109T3 + 2803x1011T4
1198701198672119874
119870119867 45
R7778 H + H2O H2 + OH 4575 times10-5 3954 times107
Log kR71f = 9408 ndash 2827x103 Tndash 3792x105T2 45
Log kR71b = -11556 + 32546x104T - 18623x107T2 + 45543x109T3 - 41364x1011T4
45
R79 H2(aq) H2(g) 2687times10-3 See Chapter 3
R80 O2(aq) O2(g) 1033times10-4 See Chapter 3

Table of Contents
2
Chapter 2 Experimental Methods 40
Source of Radiation and Dosimetry 40
Water Purification for Radiolysis Experiments 49
Determination of H2O2 ndash Photometric Analysis 50
Analytical Procedure 52
Determination of H2 - Gas Chromatography 55
Method development 55
The Crush Tube Sampling Method 56
Detection of H2 and Calibration 61
Method Validation 64
Sources of Error 66
Sources of Error in the Determination of H2O2 66
Sources of Error in the Determination of H2 68
Chapter 3 Computational Methodology 69
Production of Primary Species 70
Factors Affecting Primary Yields 72
Temperature 72
pH 77
Linear Energy Transfer (LET) 83
Mass Transfer of Volatile Species 86
Water Radiolysis Reaction Set 90
Computational Assumptions and Error 95
Chapter 4 The Radiolysis of Aqueous Solutions at High pH 97
Preliminary Radiolysis Studies of Pure Water 97
Discussion 99
Measurements of H2O2 in the Radiolysis of High pH Solutions 105
Results 105
Measurements of H2 in the Radiolysis of High pH Solutions 107
Results 108
Discussion 112
Table of Contents
3
Chapter 5 Radiolysis of Magnesium Hydroxide 122
Context 122
Method 123
Results 124
Discussion 128
Chapter 6 Radiolysis of Methanol Solutions 135
Context 135
Experimental Method 135
Results 136
Discussion 139
Chapter 7 Radiolysis of Iron Oxide-Water Systems 148
Context 148
Method 148
Results 149
Discussion 151
Chapter 8 Conclusions and Further Work 154
Further High pH Investigations 154
Further Methanol Radiolysis Investigations 156
Future Development of a Multi-Scale Radiolysis Model 157
Closing Remarks Relevant to Sellafield Ltd 158
References 160
Appendix 172
Radiolysis Model Code 172
Radiolysis Model Full Reaction Scheme 189
List of Figures
4
List of Figures
Figure 1 An aerial view of the Sellafield Site which covers approximately 6 km2 Image
provided by Sellafield Ltd Press Office 19
Figure 2 On the left is The First Generation Magnox Storage Pond (FGMSP) and on the right
are the Magnox Swarf Storage Silos (MSSS) Images provided by Sellafield Ltd Press Office 20
Figure 3 A representation demonstrating the uniform excitations and ionisations of UV
radiation compared to the structured tracks of alpha radiation 22
Figure 4 A representation of the photoelectric effect Image recreated from Spinks and Wood2
25
Figure 5 A representation of the Compton Effect Image recreated from Spinks and Wood 26
Figure 6 A representation of pair production and positron annihilation Image recreated from
Spinks and Wood2 27
Figure 7 A scheme showing the early stages of water radiolysis and the production of primary
species 29
Figure 8 A decay scheme for cobalt-60 41
Figure 9 Image on the left shows the Model-812 Irradiator On the right is the inside of the
irradiator showing the three guide rods that contain the cobalt-60 source during irradiation 42
Figure 10 Sample holding devices for use in the Model-812 Left is the 4x8 rack with its
schematic below On the right is the inverter rig again with its schematic below 46
Figure 11 A diagram of the purification system that provides the ultra-pure water used
throughout this work Image was taken from the ELGA PURELAB user manual 50
Figure 12 Structure of Potassium phthalate monobasic (C8H5KO4) 51
Figure 13 Scanned absorption spectra of a 625 μM H2O2 solution 53
Figure 14 A calibration curve of H2O2 photometric absorption to determine the molar
extinction coefficient 54
Figure 15 The modified SRI 8610C Gas chromatograph with inline ldquocrush tuberdquo setup The
sample can be seen inside the silicone tubing 56
Figure 16 Image on the left shows a schematic for the sampling apparatus on the right are the
vials used which are flame sealed at the midway neck 57
List of Figures
5
Figure 17 A schematic of the original setup for the 10-port sampling valve in both off (top
image) and on (bottom image) positions 58
Figure 18 A schematic for the modified 10-port sampling valve including the removal of the
silica gel column 59
Figure 19 Image on the left shows the bespoke frac14 inch OD 13x molecular sieve column On the
right the rotameter is connected to calibrate gas flow rates 60
Figure 20 A calibration curve to provide a conversion to determine carrier gas flow rate 61
Figure 21 A schematic of a Wheatstone bridge circuit used in the TCD 62
Figure 22 A calibration curve for quantifying hydrogen gas from chromatograms 63
Figure 23 Method validation by the determination of the well-established primary yield of H2
through hydroxyl scavenging by bromide 65
Figure 24 Collected data from literature showing measured primary yields as a function of
temperature Provided by Elliot and Bartels 2008 75
Figure 25 A comparison of the sample temperature profile logged by thermocouple to the
temperature profile calculated in the computational model 76
Figure 26 A reproduction of data provided by Hayon 82
Figure 27 An example of a Bragg peak Energy loss of alphas of 549 MeV in Air Image
released to public domain 83
Figure 28 A schematic representation of how linear energy transfer (LET) alters the
distribution of spurs along a radiation track Image was recreated from Allen AO 84
Figure 29 Simulation data showing the effects of increasing linear energy transfer on the
primary yields of water radiolysis Image was recreated from Allen AO 85
Figure 30 A representation of the stagnant two-film model used to calculate the partitioning of
volatile species 87
Figure 31 The diffusivity of O2 and H2 in both water and air as a function of temperature88
Figure 32 Measurements of H2O2 concentration as a function of dose for aerated water (diams) and
deaerated water (diams) Vertical error bars show the standard deviation between replicates while
horizontal error bars show the dose range for replicates 98
List of Figures
6
Figure 33 Measurements of H2 as a function of dose in aerated (diams) and deaerated (diams) samples
Vertical error bars show the standard deviation of replicates while horizontal error bars show the
dose range for replicates 99
Figure 34 Predicted concentrations of H2O2 as calculated by the radiolysis model for both
aerated () and deaerated () conditions 102
Figure 35 Predicted concentrations of H2 gas as calculated by the radiolysis model for both
aerated () and deaerated () conditions 102
Figure 36 Calculated concentrations of the major oxidising and reducing water radiolysis
species as a function of dose Solid lines represent aerated conditions while broken lines
represent deaerated conditions 103
Figure 37 Measurements of H2O2 concentrations as a function of dose for samples initially at
pH 7 (diams) pH 104 (diams) pH 11 (diams) pH 123 (diams) and pH 127 (diams) All samples were aerated
Vertical error bars are the standard deviation between replicates while horizontal error bars
show the dose range for replicates 106
Figure 38 Measurements of H2 gas as a function of dose at pH 7 (diams) pH 106 (diams) pH 123 (diams)
and pH 13 (diams) Dashed lines are provided to clarify the data trends all samples were deaerated
Vertical error bars show the standard deviation between replicates while horizontal error bars
show the dose range for replicates 108
Figure 39 Model calculations to show the predicted concentrations of H2O2 as a function of
dose at various pH 109
Figure 40 Model calculations to show the predicted concentrations of H2 gas as a function of
dose at various pH 110
Figure 41 Model calculations showing the concentrations of aqueous oxygen and hydrogen gas
from deaerated water after 80 kGy at 280 Gy min-1
to show the related behaviour between the
two 114
Figure 42 Model predictions of the steady-state reaction rates of R21 R50 and R32 at various
pH for γ radiolysis of deaerated water at a dose rate of 280 Gy min-1
115
Figure 43 The sum of the steady state rates of all reactions that produce O2 () compared with
the sum of the steady state rates of all reactions that remove O2 () These totals do not include
rates of production or removal from mass transfer reactions This calculation is for the γ
radiolysis of deaerated water to a dose of 80 kGy at a rate of 280 Gy min-1
116
Figure 44 Model predictions of the steady-state reaction rates of R7 R12 and R67 at various
pH This calculation is for the γ radiolysis of deaerated water to a dose of 80 kGy at a rate of
280 Gy min-1
117
List of Figures
7
Figure 45 Dashed lines show the original prediction where k50 = 60 times108 M
-1 s
-1 while solid
lines show the predictions with the increased k50 = 48 times109 M
-1 s
-1 120
Figure 46 Measurements of H2 gas as a function of dose All samples here are aerated with
vertical error bars showing the standard deviation between replicates123
Figure 47 Measurements of H2O2 concentrations in aerated samples of saturated magnesium
hydroxide solution as a function of dose 126
Figure 48 Measurements of hydrogen yields from magnesium hydroxide samples with various
solid ndash aqueous ratios All samples were irradiated to a total dose of ~52 kGy to the aqueous
phase at a dose rate of 3041 Gy min-1
128
Figure 49 Model predictions for the yield of H2 from a solution containing various
concentrations of carbonate anions 133
Figure 50 Measurements of H2O2 concentrations as a function of dose in samples containing
1 mM methanol (diams) and water as a control (diams) All samples were aerated and a dashed line is
included to highlight the data trend The dose rate was 1638 Gy min-1
for methanol solutions
and 2839 Gy min-1
for the aerated water 136
Figure 51 Measurements of H2 gas as a function of dose from deaerated samples containing
1 mM methanol deaerated water is also shown as a control Dashed lines are included to
highlight the data trend The dose rate was 1755 Gy min-1
for the methanol solutions and
2851 Gy min-1
for the deaerated water 137
Figure 52 Chemical yields of hydrogen peroxide measured from an aerated solution of
1 mM methanol as a function of dose 138
Figure 53 Chemical yields of hydrogen gas measured from a deaerated solution of 1 mM
methanol as a function of dose 139
Figure 54 Model prediction of H2O2 concentrations as a function of dose in a solution of
1 mM methanol 142
Figure 55 Calculations of hydrogen peroxide concentrations with and without modification to
the mass transfer routine142
Figure 56 Model prediction of H2 gas as a function of dose in a solution of 1 mM
methanol144
Figure 57 Model predictions of the concentrations of various stable organic products formed as
a result of using the proposed reaction scheme in table 23 146
List of Figures
8
Figure 58 Measurements of H2O2 concentrations from heterogeneous samples of 05g Fe2O3
and 10 mL aerated water The dose rate for the haematite samples was 3052 Gy min-1
and for
the aerated water the dose rate was 2839 Gy min-1
149
Figure 59 Measurements of H2O2 concentrations from heterogeneous samples of 05g Fe3O4
and 10 mL aerated water The dose rate for the magnetite samples was 1625 Gy min-1
and for
the aerated water the dose rate was 2839 Gy min-1
150
List of Tables
9
List of Tables
Table 1 Dose rates of the front most two rows of the 4x8 irradiation rack determined by Fricke
analysis The error indicates the percentage of uncertainty of the obtained gradient 47
Table 2 Dose rates of the four positions of the inverter rig determined by Fricke analysis The
error indicates the percentage of uncertainty of the obtained gradient 48
Table 3 Thermal conductivity of commonly used gases Values taken from the Handbook of
Tables for Applied Engineering Science 62
Table 4 Optimised parameters used for the analysis of H2 gas 64
Table 5 Primary yields for γ-radiolysis of water at neutral pH and standard pressure and
temperature2 71
Table 6 Temperature effects on the primary yields of water radiolysis49
72
Table 7 Polynomial equations for estimating temperature effects on primary yields44
75
Table 8 A collection of measurements of primary yields made in 04 M solution of sulphuric
acid (pH = 046)56
77
Table 9 A collection of primary yields measured in alkali solutions (pH asymp 135)56
79
Table 10 Multiple regression polynomials used to estimate the combined effect of temperature
and pH on the primary yields of water radiolysis 82
Table 11 Polynomial equations used to estimate the temperature effects on the diffusivity of O2
and H2 in both gas and aqueous phases where t = temperature (Cdeg) 90
Table 12 A list of Primary Species used to model water radiolysis helliphelliphelliphelliphelliphelliphelliphelliphellip90
Table 13 A list of reactions used to model water radiolysis 93
Table 14 A list of equilibria used to model the radiolysis of water 94
Table 15 Statistical information concerning the estimation of primary yields used to model the
radiolysis of water 95
Table 16 Parameters used to describe interfacial surface area (Aint) and boundary thicknesses
(δ) for sample vials of different geometry 96
Table 17 Conditions of samples used to investigate hydrogen peroxide in high pH radiolysis
105
List of Tables
10
Table 18 A list of important equilibria and their associated pKa values 107
Table 19 Conditions of samples used to investigate hydrogen gas in high pH radiolysis 108
Table 20 Obtained results from the measurements of H2 gas 124
Table 21 Conditions of samples containing Mg(OH)2 for measurements of H2
a ndash Powder sample with no added water estimated adsorbed water content is based on data from
Nelson et al89
b ndash Sample is a saturated solution of Mg(OH)2 ie contains no solid 127
Table 22 A reaction scheme to estimate the effect of carbonate in water radiolysis 132
Table 23 A reaction scheme to estimate the effect of methanol in water radiolysis
a ndash Rate constant for gas phase reaction
b ndash Estimated rate constant
c ndash Rate constant based on reaction of acetic acid and hydroxyl
d ndash Assumed reaction 141
Table 24 A reaction scheme to estimate the effects of dissolved iron in water radiolysis 153
List of Acronyms and Initialisms
11
List of Acronyms and Initialisms
AES - Atomic Emission Spectroscopy
AVIDAC - Argonne Version of the Institutes Digital Automatic Computer
CANDU - Canada Deuterium-Uranium
DCF - Dalton Cumbrian Facility
EDTA - Ethylenediaminetetraacetic acid
EPSRC - Engineering and Physical Sciences Research Council
FGMSP - First Generation Magnox Storage Pond
GC - Gas Chromatography
HDEHP - Di-(2-ethylhexyl)phosphoric acid
HPLC - High Performance Liquid Chromatography
ICP - Inductively Coupled Plasma
ISO - International Organization for Standardization
LET - Linear Energy Transfer
MOX - Mixed Oxide
MSSS - Magnox Swarf Storage Silo
NNL - National Nuclear Laboratory
ODE - Ordinary Differential Equation
PUREX - Plutonium Uranium Redox Extraction
PWR - Pressurised Water Reactor
SHE - Standard Hydrogen Electrode
SI - International System
TCD - Thermal Conductivity Detector
TGA - Thermogravimetric Analysis
TOC - Total Organic Carbon
UV - Ultra Violet
VIS - Visible
Word count - 42500
Abstract
13
Abstract
Sellafield is home to the UKrsquos largest repository of nuclear waste including reprocessed
uranium and plutonium as well as a backlog of unprocessed used fuel and waste kept in
outdated storage facilities commonly referred to as ldquolegacy wasterdquo For this reason
Sellafield has often been called the most hazardous place in Western Europe and as such is
currently undergoing a multi-billion pound decommissioning and clean-up operation Each
on-site facility has unique challenges associated with it many of them presenting situations
where the radiation chemistry aspects of the material degradation are not well understood
The key factors that can affect water radiolysis processes in the Sellafield challenges are a
high pH environment the presence of magnesium hydroxide the presence of iron oxide
and the presence of organic materials This work examines the effect each of these factors
has on H2 and H2O2 production in water radiolysis as well as developing a computational
model to offer some understanding to the kinetic behaviour of water radiolysis under such
conditions
The computational model was able to replicate experimental measurements of radiolytic H2
and H2O2 production in both aerated and deaerated water at neutral pH and provide a
further understanding of the role of dissolved oxygen in water radiolysis Measurements of
H2O2 from solutions containing NaOH have shown that an increase in pH generally results
in a higher steady state of H2O2 while measurements of H2 show a similar increase with a
maximum production rate at pH ~11 The model was also able to closely replicate these
experimental measurements with some over prediction which highlights a gap in our
understanding of high pH radiolysis and also brings into question the validity of the
estimated rate constant for the reaction
119926minus + 119926120784minus119919120784119926rarr 120784119926119919minus +119926120784 119948 = 120788 120782 times 120783120782
120790 119924minus120783119956minus120783
which was originally determined from kinetic model calculations designed to describe the
decay of ozonide (O3ˉ) during pulse-radiolysis studies of high pH solutions conducted by
K Sehested et al in 1982
The radiolysis of magnesium hydroxide slurry also resulted in an increased yield of
hydrogen gas but had little effect on the yield of hydrogen peroxide The hydrogen yield
was 052 molecules per 100eV while a NaOH solution of equivalent pH gave a yield of
027 however interference from carbonate may be the cause of the increased yield A
surface effect was also estimated to contribute 005 molecules per 100 eV to the hydrogen
gas yield
Hydrogen gas and hydrogen peroxide was measured from the radiolysis of aqueous
methanol This was modelled with a near agreement but modifications to the model were
necessary highlighting areas of the model that need improvement as well as providing a
reaction scheme from which a more comprehensive model for aqueous methanol radiolysis
could be developed
Declaration
14
Declaration
No portion of the work referred to in the thesis has been submitted in support of an
application for another degree or qualification of this or any other university or other
institute of learning
Thomas A Donoclift August 2016
Copyright Statement
15
Copyright Statement
The author of this thesis (including any appendices andor schedules to this thesis) owns
certain copyright or related rights in it (the ldquoCopyrightrdquo) and he has given The University
of Manchester certain rights to use such Copyright including for administrative purposes
Copies of this thesis either in full or in extracts and whether in hard or electronic copy
may be made only in accordance with the Copyright Designs and Patents Act 1988 (as
amended) and regulations issued under it or where appropriate in accordance with
licensing agreements which the University has from time to time This page must form part
of any such copies made
The ownership of certain Copyright patents designs trademarks and other intellectual
property (the ldquoIntellectual Propertyrdquo) and any reproductions of copyright works in the
thesis for example graphs and tables (ldquoReproductionsrdquo) which may be described in this
thesis may not be owned by the author and may be owned by third parties Such
Intellectual Property and Reproductions cannot and must not be made available for use
without the prior written permission of the owner(s) of the relevant Intellectual Property
andor Reproductions
Further information on the conditions under which disclosure publication and
commercialisation of this thesis the Copyright and any Intellectual Property andor
Reproductions described in it may take place is available in the University IP Policy (see
httpdocumentsmanchesteracukDocuInfoaspxDocID=487) in any relevant Thesis
restriction declarations deposited in the University Library The University Libraryrsquos
regulations (see httpwwwmanchesteracuklibraryaboutusregulations) and in The
Universityrsquos policy on Presentation of Theses
Dedications
16
Dedications
Mum
For the strength and freedom to explore
and the support and security to return
Dad
For the support and encouragement
exceeded only by pride
Acknowledgements
17
Acknowledgements
I would like to take this opportunity to thank some of the people who have made this work
possible My supervisor Simon Pimblott even with the busy work schedule that comes with
managing an entire research facility he is still able to provide support and put the well-
being of his students and staff above all else My unofficial but very much appreciated
industrial supervisors from the National Nuclear Laboratory (NNL) Howard Sims and
Robin Orr who both take a personal interest in the work going on at the Dalton Cumbrian
Facility (DCF) and dedicate much of their own time to helping the researchers in their
work
I would like to acknowledge the EPSRC and Sellafield Ltd for providing the funding that
supported this research
A special thanks to all the members of the Dalton Cumbrian Facility especially to all the
staff who work immeasurably hard and with profound dedication to the values
management and research carried out at the Dalton Cumbrian Facility Acknowledgements
to the academic staff Ruth Edge Aliaksandr Baidak and Sven Koehler for always
providing a useful and meaningful insight to almost any situation and for providing
valuable guidance in practical radiation chemistry as well as the inspiration and
encouragement to pursue potentially interesting avenues of research
Thank you to the research team at the Dalton Cumbrian Facility for their friendship and for
making the workplace an enjoyable place to conduct research
Chapter 1 Introduction
18
Chapter 1 Introduction
Overview of Sellafield
Sellafield shown in Figure 1 is the largest nuclear facility in the UK and has played a key
role in the UK nuclear industry for over 60 years Sellafield began as a Royal Ordinance
Factory producing weapons propellant for use in the Second World War Soon after the
war ended Sellafield was renamed to Windscale and was repurposed to produce plutonium
for the development of nuclear weapons in order to secure the UKrsquos position in the nuclear
arms race
Several years later the focus on acquiring nuclear weapons shifted towards the development
of new reactors for civil energy production with Magnox reactors built on a neighbouring
site known as Calder Hall The two sites were later combined and were once again named
Sellafield Previous operations carried out at Sellafield meant the site was also in a good
position to conduct fuel reprocessing operations alongside energy production Spent fuel is
separated from its now contaminated cladding and dissolved in nitric acid uranium and
plutonium are separated by solvent extraction while the cladding is treated independently
At Sellafield this industrial process meant storing the contaminated cladding swarf in
underwater silos
The fuel reprocessing process most commonly used is the Plutonium Uranium Redox
Extraction method (PUREX) and produces a number of product streams including
plutonium uranium and other highly active liquors
Chapter 1 Introduction
19
The separated uranium can be re-enriched to produce reusable uranium fuel or mixed with
plutonium to produce mixed oxide (MOX) fuel although much of the reclaimed uranium
and plutonium remains unused and is stored at Sellafield The remaining fission products
classified as high level waste are treated in various ways including vitrification and are
also stored at Sellafield
Figure 1 An aerial view of the Sellafield Site which covers approximately 6 km2
Image provided by Sellafield Ltd Press Office
Magnox reactors are now an obsolete design of reactors that use unenriched uranium fuel
which was clad in an alloy comprising almost entirely of magnesium with small amounts
of aluminium Spent fuel from Magnox reactors was briefly stored in a cooling pond before
having the cladding removed for reprocessing of the fuel pellets
Chapter 1 Introduction
20
The facilities used for this storage shown in Figure 2 were called the First Generation
Magnox Storage Pond (FGMSP) and the Magnox Swarf Storage Silos (MSSS) both of
these facilities are now considered to be ldquoLegacyrdquo facilities
Figure 2 On the left is The First Generation Magnox Storage Pond (FGMSP) and on the
right are the Magnox Swarf Storage Silos (MSSS)
Images provided by Sellafield Ltd Press Office
An extended shut down of reprocessing in the first generation reprocessing plant meant that
fuel being stored in the Magnox pond was left far longer than intended resulting in
corrosion and a backlog of spent fuel The Magnox Storage Pond now contains
approximately 14000 m3
of contaminated water which includes roughly 1200 m3 of sludge
consisting mainly of magnesium hydroxide and iron oxide1 Later technological
advancements rendered the wet storage of Magnox fuel cladding to be an obsolete method
and operations moved towards dry storage However the construction of a new facility and
the huge backlog of material stored in the silo also resulted in corrosion of stored fuel and
eventually a state of disrepair for the Magnox Swarf Storage Silos Both of these legacy
facilities present a huge challenge for decommissioning operations as well as a unique
opportunity for scientific research
Chapter 1 Introduction
21
Radiation Chemistry
Radiation chemistry is the study of chemical change driven by the absorption of energy
capable of causing ionisation This ionising radiation can be of a particulate nature
including but not limited to alpha (He2+
) and beta (eˉ) radiation or non-particulate such as
gamma (γ) or X-ray radiation Radiation chemistry and its experimental methods parallel in
many ways to photochemistry but the differences between the fields are well defined The
fundamental difference between the two fields of study is the quantity of energy involved in
the initiation of reactions In radiation chemistry this energy is provided by the atomic
decay of radioactive nuclei and is far higher than energy used in photochemistry typically
UV radiation The lower initial energies used in photochemistry tend to only produce
molecular excitations rather than direct ionisations These lower incident energies also
mean that each photon will usually only interact once and produce a uniform distribution of
excited species in any plane perpendicular to the incident beam The higher initial energies
used in radiation chemistry often provided by atomic decay can produce both excitations
and ionisations directly Interactions between ionising radiation and a substance is not
necessarily limited to only one interaction a single high energy photon or particle may
interact a number of times This behaviour gives rise to a non-uniform track-like structure
of interactions unlike the uniform distributions found in photochemistry2
Chapter 1 Introduction
22
Figure 3 A representation demonstrating the uniform excitations and ionisations of UV
radiation compared to the structured tracks of alpha radiation
To fully appreciate the chemical changes initiated by ionising radiation it is important to
have some knowledge of the different types of ionising radiation and the ways in which
they interacts with matter There are two main ways in which radiation chemists provide a
source of ionising radiation for experiments The first involves taking advantage of the
atomic decay of radioactive nuclei this may be a naturally occurring radioisotope or an
artificially created isotope The second involves specialised equipment to directly generate
radiation usually by accelerating particles to a high energy The major types of ionising
radiation are alpha beta and gamma however in the field of radiation chemistry one may
also come across the use of X-rays fast neutron radiation proton radiation and other heavy
charged particle radiation This study utilises cobalt-60 as a source of gamma radiation
other types of radiation were not investigated during this work however it is necessary to
understand some fundamental features of alpha and beta decay to fully appreciate gamma
decay
Chapter 1 Introduction
23
Alpha α Radiation
Alpha radiation occurs when an unstable atomic nuclei spontaneously ejects an alpha
particle Elements with an atomic number greater than 83 will decay by this mechanism3
Alpha particles are fully ionised helium nuclei they consist of two protons and two
neutrons and have no electrons which gives them a charge of +2 Alpha particles are
mono-energetic this means that every alpha particle emitted from a given radioactive
element will have the same energy characteristic of that element These energy values
typically range between 4 and 10 MeV This quality means that research facilities capable
of artificially producing alpha radiation by ionising and accelerating helium atoms can
select the particle energy required to effectively mimic alpha decay of any radioactive
element
Beta β Radiation
Beta decay involves the conversion of a neutron to a proton or vice versa in order to create
a more favourable proton to neutron ratio This conversion process is accompanied by the
ejection of fundamental particles directly from the atomic nucleus In the case of a neutron
converting to a proton the ejected particles are an anti-neutrino and a high energy electron
while in the reverse case the ejected particles are a neutrino and a positron (the antimatter
equivalent of an electron) Unlike alpha particles beta particles are not mono-energetic
The energy lost through beta decay is shared between the ejected particles and the recoil of
the decaying atom this means beta particle energy ranges from zero up to a maximum
energy characteristic of that element
Chapter 1 Introduction
24
Gamma γ Radiation
Gamma radiation is not a particle like the previously mentioned types of radiation but is a
photon with a short wavelength in the region of 3 x10⁻⁹
to 3 x10-11
cm or approximately 40
KeV to 4 MeV when converted to energy A gamma ray is emitted when a nucleus in an
excited state relaxes to a lower nuclear energy level there is no change in the number of
protons or neutrons during gamma decay Gamma rays like alpha particles are mono-
energetic however a nucleus may emit several photons as a cascade of energy loss As
gamma emission starts with an excited nucleus some prior process must take place to result
in a nucleus with an elevated energy level For most gamma emitters the process is
initiated with either alpha or beta decay and the resulting atomic nucleus is left in an
excited state For example ceasium-137 undergoes beta decay by emission of a beta
particle of 1174 MeV to form stable barium-137 This only happens 54 of the time and
the more common decay mechanism is the emission of a beta particle of 0512 MeV to
form and excited barium-137 nucleus this then emits a photon of 0662 MeV to relax the
nucleus to the stable barium-137
Chapter 1 Introduction
25
Radiation interactions with matter
In order for radiation to induce a chemical change it must interact with matter in some way
There are many mechanisms by which radiation can interact with matter as this project
focuses on the use of gamma rays a brief description of the interactions of gamma rays
with matter is given below
In the photoelectric effect the entire energy of an incident gamma photon is transferred to
an electron of some absorbing matter This electron is ejected from the absorbing atom with
energy equal to the incident photon minus the binding energy of that electron The electrons
ejected are often K-shell electrons which have the highest binding energy As momentum
and energy must be conserved it is necessary for the absorbing atom to recoil As this
mechanism involves the recoil of a parent atom it would not be possible for the
photoelectric effect to be the mechanism of interaction with free electrons that do not have
a parent nucleus to recoil In the photoelectric effect ejected electrons will leave a hole as
this hole is filled by electrons from higher energy levels characteristic X-rays are emitted
Figure 4 A representation of the photoelectric effect
Image recreated from Spinks and Wood2
Chapter 1 Introduction
26
Although photons cannot interact with free electrons by means of the photoelectric effect
they may interact with free and loosely bound electrons through the Compton Effect In this
mechanism a photon accelerates an electron thereby reducing its own energy The photon
is scattered now with reduced energy while the electron recoils with increased energy
Figure 5 A representation of the Compton Effect
Image recreated from Spinks and Wood2
Another mechanism by which a gamma ray may interact with matter is through pair-
production This is only a viable mechanism for photons with energy larger than 102 MeV
A photon is completely absorbed by an atomic nucleus and from that nucleus two particles
are produced an electron and a positron The energy of the incident photon is shared
between the rest energy of the two new particles and the kinetic energy of these particles as
they move away from the nucleus a negligible amount of energy is also used as the nucleus
recoils The positron behaves much the same way as the electron until it annihilates with an
electron from the medium to produce two 051 MeV gamma rays travelling at 180deg from
each other
Chapter 1 Introduction
27
Figure 6 A representation of pair production and positron annihilation
Image recreated from Spinks and Wood2
Generally the interactions of gamma rays with matter result in fast moving electrons these
are often referred to as secondary electrons or delta-rays and have the same interactions
with matter as beta particles It is these secondary electrons that are predominantly
responsible for producing the excited states and ionisations in an absorbing material that
will initiate chemical changes in said material4 For this reason it is necessary to also
understand the interactions with matter these secondary electrons may have Fast moving
electrons lose energy through three main mechanisms electromagnetic radiation elastic
scattering and inelastic scattering When a fast electron greater than 100 KeV passes close
to an atomic nucleus it is decelerated and slightly deflected This event is accompanied by
emission of electromagnetic radiation commonly known as Bremsstrahlung radiation and
is required for the conservation of energy
Chapter 1 Introduction
28
At energies below 100 keV Bremsstrahlung emission becomes negligible instead electrons
tend to lose energy through scattering Fast moving electrons interact with the bound
electrons of a molecule predominantly through inelastic collisions This interaction
transfers energy from the incident electron to the bound molecular electron which can result
in ionisation and excitation (and often with production of radical species) If there is an
ionisation event the tertiary electrons produced can cause more ionisation events in the
same manner These events tend to lie closer together as the electron that caused them has a
much lower energy than the primary electron that passed by This engenders a radiation
track structure that consists of small groups of ionisation events These groups are often
referred to as spurs
Fast moving electrons may also interact elastically with matter this interaction causes the
electrons to be deflected by a wide range of angles This means that a fast moving electron
may have moved a significant total distance but may have not travelled particularly far into
the absorbing material
Chapter 1 Introduction
29
Radiolysis of Water
As mentioned earlier it is the secondary and tertiary electrons produced from gamma ray
interactions that predominantly lead to the formation of ions and radical species that drives
chemical change in substances exposed to radiation Below is a diagram outlining the
sequence of events and the different stages of water radiolysis
Figure 7 A scheme showing the early stages of water radiolysis and the production of
primary species
In water this initial interaction between a gamma ray and a water molecule produces either
an excited state of water or a water cation accompanied by an electron this is achieved in
less than ten femtoseconds (10-14
s) Molecules in an excited state may break apart to form
hydrogen atoms and hydroxyl radicals or molecular hydrogen and oxygen atoms in a
singlet or triplet state while water cations will quickly react with nearby water molecules to
produce hydronium ions and hydroxyl radicals
Chapter 1 Introduction
30
The electron produced begins a thermalisation process eventually resulting in a solvated
electron however at this stage the electron exists as a potentially reactive precursor
intermediate This happens in a time frame of less than 1 picosecond and occurs before
diffusion of the spur During the non-homogeneous stage the produced radicals and ions
may react within the spur to produce molecular products such as H2 and H2O2 Eventually
the spur species diffuse into the bulk water and these ldquoprimaryrdquo species produced are said
to be homogeneously distributed from this point onwards The yield at which these primary
species are produced are known as primary yields and are often expressed as G-values
which have units of micromoles per Joule (SI unit) or molecules produced per 100 eV of
energy absorbed (conventional historic units)
119866 = 119873119900 119900119891 119898119900119897119890119888119906119897119890119904 119891119900119903119898119890119889
100 119890119881
This should not be confused with a ldquochemicalrdquo yield which are the yields of chemical
species sometime after homogeneous chemistry has taken place and is also often expressed
as a G-value During the homogeneous stage reactions between primary species occur
often altering the observed production rates of these species through back reactions To
avoid confusion between the two types of yield a notation system can be used to discern the
two Two notation systems are commonly used throughout the radiation chemistry
literature the first denotes primary yields with the species of interest in subscript whilst the
chemical yield is often expressed with the species of interest in parenthesis For example
the primary and chemical yield of H2 would be written as GH2 and G(H2) respectively The
second system simply uses a lowercase ldquogrdquo to denote primary yields and uppercase ldquoGrdquo for
chemical yields This study will use the latter system
Chapter 1 Introduction
31
Most often it is the chemical yield that is measured during an experiment but it is possible
to measure a primary yield with the use of scavengers A scavenger is a chemical species
that can quickly react with a targeted primary species before it is able to diffuse into the
bulk solution effectively removing it and its associated chemistry from the homogeneous
stage of radiolysis The effectiveness of a scavenger is often referred to as the ldquoscavenging
capacityrdquo and is quoted as the pseudo-first order rate of reaction between a scavenger (S)
and a radical (R) which depends only on the rate constant for said reaction and the
concentration of the scavenger In other words the scavenging capacity is equal to kS+R[S]5
A well-documented example of this is the use of bromide ions to prevent the reaction of
hydroxyl radicals with molecular hydrogen allowing for the room temperature primary
yield of H2 to be measured this has been done extensively throughout the literature and the
g-value is quoted to be 045 molecules100eV6 Without the use of the bromide scavenger
hydroxyl radicals would react with H2 reducing the observed yield this reduced yield is
what is meant by the term chemical yield
The following summarises some of the properties of the more important primary radicals
Chapter 1 Introduction
32
The Hydrated Electron eaq-
One of the most reactive primary species of water radiolysis is the hydrated electron It is a
chemical entity that can be thought of as being a single electron somewhat stabilised by a
cage of orientated water molecules Hydrated electrons typically have reaction rate
constants close to the diffusion controlled limit with low activation energies Reactions of
hydrated electrons are typically represented as single electron transfer processes and with a
reduction potential of -29 V vs the standard hydrogen electrode (SHE) the hydrated
electron will react with most other species78
119890119886119902minus + 119878119899 rarr 119878119899minus1
In the presence of organic compounds the hydrated electron will act as a nucleophile with
enhanced reactivity towards areas adjacent to electron withdrawing groups Halogenated
organics also show enhanced reactivity towards elimination of the halide ion9
119890119886119902minus + 119877119883 rarr 119877119883minus rarr 119877bull+ 119883minus
The Hydrogen Atom H˙
In terms of BroslashnstedndashLowry acidndashbase theory the hydrogen atom is the conjugate acid of
the hydrated electron with a pKa of 9679
119890119886119902minus + 119867(119886119902)
+ 119867bull
The hydrogen atom has a reduction potential of -23 V78
similar to that of the hydrated
electron however its chemistry is seldom the same
Chapter 1 Introduction
33
Inorganic ions are reduced by the hydrogen atom at slower rates than reduction by the
hydrated electron In certain circumstances such as in low pH environments hydrogen
atoms can act as an oxidant reacting with inorganic ions to form a hydride intermediate
that soon decomposes to form the oxidised ion and molecular hydrogen10
119867bull + 1198651198902+ rarr 1198651198903+119867minus119867+
rarr 1198651198903+ + 1198672
Organic molecules are also subject to oxidation reactions with the hydrogen atom
Saturated organics tend to react by hydrogen abstraction to form molecular hydrogen and a
carbon centered organic radical Unsaturated organics will react by hydrogen addition to the
center of unsaturation again forming a carbon centered organic radical9
119867bull+ 1198621198673119874119867 rarr bull1198621198672119874119867 + 1198672
119867bull+ 11986211986721198621198672 rarr bull11986211986721198621198673
The Hydroxyl Radical bullOH
Unlike the previously mentioned primary radicals the hydroxyl radical has a positive
reduction potential of 18 V in neutral solution making it a powerful oxidising species11
Reactions of hydroxyl radicals with inorganic ions are often said to be simple electron
transfer processes however it has been suggested that the mechanism actually proceeds
through an intermediate adduct12
Reactions with inorganic ions have been observed to
proceed at rates close to the diffusion limit however this is not the case with many metal
cations Reaction rates between the hydroxyl radical and metal cations tend to be slower
with rate constants of the order ~30 x108 M
-1 s
-19
Chapter 1 Introduction
34
One explanation for this is that the mechanism for metal cation oxidation involves the
addition of the hydroxyl radical to the metal cation increasing its coordination number and
allowing for inner-sphere oxidation to take place
[119872(1198672119874)119909]119899+ + ∙119874119867 [(1198672119874)119909119872-119874119867]
119899+ rarr [119872(1198672119874)119909](119899+1)+ + 119874119867minus
The intermediate species Mn+
OH has actually been observed in cases where M = Tl+ Ag
+
Cu2+
Sn2+
Fe2+
and Mn2+
12
As is the case with the hydrated electron and the hydrogen atom the hydroxyl radical also
exists in an acid-base equilibrium with the oxide radical anion bullOˉ
bull119874119867 + 119874119867minus bull119874minus + 1198672119874
With a pKa of 119 the reactions of bullOˉ only become important at high pH With a few
exceptions reactions of bullOˉ are typically slower than those of
bullOH The two species also
have different reactivity towards organic molecules Hydroxyl radicals tend to add to
unsaturated bonds as an electrophile while the conjugate base bullOˉ acts more like a
nucleophile and will abstract hydrogen from a hydrocarbon bond
Chapter 1 Introduction
35
Computational Applications in Radiation Chemistry
Early computational studies in the field of radiation chemistry were focused largely on
developing the radical diffusion theory and the non-homogeneous stage of water radiolysis
to help rationalise experimental observations One of the earliest water models used
coupled differential equations with terms for the competing diffusion and reacting
processes to represent the evolution of a spur containing six radical pairs as a function of
time13-15
Although the predicted primary yields from this type of model agree well with
experimental data there are problems associated with this type of approach the main
problems arising from the application of classical chemical kinetics to a system of
diminutive volume and extremely fast reactions occurring between only a few reactive
species Such deterministic models often use a typical spur to represent a whole system
fixing the average number of radical pairs as a single integer or in some cases a range of
integers This means that in deterministic models the long-running average value for the
number of reactive species is neglected This small difference can lead to inaccuracies in
deterministic calculations of this kind and so a stochastic approach became the preferred
method to these types of non-homogeneous radiolysis calculations16
Deterministic models however are still the preferred technique for the longer term
homogeneous stage calculations for water radiolysis Once a suitable set of primary yields
has been established it is possible to model the subsequent chemistry in much the same way
as any other chemical kinetics simulation
Chapter 1 Introduction
36
By describing a reaction set in terms of a series of simultaneous differential equations and
by including details of physical parameters such as temperature it is possible to predict
chemical yields of radiolysis and highlight important chemical pathways This is the
general methodology implemented in this study and will be discussed in further detail in
subsequent chapters
Deliverables and Project Aims
Given the technical challenges associated with the Sellafield site and the pressing
conditions of legacy facilities such as the First Generation Magnox Storage Pond and
Magnox Swarf Storage Silos there has been a renewed interest in water radiolysis
especially with respects to high pH and slurry systems Previous radiolysis studies of high
pH solutions have been contradictory and difficult to reproduce There are very few
situations in industry where knowledge of high pH water radiolysis is required as most
situations where water radiolysis may occur are in acidic media with the exception of
Pressurised water reactors (PWRs) and CANDU reactor technology which run under alkali
conditions due to added LiOH17
As mentioned previously the Magnox Swarf Storage Silos at Sellafield Ltd contains large
quantities of contaminated magnesium alloy produced from the de-cladding process of
spent nuclear fuel The material contaminated with uranium oxide is stored under water
and over time has corroded to produce large amounts of magnesium hydroxide To prevent
further corrosion some of the 22 silos at the facility dose the water with sodium hydroxide
Although alleviating some corrosion this addition increases the pH
Chapter 1 Introduction
37
One of the aims of this project is to try and obtain a better understanding of water radiolysis
at high pH Using cobalt-60 as a source of gamma radiation and a range of analytical
techniques to determine the production rates of H2 and H2O2 as a function of absorbed dose
it is hoped that the effects of high pH on water radiolysis can be experimentally quantified
Deterministic computational modelling is then used to investigate the experimentally
observed effects of high pH in order to extract a better mechanistic understanding of water
radiolysis at high pH
While there were a number of early water radiolysis studies concerning the effects of
various metal oxides and their surface interactions18
this is also a subject which has
received a renewed scientific interest as there are many situations in the nuclear industry
where an understanding of the effects of metal oxides on water radiolysis are significant
These areas include preventing corrosion within operational facilities to extend their
lifetime controlling radiolytic products associated with stored nuclear material preventing
incidences of unexpected gas build up and managing already heavily corroded facilities
such as the legacy ponds and silos at Sellafield Ltd
In addition to sodium hydroxide the Magnox Swarf Storage Silos also contain large
quantities of magnesium hydroxide the hydrated form of magnesium oxide Radiolysis
studies concerned with magnesium hydroxide solutions slurries and solids are scarce119
despite the obvious need for further investigation The slight solubility of magnesium
hydroxide in water compels a prior understanding of high pH water radiolysis to facilitate
understanding the effects of magnesium hydroxide and the presence of a surface Data
collected from experiments involving magnesium hydroxide are therefore also included in
this project
Chapter 1 Introduction
38
Up until now the discussed aims of this project have been targeted at the issues associated
with the Magnox Swarf Storage Silo rather than with the First Generation Magnox Storage
Ponds These legacy ponds are outdoor open air ponds that have been used to store spent
nuclear fuel for extended periods (far longer than ever intended) As the ponds are open air
they are susceptible to the introduction of natural debris mostly falling leaves and other
biological matter
This has led to an interest in the effects of organic substances on radiolysis processes in
water with the focus being on some of the decomposition products of decaying organic
matter substances such as humic acids The complexity of these substances requires
general underpinning by first understanding simple organic substances In this work the
radiolysis of aqueous methanol was studied
The extended storage of spent fuel in the First Generation Magnox Storage Pond has led to
various challenges concerning corrosion products and their effects on water radiolysis In
the past spent fuel rods were often grouped into small bundles and placed into steel skips
which were then submerged in the pond These skips might also contain other contaminated
material and the exact content of any given skip is largely unknown Over time much of
the steel has corroded resulting in a large build-up of what can only be described as
ldquosludgerdquo The exact composition of this sludge is fairly unknown but the major constituent
is iron oxide present as both red haematite (Fe2O3) and black magnetite (Fe3O4) Research
involving iron oxides and radiolytic processes have mostly been focused on corrosion
mechanisms predominantly adopting an electrochemical approach with very few studies
measuring chemical yields of radiolytically produced H2 and no studies measuring H2O2 in
the presence of iron oxide
Chapter 1 Introduction
39
There are studies that have demonstrated decomposition of H2O2 over iron oxide in the
absence of a radiation source but as H2O2 is a primary product of water radiolysis it is
continuously being generated and the implications of this production are largely unknown
Other studies involving metal oxides have also investigated radiation induced dissolution
With both these processes in mind this project investigates some of the effects of iron
oxide on the steady-state concentrations of the molecular radiolysis products H2 and H2O2
Chapter 2 Experimental Methods
40
Chapter 2 Experimental Methods
Source of Radiation and Dosimetry
This project uses cobalt-60 as a source of gamma radiation Cobalt-60 is an artificial
isotope with a half-life of 527 years2 As cobalt-60 is not a naturally occurring isotope it
must be manufactured This is normally done through neutron bombardment of the non-
radioactive isotope cobalt-59 Stainless steel control rods within a nuclear reactor core are
substituted with cobalt rods and the neutron flux present is enough to transmute cobalt-59
to cobalt-6020
The overall reaction for the production and decay of cobalt-60 is shown
below
1198621199002759 + 119899 rarr 11986211990027
60 rarr 119873119894lowast2860 + 119890minus + 119890 + 120574
The decay mechanism for cobalt-60 was similar to that of Caesium-137 in that it is initiated
by beta decay Unlike Caesium-137 however there is no direct route to a stable isotope
Subsequently the decay of cobalt-60 follows one of two paths both of which begin with the
ejection of a beta particle Cobalt-60 may emit two photons of gamma radiation but will
always emit at least one photon A cobalt-60 nucleus may eject a beta particle with energy
up to 148 MeV this is followed by emission of a photon with energy of 133 MeV
however there is only a 012 chance that this happens The more common decay path for
cobalt-60 is to eject a beta particle with energy up to 031 MeV followed by the emission of
two photons with energies of 117 MeV and 133 MeV
Chapter 2 Experimental Methods
41
Figure 8 A decay scheme for cobalt-60
Cobalt-60 is a popular source of gamma radiation used by radiation scientists High dose
rates can be achieved with fairly little material21
Facilities that conduct experiments using
cobalt-60 as a source of radiation use a variety of systems to shield operators from
radiation Older systems can be as rudimental as a water filled hole with cobalt-60 resting at
the bottom samples are lowered in a container and held at a given distance from the source
to accumulate dose More advanced systems involve mechanically lifting cobalt-60 from
some shielded well into an experimental area This area may be a dedicated room for
irradiating samples or it may be a shielded chamber in which samples are placed The latter
example is known as a self-contained irradiator and is the type of irradiator used in this
work
Chapter 2 Experimental Methods
42
All irradiations reported here were carried out using the Foss Therapy Model-812 Self-
Contained Cobalt-60 Irraditor located at the University of Manchesterrsquos Dalton Cumbrian
Facility (DCF) The Model-812 Irradiator contains three independent housings where
cobalt-60 sources may reside named A B and C Currently only A and C contain
cobalt-60 and had a total activity of 5281 TBq on the original date of measurement
(2nd
May 2012) Source B is due to be filled after one half-life from the original date to
bring the total activity back to a similar level Both A and C sources are used at the same
time for every irradiation throughout this work
Figure 9 Image on the left shows the Model-812 Irradiator On the right is the inside of
the irradiator showing the three guide rods that contain the cobalt-60 source during
irradiation
Chapter 2 Experimental Methods
43
Samples are placed within the irradiator and are exposed to gamma emission from the
cobalt-60 for calculated periods of time to allow samples to accumulate the desired dose
Radiation doses are defined as the amount of energy deposited per kilogram of sample
material and are often quoted as the SI derived unit Gray (Gy) which has the unit J kg-1
In
order to calculate how long a sample should be exposed for requires knowledge of the rate
at which radiation energy is deposited into the sample This is known as a dose rate and is
often quoted as Gy min-1
The practice of dose rate determination is known as ldquodosimetryrdquo
and there are a number of physical and chemical methods for determining the dose rate
from a given source Physical methods often deploy tools such as calorimeters and
scintillation chambers to directly measure energy while chemical methods depend on
measuring some chemical change that occurs during exposure to radiation that responds
linearly with increasing dose There are many chemical dosimeters available depending on
the kind of work being undertaken For example vapour phase experiments often measure
the condensation of acetylene into benzene to determine a dose rate22
For this work the
dosimeter used was a ferrous sulphate solution known as the Fricke dosimeter The Fricke
dosimeter was first described in 1927 by Hugo Fricke and has become the most adopted
chemical dosimeter among radiation scientists23
The standard recipe to make a Fricke
dosimeter used in this work is as follows
Fricke Dosimeter Dissolve 04 grams FeSO4∙7H2O (99 assay Fisher Chemicals) 006
grams NaCl (gt9999 Assay Calbiochem) and 22 mL concentrated H2SO4 (95-98
Sigma Aldrich) Dilute with distilled water to make 1 litre of Fricke solution24
Chapter 2 Experimental Methods
44
This solution will slowly oxidise and must be used within a few days by preventing light
from interacting with the solution it is possible to extend the shelf life of the Fricke
solution to three months The Fricke dosimeter relies on the oxidation of FeII to Fe
III by
species produced during the radiolysis of water
119867(119886119902)+ + 119890(119886119902)
minus rarr 119867bull
119867bull + 1198742 rarr 1198671198742bull
119865119890119868119868 + 1198671198742bull rarr 119865119890119868119868119868 + 1198671198742
minus
1198671198742minus + 119867(119886119902)
+ rarr 11986721198742
119865119890119868119868 + 11986721198742 rarr 119865119890119868119868119868 + bull119874119867 + 119874119867minus
119865119890119868119868 + bull119874119867 rarr 119865119890119868119868119868 + 119874119867minus
The extent of oxidation responds in a linear fashion to ionising radiation until dissolved
oxygen is exhausted this can be up to 500 Gy but in practice doses are usually kept
between 40 and 400 Gy to ensure measurements are made within the range in which FeIII
is
of a measurable concentration but FeII is not fully depleted
2 With a strong absorbance at
304 nm Fe3+
can be quantified by spectrophotometric analysis and an absorbed dose can be
calculated from the following equation
119863119866119910 = 9647 times 106 times
∆119860
∆휀119897120588119866(1198651198903+)
Chapter 2 Experimental Methods
45
where DGy is the absorbed dose in Grays ΔA is the difference between the optical
absorbance before and after irradiation and Δε is difference between the molar extinction
coefficient of Fe2+
and Fe3+
at 304 nm which has an established value of
2201 mol-1
cm-1
24
G(Fe3+
) is the chemical yield of Fe3+
and a value of 155 is
recommended when using cobalt-60 by the International Commission on Radiation Units
and Measurements Path length and solution density are represented by the terms l and ρ
respectively
Irradiations throughout this work were conducted using two sample holding devices each
with a number of different positions The first device consists of a standard 4x8 test tube
rack that has been fixed to an irradiation base plate The base plate allows the device to be
locked in exactly the same position within the Model-812 every time it is used
This device holds a number of 20 mL headspace vials during irradiations of samples which
are then analysed for H2O2 content the details of which will be discussed later
The second device is somewhat more complex and is used to hold samples that are
analysed for H2 content again the details of which are discussed later This device is
designed to keep samples mixed by slowly rotating them along a horizontal axis thus
continually inverting samples throughout the irradiation period it is hence referred to as the
ldquoinverter rigrdquo The construction consists of a high torque motor with a top speed of 2 rpm
Chapter 2 Experimental Methods
46
Figure 10 Sample holding devices for use in the Model-812 Left is the 4x8 rack with its
schematic below On the right is the inverter rig again with its schematic below
Dosimetry measurements were carried out in each of these devices and the results are
shown below Table 1 shows the dosimetry for the 4x8 test tube rack each position was
measured at four time intervals each of which with three replicates Measurements were
carried out in 20 mL headspace vials which were filled with 10 mL of Fricke solution
Chapter 2 Experimental Methods
47
Experiments carried out in this device only occupied positions in the first two rows hence
only these results are shown Table 2 shows the dosimetry of the inverter rig again each
position was measured at four time intervals each with three replicates The inverter rig
only has four positions which were measured with no rotation mixing Initially
experiments were to be conducted under stationary conditions before moving on to mixed
conditions however time limitations prevented progression to mixed samples and all
samples are conducted with no rotational mixing From the data obtained absorbance units
were converted to an absorbed dose by use of equation 1 and dose rates are then extracted
as the gradient of absorbed dose plotted as a function of time
Date of Original Measurement 07022014
Position Dose Rate on Date of
Measurement (Gy min-1
) plusmn Error
A1 29435 75
B1 34827 23
C1 32352 41
D1 27358 89
A2 15845 24
B2 18519 62
C2 18176 26
D2 15248 17
Table 1 Dose rates of the front most two rows of the 4x8 irradiation rack determined by
Fricke analysis The error indicates the percentage of uncertainty of the obtained gradient
Chapter 2 Experimental Methods
48
Date of Original Measurement 13012015
Position Dose Rate on Date of
Measurement (Gy min-1
) plusmn Error
A 29379 46
B 31708 46
C 30208 87
D 30616 46
Table 2 Dose rates of the four positions of the inverter rig determined by Fricke analysis
The error indicates the percentage of uncertainty of the obtained gradient
As cobalt-60 decays dose rates are subject to change with time however they change in a
predictable manner The decay of cobalt-60 follows first order kinetics it is therefore
possible to adjust dose rates to account for the decay of the source simply by multiplying
the dose rate by the ratio of initial radiation intensity and the intensity after a given time2
This can be written as
119863119877119860119889119895 = 119863119877 times1198681199051198680
Where
1198681199051198680= 119890minus120582119905
And
120582 =ln 2
11990512
Chapter 2 Experimental Methods
49
DRAdj is the decay adjusted dose rate after time t λ is the decay constant and tfrac12 is the half-
life which for cobalt-60 is 527 years The use of this equation depends on knowing how
much time has passed since the original dose rate (DR) was calculated hence the inclusion
of the date on which these measurements were made in Tables 1 and 2
Water Purification for Radiolysis Experiments
Radiation breaks water molecules into reactive radicals which can react quickly with any
impurity present in a sample It is therefore of high importance to ensure that any water
used in radiolysis experiments is of the highest purity During the early days of radiation
chemistry high purity water was often obtained through a triple distillation process Water
was distilled firstly through standard means before being distilled again from an acid
dichromate solution and finally a third time from an alkaline permanganate solution before
being stored in a fused silica container4 Advancements in modern self-contained
purification systems have significantly simplified the process of obtaining ultra-pure water
for radiolysis experiments All experiments carried out throughout this work use ultra-pure
water dispensed from the ELGA PURELAB Classic the feed water of which is provided
by the ELGA PURELAB Option-SR 715 Through the use of duel bank reverse osmosis
units two independent UV lamp purifiers and deionisation cartridges the final resistivity of
output water is measured to be 182 MΩ cm-1
Chapter 2 Experimental Methods
50
Figure 11 A diagram of the purification system that provides the ultra-pure water used
throughout this work Image was taken from the ELGA PURELAB user manual
Determination of H2O2 ndash Photometric Analysis
Throughout this work the determination of hydrogen peroxide is carried out using a
photometric technique known as the Ghormley Tri-iodide method25
This method takes
advantage of the redox reaction between hydrogen peroxide and iodide to produce iodine in
a 11 stoichiometric ratio with hydrogen peroxide This reaction takes place under acidic
conditions and is catalysed by the presence of ammonium molybdate tetrahydrate Acid is
also required to force the resulting equilibrium between iodine and tri-iodide completely
towards the production of tri-iodide which can then be measured by photometric analysis
this is achieved using potassium phthalate monobasic A general reaction scheme for this is
shown below
Chapter 2 Experimental Methods
51
11986721198742 + 2119868minus + 2119867+ rarr 1198682 + 21198672119874
1198682 + 119868minus 1198683
minus
This is a popular method for the determination of hydrogen peroxide in radiolysis studies26-
29 It is favoured for its relative simplicity over previous methods which typically involved
complicated titrations with potassium permanganate Furthermore it is also extremely
sensitive enabling accurate measurements of low concentrations of hydrogen peroxide with
a lower limit of 1 μM30
The reagent used to reduce hydrogen peroxide is susceptible to self-oxidation and has a
very short shelf life To prevent self-oxidation and prolong the shelf life the reagent is
prepared as two reagents designated ldquopart Ardquo and ldquopart Brdquo and are only mixed during
analysis One reagent contains potassium iodide under slightly alkali conditions while the
other contains an organic acid salt potassium phthalate monobasic Both reagents are
prepared according to the recipe originally described by Ghormley25
Part A Dissolve 1 gram NaOH (ge98 Sigma Aldrich) 33 grams KI (995 Assay
Fisher Scientific) and 01 gram (NH4)6Mo7O24∙4H2O (ge99 AppliChem) in 500 mL
deionised water
Part B Dissolve 10 g C8H5KO4 (ge9995 Sigma Aldrich) in 500 mL deionised water
Figure 12 Structure of Potassium phthalate monobasic (C8H5KO4)
Chapter 2 Experimental Methods
52
Analytical Procedure
The redox reaction between H2O2 and I ˉ is carried out on a 2 mL aliquot of sample
solution To this 1 mL of Part A and 1 mL of Part B are added a few seconds are required
for development before transfer to a quartz cuvette for analysis in a Cray 5000 UVVisNIR
photospectrometer Samples that contain solid material are filtered through syringe filters
before analysis to remove any solid particles Samples of elevated pH often required
additional acid to reduce the pH to the conditions required for analysis the quantity of
additional acid is determined by testing a blank sample with litmus paper the quantity is
then recorded and the dilution factor accounted for Utilisation of the Beer-Lambert law
allows for the calculation of hydrogen peroxide concentration from an absorbance within
the linear range of the technique
119860 = 휀119897119888
Where A is the optical absorbance ε is the molar extinction coefficient in M-1
cm-1
l is the
path length (always 1 cm during this work) and c is the concentration in mol dm-3
Determination of the optimum wavelength of absorption was carried out by a scanning
analysis of a 625 μM solution of hydrogen peroxide prepared by serial dilution of a 1 M
standard which itself was prepared from a 3wt stock solution of hydrogen peroxide in
water purchased from Sigma-Aldrich
Chapter 2 Experimental Methods
53
Figure 13 Scanned absorption spectra of a 625 μM H2O2 solution
The maximum absorbance was determined to be 351 nm which is consistent with values
described in literature3031
A series of standard solutions were made ranging in
concentration from 1-300 microM to determine the molar extinction coefficient shown in
Figure 14
Chapter 2 Experimental Methods
54
Figure 14 A calibration curve of H2O2 photometric absorption to determine the molar
extinction coefficient
Addition of the tri-iodide reagents dilutes the standard to half the quoted concentration A
dilution factor of 2 is used to correct for this hence the calibration curve covers the
concentration range 05-150 microM hydrogen peroxide The determined molar extinction
coefficient was 25631 M-1
cm-1
this again is consistent with values quoted in
literature263132
y = 25631x - 00012
0
05
1
15
2
25
3
35
4
45
00E+00 20E-05 40E-05 60E-05 80E-05 10E-04 12E-04 14E-04 16E-04
Ab
sorb
ance
[H2O2] (mol dm-3)
Slope Error = plusmn35548
Chapter 2 Experimental Methods
55
Determination of H2 - Gas Chromatography
Method development
Measurements of hydrogen gas are usually carried out using gas chromatography
frequently paired with mass spectroscopy3334
This work uses only gas chromatography to
measure hydrogen gas produced during the radiolysis of samples The standard technique
for gas analysis is to use a gas tight syringe and needle to extract a portion of headspace
from a sealed sample The samples are typically sealed in air tight vials with a rubber
septum to allow gas extraction however due to the effects of radiation on plastics and
rubbers the reliability of this technique remains debatable and often alternative methods are
sought One argument against the use of rubber septa in a radiation field is that they are
known to radiolytically produce their own hydrogen which would contribute to any
measurements Although some preliminary laboratory tests indicate that the production of
hydrogen from septa seems predictable and can be subtracted from any hydrogen produced
from samples this information was obtained from a single batch of septa and the
production rate of hydrogen will most likely vary between batches as nothing is known
about the manufacturersquos quality control tolerances Another important argument is
concerned with the concentration ranges of hydrogen that will be measured Aqueous
samples that contain no radical scavengers often have low chemical yields for hydrogen
and sampling with a syringe reduces the sample volume to a maximum of 100 microL
attempting to extract a larger volume leads to sampling problems associated with negative
pressure within the sealed sample
The portion of hydrogen entering the gas chromatograph may be reduced even further for
samples containing slurries as much of the hydrogen may remain trapped in the aqueous
phase even after agitation
Chapter 2 Experimental Methods
56
Headspace injections may be a viable technique for samples that are known to produce
large quantities of hydrogen but generally measurements made with this technique are
often close to or below the detection limits of the gas chromatograph Many radiation
chemists have adopted a variety of techniques for measuring small quantities of
radiolytically produced hydrogen that do not rely on the use of rubber septa One such
technique is the ldquoCrush Tuberdquo method described in references3536
This method is used for
all hydrogen analysis in this work
The Crush Tube Sampling Method
The crush tube method of gas chromatography uses a modified SRI Model 8610C Gas
Chromatograph (GC) with a bespoke sampling device that contains a section of Tygonreg
tubing that allows for a glass sample vial to be crushed by an external force such as a pair
of wrench pliers Originally the tubing was a standard silicone tube however Tygonreg
tubing proved to be more durable and less prone to leaks Figure 15 and 16 show the
general schematic for the apparatus as well as the specially made sample vials for this
method
Figure 15 The modified SRI 8610C Gas chromatograph with inline ldquocrush tuberdquo setup
The sample can be seen inside the silicone tubing
Chapter 2 Experimental Methods
57
Figure 16 Image on the left shows a schematic for the sampling apparatus on the right
are the vials used which are flame sealed at the midway neck
In order for this technique to work several modifications must be made to the GC hence
the selection of the highly modular SRI Model 8610C The first modification was made to
the 10-port gas sampling valve to enable carrier gas to flow through the bespoke sampling
device during analysis The unmodified 10-port valve contains a sample loop that connects
to the ldquoINrdquo and ldquoOUTrdquo ports on the external of the GC during sample loading When the
port is rotated to the ldquoINJECTrdquo position the loop is included in the carrier gas path and the
external ports are isolated
Chapter 2 Experimental Methods
58
Figure 17 A schematic of the original setup for the 10-port sampling valve in both off (top
image) and on (bottom image) positions
It is essential that carrier gas is allowed to continually flow through the system during both
sample loading and sample injecting As the bespoke sampling device creates a closed loop
between the external ports it is possible to swap the connections of ports 1 and 10 without
disrupting the flow of carrier gas
This modification isolates the external ports during sample loading but includes them
during sample injection and allows sample gas to be carried through the GC
Chapter 2 Experimental Methods
59
Figure 18 A schematic for the modified 10-port sampling valve including the removal of
the silica gel column
Figure 18 also depicts the removal of the silica gel column this is part of the second
modification The bespoke sampling device contains a large volume of gas that requires a
relatively fast carrier gas flow rate to achieve acceptably narrow peaks This flow rate is
quoted in literature as being around 50 mLmin35
The Packed silica gel column and the
default molecular sieve column simply did not allow for this high flow rate without
significant back pressure that can cause damage to equipment for this reason they were
removed A bespoke column was made from frac14 inch copper tubing and 13x molecular sieve
beads The new column had a total length of 4 m and allowed sufficient flow rates with
adequate separation of gasses
Chapter 2 Experimental Methods
60
Figure 19 Image on the left shows the bespoke frac14 inch OD 13x molecular sieve column
On the right the rotameter is connected to calibrate gas flow rates
The SRI Model 8610C is not equipped with a digital rotameter as such it cannot display
flow rate information and instead can only display information about the carrier gas inlet
pressure which requires a conversion formula to obtain a meaningful flow rate The user
manual includes conversion factors but these are column specific and as the column has
been custom built it is necessary to manually determine a conversion formula to obtain a
flow rate This was done using a rotameter connected to the external GC ports by adjusting
the inlet pressure and noting the rotameter value a calibration curve was obtained
Chapter 2 Experimental Methods
61
Figure 20 A calibration curve to provide a conversion to determine carrier gas flow rate
Detection of H2 and Calibration
The SRI Model 8610C is equipped with a thermal conductivity detector (TCD) for the
measurement of eluted gas The TCD consists of a Wheatstone bridge circuit with tungsten-
rhenium filaments serving as resistors (Figure 21) Carrier gas containing eluted sample
passes over one of the filaments while a second path is reserved for carrier gas only to
serve as a reverence The filaments are electrically heated and the temperature of the whole
unit is carefully controlled As carrier gas passes over the filaments it conducts heat away
from the filament to the detector body when a sample component flows over the filament
the conductivity changes causing the filament to change temperature relative to the
reference filament This change in temperature changes the resistivity of the filament and a
change in voltage is recorded
Chapter 2 Experimental Methods
62
Figure 21 A schematic of a Wheatstone bridge circuit used in the TCD
To achieve a good sensitivity towards a given analyte it is important to have a large
difference in thermal conductivity between said analyte and the carrier gas Table 3 shows
the thermal conductivity values for some common gases The carrier gas most often used is
helium which has a thermal conductivity of 36036times106 cal s
-1 cm
-1 degC
-1 As many other
gases have much lower thermal conductivities helium often performs well however
hydrogen is a special case as it also has a high thermal conductivity of
44632times106 cal s
-1 cm
-1 degC
-1 For this reason the carrier gas selected for hydrogen
measurement was argon which has a much lower thermal conductivity of
4257times106 cal s
-1 cm
-1 degC
-1
Gas Thermal Conductivity (cal s-1
cm-1
degC-1
x106)
267degC
H2 44632
O2 6364
N2 6240
Ar 4257
He 36036
Table 3 Thermal conductivity of commonly used gases
Values taken from the Handbook of Tables for Applied Engineering Science
Chapter 2 Experimental Methods
63
Measurements made by the TCD are expressed as a voltage plotted as a function of time
The peaks produced in this plot are integrated and the final result is expressed as the peak
area As the peak area unit is largely arbitrary a calibration curve must be obtained to relate
the peak area to a meaningful quantity of hydrogen Calibration is carried out by replacing
the bespoke sampling device with a simple T-section fitted with a rubber septum Known
quantities of hydrogen gas are injected into the T-section which is then carried through the
GC Figure 22 shows a calibration curve for the linear range of 1 ndash 500 microL of pure
hydrogen at standard room temperature and pressure
Figure 22 A calibration curve for quantifying hydrogen gas from chromatograms
Samples of airhydrogen mixtures were also injected to make sure there was adequate
separation between the gases good separation between hydrogen and oxygen is observed
but the separation of oxygen and nitrogen is not adequate for analysis of those gases when
both are present in large quantities
Chapter 2 Experimental Methods
64
Machine parameters were adjusted for optimum performance these are shown in Table 4
These parameters were used for every experiment throughout this work
Parameter Value
Valve Temperature 70 Cdeg
Column Temperature 40 Cdeg
TCD Temperature 220 Cdeg
Flow Rate 50 mLmin
Carrier Gas Ar
Table 4 Optimised parameters used for the analysis of H2 gas
Method Validation
It was mentioned previously that the bromide ion is an excellent scavenger of hydroxyl
radicals during radiolysis
bull119874119867 + 119861119903minus [119867119874119861119903]minus119867(119886119902)+
rarr 119861119903bull + 1198672119874119861119903minus
rarr 1198611199032bullminus
Radiolysis of an aqueous solution of 1 mM bromide results in the elimination of the
reaction between the hydroxyl radical and molecular hydrogen in solution37
Other than
diffusion to the gas phase a reaction with hydroxyl radicals is the only significant removal
path of hydrogen at neutral pH The removal of dissolved oxygen by argon sparging also
simplifies much of the radiolysis chemistry allowing for a more reproducible experiment
This means that the hydrogen measured from the radiolysis of a deaerated 1 mM bromide
solution is in fact a primary yield and is quoted throughout the literature as being
GH2 = 045 this is an average value from a range of studies
2453839
Chapter 2 Experimental Methods
65
In order to secure confidence in this technique a validation experiment was carried out in
which a 1 mM solution of potassium bromide was used to determine the primary yield of
hydrogen which was then compared to the literature value
Figure 23 Method validation by the determination of the well-established primary yield of
H2 through hydroxyl scavenging by bromide
As expected the hydrogen concentration increased linearly with absorbed dose over the
experimental range When the number of hydrogen molecules is plotted as a function of
absorbed energy in sets of 100 eV the gradient gives GH2 = 0456 plusmn0025 matching well to
the average value quoted in literature
Chapter 2 Experimental Methods
66
Sources of Error
The majority of experiments carried out in this work use the absorbed energy or dose as
the independent variable and using one of the analytic techniques discussed above either a
photometric absorption value or the integrated response to hydrogen gas detection as the
dependant variable Both the dependant and independent variable have errors associated
with them which are discussed below
Determining the quantity of absorbed energy to the sample relies on the procedure of
dosimetry discussed earlier in this chapter The errors reported in Tables 1 and 2 are the
percent error of the gradient obtained from the measurement of Fe3+
as a function of time
As the experiments carried out in this work are plotted as a function absorbed dose and
there is an element of uncertainty associated with the dose rates the uncertainty of the
calculated absorbed dose increases with increasing dose This uncertainty in the absorbed
dose is included in many of graphs showing experimental data and is represented by
horizontal error bars
Sources of Error in the Determination of H2O2
The determination of H2O2 relies mainly on the calibration curve to yield a molar extinction
coefficient determined to be 25631 M-1
cm-1
with an uncertainty of plusmn 355 M-1
cm-1
The
molar extinction coefficient is used to convert the measured absorbance of a sample to a
concentration of H2O2 however this value has a dependence on temperature The ambient
temperature of the laboratory fluctuates slightly but it was decided that the effects were too
minor to consider The irradiation of samples on the other hand resulted in samples
heating slightly to a temperature that would be significant
Chapter 2 Experimental Methods
67
This was largely mitigated by leaving samples to cool for a few minutes until they reached
room temperature however an increase in temperature may affect the radiation chemistry
Solutions used to calibrate and reagents used to analyse samples also carry an associated
uncertainty in their concentrations The standards used to produce the calibration curve
were prepared from a stock solution of 3 wt H2O2 (Sigma Aldrich) From this the
0882 M solution was diluted to 1 mM which was used in a serial dilution to create the
standards ranging from 1 ndash 300 μM Uncertainty in the concentrations will have been
introduced by the tolerances of the pipettes and volumetric flasks used The pipettes used
were the Gilson Pipetman P1000 and P20 which are certified to comply with ISO 8655 that
imposes maximum allowable systematic errors of plusmn 80 μL and plusmn 02 μL for the P1000 and
P20 respectively The maximum allowable random error for the P1000 is quoted to be
le 30 μL and le 01 μL for the P20 The volumetric flasks used were class A Glassco brand
flask that conform to ISO 1042 Of the range of flasks used the largest error was 00025
Any uncertainty in the concentrations of the analytical reagents used to reduce H2O2 is
largely irrelevant as the chemicals used to perform the analysis are provided in a large
excess Stoichiometrically speaking as long as the concentration of iodide is at least three
times that of H2O2 the analysis should work in reality the concentration of iodide is
several times higher than this ensuring all H2O2 is reduced The sum of the above errors are
assumed to contribute to less than 1 of the total uncertainty of any measurements of
H2O2
Chapter 2 Experimental Methods
68
Sources of Error in the Determination of H2
The experimental technique provides a means to quantify hydrogen gas by volume In order
to make a comparison to predictions made by the computational model it was necessary to
convert this value to a concentration (mol dm-3
) This means knowing the volume of the
headspace in the crush tube vials As these vials are flame sealed they naturally have an
irregular shape and calculating a precise volume is difficult for this reason the conversion
uses an estimated headspace volume of 2 mL
Hydrogen gas is quantified by the integration of a change in voltage with respects to time
however the voltage response measured can be affected by a number of factors Factors
such as temperature and pressure are controlled automatically by the machine Moisture can
also affect the response of the TCD and this is controlled by running a ldquobake outrdquo cycle
prior to running any analysis One factor that cannot be prevented is the slow oxidation of
the tungsten-ruthenium filament which lowers the sensitivity of gas detection This can be
accounted for by performing regular calibrations often 3 or 4 point calibrations that are
compared to the original calibration curve If there is any deviance from the original curve
then a full calibration is performed and this is then used for the following analyses The
calibration curve shown in Figure 22 was the first full calibration performed throughout the
duration of this project the gradient of this curve gradually decreased this was accounted
for using the calibration process mentioned above As calibrations are performed by hand
with a gas tight syringe most of the error is likely introduced at this point The average
error of calibration points was plusmn 25 in the calibration curve given in Figure 22 for other
calibrations not shown in this work the average error was always less than 5
Chapter 3 Computational Methodology
69
Chapter 3 Computational Methodology
The earliest recorded computational approaches to solving problems in the field of radiation
chemistry date back to 1958 when the AVIDAC computer in Chicago was used to model
radical diffusion kinetics40
Since then different mathematical techniques have found use in
modelling problems found in the field of radiation chemistry and with ever increasing
computational power complicated calculations can be performed in seconds rather than
days In the early days of computational radiation chemistry primary yields were calculated
by deterministic methods involving the diffusion of a single spur However it became
apparent that a Monte Carlo approach held several advantages over deterministic methods
for the description of early stage radiolysis Such advantages include the ability to
incorporate the effects of a variety of different spur sizes and other entities arising from
secondary electrons41
For this reason modern radiolysis models usually fall into two
categories depending on what stage of radiolysis is being modelled Monte Carlo
calculations often concern the non-homogeneous early stages of radiolysis due to the
stochastic nature of energy deposition into a medium as mentioned earlier these
calculations often predict the primary yields of radiolysis products42
If the primary yields
are already known a deterministic approach is often employed to model the resulting
homogeneous chemistry in a similar way to most other chemical kinetics models through
the use of simultaneous ordinary differential equations (ODE)2743-46
Newer radiolysis
models are moving towards a multi-scale approach in which the output of the stochastic
stage is fed directly into the deterministic stage47
In this project a deterministic kinetic model for homogeneous chemical stage radiolysis has
been developed using a software package called FACSIMILE developed by MCPA
software Ltd
Chapter 3 Computational Methodology
70
FACSIMILE utilises Gear methodology for auto-adaptive time step control coupled with
Newton-Raphson iterations for prediction correction to deliver a robust simultaneous
ordinary differential equation solver The FACSIMILE language is largely based on the
Fortran language but is tailored for use by the scientific community and includes its own
high level notations for simplifying ODE construction48
The chemical model developed
here is largely based on the rate coefficient compilation by Elliot and Bartels 46
as well as
other literature sources27434549
This chapter gives a detailed description of how the model in this project works In essence
the model functions by producing primary radiolysis species at rates determined by their
primary yields and a dose rate parameter while simultaneously solving a set of ODEs that
represent the chemical reactions that describe the radiolysis chemistry At the same time
the model is also bound by framework calculations that describe various physical
parameters including but not limited to temperature effects and species volatility Each of
these concepts is described in detail in the following sections as well as the core radiolysis
reaction set
Production of Primary Species
As this model is only concerned with the homogeneous radiolysis chemistry that occurs
after diffusion of the primary species away from any kind of track structure the effect of
radiation can be represented by a series of zero order production equations with rate
constants derived from the dose rate and the species primary yield Each primary radiolysis
species has its own equation that defines its rate of production the general form of this
equation is shown below
Chapter 3 Computational Methodology
71
119896119894 =119863119877 times 119864119862 times 120588 times 119866119894
119873119860
DR is the dose rate given in Gy min-1
and Gi is the primary yield for species i NA is
Avogadros number and provides the conversion of molecules to moles while ρ is the
density of water and converts mass to volume ρ also has its own temperature dependency
which is calculated elsewhere in the code EC is a constant that effectively converts the
units of dose rate (J kg-1
min-1
) into time units compatible with a zero order rate constant
(mol dm-3
s-1
) and energy units compatible with primary yields (molecules 100 eV-1
) and
has a value of 104 times1015
and carries the unit 100 eV s-1
The dose rate is initially set by the user and is constant throughout the calculation however
primary yields are not set by the user and are initially set depending on other parameters
such as temperature and pH Table 52 shows the primary yields for water radiolysis by
gamma-rays at neutral pH and at room temperature the following section describes the
factors that can alter these values and details how they are incorporated into the model
Primary Species eaq- H
bull
bullOH H2 H2O2
g-Value 263 055 272 045 068
Table 5 Primary yields for γ-radiolysis of water at neutral pH and standard pressure and
temperature2
Chapter 3 Computational Methodology
72
Factors Affecting Primary Yields
Temperature
The rate of diffusion of primary species away from spurs created by ionising radiation is
affected by temperature As the temperature is increased the rate of diffusion of radical
species increases as does the rate of recombination reactions The yields obtained at high
temperature are determined by this competition between diffusion and recombination rates
Experiments carried out by Hochanadel and Ghormley (Table 6)50
first show this effect
over a temperature range of 2 ndash 65 degC in which higher temperatures favour increased
radical yields and decreased molecular yields
Primary Species g-Value Temperature
coefficient degC-1
2degC 23degC 65degC
Hbull + eaqˉ 359 367 382 +010plusmn003
bullOH 280 291 313 +018plusmn004
H2 038 037 036 -006plusmn003
H2O2 078 075 070 -015plusmn003
-H2O 435 441 454 +007plusmn003
Table 6 Temperature effects on the primary yields of water radiolysis50
A recent extensive compilation by Elliot and Bartels includes measurements of primary
yields at temperatures from 20 ndash 350degC from multiple sources and collates this data to
provide fitted equations for use in computational models The primary yield of the hydrated
electron was determined by product analysis of nitrogen formation from samples containing
nitrous oxide51-54
The chemical yield of nitrogen is equal to the primary yield of the
hydrated electron due to the following scavenging reaction
119890(119886119902)minus + 1198732119874 rarr 1198732119874
minus rarr 1198732 + 119874minus
Chapter 3 Computational Methodology
73
Organic compounds were also added to scavenge hydroxyl radicals and prevent them from
reacting with hydrated electrons Pulse radiolysis studies were also included55
but only the
data from nitrogen yield measurements were recommended for use
For the determination of the hydroxyl primary yield pulse radiolysis was the primary
method used The method described used bicarbonate to effectively convert hydroxyl
radicals to the carbonate radical which is more easily measured
The temperature dependency of the extinction coefficient for the carbonate radical was
estimated by integrating normalised absorption spectra as a function of temperature
originally collected by Elliot et al53
The resulting temperature dependency of the hydroxyl
radical primary yield is in agreement with an independent pulse radiolysis study that used a
ferrocyanide ion solution to measure the temperature dependency of the hydroxyl yield up
to 105degC53
The temperature dependence of the hydrogen peroxide primary yield was determined by
three independent studies Measurements in acrylamide solutions provided the temperature
dependency up to 100degC53
Further measurements made in deaerated solutions containing
nitrate and methanol extended this range to 150degC56
Estimations of the peroxide primary
yield to high temperatures were made based on the assumption that it was equivalent to the
chemical yield of oxygen in an alkali solution containing nitrous oxide or iodine this
approach expanded the temperature range to 270degC54
The primary yield of molecular hydrogen as a function of temperature has been measured
by three laboratories In each case hydrogen was directly measured from solutions
containing either a nitrous oxide and organic mix or nitrite ions In both cases the
measurements agreed well across all three laboratories515354
Chapter 3 Computational Methodology
74
Several attempts at measuring the primary yield of the hydrogen atom as a function of
temperature have been made however only two data sets are considered reliable as others
do not agree with the established yield at room temperature although all data sets show an
increase in yield with temperature
The chemical yield of molecular hydrogen from deaerated solutions containing nitrate and
phosphite ions is said to be equal to the sum of the primary yields of molecular hydrogen
and the hydrogen atom subtracting the already established primary yield of molecular
hydrogen from these measurements should give the primary yield of the hydrogen atom
These measurements agreed well with the established room temperature value and gave a
temperature dependence up to 200degC53
The temperature dependence was expanded to
350degC based on estimations of the ratio between the hydrogen atom primary yield and
hydrated electron primary yield which was calculated from data obtained during other
experiments performed in alkali solutions Unfortunately this data is described as archived
and unpublished The collated data from the experiments described above are shown in
Figure 24 with polynomial fits overlain the equations for these polynomials are given in
Table 7 and are used in the modelling calculations reported
Chapter 3 Computational Methodology
75
Figure 24 Collected data from literature showing measured primary yields as a function
of temperature Provided by Elliot and Bartels 200845
Primary Yield
Polynomial
g(eaq-) 2641 + 4162times10
-3 t + 9093times10
-6 t
2 ndash 4717 times10
-8 t
3
g(H2O2) 0752 ndash 1620times10-3
t
g(H2) 0419 + 8721times10-4
t ndash 4971times10-6
t2 + 1503times10
-8 t3
g(bullOH) 2531 +1134times10
-2 t ndash 1269times10
-5 t2 + 3513times10
-8 t3
g(Hbull) 0556 + 2198times10
-3 t ndash 1184times10
-5 t2 + 5223times10
-8 t3
Table 7 Polynomial equations for estimating temperature effects on primary yields45
Where t is the temperature in degC
Incorporation of any kind of temperature dependence into a prediction that will be
compared with experimental data requires knowledge of the experimental temperature This
is especially important in chemical kinetic models such as this as almost all the reaction
rate constants are temperature dependent For this reason a test was conducted to measure
the temperatures experienced by samples during irradiation
Chapter 3 Computational Methodology
76
The test was carried out with vials which had thermocouples attached the vials were filled
with water The vials were irradiated for 16 hours and the temperature was recorded every 5
minutes the average recording is shown in Figure 25 A polynomial fit was made from the
first 4 hours of data which was applied in the code to control the rate of temperature change
during a calculation the simulated temperature is shown as the red dashed line in
Figure 25
Figure 25 A comparison of the sample temperature profile logged by thermocouple to the
temperature profile calculated in the computational model
There are many ldquobulkrdquo radiolysis models in literature few of which make any reference to
the way in which temperature is controlled It can only be assumed that these models use a
fixed temperature which would produce less accurate predictions especially during early
periods where the temperature change is significant It should be said that this approach
should be used with caution as this temperature profile depends on the equipment being
used to irradiate samples and the dose rate involved
20
25
30
35
40
45
0 2 4 6 8 10 12 14 16
Tem
per
atu
re (degC
)
Time (h)
Thermocouple
Facsimile
Chapter 3 Computational Methodology
77
The majority of energy from the radioactive sources ends up being deposited into the
shielding material of the irradiation unit This heats the surrounding air within the
irradiation chamber which is often not circulated
pH
The effect of pH on the primary yields of water radiolysis has been a subject of discussion
for many decades yet experimental data on the subject is relatively sparse at high and low
pH Early radiolysis experiments often took place in acidic medium and so acidity became
one of the first variables considered for investigations into the effects of pH on primary
yields Table 857
shows primary yields data from 04 M sulfuric acid samples where the
pH = 046 the values shown are averages over multiple sources
Reference g(eaq-) + g(H
bull)
g(
bullOH) g(H2) g(H2O2) g(-H2O) Ref
Ferradini C et al 370 280 045 090 460 58
Allen AO
Lefort M 365 295 045 080 455
459
Sworski T J 370 292 039 078 448 60
Hochanadel C J et al 370 290 040 080 450 61
Mahlman H A et al 368 296 045 081 458 62
Hayon E et al 366 297 040 076 450 6364
Sehested K et al 362 289 039 076 441 65
Spinks amp Wood 365 290 040 078 445 2
Table 8 A collection of measurements of primary yields made in 04 M solution of
sulphuric acid (pH = 046)57
The noticeable changes to the primary yields when compared with those at neutral pH are
consistent throughout the literature including further sources not included in Table 8
Chapter 3 Computational Methodology
78
The change in primary yields is not massive in the pH range 046 ndash 7 but neither is it
insignificant With the exception of the molecular hydrogen yield all primary yields
increase slightly at low pH The main explanation for this involves the conversion of
hydrated electrons to hydrogen atoms within the radiation spurs In neutral solutions the
hydrated electron readily reacts with the hydroxyl radical to form hydroxide but when the
hydrated electrons are converted to hydrogen atoms the reaction with hydroxyl radicals is
suppressed
The hydrogen atoms do not react with hydroxyl radicals as quickly as hydrated electrons
and so the hydroxyl radicals become effectively ldquoprotectedrdquo at low pH This explains the
increase in primary yield of the reducing species (hydrated electron plus the hydrogen
atom) and the increase in the hydroxyl radical yield With an increase in hydroxyl radicals
comes an increase in the peroxide primary yield via the dimerisation of hydroxyl radicals
The decrease of the molecular hydrogen primary yield is due to the dimerisation of
hydrogen atoms having a slower coefficient than the reaction between two hydrated
electrons
119890119886119902minus + 119867(119886119902)
+ rarr 119867bull k = 210 times1010
M-1
s-1
119890119886119902minus + bull119874119867 rarr 119874119867minus k = 302 times10
10 M
-1 s
-1
119867bull + bull119874119867 rarr 1198672119874 k = 153 times10
10 M
-1 s
-1
The effect high pH has on the primary radiolysis yields of water is not as well documented
The number of studies is fewer than those conducted in acidic medium and the data from
said studies do not always agree Table 957
shows a collection of primary yields measured
in alkali samples where the pH asymp 135
Chapter 3 Computational Methodology
79
Reference g(eaq
-) +
g(Hbull)
g(
bullOH) +
g(bullOˉ)
g(H2) g(H2O2) +
g(HO2ˉ) g(-H2O) Ref
Draganić et al 318 272 045 068 409
538
Hayon E 327 304 043 053 412
66
Haissinsky M 334 301 04 056 414
67
Dainton F S et al 385 34 036 058 457
6869
Cheek C H et al 28 21 045 084 37
70
Fielden E M et al 357 28 - - -
71
Czapski G et al 33 - - 056 -
72
Table 9 A collection of primary yields measured in alkali solutions (pH asymp 135)57
At high pH the hydroxide ion can react with the hydroxyl radical within the spur forming
the oxide radical anion bullOˉ in the following equilibrium
bull119874119867 + 119874119867minus bull119874minus + 1198672119874 pKa = 119
At high concentrations of hydroxide the hydroxyl radical may be completely replaced by
the oxide radical anion A consequence of this shift is the decrease in the peroxide primary
yield as it is thought that the dimerisation of the oxide radical anion to form peroxide is
slower than the neutral equivalent dimerisation of hydroxyl radicals This is something that
is observed across almost all the studies conducted at high pH The reaction between the
hydrated electron and the oxide radical anion is also slower than the corresponding neutral
equivalent reaction It is therefore expected that the primary yield of oxidising radicals
G(bullOH) + G(
bullOˉ) would increase with increasing pH as would the total primary yield of
reducing radicals G(e(aq)
-) + G(
bullH) The primary yield of molecular hydrogen is mostly
unaffected by the increased pH this would suggest that the net decomposition yield of
water must increase in order to satisfy the material balance equation
Chapter 3 Computational Methodology
80
119892(minus1198672119874) = 119892(119890119886119902minus ) + 119892(119867bull) + 2119892(1198672) = 119892(119874119867
bull) + 119892(119874bullminus) + 2(119892(11986721198742) + 119892(1198671198742minus))
Despite the difficulty in deriving quantitative agreement across the available data there are
studies that offer qualitative agreement with the expected changes to primary yields at high
pH66-69
There are also studies that do not agree and propose that the primary yields are
largely unaffected by pH5387073
Despite the oxide radical anion being the main radiation produced oxidising radical in
aqueous alkali medium and therefore having a significant effect on the chemistry reaction
rate coefficients associated with it are largely unknown and rely on estimation The lack of
reliable rate coefficients for the reactions of the oxide radical anion is an important factor to
consider when attempting to model the radiolysis of water at high pH
It has been shown using stochastic simulations that the chemistry of the oxide radical
anion can have a significant impact on the prediction of primary yields Initial predictions
of the stochastic model by Pimblott et al74
showed an increase in the peroxide primary
yield at high pH This is counter to the accepted trend observed experimentally of a
decreasing peroxide primary yields at high pH In order to match the observed decrease in
peroxide primary yield a single rate constant was changed from 20 times1010
M-1
s-1
to 65
times109 M
-1 s
-1 for the reaction below
119874bullminus + bull119874119867 rarr 1198671198742minus
Chapter 3 Computational Methodology
81
This change had the effect of reversing the trends of the primary yield predictions at high
pH resulting in agreement with experimental data Soon after this the rate constant for the
reaction between the oxide radical anion and the hydroxyl radical was measured to be 74
times109 M
-1 s
-1 which is much closer to the adjusted rate constant used in the stochastic
simulation than the original estimate49
Figure 26 shows literature values for the measured primary yields as a function of pH from
this polynomial equations were fitted which were combined in a multiple regression
analysis with the equations fitted to temperature analysis data Table 10 shows the resulting
equations While this approach gives an estimate of the primary yields as a function of both
temperature and pH it is not an ideal solution This type of estimation is better suited to a
stochastic type track chemistry calculation
A stochastic approach could also account for the effects of different linear energy transfer
(LET) values which are discussed in the next section A multi-scale approach could even
procedurally produce stochastically calculated primary yields that feed into a deterministic
chemical kinetic simulation
Chapter 3 Computational Methodology
82
Figure 26 A reproduction of data provided by Hayon75
showing the effect of pH on
primary radiolysis yields
Primary Yield
Multiple Regression Equation
g(eaq-) 28 + 285times10
-3 times t ndash 251times10
-2 times pH
g(H2O2) 845times10-1
ndash 151times10-3
times t ndash 17times10-2
times pH
g(H2) 388times10-1
+ 829times10-4
times t + 599times10-4
times pH
g(˙OH) 243 + 111times10-2
times t ndash 12times10-3
times pH
g(H˙) 444times10-1
+ 367times10-3
times t ndash 24times10-4
times pH
Table 10 Multiple regression polynomials used to estimate the combined effect of
temperature and pH on the primary yields of water radiolysis
0
05
1
15
2
25
3
35
0 1 2 3 4 5 6 7 8 9 10 11 12 13 14
Pri
ma
ry Y
ield
(M
ole
cule
s 1
00
eV
-1)
pH
g(OH)
g(e-)
g(H2O2)
g(H2)
Chapter 3 Computational Methodology
83
Linear Energy Transfer (LET)
Linear energy transfer is a way of expressing the rate at which an ionising particle loses
energy through a medium Sometimes referred to as ldquostopping powerrdquo linear energy
transfer is quoted as the average energy loss divided by a fixed path length usually micro
meters or nano meters (keV μm-1
or eV nm-1
) This parameter is frequently expressed as an
average rate of energy loss across the entire particlersquos track this is because the energy loss
rate of an ionising particle is not uniform As a high energy ionising particle begins its
journey through a material energy loss events are sparse and only small quantities of
energy are transferred so the particle continues largely un-deflected As this energy lost to
these small transfers accumulates and the energy of the charged particle decreases the
cross section of interactions increases This means that there are more energy loss events
for a given linear distance as the particles path becomes less linear A true linear energy
transfer profile of a particle would take the form of a Bragg curve such as the example
shown below
Figure 27 An example of a Bragg peak Energy loss of alphas of 549 MeV in Air
Image released to public domain
Chapter 3 Computational Methodology
84
For ease of comparison this profile is usually averaged to give a single LET parameter
Ionising particles of higher mass andor lower energy have higher LET values The
implications of linear energy transfer are manifested in the radiation track structure
Increasing LET values have the effect of increasing the spur distribution density as
illustrated in the diagram below
Figure 28 A schematic representation of how linear energy transfer (LET) alters the
distribution of spurs along a radiation track Image was recreated from Allen AO4
The distribution of spurs along a track has an effect on the diffusion of primary radiolysis
species and ultimately alters the primary yields Experiments carried out using 210
Po to
irradiate solutions of iron sulphate through various thicknesses of mica have shown the
effects of changing LET on the yield of oxidation of Fe2+
76
From this subsequent studies
using cyclotron accelerated protons have measured the effects of LET on the primary yields
of water radiolysis77
Compiling the data from these studies gives a general picture of the
effects of LET on water radiolysis primary yields which is shown below
Chapter 3 Computational Methodology
85
Figure 29 Simulation data showing the effects of increasing linear energy transfer on the
primary yields of water radiolysis Image was recreated from Allen AO4
The general trend shows an increase in the formation of molecular products at higher LET
at the expense of radical species (with the exception of hydroperoxyl radical (˙HO2)) at very
high LET values whilst lower LET values favour the radical species Currently there is no
clear agreed explanation as to how the hydroperoxyl radical is formed at high LET Gamma
rays from cobalt-60 fall in the low LET range and have an average value of
023 keV μm-1
78
As the experiments conducted throughout this project used only cobalt-60 as a source of
radiation it was not necessary to incorporate the effects of linear energy transfer into this
radiolysis model nor was it necessary to include the primary yield of hydroperoxyl radicals
into this model as the yield is negligible at the LET value of cobalt-60 Future iterations of
this model would need to include the effects of linear energy transfer as well as better
methods for coping with the effects of temperature and pH this is discussed in more detail
in Chapter 8
Chapter 3 Computational Methodology
86
Mass Transfer of Volatile Species
The transfer of volatile species is not something that affects radiolysis primary yields but it
is important to include as the aqueous reactions of volatile species namely molecular
hydrogen and oxygen will partition into the gas phase This mass transfer is described
within the model as two equations
1198672(119886119902) 1198672(119892)
1198742(119886119902) 1198742(119892)
These equations take the form of first order rate equations with the rate constant substituted
for a time dependant net mass transfer coefficient (kapp) which includes an interfacial mass
transfer coefficient (νint) and the Henryrsquos equilibrium partition coefficient (Kp)27
119889119862(119886119902)119894
119889119905= minus119896119886119901119901
119894 (119905) times 119862(119886119902)119894 (119905)
119896119886119901119901119894 = 120592119894119899119905
119894 times119860119894119899119905119881119886119902
(1 minus 119870119901119894119862119892119894(119905)
119862119886119902119894 (119905)
)
Ci refers to the concentration of species i in either the gas phase or the aqueous phase Aint
and Vaq are used to describe some of the geometry of the radiolysis vessels used in
experiments Aint is the interfacial surface area between the two phases while V is the
volume of the aqueous or gas phase denoted by its subscript As experiments were
conducted in different sized vials depending on the analysis technique used different values
of Aint and V were used when comparing model predictions to experimental data
Chapter 3 Computational Methodology
87
This method assumes that the volume of liquid and covering gas is the same which was
true for all the experiments conducted during this work If the liquid to gas volume ratio
was anything other than 1 then the above differential should be adjusted to account for this
ratio by the following modification
minus119881119897119881119892times119889119862(119886119902)
119894
119889119905= 119896119886119901119901
119894 (119905) times 119862(119886119902)119894 (119905)
The interfacial mass transfer coefficient (νint) incorporates the use of the stagnant two-film
model which provides a description of resistance to diffusion through un-mixed boundary
layers (see Figure 3079
)
Figure 30 A representation of the stagnant two-film model used to calculate the
partitioning of volatile species79
The stagnant two-film model is incorporated into the mass transfer coefficient by relating
the species diffusivity coefficients (D) the boundary thickness (δ) and the Henryrsquos
equilibrium partition coefficient (Kp)
Chapter 3 Computational Methodology
88
1
120592119894119899119905119894=
1
(119863119886119902119894
120575119886119902)
+119870119901119894
(119863119892119894
120575119892)
119870119901119894 =
119862119886119902119894 (119890119902)
119862119892119894(119890119902)
The diffusivity of volatile species is a temperature dependant coefficient which is included
in the model through the use of polynomial fits to data obtained from literature and is
shown in figure 3180-83
Henryrsquos coefficients were taken from literature which included
equations for describing the temperature dependence so a polynomial fit was not
necessary84
The Henryrsquos equilibrium partition coefficient is a dimensionless ratio between
the aqueous and gas phase concentrations of a volatile species at equilibrium This value is
related to the Henryrsquos law constant (kH) by the following relationship
119879 times 119896119867119894 = 122 times 119870119901
119894
The value 122 is used to convert between the Henryrsquos law coefficient in mol maq-3
Pa-1
and
the dimensionless Henryrsquos law coefficient While T represents the temperature in Kelvin
the Henryrsquos law constant also has its own temperature dependency built in this is described
by the following relationship
119896119867 = 119896119867120579 times 119864119883119875 (
∆119867119904119900119897119899119877
(1
119879minus1
119879120579))
Chapter 3 Computational Methodology
89
The Henryrsquos constant at standard temperature (29815 K) (kHθ) is quoted in the literature as
being 13times10-3
mol dm-3
atm-1
for oxygen and 78times10-4
mol dm-3
atm-1
for hydrogen ΔHsoln
is the enthalpy of solution and R is the gas constant the average ratios are quoted in the
literature as 1650 for oxygen and 543 for hydrogen84
This gives values for the Henryrsquos equilibrium partition coefficient (Kpi) of 0019 and 0031
for hydrogen and oxygen respectively at 25degC and smaller values at higher temperatures
Figure 31 The diffusivity of O2 and H2 in both water and air as a function of temperature
000
050
100
150
200
250
300
350
000E+00
100E-05
200E-05
300E-05
400E-05
500E-05
600E-05
700E-05
800E-05
900E-05
0 100 200 300 400
Dif
fusi
vit
y i
n A
ir (
cm2 s
-1)
Dif
fusi
vit
y i
n H
2O
(cm
2 s
-1)
Temperature (degC)
O2aq
H2aq
H2g
O2g
Chapter 3 Computational Methodology
90
Diffusivity
Polynomial
O2(aq) 20times10-9
times t2
+ 40times10-7
times t + 10times10-5
O2(g) 10times10-6
times t2
+ 12times10-3
times t + 02073
H2(aq) 10times10-8
times t2 + 40times10
-7 times t + 30times10
-5
H2(g) 50times10-6
times t2 + 47times10
-3 times t + 07719
Table 11 Polynomial equations used to estimate the temperature effects on the diffusivity
of O2 and H2 in both gas and aqueous phases where t = temperature (Cdeg)
Water Radiolysis Reaction Set
The radiolysis model simulates the chemical kinetics of homogeneous radiolysis through
the use of simultaneous differential equations that represent the independent chemical
reactions taking place The model therefore includes a set of reactions accompanied by
reaction rate constants Tables 12 - 14 gives a summary of the reaction set used with a full
description of the reaction set including the associated temperature dependences is given in
appendix A The reaction rate coefficients are taken from multiple sources with the
majority from the compilation of A J Elliot and D M Bartels45
Chapter 3 Computational Methodology
91
Reaction Number Primary Species
Production
G-value
(Molecules100eV) Ref
G0 H2O 119890(119886119902)minus 271 45
G1 H2O Hbull 054 45
G2 H2O H2 041 45
G3 H2O bullOH 270 45
G4 H2O H2O2 068 45
G5 H2O H(aq)+ 271 45
Table 12 A list of Primary Species used to model water radiolysis
Reaction
Number
Chemical Reactions Rate Constant k
(M-1
s-1
25degC)
Ref
R0 emacraq + emacraq rarr H2 + 2OHmacr 726 times109
45
R1 emacraq + Hbull rarr H2 + OHmacr 276 times10
10
45
R2 emacraq + bullOH rarr OHmacr 355 times10
10
45
R3 emacraq + bullOmacr rarr 2OHmacr 231 times10
10
49
R4 emacraq + H2O2 rarr OHmacr + bullOH 136 times10
10
45
R5 emacraq + HO2bull rarr HO2macr 130 times10
10
45
R6 emacraq + HO2macr rarr Obullmacr + OHmacr 351 times10
9
49
R7 emacraq + O2 rarr O2bullmacr 225 times10
10
45
R8 emacraq + O2bullmacr rarr O2
2macr + H2O 130times10
10
4349
R9 Hbull + H
bull rarr H2 514 times10
9
45
R10 Hbull +
bullOH rarr H2O 109 times10
10
45
R11 Hbull + H2O2 rarr
bullOH + H2O 365 times10
7
45
R12 Hbull + O2 rarr HO2
bull 130 times10
10
45
R13 Hbull + O2
bullmacr rarr HO2macr 114 times10
10
45
R14 Hbull + HO2
bull rarr 2
bullOH 114 times10
10
45
R15 Hbull + HO2macr rarr
bullOH + OHmacr 137times10
9
85
Chapter 3 Computational Methodology
92
R16 Hbull + O3 rarr
bullOH + O2 220 times10
10
43
R17 bullOH +
bullOH rarr H2O2 481 times10
9
45
R18 bullOH + H2O2 rarr H2O + HO2
bull 292 times10
7
45
R19 bullOH + HO2macr rarr OHmacr + HO2
bull 813 times10
9
45
R20 bullOH + HO2
bull rarr H2O + O2 884 times10
9
45
R21 bullOH + O2
bullmacr rarr OHmacr + O2 110 times10
10
45
R22 bullOH + O3 rarr HO2
bull + O2 110 times10
8
43
R23 bullO3macr + H2O2 rarr O2
bullmacr + O2 + H2O 159 times10
6
43
R24 bullO3macr + HO2macr rarr O2
bullmacr + O2 + OHmacr 887 times10
5
43
R25 bullO3macr + H2 rarr O2 + H
bull + OHmacr 249times10
5
46
R26 bullO3macr +
bullOH rarr HO2
bull + O2
bullmacr 6000 times10
9
43
R27 bullO3macr +
bullOH rarr HOmacr + O3 250 times10
9
43
R28 bullO3macr + H
+(aq) rarr O2 +
bullOH 900 times10
10
43
R29 O2bullmacr + O2
bullmacr +1198672119874rarr
O2 + O22macr 299times10
-1
43
R30 O2bullmacr + HO2macr rarr
O2 + bullOmacr + OHmacr 823 times10
-2
43
R31 O2bullmacr + H2O2 rarr
O2 +
bullOH + OHmacr 130 times10
-1
43
R32 O2bullmacr + HO2
bull rarr O2 + HO2macr 760times10
7
43
R33 O2bullmacr +
bullO3macr rarr
O2macr+ 2O2 100 times10
4
43
R34 O2bullmacr + O3 rarr
bullO3macr + O2 150 times10
9
43
R35 HO2bull + HO2
bull rarr H2O2 + O2 840 times10
5
45
R36 HO2bull + H2O2 rarr O2 + H2O +
bullOH 500 times10
-1
49
R37 HO2bull + O3 rarr
bullOH + 2O2 500 times10
8
43
R38 H2O2 + HO2macr rarr O2 + H2O + OHmacr 450times10-4
43
R39 O3 + OHmacr rarr HO2macr + O2 480 times101
43
R40 O3 + HO2macr rarr bullOH + O2 + O2
bullmacr 550 times10
6
43
R41 O3 + H2O2 rarr bullOH + O2 + HO2
bull 371 times10
-2
43
R42 Hbull +
bullOmacr rarr OHmacr 200times10
10
43
Chapter 3 Computational Methodology
93
R43 bullO3macr + emacraq rarr 2OHmacr
+
O2 160times10
10
43
R44 O3 + emacraq rarr bullO3macr 360 times10
10
43
R45 H2O2 rarr 2bullOH 230 times10
-7
86
R46 O2macr + H2O rarr 2OHmacr
100 times10
10
43
R47 bullOmacr + H2 rarr
bullH + OHmacr 128 times10
8
45
R48 bullOmacr + H2O2 rarr O2
bullmacr + H2O 555 times10
8
49
R49 bullOmacr + HO2macr rarr O2
bullmacr + OHmacr 786 times10
8
45
R50 bullOmacr + O2
bullmacr rarr O
2macr + O2 600 times10
8
43
R51 bullOmacr +
bullOmacr rarr O2
2macr 100times10
8
43
R52 bullOmacr +
bullOH rarr HO2macr 761 times10
9
49
R53 bullOmacr + O3macr rarr 2O2
bullmacr 700times10
8
43
R54 bullOmacr + O3 rarr O2
bullmacr + O2 100 times10
9
43
Table 13 A list of reactions used to model water radiolysis
Chapter 3 Computational Methodology
94
Equilibria kf
(M-1
s-1
25degC)
kb
(M-1
s-1
25degC) Ref
R5556 H2O H+
(aq) + OHmacr 117 times10-3
118times1011
45
R5758 H2O2 H+
(aq) + HO2macr 890 times10-2
478times1010
45
R5960 H2O2 + OHmacr HO2macr + H2O 127 times1010
140 times106
45
R6162 HO2macr + OHmacr
O22macr + H2O 351 times10
5 110 times10
6
43
R6364 bullOH H
+(aq) +
bullOmacr 890 times10
-2 478times10
10
45
R6566 bullOH + OHmacr
bullOmacr + H2O 127 times10
10 140 times10
6
45
R6768 bullOmacr + O2
bullO3macr 375 times10
9 262 times10
3
45
R6970 HO2bull H
+(aq) + O2
bullmacr 478 times10
10 735 times10
5
45
R7172 HO2bull + OHmacr O2
bullmacr+ H2O 127 times10
10 163 times10
-1
45
R7374 Hbull emacraq + H
+(aq) 583 210times10
10
45
R7576 Hbull + OHmacr emacraq + H2O 244 times10
7 174 times10
1
45
R7778 Hbull + H2O H2 +
bullOH 458 times10
-5 395 times10
7
45
R79 H2(aq) H2(g) 269times10-3
R80 O2(aq) O2(g) 103times10-4
Table 14 A list of equilibria used to model the radiolysis of water
Chapter 3 Computational Methodology
95
Computational Assumptions and Error
The first assumption this model makes is that radiolysis does not occur in the gas phase In
reality this is not the case however the density of the gas phase is so small compared to that
of the aqueous phase that any contribution from gas phase radiolysis will be negligible
There are several reactions that do not include any kind of temperature dependence for their
associated rate constants This is due to a lack of information available in the literature
many of the species involved in these reactions are notoriously difficult to measure reaction
rate constants for thus these reactions have a fixed rate constant across all temperatures
The method for estimating the primary yields to account for both temperature and pH
effects is not an ideal method Multiple linear regression analysis is often used to
empirically predict the value of a single dependant variable based on the contributions of
multiple independent variables In the case of this model the independent variables are
temperature and pH a full model would also include LET as a third independent variable
The number of observations considered for the regression analysis is less than ideal due to
the scarcity of available data coupled with the difficulty of relating non-linear variables
means that predictions of primary yields are loose estimates at best The coefficient of
determination (R2) gives information about how well the multiple regressions fit the data
and is shown in Table 15 where μ denotes the estimated standard deviation of the error
Primary Yield
R2 μ
g(eaq-) 0612 0249
g(H2O2) 0934 0045
g(H2) 0907 0032
g(bullOH) 0950 0265
g(Hbull) 0925 0108
Table 15 Statistical information concerning the estimation of primary yields used to model
the radiolysis of water
Chapter 3 Computational Methodology
96
The partition of volatile species depends on a number of parameters some of which are
dependent on geometry Although H2O2 is not a volatile species its concentration is
strongly affected by the concentration of aqueous O2 it is therefore necessary to include gas
partitioning methods in both H2 and H2O2 model calculations The interfacial surface area
(Aint) is one such parameter although this can be roughly determined by measuring the
geometry of the vials being used Other parameters such as the boundary thicknesses (δ) are
not so easily measured and are parameter fitted This is done using the parameter fitting
functionality built into FACSIMILE Experimental data is supplied to FACSIMILE and the
desired parameters to fit are declared the calculation is then performed a number of times
slightly varying the declared parameters each time until the predicted values better match
the provided experimental data For this work the data provided to FACSIMILE was the
concentration of H2 and H2O2 in aerated water as a function of dose (Figures 32-33) Vials
of different geometry have different boundary thicknesses the values used throughout this
work are shown in Table 16
Parameter
Vial Used for H2 Analysis Vial Used for H2O2 Analysis
Aint (m2) 502 times10
-5 284 times10
-4
δaq (m) 580 times10-4
510 times10-4
δg (m) 260 times10-2
260 times10-2
Table 16 Parameters used to describe interfacial surface area (Aint) and boundary
thicknesses (δ) for sample vials of different geometry
Chapter 4 The Radiolysis of Aqueous Solutions at High pH
97
Chapter 4 The Radiolysis of Aqueous Solutions at High pH
Preliminary Radiolysis Studies of Pure Water
Preliminary experiments to measure hydrogen peroxide and hydrogen gas concentrations
from the radiolysis of aerated and deaerated water at neutral pH were carried out as a
control to which other measurements may be compared Computational modelling of these
pure water systems were performed with the radiolysis model described in Chapter 3 to
validate the models performance
Measurements of hydrogen peroxide were made using the Ghormley Tri-iodide method
described in Chapter 2 The pH of the stock was measured using a Mettler Toledo
SevenMultitrade pH meter equipped with a probe capable of measuring pH in the range 0-14
and was found to be 699 Aliquots of 10 mL from the pure water stock were sealed in
20 mL headspace vials so that the liquid to headspace ratio was 11 and were irradiated in
row 1 of the 4x8 sample rack the average dose rate was 2839 Gy min-1
The experiment
was run twice prior to irradiation samples used in the first run were sealed but left aerated
while samples used in the second run were sealed in gas tight vials equipped with rubber
septa and were sparged for 20 minutes with zero grade argon gas to remove all dissolved
oxygen The results of the two experimental runs are shown in Figure 32
Preliminary measurements of hydrogen gas production were also carried out using pure
water 2 mL aliquots of pure water stock were flame sealed in 4 mL glass vials which were
then secured in the inverter rig and irradiated for various periods of time the average dose
rate was 2851 Gy min-1
Post irradiation analysis was carried out by the previously
described crush tube method of gas chromatography
Chapter 4 The Radiolysis of Aqueous Solutions at High pH
98
As flame sealing introduces slight irregularity in the volume of headspace an assumption
was made that the headspace of the sealed vial was 2 mL
This allows the conversion of measured quantities (microL) of hydrogen to a concentration
(mol dm-3
) Once again the experiment was run twice with the second experimental run
using samples that have been deaerated with argon and the results are shown in Figure 33
Figure 32 Measurements of H2O2 concentration as a function of dose for aerated water
(diams) and deaerated water (diams) Vertical error bars show the standard deviation between
replicates while horizontal error bars show the dose range for replicates
000E+00
100E-06
200E-06
300E-06
400E-06
500E-06
600E-06
700E-06
800E-06
000E+00
200E-05
400E-05
600E-05
800E-05
100E-04
120E-04
140E-04
0 10 20 30 40
[H2O
2]
(mo
l d
m-3
) D
eaer
ated
[H2O
2]
(mo
l d
m-3
) A
erat
ed
Dose (kGy)
Aerated Water
Deaerated Water
Chapter 4 The Radiolysis of Aqueous Solutions at High pH
99
Figure 33 Measurements of H2 as a function of dose in aerated (diams) and deaerated (diams)
samples Vertical error bars show the standard deviation of replicates while horizontal
error bars show the dose range for replicates
Discussion
Aerated samples resulted in a steady-state concentration of hydrogen peroxide at
approximately 11 times10-4
mol dm-3
while molecular hydrogen continues to form with
absorbed dose over the range considered In order to satisfy the mass balance requirements
some other species must be formed after the achievement of the peroxide steady-state that
is also proportional to hydrogen formation The most likely candidate for this is molecular
oxygen which would have to be formed at half the rate of hydrogen
Samples that did not contain any dissolved oxygen failed to produce significant quantities
of hydrogen peroxide or hydrogen gas with a very low steady state eventually achieved at
approximately 40 times10-6
mol dm-3
This may be attributed to the radiolytic production of
oxygen required to satisfy mass balance Using the radiolysis model a predicted chemical
yield can be obtained after the establishment of the hydrogen peroxide steady state to show
that mass balance is satisfied by oxygen production The predicted chemical yields were
calculated between doses of 15 kGy to 30 kGy
000E+00
100E-04
200E-04
300E-04
400E-04
500E-04
600E-04
700E-04
800E-04
0 10 20 30 40 50 60
[H2]
(mo
l d
m-3
)
Dose (kGy)
Aerated Water
Deaerated Water
Chapter 4 The Radiolysis of Aqueous Solutions at High pH
100
For oxygen gas the predicted chemical yield was G(O2) = 0011 while the predicted yield
of hydrogen gas formation in deaerated water was G(H2) = 0022 In both cases samples
that were aerated produced much larger quantities of hydrogen and hydrogen peroxide than
their deaerated equivalents This was somewhat expected as it has long been considered
that dissolved oxygen is reduced and the reduction products are able to react with hydroxyl
radicals preventing them from removing hydrogen peroxide and hydrogen87
The general
scheme first proposed in 1954 for this protection mechanism is initiated by the reaction of
hydrogen atoms with oxygen to produce hydroperoxyl radicals these then react with
hydroxyl radicals to reform water and oxygen or with itself to form hydrogen peroxide and
oxygen4
119867bull + 1198742 rarr 1198671198742bull
(R12)
bull119874119867 + 11986721198742 rarr 1198672119874 + 1198671198742bull
(R18)
1198671198742bull + 1198671198742
bull rarr 11986721198742 + 1198742 (R35)
bull119874119867 + 1198671198742bull rarr 1198672119874 + 1198742 (R20)
More recent studies by the research group led by Clara Wren have deployed computational
methods to investigate further the effects of dissolved oxygen on the steady-state
concentration of both hydrogen peroxide and molecular hydrogen86
The calculations
performed in this study also supported the idea that dissolved oxygen is reduced and it is
the reduction products that scavenge hydroxyl radicals resulting in the protection of
hydrogen peroxide and molecular hydrogen The calculations revealed that oxygen is
mainly reduced by the hydrated electron and that the superoxide formed is responsible for
the scavenging of hydroxyl radicals This process serves as a catalytic mechanism for the
overall reaction between the solvated electron and hydroxyl radicals
Chapter 4 The Radiolysis of Aqueous Solutions at High pH
101
119890119886119902minus + 1198742 rarr 1198742
minus (R7)
1198742minus + bull119874119867 rarr 119874119867minus + 1198742 (R21)
Overall Reaction 119890119886119902minus + bull119874119867 rarr 119874119867minus (R2)
This scavenging of hydroxyl radicals has a larger impact on protecting hydrogen as the
reaction between hydrogen and the hydroxyl radical is the only significant removal path of
hydrogen in neutral conditions
Wren proposes that high concentrations of hydrogen peroxide seen in aerated solutions can
be attributed to a change in the production pathway for hydrogen peroxide in the presence
of oxygen The reaction between both the reduction products of oxygen becomes the
dominant production pathway for hydrogen peroxide
1198671198742bull + 1198742
minus rarr 1198671198742minus + 1198742 (R32)
119867(119886119902)+ + 1198742
minus 1198671198742bull (R6970)
119867(119886119902)+ + 1198671198742
minus 11986721198742 (R5758)
Similar calculations were performed in this work using the computational method described
in Chapter 3 The computational predictions shown in figures 34 and 35 serve as a baseline
to demonstrate that the computational model performs well at least at a fundamental level
before building up to more complex systems
Chapter 4 The Radiolysis of Aqueous Solutions at High pH
102
Figure 34 Predicted concentrations of H2O2 as calculated by the radiolysis model for both
aerated () and deaerated () conditions
Figure 35 Predicted concentrations of H2 gas as calculated by the radiolysis model for
both aerated () and deaerated () conditions
000E+00
100E-06
200E-06
300E-06
400E-06
500E-06
600E-06
700E-06
800E-06
000E+00
200E-05
400E-05
600E-05
800E-05
100E-04
120E-04
140E-04
0 10 20 30 40
[H2O
2]
(mo
l d
m-3
) D
eaer
ated
[H2O
2]
(mo
l d
m-3
) A
erat
ed
Dose (kGy)
Aerated Water
FACSIMILE Aerated
Deaerated Water
FACSIMILE Deaerated
000E+00
100E-04
200E-04
300E-04
400E-04
500E-04
600E-04
700E-04
800E-04
0 10 20 30 40 50 60
H2 (
mo
l d
m-3
)
Dose (kGy)
Aerated Water
Deaerated Water
FACSIMILE Aerated
FACSIMILE Deaerated
Chapter 4 The Radiolysis of Aqueous Solutions at High pH
103
The predictions made for the concentrations of hydrogen peroxide and hydrogen gas in pure
water match well with the observed measurements especially for the concentration of
hydrogen peroxide produced in aerated water The most obvious discrepancy is the
disparity between the early predictions of hydrogen peroxide concentration and the
measured concentration for deaerated samples which is most likely due to imperfect
oxygen removal from the samples As the predictions are in generally good agreement with
the experimental measurements it is not unreasonable to assume that steady state
concentrations of other species which cannot or were not determined experimentally
during this work can be estimated by the model
Figure 36 Calculated concentrations of the major oxidising and reducing water radiolysis
species as a function of dose Solid lines represent aerated conditions while broken lines
represent deaerated conditions
Figure 36 shows the predicted concentrations of various radical species in both aerated and
deaerated water The calculated concentrations agree with previously published calculations
by Wren and co-workers86
100E-14
100E-12
100E-10
100E-08
100E-06
0 10 20 30 40 50
Co
nce
ntr
atio
n (
mo
l d
m-3
)
Dose (kGy)
˙OH
O2˙-
H˙
eaq-
HO2˙
Chapter 4 The Radiolysis of Aqueous Solutions at High pH
104
Under aerated conditions reducing species H˙ and eaq- have significantly lower
concentrations than in deaerated conditions due to scavenging by oxygen The resulting
reduction products of oxygen are superoxide and hydroperoxyl radicals and both show an
increased concentration in aerated conditions
The experiments in the following sections concerning the measurement of hydrogen
peroxide were all performed in aerated conditions to resemble the conditions at the
Sellafield site Measurements of hydrogen were for the most part carried out under
deaerated conditions
Chapter 4 The Radiolysis of Aqueous Solutions at High pH
105
Measurements of H2O2 in the Radiolysis of High pH Solutions
Stock solutions of various pH were prepared using NaOH dissolved in ultra-pure water
From each stock sample sets were prepared from 10 mL aliquots of stock solution and
sealed in 20 mL glass vials with aluminium crimp caps The pH of the remaining sample
stocks were measured and recorded Irradiation dose rates were calculated from original
measurements using the Fricke dosimetry method described previously Sample sets were
loaded into row 1 of the 4x8 irradiation rack and irradiated using the Model-812 cobalt-60
irradiator until they reached the desired dose Table 17 summarises the dose rates and pH of
the sample batches examined
Sample Batch ID Average Dose Rate for Row 1 (Gy min-1
) Measured pH
H2O2-PH00 28512 699
H2O2-PH01 27497 1041
H2O2-PH02 27407 1108
H2O2-PH03 28364 1230
H2O2-PH04 27467 1274
Table 17 Conditions of samples used to investigate hydrogen peroxide in high pH
radiolysis
Results
Post irradiation analysis for H2O2 was carried out immediately after irradiation using the
previously described tri-iodide method Analysis of high pH samples required additional
acid to lower the pH to the conditions required by the analytical method the quantities of
acid used were recorded and the dilution effects have been accounted for The results of this
study are shown in Figure 37
Chapter 4 The Radiolysis of Aqueous Solutions at High pH
106
Figure 37 Measurements of H2O2 concentrations as a function of dose for samples
initially at pH 7 (diams) pH 104 (diams) pH 11 (diams) pH 123 (diams) and pH 127 (diams)
All samples were aerated Vertical error bars are the standard deviation between
replicates while horizontal error bars show the dose range for replicates
The steady state concentration of hydrogen peroxide is fairly consistent at about
115 x10-4
mol dm-3
within the pH range 7-11 each attaining steady state after roughly
5 kGy At higher pH values both the steady state concentration and the dose at which
steady state is achieved increase
Samples at pH 123 required roughly 10 kGy to obtain a peak steady-state concentration of
195 x10-4
mol dm-3
of hydrogen peroxide while samples at pH 127 required even higher
doses almost 20 kGy to reach a steady concentration of 238 x10-4
mol dm-3
The data set
from samples at pH 123 shows an apparent decrease in hydrogen peroxide concentration of
~18 at 35 kGy A similar decrease in hydrogen peroxide concentration is also observed in
samples of pH 11
000E+00
500E-05
100E-04
150E-04
200E-04
250E-04
300E-04
0 10 20 30 40
[H2O
2]
(mo
l d
m-3
)
Dose (kGy)
pH 127
pH 123
pH 11
pH 104
pH 7
Chapter 4 The Radiolysis of Aqueous Solutions at High pH
107
Measurements of H2 in the Radiolysis of High pH Solutions
Stock solutions of various pH were prepared using NaOH to match the pH range used in
the measurement of hydrogen peroxide Many of the acid-base equilibria used in the
description of water radiolysis have pKa values in the pH range investigated by this study
The behaviour of H2 production observed at high pH may be influenced by a change in
chemistry brought about by a shift in one or more of the acid-base equilibria Table 18
shows the equilibria of interest and their associated pKa value while Table 19 includes the
measured pH of the stock solutions
Equilibrium pKa
bull119926119919 119919(119938119954)+ + bull119926minus 1184
119919120784119926120784 119919(119938119954)+ +119919119926120784
minus 1168
119919bull 119919(119938119954)+ + 119942119938119954
minus 974
119919119926120784bull 119919(119938119954)
+ + 119926120784minus 483
Table 18 A list of important equilibria and their associated pKa values
For the measurement of hydrogen sample sets were prepared from 2 mL aliquots of stock
solution which were transferred to glass ldquocrush tuberdquo vials described in chapter two The
vials were connected to a glass manifold via stainless steel needles and sparged with zero
grade argon for 20 minutes to remove any dissolved oxygen before samples were flame
sealed under argon
Irradiation dose rates were calculated from original Fricke dosimetry study described
previously Samples were loaded into the four positions available in the inverter rig and
irradiated until they reached the desired dose
Chapter 4 The Radiolysis of Aqueous Solutions at High pH
108
Results
After irradiation samples were analysed for hydrogen gas by gas chromatography using the
ldquocrush tuberdquo technique described in Chapter 2 Figure 38 shows the amounts of H2
produced as a function of radiation dose As production rates of hydrogen gas are linear as a
function of absorbed dose chemical yields can be identified as the gradient expressed in
terms of molecules per 100 eV of absorbed energy These results are summarised in Table
19 while the data is shown in Figure 38
Table 19 Conditions of samples used to investigate hydrogen gas in high pH radiolysis
Figure 38 Measurements of H2 gas as a function of dose at pH 7 (diams) pH 106 (diams) pH 123
(diams) and pH 13 (diams) Dashed lines are provided to clarify the data trends all samples were
deaerated Vertical error bars show the standard deviation between replicates while
horizontal error bars show the dose range for replicates
000E+00
500E-04
100E-03
150E-03
200E-03
250E-03
0 20 40 60 80
H2 (
mo
l d
m-3
)
Dose (kGy)
pH 13
pH 123
pH 106
pH 7
Sample
Batch ID
Average Dose Rate for
Inverter Rig (Gy min-1
) Measured pH G(H2) Error plusmn
H2-PH00 28385 699 0021 0002
H2-PH01 28408 1063 0071 0018
H2-PH02 29039 1232 0352 0005
H2-PH03 28634 1307 0176 0010
Chapter 4 The Radiolysis of Aqueous Solutions at High pH
109
Increasing the pH has the effect of increasing the chemical yield for hydrogen over the pH
range 7 to 123 however the data set for pH 13 shows that the chemical yield for hydrogen
is less than samples at pH 123 The results of the calculations using the reaction scheme
given in Tables 12 - 14 for both hydrogen peroxide and hydrogen gas production are
shown in Figures 39 and 40 respectively
Figure 39 Model calculations to show the predicted concentrations of H2O2 as a function
of dose at various pH
000E+00
500E-05
100E-04
150E-04
200E-04
250E-04
300E-04
350E-04
0 10 20 30 40 50
[H2O
2]
(mo
l d
m-3
)
Dose (kGy)
pH 127
pH 123
pH 11
pH 104
pH 7
Chapter 4 The Radiolysis of Aqueous Solutions at High pH
110
Figure 40 Model calculations to show the predicted concentrations of H2 gas as a function
of dose at various pH
Calculated concentrations of hydrogen peroxide show the same trends as the data The
predictions at pH 104 and 11 take slightly longer to reach steady state than what the
experimental data shows Higher pH calculations follow the same trend as the experimental
data but overestimate the steady state concentrations of hydrogen peroxide especially in the
calculations at pH 127
Calculated concentrations of molecular hydrogen follow a slightly more unexpected trend
Predictions made for pH 106 massively overestimate hydrogen production rates this is
symptomatic of a misunderstanding of the mechanistic chemistry A similar error has also
been noted by Wren when performing calculations at this pH a suggested fix was to
increase the reaction rate between ozinide and molecular hydrogen by a factor of 886
000E+00
500E-04
100E-03
150E-03
200E-03
250E-03
300E-03
0 20 40 60 80
[H2]
(mo
l d
m-3
)
Dose (kGy)
pH 13
pH 123
pH 106
pH 7
Chapter 4 The Radiolysis of Aqueous Solutions at High pH
111
Even with this higher rate the over prediction of hydrogen is still large at pH 106 while
predictions for pH 123 agree reasonably well with experimental data This information at
least helps to narrow the pH range at which this misunderstanding manifests The pH range
afflicted by over prediction of hydrogen falls close to the pKa of the dissociation of the
hydrogen atom at 974
119867bull 119867(119886119902)+ + 119890(119886119902)
minus pKa = 974
The reverse reaction rate for the above equilibrium has been measured with good agreement
over a number of laboratories however the forward reaction rate is calculated based on the
relationship between the reverse reaction rate and the equilibrium constant45
This
equilibrium constant is derived from the Gibbs free energy of formation of Hbull in the gas
phase combined with an estimated value for the free energy of solvation of Hbull This
estimation is a value between those for the free energy of solvation of He atoms and H2
molecules888
Both computational and experimental data show the same trend at pH 13 in that the
production rate of hydrogen is less than that observed at lower pH however the
calculations once again overestimate the rate shown by the experimental data Some more
features of this discrepancy are discussed further in the following section
Chapter 4 The Radiolysis of Aqueous Solutions at High pH
112
Discussion
The radiolytic removal of hydrogen from solution by the hydroxyl radical has long been
referred to as the Allen chain25
In this mechanism the hydroxyl radical reacts with
molecular hydrogen to reform water and a hydrogen atom the chain is then extended by the
reaction of the hydrogen atom with hydrogen peroxide to reform the hydroxyl radical with
the net effect being the removal of H2 and H2O2
Propagation Steps
bull119874119867 + 1198672 rarr 119867bull + 1198672119874 k78 = 40 times10
7 M
-1 s
-1
119867bull + 11986721198742 rarr bull119874119867 + 1198672119874 k11 = 365times107 M
-1 s
-1
Termination 119867bull + bull119874119867 rarr 1198672119874 k10 = 109times1010
M-1
s-1
Aside from transference into the gas phase this chain is the only removal path for hydrogen
under neutral pH conditions At higher pH radical species are converted into their base
forms and a new chain is established43
119867bull + 119874119867minus 119890119886119902minus + 1198672119874 (R7576)
bull119874119867 + 119874119867minus 119874bullminus + 1198672119874 (R6566)
Propagation Steps
119874bullminus + 1198672 rarr 119890119886119902minus + 1198672119874 k47 = 128 times10
8 M
-1 s
-1
119890119886119902minus + 1198671198742
minus rarr 119874bullminus + 119874119867minus k49 = 786times108 M
-1 s
-1
Termination 119890119886119902minus + 119874bullminus rarr 2119874119867minus k3 = 231times10
10 M
-1 s
-1
Chapter 4 The Radiolysis of Aqueous Solutions at High pH
113
Given the higher rate constants involved in the alkali chain it would seem that the chain
reaction established in the basic form has a higher efficiency than its neutral equivalent yet
observations show a higher chemical yield of hydrogen at high pH and would suggest
otherwise This can largely be resolved by considering the effects of oxygen on these chain
reactions Oxygen acts as a poison to both the chain reactions removing hydrogen causing
an increase in hydrogen yield The mechanism by which oxygen disrupts the chain is
through reactions with solvated electrons to produce superoxide which in turn reacts with
OH radicals or in the case of alkali solutions bullOˉ preventing them from reacting with
hydrogen as well as reforming oxygen
119890119886119902minus + 1198742 rarr 1198742
bullminus (R7)
bull119874119867 + 1198742bullminus rarr 119874119867minus + 1198742 (R21)
bull119874minus + 1198742bullminus + 1198672119874 rarr 2119874119867
minus + 1198742 (R50)
In alkali solution bullOˉ is also susceptible to a direct reaction with oxygen to form ozonide
ions while a neutral equivalent reaction between hydroxyl radicals and oxygen does not
exist As the experimental measurements of hydrogen gas from solutions of sodium
hydroxide were carried out in deaerated conditions there should be no initial dissolved
oxygen and any oxygen present would have been radiolytically formed Figure 41 shows
the calculated steady state concentration of aqueous oxygen compared to hydrogen gas
formation as a function of pH from this it is clear that an increase in pH leads to a rise in
radiolytically produced oxygen which is proportional to the amount of hydrogen generated
Chapter 4 The Radiolysis of Aqueous Solutions at High pH
114
Figure 41 Model calculations showing the concentrations of aqueous oxygen and
hydrogen gas from deaerated water after 80 kGy at 280 Gy min-1
to show the related
behaviour between the two
Analysis of the calculated reaction rates gives an insight to why the concentration of
radiolytic oxygen first rises with pH and then falls after pH 12 and may help to reveal the
source of the over-prediction at pH 106 All the following reaction rates are taken from the
end of the experimental range ie 80 kGy with a dose rate of 280 Gy min-1
At neutral pH
it is the reaction between the superoxide ion and the hydroxyl radical (R21) that is the main
source of radiolytic oxygen but as the pH rises beyond pH 10 the rate of this reaction
begins to fall from ~140 times10-6
mol dm-3
s-1
to 886 times10-8
mol dm-3
s-1
at pH 14 This drop
is mainly due to the equilibrium between the hydroxyl radical and its basic form bullOˉ which
has a pKa of 119 As one would expect the reaction rate of the equivalent base reaction
(R50) rises as the pH increases although this increase does not fully compensate for the
decrease in rate of R21
100E-06
100E-05
100E-04
100E-03
100E-02
7 8 9 10 11 12 13 14
Lo
g C
on
cen
trat
ion (
mo
l d
m-3
)
pH
[H2] g
[O2] aq
Chapter 4 The Radiolysis of Aqueous Solutions at High pH
115
This is because the reaction between the solvated electron and superoxide (R8) has a larger
rate constant than R50 and with the conversion of hydrogen atoms to solvated electrons at
high pH R8 out competes R50
In principal many other reactions produce oxygen but the rates of these reactions are often
negligible Only the rate of oxygen production through the reaction of superoxide and
hydroperoxyl (R32) sees an increase over the pH range 10-12 which may be significant to
radiolytic oxygen production Figure 42 shows the rates of the three main molecular oxygen
producing reactions (R21 R50 and R32) as well as the reaction rate for R8 and the
combined reaction rates for R8 and R50 as a function of pH When the combined reaction
rates of R8 and R50 are compared with the reaction rate of R21 it becomes obvious that
there is a transition from the removal of super oxide by R21 to removal by both R8 and
R50 this is the main cause of a decrease in oxygen concentration after pH 12 Figure 43
shows the sum of reaction rates that lead to oxygen formation and removal as a function of
pH
Figure 42 Model predictions of the steady-state reaction rates of R21 R50 and R32 at
various pH for γ radiolysis of deaerated water at a dose rate of 280 Gy min-1
000E+00
200E-07
400E-07
600E-07
800E-07
100E-06
120E-06
140E-06
160E-06
7 8 9 10 11 12 13 14
Rea
ctio
n R
ate
at S
tead
y S
tate
(mo
l d
m-3
s-1
)
pH
Chapter 4 The Radiolysis of Aqueous Solutions at High pH
116
Figure 43 The sum of the steady state rates of all reactions that produce O2 () compared
with the sum of the steady state rates of all reactions that remove O2 () These totals do
not include rates of production or removal from mass transfer reactions This calculation is
for the γ radiolysis of deaerated water to a dose of 80 kGy at a rate of 280 Gy min-1
At pH 7 the rate of oxygen production matches the rate at which it is removed and a low
steady state concentration of aqueous oxygen is achieved before the end of the 80 kGy
calculation range At higher pH the rate of oxygen removal diverges and so oxygen can
accumulate to a higher concentration over a longer period of time longer than that of the
80 kGy range used Excluding transfer into the gas phase there are only three reactions that
effectively remove oxygen so it was worth investigating how the rates of these reactions
changed with pH Figure 44 shows the rates of reactions R6 R7 R8 R12 and R67 as a
function of pH
000E+00
200E-07
400E-07
600E-07
800E-07
100E-06
120E-06
140E-06
160E-06
7 8 9 10 11 12 13 14
Rat
e at
Ste
ady S
tate
(mo
l d
m-3
s-1
)
pH
Chapter 4 The Radiolysis of Aqueous Solutions at High pH
117
Figure 44 Model predictions of the steady-state reaction rates of R7 R12 and R67 at
various pH This calculation is for the γ radiolysis of deaerated water to a dose of 80 kGy
at a rate of 280 Gy min-1
The first removal path of oxygen is the reaction between the solvated electron and oxygen
to produce superoxide (R7) this reaction does not see a significant change in rate below
pH 11 after which the rate begins to fall The second reaction is the reduction of oxygen by
the hydrogen atom (R12) the rate of this reaction falls steadily as pH increases this is due
to the conversion of hydrogen atoms to solvated electrons by hydroxide which has a pKa of
96 The decline in rate of this reaction accompanied by no significant increase in the rate
of oxygen removal by solvated electrons may be the main contribution to the increased
concentrations of oxygen at pH gt 9 It was thought that this might also be the cause of the
over prediction but any attempt to increase this rate constant is largely negated by an
accompanying increase in the rate of reaction R32 The final removal path of oxygen is the
reaction with O˙- to form ozonide (R67)
000E+00
200E-07
400E-07
600E-07
800E-07
100E-06
120E-06
7 8 9 10 11 12 13 14
Rea
ctio
n R
ate
at S
tead
y S
tate
(mo
l d
m-3
s-1
)
pH
Chapter 4 The Radiolysis of Aqueous Solutions at High pH
118
The rate of this reaction increases rapidly with pH from 194 times10-8
mol dm-3
s-1
at pH 9
to 146 times10-6
mol dm-3
s-1
at pH 14 however ozonide is unstable and decomposes to reform
oxygen at a rate not much lower than its formation
Subtracting the rate of oxygen reformation from the decomposition of ozonide gives the
actual rate of oxygen removal by bullOˉ of 110 times10
-9 mol dm
-3 s
-1 at pH 9 and
600 times10-8
mol dm-3
s-1
at pH 14 It should be noted that the decomposition rate of ozonide
was excluded from the total rate of oxygen formation in figure 44 while the rate of oxygen
removal by ozonide formation was the subtracted values quoted above
The main removal mechanism of hydrogen peroxide is by reaction with solvated electrons
In the presence of oxygen the removal of hydrogen peroxide by solvated electrons is
largely out competed by reactions between the solvated electrons and oxygen or
superoxide The rate constant for the reaction between oxygen and the solvated electron
(R7) is 225 times1010
dm3 mol
-1 s
-1 while for the reaction of hydrogen peroxide and the
solvated electron (R4) is only 136 times1010
dm3 mol
-1 s
-1 and so hydrogen peroxide is initially
protected from reactions with the solvated electron as long as oxygen or superoxide is
available In alkali conditions where the pH is larger than 116 the conjugate base of
hydrogen peroxide HO2- becomes the dominant peroxide species This reacts even slower
with the solvated electron with a rate constant of 365 times109
dm3 mol
-1 s
-1 so the protection
effect is even stronger It was mentioned earlier that beyond pH 11 the rate of reaction R21
falls significantly as bullOH is converted to its basic form and the equivalent base reaction
(R50) does not see a sufficient equivalent increase in rate The reason given was that R50
was out competed by the reaction between superoxide and the solvated electron (R8)
Chapter 4 The Radiolysis of Aqueous Solutions at High pH
119
This not only serves to protect hydrogen peroxide by competing with solvated electrons but
also contributes to the increased concentration of hydrogen peroxide as the product of R8 is
in fact hydrogen peroxide
119890119886119902minus + 1198742
bullminus rarr 11987422minus (R8)
11987422minus + 1198672119874 1198671198742
minus + 119874119867minus (R6162)
Although this may account for the increased steady state of hydrogen peroxide at high pH
Figure 39 still shows a slight over prediction for calculations made at pH 123 and 127 As
the equilibrium between the hydroxyl radical and the oxygen anion has a pKa of 1184 it
was thought that the over prediction could be a result of the estimations used for the rate
constants of the reactions involving the oxide radical anion There is little data available for
the rate constants of reactions involving bullOˉ As reaction R51 and R52 both lead to the
formation of peroxide it initially was thought that these reactions may have rate constants
that are too high however removing these reactions from the model made no significant
difference to the predicted production of H2O2
119874bullminus + 119874bullminus rarr 11987422minus
1198672119874rarr 1198671198742
minus + 119874119867minus (R51)
119874bullminus + bull119874119867 rarr 1198671198742minus (R52)
It was instead found that other oxide radical anion reactions had an effect on the predicted
value for H2O2 A total of four oxide radical anion reactions influence the predicted values
with two of them making a significant difference Reducing the rate constant for the
reactions R47 and R48 made a slight improvement to the prediction of H2O2 a more
significant effect can be seen by altering the rate constants for R49 and R50
Chapter 4 The Radiolysis of Aqueous Solutions at High pH
120
119874bullminus + 1198671198742minus rarr 1198742
minus + 119874119867minus (R49)
119874bullminus + 1198742minus rarr 1198742minus
1198672119874rarr 2119874119867minus + 1198742 (R50)
Originally the rate constant for R49 was an estimation reported by Buxton et al in 19889
with a value of 40 times108 M
-1 s
-1 Since then this rate constant has been measured by
C R Stuart and D C Ouellette and is reported as being 786 times108
M-1
s-1
at 25degC45
The
value for the rate constant for R50 was originally estimated by Sehested et al in 198289
to
be 60 times108 M
-1 s
-1 This estimation was made by adjusting the rate constant for R50 and
R53 in a kinetic model to produce a prediction that agreed with the decay of ozonide
measured experimentally by pulse radiolysis By increasing the rate constant for R50 from
60 times108 M
-1 s
-1 to 48 times10
9 M
-1 s
-1 an improved agreement to the predicted steady state
concentration of H2O2 is found This is shown in Figure 45
Figure 45 Dashed lines show the original prediction where k50 = 60 times108 M
-1 s
-1 while
solid lines show the predictions with the increased k50 = 48 times109 M
-1 s
-1
000E+00
500E-05
100E-04
150E-04
200E-04
250E-04
300E-04
350E-04
0 10 20 30 40 50
[H2O
2]
(mo
l d
m-3
)
Dose (kGy)
Chapter 4 The Radiolysis of Aqueous Solutions at High pH
121
With the modified reaction rate constant for R50 the predictions for the steady state
concentrations of H2O2 are closer to the experimental values at high pH
Although this calculation improves the prediction for the steady state concentration it also
appears to increase the rate at which the steady state is achieved moving the prediction
away from the experimental data The cause of this discrepancy may have something to do
with the way in which some of the equilibria have been implemented in the model and
should be investigated in the future This modification also has little effect on the over
prediction of hydrogen gas at pH 104
Chapter 5 Radiolysis of Magnesium Hydroxide
122
Chapter 5 Radiolysis of Magnesium Hydroxide
Context
The Magnox Swarf Storage Silo contains 22 silos used to store magnesium alloy cladding
that has been removed from spent Magnox fuel elements The magnesium fuel cladding is
stored underwater where it readily corrodes to form magnesium hydroxide and hydrogen
gas by the following reaction90
119872119892 + 21198672119874 rarr 119872119892(119874119867)2 +1198672
Hydrogen gas poses an obvious hazard and is closely monitored however production rates
are not predictable Much of the magnox fuel cladding is contaminated with uranium and
other fission products contributing an additional supply of hydrogen through water
radiolysis Dose rates are often further increased as some of the silos were used to dispose
of other beta and gamma emitting waste The presence of the magnesium hydroxide
complicates the radiolysis processes as (a low) solubility in water drives up the pH while
undissolved magnesium hydroxide provides additional surfaces where radiolysis processes
are poorly understood
Experiments were conducted to investigate the effects of magnesium hydroxide on the
radiolytic production yields of hydrogen gas and hydrogen peroxide The investigation
began by measuring hydrogen yields in solutions of magnesium hydroxide and comparing
hydrogen yields to solutions containing sodium hydroxide solution with the same pH Pure
water is also included as a control and the magnesium hydroxide samples included both
homogeneous saturated solutions of aqueous magnesium hydroxide and heterogeneous
slurries containing undissolved magnesium hydroxide
Chapter 5 Radiolysis of Magnesium Hydroxide
123
Method
The saturated solution was prepared in bulk using magnesium hydroxide (Sigma Aldrich
BioUltra ge 990) and ultra-pure water solids were separated by centrifuge as filters may
introduce organic contamination 2 mL aliquots of saturated magnesium hydroxide solution
were transferred to sample tubes and flame sealed under air The pH of the remainder of the
saturated solution was measured to be 106 Slurry samples were prepared by weighing
01 g of magnesium hydroxide into a glass vial before adding 2 mL of ultra-pure water
Samples were also flame sealed under air before being mechanically mixed by agitation
Samples were irradiated using the inverter rig however the samples were left stationary and
were not inverted during irradiation Samples were irradiated at an average dose rate
of 281 Gy min-1
until the desired dose was reached samples were then analysed for
hydrogen by the ldquocrush tuberdquo gas chromatography method previously described Figure 46
shows the production of hydrogen as a function of dose for both saturated solutions and
solid containing slurries of magnesium hydroxide This is compared with measurements
obtained from pure water and an aqueous solution of sodium hydroxide with a similar pH
to that of the magnesium hydroxide samples
Chapter 5 Radiolysis of Magnesium Hydroxide
124
Results
Figure 46 Measurements of H2 gas as a function of dose All samples here are aerated
with vertical error bars showing the standard deviation between replicates
It should be noted that all the samples used to produce figure 46 are aerated The chemical
yield of hydrogen for each sample set is given in Table 20
Table 20 Obtained results from the measurements of H2 gas
000E+00
200E-04
400E-04
600E-04
800E-04
100E-03
120E-03
140E-03
160E-03
180E-03
200E-03
0 10 20 30 40 50 60
[H2]
(mo
l d
m-3
)
Dose (kGy)
Sample ID Average Dose Rate for
Inverter Rig (Gy min-1
)
Measured
pH G(H2)
(Molecules 100 eV-1
) Error
plusmn
Mg(OH)2(s) 2814 1062 052 003
Mg(OH)2(aq) 2814 1057 047 002
NaOH 2845 1063 027 002
H2O 1732 699 016 001
Chapter 5 Radiolysis of Magnesium Hydroxide
125
The dose rate for the pure water samples is much lower than the other dose rates quoted as
this measurement was performed before the construction of the inverter rig and so the
samples were held further away from the source during irradiation
This data shows that the presence of magnesium hydroxide appears to increase the
hydrogen yield beyond what one would expect if the yield was controlled by pH alone
There is very little difference in hydrogen yield between samples that contain solid
magnesium hydroxide and samples that contain only dissolved magnesium hydroxide This
suggests that surface effects contribute to the hydrogen yield only a very small amount or
not at all This data is discussed further in the following section
A second set of experiments was conducted to measure the concentration of hydrogen
peroxide in irradiated saturated solutions of magnesium hydroxide 10 mL aliquots of
aerated saturated solution were transferred in to 20 mL glass headspace vials the vials were
sealed with an aluminium crimp cap and irradiated in the front row of the 4 x 8 rack the
average dose rate was 2831 Gy min-1
After irradiation the samples were analysed for
hydrogen peroxide by the Ghormley tri-iodide method described in Chapter 2 Figure 47
compares the obtained data from this experiment with data obtained from measurements
made in pure water
Chapter 5 Radiolysis of Magnesium Hydroxide
126
Figure 47 Measurements of H2O2 concentrations in aerated samples of saturated
magnesium hydroxide solution as a function of dose
The steady state concentration of hydrogen peroxide in a saturated solution of magnesium
hydroxide is almost the same as in a neutral sample of pure water as is expected given the
pH of the saturated solution was measured to be 106 which is below the 118 threshold
that is associated with an increased steady state of hydrogen peroxide observed in the
previous chapter
A further experiment was conducted to investigate the effects of the solid magnesium
hydroxide surface on the production of hydrogen Batches of samples were prepared with
various ratios of magnesium hydroxide to water each sample had a total mass of
approximately 2 g Table 21 summarises the sample ratios used Samples were irradiated
using the inverter rig which was left stationary throughout the irradiation the average dose
rate was 3042 Gy min-1
All samples were irradiated to approximately 525 kGy so that any
difference in the amount of hydrogen produced is independent of absorbed dose
000E+00
200E-05
400E-05
600E-05
800E-05
100E-04
120E-04
140E-04
0 5 10 15 20 25 30 35 40
[H2O
2]
mo
l d
m-3
Dose kGy
Aerated Water
Mg(OH)2 Saturated SolutionMg(OH)2 Aerated Saturated Solution
Chapter 5 Radiolysis of Magnesium Hydroxide
127
As the dose rate was determined by Fricke dosimetry which is a liquid phase dosimeter
with a density close to that of water the quoted dose of 525 kGy is what was received by
the aqueous phase The solid phase magnesium hydroxide has a slightly higher density and
will have received a slightly higher dose Figure 48 shows the chemical yields of hydrogen
as a function of water content percentage The results have been normalised to reflect the
amount of hydrogen produced per gram of water and the yields were calculated based on
the radiation dose absorbed by the whole system this makes the data from samples that
contain large quantities of water comparable to those with lower water content
Table 21 Conditions of samples containing Mg(OH)2 for measurements of H2
a ndash Powder sample with no added water estimated adsorbed water content is based on
data from Nelson et al91
b ndash Sample is a saturated solution of Mg(OH)2 ie contains no solid
H2O Average Mg(OH)2
Mass (g)
Average H2O
Mass (g)
Average
Dose (kGy)
4a 5303 plusmn 111
20 161 plusmn 002 040 plusmn 001 5245 plusmn 146
40 122 plusmn 002 082 plusmn 001 5255 plusmn 146
60 081 plusmn 001 122 plusmn 001 5255 plusmn 145
80 040 plusmn 001 162 plusmn 002 5245 plusmn 145
100b 5239 plusmn 145
Chapter 5 Radiolysis of Magnesium Hydroxide
128
Figure 48 Measurements of hydrogen yields from magnesium hydroxide samples with
various solid ndash aqueous ratios All samples were irradiated to a total dose of ~52 kGy to
the aqueous phase at a dose rate of 3041 Gy min-1
Discussion
The data shown in Figure 46 suggests that the presence of dissolved magnesium hydroxide
increases the chemical yield of hydrogen significantly more than if pH was the only
controlling factor Data shown in Figure 48 suggests that the presence of the solid surface
increases the hydrogen yield slightly above that for saturated solutions but it would seem
that the main contribution to the increased H2 yields in magnesium hydroxide samples
when compared to a solution of NaOH of equivalent pH is a factor present in both slurries
and saturated solutions of magnesium hydroxide The yield of H2 between 20 and 80
percent water content is not affected by changing the solid solution ratio suggesting that
there is little interaction between the solid magnesium hydroxide and the bulk water
00
02
04
06
08
10
12
14
16
0 20 40 60 80 100
G(H
2)
(Mo
lecu
les
10
0 e
V-1
)
H2O
Chapter 5 Radiolysis of Magnesium Hydroxide
129
The yield is significantly higher for samples with 4 water content (adsorbed water)
suggesting that any additional hydrogen is produced only in a few water layers away from
the solid surface as has been postulated for oxide surfaces
Petrik et al showed that oxide water systems consisting of multiple phases such as the
slurry samples measured here have different hydrogen yields depending on the oxide18
They grouped materials into three categories based on the effects they have on measured
hydrogen yields hydrogen enhancing hydrogen diminishing and hydrogen neutral
Though said study did not include magnesium hydroxide it does categorise magnesium
oxide as a material that does not significantly change the yield of hydrogen
The mechanism by which a solid surface increases the hydrogen yield is largely accredited
to an energy transfer process As solid particles in a sample absorbs energy a process of
energy migration from the bulk of the material to the interface takes place Energy can then
be transferred from the solid phase to the surrounding liquid The exact mechanism of the
energy transfer process is not well understood but the overall effect is higher dose rates in
localised areas of surrounding water
As the value of 4 water content is an estimation based on data extrapolation published by
Nelson et al in a study of water adsorption on magnesium hydroxide91
and may not be
entirely accurate This uncertainty could have a significant effect on the calculated chemical
yield if the estimation was even slightly incorrect for example an estimated water content
of just 9 has the effect of lowering the yield to the same value observed in samples
contain 20 water content This would be contradictory to an energy transfer process as
described previously
Chapter 5 Radiolysis of Magnesium Hydroxide
130
A study by Jay La Verne et al published measurements of hydrogen yields from the
gamma radiolysis of magnesium hydroxide to be 005119
This measurement was made
using magnesium hydroxide that had been dried to remove all excess water while
remaining hydroxylated The difference between the measured yields of saturated
magnesium hydroxide solution (G(H2) = 047) and a slurry sample (G(H2) = 052) given in
Table 20 is 005
This value is very close to the quoted value from dry magnesium hydroxide although it is
an average value and errors can be high with small differences between large numbers such
as this Little information is given to explain the mechanism contributing to this yield of
hydrogen from dry magnesium hydroxide other that the radiation induced conversion of
magnesium hydroxide to magnesium oxide92
A comparison was made to yields obtained
from calcium hydroxide and found that the yield of hydrogen was four times higher from
calcium hydroxide than from magnesium hydroxide This was explained in terms of the
tendency to form water during radiolysis being greater in magnesium hydroxide than in
calcium hydroxide meaning that a smaller portion of the hydroxide generates hydrogen
directly If the yield measured from the dry powder (0051) by La Verne et al is the result
of direct hydrogen production from magnesium hydroxide converting to the oxide then it
would make sense that the difference in yield between samples containing solid magnesium
hydroxide and only aqueous magnesium hydroxide would be close to this value
This does not explain why the yields of both samples are far higher than samples of sodium
hydroxide at the same pH as the magnesium hydroxide samples The chemical yield of
hydrogen from samples of sodium hydroxide with a pH of 1063 was 027 while yields
from both magnesium hydroxide systems were a little less than double this value
Chapter 5 Radiolysis of Magnesium Hydroxide
131
As this can be seen in both aqueous only samples and those containing solid magnesium
hydroxide the cause of this increased yield must be attributed to a factor present in both
aqueous only samples and samples containing solid magnesium hydroxide Magnesium
hydroxide is often discussed in literature concerning environmental science for its
properties and reactivity towards carbon dioxide9394
As the samples used in these experiments did not undergo any purification processes prior
to use they were most likely subject to carbonation reactions with atmospheric carbon
dioxide and water Magnesium hydroxide can be carbonated on exposed surfaces although
slow at standard room conditions it can be increased in the presence of water95
119872119892(119874119867)2(119904) + 1198621198742(119892) rarr 1198721198921198621198743(119904) + 1198672119874(119892)
Magnesium hydroxide can also take on intercalated carbon dioxide which can be converted
to carbonate either by reaction with water or if released into solution with hydroxide to
form bicarbonate9697
1198621198742(119860119894119903) 1198621198742(119894119899119905119890119903119897119886119910119890119903)
1198621198742(119894119899119905119890119903119897119886119910119890119903) + 1198672119874(119894119899119905119890119903119897119886119910119890119903) 2119867(119894119899119905119890119903119897119886119910119890119903)+ + 1198621198743(119894119899119905119890119903119897119886119910119890119903)
2minus
1198621198742(119886119902) + 119874119867(119886119902)minus 1198671198621198743(119886119902)
minus
Both carbonate and bicarbonate are known to be hydroxyl radical scavengers in the
radiolysis of aqueous solutions998
Using the Facsimile model described in Chapter 3 it
was possible to insert a set of reactions concerning carbonate radiolysis to estimate the
effects that small quantities of carbonate might have on hydrogen yields
Chapter 5 Radiolysis of Magnesium Hydroxide
132
The reaction set used is described in Table 22 and represents a simplified reaction scheme
of carbonate in aqueous radiolysis Initial concentrations of carbonate were set ranging
from 10 μM to 10 mM a yield of hydrogen was calculated for each initial concentration
these calculations have been graphed in Figure 49
In each case the calculated production of hydrogen was linear over the dose range used
which would be a necessary feature if carbonate is to be a valid explanation for the
increased yields observed in magnesium hydroxide experiments The calculated yield of
hydrogen increases rapidly with only small quantities of initial carbonate before reaching a
plateau at about G(H2) = 03 with an initial carbonate concentration of 50 μM The
hydrogen yield did not change much more than this increasing to just G(H2) = 036 with an
initial carbonate concentration of 10 mM The effect is almost the same in calculations for
both aerated and deaerated solutions It should be noted that these calculations were done at
pH 7 due to the systematic error of over prediction when the pH is close to 10 it would be
unadvisable to trust such calculations without first solving the error (see previous chapter)
Table 22 A reaction scheme to estimate the effect of carbonate in water radiolysis
Reaction Rate Constant Reference
CO32macr +
bullOH rarr CO3macr + OHmacr 39 times10
8
9
CO32macr + emacraq rarr products 39 times10
5
99
CO3bullmacr +
bullOH rarr products 30 times10
9
100
CO3bullmacr + H2O2 rarr HCO3macr + HO2
bull 43 times10
5
101
CO3bullmacr + HO2macr rarr HCO3macr + O2
bullmacr 30 times10
7
101
CO3bullmacr + O2
bullmacr rarr O2 + CO3
2macr 65 times10
8
102
HCO3macr + emacraq rarr products 10 times106
103
HCO3macr + bullOH rarr H2O + CO3
bullmacr 85 times10
6
9
HCO3macr + Hbull rarr products 44 times10
4
104
Chapter 5 Radiolysis of Magnesium Hydroxide
133
Figure 49 Model predictions for the yield of H2 from a solution containing various
concentrations of carbonate anions
Reaction rate analysis of the calculations reveals that the main mechanism for hydrogen
protection is through a cooperative effect of scavenging of the hydroxyl radical to form a
carbonate radical The majority of carbonate radicals are converted back to carbonate by
reaction with superoxide A secondary process of carbonate radical reactions with hydrogen
peroxide contributes slightly to regeneration of superoxide as well as forming bicarbonate
which itself contributes to hydrogen protection by scavenging hydroxyl radicals once again
forming a carbonate radical As these calculations were performed at pH 7 it is uncertain
what effect an elevated pH would have on the predicted hydrogen yield It should also be
remembered that many of the rate constants used are estimations and the reaction set is a
simplification and is not a comprehensive description
0
005
01
015
02
025
03
035
04
0 1 2 3 4 5 6 7 8 9 10 11
G(H
2)
[CO32-] mM
Aerated
Deaerated
134
With these factors in mind the predicted behaviour of hydrogen production is a reasonable
representation of the behaviour observed in experiments This could easily be investigated
further by experiments in a number of ways
Attempts could be made to measure carbonate directly from the magnesium hydroxide
used either by thermogravimetric analysis (TGA) or by total organic carbon analysis
(TOC) Radiolysis experiments of other carbonates could also be carried out to further
investigate the effect of carbonate
Chapter 6 Radiolysis of Methanol Solutions
135
Chapter 6 Radiolysis of Methanol Solutions
Context
Many of the waste storage ponds at Sellafield Ltd are open to the air and are subject to
organic matter falling in and decomposing to a range of organic products One particular
group of compounds known as humic acids and how they might affect radiolysis processes
in the ponds are of particular interest Humic acids are ill-defined but complex organic
acids with several different functional groups which will have many effects on radiolysis
The best approach to investigating this chemistry is to understand the effects of each
functional group independently before building up to a full humic acid analogue This study
takes the first steps towards this investigation through experimentation on aqueous
solutions of methanol
Experimental Method
A stock aqueous solution of 1 mM methanol was made and was used to prepare aerated
samples of 10 mL sealed by crimp cap in 20 mL headspace vials so that the liquid to
headspace ratio was 11 Samples were irradiated in row 2 of the 4x8 irradiation rack for
various periods of time The average dose rate was 1638 Gy min-1
The samples were
analysed for hydrogen peroxide immediately after irradiation using the Ghormley tri-iodide
method described in Chapter 2 A separate batch of aerated samples was prepared from the
1 mM methanol stock solution for analysis of hydrogen generation These were samples of
2 mL of 1 mM methanol and were deaerated using zero grade argon gas before being sealed
in glass tubes designed for use by the crush tube analysis method described in Chapter 2
Again the samples had a liquid to headspace ratio of 11
Chapter 6 Radiolysis of Methanol Solutions
136
These samples were irradiated in the centre positions of row 2 in the 4x8 rack where the
average dose rate was 1755 Gy min-1
Results
Figure 50 Measurements of H2O2 concentrations as a function of dose in samples
containing 1 mM methanol (diams) and water as a control (diams) All samples were aerated and a
dashed line is included to highlight the data trend The dose rate was 1638 Gy min-1
for
methanol solutions and 2839 Gy min-1
for the aerated water
000E+00
500E-05
100E-04
150E-04
200E-04
250E-04
0 5 10 15 20 25
[H2O
2]
(mo
l d
m-3
)
Dose (kGy)
Aerated Water
Methanol 1 mM
Chapter 6 Radiolysis of Methanol Solutions
137
Figure 51 Measurements of H2 gas as a function of dose from deaerated samples
containing 1 mM methanol deaerated water is also shown as a control Dashed lines are
included to highlight the data trend The dose rate was 1755 Gy min-1
for the methanol
solutions and 2851 Gy min-1
for the deaerated water
Figure 50 shows the measured concentrations of hydrogen peroxide from the 1 mM
methanol solution compared with the measured concentrations from pure aerated water At
low doses the concentration of hydrogen peroxide increases rapidly to approximately
20 times10-4
mol dm-3
at approximately 1 kGy which is almost double the steady state
concentration observed in pure water As the dose increases further the concentration
begins to fall to a steady state value at approximately 33 times10-5
mol dm-3
Figure 51 shows the measured hydrogen concentrations from the 1 mM methanol solutions
compared with hydrogen measurements from aerated water
000E+00
500E-04
100E-03
150E-03
200E-03
250E-03
300E-03
0 5 10 15 20 25 30
H2 (
mo
l d
m-3
)
Dose (kGy)
Methanol Solution 1mM Deaerated
Dearated Water
Chapter 6 Radiolysis of Methanol Solutions
138
Hydrogen concentrations measured in a deaerated 1 mM methanol solution are significantly
higher than those measured in deaerated water the initial production rate is higher in the
methanol solution but production is not linear and the rate of hydrogen production with
dose soon falls The change in production rate of hydrogen and hydrogen peroxide with
dose can be shown by converting the experimental measurements to G-values and plotting
them as a function of dose Figures 52 and 53 show the chemical yields determined by
converting the gradients between 0 and each data point to units of molecules 100 eV-1
Figure 52 Chemical yields of hydrogen peroxide measured from an aerated solution of
1 mM methanol as a function of dose
00
05
10
15
20
25
30
35
40
0 5 10 15 20
G(H
2O
2)
(mo
lecu
les
10
0eV
-1)
Dose (kGy)
Chapter 6 Radiolysis of Methanol Solutions
139
Figure 53 Chemical yields of hydrogen gas measured from a deaerated solution of 1 mM
methanol as a function of dose
Discussion
Most alcohols are effective scavengers of hydroxyl radicals and hydrogen atoms The
reactions between methanol and hydroxyl radicals or hydrogen atoms result in hydrogen
abstraction from methanol to form water or molecular hydrogen respectively and in both
cases form the hydroxymethyl radical105106
bull119874119867 + 1198621198673119874119867 rarr 1198672119874 + bull1198621198672119874119867 119896 = 83 times 108 119872minus1119904minus1
119867bull + 1198621198673119874119867 rarr 1198672 + bull1198621198672119874119867 119896 = 28 times 106 119872minus1119904minus1
Although the second order rate constant for the reaction between methanol and the solvated
electron is faster than that for the solvated electron and water the reaction rate does not
compete with the rate of reaction between the solvated electron and water until the
concentration of methanol is greater than 10-2
M2107
00
02
04
06
08
10
12
14
16
18
0 5 10 15 20
G(H
2)
(mo
lecu
les
10
0eV
-1)
Dose (kGy)
Chapter 6 Radiolysis of Methanol Solutions
140
In deaerated water methanol radicals may dimerise to form ethylene glycol or
disproportionate to form formaldehyde and reform methanol108
They may also react with
hydrogen peroxide to form formaldehyde
2bull1198621198672119874119867 rarr (1198621198672119874119867)2
2bull1198621198672119874119867 rarr 1198621198673119874119867 + 119867119862119867119874
bull1198621198672119874119867 + 11986721198742 rarr 119867119862119867119874 + 1198672119874 + bull119874119867
In solutions that contain dissolved oxygen such as those used in the measurements of
hydrogen peroxide (Figure 50) methanol radicals rapidly react with oxygen to form an
organic peroxyl radical which reacts by second-order processes resulting in the formation
of formaldehyde hydrogen peroxide and oxygen109
bull1198621198672119874119867 + 1198742 rarr bull11987421198621198672119874119867
An additional set of reactions were included in the water radiolysis model described in
Chapter 3 in an attempt to model the radiolysis chemistry of an aqueous solution of 1 mM
methanol This reaction scheme is shown in Table 23
Chapter 6 Radiolysis of Methanol Solutions
141
Reaction
Number Reaction
Rate Constant at 25degC (M
-1 s
-1)
Ref
M1 CH3OH + bullOH rarr H2O +
bullCH2OH 83times10
8
110
M2 CH3OH + Hbull rarr H2 +
bullCH2OH 28times10
6
106
M3 bullCH2OH + O2 rarr
bullO2CH2OH 49times10
9
111
M4 bullCH2OH + H2O2 rarr H2O + H2CO +
bullOH 18times10
5
112
M5 bullCH2OH +
bullCH2OH rarr CH3OH + H2CO 12times10
9
2113
M6 bullCH2OH +
bullCH2OH rarr HOCH2CH2OH 12times10
9
2113
M7 bullCH2OH +
bullOH rarr H2CO + H2O
a24times10
10
114
M8 bullO2CH2OH +
bullO2CH2OH rarr 2H2CO + H2O2 + O2 74times10
8
115
M9 bullO2CH2OH +
bullHO2 rarr H2CO + H2O2 + O2
b50times10
8
2
M10 bullO2CH2OH + O2macr rarr H2CO + HO2macr + O2
b50times10
7
2
M11 HOCH2CH2OH + bullOH rarr
bullHOCHCH2OH + H2O 24times10
9
116
M12 HOCH2CH2OH + Hbull rarr
bullHOCHCH2OH + H2 14times10
7
9
M13 bullHOCHCH2OH + O2 rarr
bullO2HOCHCH2OH 32times10
9
111
M14 bullO2HOCHCH2OH rarr HOCH2CHO + H
+ + O2macr 19times10
2 s
-1
117
M15 bullHOCHCH2OH +
bullHOCHCH2OH rarr HOCH2CH2OH +
HOCH2CHO 96times10
8
118
M16 HOCH2CHO + bullOH rarr H2O +
bullHOCHCHO
c92times10
6
119
M17 bullHOCHCHO +
bullHOCHCHO rarr HOCH2CHO + OCHCHO
d50times10
4 -
M18 OCHCHO + bullOH rarr H2O +
bullOCCHO 14times10
6
120
M19 bullOCCHO rarr CO + HCO
bull
a35times10
7 s
-1
121
M20 H2CO + emacraq rarr bullCH2OH + OHmacr 10times10
6
2
M21 H2CO + Hbull rarr H2 + HCO
bull 50times10
6
2
M22 H2CO + bullOH rarr H2O + HCO
bull 20times10
9
2
M23 HCObull + H
bull rarr H2 + CO
a68times10
10
122
M24 HCObull +
bullOH rarr CO + H2O
a11times10
11
123
M25 HCObull + O2 rarr CO + HO2
bull
a31times10
9
124
M26 HCObull + HCO
bull rarr 2CO + H2
a22times10
10
125
Table 23 A reaction scheme to estimate the effect of methanol in water radiolysis
a ndash Rate constant for gas phase reaction
b ndash Estimated rate constant
c ndash Rate constant based on reaction of acetic acid and hydroxyl
d ndash Assumed reaction
Figure 54 shows the predicted hydrogen peroxide concentration with the above chemistry
included in the calculation and compares it with the experimental data In order to achieve
the agreement shown a modification to the mass transfer routine was required
Chapter 6 Radiolysis of Methanol Solutions
142
The current implementation of the mass transfer routine does not cope with a rapid
depletion of dissolved oxygen and responds by increasing the rate of oxygen transfer from
the gas phase to the aqueous phase to an unrealistic value A temporary fix can be made by
reducing the mass transfer rate of oxygen (for instance by a factor of 15) but a more
appropriate correction to the routine should be sought in future implementations Figure 55
shows the original calculation with the un-modified mass transfer routine compared with
the modified mass transfer routine
Figure 54 Model prediction of H2O2 concentrations as a function of dose in a solution of
1 mM methanol
000E+00
500E-05
100E-04
150E-04
200E-04
250E-04
0 5 10 15 20 25
[H2O
2]
mo
l d
m-3
Dose kGy
Methanol 1 mM
Model
Chapter 6 Radiolysis of Methanol Solutions
143
Figure 55 Calculations of hydrogen peroxide concentrations with and without
modification to the mass transfer routine
Analyses of the evolution of the calculated reaction rates reveal a possible explanation for
the behaviour of hydrogen peroxide in the presence of a low concentration of methanol
Initially the most important methanol reactions are the formation of the methanol radical
by scavenging hydroxyl radicals (M1) and the formation of an organic peroxide by the
reaction between the aforementioned methanol radical and oxygen (M3)
1198621198673119874119867 + bull119874119867 rarr bull1198621198672119874119867 + 1198672119874
bull1198621198672119874119867 + 1198742 rarr bull11987421198621198672119874119867
With the formation of the organic peroxide comes an increase in the rate of the formation of
formaldehyde mainly through self-reaction or to a lesser degree through reaction with
superoxide
000E+00
100E-04
200E-04
300E-04
400E-04
500E-04
600E-04
700E-04
0 5 10 15 20 25 30 35 40 45
[H2O
2]
(mo
l d
m-3
)
Dose (kGy)
Original Calculation
Modified Calculation
Chapter 6 Radiolysis of Methanol Solutions
144
2bull11987421198621198672119874119867 rarr 21198672119862119874 + 11986721198742 + 1198742
bull11987421198621198672119874119867 + 1198742bullminus rarr 1198672119862119874 + 1198671198742
minus + 1198742
These reactions not only contribute to the production of hydrogen peroxide but also return
oxygen to the system which can scavenge solvated electrons and protect hydrogen peroxide
from the rapid reaction between the solvated electron and hydrogen peroxide
(R4 k = 136times1010
M-1
s-1
) The total rate of oxygen consumption by methanol radicals and
solvated electrons is still greater than the rate of return from the reactions of the organic
peroxide After about 11 kGy oxygen concentrations are reduced to an insignificant value
As the concentration of oxygen falls the reaction rate between hydrogen peroxide and the
solvated electron increases As mentioned in Chapter 4 oxygen plays a vital role in the
formation and protection of hydrogen peroxide The model prediction shows the
concentration of hydrogen peroxide beginning to rise again after about 8 kGy this is due to
the mass transfer of oxygen gas into the aqueous phase slowly re-establishing equilibrium
and effectively allowing a build-up of hydrogen peroxide As mentioned earlier the mass
transfer routine has been modified for this calculation and is non-representative of the real
mass transfer flux nevertheless it is reasonable to assume that after the depletion of
dissolved oxygen and the methanol has been converted to glycol or formaldehyde
equilibrium of aqueous and gaseous oxygen would eventually be re-established This could
be supported by further analysis at higher doses which may show an increase in hydrogen
peroxide concentrations
Chapter 6 Radiolysis of Methanol Solutions
145
The formation of hydrogen gas is enhanced by the presence of methanol however
hydrogen gas production is not linear with dose Figure 56 shows the model predictions for
hydrogen gas production compared to the experimentally obtained data
The calculations show a higher production rate of hydrogen gas can be attributed to the
scavenging of hydroxyl radicals by methanol and a number of methanol radiolysis
products
Figure 56 Model prediction of H2 gas as a function of dose in a solution of 1 mM
methanol
Although the model prediction somewhat overestimates the quantity of hydrogen formed
the slope is close to what is observed experimentally Many of the rate constants used in the
reaction scheme could not be found in the literature and are therefore estimations The
reaction scheme used protects molecular hydrogen from reacting with the hydroxyl radical
in a number of reactions Throughout the radiolysis of methanol a number of intermediary
organic products are formed such as ethylene glycol and formaldehyde each of which is an
effective hydroxyl scavenger
000E+00
500E-04
100E-03
150E-03
200E-03
250E-03
300E-03
0 5 10 15 20 25 30
H2 (
mo
l d
m-3
)
Dose (kGy)
Methanol 1 mM Dearated
Model
Chapter 6 Radiolysis of Methanol Solutions
146
After reacting with the hydroxyl radical the newly formed organic radical will usually form
an organic peroxide however in the absence of oxygen the radicals will tend towards
disproportionation to reform the original organic product at well as a new stable organic
usually an aldehyde Eventually the only stable product is carbon monoxide which does not
have any further reactions within this scheme Figure 57 shows the calculated
concentrations of each of the stable organic products as a function of dose in an aerated
system
Figure 57 Model predictions of the concentrations of various stable organic products
formed as a result of using the proposed reaction scheme in Table 23
Kinetic models of aqueous methanol have previously been presented in literature one such
model by Sunaryo and Domae126
was developed for calculating the effects of aqueous
methanol in light water reactors
000E+00
200E-04
400E-04
600E-04
800E-04
100E-03
120E-03
0 10 20 30 40
Co
nce
ntr
ati
on
(m
ol
dm
-3)
Dose (kGy)
Methanol
Formaldehyde
Ethylene Glycol
Glycolaldehyde
Glyoxal
Carbon Monoxide
Chapter 6 Radiolysis of Methanol Solutions
147
The reaction scheme for methanol radiolysis used in that publication is not a complete
scheme in that ldquoimaginary productsrdquo are implemented to terminate certain reaction
pathways This is still a valid approach as their interest was focused on the initial reaction
paths when delivering a maximum dose of 500 Gy and not the long term radiolysis of
methanol over several kGy
It was noted that an understanding of the radiolysis of the transient organic products is
needed they concluded that methanol is converted into ethylene glycol which may have the
same effect as methanol itself The formation of ethylene glycol and formaldehyde from
methanol radiolysis is well known and has been measured in previous studies127
The
radiolysis of ethylene glycol has also been discussed in literature128
and it has been
described that under aerated conditions the main organic product of radiolysis is
glycolaldehyde129
The reaction scheme for methanol radiolysis in this work assumes the
formation of a radical species by the reaction between glycolaldehyde and the hydroxyl
radical however this is most likely not the major radiolysis path for glycolaldehyde In
aqueous solutions glycolaldehyde exists in a number of different forms with the aldehyde
form usually being the minor component130
The existence of multiple forms of
glycolaldehyde in solution and the large number of unknown rate constants makes creating
a complete reaction scheme for methanol radiolysis difficult Furthermore the publications
mentioned above also report the formation of small amounts of methane along with carbon
monoxide The radiolysis of ethylene glycol under deaerated conditions can also lead to the
production of ethyl aldehyde Both of these points highlight gaps in the reaction scheme
that should be included in a comprehensive description of methanol radiolysis Suggestions
for an improved radiolysis scheme are given in Chapter 8
Chapter 7 Radiolysis of Iron Oxide-Water Systems
148
Chapter 7 Radiolysis of Iron Oxide-Water Systems
Context
Large quantities of iron oxide have been reported to be present in the First Generation
Magnox Storage Pond where iron skips containing spent fuel have corroded to form a layer
of haematite (Fe2O3) and magnetite (Fe3O4) several meters below the water level
Documented investigations into the effects of iron oxide on water radiolysis are sparse the
most recent of which focusing on the formation of molecular hydrogen from the radiolysis
of water-iron oxide systems131
Preliminary experiments have been carried out to
investigate the effects iron oxide may have on radiolytic production of hydrogen peroxide
from water-oxide slurries
Method
Iron oxide powders were washed with ultra-pure water to remove any soluble
contamination Excess water was decanted before the powders were washed a further two
times After the third decanting the powders were dried in a vacuum oven at 40degC
overnight Haematite samples were prepared by weighing 05 g quantities of haematite into
20 mL headspace vials to which 10 mL of ultra-pure water was added before sealing with a
crimp cap Samples of magnetite were prepared in the same way Samples were agitated
and then left to settle before irradiation The irradiations of haematite samples were carried
out in row 1 of the 4x8 irradiation rack with an average dose rate of 30518 Gy min-1
while
irradiations of magnetite samples were carried out in row 2 of the 4x8 rack with an average
dose rate of 16252 Gy min-1
After irradiation aliquots of the water from the samples were
removed by syringe and pushed through a syringe filter to remove any solid particles
Chapter 7 Radiolysis of Iron Oxide-Water Systems
149
The filtered aliquot was then analysed for hydrogen peroxide using the Ghormley tri-iodide
method described in Chapter 2
Results
Figure 58 shows the obtained results for the haematite system compared to concentrations
of hydrogen peroxide measured in aerated water Figure 59 shows the obtained results from
magnetite samples again they are compared with measurements obtained from pure water
Figure 58 Measurements of H2O2 concentrations from heterogeneous samples of 05g
Fe2O3 and 10 mL aerated water The dose rate for the haematite samples was
3052 Gy min-1
and for the aerated water the dose rate was 2839 Gy min-1
000E+00
200E-05
400E-05
600E-05
800E-05
100E-04
120E-04
140E-04
0 2 4 6 8 10 12 14
[H2O
2]
(mo
l d
m-3
)
Dose (kGy)
Haematite
Pure Water
Chapter 7 Radiolysis of Iron Oxide-Water Systems
150
Figure 59 Measurements of H2O2 concentrations from heterogeneous samples of 05g
Fe3O4 and 10 mL aerated water The dose rate for the magnetite samples was
1625 Gy min-1
and for the aerated water the dose rate was 2839 Gy min-1
The steady state concentration of hydrogen peroxide achieved in the presence of haematite
is close to that of pure water however the initial production rate is slightly higher An
increased initial production rate is also observed in samples containing magnetite but after
approximately 500 Gy the concentration of hydrogen peroxide falls dramatically and
achieves a low steady state of approximately 15 times10-5
mol dm-3
000E+00
200E-05
400E-05
600E-05
800E-05
100E-04
120E-04
140E-04
0 2 4 6 8 10 12 14 16 18 20 22
[H2O
2]
(mo
l d
m-3
)
Dose (kGy)
Magnetite
Pure Water
Chapter 7 Radiolysis of Iron Oxide-Water Systems
151
Discussion
Hydrogen peroxide undergoes surface decomposition over both haematite and
magnetite28132
The estimated second-order rate constants for the surface decomposition of
hydrogen peroxide are quoted as 30 times10-9
M-1
s-1
for haematite132
and 45 times10-10
M-1
s-1
for
magnetite28
Calculations using the water radiolysis model including a hypothetical reaction
that removes hydrogen peroxide at these rates makes no significant difference to the
predicted concentrations of hydrogen peroxide in water over the time scale of the
experiment However as the aforementioned rate constants are second-order they not only
depend on the concentration of hydrogen peroxide but the surface area of the metal oxide as
well which is unknown for the metal oxides used in this study
Furthermore the experiments carried out in the aforementioned publications to determine
these rate constants were well mixed throughout the reaction time while in this work the
samples were static with the iron powder settled at the bottom of the reaction vessel This
means that the rate of surface decomposition is greatly hindered due to the need for
hydrogen peroxide to diffuse a large distance to the iron oxide surface nevertheless a
significant difference in hydrogen peroxide concentrations were observed in samples
containing magnetite The behaviour of hydrogen peroxide observed in samples containing
magnetite is most likely due to homogeneous chemistry initiated by dissolved iron ions
The chemistry initiated by dissolved iron could serve to remove hydrogen peroxide through
a Haber-Weiss mechanism133
1198651198903+ + 1198742bullminus rarr 1198651198902+ + 1198742 k = Unknown
1198651198902+ + 11986721198742 rarr 1198651198903+ + 119874119867minus + bull119874119867 k = 10 times10
7 M
-1 s
-1
1198651198902+ + bull119874119867 rarr 1198651198903+ + 119874119867minus k = 32 times108
M-1
s-1
1198651198902+ + 1198671198742bull rarr 1198651198903+ + 1198671198742
minus k = 12 times10
6 M
-1 s
-1
Chapter 7 Radiolysis of Iron Oxide-Water Systems
152
Experiments discussed in publications by Mats Jonsson28
focus largely on the reactivity of
hydrogen peroxide and various metal oxides including iron oxide It was found that many
metal oxide surfaces show reactivity towards hydrogen peroxide and that rate of removal of
hydrogen peroxide can be calculated in heterogeneous systems based on properties such as
particle size As mentioned previously the model suggests that the rate of this surface
reactivity does not seem to be able to compete with the rate of radiolytic hydrogen peroxide
production The studies by Jonsson concerning iron oxide were met with difficulty in
discriminating between surface reactions and aqueous chemistry initiated by dissolved iron
Through the use of ICP-AES it was shown that iron can be found in water with a
concentration of 23 times10-6
mol dm-3
after just 30 minutes of mixing magnetite with distilled
water28
Even with this measurement by Jonsson the quantity of dissolved iron is difficult to
estimate for samples used in this work as they were washed with water whereas the
literature measurements were made with unwashed or EDTA treated samples More
information about the dissolution of iron from magnetite could be used to attempt to model
this behaviour using the reaction scheme in table 24 In addition to this it would also be
useful to investigate the dissolution of iron as a function of radiation dose to see what
effect if any radiation has on dissolution rates Analysis techniques such as inductively
coupled plasma mass spectroscopy (ICP-MS) can be used to determine concentrations of
dissolved iron in very low concentrations however due to the nature of the plasma used it
can often be difficult to distinguish between Fe2+
and Fe3+
as further ionization may cause
interference It is possible to chemically separate the two oxidation states of iron by solvent
extraction with n-heptane containing 01 M Di-(2-ethylhexyl)phosphoric acid (HDEHP)
before performing an analysis for iron134
Chapter 7 Radiolysis of Iron Oxide-Water Systems
153
This reaction scheme would be initiated by a production of aqueous iron based on the
dissolution behaviour observed from future experiments As mentioned earlier the
experiments conducted in this work are only preliminary and there is much more work to
be done on the subject
If a computational model could be made to accurately simulate the aqueous iron chemistry
coupled with a more detailed understanding of radiation induced iron dissolution it may be
possible to determine the surface effects of iron oxide by comparison of experimental and
calculated data and effectively subtracting the difference
Reaction
Number
Reaction Rate Constant at
25degC (M-1
s-1
)
Ref
F1 Fe2+
+ H2O2 rarr Fe3+
+ OHmacr + bullOH 100 times10
7
135
F2 Fe2+
+ bullOH rarr Fe
3+ + OHmacr 32 times10
8
136
F3 Fe2+
+ bullHO2 rarr Fe
3+HO2macr 12 times10
6
133
F45 Fe3+
HO2macr + Fe2+ Fe
3+HO2macrFe
2+ K = 27 M
-1
133
F6 Fe3+
HO2macr rarr Fe3+
+ HO2macr 18times103
s-1
133
F7 Fe3+
HO2macrFe2+
rarr Fe3+
+ Fe2+
HO2macr 25 times104
133
F8 Fe2+
HO2macr + H+
(aq) rarr Fe2+
+ H2O2 Unknown 133
F9 Fe3+
+ O2macr rarr Fe2+
+ O2 Unknown 137
F10 Fe2+
+ O2macr + H2O rarr HO2macr + Fe
3+ + OHmacr 10 times10
7
133
F11 Fe3+
+ Hbull rarr Fe
2+ + H
+(aq) 20 times10
6
138
F12 Fe3+
+ emacraq rarr Fe2+
60 times1010
139
F13 Fe2+
+ Hbull + H
+(aq)
rarr Fe
3+ + H2 75 times10
6
10
Table 24 A reaction scheme to estimate the effects of dissolved iron in water radiolysis
Chapter 8 Conclusions and Further Work
154
Chapter 8 Conclusions and Further Work
Further High pH Investigations
Experiments have shown that the radiolytic production of hydrogen gas and hydrogen
peroxide is strongly influenced by high pH Hydrogen peroxide tends to reach higher steady
state concentrations with increasing pH as well as taking longer to reach this steady state
Hydrogen gas production rates appear to also increase with increasing pH up to
approximately pH 11 where thereafter they decrease The development of a computational
model for water radiolysis has provided a mechanistic understanding to explain the
observed effects of high pH on water radiolysis Calculations suggest that an increase in
radiolytically produced oxygen could explain the behaviour of hydrogen gas at high pH
Dissolved oxygen acts as a poison to the Allen chain which normally serves to remove
dissolved hydrogen through reactions with the hydroxyl radical or the alkali equivalent the
oxide radical anion The steady state concentration of dissolved oxygen increases with pH
up to approximately pH 115 This can be attributed to the decline in the rate at which
dissolved oxygen is reduced by hydrogen atoms as the equilibrium between the hydrogen
atom and the solvated electron shifts to favour the solvated electron The reaction rate of
the equivalent alkali reaction to remove dissolved oxygen through reduction by the solvated
electron does not increase to compensate resulting in a net increase in the steady state
concentration of dissolved oxygen The model calculations also show that increasing the
pH further results in a decline in the hydrogen gas production rate This is due to the shift in
the equilibrium between the hydroxyl radical and the oxide radical anion (R6364) which
has a pKa of 119 The main pathway for the radiolytic production of dissolved oxygen is
the reaction between the hydroxyl radical and super oxide (R21)
Chapter 8 Conclusions and Further Work
155
The rate of this reaction falls at high pH as the hydroxyl radical is converted to the oxide
radical anion The alkali equivalent of this reaction (R50) has a much lower rate constant
and is out competed by the solvated electron (R8) Further experiments to measure the
concentration of radiolytically produced oxygen at high pH could help to support the model
predictions or confirm a misunderstanding in the model An inline gas chromatography
technique similar to the ldquocrush tuberdquo described in Chapter 2 may be used only instead of
crushing a sealed glass vial within the carrier gas flow a specially designed cell is
connected to the in and out ports of the carrier gas flow This cell would contain a high pH
solution and would sit inside the irradiator from here multiple analyses can be run on a
single sample The carrier gas would have to be changed from argon to helium to increase
the sensitivity towards oxygen running the carrier gas through the cell prior to irradiation
will serve to remove the initial dissolved oxygen from the sample from this point onward
any measurements of oxygen would be radiolytically produced
These experiments would help to better understand high pH water radiolysis and hopefully
help to improve the radiolysis model and understand why there is an over prediction at
pH 106 A comprehensive water radiolysis model that can accurately predict
concentrations of radiolysis products under a wide range of conditions is of high
importance to the nuclear industry and would have applications in decommissioning
maintenance of current nuclear systems and designing new nuclear technology
Chapter 8 Conclusions and Further Work
156
Further Methanol Radiolysis Investigations
The reaction scheme used to model the radiolysis of aqueous methanol results in the
temporary formation of several stable organic species before they themselves are oxidised
by hydroxyl radicals This scheme eventually converts all organic substances to carbon
monoxide however in reality this is not the case It has been reported in literature that one
of the stable products formed is methane gas a substance not included in the current
reaction scheme The gas chromatography techniques used in this work are not suitable for
the detection of small quantities of carbon monoxide or indeed other potential radiolysis
products such as methane A more sophisticated approach would be to use a gas
chromatography mass spectroscopy technique (GC-MS) This technique would allow for
the detection of carbon monoxide carbon dioxide methane and any other volatile
hydrocarbons that may be formed during radiolysis Other transient products of methanol
radiolysis such as formaldehyde ethylene glycol glycolaldehyde and glyoxal may be
analysed by high performance liquid chromatography (HPLC) It was mentioned in Chapter
6 that the reaction scheme does not accurately represent the radiolysis of the transient
product glycolaldehyde A publication by Yaylayan et al130
discusses some measurements
made by nuclear magnetic resonance spectroscopy of glycolaldehyde in deuterated water
and it was found that it exists mostly as the hydrated aldehyde 112-ethanetriol (~70) A
complete reaction scheme for the radiolysis of methanol should include the radiolysis
reactions of all the transient species of which there are potentially many
However if the major component of a glycolaldehyde solution is 112-ethanetriol an
acceptable compromise may be to include only the radiolysis reactions of this species and
ignore the radiolysis paths of minor products
Chapter 8 Conclusions and Further Work
157
Experimental analysis of aqueous methanol to determine the major transient species would
be valuable for determining which radiolysis paths have the most significant roles in
methanol radiolysis
Future Development of a Multi-Scale Radiolysis Model
As discussed in Chapter 3 the model developed in this work is a deterministic model for the
calculation of long term homogeneous phase radiolysis This calculation depends on a
series of primary values that represent the production rates of the primary species of water
radiolysis which in turn depend on a number of physical and chemical factors It is
possible to calculate these primary yields using stochastic methods which can then be fed
into the deterministic calculation to obtain predictions of chemical species concentrations
This technique has been successfully used recently to demonstrate some of the effects of
high capacity scavengers47
This technique assumes that there are no changes to the
physiochemical conditions during the radiolysis period for example if a calculation was to
be performed where the temperature were to change the primary yields would need to be
recalculated at the new temperature The model developed in this work attempts to
overcome this by estimating primary yields as a multiple regression fit of temperature and
pH however this estimation is not adequately accurate and does not include any effects that
linear energy transfer has on the primary yields A more suitable approach to the
development of a comprehensive multi-scale radiolysis model may be to utilise a stochastic
calculation of the primary yields that includes the effects of temperature pH LET and
chemical scavengers which can be called from within the deterministic calculation
whenever a significant change to one of these factors is initiated
Chapter 8 Conclusions and Further Work
158
Further work concerning the deterministic model presented in this work include an
investigation into the partitioning of gaseous species The method used is one that has been
successfully used by other research groups to model the radiolysis of water and the effect of
available headspace This implementation of the stagnant two-film model was never
intended to cope with rapid changes in aqueous oxygen concentrations Further efforts
should be made to better incorporate this gas partitioning method in a way that can more
realistically represent oxygen partitioning during the radiolysis of aqueous methanol
Closing Remarks Relevant to Sellafield Ltd
The experimental data presented in Chapters 4 and 5 are pertinent to the situations and
conditions currently found within the Magnox Swarf Storage Silos at Sellafield In the case
of elevated pH due to sodium hydroxide both the experimental and computational data
show increased rates of hydrogen gas production and an increased steady-state
concentration of hydrogen peroxide Despite some minor quantitative disagreements
between the experimental data and the computational data the qualitative trend is in
general agreement One could therefore expect to observe increased production of hydrogen
gas in the MSSS with increasing pH especially within the pH region of approximately
105 to 125 An important aspect of the situation at the MSSS is the aerated nature of the
system The obvious consideration being the increased amounts of dissolved oxygen
present which although such effects were also discussed in Chapter 4 the experimental
data shown was only for water at neutral pH Nevertheless it was discussed in Chapter 4
that dissolved oxygen acts a poison to the chain reaction that normally removes molecular
hydrogen A less obvious consideration and one that was largely overlooked in Chapter 4
is the inclusion of gas to liquid carbon dioxide exchange and its aqueous conversion to
carbonate
Chapter 8 Conclusions and Further Work
159
At high pH the concentration of aqueous CO2 and therefore CO32-
becomes significant
With CO32-
being known to react with the hydroxyl radical and given the difficulty in its
removal future research and industrial models involving high pH aqueous radiolysis would
benefit from including a description of the radiolysis chemistry of aqueous carbonate
systems Chapter 5 begins to address the concept of including carbonate chemistry into a
radiolysis model This came about from the realisation that magnesium hydroxide can be
easily carbonated on contact with CO2 and is also known to be an effective carbon trapping
material In this case not only the additional chemistry brought about carbonate should be
considered but also the effects of the magnesium compounds that can be formed for
example magnesium carbonate magnesium bicarbonate magnesium oxide and
magnesium hydroxide Similarly consideration should be given to the multitude of iron
phases that can exist in conditions comparable to those of the First Generation Magnox
Storage Ponds Although it was not considered in Chapter 7 it is likely that the corroded
iron found in the FGMSP also exists as a number of iron hydroxides and hydrated oxides
Given the open air nature of the FGMSP hydrogen gas build-up is not a major concern
however the interactions of the various iron oxide phases in a radiolysis system may affect
concentrations of oxidising species such as H2O2 which may alter corrosion rates The
results shown in Chapter 7 suggest little effect on H2O2 concentration in the presence of
haematite but the presence of magnetite had a significant effect in removing H2O2 To gain
a better understanding further work would need to be done that also investigated the other
possible phases of iron oxide and also gives consideration to the proportions in which they
can be found in the FGMSP
References
160
References
1 Pitois A Ivanov P I Abrahamsen L G Bryan N D Taylor R J amp Sims H E Magnesium Hydroxide Bulk and Colloid-Associated 152Eu in an Alkaline Environment Colloid Characterisation and Sorption Properties in the Presence and Absence of Carbonate J Environ Monit 10 315-324 (2008)
2 Spinks J W T amp Woods R J An Introduction to Radiation Chemistry (1990)
3 Loveland W D Morrissey D J amp Seaborg G T Modern Nuclear Chemistry (2005)
4 Allen A O The Radiation Chemistry of Water and Aqueous Solutions (1961)
5 Draganić I G amp Draganić Z D The Radiation Chemistry of Water (1971)
6 Schwarz H A Losee J P amp Allen A O Hydrogen Yields in the Radiolysis of Aqueous
Solutions Journal of the American Chemical Society 76 4693-4694 (1954)
7 Swallow A J Radiation Chemistry An Introduction (1973)
8 Schwarz H A Free Radicals Generated by Radiolysis of Aqueous Solutions Journal of
Chemical Education 58 101 (1981)
9 Buxton G V Clive L Greenstock W Helman P amp Ross A B Critical Review of Rate
Constants for Reactions of Hydrated Electrons Hydrogen Atoms and Hydroxyl Radicals (˙OHO˙-) in Aqueous Solution J Phys Chem Ref Data 17 513-886 (1988)
10 Jayson G G Keene J P Stirling D A amp Swallow A J Pulse-Radiolysis Study of Some
Unstable Complexes of Iron Transactions of the Faraday Society 65 2453-2464 (1969)
11 Koppenol W H amp Liebman J F The Oxidizing Nature of the Hydroxyl Radical A
Comparison with the Ferryl Ion (FeO2+) The Journal of Physical Chemistry 88 99-101 (1984)
12 Meyerstein D Complexes of Cations in Unstable Oxidation States in Aqueous Solutions as
Studied by Pulse Radiolysis Accounts of Chemical Research 11 43-48 (1978)
13 Schwarz H A Applications of the spur diffusion model to the radiation chemistry of
aqueous solutions The Journal of Physical Chemistry 73 1928-1937 (1969)
References
161
14 Dyne P J amp Kennedy J M The Kinetics of Radical Reactions in the Tracks of Fast Electrons A Detailed Study of the SamuelndashMagee Model for the Radiation Chemisty of Water Canadian Journal of Chemistry 36 1518-1536 (1958)
15 Burns W G Sims H E amp Goodall J A B Special Issue Dedicated to The Memory of the
Late John Hodson Baxendale Radiation chemical diffusion kinetic calculations with prescribed and non-prescribed diffusionmdashI Radiation Physics and Chemistry (1977) 23 143-180 (1984)
16 Pimblott S M amp LaVerne J A Comparison of Stochastic and Deterministic Methods for
Modeling Spur Kinetics Radiation Research 122 12-23 (1990)
17 Tapping R L Corrosion Issues in Pressurized Heavy Water Reactor (PHWRCANDUreg)
Systems A2 in Nuclear Corrosion Science and Engineering 581-633 (2012)
18 Petrik N G Alexandrov A B amp Vall A I Interfacial Energy Transfer During Gamma
Radiolysis of Water on the Surface of ZrO2 and Some Other Oxides The Journal of Physical Chemistry B 105 5935-5944 (2001)
19 LaVerne J A amp Tandon L H2 and Cl2 Production in the Radiolysis of Calcium and
Magnesium Chlorides and Hydroxides The Journal of Physical Chemistry A 109 2861-2865 (2005)
20 Slack J Norton J L amp Malkoske G R Cobalt-60 Production in CANDU Power Reactors
21 Unterweger M P Hoppes D D amp Schima F J New and Revised Half-Life Measurements
Results Nuclear Instruments and Methods in Physics Research Section A Accelerators Spectrometers Detectors and Associated Equipment 312 349-352 (1992)
22 Weiss J A Survey of Chemical Dosimetric Systems The International Journal of Applied
Radiation and Isotopes 4 89-95 (1958)
23 Fricke H amp Morse S The Chemical Action of Roumlntgen Rays on Dilute Ferrosulfate Solutions
as a Measure of Dose Am J Roentgenology and Radium Therapy 18 430-432 (1927)
24 Weiss J Allen A O amp Schwarz H A Fricke Ferrous Sulfate Dosimeter for γ-rays in the
Range 4 to 40 Kiloroumlntgens Proceedings of the International Conference on the Peaceful Uses of Atomic Energy 14 179-181 (1956)
25 Allen A O Hochanadel C J Ghormley J A amp Davis T W Decomposition of Water and
Aqueous Solutions under Mixed Fast Neutron and Gamma Radiation American Chemical Society (1952)
References
162
26 Hiroki A Pimblott S M amp LaVerne J A Hydrogen Peroxide Production in the Radiolysis of
Water with High Radical Scavenger Concentrations The Journal of Physical Chemistry A 106 9352-9358 (2002)
27 Yakabuskie P A Joseph J M amp Wren C J The Effect of Interfacial Mass Transfer on
Steady-State Water Radiolysis Radiation Physics and Chemistry 79 777-785 (2010)
28 Nejad M A amp Jonsson M Reactivity of Hydrogen Peroxide towards Fe3O4 Fe2CoO4 and
Fe2NiO4 Journal of Nuclear Materials 334 28-34 (2004)
29 Pastina B amp LaVerne J A Effect of Molecular Hydrogen on Hydrogen Peroxide in Water
Radiolysis The Journal of Physical Chemistry A 105 9316-9322 (2001)
30 Klassen N V Marchington D amp McGowan H C E H2O2 Determination by the I3
- Method and by KMnO4 Titration Analytical Chemistry 66 2921-2925 (1994)
31 Roth O amp LaVerne J A Effect of pH on H2O2 Production in the Radiolysis of Water J Phys
Chem A 115 700-708 (2011)
32 Wasselin-Trupin V Baldacchino G Bouffard S amp Hickel B Hydrogen Peroxide Yields in
Water Radiolysis by High-Energy Ion Beams at Constant LET Radiation Physics and Chemistry 65 53-61 (2002)
33 Essehli R Crumiegravere F Blain G Vandenborre J Pottier F Grambow B et al H2
Production by γ and He Ions Water Radiolysis Effect of Presence TiO2 Nanoparticles International Journal of Hydrogen Energy 36 14342-14348 (2011)
34 Faraggi M Zehavi D amp Anbar M Effect of Thallous Ions on the Yields of Hydrogen and
Hydrogen Peroxide in Radiolyzed Aqueous Solutions Transactions of the Faraday Society 67 2057-2067 (1971)
35 Lousada C M LaVerne J A amp Jonsson M Enhanced Hydrogen Formation During the
Catalytic Decomposition of H2O2 on Metal Oxide Surfaces in the Presence of ˙OH Radical Scavengers Phys Chem Chem Phys 15 12674-12679 (2013)
36 Schofield J Reiff S C Pimblott S M amp LaVerne J A Radiolytic Hydrogen Generation at
Silicon CarbidendashWater Interfaces Journal of Nuclear Materials 469 43-50 (2016)
37 LaVerne J A Ryan M R amp Mu T Hydrogen Production in the Radiolysis of Bromide
Solutions Radiation Physics and Chemistry 78 1148-1152 (2009)
References
163
38 Draganic I Nenadovic M T amp Draganic Z D Radiolysis of HCOOH + O2 at pH 13-13 and
the Yields of Primary Products in γ Radiolysis of Water Journal of Physical Chemistry 73 2564-2571 (1969)
39 Hart E J γ-Ray Induced Oxidation of Aqueous Formic Acid-Oxygen Solutions Effect of pH
Journal of the American Chemical Society 76 4198-4201 (1954)
40 Flanders D A amp Fricke H Application of a High-Speed Electronic Computer in Diffusion
Kinetics The Journal of Chemical Physics 28 1126-1129 (1958)
41 Burns W G Sims H E amp Goodall J A B Radiation Chemical Diffusion Kinetic Calculations
with Prescribed and Non-Prescribed DiffusionmdashI Spherical and Cylindrical Cases Radiation Physics and Chemistry 23 143-180 (1984)
42 Green N J B Pilling M J Pimblott S M amp Clifford P Stochastic Modeling of Fast Kinetics
in a Radiation Track The Journal of Physical Chemistry 94 251-258 (1990)
43 Bouniol P amp Bjergbakke E A Comprehensive Model to Describe Radiolytic Processes in
Cement Medium Journal of Nuclear Materials 372 1-15 (2008)
44 Ershov B G amp Gordeev A V A Model for Radiolysis of Water and Aqueous Solutions of H2
H2O2 and O2 Radiation Physics and Chemistry 77 928-935 (2008)
45 Elliot A J amp Bartels D M The Reaction Set Rate Constants and g-Values for the Simulation
of the Radiolysis of Light Water over the range 20degC to 350degC Based on Information Available in 2008 (Atomic Energy of Canada Limited Mississauga Ontario (Canada) 2009)
46 Wren J C amp Ball J M LIRIC 32 an Updated Model for Iodine Behaviour in the Presence of
Organic Impurities Radiation Physics and Chemistry 60 577-596 (2001)
47 Gregory P Horne Thomas A Donoclift Howard E Sims Robin M Orr amp Simon M
Pimblott Multi-Scale Modelling of the Radiolysis of Nitrate Solutions The Journal of Physical Chemistry B 120 (45) 11781 - 11789 (2016)
48 Chance E M Curtis A R Jones I P amp Kirby C R FACSIMILE A Computer Program for
Flow and Chemistry Simulation and General Initial Value Problems Report No 0436-9734 148 pp (Univ Coll 1977)
49 Elliot A J Rate Constants and G-Values for the Simulation of the Radiolysis of Light Water
Over the Range 0 - 300degC AECL-11073 COG-94-167 (1994)
References
164
50 Hochanadel C J amp Ghormley J A Effect of Temperature on the Decomposition of Water
by γ-Rays Radiat Res 16 635-660 (1962)
51 Janik D Janik I amp Bartels D M Neutron and βγ Radiolysis of Water up to Supercritical
Conditions βγ Yields for H2 Hbull Atom and Hydrated Electron The Journal of Physical
Chemistry A 111 7777-7786 (2007)
52 Jha K N Ryan T G amp Freeman G R Radiolysis of H2O and D2O between 0 and 300degC J
Phys Chem 79 868-870 (1974)
53 Elliot A J Chenier M P amp Ouellette D C Temperature Dependence of g Values for H2O
and D2O Irradiated with Low Linear Energy Transfer Radiation Journal of the Chemical Society Faraday Transactions 89 1193-1197 (1993)
54 Kent M C amp Sims H E The Yield of γ-Radiolysis Products from Water at Temperatures up
to 270degC Harwell Report AEA-RS-2301 (1992)
55 Lin M Katsumura Y Muroya Y He H Wu G Han Z et al Pulse Radiolysis Study on the
Estimation of Radiolytic Yields of Water Decomposition Products in High-Temperature and Supercritical Waterthinsp Use of Methyl Viologen as a Scavenger The Journal of Physical Chemistry A 108 8287-8295 (2004)
56 Štefanić I amp LaVerne J A Temperature Dependence of the Hydrogen Peroxide Production
in the γ-Radiolysis of Water The Journal of Physical Chemistry A 106 447-452 (2002)
57 Ferradini C amp Jay-Gerin J-P The Effect of pH on Water Radiolysis A Still Open Question mdash
A Minireview Research on Chemical Intermediates 26 549-565 (2000)
58 Ferradini C Kinetic Behavior of the Radiolysis Products of Water in Advances in Inorganic
Chemistry and Radiochemistry Vol Volume 3 (eds H J Emeleus amp A G Sharpe) 171-205 (1961)
59 Lefort M Radiation Chemistry Annual Review of Physical Chemistry 9 123-156 (1958)
60 Sworski T J Yields of Hydrogen Peroxide in the Decomposition of Water by Cobalt γ-
Rradiation I Effect of Bromide Ion Journal of the American Chemical Society 76 4687 (1954)
61 Hochanadel C J amp Lind S C Radiation Chemistry Annual Review of Physical Chemistry 7
83-106 (1956)
References
165
62 Mahlman H A amp Boyle J W Primary Cobalt-60 Radiolysis Yields in Heavy Water Journal
of the American Chemical Society 80 773 (1958)
63 Hayon E amp Stein G Radiation Chemistry of Aqueous Systems (1968)
64 Hayon E Effect of Solute Concentration on the Recombination of H˙ and ˙OH in γ-Irradiated
Aqueous Solutions Journal of Physical Chemistry 65 1502-1505 (1961)
65 Sehested K Bjergbakke E amp Fricke H The Primary Species Yields in the 60Co γ-Ray
Radiolysis of Aqueous Solutions of H2SO4 between pH 7 and 046 Radiation Research 56 385-399 (1973)
66 Hayon E Radiolysis of Heavy Water in the pD Range 0-14 Journal of Physical Chemistry 69
2628-2632 (1965)
67 Haissinsky M γ-Radiolysis of Alkaline and Neutral Solutions I Alkaline Solutions of Sodium
Phosphite Journal de Chimie Physique et de Physico-Chimie 62 1141-1148 (1965)
68 Dainton F S amp Watt W S The Effect of pH on the Radical Yields in the γ-Radiolysis of
Aqueous Systems Nature 195 1294-1296 (1962)
69 Dainton F S amp Rumfeldt R Radical and Molecular Yields in the γ-Radiolysis of Water III
The Nitrous Oxide-Sodium Tellurite System Proceedings of the Royal Society of London A Mathematical Physical and Engineering Sciences 287 444-456 (1965)
70 Cheek C H amp Linnenbom V J The Radiation Chemistry of Alkaline Hypobromite Solutions
The Journal of Physical Chemistry 67 1856-1860 (1963)
71 Fielden E M amp Hart E J Primary Radical Yields in Pulse-Irradiated Alkaline Aqueous
Solution Radiation Research 32 564-580 (1967)
72 Czapski G amp Peled E On the pH-Dependence of Greducing in the Radiation Chemistry of
Aqueous Solutions Israel Journal of Chemistry 6 421-436 (1968)
73 Balkas T Dainton F S Dishman J K amp Smithies D Radiation Chemistry of Aqueous
Solutions Containing Carbon Monoxide and Oxygen Between pH 04 and 12 Transactions of the Faraday Society 62 81-87 (1966)
References
166
74 Pimblott S M Pilling M J amp Green N J B Stochastic Models of Spur Kinetics in Water International Journal of Radiation Applications and Instrumentation Part C Radiation Physics and Chemistry 37 377-388 (1991)
75 Hayon E Radical and Molecular Yields in the Radiolysis of Alkaline Aqueous Solutions
Transactions of the Faraday Society 61 734-743 (1965)
76 Gordon S amp Hart E J Chemical Yields of Ionizing Radiations in Aqueous Solutions Effect of
Energy of Alpha Particles Radiation Research 15 440-451 (1961)
77 Kochanny G L Timnick A Hochanadel C J amp Goodman C D Radiation Chemistry Studies
of Water as Related to the Initial Linear Energy Transfer of 11-MeV to 23-MeV Protons Radiation Research 19 462-473 (1963)
78 ICRU Report 16 - Linear Energy Transfer (ICRU Washington USA 1970)
79 Schwarzenbach R P Gschwend P M amp Imboden D M Environmental Organic Chemistry
(Wiley 2005)
80 Ferrell R T amp Himmelblau D M Diffusion Coefficients of Hydrogen and Helium in Water
American Institute of Chemical Engineers 13 702-708 (1967)
81 Han P amp Bartels D M Temperature Dependence of Oxygen Diffusion in H2O and D2O The
Journal of Physical Chemistry 100 5597-5602 (1996)
82 Marrero T R amp Mason E A Gaseous Diffusion Coefficients Journal of Physical and
Chemical Reference Data 1 3-118 (1972)
83 Kestin J Knierim K Mason E A Najafi B Ro S T amp Waldman M Equilibrium and
Transport Properties of the Noble Gases and Their Mixtures at Low Density Journal of Physical and Chemical Reference Data 13 229-303 (1984)
84 Sander R Compilation of Henryrsquos Law Constants for Inorganic and Organic Species of
Potential Importance in Environmental Chemistry (1999)
85 Mezyk Stephen P amp Bartels David M Direct EPR Measurement of Arrhenius Parameters
for the Reactions of Hmiddot Atoms with H2O2 and Dmiddot Atoms with D2O2 in Aqueous Solution Journal of the Chemical Society Faraday Transactions 91 3127-3132 (1995)
References
167
86 Joseph Jiju M Seon Choi Byung Yakabuskie Pam amp Wren Clara J A Combined Experimental and Model Analysis on the Effect of pH and O2(aq) on γ-Radiolytically Produced H2 and H2O2 Radiation Physics and Chemistry 77 1009-1020 (2008)
87 Allen A O The Yields of Free H˙ and ˙OH in the Irradiation of Water Radiation Research 1
85-96 (1954)
88 Jortner J amp Noyes R M Some Thermodynamic Properties of the Hydrated Electron The
Journal of Physical Chemistry 70 770-774 (1966)
89 Sehested K Holcman J Bjergbakke E amp Hart Edwin J Ultraviolet Spectrum and Decay of
the Ozonide Ion Radical O3- in Strong Alkaline Solution Journal of Physical Chemistry 86
2066-2069 (1982)
90 Jones T Development of an Effluent Treatment Process for the Silos Direct Encapsulation
Plant IChemE Sustainable Nuclear Energy Conference (2014)
91 Nelson S M Newman A C D Tomlinson T E amp Sutton L E A Dielectric Study of the
Adsorption of Water by Magnesium Hydroxide Transactions of the Faraday Society 55 2186-2202 (1959)
92 Shpak P A Kalinichenko A E Lytovchenko S A Kalinichenko A I Legkova V G amp
Bagmut N N The Effect of γ-Irradiation on the Structure and Subsequent Thermal Decomposition of Brucite Physics and Chemistry of Minerals 30 59-68 (2003)
93 Maroto-Valer M M Developments and Innovation in Carbon Dioxide (CO2) Capture and
Storage Technology Volume One Carbon Dioxide (CO2) Capture Transport and Industrial Applications (Woodhead Publishing 2010)
94 Siriwardane R V amp Stevens R W Novel Regenerable Magnesium Hydroxide Sorbents for
CO2 Capture at Warm Gas Temperatures Industrial amp Engineering Chemistry Research 48 2135-2141 (2009)
95 Fricker Kyle J amp Park A Alissa Effect of H2O on Mg(OH)2 Carbonation Pathways for
Combined CO2 Capture and Storage Chemical Engineering Science 100 332-341 (2013)
96 Sahoo P Ishihara S Yamada K Deguchi K Ohki S Tansho M et al Rapid Exchange
between Atmospheric CO2 and Carbonate Anion Intercalated within Magnesium Rich Layered Double Hydroxide ACS Applied Materials amp Interfaces 6 18352-18359 (2014)
97 Stirling A HCO3
- Formation from CO2 at High pH Ab Initio Molecular Dynamics Study The Journal of Physical Chemistry B 115 14683-14687 (2011)
References
168
98 Shah Noor S Khan Javed Ali Al-Muhtaseb Alarsquoa H Sayed Murtaza amp Khan Hasan M
Gamma Radiolytic Decomposition of Endosulfan in Aerated Solution The Role of Carbonate Radical Environmental Science and Pollution Research 1-10 (2016)
99 Nash K Mulac W Noon M Fried S amp Sullivan J C Pulse Radiolysis Studies of U(VI)
Complexes in Aqueous Media Journal of Inorganic and Nuclear Chemistry 43 897-899 (1981)
100 Holcman J Bjergbakke E amp Sehested K The Importance of Radical-Rradical Reactions in
Pulse Radiolysis of Aqueous CarbonateBicarbonate Proceedings of the Tihany Symposium on Radiation Chemistry 6 149-153 (1987)
101 Draganic Z D Negron-Mendoza A Sehested K Vujosevic S I Navarro-Gonzales R
Albarran-Sanchez M G et al Radiolysis of Aqueous Solutions of Ammonium Bicarbonate Over a Large Dose Range Radiation Physics and Chemistry 38 317-321 (1991)
102 Eriksen T E Lind J amp Mereacutenyi G On the Acid-Base Equilibrium of the Carbonate Radical
Radiation Physics and Chemistry 26 197-199 (1985)
103 Thomas J K Gordon Sheffield amp Hart Edwin J The Rates of Reaction of the Hydrated
Electron in Aqueous Inorganic Solutions Journal of Physical Chemistry 68 1524-1527 (1964)
104 Nehari Shlomo amp Rabani Joseph The Reaction of H˙ Atoms with OH- in the Radiation
Chemistry of Aqueous Solutions Journal of Physical Chemistry 67 1609-1613 (1963)
105 Neta P amp Dorfman L M Pulse Radiolysis Studies XIII Rate Constants for the Reaction of
Hydroxyl Radicals with Aromatic Compounds in Aqueous Solutions in Radiation Chemistry Vol 81 Advances in Chemistry Ch 15 222-230 (American Chemical Society 1968)
106 Mezyk S P amp Bartels D M Rate Constant and Activation Energy Measurement for the
Reaction of Atomic Hydrogen with Methanol Iodomethane Iodoethane and 1-Iodopropane in Aqueous Solution The Journal of Physical Chemistry 98 10578-10583 (1994)
107 Anbar M amp Hart E J The Reactivity of Aromatic Compounds toward Hydrated Electrons
Journal of the American Chemical Society 86 5633-5637 (1964)
108 Theard Leslie M amp Burton Milton Radiolysis of Liquid Methanol and some Methanolic Salt
Solutions Journal of Physical Chemistry 67 59-64 (1963)
References
169
109 Porter Raymond P Noyes W amp Albert Jr Photochemical Studies LIV Methanol Vapor Journal of the American Chemical Society 81 2307-2311 (1959)
110 Motohashi N amp Saito Y Competitive Measurement of Rate Constants for Hydroxyl Radical
Reactions Using Radiolytic Hydroxylation of Benzoate Chemical amp pharmaceutical bulletin 41 1842-1845 (1993)
111 Adams G E amp Willson R L Pulse Radiolysis Studies on the Oxidation of Organic Radicals in
Aqueous Solution Transactions of the Faraday Society 65 2981-2987 (1969)
112 Kishore K Moorthy P N amp Rao K N Reactivity of H2O2 with Radiation Produced Free
Radicals Steady State Radiolysis Methods for Estimating the Rate Constants International Journal of Radiation Applications and Instrumentation Part C Radiation Physics and Chemistry 29 309-313 (1987)
113 Simic M Neta P amp Hayon E Pulse Radiolysis Study of Alcohols in Aqueous Solution The
Journal of Physical Chemistry 73 3794-3800 (1969)
114 Tsang W Chemical Kinetic Data Base for Combustion Chemistry Part 2 Methanol Journal
of Physical and Chemical Reference Data 16 471-508 (1987)
115 Huie R E amp Clifton C L Kinetics of the Self-Reaction of Hydroxymethylperoxyl Radicals
Chemical Physics Letters 205 163-167 (1993)
116 Schuchmann M N amp Von Sonntag C The Rapid Hydration of the Acetyl Radical A Pulse
Radiolysis Study of Acetaldehyde in Aqueous Solution Journal of the American Chemical Society 110 5698-5701 (1988)
117 Bothe E Schulte-Frohlinde D amp von Sonntag C Radiation Chemistry of Carbohydrates
Part 16 Kinetics of HO2˙ Elimination from Peroxyl Radicals Derived from Glucose and Polyhydric Alcohols Journal of the Chemical Society Perkin Transactions 2 416-420 (1978)
118 Zimina GM amp Bakh NA Pulse Radiolysis of Ethylene Glycol Absorption Spectra of the
Short-Lived Radicals High Energy Chem 13 187-190 (1979)
119 Thomas J K Rates of Reaction of the Hydroxyl Radical Transactions of the Faraday Society
61 702-707 (1965)
120 Draganic I amp Marcovic V Unpublished data (NIST Squib 1968DRAMARB) (1968)
References
170
121 Orlando J J amp Tyndall G S The Atmospheric Chemistry of the HC(O)CO Radical International Journal of Chemical Kinetics 33 149-156 (2001)
122 Ziemer H Doacutebeacute S Wagner H G Olzman M Viskolcz B amp Temps F Kinetics of the
Reactions of HCO with H˙ and D˙ Atoms Berichte der Bunsengesellschaft fuumlr physikalische Chemie 102 897-905 (1998)
123 Temps F amp Wagner H G Rate Constants for the Reactions of ˙OH Radicals with CH2O˙ and
HCO˙ Berichte der Bunsengesellschaft fuumlr physikalische Chemie 88 415-418 (1984)
124 Atkinson R Baulch D L Cox R A Hampson R F Kerr J A Rossi M J et al Evaluated
Kinetic and Photochemical Data for Atmospheric Chemistry Supplement VI IUPAC Subcommittee on Gas Kinetic Data Evaluation for Atmospheric Chemistry Journal of Physical and Chemical Reference Data 26 1329-1499 (1997)
125 Yee Quee M J amp Thynne J C J The Photolysis of Organic Esters Berichte der
Bunsengesellschaft fuumlr physikalische Chemie 72 211-217 (1968)
126 Sunaryoy G R amp Domae M Numerical Simulation on Effect of Methanol Addition on
Coolant Radiolysis in Pressurized Water Reactor Journal of Nuclear Science and Technology 45 1261-1274 (2008)
127 Baxendale J H amp Mellows F W The γ-Radiolysis of Methanol and Methanol Solutions
Journal of the American Chemical Society 83 4720-4726 (1961)
128 Pikaev A K amp Kartasheva L I Radiolysis of Aqueous Solutions of Ethylene Glycol
International Journal for Radiation Physics and Chemistry 7 395-415 (1975)
129 Ahmad M Awan M H amp Mohammad D γ-Radiolysis of Ethylene Glycol Aqueous
Solutions Journal of the Chemical Society B Physical Organic 945-946 (1968)
130 Yaylayan V A Harty-Majors S amp Ismail A A Investigation of the Mechanism of
Dissociation of Glycolaldehyde Dimer (25-dihydroxy-14-dioxane) by FTIR Spectroscopy Carbohydrate Research 309 31-38 (1998)
131 Reiff S C amp LaVerne J A Radiation-Induced Chemical Changes to Iron Oxides The Journal
of Physical Chemistry B 119 7358-7365 (2015)
132 Lousada C M Yang M Nilsson K amp Jonsson M Catalytic Decomposition of Hydrogen
Peroxide on Transition Metal and Lanthanide Oxides Journal of Molecular Catalysis A Chemical 379 178-184 (2013)
References
171
133 Rush J D B Benon H J Pulse Radiolytic Studies of the Reaction of Perhydroxyl
Superoxide O2- with Iron(II)Iron(III) Ions The Reactivity of HO2O2
- with Ferric Ions and its Implication on the Occurrence of the Haber-Weiss Reaction Journal of Physical Chemistry 89 5062-5066 (1985)
134 Pepper S E Borkowski M Richmann M K amp Reed D T Determination of Ferrous and
Ferric Iron in Aqueous Biological Solutions Analytica Chimica Acta 663 172-177 (2010)
135 Barb W G Baxendale J H George P amp Hargrave K R Reactions of Ferrous and Ferric
Ions with Hydrogen Peroxide Part II-The Ferric Ion Reaction Transactions of the Faraday Society 47 591-616 (1951)
136 Stuglik Z amp PawełZagoacuterski Z Pulse Radiolysis of Neutral Iron(II) Solutions Oxidation of
Ferrous Ions by ˙OH Radicals Radiation Physics and Chemistry (1977) 17 229-233 (1981)
137 Fong K-L McCay P B Poyer J L Misra H P amp Keele B B Evidence for Superoxide-
Dependent Reduction of Fe3+ and its role in Enzyme-Generated Hydroxyl Radical Formation Chemico-Biological Interactions 15 77-89 (1976)
138 Baxendale J H Dixon R S amp Stott D A Reactivity of Hydrogen Atoms with Fe3+ FeOH2+
and Cu2+ in Aqueous Solutions Transactions of the Faraday Society 64 2398-2401 (1968)
139 Jonah C D M John R Matheson Max S The Reaction of the Precursor of the Hydrated
Electron with Electron Scavengers Journal of Physical Chemistry 81 1618-1622 (1977)
Appendix
172
Appendix
Radiolysis Model Code
All computational calculations were performed with the software package Facsimile by
MCPA Software The following is a print out of the core water radiolysis model and only
includes the reactions of water other reaction schemes documented in this work can be
found on the included CD as well as the setup files containing initial parameters and
associated Python scripts used to manage output data
Appendix
173
--------------------------------------------------------------------
_ _ ___ ____ _____ _ _ _ _
| | | |__ __ | __ | (_) | | (_)
| |__| | ) | | | | | |__) |__ _ __| |_ ___ | |_ _ ___ _ ___
| __ | | | | | | _ _` | _` | | _ | | | | __| __|
| | | | _| |__| | | | | (_| | (_| | | (_) | | |_| __ | __
|_| |_|____|____ |_| ____|___|_|___|_|__ |___|_|___
__ |
|___
--------------------------------------------------------------------
-----Radiolysis Model for the Radiolysis of Pure Water--------------
----------------------Thomas Donoclift------------------------------
Rate constants mainly are from
A J Elliot Rate constants and G-values
for the simulation of the radiolysis of
light water over the range 0 - 300 C
AECL-11073 COG-94-167 19942008
P Bouniol amp E Bjergbakke ldquoA Comprehensive
Model to Describe Radiolytic processes
in Cement Mediumrdquo J Nuclear Materials 372 1-15 2008
JC Wren JM Ball ldquoLIRIC 32 an Updated model for
Iodine behaviour in the presence of organic impuritiesrdquo
Radiation Physics and Chemistry 60 577-596 2001
EXECUTE OPEN 1 RadMout UNKNOWN
EXECUTE OPEN 2 Reportout UNKNOWN
EXECUTE OPEN 3 SetUptxt OLD
EXECUTE OPEN 4 Flux_Atxt UNKNOWN
EXECUTE OPEN 7 Flux_Btxt UNKNOWN
EXECUTE OPEN 8 Flux_Ctxt UNKNOWN
EXECUTE OPEN 9 Flux_Dtxt UNKNOWN
EXECUTE OPEN 10 Flux_Etxt UNKNOWN
EXECUTE OPEN 11 FireCount_Atxt UNKNOWN
EXECUTE OPEN 12 FireCount_Btxt UNKNOWN
EXECUTE OPEN 14 TIMEtxt UNKNOWN
EXECUTE OPEN 15 FireCount_Ctxt UNKNOWN
EXECUTE OPEN 16 FireCount_Dtxt UNKNOWN
EXECUTE OPEN 17 FireCount_Etxt UNKNOWN
EXECUTE OPEN 19 TRACEtxt UNKNOWN
PERMIT +-
------------------------
Appendix
174
These variables are the concentrations of radiolysis
species Edit initial values in COMPILE INSTANT and
COMPILE INITIAL routines or SetUptxt
---------DEFINE-VARIABLES--------------
----CHEMICAL-SPECIES-FOR-H2O-RADIOLYSIS---------------
VARIABLE
H2O H2O+ H3O+ OH H H2 H2g H2O2 H2O2+ O2 O2g H+
OH- Eaq- O2- O2-- HO2 HO2- O- O-- O3- O Rx O3
---------------------------------------
------REACTION-COUNTERS-----------------------
VARIABLE
R0 R1 R2 R3 R4 R5 R6 R7 R8 R9 R10 R11 R12 R13 R14 R15 R16
R17 R18 R19 R20 R21 R22 R23 R24 R25 R26 R27 R28 R29 R30
R31 R32 R33 R34 R35 R36 R37 R38 R39 R40 R41 R42 R43 R44
R45 R46 R47 R48 R49 R50 R51 R52 R53 R54 R55 R56 R57 R58
R59 R60 R61 R62 R63 R64 R65 R66 R67 R68 R69 R70 R71 R72
R73 R74 R75 R76 R77 R78 R79 R80 R81 R82 R83
G0 G1 G2 G3 G4 G5 G6 G7 G8
---------DEFINE-PARAMETERS-------------
PARAMETER
T TK RT TAB DOSER ADOSE
DOSE EVDOSE GEaq- GH GH2 GOH GH2O2 GH+ GOH- G-H2O G+H2O GO2 GO2-
kappH2 kappO2 GHO2 GHO2-
kappO2g H2tot EA MB1 MB2 H2O2T
INTEGER RUNt
-------------------------
This set of perameters concerns radiolysis rates
G-Values are converted to rates in COMPILE INITIAL
Rate constants are given the prefix K
Arrhenius Pre-exponentials are given the prefix A
Activation Energies (-EaR) are given the prefix E
followed by letters representing reacting species ie
KAB = Rate constant of A+B
-------------------------
A=Eaq- B=H C=OH D=O-
E=O3- F=HO2 G=H2O2 H=H2O2+
I=H2O J=H+ K=OH- L=HO2-
M=O2 N=O2- O=O2-- P=H2O+
Q=O3 R=H2 S=O
-------------------------
PARAMETER
DW GREaq- GRH GRH2 GROH GRH2O2 GRH+ GROH- GR-H2O GR+H2O
GRO2 GRO2- GRHO2 GRHO2- KAA KAB KAC KAD KAG KAF KAL KAM KAN KBB KBC
KBG KBM KBN KBF KBF2 KBL KCC KCD KCG KCL KCF KCN KDR KDG KDL
KDN KEG KEL KER KEC KED KNN KFN KFNI KFF KFG KI KJK KG
KJL KGK KLI KC KJD KCK KDI KDM KE KF KJN KFK KNI KB KJA
KBK KAI KBI KRC KJNb KCKb KLK KLKb KDD KEJ KBQ KDQ
KCL2 KCQ KNQ KFQ KNG KNE KKQ KLQ KGQ KLG KLN KEC2 KAN2 KAN3
-------------------------
Appendix
175
----PRE-EXPONENTIAL-FACTORS-------------------
PARAMETER AAB AAF AAG AAM AAN ABB ABC ABG
ABN ABF ACG ACF ACN ACL ADR ADL AFNI
AFF ADM AE AG AAN2 AGQ AFN ANN ACL2 ABF2
ABL AAD AAL ADG AEG AEL AER AFG AAN3 ACD ALKb
-----------------------------------
-------ACTIVATION-ENERGIES--------------
PARAMETER EAB EAF EAG EAM EAN EBB EBC EBG
EBN EBF ECG ECF ECN ECL EDR EDL EFNI
EFF EDM EE EG EAN2 EGQ EFN ENN ECL2 EBF2
EBL EAD EAL EDG EEG EEL EER EFG EAN3 ECD ELKb
---------------------------------------
PARAMETER
pH pHreal pKw pKH2O2 pKOH pKHO2 pKH pKH2O pKHO2- KpH KpO
KfH KrH KfO KrO CONV PcH PcO O2in xO2 Kprot Khydx
TPrint pHsweep Tstart Tend DecTime
---------------------------------------------------------
Below are arrays for storing reaction flux These are limited to 20
as the output length max is 250 characters To overcome this clunky
artefact of Facsimile the arrays can be fed into Facssemblepy to
concatenate them into a single output file
----------------------------------------------------------
PARAMETER lt20gt Ra Stores Water Reaction Flux Part A
PARAMETER lt20gt Rb Stores Water Reaction Flux Part B
PARAMETER lt20gt Rc Stores Water Reaction Flux Part C
PARAMETER lt20gt Rd Stores Water Reaction Flux Part D
PARAMETER lt10gt Re Stores Water Reaction Flux Part E
PARAMETER lt2gt GR Stores Gas Partition Flux
-------------------------
--PARAMETERS-FOR-GAS-PARTITION--------------
PARAMETER
DaqH2 DgH2 DaqO2 DgO2 daq dg
vaqH2 vgH2 vaqO2 vgO2 vintH2 vintO2
KpH2 KpO2 vtot
Aint Vl Vg Vr Dose EqR
---------------INITIALISE-PARAMETERS--------
Concentrations of specis are given as Moll
T is Temp in C - TK is Temp in K
pHin is the initial pH xO2 is the fraction of O2
pHreal is the calculated pH at any given time
DW is density of water depending on temperature
DS is the density of the whole solution
Vl and Vg is the Volume of liqud and gas phases in L
DOSER is the dose rate in Gymin
ADOSE is the conversion of dose rate to sets of 100eVls
Appendix
176
COMPILE INSTANT
----PARAMETERS-FROM-SETUP-FILE-----
READ 3 DOSER
READ 3 RUNt
READ 3 Tstart
READ 3 Tend
READ 3 pH
READ 3 xO2
READ 3 Vl
READ 3 Vg
READ 3 Aint
READ 3 DaqH2
READ 3 DgH2
READ 3 DaqO2
READ 3 DgO2
READ 3 daq
READ 3 dg
READ 3 KpH2
READ 3 KpO2
---ADDITIONAL-PARAMETERS----
T = Tstart
TK = T + 27315
TAB = 1TK
RT = 8314TK
DW = (0999 + 1094E-4 T - 7397E-6 T2
+ 2693E-8 T3 - 4714E-11 T4)
ADOSE = ((DOSER 62415E16) 60) DW 100 eVsl for use with Gymin
TPrint = (FLOAT(RUNt) - 1) 60
EA = EXP(18800((129815-1TK)8314))
WRITE 2 = 4
WRITE 3 = 7
WRITE 4 = 8
WRITE 7 = 10
WRITE 8 = 9
WRITE 12 = 14
WRITE 1 = 2 WATER RADIOLYSIS MODEL - DEBUG REPORT
------INITIAL-SPECIES-CONCENTRATIONS-----
READ 3 Eaq-
READ 3 H2
READ 3 O2
READ 3 H2O2
H2O = 553DW
O2g = 101320 xO2 (1000 RT)
H2g = 1E-22 mass transfer - zero will cause floating point overflow
H+ = 10(-1pH) H+ Activity (Effective concentration)
OH- = 10(-1(14-pH))
Appendix
177
------------ARRHENIUS-PARAMETERS-----------------------------
----PRE-EXPONENTIAL-FACTORS-------------------
AAB = 114E13
AAF = 24636E12
AAG = 77E12
AAM = 2479E12
AAN = 24636E12
ABB = 27E12
ABC = 426E11
ABG = 179E11
ABN = 517E12
ABF = 517E12
ACG = 768E9
ACF = 129E11
ACN = 877E11
ACL = 100E12
ADR = 232E10
ADL = 145E13
AFNI = 263E9
AFF = 278E9
ADM = 341E11
AE = 320E11
AG = 3171E4
AAN2 = 31E12
AGQ = 28E11
AFN = 244E9
ANN = 489E8
ACL2 = 45E12
ABF2 = 72E11
ABL = 42E13
AAD = 56E11
AAL = 175E12
ADG = 300E11
AEG = 159E6
AEL = 887E5
AER = 249E5
AFG = 37
AAN3 = 2567E13
ACD = 17E11
ALKb = 295E8
------------------------------
------ACTIVATION-ENERGIES-EaR----
EAB = 17957
EAF = 15636
EAG = 18896
EAM = 14015
EAN = 15636
EBB = 18675
EBC = 10919
EBG = 25336
EBN = 18242
EBF = 18242
ECG = 16614
ECF = 7992
ECN = 13062
ECL = 14346
EDR = 15505
EDL = 29285
Appendix
178
EFNI = 9743
EFF = 24164
EDM = 13449
EE = 55521
EG = 78181
------ACTIVATION-ENERGIES---Ea-J--
EAN2 = 136000
EGQ = 735000
EFN = 86000
ENN = 525900
ECL2 = 156000
EBF2 = 106000
EBL = 256000
EAD = 79000
EAL = 154000
EDG = 156000
EEG = 188400
EEL = 188400
EER = 188400
EFG = 200000
EAN3 = 188000
ECD = 77000
ELKb = 142000
--------------------------------
---------OTHER-LITERATURE-RATE-CONSTANTS--------------------------
KLG = 45E-4 FRDuke TWHaas 1961
KLQ = 55E6 JStaehelin J Hoigne 1982
KKQ = 48E1 LForni EJ Hart 1982
KFQ = 50E8 Pastina La Verne 2001
KNQ = 15E9 EJ Hart 1983
KNE = 10E4 Pastina La Verne 2001
KNG = 13E-1 JWeinstein BBielski 1979
KLN = 823E-2 PBouniol EBjergbakke 2008
KCQ = 11E8 K Sehested EJ Hart 1984
KEC2 = 25E9 K Sehested EJ Hart 1984
KDQ = 10E9 E Bjergbakke H Christensen
KBQ = 22E10 EJ Hart 1983
KCD = 20E10
KDN = 600E8
KEC = 60E9 Sehested Holcman Hart 1984
(269)
KEC = 850E9 P Bouniol E Bjergbakke
KDD = 84E9 Adams GE Boag JW
KDD = 10E8
KED = 70E8 Hart EJ 1984
KEJ = 90E10 Hart EJ
KLK = 3506E5
KLKb = 961E5
-GENERAL-ROUTINE-CONTINUALLY-ITTERATES-THROUGHOUT-CALCULATION-
Appendix
179
COMPILE GENERAL
------TEMPERATURE-RAMPING-ROUTINE----------------
TK = T + 27315
TAB = 1TK
RT = 8314TK
DecTime = TIME 3600
T = (11414 DecTime3 - 80383 DecTime2
+ 19256 DecTime + 22918)
IF(T - Tend)211
LABEL 1
T = Tend
LABEL 2
----------------------
H2O2T = H2O2 + HO2- + O2-- Total peroxide for output use
------------------SETUP-OF-EQUILIBRIA---------------------------------
pKw = (14947 - 4273E-2 T + 2115E-4 T2
- 5786E-7 T3 + 7529E-10 T4)
pKH2O2 = (12383 - 3020E-2 T + 170E-4 T2
- 5151E-7 T3 + 696E-10 T4)
pKOH = (12383 - 3020E-2 T + 170E-4 T2
- 5151E-7 T3 + 696E-10 T4)
pKHO2 = (4943 - 623E-3 T + 4125E-5 T2
- 8182E-9 T3)
pKH = (10551 - 443E-2 T + 1902E-4 T2
- 4661E-7 T3 + 598E-10 T4)
pKH2O = (1669 - 443E-2 T + 2071E-4 T2
- 5594E-7 T3 + 7161E-10 T4)
Kprot = (341E10 + 275E8 T + 124E7 T2
- 623E4 T3 + 131E2 T4)
Khydx = (722E9 + 162E8 T + 24E6 T2
- 781E3 T3 + 106 T4)
pKHO2- = 165 see Bouniol 2001
--------------------PARTITION-OF-O2-AND-H2---------------------
It should be noted that this routine is only valid for
a liquid to gas ratio of 1 See Chapter 3 for details
---------DIFFUSIVITY-WITH-TEMPERATURE---------
DaqO2 = (2E-9 T2 + 4E-7 T + 1E-5)
DaqH2 = (1E-8 T2 + 4E-7 T + 3E-5)
DgO2 = (1E-6 T2 + 12E-3 T + 02073)
DgH2 = (5E-6 T2 + 47E-3 T + 07719)
-----HENRYS-COEFFICIENT-WITH-TEMPERATURE--------------------
KpH2 = (TK (78E-4 EXP(543((1TK) - (129815))))) 122
KpO2 = (TK (13E-3 EXP(1650((1TK) - (129815))))) 122
---H2----
vgH2 = DgH2dg
vaqH2 = DaqH2daq
vintH2 = 1(1vaqH2 + KpH2vgH2)
H2tot = H2 + H2g
Appendix
180
---O2----
vgO2 = DgO2dg
vaqO2 = DaqO2daq
vintO2 = 1(1vaqO2 + KpO2vgO2)
vtot = 1((1(vaqO2))+(1(vgO2KpO2)))
--------PARAMETER-EVOLUTION--------------
kappH2 = vintH2(AintVl)(1 - KpH2(H2gH2))
kappO2 = vintO2(AintVl)(1 - KpO2(O2gO2))
Dose = DOSER (TIME 60)
pHreal = -LOG10( H+ )
--------------------G-VALUES------------------------
G-Values with temperature dependency ONLY
G-Values are initially obtained from literature molec 100eV
G-Values are converted to rates later
GEaq- = 2641 + 4162E-3 T + 9093E-6 T2 - 4717E-8 T3
GH2 = 0419 + 872E-4 T - 4971E-6 T2 + 1503E-8 T3
GOH = 2531 + 1134E-2 T - 1269E-5 T2 + 3513E-8 T3
GH2O2 = 0752 - 162E-3 T
GH = 0556 + 2198E-3 T - 1184E-5 T2 + 5223E-8 T3
GH+ = GEaq-
G-H2O = GOH + 2GH2O2
-----------------------------------------------------
------------G-VALUES-FROM-MULTIPLE-POLYNOMIAL-REGRESSION-----
Multiple polynomial regression was used to combine data that measured
primary yields as a function of temperature AND as a function of pH
GEaq- = 2798 + 285E-3 T - 2514E-2 pHreal
GH2 = 38781E-1 + 8288E-4 T + 5988E-4 pHreal
GOH = 243146 + 1111E-2 T - 12E-3 pHreal
GH = 4444E-1 + 367E-3 T - 2378E-4 pHreal
GH+ = GEaq-
GH2O2 = 05(GH + GEaq- + (2 GH2) - GOH) Material Balance
G-H2O = GOH + 2GH2O2
MB1 = GH + GEaq- + (2 GH2) Diagnostic Material Balance Variables
MB2 = GOH + (2 GH2O2)
-------------------G-VALUES--AS--RATES--------------
GREaq- = (ADOSE GEaq-)6022E23
GRH = (ADOSE GH)6022E23
GRH2 = (ADOSE GH2)6022E23
GROH = (ADOSE GOH)6022E23
GRH2O2 =(ADOSE GH2O2)6022E23
GRH+ = (ADOSE GH+)6022E23
GROH- = (ADOSE GOH-)6022E23
GR-H2O = (ADOSE G-H2O)6022E23
GRO2 = (ADOSE GO2)6022E23
GRO2- = (ADOSE GO2-)6022E23
GRHO2 = (ADOSE GHO2)6022E23
GRHO2- = (ADOSE GHO2-)6022E23
Appendix
181
------REACTION-RATES-WITH-TEMP-DEPENDENCY--
--------POLYNOMIAL-EQUATIONS----------------
KAA = 10(12281 - 3768E2 TAB - 6673E4 TAB2 - 1075E7 TAB3)
KAC = 10(13123 - 1023E3 TAB + 7634E4 TAB2)
KBM = 10(10704 + 2840E2 TAB - 137E5 TAB2)
KCC = 10(8054 + 2193E3 TAB - 7395E5 TAB2 + 687E7 TAB3)
KJK = 10(20934 - 1236E4 TAB + 6364E6 TAB2
- 1475E9 TAB3 + 1237E11 TAB4)
KJN = 10(1641 - 4888E3 TAB + 1622E6 TAB2 - 2004E8 TAB3)
KCK = 10(13339 - 222E3 TAB + 7333E5 TAB2 - 1065E8 TAB3)
KJA = 10(39127 - 3888E4 TAB + 2054E7 TAB2 - 4899E9 TAB3
+ 4376E11 TAB4)
KBK = 10(22970 - 1971E4 TAB + 1137E7 TAB2 - 2991E9 TAB3
+ 2803E11 TAB4)
KBI = 10(9408 - 2827E3 TAB - 3792E5 TAB2)
KRC = 10(-11556 + 32546E4 TAB - 18623E7 TAB2
+ 45543E9 TAB3 - 41364E11 TAB4)
------------ARRHENIUS-EQUATIONS------------------
----------EaR-------------------
KAB = AAB(EXP(-EABTK))
KAF = AAF(EXP(-EAFTK))
KAG = AAG(EXP(-EAGTK))
KAM = AAM(EXP(-EAMTK))
KAN = AAN(EXP(-EANTK))
KBB = ABB(EXP(-EBBTK))
KBC = ABC(EXP(-EBCTK))
KBG = ABG(EXP(-EBGTK))
KBN = ABN(EXP(-EBNTK))
KBF = ABF(EXP(-EBFTK))
KCG = ACG(EXP(-ECGTK))
KCF = ACF(EXP(-ECFTK))
KCN = ACN(EXP(-ECNTK))
KCL = ACL(EXP(-ECLTK))
KDR = ADR(EXP(-EDRTK))
KDL = ADL(EXP(-EDLTK))
KFNI = AFNI(EXP(-EFNITK))
KFF = AFF(EXP(-EFFTK))
KDM = ADM(EXP(-EDMTK))
KE = AE(EXP(-EETK))
KG = AG(EXP(-EGTK))
---------Ea-----------------
KAN2 = AAN2EXP(-EAN2RT)
KGQ = AGQEXP(-EGQRT) KSehested EJ Hart1992
KFN = AFNEXP(-EFNRT) BBielski ARoss 1985
KNN = ANNEXP(-ENNRT) Eliot
KCL2 = ACL2EXP(-ECL2RT) Eliot
KBF2 = ABF2EXP(-EBF2RT) Eliot
KBL = ABLEXP(-EBLRT) SP Mezyk DM Bartels
KAD = AADEXP(-EADRT) Eliot
KAL = AALEXP(-EALRT)
KDG = ADGEXP(-EDGRT)
KEG = AEGEA Wren amp Ball
Appendix
182
KEL = AELEA Wren amp Ball
KER = (AEREA) Wren (Suggests 8 correction)
KFG = 50E-1
KAN3 = AAN3EXP(-EAN3RT)
KCD = ACDEXP(-ECDRT)
-----------EQUILIBRIA---------------------------------------
KCKb = KCK ((10(-pKH2O))(10(-pKOH)))
KI = KJK(10-pKw)
KF = KJN (10-pKHO2)
KJL = KJN
KGK = KCK
KDI = KCK((10-pKH2O)(10-pKOH))
KLI = KCK((10-pKH2O)(10-pKH2O2))
KJD = KJN
KC = KJD(10-pKOH)
KFK = KCK
KNI = KFK((10-pKH2O)(10-pKHO2))
KB = KJA(10-pKH)
KAI = KBK((10-pKH2O)(10-pKH))
KJNb = KJN(10-pKH2O2)((10(-pKw))(10(-pKHO2)))
GENERAL
-------EQUATIONS-ROUTINE-CONTAINS-RADIOLYSIS-CHEMISTRY--------
COMPILE EQUATIONS
------INITIAL-SPECIES-GENERATION----------------------------
Ralt0gtGREaq- = Eaq- + G0
Ralt1gtGRH = H + G1
Ralt2gtGRH2 = H2 + G2
Ralt3gtGROH = OH + G3
Ralt4gtGRH2O2 = H2O2 + G4
Ralt5gtGRH+ = H+ + G5
Ralt6gtGROH- = OH- + G6
Ralt7gtGR-H2OH2O H2O = G7
----------REACTIONS------------------------
Ralt8gtKAA(H2OH2O) Eaq- + Eaq- + H2O + H2O = H2 + OH- + OH- + R0
Ralt9gtKABH2O Eaq- + H + H2O = H2 + OH- + R1
Ralt10gtKAC Eaq- + OH = OH- + R2
Ralt11gtKADH2O Eaq- + H2O + O- = OH- + OH- + R3
Ralt12gtKAG Eaq- + H2O2 = OH- + OH + R4
Ralt13gtKAF Eaq- + HO2 = HO2- + R5
Ralt14gtKAL Eaq- + HO2- = O- + OH- + R6
Ralt15gtKAM Eaq- + O2 = O2- + R7
Ralt16gtKAN Eaq- + O2- = O2-- + R8
Ralt17gtKBB H + H = H2 + R9
Ralt18gtKBC H + OH = H2O + R10
Ralt19gtKBG H + H2O2 = OH + H2O + R11
Rblt0gtKBM H + O2 = HO2 + R12
Rblt1gtKBN H + O2- = HO2- + R13
Rblt2gtKBF H + HO2 = OH + OH + R14
Rblt3gtKBL H + HO2- = OH + OH- + R15
Rblt4gtKBQ H + O3 = OH + O2 + R16
Rblt5gtKCC OH + OH = H2O2 + R17
Rblt6gtKCG OH + H2O2 = H2O + HO2 + R18
Rblt7gtKCL OH + HO2- = OH- + HO2 + R19
Rblt8gtKCF OH + HO2 = H2O + O2 + R20
Appendix
183
Rblt9gtKCN OH + O2- = OH- + O2 + R21
Rblt10gtKCQ OH + O3 = O2 + HO2 + R22
Rblt11gtKEG O3- + H2O2 = O2- + O2 + H2O + R23
Rblt12gtKEL O3- + HO2- = O2- + O2 + OH- + R24
Rblt13gtKER O3- + H2 = O2 + H + OH- + R25
Rblt14gtKEC O3- + OH = HO2 + O2- + R26
Rblt15gtKEC2 O3- + OH = OH- + O3 + R27
Rblt16gtKEJ O3- + H+ = OH + O2 + R28
Rblt17gtKNN O2- + O2- = O2 + O2-- + R29
Rblt18gtKLN O2- + HO2- = O2 + OH- + O- + R30
Rblt19gtKNG O2- + H2O2 = O2 + OH + OH- + R31
Rclt1gtKFN O2- + HO2 = O2 + HO2- + R32
Rclt2gtKNE O2- + O3- = O-- + O2 + O2 + R33
Rclt3gtKNQ O2- + O3 = O2 + O3- + R34
Rclt4gtKFF HO2 + HO2 = H2O2 + O2 + R35
Rclt5gtKFG HO2 + H2O2 = O2 + H2O + OH + R36
Rclt6gtKFQ HO2 + O3 = OH + O2 + O2 + R37
Rclt7gtKLG H2O2 + HO2- = H2O + O2 + OH- + R38
Rclt8gtKKQ O3 + OH- = O2 + HO2- + R39
Rclt9gtKLQ O3 + HO2- = O2 + OH + O2- + R40
Rclt10gtKGQ O3 + H2O2 = O2 + OH + HO2 + R41
------------------ADDITIONAL-WATER-CHEMISTRY------------------------
Rclt12gt200E10 H + O- = OH- + R42 Bjergbakke Draganic
Sehested
Rclt13gt16E10 O3- + Eaq- = OH- + OH- + O2 + R43 Pastina amp La
Verne
Rclt14gt36E10 O3 + Eaq- = O3- + R44 NIST
Rclt16gt23E-7 H2O2 = OH + OH + R45 Yakabuskie et al
Rclt17gt10E10H2O O-- + H2O = OH- + OH- + R46
Bouniol and Bjergbakke 2008
----------------ALKALI-REACTIONS------------------
Relt2gtKDR O- + H2 = H + OH- + R47
Relt3gtKDG O- + H2O2 = OH- + HO2 + R48
Relt4gtKDL O- + HO2- = O2- + OH- + R49
Relt5gtKDN O- + O2- = O-- + O2 + R50
Relt6gtKDD O- + O- = O2-- + R51
Relt7gtKCD O- + OH = HO2- + R52
Relt8gtKED O- + O3- = O2- + O2- + R53
Relt9gtKDQ O- + O3 = O2- + O2 + R54
----------EQUILIBRIUM-REACTIONS--------------------
Rclt18gtKIH2O H2O = H+ + OH- + R55
Rclt19gtKJK H+ + OH- = H2O + R56
Rdlt0gtKJN10(-pKH2O2) H2O2 = H+ + HO2- + R57
Rdlt1gtKJN H+ + HO2- = H2O2 + R58
Rdlt2gtKCK H2O2 + OH- = HO2- + H2O + R59
Rdlt3gtKLIH2O HO2- + H2O = H2O2 + OH- + R60
Rdlt4gtKLK HO2- + OH- = O2-- + H2O + R61
Rdlt5gtKLKbH2O O2-- + H2O = HO2- + OH- + R62
Rdlt6gtKJN10(-pKOH) OH = H+ + O- + R63
Rdlt7gtKJN H+ + O- = OH + R64
Appendix
184
Rdlt8gtKCK OH + OH- = O- + H2O + R65
Rdlt9gtKCKbH2O O- + H2O = OH + OH- + R66
Rdlt10gtKDM O- + O2 = O3- + R67
Rdlt11gtKE O3- = O- + O2 + R68
Rdlt12gtKF HO2 = H+ + O2- + R69
Rdlt13gtKJN H+ + O2- = HO2 + R70
Rdlt14gtKFK HO2 + OH- = O2- + H2O + R71
Rdlt15gtKNIH2O O2- + H2O = HO2 + OH- + R72
Rdlt16gtKB H = H+ + Eaq- + R73
Rdlt17gtKJA H+ + Eaq- = H + R74
Rdlt18gtKBK H + OH- = Eaq- + H2O + R75
Rdlt19gtKAIH2O Eaq- + H2O = H + OH- + R76
Relt0gtKBIH2O H + H2O = H2 + OH + R77
Relt1gtKRC H2 + OH = H + H2O + R78
---------------MASS-TRANSFER----------------------
GRlt0gtkappH2 H2 = H2g + R79
GRlt1gtkappO2 O2 = O2g + R80
-------OUTPUTS-ROUTINE-------
SETPSTREAM 3 1 20
OH H H2 H2g H2O2 O2 O2g H+ OH- Eaq-
O2- O2-- HO2 HO2- O- O-- O3- O O3
SETPSTREAM 4 11 20
R0 R1 R2 R3 R4 R5 R6 R7 R8 R9 R10 R11 R12 R13 R14 R15 R16
R17 R18 R19
SETPSTREAM 5 12 20
R20 R21 R22 R23 R24 R25 R26 R27 R28 R29 R30
R31 R32 R33 R34 R35 R36 R37 R38 R39
SETPSTREAM 6 15 20
R40 R41 R42 R43 R44 R45 R46 R47 R48 R49
R50 R51 R52 R53 R54 R55 R56 R57 R58 R59
SETPSTREAM 7 16 20
R60 R61 R62 R63 R64 R65 R66 R67 R68 R69
R70 R71 R72 R73 R74 R75 R76 R77 R78 R79
Appendix
185
SETPSTREAM 8 17 20
R80 R81 R82 R83 G1 G2 G3
G4 G5 G6 G7 G8
COMPILE OUT
PSTREAM 3
PSTREAM 4
PSTREAM 5
PSTREAM 6
PSTREAM 7
PSTREAM 8
WRITE 2 250 (N20 E10 2) Ra
WRITE 3 250 (N20 E10 2) Rb
WRITE 4 250 (N20 E10 2) Rc
WRITE 8 250 (N20 E10 2) Rd
WRITE 7 250 (N10 E10 2) Re
WRITE 10 (N2 E10 2) GR
WRITE 12 (E10 2) TIME
WHENEVER
TIME = TPrint Call Report
TIME = 0 + 600 RUNt CALL OUT
------------DEBUG-REPORT---------------
-Contains a list of all parameters to
confirm that values are correct-
COMPILE Report
WRITE 1 THIS REPORT IS GENERATED AT TPrint SECONDS
WRITE 1 RUNt = RUNt
WRITE 1 KpH2 = (E12 3) KpH2
WRITE 1 KpO2 = (E12 3) KpO2
WRITE 1 pH = (F6 1) pH
WRITE 1 Temperature = (F6 1) T C
WRITE 1 Dose Rate = (F6 1) DOSER Gymin
WRITE 1 VgVl Ratio = (F6 2) Vr
WRITE 1 Run Time = (F12 2) RUNt Mins
WRITE 1 Oxygen Fraction = (F6 3) xO2
WRITE 1 G-VALUES
WRITE 1 G(Eaq-) = (F6 3) GEaq-
WRITE 1 G(H) = (F6 3) GH
WRITE 1 G(H2) = (F6 3) GH2
WRITE 1 G(OH) = (F6 3) GOH
WRITE 1 G(H2O2) = (F6 3) GH2O2
WRITE 1 G(H+) = (F6 3) GH+
WRITE 1 G(-H2O) = (F6 3) G-H2O
WRITE 1 G-VALUES AS RATES MOLLS
WRITE 1 GREaq- = (E12 3) GREaq-
WRITE 1 GRH = (E12 3) GRH
WRITE 1 GRH2 = (E12 3) GRH2
WRITE 1 GROH = (E12 3) GROH
WRITE 1 GRH2O2 = (E12 3) GRH2O2
WRITE 1 GRH+ = (E12 3) GRH+
WRITE 1 GR-H2O = (E12 3) GR-H2O
WRITE 1 RATE CONSTANTS
WRITE 1 KAA = (E12 3) KAA
WRITE 1 KAB = (E12 3) KAB
Appendix
186
WRITE 1 KAC = (E12 3) KAC
WRITE 1 KAD = (E12 3) KAD
WRITE 1 KAG = (E12 3) KAG
WRITE 1 KAF = (E12 3) KAF
WRITE 1 KAL = (E12 3) KAL
WRITE 1 KAM = (E12 3) KAM
WRITE 1 KAN = (E12 3) KAN
WRITE 1 KBB = (E12 3) KBB
WRITE 1 KBC = (E12 3) KBC
WRITE 1 KBG = (E12 3) KBG
WRITE 1 KBM = (E12 3) KBM
WRITE 1 KBN = (E12 3) KBN
WRITE 1 KBF = (E12 3) KBF
WRITE 1 KBF2 = (E12 3) KBF2
WRITE 1 KBL = (E12 3) KBL
WRITE 1 KBQ = (E12 3) KBQ
WRITE 1 KCC = (E12 3) KCC
WRITE 1 KCD = (E12 3) KCD
WRITE 1 KCG = (E12 3) KCG
WRITE 1 KCL = (E12 3) KCL
WRITE 1 KCF = (E12 3) KCF
WRITE 1 KCN = (E12 3) KCN
WRITE 1 KCQ = (E12 3) KCQ
WRITE 1 KDR = (E12 3) KDR
WRITE 1 KDG = (E12 3) KDG
WRITE 1 KDL = (E12 3) KDL
WRITE 1 KDN = (E12 3) KDN
WRITE 1 KEG = (E12 3) KEG
WRITE 1 KEL = (E12 3) KEL
WRITE 1 KER = (E12 3) KER
WRITE 1 KEC = (E12 3) KEC
WRITE 1 KED = (E12 3) KED
WRITE 1 KNN = (E12 3) KNN
WRITE 1 KFN = (E12 3) KFN
WRITE 1 KFNI = (E12 3) KFNI
WRITE 1 KFF = (E12 3) KFF
WRITE 1 KFG = (E12 3) KFG
WRITE 1 KI = (E12 3) KI
WRITE 1 KJK = (E12 3) KJK
WRITE 1 KG = (E12 3) KG
WRITE 1 KJL = (E12 3) KJL
WRITE 1 KGK = (E12 3) KGK
WRITE 1 KLI = (E12 3) KLI
WRITE 1 KC = (E12 3) KC
WRITE 1 KJD = (E12 3) KJD
WRITE 1 KCK = (E12 3) KCK
WRITE 1 KDI = (E12 3) KDI
WRITE 1 KDM = (E12 3) KDM
WRITE 1 KE = (E12 3) KE
WRITE 1 KF = (E12 3) KF
WRITE 1 KJN = (E12 3) KJN
WRITE 1 KFK = (E12 3) KFK
WRITE 1 KNI = (E12 3) KNI
WRITE 1 KB = (E12 3) KB
WRITE 1 KJA = (E12 3) KJA
WRITE 1 KBK = (E12 3) KBK
WRITE 1 KAI = (E12 3) KAI
WRITE 1 KBI = (E12 3) KBI
WRITE 1 KRC = (E12 3) KRC
Appendix
187
WRITE 1 KJNb = (E12 3) KJNB
WRITE 1 KCKb = (E12 3) KCKb
WRITE 1 KLK = (E12 3) KLK
WRITE 1 KLKb = (E12 3) KLKb
WRITE 1 KDD = (E12 3) KDD
WRITE 1 KEJ = (E12 3) KEJ
WRITE 1 KBQ = (E12 3) KBQ
WRITE 1 KDQ = (E12 3) KDQ
WRITE 1 KCL2 = (E12 3) KCL2
WRITE 1 KCQ = (E12 3) KCQ
WRITE 1 KNQ = (E12 3) KNQ
WRITE 1 KFQ = (E12 3) KFQ
WRITE 1 KNG = (E12 3) KNG
WRITE 1 KNE = (E12 3) KNE
WRITE 1 KKQ = (E12 3) KKQ
WRITE 1 KLQ = (E12 3) KLQ
WRITE 1 KGQ = (E12 3) KGQ
WRITE 1 KLG = (E12 3) KLG
WRITE 1 KLN = (E12 3) KLN
WRITE 1 KEC2 = (E12 3) KEC2
WRITE 1 KAN2 = (E12 3) KAN2
WRITE 1 KRC = (E12 3) KRC
WRITE 1 ----PRE-EXPONENTIAL-FACTORS----
WRITE 1 AAB = (E12 3) AAB
WRITE 1 AAF = (E12 3) AAF
WRITE 1 AAG = (E12 3) AAG
WRITE 1 AAM = (E12 3) AAM
WRITE 1 AAN = (E12 3) AAN
WRITE 1 ABB = (E12 3) ABB
WRITE 1 ABC = (E12 3) ABC
WRITE 1 ABG = (E12 3) ABG
WRITE 1 ABN = (E12 3) ABN
WRITE 1 ABF = (E12 3) ABF
WRITE 1 ACF = (E12 3) ACF
WRITE 1 ACL = (E12 3) ACL
WRITE 1 ACG = (E12 3) ACG
WRITE 1 ACN = (E12 3) ACN
WRITE 1 ADR = (E12 3) ADR
WRITE 1 ADL = (E12 3) ADL
WRITE 1 AFNI = (E12 3) AFNI
WRITE 1 AFF = (E12 3) AFF
WRITE 1 ADM = (E12 3) ADM
WRITE 1 AG = (E12 3) AG
WRITE 1 AAN2 = (E12 3) AAN2
WRITE 1 AGQ = (E12 3) AGQ
WRITE 1 AFN = (E12 3) AFN
WRITE 1 ANN = (E12 3) ANN
WRITE 1 ACL2 = (E12 3) ACL2
WRITE 1 ABF2 = (E12 3) ABF2
WRITE 1 ABL = (E12 3) ABL
WRITE 1 AAD = (E12 3) AAD
WRITE 1 AAL = (E12 3) AAL
WRITE 1 ADG = (E12 3) ADG
WRITE 1 AEG = (E12 3) AEG
WRITE 1 AEL = (E12 3) AEL
WRITE 1 AER = (E12 3) AER
WRITE 1 AFG = (E12 3) AFG
WRITE 1 ----ACTIVATION ENERGIES----
WRITE 1 EAG = (E12 3) EAG
Appendix
188
WRITE 1 EAM = (E12 3) EAM
WRITE 1 EAN = (E12 3) EAN
WRITE 1 EBG = (E12 3) EBG
WRITE 1 ECG = (E12 3) ECG
WRITE 1 ECL = (E12 3) ECL
WRITE 1 ECF = (E12 3) ECF
WRITE 1 ECN = (E12 3) ECN
WRITE 1 EFN = (E12 3) EFN
WRITE 1 EFNI = (E12 3) EFNI
WRITE 1 ECL2 = (E12 3) ECL2
WRITE 1 EAN2 = (E12 3) EAN2
WRITE 1 ---pKa----
WRITE 1 pKw = (E12 3) pKw
WRITE 1 pKH2O2 = (E12 3) pKH2O2
WRITE 1 pKHO2 = (E12 3) pKHO2
WRITE 1 pKOH = (E12 3) pKOH
WRITE 1 pKH = (E12 3) pKH
WRITE 1 pKH2O = (E12 3) pKH2O
WRITE 1 Kprot = (E12 3) Kprot
WRITE 1 Khydx = (E12 3) Khydx
WRITE 1 KappO2 = (E12 3) kappO2
WRITE 1 KappH2 = (E12 3) kappH2
WRITE 1 H2O2 Equ rate = (E12 3) EqR
SETHMAX 1
BEGIN
STOP
Appendix
189
Radiolysis Model Full Reaction Scheme
Primary Reaction G-value
(Molecules100eV) Temperature Dependency Ref
G0 H2O emacraq 271 2641 + 416210-3
t + 909310-6 t2
ndash 471710-8 t3 45
G1 H2O H 054 0556 + 219810-3 t ndash 118410-5 t2 + 522310-8 t3 45
G2 H2O H2 041 0419 + 872110-4 t - 497110-6 t2 + 150310-8 t3 45
G3 H2O OH 270 2531 + 113410-2 t ndash 126910-5 t2 + 351310-8 t3 45
G4 H2O H2O2 068 0752 ndash 162010-3 t 45
G5 H2O H+ 271 2641 + 416210-3
t + 909310-6 t2
ndash 471710-8 t3 45
Chemical Reaction Rate Constant
k (M-1 s-1 25degC) Arrhenius Activation Energy Ea
(kJ) Ref
R0 emacraq + emacr
aq rarr H2 + 2OHmacr 7260 times109 Log kR7 = 12281 ndash 3768102T ndash 6673104T2 - 1075107T3 45
R1 emacraq + H rarr H2 + OHmacr 2762 times1010
114 times1013 14929 45
R2 emacraq + OH rarr OHmacr 3553 times1010
Log kR9 = 13123 ndash 1023103T + 7634104T2 45
R3 emacraq + Omacr rarr 2OHmacr 2313 times1010
56 times1011 79 49
R4 emacraq + H2O2 rarr OHmacr + OH 1362 times1010
77 times1012 1571 45
R5 emacraq + HO2 rarr HO2
macr 1300 times1010 246 times1012 130 45
R6 emacraq + HO2
macr rarr Omacr + OHmacr 3507 times109 175 times1012 154 49
R7 emacraq + O2 rarr O2
macr 2253 times1010 252 times1012 11652 45
R8 emacraq + O2
macr rarr O22macr + H2O 1300times1010
31 times1012 136 4349
R9 H + H rarr H2 5142 times109 27 times1012 15526 45
R10 H + OH rarr H2O 1094 times1010 426 times1011 9078 45
R11 H + H2O2 rarr OH + H2O 3650 times107 179 times1011 21064 45
R12 H + O2 rarr HO2 1304 times1010
Log kR23 = 10704 + 2840102T - 1369105T2 45
R13 H + O2
macr rarr HO2macr 1138 times1010
517 times1012 15166 45
R14 H + HO2 rarr 2OH 1138 times1010 517 times1012 15166 45
R15 H + HO2macr rarr OH + OHmacr 1374times109
42 times1013 256 85
R16 H + O3 rarr OH + O2 2200 times1010 No temperature dependence available 43
R17 OH + OH rarr H2O2 4814 times109 Log kR25 = 8054 + 2193103T ndash 7395105T2 + 6870107T3
45
R18 OH + H2O2 rarr H2O + HO2 2920 times107 768times109 13813 45
R19 OH + HO2macr rarr OHmacr + HO2 8134 times109
100 times1012 11927 45
R20 OH + HO2 rarr H2O + O2 8840 times109
129 times1011 6645 45
Appendix
190
R21 OH + O2
macr rarr OHmacr + O2 1097 times1010 877 times1011 10860 45
R22 OH + O3 rarr HO2 + O2 1100 times108
No temperature dependence available 43
R23 O3macr + H2O2 rarr O2
macr + O2 + H2O 1590 times106 xEXP(188times103 (129815 ndash 1TK)R) 43
R24 O3macr + HO2
macr rarr O2macr + O2 + OHmacr 8870 times105
xEXP(188times103 (129815 ndash 1TK)R) 43
R25 O3macr + H2 rarr O2 + H + OHmacr 2490times105
xEXP(188times103 (129815 ndash 1TK)R) 46
R26 O3
macr + OH rarr HO2 + O2macr 6000 times109 No temperature dependence
available 46 43
R27 O3
macr + OH rarr HOmacr + O3 2500 times109 No temperature dependence available
46 43
R28 O3
macr + H+ rarr O2 + OH 9000 times1010 No temperature dependence available
4 43
R29 O2
macr + O2macr rarr O2 + O2
2macr 2988times10-1 489 times108 5259 43
R30 O2
macr + HO2macr rarr O2 + Omacr + OHmacr 8230 times10-2 No temperature dependence
available 4 43
R31 O2
macr + H2O2 rarr O2 + OH + OHmacr 1300 times10-1 No temperature dependence
available 4 43
R32 O2
macr + HO2 rarr O2 + HO2macr 7597times107
244 times109 86 43
R33 O2
macr + O3macr rarr O2-
+ 2O2 1000 times104 No temperature dependence available
47 43
R34 O2
macr + O3 rarr O3macr + O2 1500 times109 No temperature dependence
available 4 43
R35 HO2 + HO2 rarr H2O2 + O2 8399 times105
278 times109 201 45
R36 HO2 + H2O2 rarr O2 + H2O + OH 5000 times10-1 No temperature dependence
available 4 49
R37 HO2 + O3 rarr OH + 2O2 5000 times108 No temperature dependence
available 4 43
R38 H2O2 + HO2
macr rarr O2 + H2O + OHmacr 450times10-4 No temperature dependence available
4 43
R39 O3 + OHmacr rarr HO2
macr + O2 4800 times101 No temperature dependence available
4 43
R40 O3 + HO2
macr rarr OH + O2 + O2macr 5500 times106 No temperature dependence
available 4 43
R41 O3 + H2O2 rarr OH + O2 + HO2 3714 times10-2
28 times1011 735 43
R42 H +Omacr rarr OHmacr 2000times1010 No temperature dependence
available 4 43
R43 O3
macr + emacraq rarr 2OHmacr + O2 1600times1010 No temperature dependence
available 47 43
R44 O3 + emacr
aq rarr O3macr 3600 times1010 No temperature dependence
available 4 43
R45 H2O2 rarr 2OH 2300 times10-7 No temperature dependence
available - 86
R46 O2- + H2O rarr 2OH- 1000 times1010 No temperature dependence
available - 43
R47 Omacr + H2 rarr H + OHmacr 1279 times108
232 times1010 12891 45
R48 Omacr + H2O2 rarr O2
macr + H2O 5546 times108 30 times1011 156 49
R49 Omacr + HO2
macr rarr O2macr + OHmacr 7864 times108
145 times1013 24348 45
R50 Omacr + O2
macr rarr O2macr + O2 6000 times108 No temperature dependence available
46 43
R51 Omacr + Omacr rarr O2
2macr 1000times108 No temperature dependence available
4 43
R52 Omacr + OH rarr HO2
macr 7610 times109 17 times1011 77 49
Appendix
191
R53 Omacr + O3macr rarr 2O2
macr 7000times108 No temperature dependence available
46 43
R54 Omacr
+ O3 rarr O2macr + O2 1000 times109 No temperature dependence
available 4 43
Equilibria
kf
(M-1 s-1)
kb
(M-1 s-1) Temperature Dependence pKa
(25degC)
R5556 H2O H+ + OHmacr 1172 times10-3 1178times1011 Log kR67 = 20934 - 1236x104T + 6364x106T2 ndash 1475x109T3 +
1237x1011T4 1575 45
R5758 H2O2 H+ + HO2macr 8900 times10-2 4780times1010 Log kR68 = 16410 ndash 4888x10
3T + 1622x10
6T
2 ndash 2004x10
8T
3 1173 45
R5960 H2O2 + OHmacr HO2
macr + H2O
1265 times1010 1403 times106 Log kR75 = 13339 ndash 2220x103T + 7333x10
5T
2 ndash 1065x10
8T
3
1198701198672119874
11987011986721198742 45
R6162 HO2macr + OHmacr O2
2macr + H2O 3506 times105 1103 times106 339times108 142 165 43
R6364 OH H+ + Omacr 8900 times10-2 4780times1010 Log kR66 = 16410 ndash 4888x103T + 1622x106T2 ndash 2004x108T3 1173 45
R6566 OH + OHmacr Omacr + H2O 1265 times1010 1403 times106 Log kR72 = 13339 ndash 2220x103T + 7333x105T2 ndash 1065x108T3 1198701198672119874
119870119874119867 45
R6768 Omacr + O2 O3macr 3747 times109 2617 times103 341 times1011 11182 Forward 45
320 times1011 4616 Reverse 45
R6970 HO2 H+ + O2macr 4780 times1010 7354 times105 Log kR69 = 16410 ndash 4888x103T + 1622x106T2 ndash 2004x108T3 481 45
R7172 HO2 + OHmacr O2macr + H2O 1265 times1010 1628 times10-1 Log kR75 = 13339 ndash 2220x103T + 7333x105T2 ndash 1065x108T3
1198701198672119874
1198701198671198742 45
R7374 H emacraq + H+ 5832 2095times1010
Log kR74 = 39127 - 3888E4T + 2054E7T2 - 4899E9T3 + 4376E11T4
955 45
R7576 H + OHmacr emacraq + H2O 2440 times107 1735 times101
Log kR70 = 22970 ndash1971x104T + 1137x107T2 ndash 2991x109T3 + 2803x1011T4
1198701198672119874
119870119867 45
R7778 H + H2O H2 + OH 4575 times10-5 3954 times107
Log kR71f = 9408 ndash 2827x103 Tndash 3792x105T2 45
Log kR71b = -11556 + 32546x104T - 18623x107T2 + 45543x109T3 - 41364x1011T4
45
R79 H2(aq) H2(g) 2687times10-3 See Chapter 3
R80 O2(aq) O2(g) 1033times10-4 See Chapter 3

Table of Contents
3
Chapter 5 Radiolysis of Magnesium Hydroxide 122
Context 122
Method 123
Results 124
Discussion 128
Chapter 6 Radiolysis of Methanol Solutions 135
Context 135
Experimental Method 135
Results 136
Discussion 139
Chapter 7 Radiolysis of Iron Oxide-Water Systems 148
Context 148
Method 148
Results 149
Discussion 151
Chapter 8 Conclusions and Further Work 154
Further High pH Investigations 154
Further Methanol Radiolysis Investigations 156
Future Development of a Multi-Scale Radiolysis Model 157
Closing Remarks Relevant to Sellafield Ltd 158
References 160
Appendix 172
Radiolysis Model Code 172
Radiolysis Model Full Reaction Scheme 189
List of Figures
4
List of Figures
Figure 1 An aerial view of the Sellafield Site which covers approximately 6 km2 Image
provided by Sellafield Ltd Press Office 19
Figure 2 On the left is The First Generation Magnox Storage Pond (FGMSP) and on the right
are the Magnox Swarf Storage Silos (MSSS) Images provided by Sellafield Ltd Press Office 20
Figure 3 A representation demonstrating the uniform excitations and ionisations of UV
radiation compared to the structured tracks of alpha radiation 22
Figure 4 A representation of the photoelectric effect Image recreated from Spinks and Wood2
25
Figure 5 A representation of the Compton Effect Image recreated from Spinks and Wood 26
Figure 6 A representation of pair production and positron annihilation Image recreated from
Spinks and Wood2 27
Figure 7 A scheme showing the early stages of water radiolysis and the production of primary
species 29
Figure 8 A decay scheme for cobalt-60 41
Figure 9 Image on the left shows the Model-812 Irradiator On the right is the inside of the
irradiator showing the three guide rods that contain the cobalt-60 source during irradiation 42
Figure 10 Sample holding devices for use in the Model-812 Left is the 4x8 rack with its
schematic below On the right is the inverter rig again with its schematic below 46
Figure 11 A diagram of the purification system that provides the ultra-pure water used
throughout this work Image was taken from the ELGA PURELAB user manual 50
Figure 12 Structure of Potassium phthalate monobasic (C8H5KO4) 51
Figure 13 Scanned absorption spectra of a 625 μM H2O2 solution 53
Figure 14 A calibration curve of H2O2 photometric absorption to determine the molar
extinction coefficient 54
Figure 15 The modified SRI 8610C Gas chromatograph with inline ldquocrush tuberdquo setup The
sample can be seen inside the silicone tubing 56
Figure 16 Image on the left shows a schematic for the sampling apparatus on the right are the
vials used which are flame sealed at the midway neck 57
List of Figures
5
Figure 17 A schematic of the original setup for the 10-port sampling valve in both off (top
image) and on (bottom image) positions 58
Figure 18 A schematic for the modified 10-port sampling valve including the removal of the
silica gel column 59
Figure 19 Image on the left shows the bespoke frac14 inch OD 13x molecular sieve column On the
right the rotameter is connected to calibrate gas flow rates 60
Figure 20 A calibration curve to provide a conversion to determine carrier gas flow rate 61
Figure 21 A schematic of a Wheatstone bridge circuit used in the TCD 62
Figure 22 A calibration curve for quantifying hydrogen gas from chromatograms 63
Figure 23 Method validation by the determination of the well-established primary yield of H2
through hydroxyl scavenging by bromide 65
Figure 24 Collected data from literature showing measured primary yields as a function of
temperature Provided by Elliot and Bartels 2008 75
Figure 25 A comparison of the sample temperature profile logged by thermocouple to the
temperature profile calculated in the computational model 76
Figure 26 A reproduction of data provided by Hayon 82
Figure 27 An example of a Bragg peak Energy loss of alphas of 549 MeV in Air Image
released to public domain 83
Figure 28 A schematic representation of how linear energy transfer (LET) alters the
distribution of spurs along a radiation track Image was recreated from Allen AO 84
Figure 29 Simulation data showing the effects of increasing linear energy transfer on the
primary yields of water radiolysis Image was recreated from Allen AO 85
Figure 30 A representation of the stagnant two-film model used to calculate the partitioning of
volatile species 87
Figure 31 The diffusivity of O2 and H2 in both water and air as a function of temperature88
Figure 32 Measurements of H2O2 concentration as a function of dose for aerated water (diams) and
deaerated water (diams) Vertical error bars show the standard deviation between replicates while
horizontal error bars show the dose range for replicates 98
List of Figures
6
Figure 33 Measurements of H2 as a function of dose in aerated (diams) and deaerated (diams) samples
Vertical error bars show the standard deviation of replicates while horizontal error bars show the
dose range for replicates 99
Figure 34 Predicted concentrations of H2O2 as calculated by the radiolysis model for both
aerated () and deaerated () conditions 102
Figure 35 Predicted concentrations of H2 gas as calculated by the radiolysis model for both
aerated () and deaerated () conditions 102
Figure 36 Calculated concentrations of the major oxidising and reducing water radiolysis
species as a function of dose Solid lines represent aerated conditions while broken lines
represent deaerated conditions 103
Figure 37 Measurements of H2O2 concentrations as a function of dose for samples initially at
pH 7 (diams) pH 104 (diams) pH 11 (diams) pH 123 (diams) and pH 127 (diams) All samples were aerated
Vertical error bars are the standard deviation between replicates while horizontal error bars
show the dose range for replicates 106
Figure 38 Measurements of H2 gas as a function of dose at pH 7 (diams) pH 106 (diams) pH 123 (diams)
and pH 13 (diams) Dashed lines are provided to clarify the data trends all samples were deaerated
Vertical error bars show the standard deviation between replicates while horizontal error bars
show the dose range for replicates 108
Figure 39 Model calculations to show the predicted concentrations of H2O2 as a function of
dose at various pH 109
Figure 40 Model calculations to show the predicted concentrations of H2 gas as a function of
dose at various pH 110
Figure 41 Model calculations showing the concentrations of aqueous oxygen and hydrogen gas
from deaerated water after 80 kGy at 280 Gy min-1
to show the related behaviour between the
two 114
Figure 42 Model predictions of the steady-state reaction rates of R21 R50 and R32 at various
pH for γ radiolysis of deaerated water at a dose rate of 280 Gy min-1
115
Figure 43 The sum of the steady state rates of all reactions that produce O2 () compared with
the sum of the steady state rates of all reactions that remove O2 () These totals do not include
rates of production or removal from mass transfer reactions This calculation is for the γ
radiolysis of deaerated water to a dose of 80 kGy at a rate of 280 Gy min-1
116
Figure 44 Model predictions of the steady-state reaction rates of R7 R12 and R67 at various
pH This calculation is for the γ radiolysis of deaerated water to a dose of 80 kGy at a rate of
280 Gy min-1
117
List of Figures
7
Figure 45 Dashed lines show the original prediction where k50 = 60 times108 M
-1 s
-1 while solid
lines show the predictions with the increased k50 = 48 times109 M
-1 s
-1 120
Figure 46 Measurements of H2 gas as a function of dose All samples here are aerated with
vertical error bars showing the standard deviation between replicates123
Figure 47 Measurements of H2O2 concentrations in aerated samples of saturated magnesium
hydroxide solution as a function of dose 126
Figure 48 Measurements of hydrogen yields from magnesium hydroxide samples with various
solid ndash aqueous ratios All samples were irradiated to a total dose of ~52 kGy to the aqueous
phase at a dose rate of 3041 Gy min-1
128
Figure 49 Model predictions for the yield of H2 from a solution containing various
concentrations of carbonate anions 133
Figure 50 Measurements of H2O2 concentrations as a function of dose in samples containing
1 mM methanol (diams) and water as a control (diams) All samples were aerated and a dashed line is
included to highlight the data trend The dose rate was 1638 Gy min-1
for methanol solutions
and 2839 Gy min-1
for the aerated water 136
Figure 51 Measurements of H2 gas as a function of dose from deaerated samples containing
1 mM methanol deaerated water is also shown as a control Dashed lines are included to
highlight the data trend The dose rate was 1755 Gy min-1
for the methanol solutions and
2851 Gy min-1
for the deaerated water 137
Figure 52 Chemical yields of hydrogen peroxide measured from an aerated solution of
1 mM methanol as a function of dose 138
Figure 53 Chemical yields of hydrogen gas measured from a deaerated solution of 1 mM
methanol as a function of dose 139
Figure 54 Model prediction of H2O2 concentrations as a function of dose in a solution of
1 mM methanol 142
Figure 55 Calculations of hydrogen peroxide concentrations with and without modification to
the mass transfer routine142
Figure 56 Model prediction of H2 gas as a function of dose in a solution of 1 mM
methanol144
Figure 57 Model predictions of the concentrations of various stable organic products formed as
a result of using the proposed reaction scheme in table 23 146
List of Figures
8
Figure 58 Measurements of H2O2 concentrations from heterogeneous samples of 05g Fe2O3
and 10 mL aerated water The dose rate for the haematite samples was 3052 Gy min-1
and for
the aerated water the dose rate was 2839 Gy min-1
149
Figure 59 Measurements of H2O2 concentrations from heterogeneous samples of 05g Fe3O4
and 10 mL aerated water The dose rate for the magnetite samples was 1625 Gy min-1
and for
the aerated water the dose rate was 2839 Gy min-1
150
List of Tables
9
List of Tables
Table 1 Dose rates of the front most two rows of the 4x8 irradiation rack determined by Fricke
analysis The error indicates the percentage of uncertainty of the obtained gradient 47
Table 2 Dose rates of the four positions of the inverter rig determined by Fricke analysis The
error indicates the percentage of uncertainty of the obtained gradient 48
Table 3 Thermal conductivity of commonly used gases Values taken from the Handbook of
Tables for Applied Engineering Science 62
Table 4 Optimised parameters used for the analysis of H2 gas 64
Table 5 Primary yields for γ-radiolysis of water at neutral pH and standard pressure and
temperature2 71
Table 6 Temperature effects on the primary yields of water radiolysis49
72
Table 7 Polynomial equations for estimating temperature effects on primary yields44
75
Table 8 A collection of measurements of primary yields made in 04 M solution of sulphuric
acid (pH = 046)56
77
Table 9 A collection of primary yields measured in alkali solutions (pH asymp 135)56
79
Table 10 Multiple regression polynomials used to estimate the combined effect of temperature
and pH on the primary yields of water radiolysis 82
Table 11 Polynomial equations used to estimate the temperature effects on the diffusivity of O2
and H2 in both gas and aqueous phases where t = temperature (Cdeg) 90
Table 12 A list of Primary Species used to model water radiolysis helliphelliphelliphelliphelliphelliphelliphelliphellip90
Table 13 A list of reactions used to model water radiolysis 93
Table 14 A list of equilibria used to model the radiolysis of water 94
Table 15 Statistical information concerning the estimation of primary yields used to model the
radiolysis of water 95
Table 16 Parameters used to describe interfacial surface area (Aint) and boundary thicknesses
(δ) for sample vials of different geometry 96
Table 17 Conditions of samples used to investigate hydrogen peroxide in high pH radiolysis
105
List of Tables
10
Table 18 A list of important equilibria and their associated pKa values 107
Table 19 Conditions of samples used to investigate hydrogen gas in high pH radiolysis 108
Table 20 Obtained results from the measurements of H2 gas 124
Table 21 Conditions of samples containing Mg(OH)2 for measurements of H2
a ndash Powder sample with no added water estimated adsorbed water content is based on data from
Nelson et al89
b ndash Sample is a saturated solution of Mg(OH)2 ie contains no solid 127
Table 22 A reaction scheme to estimate the effect of carbonate in water radiolysis 132
Table 23 A reaction scheme to estimate the effect of methanol in water radiolysis
a ndash Rate constant for gas phase reaction
b ndash Estimated rate constant
c ndash Rate constant based on reaction of acetic acid and hydroxyl
d ndash Assumed reaction 141
Table 24 A reaction scheme to estimate the effects of dissolved iron in water radiolysis 153
List of Acronyms and Initialisms
11
List of Acronyms and Initialisms
AES - Atomic Emission Spectroscopy
AVIDAC - Argonne Version of the Institutes Digital Automatic Computer
CANDU - Canada Deuterium-Uranium
DCF - Dalton Cumbrian Facility
EDTA - Ethylenediaminetetraacetic acid
EPSRC - Engineering and Physical Sciences Research Council
FGMSP - First Generation Magnox Storage Pond
GC - Gas Chromatography
HDEHP - Di-(2-ethylhexyl)phosphoric acid
HPLC - High Performance Liquid Chromatography
ICP - Inductively Coupled Plasma
ISO - International Organization for Standardization
LET - Linear Energy Transfer
MOX - Mixed Oxide
MSSS - Magnox Swarf Storage Silo
NNL - National Nuclear Laboratory
ODE - Ordinary Differential Equation
PUREX - Plutonium Uranium Redox Extraction
PWR - Pressurised Water Reactor
SHE - Standard Hydrogen Electrode
SI - International System
TCD - Thermal Conductivity Detector
TGA - Thermogravimetric Analysis
TOC - Total Organic Carbon
UV - Ultra Violet
VIS - Visible
Word count - 42500
Abstract
13
Abstract
Sellafield is home to the UKrsquos largest repository of nuclear waste including reprocessed
uranium and plutonium as well as a backlog of unprocessed used fuel and waste kept in
outdated storage facilities commonly referred to as ldquolegacy wasterdquo For this reason
Sellafield has often been called the most hazardous place in Western Europe and as such is
currently undergoing a multi-billion pound decommissioning and clean-up operation Each
on-site facility has unique challenges associated with it many of them presenting situations
where the radiation chemistry aspects of the material degradation are not well understood
The key factors that can affect water radiolysis processes in the Sellafield challenges are a
high pH environment the presence of magnesium hydroxide the presence of iron oxide
and the presence of organic materials This work examines the effect each of these factors
has on H2 and H2O2 production in water radiolysis as well as developing a computational
model to offer some understanding to the kinetic behaviour of water radiolysis under such
conditions
The computational model was able to replicate experimental measurements of radiolytic H2
and H2O2 production in both aerated and deaerated water at neutral pH and provide a
further understanding of the role of dissolved oxygen in water radiolysis Measurements of
H2O2 from solutions containing NaOH have shown that an increase in pH generally results
in a higher steady state of H2O2 while measurements of H2 show a similar increase with a
maximum production rate at pH ~11 The model was also able to closely replicate these
experimental measurements with some over prediction which highlights a gap in our
understanding of high pH radiolysis and also brings into question the validity of the
estimated rate constant for the reaction
119926minus + 119926120784minus119919120784119926rarr 120784119926119919minus +119926120784 119948 = 120788 120782 times 120783120782
120790 119924minus120783119956minus120783
which was originally determined from kinetic model calculations designed to describe the
decay of ozonide (O3ˉ) during pulse-radiolysis studies of high pH solutions conducted by
K Sehested et al in 1982
The radiolysis of magnesium hydroxide slurry also resulted in an increased yield of
hydrogen gas but had little effect on the yield of hydrogen peroxide The hydrogen yield
was 052 molecules per 100eV while a NaOH solution of equivalent pH gave a yield of
027 however interference from carbonate may be the cause of the increased yield A
surface effect was also estimated to contribute 005 molecules per 100 eV to the hydrogen
gas yield
Hydrogen gas and hydrogen peroxide was measured from the radiolysis of aqueous
methanol This was modelled with a near agreement but modifications to the model were
necessary highlighting areas of the model that need improvement as well as providing a
reaction scheme from which a more comprehensive model for aqueous methanol radiolysis
could be developed
Declaration
14
Declaration
No portion of the work referred to in the thesis has been submitted in support of an
application for another degree or qualification of this or any other university or other
institute of learning
Thomas A Donoclift August 2016
Copyright Statement
15
Copyright Statement
The author of this thesis (including any appendices andor schedules to this thesis) owns
certain copyright or related rights in it (the ldquoCopyrightrdquo) and he has given The University
of Manchester certain rights to use such Copyright including for administrative purposes
Copies of this thesis either in full or in extracts and whether in hard or electronic copy
may be made only in accordance with the Copyright Designs and Patents Act 1988 (as
amended) and regulations issued under it or where appropriate in accordance with
licensing agreements which the University has from time to time This page must form part
of any such copies made
The ownership of certain Copyright patents designs trademarks and other intellectual
property (the ldquoIntellectual Propertyrdquo) and any reproductions of copyright works in the
thesis for example graphs and tables (ldquoReproductionsrdquo) which may be described in this
thesis may not be owned by the author and may be owned by third parties Such
Intellectual Property and Reproductions cannot and must not be made available for use
without the prior written permission of the owner(s) of the relevant Intellectual Property
andor Reproductions
Further information on the conditions under which disclosure publication and
commercialisation of this thesis the Copyright and any Intellectual Property andor
Reproductions described in it may take place is available in the University IP Policy (see
httpdocumentsmanchesteracukDocuInfoaspxDocID=487) in any relevant Thesis
restriction declarations deposited in the University Library The University Libraryrsquos
regulations (see httpwwwmanchesteracuklibraryaboutusregulations) and in The
Universityrsquos policy on Presentation of Theses
Dedications
16
Dedications
Mum
For the strength and freedom to explore
and the support and security to return
Dad
For the support and encouragement
exceeded only by pride
Acknowledgements
17
Acknowledgements
I would like to take this opportunity to thank some of the people who have made this work
possible My supervisor Simon Pimblott even with the busy work schedule that comes with
managing an entire research facility he is still able to provide support and put the well-
being of his students and staff above all else My unofficial but very much appreciated
industrial supervisors from the National Nuclear Laboratory (NNL) Howard Sims and
Robin Orr who both take a personal interest in the work going on at the Dalton Cumbrian
Facility (DCF) and dedicate much of their own time to helping the researchers in their
work
I would like to acknowledge the EPSRC and Sellafield Ltd for providing the funding that
supported this research
A special thanks to all the members of the Dalton Cumbrian Facility especially to all the
staff who work immeasurably hard and with profound dedication to the values
management and research carried out at the Dalton Cumbrian Facility Acknowledgements
to the academic staff Ruth Edge Aliaksandr Baidak and Sven Koehler for always
providing a useful and meaningful insight to almost any situation and for providing
valuable guidance in practical radiation chemistry as well as the inspiration and
encouragement to pursue potentially interesting avenues of research
Thank you to the research team at the Dalton Cumbrian Facility for their friendship and for
making the workplace an enjoyable place to conduct research
Chapter 1 Introduction
18
Chapter 1 Introduction
Overview of Sellafield
Sellafield shown in Figure 1 is the largest nuclear facility in the UK and has played a key
role in the UK nuclear industry for over 60 years Sellafield began as a Royal Ordinance
Factory producing weapons propellant for use in the Second World War Soon after the
war ended Sellafield was renamed to Windscale and was repurposed to produce plutonium
for the development of nuclear weapons in order to secure the UKrsquos position in the nuclear
arms race
Several years later the focus on acquiring nuclear weapons shifted towards the development
of new reactors for civil energy production with Magnox reactors built on a neighbouring
site known as Calder Hall The two sites were later combined and were once again named
Sellafield Previous operations carried out at Sellafield meant the site was also in a good
position to conduct fuel reprocessing operations alongside energy production Spent fuel is
separated from its now contaminated cladding and dissolved in nitric acid uranium and
plutonium are separated by solvent extraction while the cladding is treated independently
At Sellafield this industrial process meant storing the contaminated cladding swarf in
underwater silos
The fuel reprocessing process most commonly used is the Plutonium Uranium Redox
Extraction method (PUREX) and produces a number of product streams including
plutonium uranium and other highly active liquors
Chapter 1 Introduction
19
The separated uranium can be re-enriched to produce reusable uranium fuel or mixed with
plutonium to produce mixed oxide (MOX) fuel although much of the reclaimed uranium
and plutonium remains unused and is stored at Sellafield The remaining fission products
classified as high level waste are treated in various ways including vitrification and are
also stored at Sellafield
Figure 1 An aerial view of the Sellafield Site which covers approximately 6 km2
Image provided by Sellafield Ltd Press Office
Magnox reactors are now an obsolete design of reactors that use unenriched uranium fuel
which was clad in an alloy comprising almost entirely of magnesium with small amounts
of aluminium Spent fuel from Magnox reactors was briefly stored in a cooling pond before
having the cladding removed for reprocessing of the fuel pellets
Chapter 1 Introduction
20
The facilities used for this storage shown in Figure 2 were called the First Generation
Magnox Storage Pond (FGMSP) and the Magnox Swarf Storage Silos (MSSS) both of
these facilities are now considered to be ldquoLegacyrdquo facilities
Figure 2 On the left is The First Generation Magnox Storage Pond (FGMSP) and on the
right are the Magnox Swarf Storage Silos (MSSS)
Images provided by Sellafield Ltd Press Office
An extended shut down of reprocessing in the first generation reprocessing plant meant that
fuel being stored in the Magnox pond was left far longer than intended resulting in
corrosion and a backlog of spent fuel The Magnox Storage Pond now contains
approximately 14000 m3
of contaminated water which includes roughly 1200 m3 of sludge
consisting mainly of magnesium hydroxide and iron oxide1 Later technological
advancements rendered the wet storage of Magnox fuel cladding to be an obsolete method
and operations moved towards dry storage However the construction of a new facility and
the huge backlog of material stored in the silo also resulted in corrosion of stored fuel and
eventually a state of disrepair for the Magnox Swarf Storage Silos Both of these legacy
facilities present a huge challenge for decommissioning operations as well as a unique
opportunity for scientific research
Chapter 1 Introduction
21
Radiation Chemistry
Radiation chemistry is the study of chemical change driven by the absorption of energy
capable of causing ionisation This ionising radiation can be of a particulate nature
including but not limited to alpha (He2+
) and beta (eˉ) radiation or non-particulate such as
gamma (γ) or X-ray radiation Radiation chemistry and its experimental methods parallel in
many ways to photochemistry but the differences between the fields are well defined The
fundamental difference between the two fields of study is the quantity of energy involved in
the initiation of reactions In radiation chemistry this energy is provided by the atomic
decay of radioactive nuclei and is far higher than energy used in photochemistry typically
UV radiation The lower initial energies used in photochemistry tend to only produce
molecular excitations rather than direct ionisations These lower incident energies also
mean that each photon will usually only interact once and produce a uniform distribution of
excited species in any plane perpendicular to the incident beam The higher initial energies
used in radiation chemistry often provided by atomic decay can produce both excitations
and ionisations directly Interactions between ionising radiation and a substance is not
necessarily limited to only one interaction a single high energy photon or particle may
interact a number of times This behaviour gives rise to a non-uniform track-like structure
of interactions unlike the uniform distributions found in photochemistry2
Chapter 1 Introduction
22
Figure 3 A representation demonstrating the uniform excitations and ionisations of UV
radiation compared to the structured tracks of alpha radiation
To fully appreciate the chemical changes initiated by ionising radiation it is important to
have some knowledge of the different types of ionising radiation and the ways in which
they interacts with matter There are two main ways in which radiation chemists provide a
source of ionising radiation for experiments The first involves taking advantage of the
atomic decay of radioactive nuclei this may be a naturally occurring radioisotope or an
artificially created isotope The second involves specialised equipment to directly generate
radiation usually by accelerating particles to a high energy The major types of ionising
radiation are alpha beta and gamma however in the field of radiation chemistry one may
also come across the use of X-rays fast neutron radiation proton radiation and other heavy
charged particle radiation This study utilises cobalt-60 as a source of gamma radiation
other types of radiation were not investigated during this work however it is necessary to
understand some fundamental features of alpha and beta decay to fully appreciate gamma
decay
Chapter 1 Introduction
23
Alpha α Radiation
Alpha radiation occurs when an unstable atomic nuclei spontaneously ejects an alpha
particle Elements with an atomic number greater than 83 will decay by this mechanism3
Alpha particles are fully ionised helium nuclei they consist of two protons and two
neutrons and have no electrons which gives them a charge of +2 Alpha particles are
mono-energetic this means that every alpha particle emitted from a given radioactive
element will have the same energy characteristic of that element These energy values
typically range between 4 and 10 MeV This quality means that research facilities capable
of artificially producing alpha radiation by ionising and accelerating helium atoms can
select the particle energy required to effectively mimic alpha decay of any radioactive
element
Beta β Radiation
Beta decay involves the conversion of a neutron to a proton or vice versa in order to create
a more favourable proton to neutron ratio This conversion process is accompanied by the
ejection of fundamental particles directly from the atomic nucleus In the case of a neutron
converting to a proton the ejected particles are an anti-neutrino and a high energy electron
while in the reverse case the ejected particles are a neutrino and a positron (the antimatter
equivalent of an electron) Unlike alpha particles beta particles are not mono-energetic
The energy lost through beta decay is shared between the ejected particles and the recoil of
the decaying atom this means beta particle energy ranges from zero up to a maximum
energy characteristic of that element
Chapter 1 Introduction
24
Gamma γ Radiation
Gamma radiation is not a particle like the previously mentioned types of radiation but is a
photon with a short wavelength in the region of 3 x10⁻⁹
to 3 x10-11
cm or approximately 40
KeV to 4 MeV when converted to energy A gamma ray is emitted when a nucleus in an
excited state relaxes to a lower nuclear energy level there is no change in the number of
protons or neutrons during gamma decay Gamma rays like alpha particles are mono-
energetic however a nucleus may emit several photons as a cascade of energy loss As
gamma emission starts with an excited nucleus some prior process must take place to result
in a nucleus with an elevated energy level For most gamma emitters the process is
initiated with either alpha or beta decay and the resulting atomic nucleus is left in an
excited state For example ceasium-137 undergoes beta decay by emission of a beta
particle of 1174 MeV to form stable barium-137 This only happens 54 of the time and
the more common decay mechanism is the emission of a beta particle of 0512 MeV to
form and excited barium-137 nucleus this then emits a photon of 0662 MeV to relax the
nucleus to the stable barium-137
Chapter 1 Introduction
25
Radiation interactions with matter
In order for radiation to induce a chemical change it must interact with matter in some way
There are many mechanisms by which radiation can interact with matter as this project
focuses on the use of gamma rays a brief description of the interactions of gamma rays
with matter is given below
In the photoelectric effect the entire energy of an incident gamma photon is transferred to
an electron of some absorbing matter This electron is ejected from the absorbing atom with
energy equal to the incident photon minus the binding energy of that electron The electrons
ejected are often K-shell electrons which have the highest binding energy As momentum
and energy must be conserved it is necessary for the absorbing atom to recoil As this
mechanism involves the recoil of a parent atom it would not be possible for the
photoelectric effect to be the mechanism of interaction with free electrons that do not have
a parent nucleus to recoil In the photoelectric effect ejected electrons will leave a hole as
this hole is filled by electrons from higher energy levels characteristic X-rays are emitted
Figure 4 A representation of the photoelectric effect
Image recreated from Spinks and Wood2
Chapter 1 Introduction
26
Although photons cannot interact with free electrons by means of the photoelectric effect
they may interact with free and loosely bound electrons through the Compton Effect In this
mechanism a photon accelerates an electron thereby reducing its own energy The photon
is scattered now with reduced energy while the electron recoils with increased energy
Figure 5 A representation of the Compton Effect
Image recreated from Spinks and Wood2
Another mechanism by which a gamma ray may interact with matter is through pair-
production This is only a viable mechanism for photons with energy larger than 102 MeV
A photon is completely absorbed by an atomic nucleus and from that nucleus two particles
are produced an electron and a positron The energy of the incident photon is shared
between the rest energy of the two new particles and the kinetic energy of these particles as
they move away from the nucleus a negligible amount of energy is also used as the nucleus
recoils The positron behaves much the same way as the electron until it annihilates with an
electron from the medium to produce two 051 MeV gamma rays travelling at 180deg from
each other
Chapter 1 Introduction
27
Figure 6 A representation of pair production and positron annihilation
Image recreated from Spinks and Wood2
Generally the interactions of gamma rays with matter result in fast moving electrons these
are often referred to as secondary electrons or delta-rays and have the same interactions
with matter as beta particles It is these secondary electrons that are predominantly
responsible for producing the excited states and ionisations in an absorbing material that
will initiate chemical changes in said material4 For this reason it is necessary to also
understand the interactions with matter these secondary electrons may have Fast moving
electrons lose energy through three main mechanisms electromagnetic radiation elastic
scattering and inelastic scattering When a fast electron greater than 100 KeV passes close
to an atomic nucleus it is decelerated and slightly deflected This event is accompanied by
emission of electromagnetic radiation commonly known as Bremsstrahlung radiation and
is required for the conservation of energy
Chapter 1 Introduction
28
At energies below 100 keV Bremsstrahlung emission becomes negligible instead electrons
tend to lose energy through scattering Fast moving electrons interact with the bound
electrons of a molecule predominantly through inelastic collisions This interaction
transfers energy from the incident electron to the bound molecular electron which can result
in ionisation and excitation (and often with production of radical species) If there is an
ionisation event the tertiary electrons produced can cause more ionisation events in the
same manner These events tend to lie closer together as the electron that caused them has a
much lower energy than the primary electron that passed by This engenders a radiation
track structure that consists of small groups of ionisation events These groups are often
referred to as spurs
Fast moving electrons may also interact elastically with matter this interaction causes the
electrons to be deflected by a wide range of angles This means that a fast moving electron
may have moved a significant total distance but may have not travelled particularly far into
the absorbing material
Chapter 1 Introduction
29
Radiolysis of Water
As mentioned earlier it is the secondary and tertiary electrons produced from gamma ray
interactions that predominantly lead to the formation of ions and radical species that drives
chemical change in substances exposed to radiation Below is a diagram outlining the
sequence of events and the different stages of water radiolysis
Figure 7 A scheme showing the early stages of water radiolysis and the production of
primary species
In water this initial interaction between a gamma ray and a water molecule produces either
an excited state of water or a water cation accompanied by an electron this is achieved in
less than ten femtoseconds (10-14
s) Molecules in an excited state may break apart to form
hydrogen atoms and hydroxyl radicals or molecular hydrogen and oxygen atoms in a
singlet or triplet state while water cations will quickly react with nearby water molecules to
produce hydronium ions and hydroxyl radicals
Chapter 1 Introduction
30
The electron produced begins a thermalisation process eventually resulting in a solvated
electron however at this stage the electron exists as a potentially reactive precursor
intermediate This happens in a time frame of less than 1 picosecond and occurs before
diffusion of the spur During the non-homogeneous stage the produced radicals and ions
may react within the spur to produce molecular products such as H2 and H2O2 Eventually
the spur species diffuse into the bulk water and these ldquoprimaryrdquo species produced are said
to be homogeneously distributed from this point onwards The yield at which these primary
species are produced are known as primary yields and are often expressed as G-values
which have units of micromoles per Joule (SI unit) or molecules produced per 100 eV of
energy absorbed (conventional historic units)
119866 = 119873119900 119900119891 119898119900119897119890119888119906119897119890119904 119891119900119903119898119890119889
100 119890119881
This should not be confused with a ldquochemicalrdquo yield which are the yields of chemical
species sometime after homogeneous chemistry has taken place and is also often expressed
as a G-value During the homogeneous stage reactions between primary species occur
often altering the observed production rates of these species through back reactions To
avoid confusion between the two types of yield a notation system can be used to discern the
two Two notation systems are commonly used throughout the radiation chemistry
literature the first denotes primary yields with the species of interest in subscript whilst the
chemical yield is often expressed with the species of interest in parenthesis For example
the primary and chemical yield of H2 would be written as GH2 and G(H2) respectively The
second system simply uses a lowercase ldquogrdquo to denote primary yields and uppercase ldquoGrdquo for
chemical yields This study will use the latter system
Chapter 1 Introduction
31
Most often it is the chemical yield that is measured during an experiment but it is possible
to measure a primary yield with the use of scavengers A scavenger is a chemical species
that can quickly react with a targeted primary species before it is able to diffuse into the
bulk solution effectively removing it and its associated chemistry from the homogeneous
stage of radiolysis The effectiveness of a scavenger is often referred to as the ldquoscavenging
capacityrdquo and is quoted as the pseudo-first order rate of reaction between a scavenger (S)
and a radical (R) which depends only on the rate constant for said reaction and the
concentration of the scavenger In other words the scavenging capacity is equal to kS+R[S]5
A well-documented example of this is the use of bromide ions to prevent the reaction of
hydroxyl radicals with molecular hydrogen allowing for the room temperature primary
yield of H2 to be measured this has been done extensively throughout the literature and the
g-value is quoted to be 045 molecules100eV6 Without the use of the bromide scavenger
hydroxyl radicals would react with H2 reducing the observed yield this reduced yield is
what is meant by the term chemical yield
The following summarises some of the properties of the more important primary radicals
Chapter 1 Introduction
32
The Hydrated Electron eaq-
One of the most reactive primary species of water radiolysis is the hydrated electron It is a
chemical entity that can be thought of as being a single electron somewhat stabilised by a
cage of orientated water molecules Hydrated electrons typically have reaction rate
constants close to the diffusion controlled limit with low activation energies Reactions of
hydrated electrons are typically represented as single electron transfer processes and with a
reduction potential of -29 V vs the standard hydrogen electrode (SHE) the hydrated
electron will react with most other species78
119890119886119902minus + 119878119899 rarr 119878119899minus1
In the presence of organic compounds the hydrated electron will act as a nucleophile with
enhanced reactivity towards areas adjacent to electron withdrawing groups Halogenated
organics also show enhanced reactivity towards elimination of the halide ion9
119890119886119902minus + 119877119883 rarr 119877119883minus rarr 119877bull+ 119883minus
The Hydrogen Atom H˙
In terms of BroslashnstedndashLowry acidndashbase theory the hydrogen atom is the conjugate acid of
the hydrated electron with a pKa of 9679
119890119886119902minus + 119867(119886119902)
+ 119867bull
The hydrogen atom has a reduction potential of -23 V78
similar to that of the hydrated
electron however its chemistry is seldom the same
Chapter 1 Introduction
33
Inorganic ions are reduced by the hydrogen atom at slower rates than reduction by the
hydrated electron In certain circumstances such as in low pH environments hydrogen
atoms can act as an oxidant reacting with inorganic ions to form a hydride intermediate
that soon decomposes to form the oxidised ion and molecular hydrogen10
119867bull + 1198651198902+ rarr 1198651198903+119867minus119867+
rarr 1198651198903+ + 1198672
Organic molecules are also subject to oxidation reactions with the hydrogen atom
Saturated organics tend to react by hydrogen abstraction to form molecular hydrogen and a
carbon centered organic radical Unsaturated organics will react by hydrogen addition to the
center of unsaturation again forming a carbon centered organic radical9
119867bull+ 1198621198673119874119867 rarr bull1198621198672119874119867 + 1198672
119867bull+ 11986211986721198621198672 rarr bull11986211986721198621198673
The Hydroxyl Radical bullOH
Unlike the previously mentioned primary radicals the hydroxyl radical has a positive
reduction potential of 18 V in neutral solution making it a powerful oxidising species11
Reactions of hydroxyl radicals with inorganic ions are often said to be simple electron
transfer processes however it has been suggested that the mechanism actually proceeds
through an intermediate adduct12
Reactions with inorganic ions have been observed to
proceed at rates close to the diffusion limit however this is not the case with many metal
cations Reaction rates between the hydroxyl radical and metal cations tend to be slower
with rate constants of the order ~30 x108 M
-1 s
-19
Chapter 1 Introduction
34
One explanation for this is that the mechanism for metal cation oxidation involves the
addition of the hydroxyl radical to the metal cation increasing its coordination number and
allowing for inner-sphere oxidation to take place
[119872(1198672119874)119909]119899+ + ∙119874119867 [(1198672119874)119909119872-119874119867]
119899+ rarr [119872(1198672119874)119909](119899+1)+ + 119874119867minus
The intermediate species Mn+
OH has actually been observed in cases where M = Tl+ Ag
+
Cu2+
Sn2+
Fe2+
and Mn2+
12
As is the case with the hydrated electron and the hydrogen atom the hydroxyl radical also
exists in an acid-base equilibrium with the oxide radical anion bullOˉ
bull119874119867 + 119874119867minus bull119874minus + 1198672119874
With a pKa of 119 the reactions of bullOˉ only become important at high pH With a few
exceptions reactions of bullOˉ are typically slower than those of
bullOH The two species also
have different reactivity towards organic molecules Hydroxyl radicals tend to add to
unsaturated bonds as an electrophile while the conjugate base bullOˉ acts more like a
nucleophile and will abstract hydrogen from a hydrocarbon bond
Chapter 1 Introduction
35
Computational Applications in Radiation Chemistry
Early computational studies in the field of radiation chemistry were focused largely on
developing the radical diffusion theory and the non-homogeneous stage of water radiolysis
to help rationalise experimental observations One of the earliest water models used
coupled differential equations with terms for the competing diffusion and reacting
processes to represent the evolution of a spur containing six radical pairs as a function of
time13-15
Although the predicted primary yields from this type of model agree well with
experimental data there are problems associated with this type of approach the main
problems arising from the application of classical chemical kinetics to a system of
diminutive volume and extremely fast reactions occurring between only a few reactive
species Such deterministic models often use a typical spur to represent a whole system
fixing the average number of radical pairs as a single integer or in some cases a range of
integers This means that in deterministic models the long-running average value for the
number of reactive species is neglected This small difference can lead to inaccuracies in
deterministic calculations of this kind and so a stochastic approach became the preferred
method to these types of non-homogeneous radiolysis calculations16
Deterministic models however are still the preferred technique for the longer term
homogeneous stage calculations for water radiolysis Once a suitable set of primary yields
has been established it is possible to model the subsequent chemistry in much the same way
as any other chemical kinetics simulation
Chapter 1 Introduction
36
By describing a reaction set in terms of a series of simultaneous differential equations and
by including details of physical parameters such as temperature it is possible to predict
chemical yields of radiolysis and highlight important chemical pathways This is the
general methodology implemented in this study and will be discussed in further detail in
subsequent chapters
Deliverables and Project Aims
Given the technical challenges associated with the Sellafield site and the pressing
conditions of legacy facilities such as the First Generation Magnox Storage Pond and
Magnox Swarf Storage Silos there has been a renewed interest in water radiolysis
especially with respects to high pH and slurry systems Previous radiolysis studies of high
pH solutions have been contradictory and difficult to reproduce There are very few
situations in industry where knowledge of high pH water radiolysis is required as most
situations where water radiolysis may occur are in acidic media with the exception of
Pressurised water reactors (PWRs) and CANDU reactor technology which run under alkali
conditions due to added LiOH17
As mentioned previously the Magnox Swarf Storage Silos at Sellafield Ltd contains large
quantities of contaminated magnesium alloy produced from the de-cladding process of
spent nuclear fuel The material contaminated with uranium oxide is stored under water
and over time has corroded to produce large amounts of magnesium hydroxide To prevent
further corrosion some of the 22 silos at the facility dose the water with sodium hydroxide
Although alleviating some corrosion this addition increases the pH
Chapter 1 Introduction
37
One of the aims of this project is to try and obtain a better understanding of water radiolysis
at high pH Using cobalt-60 as a source of gamma radiation and a range of analytical
techniques to determine the production rates of H2 and H2O2 as a function of absorbed dose
it is hoped that the effects of high pH on water radiolysis can be experimentally quantified
Deterministic computational modelling is then used to investigate the experimentally
observed effects of high pH in order to extract a better mechanistic understanding of water
radiolysis at high pH
While there were a number of early water radiolysis studies concerning the effects of
various metal oxides and their surface interactions18
this is also a subject which has
received a renewed scientific interest as there are many situations in the nuclear industry
where an understanding of the effects of metal oxides on water radiolysis are significant
These areas include preventing corrosion within operational facilities to extend their
lifetime controlling radiolytic products associated with stored nuclear material preventing
incidences of unexpected gas build up and managing already heavily corroded facilities
such as the legacy ponds and silos at Sellafield Ltd
In addition to sodium hydroxide the Magnox Swarf Storage Silos also contain large
quantities of magnesium hydroxide the hydrated form of magnesium oxide Radiolysis
studies concerned with magnesium hydroxide solutions slurries and solids are scarce119
despite the obvious need for further investigation The slight solubility of magnesium
hydroxide in water compels a prior understanding of high pH water radiolysis to facilitate
understanding the effects of magnesium hydroxide and the presence of a surface Data
collected from experiments involving magnesium hydroxide are therefore also included in
this project
Chapter 1 Introduction
38
Up until now the discussed aims of this project have been targeted at the issues associated
with the Magnox Swarf Storage Silo rather than with the First Generation Magnox Storage
Ponds These legacy ponds are outdoor open air ponds that have been used to store spent
nuclear fuel for extended periods (far longer than ever intended) As the ponds are open air
they are susceptible to the introduction of natural debris mostly falling leaves and other
biological matter
This has led to an interest in the effects of organic substances on radiolysis processes in
water with the focus being on some of the decomposition products of decaying organic
matter substances such as humic acids The complexity of these substances requires
general underpinning by first understanding simple organic substances In this work the
radiolysis of aqueous methanol was studied
The extended storage of spent fuel in the First Generation Magnox Storage Pond has led to
various challenges concerning corrosion products and their effects on water radiolysis In
the past spent fuel rods were often grouped into small bundles and placed into steel skips
which were then submerged in the pond These skips might also contain other contaminated
material and the exact content of any given skip is largely unknown Over time much of
the steel has corroded resulting in a large build-up of what can only be described as
ldquosludgerdquo The exact composition of this sludge is fairly unknown but the major constituent
is iron oxide present as both red haematite (Fe2O3) and black magnetite (Fe3O4) Research
involving iron oxides and radiolytic processes have mostly been focused on corrosion
mechanisms predominantly adopting an electrochemical approach with very few studies
measuring chemical yields of radiolytically produced H2 and no studies measuring H2O2 in
the presence of iron oxide
Chapter 1 Introduction
39
There are studies that have demonstrated decomposition of H2O2 over iron oxide in the
absence of a radiation source but as H2O2 is a primary product of water radiolysis it is
continuously being generated and the implications of this production are largely unknown
Other studies involving metal oxides have also investigated radiation induced dissolution
With both these processes in mind this project investigates some of the effects of iron
oxide on the steady-state concentrations of the molecular radiolysis products H2 and H2O2
Chapter 2 Experimental Methods
40
Chapter 2 Experimental Methods
Source of Radiation and Dosimetry
This project uses cobalt-60 as a source of gamma radiation Cobalt-60 is an artificial
isotope with a half-life of 527 years2 As cobalt-60 is not a naturally occurring isotope it
must be manufactured This is normally done through neutron bombardment of the non-
radioactive isotope cobalt-59 Stainless steel control rods within a nuclear reactor core are
substituted with cobalt rods and the neutron flux present is enough to transmute cobalt-59
to cobalt-6020
The overall reaction for the production and decay of cobalt-60 is shown
below
1198621199002759 + 119899 rarr 11986211990027
60 rarr 119873119894lowast2860 + 119890minus + 119890 + 120574
The decay mechanism for cobalt-60 was similar to that of Caesium-137 in that it is initiated
by beta decay Unlike Caesium-137 however there is no direct route to a stable isotope
Subsequently the decay of cobalt-60 follows one of two paths both of which begin with the
ejection of a beta particle Cobalt-60 may emit two photons of gamma radiation but will
always emit at least one photon A cobalt-60 nucleus may eject a beta particle with energy
up to 148 MeV this is followed by emission of a photon with energy of 133 MeV
however there is only a 012 chance that this happens The more common decay path for
cobalt-60 is to eject a beta particle with energy up to 031 MeV followed by the emission of
two photons with energies of 117 MeV and 133 MeV
Chapter 2 Experimental Methods
41
Figure 8 A decay scheme for cobalt-60
Cobalt-60 is a popular source of gamma radiation used by radiation scientists High dose
rates can be achieved with fairly little material21
Facilities that conduct experiments using
cobalt-60 as a source of radiation use a variety of systems to shield operators from
radiation Older systems can be as rudimental as a water filled hole with cobalt-60 resting at
the bottom samples are lowered in a container and held at a given distance from the source
to accumulate dose More advanced systems involve mechanically lifting cobalt-60 from
some shielded well into an experimental area This area may be a dedicated room for
irradiating samples or it may be a shielded chamber in which samples are placed The latter
example is known as a self-contained irradiator and is the type of irradiator used in this
work
Chapter 2 Experimental Methods
42
All irradiations reported here were carried out using the Foss Therapy Model-812 Self-
Contained Cobalt-60 Irraditor located at the University of Manchesterrsquos Dalton Cumbrian
Facility (DCF) The Model-812 Irradiator contains three independent housings where
cobalt-60 sources may reside named A B and C Currently only A and C contain
cobalt-60 and had a total activity of 5281 TBq on the original date of measurement
(2nd
May 2012) Source B is due to be filled after one half-life from the original date to
bring the total activity back to a similar level Both A and C sources are used at the same
time for every irradiation throughout this work
Figure 9 Image on the left shows the Model-812 Irradiator On the right is the inside of
the irradiator showing the three guide rods that contain the cobalt-60 source during
irradiation
Chapter 2 Experimental Methods
43
Samples are placed within the irradiator and are exposed to gamma emission from the
cobalt-60 for calculated periods of time to allow samples to accumulate the desired dose
Radiation doses are defined as the amount of energy deposited per kilogram of sample
material and are often quoted as the SI derived unit Gray (Gy) which has the unit J kg-1
In
order to calculate how long a sample should be exposed for requires knowledge of the rate
at which radiation energy is deposited into the sample This is known as a dose rate and is
often quoted as Gy min-1
The practice of dose rate determination is known as ldquodosimetryrdquo
and there are a number of physical and chemical methods for determining the dose rate
from a given source Physical methods often deploy tools such as calorimeters and
scintillation chambers to directly measure energy while chemical methods depend on
measuring some chemical change that occurs during exposure to radiation that responds
linearly with increasing dose There are many chemical dosimeters available depending on
the kind of work being undertaken For example vapour phase experiments often measure
the condensation of acetylene into benzene to determine a dose rate22
For this work the
dosimeter used was a ferrous sulphate solution known as the Fricke dosimeter The Fricke
dosimeter was first described in 1927 by Hugo Fricke and has become the most adopted
chemical dosimeter among radiation scientists23
The standard recipe to make a Fricke
dosimeter used in this work is as follows
Fricke Dosimeter Dissolve 04 grams FeSO4∙7H2O (99 assay Fisher Chemicals) 006
grams NaCl (gt9999 Assay Calbiochem) and 22 mL concentrated H2SO4 (95-98
Sigma Aldrich) Dilute with distilled water to make 1 litre of Fricke solution24
Chapter 2 Experimental Methods
44
This solution will slowly oxidise and must be used within a few days by preventing light
from interacting with the solution it is possible to extend the shelf life of the Fricke
solution to three months The Fricke dosimeter relies on the oxidation of FeII to Fe
III by
species produced during the radiolysis of water
119867(119886119902)+ + 119890(119886119902)
minus rarr 119867bull
119867bull + 1198742 rarr 1198671198742bull
119865119890119868119868 + 1198671198742bull rarr 119865119890119868119868119868 + 1198671198742
minus
1198671198742minus + 119867(119886119902)
+ rarr 11986721198742
119865119890119868119868 + 11986721198742 rarr 119865119890119868119868119868 + bull119874119867 + 119874119867minus
119865119890119868119868 + bull119874119867 rarr 119865119890119868119868119868 + 119874119867minus
The extent of oxidation responds in a linear fashion to ionising radiation until dissolved
oxygen is exhausted this can be up to 500 Gy but in practice doses are usually kept
between 40 and 400 Gy to ensure measurements are made within the range in which FeIII
is
of a measurable concentration but FeII is not fully depleted
2 With a strong absorbance at
304 nm Fe3+
can be quantified by spectrophotometric analysis and an absorbed dose can be
calculated from the following equation
119863119866119910 = 9647 times 106 times
∆119860
∆휀119897120588119866(1198651198903+)
Chapter 2 Experimental Methods
45
where DGy is the absorbed dose in Grays ΔA is the difference between the optical
absorbance before and after irradiation and Δε is difference between the molar extinction
coefficient of Fe2+
and Fe3+
at 304 nm which has an established value of
2201 mol-1
cm-1
24
G(Fe3+
) is the chemical yield of Fe3+
and a value of 155 is
recommended when using cobalt-60 by the International Commission on Radiation Units
and Measurements Path length and solution density are represented by the terms l and ρ
respectively
Irradiations throughout this work were conducted using two sample holding devices each
with a number of different positions The first device consists of a standard 4x8 test tube
rack that has been fixed to an irradiation base plate The base plate allows the device to be
locked in exactly the same position within the Model-812 every time it is used
This device holds a number of 20 mL headspace vials during irradiations of samples which
are then analysed for H2O2 content the details of which will be discussed later
The second device is somewhat more complex and is used to hold samples that are
analysed for H2 content again the details of which are discussed later This device is
designed to keep samples mixed by slowly rotating them along a horizontal axis thus
continually inverting samples throughout the irradiation period it is hence referred to as the
ldquoinverter rigrdquo The construction consists of a high torque motor with a top speed of 2 rpm
Chapter 2 Experimental Methods
46
Figure 10 Sample holding devices for use in the Model-812 Left is the 4x8 rack with its
schematic below On the right is the inverter rig again with its schematic below
Dosimetry measurements were carried out in each of these devices and the results are
shown below Table 1 shows the dosimetry for the 4x8 test tube rack each position was
measured at four time intervals each of which with three replicates Measurements were
carried out in 20 mL headspace vials which were filled with 10 mL of Fricke solution
Chapter 2 Experimental Methods
47
Experiments carried out in this device only occupied positions in the first two rows hence
only these results are shown Table 2 shows the dosimetry of the inverter rig again each
position was measured at four time intervals each with three replicates The inverter rig
only has four positions which were measured with no rotation mixing Initially
experiments were to be conducted under stationary conditions before moving on to mixed
conditions however time limitations prevented progression to mixed samples and all
samples are conducted with no rotational mixing From the data obtained absorbance units
were converted to an absorbed dose by use of equation 1 and dose rates are then extracted
as the gradient of absorbed dose plotted as a function of time
Date of Original Measurement 07022014
Position Dose Rate on Date of
Measurement (Gy min-1
) plusmn Error
A1 29435 75
B1 34827 23
C1 32352 41
D1 27358 89
A2 15845 24
B2 18519 62
C2 18176 26
D2 15248 17
Table 1 Dose rates of the front most two rows of the 4x8 irradiation rack determined by
Fricke analysis The error indicates the percentage of uncertainty of the obtained gradient
Chapter 2 Experimental Methods
48
Date of Original Measurement 13012015
Position Dose Rate on Date of
Measurement (Gy min-1
) plusmn Error
A 29379 46
B 31708 46
C 30208 87
D 30616 46
Table 2 Dose rates of the four positions of the inverter rig determined by Fricke analysis
The error indicates the percentage of uncertainty of the obtained gradient
As cobalt-60 decays dose rates are subject to change with time however they change in a
predictable manner The decay of cobalt-60 follows first order kinetics it is therefore
possible to adjust dose rates to account for the decay of the source simply by multiplying
the dose rate by the ratio of initial radiation intensity and the intensity after a given time2
This can be written as
119863119877119860119889119895 = 119863119877 times1198681199051198680
Where
1198681199051198680= 119890minus120582119905
And
120582 =ln 2
11990512
Chapter 2 Experimental Methods
49
DRAdj is the decay adjusted dose rate after time t λ is the decay constant and tfrac12 is the half-
life which for cobalt-60 is 527 years The use of this equation depends on knowing how
much time has passed since the original dose rate (DR) was calculated hence the inclusion
of the date on which these measurements were made in Tables 1 and 2
Water Purification for Radiolysis Experiments
Radiation breaks water molecules into reactive radicals which can react quickly with any
impurity present in a sample It is therefore of high importance to ensure that any water
used in radiolysis experiments is of the highest purity During the early days of radiation
chemistry high purity water was often obtained through a triple distillation process Water
was distilled firstly through standard means before being distilled again from an acid
dichromate solution and finally a third time from an alkaline permanganate solution before
being stored in a fused silica container4 Advancements in modern self-contained
purification systems have significantly simplified the process of obtaining ultra-pure water
for radiolysis experiments All experiments carried out throughout this work use ultra-pure
water dispensed from the ELGA PURELAB Classic the feed water of which is provided
by the ELGA PURELAB Option-SR 715 Through the use of duel bank reverse osmosis
units two independent UV lamp purifiers and deionisation cartridges the final resistivity of
output water is measured to be 182 MΩ cm-1
Chapter 2 Experimental Methods
50
Figure 11 A diagram of the purification system that provides the ultra-pure water used
throughout this work Image was taken from the ELGA PURELAB user manual
Determination of H2O2 ndash Photometric Analysis
Throughout this work the determination of hydrogen peroxide is carried out using a
photometric technique known as the Ghormley Tri-iodide method25
This method takes
advantage of the redox reaction between hydrogen peroxide and iodide to produce iodine in
a 11 stoichiometric ratio with hydrogen peroxide This reaction takes place under acidic
conditions and is catalysed by the presence of ammonium molybdate tetrahydrate Acid is
also required to force the resulting equilibrium between iodine and tri-iodide completely
towards the production of tri-iodide which can then be measured by photometric analysis
this is achieved using potassium phthalate monobasic A general reaction scheme for this is
shown below
Chapter 2 Experimental Methods
51
11986721198742 + 2119868minus + 2119867+ rarr 1198682 + 21198672119874
1198682 + 119868minus 1198683
minus
This is a popular method for the determination of hydrogen peroxide in radiolysis studies26-
29 It is favoured for its relative simplicity over previous methods which typically involved
complicated titrations with potassium permanganate Furthermore it is also extremely
sensitive enabling accurate measurements of low concentrations of hydrogen peroxide with
a lower limit of 1 μM30
The reagent used to reduce hydrogen peroxide is susceptible to self-oxidation and has a
very short shelf life To prevent self-oxidation and prolong the shelf life the reagent is
prepared as two reagents designated ldquopart Ardquo and ldquopart Brdquo and are only mixed during
analysis One reagent contains potassium iodide under slightly alkali conditions while the
other contains an organic acid salt potassium phthalate monobasic Both reagents are
prepared according to the recipe originally described by Ghormley25
Part A Dissolve 1 gram NaOH (ge98 Sigma Aldrich) 33 grams KI (995 Assay
Fisher Scientific) and 01 gram (NH4)6Mo7O24∙4H2O (ge99 AppliChem) in 500 mL
deionised water
Part B Dissolve 10 g C8H5KO4 (ge9995 Sigma Aldrich) in 500 mL deionised water
Figure 12 Structure of Potassium phthalate monobasic (C8H5KO4)
Chapter 2 Experimental Methods
52
Analytical Procedure
The redox reaction between H2O2 and I ˉ is carried out on a 2 mL aliquot of sample
solution To this 1 mL of Part A and 1 mL of Part B are added a few seconds are required
for development before transfer to a quartz cuvette for analysis in a Cray 5000 UVVisNIR
photospectrometer Samples that contain solid material are filtered through syringe filters
before analysis to remove any solid particles Samples of elevated pH often required
additional acid to reduce the pH to the conditions required for analysis the quantity of
additional acid is determined by testing a blank sample with litmus paper the quantity is
then recorded and the dilution factor accounted for Utilisation of the Beer-Lambert law
allows for the calculation of hydrogen peroxide concentration from an absorbance within
the linear range of the technique
119860 = 휀119897119888
Where A is the optical absorbance ε is the molar extinction coefficient in M-1
cm-1
l is the
path length (always 1 cm during this work) and c is the concentration in mol dm-3
Determination of the optimum wavelength of absorption was carried out by a scanning
analysis of a 625 μM solution of hydrogen peroxide prepared by serial dilution of a 1 M
standard which itself was prepared from a 3wt stock solution of hydrogen peroxide in
water purchased from Sigma-Aldrich
Chapter 2 Experimental Methods
53
Figure 13 Scanned absorption spectra of a 625 μM H2O2 solution
The maximum absorbance was determined to be 351 nm which is consistent with values
described in literature3031
A series of standard solutions were made ranging in
concentration from 1-300 microM to determine the molar extinction coefficient shown in
Figure 14
Chapter 2 Experimental Methods
54
Figure 14 A calibration curve of H2O2 photometric absorption to determine the molar
extinction coefficient
Addition of the tri-iodide reagents dilutes the standard to half the quoted concentration A
dilution factor of 2 is used to correct for this hence the calibration curve covers the
concentration range 05-150 microM hydrogen peroxide The determined molar extinction
coefficient was 25631 M-1
cm-1
this again is consistent with values quoted in
literature263132
y = 25631x - 00012
0
05
1
15
2
25
3
35
4
45
00E+00 20E-05 40E-05 60E-05 80E-05 10E-04 12E-04 14E-04 16E-04
Ab
sorb
ance
[H2O2] (mol dm-3)
Slope Error = plusmn35548
Chapter 2 Experimental Methods
55
Determination of H2 - Gas Chromatography
Method development
Measurements of hydrogen gas are usually carried out using gas chromatography
frequently paired with mass spectroscopy3334
This work uses only gas chromatography to
measure hydrogen gas produced during the radiolysis of samples The standard technique
for gas analysis is to use a gas tight syringe and needle to extract a portion of headspace
from a sealed sample The samples are typically sealed in air tight vials with a rubber
septum to allow gas extraction however due to the effects of radiation on plastics and
rubbers the reliability of this technique remains debatable and often alternative methods are
sought One argument against the use of rubber septa in a radiation field is that they are
known to radiolytically produce their own hydrogen which would contribute to any
measurements Although some preliminary laboratory tests indicate that the production of
hydrogen from septa seems predictable and can be subtracted from any hydrogen produced
from samples this information was obtained from a single batch of septa and the
production rate of hydrogen will most likely vary between batches as nothing is known
about the manufacturersquos quality control tolerances Another important argument is
concerned with the concentration ranges of hydrogen that will be measured Aqueous
samples that contain no radical scavengers often have low chemical yields for hydrogen
and sampling with a syringe reduces the sample volume to a maximum of 100 microL
attempting to extract a larger volume leads to sampling problems associated with negative
pressure within the sealed sample
The portion of hydrogen entering the gas chromatograph may be reduced even further for
samples containing slurries as much of the hydrogen may remain trapped in the aqueous
phase even after agitation
Chapter 2 Experimental Methods
56
Headspace injections may be a viable technique for samples that are known to produce
large quantities of hydrogen but generally measurements made with this technique are
often close to or below the detection limits of the gas chromatograph Many radiation
chemists have adopted a variety of techniques for measuring small quantities of
radiolytically produced hydrogen that do not rely on the use of rubber septa One such
technique is the ldquoCrush Tuberdquo method described in references3536
This method is used for
all hydrogen analysis in this work
The Crush Tube Sampling Method
The crush tube method of gas chromatography uses a modified SRI Model 8610C Gas
Chromatograph (GC) with a bespoke sampling device that contains a section of Tygonreg
tubing that allows for a glass sample vial to be crushed by an external force such as a pair
of wrench pliers Originally the tubing was a standard silicone tube however Tygonreg
tubing proved to be more durable and less prone to leaks Figure 15 and 16 show the
general schematic for the apparatus as well as the specially made sample vials for this
method
Figure 15 The modified SRI 8610C Gas chromatograph with inline ldquocrush tuberdquo setup
The sample can be seen inside the silicone tubing
Chapter 2 Experimental Methods
57
Figure 16 Image on the left shows a schematic for the sampling apparatus on the right
are the vials used which are flame sealed at the midway neck
In order for this technique to work several modifications must be made to the GC hence
the selection of the highly modular SRI Model 8610C The first modification was made to
the 10-port gas sampling valve to enable carrier gas to flow through the bespoke sampling
device during analysis The unmodified 10-port valve contains a sample loop that connects
to the ldquoINrdquo and ldquoOUTrdquo ports on the external of the GC during sample loading When the
port is rotated to the ldquoINJECTrdquo position the loop is included in the carrier gas path and the
external ports are isolated
Chapter 2 Experimental Methods
58
Figure 17 A schematic of the original setup for the 10-port sampling valve in both off (top
image) and on (bottom image) positions
It is essential that carrier gas is allowed to continually flow through the system during both
sample loading and sample injecting As the bespoke sampling device creates a closed loop
between the external ports it is possible to swap the connections of ports 1 and 10 without
disrupting the flow of carrier gas
This modification isolates the external ports during sample loading but includes them
during sample injection and allows sample gas to be carried through the GC
Chapter 2 Experimental Methods
59
Figure 18 A schematic for the modified 10-port sampling valve including the removal of
the silica gel column
Figure 18 also depicts the removal of the silica gel column this is part of the second
modification The bespoke sampling device contains a large volume of gas that requires a
relatively fast carrier gas flow rate to achieve acceptably narrow peaks This flow rate is
quoted in literature as being around 50 mLmin35
The Packed silica gel column and the
default molecular sieve column simply did not allow for this high flow rate without
significant back pressure that can cause damage to equipment for this reason they were
removed A bespoke column was made from frac14 inch copper tubing and 13x molecular sieve
beads The new column had a total length of 4 m and allowed sufficient flow rates with
adequate separation of gasses
Chapter 2 Experimental Methods
60
Figure 19 Image on the left shows the bespoke frac14 inch OD 13x molecular sieve column
On the right the rotameter is connected to calibrate gas flow rates
The SRI Model 8610C is not equipped with a digital rotameter as such it cannot display
flow rate information and instead can only display information about the carrier gas inlet
pressure which requires a conversion formula to obtain a meaningful flow rate The user
manual includes conversion factors but these are column specific and as the column has
been custom built it is necessary to manually determine a conversion formula to obtain a
flow rate This was done using a rotameter connected to the external GC ports by adjusting
the inlet pressure and noting the rotameter value a calibration curve was obtained
Chapter 2 Experimental Methods
61
Figure 20 A calibration curve to provide a conversion to determine carrier gas flow rate
Detection of H2 and Calibration
The SRI Model 8610C is equipped with a thermal conductivity detector (TCD) for the
measurement of eluted gas The TCD consists of a Wheatstone bridge circuit with tungsten-
rhenium filaments serving as resistors (Figure 21) Carrier gas containing eluted sample
passes over one of the filaments while a second path is reserved for carrier gas only to
serve as a reverence The filaments are electrically heated and the temperature of the whole
unit is carefully controlled As carrier gas passes over the filaments it conducts heat away
from the filament to the detector body when a sample component flows over the filament
the conductivity changes causing the filament to change temperature relative to the
reference filament This change in temperature changes the resistivity of the filament and a
change in voltage is recorded
Chapter 2 Experimental Methods
62
Figure 21 A schematic of a Wheatstone bridge circuit used in the TCD
To achieve a good sensitivity towards a given analyte it is important to have a large
difference in thermal conductivity between said analyte and the carrier gas Table 3 shows
the thermal conductivity values for some common gases The carrier gas most often used is
helium which has a thermal conductivity of 36036times106 cal s
-1 cm
-1 degC
-1 As many other
gases have much lower thermal conductivities helium often performs well however
hydrogen is a special case as it also has a high thermal conductivity of
44632times106 cal s
-1 cm
-1 degC
-1 For this reason the carrier gas selected for hydrogen
measurement was argon which has a much lower thermal conductivity of
4257times106 cal s
-1 cm
-1 degC
-1
Gas Thermal Conductivity (cal s-1
cm-1
degC-1
x106)
267degC
H2 44632
O2 6364
N2 6240
Ar 4257
He 36036
Table 3 Thermal conductivity of commonly used gases
Values taken from the Handbook of Tables for Applied Engineering Science
Chapter 2 Experimental Methods
63
Measurements made by the TCD are expressed as a voltage plotted as a function of time
The peaks produced in this plot are integrated and the final result is expressed as the peak
area As the peak area unit is largely arbitrary a calibration curve must be obtained to relate
the peak area to a meaningful quantity of hydrogen Calibration is carried out by replacing
the bespoke sampling device with a simple T-section fitted with a rubber septum Known
quantities of hydrogen gas are injected into the T-section which is then carried through the
GC Figure 22 shows a calibration curve for the linear range of 1 ndash 500 microL of pure
hydrogen at standard room temperature and pressure
Figure 22 A calibration curve for quantifying hydrogen gas from chromatograms
Samples of airhydrogen mixtures were also injected to make sure there was adequate
separation between the gases good separation between hydrogen and oxygen is observed
but the separation of oxygen and nitrogen is not adequate for analysis of those gases when
both are present in large quantities
Chapter 2 Experimental Methods
64
Machine parameters were adjusted for optimum performance these are shown in Table 4
These parameters were used for every experiment throughout this work
Parameter Value
Valve Temperature 70 Cdeg
Column Temperature 40 Cdeg
TCD Temperature 220 Cdeg
Flow Rate 50 mLmin
Carrier Gas Ar
Table 4 Optimised parameters used for the analysis of H2 gas
Method Validation
It was mentioned previously that the bromide ion is an excellent scavenger of hydroxyl
radicals during radiolysis
bull119874119867 + 119861119903minus [119867119874119861119903]minus119867(119886119902)+
rarr 119861119903bull + 1198672119874119861119903minus
rarr 1198611199032bullminus
Radiolysis of an aqueous solution of 1 mM bromide results in the elimination of the
reaction between the hydroxyl radical and molecular hydrogen in solution37
Other than
diffusion to the gas phase a reaction with hydroxyl radicals is the only significant removal
path of hydrogen at neutral pH The removal of dissolved oxygen by argon sparging also
simplifies much of the radiolysis chemistry allowing for a more reproducible experiment
This means that the hydrogen measured from the radiolysis of a deaerated 1 mM bromide
solution is in fact a primary yield and is quoted throughout the literature as being
GH2 = 045 this is an average value from a range of studies
2453839
Chapter 2 Experimental Methods
65
In order to secure confidence in this technique a validation experiment was carried out in
which a 1 mM solution of potassium bromide was used to determine the primary yield of
hydrogen which was then compared to the literature value
Figure 23 Method validation by the determination of the well-established primary yield of
H2 through hydroxyl scavenging by bromide
As expected the hydrogen concentration increased linearly with absorbed dose over the
experimental range When the number of hydrogen molecules is plotted as a function of
absorbed energy in sets of 100 eV the gradient gives GH2 = 0456 plusmn0025 matching well to
the average value quoted in literature
Chapter 2 Experimental Methods
66
Sources of Error
The majority of experiments carried out in this work use the absorbed energy or dose as
the independent variable and using one of the analytic techniques discussed above either a
photometric absorption value or the integrated response to hydrogen gas detection as the
dependant variable Both the dependant and independent variable have errors associated
with them which are discussed below
Determining the quantity of absorbed energy to the sample relies on the procedure of
dosimetry discussed earlier in this chapter The errors reported in Tables 1 and 2 are the
percent error of the gradient obtained from the measurement of Fe3+
as a function of time
As the experiments carried out in this work are plotted as a function absorbed dose and
there is an element of uncertainty associated with the dose rates the uncertainty of the
calculated absorbed dose increases with increasing dose This uncertainty in the absorbed
dose is included in many of graphs showing experimental data and is represented by
horizontal error bars
Sources of Error in the Determination of H2O2
The determination of H2O2 relies mainly on the calibration curve to yield a molar extinction
coefficient determined to be 25631 M-1
cm-1
with an uncertainty of plusmn 355 M-1
cm-1
The
molar extinction coefficient is used to convert the measured absorbance of a sample to a
concentration of H2O2 however this value has a dependence on temperature The ambient
temperature of the laboratory fluctuates slightly but it was decided that the effects were too
minor to consider The irradiation of samples on the other hand resulted in samples
heating slightly to a temperature that would be significant
Chapter 2 Experimental Methods
67
This was largely mitigated by leaving samples to cool for a few minutes until they reached
room temperature however an increase in temperature may affect the radiation chemistry
Solutions used to calibrate and reagents used to analyse samples also carry an associated
uncertainty in their concentrations The standards used to produce the calibration curve
were prepared from a stock solution of 3 wt H2O2 (Sigma Aldrich) From this the
0882 M solution was diluted to 1 mM which was used in a serial dilution to create the
standards ranging from 1 ndash 300 μM Uncertainty in the concentrations will have been
introduced by the tolerances of the pipettes and volumetric flasks used The pipettes used
were the Gilson Pipetman P1000 and P20 which are certified to comply with ISO 8655 that
imposes maximum allowable systematic errors of plusmn 80 μL and plusmn 02 μL for the P1000 and
P20 respectively The maximum allowable random error for the P1000 is quoted to be
le 30 μL and le 01 μL for the P20 The volumetric flasks used were class A Glassco brand
flask that conform to ISO 1042 Of the range of flasks used the largest error was 00025
Any uncertainty in the concentrations of the analytical reagents used to reduce H2O2 is
largely irrelevant as the chemicals used to perform the analysis are provided in a large
excess Stoichiometrically speaking as long as the concentration of iodide is at least three
times that of H2O2 the analysis should work in reality the concentration of iodide is
several times higher than this ensuring all H2O2 is reduced The sum of the above errors are
assumed to contribute to less than 1 of the total uncertainty of any measurements of
H2O2
Chapter 2 Experimental Methods
68
Sources of Error in the Determination of H2
The experimental technique provides a means to quantify hydrogen gas by volume In order
to make a comparison to predictions made by the computational model it was necessary to
convert this value to a concentration (mol dm-3
) This means knowing the volume of the
headspace in the crush tube vials As these vials are flame sealed they naturally have an
irregular shape and calculating a precise volume is difficult for this reason the conversion
uses an estimated headspace volume of 2 mL
Hydrogen gas is quantified by the integration of a change in voltage with respects to time
however the voltage response measured can be affected by a number of factors Factors
such as temperature and pressure are controlled automatically by the machine Moisture can
also affect the response of the TCD and this is controlled by running a ldquobake outrdquo cycle
prior to running any analysis One factor that cannot be prevented is the slow oxidation of
the tungsten-ruthenium filament which lowers the sensitivity of gas detection This can be
accounted for by performing regular calibrations often 3 or 4 point calibrations that are
compared to the original calibration curve If there is any deviance from the original curve
then a full calibration is performed and this is then used for the following analyses The
calibration curve shown in Figure 22 was the first full calibration performed throughout the
duration of this project the gradient of this curve gradually decreased this was accounted
for using the calibration process mentioned above As calibrations are performed by hand
with a gas tight syringe most of the error is likely introduced at this point The average
error of calibration points was plusmn 25 in the calibration curve given in Figure 22 for other
calibrations not shown in this work the average error was always less than 5
Chapter 3 Computational Methodology
69
Chapter 3 Computational Methodology
The earliest recorded computational approaches to solving problems in the field of radiation
chemistry date back to 1958 when the AVIDAC computer in Chicago was used to model
radical diffusion kinetics40
Since then different mathematical techniques have found use in
modelling problems found in the field of radiation chemistry and with ever increasing
computational power complicated calculations can be performed in seconds rather than
days In the early days of computational radiation chemistry primary yields were calculated
by deterministic methods involving the diffusion of a single spur However it became
apparent that a Monte Carlo approach held several advantages over deterministic methods
for the description of early stage radiolysis Such advantages include the ability to
incorporate the effects of a variety of different spur sizes and other entities arising from
secondary electrons41
For this reason modern radiolysis models usually fall into two
categories depending on what stage of radiolysis is being modelled Monte Carlo
calculations often concern the non-homogeneous early stages of radiolysis due to the
stochastic nature of energy deposition into a medium as mentioned earlier these
calculations often predict the primary yields of radiolysis products42
If the primary yields
are already known a deterministic approach is often employed to model the resulting
homogeneous chemistry in a similar way to most other chemical kinetics models through
the use of simultaneous ordinary differential equations (ODE)2743-46
Newer radiolysis
models are moving towards a multi-scale approach in which the output of the stochastic
stage is fed directly into the deterministic stage47
In this project a deterministic kinetic model for homogeneous chemical stage radiolysis has
been developed using a software package called FACSIMILE developed by MCPA
software Ltd
Chapter 3 Computational Methodology
70
FACSIMILE utilises Gear methodology for auto-adaptive time step control coupled with
Newton-Raphson iterations for prediction correction to deliver a robust simultaneous
ordinary differential equation solver The FACSIMILE language is largely based on the
Fortran language but is tailored for use by the scientific community and includes its own
high level notations for simplifying ODE construction48
The chemical model developed
here is largely based on the rate coefficient compilation by Elliot and Bartels 46
as well as
other literature sources27434549
This chapter gives a detailed description of how the model in this project works In essence
the model functions by producing primary radiolysis species at rates determined by their
primary yields and a dose rate parameter while simultaneously solving a set of ODEs that
represent the chemical reactions that describe the radiolysis chemistry At the same time
the model is also bound by framework calculations that describe various physical
parameters including but not limited to temperature effects and species volatility Each of
these concepts is described in detail in the following sections as well as the core radiolysis
reaction set
Production of Primary Species
As this model is only concerned with the homogeneous radiolysis chemistry that occurs
after diffusion of the primary species away from any kind of track structure the effect of
radiation can be represented by a series of zero order production equations with rate
constants derived from the dose rate and the species primary yield Each primary radiolysis
species has its own equation that defines its rate of production the general form of this
equation is shown below
Chapter 3 Computational Methodology
71
119896119894 =119863119877 times 119864119862 times 120588 times 119866119894
119873119860
DR is the dose rate given in Gy min-1
and Gi is the primary yield for species i NA is
Avogadros number and provides the conversion of molecules to moles while ρ is the
density of water and converts mass to volume ρ also has its own temperature dependency
which is calculated elsewhere in the code EC is a constant that effectively converts the
units of dose rate (J kg-1
min-1
) into time units compatible with a zero order rate constant
(mol dm-3
s-1
) and energy units compatible with primary yields (molecules 100 eV-1
) and
has a value of 104 times1015
and carries the unit 100 eV s-1
The dose rate is initially set by the user and is constant throughout the calculation however
primary yields are not set by the user and are initially set depending on other parameters
such as temperature and pH Table 52 shows the primary yields for water radiolysis by
gamma-rays at neutral pH and at room temperature the following section describes the
factors that can alter these values and details how they are incorporated into the model
Primary Species eaq- H
bull
bullOH H2 H2O2
g-Value 263 055 272 045 068
Table 5 Primary yields for γ-radiolysis of water at neutral pH and standard pressure and
temperature2
Chapter 3 Computational Methodology
72
Factors Affecting Primary Yields
Temperature
The rate of diffusion of primary species away from spurs created by ionising radiation is
affected by temperature As the temperature is increased the rate of diffusion of radical
species increases as does the rate of recombination reactions The yields obtained at high
temperature are determined by this competition between diffusion and recombination rates
Experiments carried out by Hochanadel and Ghormley (Table 6)50
first show this effect
over a temperature range of 2 ndash 65 degC in which higher temperatures favour increased
radical yields and decreased molecular yields
Primary Species g-Value Temperature
coefficient degC-1
2degC 23degC 65degC
Hbull + eaqˉ 359 367 382 +010plusmn003
bullOH 280 291 313 +018plusmn004
H2 038 037 036 -006plusmn003
H2O2 078 075 070 -015plusmn003
-H2O 435 441 454 +007plusmn003
Table 6 Temperature effects on the primary yields of water radiolysis50
A recent extensive compilation by Elliot and Bartels includes measurements of primary
yields at temperatures from 20 ndash 350degC from multiple sources and collates this data to
provide fitted equations for use in computational models The primary yield of the hydrated
electron was determined by product analysis of nitrogen formation from samples containing
nitrous oxide51-54
The chemical yield of nitrogen is equal to the primary yield of the
hydrated electron due to the following scavenging reaction
119890(119886119902)minus + 1198732119874 rarr 1198732119874
minus rarr 1198732 + 119874minus
Chapter 3 Computational Methodology
73
Organic compounds were also added to scavenge hydroxyl radicals and prevent them from
reacting with hydrated electrons Pulse radiolysis studies were also included55
but only the
data from nitrogen yield measurements were recommended for use
For the determination of the hydroxyl primary yield pulse radiolysis was the primary
method used The method described used bicarbonate to effectively convert hydroxyl
radicals to the carbonate radical which is more easily measured
The temperature dependency of the extinction coefficient for the carbonate radical was
estimated by integrating normalised absorption spectra as a function of temperature
originally collected by Elliot et al53
The resulting temperature dependency of the hydroxyl
radical primary yield is in agreement with an independent pulse radiolysis study that used a
ferrocyanide ion solution to measure the temperature dependency of the hydroxyl yield up
to 105degC53
The temperature dependence of the hydrogen peroxide primary yield was determined by
three independent studies Measurements in acrylamide solutions provided the temperature
dependency up to 100degC53
Further measurements made in deaerated solutions containing
nitrate and methanol extended this range to 150degC56
Estimations of the peroxide primary
yield to high temperatures were made based on the assumption that it was equivalent to the
chemical yield of oxygen in an alkali solution containing nitrous oxide or iodine this
approach expanded the temperature range to 270degC54
The primary yield of molecular hydrogen as a function of temperature has been measured
by three laboratories In each case hydrogen was directly measured from solutions
containing either a nitrous oxide and organic mix or nitrite ions In both cases the
measurements agreed well across all three laboratories515354
Chapter 3 Computational Methodology
74
Several attempts at measuring the primary yield of the hydrogen atom as a function of
temperature have been made however only two data sets are considered reliable as others
do not agree with the established yield at room temperature although all data sets show an
increase in yield with temperature
The chemical yield of molecular hydrogen from deaerated solutions containing nitrate and
phosphite ions is said to be equal to the sum of the primary yields of molecular hydrogen
and the hydrogen atom subtracting the already established primary yield of molecular
hydrogen from these measurements should give the primary yield of the hydrogen atom
These measurements agreed well with the established room temperature value and gave a
temperature dependence up to 200degC53
The temperature dependence was expanded to
350degC based on estimations of the ratio between the hydrogen atom primary yield and
hydrated electron primary yield which was calculated from data obtained during other
experiments performed in alkali solutions Unfortunately this data is described as archived
and unpublished The collated data from the experiments described above are shown in
Figure 24 with polynomial fits overlain the equations for these polynomials are given in
Table 7 and are used in the modelling calculations reported
Chapter 3 Computational Methodology
75
Figure 24 Collected data from literature showing measured primary yields as a function
of temperature Provided by Elliot and Bartels 200845
Primary Yield
Polynomial
g(eaq-) 2641 + 4162times10
-3 t + 9093times10
-6 t
2 ndash 4717 times10
-8 t
3
g(H2O2) 0752 ndash 1620times10-3
t
g(H2) 0419 + 8721times10-4
t ndash 4971times10-6
t2 + 1503times10
-8 t3
g(bullOH) 2531 +1134times10
-2 t ndash 1269times10
-5 t2 + 3513times10
-8 t3
g(Hbull) 0556 + 2198times10
-3 t ndash 1184times10
-5 t2 + 5223times10
-8 t3
Table 7 Polynomial equations for estimating temperature effects on primary yields45
Where t is the temperature in degC
Incorporation of any kind of temperature dependence into a prediction that will be
compared with experimental data requires knowledge of the experimental temperature This
is especially important in chemical kinetic models such as this as almost all the reaction
rate constants are temperature dependent For this reason a test was conducted to measure
the temperatures experienced by samples during irradiation
Chapter 3 Computational Methodology
76
The test was carried out with vials which had thermocouples attached the vials were filled
with water The vials were irradiated for 16 hours and the temperature was recorded every 5
minutes the average recording is shown in Figure 25 A polynomial fit was made from the
first 4 hours of data which was applied in the code to control the rate of temperature change
during a calculation the simulated temperature is shown as the red dashed line in
Figure 25
Figure 25 A comparison of the sample temperature profile logged by thermocouple to the
temperature profile calculated in the computational model
There are many ldquobulkrdquo radiolysis models in literature few of which make any reference to
the way in which temperature is controlled It can only be assumed that these models use a
fixed temperature which would produce less accurate predictions especially during early
periods where the temperature change is significant It should be said that this approach
should be used with caution as this temperature profile depends on the equipment being
used to irradiate samples and the dose rate involved
20
25
30
35
40
45
0 2 4 6 8 10 12 14 16
Tem
per
atu
re (degC
)
Time (h)
Thermocouple
Facsimile
Chapter 3 Computational Methodology
77
The majority of energy from the radioactive sources ends up being deposited into the
shielding material of the irradiation unit This heats the surrounding air within the
irradiation chamber which is often not circulated
pH
The effect of pH on the primary yields of water radiolysis has been a subject of discussion
for many decades yet experimental data on the subject is relatively sparse at high and low
pH Early radiolysis experiments often took place in acidic medium and so acidity became
one of the first variables considered for investigations into the effects of pH on primary
yields Table 857
shows primary yields data from 04 M sulfuric acid samples where the
pH = 046 the values shown are averages over multiple sources
Reference g(eaq-) + g(H
bull)
g(
bullOH) g(H2) g(H2O2) g(-H2O) Ref
Ferradini C et al 370 280 045 090 460 58
Allen AO
Lefort M 365 295 045 080 455
459
Sworski T J 370 292 039 078 448 60
Hochanadel C J et al 370 290 040 080 450 61
Mahlman H A et al 368 296 045 081 458 62
Hayon E et al 366 297 040 076 450 6364
Sehested K et al 362 289 039 076 441 65
Spinks amp Wood 365 290 040 078 445 2
Table 8 A collection of measurements of primary yields made in 04 M solution of
sulphuric acid (pH = 046)57
The noticeable changes to the primary yields when compared with those at neutral pH are
consistent throughout the literature including further sources not included in Table 8
Chapter 3 Computational Methodology
78
The change in primary yields is not massive in the pH range 046 ndash 7 but neither is it
insignificant With the exception of the molecular hydrogen yield all primary yields
increase slightly at low pH The main explanation for this involves the conversion of
hydrated electrons to hydrogen atoms within the radiation spurs In neutral solutions the
hydrated electron readily reacts with the hydroxyl radical to form hydroxide but when the
hydrated electrons are converted to hydrogen atoms the reaction with hydroxyl radicals is
suppressed
The hydrogen atoms do not react with hydroxyl radicals as quickly as hydrated electrons
and so the hydroxyl radicals become effectively ldquoprotectedrdquo at low pH This explains the
increase in primary yield of the reducing species (hydrated electron plus the hydrogen
atom) and the increase in the hydroxyl radical yield With an increase in hydroxyl radicals
comes an increase in the peroxide primary yield via the dimerisation of hydroxyl radicals
The decrease of the molecular hydrogen primary yield is due to the dimerisation of
hydrogen atoms having a slower coefficient than the reaction between two hydrated
electrons
119890119886119902minus + 119867(119886119902)
+ rarr 119867bull k = 210 times1010
M-1
s-1
119890119886119902minus + bull119874119867 rarr 119874119867minus k = 302 times10
10 M
-1 s
-1
119867bull + bull119874119867 rarr 1198672119874 k = 153 times10
10 M
-1 s
-1
The effect high pH has on the primary radiolysis yields of water is not as well documented
The number of studies is fewer than those conducted in acidic medium and the data from
said studies do not always agree Table 957
shows a collection of primary yields measured
in alkali samples where the pH asymp 135
Chapter 3 Computational Methodology
79
Reference g(eaq
-) +
g(Hbull)
g(
bullOH) +
g(bullOˉ)
g(H2) g(H2O2) +
g(HO2ˉ) g(-H2O) Ref
Draganić et al 318 272 045 068 409
538
Hayon E 327 304 043 053 412
66
Haissinsky M 334 301 04 056 414
67
Dainton F S et al 385 34 036 058 457
6869
Cheek C H et al 28 21 045 084 37
70
Fielden E M et al 357 28 - - -
71
Czapski G et al 33 - - 056 -
72
Table 9 A collection of primary yields measured in alkali solutions (pH asymp 135)57
At high pH the hydroxide ion can react with the hydroxyl radical within the spur forming
the oxide radical anion bullOˉ in the following equilibrium
bull119874119867 + 119874119867minus bull119874minus + 1198672119874 pKa = 119
At high concentrations of hydroxide the hydroxyl radical may be completely replaced by
the oxide radical anion A consequence of this shift is the decrease in the peroxide primary
yield as it is thought that the dimerisation of the oxide radical anion to form peroxide is
slower than the neutral equivalent dimerisation of hydroxyl radicals This is something that
is observed across almost all the studies conducted at high pH The reaction between the
hydrated electron and the oxide radical anion is also slower than the corresponding neutral
equivalent reaction It is therefore expected that the primary yield of oxidising radicals
G(bullOH) + G(
bullOˉ) would increase with increasing pH as would the total primary yield of
reducing radicals G(e(aq)
-) + G(
bullH) The primary yield of molecular hydrogen is mostly
unaffected by the increased pH this would suggest that the net decomposition yield of
water must increase in order to satisfy the material balance equation
Chapter 3 Computational Methodology
80
119892(minus1198672119874) = 119892(119890119886119902minus ) + 119892(119867bull) + 2119892(1198672) = 119892(119874119867
bull) + 119892(119874bullminus) + 2(119892(11986721198742) + 119892(1198671198742minus))
Despite the difficulty in deriving quantitative agreement across the available data there are
studies that offer qualitative agreement with the expected changes to primary yields at high
pH66-69
There are also studies that do not agree and propose that the primary yields are
largely unaffected by pH5387073
Despite the oxide radical anion being the main radiation produced oxidising radical in
aqueous alkali medium and therefore having a significant effect on the chemistry reaction
rate coefficients associated with it are largely unknown and rely on estimation The lack of
reliable rate coefficients for the reactions of the oxide radical anion is an important factor to
consider when attempting to model the radiolysis of water at high pH
It has been shown using stochastic simulations that the chemistry of the oxide radical
anion can have a significant impact on the prediction of primary yields Initial predictions
of the stochastic model by Pimblott et al74
showed an increase in the peroxide primary
yield at high pH This is counter to the accepted trend observed experimentally of a
decreasing peroxide primary yields at high pH In order to match the observed decrease in
peroxide primary yield a single rate constant was changed from 20 times1010
M-1
s-1
to 65
times109 M
-1 s
-1 for the reaction below
119874bullminus + bull119874119867 rarr 1198671198742minus
Chapter 3 Computational Methodology
81
This change had the effect of reversing the trends of the primary yield predictions at high
pH resulting in agreement with experimental data Soon after this the rate constant for the
reaction between the oxide radical anion and the hydroxyl radical was measured to be 74
times109 M
-1 s
-1 which is much closer to the adjusted rate constant used in the stochastic
simulation than the original estimate49
Figure 26 shows literature values for the measured primary yields as a function of pH from
this polynomial equations were fitted which were combined in a multiple regression
analysis with the equations fitted to temperature analysis data Table 10 shows the resulting
equations While this approach gives an estimate of the primary yields as a function of both
temperature and pH it is not an ideal solution This type of estimation is better suited to a
stochastic type track chemistry calculation
A stochastic approach could also account for the effects of different linear energy transfer
(LET) values which are discussed in the next section A multi-scale approach could even
procedurally produce stochastically calculated primary yields that feed into a deterministic
chemical kinetic simulation
Chapter 3 Computational Methodology
82
Figure 26 A reproduction of data provided by Hayon75
showing the effect of pH on
primary radiolysis yields
Primary Yield
Multiple Regression Equation
g(eaq-) 28 + 285times10
-3 times t ndash 251times10
-2 times pH
g(H2O2) 845times10-1
ndash 151times10-3
times t ndash 17times10-2
times pH
g(H2) 388times10-1
+ 829times10-4
times t + 599times10-4
times pH
g(˙OH) 243 + 111times10-2
times t ndash 12times10-3
times pH
g(H˙) 444times10-1
+ 367times10-3
times t ndash 24times10-4
times pH
Table 10 Multiple regression polynomials used to estimate the combined effect of
temperature and pH on the primary yields of water radiolysis
0
05
1
15
2
25
3
35
0 1 2 3 4 5 6 7 8 9 10 11 12 13 14
Pri
ma
ry Y
ield
(M
ole
cule
s 1
00
eV
-1)
pH
g(OH)
g(e-)
g(H2O2)
g(H2)
Chapter 3 Computational Methodology
83
Linear Energy Transfer (LET)
Linear energy transfer is a way of expressing the rate at which an ionising particle loses
energy through a medium Sometimes referred to as ldquostopping powerrdquo linear energy
transfer is quoted as the average energy loss divided by a fixed path length usually micro
meters or nano meters (keV μm-1
or eV nm-1
) This parameter is frequently expressed as an
average rate of energy loss across the entire particlersquos track this is because the energy loss
rate of an ionising particle is not uniform As a high energy ionising particle begins its
journey through a material energy loss events are sparse and only small quantities of
energy are transferred so the particle continues largely un-deflected As this energy lost to
these small transfers accumulates and the energy of the charged particle decreases the
cross section of interactions increases This means that there are more energy loss events
for a given linear distance as the particles path becomes less linear A true linear energy
transfer profile of a particle would take the form of a Bragg curve such as the example
shown below
Figure 27 An example of a Bragg peak Energy loss of alphas of 549 MeV in Air
Image released to public domain
Chapter 3 Computational Methodology
84
For ease of comparison this profile is usually averaged to give a single LET parameter
Ionising particles of higher mass andor lower energy have higher LET values The
implications of linear energy transfer are manifested in the radiation track structure
Increasing LET values have the effect of increasing the spur distribution density as
illustrated in the diagram below
Figure 28 A schematic representation of how linear energy transfer (LET) alters the
distribution of spurs along a radiation track Image was recreated from Allen AO4
The distribution of spurs along a track has an effect on the diffusion of primary radiolysis
species and ultimately alters the primary yields Experiments carried out using 210
Po to
irradiate solutions of iron sulphate through various thicknesses of mica have shown the
effects of changing LET on the yield of oxidation of Fe2+
76
From this subsequent studies
using cyclotron accelerated protons have measured the effects of LET on the primary yields
of water radiolysis77
Compiling the data from these studies gives a general picture of the
effects of LET on water radiolysis primary yields which is shown below
Chapter 3 Computational Methodology
85
Figure 29 Simulation data showing the effects of increasing linear energy transfer on the
primary yields of water radiolysis Image was recreated from Allen AO4
The general trend shows an increase in the formation of molecular products at higher LET
at the expense of radical species (with the exception of hydroperoxyl radical (˙HO2)) at very
high LET values whilst lower LET values favour the radical species Currently there is no
clear agreed explanation as to how the hydroperoxyl radical is formed at high LET Gamma
rays from cobalt-60 fall in the low LET range and have an average value of
023 keV μm-1
78
As the experiments conducted throughout this project used only cobalt-60 as a source of
radiation it was not necessary to incorporate the effects of linear energy transfer into this
radiolysis model nor was it necessary to include the primary yield of hydroperoxyl radicals
into this model as the yield is negligible at the LET value of cobalt-60 Future iterations of
this model would need to include the effects of linear energy transfer as well as better
methods for coping with the effects of temperature and pH this is discussed in more detail
in Chapter 8
Chapter 3 Computational Methodology
86
Mass Transfer of Volatile Species
The transfer of volatile species is not something that affects radiolysis primary yields but it
is important to include as the aqueous reactions of volatile species namely molecular
hydrogen and oxygen will partition into the gas phase This mass transfer is described
within the model as two equations
1198672(119886119902) 1198672(119892)
1198742(119886119902) 1198742(119892)
These equations take the form of first order rate equations with the rate constant substituted
for a time dependant net mass transfer coefficient (kapp) which includes an interfacial mass
transfer coefficient (νint) and the Henryrsquos equilibrium partition coefficient (Kp)27
119889119862(119886119902)119894
119889119905= minus119896119886119901119901
119894 (119905) times 119862(119886119902)119894 (119905)
119896119886119901119901119894 = 120592119894119899119905
119894 times119860119894119899119905119881119886119902
(1 minus 119870119901119894119862119892119894(119905)
119862119886119902119894 (119905)
)
Ci refers to the concentration of species i in either the gas phase or the aqueous phase Aint
and Vaq are used to describe some of the geometry of the radiolysis vessels used in
experiments Aint is the interfacial surface area between the two phases while V is the
volume of the aqueous or gas phase denoted by its subscript As experiments were
conducted in different sized vials depending on the analysis technique used different values
of Aint and V were used when comparing model predictions to experimental data
Chapter 3 Computational Methodology
87
This method assumes that the volume of liquid and covering gas is the same which was
true for all the experiments conducted during this work If the liquid to gas volume ratio
was anything other than 1 then the above differential should be adjusted to account for this
ratio by the following modification
minus119881119897119881119892times119889119862(119886119902)
119894
119889119905= 119896119886119901119901
119894 (119905) times 119862(119886119902)119894 (119905)
The interfacial mass transfer coefficient (νint) incorporates the use of the stagnant two-film
model which provides a description of resistance to diffusion through un-mixed boundary
layers (see Figure 3079
)
Figure 30 A representation of the stagnant two-film model used to calculate the
partitioning of volatile species79
The stagnant two-film model is incorporated into the mass transfer coefficient by relating
the species diffusivity coefficients (D) the boundary thickness (δ) and the Henryrsquos
equilibrium partition coefficient (Kp)
Chapter 3 Computational Methodology
88
1
120592119894119899119905119894=
1
(119863119886119902119894
120575119886119902)
+119870119901119894
(119863119892119894
120575119892)
119870119901119894 =
119862119886119902119894 (119890119902)
119862119892119894(119890119902)
The diffusivity of volatile species is a temperature dependant coefficient which is included
in the model through the use of polynomial fits to data obtained from literature and is
shown in figure 3180-83
Henryrsquos coefficients were taken from literature which included
equations for describing the temperature dependence so a polynomial fit was not
necessary84
The Henryrsquos equilibrium partition coefficient is a dimensionless ratio between
the aqueous and gas phase concentrations of a volatile species at equilibrium This value is
related to the Henryrsquos law constant (kH) by the following relationship
119879 times 119896119867119894 = 122 times 119870119901
119894
The value 122 is used to convert between the Henryrsquos law coefficient in mol maq-3
Pa-1
and
the dimensionless Henryrsquos law coefficient While T represents the temperature in Kelvin
the Henryrsquos law constant also has its own temperature dependency built in this is described
by the following relationship
119896119867 = 119896119867120579 times 119864119883119875 (
∆119867119904119900119897119899119877
(1
119879minus1
119879120579))
Chapter 3 Computational Methodology
89
The Henryrsquos constant at standard temperature (29815 K) (kHθ) is quoted in the literature as
being 13times10-3
mol dm-3
atm-1
for oxygen and 78times10-4
mol dm-3
atm-1
for hydrogen ΔHsoln
is the enthalpy of solution and R is the gas constant the average ratios are quoted in the
literature as 1650 for oxygen and 543 for hydrogen84
This gives values for the Henryrsquos equilibrium partition coefficient (Kpi) of 0019 and 0031
for hydrogen and oxygen respectively at 25degC and smaller values at higher temperatures
Figure 31 The diffusivity of O2 and H2 in both water and air as a function of temperature
000
050
100
150
200
250
300
350
000E+00
100E-05
200E-05
300E-05
400E-05
500E-05
600E-05
700E-05
800E-05
900E-05
0 100 200 300 400
Dif
fusi
vit
y i
n A
ir (
cm2 s
-1)
Dif
fusi
vit
y i
n H
2O
(cm
2 s
-1)
Temperature (degC)
O2aq
H2aq
H2g
O2g
Chapter 3 Computational Methodology
90
Diffusivity
Polynomial
O2(aq) 20times10-9
times t2
+ 40times10-7
times t + 10times10-5
O2(g) 10times10-6
times t2
+ 12times10-3
times t + 02073
H2(aq) 10times10-8
times t2 + 40times10
-7 times t + 30times10
-5
H2(g) 50times10-6
times t2 + 47times10
-3 times t + 07719
Table 11 Polynomial equations used to estimate the temperature effects on the diffusivity
of O2 and H2 in both gas and aqueous phases where t = temperature (Cdeg)
Water Radiolysis Reaction Set
The radiolysis model simulates the chemical kinetics of homogeneous radiolysis through
the use of simultaneous differential equations that represent the independent chemical
reactions taking place The model therefore includes a set of reactions accompanied by
reaction rate constants Tables 12 - 14 gives a summary of the reaction set used with a full
description of the reaction set including the associated temperature dependences is given in
appendix A The reaction rate coefficients are taken from multiple sources with the
majority from the compilation of A J Elliot and D M Bartels45
Chapter 3 Computational Methodology
91
Reaction Number Primary Species
Production
G-value
(Molecules100eV) Ref
G0 H2O 119890(119886119902)minus 271 45
G1 H2O Hbull 054 45
G2 H2O H2 041 45
G3 H2O bullOH 270 45
G4 H2O H2O2 068 45
G5 H2O H(aq)+ 271 45
Table 12 A list of Primary Species used to model water radiolysis
Reaction
Number
Chemical Reactions Rate Constant k
(M-1
s-1
25degC)
Ref
R0 emacraq + emacraq rarr H2 + 2OHmacr 726 times109
45
R1 emacraq + Hbull rarr H2 + OHmacr 276 times10
10
45
R2 emacraq + bullOH rarr OHmacr 355 times10
10
45
R3 emacraq + bullOmacr rarr 2OHmacr 231 times10
10
49
R4 emacraq + H2O2 rarr OHmacr + bullOH 136 times10
10
45
R5 emacraq + HO2bull rarr HO2macr 130 times10
10
45
R6 emacraq + HO2macr rarr Obullmacr + OHmacr 351 times10
9
49
R7 emacraq + O2 rarr O2bullmacr 225 times10
10
45
R8 emacraq + O2bullmacr rarr O2
2macr + H2O 130times10
10
4349
R9 Hbull + H
bull rarr H2 514 times10
9
45
R10 Hbull +
bullOH rarr H2O 109 times10
10
45
R11 Hbull + H2O2 rarr
bullOH + H2O 365 times10
7
45
R12 Hbull + O2 rarr HO2
bull 130 times10
10
45
R13 Hbull + O2
bullmacr rarr HO2macr 114 times10
10
45
R14 Hbull + HO2
bull rarr 2
bullOH 114 times10
10
45
R15 Hbull + HO2macr rarr
bullOH + OHmacr 137times10
9
85
Chapter 3 Computational Methodology
92
R16 Hbull + O3 rarr
bullOH + O2 220 times10
10
43
R17 bullOH +
bullOH rarr H2O2 481 times10
9
45
R18 bullOH + H2O2 rarr H2O + HO2
bull 292 times10
7
45
R19 bullOH + HO2macr rarr OHmacr + HO2
bull 813 times10
9
45
R20 bullOH + HO2
bull rarr H2O + O2 884 times10
9
45
R21 bullOH + O2
bullmacr rarr OHmacr + O2 110 times10
10
45
R22 bullOH + O3 rarr HO2
bull + O2 110 times10
8
43
R23 bullO3macr + H2O2 rarr O2
bullmacr + O2 + H2O 159 times10
6
43
R24 bullO3macr + HO2macr rarr O2
bullmacr + O2 + OHmacr 887 times10
5
43
R25 bullO3macr + H2 rarr O2 + H
bull + OHmacr 249times10
5
46
R26 bullO3macr +
bullOH rarr HO2
bull + O2
bullmacr 6000 times10
9
43
R27 bullO3macr +
bullOH rarr HOmacr + O3 250 times10
9
43
R28 bullO3macr + H
+(aq) rarr O2 +
bullOH 900 times10
10
43
R29 O2bullmacr + O2
bullmacr +1198672119874rarr
O2 + O22macr 299times10
-1
43
R30 O2bullmacr + HO2macr rarr
O2 + bullOmacr + OHmacr 823 times10
-2
43
R31 O2bullmacr + H2O2 rarr
O2 +
bullOH + OHmacr 130 times10
-1
43
R32 O2bullmacr + HO2
bull rarr O2 + HO2macr 760times10
7
43
R33 O2bullmacr +
bullO3macr rarr
O2macr+ 2O2 100 times10
4
43
R34 O2bullmacr + O3 rarr
bullO3macr + O2 150 times10
9
43
R35 HO2bull + HO2
bull rarr H2O2 + O2 840 times10
5
45
R36 HO2bull + H2O2 rarr O2 + H2O +
bullOH 500 times10
-1
49
R37 HO2bull + O3 rarr
bullOH + 2O2 500 times10
8
43
R38 H2O2 + HO2macr rarr O2 + H2O + OHmacr 450times10-4
43
R39 O3 + OHmacr rarr HO2macr + O2 480 times101
43
R40 O3 + HO2macr rarr bullOH + O2 + O2
bullmacr 550 times10
6
43
R41 O3 + H2O2 rarr bullOH + O2 + HO2
bull 371 times10
-2
43
R42 Hbull +
bullOmacr rarr OHmacr 200times10
10
43
Chapter 3 Computational Methodology
93
R43 bullO3macr + emacraq rarr 2OHmacr
+
O2 160times10
10
43
R44 O3 + emacraq rarr bullO3macr 360 times10
10
43
R45 H2O2 rarr 2bullOH 230 times10
-7
86
R46 O2macr + H2O rarr 2OHmacr
100 times10
10
43
R47 bullOmacr + H2 rarr
bullH + OHmacr 128 times10
8
45
R48 bullOmacr + H2O2 rarr O2
bullmacr + H2O 555 times10
8
49
R49 bullOmacr + HO2macr rarr O2
bullmacr + OHmacr 786 times10
8
45
R50 bullOmacr + O2
bullmacr rarr O
2macr + O2 600 times10
8
43
R51 bullOmacr +
bullOmacr rarr O2
2macr 100times10
8
43
R52 bullOmacr +
bullOH rarr HO2macr 761 times10
9
49
R53 bullOmacr + O3macr rarr 2O2
bullmacr 700times10
8
43
R54 bullOmacr + O3 rarr O2
bullmacr + O2 100 times10
9
43
Table 13 A list of reactions used to model water radiolysis
Chapter 3 Computational Methodology
94
Equilibria kf
(M-1
s-1
25degC)
kb
(M-1
s-1
25degC) Ref
R5556 H2O H+
(aq) + OHmacr 117 times10-3
118times1011
45
R5758 H2O2 H+
(aq) + HO2macr 890 times10-2
478times1010
45
R5960 H2O2 + OHmacr HO2macr + H2O 127 times1010
140 times106
45
R6162 HO2macr + OHmacr
O22macr + H2O 351 times10
5 110 times10
6
43
R6364 bullOH H
+(aq) +
bullOmacr 890 times10
-2 478times10
10
45
R6566 bullOH + OHmacr
bullOmacr + H2O 127 times10
10 140 times10
6
45
R6768 bullOmacr + O2
bullO3macr 375 times10
9 262 times10
3
45
R6970 HO2bull H
+(aq) + O2
bullmacr 478 times10
10 735 times10
5
45
R7172 HO2bull + OHmacr O2
bullmacr+ H2O 127 times10
10 163 times10
-1
45
R7374 Hbull emacraq + H
+(aq) 583 210times10
10
45
R7576 Hbull + OHmacr emacraq + H2O 244 times10
7 174 times10
1
45
R7778 Hbull + H2O H2 +
bullOH 458 times10
-5 395 times10
7
45
R79 H2(aq) H2(g) 269times10-3
R80 O2(aq) O2(g) 103times10-4
Table 14 A list of equilibria used to model the radiolysis of water
Chapter 3 Computational Methodology
95
Computational Assumptions and Error
The first assumption this model makes is that radiolysis does not occur in the gas phase In
reality this is not the case however the density of the gas phase is so small compared to that
of the aqueous phase that any contribution from gas phase radiolysis will be negligible
There are several reactions that do not include any kind of temperature dependence for their
associated rate constants This is due to a lack of information available in the literature
many of the species involved in these reactions are notoriously difficult to measure reaction
rate constants for thus these reactions have a fixed rate constant across all temperatures
The method for estimating the primary yields to account for both temperature and pH
effects is not an ideal method Multiple linear regression analysis is often used to
empirically predict the value of a single dependant variable based on the contributions of
multiple independent variables In the case of this model the independent variables are
temperature and pH a full model would also include LET as a third independent variable
The number of observations considered for the regression analysis is less than ideal due to
the scarcity of available data coupled with the difficulty of relating non-linear variables
means that predictions of primary yields are loose estimates at best The coefficient of
determination (R2) gives information about how well the multiple regressions fit the data
and is shown in Table 15 where μ denotes the estimated standard deviation of the error
Primary Yield
R2 μ
g(eaq-) 0612 0249
g(H2O2) 0934 0045
g(H2) 0907 0032
g(bullOH) 0950 0265
g(Hbull) 0925 0108
Table 15 Statistical information concerning the estimation of primary yields used to model
the radiolysis of water
Chapter 3 Computational Methodology
96
The partition of volatile species depends on a number of parameters some of which are
dependent on geometry Although H2O2 is not a volatile species its concentration is
strongly affected by the concentration of aqueous O2 it is therefore necessary to include gas
partitioning methods in both H2 and H2O2 model calculations The interfacial surface area
(Aint) is one such parameter although this can be roughly determined by measuring the
geometry of the vials being used Other parameters such as the boundary thicknesses (δ) are
not so easily measured and are parameter fitted This is done using the parameter fitting
functionality built into FACSIMILE Experimental data is supplied to FACSIMILE and the
desired parameters to fit are declared the calculation is then performed a number of times
slightly varying the declared parameters each time until the predicted values better match
the provided experimental data For this work the data provided to FACSIMILE was the
concentration of H2 and H2O2 in aerated water as a function of dose (Figures 32-33) Vials
of different geometry have different boundary thicknesses the values used throughout this
work are shown in Table 16
Parameter
Vial Used for H2 Analysis Vial Used for H2O2 Analysis
Aint (m2) 502 times10
-5 284 times10
-4
δaq (m) 580 times10-4
510 times10-4
δg (m) 260 times10-2
260 times10-2
Table 16 Parameters used to describe interfacial surface area (Aint) and boundary
thicknesses (δ) for sample vials of different geometry
Chapter 4 The Radiolysis of Aqueous Solutions at High pH
97
Chapter 4 The Radiolysis of Aqueous Solutions at High pH
Preliminary Radiolysis Studies of Pure Water
Preliminary experiments to measure hydrogen peroxide and hydrogen gas concentrations
from the radiolysis of aerated and deaerated water at neutral pH were carried out as a
control to which other measurements may be compared Computational modelling of these
pure water systems were performed with the radiolysis model described in Chapter 3 to
validate the models performance
Measurements of hydrogen peroxide were made using the Ghormley Tri-iodide method
described in Chapter 2 The pH of the stock was measured using a Mettler Toledo
SevenMultitrade pH meter equipped with a probe capable of measuring pH in the range 0-14
and was found to be 699 Aliquots of 10 mL from the pure water stock were sealed in
20 mL headspace vials so that the liquid to headspace ratio was 11 and were irradiated in
row 1 of the 4x8 sample rack the average dose rate was 2839 Gy min-1
The experiment
was run twice prior to irradiation samples used in the first run were sealed but left aerated
while samples used in the second run were sealed in gas tight vials equipped with rubber
septa and were sparged for 20 minutes with zero grade argon gas to remove all dissolved
oxygen The results of the two experimental runs are shown in Figure 32
Preliminary measurements of hydrogen gas production were also carried out using pure
water 2 mL aliquots of pure water stock were flame sealed in 4 mL glass vials which were
then secured in the inverter rig and irradiated for various periods of time the average dose
rate was 2851 Gy min-1
Post irradiation analysis was carried out by the previously
described crush tube method of gas chromatography
Chapter 4 The Radiolysis of Aqueous Solutions at High pH
98
As flame sealing introduces slight irregularity in the volume of headspace an assumption
was made that the headspace of the sealed vial was 2 mL
This allows the conversion of measured quantities (microL) of hydrogen to a concentration
(mol dm-3
) Once again the experiment was run twice with the second experimental run
using samples that have been deaerated with argon and the results are shown in Figure 33
Figure 32 Measurements of H2O2 concentration as a function of dose for aerated water
(diams) and deaerated water (diams) Vertical error bars show the standard deviation between
replicates while horizontal error bars show the dose range for replicates
000E+00
100E-06
200E-06
300E-06
400E-06
500E-06
600E-06
700E-06
800E-06
000E+00
200E-05
400E-05
600E-05
800E-05
100E-04
120E-04
140E-04
0 10 20 30 40
[H2O
2]
(mo
l d
m-3
) D
eaer
ated
[H2O
2]
(mo
l d
m-3
) A
erat
ed
Dose (kGy)
Aerated Water
Deaerated Water
Chapter 4 The Radiolysis of Aqueous Solutions at High pH
99
Figure 33 Measurements of H2 as a function of dose in aerated (diams) and deaerated (diams)
samples Vertical error bars show the standard deviation of replicates while horizontal
error bars show the dose range for replicates
Discussion
Aerated samples resulted in a steady-state concentration of hydrogen peroxide at
approximately 11 times10-4
mol dm-3
while molecular hydrogen continues to form with
absorbed dose over the range considered In order to satisfy the mass balance requirements
some other species must be formed after the achievement of the peroxide steady-state that
is also proportional to hydrogen formation The most likely candidate for this is molecular
oxygen which would have to be formed at half the rate of hydrogen
Samples that did not contain any dissolved oxygen failed to produce significant quantities
of hydrogen peroxide or hydrogen gas with a very low steady state eventually achieved at
approximately 40 times10-6
mol dm-3
This may be attributed to the radiolytic production of
oxygen required to satisfy mass balance Using the radiolysis model a predicted chemical
yield can be obtained after the establishment of the hydrogen peroxide steady state to show
that mass balance is satisfied by oxygen production The predicted chemical yields were
calculated between doses of 15 kGy to 30 kGy
000E+00
100E-04
200E-04
300E-04
400E-04
500E-04
600E-04
700E-04
800E-04
0 10 20 30 40 50 60
[H2]
(mo
l d
m-3
)
Dose (kGy)
Aerated Water
Deaerated Water
Chapter 4 The Radiolysis of Aqueous Solutions at High pH
100
For oxygen gas the predicted chemical yield was G(O2) = 0011 while the predicted yield
of hydrogen gas formation in deaerated water was G(H2) = 0022 In both cases samples
that were aerated produced much larger quantities of hydrogen and hydrogen peroxide than
their deaerated equivalents This was somewhat expected as it has long been considered
that dissolved oxygen is reduced and the reduction products are able to react with hydroxyl
radicals preventing them from removing hydrogen peroxide and hydrogen87
The general
scheme first proposed in 1954 for this protection mechanism is initiated by the reaction of
hydrogen atoms with oxygen to produce hydroperoxyl radicals these then react with
hydroxyl radicals to reform water and oxygen or with itself to form hydrogen peroxide and
oxygen4
119867bull + 1198742 rarr 1198671198742bull
(R12)
bull119874119867 + 11986721198742 rarr 1198672119874 + 1198671198742bull
(R18)
1198671198742bull + 1198671198742
bull rarr 11986721198742 + 1198742 (R35)
bull119874119867 + 1198671198742bull rarr 1198672119874 + 1198742 (R20)
More recent studies by the research group led by Clara Wren have deployed computational
methods to investigate further the effects of dissolved oxygen on the steady-state
concentration of both hydrogen peroxide and molecular hydrogen86
The calculations
performed in this study also supported the idea that dissolved oxygen is reduced and it is
the reduction products that scavenge hydroxyl radicals resulting in the protection of
hydrogen peroxide and molecular hydrogen The calculations revealed that oxygen is
mainly reduced by the hydrated electron and that the superoxide formed is responsible for
the scavenging of hydroxyl radicals This process serves as a catalytic mechanism for the
overall reaction between the solvated electron and hydroxyl radicals
Chapter 4 The Radiolysis of Aqueous Solutions at High pH
101
119890119886119902minus + 1198742 rarr 1198742
minus (R7)
1198742minus + bull119874119867 rarr 119874119867minus + 1198742 (R21)
Overall Reaction 119890119886119902minus + bull119874119867 rarr 119874119867minus (R2)
This scavenging of hydroxyl radicals has a larger impact on protecting hydrogen as the
reaction between hydrogen and the hydroxyl radical is the only significant removal path of
hydrogen in neutral conditions
Wren proposes that high concentrations of hydrogen peroxide seen in aerated solutions can
be attributed to a change in the production pathway for hydrogen peroxide in the presence
of oxygen The reaction between both the reduction products of oxygen becomes the
dominant production pathway for hydrogen peroxide
1198671198742bull + 1198742
minus rarr 1198671198742minus + 1198742 (R32)
119867(119886119902)+ + 1198742
minus 1198671198742bull (R6970)
119867(119886119902)+ + 1198671198742
minus 11986721198742 (R5758)
Similar calculations were performed in this work using the computational method described
in Chapter 3 The computational predictions shown in figures 34 and 35 serve as a baseline
to demonstrate that the computational model performs well at least at a fundamental level
before building up to more complex systems
Chapter 4 The Radiolysis of Aqueous Solutions at High pH
102
Figure 34 Predicted concentrations of H2O2 as calculated by the radiolysis model for both
aerated () and deaerated () conditions
Figure 35 Predicted concentrations of H2 gas as calculated by the radiolysis model for
both aerated () and deaerated () conditions
000E+00
100E-06
200E-06
300E-06
400E-06
500E-06
600E-06
700E-06
800E-06
000E+00
200E-05
400E-05
600E-05
800E-05
100E-04
120E-04
140E-04
0 10 20 30 40
[H2O
2]
(mo
l d
m-3
) D
eaer
ated
[H2O
2]
(mo
l d
m-3
) A
erat
ed
Dose (kGy)
Aerated Water
FACSIMILE Aerated
Deaerated Water
FACSIMILE Deaerated
000E+00
100E-04
200E-04
300E-04
400E-04
500E-04
600E-04
700E-04
800E-04
0 10 20 30 40 50 60
H2 (
mo
l d
m-3
)
Dose (kGy)
Aerated Water
Deaerated Water
FACSIMILE Aerated
FACSIMILE Deaerated
Chapter 4 The Radiolysis of Aqueous Solutions at High pH
103
The predictions made for the concentrations of hydrogen peroxide and hydrogen gas in pure
water match well with the observed measurements especially for the concentration of
hydrogen peroxide produced in aerated water The most obvious discrepancy is the
disparity between the early predictions of hydrogen peroxide concentration and the
measured concentration for deaerated samples which is most likely due to imperfect
oxygen removal from the samples As the predictions are in generally good agreement with
the experimental measurements it is not unreasonable to assume that steady state
concentrations of other species which cannot or were not determined experimentally
during this work can be estimated by the model
Figure 36 Calculated concentrations of the major oxidising and reducing water radiolysis
species as a function of dose Solid lines represent aerated conditions while broken lines
represent deaerated conditions
Figure 36 shows the predicted concentrations of various radical species in both aerated and
deaerated water The calculated concentrations agree with previously published calculations
by Wren and co-workers86
100E-14
100E-12
100E-10
100E-08
100E-06
0 10 20 30 40 50
Co
nce
ntr
atio
n (
mo
l d
m-3
)
Dose (kGy)
˙OH
O2˙-
H˙
eaq-
HO2˙
Chapter 4 The Radiolysis of Aqueous Solutions at High pH
104
Under aerated conditions reducing species H˙ and eaq- have significantly lower
concentrations than in deaerated conditions due to scavenging by oxygen The resulting
reduction products of oxygen are superoxide and hydroperoxyl radicals and both show an
increased concentration in aerated conditions
The experiments in the following sections concerning the measurement of hydrogen
peroxide were all performed in aerated conditions to resemble the conditions at the
Sellafield site Measurements of hydrogen were for the most part carried out under
deaerated conditions
Chapter 4 The Radiolysis of Aqueous Solutions at High pH
105
Measurements of H2O2 in the Radiolysis of High pH Solutions
Stock solutions of various pH were prepared using NaOH dissolved in ultra-pure water
From each stock sample sets were prepared from 10 mL aliquots of stock solution and
sealed in 20 mL glass vials with aluminium crimp caps The pH of the remaining sample
stocks were measured and recorded Irradiation dose rates were calculated from original
measurements using the Fricke dosimetry method described previously Sample sets were
loaded into row 1 of the 4x8 irradiation rack and irradiated using the Model-812 cobalt-60
irradiator until they reached the desired dose Table 17 summarises the dose rates and pH of
the sample batches examined
Sample Batch ID Average Dose Rate for Row 1 (Gy min-1
) Measured pH
H2O2-PH00 28512 699
H2O2-PH01 27497 1041
H2O2-PH02 27407 1108
H2O2-PH03 28364 1230
H2O2-PH04 27467 1274
Table 17 Conditions of samples used to investigate hydrogen peroxide in high pH
radiolysis
Results
Post irradiation analysis for H2O2 was carried out immediately after irradiation using the
previously described tri-iodide method Analysis of high pH samples required additional
acid to lower the pH to the conditions required by the analytical method the quantities of
acid used were recorded and the dilution effects have been accounted for The results of this
study are shown in Figure 37
Chapter 4 The Radiolysis of Aqueous Solutions at High pH
106
Figure 37 Measurements of H2O2 concentrations as a function of dose for samples
initially at pH 7 (diams) pH 104 (diams) pH 11 (diams) pH 123 (diams) and pH 127 (diams)
All samples were aerated Vertical error bars are the standard deviation between
replicates while horizontal error bars show the dose range for replicates
The steady state concentration of hydrogen peroxide is fairly consistent at about
115 x10-4
mol dm-3
within the pH range 7-11 each attaining steady state after roughly
5 kGy At higher pH values both the steady state concentration and the dose at which
steady state is achieved increase
Samples at pH 123 required roughly 10 kGy to obtain a peak steady-state concentration of
195 x10-4
mol dm-3
of hydrogen peroxide while samples at pH 127 required even higher
doses almost 20 kGy to reach a steady concentration of 238 x10-4
mol dm-3
The data set
from samples at pH 123 shows an apparent decrease in hydrogen peroxide concentration of
~18 at 35 kGy A similar decrease in hydrogen peroxide concentration is also observed in
samples of pH 11
000E+00
500E-05
100E-04
150E-04
200E-04
250E-04
300E-04
0 10 20 30 40
[H2O
2]
(mo
l d
m-3
)
Dose (kGy)
pH 127
pH 123
pH 11
pH 104
pH 7
Chapter 4 The Radiolysis of Aqueous Solutions at High pH
107
Measurements of H2 in the Radiolysis of High pH Solutions
Stock solutions of various pH were prepared using NaOH to match the pH range used in
the measurement of hydrogen peroxide Many of the acid-base equilibria used in the
description of water radiolysis have pKa values in the pH range investigated by this study
The behaviour of H2 production observed at high pH may be influenced by a change in
chemistry brought about by a shift in one or more of the acid-base equilibria Table 18
shows the equilibria of interest and their associated pKa value while Table 19 includes the
measured pH of the stock solutions
Equilibrium pKa
bull119926119919 119919(119938119954)+ + bull119926minus 1184
119919120784119926120784 119919(119938119954)+ +119919119926120784
minus 1168
119919bull 119919(119938119954)+ + 119942119938119954
minus 974
119919119926120784bull 119919(119938119954)
+ + 119926120784minus 483
Table 18 A list of important equilibria and their associated pKa values
For the measurement of hydrogen sample sets were prepared from 2 mL aliquots of stock
solution which were transferred to glass ldquocrush tuberdquo vials described in chapter two The
vials were connected to a glass manifold via stainless steel needles and sparged with zero
grade argon for 20 minutes to remove any dissolved oxygen before samples were flame
sealed under argon
Irradiation dose rates were calculated from original Fricke dosimetry study described
previously Samples were loaded into the four positions available in the inverter rig and
irradiated until they reached the desired dose
Chapter 4 The Radiolysis of Aqueous Solutions at High pH
108
Results
After irradiation samples were analysed for hydrogen gas by gas chromatography using the
ldquocrush tuberdquo technique described in Chapter 2 Figure 38 shows the amounts of H2
produced as a function of radiation dose As production rates of hydrogen gas are linear as a
function of absorbed dose chemical yields can be identified as the gradient expressed in
terms of molecules per 100 eV of absorbed energy These results are summarised in Table
19 while the data is shown in Figure 38
Table 19 Conditions of samples used to investigate hydrogen gas in high pH radiolysis
Figure 38 Measurements of H2 gas as a function of dose at pH 7 (diams) pH 106 (diams) pH 123
(diams) and pH 13 (diams) Dashed lines are provided to clarify the data trends all samples were
deaerated Vertical error bars show the standard deviation between replicates while
horizontal error bars show the dose range for replicates
000E+00
500E-04
100E-03
150E-03
200E-03
250E-03
0 20 40 60 80
H2 (
mo
l d
m-3
)
Dose (kGy)
pH 13
pH 123
pH 106
pH 7
Sample
Batch ID
Average Dose Rate for
Inverter Rig (Gy min-1
) Measured pH G(H2) Error plusmn
H2-PH00 28385 699 0021 0002
H2-PH01 28408 1063 0071 0018
H2-PH02 29039 1232 0352 0005
H2-PH03 28634 1307 0176 0010
Chapter 4 The Radiolysis of Aqueous Solutions at High pH
109
Increasing the pH has the effect of increasing the chemical yield for hydrogen over the pH
range 7 to 123 however the data set for pH 13 shows that the chemical yield for hydrogen
is less than samples at pH 123 The results of the calculations using the reaction scheme
given in Tables 12 - 14 for both hydrogen peroxide and hydrogen gas production are
shown in Figures 39 and 40 respectively
Figure 39 Model calculations to show the predicted concentrations of H2O2 as a function
of dose at various pH
000E+00
500E-05
100E-04
150E-04
200E-04
250E-04
300E-04
350E-04
0 10 20 30 40 50
[H2O
2]
(mo
l d
m-3
)
Dose (kGy)
pH 127
pH 123
pH 11
pH 104
pH 7
Chapter 4 The Radiolysis of Aqueous Solutions at High pH
110
Figure 40 Model calculations to show the predicted concentrations of H2 gas as a function
of dose at various pH
Calculated concentrations of hydrogen peroxide show the same trends as the data The
predictions at pH 104 and 11 take slightly longer to reach steady state than what the
experimental data shows Higher pH calculations follow the same trend as the experimental
data but overestimate the steady state concentrations of hydrogen peroxide especially in the
calculations at pH 127
Calculated concentrations of molecular hydrogen follow a slightly more unexpected trend
Predictions made for pH 106 massively overestimate hydrogen production rates this is
symptomatic of a misunderstanding of the mechanistic chemistry A similar error has also
been noted by Wren when performing calculations at this pH a suggested fix was to
increase the reaction rate between ozinide and molecular hydrogen by a factor of 886
000E+00
500E-04
100E-03
150E-03
200E-03
250E-03
300E-03
0 20 40 60 80
[H2]
(mo
l d
m-3
)
Dose (kGy)
pH 13
pH 123
pH 106
pH 7
Chapter 4 The Radiolysis of Aqueous Solutions at High pH
111
Even with this higher rate the over prediction of hydrogen is still large at pH 106 while
predictions for pH 123 agree reasonably well with experimental data This information at
least helps to narrow the pH range at which this misunderstanding manifests The pH range
afflicted by over prediction of hydrogen falls close to the pKa of the dissociation of the
hydrogen atom at 974
119867bull 119867(119886119902)+ + 119890(119886119902)
minus pKa = 974
The reverse reaction rate for the above equilibrium has been measured with good agreement
over a number of laboratories however the forward reaction rate is calculated based on the
relationship between the reverse reaction rate and the equilibrium constant45
This
equilibrium constant is derived from the Gibbs free energy of formation of Hbull in the gas
phase combined with an estimated value for the free energy of solvation of Hbull This
estimation is a value between those for the free energy of solvation of He atoms and H2
molecules888
Both computational and experimental data show the same trend at pH 13 in that the
production rate of hydrogen is less than that observed at lower pH however the
calculations once again overestimate the rate shown by the experimental data Some more
features of this discrepancy are discussed further in the following section
Chapter 4 The Radiolysis of Aqueous Solutions at High pH
112
Discussion
The radiolytic removal of hydrogen from solution by the hydroxyl radical has long been
referred to as the Allen chain25
In this mechanism the hydroxyl radical reacts with
molecular hydrogen to reform water and a hydrogen atom the chain is then extended by the
reaction of the hydrogen atom with hydrogen peroxide to reform the hydroxyl radical with
the net effect being the removal of H2 and H2O2
Propagation Steps
bull119874119867 + 1198672 rarr 119867bull + 1198672119874 k78 = 40 times10
7 M
-1 s
-1
119867bull + 11986721198742 rarr bull119874119867 + 1198672119874 k11 = 365times107 M
-1 s
-1
Termination 119867bull + bull119874119867 rarr 1198672119874 k10 = 109times1010
M-1
s-1
Aside from transference into the gas phase this chain is the only removal path for hydrogen
under neutral pH conditions At higher pH radical species are converted into their base
forms and a new chain is established43
119867bull + 119874119867minus 119890119886119902minus + 1198672119874 (R7576)
bull119874119867 + 119874119867minus 119874bullminus + 1198672119874 (R6566)
Propagation Steps
119874bullminus + 1198672 rarr 119890119886119902minus + 1198672119874 k47 = 128 times10
8 M
-1 s
-1
119890119886119902minus + 1198671198742
minus rarr 119874bullminus + 119874119867minus k49 = 786times108 M
-1 s
-1
Termination 119890119886119902minus + 119874bullminus rarr 2119874119867minus k3 = 231times10
10 M
-1 s
-1
Chapter 4 The Radiolysis of Aqueous Solutions at High pH
113
Given the higher rate constants involved in the alkali chain it would seem that the chain
reaction established in the basic form has a higher efficiency than its neutral equivalent yet
observations show a higher chemical yield of hydrogen at high pH and would suggest
otherwise This can largely be resolved by considering the effects of oxygen on these chain
reactions Oxygen acts as a poison to both the chain reactions removing hydrogen causing
an increase in hydrogen yield The mechanism by which oxygen disrupts the chain is
through reactions with solvated electrons to produce superoxide which in turn reacts with
OH radicals or in the case of alkali solutions bullOˉ preventing them from reacting with
hydrogen as well as reforming oxygen
119890119886119902minus + 1198742 rarr 1198742
bullminus (R7)
bull119874119867 + 1198742bullminus rarr 119874119867minus + 1198742 (R21)
bull119874minus + 1198742bullminus + 1198672119874 rarr 2119874119867
minus + 1198742 (R50)
In alkali solution bullOˉ is also susceptible to a direct reaction with oxygen to form ozonide
ions while a neutral equivalent reaction between hydroxyl radicals and oxygen does not
exist As the experimental measurements of hydrogen gas from solutions of sodium
hydroxide were carried out in deaerated conditions there should be no initial dissolved
oxygen and any oxygen present would have been radiolytically formed Figure 41 shows
the calculated steady state concentration of aqueous oxygen compared to hydrogen gas
formation as a function of pH from this it is clear that an increase in pH leads to a rise in
radiolytically produced oxygen which is proportional to the amount of hydrogen generated
Chapter 4 The Radiolysis of Aqueous Solutions at High pH
114
Figure 41 Model calculations showing the concentrations of aqueous oxygen and
hydrogen gas from deaerated water after 80 kGy at 280 Gy min-1
to show the related
behaviour between the two
Analysis of the calculated reaction rates gives an insight to why the concentration of
radiolytic oxygen first rises with pH and then falls after pH 12 and may help to reveal the
source of the over-prediction at pH 106 All the following reaction rates are taken from the
end of the experimental range ie 80 kGy with a dose rate of 280 Gy min-1
At neutral pH
it is the reaction between the superoxide ion and the hydroxyl radical (R21) that is the main
source of radiolytic oxygen but as the pH rises beyond pH 10 the rate of this reaction
begins to fall from ~140 times10-6
mol dm-3
s-1
to 886 times10-8
mol dm-3
s-1
at pH 14 This drop
is mainly due to the equilibrium between the hydroxyl radical and its basic form bullOˉ which
has a pKa of 119 As one would expect the reaction rate of the equivalent base reaction
(R50) rises as the pH increases although this increase does not fully compensate for the
decrease in rate of R21
100E-06
100E-05
100E-04
100E-03
100E-02
7 8 9 10 11 12 13 14
Lo
g C
on
cen
trat
ion (
mo
l d
m-3
)
pH
[H2] g
[O2] aq
Chapter 4 The Radiolysis of Aqueous Solutions at High pH
115
This is because the reaction between the solvated electron and superoxide (R8) has a larger
rate constant than R50 and with the conversion of hydrogen atoms to solvated electrons at
high pH R8 out competes R50
In principal many other reactions produce oxygen but the rates of these reactions are often
negligible Only the rate of oxygen production through the reaction of superoxide and
hydroperoxyl (R32) sees an increase over the pH range 10-12 which may be significant to
radiolytic oxygen production Figure 42 shows the rates of the three main molecular oxygen
producing reactions (R21 R50 and R32) as well as the reaction rate for R8 and the
combined reaction rates for R8 and R50 as a function of pH When the combined reaction
rates of R8 and R50 are compared with the reaction rate of R21 it becomes obvious that
there is a transition from the removal of super oxide by R21 to removal by both R8 and
R50 this is the main cause of a decrease in oxygen concentration after pH 12 Figure 43
shows the sum of reaction rates that lead to oxygen formation and removal as a function of
pH
Figure 42 Model predictions of the steady-state reaction rates of R21 R50 and R32 at
various pH for γ radiolysis of deaerated water at a dose rate of 280 Gy min-1
000E+00
200E-07
400E-07
600E-07
800E-07
100E-06
120E-06
140E-06
160E-06
7 8 9 10 11 12 13 14
Rea
ctio
n R
ate
at S
tead
y S
tate
(mo
l d
m-3
s-1
)
pH
Chapter 4 The Radiolysis of Aqueous Solutions at High pH
116
Figure 43 The sum of the steady state rates of all reactions that produce O2 () compared
with the sum of the steady state rates of all reactions that remove O2 () These totals do
not include rates of production or removal from mass transfer reactions This calculation is
for the γ radiolysis of deaerated water to a dose of 80 kGy at a rate of 280 Gy min-1
At pH 7 the rate of oxygen production matches the rate at which it is removed and a low
steady state concentration of aqueous oxygen is achieved before the end of the 80 kGy
calculation range At higher pH the rate of oxygen removal diverges and so oxygen can
accumulate to a higher concentration over a longer period of time longer than that of the
80 kGy range used Excluding transfer into the gas phase there are only three reactions that
effectively remove oxygen so it was worth investigating how the rates of these reactions
changed with pH Figure 44 shows the rates of reactions R6 R7 R8 R12 and R67 as a
function of pH
000E+00
200E-07
400E-07
600E-07
800E-07
100E-06
120E-06
140E-06
160E-06
7 8 9 10 11 12 13 14
Rat
e at
Ste
ady S
tate
(mo
l d
m-3
s-1
)
pH
Chapter 4 The Radiolysis of Aqueous Solutions at High pH
117
Figure 44 Model predictions of the steady-state reaction rates of R7 R12 and R67 at
various pH This calculation is for the γ radiolysis of deaerated water to a dose of 80 kGy
at a rate of 280 Gy min-1
The first removal path of oxygen is the reaction between the solvated electron and oxygen
to produce superoxide (R7) this reaction does not see a significant change in rate below
pH 11 after which the rate begins to fall The second reaction is the reduction of oxygen by
the hydrogen atom (R12) the rate of this reaction falls steadily as pH increases this is due
to the conversion of hydrogen atoms to solvated electrons by hydroxide which has a pKa of
96 The decline in rate of this reaction accompanied by no significant increase in the rate
of oxygen removal by solvated electrons may be the main contribution to the increased
concentrations of oxygen at pH gt 9 It was thought that this might also be the cause of the
over prediction but any attempt to increase this rate constant is largely negated by an
accompanying increase in the rate of reaction R32 The final removal path of oxygen is the
reaction with O˙- to form ozonide (R67)
000E+00
200E-07
400E-07
600E-07
800E-07
100E-06
120E-06
7 8 9 10 11 12 13 14
Rea
ctio
n R
ate
at S
tead
y S
tate
(mo
l d
m-3
s-1
)
pH
Chapter 4 The Radiolysis of Aqueous Solutions at High pH
118
The rate of this reaction increases rapidly with pH from 194 times10-8
mol dm-3
s-1
at pH 9
to 146 times10-6
mol dm-3
s-1
at pH 14 however ozonide is unstable and decomposes to reform
oxygen at a rate not much lower than its formation
Subtracting the rate of oxygen reformation from the decomposition of ozonide gives the
actual rate of oxygen removal by bullOˉ of 110 times10
-9 mol dm
-3 s
-1 at pH 9 and
600 times10-8
mol dm-3
s-1
at pH 14 It should be noted that the decomposition rate of ozonide
was excluded from the total rate of oxygen formation in figure 44 while the rate of oxygen
removal by ozonide formation was the subtracted values quoted above
The main removal mechanism of hydrogen peroxide is by reaction with solvated electrons
In the presence of oxygen the removal of hydrogen peroxide by solvated electrons is
largely out competed by reactions between the solvated electrons and oxygen or
superoxide The rate constant for the reaction between oxygen and the solvated electron
(R7) is 225 times1010
dm3 mol
-1 s
-1 while for the reaction of hydrogen peroxide and the
solvated electron (R4) is only 136 times1010
dm3 mol
-1 s
-1 and so hydrogen peroxide is initially
protected from reactions with the solvated electron as long as oxygen or superoxide is
available In alkali conditions where the pH is larger than 116 the conjugate base of
hydrogen peroxide HO2- becomes the dominant peroxide species This reacts even slower
with the solvated electron with a rate constant of 365 times109
dm3 mol
-1 s
-1 so the protection
effect is even stronger It was mentioned earlier that beyond pH 11 the rate of reaction R21
falls significantly as bullOH is converted to its basic form and the equivalent base reaction
(R50) does not see a sufficient equivalent increase in rate The reason given was that R50
was out competed by the reaction between superoxide and the solvated electron (R8)
Chapter 4 The Radiolysis of Aqueous Solutions at High pH
119
This not only serves to protect hydrogen peroxide by competing with solvated electrons but
also contributes to the increased concentration of hydrogen peroxide as the product of R8 is
in fact hydrogen peroxide
119890119886119902minus + 1198742
bullminus rarr 11987422minus (R8)
11987422minus + 1198672119874 1198671198742
minus + 119874119867minus (R6162)
Although this may account for the increased steady state of hydrogen peroxide at high pH
Figure 39 still shows a slight over prediction for calculations made at pH 123 and 127 As
the equilibrium between the hydroxyl radical and the oxygen anion has a pKa of 1184 it
was thought that the over prediction could be a result of the estimations used for the rate
constants of the reactions involving the oxide radical anion There is little data available for
the rate constants of reactions involving bullOˉ As reaction R51 and R52 both lead to the
formation of peroxide it initially was thought that these reactions may have rate constants
that are too high however removing these reactions from the model made no significant
difference to the predicted production of H2O2
119874bullminus + 119874bullminus rarr 11987422minus
1198672119874rarr 1198671198742
minus + 119874119867minus (R51)
119874bullminus + bull119874119867 rarr 1198671198742minus (R52)
It was instead found that other oxide radical anion reactions had an effect on the predicted
value for H2O2 A total of four oxide radical anion reactions influence the predicted values
with two of them making a significant difference Reducing the rate constant for the
reactions R47 and R48 made a slight improvement to the prediction of H2O2 a more
significant effect can be seen by altering the rate constants for R49 and R50
Chapter 4 The Radiolysis of Aqueous Solutions at High pH
120
119874bullminus + 1198671198742minus rarr 1198742
minus + 119874119867minus (R49)
119874bullminus + 1198742minus rarr 1198742minus
1198672119874rarr 2119874119867minus + 1198742 (R50)
Originally the rate constant for R49 was an estimation reported by Buxton et al in 19889
with a value of 40 times108 M
-1 s
-1 Since then this rate constant has been measured by
C R Stuart and D C Ouellette and is reported as being 786 times108
M-1
s-1
at 25degC45
The
value for the rate constant for R50 was originally estimated by Sehested et al in 198289
to
be 60 times108 M
-1 s
-1 This estimation was made by adjusting the rate constant for R50 and
R53 in a kinetic model to produce a prediction that agreed with the decay of ozonide
measured experimentally by pulse radiolysis By increasing the rate constant for R50 from
60 times108 M
-1 s
-1 to 48 times10
9 M
-1 s
-1 an improved agreement to the predicted steady state
concentration of H2O2 is found This is shown in Figure 45
Figure 45 Dashed lines show the original prediction where k50 = 60 times108 M
-1 s
-1 while
solid lines show the predictions with the increased k50 = 48 times109 M
-1 s
-1
000E+00
500E-05
100E-04
150E-04
200E-04
250E-04
300E-04
350E-04
0 10 20 30 40 50
[H2O
2]
(mo
l d
m-3
)
Dose (kGy)
Chapter 4 The Radiolysis of Aqueous Solutions at High pH
121
With the modified reaction rate constant for R50 the predictions for the steady state
concentrations of H2O2 are closer to the experimental values at high pH
Although this calculation improves the prediction for the steady state concentration it also
appears to increase the rate at which the steady state is achieved moving the prediction
away from the experimental data The cause of this discrepancy may have something to do
with the way in which some of the equilibria have been implemented in the model and
should be investigated in the future This modification also has little effect on the over
prediction of hydrogen gas at pH 104
Chapter 5 Radiolysis of Magnesium Hydroxide
122
Chapter 5 Radiolysis of Magnesium Hydroxide
Context
The Magnox Swarf Storage Silo contains 22 silos used to store magnesium alloy cladding
that has been removed from spent Magnox fuel elements The magnesium fuel cladding is
stored underwater where it readily corrodes to form magnesium hydroxide and hydrogen
gas by the following reaction90
119872119892 + 21198672119874 rarr 119872119892(119874119867)2 +1198672
Hydrogen gas poses an obvious hazard and is closely monitored however production rates
are not predictable Much of the magnox fuel cladding is contaminated with uranium and
other fission products contributing an additional supply of hydrogen through water
radiolysis Dose rates are often further increased as some of the silos were used to dispose
of other beta and gamma emitting waste The presence of the magnesium hydroxide
complicates the radiolysis processes as (a low) solubility in water drives up the pH while
undissolved magnesium hydroxide provides additional surfaces where radiolysis processes
are poorly understood
Experiments were conducted to investigate the effects of magnesium hydroxide on the
radiolytic production yields of hydrogen gas and hydrogen peroxide The investigation
began by measuring hydrogen yields in solutions of magnesium hydroxide and comparing
hydrogen yields to solutions containing sodium hydroxide solution with the same pH Pure
water is also included as a control and the magnesium hydroxide samples included both
homogeneous saturated solutions of aqueous magnesium hydroxide and heterogeneous
slurries containing undissolved magnesium hydroxide
Chapter 5 Radiolysis of Magnesium Hydroxide
123
Method
The saturated solution was prepared in bulk using magnesium hydroxide (Sigma Aldrich
BioUltra ge 990) and ultra-pure water solids were separated by centrifuge as filters may
introduce organic contamination 2 mL aliquots of saturated magnesium hydroxide solution
were transferred to sample tubes and flame sealed under air The pH of the remainder of the
saturated solution was measured to be 106 Slurry samples were prepared by weighing
01 g of magnesium hydroxide into a glass vial before adding 2 mL of ultra-pure water
Samples were also flame sealed under air before being mechanically mixed by agitation
Samples were irradiated using the inverter rig however the samples were left stationary and
were not inverted during irradiation Samples were irradiated at an average dose rate
of 281 Gy min-1
until the desired dose was reached samples were then analysed for
hydrogen by the ldquocrush tuberdquo gas chromatography method previously described Figure 46
shows the production of hydrogen as a function of dose for both saturated solutions and
solid containing slurries of magnesium hydroxide This is compared with measurements
obtained from pure water and an aqueous solution of sodium hydroxide with a similar pH
to that of the magnesium hydroxide samples
Chapter 5 Radiolysis of Magnesium Hydroxide
124
Results
Figure 46 Measurements of H2 gas as a function of dose All samples here are aerated
with vertical error bars showing the standard deviation between replicates
It should be noted that all the samples used to produce figure 46 are aerated The chemical
yield of hydrogen for each sample set is given in Table 20
Table 20 Obtained results from the measurements of H2 gas
000E+00
200E-04
400E-04
600E-04
800E-04
100E-03
120E-03
140E-03
160E-03
180E-03
200E-03
0 10 20 30 40 50 60
[H2]
(mo
l d
m-3
)
Dose (kGy)
Sample ID Average Dose Rate for
Inverter Rig (Gy min-1
)
Measured
pH G(H2)
(Molecules 100 eV-1
) Error
plusmn
Mg(OH)2(s) 2814 1062 052 003
Mg(OH)2(aq) 2814 1057 047 002
NaOH 2845 1063 027 002
H2O 1732 699 016 001
Chapter 5 Radiolysis of Magnesium Hydroxide
125
The dose rate for the pure water samples is much lower than the other dose rates quoted as
this measurement was performed before the construction of the inverter rig and so the
samples were held further away from the source during irradiation
This data shows that the presence of magnesium hydroxide appears to increase the
hydrogen yield beyond what one would expect if the yield was controlled by pH alone
There is very little difference in hydrogen yield between samples that contain solid
magnesium hydroxide and samples that contain only dissolved magnesium hydroxide This
suggests that surface effects contribute to the hydrogen yield only a very small amount or
not at all This data is discussed further in the following section
A second set of experiments was conducted to measure the concentration of hydrogen
peroxide in irradiated saturated solutions of magnesium hydroxide 10 mL aliquots of
aerated saturated solution were transferred in to 20 mL glass headspace vials the vials were
sealed with an aluminium crimp cap and irradiated in the front row of the 4 x 8 rack the
average dose rate was 2831 Gy min-1
After irradiation the samples were analysed for
hydrogen peroxide by the Ghormley tri-iodide method described in Chapter 2 Figure 47
compares the obtained data from this experiment with data obtained from measurements
made in pure water
Chapter 5 Radiolysis of Magnesium Hydroxide
126
Figure 47 Measurements of H2O2 concentrations in aerated samples of saturated
magnesium hydroxide solution as a function of dose
The steady state concentration of hydrogen peroxide in a saturated solution of magnesium
hydroxide is almost the same as in a neutral sample of pure water as is expected given the
pH of the saturated solution was measured to be 106 which is below the 118 threshold
that is associated with an increased steady state of hydrogen peroxide observed in the
previous chapter
A further experiment was conducted to investigate the effects of the solid magnesium
hydroxide surface on the production of hydrogen Batches of samples were prepared with
various ratios of magnesium hydroxide to water each sample had a total mass of
approximately 2 g Table 21 summarises the sample ratios used Samples were irradiated
using the inverter rig which was left stationary throughout the irradiation the average dose
rate was 3042 Gy min-1
All samples were irradiated to approximately 525 kGy so that any
difference in the amount of hydrogen produced is independent of absorbed dose
000E+00
200E-05
400E-05
600E-05
800E-05
100E-04
120E-04
140E-04
0 5 10 15 20 25 30 35 40
[H2O
2]
mo
l d
m-3
Dose kGy
Aerated Water
Mg(OH)2 Saturated SolutionMg(OH)2 Aerated Saturated Solution
Chapter 5 Radiolysis of Magnesium Hydroxide
127
As the dose rate was determined by Fricke dosimetry which is a liquid phase dosimeter
with a density close to that of water the quoted dose of 525 kGy is what was received by
the aqueous phase The solid phase magnesium hydroxide has a slightly higher density and
will have received a slightly higher dose Figure 48 shows the chemical yields of hydrogen
as a function of water content percentage The results have been normalised to reflect the
amount of hydrogen produced per gram of water and the yields were calculated based on
the radiation dose absorbed by the whole system this makes the data from samples that
contain large quantities of water comparable to those with lower water content
Table 21 Conditions of samples containing Mg(OH)2 for measurements of H2
a ndash Powder sample with no added water estimated adsorbed water content is based on
data from Nelson et al91
b ndash Sample is a saturated solution of Mg(OH)2 ie contains no solid
H2O Average Mg(OH)2
Mass (g)
Average H2O
Mass (g)
Average
Dose (kGy)
4a 5303 plusmn 111
20 161 plusmn 002 040 plusmn 001 5245 plusmn 146
40 122 plusmn 002 082 plusmn 001 5255 plusmn 146
60 081 plusmn 001 122 plusmn 001 5255 plusmn 145
80 040 plusmn 001 162 plusmn 002 5245 plusmn 145
100b 5239 plusmn 145
Chapter 5 Radiolysis of Magnesium Hydroxide
128
Figure 48 Measurements of hydrogen yields from magnesium hydroxide samples with
various solid ndash aqueous ratios All samples were irradiated to a total dose of ~52 kGy to
the aqueous phase at a dose rate of 3041 Gy min-1
Discussion
The data shown in Figure 46 suggests that the presence of dissolved magnesium hydroxide
increases the chemical yield of hydrogen significantly more than if pH was the only
controlling factor Data shown in Figure 48 suggests that the presence of the solid surface
increases the hydrogen yield slightly above that for saturated solutions but it would seem
that the main contribution to the increased H2 yields in magnesium hydroxide samples
when compared to a solution of NaOH of equivalent pH is a factor present in both slurries
and saturated solutions of magnesium hydroxide The yield of H2 between 20 and 80
percent water content is not affected by changing the solid solution ratio suggesting that
there is little interaction between the solid magnesium hydroxide and the bulk water
00
02
04
06
08
10
12
14
16
0 20 40 60 80 100
G(H
2)
(Mo
lecu
les
10
0 e
V-1
)
H2O
Chapter 5 Radiolysis of Magnesium Hydroxide
129
The yield is significantly higher for samples with 4 water content (adsorbed water)
suggesting that any additional hydrogen is produced only in a few water layers away from
the solid surface as has been postulated for oxide surfaces
Petrik et al showed that oxide water systems consisting of multiple phases such as the
slurry samples measured here have different hydrogen yields depending on the oxide18
They grouped materials into three categories based on the effects they have on measured
hydrogen yields hydrogen enhancing hydrogen diminishing and hydrogen neutral
Though said study did not include magnesium hydroxide it does categorise magnesium
oxide as a material that does not significantly change the yield of hydrogen
The mechanism by which a solid surface increases the hydrogen yield is largely accredited
to an energy transfer process As solid particles in a sample absorbs energy a process of
energy migration from the bulk of the material to the interface takes place Energy can then
be transferred from the solid phase to the surrounding liquid The exact mechanism of the
energy transfer process is not well understood but the overall effect is higher dose rates in
localised areas of surrounding water
As the value of 4 water content is an estimation based on data extrapolation published by
Nelson et al in a study of water adsorption on magnesium hydroxide91
and may not be
entirely accurate This uncertainty could have a significant effect on the calculated chemical
yield if the estimation was even slightly incorrect for example an estimated water content
of just 9 has the effect of lowering the yield to the same value observed in samples
contain 20 water content This would be contradictory to an energy transfer process as
described previously
Chapter 5 Radiolysis of Magnesium Hydroxide
130
A study by Jay La Verne et al published measurements of hydrogen yields from the
gamma radiolysis of magnesium hydroxide to be 005119
This measurement was made
using magnesium hydroxide that had been dried to remove all excess water while
remaining hydroxylated The difference between the measured yields of saturated
magnesium hydroxide solution (G(H2) = 047) and a slurry sample (G(H2) = 052) given in
Table 20 is 005
This value is very close to the quoted value from dry magnesium hydroxide although it is
an average value and errors can be high with small differences between large numbers such
as this Little information is given to explain the mechanism contributing to this yield of
hydrogen from dry magnesium hydroxide other that the radiation induced conversion of
magnesium hydroxide to magnesium oxide92
A comparison was made to yields obtained
from calcium hydroxide and found that the yield of hydrogen was four times higher from
calcium hydroxide than from magnesium hydroxide This was explained in terms of the
tendency to form water during radiolysis being greater in magnesium hydroxide than in
calcium hydroxide meaning that a smaller portion of the hydroxide generates hydrogen
directly If the yield measured from the dry powder (0051) by La Verne et al is the result
of direct hydrogen production from magnesium hydroxide converting to the oxide then it
would make sense that the difference in yield between samples containing solid magnesium
hydroxide and only aqueous magnesium hydroxide would be close to this value
This does not explain why the yields of both samples are far higher than samples of sodium
hydroxide at the same pH as the magnesium hydroxide samples The chemical yield of
hydrogen from samples of sodium hydroxide with a pH of 1063 was 027 while yields
from both magnesium hydroxide systems were a little less than double this value
Chapter 5 Radiolysis of Magnesium Hydroxide
131
As this can be seen in both aqueous only samples and those containing solid magnesium
hydroxide the cause of this increased yield must be attributed to a factor present in both
aqueous only samples and samples containing solid magnesium hydroxide Magnesium
hydroxide is often discussed in literature concerning environmental science for its
properties and reactivity towards carbon dioxide9394
As the samples used in these experiments did not undergo any purification processes prior
to use they were most likely subject to carbonation reactions with atmospheric carbon
dioxide and water Magnesium hydroxide can be carbonated on exposed surfaces although
slow at standard room conditions it can be increased in the presence of water95
119872119892(119874119867)2(119904) + 1198621198742(119892) rarr 1198721198921198621198743(119904) + 1198672119874(119892)
Magnesium hydroxide can also take on intercalated carbon dioxide which can be converted
to carbonate either by reaction with water or if released into solution with hydroxide to
form bicarbonate9697
1198621198742(119860119894119903) 1198621198742(119894119899119905119890119903119897119886119910119890119903)
1198621198742(119894119899119905119890119903119897119886119910119890119903) + 1198672119874(119894119899119905119890119903119897119886119910119890119903) 2119867(119894119899119905119890119903119897119886119910119890119903)+ + 1198621198743(119894119899119905119890119903119897119886119910119890119903)
2minus
1198621198742(119886119902) + 119874119867(119886119902)minus 1198671198621198743(119886119902)
minus
Both carbonate and bicarbonate are known to be hydroxyl radical scavengers in the
radiolysis of aqueous solutions998
Using the Facsimile model described in Chapter 3 it
was possible to insert a set of reactions concerning carbonate radiolysis to estimate the
effects that small quantities of carbonate might have on hydrogen yields
Chapter 5 Radiolysis of Magnesium Hydroxide
132
The reaction set used is described in Table 22 and represents a simplified reaction scheme
of carbonate in aqueous radiolysis Initial concentrations of carbonate were set ranging
from 10 μM to 10 mM a yield of hydrogen was calculated for each initial concentration
these calculations have been graphed in Figure 49
In each case the calculated production of hydrogen was linear over the dose range used
which would be a necessary feature if carbonate is to be a valid explanation for the
increased yields observed in magnesium hydroxide experiments The calculated yield of
hydrogen increases rapidly with only small quantities of initial carbonate before reaching a
plateau at about G(H2) = 03 with an initial carbonate concentration of 50 μM The
hydrogen yield did not change much more than this increasing to just G(H2) = 036 with an
initial carbonate concentration of 10 mM The effect is almost the same in calculations for
both aerated and deaerated solutions It should be noted that these calculations were done at
pH 7 due to the systematic error of over prediction when the pH is close to 10 it would be
unadvisable to trust such calculations without first solving the error (see previous chapter)
Table 22 A reaction scheme to estimate the effect of carbonate in water radiolysis
Reaction Rate Constant Reference
CO32macr +
bullOH rarr CO3macr + OHmacr 39 times10
8
9
CO32macr + emacraq rarr products 39 times10
5
99
CO3bullmacr +
bullOH rarr products 30 times10
9
100
CO3bullmacr + H2O2 rarr HCO3macr + HO2
bull 43 times10
5
101
CO3bullmacr + HO2macr rarr HCO3macr + O2
bullmacr 30 times10
7
101
CO3bullmacr + O2
bullmacr rarr O2 + CO3
2macr 65 times10
8
102
HCO3macr + emacraq rarr products 10 times106
103
HCO3macr + bullOH rarr H2O + CO3
bullmacr 85 times10
6
9
HCO3macr + Hbull rarr products 44 times10
4
104
Chapter 5 Radiolysis of Magnesium Hydroxide
133
Figure 49 Model predictions for the yield of H2 from a solution containing various
concentrations of carbonate anions
Reaction rate analysis of the calculations reveals that the main mechanism for hydrogen
protection is through a cooperative effect of scavenging of the hydroxyl radical to form a
carbonate radical The majority of carbonate radicals are converted back to carbonate by
reaction with superoxide A secondary process of carbonate radical reactions with hydrogen
peroxide contributes slightly to regeneration of superoxide as well as forming bicarbonate
which itself contributes to hydrogen protection by scavenging hydroxyl radicals once again
forming a carbonate radical As these calculations were performed at pH 7 it is uncertain
what effect an elevated pH would have on the predicted hydrogen yield It should also be
remembered that many of the rate constants used are estimations and the reaction set is a
simplification and is not a comprehensive description
0
005
01
015
02
025
03
035
04
0 1 2 3 4 5 6 7 8 9 10 11
G(H
2)
[CO32-] mM
Aerated
Deaerated
134
With these factors in mind the predicted behaviour of hydrogen production is a reasonable
representation of the behaviour observed in experiments This could easily be investigated
further by experiments in a number of ways
Attempts could be made to measure carbonate directly from the magnesium hydroxide
used either by thermogravimetric analysis (TGA) or by total organic carbon analysis
(TOC) Radiolysis experiments of other carbonates could also be carried out to further
investigate the effect of carbonate
Chapter 6 Radiolysis of Methanol Solutions
135
Chapter 6 Radiolysis of Methanol Solutions
Context
Many of the waste storage ponds at Sellafield Ltd are open to the air and are subject to
organic matter falling in and decomposing to a range of organic products One particular
group of compounds known as humic acids and how they might affect radiolysis processes
in the ponds are of particular interest Humic acids are ill-defined but complex organic
acids with several different functional groups which will have many effects on radiolysis
The best approach to investigating this chemistry is to understand the effects of each
functional group independently before building up to a full humic acid analogue This study
takes the first steps towards this investigation through experimentation on aqueous
solutions of methanol
Experimental Method
A stock aqueous solution of 1 mM methanol was made and was used to prepare aerated
samples of 10 mL sealed by crimp cap in 20 mL headspace vials so that the liquid to
headspace ratio was 11 Samples were irradiated in row 2 of the 4x8 irradiation rack for
various periods of time The average dose rate was 1638 Gy min-1
The samples were
analysed for hydrogen peroxide immediately after irradiation using the Ghormley tri-iodide
method described in Chapter 2 A separate batch of aerated samples was prepared from the
1 mM methanol stock solution for analysis of hydrogen generation These were samples of
2 mL of 1 mM methanol and were deaerated using zero grade argon gas before being sealed
in glass tubes designed for use by the crush tube analysis method described in Chapter 2
Again the samples had a liquid to headspace ratio of 11
Chapter 6 Radiolysis of Methanol Solutions
136
These samples were irradiated in the centre positions of row 2 in the 4x8 rack where the
average dose rate was 1755 Gy min-1
Results
Figure 50 Measurements of H2O2 concentrations as a function of dose in samples
containing 1 mM methanol (diams) and water as a control (diams) All samples were aerated and a
dashed line is included to highlight the data trend The dose rate was 1638 Gy min-1
for
methanol solutions and 2839 Gy min-1
for the aerated water
000E+00
500E-05
100E-04
150E-04
200E-04
250E-04
0 5 10 15 20 25
[H2O
2]
(mo
l d
m-3
)
Dose (kGy)
Aerated Water
Methanol 1 mM
Chapter 6 Radiolysis of Methanol Solutions
137
Figure 51 Measurements of H2 gas as a function of dose from deaerated samples
containing 1 mM methanol deaerated water is also shown as a control Dashed lines are
included to highlight the data trend The dose rate was 1755 Gy min-1
for the methanol
solutions and 2851 Gy min-1
for the deaerated water
Figure 50 shows the measured concentrations of hydrogen peroxide from the 1 mM
methanol solution compared with the measured concentrations from pure aerated water At
low doses the concentration of hydrogen peroxide increases rapidly to approximately
20 times10-4
mol dm-3
at approximately 1 kGy which is almost double the steady state
concentration observed in pure water As the dose increases further the concentration
begins to fall to a steady state value at approximately 33 times10-5
mol dm-3
Figure 51 shows the measured hydrogen concentrations from the 1 mM methanol solutions
compared with hydrogen measurements from aerated water
000E+00
500E-04
100E-03
150E-03
200E-03
250E-03
300E-03
0 5 10 15 20 25 30
H2 (
mo
l d
m-3
)
Dose (kGy)
Methanol Solution 1mM Deaerated
Dearated Water
Chapter 6 Radiolysis of Methanol Solutions
138
Hydrogen concentrations measured in a deaerated 1 mM methanol solution are significantly
higher than those measured in deaerated water the initial production rate is higher in the
methanol solution but production is not linear and the rate of hydrogen production with
dose soon falls The change in production rate of hydrogen and hydrogen peroxide with
dose can be shown by converting the experimental measurements to G-values and plotting
them as a function of dose Figures 52 and 53 show the chemical yields determined by
converting the gradients between 0 and each data point to units of molecules 100 eV-1
Figure 52 Chemical yields of hydrogen peroxide measured from an aerated solution of
1 mM methanol as a function of dose
00
05
10
15
20
25
30
35
40
0 5 10 15 20
G(H
2O
2)
(mo
lecu
les
10
0eV
-1)
Dose (kGy)
Chapter 6 Radiolysis of Methanol Solutions
139
Figure 53 Chemical yields of hydrogen gas measured from a deaerated solution of 1 mM
methanol as a function of dose
Discussion
Most alcohols are effective scavengers of hydroxyl radicals and hydrogen atoms The
reactions between methanol and hydroxyl radicals or hydrogen atoms result in hydrogen
abstraction from methanol to form water or molecular hydrogen respectively and in both
cases form the hydroxymethyl radical105106
bull119874119867 + 1198621198673119874119867 rarr 1198672119874 + bull1198621198672119874119867 119896 = 83 times 108 119872minus1119904minus1
119867bull + 1198621198673119874119867 rarr 1198672 + bull1198621198672119874119867 119896 = 28 times 106 119872minus1119904minus1
Although the second order rate constant for the reaction between methanol and the solvated
electron is faster than that for the solvated electron and water the reaction rate does not
compete with the rate of reaction between the solvated electron and water until the
concentration of methanol is greater than 10-2
M2107
00
02
04
06
08
10
12
14
16
18
0 5 10 15 20
G(H
2)
(mo
lecu
les
10
0eV
-1)
Dose (kGy)
Chapter 6 Radiolysis of Methanol Solutions
140
In deaerated water methanol radicals may dimerise to form ethylene glycol or
disproportionate to form formaldehyde and reform methanol108
They may also react with
hydrogen peroxide to form formaldehyde
2bull1198621198672119874119867 rarr (1198621198672119874119867)2
2bull1198621198672119874119867 rarr 1198621198673119874119867 + 119867119862119867119874
bull1198621198672119874119867 + 11986721198742 rarr 119867119862119867119874 + 1198672119874 + bull119874119867
In solutions that contain dissolved oxygen such as those used in the measurements of
hydrogen peroxide (Figure 50) methanol radicals rapidly react with oxygen to form an
organic peroxyl radical which reacts by second-order processes resulting in the formation
of formaldehyde hydrogen peroxide and oxygen109
bull1198621198672119874119867 + 1198742 rarr bull11987421198621198672119874119867
An additional set of reactions were included in the water radiolysis model described in
Chapter 3 in an attempt to model the radiolysis chemistry of an aqueous solution of 1 mM
methanol This reaction scheme is shown in Table 23
Chapter 6 Radiolysis of Methanol Solutions
141
Reaction
Number Reaction
Rate Constant at 25degC (M
-1 s
-1)
Ref
M1 CH3OH + bullOH rarr H2O +
bullCH2OH 83times10
8
110
M2 CH3OH + Hbull rarr H2 +
bullCH2OH 28times10
6
106
M3 bullCH2OH + O2 rarr
bullO2CH2OH 49times10
9
111
M4 bullCH2OH + H2O2 rarr H2O + H2CO +
bullOH 18times10
5
112
M5 bullCH2OH +
bullCH2OH rarr CH3OH + H2CO 12times10
9
2113
M6 bullCH2OH +
bullCH2OH rarr HOCH2CH2OH 12times10
9
2113
M7 bullCH2OH +
bullOH rarr H2CO + H2O
a24times10
10
114
M8 bullO2CH2OH +
bullO2CH2OH rarr 2H2CO + H2O2 + O2 74times10
8
115
M9 bullO2CH2OH +
bullHO2 rarr H2CO + H2O2 + O2
b50times10
8
2
M10 bullO2CH2OH + O2macr rarr H2CO + HO2macr + O2
b50times10
7
2
M11 HOCH2CH2OH + bullOH rarr
bullHOCHCH2OH + H2O 24times10
9
116
M12 HOCH2CH2OH + Hbull rarr
bullHOCHCH2OH + H2 14times10
7
9
M13 bullHOCHCH2OH + O2 rarr
bullO2HOCHCH2OH 32times10
9
111
M14 bullO2HOCHCH2OH rarr HOCH2CHO + H
+ + O2macr 19times10
2 s
-1
117
M15 bullHOCHCH2OH +
bullHOCHCH2OH rarr HOCH2CH2OH +
HOCH2CHO 96times10
8
118
M16 HOCH2CHO + bullOH rarr H2O +
bullHOCHCHO
c92times10
6
119
M17 bullHOCHCHO +
bullHOCHCHO rarr HOCH2CHO + OCHCHO
d50times10
4 -
M18 OCHCHO + bullOH rarr H2O +
bullOCCHO 14times10
6
120
M19 bullOCCHO rarr CO + HCO
bull
a35times10
7 s
-1
121
M20 H2CO + emacraq rarr bullCH2OH + OHmacr 10times10
6
2
M21 H2CO + Hbull rarr H2 + HCO
bull 50times10
6
2
M22 H2CO + bullOH rarr H2O + HCO
bull 20times10
9
2
M23 HCObull + H
bull rarr H2 + CO
a68times10
10
122
M24 HCObull +
bullOH rarr CO + H2O
a11times10
11
123
M25 HCObull + O2 rarr CO + HO2
bull
a31times10
9
124
M26 HCObull + HCO
bull rarr 2CO + H2
a22times10
10
125
Table 23 A reaction scheme to estimate the effect of methanol in water radiolysis
a ndash Rate constant for gas phase reaction
b ndash Estimated rate constant
c ndash Rate constant based on reaction of acetic acid and hydroxyl
d ndash Assumed reaction
Figure 54 shows the predicted hydrogen peroxide concentration with the above chemistry
included in the calculation and compares it with the experimental data In order to achieve
the agreement shown a modification to the mass transfer routine was required
Chapter 6 Radiolysis of Methanol Solutions
142
The current implementation of the mass transfer routine does not cope with a rapid
depletion of dissolved oxygen and responds by increasing the rate of oxygen transfer from
the gas phase to the aqueous phase to an unrealistic value A temporary fix can be made by
reducing the mass transfer rate of oxygen (for instance by a factor of 15) but a more
appropriate correction to the routine should be sought in future implementations Figure 55
shows the original calculation with the un-modified mass transfer routine compared with
the modified mass transfer routine
Figure 54 Model prediction of H2O2 concentrations as a function of dose in a solution of
1 mM methanol
000E+00
500E-05
100E-04
150E-04
200E-04
250E-04
0 5 10 15 20 25
[H2O
2]
mo
l d
m-3
Dose kGy
Methanol 1 mM
Model
Chapter 6 Radiolysis of Methanol Solutions
143
Figure 55 Calculations of hydrogen peroxide concentrations with and without
modification to the mass transfer routine
Analyses of the evolution of the calculated reaction rates reveal a possible explanation for
the behaviour of hydrogen peroxide in the presence of a low concentration of methanol
Initially the most important methanol reactions are the formation of the methanol radical
by scavenging hydroxyl radicals (M1) and the formation of an organic peroxide by the
reaction between the aforementioned methanol radical and oxygen (M3)
1198621198673119874119867 + bull119874119867 rarr bull1198621198672119874119867 + 1198672119874
bull1198621198672119874119867 + 1198742 rarr bull11987421198621198672119874119867
With the formation of the organic peroxide comes an increase in the rate of the formation of
formaldehyde mainly through self-reaction or to a lesser degree through reaction with
superoxide
000E+00
100E-04
200E-04
300E-04
400E-04
500E-04
600E-04
700E-04
0 5 10 15 20 25 30 35 40 45
[H2O
2]
(mo
l d
m-3
)
Dose (kGy)
Original Calculation
Modified Calculation
Chapter 6 Radiolysis of Methanol Solutions
144
2bull11987421198621198672119874119867 rarr 21198672119862119874 + 11986721198742 + 1198742
bull11987421198621198672119874119867 + 1198742bullminus rarr 1198672119862119874 + 1198671198742
minus + 1198742
These reactions not only contribute to the production of hydrogen peroxide but also return
oxygen to the system which can scavenge solvated electrons and protect hydrogen peroxide
from the rapid reaction between the solvated electron and hydrogen peroxide
(R4 k = 136times1010
M-1
s-1
) The total rate of oxygen consumption by methanol radicals and
solvated electrons is still greater than the rate of return from the reactions of the organic
peroxide After about 11 kGy oxygen concentrations are reduced to an insignificant value
As the concentration of oxygen falls the reaction rate between hydrogen peroxide and the
solvated electron increases As mentioned in Chapter 4 oxygen plays a vital role in the
formation and protection of hydrogen peroxide The model prediction shows the
concentration of hydrogen peroxide beginning to rise again after about 8 kGy this is due to
the mass transfer of oxygen gas into the aqueous phase slowly re-establishing equilibrium
and effectively allowing a build-up of hydrogen peroxide As mentioned earlier the mass
transfer routine has been modified for this calculation and is non-representative of the real
mass transfer flux nevertheless it is reasonable to assume that after the depletion of
dissolved oxygen and the methanol has been converted to glycol or formaldehyde
equilibrium of aqueous and gaseous oxygen would eventually be re-established This could
be supported by further analysis at higher doses which may show an increase in hydrogen
peroxide concentrations
Chapter 6 Radiolysis of Methanol Solutions
145
The formation of hydrogen gas is enhanced by the presence of methanol however
hydrogen gas production is not linear with dose Figure 56 shows the model predictions for
hydrogen gas production compared to the experimentally obtained data
The calculations show a higher production rate of hydrogen gas can be attributed to the
scavenging of hydroxyl radicals by methanol and a number of methanol radiolysis
products
Figure 56 Model prediction of H2 gas as a function of dose in a solution of 1 mM
methanol
Although the model prediction somewhat overestimates the quantity of hydrogen formed
the slope is close to what is observed experimentally Many of the rate constants used in the
reaction scheme could not be found in the literature and are therefore estimations The
reaction scheme used protects molecular hydrogen from reacting with the hydroxyl radical
in a number of reactions Throughout the radiolysis of methanol a number of intermediary
organic products are formed such as ethylene glycol and formaldehyde each of which is an
effective hydroxyl scavenger
000E+00
500E-04
100E-03
150E-03
200E-03
250E-03
300E-03
0 5 10 15 20 25 30
H2 (
mo
l d
m-3
)
Dose (kGy)
Methanol 1 mM Dearated
Model
Chapter 6 Radiolysis of Methanol Solutions
146
After reacting with the hydroxyl radical the newly formed organic radical will usually form
an organic peroxide however in the absence of oxygen the radicals will tend towards
disproportionation to reform the original organic product at well as a new stable organic
usually an aldehyde Eventually the only stable product is carbon monoxide which does not
have any further reactions within this scheme Figure 57 shows the calculated
concentrations of each of the stable organic products as a function of dose in an aerated
system
Figure 57 Model predictions of the concentrations of various stable organic products
formed as a result of using the proposed reaction scheme in Table 23
Kinetic models of aqueous methanol have previously been presented in literature one such
model by Sunaryo and Domae126
was developed for calculating the effects of aqueous
methanol in light water reactors
000E+00
200E-04
400E-04
600E-04
800E-04
100E-03
120E-03
0 10 20 30 40
Co
nce
ntr
ati
on
(m
ol
dm
-3)
Dose (kGy)
Methanol
Formaldehyde
Ethylene Glycol
Glycolaldehyde
Glyoxal
Carbon Monoxide
Chapter 6 Radiolysis of Methanol Solutions
147
The reaction scheme for methanol radiolysis used in that publication is not a complete
scheme in that ldquoimaginary productsrdquo are implemented to terminate certain reaction
pathways This is still a valid approach as their interest was focused on the initial reaction
paths when delivering a maximum dose of 500 Gy and not the long term radiolysis of
methanol over several kGy
It was noted that an understanding of the radiolysis of the transient organic products is
needed they concluded that methanol is converted into ethylene glycol which may have the
same effect as methanol itself The formation of ethylene glycol and formaldehyde from
methanol radiolysis is well known and has been measured in previous studies127
The
radiolysis of ethylene glycol has also been discussed in literature128
and it has been
described that under aerated conditions the main organic product of radiolysis is
glycolaldehyde129
The reaction scheme for methanol radiolysis in this work assumes the
formation of a radical species by the reaction between glycolaldehyde and the hydroxyl
radical however this is most likely not the major radiolysis path for glycolaldehyde In
aqueous solutions glycolaldehyde exists in a number of different forms with the aldehyde
form usually being the minor component130
The existence of multiple forms of
glycolaldehyde in solution and the large number of unknown rate constants makes creating
a complete reaction scheme for methanol radiolysis difficult Furthermore the publications
mentioned above also report the formation of small amounts of methane along with carbon
monoxide The radiolysis of ethylene glycol under deaerated conditions can also lead to the
production of ethyl aldehyde Both of these points highlight gaps in the reaction scheme
that should be included in a comprehensive description of methanol radiolysis Suggestions
for an improved radiolysis scheme are given in Chapter 8
Chapter 7 Radiolysis of Iron Oxide-Water Systems
148
Chapter 7 Radiolysis of Iron Oxide-Water Systems
Context
Large quantities of iron oxide have been reported to be present in the First Generation
Magnox Storage Pond where iron skips containing spent fuel have corroded to form a layer
of haematite (Fe2O3) and magnetite (Fe3O4) several meters below the water level
Documented investigations into the effects of iron oxide on water radiolysis are sparse the
most recent of which focusing on the formation of molecular hydrogen from the radiolysis
of water-iron oxide systems131
Preliminary experiments have been carried out to
investigate the effects iron oxide may have on radiolytic production of hydrogen peroxide
from water-oxide slurries
Method
Iron oxide powders were washed with ultra-pure water to remove any soluble
contamination Excess water was decanted before the powders were washed a further two
times After the third decanting the powders were dried in a vacuum oven at 40degC
overnight Haematite samples were prepared by weighing 05 g quantities of haematite into
20 mL headspace vials to which 10 mL of ultra-pure water was added before sealing with a
crimp cap Samples of magnetite were prepared in the same way Samples were agitated
and then left to settle before irradiation The irradiations of haematite samples were carried
out in row 1 of the 4x8 irradiation rack with an average dose rate of 30518 Gy min-1
while
irradiations of magnetite samples were carried out in row 2 of the 4x8 rack with an average
dose rate of 16252 Gy min-1
After irradiation aliquots of the water from the samples were
removed by syringe and pushed through a syringe filter to remove any solid particles
Chapter 7 Radiolysis of Iron Oxide-Water Systems
149
The filtered aliquot was then analysed for hydrogen peroxide using the Ghormley tri-iodide
method described in Chapter 2
Results
Figure 58 shows the obtained results for the haematite system compared to concentrations
of hydrogen peroxide measured in aerated water Figure 59 shows the obtained results from
magnetite samples again they are compared with measurements obtained from pure water
Figure 58 Measurements of H2O2 concentrations from heterogeneous samples of 05g
Fe2O3 and 10 mL aerated water The dose rate for the haematite samples was
3052 Gy min-1
and for the aerated water the dose rate was 2839 Gy min-1
000E+00
200E-05
400E-05
600E-05
800E-05
100E-04
120E-04
140E-04
0 2 4 6 8 10 12 14
[H2O
2]
(mo
l d
m-3
)
Dose (kGy)
Haematite
Pure Water
Chapter 7 Radiolysis of Iron Oxide-Water Systems
150
Figure 59 Measurements of H2O2 concentrations from heterogeneous samples of 05g
Fe3O4 and 10 mL aerated water The dose rate for the magnetite samples was
1625 Gy min-1
and for the aerated water the dose rate was 2839 Gy min-1
The steady state concentration of hydrogen peroxide achieved in the presence of haematite
is close to that of pure water however the initial production rate is slightly higher An
increased initial production rate is also observed in samples containing magnetite but after
approximately 500 Gy the concentration of hydrogen peroxide falls dramatically and
achieves a low steady state of approximately 15 times10-5
mol dm-3
000E+00
200E-05
400E-05
600E-05
800E-05
100E-04
120E-04
140E-04
0 2 4 6 8 10 12 14 16 18 20 22
[H2O
2]
(mo
l d
m-3
)
Dose (kGy)
Magnetite
Pure Water
Chapter 7 Radiolysis of Iron Oxide-Water Systems
151
Discussion
Hydrogen peroxide undergoes surface decomposition over both haematite and
magnetite28132
The estimated second-order rate constants for the surface decomposition of
hydrogen peroxide are quoted as 30 times10-9
M-1
s-1
for haematite132
and 45 times10-10
M-1
s-1
for
magnetite28
Calculations using the water radiolysis model including a hypothetical reaction
that removes hydrogen peroxide at these rates makes no significant difference to the
predicted concentrations of hydrogen peroxide in water over the time scale of the
experiment However as the aforementioned rate constants are second-order they not only
depend on the concentration of hydrogen peroxide but the surface area of the metal oxide as
well which is unknown for the metal oxides used in this study
Furthermore the experiments carried out in the aforementioned publications to determine
these rate constants were well mixed throughout the reaction time while in this work the
samples were static with the iron powder settled at the bottom of the reaction vessel This
means that the rate of surface decomposition is greatly hindered due to the need for
hydrogen peroxide to diffuse a large distance to the iron oxide surface nevertheless a
significant difference in hydrogen peroxide concentrations were observed in samples
containing magnetite The behaviour of hydrogen peroxide observed in samples containing
magnetite is most likely due to homogeneous chemistry initiated by dissolved iron ions
The chemistry initiated by dissolved iron could serve to remove hydrogen peroxide through
a Haber-Weiss mechanism133
1198651198903+ + 1198742bullminus rarr 1198651198902+ + 1198742 k = Unknown
1198651198902+ + 11986721198742 rarr 1198651198903+ + 119874119867minus + bull119874119867 k = 10 times10
7 M
-1 s
-1
1198651198902+ + bull119874119867 rarr 1198651198903+ + 119874119867minus k = 32 times108
M-1
s-1
1198651198902+ + 1198671198742bull rarr 1198651198903+ + 1198671198742
minus k = 12 times10
6 M
-1 s
-1
Chapter 7 Radiolysis of Iron Oxide-Water Systems
152
Experiments discussed in publications by Mats Jonsson28
focus largely on the reactivity of
hydrogen peroxide and various metal oxides including iron oxide It was found that many
metal oxide surfaces show reactivity towards hydrogen peroxide and that rate of removal of
hydrogen peroxide can be calculated in heterogeneous systems based on properties such as
particle size As mentioned previously the model suggests that the rate of this surface
reactivity does not seem to be able to compete with the rate of radiolytic hydrogen peroxide
production The studies by Jonsson concerning iron oxide were met with difficulty in
discriminating between surface reactions and aqueous chemistry initiated by dissolved iron
Through the use of ICP-AES it was shown that iron can be found in water with a
concentration of 23 times10-6
mol dm-3
after just 30 minutes of mixing magnetite with distilled
water28
Even with this measurement by Jonsson the quantity of dissolved iron is difficult to
estimate for samples used in this work as they were washed with water whereas the
literature measurements were made with unwashed or EDTA treated samples More
information about the dissolution of iron from magnetite could be used to attempt to model
this behaviour using the reaction scheme in table 24 In addition to this it would also be
useful to investigate the dissolution of iron as a function of radiation dose to see what
effect if any radiation has on dissolution rates Analysis techniques such as inductively
coupled plasma mass spectroscopy (ICP-MS) can be used to determine concentrations of
dissolved iron in very low concentrations however due to the nature of the plasma used it
can often be difficult to distinguish between Fe2+
and Fe3+
as further ionization may cause
interference It is possible to chemically separate the two oxidation states of iron by solvent
extraction with n-heptane containing 01 M Di-(2-ethylhexyl)phosphoric acid (HDEHP)
before performing an analysis for iron134
Chapter 7 Radiolysis of Iron Oxide-Water Systems
153
This reaction scheme would be initiated by a production of aqueous iron based on the
dissolution behaviour observed from future experiments As mentioned earlier the
experiments conducted in this work are only preliminary and there is much more work to
be done on the subject
If a computational model could be made to accurately simulate the aqueous iron chemistry
coupled with a more detailed understanding of radiation induced iron dissolution it may be
possible to determine the surface effects of iron oxide by comparison of experimental and
calculated data and effectively subtracting the difference
Reaction
Number
Reaction Rate Constant at
25degC (M-1
s-1
)
Ref
F1 Fe2+
+ H2O2 rarr Fe3+
+ OHmacr + bullOH 100 times10
7
135
F2 Fe2+
+ bullOH rarr Fe
3+ + OHmacr 32 times10
8
136
F3 Fe2+
+ bullHO2 rarr Fe
3+HO2macr 12 times10
6
133
F45 Fe3+
HO2macr + Fe2+ Fe
3+HO2macrFe
2+ K = 27 M
-1
133
F6 Fe3+
HO2macr rarr Fe3+
+ HO2macr 18times103
s-1
133
F7 Fe3+
HO2macrFe2+
rarr Fe3+
+ Fe2+
HO2macr 25 times104
133
F8 Fe2+
HO2macr + H+
(aq) rarr Fe2+
+ H2O2 Unknown 133
F9 Fe3+
+ O2macr rarr Fe2+
+ O2 Unknown 137
F10 Fe2+
+ O2macr + H2O rarr HO2macr + Fe
3+ + OHmacr 10 times10
7
133
F11 Fe3+
+ Hbull rarr Fe
2+ + H
+(aq) 20 times10
6
138
F12 Fe3+
+ emacraq rarr Fe2+
60 times1010
139
F13 Fe2+
+ Hbull + H
+(aq)
rarr Fe
3+ + H2 75 times10
6
10
Table 24 A reaction scheme to estimate the effects of dissolved iron in water radiolysis
Chapter 8 Conclusions and Further Work
154
Chapter 8 Conclusions and Further Work
Further High pH Investigations
Experiments have shown that the radiolytic production of hydrogen gas and hydrogen
peroxide is strongly influenced by high pH Hydrogen peroxide tends to reach higher steady
state concentrations with increasing pH as well as taking longer to reach this steady state
Hydrogen gas production rates appear to also increase with increasing pH up to
approximately pH 11 where thereafter they decrease The development of a computational
model for water radiolysis has provided a mechanistic understanding to explain the
observed effects of high pH on water radiolysis Calculations suggest that an increase in
radiolytically produced oxygen could explain the behaviour of hydrogen gas at high pH
Dissolved oxygen acts as a poison to the Allen chain which normally serves to remove
dissolved hydrogen through reactions with the hydroxyl radical or the alkali equivalent the
oxide radical anion The steady state concentration of dissolved oxygen increases with pH
up to approximately pH 115 This can be attributed to the decline in the rate at which
dissolved oxygen is reduced by hydrogen atoms as the equilibrium between the hydrogen
atom and the solvated electron shifts to favour the solvated electron The reaction rate of
the equivalent alkali reaction to remove dissolved oxygen through reduction by the solvated
electron does not increase to compensate resulting in a net increase in the steady state
concentration of dissolved oxygen The model calculations also show that increasing the
pH further results in a decline in the hydrogen gas production rate This is due to the shift in
the equilibrium between the hydroxyl radical and the oxide radical anion (R6364) which
has a pKa of 119 The main pathway for the radiolytic production of dissolved oxygen is
the reaction between the hydroxyl radical and super oxide (R21)
Chapter 8 Conclusions and Further Work
155
The rate of this reaction falls at high pH as the hydroxyl radical is converted to the oxide
radical anion The alkali equivalent of this reaction (R50) has a much lower rate constant
and is out competed by the solvated electron (R8) Further experiments to measure the
concentration of radiolytically produced oxygen at high pH could help to support the model
predictions or confirm a misunderstanding in the model An inline gas chromatography
technique similar to the ldquocrush tuberdquo described in Chapter 2 may be used only instead of
crushing a sealed glass vial within the carrier gas flow a specially designed cell is
connected to the in and out ports of the carrier gas flow This cell would contain a high pH
solution and would sit inside the irradiator from here multiple analyses can be run on a
single sample The carrier gas would have to be changed from argon to helium to increase
the sensitivity towards oxygen running the carrier gas through the cell prior to irradiation
will serve to remove the initial dissolved oxygen from the sample from this point onward
any measurements of oxygen would be radiolytically produced
These experiments would help to better understand high pH water radiolysis and hopefully
help to improve the radiolysis model and understand why there is an over prediction at
pH 106 A comprehensive water radiolysis model that can accurately predict
concentrations of radiolysis products under a wide range of conditions is of high
importance to the nuclear industry and would have applications in decommissioning
maintenance of current nuclear systems and designing new nuclear technology
Chapter 8 Conclusions and Further Work
156
Further Methanol Radiolysis Investigations
The reaction scheme used to model the radiolysis of aqueous methanol results in the
temporary formation of several stable organic species before they themselves are oxidised
by hydroxyl radicals This scheme eventually converts all organic substances to carbon
monoxide however in reality this is not the case It has been reported in literature that one
of the stable products formed is methane gas a substance not included in the current
reaction scheme The gas chromatography techniques used in this work are not suitable for
the detection of small quantities of carbon monoxide or indeed other potential radiolysis
products such as methane A more sophisticated approach would be to use a gas
chromatography mass spectroscopy technique (GC-MS) This technique would allow for
the detection of carbon monoxide carbon dioxide methane and any other volatile
hydrocarbons that may be formed during radiolysis Other transient products of methanol
radiolysis such as formaldehyde ethylene glycol glycolaldehyde and glyoxal may be
analysed by high performance liquid chromatography (HPLC) It was mentioned in Chapter
6 that the reaction scheme does not accurately represent the radiolysis of the transient
product glycolaldehyde A publication by Yaylayan et al130
discusses some measurements
made by nuclear magnetic resonance spectroscopy of glycolaldehyde in deuterated water
and it was found that it exists mostly as the hydrated aldehyde 112-ethanetriol (~70) A
complete reaction scheme for the radiolysis of methanol should include the radiolysis
reactions of all the transient species of which there are potentially many
However if the major component of a glycolaldehyde solution is 112-ethanetriol an
acceptable compromise may be to include only the radiolysis reactions of this species and
ignore the radiolysis paths of minor products
Chapter 8 Conclusions and Further Work
157
Experimental analysis of aqueous methanol to determine the major transient species would
be valuable for determining which radiolysis paths have the most significant roles in
methanol radiolysis
Future Development of a Multi-Scale Radiolysis Model
As discussed in Chapter 3 the model developed in this work is a deterministic model for the
calculation of long term homogeneous phase radiolysis This calculation depends on a
series of primary values that represent the production rates of the primary species of water
radiolysis which in turn depend on a number of physical and chemical factors It is
possible to calculate these primary yields using stochastic methods which can then be fed
into the deterministic calculation to obtain predictions of chemical species concentrations
This technique has been successfully used recently to demonstrate some of the effects of
high capacity scavengers47
This technique assumes that there are no changes to the
physiochemical conditions during the radiolysis period for example if a calculation was to
be performed where the temperature were to change the primary yields would need to be
recalculated at the new temperature The model developed in this work attempts to
overcome this by estimating primary yields as a multiple regression fit of temperature and
pH however this estimation is not adequately accurate and does not include any effects that
linear energy transfer has on the primary yields A more suitable approach to the
development of a comprehensive multi-scale radiolysis model may be to utilise a stochastic
calculation of the primary yields that includes the effects of temperature pH LET and
chemical scavengers which can be called from within the deterministic calculation
whenever a significant change to one of these factors is initiated
Chapter 8 Conclusions and Further Work
158
Further work concerning the deterministic model presented in this work include an
investigation into the partitioning of gaseous species The method used is one that has been
successfully used by other research groups to model the radiolysis of water and the effect of
available headspace This implementation of the stagnant two-film model was never
intended to cope with rapid changes in aqueous oxygen concentrations Further efforts
should be made to better incorporate this gas partitioning method in a way that can more
realistically represent oxygen partitioning during the radiolysis of aqueous methanol
Closing Remarks Relevant to Sellafield Ltd
The experimental data presented in Chapters 4 and 5 are pertinent to the situations and
conditions currently found within the Magnox Swarf Storage Silos at Sellafield In the case
of elevated pH due to sodium hydroxide both the experimental and computational data
show increased rates of hydrogen gas production and an increased steady-state
concentration of hydrogen peroxide Despite some minor quantitative disagreements
between the experimental data and the computational data the qualitative trend is in
general agreement One could therefore expect to observe increased production of hydrogen
gas in the MSSS with increasing pH especially within the pH region of approximately
105 to 125 An important aspect of the situation at the MSSS is the aerated nature of the
system The obvious consideration being the increased amounts of dissolved oxygen
present which although such effects were also discussed in Chapter 4 the experimental
data shown was only for water at neutral pH Nevertheless it was discussed in Chapter 4
that dissolved oxygen acts a poison to the chain reaction that normally removes molecular
hydrogen A less obvious consideration and one that was largely overlooked in Chapter 4
is the inclusion of gas to liquid carbon dioxide exchange and its aqueous conversion to
carbonate
Chapter 8 Conclusions and Further Work
159
At high pH the concentration of aqueous CO2 and therefore CO32-
becomes significant
With CO32-
being known to react with the hydroxyl radical and given the difficulty in its
removal future research and industrial models involving high pH aqueous radiolysis would
benefit from including a description of the radiolysis chemistry of aqueous carbonate
systems Chapter 5 begins to address the concept of including carbonate chemistry into a
radiolysis model This came about from the realisation that magnesium hydroxide can be
easily carbonated on contact with CO2 and is also known to be an effective carbon trapping
material In this case not only the additional chemistry brought about carbonate should be
considered but also the effects of the magnesium compounds that can be formed for
example magnesium carbonate magnesium bicarbonate magnesium oxide and
magnesium hydroxide Similarly consideration should be given to the multitude of iron
phases that can exist in conditions comparable to those of the First Generation Magnox
Storage Ponds Although it was not considered in Chapter 7 it is likely that the corroded
iron found in the FGMSP also exists as a number of iron hydroxides and hydrated oxides
Given the open air nature of the FGMSP hydrogen gas build-up is not a major concern
however the interactions of the various iron oxide phases in a radiolysis system may affect
concentrations of oxidising species such as H2O2 which may alter corrosion rates The
results shown in Chapter 7 suggest little effect on H2O2 concentration in the presence of
haematite but the presence of magnetite had a significant effect in removing H2O2 To gain
a better understanding further work would need to be done that also investigated the other
possible phases of iron oxide and also gives consideration to the proportions in which they
can be found in the FGMSP
References
160
References
1 Pitois A Ivanov P I Abrahamsen L G Bryan N D Taylor R J amp Sims H E Magnesium Hydroxide Bulk and Colloid-Associated 152Eu in an Alkaline Environment Colloid Characterisation and Sorption Properties in the Presence and Absence of Carbonate J Environ Monit 10 315-324 (2008)
2 Spinks J W T amp Woods R J An Introduction to Radiation Chemistry (1990)
3 Loveland W D Morrissey D J amp Seaborg G T Modern Nuclear Chemistry (2005)
4 Allen A O The Radiation Chemistry of Water and Aqueous Solutions (1961)
5 Draganić I G amp Draganić Z D The Radiation Chemistry of Water (1971)
6 Schwarz H A Losee J P amp Allen A O Hydrogen Yields in the Radiolysis of Aqueous
Solutions Journal of the American Chemical Society 76 4693-4694 (1954)
7 Swallow A J Radiation Chemistry An Introduction (1973)
8 Schwarz H A Free Radicals Generated by Radiolysis of Aqueous Solutions Journal of
Chemical Education 58 101 (1981)
9 Buxton G V Clive L Greenstock W Helman P amp Ross A B Critical Review of Rate
Constants for Reactions of Hydrated Electrons Hydrogen Atoms and Hydroxyl Radicals (˙OHO˙-) in Aqueous Solution J Phys Chem Ref Data 17 513-886 (1988)
10 Jayson G G Keene J P Stirling D A amp Swallow A J Pulse-Radiolysis Study of Some
Unstable Complexes of Iron Transactions of the Faraday Society 65 2453-2464 (1969)
11 Koppenol W H amp Liebman J F The Oxidizing Nature of the Hydroxyl Radical A
Comparison with the Ferryl Ion (FeO2+) The Journal of Physical Chemistry 88 99-101 (1984)
12 Meyerstein D Complexes of Cations in Unstable Oxidation States in Aqueous Solutions as
Studied by Pulse Radiolysis Accounts of Chemical Research 11 43-48 (1978)
13 Schwarz H A Applications of the spur diffusion model to the radiation chemistry of
aqueous solutions The Journal of Physical Chemistry 73 1928-1937 (1969)
References
161
14 Dyne P J amp Kennedy J M The Kinetics of Radical Reactions in the Tracks of Fast Electrons A Detailed Study of the SamuelndashMagee Model for the Radiation Chemisty of Water Canadian Journal of Chemistry 36 1518-1536 (1958)
15 Burns W G Sims H E amp Goodall J A B Special Issue Dedicated to The Memory of the
Late John Hodson Baxendale Radiation chemical diffusion kinetic calculations with prescribed and non-prescribed diffusionmdashI Radiation Physics and Chemistry (1977) 23 143-180 (1984)
16 Pimblott S M amp LaVerne J A Comparison of Stochastic and Deterministic Methods for
Modeling Spur Kinetics Radiation Research 122 12-23 (1990)
17 Tapping R L Corrosion Issues in Pressurized Heavy Water Reactor (PHWRCANDUreg)
Systems A2 in Nuclear Corrosion Science and Engineering 581-633 (2012)
18 Petrik N G Alexandrov A B amp Vall A I Interfacial Energy Transfer During Gamma
Radiolysis of Water on the Surface of ZrO2 and Some Other Oxides The Journal of Physical Chemistry B 105 5935-5944 (2001)
19 LaVerne J A amp Tandon L H2 and Cl2 Production in the Radiolysis of Calcium and
Magnesium Chlorides and Hydroxides The Journal of Physical Chemistry A 109 2861-2865 (2005)
20 Slack J Norton J L amp Malkoske G R Cobalt-60 Production in CANDU Power Reactors
21 Unterweger M P Hoppes D D amp Schima F J New and Revised Half-Life Measurements
Results Nuclear Instruments and Methods in Physics Research Section A Accelerators Spectrometers Detectors and Associated Equipment 312 349-352 (1992)
22 Weiss J A Survey of Chemical Dosimetric Systems The International Journal of Applied
Radiation and Isotopes 4 89-95 (1958)
23 Fricke H amp Morse S The Chemical Action of Roumlntgen Rays on Dilute Ferrosulfate Solutions
as a Measure of Dose Am J Roentgenology and Radium Therapy 18 430-432 (1927)
24 Weiss J Allen A O amp Schwarz H A Fricke Ferrous Sulfate Dosimeter for γ-rays in the
Range 4 to 40 Kiloroumlntgens Proceedings of the International Conference on the Peaceful Uses of Atomic Energy 14 179-181 (1956)
25 Allen A O Hochanadel C J Ghormley J A amp Davis T W Decomposition of Water and
Aqueous Solutions under Mixed Fast Neutron and Gamma Radiation American Chemical Society (1952)
References
162
26 Hiroki A Pimblott S M amp LaVerne J A Hydrogen Peroxide Production in the Radiolysis of
Water with High Radical Scavenger Concentrations The Journal of Physical Chemistry A 106 9352-9358 (2002)
27 Yakabuskie P A Joseph J M amp Wren C J The Effect of Interfacial Mass Transfer on
Steady-State Water Radiolysis Radiation Physics and Chemistry 79 777-785 (2010)
28 Nejad M A amp Jonsson M Reactivity of Hydrogen Peroxide towards Fe3O4 Fe2CoO4 and
Fe2NiO4 Journal of Nuclear Materials 334 28-34 (2004)
29 Pastina B amp LaVerne J A Effect of Molecular Hydrogen on Hydrogen Peroxide in Water
Radiolysis The Journal of Physical Chemistry A 105 9316-9322 (2001)
30 Klassen N V Marchington D amp McGowan H C E H2O2 Determination by the I3
- Method and by KMnO4 Titration Analytical Chemistry 66 2921-2925 (1994)
31 Roth O amp LaVerne J A Effect of pH on H2O2 Production in the Radiolysis of Water J Phys
Chem A 115 700-708 (2011)
32 Wasselin-Trupin V Baldacchino G Bouffard S amp Hickel B Hydrogen Peroxide Yields in
Water Radiolysis by High-Energy Ion Beams at Constant LET Radiation Physics and Chemistry 65 53-61 (2002)
33 Essehli R Crumiegravere F Blain G Vandenborre J Pottier F Grambow B et al H2
Production by γ and He Ions Water Radiolysis Effect of Presence TiO2 Nanoparticles International Journal of Hydrogen Energy 36 14342-14348 (2011)
34 Faraggi M Zehavi D amp Anbar M Effect of Thallous Ions on the Yields of Hydrogen and
Hydrogen Peroxide in Radiolyzed Aqueous Solutions Transactions of the Faraday Society 67 2057-2067 (1971)
35 Lousada C M LaVerne J A amp Jonsson M Enhanced Hydrogen Formation During the
Catalytic Decomposition of H2O2 on Metal Oxide Surfaces in the Presence of ˙OH Radical Scavengers Phys Chem Chem Phys 15 12674-12679 (2013)
36 Schofield J Reiff S C Pimblott S M amp LaVerne J A Radiolytic Hydrogen Generation at
Silicon CarbidendashWater Interfaces Journal of Nuclear Materials 469 43-50 (2016)
37 LaVerne J A Ryan M R amp Mu T Hydrogen Production in the Radiolysis of Bromide
Solutions Radiation Physics and Chemistry 78 1148-1152 (2009)
References
163
38 Draganic I Nenadovic M T amp Draganic Z D Radiolysis of HCOOH + O2 at pH 13-13 and
the Yields of Primary Products in γ Radiolysis of Water Journal of Physical Chemistry 73 2564-2571 (1969)
39 Hart E J γ-Ray Induced Oxidation of Aqueous Formic Acid-Oxygen Solutions Effect of pH
Journal of the American Chemical Society 76 4198-4201 (1954)
40 Flanders D A amp Fricke H Application of a High-Speed Electronic Computer in Diffusion
Kinetics The Journal of Chemical Physics 28 1126-1129 (1958)
41 Burns W G Sims H E amp Goodall J A B Radiation Chemical Diffusion Kinetic Calculations
with Prescribed and Non-Prescribed DiffusionmdashI Spherical and Cylindrical Cases Radiation Physics and Chemistry 23 143-180 (1984)
42 Green N J B Pilling M J Pimblott S M amp Clifford P Stochastic Modeling of Fast Kinetics
in a Radiation Track The Journal of Physical Chemistry 94 251-258 (1990)
43 Bouniol P amp Bjergbakke E A Comprehensive Model to Describe Radiolytic Processes in
Cement Medium Journal of Nuclear Materials 372 1-15 (2008)
44 Ershov B G amp Gordeev A V A Model for Radiolysis of Water and Aqueous Solutions of H2
H2O2 and O2 Radiation Physics and Chemistry 77 928-935 (2008)
45 Elliot A J amp Bartels D M The Reaction Set Rate Constants and g-Values for the Simulation
of the Radiolysis of Light Water over the range 20degC to 350degC Based on Information Available in 2008 (Atomic Energy of Canada Limited Mississauga Ontario (Canada) 2009)
46 Wren J C amp Ball J M LIRIC 32 an Updated Model for Iodine Behaviour in the Presence of
Organic Impurities Radiation Physics and Chemistry 60 577-596 (2001)
47 Gregory P Horne Thomas A Donoclift Howard E Sims Robin M Orr amp Simon M
Pimblott Multi-Scale Modelling of the Radiolysis of Nitrate Solutions The Journal of Physical Chemistry B 120 (45) 11781 - 11789 (2016)
48 Chance E M Curtis A R Jones I P amp Kirby C R FACSIMILE A Computer Program for
Flow and Chemistry Simulation and General Initial Value Problems Report No 0436-9734 148 pp (Univ Coll 1977)
49 Elliot A J Rate Constants and G-Values for the Simulation of the Radiolysis of Light Water
Over the Range 0 - 300degC AECL-11073 COG-94-167 (1994)
References
164
50 Hochanadel C J amp Ghormley J A Effect of Temperature on the Decomposition of Water
by γ-Rays Radiat Res 16 635-660 (1962)
51 Janik D Janik I amp Bartels D M Neutron and βγ Radiolysis of Water up to Supercritical
Conditions βγ Yields for H2 Hbull Atom and Hydrated Electron The Journal of Physical
Chemistry A 111 7777-7786 (2007)
52 Jha K N Ryan T G amp Freeman G R Radiolysis of H2O and D2O between 0 and 300degC J
Phys Chem 79 868-870 (1974)
53 Elliot A J Chenier M P amp Ouellette D C Temperature Dependence of g Values for H2O
and D2O Irradiated with Low Linear Energy Transfer Radiation Journal of the Chemical Society Faraday Transactions 89 1193-1197 (1993)
54 Kent M C amp Sims H E The Yield of γ-Radiolysis Products from Water at Temperatures up
to 270degC Harwell Report AEA-RS-2301 (1992)
55 Lin M Katsumura Y Muroya Y He H Wu G Han Z et al Pulse Radiolysis Study on the
Estimation of Radiolytic Yields of Water Decomposition Products in High-Temperature and Supercritical Waterthinsp Use of Methyl Viologen as a Scavenger The Journal of Physical Chemistry A 108 8287-8295 (2004)
56 Štefanić I amp LaVerne J A Temperature Dependence of the Hydrogen Peroxide Production
in the γ-Radiolysis of Water The Journal of Physical Chemistry A 106 447-452 (2002)
57 Ferradini C amp Jay-Gerin J-P The Effect of pH on Water Radiolysis A Still Open Question mdash
A Minireview Research on Chemical Intermediates 26 549-565 (2000)
58 Ferradini C Kinetic Behavior of the Radiolysis Products of Water in Advances in Inorganic
Chemistry and Radiochemistry Vol Volume 3 (eds H J Emeleus amp A G Sharpe) 171-205 (1961)
59 Lefort M Radiation Chemistry Annual Review of Physical Chemistry 9 123-156 (1958)
60 Sworski T J Yields of Hydrogen Peroxide in the Decomposition of Water by Cobalt γ-
Rradiation I Effect of Bromide Ion Journal of the American Chemical Society 76 4687 (1954)
61 Hochanadel C J amp Lind S C Radiation Chemistry Annual Review of Physical Chemistry 7
83-106 (1956)
References
165
62 Mahlman H A amp Boyle J W Primary Cobalt-60 Radiolysis Yields in Heavy Water Journal
of the American Chemical Society 80 773 (1958)
63 Hayon E amp Stein G Radiation Chemistry of Aqueous Systems (1968)
64 Hayon E Effect of Solute Concentration on the Recombination of H˙ and ˙OH in γ-Irradiated
Aqueous Solutions Journal of Physical Chemistry 65 1502-1505 (1961)
65 Sehested K Bjergbakke E amp Fricke H The Primary Species Yields in the 60Co γ-Ray
Radiolysis of Aqueous Solutions of H2SO4 between pH 7 and 046 Radiation Research 56 385-399 (1973)
66 Hayon E Radiolysis of Heavy Water in the pD Range 0-14 Journal of Physical Chemistry 69
2628-2632 (1965)
67 Haissinsky M γ-Radiolysis of Alkaline and Neutral Solutions I Alkaline Solutions of Sodium
Phosphite Journal de Chimie Physique et de Physico-Chimie 62 1141-1148 (1965)
68 Dainton F S amp Watt W S The Effect of pH on the Radical Yields in the γ-Radiolysis of
Aqueous Systems Nature 195 1294-1296 (1962)
69 Dainton F S amp Rumfeldt R Radical and Molecular Yields in the γ-Radiolysis of Water III
The Nitrous Oxide-Sodium Tellurite System Proceedings of the Royal Society of London A Mathematical Physical and Engineering Sciences 287 444-456 (1965)
70 Cheek C H amp Linnenbom V J The Radiation Chemistry of Alkaline Hypobromite Solutions
The Journal of Physical Chemistry 67 1856-1860 (1963)
71 Fielden E M amp Hart E J Primary Radical Yields in Pulse-Irradiated Alkaline Aqueous
Solution Radiation Research 32 564-580 (1967)
72 Czapski G amp Peled E On the pH-Dependence of Greducing in the Radiation Chemistry of
Aqueous Solutions Israel Journal of Chemistry 6 421-436 (1968)
73 Balkas T Dainton F S Dishman J K amp Smithies D Radiation Chemistry of Aqueous
Solutions Containing Carbon Monoxide and Oxygen Between pH 04 and 12 Transactions of the Faraday Society 62 81-87 (1966)
References
166
74 Pimblott S M Pilling M J amp Green N J B Stochastic Models of Spur Kinetics in Water International Journal of Radiation Applications and Instrumentation Part C Radiation Physics and Chemistry 37 377-388 (1991)
75 Hayon E Radical and Molecular Yields in the Radiolysis of Alkaline Aqueous Solutions
Transactions of the Faraday Society 61 734-743 (1965)
76 Gordon S amp Hart E J Chemical Yields of Ionizing Radiations in Aqueous Solutions Effect of
Energy of Alpha Particles Radiation Research 15 440-451 (1961)
77 Kochanny G L Timnick A Hochanadel C J amp Goodman C D Radiation Chemistry Studies
of Water as Related to the Initial Linear Energy Transfer of 11-MeV to 23-MeV Protons Radiation Research 19 462-473 (1963)
78 ICRU Report 16 - Linear Energy Transfer (ICRU Washington USA 1970)
79 Schwarzenbach R P Gschwend P M amp Imboden D M Environmental Organic Chemistry
(Wiley 2005)
80 Ferrell R T amp Himmelblau D M Diffusion Coefficients of Hydrogen and Helium in Water
American Institute of Chemical Engineers 13 702-708 (1967)
81 Han P amp Bartels D M Temperature Dependence of Oxygen Diffusion in H2O and D2O The
Journal of Physical Chemistry 100 5597-5602 (1996)
82 Marrero T R amp Mason E A Gaseous Diffusion Coefficients Journal of Physical and
Chemical Reference Data 1 3-118 (1972)
83 Kestin J Knierim K Mason E A Najafi B Ro S T amp Waldman M Equilibrium and
Transport Properties of the Noble Gases and Their Mixtures at Low Density Journal of Physical and Chemical Reference Data 13 229-303 (1984)
84 Sander R Compilation of Henryrsquos Law Constants for Inorganic and Organic Species of
Potential Importance in Environmental Chemistry (1999)
85 Mezyk Stephen P amp Bartels David M Direct EPR Measurement of Arrhenius Parameters
for the Reactions of Hmiddot Atoms with H2O2 and Dmiddot Atoms with D2O2 in Aqueous Solution Journal of the Chemical Society Faraday Transactions 91 3127-3132 (1995)
References
167
86 Joseph Jiju M Seon Choi Byung Yakabuskie Pam amp Wren Clara J A Combined Experimental and Model Analysis on the Effect of pH and O2(aq) on γ-Radiolytically Produced H2 and H2O2 Radiation Physics and Chemistry 77 1009-1020 (2008)
87 Allen A O The Yields of Free H˙ and ˙OH in the Irradiation of Water Radiation Research 1
85-96 (1954)
88 Jortner J amp Noyes R M Some Thermodynamic Properties of the Hydrated Electron The
Journal of Physical Chemistry 70 770-774 (1966)
89 Sehested K Holcman J Bjergbakke E amp Hart Edwin J Ultraviolet Spectrum and Decay of
the Ozonide Ion Radical O3- in Strong Alkaline Solution Journal of Physical Chemistry 86
2066-2069 (1982)
90 Jones T Development of an Effluent Treatment Process for the Silos Direct Encapsulation
Plant IChemE Sustainable Nuclear Energy Conference (2014)
91 Nelson S M Newman A C D Tomlinson T E amp Sutton L E A Dielectric Study of the
Adsorption of Water by Magnesium Hydroxide Transactions of the Faraday Society 55 2186-2202 (1959)
92 Shpak P A Kalinichenko A E Lytovchenko S A Kalinichenko A I Legkova V G amp
Bagmut N N The Effect of γ-Irradiation on the Structure and Subsequent Thermal Decomposition of Brucite Physics and Chemistry of Minerals 30 59-68 (2003)
93 Maroto-Valer M M Developments and Innovation in Carbon Dioxide (CO2) Capture and
Storage Technology Volume One Carbon Dioxide (CO2) Capture Transport and Industrial Applications (Woodhead Publishing 2010)
94 Siriwardane R V amp Stevens R W Novel Regenerable Magnesium Hydroxide Sorbents for
CO2 Capture at Warm Gas Temperatures Industrial amp Engineering Chemistry Research 48 2135-2141 (2009)
95 Fricker Kyle J amp Park A Alissa Effect of H2O on Mg(OH)2 Carbonation Pathways for
Combined CO2 Capture and Storage Chemical Engineering Science 100 332-341 (2013)
96 Sahoo P Ishihara S Yamada K Deguchi K Ohki S Tansho M et al Rapid Exchange
between Atmospheric CO2 and Carbonate Anion Intercalated within Magnesium Rich Layered Double Hydroxide ACS Applied Materials amp Interfaces 6 18352-18359 (2014)
97 Stirling A HCO3
- Formation from CO2 at High pH Ab Initio Molecular Dynamics Study The Journal of Physical Chemistry B 115 14683-14687 (2011)
References
168
98 Shah Noor S Khan Javed Ali Al-Muhtaseb Alarsquoa H Sayed Murtaza amp Khan Hasan M
Gamma Radiolytic Decomposition of Endosulfan in Aerated Solution The Role of Carbonate Radical Environmental Science and Pollution Research 1-10 (2016)
99 Nash K Mulac W Noon M Fried S amp Sullivan J C Pulse Radiolysis Studies of U(VI)
Complexes in Aqueous Media Journal of Inorganic and Nuclear Chemistry 43 897-899 (1981)
100 Holcman J Bjergbakke E amp Sehested K The Importance of Radical-Rradical Reactions in
Pulse Radiolysis of Aqueous CarbonateBicarbonate Proceedings of the Tihany Symposium on Radiation Chemistry 6 149-153 (1987)
101 Draganic Z D Negron-Mendoza A Sehested K Vujosevic S I Navarro-Gonzales R
Albarran-Sanchez M G et al Radiolysis of Aqueous Solutions of Ammonium Bicarbonate Over a Large Dose Range Radiation Physics and Chemistry 38 317-321 (1991)
102 Eriksen T E Lind J amp Mereacutenyi G On the Acid-Base Equilibrium of the Carbonate Radical
Radiation Physics and Chemistry 26 197-199 (1985)
103 Thomas J K Gordon Sheffield amp Hart Edwin J The Rates of Reaction of the Hydrated
Electron in Aqueous Inorganic Solutions Journal of Physical Chemistry 68 1524-1527 (1964)
104 Nehari Shlomo amp Rabani Joseph The Reaction of H˙ Atoms with OH- in the Radiation
Chemistry of Aqueous Solutions Journal of Physical Chemistry 67 1609-1613 (1963)
105 Neta P amp Dorfman L M Pulse Radiolysis Studies XIII Rate Constants for the Reaction of
Hydroxyl Radicals with Aromatic Compounds in Aqueous Solutions in Radiation Chemistry Vol 81 Advances in Chemistry Ch 15 222-230 (American Chemical Society 1968)
106 Mezyk S P amp Bartels D M Rate Constant and Activation Energy Measurement for the
Reaction of Atomic Hydrogen with Methanol Iodomethane Iodoethane and 1-Iodopropane in Aqueous Solution The Journal of Physical Chemistry 98 10578-10583 (1994)
107 Anbar M amp Hart E J The Reactivity of Aromatic Compounds toward Hydrated Electrons
Journal of the American Chemical Society 86 5633-5637 (1964)
108 Theard Leslie M amp Burton Milton Radiolysis of Liquid Methanol and some Methanolic Salt
Solutions Journal of Physical Chemistry 67 59-64 (1963)
References
169
109 Porter Raymond P Noyes W amp Albert Jr Photochemical Studies LIV Methanol Vapor Journal of the American Chemical Society 81 2307-2311 (1959)
110 Motohashi N amp Saito Y Competitive Measurement of Rate Constants for Hydroxyl Radical
Reactions Using Radiolytic Hydroxylation of Benzoate Chemical amp pharmaceutical bulletin 41 1842-1845 (1993)
111 Adams G E amp Willson R L Pulse Radiolysis Studies on the Oxidation of Organic Radicals in
Aqueous Solution Transactions of the Faraday Society 65 2981-2987 (1969)
112 Kishore K Moorthy P N amp Rao K N Reactivity of H2O2 with Radiation Produced Free
Radicals Steady State Radiolysis Methods for Estimating the Rate Constants International Journal of Radiation Applications and Instrumentation Part C Radiation Physics and Chemistry 29 309-313 (1987)
113 Simic M Neta P amp Hayon E Pulse Radiolysis Study of Alcohols in Aqueous Solution The
Journal of Physical Chemistry 73 3794-3800 (1969)
114 Tsang W Chemical Kinetic Data Base for Combustion Chemistry Part 2 Methanol Journal
of Physical and Chemical Reference Data 16 471-508 (1987)
115 Huie R E amp Clifton C L Kinetics of the Self-Reaction of Hydroxymethylperoxyl Radicals
Chemical Physics Letters 205 163-167 (1993)
116 Schuchmann M N amp Von Sonntag C The Rapid Hydration of the Acetyl Radical A Pulse
Radiolysis Study of Acetaldehyde in Aqueous Solution Journal of the American Chemical Society 110 5698-5701 (1988)
117 Bothe E Schulte-Frohlinde D amp von Sonntag C Radiation Chemistry of Carbohydrates
Part 16 Kinetics of HO2˙ Elimination from Peroxyl Radicals Derived from Glucose and Polyhydric Alcohols Journal of the Chemical Society Perkin Transactions 2 416-420 (1978)
118 Zimina GM amp Bakh NA Pulse Radiolysis of Ethylene Glycol Absorption Spectra of the
Short-Lived Radicals High Energy Chem 13 187-190 (1979)
119 Thomas J K Rates of Reaction of the Hydroxyl Radical Transactions of the Faraday Society
61 702-707 (1965)
120 Draganic I amp Marcovic V Unpublished data (NIST Squib 1968DRAMARB) (1968)
References
170
121 Orlando J J amp Tyndall G S The Atmospheric Chemistry of the HC(O)CO Radical International Journal of Chemical Kinetics 33 149-156 (2001)
122 Ziemer H Doacutebeacute S Wagner H G Olzman M Viskolcz B amp Temps F Kinetics of the
Reactions of HCO with H˙ and D˙ Atoms Berichte der Bunsengesellschaft fuumlr physikalische Chemie 102 897-905 (1998)
123 Temps F amp Wagner H G Rate Constants for the Reactions of ˙OH Radicals with CH2O˙ and
HCO˙ Berichte der Bunsengesellschaft fuumlr physikalische Chemie 88 415-418 (1984)
124 Atkinson R Baulch D L Cox R A Hampson R F Kerr J A Rossi M J et al Evaluated
Kinetic and Photochemical Data for Atmospheric Chemistry Supplement VI IUPAC Subcommittee on Gas Kinetic Data Evaluation for Atmospheric Chemistry Journal of Physical and Chemical Reference Data 26 1329-1499 (1997)
125 Yee Quee M J amp Thynne J C J The Photolysis of Organic Esters Berichte der
Bunsengesellschaft fuumlr physikalische Chemie 72 211-217 (1968)
126 Sunaryoy G R amp Domae M Numerical Simulation on Effect of Methanol Addition on
Coolant Radiolysis in Pressurized Water Reactor Journal of Nuclear Science and Technology 45 1261-1274 (2008)
127 Baxendale J H amp Mellows F W The γ-Radiolysis of Methanol and Methanol Solutions
Journal of the American Chemical Society 83 4720-4726 (1961)
128 Pikaev A K amp Kartasheva L I Radiolysis of Aqueous Solutions of Ethylene Glycol
International Journal for Radiation Physics and Chemistry 7 395-415 (1975)
129 Ahmad M Awan M H amp Mohammad D γ-Radiolysis of Ethylene Glycol Aqueous
Solutions Journal of the Chemical Society B Physical Organic 945-946 (1968)
130 Yaylayan V A Harty-Majors S amp Ismail A A Investigation of the Mechanism of
Dissociation of Glycolaldehyde Dimer (25-dihydroxy-14-dioxane) by FTIR Spectroscopy Carbohydrate Research 309 31-38 (1998)
131 Reiff S C amp LaVerne J A Radiation-Induced Chemical Changes to Iron Oxides The Journal
of Physical Chemistry B 119 7358-7365 (2015)
132 Lousada C M Yang M Nilsson K amp Jonsson M Catalytic Decomposition of Hydrogen
Peroxide on Transition Metal and Lanthanide Oxides Journal of Molecular Catalysis A Chemical 379 178-184 (2013)
References
171
133 Rush J D B Benon H J Pulse Radiolytic Studies of the Reaction of Perhydroxyl
Superoxide O2- with Iron(II)Iron(III) Ions The Reactivity of HO2O2
- with Ferric Ions and its Implication on the Occurrence of the Haber-Weiss Reaction Journal of Physical Chemistry 89 5062-5066 (1985)
134 Pepper S E Borkowski M Richmann M K amp Reed D T Determination of Ferrous and
Ferric Iron in Aqueous Biological Solutions Analytica Chimica Acta 663 172-177 (2010)
135 Barb W G Baxendale J H George P amp Hargrave K R Reactions of Ferrous and Ferric
Ions with Hydrogen Peroxide Part II-The Ferric Ion Reaction Transactions of the Faraday Society 47 591-616 (1951)
136 Stuglik Z amp PawełZagoacuterski Z Pulse Radiolysis of Neutral Iron(II) Solutions Oxidation of
Ferrous Ions by ˙OH Radicals Radiation Physics and Chemistry (1977) 17 229-233 (1981)
137 Fong K-L McCay P B Poyer J L Misra H P amp Keele B B Evidence for Superoxide-
Dependent Reduction of Fe3+ and its role in Enzyme-Generated Hydroxyl Radical Formation Chemico-Biological Interactions 15 77-89 (1976)
138 Baxendale J H Dixon R S amp Stott D A Reactivity of Hydrogen Atoms with Fe3+ FeOH2+
and Cu2+ in Aqueous Solutions Transactions of the Faraday Society 64 2398-2401 (1968)
139 Jonah C D M John R Matheson Max S The Reaction of the Precursor of the Hydrated
Electron with Electron Scavengers Journal of Physical Chemistry 81 1618-1622 (1977)
Appendix
172
Appendix
Radiolysis Model Code
All computational calculations were performed with the software package Facsimile by
MCPA Software The following is a print out of the core water radiolysis model and only
includes the reactions of water other reaction schemes documented in this work can be
found on the included CD as well as the setup files containing initial parameters and
associated Python scripts used to manage output data
Appendix
173
--------------------------------------------------------------------
_ _ ___ ____ _____ _ _ _ _
| | | |__ __ | __ | (_) | | (_)
| |__| | ) | | | | | |__) |__ _ __| |_ ___ | |_ _ ___ _ ___
| __ | | | | | | _ _` | _` | | _ | | | | __| __|
| | | | _| |__| | | | | (_| | (_| | | (_) | | |_| __ | __
|_| |_|____|____ |_| ____|___|_|___|_|__ |___|_|___
__ |
|___
--------------------------------------------------------------------
-----Radiolysis Model for the Radiolysis of Pure Water--------------
----------------------Thomas Donoclift------------------------------
Rate constants mainly are from
A J Elliot Rate constants and G-values
for the simulation of the radiolysis of
light water over the range 0 - 300 C
AECL-11073 COG-94-167 19942008
P Bouniol amp E Bjergbakke ldquoA Comprehensive
Model to Describe Radiolytic processes
in Cement Mediumrdquo J Nuclear Materials 372 1-15 2008
JC Wren JM Ball ldquoLIRIC 32 an Updated model for
Iodine behaviour in the presence of organic impuritiesrdquo
Radiation Physics and Chemistry 60 577-596 2001
EXECUTE OPEN 1 RadMout UNKNOWN
EXECUTE OPEN 2 Reportout UNKNOWN
EXECUTE OPEN 3 SetUptxt OLD
EXECUTE OPEN 4 Flux_Atxt UNKNOWN
EXECUTE OPEN 7 Flux_Btxt UNKNOWN
EXECUTE OPEN 8 Flux_Ctxt UNKNOWN
EXECUTE OPEN 9 Flux_Dtxt UNKNOWN
EXECUTE OPEN 10 Flux_Etxt UNKNOWN
EXECUTE OPEN 11 FireCount_Atxt UNKNOWN
EXECUTE OPEN 12 FireCount_Btxt UNKNOWN
EXECUTE OPEN 14 TIMEtxt UNKNOWN
EXECUTE OPEN 15 FireCount_Ctxt UNKNOWN
EXECUTE OPEN 16 FireCount_Dtxt UNKNOWN
EXECUTE OPEN 17 FireCount_Etxt UNKNOWN
EXECUTE OPEN 19 TRACEtxt UNKNOWN
PERMIT +-
------------------------
Appendix
174
These variables are the concentrations of radiolysis
species Edit initial values in COMPILE INSTANT and
COMPILE INITIAL routines or SetUptxt
---------DEFINE-VARIABLES--------------
----CHEMICAL-SPECIES-FOR-H2O-RADIOLYSIS---------------
VARIABLE
H2O H2O+ H3O+ OH H H2 H2g H2O2 H2O2+ O2 O2g H+
OH- Eaq- O2- O2-- HO2 HO2- O- O-- O3- O Rx O3
---------------------------------------
------REACTION-COUNTERS-----------------------
VARIABLE
R0 R1 R2 R3 R4 R5 R6 R7 R8 R9 R10 R11 R12 R13 R14 R15 R16
R17 R18 R19 R20 R21 R22 R23 R24 R25 R26 R27 R28 R29 R30
R31 R32 R33 R34 R35 R36 R37 R38 R39 R40 R41 R42 R43 R44
R45 R46 R47 R48 R49 R50 R51 R52 R53 R54 R55 R56 R57 R58
R59 R60 R61 R62 R63 R64 R65 R66 R67 R68 R69 R70 R71 R72
R73 R74 R75 R76 R77 R78 R79 R80 R81 R82 R83
G0 G1 G2 G3 G4 G5 G6 G7 G8
---------DEFINE-PARAMETERS-------------
PARAMETER
T TK RT TAB DOSER ADOSE
DOSE EVDOSE GEaq- GH GH2 GOH GH2O2 GH+ GOH- G-H2O G+H2O GO2 GO2-
kappH2 kappO2 GHO2 GHO2-
kappO2g H2tot EA MB1 MB2 H2O2T
INTEGER RUNt
-------------------------
This set of perameters concerns radiolysis rates
G-Values are converted to rates in COMPILE INITIAL
Rate constants are given the prefix K
Arrhenius Pre-exponentials are given the prefix A
Activation Energies (-EaR) are given the prefix E
followed by letters representing reacting species ie
KAB = Rate constant of A+B
-------------------------
A=Eaq- B=H C=OH D=O-
E=O3- F=HO2 G=H2O2 H=H2O2+
I=H2O J=H+ K=OH- L=HO2-
M=O2 N=O2- O=O2-- P=H2O+
Q=O3 R=H2 S=O
-------------------------
PARAMETER
DW GREaq- GRH GRH2 GROH GRH2O2 GRH+ GROH- GR-H2O GR+H2O
GRO2 GRO2- GRHO2 GRHO2- KAA KAB KAC KAD KAG KAF KAL KAM KAN KBB KBC
KBG KBM KBN KBF KBF2 KBL KCC KCD KCG KCL KCF KCN KDR KDG KDL
KDN KEG KEL KER KEC KED KNN KFN KFNI KFF KFG KI KJK KG
KJL KGK KLI KC KJD KCK KDI KDM KE KF KJN KFK KNI KB KJA
KBK KAI KBI KRC KJNb KCKb KLK KLKb KDD KEJ KBQ KDQ
KCL2 KCQ KNQ KFQ KNG KNE KKQ KLQ KGQ KLG KLN KEC2 KAN2 KAN3
-------------------------
Appendix
175
----PRE-EXPONENTIAL-FACTORS-------------------
PARAMETER AAB AAF AAG AAM AAN ABB ABC ABG
ABN ABF ACG ACF ACN ACL ADR ADL AFNI
AFF ADM AE AG AAN2 AGQ AFN ANN ACL2 ABF2
ABL AAD AAL ADG AEG AEL AER AFG AAN3 ACD ALKb
-----------------------------------
-------ACTIVATION-ENERGIES--------------
PARAMETER EAB EAF EAG EAM EAN EBB EBC EBG
EBN EBF ECG ECF ECN ECL EDR EDL EFNI
EFF EDM EE EG EAN2 EGQ EFN ENN ECL2 EBF2
EBL EAD EAL EDG EEG EEL EER EFG EAN3 ECD ELKb
---------------------------------------
PARAMETER
pH pHreal pKw pKH2O2 pKOH pKHO2 pKH pKH2O pKHO2- KpH KpO
KfH KrH KfO KrO CONV PcH PcO O2in xO2 Kprot Khydx
TPrint pHsweep Tstart Tend DecTime
---------------------------------------------------------
Below are arrays for storing reaction flux These are limited to 20
as the output length max is 250 characters To overcome this clunky
artefact of Facsimile the arrays can be fed into Facssemblepy to
concatenate them into a single output file
----------------------------------------------------------
PARAMETER lt20gt Ra Stores Water Reaction Flux Part A
PARAMETER lt20gt Rb Stores Water Reaction Flux Part B
PARAMETER lt20gt Rc Stores Water Reaction Flux Part C
PARAMETER lt20gt Rd Stores Water Reaction Flux Part D
PARAMETER lt10gt Re Stores Water Reaction Flux Part E
PARAMETER lt2gt GR Stores Gas Partition Flux
-------------------------
--PARAMETERS-FOR-GAS-PARTITION--------------
PARAMETER
DaqH2 DgH2 DaqO2 DgO2 daq dg
vaqH2 vgH2 vaqO2 vgO2 vintH2 vintO2
KpH2 KpO2 vtot
Aint Vl Vg Vr Dose EqR
---------------INITIALISE-PARAMETERS--------
Concentrations of specis are given as Moll
T is Temp in C - TK is Temp in K
pHin is the initial pH xO2 is the fraction of O2
pHreal is the calculated pH at any given time
DW is density of water depending on temperature
DS is the density of the whole solution
Vl and Vg is the Volume of liqud and gas phases in L
DOSER is the dose rate in Gymin
ADOSE is the conversion of dose rate to sets of 100eVls
Appendix
176
COMPILE INSTANT
----PARAMETERS-FROM-SETUP-FILE-----
READ 3 DOSER
READ 3 RUNt
READ 3 Tstart
READ 3 Tend
READ 3 pH
READ 3 xO2
READ 3 Vl
READ 3 Vg
READ 3 Aint
READ 3 DaqH2
READ 3 DgH2
READ 3 DaqO2
READ 3 DgO2
READ 3 daq
READ 3 dg
READ 3 KpH2
READ 3 KpO2
---ADDITIONAL-PARAMETERS----
T = Tstart
TK = T + 27315
TAB = 1TK
RT = 8314TK
DW = (0999 + 1094E-4 T - 7397E-6 T2
+ 2693E-8 T3 - 4714E-11 T4)
ADOSE = ((DOSER 62415E16) 60) DW 100 eVsl for use with Gymin
TPrint = (FLOAT(RUNt) - 1) 60
EA = EXP(18800((129815-1TK)8314))
WRITE 2 = 4
WRITE 3 = 7
WRITE 4 = 8
WRITE 7 = 10
WRITE 8 = 9
WRITE 12 = 14
WRITE 1 = 2 WATER RADIOLYSIS MODEL - DEBUG REPORT
------INITIAL-SPECIES-CONCENTRATIONS-----
READ 3 Eaq-
READ 3 H2
READ 3 O2
READ 3 H2O2
H2O = 553DW
O2g = 101320 xO2 (1000 RT)
H2g = 1E-22 mass transfer - zero will cause floating point overflow
H+ = 10(-1pH) H+ Activity (Effective concentration)
OH- = 10(-1(14-pH))
Appendix
177
------------ARRHENIUS-PARAMETERS-----------------------------
----PRE-EXPONENTIAL-FACTORS-------------------
AAB = 114E13
AAF = 24636E12
AAG = 77E12
AAM = 2479E12
AAN = 24636E12
ABB = 27E12
ABC = 426E11
ABG = 179E11
ABN = 517E12
ABF = 517E12
ACG = 768E9
ACF = 129E11
ACN = 877E11
ACL = 100E12
ADR = 232E10
ADL = 145E13
AFNI = 263E9
AFF = 278E9
ADM = 341E11
AE = 320E11
AG = 3171E4
AAN2 = 31E12
AGQ = 28E11
AFN = 244E9
ANN = 489E8
ACL2 = 45E12
ABF2 = 72E11
ABL = 42E13
AAD = 56E11
AAL = 175E12
ADG = 300E11
AEG = 159E6
AEL = 887E5
AER = 249E5
AFG = 37
AAN3 = 2567E13
ACD = 17E11
ALKb = 295E8
------------------------------
------ACTIVATION-ENERGIES-EaR----
EAB = 17957
EAF = 15636
EAG = 18896
EAM = 14015
EAN = 15636
EBB = 18675
EBC = 10919
EBG = 25336
EBN = 18242
EBF = 18242
ECG = 16614
ECF = 7992
ECN = 13062
ECL = 14346
EDR = 15505
EDL = 29285
Appendix
178
EFNI = 9743
EFF = 24164
EDM = 13449
EE = 55521
EG = 78181
------ACTIVATION-ENERGIES---Ea-J--
EAN2 = 136000
EGQ = 735000
EFN = 86000
ENN = 525900
ECL2 = 156000
EBF2 = 106000
EBL = 256000
EAD = 79000
EAL = 154000
EDG = 156000
EEG = 188400
EEL = 188400
EER = 188400
EFG = 200000
EAN3 = 188000
ECD = 77000
ELKb = 142000
--------------------------------
---------OTHER-LITERATURE-RATE-CONSTANTS--------------------------
KLG = 45E-4 FRDuke TWHaas 1961
KLQ = 55E6 JStaehelin J Hoigne 1982
KKQ = 48E1 LForni EJ Hart 1982
KFQ = 50E8 Pastina La Verne 2001
KNQ = 15E9 EJ Hart 1983
KNE = 10E4 Pastina La Verne 2001
KNG = 13E-1 JWeinstein BBielski 1979
KLN = 823E-2 PBouniol EBjergbakke 2008
KCQ = 11E8 K Sehested EJ Hart 1984
KEC2 = 25E9 K Sehested EJ Hart 1984
KDQ = 10E9 E Bjergbakke H Christensen
KBQ = 22E10 EJ Hart 1983
KCD = 20E10
KDN = 600E8
KEC = 60E9 Sehested Holcman Hart 1984
(269)
KEC = 850E9 P Bouniol E Bjergbakke
KDD = 84E9 Adams GE Boag JW
KDD = 10E8
KED = 70E8 Hart EJ 1984
KEJ = 90E10 Hart EJ
KLK = 3506E5
KLKb = 961E5
-GENERAL-ROUTINE-CONTINUALLY-ITTERATES-THROUGHOUT-CALCULATION-
Appendix
179
COMPILE GENERAL
------TEMPERATURE-RAMPING-ROUTINE----------------
TK = T + 27315
TAB = 1TK
RT = 8314TK
DecTime = TIME 3600
T = (11414 DecTime3 - 80383 DecTime2
+ 19256 DecTime + 22918)
IF(T - Tend)211
LABEL 1
T = Tend
LABEL 2
----------------------
H2O2T = H2O2 + HO2- + O2-- Total peroxide for output use
------------------SETUP-OF-EQUILIBRIA---------------------------------
pKw = (14947 - 4273E-2 T + 2115E-4 T2
- 5786E-7 T3 + 7529E-10 T4)
pKH2O2 = (12383 - 3020E-2 T + 170E-4 T2
- 5151E-7 T3 + 696E-10 T4)
pKOH = (12383 - 3020E-2 T + 170E-4 T2
- 5151E-7 T3 + 696E-10 T4)
pKHO2 = (4943 - 623E-3 T + 4125E-5 T2
- 8182E-9 T3)
pKH = (10551 - 443E-2 T + 1902E-4 T2
- 4661E-7 T3 + 598E-10 T4)
pKH2O = (1669 - 443E-2 T + 2071E-4 T2
- 5594E-7 T3 + 7161E-10 T4)
Kprot = (341E10 + 275E8 T + 124E7 T2
- 623E4 T3 + 131E2 T4)
Khydx = (722E9 + 162E8 T + 24E6 T2
- 781E3 T3 + 106 T4)
pKHO2- = 165 see Bouniol 2001
--------------------PARTITION-OF-O2-AND-H2---------------------
It should be noted that this routine is only valid for
a liquid to gas ratio of 1 See Chapter 3 for details
---------DIFFUSIVITY-WITH-TEMPERATURE---------
DaqO2 = (2E-9 T2 + 4E-7 T + 1E-5)
DaqH2 = (1E-8 T2 + 4E-7 T + 3E-5)
DgO2 = (1E-6 T2 + 12E-3 T + 02073)
DgH2 = (5E-6 T2 + 47E-3 T + 07719)
-----HENRYS-COEFFICIENT-WITH-TEMPERATURE--------------------
KpH2 = (TK (78E-4 EXP(543((1TK) - (129815))))) 122
KpO2 = (TK (13E-3 EXP(1650((1TK) - (129815))))) 122
---H2----
vgH2 = DgH2dg
vaqH2 = DaqH2daq
vintH2 = 1(1vaqH2 + KpH2vgH2)
H2tot = H2 + H2g
Appendix
180
---O2----
vgO2 = DgO2dg
vaqO2 = DaqO2daq
vintO2 = 1(1vaqO2 + KpO2vgO2)
vtot = 1((1(vaqO2))+(1(vgO2KpO2)))
--------PARAMETER-EVOLUTION--------------
kappH2 = vintH2(AintVl)(1 - KpH2(H2gH2))
kappO2 = vintO2(AintVl)(1 - KpO2(O2gO2))
Dose = DOSER (TIME 60)
pHreal = -LOG10( H+ )
--------------------G-VALUES------------------------
G-Values with temperature dependency ONLY
G-Values are initially obtained from literature molec 100eV
G-Values are converted to rates later
GEaq- = 2641 + 4162E-3 T + 9093E-6 T2 - 4717E-8 T3
GH2 = 0419 + 872E-4 T - 4971E-6 T2 + 1503E-8 T3
GOH = 2531 + 1134E-2 T - 1269E-5 T2 + 3513E-8 T3
GH2O2 = 0752 - 162E-3 T
GH = 0556 + 2198E-3 T - 1184E-5 T2 + 5223E-8 T3
GH+ = GEaq-
G-H2O = GOH + 2GH2O2
-----------------------------------------------------
------------G-VALUES-FROM-MULTIPLE-POLYNOMIAL-REGRESSION-----
Multiple polynomial regression was used to combine data that measured
primary yields as a function of temperature AND as a function of pH
GEaq- = 2798 + 285E-3 T - 2514E-2 pHreal
GH2 = 38781E-1 + 8288E-4 T + 5988E-4 pHreal
GOH = 243146 + 1111E-2 T - 12E-3 pHreal
GH = 4444E-1 + 367E-3 T - 2378E-4 pHreal
GH+ = GEaq-
GH2O2 = 05(GH + GEaq- + (2 GH2) - GOH) Material Balance
G-H2O = GOH + 2GH2O2
MB1 = GH + GEaq- + (2 GH2) Diagnostic Material Balance Variables
MB2 = GOH + (2 GH2O2)
-------------------G-VALUES--AS--RATES--------------
GREaq- = (ADOSE GEaq-)6022E23
GRH = (ADOSE GH)6022E23
GRH2 = (ADOSE GH2)6022E23
GROH = (ADOSE GOH)6022E23
GRH2O2 =(ADOSE GH2O2)6022E23
GRH+ = (ADOSE GH+)6022E23
GROH- = (ADOSE GOH-)6022E23
GR-H2O = (ADOSE G-H2O)6022E23
GRO2 = (ADOSE GO2)6022E23
GRO2- = (ADOSE GO2-)6022E23
GRHO2 = (ADOSE GHO2)6022E23
GRHO2- = (ADOSE GHO2-)6022E23
Appendix
181
------REACTION-RATES-WITH-TEMP-DEPENDENCY--
--------POLYNOMIAL-EQUATIONS----------------
KAA = 10(12281 - 3768E2 TAB - 6673E4 TAB2 - 1075E7 TAB3)
KAC = 10(13123 - 1023E3 TAB + 7634E4 TAB2)
KBM = 10(10704 + 2840E2 TAB - 137E5 TAB2)
KCC = 10(8054 + 2193E3 TAB - 7395E5 TAB2 + 687E7 TAB3)
KJK = 10(20934 - 1236E4 TAB + 6364E6 TAB2
- 1475E9 TAB3 + 1237E11 TAB4)
KJN = 10(1641 - 4888E3 TAB + 1622E6 TAB2 - 2004E8 TAB3)
KCK = 10(13339 - 222E3 TAB + 7333E5 TAB2 - 1065E8 TAB3)
KJA = 10(39127 - 3888E4 TAB + 2054E7 TAB2 - 4899E9 TAB3
+ 4376E11 TAB4)
KBK = 10(22970 - 1971E4 TAB + 1137E7 TAB2 - 2991E9 TAB3
+ 2803E11 TAB4)
KBI = 10(9408 - 2827E3 TAB - 3792E5 TAB2)
KRC = 10(-11556 + 32546E4 TAB - 18623E7 TAB2
+ 45543E9 TAB3 - 41364E11 TAB4)
------------ARRHENIUS-EQUATIONS------------------
----------EaR-------------------
KAB = AAB(EXP(-EABTK))
KAF = AAF(EXP(-EAFTK))
KAG = AAG(EXP(-EAGTK))
KAM = AAM(EXP(-EAMTK))
KAN = AAN(EXP(-EANTK))
KBB = ABB(EXP(-EBBTK))
KBC = ABC(EXP(-EBCTK))
KBG = ABG(EXP(-EBGTK))
KBN = ABN(EXP(-EBNTK))
KBF = ABF(EXP(-EBFTK))
KCG = ACG(EXP(-ECGTK))
KCF = ACF(EXP(-ECFTK))
KCN = ACN(EXP(-ECNTK))
KCL = ACL(EXP(-ECLTK))
KDR = ADR(EXP(-EDRTK))
KDL = ADL(EXP(-EDLTK))
KFNI = AFNI(EXP(-EFNITK))
KFF = AFF(EXP(-EFFTK))
KDM = ADM(EXP(-EDMTK))
KE = AE(EXP(-EETK))
KG = AG(EXP(-EGTK))
---------Ea-----------------
KAN2 = AAN2EXP(-EAN2RT)
KGQ = AGQEXP(-EGQRT) KSehested EJ Hart1992
KFN = AFNEXP(-EFNRT) BBielski ARoss 1985
KNN = ANNEXP(-ENNRT) Eliot
KCL2 = ACL2EXP(-ECL2RT) Eliot
KBF2 = ABF2EXP(-EBF2RT) Eliot
KBL = ABLEXP(-EBLRT) SP Mezyk DM Bartels
KAD = AADEXP(-EADRT) Eliot
KAL = AALEXP(-EALRT)
KDG = ADGEXP(-EDGRT)
KEG = AEGEA Wren amp Ball
Appendix
182
KEL = AELEA Wren amp Ball
KER = (AEREA) Wren (Suggests 8 correction)
KFG = 50E-1
KAN3 = AAN3EXP(-EAN3RT)
KCD = ACDEXP(-ECDRT)
-----------EQUILIBRIA---------------------------------------
KCKb = KCK ((10(-pKH2O))(10(-pKOH)))
KI = KJK(10-pKw)
KF = KJN (10-pKHO2)
KJL = KJN
KGK = KCK
KDI = KCK((10-pKH2O)(10-pKOH))
KLI = KCK((10-pKH2O)(10-pKH2O2))
KJD = KJN
KC = KJD(10-pKOH)
KFK = KCK
KNI = KFK((10-pKH2O)(10-pKHO2))
KB = KJA(10-pKH)
KAI = KBK((10-pKH2O)(10-pKH))
KJNb = KJN(10-pKH2O2)((10(-pKw))(10(-pKHO2)))
GENERAL
-------EQUATIONS-ROUTINE-CONTAINS-RADIOLYSIS-CHEMISTRY--------
COMPILE EQUATIONS
------INITIAL-SPECIES-GENERATION----------------------------
Ralt0gtGREaq- = Eaq- + G0
Ralt1gtGRH = H + G1
Ralt2gtGRH2 = H2 + G2
Ralt3gtGROH = OH + G3
Ralt4gtGRH2O2 = H2O2 + G4
Ralt5gtGRH+ = H+ + G5
Ralt6gtGROH- = OH- + G6
Ralt7gtGR-H2OH2O H2O = G7
----------REACTIONS------------------------
Ralt8gtKAA(H2OH2O) Eaq- + Eaq- + H2O + H2O = H2 + OH- + OH- + R0
Ralt9gtKABH2O Eaq- + H + H2O = H2 + OH- + R1
Ralt10gtKAC Eaq- + OH = OH- + R2
Ralt11gtKADH2O Eaq- + H2O + O- = OH- + OH- + R3
Ralt12gtKAG Eaq- + H2O2 = OH- + OH + R4
Ralt13gtKAF Eaq- + HO2 = HO2- + R5
Ralt14gtKAL Eaq- + HO2- = O- + OH- + R6
Ralt15gtKAM Eaq- + O2 = O2- + R7
Ralt16gtKAN Eaq- + O2- = O2-- + R8
Ralt17gtKBB H + H = H2 + R9
Ralt18gtKBC H + OH = H2O + R10
Ralt19gtKBG H + H2O2 = OH + H2O + R11
Rblt0gtKBM H + O2 = HO2 + R12
Rblt1gtKBN H + O2- = HO2- + R13
Rblt2gtKBF H + HO2 = OH + OH + R14
Rblt3gtKBL H + HO2- = OH + OH- + R15
Rblt4gtKBQ H + O3 = OH + O2 + R16
Rblt5gtKCC OH + OH = H2O2 + R17
Rblt6gtKCG OH + H2O2 = H2O + HO2 + R18
Rblt7gtKCL OH + HO2- = OH- + HO2 + R19
Rblt8gtKCF OH + HO2 = H2O + O2 + R20
Appendix
183
Rblt9gtKCN OH + O2- = OH- + O2 + R21
Rblt10gtKCQ OH + O3 = O2 + HO2 + R22
Rblt11gtKEG O3- + H2O2 = O2- + O2 + H2O + R23
Rblt12gtKEL O3- + HO2- = O2- + O2 + OH- + R24
Rblt13gtKER O3- + H2 = O2 + H + OH- + R25
Rblt14gtKEC O3- + OH = HO2 + O2- + R26
Rblt15gtKEC2 O3- + OH = OH- + O3 + R27
Rblt16gtKEJ O3- + H+ = OH + O2 + R28
Rblt17gtKNN O2- + O2- = O2 + O2-- + R29
Rblt18gtKLN O2- + HO2- = O2 + OH- + O- + R30
Rblt19gtKNG O2- + H2O2 = O2 + OH + OH- + R31
Rclt1gtKFN O2- + HO2 = O2 + HO2- + R32
Rclt2gtKNE O2- + O3- = O-- + O2 + O2 + R33
Rclt3gtKNQ O2- + O3 = O2 + O3- + R34
Rclt4gtKFF HO2 + HO2 = H2O2 + O2 + R35
Rclt5gtKFG HO2 + H2O2 = O2 + H2O + OH + R36
Rclt6gtKFQ HO2 + O3 = OH + O2 + O2 + R37
Rclt7gtKLG H2O2 + HO2- = H2O + O2 + OH- + R38
Rclt8gtKKQ O3 + OH- = O2 + HO2- + R39
Rclt9gtKLQ O3 + HO2- = O2 + OH + O2- + R40
Rclt10gtKGQ O3 + H2O2 = O2 + OH + HO2 + R41
------------------ADDITIONAL-WATER-CHEMISTRY------------------------
Rclt12gt200E10 H + O- = OH- + R42 Bjergbakke Draganic
Sehested
Rclt13gt16E10 O3- + Eaq- = OH- + OH- + O2 + R43 Pastina amp La
Verne
Rclt14gt36E10 O3 + Eaq- = O3- + R44 NIST
Rclt16gt23E-7 H2O2 = OH + OH + R45 Yakabuskie et al
Rclt17gt10E10H2O O-- + H2O = OH- + OH- + R46
Bouniol and Bjergbakke 2008
----------------ALKALI-REACTIONS------------------
Relt2gtKDR O- + H2 = H + OH- + R47
Relt3gtKDG O- + H2O2 = OH- + HO2 + R48
Relt4gtKDL O- + HO2- = O2- + OH- + R49
Relt5gtKDN O- + O2- = O-- + O2 + R50
Relt6gtKDD O- + O- = O2-- + R51
Relt7gtKCD O- + OH = HO2- + R52
Relt8gtKED O- + O3- = O2- + O2- + R53
Relt9gtKDQ O- + O3 = O2- + O2 + R54
----------EQUILIBRIUM-REACTIONS--------------------
Rclt18gtKIH2O H2O = H+ + OH- + R55
Rclt19gtKJK H+ + OH- = H2O + R56
Rdlt0gtKJN10(-pKH2O2) H2O2 = H+ + HO2- + R57
Rdlt1gtKJN H+ + HO2- = H2O2 + R58
Rdlt2gtKCK H2O2 + OH- = HO2- + H2O + R59
Rdlt3gtKLIH2O HO2- + H2O = H2O2 + OH- + R60
Rdlt4gtKLK HO2- + OH- = O2-- + H2O + R61
Rdlt5gtKLKbH2O O2-- + H2O = HO2- + OH- + R62
Rdlt6gtKJN10(-pKOH) OH = H+ + O- + R63
Rdlt7gtKJN H+ + O- = OH + R64
Appendix
184
Rdlt8gtKCK OH + OH- = O- + H2O + R65
Rdlt9gtKCKbH2O O- + H2O = OH + OH- + R66
Rdlt10gtKDM O- + O2 = O3- + R67
Rdlt11gtKE O3- = O- + O2 + R68
Rdlt12gtKF HO2 = H+ + O2- + R69
Rdlt13gtKJN H+ + O2- = HO2 + R70
Rdlt14gtKFK HO2 + OH- = O2- + H2O + R71
Rdlt15gtKNIH2O O2- + H2O = HO2 + OH- + R72
Rdlt16gtKB H = H+ + Eaq- + R73
Rdlt17gtKJA H+ + Eaq- = H + R74
Rdlt18gtKBK H + OH- = Eaq- + H2O + R75
Rdlt19gtKAIH2O Eaq- + H2O = H + OH- + R76
Relt0gtKBIH2O H + H2O = H2 + OH + R77
Relt1gtKRC H2 + OH = H + H2O + R78
---------------MASS-TRANSFER----------------------
GRlt0gtkappH2 H2 = H2g + R79
GRlt1gtkappO2 O2 = O2g + R80
-------OUTPUTS-ROUTINE-------
SETPSTREAM 3 1 20
OH H H2 H2g H2O2 O2 O2g H+ OH- Eaq-
O2- O2-- HO2 HO2- O- O-- O3- O O3
SETPSTREAM 4 11 20
R0 R1 R2 R3 R4 R5 R6 R7 R8 R9 R10 R11 R12 R13 R14 R15 R16
R17 R18 R19
SETPSTREAM 5 12 20
R20 R21 R22 R23 R24 R25 R26 R27 R28 R29 R30
R31 R32 R33 R34 R35 R36 R37 R38 R39
SETPSTREAM 6 15 20
R40 R41 R42 R43 R44 R45 R46 R47 R48 R49
R50 R51 R52 R53 R54 R55 R56 R57 R58 R59
SETPSTREAM 7 16 20
R60 R61 R62 R63 R64 R65 R66 R67 R68 R69
R70 R71 R72 R73 R74 R75 R76 R77 R78 R79
Appendix
185
SETPSTREAM 8 17 20
R80 R81 R82 R83 G1 G2 G3
G4 G5 G6 G7 G8
COMPILE OUT
PSTREAM 3
PSTREAM 4
PSTREAM 5
PSTREAM 6
PSTREAM 7
PSTREAM 8
WRITE 2 250 (N20 E10 2) Ra
WRITE 3 250 (N20 E10 2) Rb
WRITE 4 250 (N20 E10 2) Rc
WRITE 8 250 (N20 E10 2) Rd
WRITE 7 250 (N10 E10 2) Re
WRITE 10 (N2 E10 2) GR
WRITE 12 (E10 2) TIME
WHENEVER
TIME = TPrint Call Report
TIME = 0 + 600 RUNt CALL OUT
------------DEBUG-REPORT---------------
-Contains a list of all parameters to
confirm that values are correct-
COMPILE Report
WRITE 1 THIS REPORT IS GENERATED AT TPrint SECONDS
WRITE 1 RUNt = RUNt
WRITE 1 KpH2 = (E12 3) KpH2
WRITE 1 KpO2 = (E12 3) KpO2
WRITE 1 pH = (F6 1) pH
WRITE 1 Temperature = (F6 1) T C
WRITE 1 Dose Rate = (F6 1) DOSER Gymin
WRITE 1 VgVl Ratio = (F6 2) Vr
WRITE 1 Run Time = (F12 2) RUNt Mins
WRITE 1 Oxygen Fraction = (F6 3) xO2
WRITE 1 G-VALUES
WRITE 1 G(Eaq-) = (F6 3) GEaq-
WRITE 1 G(H) = (F6 3) GH
WRITE 1 G(H2) = (F6 3) GH2
WRITE 1 G(OH) = (F6 3) GOH
WRITE 1 G(H2O2) = (F6 3) GH2O2
WRITE 1 G(H+) = (F6 3) GH+
WRITE 1 G(-H2O) = (F6 3) G-H2O
WRITE 1 G-VALUES AS RATES MOLLS
WRITE 1 GREaq- = (E12 3) GREaq-
WRITE 1 GRH = (E12 3) GRH
WRITE 1 GRH2 = (E12 3) GRH2
WRITE 1 GROH = (E12 3) GROH
WRITE 1 GRH2O2 = (E12 3) GRH2O2
WRITE 1 GRH+ = (E12 3) GRH+
WRITE 1 GR-H2O = (E12 3) GR-H2O
WRITE 1 RATE CONSTANTS
WRITE 1 KAA = (E12 3) KAA
WRITE 1 KAB = (E12 3) KAB
Appendix
186
WRITE 1 KAC = (E12 3) KAC
WRITE 1 KAD = (E12 3) KAD
WRITE 1 KAG = (E12 3) KAG
WRITE 1 KAF = (E12 3) KAF
WRITE 1 KAL = (E12 3) KAL
WRITE 1 KAM = (E12 3) KAM
WRITE 1 KAN = (E12 3) KAN
WRITE 1 KBB = (E12 3) KBB
WRITE 1 KBC = (E12 3) KBC
WRITE 1 KBG = (E12 3) KBG
WRITE 1 KBM = (E12 3) KBM
WRITE 1 KBN = (E12 3) KBN
WRITE 1 KBF = (E12 3) KBF
WRITE 1 KBF2 = (E12 3) KBF2
WRITE 1 KBL = (E12 3) KBL
WRITE 1 KBQ = (E12 3) KBQ
WRITE 1 KCC = (E12 3) KCC
WRITE 1 KCD = (E12 3) KCD
WRITE 1 KCG = (E12 3) KCG
WRITE 1 KCL = (E12 3) KCL
WRITE 1 KCF = (E12 3) KCF
WRITE 1 KCN = (E12 3) KCN
WRITE 1 KCQ = (E12 3) KCQ
WRITE 1 KDR = (E12 3) KDR
WRITE 1 KDG = (E12 3) KDG
WRITE 1 KDL = (E12 3) KDL
WRITE 1 KDN = (E12 3) KDN
WRITE 1 KEG = (E12 3) KEG
WRITE 1 KEL = (E12 3) KEL
WRITE 1 KER = (E12 3) KER
WRITE 1 KEC = (E12 3) KEC
WRITE 1 KED = (E12 3) KED
WRITE 1 KNN = (E12 3) KNN
WRITE 1 KFN = (E12 3) KFN
WRITE 1 KFNI = (E12 3) KFNI
WRITE 1 KFF = (E12 3) KFF
WRITE 1 KFG = (E12 3) KFG
WRITE 1 KI = (E12 3) KI
WRITE 1 KJK = (E12 3) KJK
WRITE 1 KG = (E12 3) KG
WRITE 1 KJL = (E12 3) KJL
WRITE 1 KGK = (E12 3) KGK
WRITE 1 KLI = (E12 3) KLI
WRITE 1 KC = (E12 3) KC
WRITE 1 KJD = (E12 3) KJD
WRITE 1 KCK = (E12 3) KCK
WRITE 1 KDI = (E12 3) KDI
WRITE 1 KDM = (E12 3) KDM
WRITE 1 KE = (E12 3) KE
WRITE 1 KF = (E12 3) KF
WRITE 1 KJN = (E12 3) KJN
WRITE 1 KFK = (E12 3) KFK
WRITE 1 KNI = (E12 3) KNI
WRITE 1 KB = (E12 3) KB
WRITE 1 KJA = (E12 3) KJA
WRITE 1 KBK = (E12 3) KBK
WRITE 1 KAI = (E12 3) KAI
WRITE 1 KBI = (E12 3) KBI
WRITE 1 KRC = (E12 3) KRC
Appendix
187
WRITE 1 KJNb = (E12 3) KJNB
WRITE 1 KCKb = (E12 3) KCKb
WRITE 1 KLK = (E12 3) KLK
WRITE 1 KLKb = (E12 3) KLKb
WRITE 1 KDD = (E12 3) KDD
WRITE 1 KEJ = (E12 3) KEJ
WRITE 1 KBQ = (E12 3) KBQ
WRITE 1 KDQ = (E12 3) KDQ
WRITE 1 KCL2 = (E12 3) KCL2
WRITE 1 KCQ = (E12 3) KCQ
WRITE 1 KNQ = (E12 3) KNQ
WRITE 1 KFQ = (E12 3) KFQ
WRITE 1 KNG = (E12 3) KNG
WRITE 1 KNE = (E12 3) KNE
WRITE 1 KKQ = (E12 3) KKQ
WRITE 1 KLQ = (E12 3) KLQ
WRITE 1 KGQ = (E12 3) KGQ
WRITE 1 KLG = (E12 3) KLG
WRITE 1 KLN = (E12 3) KLN
WRITE 1 KEC2 = (E12 3) KEC2
WRITE 1 KAN2 = (E12 3) KAN2
WRITE 1 KRC = (E12 3) KRC
WRITE 1 ----PRE-EXPONENTIAL-FACTORS----
WRITE 1 AAB = (E12 3) AAB
WRITE 1 AAF = (E12 3) AAF
WRITE 1 AAG = (E12 3) AAG
WRITE 1 AAM = (E12 3) AAM
WRITE 1 AAN = (E12 3) AAN
WRITE 1 ABB = (E12 3) ABB
WRITE 1 ABC = (E12 3) ABC
WRITE 1 ABG = (E12 3) ABG
WRITE 1 ABN = (E12 3) ABN
WRITE 1 ABF = (E12 3) ABF
WRITE 1 ACF = (E12 3) ACF
WRITE 1 ACL = (E12 3) ACL
WRITE 1 ACG = (E12 3) ACG
WRITE 1 ACN = (E12 3) ACN
WRITE 1 ADR = (E12 3) ADR
WRITE 1 ADL = (E12 3) ADL
WRITE 1 AFNI = (E12 3) AFNI
WRITE 1 AFF = (E12 3) AFF
WRITE 1 ADM = (E12 3) ADM
WRITE 1 AG = (E12 3) AG
WRITE 1 AAN2 = (E12 3) AAN2
WRITE 1 AGQ = (E12 3) AGQ
WRITE 1 AFN = (E12 3) AFN
WRITE 1 ANN = (E12 3) ANN
WRITE 1 ACL2 = (E12 3) ACL2
WRITE 1 ABF2 = (E12 3) ABF2
WRITE 1 ABL = (E12 3) ABL
WRITE 1 AAD = (E12 3) AAD
WRITE 1 AAL = (E12 3) AAL
WRITE 1 ADG = (E12 3) ADG
WRITE 1 AEG = (E12 3) AEG
WRITE 1 AEL = (E12 3) AEL
WRITE 1 AER = (E12 3) AER
WRITE 1 AFG = (E12 3) AFG
WRITE 1 ----ACTIVATION ENERGIES----
WRITE 1 EAG = (E12 3) EAG
Appendix
188
WRITE 1 EAM = (E12 3) EAM
WRITE 1 EAN = (E12 3) EAN
WRITE 1 EBG = (E12 3) EBG
WRITE 1 ECG = (E12 3) ECG
WRITE 1 ECL = (E12 3) ECL
WRITE 1 ECF = (E12 3) ECF
WRITE 1 ECN = (E12 3) ECN
WRITE 1 EFN = (E12 3) EFN
WRITE 1 EFNI = (E12 3) EFNI
WRITE 1 ECL2 = (E12 3) ECL2
WRITE 1 EAN2 = (E12 3) EAN2
WRITE 1 ---pKa----
WRITE 1 pKw = (E12 3) pKw
WRITE 1 pKH2O2 = (E12 3) pKH2O2
WRITE 1 pKHO2 = (E12 3) pKHO2
WRITE 1 pKOH = (E12 3) pKOH
WRITE 1 pKH = (E12 3) pKH
WRITE 1 pKH2O = (E12 3) pKH2O
WRITE 1 Kprot = (E12 3) Kprot
WRITE 1 Khydx = (E12 3) Khydx
WRITE 1 KappO2 = (E12 3) kappO2
WRITE 1 KappH2 = (E12 3) kappH2
WRITE 1 H2O2 Equ rate = (E12 3) EqR
SETHMAX 1
BEGIN
STOP
Appendix
189
Radiolysis Model Full Reaction Scheme
Primary Reaction G-value
(Molecules100eV) Temperature Dependency Ref
G0 H2O emacraq 271 2641 + 416210-3
t + 909310-6 t2
ndash 471710-8 t3 45
G1 H2O H 054 0556 + 219810-3 t ndash 118410-5 t2 + 522310-8 t3 45
G2 H2O H2 041 0419 + 872110-4 t - 497110-6 t2 + 150310-8 t3 45
G3 H2O OH 270 2531 + 113410-2 t ndash 126910-5 t2 + 351310-8 t3 45
G4 H2O H2O2 068 0752 ndash 162010-3 t 45
G5 H2O H+ 271 2641 + 416210-3
t + 909310-6 t2
ndash 471710-8 t3 45
Chemical Reaction Rate Constant
k (M-1 s-1 25degC) Arrhenius Activation Energy Ea
(kJ) Ref
R0 emacraq + emacr
aq rarr H2 + 2OHmacr 7260 times109 Log kR7 = 12281 ndash 3768102T ndash 6673104T2 - 1075107T3 45
R1 emacraq + H rarr H2 + OHmacr 2762 times1010
114 times1013 14929 45
R2 emacraq + OH rarr OHmacr 3553 times1010
Log kR9 = 13123 ndash 1023103T + 7634104T2 45
R3 emacraq + Omacr rarr 2OHmacr 2313 times1010
56 times1011 79 49
R4 emacraq + H2O2 rarr OHmacr + OH 1362 times1010
77 times1012 1571 45
R5 emacraq + HO2 rarr HO2
macr 1300 times1010 246 times1012 130 45
R6 emacraq + HO2
macr rarr Omacr + OHmacr 3507 times109 175 times1012 154 49
R7 emacraq + O2 rarr O2
macr 2253 times1010 252 times1012 11652 45
R8 emacraq + O2
macr rarr O22macr + H2O 1300times1010
31 times1012 136 4349
R9 H + H rarr H2 5142 times109 27 times1012 15526 45
R10 H + OH rarr H2O 1094 times1010 426 times1011 9078 45
R11 H + H2O2 rarr OH + H2O 3650 times107 179 times1011 21064 45
R12 H + O2 rarr HO2 1304 times1010
Log kR23 = 10704 + 2840102T - 1369105T2 45
R13 H + O2
macr rarr HO2macr 1138 times1010
517 times1012 15166 45
R14 H + HO2 rarr 2OH 1138 times1010 517 times1012 15166 45
R15 H + HO2macr rarr OH + OHmacr 1374times109
42 times1013 256 85
R16 H + O3 rarr OH + O2 2200 times1010 No temperature dependence available 43
R17 OH + OH rarr H2O2 4814 times109 Log kR25 = 8054 + 2193103T ndash 7395105T2 + 6870107T3
45
R18 OH + H2O2 rarr H2O + HO2 2920 times107 768times109 13813 45
R19 OH + HO2macr rarr OHmacr + HO2 8134 times109
100 times1012 11927 45
R20 OH + HO2 rarr H2O + O2 8840 times109
129 times1011 6645 45
Appendix
190
R21 OH + O2
macr rarr OHmacr + O2 1097 times1010 877 times1011 10860 45
R22 OH + O3 rarr HO2 + O2 1100 times108
No temperature dependence available 43
R23 O3macr + H2O2 rarr O2
macr + O2 + H2O 1590 times106 xEXP(188times103 (129815 ndash 1TK)R) 43
R24 O3macr + HO2
macr rarr O2macr + O2 + OHmacr 8870 times105
xEXP(188times103 (129815 ndash 1TK)R) 43
R25 O3macr + H2 rarr O2 + H + OHmacr 2490times105
xEXP(188times103 (129815 ndash 1TK)R) 46
R26 O3
macr + OH rarr HO2 + O2macr 6000 times109 No temperature dependence
available 46 43
R27 O3
macr + OH rarr HOmacr + O3 2500 times109 No temperature dependence available
46 43
R28 O3
macr + H+ rarr O2 + OH 9000 times1010 No temperature dependence available
4 43
R29 O2
macr + O2macr rarr O2 + O2
2macr 2988times10-1 489 times108 5259 43
R30 O2
macr + HO2macr rarr O2 + Omacr + OHmacr 8230 times10-2 No temperature dependence
available 4 43
R31 O2
macr + H2O2 rarr O2 + OH + OHmacr 1300 times10-1 No temperature dependence
available 4 43
R32 O2
macr + HO2 rarr O2 + HO2macr 7597times107
244 times109 86 43
R33 O2
macr + O3macr rarr O2-
+ 2O2 1000 times104 No temperature dependence available
47 43
R34 O2
macr + O3 rarr O3macr + O2 1500 times109 No temperature dependence
available 4 43
R35 HO2 + HO2 rarr H2O2 + O2 8399 times105
278 times109 201 45
R36 HO2 + H2O2 rarr O2 + H2O + OH 5000 times10-1 No temperature dependence
available 4 49
R37 HO2 + O3 rarr OH + 2O2 5000 times108 No temperature dependence
available 4 43
R38 H2O2 + HO2
macr rarr O2 + H2O + OHmacr 450times10-4 No temperature dependence available
4 43
R39 O3 + OHmacr rarr HO2
macr + O2 4800 times101 No temperature dependence available
4 43
R40 O3 + HO2
macr rarr OH + O2 + O2macr 5500 times106 No temperature dependence
available 4 43
R41 O3 + H2O2 rarr OH + O2 + HO2 3714 times10-2
28 times1011 735 43
R42 H +Omacr rarr OHmacr 2000times1010 No temperature dependence
available 4 43
R43 O3
macr + emacraq rarr 2OHmacr + O2 1600times1010 No temperature dependence
available 47 43
R44 O3 + emacr
aq rarr O3macr 3600 times1010 No temperature dependence
available 4 43
R45 H2O2 rarr 2OH 2300 times10-7 No temperature dependence
available - 86
R46 O2- + H2O rarr 2OH- 1000 times1010 No temperature dependence
available - 43
R47 Omacr + H2 rarr H + OHmacr 1279 times108
232 times1010 12891 45
R48 Omacr + H2O2 rarr O2
macr + H2O 5546 times108 30 times1011 156 49
R49 Omacr + HO2
macr rarr O2macr + OHmacr 7864 times108
145 times1013 24348 45
R50 Omacr + O2
macr rarr O2macr + O2 6000 times108 No temperature dependence available
46 43
R51 Omacr + Omacr rarr O2
2macr 1000times108 No temperature dependence available
4 43
R52 Omacr + OH rarr HO2
macr 7610 times109 17 times1011 77 49
Appendix
191
R53 Omacr + O3macr rarr 2O2
macr 7000times108 No temperature dependence available
46 43
R54 Omacr
+ O3 rarr O2macr + O2 1000 times109 No temperature dependence
available 4 43
Equilibria
kf
(M-1 s-1)
kb
(M-1 s-1) Temperature Dependence pKa
(25degC)
R5556 H2O H+ + OHmacr 1172 times10-3 1178times1011 Log kR67 = 20934 - 1236x104T + 6364x106T2 ndash 1475x109T3 +
1237x1011T4 1575 45
R5758 H2O2 H+ + HO2macr 8900 times10-2 4780times1010 Log kR68 = 16410 ndash 4888x10
3T + 1622x10
6T
2 ndash 2004x10
8T
3 1173 45
R5960 H2O2 + OHmacr HO2
macr + H2O
1265 times1010 1403 times106 Log kR75 = 13339 ndash 2220x103T + 7333x10
5T
2 ndash 1065x10
8T
3
1198701198672119874
11987011986721198742 45
R6162 HO2macr + OHmacr O2
2macr + H2O 3506 times105 1103 times106 339times108 142 165 43
R6364 OH H+ + Omacr 8900 times10-2 4780times1010 Log kR66 = 16410 ndash 4888x103T + 1622x106T2 ndash 2004x108T3 1173 45
R6566 OH + OHmacr Omacr + H2O 1265 times1010 1403 times106 Log kR72 = 13339 ndash 2220x103T + 7333x105T2 ndash 1065x108T3 1198701198672119874
119870119874119867 45
R6768 Omacr + O2 O3macr 3747 times109 2617 times103 341 times1011 11182 Forward 45
320 times1011 4616 Reverse 45
R6970 HO2 H+ + O2macr 4780 times1010 7354 times105 Log kR69 = 16410 ndash 4888x103T + 1622x106T2 ndash 2004x108T3 481 45
R7172 HO2 + OHmacr O2macr + H2O 1265 times1010 1628 times10-1 Log kR75 = 13339 ndash 2220x103T + 7333x105T2 ndash 1065x108T3
1198701198672119874
1198701198671198742 45
R7374 H emacraq + H+ 5832 2095times1010
Log kR74 = 39127 - 3888E4T + 2054E7T2 - 4899E9T3 + 4376E11T4
955 45
R7576 H + OHmacr emacraq + H2O 2440 times107 1735 times101
Log kR70 = 22970 ndash1971x104T + 1137x107T2 ndash 2991x109T3 + 2803x1011T4
1198701198672119874
119870119867 45
R7778 H + H2O H2 + OH 4575 times10-5 3954 times107
Log kR71f = 9408 ndash 2827x103 Tndash 3792x105T2 45
Log kR71b = -11556 + 32546x104T - 18623x107T2 + 45543x109T3 - 41364x1011T4
45
R79 H2(aq) H2(g) 2687times10-3 See Chapter 3
R80 O2(aq) O2(g) 1033times10-4 See Chapter 3

List of Figures
4
List of Figures
Figure 1 An aerial view of the Sellafield Site which covers approximately 6 km2 Image
provided by Sellafield Ltd Press Office 19
Figure 2 On the left is The First Generation Magnox Storage Pond (FGMSP) and on the right
are the Magnox Swarf Storage Silos (MSSS) Images provided by Sellafield Ltd Press Office 20
Figure 3 A representation demonstrating the uniform excitations and ionisations of UV
radiation compared to the structured tracks of alpha radiation 22
Figure 4 A representation of the photoelectric effect Image recreated from Spinks and Wood2
25
Figure 5 A representation of the Compton Effect Image recreated from Spinks and Wood 26
Figure 6 A representation of pair production and positron annihilation Image recreated from
Spinks and Wood2 27
Figure 7 A scheme showing the early stages of water radiolysis and the production of primary
species 29
Figure 8 A decay scheme for cobalt-60 41
Figure 9 Image on the left shows the Model-812 Irradiator On the right is the inside of the
irradiator showing the three guide rods that contain the cobalt-60 source during irradiation 42
Figure 10 Sample holding devices for use in the Model-812 Left is the 4x8 rack with its
schematic below On the right is the inverter rig again with its schematic below 46
Figure 11 A diagram of the purification system that provides the ultra-pure water used
throughout this work Image was taken from the ELGA PURELAB user manual 50
Figure 12 Structure of Potassium phthalate monobasic (C8H5KO4) 51
Figure 13 Scanned absorption spectra of a 625 μM H2O2 solution 53
Figure 14 A calibration curve of H2O2 photometric absorption to determine the molar
extinction coefficient 54
Figure 15 The modified SRI 8610C Gas chromatograph with inline ldquocrush tuberdquo setup The
sample can be seen inside the silicone tubing 56
Figure 16 Image on the left shows a schematic for the sampling apparatus on the right are the
vials used which are flame sealed at the midway neck 57
List of Figures
5
Figure 17 A schematic of the original setup for the 10-port sampling valve in both off (top
image) and on (bottom image) positions 58
Figure 18 A schematic for the modified 10-port sampling valve including the removal of the
silica gel column 59
Figure 19 Image on the left shows the bespoke frac14 inch OD 13x molecular sieve column On the
right the rotameter is connected to calibrate gas flow rates 60
Figure 20 A calibration curve to provide a conversion to determine carrier gas flow rate 61
Figure 21 A schematic of a Wheatstone bridge circuit used in the TCD 62
Figure 22 A calibration curve for quantifying hydrogen gas from chromatograms 63
Figure 23 Method validation by the determination of the well-established primary yield of H2
through hydroxyl scavenging by bromide 65
Figure 24 Collected data from literature showing measured primary yields as a function of
temperature Provided by Elliot and Bartels 2008 75
Figure 25 A comparison of the sample temperature profile logged by thermocouple to the
temperature profile calculated in the computational model 76
Figure 26 A reproduction of data provided by Hayon 82
Figure 27 An example of a Bragg peak Energy loss of alphas of 549 MeV in Air Image
released to public domain 83
Figure 28 A schematic representation of how linear energy transfer (LET) alters the
distribution of spurs along a radiation track Image was recreated from Allen AO 84
Figure 29 Simulation data showing the effects of increasing linear energy transfer on the
primary yields of water radiolysis Image was recreated from Allen AO 85
Figure 30 A representation of the stagnant two-film model used to calculate the partitioning of
volatile species 87
Figure 31 The diffusivity of O2 and H2 in both water and air as a function of temperature88
Figure 32 Measurements of H2O2 concentration as a function of dose for aerated water (diams) and
deaerated water (diams) Vertical error bars show the standard deviation between replicates while
horizontal error bars show the dose range for replicates 98
List of Figures
6
Figure 33 Measurements of H2 as a function of dose in aerated (diams) and deaerated (diams) samples
Vertical error bars show the standard deviation of replicates while horizontal error bars show the
dose range for replicates 99
Figure 34 Predicted concentrations of H2O2 as calculated by the radiolysis model for both
aerated () and deaerated () conditions 102
Figure 35 Predicted concentrations of H2 gas as calculated by the radiolysis model for both
aerated () and deaerated () conditions 102
Figure 36 Calculated concentrations of the major oxidising and reducing water radiolysis
species as a function of dose Solid lines represent aerated conditions while broken lines
represent deaerated conditions 103
Figure 37 Measurements of H2O2 concentrations as a function of dose for samples initially at
pH 7 (diams) pH 104 (diams) pH 11 (diams) pH 123 (diams) and pH 127 (diams) All samples were aerated
Vertical error bars are the standard deviation between replicates while horizontal error bars
show the dose range for replicates 106
Figure 38 Measurements of H2 gas as a function of dose at pH 7 (diams) pH 106 (diams) pH 123 (diams)
and pH 13 (diams) Dashed lines are provided to clarify the data trends all samples were deaerated
Vertical error bars show the standard deviation between replicates while horizontal error bars
show the dose range for replicates 108
Figure 39 Model calculations to show the predicted concentrations of H2O2 as a function of
dose at various pH 109
Figure 40 Model calculations to show the predicted concentrations of H2 gas as a function of
dose at various pH 110
Figure 41 Model calculations showing the concentrations of aqueous oxygen and hydrogen gas
from deaerated water after 80 kGy at 280 Gy min-1
to show the related behaviour between the
two 114
Figure 42 Model predictions of the steady-state reaction rates of R21 R50 and R32 at various
pH for γ radiolysis of deaerated water at a dose rate of 280 Gy min-1
115
Figure 43 The sum of the steady state rates of all reactions that produce O2 () compared with
the sum of the steady state rates of all reactions that remove O2 () These totals do not include
rates of production or removal from mass transfer reactions This calculation is for the γ
radiolysis of deaerated water to a dose of 80 kGy at a rate of 280 Gy min-1
116
Figure 44 Model predictions of the steady-state reaction rates of R7 R12 and R67 at various
pH This calculation is for the γ radiolysis of deaerated water to a dose of 80 kGy at a rate of
280 Gy min-1
117
List of Figures
7
Figure 45 Dashed lines show the original prediction where k50 = 60 times108 M
-1 s
-1 while solid
lines show the predictions with the increased k50 = 48 times109 M
-1 s
-1 120
Figure 46 Measurements of H2 gas as a function of dose All samples here are aerated with
vertical error bars showing the standard deviation between replicates123
Figure 47 Measurements of H2O2 concentrations in aerated samples of saturated magnesium
hydroxide solution as a function of dose 126
Figure 48 Measurements of hydrogen yields from magnesium hydroxide samples with various
solid ndash aqueous ratios All samples were irradiated to a total dose of ~52 kGy to the aqueous
phase at a dose rate of 3041 Gy min-1
128
Figure 49 Model predictions for the yield of H2 from a solution containing various
concentrations of carbonate anions 133
Figure 50 Measurements of H2O2 concentrations as a function of dose in samples containing
1 mM methanol (diams) and water as a control (diams) All samples were aerated and a dashed line is
included to highlight the data trend The dose rate was 1638 Gy min-1
for methanol solutions
and 2839 Gy min-1
for the aerated water 136
Figure 51 Measurements of H2 gas as a function of dose from deaerated samples containing
1 mM methanol deaerated water is also shown as a control Dashed lines are included to
highlight the data trend The dose rate was 1755 Gy min-1
for the methanol solutions and
2851 Gy min-1
for the deaerated water 137
Figure 52 Chemical yields of hydrogen peroxide measured from an aerated solution of
1 mM methanol as a function of dose 138
Figure 53 Chemical yields of hydrogen gas measured from a deaerated solution of 1 mM
methanol as a function of dose 139
Figure 54 Model prediction of H2O2 concentrations as a function of dose in a solution of
1 mM methanol 142
Figure 55 Calculations of hydrogen peroxide concentrations with and without modification to
the mass transfer routine142
Figure 56 Model prediction of H2 gas as a function of dose in a solution of 1 mM
methanol144
Figure 57 Model predictions of the concentrations of various stable organic products formed as
a result of using the proposed reaction scheme in table 23 146
List of Figures
8
Figure 58 Measurements of H2O2 concentrations from heterogeneous samples of 05g Fe2O3
and 10 mL aerated water The dose rate for the haematite samples was 3052 Gy min-1
and for
the aerated water the dose rate was 2839 Gy min-1
149
Figure 59 Measurements of H2O2 concentrations from heterogeneous samples of 05g Fe3O4
and 10 mL aerated water The dose rate for the magnetite samples was 1625 Gy min-1
and for
the aerated water the dose rate was 2839 Gy min-1
150
List of Tables
9
List of Tables
Table 1 Dose rates of the front most two rows of the 4x8 irradiation rack determined by Fricke
analysis The error indicates the percentage of uncertainty of the obtained gradient 47
Table 2 Dose rates of the four positions of the inverter rig determined by Fricke analysis The
error indicates the percentage of uncertainty of the obtained gradient 48
Table 3 Thermal conductivity of commonly used gases Values taken from the Handbook of
Tables for Applied Engineering Science 62
Table 4 Optimised parameters used for the analysis of H2 gas 64
Table 5 Primary yields for γ-radiolysis of water at neutral pH and standard pressure and
temperature2 71
Table 6 Temperature effects on the primary yields of water radiolysis49
72
Table 7 Polynomial equations for estimating temperature effects on primary yields44
75
Table 8 A collection of measurements of primary yields made in 04 M solution of sulphuric
acid (pH = 046)56
77
Table 9 A collection of primary yields measured in alkali solutions (pH asymp 135)56
79
Table 10 Multiple regression polynomials used to estimate the combined effect of temperature
and pH on the primary yields of water radiolysis 82
Table 11 Polynomial equations used to estimate the temperature effects on the diffusivity of O2
and H2 in both gas and aqueous phases where t = temperature (Cdeg) 90
Table 12 A list of Primary Species used to model water radiolysis helliphelliphelliphelliphelliphelliphelliphelliphellip90
Table 13 A list of reactions used to model water radiolysis 93
Table 14 A list of equilibria used to model the radiolysis of water 94
Table 15 Statistical information concerning the estimation of primary yields used to model the
radiolysis of water 95
Table 16 Parameters used to describe interfacial surface area (Aint) and boundary thicknesses
(δ) for sample vials of different geometry 96
Table 17 Conditions of samples used to investigate hydrogen peroxide in high pH radiolysis
105
List of Tables
10
Table 18 A list of important equilibria and their associated pKa values 107
Table 19 Conditions of samples used to investigate hydrogen gas in high pH radiolysis 108
Table 20 Obtained results from the measurements of H2 gas 124
Table 21 Conditions of samples containing Mg(OH)2 for measurements of H2
a ndash Powder sample with no added water estimated adsorbed water content is based on data from
Nelson et al89
b ndash Sample is a saturated solution of Mg(OH)2 ie contains no solid 127
Table 22 A reaction scheme to estimate the effect of carbonate in water radiolysis 132
Table 23 A reaction scheme to estimate the effect of methanol in water radiolysis
a ndash Rate constant for gas phase reaction
b ndash Estimated rate constant
c ndash Rate constant based on reaction of acetic acid and hydroxyl
d ndash Assumed reaction 141
Table 24 A reaction scheme to estimate the effects of dissolved iron in water radiolysis 153
List of Acronyms and Initialisms
11
List of Acronyms and Initialisms
AES - Atomic Emission Spectroscopy
AVIDAC - Argonne Version of the Institutes Digital Automatic Computer
CANDU - Canada Deuterium-Uranium
DCF - Dalton Cumbrian Facility
EDTA - Ethylenediaminetetraacetic acid
EPSRC - Engineering and Physical Sciences Research Council
FGMSP - First Generation Magnox Storage Pond
GC - Gas Chromatography
HDEHP - Di-(2-ethylhexyl)phosphoric acid
HPLC - High Performance Liquid Chromatography
ICP - Inductively Coupled Plasma
ISO - International Organization for Standardization
LET - Linear Energy Transfer
MOX - Mixed Oxide
MSSS - Magnox Swarf Storage Silo
NNL - National Nuclear Laboratory
ODE - Ordinary Differential Equation
PUREX - Plutonium Uranium Redox Extraction
PWR - Pressurised Water Reactor
SHE - Standard Hydrogen Electrode
SI - International System
TCD - Thermal Conductivity Detector
TGA - Thermogravimetric Analysis
TOC - Total Organic Carbon
UV - Ultra Violet
VIS - Visible
Word count - 42500
Abstract
13
Abstract
Sellafield is home to the UKrsquos largest repository of nuclear waste including reprocessed
uranium and plutonium as well as a backlog of unprocessed used fuel and waste kept in
outdated storage facilities commonly referred to as ldquolegacy wasterdquo For this reason
Sellafield has often been called the most hazardous place in Western Europe and as such is
currently undergoing a multi-billion pound decommissioning and clean-up operation Each
on-site facility has unique challenges associated with it many of them presenting situations
where the radiation chemistry aspects of the material degradation are not well understood
The key factors that can affect water radiolysis processes in the Sellafield challenges are a
high pH environment the presence of magnesium hydroxide the presence of iron oxide
and the presence of organic materials This work examines the effect each of these factors
has on H2 and H2O2 production in water radiolysis as well as developing a computational
model to offer some understanding to the kinetic behaviour of water radiolysis under such
conditions
The computational model was able to replicate experimental measurements of radiolytic H2
and H2O2 production in both aerated and deaerated water at neutral pH and provide a
further understanding of the role of dissolved oxygen in water radiolysis Measurements of
H2O2 from solutions containing NaOH have shown that an increase in pH generally results
in a higher steady state of H2O2 while measurements of H2 show a similar increase with a
maximum production rate at pH ~11 The model was also able to closely replicate these
experimental measurements with some over prediction which highlights a gap in our
understanding of high pH radiolysis and also brings into question the validity of the
estimated rate constant for the reaction
119926minus + 119926120784minus119919120784119926rarr 120784119926119919minus +119926120784 119948 = 120788 120782 times 120783120782
120790 119924minus120783119956minus120783
which was originally determined from kinetic model calculations designed to describe the
decay of ozonide (O3ˉ) during pulse-radiolysis studies of high pH solutions conducted by
K Sehested et al in 1982
The radiolysis of magnesium hydroxide slurry also resulted in an increased yield of
hydrogen gas but had little effect on the yield of hydrogen peroxide The hydrogen yield
was 052 molecules per 100eV while a NaOH solution of equivalent pH gave a yield of
027 however interference from carbonate may be the cause of the increased yield A
surface effect was also estimated to contribute 005 molecules per 100 eV to the hydrogen
gas yield
Hydrogen gas and hydrogen peroxide was measured from the radiolysis of aqueous
methanol This was modelled with a near agreement but modifications to the model were
necessary highlighting areas of the model that need improvement as well as providing a
reaction scheme from which a more comprehensive model for aqueous methanol radiolysis
could be developed
Declaration
14
Declaration
No portion of the work referred to in the thesis has been submitted in support of an
application for another degree or qualification of this or any other university or other
institute of learning
Thomas A Donoclift August 2016
Copyright Statement
15
Copyright Statement
The author of this thesis (including any appendices andor schedules to this thesis) owns
certain copyright or related rights in it (the ldquoCopyrightrdquo) and he has given The University
of Manchester certain rights to use such Copyright including for administrative purposes
Copies of this thesis either in full or in extracts and whether in hard or electronic copy
may be made only in accordance with the Copyright Designs and Patents Act 1988 (as
amended) and regulations issued under it or where appropriate in accordance with
licensing agreements which the University has from time to time This page must form part
of any such copies made
The ownership of certain Copyright patents designs trademarks and other intellectual
property (the ldquoIntellectual Propertyrdquo) and any reproductions of copyright works in the
thesis for example graphs and tables (ldquoReproductionsrdquo) which may be described in this
thesis may not be owned by the author and may be owned by third parties Such
Intellectual Property and Reproductions cannot and must not be made available for use
without the prior written permission of the owner(s) of the relevant Intellectual Property
andor Reproductions
Further information on the conditions under which disclosure publication and
commercialisation of this thesis the Copyright and any Intellectual Property andor
Reproductions described in it may take place is available in the University IP Policy (see
httpdocumentsmanchesteracukDocuInfoaspxDocID=487) in any relevant Thesis
restriction declarations deposited in the University Library The University Libraryrsquos
regulations (see httpwwwmanchesteracuklibraryaboutusregulations) and in The
Universityrsquos policy on Presentation of Theses
Dedications
16
Dedications
Mum
For the strength and freedom to explore
and the support and security to return
Dad
For the support and encouragement
exceeded only by pride
Acknowledgements
17
Acknowledgements
I would like to take this opportunity to thank some of the people who have made this work
possible My supervisor Simon Pimblott even with the busy work schedule that comes with
managing an entire research facility he is still able to provide support and put the well-
being of his students and staff above all else My unofficial but very much appreciated
industrial supervisors from the National Nuclear Laboratory (NNL) Howard Sims and
Robin Orr who both take a personal interest in the work going on at the Dalton Cumbrian
Facility (DCF) and dedicate much of their own time to helping the researchers in their
work
I would like to acknowledge the EPSRC and Sellafield Ltd for providing the funding that
supported this research
A special thanks to all the members of the Dalton Cumbrian Facility especially to all the
staff who work immeasurably hard and with profound dedication to the values
management and research carried out at the Dalton Cumbrian Facility Acknowledgements
to the academic staff Ruth Edge Aliaksandr Baidak and Sven Koehler for always
providing a useful and meaningful insight to almost any situation and for providing
valuable guidance in practical radiation chemistry as well as the inspiration and
encouragement to pursue potentially interesting avenues of research
Thank you to the research team at the Dalton Cumbrian Facility for their friendship and for
making the workplace an enjoyable place to conduct research
Chapter 1 Introduction
18
Chapter 1 Introduction
Overview of Sellafield
Sellafield shown in Figure 1 is the largest nuclear facility in the UK and has played a key
role in the UK nuclear industry for over 60 years Sellafield began as a Royal Ordinance
Factory producing weapons propellant for use in the Second World War Soon after the
war ended Sellafield was renamed to Windscale and was repurposed to produce plutonium
for the development of nuclear weapons in order to secure the UKrsquos position in the nuclear
arms race
Several years later the focus on acquiring nuclear weapons shifted towards the development
of new reactors for civil energy production with Magnox reactors built on a neighbouring
site known as Calder Hall The two sites were later combined and were once again named
Sellafield Previous operations carried out at Sellafield meant the site was also in a good
position to conduct fuel reprocessing operations alongside energy production Spent fuel is
separated from its now contaminated cladding and dissolved in nitric acid uranium and
plutonium are separated by solvent extraction while the cladding is treated independently
At Sellafield this industrial process meant storing the contaminated cladding swarf in
underwater silos
The fuel reprocessing process most commonly used is the Plutonium Uranium Redox
Extraction method (PUREX) and produces a number of product streams including
plutonium uranium and other highly active liquors
Chapter 1 Introduction
19
The separated uranium can be re-enriched to produce reusable uranium fuel or mixed with
plutonium to produce mixed oxide (MOX) fuel although much of the reclaimed uranium
and plutonium remains unused and is stored at Sellafield The remaining fission products
classified as high level waste are treated in various ways including vitrification and are
also stored at Sellafield
Figure 1 An aerial view of the Sellafield Site which covers approximately 6 km2
Image provided by Sellafield Ltd Press Office
Magnox reactors are now an obsolete design of reactors that use unenriched uranium fuel
which was clad in an alloy comprising almost entirely of magnesium with small amounts
of aluminium Spent fuel from Magnox reactors was briefly stored in a cooling pond before
having the cladding removed for reprocessing of the fuel pellets
Chapter 1 Introduction
20
The facilities used for this storage shown in Figure 2 were called the First Generation
Magnox Storage Pond (FGMSP) and the Magnox Swarf Storage Silos (MSSS) both of
these facilities are now considered to be ldquoLegacyrdquo facilities
Figure 2 On the left is The First Generation Magnox Storage Pond (FGMSP) and on the
right are the Magnox Swarf Storage Silos (MSSS)
Images provided by Sellafield Ltd Press Office
An extended shut down of reprocessing in the first generation reprocessing plant meant that
fuel being stored in the Magnox pond was left far longer than intended resulting in
corrosion and a backlog of spent fuel The Magnox Storage Pond now contains
approximately 14000 m3
of contaminated water which includes roughly 1200 m3 of sludge
consisting mainly of magnesium hydroxide and iron oxide1 Later technological
advancements rendered the wet storage of Magnox fuel cladding to be an obsolete method
and operations moved towards dry storage However the construction of a new facility and
the huge backlog of material stored in the silo also resulted in corrosion of stored fuel and
eventually a state of disrepair for the Magnox Swarf Storage Silos Both of these legacy
facilities present a huge challenge for decommissioning operations as well as a unique
opportunity for scientific research
Chapter 1 Introduction
21
Radiation Chemistry
Radiation chemistry is the study of chemical change driven by the absorption of energy
capable of causing ionisation This ionising radiation can be of a particulate nature
including but not limited to alpha (He2+
) and beta (eˉ) radiation or non-particulate such as
gamma (γ) or X-ray radiation Radiation chemistry and its experimental methods parallel in
many ways to photochemistry but the differences between the fields are well defined The
fundamental difference between the two fields of study is the quantity of energy involved in
the initiation of reactions In radiation chemistry this energy is provided by the atomic
decay of radioactive nuclei and is far higher than energy used in photochemistry typically
UV radiation The lower initial energies used in photochemistry tend to only produce
molecular excitations rather than direct ionisations These lower incident energies also
mean that each photon will usually only interact once and produce a uniform distribution of
excited species in any plane perpendicular to the incident beam The higher initial energies
used in radiation chemistry often provided by atomic decay can produce both excitations
and ionisations directly Interactions between ionising radiation and a substance is not
necessarily limited to only one interaction a single high energy photon or particle may
interact a number of times This behaviour gives rise to a non-uniform track-like structure
of interactions unlike the uniform distributions found in photochemistry2
Chapter 1 Introduction
22
Figure 3 A representation demonstrating the uniform excitations and ionisations of UV
radiation compared to the structured tracks of alpha radiation
To fully appreciate the chemical changes initiated by ionising radiation it is important to
have some knowledge of the different types of ionising radiation and the ways in which
they interacts with matter There are two main ways in which radiation chemists provide a
source of ionising radiation for experiments The first involves taking advantage of the
atomic decay of radioactive nuclei this may be a naturally occurring radioisotope or an
artificially created isotope The second involves specialised equipment to directly generate
radiation usually by accelerating particles to a high energy The major types of ionising
radiation are alpha beta and gamma however in the field of radiation chemistry one may
also come across the use of X-rays fast neutron radiation proton radiation and other heavy
charged particle radiation This study utilises cobalt-60 as a source of gamma radiation
other types of radiation were not investigated during this work however it is necessary to
understand some fundamental features of alpha and beta decay to fully appreciate gamma
decay
Chapter 1 Introduction
23
Alpha α Radiation
Alpha radiation occurs when an unstable atomic nuclei spontaneously ejects an alpha
particle Elements with an atomic number greater than 83 will decay by this mechanism3
Alpha particles are fully ionised helium nuclei they consist of two protons and two
neutrons and have no electrons which gives them a charge of +2 Alpha particles are
mono-energetic this means that every alpha particle emitted from a given radioactive
element will have the same energy characteristic of that element These energy values
typically range between 4 and 10 MeV This quality means that research facilities capable
of artificially producing alpha radiation by ionising and accelerating helium atoms can
select the particle energy required to effectively mimic alpha decay of any radioactive
element
Beta β Radiation
Beta decay involves the conversion of a neutron to a proton or vice versa in order to create
a more favourable proton to neutron ratio This conversion process is accompanied by the
ejection of fundamental particles directly from the atomic nucleus In the case of a neutron
converting to a proton the ejected particles are an anti-neutrino and a high energy electron
while in the reverse case the ejected particles are a neutrino and a positron (the antimatter
equivalent of an electron) Unlike alpha particles beta particles are not mono-energetic
The energy lost through beta decay is shared between the ejected particles and the recoil of
the decaying atom this means beta particle energy ranges from zero up to a maximum
energy characteristic of that element
Chapter 1 Introduction
24
Gamma γ Radiation
Gamma radiation is not a particle like the previously mentioned types of radiation but is a
photon with a short wavelength in the region of 3 x10⁻⁹
to 3 x10-11
cm or approximately 40
KeV to 4 MeV when converted to energy A gamma ray is emitted when a nucleus in an
excited state relaxes to a lower nuclear energy level there is no change in the number of
protons or neutrons during gamma decay Gamma rays like alpha particles are mono-
energetic however a nucleus may emit several photons as a cascade of energy loss As
gamma emission starts with an excited nucleus some prior process must take place to result
in a nucleus with an elevated energy level For most gamma emitters the process is
initiated with either alpha or beta decay and the resulting atomic nucleus is left in an
excited state For example ceasium-137 undergoes beta decay by emission of a beta
particle of 1174 MeV to form stable barium-137 This only happens 54 of the time and
the more common decay mechanism is the emission of a beta particle of 0512 MeV to
form and excited barium-137 nucleus this then emits a photon of 0662 MeV to relax the
nucleus to the stable barium-137
Chapter 1 Introduction
25
Radiation interactions with matter
In order for radiation to induce a chemical change it must interact with matter in some way
There are many mechanisms by which radiation can interact with matter as this project
focuses on the use of gamma rays a brief description of the interactions of gamma rays
with matter is given below
In the photoelectric effect the entire energy of an incident gamma photon is transferred to
an electron of some absorbing matter This electron is ejected from the absorbing atom with
energy equal to the incident photon minus the binding energy of that electron The electrons
ejected are often K-shell electrons which have the highest binding energy As momentum
and energy must be conserved it is necessary for the absorbing atom to recoil As this
mechanism involves the recoil of a parent atom it would not be possible for the
photoelectric effect to be the mechanism of interaction with free electrons that do not have
a parent nucleus to recoil In the photoelectric effect ejected electrons will leave a hole as
this hole is filled by electrons from higher energy levels characteristic X-rays are emitted
Figure 4 A representation of the photoelectric effect
Image recreated from Spinks and Wood2
Chapter 1 Introduction
26
Although photons cannot interact with free electrons by means of the photoelectric effect
they may interact with free and loosely bound electrons through the Compton Effect In this
mechanism a photon accelerates an electron thereby reducing its own energy The photon
is scattered now with reduced energy while the electron recoils with increased energy
Figure 5 A representation of the Compton Effect
Image recreated from Spinks and Wood2
Another mechanism by which a gamma ray may interact with matter is through pair-
production This is only a viable mechanism for photons with energy larger than 102 MeV
A photon is completely absorbed by an atomic nucleus and from that nucleus two particles
are produced an electron and a positron The energy of the incident photon is shared
between the rest energy of the two new particles and the kinetic energy of these particles as
they move away from the nucleus a negligible amount of energy is also used as the nucleus
recoils The positron behaves much the same way as the electron until it annihilates with an
electron from the medium to produce two 051 MeV gamma rays travelling at 180deg from
each other
Chapter 1 Introduction
27
Figure 6 A representation of pair production and positron annihilation
Image recreated from Spinks and Wood2
Generally the interactions of gamma rays with matter result in fast moving electrons these
are often referred to as secondary electrons or delta-rays and have the same interactions
with matter as beta particles It is these secondary electrons that are predominantly
responsible for producing the excited states and ionisations in an absorbing material that
will initiate chemical changes in said material4 For this reason it is necessary to also
understand the interactions with matter these secondary electrons may have Fast moving
electrons lose energy through three main mechanisms electromagnetic radiation elastic
scattering and inelastic scattering When a fast electron greater than 100 KeV passes close
to an atomic nucleus it is decelerated and slightly deflected This event is accompanied by
emission of electromagnetic radiation commonly known as Bremsstrahlung radiation and
is required for the conservation of energy
Chapter 1 Introduction
28
At energies below 100 keV Bremsstrahlung emission becomes negligible instead electrons
tend to lose energy through scattering Fast moving electrons interact with the bound
electrons of a molecule predominantly through inelastic collisions This interaction
transfers energy from the incident electron to the bound molecular electron which can result
in ionisation and excitation (and often with production of radical species) If there is an
ionisation event the tertiary electrons produced can cause more ionisation events in the
same manner These events tend to lie closer together as the electron that caused them has a
much lower energy than the primary electron that passed by This engenders a radiation
track structure that consists of small groups of ionisation events These groups are often
referred to as spurs
Fast moving electrons may also interact elastically with matter this interaction causes the
electrons to be deflected by a wide range of angles This means that a fast moving electron
may have moved a significant total distance but may have not travelled particularly far into
the absorbing material
Chapter 1 Introduction
29
Radiolysis of Water
As mentioned earlier it is the secondary and tertiary electrons produced from gamma ray
interactions that predominantly lead to the formation of ions and radical species that drives
chemical change in substances exposed to radiation Below is a diagram outlining the
sequence of events and the different stages of water radiolysis
Figure 7 A scheme showing the early stages of water radiolysis and the production of
primary species
In water this initial interaction between a gamma ray and a water molecule produces either
an excited state of water or a water cation accompanied by an electron this is achieved in
less than ten femtoseconds (10-14
s) Molecules in an excited state may break apart to form
hydrogen atoms and hydroxyl radicals or molecular hydrogen and oxygen atoms in a
singlet or triplet state while water cations will quickly react with nearby water molecules to
produce hydronium ions and hydroxyl radicals
Chapter 1 Introduction
30
The electron produced begins a thermalisation process eventually resulting in a solvated
electron however at this stage the electron exists as a potentially reactive precursor
intermediate This happens in a time frame of less than 1 picosecond and occurs before
diffusion of the spur During the non-homogeneous stage the produced radicals and ions
may react within the spur to produce molecular products such as H2 and H2O2 Eventually
the spur species diffuse into the bulk water and these ldquoprimaryrdquo species produced are said
to be homogeneously distributed from this point onwards The yield at which these primary
species are produced are known as primary yields and are often expressed as G-values
which have units of micromoles per Joule (SI unit) or molecules produced per 100 eV of
energy absorbed (conventional historic units)
119866 = 119873119900 119900119891 119898119900119897119890119888119906119897119890119904 119891119900119903119898119890119889
100 119890119881
This should not be confused with a ldquochemicalrdquo yield which are the yields of chemical
species sometime after homogeneous chemistry has taken place and is also often expressed
as a G-value During the homogeneous stage reactions between primary species occur
often altering the observed production rates of these species through back reactions To
avoid confusion between the two types of yield a notation system can be used to discern the
two Two notation systems are commonly used throughout the radiation chemistry
literature the first denotes primary yields with the species of interest in subscript whilst the
chemical yield is often expressed with the species of interest in parenthesis For example
the primary and chemical yield of H2 would be written as GH2 and G(H2) respectively The
second system simply uses a lowercase ldquogrdquo to denote primary yields and uppercase ldquoGrdquo for
chemical yields This study will use the latter system
Chapter 1 Introduction
31
Most often it is the chemical yield that is measured during an experiment but it is possible
to measure a primary yield with the use of scavengers A scavenger is a chemical species
that can quickly react with a targeted primary species before it is able to diffuse into the
bulk solution effectively removing it and its associated chemistry from the homogeneous
stage of radiolysis The effectiveness of a scavenger is often referred to as the ldquoscavenging
capacityrdquo and is quoted as the pseudo-first order rate of reaction between a scavenger (S)
and a radical (R) which depends only on the rate constant for said reaction and the
concentration of the scavenger In other words the scavenging capacity is equal to kS+R[S]5
A well-documented example of this is the use of bromide ions to prevent the reaction of
hydroxyl radicals with molecular hydrogen allowing for the room temperature primary
yield of H2 to be measured this has been done extensively throughout the literature and the
g-value is quoted to be 045 molecules100eV6 Without the use of the bromide scavenger
hydroxyl radicals would react with H2 reducing the observed yield this reduced yield is
what is meant by the term chemical yield
The following summarises some of the properties of the more important primary radicals
Chapter 1 Introduction
32
The Hydrated Electron eaq-
One of the most reactive primary species of water radiolysis is the hydrated electron It is a
chemical entity that can be thought of as being a single electron somewhat stabilised by a
cage of orientated water molecules Hydrated electrons typically have reaction rate
constants close to the diffusion controlled limit with low activation energies Reactions of
hydrated electrons are typically represented as single electron transfer processes and with a
reduction potential of -29 V vs the standard hydrogen electrode (SHE) the hydrated
electron will react with most other species78
119890119886119902minus + 119878119899 rarr 119878119899minus1
In the presence of organic compounds the hydrated electron will act as a nucleophile with
enhanced reactivity towards areas adjacent to electron withdrawing groups Halogenated
organics also show enhanced reactivity towards elimination of the halide ion9
119890119886119902minus + 119877119883 rarr 119877119883minus rarr 119877bull+ 119883minus
The Hydrogen Atom H˙
In terms of BroslashnstedndashLowry acidndashbase theory the hydrogen atom is the conjugate acid of
the hydrated electron with a pKa of 9679
119890119886119902minus + 119867(119886119902)
+ 119867bull
The hydrogen atom has a reduction potential of -23 V78
similar to that of the hydrated
electron however its chemistry is seldom the same
Chapter 1 Introduction
33
Inorganic ions are reduced by the hydrogen atom at slower rates than reduction by the
hydrated electron In certain circumstances such as in low pH environments hydrogen
atoms can act as an oxidant reacting with inorganic ions to form a hydride intermediate
that soon decomposes to form the oxidised ion and molecular hydrogen10
119867bull + 1198651198902+ rarr 1198651198903+119867minus119867+
rarr 1198651198903+ + 1198672
Organic molecules are also subject to oxidation reactions with the hydrogen atom
Saturated organics tend to react by hydrogen abstraction to form molecular hydrogen and a
carbon centered organic radical Unsaturated organics will react by hydrogen addition to the
center of unsaturation again forming a carbon centered organic radical9
119867bull+ 1198621198673119874119867 rarr bull1198621198672119874119867 + 1198672
119867bull+ 11986211986721198621198672 rarr bull11986211986721198621198673
The Hydroxyl Radical bullOH
Unlike the previously mentioned primary radicals the hydroxyl radical has a positive
reduction potential of 18 V in neutral solution making it a powerful oxidising species11
Reactions of hydroxyl radicals with inorganic ions are often said to be simple electron
transfer processes however it has been suggested that the mechanism actually proceeds
through an intermediate adduct12
Reactions with inorganic ions have been observed to
proceed at rates close to the diffusion limit however this is not the case with many metal
cations Reaction rates between the hydroxyl radical and metal cations tend to be slower
with rate constants of the order ~30 x108 M
-1 s
-19
Chapter 1 Introduction
34
One explanation for this is that the mechanism for metal cation oxidation involves the
addition of the hydroxyl radical to the metal cation increasing its coordination number and
allowing for inner-sphere oxidation to take place
[119872(1198672119874)119909]119899+ + ∙119874119867 [(1198672119874)119909119872-119874119867]
119899+ rarr [119872(1198672119874)119909](119899+1)+ + 119874119867minus
The intermediate species Mn+
OH has actually been observed in cases where M = Tl+ Ag
+
Cu2+
Sn2+
Fe2+
and Mn2+
12
As is the case with the hydrated electron and the hydrogen atom the hydroxyl radical also
exists in an acid-base equilibrium with the oxide radical anion bullOˉ
bull119874119867 + 119874119867minus bull119874minus + 1198672119874
With a pKa of 119 the reactions of bullOˉ only become important at high pH With a few
exceptions reactions of bullOˉ are typically slower than those of
bullOH The two species also
have different reactivity towards organic molecules Hydroxyl radicals tend to add to
unsaturated bonds as an electrophile while the conjugate base bullOˉ acts more like a
nucleophile and will abstract hydrogen from a hydrocarbon bond
Chapter 1 Introduction
35
Computational Applications in Radiation Chemistry
Early computational studies in the field of radiation chemistry were focused largely on
developing the radical diffusion theory and the non-homogeneous stage of water radiolysis
to help rationalise experimental observations One of the earliest water models used
coupled differential equations with terms for the competing diffusion and reacting
processes to represent the evolution of a spur containing six radical pairs as a function of
time13-15
Although the predicted primary yields from this type of model agree well with
experimental data there are problems associated with this type of approach the main
problems arising from the application of classical chemical kinetics to a system of
diminutive volume and extremely fast reactions occurring between only a few reactive
species Such deterministic models often use a typical spur to represent a whole system
fixing the average number of radical pairs as a single integer or in some cases a range of
integers This means that in deterministic models the long-running average value for the
number of reactive species is neglected This small difference can lead to inaccuracies in
deterministic calculations of this kind and so a stochastic approach became the preferred
method to these types of non-homogeneous radiolysis calculations16
Deterministic models however are still the preferred technique for the longer term
homogeneous stage calculations for water radiolysis Once a suitable set of primary yields
has been established it is possible to model the subsequent chemistry in much the same way
as any other chemical kinetics simulation
Chapter 1 Introduction
36
By describing a reaction set in terms of a series of simultaneous differential equations and
by including details of physical parameters such as temperature it is possible to predict
chemical yields of radiolysis and highlight important chemical pathways This is the
general methodology implemented in this study and will be discussed in further detail in
subsequent chapters
Deliverables and Project Aims
Given the technical challenges associated with the Sellafield site and the pressing
conditions of legacy facilities such as the First Generation Magnox Storage Pond and
Magnox Swarf Storage Silos there has been a renewed interest in water radiolysis
especially with respects to high pH and slurry systems Previous radiolysis studies of high
pH solutions have been contradictory and difficult to reproduce There are very few
situations in industry where knowledge of high pH water radiolysis is required as most
situations where water radiolysis may occur are in acidic media with the exception of
Pressurised water reactors (PWRs) and CANDU reactor technology which run under alkali
conditions due to added LiOH17
As mentioned previously the Magnox Swarf Storage Silos at Sellafield Ltd contains large
quantities of contaminated magnesium alloy produced from the de-cladding process of
spent nuclear fuel The material contaminated with uranium oxide is stored under water
and over time has corroded to produce large amounts of magnesium hydroxide To prevent
further corrosion some of the 22 silos at the facility dose the water with sodium hydroxide
Although alleviating some corrosion this addition increases the pH
Chapter 1 Introduction
37
One of the aims of this project is to try and obtain a better understanding of water radiolysis
at high pH Using cobalt-60 as a source of gamma radiation and a range of analytical
techniques to determine the production rates of H2 and H2O2 as a function of absorbed dose
it is hoped that the effects of high pH on water radiolysis can be experimentally quantified
Deterministic computational modelling is then used to investigate the experimentally
observed effects of high pH in order to extract a better mechanistic understanding of water
radiolysis at high pH
While there were a number of early water radiolysis studies concerning the effects of
various metal oxides and their surface interactions18
this is also a subject which has
received a renewed scientific interest as there are many situations in the nuclear industry
where an understanding of the effects of metal oxides on water radiolysis are significant
These areas include preventing corrosion within operational facilities to extend their
lifetime controlling radiolytic products associated with stored nuclear material preventing
incidences of unexpected gas build up and managing already heavily corroded facilities
such as the legacy ponds and silos at Sellafield Ltd
In addition to sodium hydroxide the Magnox Swarf Storage Silos also contain large
quantities of magnesium hydroxide the hydrated form of magnesium oxide Radiolysis
studies concerned with magnesium hydroxide solutions slurries and solids are scarce119
despite the obvious need for further investigation The slight solubility of magnesium
hydroxide in water compels a prior understanding of high pH water radiolysis to facilitate
understanding the effects of magnesium hydroxide and the presence of a surface Data
collected from experiments involving magnesium hydroxide are therefore also included in
this project
Chapter 1 Introduction
38
Up until now the discussed aims of this project have been targeted at the issues associated
with the Magnox Swarf Storage Silo rather than with the First Generation Magnox Storage
Ponds These legacy ponds are outdoor open air ponds that have been used to store spent
nuclear fuel for extended periods (far longer than ever intended) As the ponds are open air
they are susceptible to the introduction of natural debris mostly falling leaves and other
biological matter
This has led to an interest in the effects of organic substances on radiolysis processes in
water with the focus being on some of the decomposition products of decaying organic
matter substances such as humic acids The complexity of these substances requires
general underpinning by first understanding simple organic substances In this work the
radiolysis of aqueous methanol was studied
The extended storage of spent fuel in the First Generation Magnox Storage Pond has led to
various challenges concerning corrosion products and their effects on water radiolysis In
the past spent fuel rods were often grouped into small bundles and placed into steel skips
which were then submerged in the pond These skips might also contain other contaminated
material and the exact content of any given skip is largely unknown Over time much of
the steel has corroded resulting in a large build-up of what can only be described as
ldquosludgerdquo The exact composition of this sludge is fairly unknown but the major constituent
is iron oxide present as both red haematite (Fe2O3) and black magnetite (Fe3O4) Research
involving iron oxides and radiolytic processes have mostly been focused on corrosion
mechanisms predominantly adopting an electrochemical approach with very few studies
measuring chemical yields of radiolytically produced H2 and no studies measuring H2O2 in
the presence of iron oxide
Chapter 1 Introduction
39
There are studies that have demonstrated decomposition of H2O2 over iron oxide in the
absence of a radiation source but as H2O2 is a primary product of water radiolysis it is
continuously being generated and the implications of this production are largely unknown
Other studies involving metal oxides have also investigated radiation induced dissolution
With both these processes in mind this project investigates some of the effects of iron
oxide on the steady-state concentrations of the molecular radiolysis products H2 and H2O2
Chapter 2 Experimental Methods
40
Chapter 2 Experimental Methods
Source of Radiation and Dosimetry
This project uses cobalt-60 as a source of gamma radiation Cobalt-60 is an artificial
isotope with a half-life of 527 years2 As cobalt-60 is not a naturally occurring isotope it
must be manufactured This is normally done through neutron bombardment of the non-
radioactive isotope cobalt-59 Stainless steel control rods within a nuclear reactor core are
substituted with cobalt rods and the neutron flux present is enough to transmute cobalt-59
to cobalt-6020
The overall reaction for the production and decay of cobalt-60 is shown
below
1198621199002759 + 119899 rarr 11986211990027
60 rarr 119873119894lowast2860 + 119890minus + 119890 + 120574
The decay mechanism for cobalt-60 was similar to that of Caesium-137 in that it is initiated
by beta decay Unlike Caesium-137 however there is no direct route to a stable isotope
Subsequently the decay of cobalt-60 follows one of two paths both of which begin with the
ejection of a beta particle Cobalt-60 may emit two photons of gamma radiation but will
always emit at least one photon A cobalt-60 nucleus may eject a beta particle with energy
up to 148 MeV this is followed by emission of a photon with energy of 133 MeV
however there is only a 012 chance that this happens The more common decay path for
cobalt-60 is to eject a beta particle with energy up to 031 MeV followed by the emission of
two photons with energies of 117 MeV and 133 MeV
Chapter 2 Experimental Methods
41
Figure 8 A decay scheme for cobalt-60
Cobalt-60 is a popular source of gamma radiation used by radiation scientists High dose
rates can be achieved with fairly little material21
Facilities that conduct experiments using
cobalt-60 as a source of radiation use a variety of systems to shield operators from
radiation Older systems can be as rudimental as a water filled hole with cobalt-60 resting at
the bottom samples are lowered in a container and held at a given distance from the source
to accumulate dose More advanced systems involve mechanically lifting cobalt-60 from
some shielded well into an experimental area This area may be a dedicated room for
irradiating samples or it may be a shielded chamber in which samples are placed The latter
example is known as a self-contained irradiator and is the type of irradiator used in this
work
Chapter 2 Experimental Methods
42
All irradiations reported here were carried out using the Foss Therapy Model-812 Self-
Contained Cobalt-60 Irraditor located at the University of Manchesterrsquos Dalton Cumbrian
Facility (DCF) The Model-812 Irradiator contains three independent housings where
cobalt-60 sources may reside named A B and C Currently only A and C contain
cobalt-60 and had a total activity of 5281 TBq on the original date of measurement
(2nd
May 2012) Source B is due to be filled after one half-life from the original date to
bring the total activity back to a similar level Both A and C sources are used at the same
time for every irradiation throughout this work
Figure 9 Image on the left shows the Model-812 Irradiator On the right is the inside of
the irradiator showing the three guide rods that contain the cobalt-60 source during
irradiation
Chapter 2 Experimental Methods
43
Samples are placed within the irradiator and are exposed to gamma emission from the
cobalt-60 for calculated periods of time to allow samples to accumulate the desired dose
Radiation doses are defined as the amount of energy deposited per kilogram of sample
material and are often quoted as the SI derived unit Gray (Gy) which has the unit J kg-1
In
order to calculate how long a sample should be exposed for requires knowledge of the rate
at which radiation energy is deposited into the sample This is known as a dose rate and is
often quoted as Gy min-1
The practice of dose rate determination is known as ldquodosimetryrdquo
and there are a number of physical and chemical methods for determining the dose rate
from a given source Physical methods often deploy tools such as calorimeters and
scintillation chambers to directly measure energy while chemical methods depend on
measuring some chemical change that occurs during exposure to radiation that responds
linearly with increasing dose There are many chemical dosimeters available depending on
the kind of work being undertaken For example vapour phase experiments often measure
the condensation of acetylene into benzene to determine a dose rate22
For this work the
dosimeter used was a ferrous sulphate solution known as the Fricke dosimeter The Fricke
dosimeter was first described in 1927 by Hugo Fricke and has become the most adopted
chemical dosimeter among radiation scientists23
The standard recipe to make a Fricke
dosimeter used in this work is as follows
Fricke Dosimeter Dissolve 04 grams FeSO4∙7H2O (99 assay Fisher Chemicals) 006
grams NaCl (gt9999 Assay Calbiochem) and 22 mL concentrated H2SO4 (95-98
Sigma Aldrich) Dilute with distilled water to make 1 litre of Fricke solution24
Chapter 2 Experimental Methods
44
This solution will slowly oxidise and must be used within a few days by preventing light
from interacting with the solution it is possible to extend the shelf life of the Fricke
solution to three months The Fricke dosimeter relies on the oxidation of FeII to Fe
III by
species produced during the radiolysis of water
119867(119886119902)+ + 119890(119886119902)
minus rarr 119867bull
119867bull + 1198742 rarr 1198671198742bull
119865119890119868119868 + 1198671198742bull rarr 119865119890119868119868119868 + 1198671198742
minus
1198671198742minus + 119867(119886119902)
+ rarr 11986721198742
119865119890119868119868 + 11986721198742 rarr 119865119890119868119868119868 + bull119874119867 + 119874119867minus
119865119890119868119868 + bull119874119867 rarr 119865119890119868119868119868 + 119874119867minus
The extent of oxidation responds in a linear fashion to ionising radiation until dissolved
oxygen is exhausted this can be up to 500 Gy but in practice doses are usually kept
between 40 and 400 Gy to ensure measurements are made within the range in which FeIII
is
of a measurable concentration but FeII is not fully depleted
2 With a strong absorbance at
304 nm Fe3+
can be quantified by spectrophotometric analysis and an absorbed dose can be
calculated from the following equation
119863119866119910 = 9647 times 106 times
∆119860
∆휀119897120588119866(1198651198903+)
Chapter 2 Experimental Methods
45
where DGy is the absorbed dose in Grays ΔA is the difference between the optical
absorbance before and after irradiation and Δε is difference between the molar extinction
coefficient of Fe2+
and Fe3+
at 304 nm which has an established value of
2201 mol-1
cm-1
24
G(Fe3+
) is the chemical yield of Fe3+
and a value of 155 is
recommended when using cobalt-60 by the International Commission on Radiation Units
and Measurements Path length and solution density are represented by the terms l and ρ
respectively
Irradiations throughout this work were conducted using two sample holding devices each
with a number of different positions The first device consists of a standard 4x8 test tube
rack that has been fixed to an irradiation base plate The base plate allows the device to be
locked in exactly the same position within the Model-812 every time it is used
This device holds a number of 20 mL headspace vials during irradiations of samples which
are then analysed for H2O2 content the details of which will be discussed later
The second device is somewhat more complex and is used to hold samples that are
analysed for H2 content again the details of which are discussed later This device is
designed to keep samples mixed by slowly rotating them along a horizontal axis thus
continually inverting samples throughout the irradiation period it is hence referred to as the
ldquoinverter rigrdquo The construction consists of a high torque motor with a top speed of 2 rpm
Chapter 2 Experimental Methods
46
Figure 10 Sample holding devices for use in the Model-812 Left is the 4x8 rack with its
schematic below On the right is the inverter rig again with its schematic below
Dosimetry measurements were carried out in each of these devices and the results are
shown below Table 1 shows the dosimetry for the 4x8 test tube rack each position was
measured at four time intervals each of which with three replicates Measurements were
carried out in 20 mL headspace vials which were filled with 10 mL of Fricke solution
Chapter 2 Experimental Methods
47
Experiments carried out in this device only occupied positions in the first two rows hence
only these results are shown Table 2 shows the dosimetry of the inverter rig again each
position was measured at four time intervals each with three replicates The inverter rig
only has four positions which were measured with no rotation mixing Initially
experiments were to be conducted under stationary conditions before moving on to mixed
conditions however time limitations prevented progression to mixed samples and all
samples are conducted with no rotational mixing From the data obtained absorbance units
were converted to an absorbed dose by use of equation 1 and dose rates are then extracted
as the gradient of absorbed dose plotted as a function of time
Date of Original Measurement 07022014
Position Dose Rate on Date of
Measurement (Gy min-1
) plusmn Error
A1 29435 75
B1 34827 23
C1 32352 41
D1 27358 89
A2 15845 24
B2 18519 62
C2 18176 26
D2 15248 17
Table 1 Dose rates of the front most two rows of the 4x8 irradiation rack determined by
Fricke analysis The error indicates the percentage of uncertainty of the obtained gradient
Chapter 2 Experimental Methods
48
Date of Original Measurement 13012015
Position Dose Rate on Date of
Measurement (Gy min-1
) plusmn Error
A 29379 46
B 31708 46
C 30208 87
D 30616 46
Table 2 Dose rates of the four positions of the inverter rig determined by Fricke analysis
The error indicates the percentage of uncertainty of the obtained gradient
As cobalt-60 decays dose rates are subject to change with time however they change in a
predictable manner The decay of cobalt-60 follows first order kinetics it is therefore
possible to adjust dose rates to account for the decay of the source simply by multiplying
the dose rate by the ratio of initial radiation intensity and the intensity after a given time2
This can be written as
119863119877119860119889119895 = 119863119877 times1198681199051198680
Where
1198681199051198680= 119890minus120582119905
And
120582 =ln 2
11990512
Chapter 2 Experimental Methods
49
DRAdj is the decay adjusted dose rate after time t λ is the decay constant and tfrac12 is the half-
life which for cobalt-60 is 527 years The use of this equation depends on knowing how
much time has passed since the original dose rate (DR) was calculated hence the inclusion
of the date on which these measurements were made in Tables 1 and 2
Water Purification for Radiolysis Experiments
Radiation breaks water molecules into reactive radicals which can react quickly with any
impurity present in a sample It is therefore of high importance to ensure that any water
used in radiolysis experiments is of the highest purity During the early days of radiation
chemistry high purity water was often obtained through a triple distillation process Water
was distilled firstly through standard means before being distilled again from an acid
dichromate solution and finally a third time from an alkaline permanganate solution before
being stored in a fused silica container4 Advancements in modern self-contained
purification systems have significantly simplified the process of obtaining ultra-pure water
for radiolysis experiments All experiments carried out throughout this work use ultra-pure
water dispensed from the ELGA PURELAB Classic the feed water of which is provided
by the ELGA PURELAB Option-SR 715 Through the use of duel bank reverse osmosis
units two independent UV lamp purifiers and deionisation cartridges the final resistivity of
output water is measured to be 182 MΩ cm-1
Chapter 2 Experimental Methods
50
Figure 11 A diagram of the purification system that provides the ultra-pure water used
throughout this work Image was taken from the ELGA PURELAB user manual
Determination of H2O2 ndash Photometric Analysis
Throughout this work the determination of hydrogen peroxide is carried out using a
photometric technique known as the Ghormley Tri-iodide method25
This method takes
advantage of the redox reaction between hydrogen peroxide and iodide to produce iodine in
a 11 stoichiometric ratio with hydrogen peroxide This reaction takes place under acidic
conditions and is catalysed by the presence of ammonium molybdate tetrahydrate Acid is
also required to force the resulting equilibrium between iodine and tri-iodide completely
towards the production of tri-iodide which can then be measured by photometric analysis
this is achieved using potassium phthalate monobasic A general reaction scheme for this is
shown below
Chapter 2 Experimental Methods
51
11986721198742 + 2119868minus + 2119867+ rarr 1198682 + 21198672119874
1198682 + 119868minus 1198683
minus
This is a popular method for the determination of hydrogen peroxide in radiolysis studies26-
29 It is favoured for its relative simplicity over previous methods which typically involved
complicated titrations with potassium permanganate Furthermore it is also extremely
sensitive enabling accurate measurements of low concentrations of hydrogen peroxide with
a lower limit of 1 μM30
The reagent used to reduce hydrogen peroxide is susceptible to self-oxidation and has a
very short shelf life To prevent self-oxidation and prolong the shelf life the reagent is
prepared as two reagents designated ldquopart Ardquo and ldquopart Brdquo and are only mixed during
analysis One reagent contains potassium iodide under slightly alkali conditions while the
other contains an organic acid salt potassium phthalate monobasic Both reagents are
prepared according to the recipe originally described by Ghormley25
Part A Dissolve 1 gram NaOH (ge98 Sigma Aldrich) 33 grams KI (995 Assay
Fisher Scientific) and 01 gram (NH4)6Mo7O24∙4H2O (ge99 AppliChem) in 500 mL
deionised water
Part B Dissolve 10 g C8H5KO4 (ge9995 Sigma Aldrich) in 500 mL deionised water
Figure 12 Structure of Potassium phthalate monobasic (C8H5KO4)
Chapter 2 Experimental Methods
52
Analytical Procedure
The redox reaction between H2O2 and I ˉ is carried out on a 2 mL aliquot of sample
solution To this 1 mL of Part A and 1 mL of Part B are added a few seconds are required
for development before transfer to a quartz cuvette for analysis in a Cray 5000 UVVisNIR
photospectrometer Samples that contain solid material are filtered through syringe filters
before analysis to remove any solid particles Samples of elevated pH often required
additional acid to reduce the pH to the conditions required for analysis the quantity of
additional acid is determined by testing a blank sample with litmus paper the quantity is
then recorded and the dilution factor accounted for Utilisation of the Beer-Lambert law
allows for the calculation of hydrogen peroxide concentration from an absorbance within
the linear range of the technique
119860 = 휀119897119888
Where A is the optical absorbance ε is the molar extinction coefficient in M-1
cm-1
l is the
path length (always 1 cm during this work) and c is the concentration in mol dm-3
Determination of the optimum wavelength of absorption was carried out by a scanning
analysis of a 625 μM solution of hydrogen peroxide prepared by serial dilution of a 1 M
standard which itself was prepared from a 3wt stock solution of hydrogen peroxide in
water purchased from Sigma-Aldrich
Chapter 2 Experimental Methods
53
Figure 13 Scanned absorption spectra of a 625 μM H2O2 solution
The maximum absorbance was determined to be 351 nm which is consistent with values
described in literature3031
A series of standard solutions were made ranging in
concentration from 1-300 microM to determine the molar extinction coefficient shown in
Figure 14
Chapter 2 Experimental Methods
54
Figure 14 A calibration curve of H2O2 photometric absorption to determine the molar
extinction coefficient
Addition of the tri-iodide reagents dilutes the standard to half the quoted concentration A
dilution factor of 2 is used to correct for this hence the calibration curve covers the
concentration range 05-150 microM hydrogen peroxide The determined molar extinction
coefficient was 25631 M-1
cm-1
this again is consistent with values quoted in
literature263132
y = 25631x - 00012
0
05
1
15
2
25
3
35
4
45
00E+00 20E-05 40E-05 60E-05 80E-05 10E-04 12E-04 14E-04 16E-04
Ab
sorb
ance
[H2O2] (mol dm-3)
Slope Error = plusmn35548
Chapter 2 Experimental Methods
55
Determination of H2 - Gas Chromatography
Method development
Measurements of hydrogen gas are usually carried out using gas chromatography
frequently paired with mass spectroscopy3334
This work uses only gas chromatography to
measure hydrogen gas produced during the radiolysis of samples The standard technique
for gas analysis is to use a gas tight syringe and needle to extract a portion of headspace
from a sealed sample The samples are typically sealed in air tight vials with a rubber
septum to allow gas extraction however due to the effects of radiation on plastics and
rubbers the reliability of this technique remains debatable and often alternative methods are
sought One argument against the use of rubber septa in a radiation field is that they are
known to radiolytically produce their own hydrogen which would contribute to any
measurements Although some preliminary laboratory tests indicate that the production of
hydrogen from septa seems predictable and can be subtracted from any hydrogen produced
from samples this information was obtained from a single batch of septa and the
production rate of hydrogen will most likely vary between batches as nothing is known
about the manufacturersquos quality control tolerances Another important argument is
concerned with the concentration ranges of hydrogen that will be measured Aqueous
samples that contain no radical scavengers often have low chemical yields for hydrogen
and sampling with a syringe reduces the sample volume to a maximum of 100 microL
attempting to extract a larger volume leads to sampling problems associated with negative
pressure within the sealed sample
The portion of hydrogen entering the gas chromatograph may be reduced even further for
samples containing slurries as much of the hydrogen may remain trapped in the aqueous
phase even after agitation
Chapter 2 Experimental Methods
56
Headspace injections may be a viable technique for samples that are known to produce
large quantities of hydrogen but generally measurements made with this technique are
often close to or below the detection limits of the gas chromatograph Many radiation
chemists have adopted a variety of techniques for measuring small quantities of
radiolytically produced hydrogen that do not rely on the use of rubber septa One such
technique is the ldquoCrush Tuberdquo method described in references3536
This method is used for
all hydrogen analysis in this work
The Crush Tube Sampling Method
The crush tube method of gas chromatography uses a modified SRI Model 8610C Gas
Chromatograph (GC) with a bespoke sampling device that contains a section of Tygonreg
tubing that allows for a glass sample vial to be crushed by an external force such as a pair
of wrench pliers Originally the tubing was a standard silicone tube however Tygonreg
tubing proved to be more durable and less prone to leaks Figure 15 and 16 show the
general schematic for the apparatus as well as the specially made sample vials for this
method
Figure 15 The modified SRI 8610C Gas chromatograph with inline ldquocrush tuberdquo setup
The sample can be seen inside the silicone tubing
Chapter 2 Experimental Methods
57
Figure 16 Image on the left shows a schematic for the sampling apparatus on the right
are the vials used which are flame sealed at the midway neck
In order for this technique to work several modifications must be made to the GC hence
the selection of the highly modular SRI Model 8610C The first modification was made to
the 10-port gas sampling valve to enable carrier gas to flow through the bespoke sampling
device during analysis The unmodified 10-port valve contains a sample loop that connects
to the ldquoINrdquo and ldquoOUTrdquo ports on the external of the GC during sample loading When the
port is rotated to the ldquoINJECTrdquo position the loop is included in the carrier gas path and the
external ports are isolated
Chapter 2 Experimental Methods
58
Figure 17 A schematic of the original setup for the 10-port sampling valve in both off (top
image) and on (bottom image) positions
It is essential that carrier gas is allowed to continually flow through the system during both
sample loading and sample injecting As the bespoke sampling device creates a closed loop
between the external ports it is possible to swap the connections of ports 1 and 10 without
disrupting the flow of carrier gas
This modification isolates the external ports during sample loading but includes them
during sample injection and allows sample gas to be carried through the GC
Chapter 2 Experimental Methods
59
Figure 18 A schematic for the modified 10-port sampling valve including the removal of
the silica gel column
Figure 18 also depicts the removal of the silica gel column this is part of the second
modification The bespoke sampling device contains a large volume of gas that requires a
relatively fast carrier gas flow rate to achieve acceptably narrow peaks This flow rate is
quoted in literature as being around 50 mLmin35
The Packed silica gel column and the
default molecular sieve column simply did not allow for this high flow rate without
significant back pressure that can cause damage to equipment for this reason they were
removed A bespoke column was made from frac14 inch copper tubing and 13x molecular sieve
beads The new column had a total length of 4 m and allowed sufficient flow rates with
adequate separation of gasses
Chapter 2 Experimental Methods
60
Figure 19 Image on the left shows the bespoke frac14 inch OD 13x molecular sieve column
On the right the rotameter is connected to calibrate gas flow rates
The SRI Model 8610C is not equipped with a digital rotameter as such it cannot display
flow rate information and instead can only display information about the carrier gas inlet
pressure which requires a conversion formula to obtain a meaningful flow rate The user
manual includes conversion factors but these are column specific and as the column has
been custom built it is necessary to manually determine a conversion formula to obtain a
flow rate This was done using a rotameter connected to the external GC ports by adjusting
the inlet pressure and noting the rotameter value a calibration curve was obtained
Chapter 2 Experimental Methods
61
Figure 20 A calibration curve to provide a conversion to determine carrier gas flow rate
Detection of H2 and Calibration
The SRI Model 8610C is equipped with a thermal conductivity detector (TCD) for the
measurement of eluted gas The TCD consists of a Wheatstone bridge circuit with tungsten-
rhenium filaments serving as resistors (Figure 21) Carrier gas containing eluted sample
passes over one of the filaments while a second path is reserved for carrier gas only to
serve as a reverence The filaments are electrically heated and the temperature of the whole
unit is carefully controlled As carrier gas passes over the filaments it conducts heat away
from the filament to the detector body when a sample component flows over the filament
the conductivity changes causing the filament to change temperature relative to the
reference filament This change in temperature changes the resistivity of the filament and a
change in voltage is recorded
Chapter 2 Experimental Methods
62
Figure 21 A schematic of a Wheatstone bridge circuit used in the TCD
To achieve a good sensitivity towards a given analyte it is important to have a large
difference in thermal conductivity between said analyte and the carrier gas Table 3 shows
the thermal conductivity values for some common gases The carrier gas most often used is
helium which has a thermal conductivity of 36036times106 cal s
-1 cm
-1 degC
-1 As many other
gases have much lower thermal conductivities helium often performs well however
hydrogen is a special case as it also has a high thermal conductivity of
44632times106 cal s
-1 cm
-1 degC
-1 For this reason the carrier gas selected for hydrogen
measurement was argon which has a much lower thermal conductivity of
4257times106 cal s
-1 cm
-1 degC
-1
Gas Thermal Conductivity (cal s-1
cm-1
degC-1
x106)
267degC
H2 44632
O2 6364
N2 6240
Ar 4257
He 36036
Table 3 Thermal conductivity of commonly used gases
Values taken from the Handbook of Tables for Applied Engineering Science
Chapter 2 Experimental Methods
63
Measurements made by the TCD are expressed as a voltage plotted as a function of time
The peaks produced in this plot are integrated and the final result is expressed as the peak
area As the peak area unit is largely arbitrary a calibration curve must be obtained to relate
the peak area to a meaningful quantity of hydrogen Calibration is carried out by replacing
the bespoke sampling device with a simple T-section fitted with a rubber septum Known
quantities of hydrogen gas are injected into the T-section which is then carried through the
GC Figure 22 shows a calibration curve for the linear range of 1 ndash 500 microL of pure
hydrogen at standard room temperature and pressure
Figure 22 A calibration curve for quantifying hydrogen gas from chromatograms
Samples of airhydrogen mixtures were also injected to make sure there was adequate
separation between the gases good separation between hydrogen and oxygen is observed
but the separation of oxygen and nitrogen is not adequate for analysis of those gases when
both are present in large quantities
Chapter 2 Experimental Methods
64
Machine parameters were adjusted for optimum performance these are shown in Table 4
These parameters were used for every experiment throughout this work
Parameter Value
Valve Temperature 70 Cdeg
Column Temperature 40 Cdeg
TCD Temperature 220 Cdeg
Flow Rate 50 mLmin
Carrier Gas Ar
Table 4 Optimised parameters used for the analysis of H2 gas
Method Validation
It was mentioned previously that the bromide ion is an excellent scavenger of hydroxyl
radicals during radiolysis
bull119874119867 + 119861119903minus [119867119874119861119903]minus119867(119886119902)+
rarr 119861119903bull + 1198672119874119861119903minus
rarr 1198611199032bullminus
Radiolysis of an aqueous solution of 1 mM bromide results in the elimination of the
reaction between the hydroxyl radical and molecular hydrogen in solution37
Other than
diffusion to the gas phase a reaction with hydroxyl radicals is the only significant removal
path of hydrogen at neutral pH The removal of dissolved oxygen by argon sparging also
simplifies much of the radiolysis chemistry allowing for a more reproducible experiment
This means that the hydrogen measured from the radiolysis of a deaerated 1 mM bromide
solution is in fact a primary yield and is quoted throughout the literature as being
GH2 = 045 this is an average value from a range of studies
2453839
Chapter 2 Experimental Methods
65
In order to secure confidence in this technique a validation experiment was carried out in
which a 1 mM solution of potassium bromide was used to determine the primary yield of
hydrogen which was then compared to the literature value
Figure 23 Method validation by the determination of the well-established primary yield of
H2 through hydroxyl scavenging by bromide
As expected the hydrogen concentration increased linearly with absorbed dose over the
experimental range When the number of hydrogen molecules is plotted as a function of
absorbed energy in sets of 100 eV the gradient gives GH2 = 0456 plusmn0025 matching well to
the average value quoted in literature
Chapter 2 Experimental Methods
66
Sources of Error
The majority of experiments carried out in this work use the absorbed energy or dose as
the independent variable and using one of the analytic techniques discussed above either a
photometric absorption value or the integrated response to hydrogen gas detection as the
dependant variable Both the dependant and independent variable have errors associated
with them which are discussed below
Determining the quantity of absorbed energy to the sample relies on the procedure of
dosimetry discussed earlier in this chapter The errors reported in Tables 1 and 2 are the
percent error of the gradient obtained from the measurement of Fe3+
as a function of time
As the experiments carried out in this work are plotted as a function absorbed dose and
there is an element of uncertainty associated with the dose rates the uncertainty of the
calculated absorbed dose increases with increasing dose This uncertainty in the absorbed
dose is included in many of graphs showing experimental data and is represented by
horizontal error bars
Sources of Error in the Determination of H2O2
The determination of H2O2 relies mainly on the calibration curve to yield a molar extinction
coefficient determined to be 25631 M-1
cm-1
with an uncertainty of plusmn 355 M-1
cm-1
The
molar extinction coefficient is used to convert the measured absorbance of a sample to a
concentration of H2O2 however this value has a dependence on temperature The ambient
temperature of the laboratory fluctuates slightly but it was decided that the effects were too
minor to consider The irradiation of samples on the other hand resulted in samples
heating slightly to a temperature that would be significant
Chapter 2 Experimental Methods
67
This was largely mitigated by leaving samples to cool for a few minutes until they reached
room temperature however an increase in temperature may affect the radiation chemistry
Solutions used to calibrate and reagents used to analyse samples also carry an associated
uncertainty in their concentrations The standards used to produce the calibration curve
were prepared from a stock solution of 3 wt H2O2 (Sigma Aldrich) From this the
0882 M solution was diluted to 1 mM which was used in a serial dilution to create the
standards ranging from 1 ndash 300 μM Uncertainty in the concentrations will have been
introduced by the tolerances of the pipettes and volumetric flasks used The pipettes used
were the Gilson Pipetman P1000 and P20 which are certified to comply with ISO 8655 that
imposes maximum allowable systematic errors of plusmn 80 μL and plusmn 02 μL for the P1000 and
P20 respectively The maximum allowable random error for the P1000 is quoted to be
le 30 μL and le 01 μL for the P20 The volumetric flasks used were class A Glassco brand
flask that conform to ISO 1042 Of the range of flasks used the largest error was 00025
Any uncertainty in the concentrations of the analytical reagents used to reduce H2O2 is
largely irrelevant as the chemicals used to perform the analysis are provided in a large
excess Stoichiometrically speaking as long as the concentration of iodide is at least three
times that of H2O2 the analysis should work in reality the concentration of iodide is
several times higher than this ensuring all H2O2 is reduced The sum of the above errors are
assumed to contribute to less than 1 of the total uncertainty of any measurements of
H2O2
Chapter 2 Experimental Methods
68
Sources of Error in the Determination of H2
The experimental technique provides a means to quantify hydrogen gas by volume In order
to make a comparison to predictions made by the computational model it was necessary to
convert this value to a concentration (mol dm-3
) This means knowing the volume of the
headspace in the crush tube vials As these vials are flame sealed they naturally have an
irregular shape and calculating a precise volume is difficult for this reason the conversion
uses an estimated headspace volume of 2 mL
Hydrogen gas is quantified by the integration of a change in voltage with respects to time
however the voltage response measured can be affected by a number of factors Factors
such as temperature and pressure are controlled automatically by the machine Moisture can
also affect the response of the TCD and this is controlled by running a ldquobake outrdquo cycle
prior to running any analysis One factor that cannot be prevented is the slow oxidation of
the tungsten-ruthenium filament which lowers the sensitivity of gas detection This can be
accounted for by performing regular calibrations often 3 or 4 point calibrations that are
compared to the original calibration curve If there is any deviance from the original curve
then a full calibration is performed and this is then used for the following analyses The
calibration curve shown in Figure 22 was the first full calibration performed throughout the
duration of this project the gradient of this curve gradually decreased this was accounted
for using the calibration process mentioned above As calibrations are performed by hand
with a gas tight syringe most of the error is likely introduced at this point The average
error of calibration points was plusmn 25 in the calibration curve given in Figure 22 for other
calibrations not shown in this work the average error was always less than 5
Chapter 3 Computational Methodology
69
Chapter 3 Computational Methodology
The earliest recorded computational approaches to solving problems in the field of radiation
chemistry date back to 1958 when the AVIDAC computer in Chicago was used to model
radical diffusion kinetics40
Since then different mathematical techniques have found use in
modelling problems found in the field of radiation chemistry and with ever increasing
computational power complicated calculations can be performed in seconds rather than
days In the early days of computational radiation chemistry primary yields were calculated
by deterministic methods involving the diffusion of a single spur However it became
apparent that a Monte Carlo approach held several advantages over deterministic methods
for the description of early stage radiolysis Such advantages include the ability to
incorporate the effects of a variety of different spur sizes and other entities arising from
secondary electrons41
For this reason modern radiolysis models usually fall into two
categories depending on what stage of radiolysis is being modelled Monte Carlo
calculations often concern the non-homogeneous early stages of radiolysis due to the
stochastic nature of energy deposition into a medium as mentioned earlier these
calculations often predict the primary yields of radiolysis products42
If the primary yields
are already known a deterministic approach is often employed to model the resulting
homogeneous chemistry in a similar way to most other chemical kinetics models through
the use of simultaneous ordinary differential equations (ODE)2743-46
Newer radiolysis
models are moving towards a multi-scale approach in which the output of the stochastic
stage is fed directly into the deterministic stage47
In this project a deterministic kinetic model for homogeneous chemical stage radiolysis has
been developed using a software package called FACSIMILE developed by MCPA
software Ltd
Chapter 3 Computational Methodology
70
FACSIMILE utilises Gear methodology for auto-adaptive time step control coupled with
Newton-Raphson iterations for prediction correction to deliver a robust simultaneous
ordinary differential equation solver The FACSIMILE language is largely based on the
Fortran language but is tailored for use by the scientific community and includes its own
high level notations for simplifying ODE construction48
The chemical model developed
here is largely based on the rate coefficient compilation by Elliot and Bartels 46
as well as
other literature sources27434549
This chapter gives a detailed description of how the model in this project works In essence
the model functions by producing primary radiolysis species at rates determined by their
primary yields and a dose rate parameter while simultaneously solving a set of ODEs that
represent the chemical reactions that describe the radiolysis chemistry At the same time
the model is also bound by framework calculations that describe various physical
parameters including but not limited to temperature effects and species volatility Each of
these concepts is described in detail in the following sections as well as the core radiolysis
reaction set
Production of Primary Species
As this model is only concerned with the homogeneous radiolysis chemistry that occurs
after diffusion of the primary species away from any kind of track structure the effect of
radiation can be represented by a series of zero order production equations with rate
constants derived from the dose rate and the species primary yield Each primary radiolysis
species has its own equation that defines its rate of production the general form of this
equation is shown below
Chapter 3 Computational Methodology
71
119896119894 =119863119877 times 119864119862 times 120588 times 119866119894
119873119860
DR is the dose rate given in Gy min-1
and Gi is the primary yield for species i NA is
Avogadros number and provides the conversion of molecules to moles while ρ is the
density of water and converts mass to volume ρ also has its own temperature dependency
which is calculated elsewhere in the code EC is a constant that effectively converts the
units of dose rate (J kg-1
min-1
) into time units compatible with a zero order rate constant
(mol dm-3
s-1
) and energy units compatible with primary yields (molecules 100 eV-1
) and
has a value of 104 times1015
and carries the unit 100 eV s-1
The dose rate is initially set by the user and is constant throughout the calculation however
primary yields are not set by the user and are initially set depending on other parameters
such as temperature and pH Table 52 shows the primary yields for water radiolysis by
gamma-rays at neutral pH and at room temperature the following section describes the
factors that can alter these values and details how they are incorporated into the model
Primary Species eaq- H
bull
bullOH H2 H2O2
g-Value 263 055 272 045 068
Table 5 Primary yields for γ-radiolysis of water at neutral pH and standard pressure and
temperature2
Chapter 3 Computational Methodology
72
Factors Affecting Primary Yields
Temperature
The rate of diffusion of primary species away from spurs created by ionising radiation is
affected by temperature As the temperature is increased the rate of diffusion of radical
species increases as does the rate of recombination reactions The yields obtained at high
temperature are determined by this competition between diffusion and recombination rates
Experiments carried out by Hochanadel and Ghormley (Table 6)50
first show this effect
over a temperature range of 2 ndash 65 degC in which higher temperatures favour increased
radical yields and decreased molecular yields
Primary Species g-Value Temperature
coefficient degC-1
2degC 23degC 65degC
Hbull + eaqˉ 359 367 382 +010plusmn003
bullOH 280 291 313 +018plusmn004
H2 038 037 036 -006plusmn003
H2O2 078 075 070 -015plusmn003
-H2O 435 441 454 +007plusmn003
Table 6 Temperature effects on the primary yields of water radiolysis50
A recent extensive compilation by Elliot and Bartels includes measurements of primary
yields at temperatures from 20 ndash 350degC from multiple sources and collates this data to
provide fitted equations for use in computational models The primary yield of the hydrated
electron was determined by product analysis of nitrogen formation from samples containing
nitrous oxide51-54
The chemical yield of nitrogen is equal to the primary yield of the
hydrated electron due to the following scavenging reaction
119890(119886119902)minus + 1198732119874 rarr 1198732119874
minus rarr 1198732 + 119874minus
Chapter 3 Computational Methodology
73
Organic compounds were also added to scavenge hydroxyl radicals and prevent them from
reacting with hydrated electrons Pulse radiolysis studies were also included55
but only the
data from nitrogen yield measurements were recommended for use
For the determination of the hydroxyl primary yield pulse radiolysis was the primary
method used The method described used bicarbonate to effectively convert hydroxyl
radicals to the carbonate radical which is more easily measured
The temperature dependency of the extinction coefficient for the carbonate radical was
estimated by integrating normalised absorption spectra as a function of temperature
originally collected by Elliot et al53
The resulting temperature dependency of the hydroxyl
radical primary yield is in agreement with an independent pulse radiolysis study that used a
ferrocyanide ion solution to measure the temperature dependency of the hydroxyl yield up
to 105degC53
The temperature dependence of the hydrogen peroxide primary yield was determined by
three independent studies Measurements in acrylamide solutions provided the temperature
dependency up to 100degC53
Further measurements made in deaerated solutions containing
nitrate and methanol extended this range to 150degC56
Estimations of the peroxide primary
yield to high temperatures were made based on the assumption that it was equivalent to the
chemical yield of oxygen in an alkali solution containing nitrous oxide or iodine this
approach expanded the temperature range to 270degC54
The primary yield of molecular hydrogen as a function of temperature has been measured
by three laboratories In each case hydrogen was directly measured from solutions
containing either a nitrous oxide and organic mix or nitrite ions In both cases the
measurements agreed well across all three laboratories515354
Chapter 3 Computational Methodology
74
Several attempts at measuring the primary yield of the hydrogen atom as a function of
temperature have been made however only two data sets are considered reliable as others
do not agree with the established yield at room temperature although all data sets show an
increase in yield with temperature
The chemical yield of molecular hydrogen from deaerated solutions containing nitrate and
phosphite ions is said to be equal to the sum of the primary yields of molecular hydrogen
and the hydrogen atom subtracting the already established primary yield of molecular
hydrogen from these measurements should give the primary yield of the hydrogen atom
These measurements agreed well with the established room temperature value and gave a
temperature dependence up to 200degC53
The temperature dependence was expanded to
350degC based on estimations of the ratio between the hydrogen atom primary yield and
hydrated electron primary yield which was calculated from data obtained during other
experiments performed in alkali solutions Unfortunately this data is described as archived
and unpublished The collated data from the experiments described above are shown in
Figure 24 with polynomial fits overlain the equations for these polynomials are given in
Table 7 and are used in the modelling calculations reported
Chapter 3 Computational Methodology
75
Figure 24 Collected data from literature showing measured primary yields as a function
of temperature Provided by Elliot and Bartels 200845
Primary Yield
Polynomial
g(eaq-) 2641 + 4162times10
-3 t + 9093times10
-6 t
2 ndash 4717 times10
-8 t
3
g(H2O2) 0752 ndash 1620times10-3
t
g(H2) 0419 + 8721times10-4
t ndash 4971times10-6
t2 + 1503times10
-8 t3
g(bullOH) 2531 +1134times10
-2 t ndash 1269times10
-5 t2 + 3513times10
-8 t3
g(Hbull) 0556 + 2198times10
-3 t ndash 1184times10
-5 t2 + 5223times10
-8 t3
Table 7 Polynomial equations for estimating temperature effects on primary yields45
Where t is the temperature in degC
Incorporation of any kind of temperature dependence into a prediction that will be
compared with experimental data requires knowledge of the experimental temperature This
is especially important in chemical kinetic models such as this as almost all the reaction
rate constants are temperature dependent For this reason a test was conducted to measure
the temperatures experienced by samples during irradiation
Chapter 3 Computational Methodology
76
The test was carried out with vials which had thermocouples attached the vials were filled
with water The vials were irradiated for 16 hours and the temperature was recorded every 5
minutes the average recording is shown in Figure 25 A polynomial fit was made from the
first 4 hours of data which was applied in the code to control the rate of temperature change
during a calculation the simulated temperature is shown as the red dashed line in
Figure 25
Figure 25 A comparison of the sample temperature profile logged by thermocouple to the
temperature profile calculated in the computational model
There are many ldquobulkrdquo radiolysis models in literature few of which make any reference to
the way in which temperature is controlled It can only be assumed that these models use a
fixed temperature which would produce less accurate predictions especially during early
periods where the temperature change is significant It should be said that this approach
should be used with caution as this temperature profile depends on the equipment being
used to irradiate samples and the dose rate involved
20
25
30
35
40
45
0 2 4 6 8 10 12 14 16
Tem
per
atu
re (degC
)
Time (h)
Thermocouple
Facsimile
Chapter 3 Computational Methodology
77
The majority of energy from the radioactive sources ends up being deposited into the
shielding material of the irradiation unit This heats the surrounding air within the
irradiation chamber which is often not circulated
pH
The effect of pH on the primary yields of water radiolysis has been a subject of discussion
for many decades yet experimental data on the subject is relatively sparse at high and low
pH Early radiolysis experiments often took place in acidic medium and so acidity became
one of the first variables considered for investigations into the effects of pH on primary
yields Table 857
shows primary yields data from 04 M sulfuric acid samples where the
pH = 046 the values shown are averages over multiple sources
Reference g(eaq-) + g(H
bull)
g(
bullOH) g(H2) g(H2O2) g(-H2O) Ref
Ferradini C et al 370 280 045 090 460 58
Allen AO
Lefort M 365 295 045 080 455
459
Sworski T J 370 292 039 078 448 60
Hochanadel C J et al 370 290 040 080 450 61
Mahlman H A et al 368 296 045 081 458 62
Hayon E et al 366 297 040 076 450 6364
Sehested K et al 362 289 039 076 441 65
Spinks amp Wood 365 290 040 078 445 2
Table 8 A collection of measurements of primary yields made in 04 M solution of
sulphuric acid (pH = 046)57
The noticeable changes to the primary yields when compared with those at neutral pH are
consistent throughout the literature including further sources not included in Table 8
Chapter 3 Computational Methodology
78
The change in primary yields is not massive in the pH range 046 ndash 7 but neither is it
insignificant With the exception of the molecular hydrogen yield all primary yields
increase slightly at low pH The main explanation for this involves the conversion of
hydrated electrons to hydrogen atoms within the radiation spurs In neutral solutions the
hydrated electron readily reacts with the hydroxyl radical to form hydroxide but when the
hydrated electrons are converted to hydrogen atoms the reaction with hydroxyl radicals is
suppressed
The hydrogen atoms do not react with hydroxyl radicals as quickly as hydrated electrons
and so the hydroxyl radicals become effectively ldquoprotectedrdquo at low pH This explains the
increase in primary yield of the reducing species (hydrated electron plus the hydrogen
atom) and the increase in the hydroxyl radical yield With an increase in hydroxyl radicals
comes an increase in the peroxide primary yield via the dimerisation of hydroxyl radicals
The decrease of the molecular hydrogen primary yield is due to the dimerisation of
hydrogen atoms having a slower coefficient than the reaction between two hydrated
electrons
119890119886119902minus + 119867(119886119902)
+ rarr 119867bull k = 210 times1010
M-1
s-1
119890119886119902minus + bull119874119867 rarr 119874119867minus k = 302 times10
10 M
-1 s
-1
119867bull + bull119874119867 rarr 1198672119874 k = 153 times10
10 M
-1 s
-1
The effect high pH has on the primary radiolysis yields of water is not as well documented
The number of studies is fewer than those conducted in acidic medium and the data from
said studies do not always agree Table 957
shows a collection of primary yields measured
in alkali samples where the pH asymp 135
Chapter 3 Computational Methodology
79
Reference g(eaq
-) +
g(Hbull)
g(
bullOH) +
g(bullOˉ)
g(H2) g(H2O2) +
g(HO2ˉ) g(-H2O) Ref
Draganić et al 318 272 045 068 409
538
Hayon E 327 304 043 053 412
66
Haissinsky M 334 301 04 056 414
67
Dainton F S et al 385 34 036 058 457
6869
Cheek C H et al 28 21 045 084 37
70
Fielden E M et al 357 28 - - -
71
Czapski G et al 33 - - 056 -
72
Table 9 A collection of primary yields measured in alkali solutions (pH asymp 135)57
At high pH the hydroxide ion can react with the hydroxyl radical within the spur forming
the oxide radical anion bullOˉ in the following equilibrium
bull119874119867 + 119874119867minus bull119874minus + 1198672119874 pKa = 119
At high concentrations of hydroxide the hydroxyl radical may be completely replaced by
the oxide radical anion A consequence of this shift is the decrease in the peroxide primary
yield as it is thought that the dimerisation of the oxide radical anion to form peroxide is
slower than the neutral equivalent dimerisation of hydroxyl radicals This is something that
is observed across almost all the studies conducted at high pH The reaction between the
hydrated electron and the oxide radical anion is also slower than the corresponding neutral
equivalent reaction It is therefore expected that the primary yield of oxidising radicals
G(bullOH) + G(
bullOˉ) would increase with increasing pH as would the total primary yield of
reducing radicals G(e(aq)
-) + G(
bullH) The primary yield of molecular hydrogen is mostly
unaffected by the increased pH this would suggest that the net decomposition yield of
water must increase in order to satisfy the material balance equation
Chapter 3 Computational Methodology
80
119892(minus1198672119874) = 119892(119890119886119902minus ) + 119892(119867bull) + 2119892(1198672) = 119892(119874119867
bull) + 119892(119874bullminus) + 2(119892(11986721198742) + 119892(1198671198742minus))
Despite the difficulty in deriving quantitative agreement across the available data there are
studies that offer qualitative agreement with the expected changes to primary yields at high
pH66-69
There are also studies that do not agree and propose that the primary yields are
largely unaffected by pH5387073
Despite the oxide radical anion being the main radiation produced oxidising radical in
aqueous alkali medium and therefore having a significant effect on the chemistry reaction
rate coefficients associated with it are largely unknown and rely on estimation The lack of
reliable rate coefficients for the reactions of the oxide radical anion is an important factor to
consider when attempting to model the radiolysis of water at high pH
It has been shown using stochastic simulations that the chemistry of the oxide radical
anion can have a significant impact on the prediction of primary yields Initial predictions
of the stochastic model by Pimblott et al74
showed an increase in the peroxide primary
yield at high pH This is counter to the accepted trend observed experimentally of a
decreasing peroxide primary yields at high pH In order to match the observed decrease in
peroxide primary yield a single rate constant was changed from 20 times1010
M-1
s-1
to 65
times109 M
-1 s
-1 for the reaction below
119874bullminus + bull119874119867 rarr 1198671198742minus
Chapter 3 Computational Methodology
81
This change had the effect of reversing the trends of the primary yield predictions at high
pH resulting in agreement with experimental data Soon after this the rate constant for the
reaction between the oxide radical anion and the hydroxyl radical was measured to be 74
times109 M
-1 s
-1 which is much closer to the adjusted rate constant used in the stochastic
simulation than the original estimate49
Figure 26 shows literature values for the measured primary yields as a function of pH from
this polynomial equations were fitted which were combined in a multiple regression
analysis with the equations fitted to temperature analysis data Table 10 shows the resulting
equations While this approach gives an estimate of the primary yields as a function of both
temperature and pH it is not an ideal solution This type of estimation is better suited to a
stochastic type track chemistry calculation
A stochastic approach could also account for the effects of different linear energy transfer
(LET) values which are discussed in the next section A multi-scale approach could even
procedurally produce stochastically calculated primary yields that feed into a deterministic
chemical kinetic simulation
Chapter 3 Computational Methodology
82
Figure 26 A reproduction of data provided by Hayon75
showing the effect of pH on
primary radiolysis yields
Primary Yield
Multiple Regression Equation
g(eaq-) 28 + 285times10
-3 times t ndash 251times10
-2 times pH
g(H2O2) 845times10-1
ndash 151times10-3
times t ndash 17times10-2
times pH
g(H2) 388times10-1
+ 829times10-4
times t + 599times10-4
times pH
g(˙OH) 243 + 111times10-2
times t ndash 12times10-3
times pH
g(H˙) 444times10-1
+ 367times10-3
times t ndash 24times10-4
times pH
Table 10 Multiple regression polynomials used to estimate the combined effect of
temperature and pH on the primary yields of water radiolysis
0
05
1
15
2
25
3
35
0 1 2 3 4 5 6 7 8 9 10 11 12 13 14
Pri
ma
ry Y
ield
(M
ole
cule
s 1
00
eV
-1)
pH
g(OH)
g(e-)
g(H2O2)
g(H2)
Chapter 3 Computational Methodology
83
Linear Energy Transfer (LET)
Linear energy transfer is a way of expressing the rate at which an ionising particle loses
energy through a medium Sometimes referred to as ldquostopping powerrdquo linear energy
transfer is quoted as the average energy loss divided by a fixed path length usually micro
meters or nano meters (keV μm-1
or eV nm-1
) This parameter is frequently expressed as an
average rate of energy loss across the entire particlersquos track this is because the energy loss
rate of an ionising particle is not uniform As a high energy ionising particle begins its
journey through a material energy loss events are sparse and only small quantities of
energy are transferred so the particle continues largely un-deflected As this energy lost to
these small transfers accumulates and the energy of the charged particle decreases the
cross section of interactions increases This means that there are more energy loss events
for a given linear distance as the particles path becomes less linear A true linear energy
transfer profile of a particle would take the form of a Bragg curve such as the example
shown below
Figure 27 An example of a Bragg peak Energy loss of alphas of 549 MeV in Air
Image released to public domain
Chapter 3 Computational Methodology
84
For ease of comparison this profile is usually averaged to give a single LET parameter
Ionising particles of higher mass andor lower energy have higher LET values The
implications of linear energy transfer are manifested in the radiation track structure
Increasing LET values have the effect of increasing the spur distribution density as
illustrated in the diagram below
Figure 28 A schematic representation of how linear energy transfer (LET) alters the
distribution of spurs along a radiation track Image was recreated from Allen AO4
The distribution of spurs along a track has an effect on the diffusion of primary radiolysis
species and ultimately alters the primary yields Experiments carried out using 210
Po to
irradiate solutions of iron sulphate through various thicknesses of mica have shown the
effects of changing LET on the yield of oxidation of Fe2+
76
From this subsequent studies
using cyclotron accelerated protons have measured the effects of LET on the primary yields
of water radiolysis77
Compiling the data from these studies gives a general picture of the
effects of LET on water radiolysis primary yields which is shown below
Chapter 3 Computational Methodology
85
Figure 29 Simulation data showing the effects of increasing linear energy transfer on the
primary yields of water radiolysis Image was recreated from Allen AO4
The general trend shows an increase in the formation of molecular products at higher LET
at the expense of radical species (with the exception of hydroperoxyl radical (˙HO2)) at very
high LET values whilst lower LET values favour the radical species Currently there is no
clear agreed explanation as to how the hydroperoxyl radical is formed at high LET Gamma
rays from cobalt-60 fall in the low LET range and have an average value of
023 keV μm-1
78
As the experiments conducted throughout this project used only cobalt-60 as a source of
radiation it was not necessary to incorporate the effects of linear energy transfer into this
radiolysis model nor was it necessary to include the primary yield of hydroperoxyl radicals
into this model as the yield is negligible at the LET value of cobalt-60 Future iterations of
this model would need to include the effects of linear energy transfer as well as better
methods for coping with the effects of temperature and pH this is discussed in more detail
in Chapter 8
Chapter 3 Computational Methodology
86
Mass Transfer of Volatile Species
The transfer of volatile species is not something that affects radiolysis primary yields but it
is important to include as the aqueous reactions of volatile species namely molecular
hydrogen and oxygen will partition into the gas phase This mass transfer is described
within the model as two equations
1198672(119886119902) 1198672(119892)
1198742(119886119902) 1198742(119892)
These equations take the form of first order rate equations with the rate constant substituted
for a time dependant net mass transfer coefficient (kapp) which includes an interfacial mass
transfer coefficient (νint) and the Henryrsquos equilibrium partition coefficient (Kp)27
119889119862(119886119902)119894
119889119905= minus119896119886119901119901
119894 (119905) times 119862(119886119902)119894 (119905)
119896119886119901119901119894 = 120592119894119899119905
119894 times119860119894119899119905119881119886119902
(1 minus 119870119901119894119862119892119894(119905)
119862119886119902119894 (119905)
)
Ci refers to the concentration of species i in either the gas phase or the aqueous phase Aint
and Vaq are used to describe some of the geometry of the radiolysis vessels used in
experiments Aint is the interfacial surface area between the two phases while V is the
volume of the aqueous or gas phase denoted by its subscript As experiments were
conducted in different sized vials depending on the analysis technique used different values
of Aint and V were used when comparing model predictions to experimental data
Chapter 3 Computational Methodology
87
This method assumes that the volume of liquid and covering gas is the same which was
true for all the experiments conducted during this work If the liquid to gas volume ratio
was anything other than 1 then the above differential should be adjusted to account for this
ratio by the following modification
minus119881119897119881119892times119889119862(119886119902)
119894
119889119905= 119896119886119901119901
119894 (119905) times 119862(119886119902)119894 (119905)
The interfacial mass transfer coefficient (νint) incorporates the use of the stagnant two-film
model which provides a description of resistance to diffusion through un-mixed boundary
layers (see Figure 3079
)
Figure 30 A representation of the stagnant two-film model used to calculate the
partitioning of volatile species79
The stagnant two-film model is incorporated into the mass transfer coefficient by relating
the species diffusivity coefficients (D) the boundary thickness (δ) and the Henryrsquos
equilibrium partition coefficient (Kp)
Chapter 3 Computational Methodology
88
1
120592119894119899119905119894=
1
(119863119886119902119894
120575119886119902)
+119870119901119894
(119863119892119894
120575119892)
119870119901119894 =
119862119886119902119894 (119890119902)
119862119892119894(119890119902)
The diffusivity of volatile species is a temperature dependant coefficient which is included
in the model through the use of polynomial fits to data obtained from literature and is
shown in figure 3180-83
Henryrsquos coefficients were taken from literature which included
equations for describing the temperature dependence so a polynomial fit was not
necessary84
The Henryrsquos equilibrium partition coefficient is a dimensionless ratio between
the aqueous and gas phase concentrations of a volatile species at equilibrium This value is
related to the Henryrsquos law constant (kH) by the following relationship
119879 times 119896119867119894 = 122 times 119870119901
119894
The value 122 is used to convert between the Henryrsquos law coefficient in mol maq-3
Pa-1
and
the dimensionless Henryrsquos law coefficient While T represents the temperature in Kelvin
the Henryrsquos law constant also has its own temperature dependency built in this is described
by the following relationship
119896119867 = 119896119867120579 times 119864119883119875 (
∆119867119904119900119897119899119877
(1
119879minus1
119879120579))
Chapter 3 Computational Methodology
89
The Henryrsquos constant at standard temperature (29815 K) (kHθ) is quoted in the literature as
being 13times10-3
mol dm-3
atm-1
for oxygen and 78times10-4
mol dm-3
atm-1
for hydrogen ΔHsoln
is the enthalpy of solution and R is the gas constant the average ratios are quoted in the
literature as 1650 for oxygen and 543 for hydrogen84
This gives values for the Henryrsquos equilibrium partition coefficient (Kpi) of 0019 and 0031
for hydrogen and oxygen respectively at 25degC and smaller values at higher temperatures
Figure 31 The diffusivity of O2 and H2 in both water and air as a function of temperature
000
050
100
150
200
250
300
350
000E+00
100E-05
200E-05
300E-05
400E-05
500E-05
600E-05
700E-05
800E-05
900E-05
0 100 200 300 400
Dif
fusi
vit
y i
n A
ir (
cm2 s
-1)
Dif
fusi
vit
y i
n H
2O
(cm
2 s
-1)
Temperature (degC)
O2aq
H2aq
H2g
O2g
Chapter 3 Computational Methodology
90
Diffusivity
Polynomial
O2(aq) 20times10-9
times t2
+ 40times10-7
times t + 10times10-5
O2(g) 10times10-6
times t2
+ 12times10-3
times t + 02073
H2(aq) 10times10-8
times t2 + 40times10
-7 times t + 30times10
-5
H2(g) 50times10-6
times t2 + 47times10
-3 times t + 07719
Table 11 Polynomial equations used to estimate the temperature effects on the diffusivity
of O2 and H2 in both gas and aqueous phases where t = temperature (Cdeg)
Water Radiolysis Reaction Set
The radiolysis model simulates the chemical kinetics of homogeneous radiolysis through
the use of simultaneous differential equations that represent the independent chemical
reactions taking place The model therefore includes a set of reactions accompanied by
reaction rate constants Tables 12 - 14 gives a summary of the reaction set used with a full
description of the reaction set including the associated temperature dependences is given in
appendix A The reaction rate coefficients are taken from multiple sources with the
majority from the compilation of A J Elliot and D M Bartels45
Chapter 3 Computational Methodology
91
Reaction Number Primary Species
Production
G-value
(Molecules100eV) Ref
G0 H2O 119890(119886119902)minus 271 45
G1 H2O Hbull 054 45
G2 H2O H2 041 45
G3 H2O bullOH 270 45
G4 H2O H2O2 068 45
G5 H2O H(aq)+ 271 45
Table 12 A list of Primary Species used to model water radiolysis
Reaction
Number
Chemical Reactions Rate Constant k
(M-1
s-1
25degC)
Ref
R0 emacraq + emacraq rarr H2 + 2OHmacr 726 times109
45
R1 emacraq + Hbull rarr H2 + OHmacr 276 times10
10
45
R2 emacraq + bullOH rarr OHmacr 355 times10
10
45
R3 emacraq + bullOmacr rarr 2OHmacr 231 times10
10
49
R4 emacraq + H2O2 rarr OHmacr + bullOH 136 times10
10
45
R5 emacraq + HO2bull rarr HO2macr 130 times10
10
45
R6 emacraq + HO2macr rarr Obullmacr + OHmacr 351 times10
9
49
R7 emacraq + O2 rarr O2bullmacr 225 times10
10
45
R8 emacraq + O2bullmacr rarr O2
2macr + H2O 130times10
10
4349
R9 Hbull + H
bull rarr H2 514 times10
9
45
R10 Hbull +
bullOH rarr H2O 109 times10
10
45
R11 Hbull + H2O2 rarr
bullOH + H2O 365 times10
7
45
R12 Hbull + O2 rarr HO2
bull 130 times10
10
45
R13 Hbull + O2
bullmacr rarr HO2macr 114 times10
10
45
R14 Hbull + HO2
bull rarr 2
bullOH 114 times10
10
45
R15 Hbull + HO2macr rarr
bullOH + OHmacr 137times10
9
85
Chapter 3 Computational Methodology
92
R16 Hbull + O3 rarr
bullOH + O2 220 times10
10
43
R17 bullOH +
bullOH rarr H2O2 481 times10
9
45
R18 bullOH + H2O2 rarr H2O + HO2
bull 292 times10
7
45
R19 bullOH + HO2macr rarr OHmacr + HO2
bull 813 times10
9
45
R20 bullOH + HO2
bull rarr H2O + O2 884 times10
9
45
R21 bullOH + O2
bullmacr rarr OHmacr + O2 110 times10
10
45
R22 bullOH + O3 rarr HO2
bull + O2 110 times10
8
43
R23 bullO3macr + H2O2 rarr O2
bullmacr + O2 + H2O 159 times10
6
43
R24 bullO3macr + HO2macr rarr O2
bullmacr + O2 + OHmacr 887 times10
5
43
R25 bullO3macr + H2 rarr O2 + H
bull + OHmacr 249times10
5
46
R26 bullO3macr +
bullOH rarr HO2
bull + O2
bullmacr 6000 times10
9
43
R27 bullO3macr +
bullOH rarr HOmacr + O3 250 times10
9
43
R28 bullO3macr + H
+(aq) rarr O2 +
bullOH 900 times10
10
43
R29 O2bullmacr + O2
bullmacr +1198672119874rarr
O2 + O22macr 299times10
-1
43
R30 O2bullmacr + HO2macr rarr
O2 + bullOmacr + OHmacr 823 times10
-2
43
R31 O2bullmacr + H2O2 rarr
O2 +
bullOH + OHmacr 130 times10
-1
43
R32 O2bullmacr + HO2
bull rarr O2 + HO2macr 760times10
7
43
R33 O2bullmacr +
bullO3macr rarr
O2macr+ 2O2 100 times10
4
43
R34 O2bullmacr + O3 rarr
bullO3macr + O2 150 times10
9
43
R35 HO2bull + HO2
bull rarr H2O2 + O2 840 times10
5
45
R36 HO2bull + H2O2 rarr O2 + H2O +
bullOH 500 times10
-1
49
R37 HO2bull + O3 rarr
bullOH + 2O2 500 times10
8
43
R38 H2O2 + HO2macr rarr O2 + H2O + OHmacr 450times10-4
43
R39 O3 + OHmacr rarr HO2macr + O2 480 times101
43
R40 O3 + HO2macr rarr bullOH + O2 + O2
bullmacr 550 times10
6
43
R41 O3 + H2O2 rarr bullOH + O2 + HO2
bull 371 times10
-2
43
R42 Hbull +
bullOmacr rarr OHmacr 200times10
10
43
Chapter 3 Computational Methodology
93
R43 bullO3macr + emacraq rarr 2OHmacr
+
O2 160times10
10
43
R44 O3 + emacraq rarr bullO3macr 360 times10
10
43
R45 H2O2 rarr 2bullOH 230 times10
-7
86
R46 O2macr + H2O rarr 2OHmacr
100 times10
10
43
R47 bullOmacr + H2 rarr
bullH + OHmacr 128 times10
8
45
R48 bullOmacr + H2O2 rarr O2
bullmacr + H2O 555 times10
8
49
R49 bullOmacr + HO2macr rarr O2
bullmacr + OHmacr 786 times10
8
45
R50 bullOmacr + O2
bullmacr rarr O
2macr + O2 600 times10
8
43
R51 bullOmacr +
bullOmacr rarr O2
2macr 100times10
8
43
R52 bullOmacr +
bullOH rarr HO2macr 761 times10
9
49
R53 bullOmacr + O3macr rarr 2O2
bullmacr 700times10
8
43
R54 bullOmacr + O3 rarr O2
bullmacr + O2 100 times10
9
43
Table 13 A list of reactions used to model water radiolysis
Chapter 3 Computational Methodology
94
Equilibria kf
(M-1
s-1
25degC)
kb
(M-1
s-1
25degC) Ref
R5556 H2O H+
(aq) + OHmacr 117 times10-3
118times1011
45
R5758 H2O2 H+
(aq) + HO2macr 890 times10-2
478times1010
45
R5960 H2O2 + OHmacr HO2macr + H2O 127 times1010
140 times106
45
R6162 HO2macr + OHmacr
O22macr + H2O 351 times10
5 110 times10
6
43
R6364 bullOH H
+(aq) +
bullOmacr 890 times10
-2 478times10
10
45
R6566 bullOH + OHmacr
bullOmacr + H2O 127 times10
10 140 times10
6
45
R6768 bullOmacr + O2
bullO3macr 375 times10
9 262 times10
3
45
R6970 HO2bull H
+(aq) + O2
bullmacr 478 times10
10 735 times10
5
45
R7172 HO2bull + OHmacr O2
bullmacr+ H2O 127 times10
10 163 times10
-1
45
R7374 Hbull emacraq + H
+(aq) 583 210times10
10
45
R7576 Hbull + OHmacr emacraq + H2O 244 times10
7 174 times10
1
45
R7778 Hbull + H2O H2 +
bullOH 458 times10
-5 395 times10
7
45
R79 H2(aq) H2(g) 269times10-3
R80 O2(aq) O2(g) 103times10-4
Table 14 A list of equilibria used to model the radiolysis of water
Chapter 3 Computational Methodology
95
Computational Assumptions and Error
The first assumption this model makes is that radiolysis does not occur in the gas phase In
reality this is not the case however the density of the gas phase is so small compared to that
of the aqueous phase that any contribution from gas phase radiolysis will be negligible
There are several reactions that do not include any kind of temperature dependence for their
associated rate constants This is due to a lack of information available in the literature
many of the species involved in these reactions are notoriously difficult to measure reaction
rate constants for thus these reactions have a fixed rate constant across all temperatures
The method for estimating the primary yields to account for both temperature and pH
effects is not an ideal method Multiple linear regression analysis is often used to
empirically predict the value of a single dependant variable based on the contributions of
multiple independent variables In the case of this model the independent variables are
temperature and pH a full model would also include LET as a third independent variable
The number of observations considered for the regression analysis is less than ideal due to
the scarcity of available data coupled with the difficulty of relating non-linear variables
means that predictions of primary yields are loose estimates at best The coefficient of
determination (R2) gives information about how well the multiple regressions fit the data
and is shown in Table 15 where μ denotes the estimated standard deviation of the error
Primary Yield
R2 μ
g(eaq-) 0612 0249
g(H2O2) 0934 0045
g(H2) 0907 0032
g(bullOH) 0950 0265
g(Hbull) 0925 0108
Table 15 Statistical information concerning the estimation of primary yields used to model
the radiolysis of water
Chapter 3 Computational Methodology
96
The partition of volatile species depends on a number of parameters some of which are
dependent on geometry Although H2O2 is not a volatile species its concentration is
strongly affected by the concentration of aqueous O2 it is therefore necessary to include gas
partitioning methods in both H2 and H2O2 model calculations The interfacial surface area
(Aint) is one such parameter although this can be roughly determined by measuring the
geometry of the vials being used Other parameters such as the boundary thicknesses (δ) are
not so easily measured and are parameter fitted This is done using the parameter fitting
functionality built into FACSIMILE Experimental data is supplied to FACSIMILE and the
desired parameters to fit are declared the calculation is then performed a number of times
slightly varying the declared parameters each time until the predicted values better match
the provided experimental data For this work the data provided to FACSIMILE was the
concentration of H2 and H2O2 in aerated water as a function of dose (Figures 32-33) Vials
of different geometry have different boundary thicknesses the values used throughout this
work are shown in Table 16
Parameter
Vial Used for H2 Analysis Vial Used for H2O2 Analysis
Aint (m2) 502 times10
-5 284 times10
-4
δaq (m) 580 times10-4
510 times10-4
δg (m) 260 times10-2
260 times10-2
Table 16 Parameters used to describe interfacial surface area (Aint) and boundary
thicknesses (δ) for sample vials of different geometry
Chapter 4 The Radiolysis of Aqueous Solutions at High pH
97
Chapter 4 The Radiolysis of Aqueous Solutions at High pH
Preliminary Radiolysis Studies of Pure Water
Preliminary experiments to measure hydrogen peroxide and hydrogen gas concentrations
from the radiolysis of aerated and deaerated water at neutral pH were carried out as a
control to which other measurements may be compared Computational modelling of these
pure water systems were performed with the radiolysis model described in Chapter 3 to
validate the models performance
Measurements of hydrogen peroxide were made using the Ghormley Tri-iodide method
described in Chapter 2 The pH of the stock was measured using a Mettler Toledo
SevenMultitrade pH meter equipped with a probe capable of measuring pH in the range 0-14
and was found to be 699 Aliquots of 10 mL from the pure water stock were sealed in
20 mL headspace vials so that the liquid to headspace ratio was 11 and were irradiated in
row 1 of the 4x8 sample rack the average dose rate was 2839 Gy min-1
The experiment
was run twice prior to irradiation samples used in the first run were sealed but left aerated
while samples used in the second run were sealed in gas tight vials equipped with rubber
septa and were sparged for 20 minutes with zero grade argon gas to remove all dissolved
oxygen The results of the two experimental runs are shown in Figure 32
Preliminary measurements of hydrogen gas production were also carried out using pure
water 2 mL aliquots of pure water stock were flame sealed in 4 mL glass vials which were
then secured in the inverter rig and irradiated for various periods of time the average dose
rate was 2851 Gy min-1
Post irradiation analysis was carried out by the previously
described crush tube method of gas chromatography
Chapter 4 The Radiolysis of Aqueous Solutions at High pH
98
As flame sealing introduces slight irregularity in the volume of headspace an assumption
was made that the headspace of the sealed vial was 2 mL
This allows the conversion of measured quantities (microL) of hydrogen to a concentration
(mol dm-3
) Once again the experiment was run twice with the second experimental run
using samples that have been deaerated with argon and the results are shown in Figure 33
Figure 32 Measurements of H2O2 concentration as a function of dose for aerated water
(diams) and deaerated water (diams) Vertical error bars show the standard deviation between
replicates while horizontal error bars show the dose range for replicates
000E+00
100E-06
200E-06
300E-06
400E-06
500E-06
600E-06
700E-06
800E-06
000E+00
200E-05
400E-05
600E-05
800E-05
100E-04
120E-04
140E-04
0 10 20 30 40
[H2O
2]
(mo
l d
m-3
) D
eaer
ated
[H2O
2]
(mo
l d
m-3
) A
erat
ed
Dose (kGy)
Aerated Water
Deaerated Water
Chapter 4 The Radiolysis of Aqueous Solutions at High pH
99
Figure 33 Measurements of H2 as a function of dose in aerated (diams) and deaerated (diams)
samples Vertical error bars show the standard deviation of replicates while horizontal
error bars show the dose range for replicates
Discussion
Aerated samples resulted in a steady-state concentration of hydrogen peroxide at
approximately 11 times10-4
mol dm-3
while molecular hydrogen continues to form with
absorbed dose over the range considered In order to satisfy the mass balance requirements
some other species must be formed after the achievement of the peroxide steady-state that
is also proportional to hydrogen formation The most likely candidate for this is molecular
oxygen which would have to be formed at half the rate of hydrogen
Samples that did not contain any dissolved oxygen failed to produce significant quantities
of hydrogen peroxide or hydrogen gas with a very low steady state eventually achieved at
approximately 40 times10-6
mol dm-3
This may be attributed to the radiolytic production of
oxygen required to satisfy mass balance Using the radiolysis model a predicted chemical
yield can be obtained after the establishment of the hydrogen peroxide steady state to show
that mass balance is satisfied by oxygen production The predicted chemical yields were
calculated between doses of 15 kGy to 30 kGy
000E+00
100E-04
200E-04
300E-04
400E-04
500E-04
600E-04
700E-04
800E-04
0 10 20 30 40 50 60
[H2]
(mo
l d
m-3
)
Dose (kGy)
Aerated Water
Deaerated Water
Chapter 4 The Radiolysis of Aqueous Solutions at High pH
100
For oxygen gas the predicted chemical yield was G(O2) = 0011 while the predicted yield
of hydrogen gas formation in deaerated water was G(H2) = 0022 In both cases samples
that were aerated produced much larger quantities of hydrogen and hydrogen peroxide than
their deaerated equivalents This was somewhat expected as it has long been considered
that dissolved oxygen is reduced and the reduction products are able to react with hydroxyl
radicals preventing them from removing hydrogen peroxide and hydrogen87
The general
scheme first proposed in 1954 for this protection mechanism is initiated by the reaction of
hydrogen atoms with oxygen to produce hydroperoxyl radicals these then react with
hydroxyl radicals to reform water and oxygen or with itself to form hydrogen peroxide and
oxygen4
119867bull + 1198742 rarr 1198671198742bull
(R12)
bull119874119867 + 11986721198742 rarr 1198672119874 + 1198671198742bull
(R18)
1198671198742bull + 1198671198742
bull rarr 11986721198742 + 1198742 (R35)
bull119874119867 + 1198671198742bull rarr 1198672119874 + 1198742 (R20)
More recent studies by the research group led by Clara Wren have deployed computational
methods to investigate further the effects of dissolved oxygen on the steady-state
concentration of both hydrogen peroxide and molecular hydrogen86
The calculations
performed in this study also supported the idea that dissolved oxygen is reduced and it is
the reduction products that scavenge hydroxyl radicals resulting in the protection of
hydrogen peroxide and molecular hydrogen The calculations revealed that oxygen is
mainly reduced by the hydrated electron and that the superoxide formed is responsible for
the scavenging of hydroxyl radicals This process serves as a catalytic mechanism for the
overall reaction between the solvated electron and hydroxyl radicals
Chapter 4 The Radiolysis of Aqueous Solutions at High pH
101
119890119886119902minus + 1198742 rarr 1198742
minus (R7)
1198742minus + bull119874119867 rarr 119874119867minus + 1198742 (R21)
Overall Reaction 119890119886119902minus + bull119874119867 rarr 119874119867minus (R2)
This scavenging of hydroxyl radicals has a larger impact on protecting hydrogen as the
reaction between hydrogen and the hydroxyl radical is the only significant removal path of
hydrogen in neutral conditions
Wren proposes that high concentrations of hydrogen peroxide seen in aerated solutions can
be attributed to a change in the production pathway for hydrogen peroxide in the presence
of oxygen The reaction between both the reduction products of oxygen becomes the
dominant production pathway for hydrogen peroxide
1198671198742bull + 1198742
minus rarr 1198671198742minus + 1198742 (R32)
119867(119886119902)+ + 1198742
minus 1198671198742bull (R6970)
119867(119886119902)+ + 1198671198742
minus 11986721198742 (R5758)
Similar calculations were performed in this work using the computational method described
in Chapter 3 The computational predictions shown in figures 34 and 35 serve as a baseline
to demonstrate that the computational model performs well at least at a fundamental level
before building up to more complex systems
Chapter 4 The Radiolysis of Aqueous Solutions at High pH
102
Figure 34 Predicted concentrations of H2O2 as calculated by the radiolysis model for both
aerated () and deaerated () conditions
Figure 35 Predicted concentrations of H2 gas as calculated by the radiolysis model for
both aerated () and deaerated () conditions
000E+00
100E-06
200E-06
300E-06
400E-06
500E-06
600E-06
700E-06
800E-06
000E+00
200E-05
400E-05
600E-05
800E-05
100E-04
120E-04
140E-04
0 10 20 30 40
[H2O
2]
(mo
l d
m-3
) D
eaer
ated
[H2O
2]
(mo
l d
m-3
) A
erat
ed
Dose (kGy)
Aerated Water
FACSIMILE Aerated
Deaerated Water
FACSIMILE Deaerated
000E+00
100E-04
200E-04
300E-04
400E-04
500E-04
600E-04
700E-04
800E-04
0 10 20 30 40 50 60
H2 (
mo
l d
m-3
)
Dose (kGy)
Aerated Water
Deaerated Water
FACSIMILE Aerated
FACSIMILE Deaerated
Chapter 4 The Radiolysis of Aqueous Solutions at High pH
103
The predictions made for the concentrations of hydrogen peroxide and hydrogen gas in pure
water match well with the observed measurements especially for the concentration of
hydrogen peroxide produced in aerated water The most obvious discrepancy is the
disparity between the early predictions of hydrogen peroxide concentration and the
measured concentration for deaerated samples which is most likely due to imperfect
oxygen removal from the samples As the predictions are in generally good agreement with
the experimental measurements it is not unreasonable to assume that steady state
concentrations of other species which cannot or were not determined experimentally
during this work can be estimated by the model
Figure 36 Calculated concentrations of the major oxidising and reducing water radiolysis
species as a function of dose Solid lines represent aerated conditions while broken lines
represent deaerated conditions
Figure 36 shows the predicted concentrations of various radical species in both aerated and
deaerated water The calculated concentrations agree with previously published calculations
by Wren and co-workers86
100E-14
100E-12
100E-10
100E-08
100E-06
0 10 20 30 40 50
Co
nce
ntr
atio
n (
mo
l d
m-3
)
Dose (kGy)
˙OH
O2˙-
H˙
eaq-
HO2˙
Chapter 4 The Radiolysis of Aqueous Solutions at High pH
104
Under aerated conditions reducing species H˙ and eaq- have significantly lower
concentrations than in deaerated conditions due to scavenging by oxygen The resulting
reduction products of oxygen are superoxide and hydroperoxyl radicals and both show an
increased concentration in aerated conditions
The experiments in the following sections concerning the measurement of hydrogen
peroxide were all performed in aerated conditions to resemble the conditions at the
Sellafield site Measurements of hydrogen were for the most part carried out under
deaerated conditions
Chapter 4 The Radiolysis of Aqueous Solutions at High pH
105
Measurements of H2O2 in the Radiolysis of High pH Solutions
Stock solutions of various pH were prepared using NaOH dissolved in ultra-pure water
From each stock sample sets were prepared from 10 mL aliquots of stock solution and
sealed in 20 mL glass vials with aluminium crimp caps The pH of the remaining sample
stocks were measured and recorded Irradiation dose rates were calculated from original
measurements using the Fricke dosimetry method described previously Sample sets were
loaded into row 1 of the 4x8 irradiation rack and irradiated using the Model-812 cobalt-60
irradiator until they reached the desired dose Table 17 summarises the dose rates and pH of
the sample batches examined
Sample Batch ID Average Dose Rate for Row 1 (Gy min-1
) Measured pH
H2O2-PH00 28512 699
H2O2-PH01 27497 1041
H2O2-PH02 27407 1108
H2O2-PH03 28364 1230
H2O2-PH04 27467 1274
Table 17 Conditions of samples used to investigate hydrogen peroxide in high pH
radiolysis
Results
Post irradiation analysis for H2O2 was carried out immediately after irradiation using the
previously described tri-iodide method Analysis of high pH samples required additional
acid to lower the pH to the conditions required by the analytical method the quantities of
acid used were recorded and the dilution effects have been accounted for The results of this
study are shown in Figure 37
Chapter 4 The Radiolysis of Aqueous Solutions at High pH
106
Figure 37 Measurements of H2O2 concentrations as a function of dose for samples
initially at pH 7 (diams) pH 104 (diams) pH 11 (diams) pH 123 (diams) and pH 127 (diams)
All samples were aerated Vertical error bars are the standard deviation between
replicates while horizontal error bars show the dose range for replicates
The steady state concentration of hydrogen peroxide is fairly consistent at about
115 x10-4
mol dm-3
within the pH range 7-11 each attaining steady state after roughly
5 kGy At higher pH values both the steady state concentration and the dose at which
steady state is achieved increase
Samples at pH 123 required roughly 10 kGy to obtain a peak steady-state concentration of
195 x10-4
mol dm-3
of hydrogen peroxide while samples at pH 127 required even higher
doses almost 20 kGy to reach a steady concentration of 238 x10-4
mol dm-3
The data set
from samples at pH 123 shows an apparent decrease in hydrogen peroxide concentration of
~18 at 35 kGy A similar decrease in hydrogen peroxide concentration is also observed in
samples of pH 11
000E+00
500E-05
100E-04
150E-04
200E-04
250E-04
300E-04
0 10 20 30 40
[H2O
2]
(mo
l d
m-3
)
Dose (kGy)
pH 127
pH 123
pH 11
pH 104
pH 7
Chapter 4 The Radiolysis of Aqueous Solutions at High pH
107
Measurements of H2 in the Radiolysis of High pH Solutions
Stock solutions of various pH were prepared using NaOH to match the pH range used in
the measurement of hydrogen peroxide Many of the acid-base equilibria used in the
description of water radiolysis have pKa values in the pH range investigated by this study
The behaviour of H2 production observed at high pH may be influenced by a change in
chemistry brought about by a shift in one or more of the acid-base equilibria Table 18
shows the equilibria of interest and their associated pKa value while Table 19 includes the
measured pH of the stock solutions
Equilibrium pKa
bull119926119919 119919(119938119954)+ + bull119926minus 1184
119919120784119926120784 119919(119938119954)+ +119919119926120784
minus 1168
119919bull 119919(119938119954)+ + 119942119938119954
minus 974
119919119926120784bull 119919(119938119954)
+ + 119926120784minus 483
Table 18 A list of important equilibria and their associated pKa values
For the measurement of hydrogen sample sets were prepared from 2 mL aliquots of stock
solution which were transferred to glass ldquocrush tuberdquo vials described in chapter two The
vials were connected to a glass manifold via stainless steel needles and sparged with zero
grade argon for 20 minutes to remove any dissolved oxygen before samples were flame
sealed under argon
Irradiation dose rates were calculated from original Fricke dosimetry study described
previously Samples were loaded into the four positions available in the inverter rig and
irradiated until they reached the desired dose
Chapter 4 The Radiolysis of Aqueous Solutions at High pH
108
Results
After irradiation samples were analysed for hydrogen gas by gas chromatography using the
ldquocrush tuberdquo technique described in Chapter 2 Figure 38 shows the amounts of H2
produced as a function of radiation dose As production rates of hydrogen gas are linear as a
function of absorbed dose chemical yields can be identified as the gradient expressed in
terms of molecules per 100 eV of absorbed energy These results are summarised in Table
19 while the data is shown in Figure 38
Table 19 Conditions of samples used to investigate hydrogen gas in high pH radiolysis
Figure 38 Measurements of H2 gas as a function of dose at pH 7 (diams) pH 106 (diams) pH 123
(diams) and pH 13 (diams) Dashed lines are provided to clarify the data trends all samples were
deaerated Vertical error bars show the standard deviation between replicates while
horizontal error bars show the dose range for replicates
000E+00
500E-04
100E-03
150E-03
200E-03
250E-03
0 20 40 60 80
H2 (
mo
l d
m-3
)
Dose (kGy)
pH 13
pH 123
pH 106
pH 7
Sample
Batch ID
Average Dose Rate for
Inverter Rig (Gy min-1
) Measured pH G(H2) Error plusmn
H2-PH00 28385 699 0021 0002
H2-PH01 28408 1063 0071 0018
H2-PH02 29039 1232 0352 0005
H2-PH03 28634 1307 0176 0010
Chapter 4 The Radiolysis of Aqueous Solutions at High pH
109
Increasing the pH has the effect of increasing the chemical yield for hydrogen over the pH
range 7 to 123 however the data set for pH 13 shows that the chemical yield for hydrogen
is less than samples at pH 123 The results of the calculations using the reaction scheme
given in Tables 12 - 14 for both hydrogen peroxide and hydrogen gas production are
shown in Figures 39 and 40 respectively
Figure 39 Model calculations to show the predicted concentrations of H2O2 as a function
of dose at various pH
000E+00
500E-05
100E-04
150E-04
200E-04
250E-04
300E-04
350E-04
0 10 20 30 40 50
[H2O
2]
(mo
l d
m-3
)
Dose (kGy)
pH 127
pH 123
pH 11
pH 104
pH 7
Chapter 4 The Radiolysis of Aqueous Solutions at High pH
110
Figure 40 Model calculations to show the predicted concentrations of H2 gas as a function
of dose at various pH
Calculated concentrations of hydrogen peroxide show the same trends as the data The
predictions at pH 104 and 11 take slightly longer to reach steady state than what the
experimental data shows Higher pH calculations follow the same trend as the experimental
data but overestimate the steady state concentrations of hydrogen peroxide especially in the
calculations at pH 127
Calculated concentrations of molecular hydrogen follow a slightly more unexpected trend
Predictions made for pH 106 massively overestimate hydrogen production rates this is
symptomatic of a misunderstanding of the mechanistic chemistry A similar error has also
been noted by Wren when performing calculations at this pH a suggested fix was to
increase the reaction rate between ozinide and molecular hydrogen by a factor of 886
000E+00
500E-04
100E-03
150E-03
200E-03
250E-03
300E-03
0 20 40 60 80
[H2]
(mo
l d
m-3
)
Dose (kGy)
pH 13
pH 123
pH 106
pH 7
Chapter 4 The Radiolysis of Aqueous Solutions at High pH
111
Even with this higher rate the over prediction of hydrogen is still large at pH 106 while
predictions for pH 123 agree reasonably well with experimental data This information at
least helps to narrow the pH range at which this misunderstanding manifests The pH range
afflicted by over prediction of hydrogen falls close to the pKa of the dissociation of the
hydrogen atom at 974
119867bull 119867(119886119902)+ + 119890(119886119902)
minus pKa = 974
The reverse reaction rate for the above equilibrium has been measured with good agreement
over a number of laboratories however the forward reaction rate is calculated based on the
relationship between the reverse reaction rate and the equilibrium constant45
This
equilibrium constant is derived from the Gibbs free energy of formation of Hbull in the gas
phase combined with an estimated value for the free energy of solvation of Hbull This
estimation is a value between those for the free energy of solvation of He atoms and H2
molecules888
Both computational and experimental data show the same trend at pH 13 in that the
production rate of hydrogen is less than that observed at lower pH however the
calculations once again overestimate the rate shown by the experimental data Some more
features of this discrepancy are discussed further in the following section
Chapter 4 The Radiolysis of Aqueous Solutions at High pH
112
Discussion
The radiolytic removal of hydrogen from solution by the hydroxyl radical has long been
referred to as the Allen chain25
In this mechanism the hydroxyl radical reacts with
molecular hydrogen to reform water and a hydrogen atom the chain is then extended by the
reaction of the hydrogen atom with hydrogen peroxide to reform the hydroxyl radical with
the net effect being the removal of H2 and H2O2
Propagation Steps
bull119874119867 + 1198672 rarr 119867bull + 1198672119874 k78 = 40 times10
7 M
-1 s
-1
119867bull + 11986721198742 rarr bull119874119867 + 1198672119874 k11 = 365times107 M
-1 s
-1
Termination 119867bull + bull119874119867 rarr 1198672119874 k10 = 109times1010
M-1
s-1
Aside from transference into the gas phase this chain is the only removal path for hydrogen
under neutral pH conditions At higher pH radical species are converted into their base
forms and a new chain is established43
119867bull + 119874119867minus 119890119886119902minus + 1198672119874 (R7576)
bull119874119867 + 119874119867minus 119874bullminus + 1198672119874 (R6566)
Propagation Steps
119874bullminus + 1198672 rarr 119890119886119902minus + 1198672119874 k47 = 128 times10
8 M
-1 s
-1
119890119886119902minus + 1198671198742
minus rarr 119874bullminus + 119874119867minus k49 = 786times108 M
-1 s
-1
Termination 119890119886119902minus + 119874bullminus rarr 2119874119867minus k3 = 231times10
10 M
-1 s
-1
Chapter 4 The Radiolysis of Aqueous Solutions at High pH
113
Given the higher rate constants involved in the alkali chain it would seem that the chain
reaction established in the basic form has a higher efficiency than its neutral equivalent yet
observations show a higher chemical yield of hydrogen at high pH and would suggest
otherwise This can largely be resolved by considering the effects of oxygen on these chain
reactions Oxygen acts as a poison to both the chain reactions removing hydrogen causing
an increase in hydrogen yield The mechanism by which oxygen disrupts the chain is
through reactions with solvated electrons to produce superoxide which in turn reacts with
OH radicals or in the case of alkali solutions bullOˉ preventing them from reacting with
hydrogen as well as reforming oxygen
119890119886119902minus + 1198742 rarr 1198742
bullminus (R7)
bull119874119867 + 1198742bullminus rarr 119874119867minus + 1198742 (R21)
bull119874minus + 1198742bullminus + 1198672119874 rarr 2119874119867
minus + 1198742 (R50)
In alkali solution bullOˉ is also susceptible to a direct reaction with oxygen to form ozonide
ions while a neutral equivalent reaction between hydroxyl radicals and oxygen does not
exist As the experimental measurements of hydrogen gas from solutions of sodium
hydroxide were carried out in deaerated conditions there should be no initial dissolved
oxygen and any oxygen present would have been radiolytically formed Figure 41 shows
the calculated steady state concentration of aqueous oxygen compared to hydrogen gas
formation as a function of pH from this it is clear that an increase in pH leads to a rise in
radiolytically produced oxygen which is proportional to the amount of hydrogen generated
Chapter 4 The Radiolysis of Aqueous Solutions at High pH
114
Figure 41 Model calculations showing the concentrations of aqueous oxygen and
hydrogen gas from deaerated water after 80 kGy at 280 Gy min-1
to show the related
behaviour between the two
Analysis of the calculated reaction rates gives an insight to why the concentration of
radiolytic oxygen first rises with pH and then falls after pH 12 and may help to reveal the
source of the over-prediction at pH 106 All the following reaction rates are taken from the
end of the experimental range ie 80 kGy with a dose rate of 280 Gy min-1
At neutral pH
it is the reaction between the superoxide ion and the hydroxyl radical (R21) that is the main
source of radiolytic oxygen but as the pH rises beyond pH 10 the rate of this reaction
begins to fall from ~140 times10-6
mol dm-3
s-1
to 886 times10-8
mol dm-3
s-1
at pH 14 This drop
is mainly due to the equilibrium between the hydroxyl radical and its basic form bullOˉ which
has a pKa of 119 As one would expect the reaction rate of the equivalent base reaction
(R50) rises as the pH increases although this increase does not fully compensate for the
decrease in rate of R21
100E-06
100E-05
100E-04
100E-03
100E-02
7 8 9 10 11 12 13 14
Lo
g C
on
cen
trat
ion (
mo
l d
m-3
)
pH
[H2] g
[O2] aq
Chapter 4 The Radiolysis of Aqueous Solutions at High pH
115
This is because the reaction between the solvated electron and superoxide (R8) has a larger
rate constant than R50 and with the conversion of hydrogen atoms to solvated electrons at
high pH R8 out competes R50
In principal many other reactions produce oxygen but the rates of these reactions are often
negligible Only the rate of oxygen production through the reaction of superoxide and
hydroperoxyl (R32) sees an increase over the pH range 10-12 which may be significant to
radiolytic oxygen production Figure 42 shows the rates of the three main molecular oxygen
producing reactions (R21 R50 and R32) as well as the reaction rate for R8 and the
combined reaction rates for R8 and R50 as a function of pH When the combined reaction
rates of R8 and R50 are compared with the reaction rate of R21 it becomes obvious that
there is a transition from the removal of super oxide by R21 to removal by both R8 and
R50 this is the main cause of a decrease in oxygen concentration after pH 12 Figure 43
shows the sum of reaction rates that lead to oxygen formation and removal as a function of
pH
Figure 42 Model predictions of the steady-state reaction rates of R21 R50 and R32 at
various pH for γ radiolysis of deaerated water at a dose rate of 280 Gy min-1
000E+00
200E-07
400E-07
600E-07
800E-07
100E-06
120E-06
140E-06
160E-06
7 8 9 10 11 12 13 14
Rea
ctio
n R
ate
at S
tead
y S
tate
(mo
l d
m-3
s-1
)
pH
Chapter 4 The Radiolysis of Aqueous Solutions at High pH
116
Figure 43 The sum of the steady state rates of all reactions that produce O2 () compared
with the sum of the steady state rates of all reactions that remove O2 () These totals do
not include rates of production or removal from mass transfer reactions This calculation is
for the γ radiolysis of deaerated water to a dose of 80 kGy at a rate of 280 Gy min-1
At pH 7 the rate of oxygen production matches the rate at which it is removed and a low
steady state concentration of aqueous oxygen is achieved before the end of the 80 kGy
calculation range At higher pH the rate of oxygen removal diverges and so oxygen can
accumulate to a higher concentration over a longer period of time longer than that of the
80 kGy range used Excluding transfer into the gas phase there are only three reactions that
effectively remove oxygen so it was worth investigating how the rates of these reactions
changed with pH Figure 44 shows the rates of reactions R6 R7 R8 R12 and R67 as a
function of pH
000E+00
200E-07
400E-07
600E-07
800E-07
100E-06
120E-06
140E-06
160E-06
7 8 9 10 11 12 13 14
Rat
e at
Ste
ady S
tate
(mo
l d
m-3
s-1
)
pH
Chapter 4 The Radiolysis of Aqueous Solutions at High pH
117
Figure 44 Model predictions of the steady-state reaction rates of R7 R12 and R67 at
various pH This calculation is for the γ radiolysis of deaerated water to a dose of 80 kGy
at a rate of 280 Gy min-1
The first removal path of oxygen is the reaction between the solvated electron and oxygen
to produce superoxide (R7) this reaction does not see a significant change in rate below
pH 11 after which the rate begins to fall The second reaction is the reduction of oxygen by
the hydrogen atom (R12) the rate of this reaction falls steadily as pH increases this is due
to the conversion of hydrogen atoms to solvated electrons by hydroxide which has a pKa of
96 The decline in rate of this reaction accompanied by no significant increase in the rate
of oxygen removal by solvated electrons may be the main contribution to the increased
concentrations of oxygen at pH gt 9 It was thought that this might also be the cause of the
over prediction but any attempt to increase this rate constant is largely negated by an
accompanying increase in the rate of reaction R32 The final removal path of oxygen is the
reaction with O˙- to form ozonide (R67)
000E+00
200E-07
400E-07
600E-07
800E-07
100E-06
120E-06
7 8 9 10 11 12 13 14
Rea
ctio
n R
ate
at S
tead
y S
tate
(mo
l d
m-3
s-1
)
pH
Chapter 4 The Radiolysis of Aqueous Solutions at High pH
118
The rate of this reaction increases rapidly with pH from 194 times10-8
mol dm-3
s-1
at pH 9
to 146 times10-6
mol dm-3
s-1
at pH 14 however ozonide is unstable and decomposes to reform
oxygen at a rate not much lower than its formation
Subtracting the rate of oxygen reformation from the decomposition of ozonide gives the
actual rate of oxygen removal by bullOˉ of 110 times10
-9 mol dm
-3 s
-1 at pH 9 and
600 times10-8
mol dm-3
s-1
at pH 14 It should be noted that the decomposition rate of ozonide
was excluded from the total rate of oxygen formation in figure 44 while the rate of oxygen
removal by ozonide formation was the subtracted values quoted above
The main removal mechanism of hydrogen peroxide is by reaction with solvated electrons
In the presence of oxygen the removal of hydrogen peroxide by solvated electrons is
largely out competed by reactions between the solvated electrons and oxygen or
superoxide The rate constant for the reaction between oxygen and the solvated electron
(R7) is 225 times1010
dm3 mol
-1 s
-1 while for the reaction of hydrogen peroxide and the
solvated electron (R4) is only 136 times1010
dm3 mol
-1 s
-1 and so hydrogen peroxide is initially
protected from reactions with the solvated electron as long as oxygen or superoxide is
available In alkali conditions where the pH is larger than 116 the conjugate base of
hydrogen peroxide HO2- becomes the dominant peroxide species This reacts even slower
with the solvated electron with a rate constant of 365 times109
dm3 mol
-1 s
-1 so the protection
effect is even stronger It was mentioned earlier that beyond pH 11 the rate of reaction R21
falls significantly as bullOH is converted to its basic form and the equivalent base reaction
(R50) does not see a sufficient equivalent increase in rate The reason given was that R50
was out competed by the reaction between superoxide and the solvated electron (R8)
Chapter 4 The Radiolysis of Aqueous Solutions at High pH
119
This not only serves to protect hydrogen peroxide by competing with solvated electrons but
also contributes to the increased concentration of hydrogen peroxide as the product of R8 is
in fact hydrogen peroxide
119890119886119902minus + 1198742
bullminus rarr 11987422minus (R8)
11987422minus + 1198672119874 1198671198742
minus + 119874119867minus (R6162)
Although this may account for the increased steady state of hydrogen peroxide at high pH
Figure 39 still shows a slight over prediction for calculations made at pH 123 and 127 As
the equilibrium between the hydroxyl radical and the oxygen anion has a pKa of 1184 it
was thought that the over prediction could be a result of the estimations used for the rate
constants of the reactions involving the oxide radical anion There is little data available for
the rate constants of reactions involving bullOˉ As reaction R51 and R52 both lead to the
formation of peroxide it initially was thought that these reactions may have rate constants
that are too high however removing these reactions from the model made no significant
difference to the predicted production of H2O2
119874bullminus + 119874bullminus rarr 11987422minus
1198672119874rarr 1198671198742
minus + 119874119867minus (R51)
119874bullminus + bull119874119867 rarr 1198671198742minus (R52)
It was instead found that other oxide radical anion reactions had an effect on the predicted
value for H2O2 A total of four oxide radical anion reactions influence the predicted values
with two of them making a significant difference Reducing the rate constant for the
reactions R47 and R48 made a slight improvement to the prediction of H2O2 a more
significant effect can be seen by altering the rate constants for R49 and R50
Chapter 4 The Radiolysis of Aqueous Solutions at High pH
120
119874bullminus + 1198671198742minus rarr 1198742
minus + 119874119867minus (R49)
119874bullminus + 1198742minus rarr 1198742minus
1198672119874rarr 2119874119867minus + 1198742 (R50)
Originally the rate constant for R49 was an estimation reported by Buxton et al in 19889
with a value of 40 times108 M
-1 s
-1 Since then this rate constant has been measured by
C R Stuart and D C Ouellette and is reported as being 786 times108
M-1
s-1
at 25degC45
The
value for the rate constant for R50 was originally estimated by Sehested et al in 198289
to
be 60 times108 M
-1 s
-1 This estimation was made by adjusting the rate constant for R50 and
R53 in a kinetic model to produce a prediction that agreed with the decay of ozonide
measured experimentally by pulse radiolysis By increasing the rate constant for R50 from
60 times108 M
-1 s
-1 to 48 times10
9 M
-1 s
-1 an improved agreement to the predicted steady state
concentration of H2O2 is found This is shown in Figure 45
Figure 45 Dashed lines show the original prediction where k50 = 60 times108 M
-1 s
-1 while
solid lines show the predictions with the increased k50 = 48 times109 M
-1 s
-1
000E+00
500E-05
100E-04
150E-04
200E-04
250E-04
300E-04
350E-04
0 10 20 30 40 50
[H2O
2]
(mo
l d
m-3
)
Dose (kGy)
Chapter 4 The Radiolysis of Aqueous Solutions at High pH
121
With the modified reaction rate constant for R50 the predictions for the steady state
concentrations of H2O2 are closer to the experimental values at high pH
Although this calculation improves the prediction for the steady state concentration it also
appears to increase the rate at which the steady state is achieved moving the prediction
away from the experimental data The cause of this discrepancy may have something to do
with the way in which some of the equilibria have been implemented in the model and
should be investigated in the future This modification also has little effect on the over
prediction of hydrogen gas at pH 104
Chapter 5 Radiolysis of Magnesium Hydroxide
122
Chapter 5 Radiolysis of Magnesium Hydroxide
Context
The Magnox Swarf Storage Silo contains 22 silos used to store magnesium alloy cladding
that has been removed from spent Magnox fuel elements The magnesium fuel cladding is
stored underwater where it readily corrodes to form magnesium hydroxide and hydrogen
gas by the following reaction90
119872119892 + 21198672119874 rarr 119872119892(119874119867)2 +1198672
Hydrogen gas poses an obvious hazard and is closely monitored however production rates
are not predictable Much of the magnox fuel cladding is contaminated with uranium and
other fission products contributing an additional supply of hydrogen through water
radiolysis Dose rates are often further increased as some of the silos were used to dispose
of other beta and gamma emitting waste The presence of the magnesium hydroxide
complicates the radiolysis processes as (a low) solubility in water drives up the pH while
undissolved magnesium hydroxide provides additional surfaces where radiolysis processes
are poorly understood
Experiments were conducted to investigate the effects of magnesium hydroxide on the
radiolytic production yields of hydrogen gas and hydrogen peroxide The investigation
began by measuring hydrogen yields in solutions of magnesium hydroxide and comparing
hydrogen yields to solutions containing sodium hydroxide solution with the same pH Pure
water is also included as a control and the magnesium hydroxide samples included both
homogeneous saturated solutions of aqueous magnesium hydroxide and heterogeneous
slurries containing undissolved magnesium hydroxide
Chapter 5 Radiolysis of Magnesium Hydroxide
123
Method
The saturated solution was prepared in bulk using magnesium hydroxide (Sigma Aldrich
BioUltra ge 990) and ultra-pure water solids were separated by centrifuge as filters may
introduce organic contamination 2 mL aliquots of saturated magnesium hydroxide solution
were transferred to sample tubes and flame sealed under air The pH of the remainder of the
saturated solution was measured to be 106 Slurry samples were prepared by weighing
01 g of magnesium hydroxide into a glass vial before adding 2 mL of ultra-pure water
Samples were also flame sealed under air before being mechanically mixed by agitation
Samples were irradiated using the inverter rig however the samples were left stationary and
were not inverted during irradiation Samples were irradiated at an average dose rate
of 281 Gy min-1
until the desired dose was reached samples were then analysed for
hydrogen by the ldquocrush tuberdquo gas chromatography method previously described Figure 46
shows the production of hydrogen as a function of dose for both saturated solutions and
solid containing slurries of magnesium hydroxide This is compared with measurements
obtained from pure water and an aqueous solution of sodium hydroxide with a similar pH
to that of the magnesium hydroxide samples
Chapter 5 Radiolysis of Magnesium Hydroxide
124
Results
Figure 46 Measurements of H2 gas as a function of dose All samples here are aerated
with vertical error bars showing the standard deviation between replicates
It should be noted that all the samples used to produce figure 46 are aerated The chemical
yield of hydrogen for each sample set is given in Table 20
Table 20 Obtained results from the measurements of H2 gas
000E+00
200E-04
400E-04
600E-04
800E-04
100E-03
120E-03
140E-03
160E-03
180E-03
200E-03
0 10 20 30 40 50 60
[H2]
(mo
l d
m-3
)
Dose (kGy)
Sample ID Average Dose Rate for
Inverter Rig (Gy min-1
)
Measured
pH G(H2)
(Molecules 100 eV-1
) Error
plusmn
Mg(OH)2(s) 2814 1062 052 003
Mg(OH)2(aq) 2814 1057 047 002
NaOH 2845 1063 027 002
H2O 1732 699 016 001
Chapter 5 Radiolysis of Magnesium Hydroxide
125
The dose rate for the pure water samples is much lower than the other dose rates quoted as
this measurement was performed before the construction of the inverter rig and so the
samples were held further away from the source during irradiation
This data shows that the presence of magnesium hydroxide appears to increase the
hydrogen yield beyond what one would expect if the yield was controlled by pH alone
There is very little difference in hydrogen yield between samples that contain solid
magnesium hydroxide and samples that contain only dissolved magnesium hydroxide This
suggests that surface effects contribute to the hydrogen yield only a very small amount or
not at all This data is discussed further in the following section
A second set of experiments was conducted to measure the concentration of hydrogen
peroxide in irradiated saturated solutions of magnesium hydroxide 10 mL aliquots of
aerated saturated solution were transferred in to 20 mL glass headspace vials the vials were
sealed with an aluminium crimp cap and irradiated in the front row of the 4 x 8 rack the
average dose rate was 2831 Gy min-1
After irradiation the samples were analysed for
hydrogen peroxide by the Ghormley tri-iodide method described in Chapter 2 Figure 47
compares the obtained data from this experiment with data obtained from measurements
made in pure water
Chapter 5 Radiolysis of Magnesium Hydroxide
126
Figure 47 Measurements of H2O2 concentrations in aerated samples of saturated
magnesium hydroxide solution as a function of dose
The steady state concentration of hydrogen peroxide in a saturated solution of magnesium
hydroxide is almost the same as in a neutral sample of pure water as is expected given the
pH of the saturated solution was measured to be 106 which is below the 118 threshold
that is associated with an increased steady state of hydrogen peroxide observed in the
previous chapter
A further experiment was conducted to investigate the effects of the solid magnesium
hydroxide surface on the production of hydrogen Batches of samples were prepared with
various ratios of magnesium hydroxide to water each sample had a total mass of
approximately 2 g Table 21 summarises the sample ratios used Samples were irradiated
using the inverter rig which was left stationary throughout the irradiation the average dose
rate was 3042 Gy min-1
All samples were irradiated to approximately 525 kGy so that any
difference in the amount of hydrogen produced is independent of absorbed dose
000E+00
200E-05
400E-05
600E-05
800E-05
100E-04
120E-04
140E-04
0 5 10 15 20 25 30 35 40
[H2O
2]
mo
l d
m-3
Dose kGy
Aerated Water
Mg(OH)2 Saturated SolutionMg(OH)2 Aerated Saturated Solution
Chapter 5 Radiolysis of Magnesium Hydroxide
127
As the dose rate was determined by Fricke dosimetry which is a liquid phase dosimeter
with a density close to that of water the quoted dose of 525 kGy is what was received by
the aqueous phase The solid phase magnesium hydroxide has a slightly higher density and
will have received a slightly higher dose Figure 48 shows the chemical yields of hydrogen
as a function of water content percentage The results have been normalised to reflect the
amount of hydrogen produced per gram of water and the yields were calculated based on
the radiation dose absorbed by the whole system this makes the data from samples that
contain large quantities of water comparable to those with lower water content
Table 21 Conditions of samples containing Mg(OH)2 for measurements of H2
a ndash Powder sample with no added water estimated adsorbed water content is based on
data from Nelson et al91
b ndash Sample is a saturated solution of Mg(OH)2 ie contains no solid
H2O Average Mg(OH)2
Mass (g)
Average H2O
Mass (g)
Average
Dose (kGy)
4a 5303 plusmn 111
20 161 plusmn 002 040 plusmn 001 5245 plusmn 146
40 122 plusmn 002 082 plusmn 001 5255 plusmn 146
60 081 plusmn 001 122 plusmn 001 5255 plusmn 145
80 040 plusmn 001 162 plusmn 002 5245 plusmn 145
100b 5239 plusmn 145
Chapter 5 Radiolysis of Magnesium Hydroxide
128
Figure 48 Measurements of hydrogen yields from magnesium hydroxide samples with
various solid ndash aqueous ratios All samples were irradiated to a total dose of ~52 kGy to
the aqueous phase at a dose rate of 3041 Gy min-1
Discussion
The data shown in Figure 46 suggests that the presence of dissolved magnesium hydroxide
increases the chemical yield of hydrogen significantly more than if pH was the only
controlling factor Data shown in Figure 48 suggests that the presence of the solid surface
increases the hydrogen yield slightly above that for saturated solutions but it would seem
that the main contribution to the increased H2 yields in magnesium hydroxide samples
when compared to a solution of NaOH of equivalent pH is a factor present in both slurries
and saturated solutions of magnesium hydroxide The yield of H2 between 20 and 80
percent water content is not affected by changing the solid solution ratio suggesting that
there is little interaction between the solid magnesium hydroxide and the bulk water
00
02
04
06
08
10
12
14
16
0 20 40 60 80 100
G(H
2)
(Mo
lecu
les
10
0 e
V-1
)
H2O
Chapter 5 Radiolysis of Magnesium Hydroxide
129
The yield is significantly higher for samples with 4 water content (adsorbed water)
suggesting that any additional hydrogen is produced only in a few water layers away from
the solid surface as has been postulated for oxide surfaces
Petrik et al showed that oxide water systems consisting of multiple phases such as the
slurry samples measured here have different hydrogen yields depending on the oxide18
They grouped materials into three categories based on the effects they have on measured
hydrogen yields hydrogen enhancing hydrogen diminishing and hydrogen neutral
Though said study did not include magnesium hydroxide it does categorise magnesium
oxide as a material that does not significantly change the yield of hydrogen
The mechanism by which a solid surface increases the hydrogen yield is largely accredited
to an energy transfer process As solid particles in a sample absorbs energy a process of
energy migration from the bulk of the material to the interface takes place Energy can then
be transferred from the solid phase to the surrounding liquid The exact mechanism of the
energy transfer process is not well understood but the overall effect is higher dose rates in
localised areas of surrounding water
As the value of 4 water content is an estimation based on data extrapolation published by
Nelson et al in a study of water adsorption on magnesium hydroxide91
and may not be
entirely accurate This uncertainty could have a significant effect on the calculated chemical
yield if the estimation was even slightly incorrect for example an estimated water content
of just 9 has the effect of lowering the yield to the same value observed in samples
contain 20 water content This would be contradictory to an energy transfer process as
described previously
Chapter 5 Radiolysis of Magnesium Hydroxide
130
A study by Jay La Verne et al published measurements of hydrogen yields from the
gamma radiolysis of magnesium hydroxide to be 005119
This measurement was made
using magnesium hydroxide that had been dried to remove all excess water while
remaining hydroxylated The difference between the measured yields of saturated
magnesium hydroxide solution (G(H2) = 047) and a slurry sample (G(H2) = 052) given in
Table 20 is 005
This value is very close to the quoted value from dry magnesium hydroxide although it is
an average value and errors can be high with small differences between large numbers such
as this Little information is given to explain the mechanism contributing to this yield of
hydrogen from dry magnesium hydroxide other that the radiation induced conversion of
magnesium hydroxide to magnesium oxide92
A comparison was made to yields obtained
from calcium hydroxide and found that the yield of hydrogen was four times higher from
calcium hydroxide than from magnesium hydroxide This was explained in terms of the
tendency to form water during radiolysis being greater in magnesium hydroxide than in
calcium hydroxide meaning that a smaller portion of the hydroxide generates hydrogen
directly If the yield measured from the dry powder (0051) by La Verne et al is the result
of direct hydrogen production from magnesium hydroxide converting to the oxide then it
would make sense that the difference in yield between samples containing solid magnesium
hydroxide and only aqueous magnesium hydroxide would be close to this value
This does not explain why the yields of both samples are far higher than samples of sodium
hydroxide at the same pH as the magnesium hydroxide samples The chemical yield of
hydrogen from samples of sodium hydroxide with a pH of 1063 was 027 while yields
from both magnesium hydroxide systems were a little less than double this value
Chapter 5 Radiolysis of Magnesium Hydroxide
131
As this can be seen in both aqueous only samples and those containing solid magnesium
hydroxide the cause of this increased yield must be attributed to a factor present in both
aqueous only samples and samples containing solid magnesium hydroxide Magnesium
hydroxide is often discussed in literature concerning environmental science for its
properties and reactivity towards carbon dioxide9394
As the samples used in these experiments did not undergo any purification processes prior
to use they were most likely subject to carbonation reactions with atmospheric carbon
dioxide and water Magnesium hydroxide can be carbonated on exposed surfaces although
slow at standard room conditions it can be increased in the presence of water95
119872119892(119874119867)2(119904) + 1198621198742(119892) rarr 1198721198921198621198743(119904) + 1198672119874(119892)
Magnesium hydroxide can also take on intercalated carbon dioxide which can be converted
to carbonate either by reaction with water or if released into solution with hydroxide to
form bicarbonate9697
1198621198742(119860119894119903) 1198621198742(119894119899119905119890119903119897119886119910119890119903)
1198621198742(119894119899119905119890119903119897119886119910119890119903) + 1198672119874(119894119899119905119890119903119897119886119910119890119903) 2119867(119894119899119905119890119903119897119886119910119890119903)+ + 1198621198743(119894119899119905119890119903119897119886119910119890119903)
2minus
1198621198742(119886119902) + 119874119867(119886119902)minus 1198671198621198743(119886119902)
minus
Both carbonate and bicarbonate are known to be hydroxyl radical scavengers in the
radiolysis of aqueous solutions998
Using the Facsimile model described in Chapter 3 it
was possible to insert a set of reactions concerning carbonate radiolysis to estimate the
effects that small quantities of carbonate might have on hydrogen yields
Chapter 5 Radiolysis of Magnesium Hydroxide
132
The reaction set used is described in Table 22 and represents a simplified reaction scheme
of carbonate in aqueous radiolysis Initial concentrations of carbonate were set ranging
from 10 μM to 10 mM a yield of hydrogen was calculated for each initial concentration
these calculations have been graphed in Figure 49
In each case the calculated production of hydrogen was linear over the dose range used
which would be a necessary feature if carbonate is to be a valid explanation for the
increased yields observed in magnesium hydroxide experiments The calculated yield of
hydrogen increases rapidly with only small quantities of initial carbonate before reaching a
plateau at about G(H2) = 03 with an initial carbonate concentration of 50 μM The
hydrogen yield did not change much more than this increasing to just G(H2) = 036 with an
initial carbonate concentration of 10 mM The effect is almost the same in calculations for
both aerated and deaerated solutions It should be noted that these calculations were done at
pH 7 due to the systematic error of over prediction when the pH is close to 10 it would be
unadvisable to trust such calculations without first solving the error (see previous chapter)
Table 22 A reaction scheme to estimate the effect of carbonate in water radiolysis
Reaction Rate Constant Reference
CO32macr +
bullOH rarr CO3macr + OHmacr 39 times10
8
9
CO32macr + emacraq rarr products 39 times10
5
99
CO3bullmacr +
bullOH rarr products 30 times10
9
100
CO3bullmacr + H2O2 rarr HCO3macr + HO2
bull 43 times10
5
101
CO3bullmacr + HO2macr rarr HCO3macr + O2
bullmacr 30 times10
7
101
CO3bullmacr + O2
bullmacr rarr O2 + CO3
2macr 65 times10
8
102
HCO3macr + emacraq rarr products 10 times106
103
HCO3macr + bullOH rarr H2O + CO3
bullmacr 85 times10
6
9
HCO3macr + Hbull rarr products 44 times10
4
104
Chapter 5 Radiolysis of Magnesium Hydroxide
133
Figure 49 Model predictions for the yield of H2 from a solution containing various
concentrations of carbonate anions
Reaction rate analysis of the calculations reveals that the main mechanism for hydrogen
protection is through a cooperative effect of scavenging of the hydroxyl radical to form a
carbonate radical The majority of carbonate radicals are converted back to carbonate by
reaction with superoxide A secondary process of carbonate radical reactions with hydrogen
peroxide contributes slightly to regeneration of superoxide as well as forming bicarbonate
which itself contributes to hydrogen protection by scavenging hydroxyl radicals once again
forming a carbonate radical As these calculations were performed at pH 7 it is uncertain
what effect an elevated pH would have on the predicted hydrogen yield It should also be
remembered that many of the rate constants used are estimations and the reaction set is a
simplification and is not a comprehensive description
0
005
01
015
02
025
03
035
04
0 1 2 3 4 5 6 7 8 9 10 11
G(H
2)
[CO32-] mM
Aerated
Deaerated
134
With these factors in mind the predicted behaviour of hydrogen production is a reasonable
representation of the behaviour observed in experiments This could easily be investigated
further by experiments in a number of ways
Attempts could be made to measure carbonate directly from the magnesium hydroxide
used either by thermogravimetric analysis (TGA) or by total organic carbon analysis
(TOC) Radiolysis experiments of other carbonates could also be carried out to further
investigate the effect of carbonate
Chapter 6 Radiolysis of Methanol Solutions
135
Chapter 6 Radiolysis of Methanol Solutions
Context
Many of the waste storage ponds at Sellafield Ltd are open to the air and are subject to
organic matter falling in and decomposing to a range of organic products One particular
group of compounds known as humic acids and how they might affect radiolysis processes
in the ponds are of particular interest Humic acids are ill-defined but complex organic
acids with several different functional groups which will have many effects on radiolysis
The best approach to investigating this chemistry is to understand the effects of each
functional group independently before building up to a full humic acid analogue This study
takes the first steps towards this investigation through experimentation on aqueous
solutions of methanol
Experimental Method
A stock aqueous solution of 1 mM methanol was made and was used to prepare aerated
samples of 10 mL sealed by crimp cap in 20 mL headspace vials so that the liquid to
headspace ratio was 11 Samples were irradiated in row 2 of the 4x8 irradiation rack for
various periods of time The average dose rate was 1638 Gy min-1
The samples were
analysed for hydrogen peroxide immediately after irradiation using the Ghormley tri-iodide
method described in Chapter 2 A separate batch of aerated samples was prepared from the
1 mM methanol stock solution for analysis of hydrogen generation These were samples of
2 mL of 1 mM methanol and were deaerated using zero grade argon gas before being sealed
in glass tubes designed for use by the crush tube analysis method described in Chapter 2
Again the samples had a liquid to headspace ratio of 11
Chapter 6 Radiolysis of Methanol Solutions
136
These samples were irradiated in the centre positions of row 2 in the 4x8 rack where the
average dose rate was 1755 Gy min-1
Results
Figure 50 Measurements of H2O2 concentrations as a function of dose in samples
containing 1 mM methanol (diams) and water as a control (diams) All samples were aerated and a
dashed line is included to highlight the data trend The dose rate was 1638 Gy min-1
for
methanol solutions and 2839 Gy min-1
for the aerated water
000E+00
500E-05
100E-04
150E-04
200E-04
250E-04
0 5 10 15 20 25
[H2O
2]
(mo
l d
m-3
)
Dose (kGy)
Aerated Water
Methanol 1 mM
Chapter 6 Radiolysis of Methanol Solutions
137
Figure 51 Measurements of H2 gas as a function of dose from deaerated samples
containing 1 mM methanol deaerated water is also shown as a control Dashed lines are
included to highlight the data trend The dose rate was 1755 Gy min-1
for the methanol
solutions and 2851 Gy min-1
for the deaerated water
Figure 50 shows the measured concentrations of hydrogen peroxide from the 1 mM
methanol solution compared with the measured concentrations from pure aerated water At
low doses the concentration of hydrogen peroxide increases rapidly to approximately
20 times10-4
mol dm-3
at approximately 1 kGy which is almost double the steady state
concentration observed in pure water As the dose increases further the concentration
begins to fall to a steady state value at approximately 33 times10-5
mol dm-3
Figure 51 shows the measured hydrogen concentrations from the 1 mM methanol solutions
compared with hydrogen measurements from aerated water
000E+00
500E-04
100E-03
150E-03
200E-03
250E-03
300E-03
0 5 10 15 20 25 30
H2 (
mo
l d
m-3
)
Dose (kGy)
Methanol Solution 1mM Deaerated
Dearated Water
Chapter 6 Radiolysis of Methanol Solutions
138
Hydrogen concentrations measured in a deaerated 1 mM methanol solution are significantly
higher than those measured in deaerated water the initial production rate is higher in the
methanol solution but production is not linear and the rate of hydrogen production with
dose soon falls The change in production rate of hydrogen and hydrogen peroxide with
dose can be shown by converting the experimental measurements to G-values and plotting
them as a function of dose Figures 52 and 53 show the chemical yields determined by
converting the gradients between 0 and each data point to units of molecules 100 eV-1
Figure 52 Chemical yields of hydrogen peroxide measured from an aerated solution of
1 mM methanol as a function of dose
00
05
10
15
20
25
30
35
40
0 5 10 15 20
G(H
2O
2)
(mo
lecu
les
10
0eV
-1)
Dose (kGy)
Chapter 6 Radiolysis of Methanol Solutions
139
Figure 53 Chemical yields of hydrogen gas measured from a deaerated solution of 1 mM
methanol as a function of dose
Discussion
Most alcohols are effective scavengers of hydroxyl radicals and hydrogen atoms The
reactions between methanol and hydroxyl radicals or hydrogen atoms result in hydrogen
abstraction from methanol to form water or molecular hydrogen respectively and in both
cases form the hydroxymethyl radical105106
bull119874119867 + 1198621198673119874119867 rarr 1198672119874 + bull1198621198672119874119867 119896 = 83 times 108 119872minus1119904minus1
119867bull + 1198621198673119874119867 rarr 1198672 + bull1198621198672119874119867 119896 = 28 times 106 119872minus1119904minus1
Although the second order rate constant for the reaction between methanol and the solvated
electron is faster than that for the solvated electron and water the reaction rate does not
compete with the rate of reaction between the solvated electron and water until the
concentration of methanol is greater than 10-2
M2107
00
02
04
06
08
10
12
14
16
18
0 5 10 15 20
G(H
2)
(mo
lecu
les
10
0eV
-1)
Dose (kGy)
Chapter 6 Radiolysis of Methanol Solutions
140
In deaerated water methanol radicals may dimerise to form ethylene glycol or
disproportionate to form formaldehyde and reform methanol108
They may also react with
hydrogen peroxide to form formaldehyde
2bull1198621198672119874119867 rarr (1198621198672119874119867)2
2bull1198621198672119874119867 rarr 1198621198673119874119867 + 119867119862119867119874
bull1198621198672119874119867 + 11986721198742 rarr 119867119862119867119874 + 1198672119874 + bull119874119867
In solutions that contain dissolved oxygen such as those used in the measurements of
hydrogen peroxide (Figure 50) methanol radicals rapidly react with oxygen to form an
organic peroxyl radical which reacts by second-order processes resulting in the formation
of formaldehyde hydrogen peroxide and oxygen109
bull1198621198672119874119867 + 1198742 rarr bull11987421198621198672119874119867
An additional set of reactions were included in the water radiolysis model described in
Chapter 3 in an attempt to model the radiolysis chemistry of an aqueous solution of 1 mM
methanol This reaction scheme is shown in Table 23
Chapter 6 Radiolysis of Methanol Solutions
141
Reaction
Number Reaction
Rate Constant at 25degC (M
-1 s
-1)
Ref
M1 CH3OH + bullOH rarr H2O +
bullCH2OH 83times10
8
110
M2 CH3OH + Hbull rarr H2 +
bullCH2OH 28times10
6
106
M3 bullCH2OH + O2 rarr
bullO2CH2OH 49times10
9
111
M4 bullCH2OH + H2O2 rarr H2O + H2CO +
bullOH 18times10
5
112
M5 bullCH2OH +
bullCH2OH rarr CH3OH + H2CO 12times10
9
2113
M6 bullCH2OH +
bullCH2OH rarr HOCH2CH2OH 12times10
9
2113
M7 bullCH2OH +
bullOH rarr H2CO + H2O
a24times10
10
114
M8 bullO2CH2OH +
bullO2CH2OH rarr 2H2CO + H2O2 + O2 74times10
8
115
M9 bullO2CH2OH +
bullHO2 rarr H2CO + H2O2 + O2
b50times10
8
2
M10 bullO2CH2OH + O2macr rarr H2CO + HO2macr + O2
b50times10
7
2
M11 HOCH2CH2OH + bullOH rarr
bullHOCHCH2OH + H2O 24times10
9
116
M12 HOCH2CH2OH + Hbull rarr
bullHOCHCH2OH + H2 14times10
7
9
M13 bullHOCHCH2OH + O2 rarr
bullO2HOCHCH2OH 32times10
9
111
M14 bullO2HOCHCH2OH rarr HOCH2CHO + H
+ + O2macr 19times10
2 s
-1
117
M15 bullHOCHCH2OH +
bullHOCHCH2OH rarr HOCH2CH2OH +
HOCH2CHO 96times10
8
118
M16 HOCH2CHO + bullOH rarr H2O +
bullHOCHCHO
c92times10
6
119
M17 bullHOCHCHO +
bullHOCHCHO rarr HOCH2CHO + OCHCHO
d50times10
4 -
M18 OCHCHO + bullOH rarr H2O +
bullOCCHO 14times10
6
120
M19 bullOCCHO rarr CO + HCO
bull
a35times10
7 s
-1
121
M20 H2CO + emacraq rarr bullCH2OH + OHmacr 10times10
6
2
M21 H2CO + Hbull rarr H2 + HCO
bull 50times10
6
2
M22 H2CO + bullOH rarr H2O + HCO
bull 20times10
9
2
M23 HCObull + H
bull rarr H2 + CO
a68times10
10
122
M24 HCObull +
bullOH rarr CO + H2O
a11times10
11
123
M25 HCObull + O2 rarr CO + HO2
bull
a31times10
9
124
M26 HCObull + HCO
bull rarr 2CO + H2
a22times10
10
125
Table 23 A reaction scheme to estimate the effect of methanol in water radiolysis
a ndash Rate constant for gas phase reaction
b ndash Estimated rate constant
c ndash Rate constant based on reaction of acetic acid and hydroxyl
d ndash Assumed reaction
Figure 54 shows the predicted hydrogen peroxide concentration with the above chemistry
included in the calculation and compares it with the experimental data In order to achieve
the agreement shown a modification to the mass transfer routine was required
Chapter 6 Radiolysis of Methanol Solutions
142
The current implementation of the mass transfer routine does not cope with a rapid
depletion of dissolved oxygen and responds by increasing the rate of oxygen transfer from
the gas phase to the aqueous phase to an unrealistic value A temporary fix can be made by
reducing the mass transfer rate of oxygen (for instance by a factor of 15) but a more
appropriate correction to the routine should be sought in future implementations Figure 55
shows the original calculation with the un-modified mass transfer routine compared with
the modified mass transfer routine
Figure 54 Model prediction of H2O2 concentrations as a function of dose in a solution of
1 mM methanol
000E+00
500E-05
100E-04
150E-04
200E-04
250E-04
0 5 10 15 20 25
[H2O
2]
mo
l d
m-3
Dose kGy
Methanol 1 mM
Model
Chapter 6 Radiolysis of Methanol Solutions
143
Figure 55 Calculations of hydrogen peroxide concentrations with and without
modification to the mass transfer routine
Analyses of the evolution of the calculated reaction rates reveal a possible explanation for
the behaviour of hydrogen peroxide in the presence of a low concentration of methanol
Initially the most important methanol reactions are the formation of the methanol radical
by scavenging hydroxyl radicals (M1) and the formation of an organic peroxide by the
reaction between the aforementioned methanol radical and oxygen (M3)
1198621198673119874119867 + bull119874119867 rarr bull1198621198672119874119867 + 1198672119874
bull1198621198672119874119867 + 1198742 rarr bull11987421198621198672119874119867
With the formation of the organic peroxide comes an increase in the rate of the formation of
formaldehyde mainly through self-reaction or to a lesser degree through reaction with
superoxide
000E+00
100E-04
200E-04
300E-04
400E-04
500E-04
600E-04
700E-04
0 5 10 15 20 25 30 35 40 45
[H2O
2]
(mo
l d
m-3
)
Dose (kGy)
Original Calculation
Modified Calculation
Chapter 6 Radiolysis of Methanol Solutions
144
2bull11987421198621198672119874119867 rarr 21198672119862119874 + 11986721198742 + 1198742
bull11987421198621198672119874119867 + 1198742bullminus rarr 1198672119862119874 + 1198671198742
minus + 1198742
These reactions not only contribute to the production of hydrogen peroxide but also return
oxygen to the system which can scavenge solvated electrons and protect hydrogen peroxide
from the rapid reaction between the solvated electron and hydrogen peroxide
(R4 k = 136times1010
M-1
s-1
) The total rate of oxygen consumption by methanol radicals and
solvated electrons is still greater than the rate of return from the reactions of the organic
peroxide After about 11 kGy oxygen concentrations are reduced to an insignificant value
As the concentration of oxygen falls the reaction rate between hydrogen peroxide and the
solvated electron increases As mentioned in Chapter 4 oxygen plays a vital role in the
formation and protection of hydrogen peroxide The model prediction shows the
concentration of hydrogen peroxide beginning to rise again after about 8 kGy this is due to
the mass transfer of oxygen gas into the aqueous phase slowly re-establishing equilibrium
and effectively allowing a build-up of hydrogen peroxide As mentioned earlier the mass
transfer routine has been modified for this calculation and is non-representative of the real
mass transfer flux nevertheless it is reasonable to assume that after the depletion of
dissolved oxygen and the methanol has been converted to glycol or formaldehyde
equilibrium of aqueous and gaseous oxygen would eventually be re-established This could
be supported by further analysis at higher doses which may show an increase in hydrogen
peroxide concentrations
Chapter 6 Radiolysis of Methanol Solutions
145
The formation of hydrogen gas is enhanced by the presence of methanol however
hydrogen gas production is not linear with dose Figure 56 shows the model predictions for
hydrogen gas production compared to the experimentally obtained data
The calculations show a higher production rate of hydrogen gas can be attributed to the
scavenging of hydroxyl radicals by methanol and a number of methanol radiolysis
products
Figure 56 Model prediction of H2 gas as a function of dose in a solution of 1 mM
methanol
Although the model prediction somewhat overestimates the quantity of hydrogen formed
the slope is close to what is observed experimentally Many of the rate constants used in the
reaction scheme could not be found in the literature and are therefore estimations The
reaction scheme used protects molecular hydrogen from reacting with the hydroxyl radical
in a number of reactions Throughout the radiolysis of methanol a number of intermediary
organic products are formed such as ethylene glycol and formaldehyde each of which is an
effective hydroxyl scavenger
000E+00
500E-04
100E-03
150E-03
200E-03
250E-03
300E-03
0 5 10 15 20 25 30
H2 (
mo
l d
m-3
)
Dose (kGy)
Methanol 1 mM Dearated
Model
Chapter 6 Radiolysis of Methanol Solutions
146
After reacting with the hydroxyl radical the newly formed organic radical will usually form
an organic peroxide however in the absence of oxygen the radicals will tend towards
disproportionation to reform the original organic product at well as a new stable organic
usually an aldehyde Eventually the only stable product is carbon monoxide which does not
have any further reactions within this scheme Figure 57 shows the calculated
concentrations of each of the stable organic products as a function of dose in an aerated
system
Figure 57 Model predictions of the concentrations of various stable organic products
formed as a result of using the proposed reaction scheme in Table 23
Kinetic models of aqueous methanol have previously been presented in literature one such
model by Sunaryo and Domae126
was developed for calculating the effects of aqueous
methanol in light water reactors
000E+00
200E-04
400E-04
600E-04
800E-04
100E-03
120E-03
0 10 20 30 40
Co
nce
ntr
ati
on
(m
ol
dm
-3)
Dose (kGy)
Methanol
Formaldehyde
Ethylene Glycol
Glycolaldehyde
Glyoxal
Carbon Monoxide
Chapter 6 Radiolysis of Methanol Solutions
147
The reaction scheme for methanol radiolysis used in that publication is not a complete
scheme in that ldquoimaginary productsrdquo are implemented to terminate certain reaction
pathways This is still a valid approach as their interest was focused on the initial reaction
paths when delivering a maximum dose of 500 Gy and not the long term radiolysis of
methanol over several kGy
It was noted that an understanding of the radiolysis of the transient organic products is
needed they concluded that methanol is converted into ethylene glycol which may have the
same effect as methanol itself The formation of ethylene glycol and formaldehyde from
methanol radiolysis is well known and has been measured in previous studies127
The
radiolysis of ethylene glycol has also been discussed in literature128
and it has been
described that under aerated conditions the main organic product of radiolysis is
glycolaldehyde129
The reaction scheme for methanol radiolysis in this work assumes the
formation of a radical species by the reaction between glycolaldehyde and the hydroxyl
radical however this is most likely not the major radiolysis path for glycolaldehyde In
aqueous solutions glycolaldehyde exists in a number of different forms with the aldehyde
form usually being the minor component130
The existence of multiple forms of
glycolaldehyde in solution and the large number of unknown rate constants makes creating
a complete reaction scheme for methanol radiolysis difficult Furthermore the publications
mentioned above also report the formation of small amounts of methane along with carbon
monoxide The radiolysis of ethylene glycol under deaerated conditions can also lead to the
production of ethyl aldehyde Both of these points highlight gaps in the reaction scheme
that should be included in a comprehensive description of methanol radiolysis Suggestions
for an improved radiolysis scheme are given in Chapter 8
Chapter 7 Radiolysis of Iron Oxide-Water Systems
148
Chapter 7 Radiolysis of Iron Oxide-Water Systems
Context
Large quantities of iron oxide have been reported to be present in the First Generation
Magnox Storage Pond where iron skips containing spent fuel have corroded to form a layer
of haematite (Fe2O3) and magnetite (Fe3O4) several meters below the water level
Documented investigations into the effects of iron oxide on water radiolysis are sparse the
most recent of which focusing on the formation of molecular hydrogen from the radiolysis
of water-iron oxide systems131
Preliminary experiments have been carried out to
investigate the effects iron oxide may have on radiolytic production of hydrogen peroxide
from water-oxide slurries
Method
Iron oxide powders were washed with ultra-pure water to remove any soluble
contamination Excess water was decanted before the powders were washed a further two
times After the third decanting the powders were dried in a vacuum oven at 40degC
overnight Haematite samples were prepared by weighing 05 g quantities of haematite into
20 mL headspace vials to which 10 mL of ultra-pure water was added before sealing with a
crimp cap Samples of magnetite were prepared in the same way Samples were agitated
and then left to settle before irradiation The irradiations of haematite samples were carried
out in row 1 of the 4x8 irradiation rack with an average dose rate of 30518 Gy min-1
while
irradiations of magnetite samples were carried out in row 2 of the 4x8 rack with an average
dose rate of 16252 Gy min-1
After irradiation aliquots of the water from the samples were
removed by syringe and pushed through a syringe filter to remove any solid particles
Chapter 7 Radiolysis of Iron Oxide-Water Systems
149
The filtered aliquot was then analysed for hydrogen peroxide using the Ghormley tri-iodide
method described in Chapter 2
Results
Figure 58 shows the obtained results for the haematite system compared to concentrations
of hydrogen peroxide measured in aerated water Figure 59 shows the obtained results from
magnetite samples again they are compared with measurements obtained from pure water
Figure 58 Measurements of H2O2 concentrations from heterogeneous samples of 05g
Fe2O3 and 10 mL aerated water The dose rate for the haematite samples was
3052 Gy min-1
and for the aerated water the dose rate was 2839 Gy min-1
000E+00
200E-05
400E-05
600E-05
800E-05
100E-04
120E-04
140E-04
0 2 4 6 8 10 12 14
[H2O
2]
(mo
l d
m-3
)
Dose (kGy)
Haematite
Pure Water
Chapter 7 Radiolysis of Iron Oxide-Water Systems
150
Figure 59 Measurements of H2O2 concentrations from heterogeneous samples of 05g
Fe3O4 and 10 mL aerated water The dose rate for the magnetite samples was
1625 Gy min-1
and for the aerated water the dose rate was 2839 Gy min-1
The steady state concentration of hydrogen peroxide achieved in the presence of haematite
is close to that of pure water however the initial production rate is slightly higher An
increased initial production rate is also observed in samples containing magnetite but after
approximately 500 Gy the concentration of hydrogen peroxide falls dramatically and
achieves a low steady state of approximately 15 times10-5
mol dm-3
000E+00
200E-05
400E-05
600E-05
800E-05
100E-04
120E-04
140E-04
0 2 4 6 8 10 12 14 16 18 20 22
[H2O
2]
(mo
l d
m-3
)
Dose (kGy)
Magnetite
Pure Water
Chapter 7 Radiolysis of Iron Oxide-Water Systems
151
Discussion
Hydrogen peroxide undergoes surface decomposition over both haematite and
magnetite28132
The estimated second-order rate constants for the surface decomposition of
hydrogen peroxide are quoted as 30 times10-9
M-1
s-1
for haematite132
and 45 times10-10
M-1
s-1
for
magnetite28
Calculations using the water radiolysis model including a hypothetical reaction
that removes hydrogen peroxide at these rates makes no significant difference to the
predicted concentrations of hydrogen peroxide in water over the time scale of the
experiment However as the aforementioned rate constants are second-order they not only
depend on the concentration of hydrogen peroxide but the surface area of the metal oxide as
well which is unknown for the metal oxides used in this study
Furthermore the experiments carried out in the aforementioned publications to determine
these rate constants were well mixed throughout the reaction time while in this work the
samples were static with the iron powder settled at the bottom of the reaction vessel This
means that the rate of surface decomposition is greatly hindered due to the need for
hydrogen peroxide to diffuse a large distance to the iron oxide surface nevertheless a
significant difference in hydrogen peroxide concentrations were observed in samples
containing magnetite The behaviour of hydrogen peroxide observed in samples containing
magnetite is most likely due to homogeneous chemistry initiated by dissolved iron ions
The chemistry initiated by dissolved iron could serve to remove hydrogen peroxide through
a Haber-Weiss mechanism133
1198651198903+ + 1198742bullminus rarr 1198651198902+ + 1198742 k = Unknown
1198651198902+ + 11986721198742 rarr 1198651198903+ + 119874119867minus + bull119874119867 k = 10 times10
7 M
-1 s
-1
1198651198902+ + bull119874119867 rarr 1198651198903+ + 119874119867minus k = 32 times108
M-1
s-1
1198651198902+ + 1198671198742bull rarr 1198651198903+ + 1198671198742
minus k = 12 times10
6 M
-1 s
-1
Chapter 7 Radiolysis of Iron Oxide-Water Systems
152
Experiments discussed in publications by Mats Jonsson28
focus largely on the reactivity of
hydrogen peroxide and various metal oxides including iron oxide It was found that many
metal oxide surfaces show reactivity towards hydrogen peroxide and that rate of removal of
hydrogen peroxide can be calculated in heterogeneous systems based on properties such as
particle size As mentioned previously the model suggests that the rate of this surface
reactivity does not seem to be able to compete with the rate of radiolytic hydrogen peroxide
production The studies by Jonsson concerning iron oxide were met with difficulty in
discriminating between surface reactions and aqueous chemistry initiated by dissolved iron
Through the use of ICP-AES it was shown that iron can be found in water with a
concentration of 23 times10-6
mol dm-3
after just 30 minutes of mixing magnetite with distilled
water28
Even with this measurement by Jonsson the quantity of dissolved iron is difficult to
estimate for samples used in this work as they were washed with water whereas the
literature measurements were made with unwashed or EDTA treated samples More
information about the dissolution of iron from magnetite could be used to attempt to model
this behaviour using the reaction scheme in table 24 In addition to this it would also be
useful to investigate the dissolution of iron as a function of radiation dose to see what
effect if any radiation has on dissolution rates Analysis techniques such as inductively
coupled plasma mass spectroscopy (ICP-MS) can be used to determine concentrations of
dissolved iron in very low concentrations however due to the nature of the plasma used it
can often be difficult to distinguish between Fe2+
and Fe3+
as further ionization may cause
interference It is possible to chemically separate the two oxidation states of iron by solvent
extraction with n-heptane containing 01 M Di-(2-ethylhexyl)phosphoric acid (HDEHP)
before performing an analysis for iron134
Chapter 7 Radiolysis of Iron Oxide-Water Systems
153
This reaction scheme would be initiated by a production of aqueous iron based on the
dissolution behaviour observed from future experiments As mentioned earlier the
experiments conducted in this work are only preliminary and there is much more work to
be done on the subject
If a computational model could be made to accurately simulate the aqueous iron chemistry
coupled with a more detailed understanding of radiation induced iron dissolution it may be
possible to determine the surface effects of iron oxide by comparison of experimental and
calculated data and effectively subtracting the difference
Reaction
Number
Reaction Rate Constant at
25degC (M-1
s-1
)
Ref
F1 Fe2+
+ H2O2 rarr Fe3+
+ OHmacr + bullOH 100 times10
7
135
F2 Fe2+
+ bullOH rarr Fe
3+ + OHmacr 32 times10
8
136
F3 Fe2+
+ bullHO2 rarr Fe
3+HO2macr 12 times10
6
133
F45 Fe3+
HO2macr + Fe2+ Fe
3+HO2macrFe
2+ K = 27 M
-1
133
F6 Fe3+
HO2macr rarr Fe3+
+ HO2macr 18times103
s-1
133
F7 Fe3+
HO2macrFe2+
rarr Fe3+
+ Fe2+
HO2macr 25 times104
133
F8 Fe2+
HO2macr + H+
(aq) rarr Fe2+
+ H2O2 Unknown 133
F9 Fe3+
+ O2macr rarr Fe2+
+ O2 Unknown 137
F10 Fe2+
+ O2macr + H2O rarr HO2macr + Fe
3+ + OHmacr 10 times10
7
133
F11 Fe3+
+ Hbull rarr Fe
2+ + H
+(aq) 20 times10
6
138
F12 Fe3+
+ emacraq rarr Fe2+
60 times1010
139
F13 Fe2+
+ Hbull + H
+(aq)
rarr Fe
3+ + H2 75 times10
6
10
Table 24 A reaction scheme to estimate the effects of dissolved iron in water radiolysis
Chapter 8 Conclusions and Further Work
154
Chapter 8 Conclusions and Further Work
Further High pH Investigations
Experiments have shown that the radiolytic production of hydrogen gas and hydrogen
peroxide is strongly influenced by high pH Hydrogen peroxide tends to reach higher steady
state concentrations with increasing pH as well as taking longer to reach this steady state
Hydrogen gas production rates appear to also increase with increasing pH up to
approximately pH 11 where thereafter they decrease The development of a computational
model for water radiolysis has provided a mechanistic understanding to explain the
observed effects of high pH on water radiolysis Calculations suggest that an increase in
radiolytically produced oxygen could explain the behaviour of hydrogen gas at high pH
Dissolved oxygen acts as a poison to the Allen chain which normally serves to remove
dissolved hydrogen through reactions with the hydroxyl radical or the alkali equivalent the
oxide radical anion The steady state concentration of dissolved oxygen increases with pH
up to approximately pH 115 This can be attributed to the decline in the rate at which
dissolved oxygen is reduced by hydrogen atoms as the equilibrium between the hydrogen
atom and the solvated electron shifts to favour the solvated electron The reaction rate of
the equivalent alkali reaction to remove dissolved oxygen through reduction by the solvated
electron does not increase to compensate resulting in a net increase in the steady state
concentration of dissolved oxygen The model calculations also show that increasing the
pH further results in a decline in the hydrogen gas production rate This is due to the shift in
the equilibrium between the hydroxyl radical and the oxide radical anion (R6364) which
has a pKa of 119 The main pathway for the radiolytic production of dissolved oxygen is
the reaction between the hydroxyl radical and super oxide (R21)
Chapter 8 Conclusions and Further Work
155
The rate of this reaction falls at high pH as the hydroxyl radical is converted to the oxide
radical anion The alkali equivalent of this reaction (R50) has a much lower rate constant
and is out competed by the solvated electron (R8) Further experiments to measure the
concentration of radiolytically produced oxygen at high pH could help to support the model
predictions or confirm a misunderstanding in the model An inline gas chromatography
technique similar to the ldquocrush tuberdquo described in Chapter 2 may be used only instead of
crushing a sealed glass vial within the carrier gas flow a specially designed cell is
connected to the in and out ports of the carrier gas flow This cell would contain a high pH
solution and would sit inside the irradiator from here multiple analyses can be run on a
single sample The carrier gas would have to be changed from argon to helium to increase
the sensitivity towards oxygen running the carrier gas through the cell prior to irradiation
will serve to remove the initial dissolved oxygen from the sample from this point onward
any measurements of oxygen would be radiolytically produced
These experiments would help to better understand high pH water radiolysis and hopefully
help to improve the radiolysis model and understand why there is an over prediction at
pH 106 A comprehensive water radiolysis model that can accurately predict
concentrations of radiolysis products under a wide range of conditions is of high
importance to the nuclear industry and would have applications in decommissioning
maintenance of current nuclear systems and designing new nuclear technology
Chapter 8 Conclusions and Further Work
156
Further Methanol Radiolysis Investigations
The reaction scheme used to model the radiolysis of aqueous methanol results in the
temporary formation of several stable organic species before they themselves are oxidised
by hydroxyl radicals This scheme eventually converts all organic substances to carbon
monoxide however in reality this is not the case It has been reported in literature that one
of the stable products formed is methane gas a substance not included in the current
reaction scheme The gas chromatography techniques used in this work are not suitable for
the detection of small quantities of carbon monoxide or indeed other potential radiolysis
products such as methane A more sophisticated approach would be to use a gas
chromatography mass spectroscopy technique (GC-MS) This technique would allow for
the detection of carbon monoxide carbon dioxide methane and any other volatile
hydrocarbons that may be formed during radiolysis Other transient products of methanol
radiolysis such as formaldehyde ethylene glycol glycolaldehyde and glyoxal may be
analysed by high performance liquid chromatography (HPLC) It was mentioned in Chapter
6 that the reaction scheme does not accurately represent the radiolysis of the transient
product glycolaldehyde A publication by Yaylayan et al130
discusses some measurements
made by nuclear magnetic resonance spectroscopy of glycolaldehyde in deuterated water
and it was found that it exists mostly as the hydrated aldehyde 112-ethanetriol (~70) A
complete reaction scheme for the radiolysis of methanol should include the radiolysis
reactions of all the transient species of which there are potentially many
However if the major component of a glycolaldehyde solution is 112-ethanetriol an
acceptable compromise may be to include only the radiolysis reactions of this species and
ignore the radiolysis paths of minor products
Chapter 8 Conclusions and Further Work
157
Experimental analysis of aqueous methanol to determine the major transient species would
be valuable for determining which radiolysis paths have the most significant roles in
methanol radiolysis
Future Development of a Multi-Scale Radiolysis Model
As discussed in Chapter 3 the model developed in this work is a deterministic model for the
calculation of long term homogeneous phase radiolysis This calculation depends on a
series of primary values that represent the production rates of the primary species of water
radiolysis which in turn depend on a number of physical and chemical factors It is
possible to calculate these primary yields using stochastic methods which can then be fed
into the deterministic calculation to obtain predictions of chemical species concentrations
This technique has been successfully used recently to demonstrate some of the effects of
high capacity scavengers47
This technique assumes that there are no changes to the
physiochemical conditions during the radiolysis period for example if a calculation was to
be performed where the temperature were to change the primary yields would need to be
recalculated at the new temperature The model developed in this work attempts to
overcome this by estimating primary yields as a multiple regression fit of temperature and
pH however this estimation is not adequately accurate and does not include any effects that
linear energy transfer has on the primary yields A more suitable approach to the
development of a comprehensive multi-scale radiolysis model may be to utilise a stochastic
calculation of the primary yields that includes the effects of temperature pH LET and
chemical scavengers which can be called from within the deterministic calculation
whenever a significant change to one of these factors is initiated
Chapter 8 Conclusions and Further Work
158
Further work concerning the deterministic model presented in this work include an
investigation into the partitioning of gaseous species The method used is one that has been
successfully used by other research groups to model the radiolysis of water and the effect of
available headspace This implementation of the stagnant two-film model was never
intended to cope with rapid changes in aqueous oxygen concentrations Further efforts
should be made to better incorporate this gas partitioning method in a way that can more
realistically represent oxygen partitioning during the radiolysis of aqueous methanol
Closing Remarks Relevant to Sellafield Ltd
The experimental data presented in Chapters 4 and 5 are pertinent to the situations and
conditions currently found within the Magnox Swarf Storage Silos at Sellafield In the case
of elevated pH due to sodium hydroxide both the experimental and computational data
show increased rates of hydrogen gas production and an increased steady-state
concentration of hydrogen peroxide Despite some minor quantitative disagreements
between the experimental data and the computational data the qualitative trend is in
general agreement One could therefore expect to observe increased production of hydrogen
gas in the MSSS with increasing pH especially within the pH region of approximately
105 to 125 An important aspect of the situation at the MSSS is the aerated nature of the
system The obvious consideration being the increased amounts of dissolved oxygen
present which although such effects were also discussed in Chapter 4 the experimental
data shown was only for water at neutral pH Nevertheless it was discussed in Chapter 4
that dissolved oxygen acts a poison to the chain reaction that normally removes molecular
hydrogen A less obvious consideration and one that was largely overlooked in Chapter 4
is the inclusion of gas to liquid carbon dioxide exchange and its aqueous conversion to
carbonate
Chapter 8 Conclusions and Further Work
159
At high pH the concentration of aqueous CO2 and therefore CO32-
becomes significant
With CO32-
being known to react with the hydroxyl radical and given the difficulty in its
removal future research and industrial models involving high pH aqueous radiolysis would
benefit from including a description of the radiolysis chemistry of aqueous carbonate
systems Chapter 5 begins to address the concept of including carbonate chemistry into a
radiolysis model This came about from the realisation that magnesium hydroxide can be
easily carbonated on contact with CO2 and is also known to be an effective carbon trapping
material In this case not only the additional chemistry brought about carbonate should be
considered but also the effects of the magnesium compounds that can be formed for
example magnesium carbonate magnesium bicarbonate magnesium oxide and
magnesium hydroxide Similarly consideration should be given to the multitude of iron
phases that can exist in conditions comparable to those of the First Generation Magnox
Storage Ponds Although it was not considered in Chapter 7 it is likely that the corroded
iron found in the FGMSP also exists as a number of iron hydroxides and hydrated oxides
Given the open air nature of the FGMSP hydrogen gas build-up is not a major concern
however the interactions of the various iron oxide phases in a radiolysis system may affect
concentrations of oxidising species such as H2O2 which may alter corrosion rates The
results shown in Chapter 7 suggest little effect on H2O2 concentration in the presence of
haematite but the presence of magnetite had a significant effect in removing H2O2 To gain
a better understanding further work would need to be done that also investigated the other
possible phases of iron oxide and also gives consideration to the proportions in which they
can be found in the FGMSP
References
160
References
1 Pitois A Ivanov P I Abrahamsen L G Bryan N D Taylor R J amp Sims H E Magnesium Hydroxide Bulk and Colloid-Associated 152Eu in an Alkaline Environment Colloid Characterisation and Sorption Properties in the Presence and Absence of Carbonate J Environ Monit 10 315-324 (2008)
2 Spinks J W T amp Woods R J An Introduction to Radiation Chemistry (1990)
3 Loveland W D Morrissey D J amp Seaborg G T Modern Nuclear Chemistry (2005)
4 Allen A O The Radiation Chemistry of Water and Aqueous Solutions (1961)
5 Draganić I G amp Draganić Z D The Radiation Chemistry of Water (1971)
6 Schwarz H A Losee J P amp Allen A O Hydrogen Yields in the Radiolysis of Aqueous
Solutions Journal of the American Chemical Society 76 4693-4694 (1954)
7 Swallow A J Radiation Chemistry An Introduction (1973)
8 Schwarz H A Free Radicals Generated by Radiolysis of Aqueous Solutions Journal of
Chemical Education 58 101 (1981)
9 Buxton G V Clive L Greenstock W Helman P amp Ross A B Critical Review of Rate
Constants for Reactions of Hydrated Electrons Hydrogen Atoms and Hydroxyl Radicals (˙OHO˙-) in Aqueous Solution J Phys Chem Ref Data 17 513-886 (1988)
10 Jayson G G Keene J P Stirling D A amp Swallow A J Pulse-Radiolysis Study of Some
Unstable Complexes of Iron Transactions of the Faraday Society 65 2453-2464 (1969)
11 Koppenol W H amp Liebman J F The Oxidizing Nature of the Hydroxyl Radical A
Comparison with the Ferryl Ion (FeO2+) The Journal of Physical Chemistry 88 99-101 (1984)
12 Meyerstein D Complexes of Cations in Unstable Oxidation States in Aqueous Solutions as
Studied by Pulse Radiolysis Accounts of Chemical Research 11 43-48 (1978)
13 Schwarz H A Applications of the spur diffusion model to the radiation chemistry of
aqueous solutions The Journal of Physical Chemistry 73 1928-1937 (1969)
References
161
14 Dyne P J amp Kennedy J M The Kinetics of Radical Reactions in the Tracks of Fast Electrons A Detailed Study of the SamuelndashMagee Model for the Radiation Chemisty of Water Canadian Journal of Chemistry 36 1518-1536 (1958)
15 Burns W G Sims H E amp Goodall J A B Special Issue Dedicated to The Memory of the
Late John Hodson Baxendale Radiation chemical diffusion kinetic calculations with prescribed and non-prescribed diffusionmdashI Radiation Physics and Chemistry (1977) 23 143-180 (1984)
16 Pimblott S M amp LaVerne J A Comparison of Stochastic and Deterministic Methods for
Modeling Spur Kinetics Radiation Research 122 12-23 (1990)
17 Tapping R L Corrosion Issues in Pressurized Heavy Water Reactor (PHWRCANDUreg)
Systems A2 in Nuclear Corrosion Science and Engineering 581-633 (2012)
18 Petrik N G Alexandrov A B amp Vall A I Interfacial Energy Transfer During Gamma
Radiolysis of Water on the Surface of ZrO2 and Some Other Oxides The Journal of Physical Chemistry B 105 5935-5944 (2001)
19 LaVerne J A amp Tandon L H2 and Cl2 Production in the Radiolysis of Calcium and
Magnesium Chlorides and Hydroxides The Journal of Physical Chemistry A 109 2861-2865 (2005)
20 Slack J Norton J L amp Malkoske G R Cobalt-60 Production in CANDU Power Reactors
21 Unterweger M P Hoppes D D amp Schima F J New and Revised Half-Life Measurements
Results Nuclear Instruments and Methods in Physics Research Section A Accelerators Spectrometers Detectors and Associated Equipment 312 349-352 (1992)
22 Weiss J A Survey of Chemical Dosimetric Systems The International Journal of Applied
Radiation and Isotopes 4 89-95 (1958)
23 Fricke H amp Morse S The Chemical Action of Roumlntgen Rays on Dilute Ferrosulfate Solutions
as a Measure of Dose Am J Roentgenology and Radium Therapy 18 430-432 (1927)
24 Weiss J Allen A O amp Schwarz H A Fricke Ferrous Sulfate Dosimeter for γ-rays in the
Range 4 to 40 Kiloroumlntgens Proceedings of the International Conference on the Peaceful Uses of Atomic Energy 14 179-181 (1956)
25 Allen A O Hochanadel C J Ghormley J A amp Davis T W Decomposition of Water and
Aqueous Solutions under Mixed Fast Neutron and Gamma Radiation American Chemical Society (1952)
References
162
26 Hiroki A Pimblott S M amp LaVerne J A Hydrogen Peroxide Production in the Radiolysis of
Water with High Radical Scavenger Concentrations The Journal of Physical Chemistry A 106 9352-9358 (2002)
27 Yakabuskie P A Joseph J M amp Wren C J The Effect of Interfacial Mass Transfer on
Steady-State Water Radiolysis Radiation Physics and Chemistry 79 777-785 (2010)
28 Nejad M A amp Jonsson M Reactivity of Hydrogen Peroxide towards Fe3O4 Fe2CoO4 and
Fe2NiO4 Journal of Nuclear Materials 334 28-34 (2004)
29 Pastina B amp LaVerne J A Effect of Molecular Hydrogen on Hydrogen Peroxide in Water
Radiolysis The Journal of Physical Chemistry A 105 9316-9322 (2001)
30 Klassen N V Marchington D amp McGowan H C E H2O2 Determination by the I3
- Method and by KMnO4 Titration Analytical Chemistry 66 2921-2925 (1994)
31 Roth O amp LaVerne J A Effect of pH on H2O2 Production in the Radiolysis of Water J Phys
Chem A 115 700-708 (2011)
32 Wasselin-Trupin V Baldacchino G Bouffard S amp Hickel B Hydrogen Peroxide Yields in
Water Radiolysis by High-Energy Ion Beams at Constant LET Radiation Physics and Chemistry 65 53-61 (2002)
33 Essehli R Crumiegravere F Blain G Vandenborre J Pottier F Grambow B et al H2
Production by γ and He Ions Water Radiolysis Effect of Presence TiO2 Nanoparticles International Journal of Hydrogen Energy 36 14342-14348 (2011)
34 Faraggi M Zehavi D amp Anbar M Effect of Thallous Ions on the Yields of Hydrogen and
Hydrogen Peroxide in Radiolyzed Aqueous Solutions Transactions of the Faraday Society 67 2057-2067 (1971)
35 Lousada C M LaVerne J A amp Jonsson M Enhanced Hydrogen Formation During the
Catalytic Decomposition of H2O2 on Metal Oxide Surfaces in the Presence of ˙OH Radical Scavengers Phys Chem Chem Phys 15 12674-12679 (2013)
36 Schofield J Reiff S C Pimblott S M amp LaVerne J A Radiolytic Hydrogen Generation at
Silicon CarbidendashWater Interfaces Journal of Nuclear Materials 469 43-50 (2016)
37 LaVerne J A Ryan M R amp Mu T Hydrogen Production in the Radiolysis of Bromide
Solutions Radiation Physics and Chemistry 78 1148-1152 (2009)
References
163
38 Draganic I Nenadovic M T amp Draganic Z D Radiolysis of HCOOH + O2 at pH 13-13 and
the Yields of Primary Products in γ Radiolysis of Water Journal of Physical Chemistry 73 2564-2571 (1969)
39 Hart E J γ-Ray Induced Oxidation of Aqueous Formic Acid-Oxygen Solutions Effect of pH
Journal of the American Chemical Society 76 4198-4201 (1954)
40 Flanders D A amp Fricke H Application of a High-Speed Electronic Computer in Diffusion
Kinetics The Journal of Chemical Physics 28 1126-1129 (1958)
41 Burns W G Sims H E amp Goodall J A B Radiation Chemical Diffusion Kinetic Calculations
with Prescribed and Non-Prescribed DiffusionmdashI Spherical and Cylindrical Cases Radiation Physics and Chemistry 23 143-180 (1984)
42 Green N J B Pilling M J Pimblott S M amp Clifford P Stochastic Modeling of Fast Kinetics
in a Radiation Track The Journal of Physical Chemistry 94 251-258 (1990)
43 Bouniol P amp Bjergbakke E A Comprehensive Model to Describe Radiolytic Processes in
Cement Medium Journal of Nuclear Materials 372 1-15 (2008)
44 Ershov B G amp Gordeev A V A Model for Radiolysis of Water and Aqueous Solutions of H2
H2O2 and O2 Radiation Physics and Chemistry 77 928-935 (2008)
45 Elliot A J amp Bartels D M The Reaction Set Rate Constants and g-Values for the Simulation
of the Radiolysis of Light Water over the range 20degC to 350degC Based on Information Available in 2008 (Atomic Energy of Canada Limited Mississauga Ontario (Canada) 2009)
46 Wren J C amp Ball J M LIRIC 32 an Updated Model for Iodine Behaviour in the Presence of
Organic Impurities Radiation Physics and Chemistry 60 577-596 (2001)
47 Gregory P Horne Thomas A Donoclift Howard E Sims Robin M Orr amp Simon M
Pimblott Multi-Scale Modelling of the Radiolysis of Nitrate Solutions The Journal of Physical Chemistry B 120 (45) 11781 - 11789 (2016)
48 Chance E M Curtis A R Jones I P amp Kirby C R FACSIMILE A Computer Program for
Flow and Chemistry Simulation and General Initial Value Problems Report No 0436-9734 148 pp (Univ Coll 1977)
49 Elliot A J Rate Constants and G-Values for the Simulation of the Radiolysis of Light Water
Over the Range 0 - 300degC AECL-11073 COG-94-167 (1994)
References
164
50 Hochanadel C J amp Ghormley J A Effect of Temperature on the Decomposition of Water
by γ-Rays Radiat Res 16 635-660 (1962)
51 Janik D Janik I amp Bartels D M Neutron and βγ Radiolysis of Water up to Supercritical
Conditions βγ Yields for H2 Hbull Atom and Hydrated Electron The Journal of Physical
Chemistry A 111 7777-7786 (2007)
52 Jha K N Ryan T G amp Freeman G R Radiolysis of H2O and D2O between 0 and 300degC J
Phys Chem 79 868-870 (1974)
53 Elliot A J Chenier M P amp Ouellette D C Temperature Dependence of g Values for H2O
and D2O Irradiated with Low Linear Energy Transfer Radiation Journal of the Chemical Society Faraday Transactions 89 1193-1197 (1993)
54 Kent M C amp Sims H E The Yield of γ-Radiolysis Products from Water at Temperatures up
to 270degC Harwell Report AEA-RS-2301 (1992)
55 Lin M Katsumura Y Muroya Y He H Wu G Han Z et al Pulse Radiolysis Study on the
Estimation of Radiolytic Yields of Water Decomposition Products in High-Temperature and Supercritical Waterthinsp Use of Methyl Viologen as a Scavenger The Journal of Physical Chemistry A 108 8287-8295 (2004)
56 Štefanić I amp LaVerne J A Temperature Dependence of the Hydrogen Peroxide Production
in the γ-Radiolysis of Water The Journal of Physical Chemistry A 106 447-452 (2002)
57 Ferradini C amp Jay-Gerin J-P The Effect of pH on Water Radiolysis A Still Open Question mdash
A Minireview Research on Chemical Intermediates 26 549-565 (2000)
58 Ferradini C Kinetic Behavior of the Radiolysis Products of Water in Advances in Inorganic
Chemistry and Radiochemistry Vol Volume 3 (eds H J Emeleus amp A G Sharpe) 171-205 (1961)
59 Lefort M Radiation Chemistry Annual Review of Physical Chemistry 9 123-156 (1958)
60 Sworski T J Yields of Hydrogen Peroxide in the Decomposition of Water by Cobalt γ-
Rradiation I Effect of Bromide Ion Journal of the American Chemical Society 76 4687 (1954)
61 Hochanadel C J amp Lind S C Radiation Chemistry Annual Review of Physical Chemistry 7
83-106 (1956)
References
165
62 Mahlman H A amp Boyle J W Primary Cobalt-60 Radiolysis Yields in Heavy Water Journal
of the American Chemical Society 80 773 (1958)
63 Hayon E amp Stein G Radiation Chemistry of Aqueous Systems (1968)
64 Hayon E Effect of Solute Concentration on the Recombination of H˙ and ˙OH in γ-Irradiated
Aqueous Solutions Journal of Physical Chemistry 65 1502-1505 (1961)
65 Sehested K Bjergbakke E amp Fricke H The Primary Species Yields in the 60Co γ-Ray
Radiolysis of Aqueous Solutions of H2SO4 between pH 7 and 046 Radiation Research 56 385-399 (1973)
66 Hayon E Radiolysis of Heavy Water in the pD Range 0-14 Journal of Physical Chemistry 69
2628-2632 (1965)
67 Haissinsky M γ-Radiolysis of Alkaline and Neutral Solutions I Alkaline Solutions of Sodium
Phosphite Journal de Chimie Physique et de Physico-Chimie 62 1141-1148 (1965)
68 Dainton F S amp Watt W S The Effect of pH on the Radical Yields in the γ-Radiolysis of
Aqueous Systems Nature 195 1294-1296 (1962)
69 Dainton F S amp Rumfeldt R Radical and Molecular Yields in the γ-Radiolysis of Water III
The Nitrous Oxide-Sodium Tellurite System Proceedings of the Royal Society of London A Mathematical Physical and Engineering Sciences 287 444-456 (1965)
70 Cheek C H amp Linnenbom V J The Radiation Chemistry of Alkaline Hypobromite Solutions
The Journal of Physical Chemistry 67 1856-1860 (1963)
71 Fielden E M amp Hart E J Primary Radical Yields in Pulse-Irradiated Alkaline Aqueous
Solution Radiation Research 32 564-580 (1967)
72 Czapski G amp Peled E On the pH-Dependence of Greducing in the Radiation Chemistry of
Aqueous Solutions Israel Journal of Chemistry 6 421-436 (1968)
73 Balkas T Dainton F S Dishman J K amp Smithies D Radiation Chemistry of Aqueous
Solutions Containing Carbon Monoxide and Oxygen Between pH 04 and 12 Transactions of the Faraday Society 62 81-87 (1966)
References
166
74 Pimblott S M Pilling M J amp Green N J B Stochastic Models of Spur Kinetics in Water International Journal of Radiation Applications and Instrumentation Part C Radiation Physics and Chemistry 37 377-388 (1991)
75 Hayon E Radical and Molecular Yields in the Radiolysis of Alkaline Aqueous Solutions
Transactions of the Faraday Society 61 734-743 (1965)
76 Gordon S amp Hart E J Chemical Yields of Ionizing Radiations in Aqueous Solutions Effect of
Energy of Alpha Particles Radiation Research 15 440-451 (1961)
77 Kochanny G L Timnick A Hochanadel C J amp Goodman C D Radiation Chemistry Studies
of Water as Related to the Initial Linear Energy Transfer of 11-MeV to 23-MeV Protons Radiation Research 19 462-473 (1963)
78 ICRU Report 16 - Linear Energy Transfer (ICRU Washington USA 1970)
79 Schwarzenbach R P Gschwend P M amp Imboden D M Environmental Organic Chemistry
(Wiley 2005)
80 Ferrell R T amp Himmelblau D M Diffusion Coefficients of Hydrogen and Helium in Water
American Institute of Chemical Engineers 13 702-708 (1967)
81 Han P amp Bartels D M Temperature Dependence of Oxygen Diffusion in H2O and D2O The
Journal of Physical Chemistry 100 5597-5602 (1996)
82 Marrero T R amp Mason E A Gaseous Diffusion Coefficients Journal of Physical and
Chemical Reference Data 1 3-118 (1972)
83 Kestin J Knierim K Mason E A Najafi B Ro S T amp Waldman M Equilibrium and
Transport Properties of the Noble Gases and Their Mixtures at Low Density Journal of Physical and Chemical Reference Data 13 229-303 (1984)
84 Sander R Compilation of Henryrsquos Law Constants for Inorganic and Organic Species of
Potential Importance in Environmental Chemistry (1999)
85 Mezyk Stephen P amp Bartels David M Direct EPR Measurement of Arrhenius Parameters
for the Reactions of Hmiddot Atoms with H2O2 and Dmiddot Atoms with D2O2 in Aqueous Solution Journal of the Chemical Society Faraday Transactions 91 3127-3132 (1995)
References
167
86 Joseph Jiju M Seon Choi Byung Yakabuskie Pam amp Wren Clara J A Combined Experimental and Model Analysis on the Effect of pH and O2(aq) on γ-Radiolytically Produced H2 and H2O2 Radiation Physics and Chemistry 77 1009-1020 (2008)
87 Allen A O The Yields of Free H˙ and ˙OH in the Irradiation of Water Radiation Research 1
85-96 (1954)
88 Jortner J amp Noyes R M Some Thermodynamic Properties of the Hydrated Electron The
Journal of Physical Chemistry 70 770-774 (1966)
89 Sehested K Holcman J Bjergbakke E amp Hart Edwin J Ultraviolet Spectrum and Decay of
the Ozonide Ion Radical O3- in Strong Alkaline Solution Journal of Physical Chemistry 86
2066-2069 (1982)
90 Jones T Development of an Effluent Treatment Process for the Silos Direct Encapsulation
Plant IChemE Sustainable Nuclear Energy Conference (2014)
91 Nelson S M Newman A C D Tomlinson T E amp Sutton L E A Dielectric Study of the
Adsorption of Water by Magnesium Hydroxide Transactions of the Faraday Society 55 2186-2202 (1959)
92 Shpak P A Kalinichenko A E Lytovchenko S A Kalinichenko A I Legkova V G amp
Bagmut N N The Effect of γ-Irradiation on the Structure and Subsequent Thermal Decomposition of Brucite Physics and Chemistry of Minerals 30 59-68 (2003)
93 Maroto-Valer M M Developments and Innovation in Carbon Dioxide (CO2) Capture and
Storage Technology Volume One Carbon Dioxide (CO2) Capture Transport and Industrial Applications (Woodhead Publishing 2010)
94 Siriwardane R V amp Stevens R W Novel Regenerable Magnesium Hydroxide Sorbents for
CO2 Capture at Warm Gas Temperatures Industrial amp Engineering Chemistry Research 48 2135-2141 (2009)
95 Fricker Kyle J amp Park A Alissa Effect of H2O on Mg(OH)2 Carbonation Pathways for
Combined CO2 Capture and Storage Chemical Engineering Science 100 332-341 (2013)
96 Sahoo P Ishihara S Yamada K Deguchi K Ohki S Tansho M et al Rapid Exchange
between Atmospheric CO2 and Carbonate Anion Intercalated within Magnesium Rich Layered Double Hydroxide ACS Applied Materials amp Interfaces 6 18352-18359 (2014)
97 Stirling A HCO3
- Formation from CO2 at High pH Ab Initio Molecular Dynamics Study The Journal of Physical Chemistry B 115 14683-14687 (2011)
References
168
98 Shah Noor S Khan Javed Ali Al-Muhtaseb Alarsquoa H Sayed Murtaza amp Khan Hasan M
Gamma Radiolytic Decomposition of Endosulfan in Aerated Solution The Role of Carbonate Radical Environmental Science and Pollution Research 1-10 (2016)
99 Nash K Mulac W Noon M Fried S amp Sullivan J C Pulse Radiolysis Studies of U(VI)
Complexes in Aqueous Media Journal of Inorganic and Nuclear Chemistry 43 897-899 (1981)
100 Holcman J Bjergbakke E amp Sehested K The Importance of Radical-Rradical Reactions in
Pulse Radiolysis of Aqueous CarbonateBicarbonate Proceedings of the Tihany Symposium on Radiation Chemistry 6 149-153 (1987)
101 Draganic Z D Negron-Mendoza A Sehested K Vujosevic S I Navarro-Gonzales R
Albarran-Sanchez M G et al Radiolysis of Aqueous Solutions of Ammonium Bicarbonate Over a Large Dose Range Radiation Physics and Chemistry 38 317-321 (1991)
102 Eriksen T E Lind J amp Mereacutenyi G On the Acid-Base Equilibrium of the Carbonate Radical
Radiation Physics and Chemistry 26 197-199 (1985)
103 Thomas J K Gordon Sheffield amp Hart Edwin J The Rates of Reaction of the Hydrated
Electron in Aqueous Inorganic Solutions Journal of Physical Chemistry 68 1524-1527 (1964)
104 Nehari Shlomo amp Rabani Joseph The Reaction of H˙ Atoms with OH- in the Radiation
Chemistry of Aqueous Solutions Journal of Physical Chemistry 67 1609-1613 (1963)
105 Neta P amp Dorfman L M Pulse Radiolysis Studies XIII Rate Constants for the Reaction of
Hydroxyl Radicals with Aromatic Compounds in Aqueous Solutions in Radiation Chemistry Vol 81 Advances in Chemistry Ch 15 222-230 (American Chemical Society 1968)
106 Mezyk S P amp Bartels D M Rate Constant and Activation Energy Measurement for the
Reaction of Atomic Hydrogen with Methanol Iodomethane Iodoethane and 1-Iodopropane in Aqueous Solution The Journal of Physical Chemistry 98 10578-10583 (1994)
107 Anbar M amp Hart E J The Reactivity of Aromatic Compounds toward Hydrated Electrons
Journal of the American Chemical Society 86 5633-5637 (1964)
108 Theard Leslie M amp Burton Milton Radiolysis of Liquid Methanol and some Methanolic Salt
Solutions Journal of Physical Chemistry 67 59-64 (1963)
References
169
109 Porter Raymond P Noyes W amp Albert Jr Photochemical Studies LIV Methanol Vapor Journal of the American Chemical Society 81 2307-2311 (1959)
110 Motohashi N amp Saito Y Competitive Measurement of Rate Constants for Hydroxyl Radical
Reactions Using Radiolytic Hydroxylation of Benzoate Chemical amp pharmaceutical bulletin 41 1842-1845 (1993)
111 Adams G E amp Willson R L Pulse Radiolysis Studies on the Oxidation of Organic Radicals in
Aqueous Solution Transactions of the Faraday Society 65 2981-2987 (1969)
112 Kishore K Moorthy P N amp Rao K N Reactivity of H2O2 with Radiation Produced Free
Radicals Steady State Radiolysis Methods for Estimating the Rate Constants International Journal of Radiation Applications and Instrumentation Part C Radiation Physics and Chemistry 29 309-313 (1987)
113 Simic M Neta P amp Hayon E Pulse Radiolysis Study of Alcohols in Aqueous Solution The
Journal of Physical Chemistry 73 3794-3800 (1969)
114 Tsang W Chemical Kinetic Data Base for Combustion Chemistry Part 2 Methanol Journal
of Physical and Chemical Reference Data 16 471-508 (1987)
115 Huie R E amp Clifton C L Kinetics of the Self-Reaction of Hydroxymethylperoxyl Radicals
Chemical Physics Letters 205 163-167 (1993)
116 Schuchmann M N amp Von Sonntag C The Rapid Hydration of the Acetyl Radical A Pulse
Radiolysis Study of Acetaldehyde in Aqueous Solution Journal of the American Chemical Society 110 5698-5701 (1988)
117 Bothe E Schulte-Frohlinde D amp von Sonntag C Radiation Chemistry of Carbohydrates
Part 16 Kinetics of HO2˙ Elimination from Peroxyl Radicals Derived from Glucose and Polyhydric Alcohols Journal of the Chemical Society Perkin Transactions 2 416-420 (1978)
118 Zimina GM amp Bakh NA Pulse Radiolysis of Ethylene Glycol Absorption Spectra of the
Short-Lived Radicals High Energy Chem 13 187-190 (1979)
119 Thomas J K Rates of Reaction of the Hydroxyl Radical Transactions of the Faraday Society
61 702-707 (1965)
120 Draganic I amp Marcovic V Unpublished data (NIST Squib 1968DRAMARB) (1968)
References
170
121 Orlando J J amp Tyndall G S The Atmospheric Chemistry of the HC(O)CO Radical International Journal of Chemical Kinetics 33 149-156 (2001)
122 Ziemer H Doacutebeacute S Wagner H G Olzman M Viskolcz B amp Temps F Kinetics of the
Reactions of HCO with H˙ and D˙ Atoms Berichte der Bunsengesellschaft fuumlr physikalische Chemie 102 897-905 (1998)
123 Temps F amp Wagner H G Rate Constants for the Reactions of ˙OH Radicals with CH2O˙ and
HCO˙ Berichte der Bunsengesellschaft fuumlr physikalische Chemie 88 415-418 (1984)
124 Atkinson R Baulch D L Cox R A Hampson R F Kerr J A Rossi M J et al Evaluated
Kinetic and Photochemical Data for Atmospheric Chemistry Supplement VI IUPAC Subcommittee on Gas Kinetic Data Evaluation for Atmospheric Chemistry Journal of Physical and Chemical Reference Data 26 1329-1499 (1997)
125 Yee Quee M J amp Thynne J C J The Photolysis of Organic Esters Berichte der
Bunsengesellschaft fuumlr physikalische Chemie 72 211-217 (1968)
126 Sunaryoy G R amp Domae M Numerical Simulation on Effect of Methanol Addition on
Coolant Radiolysis in Pressurized Water Reactor Journal of Nuclear Science and Technology 45 1261-1274 (2008)
127 Baxendale J H amp Mellows F W The γ-Radiolysis of Methanol and Methanol Solutions
Journal of the American Chemical Society 83 4720-4726 (1961)
128 Pikaev A K amp Kartasheva L I Radiolysis of Aqueous Solutions of Ethylene Glycol
International Journal for Radiation Physics and Chemistry 7 395-415 (1975)
129 Ahmad M Awan M H amp Mohammad D γ-Radiolysis of Ethylene Glycol Aqueous
Solutions Journal of the Chemical Society B Physical Organic 945-946 (1968)
130 Yaylayan V A Harty-Majors S amp Ismail A A Investigation of the Mechanism of
Dissociation of Glycolaldehyde Dimer (25-dihydroxy-14-dioxane) by FTIR Spectroscopy Carbohydrate Research 309 31-38 (1998)
131 Reiff S C amp LaVerne J A Radiation-Induced Chemical Changes to Iron Oxides The Journal
of Physical Chemistry B 119 7358-7365 (2015)
132 Lousada C M Yang M Nilsson K amp Jonsson M Catalytic Decomposition of Hydrogen
Peroxide on Transition Metal and Lanthanide Oxides Journal of Molecular Catalysis A Chemical 379 178-184 (2013)
References
171
133 Rush J D B Benon H J Pulse Radiolytic Studies of the Reaction of Perhydroxyl
Superoxide O2- with Iron(II)Iron(III) Ions The Reactivity of HO2O2
- with Ferric Ions and its Implication on the Occurrence of the Haber-Weiss Reaction Journal of Physical Chemistry 89 5062-5066 (1985)
134 Pepper S E Borkowski M Richmann M K amp Reed D T Determination of Ferrous and
Ferric Iron in Aqueous Biological Solutions Analytica Chimica Acta 663 172-177 (2010)
135 Barb W G Baxendale J H George P amp Hargrave K R Reactions of Ferrous and Ferric
Ions with Hydrogen Peroxide Part II-The Ferric Ion Reaction Transactions of the Faraday Society 47 591-616 (1951)
136 Stuglik Z amp PawełZagoacuterski Z Pulse Radiolysis of Neutral Iron(II) Solutions Oxidation of
Ferrous Ions by ˙OH Radicals Radiation Physics and Chemistry (1977) 17 229-233 (1981)
137 Fong K-L McCay P B Poyer J L Misra H P amp Keele B B Evidence for Superoxide-
Dependent Reduction of Fe3+ and its role in Enzyme-Generated Hydroxyl Radical Formation Chemico-Biological Interactions 15 77-89 (1976)
138 Baxendale J H Dixon R S amp Stott D A Reactivity of Hydrogen Atoms with Fe3+ FeOH2+
and Cu2+ in Aqueous Solutions Transactions of the Faraday Society 64 2398-2401 (1968)
139 Jonah C D M John R Matheson Max S The Reaction of the Precursor of the Hydrated
Electron with Electron Scavengers Journal of Physical Chemistry 81 1618-1622 (1977)
Appendix
172
Appendix
Radiolysis Model Code
All computational calculations were performed with the software package Facsimile by
MCPA Software The following is a print out of the core water radiolysis model and only
includes the reactions of water other reaction schemes documented in this work can be
found on the included CD as well as the setup files containing initial parameters and
associated Python scripts used to manage output data
Appendix
173
--------------------------------------------------------------------
_ _ ___ ____ _____ _ _ _ _
| | | |__ __ | __ | (_) | | (_)
| |__| | ) | | | | | |__) |__ _ __| |_ ___ | |_ _ ___ _ ___
| __ | | | | | | _ _` | _` | | _ | | | | __| __|
| | | | _| |__| | | | | (_| | (_| | | (_) | | |_| __ | __
|_| |_|____|____ |_| ____|___|_|___|_|__ |___|_|___
__ |
|___
--------------------------------------------------------------------
-----Radiolysis Model for the Radiolysis of Pure Water--------------
----------------------Thomas Donoclift------------------------------
Rate constants mainly are from
A J Elliot Rate constants and G-values
for the simulation of the radiolysis of
light water over the range 0 - 300 C
AECL-11073 COG-94-167 19942008
P Bouniol amp E Bjergbakke ldquoA Comprehensive
Model to Describe Radiolytic processes
in Cement Mediumrdquo J Nuclear Materials 372 1-15 2008
JC Wren JM Ball ldquoLIRIC 32 an Updated model for
Iodine behaviour in the presence of organic impuritiesrdquo
Radiation Physics and Chemistry 60 577-596 2001
EXECUTE OPEN 1 RadMout UNKNOWN
EXECUTE OPEN 2 Reportout UNKNOWN
EXECUTE OPEN 3 SetUptxt OLD
EXECUTE OPEN 4 Flux_Atxt UNKNOWN
EXECUTE OPEN 7 Flux_Btxt UNKNOWN
EXECUTE OPEN 8 Flux_Ctxt UNKNOWN
EXECUTE OPEN 9 Flux_Dtxt UNKNOWN
EXECUTE OPEN 10 Flux_Etxt UNKNOWN
EXECUTE OPEN 11 FireCount_Atxt UNKNOWN
EXECUTE OPEN 12 FireCount_Btxt UNKNOWN
EXECUTE OPEN 14 TIMEtxt UNKNOWN
EXECUTE OPEN 15 FireCount_Ctxt UNKNOWN
EXECUTE OPEN 16 FireCount_Dtxt UNKNOWN
EXECUTE OPEN 17 FireCount_Etxt UNKNOWN
EXECUTE OPEN 19 TRACEtxt UNKNOWN
PERMIT +-
------------------------
Appendix
174
These variables are the concentrations of radiolysis
species Edit initial values in COMPILE INSTANT and
COMPILE INITIAL routines or SetUptxt
---------DEFINE-VARIABLES--------------
----CHEMICAL-SPECIES-FOR-H2O-RADIOLYSIS---------------
VARIABLE
H2O H2O+ H3O+ OH H H2 H2g H2O2 H2O2+ O2 O2g H+
OH- Eaq- O2- O2-- HO2 HO2- O- O-- O3- O Rx O3
---------------------------------------
------REACTION-COUNTERS-----------------------
VARIABLE
R0 R1 R2 R3 R4 R5 R6 R7 R8 R9 R10 R11 R12 R13 R14 R15 R16
R17 R18 R19 R20 R21 R22 R23 R24 R25 R26 R27 R28 R29 R30
R31 R32 R33 R34 R35 R36 R37 R38 R39 R40 R41 R42 R43 R44
R45 R46 R47 R48 R49 R50 R51 R52 R53 R54 R55 R56 R57 R58
R59 R60 R61 R62 R63 R64 R65 R66 R67 R68 R69 R70 R71 R72
R73 R74 R75 R76 R77 R78 R79 R80 R81 R82 R83
G0 G1 G2 G3 G4 G5 G6 G7 G8
---------DEFINE-PARAMETERS-------------
PARAMETER
T TK RT TAB DOSER ADOSE
DOSE EVDOSE GEaq- GH GH2 GOH GH2O2 GH+ GOH- G-H2O G+H2O GO2 GO2-
kappH2 kappO2 GHO2 GHO2-
kappO2g H2tot EA MB1 MB2 H2O2T
INTEGER RUNt
-------------------------
This set of perameters concerns radiolysis rates
G-Values are converted to rates in COMPILE INITIAL
Rate constants are given the prefix K
Arrhenius Pre-exponentials are given the prefix A
Activation Energies (-EaR) are given the prefix E
followed by letters representing reacting species ie
KAB = Rate constant of A+B
-------------------------
A=Eaq- B=H C=OH D=O-
E=O3- F=HO2 G=H2O2 H=H2O2+
I=H2O J=H+ K=OH- L=HO2-
M=O2 N=O2- O=O2-- P=H2O+
Q=O3 R=H2 S=O
-------------------------
PARAMETER
DW GREaq- GRH GRH2 GROH GRH2O2 GRH+ GROH- GR-H2O GR+H2O
GRO2 GRO2- GRHO2 GRHO2- KAA KAB KAC KAD KAG KAF KAL KAM KAN KBB KBC
KBG KBM KBN KBF KBF2 KBL KCC KCD KCG KCL KCF KCN KDR KDG KDL
KDN KEG KEL KER KEC KED KNN KFN KFNI KFF KFG KI KJK KG
KJL KGK KLI KC KJD KCK KDI KDM KE KF KJN KFK KNI KB KJA
KBK KAI KBI KRC KJNb KCKb KLK KLKb KDD KEJ KBQ KDQ
KCL2 KCQ KNQ KFQ KNG KNE KKQ KLQ KGQ KLG KLN KEC2 KAN2 KAN3
-------------------------
Appendix
175
----PRE-EXPONENTIAL-FACTORS-------------------
PARAMETER AAB AAF AAG AAM AAN ABB ABC ABG
ABN ABF ACG ACF ACN ACL ADR ADL AFNI
AFF ADM AE AG AAN2 AGQ AFN ANN ACL2 ABF2
ABL AAD AAL ADG AEG AEL AER AFG AAN3 ACD ALKb
-----------------------------------
-------ACTIVATION-ENERGIES--------------
PARAMETER EAB EAF EAG EAM EAN EBB EBC EBG
EBN EBF ECG ECF ECN ECL EDR EDL EFNI
EFF EDM EE EG EAN2 EGQ EFN ENN ECL2 EBF2
EBL EAD EAL EDG EEG EEL EER EFG EAN3 ECD ELKb
---------------------------------------
PARAMETER
pH pHreal pKw pKH2O2 pKOH pKHO2 pKH pKH2O pKHO2- KpH KpO
KfH KrH KfO KrO CONV PcH PcO O2in xO2 Kprot Khydx
TPrint pHsweep Tstart Tend DecTime
---------------------------------------------------------
Below are arrays for storing reaction flux These are limited to 20
as the output length max is 250 characters To overcome this clunky
artefact of Facsimile the arrays can be fed into Facssemblepy to
concatenate them into a single output file
----------------------------------------------------------
PARAMETER lt20gt Ra Stores Water Reaction Flux Part A
PARAMETER lt20gt Rb Stores Water Reaction Flux Part B
PARAMETER lt20gt Rc Stores Water Reaction Flux Part C
PARAMETER lt20gt Rd Stores Water Reaction Flux Part D
PARAMETER lt10gt Re Stores Water Reaction Flux Part E
PARAMETER lt2gt GR Stores Gas Partition Flux
-------------------------
--PARAMETERS-FOR-GAS-PARTITION--------------
PARAMETER
DaqH2 DgH2 DaqO2 DgO2 daq dg
vaqH2 vgH2 vaqO2 vgO2 vintH2 vintO2
KpH2 KpO2 vtot
Aint Vl Vg Vr Dose EqR
---------------INITIALISE-PARAMETERS--------
Concentrations of specis are given as Moll
T is Temp in C - TK is Temp in K
pHin is the initial pH xO2 is the fraction of O2
pHreal is the calculated pH at any given time
DW is density of water depending on temperature
DS is the density of the whole solution
Vl and Vg is the Volume of liqud and gas phases in L
DOSER is the dose rate in Gymin
ADOSE is the conversion of dose rate to sets of 100eVls
Appendix
176
COMPILE INSTANT
----PARAMETERS-FROM-SETUP-FILE-----
READ 3 DOSER
READ 3 RUNt
READ 3 Tstart
READ 3 Tend
READ 3 pH
READ 3 xO2
READ 3 Vl
READ 3 Vg
READ 3 Aint
READ 3 DaqH2
READ 3 DgH2
READ 3 DaqO2
READ 3 DgO2
READ 3 daq
READ 3 dg
READ 3 KpH2
READ 3 KpO2
---ADDITIONAL-PARAMETERS----
T = Tstart
TK = T + 27315
TAB = 1TK
RT = 8314TK
DW = (0999 + 1094E-4 T - 7397E-6 T2
+ 2693E-8 T3 - 4714E-11 T4)
ADOSE = ((DOSER 62415E16) 60) DW 100 eVsl for use with Gymin
TPrint = (FLOAT(RUNt) - 1) 60
EA = EXP(18800((129815-1TK)8314))
WRITE 2 = 4
WRITE 3 = 7
WRITE 4 = 8
WRITE 7 = 10
WRITE 8 = 9
WRITE 12 = 14
WRITE 1 = 2 WATER RADIOLYSIS MODEL - DEBUG REPORT
------INITIAL-SPECIES-CONCENTRATIONS-----
READ 3 Eaq-
READ 3 H2
READ 3 O2
READ 3 H2O2
H2O = 553DW
O2g = 101320 xO2 (1000 RT)
H2g = 1E-22 mass transfer - zero will cause floating point overflow
H+ = 10(-1pH) H+ Activity (Effective concentration)
OH- = 10(-1(14-pH))
Appendix
177
------------ARRHENIUS-PARAMETERS-----------------------------
----PRE-EXPONENTIAL-FACTORS-------------------
AAB = 114E13
AAF = 24636E12
AAG = 77E12
AAM = 2479E12
AAN = 24636E12
ABB = 27E12
ABC = 426E11
ABG = 179E11
ABN = 517E12
ABF = 517E12
ACG = 768E9
ACF = 129E11
ACN = 877E11
ACL = 100E12
ADR = 232E10
ADL = 145E13
AFNI = 263E9
AFF = 278E9
ADM = 341E11
AE = 320E11
AG = 3171E4
AAN2 = 31E12
AGQ = 28E11
AFN = 244E9
ANN = 489E8
ACL2 = 45E12
ABF2 = 72E11
ABL = 42E13
AAD = 56E11
AAL = 175E12
ADG = 300E11
AEG = 159E6
AEL = 887E5
AER = 249E5
AFG = 37
AAN3 = 2567E13
ACD = 17E11
ALKb = 295E8
------------------------------
------ACTIVATION-ENERGIES-EaR----
EAB = 17957
EAF = 15636
EAG = 18896
EAM = 14015
EAN = 15636
EBB = 18675
EBC = 10919
EBG = 25336
EBN = 18242
EBF = 18242
ECG = 16614
ECF = 7992
ECN = 13062
ECL = 14346
EDR = 15505
EDL = 29285
Appendix
178
EFNI = 9743
EFF = 24164
EDM = 13449
EE = 55521
EG = 78181
------ACTIVATION-ENERGIES---Ea-J--
EAN2 = 136000
EGQ = 735000
EFN = 86000
ENN = 525900
ECL2 = 156000
EBF2 = 106000
EBL = 256000
EAD = 79000
EAL = 154000
EDG = 156000
EEG = 188400
EEL = 188400
EER = 188400
EFG = 200000
EAN3 = 188000
ECD = 77000
ELKb = 142000
--------------------------------
---------OTHER-LITERATURE-RATE-CONSTANTS--------------------------
KLG = 45E-4 FRDuke TWHaas 1961
KLQ = 55E6 JStaehelin J Hoigne 1982
KKQ = 48E1 LForni EJ Hart 1982
KFQ = 50E8 Pastina La Verne 2001
KNQ = 15E9 EJ Hart 1983
KNE = 10E4 Pastina La Verne 2001
KNG = 13E-1 JWeinstein BBielski 1979
KLN = 823E-2 PBouniol EBjergbakke 2008
KCQ = 11E8 K Sehested EJ Hart 1984
KEC2 = 25E9 K Sehested EJ Hart 1984
KDQ = 10E9 E Bjergbakke H Christensen
KBQ = 22E10 EJ Hart 1983
KCD = 20E10
KDN = 600E8
KEC = 60E9 Sehested Holcman Hart 1984
(269)
KEC = 850E9 P Bouniol E Bjergbakke
KDD = 84E9 Adams GE Boag JW
KDD = 10E8
KED = 70E8 Hart EJ 1984
KEJ = 90E10 Hart EJ
KLK = 3506E5
KLKb = 961E5
-GENERAL-ROUTINE-CONTINUALLY-ITTERATES-THROUGHOUT-CALCULATION-
Appendix
179
COMPILE GENERAL
------TEMPERATURE-RAMPING-ROUTINE----------------
TK = T + 27315
TAB = 1TK
RT = 8314TK
DecTime = TIME 3600
T = (11414 DecTime3 - 80383 DecTime2
+ 19256 DecTime + 22918)
IF(T - Tend)211
LABEL 1
T = Tend
LABEL 2
----------------------
H2O2T = H2O2 + HO2- + O2-- Total peroxide for output use
------------------SETUP-OF-EQUILIBRIA---------------------------------
pKw = (14947 - 4273E-2 T + 2115E-4 T2
- 5786E-7 T3 + 7529E-10 T4)
pKH2O2 = (12383 - 3020E-2 T + 170E-4 T2
- 5151E-7 T3 + 696E-10 T4)
pKOH = (12383 - 3020E-2 T + 170E-4 T2
- 5151E-7 T3 + 696E-10 T4)
pKHO2 = (4943 - 623E-3 T + 4125E-5 T2
- 8182E-9 T3)
pKH = (10551 - 443E-2 T + 1902E-4 T2
- 4661E-7 T3 + 598E-10 T4)
pKH2O = (1669 - 443E-2 T + 2071E-4 T2
- 5594E-7 T3 + 7161E-10 T4)
Kprot = (341E10 + 275E8 T + 124E7 T2
- 623E4 T3 + 131E2 T4)
Khydx = (722E9 + 162E8 T + 24E6 T2
- 781E3 T3 + 106 T4)
pKHO2- = 165 see Bouniol 2001
--------------------PARTITION-OF-O2-AND-H2---------------------
It should be noted that this routine is only valid for
a liquid to gas ratio of 1 See Chapter 3 for details
---------DIFFUSIVITY-WITH-TEMPERATURE---------
DaqO2 = (2E-9 T2 + 4E-7 T + 1E-5)
DaqH2 = (1E-8 T2 + 4E-7 T + 3E-5)
DgO2 = (1E-6 T2 + 12E-3 T + 02073)
DgH2 = (5E-6 T2 + 47E-3 T + 07719)
-----HENRYS-COEFFICIENT-WITH-TEMPERATURE--------------------
KpH2 = (TK (78E-4 EXP(543((1TK) - (129815))))) 122
KpO2 = (TK (13E-3 EXP(1650((1TK) - (129815))))) 122
---H2----
vgH2 = DgH2dg
vaqH2 = DaqH2daq
vintH2 = 1(1vaqH2 + KpH2vgH2)
H2tot = H2 + H2g
Appendix
180
---O2----
vgO2 = DgO2dg
vaqO2 = DaqO2daq
vintO2 = 1(1vaqO2 + KpO2vgO2)
vtot = 1((1(vaqO2))+(1(vgO2KpO2)))
--------PARAMETER-EVOLUTION--------------
kappH2 = vintH2(AintVl)(1 - KpH2(H2gH2))
kappO2 = vintO2(AintVl)(1 - KpO2(O2gO2))
Dose = DOSER (TIME 60)
pHreal = -LOG10( H+ )
--------------------G-VALUES------------------------
G-Values with temperature dependency ONLY
G-Values are initially obtained from literature molec 100eV
G-Values are converted to rates later
GEaq- = 2641 + 4162E-3 T + 9093E-6 T2 - 4717E-8 T3
GH2 = 0419 + 872E-4 T - 4971E-6 T2 + 1503E-8 T3
GOH = 2531 + 1134E-2 T - 1269E-5 T2 + 3513E-8 T3
GH2O2 = 0752 - 162E-3 T
GH = 0556 + 2198E-3 T - 1184E-5 T2 + 5223E-8 T3
GH+ = GEaq-
G-H2O = GOH + 2GH2O2
-----------------------------------------------------
------------G-VALUES-FROM-MULTIPLE-POLYNOMIAL-REGRESSION-----
Multiple polynomial regression was used to combine data that measured
primary yields as a function of temperature AND as a function of pH
GEaq- = 2798 + 285E-3 T - 2514E-2 pHreal
GH2 = 38781E-1 + 8288E-4 T + 5988E-4 pHreal
GOH = 243146 + 1111E-2 T - 12E-3 pHreal
GH = 4444E-1 + 367E-3 T - 2378E-4 pHreal
GH+ = GEaq-
GH2O2 = 05(GH + GEaq- + (2 GH2) - GOH) Material Balance
G-H2O = GOH + 2GH2O2
MB1 = GH + GEaq- + (2 GH2) Diagnostic Material Balance Variables
MB2 = GOH + (2 GH2O2)
-------------------G-VALUES--AS--RATES--------------
GREaq- = (ADOSE GEaq-)6022E23
GRH = (ADOSE GH)6022E23
GRH2 = (ADOSE GH2)6022E23
GROH = (ADOSE GOH)6022E23
GRH2O2 =(ADOSE GH2O2)6022E23
GRH+ = (ADOSE GH+)6022E23
GROH- = (ADOSE GOH-)6022E23
GR-H2O = (ADOSE G-H2O)6022E23
GRO2 = (ADOSE GO2)6022E23
GRO2- = (ADOSE GO2-)6022E23
GRHO2 = (ADOSE GHO2)6022E23
GRHO2- = (ADOSE GHO2-)6022E23
Appendix
181
------REACTION-RATES-WITH-TEMP-DEPENDENCY--
--------POLYNOMIAL-EQUATIONS----------------
KAA = 10(12281 - 3768E2 TAB - 6673E4 TAB2 - 1075E7 TAB3)
KAC = 10(13123 - 1023E3 TAB + 7634E4 TAB2)
KBM = 10(10704 + 2840E2 TAB - 137E5 TAB2)
KCC = 10(8054 + 2193E3 TAB - 7395E5 TAB2 + 687E7 TAB3)
KJK = 10(20934 - 1236E4 TAB + 6364E6 TAB2
- 1475E9 TAB3 + 1237E11 TAB4)
KJN = 10(1641 - 4888E3 TAB + 1622E6 TAB2 - 2004E8 TAB3)
KCK = 10(13339 - 222E3 TAB + 7333E5 TAB2 - 1065E8 TAB3)
KJA = 10(39127 - 3888E4 TAB + 2054E7 TAB2 - 4899E9 TAB3
+ 4376E11 TAB4)
KBK = 10(22970 - 1971E4 TAB + 1137E7 TAB2 - 2991E9 TAB3
+ 2803E11 TAB4)
KBI = 10(9408 - 2827E3 TAB - 3792E5 TAB2)
KRC = 10(-11556 + 32546E4 TAB - 18623E7 TAB2
+ 45543E9 TAB3 - 41364E11 TAB4)
------------ARRHENIUS-EQUATIONS------------------
----------EaR-------------------
KAB = AAB(EXP(-EABTK))
KAF = AAF(EXP(-EAFTK))
KAG = AAG(EXP(-EAGTK))
KAM = AAM(EXP(-EAMTK))
KAN = AAN(EXP(-EANTK))
KBB = ABB(EXP(-EBBTK))
KBC = ABC(EXP(-EBCTK))
KBG = ABG(EXP(-EBGTK))
KBN = ABN(EXP(-EBNTK))
KBF = ABF(EXP(-EBFTK))
KCG = ACG(EXP(-ECGTK))
KCF = ACF(EXP(-ECFTK))
KCN = ACN(EXP(-ECNTK))
KCL = ACL(EXP(-ECLTK))
KDR = ADR(EXP(-EDRTK))
KDL = ADL(EXP(-EDLTK))
KFNI = AFNI(EXP(-EFNITK))
KFF = AFF(EXP(-EFFTK))
KDM = ADM(EXP(-EDMTK))
KE = AE(EXP(-EETK))
KG = AG(EXP(-EGTK))
---------Ea-----------------
KAN2 = AAN2EXP(-EAN2RT)
KGQ = AGQEXP(-EGQRT) KSehested EJ Hart1992
KFN = AFNEXP(-EFNRT) BBielski ARoss 1985
KNN = ANNEXP(-ENNRT) Eliot
KCL2 = ACL2EXP(-ECL2RT) Eliot
KBF2 = ABF2EXP(-EBF2RT) Eliot
KBL = ABLEXP(-EBLRT) SP Mezyk DM Bartels
KAD = AADEXP(-EADRT) Eliot
KAL = AALEXP(-EALRT)
KDG = ADGEXP(-EDGRT)
KEG = AEGEA Wren amp Ball
Appendix
182
KEL = AELEA Wren amp Ball
KER = (AEREA) Wren (Suggests 8 correction)
KFG = 50E-1
KAN3 = AAN3EXP(-EAN3RT)
KCD = ACDEXP(-ECDRT)
-----------EQUILIBRIA---------------------------------------
KCKb = KCK ((10(-pKH2O))(10(-pKOH)))
KI = KJK(10-pKw)
KF = KJN (10-pKHO2)
KJL = KJN
KGK = KCK
KDI = KCK((10-pKH2O)(10-pKOH))
KLI = KCK((10-pKH2O)(10-pKH2O2))
KJD = KJN
KC = KJD(10-pKOH)
KFK = KCK
KNI = KFK((10-pKH2O)(10-pKHO2))
KB = KJA(10-pKH)
KAI = KBK((10-pKH2O)(10-pKH))
KJNb = KJN(10-pKH2O2)((10(-pKw))(10(-pKHO2)))
GENERAL
-------EQUATIONS-ROUTINE-CONTAINS-RADIOLYSIS-CHEMISTRY--------
COMPILE EQUATIONS
------INITIAL-SPECIES-GENERATION----------------------------
Ralt0gtGREaq- = Eaq- + G0
Ralt1gtGRH = H + G1
Ralt2gtGRH2 = H2 + G2
Ralt3gtGROH = OH + G3
Ralt4gtGRH2O2 = H2O2 + G4
Ralt5gtGRH+ = H+ + G5
Ralt6gtGROH- = OH- + G6
Ralt7gtGR-H2OH2O H2O = G7
----------REACTIONS------------------------
Ralt8gtKAA(H2OH2O) Eaq- + Eaq- + H2O + H2O = H2 + OH- + OH- + R0
Ralt9gtKABH2O Eaq- + H + H2O = H2 + OH- + R1
Ralt10gtKAC Eaq- + OH = OH- + R2
Ralt11gtKADH2O Eaq- + H2O + O- = OH- + OH- + R3
Ralt12gtKAG Eaq- + H2O2 = OH- + OH + R4
Ralt13gtKAF Eaq- + HO2 = HO2- + R5
Ralt14gtKAL Eaq- + HO2- = O- + OH- + R6
Ralt15gtKAM Eaq- + O2 = O2- + R7
Ralt16gtKAN Eaq- + O2- = O2-- + R8
Ralt17gtKBB H + H = H2 + R9
Ralt18gtKBC H + OH = H2O + R10
Ralt19gtKBG H + H2O2 = OH + H2O + R11
Rblt0gtKBM H + O2 = HO2 + R12
Rblt1gtKBN H + O2- = HO2- + R13
Rblt2gtKBF H + HO2 = OH + OH + R14
Rblt3gtKBL H + HO2- = OH + OH- + R15
Rblt4gtKBQ H + O3 = OH + O2 + R16
Rblt5gtKCC OH + OH = H2O2 + R17
Rblt6gtKCG OH + H2O2 = H2O + HO2 + R18
Rblt7gtKCL OH + HO2- = OH- + HO2 + R19
Rblt8gtKCF OH + HO2 = H2O + O2 + R20
Appendix
183
Rblt9gtKCN OH + O2- = OH- + O2 + R21
Rblt10gtKCQ OH + O3 = O2 + HO2 + R22
Rblt11gtKEG O3- + H2O2 = O2- + O2 + H2O + R23
Rblt12gtKEL O3- + HO2- = O2- + O2 + OH- + R24
Rblt13gtKER O3- + H2 = O2 + H + OH- + R25
Rblt14gtKEC O3- + OH = HO2 + O2- + R26
Rblt15gtKEC2 O3- + OH = OH- + O3 + R27
Rblt16gtKEJ O3- + H+ = OH + O2 + R28
Rblt17gtKNN O2- + O2- = O2 + O2-- + R29
Rblt18gtKLN O2- + HO2- = O2 + OH- + O- + R30
Rblt19gtKNG O2- + H2O2 = O2 + OH + OH- + R31
Rclt1gtKFN O2- + HO2 = O2 + HO2- + R32
Rclt2gtKNE O2- + O3- = O-- + O2 + O2 + R33
Rclt3gtKNQ O2- + O3 = O2 + O3- + R34
Rclt4gtKFF HO2 + HO2 = H2O2 + O2 + R35
Rclt5gtKFG HO2 + H2O2 = O2 + H2O + OH + R36
Rclt6gtKFQ HO2 + O3 = OH + O2 + O2 + R37
Rclt7gtKLG H2O2 + HO2- = H2O + O2 + OH- + R38
Rclt8gtKKQ O3 + OH- = O2 + HO2- + R39
Rclt9gtKLQ O3 + HO2- = O2 + OH + O2- + R40
Rclt10gtKGQ O3 + H2O2 = O2 + OH + HO2 + R41
------------------ADDITIONAL-WATER-CHEMISTRY------------------------
Rclt12gt200E10 H + O- = OH- + R42 Bjergbakke Draganic
Sehested
Rclt13gt16E10 O3- + Eaq- = OH- + OH- + O2 + R43 Pastina amp La
Verne
Rclt14gt36E10 O3 + Eaq- = O3- + R44 NIST
Rclt16gt23E-7 H2O2 = OH + OH + R45 Yakabuskie et al
Rclt17gt10E10H2O O-- + H2O = OH- + OH- + R46
Bouniol and Bjergbakke 2008
----------------ALKALI-REACTIONS------------------
Relt2gtKDR O- + H2 = H + OH- + R47
Relt3gtKDG O- + H2O2 = OH- + HO2 + R48
Relt4gtKDL O- + HO2- = O2- + OH- + R49
Relt5gtKDN O- + O2- = O-- + O2 + R50
Relt6gtKDD O- + O- = O2-- + R51
Relt7gtKCD O- + OH = HO2- + R52
Relt8gtKED O- + O3- = O2- + O2- + R53
Relt9gtKDQ O- + O3 = O2- + O2 + R54
----------EQUILIBRIUM-REACTIONS--------------------
Rclt18gtKIH2O H2O = H+ + OH- + R55
Rclt19gtKJK H+ + OH- = H2O + R56
Rdlt0gtKJN10(-pKH2O2) H2O2 = H+ + HO2- + R57
Rdlt1gtKJN H+ + HO2- = H2O2 + R58
Rdlt2gtKCK H2O2 + OH- = HO2- + H2O + R59
Rdlt3gtKLIH2O HO2- + H2O = H2O2 + OH- + R60
Rdlt4gtKLK HO2- + OH- = O2-- + H2O + R61
Rdlt5gtKLKbH2O O2-- + H2O = HO2- + OH- + R62
Rdlt6gtKJN10(-pKOH) OH = H+ + O- + R63
Rdlt7gtKJN H+ + O- = OH + R64
Appendix
184
Rdlt8gtKCK OH + OH- = O- + H2O + R65
Rdlt9gtKCKbH2O O- + H2O = OH + OH- + R66
Rdlt10gtKDM O- + O2 = O3- + R67
Rdlt11gtKE O3- = O- + O2 + R68
Rdlt12gtKF HO2 = H+ + O2- + R69
Rdlt13gtKJN H+ + O2- = HO2 + R70
Rdlt14gtKFK HO2 + OH- = O2- + H2O + R71
Rdlt15gtKNIH2O O2- + H2O = HO2 + OH- + R72
Rdlt16gtKB H = H+ + Eaq- + R73
Rdlt17gtKJA H+ + Eaq- = H + R74
Rdlt18gtKBK H + OH- = Eaq- + H2O + R75
Rdlt19gtKAIH2O Eaq- + H2O = H + OH- + R76
Relt0gtKBIH2O H + H2O = H2 + OH + R77
Relt1gtKRC H2 + OH = H + H2O + R78
---------------MASS-TRANSFER----------------------
GRlt0gtkappH2 H2 = H2g + R79
GRlt1gtkappO2 O2 = O2g + R80
-------OUTPUTS-ROUTINE-------
SETPSTREAM 3 1 20
OH H H2 H2g H2O2 O2 O2g H+ OH- Eaq-
O2- O2-- HO2 HO2- O- O-- O3- O O3
SETPSTREAM 4 11 20
R0 R1 R2 R3 R4 R5 R6 R7 R8 R9 R10 R11 R12 R13 R14 R15 R16
R17 R18 R19
SETPSTREAM 5 12 20
R20 R21 R22 R23 R24 R25 R26 R27 R28 R29 R30
R31 R32 R33 R34 R35 R36 R37 R38 R39
SETPSTREAM 6 15 20
R40 R41 R42 R43 R44 R45 R46 R47 R48 R49
R50 R51 R52 R53 R54 R55 R56 R57 R58 R59
SETPSTREAM 7 16 20
R60 R61 R62 R63 R64 R65 R66 R67 R68 R69
R70 R71 R72 R73 R74 R75 R76 R77 R78 R79
Appendix
185
SETPSTREAM 8 17 20
R80 R81 R82 R83 G1 G2 G3
G4 G5 G6 G7 G8
COMPILE OUT
PSTREAM 3
PSTREAM 4
PSTREAM 5
PSTREAM 6
PSTREAM 7
PSTREAM 8
WRITE 2 250 (N20 E10 2) Ra
WRITE 3 250 (N20 E10 2) Rb
WRITE 4 250 (N20 E10 2) Rc
WRITE 8 250 (N20 E10 2) Rd
WRITE 7 250 (N10 E10 2) Re
WRITE 10 (N2 E10 2) GR
WRITE 12 (E10 2) TIME
WHENEVER
TIME = TPrint Call Report
TIME = 0 + 600 RUNt CALL OUT
------------DEBUG-REPORT---------------
-Contains a list of all parameters to
confirm that values are correct-
COMPILE Report
WRITE 1 THIS REPORT IS GENERATED AT TPrint SECONDS
WRITE 1 RUNt = RUNt
WRITE 1 KpH2 = (E12 3) KpH2
WRITE 1 KpO2 = (E12 3) KpO2
WRITE 1 pH = (F6 1) pH
WRITE 1 Temperature = (F6 1) T C
WRITE 1 Dose Rate = (F6 1) DOSER Gymin
WRITE 1 VgVl Ratio = (F6 2) Vr
WRITE 1 Run Time = (F12 2) RUNt Mins
WRITE 1 Oxygen Fraction = (F6 3) xO2
WRITE 1 G-VALUES
WRITE 1 G(Eaq-) = (F6 3) GEaq-
WRITE 1 G(H) = (F6 3) GH
WRITE 1 G(H2) = (F6 3) GH2
WRITE 1 G(OH) = (F6 3) GOH
WRITE 1 G(H2O2) = (F6 3) GH2O2
WRITE 1 G(H+) = (F6 3) GH+
WRITE 1 G(-H2O) = (F6 3) G-H2O
WRITE 1 G-VALUES AS RATES MOLLS
WRITE 1 GREaq- = (E12 3) GREaq-
WRITE 1 GRH = (E12 3) GRH
WRITE 1 GRH2 = (E12 3) GRH2
WRITE 1 GROH = (E12 3) GROH
WRITE 1 GRH2O2 = (E12 3) GRH2O2
WRITE 1 GRH+ = (E12 3) GRH+
WRITE 1 GR-H2O = (E12 3) GR-H2O
WRITE 1 RATE CONSTANTS
WRITE 1 KAA = (E12 3) KAA
WRITE 1 KAB = (E12 3) KAB
Appendix
186
WRITE 1 KAC = (E12 3) KAC
WRITE 1 KAD = (E12 3) KAD
WRITE 1 KAG = (E12 3) KAG
WRITE 1 KAF = (E12 3) KAF
WRITE 1 KAL = (E12 3) KAL
WRITE 1 KAM = (E12 3) KAM
WRITE 1 KAN = (E12 3) KAN
WRITE 1 KBB = (E12 3) KBB
WRITE 1 KBC = (E12 3) KBC
WRITE 1 KBG = (E12 3) KBG
WRITE 1 KBM = (E12 3) KBM
WRITE 1 KBN = (E12 3) KBN
WRITE 1 KBF = (E12 3) KBF
WRITE 1 KBF2 = (E12 3) KBF2
WRITE 1 KBL = (E12 3) KBL
WRITE 1 KBQ = (E12 3) KBQ
WRITE 1 KCC = (E12 3) KCC
WRITE 1 KCD = (E12 3) KCD
WRITE 1 KCG = (E12 3) KCG
WRITE 1 KCL = (E12 3) KCL
WRITE 1 KCF = (E12 3) KCF
WRITE 1 KCN = (E12 3) KCN
WRITE 1 KCQ = (E12 3) KCQ
WRITE 1 KDR = (E12 3) KDR
WRITE 1 KDG = (E12 3) KDG
WRITE 1 KDL = (E12 3) KDL
WRITE 1 KDN = (E12 3) KDN
WRITE 1 KEG = (E12 3) KEG
WRITE 1 KEL = (E12 3) KEL
WRITE 1 KER = (E12 3) KER
WRITE 1 KEC = (E12 3) KEC
WRITE 1 KED = (E12 3) KED
WRITE 1 KNN = (E12 3) KNN
WRITE 1 KFN = (E12 3) KFN
WRITE 1 KFNI = (E12 3) KFNI
WRITE 1 KFF = (E12 3) KFF
WRITE 1 KFG = (E12 3) KFG
WRITE 1 KI = (E12 3) KI
WRITE 1 KJK = (E12 3) KJK
WRITE 1 KG = (E12 3) KG
WRITE 1 KJL = (E12 3) KJL
WRITE 1 KGK = (E12 3) KGK
WRITE 1 KLI = (E12 3) KLI
WRITE 1 KC = (E12 3) KC
WRITE 1 KJD = (E12 3) KJD
WRITE 1 KCK = (E12 3) KCK
WRITE 1 KDI = (E12 3) KDI
WRITE 1 KDM = (E12 3) KDM
WRITE 1 KE = (E12 3) KE
WRITE 1 KF = (E12 3) KF
WRITE 1 KJN = (E12 3) KJN
WRITE 1 KFK = (E12 3) KFK
WRITE 1 KNI = (E12 3) KNI
WRITE 1 KB = (E12 3) KB
WRITE 1 KJA = (E12 3) KJA
WRITE 1 KBK = (E12 3) KBK
WRITE 1 KAI = (E12 3) KAI
WRITE 1 KBI = (E12 3) KBI
WRITE 1 KRC = (E12 3) KRC
Appendix
187
WRITE 1 KJNb = (E12 3) KJNB
WRITE 1 KCKb = (E12 3) KCKb
WRITE 1 KLK = (E12 3) KLK
WRITE 1 KLKb = (E12 3) KLKb
WRITE 1 KDD = (E12 3) KDD
WRITE 1 KEJ = (E12 3) KEJ
WRITE 1 KBQ = (E12 3) KBQ
WRITE 1 KDQ = (E12 3) KDQ
WRITE 1 KCL2 = (E12 3) KCL2
WRITE 1 KCQ = (E12 3) KCQ
WRITE 1 KNQ = (E12 3) KNQ
WRITE 1 KFQ = (E12 3) KFQ
WRITE 1 KNG = (E12 3) KNG
WRITE 1 KNE = (E12 3) KNE
WRITE 1 KKQ = (E12 3) KKQ
WRITE 1 KLQ = (E12 3) KLQ
WRITE 1 KGQ = (E12 3) KGQ
WRITE 1 KLG = (E12 3) KLG
WRITE 1 KLN = (E12 3) KLN
WRITE 1 KEC2 = (E12 3) KEC2
WRITE 1 KAN2 = (E12 3) KAN2
WRITE 1 KRC = (E12 3) KRC
WRITE 1 ----PRE-EXPONENTIAL-FACTORS----
WRITE 1 AAB = (E12 3) AAB
WRITE 1 AAF = (E12 3) AAF
WRITE 1 AAG = (E12 3) AAG
WRITE 1 AAM = (E12 3) AAM
WRITE 1 AAN = (E12 3) AAN
WRITE 1 ABB = (E12 3) ABB
WRITE 1 ABC = (E12 3) ABC
WRITE 1 ABG = (E12 3) ABG
WRITE 1 ABN = (E12 3) ABN
WRITE 1 ABF = (E12 3) ABF
WRITE 1 ACF = (E12 3) ACF
WRITE 1 ACL = (E12 3) ACL
WRITE 1 ACG = (E12 3) ACG
WRITE 1 ACN = (E12 3) ACN
WRITE 1 ADR = (E12 3) ADR
WRITE 1 ADL = (E12 3) ADL
WRITE 1 AFNI = (E12 3) AFNI
WRITE 1 AFF = (E12 3) AFF
WRITE 1 ADM = (E12 3) ADM
WRITE 1 AG = (E12 3) AG
WRITE 1 AAN2 = (E12 3) AAN2
WRITE 1 AGQ = (E12 3) AGQ
WRITE 1 AFN = (E12 3) AFN
WRITE 1 ANN = (E12 3) ANN
WRITE 1 ACL2 = (E12 3) ACL2
WRITE 1 ABF2 = (E12 3) ABF2
WRITE 1 ABL = (E12 3) ABL
WRITE 1 AAD = (E12 3) AAD
WRITE 1 AAL = (E12 3) AAL
WRITE 1 ADG = (E12 3) ADG
WRITE 1 AEG = (E12 3) AEG
WRITE 1 AEL = (E12 3) AEL
WRITE 1 AER = (E12 3) AER
WRITE 1 AFG = (E12 3) AFG
WRITE 1 ----ACTIVATION ENERGIES----
WRITE 1 EAG = (E12 3) EAG
Appendix
188
WRITE 1 EAM = (E12 3) EAM
WRITE 1 EAN = (E12 3) EAN
WRITE 1 EBG = (E12 3) EBG
WRITE 1 ECG = (E12 3) ECG
WRITE 1 ECL = (E12 3) ECL
WRITE 1 ECF = (E12 3) ECF
WRITE 1 ECN = (E12 3) ECN
WRITE 1 EFN = (E12 3) EFN
WRITE 1 EFNI = (E12 3) EFNI
WRITE 1 ECL2 = (E12 3) ECL2
WRITE 1 EAN2 = (E12 3) EAN2
WRITE 1 ---pKa----
WRITE 1 pKw = (E12 3) pKw
WRITE 1 pKH2O2 = (E12 3) pKH2O2
WRITE 1 pKHO2 = (E12 3) pKHO2
WRITE 1 pKOH = (E12 3) pKOH
WRITE 1 pKH = (E12 3) pKH
WRITE 1 pKH2O = (E12 3) pKH2O
WRITE 1 Kprot = (E12 3) Kprot
WRITE 1 Khydx = (E12 3) Khydx
WRITE 1 KappO2 = (E12 3) kappO2
WRITE 1 KappH2 = (E12 3) kappH2
WRITE 1 H2O2 Equ rate = (E12 3) EqR
SETHMAX 1
BEGIN
STOP
Appendix
189
Radiolysis Model Full Reaction Scheme
Primary Reaction G-value
(Molecules100eV) Temperature Dependency Ref
G0 H2O emacraq 271 2641 + 416210-3
t + 909310-6 t2
ndash 471710-8 t3 45
G1 H2O H 054 0556 + 219810-3 t ndash 118410-5 t2 + 522310-8 t3 45
G2 H2O H2 041 0419 + 872110-4 t - 497110-6 t2 + 150310-8 t3 45
G3 H2O OH 270 2531 + 113410-2 t ndash 126910-5 t2 + 351310-8 t3 45
G4 H2O H2O2 068 0752 ndash 162010-3 t 45
G5 H2O H+ 271 2641 + 416210-3
t + 909310-6 t2
ndash 471710-8 t3 45
Chemical Reaction Rate Constant
k (M-1 s-1 25degC) Arrhenius Activation Energy Ea
(kJ) Ref
R0 emacraq + emacr
aq rarr H2 + 2OHmacr 7260 times109 Log kR7 = 12281 ndash 3768102T ndash 6673104T2 - 1075107T3 45
R1 emacraq + H rarr H2 + OHmacr 2762 times1010
114 times1013 14929 45
R2 emacraq + OH rarr OHmacr 3553 times1010
Log kR9 = 13123 ndash 1023103T + 7634104T2 45
R3 emacraq + Omacr rarr 2OHmacr 2313 times1010
56 times1011 79 49
R4 emacraq + H2O2 rarr OHmacr + OH 1362 times1010
77 times1012 1571 45
R5 emacraq + HO2 rarr HO2
macr 1300 times1010 246 times1012 130 45
R6 emacraq + HO2
macr rarr Omacr + OHmacr 3507 times109 175 times1012 154 49
R7 emacraq + O2 rarr O2
macr 2253 times1010 252 times1012 11652 45
R8 emacraq + O2
macr rarr O22macr + H2O 1300times1010
31 times1012 136 4349
R9 H + H rarr H2 5142 times109 27 times1012 15526 45
R10 H + OH rarr H2O 1094 times1010 426 times1011 9078 45
R11 H + H2O2 rarr OH + H2O 3650 times107 179 times1011 21064 45
R12 H + O2 rarr HO2 1304 times1010
Log kR23 = 10704 + 2840102T - 1369105T2 45
R13 H + O2
macr rarr HO2macr 1138 times1010
517 times1012 15166 45
R14 H + HO2 rarr 2OH 1138 times1010 517 times1012 15166 45
R15 H + HO2macr rarr OH + OHmacr 1374times109
42 times1013 256 85
R16 H + O3 rarr OH + O2 2200 times1010 No temperature dependence available 43
R17 OH + OH rarr H2O2 4814 times109 Log kR25 = 8054 + 2193103T ndash 7395105T2 + 6870107T3
45
R18 OH + H2O2 rarr H2O + HO2 2920 times107 768times109 13813 45
R19 OH + HO2macr rarr OHmacr + HO2 8134 times109
100 times1012 11927 45
R20 OH + HO2 rarr H2O + O2 8840 times109
129 times1011 6645 45
Appendix
190
R21 OH + O2
macr rarr OHmacr + O2 1097 times1010 877 times1011 10860 45
R22 OH + O3 rarr HO2 + O2 1100 times108
No temperature dependence available 43
R23 O3macr + H2O2 rarr O2
macr + O2 + H2O 1590 times106 xEXP(188times103 (129815 ndash 1TK)R) 43
R24 O3macr + HO2
macr rarr O2macr + O2 + OHmacr 8870 times105
xEXP(188times103 (129815 ndash 1TK)R) 43
R25 O3macr + H2 rarr O2 + H + OHmacr 2490times105
xEXP(188times103 (129815 ndash 1TK)R) 46
R26 O3
macr + OH rarr HO2 + O2macr 6000 times109 No temperature dependence
available 46 43
R27 O3
macr + OH rarr HOmacr + O3 2500 times109 No temperature dependence available
46 43
R28 O3
macr + H+ rarr O2 + OH 9000 times1010 No temperature dependence available
4 43
R29 O2
macr + O2macr rarr O2 + O2
2macr 2988times10-1 489 times108 5259 43
R30 O2
macr + HO2macr rarr O2 + Omacr + OHmacr 8230 times10-2 No temperature dependence
available 4 43
R31 O2
macr + H2O2 rarr O2 + OH + OHmacr 1300 times10-1 No temperature dependence
available 4 43
R32 O2
macr + HO2 rarr O2 + HO2macr 7597times107
244 times109 86 43
R33 O2
macr + O3macr rarr O2-
+ 2O2 1000 times104 No temperature dependence available
47 43
R34 O2
macr + O3 rarr O3macr + O2 1500 times109 No temperature dependence
available 4 43
R35 HO2 + HO2 rarr H2O2 + O2 8399 times105
278 times109 201 45
R36 HO2 + H2O2 rarr O2 + H2O + OH 5000 times10-1 No temperature dependence
available 4 49
R37 HO2 + O3 rarr OH + 2O2 5000 times108 No temperature dependence
available 4 43
R38 H2O2 + HO2
macr rarr O2 + H2O + OHmacr 450times10-4 No temperature dependence available
4 43
R39 O3 + OHmacr rarr HO2
macr + O2 4800 times101 No temperature dependence available
4 43
R40 O3 + HO2
macr rarr OH + O2 + O2macr 5500 times106 No temperature dependence
available 4 43
R41 O3 + H2O2 rarr OH + O2 + HO2 3714 times10-2
28 times1011 735 43
R42 H +Omacr rarr OHmacr 2000times1010 No temperature dependence
available 4 43
R43 O3
macr + emacraq rarr 2OHmacr + O2 1600times1010 No temperature dependence
available 47 43
R44 O3 + emacr
aq rarr O3macr 3600 times1010 No temperature dependence
available 4 43
R45 H2O2 rarr 2OH 2300 times10-7 No temperature dependence
available - 86
R46 O2- + H2O rarr 2OH- 1000 times1010 No temperature dependence
available - 43
R47 Omacr + H2 rarr H + OHmacr 1279 times108
232 times1010 12891 45
R48 Omacr + H2O2 rarr O2
macr + H2O 5546 times108 30 times1011 156 49
R49 Omacr + HO2
macr rarr O2macr + OHmacr 7864 times108
145 times1013 24348 45
R50 Omacr + O2
macr rarr O2macr + O2 6000 times108 No temperature dependence available
46 43
R51 Omacr + Omacr rarr O2
2macr 1000times108 No temperature dependence available
4 43
R52 Omacr + OH rarr HO2
macr 7610 times109 17 times1011 77 49
Appendix
191
R53 Omacr + O3macr rarr 2O2
macr 7000times108 No temperature dependence available
46 43
R54 Omacr
+ O3 rarr O2macr + O2 1000 times109 No temperature dependence
available 4 43
Equilibria
kf
(M-1 s-1)
kb
(M-1 s-1) Temperature Dependence pKa
(25degC)
R5556 H2O H+ + OHmacr 1172 times10-3 1178times1011 Log kR67 = 20934 - 1236x104T + 6364x106T2 ndash 1475x109T3 +
1237x1011T4 1575 45
R5758 H2O2 H+ + HO2macr 8900 times10-2 4780times1010 Log kR68 = 16410 ndash 4888x10
3T + 1622x10
6T
2 ndash 2004x10
8T
3 1173 45
R5960 H2O2 + OHmacr HO2
macr + H2O
1265 times1010 1403 times106 Log kR75 = 13339 ndash 2220x103T + 7333x10
5T
2 ndash 1065x10
8T
3
1198701198672119874
11987011986721198742 45
R6162 HO2macr + OHmacr O2
2macr + H2O 3506 times105 1103 times106 339times108 142 165 43
R6364 OH H+ + Omacr 8900 times10-2 4780times1010 Log kR66 = 16410 ndash 4888x103T + 1622x106T2 ndash 2004x108T3 1173 45
R6566 OH + OHmacr Omacr + H2O 1265 times1010 1403 times106 Log kR72 = 13339 ndash 2220x103T + 7333x105T2 ndash 1065x108T3 1198701198672119874
119870119874119867 45
R6768 Omacr + O2 O3macr 3747 times109 2617 times103 341 times1011 11182 Forward 45
320 times1011 4616 Reverse 45
R6970 HO2 H+ + O2macr 4780 times1010 7354 times105 Log kR69 = 16410 ndash 4888x103T + 1622x106T2 ndash 2004x108T3 481 45
R7172 HO2 + OHmacr O2macr + H2O 1265 times1010 1628 times10-1 Log kR75 = 13339 ndash 2220x103T + 7333x105T2 ndash 1065x108T3
1198701198672119874
1198701198671198742 45
R7374 H emacraq + H+ 5832 2095times1010
Log kR74 = 39127 - 3888E4T + 2054E7T2 - 4899E9T3 + 4376E11T4
955 45
R7576 H + OHmacr emacraq + H2O 2440 times107 1735 times101
Log kR70 = 22970 ndash1971x104T + 1137x107T2 ndash 2991x109T3 + 2803x1011T4
1198701198672119874
119870119867 45
R7778 H + H2O H2 + OH 4575 times10-5 3954 times107
Log kR71f = 9408 ndash 2827x103 Tndash 3792x105T2 45
Log kR71b = -11556 + 32546x104T - 18623x107T2 + 45543x109T3 - 41364x1011T4
45
R79 H2(aq) H2(g) 2687times10-3 See Chapter 3
R80 O2(aq) O2(g) 1033times10-4 See Chapter 3

List of Figures
5
Figure 17 A schematic of the original setup for the 10-port sampling valve in both off (top
image) and on (bottom image) positions 58
Figure 18 A schematic for the modified 10-port sampling valve including the removal of the
silica gel column 59
Figure 19 Image on the left shows the bespoke frac14 inch OD 13x molecular sieve column On the
right the rotameter is connected to calibrate gas flow rates 60
Figure 20 A calibration curve to provide a conversion to determine carrier gas flow rate 61
Figure 21 A schematic of a Wheatstone bridge circuit used in the TCD 62
Figure 22 A calibration curve for quantifying hydrogen gas from chromatograms 63
Figure 23 Method validation by the determination of the well-established primary yield of H2
through hydroxyl scavenging by bromide 65
Figure 24 Collected data from literature showing measured primary yields as a function of
temperature Provided by Elliot and Bartels 2008 75
Figure 25 A comparison of the sample temperature profile logged by thermocouple to the
temperature profile calculated in the computational model 76
Figure 26 A reproduction of data provided by Hayon 82
Figure 27 An example of a Bragg peak Energy loss of alphas of 549 MeV in Air Image
released to public domain 83
Figure 28 A schematic representation of how linear energy transfer (LET) alters the
distribution of spurs along a radiation track Image was recreated from Allen AO 84
Figure 29 Simulation data showing the effects of increasing linear energy transfer on the
primary yields of water radiolysis Image was recreated from Allen AO 85
Figure 30 A representation of the stagnant two-film model used to calculate the partitioning of
volatile species 87
Figure 31 The diffusivity of O2 and H2 in both water and air as a function of temperature88
Figure 32 Measurements of H2O2 concentration as a function of dose for aerated water (diams) and
deaerated water (diams) Vertical error bars show the standard deviation between replicates while
horizontal error bars show the dose range for replicates 98
List of Figures
6
Figure 33 Measurements of H2 as a function of dose in aerated (diams) and deaerated (diams) samples
Vertical error bars show the standard deviation of replicates while horizontal error bars show the
dose range for replicates 99
Figure 34 Predicted concentrations of H2O2 as calculated by the radiolysis model for both
aerated () and deaerated () conditions 102
Figure 35 Predicted concentrations of H2 gas as calculated by the radiolysis model for both
aerated () and deaerated () conditions 102
Figure 36 Calculated concentrations of the major oxidising and reducing water radiolysis
species as a function of dose Solid lines represent aerated conditions while broken lines
represent deaerated conditions 103
Figure 37 Measurements of H2O2 concentrations as a function of dose for samples initially at
pH 7 (diams) pH 104 (diams) pH 11 (diams) pH 123 (diams) and pH 127 (diams) All samples were aerated
Vertical error bars are the standard deviation between replicates while horizontal error bars
show the dose range for replicates 106
Figure 38 Measurements of H2 gas as a function of dose at pH 7 (diams) pH 106 (diams) pH 123 (diams)
and pH 13 (diams) Dashed lines are provided to clarify the data trends all samples were deaerated
Vertical error bars show the standard deviation between replicates while horizontal error bars
show the dose range for replicates 108
Figure 39 Model calculations to show the predicted concentrations of H2O2 as a function of
dose at various pH 109
Figure 40 Model calculations to show the predicted concentrations of H2 gas as a function of
dose at various pH 110
Figure 41 Model calculations showing the concentrations of aqueous oxygen and hydrogen gas
from deaerated water after 80 kGy at 280 Gy min-1
to show the related behaviour between the
two 114
Figure 42 Model predictions of the steady-state reaction rates of R21 R50 and R32 at various
pH for γ radiolysis of deaerated water at a dose rate of 280 Gy min-1
115
Figure 43 The sum of the steady state rates of all reactions that produce O2 () compared with
the sum of the steady state rates of all reactions that remove O2 () These totals do not include
rates of production or removal from mass transfer reactions This calculation is for the γ
radiolysis of deaerated water to a dose of 80 kGy at a rate of 280 Gy min-1
116
Figure 44 Model predictions of the steady-state reaction rates of R7 R12 and R67 at various
pH This calculation is for the γ radiolysis of deaerated water to a dose of 80 kGy at a rate of
280 Gy min-1
117
List of Figures
7
Figure 45 Dashed lines show the original prediction where k50 = 60 times108 M
-1 s
-1 while solid
lines show the predictions with the increased k50 = 48 times109 M
-1 s
-1 120
Figure 46 Measurements of H2 gas as a function of dose All samples here are aerated with
vertical error bars showing the standard deviation between replicates123
Figure 47 Measurements of H2O2 concentrations in aerated samples of saturated magnesium
hydroxide solution as a function of dose 126
Figure 48 Measurements of hydrogen yields from magnesium hydroxide samples with various
solid ndash aqueous ratios All samples were irradiated to a total dose of ~52 kGy to the aqueous
phase at a dose rate of 3041 Gy min-1
128
Figure 49 Model predictions for the yield of H2 from a solution containing various
concentrations of carbonate anions 133
Figure 50 Measurements of H2O2 concentrations as a function of dose in samples containing
1 mM methanol (diams) and water as a control (diams) All samples were aerated and a dashed line is
included to highlight the data trend The dose rate was 1638 Gy min-1
for methanol solutions
and 2839 Gy min-1
for the aerated water 136
Figure 51 Measurements of H2 gas as a function of dose from deaerated samples containing
1 mM methanol deaerated water is also shown as a control Dashed lines are included to
highlight the data trend The dose rate was 1755 Gy min-1
for the methanol solutions and
2851 Gy min-1
for the deaerated water 137
Figure 52 Chemical yields of hydrogen peroxide measured from an aerated solution of
1 mM methanol as a function of dose 138
Figure 53 Chemical yields of hydrogen gas measured from a deaerated solution of 1 mM
methanol as a function of dose 139
Figure 54 Model prediction of H2O2 concentrations as a function of dose in a solution of
1 mM methanol 142
Figure 55 Calculations of hydrogen peroxide concentrations with and without modification to
the mass transfer routine142
Figure 56 Model prediction of H2 gas as a function of dose in a solution of 1 mM
methanol144
Figure 57 Model predictions of the concentrations of various stable organic products formed as
a result of using the proposed reaction scheme in table 23 146
List of Figures
8
Figure 58 Measurements of H2O2 concentrations from heterogeneous samples of 05g Fe2O3
and 10 mL aerated water The dose rate for the haematite samples was 3052 Gy min-1
and for
the aerated water the dose rate was 2839 Gy min-1
149
Figure 59 Measurements of H2O2 concentrations from heterogeneous samples of 05g Fe3O4
and 10 mL aerated water The dose rate for the magnetite samples was 1625 Gy min-1
and for
the aerated water the dose rate was 2839 Gy min-1
150
List of Tables
9
List of Tables
Table 1 Dose rates of the front most two rows of the 4x8 irradiation rack determined by Fricke
analysis The error indicates the percentage of uncertainty of the obtained gradient 47
Table 2 Dose rates of the four positions of the inverter rig determined by Fricke analysis The
error indicates the percentage of uncertainty of the obtained gradient 48
Table 3 Thermal conductivity of commonly used gases Values taken from the Handbook of
Tables for Applied Engineering Science 62
Table 4 Optimised parameters used for the analysis of H2 gas 64
Table 5 Primary yields for γ-radiolysis of water at neutral pH and standard pressure and
temperature2 71
Table 6 Temperature effects on the primary yields of water radiolysis49
72
Table 7 Polynomial equations for estimating temperature effects on primary yields44
75
Table 8 A collection of measurements of primary yields made in 04 M solution of sulphuric
acid (pH = 046)56
77
Table 9 A collection of primary yields measured in alkali solutions (pH asymp 135)56
79
Table 10 Multiple regression polynomials used to estimate the combined effect of temperature
and pH on the primary yields of water radiolysis 82
Table 11 Polynomial equations used to estimate the temperature effects on the diffusivity of O2
and H2 in both gas and aqueous phases where t = temperature (Cdeg) 90
Table 12 A list of Primary Species used to model water radiolysis helliphelliphelliphelliphelliphelliphelliphelliphellip90
Table 13 A list of reactions used to model water radiolysis 93
Table 14 A list of equilibria used to model the radiolysis of water 94
Table 15 Statistical information concerning the estimation of primary yields used to model the
radiolysis of water 95
Table 16 Parameters used to describe interfacial surface area (Aint) and boundary thicknesses
(δ) for sample vials of different geometry 96
Table 17 Conditions of samples used to investigate hydrogen peroxide in high pH radiolysis
105
List of Tables
10
Table 18 A list of important equilibria and their associated pKa values 107
Table 19 Conditions of samples used to investigate hydrogen gas in high pH radiolysis 108
Table 20 Obtained results from the measurements of H2 gas 124
Table 21 Conditions of samples containing Mg(OH)2 for measurements of H2
a ndash Powder sample with no added water estimated adsorbed water content is based on data from
Nelson et al89
b ndash Sample is a saturated solution of Mg(OH)2 ie contains no solid 127
Table 22 A reaction scheme to estimate the effect of carbonate in water radiolysis 132
Table 23 A reaction scheme to estimate the effect of methanol in water radiolysis
a ndash Rate constant for gas phase reaction
b ndash Estimated rate constant
c ndash Rate constant based on reaction of acetic acid and hydroxyl
d ndash Assumed reaction 141
Table 24 A reaction scheme to estimate the effects of dissolved iron in water radiolysis 153
List of Acronyms and Initialisms
11
List of Acronyms and Initialisms
AES - Atomic Emission Spectroscopy
AVIDAC - Argonne Version of the Institutes Digital Automatic Computer
CANDU - Canada Deuterium-Uranium
DCF - Dalton Cumbrian Facility
EDTA - Ethylenediaminetetraacetic acid
EPSRC - Engineering and Physical Sciences Research Council
FGMSP - First Generation Magnox Storage Pond
GC - Gas Chromatography
HDEHP - Di-(2-ethylhexyl)phosphoric acid
HPLC - High Performance Liquid Chromatography
ICP - Inductively Coupled Plasma
ISO - International Organization for Standardization
LET - Linear Energy Transfer
MOX - Mixed Oxide
MSSS - Magnox Swarf Storage Silo
NNL - National Nuclear Laboratory
ODE - Ordinary Differential Equation
PUREX - Plutonium Uranium Redox Extraction
PWR - Pressurised Water Reactor
SHE - Standard Hydrogen Electrode
SI - International System
TCD - Thermal Conductivity Detector
TGA - Thermogravimetric Analysis
TOC - Total Organic Carbon
UV - Ultra Violet
VIS - Visible
Word count - 42500
Abstract
13
Abstract
Sellafield is home to the UKrsquos largest repository of nuclear waste including reprocessed
uranium and plutonium as well as a backlog of unprocessed used fuel and waste kept in
outdated storage facilities commonly referred to as ldquolegacy wasterdquo For this reason
Sellafield has often been called the most hazardous place in Western Europe and as such is
currently undergoing a multi-billion pound decommissioning and clean-up operation Each
on-site facility has unique challenges associated with it many of them presenting situations
where the radiation chemistry aspects of the material degradation are not well understood
The key factors that can affect water radiolysis processes in the Sellafield challenges are a
high pH environment the presence of magnesium hydroxide the presence of iron oxide
and the presence of organic materials This work examines the effect each of these factors
has on H2 and H2O2 production in water radiolysis as well as developing a computational
model to offer some understanding to the kinetic behaviour of water radiolysis under such
conditions
The computational model was able to replicate experimental measurements of radiolytic H2
and H2O2 production in both aerated and deaerated water at neutral pH and provide a
further understanding of the role of dissolved oxygen in water radiolysis Measurements of
H2O2 from solutions containing NaOH have shown that an increase in pH generally results
in a higher steady state of H2O2 while measurements of H2 show a similar increase with a
maximum production rate at pH ~11 The model was also able to closely replicate these
experimental measurements with some over prediction which highlights a gap in our
understanding of high pH radiolysis and also brings into question the validity of the
estimated rate constant for the reaction
119926minus + 119926120784minus119919120784119926rarr 120784119926119919minus +119926120784 119948 = 120788 120782 times 120783120782
120790 119924minus120783119956minus120783
which was originally determined from kinetic model calculations designed to describe the
decay of ozonide (O3ˉ) during pulse-radiolysis studies of high pH solutions conducted by
K Sehested et al in 1982
The radiolysis of magnesium hydroxide slurry also resulted in an increased yield of
hydrogen gas but had little effect on the yield of hydrogen peroxide The hydrogen yield
was 052 molecules per 100eV while a NaOH solution of equivalent pH gave a yield of
027 however interference from carbonate may be the cause of the increased yield A
surface effect was also estimated to contribute 005 molecules per 100 eV to the hydrogen
gas yield
Hydrogen gas and hydrogen peroxide was measured from the radiolysis of aqueous
methanol This was modelled with a near agreement but modifications to the model were
necessary highlighting areas of the model that need improvement as well as providing a
reaction scheme from which a more comprehensive model for aqueous methanol radiolysis
could be developed
Declaration
14
Declaration
No portion of the work referred to in the thesis has been submitted in support of an
application for another degree or qualification of this or any other university or other
institute of learning
Thomas A Donoclift August 2016
Copyright Statement
15
Copyright Statement
The author of this thesis (including any appendices andor schedules to this thesis) owns
certain copyright or related rights in it (the ldquoCopyrightrdquo) and he has given The University
of Manchester certain rights to use such Copyright including for administrative purposes
Copies of this thesis either in full or in extracts and whether in hard or electronic copy
may be made only in accordance with the Copyright Designs and Patents Act 1988 (as
amended) and regulations issued under it or where appropriate in accordance with
licensing agreements which the University has from time to time This page must form part
of any such copies made
The ownership of certain Copyright patents designs trademarks and other intellectual
property (the ldquoIntellectual Propertyrdquo) and any reproductions of copyright works in the
thesis for example graphs and tables (ldquoReproductionsrdquo) which may be described in this
thesis may not be owned by the author and may be owned by third parties Such
Intellectual Property and Reproductions cannot and must not be made available for use
without the prior written permission of the owner(s) of the relevant Intellectual Property
andor Reproductions
Further information on the conditions under which disclosure publication and
commercialisation of this thesis the Copyright and any Intellectual Property andor
Reproductions described in it may take place is available in the University IP Policy (see
httpdocumentsmanchesteracukDocuInfoaspxDocID=487) in any relevant Thesis
restriction declarations deposited in the University Library The University Libraryrsquos
regulations (see httpwwwmanchesteracuklibraryaboutusregulations) and in The
Universityrsquos policy on Presentation of Theses
Dedications
16
Dedications
Mum
For the strength and freedom to explore
and the support and security to return
Dad
For the support and encouragement
exceeded only by pride
Acknowledgements
17
Acknowledgements
I would like to take this opportunity to thank some of the people who have made this work
possible My supervisor Simon Pimblott even with the busy work schedule that comes with
managing an entire research facility he is still able to provide support and put the well-
being of his students and staff above all else My unofficial but very much appreciated
industrial supervisors from the National Nuclear Laboratory (NNL) Howard Sims and
Robin Orr who both take a personal interest in the work going on at the Dalton Cumbrian
Facility (DCF) and dedicate much of their own time to helping the researchers in their
work
I would like to acknowledge the EPSRC and Sellafield Ltd for providing the funding that
supported this research
A special thanks to all the members of the Dalton Cumbrian Facility especially to all the
staff who work immeasurably hard and with profound dedication to the values
management and research carried out at the Dalton Cumbrian Facility Acknowledgements
to the academic staff Ruth Edge Aliaksandr Baidak and Sven Koehler for always
providing a useful and meaningful insight to almost any situation and for providing
valuable guidance in practical radiation chemistry as well as the inspiration and
encouragement to pursue potentially interesting avenues of research
Thank you to the research team at the Dalton Cumbrian Facility for their friendship and for
making the workplace an enjoyable place to conduct research
Chapter 1 Introduction
18
Chapter 1 Introduction
Overview of Sellafield
Sellafield shown in Figure 1 is the largest nuclear facility in the UK and has played a key
role in the UK nuclear industry for over 60 years Sellafield began as a Royal Ordinance
Factory producing weapons propellant for use in the Second World War Soon after the
war ended Sellafield was renamed to Windscale and was repurposed to produce plutonium
for the development of nuclear weapons in order to secure the UKrsquos position in the nuclear
arms race
Several years later the focus on acquiring nuclear weapons shifted towards the development
of new reactors for civil energy production with Magnox reactors built on a neighbouring
site known as Calder Hall The two sites were later combined and were once again named
Sellafield Previous operations carried out at Sellafield meant the site was also in a good
position to conduct fuel reprocessing operations alongside energy production Spent fuel is
separated from its now contaminated cladding and dissolved in nitric acid uranium and
plutonium are separated by solvent extraction while the cladding is treated independently
At Sellafield this industrial process meant storing the contaminated cladding swarf in
underwater silos
The fuel reprocessing process most commonly used is the Plutonium Uranium Redox
Extraction method (PUREX) and produces a number of product streams including
plutonium uranium and other highly active liquors
Chapter 1 Introduction
19
The separated uranium can be re-enriched to produce reusable uranium fuel or mixed with
plutonium to produce mixed oxide (MOX) fuel although much of the reclaimed uranium
and plutonium remains unused and is stored at Sellafield The remaining fission products
classified as high level waste are treated in various ways including vitrification and are
also stored at Sellafield
Figure 1 An aerial view of the Sellafield Site which covers approximately 6 km2
Image provided by Sellafield Ltd Press Office
Magnox reactors are now an obsolete design of reactors that use unenriched uranium fuel
which was clad in an alloy comprising almost entirely of magnesium with small amounts
of aluminium Spent fuel from Magnox reactors was briefly stored in a cooling pond before
having the cladding removed for reprocessing of the fuel pellets
Chapter 1 Introduction
20
The facilities used for this storage shown in Figure 2 were called the First Generation
Magnox Storage Pond (FGMSP) and the Magnox Swarf Storage Silos (MSSS) both of
these facilities are now considered to be ldquoLegacyrdquo facilities
Figure 2 On the left is The First Generation Magnox Storage Pond (FGMSP) and on the
right are the Magnox Swarf Storage Silos (MSSS)
Images provided by Sellafield Ltd Press Office
An extended shut down of reprocessing in the first generation reprocessing plant meant that
fuel being stored in the Magnox pond was left far longer than intended resulting in
corrosion and a backlog of spent fuel The Magnox Storage Pond now contains
approximately 14000 m3
of contaminated water which includes roughly 1200 m3 of sludge
consisting mainly of magnesium hydroxide and iron oxide1 Later technological
advancements rendered the wet storage of Magnox fuel cladding to be an obsolete method
and operations moved towards dry storage However the construction of a new facility and
the huge backlog of material stored in the silo also resulted in corrosion of stored fuel and
eventually a state of disrepair for the Magnox Swarf Storage Silos Both of these legacy
facilities present a huge challenge for decommissioning operations as well as a unique
opportunity for scientific research
Chapter 1 Introduction
21
Radiation Chemistry
Radiation chemistry is the study of chemical change driven by the absorption of energy
capable of causing ionisation This ionising radiation can be of a particulate nature
including but not limited to alpha (He2+
) and beta (eˉ) radiation or non-particulate such as
gamma (γ) or X-ray radiation Radiation chemistry and its experimental methods parallel in
many ways to photochemistry but the differences between the fields are well defined The
fundamental difference between the two fields of study is the quantity of energy involved in
the initiation of reactions In radiation chemistry this energy is provided by the atomic
decay of radioactive nuclei and is far higher than energy used in photochemistry typically
UV radiation The lower initial energies used in photochemistry tend to only produce
molecular excitations rather than direct ionisations These lower incident energies also
mean that each photon will usually only interact once and produce a uniform distribution of
excited species in any plane perpendicular to the incident beam The higher initial energies
used in radiation chemistry often provided by atomic decay can produce both excitations
and ionisations directly Interactions between ionising radiation and a substance is not
necessarily limited to only one interaction a single high energy photon or particle may
interact a number of times This behaviour gives rise to a non-uniform track-like structure
of interactions unlike the uniform distributions found in photochemistry2
Chapter 1 Introduction
22
Figure 3 A representation demonstrating the uniform excitations and ionisations of UV
radiation compared to the structured tracks of alpha radiation
To fully appreciate the chemical changes initiated by ionising radiation it is important to
have some knowledge of the different types of ionising radiation and the ways in which
they interacts with matter There are two main ways in which radiation chemists provide a
source of ionising radiation for experiments The first involves taking advantage of the
atomic decay of radioactive nuclei this may be a naturally occurring radioisotope or an
artificially created isotope The second involves specialised equipment to directly generate
radiation usually by accelerating particles to a high energy The major types of ionising
radiation are alpha beta and gamma however in the field of radiation chemistry one may
also come across the use of X-rays fast neutron radiation proton radiation and other heavy
charged particle radiation This study utilises cobalt-60 as a source of gamma radiation
other types of radiation were not investigated during this work however it is necessary to
understand some fundamental features of alpha and beta decay to fully appreciate gamma
decay
Chapter 1 Introduction
23
Alpha α Radiation
Alpha radiation occurs when an unstable atomic nuclei spontaneously ejects an alpha
particle Elements with an atomic number greater than 83 will decay by this mechanism3
Alpha particles are fully ionised helium nuclei they consist of two protons and two
neutrons and have no electrons which gives them a charge of +2 Alpha particles are
mono-energetic this means that every alpha particle emitted from a given radioactive
element will have the same energy characteristic of that element These energy values
typically range between 4 and 10 MeV This quality means that research facilities capable
of artificially producing alpha radiation by ionising and accelerating helium atoms can
select the particle energy required to effectively mimic alpha decay of any radioactive
element
Beta β Radiation
Beta decay involves the conversion of a neutron to a proton or vice versa in order to create
a more favourable proton to neutron ratio This conversion process is accompanied by the
ejection of fundamental particles directly from the atomic nucleus In the case of a neutron
converting to a proton the ejected particles are an anti-neutrino and a high energy electron
while in the reverse case the ejected particles are a neutrino and a positron (the antimatter
equivalent of an electron) Unlike alpha particles beta particles are not mono-energetic
The energy lost through beta decay is shared between the ejected particles and the recoil of
the decaying atom this means beta particle energy ranges from zero up to a maximum
energy characteristic of that element
Chapter 1 Introduction
24
Gamma γ Radiation
Gamma radiation is not a particle like the previously mentioned types of radiation but is a
photon with a short wavelength in the region of 3 x10⁻⁹
to 3 x10-11
cm or approximately 40
KeV to 4 MeV when converted to energy A gamma ray is emitted when a nucleus in an
excited state relaxes to a lower nuclear energy level there is no change in the number of
protons or neutrons during gamma decay Gamma rays like alpha particles are mono-
energetic however a nucleus may emit several photons as a cascade of energy loss As
gamma emission starts with an excited nucleus some prior process must take place to result
in a nucleus with an elevated energy level For most gamma emitters the process is
initiated with either alpha or beta decay and the resulting atomic nucleus is left in an
excited state For example ceasium-137 undergoes beta decay by emission of a beta
particle of 1174 MeV to form stable barium-137 This only happens 54 of the time and
the more common decay mechanism is the emission of a beta particle of 0512 MeV to
form and excited barium-137 nucleus this then emits a photon of 0662 MeV to relax the
nucleus to the stable barium-137
Chapter 1 Introduction
25
Radiation interactions with matter
In order for radiation to induce a chemical change it must interact with matter in some way
There are many mechanisms by which radiation can interact with matter as this project
focuses on the use of gamma rays a brief description of the interactions of gamma rays
with matter is given below
In the photoelectric effect the entire energy of an incident gamma photon is transferred to
an electron of some absorbing matter This electron is ejected from the absorbing atom with
energy equal to the incident photon minus the binding energy of that electron The electrons
ejected are often K-shell electrons which have the highest binding energy As momentum
and energy must be conserved it is necessary for the absorbing atom to recoil As this
mechanism involves the recoil of a parent atom it would not be possible for the
photoelectric effect to be the mechanism of interaction with free electrons that do not have
a parent nucleus to recoil In the photoelectric effect ejected electrons will leave a hole as
this hole is filled by electrons from higher energy levels characteristic X-rays are emitted
Figure 4 A representation of the photoelectric effect
Image recreated from Spinks and Wood2
Chapter 1 Introduction
26
Although photons cannot interact with free electrons by means of the photoelectric effect
they may interact with free and loosely bound electrons through the Compton Effect In this
mechanism a photon accelerates an electron thereby reducing its own energy The photon
is scattered now with reduced energy while the electron recoils with increased energy
Figure 5 A representation of the Compton Effect
Image recreated from Spinks and Wood2
Another mechanism by which a gamma ray may interact with matter is through pair-
production This is only a viable mechanism for photons with energy larger than 102 MeV
A photon is completely absorbed by an atomic nucleus and from that nucleus two particles
are produced an electron and a positron The energy of the incident photon is shared
between the rest energy of the two new particles and the kinetic energy of these particles as
they move away from the nucleus a negligible amount of energy is also used as the nucleus
recoils The positron behaves much the same way as the electron until it annihilates with an
electron from the medium to produce two 051 MeV gamma rays travelling at 180deg from
each other
Chapter 1 Introduction
27
Figure 6 A representation of pair production and positron annihilation
Image recreated from Spinks and Wood2
Generally the interactions of gamma rays with matter result in fast moving electrons these
are often referred to as secondary electrons or delta-rays and have the same interactions
with matter as beta particles It is these secondary electrons that are predominantly
responsible for producing the excited states and ionisations in an absorbing material that
will initiate chemical changes in said material4 For this reason it is necessary to also
understand the interactions with matter these secondary electrons may have Fast moving
electrons lose energy through three main mechanisms electromagnetic radiation elastic
scattering and inelastic scattering When a fast electron greater than 100 KeV passes close
to an atomic nucleus it is decelerated and slightly deflected This event is accompanied by
emission of electromagnetic radiation commonly known as Bremsstrahlung radiation and
is required for the conservation of energy
Chapter 1 Introduction
28
At energies below 100 keV Bremsstrahlung emission becomes negligible instead electrons
tend to lose energy through scattering Fast moving electrons interact with the bound
electrons of a molecule predominantly through inelastic collisions This interaction
transfers energy from the incident electron to the bound molecular electron which can result
in ionisation and excitation (and often with production of radical species) If there is an
ionisation event the tertiary electrons produced can cause more ionisation events in the
same manner These events tend to lie closer together as the electron that caused them has a
much lower energy than the primary electron that passed by This engenders a radiation
track structure that consists of small groups of ionisation events These groups are often
referred to as spurs
Fast moving electrons may also interact elastically with matter this interaction causes the
electrons to be deflected by a wide range of angles This means that a fast moving electron
may have moved a significant total distance but may have not travelled particularly far into
the absorbing material
Chapter 1 Introduction
29
Radiolysis of Water
As mentioned earlier it is the secondary and tertiary electrons produced from gamma ray
interactions that predominantly lead to the formation of ions and radical species that drives
chemical change in substances exposed to radiation Below is a diagram outlining the
sequence of events and the different stages of water radiolysis
Figure 7 A scheme showing the early stages of water radiolysis and the production of
primary species
In water this initial interaction between a gamma ray and a water molecule produces either
an excited state of water or a water cation accompanied by an electron this is achieved in
less than ten femtoseconds (10-14
s) Molecules in an excited state may break apart to form
hydrogen atoms and hydroxyl radicals or molecular hydrogen and oxygen atoms in a
singlet or triplet state while water cations will quickly react with nearby water molecules to
produce hydronium ions and hydroxyl radicals
Chapter 1 Introduction
30
The electron produced begins a thermalisation process eventually resulting in a solvated
electron however at this stage the electron exists as a potentially reactive precursor
intermediate This happens in a time frame of less than 1 picosecond and occurs before
diffusion of the spur During the non-homogeneous stage the produced radicals and ions
may react within the spur to produce molecular products such as H2 and H2O2 Eventually
the spur species diffuse into the bulk water and these ldquoprimaryrdquo species produced are said
to be homogeneously distributed from this point onwards The yield at which these primary
species are produced are known as primary yields and are often expressed as G-values
which have units of micromoles per Joule (SI unit) or molecules produced per 100 eV of
energy absorbed (conventional historic units)
119866 = 119873119900 119900119891 119898119900119897119890119888119906119897119890119904 119891119900119903119898119890119889
100 119890119881
This should not be confused with a ldquochemicalrdquo yield which are the yields of chemical
species sometime after homogeneous chemistry has taken place and is also often expressed
as a G-value During the homogeneous stage reactions between primary species occur
often altering the observed production rates of these species through back reactions To
avoid confusion between the two types of yield a notation system can be used to discern the
two Two notation systems are commonly used throughout the radiation chemistry
literature the first denotes primary yields with the species of interest in subscript whilst the
chemical yield is often expressed with the species of interest in parenthesis For example
the primary and chemical yield of H2 would be written as GH2 and G(H2) respectively The
second system simply uses a lowercase ldquogrdquo to denote primary yields and uppercase ldquoGrdquo for
chemical yields This study will use the latter system
Chapter 1 Introduction
31
Most often it is the chemical yield that is measured during an experiment but it is possible
to measure a primary yield with the use of scavengers A scavenger is a chemical species
that can quickly react with a targeted primary species before it is able to diffuse into the
bulk solution effectively removing it and its associated chemistry from the homogeneous
stage of radiolysis The effectiveness of a scavenger is often referred to as the ldquoscavenging
capacityrdquo and is quoted as the pseudo-first order rate of reaction between a scavenger (S)
and a radical (R) which depends only on the rate constant for said reaction and the
concentration of the scavenger In other words the scavenging capacity is equal to kS+R[S]5
A well-documented example of this is the use of bromide ions to prevent the reaction of
hydroxyl radicals with molecular hydrogen allowing for the room temperature primary
yield of H2 to be measured this has been done extensively throughout the literature and the
g-value is quoted to be 045 molecules100eV6 Without the use of the bromide scavenger
hydroxyl radicals would react with H2 reducing the observed yield this reduced yield is
what is meant by the term chemical yield
The following summarises some of the properties of the more important primary radicals
Chapter 1 Introduction
32
The Hydrated Electron eaq-
One of the most reactive primary species of water radiolysis is the hydrated electron It is a
chemical entity that can be thought of as being a single electron somewhat stabilised by a
cage of orientated water molecules Hydrated electrons typically have reaction rate
constants close to the diffusion controlled limit with low activation energies Reactions of
hydrated electrons are typically represented as single electron transfer processes and with a
reduction potential of -29 V vs the standard hydrogen electrode (SHE) the hydrated
electron will react with most other species78
119890119886119902minus + 119878119899 rarr 119878119899minus1
In the presence of organic compounds the hydrated electron will act as a nucleophile with
enhanced reactivity towards areas adjacent to electron withdrawing groups Halogenated
organics also show enhanced reactivity towards elimination of the halide ion9
119890119886119902minus + 119877119883 rarr 119877119883minus rarr 119877bull+ 119883minus
The Hydrogen Atom H˙
In terms of BroslashnstedndashLowry acidndashbase theory the hydrogen atom is the conjugate acid of
the hydrated electron with a pKa of 9679
119890119886119902minus + 119867(119886119902)
+ 119867bull
The hydrogen atom has a reduction potential of -23 V78
similar to that of the hydrated
electron however its chemistry is seldom the same
Chapter 1 Introduction
33
Inorganic ions are reduced by the hydrogen atom at slower rates than reduction by the
hydrated electron In certain circumstances such as in low pH environments hydrogen
atoms can act as an oxidant reacting with inorganic ions to form a hydride intermediate
that soon decomposes to form the oxidised ion and molecular hydrogen10
119867bull + 1198651198902+ rarr 1198651198903+119867minus119867+
rarr 1198651198903+ + 1198672
Organic molecules are also subject to oxidation reactions with the hydrogen atom
Saturated organics tend to react by hydrogen abstraction to form molecular hydrogen and a
carbon centered organic radical Unsaturated organics will react by hydrogen addition to the
center of unsaturation again forming a carbon centered organic radical9
119867bull+ 1198621198673119874119867 rarr bull1198621198672119874119867 + 1198672
119867bull+ 11986211986721198621198672 rarr bull11986211986721198621198673
The Hydroxyl Radical bullOH
Unlike the previously mentioned primary radicals the hydroxyl radical has a positive
reduction potential of 18 V in neutral solution making it a powerful oxidising species11
Reactions of hydroxyl radicals with inorganic ions are often said to be simple electron
transfer processes however it has been suggested that the mechanism actually proceeds
through an intermediate adduct12
Reactions with inorganic ions have been observed to
proceed at rates close to the diffusion limit however this is not the case with many metal
cations Reaction rates between the hydroxyl radical and metal cations tend to be slower
with rate constants of the order ~30 x108 M
-1 s
-19
Chapter 1 Introduction
34
One explanation for this is that the mechanism for metal cation oxidation involves the
addition of the hydroxyl radical to the metal cation increasing its coordination number and
allowing for inner-sphere oxidation to take place
[119872(1198672119874)119909]119899+ + ∙119874119867 [(1198672119874)119909119872-119874119867]
119899+ rarr [119872(1198672119874)119909](119899+1)+ + 119874119867minus
The intermediate species Mn+
OH has actually been observed in cases where M = Tl+ Ag
+
Cu2+
Sn2+
Fe2+
and Mn2+
12
As is the case with the hydrated electron and the hydrogen atom the hydroxyl radical also
exists in an acid-base equilibrium with the oxide radical anion bullOˉ
bull119874119867 + 119874119867minus bull119874minus + 1198672119874
With a pKa of 119 the reactions of bullOˉ only become important at high pH With a few
exceptions reactions of bullOˉ are typically slower than those of
bullOH The two species also
have different reactivity towards organic molecules Hydroxyl radicals tend to add to
unsaturated bonds as an electrophile while the conjugate base bullOˉ acts more like a
nucleophile and will abstract hydrogen from a hydrocarbon bond
Chapter 1 Introduction
35
Computational Applications in Radiation Chemistry
Early computational studies in the field of radiation chemistry were focused largely on
developing the radical diffusion theory and the non-homogeneous stage of water radiolysis
to help rationalise experimental observations One of the earliest water models used
coupled differential equations with terms for the competing diffusion and reacting
processes to represent the evolution of a spur containing six radical pairs as a function of
time13-15
Although the predicted primary yields from this type of model agree well with
experimental data there are problems associated with this type of approach the main
problems arising from the application of classical chemical kinetics to a system of
diminutive volume and extremely fast reactions occurring between only a few reactive
species Such deterministic models often use a typical spur to represent a whole system
fixing the average number of radical pairs as a single integer or in some cases a range of
integers This means that in deterministic models the long-running average value for the
number of reactive species is neglected This small difference can lead to inaccuracies in
deterministic calculations of this kind and so a stochastic approach became the preferred
method to these types of non-homogeneous radiolysis calculations16
Deterministic models however are still the preferred technique for the longer term
homogeneous stage calculations for water radiolysis Once a suitable set of primary yields
has been established it is possible to model the subsequent chemistry in much the same way
as any other chemical kinetics simulation
Chapter 1 Introduction
36
By describing a reaction set in terms of a series of simultaneous differential equations and
by including details of physical parameters such as temperature it is possible to predict
chemical yields of radiolysis and highlight important chemical pathways This is the
general methodology implemented in this study and will be discussed in further detail in
subsequent chapters
Deliverables and Project Aims
Given the technical challenges associated with the Sellafield site and the pressing
conditions of legacy facilities such as the First Generation Magnox Storage Pond and
Magnox Swarf Storage Silos there has been a renewed interest in water radiolysis
especially with respects to high pH and slurry systems Previous radiolysis studies of high
pH solutions have been contradictory and difficult to reproduce There are very few
situations in industry where knowledge of high pH water radiolysis is required as most
situations where water radiolysis may occur are in acidic media with the exception of
Pressurised water reactors (PWRs) and CANDU reactor technology which run under alkali
conditions due to added LiOH17
As mentioned previously the Magnox Swarf Storage Silos at Sellafield Ltd contains large
quantities of contaminated magnesium alloy produced from the de-cladding process of
spent nuclear fuel The material contaminated with uranium oxide is stored under water
and over time has corroded to produce large amounts of magnesium hydroxide To prevent
further corrosion some of the 22 silos at the facility dose the water with sodium hydroxide
Although alleviating some corrosion this addition increases the pH
Chapter 1 Introduction
37
One of the aims of this project is to try and obtain a better understanding of water radiolysis
at high pH Using cobalt-60 as a source of gamma radiation and a range of analytical
techniques to determine the production rates of H2 and H2O2 as a function of absorbed dose
it is hoped that the effects of high pH on water radiolysis can be experimentally quantified
Deterministic computational modelling is then used to investigate the experimentally
observed effects of high pH in order to extract a better mechanistic understanding of water
radiolysis at high pH
While there were a number of early water radiolysis studies concerning the effects of
various metal oxides and their surface interactions18
this is also a subject which has
received a renewed scientific interest as there are many situations in the nuclear industry
where an understanding of the effects of metal oxides on water radiolysis are significant
These areas include preventing corrosion within operational facilities to extend their
lifetime controlling radiolytic products associated with stored nuclear material preventing
incidences of unexpected gas build up and managing already heavily corroded facilities
such as the legacy ponds and silos at Sellafield Ltd
In addition to sodium hydroxide the Magnox Swarf Storage Silos also contain large
quantities of magnesium hydroxide the hydrated form of magnesium oxide Radiolysis
studies concerned with magnesium hydroxide solutions slurries and solids are scarce119
despite the obvious need for further investigation The slight solubility of magnesium
hydroxide in water compels a prior understanding of high pH water radiolysis to facilitate
understanding the effects of magnesium hydroxide and the presence of a surface Data
collected from experiments involving magnesium hydroxide are therefore also included in
this project
Chapter 1 Introduction
38
Up until now the discussed aims of this project have been targeted at the issues associated
with the Magnox Swarf Storage Silo rather than with the First Generation Magnox Storage
Ponds These legacy ponds are outdoor open air ponds that have been used to store spent
nuclear fuel for extended periods (far longer than ever intended) As the ponds are open air
they are susceptible to the introduction of natural debris mostly falling leaves and other
biological matter
This has led to an interest in the effects of organic substances on radiolysis processes in
water with the focus being on some of the decomposition products of decaying organic
matter substances such as humic acids The complexity of these substances requires
general underpinning by first understanding simple organic substances In this work the
radiolysis of aqueous methanol was studied
The extended storage of spent fuel in the First Generation Magnox Storage Pond has led to
various challenges concerning corrosion products and their effects on water radiolysis In
the past spent fuel rods were often grouped into small bundles and placed into steel skips
which were then submerged in the pond These skips might also contain other contaminated
material and the exact content of any given skip is largely unknown Over time much of
the steel has corroded resulting in a large build-up of what can only be described as
ldquosludgerdquo The exact composition of this sludge is fairly unknown but the major constituent
is iron oxide present as both red haematite (Fe2O3) and black magnetite (Fe3O4) Research
involving iron oxides and radiolytic processes have mostly been focused on corrosion
mechanisms predominantly adopting an electrochemical approach with very few studies
measuring chemical yields of radiolytically produced H2 and no studies measuring H2O2 in
the presence of iron oxide
Chapter 1 Introduction
39
There are studies that have demonstrated decomposition of H2O2 over iron oxide in the
absence of a radiation source but as H2O2 is a primary product of water radiolysis it is
continuously being generated and the implications of this production are largely unknown
Other studies involving metal oxides have also investigated radiation induced dissolution
With both these processes in mind this project investigates some of the effects of iron
oxide on the steady-state concentrations of the molecular radiolysis products H2 and H2O2
Chapter 2 Experimental Methods
40
Chapter 2 Experimental Methods
Source of Radiation and Dosimetry
This project uses cobalt-60 as a source of gamma radiation Cobalt-60 is an artificial
isotope with a half-life of 527 years2 As cobalt-60 is not a naturally occurring isotope it
must be manufactured This is normally done through neutron bombardment of the non-
radioactive isotope cobalt-59 Stainless steel control rods within a nuclear reactor core are
substituted with cobalt rods and the neutron flux present is enough to transmute cobalt-59
to cobalt-6020
The overall reaction for the production and decay of cobalt-60 is shown
below
1198621199002759 + 119899 rarr 11986211990027
60 rarr 119873119894lowast2860 + 119890minus + 119890 + 120574
The decay mechanism for cobalt-60 was similar to that of Caesium-137 in that it is initiated
by beta decay Unlike Caesium-137 however there is no direct route to a stable isotope
Subsequently the decay of cobalt-60 follows one of two paths both of which begin with the
ejection of a beta particle Cobalt-60 may emit two photons of gamma radiation but will
always emit at least one photon A cobalt-60 nucleus may eject a beta particle with energy
up to 148 MeV this is followed by emission of a photon with energy of 133 MeV
however there is only a 012 chance that this happens The more common decay path for
cobalt-60 is to eject a beta particle with energy up to 031 MeV followed by the emission of
two photons with energies of 117 MeV and 133 MeV
Chapter 2 Experimental Methods
41
Figure 8 A decay scheme for cobalt-60
Cobalt-60 is a popular source of gamma radiation used by radiation scientists High dose
rates can be achieved with fairly little material21
Facilities that conduct experiments using
cobalt-60 as a source of radiation use a variety of systems to shield operators from
radiation Older systems can be as rudimental as a water filled hole with cobalt-60 resting at
the bottom samples are lowered in a container and held at a given distance from the source
to accumulate dose More advanced systems involve mechanically lifting cobalt-60 from
some shielded well into an experimental area This area may be a dedicated room for
irradiating samples or it may be a shielded chamber in which samples are placed The latter
example is known as a self-contained irradiator and is the type of irradiator used in this
work
Chapter 2 Experimental Methods
42
All irradiations reported here were carried out using the Foss Therapy Model-812 Self-
Contained Cobalt-60 Irraditor located at the University of Manchesterrsquos Dalton Cumbrian
Facility (DCF) The Model-812 Irradiator contains three independent housings where
cobalt-60 sources may reside named A B and C Currently only A and C contain
cobalt-60 and had a total activity of 5281 TBq on the original date of measurement
(2nd
May 2012) Source B is due to be filled after one half-life from the original date to
bring the total activity back to a similar level Both A and C sources are used at the same
time for every irradiation throughout this work
Figure 9 Image on the left shows the Model-812 Irradiator On the right is the inside of
the irradiator showing the three guide rods that contain the cobalt-60 source during
irradiation
Chapter 2 Experimental Methods
43
Samples are placed within the irradiator and are exposed to gamma emission from the
cobalt-60 for calculated periods of time to allow samples to accumulate the desired dose
Radiation doses are defined as the amount of energy deposited per kilogram of sample
material and are often quoted as the SI derived unit Gray (Gy) which has the unit J kg-1
In
order to calculate how long a sample should be exposed for requires knowledge of the rate
at which radiation energy is deposited into the sample This is known as a dose rate and is
often quoted as Gy min-1
The practice of dose rate determination is known as ldquodosimetryrdquo
and there are a number of physical and chemical methods for determining the dose rate
from a given source Physical methods often deploy tools such as calorimeters and
scintillation chambers to directly measure energy while chemical methods depend on
measuring some chemical change that occurs during exposure to radiation that responds
linearly with increasing dose There are many chemical dosimeters available depending on
the kind of work being undertaken For example vapour phase experiments often measure
the condensation of acetylene into benzene to determine a dose rate22
For this work the
dosimeter used was a ferrous sulphate solution known as the Fricke dosimeter The Fricke
dosimeter was first described in 1927 by Hugo Fricke and has become the most adopted
chemical dosimeter among radiation scientists23
The standard recipe to make a Fricke
dosimeter used in this work is as follows
Fricke Dosimeter Dissolve 04 grams FeSO4∙7H2O (99 assay Fisher Chemicals) 006
grams NaCl (gt9999 Assay Calbiochem) and 22 mL concentrated H2SO4 (95-98
Sigma Aldrich) Dilute with distilled water to make 1 litre of Fricke solution24
Chapter 2 Experimental Methods
44
This solution will slowly oxidise and must be used within a few days by preventing light
from interacting with the solution it is possible to extend the shelf life of the Fricke
solution to three months The Fricke dosimeter relies on the oxidation of FeII to Fe
III by
species produced during the radiolysis of water
119867(119886119902)+ + 119890(119886119902)
minus rarr 119867bull
119867bull + 1198742 rarr 1198671198742bull
119865119890119868119868 + 1198671198742bull rarr 119865119890119868119868119868 + 1198671198742
minus
1198671198742minus + 119867(119886119902)
+ rarr 11986721198742
119865119890119868119868 + 11986721198742 rarr 119865119890119868119868119868 + bull119874119867 + 119874119867minus
119865119890119868119868 + bull119874119867 rarr 119865119890119868119868119868 + 119874119867minus
The extent of oxidation responds in a linear fashion to ionising radiation until dissolved
oxygen is exhausted this can be up to 500 Gy but in practice doses are usually kept
between 40 and 400 Gy to ensure measurements are made within the range in which FeIII
is
of a measurable concentration but FeII is not fully depleted
2 With a strong absorbance at
304 nm Fe3+
can be quantified by spectrophotometric analysis and an absorbed dose can be
calculated from the following equation
119863119866119910 = 9647 times 106 times
∆119860
∆휀119897120588119866(1198651198903+)
Chapter 2 Experimental Methods
45
where DGy is the absorbed dose in Grays ΔA is the difference between the optical
absorbance before and after irradiation and Δε is difference between the molar extinction
coefficient of Fe2+
and Fe3+
at 304 nm which has an established value of
2201 mol-1
cm-1
24
G(Fe3+
) is the chemical yield of Fe3+
and a value of 155 is
recommended when using cobalt-60 by the International Commission on Radiation Units
and Measurements Path length and solution density are represented by the terms l and ρ
respectively
Irradiations throughout this work were conducted using two sample holding devices each
with a number of different positions The first device consists of a standard 4x8 test tube
rack that has been fixed to an irradiation base plate The base plate allows the device to be
locked in exactly the same position within the Model-812 every time it is used
This device holds a number of 20 mL headspace vials during irradiations of samples which
are then analysed for H2O2 content the details of which will be discussed later
The second device is somewhat more complex and is used to hold samples that are
analysed for H2 content again the details of which are discussed later This device is
designed to keep samples mixed by slowly rotating them along a horizontal axis thus
continually inverting samples throughout the irradiation period it is hence referred to as the
ldquoinverter rigrdquo The construction consists of a high torque motor with a top speed of 2 rpm
Chapter 2 Experimental Methods
46
Figure 10 Sample holding devices for use in the Model-812 Left is the 4x8 rack with its
schematic below On the right is the inverter rig again with its schematic below
Dosimetry measurements were carried out in each of these devices and the results are
shown below Table 1 shows the dosimetry for the 4x8 test tube rack each position was
measured at four time intervals each of which with three replicates Measurements were
carried out in 20 mL headspace vials which were filled with 10 mL of Fricke solution
Chapter 2 Experimental Methods
47
Experiments carried out in this device only occupied positions in the first two rows hence
only these results are shown Table 2 shows the dosimetry of the inverter rig again each
position was measured at four time intervals each with three replicates The inverter rig
only has four positions which were measured with no rotation mixing Initially
experiments were to be conducted under stationary conditions before moving on to mixed
conditions however time limitations prevented progression to mixed samples and all
samples are conducted with no rotational mixing From the data obtained absorbance units
were converted to an absorbed dose by use of equation 1 and dose rates are then extracted
as the gradient of absorbed dose plotted as a function of time
Date of Original Measurement 07022014
Position Dose Rate on Date of
Measurement (Gy min-1
) plusmn Error
A1 29435 75
B1 34827 23
C1 32352 41
D1 27358 89
A2 15845 24
B2 18519 62
C2 18176 26
D2 15248 17
Table 1 Dose rates of the front most two rows of the 4x8 irradiation rack determined by
Fricke analysis The error indicates the percentage of uncertainty of the obtained gradient
Chapter 2 Experimental Methods
48
Date of Original Measurement 13012015
Position Dose Rate on Date of
Measurement (Gy min-1
) plusmn Error
A 29379 46
B 31708 46
C 30208 87
D 30616 46
Table 2 Dose rates of the four positions of the inverter rig determined by Fricke analysis
The error indicates the percentage of uncertainty of the obtained gradient
As cobalt-60 decays dose rates are subject to change with time however they change in a
predictable manner The decay of cobalt-60 follows first order kinetics it is therefore
possible to adjust dose rates to account for the decay of the source simply by multiplying
the dose rate by the ratio of initial radiation intensity and the intensity after a given time2
This can be written as
119863119877119860119889119895 = 119863119877 times1198681199051198680
Where
1198681199051198680= 119890minus120582119905
And
120582 =ln 2
11990512
Chapter 2 Experimental Methods
49
DRAdj is the decay adjusted dose rate after time t λ is the decay constant and tfrac12 is the half-
life which for cobalt-60 is 527 years The use of this equation depends on knowing how
much time has passed since the original dose rate (DR) was calculated hence the inclusion
of the date on which these measurements were made in Tables 1 and 2
Water Purification for Radiolysis Experiments
Radiation breaks water molecules into reactive radicals which can react quickly with any
impurity present in a sample It is therefore of high importance to ensure that any water
used in radiolysis experiments is of the highest purity During the early days of radiation
chemistry high purity water was often obtained through a triple distillation process Water
was distilled firstly through standard means before being distilled again from an acid
dichromate solution and finally a third time from an alkaline permanganate solution before
being stored in a fused silica container4 Advancements in modern self-contained
purification systems have significantly simplified the process of obtaining ultra-pure water
for radiolysis experiments All experiments carried out throughout this work use ultra-pure
water dispensed from the ELGA PURELAB Classic the feed water of which is provided
by the ELGA PURELAB Option-SR 715 Through the use of duel bank reverse osmosis
units two independent UV lamp purifiers and deionisation cartridges the final resistivity of
output water is measured to be 182 MΩ cm-1
Chapter 2 Experimental Methods
50
Figure 11 A diagram of the purification system that provides the ultra-pure water used
throughout this work Image was taken from the ELGA PURELAB user manual
Determination of H2O2 ndash Photometric Analysis
Throughout this work the determination of hydrogen peroxide is carried out using a
photometric technique known as the Ghormley Tri-iodide method25
This method takes
advantage of the redox reaction between hydrogen peroxide and iodide to produce iodine in
a 11 stoichiometric ratio with hydrogen peroxide This reaction takes place under acidic
conditions and is catalysed by the presence of ammonium molybdate tetrahydrate Acid is
also required to force the resulting equilibrium between iodine and tri-iodide completely
towards the production of tri-iodide which can then be measured by photometric analysis
this is achieved using potassium phthalate monobasic A general reaction scheme for this is
shown below
Chapter 2 Experimental Methods
51
11986721198742 + 2119868minus + 2119867+ rarr 1198682 + 21198672119874
1198682 + 119868minus 1198683
minus
This is a popular method for the determination of hydrogen peroxide in radiolysis studies26-
29 It is favoured for its relative simplicity over previous methods which typically involved
complicated titrations with potassium permanganate Furthermore it is also extremely
sensitive enabling accurate measurements of low concentrations of hydrogen peroxide with
a lower limit of 1 μM30
The reagent used to reduce hydrogen peroxide is susceptible to self-oxidation and has a
very short shelf life To prevent self-oxidation and prolong the shelf life the reagent is
prepared as two reagents designated ldquopart Ardquo and ldquopart Brdquo and are only mixed during
analysis One reagent contains potassium iodide under slightly alkali conditions while the
other contains an organic acid salt potassium phthalate monobasic Both reagents are
prepared according to the recipe originally described by Ghormley25
Part A Dissolve 1 gram NaOH (ge98 Sigma Aldrich) 33 grams KI (995 Assay
Fisher Scientific) and 01 gram (NH4)6Mo7O24∙4H2O (ge99 AppliChem) in 500 mL
deionised water
Part B Dissolve 10 g C8H5KO4 (ge9995 Sigma Aldrich) in 500 mL deionised water
Figure 12 Structure of Potassium phthalate monobasic (C8H5KO4)
Chapter 2 Experimental Methods
52
Analytical Procedure
The redox reaction between H2O2 and I ˉ is carried out on a 2 mL aliquot of sample
solution To this 1 mL of Part A and 1 mL of Part B are added a few seconds are required
for development before transfer to a quartz cuvette for analysis in a Cray 5000 UVVisNIR
photospectrometer Samples that contain solid material are filtered through syringe filters
before analysis to remove any solid particles Samples of elevated pH often required
additional acid to reduce the pH to the conditions required for analysis the quantity of
additional acid is determined by testing a blank sample with litmus paper the quantity is
then recorded and the dilution factor accounted for Utilisation of the Beer-Lambert law
allows for the calculation of hydrogen peroxide concentration from an absorbance within
the linear range of the technique
119860 = 휀119897119888
Where A is the optical absorbance ε is the molar extinction coefficient in M-1
cm-1
l is the
path length (always 1 cm during this work) and c is the concentration in mol dm-3
Determination of the optimum wavelength of absorption was carried out by a scanning
analysis of a 625 μM solution of hydrogen peroxide prepared by serial dilution of a 1 M
standard which itself was prepared from a 3wt stock solution of hydrogen peroxide in
water purchased from Sigma-Aldrich
Chapter 2 Experimental Methods
53
Figure 13 Scanned absorption spectra of a 625 μM H2O2 solution
The maximum absorbance was determined to be 351 nm which is consistent with values
described in literature3031
A series of standard solutions were made ranging in
concentration from 1-300 microM to determine the molar extinction coefficient shown in
Figure 14
Chapter 2 Experimental Methods
54
Figure 14 A calibration curve of H2O2 photometric absorption to determine the molar
extinction coefficient
Addition of the tri-iodide reagents dilutes the standard to half the quoted concentration A
dilution factor of 2 is used to correct for this hence the calibration curve covers the
concentration range 05-150 microM hydrogen peroxide The determined molar extinction
coefficient was 25631 M-1
cm-1
this again is consistent with values quoted in
literature263132
y = 25631x - 00012
0
05
1
15
2
25
3
35
4
45
00E+00 20E-05 40E-05 60E-05 80E-05 10E-04 12E-04 14E-04 16E-04
Ab
sorb
ance
[H2O2] (mol dm-3)
Slope Error = plusmn35548
Chapter 2 Experimental Methods
55
Determination of H2 - Gas Chromatography
Method development
Measurements of hydrogen gas are usually carried out using gas chromatography
frequently paired with mass spectroscopy3334
This work uses only gas chromatography to
measure hydrogen gas produced during the radiolysis of samples The standard technique
for gas analysis is to use a gas tight syringe and needle to extract a portion of headspace
from a sealed sample The samples are typically sealed in air tight vials with a rubber
septum to allow gas extraction however due to the effects of radiation on plastics and
rubbers the reliability of this technique remains debatable and often alternative methods are
sought One argument against the use of rubber septa in a radiation field is that they are
known to radiolytically produce their own hydrogen which would contribute to any
measurements Although some preliminary laboratory tests indicate that the production of
hydrogen from septa seems predictable and can be subtracted from any hydrogen produced
from samples this information was obtained from a single batch of septa and the
production rate of hydrogen will most likely vary between batches as nothing is known
about the manufacturersquos quality control tolerances Another important argument is
concerned with the concentration ranges of hydrogen that will be measured Aqueous
samples that contain no radical scavengers often have low chemical yields for hydrogen
and sampling with a syringe reduces the sample volume to a maximum of 100 microL
attempting to extract a larger volume leads to sampling problems associated with negative
pressure within the sealed sample
The portion of hydrogen entering the gas chromatograph may be reduced even further for
samples containing slurries as much of the hydrogen may remain trapped in the aqueous
phase even after agitation
Chapter 2 Experimental Methods
56
Headspace injections may be a viable technique for samples that are known to produce
large quantities of hydrogen but generally measurements made with this technique are
often close to or below the detection limits of the gas chromatograph Many radiation
chemists have adopted a variety of techniques for measuring small quantities of
radiolytically produced hydrogen that do not rely on the use of rubber septa One such
technique is the ldquoCrush Tuberdquo method described in references3536
This method is used for
all hydrogen analysis in this work
The Crush Tube Sampling Method
The crush tube method of gas chromatography uses a modified SRI Model 8610C Gas
Chromatograph (GC) with a bespoke sampling device that contains a section of Tygonreg
tubing that allows for a glass sample vial to be crushed by an external force such as a pair
of wrench pliers Originally the tubing was a standard silicone tube however Tygonreg
tubing proved to be more durable and less prone to leaks Figure 15 and 16 show the
general schematic for the apparatus as well as the specially made sample vials for this
method
Figure 15 The modified SRI 8610C Gas chromatograph with inline ldquocrush tuberdquo setup
The sample can be seen inside the silicone tubing
Chapter 2 Experimental Methods
57
Figure 16 Image on the left shows a schematic for the sampling apparatus on the right
are the vials used which are flame sealed at the midway neck
In order for this technique to work several modifications must be made to the GC hence
the selection of the highly modular SRI Model 8610C The first modification was made to
the 10-port gas sampling valve to enable carrier gas to flow through the bespoke sampling
device during analysis The unmodified 10-port valve contains a sample loop that connects
to the ldquoINrdquo and ldquoOUTrdquo ports on the external of the GC during sample loading When the
port is rotated to the ldquoINJECTrdquo position the loop is included in the carrier gas path and the
external ports are isolated
Chapter 2 Experimental Methods
58
Figure 17 A schematic of the original setup for the 10-port sampling valve in both off (top
image) and on (bottom image) positions
It is essential that carrier gas is allowed to continually flow through the system during both
sample loading and sample injecting As the bespoke sampling device creates a closed loop
between the external ports it is possible to swap the connections of ports 1 and 10 without
disrupting the flow of carrier gas
This modification isolates the external ports during sample loading but includes them
during sample injection and allows sample gas to be carried through the GC
Chapter 2 Experimental Methods
59
Figure 18 A schematic for the modified 10-port sampling valve including the removal of
the silica gel column
Figure 18 also depicts the removal of the silica gel column this is part of the second
modification The bespoke sampling device contains a large volume of gas that requires a
relatively fast carrier gas flow rate to achieve acceptably narrow peaks This flow rate is
quoted in literature as being around 50 mLmin35
The Packed silica gel column and the
default molecular sieve column simply did not allow for this high flow rate without
significant back pressure that can cause damage to equipment for this reason they were
removed A bespoke column was made from frac14 inch copper tubing and 13x molecular sieve
beads The new column had a total length of 4 m and allowed sufficient flow rates with
adequate separation of gasses
Chapter 2 Experimental Methods
60
Figure 19 Image on the left shows the bespoke frac14 inch OD 13x molecular sieve column
On the right the rotameter is connected to calibrate gas flow rates
The SRI Model 8610C is not equipped with a digital rotameter as such it cannot display
flow rate information and instead can only display information about the carrier gas inlet
pressure which requires a conversion formula to obtain a meaningful flow rate The user
manual includes conversion factors but these are column specific and as the column has
been custom built it is necessary to manually determine a conversion formula to obtain a
flow rate This was done using a rotameter connected to the external GC ports by adjusting
the inlet pressure and noting the rotameter value a calibration curve was obtained
Chapter 2 Experimental Methods
61
Figure 20 A calibration curve to provide a conversion to determine carrier gas flow rate
Detection of H2 and Calibration
The SRI Model 8610C is equipped with a thermal conductivity detector (TCD) for the
measurement of eluted gas The TCD consists of a Wheatstone bridge circuit with tungsten-
rhenium filaments serving as resistors (Figure 21) Carrier gas containing eluted sample
passes over one of the filaments while a second path is reserved for carrier gas only to
serve as a reverence The filaments are electrically heated and the temperature of the whole
unit is carefully controlled As carrier gas passes over the filaments it conducts heat away
from the filament to the detector body when a sample component flows over the filament
the conductivity changes causing the filament to change temperature relative to the
reference filament This change in temperature changes the resistivity of the filament and a
change in voltage is recorded
Chapter 2 Experimental Methods
62
Figure 21 A schematic of a Wheatstone bridge circuit used in the TCD
To achieve a good sensitivity towards a given analyte it is important to have a large
difference in thermal conductivity between said analyte and the carrier gas Table 3 shows
the thermal conductivity values for some common gases The carrier gas most often used is
helium which has a thermal conductivity of 36036times106 cal s
-1 cm
-1 degC
-1 As many other
gases have much lower thermal conductivities helium often performs well however
hydrogen is a special case as it also has a high thermal conductivity of
44632times106 cal s
-1 cm
-1 degC
-1 For this reason the carrier gas selected for hydrogen
measurement was argon which has a much lower thermal conductivity of
4257times106 cal s
-1 cm
-1 degC
-1
Gas Thermal Conductivity (cal s-1
cm-1
degC-1
x106)
267degC
H2 44632
O2 6364
N2 6240
Ar 4257
He 36036
Table 3 Thermal conductivity of commonly used gases
Values taken from the Handbook of Tables for Applied Engineering Science
Chapter 2 Experimental Methods
63
Measurements made by the TCD are expressed as a voltage plotted as a function of time
The peaks produced in this plot are integrated and the final result is expressed as the peak
area As the peak area unit is largely arbitrary a calibration curve must be obtained to relate
the peak area to a meaningful quantity of hydrogen Calibration is carried out by replacing
the bespoke sampling device with a simple T-section fitted with a rubber septum Known
quantities of hydrogen gas are injected into the T-section which is then carried through the
GC Figure 22 shows a calibration curve for the linear range of 1 ndash 500 microL of pure
hydrogen at standard room temperature and pressure
Figure 22 A calibration curve for quantifying hydrogen gas from chromatograms
Samples of airhydrogen mixtures were also injected to make sure there was adequate
separation between the gases good separation between hydrogen and oxygen is observed
but the separation of oxygen and nitrogen is not adequate for analysis of those gases when
both are present in large quantities
Chapter 2 Experimental Methods
64
Machine parameters were adjusted for optimum performance these are shown in Table 4
These parameters were used for every experiment throughout this work
Parameter Value
Valve Temperature 70 Cdeg
Column Temperature 40 Cdeg
TCD Temperature 220 Cdeg
Flow Rate 50 mLmin
Carrier Gas Ar
Table 4 Optimised parameters used for the analysis of H2 gas
Method Validation
It was mentioned previously that the bromide ion is an excellent scavenger of hydroxyl
radicals during radiolysis
bull119874119867 + 119861119903minus [119867119874119861119903]minus119867(119886119902)+
rarr 119861119903bull + 1198672119874119861119903minus
rarr 1198611199032bullminus
Radiolysis of an aqueous solution of 1 mM bromide results in the elimination of the
reaction between the hydroxyl radical and molecular hydrogen in solution37
Other than
diffusion to the gas phase a reaction with hydroxyl radicals is the only significant removal
path of hydrogen at neutral pH The removal of dissolved oxygen by argon sparging also
simplifies much of the radiolysis chemistry allowing for a more reproducible experiment
This means that the hydrogen measured from the radiolysis of a deaerated 1 mM bromide
solution is in fact a primary yield and is quoted throughout the literature as being
GH2 = 045 this is an average value from a range of studies
2453839
Chapter 2 Experimental Methods
65
In order to secure confidence in this technique a validation experiment was carried out in
which a 1 mM solution of potassium bromide was used to determine the primary yield of
hydrogen which was then compared to the literature value
Figure 23 Method validation by the determination of the well-established primary yield of
H2 through hydroxyl scavenging by bromide
As expected the hydrogen concentration increased linearly with absorbed dose over the
experimental range When the number of hydrogen molecules is plotted as a function of
absorbed energy in sets of 100 eV the gradient gives GH2 = 0456 plusmn0025 matching well to
the average value quoted in literature
Chapter 2 Experimental Methods
66
Sources of Error
The majority of experiments carried out in this work use the absorbed energy or dose as
the independent variable and using one of the analytic techniques discussed above either a
photometric absorption value or the integrated response to hydrogen gas detection as the
dependant variable Both the dependant and independent variable have errors associated
with them which are discussed below
Determining the quantity of absorbed energy to the sample relies on the procedure of
dosimetry discussed earlier in this chapter The errors reported in Tables 1 and 2 are the
percent error of the gradient obtained from the measurement of Fe3+
as a function of time
As the experiments carried out in this work are plotted as a function absorbed dose and
there is an element of uncertainty associated with the dose rates the uncertainty of the
calculated absorbed dose increases with increasing dose This uncertainty in the absorbed
dose is included in many of graphs showing experimental data and is represented by
horizontal error bars
Sources of Error in the Determination of H2O2
The determination of H2O2 relies mainly on the calibration curve to yield a molar extinction
coefficient determined to be 25631 M-1
cm-1
with an uncertainty of plusmn 355 M-1
cm-1
The
molar extinction coefficient is used to convert the measured absorbance of a sample to a
concentration of H2O2 however this value has a dependence on temperature The ambient
temperature of the laboratory fluctuates slightly but it was decided that the effects were too
minor to consider The irradiation of samples on the other hand resulted in samples
heating slightly to a temperature that would be significant
Chapter 2 Experimental Methods
67
This was largely mitigated by leaving samples to cool for a few minutes until they reached
room temperature however an increase in temperature may affect the radiation chemistry
Solutions used to calibrate and reagents used to analyse samples also carry an associated
uncertainty in their concentrations The standards used to produce the calibration curve
were prepared from a stock solution of 3 wt H2O2 (Sigma Aldrich) From this the
0882 M solution was diluted to 1 mM which was used in a serial dilution to create the
standards ranging from 1 ndash 300 μM Uncertainty in the concentrations will have been
introduced by the tolerances of the pipettes and volumetric flasks used The pipettes used
were the Gilson Pipetman P1000 and P20 which are certified to comply with ISO 8655 that
imposes maximum allowable systematic errors of plusmn 80 μL and plusmn 02 μL for the P1000 and
P20 respectively The maximum allowable random error for the P1000 is quoted to be
le 30 μL and le 01 μL for the P20 The volumetric flasks used were class A Glassco brand
flask that conform to ISO 1042 Of the range of flasks used the largest error was 00025
Any uncertainty in the concentrations of the analytical reagents used to reduce H2O2 is
largely irrelevant as the chemicals used to perform the analysis are provided in a large
excess Stoichiometrically speaking as long as the concentration of iodide is at least three
times that of H2O2 the analysis should work in reality the concentration of iodide is
several times higher than this ensuring all H2O2 is reduced The sum of the above errors are
assumed to contribute to less than 1 of the total uncertainty of any measurements of
H2O2
Chapter 2 Experimental Methods
68
Sources of Error in the Determination of H2
The experimental technique provides a means to quantify hydrogen gas by volume In order
to make a comparison to predictions made by the computational model it was necessary to
convert this value to a concentration (mol dm-3
) This means knowing the volume of the
headspace in the crush tube vials As these vials are flame sealed they naturally have an
irregular shape and calculating a precise volume is difficult for this reason the conversion
uses an estimated headspace volume of 2 mL
Hydrogen gas is quantified by the integration of a change in voltage with respects to time
however the voltage response measured can be affected by a number of factors Factors
such as temperature and pressure are controlled automatically by the machine Moisture can
also affect the response of the TCD and this is controlled by running a ldquobake outrdquo cycle
prior to running any analysis One factor that cannot be prevented is the slow oxidation of
the tungsten-ruthenium filament which lowers the sensitivity of gas detection This can be
accounted for by performing regular calibrations often 3 or 4 point calibrations that are
compared to the original calibration curve If there is any deviance from the original curve
then a full calibration is performed and this is then used for the following analyses The
calibration curve shown in Figure 22 was the first full calibration performed throughout the
duration of this project the gradient of this curve gradually decreased this was accounted
for using the calibration process mentioned above As calibrations are performed by hand
with a gas tight syringe most of the error is likely introduced at this point The average
error of calibration points was plusmn 25 in the calibration curve given in Figure 22 for other
calibrations not shown in this work the average error was always less than 5
Chapter 3 Computational Methodology
69
Chapter 3 Computational Methodology
The earliest recorded computational approaches to solving problems in the field of radiation
chemistry date back to 1958 when the AVIDAC computer in Chicago was used to model
radical diffusion kinetics40
Since then different mathematical techniques have found use in
modelling problems found in the field of radiation chemistry and with ever increasing
computational power complicated calculations can be performed in seconds rather than
days In the early days of computational radiation chemistry primary yields were calculated
by deterministic methods involving the diffusion of a single spur However it became
apparent that a Monte Carlo approach held several advantages over deterministic methods
for the description of early stage radiolysis Such advantages include the ability to
incorporate the effects of a variety of different spur sizes and other entities arising from
secondary electrons41
For this reason modern radiolysis models usually fall into two
categories depending on what stage of radiolysis is being modelled Monte Carlo
calculations often concern the non-homogeneous early stages of radiolysis due to the
stochastic nature of energy deposition into a medium as mentioned earlier these
calculations often predict the primary yields of radiolysis products42
If the primary yields
are already known a deterministic approach is often employed to model the resulting
homogeneous chemistry in a similar way to most other chemical kinetics models through
the use of simultaneous ordinary differential equations (ODE)2743-46
Newer radiolysis
models are moving towards a multi-scale approach in which the output of the stochastic
stage is fed directly into the deterministic stage47
In this project a deterministic kinetic model for homogeneous chemical stage radiolysis has
been developed using a software package called FACSIMILE developed by MCPA
software Ltd
Chapter 3 Computational Methodology
70
FACSIMILE utilises Gear methodology for auto-adaptive time step control coupled with
Newton-Raphson iterations for prediction correction to deliver a robust simultaneous
ordinary differential equation solver The FACSIMILE language is largely based on the
Fortran language but is tailored for use by the scientific community and includes its own
high level notations for simplifying ODE construction48
The chemical model developed
here is largely based on the rate coefficient compilation by Elliot and Bartels 46
as well as
other literature sources27434549
This chapter gives a detailed description of how the model in this project works In essence
the model functions by producing primary radiolysis species at rates determined by their
primary yields and a dose rate parameter while simultaneously solving a set of ODEs that
represent the chemical reactions that describe the radiolysis chemistry At the same time
the model is also bound by framework calculations that describe various physical
parameters including but not limited to temperature effects and species volatility Each of
these concepts is described in detail in the following sections as well as the core radiolysis
reaction set
Production of Primary Species
As this model is only concerned with the homogeneous radiolysis chemistry that occurs
after diffusion of the primary species away from any kind of track structure the effect of
radiation can be represented by a series of zero order production equations with rate
constants derived from the dose rate and the species primary yield Each primary radiolysis
species has its own equation that defines its rate of production the general form of this
equation is shown below
Chapter 3 Computational Methodology
71
119896119894 =119863119877 times 119864119862 times 120588 times 119866119894
119873119860
DR is the dose rate given in Gy min-1
and Gi is the primary yield for species i NA is
Avogadros number and provides the conversion of molecules to moles while ρ is the
density of water and converts mass to volume ρ also has its own temperature dependency
which is calculated elsewhere in the code EC is a constant that effectively converts the
units of dose rate (J kg-1
min-1
) into time units compatible with a zero order rate constant
(mol dm-3
s-1
) and energy units compatible with primary yields (molecules 100 eV-1
) and
has a value of 104 times1015
and carries the unit 100 eV s-1
The dose rate is initially set by the user and is constant throughout the calculation however
primary yields are not set by the user and are initially set depending on other parameters
such as temperature and pH Table 52 shows the primary yields for water radiolysis by
gamma-rays at neutral pH and at room temperature the following section describes the
factors that can alter these values and details how they are incorporated into the model
Primary Species eaq- H
bull
bullOH H2 H2O2
g-Value 263 055 272 045 068
Table 5 Primary yields for γ-radiolysis of water at neutral pH and standard pressure and
temperature2
Chapter 3 Computational Methodology
72
Factors Affecting Primary Yields
Temperature
The rate of diffusion of primary species away from spurs created by ionising radiation is
affected by temperature As the temperature is increased the rate of diffusion of radical
species increases as does the rate of recombination reactions The yields obtained at high
temperature are determined by this competition between diffusion and recombination rates
Experiments carried out by Hochanadel and Ghormley (Table 6)50
first show this effect
over a temperature range of 2 ndash 65 degC in which higher temperatures favour increased
radical yields and decreased molecular yields
Primary Species g-Value Temperature
coefficient degC-1
2degC 23degC 65degC
Hbull + eaqˉ 359 367 382 +010plusmn003
bullOH 280 291 313 +018plusmn004
H2 038 037 036 -006plusmn003
H2O2 078 075 070 -015plusmn003
-H2O 435 441 454 +007plusmn003
Table 6 Temperature effects on the primary yields of water radiolysis50
A recent extensive compilation by Elliot and Bartels includes measurements of primary
yields at temperatures from 20 ndash 350degC from multiple sources and collates this data to
provide fitted equations for use in computational models The primary yield of the hydrated
electron was determined by product analysis of nitrogen formation from samples containing
nitrous oxide51-54
The chemical yield of nitrogen is equal to the primary yield of the
hydrated electron due to the following scavenging reaction
119890(119886119902)minus + 1198732119874 rarr 1198732119874
minus rarr 1198732 + 119874minus
Chapter 3 Computational Methodology
73
Organic compounds were also added to scavenge hydroxyl radicals and prevent them from
reacting with hydrated electrons Pulse radiolysis studies were also included55
but only the
data from nitrogen yield measurements were recommended for use
For the determination of the hydroxyl primary yield pulse radiolysis was the primary
method used The method described used bicarbonate to effectively convert hydroxyl
radicals to the carbonate radical which is more easily measured
The temperature dependency of the extinction coefficient for the carbonate radical was
estimated by integrating normalised absorption spectra as a function of temperature
originally collected by Elliot et al53
The resulting temperature dependency of the hydroxyl
radical primary yield is in agreement with an independent pulse radiolysis study that used a
ferrocyanide ion solution to measure the temperature dependency of the hydroxyl yield up
to 105degC53
The temperature dependence of the hydrogen peroxide primary yield was determined by
three independent studies Measurements in acrylamide solutions provided the temperature
dependency up to 100degC53
Further measurements made in deaerated solutions containing
nitrate and methanol extended this range to 150degC56
Estimations of the peroxide primary
yield to high temperatures were made based on the assumption that it was equivalent to the
chemical yield of oxygen in an alkali solution containing nitrous oxide or iodine this
approach expanded the temperature range to 270degC54
The primary yield of molecular hydrogen as a function of temperature has been measured
by three laboratories In each case hydrogen was directly measured from solutions
containing either a nitrous oxide and organic mix or nitrite ions In both cases the
measurements agreed well across all three laboratories515354
Chapter 3 Computational Methodology
74
Several attempts at measuring the primary yield of the hydrogen atom as a function of
temperature have been made however only two data sets are considered reliable as others
do not agree with the established yield at room temperature although all data sets show an
increase in yield with temperature
The chemical yield of molecular hydrogen from deaerated solutions containing nitrate and
phosphite ions is said to be equal to the sum of the primary yields of molecular hydrogen
and the hydrogen atom subtracting the already established primary yield of molecular
hydrogen from these measurements should give the primary yield of the hydrogen atom
These measurements agreed well with the established room temperature value and gave a
temperature dependence up to 200degC53
The temperature dependence was expanded to
350degC based on estimations of the ratio between the hydrogen atom primary yield and
hydrated electron primary yield which was calculated from data obtained during other
experiments performed in alkali solutions Unfortunately this data is described as archived
and unpublished The collated data from the experiments described above are shown in
Figure 24 with polynomial fits overlain the equations for these polynomials are given in
Table 7 and are used in the modelling calculations reported
Chapter 3 Computational Methodology
75
Figure 24 Collected data from literature showing measured primary yields as a function
of temperature Provided by Elliot and Bartels 200845
Primary Yield
Polynomial
g(eaq-) 2641 + 4162times10
-3 t + 9093times10
-6 t
2 ndash 4717 times10
-8 t
3
g(H2O2) 0752 ndash 1620times10-3
t
g(H2) 0419 + 8721times10-4
t ndash 4971times10-6
t2 + 1503times10
-8 t3
g(bullOH) 2531 +1134times10
-2 t ndash 1269times10
-5 t2 + 3513times10
-8 t3
g(Hbull) 0556 + 2198times10
-3 t ndash 1184times10
-5 t2 + 5223times10
-8 t3
Table 7 Polynomial equations for estimating temperature effects on primary yields45
Where t is the temperature in degC
Incorporation of any kind of temperature dependence into a prediction that will be
compared with experimental data requires knowledge of the experimental temperature This
is especially important in chemical kinetic models such as this as almost all the reaction
rate constants are temperature dependent For this reason a test was conducted to measure
the temperatures experienced by samples during irradiation
Chapter 3 Computational Methodology
76
The test was carried out with vials which had thermocouples attached the vials were filled
with water The vials were irradiated for 16 hours and the temperature was recorded every 5
minutes the average recording is shown in Figure 25 A polynomial fit was made from the
first 4 hours of data which was applied in the code to control the rate of temperature change
during a calculation the simulated temperature is shown as the red dashed line in
Figure 25
Figure 25 A comparison of the sample temperature profile logged by thermocouple to the
temperature profile calculated in the computational model
There are many ldquobulkrdquo radiolysis models in literature few of which make any reference to
the way in which temperature is controlled It can only be assumed that these models use a
fixed temperature which would produce less accurate predictions especially during early
periods where the temperature change is significant It should be said that this approach
should be used with caution as this temperature profile depends on the equipment being
used to irradiate samples and the dose rate involved
20
25
30
35
40
45
0 2 4 6 8 10 12 14 16
Tem
per
atu
re (degC
)
Time (h)
Thermocouple
Facsimile
Chapter 3 Computational Methodology
77
The majority of energy from the radioactive sources ends up being deposited into the
shielding material of the irradiation unit This heats the surrounding air within the
irradiation chamber which is often not circulated
pH
The effect of pH on the primary yields of water radiolysis has been a subject of discussion
for many decades yet experimental data on the subject is relatively sparse at high and low
pH Early radiolysis experiments often took place in acidic medium and so acidity became
one of the first variables considered for investigations into the effects of pH on primary
yields Table 857
shows primary yields data from 04 M sulfuric acid samples where the
pH = 046 the values shown are averages over multiple sources
Reference g(eaq-) + g(H
bull)
g(
bullOH) g(H2) g(H2O2) g(-H2O) Ref
Ferradini C et al 370 280 045 090 460 58
Allen AO
Lefort M 365 295 045 080 455
459
Sworski T J 370 292 039 078 448 60
Hochanadel C J et al 370 290 040 080 450 61
Mahlman H A et al 368 296 045 081 458 62
Hayon E et al 366 297 040 076 450 6364
Sehested K et al 362 289 039 076 441 65
Spinks amp Wood 365 290 040 078 445 2
Table 8 A collection of measurements of primary yields made in 04 M solution of
sulphuric acid (pH = 046)57
The noticeable changes to the primary yields when compared with those at neutral pH are
consistent throughout the literature including further sources not included in Table 8
Chapter 3 Computational Methodology
78
The change in primary yields is not massive in the pH range 046 ndash 7 but neither is it
insignificant With the exception of the molecular hydrogen yield all primary yields
increase slightly at low pH The main explanation for this involves the conversion of
hydrated electrons to hydrogen atoms within the radiation spurs In neutral solutions the
hydrated electron readily reacts with the hydroxyl radical to form hydroxide but when the
hydrated electrons are converted to hydrogen atoms the reaction with hydroxyl radicals is
suppressed
The hydrogen atoms do not react with hydroxyl radicals as quickly as hydrated electrons
and so the hydroxyl radicals become effectively ldquoprotectedrdquo at low pH This explains the
increase in primary yield of the reducing species (hydrated electron plus the hydrogen
atom) and the increase in the hydroxyl radical yield With an increase in hydroxyl radicals
comes an increase in the peroxide primary yield via the dimerisation of hydroxyl radicals
The decrease of the molecular hydrogen primary yield is due to the dimerisation of
hydrogen atoms having a slower coefficient than the reaction between two hydrated
electrons
119890119886119902minus + 119867(119886119902)
+ rarr 119867bull k = 210 times1010
M-1
s-1
119890119886119902minus + bull119874119867 rarr 119874119867minus k = 302 times10
10 M
-1 s
-1
119867bull + bull119874119867 rarr 1198672119874 k = 153 times10
10 M
-1 s
-1
The effect high pH has on the primary radiolysis yields of water is not as well documented
The number of studies is fewer than those conducted in acidic medium and the data from
said studies do not always agree Table 957
shows a collection of primary yields measured
in alkali samples where the pH asymp 135
Chapter 3 Computational Methodology
79
Reference g(eaq
-) +
g(Hbull)
g(
bullOH) +
g(bullOˉ)
g(H2) g(H2O2) +
g(HO2ˉ) g(-H2O) Ref
Draganić et al 318 272 045 068 409
538
Hayon E 327 304 043 053 412
66
Haissinsky M 334 301 04 056 414
67
Dainton F S et al 385 34 036 058 457
6869
Cheek C H et al 28 21 045 084 37
70
Fielden E M et al 357 28 - - -
71
Czapski G et al 33 - - 056 -
72
Table 9 A collection of primary yields measured in alkali solutions (pH asymp 135)57
At high pH the hydroxide ion can react with the hydroxyl radical within the spur forming
the oxide radical anion bullOˉ in the following equilibrium
bull119874119867 + 119874119867minus bull119874minus + 1198672119874 pKa = 119
At high concentrations of hydroxide the hydroxyl radical may be completely replaced by
the oxide radical anion A consequence of this shift is the decrease in the peroxide primary
yield as it is thought that the dimerisation of the oxide radical anion to form peroxide is
slower than the neutral equivalent dimerisation of hydroxyl radicals This is something that
is observed across almost all the studies conducted at high pH The reaction between the
hydrated electron and the oxide radical anion is also slower than the corresponding neutral
equivalent reaction It is therefore expected that the primary yield of oxidising radicals
G(bullOH) + G(
bullOˉ) would increase with increasing pH as would the total primary yield of
reducing radicals G(e(aq)
-) + G(
bullH) The primary yield of molecular hydrogen is mostly
unaffected by the increased pH this would suggest that the net decomposition yield of
water must increase in order to satisfy the material balance equation
Chapter 3 Computational Methodology
80
119892(minus1198672119874) = 119892(119890119886119902minus ) + 119892(119867bull) + 2119892(1198672) = 119892(119874119867
bull) + 119892(119874bullminus) + 2(119892(11986721198742) + 119892(1198671198742minus))
Despite the difficulty in deriving quantitative agreement across the available data there are
studies that offer qualitative agreement with the expected changes to primary yields at high
pH66-69
There are also studies that do not agree and propose that the primary yields are
largely unaffected by pH5387073
Despite the oxide radical anion being the main radiation produced oxidising radical in
aqueous alkali medium and therefore having a significant effect on the chemistry reaction
rate coefficients associated with it are largely unknown and rely on estimation The lack of
reliable rate coefficients for the reactions of the oxide radical anion is an important factor to
consider when attempting to model the radiolysis of water at high pH
It has been shown using stochastic simulations that the chemistry of the oxide radical
anion can have a significant impact on the prediction of primary yields Initial predictions
of the stochastic model by Pimblott et al74
showed an increase in the peroxide primary
yield at high pH This is counter to the accepted trend observed experimentally of a
decreasing peroxide primary yields at high pH In order to match the observed decrease in
peroxide primary yield a single rate constant was changed from 20 times1010
M-1
s-1
to 65
times109 M
-1 s
-1 for the reaction below
119874bullminus + bull119874119867 rarr 1198671198742minus
Chapter 3 Computational Methodology
81
This change had the effect of reversing the trends of the primary yield predictions at high
pH resulting in agreement with experimental data Soon after this the rate constant for the
reaction between the oxide radical anion and the hydroxyl radical was measured to be 74
times109 M
-1 s
-1 which is much closer to the adjusted rate constant used in the stochastic
simulation than the original estimate49
Figure 26 shows literature values for the measured primary yields as a function of pH from
this polynomial equations were fitted which were combined in a multiple regression
analysis with the equations fitted to temperature analysis data Table 10 shows the resulting
equations While this approach gives an estimate of the primary yields as a function of both
temperature and pH it is not an ideal solution This type of estimation is better suited to a
stochastic type track chemistry calculation
A stochastic approach could also account for the effects of different linear energy transfer
(LET) values which are discussed in the next section A multi-scale approach could even
procedurally produce stochastically calculated primary yields that feed into a deterministic
chemical kinetic simulation
Chapter 3 Computational Methodology
82
Figure 26 A reproduction of data provided by Hayon75
showing the effect of pH on
primary radiolysis yields
Primary Yield
Multiple Regression Equation
g(eaq-) 28 + 285times10
-3 times t ndash 251times10
-2 times pH
g(H2O2) 845times10-1
ndash 151times10-3
times t ndash 17times10-2
times pH
g(H2) 388times10-1
+ 829times10-4
times t + 599times10-4
times pH
g(˙OH) 243 + 111times10-2
times t ndash 12times10-3
times pH
g(H˙) 444times10-1
+ 367times10-3
times t ndash 24times10-4
times pH
Table 10 Multiple regression polynomials used to estimate the combined effect of
temperature and pH on the primary yields of water radiolysis
0
05
1
15
2
25
3
35
0 1 2 3 4 5 6 7 8 9 10 11 12 13 14
Pri
ma
ry Y
ield
(M
ole
cule
s 1
00
eV
-1)
pH
g(OH)
g(e-)
g(H2O2)
g(H2)
Chapter 3 Computational Methodology
83
Linear Energy Transfer (LET)
Linear energy transfer is a way of expressing the rate at which an ionising particle loses
energy through a medium Sometimes referred to as ldquostopping powerrdquo linear energy
transfer is quoted as the average energy loss divided by a fixed path length usually micro
meters or nano meters (keV μm-1
or eV nm-1
) This parameter is frequently expressed as an
average rate of energy loss across the entire particlersquos track this is because the energy loss
rate of an ionising particle is not uniform As a high energy ionising particle begins its
journey through a material energy loss events are sparse and only small quantities of
energy are transferred so the particle continues largely un-deflected As this energy lost to
these small transfers accumulates and the energy of the charged particle decreases the
cross section of interactions increases This means that there are more energy loss events
for a given linear distance as the particles path becomes less linear A true linear energy
transfer profile of a particle would take the form of a Bragg curve such as the example
shown below
Figure 27 An example of a Bragg peak Energy loss of alphas of 549 MeV in Air
Image released to public domain
Chapter 3 Computational Methodology
84
For ease of comparison this profile is usually averaged to give a single LET parameter
Ionising particles of higher mass andor lower energy have higher LET values The
implications of linear energy transfer are manifested in the radiation track structure
Increasing LET values have the effect of increasing the spur distribution density as
illustrated in the diagram below
Figure 28 A schematic representation of how linear energy transfer (LET) alters the
distribution of spurs along a radiation track Image was recreated from Allen AO4
The distribution of spurs along a track has an effect on the diffusion of primary radiolysis
species and ultimately alters the primary yields Experiments carried out using 210
Po to
irradiate solutions of iron sulphate through various thicknesses of mica have shown the
effects of changing LET on the yield of oxidation of Fe2+
76
From this subsequent studies
using cyclotron accelerated protons have measured the effects of LET on the primary yields
of water radiolysis77
Compiling the data from these studies gives a general picture of the
effects of LET on water radiolysis primary yields which is shown below
Chapter 3 Computational Methodology
85
Figure 29 Simulation data showing the effects of increasing linear energy transfer on the
primary yields of water radiolysis Image was recreated from Allen AO4
The general trend shows an increase in the formation of molecular products at higher LET
at the expense of radical species (with the exception of hydroperoxyl radical (˙HO2)) at very
high LET values whilst lower LET values favour the radical species Currently there is no
clear agreed explanation as to how the hydroperoxyl radical is formed at high LET Gamma
rays from cobalt-60 fall in the low LET range and have an average value of
023 keV μm-1
78
As the experiments conducted throughout this project used only cobalt-60 as a source of
radiation it was not necessary to incorporate the effects of linear energy transfer into this
radiolysis model nor was it necessary to include the primary yield of hydroperoxyl radicals
into this model as the yield is negligible at the LET value of cobalt-60 Future iterations of
this model would need to include the effects of linear energy transfer as well as better
methods for coping with the effects of temperature and pH this is discussed in more detail
in Chapter 8
Chapter 3 Computational Methodology
86
Mass Transfer of Volatile Species
The transfer of volatile species is not something that affects radiolysis primary yields but it
is important to include as the aqueous reactions of volatile species namely molecular
hydrogen and oxygen will partition into the gas phase This mass transfer is described
within the model as two equations
1198672(119886119902) 1198672(119892)
1198742(119886119902) 1198742(119892)
These equations take the form of first order rate equations with the rate constant substituted
for a time dependant net mass transfer coefficient (kapp) which includes an interfacial mass
transfer coefficient (νint) and the Henryrsquos equilibrium partition coefficient (Kp)27
119889119862(119886119902)119894
119889119905= minus119896119886119901119901
119894 (119905) times 119862(119886119902)119894 (119905)
119896119886119901119901119894 = 120592119894119899119905
119894 times119860119894119899119905119881119886119902
(1 minus 119870119901119894119862119892119894(119905)
119862119886119902119894 (119905)
)
Ci refers to the concentration of species i in either the gas phase or the aqueous phase Aint
and Vaq are used to describe some of the geometry of the radiolysis vessels used in
experiments Aint is the interfacial surface area between the two phases while V is the
volume of the aqueous or gas phase denoted by its subscript As experiments were
conducted in different sized vials depending on the analysis technique used different values
of Aint and V were used when comparing model predictions to experimental data
Chapter 3 Computational Methodology
87
This method assumes that the volume of liquid and covering gas is the same which was
true for all the experiments conducted during this work If the liquid to gas volume ratio
was anything other than 1 then the above differential should be adjusted to account for this
ratio by the following modification
minus119881119897119881119892times119889119862(119886119902)
119894
119889119905= 119896119886119901119901
119894 (119905) times 119862(119886119902)119894 (119905)
The interfacial mass transfer coefficient (νint) incorporates the use of the stagnant two-film
model which provides a description of resistance to diffusion through un-mixed boundary
layers (see Figure 3079
)
Figure 30 A representation of the stagnant two-film model used to calculate the
partitioning of volatile species79
The stagnant two-film model is incorporated into the mass transfer coefficient by relating
the species diffusivity coefficients (D) the boundary thickness (δ) and the Henryrsquos
equilibrium partition coefficient (Kp)
Chapter 3 Computational Methodology
88
1
120592119894119899119905119894=
1
(119863119886119902119894
120575119886119902)
+119870119901119894
(119863119892119894
120575119892)
119870119901119894 =
119862119886119902119894 (119890119902)
119862119892119894(119890119902)
The diffusivity of volatile species is a temperature dependant coefficient which is included
in the model through the use of polynomial fits to data obtained from literature and is
shown in figure 3180-83
Henryrsquos coefficients were taken from literature which included
equations for describing the temperature dependence so a polynomial fit was not
necessary84
The Henryrsquos equilibrium partition coefficient is a dimensionless ratio between
the aqueous and gas phase concentrations of a volatile species at equilibrium This value is
related to the Henryrsquos law constant (kH) by the following relationship
119879 times 119896119867119894 = 122 times 119870119901
119894
The value 122 is used to convert between the Henryrsquos law coefficient in mol maq-3
Pa-1
and
the dimensionless Henryrsquos law coefficient While T represents the temperature in Kelvin
the Henryrsquos law constant also has its own temperature dependency built in this is described
by the following relationship
119896119867 = 119896119867120579 times 119864119883119875 (
∆119867119904119900119897119899119877
(1
119879minus1
119879120579))
Chapter 3 Computational Methodology
89
The Henryrsquos constant at standard temperature (29815 K) (kHθ) is quoted in the literature as
being 13times10-3
mol dm-3
atm-1
for oxygen and 78times10-4
mol dm-3
atm-1
for hydrogen ΔHsoln
is the enthalpy of solution and R is the gas constant the average ratios are quoted in the
literature as 1650 for oxygen and 543 for hydrogen84
This gives values for the Henryrsquos equilibrium partition coefficient (Kpi) of 0019 and 0031
for hydrogen and oxygen respectively at 25degC and smaller values at higher temperatures
Figure 31 The diffusivity of O2 and H2 in both water and air as a function of temperature
000
050
100
150
200
250
300
350
000E+00
100E-05
200E-05
300E-05
400E-05
500E-05
600E-05
700E-05
800E-05
900E-05
0 100 200 300 400
Dif
fusi
vit
y i
n A
ir (
cm2 s
-1)
Dif
fusi
vit
y i
n H
2O
(cm
2 s
-1)
Temperature (degC)
O2aq
H2aq
H2g
O2g
Chapter 3 Computational Methodology
90
Diffusivity
Polynomial
O2(aq) 20times10-9
times t2
+ 40times10-7
times t + 10times10-5
O2(g) 10times10-6
times t2
+ 12times10-3
times t + 02073
H2(aq) 10times10-8
times t2 + 40times10
-7 times t + 30times10
-5
H2(g) 50times10-6
times t2 + 47times10
-3 times t + 07719
Table 11 Polynomial equations used to estimate the temperature effects on the diffusivity
of O2 and H2 in both gas and aqueous phases where t = temperature (Cdeg)
Water Radiolysis Reaction Set
The radiolysis model simulates the chemical kinetics of homogeneous radiolysis through
the use of simultaneous differential equations that represent the independent chemical
reactions taking place The model therefore includes a set of reactions accompanied by
reaction rate constants Tables 12 - 14 gives a summary of the reaction set used with a full
description of the reaction set including the associated temperature dependences is given in
appendix A The reaction rate coefficients are taken from multiple sources with the
majority from the compilation of A J Elliot and D M Bartels45
Chapter 3 Computational Methodology
91
Reaction Number Primary Species
Production
G-value
(Molecules100eV) Ref
G0 H2O 119890(119886119902)minus 271 45
G1 H2O Hbull 054 45
G2 H2O H2 041 45
G3 H2O bullOH 270 45
G4 H2O H2O2 068 45
G5 H2O H(aq)+ 271 45
Table 12 A list of Primary Species used to model water radiolysis
Reaction
Number
Chemical Reactions Rate Constant k
(M-1
s-1
25degC)
Ref
R0 emacraq + emacraq rarr H2 + 2OHmacr 726 times109
45
R1 emacraq + Hbull rarr H2 + OHmacr 276 times10
10
45
R2 emacraq + bullOH rarr OHmacr 355 times10
10
45
R3 emacraq + bullOmacr rarr 2OHmacr 231 times10
10
49
R4 emacraq + H2O2 rarr OHmacr + bullOH 136 times10
10
45
R5 emacraq + HO2bull rarr HO2macr 130 times10
10
45
R6 emacraq + HO2macr rarr Obullmacr + OHmacr 351 times10
9
49
R7 emacraq + O2 rarr O2bullmacr 225 times10
10
45
R8 emacraq + O2bullmacr rarr O2
2macr + H2O 130times10
10
4349
R9 Hbull + H
bull rarr H2 514 times10
9
45
R10 Hbull +
bullOH rarr H2O 109 times10
10
45
R11 Hbull + H2O2 rarr
bullOH + H2O 365 times10
7
45
R12 Hbull + O2 rarr HO2
bull 130 times10
10
45
R13 Hbull + O2
bullmacr rarr HO2macr 114 times10
10
45
R14 Hbull + HO2
bull rarr 2
bullOH 114 times10
10
45
R15 Hbull + HO2macr rarr
bullOH + OHmacr 137times10
9
85
Chapter 3 Computational Methodology
92
R16 Hbull + O3 rarr
bullOH + O2 220 times10
10
43
R17 bullOH +
bullOH rarr H2O2 481 times10
9
45
R18 bullOH + H2O2 rarr H2O + HO2
bull 292 times10
7
45
R19 bullOH + HO2macr rarr OHmacr + HO2
bull 813 times10
9
45
R20 bullOH + HO2
bull rarr H2O + O2 884 times10
9
45
R21 bullOH + O2
bullmacr rarr OHmacr + O2 110 times10
10
45
R22 bullOH + O3 rarr HO2
bull + O2 110 times10
8
43
R23 bullO3macr + H2O2 rarr O2
bullmacr + O2 + H2O 159 times10
6
43
R24 bullO3macr + HO2macr rarr O2
bullmacr + O2 + OHmacr 887 times10
5
43
R25 bullO3macr + H2 rarr O2 + H
bull + OHmacr 249times10
5
46
R26 bullO3macr +
bullOH rarr HO2
bull + O2
bullmacr 6000 times10
9
43
R27 bullO3macr +
bullOH rarr HOmacr + O3 250 times10
9
43
R28 bullO3macr + H
+(aq) rarr O2 +
bullOH 900 times10
10
43
R29 O2bullmacr + O2
bullmacr +1198672119874rarr
O2 + O22macr 299times10
-1
43
R30 O2bullmacr + HO2macr rarr
O2 + bullOmacr + OHmacr 823 times10
-2
43
R31 O2bullmacr + H2O2 rarr
O2 +
bullOH + OHmacr 130 times10
-1
43
R32 O2bullmacr + HO2
bull rarr O2 + HO2macr 760times10
7
43
R33 O2bullmacr +
bullO3macr rarr
O2macr+ 2O2 100 times10
4
43
R34 O2bullmacr + O3 rarr
bullO3macr + O2 150 times10
9
43
R35 HO2bull + HO2
bull rarr H2O2 + O2 840 times10
5
45
R36 HO2bull + H2O2 rarr O2 + H2O +
bullOH 500 times10
-1
49
R37 HO2bull + O3 rarr
bullOH + 2O2 500 times10
8
43
R38 H2O2 + HO2macr rarr O2 + H2O + OHmacr 450times10-4
43
R39 O3 + OHmacr rarr HO2macr + O2 480 times101
43
R40 O3 + HO2macr rarr bullOH + O2 + O2
bullmacr 550 times10
6
43
R41 O3 + H2O2 rarr bullOH + O2 + HO2
bull 371 times10
-2
43
R42 Hbull +
bullOmacr rarr OHmacr 200times10
10
43
Chapter 3 Computational Methodology
93
R43 bullO3macr + emacraq rarr 2OHmacr
+
O2 160times10
10
43
R44 O3 + emacraq rarr bullO3macr 360 times10
10
43
R45 H2O2 rarr 2bullOH 230 times10
-7
86
R46 O2macr + H2O rarr 2OHmacr
100 times10
10
43
R47 bullOmacr + H2 rarr
bullH + OHmacr 128 times10
8
45
R48 bullOmacr + H2O2 rarr O2
bullmacr + H2O 555 times10
8
49
R49 bullOmacr + HO2macr rarr O2
bullmacr + OHmacr 786 times10
8
45
R50 bullOmacr + O2
bullmacr rarr O
2macr + O2 600 times10
8
43
R51 bullOmacr +
bullOmacr rarr O2
2macr 100times10
8
43
R52 bullOmacr +
bullOH rarr HO2macr 761 times10
9
49
R53 bullOmacr + O3macr rarr 2O2
bullmacr 700times10
8
43
R54 bullOmacr + O3 rarr O2
bullmacr + O2 100 times10
9
43
Table 13 A list of reactions used to model water radiolysis
Chapter 3 Computational Methodology
94
Equilibria kf
(M-1
s-1
25degC)
kb
(M-1
s-1
25degC) Ref
R5556 H2O H+
(aq) + OHmacr 117 times10-3
118times1011
45
R5758 H2O2 H+
(aq) + HO2macr 890 times10-2
478times1010
45
R5960 H2O2 + OHmacr HO2macr + H2O 127 times1010
140 times106
45
R6162 HO2macr + OHmacr
O22macr + H2O 351 times10
5 110 times10
6
43
R6364 bullOH H
+(aq) +
bullOmacr 890 times10
-2 478times10
10
45
R6566 bullOH + OHmacr
bullOmacr + H2O 127 times10
10 140 times10
6
45
R6768 bullOmacr + O2
bullO3macr 375 times10
9 262 times10
3
45
R6970 HO2bull H
+(aq) + O2
bullmacr 478 times10
10 735 times10
5
45
R7172 HO2bull + OHmacr O2
bullmacr+ H2O 127 times10
10 163 times10
-1
45
R7374 Hbull emacraq + H
+(aq) 583 210times10
10
45
R7576 Hbull + OHmacr emacraq + H2O 244 times10
7 174 times10
1
45
R7778 Hbull + H2O H2 +
bullOH 458 times10
-5 395 times10
7
45
R79 H2(aq) H2(g) 269times10-3
R80 O2(aq) O2(g) 103times10-4
Table 14 A list of equilibria used to model the radiolysis of water
Chapter 3 Computational Methodology
95
Computational Assumptions and Error
The first assumption this model makes is that radiolysis does not occur in the gas phase In
reality this is not the case however the density of the gas phase is so small compared to that
of the aqueous phase that any contribution from gas phase radiolysis will be negligible
There are several reactions that do not include any kind of temperature dependence for their
associated rate constants This is due to a lack of information available in the literature
many of the species involved in these reactions are notoriously difficult to measure reaction
rate constants for thus these reactions have a fixed rate constant across all temperatures
The method for estimating the primary yields to account for both temperature and pH
effects is not an ideal method Multiple linear regression analysis is often used to
empirically predict the value of a single dependant variable based on the contributions of
multiple independent variables In the case of this model the independent variables are
temperature and pH a full model would also include LET as a third independent variable
The number of observations considered for the regression analysis is less than ideal due to
the scarcity of available data coupled with the difficulty of relating non-linear variables
means that predictions of primary yields are loose estimates at best The coefficient of
determination (R2) gives information about how well the multiple regressions fit the data
and is shown in Table 15 where μ denotes the estimated standard deviation of the error
Primary Yield
R2 μ
g(eaq-) 0612 0249
g(H2O2) 0934 0045
g(H2) 0907 0032
g(bullOH) 0950 0265
g(Hbull) 0925 0108
Table 15 Statistical information concerning the estimation of primary yields used to model
the radiolysis of water
Chapter 3 Computational Methodology
96
The partition of volatile species depends on a number of parameters some of which are
dependent on geometry Although H2O2 is not a volatile species its concentration is
strongly affected by the concentration of aqueous O2 it is therefore necessary to include gas
partitioning methods in both H2 and H2O2 model calculations The interfacial surface area
(Aint) is one such parameter although this can be roughly determined by measuring the
geometry of the vials being used Other parameters such as the boundary thicknesses (δ) are
not so easily measured and are parameter fitted This is done using the parameter fitting
functionality built into FACSIMILE Experimental data is supplied to FACSIMILE and the
desired parameters to fit are declared the calculation is then performed a number of times
slightly varying the declared parameters each time until the predicted values better match
the provided experimental data For this work the data provided to FACSIMILE was the
concentration of H2 and H2O2 in aerated water as a function of dose (Figures 32-33) Vials
of different geometry have different boundary thicknesses the values used throughout this
work are shown in Table 16
Parameter
Vial Used for H2 Analysis Vial Used for H2O2 Analysis
Aint (m2) 502 times10
-5 284 times10
-4
δaq (m) 580 times10-4
510 times10-4
δg (m) 260 times10-2
260 times10-2
Table 16 Parameters used to describe interfacial surface area (Aint) and boundary
thicknesses (δ) for sample vials of different geometry
Chapter 4 The Radiolysis of Aqueous Solutions at High pH
97
Chapter 4 The Radiolysis of Aqueous Solutions at High pH
Preliminary Radiolysis Studies of Pure Water
Preliminary experiments to measure hydrogen peroxide and hydrogen gas concentrations
from the radiolysis of aerated and deaerated water at neutral pH were carried out as a
control to which other measurements may be compared Computational modelling of these
pure water systems were performed with the radiolysis model described in Chapter 3 to
validate the models performance
Measurements of hydrogen peroxide were made using the Ghormley Tri-iodide method
described in Chapter 2 The pH of the stock was measured using a Mettler Toledo
SevenMultitrade pH meter equipped with a probe capable of measuring pH in the range 0-14
and was found to be 699 Aliquots of 10 mL from the pure water stock were sealed in
20 mL headspace vials so that the liquid to headspace ratio was 11 and were irradiated in
row 1 of the 4x8 sample rack the average dose rate was 2839 Gy min-1
The experiment
was run twice prior to irradiation samples used in the first run were sealed but left aerated
while samples used in the second run were sealed in gas tight vials equipped with rubber
septa and were sparged for 20 minutes with zero grade argon gas to remove all dissolved
oxygen The results of the two experimental runs are shown in Figure 32
Preliminary measurements of hydrogen gas production were also carried out using pure
water 2 mL aliquots of pure water stock were flame sealed in 4 mL glass vials which were
then secured in the inverter rig and irradiated for various periods of time the average dose
rate was 2851 Gy min-1
Post irradiation analysis was carried out by the previously
described crush tube method of gas chromatography
Chapter 4 The Radiolysis of Aqueous Solutions at High pH
98
As flame sealing introduces slight irregularity in the volume of headspace an assumption
was made that the headspace of the sealed vial was 2 mL
This allows the conversion of measured quantities (microL) of hydrogen to a concentration
(mol dm-3
) Once again the experiment was run twice with the second experimental run
using samples that have been deaerated with argon and the results are shown in Figure 33
Figure 32 Measurements of H2O2 concentration as a function of dose for aerated water
(diams) and deaerated water (diams) Vertical error bars show the standard deviation between
replicates while horizontal error bars show the dose range for replicates
000E+00
100E-06
200E-06
300E-06
400E-06
500E-06
600E-06
700E-06
800E-06
000E+00
200E-05
400E-05
600E-05
800E-05
100E-04
120E-04
140E-04
0 10 20 30 40
[H2O
2]
(mo
l d
m-3
) D
eaer
ated
[H2O
2]
(mo
l d
m-3
) A
erat
ed
Dose (kGy)
Aerated Water
Deaerated Water
Chapter 4 The Radiolysis of Aqueous Solutions at High pH
99
Figure 33 Measurements of H2 as a function of dose in aerated (diams) and deaerated (diams)
samples Vertical error bars show the standard deviation of replicates while horizontal
error bars show the dose range for replicates
Discussion
Aerated samples resulted in a steady-state concentration of hydrogen peroxide at
approximately 11 times10-4
mol dm-3
while molecular hydrogen continues to form with
absorbed dose over the range considered In order to satisfy the mass balance requirements
some other species must be formed after the achievement of the peroxide steady-state that
is also proportional to hydrogen formation The most likely candidate for this is molecular
oxygen which would have to be formed at half the rate of hydrogen
Samples that did not contain any dissolved oxygen failed to produce significant quantities
of hydrogen peroxide or hydrogen gas with a very low steady state eventually achieved at
approximately 40 times10-6
mol dm-3
This may be attributed to the radiolytic production of
oxygen required to satisfy mass balance Using the radiolysis model a predicted chemical
yield can be obtained after the establishment of the hydrogen peroxide steady state to show
that mass balance is satisfied by oxygen production The predicted chemical yields were
calculated between doses of 15 kGy to 30 kGy
000E+00
100E-04
200E-04
300E-04
400E-04
500E-04
600E-04
700E-04
800E-04
0 10 20 30 40 50 60
[H2]
(mo
l d
m-3
)
Dose (kGy)
Aerated Water
Deaerated Water
Chapter 4 The Radiolysis of Aqueous Solutions at High pH
100
For oxygen gas the predicted chemical yield was G(O2) = 0011 while the predicted yield
of hydrogen gas formation in deaerated water was G(H2) = 0022 In both cases samples
that were aerated produced much larger quantities of hydrogen and hydrogen peroxide than
their deaerated equivalents This was somewhat expected as it has long been considered
that dissolved oxygen is reduced and the reduction products are able to react with hydroxyl
radicals preventing them from removing hydrogen peroxide and hydrogen87
The general
scheme first proposed in 1954 for this protection mechanism is initiated by the reaction of
hydrogen atoms with oxygen to produce hydroperoxyl radicals these then react with
hydroxyl radicals to reform water and oxygen or with itself to form hydrogen peroxide and
oxygen4
119867bull + 1198742 rarr 1198671198742bull
(R12)
bull119874119867 + 11986721198742 rarr 1198672119874 + 1198671198742bull
(R18)
1198671198742bull + 1198671198742
bull rarr 11986721198742 + 1198742 (R35)
bull119874119867 + 1198671198742bull rarr 1198672119874 + 1198742 (R20)
More recent studies by the research group led by Clara Wren have deployed computational
methods to investigate further the effects of dissolved oxygen on the steady-state
concentration of both hydrogen peroxide and molecular hydrogen86
The calculations
performed in this study also supported the idea that dissolved oxygen is reduced and it is
the reduction products that scavenge hydroxyl radicals resulting in the protection of
hydrogen peroxide and molecular hydrogen The calculations revealed that oxygen is
mainly reduced by the hydrated electron and that the superoxide formed is responsible for
the scavenging of hydroxyl radicals This process serves as a catalytic mechanism for the
overall reaction between the solvated electron and hydroxyl radicals
Chapter 4 The Radiolysis of Aqueous Solutions at High pH
101
119890119886119902minus + 1198742 rarr 1198742
minus (R7)
1198742minus + bull119874119867 rarr 119874119867minus + 1198742 (R21)
Overall Reaction 119890119886119902minus + bull119874119867 rarr 119874119867minus (R2)
This scavenging of hydroxyl radicals has a larger impact on protecting hydrogen as the
reaction between hydrogen and the hydroxyl radical is the only significant removal path of
hydrogen in neutral conditions
Wren proposes that high concentrations of hydrogen peroxide seen in aerated solutions can
be attributed to a change in the production pathway for hydrogen peroxide in the presence
of oxygen The reaction between both the reduction products of oxygen becomes the
dominant production pathway for hydrogen peroxide
1198671198742bull + 1198742
minus rarr 1198671198742minus + 1198742 (R32)
119867(119886119902)+ + 1198742
minus 1198671198742bull (R6970)
119867(119886119902)+ + 1198671198742
minus 11986721198742 (R5758)
Similar calculations were performed in this work using the computational method described
in Chapter 3 The computational predictions shown in figures 34 and 35 serve as a baseline
to demonstrate that the computational model performs well at least at a fundamental level
before building up to more complex systems
Chapter 4 The Radiolysis of Aqueous Solutions at High pH
102
Figure 34 Predicted concentrations of H2O2 as calculated by the radiolysis model for both
aerated () and deaerated () conditions
Figure 35 Predicted concentrations of H2 gas as calculated by the radiolysis model for
both aerated () and deaerated () conditions
000E+00
100E-06
200E-06
300E-06
400E-06
500E-06
600E-06
700E-06
800E-06
000E+00
200E-05
400E-05
600E-05
800E-05
100E-04
120E-04
140E-04
0 10 20 30 40
[H2O
2]
(mo
l d
m-3
) D
eaer
ated
[H2O
2]
(mo
l d
m-3
) A
erat
ed
Dose (kGy)
Aerated Water
FACSIMILE Aerated
Deaerated Water
FACSIMILE Deaerated
000E+00
100E-04
200E-04
300E-04
400E-04
500E-04
600E-04
700E-04
800E-04
0 10 20 30 40 50 60
H2 (
mo
l d
m-3
)
Dose (kGy)
Aerated Water
Deaerated Water
FACSIMILE Aerated
FACSIMILE Deaerated
Chapter 4 The Radiolysis of Aqueous Solutions at High pH
103
The predictions made for the concentrations of hydrogen peroxide and hydrogen gas in pure
water match well with the observed measurements especially for the concentration of
hydrogen peroxide produced in aerated water The most obvious discrepancy is the
disparity between the early predictions of hydrogen peroxide concentration and the
measured concentration for deaerated samples which is most likely due to imperfect
oxygen removal from the samples As the predictions are in generally good agreement with
the experimental measurements it is not unreasonable to assume that steady state
concentrations of other species which cannot or were not determined experimentally
during this work can be estimated by the model
Figure 36 Calculated concentrations of the major oxidising and reducing water radiolysis
species as a function of dose Solid lines represent aerated conditions while broken lines
represent deaerated conditions
Figure 36 shows the predicted concentrations of various radical species in both aerated and
deaerated water The calculated concentrations agree with previously published calculations
by Wren and co-workers86
100E-14
100E-12
100E-10
100E-08
100E-06
0 10 20 30 40 50
Co
nce
ntr
atio
n (
mo
l d
m-3
)
Dose (kGy)
˙OH
O2˙-
H˙
eaq-
HO2˙
Chapter 4 The Radiolysis of Aqueous Solutions at High pH
104
Under aerated conditions reducing species H˙ and eaq- have significantly lower
concentrations than in deaerated conditions due to scavenging by oxygen The resulting
reduction products of oxygen are superoxide and hydroperoxyl radicals and both show an
increased concentration in aerated conditions
The experiments in the following sections concerning the measurement of hydrogen
peroxide were all performed in aerated conditions to resemble the conditions at the
Sellafield site Measurements of hydrogen were for the most part carried out under
deaerated conditions
Chapter 4 The Radiolysis of Aqueous Solutions at High pH
105
Measurements of H2O2 in the Radiolysis of High pH Solutions
Stock solutions of various pH were prepared using NaOH dissolved in ultra-pure water
From each stock sample sets were prepared from 10 mL aliquots of stock solution and
sealed in 20 mL glass vials with aluminium crimp caps The pH of the remaining sample
stocks were measured and recorded Irradiation dose rates were calculated from original
measurements using the Fricke dosimetry method described previously Sample sets were
loaded into row 1 of the 4x8 irradiation rack and irradiated using the Model-812 cobalt-60
irradiator until they reached the desired dose Table 17 summarises the dose rates and pH of
the sample batches examined
Sample Batch ID Average Dose Rate for Row 1 (Gy min-1
) Measured pH
H2O2-PH00 28512 699
H2O2-PH01 27497 1041
H2O2-PH02 27407 1108
H2O2-PH03 28364 1230
H2O2-PH04 27467 1274
Table 17 Conditions of samples used to investigate hydrogen peroxide in high pH
radiolysis
Results
Post irradiation analysis for H2O2 was carried out immediately after irradiation using the
previously described tri-iodide method Analysis of high pH samples required additional
acid to lower the pH to the conditions required by the analytical method the quantities of
acid used were recorded and the dilution effects have been accounted for The results of this
study are shown in Figure 37
Chapter 4 The Radiolysis of Aqueous Solutions at High pH
106
Figure 37 Measurements of H2O2 concentrations as a function of dose for samples
initially at pH 7 (diams) pH 104 (diams) pH 11 (diams) pH 123 (diams) and pH 127 (diams)
All samples were aerated Vertical error bars are the standard deviation between
replicates while horizontal error bars show the dose range for replicates
The steady state concentration of hydrogen peroxide is fairly consistent at about
115 x10-4
mol dm-3
within the pH range 7-11 each attaining steady state after roughly
5 kGy At higher pH values both the steady state concentration and the dose at which
steady state is achieved increase
Samples at pH 123 required roughly 10 kGy to obtain a peak steady-state concentration of
195 x10-4
mol dm-3
of hydrogen peroxide while samples at pH 127 required even higher
doses almost 20 kGy to reach a steady concentration of 238 x10-4
mol dm-3
The data set
from samples at pH 123 shows an apparent decrease in hydrogen peroxide concentration of
~18 at 35 kGy A similar decrease in hydrogen peroxide concentration is also observed in
samples of pH 11
000E+00
500E-05
100E-04
150E-04
200E-04
250E-04
300E-04
0 10 20 30 40
[H2O
2]
(mo
l d
m-3
)
Dose (kGy)
pH 127
pH 123
pH 11
pH 104
pH 7
Chapter 4 The Radiolysis of Aqueous Solutions at High pH
107
Measurements of H2 in the Radiolysis of High pH Solutions
Stock solutions of various pH were prepared using NaOH to match the pH range used in
the measurement of hydrogen peroxide Many of the acid-base equilibria used in the
description of water radiolysis have pKa values in the pH range investigated by this study
The behaviour of H2 production observed at high pH may be influenced by a change in
chemistry brought about by a shift in one or more of the acid-base equilibria Table 18
shows the equilibria of interest and their associated pKa value while Table 19 includes the
measured pH of the stock solutions
Equilibrium pKa
bull119926119919 119919(119938119954)+ + bull119926minus 1184
119919120784119926120784 119919(119938119954)+ +119919119926120784
minus 1168
119919bull 119919(119938119954)+ + 119942119938119954
minus 974
119919119926120784bull 119919(119938119954)
+ + 119926120784minus 483
Table 18 A list of important equilibria and their associated pKa values
For the measurement of hydrogen sample sets were prepared from 2 mL aliquots of stock
solution which were transferred to glass ldquocrush tuberdquo vials described in chapter two The
vials were connected to a glass manifold via stainless steel needles and sparged with zero
grade argon for 20 minutes to remove any dissolved oxygen before samples were flame
sealed under argon
Irradiation dose rates were calculated from original Fricke dosimetry study described
previously Samples were loaded into the four positions available in the inverter rig and
irradiated until they reached the desired dose
Chapter 4 The Radiolysis of Aqueous Solutions at High pH
108
Results
After irradiation samples were analysed for hydrogen gas by gas chromatography using the
ldquocrush tuberdquo technique described in Chapter 2 Figure 38 shows the amounts of H2
produced as a function of radiation dose As production rates of hydrogen gas are linear as a
function of absorbed dose chemical yields can be identified as the gradient expressed in
terms of molecules per 100 eV of absorbed energy These results are summarised in Table
19 while the data is shown in Figure 38
Table 19 Conditions of samples used to investigate hydrogen gas in high pH radiolysis
Figure 38 Measurements of H2 gas as a function of dose at pH 7 (diams) pH 106 (diams) pH 123
(diams) and pH 13 (diams) Dashed lines are provided to clarify the data trends all samples were
deaerated Vertical error bars show the standard deviation between replicates while
horizontal error bars show the dose range for replicates
000E+00
500E-04
100E-03
150E-03
200E-03
250E-03
0 20 40 60 80
H2 (
mo
l d
m-3
)
Dose (kGy)
pH 13
pH 123
pH 106
pH 7
Sample
Batch ID
Average Dose Rate for
Inverter Rig (Gy min-1
) Measured pH G(H2) Error plusmn
H2-PH00 28385 699 0021 0002
H2-PH01 28408 1063 0071 0018
H2-PH02 29039 1232 0352 0005
H2-PH03 28634 1307 0176 0010
Chapter 4 The Radiolysis of Aqueous Solutions at High pH
109
Increasing the pH has the effect of increasing the chemical yield for hydrogen over the pH
range 7 to 123 however the data set for pH 13 shows that the chemical yield for hydrogen
is less than samples at pH 123 The results of the calculations using the reaction scheme
given in Tables 12 - 14 for both hydrogen peroxide and hydrogen gas production are
shown in Figures 39 and 40 respectively
Figure 39 Model calculations to show the predicted concentrations of H2O2 as a function
of dose at various pH
000E+00
500E-05
100E-04
150E-04
200E-04
250E-04
300E-04
350E-04
0 10 20 30 40 50
[H2O
2]
(mo
l d
m-3
)
Dose (kGy)
pH 127
pH 123
pH 11
pH 104
pH 7
Chapter 4 The Radiolysis of Aqueous Solutions at High pH
110
Figure 40 Model calculations to show the predicted concentrations of H2 gas as a function
of dose at various pH
Calculated concentrations of hydrogen peroxide show the same trends as the data The
predictions at pH 104 and 11 take slightly longer to reach steady state than what the
experimental data shows Higher pH calculations follow the same trend as the experimental
data but overestimate the steady state concentrations of hydrogen peroxide especially in the
calculations at pH 127
Calculated concentrations of molecular hydrogen follow a slightly more unexpected trend
Predictions made for pH 106 massively overestimate hydrogen production rates this is
symptomatic of a misunderstanding of the mechanistic chemistry A similar error has also
been noted by Wren when performing calculations at this pH a suggested fix was to
increase the reaction rate between ozinide and molecular hydrogen by a factor of 886
000E+00
500E-04
100E-03
150E-03
200E-03
250E-03
300E-03
0 20 40 60 80
[H2]
(mo
l d
m-3
)
Dose (kGy)
pH 13
pH 123
pH 106
pH 7
Chapter 4 The Radiolysis of Aqueous Solutions at High pH
111
Even with this higher rate the over prediction of hydrogen is still large at pH 106 while
predictions for pH 123 agree reasonably well with experimental data This information at
least helps to narrow the pH range at which this misunderstanding manifests The pH range
afflicted by over prediction of hydrogen falls close to the pKa of the dissociation of the
hydrogen atom at 974
119867bull 119867(119886119902)+ + 119890(119886119902)
minus pKa = 974
The reverse reaction rate for the above equilibrium has been measured with good agreement
over a number of laboratories however the forward reaction rate is calculated based on the
relationship between the reverse reaction rate and the equilibrium constant45
This
equilibrium constant is derived from the Gibbs free energy of formation of Hbull in the gas
phase combined with an estimated value for the free energy of solvation of Hbull This
estimation is a value between those for the free energy of solvation of He atoms and H2
molecules888
Both computational and experimental data show the same trend at pH 13 in that the
production rate of hydrogen is less than that observed at lower pH however the
calculations once again overestimate the rate shown by the experimental data Some more
features of this discrepancy are discussed further in the following section
Chapter 4 The Radiolysis of Aqueous Solutions at High pH
112
Discussion
The radiolytic removal of hydrogen from solution by the hydroxyl radical has long been
referred to as the Allen chain25
In this mechanism the hydroxyl radical reacts with
molecular hydrogen to reform water and a hydrogen atom the chain is then extended by the
reaction of the hydrogen atom with hydrogen peroxide to reform the hydroxyl radical with
the net effect being the removal of H2 and H2O2
Propagation Steps
bull119874119867 + 1198672 rarr 119867bull + 1198672119874 k78 = 40 times10
7 M
-1 s
-1
119867bull + 11986721198742 rarr bull119874119867 + 1198672119874 k11 = 365times107 M
-1 s
-1
Termination 119867bull + bull119874119867 rarr 1198672119874 k10 = 109times1010
M-1
s-1
Aside from transference into the gas phase this chain is the only removal path for hydrogen
under neutral pH conditions At higher pH radical species are converted into their base
forms and a new chain is established43
119867bull + 119874119867minus 119890119886119902minus + 1198672119874 (R7576)
bull119874119867 + 119874119867minus 119874bullminus + 1198672119874 (R6566)
Propagation Steps
119874bullminus + 1198672 rarr 119890119886119902minus + 1198672119874 k47 = 128 times10
8 M
-1 s
-1
119890119886119902minus + 1198671198742
minus rarr 119874bullminus + 119874119867minus k49 = 786times108 M
-1 s
-1
Termination 119890119886119902minus + 119874bullminus rarr 2119874119867minus k3 = 231times10
10 M
-1 s
-1
Chapter 4 The Radiolysis of Aqueous Solutions at High pH
113
Given the higher rate constants involved in the alkali chain it would seem that the chain
reaction established in the basic form has a higher efficiency than its neutral equivalent yet
observations show a higher chemical yield of hydrogen at high pH and would suggest
otherwise This can largely be resolved by considering the effects of oxygen on these chain
reactions Oxygen acts as a poison to both the chain reactions removing hydrogen causing
an increase in hydrogen yield The mechanism by which oxygen disrupts the chain is
through reactions with solvated electrons to produce superoxide which in turn reacts with
OH radicals or in the case of alkali solutions bullOˉ preventing them from reacting with
hydrogen as well as reforming oxygen
119890119886119902minus + 1198742 rarr 1198742
bullminus (R7)
bull119874119867 + 1198742bullminus rarr 119874119867minus + 1198742 (R21)
bull119874minus + 1198742bullminus + 1198672119874 rarr 2119874119867
minus + 1198742 (R50)
In alkali solution bullOˉ is also susceptible to a direct reaction with oxygen to form ozonide
ions while a neutral equivalent reaction between hydroxyl radicals and oxygen does not
exist As the experimental measurements of hydrogen gas from solutions of sodium
hydroxide were carried out in deaerated conditions there should be no initial dissolved
oxygen and any oxygen present would have been radiolytically formed Figure 41 shows
the calculated steady state concentration of aqueous oxygen compared to hydrogen gas
formation as a function of pH from this it is clear that an increase in pH leads to a rise in
radiolytically produced oxygen which is proportional to the amount of hydrogen generated
Chapter 4 The Radiolysis of Aqueous Solutions at High pH
114
Figure 41 Model calculations showing the concentrations of aqueous oxygen and
hydrogen gas from deaerated water after 80 kGy at 280 Gy min-1
to show the related
behaviour between the two
Analysis of the calculated reaction rates gives an insight to why the concentration of
radiolytic oxygen first rises with pH and then falls after pH 12 and may help to reveal the
source of the over-prediction at pH 106 All the following reaction rates are taken from the
end of the experimental range ie 80 kGy with a dose rate of 280 Gy min-1
At neutral pH
it is the reaction between the superoxide ion and the hydroxyl radical (R21) that is the main
source of radiolytic oxygen but as the pH rises beyond pH 10 the rate of this reaction
begins to fall from ~140 times10-6
mol dm-3
s-1
to 886 times10-8
mol dm-3
s-1
at pH 14 This drop
is mainly due to the equilibrium between the hydroxyl radical and its basic form bullOˉ which
has a pKa of 119 As one would expect the reaction rate of the equivalent base reaction
(R50) rises as the pH increases although this increase does not fully compensate for the
decrease in rate of R21
100E-06
100E-05
100E-04
100E-03
100E-02
7 8 9 10 11 12 13 14
Lo
g C
on
cen
trat
ion (
mo
l d
m-3
)
pH
[H2] g
[O2] aq
Chapter 4 The Radiolysis of Aqueous Solutions at High pH
115
This is because the reaction between the solvated electron and superoxide (R8) has a larger
rate constant than R50 and with the conversion of hydrogen atoms to solvated electrons at
high pH R8 out competes R50
In principal many other reactions produce oxygen but the rates of these reactions are often
negligible Only the rate of oxygen production through the reaction of superoxide and
hydroperoxyl (R32) sees an increase over the pH range 10-12 which may be significant to
radiolytic oxygen production Figure 42 shows the rates of the three main molecular oxygen
producing reactions (R21 R50 and R32) as well as the reaction rate for R8 and the
combined reaction rates for R8 and R50 as a function of pH When the combined reaction
rates of R8 and R50 are compared with the reaction rate of R21 it becomes obvious that
there is a transition from the removal of super oxide by R21 to removal by both R8 and
R50 this is the main cause of a decrease in oxygen concentration after pH 12 Figure 43
shows the sum of reaction rates that lead to oxygen formation and removal as a function of
pH
Figure 42 Model predictions of the steady-state reaction rates of R21 R50 and R32 at
various pH for γ radiolysis of deaerated water at a dose rate of 280 Gy min-1
000E+00
200E-07
400E-07
600E-07
800E-07
100E-06
120E-06
140E-06
160E-06
7 8 9 10 11 12 13 14
Rea
ctio
n R
ate
at S
tead
y S
tate
(mo
l d
m-3
s-1
)
pH
Chapter 4 The Radiolysis of Aqueous Solutions at High pH
116
Figure 43 The sum of the steady state rates of all reactions that produce O2 () compared
with the sum of the steady state rates of all reactions that remove O2 () These totals do
not include rates of production or removal from mass transfer reactions This calculation is
for the γ radiolysis of deaerated water to a dose of 80 kGy at a rate of 280 Gy min-1
At pH 7 the rate of oxygen production matches the rate at which it is removed and a low
steady state concentration of aqueous oxygen is achieved before the end of the 80 kGy
calculation range At higher pH the rate of oxygen removal diverges and so oxygen can
accumulate to a higher concentration over a longer period of time longer than that of the
80 kGy range used Excluding transfer into the gas phase there are only three reactions that
effectively remove oxygen so it was worth investigating how the rates of these reactions
changed with pH Figure 44 shows the rates of reactions R6 R7 R8 R12 and R67 as a
function of pH
000E+00
200E-07
400E-07
600E-07
800E-07
100E-06
120E-06
140E-06
160E-06
7 8 9 10 11 12 13 14
Rat
e at
Ste
ady S
tate
(mo
l d
m-3
s-1
)
pH
Chapter 4 The Radiolysis of Aqueous Solutions at High pH
117
Figure 44 Model predictions of the steady-state reaction rates of R7 R12 and R67 at
various pH This calculation is for the γ radiolysis of deaerated water to a dose of 80 kGy
at a rate of 280 Gy min-1
The first removal path of oxygen is the reaction between the solvated electron and oxygen
to produce superoxide (R7) this reaction does not see a significant change in rate below
pH 11 after which the rate begins to fall The second reaction is the reduction of oxygen by
the hydrogen atom (R12) the rate of this reaction falls steadily as pH increases this is due
to the conversion of hydrogen atoms to solvated electrons by hydroxide which has a pKa of
96 The decline in rate of this reaction accompanied by no significant increase in the rate
of oxygen removal by solvated electrons may be the main contribution to the increased
concentrations of oxygen at pH gt 9 It was thought that this might also be the cause of the
over prediction but any attempt to increase this rate constant is largely negated by an
accompanying increase in the rate of reaction R32 The final removal path of oxygen is the
reaction with O˙- to form ozonide (R67)
000E+00
200E-07
400E-07
600E-07
800E-07
100E-06
120E-06
7 8 9 10 11 12 13 14
Rea
ctio
n R
ate
at S
tead
y S
tate
(mo
l d
m-3
s-1
)
pH
Chapter 4 The Radiolysis of Aqueous Solutions at High pH
118
The rate of this reaction increases rapidly with pH from 194 times10-8
mol dm-3
s-1
at pH 9
to 146 times10-6
mol dm-3
s-1
at pH 14 however ozonide is unstable and decomposes to reform
oxygen at a rate not much lower than its formation
Subtracting the rate of oxygen reformation from the decomposition of ozonide gives the
actual rate of oxygen removal by bullOˉ of 110 times10
-9 mol dm
-3 s
-1 at pH 9 and
600 times10-8
mol dm-3
s-1
at pH 14 It should be noted that the decomposition rate of ozonide
was excluded from the total rate of oxygen formation in figure 44 while the rate of oxygen
removal by ozonide formation was the subtracted values quoted above
The main removal mechanism of hydrogen peroxide is by reaction with solvated electrons
In the presence of oxygen the removal of hydrogen peroxide by solvated electrons is
largely out competed by reactions between the solvated electrons and oxygen or
superoxide The rate constant for the reaction between oxygen and the solvated electron
(R7) is 225 times1010
dm3 mol
-1 s
-1 while for the reaction of hydrogen peroxide and the
solvated electron (R4) is only 136 times1010
dm3 mol
-1 s
-1 and so hydrogen peroxide is initially
protected from reactions with the solvated electron as long as oxygen or superoxide is
available In alkali conditions where the pH is larger than 116 the conjugate base of
hydrogen peroxide HO2- becomes the dominant peroxide species This reacts even slower
with the solvated electron with a rate constant of 365 times109
dm3 mol
-1 s
-1 so the protection
effect is even stronger It was mentioned earlier that beyond pH 11 the rate of reaction R21
falls significantly as bullOH is converted to its basic form and the equivalent base reaction
(R50) does not see a sufficient equivalent increase in rate The reason given was that R50
was out competed by the reaction between superoxide and the solvated electron (R8)
Chapter 4 The Radiolysis of Aqueous Solutions at High pH
119
This not only serves to protect hydrogen peroxide by competing with solvated electrons but
also contributes to the increased concentration of hydrogen peroxide as the product of R8 is
in fact hydrogen peroxide
119890119886119902minus + 1198742
bullminus rarr 11987422minus (R8)
11987422minus + 1198672119874 1198671198742
minus + 119874119867minus (R6162)
Although this may account for the increased steady state of hydrogen peroxide at high pH
Figure 39 still shows a slight over prediction for calculations made at pH 123 and 127 As
the equilibrium between the hydroxyl radical and the oxygen anion has a pKa of 1184 it
was thought that the over prediction could be a result of the estimations used for the rate
constants of the reactions involving the oxide radical anion There is little data available for
the rate constants of reactions involving bullOˉ As reaction R51 and R52 both lead to the
formation of peroxide it initially was thought that these reactions may have rate constants
that are too high however removing these reactions from the model made no significant
difference to the predicted production of H2O2
119874bullminus + 119874bullminus rarr 11987422minus
1198672119874rarr 1198671198742
minus + 119874119867minus (R51)
119874bullminus + bull119874119867 rarr 1198671198742minus (R52)
It was instead found that other oxide radical anion reactions had an effect on the predicted
value for H2O2 A total of four oxide radical anion reactions influence the predicted values
with two of them making a significant difference Reducing the rate constant for the
reactions R47 and R48 made a slight improvement to the prediction of H2O2 a more
significant effect can be seen by altering the rate constants for R49 and R50
Chapter 4 The Radiolysis of Aqueous Solutions at High pH
120
119874bullminus + 1198671198742minus rarr 1198742
minus + 119874119867minus (R49)
119874bullminus + 1198742minus rarr 1198742minus
1198672119874rarr 2119874119867minus + 1198742 (R50)
Originally the rate constant for R49 was an estimation reported by Buxton et al in 19889
with a value of 40 times108 M
-1 s
-1 Since then this rate constant has been measured by
C R Stuart and D C Ouellette and is reported as being 786 times108
M-1
s-1
at 25degC45
The
value for the rate constant for R50 was originally estimated by Sehested et al in 198289
to
be 60 times108 M
-1 s
-1 This estimation was made by adjusting the rate constant for R50 and
R53 in a kinetic model to produce a prediction that agreed with the decay of ozonide
measured experimentally by pulse radiolysis By increasing the rate constant for R50 from
60 times108 M
-1 s
-1 to 48 times10
9 M
-1 s
-1 an improved agreement to the predicted steady state
concentration of H2O2 is found This is shown in Figure 45
Figure 45 Dashed lines show the original prediction where k50 = 60 times108 M
-1 s
-1 while
solid lines show the predictions with the increased k50 = 48 times109 M
-1 s
-1
000E+00
500E-05
100E-04
150E-04
200E-04
250E-04
300E-04
350E-04
0 10 20 30 40 50
[H2O
2]
(mo
l d
m-3
)
Dose (kGy)
Chapter 4 The Radiolysis of Aqueous Solutions at High pH
121
With the modified reaction rate constant for R50 the predictions for the steady state
concentrations of H2O2 are closer to the experimental values at high pH
Although this calculation improves the prediction for the steady state concentration it also
appears to increase the rate at which the steady state is achieved moving the prediction
away from the experimental data The cause of this discrepancy may have something to do
with the way in which some of the equilibria have been implemented in the model and
should be investigated in the future This modification also has little effect on the over
prediction of hydrogen gas at pH 104
Chapter 5 Radiolysis of Magnesium Hydroxide
122
Chapter 5 Radiolysis of Magnesium Hydroxide
Context
The Magnox Swarf Storage Silo contains 22 silos used to store magnesium alloy cladding
that has been removed from spent Magnox fuel elements The magnesium fuel cladding is
stored underwater where it readily corrodes to form magnesium hydroxide and hydrogen
gas by the following reaction90
119872119892 + 21198672119874 rarr 119872119892(119874119867)2 +1198672
Hydrogen gas poses an obvious hazard and is closely monitored however production rates
are not predictable Much of the magnox fuel cladding is contaminated with uranium and
other fission products contributing an additional supply of hydrogen through water
radiolysis Dose rates are often further increased as some of the silos were used to dispose
of other beta and gamma emitting waste The presence of the magnesium hydroxide
complicates the radiolysis processes as (a low) solubility in water drives up the pH while
undissolved magnesium hydroxide provides additional surfaces where radiolysis processes
are poorly understood
Experiments were conducted to investigate the effects of magnesium hydroxide on the
radiolytic production yields of hydrogen gas and hydrogen peroxide The investigation
began by measuring hydrogen yields in solutions of magnesium hydroxide and comparing
hydrogen yields to solutions containing sodium hydroxide solution with the same pH Pure
water is also included as a control and the magnesium hydroxide samples included both
homogeneous saturated solutions of aqueous magnesium hydroxide and heterogeneous
slurries containing undissolved magnesium hydroxide
Chapter 5 Radiolysis of Magnesium Hydroxide
123
Method
The saturated solution was prepared in bulk using magnesium hydroxide (Sigma Aldrich
BioUltra ge 990) and ultra-pure water solids were separated by centrifuge as filters may
introduce organic contamination 2 mL aliquots of saturated magnesium hydroxide solution
were transferred to sample tubes and flame sealed under air The pH of the remainder of the
saturated solution was measured to be 106 Slurry samples were prepared by weighing
01 g of magnesium hydroxide into a glass vial before adding 2 mL of ultra-pure water
Samples were also flame sealed under air before being mechanically mixed by agitation
Samples were irradiated using the inverter rig however the samples were left stationary and
were not inverted during irradiation Samples were irradiated at an average dose rate
of 281 Gy min-1
until the desired dose was reached samples were then analysed for
hydrogen by the ldquocrush tuberdquo gas chromatography method previously described Figure 46
shows the production of hydrogen as a function of dose for both saturated solutions and
solid containing slurries of magnesium hydroxide This is compared with measurements
obtained from pure water and an aqueous solution of sodium hydroxide with a similar pH
to that of the magnesium hydroxide samples
Chapter 5 Radiolysis of Magnesium Hydroxide
124
Results
Figure 46 Measurements of H2 gas as a function of dose All samples here are aerated
with vertical error bars showing the standard deviation between replicates
It should be noted that all the samples used to produce figure 46 are aerated The chemical
yield of hydrogen for each sample set is given in Table 20
Table 20 Obtained results from the measurements of H2 gas
000E+00
200E-04
400E-04
600E-04
800E-04
100E-03
120E-03
140E-03
160E-03
180E-03
200E-03
0 10 20 30 40 50 60
[H2]
(mo
l d
m-3
)
Dose (kGy)
Sample ID Average Dose Rate for
Inverter Rig (Gy min-1
)
Measured
pH G(H2)
(Molecules 100 eV-1
) Error
plusmn
Mg(OH)2(s) 2814 1062 052 003
Mg(OH)2(aq) 2814 1057 047 002
NaOH 2845 1063 027 002
H2O 1732 699 016 001
Chapter 5 Radiolysis of Magnesium Hydroxide
125
The dose rate for the pure water samples is much lower than the other dose rates quoted as
this measurement was performed before the construction of the inverter rig and so the
samples were held further away from the source during irradiation
This data shows that the presence of magnesium hydroxide appears to increase the
hydrogen yield beyond what one would expect if the yield was controlled by pH alone
There is very little difference in hydrogen yield between samples that contain solid
magnesium hydroxide and samples that contain only dissolved magnesium hydroxide This
suggests that surface effects contribute to the hydrogen yield only a very small amount or
not at all This data is discussed further in the following section
A second set of experiments was conducted to measure the concentration of hydrogen
peroxide in irradiated saturated solutions of magnesium hydroxide 10 mL aliquots of
aerated saturated solution were transferred in to 20 mL glass headspace vials the vials were
sealed with an aluminium crimp cap and irradiated in the front row of the 4 x 8 rack the
average dose rate was 2831 Gy min-1
After irradiation the samples were analysed for
hydrogen peroxide by the Ghormley tri-iodide method described in Chapter 2 Figure 47
compares the obtained data from this experiment with data obtained from measurements
made in pure water
Chapter 5 Radiolysis of Magnesium Hydroxide
126
Figure 47 Measurements of H2O2 concentrations in aerated samples of saturated
magnesium hydroxide solution as a function of dose
The steady state concentration of hydrogen peroxide in a saturated solution of magnesium
hydroxide is almost the same as in a neutral sample of pure water as is expected given the
pH of the saturated solution was measured to be 106 which is below the 118 threshold
that is associated with an increased steady state of hydrogen peroxide observed in the
previous chapter
A further experiment was conducted to investigate the effects of the solid magnesium
hydroxide surface on the production of hydrogen Batches of samples were prepared with
various ratios of magnesium hydroxide to water each sample had a total mass of
approximately 2 g Table 21 summarises the sample ratios used Samples were irradiated
using the inverter rig which was left stationary throughout the irradiation the average dose
rate was 3042 Gy min-1
All samples were irradiated to approximately 525 kGy so that any
difference in the amount of hydrogen produced is independent of absorbed dose
000E+00
200E-05
400E-05
600E-05
800E-05
100E-04
120E-04
140E-04
0 5 10 15 20 25 30 35 40
[H2O
2]
mo
l d
m-3
Dose kGy
Aerated Water
Mg(OH)2 Saturated SolutionMg(OH)2 Aerated Saturated Solution
Chapter 5 Radiolysis of Magnesium Hydroxide
127
As the dose rate was determined by Fricke dosimetry which is a liquid phase dosimeter
with a density close to that of water the quoted dose of 525 kGy is what was received by
the aqueous phase The solid phase magnesium hydroxide has a slightly higher density and
will have received a slightly higher dose Figure 48 shows the chemical yields of hydrogen
as a function of water content percentage The results have been normalised to reflect the
amount of hydrogen produced per gram of water and the yields were calculated based on
the radiation dose absorbed by the whole system this makes the data from samples that
contain large quantities of water comparable to those with lower water content
Table 21 Conditions of samples containing Mg(OH)2 for measurements of H2
a ndash Powder sample with no added water estimated adsorbed water content is based on
data from Nelson et al91
b ndash Sample is a saturated solution of Mg(OH)2 ie contains no solid
H2O Average Mg(OH)2
Mass (g)
Average H2O
Mass (g)
Average
Dose (kGy)
4a 5303 plusmn 111
20 161 plusmn 002 040 plusmn 001 5245 plusmn 146
40 122 plusmn 002 082 plusmn 001 5255 plusmn 146
60 081 plusmn 001 122 plusmn 001 5255 plusmn 145
80 040 plusmn 001 162 plusmn 002 5245 plusmn 145
100b 5239 plusmn 145
Chapter 5 Radiolysis of Magnesium Hydroxide
128
Figure 48 Measurements of hydrogen yields from magnesium hydroxide samples with
various solid ndash aqueous ratios All samples were irradiated to a total dose of ~52 kGy to
the aqueous phase at a dose rate of 3041 Gy min-1
Discussion
The data shown in Figure 46 suggests that the presence of dissolved magnesium hydroxide
increases the chemical yield of hydrogen significantly more than if pH was the only
controlling factor Data shown in Figure 48 suggests that the presence of the solid surface
increases the hydrogen yield slightly above that for saturated solutions but it would seem
that the main contribution to the increased H2 yields in magnesium hydroxide samples
when compared to a solution of NaOH of equivalent pH is a factor present in both slurries
and saturated solutions of magnesium hydroxide The yield of H2 between 20 and 80
percent water content is not affected by changing the solid solution ratio suggesting that
there is little interaction between the solid magnesium hydroxide and the bulk water
00
02
04
06
08
10
12
14
16
0 20 40 60 80 100
G(H
2)
(Mo
lecu
les
10
0 e
V-1
)
H2O
Chapter 5 Radiolysis of Magnesium Hydroxide
129
The yield is significantly higher for samples with 4 water content (adsorbed water)
suggesting that any additional hydrogen is produced only in a few water layers away from
the solid surface as has been postulated for oxide surfaces
Petrik et al showed that oxide water systems consisting of multiple phases such as the
slurry samples measured here have different hydrogen yields depending on the oxide18
They grouped materials into three categories based on the effects they have on measured
hydrogen yields hydrogen enhancing hydrogen diminishing and hydrogen neutral
Though said study did not include magnesium hydroxide it does categorise magnesium
oxide as a material that does not significantly change the yield of hydrogen
The mechanism by which a solid surface increases the hydrogen yield is largely accredited
to an energy transfer process As solid particles in a sample absorbs energy a process of
energy migration from the bulk of the material to the interface takes place Energy can then
be transferred from the solid phase to the surrounding liquid The exact mechanism of the
energy transfer process is not well understood but the overall effect is higher dose rates in
localised areas of surrounding water
As the value of 4 water content is an estimation based on data extrapolation published by
Nelson et al in a study of water adsorption on magnesium hydroxide91
and may not be
entirely accurate This uncertainty could have a significant effect on the calculated chemical
yield if the estimation was even slightly incorrect for example an estimated water content
of just 9 has the effect of lowering the yield to the same value observed in samples
contain 20 water content This would be contradictory to an energy transfer process as
described previously
Chapter 5 Radiolysis of Magnesium Hydroxide
130
A study by Jay La Verne et al published measurements of hydrogen yields from the
gamma radiolysis of magnesium hydroxide to be 005119
This measurement was made
using magnesium hydroxide that had been dried to remove all excess water while
remaining hydroxylated The difference between the measured yields of saturated
magnesium hydroxide solution (G(H2) = 047) and a slurry sample (G(H2) = 052) given in
Table 20 is 005
This value is very close to the quoted value from dry magnesium hydroxide although it is
an average value and errors can be high with small differences between large numbers such
as this Little information is given to explain the mechanism contributing to this yield of
hydrogen from dry magnesium hydroxide other that the radiation induced conversion of
magnesium hydroxide to magnesium oxide92
A comparison was made to yields obtained
from calcium hydroxide and found that the yield of hydrogen was four times higher from
calcium hydroxide than from magnesium hydroxide This was explained in terms of the
tendency to form water during radiolysis being greater in magnesium hydroxide than in
calcium hydroxide meaning that a smaller portion of the hydroxide generates hydrogen
directly If the yield measured from the dry powder (0051) by La Verne et al is the result
of direct hydrogen production from magnesium hydroxide converting to the oxide then it
would make sense that the difference in yield between samples containing solid magnesium
hydroxide and only aqueous magnesium hydroxide would be close to this value
This does not explain why the yields of both samples are far higher than samples of sodium
hydroxide at the same pH as the magnesium hydroxide samples The chemical yield of
hydrogen from samples of sodium hydroxide with a pH of 1063 was 027 while yields
from both magnesium hydroxide systems were a little less than double this value
Chapter 5 Radiolysis of Magnesium Hydroxide
131
As this can be seen in both aqueous only samples and those containing solid magnesium
hydroxide the cause of this increased yield must be attributed to a factor present in both
aqueous only samples and samples containing solid magnesium hydroxide Magnesium
hydroxide is often discussed in literature concerning environmental science for its
properties and reactivity towards carbon dioxide9394
As the samples used in these experiments did not undergo any purification processes prior
to use they were most likely subject to carbonation reactions with atmospheric carbon
dioxide and water Magnesium hydroxide can be carbonated on exposed surfaces although
slow at standard room conditions it can be increased in the presence of water95
119872119892(119874119867)2(119904) + 1198621198742(119892) rarr 1198721198921198621198743(119904) + 1198672119874(119892)
Magnesium hydroxide can also take on intercalated carbon dioxide which can be converted
to carbonate either by reaction with water or if released into solution with hydroxide to
form bicarbonate9697
1198621198742(119860119894119903) 1198621198742(119894119899119905119890119903119897119886119910119890119903)
1198621198742(119894119899119905119890119903119897119886119910119890119903) + 1198672119874(119894119899119905119890119903119897119886119910119890119903) 2119867(119894119899119905119890119903119897119886119910119890119903)+ + 1198621198743(119894119899119905119890119903119897119886119910119890119903)
2minus
1198621198742(119886119902) + 119874119867(119886119902)minus 1198671198621198743(119886119902)
minus
Both carbonate and bicarbonate are known to be hydroxyl radical scavengers in the
radiolysis of aqueous solutions998
Using the Facsimile model described in Chapter 3 it
was possible to insert a set of reactions concerning carbonate radiolysis to estimate the
effects that small quantities of carbonate might have on hydrogen yields
Chapter 5 Radiolysis of Magnesium Hydroxide
132
The reaction set used is described in Table 22 and represents a simplified reaction scheme
of carbonate in aqueous radiolysis Initial concentrations of carbonate were set ranging
from 10 μM to 10 mM a yield of hydrogen was calculated for each initial concentration
these calculations have been graphed in Figure 49
In each case the calculated production of hydrogen was linear over the dose range used
which would be a necessary feature if carbonate is to be a valid explanation for the
increased yields observed in magnesium hydroxide experiments The calculated yield of
hydrogen increases rapidly with only small quantities of initial carbonate before reaching a
plateau at about G(H2) = 03 with an initial carbonate concentration of 50 μM The
hydrogen yield did not change much more than this increasing to just G(H2) = 036 with an
initial carbonate concentration of 10 mM The effect is almost the same in calculations for
both aerated and deaerated solutions It should be noted that these calculations were done at
pH 7 due to the systematic error of over prediction when the pH is close to 10 it would be
unadvisable to trust such calculations without first solving the error (see previous chapter)
Table 22 A reaction scheme to estimate the effect of carbonate in water radiolysis
Reaction Rate Constant Reference
CO32macr +
bullOH rarr CO3macr + OHmacr 39 times10
8
9
CO32macr + emacraq rarr products 39 times10
5
99
CO3bullmacr +
bullOH rarr products 30 times10
9
100
CO3bullmacr + H2O2 rarr HCO3macr + HO2
bull 43 times10
5
101
CO3bullmacr + HO2macr rarr HCO3macr + O2
bullmacr 30 times10
7
101
CO3bullmacr + O2
bullmacr rarr O2 + CO3
2macr 65 times10
8
102
HCO3macr + emacraq rarr products 10 times106
103
HCO3macr + bullOH rarr H2O + CO3
bullmacr 85 times10
6
9
HCO3macr + Hbull rarr products 44 times10
4
104
Chapter 5 Radiolysis of Magnesium Hydroxide
133
Figure 49 Model predictions for the yield of H2 from a solution containing various
concentrations of carbonate anions
Reaction rate analysis of the calculations reveals that the main mechanism for hydrogen
protection is through a cooperative effect of scavenging of the hydroxyl radical to form a
carbonate radical The majority of carbonate radicals are converted back to carbonate by
reaction with superoxide A secondary process of carbonate radical reactions with hydrogen
peroxide contributes slightly to regeneration of superoxide as well as forming bicarbonate
which itself contributes to hydrogen protection by scavenging hydroxyl radicals once again
forming a carbonate radical As these calculations were performed at pH 7 it is uncertain
what effect an elevated pH would have on the predicted hydrogen yield It should also be
remembered that many of the rate constants used are estimations and the reaction set is a
simplification and is not a comprehensive description
0
005
01
015
02
025
03
035
04
0 1 2 3 4 5 6 7 8 9 10 11
G(H
2)
[CO32-] mM
Aerated
Deaerated
134
With these factors in mind the predicted behaviour of hydrogen production is a reasonable
representation of the behaviour observed in experiments This could easily be investigated
further by experiments in a number of ways
Attempts could be made to measure carbonate directly from the magnesium hydroxide
used either by thermogravimetric analysis (TGA) or by total organic carbon analysis
(TOC) Radiolysis experiments of other carbonates could also be carried out to further
investigate the effect of carbonate
Chapter 6 Radiolysis of Methanol Solutions
135
Chapter 6 Radiolysis of Methanol Solutions
Context
Many of the waste storage ponds at Sellafield Ltd are open to the air and are subject to
organic matter falling in and decomposing to a range of organic products One particular
group of compounds known as humic acids and how they might affect radiolysis processes
in the ponds are of particular interest Humic acids are ill-defined but complex organic
acids with several different functional groups which will have many effects on radiolysis
The best approach to investigating this chemistry is to understand the effects of each
functional group independently before building up to a full humic acid analogue This study
takes the first steps towards this investigation through experimentation on aqueous
solutions of methanol
Experimental Method
A stock aqueous solution of 1 mM methanol was made and was used to prepare aerated
samples of 10 mL sealed by crimp cap in 20 mL headspace vials so that the liquid to
headspace ratio was 11 Samples were irradiated in row 2 of the 4x8 irradiation rack for
various periods of time The average dose rate was 1638 Gy min-1
The samples were
analysed for hydrogen peroxide immediately after irradiation using the Ghormley tri-iodide
method described in Chapter 2 A separate batch of aerated samples was prepared from the
1 mM methanol stock solution for analysis of hydrogen generation These were samples of
2 mL of 1 mM methanol and were deaerated using zero grade argon gas before being sealed
in glass tubes designed for use by the crush tube analysis method described in Chapter 2
Again the samples had a liquid to headspace ratio of 11
Chapter 6 Radiolysis of Methanol Solutions
136
These samples were irradiated in the centre positions of row 2 in the 4x8 rack where the
average dose rate was 1755 Gy min-1
Results
Figure 50 Measurements of H2O2 concentrations as a function of dose in samples
containing 1 mM methanol (diams) and water as a control (diams) All samples were aerated and a
dashed line is included to highlight the data trend The dose rate was 1638 Gy min-1
for
methanol solutions and 2839 Gy min-1
for the aerated water
000E+00
500E-05
100E-04
150E-04
200E-04
250E-04
0 5 10 15 20 25
[H2O
2]
(mo
l d
m-3
)
Dose (kGy)
Aerated Water
Methanol 1 mM
Chapter 6 Radiolysis of Methanol Solutions
137
Figure 51 Measurements of H2 gas as a function of dose from deaerated samples
containing 1 mM methanol deaerated water is also shown as a control Dashed lines are
included to highlight the data trend The dose rate was 1755 Gy min-1
for the methanol
solutions and 2851 Gy min-1
for the deaerated water
Figure 50 shows the measured concentrations of hydrogen peroxide from the 1 mM
methanol solution compared with the measured concentrations from pure aerated water At
low doses the concentration of hydrogen peroxide increases rapidly to approximately
20 times10-4
mol dm-3
at approximately 1 kGy which is almost double the steady state
concentration observed in pure water As the dose increases further the concentration
begins to fall to a steady state value at approximately 33 times10-5
mol dm-3
Figure 51 shows the measured hydrogen concentrations from the 1 mM methanol solutions
compared with hydrogen measurements from aerated water
000E+00
500E-04
100E-03
150E-03
200E-03
250E-03
300E-03
0 5 10 15 20 25 30
H2 (
mo
l d
m-3
)
Dose (kGy)
Methanol Solution 1mM Deaerated
Dearated Water
Chapter 6 Radiolysis of Methanol Solutions
138
Hydrogen concentrations measured in a deaerated 1 mM methanol solution are significantly
higher than those measured in deaerated water the initial production rate is higher in the
methanol solution but production is not linear and the rate of hydrogen production with
dose soon falls The change in production rate of hydrogen and hydrogen peroxide with
dose can be shown by converting the experimental measurements to G-values and plotting
them as a function of dose Figures 52 and 53 show the chemical yields determined by
converting the gradients between 0 and each data point to units of molecules 100 eV-1
Figure 52 Chemical yields of hydrogen peroxide measured from an aerated solution of
1 mM methanol as a function of dose
00
05
10
15
20
25
30
35
40
0 5 10 15 20
G(H
2O
2)
(mo
lecu
les
10
0eV
-1)
Dose (kGy)
Chapter 6 Radiolysis of Methanol Solutions
139
Figure 53 Chemical yields of hydrogen gas measured from a deaerated solution of 1 mM
methanol as a function of dose
Discussion
Most alcohols are effective scavengers of hydroxyl radicals and hydrogen atoms The
reactions between methanol and hydroxyl radicals or hydrogen atoms result in hydrogen
abstraction from methanol to form water or molecular hydrogen respectively and in both
cases form the hydroxymethyl radical105106
bull119874119867 + 1198621198673119874119867 rarr 1198672119874 + bull1198621198672119874119867 119896 = 83 times 108 119872minus1119904minus1
119867bull + 1198621198673119874119867 rarr 1198672 + bull1198621198672119874119867 119896 = 28 times 106 119872minus1119904minus1
Although the second order rate constant for the reaction between methanol and the solvated
electron is faster than that for the solvated electron and water the reaction rate does not
compete with the rate of reaction between the solvated electron and water until the
concentration of methanol is greater than 10-2
M2107
00
02
04
06
08
10
12
14
16
18
0 5 10 15 20
G(H
2)
(mo
lecu
les
10
0eV
-1)
Dose (kGy)
Chapter 6 Radiolysis of Methanol Solutions
140
In deaerated water methanol radicals may dimerise to form ethylene glycol or
disproportionate to form formaldehyde and reform methanol108
They may also react with
hydrogen peroxide to form formaldehyde
2bull1198621198672119874119867 rarr (1198621198672119874119867)2
2bull1198621198672119874119867 rarr 1198621198673119874119867 + 119867119862119867119874
bull1198621198672119874119867 + 11986721198742 rarr 119867119862119867119874 + 1198672119874 + bull119874119867
In solutions that contain dissolved oxygen such as those used in the measurements of
hydrogen peroxide (Figure 50) methanol radicals rapidly react with oxygen to form an
organic peroxyl radical which reacts by second-order processes resulting in the formation
of formaldehyde hydrogen peroxide and oxygen109
bull1198621198672119874119867 + 1198742 rarr bull11987421198621198672119874119867
An additional set of reactions were included in the water radiolysis model described in
Chapter 3 in an attempt to model the radiolysis chemistry of an aqueous solution of 1 mM
methanol This reaction scheme is shown in Table 23
Chapter 6 Radiolysis of Methanol Solutions
141
Reaction
Number Reaction
Rate Constant at 25degC (M
-1 s
-1)
Ref
M1 CH3OH + bullOH rarr H2O +
bullCH2OH 83times10
8
110
M2 CH3OH + Hbull rarr H2 +
bullCH2OH 28times10
6
106
M3 bullCH2OH + O2 rarr
bullO2CH2OH 49times10
9
111
M4 bullCH2OH + H2O2 rarr H2O + H2CO +
bullOH 18times10
5
112
M5 bullCH2OH +
bullCH2OH rarr CH3OH + H2CO 12times10
9
2113
M6 bullCH2OH +
bullCH2OH rarr HOCH2CH2OH 12times10
9
2113
M7 bullCH2OH +
bullOH rarr H2CO + H2O
a24times10
10
114
M8 bullO2CH2OH +
bullO2CH2OH rarr 2H2CO + H2O2 + O2 74times10
8
115
M9 bullO2CH2OH +
bullHO2 rarr H2CO + H2O2 + O2
b50times10
8
2
M10 bullO2CH2OH + O2macr rarr H2CO + HO2macr + O2
b50times10
7
2
M11 HOCH2CH2OH + bullOH rarr
bullHOCHCH2OH + H2O 24times10
9
116
M12 HOCH2CH2OH + Hbull rarr
bullHOCHCH2OH + H2 14times10
7
9
M13 bullHOCHCH2OH + O2 rarr
bullO2HOCHCH2OH 32times10
9
111
M14 bullO2HOCHCH2OH rarr HOCH2CHO + H
+ + O2macr 19times10
2 s
-1
117
M15 bullHOCHCH2OH +
bullHOCHCH2OH rarr HOCH2CH2OH +
HOCH2CHO 96times10
8
118
M16 HOCH2CHO + bullOH rarr H2O +
bullHOCHCHO
c92times10
6
119
M17 bullHOCHCHO +
bullHOCHCHO rarr HOCH2CHO + OCHCHO
d50times10
4 -
M18 OCHCHO + bullOH rarr H2O +
bullOCCHO 14times10
6
120
M19 bullOCCHO rarr CO + HCO
bull
a35times10
7 s
-1
121
M20 H2CO + emacraq rarr bullCH2OH + OHmacr 10times10
6
2
M21 H2CO + Hbull rarr H2 + HCO
bull 50times10
6
2
M22 H2CO + bullOH rarr H2O + HCO
bull 20times10
9
2
M23 HCObull + H
bull rarr H2 + CO
a68times10
10
122
M24 HCObull +
bullOH rarr CO + H2O
a11times10
11
123
M25 HCObull + O2 rarr CO + HO2
bull
a31times10
9
124
M26 HCObull + HCO
bull rarr 2CO + H2
a22times10
10
125
Table 23 A reaction scheme to estimate the effect of methanol in water radiolysis
a ndash Rate constant for gas phase reaction
b ndash Estimated rate constant
c ndash Rate constant based on reaction of acetic acid and hydroxyl
d ndash Assumed reaction
Figure 54 shows the predicted hydrogen peroxide concentration with the above chemistry
included in the calculation and compares it with the experimental data In order to achieve
the agreement shown a modification to the mass transfer routine was required
Chapter 6 Radiolysis of Methanol Solutions
142
The current implementation of the mass transfer routine does not cope with a rapid
depletion of dissolved oxygen and responds by increasing the rate of oxygen transfer from
the gas phase to the aqueous phase to an unrealistic value A temporary fix can be made by
reducing the mass transfer rate of oxygen (for instance by a factor of 15) but a more
appropriate correction to the routine should be sought in future implementations Figure 55
shows the original calculation with the un-modified mass transfer routine compared with
the modified mass transfer routine
Figure 54 Model prediction of H2O2 concentrations as a function of dose in a solution of
1 mM methanol
000E+00
500E-05
100E-04
150E-04
200E-04
250E-04
0 5 10 15 20 25
[H2O
2]
mo
l d
m-3
Dose kGy
Methanol 1 mM
Model
Chapter 6 Radiolysis of Methanol Solutions
143
Figure 55 Calculations of hydrogen peroxide concentrations with and without
modification to the mass transfer routine
Analyses of the evolution of the calculated reaction rates reveal a possible explanation for
the behaviour of hydrogen peroxide in the presence of a low concentration of methanol
Initially the most important methanol reactions are the formation of the methanol radical
by scavenging hydroxyl radicals (M1) and the formation of an organic peroxide by the
reaction between the aforementioned methanol radical and oxygen (M3)
1198621198673119874119867 + bull119874119867 rarr bull1198621198672119874119867 + 1198672119874
bull1198621198672119874119867 + 1198742 rarr bull11987421198621198672119874119867
With the formation of the organic peroxide comes an increase in the rate of the formation of
formaldehyde mainly through self-reaction or to a lesser degree through reaction with
superoxide
000E+00
100E-04
200E-04
300E-04
400E-04
500E-04
600E-04
700E-04
0 5 10 15 20 25 30 35 40 45
[H2O
2]
(mo
l d
m-3
)
Dose (kGy)
Original Calculation
Modified Calculation
Chapter 6 Radiolysis of Methanol Solutions
144
2bull11987421198621198672119874119867 rarr 21198672119862119874 + 11986721198742 + 1198742
bull11987421198621198672119874119867 + 1198742bullminus rarr 1198672119862119874 + 1198671198742
minus + 1198742
These reactions not only contribute to the production of hydrogen peroxide but also return
oxygen to the system which can scavenge solvated electrons and protect hydrogen peroxide
from the rapid reaction between the solvated electron and hydrogen peroxide
(R4 k = 136times1010
M-1
s-1
) The total rate of oxygen consumption by methanol radicals and
solvated electrons is still greater than the rate of return from the reactions of the organic
peroxide After about 11 kGy oxygen concentrations are reduced to an insignificant value
As the concentration of oxygen falls the reaction rate between hydrogen peroxide and the
solvated electron increases As mentioned in Chapter 4 oxygen plays a vital role in the
formation and protection of hydrogen peroxide The model prediction shows the
concentration of hydrogen peroxide beginning to rise again after about 8 kGy this is due to
the mass transfer of oxygen gas into the aqueous phase slowly re-establishing equilibrium
and effectively allowing a build-up of hydrogen peroxide As mentioned earlier the mass
transfer routine has been modified for this calculation and is non-representative of the real
mass transfer flux nevertheless it is reasonable to assume that after the depletion of
dissolved oxygen and the methanol has been converted to glycol or formaldehyde
equilibrium of aqueous and gaseous oxygen would eventually be re-established This could
be supported by further analysis at higher doses which may show an increase in hydrogen
peroxide concentrations
Chapter 6 Radiolysis of Methanol Solutions
145
The formation of hydrogen gas is enhanced by the presence of methanol however
hydrogen gas production is not linear with dose Figure 56 shows the model predictions for
hydrogen gas production compared to the experimentally obtained data
The calculations show a higher production rate of hydrogen gas can be attributed to the
scavenging of hydroxyl radicals by methanol and a number of methanol radiolysis
products
Figure 56 Model prediction of H2 gas as a function of dose in a solution of 1 mM
methanol
Although the model prediction somewhat overestimates the quantity of hydrogen formed
the slope is close to what is observed experimentally Many of the rate constants used in the
reaction scheme could not be found in the literature and are therefore estimations The
reaction scheme used protects molecular hydrogen from reacting with the hydroxyl radical
in a number of reactions Throughout the radiolysis of methanol a number of intermediary
organic products are formed such as ethylene glycol and formaldehyde each of which is an
effective hydroxyl scavenger
000E+00
500E-04
100E-03
150E-03
200E-03
250E-03
300E-03
0 5 10 15 20 25 30
H2 (
mo
l d
m-3
)
Dose (kGy)
Methanol 1 mM Dearated
Model
Chapter 6 Radiolysis of Methanol Solutions
146
After reacting with the hydroxyl radical the newly formed organic radical will usually form
an organic peroxide however in the absence of oxygen the radicals will tend towards
disproportionation to reform the original organic product at well as a new stable organic
usually an aldehyde Eventually the only stable product is carbon monoxide which does not
have any further reactions within this scheme Figure 57 shows the calculated
concentrations of each of the stable organic products as a function of dose in an aerated
system
Figure 57 Model predictions of the concentrations of various stable organic products
formed as a result of using the proposed reaction scheme in Table 23
Kinetic models of aqueous methanol have previously been presented in literature one such
model by Sunaryo and Domae126
was developed for calculating the effects of aqueous
methanol in light water reactors
000E+00
200E-04
400E-04
600E-04
800E-04
100E-03
120E-03
0 10 20 30 40
Co
nce
ntr
ati
on
(m
ol
dm
-3)
Dose (kGy)
Methanol
Formaldehyde
Ethylene Glycol
Glycolaldehyde
Glyoxal
Carbon Monoxide
Chapter 6 Radiolysis of Methanol Solutions
147
The reaction scheme for methanol radiolysis used in that publication is not a complete
scheme in that ldquoimaginary productsrdquo are implemented to terminate certain reaction
pathways This is still a valid approach as their interest was focused on the initial reaction
paths when delivering a maximum dose of 500 Gy and not the long term radiolysis of
methanol over several kGy
It was noted that an understanding of the radiolysis of the transient organic products is
needed they concluded that methanol is converted into ethylene glycol which may have the
same effect as methanol itself The formation of ethylene glycol and formaldehyde from
methanol radiolysis is well known and has been measured in previous studies127
The
radiolysis of ethylene glycol has also been discussed in literature128
and it has been
described that under aerated conditions the main organic product of radiolysis is
glycolaldehyde129
The reaction scheme for methanol radiolysis in this work assumes the
formation of a radical species by the reaction between glycolaldehyde and the hydroxyl
radical however this is most likely not the major radiolysis path for glycolaldehyde In
aqueous solutions glycolaldehyde exists in a number of different forms with the aldehyde
form usually being the minor component130
The existence of multiple forms of
glycolaldehyde in solution and the large number of unknown rate constants makes creating
a complete reaction scheme for methanol radiolysis difficult Furthermore the publications
mentioned above also report the formation of small amounts of methane along with carbon
monoxide The radiolysis of ethylene glycol under deaerated conditions can also lead to the
production of ethyl aldehyde Both of these points highlight gaps in the reaction scheme
that should be included in a comprehensive description of methanol radiolysis Suggestions
for an improved radiolysis scheme are given in Chapter 8
Chapter 7 Radiolysis of Iron Oxide-Water Systems
148
Chapter 7 Radiolysis of Iron Oxide-Water Systems
Context
Large quantities of iron oxide have been reported to be present in the First Generation
Magnox Storage Pond where iron skips containing spent fuel have corroded to form a layer
of haematite (Fe2O3) and magnetite (Fe3O4) several meters below the water level
Documented investigations into the effects of iron oxide on water radiolysis are sparse the
most recent of which focusing on the formation of molecular hydrogen from the radiolysis
of water-iron oxide systems131
Preliminary experiments have been carried out to
investigate the effects iron oxide may have on radiolytic production of hydrogen peroxide
from water-oxide slurries
Method
Iron oxide powders were washed with ultra-pure water to remove any soluble
contamination Excess water was decanted before the powders were washed a further two
times After the third decanting the powders were dried in a vacuum oven at 40degC
overnight Haematite samples were prepared by weighing 05 g quantities of haematite into
20 mL headspace vials to which 10 mL of ultra-pure water was added before sealing with a
crimp cap Samples of magnetite were prepared in the same way Samples were agitated
and then left to settle before irradiation The irradiations of haematite samples were carried
out in row 1 of the 4x8 irradiation rack with an average dose rate of 30518 Gy min-1
while
irradiations of magnetite samples were carried out in row 2 of the 4x8 rack with an average
dose rate of 16252 Gy min-1
After irradiation aliquots of the water from the samples were
removed by syringe and pushed through a syringe filter to remove any solid particles
Chapter 7 Radiolysis of Iron Oxide-Water Systems
149
The filtered aliquot was then analysed for hydrogen peroxide using the Ghormley tri-iodide
method described in Chapter 2
Results
Figure 58 shows the obtained results for the haematite system compared to concentrations
of hydrogen peroxide measured in aerated water Figure 59 shows the obtained results from
magnetite samples again they are compared with measurements obtained from pure water
Figure 58 Measurements of H2O2 concentrations from heterogeneous samples of 05g
Fe2O3 and 10 mL aerated water The dose rate for the haematite samples was
3052 Gy min-1
and for the aerated water the dose rate was 2839 Gy min-1
000E+00
200E-05
400E-05
600E-05
800E-05
100E-04
120E-04
140E-04
0 2 4 6 8 10 12 14
[H2O
2]
(mo
l d
m-3
)
Dose (kGy)
Haematite
Pure Water
Chapter 7 Radiolysis of Iron Oxide-Water Systems
150
Figure 59 Measurements of H2O2 concentrations from heterogeneous samples of 05g
Fe3O4 and 10 mL aerated water The dose rate for the magnetite samples was
1625 Gy min-1
and for the aerated water the dose rate was 2839 Gy min-1
The steady state concentration of hydrogen peroxide achieved in the presence of haematite
is close to that of pure water however the initial production rate is slightly higher An
increased initial production rate is also observed in samples containing magnetite but after
approximately 500 Gy the concentration of hydrogen peroxide falls dramatically and
achieves a low steady state of approximately 15 times10-5
mol dm-3
000E+00
200E-05
400E-05
600E-05
800E-05
100E-04
120E-04
140E-04
0 2 4 6 8 10 12 14 16 18 20 22
[H2O
2]
(mo
l d
m-3
)
Dose (kGy)
Magnetite
Pure Water
Chapter 7 Radiolysis of Iron Oxide-Water Systems
151
Discussion
Hydrogen peroxide undergoes surface decomposition over both haematite and
magnetite28132
The estimated second-order rate constants for the surface decomposition of
hydrogen peroxide are quoted as 30 times10-9
M-1
s-1
for haematite132
and 45 times10-10
M-1
s-1
for
magnetite28
Calculations using the water radiolysis model including a hypothetical reaction
that removes hydrogen peroxide at these rates makes no significant difference to the
predicted concentrations of hydrogen peroxide in water over the time scale of the
experiment However as the aforementioned rate constants are second-order they not only
depend on the concentration of hydrogen peroxide but the surface area of the metal oxide as
well which is unknown for the metal oxides used in this study
Furthermore the experiments carried out in the aforementioned publications to determine
these rate constants were well mixed throughout the reaction time while in this work the
samples were static with the iron powder settled at the bottom of the reaction vessel This
means that the rate of surface decomposition is greatly hindered due to the need for
hydrogen peroxide to diffuse a large distance to the iron oxide surface nevertheless a
significant difference in hydrogen peroxide concentrations were observed in samples
containing magnetite The behaviour of hydrogen peroxide observed in samples containing
magnetite is most likely due to homogeneous chemistry initiated by dissolved iron ions
The chemistry initiated by dissolved iron could serve to remove hydrogen peroxide through
a Haber-Weiss mechanism133
1198651198903+ + 1198742bullminus rarr 1198651198902+ + 1198742 k = Unknown
1198651198902+ + 11986721198742 rarr 1198651198903+ + 119874119867minus + bull119874119867 k = 10 times10
7 M
-1 s
-1
1198651198902+ + bull119874119867 rarr 1198651198903+ + 119874119867minus k = 32 times108
M-1
s-1
1198651198902+ + 1198671198742bull rarr 1198651198903+ + 1198671198742
minus k = 12 times10
6 M
-1 s
-1
Chapter 7 Radiolysis of Iron Oxide-Water Systems
152
Experiments discussed in publications by Mats Jonsson28
focus largely on the reactivity of
hydrogen peroxide and various metal oxides including iron oxide It was found that many
metal oxide surfaces show reactivity towards hydrogen peroxide and that rate of removal of
hydrogen peroxide can be calculated in heterogeneous systems based on properties such as
particle size As mentioned previously the model suggests that the rate of this surface
reactivity does not seem to be able to compete with the rate of radiolytic hydrogen peroxide
production The studies by Jonsson concerning iron oxide were met with difficulty in
discriminating between surface reactions and aqueous chemistry initiated by dissolved iron
Through the use of ICP-AES it was shown that iron can be found in water with a
concentration of 23 times10-6
mol dm-3
after just 30 minutes of mixing magnetite with distilled
water28
Even with this measurement by Jonsson the quantity of dissolved iron is difficult to
estimate for samples used in this work as they were washed with water whereas the
literature measurements were made with unwashed or EDTA treated samples More
information about the dissolution of iron from magnetite could be used to attempt to model
this behaviour using the reaction scheme in table 24 In addition to this it would also be
useful to investigate the dissolution of iron as a function of radiation dose to see what
effect if any radiation has on dissolution rates Analysis techniques such as inductively
coupled plasma mass spectroscopy (ICP-MS) can be used to determine concentrations of
dissolved iron in very low concentrations however due to the nature of the plasma used it
can often be difficult to distinguish between Fe2+
and Fe3+
as further ionization may cause
interference It is possible to chemically separate the two oxidation states of iron by solvent
extraction with n-heptane containing 01 M Di-(2-ethylhexyl)phosphoric acid (HDEHP)
before performing an analysis for iron134
Chapter 7 Radiolysis of Iron Oxide-Water Systems
153
This reaction scheme would be initiated by a production of aqueous iron based on the
dissolution behaviour observed from future experiments As mentioned earlier the
experiments conducted in this work are only preliminary and there is much more work to
be done on the subject
If a computational model could be made to accurately simulate the aqueous iron chemistry
coupled with a more detailed understanding of radiation induced iron dissolution it may be
possible to determine the surface effects of iron oxide by comparison of experimental and
calculated data and effectively subtracting the difference
Reaction
Number
Reaction Rate Constant at
25degC (M-1
s-1
)
Ref
F1 Fe2+
+ H2O2 rarr Fe3+
+ OHmacr + bullOH 100 times10
7
135
F2 Fe2+
+ bullOH rarr Fe
3+ + OHmacr 32 times10
8
136
F3 Fe2+
+ bullHO2 rarr Fe
3+HO2macr 12 times10
6
133
F45 Fe3+
HO2macr + Fe2+ Fe
3+HO2macrFe
2+ K = 27 M
-1
133
F6 Fe3+
HO2macr rarr Fe3+
+ HO2macr 18times103
s-1
133
F7 Fe3+
HO2macrFe2+
rarr Fe3+
+ Fe2+
HO2macr 25 times104
133
F8 Fe2+
HO2macr + H+
(aq) rarr Fe2+
+ H2O2 Unknown 133
F9 Fe3+
+ O2macr rarr Fe2+
+ O2 Unknown 137
F10 Fe2+
+ O2macr + H2O rarr HO2macr + Fe
3+ + OHmacr 10 times10
7
133
F11 Fe3+
+ Hbull rarr Fe
2+ + H
+(aq) 20 times10
6
138
F12 Fe3+
+ emacraq rarr Fe2+
60 times1010
139
F13 Fe2+
+ Hbull + H
+(aq)
rarr Fe
3+ + H2 75 times10
6
10
Table 24 A reaction scheme to estimate the effects of dissolved iron in water radiolysis
Chapter 8 Conclusions and Further Work
154
Chapter 8 Conclusions and Further Work
Further High pH Investigations
Experiments have shown that the radiolytic production of hydrogen gas and hydrogen
peroxide is strongly influenced by high pH Hydrogen peroxide tends to reach higher steady
state concentrations with increasing pH as well as taking longer to reach this steady state
Hydrogen gas production rates appear to also increase with increasing pH up to
approximately pH 11 where thereafter they decrease The development of a computational
model for water radiolysis has provided a mechanistic understanding to explain the
observed effects of high pH on water radiolysis Calculations suggest that an increase in
radiolytically produced oxygen could explain the behaviour of hydrogen gas at high pH
Dissolved oxygen acts as a poison to the Allen chain which normally serves to remove
dissolved hydrogen through reactions with the hydroxyl radical or the alkali equivalent the
oxide radical anion The steady state concentration of dissolved oxygen increases with pH
up to approximately pH 115 This can be attributed to the decline in the rate at which
dissolved oxygen is reduced by hydrogen atoms as the equilibrium between the hydrogen
atom and the solvated electron shifts to favour the solvated electron The reaction rate of
the equivalent alkali reaction to remove dissolved oxygen through reduction by the solvated
electron does not increase to compensate resulting in a net increase in the steady state
concentration of dissolved oxygen The model calculations also show that increasing the
pH further results in a decline in the hydrogen gas production rate This is due to the shift in
the equilibrium between the hydroxyl radical and the oxide radical anion (R6364) which
has a pKa of 119 The main pathway for the radiolytic production of dissolved oxygen is
the reaction between the hydroxyl radical and super oxide (R21)
Chapter 8 Conclusions and Further Work
155
The rate of this reaction falls at high pH as the hydroxyl radical is converted to the oxide
radical anion The alkali equivalent of this reaction (R50) has a much lower rate constant
and is out competed by the solvated electron (R8) Further experiments to measure the
concentration of radiolytically produced oxygen at high pH could help to support the model
predictions or confirm a misunderstanding in the model An inline gas chromatography
technique similar to the ldquocrush tuberdquo described in Chapter 2 may be used only instead of
crushing a sealed glass vial within the carrier gas flow a specially designed cell is
connected to the in and out ports of the carrier gas flow This cell would contain a high pH
solution and would sit inside the irradiator from here multiple analyses can be run on a
single sample The carrier gas would have to be changed from argon to helium to increase
the sensitivity towards oxygen running the carrier gas through the cell prior to irradiation
will serve to remove the initial dissolved oxygen from the sample from this point onward
any measurements of oxygen would be radiolytically produced
These experiments would help to better understand high pH water radiolysis and hopefully
help to improve the radiolysis model and understand why there is an over prediction at
pH 106 A comprehensive water radiolysis model that can accurately predict
concentrations of radiolysis products under a wide range of conditions is of high
importance to the nuclear industry and would have applications in decommissioning
maintenance of current nuclear systems and designing new nuclear technology
Chapter 8 Conclusions and Further Work
156
Further Methanol Radiolysis Investigations
The reaction scheme used to model the radiolysis of aqueous methanol results in the
temporary formation of several stable organic species before they themselves are oxidised
by hydroxyl radicals This scheme eventually converts all organic substances to carbon
monoxide however in reality this is not the case It has been reported in literature that one
of the stable products formed is methane gas a substance not included in the current
reaction scheme The gas chromatography techniques used in this work are not suitable for
the detection of small quantities of carbon monoxide or indeed other potential radiolysis
products such as methane A more sophisticated approach would be to use a gas
chromatography mass spectroscopy technique (GC-MS) This technique would allow for
the detection of carbon monoxide carbon dioxide methane and any other volatile
hydrocarbons that may be formed during radiolysis Other transient products of methanol
radiolysis such as formaldehyde ethylene glycol glycolaldehyde and glyoxal may be
analysed by high performance liquid chromatography (HPLC) It was mentioned in Chapter
6 that the reaction scheme does not accurately represent the radiolysis of the transient
product glycolaldehyde A publication by Yaylayan et al130
discusses some measurements
made by nuclear magnetic resonance spectroscopy of glycolaldehyde in deuterated water
and it was found that it exists mostly as the hydrated aldehyde 112-ethanetriol (~70) A
complete reaction scheme for the radiolysis of methanol should include the radiolysis
reactions of all the transient species of which there are potentially many
However if the major component of a glycolaldehyde solution is 112-ethanetriol an
acceptable compromise may be to include only the radiolysis reactions of this species and
ignore the radiolysis paths of minor products
Chapter 8 Conclusions and Further Work
157
Experimental analysis of aqueous methanol to determine the major transient species would
be valuable for determining which radiolysis paths have the most significant roles in
methanol radiolysis
Future Development of a Multi-Scale Radiolysis Model
As discussed in Chapter 3 the model developed in this work is a deterministic model for the
calculation of long term homogeneous phase radiolysis This calculation depends on a
series of primary values that represent the production rates of the primary species of water
radiolysis which in turn depend on a number of physical and chemical factors It is
possible to calculate these primary yields using stochastic methods which can then be fed
into the deterministic calculation to obtain predictions of chemical species concentrations
This technique has been successfully used recently to demonstrate some of the effects of
high capacity scavengers47
This technique assumes that there are no changes to the
physiochemical conditions during the radiolysis period for example if a calculation was to
be performed where the temperature were to change the primary yields would need to be
recalculated at the new temperature The model developed in this work attempts to
overcome this by estimating primary yields as a multiple regression fit of temperature and
pH however this estimation is not adequately accurate and does not include any effects that
linear energy transfer has on the primary yields A more suitable approach to the
development of a comprehensive multi-scale radiolysis model may be to utilise a stochastic
calculation of the primary yields that includes the effects of temperature pH LET and
chemical scavengers which can be called from within the deterministic calculation
whenever a significant change to one of these factors is initiated
Chapter 8 Conclusions and Further Work
158
Further work concerning the deterministic model presented in this work include an
investigation into the partitioning of gaseous species The method used is one that has been
successfully used by other research groups to model the radiolysis of water and the effect of
available headspace This implementation of the stagnant two-film model was never
intended to cope with rapid changes in aqueous oxygen concentrations Further efforts
should be made to better incorporate this gas partitioning method in a way that can more
realistically represent oxygen partitioning during the radiolysis of aqueous methanol
Closing Remarks Relevant to Sellafield Ltd
The experimental data presented in Chapters 4 and 5 are pertinent to the situations and
conditions currently found within the Magnox Swarf Storage Silos at Sellafield In the case
of elevated pH due to sodium hydroxide both the experimental and computational data
show increased rates of hydrogen gas production and an increased steady-state
concentration of hydrogen peroxide Despite some minor quantitative disagreements
between the experimental data and the computational data the qualitative trend is in
general agreement One could therefore expect to observe increased production of hydrogen
gas in the MSSS with increasing pH especially within the pH region of approximately
105 to 125 An important aspect of the situation at the MSSS is the aerated nature of the
system The obvious consideration being the increased amounts of dissolved oxygen
present which although such effects were also discussed in Chapter 4 the experimental
data shown was only for water at neutral pH Nevertheless it was discussed in Chapter 4
that dissolved oxygen acts a poison to the chain reaction that normally removes molecular
hydrogen A less obvious consideration and one that was largely overlooked in Chapter 4
is the inclusion of gas to liquid carbon dioxide exchange and its aqueous conversion to
carbonate
Chapter 8 Conclusions and Further Work
159
At high pH the concentration of aqueous CO2 and therefore CO32-
becomes significant
With CO32-
being known to react with the hydroxyl radical and given the difficulty in its
removal future research and industrial models involving high pH aqueous radiolysis would
benefit from including a description of the radiolysis chemistry of aqueous carbonate
systems Chapter 5 begins to address the concept of including carbonate chemistry into a
radiolysis model This came about from the realisation that magnesium hydroxide can be
easily carbonated on contact with CO2 and is also known to be an effective carbon trapping
material In this case not only the additional chemistry brought about carbonate should be
considered but also the effects of the magnesium compounds that can be formed for
example magnesium carbonate magnesium bicarbonate magnesium oxide and
magnesium hydroxide Similarly consideration should be given to the multitude of iron
phases that can exist in conditions comparable to those of the First Generation Magnox
Storage Ponds Although it was not considered in Chapter 7 it is likely that the corroded
iron found in the FGMSP also exists as a number of iron hydroxides and hydrated oxides
Given the open air nature of the FGMSP hydrogen gas build-up is not a major concern
however the interactions of the various iron oxide phases in a radiolysis system may affect
concentrations of oxidising species such as H2O2 which may alter corrosion rates The
results shown in Chapter 7 suggest little effect on H2O2 concentration in the presence of
haematite but the presence of magnetite had a significant effect in removing H2O2 To gain
a better understanding further work would need to be done that also investigated the other
possible phases of iron oxide and also gives consideration to the proportions in which they
can be found in the FGMSP
References
160
References
1 Pitois A Ivanov P I Abrahamsen L G Bryan N D Taylor R J amp Sims H E Magnesium Hydroxide Bulk and Colloid-Associated 152Eu in an Alkaline Environment Colloid Characterisation and Sorption Properties in the Presence and Absence of Carbonate J Environ Monit 10 315-324 (2008)
2 Spinks J W T amp Woods R J An Introduction to Radiation Chemistry (1990)
3 Loveland W D Morrissey D J amp Seaborg G T Modern Nuclear Chemistry (2005)
4 Allen A O The Radiation Chemistry of Water and Aqueous Solutions (1961)
5 Draganić I G amp Draganić Z D The Radiation Chemistry of Water (1971)
6 Schwarz H A Losee J P amp Allen A O Hydrogen Yields in the Radiolysis of Aqueous
Solutions Journal of the American Chemical Society 76 4693-4694 (1954)
7 Swallow A J Radiation Chemistry An Introduction (1973)
8 Schwarz H A Free Radicals Generated by Radiolysis of Aqueous Solutions Journal of
Chemical Education 58 101 (1981)
9 Buxton G V Clive L Greenstock W Helman P amp Ross A B Critical Review of Rate
Constants for Reactions of Hydrated Electrons Hydrogen Atoms and Hydroxyl Radicals (˙OHO˙-) in Aqueous Solution J Phys Chem Ref Data 17 513-886 (1988)
10 Jayson G G Keene J P Stirling D A amp Swallow A J Pulse-Radiolysis Study of Some
Unstable Complexes of Iron Transactions of the Faraday Society 65 2453-2464 (1969)
11 Koppenol W H amp Liebman J F The Oxidizing Nature of the Hydroxyl Radical A
Comparison with the Ferryl Ion (FeO2+) The Journal of Physical Chemistry 88 99-101 (1984)
12 Meyerstein D Complexes of Cations in Unstable Oxidation States in Aqueous Solutions as
Studied by Pulse Radiolysis Accounts of Chemical Research 11 43-48 (1978)
13 Schwarz H A Applications of the spur diffusion model to the radiation chemistry of
aqueous solutions The Journal of Physical Chemistry 73 1928-1937 (1969)
References
161
14 Dyne P J amp Kennedy J M The Kinetics of Radical Reactions in the Tracks of Fast Electrons A Detailed Study of the SamuelndashMagee Model for the Radiation Chemisty of Water Canadian Journal of Chemistry 36 1518-1536 (1958)
15 Burns W G Sims H E amp Goodall J A B Special Issue Dedicated to The Memory of the
Late John Hodson Baxendale Radiation chemical diffusion kinetic calculations with prescribed and non-prescribed diffusionmdashI Radiation Physics and Chemistry (1977) 23 143-180 (1984)
16 Pimblott S M amp LaVerne J A Comparison of Stochastic and Deterministic Methods for
Modeling Spur Kinetics Radiation Research 122 12-23 (1990)
17 Tapping R L Corrosion Issues in Pressurized Heavy Water Reactor (PHWRCANDUreg)
Systems A2 in Nuclear Corrosion Science and Engineering 581-633 (2012)
18 Petrik N G Alexandrov A B amp Vall A I Interfacial Energy Transfer During Gamma
Radiolysis of Water on the Surface of ZrO2 and Some Other Oxides The Journal of Physical Chemistry B 105 5935-5944 (2001)
19 LaVerne J A amp Tandon L H2 and Cl2 Production in the Radiolysis of Calcium and
Magnesium Chlorides and Hydroxides The Journal of Physical Chemistry A 109 2861-2865 (2005)
20 Slack J Norton J L amp Malkoske G R Cobalt-60 Production in CANDU Power Reactors
21 Unterweger M P Hoppes D D amp Schima F J New and Revised Half-Life Measurements
Results Nuclear Instruments and Methods in Physics Research Section A Accelerators Spectrometers Detectors and Associated Equipment 312 349-352 (1992)
22 Weiss J A Survey of Chemical Dosimetric Systems The International Journal of Applied
Radiation and Isotopes 4 89-95 (1958)
23 Fricke H amp Morse S The Chemical Action of Roumlntgen Rays on Dilute Ferrosulfate Solutions
as a Measure of Dose Am J Roentgenology and Radium Therapy 18 430-432 (1927)
24 Weiss J Allen A O amp Schwarz H A Fricke Ferrous Sulfate Dosimeter for γ-rays in the
Range 4 to 40 Kiloroumlntgens Proceedings of the International Conference on the Peaceful Uses of Atomic Energy 14 179-181 (1956)
25 Allen A O Hochanadel C J Ghormley J A amp Davis T W Decomposition of Water and
Aqueous Solutions under Mixed Fast Neutron and Gamma Radiation American Chemical Society (1952)
References
162
26 Hiroki A Pimblott S M amp LaVerne J A Hydrogen Peroxide Production in the Radiolysis of
Water with High Radical Scavenger Concentrations The Journal of Physical Chemistry A 106 9352-9358 (2002)
27 Yakabuskie P A Joseph J M amp Wren C J The Effect of Interfacial Mass Transfer on
Steady-State Water Radiolysis Radiation Physics and Chemistry 79 777-785 (2010)
28 Nejad M A amp Jonsson M Reactivity of Hydrogen Peroxide towards Fe3O4 Fe2CoO4 and
Fe2NiO4 Journal of Nuclear Materials 334 28-34 (2004)
29 Pastina B amp LaVerne J A Effect of Molecular Hydrogen on Hydrogen Peroxide in Water
Radiolysis The Journal of Physical Chemistry A 105 9316-9322 (2001)
30 Klassen N V Marchington D amp McGowan H C E H2O2 Determination by the I3
- Method and by KMnO4 Titration Analytical Chemistry 66 2921-2925 (1994)
31 Roth O amp LaVerne J A Effect of pH on H2O2 Production in the Radiolysis of Water J Phys
Chem A 115 700-708 (2011)
32 Wasselin-Trupin V Baldacchino G Bouffard S amp Hickel B Hydrogen Peroxide Yields in
Water Radiolysis by High-Energy Ion Beams at Constant LET Radiation Physics and Chemistry 65 53-61 (2002)
33 Essehli R Crumiegravere F Blain G Vandenborre J Pottier F Grambow B et al H2
Production by γ and He Ions Water Radiolysis Effect of Presence TiO2 Nanoparticles International Journal of Hydrogen Energy 36 14342-14348 (2011)
34 Faraggi M Zehavi D amp Anbar M Effect of Thallous Ions on the Yields of Hydrogen and
Hydrogen Peroxide in Radiolyzed Aqueous Solutions Transactions of the Faraday Society 67 2057-2067 (1971)
35 Lousada C M LaVerne J A amp Jonsson M Enhanced Hydrogen Formation During the
Catalytic Decomposition of H2O2 on Metal Oxide Surfaces in the Presence of ˙OH Radical Scavengers Phys Chem Chem Phys 15 12674-12679 (2013)
36 Schofield J Reiff S C Pimblott S M amp LaVerne J A Radiolytic Hydrogen Generation at
Silicon CarbidendashWater Interfaces Journal of Nuclear Materials 469 43-50 (2016)
37 LaVerne J A Ryan M R amp Mu T Hydrogen Production in the Radiolysis of Bromide
Solutions Radiation Physics and Chemistry 78 1148-1152 (2009)
References
163
38 Draganic I Nenadovic M T amp Draganic Z D Radiolysis of HCOOH + O2 at pH 13-13 and
the Yields of Primary Products in γ Radiolysis of Water Journal of Physical Chemistry 73 2564-2571 (1969)
39 Hart E J γ-Ray Induced Oxidation of Aqueous Formic Acid-Oxygen Solutions Effect of pH
Journal of the American Chemical Society 76 4198-4201 (1954)
40 Flanders D A amp Fricke H Application of a High-Speed Electronic Computer in Diffusion
Kinetics The Journal of Chemical Physics 28 1126-1129 (1958)
41 Burns W G Sims H E amp Goodall J A B Radiation Chemical Diffusion Kinetic Calculations
with Prescribed and Non-Prescribed DiffusionmdashI Spherical and Cylindrical Cases Radiation Physics and Chemistry 23 143-180 (1984)
42 Green N J B Pilling M J Pimblott S M amp Clifford P Stochastic Modeling of Fast Kinetics
in a Radiation Track The Journal of Physical Chemistry 94 251-258 (1990)
43 Bouniol P amp Bjergbakke E A Comprehensive Model to Describe Radiolytic Processes in
Cement Medium Journal of Nuclear Materials 372 1-15 (2008)
44 Ershov B G amp Gordeev A V A Model for Radiolysis of Water and Aqueous Solutions of H2
H2O2 and O2 Radiation Physics and Chemistry 77 928-935 (2008)
45 Elliot A J amp Bartels D M The Reaction Set Rate Constants and g-Values for the Simulation
of the Radiolysis of Light Water over the range 20degC to 350degC Based on Information Available in 2008 (Atomic Energy of Canada Limited Mississauga Ontario (Canada) 2009)
46 Wren J C amp Ball J M LIRIC 32 an Updated Model for Iodine Behaviour in the Presence of
Organic Impurities Radiation Physics and Chemistry 60 577-596 (2001)
47 Gregory P Horne Thomas A Donoclift Howard E Sims Robin M Orr amp Simon M
Pimblott Multi-Scale Modelling of the Radiolysis of Nitrate Solutions The Journal of Physical Chemistry B 120 (45) 11781 - 11789 (2016)
48 Chance E M Curtis A R Jones I P amp Kirby C R FACSIMILE A Computer Program for
Flow and Chemistry Simulation and General Initial Value Problems Report No 0436-9734 148 pp (Univ Coll 1977)
49 Elliot A J Rate Constants and G-Values for the Simulation of the Radiolysis of Light Water
Over the Range 0 - 300degC AECL-11073 COG-94-167 (1994)
References
164
50 Hochanadel C J amp Ghormley J A Effect of Temperature on the Decomposition of Water
by γ-Rays Radiat Res 16 635-660 (1962)
51 Janik D Janik I amp Bartels D M Neutron and βγ Radiolysis of Water up to Supercritical
Conditions βγ Yields for H2 Hbull Atom and Hydrated Electron The Journal of Physical
Chemistry A 111 7777-7786 (2007)
52 Jha K N Ryan T G amp Freeman G R Radiolysis of H2O and D2O between 0 and 300degC J
Phys Chem 79 868-870 (1974)
53 Elliot A J Chenier M P amp Ouellette D C Temperature Dependence of g Values for H2O
and D2O Irradiated with Low Linear Energy Transfer Radiation Journal of the Chemical Society Faraday Transactions 89 1193-1197 (1993)
54 Kent M C amp Sims H E The Yield of γ-Radiolysis Products from Water at Temperatures up
to 270degC Harwell Report AEA-RS-2301 (1992)
55 Lin M Katsumura Y Muroya Y He H Wu G Han Z et al Pulse Radiolysis Study on the
Estimation of Radiolytic Yields of Water Decomposition Products in High-Temperature and Supercritical Waterthinsp Use of Methyl Viologen as a Scavenger The Journal of Physical Chemistry A 108 8287-8295 (2004)
56 Štefanić I amp LaVerne J A Temperature Dependence of the Hydrogen Peroxide Production
in the γ-Radiolysis of Water The Journal of Physical Chemistry A 106 447-452 (2002)
57 Ferradini C amp Jay-Gerin J-P The Effect of pH on Water Radiolysis A Still Open Question mdash
A Minireview Research on Chemical Intermediates 26 549-565 (2000)
58 Ferradini C Kinetic Behavior of the Radiolysis Products of Water in Advances in Inorganic
Chemistry and Radiochemistry Vol Volume 3 (eds H J Emeleus amp A G Sharpe) 171-205 (1961)
59 Lefort M Radiation Chemistry Annual Review of Physical Chemistry 9 123-156 (1958)
60 Sworski T J Yields of Hydrogen Peroxide in the Decomposition of Water by Cobalt γ-
Rradiation I Effect of Bromide Ion Journal of the American Chemical Society 76 4687 (1954)
61 Hochanadel C J amp Lind S C Radiation Chemistry Annual Review of Physical Chemistry 7
83-106 (1956)
References
165
62 Mahlman H A amp Boyle J W Primary Cobalt-60 Radiolysis Yields in Heavy Water Journal
of the American Chemical Society 80 773 (1958)
63 Hayon E amp Stein G Radiation Chemistry of Aqueous Systems (1968)
64 Hayon E Effect of Solute Concentration on the Recombination of H˙ and ˙OH in γ-Irradiated
Aqueous Solutions Journal of Physical Chemistry 65 1502-1505 (1961)
65 Sehested K Bjergbakke E amp Fricke H The Primary Species Yields in the 60Co γ-Ray
Radiolysis of Aqueous Solutions of H2SO4 between pH 7 and 046 Radiation Research 56 385-399 (1973)
66 Hayon E Radiolysis of Heavy Water in the pD Range 0-14 Journal of Physical Chemistry 69
2628-2632 (1965)
67 Haissinsky M γ-Radiolysis of Alkaline and Neutral Solutions I Alkaline Solutions of Sodium
Phosphite Journal de Chimie Physique et de Physico-Chimie 62 1141-1148 (1965)
68 Dainton F S amp Watt W S The Effect of pH on the Radical Yields in the γ-Radiolysis of
Aqueous Systems Nature 195 1294-1296 (1962)
69 Dainton F S amp Rumfeldt R Radical and Molecular Yields in the γ-Radiolysis of Water III
The Nitrous Oxide-Sodium Tellurite System Proceedings of the Royal Society of London A Mathematical Physical and Engineering Sciences 287 444-456 (1965)
70 Cheek C H amp Linnenbom V J The Radiation Chemistry of Alkaline Hypobromite Solutions
The Journal of Physical Chemistry 67 1856-1860 (1963)
71 Fielden E M amp Hart E J Primary Radical Yields in Pulse-Irradiated Alkaline Aqueous
Solution Radiation Research 32 564-580 (1967)
72 Czapski G amp Peled E On the pH-Dependence of Greducing in the Radiation Chemistry of
Aqueous Solutions Israel Journal of Chemistry 6 421-436 (1968)
73 Balkas T Dainton F S Dishman J K amp Smithies D Radiation Chemistry of Aqueous
Solutions Containing Carbon Monoxide and Oxygen Between pH 04 and 12 Transactions of the Faraday Society 62 81-87 (1966)
References
166
74 Pimblott S M Pilling M J amp Green N J B Stochastic Models of Spur Kinetics in Water International Journal of Radiation Applications and Instrumentation Part C Radiation Physics and Chemistry 37 377-388 (1991)
75 Hayon E Radical and Molecular Yields in the Radiolysis of Alkaline Aqueous Solutions
Transactions of the Faraday Society 61 734-743 (1965)
76 Gordon S amp Hart E J Chemical Yields of Ionizing Radiations in Aqueous Solutions Effect of
Energy of Alpha Particles Radiation Research 15 440-451 (1961)
77 Kochanny G L Timnick A Hochanadel C J amp Goodman C D Radiation Chemistry Studies
of Water as Related to the Initial Linear Energy Transfer of 11-MeV to 23-MeV Protons Radiation Research 19 462-473 (1963)
78 ICRU Report 16 - Linear Energy Transfer (ICRU Washington USA 1970)
79 Schwarzenbach R P Gschwend P M amp Imboden D M Environmental Organic Chemistry
(Wiley 2005)
80 Ferrell R T amp Himmelblau D M Diffusion Coefficients of Hydrogen and Helium in Water
American Institute of Chemical Engineers 13 702-708 (1967)
81 Han P amp Bartels D M Temperature Dependence of Oxygen Diffusion in H2O and D2O The
Journal of Physical Chemistry 100 5597-5602 (1996)
82 Marrero T R amp Mason E A Gaseous Diffusion Coefficients Journal of Physical and
Chemical Reference Data 1 3-118 (1972)
83 Kestin J Knierim K Mason E A Najafi B Ro S T amp Waldman M Equilibrium and
Transport Properties of the Noble Gases and Their Mixtures at Low Density Journal of Physical and Chemical Reference Data 13 229-303 (1984)
84 Sander R Compilation of Henryrsquos Law Constants for Inorganic and Organic Species of
Potential Importance in Environmental Chemistry (1999)
85 Mezyk Stephen P amp Bartels David M Direct EPR Measurement of Arrhenius Parameters
for the Reactions of Hmiddot Atoms with H2O2 and Dmiddot Atoms with D2O2 in Aqueous Solution Journal of the Chemical Society Faraday Transactions 91 3127-3132 (1995)
References
167
86 Joseph Jiju M Seon Choi Byung Yakabuskie Pam amp Wren Clara J A Combined Experimental and Model Analysis on the Effect of pH and O2(aq) on γ-Radiolytically Produced H2 and H2O2 Radiation Physics and Chemistry 77 1009-1020 (2008)
87 Allen A O The Yields of Free H˙ and ˙OH in the Irradiation of Water Radiation Research 1
85-96 (1954)
88 Jortner J amp Noyes R M Some Thermodynamic Properties of the Hydrated Electron The
Journal of Physical Chemistry 70 770-774 (1966)
89 Sehested K Holcman J Bjergbakke E amp Hart Edwin J Ultraviolet Spectrum and Decay of
the Ozonide Ion Radical O3- in Strong Alkaline Solution Journal of Physical Chemistry 86
2066-2069 (1982)
90 Jones T Development of an Effluent Treatment Process for the Silos Direct Encapsulation
Plant IChemE Sustainable Nuclear Energy Conference (2014)
91 Nelson S M Newman A C D Tomlinson T E amp Sutton L E A Dielectric Study of the
Adsorption of Water by Magnesium Hydroxide Transactions of the Faraday Society 55 2186-2202 (1959)
92 Shpak P A Kalinichenko A E Lytovchenko S A Kalinichenko A I Legkova V G amp
Bagmut N N The Effect of γ-Irradiation on the Structure and Subsequent Thermal Decomposition of Brucite Physics and Chemistry of Minerals 30 59-68 (2003)
93 Maroto-Valer M M Developments and Innovation in Carbon Dioxide (CO2) Capture and
Storage Technology Volume One Carbon Dioxide (CO2) Capture Transport and Industrial Applications (Woodhead Publishing 2010)
94 Siriwardane R V amp Stevens R W Novel Regenerable Magnesium Hydroxide Sorbents for
CO2 Capture at Warm Gas Temperatures Industrial amp Engineering Chemistry Research 48 2135-2141 (2009)
95 Fricker Kyle J amp Park A Alissa Effect of H2O on Mg(OH)2 Carbonation Pathways for
Combined CO2 Capture and Storage Chemical Engineering Science 100 332-341 (2013)
96 Sahoo P Ishihara S Yamada K Deguchi K Ohki S Tansho M et al Rapid Exchange
between Atmospheric CO2 and Carbonate Anion Intercalated within Magnesium Rich Layered Double Hydroxide ACS Applied Materials amp Interfaces 6 18352-18359 (2014)
97 Stirling A HCO3
- Formation from CO2 at High pH Ab Initio Molecular Dynamics Study The Journal of Physical Chemistry B 115 14683-14687 (2011)
References
168
98 Shah Noor S Khan Javed Ali Al-Muhtaseb Alarsquoa H Sayed Murtaza amp Khan Hasan M
Gamma Radiolytic Decomposition of Endosulfan in Aerated Solution The Role of Carbonate Radical Environmental Science and Pollution Research 1-10 (2016)
99 Nash K Mulac W Noon M Fried S amp Sullivan J C Pulse Radiolysis Studies of U(VI)
Complexes in Aqueous Media Journal of Inorganic and Nuclear Chemistry 43 897-899 (1981)
100 Holcman J Bjergbakke E amp Sehested K The Importance of Radical-Rradical Reactions in
Pulse Radiolysis of Aqueous CarbonateBicarbonate Proceedings of the Tihany Symposium on Radiation Chemistry 6 149-153 (1987)
101 Draganic Z D Negron-Mendoza A Sehested K Vujosevic S I Navarro-Gonzales R
Albarran-Sanchez M G et al Radiolysis of Aqueous Solutions of Ammonium Bicarbonate Over a Large Dose Range Radiation Physics and Chemistry 38 317-321 (1991)
102 Eriksen T E Lind J amp Mereacutenyi G On the Acid-Base Equilibrium of the Carbonate Radical
Radiation Physics and Chemistry 26 197-199 (1985)
103 Thomas J K Gordon Sheffield amp Hart Edwin J The Rates of Reaction of the Hydrated
Electron in Aqueous Inorganic Solutions Journal of Physical Chemistry 68 1524-1527 (1964)
104 Nehari Shlomo amp Rabani Joseph The Reaction of H˙ Atoms with OH- in the Radiation
Chemistry of Aqueous Solutions Journal of Physical Chemistry 67 1609-1613 (1963)
105 Neta P amp Dorfman L M Pulse Radiolysis Studies XIII Rate Constants for the Reaction of
Hydroxyl Radicals with Aromatic Compounds in Aqueous Solutions in Radiation Chemistry Vol 81 Advances in Chemistry Ch 15 222-230 (American Chemical Society 1968)
106 Mezyk S P amp Bartels D M Rate Constant and Activation Energy Measurement for the
Reaction of Atomic Hydrogen with Methanol Iodomethane Iodoethane and 1-Iodopropane in Aqueous Solution The Journal of Physical Chemistry 98 10578-10583 (1994)
107 Anbar M amp Hart E J The Reactivity of Aromatic Compounds toward Hydrated Electrons
Journal of the American Chemical Society 86 5633-5637 (1964)
108 Theard Leslie M amp Burton Milton Radiolysis of Liquid Methanol and some Methanolic Salt
Solutions Journal of Physical Chemistry 67 59-64 (1963)
References
169
109 Porter Raymond P Noyes W amp Albert Jr Photochemical Studies LIV Methanol Vapor Journal of the American Chemical Society 81 2307-2311 (1959)
110 Motohashi N amp Saito Y Competitive Measurement of Rate Constants for Hydroxyl Radical
Reactions Using Radiolytic Hydroxylation of Benzoate Chemical amp pharmaceutical bulletin 41 1842-1845 (1993)
111 Adams G E amp Willson R L Pulse Radiolysis Studies on the Oxidation of Organic Radicals in
Aqueous Solution Transactions of the Faraday Society 65 2981-2987 (1969)
112 Kishore K Moorthy P N amp Rao K N Reactivity of H2O2 with Radiation Produced Free
Radicals Steady State Radiolysis Methods for Estimating the Rate Constants International Journal of Radiation Applications and Instrumentation Part C Radiation Physics and Chemistry 29 309-313 (1987)
113 Simic M Neta P amp Hayon E Pulse Radiolysis Study of Alcohols in Aqueous Solution The
Journal of Physical Chemistry 73 3794-3800 (1969)
114 Tsang W Chemical Kinetic Data Base for Combustion Chemistry Part 2 Methanol Journal
of Physical and Chemical Reference Data 16 471-508 (1987)
115 Huie R E amp Clifton C L Kinetics of the Self-Reaction of Hydroxymethylperoxyl Radicals
Chemical Physics Letters 205 163-167 (1993)
116 Schuchmann M N amp Von Sonntag C The Rapid Hydration of the Acetyl Radical A Pulse
Radiolysis Study of Acetaldehyde in Aqueous Solution Journal of the American Chemical Society 110 5698-5701 (1988)
117 Bothe E Schulte-Frohlinde D amp von Sonntag C Radiation Chemistry of Carbohydrates
Part 16 Kinetics of HO2˙ Elimination from Peroxyl Radicals Derived from Glucose and Polyhydric Alcohols Journal of the Chemical Society Perkin Transactions 2 416-420 (1978)
118 Zimina GM amp Bakh NA Pulse Radiolysis of Ethylene Glycol Absorption Spectra of the
Short-Lived Radicals High Energy Chem 13 187-190 (1979)
119 Thomas J K Rates of Reaction of the Hydroxyl Radical Transactions of the Faraday Society
61 702-707 (1965)
120 Draganic I amp Marcovic V Unpublished data (NIST Squib 1968DRAMARB) (1968)
References
170
121 Orlando J J amp Tyndall G S The Atmospheric Chemistry of the HC(O)CO Radical International Journal of Chemical Kinetics 33 149-156 (2001)
122 Ziemer H Doacutebeacute S Wagner H G Olzman M Viskolcz B amp Temps F Kinetics of the
Reactions of HCO with H˙ and D˙ Atoms Berichte der Bunsengesellschaft fuumlr physikalische Chemie 102 897-905 (1998)
123 Temps F amp Wagner H G Rate Constants for the Reactions of ˙OH Radicals with CH2O˙ and
HCO˙ Berichte der Bunsengesellschaft fuumlr physikalische Chemie 88 415-418 (1984)
124 Atkinson R Baulch D L Cox R A Hampson R F Kerr J A Rossi M J et al Evaluated
Kinetic and Photochemical Data for Atmospheric Chemistry Supplement VI IUPAC Subcommittee on Gas Kinetic Data Evaluation for Atmospheric Chemistry Journal of Physical and Chemical Reference Data 26 1329-1499 (1997)
125 Yee Quee M J amp Thynne J C J The Photolysis of Organic Esters Berichte der
Bunsengesellschaft fuumlr physikalische Chemie 72 211-217 (1968)
126 Sunaryoy G R amp Domae M Numerical Simulation on Effect of Methanol Addition on
Coolant Radiolysis in Pressurized Water Reactor Journal of Nuclear Science and Technology 45 1261-1274 (2008)
127 Baxendale J H amp Mellows F W The γ-Radiolysis of Methanol and Methanol Solutions
Journal of the American Chemical Society 83 4720-4726 (1961)
128 Pikaev A K amp Kartasheva L I Radiolysis of Aqueous Solutions of Ethylene Glycol
International Journal for Radiation Physics and Chemistry 7 395-415 (1975)
129 Ahmad M Awan M H amp Mohammad D γ-Radiolysis of Ethylene Glycol Aqueous
Solutions Journal of the Chemical Society B Physical Organic 945-946 (1968)
130 Yaylayan V A Harty-Majors S amp Ismail A A Investigation of the Mechanism of
Dissociation of Glycolaldehyde Dimer (25-dihydroxy-14-dioxane) by FTIR Spectroscopy Carbohydrate Research 309 31-38 (1998)
131 Reiff S C amp LaVerne J A Radiation-Induced Chemical Changes to Iron Oxides The Journal
of Physical Chemistry B 119 7358-7365 (2015)
132 Lousada C M Yang M Nilsson K amp Jonsson M Catalytic Decomposition of Hydrogen
Peroxide on Transition Metal and Lanthanide Oxides Journal of Molecular Catalysis A Chemical 379 178-184 (2013)
References
171
133 Rush J D B Benon H J Pulse Radiolytic Studies of the Reaction of Perhydroxyl
Superoxide O2- with Iron(II)Iron(III) Ions The Reactivity of HO2O2
- with Ferric Ions and its Implication on the Occurrence of the Haber-Weiss Reaction Journal of Physical Chemistry 89 5062-5066 (1985)
134 Pepper S E Borkowski M Richmann M K amp Reed D T Determination of Ferrous and
Ferric Iron in Aqueous Biological Solutions Analytica Chimica Acta 663 172-177 (2010)
135 Barb W G Baxendale J H George P amp Hargrave K R Reactions of Ferrous and Ferric
Ions with Hydrogen Peroxide Part II-The Ferric Ion Reaction Transactions of the Faraday Society 47 591-616 (1951)
136 Stuglik Z amp PawełZagoacuterski Z Pulse Radiolysis of Neutral Iron(II) Solutions Oxidation of
Ferrous Ions by ˙OH Radicals Radiation Physics and Chemistry (1977) 17 229-233 (1981)
137 Fong K-L McCay P B Poyer J L Misra H P amp Keele B B Evidence for Superoxide-
Dependent Reduction of Fe3+ and its role in Enzyme-Generated Hydroxyl Radical Formation Chemico-Biological Interactions 15 77-89 (1976)
138 Baxendale J H Dixon R S amp Stott D A Reactivity of Hydrogen Atoms with Fe3+ FeOH2+
and Cu2+ in Aqueous Solutions Transactions of the Faraday Society 64 2398-2401 (1968)
139 Jonah C D M John R Matheson Max S The Reaction of the Precursor of the Hydrated
Electron with Electron Scavengers Journal of Physical Chemistry 81 1618-1622 (1977)
Appendix
172
Appendix
Radiolysis Model Code
All computational calculations were performed with the software package Facsimile by
MCPA Software The following is a print out of the core water radiolysis model and only
includes the reactions of water other reaction schemes documented in this work can be
found on the included CD as well as the setup files containing initial parameters and
associated Python scripts used to manage output data
Appendix
173
--------------------------------------------------------------------
_ _ ___ ____ _____ _ _ _ _
| | | |__ __ | __ | (_) | | (_)
| |__| | ) | | | | | |__) |__ _ __| |_ ___ | |_ _ ___ _ ___
| __ | | | | | | _ _` | _` | | _ | | | | __| __|
| | | | _| |__| | | | | (_| | (_| | | (_) | | |_| __ | __
|_| |_|____|____ |_| ____|___|_|___|_|__ |___|_|___
__ |
|___
--------------------------------------------------------------------
-----Radiolysis Model for the Radiolysis of Pure Water--------------
----------------------Thomas Donoclift------------------------------
Rate constants mainly are from
A J Elliot Rate constants and G-values
for the simulation of the radiolysis of
light water over the range 0 - 300 C
AECL-11073 COG-94-167 19942008
P Bouniol amp E Bjergbakke ldquoA Comprehensive
Model to Describe Radiolytic processes
in Cement Mediumrdquo J Nuclear Materials 372 1-15 2008
JC Wren JM Ball ldquoLIRIC 32 an Updated model for
Iodine behaviour in the presence of organic impuritiesrdquo
Radiation Physics and Chemistry 60 577-596 2001
EXECUTE OPEN 1 RadMout UNKNOWN
EXECUTE OPEN 2 Reportout UNKNOWN
EXECUTE OPEN 3 SetUptxt OLD
EXECUTE OPEN 4 Flux_Atxt UNKNOWN
EXECUTE OPEN 7 Flux_Btxt UNKNOWN
EXECUTE OPEN 8 Flux_Ctxt UNKNOWN
EXECUTE OPEN 9 Flux_Dtxt UNKNOWN
EXECUTE OPEN 10 Flux_Etxt UNKNOWN
EXECUTE OPEN 11 FireCount_Atxt UNKNOWN
EXECUTE OPEN 12 FireCount_Btxt UNKNOWN
EXECUTE OPEN 14 TIMEtxt UNKNOWN
EXECUTE OPEN 15 FireCount_Ctxt UNKNOWN
EXECUTE OPEN 16 FireCount_Dtxt UNKNOWN
EXECUTE OPEN 17 FireCount_Etxt UNKNOWN
EXECUTE OPEN 19 TRACEtxt UNKNOWN
PERMIT +-
------------------------
Appendix
174
These variables are the concentrations of radiolysis
species Edit initial values in COMPILE INSTANT and
COMPILE INITIAL routines or SetUptxt
---------DEFINE-VARIABLES--------------
----CHEMICAL-SPECIES-FOR-H2O-RADIOLYSIS---------------
VARIABLE
H2O H2O+ H3O+ OH H H2 H2g H2O2 H2O2+ O2 O2g H+
OH- Eaq- O2- O2-- HO2 HO2- O- O-- O3- O Rx O3
---------------------------------------
------REACTION-COUNTERS-----------------------
VARIABLE
R0 R1 R2 R3 R4 R5 R6 R7 R8 R9 R10 R11 R12 R13 R14 R15 R16
R17 R18 R19 R20 R21 R22 R23 R24 R25 R26 R27 R28 R29 R30
R31 R32 R33 R34 R35 R36 R37 R38 R39 R40 R41 R42 R43 R44
R45 R46 R47 R48 R49 R50 R51 R52 R53 R54 R55 R56 R57 R58
R59 R60 R61 R62 R63 R64 R65 R66 R67 R68 R69 R70 R71 R72
R73 R74 R75 R76 R77 R78 R79 R80 R81 R82 R83
G0 G1 G2 G3 G4 G5 G6 G7 G8
---------DEFINE-PARAMETERS-------------
PARAMETER
T TK RT TAB DOSER ADOSE
DOSE EVDOSE GEaq- GH GH2 GOH GH2O2 GH+ GOH- G-H2O G+H2O GO2 GO2-
kappH2 kappO2 GHO2 GHO2-
kappO2g H2tot EA MB1 MB2 H2O2T
INTEGER RUNt
-------------------------
This set of perameters concerns radiolysis rates
G-Values are converted to rates in COMPILE INITIAL
Rate constants are given the prefix K
Arrhenius Pre-exponentials are given the prefix A
Activation Energies (-EaR) are given the prefix E
followed by letters representing reacting species ie
KAB = Rate constant of A+B
-------------------------
A=Eaq- B=H C=OH D=O-
E=O3- F=HO2 G=H2O2 H=H2O2+
I=H2O J=H+ K=OH- L=HO2-
M=O2 N=O2- O=O2-- P=H2O+
Q=O3 R=H2 S=O
-------------------------
PARAMETER
DW GREaq- GRH GRH2 GROH GRH2O2 GRH+ GROH- GR-H2O GR+H2O
GRO2 GRO2- GRHO2 GRHO2- KAA KAB KAC KAD KAG KAF KAL KAM KAN KBB KBC
KBG KBM KBN KBF KBF2 KBL KCC KCD KCG KCL KCF KCN KDR KDG KDL
KDN KEG KEL KER KEC KED KNN KFN KFNI KFF KFG KI KJK KG
KJL KGK KLI KC KJD KCK KDI KDM KE KF KJN KFK KNI KB KJA
KBK KAI KBI KRC KJNb KCKb KLK KLKb KDD KEJ KBQ KDQ
KCL2 KCQ KNQ KFQ KNG KNE KKQ KLQ KGQ KLG KLN KEC2 KAN2 KAN3
-------------------------
Appendix
175
----PRE-EXPONENTIAL-FACTORS-------------------
PARAMETER AAB AAF AAG AAM AAN ABB ABC ABG
ABN ABF ACG ACF ACN ACL ADR ADL AFNI
AFF ADM AE AG AAN2 AGQ AFN ANN ACL2 ABF2
ABL AAD AAL ADG AEG AEL AER AFG AAN3 ACD ALKb
-----------------------------------
-------ACTIVATION-ENERGIES--------------
PARAMETER EAB EAF EAG EAM EAN EBB EBC EBG
EBN EBF ECG ECF ECN ECL EDR EDL EFNI
EFF EDM EE EG EAN2 EGQ EFN ENN ECL2 EBF2
EBL EAD EAL EDG EEG EEL EER EFG EAN3 ECD ELKb
---------------------------------------
PARAMETER
pH pHreal pKw pKH2O2 pKOH pKHO2 pKH pKH2O pKHO2- KpH KpO
KfH KrH KfO KrO CONV PcH PcO O2in xO2 Kprot Khydx
TPrint pHsweep Tstart Tend DecTime
---------------------------------------------------------
Below are arrays for storing reaction flux These are limited to 20
as the output length max is 250 characters To overcome this clunky
artefact of Facsimile the arrays can be fed into Facssemblepy to
concatenate them into a single output file
----------------------------------------------------------
PARAMETER lt20gt Ra Stores Water Reaction Flux Part A
PARAMETER lt20gt Rb Stores Water Reaction Flux Part B
PARAMETER lt20gt Rc Stores Water Reaction Flux Part C
PARAMETER lt20gt Rd Stores Water Reaction Flux Part D
PARAMETER lt10gt Re Stores Water Reaction Flux Part E
PARAMETER lt2gt GR Stores Gas Partition Flux
-------------------------
--PARAMETERS-FOR-GAS-PARTITION--------------
PARAMETER
DaqH2 DgH2 DaqO2 DgO2 daq dg
vaqH2 vgH2 vaqO2 vgO2 vintH2 vintO2
KpH2 KpO2 vtot
Aint Vl Vg Vr Dose EqR
---------------INITIALISE-PARAMETERS--------
Concentrations of specis are given as Moll
T is Temp in C - TK is Temp in K
pHin is the initial pH xO2 is the fraction of O2
pHreal is the calculated pH at any given time
DW is density of water depending on temperature
DS is the density of the whole solution
Vl and Vg is the Volume of liqud and gas phases in L
DOSER is the dose rate in Gymin
ADOSE is the conversion of dose rate to sets of 100eVls
Appendix
176
COMPILE INSTANT
----PARAMETERS-FROM-SETUP-FILE-----
READ 3 DOSER
READ 3 RUNt
READ 3 Tstart
READ 3 Tend
READ 3 pH
READ 3 xO2
READ 3 Vl
READ 3 Vg
READ 3 Aint
READ 3 DaqH2
READ 3 DgH2
READ 3 DaqO2
READ 3 DgO2
READ 3 daq
READ 3 dg
READ 3 KpH2
READ 3 KpO2
---ADDITIONAL-PARAMETERS----
T = Tstart
TK = T + 27315
TAB = 1TK
RT = 8314TK
DW = (0999 + 1094E-4 T - 7397E-6 T2
+ 2693E-8 T3 - 4714E-11 T4)
ADOSE = ((DOSER 62415E16) 60) DW 100 eVsl for use with Gymin
TPrint = (FLOAT(RUNt) - 1) 60
EA = EXP(18800((129815-1TK)8314))
WRITE 2 = 4
WRITE 3 = 7
WRITE 4 = 8
WRITE 7 = 10
WRITE 8 = 9
WRITE 12 = 14
WRITE 1 = 2 WATER RADIOLYSIS MODEL - DEBUG REPORT
------INITIAL-SPECIES-CONCENTRATIONS-----
READ 3 Eaq-
READ 3 H2
READ 3 O2
READ 3 H2O2
H2O = 553DW
O2g = 101320 xO2 (1000 RT)
H2g = 1E-22 mass transfer - zero will cause floating point overflow
H+ = 10(-1pH) H+ Activity (Effective concentration)
OH- = 10(-1(14-pH))
Appendix
177
------------ARRHENIUS-PARAMETERS-----------------------------
----PRE-EXPONENTIAL-FACTORS-------------------
AAB = 114E13
AAF = 24636E12
AAG = 77E12
AAM = 2479E12
AAN = 24636E12
ABB = 27E12
ABC = 426E11
ABG = 179E11
ABN = 517E12
ABF = 517E12
ACG = 768E9
ACF = 129E11
ACN = 877E11
ACL = 100E12
ADR = 232E10
ADL = 145E13
AFNI = 263E9
AFF = 278E9
ADM = 341E11
AE = 320E11
AG = 3171E4
AAN2 = 31E12
AGQ = 28E11
AFN = 244E9
ANN = 489E8
ACL2 = 45E12
ABF2 = 72E11
ABL = 42E13
AAD = 56E11
AAL = 175E12
ADG = 300E11
AEG = 159E6
AEL = 887E5
AER = 249E5
AFG = 37
AAN3 = 2567E13
ACD = 17E11
ALKb = 295E8
------------------------------
------ACTIVATION-ENERGIES-EaR----
EAB = 17957
EAF = 15636
EAG = 18896
EAM = 14015
EAN = 15636
EBB = 18675
EBC = 10919
EBG = 25336
EBN = 18242
EBF = 18242
ECG = 16614
ECF = 7992
ECN = 13062
ECL = 14346
EDR = 15505
EDL = 29285
Appendix
178
EFNI = 9743
EFF = 24164
EDM = 13449
EE = 55521
EG = 78181
------ACTIVATION-ENERGIES---Ea-J--
EAN2 = 136000
EGQ = 735000
EFN = 86000
ENN = 525900
ECL2 = 156000
EBF2 = 106000
EBL = 256000
EAD = 79000
EAL = 154000
EDG = 156000
EEG = 188400
EEL = 188400
EER = 188400
EFG = 200000
EAN3 = 188000
ECD = 77000
ELKb = 142000
--------------------------------
---------OTHER-LITERATURE-RATE-CONSTANTS--------------------------
KLG = 45E-4 FRDuke TWHaas 1961
KLQ = 55E6 JStaehelin J Hoigne 1982
KKQ = 48E1 LForni EJ Hart 1982
KFQ = 50E8 Pastina La Verne 2001
KNQ = 15E9 EJ Hart 1983
KNE = 10E4 Pastina La Verne 2001
KNG = 13E-1 JWeinstein BBielski 1979
KLN = 823E-2 PBouniol EBjergbakke 2008
KCQ = 11E8 K Sehested EJ Hart 1984
KEC2 = 25E9 K Sehested EJ Hart 1984
KDQ = 10E9 E Bjergbakke H Christensen
KBQ = 22E10 EJ Hart 1983
KCD = 20E10
KDN = 600E8
KEC = 60E9 Sehested Holcman Hart 1984
(269)
KEC = 850E9 P Bouniol E Bjergbakke
KDD = 84E9 Adams GE Boag JW
KDD = 10E8
KED = 70E8 Hart EJ 1984
KEJ = 90E10 Hart EJ
KLK = 3506E5
KLKb = 961E5
-GENERAL-ROUTINE-CONTINUALLY-ITTERATES-THROUGHOUT-CALCULATION-
Appendix
179
COMPILE GENERAL
------TEMPERATURE-RAMPING-ROUTINE----------------
TK = T + 27315
TAB = 1TK
RT = 8314TK
DecTime = TIME 3600
T = (11414 DecTime3 - 80383 DecTime2
+ 19256 DecTime + 22918)
IF(T - Tend)211
LABEL 1
T = Tend
LABEL 2
----------------------
H2O2T = H2O2 + HO2- + O2-- Total peroxide for output use
------------------SETUP-OF-EQUILIBRIA---------------------------------
pKw = (14947 - 4273E-2 T + 2115E-4 T2
- 5786E-7 T3 + 7529E-10 T4)
pKH2O2 = (12383 - 3020E-2 T + 170E-4 T2
- 5151E-7 T3 + 696E-10 T4)
pKOH = (12383 - 3020E-2 T + 170E-4 T2
- 5151E-7 T3 + 696E-10 T4)
pKHO2 = (4943 - 623E-3 T + 4125E-5 T2
- 8182E-9 T3)
pKH = (10551 - 443E-2 T + 1902E-4 T2
- 4661E-7 T3 + 598E-10 T4)
pKH2O = (1669 - 443E-2 T + 2071E-4 T2
- 5594E-7 T3 + 7161E-10 T4)
Kprot = (341E10 + 275E8 T + 124E7 T2
- 623E4 T3 + 131E2 T4)
Khydx = (722E9 + 162E8 T + 24E6 T2
- 781E3 T3 + 106 T4)
pKHO2- = 165 see Bouniol 2001
--------------------PARTITION-OF-O2-AND-H2---------------------
It should be noted that this routine is only valid for
a liquid to gas ratio of 1 See Chapter 3 for details
---------DIFFUSIVITY-WITH-TEMPERATURE---------
DaqO2 = (2E-9 T2 + 4E-7 T + 1E-5)
DaqH2 = (1E-8 T2 + 4E-7 T + 3E-5)
DgO2 = (1E-6 T2 + 12E-3 T + 02073)
DgH2 = (5E-6 T2 + 47E-3 T + 07719)
-----HENRYS-COEFFICIENT-WITH-TEMPERATURE--------------------
KpH2 = (TK (78E-4 EXP(543((1TK) - (129815))))) 122
KpO2 = (TK (13E-3 EXP(1650((1TK) - (129815))))) 122
---H2----
vgH2 = DgH2dg
vaqH2 = DaqH2daq
vintH2 = 1(1vaqH2 + KpH2vgH2)
H2tot = H2 + H2g
Appendix
180
---O2----
vgO2 = DgO2dg
vaqO2 = DaqO2daq
vintO2 = 1(1vaqO2 + KpO2vgO2)
vtot = 1((1(vaqO2))+(1(vgO2KpO2)))
--------PARAMETER-EVOLUTION--------------
kappH2 = vintH2(AintVl)(1 - KpH2(H2gH2))
kappO2 = vintO2(AintVl)(1 - KpO2(O2gO2))
Dose = DOSER (TIME 60)
pHreal = -LOG10( H+ )
--------------------G-VALUES------------------------
G-Values with temperature dependency ONLY
G-Values are initially obtained from literature molec 100eV
G-Values are converted to rates later
GEaq- = 2641 + 4162E-3 T + 9093E-6 T2 - 4717E-8 T3
GH2 = 0419 + 872E-4 T - 4971E-6 T2 + 1503E-8 T3
GOH = 2531 + 1134E-2 T - 1269E-5 T2 + 3513E-8 T3
GH2O2 = 0752 - 162E-3 T
GH = 0556 + 2198E-3 T - 1184E-5 T2 + 5223E-8 T3
GH+ = GEaq-
G-H2O = GOH + 2GH2O2
-----------------------------------------------------
------------G-VALUES-FROM-MULTIPLE-POLYNOMIAL-REGRESSION-----
Multiple polynomial regression was used to combine data that measured
primary yields as a function of temperature AND as a function of pH
GEaq- = 2798 + 285E-3 T - 2514E-2 pHreal
GH2 = 38781E-1 + 8288E-4 T + 5988E-4 pHreal
GOH = 243146 + 1111E-2 T - 12E-3 pHreal
GH = 4444E-1 + 367E-3 T - 2378E-4 pHreal
GH+ = GEaq-
GH2O2 = 05(GH + GEaq- + (2 GH2) - GOH) Material Balance
G-H2O = GOH + 2GH2O2
MB1 = GH + GEaq- + (2 GH2) Diagnostic Material Balance Variables
MB2 = GOH + (2 GH2O2)
-------------------G-VALUES--AS--RATES--------------
GREaq- = (ADOSE GEaq-)6022E23
GRH = (ADOSE GH)6022E23
GRH2 = (ADOSE GH2)6022E23
GROH = (ADOSE GOH)6022E23
GRH2O2 =(ADOSE GH2O2)6022E23
GRH+ = (ADOSE GH+)6022E23
GROH- = (ADOSE GOH-)6022E23
GR-H2O = (ADOSE G-H2O)6022E23
GRO2 = (ADOSE GO2)6022E23
GRO2- = (ADOSE GO2-)6022E23
GRHO2 = (ADOSE GHO2)6022E23
GRHO2- = (ADOSE GHO2-)6022E23
Appendix
181
------REACTION-RATES-WITH-TEMP-DEPENDENCY--
--------POLYNOMIAL-EQUATIONS----------------
KAA = 10(12281 - 3768E2 TAB - 6673E4 TAB2 - 1075E7 TAB3)
KAC = 10(13123 - 1023E3 TAB + 7634E4 TAB2)
KBM = 10(10704 + 2840E2 TAB - 137E5 TAB2)
KCC = 10(8054 + 2193E3 TAB - 7395E5 TAB2 + 687E7 TAB3)
KJK = 10(20934 - 1236E4 TAB + 6364E6 TAB2
- 1475E9 TAB3 + 1237E11 TAB4)
KJN = 10(1641 - 4888E3 TAB + 1622E6 TAB2 - 2004E8 TAB3)
KCK = 10(13339 - 222E3 TAB + 7333E5 TAB2 - 1065E8 TAB3)
KJA = 10(39127 - 3888E4 TAB + 2054E7 TAB2 - 4899E9 TAB3
+ 4376E11 TAB4)
KBK = 10(22970 - 1971E4 TAB + 1137E7 TAB2 - 2991E9 TAB3
+ 2803E11 TAB4)
KBI = 10(9408 - 2827E3 TAB - 3792E5 TAB2)
KRC = 10(-11556 + 32546E4 TAB - 18623E7 TAB2
+ 45543E9 TAB3 - 41364E11 TAB4)
------------ARRHENIUS-EQUATIONS------------------
----------EaR-------------------
KAB = AAB(EXP(-EABTK))
KAF = AAF(EXP(-EAFTK))
KAG = AAG(EXP(-EAGTK))
KAM = AAM(EXP(-EAMTK))
KAN = AAN(EXP(-EANTK))
KBB = ABB(EXP(-EBBTK))
KBC = ABC(EXP(-EBCTK))
KBG = ABG(EXP(-EBGTK))
KBN = ABN(EXP(-EBNTK))
KBF = ABF(EXP(-EBFTK))
KCG = ACG(EXP(-ECGTK))
KCF = ACF(EXP(-ECFTK))
KCN = ACN(EXP(-ECNTK))
KCL = ACL(EXP(-ECLTK))
KDR = ADR(EXP(-EDRTK))
KDL = ADL(EXP(-EDLTK))
KFNI = AFNI(EXP(-EFNITK))
KFF = AFF(EXP(-EFFTK))
KDM = ADM(EXP(-EDMTK))
KE = AE(EXP(-EETK))
KG = AG(EXP(-EGTK))
---------Ea-----------------
KAN2 = AAN2EXP(-EAN2RT)
KGQ = AGQEXP(-EGQRT) KSehested EJ Hart1992
KFN = AFNEXP(-EFNRT) BBielski ARoss 1985
KNN = ANNEXP(-ENNRT) Eliot
KCL2 = ACL2EXP(-ECL2RT) Eliot
KBF2 = ABF2EXP(-EBF2RT) Eliot
KBL = ABLEXP(-EBLRT) SP Mezyk DM Bartels
KAD = AADEXP(-EADRT) Eliot
KAL = AALEXP(-EALRT)
KDG = ADGEXP(-EDGRT)
KEG = AEGEA Wren amp Ball
Appendix
182
KEL = AELEA Wren amp Ball
KER = (AEREA) Wren (Suggests 8 correction)
KFG = 50E-1
KAN3 = AAN3EXP(-EAN3RT)
KCD = ACDEXP(-ECDRT)
-----------EQUILIBRIA---------------------------------------
KCKb = KCK ((10(-pKH2O))(10(-pKOH)))
KI = KJK(10-pKw)
KF = KJN (10-pKHO2)
KJL = KJN
KGK = KCK
KDI = KCK((10-pKH2O)(10-pKOH))
KLI = KCK((10-pKH2O)(10-pKH2O2))
KJD = KJN
KC = KJD(10-pKOH)
KFK = KCK
KNI = KFK((10-pKH2O)(10-pKHO2))
KB = KJA(10-pKH)
KAI = KBK((10-pKH2O)(10-pKH))
KJNb = KJN(10-pKH2O2)((10(-pKw))(10(-pKHO2)))
GENERAL
-------EQUATIONS-ROUTINE-CONTAINS-RADIOLYSIS-CHEMISTRY--------
COMPILE EQUATIONS
------INITIAL-SPECIES-GENERATION----------------------------
Ralt0gtGREaq- = Eaq- + G0
Ralt1gtGRH = H + G1
Ralt2gtGRH2 = H2 + G2
Ralt3gtGROH = OH + G3
Ralt4gtGRH2O2 = H2O2 + G4
Ralt5gtGRH+ = H+ + G5
Ralt6gtGROH- = OH- + G6
Ralt7gtGR-H2OH2O H2O = G7
----------REACTIONS------------------------
Ralt8gtKAA(H2OH2O) Eaq- + Eaq- + H2O + H2O = H2 + OH- + OH- + R0
Ralt9gtKABH2O Eaq- + H + H2O = H2 + OH- + R1
Ralt10gtKAC Eaq- + OH = OH- + R2
Ralt11gtKADH2O Eaq- + H2O + O- = OH- + OH- + R3
Ralt12gtKAG Eaq- + H2O2 = OH- + OH + R4
Ralt13gtKAF Eaq- + HO2 = HO2- + R5
Ralt14gtKAL Eaq- + HO2- = O- + OH- + R6
Ralt15gtKAM Eaq- + O2 = O2- + R7
Ralt16gtKAN Eaq- + O2- = O2-- + R8
Ralt17gtKBB H + H = H2 + R9
Ralt18gtKBC H + OH = H2O + R10
Ralt19gtKBG H + H2O2 = OH + H2O + R11
Rblt0gtKBM H + O2 = HO2 + R12
Rblt1gtKBN H + O2- = HO2- + R13
Rblt2gtKBF H + HO2 = OH + OH + R14
Rblt3gtKBL H + HO2- = OH + OH- + R15
Rblt4gtKBQ H + O3 = OH + O2 + R16
Rblt5gtKCC OH + OH = H2O2 + R17
Rblt6gtKCG OH + H2O2 = H2O + HO2 + R18
Rblt7gtKCL OH + HO2- = OH- + HO2 + R19
Rblt8gtKCF OH + HO2 = H2O + O2 + R20
Appendix
183
Rblt9gtKCN OH + O2- = OH- + O2 + R21
Rblt10gtKCQ OH + O3 = O2 + HO2 + R22
Rblt11gtKEG O3- + H2O2 = O2- + O2 + H2O + R23
Rblt12gtKEL O3- + HO2- = O2- + O2 + OH- + R24
Rblt13gtKER O3- + H2 = O2 + H + OH- + R25
Rblt14gtKEC O3- + OH = HO2 + O2- + R26
Rblt15gtKEC2 O3- + OH = OH- + O3 + R27
Rblt16gtKEJ O3- + H+ = OH + O2 + R28
Rblt17gtKNN O2- + O2- = O2 + O2-- + R29
Rblt18gtKLN O2- + HO2- = O2 + OH- + O- + R30
Rblt19gtKNG O2- + H2O2 = O2 + OH + OH- + R31
Rclt1gtKFN O2- + HO2 = O2 + HO2- + R32
Rclt2gtKNE O2- + O3- = O-- + O2 + O2 + R33
Rclt3gtKNQ O2- + O3 = O2 + O3- + R34
Rclt4gtKFF HO2 + HO2 = H2O2 + O2 + R35
Rclt5gtKFG HO2 + H2O2 = O2 + H2O + OH + R36
Rclt6gtKFQ HO2 + O3 = OH + O2 + O2 + R37
Rclt7gtKLG H2O2 + HO2- = H2O + O2 + OH- + R38
Rclt8gtKKQ O3 + OH- = O2 + HO2- + R39
Rclt9gtKLQ O3 + HO2- = O2 + OH + O2- + R40
Rclt10gtKGQ O3 + H2O2 = O2 + OH + HO2 + R41
------------------ADDITIONAL-WATER-CHEMISTRY------------------------
Rclt12gt200E10 H + O- = OH- + R42 Bjergbakke Draganic
Sehested
Rclt13gt16E10 O3- + Eaq- = OH- + OH- + O2 + R43 Pastina amp La
Verne
Rclt14gt36E10 O3 + Eaq- = O3- + R44 NIST
Rclt16gt23E-7 H2O2 = OH + OH + R45 Yakabuskie et al
Rclt17gt10E10H2O O-- + H2O = OH- + OH- + R46
Bouniol and Bjergbakke 2008
----------------ALKALI-REACTIONS------------------
Relt2gtKDR O- + H2 = H + OH- + R47
Relt3gtKDG O- + H2O2 = OH- + HO2 + R48
Relt4gtKDL O- + HO2- = O2- + OH- + R49
Relt5gtKDN O- + O2- = O-- + O2 + R50
Relt6gtKDD O- + O- = O2-- + R51
Relt7gtKCD O- + OH = HO2- + R52
Relt8gtKED O- + O3- = O2- + O2- + R53
Relt9gtKDQ O- + O3 = O2- + O2 + R54
----------EQUILIBRIUM-REACTIONS--------------------
Rclt18gtKIH2O H2O = H+ + OH- + R55
Rclt19gtKJK H+ + OH- = H2O + R56
Rdlt0gtKJN10(-pKH2O2) H2O2 = H+ + HO2- + R57
Rdlt1gtKJN H+ + HO2- = H2O2 + R58
Rdlt2gtKCK H2O2 + OH- = HO2- + H2O + R59
Rdlt3gtKLIH2O HO2- + H2O = H2O2 + OH- + R60
Rdlt4gtKLK HO2- + OH- = O2-- + H2O + R61
Rdlt5gtKLKbH2O O2-- + H2O = HO2- + OH- + R62
Rdlt6gtKJN10(-pKOH) OH = H+ + O- + R63
Rdlt7gtKJN H+ + O- = OH + R64
Appendix
184
Rdlt8gtKCK OH + OH- = O- + H2O + R65
Rdlt9gtKCKbH2O O- + H2O = OH + OH- + R66
Rdlt10gtKDM O- + O2 = O3- + R67
Rdlt11gtKE O3- = O- + O2 + R68
Rdlt12gtKF HO2 = H+ + O2- + R69
Rdlt13gtKJN H+ + O2- = HO2 + R70
Rdlt14gtKFK HO2 + OH- = O2- + H2O + R71
Rdlt15gtKNIH2O O2- + H2O = HO2 + OH- + R72
Rdlt16gtKB H = H+ + Eaq- + R73
Rdlt17gtKJA H+ + Eaq- = H + R74
Rdlt18gtKBK H + OH- = Eaq- + H2O + R75
Rdlt19gtKAIH2O Eaq- + H2O = H + OH- + R76
Relt0gtKBIH2O H + H2O = H2 + OH + R77
Relt1gtKRC H2 + OH = H + H2O + R78
---------------MASS-TRANSFER----------------------
GRlt0gtkappH2 H2 = H2g + R79
GRlt1gtkappO2 O2 = O2g + R80
-------OUTPUTS-ROUTINE-------
SETPSTREAM 3 1 20
OH H H2 H2g H2O2 O2 O2g H+ OH- Eaq-
O2- O2-- HO2 HO2- O- O-- O3- O O3
SETPSTREAM 4 11 20
R0 R1 R2 R3 R4 R5 R6 R7 R8 R9 R10 R11 R12 R13 R14 R15 R16
R17 R18 R19
SETPSTREAM 5 12 20
R20 R21 R22 R23 R24 R25 R26 R27 R28 R29 R30
R31 R32 R33 R34 R35 R36 R37 R38 R39
SETPSTREAM 6 15 20
R40 R41 R42 R43 R44 R45 R46 R47 R48 R49
R50 R51 R52 R53 R54 R55 R56 R57 R58 R59
SETPSTREAM 7 16 20
R60 R61 R62 R63 R64 R65 R66 R67 R68 R69
R70 R71 R72 R73 R74 R75 R76 R77 R78 R79
Appendix
185
SETPSTREAM 8 17 20
R80 R81 R82 R83 G1 G2 G3
G4 G5 G6 G7 G8
COMPILE OUT
PSTREAM 3
PSTREAM 4
PSTREAM 5
PSTREAM 6
PSTREAM 7
PSTREAM 8
WRITE 2 250 (N20 E10 2) Ra
WRITE 3 250 (N20 E10 2) Rb
WRITE 4 250 (N20 E10 2) Rc
WRITE 8 250 (N20 E10 2) Rd
WRITE 7 250 (N10 E10 2) Re
WRITE 10 (N2 E10 2) GR
WRITE 12 (E10 2) TIME
WHENEVER
TIME = TPrint Call Report
TIME = 0 + 600 RUNt CALL OUT
------------DEBUG-REPORT---------------
-Contains a list of all parameters to
confirm that values are correct-
COMPILE Report
WRITE 1 THIS REPORT IS GENERATED AT TPrint SECONDS
WRITE 1 RUNt = RUNt
WRITE 1 KpH2 = (E12 3) KpH2
WRITE 1 KpO2 = (E12 3) KpO2
WRITE 1 pH = (F6 1) pH
WRITE 1 Temperature = (F6 1) T C
WRITE 1 Dose Rate = (F6 1) DOSER Gymin
WRITE 1 VgVl Ratio = (F6 2) Vr
WRITE 1 Run Time = (F12 2) RUNt Mins
WRITE 1 Oxygen Fraction = (F6 3) xO2
WRITE 1 G-VALUES
WRITE 1 G(Eaq-) = (F6 3) GEaq-
WRITE 1 G(H) = (F6 3) GH
WRITE 1 G(H2) = (F6 3) GH2
WRITE 1 G(OH) = (F6 3) GOH
WRITE 1 G(H2O2) = (F6 3) GH2O2
WRITE 1 G(H+) = (F6 3) GH+
WRITE 1 G(-H2O) = (F6 3) G-H2O
WRITE 1 G-VALUES AS RATES MOLLS
WRITE 1 GREaq- = (E12 3) GREaq-
WRITE 1 GRH = (E12 3) GRH
WRITE 1 GRH2 = (E12 3) GRH2
WRITE 1 GROH = (E12 3) GROH
WRITE 1 GRH2O2 = (E12 3) GRH2O2
WRITE 1 GRH+ = (E12 3) GRH+
WRITE 1 GR-H2O = (E12 3) GR-H2O
WRITE 1 RATE CONSTANTS
WRITE 1 KAA = (E12 3) KAA
WRITE 1 KAB = (E12 3) KAB
Appendix
186
WRITE 1 KAC = (E12 3) KAC
WRITE 1 KAD = (E12 3) KAD
WRITE 1 KAG = (E12 3) KAG
WRITE 1 KAF = (E12 3) KAF
WRITE 1 KAL = (E12 3) KAL
WRITE 1 KAM = (E12 3) KAM
WRITE 1 KAN = (E12 3) KAN
WRITE 1 KBB = (E12 3) KBB
WRITE 1 KBC = (E12 3) KBC
WRITE 1 KBG = (E12 3) KBG
WRITE 1 KBM = (E12 3) KBM
WRITE 1 KBN = (E12 3) KBN
WRITE 1 KBF = (E12 3) KBF
WRITE 1 KBF2 = (E12 3) KBF2
WRITE 1 KBL = (E12 3) KBL
WRITE 1 KBQ = (E12 3) KBQ
WRITE 1 KCC = (E12 3) KCC
WRITE 1 KCD = (E12 3) KCD
WRITE 1 KCG = (E12 3) KCG
WRITE 1 KCL = (E12 3) KCL
WRITE 1 KCF = (E12 3) KCF
WRITE 1 KCN = (E12 3) KCN
WRITE 1 KCQ = (E12 3) KCQ
WRITE 1 KDR = (E12 3) KDR
WRITE 1 KDG = (E12 3) KDG
WRITE 1 KDL = (E12 3) KDL
WRITE 1 KDN = (E12 3) KDN
WRITE 1 KEG = (E12 3) KEG
WRITE 1 KEL = (E12 3) KEL
WRITE 1 KER = (E12 3) KER
WRITE 1 KEC = (E12 3) KEC
WRITE 1 KED = (E12 3) KED
WRITE 1 KNN = (E12 3) KNN
WRITE 1 KFN = (E12 3) KFN
WRITE 1 KFNI = (E12 3) KFNI
WRITE 1 KFF = (E12 3) KFF
WRITE 1 KFG = (E12 3) KFG
WRITE 1 KI = (E12 3) KI
WRITE 1 KJK = (E12 3) KJK
WRITE 1 KG = (E12 3) KG
WRITE 1 KJL = (E12 3) KJL
WRITE 1 KGK = (E12 3) KGK
WRITE 1 KLI = (E12 3) KLI
WRITE 1 KC = (E12 3) KC
WRITE 1 KJD = (E12 3) KJD
WRITE 1 KCK = (E12 3) KCK
WRITE 1 KDI = (E12 3) KDI
WRITE 1 KDM = (E12 3) KDM
WRITE 1 KE = (E12 3) KE
WRITE 1 KF = (E12 3) KF
WRITE 1 KJN = (E12 3) KJN
WRITE 1 KFK = (E12 3) KFK
WRITE 1 KNI = (E12 3) KNI
WRITE 1 KB = (E12 3) KB
WRITE 1 KJA = (E12 3) KJA
WRITE 1 KBK = (E12 3) KBK
WRITE 1 KAI = (E12 3) KAI
WRITE 1 KBI = (E12 3) KBI
WRITE 1 KRC = (E12 3) KRC
Appendix
187
WRITE 1 KJNb = (E12 3) KJNB
WRITE 1 KCKb = (E12 3) KCKb
WRITE 1 KLK = (E12 3) KLK
WRITE 1 KLKb = (E12 3) KLKb
WRITE 1 KDD = (E12 3) KDD
WRITE 1 KEJ = (E12 3) KEJ
WRITE 1 KBQ = (E12 3) KBQ
WRITE 1 KDQ = (E12 3) KDQ
WRITE 1 KCL2 = (E12 3) KCL2
WRITE 1 KCQ = (E12 3) KCQ
WRITE 1 KNQ = (E12 3) KNQ
WRITE 1 KFQ = (E12 3) KFQ
WRITE 1 KNG = (E12 3) KNG
WRITE 1 KNE = (E12 3) KNE
WRITE 1 KKQ = (E12 3) KKQ
WRITE 1 KLQ = (E12 3) KLQ
WRITE 1 KGQ = (E12 3) KGQ
WRITE 1 KLG = (E12 3) KLG
WRITE 1 KLN = (E12 3) KLN
WRITE 1 KEC2 = (E12 3) KEC2
WRITE 1 KAN2 = (E12 3) KAN2
WRITE 1 KRC = (E12 3) KRC
WRITE 1 ----PRE-EXPONENTIAL-FACTORS----
WRITE 1 AAB = (E12 3) AAB
WRITE 1 AAF = (E12 3) AAF
WRITE 1 AAG = (E12 3) AAG
WRITE 1 AAM = (E12 3) AAM
WRITE 1 AAN = (E12 3) AAN
WRITE 1 ABB = (E12 3) ABB
WRITE 1 ABC = (E12 3) ABC
WRITE 1 ABG = (E12 3) ABG
WRITE 1 ABN = (E12 3) ABN
WRITE 1 ABF = (E12 3) ABF
WRITE 1 ACF = (E12 3) ACF
WRITE 1 ACL = (E12 3) ACL
WRITE 1 ACG = (E12 3) ACG
WRITE 1 ACN = (E12 3) ACN
WRITE 1 ADR = (E12 3) ADR
WRITE 1 ADL = (E12 3) ADL
WRITE 1 AFNI = (E12 3) AFNI
WRITE 1 AFF = (E12 3) AFF
WRITE 1 ADM = (E12 3) ADM
WRITE 1 AG = (E12 3) AG
WRITE 1 AAN2 = (E12 3) AAN2
WRITE 1 AGQ = (E12 3) AGQ
WRITE 1 AFN = (E12 3) AFN
WRITE 1 ANN = (E12 3) ANN
WRITE 1 ACL2 = (E12 3) ACL2
WRITE 1 ABF2 = (E12 3) ABF2
WRITE 1 ABL = (E12 3) ABL
WRITE 1 AAD = (E12 3) AAD
WRITE 1 AAL = (E12 3) AAL
WRITE 1 ADG = (E12 3) ADG
WRITE 1 AEG = (E12 3) AEG
WRITE 1 AEL = (E12 3) AEL
WRITE 1 AER = (E12 3) AER
WRITE 1 AFG = (E12 3) AFG
WRITE 1 ----ACTIVATION ENERGIES----
WRITE 1 EAG = (E12 3) EAG
Appendix
188
WRITE 1 EAM = (E12 3) EAM
WRITE 1 EAN = (E12 3) EAN
WRITE 1 EBG = (E12 3) EBG
WRITE 1 ECG = (E12 3) ECG
WRITE 1 ECL = (E12 3) ECL
WRITE 1 ECF = (E12 3) ECF
WRITE 1 ECN = (E12 3) ECN
WRITE 1 EFN = (E12 3) EFN
WRITE 1 EFNI = (E12 3) EFNI
WRITE 1 ECL2 = (E12 3) ECL2
WRITE 1 EAN2 = (E12 3) EAN2
WRITE 1 ---pKa----
WRITE 1 pKw = (E12 3) pKw
WRITE 1 pKH2O2 = (E12 3) pKH2O2
WRITE 1 pKHO2 = (E12 3) pKHO2
WRITE 1 pKOH = (E12 3) pKOH
WRITE 1 pKH = (E12 3) pKH
WRITE 1 pKH2O = (E12 3) pKH2O
WRITE 1 Kprot = (E12 3) Kprot
WRITE 1 Khydx = (E12 3) Khydx
WRITE 1 KappO2 = (E12 3) kappO2
WRITE 1 KappH2 = (E12 3) kappH2
WRITE 1 H2O2 Equ rate = (E12 3) EqR
SETHMAX 1
BEGIN
STOP
Appendix
189
Radiolysis Model Full Reaction Scheme
Primary Reaction G-value
(Molecules100eV) Temperature Dependency Ref
G0 H2O emacraq 271 2641 + 416210-3
t + 909310-6 t2
ndash 471710-8 t3 45
G1 H2O H 054 0556 + 219810-3 t ndash 118410-5 t2 + 522310-8 t3 45
G2 H2O H2 041 0419 + 872110-4 t - 497110-6 t2 + 150310-8 t3 45
G3 H2O OH 270 2531 + 113410-2 t ndash 126910-5 t2 + 351310-8 t3 45
G4 H2O H2O2 068 0752 ndash 162010-3 t 45
G5 H2O H+ 271 2641 + 416210-3
t + 909310-6 t2
ndash 471710-8 t3 45
Chemical Reaction Rate Constant
k (M-1 s-1 25degC) Arrhenius Activation Energy Ea
(kJ) Ref
R0 emacraq + emacr
aq rarr H2 + 2OHmacr 7260 times109 Log kR7 = 12281 ndash 3768102T ndash 6673104T2 - 1075107T3 45
R1 emacraq + H rarr H2 + OHmacr 2762 times1010
114 times1013 14929 45
R2 emacraq + OH rarr OHmacr 3553 times1010
Log kR9 = 13123 ndash 1023103T + 7634104T2 45
R3 emacraq + Omacr rarr 2OHmacr 2313 times1010
56 times1011 79 49
R4 emacraq + H2O2 rarr OHmacr + OH 1362 times1010
77 times1012 1571 45
R5 emacraq + HO2 rarr HO2
macr 1300 times1010 246 times1012 130 45
R6 emacraq + HO2
macr rarr Omacr + OHmacr 3507 times109 175 times1012 154 49
R7 emacraq + O2 rarr O2
macr 2253 times1010 252 times1012 11652 45
R8 emacraq + O2
macr rarr O22macr + H2O 1300times1010
31 times1012 136 4349
R9 H + H rarr H2 5142 times109 27 times1012 15526 45
R10 H + OH rarr H2O 1094 times1010 426 times1011 9078 45
R11 H + H2O2 rarr OH + H2O 3650 times107 179 times1011 21064 45
R12 H + O2 rarr HO2 1304 times1010
Log kR23 = 10704 + 2840102T - 1369105T2 45
R13 H + O2
macr rarr HO2macr 1138 times1010
517 times1012 15166 45
R14 H + HO2 rarr 2OH 1138 times1010 517 times1012 15166 45
R15 H + HO2macr rarr OH + OHmacr 1374times109
42 times1013 256 85
R16 H + O3 rarr OH + O2 2200 times1010 No temperature dependence available 43
R17 OH + OH rarr H2O2 4814 times109 Log kR25 = 8054 + 2193103T ndash 7395105T2 + 6870107T3
45
R18 OH + H2O2 rarr H2O + HO2 2920 times107 768times109 13813 45
R19 OH + HO2macr rarr OHmacr + HO2 8134 times109
100 times1012 11927 45
R20 OH + HO2 rarr H2O + O2 8840 times109
129 times1011 6645 45
Appendix
190
R21 OH + O2
macr rarr OHmacr + O2 1097 times1010 877 times1011 10860 45
R22 OH + O3 rarr HO2 + O2 1100 times108
No temperature dependence available 43
R23 O3macr + H2O2 rarr O2
macr + O2 + H2O 1590 times106 xEXP(188times103 (129815 ndash 1TK)R) 43
R24 O3macr + HO2
macr rarr O2macr + O2 + OHmacr 8870 times105
xEXP(188times103 (129815 ndash 1TK)R) 43
R25 O3macr + H2 rarr O2 + H + OHmacr 2490times105
xEXP(188times103 (129815 ndash 1TK)R) 46
R26 O3
macr + OH rarr HO2 + O2macr 6000 times109 No temperature dependence
available 46 43
R27 O3
macr + OH rarr HOmacr + O3 2500 times109 No temperature dependence available
46 43
R28 O3
macr + H+ rarr O2 + OH 9000 times1010 No temperature dependence available
4 43
R29 O2
macr + O2macr rarr O2 + O2
2macr 2988times10-1 489 times108 5259 43
R30 O2
macr + HO2macr rarr O2 + Omacr + OHmacr 8230 times10-2 No temperature dependence
available 4 43
R31 O2
macr + H2O2 rarr O2 + OH + OHmacr 1300 times10-1 No temperature dependence
available 4 43
R32 O2
macr + HO2 rarr O2 + HO2macr 7597times107
244 times109 86 43
R33 O2
macr + O3macr rarr O2-
+ 2O2 1000 times104 No temperature dependence available
47 43
R34 O2
macr + O3 rarr O3macr + O2 1500 times109 No temperature dependence
available 4 43
R35 HO2 + HO2 rarr H2O2 + O2 8399 times105
278 times109 201 45
R36 HO2 + H2O2 rarr O2 + H2O + OH 5000 times10-1 No temperature dependence
available 4 49
R37 HO2 + O3 rarr OH + 2O2 5000 times108 No temperature dependence
available 4 43
R38 H2O2 + HO2
macr rarr O2 + H2O + OHmacr 450times10-4 No temperature dependence available
4 43
R39 O3 + OHmacr rarr HO2
macr + O2 4800 times101 No temperature dependence available
4 43
R40 O3 + HO2
macr rarr OH + O2 + O2macr 5500 times106 No temperature dependence
available 4 43
R41 O3 + H2O2 rarr OH + O2 + HO2 3714 times10-2
28 times1011 735 43
R42 H +Omacr rarr OHmacr 2000times1010 No temperature dependence
available 4 43
R43 O3
macr + emacraq rarr 2OHmacr + O2 1600times1010 No temperature dependence
available 47 43
R44 O3 + emacr
aq rarr O3macr 3600 times1010 No temperature dependence
available 4 43
R45 H2O2 rarr 2OH 2300 times10-7 No temperature dependence
available - 86
R46 O2- + H2O rarr 2OH- 1000 times1010 No temperature dependence
available - 43
R47 Omacr + H2 rarr H + OHmacr 1279 times108
232 times1010 12891 45
R48 Omacr + H2O2 rarr O2
macr + H2O 5546 times108 30 times1011 156 49
R49 Omacr + HO2
macr rarr O2macr + OHmacr 7864 times108
145 times1013 24348 45
R50 Omacr + O2
macr rarr O2macr + O2 6000 times108 No temperature dependence available
46 43
R51 Omacr + Omacr rarr O2
2macr 1000times108 No temperature dependence available
4 43
R52 Omacr + OH rarr HO2
macr 7610 times109 17 times1011 77 49
Appendix
191
R53 Omacr + O3macr rarr 2O2
macr 7000times108 No temperature dependence available
46 43
R54 Omacr
+ O3 rarr O2macr + O2 1000 times109 No temperature dependence
available 4 43
Equilibria
kf
(M-1 s-1)
kb
(M-1 s-1) Temperature Dependence pKa
(25degC)
R5556 H2O H+ + OHmacr 1172 times10-3 1178times1011 Log kR67 = 20934 - 1236x104T + 6364x106T2 ndash 1475x109T3 +
1237x1011T4 1575 45
R5758 H2O2 H+ + HO2macr 8900 times10-2 4780times1010 Log kR68 = 16410 ndash 4888x10
3T + 1622x10
6T
2 ndash 2004x10
8T
3 1173 45
R5960 H2O2 + OHmacr HO2
macr + H2O
1265 times1010 1403 times106 Log kR75 = 13339 ndash 2220x103T + 7333x10
5T
2 ndash 1065x10
8T
3
1198701198672119874
11987011986721198742 45
R6162 HO2macr + OHmacr O2
2macr + H2O 3506 times105 1103 times106 339times108 142 165 43
R6364 OH H+ + Omacr 8900 times10-2 4780times1010 Log kR66 = 16410 ndash 4888x103T + 1622x106T2 ndash 2004x108T3 1173 45
R6566 OH + OHmacr Omacr + H2O 1265 times1010 1403 times106 Log kR72 = 13339 ndash 2220x103T + 7333x105T2 ndash 1065x108T3 1198701198672119874
119870119874119867 45
R6768 Omacr + O2 O3macr 3747 times109 2617 times103 341 times1011 11182 Forward 45
320 times1011 4616 Reverse 45
R6970 HO2 H+ + O2macr 4780 times1010 7354 times105 Log kR69 = 16410 ndash 4888x103T + 1622x106T2 ndash 2004x108T3 481 45
R7172 HO2 + OHmacr O2macr + H2O 1265 times1010 1628 times10-1 Log kR75 = 13339 ndash 2220x103T + 7333x105T2 ndash 1065x108T3
1198701198672119874
1198701198671198742 45
R7374 H emacraq + H+ 5832 2095times1010
Log kR74 = 39127 - 3888E4T + 2054E7T2 - 4899E9T3 + 4376E11T4
955 45
R7576 H + OHmacr emacraq + H2O 2440 times107 1735 times101
Log kR70 = 22970 ndash1971x104T + 1137x107T2 ndash 2991x109T3 + 2803x1011T4
1198701198672119874
119870119867 45
R7778 H + H2O H2 + OH 4575 times10-5 3954 times107
Log kR71f = 9408 ndash 2827x103 Tndash 3792x105T2 45
Log kR71b = -11556 + 32546x104T - 18623x107T2 + 45543x109T3 - 41364x1011T4
45
R79 H2(aq) H2(g) 2687times10-3 See Chapter 3
R80 O2(aq) O2(g) 1033times10-4 See Chapter 3

List of Figures
6
Figure 33 Measurements of H2 as a function of dose in aerated (diams) and deaerated (diams) samples
Vertical error bars show the standard deviation of replicates while horizontal error bars show the
dose range for replicates 99
Figure 34 Predicted concentrations of H2O2 as calculated by the radiolysis model for both
aerated () and deaerated () conditions 102
Figure 35 Predicted concentrations of H2 gas as calculated by the radiolysis model for both
aerated () and deaerated () conditions 102
Figure 36 Calculated concentrations of the major oxidising and reducing water radiolysis
species as a function of dose Solid lines represent aerated conditions while broken lines
represent deaerated conditions 103
Figure 37 Measurements of H2O2 concentrations as a function of dose for samples initially at
pH 7 (diams) pH 104 (diams) pH 11 (diams) pH 123 (diams) and pH 127 (diams) All samples were aerated
Vertical error bars are the standard deviation between replicates while horizontal error bars
show the dose range for replicates 106
Figure 38 Measurements of H2 gas as a function of dose at pH 7 (diams) pH 106 (diams) pH 123 (diams)
and pH 13 (diams) Dashed lines are provided to clarify the data trends all samples were deaerated
Vertical error bars show the standard deviation between replicates while horizontal error bars
show the dose range for replicates 108
Figure 39 Model calculations to show the predicted concentrations of H2O2 as a function of
dose at various pH 109
Figure 40 Model calculations to show the predicted concentrations of H2 gas as a function of
dose at various pH 110
Figure 41 Model calculations showing the concentrations of aqueous oxygen and hydrogen gas
from deaerated water after 80 kGy at 280 Gy min-1
to show the related behaviour between the
two 114
Figure 42 Model predictions of the steady-state reaction rates of R21 R50 and R32 at various
pH for γ radiolysis of deaerated water at a dose rate of 280 Gy min-1
115
Figure 43 The sum of the steady state rates of all reactions that produce O2 () compared with
the sum of the steady state rates of all reactions that remove O2 () These totals do not include
rates of production or removal from mass transfer reactions This calculation is for the γ
radiolysis of deaerated water to a dose of 80 kGy at a rate of 280 Gy min-1
116
Figure 44 Model predictions of the steady-state reaction rates of R7 R12 and R67 at various
pH This calculation is for the γ radiolysis of deaerated water to a dose of 80 kGy at a rate of
280 Gy min-1
117
List of Figures
7
Figure 45 Dashed lines show the original prediction where k50 = 60 times108 M
-1 s
-1 while solid
lines show the predictions with the increased k50 = 48 times109 M
-1 s
-1 120
Figure 46 Measurements of H2 gas as a function of dose All samples here are aerated with
vertical error bars showing the standard deviation between replicates123
Figure 47 Measurements of H2O2 concentrations in aerated samples of saturated magnesium
hydroxide solution as a function of dose 126
Figure 48 Measurements of hydrogen yields from magnesium hydroxide samples with various
solid ndash aqueous ratios All samples were irradiated to a total dose of ~52 kGy to the aqueous
phase at a dose rate of 3041 Gy min-1
128
Figure 49 Model predictions for the yield of H2 from a solution containing various
concentrations of carbonate anions 133
Figure 50 Measurements of H2O2 concentrations as a function of dose in samples containing
1 mM methanol (diams) and water as a control (diams) All samples were aerated and a dashed line is
included to highlight the data trend The dose rate was 1638 Gy min-1
for methanol solutions
and 2839 Gy min-1
for the aerated water 136
Figure 51 Measurements of H2 gas as a function of dose from deaerated samples containing
1 mM methanol deaerated water is also shown as a control Dashed lines are included to
highlight the data trend The dose rate was 1755 Gy min-1
for the methanol solutions and
2851 Gy min-1
for the deaerated water 137
Figure 52 Chemical yields of hydrogen peroxide measured from an aerated solution of
1 mM methanol as a function of dose 138
Figure 53 Chemical yields of hydrogen gas measured from a deaerated solution of 1 mM
methanol as a function of dose 139
Figure 54 Model prediction of H2O2 concentrations as a function of dose in a solution of
1 mM methanol 142
Figure 55 Calculations of hydrogen peroxide concentrations with and without modification to
the mass transfer routine142
Figure 56 Model prediction of H2 gas as a function of dose in a solution of 1 mM
methanol144
Figure 57 Model predictions of the concentrations of various stable organic products formed as
a result of using the proposed reaction scheme in table 23 146
List of Figures
8
Figure 58 Measurements of H2O2 concentrations from heterogeneous samples of 05g Fe2O3
and 10 mL aerated water The dose rate for the haematite samples was 3052 Gy min-1
and for
the aerated water the dose rate was 2839 Gy min-1
149
Figure 59 Measurements of H2O2 concentrations from heterogeneous samples of 05g Fe3O4
and 10 mL aerated water The dose rate for the magnetite samples was 1625 Gy min-1
and for
the aerated water the dose rate was 2839 Gy min-1
150
List of Tables
9
List of Tables
Table 1 Dose rates of the front most two rows of the 4x8 irradiation rack determined by Fricke
analysis The error indicates the percentage of uncertainty of the obtained gradient 47
Table 2 Dose rates of the four positions of the inverter rig determined by Fricke analysis The
error indicates the percentage of uncertainty of the obtained gradient 48
Table 3 Thermal conductivity of commonly used gases Values taken from the Handbook of
Tables for Applied Engineering Science 62
Table 4 Optimised parameters used for the analysis of H2 gas 64
Table 5 Primary yields for γ-radiolysis of water at neutral pH and standard pressure and
temperature2 71
Table 6 Temperature effects on the primary yields of water radiolysis49
72
Table 7 Polynomial equations for estimating temperature effects on primary yields44
75
Table 8 A collection of measurements of primary yields made in 04 M solution of sulphuric
acid (pH = 046)56
77
Table 9 A collection of primary yields measured in alkali solutions (pH asymp 135)56
79
Table 10 Multiple regression polynomials used to estimate the combined effect of temperature
and pH on the primary yields of water radiolysis 82
Table 11 Polynomial equations used to estimate the temperature effects on the diffusivity of O2
and H2 in both gas and aqueous phases where t = temperature (Cdeg) 90
Table 12 A list of Primary Species used to model water radiolysis helliphelliphelliphelliphelliphelliphelliphelliphellip90
Table 13 A list of reactions used to model water radiolysis 93
Table 14 A list of equilibria used to model the radiolysis of water 94
Table 15 Statistical information concerning the estimation of primary yields used to model the
radiolysis of water 95
Table 16 Parameters used to describe interfacial surface area (Aint) and boundary thicknesses
(δ) for sample vials of different geometry 96
Table 17 Conditions of samples used to investigate hydrogen peroxide in high pH radiolysis
105
List of Tables
10
Table 18 A list of important equilibria and their associated pKa values 107
Table 19 Conditions of samples used to investigate hydrogen gas in high pH radiolysis 108
Table 20 Obtained results from the measurements of H2 gas 124
Table 21 Conditions of samples containing Mg(OH)2 for measurements of H2
a ndash Powder sample with no added water estimated adsorbed water content is based on data from
Nelson et al89
b ndash Sample is a saturated solution of Mg(OH)2 ie contains no solid 127
Table 22 A reaction scheme to estimate the effect of carbonate in water radiolysis 132
Table 23 A reaction scheme to estimate the effect of methanol in water radiolysis
a ndash Rate constant for gas phase reaction
b ndash Estimated rate constant
c ndash Rate constant based on reaction of acetic acid and hydroxyl
d ndash Assumed reaction 141
Table 24 A reaction scheme to estimate the effects of dissolved iron in water radiolysis 153
List of Acronyms and Initialisms
11
List of Acronyms and Initialisms
AES - Atomic Emission Spectroscopy
AVIDAC - Argonne Version of the Institutes Digital Automatic Computer
CANDU - Canada Deuterium-Uranium
DCF - Dalton Cumbrian Facility
EDTA - Ethylenediaminetetraacetic acid
EPSRC - Engineering and Physical Sciences Research Council
FGMSP - First Generation Magnox Storage Pond
GC - Gas Chromatography
HDEHP - Di-(2-ethylhexyl)phosphoric acid
HPLC - High Performance Liquid Chromatography
ICP - Inductively Coupled Plasma
ISO - International Organization for Standardization
LET - Linear Energy Transfer
MOX - Mixed Oxide
MSSS - Magnox Swarf Storage Silo
NNL - National Nuclear Laboratory
ODE - Ordinary Differential Equation
PUREX - Plutonium Uranium Redox Extraction
PWR - Pressurised Water Reactor
SHE - Standard Hydrogen Electrode
SI - International System
TCD - Thermal Conductivity Detector
TGA - Thermogravimetric Analysis
TOC - Total Organic Carbon
UV - Ultra Violet
VIS - Visible
Word count - 42500
Abstract
13
Abstract
Sellafield is home to the UKrsquos largest repository of nuclear waste including reprocessed
uranium and plutonium as well as a backlog of unprocessed used fuel and waste kept in
outdated storage facilities commonly referred to as ldquolegacy wasterdquo For this reason
Sellafield has often been called the most hazardous place in Western Europe and as such is
currently undergoing a multi-billion pound decommissioning and clean-up operation Each
on-site facility has unique challenges associated with it many of them presenting situations
where the radiation chemistry aspects of the material degradation are not well understood
The key factors that can affect water radiolysis processes in the Sellafield challenges are a
high pH environment the presence of magnesium hydroxide the presence of iron oxide
and the presence of organic materials This work examines the effect each of these factors
has on H2 and H2O2 production in water radiolysis as well as developing a computational
model to offer some understanding to the kinetic behaviour of water radiolysis under such
conditions
The computational model was able to replicate experimental measurements of radiolytic H2
and H2O2 production in both aerated and deaerated water at neutral pH and provide a
further understanding of the role of dissolved oxygen in water radiolysis Measurements of
H2O2 from solutions containing NaOH have shown that an increase in pH generally results
in a higher steady state of H2O2 while measurements of H2 show a similar increase with a
maximum production rate at pH ~11 The model was also able to closely replicate these
experimental measurements with some over prediction which highlights a gap in our
understanding of high pH radiolysis and also brings into question the validity of the
estimated rate constant for the reaction
119926minus + 119926120784minus119919120784119926rarr 120784119926119919minus +119926120784 119948 = 120788 120782 times 120783120782
120790 119924minus120783119956minus120783
which was originally determined from kinetic model calculations designed to describe the
decay of ozonide (O3ˉ) during pulse-radiolysis studies of high pH solutions conducted by
K Sehested et al in 1982
The radiolysis of magnesium hydroxide slurry also resulted in an increased yield of
hydrogen gas but had little effect on the yield of hydrogen peroxide The hydrogen yield
was 052 molecules per 100eV while a NaOH solution of equivalent pH gave a yield of
027 however interference from carbonate may be the cause of the increased yield A
surface effect was also estimated to contribute 005 molecules per 100 eV to the hydrogen
gas yield
Hydrogen gas and hydrogen peroxide was measured from the radiolysis of aqueous
methanol This was modelled with a near agreement but modifications to the model were
necessary highlighting areas of the model that need improvement as well as providing a
reaction scheme from which a more comprehensive model for aqueous methanol radiolysis
could be developed
Declaration
14
Declaration
No portion of the work referred to in the thesis has been submitted in support of an
application for another degree or qualification of this or any other university or other
institute of learning
Thomas A Donoclift August 2016
Copyright Statement
15
Copyright Statement
The author of this thesis (including any appendices andor schedules to this thesis) owns
certain copyright or related rights in it (the ldquoCopyrightrdquo) and he has given The University
of Manchester certain rights to use such Copyright including for administrative purposes
Copies of this thesis either in full or in extracts and whether in hard or electronic copy
may be made only in accordance with the Copyright Designs and Patents Act 1988 (as
amended) and regulations issued under it or where appropriate in accordance with
licensing agreements which the University has from time to time This page must form part
of any such copies made
The ownership of certain Copyright patents designs trademarks and other intellectual
property (the ldquoIntellectual Propertyrdquo) and any reproductions of copyright works in the
thesis for example graphs and tables (ldquoReproductionsrdquo) which may be described in this
thesis may not be owned by the author and may be owned by third parties Such
Intellectual Property and Reproductions cannot and must not be made available for use
without the prior written permission of the owner(s) of the relevant Intellectual Property
andor Reproductions
Further information on the conditions under which disclosure publication and
commercialisation of this thesis the Copyright and any Intellectual Property andor
Reproductions described in it may take place is available in the University IP Policy (see
httpdocumentsmanchesteracukDocuInfoaspxDocID=487) in any relevant Thesis
restriction declarations deposited in the University Library The University Libraryrsquos
regulations (see httpwwwmanchesteracuklibraryaboutusregulations) and in The
Universityrsquos policy on Presentation of Theses
Dedications
16
Dedications
Mum
For the strength and freedom to explore
and the support and security to return
Dad
For the support and encouragement
exceeded only by pride
Acknowledgements
17
Acknowledgements
I would like to take this opportunity to thank some of the people who have made this work
possible My supervisor Simon Pimblott even with the busy work schedule that comes with
managing an entire research facility he is still able to provide support and put the well-
being of his students and staff above all else My unofficial but very much appreciated
industrial supervisors from the National Nuclear Laboratory (NNL) Howard Sims and
Robin Orr who both take a personal interest in the work going on at the Dalton Cumbrian
Facility (DCF) and dedicate much of their own time to helping the researchers in their
work
I would like to acknowledge the EPSRC and Sellafield Ltd for providing the funding that
supported this research
A special thanks to all the members of the Dalton Cumbrian Facility especially to all the
staff who work immeasurably hard and with profound dedication to the values
management and research carried out at the Dalton Cumbrian Facility Acknowledgements
to the academic staff Ruth Edge Aliaksandr Baidak and Sven Koehler for always
providing a useful and meaningful insight to almost any situation and for providing
valuable guidance in practical radiation chemistry as well as the inspiration and
encouragement to pursue potentially interesting avenues of research
Thank you to the research team at the Dalton Cumbrian Facility for their friendship and for
making the workplace an enjoyable place to conduct research
Chapter 1 Introduction
18
Chapter 1 Introduction
Overview of Sellafield
Sellafield shown in Figure 1 is the largest nuclear facility in the UK and has played a key
role in the UK nuclear industry for over 60 years Sellafield began as a Royal Ordinance
Factory producing weapons propellant for use in the Second World War Soon after the
war ended Sellafield was renamed to Windscale and was repurposed to produce plutonium
for the development of nuclear weapons in order to secure the UKrsquos position in the nuclear
arms race
Several years later the focus on acquiring nuclear weapons shifted towards the development
of new reactors for civil energy production with Magnox reactors built on a neighbouring
site known as Calder Hall The two sites were later combined and were once again named
Sellafield Previous operations carried out at Sellafield meant the site was also in a good
position to conduct fuel reprocessing operations alongside energy production Spent fuel is
separated from its now contaminated cladding and dissolved in nitric acid uranium and
plutonium are separated by solvent extraction while the cladding is treated independently
At Sellafield this industrial process meant storing the contaminated cladding swarf in
underwater silos
The fuel reprocessing process most commonly used is the Plutonium Uranium Redox
Extraction method (PUREX) and produces a number of product streams including
plutonium uranium and other highly active liquors
Chapter 1 Introduction
19
The separated uranium can be re-enriched to produce reusable uranium fuel or mixed with
plutonium to produce mixed oxide (MOX) fuel although much of the reclaimed uranium
and plutonium remains unused and is stored at Sellafield The remaining fission products
classified as high level waste are treated in various ways including vitrification and are
also stored at Sellafield
Figure 1 An aerial view of the Sellafield Site which covers approximately 6 km2
Image provided by Sellafield Ltd Press Office
Magnox reactors are now an obsolete design of reactors that use unenriched uranium fuel
which was clad in an alloy comprising almost entirely of magnesium with small amounts
of aluminium Spent fuel from Magnox reactors was briefly stored in a cooling pond before
having the cladding removed for reprocessing of the fuel pellets
Chapter 1 Introduction
20
The facilities used for this storage shown in Figure 2 were called the First Generation
Magnox Storage Pond (FGMSP) and the Magnox Swarf Storage Silos (MSSS) both of
these facilities are now considered to be ldquoLegacyrdquo facilities
Figure 2 On the left is The First Generation Magnox Storage Pond (FGMSP) and on the
right are the Magnox Swarf Storage Silos (MSSS)
Images provided by Sellafield Ltd Press Office
An extended shut down of reprocessing in the first generation reprocessing plant meant that
fuel being stored in the Magnox pond was left far longer than intended resulting in
corrosion and a backlog of spent fuel The Magnox Storage Pond now contains
approximately 14000 m3
of contaminated water which includes roughly 1200 m3 of sludge
consisting mainly of magnesium hydroxide and iron oxide1 Later technological
advancements rendered the wet storage of Magnox fuel cladding to be an obsolete method
and operations moved towards dry storage However the construction of a new facility and
the huge backlog of material stored in the silo also resulted in corrosion of stored fuel and
eventually a state of disrepair for the Magnox Swarf Storage Silos Both of these legacy
facilities present a huge challenge for decommissioning operations as well as a unique
opportunity for scientific research
Chapter 1 Introduction
21
Radiation Chemistry
Radiation chemistry is the study of chemical change driven by the absorption of energy
capable of causing ionisation This ionising radiation can be of a particulate nature
including but not limited to alpha (He2+
) and beta (eˉ) radiation or non-particulate such as
gamma (γ) or X-ray radiation Radiation chemistry and its experimental methods parallel in
many ways to photochemistry but the differences between the fields are well defined The
fundamental difference between the two fields of study is the quantity of energy involved in
the initiation of reactions In radiation chemistry this energy is provided by the atomic
decay of radioactive nuclei and is far higher than energy used in photochemistry typically
UV radiation The lower initial energies used in photochemistry tend to only produce
molecular excitations rather than direct ionisations These lower incident energies also
mean that each photon will usually only interact once and produce a uniform distribution of
excited species in any plane perpendicular to the incident beam The higher initial energies
used in radiation chemistry often provided by atomic decay can produce both excitations
and ionisations directly Interactions between ionising radiation and a substance is not
necessarily limited to only one interaction a single high energy photon or particle may
interact a number of times This behaviour gives rise to a non-uniform track-like structure
of interactions unlike the uniform distributions found in photochemistry2
Chapter 1 Introduction
22
Figure 3 A representation demonstrating the uniform excitations and ionisations of UV
radiation compared to the structured tracks of alpha radiation
To fully appreciate the chemical changes initiated by ionising radiation it is important to
have some knowledge of the different types of ionising radiation and the ways in which
they interacts with matter There are two main ways in which radiation chemists provide a
source of ionising radiation for experiments The first involves taking advantage of the
atomic decay of radioactive nuclei this may be a naturally occurring radioisotope or an
artificially created isotope The second involves specialised equipment to directly generate
radiation usually by accelerating particles to a high energy The major types of ionising
radiation are alpha beta and gamma however in the field of radiation chemistry one may
also come across the use of X-rays fast neutron radiation proton radiation and other heavy
charged particle radiation This study utilises cobalt-60 as a source of gamma radiation
other types of radiation were not investigated during this work however it is necessary to
understand some fundamental features of alpha and beta decay to fully appreciate gamma
decay
Chapter 1 Introduction
23
Alpha α Radiation
Alpha radiation occurs when an unstable atomic nuclei spontaneously ejects an alpha
particle Elements with an atomic number greater than 83 will decay by this mechanism3
Alpha particles are fully ionised helium nuclei they consist of two protons and two
neutrons and have no electrons which gives them a charge of +2 Alpha particles are
mono-energetic this means that every alpha particle emitted from a given radioactive
element will have the same energy characteristic of that element These energy values
typically range between 4 and 10 MeV This quality means that research facilities capable
of artificially producing alpha radiation by ionising and accelerating helium atoms can
select the particle energy required to effectively mimic alpha decay of any radioactive
element
Beta β Radiation
Beta decay involves the conversion of a neutron to a proton or vice versa in order to create
a more favourable proton to neutron ratio This conversion process is accompanied by the
ejection of fundamental particles directly from the atomic nucleus In the case of a neutron
converting to a proton the ejected particles are an anti-neutrino and a high energy electron
while in the reverse case the ejected particles are a neutrino and a positron (the antimatter
equivalent of an electron) Unlike alpha particles beta particles are not mono-energetic
The energy lost through beta decay is shared between the ejected particles and the recoil of
the decaying atom this means beta particle energy ranges from zero up to a maximum
energy characteristic of that element
Chapter 1 Introduction
24
Gamma γ Radiation
Gamma radiation is not a particle like the previously mentioned types of radiation but is a
photon with a short wavelength in the region of 3 x10⁻⁹
to 3 x10-11
cm or approximately 40
KeV to 4 MeV when converted to energy A gamma ray is emitted when a nucleus in an
excited state relaxes to a lower nuclear energy level there is no change in the number of
protons or neutrons during gamma decay Gamma rays like alpha particles are mono-
energetic however a nucleus may emit several photons as a cascade of energy loss As
gamma emission starts with an excited nucleus some prior process must take place to result
in a nucleus with an elevated energy level For most gamma emitters the process is
initiated with either alpha or beta decay and the resulting atomic nucleus is left in an
excited state For example ceasium-137 undergoes beta decay by emission of a beta
particle of 1174 MeV to form stable barium-137 This only happens 54 of the time and
the more common decay mechanism is the emission of a beta particle of 0512 MeV to
form and excited barium-137 nucleus this then emits a photon of 0662 MeV to relax the
nucleus to the stable barium-137
Chapter 1 Introduction
25
Radiation interactions with matter
In order for radiation to induce a chemical change it must interact with matter in some way
There are many mechanisms by which radiation can interact with matter as this project
focuses on the use of gamma rays a brief description of the interactions of gamma rays
with matter is given below
In the photoelectric effect the entire energy of an incident gamma photon is transferred to
an electron of some absorbing matter This electron is ejected from the absorbing atom with
energy equal to the incident photon minus the binding energy of that electron The electrons
ejected are often K-shell electrons which have the highest binding energy As momentum
and energy must be conserved it is necessary for the absorbing atom to recoil As this
mechanism involves the recoil of a parent atom it would not be possible for the
photoelectric effect to be the mechanism of interaction with free electrons that do not have
a parent nucleus to recoil In the photoelectric effect ejected electrons will leave a hole as
this hole is filled by electrons from higher energy levels characteristic X-rays are emitted
Figure 4 A representation of the photoelectric effect
Image recreated from Spinks and Wood2
Chapter 1 Introduction
26
Although photons cannot interact with free electrons by means of the photoelectric effect
they may interact with free and loosely bound electrons through the Compton Effect In this
mechanism a photon accelerates an electron thereby reducing its own energy The photon
is scattered now with reduced energy while the electron recoils with increased energy
Figure 5 A representation of the Compton Effect
Image recreated from Spinks and Wood2
Another mechanism by which a gamma ray may interact with matter is through pair-
production This is only a viable mechanism for photons with energy larger than 102 MeV
A photon is completely absorbed by an atomic nucleus and from that nucleus two particles
are produced an electron and a positron The energy of the incident photon is shared
between the rest energy of the two new particles and the kinetic energy of these particles as
they move away from the nucleus a negligible amount of energy is also used as the nucleus
recoils The positron behaves much the same way as the electron until it annihilates with an
electron from the medium to produce two 051 MeV gamma rays travelling at 180deg from
each other
Chapter 1 Introduction
27
Figure 6 A representation of pair production and positron annihilation
Image recreated from Spinks and Wood2
Generally the interactions of gamma rays with matter result in fast moving electrons these
are often referred to as secondary electrons or delta-rays and have the same interactions
with matter as beta particles It is these secondary electrons that are predominantly
responsible for producing the excited states and ionisations in an absorbing material that
will initiate chemical changes in said material4 For this reason it is necessary to also
understand the interactions with matter these secondary electrons may have Fast moving
electrons lose energy through three main mechanisms electromagnetic radiation elastic
scattering and inelastic scattering When a fast electron greater than 100 KeV passes close
to an atomic nucleus it is decelerated and slightly deflected This event is accompanied by
emission of electromagnetic radiation commonly known as Bremsstrahlung radiation and
is required for the conservation of energy
Chapter 1 Introduction
28
At energies below 100 keV Bremsstrahlung emission becomes negligible instead electrons
tend to lose energy through scattering Fast moving electrons interact with the bound
electrons of a molecule predominantly through inelastic collisions This interaction
transfers energy from the incident electron to the bound molecular electron which can result
in ionisation and excitation (and often with production of radical species) If there is an
ionisation event the tertiary electrons produced can cause more ionisation events in the
same manner These events tend to lie closer together as the electron that caused them has a
much lower energy than the primary electron that passed by This engenders a radiation
track structure that consists of small groups of ionisation events These groups are often
referred to as spurs
Fast moving electrons may also interact elastically with matter this interaction causes the
electrons to be deflected by a wide range of angles This means that a fast moving electron
may have moved a significant total distance but may have not travelled particularly far into
the absorbing material
Chapter 1 Introduction
29
Radiolysis of Water
As mentioned earlier it is the secondary and tertiary electrons produced from gamma ray
interactions that predominantly lead to the formation of ions and radical species that drives
chemical change in substances exposed to radiation Below is a diagram outlining the
sequence of events and the different stages of water radiolysis
Figure 7 A scheme showing the early stages of water radiolysis and the production of
primary species
In water this initial interaction between a gamma ray and a water molecule produces either
an excited state of water or a water cation accompanied by an electron this is achieved in
less than ten femtoseconds (10-14
s) Molecules in an excited state may break apart to form
hydrogen atoms and hydroxyl radicals or molecular hydrogen and oxygen atoms in a
singlet or triplet state while water cations will quickly react with nearby water molecules to
produce hydronium ions and hydroxyl radicals
Chapter 1 Introduction
30
The electron produced begins a thermalisation process eventually resulting in a solvated
electron however at this stage the electron exists as a potentially reactive precursor
intermediate This happens in a time frame of less than 1 picosecond and occurs before
diffusion of the spur During the non-homogeneous stage the produced radicals and ions
may react within the spur to produce molecular products such as H2 and H2O2 Eventually
the spur species diffuse into the bulk water and these ldquoprimaryrdquo species produced are said
to be homogeneously distributed from this point onwards The yield at which these primary
species are produced are known as primary yields and are often expressed as G-values
which have units of micromoles per Joule (SI unit) or molecules produced per 100 eV of
energy absorbed (conventional historic units)
119866 = 119873119900 119900119891 119898119900119897119890119888119906119897119890119904 119891119900119903119898119890119889
100 119890119881
This should not be confused with a ldquochemicalrdquo yield which are the yields of chemical
species sometime after homogeneous chemistry has taken place and is also often expressed
as a G-value During the homogeneous stage reactions between primary species occur
often altering the observed production rates of these species through back reactions To
avoid confusion between the two types of yield a notation system can be used to discern the
two Two notation systems are commonly used throughout the radiation chemistry
literature the first denotes primary yields with the species of interest in subscript whilst the
chemical yield is often expressed with the species of interest in parenthesis For example
the primary and chemical yield of H2 would be written as GH2 and G(H2) respectively The
second system simply uses a lowercase ldquogrdquo to denote primary yields and uppercase ldquoGrdquo for
chemical yields This study will use the latter system
Chapter 1 Introduction
31
Most often it is the chemical yield that is measured during an experiment but it is possible
to measure a primary yield with the use of scavengers A scavenger is a chemical species
that can quickly react with a targeted primary species before it is able to diffuse into the
bulk solution effectively removing it and its associated chemistry from the homogeneous
stage of radiolysis The effectiveness of a scavenger is often referred to as the ldquoscavenging
capacityrdquo and is quoted as the pseudo-first order rate of reaction between a scavenger (S)
and a radical (R) which depends only on the rate constant for said reaction and the
concentration of the scavenger In other words the scavenging capacity is equal to kS+R[S]5
A well-documented example of this is the use of bromide ions to prevent the reaction of
hydroxyl radicals with molecular hydrogen allowing for the room temperature primary
yield of H2 to be measured this has been done extensively throughout the literature and the
g-value is quoted to be 045 molecules100eV6 Without the use of the bromide scavenger
hydroxyl radicals would react with H2 reducing the observed yield this reduced yield is
what is meant by the term chemical yield
The following summarises some of the properties of the more important primary radicals
Chapter 1 Introduction
32
The Hydrated Electron eaq-
One of the most reactive primary species of water radiolysis is the hydrated electron It is a
chemical entity that can be thought of as being a single electron somewhat stabilised by a
cage of orientated water molecules Hydrated electrons typically have reaction rate
constants close to the diffusion controlled limit with low activation energies Reactions of
hydrated electrons are typically represented as single electron transfer processes and with a
reduction potential of -29 V vs the standard hydrogen electrode (SHE) the hydrated
electron will react with most other species78
119890119886119902minus + 119878119899 rarr 119878119899minus1
In the presence of organic compounds the hydrated electron will act as a nucleophile with
enhanced reactivity towards areas adjacent to electron withdrawing groups Halogenated
organics also show enhanced reactivity towards elimination of the halide ion9
119890119886119902minus + 119877119883 rarr 119877119883minus rarr 119877bull+ 119883minus
The Hydrogen Atom H˙
In terms of BroslashnstedndashLowry acidndashbase theory the hydrogen atom is the conjugate acid of
the hydrated electron with a pKa of 9679
119890119886119902minus + 119867(119886119902)
+ 119867bull
The hydrogen atom has a reduction potential of -23 V78
similar to that of the hydrated
electron however its chemistry is seldom the same
Chapter 1 Introduction
33
Inorganic ions are reduced by the hydrogen atom at slower rates than reduction by the
hydrated electron In certain circumstances such as in low pH environments hydrogen
atoms can act as an oxidant reacting with inorganic ions to form a hydride intermediate
that soon decomposes to form the oxidised ion and molecular hydrogen10
119867bull + 1198651198902+ rarr 1198651198903+119867minus119867+
rarr 1198651198903+ + 1198672
Organic molecules are also subject to oxidation reactions with the hydrogen atom
Saturated organics tend to react by hydrogen abstraction to form molecular hydrogen and a
carbon centered organic radical Unsaturated organics will react by hydrogen addition to the
center of unsaturation again forming a carbon centered organic radical9
119867bull+ 1198621198673119874119867 rarr bull1198621198672119874119867 + 1198672
119867bull+ 11986211986721198621198672 rarr bull11986211986721198621198673
The Hydroxyl Radical bullOH
Unlike the previously mentioned primary radicals the hydroxyl radical has a positive
reduction potential of 18 V in neutral solution making it a powerful oxidising species11
Reactions of hydroxyl radicals with inorganic ions are often said to be simple electron
transfer processes however it has been suggested that the mechanism actually proceeds
through an intermediate adduct12
Reactions with inorganic ions have been observed to
proceed at rates close to the diffusion limit however this is not the case with many metal
cations Reaction rates between the hydroxyl radical and metal cations tend to be slower
with rate constants of the order ~30 x108 M
-1 s
-19
Chapter 1 Introduction
34
One explanation for this is that the mechanism for metal cation oxidation involves the
addition of the hydroxyl radical to the metal cation increasing its coordination number and
allowing for inner-sphere oxidation to take place
[119872(1198672119874)119909]119899+ + ∙119874119867 [(1198672119874)119909119872-119874119867]
119899+ rarr [119872(1198672119874)119909](119899+1)+ + 119874119867minus
The intermediate species Mn+
OH has actually been observed in cases where M = Tl+ Ag
+
Cu2+
Sn2+
Fe2+
and Mn2+
12
As is the case with the hydrated electron and the hydrogen atom the hydroxyl radical also
exists in an acid-base equilibrium with the oxide radical anion bullOˉ
bull119874119867 + 119874119867minus bull119874minus + 1198672119874
With a pKa of 119 the reactions of bullOˉ only become important at high pH With a few
exceptions reactions of bullOˉ are typically slower than those of
bullOH The two species also
have different reactivity towards organic molecules Hydroxyl radicals tend to add to
unsaturated bonds as an electrophile while the conjugate base bullOˉ acts more like a
nucleophile and will abstract hydrogen from a hydrocarbon bond
Chapter 1 Introduction
35
Computational Applications in Radiation Chemistry
Early computational studies in the field of radiation chemistry were focused largely on
developing the radical diffusion theory and the non-homogeneous stage of water radiolysis
to help rationalise experimental observations One of the earliest water models used
coupled differential equations with terms for the competing diffusion and reacting
processes to represent the evolution of a spur containing six radical pairs as a function of
time13-15
Although the predicted primary yields from this type of model agree well with
experimental data there are problems associated with this type of approach the main
problems arising from the application of classical chemical kinetics to a system of
diminutive volume and extremely fast reactions occurring between only a few reactive
species Such deterministic models often use a typical spur to represent a whole system
fixing the average number of radical pairs as a single integer or in some cases a range of
integers This means that in deterministic models the long-running average value for the
number of reactive species is neglected This small difference can lead to inaccuracies in
deterministic calculations of this kind and so a stochastic approach became the preferred
method to these types of non-homogeneous radiolysis calculations16
Deterministic models however are still the preferred technique for the longer term
homogeneous stage calculations for water radiolysis Once a suitable set of primary yields
has been established it is possible to model the subsequent chemistry in much the same way
as any other chemical kinetics simulation
Chapter 1 Introduction
36
By describing a reaction set in terms of a series of simultaneous differential equations and
by including details of physical parameters such as temperature it is possible to predict
chemical yields of radiolysis and highlight important chemical pathways This is the
general methodology implemented in this study and will be discussed in further detail in
subsequent chapters
Deliverables and Project Aims
Given the technical challenges associated with the Sellafield site and the pressing
conditions of legacy facilities such as the First Generation Magnox Storage Pond and
Magnox Swarf Storage Silos there has been a renewed interest in water radiolysis
especially with respects to high pH and slurry systems Previous radiolysis studies of high
pH solutions have been contradictory and difficult to reproduce There are very few
situations in industry where knowledge of high pH water radiolysis is required as most
situations where water radiolysis may occur are in acidic media with the exception of
Pressurised water reactors (PWRs) and CANDU reactor technology which run under alkali
conditions due to added LiOH17
As mentioned previously the Magnox Swarf Storage Silos at Sellafield Ltd contains large
quantities of contaminated magnesium alloy produced from the de-cladding process of
spent nuclear fuel The material contaminated with uranium oxide is stored under water
and over time has corroded to produce large amounts of magnesium hydroxide To prevent
further corrosion some of the 22 silos at the facility dose the water with sodium hydroxide
Although alleviating some corrosion this addition increases the pH
Chapter 1 Introduction
37
One of the aims of this project is to try and obtain a better understanding of water radiolysis
at high pH Using cobalt-60 as a source of gamma radiation and a range of analytical
techniques to determine the production rates of H2 and H2O2 as a function of absorbed dose
it is hoped that the effects of high pH on water radiolysis can be experimentally quantified
Deterministic computational modelling is then used to investigate the experimentally
observed effects of high pH in order to extract a better mechanistic understanding of water
radiolysis at high pH
While there were a number of early water radiolysis studies concerning the effects of
various metal oxides and their surface interactions18
this is also a subject which has
received a renewed scientific interest as there are many situations in the nuclear industry
where an understanding of the effects of metal oxides on water radiolysis are significant
These areas include preventing corrosion within operational facilities to extend their
lifetime controlling radiolytic products associated with stored nuclear material preventing
incidences of unexpected gas build up and managing already heavily corroded facilities
such as the legacy ponds and silos at Sellafield Ltd
In addition to sodium hydroxide the Magnox Swarf Storage Silos also contain large
quantities of magnesium hydroxide the hydrated form of magnesium oxide Radiolysis
studies concerned with magnesium hydroxide solutions slurries and solids are scarce119
despite the obvious need for further investigation The slight solubility of magnesium
hydroxide in water compels a prior understanding of high pH water radiolysis to facilitate
understanding the effects of magnesium hydroxide and the presence of a surface Data
collected from experiments involving magnesium hydroxide are therefore also included in
this project
Chapter 1 Introduction
38
Up until now the discussed aims of this project have been targeted at the issues associated
with the Magnox Swarf Storage Silo rather than with the First Generation Magnox Storage
Ponds These legacy ponds are outdoor open air ponds that have been used to store spent
nuclear fuel for extended periods (far longer than ever intended) As the ponds are open air
they are susceptible to the introduction of natural debris mostly falling leaves and other
biological matter
This has led to an interest in the effects of organic substances on radiolysis processes in
water with the focus being on some of the decomposition products of decaying organic
matter substances such as humic acids The complexity of these substances requires
general underpinning by first understanding simple organic substances In this work the
radiolysis of aqueous methanol was studied
The extended storage of spent fuel in the First Generation Magnox Storage Pond has led to
various challenges concerning corrosion products and their effects on water radiolysis In
the past spent fuel rods were often grouped into small bundles and placed into steel skips
which were then submerged in the pond These skips might also contain other contaminated
material and the exact content of any given skip is largely unknown Over time much of
the steel has corroded resulting in a large build-up of what can only be described as
ldquosludgerdquo The exact composition of this sludge is fairly unknown but the major constituent
is iron oxide present as both red haematite (Fe2O3) and black magnetite (Fe3O4) Research
involving iron oxides and radiolytic processes have mostly been focused on corrosion
mechanisms predominantly adopting an electrochemical approach with very few studies
measuring chemical yields of radiolytically produced H2 and no studies measuring H2O2 in
the presence of iron oxide
Chapter 1 Introduction
39
There are studies that have demonstrated decomposition of H2O2 over iron oxide in the
absence of a radiation source but as H2O2 is a primary product of water radiolysis it is
continuously being generated and the implications of this production are largely unknown
Other studies involving metal oxides have also investigated radiation induced dissolution
With both these processes in mind this project investigates some of the effects of iron
oxide on the steady-state concentrations of the molecular radiolysis products H2 and H2O2
Chapter 2 Experimental Methods
40
Chapter 2 Experimental Methods
Source of Radiation and Dosimetry
This project uses cobalt-60 as a source of gamma radiation Cobalt-60 is an artificial
isotope with a half-life of 527 years2 As cobalt-60 is not a naturally occurring isotope it
must be manufactured This is normally done through neutron bombardment of the non-
radioactive isotope cobalt-59 Stainless steel control rods within a nuclear reactor core are
substituted with cobalt rods and the neutron flux present is enough to transmute cobalt-59
to cobalt-6020
The overall reaction for the production and decay of cobalt-60 is shown
below
1198621199002759 + 119899 rarr 11986211990027
60 rarr 119873119894lowast2860 + 119890minus + 119890 + 120574
The decay mechanism for cobalt-60 was similar to that of Caesium-137 in that it is initiated
by beta decay Unlike Caesium-137 however there is no direct route to a stable isotope
Subsequently the decay of cobalt-60 follows one of two paths both of which begin with the
ejection of a beta particle Cobalt-60 may emit two photons of gamma radiation but will
always emit at least one photon A cobalt-60 nucleus may eject a beta particle with energy
up to 148 MeV this is followed by emission of a photon with energy of 133 MeV
however there is only a 012 chance that this happens The more common decay path for
cobalt-60 is to eject a beta particle with energy up to 031 MeV followed by the emission of
two photons with energies of 117 MeV and 133 MeV
Chapter 2 Experimental Methods
41
Figure 8 A decay scheme for cobalt-60
Cobalt-60 is a popular source of gamma radiation used by radiation scientists High dose
rates can be achieved with fairly little material21
Facilities that conduct experiments using
cobalt-60 as a source of radiation use a variety of systems to shield operators from
radiation Older systems can be as rudimental as a water filled hole with cobalt-60 resting at
the bottom samples are lowered in a container and held at a given distance from the source
to accumulate dose More advanced systems involve mechanically lifting cobalt-60 from
some shielded well into an experimental area This area may be a dedicated room for
irradiating samples or it may be a shielded chamber in which samples are placed The latter
example is known as a self-contained irradiator and is the type of irradiator used in this
work
Chapter 2 Experimental Methods
42
All irradiations reported here were carried out using the Foss Therapy Model-812 Self-
Contained Cobalt-60 Irraditor located at the University of Manchesterrsquos Dalton Cumbrian
Facility (DCF) The Model-812 Irradiator contains three independent housings where
cobalt-60 sources may reside named A B and C Currently only A and C contain
cobalt-60 and had a total activity of 5281 TBq on the original date of measurement
(2nd
May 2012) Source B is due to be filled after one half-life from the original date to
bring the total activity back to a similar level Both A and C sources are used at the same
time for every irradiation throughout this work
Figure 9 Image on the left shows the Model-812 Irradiator On the right is the inside of
the irradiator showing the three guide rods that contain the cobalt-60 source during
irradiation
Chapter 2 Experimental Methods
43
Samples are placed within the irradiator and are exposed to gamma emission from the
cobalt-60 for calculated periods of time to allow samples to accumulate the desired dose
Radiation doses are defined as the amount of energy deposited per kilogram of sample
material and are often quoted as the SI derived unit Gray (Gy) which has the unit J kg-1
In
order to calculate how long a sample should be exposed for requires knowledge of the rate
at which radiation energy is deposited into the sample This is known as a dose rate and is
often quoted as Gy min-1
The practice of dose rate determination is known as ldquodosimetryrdquo
and there are a number of physical and chemical methods for determining the dose rate
from a given source Physical methods often deploy tools such as calorimeters and
scintillation chambers to directly measure energy while chemical methods depend on
measuring some chemical change that occurs during exposure to radiation that responds
linearly with increasing dose There are many chemical dosimeters available depending on
the kind of work being undertaken For example vapour phase experiments often measure
the condensation of acetylene into benzene to determine a dose rate22
For this work the
dosimeter used was a ferrous sulphate solution known as the Fricke dosimeter The Fricke
dosimeter was first described in 1927 by Hugo Fricke and has become the most adopted
chemical dosimeter among radiation scientists23
The standard recipe to make a Fricke
dosimeter used in this work is as follows
Fricke Dosimeter Dissolve 04 grams FeSO4∙7H2O (99 assay Fisher Chemicals) 006
grams NaCl (gt9999 Assay Calbiochem) and 22 mL concentrated H2SO4 (95-98
Sigma Aldrich) Dilute with distilled water to make 1 litre of Fricke solution24
Chapter 2 Experimental Methods
44
This solution will slowly oxidise and must be used within a few days by preventing light
from interacting with the solution it is possible to extend the shelf life of the Fricke
solution to three months The Fricke dosimeter relies on the oxidation of FeII to Fe
III by
species produced during the radiolysis of water
119867(119886119902)+ + 119890(119886119902)
minus rarr 119867bull
119867bull + 1198742 rarr 1198671198742bull
119865119890119868119868 + 1198671198742bull rarr 119865119890119868119868119868 + 1198671198742
minus
1198671198742minus + 119867(119886119902)
+ rarr 11986721198742
119865119890119868119868 + 11986721198742 rarr 119865119890119868119868119868 + bull119874119867 + 119874119867minus
119865119890119868119868 + bull119874119867 rarr 119865119890119868119868119868 + 119874119867minus
The extent of oxidation responds in a linear fashion to ionising radiation until dissolved
oxygen is exhausted this can be up to 500 Gy but in practice doses are usually kept
between 40 and 400 Gy to ensure measurements are made within the range in which FeIII
is
of a measurable concentration but FeII is not fully depleted
2 With a strong absorbance at
304 nm Fe3+
can be quantified by spectrophotometric analysis and an absorbed dose can be
calculated from the following equation
119863119866119910 = 9647 times 106 times
∆119860
∆휀119897120588119866(1198651198903+)
Chapter 2 Experimental Methods
45
where DGy is the absorbed dose in Grays ΔA is the difference between the optical
absorbance before and after irradiation and Δε is difference between the molar extinction
coefficient of Fe2+
and Fe3+
at 304 nm which has an established value of
2201 mol-1
cm-1
24
G(Fe3+
) is the chemical yield of Fe3+
and a value of 155 is
recommended when using cobalt-60 by the International Commission on Radiation Units
and Measurements Path length and solution density are represented by the terms l and ρ
respectively
Irradiations throughout this work were conducted using two sample holding devices each
with a number of different positions The first device consists of a standard 4x8 test tube
rack that has been fixed to an irradiation base plate The base plate allows the device to be
locked in exactly the same position within the Model-812 every time it is used
This device holds a number of 20 mL headspace vials during irradiations of samples which
are then analysed for H2O2 content the details of which will be discussed later
The second device is somewhat more complex and is used to hold samples that are
analysed for H2 content again the details of which are discussed later This device is
designed to keep samples mixed by slowly rotating them along a horizontal axis thus
continually inverting samples throughout the irradiation period it is hence referred to as the
ldquoinverter rigrdquo The construction consists of a high torque motor with a top speed of 2 rpm
Chapter 2 Experimental Methods
46
Figure 10 Sample holding devices for use in the Model-812 Left is the 4x8 rack with its
schematic below On the right is the inverter rig again with its schematic below
Dosimetry measurements were carried out in each of these devices and the results are
shown below Table 1 shows the dosimetry for the 4x8 test tube rack each position was
measured at four time intervals each of which with three replicates Measurements were
carried out in 20 mL headspace vials which were filled with 10 mL of Fricke solution
Chapter 2 Experimental Methods
47
Experiments carried out in this device only occupied positions in the first two rows hence
only these results are shown Table 2 shows the dosimetry of the inverter rig again each
position was measured at four time intervals each with three replicates The inverter rig
only has four positions which were measured with no rotation mixing Initially
experiments were to be conducted under stationary conditions before moving on to mixed
conditions however time limitations prevented progression to mixed samples and all
samples are conducted with no rotational mixing From the data obtained absorbance units
were converted to an absorbed dose by use of equation 1 and dose rates are then extracted
as the gradient of absorbed dose plotted as a function of time
Date of Original Measurement 07022014
Position Dose Rate on Date of
Measurement (Gy min-1
) plusmn Error
A1 29435 75
B1 34827 23
C1 32352 41
D1 27358 89
A2 15845 24
B2 18519 62
C2 18176 26
D2 15248 17
Table 1 Dose rates of the front most two rows of the 4x8 irradiation rack determined by
Fricke analysis The error indicates the percentage of uncertainty of the obtained gradient
Chapter 2 Experimental Methods
48
Date of Original Measurement 13012015
Position Dose Rate on Date of
Measurement (Gy min-1
) plusmn Error
A 29379 46
B 31708 46
C 30208 87
D 30616 46
Table 2 Dose rates of the four positions of the inverter rig determined by Fricke analysis
The error indicates the percentage of uncertainty of the obtained gradient
As cobalt-60 decays dose rates are subject to change with time however they change in a
predictable manner The decay of cobalt-60 follows first order kinetics it is therefore
possible to adjust dose rates to account for the decay of the source simply by multiplying
the dose rate by the ratio of initial radiation intensity and the intensity after a given time2
This can be written as
119863119877119860119889119895 = 119863119877 times1198681199051198680
Where
1198681199051198680= 119890minus120582119905
And
120582 =ln 2
11990512
Chapter 2 Experimental Methods
49
DRAdj is the decay adjusted dose rate after time t λ is the decay constant and tfrac12 is the half-
life which for cobalt-60 is 527 years The use of this equation depends on knowing how
much time has passed since the original dose rate (DR) was calculated hence the inclusion
of the date on which these measurements were made in Tables 1 and 2
Water Purification for Radiolysis Experiments
Radiation breaks water molecules into reactive radicals which can react quickly with any
impurity present in a sample It is therefore of high importance to ensure that any water
used in radiolysis experiments is of the highest purity During the early days of radiation
chemistry high purity water was often obtained through a triple distillation process Water
was distilled firstly through standard means before being distilled again from an acid
dichromate solution and finally a third time from an alkaline permanganate solution before
being stored in a fused silica container4 Advancements in modern self-contained
purification systems have significantly simplified the process of obtaining ultra-pure water
for radiolysis experiments All experiments carried out throughout this work use ultra-pure
water dispensed from the ELGA PURELAB Classic the feed water of which is provided
by the ELGA PURELAB Option-SR 715 Through the use of duel bank reverse osmosis
units two independent UV lamp purifiers and deionisation cartridges the final resistivity of
output water is measured to be 182 MΩ cm-1
Chapter 2 Experimental Methods
50
Figure 11 A diagram of the purification system that provides the ultra-pure water used
throughout this work Image was taken from the ELGA PURELAB user manual
Determination of H2O2 ndash Photometric Analysis
Throughout this work the determination of hydrogen peroxide is carried out using a
photometric technique known as the Ghormley Tri-iodide method25
This method takes
advantage of the redox reaction between hydrogen peroxide and iodide to produce iodine in
a 11 stoichiometric ratio with hydrogen peroxide This reaction takes place under acidic
conditions and is catalysed by the presence of ammonium molybdate tetrahydrate Acid is
also required to force the resulting equilibrium between iodine and tri-iodide completely
towards the production of tri-iodide which can then be measured by photometric analysis
this is achieved using potassium phthalate monobasic A general reaction scheme for this is
shown below
Chapter 2 Experimental Methods
51
11986721198742 + 2119868minus + 2119867+ rarr 1198682 + 21198672119874
1198682 + 119868minus 1198683
minus
This is a popular method for the determination of hydrogen peroxide in radiolysis studies26-
29 It is favoured for its relative simplicity over previous methods which typically involved
complicated titrations with potassium permanganate Furthermore it is also extremely
sensitive enabling accurate measurements of low concentrations of hydrogen peroxide with
a lower limit of 1 μM30
The reagent used to reduce hydrogen peroxide is susceptible to self-oxidation and has a
very short shelf life To prevent self-oxidation and prolong the shelf life the reagent is
prepared as two reagents designated ldquopart Ardquo and ldquopart Brdquo and are only mixed during
analysis One reagent contains potassium iodide under slightly alkali conditions while the
other contains an organic acid salt potassium phthalate monobasic Both reagents are
prepared according to the recipe originally described by Ghormley25
Part A Dissolve 1 gram NaOH (ge98 Sigma Aldrich) 33 grams KI (995 Assay
Fisher Scientific) and 01 gram (NH4)6Mo7O24∙4H2O (ge99 AppliChem) in 500 mL
deionised water
Part B Dissolve 10 g C8H5KO4 (ge9995 Sigma Aldrich) in 500 mL deionised water
Figure 12 Structure of Potassium phthalate monobasic (C8H5KO4)
Chapter 2 Experimental Methods
52
Analytical Procedure
The redox reaction between H2O2 and I ˉ is carried out on a 2 mL aliquot of sample
solution To this 1 mL of Part A and 1 mL of Part B are added a few seconds are required
for development before transfer to a quartz cuvette for analysis in a Cray 5000 UVVisNIR
photospectrometer Samples that contain solid material are filtered through syringe filters
before analysis to remove any solid particles Samples of elevated pH often required
additional acid to reduce the pH to the conditions required for analysis the quantity of
additional acid is determined by testing a blank sample with litmus paper the quantity is
then recorded and the dilution factor accounted for Utilisation of the Beer-Lambert law
allows for the calculation of hydrogen peroxide concentration from an absorbance within
the linear range of the technique
119860 = 휀119897119888
Where A is the optical absorbance ε is the molar extinction coefficient in M-1
cm-1
l is the
path length (always 1 cm during this work) and c is the concentration in mol dm-3
Determination of the optimum wavelength of absorption was carried out by a scanning
analysis of a 625 μM solution of hydrogen peroxide prepared by serial dilution of a 1 M
standard which itself was prepared from a 3wt stock solution of hydrogen peroxide in
water purchased from Sigma-Aldrich
Chapter 2 Experimental Methods
53
Figure 13 Scanned absorption spectra of a 625 μM H2O2 solution
The maximum absorbance was determined to be 351 nm which is consistent with values
described in literature3031
A series of standard solutions were made ranging in
concentration from 1-300 microM to determine the molar extinction coefficient shown in
Figure 14
Chapter 2 Experimental Methods
54
Figure 14 A calibration curve of H2O2 photometric absorption to determine the molar
extinction coefficient
Addition of the tri-iodide reagents dilutes the standard to half the quoted concentration A
dilution factor of 2 is used to correct for this hence the calibration curve covers the
concentration range 05-150 microM hydrogen peroxide The determined molar extinction
coefficient was 25631 M-1
cm-1
this again is consistent with values quoted in
literature263132
y = 25631x - 00012
0
05
1
15
2
25
3
35
4
45
00E+00 20E-05 40E-05 60E-05 80E-05 10E-04 12E-04 14E-04 16E-04
Ab
sorb
ance
[H2O2] (mol dm-3)
Slope Error = plusmn35548
Chapter 2 Experimental Methods
55
Determination of H2 - Gas Chromatography
Method development
Measurements of hydrogen gas are usually carried out using gas chromatography
frequently paired with mass spectroscopy3334
This work uses only gas chromatography to
measure hydrogen gas produced during the radiolysis of samples The standard technique
for gas analysis is to use a gas tight syringe and needle to extract a portion of headspace
from a sealed sample The samples are typically sealed in air tight vials with a rubber
septum to allow gas extraction however due to the effects of radiation on plastics and
rubbers the reliability of this technique remains debatable and often alternative methods are
sought One argument against the use of rubber septa in a radiation field is that they are
known to radiolytically produce their own hydrogen which would contribute to any
measurements Although some preliminary laboratory tests indicate that the production of
hydrogen from septa seems predictable and can be subtracted from any hydrogen produced
from samples this information was obtained from a single batch of septa and the
production rate of hydrogen will most likely vary between batches as nothing is known
about the manufacturersquos quality control tolerances Another important argument is
concerned with the concentration ranges of hydrogen that will be measured Aqueous
samples that contain no radical scavengers often have low chemical yields for hydrogen
and sampling with a syringe reduces the sample volume to a maximum of 100 microL
attempting to extract a larger volume leads to sampling problems associated with negative
pressure within the sealed sample
The portion of hydrogen entering the gas chromatograph may be reduced even further for
samples containing slurries as much of the hydrogen may remain trapped in the aqueous
phase even after agitation
Chapter 2 Experimental Methods
56
Headspace injections may be a viable technique for samples that are known to produce
large quantities of hydrogen but generally measurements made with this technique are
often close to or below the detection limits of the gas chromatograph Many radiation
chemists have adopted a variety of techniques for measuring small quantities of
radiolytically produced hydrogen that do not rely on the use of rubber septa One such
technique is the ldquoCrush Tuberdquo method described in references3536
This method is used for
all hydrogen analysis in this work
The Crush Tube Sampling Method
The crush tube method of gas chromatography uses a modified SRI Model 8610C Gas
Chromatograph (GC) with a bespoke sampling device that contains a section of Tygonreg
tubing that allows for a glass sample vial to be crushed by an external force such as a pair
of wrench pliers Originally the tubing was a standard silicone tube however Tygonreg
tubing proved to be more durable and less prone to leaks Figure 15 and 16 show the
general schematic for the apparatus as well as the specially made sample vials for this
method
Figure 15 The modified SRI 8610C Gas chromatograph with inline ldquocrush tuberdquo setup
The sample can be seen inside the silicone tubing
Chapter 2 Experimental Methods
57
Figure 16 Image on the left shows a schematic for the sampling apparatus on the right
are the vials used which are flame sealed at the midway neck
In order for this technique to work several modifications must be made to the GC hence
the selection of the highly modular SRI Model 8610C The first modification was made to
the 10-port gas sampling valve to enable carrier gas to flow through the bespoke sampling
device during analysis The unmodified 10-port valve contains a sample loop that connects
to the ldquoINrdquo and ldquoOUTrdquo ports on the external of the GC during sample loading When the
port is rotated to the ldquoINJECTrdquo position the loop is included in the carrier gas path and the
external ports are isolated
Chapter 2 Experimental Methods
58
Figure 17 A schematic of the original setup for the 10-port sampling valve in both off (top
image) and on (bottom image) positions
It is essential that carrier gas is allowed to continually flow through the system during both
sample loading and sample injecting As the bespoke sampling device creates a closed loop
between the external ports it is possible to swap the connections of ports 1 and 10 without
disrupting the flow of carrier gas
This modification isolates the external ports during sample loading but includes them
during sample injection and allows sample gas to be carried through the GC
Chapter 2 Experimental Methods
59
Figure 18 A schematic for the modified 10-port sampling valve including the removal of
the silica gel column
Figure 18 also depicts the removal of the silica gel column this is part of the second
modification The bespoke sampling device contains a large volume of gas that requires a
relatively fast carrier gas flow rate to achieve acceptably narrow peaks This flow rate is
quoted in literature as being around 50 mLmin35
The Packed silica gel column and the
default molecular sieve column simply did not allow for this high flow rate without
significant back pressure that can cause damage to equipment for this reason they were
removed A bespoke column was made from frac14 inch copper tubing and 13x molecular sieve
beads The new column had a total length of 4 m and allowed sufficient flow rates with
adequate separation of gasses
Chapter 2 Experimental Methods
60
Figure 19 Image on the left shows the bespoke frac14 inch OD 13x molecular sieve column
On the right the rotameter is connected to calibrate gas flow rates
The SRI Model 8610C is not equipped with a digital rotameter as such it cannot display
flow rate information and instead can only display information about the carrier gas inlet
pressure which requires a conversion formula to obtain a meaningful flow rate The user
manual includes conversion factors but these are column specific and as the column has
been custom built it is necessary to manually determine a conversion formula to obtain a
flow rate This was done using a rotameter connected to the external GC ports by adjusting
the inlet pressure and noting the rotameter value a calibration curve was obtained
Chapter 2 Experimental Methods
61
Figure 20 A calibration curve to provide a conversion to determine carrier gas flow rate
Detection of H2 and Calibration
The SRI Model 8610C is equipped with a thermal conductivity detector (TCD) for the
measurement of eluted gas The TCD consists of a Wheatstone bridge circuit with tungsten-
rhenium filaments serving as resistors (Figure 21) Carrier gas containing eluted sample
passes over one of the filaments while a second path is reserved for carrier gas only to
serve as a reverence The filaments are electrically heated and the temperature of the whole
unit is carefully controlled As carrier gas passes over the filaments it conducts heat away
from the filament to the detector body when a sample component flows over the filament
the conductivity changes causing the filament to change temperature relative to the
reference filament This change in temperature changes the resistivity of the filament and a
change in voltage is recorded
Chapter 2 Experimental Methods
62
Figure 21 A schematic of a Wheatstone bridge circuit used in the TCD
To achieve a good sensitivity towards a given analyte it is important to have a large
difference in thermal conductivity between said analyte and the carrier gas Table 3 shows
the thermal conductivity values for some common gases The carrier gas most often used is
helium which has a thermal conductivity of 36036times106 cal s
-1 cm
-1 degC
-1 As many other
gases have much lower thermal conductivities helium often performs well however
hydrogen is a special case as it also has a high thermal conductivity of
44632times106 cal s
-1 cm
-1 degC
-1 For this reason the carrier gas selected for hydrogen
measurement was argon which has a much lower thermal conductivity of
4257times106 cal s
-1 cm
-1 degC
-1
Gas Thermal Conductivity (cal s-1
cm-1
degC-1
x106)
267degC
H2 44632
O2 6364
N2 6240
Ar 4257
He 36036
Table 3 Thermal conductivity of commonly used gases
Values taken from the Handbook of Tables for Applied Engineering Science
Chapter 2 Experimental Methods
63
Measurements made by the TCD are expressed as a voltage plotted as a function of time
The peaks produced in this plot are integrated and the final result is expressed as the peak
area As the peak area unit is largely arbitrary a calibration curve must be obtained to relate
the peak area to a meaningful quantity of hydrogen Calibration is carried out by replacing
the bespoke sampling device with a simple T-section fitted with a rubber septum Known
quantities of hydrogen gas are injected into the T-section which is then carried through the
GC Figure 22 shows a calibration curve for the linear range of 1 ndash 500 microL of pure
hydrogen at standard room temperature and pressure
Figure 22 A calibration curve for quantifying hydrogen gas from chromatograms
Samples of airhydrogen mixtures were also injected to make sure there was adequate
separation between the gases good separation between hydrogen and oxygen is observed
but the separation of oxygen and nitrogen is not adequate for analysis of those gases when
both are present in large quantities
Chapter 2 Experimental Methods
64
Machine parameters were adjusted for optimum performance these are shown in Table 4
These parameters were used for every experiment throughout this work
Parameter Value
Valve Temperature 70 Cdeg
Column Temperature 40 Cdeg
TCD Temperature 220 Cdeg
Flow Rate 50 mLmin
Carrier Gas Ar
Table 4 Optimised parameters used for the analysis of H2 gas
Method Validation
It was mentioned previously that the bromide ion is an excellent scavenger of hydroxyl
radicals during radiolysis
bull119874119867 + 119861119903minus [119867119874119861119903]minus119867(119886119902)+
rarr 119861119903bull + 1198672119874119861119903minus
rarr 1198611199032bullminus
Radiolysis of an aqueous solution of 1 mM bromide results in the elimination of the
reaction between the hydroxyl radical and molecular hydrogen in solution37
Other than
diffusion to the gas phase a reaction with hydroxyl radicals is the only significant removal
path of hydrogen at neutral pH The removal of dissolved oxygen by argon sparging also
simplifies much of the radiolysis chemistry allowing for a more reproducible experiment
This means that the hydrogen measured from the radiolysis of a deaerated 1 mM bromide
solution is in fact a primary yield and is quoted throughout the literature as being
GH2 = 045 this is an average value from a range of studies
2453839
Chapter 2 Experimental Methods
65
In order to secure confidence in this technique a validation experiment was carried out in
which a 1 mM solution of potassium bromide was used to determine the primary yield of
hydrogen which was then compared to the literature value
Figure 23 Method validation by the determination of the well-established primary yield of
H2 through hydroxyl scavenging by bromide
As expected the hydrogen concentration increased linearly with absorbed dose over the
experimental range When the number of hydrogen molecules is plotted as a function of
absorbed energy in sets of 100 eV the gradient gives GH2 = 0456 plusmn0025 matching well to
the average value quoted in literature
Chapter 2 Experimental Methods
66
Sources of Error
The majority of experiments carried out in this work use the absorbed energy or dose as
the independent variable and using one of the analytic techniques discussed above either a
photometric absorption value or the integrated response to hydrogen gas detection as the
dependant variable Both the dependant and independent variable have errors associated
with them which are discussed below
Determining the quantity of absorbed energy to the sample relies on the procedure of
dosimetry discussed earlier in this chapter The errors reported in Tables 1 and 2 are the
percent error of the gradient obtained from the measurement of Fe3+
as a function of time
As the experiments carried out in this work are plotted as a function absorbed dose and
there is an element of uncertainty associated with the dose rates the uncertainty of the
calculated absorbed dose increases with increasing dose This uncertainty in the absorbed
dose is included in many of graphs showing experimental data and is represented by
horizontal error bars
Sources of Error in the Determination of H2O2
The determination of H2O2 relies mainly on the calibration curve to yield a molar extinction
coefficient determined to be 25631 M-1
cm-1
with an uncertainty of plusmn 355 M-1
cm-1
The
molar extinction coefficient is used to convert the measured absorbance of a sample to a
concentration of H2O2 however this value has a dependence on temperature The ambient
temperature of the laboratory fluctuates slightly but it was decided that the effects were too
minor to consider The irradiation of samples on the other hand resulted in samples
heating slightly to a temperature that would be significant
Chapter 2 Experimental Methods
67
This was largely mitigated by leaving samples to cool for a few minutes until they reached
room temperature however an increase in temperature may affect the radiation chemistry
Solutions used to calibrate and reagents used to analyse samples also carry an associated
uncertainty in their concentrations The standards used to produce the calibration curve
were prepared from a stock solution of 3 wt H2O2 (Sigma Aldrich) From this the
0882 M solution was diluted to 1 mM which was used in a serial dilution to create the
standards ranging from 1 ndash 300 μM Uncertainty in the concentrations will have been
introduced by the tolerances of the pipettes and volumetric flasks used The pipettes used
were the Gilson Pipetman P1000 and P20 which are certified to comply with ISO 8655 that
imposes maximum allowable systematic errors of plusmn 80 μL and plusmn 02 μL for the P1000 and
P20 respectively The maximum allowable random error for the P1000 is quoted to be
le 30 μL and le 01 μL for the P20 The volumetric flasks used were class A Glassco brand
flask that conform to ISO 1042 Of the range of flasks used the largest error was 00025
Any uncertainty in the concentrations of the analytical reagents used to reduce H2O2 is
largely irrelevant as the chemicals used to perform the analysis are provided in a large
excess Stoichiometrically speaking as long as the concentration of iodide is at least three
times that of H2O2 the analysis should work in reality the concentration of iodide is
several times higher than this ensuring all H2O2 is reduced The sum of the above errors are
assumed to contribute to less than 1 of the total uncertainty of any measurements of
H2O2
Chapter 2 Experimental Methods
68
Sources of Error in the Determination of H2
The experimental technique provides a means to quantify hydrogen gas by volume In order
to make a comparison to predictions made by the computational model it was necessary to
convert this value to a concentration (mol dm-3
) This means knowing the volume of the
headspace in the crush tube vials As these vials are flame sealed they naturally have an
irregular shape and calculating a precise volume is difficult for this reason the conversion
uses an estimated headspace volume of 2 mL
Hydrogen gas is quantified by the integration of a change in voltage with respects to time
however the voltage response measured can be affected by a number of factors Factors
such as temperature and pressure are controlled automatically by the machine Moisture can
also affect the response of the TCD and this is controlled by running a ldquobake outrdquo cycle
prior to running any analysis One factor that cannot be prevented is the slow oxidation of
the tungsten-ruthenium filament which lowers the sensitivity of gas detection This can be
accounted for by performing regular calibrations often 3 or 4 point calibrations that are
compared to the original calibration curve If there is any deviance from the original curve
then a full calibration is performed and this is then used for the following analyses The
calibration curve shown in Figure 22 was the first full calibration performed throughout the
duration of this project the gradient of this curve gradually decreased this was accounted
for using the calibration process mentioned above As calibrations are performed by hand
with a gas tight syringe most of the error is likely introduced at this point The average
error of calibration points was plusmn 25 in the calibration curve given in Figure 22 for other
calibrations not shown in this work the average error was always less than 5
Chapter 3 Computational Methodology
69
Chapter 3 Computational Methodology
The earliest recorded computational approaches to solving problems in the field of radiation
chemistry date back to 1958 when the AVIDAC computer in Chicago was used to model
radical diffusion kinetics40
Since then different mathematical techniques have found use in
modelling problems found in the field of radiation chemistry and with ever increasing
computational power complicated calculations can be performed in seconds rather than
days In the early days of computational radiation chemistry primary yields were calculated
by deterministic methods involving the diffusion of a single spur However it became
apparent that a Monte Carlo approach held several advantages over deterministic methods
for the description of early stage radiolysis Such advantages include the ability to
incorporate the effects of a variety of different spur sizes and other entities arising from
secondary electrons41
For this reason modern radiolysis models usually fall into two
categories depending on what stage of radiolysis is being modelled Monte Carlo
calculations often concern the non-homogeneous early stages of radiolysis due to the
stochastic nature of energy deposition into a medium as mentioned earlier these
calculations often predict the primary yields of radiolysis products42
If the primary yields
are already known a deterministic approach is often employed to model the resulting
homogeneous chemistry in a similar way to most other chemical kinetics models through
the use of simultaneous ordinary differential equations (ODE)2743-46
Newer radiolysis
models are moving towards a multi-scale approach in which the output of the stochastic
stage is fed directly into the deterministic stage47
In this project a deterministic kinetic model for homogeneous chemical stage radiolysis has
been developed using a software package called FACSIMILE developed by MCPA
software Ltd
Chapter 3 Computational Methodology
70
FACSIMILE utilises Gear methodology for auto-adaptive time step control coupled with
Newton-Raphson iterations for prediction correction to deliver a robust simultaneous
ordinary differential equation solver The FACSIMILE language is largely based on the
Fortran language but is tailored for use by the scientific community and includes its own
high level notations for simplifying ODE construction48
The chemical model developed
here is largely based on the rate coefficient compilation by Elliot and Bartels 46
as well as
other literature sources27434549
This chapter gives a detailed description of how the model in this project works In essence
the model functions by producing primary radiolysis species at rates determined by their
primary yields and a dose rate parameter while simultaneously solving a set of ODEs that
represent the chemical reactions that describe the radiolysis chemistry At the same time
the model is also bound by framework calculations that describe various physical
parameters including but not limited to temperature effects and species volatility Each of
these concepts is described in detail in the following sections as well as the core radiolysis
reaction set
Production of Primary Species
As this model is only concerned with the homogeneous radiolysis chemistry that occurs
after diffusion of the primary species away from any kind of track structure the effect of
radiation can be represented by a series of zero order production equations with rate
constants derived from the dose rate and the species primary yield Each primary radiolysis
species has its own equation that defines its rate of production the general form of this
equation is shown below
Chapter 3 Computational Methodology
71
119896119894 =119863119877 times 119864119862 times 120588 times 119866119894
119873119860
DR is the dose rate given in Gy min-1
and Gi is the primary yield for species i NA is
Avogadros number and provides the conversion of molecules to moles while ρ is the
density of water and converts mass to volume ρ also has its own temperature dependency
which is calculated elsewhere in the code EC is a constant that effectively converts the
units of dose rate (J kg-1
min-1
) into time units compatible with a zero order rate constant
(mol dm-3
s-1
) and energy units compatible with primary yields (molecules 100 eV-1
) and
has a value of 104 times1015
and carries the unit 100 eV s-1
The dose rate is initially set by the user and is constant throughout the calculation however
primary yields are not set by the user and are initially set depending on other parameters
such as temperature and pH Table 52 shows the primary yields for water radiolysis by
gamma-rays at neutral pH and at room temperature the following section describes the
factors that can alter these values and details how they are incorporated into the model
Primary Species eaq- H
bull
bullOH H2 H2O2
g-Value 263 055 272 045 068
Table 5 Primary yields for γ-radiolysis of water at neutral pH and standard pressure and
temperature2
Chapter 3 Computational Methodology
72
Factors Affecting Primary Yields
Temperature
The rate of diffusion of primary species away from spurs created by ionising radiation is
affected by temperature As the temperature is increased the rate of diffusion of radical
species increases as does the rate of recombination reactions The yields obtained at high
temperature are determined by this competition between diffusion and recombination rates
Experiments carried out by Hochanadel and Ghormley (Table 6)50
first show this effect
over a temperature range of 2 ndash 65 degC in which higher temperatures favour increased
radical yields and decreased molecular yields
Primary Species g-Value Temperature
coefficient degC-1
2degC 23degC 65degC
Hbull + eaqˉ 359 367 382 +010plusmn003
bullOH 280 291 313 +018plusmn004
H2 038 037 036 -006plusmn003
H2O2 078 075 070 -015plusmn003
-H2O 435 441 454 +007plusmn003
Table 6 Temperature effects on the primary yields of water radiolysis50
A recent extensive compilation by Elliot and Bartels includes measurements of primary
yields at temperatures from 20 ndash 350degC from multiple sources and collates this data to
provide fitted equations for use in computational models The primary yield of the hydrated
electron was determined by product analysis of nitrogen formation from samples containing
nitrous oxide51-54
The chemical yield of nitrogen is equal to the primary yield of the
hydrated electron due to the following scavenging reaction
119890(119886119902)minus + 1198732119874 rarr 1198732119874
minus rarr 1198732 + 119874minus
Chapter 3 Computational Methodology
73
Organic compounds were also added to scavenge hydroxyl radicals and prevent them from
reacting with hydrated electrons Pulse radiolysis studies were also included55
but only the
data from nitrogen yield measurements were recommended for use
For the determination of the hydroxyl primary yield pulse radiolysis was the primary
method used The method described used bicarbonate to effectively convert hydroxyl
radicals to the carbonate radical which is more easily measured
The temperature dependency of the extinction coefficient for the carbonate radical was
estimated by integrating normalised absorption spectra as a function of temperature
originally collected by Elliot et al53
The resulting temperature dependency of the hydroxyl
radical primary yield is in agreement with an independent pulse radiolysis study that used a
ferrocyanide ion solution to measure the temperature dependency of the hydroxyl yield up
to 105degC53
The temperature dependence of the hydrogen peroxide primary yield was determined by
three independent studies Measurements in acrylamide solutions provided the temperature
dependency up to 100degC53
Further measurements made in deaerated solutions containing
nitrate and methanol extended this range to 150degC56
Estimations of the peroxide primary
yield to high temperatures were made based on the assumption that it was equivalent to the
chemical yield of oxygen in an alkali solution containing nitrous oxide or iodine this
approach expanded the temperature range to 270degC54
The primary yield of molecular hydrogen as a function of temperature has been measured
by three laboratories In each case hydrogen was directly measured from solutions
containing either a nitrous oxide and organic mix or nitrite ions In both cases the
measurements agreed well across all three laboratories515354
Chapter 3 Computational Methodology
74
Several attempts at measuring the primary yield of the hydrogen atom as a function of
temperature have been made however only two data sets are considered reliable as others
do not agree with the established yield at room temperature although all data sets show an
increase in yield with temperature
The chemical yield of molecular hydrogen from deaerated solutions containing nitrate and
phosphite ions is said to be equal to the sum of the primary yields of molecular hydrogen
and the hydrogen atom subtracting the already established primary yield of molecular
hydrogen from these measurements should give the primary yield of the hydrogen atom
These measurements agreed well with the established room temperature value and gave a
temperature dependence up to 200degC53
The temperature dependence was expanded to
350degC based on estimations of the ratio between the hydrogen atom primary yield and
hydrated electron primary yield which was calculated from data obtained during other
experiments performed in alkali solutions Unfortunately this data is described as archived
and unpublished The collated data from the experiments described above are shown in
Figure 24 with polynomial fits overlain the equations for these polynomials are given in
Table 7 and are used in the modelling calculations reported
Chapter 3 Computational Methodology
75
Figure 24 Collected data from literature showing measured primary yields as a function
of temperature Provided by Elliot and Bartels 200845
Primary Yield
Polynomial
g(eaq-) 2641 + 4162times10
-3 t + 9093times10
-6 t
2 ndash 4717 times10
-8 t
3
g(H2O2) 0752 ndash 1620times10-3
t
g(H2) 0419 + 8721times10-4
t ndash 4971times10-6
t2 + 1503times10
-8 t3
g(bullOH) 2531 +1134times10
-2 t ndash 1269times10
-5 t2 + 3513times10
-8 t3
g(Hbull) 0556 + 2198times10
-3 t ndash 1184times10
-5 t2 + 5223times10
-8 t3
Table 7 Polynomial equations for estimating temperature effects on primary yields45
Where t is the temperature in degC
Incorporation of any kind of temperature dependence into a prediction that will be
compared with experimental data requires knowledge of the experimental temperature This
is especially important in chemical kinetic models such as this as almost all the reaction
rate constants are temperature dependent For this reason a test was conducted to measure
the temperatures experienced by samples during irradiation
Chapter 3 Computational Methodology
76
The test was carried out with vials which had thermocouples attached the vials were filled
with water The vials were irradiated for 16 hours and the temperature was recorded every 5
minutes the average recording is shown in Figure 25 A polynomial fit was made from the
first 4 hours of data which was applied in the code to control the rate of temperature change
during a calculation the simulated temperature is shown as the red dashed line in
Figure 25
Figure 25 A comparison of the sample temperature profile logged by thermocouple to the
temperature profile calculated in the computational model
There are many ldquobulkrdquo radiolysis models in literature few of which make any reference to
the way in which temperature is controlled It can only be assumed that these models use a
fixed temperature which would produce less accurate predictions especially during early
periods where the temperature change is significant It should be said that this approach
should be used with caution as this temperature profile depends on the equipment being
used to irradiate samples and the dose rate involved
20
25
30
35
40
45
0 2 4 6 8 10 12 14 16
Tem
per
atu
re (degC
)
Time (h)
Thermocouple
Facsimile
Chapter 3 Computational Methodology
77
The majority of energy from the radioactive sources ends up being deposited into the
shielding material of the irradiation unit This heats the surrounding air within the
irradiation chamber which is often not circulated
pH
The effect of pH on the primary yields of water radiolysis has been a subject of discussion
for many decades yet experimental data on the subject is relatively sparse at high and low
pH Early radiolysis experiments often took place in acidic medium and so acidity became
one of the first variables considered for investigations into the effects of pH on primary
yields Table 857
shows primary yields data from 04 M sulfuric acid samples where the
pH = 046 the values shown are averages over multiple sources
Reference g(eaq-) + g(H
bull)
g(
bullOH) g(H2) g(H2O2) g(-H2O) Ref
Ferradini C et al 370 280 045 090 460 58
Allen AO
Lefort M 365 295 045 080 455
459
Sworski T J 370 292 039 078 448 60
Hochanadel C J et al 370 290 040 080 450 61
Mahlman H A et al 368 296 045 081 458 62
Hayon E et al 366 297 040 076 450 6364
Sehested K et al 362 289 039 076 441 65
Spinks amp Wood 365 290 040 078 445 2
Table 8 A collection of measurements of primary yields made in 04 M solution of
sulphuric acid (pH = 046)57
The noticeable changes to the primary yields when compared with those at neutral pH are
consistent throughout the literature including further sources not included in Table 8
Chapter 3 Computational Methodology
78
The change in primary yields is not massive in the pH range 046 ndash 7 but neither is it
insignificant With the exception of the molecular hydrogen yield all primary yields
increase slightly at low pH The main explanation for this involves the conversion of
hydrated electrons to hydrogen atoms within the radiation spurs In neutral solutions the
hydrated electron readily reacts with the hydroxyl radical to form hydroxide but when the
hydrated electrons are converted to hydrogen atoms the reaction with hydroxyl radicals is
suppressed
The hydrogen atoms do not react with hydroxyl radicals as quickly as hydrated electrons
and so the hydroxyl radicals become effectively ldquoprotectedrdquo at low pH This explains the
increase in primary yield of the reducing species (hydrated electron plus the hydrogen
atom) and the increase in the hydroxyl radical yield With an increase in hydroxyl radicals
comes an increase in the peroxide primary yield via the dimerisation of hydroxyl radicals
The decrease of the molecular hydrogen primary yield is due to the dimerisation of
hydrogen atoms having a slower coefficient than the reaction between two hydrated
electrons
119890119886119902minus + 119867(119886119902)
+ rarr 119867bull k = 210 times1010
M-1
s-1
119890119886119902minus + bull119874119867 rarr 119874119867minus k = 302 times10
10 M
-1 s
-1
119867bull + bull119874119867 rarr 1198672119874 k = 153 times10
10 M
-1 s
-1
The effect high pH has on the primary radiolysis yields of water is not as well documented
The number of studies is fewer than those conducted in acidic medium and the data from
said studies do not always agree Table 957
shows a collection of primary yields measured
in alkali samples where the pH asymp 135
Chapter 3 Computational Methodology
79
Reference g(eaq
-) +
g(Hbull)
g(
bullOH) +
g(bullOˉ)
g(H2) g(H2O2) +
g(HO2ˉ) g(-H2O) Ref
Draganić et al 318 272 045 068 409
538
Hayon E 327 304 043 053 412
66
Haissinsky M 334 301 04 056 414
67
Dainton F S et al 385 34 036 058 457
6869
Cheek C H et al 28 21 045 084 37
70
Fielden E M et al 357 28 - - -
71
Czapski G et al 33 - - 056 -
72
Table 9 A collection of primary yields measured in alkali solutions (pH asymp 135)57
At high pH the hydroxide ion can react with the hydroxyl radical within the spur forming
the oxide radical anion bullOˉ in the following equilibrium
bull119874119867 + 119874119867minus bull119874minus + 1198672119874 pKa = 119
At high concentrations of hydroxide the hydroxyl radical may be completely replaced by
the oxide radical anion A consequence of this shift is the decrease in the peroxide primary
yield as it is thought that the dimerisation of the oxide radical anion to form peroxide is
slower than the neutral equivalent dimerisation of hydroxyl radicals This is something that
is observed across almost all the studies conducted at high pH The reaction between the
hydrated electron and the oxide radical anion is also slower than the corresponding neutral
equivalent reaction It is therefore expected that the primary yield of oxidising radicals
G(bullOH) + G(
bullOˉ) would increase with increasing pH as would the total primary yield of
reducing radicals G(e(aq)
-) + G(
bullH) The primary yield of molecular hydrogen is mostly
unaffected by the increased pH this would suggest that the net decomposition yield of
water must increase in order to satisfy the material balance equation
Chapter 3 Computational Methodology
80
119892(minus1198672119874) = 119892(119890119886119902minus ) + 119892(119867bull) + 2119892(1198672) = 119892(119874119867
bull) + 119892(119874bullminus) + 2(119892(11986721198742) + 119892(1198671198742minus))
Despite the difficulty in deriving quantitative agreement across the available data there are
studies that offer qualitative agreement with the expected changes to primary yields at high
pH66-69
There are also studies that do not agree and propose that the primary yields are
largely unaffected by pH5387073
Despite the oxide radical anion being the main radiation produced oxidising radical in
aqueous alkali medium and therefore having a significant effect on the chemistry reaction
rate coefficients associated with it are largely unknown and rely on estimation The lack of
reliable rate coefficients for the reactions of the oxide radical anion is an important factor to
consider when attempting to model the radiolysis of water at high pH
It has been shown using stochastic simulations that the chemistry of the oxide radical
anion can have a significant impact on the prediction of primary yields Initial predictions
of the stochastic model by Pimblott et al74
showed an increase in the peroxide primary
yield at high pH This is counter to the accepted trend observed experimentally of a
decreasing peroxide primary yields at high pH In order to match the observed decrease in
peroxide primary yield a single rate constant was changed from 20 times1010
M-1
s-1
to 65
times109 M
-1 s
-1 for the reaction below
119874bullminus + bull119874119867 rarr 1198671198742minus
Chapter 3 Computational Methodology
81
This change had the effect of reversing the trends of the primary yield predictions at high
pH resulting in agreement with experimental data Soon after this the rate constant for the
reaction between the oxide radical anion and the hydroxyl radical was measured to be 74
times109 M
-1 s
-1 which is much closer to the adjusted rate constant used in the stochastic
simulation than the original estimate49
Figure 26 shows literature values for the measured primary yields as a function of pH from
this polynomial equations were fitted which were combined in a multiple regression
analysis with the equations fitted to temperature analysis data Table 10 shows the resulting
equations While this approach gives an estimate of the primary yields as a function of both
temperature and pH it is not an ideal solution This type of estimation is better suited to a
stochastic type track chemistry calculation
A stochastic approach could also account for the effects of different linear energy transfer
(LET) values which are discussed in the next section A multi-scale approach could even
procedurally produce stochastically calculated primary yields that feed into a deterministic
chemical kinetic simulation
Chapter 3 Computational Methodology
82
Figure 26 A reproduction of data provided by Hayon75
showing the effect of pH on
primary radiolysis yields
Primary Yield
Multiple Regression Equation
g(eaq-) 28 + 285times10
-3 times t ndash 251times10
-2 times pH
g(H2O2) 845times10-1
ndash 151times10-3
times t ndash 17times10-2
times pH
g(H2) 388times10-1
+ 829times10-4
times t + 599times10-4
times pH
g(˙OH) 243 + 111times10-2
times t ndash 12times10-3
times pH
g(H˙) 444times10-1
+ 367times10-3
times t ndash 24times10-4
times pH
Table 10 Multiple regression polynomials used to estimate the combined effect of
temperature and pH on the primary yields of water radiolysis
0
05
1
15
2
25
3
35
0 1 2 3 4 5 6 7 8 9 10 11 12 13 14
Pri
ma
ry Y
ield
(M
ole
cule
s 1
00
eV
-1)
pH
g(OH)
g(e-)
g(H2O2)
g(H2)
Chapter 3 Computational Methodology
83
Linear Energy Transfer (LET)
Linear energy transfer is a way of expressing the rate at which an ionising particle loses
energy through a medium Sometimes referred to as ldquostopping powerrdquo linear energy
transfer is quoted as the average energy loss divided by a fixed path length usually micro
meters or nano meters (keV μm-1
or eV nm-1
) This parameter is frequently expressed as an
average rate of energy loss across the entire particlersquos track this is because the energy loss
rate of an ionising particle is not uniform As a high energy ionising particle begins its
journey through a material energy loss events are sparse and only small quantities of
energy are transferred so the particle continues largely un-deflected As this energy lost to
these small transfers accumulates and the energy of the charged particle decreases the
cross section of interactions increases This means that there are more energy loss events
for a given linear distance as the particles path becomes less linear A true linear energy
transfer profile of a particle would take the form of a Bragg curve such as the example
shown below
Figure 27 An example of a Bragg peak Energy loss of alphas of 549 MeV in Air
Image released to public domain
Chapter 3 Computational Methodology
84
For ease of comparison this profile is usually averaged to give a single LET parameter
Ionising particles of higher mass andor lower energy have higher LET values The
implications of linear energy transfer are manifested in the radiation track structure
Increasing LET values have the effect of increasing the spur distribution density as
illustrated in the diagram below
Figure 28 A schematic representation of how linear energy transfer (LET) alters the
distribution of spurs along a radiation track Image was recreated from Allen AO4
The distribution of spurs along a track has an effect on the diffusion of primary radiolysis
species and ultimately alters the primary yields Experiments carried out using 210
Po to
irradiate solutions of iron sulphate through various thicknesses of mica have shown the
effects of changing LET on the yield of oxidation of Fe2+
76
From this subsequent studies
using cyclotron accelerated protons have measured the effects of LET on the primary yields
of water radiolysis77
Compiling the data from these studies gives a general picture of the
effects of LET on water radiolysis primary yields which is shown below
Chapter 3 Computational Methodology
85
Figure 29 Simulation data showing the effects of increasing linear energy transfer on the
primary yields of water radiolysis Image was recreated from Allen AO4
The general trend shows an increase in the formation of molecular products at higher LET
at the expense of radical species (with the exception of hydroperoxyl radical (˙HO2)) at very
high LET values whilst lower LET values favour the radical species Currently there is no
clear agreed explanation as to how the hydroperoxyl radical is formed at high LET Gamma
rays from cobalt-60 fall in the low LET range and have an average value of
023 keV μm-1
78
As the experiments conducted throughout this project used only cobalt-60 as a source of
radiation it was not necessary to incorporate the effects of linear energy transfer into this
radiolysis model nor was it necessary to include the primary yield of hydroperoxyl radicals
into this model as the yield is negligible at the LET value of cobalt-60 Future iterations of
this model would need to include the effects of linear energy transfer as well as better
methods for coping with the effects of temperature and pH this is discussed in more detail
in Chapter 8
Chapter 3 Computational Methodology
86
Mass Transfer of Volatile Species
The transfer of volatile species is not something that affects radiolysis primary yields but it
is important to include as the aqueous reactions of volatile species namely molecular
hydrogen and oxygen will partition into the gas phase This mass transfer is described
within the model as two equations
1198672(119886119902) 1198672(119892)
1198742(119886119902) 1198742(119892)
These equations take the form of first order rate equations with the rate constant substituted
for a time dependant net mass transfer coefficient (kapp) which includes an interfacial mass
transfer coefficient (νint) and the Henryrsquos equilibrium partition coefficient (Kp)27
119889119862(119886119902)119894
119889119905= minus119896119886119901119901
119894 (119905) times 119862(119886119902)119894 (119905)
119896119886119901119901119894 = 120592119894119899119905
119894 times119860119894119899119905119881119886119902
(1 minus 119870119901119894119862119892119894(119905)
119862119886119902119894 (119905)
)
Ci refers to the concentration of species i in either the gas phase or the aqueous phase Aint
and Vaq are used to describe some of the geometry of the radiolysis vessels used in
experiments Aint is the interfacial surface area between the two phases while V is the
volume of the aqueous or gas phase denoted by its subscript As experiments were
conducted in different sized vials depending on the analysis technique used different values
of Aint and V were used when comparing model predictions to experimental data
Chapter 3 Computational Methodology
87
This method assumes that the volume of liquid and covering gas is the same which was
true for all the experiments conducted during this work If the liquid to gas volume ratio
was anything other than 1 then the above differential should be adjusted to account for this
ratio by the following modification
minus119881119897119881119892times119889119862(119886119902)
119894
119889119905= 119896119886119901119901
119894 (119905) times 119862(119886119902)119894 (119905)
The interfacial mass transfer coefficient (νint) incorporates the use of the stagnant two-film
model which provides a description of resistance to diffusion through un-mixed boundary
layers (see Figure 3079
)
Figure 30 A representation of the stagnant two-film model used to calculate the
partitioning of volatile species79
The stagnant two-film model is incorporated into the mass transfer coefficient by relating
the species diffusivity coefficients (D) the boundary thickness (δ) and the Henryrsquos
equilibrium partition coefficient (Kp)
Chapter 3 Computational Methodology
88
1
120592119894119899119905119894=
1
(119863119886119902119894
120575119886119902)
+119870119901119894
(119863119892119894
120575119892)
119870119901119894 =
119862119886119902119894 (119890119902)
119862119892119894(119890119902)
The diffusivity of volatile species is a temperature dependant coefficient which is included
in the model through the use of polynomial fits to data obtained from literature and is
shown in figure 3180-83
Henryrsquos coefficients were taken from literature which included
equations for describing the temperature dependence so a polynomial fit was not
necessary84
The Henryrsquos equilibrium partition coefficient is a dimensionless ratio between
the aqueous and gas phase concentrations of a volatile species at equilibrium This value is
related to the Henryrsquos law constant (kH) by the following relationship
119879 times 119896119867119894 = 122 times 119870119901
119894
The value 122 is used to convert between the Henryrsquos law coefficient in mol maq-3
Pa-1
and
the dimensionless Henryrsquos law coefficient While T represents the temperature in Kelvin
the Henryrsquos law constant also has its own temperature dependency built in this is described
by the following relationship
119896119867 = 119896119867120579 times 119864119883119875 (
∆119867119904119900119897119899119877
(1
119879minus1
119879120579))
Chapter 3 Computational Methodology
89
The Henryrsquos constant at standard temperature (29815 K) (kHθ) is quoted in the literature as
being 13times10-3
mol dm-3
atm-1
for oxygen and 78times10-4
mol dm-3
atm-1
for hydrogen ΔHsoln
is the enthalpy of solution and R is the gas constant the average ratios are quoted in the
literature as 1650 for oxygen and 543 for hydrogen84
This gives values for the Henryrsquos equilibrium partition coefficient (Kpi) of 0019 and 0031
for hydrogen and oxygen respectively at 25degC and smaller values at higher temperatures
Figure 31 The diffusivity of O2 and H2 in both water and air as a function of temperature
000
050
100
150
200
250
300
350
000E+00
100E-05
200E-05
300E-05
400E-05
500E-05
600E-05
700E-05
800E-05
900E-05
0 100 200 300 400
Dif
fusi
vit
y i
n A
ir (
cm2 s
-1)
Dif
fusi
vit
y i
n H
2O
(cm
2 s
-1)
Temperature (degC)
O2aq
H2aq
H2g
O2g
Chapter 3 Computational Methodology
90
Diffusivity
Polynomial
O2(aq) 20times10-9
times t2
+ 40times10-7
times t + 10times10-5
O2(g) 10times10-6
times t2
+ 12times10-3
times t + 02073
H2(aq) 10times10-8
times t2 + 40times10
-7 times t + 30times10
-5
H2(g) 50times10-6
times t2 + 47times10
-3 times t + 07719
Table 11 Polynomial equations used to estimate the temperature effects on the diffusivity
of O2 and H2 in both gas and aqueous phases where t = temperature (Cdeg)
Water Radiolysis Reaction Set
The radiolysis model simulates the chemical kinetics of homogeneous radiolysis through
the use of simultaneous differential equations that represent the independent chemical
reactions taking place The model therefore includes a set of reactions accompanied by
reaction rate constants Tables 12 - 14 gives a summary of the reaction set used with a full
description of the reaction set including the associated temperature dependences is given in
appendix A The reaction rate coefficients are taken from multiple sources with the
majority from the compilation of A J Elliot and D M Bartels45
Chapter 3 Computational Methodology
91
Reaction Number Primary Species
Production
G-value
(Molecules100eV) Ref
G0 H2O 119890(119886119902)minus 271 45
G1 H2O Hbull 054 45
G2 H2O H2 041 45
G3 H2O bullOH 270 45
G4 H2O H2O2 068 45
G5 H2O H(aq)+ 271 45
Table 12 A list of Primary Species used to model water radiolysis
Reaction
Number
Chemical Reactions Rate Constant k
(M-1
s-1
25degC)
Ref
R0 emacraq + emacraq rarr H2 + 2OHmacr 726 times109
45
R1 emacraq + Hbull rarr H2 + OHmacr 276 times10
10
45
R2 emacraq + bullOH rarr OHmacr 355 times10
10
45
R3 emacraq + bullOmacr rarr 2OHmacr 231 times10
10
49
R4 emacraq + H2O2 rarr OHmacr + bullOH 136 times10
10
45
R5 emacraq + HO2bull rarr HO2macr 130 times10
10
45
R6 emacraq + HO2macr rarr Obullmacr + OHmacr 351 times10
9
49
R7 emacraq + O2 rarr O2bullmacr 225 times10
10
45
R8 emacraq + O2bullmacr rarr O2
2macr + H2O 130times10
10
4349
R9 Hbull + H
bull rarr H2 514 times10
9
45
R10 Hbull +
bullOH rarr H2O 109 times10
10
45
R11 Hbull + H2O2 rarr
bullOH + H2O 365 times10
7
45
R12 Hbull + O2 rarr HO2
bull 130 times10
10
45
R13 Hbull + O2
bullmacr rarr HO2macr 114 times10
10
45
R14 Hbull + HO2
bull rarr 2
bullOH 114 times10
10
45
R15 Hbull + HO2macr rarr
bullOH + OHmacr 137times10
9
85
Chapter 3 Computational Methodology
92
R16 Hbull + O3 rarr
bullOH + O2 220 times10
10
43
R17 bullOH +
bullOH rarr H2O2 481 times10
9
45
R18 bullOH + H2O2 rarr H2O + HO2
bull 292 times10
7
45
R19 bullOH + HO2macr rarr OHmacr + HO2
bull 813 times10
9
45
R20 bullOH + HO2
bull rarr H2O + O2 884 times10
9
45
R21 bullOH + O2
bullmacr rarr OHmacr + O2 110 times10
10
45
R22 bullOH + O3 rarr HO2
bull + O2 110 times10
8
43
R23 bullO3macr + H2O2 rarr O2
bullmacr + O2 + H2O 159 times10
6
43
R24 bullO3macr + HO2macr rarr O2
bullmacr + O2 + OHmacr 887 times10
5
43
R25 bullO3macr + H2 rarr O2 + H
bull + OHmacr 249times10
5
46
R26 bullO3macr +
bullOH rarr HO2
bull + O2
bullmacr 6000 times10
9
43
R27 bullO3macr +
bullOH rarr HOmacr + O3 250 times10
9
43
R28 bullO3macr + H
+(aq) rarr O2 +
bullOH 900 times10
10
43
R29 O2bullmacr + O2
bullmacr +1198672119874rarr
O2 + O22macr 299times10
-1
43
R30 O2bullmacr + HO2macr rarr
O2 + bullOmacr + OHmacr 823 times10
-2
43
R31 O2bullmacr + H2O2 rarr
O2 +
bullOH + OHmacr 130 times10
-1
43
R32 O2bullmacr + HO2
bull rarr O2 + HO2macr 760times10
7
43
R33 O2bullmacr +
bullO3macr rarr
O2macr+ 2O2 100 times10
4
43
R34 O2bullmacr + O3 rarr
bullO3macr + O2 150 times10
9
43
R35 HO2bull + HO2
bull rarr H2O2 + O2 840 times10
5
45
R36 HO2bull + H2O2 rarr O2 + H2O +
bullOH 500 times10
-1
49
R37 HO2bull + O3 rarr
bullOH + 2O2 500 times10
8
43
R38 H2O2 + HO2macr rarr O2 + H2O + OHmacr 450times10-4
43
R39 O3 + OHmacr rarr HO2macr + O2 480 times101
43
R40 O3 + HO2macr rarr bullOH + O2 + O2
bullmacr 550 times10
6
43
R41 O3 + H2O2 rarr bullOH + O2 + HO2
bull 371 times10
-2
43
R42 Hbull +
bullOmacr rarr OHmacr 200times10
10
43
Chapter 3 Computational Methodology
93
R43 bullO3macr + emacraq rarr 2OHmacr
+
O2 160times10
10
43
R44 O3 + emacraq rarr bullO3macr 360 times10
10
43
R45 H2O2 rarr 2bullOH 230 times10
-7
86
R46 O2macr + H2O rarr 2OHmacr
100 times10
10
43
R47 bullOmacr + H2 rarr
bullH + OHmacr 128 times10
8
45
R48 bullOmacr + H2O2 rarr O2
bullmacr + H2O 555 times10
8
49
R49 bullOmacr + HO2macr rarr O2
bullmacr + OHmacr 786 times10
8
45
R50 bullOmacr + O2
bullmacr rarr O
2macr + O2 600 times10
8
43
R51 bullOmacr +
bullOmacr rarr O2
2macr 100times10
8
43
R52 bullOmacr +
bullOH rarr HO2macr 761 times10
9
49
R53 bullOmacr + O3macr rarr 2O2
bullmacr 700times10
8
43
R54 bullOmacr + O3 rarr O2
bullmacr + O2 100 times10
9
43
Table 13 A list of reactions used to model water radiolysis
Chapter 3 Computational Methodology
94
Equilibria kf
(M-1
s-1
25degC)
kb
(M-1
s-1
25degC) Ref
R5556 H2O H+
(aq) + OHmacr 117 times10-3
118times1011
45
R5758 H2O2 H+
(aq) + HO2macr 890 times10-2
478times1010
45
R5960 H2O2 + OHmacr HO2macr + H2O 127 times1010
140 times106
45
R6162 HO2macr + OHmacr
O22macr + H2O 351 times10
5 110 times10
6
43
R6364 bullOH H
+(aq) +
bullOmacr 890 times10
-2 478times10
10
45
R6566 bullOH + OHmacr
bullOmacr + H2O 127 times10
10 140 times10
6
45
R6768 bullOmacr + O2
bullO3macr 375 times10
9 262 times10
3
45
R6970 HO2bull H
+(aq) + O2
bullmacr 478 times10
10 735 times10
5
45
R7172 HO2bull + OHmacr O2
bullmacr+ H2O 127 times10
10 163 times10
-1
45
R7374 Hbull emacraq + H
+(aq) 583 210times10
10
45
R7576 Hbull + OHmacr emacraq + H2O 244 times10
7 174 times10
1
45
R7778 Hbull + H2O H2 +
bullOH 458 times10
-5 395 times10
7
45
R79 H2(aq) H2(g) 269times10-3
R80 O2(aq) O2(g) 103times10-4
Table 14 A list of equilibria used to model the radiolysis of water
Chapter 3 Computational Methodology
95
Computational Assumptions and Error
The first assumption this model makes is that radiolysis does not occur in the gas phase In
reality this is not the case however the density of the gas phase is so small compared to that
of the aqueous phase that any contribution from gas phase radiolysis will be negligible
There are several reactions that do not include any kind of temperature dependence for their
associated rate constants This is due to a lack of information available in the literature
many of the species involved in these reactions are notoriously difficult to measure reaction
rate constants for thus these reactions have a fixed rate constant across all temperatures
The method for estimating the primary yields to account for both temperature and pH
effects is not an ideal method Multiple linear regression analysis is often used to
empirically predict the value of a single dependant variable based on the contributions of
multiple independent variables In the case of this model the independent variables are
temperature and pH a full model would also include LET as a third independent variable
The number of observations considered for the regression analysis is less than ideal due to
the scarcity of available data coupled with the difficulty of relating non-linear variables
means that predictions of primary yields are loose estimates at best The coefficient of
determination (R2) gives information about how well the multiple regressions fit the data
and is shown in Table 15 where μ denotes the estimated standard deviation of the error
Primary Yield
R2 μ
g(eaq-) 0612 0249
g(H2O2) 0934 0045
g(H2) 0907 0032
g(bullOH) 0950 0265
g(Hbull) 0925 0108
Table 15 Statistical information concerning the estimation of primary yields used to model
the radiolysis of water
Chapter 3 Computational Methodology
96
The partition of volatile species depends on a number of parameters some of which are
dependent on geometry Although H2O2 is not a volatile species its concentration is
strongly affected by the concentration of aqueous O2 it is therefore necessary to include gas
partitioning methods in both H2 and H2O2 model calculations The interfacial surface area
(Aint) is one such parameter although this can be roughly determined by measuring the
geometry of the vials being used Other parameters such as the boundary thicknesses (δ) are
not so easily measured and are parameter fitted This is done using the parameter fitting
functionality built into FACSIMILE Experimental data is supplied to FACSIMILE and the
desired parameters to fit are declared the calculation is then performed a number of times
slightly varying the declared parameters each time until the predicted values better match
the provided experimental data For this work the data provided to FACSIMILE was the
concentration of H2 and H2O2 in aerated water as a function of dose (Figures 32-33) Vials
of different geometry have different boundary thicknesses the values used throughout this
work are shown in Table 16
Parameter
Vial Used for H2 Analysis Vial Used for H2O2 Analysis
Aint (m2) 502 times10
-5 284 times10
-4
δaq (m) 580 times10-4
510 times10-4
δg (m) 260 times10-2
260 times10-2
Table 16 Parameters used to describe interfacial surface area (Aint) and boundary
thicknesses (δ) for sample vials of different geometry
Chapter 4 The Radiolysis of Aqueous Solutions at High pH
97
Chapter 4 The Radiolysis of Aqueous Solutions at High pH
Preliminary Radiolysis Studies of Pure Water
Preliminary experiments to measure hydrogen peroxide and hydrogen gas concentrations
from the radiolysis of aerated and deaerated water at neutral pH were carried out as a
control to which other measurements may be compared Computational modelling of these
pure water systems were performed with the radiolysis model described in Chapter 3 to
validate the models performance
Measurements of hydrogen peroxide were made using the Ghormley Tri-iodide method
described in Chapter 2 The pH of the stock was measured using a Mettler Toledo
SevenMultitrade pH meter equipped with a probe capable of measuring pH in the range 0-14
and was found to be 699 Aliquots of 10 mL from the pure water stock were sealed in
20 mL headspace vials so that the liquid to headspace ratio was 11 and were irradiated in
row 1 of the 4x8 sample rack the average dose rate was 2839 Gy min-1
The experiment
was run twice prior to irradiation samples used in the first run were sealed but left aerated
while samples used in the second run were sealed in gas tight vials equipped with rubber
septa and were sparged for 20 minutes with zero grade argon gas to remove all dissolved
oxygen The results of the two experimental runs are shown in Figure 32
Preliminary measurements of hydrogen gas production were also carried out using pure
water 2 mL aliquots of pure water stock were flame sealed in 4 mL glass vials which were
then secured in the inverter rig and irradiated for various periods of time the average dose
rate was 2851 Gy min-1
Post irradiation analysis was carried out by the previously
described crush tube method of gas chromatography
Chapter 4 The Radiolysis of Aqueous Solutions at High pH
98
As flame sealing introduces slight irregularity in the volume of headspace an assumption
was made that the headspace of the sealed vial was 2 mL
This allows the conversion of measured quantities (microL) of hydrogen to a concentration
(mol dm-3
) Once again the experiment was run twice with the second experimental run
using samples that have been deaerated with argon and the results are shown in Figure 33
Figure 32 Measurements of H2O2 concentration as a function of dose for aerated water
(diams) and deaerated water (diams) Vertical error bars show the standard deviation between
replicates while horizontal error bars show the dose range for replicates
000E+00
100E-06
200E-06
300E-06
400E-06
500E-06
600E-06
700E-06
800E-06
000E+00
200E-05
400E-05
600E-05
800E-05
100E-04
120E-04
140E-04
0 10 20 30 40
[H2O
2]
(mo
l d
m-3
) D
eaer
ated
[H2O
2]
(mo
l d
m-3
) A
erat
ed
Dose (kGy)
Aerated Water
Deaerated Water
Chapter 4 The Radiolysis of Aqueous Solutions at High pH
99
Figure 33 Measurements of H2 as a function of dose in aerated (diams) and deaerated (diams)
samples Vertical error bars show the standard deviation of replicates while horizontal
error bars show the dose range for replicates
Discussion
Aerated samples resulted in a steady-state concentration of hydrogen peroxide at
approximately 11 times10-4
mol dm-3
while molecular hydrogen continues to form with
absorbed dose over the range considered In order to satisfy the mass balance requirements
some other species must be formed after the achievement of the peroxide steady-state that
is also proportional to hydrogen formation The most likely candidate for this is molecular
oxygen which would have to be formed at half the rate of hydrogen
Samples that did not contain any dissolved oxygen failed to produce significant quantities
of hydrogen peroxide or hydrogen gas with a very low steady state eventually achieved at
approximately 40 times10-6
mol dm-3
This may be attributed to the radiolytic production of
oxygen required to satisfy mass balance Using the radiolysis model a predicted chemical
yield can be obtained after the establishment of the hydrogen peroxide steady state to show
that mass balance is satisfied by oxygen production The predicted chemical yields were
calculated between doses of 15 kGy to 30 kGy
000E+00
100E-04
200E-04
300E-04
400E-04
500E-04
600E-04
700E-04
800E-04
0 10 20 30 40 50 60
[H2]
(mo
l d
m-3
)
Dose (kGy)
Aerated Water
Deaerated Water
Chapter 4 The Radiolysis of Aqueous Solutions at High pH
100
For oxygen gas the predicted chemical yield was G(O2) = 0011 while the predicted yield
of hydrogen gas formation in deaerated water was G(H2) = 0022 In both cases samples
that were aerated produced much larger quantities of hydrogen and hydrogen peroxide than
their deaerated equivalents This was somewhat expected as it has long been considered
that dissolved oxygen is reduced and the reduction products are able to react with hydroxyl
radicals preventing them from removing hydrogen peroxide and hydrogen87
The general
scheme first proposed in 1954 for this protection mechanism is initiated by the reaction of
hydrogen atoms with oxygen to produce hydroperoxyl radicals these then react with
hydroxyl radicals to reform water and oxygen or with itself to form hydrogen peroxide and
oxygen4
119867bull + 1198742 rarr 1198671198742bull
(R12)
bull119874119867 + 11986721198742 rarr 1198672119874 + 1198671198742bull
(R18)
1198671198742bull + 1198671198742
bull rarr 11986721198742 + 1198742 (R35)
bull119874119867 + 1198671198742bull rarr 1198672119874 + 1198742 (R20)
More recent studies by the research group led by Clara Wren have deployed computational
methods to investigate further the effects of dissolved oxygen on the steady-state
concentration of both hydrogen peroxide and molecular hydrogen86
The calculations
performed in this study also supported the idea that dissolved oxygen is reduced and it is
the reduction products that scavenge hydroxyl radicals resulting in the protection of
hydrogen peroxide and molecular hydrogen The calculations revealed that oxygen is
mainly reduced by the hydrated electron and that the superoxide formed is responsible for
the scavenging of hydroxyl radicals This process serves as a catalytic mechanism for the
overall reaction between the solvated electron and hydroxyl radicals
Chapter 4 The Radiolysis of Aqueous Solutions at High pH
101
119890119886119902minus + 1198742 rarr 1198742
minus (R7)
1198742minus + bull119874119867 rarr 119874119867minus + 1198742 (R21)
Overall Reaction 119890119886119902minus + bull119874119867 rarr 119874119867minus (R2)
This scavenging of hydroxyl radicals has a larger impact on protecting hydrogen as the
reaction between hydrogen and the hydroxyl radical is the only significant removal path of
hydrogen in neutral conditions
Wren proposes that high concentrations of hydrogen peroxide seen in aerated solutions can
be attributed to a change in the production pathway for hydrogen peroxide in the presence
of oxygen The reaction between both the reduction products of oxygen becomes the
dominant production pathway for hydrogen peroxide
1198671198742bull + 1198742
minus rarr 1198671198742minus + 1198742 (R32)
119867(119886119902)+ + 1198742
minus 1198671198742bull (R6970)
119867(119886119902)+ + 1198671198742
minus 11986721198742 (R5758)
Similar calculations were performed in this work using the computational method described
in Chapter 3 The computational predictions shown in figures 34 and 35 serve as a baseline
to demonstrate that the computational model performs well at least at a fundamental level
before building up to more complex systems
Chapter 4 The Radiolysis of Aqueous Solutions at High pH
102
Figure 34 Predicted concentrations of H2O2 as calculated by the radiolysis model for both
aerated () and deaerated () conditions
Figure 35 Predicted concentrations of H2 gas as calculated by the radiolysis model for
both aerated () and deaerated () conditions
000E+00
100E-06
200E-06
300E-06
400E-06
500E-06
600E-06
700E-06
800E-06
000E+00
200E-05
400E-05
600E-05
800E-05
100E-04
120E-04
140E-04
0 10 20 30 40
[H2O
2]
(mo
l d
m-3
) D
eaer
ated
[H2O
2]
(mo
l d
m-3
) A
erat
ed
Dose (kGy)
Aerated Water
FACSIMILE Aerated
Deaerated Water
FACSIMILE Deaerated
000E+00
100E-04
200E-04
300E-04
400E-04
500E-04
600E-04
700E-04
800E-04
0 10 20 30 40 50 60
H2 (
mo
l d
m-3
)
Dose (kGy)
Aerated Water
Deaerated Water
FACSIMILE Aerated
FACSIMILE Deaerated
Chapter 4 The Radiolysis of Aqueous Solutions at High pH
103
The predictions made for the concentrations of hydrogen peroxide and hydrogen gas in pure
water match well with the observed measurements especially for the concentration of
hydrogen peroxide produced in aerated water The most obvious discrepancy is the
disparity between the early predictions of hydrogen peroxide concentration and the
measured concentration for deaerated samples which is most likely due to imperfect
oxygen removal from the samples As the predictions are in generally good agreement with
the experimental measurements it is not unreasonable to assume that steady state
concentrations of other species which cannot or were not determined experimentally
during this work can be estimated by the model
Figure 36 Calculated concentrations of the major oxidising and reducing water radiolysis
species as a function of dose Solid lines represent aerated conditions while broken lines
represent deaerated conditions
Figure 36 shows the predicted concentrations of various radical species in both aerated and
deaerated water The calculated concentrations agree with previously published calculations
by Wren and co-workers86
100E-14
100E-12
100E-10
100E-08
100E-06
0 10 20 30 40 50
Co
nce
ntr
atio
n (
mo
l d
m-3
)
Dose (kGy)
˙OH
O2˙-
H˙
eaq-
HO2˙
Chapter 4 The Radiolysis of Aqueous Solutions at High pH
104
Under aerated conditions reducing species H˙ and eaq- have significantly lower
concentrations than in deaerated conditions due to scavenging by oxygen The resulting
reduction products of oxygen are superoxide and hydroperoxyl radicals and both show an
increased concentration in aerated conditions
The experiments in the following sections concerning the measurement of hydrogen
peroxide were all performed in aerated conditions to resemble the conditions at the
Sellafield site Measurements of hydrogen were for the most part carried out under
deaerated conditions
Chapter 4 The Radiolysis of Aqueous Solutions at High pH
105
Measurements of H2O2 in the Radiolysis of High pH Solutions
Stock solutions of various pH were prepared using NaOH dissolved in ultra-pure water
From each stock sample sets were prepared from 10 mL aliquots of stock solution and
sealed in 20 mL glass vials with aluminium crimp caps The pH of the remaining sample
stocks were measured and recorded Irradiation dose rates were calculated from original
measurements using the Fricke dosimetry method described previously Sample sets were
loaded into row 1 of the 4x8 irradiation rack and irradiated using the Model-812 cobalt-60
irradiator until they reached the desired dose Table 17 summarises the dose rates and pH of
the sample batches examined
Sample Batch ID Average Dose Rate for Row 1 (Gy min-1
) Measured pH
H2O2-PH00 28512 699
H2O2-PH01 27497 1041
H2O2-PH02 27407 1108
H2O2-PH03 28364 1230
H2O2-PH04 27467 1274
Table 17 Conditions of samples used to investigate hydrogen peroxide in high pH
radiolysis
Results
Post irradiation analysis for H2O2 was carried out immediately after irradiation using the
previously described tri-iodide method Analysis of high pH samples required additional
acid to lower the pH to the conditions required by the analytical method the quantities of
acid used were recorded and the dilution effects have been accounted for The results of this
study are shown in Figure 37
Chapter 4 The Radiolysis of Aqueous Solutions at High pH
106
Figure 37 Measurements of H2O2 concentrations as a function of dose for samples
initially at pH 7 (diams) pH 104 (diams) pH 11 (diams) pH 123 (diams) and pH 127 (diams)
All samples were aerated Vertical error bars are the standard deviation between
replicates while horizontal error bars show the dose range for replicates
The steady state concentration of hydrogen peroxide is fairly consistent at about
115 x10-4
mol dm-3
within the pH range 7-11 each attaining steady state after roughly
5 kGy At higher pH values both the steady state concentration and the dose at which
steady state is achieved increase
Samples at pH 123 required roughly 10 kGy to obtain a peak steady-state concentration of
195 x10-4
mol dm-3
of hydrogen peroxide while samples at pH 127 required even higher
doses almost 20 kGy to reach a steady concentration of 238 x10-4
mol dm-3
The data set
from samples at pH 123 shows an apparent decrease in hydrogen peroxide concentration of
~18 at 35 kGy A similar decrease in hydrogen peroxide concentration is also observed in
samples of pH 11
000E+00
500E-05
100E-04
150E-04
200E-04
250E-04
300E-04
0 10 20 30 40
[H2O
2]
(mo
l d
m-3
)
Dose (kGy)
pH 127
pH 123
pH 11
pH 104
pH 7
Chapter 4 The Radiolysis of Aqueous Solutions at High pH
107
Measurements of H2 in the Radiolysis of High pH Solutions
Stock solutions of various pH were prepared using NaOH to match the pH range used in
the measurement of hydrogen peroxide Many of the acid-base equilibria used in the
description of water radiolysis have pKa values in the pH range investigated by this study
The behaviour of H2 production observed at high pH may be influenced by a change in
chemistry brought about by a shift in one or more of the acid-base equilibria Table 18
shows the equilibria of interest and their associated pKa value while Table 19 includes the
measured pH of the stock solutions
Equilibrium pKa
bull119926119919 119919(119938119954)+ + bull119926minus 1184
119919120784119926120784 119919(119938119954)+ +119919119926120784
minus 1168
119919bull 119919(119938119954)+ + 119942119938119954
minus 974
119919119926120784bull 119919(119938119954)
+ + 119926120784minus 483
Table 18 A list of important equilibria and their associated pKa values
For the measurement of hydrogen sample sets were prepared from 2 mL aliquots of stock
solution which were transferred to glass ldquocrush tuberdquo vials described in chapter two The
vials were connected to a glass manifold via stainless steel needles and sparged with zero
grade argon for 20 minutes to remove any dissolved oxygen before samples were flame
sealed under argon
Irradiation dose rates were calculated from original Fricke dosimetry study described
previously Samples were loaded into the four positions available in the inverter rig and
irradiated until they reached the desired dose
Chapter 4 The Radiolysis of Aqueous Solutions at High pH
108
Results
After irradiation samples were analysed for hydrogen gas by gas chromatography using the
ldquocrush tuberdquo technique described in Chapter 2 Figure 38 shows the amounts of H2
produced as a function of radiation dose As production rates of hydrogen gas are linear as a
function of absorbed dose chemical yields can be identified as the gradient expressed in
terms of molecules per 100 eV of absorbed energy These results are summarised in Table
19 while the data is shown in Figure 38
Table 19 Conditions of samples used to investigate hydrogen gas in high pH radiolysis
Figure 38 Measurements of H2 gas as a function of dose at pH 7 (diams) pH 106 (diams) pH 123
(diams) and pH 13 (diams) Dashed lines are provided to clarify the data trends all samples were
deaerated Vertical error bars show the standard deviation between replicates while
horizontal error bars show the dose range for replicates
000E+00
500E-04
100E-03
150E-03
200E-03
250E-03
0 20 40 60 80
H2 (
mo
l d
m-3
)
Dose (kGy)
pH 13
pH 123
pH 106
pH 7
Sample
Batch ID
Average Dose Rate for
Inverter Rig (Gy min-1
) Measured pH G(H2) Error plusmn
H2-PH00 28385 699 0021 0002
H2-PH01 28408 1063 0071 0018
H2-PH02 29039 1232 0352 0005
H2-PH03 28634 1307 0176 0010
Chapter 4 The Radiolysis of Aqueous Solutions at High pH
109
Increasing the pH has the effect of increasing the chemical yield for hydrogen over the pH
range 7 to 123 however the data set for pH 13 shows that the chemical yield for hydrogen
is less than samples at pH 123 The results of the calculations using the reaction scheme
given in Tables 12 - 14 for both hydrogen peroxide and hydrogen gas production are
shown in Figures 39 and 40 respectively
Figure 39 Model calculations to show the predicted concentrations of H2O2 as a function
of dose at various pH
000E+00
500E-05
100E-04
150E-04
200E-04
250E-04
300E-04
350E-04
0 10 20 30 40 50
[H2O
2]
(mo
l d
m-3
)
Dose (kGy)
pH 127
pH 123
pH 11
pH 104
pH 7
Chapter 4 The Radiolysis of Aqueous Solutions at High pH
110
Figure 40 Model calculations to show the predicted concentrations of H2 gas as a function
of dose at various pH
Calculated concentrations of hydrogen peroxide show the same trends as the data The
predictions at pH 104 and 11 take slightly longer to reach steady state than what the
experimental data shows Higher pH calculations follow the same trend as the experimental
data but overestimate the steady state concentrations of hydrogen peroxide especially in the
calculations at pH 127
Calculated concentrations of molecular hydrogen follow a slightly more unexpected trend
Predictions made for pH 106 massively overestimate hydrogen production rates this is
symptomatic of a misunderstanding of the mechanistic chemistry A similar error has also
been noted by Wren when performing calculations at this pH a suggested fix was to
increase the reaction rate between ozinide and molecular hydrogen by a factor of 886
000E+00
500E-04
100E-03
150E-03
200E-03
250E-03
300E-03
0 20 40 60 80
[H2]
(mo
l d
m-3
)
Dose (kGy)
pH 13
pH 123
pH 106
pH 7
Chapter 4 The Radiolysis of Aqueous Solutions at High pH
111
Even with this higher rate the over prediction of hydrogen is still large at pH 106 while
predictions for pH 123 agree reasonably well with experimental data This information at
least helps to narrow the pH range at which this misunderstanding manifests The pH range
afflicted by over prediction of hydrogen falls close to the pKa of the dissociation of the
hydrogen atom at 974
119867bull 119867(119886119902)+ + 119890(119886119902)
minus pKa = 974
The reverse reaction rate for the above equilibrium has been measured with good agreement
over a number of laboratories however the forward reaction rate is calculated based on the
relationship between the reverse reaction rate and the equilibrium constant45
This
equilibrium constant is derived from the Gibbs free energy of formation of Hbull in the gas
phase combined with an estimated value for the free energy of solvation of Hbull This
estimation is a value between those for the free energy of solvation of He atoms and H2
molecules888
Both computational and experimental data show the same trend at pH 13 in that the
production rate of hydrogen is less than that observed at lower pH however the
calculations once again overestimate the rate shown by the experimental data Some more
features of this discrepancy are discussed further in the following section
Chapter 4 The Radiolysis of Aqueous Solutions at High pH
112
Discussion
The radiolytic removal of hydrogen from solution by the hydroxyl radical has long been
referred to as the Allen chain25
In this mechanism the hydroxyl radical reacts with
molecular hydrogen to reform water and a hydrogen atom the chain is then extended by the
reaction of the hydrogen atom with hydrogen peroxide to reform the hydroxyl radical with
the net effect being the removal of H2 and H2O2
Propagation Steps
bull119874119867 + 1198672 rarr 119867bull + 1198672119874 k78 = 40 times10
7 M
-1 s
-1
119867bull + 11986721198742 rarr bull119874119867 + 1198672119874 k11 = 365times107 M
-1 s
-1
Termination 119867bull + bull119874119867 rarr 1198672119874 k10 = 109times1010
M-1
s-1
Aside from transference into the gas phase this chain is the only removal path for hydrogen
under neutral pH conditions At higher pH radical species are converted into their base
forms and a new chain is established43
119867bull + 119874119867minus 119890119886119902minus + 1198672119874 (R7576)
bull119874119867 + 119874119867minus 119874bullminus + 1198672119874 (R6566)
Propagation Steps
119874bullminus + 1198672 rarr 119890119886119902minus + 1198672119874 k47 = 128 times10
8 M
-1 s
-1
119890119886119902minus + 1198671198742
minus rarr 119874bullminus + 119874119867minus k49 = 786times108 M
-1 s
-1
Termination 119890119886119902minus + 119874bullminus rarr 2119874119867minus k3 = 231times10
10 M
-1 s
-1
Chapter 4 The Radiolysis of Aqueous Solutions at High pH
113
Given the higher rate constants involved in the alkali chain it would seem that the chain
reaction established in the basic form has a higher efficiency than its neutral equivalent yet
observations show a higher chemical yield of hydrogen at high pH and would suggest
otherwise This can largely be resolved by considering the effects of oxygen on these chain
reactions Oxygen acts as a poison to both the chain reactions removing hydrogen causing
an increase in hydrogen yield The mechanism by which oxygen disrupts the chain is
through reactions with solvated electrons to produce superoxide which in turn reacts with
OH radicals or in the case of alkali solutions bullOˉ preventing them from reacting with
hydrogen as well as reforming oxygen
119890119886119902minus + 1198742 rarr 1198742
bullminus (R7)
bull119874119867 + 1198742bullminus rarr 119874119867minus + 1198742 (R21)
bull119874minus + 1198742bullminus + 1198672119874 rarr 2119874119867
minus + 1198742 (R50)
In alkali solution bullOˉ is also susceptible to a direct reaction with oxygen to form ozonide
ions while a neutral equivalent reaction between hydroxyl radicals and oxygen does not
exist As the experimental measurements of hydrogen gas from solutions of sodium
hydroxide were carried out in deaerated conditions there should be no initial dissolved
oxygen and any oxygen present would have been radiolytically formed Figure 41 shows
the calculated steady state concentration of aqueous oxygen compared to hydrogen gas
formation as a function of pH from this it is clear that an increase in pH leads to a rise in
radiolytically produced oxygen which is proportional to the amount of hydrogen generated
Chapter 4 The Radiolysis of Aqueous Solutions at High pH
114
Figure 41 Model calculations showing the concentrations of aqueous oxygen and
hydrogen gas from deaerated water after 80 kGy at 280 Gy min-1
to show the related
behaviour between the two
Analysis of the calculated reaction rates gives an insight to why the concentration of
radiolytic oxygen first rises with pH and then falls after pH 12 and may help to reveal the
source of the over-prediction at pH 106 All the following reaction rates are taken from the
end of the experimental range ie 80 kGy with a dose rate of 280 Gy min-1
At neutral pH
it is the reaction between the superoxide ion and the hydroxyl radical (R21) that is the main
source of radiolytic oxygen but as the pH rises beyond pH 10 the rate of this reaction
begins to fall from ~140 times10-6
mol dm-3
s-1
to 886 times10-8
mol dm-3
s-1
at pH 14 This drop
is mainly due to the equilibrium between the hydroxyl radical and its basic form bullOˉ which
has a pKa of 119 As one would expect the reaction rate of the equivalent base reaction
(R50) rises as the pH increases although this increase does not fully compensate for the
decrease in rate of R21
100E-06
100E-05
100E-04
100E-03
100E-02
7 8 9 10 11 12 13 14
Lo
g C
on
cen
trat
ion (
mo
l d
m-3
)
pH
[H2] g
[O2] aq
Chapter 4 The Radiolysis of Aqueous Solutions at High pH
115
This is because the reaction between the solvated electron and superoxide (R8) has a larger
rate constant than R50 and with the conversion of hydrogen atoms to solvated electrons at
high pH R8 out competes R50
In principal many other reactions produce oxygen but the rates of these reactions are often
negligible Only the rate of oxygen production through the reaction of superoxide and
hydroperoxyl (R32) sees an increase over the pH range 10-12 which may be significant to
radiolytic oxygen production Figure 42 shows the rates of the three main molecular oxygen
producing reactions (R21 R50 and R32) as well as the reaction rate for R8 and the
combined reaction rates for R8 and R50 as a function of pH When the combined reaction
rates of R8 and R50 are compared with the reaction rate of R21 it becomes obvious that
there is a transition from the removal of super oxide by R21 to removal by both R8 and
R50 this is the main cause of a decrease in oxygen concentration after pH 12 Figure 43
shows the sum of reaction rates that lead to oxygen formation and removal as a function of
pH
Figure 42 Model predictions of the steady-state reaction rates of R21 R50 and R32 at
various pH for γ radiolysis of deaerated water at a dose rate of 280 Gy min-1
000E+00
200E-07
400E-07
600E-07
800E-07
100E-06
120E-06
140E-06
160E-06
7 8 9 10 11 12 13 14
Rea
ctio
n R
ate
at S
tead
y S
tate
(mo
l d
m-3
s-1
)
pH
Chapter 4 The Radiolysis of Aqueous Solutions at High pH
116
Figure 43 The sum of the steady state rates of all reactions that produce O2 () compared
with the sum of the steady state rates of all reactions that remove O2 () These totals do
not include rates of production or removal from mass transfer reactions This calculation is
for the γ radiolysis of deaerated water to a dose of 80 kGy at a rate of 280 Gy min-1
At pH 7 the rate of oxygen production matches the rate at which it is removed and a low
steady state concentration of aqueous oxygen is achieved before the end of the 80 kGy
calculation range At higher pH the rate of oxygen removal diverges and so oxygen can
accumulate to a higher concentration over a longer period of time longer than that of the
80 kGy range used Excluding transfer into the gas phase there are only three reactions that
effectively remove oxygen so it was worth investigating how the rates of these reactions
changed with pH Figure 44 shows the rates of reactions R6 R7 R8 R12 and R67 as a
function of pH
000E+00
200E-07
400E-07
600E-07
800E-07
100E-06
120E-06
140E-06
160E-06
7 8 9 10 11 12 13 14
Rat
e at
Ste
ady S
tate
(mo
l d
m-3
s-1
)
pH
Chapter 4 The Radiolysis of Aqueous Solutions at High pH
117
Figure 44 Model predictions of the steady-state reaction rates of R7 R12 and R67 at
various pH This calculation is for the γ radiolysis of deaerated water to a dose of 80 kGy
at a rate of 280 Gy min-1
The first removal path of oxygen is the reaction between the solvated electron and oxygen
to produce superoxide (R7) this reaction does not see a significant change in rate below
pH 11 after which the rate begins to fall The second reaction is the reduction of oxygen by
the hydrogen atom (R12) the rate of this reaction falls steadily as pH increases this is due
to the conversion of hydrogen atoms to solvated electrons by hydroxide which has a pKa of
96 The decline in rate of this reaction accompanied by no significant increase in the rate
of oxygen removal by solvated electrons may be the main contribution to the increased
concentrations of oxygen at pH gt 9 It was thought that this might also be the cause of the
over prediction but any attempt to increase this rate constant is largely negated by an
accompanying increase in the rate of reaction R32 The final removal path of oxygen is the
reaction with O˙- to form ozonide (R67)
000E+00
200E-07
400E-07
600E-07
800E-07
100E-06
120E-06
7 8 9 10 11 12 13 14
Rea
ctio
n R
ate
at S
tead
y S
tate
(mo
l d
m-3
s-1
)
pH
Chapter 4 The Radiolysis of Aqueous Solutions at High pH
118
The rate of this reaction increases rapidly with pH from 194 times10-8
mol dm-3
s-1
at pH 9
to 146 times10-6
mol dm-3
s-1
at pH 14 however ozonide is unstable and decomposes to reform
oxygen at a rate not much lower than its formation
Subtracting the rate of oxygen reformation from the decomposition of ozonide gives the
actual rate of oxygen removal by bullOˉ of 110 times10
-9 mol dm
-3 s
-1 at pH 9 and
600 times10-8
mol dm-3
s-1
at pH 14 It should be noted that the decomposition rate of ozonide
was excluded from the total rate of oxygen formation in figure 44 while the rate of oxygen
removal by ozonide formation was the subtracted values quoted above
The main removal mechanism of hydrogen peroxide is by reaction with solvated electrons
In the presence of oxygen the removal of hydrogen peroxide by solvated electrons is
largely out competed by reactions between the solvated electrons and oxygen or
superoxide The rate constant for the reaction between oxygen and the solvated electron
(R7) is 225 times1010
dm3 mol
-1 s
-1 while for the reaction of hydrogen peroxide and the
solvated electron (R4) is only 136 times1010
dm3 mol
-1 s
-1 and so hydrogen peroxide is initially
protected from reactions with the solvated electron as long as oxygen or superoxide is
available In alkali conditions where the pH is larger than 116 the conjugate base of
hydrogen peroxide HO2- becomes the dominant peroxide species This reacts even slower
with the solvated electron with a rate constant of 365 times109
dm3 mol
-1 s
-1 so the protection
effect is even stronger It was mentioned earlier that beyond pH 11 the rate of reaction R21
falls significantly as bullOH is converted to its basic form and the equivalent base reaction
(R50) does not see a sufficient equivalent increase in rate The reason given was that R50
was out competed by the reaction between superoxide and the solvated electron (R8)
Chapter 4 The Radiolysis of Aqueous Solutions at High pH
119
This not only serves to protect hydrogen peroxide by competing with solvated electrons but
also contributes to the increased concentration of hydrogen peroxide as the product of R8 is
in fact hydrogen peroxide
119890119886119902minus + 1198742
bullminus rarr 11987422minus (R8)
11987422minus + 1198672119874 1198671198742
minus + 119874119867minus (R6162)
Although this may account for the increased steady state of hydrogen peroxide at high pH
Figure 39 still shows a slight over prediction for calculations made at pH 123 and 127 As
the equilibrium between the hydroxyl radical and the oxygen anion has a pKa of 1184 it
was thought that the over prediction could be a result of the estimations used for the rate
constants of the reactions involving the oxide radical anion There is little data available for
the rate constants of reactions involving bullOˉ As reaction R51 and R52 both lead to the
formation of peroxide it initially was thought that these reactions may have rate constants
that are too high however removing these reactions from the model made no significant
difference to the predicted production of H2O2
119874bullminus + 119874bullminus rarr 11987422minus
1198672119874rarr 1198671198742
minus + 119874119867minus (R51)
119874bullminus + bull119874119867 rarr 1198671198742minus (R52)
It was instead found that other oxide radical anion reactions had an effect on the predicted
value for H2O2 A total of four oxide radical anion reactions influence the predicted values
with two of them making a significant difference Reducing the rate constant for the
reactions R47 and R48 made a slight improvement to the prediction of H2O2 a more
significant effect can be seen by altering the rate constants for R49 and R50
Chapter 4 The Radiolysis of Aqueous Solutions at High pH
120
119874bullminus + 1198671198742minus rarr 1198742
minus + 119874119867minus (R49)
119874bullminus + 1198742minus rarr 1198742minus
1198672119874rarr 2119874119867minus + 1198742 (R50)
Originally the rate constant for R49 was an estimation reported by Buxton et al in 19889
with a value of 40 times108 M
-1 s
-1 Since then this rate constant has been measured by
C R Stuart and D C Ouellette and is reported as being 786 times108
M-1
s-1
at 25degC45
The
value for the rate constant for R50 was originally estimated by Sehested et al in 198289
to
be 60 times108 M
-1 s
-1 This estimation was made by adjusting the rate constant for R50 and
R53 in a kinetic model to produce a prediction that agreed with the decay of ozonide
measured experimentally by pulse radiolysis By increasing the rate constant for R50 from
60 times108 M
-1 s
-1 to 48 times10
9 M
-1 s
-1 an improved agreement to the predicted steady state
concentration of H2O2 is found This is shown in Figure 45
Figure 45 Dashed lines show the original prediction where k50 = 60 times108 M
-1 s
-1 while
solid lines show the predictions with the increased k50 = 48 times109 M
-1 s
-1
000E+00
500E-05
100E-04
150E-04
200E-04
250E-04
300E-04
350E-04
0 10 20 30 40 50
[H2O
2]
(mo
l d
m-3
)
Dose (kGy)
Chapter 4 The Radiolysis of Aqueous Solutions at High pH
121
With the modified reaction rate constant for R50 the predictions for the steady state
concentrations of H2O2 are closer to the experimental values at high pH
Although this calculation improves the prediction for the steady state concentration it also
appears to increase the rate at which the steady state is achieved moving the prediction
away from the experimental data The cause of this discrepancy may have something to do
with the way in which some of the equilibria have been implemented in the model and
should be investigated in the future This modification also has little effect on the over
prediction of hydrogen gas at pH 104
Chapter 5 Radiolysis of Magnesium Hydroxide
122
Chapter 5 Radiolysis of Magnesium Hydroxide
Context
The Magnox Swarf Storage Silo contains 22 silos used to store magnesium alloy cladding
that has been removed from spent Magnox fuel elements The magnesium fuel cladding is
stored underwater where it readily corrodes to form magnesium hydroxide and hydrogen
gas by the following reaction90
119872119892 + 21198672119874 rarr 119872119892(119874119867)2 +1198672
Hydrogen gas poses an obvious hazard and is closely monitored however production rates
are not predictable Much of the magnox fuel cladding is contaminated with uranium and
other fission products contributing an additional supply of hydrogen through water
radiolysis Dose rates are often further increased as some of the silos were used to dispose
of other beta and gamma emitting waste The presence of the magnesium hydroxide
complicates the radiolysis processes as (a low) solubility in water drives up the pH while
undissolved magnesium hydroxide provides additional surfaces where radiolysis processes
are poorly understood
Experiments were conducted to investigate the effects of magnesium hydroxide on the
radiolytic production yields of hydrogen gas and hydrogen peroxide The investigation
began by measuring hydrogen yields in solutions of magnesium hydroxide and comparing
hydrogen yields to solutions containing sodium hydroxide solution with the same pH Pure
water is also included as a control and the magnesium hydroxide samples included both
homogeneous saturated solutions of aqueous magnesium hydroxide and heterogeneous
slurries containing undissolved magnesium hydroxide
Chapter 5 Radiolysis of Magnesium Hydroxide
123
Method
The saturated solution was prepared in bulk using magnesium hydroxide (Sigma Aldrich
BioUltra ge 990) and ultra-pure water solids were separated by centrifuge as filters may
introduce organic contamination 2 mL aliquots of saturated magnesium hydroxide solution
were transferred to sample tubes and flame sealed under air The pH of the remainder of the
saturated solution was measured to be 106 Slurry samples were prepared by weighing
01 g of magnesium hydroxide into a glass vial before adding 2 mL of ultra-pure water
Samples were also flame sealed under air before being mechanically mixed by agitation
Samples were irradiated using the inverter rig however the samples were left stationary and
were not inverted during irradiation Samples were irradiated at an average dose rate
of 281 Gy min-1
until the desired dose was reached samples were then analysed for
hydrogen by the ldquocrush tuberdquo gas chromatography method previously described Figure 46
shows the production of hydrogen as a function of dose for both saturated solutions and
solid containing slurries of magnesium hydroxide This is compared with measurements
obtained from pure water and an aqueous solution of sodium hydroxide with a similar pH
to that of the magnesium hydroxide samples
Chapter 5 Radiolysis of Magnesium Hydroxide
124
Results
Figure 46 Measurements of H2 gas as a function of dose All samples here are aerated
with vertical error bars showing the standard deviation between replicates
It should be noted that all the samples used to produce figure 46 are aerated The chemical
yield of hydrogen for each sample set is given in Table 20
Table 20 Obtained results from the measurements of H2 gas
000E+00
200E-04
400E-04
600E-04
800E-04
100E-03
120E-03
140E-03
160E-03
180E-03
200E-03
0 10 20 30 40 50 60
[H2]
(mo
l d
m-3
)
Dose (kGy)
Sample ID Average Dose Rate for
Inverter Rig (Gy min-1
)
Measured
pH G(H2)
(Molecules 100 eV-1
) Error
plusmn
Mg(OH)2(s) 2814 1062 052 003
Mg(OH)2(aq) 2814 1057 047 002
NaOH 2845 1063 027 002
H2O 1732 699 016 001
Chapter 5 Radiolysis of Magnesium Hydroxide
125
The dose rate for the pure water samples is much lower than the other dose rates quoted as
this measurement was performed before the construction of the inverter rig and so the
samples were held further away from the source during irradiation
This data shows that the presence of magnesium hydroxide appears to increase the
hydrogen yield beyond what one would expect if the yield was controlled by pH alone
There is very little difference in hydrogen yield between samples that contain solid
magnesium hydroxide and samples that contain only dissolved magnesium hydroxide This
suggests that surface effects contribute to the hydrogen yield only a very small amount or
not at all This data is discussed further in the following section
A second set of experiments was conducted to measure the concentration of hydrogen
peroxide in irradiated saturated solutions of magnesium hydroxide 10 mL aliquots of
aerated saturated solution were transferred in to 20 mL glass headspace vials the vials were
sealed with an aluminium crimp cap and irradiated in the front row of the 4 x 8 rack the
average dose rate was 2831 Gy min-1
After irradiation the samples were analysed for
hydrogen peroxide by the Ghormley tri-iodide method described in Chapter 2 Figure 47
compares the obtained data from this experiment with data obtained from measurements
made in pure water
Chapter 5 Radiolysis of Magnesium Hydroxide
126
Figure 47 Measurements of H2O2 concentrations in aerated samples of saturated
magnesium hydroxide solution as a function of dose
The steady state concentration of hydrogen peroxide in a saturated solution of magnesium
hydroxide is almost the same as in a neutral sample of pure water as is expected given the
pH of the saturated solution was measured to be 106 which is below the 118 threshold
that is associated with an increased steady state of hydrogen peroxide observed in the
previous chapter
A further experiment was conducted to investigate the effects of the solid magnesium
hydroxide surface on the production of hydrogen Batches of samples were prepared with
various ratios of magnesium hydroxide to water each sample had a total mass of
approximately 2 g Table 21 summarises the sample ratios used Samples were irradiated
using the inverter rig which was left stationary throughout the irradiation the average dose
rate was 3042 Gy min-1
All samples were irradiated to approximately 525 kGy so that any
difference in the amount of hydrogen produced is independent of absorbed dose
000E+00
200E-05
400E-05
600E-05
800E-05
100E-04
120E-04
140E-04
0 5 10 15 20 25 30 35 40
[H2O
2]
mo
l d
m-3
Dose kGy
Aerated Water
Mg(OH)2 Saturated SolutionMg(OH)2 Aerated Saturated Solution
Chapter 5 Radiolysis of Magnesium Hydroxide
127
As the dose rate was determined by Fricke dosimetry which is a liquid phase dosimeter
with a density close to that of water the quoted dose of 525 kGy is what was received by
the aqueous phase The solid phase magnesium hydroxide has a slightly higher density and
will have received a slightly higher dose Figure 48 shows the chemical yields of hydrogen
as a function of water content percentage The results have been normalised to reflect the
amount of hydrogen produced per gram of water and the yields were calculated based on
the radiation dose absorbed by the whole system this makes the data from samples that
contain large quantities of water comparable to those with lower water content
Table 21 Conditions of samples containing Mg(OH)2 for measurements of H2
a ndash Powder sample with no added water estimated adsorbed water content is based on
data from Nelson et al91
b ndash Sample is a saturated solution of Mg(OH)2 ie contains no solid
H2O Average Mg(OH)2
Mass (g)
Average H2O
Mass (g)
Average
Dose (kGy)
4a 5303 plusmn 111
20 161 plusmn 002 040 plusmn 001 5245 plusmn 146
40 122 plusmn 002 082 plusmn 001 5255 plusmn 146
60 081 plusmn 001 122 plusmn 001 5255 plusmn 145
80 040 plusmn 001 162 plusmn 002 5245 plusmn 145
100b 5239 plusmn 145
Chapter 5 Radiolysis of Magnesium Hydroxide
128
Figure 48 Measurements of hydrogen yields from magnesium hydroxide samples with
various solid ndash aqueous ratios All samples were irradiated to a total dose of ~52 kGy to
the aqueous phase at a dose rate of 3041 Gy min-1
Discussion
The data shown in Figure 46 suggests that the presence of dissolved magnesium hydroxide
increases the chemical yield of hydrogen significantly more than if pH was the only
controlling factor Data shown in Figure 48 suggests that the presence of the solid surface
increases the hydrogen yield slightly above that for saturated solutions but it would seem
that the main contribution to the increased H2 yields in magnesium hydroxide samples
when compared to a solution of NaOH of equivalent pH is a factor present in both slurries
and saturated solutions of magnesium hydroxide The yield of H2 between 20 and 80
percent water content is not affected by changing the solid solution ratio suggesting that
there is little interaction between the solid magnesium hydroxide and the bulk water
00
02
04
06
08
10
12
14
16
0 20 40 60 80 100
G(H
2)
(Mo
lecu
les
10
0 e
V-1
)
H2O
Chapter 5 Radiolysis of Magnesium Hydroxide
129
The yield is significantly higher for samples with 4 water content (adsorbed water)
suggesting that any additional hydrogen is produced only in a few water layers away from
the solid surface as has been postulated for oxide surfaces
Petrik et al showed that oxide water systems consisting of multiple phases such as the
slurry samples measured here have different hydrogen yields depending on the oxide18
They grouped materials into three categories based on the effects they have on measured
hydrogen yields hydrogen enhancing hydrogen diminishing and hydrogen neutral
Though said study did not include magnesium hydroxide it does categorise magnesium
oxide as a material that does not significantly change the yield of hydrogen
The mechanism by which a solid surface increases the hydrogen yield is largely accredited
to an energy transfer process As solid particles in a sample absorbs energy a process of
energy migration from the bulk of the material to the interface takes place Energy can then
be transferred from the solid phase to the surrounding liquid The exact mechanism of the
energy transfer process is not well understood but the overall effect is higher dose rates in
localised areas of surrounding water
As the value of 4 water content is an estimation based on data extrapolation published by
Nelson et al in a study of water adsorption on magnesium hydroxide91
and may not be
entirely accurate This uncertainty could have a significant effect on the calculated chemical
yield if the estimation was even slightly incorrect for example an estimated water content
of just 9 has the effect of lowering the yield to the same value observed in samples
contain 20 water content This would be contradictory to an energy transfer process as
described previously
Chapter 5 Radiolysis of Magnesium Hydroxide
130
A study by Jay La Verne et al published measurements of hydrogen yields from the
gamma radiolysis of magnesium hydroxide to be 005119
This measurement was made
using magnesium hydroxide that had been dried to remove all excess water while
remaining hydroxylated The difference between the measured yields of saturated
magnesium hydroxide solution (G(H2) = 047) and a slurry sample (G(H2) = 052) given in
Table 20 is 005
This value is very close to the quoted value from dry magnesium hydroxide although it is
an average value and errors can be high with small differences between large numbers such
as this Little information is given to explain the mechanism contributing to this yield of
hydrogen from dry magnesium hydroxide other that the radiation induced conversion of
magnesium hydroxide to magnesium oxide92
A comparison was made to yields obtained
from calcium hydroxide and found that the yield of hydrogen was four times higher from
calcium hydroxide than from magnesium hydroxide This was explained in terms of the
tendency to form water during radiolysis being greater in magnesium hydroxide than in
calcium hydroxide meaning that a smaller portion of the hydroxide generates hydrogen
directly If the yield measured from the dry powder (0051) by La Verne et al is the result
of direct hydrogen production from magnesium hydroxide converting to the oxide then it
would make sense that the difference in yield between samples containing solid magnesium
hydroxide and only aqueous magnesium hydroxide would be close to this value
This does not explain why the yields of both samples are far higher than samples of sodium
hydroxide at the same pH as the magnesium hydroxide samples The chemical yield of
hydrogen from samples of sodium hydroxide with a pH of 1063 was 027 while yields
from both magnesium hydroxide systems were a little less than double this value
Chapter 5 Radiolysis of Magnesium Hydroxide
131
As this can be seen in both aqueous only samples and those containing solid magnesium
hydroxide the cause of this increased yield must be attributed to a factor present in both
aqueous only samples and samples containing solid magnesium hydroxide Magnesium
hydroxide is often discussed in literature concerning environmental science for its
properties and reactivity towards carbon dioxide9394
As the samples used in these experiments did not undergo any purification processes prior
to use they were most likely subject to carbonation reactions with atmospheric carbon
dioxide and water Magnesium hydroxide can be carbonated on exposed surfaces although
slow at standard room conditions it can be increased in the presence of water95
119872119892(119874119867)2(119904) + 1198621198742(119892) rarr 1198721198921198621198743(119904) + 1198672119874(119892)
Magnesium hydroxide can also take on intercalated carbon dioxide which can be converted
to carbonate either by reaction with water or if released into solution with hydroxide to
form bicarbonate9697
1198621198742(119860119894119903) 1198621198742(119894119899119905119890119903119897119886119910119890119903)
1198621198742(119894119899119905119890119903119897119886119910119890119903) + 1198672119874(119894119899119905119890119903119897119886119910119890119903) 2119867(119894119899119905119890119903119897119886119910119890119903)+ + 1198621198743(119894119899119905119890119903119897119886119910119890119903)
2minus
1198621198742(119886119902) + 119874119867(119886119902)minus 1198671198621198743(119886119902)
minus
Both carbonate and bicarbonate are known to be hydroxyl radical scavengers in the
radiolysis of aqueous solutions998
Using the Facsimile model described in Chapter 3 it
was possible to insert a set of reactions concerning carbonate radiolysis to estimate the
effects that small quantities of carbonate might have on hydrogen yields
Chapter 5 Radiolysis of Magnesium Hydroxide
132
The reaction set used is described in Table 22 and represents a simplified reaction scheme
of carbonate in aqueous radiolysis Initial concentrations of carbonate were set ranging
from 10 μM to 10 mM a yield of hydrogen was calculated for each initial concentration
these calculations have been graphed in Figure 49
In each case the calculated production of hydrogen was linear over the dose range used
which would be a necessary feature if carbonate is to be a valid explanation for the
increased yields observed in magnesium hydroxide experiments The calculated yield of
hydrogen increases rapidly with only small quantities of initial carbonate before reaching a
plateau at about G(H2) = 03 with an initial carbonate concentration of 50 μM The
hydrogen yield did not change much more than this increasing to just G(H2) = 036 with an
initial carbonate concentration of 10 mM The effect is almost the same in calculations for
both aerated and deaerated solutions It should be noted that these calculations were done at
pH 7 due to the systematic error of over prediction when the pH is close to 10 it would be
unadvisable to trust such calculations without first solving the error (see previous chapter)
Table 22 A reaction scheme to estimate the effect of carbonate in water radiolysis
Reaction Rate Constant Reference
CO32macr +
bullOH rarr CO3macr + OHmacr 39 times10
8
9
CO32macr + emacraq rarr products 39 times10
5
99
CO3bullmacr +
bullOH rarr products 30 times10
9
100
CO3bullmacr + H2O2 rarr HCO3macr + HO2
bull 43 times10
5
101
CO3bullmacr + HO2macr rarr HCO3macr + O2
bullmacr 30 times10
7
101
CO3bullmacr + O2
bullmacr rarr O2 + CO3
2macr 65 times10
8
102
HCO3macr + emacraq rarr products 10 times106
103
HCO3macr + bullOH rarr H2O + CO3
bullmacr 85 times10
6
9
HCO3macr + Hbull rarr products 44 times10
4
104
Chapter 5 Radiolysis of Magnesium Hydroxide
133
Figure 49 Model predictions for the yield of H2 from a solution containing various
concentrations of carbonate anions
Reaction rate analysis of the calculations reveals that the main mechanism for hydrogen
protection is through a cooperative effect of scavenging of the hydroxyl radical to form a
carbonate radical The majority of carbonate radicals are converted back to carbonate by
reaction with superoxide A secondary process of carbonate radical reactions with hydrogen
peroxide contributes slightly to regeneration of superoxide as well as forming bicarbonate
which itself contributes to hydrogen protection by scavenging hydroxyl radicals once again
forming a carbonate radical As these calculations were performed at pH 7 it is uncertain
what effect an elevated pH would have on the predicted hydrogen yield It should also be
remembered that many of the rate constants used are estimations and the reaction set is a
simplification and is not a comprehensive description
0
005
01
015
02
025
03
035
04
0 1 2 3 4 5 6 7 8 9 10 11
G(H
2)
[CO32-] mM
Aerated
Deaerated
134
With these factors in mind the predicted behaviour of hydrogen production is a reasonable
representation of the behaviour observed in experiments This could easily be investigated
further by experiments in a number of ways
Attempts could be made to measure carbonate directly from the magnesium hydroxide
used either by thermogravimetric analysis (TGA) or by total organic carbon analysis
(TOC) Radiolysis experiments of other carbonates could also be carried out to further
investigate the effect of carbonate
Chapter 6 Radiolysis of Methanol Solutions
135
Chapter 6 Radiolysis of Methanol Solutions
Context
Many of the waste storage ponds at Sellafield Ltd are open to the air and are subject to
organic matter falling in and decomposing to a range of organic products One particular
group of compounds known as humic acids and how they might affect radiolysis processes
in the ponds are of particular interest Humic acids are ill-defined but complex organic
acids with several different functional groups which will have many effects on radiolysis
The best approach to investigating this chemistry is to understand the effects of each
functional group independently before building up to a full humic acid analogue This study
takes the first steps towards this investigation through experimentation on aqueous
solutions of methanol
Experimental Method
A stock aqueous solution of 1 mM methanol was made and was used to prepare aerated
samples of 10 mL sealed by crimp cap in 20 mL headspace vials so that the liquid to
headspace ratio was 11 Samples were irradiated in row 2 of the 4x8 irradiation rack for
various periods of time The average dose rate was 1638 Gy min-1
The samples were
analysed for hydrogen peroxide immediately after irradiation using the Ghormley tri-iodide
method described in Chapter 2 A separate batch of aerated samples was prepared from the
1 mM methanol stock solution for analysis of hydrogen generation These were samples of
2 mL of 1 mM methanol and were deaerated using zero grade argon gas before being sealed
in glass tubes designed for use by the crush tube analysis method described in Chapter 2
Again the samples had a liquid to headspace ratio of 11
Chapter 6 Radiolysis of Methanol Solutions
136
These samples were irradiated in the centre positions of row 2 in the 4x8 rack where the
average dose rate was 1755 Gy min-1
Results
Figure 50 Measurements of H2O2 concentrations as a function of dose in samples
containing 1 mM methanol (diams) and water as a control (diams) All samples were aerated and a
dashed line is included to highlight the data trend The dose rate was 1638 Gy min-1
for
methanol solutions and 2839 Gy min-1
for the aerated water
000E+00
500E-05
100E-04
150E-04
200E-04
250E-04
0 5 10 15 20 25
[H2O
2]
(mo
l d
m-3
)
Dose (kGy)
Aerated Water
Methanol 1 mM
Chapter 6 Radiolysis of Methanol Solutions
137
Figure 51 Measurements of H2 gas as a function of dose from deaerated samples
containing 1 mM methanol deaerated water is also shown as a control Dashed lines are
included to highlight the data trend The dose rate was 1755 Gy min-1
for the methanol
solutions and 2851 Gy min-1
for the deaerated water
Figure 50 shows the measured concentrations of hydrogen peroxide from the 1 mM
methanol solution compared with the measured concentrations from pure aerated water At
low doses the concentration of hydrogen peroxide increases rapidly to approximately
20 times10-4
mol dm-3
at approximately 1 kGy which is almost double the steady state
concentration observed in pure water As the dose increases further the concentration
begins to fall to a steady state value at approximately 33 times10-5
mol dm-3
Figure 51 shows the measured hydrogen concentrations from the 1 mM methanol solutions
compared with hydrogen measurements from aerated water
000E+00
500E-04
100E-03
150E-03
200E-03
250E-03
300E-03
0 5 10 15 20 25 30
H2 (
mo
l d
m-3
)
Dose (kGy)
Methanol Solution 1mM Deaerated
Dearated Water
Chapter 6 Radiolysis of Methanol Solutions
138
Hydrogen concentrations measured in a deaerated 1 mM methanol solution are significantly
higher than those measured in deaerated water the initial production rate is higher in the
methanol solution but production is not linear and the rate of hydrogen production with
dose soon falls The change in production rate of hydrogen and hydrogen peroxide with
dose can be shown by converting the experimental measurements to G-values and plotting
them as a function of dose Figures 52 and 53 show the chemical yields determined by
converting the gradients between 0 and each data point to units of molecules 100 eV-1
Figure 52 Chemical yields of hydrogen peroxide measured from an aerated solution of
1 mM methanol as a function of dose
00
05
10
15
20
25
30
35
40
0 5 10 15 20
G(H
2O
2)
(mo
lecu
les
10
0eV
-1)
Dose (kGy)
Chapter 6 Radiolysis of Methanol Solutions
139
Figure 53 Chemical yields of hydrogen gas measured from a deaerated solution of 1 mM
methanol as a function of dose
Discussion
Most alcohols are effective scavengers of hydroxyl radicals and hydrogen atoms The
reactions between methanol and hydroxyl radicals or hydrogen atoms result in hydrogen
abstraction from methanol to form water or molecular hydrogen respectively and in both
cases form the hydroxymethyl radical105106
bull119874119867 + 1198621198673119874119867 rarr 1198672119874 + bull1198621198672119874119867 119896 = 83 times 108 119872minus1119904minus1
119867bull + 1198621198673119874119867 rarr 1198672 + bull1198621198672119874119867 119896 = 28 times 106 119872minus1119904minus1
Although the second order rate constant for the reaction between methanol and the solvated
electron is faster than that for the solvated electron and water the reaction rate does not
compete with the rate of reaction between the solvated electron and water until the
concentration of methanol is greater than 10-2
M2107
00
02
04
06
08
10
12
14
16
18
0 5 10 15 20
G(H
2)
(mo
lecu
les
10
0eV
-1)
Dose (kGy)
Chapter 6 Radiolysis of Methanol Solutions
140
In deaerated water methanol radicals may dimerise to form ethylene glycol or
disproportionate to form formaldehyde and reform methanol108
They may also react with
hydrogen peroxide to form formaldehyde
2bull1198621198672119874119867 rarr (1198621198672119874119867)2
2bull1198621198672119874119867 rarr 1198621198673119874119867 + 119867119862119867119874
bull1198621198672119874119867 + 11986721198742 rarr 119867119862119867119874 + 1198672119874 + bull119874119867
In solutions that contain dissolved oxygen such as those used in the measurements of
hydrogen peroxide (Figure 50) methanol radicals rapidly react with oxygen to form an
organic peroxyl radical which reacts by second-order processes resulting in the formation
of formaldehyde hydrogen peroxide and oxygen109
bull1198621198672119874119867 + 1198742 rarr bull11987421198621198672119874119867
An additional set of reactions were included in the water radiolysis model described in
Chapter 3 in an attempt to model the radiolysis chemistry of an aqueous solution of 1 mM
methanol This reaction scheme is shown in Table 23
Chapter 6 Radiolysis of Methanol Solutions
141
Reaction
Number Reaction
Rate Constant at 25degC (M
-1 s
-1)
Ref
M1 CH3OH + bullOH rarr H2O +
bullCH2OH 83times10
8
110
M2 CH3OH + Hbull rarr H2 +
bullCH2OH 28times10
6
106
M3 bullCH2OH + O2 rarr
bullO2CH2OH 49times10
9
111
M4 bullCH2OH + H2O2 rarr H2O + H2CO +
bullOH 18times10
5
112
M5 bullCH2OH +
bullCH2OH rarr CH3OH + H2CO 12times10
9
2113
M6 bullCH2OH +
bullCH2OH rarr HOCH2CH2OH 12times10
9
2113
M7 bullCH2OH +
bullOH rarr H2CO + H2O
a24times10
10
114
M8 bullO2CH2OH +
bullO2CH2OH rarr 2H2CO + H2O2 + O2 74times10
8
115
M9 bullO2CH2OH +
bullHO2 rarr H2CO + H2O2 + O2
b50times10
8
2
M10 bullO2CH2OH + O2macr rarr H2CO + HO2macr + O2
b50times10
7
2
M11 HOCH2CH2OH + bullOH rarr
bullHOCHCH2OH + H2O 24times10
9
116
M12 HOCH2CH2OH + Hbull rarr
bullHOCHCH2OH + H2 14times10
7
9
M13 bullHOCHCH2OH + O2 rarr
bullO2HOCHCH2OH 32times10
9
111
M14 bullO2HOCHCH2OH rarr HOCH2CHO + H
+ + O2macr 19times10
2 s
-1
117
M15 bullHOCHCH2OH +
bullHOCHCH2OH rarr HOCH2CH2OH +
HOCH2CHO 96times10
8
118
M16 HOCH2CHO + bullOH rarr H2O +
bullHOCHCHO
c92times10
6
119
M17 bullHOCHCHO +
bullHOCHCHO rarr HOCH2CHO + OCHCHO
d50times10
4 -
M18 OCHCHO + bullOH rarr H2O +
bullOCCHO 14times10
6
120
M19 bullOCCHO rarr CO + HCO
bull
a35times10
7 s
-1
121
M20 H2CO + emacraq rarr bullCH2OH + OHmacr 10times10
6
2
M21 H2CO + Hbull rarr H2 + HCO
bull 50times10
6
2
M22 H2CO + bullOH rarr H2O + HCO
bull 20times10
9
2
M23 HCObull + H
bull rarr H2 + CO
a68times10
10
122
M24 HCObull +
bullOH rarr CO + H2O
a11times10
11
123
M25 HCObull + O2 rarr CO + HO2
bull
a31times10
9
124
M26 HCObull + HCO
bull rarr 2CO + H2
a22times10
10
125
Table 23 A reaction scheme to estimate the effect of methanol in water radiolysis
a ndash Rate constant for gas phase reaction
b ndash Estimated rate constant
c ndash Rate constant based on reaction of acetic acid and hydroxyl
d ndash Assumed reaction
Figure 54 shows the predicted hydrogen peroxide concentration with the above chemistry
included in the calculation and compares it with the experimental data In order to achieve
the agreement shown a modification to the mass transfer routine was required
Chapter 6 Radiolysis of Methanol Solutions
142
The current implementation of the mass transfer routine does not cope with a rapid
depletion of dissolved oxygen and responds by increasing the rate of oxygen transfer from
the gas phase to the aqueous phase to an unrealistic value A temporary fix can be made by
reducing the mass transfer rate of oxygen (for instance by a factor of 15) but a more
appropriate correction to the routine should be sought in future implementations Figure 55
shows the original calculation with the un-modified mass transfer routine compared with
the modified mass transfer routine
Figure 54 Model prediction of H2O2 concentrations as a function of dose in a solution of
1 mM methanol
000E+00
500E-05
100E-04
150E-04
200E-04
250E-04
0 5 10 15 20 25
[H2O
2]
mo
l d
m-3
Dose kGy
Methanol 1 mM
Model
Chapter 6 Radiolysis of Methanol Solutions
143
Figure 55 Calculations of hydrogen peroxide concentrations with and without
modification to the mass transfer routine
Analyses of the evolution of the calculated reaction rates reveal a possible explanation for
the behaviour of hydrogen peroxide in the presence of a low concentration of methanol
Initially the most important methanol reactions are the formation of the methanol radical
by scavenging hydroxyl radicals (M1) and the formation of an organic peroxide by the
reaction between the aforementioned methanol radical and oxygen (M3)
1198621198673119874119867 + bull119874119867 rarr bull1198621198672119874119867 + 1198672119874
bull1198621198672119874119867 + 1198742 rarr bull11987421198621198672119874119867
With the formation of the organic peroxide comes an increase in the rate of the formation of
formaldehyde mainly through self-reaction or to a lesser degree through reaction with
superoxide
000E+00
100E-04
200E-04
300E-04
400E-04
500E-04
600E-04
700E-04
0 5 10 15 20 25 30 35 40 45
[H2O
2]
(mo
l d
m-3
)
Dose (kGy)
Original Calculation
Modified Calculation
Chapter 6 Radiolysis of Methanol Solutions
144
2bull11987421198621198672119874119867 rarr 21198672119862119874 + 11986721198742 + 1198742
bull11987421198621198672119874119867 + 1198742bullminus rarr 1198672119862119874 + 1198671198742
minus + 1198742
These reactions not only contribute to the production of hydrogen peroxide but also return
oxygen to the system which can scavenge solvated electrons and protect hydrogen peroxide
from the rapid reaction between the solvated electron and hydrogen peroxide
(R4 k = 136times1010
M-1
s-1
) The total rate of oxygen consumption by methanol radicals and
solvated electrons is still greater than the rate of return from the reactions of the organic
peroxide After about 11 kGy oxygen concentrations are reduced to an insignificant value
As the concentration of oxygen falls the reaction rate between hydrogen peroxide and the
solvated electron increases As mentioned in Chapter 4 oxygen plays a vital role in the
formation and protection of hydrogen peroxide The model prediction shows the
concentration of hydrogen peroxide beginning to rise again after about 8 kGy this is due to
the mass transfer of oxygen gas into the aqueous phase slowly re-establishing equilibrium
and effectively allowing a build-up of hydrogen peroxide As mentioned earlier the mass
transfer routine has been modified for this calculation and is non-representative of the real
mass transfer flux nevertheless it is reasonable to assume that after the depletion of
dissolved oxygen and the methanol has been converted to glycol or formaldehyde
equilibrium of aqueous and gaseous oxygen would eventually be re-established This could
be supported by further analysis at higher doses which may show an increase in hydrogen
peroxide concentrations
Chapter 6 Radiolysis of Methanol Solutions
145
The formation of hydrogen gas is enhanced by the presence of methanol however
hydrogen gas production is not linear with dose Figure 56 shows the model predictions for
hydrogen gas production compared to the experimentally obtained data
The calculations show a higher production rate of hydrogen gas can be attributed to the
scavenging of hydroxyl radicals by methanol and a number of methanol radiolysis
products
Figure 56 Model prediction of H2 gas as a function of dose in a solution of 1 mM
methanol
Although the model prediction somewhat overestimates the quantity of hydrogen formed
the slope is close to what is observed experimentally Many of the rate constants used in the
reaction scheme could not be found in the literature and are therefore estimations The
reaction scheme used protects molecular hydrogen from reacting with the hydroxyl radical
in a number of reactions Throughout the radiolysis of methanol a number of intermediary
organic products are formed such as ethylene glycol and formaldehyde each of which is an
effective hydroxyl scavenger
000E+00
500E-04
100E-03
150E-03
200E-03
250E-03
300E-03
0 5 10 15 20 25 30
H2 (
mo
l d
m-3
)
Dose (kGy)
Methanol 1 mM Dearated
Model
Chapter 6 Radiolysis of Methanol Solutions
146
After reacting with the hydroxyl radical the newly formed organic radical will usually form
an organic peroxide however in the absence of oxygen the radicals will tend towards
disproportionation to reform the original organic product at well as a new stable organic
usually an aldehyde Eventually the only stable product is carbon monoxide which does not
have any further reactions within this scheme Figure 57 shows the calculated
concentrations of each of the stable organic products as a function of dose in an aerated
system
Figure 57 Model predictions of the concentrations of various stable organic products
formed as a result of using the proposed reaction scheme in Table 23
Kinetic models of aqueous methanol have previously been presented in literature one such
model by Sunaryo and Domae126
was developed for calculating the effects of aqueous
methanol in light water reactors
000E+00
200E-04
400E-04
600E-04
800E-04
100E-03
120E-03
0 10 20 30 40
Co
nce
ntr
ati
on
(m
ol
dm
-3)
Dose (kGy)
Methanol
Formaldehyde
Ethylene Glycol
Glycolaldehyde
Glyoxal
Carbon Monoxide
Chapter 6 Radiolysis of Methanol Solutions
147
The reaction scheme for methanol radiolysis used in that publication is not a complete
scheme in that ldquoimaginary productsrdquo are implemented to terminate certain reaction
pathways This is still a valid approach as their interest was focused on the initial reaction
paths when delivering a maximum dose of 500 Gy and not the long term radiolysis of
methanol over several kGy
It was noted that an understanding of the radiolysis of the transient organic products is
needed they concluded that methanol is converted into ethylene glycol which may have the
same effect as methanol itself The formation of ethylene glycol and formaldehyde from
methanol radiolysis is well known and has been measured in previous studies127
The
radiolysis of ethylene glycol has also been discussed in literature128
and it has been
described that under aerated conditions the main organic product of radiolysis is
glycolaldehyde129
The reaction scheme for methanol radiolysis in this work assumes the
formation of a radical species by the reaction between glycolaldehyde and the hydroxyl
radical however this is most likely not the major radiolysis path for glycolaldehyde In
aqueous solutions glycolaldehyde exists in a number of different forms with the aldehyde
form usually being the minor component130
The existence of multiple forms of
glycolaldehyde in solution and the large number of unknown rate constants makes creating
a complete reaction scheme for methanol radiolysis difficult Furthermore the publications
mentioned above also report the formation of small amounts of methane along with carbon
monoxide The radiolysis of ethylene glycol under deaerated conditions can also lead to the
production of ethyl aldehyde Both of these points highlight gaps in the reaction scheme
that should be included in a comprehensive description of methanol radiolysis Suggestions
for an improved radiolysis scheme are given in Chapter 8
Chapter 7 Radiolysis of Iron Oxide-Water Systems
148
Chapter 7 Radiolysis of Iron Oxide-Water Systems
Context
Large quantities of iron oxide have been reported to be present in the First Generation
Magnox Storage Pond where iron skips containing spent fuel have corroded to form a layer
of haematite (Fe2O3) and magnetite (Fe3O4) several meters below the water level
Documented investigations into the effects of iron oxide on water radiolysis are sparse the
most recent of which focusing on the formation of molecular hydrogen from the radiolysis
of water-iron oxide systems131
Preliminary experiments have been carried out to
investigate the effects iron oxide may have on radiolytic production of hydrogen peroxide
from water-oxide slurries
Method
Iron oxide powders were washed with ultra-pure water to remove any soluble
contamination Excess water was decanted before the powders were washed a further two
times After the third decanting the powders were dried in a vacuum oven at 40degC
overnight Haematite samples were prepared by weighing 05 g quantities of haematite into
20 mL headspace vials to which 10 mL of ultra-pure water was added before sealing with a
crimp cap Samples of magnetite were prepared in the same way Samples were agitated
and then left to settle before irradiation The irradiations of haematite samples were carried
out in row 1 of the 4x8 irradiation rack with an average dose rate of 30518 Gy min-1
while
irradiations of magnetite samples were carried out in row 2 of the 4x8 rack with an average
dose rate of 16252 Gy min-1
After irradiation aliquots of the water from the samples were
removed by syringe and pushed through a syringe filter to remove any solid particles
Chapter 7 Radiolysis of Iron Oxide-Water Systems
149
The filtered aliquot was then analysed for hydrogen peroxide using the Ghormley tri-iodide
method described in Chapter 2
Results
Figure 58 shows the obtained results for the haematite system compared to concentrations
of hydrogen peroxide measured in aerated water Figure 59 shows the obtained results from
magnetite samples again they are compared with measurements obtained from pure water
Figure 58 Measurements of H2O2 concentrations from heterogeneous samples of 05g
Fe2O3 and 10 mL aerated water The dose rate for the haematite samples was
3052 Gy min-1
and for the aerated water the dose rate was 2839 Gy min-1
000E+00
200E-05
400E-05
600E-05
800E-05
100E-04
120E-04
140E-04
0 2 4 6 8 10 12 14
[H2O
2]
(mo
l d
m-3
)
Dose (kGy)
Haematite
Pure Water
Chapter 7 Radiolysis of Iron Oxide-Water Systems
150
Figure 59 Measurements of H2O2 concentrations from heterogeneous samples of 05g
Fe3O4 and 10 mL aerated water The dose rate for the magnetite samples was
1625 Gy min-1
and for the aerated water the dose rate was 2839 Gy min-1
The steady state concentration of hydrogen peroxide achieved in the presence of haematite
is close to that of pure water however the initial production rate is slightly higher An
increased initial production rate is also observed in samples containing magnetite but after
approximately 500 Gy the concentration of hydrogen peroxide falls dramatically and
achieves a low steady state of approximately 15 times10-5
mol dm-3
000E+00
200E-05
400E-05
600E-05
800E-05
100E-04
120E-04
140E-04
0 2 4 6 8 10 12 14 16 18 20 22
[H2O
2]
(mo
l d
m-3
)
Dose (kGy)
Magnetite
Pure Water
Chapter 7 Radiolysis of Iron Oxide-Water Systems
151
Discussion
Hydrogen peroxide undergoes surface decomposition over both haematite and
magnetite28132
The estimated second-order rate constants for the surface decomposition of
hydrogen peroxide are quoted as 30 times10-9
M-1
s-1
for haematite132
and 45 times10-10
M-1
s-1
for
magnetite28
Calculations using the water radiolysis model including a hypothetical reaction
that removes hydrogen peroxide at these rates makes no significant difference to the
predicted concentrations of hydrogen peroxide in water over the time scale of the
experiment However as the aforementioned rate constants are second-order they not only
depend on the concentration of hydrogen peroxide but the surface area of the metal oxide as
well which is unknown for the metal oxides used in this study
Furthermore the experiments carried out in the aforementioned publications to determine
these rate constants were well mixed throughout the reaction time while in this work the
samples were static with the iron powder settled at the bottom of the reaction vessel This
means that the rate of surface decomposition is greatly hindered due to the need for
hydrogen peroxide to diffuse a large distance to the iron oxide surface nevertheless a
significant difference in hydrogen peroxide concentrations were observed in samples
containing magnetite The behaviour of hydrogen peroxide observed in samples containing
magnetite is most likely due to homogeneous chemistry initiated by dissolved iron ions
The chemistry initiated by dissolved iron could serve to remove hydrogen peroxide through
a Haber-Weiss mechanism133
1198651198903+ + 1198742bullminus rarr 1198651198902+ + 1198742 k = Unknown
1198651198902+ + 11986721198742 rarr 1198651198903+ + 119874119867minus + bull119874119867 k = 10 times10
7 M
-1 s
-1
1198651198902+ + bull119874119867 rarr 1198651198903+ + 119874119867minus k = 32 times108
M-1
s-1
1198651198902+ + 1198671198742bull rarr 1198651198903+ + 1198671198742
minus k = 12 times10
6 M
-1 s
-1
Chapter 7 Radiolysis of Iron Oxide-Water Systems
152
Experiments discussed in publications by Mats Jonsson28
focus largely on the reactivity of
hydrogen peroxide and various metal oxides including iron oxide It was found that many
metal oxide surfaces show reactivity towards hydrogen peroxide and that rate of removal of
hydrogen peroxide can be calculated in heterogeneous systems based on properties such as
particle size As mentioned previously the model suggests that the rate of this surface
reactivity does not seem to be able to compete with the rate of radiolytic hydrogen peroxide
production The studies by Jonsson concerning iron oxide were met with difficulty in
discriminating between surface reactions and aqueous chemistry initiated by dissolved iron
Through the use of ICP-AES it was shown that iron can be found in water with a
concentration of 23 times10-6
mol dm-3
after just 30 minutes of mixing magnetite with distilled
water28
Even with this measurement by Jonsson the quantity of dissolved iron is difficult to
estimate for samples used in this work as they were washed with water whereas the
literature measurements were made with unwashed or EDTA treated samples More
information about the dissolution of iron from magnetite could be used to attempt to model
this behaviour using the reaction scheme in table 24 In addition to this it would also be
useful to investigate the dissolution of iron as a function of radiation dose to see what
effect if any radiation has on dissolution rates Analysis techniques such as inductively
coupled plasma mass spectroscopy (ICP-MS) can be used to determine concentrations of
dissolved iron in very low concentrations however due to the nature of the plasma used it
can often be difficult to distinguish between Fe2+
and Fe3+
as further ionization may cause
interference It is possible to chemically separate the two oxidation states of iron by solvent
extraction with n-heptane containing 01 M Di-(2-ethylhexyl)phosphoric acid (HDEHP)
before performing an analysis for iron134
Chapter 7 Radiolysis of Iron Oxide-Water Systems
153
This reaction scheme would be initiated by a production of aqueous iron based on the
dissolution behaviour observed from future experiments As mentioned earlier the
experiments conducted in this work are only preliminary and there is much more work to
be done on the subject
If a computational model could be made to accurately simulate the aqueous iron chemistry
coupled with a more detailed understanding of radiation induced iron dissolution it may be
possible to determine the surface effects of iron oxide by comparison of experimental and
calculated data and effectively subtracting the difference
Reaction
Number
Reaction Rate Constant at
25degC (M-1
s-1
)
Ref
F1 Fe2+
+ H2O2 rarr Fe3+
+ OHmacr + bullOH 100 times10
7
135
F2 Fe2+
+ bullOH rarr Fe
3+ + OHmacr 32 times10
8
136
F3 Fe2+
+ bullHO2 rarr Fe
3+HO2macr 12 times10
6
133
F45 Fe3+
HO2macr + Fe2+ Fe
3+HO2macrFe
2+ K = 27 M
-1
133
F6 Fe3+
HO2macr rarr Fe3+
+ HO2macr 18times103
s-1
133
F7 Fe3+
HO2macrFe2+
rarr Fe3+
+ Fe2+
HO2macr 25 times104
133
F8 Fe2+
HO2macr + H+
(aq) rarr Fe2+
+ H2O2 Unknown 133
F9 Fe3+
+ O2macr rarr Fe2+
+ O2 Unknown 137
F10 Fe2+
+ O2macr + H2O rarr HO2macr + Fe
3+ + OHmacr 10 times10
7
133
F11 Fe3+
+ Hbull rarr Fe
2+ + H
+(aq) 20 times10
6
138
F12 Fe3+
+ emacraq rarr Fe2+
60 times1010
139
F13 Fe2+
+ Hbull + H
+(aq)
rarr Fe
3+ + H2 75 times10
6
10
Table 24 A reaction scheme to estimate the effects of dissolved iron in water radiolysis
Chapter 8 Conclusions and Further Work
154
Chapter 8 Conclusions and Further Work
Further High pH Investigations
Experiments have shown that the radiolytic production of hydrogen gas and hydrogen
peroxide is strongly influenced by high pH Hydrogen peroxide tends to reach higher steady
state concentrations with increasing pH as well as taking longer to reach this steady state
Hydrogen gas production rates appear to also increase with increasing pH up to
approximately pH 11 where thereafter they decrease The development of a computational
model for water radiolysis has provided a mechanistic understanding to explain the
observed effects of high pH on water radiolysis Calculations suggest that an increase in
radiolytically produced oxygen could explain the behaviour of hydrogen gas at high pH
Dissolved oxygen acts as a poison to the Allen chain which normally serves to remove
dissolved hydrogen through reactions with the hydroxyl radical or the alkali equivalent the
oxide radical anion The steady state concentration of dissolved oxygen increases with pH
up to approximately pH 115 This can be attributed to the decline in the rate at which
dissolved oxygen is reduced by hydrogen atoms as the equilibrium between the hydrogen
atom and the solvated electron shifts to favour the solvated electron The reaction rate of
the equivalent alkali reaction to remove dissolved oxygen through reduction by the solvated
electron does not increase to compensate resulting in a net increase in the steady state
concentration of dissolved oxygen The model calculations also show that increasing the
pH further results in a decline in the hydrogen gas production rate This is due to the shift in
the equilibrium between the hydroxyl radical and the oxide radical anion (R6364) which
has a pKa of 119 The main pathway for the radiolytic production of dissolved oxygen is
the reaction between the hydroxyl radical and super oxide (R21)
Chapter 8 Conclusions and Further Work
155
The rate of this reaction falls at high pH as the hydroxyl radical is converted to the oxide
radical anion The alkali equivalent of this reaction (R50) has a much lower rate constant
and is out competed by the solvated electron (R8) Further experiments to measure the
concentration of radiolytically produced oxygen at high pH could help to support the model
predictions or confirm a misunderstanding in the model An inline gas chromatography
technique similar to the ldquocrush tuberdquo described in Chapter 2 may be used only instead of
crushing a sealed glass vial within the carrier gas flow a specially designed cell is
connected to the in and out ports of the carrier gas flow This cell would contain a high pH
solution and would sit inside the irradiator from here multiple analyses can be run on a
single sample The carrier gas would have to be changed from argon to helium to increase
the sensitivity towards oxygen running the carrier gas through the cell prior to irradiation
will serve to remove the initial dissolved oxygen from the sample from this point onward
any measurements of oxygen would be radiolytically produced
These experiments would help to better understand high pH water radiolysis and hopefully
help to improve the radiolysis model and understand why there is an over prediction at
pH 106 A comprehensive water radiolysis model that can accurately predict
concentrations of radiolysis products under a wide range of conditions is of high
importance to the nuclear industry and would have applications in decommissioning
maintenance of current nuclear systems and designing new nuclear technology
Chapter 8 Conclusions and Further Work
156
Further Methanol Radiolysis Investigations
The reaction scheme used to model the radiolysis of aqueous methanol results in the
temporary formation of several stable organic species before they themselves are oxidised
by hydroxyl radicals This scheme eventually converts all organic substances to carbon
monoxide however in reality this is not the case It has been reported in literature that one
of the stable products formed is methane gas a substance not included in the current
reaction scheme The gas chromatography techniques used in this work are not suitable for
the detection of small quantities of carbon monoxide or indeed other potential radiolysis
products such as methane A more sophisticated approach would be to use a gas
chromatography mass spectroscopy technique (GC-MS) This technique would allow for
the detection of carbon monoxide carbon dioxide methane and any other volatile
hydrocarbons that may be formed during radiolysis Other transient products of methanol
radiolysis such as formaldehyde ethylene glycol glycolaldehyde and glyoxal may be
analysed by high performance liquid chromatography (HPLC) It was mentioned in Chapter
6 that the reaction scheme does not accurately represent the radiolysis of the transient
product glycolaldehyde A publication by Yaylayan et al130
discusses some measurements
made by nuclear magnetic resonance spectroscopy of glycolaldehyde in deuterated water
and it was found that it exists mostly as the hydrated aldehyde 112-ethanetriol (~70) A
complete reaction scheme for the radiolysis of methanol should include the radiolysis
reactions of all the transient species of which there are potentially many
However if the major component of a glycolaldehyde solution is 112-ethanetriol an
acceptable compromise may be to include only the radiolysis reactions of this species and
ignore the radiolysis paths of minor products
Chapter 8 Conclusions and Further Work
157
Experimental analysis of aqueous methanol to determine the major transient species would
be valuable for determining which radiolysis paths have the most significant roles in
methanol radiolysis
Future Development of a Multi-Scale Radiolysis Model
As discussed in Chapter 3 the model developed in this work is a deterministic model for the
calculation of long term homogeneous phase radiolysis This calculation depends on a
series of primary values that represent the production rates of the primary species of water
radiolysis which in turn depend on a number of physical and chemical factors It is
possible to calculate these primary yields using stochastic methods which can then be fed
into the deterministic calculation to obtain predictions of chemical species concentrations
This technique has been successfully used recently to demonstrate some of the effects of
high capacity scavengers47
This technique assumes that there are no changes to the
physiochemical conditions during the radiolysis period for example if a calculation was to
be performed where the temperature were to change the primary yields would need to be
recalculated at the new temperature The model developed in this work attempts to
overcome this by estimating primary yields as a multiple regression fit of temperature and
pH however this estimation is not adequately accurate and does not include any effects that
linear energy transfer has on the primary yields A more suitable approach to the
development of a comprehensive multi-scale radiolysis model may be to utilise a stochastic
calculation of the primary yields that includes the effects of temperature pH LET and
chemical scavengers which can be called from within the deterministic calculation
whenever a significant change to one of these factors is initiated
Chapter 8 Conclusions and Further Work
158
Further work concerning the deterministic model presented in this work include an
investigation into the partitioning of gaseous species The method used is one that has been
successfully used by other research groups to model the radiolysis of water and the effect of
available headspace This implementation of the stagnant two-film model was never
intended to cope with rapid changes in aqueous oxygen concentrations Further efforts
should be made to better incorporate this gas partitioning method in a way that can more
realistically represent oxygen partitioning during the radiolysis of aqueous methanol
Closing Remarks Relevant to Sellafield Ltd
The experimental data presented in Chapters 4 and 5 are pertinent to the situations and
conditions currently found within the Magnox Swarf Storage Silos at Sellafield In the case
of elevated pH due to sodium hydroxide both the experimental and computational data
show increased rates of hydrogen gas production and an increased steady-state
concentration of hydrogen peroxide Despite some minor quantitative disagreements
between the experimental data and the computational data the qualitative trend is in
general agreement One could therefore expect to observe increased production of hydrogen
gas in the MSSS with increasing pH especially within the pH region of approximately
105 to 125 An important aspect of the situation at the MSSS is the aerated nature of the
system The obvious consideration being the increased amounts of dissolved oxygen
present which although such effects were also discussed in Chapter 4 the experimental
data shown was only for water at neutral pH Nevertheless it was discussed in Chapter 4
that dissolved oxygen acts a poison to the chain reaction that normally removes molecular
hydrogen A less obvious consideration and one that was largely overlooked in Chapter 4
is the inclusion of gas to liquid carbon dioxide exchange and its aqueous conversion to
carbonate
Chapter 8 Conclusions and Further Work
159
At high pH the concentration of aqueous CO2 and therefore CO32-
becomes significant
With CO32-
being known to react with the hydroxyl radical and given the difficulty in its
removal future research and industrial models involving high pH aqueous radiolysis would
benefit from including a description of the radiolysis chemistry of aqueous carbonate
systems Chapter 5 begins to address the concept of including carbonate chemistry into a
radiolysis model This came about from the realisation that magnesium hydroxide can be
easily carbonated on contact with CO2 and is also known to be an effective carbon trapping
material In this case not only the additional chemistry brought about carbonate should be
considered but also the effects of the magnesium compounds that can be formed for
example magnesium carbonate magnesium bicarbonate magnesium oxide and
magnesium hydroxide Similarly consideration should be given to the multitude of iron
phases that can exist in conditions comparable to those of the First Generation Magnox
Storage Ponds Although it was not considered in Chapter 7 it is likely that the corroded
iron found in the FGMSP also exists as a number of iron hydroxides and hydrated oxides
Given the open air nature of the FGMSP hydrogen gas build-up is not a major concern
however the interactions of the various iron oxide phases in a radiolysis system may affect
concentrations of oxidising species such as H2O2 which may alter corrosion rates The
results shown in Chapter 7 suggest little effect on H2O2 concentration in the presence of
haematite but the presence of magnetite had a significant effect in removing H2O2 To gain
a better understanding further work would need to be done that also investigated the other
possible phases of iron oxide and also gives consideration to the proportions in which they
can be found in the FGMSP
References
160
References
1 Pitois A Ivanov P I Abrahamsen L G Bryan N D Taylor R J amp Sims H E Magnesium Hydroxide Bulk and Colloid-Associated 152Eu in an Alkaline Environment Colloid Characterisation and Sorption Properties in the Presence and Absence of Carbonate J Environ Monit 10 315-324 (2008)
2 Spinks J W T amp Woods R J An Introduction to Radiation Chemistry (1990)
3 Loveland W D Morrissey D J amp Seaborg G T Modern Nuclear Chemistry (2005)
4 Allen A O The Radiation Chemistry of Water and Aqueous Solutions (1961)
5 Draganić I G amp Draganić Z D The Radiation Chemistry of Water (1971)
6 Schwarz H A Losee J P amp Allen A O Hydrogen Yields in the Radiolysis of Aqueous
Solutions Journal of the American Chemical Society 76 4693-4694 (1954)
7 Swallow A J Radiation Chemistry An Introduction (1973)
8 Schwarz H A Free Radicals Generated by Radiolysis of Aqueous Solutions Journal of
Chemical Education 58 101 (1981)
9 Buxton G V Clive L Greenstock W Helman P amp Ross A B Critical Review of Rate
Constants for Reactions of Hydrated Electrons Hydrogen Atoms and Hydroxyl Radicals (˙OHO˙-) in Aqueous Solution J Phys Chem Ref Data 17 513-886 (1988)
10 Jayson G G Keene J P Stirling D A amp Swallow A J Pulse-Radiolysis Study of Some
Unstable Complexes of Iron Transactions of the Faraday Society 65 2453-2464 (1969)
11 Koppenol W H amp Liebman J F The Oxidizing Nature of the Hydroxyl Radical A
Comparison with the Ferryl Ion (FeO2+) The Journal of Physical Chemistry 88 99-101 (1984)
12 Meyerstein D Complexes of Cations in Unstable Oxidation States in Aqueous Solutions as
Studied by Pulse Radiolysis Accounts of Chemical Research 11 43-48 (1978)
13 Schwarz H A Applications of the spur diffusion model to the radiation chemistry of
aqueous solutions The Journal of Physical Chemistry 73 1928-1937 (1969)
References
161
14 Dyne P J amp Kennedy J M The Kinetics of Radical Reactions in the Tracks of Fast Electrons A Detailed Study of the SamuelndashMagee Model for the Radiation Chemisty of Water Canadian Journal of Chemistry 36 1518-1536 (1958)
15 Burns W G Sims H E amp Goodall J A B Special Issue Dedicated to The Memory of the
Late John Hodson Baxendale Radiation chemical diffusion kinetic calculations with prescribed and non-prescribed diffusionmdashI Radiation Physics and Chemistry (1977) 23 143-180 (1984)
16 Pimblott S M amp LaVerne J A Comparison of Stochastic and Deterministic Methods for
Modeling Spur Kinetics Radiation Research 122 12-23 (1990)
17 Tapping R L Corrosion Issues in Pressurized Heavy Water Reactor (PHWRCANDUreg)
Systems A2 in Nuclear Corrosion Science and Engineering 581-633 (2012)
18 Petrik N G Alexandrov A B amp Vall A I Interfacial Energy Transfer During Gamma
Radiolysis of Water on the Surface of ZrO2 and Some Other Oxides The Journal of Physical Chemistry B 105 5935-5944 (2001)
19 LaVerne J A amp Tandon L H2 and Cl2 Production in the Radiolysis of Calcium and
Magnesium Chlorides and Hydroxides The Journal of Physical Chemistry A 109 2861-2865 (2005)
20 Slack J Norton J L amp Malkoske G R Cobalt-60 Production in CANDU Power Reactors
21 Unterweger M P Hoppes D D amp Schima F J New and Revised Half-Life Measurements
Results Nuclear Instruments and Methods in Physics Research Section A Accelerators Spectrometers Detectors and Associated Equipment 312 349-352 (1992)
22 Weiss J A Survey of Chemical Dosimetric Systems The International Journal of Applied
Radiation and Isotopes 4 89-95 (1958)
23 Fricke H amp Morse S The Chemical Action of Roumlntgen Rays on Dilute Ferrosulfate Solutions
as a Measure of Dose Am J Roentgenology and Radium Therapy 18 430-432 (1927)
24 Weiss J Allen A O amp Schwarz H A Fricke Ferrous Sulfate Dosimeter for γ-rays in the
Range 4 to 40 Kiloroumlntgens Proceedings of the International Conference on the Peaceful Uses of Atomic Energy 14 179-181 (1956)
25 Allen A O Hochanadel C J Ghormley J A amp Davis T W Decomposition of Water and
Aqueous Solutions under Mixed Fast Neutron and Gamma Radiation American Chemical Society (1952)
References
162
26 Hiroki A Pimblott S M amp LaVerne J A Hydrogen Peroxide Production in the Radiolysis of
Water with High Radical Scavenger Concentrations The Journal of Physical Chemistry A 106 9352-9358 (2002)
27 Yakabuskie P A Joseph J M amp Wren C J The Effect of Interfacial Mass Transfer on
Steady-State Water Radiolysis Radiation Physics and Chemistry 79 777-785 (2010)
28 Nejad M A amp Jonsson M Reactivity of Hydrogen Peroxide towards Fe3O4 Fe2CoO4 and
Fe2NiO4 Journal of Nuclear Materials 334 28-34 (2004)
29 Pastina B amp LaVerne J A Effect of Molecular Hydrogen on Hydrogen Peroxide in Water
Radiolysis The Journal of Physical Chemistry A 105 9316-9322 (2001)
30 Klassen N V Marchington D amp McGowan H C E H2O2 Determination by the I3
- Method and by KMnO4 Titration Analytical Chemistry 66 2921-2925 (1994)
31 Roth O amp LaVerne J A Effect of pH on H2O2 Production in the Radiolysis of Water J Phys
Chem A 115 700-708 (2011)
32 Wasselin-Trupin V Baldacchino G Bouffard S amp Hickel B Hydrogen Peroxide Yields in
Water Radiolysis by High-Energy Ion Beams at Constant LET Radiation Physics and Chemistry 65 53-61 (2002)
33 Essehli R Crumiegravere F Blain G Vandenborre J Pottier F Grambow B et al H2
Production by γ and He Ions Water Radiolysis Effect of Presence TiO2 Nanoparticles International Journal of Hydrogen Energy 36 14342-14348 (2011)
34 Faraggi M Zehavi D amp Anbar M Effect of Thallous Ions on the Yields of Hydrogen and
Hydrogen Peroxide in Radiolyzed Aqueous Solutions Transactions of the Faraday Society 67 2057-2067 (1971)
35 Lousada C M LaVerne J A amp Jonsson M Enhanced Hydrogen Formation During the
Catalytic Decomposition of H2O2 on Metal Oxide Surfaces in the Presence of ˙OH Radical Scavengers Phys Chem Chem Phys 15 12674-12679 (2013)
36 Schofield J Reiff S C Pimblott S M amp LaVerne J A Radiolytic Hydrogen Generation at
Silicon CarbidendashWater Interfaces Journal of Nuclear Materials 469 43-50 (2016)
37 LaVerne J A Ryan M R amp Mu T Hydrogen Production in the Radiolysis of Bromide
Solutions Radiation Physics and Chemistry 78 1148-1152 (2009)
References
163
38 Draganic I Nenadovic M T amp Draganic Z D Radiolysis of HCOOH + O2 at pH 13-13 and
the Yields of Primary Products in γ Radiolysis of Water Journal of Physical Chemistry 73 2564-2571 (1969)
39 Hart E J γ-Ray Induced Oxidation of Aqueous Formic Acid-Oxygen Solutions Effect of pH
Journal of the American Chemical Society 76 4198-4201 (1954)
40 Flanders D A amp Fricke H Application of a High-Speed Electronic Computer in Diffusion
Kinetics The Journal of Chemical Physics 28 1126-1129 (1958)
41 Burns W G Sims H E amp Goodall J A B Radiation Chemical Diffusion Kinetic Calculations
with Prescribed and Non-Prescribed DiffusionmdashI Spherical and Cylindrical Cases Radiation Physics and Chemistry 23 143-180 (1984)
42 Green N J B Pilling M J Pimblott S M amp Clifford P Stochastic Modeling of Fast Kinetics
in a Radiation Track The Journal of Physical Chemistry 94 251-258 (1990)
43 Bouniol P amp Bjergbakke E A Comprehensive Model to Describe Radiolytic Processes in
Cement Medium Journal of Nuclear Materials 372 1-15 (2008)
44 Ershov B G amp Gordeev A V A Model for Radiolysis of Water and Aqueous Solutions of H2
H2O2 and O2 Radiation Physics and Chemistry 77 928-935 (2008)
45 Elliot A J amp Bartels D M The Reaction Set Rate Constants and g-Values for the Simulation
of the Radiolysis of Light Water over the range 20degC to 350degC Based on Information Available in 2008 (Atomic Energy of Canada Limited Mississauga Ontario (Canada) 2009)
46 Wren J C amp Ball J M LIRIC 32 an Updated Model for Iodine Behaviour in the Presence of
Organic Impurities Radiation Physics and Chemistry 60 577-596 (2001)
47 Gregory P Horne Thomas A Donoclift Howard E Sims Robin M Orr amp Simon M
Pimblott Multi-Scale Modelling of the Radiolysis of Nitrate Solutions The Journal of Physical Chemistry B 120 (45) 11781 - 11789 (2016)
48 Chance E M Curtis A R Jones I P amp Kirby C R FACSIMILE A Computer Program for
Flow and Chemistry Simulation and General Initial Value Problems Report No 0436-9734 148 pp (Univ Coll 1977)
49 Elliot A J Rate Constants and G-Values for the Simulation of the Radiolysis of Light Water
Over the Range 0 - 300degC AECL-11073 COG-94-167 (1994)
References
164
50 Hochanadel C J amp Ghormley J A Effect of Temperature on the Decomposition of Water
by γ-Rays Radiat Res 16 635-660 (1962)
51 Janik D Janik I amp Bartels D M Neutron and βγ Radiolysis of Water up to Supercritical
Conditions βγ Yields for H2 Hbull Atom and Hydrated Electron The Journal of Physical
Chemistry A 111 7777-7786 (2007)
52 Jha K N Ryan T G amp Freeman G R Radiolysis of H2O and D2O between 0 and 300degC J
Phys Chem 79 868-870 (1974)
53 Elliot A J Chenier M P amp Ouellette D C Temperature Dependence of g Values for H2O
and D2O Irradiated with Low Linear Energy Transfer Radiation Journal of the Chemical Society Faraday Transactions 89 1193-1197 (1993)
54 Kent M C amp Sims H E The Yield of γ-Radiolysis Products from Water at Temperatures up
to 270degC Harwell Report AEA-RS-2301 (1992)
55 Lin M Katsumura Y Muroya Y He H Wu G Han Z et al Pulse Radiolysis Study on the
Estimation of Radiolytic Yields of Water Decomposition Products in High-Temperature and Supercritical Waterthinsp Use of Methyl Viologen as a Scavenger The Journal of Physical Chemistry A 108 8287-8295 (2004)
56 Štefanić I amp LaVerne J A Temperature Dependence of the Hydrogen Peroxide Production
in the γ-Radiolysis of Water The Journal of Physical Chemistry A 106 447-452 (2002)
57 Ferradini C amp Jay-Gerin J-P The Effect of pH on Water Radiolysis A Still Open Question mdash
A Minireview Research on Chemical Intermediates 26 549-565 (2000)
58 Ferradini C Kinetic Behavior of the Radiolysis Products of Water in Advances in Inorganic
Chemistry and Radiochemistry Vol Volume 3 (eds H J Emeleus amp A G Sharpe) 171-205 (1961)
59 Lefort M Radiation Chemistry Annual Review of Physical Chemistry 9 123-156 (1958)
60 Sworski T J Yields of Hydrogen Peroxide in the Decomposition of Water by Cobalt γ-
Rradiation I Effect of Bromide Ion Journal of the American Chemical Society 76 4687 (1954)
61 Hochanadel C J amp Lind S C Radiation Chemistry Annual Review of Physical Chemistry 7
83-106 (1956)
References
165
62 Mahlman H A amp Boyle J W Primary Cobalt-60 Radiolysis Yields in Heavy Water Journal
of the American Chemical Society 80 773 (1958)
63 Hayon E amp Stein G Radiation Chemistry of Aqueous Systems (1968)
64 Hayon E Effect of Solute Concentration on the Recombination of H˙ and ˙OH in γ-Irradiated
Aqueous Solutions Journal of Physical Chemistry 65 1502-1505 (1961)
65 Sehested K Bjergbakke E amp Fricke H The Primary Species Yields in the 60Co γ-Ray
Radiolysis of Aqueous Solutions of H2SO4 between pH 7 and 046 Radiation Research 56 385-399 (1973)
66 Hayon E Radiolysis of Heavy Water in the pD Range 0-14 Journal of Physical Chemistry 69
2628-2632 (1965)
67 Haissinsky M γ-Radiolysis of Alkaline and Neutral Solutions I Alkaline Solutions of Sodium
Phosphite Journal de Chimie Physique et de Physico-Chimie 62 1141-1148 (1965)
68 Dainton F S amp Watt W S The Effect of pH on the Radical Yields in the γ-Radiolysis of
Aqueous Systems Nature 195 1294-1296 (1962)
69 Dainton F S amp Rumfeldt R Radical and Molecular Yields in the γ-Radiolysis of Water III
The Nitrous Oxide-Sodium Tellurite System Proceedings of the Royal Society of London A Mathematical Physical and Engineering Sciences 287 444-456 (1965)
70 Cheek C H amp Linnenbom V J The Radiation Chemistry of Alkaline Hypobromite Solutions
The Journal of Physical Chemistry 67 1856-1860 (1963)
71 Fielden E M amp Hart E J Primary Radical Yields in Pulse-Irradiated Alkaline Aqueous
Solution Radiation Research 32 564-580 (1967)
72 Czapski G amp Peled E On the pH-Dependence of Greducing in the Radiation Chemistry of
Aqueous Solutions Israel Journal of Chemistry 6 421-436 (1968)
73 Balkas T Dainton F S Dishman J K amp Smithies D Radiation Chemistry of Aqueous
Solutions Containing Carbon Monoxide and Oxygen Between pH 04 and 12 Transactions of the Faraday Society 62 81-87 (1966)
References
166
74 Pimblott S M Pilling M J amp Green N J B Stochastic Models of Spur Kinetics in Water International Journal of Radiation Applications and Instrumentation Part C Radiation Physics and Chemistry 37 377-388 (1991)
75 Hayon E Radical and Molecular Yields in the Radiolysis of Alkaline Aqueous Solutions
Transactions of the Faraday Society 61 734-743 (1965)
76 Gordon S amp Hart E J Chemical Yields of Ionizing Radiations in Aqueous Solutions Effect of
Energy of Alpha Particles Radiation Research 15 440-451 (1961)
77 Kochanny G L Timnick A Hochanadel C J amp Goodman C D Radiation Chemistry Studies
of Water as Related to the Initial Linear Energy Transfer of 11-MeV to 23-MeV Protons Radiation Research 19 462-473 (1963)
78 ICRU Report 16 - Linear Energy Transfer (ICRU Washington USA 1970)
79 Schwarzenbach R P Gschwend P M amp Imboden D M Environmental Organic Chemistry
(Wiley 2005)
80 Ferrell R T amp Himmelblau D M Diffusion Coefficients of Hydrogen and Helium in Water
American Institute of Chemical Engineers 13 702-708 (1967)
81 Han P amp Bartels D M Temperature Dependence of Oxygen Diffusion in H2O and D2O The
Journal of Physical Chemistry 100 5597-5602 (1996)
82 Marrero T R amp Mason E A Gaseous Diffusion Coefficients Journal of Physical and
Chemical Reference Data 1 3-118 (1972)
83 Kestin J Knierim K Mason E A Najafi B Ro S T amp Waldman M Equilibrium and
Transport Properties of the Noble Gases and Their Mixtures at Low Density Journal of Physical and Chemical Reference Data 13 229-303 (1984)
84 Sander R Compilation of Henryrsquos Law Constants for Inorganic and Organic Species of
Potential Importance in Environmental Chemistry (1999)
85 Mezyk Stephen P amp Bartels David M Direct EPR Measurement of Arrhenius Parameters
for the Reactions of Hmiddot Atoms with H2O2 and Dmiddot Atoms with D2O2 in Aqueous Solution Journal of the Chemical Society Faraday Transactions 91 3127-3132 (1995)
References
167
86 Joseph Jiju M Seon Choi Byung Yakabuskie Pam amp Wren Clara J A Combined Experimental and Model Analysis on the Effect of pH and O2(aq) on γ-Radiolytically Produced H2 and H2O2 Radiation Physics and Chemistry 77 1009-1020 (2008)
87 Allen A O The Yields of Free H˙ and ˙OH in the Irradiation of Water Radiation Research 1
85-96 (1954)
88 Jortner J amp Noyes R M Some Thermodynamic Properties of the Hydrated Electron The
Journal of Physical Chemistry 70 770-774 (1966)
89 Sehested K Holcman J Bjergbakke E amp Hart Edwin J Ultraviolet Spectrum and Decay of
the Ozonide Ion Radical O3- in Strong Alkaline Solution Journal of Physical Chemistry 86
2066-2069 (1982)
90 Jones T Development of an Effluent Treatment Process for the Silos Direct Encapsulation
Plant IChemE Sustainable Nuclear Energy Conference (2014)
91 Nelson S M Newman A C D Tomlinson T E amp Sutton L E A Dielectric Study of the
Adsorption of Water by Magnesium Hydroxide Transactions of the Faraday Society 55 2186-2202 (1959)
92 Shpak P A Kalinichenko A E Lytovchenko S A Kalinichenko A I Legkova V G amp
Bagmut N N The Effect of γ-Irradiation on the Structure and Subsequent Thermal Decomposition of Brucite Physics and Chemistry of Minerals 30 59-68 (2003)
93 Maroto-Valer M M Developments and Innovation in Carbon Dioxide (CO2) Capture and
Storage Technology Volume One Carbon Dioxide (CO2) Capture Transport and Industrial Applications (Woodhead Publishing 2010)
94 Siriwardane R V amp Stevens R W Novel Regenerable Magnesium Hydroxide Sorbents for
CO2 Capture at Warm Gas Temperatures Industrial amp Engineering Chemistry Research 48 2135-2141 (2009)
95 Fricker Kyle J amp Park A Alissa Effect of H2O on Mg(OH)2 Carbonation Pathways for
Combined CO2 Capture and Storage Chemical Engineering Science 100 332-341 (2013)
96 Sahoo P Ishihara S Yamada K Deguchi K Ohki S Tansho M et al Rapid Exchange
between Atmospheric CO2 and Carbonate Anion Intercalated within Magnesium Rich Layered Double Hydroxide ACS Applied Materials amp Interfaces 6 18352-18359 (2014)
97 Stirling A HCO3
- Formation from CO2 at High pH Ab Initio Molecular Dynamics Study The Journal of Physical Chemistry B 115 14683-14687 (2011)
References
168
98 Shah Noor S Khan Javed Ali Al-Muhtaseb Alarsquoa H Sayed Murtaza amp Khan Hasan M
Gamma Radiolytic Decomposition of Endosulfan in Aerated Solution The Role of Carbonate Radical Environmental Science and Pollution Research 1-10 (2016)
99 Nash K Mulac W Noon M Fried S amp Sullivan J C Pulse Radiolysis Studies of U(VI)
Complexes in Aqueous Media Journal of Inorganic and Nuclear Chemistry 43 897-899 (1981)
100 Holcman J Bjergbakke E amp Sehested K The Importance of Radical-Rradical Reactions in
Pulse Radiolysis of Aqueous CarbonateBicarbonate Proceedings of the Tihany Symposium on Radiation Chemistry 6 149-153 (1987)
101 Draganic Z D Negron-Mendoza A Sehested K Vujosevic S I Navarro-Gonzales R
Albarran-Sanchez M G et al Radiolysis of Aqueous Solutions of Ammonium Bicarbonate Over a Large Dose Range Radiation Physics and Chemistry 38 317-321 (1991)
102 Eriksen T E Lind J amp Mereacutenyi G On the Acid-Base Equilibrium of the Carbonate Radical
Radiation Physics and Chemistry 26 197-199 (1985)
103 Thomas J K Gordon Sheffield amp Hart Edwin J The Rates of Reaction of the Hydrated
Electron in Aqueous Inorganic Solutions Journal of Physical Chemistry 68 1524-1527 (1964)
104 Nehari Shlomo amp Rabani Joseph The Reaction of H˙ Atoms with OH- in the Radiation
Chemistry of Aqueous Solutions Journal of Physical Chemistry 67 1609-1613 (1963)
105 Neta P amp Dorfman L M Pulse Radiolysis Studies XIII Rate Constants for the Reaction of
Hydroxyl Radicals with Aromatic Compounds in Aqueous Solutions in Radiation Chemistry Vol 81 Advances in Chemistry Ch 15 222-230 (American Chemical Society 1968)
106 Mezyk S P amp Bartels D M Rate Constant and Activation Energy Measurement for the
Reaction of Atomic Hydrogen with Methanol Iodomethane Iodoethane and 1-Iodopropane in Aqueous Solution The Journal of Physical Chemistry 98 10578-10583 (1994)
107 Anbar M amp Hart E J The Reactivity of Aromatic Compounds toward Hydrated Electrons
Journal of the American Chemical Society 86 5633-5637 (1964)
108 Theard Leslie M amp Burton Milton Radiolysis of Liquid Methanol and some Methanolic Salt
Solutions Journal of Physical Chemistry 67 59-64 (1963)
References
169
109 Porter Raymond P Noyes W amp Albert Jr Photochemical Studies LIV Methanol Vapor Journal of the American Chemical Society 81 2307-2311 (1959)
110 Motohashi N amp Saito Y Competitive Measurement of Rate Constants for Hydroxyl Radical
Reactions Using Radiolytic Hydroxylation of Benzoate Chemical amp pharmaceutical bulletin 41 1842-1845 (1993)
111 Adams G E amp Willson R L Pulse Radiolysis Studies on the Oxidation of Organic Radicals in
Aqueous Solution Transactions of the Faraday Society 65 2981-2987 (1969)
112 Kishore K Moorthy P N amp Rao K N Reactivity of H2O2 with Radiation Produced Free
Radicals Steady State Radiolysis Methods for Estimating the Rate Constants International Journal of Radiation Applications and Instrumentation Part C Radiation Physics and Chemistry 29 309-313 (1987)
113 Simic M Neta P amp Hayon E Pulse Radiolysis Study of Alcohols in Aqueous Solution The
Journal of Physical Chemistry 73 3794-3800 (1969)
114 Tsang W Chemical Kinetic Data Base for Combustion Chemistry Part 2 Methanol Journal
of Physical and Chemical Reference Data 16 471-508 (1987)
115 Huie R E amp Clifton C L Kinetics of the Self-Reaction of Hydroxymethylperoxyl Radicals
Chemical Physics Letters 205 163-167 (1993)
116 Schuchmann M N amp Von Sonntag C The Rapid Hydration of the Acetyl Radical A Pulse
Radiolysis Study of Acetaldehyde in Aqueous Solution Journal of the American Chemical Society 110 5698-5701 (1988)
117 Bothe E Schulte-Frohlinde D amp von Sonntag C Radiation Chemistry of Carbohydrates
Part 16 Kinetics of HO2˙ Elimination from Peroxyl Radicals Derived from Glucose and Polyhydric Alcohols Journal of the Chemical Society Perkin Transactions 2 416-420 (1978)
118 Zimina GM amp Bakh NA Pulse Radiolysis of Ethylene Glycol Absorption Spectra of the
Short-Lived Radicals High Energy Chem 13 187-190 (1979)
119 Thomas J K Rates of Reaction of the Hydroxyl Radical Transactions of the Faraday Society
61 702-707 (1965)
120 Draganic I amp Marcovic V Unpublished data (NIST Squib 1968DRAMARB) (1968)
References
170
121 Orlando J J amp Tyndall G S The Atmospheric Chemistry of the HC(O)CO Radical International Journal of Chemical Kinetics 33 149-156 (2001)
122 Ziemer H Doacutebeacute S Wagner H G Olzman M Viskolcz B amp Temps F Kinetics of the
Reactions of HCO with H˙ and D˙ Atoms Berichte der Bunsengesellschaft fuumlr physikalische Chemie 102 897-905 (1998)
123 Temps F amp Wagner H G Rate Constants for the Reactions of ˙OH Radicals with CH2O˙ and
HCO˙ Berichte der Bunsengesellschaft fuumlr physikalische Chemie 88 415-418 (1984)
124 Atkinson R Baulch D L Cox R A Hampson R F Kerr J A Rossi M J et al Evaluated
Kinetic and Photochemical Data for Atmospheric Chemistry Supplement VI IUPAC Subcommittee on Gas Kinetic Data Evaluation for Atmospheric Chemistry Journal of Physical and Chemical Reference Data 26 1329-1499 (1997)
125 Yee Quee M J amp Thynne J C J The Photolysis of Organic Esters Berichte der
Bunsengesellschaft fuumlr physikalische Chemie 72 211-217 (1968)
126 Sunaryoy G R amp Domae M Numerical Simulation on Effect of Methanol Addition on
Coolant Radiolysis in Pressurized Water Reactor Journal of Nuclear Science and Technology 45 1261-1274 (2008)
127 Baxendale J H amp Mellows F W The γ-Radiolysis of Methanol and Methanol Solutions
Journal of the American Chemical Society 83 4720-4726 (1961)
128 Pikaev A K amp Kartasheva L I Radiolysis of Aqueous Solutions of Ethylene Glycol
International Journal for Radiation Physics and Chemistry 7 395-415 (1975)
129 Ahmad M Awan M H amp Mohammad D γ-Radiolysis of Ethylene Glycol Aqueous
Solutions Journal of the Chemical Society B Physical Organic 945-946 (1968)
130 Yaylayan V A Harty-Majors S amp Ismail A A Investigation of the Mechanism of
Dissociation of Glycolaldehyde Dimer (25-dihydroxy-14-dioxane) by FTIR Spectroscopy Carbohydrate Research 309 31-38 (1998)
131 Reiff S C amp LaVerne J A Radiation-Induced Chemical Changes to Iron Oxides The Journal
of Physical Chemistry B 119 7358-7365 (2015)
132 Lousada C M Yang M Nilsson K amp Jonsson M Catalytic Decomposition of Hydrogen
Peroxide on Transition Metal and Lanthanide Oxides Journal of Molecular Catalysis A Chemical 379 178-184 (2013)
References
171
133 Rush J D B Benon H J Pulse Radiolytic Studies of the Reaction of Perhydroxyl
Superoxide O2- with Iron(II)Iron(III) Ions The Reactivity of HO2O2
- with Ferric Ions and its Implication on the Occurrence of the Haber-Weiss Reaction Journal of Physical Chemistry 89 5062-5066 (1985)
134 Pepper S E Borkowski M Richmann M K amp Reed D T Determination of Ferrous and
Ferric Iron in Aqueous Biological Solutions Analytica Chimica Acta 663 172-177 (2010)
135 Barb W G Baxendale J H George P amp Hargrave K R Reactions of Ferrous and Ferric
Ions with Hydrogen Peroxide Part II-The Ferric Ion Reaction Transactions of the Faraday Society 47 591-616 (1951)
136 Stuglik Z amp PawełZagoacuterski Z Pulse Radiolysis of Neutral Iron(II) Solutions Oxidation of
Ferrous Ions by ˙OH Radicals Radiation Physics and Chemistry (1977) 17 229-233 (1981)
137 Fong K-L McCay P B Poyer J L Misra H P amp Keele B B Evidence for Superoxide-
Dependent Reduction of Fe3+ and its role in Enzyme-Generated Hydroxyl Radical Formation Chemico-Biological Interactions 15 77-89 (1976)
138 Baxendale J H Dixon R S amp Stott D A Reactivity of Hydrogen Atoms with Fe3+ FeOH2+
and Cu2+ in Aqueous Solutions Transactions of the Faraday Society 64 2398-2401 (1968)
139 Jonah C D M John R Matheson Max S The Reaction of the Precursor of the Hydrated
Electron with Electron Scavengers Journal of Physical Chemistry 81 1618-1622 (1977)
Appendix
172
Appendix
Radiolysis Model Code
All computational calculations were performed with the software package Facsimile by
MCPA Software The following is a print out of the core water radiolysis model and only
includes the reactions of water other reaction schemes documented in this work can be
found on the included CD as well as the setup files containing initial parameters and
associated Python scripts used to manage output data
Appendix
173
--------------------------------------------------------------------
_ _ ___ ____ _____ _ _ _ _
| | | |__ __ | __ | (_) | | (_)
| |__| | ) | | | | | |__) |__ _ __| |_ ___ | |_ _ ___ _ ___
| __ | | | | | | _ _` | _` | | _ | | | | __| __|
| | | | _| |__| | | | | (_| | (_| | | (_) | | |_| __ | __
|_| |_|____|____ |_| ____|___|_|___|_|__ |___|_|___
__ |
|___
--------------------------------------------------------------------
-----Radiolysis Model for the Radiolysis of Pure Water--------------
----------------------Thomas Donoclift------------------------------
Rate constants mainly are from
A J Elliot Rate constants and G-values
for the simulation of the radiolysis of
light water over the range 0 - 300 C
AECL-11073 COG-94-167 19942008
P Bouniol amp E Bjergbakke ldquoA Comprehensive
Model to Describe Radiolytic processes
in Cement Mediumrdquo J Nuclear Materials 372 1-15 2008
JC Wren JM Ball ldquoLIRIC 32 an Updated model for
Iodine behaviour in the presence of organic impuritiesrdquo
Radiation Physics and Chemistry 60 577-596 2001
EXECUTE OPEN 1 RadMout UNKNOWN
EXECUTE OPEN 2 Reportout UNKNOWN
EXECUTE OPEN 3 SetUptxt OLD
EXECUTE OPEN 4 Flux_Atxt UNKNOWN
EXECUTE OPEN 7 Flux_Btxt UNKNOWN
EXECUTE OPEN 8 Flux_Ctxt UNKNOWN
EXECUTE OPEN 9 Flux_Dtxt UNKNOWN
EXECUTE OPEN 10 Flux_Etxt UNKNOWN
EXECUTE OPEN 11 FireCount_Atxt UNKNOWN
EXECUTE OPEN 12 FireCount_Btxt UNKNOWN
EXECUTE OPEN 14 TIMEtxt UNKNOWN
EXECUTE OPEN 15 FireCount_Ctxt UNKNOWN
EXECUTE OPEN 16 FireCount_Dtxt UNKNOWN
EXECUTE OPEN 17 FireCount_Etxt UNKNOWN
EXECUTE OPEN 19 TRACEtxt UNKNOWN
PERMIT +-
------------------------
Appendix
174
These variables are the concentrations of radiolysis
species Edit initial values in COMPILE INSTANT and
COMPILE INITIAL routines or SetUptxt
---------DEFINE-VARIABLES--------------
----CHEMICAL-SPECIES-FOR-H2O-RADIOLYSIS---------------
VARIABLE
H2O H2O+ H3O+ OH H H2 H2g H2O2 H2O2+ O2 O2g H+
OH- Eaq- O2- O2-- HO2 HO2- O- O-- O3- O Rx O3
---------------------------------------
------REACTION-COUNTERS-----------------------
VARIABLE
R0 R1 R2 R3 R4 R5 R6 R7 R8 R9 R10 R11 R12 R13 R14 R15 R16
R17 R18 R19 R20 R21 R22 R23 R24 R25 R26 R27 R28 R29 R30
R31 R32 R33 R34 R35 R36 R37 R38 R39 R40 R41 R42 R43 R44
R45 R46 R47 R48 R49 R50 R51 R52 R53 R54 R55 R56 R57 R58
R59 R60 R61 R62 R63 R64 R65 R66 R67 R68 R69 R70 R71 R72
R73 R74 R75 R76 R77 R78 R79 R80 R81 R82 R83
G0 G1 G2 G3 G4 G5 G6 G7 G8
---------DEFINE-PARAMETERS-------------
PARAMETER
T TK RT TAB DOSER ADOSE
DOSE EVDOSE GEaq- GH GH2 GOH GH2O2 GH+ GOH- G-H2O G+H2O GO2 GO2-
kappH2 kappO2 GHO2 GHO2-
kappO2g H2tot EA MB1 MB2 H2O2T
INTEGER RUNt
-------------------------
This set of perameters concerns radiolysis rates
G-Values are converted to rates in COMPILE INITIAL
Rate constants are given the prefix K
Arrhenius Pre-exponentials are given the prefix A
Activation Energies (-EaR) are given the prefix E
followed by letters representing reacting species ie
KAB = Rate constant of A+B
-------------------------
A=Eaq- B=H C=OH D=O-
E=O3- F=HO2 G=H2O2 H=H2O2+
I=H2O J=H+ K=OH- L=HO2-
M=O2 N=O2- O=O2-- P=H2O+
Q=O3 R=H2 S=O
-------------------------
PARAMETER
DW GREaq- GRH GRH2 GROH GRH2O2 GRH+ GROH- GR-H2O GR+H2O
GRO2 GRO2- GRHO2 GRHO2- KAA KAB KAC KAD KAG KAF KAL KAM KAN KBB KBC
KBG KBM KBN KBF KBF2 KBL KCC KCD KCG KCL KCF KCN KDR KDG KDL
KDN KEG KEL KER KEC KED KNN KFN KFNI KFF KFG KI KJK KG
KJL KGK KLI KC KJD KCK KDI KDM KE KF KJN KFK KNI KB KJA
KBK KAI KBI KRC KJNb KCKb KLK KLKb KDD KEJ KBQ KDQ
KCL2 KCQ KNQ KFQ KNG KNE KKQ KLQ KGQ KLG KLN KEC2 KAN2 KAN3
-------------------------
Appendix
175
----PRE-EXPONENTIAL-FACTORS-------------------
PARAMETER AAB AAF AAG AAM AAN ABB ABC ABG
ABN ABF ACG ACF ACN ACL ADR ADL AFNI
AFF ADM AE AG AAN2 AGQ AFN ANN ACL2 ABF2
ABL AAD AAL ADG AEG AEL AER AFG AAN3 ACD ALKb
-----------------------------------
-------ACTIVATION-ENERGIES--------------
PARAMETER EAB EAF EAG EAM EAN EBB EBC EBG
EBN EBF ECG ECF ECN ECL EDR EDL EFNI
EFF EDM EE EG EAN2 EGQ EFN ENN ECL2 EBF2
EBL EAD EAL EDG EEG EEL EER EFG EAN3 ECD ELKb
---------------------------------------
PARAMETER
pH pHreal pKw pKH2O2 pKOH pKHO2 pKH pKH2O pKHO2- KpH KpO
KfH KrH KfO KrO CONV PcH PcO O2in xO2 Kprot Khydx
TPrint pHsweep Tstart Tend DecTime
---------------------------------------------------------
Below are arrays for storing reaction flux These are limited to 20
as the output length max is 250 characters To overcome this clunky
artefact of Facsimile the arrays can be fed into Facssemblepy to
concatenate them into a single output file
----------------------------------------------------------
PARAMETER lt20gt Ra Stores Water Reaction Flux Part A
PARAMETER lt20gt Rb Stores Water Reaction Flux Part B
PARAMETER lt20gt Rc Stores Water Reaction Flux Part C
PARAMETER lt20gt Rd Stores Water Reaction Flux Part D
PARAMETER lt10gt Re Stores Water Reaction Flux Part E
PARAMETER lt2gt GR Stores Gas Partition Flux
-------------------------
--PARAMETERS-FOR-GAS-PARTITION--------------
PARAMETER
DaqH2 DgH2 DaqO2 DgO2 daq dg
vaqH2 vgH2 vaqO2 vgO2 vintH2 vintO2
KpH2 KpO2 vtot
Aint Vl Vg Vr Dose EqR
---------------INITIALISE-PARAMETERS--------
Concentrations of specis are given as Moll
T is Temp in C - TK is Temp in K
pHin is the initial pH xO2 is the fraction of O2
pHreal is the calculated pH at any given time
DW is density of water depending on temperature
DS is the density of the whole solution
Vl and Vg is the Volume of liqud and gas phases in L
DOSER is the dose rate in Gymin
ADOSE is the conversion of dose rate to sets of 100eVls
Appendix
176
COMPILE INSTANT
----PARAMETERS-FROM-SETUP-FILE-----
READ 3 DOSER
READ 3 RUNt
READ 3 Tstart
READ 3 Tend
READ 3 pH
READ 3 xO2
READ 3 Vl
READ 3 Vg
READ 3 Aint
READ 3 DaqH2
READ 3 DgH2
READ 3 DaqO2
READ 3 DgO2
READ 3 daq
READ 3 dg
READ 3 KpH2
READ 3 KpO2
---ADDITIONAL-PARAMETERS----
T = Tstart
TK = T + 27315
TAB = 1TK
RT = 8314TK
DW = (0999 + 1094E-4 T - 7397E-6 T2
+ 2693E-8 T3 - 4714E-11 T4)
ADOSE = ((DOSER 62415E16) 60) DW 100 eVsl for use with Gymin
TPrint = (FLOAT(RUNt) - 1) 60
EA = EXP(18800((129815-1TK)8314))
WRITE 2 = 4
WRITE 3 = 7
WRITE 4 = 8
WRITE 7 = 10
WRITE 8 = 9
WRITE 12 = 14
WRITE 1 = 2 WATER RADIOLYSIS MODEL - DEBUG REPORT
------INITIAL-SPECIES-CONCENTRATIONS-----
READ 3 Eaq-
READ 3 H2
READ 3 O2
READ 3 H2O2
H2O = 553DW
O2g = 101320 xO2 (1000 RT)
H2g = 1E-22 mass transfer - zero will cause floating point overflow
H+ = 10(-1pH) H+ Activity (Effective concentration)
OH- = 10(-1(14-pH))
Appendix
177
------------ARRHENIUS-PARAMETERS-----------------------------
----PRE-EXPONENTIAL-FACTORS-------------------
AAB = 114E13
AAF = 24636E12
AAG = 77E12
AAM = 2479E12
AAN = 24636E12
ABB = 27E12
ABC = 426E11
ABG = 179E11
ABN = 517E12
ABF = 517E12
ACG = 768E9
ACF = 129E11
ACN = 877E11
ACL = 100E12
ADR = 232E10
ADL = 145E13
AFNI = 263E9
AFF = 278E9
ADM = 341E11
AE = 320E11
AG = 3171E4
AAN2 = 31E12
AGQ = 28E11
AFN = 244E9
ANN = 489E8
ACL2 = 45E12
ABF2 = 72E11
ABL = 42E13
AAD = 56E11
AAL = 175E12
ADG = 300E11
AEG = 159E6
AEL = 887E5
AER = 249E5
AFG = 37
AAN3 = 2567E13
ACD = 17E11
ALKb = 295E8
------------------------------
------ACTIVATION-ENERGIES-EaR----
EAB = 17957
EAF = 15636
EAG = 18896
EAM = 14015
EAN = 15636
EBB = 18675
EBC = 10919
EBG = 25336
EBN = 18242
EBF = 18242
ECG = 16614
ECF = 7992
ECN = 13062
ECL = 14346
EDR = 15505
EDL = 29285
Appendix
178
EFNI = 9743
EFF = 24164
EDM = 13449
EE = 55521
EG = 78181
------ACTIVATION-ENERGIES---Ea-J--
EAN2 = 136000
EGQ = 735000
EFN = 86000
ENN = 525900
ECL2 = 156000
EBF2 = 106000
EBL = 256000
EAD = 79000
EAL = 154000
EDG = 156000
EEG = 188400
EEL = 188400
EER = 188400
EFG = 200000
EAN3 = 188000
ECD = 77000
ELKb = 142000
--------------------------------
---------OTHER-LITERATURE-RATE-CONSTANTS--------------------------
KLG = 45E-4 FRDuke TWHaas 1961
KLQ = 55E6 JStaehelin J Hoigne 1982
KKQ = 48E1 LForni EJ Hart 1982
KFQ = 50E8 Pastina La Verne 2001
KNQ = 15E9 EJ Hart 1983
KNE = 10E4 Pastina La Verne 2001
KNG = 13E-1 JWeinstein BBielski 1979
KLN = 823E-2 PBouniol EBjergbakke 2008
KCQ = 11E8 K Sehested EJ Hart 1984
KEC2 = 25E9 K Sehested EJ Hart 1984
KDQ = 10E9 E Bjergbakke H Christensen
KBQ = 22E10 EJ Hart 1983
KCD = 20E10
KDN = 600E8
KEC = 60E9 Sehested Holcman Hart 1984
(269)
KEC = 850E9 P Bouniol E Bjergbakke
KDD = 84E9 Adams GE Boag JW
KDD = 10E8
KED = 70E8 Hart EJ 1984
KEJ = 90E10 Hart EJ
KLK = 3506E5
KLKb = 961E5
-GENERAL-ROUTINE-CONTINUALLY-ITTERATES-THROUGHOUT-CALCULATION-
Appendix
179
COMPILE GENERAL
------TEMPERATURE-RAMPING-ROUTINE----------------
TK = T + 27315
TAB = 1TK
RT = 8314TK
DecTime = TIME 3600
T = (11414 DecTime3 - 80383 DecTime2
+ 19256 DecTime + 22918)
IF(T - Tend)211
LABEL 1
T = Tend
LABEL 2
----------------------
H2O2T = H2O2 + HO2- + O2-- Total peroxide for output use
------------------SETUP-OF-EQUILIBRIA---------------------------------
pKw = (14947 - 4273E-2 T + 2115E-4 T2
- 5786E-7 T3 + 7529E-10 T4)
pKH2O2 = (12383 - 3020E-2 T + 170E-4 T2
- 5151E-7 T3 + 696E-10 T4)
pKOH = (12383 - 3020E-2 T + 170E-4 T2
- 5151E-7 T3 + 696E-10 T4)
pKHO2 = (4943 - 623E-3 T + 4125E-5 T2
- 8182E-9 T3)
pKH = (10551 - 443E-2 T + 1902E-4 T2
- 4661E-7 T3 + 598E-10 T4)
pKH2O = (1669 - 443E-2 T + 2071E-4 T2
- 5594E-7 T3 + 7161E-10 T4)
Kprot = (341E10 + 275E8 T + 124E7 T2
- 623E4 T3 + 131E2 T4)
Khydx = (722E9 + 162E8 T + 24E6 T2
- 781E3 T3 + 106 T4)
pKHO2- = 165 see Bouniol 2001
--------------------PARTITION-OF-O2-AND-H2---------------------
It should be noted that this routine is only valid for
a liquid to gas ratio of 1 See Chapter 3 for details
---------DIFFUSIVITY-WITH-TEMPERATURE---------
DaqO2 = (2E-9 T2 + 4E-7 T + 1E-5)
DaqH2 = (1E-8 T2 + 4E-7 T + 3E-5)
DgO2 = (1E-6 T2 + 12E-3 T + 02073)
DgH2 = (5E-6 T2 + 47E-3 T + 07719)
-----HENRYS-COEFFICIENT-WITH-TEMPERATURE--------------------
KpH2 = (TK (78E-4 EXP(543((1TK) - (129815))))) 122
KpO2 = (TK (13E-3 EXP(1650((1TK) - (129815))))) 122
---H2----
vgH2 = DgH2dg
vaqH2 = DaqH2daq
vintH2 = 1(1vaqH2 + KpH2vgH2)
H2tot = H2 + H2g
Appendix
180
---O2----
vgO2 = DgO2dg
vaqO2 = DaqO2daq
vintO2 = 1(1vaqO2 + KpO2vgO2)
vtot = 1((1(vaqO2))+(1(vgO2KpO2)))
--------PARAMETER-EVOLUTION--------------
kappH2 = vintH2(AintVl)(1 - KpH2(H2gH2))
kappO2 = vintO2(AintVl)(1 - KpO2(O2gO2))
Dose = DOSER (TIME 60)
pHreal = -LOG10( H+ )
--------------------G-VALUES------------------------
G-Values with temperature dependency ONLY
G-Values are initially obtained from literature molec 100eV
G-Values are converted to rates later
GEaq- = 2641 + 4162E-3 T + 9093E-6 T2 - 4717E-8 T3
GH2 = 0419 + 872E-4 T - 4971E-6 T2 + 1503E-8 T3
GOH = 2531 + 1134E-2 T - 1269E-5 T2 + 3513E-8 T3
GH2O2 = 0752 - 162E-3 T
GH = 0556 + 2198E-3 T - 1184E-5 T2 + 5223E-8 T3
GH+ = GEaq-
G-H2O = GOH + 2GH2O2
-----------------------------------------------------
------------G-VALUES-FROM-MULTIPLE-POLYNOMIAL-REGRESSION-----
Multiple polynomial regression was used to combine data that measured
primary yields as a function of temperature AND as a function of pH
GEaq- = 2798 + 285E-3 T - 2514E-2 pHreal
GH2 = 38781E-1 + 8288E-4 T + 5988E-4 pHreal
GOH = 243146 + 1111E-2 T - 12E-3 pHreal
GH = 4444E-1 + 367E-3 T - 2378E-4 pHreal
GH+ = GEaq-
GH2O2 = 05(GH + GEaq- + (2 GH2) - GOH) Material Balance
G-H2O = GOH + 2GH2O2
MB1 = GH + GEaq- + (2 GH2) Diagnostic Material Balance Variables
MB2 = GOH + (2 GH2O2)
-------------------G-VALUES--AS--RATES--------------
GREaq- = (ADOSE GEaq-)6022E23
GRH = (ADOSE GH)6022E23
GRH2 = (ADOSE GH2)6022E23
GROH = (ADOSE GOH)6022E23
GRH2O2 =(ADOSE GH2O2)6022E23
GRH+ = (ADOSE GH+)6022E23
GROH- = (ADOSE GOH-)6022E23
GR-H2O = (ADOSE G-H2O)6022E23
GRO2 = (ADOSE GO2)6022E23
GRO2- = (ADOSE GO2-)6022E23
GRHO2 = (ADOSE GHO2)6022E23
GRHO2- = (ADOSE GHO2-)6022E23
Appendix
181
------REACTION-RATES-WITH-TEMP-DEPENDENCY--
--------POLYNOMIAL-EQUATIONS----------------
KAA = 10(12281 - 3768E2 TAB - 6673E4 TAB2 - 1075E7 TAB3)
KAC = 10(13123 - 1023E3 TAB + 7634E4 TAB2)
KBM = 10(10704 + 2840E2 TAB - 137E5 TAB2)
KCC = 10(8054 + 2193E3 TAB - 7395E5 TAB2 + 687E7 TAB3)
KJK = 10(20934 - 1236E4 TAB + 6364E6 TAB2
- 1475E9 TAB3 + 1237E11 TAB4)
KJN = 10(1641 - 4888E3 TAB + 1622E6 TAB2 - 2004E8 TAB3)
KCK = 10(13339 - 222E3 TAB + 7333E5 TAB2 - 1065E8 TAB3)
KJA = 10(39127 - 3888E4 TAB + 2054E7 TAB2 - 4899E9 TAB3
+ 4376E11 TAB4)
KBK = 10(22970 - 1971E4 TAB + 1137E7 TAB2 - 2991E9 TAB3
+ 2803E11 TAB4)
KBI = 10(9408 - 2827E3 TAB - 3792E5 TAB2)
KRC = 10(-11556 + 32546E4 TAB - 18623E7 TAB2
+ 45543E9 TAB3 - 41364E11 TAB4)
------------ARRHENIUS-EQUATIONS------------------
----------EaR-------------------
KAB = AAB(EXP(-EABTK))
KAF = AAF(EXP(-EAFTK))
KAG = AAG(EXP(-EAGTK))
KAM = AAM(EXP(-EAMTK))
KAN = AAN(EXP(-EANTK))
KBB = ABB(EXP(-EBBTK))
KBC = ABC(EXP(-EBCTK))
KBG = ABG(EXP(-EBGTK))
KBN = ABN(EXP(-EBNTK))
KBF = ABF(EXP(-EBFTK))
KCG = ACG(EXP(-ECGTK))
KCF = ACF(EXP(-ECFTK))
KCN = ACN(EXP(-ECNTK))
KCL = ACL(EXP(-ECLTK))
KDR = ADR(EXP(-EDRTK))
KDL = ADL(EXP(-EDLTK))
KFNI = AFNI(EXP(-EFNITK))
KFF = AFF(EXP(-EFFTK))
KDM = ADM(EXP(-EDMTK))
KE = AE(EXP(-EETK))
KG = AG(EXP(-EGTK))
---------Ea-----------------
KAN2 = AAN2EXP(-EAN2RT)
KGQ = AGQEXP(-EGQRT) KSehested EJ Hart1992
KFN = AFNEXP(-EFNRT) BBielski ARoss 1985
KNN = ANNEXP(-ENNRT) Eliot
KCL2 = ACL2EXP(-ECL2RT) Eliot
KBF2 = ABF2EXP(-EBF2RT) Eliot
KBL = ABLEXP(-EBLRT) SP Mezyk DM Bartels
KAD = AADEXP(-EADRT) Eliot
KAL = AALEXP(-EALRT)
KDG = ADGEXP(-EDGRT)
KEG = AEGEA Wren amp Ball
Appendix
182
KEL = AELEA Wren amp Ball
KER = (AEREA) Wren (Suggests 8 correction)
KFG = 50E-1
KAN3 = AAN3EXP(-EAN3RT)
KCD = ACDEXP(-ECDRT)
-----------EQUILIBRIA---------------------------------------
KCKb = KCK ((10(-pKH2O))(10(-pKOH)))
KI = KJK(10-pKw)
KF = KJN (10-pKHO2)
KJL = KJN
KGK = KCK
KDI = KCK((10-pKH2O)(10-pKOH))
KLI = KCK((10-pKH2O)(10-pKH2O2))
KJD = KJN
KC = KJD(10-pKOH)
KFK = KCK
KNI = KFK((10-pKH2O)(10-pKHO2))
KB = KJA(10-pKH)
KAI = KBK((10-pKH2O)(10-pKH))
KJNb = KJN(10-pKH2O2)((10(-pKw))(10(-pKHO2)))
GENERAL
-------EQUATIONS-ROUTINE-CONTAINS-RADIOLYSIS-CHEMISTRY--------
COMPILE EQUATIONS
------INITIAL-SPECIES-GENERATION----------------------------
Ralt0gtGREaq- = Eaq- + G0
Ralt1gtGRH = H + G1
Ralt2gtGRH2 = H2 + G2
Ralt3gtGROH = OH + G3
Ralt4gtGRH2O2 = H2O2 + G4
Ralt5gtGRH+ = H+ + G5
Ralt6gtGROH- = OH- + G6
Ralt7gtGR-H2OH2O H2O = G7
----------REACTIONS------------------------
Ralt8gtKAA(H2OH2O) Eaq- + Eaq- + H2O + H2O = H2 + OH- + OH- + R0
Ralt9gtKABH2O Eaq- + H + H2O = H2 + OH- + R1
Ralt10gtKAC Eaq- + OH = OH- + R2
Ralt11gtKADH2O Eaq- + H2O + O- = OH- + OH- + R3
Ralt12gtKAG Eaq- + H2O2 = OH- + OH + R4
Ralt13gtKAF Eaq- + HO2 = HO2- + R5
Ralt14gtKAL Eaq- + HO2- = O- + OH- + R6
Ralt15gtKAM Eaq- + O2 = O2- + R7
Ralt16gtKAN Eaq- + O2- = O2-- + R8
Ralt17gtKBB H + H = H2 + R9
Ralt18gtKBC H + OH = H2O + R10
Ralt19gtKBG H + H2O2 = OH + H2O + R11
Rblt0gtKBM H + O2 = HO2 + R12
Rblt1gtKBN H + O2- = HO2- + R13
Rblt2gtKBF H + HO2 = OH + OH + R14
Rblt3gtKBL H + HO2- = OH + OH- + R15
Rblt4gtKBQ H + O3 = OH + O2 + R16
Rblt5gtKCC OH + OH = H2O2 + R17
Rblt6gtKCG OH + H2O2 = H2O + HO2 + R18
Rblt7gtKCL OH + HO2- = OH- + HO2 + R19
Rblt8gtKCF OH + HO2 = H2O + O2 + R20
Appendix
183
Rblt9gtKCN OH + O2- = OH- + O2 + R21
Rblt10gtKCQ OH + O3 = O2 + HO2 + R22
Rblt11gtKEG O3- + H2O2 = O2- + O2 + H2O + R23
Rblt12gtKEL O3- + HO2- = O2- + O2 + OH- + R24
Rblt13gtKER O3- + H2 = O2 + H + OH- + R25
Rblt14gtKEC O3- + OH = HO2 + O2- + R26
Rblt15gtKEC2 O3- + OH = OH- + O3 + R27
Rblt16gtKEJ O3- + H+ = OH + O2 + R28
Rblt17gtKNN O2- + O2- = O2 + O2-- + R29
Rblt18gtKLN O2- + HO2- = O2 + OH- + O- + R30
Rblt19gtKNG O2- + H2O2 = O2 + OH + OH- + R31
Rclt1gtKFN O2- + HO2 = O2 + HO2- + R32
Rclt2gtKNE O2- + O3- = O-- + O2 + O2 + R33
Rclt3gtKNQ O2- + O3 = O2 + O3- + R34
Rclt4gtKFF HO2 + HO2 = H2O2 + O2 + R35
Rclt5gtKFG HO2 + H2O2 = O2 + H2O + OH + R36
Rclt6gtKFQ HO2 + O3 = OH + O2 + O2 + R37
Rclt7gtKLG H2O2 + HO2- = H2O + O2 + OH- + R38
Rclt8gtKKQ O3 + OH- = O2 + HO2- + R39
Rclt9gtKLQ O3 + HO2- = O2 + OH + O2- + R40
Rclt10gtKGQ O3 + H2O2 = O2 + OH + HO2 + R41
------------------ADDITIONAL-WATER-CHEMISTRY------------------------
Rclt12gt200E10 H + O- = OH- + R42 Bjergbakke Draganic
Sehested
Rclt13gt16E10 O3- + Eaq- = OH- + OH- + O2 + R43 Pastina amp La
Verne
Rclt14gt36E10 O3 + Eaq- = O3- + R44 NIST
Rclt16gt23E-7 H2O2 = OH + OH + R45 Yakabuskie et al
Rclt17gt10E10H2O O-- + H2O = OH- + OH- + R46
Bouniol and Bjergbakke 2008
----------------ALKALI-REACTIONS------------------
Relt2gtKDR O- + H2 = H + OH- + R47
Relt3gtKDG O- + H2O2 = OH- + HO2 + R48
Relt4gtKDL O- + HO2- = O2- + OH- + R49
Relt5gtKDN O- + O2- = O-- + O2 + R50
Relt6gtKDD O- + O- = O2-- + R51
Relt7gtKCD O- + OH = HO2- + R52
Relt8gtKED O- + O3- = O2- + O2- + R53
Relt9gtKDQ O- + O3 = O2- + O2 + R54
----------EQUILIBRIUM-REACTIONS--------------------
Rclt18gtKIH2O H2O = H+ + OH- + R55
Rclt19gtKJK H+ + OH- = H2O + R56
Rdlt0gtKJN10(-pKH2O2) H2O2 = H+ + HO2- + R57
Rdlt1gtKJN H+ + HO2- = H2O2 + R58
Rdlt2gtKCK H2O2 + OH- = HO2- + H2O + R59
Rdlt3gtKLIH2O HO2- + H2O = H2O2 + OH- + R60
Rdlt4gtKLK HO2- + OH- = O2-- + H2O + R61
Rdlt5gtKLKbH2O O2-- + H2O = HO2- + OH- + R62
Rdlt6gtKJN10(-pKOH) OH = H+ + O- + R63
Rdlt7gtKJN H+ + O- = OH + R64
Appendix
184
Rdlt8gtKCK OH + OH- = O- + H2O + R65
Rdlt9gtKCKbH2O O- + H2O = OH + OH- + R66
Rdlt10gtKDM O- + O2 = O3- + R67
Rdlt11gtKE O3- = O- + O2 + R68
Rdlt12gtKF HO2 = H+ + O2- + R69
Rdlt13gtKJN H+ + O2- = HO2 + R70
Rdlt14gtKFK HO2 + OH- = O2- + H2O + R71
Rdlt15gtKNIH2O O2- + H2O = HO2 + OH- + R72
Rdlt16gtKB H = H+ + Eaq- + R73
Rdlt17gtKJA H+ + Eaq- = H + R74
Rdlt18gtKBK H + OH- = Eaq- + H2O + R75
Rdlt19gtKAIH2O Eaq- + H2O = H + OH- + R76
Relt0gtKBIH2O H + H2O = H2 + OH + R77
Relt1gtKRC H2 + OH = H + H2O + R78
---------------MASS-TRANSFER----------------------
GRlt0gtkappH2 H2 = H2g + R79
GRlt1gtkappO2 O2 = O2g + R80
-------OUTPUTS-ROUTINE-------
SETPSTREAM 3 1 20
OH H H2 H2g H2O2 O2 O2g H+ OH- Eaq-
O2- O2-- HO2 HO2- O- O-- O3- O O3
SETPSTREAM 4 11 20
R0 R1 R2 R3 R4 R5 R6 R7 R8 R9 R10 R11 R12 R13 R14 R15 R16
R17 R18 R19
SETPSTREAM 5 12 20
R20 R21 R22 R23 R24 R25 R26 R27 R28 R29 R30
R31 R32 R33 R34 R35 R36 R37 R38 R39
SETPSTREAM 6 15 20
R40 R41 R42 R43 R44 R45 R46 R47 R48 R49
R50 R51 R52 R53 R54 R55 R56 R57 R58 R59
SETPSTREAM 7 16 20
R60 R61 R62 R63 R64 R65 R66 R67 R68 R69
R70 R71 R72 R73 R74 R75 R76 R77 R78 R79
Appendix
185
SETPSTREAM 8 17 20
R80 R81 R82 R83 G1 G2 G3
G4 G5 G6 G7 G8
COMPILE OUT
PSTREAM 3
PSTREAM 4
PSTREAM 5
PSTREAM 6
PSTREAM 7
PSTREAM 8
WRITE 2 250 (N20 E10 2) Ra
WRITE 3 250 (N20 E10 2) Rb
WRITE 4 250 (N20 E10 2) Rc
WRITE 8 250 (N20 E10 2) Rd
WRITE 7 250 (N10 E10 2) Re
WRITE 10 (N2 E10 2) GR
WRITE 12 (E10 2) TIME
WHENEVER
TIME = TPrint Call Report
TIME = 0 + 600 RUNt CALL OUT
------------DEBUG-REPORT---------------
-Contains a list of all parameters to
confirm that values are correct-
COMPILE Report
WRITE 1 THIS REPORT IS GENERATED AT TPrint SECONDS
WRITE 1 RUNt = RUNt
WRITE 1 KpH2 = (E12 3) KpH2
WRITE 1 KpO2 = (E12 3) KpO2
WRITE 1 pH = (F6 1) pH
WRITE 1 Temperature = (F6 1) T C
WRITE 1 Dose Rate = (F6 1) DOSER Gymin
WRITE 1 VgVl Ratio = (F6 2) Vr
WRITE 1 Run Time = (F12 2) RUNt Mins
WRITE 1 Oxygen Fraction = (F6 3) xO2
WRITE 1 G-VALUES
WRITE 1 G(Eaq-) = (F6 3) GEaq-
WRITE 1 G(H) = (F6 3) GH
WRITE 1 G(H2) = (F6 3) GH2
WRITE 1 G(OH) = (F6 3) GOH
WRITE 1 G(H2O2) = (F6 3) GH2O2
WRITE 1 G(H+) = (F6 3) GH+
WRITE 1 G(-H2O) = (F6 3) G-H2O
WRITE 1 G-VALUES AS RATES MOLLS
WRITE 1 GREaq- = (E12 3) GREaq-
WRITE 1 GRH = (E12 3) GRH
WRITE 1 GRH2 = (E12 3) GRH2
WRITE 1 GROH = (E12 3) GROH
WRITE 1 GRH2O2 = (E12 3) GRH2O2
WRITE 1 GRH+ = (E12 3) GRH+
WRITE 1 GR-H2O = (E12 3) GR-H2O
WRITE 1 RATE CONSTANTS
WRITE 1 KAA = (E12 3) KAA
WRITE 1 KAB = (E12 3) KAB
Appendix
186
WRITE 1 KAC = (E12 3) KAC
WRITE 1 KAD = (E12 3) KAD
WRITE 1 KAG = (E12 3) KAG
WRITE 1 KAF = (E12 3) KAF
WRITE 1 KAL = (E12 3) KAL
WRITE 1 KAM = (E12 3) KAM
WRITE 1 KAN = (E12 3) KAN
WRITE 1 KBB = (E12 3) KBB
WRITE 1 KBC = (E12 3) KBC
WRITE 1 KBG = (E12 3) KBG
WRITE 1 KBM = (E12 3) KBM
WRITE 1 KBN = (E12 3) KBN
WRITE 1 KBF = (E12 3) KBF
WRITE 1 KBF2 = (E12 3) KBF2
WRITE 1 KBL = (E12 3) KBL
WRITE 1 KBQ = (E12 3) KBQ
WRITE 1 KCC = (E12 3) KCC
WRITE 1 KCD = (E12 3) KCD
WRITE 1 KCG = (E12 3) KCG
WRITE 1 KCL = (E12 3) KCL
WRITE 1 KCF = (E12 3) KCF
WRITE 1 KCN = (E12 3) KCN
WRITE 1 KCQ = (E12 3) KCQ
WRITE 1 KDR = (E12 3) KDR
WRITE 1 KDG = (E12 3) KDG
WRITE 1 KDL = (E12 3) KDL
WRITE 1 KDN = (E12 3) KDN
WRITE 1 KEG = (E12 3) KEG
WRITE 1 KEL = (E12 3) KEL
WRITE 1 KER = (E12 3) KER
WRITE 1 KEC = (E12 3) KEC
WRITE 1 KED = (E12 3) KED
WRITE 1 KNN = (E12 3) KNN
WRITE 1 KFN = (E12 3) KFN
WRITE 1 KFNI = (E12 3) KFNI
WRITE 1 KFF = (E12 3) KFF
WRITE 1 KFG = (E12 3) KFG
WRITE 1 KI = (E12 3) KI
WRITE 1 KJK = (E12 3) KJK
WRITE 1 KG = (E12 3) KG
WRITE 1 KJL = (E12 3) KJL
WRITE 1 KGK = (E12 3) KGK
WRITE 1 KLI = (E12 3) KLI
WRITE 1 KC = (E12 3) KC
WRITE 1 KJD = (E12 3) KJD
WRITE 1 KCK = (E12 3) KCK
WRITE 1 KDI = (E12 3) KDI
WRITE 1 KDM = (E12 3) KDM
WRITE 1 KE = (E12 3) KE
WRITE 1 KF = (E12 3) KF
WRITE 1 KJN = (E12 3) KJN
WRITE 1 KFK = (E12 3) KFK
WRITE 1 KNI = (E12 3) KNI
WRITE 1 KB = (E12 3) KB
WRITE 1 KJA = (E12 3) KJA
WRITE 1 KBK = (E12 3) KBK
WRITE 1 KAI = (E12 3) KAI
WRITE 1 KBI = (E12 3) KBI
WRITE 1 KRC = (E12 3) KRC
Appendix
187
WRITE 1 KJNb = (E12 3) KJNB
WRITE 1 KCKb = (E12 3) KCKb
WRITE 1 KLK = (E12 3) KLK
WRITE 1 KLKb = (E12 3) KLKb
WRITE 1 KDD = (E12 3) KDD
WRITE 1 KEJ = (E12 3) KEJ
WRITE 1 KBQ = (E12 3) KBQ
WRITE 1 KDQ = (E12 3) KDQ
WRITE 1 KCL2 = (E12 3) KCL2
WRITE 1 KCQ = (E12 3) KCQ
WRITE 1 KNQ = (E12 3) KNQ
WRITE 1 KFQ = (E12 3) KFQ
WRITE 1 KNG = (E12 3) KNG
WRITE 1 KNE = (E12 3) KNE
WRITE 1 KKQ = (E12 3) KKQ
WRITE 1 KLQ = (E12 3) KLQ
WRITE 1 KGQ = (E12 3) KGQ
WRITE 1 KLG = (E12 3) KLG
WRITE 1 KLN = (E12 3) KLN
WRITE 1 KEC2 = (E12 3) KEC2
WRITE 1 KAN2 = (E12 3) KAN2
WRITE 1 KRC = (E12 3) KRC
WRITE 1 ----PRE-EXPONENTIAL-FACTORS----
WRITE 1 AAB = (E12 3) AAB
WRITE 1 AAF = (E12 3) AAF
WRITE 1 AAG = (E12 3) AAG
WRITE 1 AAM = (E12 3) AAM
WRITE 1 AAN = (E12 3) AAN
WRITE 1 ABB = (E12 3) ABB
WRITE 1 ABC = (E12 3) ABC
WRITE 1 ABG = (E12 3) ABG
WRITE 1 ABN = (E12 3) ABN
WRITE 1 ABF = (E12 3) ABF
WRITE 1 ACF = (E12 3) ACF
WRITE 1 ACL = (E12 3) ACL
WRITE 1 ACG = (E12 3) ACG
WRITE 1 ACN = (E12 3) ACN
WRITE 1 ADR = (E12 3) ADR
WRITE 1 ADL = (E12 3) ADL
WRITE 1 AFNI = (E12 3) AFNI
WRITE 1 AFF = (E12 3) AFF
WRITE 1 ADM = (E12 3) ADM
WRITE 1 AG = (E12 3) AG
WRITE 1 AAN2 = (E12 3) AAN2
WRITE 1 AGQ = (E12 3) AGQ
WRITE 1 AFN = (E12 3) AFN
WRITE 1 ANN = (E12 3) ANN
WRITE 1 ACL2 = (E12 3) ACL2
WRITE 1 ABF2 = (E12 3) ABF2
WRITE 1 ABL = (E12 3) ABL
WRITE 1 AAD = (E12 3) AAD
WRITE 1 AAL = (E12 3) AAL
WRITE 1 ADG = (E12 3) ADG
WRITE 1 AEG = (E12 3) AEG
WRITE 1 AEL = (E12 3) AEL
WRITE 1 AER = (E12 3) AER
WRITE 1 AFG = (E12 3) AFG
WRITE 1 ----ACTIVATION ENERGIES----
WRITE 1 EAG = (E12 3) EAG
Appendix
188
WRITE 1 EAM = (E12 3) EAM
WRITE 1 EAN = (E12 3) EAN
WRITE 1 EBG = (E12 3) EBG
WRITE 1 ECG = (E12 3) ECG
WRITE 1 ECL = (E12 3) ECL
WRITE 1 ECF = (E12 3) ECF
WRITE 1 ECN = (E12 3) ECN
WRITE 1 EFN = (E12 3) EFN
WRITE 1 EFNI = (E12 3) EFNI
WRITE 1 ECL2 = (E12 3) ECL2
WRITE 1 EAN2 = (E12 3) EAN2
WRITE 1 ---pKa----
WRITE 1 pKw = (E12 3) pKw
WRITE 1 pKH2O2 = (E12 3) pKH2O2
WRITE 1 pKHO2 = (E12 3) pKHO2
WRITE 1 pKOH = (E12 3) pKOH
WRITE 1 pKH = (E12 3) pKH
WRITE 1 pKH2O = (E12 3) pKH2O
WRITE 1 Kprot = (E12 3) Kprot
WRITE 1 Khydx = (E12 3) Khydx
WRITE 1 KappO2 = (E12 3) kappO2
WRITE 1 KappH2 = (E12 3) kappH2
WRITE 1 H2O2 Equ rate = (E12 3) EqR
SETHMAX 1
BEGIN
STOP
Appendix
189
Radiolysis Model Full Reaction Scheme
Primary Reaction G-value
(Molecules100eV) Temperature Dependency Ref
G0 H2O emacraq 271 2641 + 416210-3
t + 909310-6 t2
ndash 471710-8 t3 45
G1 H2O H 054 0556 + 219810-3 t ndash 118410-5 t2 + 522310-8 t3 45
G2 H2O H2 041 0419 + 872110-4 t - 497110-6 t2 + 150310-8 t3 45
G3 H2O OH 270 2531 + 113410-2 t ndash 126910-5 t2 + 351310-8 t3 45
G4 H2O H2O2 068 0752 ndash 162010-3 t 45
G5 H2O H+ 271 2641 + 416210-3
t + 909310-6 t2
ndash 471710-8 t3 45
Chemical Reaction Rate Constant
k (M-1 s-1 25degC) Arrhenius Activation Energy Ea
(kJ) Ref
R0 emacraq + emacr
aq rarr H2 + 2OHmacr 7260 times109 Log kR7 = 12281 ndash 3768102T ndash 6673104T2 - 1075107T3 45
R1 emacraq + H rarr H2 + OHmacr 2762 times1010
114 times1013 14929 45
R2 emacraq + OH rarr OHmacr 3553 times1010
Log kR9 = 13123 ndash 1023103T + 7634104T2 45
R3 emacraq + Omacr rarr 2OHmacr 2313 times1010
56 times1011 79 49
R4 emacraq + H2O2 rarr OHmacr + OH 1362 times1010
77 times1012 1571 45
R5 emacraq + HO2 rarr HO2
macr 1300 times1010 246 times1012 130 45
R6 emacraq + HO2
macr rarr Omacr + OHmacr 3507 times109 175 times1012 154 49
R7 emacraq + O2 rarr O2
macr 2253 times1010 252 times1012 11652 45
R8 emacraq + O2
macr rarr O22macr + H2O 1300times1010
31 times1012 136 4349
R9 H + H rarr H2 5142 times109 27 times1012 15526 45
R10 H + OH rarr H2O 1094 times1010 426 times1011 9078 45
R11 H + H2O2 rarr OH + H2O 3650 times107 179 times1011 21064 45
R12 H + O2 rarr HO2 1304 times1010
Log kR23 = 10704 + 2840102T - 1369105T2 45
R13 H + O2
macr rarr HO2macr 1138 times1010
517 times1012 15166 45
R14 H + HO2 rarr 2OH 1138 times1010 517 times1012 15166 45
R15 H + HO2macr rarr OH + OHmacr 1374times109
42 times1013 256 85
R16 H + O3 rarr OH + O2 2200 times1010 No temperature dependence available 43
R17 OH + OH rarr H2O2 4814 times109 Log kR25 = 8054 + 2193103T ndash 7395105T2 + 6870107T3
45
R18 OH + H2O2 rarr H2O + HO2 2920 times107 768times109 13813 45
R19 OH + HO2macr rarr OHmacr + HO2 8134 times109
100 times1012 11927 45
R20 OH + HO2 rarr H2O + O2 8840 times109
129 times1011 6645 45
Appendix
190
R21 OH + O2
macr rarr OHmacr + O2 1097 times1010 877 times1011 10860 45
R22 OH + O3 rarr HO2 + O2 1100 times108
No temperature dependence available 43
R23 O3macr + H2O2 rarr O2
macr + O2 + H2O 1590 times106 xEXP(188times103 (129815 ndash 1TK)R) 43
R24 O3macr + HO2
macr rarr O2macr + O2 + OHmacr 8870 times105
xEXP(188times103 (129815 ndash 1TK)R) 43
R25 O3macr + H2 rarr O2 + H + OHmacr 2490times105
xEXP(188times103 (129815 ndash 1TK)R) 46
R26 O3
macr + OH rarr HO2 + O2macr 6000 times109 No temperature dependence
available 46 43
R27 O3
macr + OH rarr HOmacr + O3 2500 times109 No temperature dependence available
46 43
R28 O3
macr + H+ rarr O2 + OH 9000 times1010 No temperature dependence available
4 43
R29 O2
macr + O2macr rarr O2 + O2
2macr 2988times10-1 489 times108 5259 43
R30 O2
macr + HO2macr rarr O2 + Omacr + OHmacr 8230 times10-2 No temperature dependence
available 4 43
R31 O2
macr + H2O2 rarr O2 + OH + OHmacr 1300 times10-1 No temperature dependence
available 4 43
R32 O2
macr + HO2 rarr O2 + HO2macr 7597times107
244 times109 86 43
R33 O2
macr + O3macr rarr O2-
+ 2O2 1000 times104 No temperature dependence available
47 43
R34 O2
macr + O3 rarr O3macr + O2 1500 times109 No temperature dependence
available 4 43
R35 HO2 + HO2 rarr H2O2 + O2 8399 times105
278 times109 201 45
R36 HO2 + H2O2 rarr O2 + H2O + OH 5000 times10-1 No temperature dependence
available 4 49
R37 HO2 + O3 rarr OH + 2O2 5000 times108 No temperature dependence
available 4 43
R38 H2O2 + HO2
macr rarr O2 + H2O + OHmacr 450times10-4 No temperature dependence available
4 43
R39 O3 + OHmacr rarr HO2
macr + O2 4800 times101 No temperature dependence available
4 43
R40 O3 + HO2
macr rarr OH + O2 + O2macr 5500 times106 No temperature dependence
available 4 43
R41 O3 + H2O2 rarr OH + O2 + HO2 3714 times10-2
28 times1011 735 43
R42 H +Omacr rarr OHmacr 2000times1010 No temperature dependence
available 4 43
R43 O3
macr + emacraq rarr 2OHmacr + O2 1600times1010 No temperature dependence
available 47 43
R44 O3 + emacr
aq rarr O3macr 3600 times1010 No temperature dependence
available 4 43
R45 H2O2 rarr 2OH 2300 times10-7 No temperature dependence
available - 86
R46 O2- + H2O rarr 2OH- 1000 times1010 No temperature dependence
available - 43
R47 Omacr + H2 rarr H + OHmacr 1279 times108
232 times1010 12891 45
R48 Omacr + H2O2 rarr O2
macr + H2O 5546 times108 30 times1011 156 49
R49 Omacr + HO2
macr rarr O2macr + OHmacr 7864 times108
145 times1013 24348 45
R50 Omacr + O2
macr rarr O2macr + O2 6000 times108 No temperature dependence available
46 43
R51 Omacr + Omacr rarr O2
2macr 1000times108 No temperature dependence available
4 43
R52 Omacr + OH rarr HO2
macr 7610 times109 17 times1011 77 49
Appendix
191
R53 Omacr + O3macr rarr 2O2
macr 7000times108 No temperature dependence available
46 43
R54 Omacr
+ O3 rarr O2macr + O2 1000 times109 No temperature dependence
available 4 43
Equilibria
kf
(M-1 s-1)
kb
(M-1 s-1) Temperature Dependence pKa
(25degC)
R5556 H2O H+ + OHmacr 1172 times10-3 1178times1011 Log kR67 = 20934 - 1236x104T + 6364x106T2 ndash 1475x109T3 +
1237x1011T4 1575 45
R5758 H2O2 H+ + HO2macr 8900 times10-2 4780times1010 Log kR68 = 16410 ndash 4888x10
3T + 1622x10
6T
2 ndash 2004x10
8T
3 1173 45
R5960 H2O2 + OHmacr HO2
macr + H2O
1265 times1010 1403 times106 Log kR75 = 13339 ndash 2220x103T + 7333x10
5T
2 ndash 1065x10
8T
3
1198701198672119874
11987011986721198742 45
R6162 HO2macr + OHmacr O2
2macr + H2O 3506 times105 1103 times106 339times108 142 165 43
R6364 OH H+ + Omacr 8900 times10-2 4780times1010 Log kR66 = 16410 ndash 4888x103T + 1622x106T2 ndash 2004x108T3 1173 45
R6566 OH + OHmacr Omacr + H2O 1265 times1010 1403 times106 Log kR72 = 13339 ndash 2220x103T + 7333x105T2 ndash 1065x108T3 1198701198672119874
119870119874119867 45
R6768 Omacr + O2 O3macr 3747 times109 2617 times103 341 times1011 11182 Forward 45
320 times1011 4616 Reverse 45
R6970 HO2 H+ + O2macr 4780 times1010 7354 times105 Log kR69 = 16410 ndash 4888x103T + 1622x106T2 ndash 2004x108T3 481 45
R7172 HO2 + OHmacr O2macr + H2O 1265 times1010 1628 times10-1 Log kR75 = 13339 ndash 2220x103T + 7333x105T2 ndash 1065x108T3
1198701198672119874
1198701198671198742 45
R7374 H emacraq + H+ 5832 2095times1010
Log kR74 = 39127 - 3888E4T + 2054E7T2 - 4899E9T3 + 4376E11T4
955 45
R7576 H + OHmacr emacraq + H2O 2440 times107 1735 times101
Log kR70 = 22970 ndash1971x104T + 1137x107T2 ndash 2991x109T3 + 2803x1011T4
1198701198672119874
119870119867 45
R7778 H + H2O H2 + OH 4575 times10-5 3954 times107
Log kR71f = 9408 ndash 2827x103 Tndash 3792x105T2 45
Log kR71b = -11556 + 32546x104T - 18623x107T2 + 45543x109T3 - 41364x1011T4
45
R79 H2(aq) H2(g) 2687times10-3 See Chapter 3
R80 O2(aq) O2(g) 1033times10-4 See Chapter 3