Embed Size (px)
Citation preview

materials
Article
Numerical Analysis of Fatigue Crack Growth Pathand Life Predictions for Linear Elastic Material
Abdulnaser M. Alshoaibi * and Yahya Ali Fageehi
Department of Mechanical Engineering, Jazan University, P. O. Box 706, Jazan 45142, Saudi Arabia;[email protected]* Correspondence: [email protected]
Received: 3 July 2020; Accepted: 28 July 2020; Published: 30 July 2020�����������������
Abstract: The main objective of this work was to present a numerical modelling of crack growthpath in linear elastic materials under mixed-mode loadings, as well as to study the effect of presenceof a hole on fatigue crack propagation and fatigue life in a modified compact tension specimenunder constant amplitude loading condition. The ANSYS Mechanical APDL 19.2 is implementedfor accurate prediction of the crack propagation paths and the associated fatigue life under constantamplitude loading conditions using a new feature in ANSYS which is the smart crack growthtechnique. The Paris law model has been employed for the evaluation of the mixed-mode fatigue lifefor the modified compact tension specimen (MCTS) with different configuration of MCTS under thelinear elastic fracture mechanics (LEFM) assumption. The approach involves accurate evaluation ofstress intensity factors (SIFs), path of crack growth and a fatigue life evaluation through an incrementalcrack extension analysis. Fatigue crack growth results indicate that the fatigue crack has always beenattracted to the hole, so either it can only curve its path and propagate towards the hole, or it canonly float from the hole and grow further once the hole has been lost. In terms of trajectories of crackpropagation under mixed-mode load conditions, the results of this study are validated with severalcrack propagation experiments published in literature showing the similar observations. Accurateresults of the predicted fatigue life were achieved compared to the two-dimensional data performedby other researchers.
Keywords: fatigue crack growth; mixed mode; MCTS; ANSYS; LEFM; fatigue life
1. Introduction
The assessment of FCG and the fracture toughness of materials is commonly performed using theCT specimen (ASTM 2013). In fatigue crack growth (FCG) studies, the specimen geometry typicallyinvestigates the ratio of minimum stress to maximum stress (R) [1,2]. The compact tension CT specimenhas the beneficial effects of a relatively smaller material volume and comparatively less stress for FCGevaluation [3]. Practical structures are almost subjected to many loading types like tension, shear andtorsion resulting in a mixed-mode interaction. Accordingly, the stress state ahead of a crack is commonlybased on mixed-mode I/II type of interactions, indicating the magnitude of the stresses at the cracktip. Therefore, cracks can grow in the skin of aircraft fuselages and may subject to mixed-mode typeof loading. Generally, crack initiation and propagation must be associated with the governing stressintensity factors (SIFs) in a complicated state [4–7]. Fatigue crack analysis is essential in different fieldsof engineering since fatigue cracks are one among the main sources of catastrophic fracture failures.It is important to guarantee the durability of crucial structures and establishing safety of structures inworking conditions. Accordingly, in many industries, the precise crack path prediction and estimationof fatigue life are of primary importance in terms of the reliability requirement. Experimental studiesare required for fatigue analysis in various applications, such as aerospace manufacturing and aviation
Materials 2020, 13, 3380; doi:10.3390/ma13153380 www.mdpi.com/journal/materials

Materials 2020, 13, 3380 2 of 15
industry, but due to high costs, precise computational methods are required for crack propagationanalysis to predict the path of crack growth and fatigue lifetime in both static and dynamic loadingconditions [8]. The scientific literature on FCG activity concentrate on mode-I crack, while cracksand defects in real-world structures are typically mixed-mode (I–II) cracking and the cracks in actualengineering components (e.g., aircraft, pressure vessels component, high-pressure pipelines, etc.) seemto be some combination of mixed-mode (mode I, mode II and mode III) [9]. Practically, mixed modecan also be encountered, e.g., in the case of shafts attached to turbines subjected to abrupt changein loading directions. Generally, the initiation process in crack formation is due to the plastic strainresulting from cyclic tension and the propagation of cracks happen due to the presence of tensile stressin matrix. In spite of the presence of local stresses, the compressive loads cannot cause the fatigue crackinitiation [10]. In order to prevent failures of fatigue, extensive work was done to develop efficientmodels to evaluate the FCG and fatigue life. There are several experimental models proposed, but itis usually time consuming and expensive to conduct the experimental procedures. The simulationtechnique involving the numerical analysis and usage of ANSYS APDL.19.2 extended finite-elementapproach is an appropriate way of minimizing experimental work, time and cost. Stress intensityfactors (SIFs) are used to describe the displacement and stresses of the crack front and consequentlythe evaluation of FCG under the assumption of linear elastic fracture mechanics (LEFM). As soon asthe crack is growing, the SIF will shift to a critical range in which the structure deformation initiatesleading to the failure process. The majority of fatigue-crack problems reported in the literature tilldate are using various methods of analysis in terms of two- and three-dimensional simulation forsimple as well as complex geometries [8,11–18], etc.. Because of the complexity of applied loads andthe geometry specification, mixed mode (I/II) are the usual types of loads that depend on those used infatigue life predictions [19–22]. Hence, this work utilizes the XEFM employed by ANSYS APDL 19.2 todetermine the influence of the hole position in the crack growth direction, stress intensity factors andalso fatigue life of the modified compact tension specimen (MCTS) specimen. The main motivationof this work was to bring some contribution on the use of the ANSYS as an alternative method forthe simulation of fatigue crack propagation problems under mixed-mode loading and to providemonitoring of the crack growth trajectory in the cases of the presence of holes in the geometry.
2. Numerical Predication of Mixed-Mode Fatigue Life
The latest innovation by Ansys Mechanical APDL 19.2 is the “smart crack growth” feature whichwas applied in the present study. By using this feature in Ansys Mechanical APDL (version 19.2,Ansys, Inc., Canonsburg, PA, USA), engineers have recently employed the modern unstructured meshmethod (UMM) to minimize pre-processing times by using the automatically generated all-tetrahedralmesh for the crack fronts and achieve the same high-fidelity results as a simulation with the ideal hexmesh configuration. Meshing time has been reduced from a few days to a few minutes. With severalclicks, a SMART simulation can be set up, eliminating long pre-processing sessions. UMM is moreflexible and simpler to use than any previous technology for fracture simulation. Automatic remeshingis automatically done in the vicinity of the crack tip as well as refines calculations in the most neededregions with higher stresses for better visualization and accurate results calculation without requiringthe engineer’s intervention. Another feature for the “Smart Crack Growth” is the introducing of the“premeshed crack.” The mesh around the crack tip should be refined using the sphere of influencemethod around the geometric edge going through thickness. Within the premesh crack object, the nodesets created previously are allocated to the crack front and the crack top and bottom faces. Reference ismade to the crack coordination system and the number of contours for the solution is set to 5. There are“loops” through the mesh around the crack point that are used by the integration of the crack tip regionwith the strain energy to determine the stress factor. The fracture mechanics method avoids the stresssingularities at the crack tip in the analysis.

Materials 2020, 13, 3380 3 of 15
Three methods were used mainly to demonstrate material fatigue assessments, namely, thetechnique of fracture mechanics [23], the method of strain-life introduction independently [24] and themethod involving stress-life [25].
In order to explain the cracking tip by individual SIFs, the first technique for predicting fatiguelife was employed. Therefore, the fatigue crack growth direction must be precisely calculated for theevaluation of fatigue life. As a result, the maximum tangent stress theory was used to determine theangle of crack growth [15,26,27] as:
θ = 2arc tan
14
KI
KII+
14
√( KI
KII
)2+ 8
for KII < 0
(1)
θ = 2arc tan
14
KI
KII−
14
√( KI
KII
)2+ 8
for KII > 0
(2)
where θ is the crack growth angle and KI and KII are the first and second mode of stress intensity factor,respectively. The crack growth angles according to the sign of the second mode of stress intensityfactor, KII, are displayed in Figure 1.
Figure 1. Prospects of the angle of crack propagation (a) KII › 0 and (b) KII ‹ 0.
Prediction of FCG by utilizing the corresponding SIFs is the most commonly utilized techniquefor mixed-mode fatigue loading structures. Tanaka [20] derived an innovative law, so-called powerlaw, for the modified Paris law equation for the determination of crack growth in response to fatiguewith respect to parameter the equivalent stress intensity factor (∆Keq). It is indicated as:
dadN
= C(∆Keq
)(3)
where a is the crack length, N is the number of cycles, C is the Paris constant (mm/cycle) and m is theParis exponent.
The quantitative nature of fatigue life cycles can be calculated using Equation (3) for an increasein crack length as:
∆a∫0
daC(∆Keq)m =
∆N∫0
dN = ∆N (4)
3. Numerical Results and Discussion
The experimental work conducted by [28] on four SAE 1020 carbon steel hole MCTS specimens isused in this study of the MCTS to demonstrate an ability to predict the crack propagation trajectories andthe fatigue life in mixed-mode under constant amplitude load conditions. The geometric dimensions

Materials 2020, 13, 3380 4 of 15
of modified CT specimen are shown in Figure 2. The main hole diameter is 7 mm, positioned athorizontal and vertical distances K and C, respectively, from the crack initiation position as shown inFigure 2. The properties of the considered material are shown in Table 1. The simulation is performedunder fatigue loading with the assumption that the tested material is isotropic and linear elastic withload ratio of R = 0.1.
Figure 2. Geometrical description of the modified compact tension specimen (MCTS) (dimensions inmm).
Table 1. Material properties of SAE 1020 carbon steel.
Property Value in Metric Unit
Modulus of elasticity, E 205 GPaPoisson’s ratio, υ 0.29Yield strength, σy 285 MPa
Ultimate strength, σu 491 MPaParis’ law coefficient, C 8.59 × 10⁻¹⁴
Paris law exponent m 4.26
ANSYS Workbench software is used to generate the mesh for the four specimens with followingmesh densities (Table 2). Figure 3 shows the initial FE model of the specimen along with itsboundary condition.
Table 2. Mesh density based on the number of elements and nodes.
MCTS# Number of Elements Number of Nodes
MCTS01 120,097 182,971MCTS02 130,710 198,991MCTS03 119,370 181,989MCTS04 121,409 184,850
The comparisons of simulated and experimental and numerical crack path performed by [28]and [16] are shown for CT01, CT02, CT03 and CT04 in Figures 4–7, respectively. The modified CTSholes were explicitly designed to manipulate the crack direction. As shown in the figures, the crackgrowth paths are almost identical to the path predicted experimentally and numerically [28] and [16],using boundary element method (BEM) with BemCracker2D software (which is a special purposeeducational program for simulating two-dimensional crack growth based on the dual boundaryelement method, written in C++ with a MATLAB graphic user interface developed by [16,28] and finite

Materials 2020, 13, 3380 5 of 15
element method with Quebra2D (which is a finite element based software developed by [16,28]). Also,it is worth visualizing the maximum principle stress and the equivalent stress distribution of Von Misesof mentioned four different CTS configurations as shown in Figures 8 and 9, respectively. The VonMises yield criterion is used to compute yielding of materials under multiaxial loading conditionsdepending on the maximum and minimum principal stress and also the shear stress. As these twofigures explicitly demonstrate, there is a significant association between the maximum principal stressand Von Mises stress in the four different models of the CTS.
Figure 3. Finite element model for the MCTS, (a) CT01, (b) CT02, (c) CT03 and (d) CT04.
Figure 4. Predicted crack growth direction of CTS01: (a) current study result, (b) experimental andnumerical results of [28], (c) BemCracker2D [16] and (d) Quebra2D [16].

Materials 2020, 13, 3380 6 of 15
Figure 5. Predicted crack growth direction of CTS02: (a) current study result, (b) experimental andnumerical results of [28], (c) BemCracker2D [16] and (d) Quebra2D [16].
Figure 6. Predicted crack growth direction of CTS03: (a) current study result, (b) experimental andnumerical results of [28], (c) BemCracker2D [16] and (d) Quebra2D [16].

Materials 2020, 13, 3380 7 of 15
Figure 7. Predicted crack growth direction of CTS04: (a) current study result, (b) experimental andnumerical results of [28], (c) BemCracker2D [16] and (d) Quebra2D [16].
Figure 8. Maximum principal stress distribution for different configuration of CTS, (a) CT01, (b) CT02,(c) CT03 and (d) CT04.

Materials 2020, 13, 3380 8 of 15
Figure 9. Equivalent Von Mises stress distribution for different configuration of CTS, (a) CT01, (b) CT02,(c) CT03 and (d) CT04.
The stress intensity factor (SIF) is the essential parameter for life assessment. Numerous handbookscan also provide analytical computation of the SIF for the standard CT geometry. The formulatedanalytical stress intensity factor solution for the standard CT geometry is expressed as follows [29–31]:
K =P f (a/w)
t√
w. (5)
where P is the applied load, t is the geometry thickness and f(a/w) is referred to as either the correctionfactor or the dimensionless SIF, which depends on the length of the crack (a) to the width of thespecimen (w) ratio and is defined from [31,32] and [33] as:
f( a
w
)=
2 + aw(
1− aw
) 32
[0.886 + 4.64
( aw
)− 13.32
( aw
)2+ 14.72
( aw
)3− 5.6
( aw
)4]
(6)
This correction factor manual approach is provided for loading mode I. The presence of the holein this modified specimen has produced a curved crack trajectory. Due to the curved crack trajectory,the solution for correction factor given under Equation (5) is no longer valid. At this point, we can seethe main advantages of mixed-mode crack growth with numerical analysis like using XFEM. ANSYScan achieve accurate predicted values for f(a/w) different from manual solutions obtained for regularCT specimens. At each step of the crack growth, mode I SIF’s (KI) is collected from ANSYS results andsubstituted in Equation (5) to obtain the dimensionless stress intensity factor f(a/w). The polynomial ofthe fourth degree is fitted with the stress intensity factor in the following equations for CT01, CT02,CT03 and CT04, respectively.
CT01 KI =Pwt√πa (209.07(a/w)4
− 1572.1(a/w)3 + 235.85(a/w)2− 58.901(a/w) + 10.44) (7)
CT02 KI =Pwt√πa (−106.8(a/w)4 + 175.9(a/w)3
− 84.369(a/w)2 + 24.324(a/w) + 2.5509) (8)

Materials 2020, 13, 3380 9 of 15
CT03 KI =Pwt√πa (300.81(a/w)4
− 511.98(a/w)3 + 325.41(a/w)2− 80.886(a/w) + 12.372) (9)
CT04 KI =Pwt√πa (1130.1(a/w)4
− 1572.1(a/w)3 + 829.56(a/w)2− 184.61(a/w) + 20.36 ) (10)
The obtained SIF data set can be used to construct an easy-to-use formula through the generallinear regression technique, expressing the SIF as a function of the interested crack and contactparameters and facilitating the evaluation of the crack propagation behaviour.
The numerical SIF independent of dimension for the MCTS specimen in this analysis is comparedwith the analytical solution represented in Equation (6) for the CTS without a hole for the four differentconfigurations of the MCTS as shown in Figures 10–13. As seen in these figures as the curved cracktrajectory established, the f(a/w) pattern deviates from each other. Also, the result analysis in presentstudy related to the correction factor f(a/w) are analysed with the dimensionless SIF values calculated by(Gomes and Miranda 2018) utilizing the boundary element method (BEM) with BemCracker2D softwareand the finite element method with Quebra2D (FEM) for the four different configurations as seen inFigures 10, 12 and 13. According to these figures, a strong correlation is observed between the obtainedresults of the present work and the Quebra2D results when compared to that of BemCracker2D.
In all cases, the crack pathways expected in this work closely match with the results of Gomesand Miranda [16]. Therefore, fatigue crack propagation is also attracted by a hole, so that it can eithercurve its direction and grow into a hole (sink in the hole’s behaviour) or actually be deflected by ahole and continue to grow when it is ignored (missing the hole’s behaviour). Even if the position ofthe hole is significantly different, the fatigue life cycles of each structure can vary drastically basedon the difference of the crack direction. This also indicates the significance of numerical modellingto simulate these unpredictable fatigue cracks. The simulation results proved that, the fatigue crackwas still attracted by the hole dependent of its position from the crack tip, so it could either curve itstrajectory and propagate toward the hole or simply deflect at the hole and grow on in its direction.
Figure 10. Dimensionless stress intensity factor (SIF) of the modified compact tension specimen CTS01compared to the work of Gomes and Miranda [16].
Materials 2020, 13, 3380 10 of 15
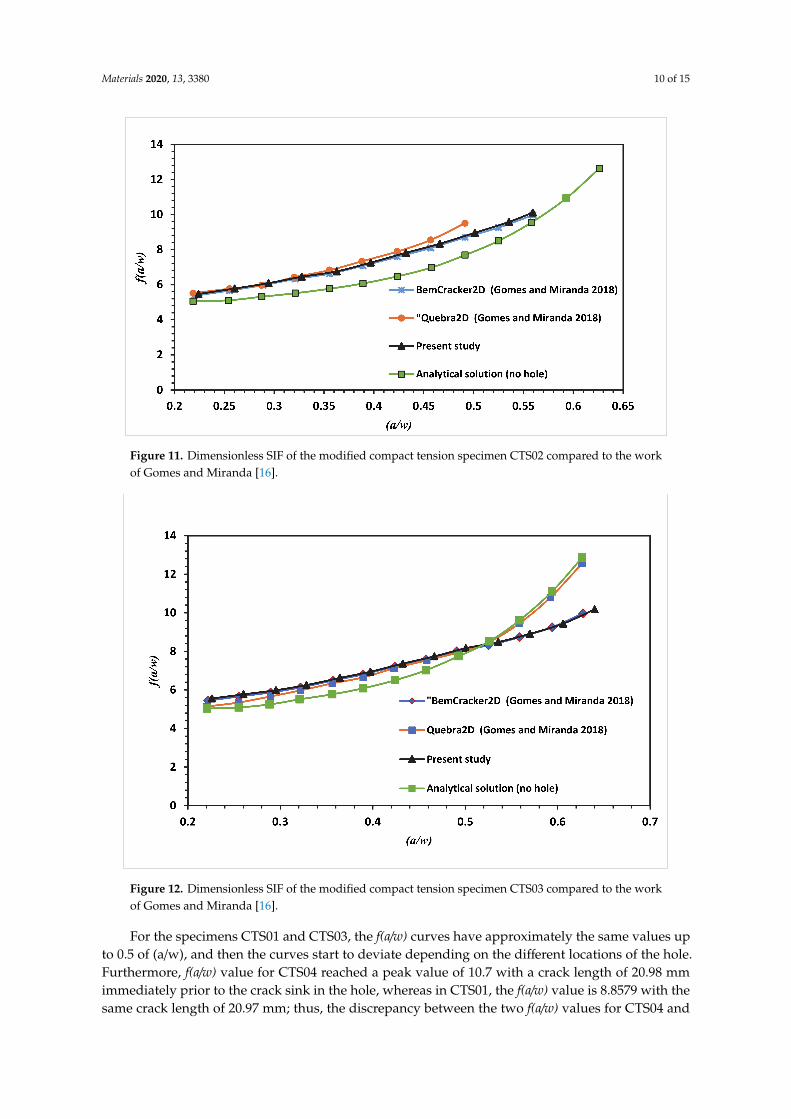
Figure 11. Dimensionless SIF of the modified compact tension specimen CTS02 compared to the workof Gomes and Miranda [16].
Figure 12. Dimensionless SIF of the modified compact tension specimen CTS03 compared to the workof Gomes and Miranda [16].
For the specimens CTS01 and CTS03, the f(a/w) curves have approximately the same values upto 0.5 of (a/w), and then the curves start to deviate depending on the different locations of the hole.Furthermore, f(a/w) value for CTS04 reached a peak value of 10.7 with a crack length of 20.98 mmimmediately prior to the crack sink in the hole, whereas in CTS01, the f(a/w) value is 8.8579 with thesame crack length of 20.97 mm; thus, the discrepancy between the two f(a/w) values for CTS04 and

Materials 2020, 13, 3380 11 of 15
CT01 is 1.8421 with the same crack length of 20.98 mm as shown in Figure 13. The disparity is becauseof the third hole’s different location. Therefore, in the estimation of a dimensionless stress intensityfactor, the third hole location plays a major role.
Figure 13. Dimensionless SIF of the modified compact tension specimen CTS04 compared to the workof Gomes and Miranda [16].
Figure 14 shows the influence of hole position on dimensional stress intensity factor of the differentfour configurations based on Equations (7)–(10) for CT01, CT02, CT03 and CT 04 respectively.
Figure 14. Dimensionless SIF of different configuration of MCTS.
Fatigue crack growth life estimated using the mixed-mode equivalent SIF is described (Tanaka1974) as represented in Equation (3). Comparisons between the present study simulated fatigue liferesults and the experimental results (Gomes and Miranda 2018) for the four different MCTS geometriesare shown in Figures 15–18 for CT01, CT02, CT03 and CT04, respectively. The simulated FCG life using

Materials 2020, 13, 3380 12 of 15
ANSYS has excellent agreements with the obtained results of Gomes and Miranda [16] as observed inthese figures. The present study results were more accurate in the prediction of fatigue life comparedto the numerical results obtained by Gomes and Miranda [16] using two software which are VIDA andBemCracker2D (BC2D).
Figure 15. Fatigue life for the MCTS, CTS01.
Figure 16. Fatigue life for the MCTS, CTS02.

Materials 2020, 13, 3380 13 of 15
Figure 17. Fatigue life for the MCTS, CTS03.
Figure 18. Fatigue life for the MCTS, CTS04.
4. Conclusions
For MCTS, an extended finite element analysis of mixed-mode fatigue crack propagation wasperformed using ANSYS Mechanical APDL. The results of XFEM analysis were compared withexperimental data for different configurations of MCTS depending on the third hole position fromthe crack tip with excellent agreement for all cases. The structure and configuration of the specimenplay a crucial role in the acquisition of higher values of SIFs in mixed modes which demonstrated thecrack growth trajectory. The presence of the hole in the plate influences the crack and changes its pathto the hole depending on the location of the hole, so it can either change its way and grow into the

Materials 2020, 13, 3380 14 of 15
hole or it can only be deviated away from the hole and grow. Comparisons with experimental resultsdemonstrate that implementing ANSYS Mechanical APDL 19.2 can predict crack propagation andfatigue life for arbitrary 3D structural components in an effective and economical manner. A best-fitis also proposed for the representation of the dimensionless stress intensity factor for the differentconfigurations of the MCTS based on the numerical data extracted from ANSYS. The best representationof stress distribution was also achieved for all geometries.
Author Contributions: Conceptualization, A.M.A. and Y.A.F.; data curation, A.M.A.; methodology, A.M.A.and Y.A.F.; project administration, A.M.A.; resources, A.M.A.; software, A.M.A. and Y.A.F.; validation, A.M.A.;and writing—review and editing, A.M.A. and Y.A.F. All authors have read and agreed to the published version ofthe manuscript.
Funding: This research received no external funding.
Conflicts of Interest: The authors declare no conflict of interest
References
1. Alegre, J.M.; Preciado, M.; Ferreño, D. Study of the fatigue failure of an anti-return valve of a high pressuremachine. Eng. Fail. Anal. 2007, 14, 408–416. [CrossRef]
2. Alshoaibi, A.M. Finite element procedures for the numerical simulation of fatigue crack propagation undermixed mode loading. Struct. Eng. Mech. 2010, 35, 283–299. [CrossRef]
3. Alshoaibi, A.M. Comprehensive comparisons of two and three-dimensional numerical estimation of stressintensity factors and crack propagation in linear elastic analysis. Int. J. Integr. Eng. 2019, 11, 45–52. [CrossRef]
4. Alshoaibi, A.M.; Bin Ghouth, A.; Fageehi, Y.A. Three-dimensional simulation of crack propagation usingfinite element method. Intern. J. Eng. Adv. Technol. 2019, 9, 892–897.
5. Alshoaibi, A.M.; Fageehi, Y.A. 2D finite element simulation of mixed mode fatigue crack propagation forCTS specimen. J. Mater. Res. Technol. 2020, 9, 7850–7861. [CrossRef]
6. Anderson, T.L. Fracture Mechanics: Fundamentals and Applications; CRC Press: Boca Raton, FL, USA, 2017.7. ASTM. Standard Test Method for Measurement of Fatigue Crack Growth Rates; E647-13-08; American Society for
Testing and Materials: West Consonance, PA, USA, 2013; Volume 712.8. Barsom, J.; Rolfe, S. Fracture and Fatigue in Structure: Application of Fracture Mechanics; American Society for
Testing and Materials: Philadelphia, PA, USA, 1999.9. Boyce, B.L.; Ritchie, R.O. Effect of load ratio and maximum stress intensity on the fatigue threshold in
Ti–6Al–4V. Eng. Fract. Mech. 2001, 68, 129–147. [CrossRef]10. Broek, D. Elementary Engineering Fracture Mechanics; Springer Science & Business Media: Berlin/Heidelberg,
Germany, 2012.11. Chandran, K.S.R. Net-section based approach for fatigue crack growth characterization using compact
tension specimen: Physical correlation of mean stress or stress ratio effects. Int. J. Fatigue 2019, 124, 473–482.[CrossRef]
12. Chen, H.; Wang, Q.; Zeng, W.; Liu, G.; Sun, J.; He, L.; Bui, T.Q. Dynamic brittle crack propagation modelingusing singular edge-based smoothed finite element method with local mesh rezoning. Eur. J. Mech. A/Solids2019, 76, 208–223. [CrossRef]
13. Coffin, L. Cyclic Deformation and Fatigue of Metals; IZO: Moscow, Russia, 1963.14. Demir, O.; Ayhan, A.O.; Iriç, S. A new specimen for mixed mode-I/II fracture tests: Modeling, experiments
and criteria development. Eng. Fract. Mech. 2017, 178, 457–476. [CrossRef]15. Dirik, H.; Yalçinkaya, T. Crack path and life prediction under mixed mode cyclic variable amplitude loading
through XFEM. Int. J. Fatigue 2018, 114, 34–50. [CrossRef]16. Fageehi, Y.A.; Alshoaibi, A.M. Numerical simulation of mixed-mode fatigue crack growth for compact
tension shear specimen. Adv. Mater. Sci. Eng. 2020, 2020, 1–14. [CrossRef]17. Gomes, G.O.; Miranda, A.C. Analysis of crack growth problems using the object-oriented program
bemcracker2D. Frat. Ed Integrità Strutt. 2018, 12, 67–85. [CrossRef]18. Hellan, K.; Saunders, H. Introduction to Fracture Mechanics. J. Vib. Acoust. 1987, 109, 325–326. [CrossRef]
Materials 2020, 13, 3380 15 of 15
19. Hussain, M.; Pu, S.; Underwood, J. Strain Energy Release Rate for a Crack Under Combined Mode I and Mode II,Proceedings of the National Symposium on Fracture Mechanics, Vancouver, BC, Canada, 20–22 May 2009; ASTMInternational: Conshohocken, PA, USA, 2009; p. 2.
20. Liu, A.F. Mechanics and Mechanisms of Fracture: An Introduction; ASM International: Cleveland, OH, USA,2005.
21. Miranda, A.; Meggiolaro, M.A.; De Castro, J.T.P.; Martha, L.; Bittencourt, T. Fatigue life and crack pathpredictions in generic 2D structural components. Eng. Fract. Mech. 2003, 70, 1259–1279. [CrossRef]
22. Newman, J. Stress Analysis of the Compact Specimen Including the Effects of Pin Loading. Proceedings of theNational Symposium on Fracture Mechanics, Vancouver, BC, Canada, 20–22 May 2009; ASTM International:Conshohocken, PA, USA, 2009; p. 105.
23. Newman, J.C., Jr.; Ruschau, J.J.; Hill, M.R. Improved test method for very lowfatigue-crack-growth-rate data.Fatigue. Fract. Eng. Mater. Struct. 2011, 34, 270–279. [CrossRef]
24. Paris, P.; Erdogan, F. A Critical Analysis of Crack Propagation Laws. J. Basic Eng. 1963, 85, 528–533. [CrossRef]25. Qi, S.; Cai, L.; Bao, C.; Chen, H.; Shi, K.; Wu, H. Analytical theory for fatigue crack propagation rates of
mixed-mode I–II cracks and its application. Int. J. Fatigue 2019, 119, 150–159. [CrossRef]26. Richard, H.A.; Sander, M.; Fulland, M.; Kullmer, G. Development of fatigue crack growth in real structures.
Eng. Fract. Mech. 2008, 75, 331–340. [CrossRef]27. Sajith, S.; Murthy, K.; Robi, P.S. Prediction of Accurate Mixed Mode Fatigue Crack Growth Curves using the
Paris’ Law. J. Inst. Eng. (India) Ser. C. 2017, 100, 165–174. [CrossRef]28. Schijve, J. Fatigue of Structures and Materials; Springer Science & Business Media: Berlin/Heidelberg, Germany,
2008.29. Sih, G.; Liebowitz, H. Mathematical Fundamentals; Fracture, Academic Press: New York, NY, USA, 1968;
Volume 2, pp. 67–190.30. Srawley, J.E. Wide range stress intensity factor expressions for ASTM E 399 standard fracturetoughness
specimens. Int. J. Fract. 1976, 12, 475–476.31. Tada, H.; Paris, P.C.; Irwin, G.R. The Stress Analysis of Cracks Handbook, 3rd ed.; ASME International: New
York, NY, USA, 2000.32. Tanaka, K. Fatigue crack propagation from a crack inclined to the cyclic tensile axis. Eng. Fract. Mech. 1974,
6, 493–507. [CrossRef]33. Wöhler, A. Versuche zur Ermittlung der auf die Eisenbahnwagenachsen einwirkenden Kräfte und die
Widerstandsfähigkeit der Wagen-Achsen. Zeitschrift für Bauwesen 1860, 10, 583–614.
© 2020 by the authors. Licensee MDPI, Basel, Switzerland. This article is an open accessarticle distributed under the terms and conditions of the Creative Commons Attribution(CC BY) license (http://creativecommons.org/licenses/by/4.0/).