Embed Size (px)
Citation preview

General rights Copyright and moral rights for the publications made accessible in the public portal are retained by the authors and/or other copyright owners and it is a condition of accessing publications that users recognise and abide by the legal requirements associated with these rights.
• Users may download and print one copy of any publication from the public portal for the purpose of private study or research. • You may not further distribute the material or use it for any profit-making activity or commercial gain • You may freely distribute the URL identifying the publication in the public portal
If you believe that this document breaches copyright please contact us providing details, and we will remove access to the work immediately and investigate your claim.
Downloaded from orbit.dtu.dk on: Jun 06, 2018
Application of statistical linear elastic fracture mechanics to pressure vessel reliabilityanalysis
Becher, Per Erik; Pedersen, A.
Publication date:1973
Document VersionPublisher's PDF, also known as Version of record
Link back to DTU Orbit
Citation (APA):Becher, P. E., & Pedersen, A. (1973). Application of statistical linear elastic fracture mechanics to pressurevessel reliability analysis. (Risø-M; No. 1650).

A. E. K.Risø Risø-M-Dl^ Title and author(s)
Application of Statistical Linear El -it:tic Fracture
Mechanics to Prer.oure Vocicel Reliability Analysis
ty
P.E. Becher and Arne Pedersen
pages + tables -f- 16 illustrations
Date Octobe r 1 -}? $
Department or group
R e a c t o r
Group's own registration number(s)
25-3-1?
Abstract An evaluation of the failure
pressure vessel is made on the basis Elastic Fracture Mechanics). Failur by actual crack length (i.e. stress Kj) equal critical crack length (i.e fracture toughness K J Q ) .
The probability of failure is ability that there exists a crack (i than a given crack (i.e. K) and that crack (i.e.Kjg) is smaller than that where Kj and KJQ are considered for location. KJQ as well as Kj are tre cal variables with probability densi which are functions of material, ini stresses and crack growth.
The integrated calculations o ability are performed by a computer the Monte Carlo method with importan
probability for a of LEFM (Linear
e is identified intensity factor . plain strain
the joint prob-.e. Kj) greater the critical same crack,
same time and ated as statisti-ty functions, tial cracks,
f failure prob-program utilizing ce sampling.
Copies to
Library
Reactor
100
50
Abstract to
Available on request from the Library of the Danish Atomic Energy Commission (Atomenergikommissionens Bibliotek), Risø, Roskilde, Denmark. Telephone: (03) 35 51 01, ext. 334, telex: 5072.

. ; ; . t - ! - : . ; : - i or . - . l C. :.f- i . - . . c - ,.-;.
'•" r u e ' ur-' L '..•:<.• :\:\:: i er i ' . Ko^c' .cr 1 eeh*- •! - -r-
r- r Li.. '0 - i-, Jv?t<.-m":.'.--.- ; -, /
M6/4
APPLICATION OF STATISTICAL LINEAR ELASTIC FRACTURE MECHANICS TO PRESSURE VESSEL RELIABILITY ANALYSIS
P.E. BECHER, A. PEDERSEN Danish Atomic Energy Commission,
Reactor Engineering Department, Research Establishment Rise, DK-4000 Roskilde, Denmark
SUMMARY
An evaluation of the failure probability for a pressure vessel is made on the basis of LEFM (Linear Elastic Fracture Mechanics). Failure is identified by actual crack length equal critical crack length.
The probability of failure is the joint probability that there exists a crack (i.e. Kt) greater than a given crack (i.e. K) and that the critical crack (i.e. Klc) is smaller than that same crack, where K, and K]C are considered for same tirre and location.
KjC as well as K, are treated as statistical variables with probability density functions (p.d.f.), which are functions of material, location and time.
The variability of Klc (that is the p.d.f. of K,c) is a result primarily of the statistical nature of the material properties and to a lesser degree of the increasing neutron-do»e experienced by certain parts of the pressure vessel.
The variability of Ks (that is the p.d.f. of K,) is a result of the following parameters
(1) Initial distribution of cracks (that is the crack distribution at the start-up of the reactor) regarded as a statistical variable, because of the uncertainty in the non-destructive testing of the pressure vessel prior to start-up.
(2) Stresses, regarded as a statistical variable because of the uncertainty in the stress analysis and the geometry of the vessel.
(3) Crack growth by fatigue, which is a result of the normal (with probability equal to 1.0) and abnormal (with a p.d.f.) operational transients. The statistical nature of the crack growth is due to the statistical variation of the abnormal operational transients.
(4) Material properties (that is KIC, yield strength and the factors governing the fatigue crack growth) regarded as statistical variables.
The p.d.f.'s of the above mentioned parameters are evaluated on basis of available literature. The integrated calculations of failure probability are performed by a computer program utilizing the Monte Carlo technique with importance sampling, which gives a greater freedom in selection of p.d.f.'s. The influence of periodic in service inspection on the failure probability isconsidered. Calculations of failure probability on existing reactors are presented.

- 1 -
i. lilTKODrCTIOi:
Failure probabilities of reactor pressure vessels have been
devoted considerable attention during the last years. Many efforts
have been made to translate statistical evidence of conventional
high pressure vessel integrity and results of surveillance testing
into failure probabiliries of nuclear pressure vessels. Both in UK
and in Germany sui-h investigations on vessels comparable with nu
clear vessels were conducted (ref. 1 and 2) covering a total of ap
proximately 100.000 and 1.000.000 vessel years respectively. The
total number of failures relevant for nuclear vessel services cor--3 -k
respond to failure rates of 10 - 10 per year and catastrophic
failure rates of 2 x 10 per year in the UK investigations,
3 x 10 per year in the German ones.
Another approach to evaluation of pressure vessel failure
probabilities has developed from the increasing application of re
liability engineering methods in the aircraft and satellite design.
Most of these applications are concerned with reliability calcula
tions of integrated system performance from knowledge of failure
statistics of the different components in the systems. However,
the methodology is applicable also to calculations of the prob
ability that a given failure mode for a specific component is ex
ceeded when the variations of the associated design parameters are
known.
Examples of such calculations on pressure vessels are given
in ref. J>. In these cases the failure criterium is related to
either the yield strength or the ultimate tensile strength of the
construction material neglecting possible defects. In the first
case the failure criterium is hardly to be considered as a failure,
in fact yielding is accepted for certain loading conditions and in
certain areas of the vessel. In the second case the failure prob
ability calculated is bound to be extremely low.
A more advanced example in which defects and crack growth
are considered is presented in connection with the pipe rupture

study performed by the General Electric Company (rof. 4). This
study makes an estimate of pipe reliability by "the distribution
of time to damage method" (ref. 5). Using Monte Carlo technique
with importance sampling, the method gives the probability that
cracks grow through the wall of a cylindrical pipe in a chosen
time period due to low cycle fatigue. All parameters are regarded
as distributed variables, each with separate distribution functions.
The failure probability calculated by this method seems to be in
better agreement with practical failure experience.
2. FAILURE MODEL
In calculations of the reliability of a nuclear pressure ves
sel on a fully probabilistic basis, all the variables used in the
calculations should be regarded as statistical variables each with
their own probability distribution (p.d.) function. The number and
nature of the parameters are governed by the particular failure mode
to be examined. Furthermore the time-dependency of every parameter
has to be evaluated, in order to give "probability of failure" as a
function of time.
In this paper the type of pressure vessel failure considered
has been restricted to gross failures of the vessel in excess of the
type of failures considered as design basis for engineered safeguards
such as containment and emergency core cooling.
The only available method considered to give a realistic de
scription of that type of catastrophic failure is the Linear Elastic
Fracture Mechanics theory (LEFM). In brief, the theory suggests
that gross failure occurs when the stress intensity factor around
a cracks with a depth "a" in a nominal stress field S exceedr the
plain strain fracture toughness KTf,, i.e. when
Kj = S • tfM • a i" KIC
where
M is a constant which depend upon the type of load and the
geometry of the crack.

The probability that cracks of different sir.es exist in the
vessel, the uncertainty about the real stress field and in principle
also the variation in the constant M due to different crack geom
etries are combined into a probability distribution function for
the stress intensity factor, K . These values of KT are compared
with the variation in the fracture toughness K giving the probity
ability of failur- as:
Prob. o4- failure = Probability (KT = KX and K r ^ K
X)
where
K assumes all values 0 < K < 00 (.see fig- 1).
Tn this first application of the method a few simplifications
have been introduced.
In calculating the time dependency of the probability rf
failure, the only contribution considered is crack growth by low
cycle fatigue. The crack distribution function is thus the only
parameter which is assumed to vary with time. The variation is de
termined on basis of the initial distribution of cracks, the stress
transients and the parameters governing low cycle fatigue. The
most important limitation is that degradation of material properties
from neutron irradiation is neglected. This will normally be true
for most boiling water reactors while the phenomena probably should
be included in calculations on pressurized water reactors.
Further only the cylindrical part of the vessel free from
structural discontinuities is treated so far. Admittedly uhe nozzle
and flange areas of the vessel, subject to higher stresses and more
severe stress cycles, are the more questionable parts of the vessel.
The T.T-FM theory, however, is not direct applicable in these circum
stances when the stresses approach the yield stress - at best the
theory represents a conservative approach in this case and very high
values of failure probabilities which is calculated on this basis
might be acceptable.
Finally, the geometry of the cracks considered has been
idealized. They are all considered to be semi-elliptic surface

;'r;ickf" or elliptic i.-mbeddod cracks with a length: depth ratio ol"
10:1. Shorter crack;; resul:, in lowt'r slrcn:; intercity factors.
The difference, iiow(- ve r, it; not very V Lp - a 1:1 ii.stead of a 10: i
crack will reduce the stress intensity factor with only Yj% for the
same crack depth.
Beside these simplifications which may be deleted without
greater difficulty it has been necessary to introduce an approxi
mation of a more fundamental nature due to difficulties in measuring
the plain strain fracture toughness KT_ at temperatures of above 10
- 20 C. These difficulties are directly connected to the discussion
about the validity of the LEFM concept in the tough region at elev
ated temperatures. However, Corten and Sailor (ref. 6) has suggested
that the plain strain fracture toughness above the transition tem
perature may be calculated on basis of the upper shelf Charpy-V, C ,
fracture toughness and the yield strength, Sy, at the temperature
in question as:
KIC = V5(cv sy - 0.05 Sy
The distribution function of KTr, is thus readily calculated from the
distribution functions of C and S„.
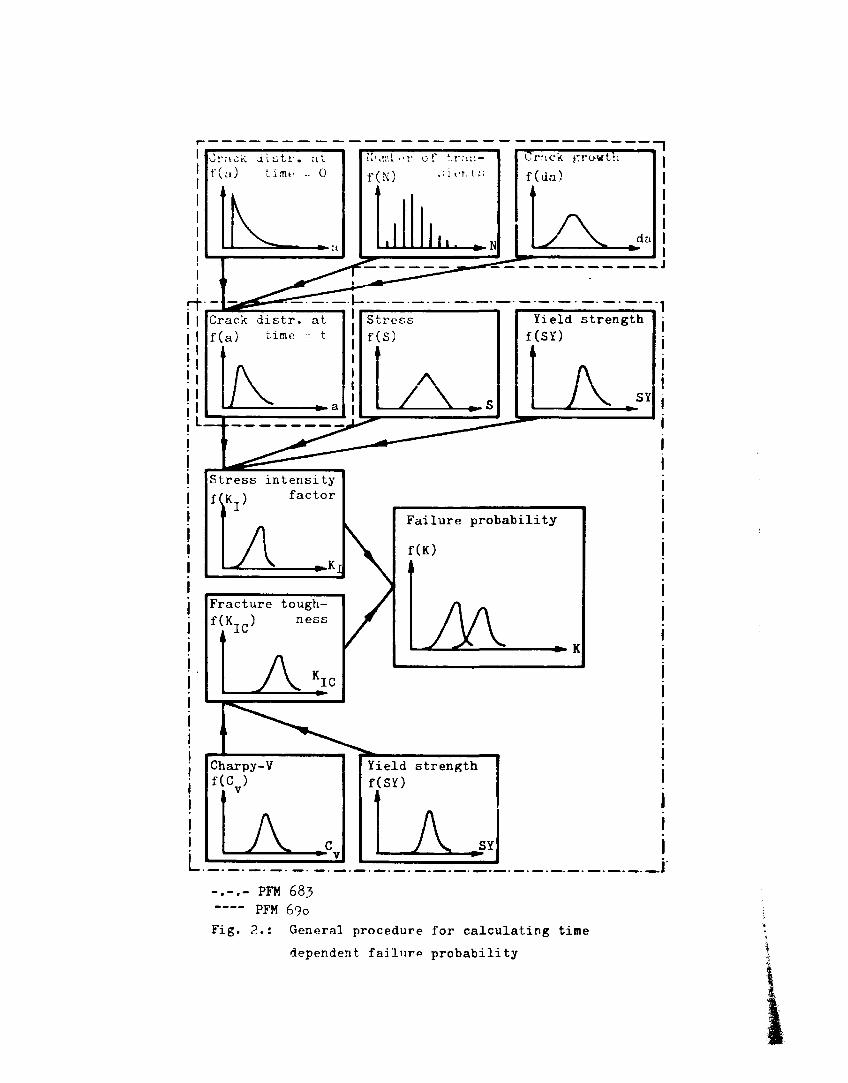
A survey of the relations between the different parameters
used in the calculations and the resulting failure probability are
shown in fig. 2.
In order to carry out such calculations in which different
types of distribution functions obviously exist, Monte Carlo tech
nique (simulation) is the only possible solution. However, since
the failure probability expected is in the order of 10~ the number 8 9
of Monte Carlo trials would be in the order o* 10 - 10 if a
reasonable small error should be obtained. With a typical computer
time of 10 sec/trial direct simulation becomes impossible and im
portance sampling is just as necessary a feature as the Monte Carlo
technique itself.
As indicated in fig. 2 the calculations are performed in two
steps by computer programs named PFM 690 and PFM 683 respectively.
Separate block diagrams for the two programs are shown at fig. 3 and
k.

PFM 69O calculates the crack growth as a function of time on
basis of an initial crack distribution (or a single crack of a given
length), crack growth characteristics and stress transients. Re
sulting crack distribubions after different intervals of operation
are supplied in the form of hi s fco gramt;.
PFM 683 calculates the probability of failure from a given
set of distribution functions for cracks, stresses, yield strength
and Charpy-V fracture toughness. The result is thus the probability
of failure wheii the vessel is loaded with the stresses used in the
calculations. Performing such .calculations at different intervals
of operation with the relevant crack and material data distribution
functions, failure probability as function of time may be calculated.
The program may also supply histograms of the resulting f (K ) and
f (K I C).
PFM 690 uses direct Monte Carlo simulation while PFM 683 uses
Monte Carlo simulation with importance sampling. The probability
distribution functions may be supplied either in the form of a table
x, f(x) or as a Weibull function given by the three constants m, K
and x . The importance sampling is accomplished by Weibull functions
as weighting functions supplied as another set of constants.
3. DISTRIBUTION FUNCTIONS
OF INPUT PARAMETERS
3«1 Initial cracks
The existence of cracks in a vessel when it is taken into
operation after initial testing and control depends upon many dif
ferent factors such as fabrication techniques, non-destructive
testing methods and requirements, reliability of the methods and
the operators, etc. The general appearance of the crack distribu
tion function is expected to be an exponential distribution with
respect to crack size. Small cracks with a depth in the order of
1 - 2 mm exist almost for sure while the probability that bigger

cracks will not be detected decreases sharply with the crack size.
Defects in the order of 10% of the wall thickness of the vessel
i.e. typically 10 - 20 mm in depth should be readily detectable.
Nevertheless vessels do fail now and then aue to unrevealed big
cracks approaching critical crack sizes. In ref. 8 Jordan and
O'Neil suggest that the probability of missing a potential danger-_2
ous defect by ultrasonic testing is somewhere between 1 and 10
Under the impression of these indications the crack distribution
function shown at fig. 5 was chosen. The probability that a crack
with a depth of 2 cm will not be detected was specified to 10
5.2 Crack growth characteristics
Crack growth data are normally expressed in terms of the
cyclic range of the stress intensity factor AKT. Fig. 6 shows a
logaritmic diagram of the generalized fatigue crack growth rate
law:
4ff = C ^ dN o
For a given AK the variation in measurements of the crack
growth rate may be expressed as a probability distribution func
tion f(da/dN). In the calculations the distribution function is
considered to be normal in the logaritmic scale and the same func
tion is used for all AK.
Crack growth data on the pressure vessel steel A533B pub
lished from the HSST program are combined in fig. 7« The data
represent measurements on different types of material (base plate,
heat affected zone and electro slag weld material) and in differ
ent environments (BWR, PWR and air). From fig. 7 the constants in
the crack growth equation and standard deviation of the normal
distribution function are evaluated.
5.5 Stress transients
A typical set of reactor operating transients used to evalu
ate fatigue life of the pressure vessel in a BWR is reproduced from
a safety analysis report (ref. 10) in fig. 8. The number of tran-

sients indicated are considered to be the most probable number of
occurrences.
The effects of thece transients in terms of imposed stress
cycles on the cylindrical part of the vessel has been evaluated.
Some of the transients are connected to normal operation
of the plant, e.g. start up, shut down, pressure tests etc. and
may be considered to occur with a given frequency characterized by
a period of not more than one year.
The other transients are connected to incidents and other
abnormal events with an occurrence which is statistical by nature.
Average numbers of the different abnormal transients may be derived
from practical operational experience and they are considered to
occur evenly distributed over the lifetime of the plant.
The operating history of the plant has therefore been div
ided into periods of one year such that the combination of tran
sients is the same in each one year period. The average numbers
per year for the different transients used in the calculations are
specified in the table fig. 9 together with the corresponding
stress cycles.
Since the number cf abnormal transients are statistical
figures it is necessary to evaluate the probability that different
numbers of a particular transient occur in the one year period. A
binomial distribution function may be used to calculate these prob
abilities if the period is divided into so many intervals that not
more than one transient of the type considered can occur in each
interval.
In the calculations intervals of one month are used. With
the probability of occurence p in each single interval being equal
to the average number of transients per month, the probability
distribution function with respect to the number of occurrences in
one year will be (ref. 7):
f (x) = (̂ 2) px (1 - p ) 1 2 " x
where
x = 0, 1, 12.

'i'hi :••-;';! !! i fif; proi>al> i i i t y d i r>tr i bu l i o n fuiift. I otu-; f o r e a c h
of t.'su- a b n o r m a l 1 rat i : ; i <MI U; u^cd in !.h>' '-;il cu l a t . i oti;- a r p shown i n
f i r ; . 10 .
•j.Li Stl'OSSL'!.--
In order to calculate the failure probability in a specific
operating situation, the stress distribution function should de
scribe the real stress condition in the area of the vessel con
sidered. Calculation of the stresses in the plain cylindrical
part of the veasel can be done very accurate - the real stresses,
however, may be different.
Residual stresses from welding may be considerable but also
deviations in geometry, in the elastic modulus of the material etc.
may influence the real stresses. For the material considered the
allowable calculated stress in normal and upset operation is 26,7
KSI (l8,7 kg/mm ) according to the ASME III code for nuclear pres-2
sure vessels. Residual stresses up to 8 KSI (5,6 kg/mm ) may be
present according to ref. 9« The esidual stresses are considered
to exist equally probable as tensile and compression. The result
ing real stresses in the vessel cylinder may thus vary from approx.
18 KSI (12,7 kg/mm2) to 3^ KSI (23,9 kg/mm2) with a distribution
function as shown at fig. 11. This stress level exists in the
vessel cylinder during start up and shut down of the plant and in
the rather frequent abnormal situations in which the pressure ap
proach the s-f-Lj valve set point.
If other pressure vessel codes were used in which allowable
stresses are related solely to the yield strength of the material
the calculated stress level in the example considered would have
o
been 28, rj KSI (20 kg/mm"") instead of 26,7 KSI and the stress dis
tribution curve moved to correspondingly higher stresses.
A special situation which might be interesting to consider
is the p re-operational pressure test of the vessel. Most pressure
vessel codes require test pressures which result in stress levels
in the cylindrical part of a typical reactor pressure vessel of 33
KSI (23,1 kg/mm 2).
The yield strength distribution function is also shown in
i i<j. 11.

3.5 Yield strength and Charpy-V toughness
Published data from the HSST program on pressure vessel
steel plate A533-B have been used to evaluate frequency distribu
tion curves for the yield strength and the Charpy-V toughness.
Only test specimens from the inner half of the plate were included
in order to eleminate the variation in material properties due to
the location within the plate. The distribution functions were
fitted to Weibull distribution functions in order to allow a
specific lower limit of the material properties to be introduced.
The actual distribution functions are shown at fig. 12 and 13« The
lowest possible values in the distribution functions chosen are 60
ftlb and 35 KSi for the Charpy-V toughness and the yield strength
respectively. These lower limits compare very well with
the code requirements of a minimum yield strength of 42,7 KSI and a
minimum charpy-V toughness of 50 ftlb based upon measurements from
rather few specimens.
k. RESULTS
On basis o^ the distribution functions discussed above cal
culations of crack growth, crack distribution functions and failure
probabilities at different intervals of operation have been perfor
med.
The calculated crack growth proved to be rather small even
for the bigger cracks. In order to obtain a sufficient acctirate
calculation of the change of the crack distribution function with
time very long computer times would therefore be required. There
fore an indirect method for evaluation of the changes of the crack
distribution function with time were introduced.
Distribution functions for single cracks are much easier to
calculate. Results for 1", 2" and 3" cracks are shown in fig. 14.
Most probable and maximum expected growth of the different crack •
sizes are easily recognized. For the biggest crack considered (3"
depth) it appears that the growth after 40 years of operation is

- 10 -
in the order of 1/1O". From these figures the most probable and
maximum expected changes of the initial crack distribution func
tion after 10 and hO years of operation are evaluated as shown in
fig. 1S. Only failure probabilities corresponding to maximum ex
pected crack distribution functions are included.
Results from the failure probability calculations are shown
in the table fig. 16. It appears that a nominal stress of 26 KSI P _o
(18,3 kg/mm ) gives a probability of failure of app. 10 in the
beginning of the vessel life. Such stress levels exist during
normal heat up and cool in the cylindrical part of a reactor ves
sel designed in accordance with the ASME III code. An increase of
the nominal stress with app. 10$, which would be allowable accord
ing to the DIN code with the material considered, increases the
failure probability with a factor of 7. Even higher stresses are
allowed during pre-operational hydrostatic testing, typical Z5%
higher than the stresses during normal operation. The resulting
failure probability is app. 2 x 10 , i.e. an increase with a fac
tor of 200.
Further it is seen that the failure probability remains
almost constant with time. This means, that the contribution from
crack growth to the time dependency of the failure probability is
insignificant. Our calculations thus imply that most catastrophic
failures occur during hydrostatic testing before the vessel is
taken into operation. An estimate of the failure probability per
vessel year, as it is normally given, would be 5 x 10~ (2 x 10~ /
ko).
Practical failure experience seems to be inconsistent with
these results. To explain these differencies it should be recalled
that deterioration of material properties with time is neglected
and that only crack growth by low cycle fatigue is considered.
Other possibilities such as corrosion fatigue and stress corrosion
are not included. Further the stress cycles in the cylindrical
part of the vessel are actually modest. In other parts of the
vessel jspeically in some of the nozzles the stress cycles are
more severe both in terms of frequency and stress range. Finally

- 11 -
recent crack growth rate data published from the HSST program
(ref. 11) indicate that crack growth rates may increase consider
ably if the load cycling is carried out at lower frequencies than
normally used, i.e. at frequencies more representative of the load
cycles in a reactor pressure vessel.
These limitations in the calculations carried out so far
imply that specific figures of failure probabilities calculated
should be somewhat lower than figures from practical statistical
experience.
Further development of the method will include establishment
of more accurate distribution functions, inclusion of other factors
contributing to time dependency and application of the method to
other parts of the vessel.
ACKNOWLEDGEMENT
The adaption of the Monte Carlo technique into the computer
program has been performed by Mr. H.E. Kongsø for which we are deeply
indebted.

REFERENCES
Rof. i. AHSB(S)R 16?
C.A.G. Phillips & R.G. Warwick
A Survey of defects in pressure vessels built to high
standards of construction and its relevance to nuclear
primary circuit enveloprrt.
19*-.
Ref. 2. 0. Kellermann & H.G. Seipel
Analysis of the improvement in safety obtained by a
containment and by other safety devices for v.-i er oo<
reactors.
IAEA Symposium on the Containment and Siting of Nuclear
Powered Reactors.
Vienna, April 1967»
Ref. 3. ORNL-TM-3858
H.G. Arnold
Pressure Vessel Reliability as a function of Allowable
Stress.
June 1972.
Ref. k. GEAP-10205
Status of Pipe Rupture Study of General Electric Company
Part III
Vandenberg, S.R. (General Electric Co., San Jose, Cali
fornia Atomic Power Equipment Dept.).
June 1970 and references therein.
Ref. 5. ""GEAP-10't52
Estimating Pipe Reliability by the distribution of time-
to-damage method.
Wilson, S.A. (General Electric Co., San Jose, California
Atomic Power Equipment Dept.).
March 1972.

hi1 : • \ » ii »u *̂ » . •' • | :'-. ri'.'ir. * . »" ;* - * ' ' r.• • • • 1 — * — I 7/ 1
H . T . C o v 1 - - . v i \ . : . . .••:!"...--•.•
Kt.-i.v.'. i o r . : : t i i p i o t w o o ; . r a i - - r i a l ."r-ictu;--- t o i i r h n e n c u s i f i t
f r a i r L u r o rnochaniec- a ra : t r - : : - s i L ion t - s r o r n t u r e t c s t u .
ft i • ** *̂ M r* **•A "* M L. 21*• ̂ ̂ ** i *
Fro1. -ibilL::tic Reliability:
AE: n̂riiioeri.'if- approach.
McGr aw-Hill. 1 36a.
Ri-!". ?. R. O'Neil & G.M. Jordan
Safety and reliability requirements for periodic in-
spectpion of pressure vessels in the nuclear industry.
Conference on Periodic Inspection of Pressure Vessels.
London, 9 - 1 1 May 1972.
Ref. 9. NEDO 10029
L.C. Hsu
An analytical study on brittle fracture of G.E.-BWR
vessels subject to the design basis accident.
June 1969«
Ref. 10. DOCKET 50321-1*6
Edwin I Hatch Nuclear Plant unit 1.
F.S.A.R. Amend. 17
(Georgia Power Co., Atlanta)
26-6-1972.
Ref. 11. ORNL-4855
Heavy-Section Steel Technology Program.
Semi-Annual Progress Report, ending August 31« 1972.
(Oak Ridge National Lab., Tenn)
April 1973.

density function
f(K)
f(KT)
f(KT„) / \ " IC
stress intensity factor K
Jrrtok a i o t r . a t f ( a ) t ime - 0
•-t^i
u'.Kil . • f o !' t r : : ; ; -
f ( N ) • : i , , , ; t ! ;
Ir.vck jTro-wtii f ( d a )
1 1
Crack distr. at f(a) time -= t
Yield strength f(SY)
K SY
Stress intensity
f(K ) factor
L
Failure probability
/w . Yield strength
f(SY)
A. SY -.-.- PFM 685
PFM 690
Fig. 2.: General procedure for calculating time
dependent failure probability

PFM i>00
INPUT:
Initial crack distr. (or
Crack growth characterist
Stress distr.
Normal transients
Frequency for
single crack)
ics
abnormal transients
Number of periods
(table x,f(x) or Weibull
(for f(x) = K(x-xo)B exp(
constants m, K, xQ
-mTT(*-Xo)m+1)) m+i o
Monte Carlo trail on initial crack distr
I Crack growth procedure
Monte Carlo trail on: Number of abnormal transients
Stress distr.
Crack growth charac.
a:= a • da
Period no.: = Period no. + 1
Period no. < Number of periods >
Histogram for f(a)
Fig. 3«: Diagram for computer code
PFM 690, which calculates
crack growth

INPUT:
p.d.f.'s for: cracks
Gtress
yield strength
Chnrpy-V
Weibull constants for weighting
sampling
a
S
SY
V
functions for importance
Weighting for
importance sampling
Monte Carlo trail on:
a, S, SY and C
I K I C = \ ^
•SY - O.OS'SY'
K =sÆmznz 1 »1.1 - 0.212(|y)
I Failure criterium
f KI > KIC
Histogram for f(KIC) and fCKj)
if no weighting
No. of failures: = No. of failures + weighting factor
Fig. h.t Diagram for computer code
PFM 683, which calculates
failure probability

t i, - 1 1
.'•5
2.0
1.5
1.0
0.5 .
0
i
.
•
»
\ f(a) = 2.56 exp(-2.5
crack depth »•a in
0,1 0,5 1,0 1,5 2,0 3,0
Fig. 5̂ 5 Initial crack distribution.
i

• rai'.\ tiros i 'i vi'
f(da
stress intensity ^ ^ factor AK
Fig. 6.: Statistical model for crack growth
(log-log diagram).
Fig. 7.: Crack growth data for A5J3B
steel (from HSST-program)

Transient Condition Occurrences
Normal Startup (100°F/Hr) 120
jG% Power Operation 1^,600
Rod Worth Tests *f00
Loss of Feedwater Heaters
Turbine Trip at 25# Power 10
Feedwater Heater Bypass 70
Loss of .p'eedwater Pumps 10
Turbine Generator Trip kO
Reactor Overpressure 1
Safety Valve Blowdown 2
All Other Scrams ^^7
Improper Start of Cold Recirc. Loop 5
Sudden Start of Cold Recirc. Loop 5
Normal Shutdown
100°F/hr Cooldown (5^6-375°F)
Shutdown Flooding (375-330°F)
100°F/hr Cooldown (330-10O°F) 118
In addition, the vessel is expected to be subjected to 133 cycles
of hydrostatic pressure tests, three of which will be at 125$ of
design pressure, and 130 at design pressure.
Fig. 8.: Standard design operating con
ditions (from. ref. 10 ).

Operating condition
Preoperational hydrostatic test to 125^ of design press
Start-up/ Shutdown
Hydrostatic test to design press
Scram -Hot Standby - Full Power
Scram -Shutdown -start-up
Loss of recirculation flow
Blow down
Category
Normal
Normal
Normal
Abnormal
Abnormal
Abnormal
Abnormal
Stress psi
33-000
26.000
27.000
26.000
30.000
28.000
27.000
No. of cycles 40 years
No. of cycles 1 year
No. of cycles 1 month
3 prior to initial start-up
240
120
240
60
5
2
6
3
6
1.5
0.125
0.05
-
-
0.5
0.125
0.01
0.0042
Fig. 9.5 Condensed scheme of stress transients.

Hi«) = ( N ;p (i-p;
Fig. 10.: Probability density function for number of
abnormal transiente.

f(S)
Yield strength
(fig. 9)
?o 30 26 28,5 33
ASME Ken. TTI
DIN
Preoperational hydroteBt
Fig. 11.: Probability density function for stresses

f(" ): <• •', . ' O -•'I '
70 UO 50 60 80 90 100 110 1?0 i 50 !'̂0 150 ft i I
Fig.12.: Probability density function for Charpy-V.
Published data from HSST-program.
f(SY)
f(SY), 1,57-lO'12(SY-35)8,2 exp(- a'57;1° "(SY-35) 8 , ?
30 35
SY
ksi
Fig.13«: Probability density function.
Published data from HSST-program.

In i t i r i l c r ack in
1.0
2 . 0
3 .0
S t a t i s t i c a l c o n d i t i o n
Mof;t p r o b .
Max.
Most p r o b .
Max.
Most p r o b .
Max.
R e s u l t i n g c r a c k a f t e r 10 y e a r s
of o p e r a t i o n
1.01
1.02
2 . 0 1 5
2.0*15
3-02
3-075
R e s u l t i n g c r a c k a f t e r *t0 y e a r s
of o p e r a t i o n
1.025
1.0^5
2 . 0 5 5
2 . 0 9 5
3 .09
3-155
f(a)
i
1 1.0
Fig. 1 if.: Statistical crack growth for 1", 2 " and 3 " cracks
after 10 and M) years of operation

0,5
f(a) - K oxp(-K(a-a )) o
Initial crack distr.; K - 2.^6, 0,1 in
Max. growth after 10 years; K=2,50i a =0,1 ir.
Most prob. growth after +̂0 years;
r K -- iM, a = 0.1 it ' ' '— o
Max. growth after kO years: K = 2.13. a^ = 0,103 in
2,0 3,0 in
0,103
Fig. 15.: Crack diatribution at 0, 10 and kO years of operation,
Evaluated on basis of fig. 13.

Years of
operation
0
10
4o
0
0
Mean stress
Ksi
26.0
26.0
26.0
53.0
28.5
Failure probability
6
1.24 x 10
1.89 x 10~~
2.45 x 10
178 x 10~B
7.8 x 10"b
95$ confidence
limits
0.90 -, x 10-8
1.58 J 1 ' ^ l x 1 0 - 8
2.45 J 1 - 7 3 l x 1 0 " 8
-z: 01 I r?"~ ' 1 6 3 1x10-« 194 i 7 ' 5 ) X 1 0 - 8
8.3 J
f(K)
4.10 -2
3-10
2-10
-2
1-10 -2
f(KI0)
20 40 60 80 100 120 140 160 180 200 220 240 kai/in
Fig. 16. Result of failure calculati ons


![[XLS] · Web viewStandard Method of Test for Elastic-Plastic Fracture Toughness Standard Method of Statistical Fatigue Testing Standard of Casting Design Standard Method for Model](https://img.pdfslide.us/doc/110x75/5b31f7b77f8b9aa0238bc29f/xls-web-viewstandard-method-of-test-for-elastic-plastic-fracture-toughness.jpg)