Embed Size (px)
Citation preview
AAnnaallyyttiisscchhee QQuuaalliittäättssssiicchheerruunngg
BBaaddeenn--WWüürrtttteemmbbeerrgg
Proficiency Test 1/10
TW A1 – Anions in drinking water
bromate, fluoride, nitrate, nitrite, chloride, sulphate
phosphorous, cyanide, turbidity
provided by
AQS Baden-Württemberg at Institute for Sanitary Engineering, Water Quality and Solid Waste Management,
University of Stuttgart Bandtäle 2, 70569 Stuttgart-Büsnau, Germany
on behalf of the Ministry of Rural Affairs, Food an d Consumer Protection Baden-Württemberg
Stuttgart, in May 2010
Responsibilities: Scientific director AQS: Dr.-Ing. Dipl.-Chem. Michael Koch PT manager: Dr.-Ing. Frank Baumeister AQS Baden-Württemberg at Institute of Sanitary Engineering, Water Quality and Solid Waste Management at University of Stuttgart Bandtäle 2 70569 Stuttgart-Büsnau Germany http://www.aqsbw.de Tel.: +49 (0)711 / 685-65446 Fax: +49 (0)711 / 685-63769 E-Mail: [email protected]
PT 1/10 – TW A1 page 1 LIST OF CONTENTS
1. GENERAL ............................................ ............................................................2
2. PT DESIGN ......................................................................................................3
3. SAMPLE PREPARATION................................. ...............................................3
4. SAMPLE DISTRIBUTION ................................ ................................................3
5. ANALYTICAL METHODS................................. ...............................................4
6. SUBMISSION OF RESULTS .............................. .............................................4
7. EVALUATION PROCEDURE ............................... ...........................................4
8. ASSESSMENT.................................................................................................5
9. EVALUATION ......................................... .........................................................5
10. EXPLANATION OF APPENDIX A .......................... .........................................5
11. EXPLANATION OF APPENDIX B .......................... .........................................7
12. EXPLANATION OF APPENDIX C .......................... .........................................7
14. TRACEABLE REFERENCE VALUES......................... ....................................8
15. INTERNET......................................................................................................11
Appendix A
BROMATE............................................ .......................................................... A-1
FLUORIDE ................................................................................................... A-10
NITRATE ...................................................................................................... A-20
NITRITE........................................................................................................ A-29
CHLORIDE ................................................................................................... A-39
SULPHATE ......................................... ......................................................... A-48
PHOSPHOROUS ......................................................................................... A-58
CYANIDE...................................................................................................... A-68
TURBIDITY................................................................................................... A-78
Appendix B
Appendix C
BROMATE............................................ .......................................................... C-1
FLUORIDE.................................................................................................... C-28
NITRATE ...................................................................................................... C-64
NITRITE...................................................................................................... C-100
CHLORIDE ................................................................................................. C-136
SULPHATE ......................................... ....................................................... C-172
PHOSPHOROUS ....................................................................................... C-208
CYANIDE.................................................................................................... C-244
TURBIDITY................................................................................................. C-280
PT 1/10 – TW A1 page 2
1. General This PT was provided in the context of the AQS Baden-Württemberg drinking water PT scheme. In this round bromate, fluoride, nitrate, nitrite, chloride, sulphate, phos-phorous, cyanide and turbidity were to be determined. The PT was executed according to the recommendations of the German Federal En-vironment Agency from December 2003. These recommendations “for the execution of PTs for the measurement of chemical parameter and indicator parameter for the external quality control of drinking water laboratories” (Bundesgesundheitsblatt 46 12, 1094-1095) require, that drinking water laboratories must demonstrate their com-petence for all parameters they are accredited for or they want to be accredited for by a successful participation in a PT round within a cycle of 2-3 years. The PT was executed and evaluated according to the requirements of the DIN 38402-A45 and ISO/TS 20612.
PT 1/10 – TW A1 page 3
2. PT design Each participant received the following samples:
• 3 samples for the determination of fluoride, nitrate, nitrite, chloride, sulphate, total phosphorous in 1000 ml plastic bottles. Sample preservation by cooling.
• 3 samples for the determination of bromate in 250 ml plastic bottles. Sample preservation by cooling.
• 3 samples for the determination of turbidity in 250 ml glass bottles with screw cap.
• 3 samples for the determination of total cyanide in 500 ml glass bottles with screw cap. Sample preservation by cooling and NaOH (pH 11,4).
9 different concentration levels/batches were produced. The concentration levels were randomly allocated to the participants. It was ensured that each participant re-ceived one concentration level from the lower concentration range (level 1–3).
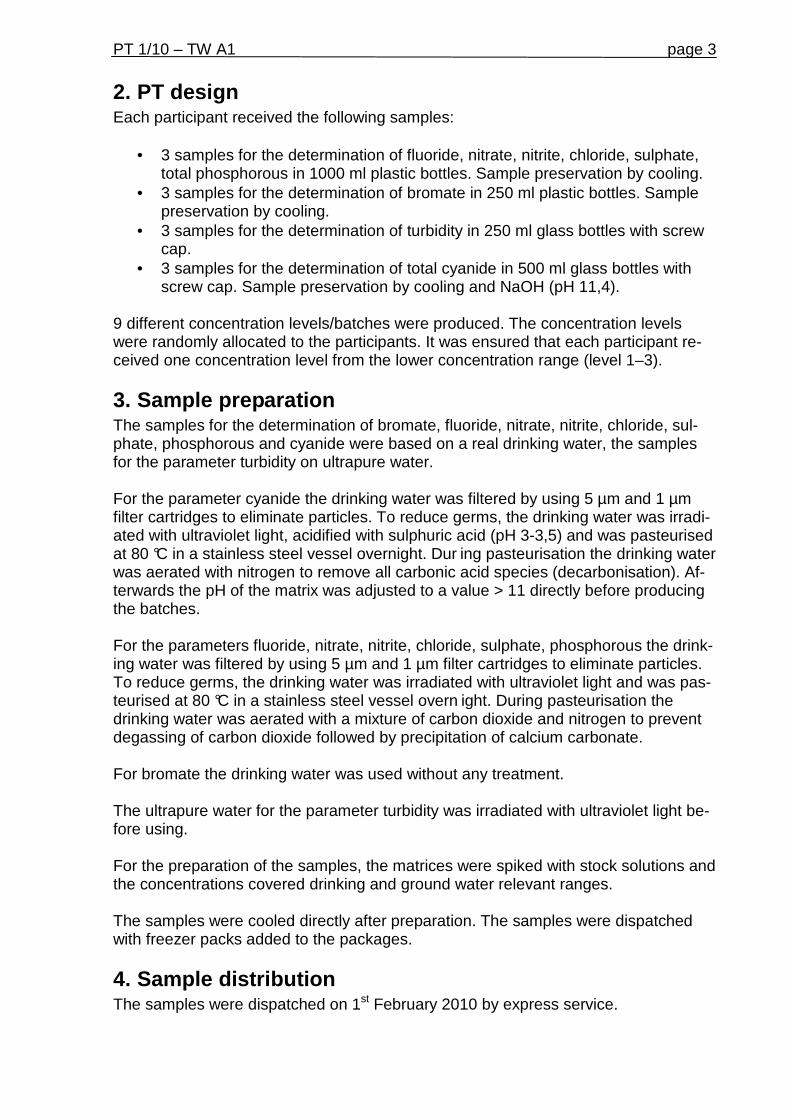
3. Sample preparation The samples for the determination of bromate, fluoride, nitrate, nitrite, chloride, sul-phate, phosphorous and cyanide were based on a real drinking water, the samples for the parameter turbidity on ultrapure water. For the parameter cyanide the drinking water was filtered by using 5 µm and 1 µm filter cartridges to eliminate particles. To reduce germs, the drinking water was irradi-ated with ultraviolet light, acidified with sulphuric acid (pH 3-3,5) and was pasteurised at 80 °C in a stainless steel vessel overnight. Dur ing pasteurisation the drinking water was aerated with nitrogen to remove all carbonic acid species (decarbonisation). Af-terwards the pH of the matrix was adjusted to a value > 11 directly before producing the batches. For the parameters fluoride, nitrate, nitrite, chloride, sulphate, phosphorous the drink-ing water was filtered by using 5 µm and 1 µm filter cartridges to eliminate particles. To reduce germs, the drinking water was irradiated with ultraviolet light and was pas-teurised at 80 °C in a stainless steel vessel overn ight. During pasteurisation the drinking water was aerated with a mixture of carbon dioxide and nitrogen to prevent degassing of carbon dioxide followed by precipitation of calcium carbonate. For bromate the drinking water was used without any treatment. The ultrapure water for the parameter turbidity was irradiated with ultraviolet light be-fore using. For the preparation of the samples, the matrices were spiked with stock solutions and the concentrations covered drinking and ground water relevant ranges. The samples were cooled directly after preparation. The samples were dispatched with freezer packs added to the packages.
4. Sample distribution The samples were dispatched on 1st February 2010 by express service.
PT 1/10 – TW A1 page 4
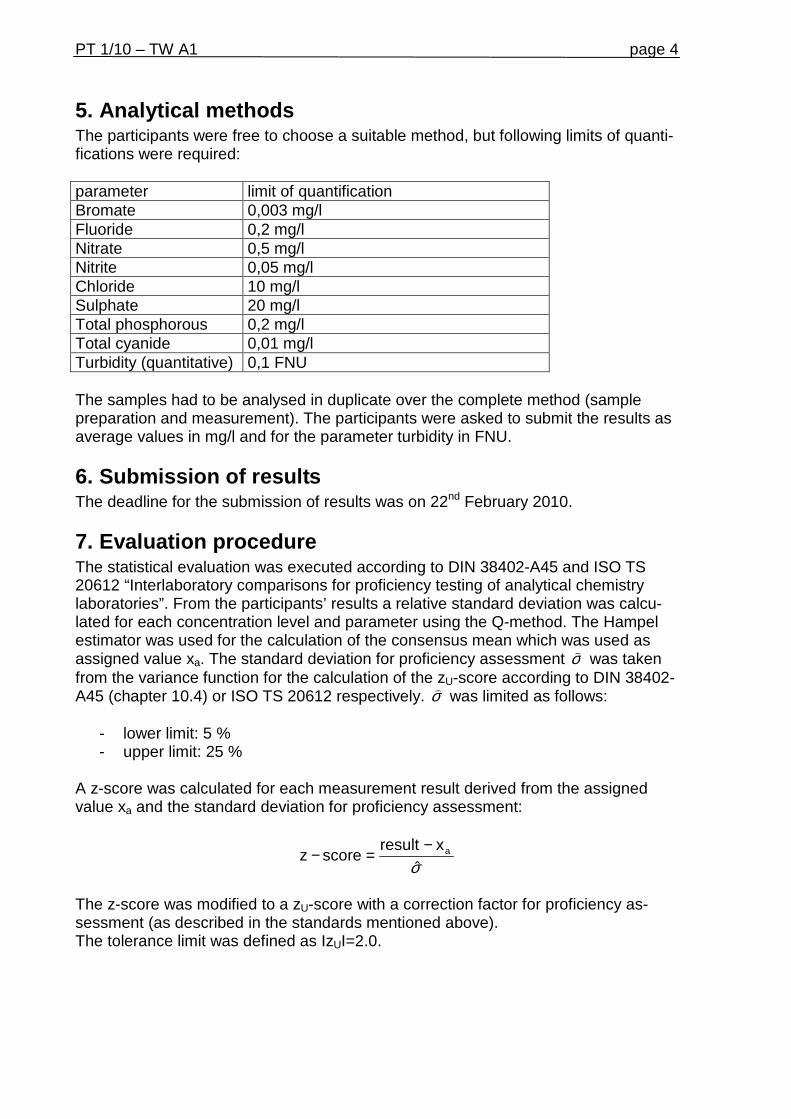
5. Analytical methods The participants were free to choose a suitable method, but following limits of quanti-fications were required: parameter limit of quantification Bromate 0,003 mg/l Fluoride 0,2 mg/l Nitrate 0,5 mg/l Nitrite 0,05 mg/l Chloride 10 mg/l Sulphate 20 mg/l Total phosphorous 0,2 mg/l Total cyanide 0,01 mg/l Turbidity (quantitative) 0,1 FNU The samples had to be analysed in duplicate over the complete method (sample preparation and measurement). The participants were asked to submit the results as average values in mg/l and for the parameter turbidity in FNU.
6. Submission of results The deadline for the submission of results was on 22nd February 2010.
7. Evaluation procedure The statistical evaluation was executed according to DIN 38402-A45 and ISO TS 20612 “Interlaboratory comparisons for proficiency testing of analytical chemistry laboratories”. From the participants’ results a relative standard deviation was calcu-lated for each concentration level and parameter using the Q-method. The Hampel estimator was used for the calculation of the consensus mean which was used as assigned value xa. The standard deviation for proficiency assessment σ) was taken from the variance function for the calculation of the zU-score according to DIN 38402-A45 (chapter 10.4) or ISO TS 20612 respectively. σ) was limited as follows:
- lower limit: 5 % - upper limit: 25 %
A z-score was calculated for each measurement result derived from the assigned value xa and the standard deviation for proficiency assessment:
σ̂axresult
scorez−
=−
The z-score was modified to a zU-score with a correction factor for proficiency as-sessment (as described in the standards mentioned above). The tolerance limit was defined as IzUI=2.0.
PT 1/10 – TW A1 page 5
8. Assessment There was no overall assessment of the proficiency test round, but the single pa-rameters were assessed. A parameter was assessed as successful, if more than half of the values were cor-rectly determined (2 out of 3 values are within the tolerance limits). Not successful were:
1) Values which were not determined (if the other samples of this parameters are analysed),
2) Values, which were indicated with “lower than limit of quantification”, 3) Values, which were subcontracted, 4) Values, which were submitted after the deadline of submission of results.
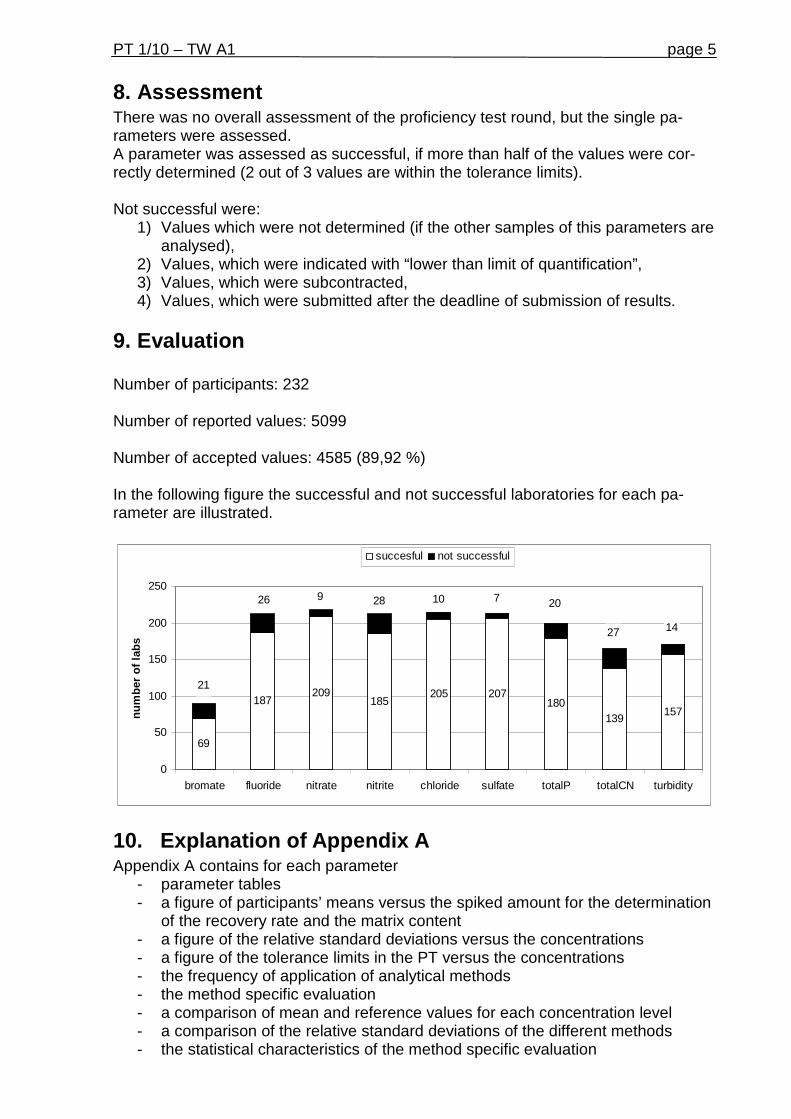
9. Evaluation Number of participants: 232 Number of reported values: 5099 Number of accepted values: 4585 (89,92 %) In the following figure the successful and not successful laboratories for each pa-rameter are illustrated.
69
187209
185205 207
180139
157
1427
2071028926
21
0
50
100
150
200
250
bromate fluoride nitrate nitrite chloride sulfate totalP totalCN turbidity
num
ber
of la
bs
succesful not successful
10. Explanation of Appendix A Appendix A contains for each parameter
- parameter tables - a figure of participants’ means versus the spiked amount for the determination
of the recovery rate and the matrix content - a figure of the relative standard deviations versus the concentrations - a figure of the tolerance limits in the PT versus the concentrations - the frequency of application of analytical methods - the method specific evaluation - a comparison of mean and reference values for each concentration level - a comparison of the relative standard deviations of the different methods - the statistical characteristics of the method specific evaluation
PT 1/10 – TW A1 page 6
- a tabular comparison of the means with the reference values and their uncer-tainties
Parameter tables
In these tables the following values for each concentration level are listed:
• assigned value • expanded uncertainty of the assigned value in %, calculated according to ISO
13528 using the formula
values of number
deviation standard rel.25.12U ⋅⋅=
• standard deviation, calculated using robust statistical method • standard deviation for proficiency assessment for the calculation of zU-scores • rel. standard deviation for proficiency assessment • tolerance limits above and below • permitted deviations above and below in % • number of values in this level • number of not satisfactory values below and above the assigned value and the
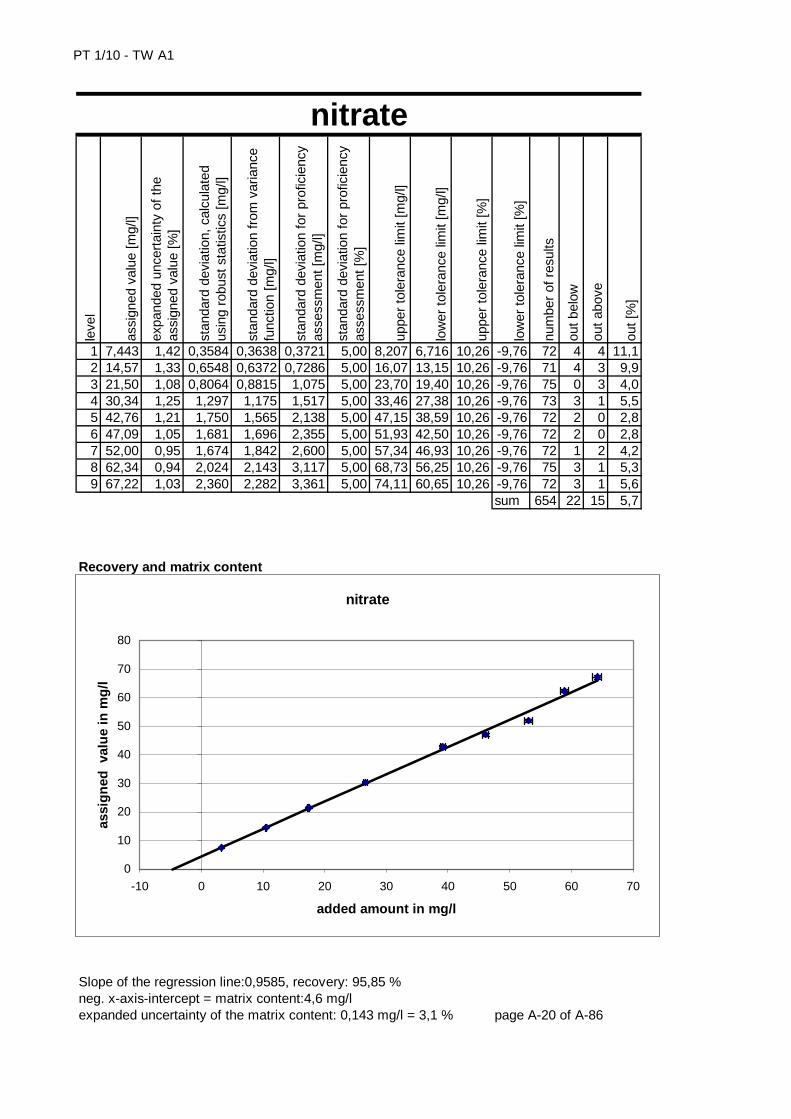
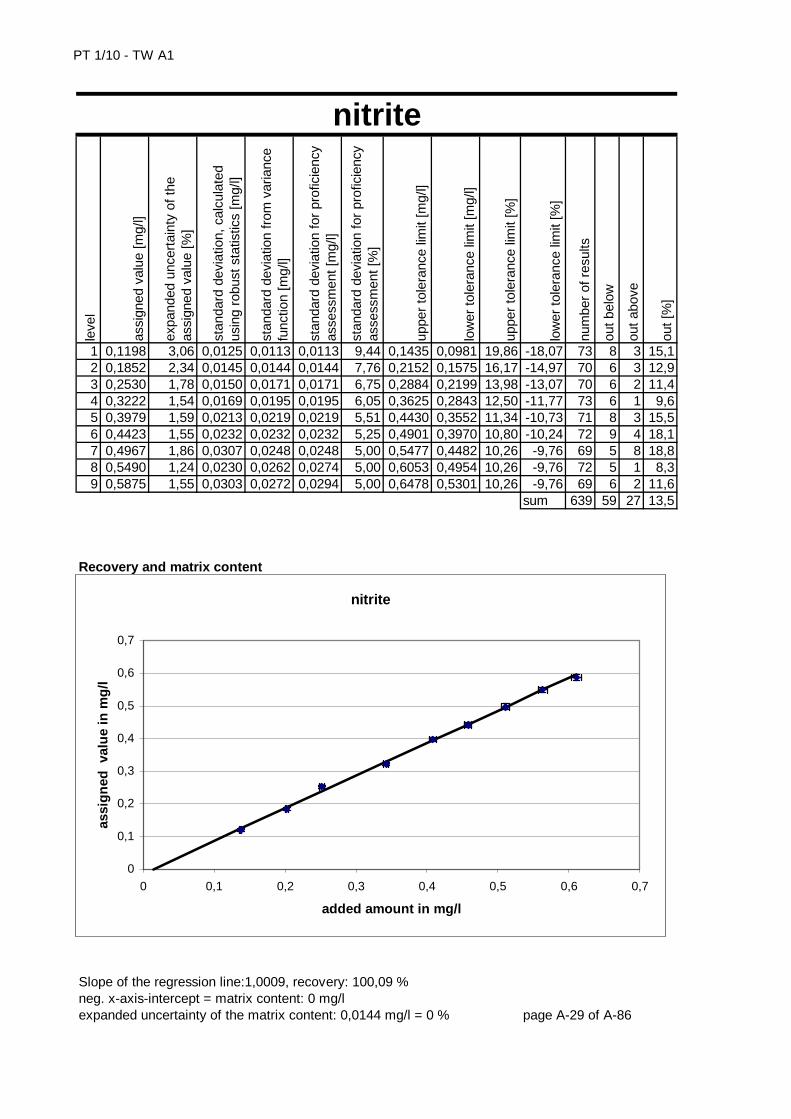
percentage of these values in total. Determination of recovery rate
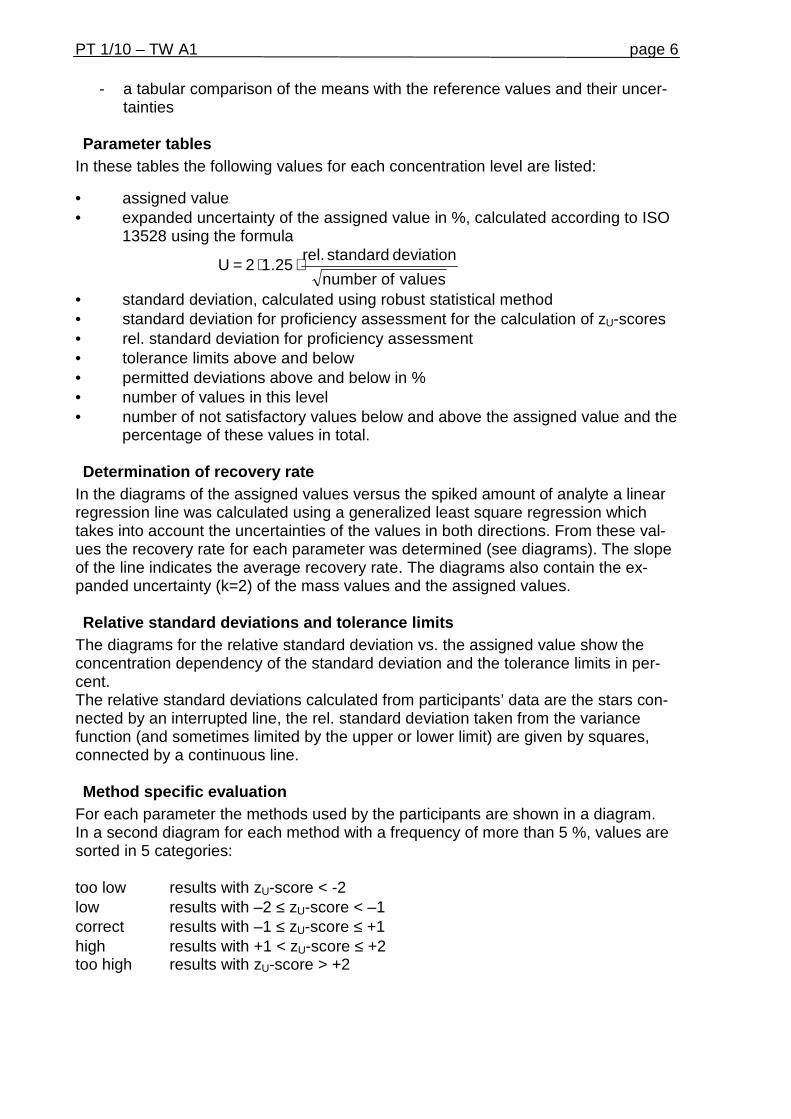
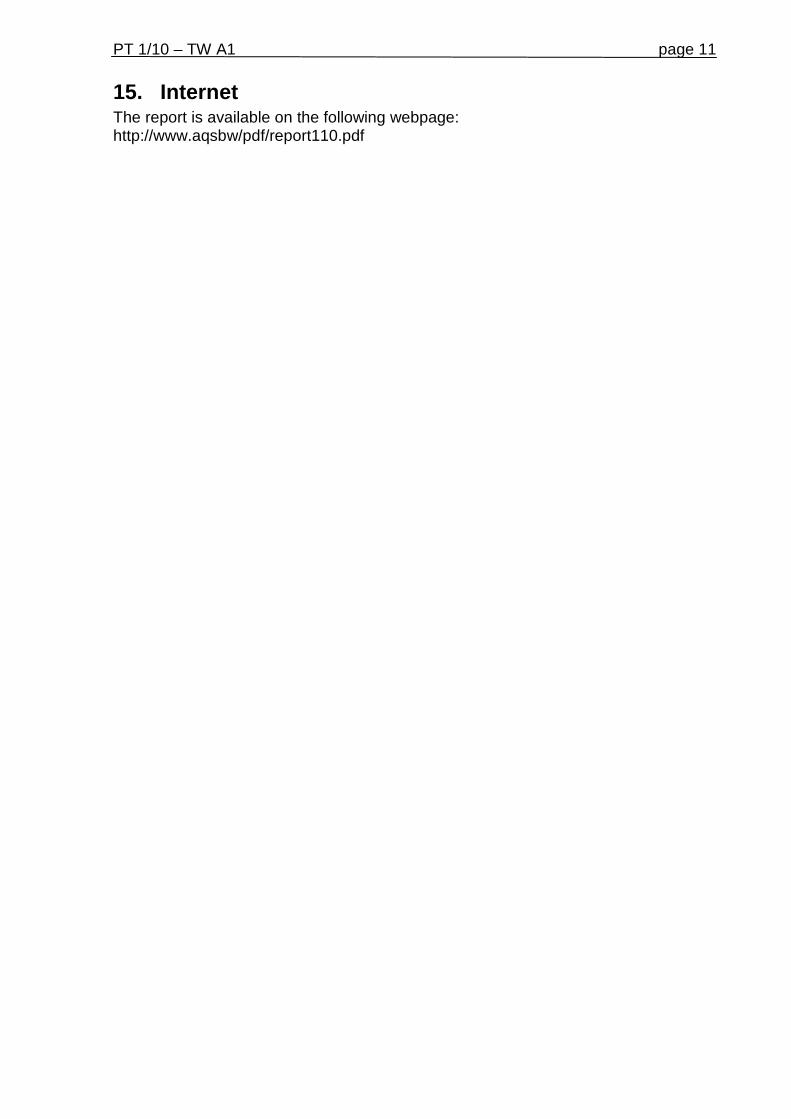
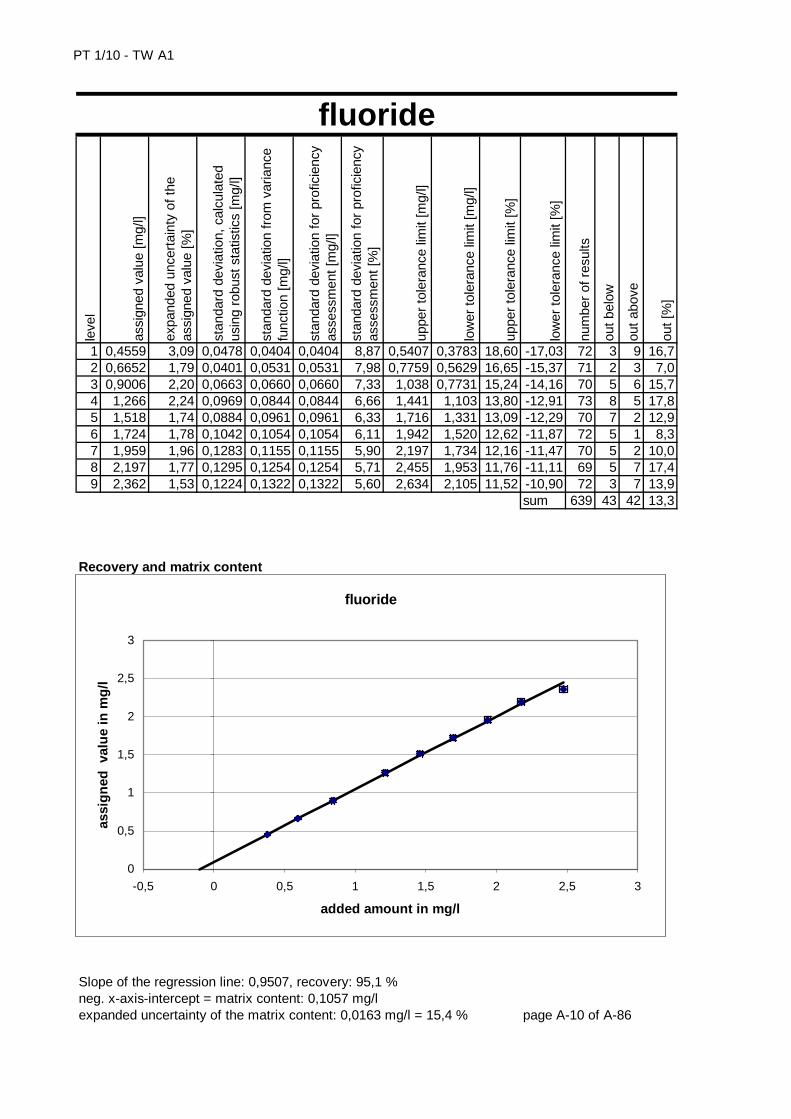
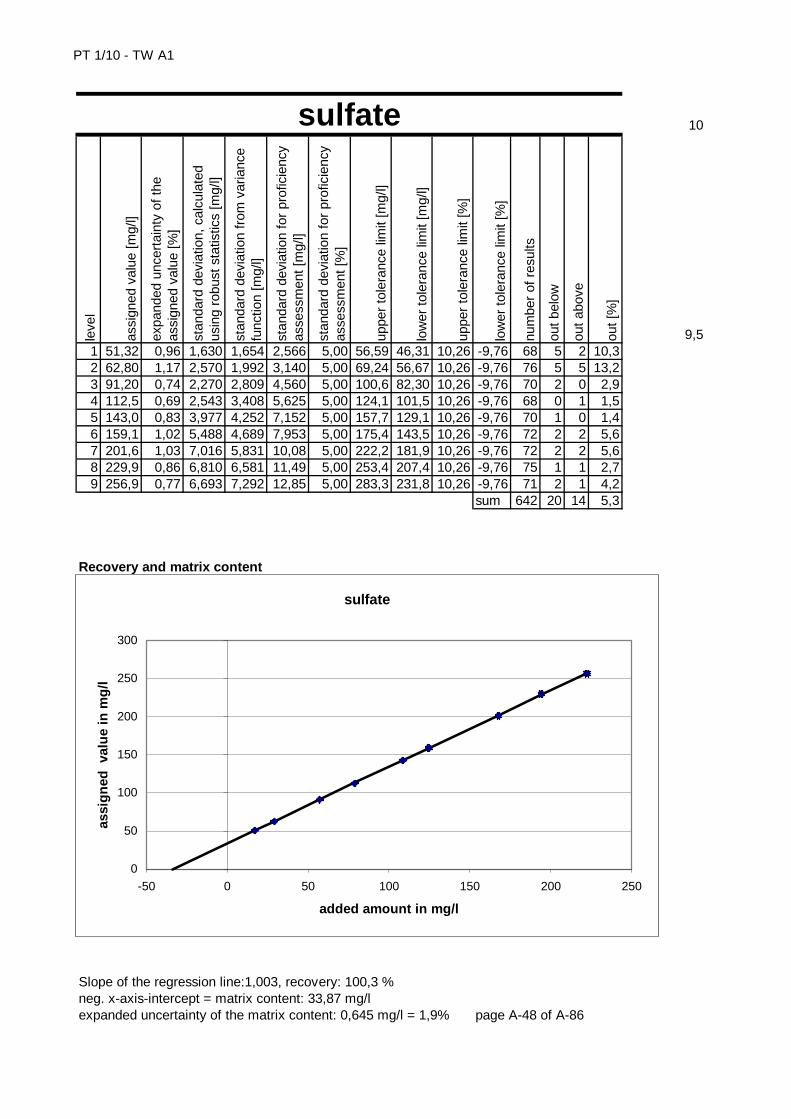
In the diagrams of the assigned values versus the spiked amount of analyte a linear regression line was calculated using a generalized least square regression which takes into account the uncertainties of the values in both directions. From these val-ues the recovery rate for each parameter was determined (see diagrams). The slope of the line indicates the average recovery rate. The diagrams also contain the ex-panded uncertainty (k=2) of the mass values and the assigned values. Relative standard deviations and tolerance limits
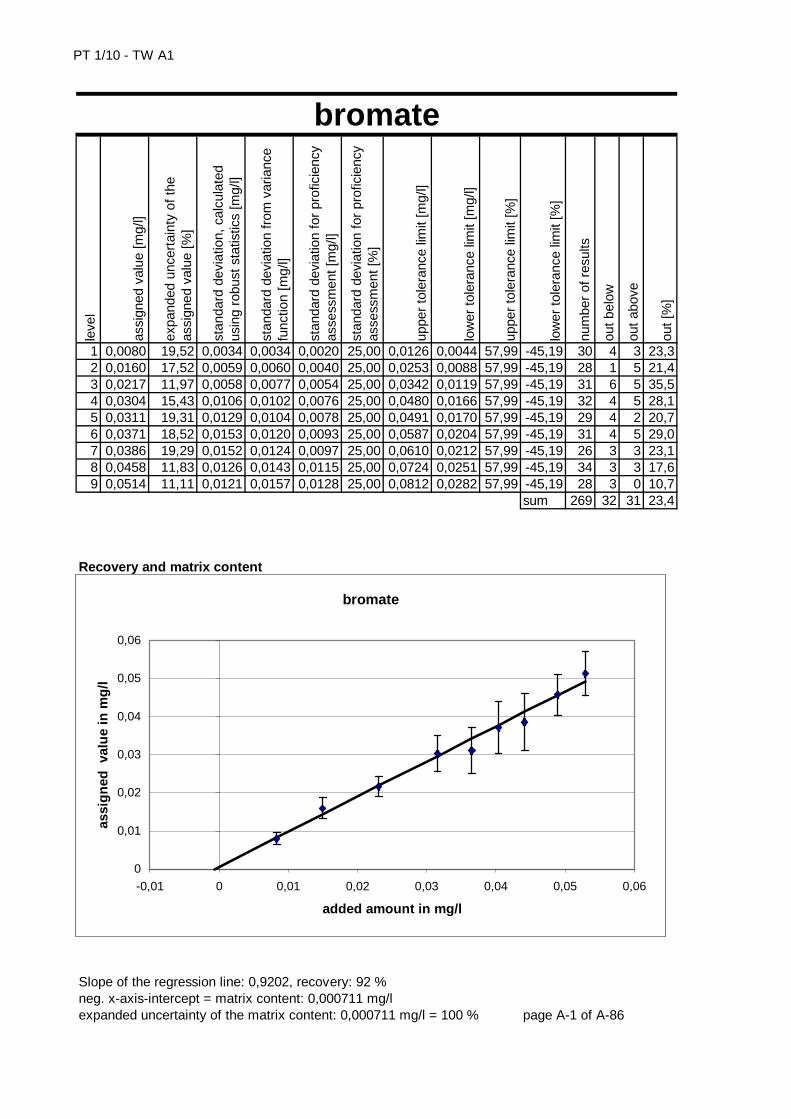
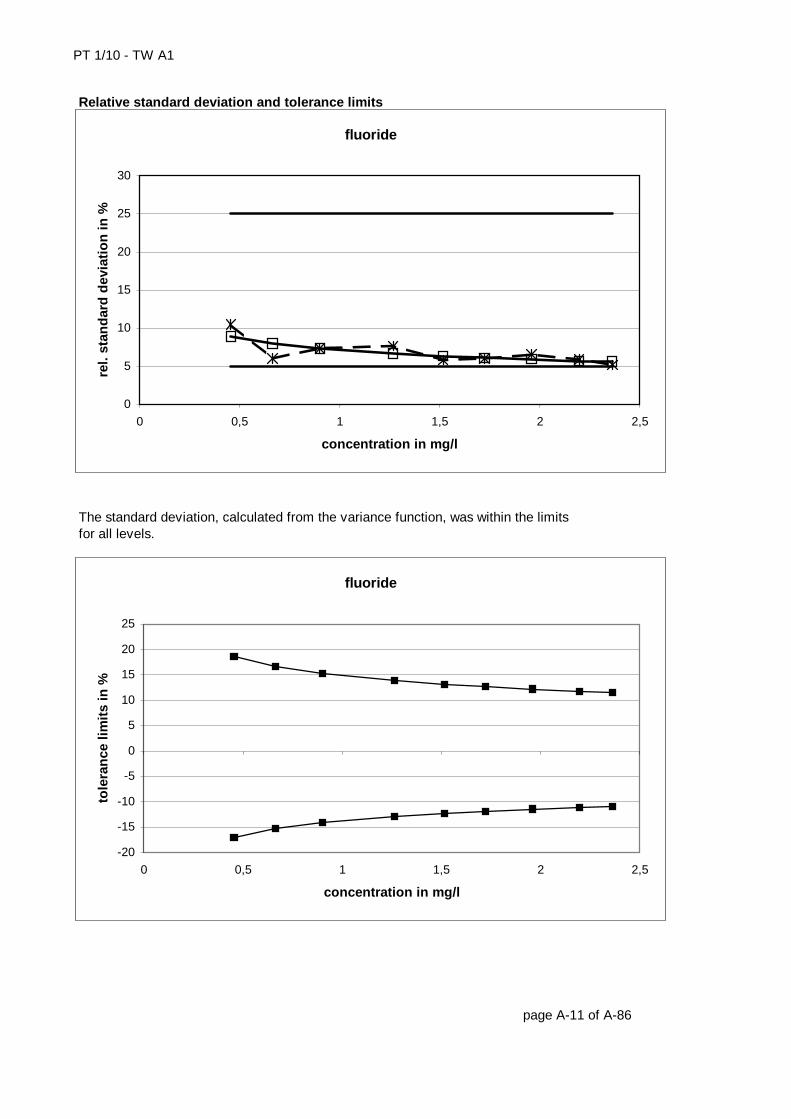
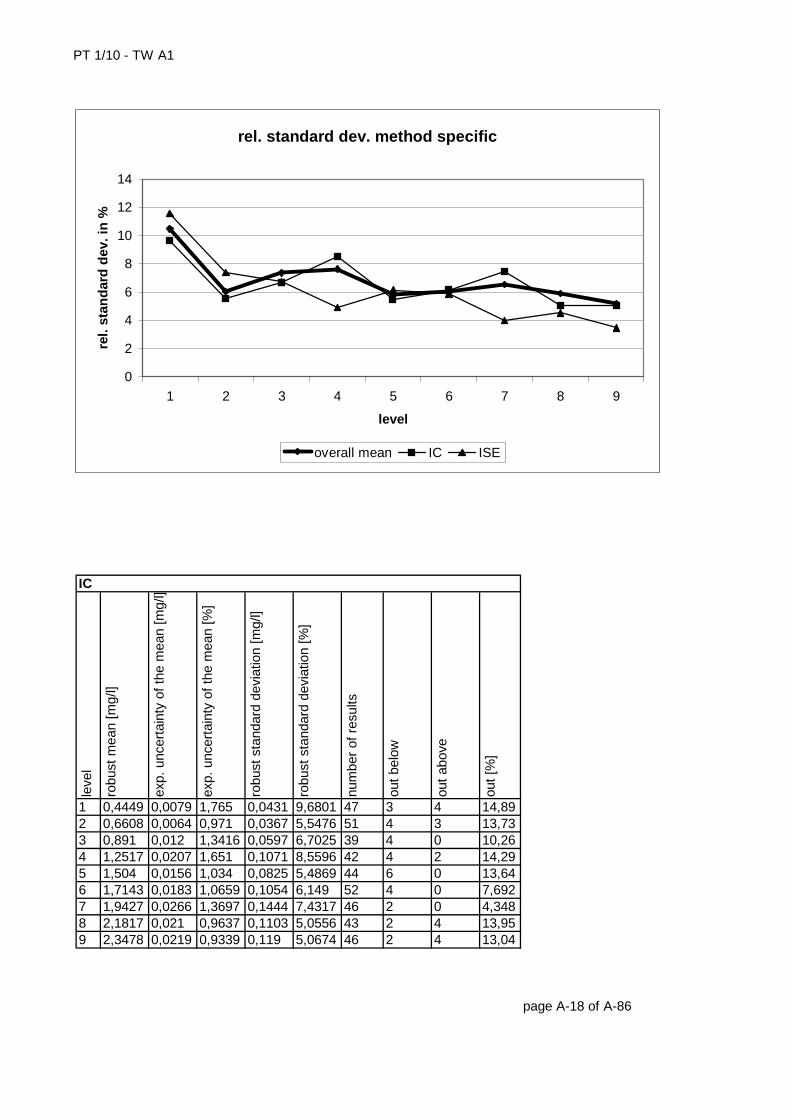
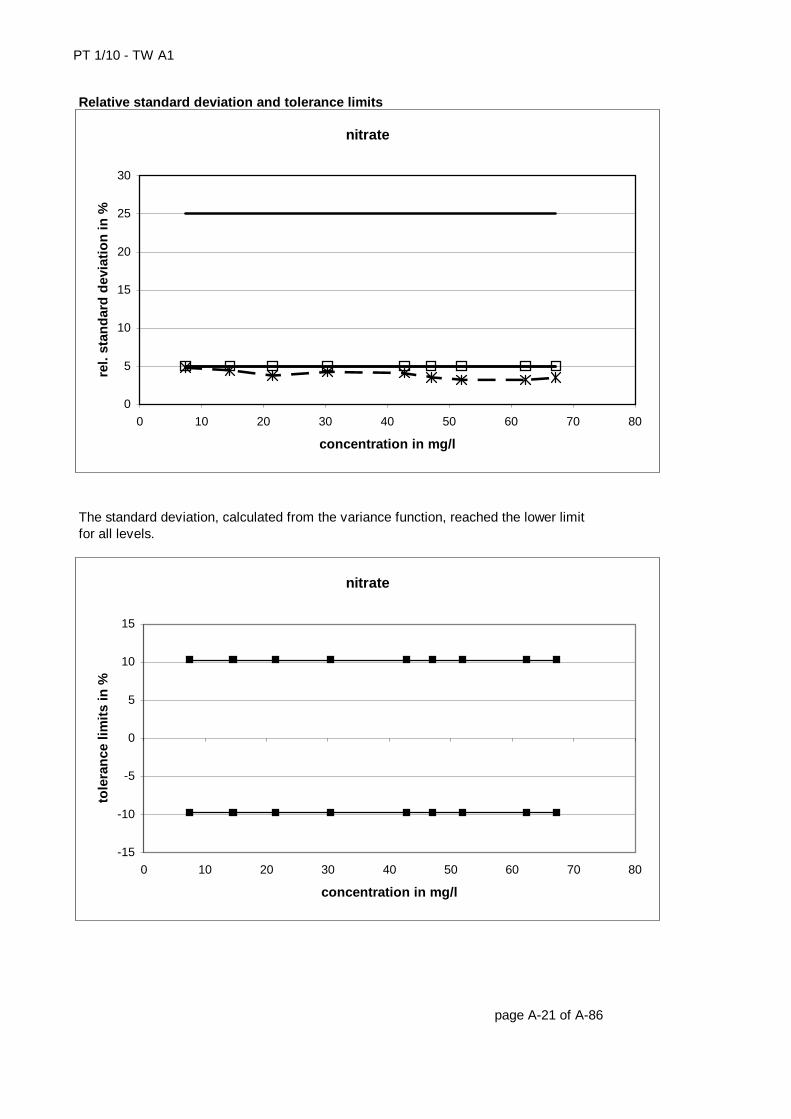
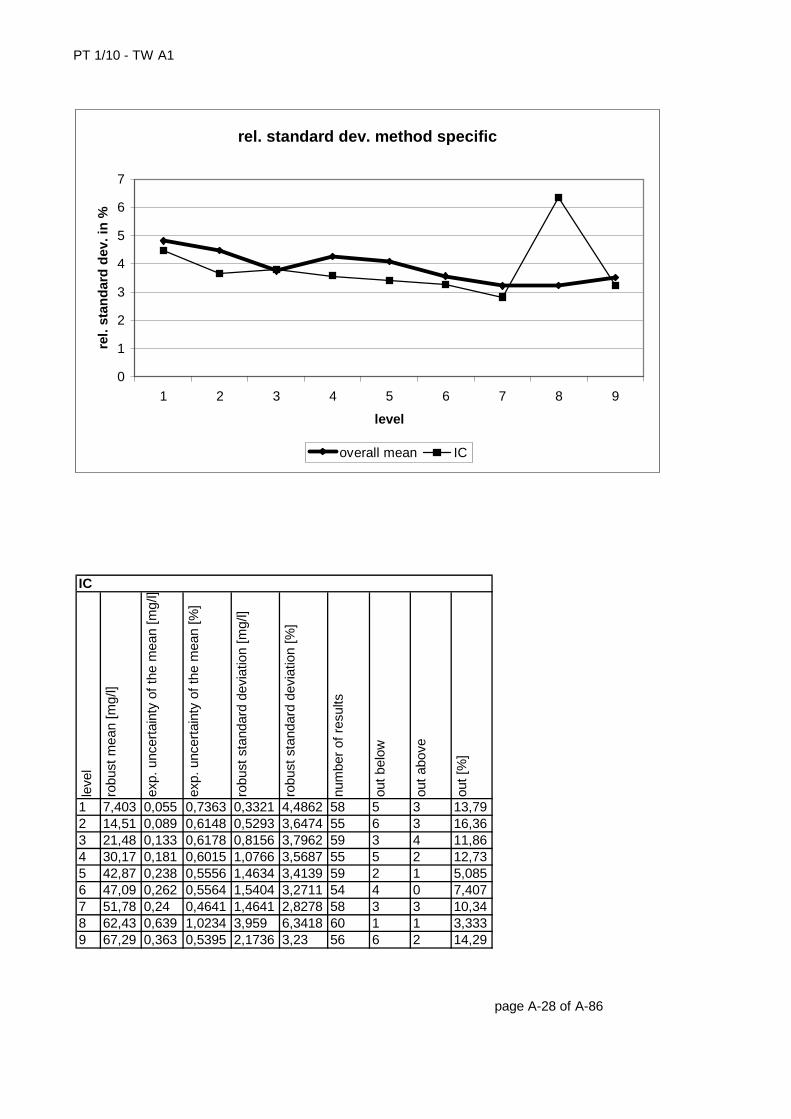
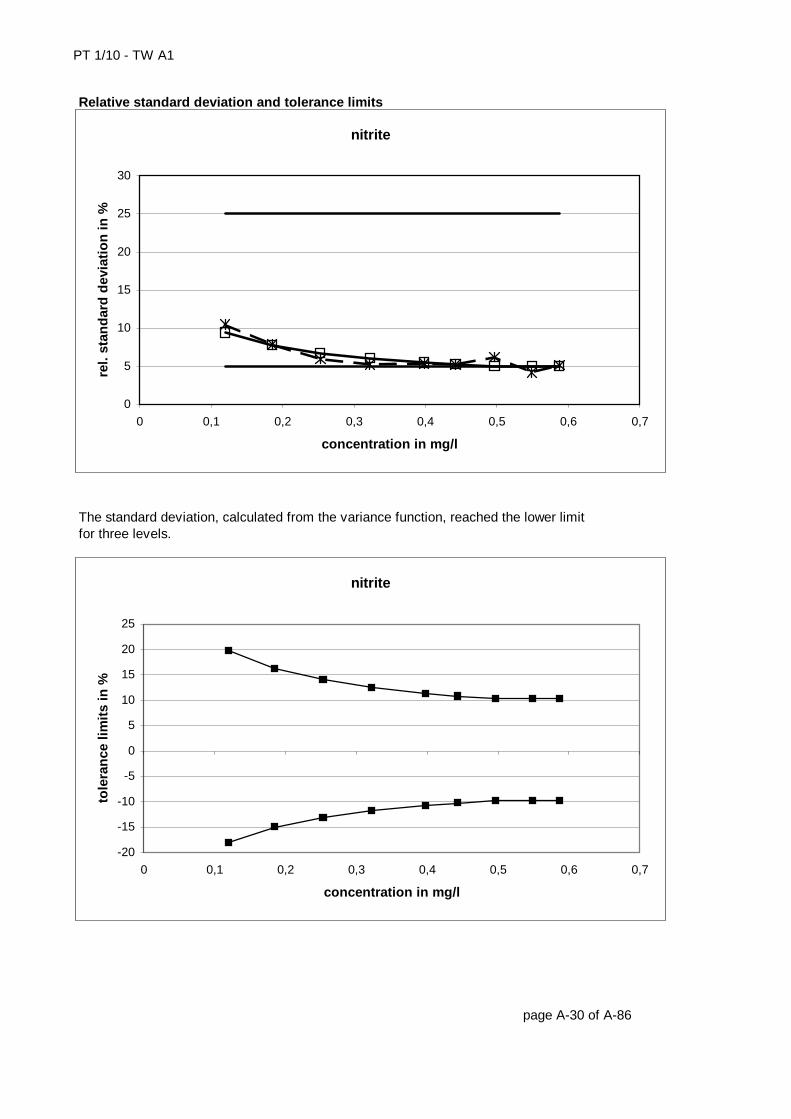
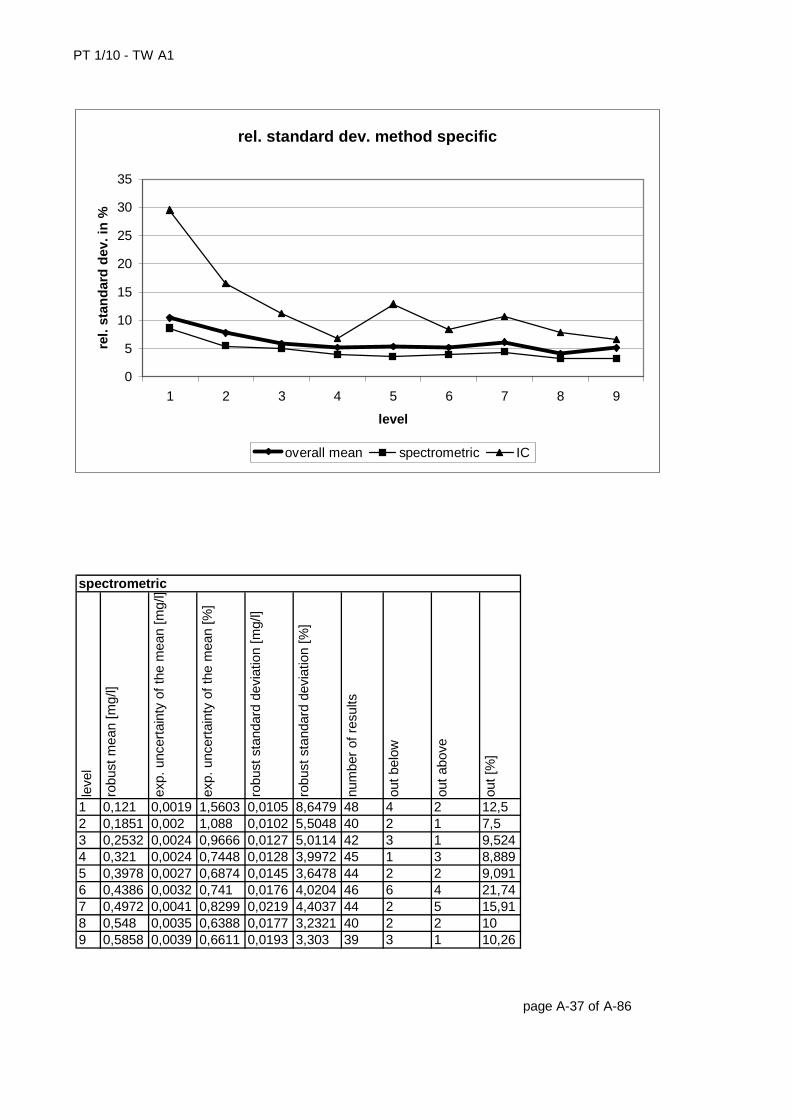
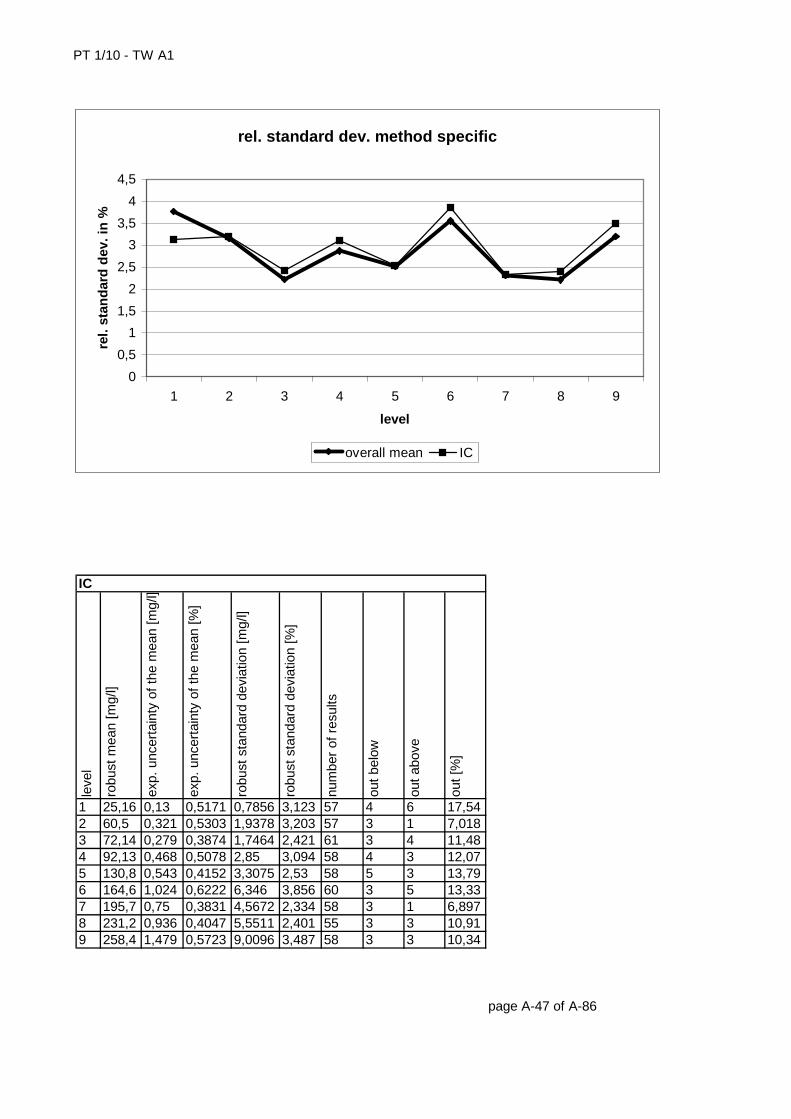
The diagrams for the relative standard deviation vs. the assigned value show the concentration dependency of the standard deviation and the tolerance limits in per-cent. The relative standard deviations calculated from participants’ data are the stars con-nected by an interrupted line, the rel. standard deviation taken from the variance function (and sometimes limited by the upper or lower limit) are given by squares, connected by a continuous line. Method specific evaluation
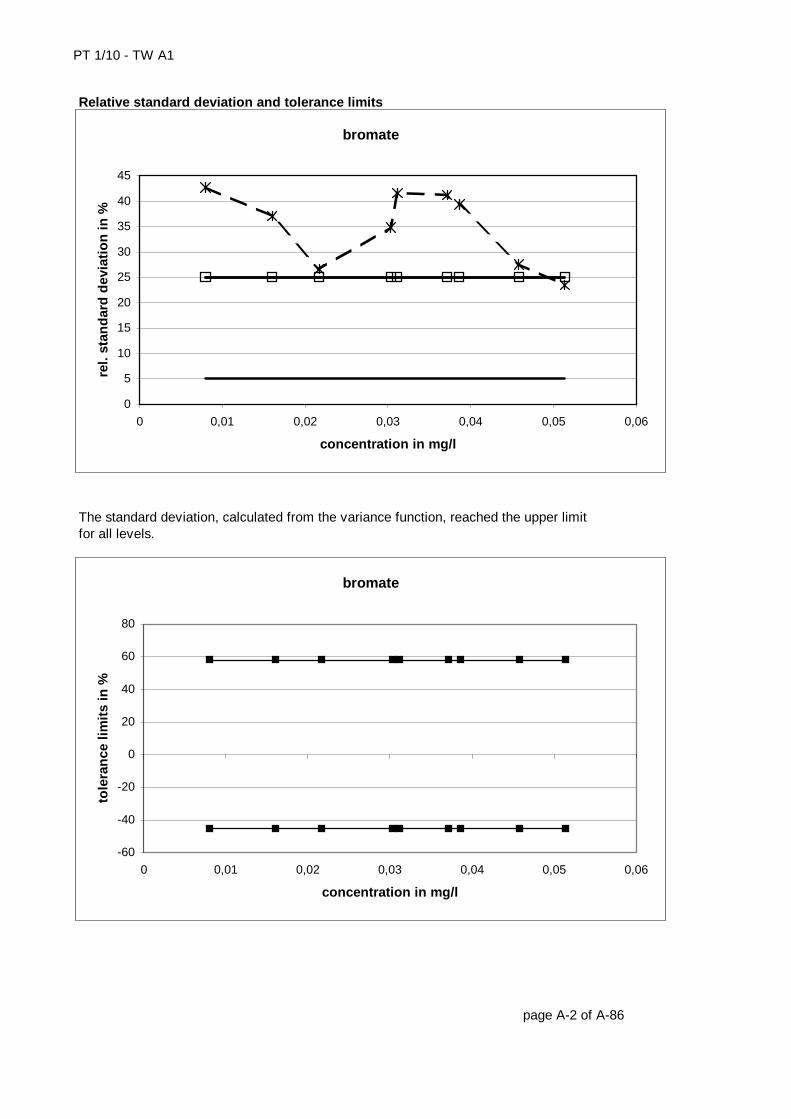
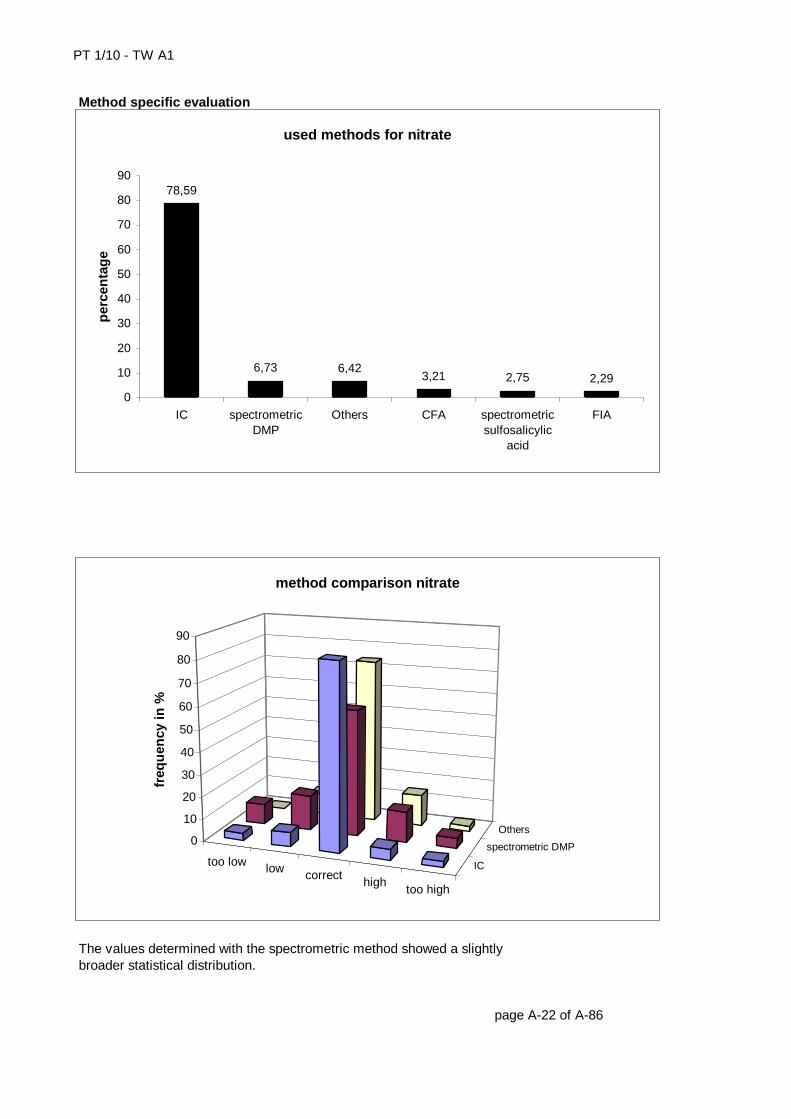
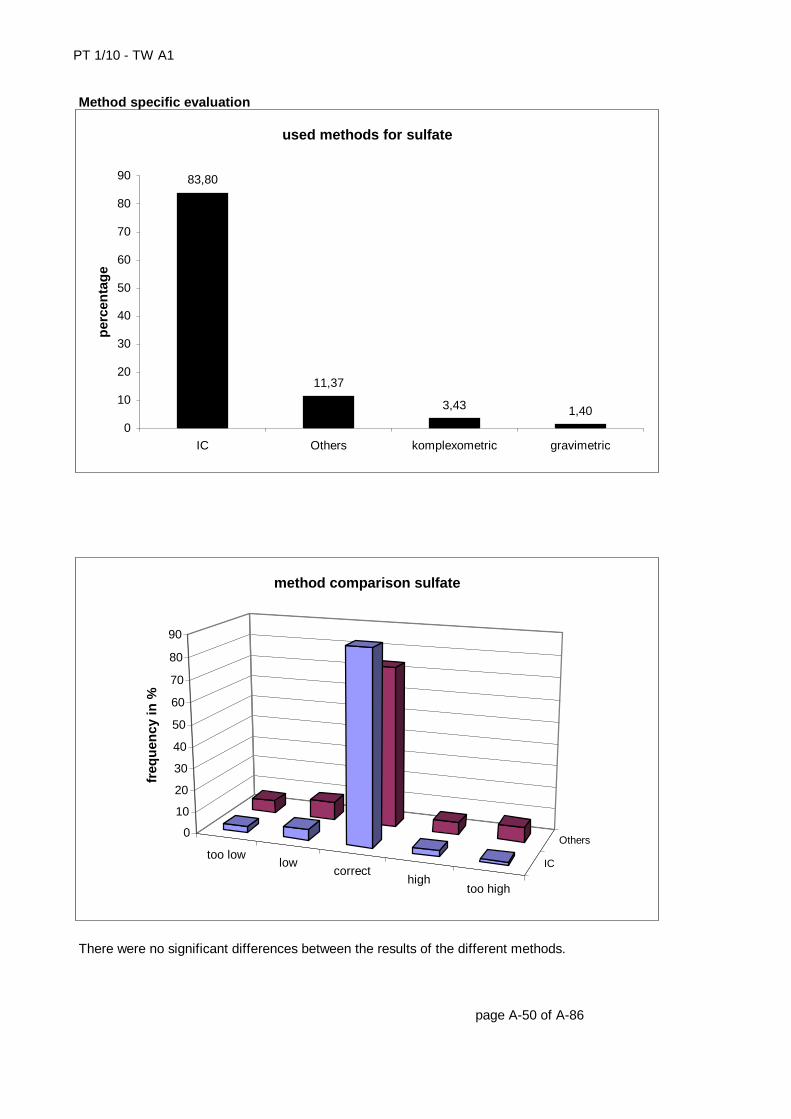
For each parameter the methods used by the participants are shown in a diagram. In a second diagram for each method with a frequency of more than 5 %, values are sorted in 5 categories: too low results with zU-score < -2 low results with –2 ≤ zU-score < –1 correct results with –1 ≤ zU-score ≤ +1 high results with +1 < zU-score ≤ +2 too high results with zU-score > +2
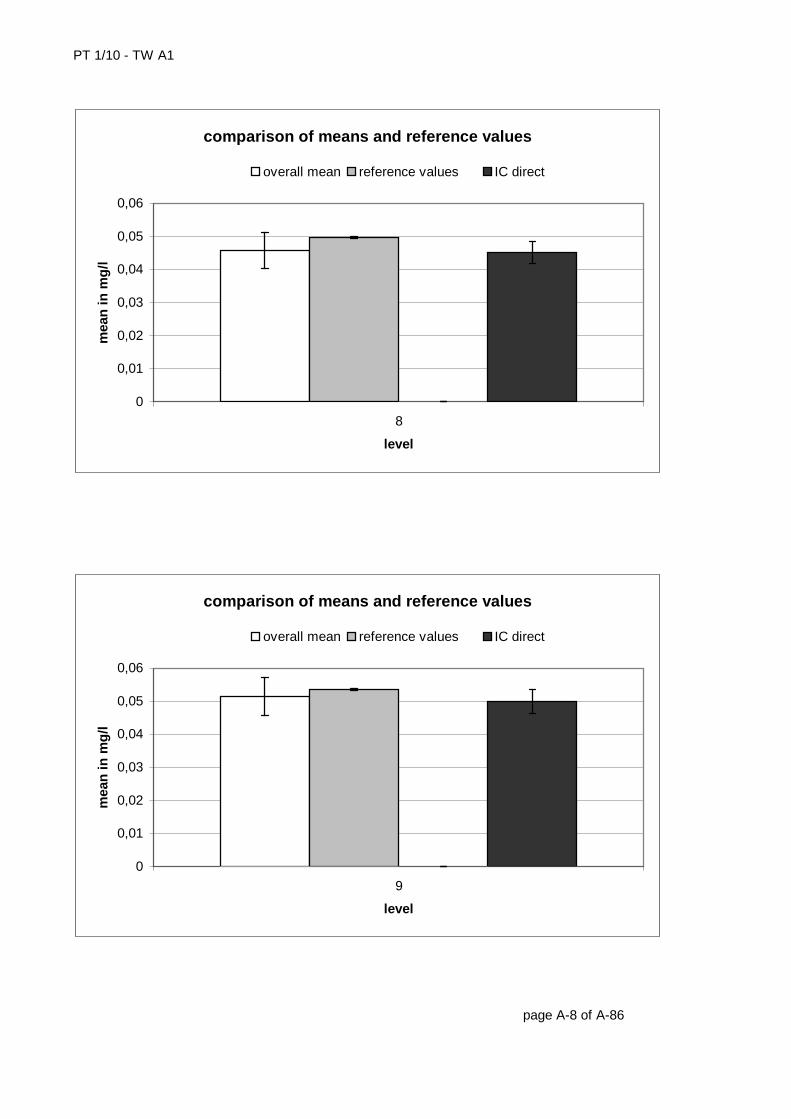
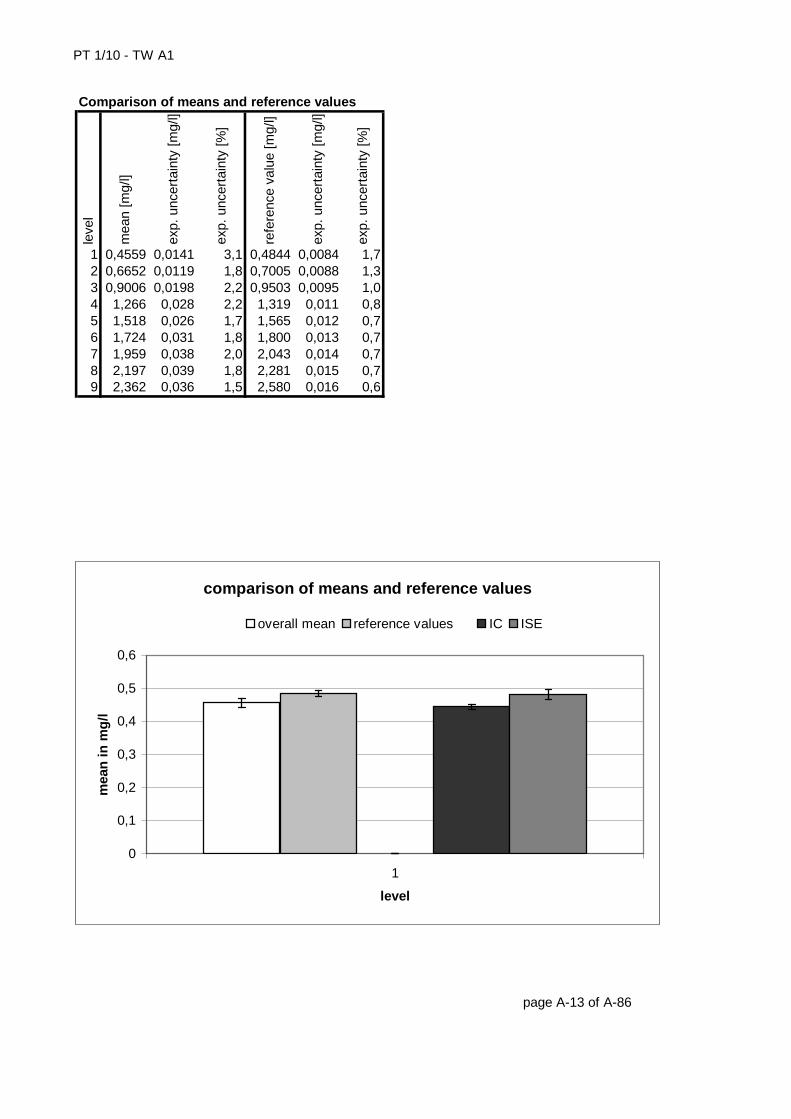
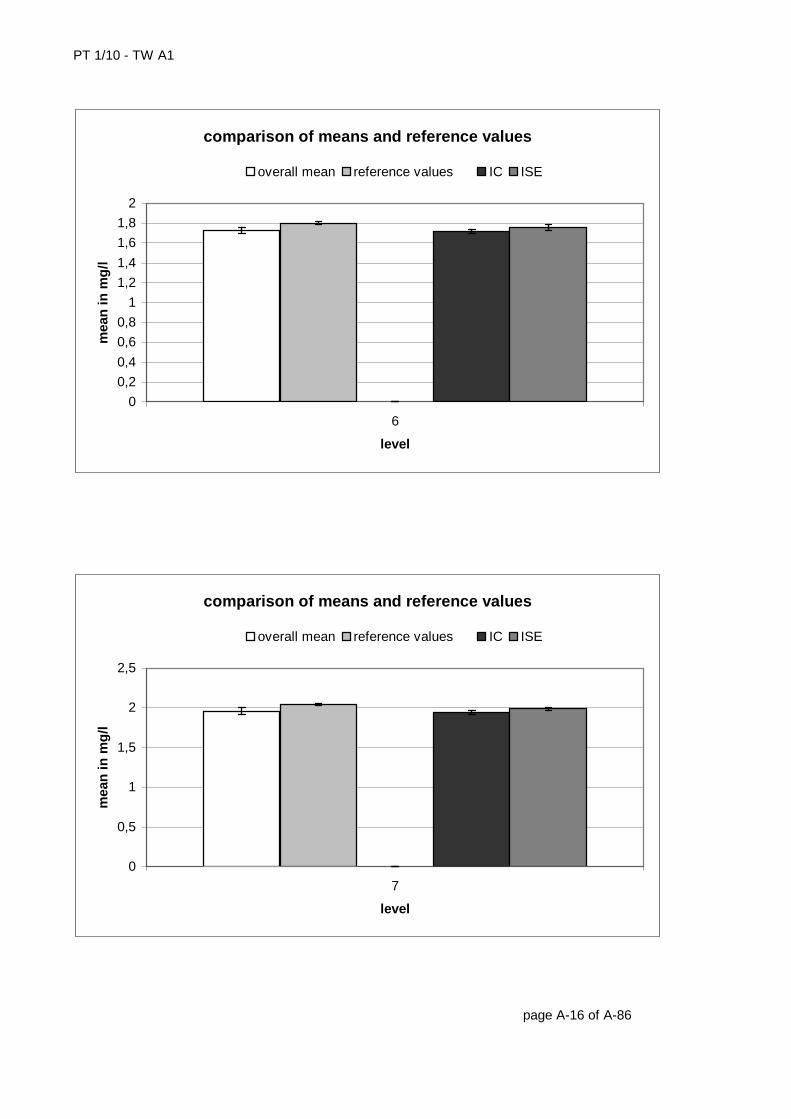
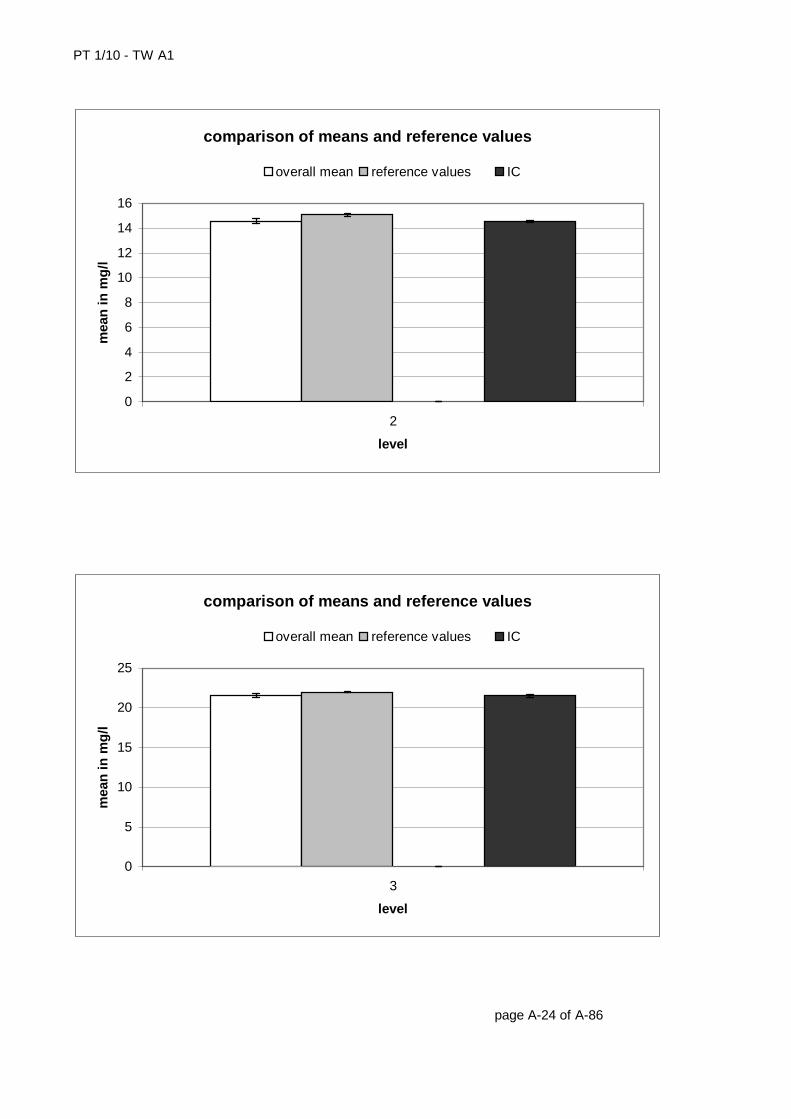
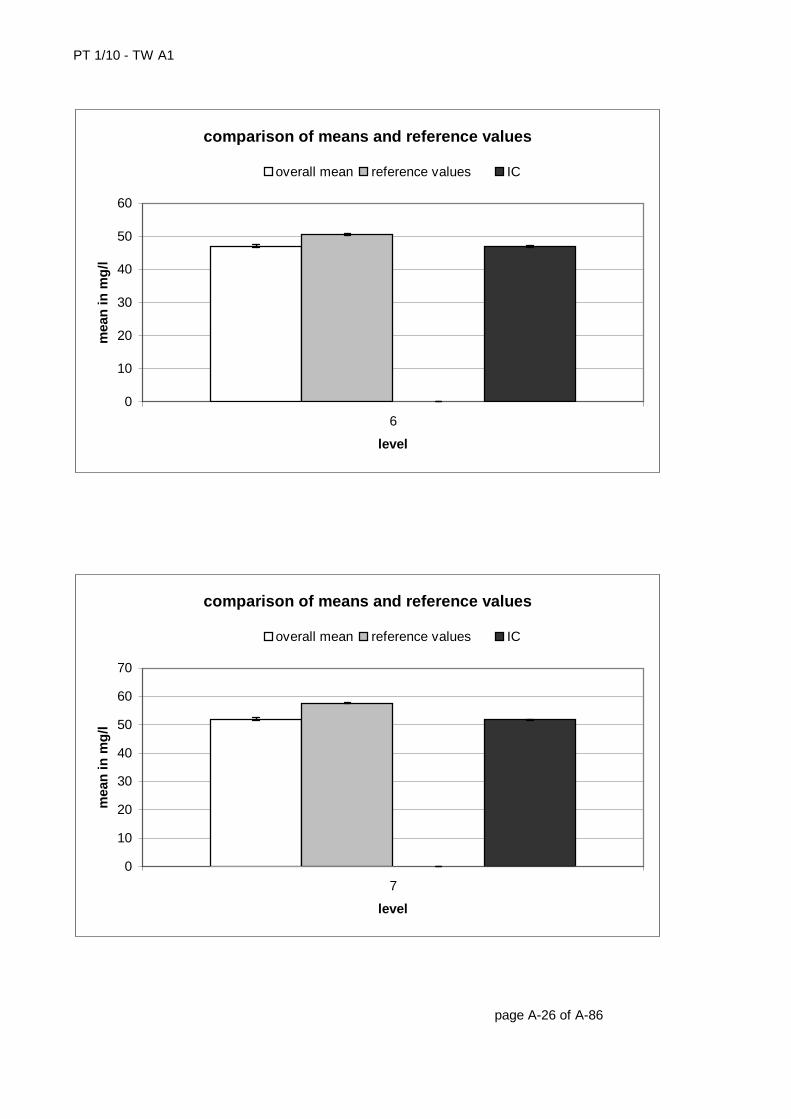
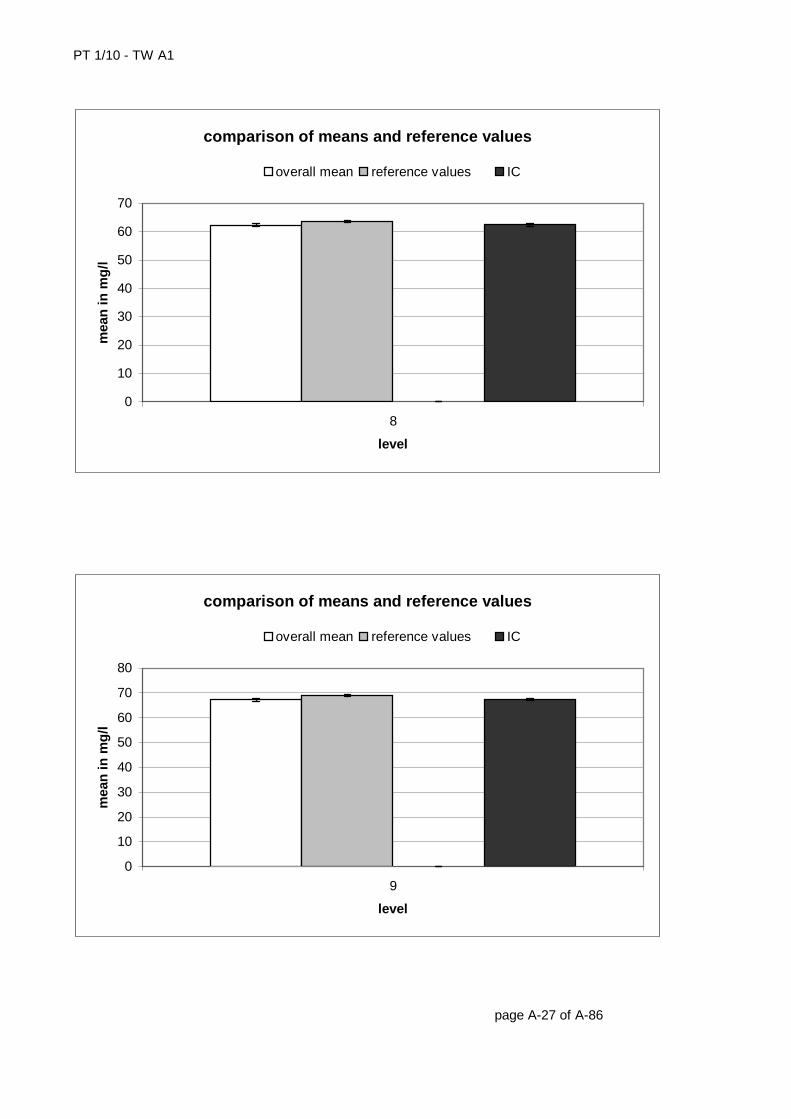
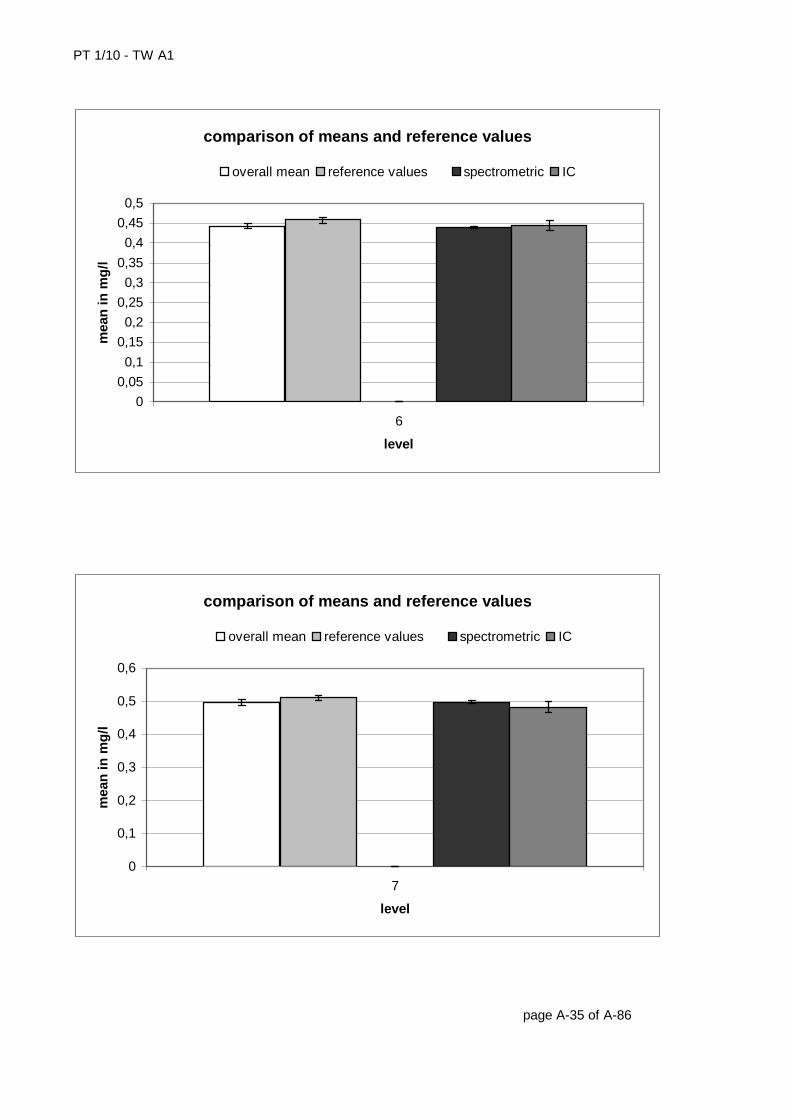
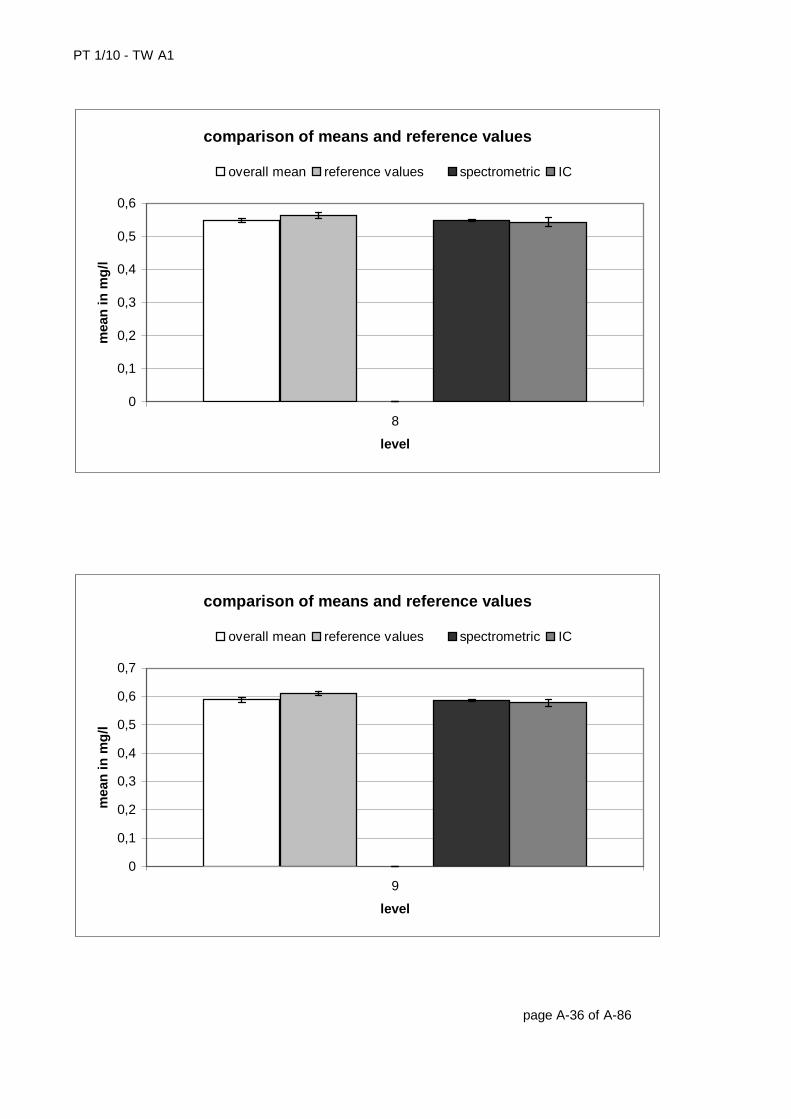
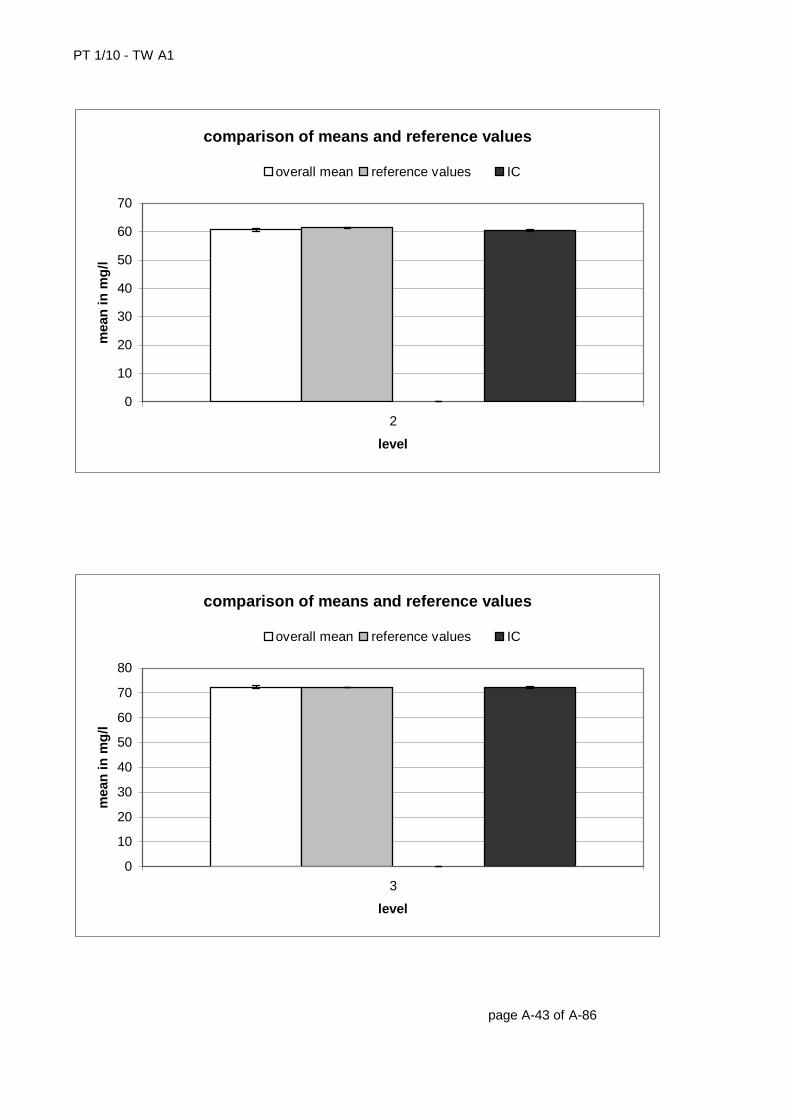
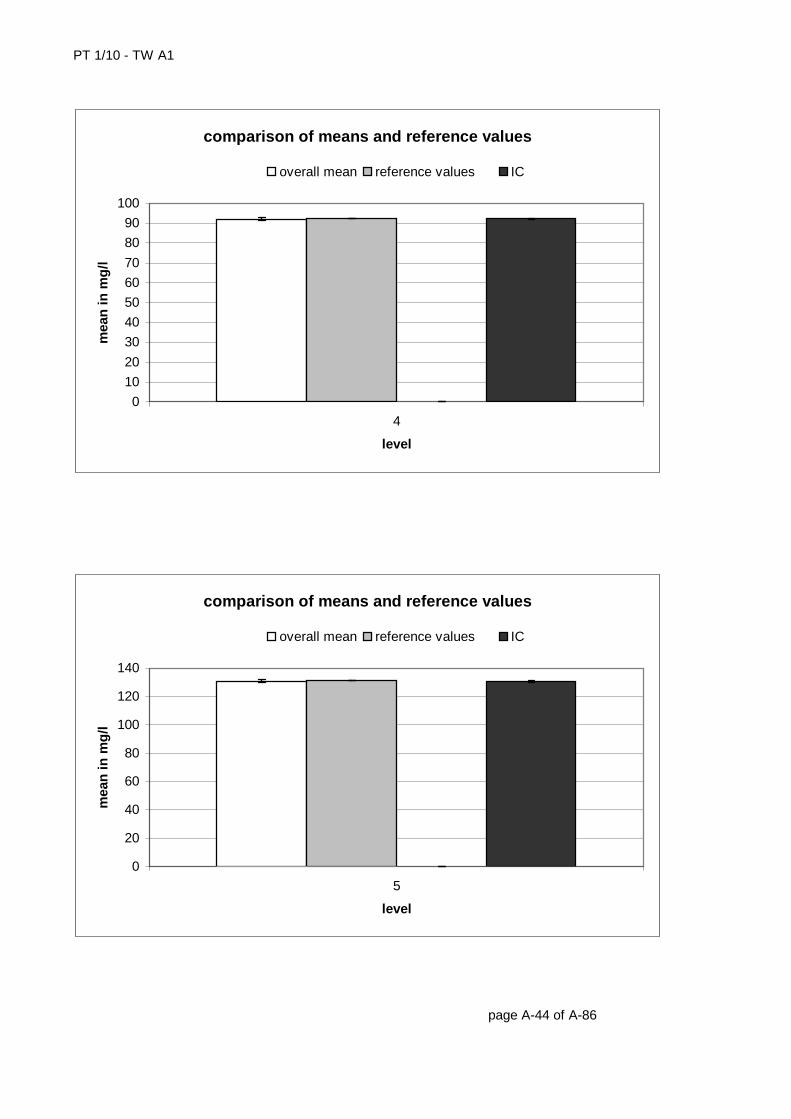
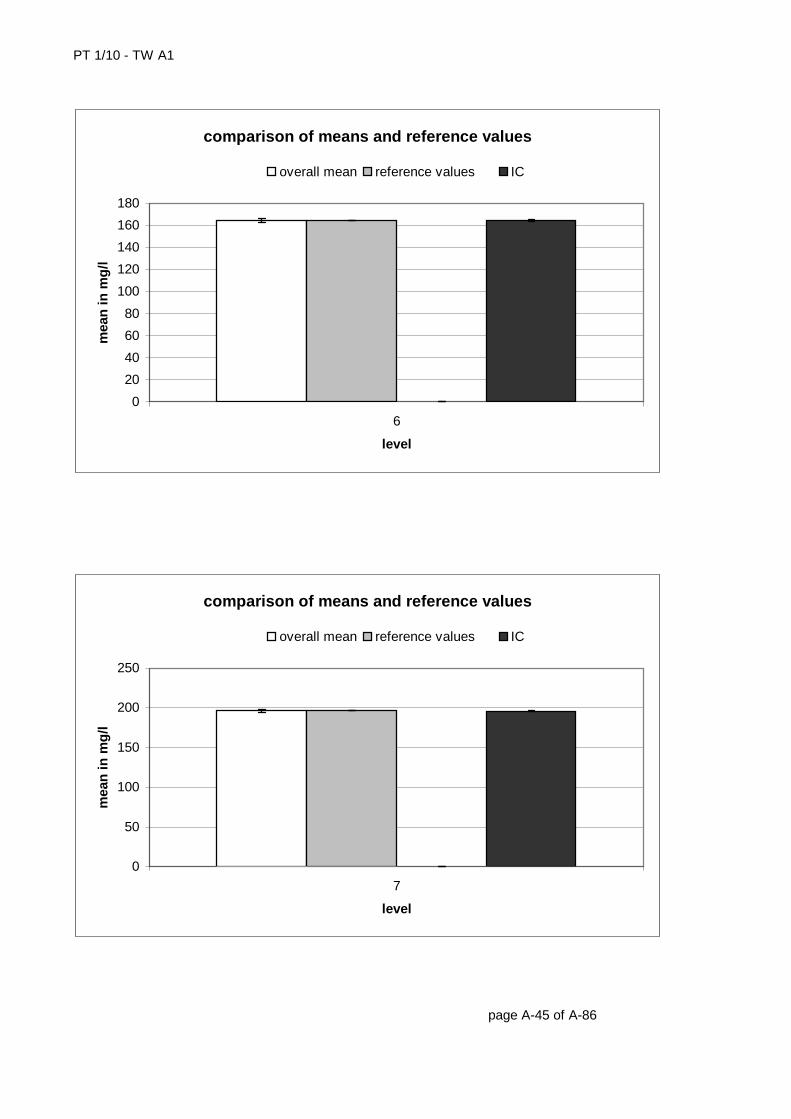
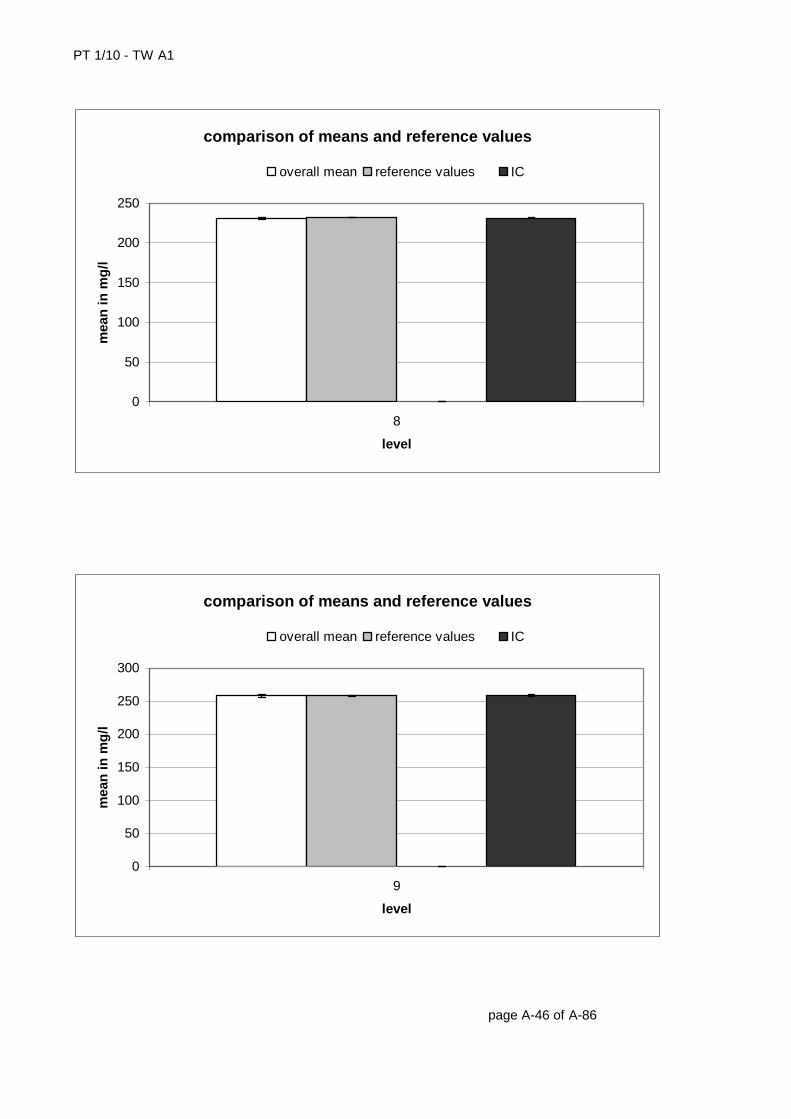
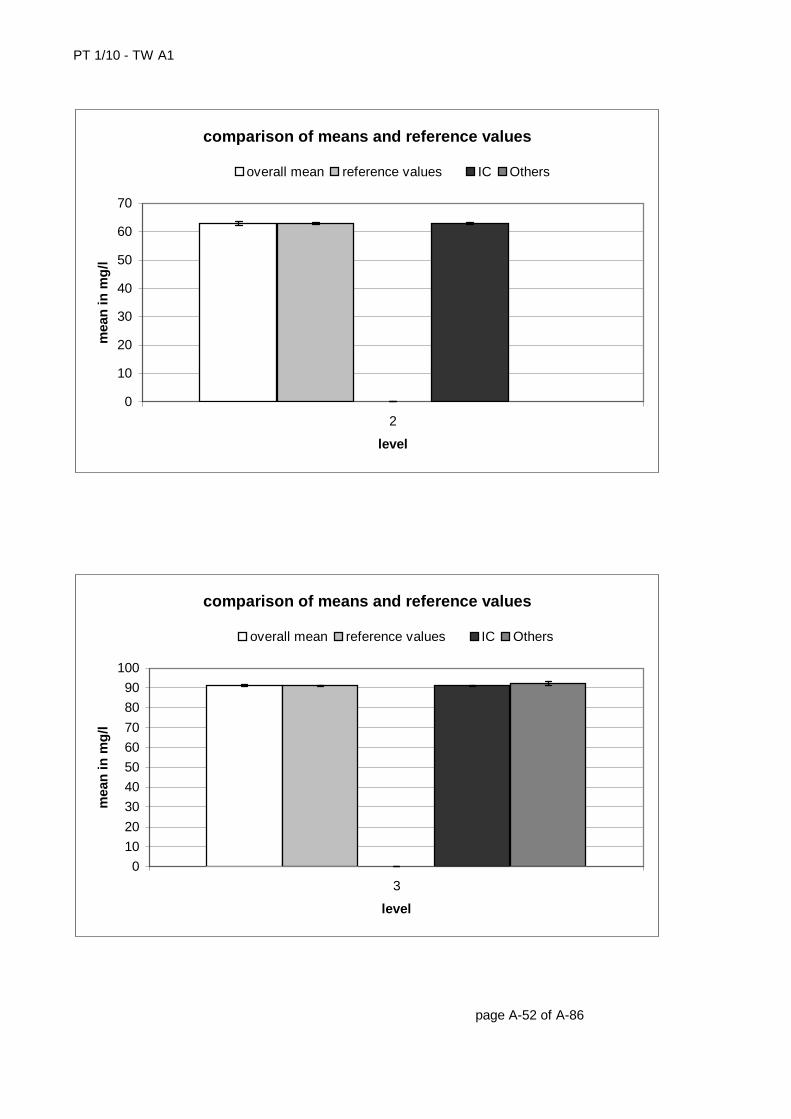
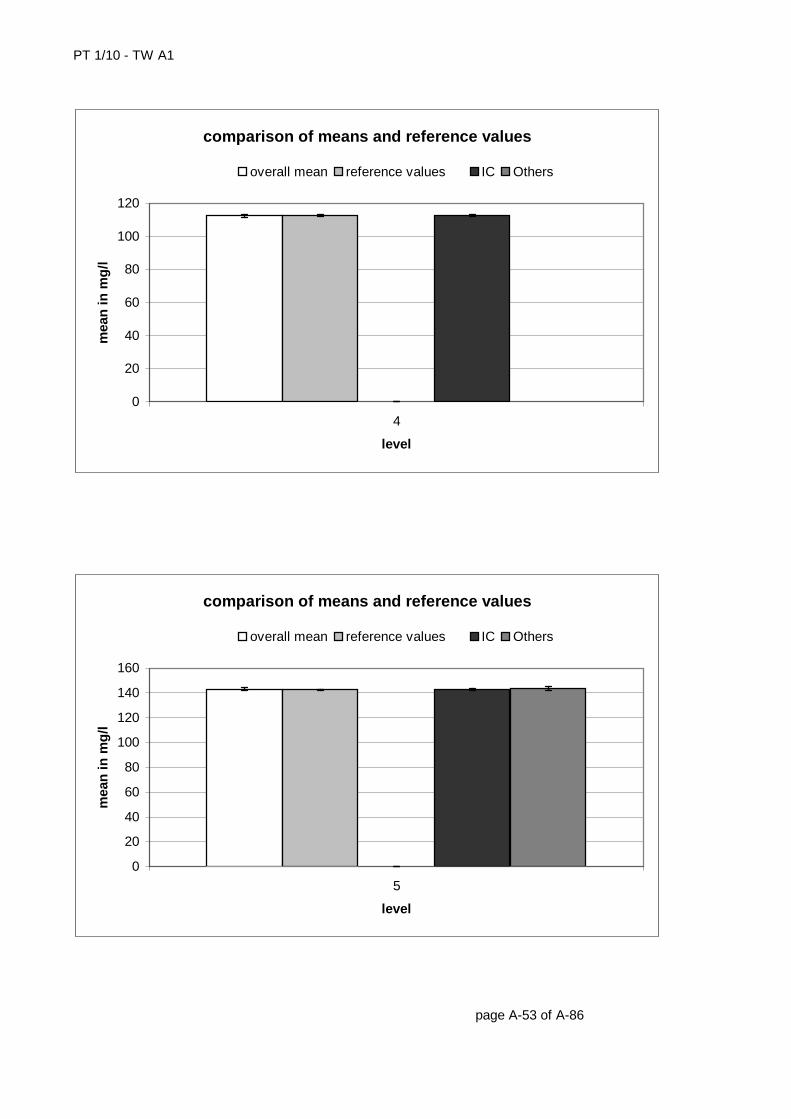
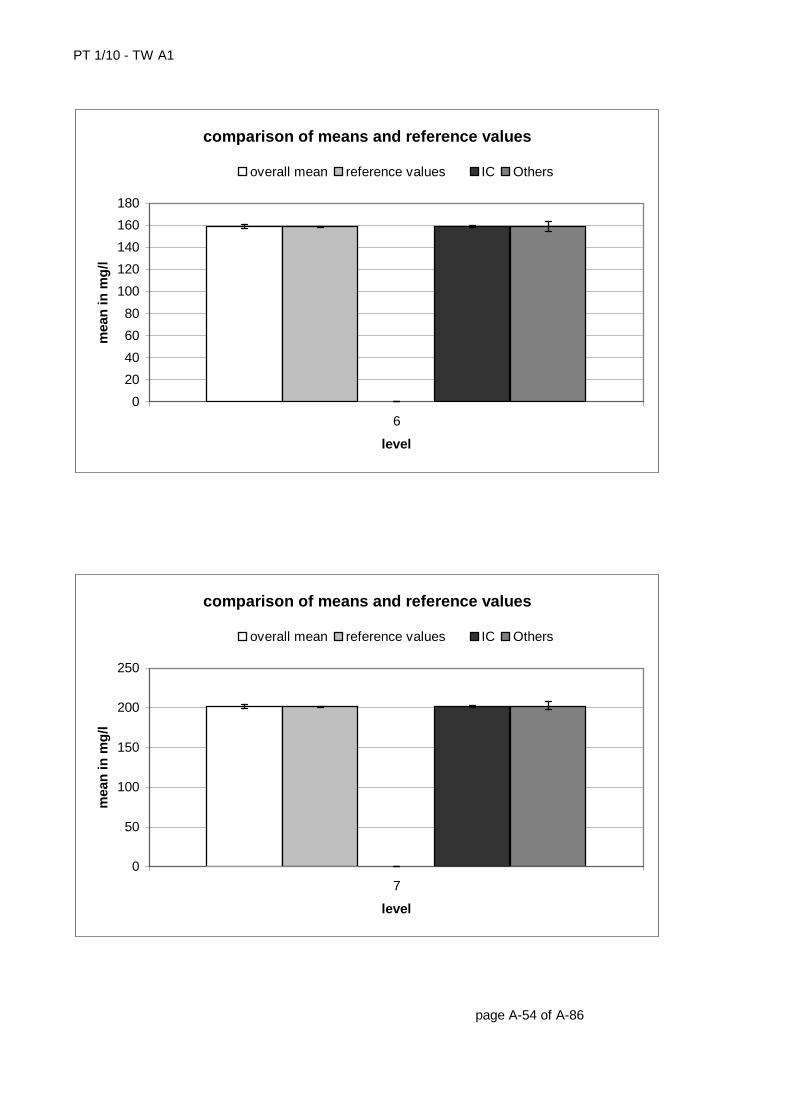
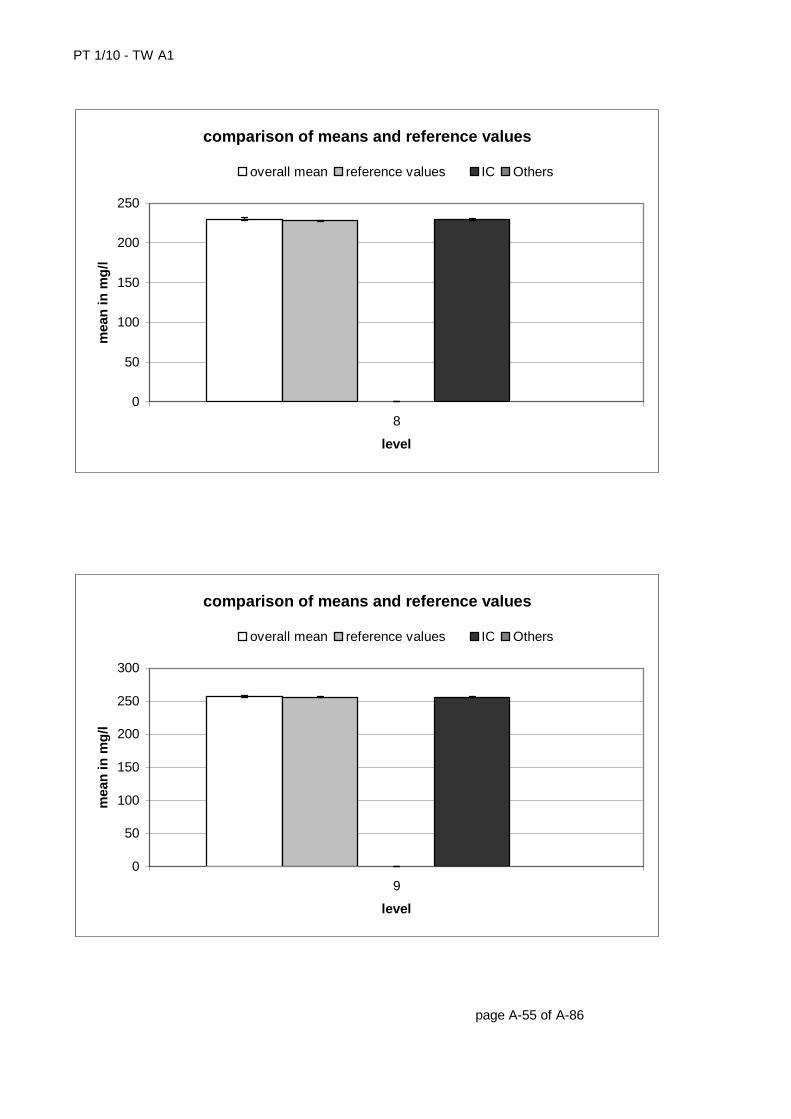
PT 1/10 – TW A1 page 7 Comparison of means and reference values for each c oncentration level
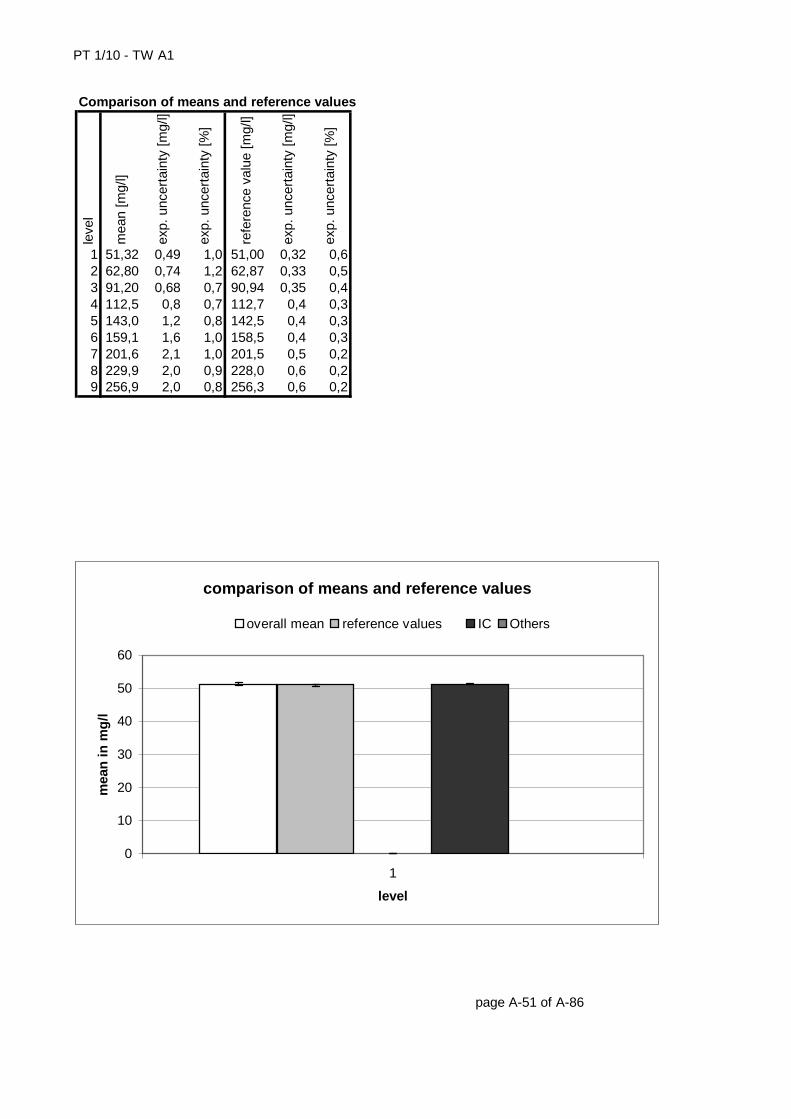
Finally the mean value calculated from all results (used as assigned value) is com-pared with mean values calculated for all methods separately (in this case using the Hampel estimator described in ISO/TS 20612). Mean values were calculated only, if more than 7 results were within a z-score-range of ± 2. The means are reported with their expanded uncertainty calculated according to ISO 13528.
11. Explanation of Appendix B Participants were asked to report expanded uncertainties of their results on a volun-tary basis. In this diagram for each parameter the reported uncertainties for all con-centration levels with the reproducibility standard deviation (horizontal line) are dis-played. Values which deviate from the reproducibility standard deviation with a factor more than 2 are usually not realistic.
12. Explanation of Appendix C In the last part of the report, for all concentration levels the results of all participants are illustrated. Confidentiality of participants is ensured by using lab codes. The lab codes were sent to participants with the certificates. In detail Appendix C contains:
- a table with all data - figures with
o all reported results o all zU-scores o all reported expanded uncertainties o all ζ−scores
Table with all data
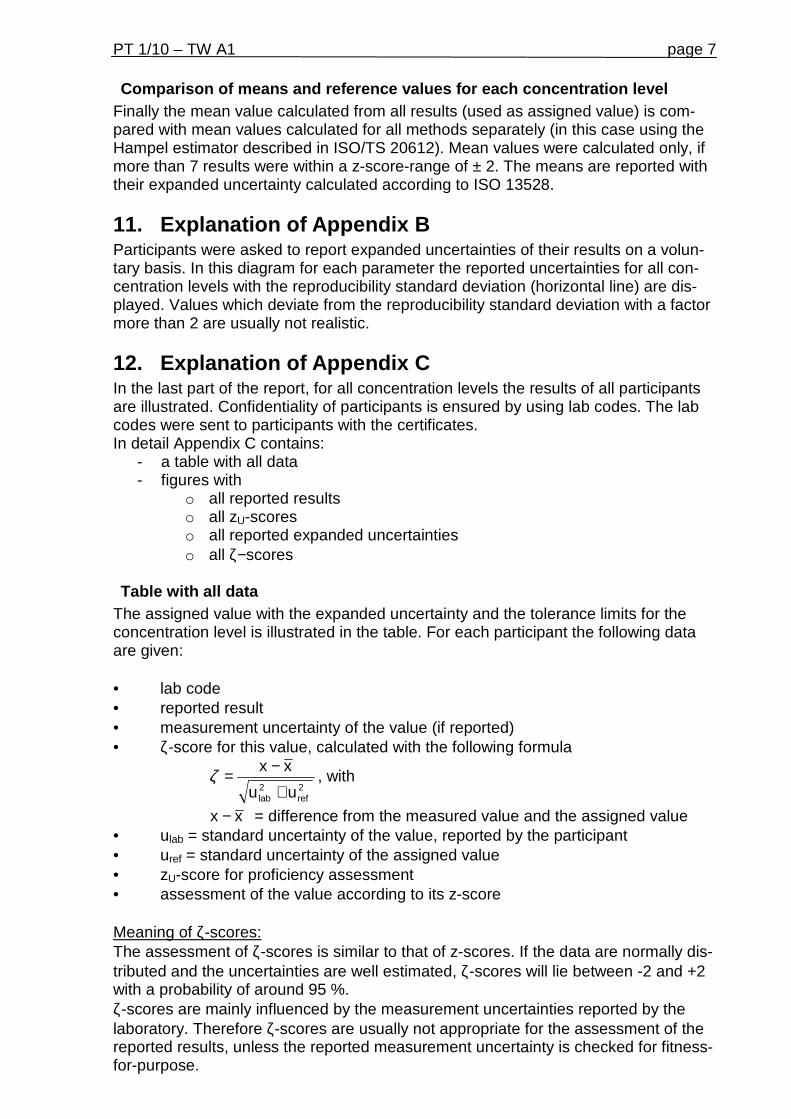
The assigned value with the expanded uncertainty and the tolerance limits for the concentration level is illustrated in the table. For each participant the following data are given: • lab code • reported result • measurement uncertainty of the value (if reported) • ζ-score for this value, calculated with the following formula
22reflab uu
xx
+
−=ζ , with
xx − = difference from the measured value and the assigned value • ulab = standard uncertainty of the value, reported by the participant • uref = standard uncertainty of the assigned value • zU-score for proficiency assessment • assessment of the value according to its z-score Meaning of ζ-scores: The assessment of ζ-scores is similar to that of z-scores. If the data are normally dis-tributed and the uncertainties are well estimated, ζ-scores will lie between -2 and +2 with a probability of around 95 %. ζ-scores are mainly influenced by the measurement uncertainties reported by the laboratory. Therefore ζ-scores are usually not appropriate for the assessment of the reported results, unless the reported measurement uncertainty is checked for fitness-for-purpose.
PT 1/10 – TW A1 page 8 Therefore we do not use the ζ-scores for the assessment of the laboratories. Nevertheless ζ-scores are appropriate to check the plausibility of the reported meas-urement uncertainty: If the z-score of a result is within the tolerance limit and the ζ-score is outside, then the measurement uncertainty is underestimated. If the z-score is outside the tolerance limits and the absolute value of the ζ-score is lower than two, then the requirements of the proficiency test were stronger compared with the reported measurement uncertainty. Diagrams of uncertainty data In the first figure for all lab codes the measurement uncertainty (together with the re-producibility standard deviation) is illustrated. The second figure shows the associ-ated ζ-scores.
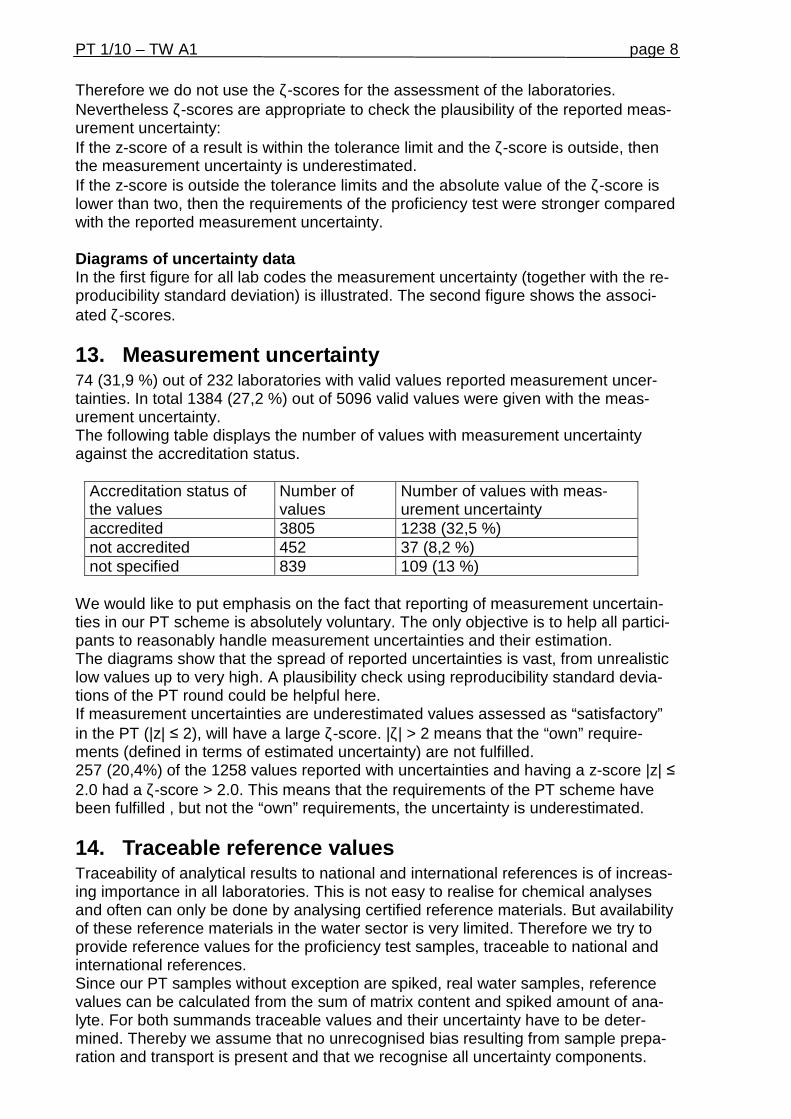
13. Measurement uncertainty 74 (31,9 %) out of 232 laboratories with valid values reported measurement uncer-tainties. In total 1384 (27,2 %) out of 5096 valid values were given with the meas-urement uncertainty. The following table displays the number of values with measurement uncertainty against the accreditation status.
Accreditation status of the values
Number of values
Number of values with meas-urement uncertainty
accredited 3805 1238 (32,5 %) not accredited 452 37 (8,2 %) not specified 839 109 (13 %)
We would like to put emphasis on the fact that reporting of measurement uncertain-ties in our PT scheme is absolutely voluntary. The only objective is to help all partici-pants to reasonably handle measurement uncertainties and their estimation. The diagrams show that the spread of reported uncertainties is vast, from unrealistic low values up to very high. A plausibility check using reproducibility standard devia-tions of the PT round could be helpful here. If measurement uncertainties are underestimated values assessed as “satisfactory” in the PT (|z| ≤ 2), will have a large ζ-score. |ζ| > 2 means that the “own” require-ments (defined in terms of estimated uncertainty) are not fulfilled. 257 (20,4%) of the 1258 values reported with uncertainties and having a z-score |z| ≤ 2.0 had a ζ-score > 2.0. This means that the requirements of the PT scheme have been fulfilled , but not the “own” requirements, the uncertainty is underestimated.
14. Traceable reference values Traceability of analytical results to national and international references is of increas-ing importance in all laboratories. This is not easy to realise for chemical analyses and often can only be done by analysing certified reference materials. But availability of these reference materials in the water sector is very limited. Therefore we try to provide reference values for the proficiency test samples, traceable to national and international references. Since our PT samples without exception are spiked, real water samples, reference values can be calculated from the sum of matrix content and spiked amount of ana-lyte. For both summands traceable values and their uncertainty have to be deter-mined. Thereby we assume that no unrecognised bias resulting from sample prepa-ration and transport is present and that we recognise all uncertainty components.
PT 1/10 – TW A1 page 9 Unfortunately this cannot absolutely be assured for samples for the analysis of highly volatile compounds. We have to accept that a small part of the analyte is lost during sample preparation leading to reduced recovery rate. The trueness of the reference values reported here therefore cannot absolutely be guaranteed. Please consider that in the interpretation of these values and your deviation from the reference val-ues. Determination of the spiked amount and its uncertai nty
All spiking of samples was controlled gravimetrically. Conversion to concentration was done by measuring the density of the resulting samples using a pycnometer. This procedure allows the preparation of a complete uncertainty budget. The first step is the specification of the measurand with a formula. This shows the links between the result and all influence quantities
Kmm
mFPmc
lotss
lotlotsssssubst
lot ⋅⋅⋅⋅⋅⋅
=ρ__
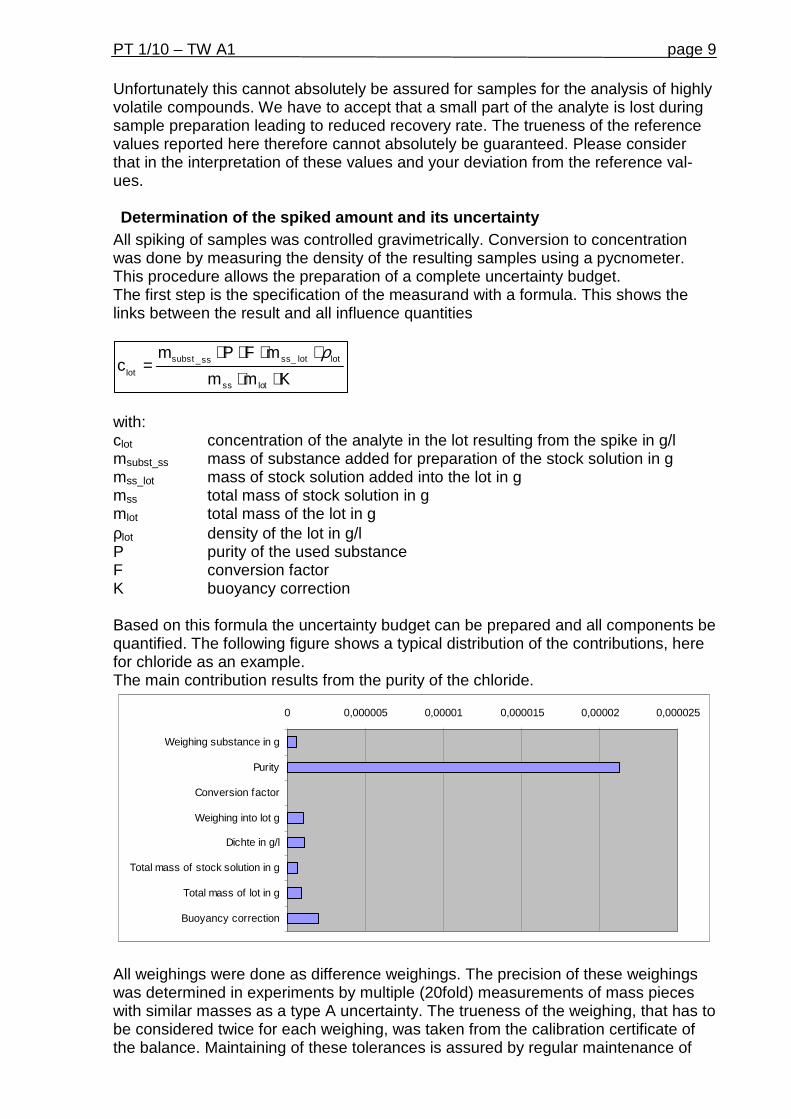
with: clot concentration of the analyte in the lot resulting from the spike in g/l msubst_ss mass of substance added for preparation of the stock solution in g mss_lot mass of stock solution added into the lot in g mss total mass of stock solution in g mlot total mass of the lot in g ρlot density of the lot in g/l P purity of the used substance F conversion factor K buoyancy correction Based on this formula the uncertainty budget can be prepared and all components be quantified. The following figure shows a typical distribution of the contributions, here for chloride as an example. The main contribution results from the purity of the chloride.
0 0,000005 0,00001 0,000015 0,00002 0,000025
Weighing substance in g
Purity
Conversion factor
Weighing into lot g
Dichte in g/l
Total mass of stock solution in g
Total mass of lot in g
Buoyancy correction
All weighings were done as difference weighings. The precision of these weighings was determined in experiments by multiple (20fold) measurements of mass pieces with similar masses as a type A uncertainty. The trueness of the weighing, that has to be considered twice for each weighing, was taken from the calibration certificate of the balance. Maintaining of these tolerances is assured by regular maintenance of
PT 1/10 – TW A1 page 10 the balances by a calibration laboratory and by supervision with our mass pieces (calibrated by an accredited calibration laboratory). The determination of the density was also made using weighings (of the pycnome-ter). The above said also applies here. Temperature measurement was made with a calibrated thermometer. The purity of the used benzene was taken from the certificate of the manufacturer. With all these uncertainty components the combined uncertainty, as described in the EURACHEM/CITAC-Guide „Quantifying Uncertainty in Analytical Measurement“, was calculated using the sensitivity coefficients determined by partial derivation of the formula to the respective influence quantities. So traceability was assured by using calibrated balances and thermometers. Determination of the matrix content
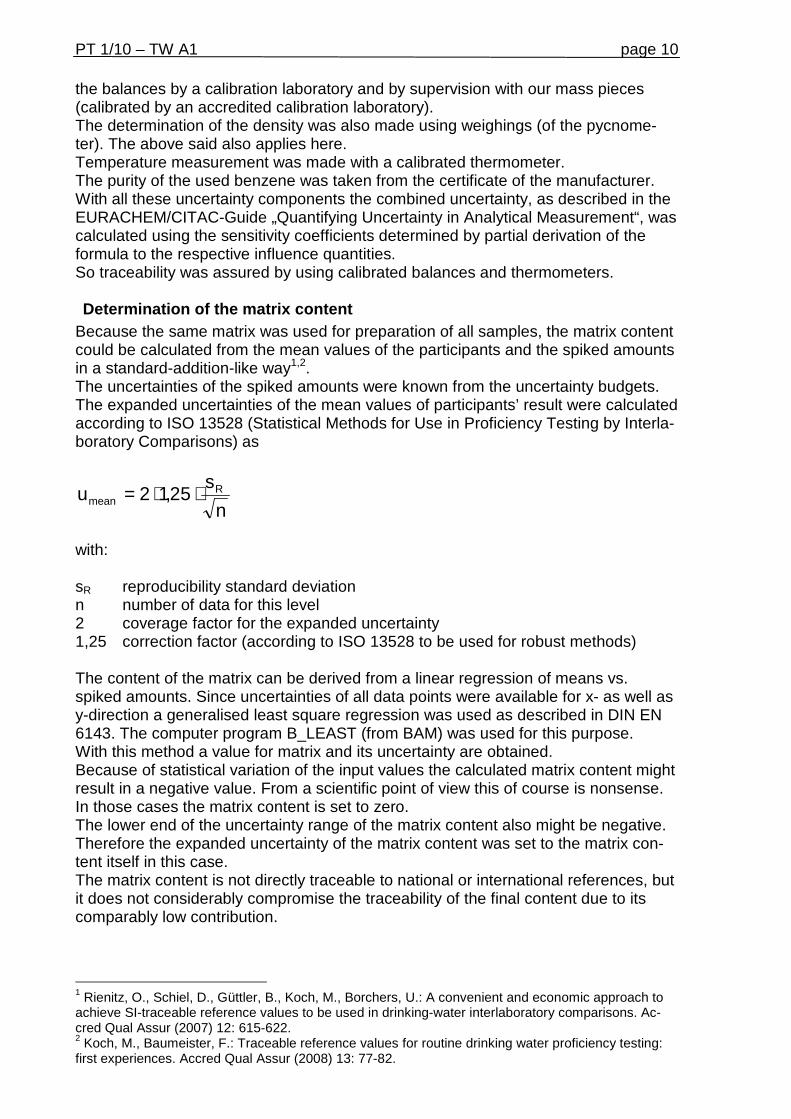
Because the same matrix was used for preparation of all samples, the matrix content could be calculated from the mean values of the participants and the spiked amounts in a standard-addition-like way1,2. The uncertainties of the spiked amounts were known from the uncertainty budgets. The expanded uncertainties of the mean values of participants’ result were calculated according to ISO 13528 (Statistical Methods for Use in Proficiency Testing by Interla-boratory Comparisons) as
n
su R
mean ⋅⋅= 25,12
with: sR reproducibility standard deviation n number of data for this level 2 coverage factor for the expanded uncertainty 1,25 correction factor (according to ISO 13528 to be used for robust methods) The content of the matrix can be derived from a linear regression of means vs. spiked amounts. Since uncertainties of all data points were available for x- as well as y-direction a generalised least square regression was used as described in DIN EN 6143. The computer program B_LEAST (from BAM) was used for this purpose. With this method a value for matrix and its uncertainty are obtained. Because of statistical variation of the input values the calculated matrix content might result in a negative value. From a scientific point of view this of course is nonsense. In those cases the matrix content is set to zero. The lower end of the uncertainty range of the matrix content also might be negative. Therefore the expanded uncertainty of the matrix content was set to the matrix con-tent itself in this case. The matrix content is not directly traceable to national or international references, but it does not considerably compromise the traceability of the final content due to its comparably low contribution.
1 Rienitz, O., Schiel, D., Güttler, B., Koch, M., Borchers, U.: A convenient and economic approach to achieve SI-traceable reference values to be used in drinking-water interlaboratory comparisons. Ac-cred Qual Assur (2007) 12: 615-622. 2 Koch, M., Baumeister, F.: Traceable reference values for routine drinking water proficiency testing: first experiences. Accred Qual Assur (2008) 13: 77-82.
PT 1/10 – TW A1 page 11
15. Internet The report is available on the following webpage: http://www.aqsbw/pdf/report110.pdf
PT 1/10 - TW A1
leve
l
assi
gned
val
ue [m
g/l]
expa
nded
unc
erta
inty
of t
he
assi
gned
val
ue [%
]
stan
dard
dev
iatio
n, c
alcu
late
d us
ing
robu
st s
tatis
tics
[mg/
l]
stan
dard
dev
iatio
n fr
om v
aria
nce
func
tion
[mg/
l]
stan
dard
dev
iatio
n fo
r pr
ofic
ienc
y as
sess
men
t [m
g/l]
stan
dard
dev
iatio
n fo
r pr
ofic
ienc
y as
sess
men
t [%
]
uppe
r to
lera
nce
limit
[mg/
l]
low
er to
lera
nce
limit
[mg/
l]
uppe
r to
lera
nce
limit
[%]
low
er to
lera
nce
limit
[%]
num
ber
of r
esul
ts
out b
elow
out a
bove
out [
%]
1 0,0080 19,52 0,0034 0,0034 0,0020 25,00 0,0126 0,0044 57,99 -45,19 30 4 3 23,32 0,0160 17,52 0,0059 0,0060 0,0040 25,00 0,0253 0,0088 57,99 -45,19 28 1 5 21,43 0,0217 11,97 0,0058 0,0077 0,0054 25,00 0,0342 0,0119 57,99 -45,19 31 6 5 35,54 0,0304 15,43 0,0106 0,0102 0,0076 25,00 0,0480 0,0166 57,99 -45,19 32 4 5 28,15 0,0311 19,31 0,0129 0,0104 0,0078 25,00 0,0491 0,0170 57,99 -45,19 29 4 2 20,76 0,0371 18,52 0,0153 0,0120 0,0093 25,00 0,0587 0,0204 57,99 -45,19 31 4 5 29,07 0,0386 19,29 0,0152 0,0124 0,0097 25,00 0,0610 0,0212 57,99 -45,19 26 3 3 23,18 0,0458 11,83 0,0126 0,0143 0,0115 25,00 0,0724 0,0251 57,99 -45,19 34 3 3 17,69 0,0514 11,11 0,0121 0,0157 0,0128 25,00 0,0812 0,0282 57,99 -45,19 28 3 0 10,7
sum 269 32 31 23,4 Recovery and matrix content Slope of the regression line: 0,9202, recovery: 92 %neg. x-axis-intercept = matrix content: 0,000711 mg/lexpanded uncertainty of the matrix content: 0,000711 mg/l = 100 % page A-1 of A-86
bromate
bromate
0
0,01
0,02
0,03
0,04
0,05
0,06
-0,01 0 0,01 0,02 0,03 0,04 0,05 0,06
added amount in mg/l
assi
gn
ed v
alu
e in
mg
/l
PT 1/10 - TW A1
Relative standard deviation and tolerance limits The standard deviation, calculated from the variance function, reached the upper limitfor all levels. page A-2 of A-86
bromate
0
5
10
15
20
25
30
35
40
45
0 0,01 0,02 0,03 0,04 0,05 0,06
concentration in mg/l
rel.
stan
dar
d d
evia
tio
n in
%
bromate
-60
-40
-20
0
20
40
60
80
0 0,01 0,02 0,03 0,04 0,05 0,06
concentration in mg/l
tole
ran
ce li
mit
s in
%
PT 1/10 - TW A1
Method specific evaluation There were no significant differences between the methods. page A-3 of A-86
used methods for bromate
81,04
14,50
4,46
0
10
20
30
40
50
60
70
80
90
IC direct Others IC with enrichment
per
cen
tag
e
too lowlow
correcthigh
too high
IC direct
Others0
10
20
30
40
50
60
70
80
freq
uen
cy in
%
method comparison bromate
PT 1/10 - TW A1
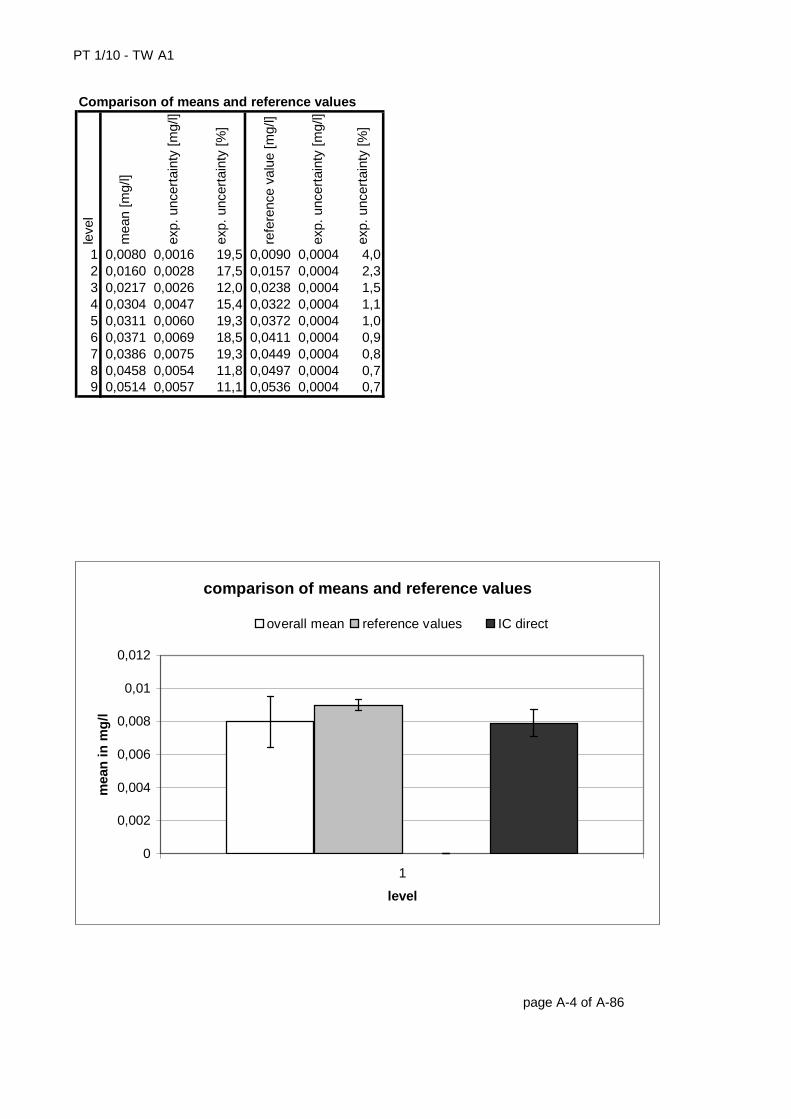
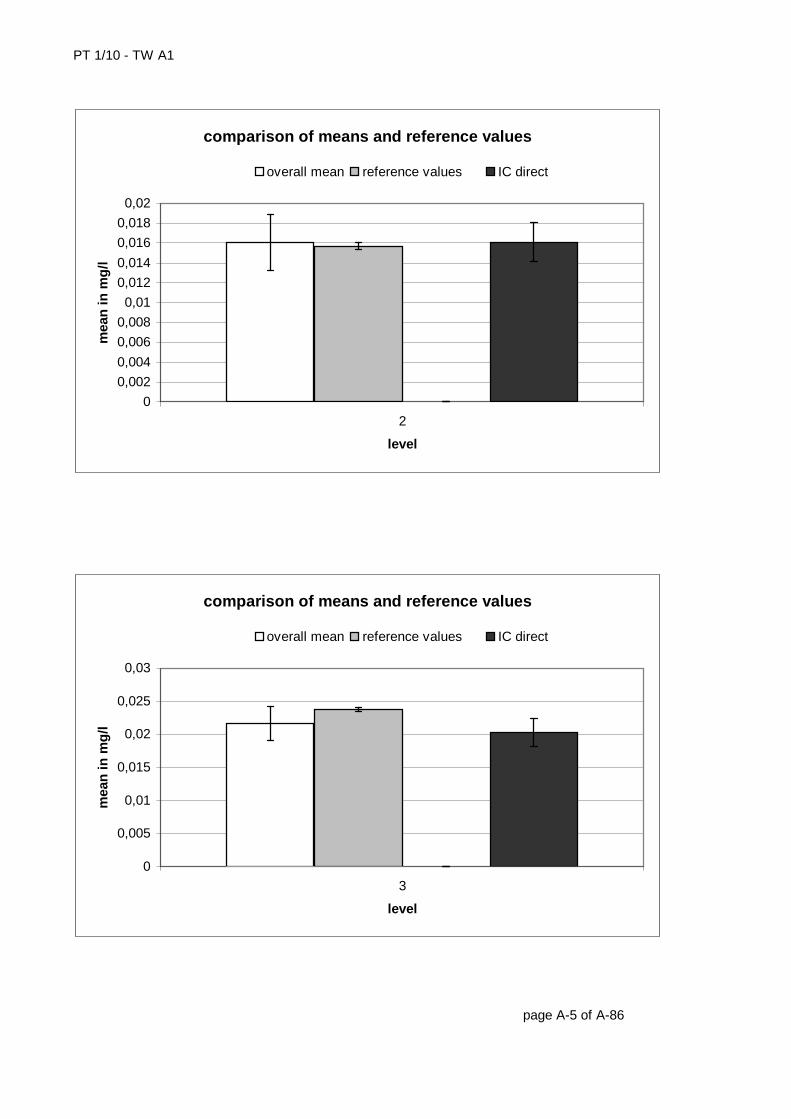
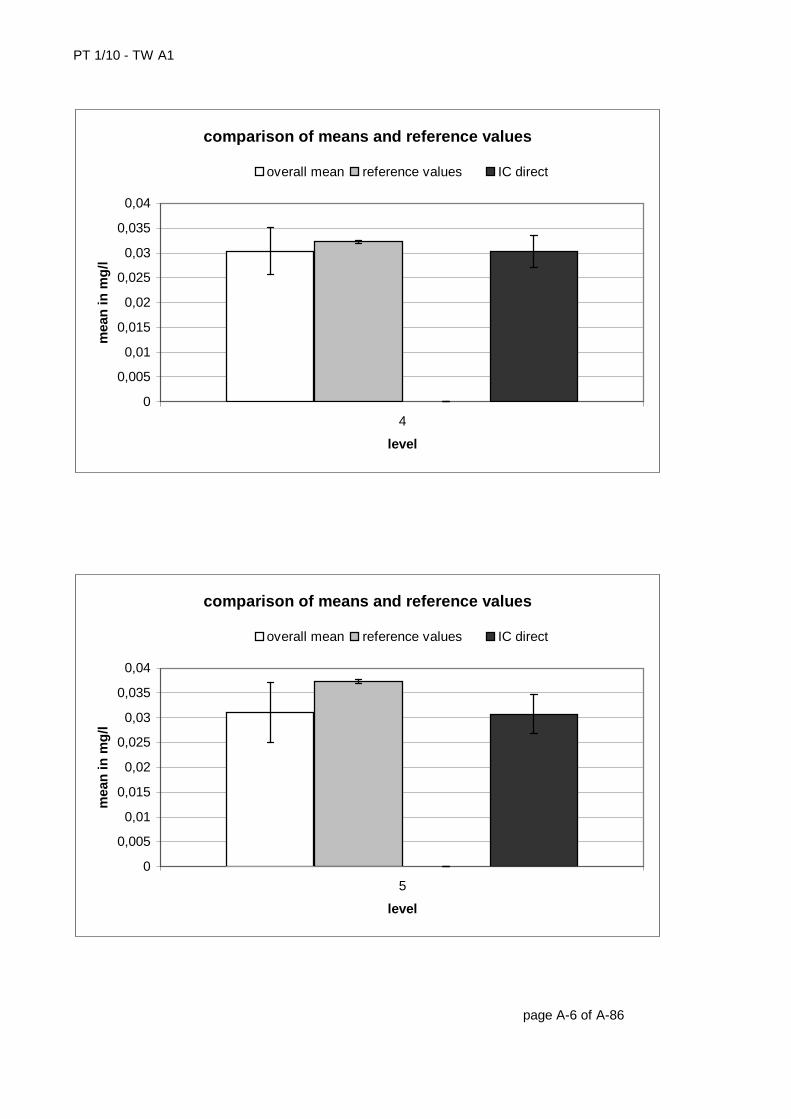
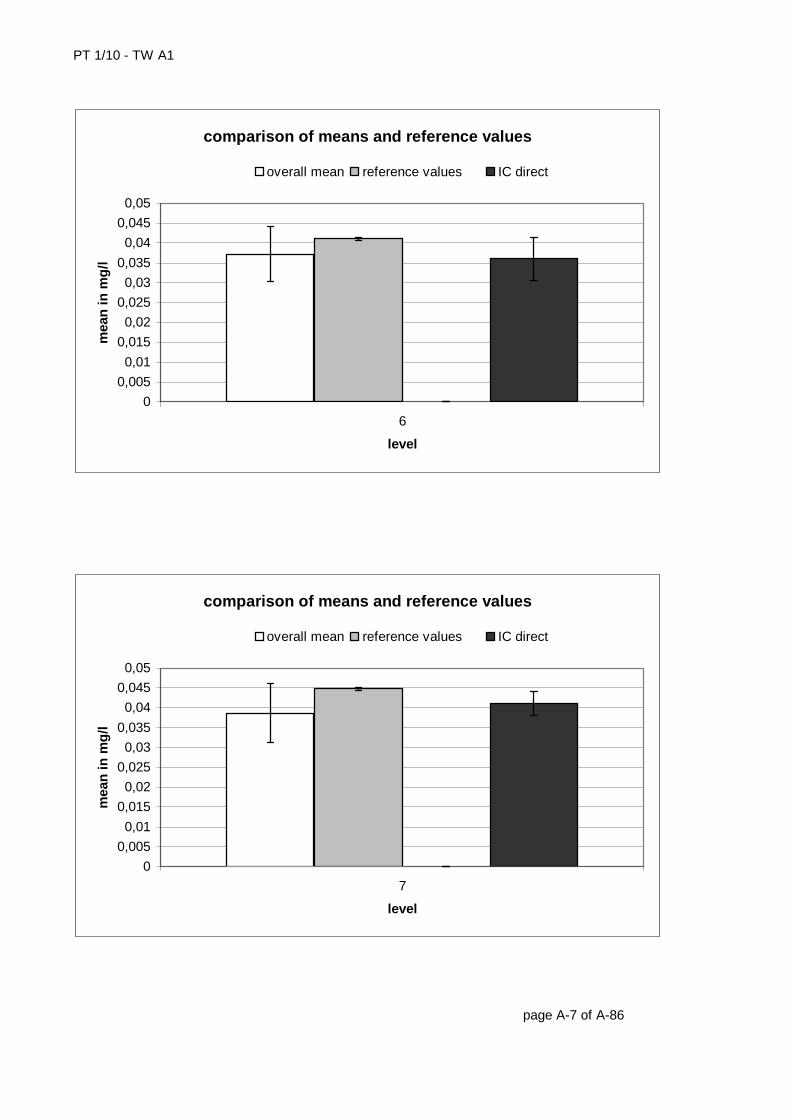
Comparison of means and reference valuesle
vel
mea
n [m
g/l]
exp.
unc
erta
inty
[mg/
l]
exp.
unc
erta
inty
[%]
refe
renc
e va
lue
[mg/
l]
exp.
unc
erta
inty
[mg/
l]
exp.
unc
erta
inty
[%]
1 0,0080 0,0016 19,5 0,0090 0,0004 4,02 0,0160 0,0028 17,5 0,0157 0,0004 2,33 0,0217 0,0026 12,0 0,0238 0,0004 1,54 0,0304 0,0047 15,4 0,0322 0,0004 1,15 0,0311 0,0060 19,3 0,0372 0,0004 1,06 0,0371 0,0069 18,5 0,0411 0,0004 0,97 0,0386 0,0075 19,3 0,0449 0,0004 0,88 0,0458 0,0054 11,8 0,0497 0,0004 0,79 0,0514 0,0057 11,1 0,0536 0,0004 0,7
page A-4 of A-86
comparison of means and reference values
0
0,002
0,004
0,006
0,008
0,01
0,012
1
level
mea
n in
mg
/l
overall mean reference values IC direct
PT 1/10 - TW A1
page A-5 of A-86
comparison of means and reference values
0
0,002
0,004
0,006
0,008
0,01
0,012
0,014
0,016
0,018
0,02
2
level
mea
n in
mg
/l
overall mean reference values IC direct
comparison of means and reference values
0
0,005
0,01
0,015
0,02
0,025
0,03
3
level
mea
n in
mg
/l
overall mean reference values IC direct
PT 1/10 - TW A1
page A-6 of A-86
comparison of means and reference values
0
0,005
0,01
0,015
0,02
0,025
0,03
0,035
0,04
4
level
mea
n in
mg
/l
overall mean reference values IC direct
comparison of means and reference values
0
0,005
0,01
0,015
0,02
0,025
0,03
0,035
0,04
5
level
mea
n in
mg
/l
overall mean reference values IC direct
PT 1/10 - TW A1
page A-7 of A-86
comparison of means and reference values
0
0,005
0,01
0,015
0,02
0,025
0,03
0,035
0,04
0,045
0,05
6
level
mea
n in
mg
/l
overall mean reference values IC direct
comparison of means and reference values
0
0,005
0,01
0,015
0,02
0,025
0,03
0,035
0,04
0,045
0,05
7
level
mea
n in
mg
/l
overall mean reference values IC direct
PT 1/10 - TW A1
page A-8 of A-86
comparison of means and reference values
0
0,01
0,02
0,03
0,04
0,05
0,06
8
level
mea
n in
mg
/l
overall mean reference values IC direct
comparison of means and reference values
0
0,01
0,02
0,03
0,04
0,05
0,06
9
level
mea
n in
mg
/l
overall mean reference values IC direct
PT 1/10 - TW A1
leve
l
robu
st m
ean
[mg/
l]
exp.
unc
erta
inty
of t
he m
ean
[mg/
l]
exp.
unc
erta
inty
of t
he m
ean
[%]
robu
st s
tand
ard
devi
atio
n [m
g/l]
robu
st s
tand
ard
devi
atio
n [%
]
num
ber
of r
esul
ts
out b
elow
out a
bove
out [
%]
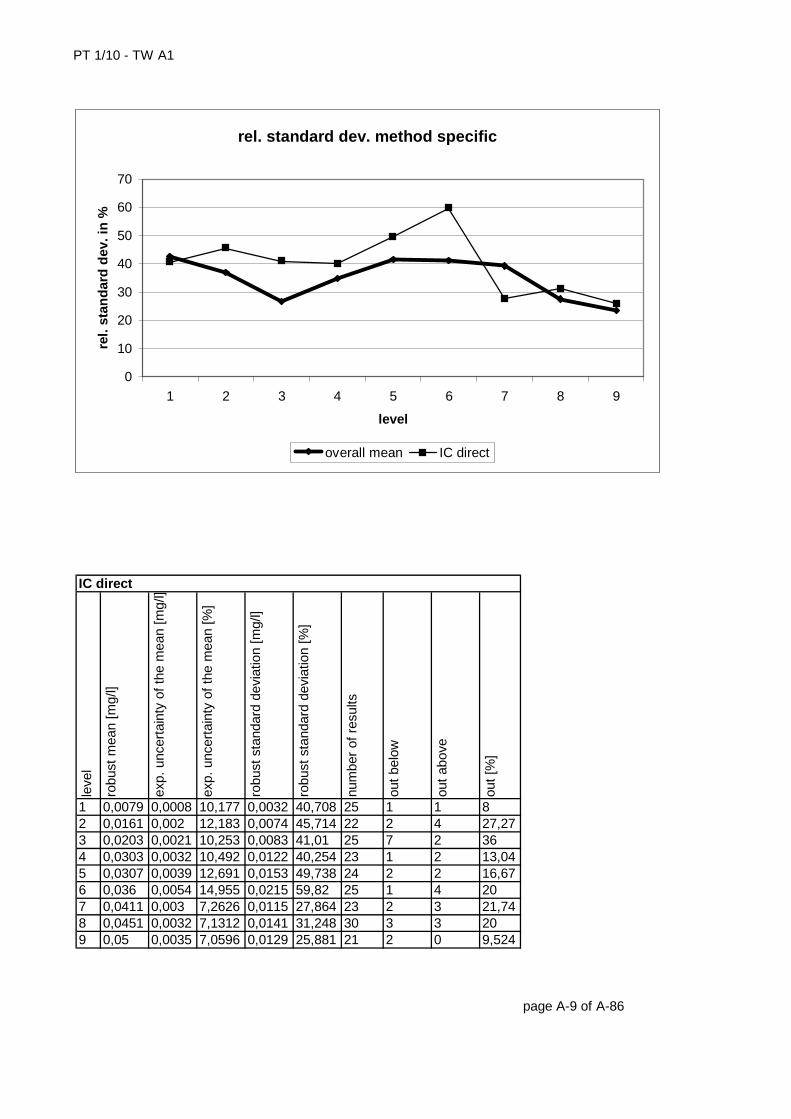
1 0,0079 0,0008 10,177 0,0032 40,708 25 1 1 82 0,0161 0,002 12,183 0,0074 45,714 22 2 4 27,273 0,0203 0,0021 10,253 0,0083 41,01 25 7 2 364 0,0303 0,0032 10,492 0,0122 40,254 23 1 2 13,045 0,0307 0,0039 12,691 0,0153 49,738 24 2 2 16,676 0,036 0,0054 14,955 0,0215 59,82 25 1 4 207 0,0411 0,003 7,2626 0,0115 27,864 23 2 3 21,748 0,0451 0,0032 7,1312 0,0141 31,248 30 3 3 209 0,05 0,0035 7,0596 0,0129 25,881 21 2 0 9,524 page A-9 of A-86
IC direct
rel. standard dev. method specific
0
10
20
30
40
50
60
70
1 2 3 4 5 6 7 8 9
level
rel.
stan
dar
d d
ev. i
n %
overall mean IC direct
PT 1/10 - TW A1
leve
l
assi
gned
val
ue [m
g/l]
expa
nded
unc
erta
inty
of t
he
assi
gned
val
ue [%
]
stan
dard
dev
iatio
n, c
alcu
late
d us
ing
robu
st s
tatis
tics
[mg/
l]
stan
dard
dev
iatio
n fr
om v
aria
nce
func
tion
[mg/
l]
stan
dard
dev
iatio
n fo
r pr
ofic
ienc
y as
sess
men
t [m
g/l]
stan
dard
dev
iatio
n fo
r pr
ofic
ienc
y as
sess
men
t [%
]
uppe
r to
lera
nce
limit
[mg/
l]
low
er to
lera
nce
limit
[mg/
l]
uppe
r to
lera
nce
limit
[%]
low
er to
lera
nce
limit
[%]
num
ber
of r
esul
ts
out b
elow
out a
bove
out [
%]
1 0,4559 3,09 0,0478 0,0404 0,0404 8,87 0,5407 0,3783 18,60 -17,03 72 3 9 16,72 0,6652 1,79 0,0401 0,0531 0,0531 7,98 0,7759 0,5629 16,65 -15,37 71 2 3 7,03 0,9006 2,20 0,0663 0,0660 0,0660 7,33 1,038 0,7731 15,24 -14,16 70 5 6 15,74 1,266 2,24 0,0969 0,0844 0,0844 6,66 1,441 1,103 13,80 -12,91 73 8 5 17,85 1,518 1,74 0,0884 0,0961 0,0961 6,33 1,716 1,331 13,09 -12,29 70 7 2 12,96 1,724 1,78 0,1042 0,1054 0,1054 6,11 1,942 1,520 12,62 -11,87 72 5 1 8,37 1,959 1,96 0,1283 0,1155 0,1155 5,90 2,197 1,734 12,16 -11,47 70 5 2 10,08 2,197 1,77 0,1295 0,1254 0,1254 5,71 2,455 1,953 11,76 -11,11 69 5 7 17,49 2,362 1,53 0,1224 0,1322 0,1322 5,60 2,634 2,105 11,52 -10,90 72 3 7 13,9
sum 639 43 42 13,3 Recovery and matrix content Slope of the regression line: 0,9507, recovery: 95,1 %neg. x-axis-intercept = matrix content: 0,1057 mg/lexpanded uncertainty of the matrix content: 0,0163 mg/l = 15,4 % page A-10 of A-86
fluoride
fluoride
0
0,5
1
1,5
2
2,5
3
-0,5 0 0,5 1 1,5 2 2,5 3
added amount in mg/l
assi
gn
ed v
alu
e in
mg
/l
PT 1/10 - TW A1
Relative standard deviation and tolerance limits The standard deviation, calculated from the variance function, was within the limitsfor all levels. page A-11 of A-86
fluoride
0
5
10
15
20
25
30
0 0,5 1 1,5 2 2,5
concentration in mg/l
rel.
stan
dar
d d
evia
tio
n in
%
fluoride
-20
-15
-10
-5
0
5
10
15
20
25
0 0,5 1 1,5 2 2,5
concentration in mg/l
tole
ran
ce li
mit
s in
%
PT 1/10 - TW A1
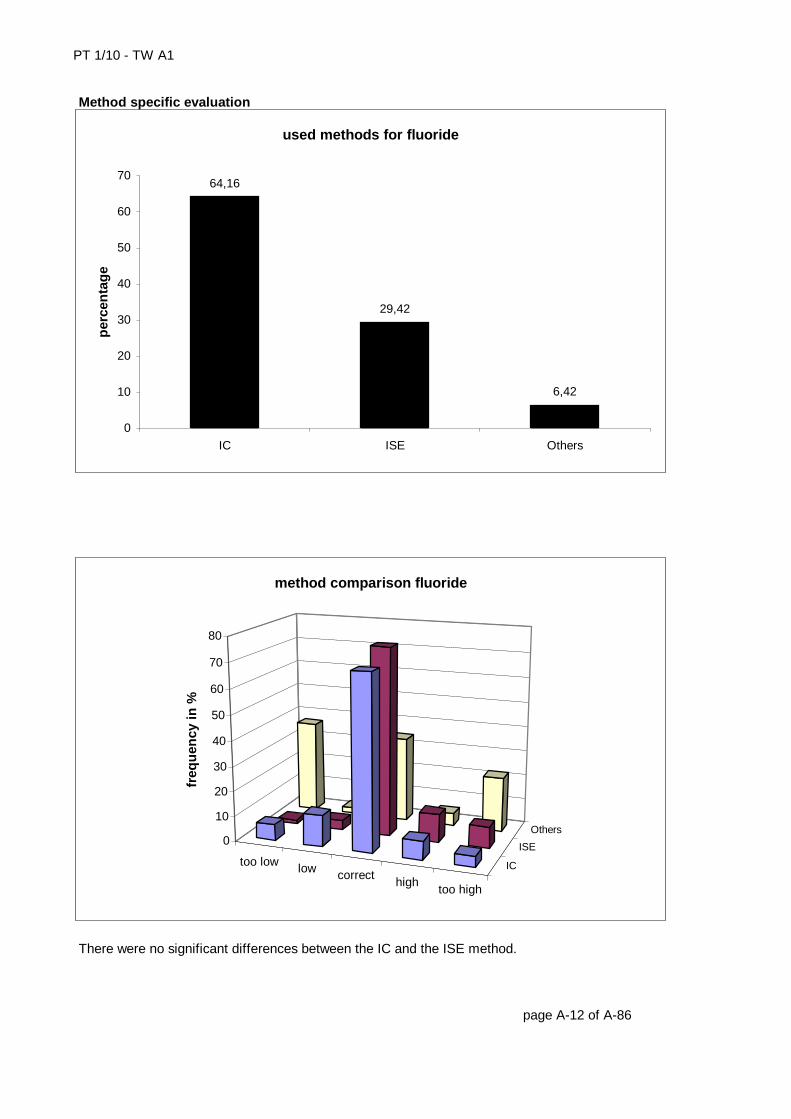
Method specific evaluation There were no significant differences between the IC and the ISE method. page A-12 of A-86
used methods for fluoride
64,16
29,42
6,42
0
10
20
30
40
50
60
70
IC ISE Others
per
cen
tag
e
too low low correcthigh
too high
IC
ISE
Others0
10
20
30
40
50
60
70
80
freq
uen
cy in
%
method comparison fluoride
PT 1/10 - TW A1
Comparison of means and reference valuesle
vel
mea
n [m
g/l]
exp.
unc
erta
inty
[mg/
l]
exp.
unc
erta
inty
[%]
refe
renc
e va
lue
[mg/
l]
exp.
unc
erta
inty
[mg/
l]
exp.
unc
erta
inty
[%]
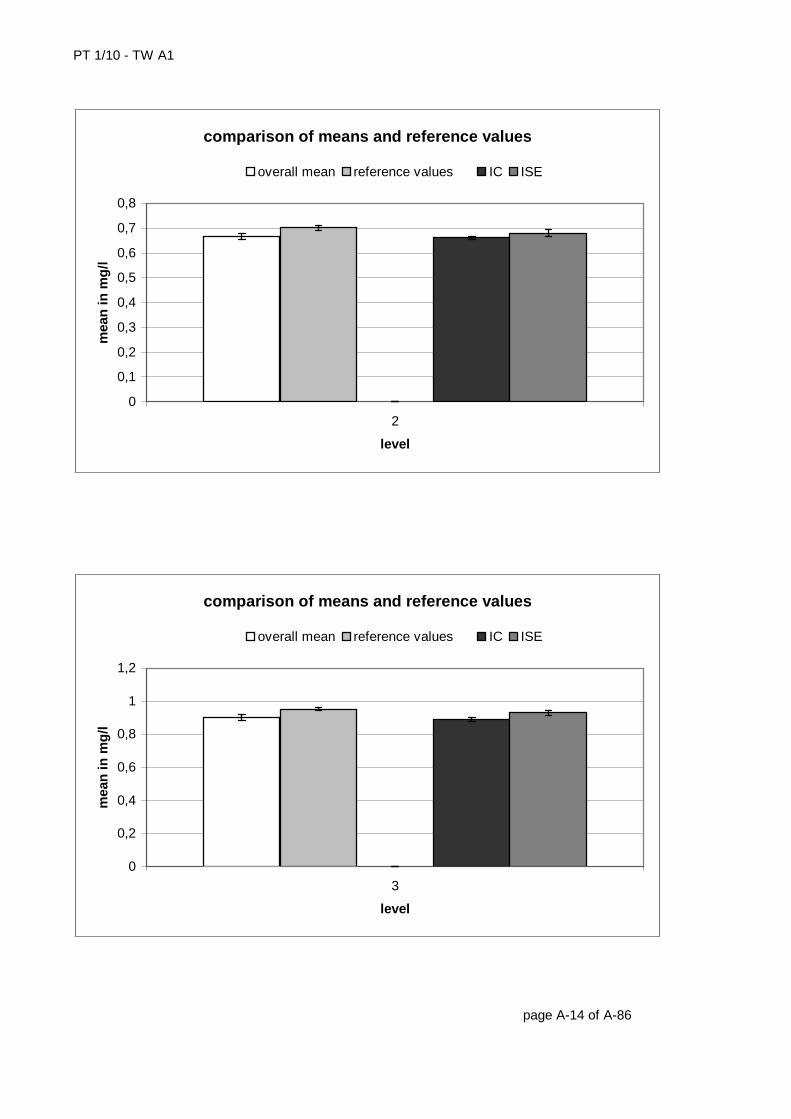
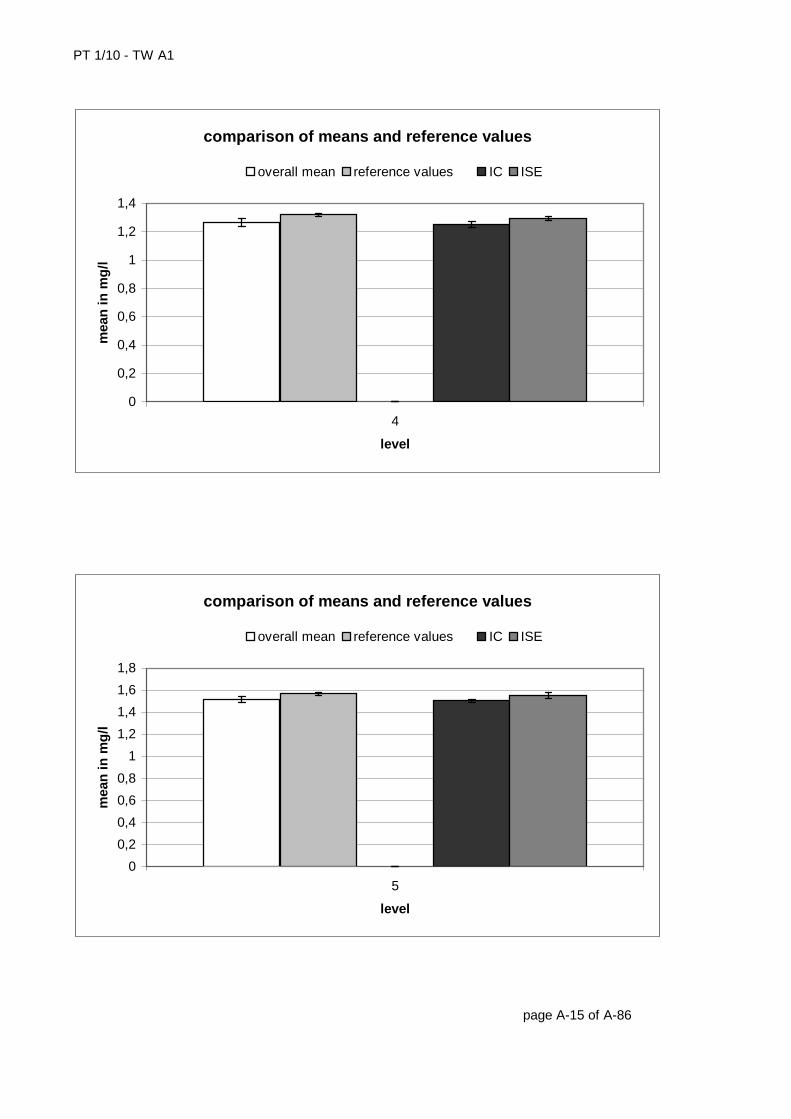
1 0,4559 0,0141 3,1 0,4844 0,0084 1,72 0,6652 0,0119 1,8 0,7005 0,0088 1,33 0,9006 0,0198 2,2 0,9503 0,0095 1,04 1,266 0,028 2,2 1,319 0,011 0,85 1,518 0,026 1,7 1,565 0,012 0,76 1,724 0,031 1,8 1,800 0,013 0,77 1,959 0,038 2,0 2,043 0,014 0,78 2,197 0,039 1,8 2,281 0,015 0,79 2,362 0,036 1,5 2,580 0,016 0,6
page A-13 of A-86
comparison of means and reference values
0
0,1
0,2
0,3
0,4
0,5
0,6
1
level
mea
n in
mg
/l
overall mean reference values IC ISE
PT 1/10 - TW A1
page A-14 of A-86
comparison of means and reference values
0
0,1
0,2
0,3
0,4
0,5
0,6
0,7
0,8
2
level
mea
n in
mg
/l
overall mean reference values IC ISE
comparison of means and reference values
0
0,2
0,4
0,6
0,8
1
1,2
3
level
mea
n in
mg
/l
overall mean reference values IC ISE
PT 1/10 - TW A1
page A-15 of A-86
comparison of means and reference values
0
0,2
0,4
0,6
0,8
1
1,2
1,4
4
level
mea
n in
mg
/l
overall mean reference values IC ISE
comparison of means and reference values
0
0,2
0,4
0,6
0,8
1
1,2
1,4
1,6
1,8
5
level
mea
n in
mg
/l
overall mean reference values IC ISE
PT 1/10 - TW A1
page A-16 of A-86
comparison of means and reference values
0
0,2
0,4
0,6
0,8
1
1,2
1,4
1,6
1,8
2
6
level
mea
n in
mg
/l
overall mean reference values IC ISE
comparison of means and reference values
0
0,5
1
1,5
2
2,5
7
level
mea
n in
mg
/l
overall mean reference values IC ISE
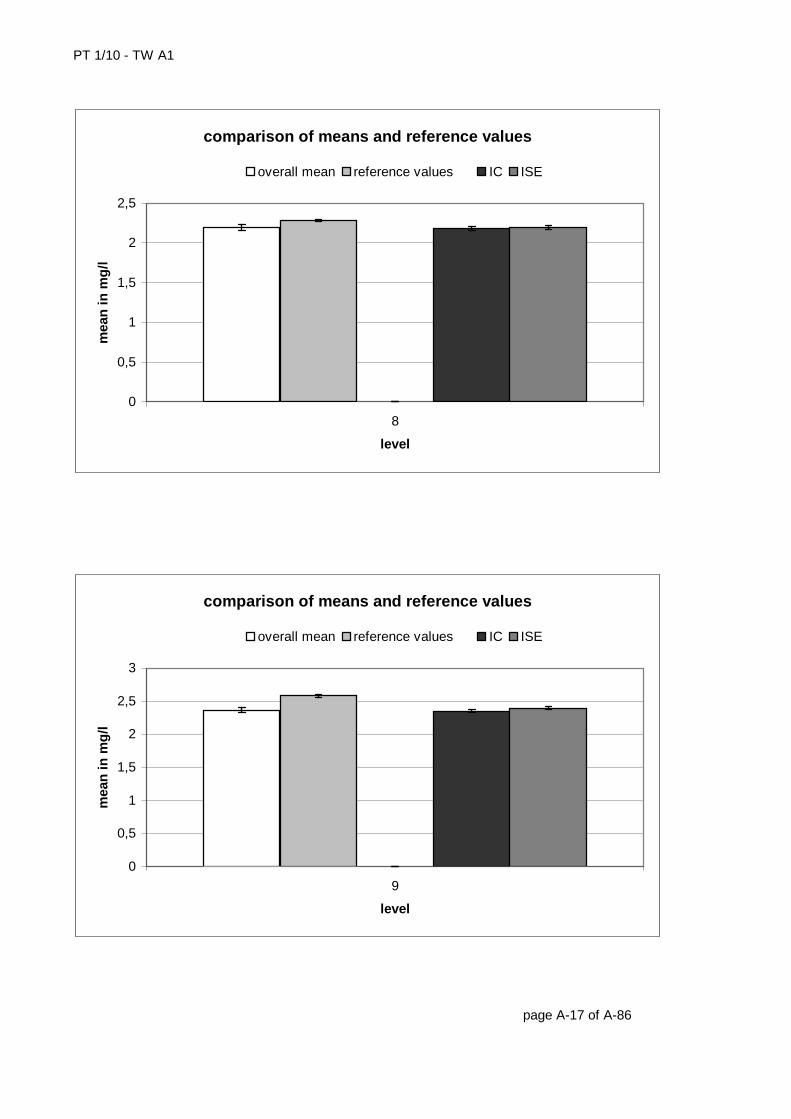
PT 1/10 - TW A1
page A-17 of A-86
comparison of means and reference values
0
0,5
1
1,5
2
2,5
8
level
mea
n in
mg
/l
overall mean reference values IC ISE
comparison of means and reference values
0
0,5
1
1,5
2
2,5
3
9
level
mea
n in
mg
/l
overall mean reference values IC ISE
PT 1/10 - TW A1
leve
l
robu
st m
ean
[mg/
l]
exp.
unc
erta
inty
of t
he m
ean
[mg/
l]
exp.
unc
erta
inty
of t
he m
ean
[%]
robu
st s
tand
ard
devi
atio
n [m
g/l]
robu
st s
tand
ard
devi
atio
n [%
]
num
ber
of r
esul
ts
out b
elow
out a
bove
out [
%]
1 0,4449 0,0079 1,765 0,0431 9,6801 47 3 4 14,892 0,6608 0,0064 0,971 0,0367 5,5476 51 4 3 13,733 0,891 0,012 1,3416 0,0597 6,7025 39 4 0 10,264 1,2517 0,0207 1,651 0,1071 8,5596 42 4 2 14,295 1,504 0,0156 1,034 0,0825 5,4869 44 6 0 13,646 1,7143 0,0183 1,0659 0,1054 6,149 52 4 0 7,6927 1,9427 0,0266 1,3697 0,1444 7,4317 46 2 0 4,3488 2,1817 0,021 0,9637 0,1103 5,0556 43 2 4 13,959 2,3478 0,0219 0,9339 0,119 5,0674 46 2 4 13,04 page A-18 of A-86
IC
rel. standard dev. method specific
0
2
4
6
8
10
12
14
1 2 3 4 5 6 7 8 9
level
rel.
stan
dar
d d
ev. i
n %
overall mean IC ISE

PT 1/10 - TW A1
leve
l
robu
st m
ean
[mg/
l]
exp.
unc
erta
inty
of t
he m
ean
[mg/
l]
exp.
unc
erta
inty
of t
he m
ean
[%]
robu
st s
tand
ard
devi
atio
n [m
g/l]
robu
st s
tand
ard
devi
atio
n [%
]
num
ber
of r
esul
ts
out b
elow
out a
bove
out [
%]
1 0,4811 0,0149 3,0932 0,0558 11,607 22 0 2 9,0912 0,6801 0,0153 2,243 0,0503 7,3985 17 1 1 11,763 0,9294 0,016 1,7213 0,0627 6,7462 24 1 3 16,674 1,293 0,0162 1,2543 0,0636 4,9158 24 1 2 12,55 1,5506 0,0254 1,6407 0,0955 6,1565 22 1 2 13,646 1,7538 0,0296 1,689 0,1033 5,8898 19 2 1 15,797 1,9855 0,0223 1,1209 0,0796 4,0104 20 2 2 208 2,2 0,028 1,2716 0,1001 4,5492 20 1 1 109 2,3936 0,0233 0,9726 0,0833 3,4795 20 2 3 25 page A-19 of A-86
ISE
PT 1/10 - TW A1
leve
l
assi
gned
val
ue [m
g/l]
expa
nded
unc
erta
inty
of t
he
assi
gned
val
ue [%
]
stan
dard
dev
iatio
n, c
alcu
late
d us
ing
robu
st s
tatis
tics
[mg/
l]
stan
dard
dev
iatio
n fr
om v
aria
nce
func
tion
[mg/
l]
stan
dard
dev
iatio
n fo
r pr
ofic
ienc
y as
sess
men
t [m
g/l]
stan
dard
dev
iatio
n fo
r pr
ofic
ienc
y as
sess
men
t [%
]
uppe
r to
lera
nce
limit
[mg/
l]
low
er to
lera
nce
limit
[mg/
l]
uppe
r to
lera
nce
limit
[%]
low
er to
lera
nce
limit
[%]
num
ber
of r
esul
ts
out b
elow
out a
bove
out [
%]
1 7,443 1,42 0,3584 0,3638 0,3721 5,00 8,207 6,716 10,26 -9,76 72 4 4 11,12 14,57 1,33 0,6548 0,6372 0,7286 5,00 16,07 13,15 10,26 -9,76 71 4 3 9,93 21,50 1,08 0,8064 0,8815 1,075 5,00 23,70 19,40 10,26 -9,76 75 0 3 4,04 30,34 1,25 1,297 1,175 1,517 5,00 33,46 27,38 10,26 -9,76 73 3 1 5,55 42,76 1,21 1,750 1,565 2,138 5,00 47,15 38,59 10,26 -9,76 72 2 0 2,86 47,09 1,05 1,681 1,696 2,355 5,00 51,93 42,50 10,26 -9,76 72 2 0 2,87 52,00 0,95 1,674 1,842 2,600 5,00 57,34 46,93 10,26 -9,76 72 1 2 4,28 62,34 0,94 2,024 2,143 3,117 5,00 68,73 56,25 10,26 -9,76 75 3 1 5,39 67,22 1,03 2,360 2,282 3,361 5,00 74,11 60,65 10,26 -9,76 72 3 1 5,6
sum 654 22 15 5,7 Recovery and matrix content Slope of the regression line:0,9585, recovery: 95,85 %neg. x-axis-intercept = matrix content:4,6 mg/lexpanded uncertainty of the matrix content: 0,143 mg/l = 3,1 % page A-20 of A-86
nitrate
nitrate
0
10
20
30
40
50
60
70
80
-10 0 10 20 30 40 50 60 70
added amount in mg/l
assi
gn
ed v
alu
e in
mg
/l
PT 1/10 - TW A1
Relative standard deviation and tolerance limits The standard deviation, calculated from the variance function, reached the lower limitfor all levels. page A-21 of A-86
nitrate
0
5
10
15
20
25
30
0 10 20 30 40 50 60 70 80
concentration in mg/l
rel.
stan
dar
d d
evia
tio
n in
%
nitrate
-15
-10
-5
0
5
10
15
0 10 20 30 40 50 60 70 80
concentration in mg/l
tole
ran
ce li
mit
s in
%
PT 1/10 - TW A1
Method specific evaluation The values determined with the spectrometric method showed a slightly broader statistical distribution. page A-22 of A-86
used methods for nitrate
78,59
6,73 6,423,21 2,75 2,29
0
10
20
30
40
50
60
70
80
90
IC spectrometricDMP
Others CFA spectrometricsulfosalicylic
acid
FIA
per
cen
tag
e
too low low correcthigh
too high
IC
spectrometric DMP
Others0
10
20
30
40
50
60
70
80
90
freq
uen
cy in
%
method comparison nitrate

PT 1/10 - TW A1
Comparison of means and reference valuesle
vel
mea
n [m
g/l]
exp.
unc
erta
inty
[mg/
l]
exp.
unc
erta
inty
[%]
refe
renc
e va
lue
[mg/
l]
exp.
unc
erta
inty
[mg/
l]
exp.
unc
erta
inty
[%]
1 7,443 0,106 1,4 7,839 0,074 0,92 14,57 0,19 1,3 15,07 0,09 0,63 21,50 0,23 1,1 22,00 0,12 0,64 30,34 0,38 1,3 31,16 0,17 0,55 42,76 0,52 1,2 43,75 0,23 0,56 47,09 0,50 1,1 50,67 0,27 0,57 52,00 0,49 0,9 57,66 0,31 0,58 62,34 0,58 0,9 63,46 0,34 0,59 67,22 0,70 1,0 68,79 0,37 0,5
page A-23 of A-86
comparison of means and reference values
0
1
2
3
4
5
6
7
8
9
1
level
mea
n in
mg
/l
overall mean reference values IC
PT 1/10 - TW A1
page A-24 of A-86
comparison of means and reference values
0
2
4
6
8
10
12
14
16
2
level
mea
n in
mg
/l
overall mean reference values IC
comparison of means and reference values
0
5
10
15
20
25
3
level
mea
n in
mg
/l
overall mean reference values IC

PT 1/10 - TW A1
page A-25 of A-86
comparison of means and reference values
0
5
10
15
20
25
30
35
4
level
mea
n in
mg
/l
overall mean reference values IC
comparison of means and reference values
0
5
10
15
20
25
30
35
40
45
50
5
level
mea
n in
mg
/l
overall mean reference values IC
PT 1/10 - TW A1
page A-26 of A-86
comparison of means and reference values
0
10
20
30
40
50
60
6
level
mea
n in
mg
/l
overall mean reference values IC
comparison of means and reference values
0
10
20
30
40
50
60
70
7
level
mea
n in
mg
/l
overall mean reference values IC
PT 1/10 - TW A1
page A-27 of A-86
comparison of means and reference values
0
10
20
30
40
50
60
70
8
level
mea
n in
mg
/l
overall mean reference values IC
comparison of means and reference values
0
10
20
30
40
50
60
70
80
9
level
mea
n in
mg
/l
overall mean reference values IC
PT 1/10 - TW A1
leve
l
robu
st m
ean
[mg/
l]
exp.
unc
erta
inty
of t
he m
ean
[mg/
l]
exp.
unc
erta
inty
of t
he m
ean
[%]
robu
st s
tand
ard
devi
atio
n [m
g/l]
robu
st s
tand
ard
devi
atio
n [%
]
num
ber
of r
esul
ts
out b
elow
out a
bove
out [
%]
1 7,403 0,055 0,7363 0,3321 4,4862 58 5 3 13,792 14,51 0,089 0,6148 0,5293 3,6474 55 6 3 16,363 21,48 0,133 0,6178 0,8156 3,7962 59 3 4 11,864 30,17 0,181 0,6015 1,0766 3,5687 55 5 2 12,735 42,87 0,238 0,5556 1,4634 3,4139 59 2 1 5,0856 47,09 0,262 0,5564 1,5404 3,2711 54 4 0 7,4077 51,78 0,24 0,4641 1,4641 2,8278 58 3 3 10,348 62,43 0,639 1,0234 3,959 6,3418 60 1 1 3,3339 67,29 0,363 0,5395 2,1736 3,23 56 6 2 14,29 page A-28 of A-86
IC
rel. standard dev. method specific
0
1
2
3
4
5
6
7
1 2 3 4 5 6 7 8 9
level
rel.
stan
dar
d d
ev. i
n %
overall mean IC
PT 1/10 - TW A1
leve
l
assi
gned
val
ue [m
g/l]
expa
nded
unc
erta
inty
of t
he
assi
gned
val
ue [%
]
stan
dard
dev
iatio
n, c
alcu
late
d us
ing
robu
st s
tatis
tics
[mg/
l]
stan
dard
dev
iatio
n fr
om v
aria
nce
func
tion
[mg/
l]
stan
dard
dev
iatio
n fo
r pr
ofic
ienc
y as
sess
men
t [m
g/l]
stan
dard
dev
iatio
n fo
r pr
ofic
ienc
y as
sess
men
t [%
]
uppe
r to
lera
nce
limit
[mg/
l]
low
er to
lera
nce
limit
[mg/
l]
uppe
r to
lera
nce
limit
[%]
low
er to
lera
nce
limit
[%]
num
ber
of r
esul
ts
out b
elow
out a
bove
out [
%]
1 0,1198 3,06 0,0125 0,0113 0,0113 9,44 0,1435 0,0981 19,86 -18,07 73 8 3 15,12 0,1852 2,34 0,0145 0,0144 0,0144 7,76 0,2152 0,1575 16,17 -14,97 70 6 3 12,93 0,2530 1,78 0,0150 0,0171 0,0171 6,75 0,2884 0,2199 13,98 -13,07 70 6 2 11,44 0,3222 1,54 0,0169 0,0195 0,0195 6,05 0,3625 0,2843 12,50 -11,77 73 6 1 9,65 0,3979 1,59 0,0213 0,0219 0,0219 5,51 0,4430 0,3552 11,34 -10,73 71 8 3 15,56 0,4423 1,55 0,0232 0,0232 0,0232 5,25 0,4901 0,3970 10,80 -10,24 72 9 4 18,17 0,4967 1,86 0,0307 0,0248 0,0248 5,00 0,5477 0,4482 10,26 -9,76 69 5 8 18,88 0,5490 1,24 0,0230 0,0262 0,0274 5,00 0,6053 0,4954 10,26 -9,76 72 5 1 8,39 0,5875 1,55 0,0303 0,0272 0,0294 5,00 0,6478 0,5301 10,26 -9,76 69 6 2 11,6
sum 639 59 27 13,5 Recovery and matrix content Slope of the regression line:1,0009, recovery: 100,09 %neg. x-axis-intercept = matrix content: 0 mg/lexpanded uncertainty of the matrix content: 0,0144 mg/l = 0 % page A-29 of A-86
nitrite
nitrite
0
0,1
0,2
0,3
0,4
0,5
0,6
0,7
0 0,1 0,2 0,3 0,4 0,5 0,6 0,7
added amount in mg/l
assi
gn
ed v
alu
e in
mg
/l
PT 1/10 - TW A1
Relative standard deviation and tolerance limits The standard deviation, calculated from the variance function, reached the lower limitfor three levels. page A-30 of A-86
nitrite
0
5
10
15
20
25
30
0 0,1 0,2 0,3 0,4 0,5 0,6 0,7
concentration in mg/l
rel.
stan
dar
d d
evia
tio
n in
%
nitrite
-20
-15
-10
-5
0
5
10
15
20
25
0 0,1 0,2 0,3 0,4 0,5 0,6 0,7
concentration in mg/l
tole
ran
ce li
mit
s in
%
PT 1/10 - TW A1
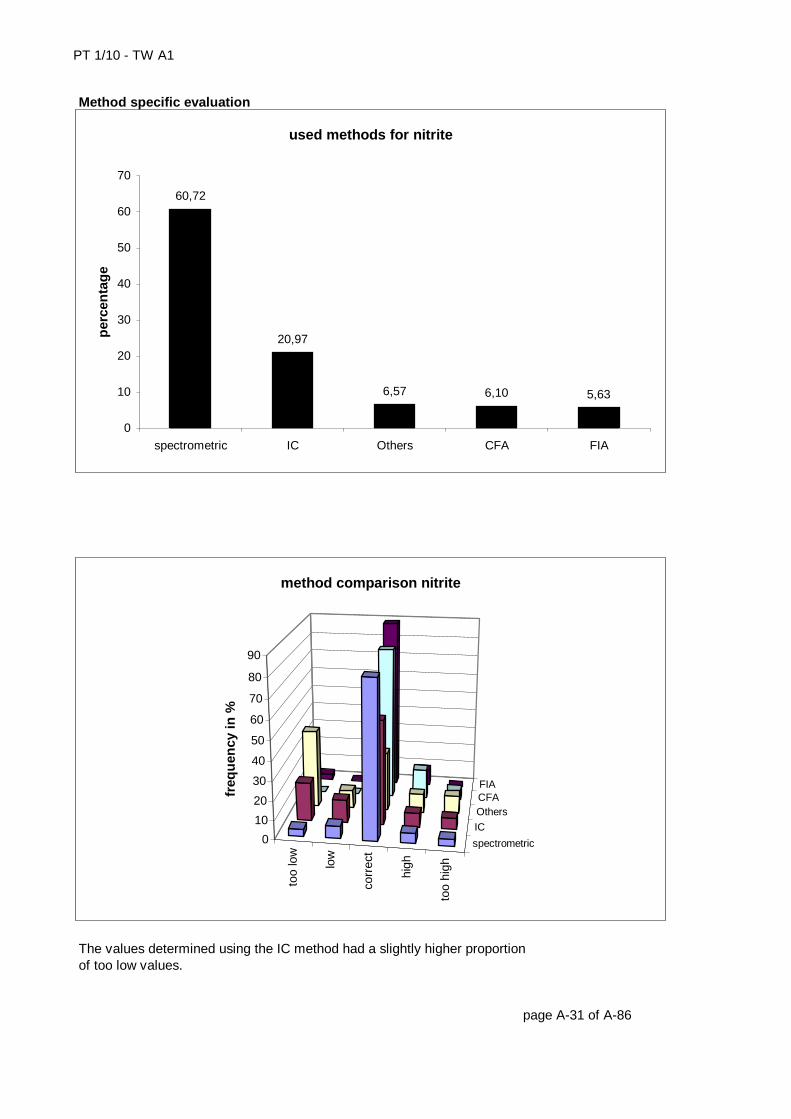
Method specific evaluation The values determined using the IC method had a slightly higher proportionof too low values. page A-31 of A-86
used methods for nitrite
60,72
20,97
6,57 6,10 5,63
0
10
20
30
40
50
60
70
spectrometric IC Others CFA FIA
per
cen
tag
e
too
low
low
corr
ect
high
too
high
spectrometric
IC
OthersCFAFIA
0
10
20
30
40
50
60
70
80
90
freq
uen
cy in
%
method comparison nitrite
PT 1/10 - TW A1
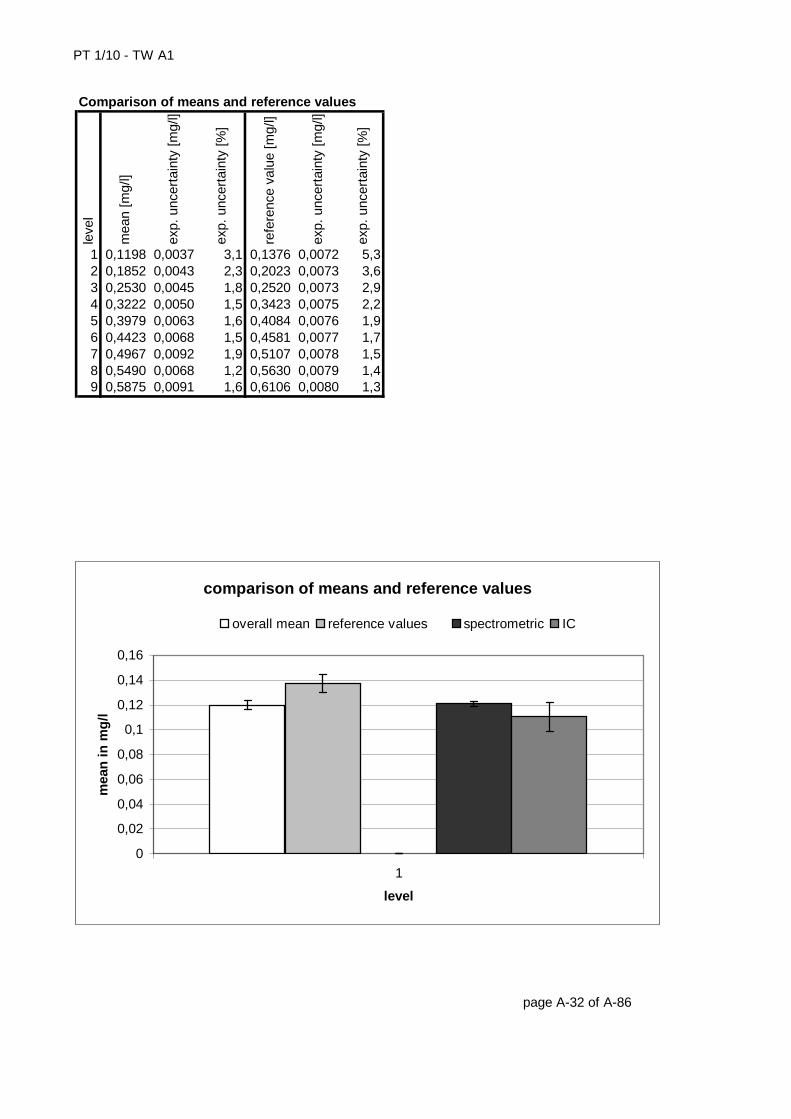
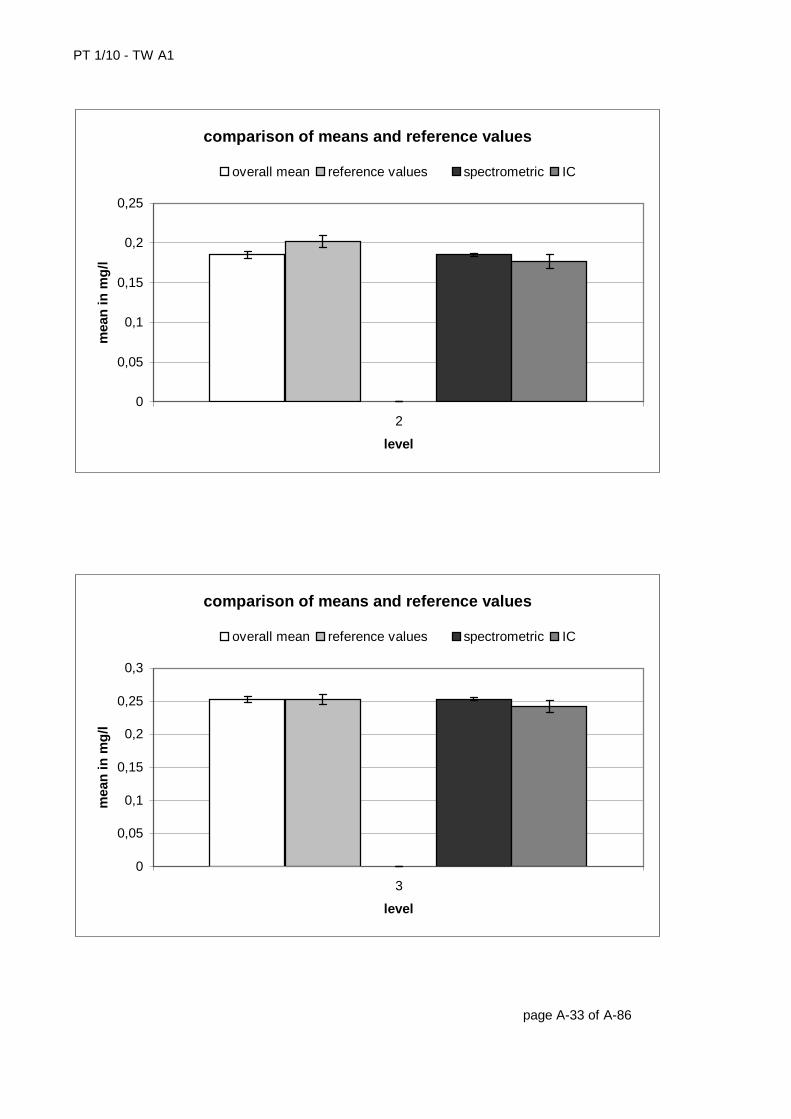
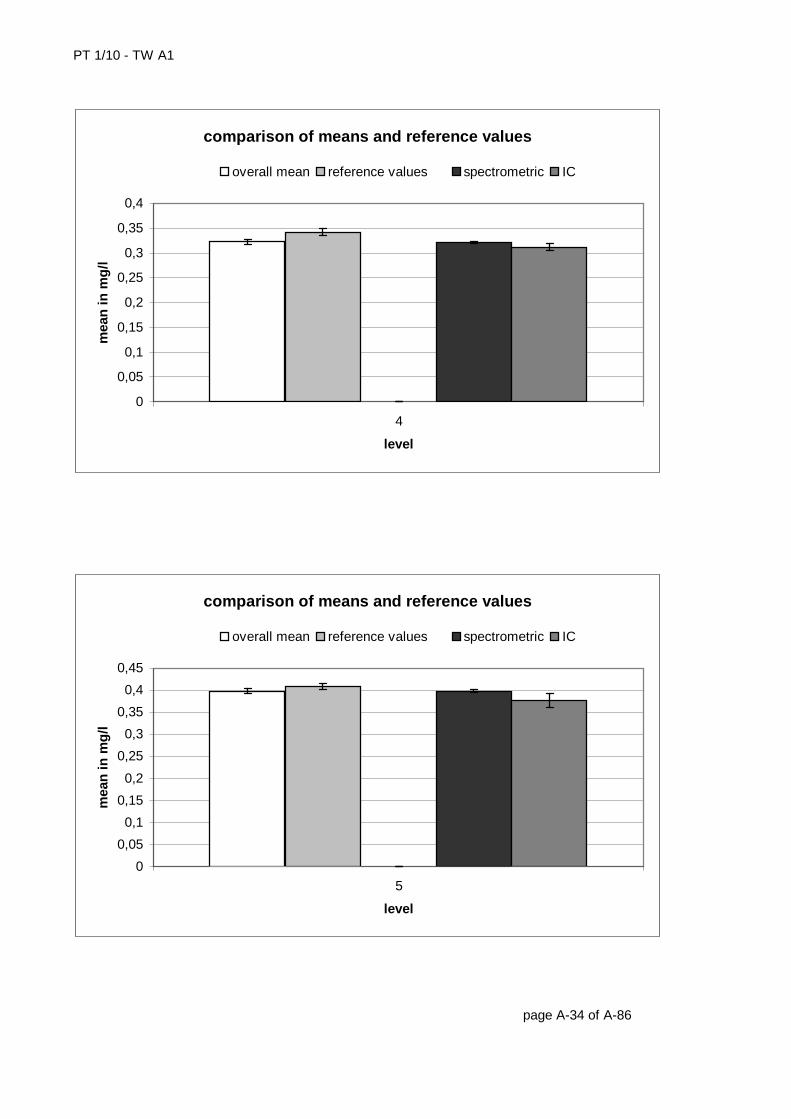
Comparison of means and reference valuesle
vel
mea
n [m
g/l]
exp.
unc
erta
inty
[mg/
l]
exp.
unc
erta
inty
[%]
refe
renc
e va
lue
[mg/
l]
exp.
unc
erta
inty
[mg/
l]
exp.
unc
erta
inty
[%]
1 0,1198 0,0037 3,1 0,1376 0,0072 5,32 0,1852 0,0043 2,3 0,2023 0,0073 3,63 0,2530 0,0045 1,8 0,2520 0,0073 2,94 0,3222 0,0050 1,5 0,3423 0,0075 2,25 0,3979 0,0063 1,6 0,4084 0,0076 1,96 0,4423 0,0068 1,5 0,4581 0,0077 1,77 0,4967 0,0092 1,9 0,5107 0,0078 1,58 0,5490 0,0068 1,2 0,5630 0,0079 1,49 0,5875 0,0091 1,6 0,6106 0,0080 1,3
page A-32 of A-86
comparison of means and reference values
0
0,02
0,04
0,06
0,08
0,1
0,12
0,14
0,16
1
level
mea
n in
mg
/l
overall mean reference values spectrometric IC
PT 1/10 - TW A1
page A-33 of A-86
comparison of means and reference values
0
0,05
0,1
0,15
0,2
0,25
2
level
mea
n in
mg
/l
overall mean reference values spectrometric IC
comparison of means and reference values
0
0,05
0,1
0,15
0,2
0,25
0,3
3
level
mea
n in
mg
/l
overall mean reference values spectrometric IC
PT 1/10 - TW A1
page A-34 of A-86
comparison of means and reference values
0
0,05
0,1
0,15
0,2
0,25
0,3
0,35
0,4
4
level
mea
n in
mg
/l
overall mean reference values spectrometric IC
comparison of means and reference values
0
0,05
0,1
0,15
0,2
0,25
0,3
0,35
0,4
0,45
5
level
mea
n in
mg
/l
overall mean reference values spectrometric IC
PT 1/10 - TW A1
page A-35 of A-86
comparison of means and reference values
0
0,05
0,1
0,15
0,2
0,25
0,3
0,35
0,4
0,45
0,5
6
level
mea
n in
mg
/l
overall mean reference values spectrometric IC
comparison of means and reference values
0
0,1
0,2
0,3
0,4
0,5
0,6
7
level
mea
n in
mg
/l
overall mean reference values spectrometric IC
PT 1/10 - TW A1
page A-36 of A-86
comparison of means and reference values
0
0,1
0,2
0,3
0,4
0,5
0,6
8
level
mea
n in
mg
/l
overall mean reference values spectrometric IC
comparison of means and reference values
0
0,1
0,2
0,3
0,4
0,5
0,6
0,7
9
level
mea
n in
mg
/l
overall mean reference values spectrometric IC
PT 1/10 - TW A1
leve
l
robu
st m
ean
[mg/
l]
exp.
unc
erta
inty
of t
he m
ean
[mg/
l]
exp.
unc
erta
inty
of t
he m
ean
[%]
robu
st s
tand
ard
devi
atio
n [m
g/l]
robu
st s
tand
ard
devi
atio
n [%
]
num
ber
of r
esul
ts
out b
elow
out a
bove
out [
%]
1 0,121 0,0019 1,5603 0,0105 8,6479 48 4 2 12,52 0,1851 0,002 1,088 0,0102 5,5048 40 2 1 7,53 0,2532 0,0024 0,9666 0,0127 5,0114 42 3 1 9,5244 0,321 0,0024 0,7448 0,0128 3,9972 45 1 3 8,8895 0,3978 0,0027 0,6874 0,0145 3,6478 44 2 2 9,0916 0,4386 0,0032 0,741 0,0176 4,0204 46 6 4 21,747 0,4972 0,0041 0,8299 0,0219 4,4037 44 2 5 15,918 0,548 0,0035 0,6388 0,0177 3,2321 40 2 2 109 0,5858 0,0039 0,6611 0,0193 3,303 39 3 1 10,26 page A-37 of A-86
spectrometric
rel. standard dev. method specific
0
5
10
15
20
25
30
35
1 2 3 4 5 6 7 8 9
level
rel.
stan
dar
d d
ev. i
n %
overall mean spectrometric IC
PT 1/10 - TW A1
leve
l
robu
st m
ean
[mg/
l]
exp.
unc
erta
inty
of t
he m
ean
[mg/
l]
exp.
unc
erta
inty
of t
he m
ean
[%]
robu
st s
tand
ard
devi
atio
n [m
g/l]
robu
st s
tand
ard
devi
atio
n [%
]
num
ber
of r
esul
ts
out b
elow
out a
bove
out [
%]
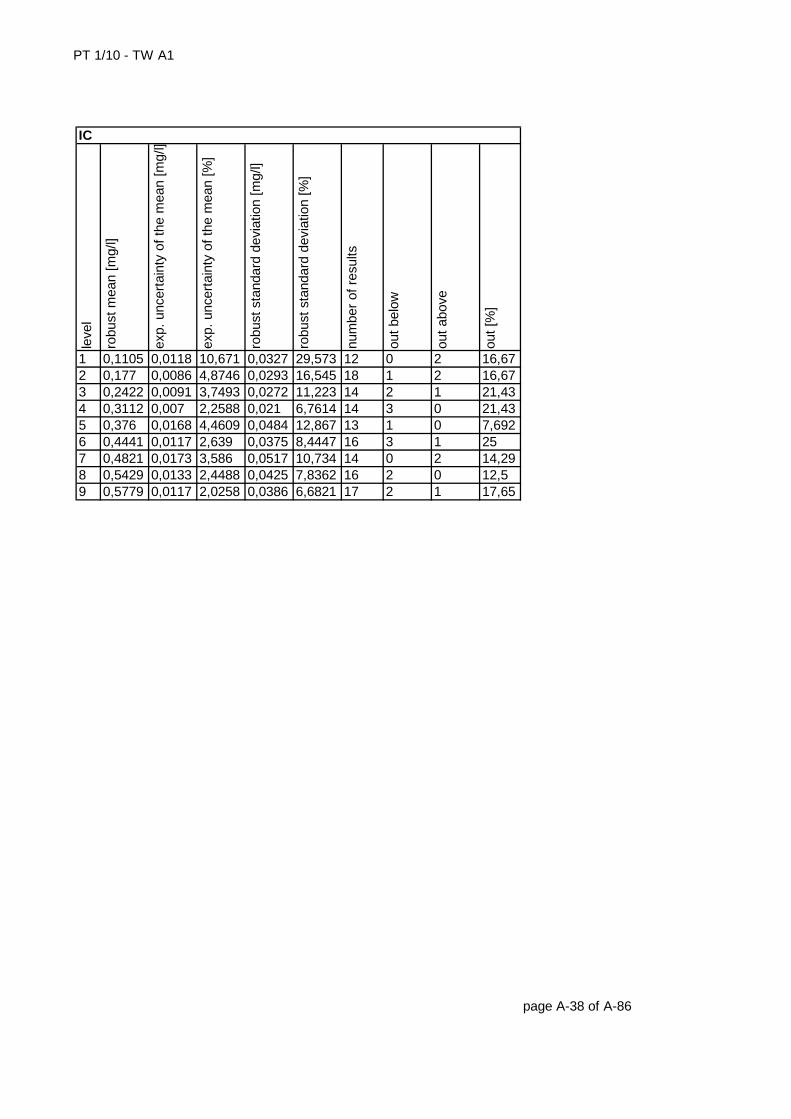
1 0,1105 0,0118 10,671 0,0327 29,573 12 0 2 16,672 0,177 0,0086 4,8746 0,0293 16,545 18 1 2 16,673 0,2422 0,0091 3,7493 0,0272 11,223 14 2 1 21,434 0,3112 0,007 2,2588 0,021 6,7614 14 3 0 21,435 0,376 0,0168 4,4609 0,0484 12,867 13 1 0 7,6926 0,4441 0,0117 2,639 0,0375 8,4447 16 3 1 257 0,4821 0,0173 3,586 0,0517 10,734 14 0 2 14,298 0,5429 0,0133 2,4488 0,0425 7,8362 16 2 0 12,59 0,5779 0,0117 2,0258 0,0386 6,6821 17 2 1 17,65 page A-38 of A-86
IC
PT 1/10 - TW A1
9
leve
l
assi
gned
val
ue [m
g/l]
expa
nded
unc
erta
inty
of t
he
assi
gned
val
ue [%
]
stan
dard
dev
iatio
n, c
alcu
late
d us
ing
robu
st s
tatis
tics
[mg/
l]
stan
dard
dev
iatio
n fr
om v
aria
nce
func
tion
[mg/
l]
stan
dard
dev
iatio
n fo
r pr
ofic
ienc
y as
sess
men
t [m
g/l]
stan
dard
dev
iatio
n fo
r pr
ofic
ienc
y as
sess
men
t [%
]
uppe
r to
lera
nce
limit
[mg/
l]
low
er to
lera
nce
limit
[mg/
l]
uppe
r to
lera
nce
limit
[%]
low
er to
lera
nce
limit
[%]
num
ber
of r
esul
ts
out b
elow
out a
bove
out [
%]
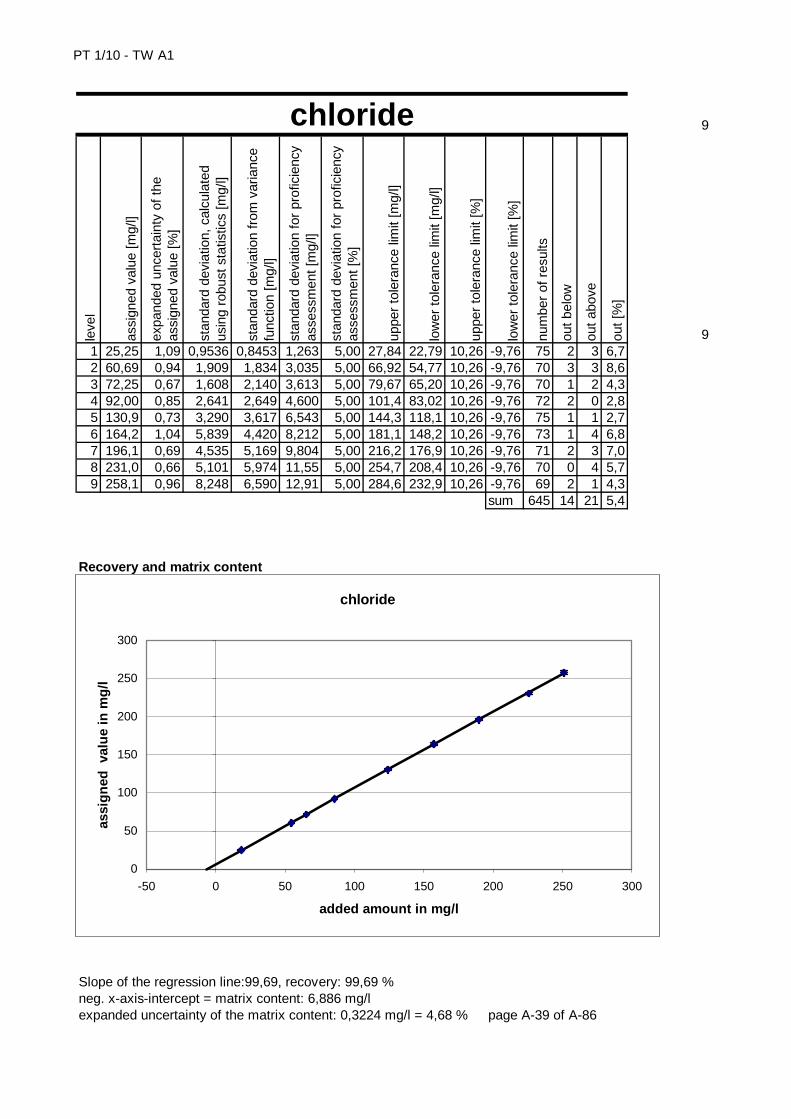
91 25,25 1,09 0,9536 0,8453 1,263 5,00 27,84 22,79 10,26 -9,76 75 2 3 6,72 60,69 0,94 1,909 1,834 3,035 5,00 66,92 54,77 10,26 -9,76 70 3 3 8,63 72,25 0,67 1,608 2,140 3,613 5,00 79,67 65,20 10,26 -9,76 70 1 2 4,34 92,00 0,85 2,641 2,649 4,600 5,00 101,4 83,02 10,26 -9,76 72 2 0 2,85 130,9 0,73 3,290 3,617 6,543 5,00 144,3 118,1 10,26 -9,76 75 1 1 2,76 164,2 1,04 5,839 4,420 8,212 5,00 181,1 148,2 10,26 -9,76 73 1 4 6,87 196,1 0,69 4,535 5,169 9,804 5,00 216,2 176,9 10,26 -9,76 71 2 3 7,08 231,0 0,66 5,101 5,974 11,55 5,00 254,7 208,4 10,26 -9,76 70 0 4 5,79 258,1 0,96 8,248 6,590 12,91 5,00 284,6 232,9 10,26 -9,76 69 2 1 4,3
sum 645 14 21 5,4 Recovery and matrix content Slope of the regression line:99,69, recovery: 99,69 %neg. x-axis-intercept = matrix content: 6,886 mg/lexpanded uncertainty of the matrix content: 0,3224 mg/l = 4,68 % page A-39 of A-86
chloride
chloride
0
50
100
150
200
250
300
-50 0 50 100 150 200 250 300
added amount in mg/l
assi
gn
ed v
alu
e in
mg
/l
PT 1/10 - TW A1
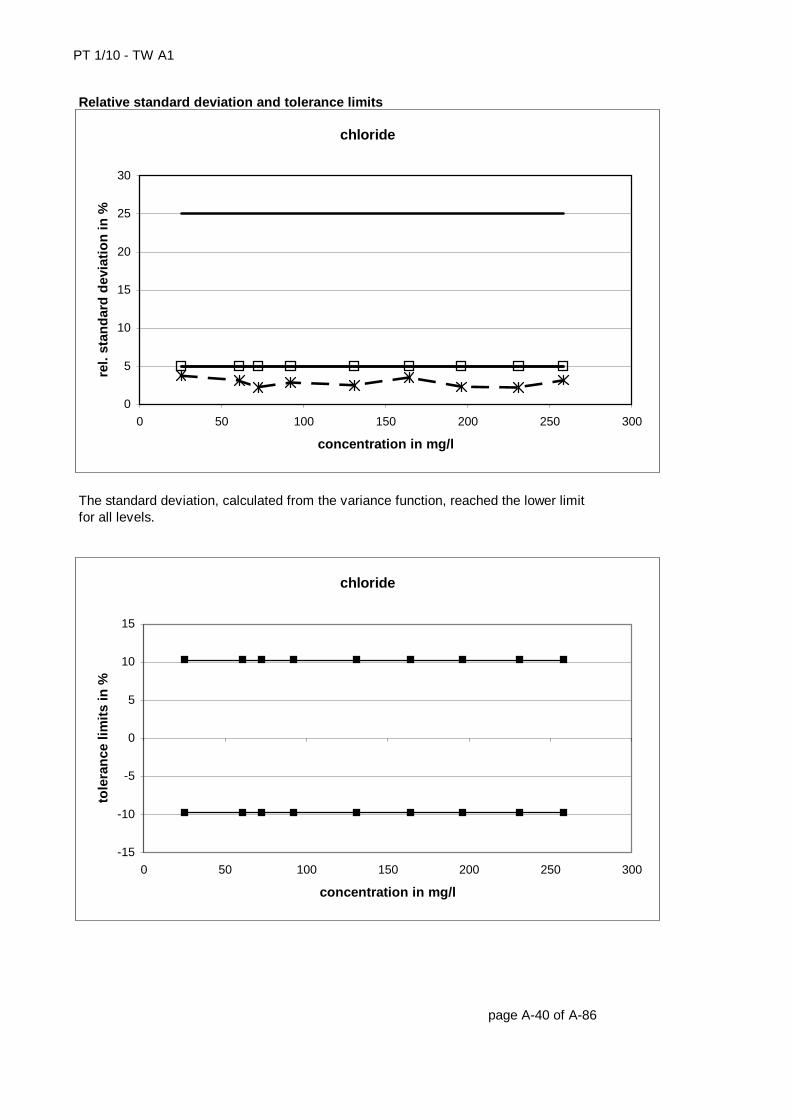
Relative standard deviation and tolerance limits The standard deviation, calculated from the variance function, reached the lower limitfor all levels. page A-40 of A-86
chloride
0
5
10
15
20
25
30
0 50 100 150 200 250 300
concentration in mg/l
rel.
stan
dar
d d
evia
tio
n in
%
chloride
-15
-10
-5
0
5
10
15
0 50 100 150 200 250 300
concentration in mg/l
tole
ran
ce li
mit
s in
%
PT 1/10 - TW A1
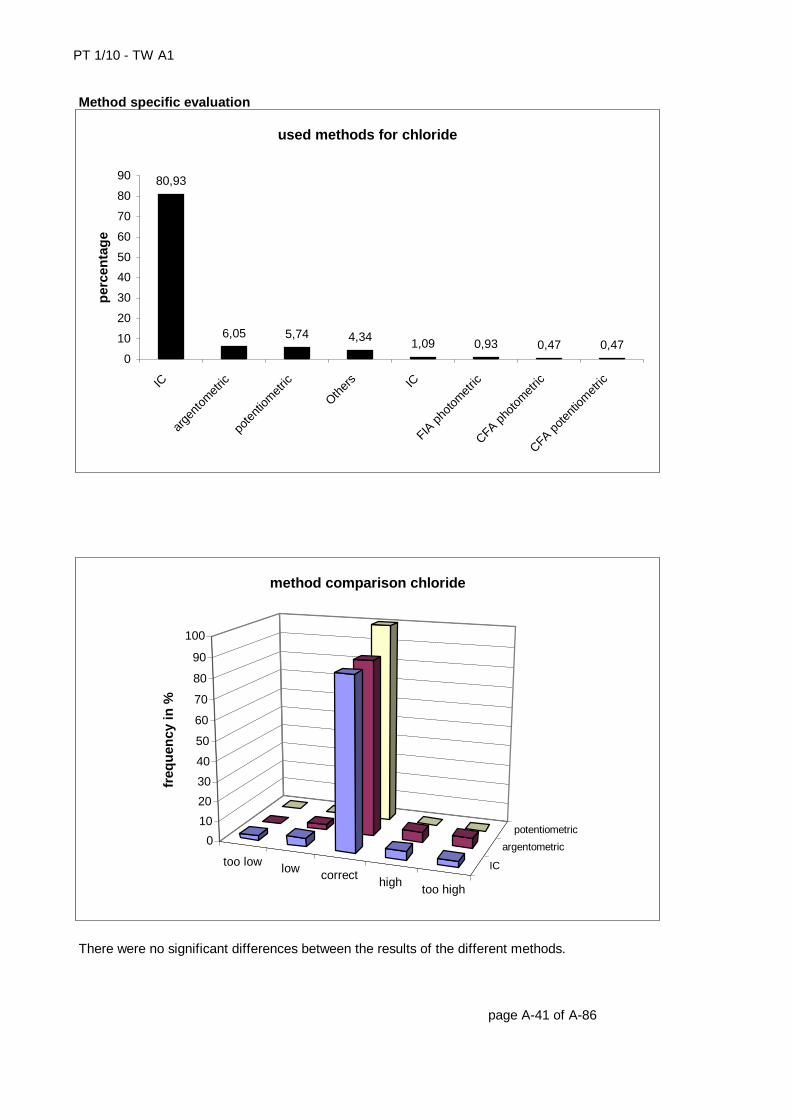
Method specific evaluation There were no significant differences between the results of the different methods. page A-41 of A-86
used methods for chloride
80,93
6,05 5,74 4,34 1,09 0,93 0,47 0,470
10
20
30
40
50
60
70
80
90
IC
arge
ntom
etric
pote
ntiom
etric
Other
s IC
FIA p
hoto
met
ric
CFA pho
tom
etric
CFA pot
entio
met
ric
per
cen
tag
e
too low low correcthigh
too high
IC
argentometric
potentiometric0
10
20
30
40
50
60
70
80
90
100
freq
uen
cy in
%
method comparison chloride
PT 1/10 - TW A1
Comparison of means and reference valuesle
vel
mea
n [m
g/l]
exp.
unc
erta
inty
[mg/
l]
exp.
unc
erta
inty
[%]
refe
renc
e va
lue
[mg/
l]
exp.
unc
erta
inty
[mg/
l]
exp.
unc
erta
inty
[%]
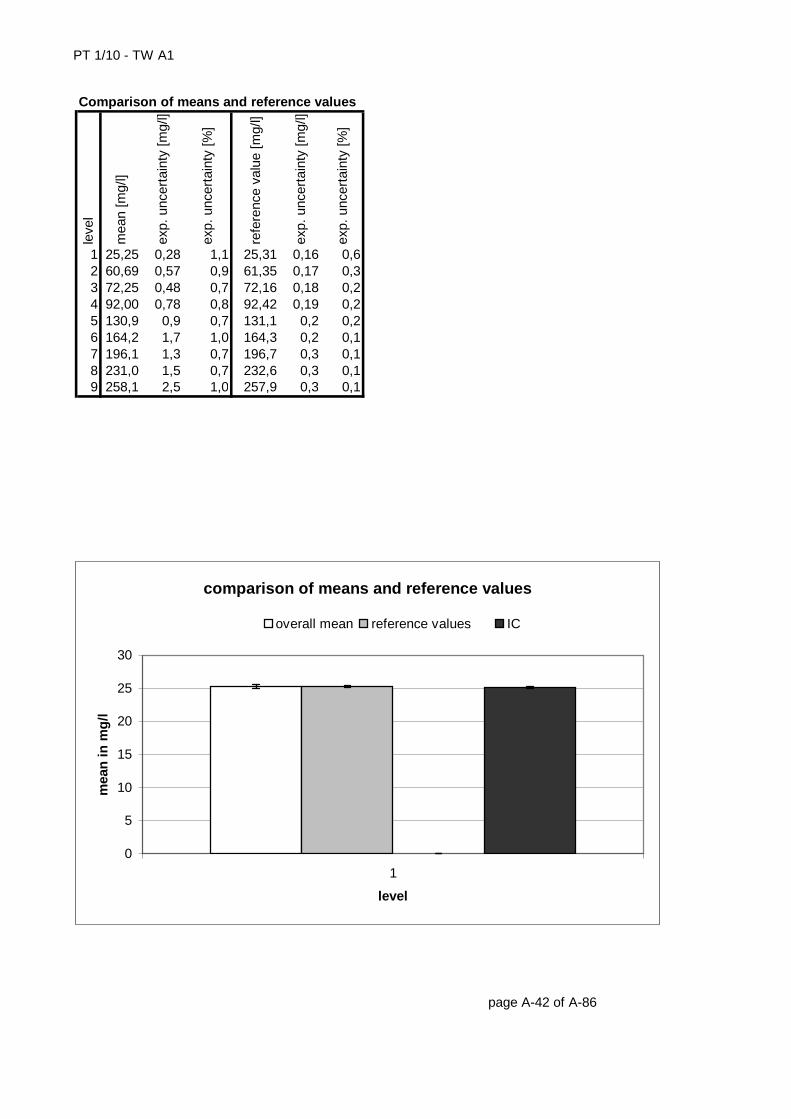
1 25,25 0,28 1,1 25,31 0,16 0,62 60,69 0,57 0,9 61,35 0,17 0,33 72,25 0,48 0,7 72,16 0,18 0,24 92,00 0,78 0,8 92,42 0,19 0,25 130,9 0,9 0,7 131,1 0,2 0,26 164,2 1,7 1,0 164,3 0,2 0,17 196,1 1,3 0,7 196,7 0,3 0,18 231,0 1,5 0,7 232,6 0,3 0,19 258,1 2,5 1,0 257,9 0,3 0,1
page A-42 of A-86
comparison of means and reference values
0
5
10
15
20
25
30
1
level
mea
n in
mg
/l
overall mean reference values IC
PT 1/10 - TW A1
page A-43 of A-86
comparison of means and reference values
0
10
20
30
40
50
60
70
2
level
mea
n in
mg
/l
overall mean reference values IC
comparison of means and reference values
0
10
20
30
40
50
60
70
80
3
level
mea
n in
mg
/l
overall mean reference values IC
PT 1/10 - TW A1
page A-44 of A-86
comparison of means and reference values
0
10
20
30
40
50
60
70
80
90
100
4
level
mea
n in
mg
/l
overall mean reference values IC
comparison of means and reference values
0
20
40
60
80
100
120
140
5
level
mea
n in
mg
/l
overall mean reference values IC
PT 1/10 - TW A1
page A-45 of A-86
comparison of means and reference values
0
20
40
60
80
100
120
140
160
180
6
level
mea
n in
mg
/l
overall mean reference values IC
comparison of means and reference values
0
50
100
150
200
250
7
level
mea
n in
mg
/l
overall mean reference values IC
PT 1/10 - TW A1
page A-46 of A-86
comparison of means and reference values
0
50
100
150
200
250
8
level
mea
n in
mg
/l
overall mean reference values IC
comparison of means and reference values
0
50
100
150
200
250
300
9
level
mea
n in
mg
/l
overall mean reference values IC
PT 1/10 - TW A1
leve
l
robu
st m
ean
[mg/
l]
exp.
unc
erta
inty
of t
he m
ean
[mg/
l]
exp.
unc
erta
inty
of t
he m
ean
[%]
robu
st s
tand
ard
devi
atio
n [m
g/l]
robu
st s
tand
ard
devi
atio
n [%
]
num
ber
of r
esul
ts
out b
elow
out a
bove
out [
%]
1 25,16 0,13 0,5171 0,7856 3,123 57 4 6 17,542 60,5 0,321 0,5303 1,9378 3,203 57 3 1 7,0183 72,14 0,279 0,3874 1,7464 2,421 61 3 4 11,484 92,13 0,468 0,5078 2,85 3,094 58 4 3 12,075 130,8 0,543 0,4152 3,3075 2,53 58 5 3 13,796 164,6 1,024 0,6222 6,346 3,856 60 3 5 13,337 195,7 0,75 0,3831 4,5672 2,334 58 3 1 6,8978 231,2 0,936 0,4047 5,5511 2,401 55 3 3 10,919 258,4 1,479 0,5723 9,0096 3,487 58 3 3 10,34 page A-47 of A-86
IC
rel. standard dev. method specific
0
0,5
1
1,5
2
2,5
3
3,5
4
4,5
1 2 3 4 5 6 7 8 9
level
rel.
stan
dar
d d
ev. i
n %
overall mean IC
PT 1/10 - TW A1
10
leve
l
assi
gned
val
ue [m
g/l]
expa
nded
unc
erta
inty
of t
he
assi
gned
val
ue [%
]
stan
dard
dev
iatio
n, c
alcu
late
d us
ing
robu
st s
tatis
tics
[mg/
l]
stan
dard
dev
iatio
n fr
om v
aria
nce
func
tion
[mg/
l]
stan
dard
dev
iatio
n fo
r pr
ofic
ienc
y as
sess
men
t [m
g/l]
stan
dard
dev
iatio
n fo
r pr
ofic
ienc
y as
sess
men
t [%
]
uppe
r to
lera
nce
limit
[mg/
l]
low
er to
lera
nce
limit
[mg/
l]
uppe
r to
lera
nce
limit
[%]
low
er to
lera
nce
limit
[%]
num
ber
of r
esul
ts
out b
elow
out a
bove
out [
%]
9,51 51,32 0,96 1,630 1,654 2,566 5,00 56,59 46,31 10,26 -9,76 68 5 2 10,32 62,80 1,17 2,570 1,992 3,140 5,00 69,24 56,67 10,26 -9,76 76 5 5 13,23 91,20 0,74 2,270 2,809 4,560 5,00 100,6 82,30 10,26 -9,76 70 2 0 2,94 112,5 0,69 2,543 3,408 5,625 5,00 124,1 101,5 10,26 -9,76 68 0 1 1,55 143,0 0,83 3,977 4,252 7,152 5,00 157,7 129,1 10,26 -9,76 70 1 0 1,46 159,1 1,02 5,488 4,689 7,953 5,00 175,4 143,5 10,26 -9,76 72 2 2 5,67 201,6 1,03 7,016 5,831 10,08 5,00 222,2 181,9 10,26 -9,76 72 2 2 5,68 229,9 0,86 6,810 6,581 11,49 5,00 253,4 207,4 10,26 -9,76 75 1 1 2,79 256,9 0,77 6,693 7,292 12,85 5,00 283,3 231,8 10,26 -9,76 71 2 1 4,2
sum 642 20 14 5,3 Recovery and matrix content Slope of the regression line:1,003, recovery: 100,3 %neg. x-axis-intercept = matrix content: 33,87 mg/lexpanded uncertainty of the matrix content: 0,645 mg/l = 1,9% page A-48 of A-86
sulfate
sulfate
0
50
100
150
200
250
300
-50 0 50 100 150 200 250
added amount in mg/l
assi
gn
ed v
alu
e in
mg
/l

PT 1/10 - TW A1
Relative standard deviation and tolerance limits The standard deviation, calculated from the variance function, reached the lower limitfor all levels. page A-49 of A-86
sulfate
0
5
10
15
20
25
30
0 50 100 150 200 250 300
concentration in mg/l
rel.
stan
dar
d d
evia
tio
n in
%
sulfate
-15
-10
-5
0
5
10
15
0 50 100 150 200 250 300
concentration in mg/l
tole
ran
ce li
mit
s in
%
PT 1/10 - TW A1
Method specific evaluation There were no significant differences between the results of the different methods. page A-50 of A-86
used methods for sulfate
83,80
11,37
3,43 1,400
10
20
30
40
50
60
70
80
90
IC Others komplexometric gravimetric
per
cen
tag
e
too lowlow
correcthigh
too high
IC
Others0
10
20
30
40
50
60
70
80
90
freq
uen
cy in
%
method comparison sulfate
PT 1/10 - TW A1
Comparison of means and reference valuesle
vel
mea
n [m
g/l]
exp.
unc
erta
inty
[mg/
l]
exp.
unc
erta
inty
[%]
refe
renc
e va
lue
[mg/
l]
exp.
unc
erta
inty
[mg/
l]
exp.
unc
erta
inty
[%]
1 51,32 0,49 1,0 51,00 0,32 0,62 62,80 0,74 1,2 62,87 0,33 0,53 91,20 0,68 0,7 90,94 0,35 0,44 112,5 0,8 0,7 112,7 0,4 0,35 143,0 1,2 0,8 142,5 0,4 0,36 159,1 1,6 1,0 158,5 0,4 0,37 201,6 2,1 1,0 201,5 0,5 0,28 229,9 2,0 0,9 228,0 0,6 0,29 256,9 2,0 0,8 256,3 0,6 0,2
page A-51 of A-86
comparison of means and reference values
0
10
20
30
40
50
60
1
level
mea
n in
mg
/l
overall mean reference values IC Others
PT 1/10 - TW A1
page A-52 of A-86
comparison of means and reference values
0
10
20
30
40
50
60
70
2
level
mea
n in
mg
/l
overall mean reference values IC Others
comparison of means and reference values
0
10
20
30
40
50
60
70
80
90
100
3
level
mea
n in
mg
/l
overall mean reference values IC Others
PT 1/10 - TW A1
page A-53 of A-86
comparison of means and reference values
0
20
40
60
80
100
120
4
level
mea
n in
mg
/l
overall mean reference values IC Others
comparison of means and reference values
0
20
40
60
80
100
120
140
160
5
level
mea
n in
mg
/l
overall mean reference values IC Others
PT 1/10 - TW A1
page A-54 of A-86
comparison of means and reference values
0
20
40
60
80
100
120
140
160
180
6
level
mea
n in
mg
/l
overall mean reference values IC Others
comparison of means and reference values
0
50
100
150
200
250
7
level
mea
n in
mg
/l
overall mean reference values IC Others
PT 1/10 - TW A1
page A-55 of A-86
comparison of means and reference values
0
50
100
150
200
250
8
level
mea
n in
mg
/l
overall mean reference values IC Others
comparison of means and reference values
0
50
100
150
200
250
300
9
level
mea
n in
mg
/l
overall mean reference values IC Others
PT 1/10 - TW A1
leve
l
robu
st m
ean
[mg/
l]
exp.
unc
erta
inty
of t
he m
ean
[mg/
l]
exp.
unc
erta
inty
of t
he m
ean
[%]
robu
st s
tand
ard
devi
atio
n [m
g/l]
robu
st s
tand
ard
devi
atio
n [%
]
num
ber
of r
esul
ts
out b
elow
out a
bove
out [
%]
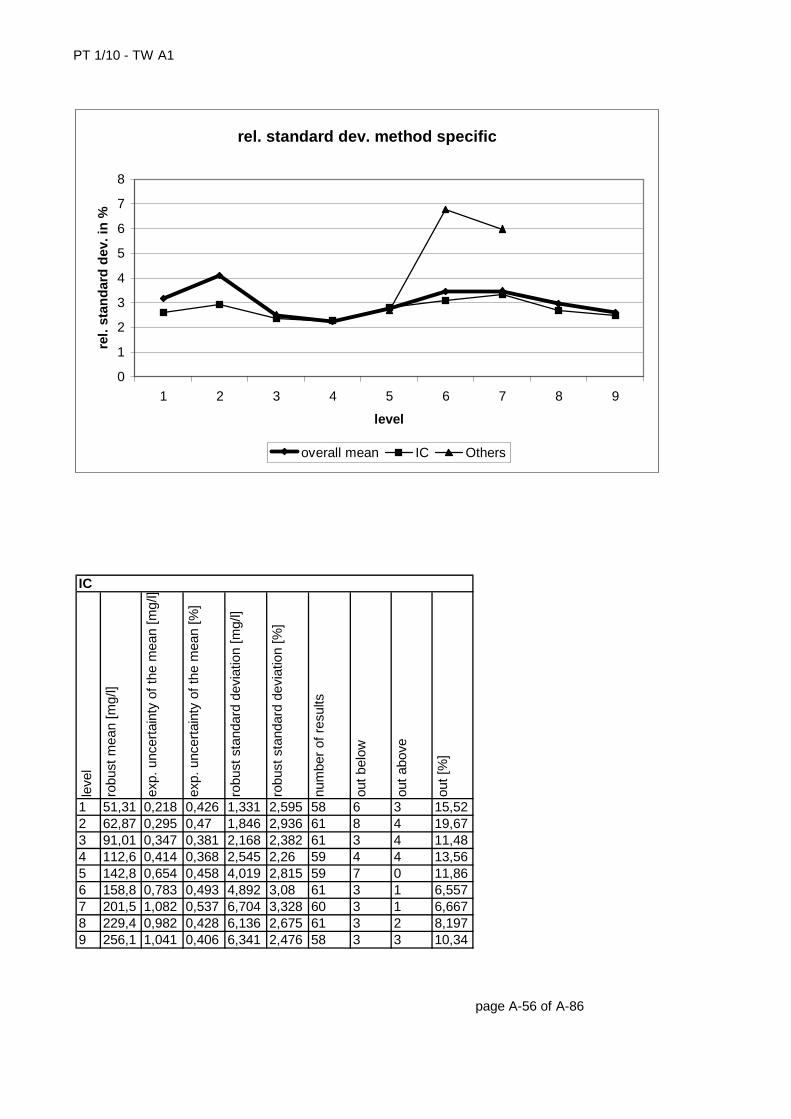
1 51,31 0,218 0,426 1,331 2,595 58 6 3 15,522 62,87 0,295 0,47 1,846 2,936 61 8 4 19,673 91,01 0,347 0,381 2,168 2,382 61 3 4 11,484 112,6 0,414 0,368 2,545 2,26 59 4 4 13,565 142,8 0,654 0,458 4,019 2,815 59 7 0 11,866 158,8 0,783 0,493 4,892 3,08 61 3 1 6,5577 201,5 1,082 0,537 6,704 3,328 60 3 1 6,6678 229,4 0,982 0,428 6,136 2,675 61 3 2 8,1979 256,1 1,041 0,406 6,341 2,476 58 3 3 10,34 page A-56 of A-86
IC
rel. standard dev. method specific
0
1
2
3
4
5
6
7
8
1 2 3 4 5 6 7 8 9
level
rel.
stan
dar
d d
ev. i
n %
overall mean IC Others
PT 1/10 - TW A1
leve
l
robu
st m
ean
[mg/
l]
exp.
unc
erta
inty
of t
he m
ean
[mg/
l]
exp.
unc
erta
inty
of t
he m
ean
[%]
robu
st s
tand
ard
devi
atio
n [m
g/l]
robu
st s
tand
ard
devi
atio
n [%
]
num
ber
of r
esul
ts
out b
elow
out a
bove
out [
%]
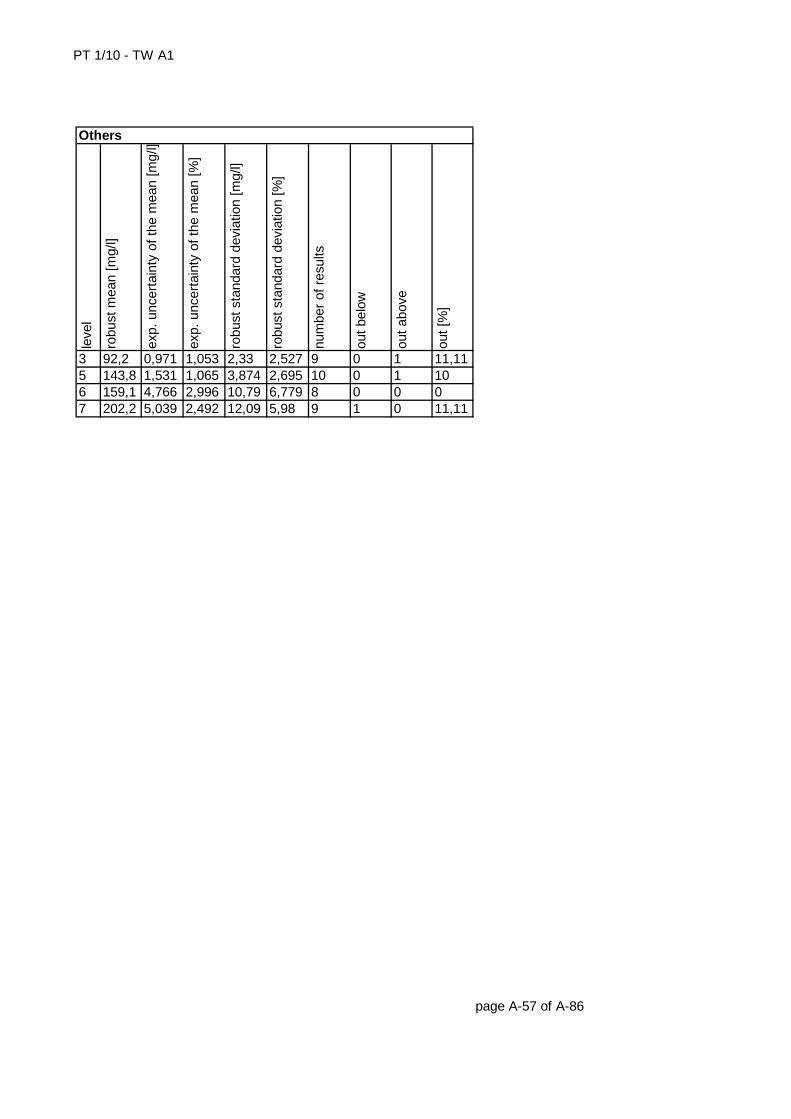
3 92,2 0,971 1,053 2,33 2,527 9 0 1 11,115 143,8 1,531 1,065 3,874 2,695 10 0 1 106 159,1 4,766 2,996 10,79 6,779 8 0 0 07 202,2 5,039 2,492 12,09 5,98 9 1 0 11,11 page A-57 of A-86
Others
PT 1/10 - TW A1
leve
l
assi
gned
val
ue [m
g/l]
expa
nded
unc
erta
inty
of t
he
assi
gned
val
ue [%
]
stan
dard
dev
iatio
n, c
alcu
late
d us
ing
robu
st s
tatis
tics
[mg/
l]
stan
dard
dev
iatio
n fr
om v
aria
nce
func
tion
[mg/
l]
stan
dard
dev
iatio
n fo
r pr
ofic
ienc
y as
sess
men
t [m
g/l]
stan
dard
dev
iatio
n fo
r pr
ofic
ienc
y as
sess
men
t [%
]
uppe
r to
lera
nce
limit
[mg/
l]
low
er to
lera
nce
limit
[mg/
l]
uppe
r to
lera
nce
limit
[%]
low
er to
lera
nce
limit
[%]
num
ber
of r
esul
ts
out b
elow
out a
bove
out [
%]
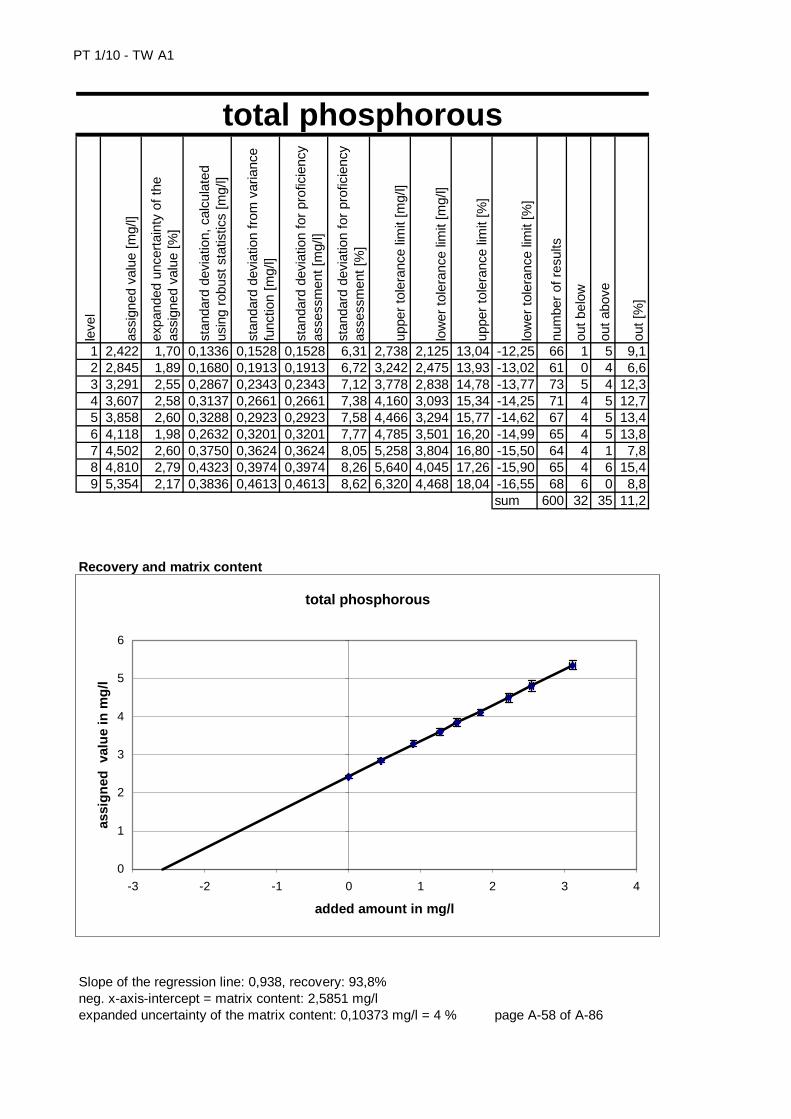
1 2,422 1,70 0,1336 0,1528 0,1528 6,31 2,738 2,125 13,04 -12,25 66 1 5 9,12 2,845 1,89 0,1680 0,1913 0,1913 6,72 3,242 2,475 13,93 -13,02 61 0 4 6,63 3,291 2,55 0,2867 0,2343 0,2343 7,12 3,778 2,838 14,78 -13,77 73 5 4 12,34 3,607 2,58 0,3137 0,2661 0,2661 7,38 4,160 3,093 15,34 -14,25 71 4 5 12,75 3,858 2,60 0,3288 0,2923 0,2923 7,58 4,466 3,294 15,77 -14,62 67 4 5 13,46 4,118 1,98 0,2632 0,3201 0,3201 7,77 4,785 3,501 16,20 -14,99 65 4 5 13,87 4,502 2,60 0,3750 0,3624 0,3624 8,05 5,258 3,804 16,80 -15,50 64 4 1 7,88 4,810 2,79 0,4323 0,3974 0,3974 8,26 5,640 4,045 17,26 -15,90 65 4 6 15,49 5,354 2,17 0,3836 0,4613 0,4613 8,62 6,320 4,468 18,04 -16,55 68 6 0 8,8
sum 600 32 35 11,2 Recovery and matrix content Slope of the regression line: 0,938, recovery: 93,8%neg. x-axis-intercept = matrix content: 2,5851 mg/lexpanded uncertainty of the matrix content: 0,10373 mg/l = 4 % page A-58 of A-86
total phosphorous
total phosphorous
0
1
2
3
4
5
6
-3 -2 -1 0 1 2 3 4
added amount in mg/l
assi
gn
ed v
alu
e in
mg
/l
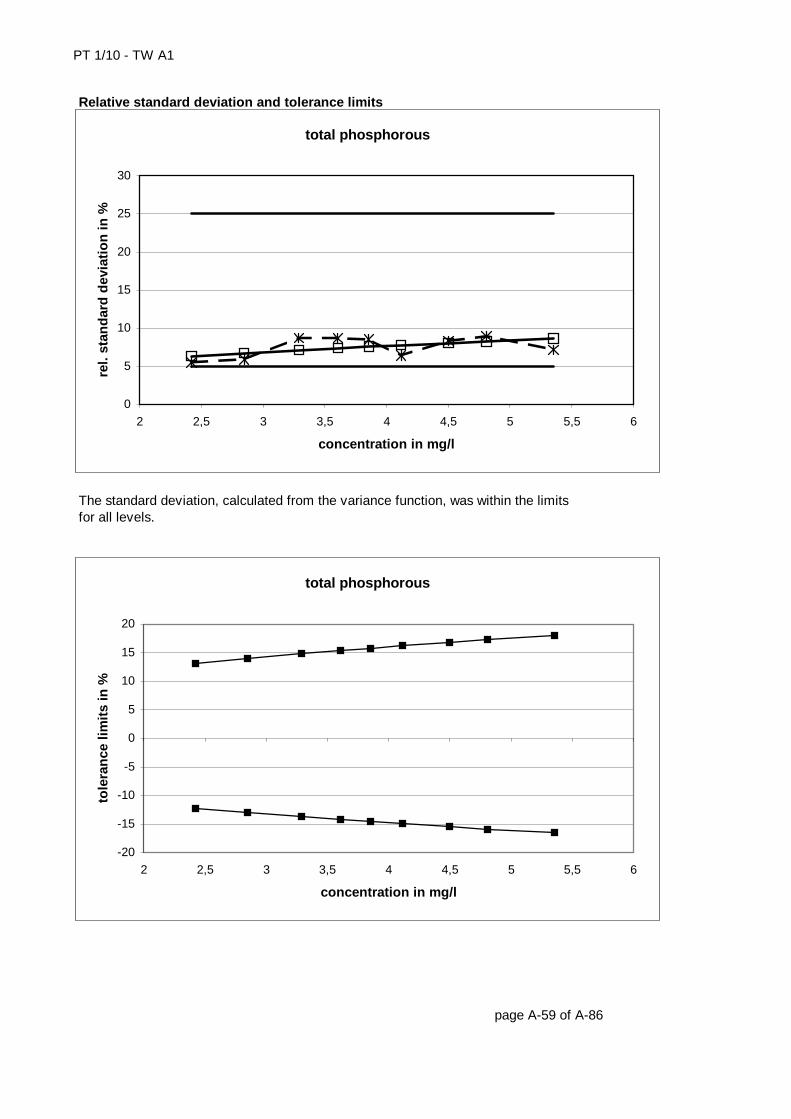
PT 1/10 - TW A1
Relative standard deviation and tolerance limits The standard deviation, calculated from the variance function, was within the limitsfor all levels. page A-59 of A-86
total phosphorous
0
5
10
15
20
25
30
2 2,5 3 3,5 4 4,5 5 5,5 6
concentration in mg/l
rel.
stan
dar
d d
evia
tio
n in
%
total phosphorous
-20
-15
-10
-5
0
5
10
15
20
2 2,5 3 3,5 4 4,5 5 5,5 6
concentration in mg/l
tole
ran
ce li
mit
s in
%
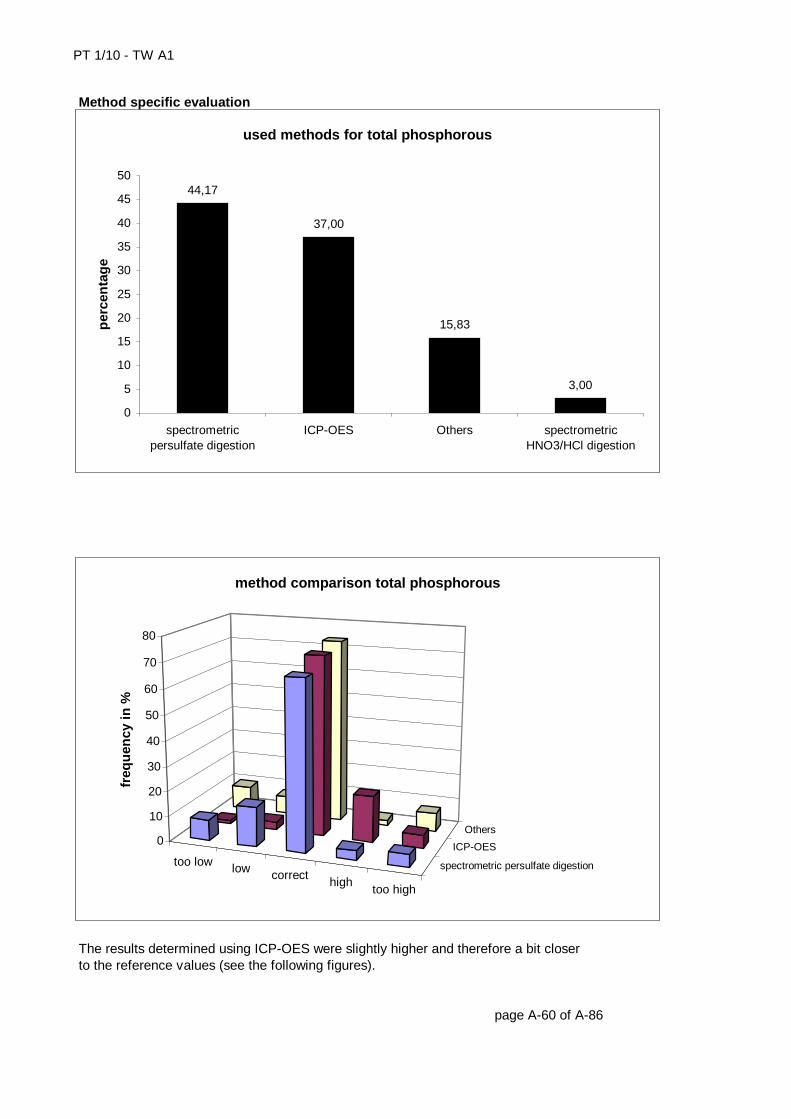
PT 1/10 - TW A1
Method specific evaluation The results determined using ICP-OES were slightly higher and therefore a bit closerto the reference values (see the following figures). page A-60 of A-86
used methods for total phosphorous
44,17
37,00
15,83
3,00
0
5
10
15
20
25
30
35
40
45
50
spectrometricpersulfate digestion
ICP-OES Others spectrometricHNO3/HCl digestion
per
cen
tag
e
too low low correcthigh
too high
spectrometric persulfate digestion
ICP-OES
Others0
10
20
30
40
50
60
70
80
freq
uen
cy in
%
method comparison total phosphorous
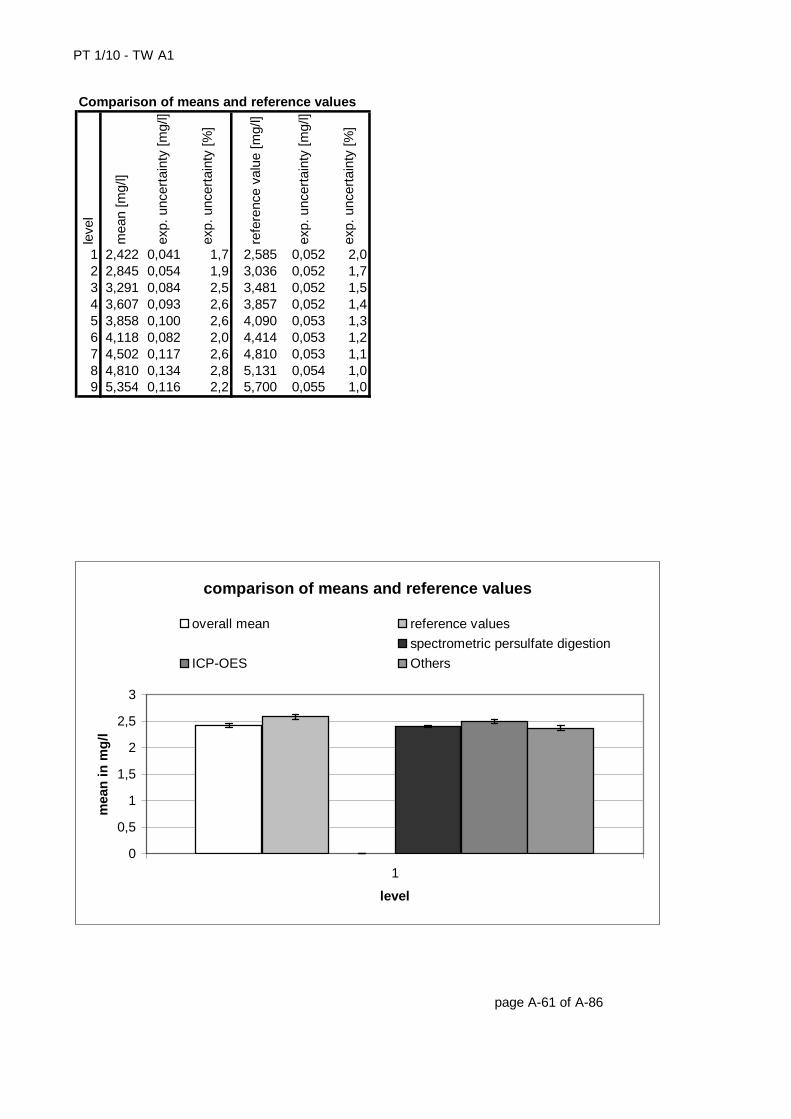
PT 1/10 - TW A1
Comparison of means and reference valuesle
vel
mea
n [m
g/l]
exp.
unc
erta
inty
[mg/
l]
exp.
unc
erta
inty
[%]
refe
renc
e va
lue
[mg/
l]
exp.
unc
erta
inty
[mg/
l]
exp.
unc
erta
inty
[%]
1 2,422 0,041 1,7 2,585 0,052 2,02 2,845 0,054 1,9 3,036 0,052 1,73 3,291 0,084 2,5 3,481 0,052 1,54 3,607 0,093 2,6 3,857 0,052 1,45 3,858 0,100 2,6 4,090 0,053 1,36 4,118 0,082 2,0 4,414 0,053 1,27 4,502 0,117 2,6 4,810 0,053 1,18 4,810 0,134 2,8 5,131 0,054 1,09 5,354 0,116 2,2 5,700 0,055 1,0
page A-61 of A-86
comparison of means and reference values
0
0,5
1
1,5
2
2,5
3
1
level
mea
n in
mg
/l
overall mean reference values
spectrometric persulfate digestion
ICP-OES Others
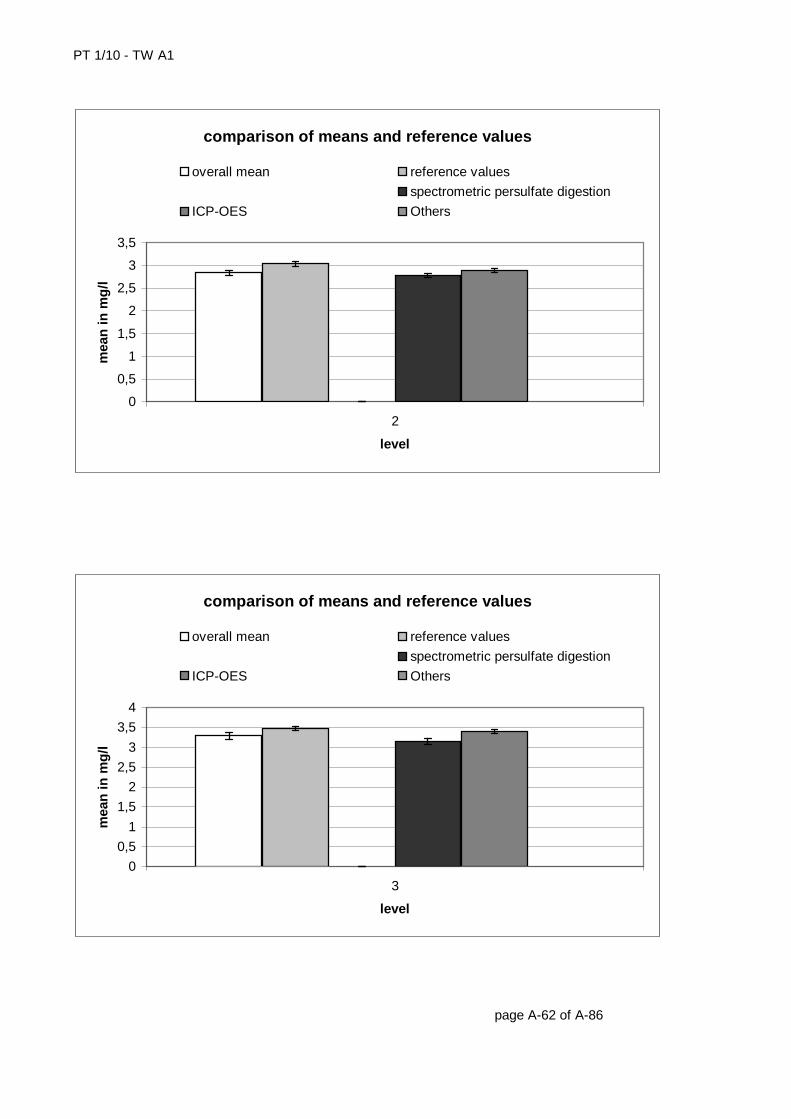
PT 1/10 - TW A1
page A-62 of A-86
comparison of means and reference values
0
0,5
1
1,5
2
2,5
3
3,5
2
level
mea
n in
mg
/l
overall mean reference values
spectrometric persulfate digestion
ICP-OES Others
comparison of means and reference values
0
0,5
1
1,5
2
2,5
3
3,5
4
3
level
mea
n in
mg
/l
overall mean reference values
spectrometric persulfate digestion
ICP-OES Others
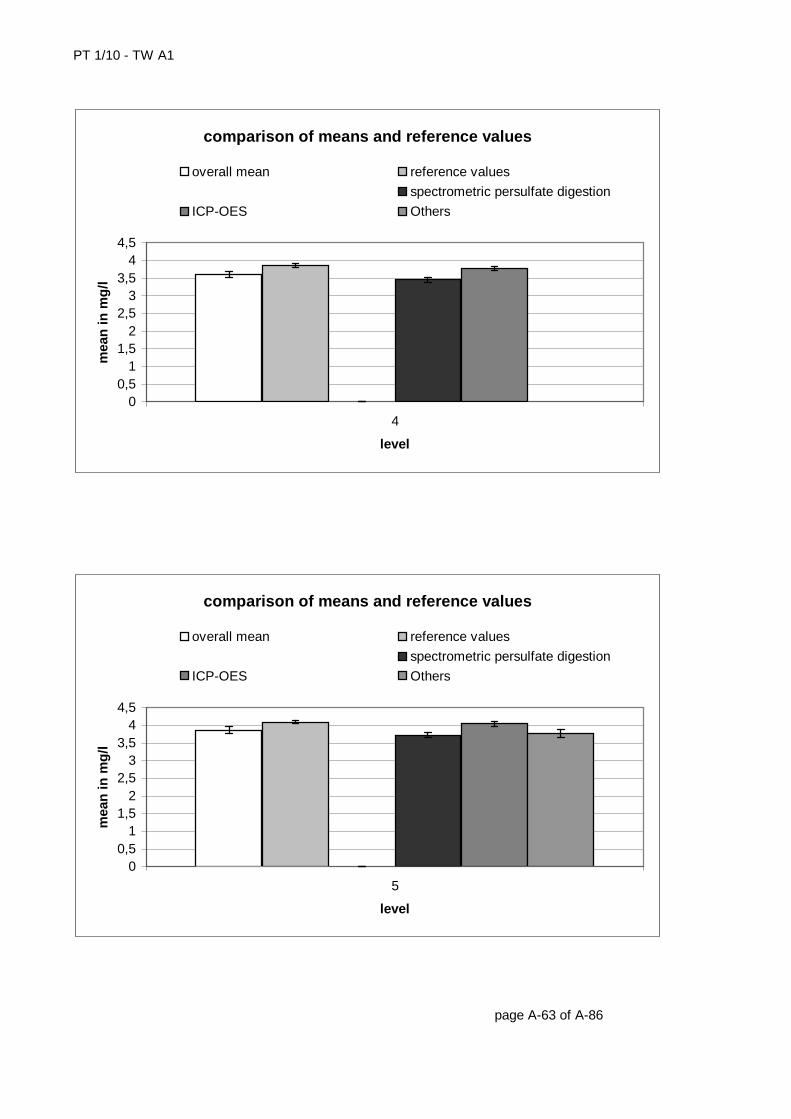
PT 1/10 - TW A1
page A-63 of A-86
comparison of means and reference values
00,5
11,5
22,5
33,5
44,5
4
level
mea
n in
mg
/l
overall mean reference values
spectrometric persulfate digestion
ICP-OES Others
comparison of means and reference values
00,5
11,5
22,5
33,5
44,5
5
level
mea
n in
mg
/l
overall mean reference values
spectrometric persulfate digestion
ICP-OES Others
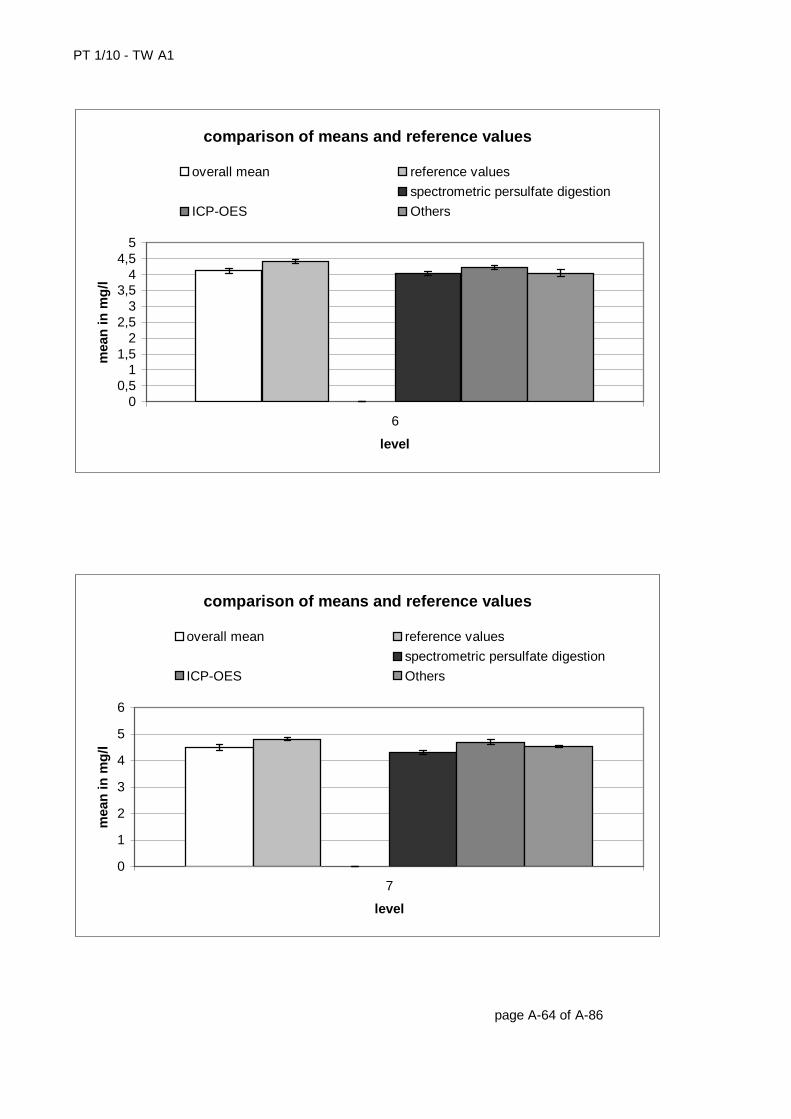
PT 1/10 - TW A1
page A-64 of A-86
comparison of means and reference values
00,5
11,5
22,5
33,5
44,5
5
6
level
mea
n in
mg
/l
overall mean reference values
spectrometric persulfate digestion
ICP-OES Others
comparison of means and reference values
0
1
2
3
4
5
6
7
level
mea
n in
mg
/l
overall mean reference values
spectrometric persulfate digestion
ICP-OES Others
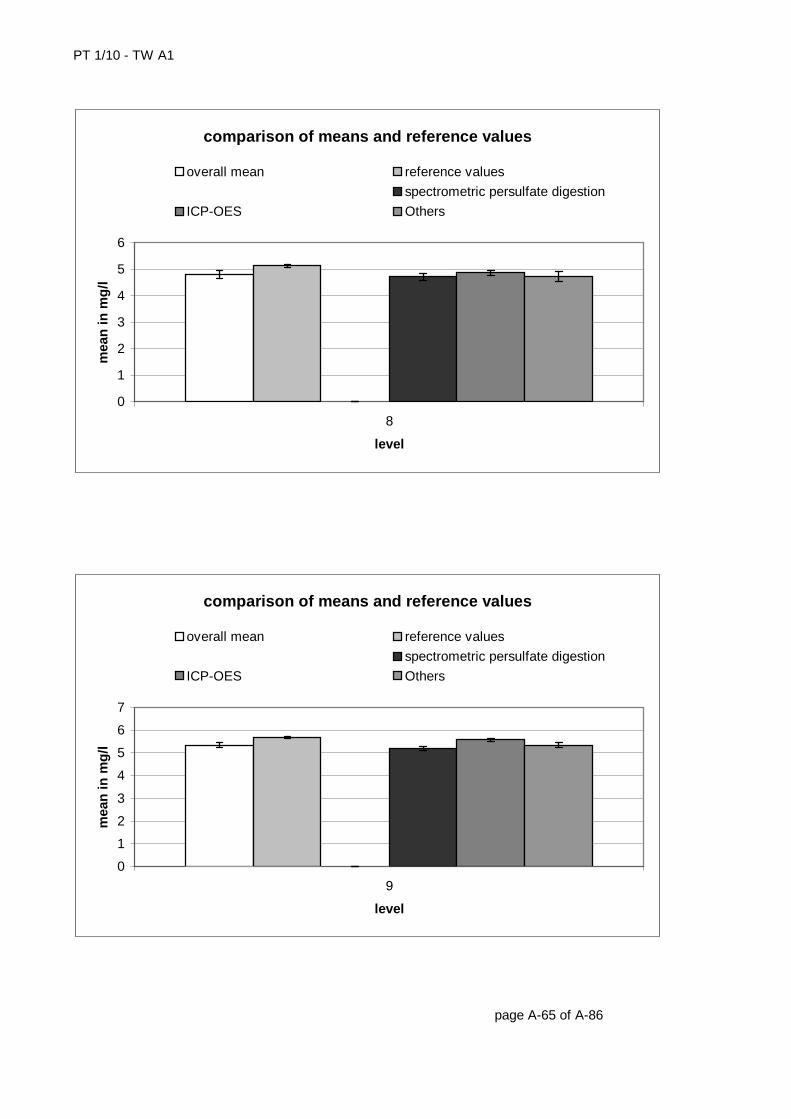
PT 1/10 - TW A1
page A-65 of A-86
comparison of means and reference values
0
1
2
3
4
5
6
8
level
mea
n in
mg
/l
overall mean reference values
spectrometric persulfate digestion
ICP-OES Others
comparison of means and reference values
0
1
2
3
4
5
6
7
9
level
mea
n in
mg
/l
overall mean reference values
spectrometric persulfate digestion
ICP-OES Others
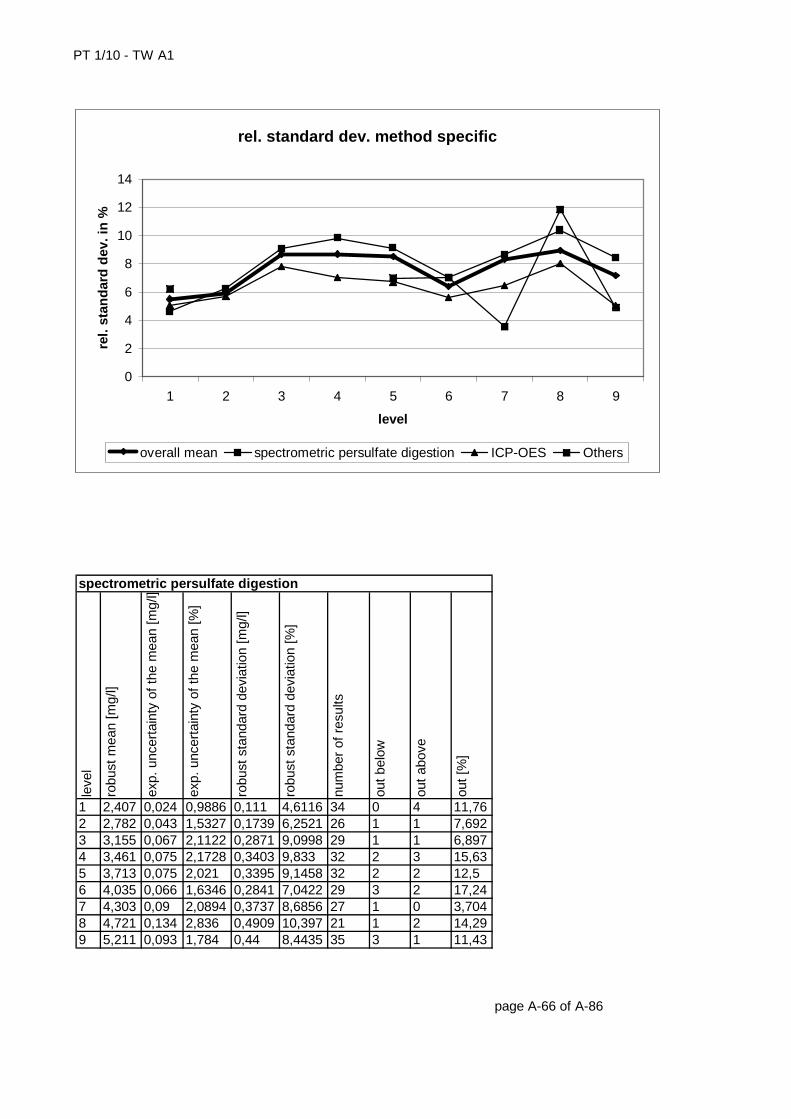
PT 1/10 - TW A1
leve
l
robu
st m
ean
[mg/
l]
exp.
unc
erta
inty
of t
he m
ean
[mg/
l]
exp.
unc
erta
inty
of t
he m
ean
[%]
robu
st s
tand
ard
devi
atio
n [m
g/l]
robu
st s
tand
ard
devi
atio
n [%
]
num
ber
of r
esul
ts
out b
elow
out a
bove
out [
%]
1 2,407 0,024 0,9886 0,111 4,6116 34 0 4 11,762 2,782 0,043 1,5327 0,1739 6,2521 26 1 1 7,6923 3,155 0,067 2,1122 0,2871 9,0998 29 1 1 6,8974 3,461 0,075 2,1728 0,3403 9,833 32 2 3 15,635 3,713 0,075 2,021 0,3395 9,1458 32 2 2 12,56 4,035 0,066 1,6346 0,2841 7,0422 29 3 2 17,247 4,303 0,09 2,0894 0,3737 8,6856 27 1 0 3,7048 4,721 0,134 2,836 0,4909 10,397 21 1 2 14,299 5,211 0,093 1,784 0,44 8,4435 35 3 1 11,43 page A-66 of A-86
spectrometric persulfate digestion
rel. standard dev. method specific
0
2
4
6
8
10
12
14
1 2 3 4 5 6 7 8 9
level
rel.
stan
dar
d d
ev. i
n %
overall mean spectrometric persulfate digestion ICP-OES Others
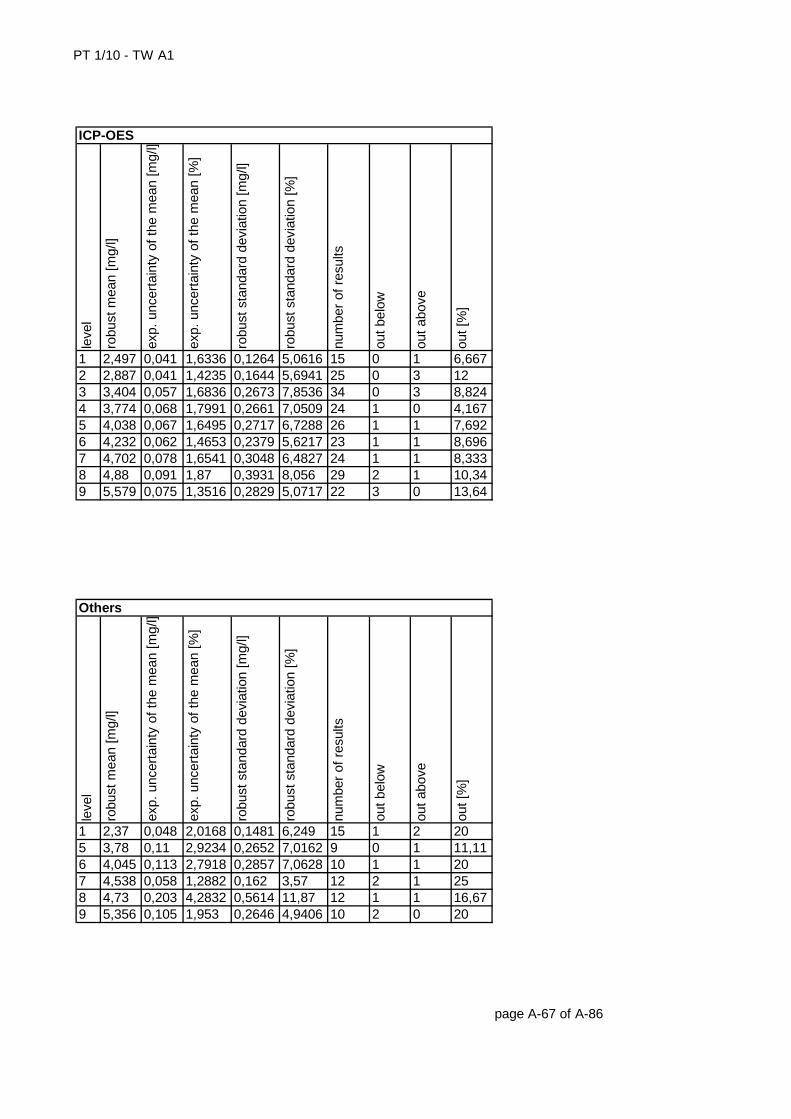
PT 1/10 - TW A1
leve
l
robu
st m
ean
[mg/
l]
exp.
unc
erta
inty
of t
he m
ean
[mg/
l]
exp.
unc
erta
inty
of t
he m
ean
[%]
robu
st s
tand
ard
devi
atio
n [m
g/l]
robu
st s
tand
ard
devi
atio
n [%
]
num
ber
of r
esul
ts
out b
elow
out a
bove
out [
%]
1 2,497 0,041 1,6336 0,1264 5,0616 15 0 1 6,6672 2,887 0,041 1,4235 0,1644 5,6941 25 0 3 123 3,404 0,057 1,6836 0,2673 7,8536 34 0 3 8,8244 3,774 0,068 1,7991 0,2661 7,0509 24 1 0 4,1675 4,038 0,067 1,6495 0,2717 6,7288 26 1 1 7,6926 4,232 0,062 1,4653 0,2379 5,6217 23 1 1 8,6967 4,702 0,078 1,6541 0,3048 6,4827 24 1 1 8,3338 4,88 0,091 1,87 0,3931 8,056 29 2 1 10,349 5,579 0,075 1,3516 0,2829 5,0717 22 3 0 13,64
leve
l
robu
st m
ean
[mg/
l]
exp.
unc
erta
inty
of t
he m
ean
[mg/
l]
exp.
unc
erta
inty
of t
he m
ean
[%]
robu
st s
tand
ard
devi
atio
n [m
g/l]
robu
st s
tand
ard
devi
atio
n [%
]
num
ber
of r
esul
ts
out b
elow
out a
bove
out [
%]
1 2,37 0,048 2,0168 0,1481 6,249 15 1 2 205 3,78 0,11 2,9234 0,2652 7,0162 9 0 1 11,116 4,045 0,113 2,7918 0,2857 7,0628 10 1 1 207 4,538 0,058 1,2882 0,162 3,57 12 2 1 258 4,73 0,203 4,2832 0,5614 11,87 12 1 1 16,679 5,356 0,105 1,953 0,2646 4,9406 10 2 0 20 page A-67 of A-86
ICP-OES
Others
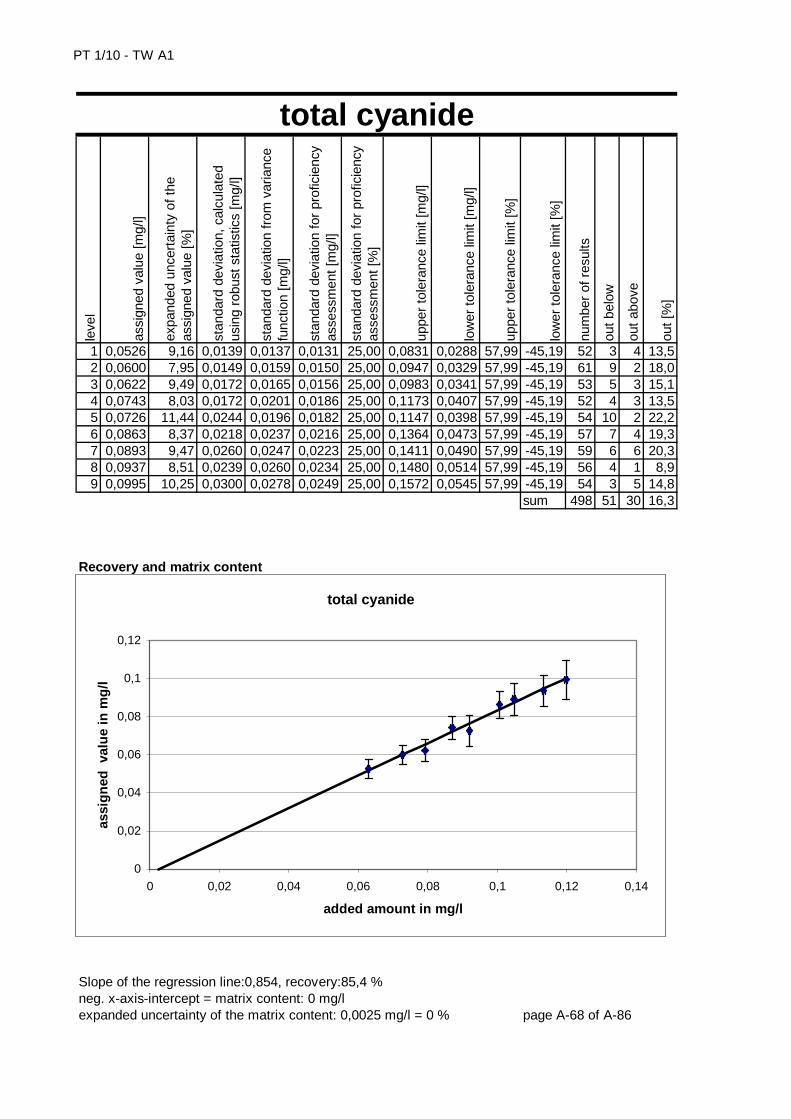
PT 1/10 - TW A1
leve
l
assi
gned
val
ue [m
g/l]
expa
nded
unc
erta
inty
of t
he
assi
gned
val
ue [%
]
stan
dard
dev
iatio
n, c
alcu
late
d us
ing
robu
st s
tatis
tics
[mg/
l]
stan
dard
dev
iatio
n fr
om v
aria
nce
func
tion
[mg/
l]
stan
dard
dev
iatio
n fo
r pr
ofic
ienc
y as
sess
men
t [m
g/l]
stan
dard
dev
iatio
n fo
r pr
ofic
ienc
y as
sess
men
t [%
]
uppe
r to
lera
nce
limit
[mg/
l]
low
er to
lera
nce
limit
[mg/
l]
uppe
r to
lera
nce
limit
[%]
low
er to
lera
nce
limit
[%]
num
ber
of r
esul
ts
out b
elow
out a
bove
out [
%]
1 0,0526 9,16 0,0139 0,0137 0,0131 25,00 0,0831 0,0288 57,99 -45,19 52 3 4 13,52 0,0600 7,95 0,0149 0,0159 0,0150 25,00 0,0947 0,0329 57,99 -45,19 61 9 2 18,03 0,0622 9,49 0,0172 0,0165 0,0156 25,00 0,0983 0,0341 57,99 -45,19 53 5 3 15,14 0,0743 8,03 0,0172 0,0201 0,0186 25,00 0,1173 0,0407 57,99 -45,19 52 4 3 13,55 0,0726 11,44 0,0244 0,0196 0,0182 25,00 0,1147 0,0398 57,99 -45,19 54 10 2 22,26 0,0863 8,37 0,0218 0,0237 0,0216 25,00 0,1364 0,0473 57,99 -45,19 57 7 4 19,37 0,0893 9,47 0,0260 0,0247 0,0223 25,00 0,1411 0,0490 57,99 -45,19 59 6 6 20,38 0,0937 8,51 0,0239 0,0260 0,0234 25,00 0,1480 0,0514 57,99 -45,19 56 4 1 8,99 0,0995 10,25 0,0300 0,0278 0,0249 25,00 0,1572 0,0545 57,99 -45,19 54 3 5 14,8
sum 498 51 30 16,3 Recovery and matrix content Slope of the regression line:0,854, recovery:85,4 %neg. x-axis-intercept = matrix content: 0 mg/lexpanded uncertainty of the matrix content: 0,0025 mg/l = 0 % page A-68 of A-86
total cyanide
total cyanide
0
0,02
0,04
0,06
0,08
0,1
0,12
0 0,02 0,04 0,06 0,08 0,1 0,12 0,14
added amount in mg/l
assi
gn
ed v
alu
e in
mg
/l
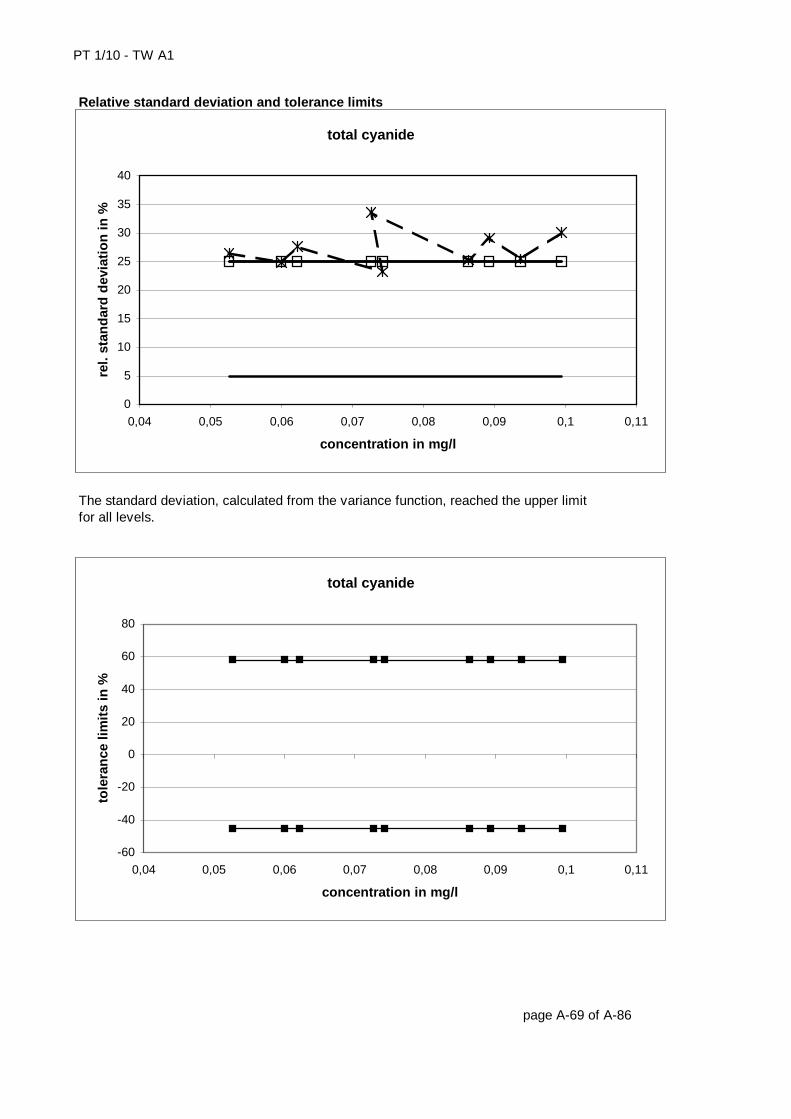
PT 1/10 - TW A1
Relative standard deviation and tolerance limits The standard deviation, calculated from the variance function, reached the upper limitfor all levels. page A-69 of A-86
total cyanide
0
5
10
15
20
25
30
35
40
0,04 0,05 0,06 0,07 0,08 0,09 0,1 0,11
concentration in mg/l
rel.
stan
dar
d d
evia
tio
n in
%
total cyanide
-60
-40
-20
0
20
40
60
80
0,04 0,05 0,06 0,07 0,08 0,09 0,1 0,11
concentration in mg/l
tole
ran
ce li
mit
s in
%
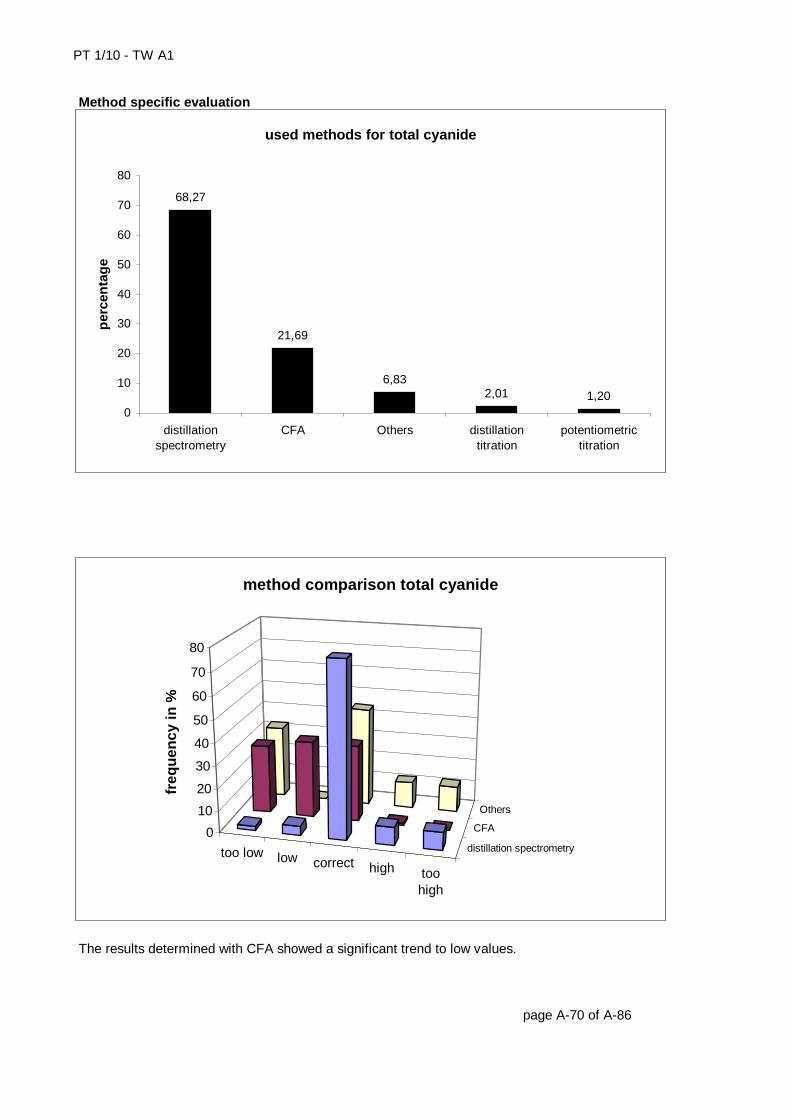
PT 1/10 - TW A1
Method specific evaluation The results determined with CFA showed a significant trend to low values. page A-70 of A-86
used methods for total cyanide
68,27
21,69
6,832,01 1,20
0
10
20
30
40
50
60
70
80
distillationspectrometry
CFA Others distillationtitration
potentiometrictitration
per
cen
tag
e
too low low correct high toohigh
distillation spectrometry
CFA
Others
0
10
20
30
40
50
60
70
80
freq
uen
cy in
%
method comparison total cyanide
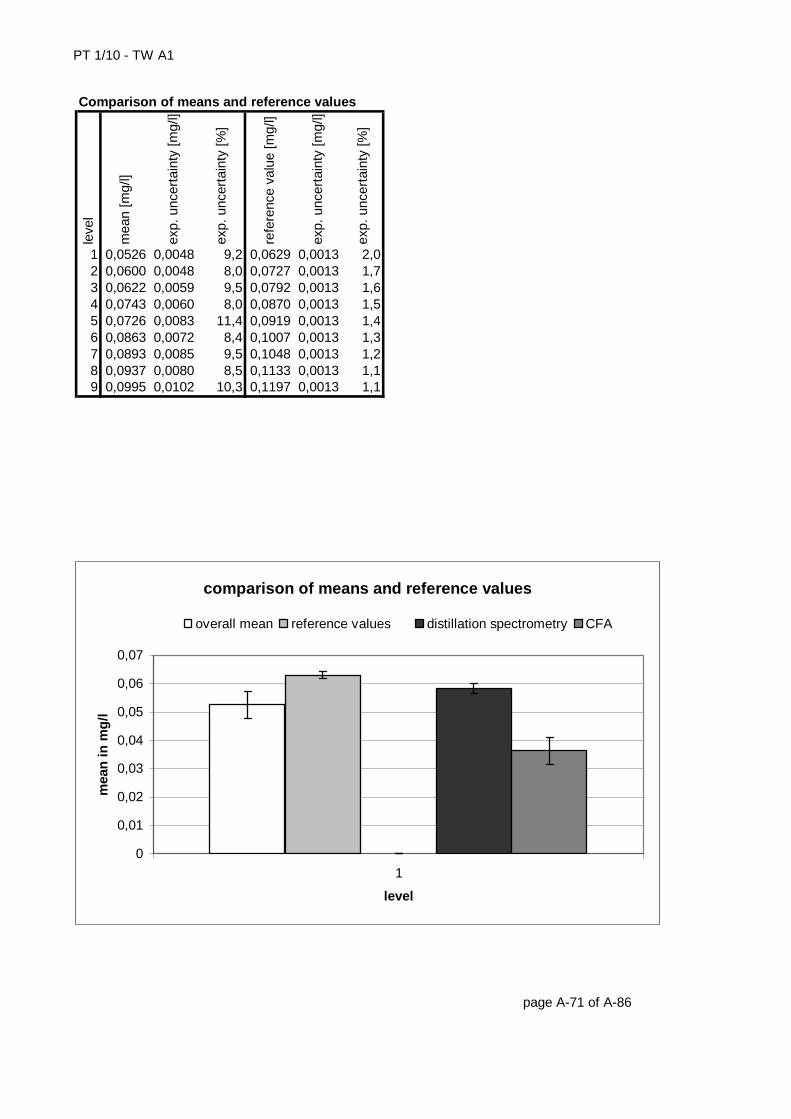
PT 1/10 - TW A1
Comparison of means and reference valuesle
vel
mea
n [m
g/l]
exp.
unc
erta
inty
[mg/
l]
exp.
unc
erta
inty
[%]
refe
renc
e va
lue
[mg/
l]
exp.
unc
erta
inty
[mg/
l]
exp.
unc
erta
inty
[%]
1 0,0526 0,0048 9,2 0,0629 0,0013 2,02 0,0600 0,0048 8,0 0,0727 0,0013 1,73 0,0622 0,0059 9,5 0,0792 0,0013 1,64 0,0743 0,0060 8,0 0,0870 0,0013 1,55 0,0726 0,0083 11,4 0,0919 0,0013 1,46 0,0863 0,0072 8,4 0,1007 0,0013 1,37 0,0893 0,0085 9,5 0,1048 0,0013 1,28 0,0937 0,0080 8,5 0,1133 0,0013 1,19 0,0995 0,0102 10,3 0,1197 0,0013 1,1
page A-71 of A-86
comparison of means and reference values
0
0,01
0,02
0,03
0,04
0,05
0,06
0,07
1
level
mea
n in
mg
/l
overall mean reference values distillation spectrometry CFA
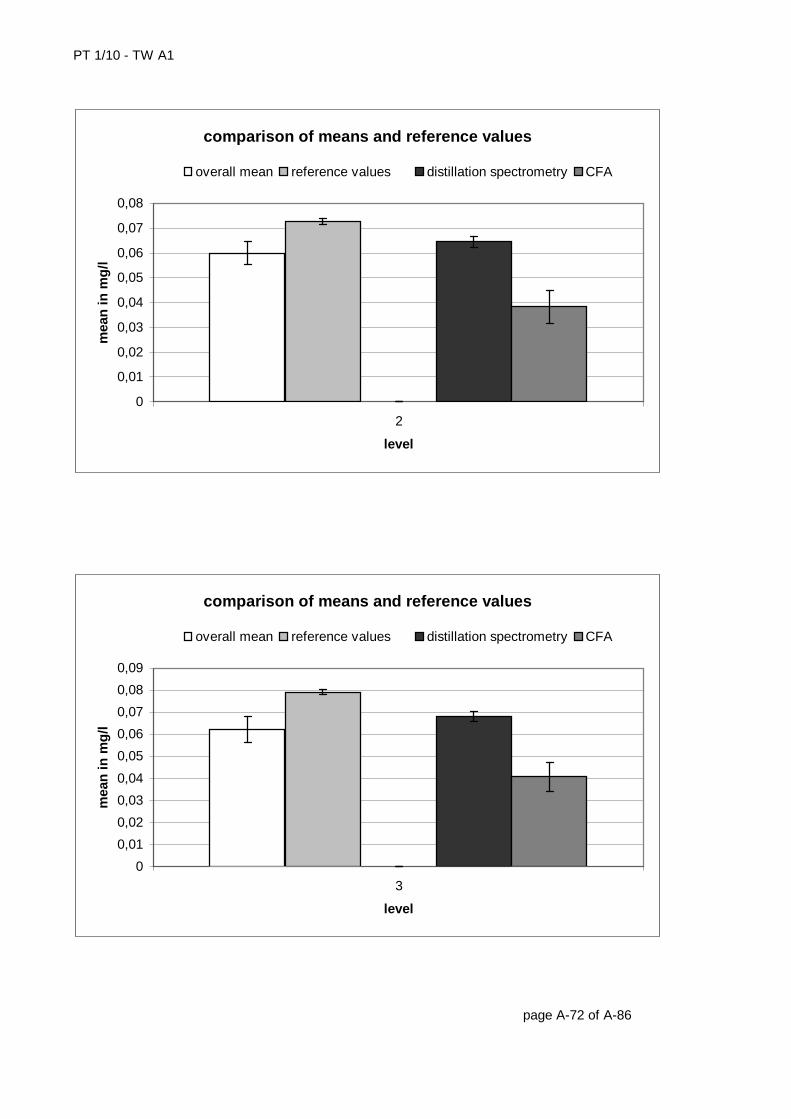
PT 1/10 - TW A1
page A-72 of A-86
comparison of means and reference values
0
0,01
0,02
0,03
0,04
0,05
0,06
0,07
0,08
2
level
mea
n in
mg
/l
overall mean reference values distillation spectrometry CFA
comparison of means and reference values
0
0,01
0,02
0,03
0,04
0,05
0,06
0,07
0,08
0,09
3
level
mea
n in
mg
/l
overall mean reference values distillation spectrometry CFA
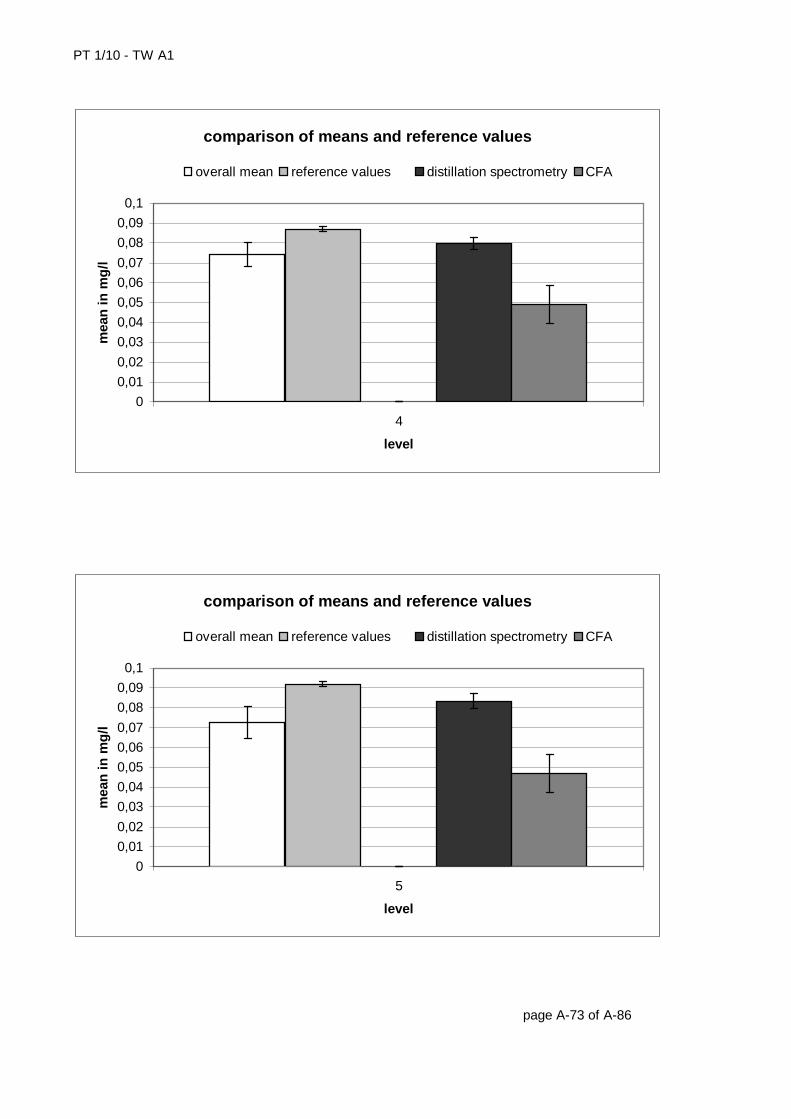
PT 1/10 - TW A1
page A-73 of A-86
comparison of means and reference values
0
0,01
0,02
0,03
0,04
0,05
0,06
0,07
0,08
0,09
0,1
4
level
mea
n in
mg
/l
overall mean reference values distillation spectrometry CFA
comparison of means and reference values
0
0,01
0,02
0,03
0,04
0,05
0,06
0,07
0,08
0,09
0,1
5
level
mea
n in
mg
/l
overall mean reference values distillation spectrometry CFA
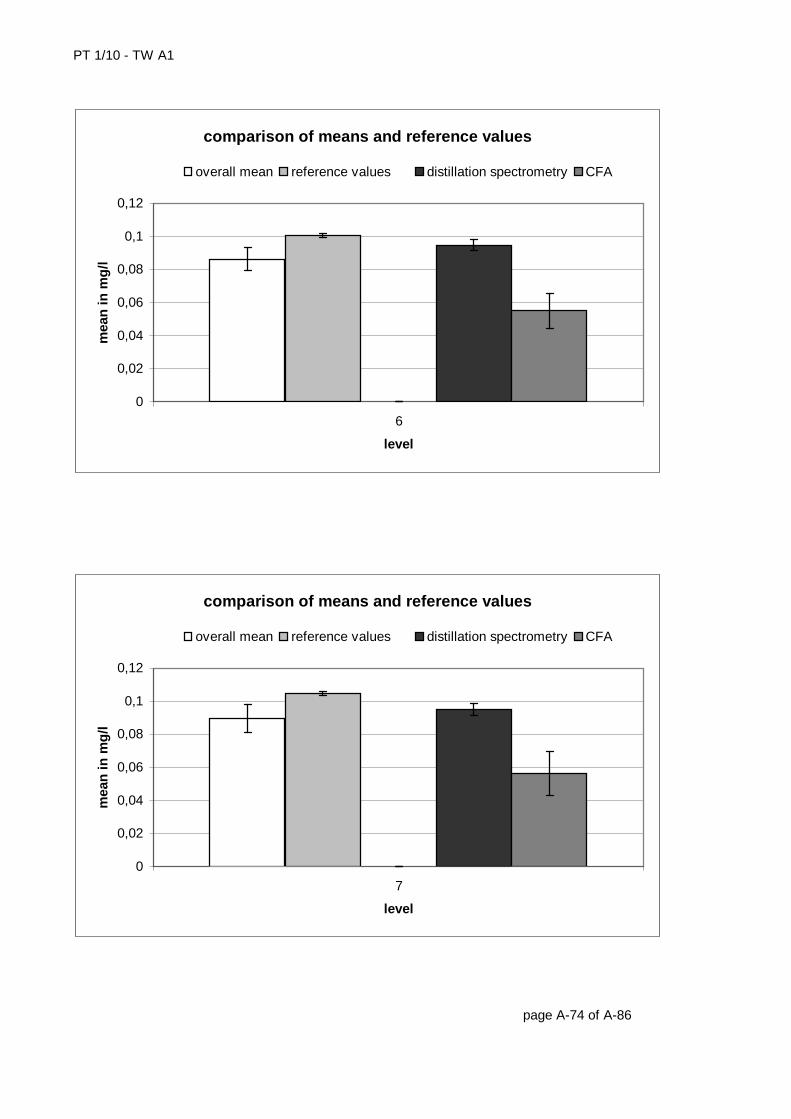
PT 1/10 - TW A1
page A-74 of A-86
comparison of means and reference values
0
0,02
0,04
0,06
0,08
0,1
0,12
6
level
mea
n in
mg
/l
overall mean reference values distillation spectrometry CFA
comparison of means and reference values
0
0,02
0,04
0,06
0,08
0,1
0,12
7
level
mea
n in
mg
/l
overall mean reference values distillation spectrometry CFA
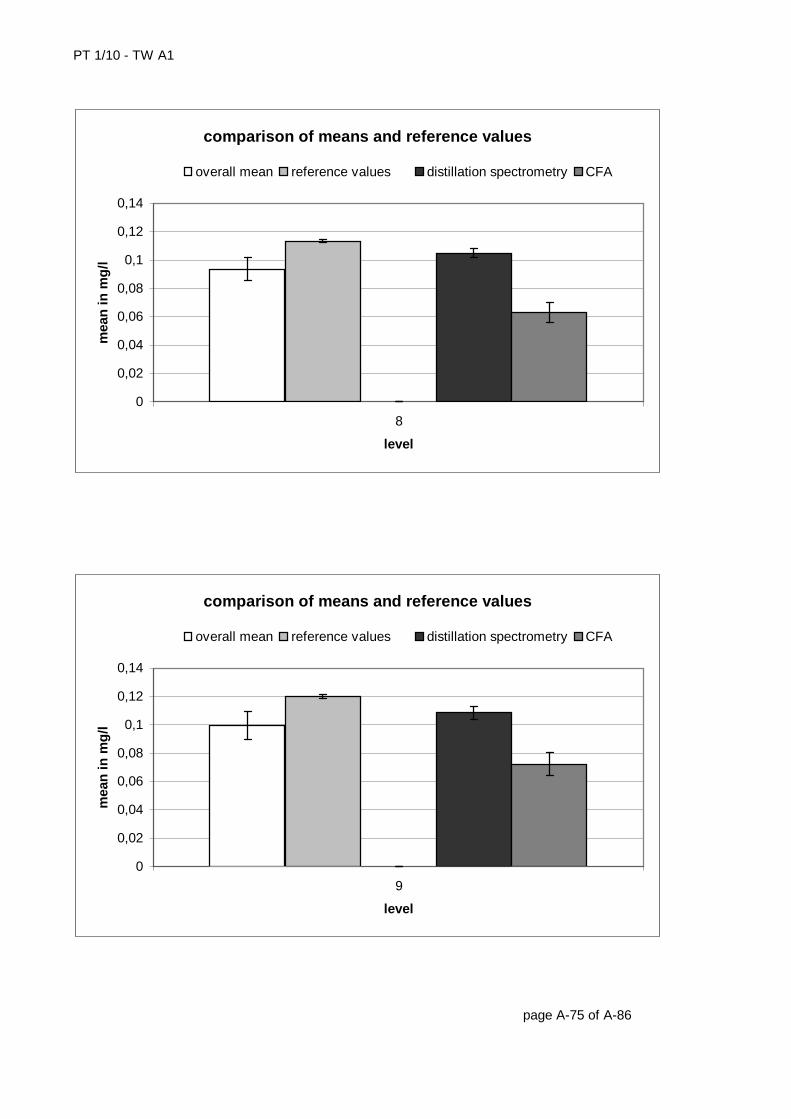
PT 1/10 - TW A1
page A-75 of A-86
comparison of means and reference values
0
0,02
0,04
0,06
0,08
0,1
0,12
0,14
8
level
mea
n in
mg
/l
overall mean reference values distillation spectrometry CFA
comparison of means and reference values
0
0,02
0,04
0,06
0,08
0,1
0,12
0,14
9
level
mea
n in
mg
/l
overall mean reference values distillation spectrometry CFA
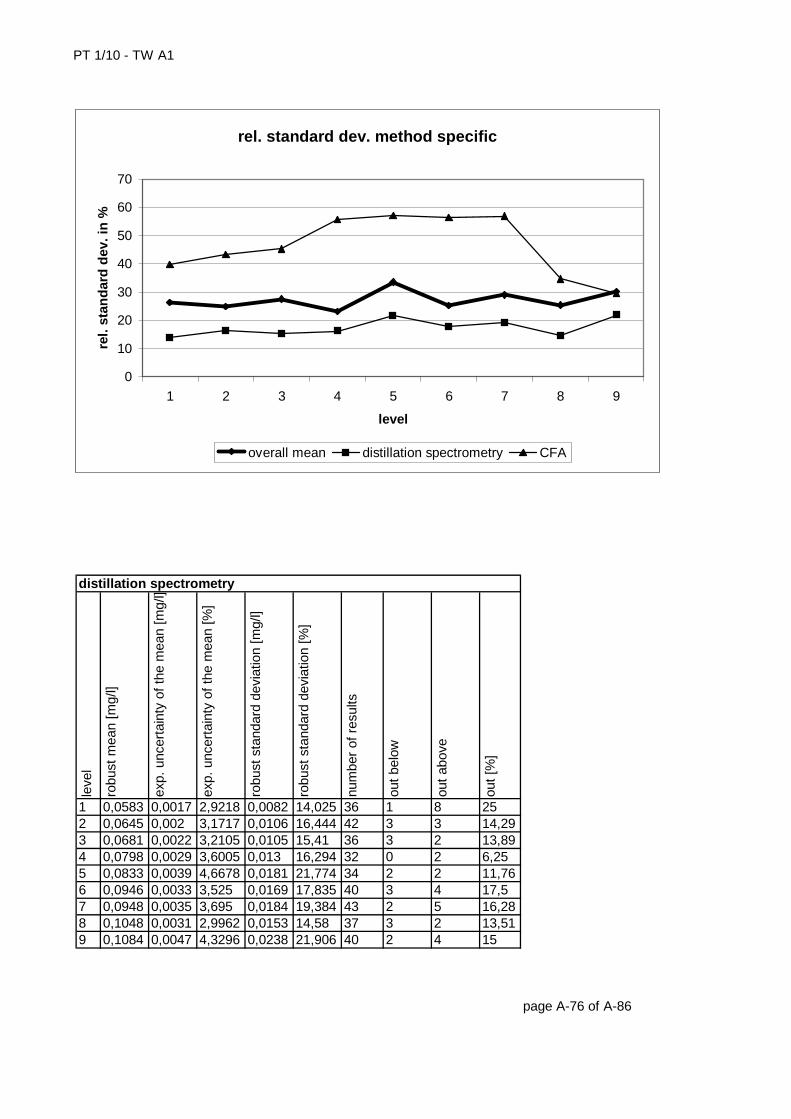
PT 1/10 - TW A1
leve
l
robu
st m
ean
[mg/
l]
exp.
unc
erta
inty
of t
he m
ean
[mg/
l]
exp.
unc
erta
inty
of t
he m
ean
[%]
robu
st s
tand
ard
devi
atio
n [m
g/l]
robu
st s
tand
ard
devi
atio
n [%
]
num
ber
of r
esul
ts
out b
elow
out a
bove
out [
%]
1 0,0583 0,0017 2,9218 0,0082 14,025 36 1 8 252 0,0645 0,002 3,1717 0,0106 16,444 42 3 3 14,293 0,0681 0,0022 3,2105 0,0105 15,41 36 3 2 13,894 0,0798 0,0029 3,6005 0,013 16,294 32 0 2 6,255 0,0833 0,0039 4,6678 0,0181 21,774 34 2 2 11,766 0,0946 0,0033 3,525 0,0169 17,835 40 3 4 17,57 0,0948 0,0035 3,695 0,0184 19,384 43 2 5 16,288 0,1048 0,0031 2,9962 0,0153 14,58 37 3 2 13,519 0,1084 0,0047 4,3296 0,0238 21,906 40 2 4 15 page A-76 of A-86
distillation spectrometry
rel. standard dev. method specific
0
10
20
30
40
50
60
70
1 2 3 4 5 6 7 8 9
level
rel.
stan
dar
d d
ev. i
n %
overall mean distillation spectrometry CFA

PT 1/10 - TW A1
leve
l
robu
st m
ean
[mg/
l]
exp.
unc
erta
inty
of t
he m
ean
[mg/
l]
exp.
unc
erta
inty
of t
he m
ean
[%]
robu
st s
tand
ard
devi
atio
n [m
g/l]
robu
st s
tand
ard
devi
atio
n [%
]
num
ber
of r
esul
ts
out b
elow
out a
bove
out [
%]
1 0,0363 0,0048 13,317 0,0145 39,862 14 1 1 14,292 0,0383 0,0066 17,15 0,0166 43,386 10 0 0 03 0,0406 0,0066 16,362 0,0184 45,344 12 0 0 04 0,049 0,0099 20,142 0,0274 55,818 12 0 0 05 0,047 0,0097 20,626 0,0269 57,162 12 0 0 06 0,0549 0,0108 19,614 0,0311 56,574 13 0 0 07 0,0564 0,0134 23,768 0,0322 57,044 9 0 0 08 0,063 0,0071 11,213 0,0219 34,743 15 0 0 09 0,0723 0,0081 11,129 0,0214 29,529 11 1 0 9,091 page A-77 of A-86
CFA
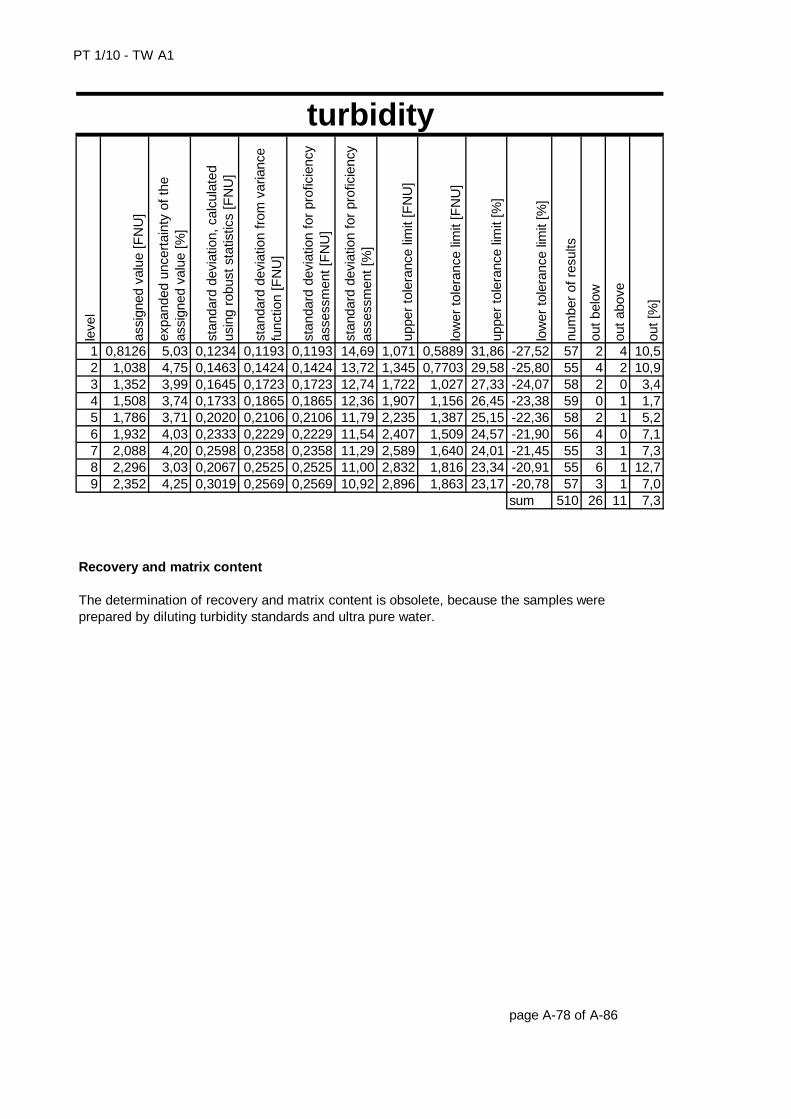
PT 1/10 - TW A1
leve
l
assi
gned
val
ue [F
NU
]
expa
nded
unc
erta
inty
of t
he
assi
gned
val
ue [%
]
stan
dard
dev
iatio
n, c
alcu
late
d us
ing
robu
st s
tatis
tics
[FN
U]
stan
dard
dev
iatio
n fr
om v
aria
nce
func
tion
[FN
U]
stan
dard
dev
iatio
n fo
r pr
ofic
ienc
y as
sess
men
t [F
NU
]
stan
dard
dev
iatio
n fo
r pr
ofic
ienc
y as
sess
men
t [%
]
uppe
r to
lera
nce
limit
[FN
U]
low
er to
lera
nce
limit
[FN
U]
uppe
r to
lera
nce
limit
[%]
low
er to
lera
nce
limit
[%]
num
ber
of r
esul
ts
out b
elow
out a
bove
out [
%]
1 0,8126 5,03 0,1234 0,1193 0,1193 14,69 1,071 0,5889 31,86 -27,52 57 2 4 10,52 1,038 4,75 0,1463 0,1424 0,1424 13,72 1,345 0,7703 29,58 -25,80 55 4 2 10,93 1,352 3,99 0,1645 0,1723 0,1723 12,74 1,722 1,027 27,33 -24,07 58 2 0 3,44 1,508 3,74 0,1733 0,1865 0,1865 12,36 1,907 1,156 26,45 -23,38 59 0 1 1,75 1,786 3,71 0,2020 0,2106 0,2106 11,79 2,235 1,387 25,15 -22,36 58 2 1 5,26 1,932 4,03 0,2333 0,2229 0,2229 11,54 2,407 1,509 24,57 -21,90 56 4 0 7,17 2,088 4,20 0,2598 0,2358 0,2358 11,29 2,589 1,640 24,01 -21,45 55 3 1 7,38 2,296 3,03 0,2067 0,2525 0,2525 11,00 2,832 1,816 23,34 -20,91 55 6 1 12,79 2,352 4,25 0,3019 0,2569 0,2569 10,92 2,896 1,863 23,17 -20,78 57 3 1 7,0
sum 510 26 11 7,3 Recovery and matrix content The determination of recovery and matrix content is obsolete, because the samples wereprepared by diluting turbidity standards and ultra pure water.
page A-78 of A-86
turbidity
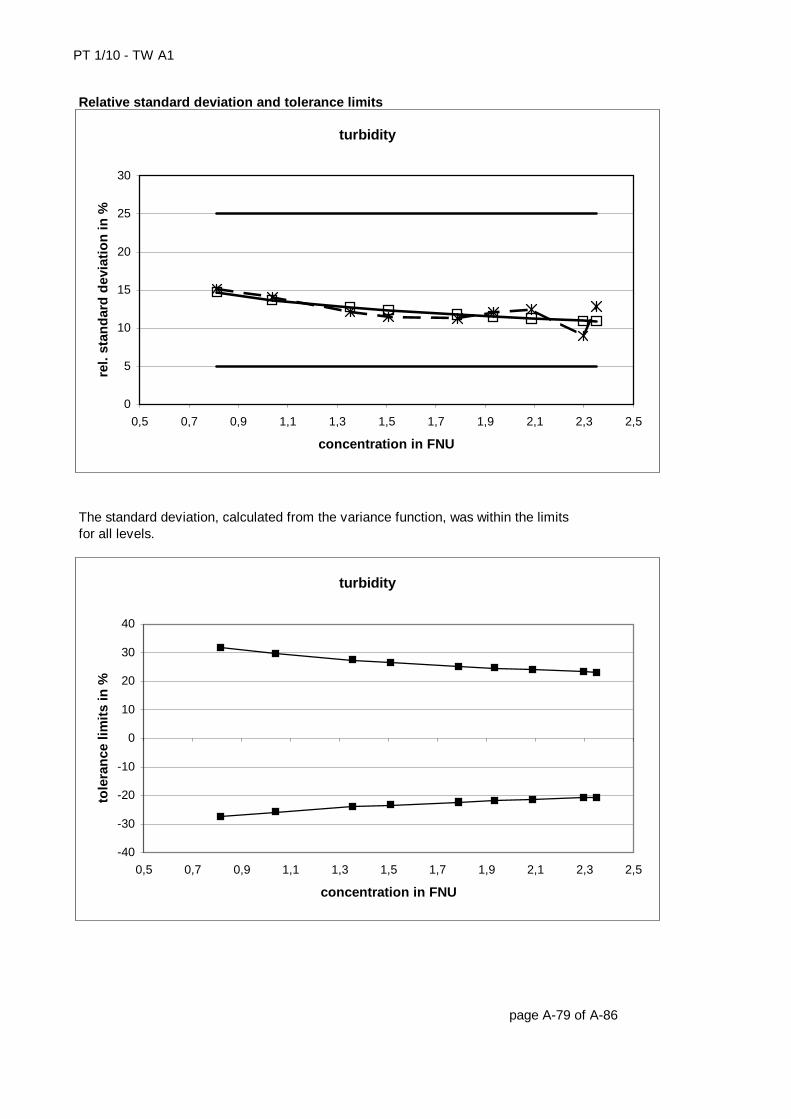
PT 1/10 - TW A1
Relative standard deviation and tolerance limits The standard deviation, calculated from the variance function, was within the limitsfor all levels. page A-79 of A-86
turbidity
0
5
10
15
20
25
30
0,5 0,7 0,9 1,1 1,3 1,5 1,7 1,9 2,1 2,3 2,5
concentration in FNU
rel.
stan
dar
d d
evia
tio
n in
%
turbidity
-40
-30
-20
-10
0
10
20
30
40
0,5 0,7 0,9 1,1 1,3 1,5 1,7 1,9 2,1 2,3 2,5
concentration in FNU
tole
ran
ce li
mit
s in
%
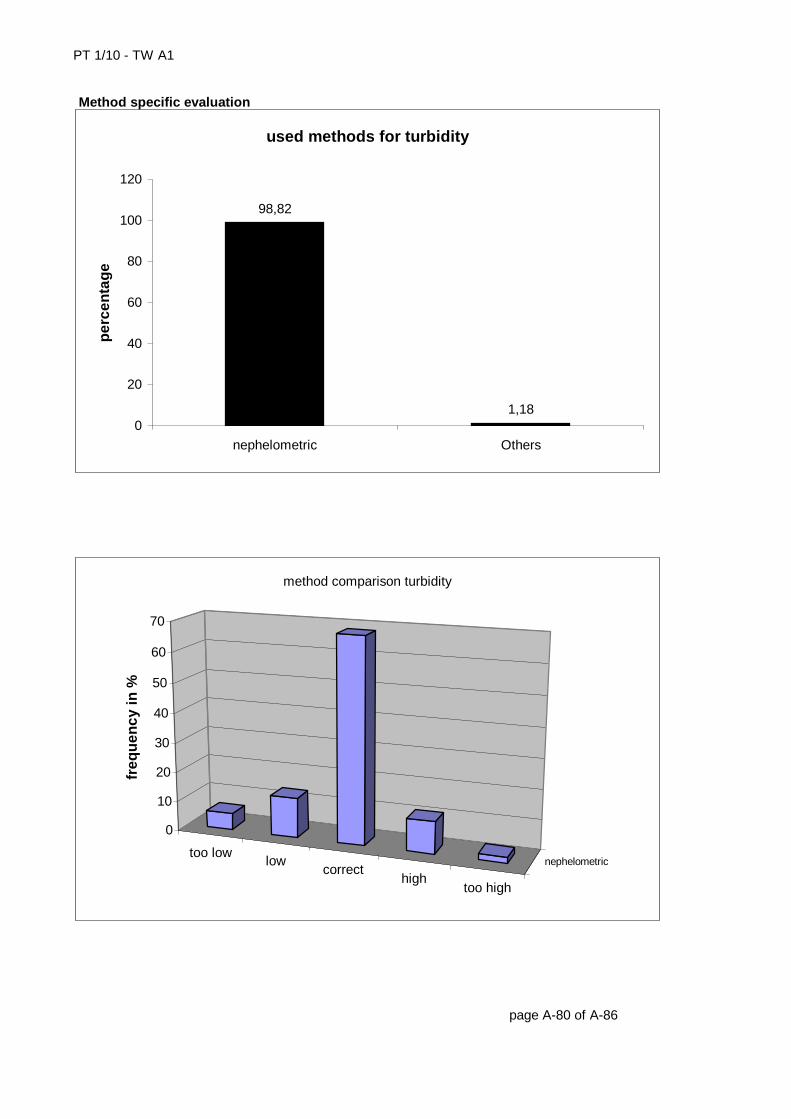
PT 1/10 - TW A1
Method specific evaluation page A-80 of A-86
used methods for turbidity
98,82
1,180
20
40
60
80
100
120
nephelometric Others
per
cen
tag
e
too lowlow
correcthigh
too high
nephelometric
0
10
20
30
40
50
60
70
freq
uen
cy in
%
method comparison turbidity
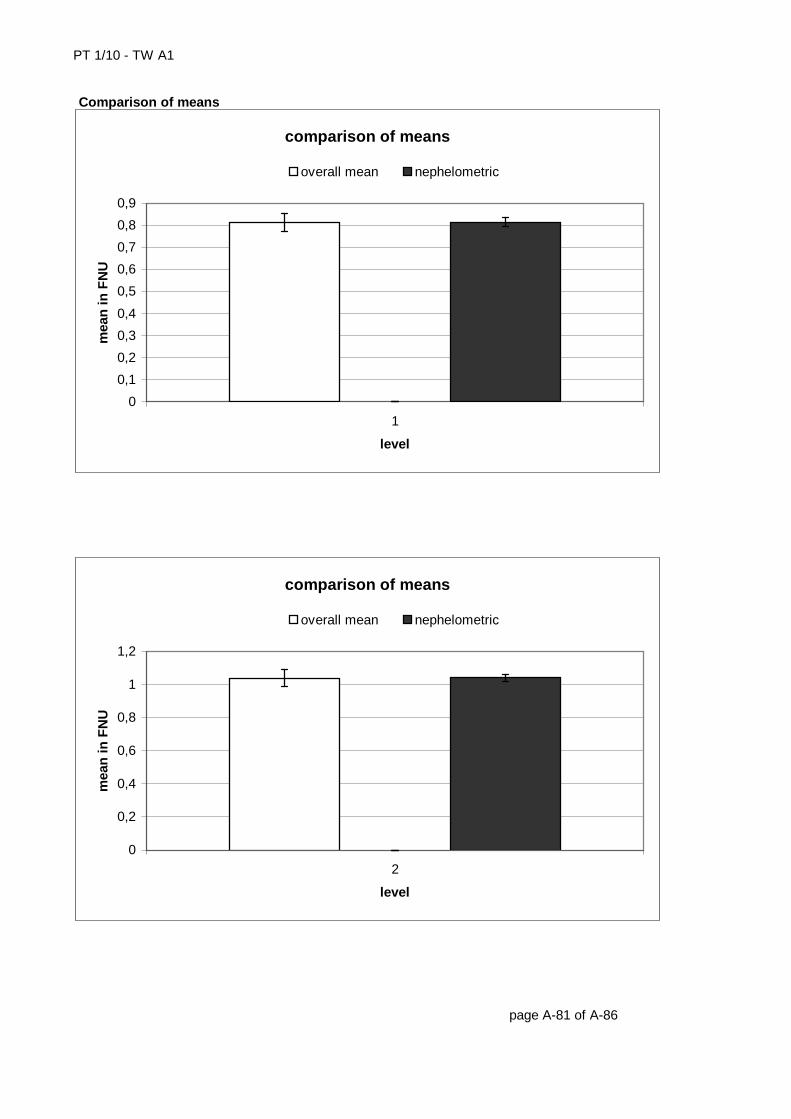
PT 1/10 - TW A1
Comparison of means page A-81 of A-86
comparison of means
0
0,1
0,2
0,3
0,4
0,5
0,6
0,7
0,8
0,9
1
level
mea
n in
FN
U
overall mean nephelometric
comparison of means
0
0,2
0,4
0,6
0,8
1
1,2
2
level
mea
n in
FN
U
overall mean nephelometric
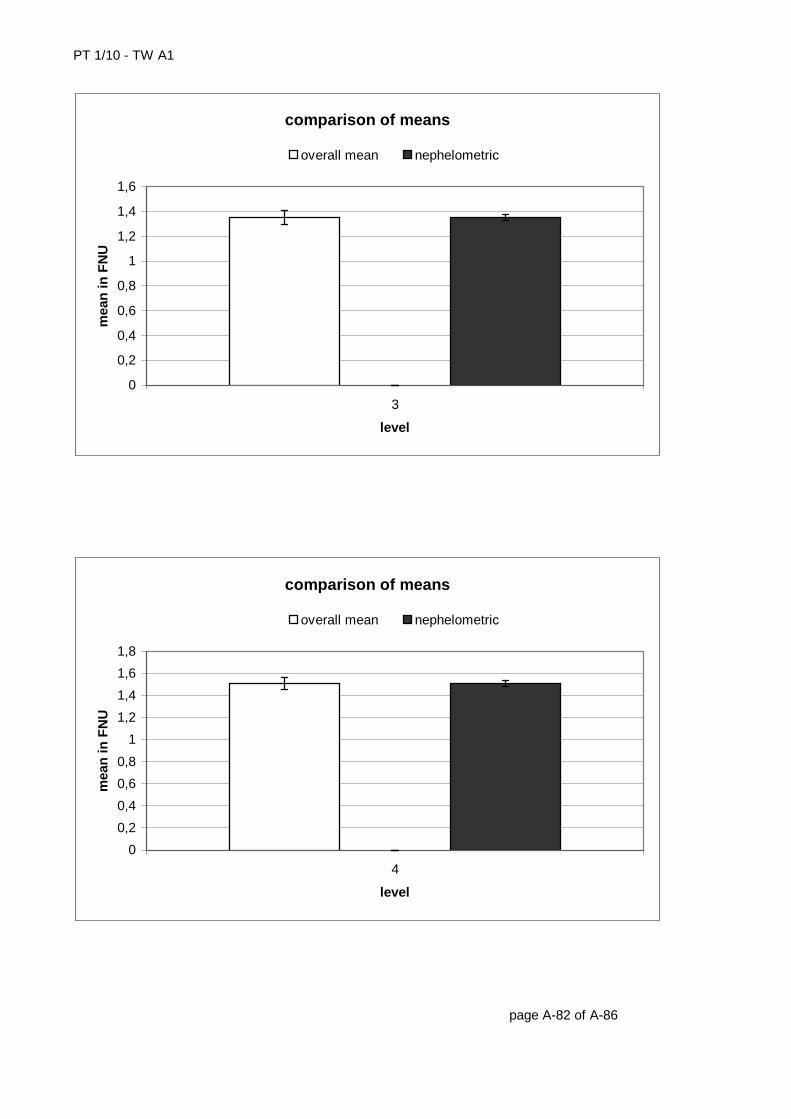
PT 1/10 - TW A1
page A-82 of A-86
comparison of means
0
0,2
0,4
0,6
0,8
1
1,2
1,4
1,6
3
level
mea
n in
FN
U
overall mean nephelometric
comparison of means
0
0,2
0,4
0,6
0,8
1
1,2
1,4
1,6
1,8
4
level
mea
n in
FN
U
overall mean nephelometric
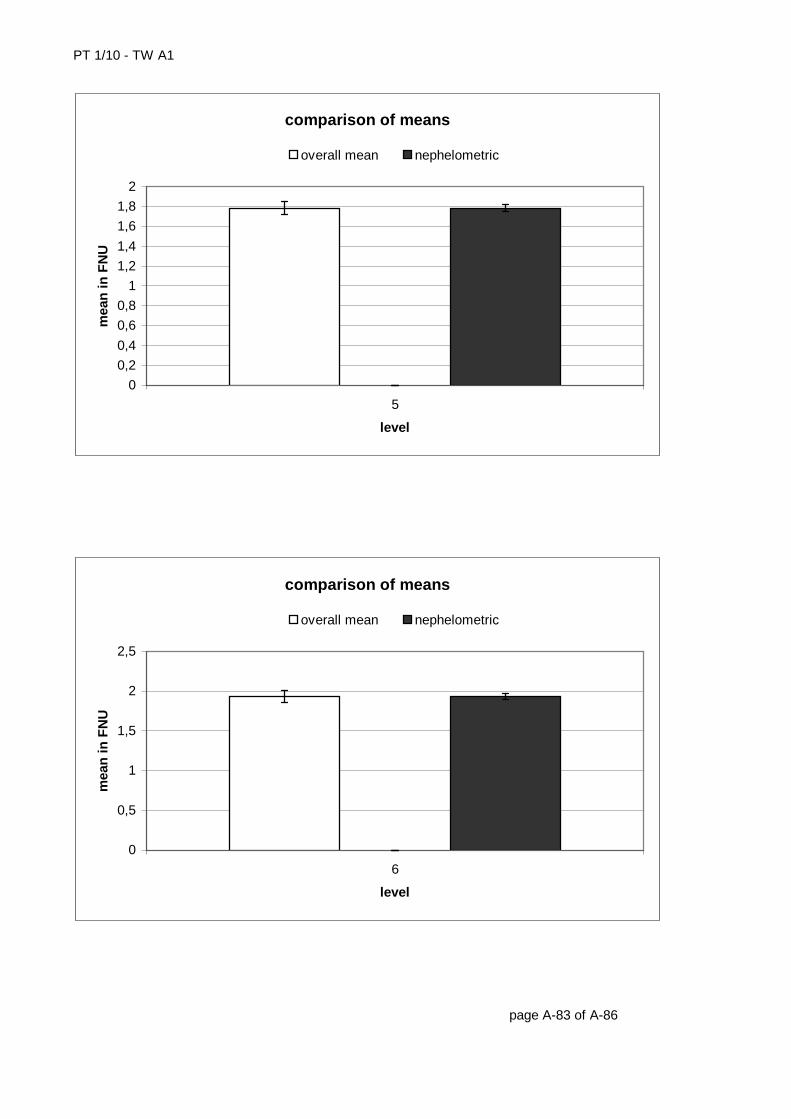
PT 1/10 - TW A1
page A-83 of A-86
comparison of means
0
0,2
0,4
0,6
0,8
1
1,2
1,4
1,6
1,8
2
5
level
mea
n in
FN
U
overall mean nephelometric
comparison of means
0
0,5
1
1,5
2
2,5
6
level
mea
n in
FN
U
overall mean nephelometric
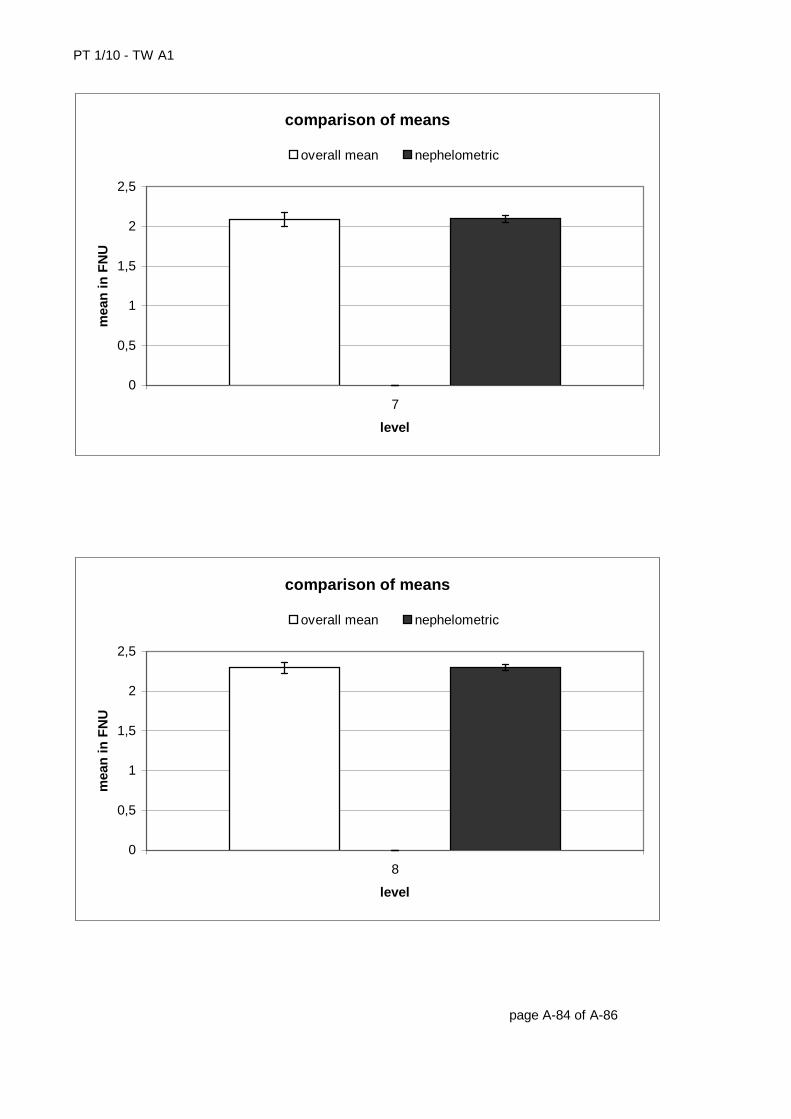
PT 1/10 - TW A1
page A-84 of A-86
comparison of means
0
0,5
1
1,5
2
2,5
7
level
mea
n in
FN
U
overall mean nephelometric
comparison of means
0
0,5
1
1,5
2
2,5
8
level
mea
n in
FN
U
overall mean nephelometric
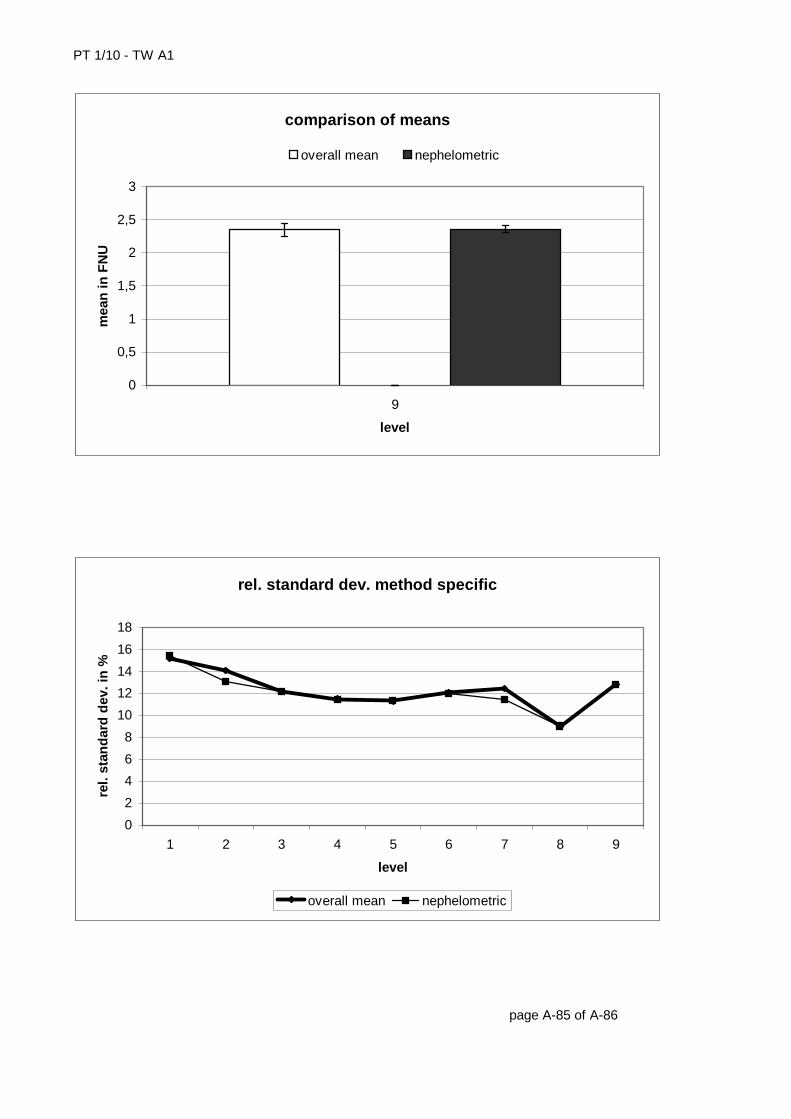
PT 1/10 - TW A1
page A-85 of A-86
comparison of means
0
0,5
1
1,5
2
2,5
3
9
level
mea
n in
FN
U
overall mean nephelometric
rel. standard dev. method specific
0
2
4
6
8
10
12
14
16
18
1 2 3 4 5 6 7 8 9
level
rel.
stan
dar
d d
ev. i
n %
overall mean nephelometric
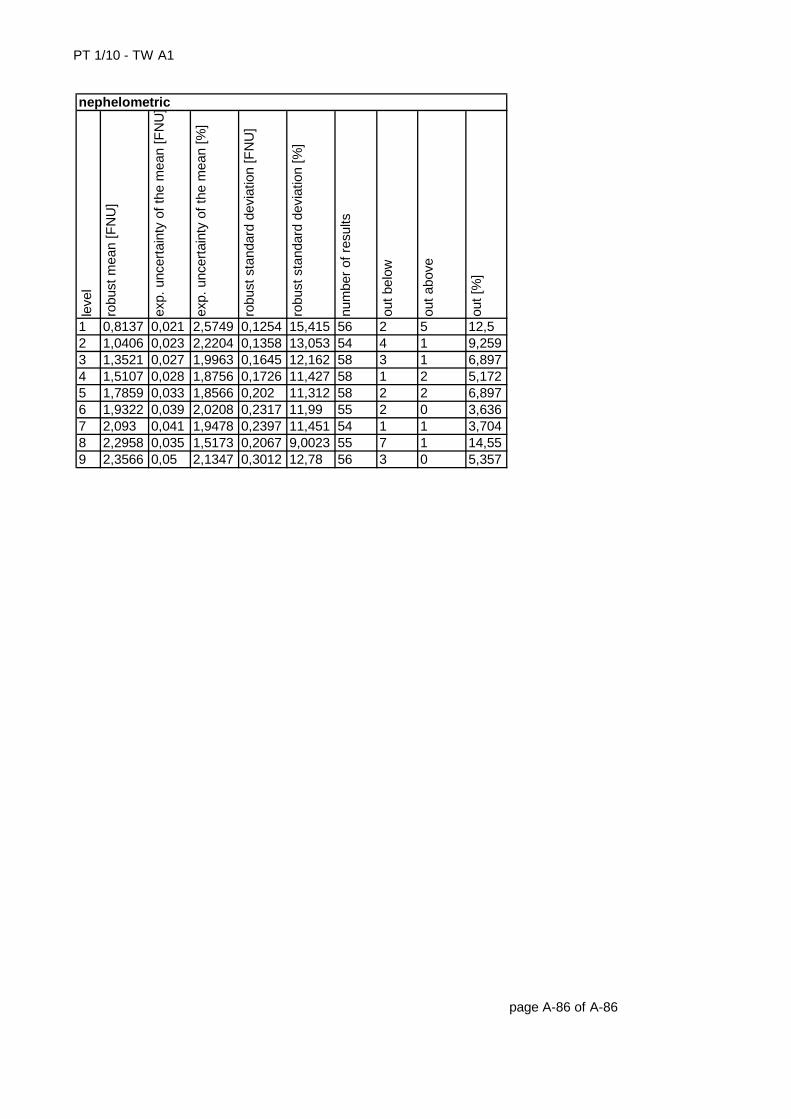
PT 1/10 - TW A1
leve
l
robu
st m
ean
[FN
U]
exp.
unc
erta
inty
of t
he m
ean
[FN
U]
exp.
unc
erta
inty
of t
he m
ean
[%]
robu
st s
tand
ard
devi
atio
n [F
NU
]
robu
st s
tand
ard
devi
atio
n [%
]
num
ber
of r
esul
ts
out b
elow
out a
bove
out [
%]
1 0,8137 0,021 2,5749 0,1254 15,415 56 2 5 12,52 1,0406 0,023 2,2204 0,1358 13,053 54 4 1 9,2593 1,3521 0,027 1,9963 0,1645 12,162 58 3 1 6,8974 1,5107 0,028 1,8756 0,1726 11,427 58 1 2 5,1725 1,7859 0,033 1,8566 0,202 11,312 58 2 2 6,8976 1,9322 0,039 2,0208 0,2317 11,99 55 2 0 3,6367 2,093 0,041 1,9478 0,2397 11,451 54 1 1 3,7048 2,2958 0,035 1,5173 0,2067 9,0023 55 7 1 14,559 2,3566 0,05 2,1347 0,3012 12,78 56 3 0 5,357 page A-86 of A-86
nephelometric
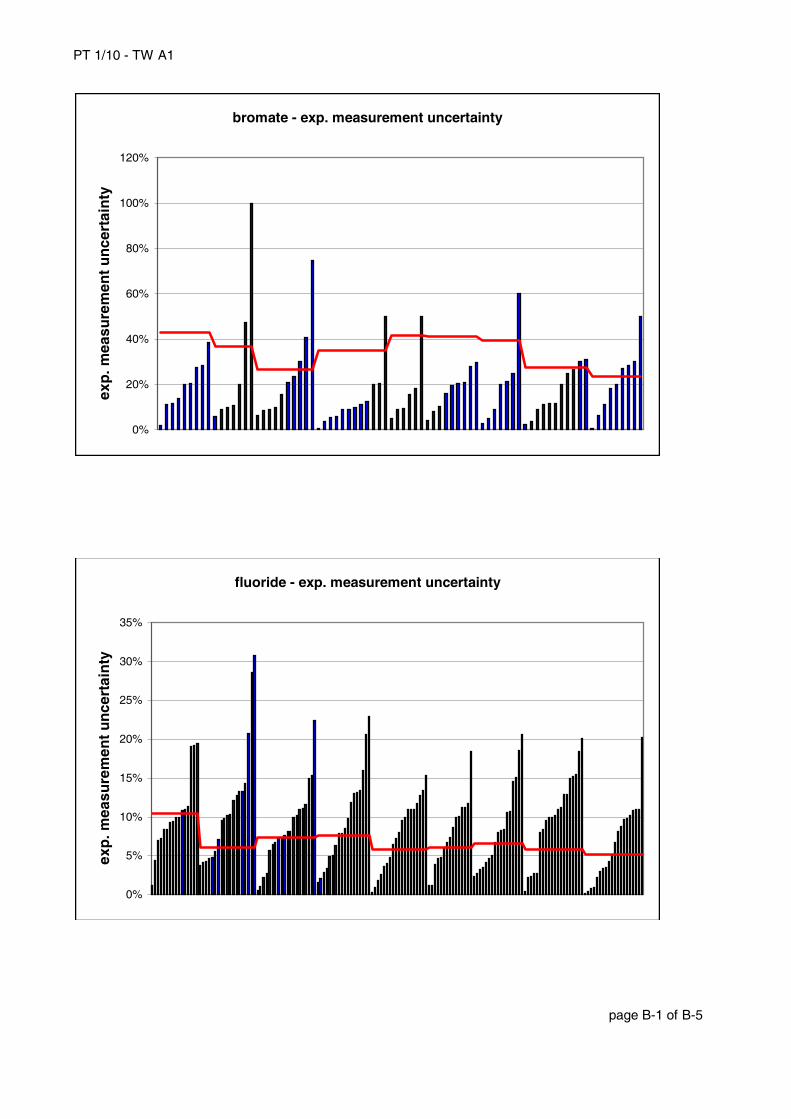
PT 1/10 - TW A1
page B-1 of B-5
bromate - exp. measurement uncertainty
0%
20%
40%
60%
80%
100%
120%
exp
. mea
sure
men
t u
nce
rtai
nty
fluoride - exp. measurement uncertainty
0%
5%
10%
15%
20%
25%
30%
35%
exp
. mea
sure
men
t u
nce
rtai
nty
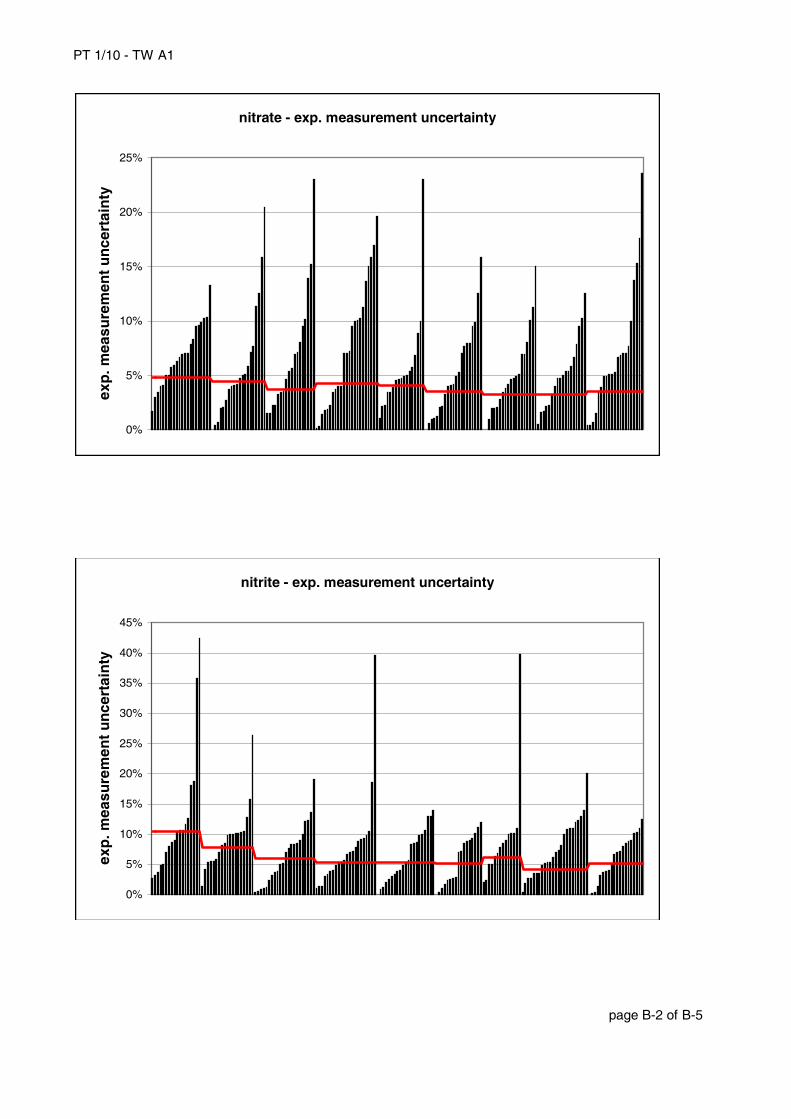
PT 1/10 - TW A1
page B-2 of B-5
nitrate - exp. measurement uncertainty
0%
5%
10%
15%
20%
25%
exp
. mea
sure
men
t u
nce
rtai
nty
nitrite - exp. measurement uncertainty
0%
5%
10%
15%
20%
25%
30%
35%
40%
45%
exp
. mea
sure
men
t u
nce
rtai
nty
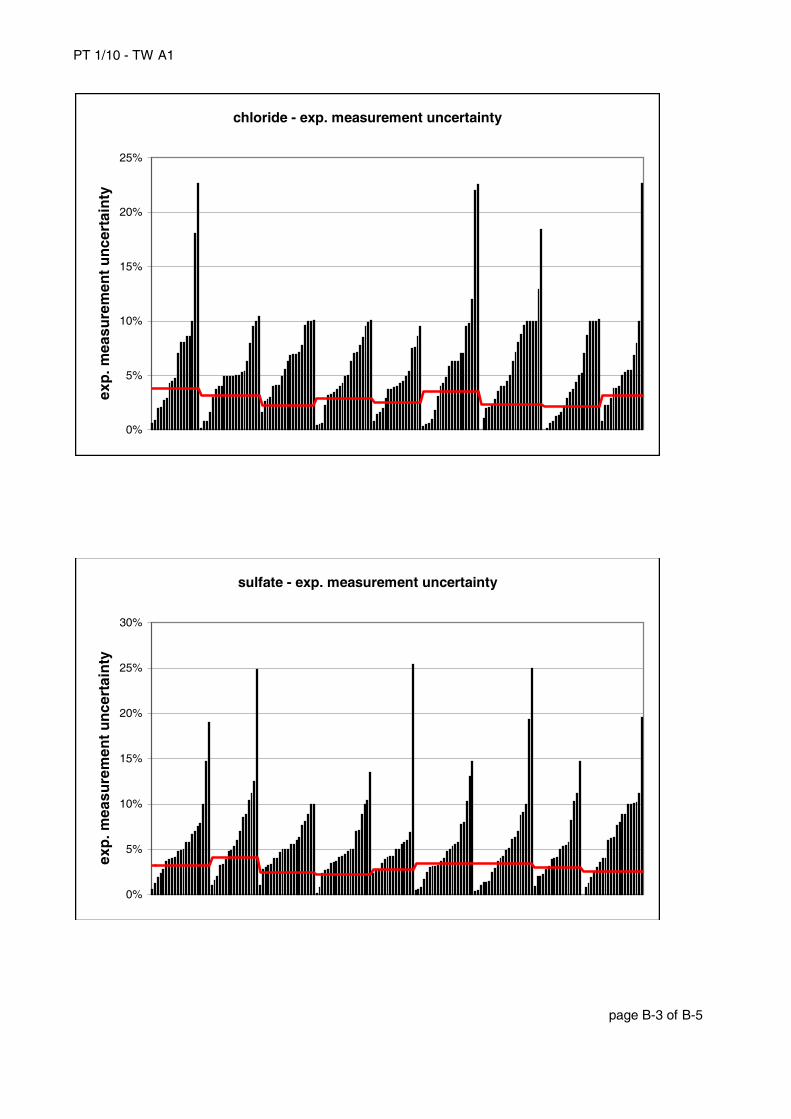
PT 1/10 - TW A1
page B-3 of B-5
chloride - exp. measurement uncertainty
0%
5%
10%
15%
20%
25%
exp
. mea
sure
men
t u
nce
rtai
nty
sulfate - exp. measurement uncertainty
0%
5%
10%
15%
20%
25%
30%
exp
. mea
sure
men
t u
nce
rtai
nty
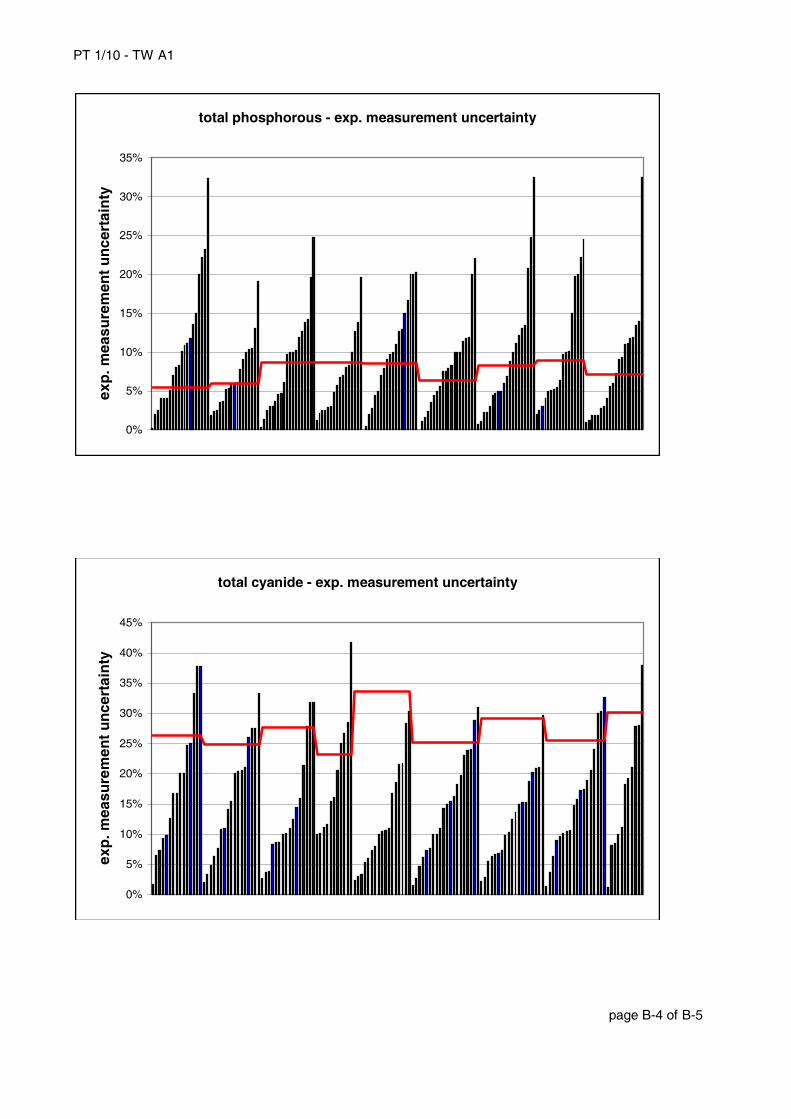
PT 1/10 - TW A1
page B-4 of B-5
total phosphorous - exp. measurement uncertainty
0%
5%
10%
15%
20%
25%
30%
35%
exp
. mea
sure
men
t u
nce
rtai
nty
total cyanide - exp. measurement uncertainty
0%
5%
10%
15%
20%
25%
30%
35%
40%
45%
exp
. mea
sure
men
t u
nce
rtai
nty
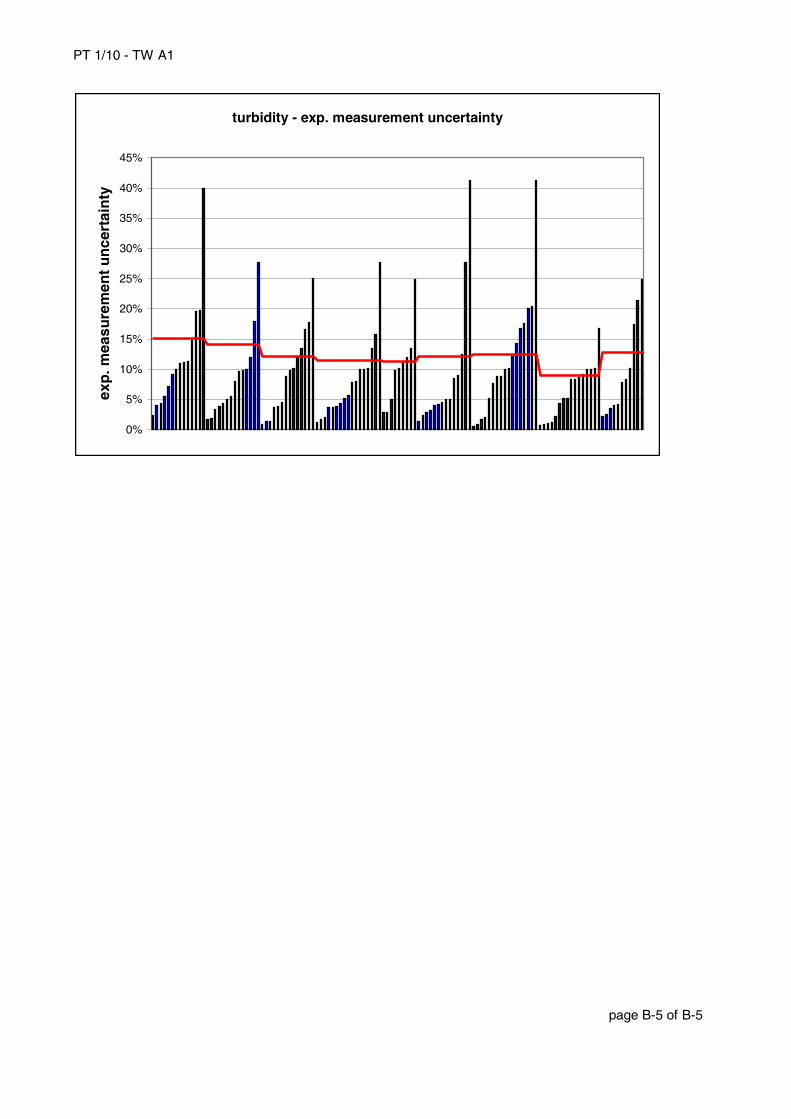
PT 1/10 - TW A1
page B-5 of B-5
turbidity - exp. measurement uncertainty
0%
5%
10%
15%
20%
25%
30%
35%
40%
45%
exp
. mea
sure
men
t u
nce
rtai
nty
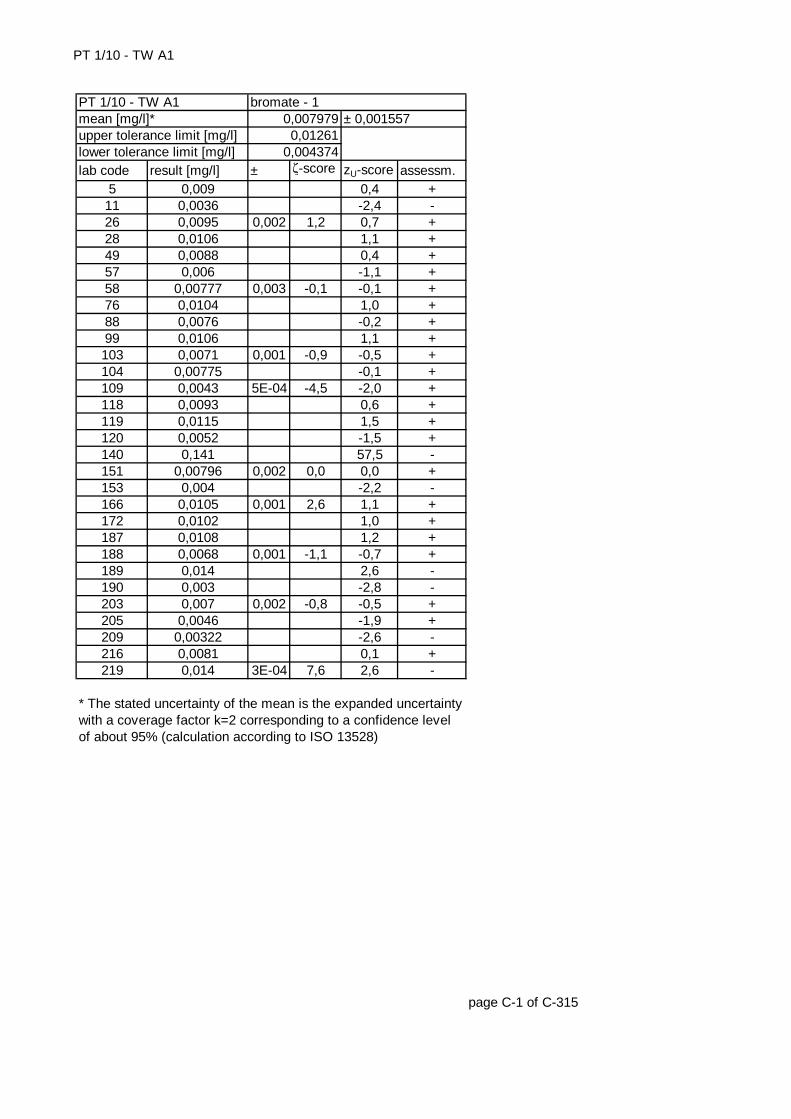
PT 1/10 - TW A1
lab code result [mg/l] ± ζ-score zU-score assessm.5 0,009 0,4 +
11 0,0036 -2,4 -26 0,0095 0,002 1,2 0,7 +28 0,0106 1,1 +49 0,0088 0,4 +57 0,006 -1,1 +58 0,00777 0,003 -0,1 -0,1 +76 0,0104 1,0 +88 0,0076 -0,2 +99 0,0106 1,1 +103 0,0071 0,001 -0,9 -0,5 +104 0,00775 -0,1 +109 0,0043 5E-04 -4,5 -2,0 +118 0,0093 0,6 +119 0,0115 1,5 +120 0,0052 -1,5 +140 0,141 57,5 -151 0,00796 0,002 0,0 0,0 +153 0,004 -2,2 -166 0,0105 0,001 2,6 1,1 +172 0,0102 1,0 +187 0,0108 1,2 +188 0,0068 0,001 -1,1 -0,7 +189 0,014 2,6 -190 0,003 -2,8 -203 0,007 0,002 -0,8 -0,5 +205 0,0046 -1,9 +209 0,00322 -2,6 -216 0,0081 0,1 +219 0,014 3E-04 7,6 2,6 -
page C-1 of C-315
PT 1/10 - TW A1 bromate - 10,0079790,01261
* The stated uncertainty of the mean is the expanded uncertainty with a coverage factor k=2 corresponding to a confidence level of about 95% (calculation according to ISO 13528)
0,004374
± 0,001557mean [mg/l]*upper tolerance limit [mg/l]lower tolerance limit [mg/l]
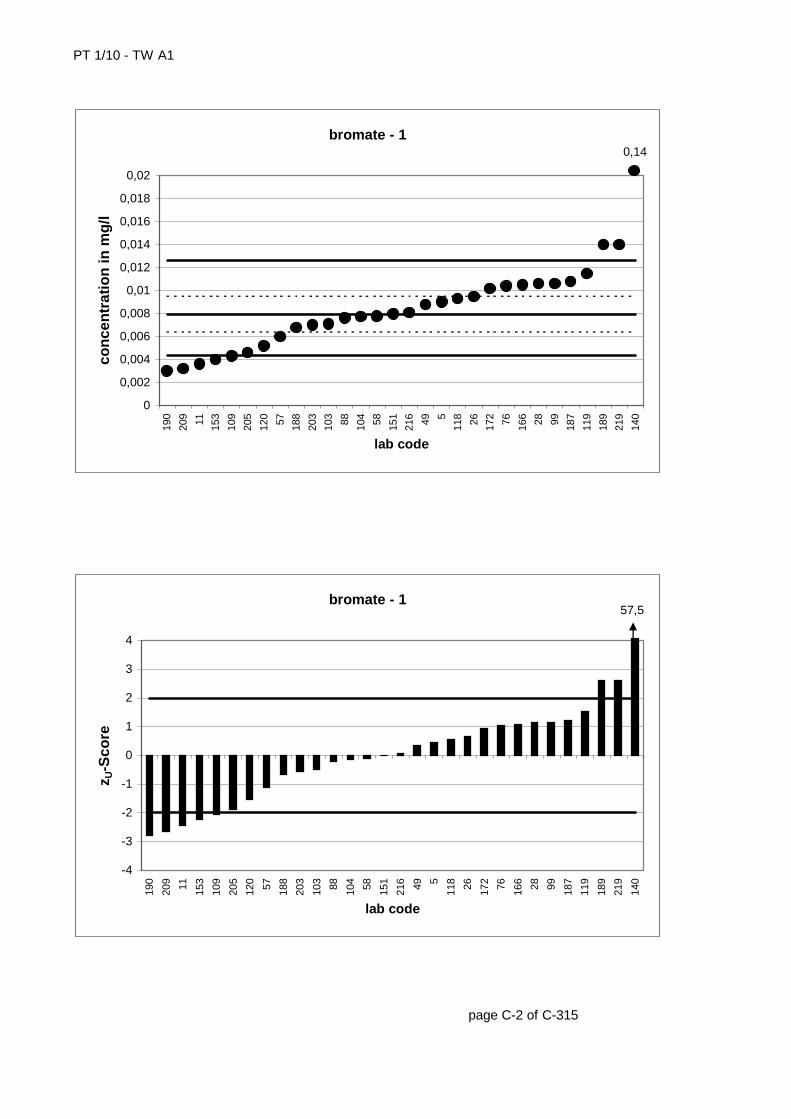
PT 1/10 - TW A1
page C-2 of C-315
bromate - 1
0
0,002
0,004
0,006
0,008
0,01
0,012
0,014
0,016
0,018
0,0219
0
209 11 153
109
205
120 57 188
203
103 88 104 58 151
216 49 5
118 26 172 76 166 28 99 187
119
189
219
140
lab code
con
cen
trat
ion
in m
g/l
0,14
bromate - 1
-4
-3
-2
-1
0
1
2
3
4
190
209 11 153
109
205
120 57 188
203
103 88 104 58 151
216 49 5
118 26 172 76 166 28 99 187
119
189
219
140
lab code
z U-S
core
57,5

PT 1/10 - TW A1
page C-3 of C-315
bromate - 1
0
0,0005
0,001
0,0015
0,002
0,0025
0,003
0,0035
0,00421
9
109
103
166
188 26 203
151 58
lab code
exp
and
ed u
nce
rtai
nty
bromate - 1
-5
-4
-3
-2
-1
0
1
2
3
4
109
188
103
203 58 151 26 166
219
lab code
ζ-S
core
7,59
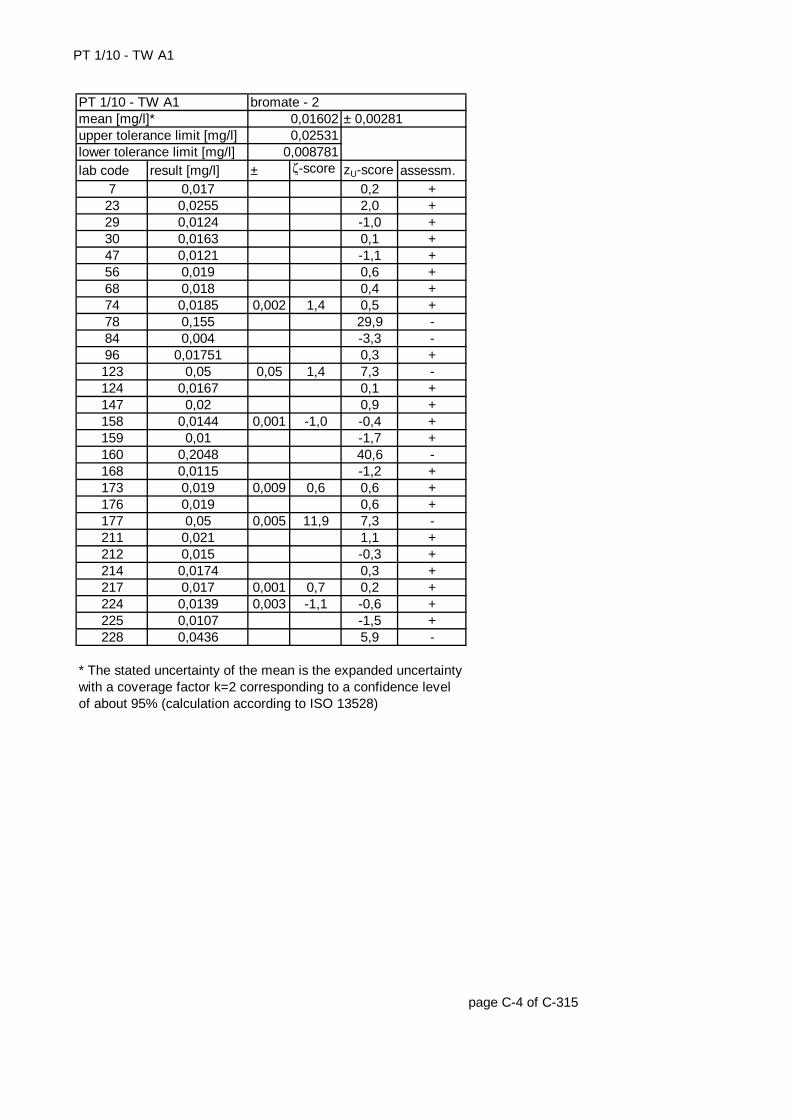
PT 1/10 - TW A1
lab code result [mg/l] ± ζ-score zU-score assessm.7 0,017 0,2 +
23 0,0255 2,0 +29 0,0124 -1,0 +30 0,0163 0,1 +47 0,0121 -1,1 +56 0,019 0,6 +68 0,018 0,4 +74 0,0185 0,002 1,4 0,5 +78 0,155 29,9 -84 0,004 -3,3 -96 0,01751 0,3 +123 0,05 0,05 1,4 7,3 -124 0,0167 0,1 +147 0,02 0,9 +158 0,0144 0,001 -1,0 -0,4 +159 0,01 -1,7 +160 0,2048 40,6 -168 0,0115 -1,2 +173 0,019 0,009 0,6 0,6 +176 0,019 0,6 +177 0,05 0,005 11,9 7,3 -211 0,021 1,1 +212 0,015 -0,3 +214 0,0174 0,3 +217 0,017 0,001 0,7 0,2 +224 0,0139 0,003 -1,1 -0,6 +225 0,0107 -1,5 +228 0,0436 5,9 -
page C-4 of C-315
PT 1/10 - TW A1 bromate - 20,016020,02531
* The stated uncertainty of the mean is the expanded uncertainty with a coverage factor k=2 corresponding to a confidence level of about 95% (calculation according to ISO 13528)
0,008781
± 0,00281mean [mg/l]*upper tolerance limit [mg/l]lower tolerance limit [mg/l]
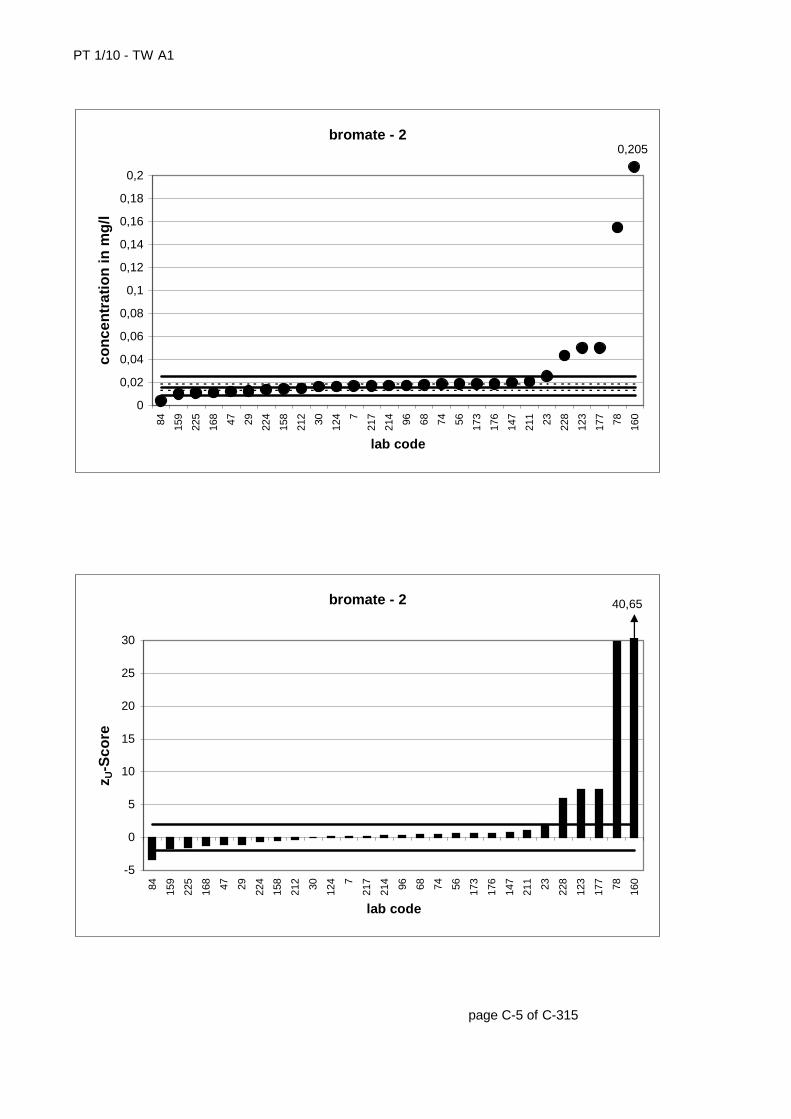
PT 1/10 - TW A1
page C-5 of C-315
bromate - 2
0
0,02
0,04
0,06
0,08
0,1
0,12
0,14
0,16
0,18
0,284 159
225
168 47 29 224
158
212 30 124 7
217
214 96 68 74 56 173
176
147
211 23 228
123
177 78 160
lab code
con
cen
trat
ion
in m
g/l
0,205
bromate - 2
-5
0
5
10
15
20
25
30
84 159
225
168 47 29 224
158
212 30 124 7
217
214 96 68 74 56 173
176
147
211 23 228
123
177 78 160
lab code
z U-S
core
40,65
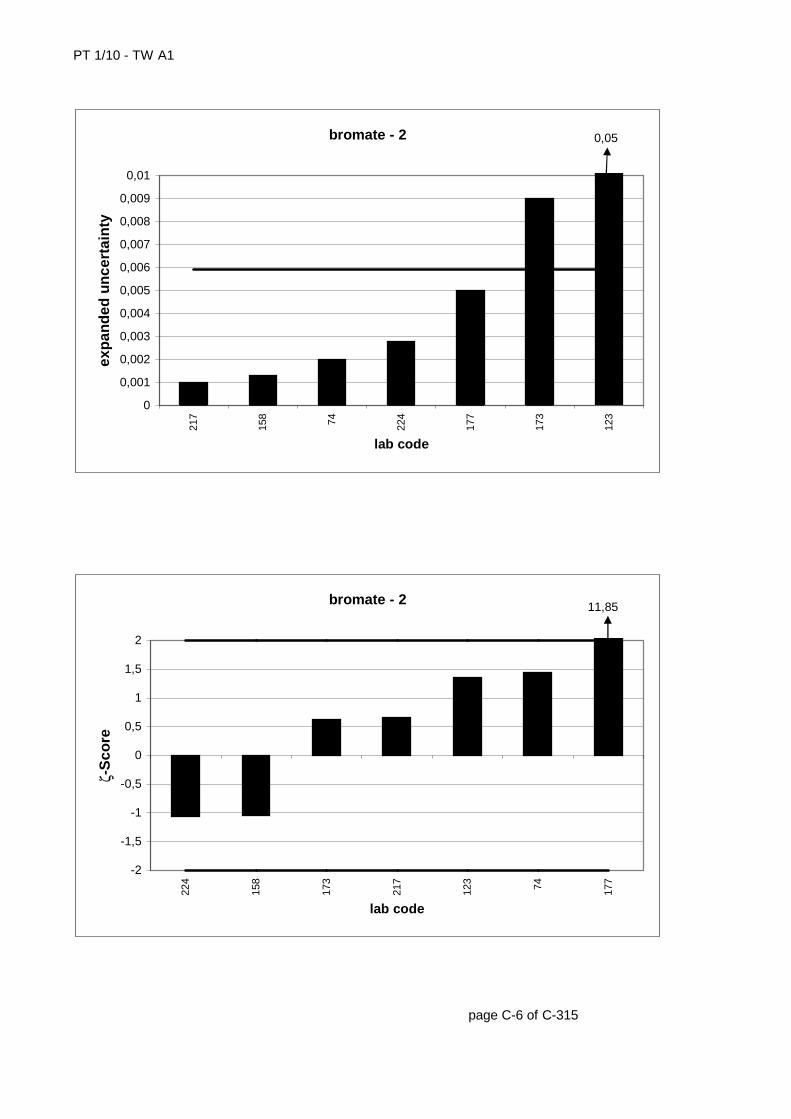
PT 1/10 - TW A1
page C-6 of C-315
bromate - 2
0
0,001
0,002
0,003
0,004
0,005
0,006
0,007
0,008
0,009
0,0121
7
158 74 224
177
173
123
lab code
exp
and
ed u
nce
rtai
nty
0,05
bromate - 2
-2
-1,5
-1
-0,5
0
0,5
1
1,5
2
224
158
173
217
123 74 177
lab code
ζ-S
core
11,85
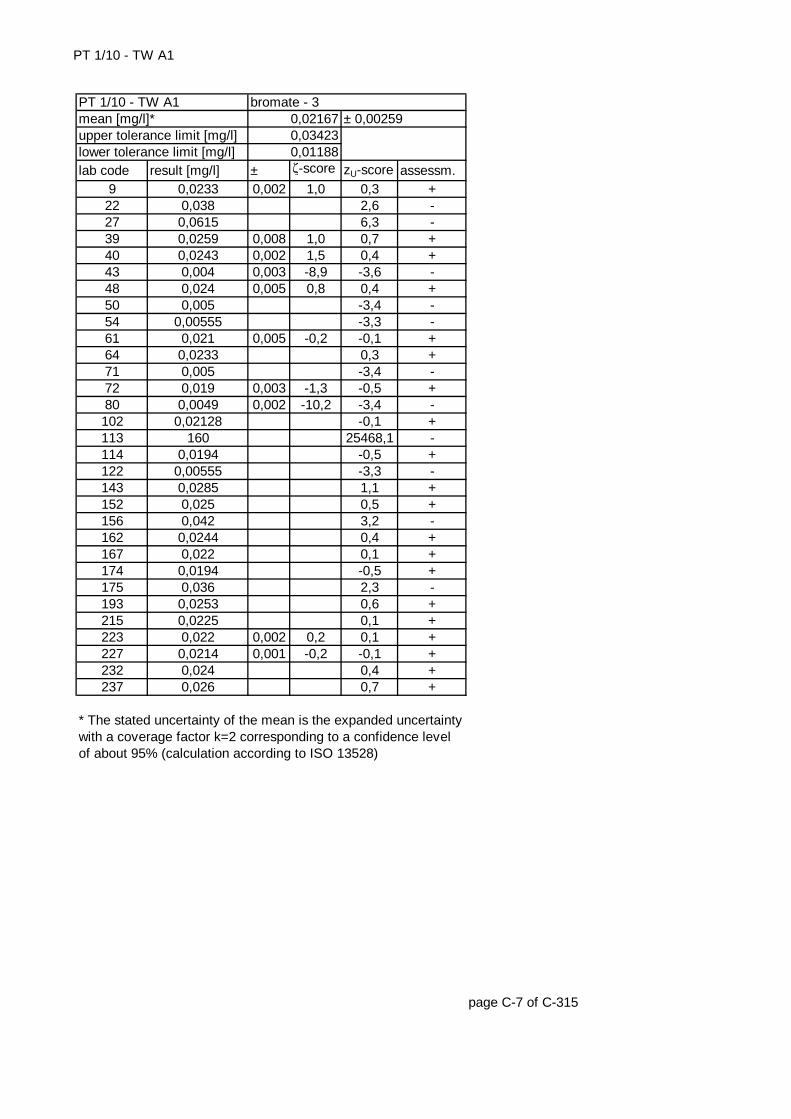
PT 1/10 - TW A1
lab code result [mg/l] ± ζ-score zU-score assessm.9 0,0233 0,002 1,0 0,3 +
22 0,038 2,6 -27 0,0615 6,3 -39 0,0259 0,008 1,0 0,7 +40 0,0243 0,002 1,5 0,4 +43 0,004 0,003 -8,9 -3,6 -48 0,024 0,005 0,8 0,4 +50 0,005 -3,4 -54 0,00555 -3,3 -61 0,021 0,005 -0,2 -0,1 +64 0,0233 0,3 +71 0,005 -3,4 -72 0,019 0,003 -1,3 -0,5 +80 0,0049 0,002 -10,2 -3,4 -102 0,02128 -0,1 +113 160 25468,1 -114 0,0194 -0,5 +122 0,00555 -3,3 -143 0,0285 1,1 +152 0,025 0,5 +156 0,042 3,2 -162 0,0244 0,4 +167 0,022 0,1 +174 0,0194 -0,5 +175 0,036 2,3 -193 0,0253 0,6 +215 0,0225 0,1 +223 0,022 0,002 0,2 0,1 +227 0,0214 0,001 -0,2 -0,1 +232 0,024 0,4 +237 0,026 0,7 +
page C-7 of C-315
PT 1/10 - TW A1 bromate - 30,021670,03423
* The stated uncertainty of the mean is the expanded uncertainty with a coverage factor k=2 corresponding to a confidence level of about 95% (calculation according to ISO 13528)
0,01188
± 0,00259mean [mg/l]*upper tolerance limit [mg/l]lower tolerance limit [mg/l]
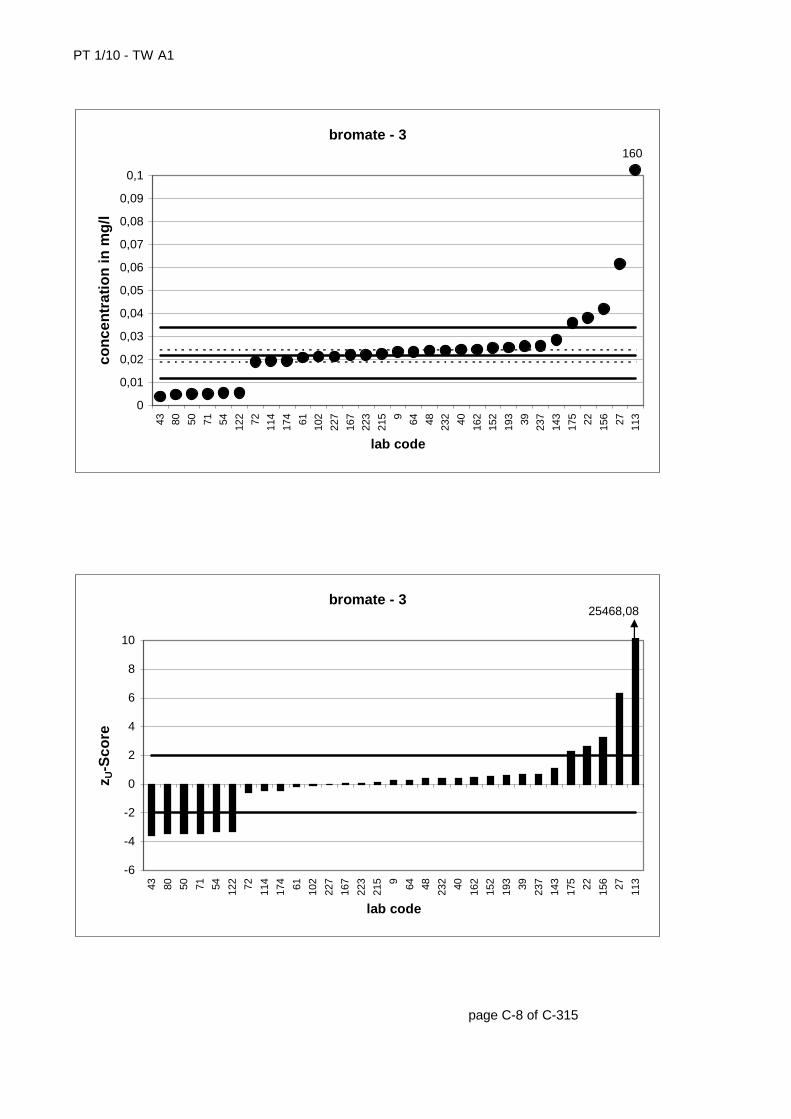
PT 1/10 - TW A1
page C-8 of C-315
bromate - 3
0
0,01
0,02
0,03
0,04
0,05
0,06
0,07
0,08
0,09
0,143 80 50 71 54 122 72 114
174 61 102
227
167
223
215 9 64 48 232 40 162
152
193 39 237
143
175 22 156 27 113
lab code
con
cen
trat
ion
in m
g/l
160
bromate - 3
-6
-4
-2
0
2
4
6
8
10
43 80 50 71 54 122 72 114
174 61 102
227
167
223
215 9 64 48 232 40 162
152
193 39 237
143
175 22 156 27 113
lab code
z U-S
core
25468,08
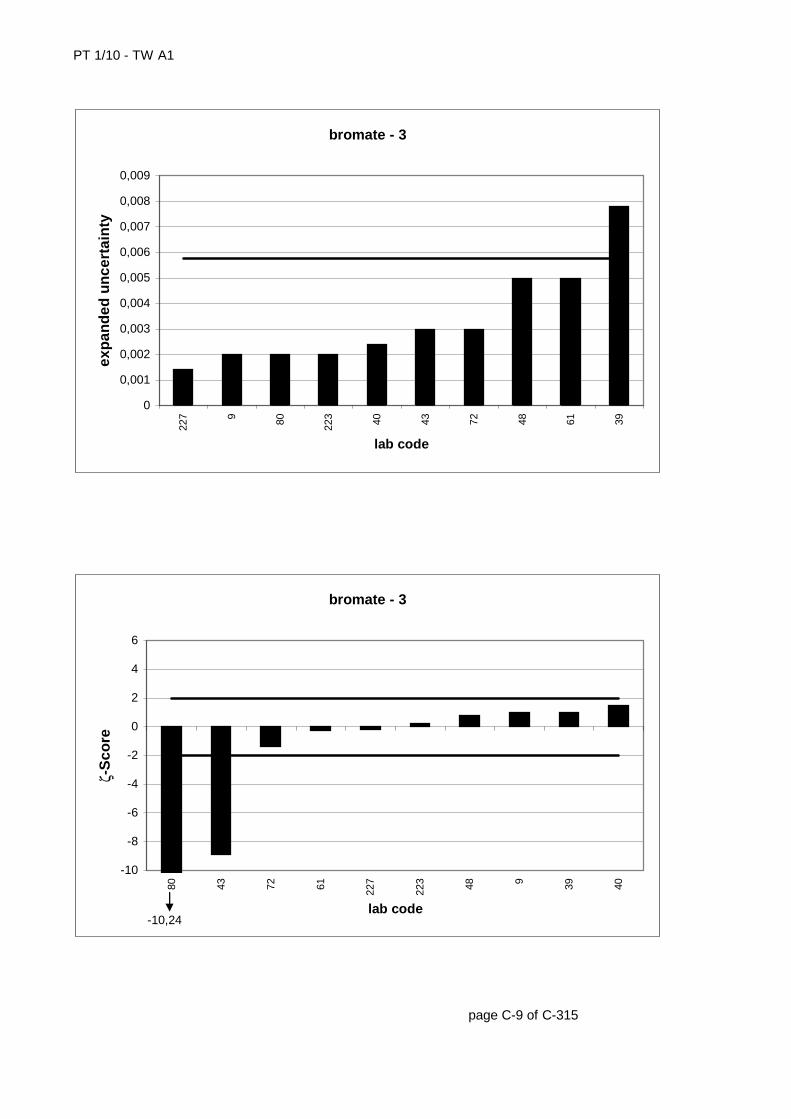
PT 1/10 - TW A1
page C-9 of C-315
bromate - 3
0
0,001
0,002
0,003
0,004
0,005
0,006
0,007
0,008
0,00922
7 9 80 223 40 43 72 48 61 39
lab code
exp
and
ed u
nce
rtai
nty
bromate - 3
-10
-8
-6
-4
-2
0
2
4
6
80 43 72 61 227
223 48 9 39 40
lab code
ζ-S
core
-10,24
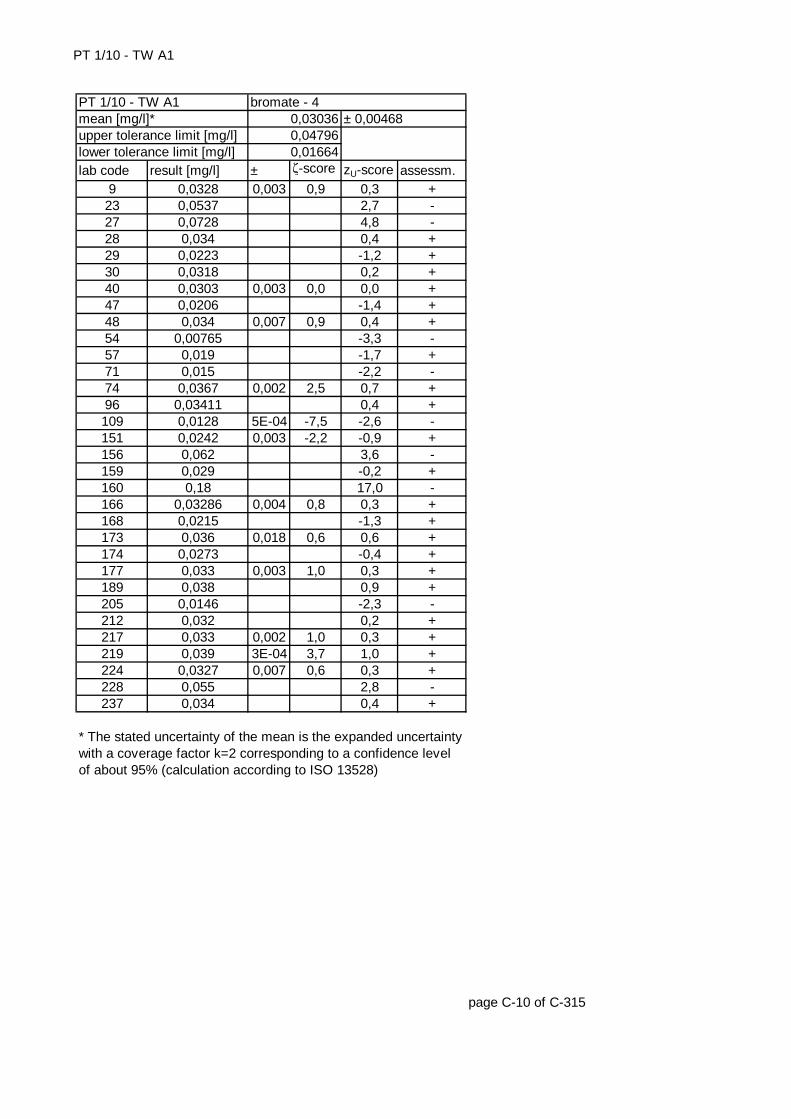
PT 1/10 - TW A1
lab code result [mg/l] ± ζ-score zU-score assessm.9 0,0328 0,003 0,9 0,3 +
23 0,0537 2,7 -27 0,0728 4,8 -28 0,034 0,4 +29 0,0223 -1,2 +30 0,0318 0,2 +40 0,0303 0,003 0,0 0,0 +47 0,0206 -1,4 +48 0,034 0,007 0,9 0,4 +54 0,00765 -3,3 -57 0,019 -1,7 +71 0,015 -2,2 -74 0,0367 0,002 2,5 0,7 +96 0,03411 0,4 +109 0,0128 5E-04 -7,5 -2,6 -151 0,0242 0,003 -2,2 -0,9 +156 0,062 3,6 -159 0,029 -0,2 +160 0,18 17,0 -166 0,03286 0,004 0,8 0,3 +168 0,0215 -1,3 +173 0,036 0,018 0,6 0,6 +174 0,0273 -0,4 +177 0,033 0,003 1,0 0,3 +189 0,038 0,9 +205 0,0146 -2,3 -212 0,032 0,2 +217 0,033 0,002 1,0 0,3 +219 0,039 3E-04 3,7 1,0 +224 0,0327 0,007 0,6 0,3 +228 0,055 2,8 -237 0,034 0,4 +
page C-10 of C-315
PT 1/10 - TW A1 bromate - 40,030360,04796
* The stated uncertainty of the mean is the expanded uncertainty with a coverage factor k=2 corresponding to a confidence level of about 95% (calculation according to ISO 13528)
0,01664
± 0,00468mean [mg/l]*upper tolerance limit [mg/l]lower tolerance limit [mg/l]
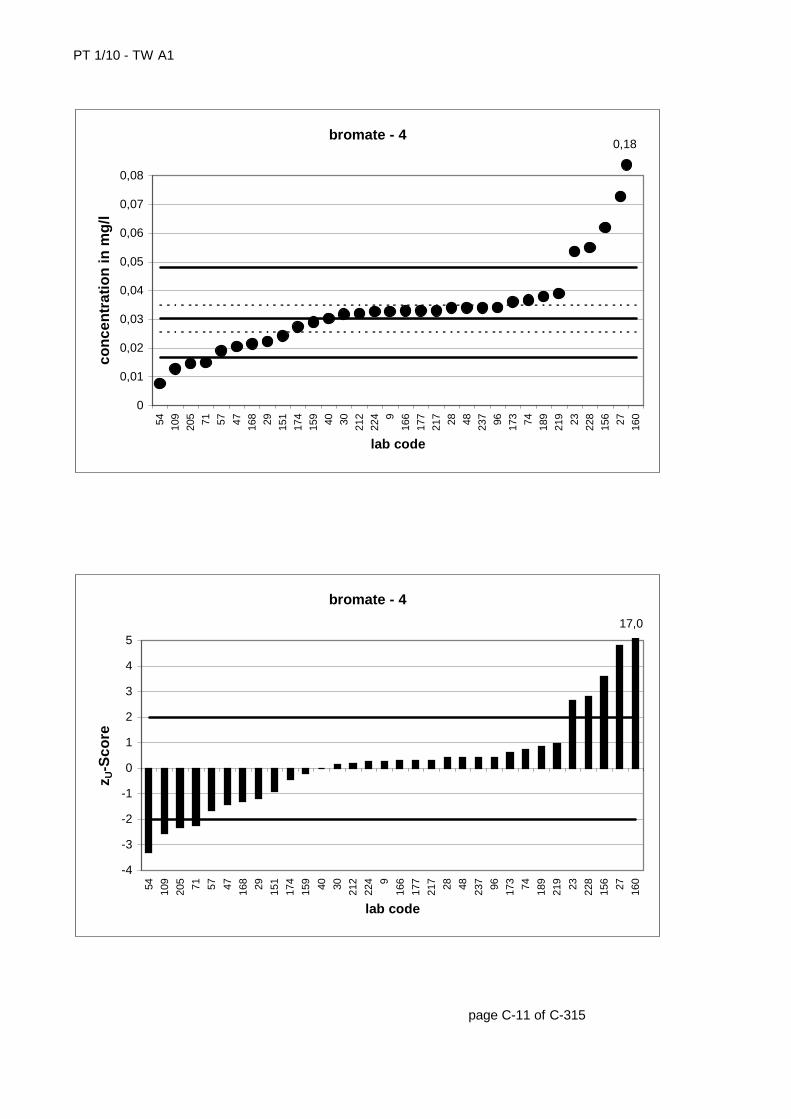
PT 1/10 - TW A1
page C-11 of C-315
bromate - 4
0
0,01
0,02
0,03
0,04
0,05
0,06
0,07
0,0854 109
205 71 57 47 168 29 151
174
159 40 30 212
224 9
166
177
217 28 48 237 96 173 74 189
219 23 228
156 27 160
lab code
con
cen
trat
ion
in m
g/l
0,18
bromate - 4
-4
-3
-2
-1
0
1
2
3
4
5
54 109
205 71 57 47 168 29 151
174
159 40 30 212
224 9
166
177
217 28 48 237 96 173 74 189
219 23 228
156 27 160
lab code
z U-S
core
17,0

PT 1/10 - TW A1
page C-12 of C-315
bromate - 4
0
0,001
0,002
0,003
0,004
0,005
0,006
0,007
0,00821
9
109 74 217 9 40 151
177
166
224 48 173
lab code
exp
and
ed u
nce
rtai
nty
0,018
bromate - 4
-4
-3
-2
-1
0
1
2
3
4
109
151 40 224
173
166 48 9
177
217 74 219
lab code
ζ-S
core
-7,45
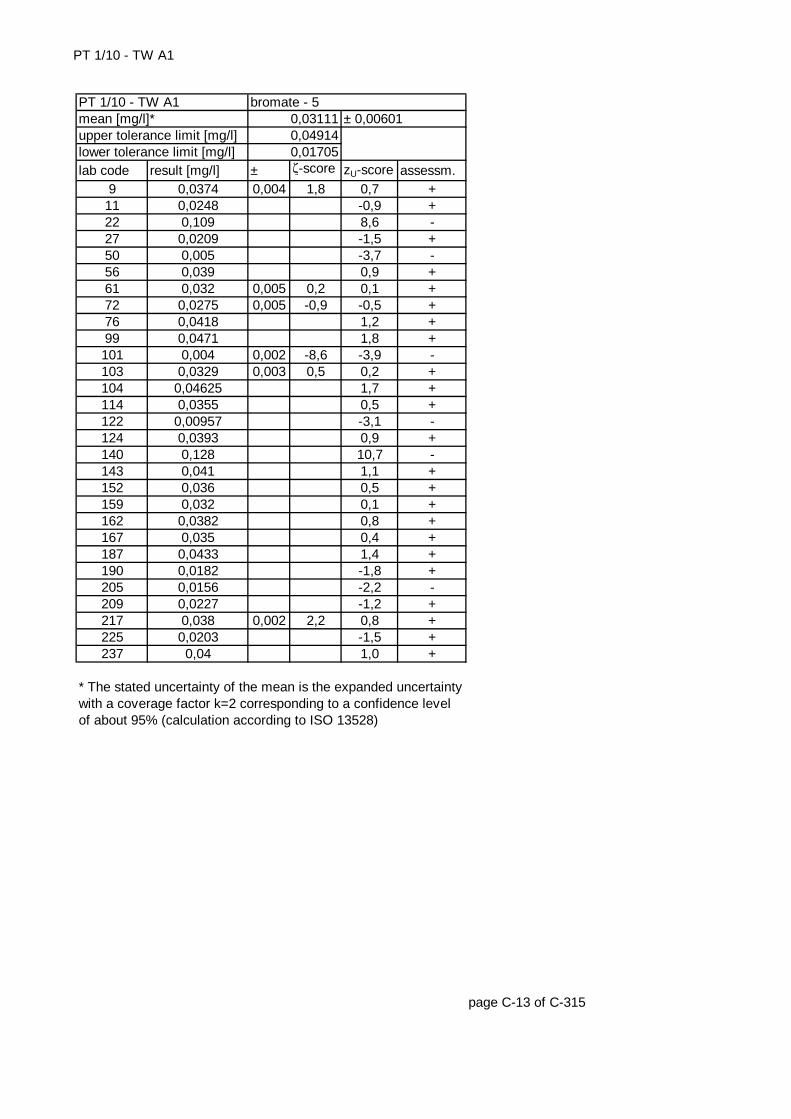
PT 1/10 - TW A1
lab code result [mg/l] ± ζ-score zU-score assessm.9 0,0374 0,004 1,8 0,7 +
11 0,0248 -0,9 +22 0,109 8,6 -27 0,0209 -1,5 +50 0,005 -3,7 -56 0,039 0,9 +61 0,032 0,005 0,2 0,1 +72 0,0275 0,005 -0,9 -0,5 +76 0,0418 1,2 +99 0,0471 1,8 +101 0,004 0,002 -8,6 -3,9 -103 0,0329 0,003 0,5 0,2 +104 0,04625 1,7 +114 0,0355 0,5 +122 0,00957 -3,1 -124 0,0393 0,9 +140 0,128 10,7 -143 0,041 1,1 +152 0,036 0,5 +159 0,032 0,1 +162 0,0382 0,8 +167 0,035 0,4 +187 0,0433 1,4 +190 0,0182 -1,8 +205 0,0156 -2,2 -209 0,0227 -1,2 +217 0,038 0,002 2,2 0,8 +225 0,0203 -1,5 +237 0,04 1,0 +
page C-13 of C-315
PT 1/10 - TW A1 bromate - 50,031110,04914
* The stated uncertainty of the mean is the expanded uncertainty with a coverage factor k=2 corresponding to a confidence level of about 95% (calculation according to ISO 13528)
0,01705
± 0,00601mean [mg/l]*upper tolerance limit [mg/l]lower tolerance limit [mg/l]
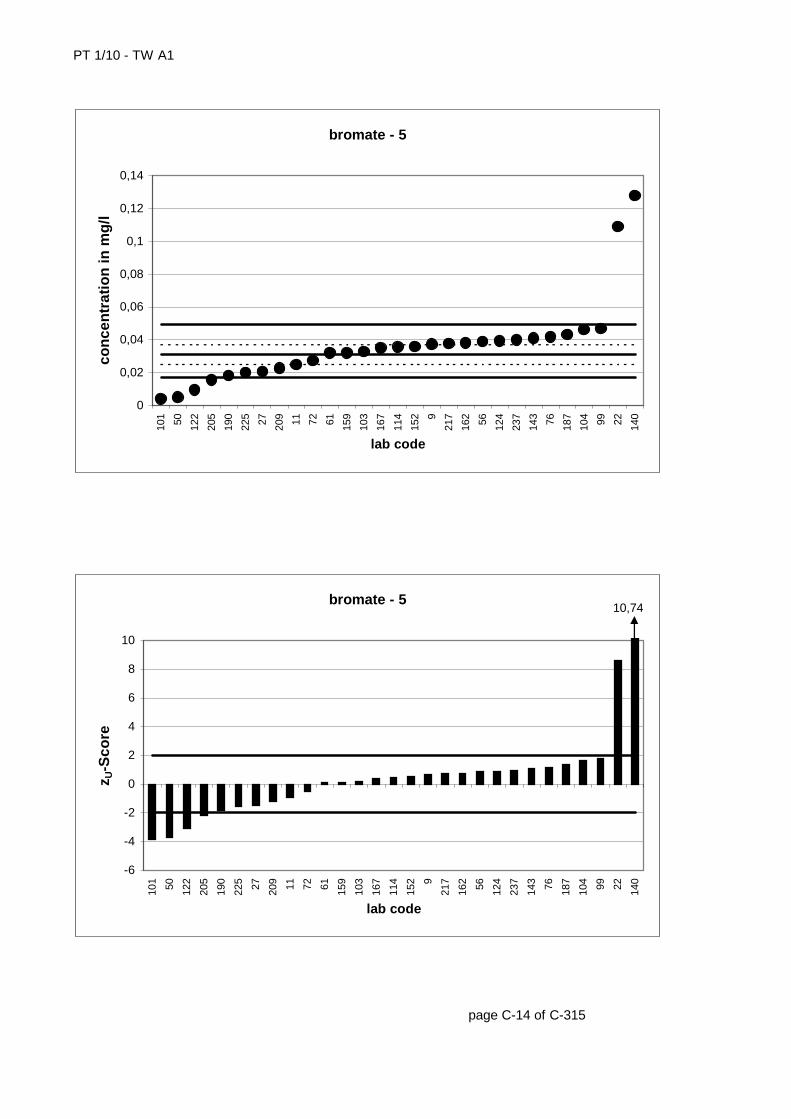
PT 1/10 - TW A1
page C-14 of C-315
bromate - 5
0
0,02
0,04
0,06
0,08
0,1
0,12
0,1410
1 50 122
205
190
225 27 209 11 72 61 159
103
167
114
152 9
217
162 56 124
237
143 76 187
104 99 22 140
lab code
con
cen
trat
ion
in m
g/l
bromate - 5
-6
-4
-2
0
2
4
6
8
10
101 50 122
205
190
225 27 209 11 72 61 159
103
167
114
152 9
217
162 56 124
237
143 76 187
104 99 22 140
lab code
z U-S
core
10,74
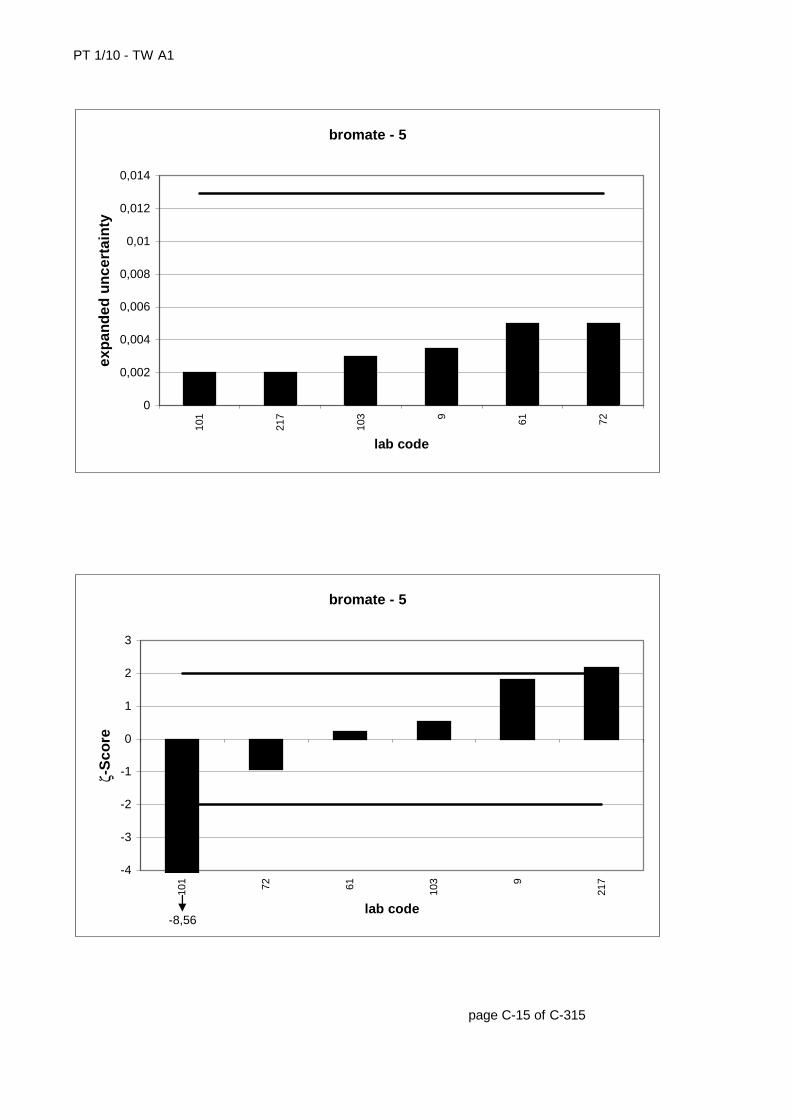
PT 1/10 - TW A1
page C-15 of C-315
bromate - 5
0
0,002
0,004
0,006
0,008
0,01
0,012
0,014
101
217
103 9 61 72
lab code
exp
and
ed u
nce
rtai
nty
bromate - 5
-4
-3
-2
-1
0
1
2
3
101 72 61 103 9
217
lab code
ζ-S
core
-8,56
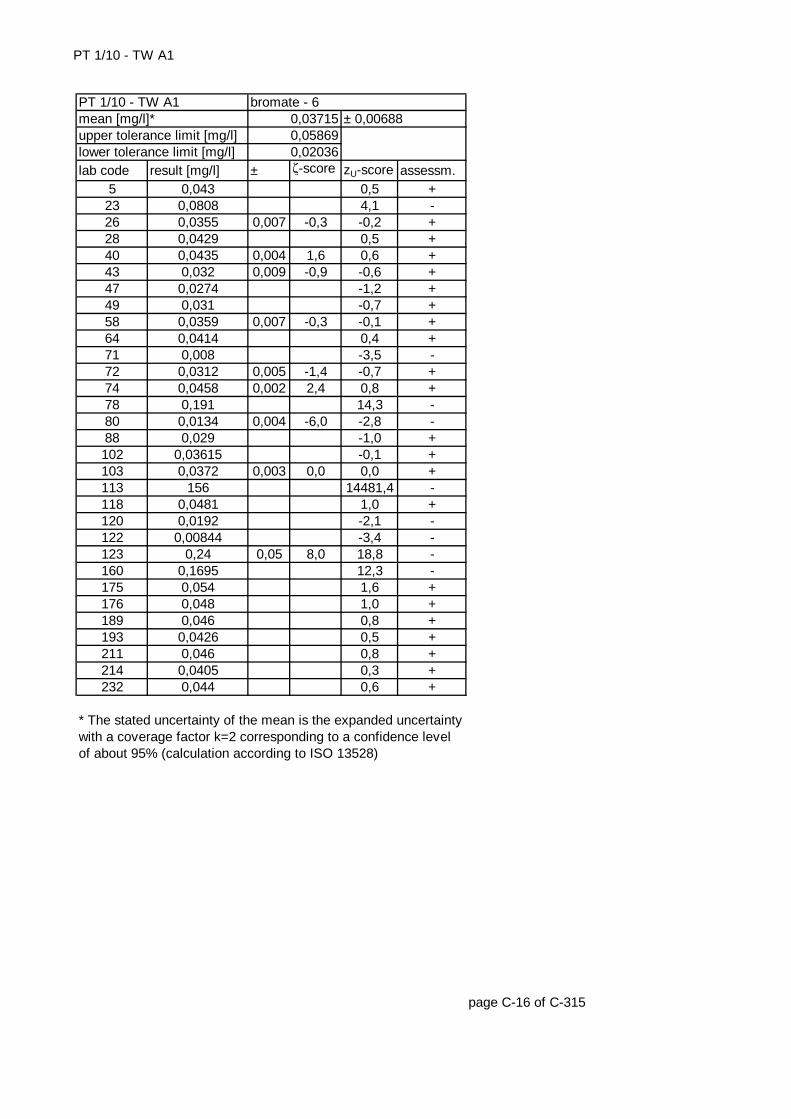
PT 1/10 - TW A1
lab code result [mg/l] ± ζ-score zU-score assessm.5 0,043 0,5 +
23 0,0808 4,1 -26 0,0355 0,007 -0,3 -0,2 +28 0,0429 0,5 +40 0,0435 0,004 1,6 0,6 +43 0,032 0,009 -0,9 -0,6 +47 0,0274 -1,2 +49 0,031 -0,7 +58 0,0359 0,007 -0,3 -0,1 +64 0,0414 0,4 +71 0,008 -3,5 -72 0,0312 0,005 -1,4 -0,7 +74 0,0458 0,002 2,4 0,8 +78 0,191 14,3 -80 0,0134 0,004 -6,0 -2,8 -88 0,029 -1,0 +102 0,03615 -0,1 +103 0,0372 0,003 0,0 0,0 +113 156 14481,4 -118 0,0481 1,0 +120 0,0192 -2,1 -122 0,00844 -3,4 -123 0,24 0,05 8,0 18,8 -160 0,1695 12,3 -175 0,054 1,6 +176 0,048 1,0 +189 0,046 0,8 +193 0,0426 0,5 +211 0,046 0,8 +214 0,0405 0,3 +232 0,044 0,6 +
page C-16 of C-315
PT 1/10 - TW A1 bromate - 60,037150,05869
* The stated uncertainty of the mean is the expanded uncertainty with a coverage factor k=2 corresponding to a confidence level of about 95% (calculation according to ISO 13528)
0,02036
± 0,00688mean [mg/l]*upper tolerance limit [mg/l]lower tolerance limit [mg/l]
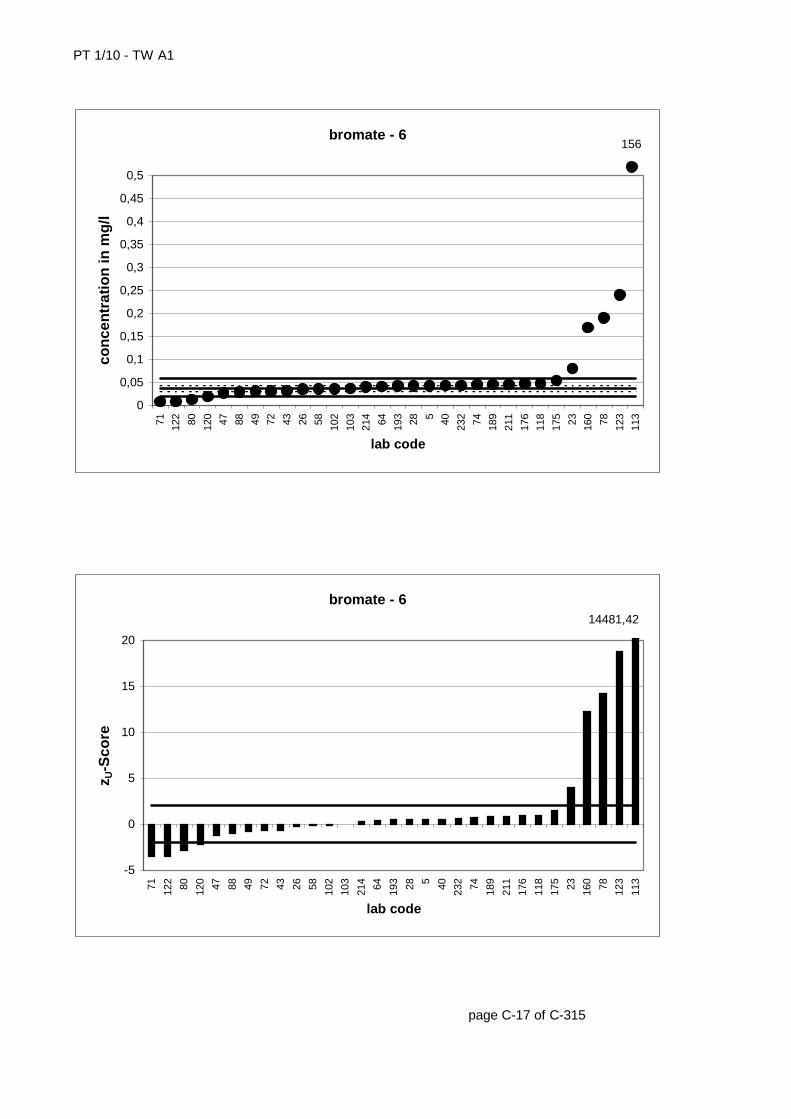
PT 1/10 - TW A1
page C-17 of C-315
bromate - 6
0
0,05
0,1
0,15
0,2
0,25
0,3
0,35
0,4
0,45
0,571 122 80 120 47 88 49 72 43 26 58 102
103
214 64 193 28 5 40 232 74 189
211
176
118
175 23 160 78 123
113
lab code
con
cen
trat
ion
in m
g/l
156
bromate - 6
-5
0
5
10
15
20
71 122 80 120 47 88 49 72 43 26 58 102
103
214 64 193 28 5 40 232 74 189
211
176
118
175 23 160 78 123
113
lab code
z U-S
core
14481,42
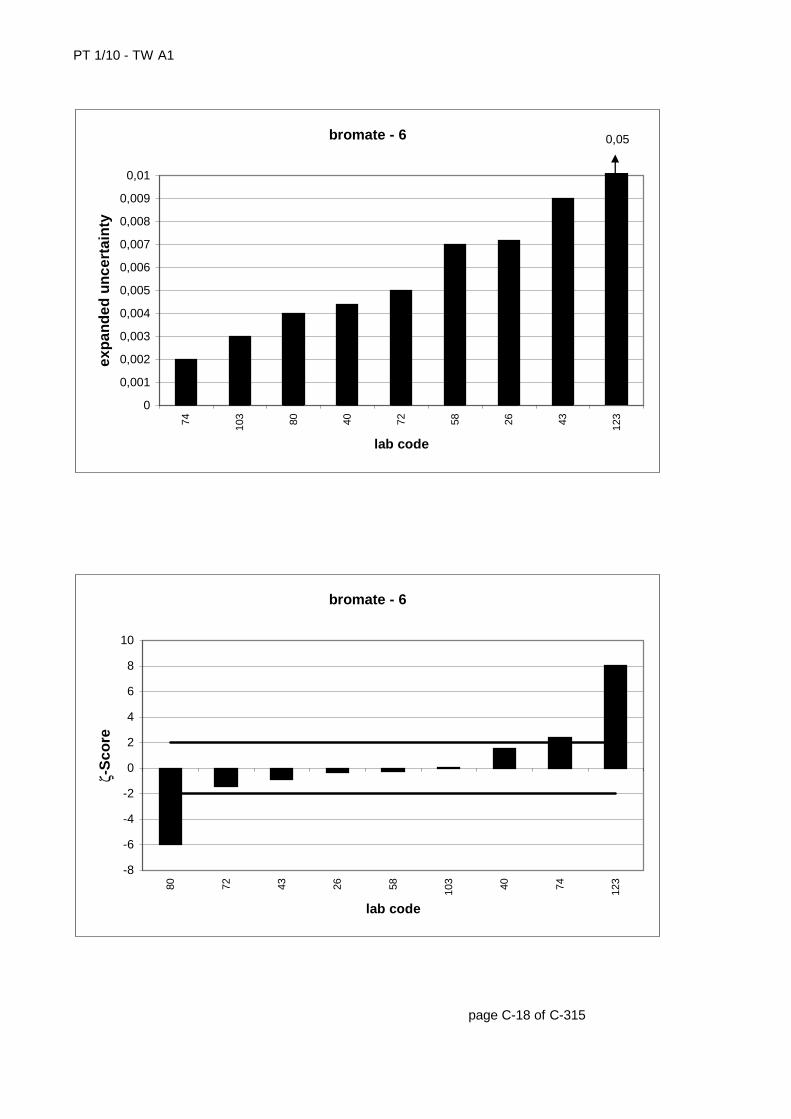
PT 1/10 - TW A1
page C-18 of C-315
bromate - 6
0
0,001
0,002
0,003
0,004
0,005
0,006
0,007
0,008
0,009
0,0174 103 80 40 72 58 26 43 123
lab code
exp
and
ed u
nce
rtai
nty
0,05
bromate - 6
-8
-6
-4
-2
0
2
4
6
8
10
80 72 43 26 58 103 40 74 123
lab code
ζ-S
core
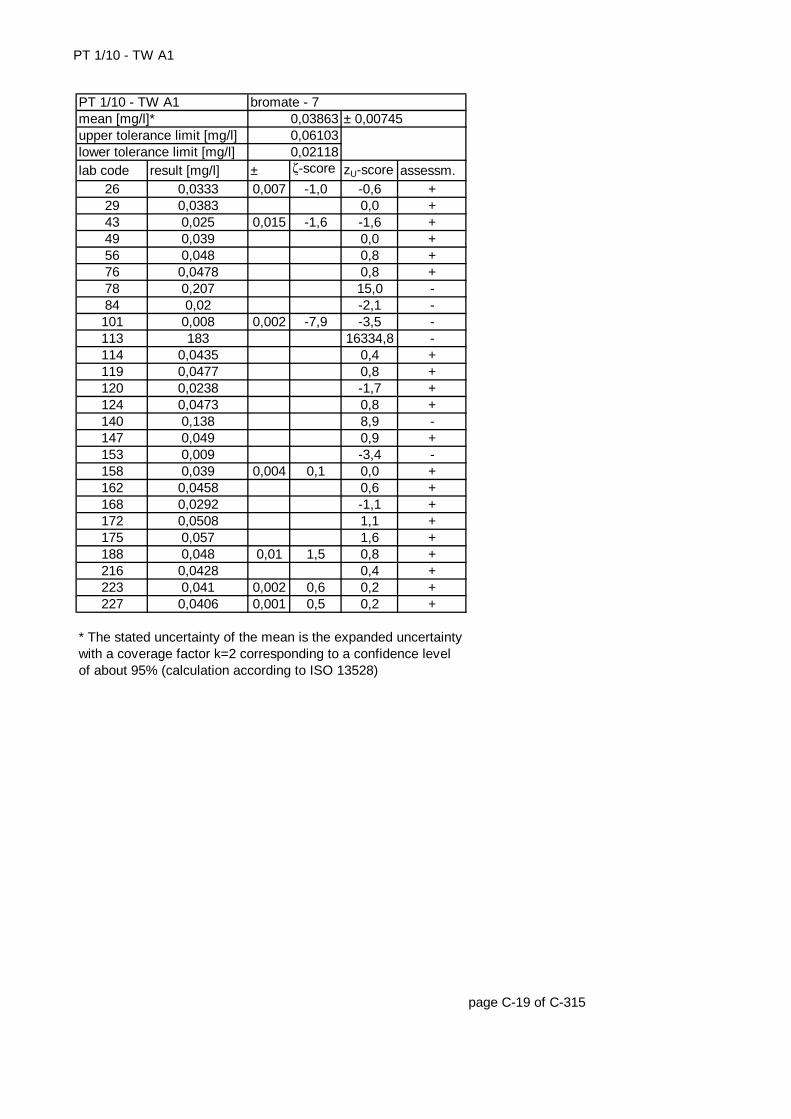
PT 1/10 - TW A1
lab code result [mg/l] ± ζ-score zU-score assessm.26 0,0333 0,007 -1,0 -0,6 +29 0,0383 0,0 +43 0,025 0,015 -1,6 -1,6 +49 0,039 0,0 +56 0,048 0,8 +76 0,0478 0,8 +78 0,207 15,0 -84 0,02 -2,1 -101 0,008 0,002 -7,9 -3,5 -113 183 16334,8 -114 0,0435 0,4 +119 0,0477 0,8 +120 0,0238 -1,7 +124 0,0473 0,8 +140 0,138 8,9 -147 0,049 0,9 +153 0,009 -3,4 -158 0,039 0,004 0,1 0,0 +162 0,0458 0,6 +168 0,0292 -1,1 +172 0,0508 1,1 +175 0,057 1,6 +188 0,048 0,01 1,5 0,8 +216 0,0428 0,4 +223 0,041 0,002 0,6 0,2 +227 0,0406 0,001 0,5 0,2 +
page C-19 of C-315
PT 1/10 - TW A1 bromate - 70,038630,06103
* The stated uncertainty of the mean is the expanded uncertainty with a coverage factor k=2 corresponding to a confidence level of about 95% (calculation according to ISO 13528)
0,02118
± 0,00745mean [mg/l]*upper tolerance limit [mg/l]lower tolerance limit [mg/l]
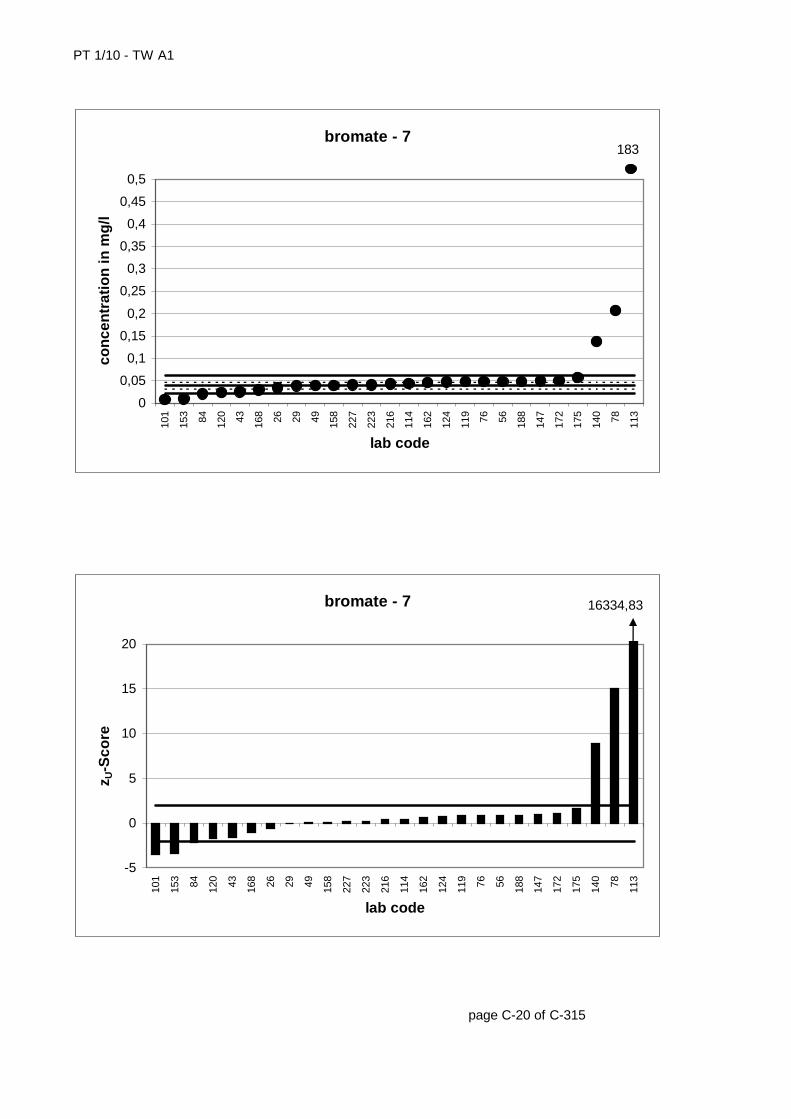
PT 1/10 - TW A1
page C-20 of C-315
bromate - 7
0
0,05
0,1
0,15
0,2
0,25
0,3
0,35
0,4
0,45
0,510
1
153 84 120 43 168 26 29 49 158
227
223
216
114
162
124
119 76 56 188
147
172
175
140 78 113
lab code
con
cen
trat
ion
in m
g/l
183
bromate - 7
-5
0
5
10
15
20
101
153 84 120 43 168 26 29 49 158
227
223
216
114
162
124
119 76 56 188
147
172
175
140 78 113
lab code
z U-S
core
16334,83
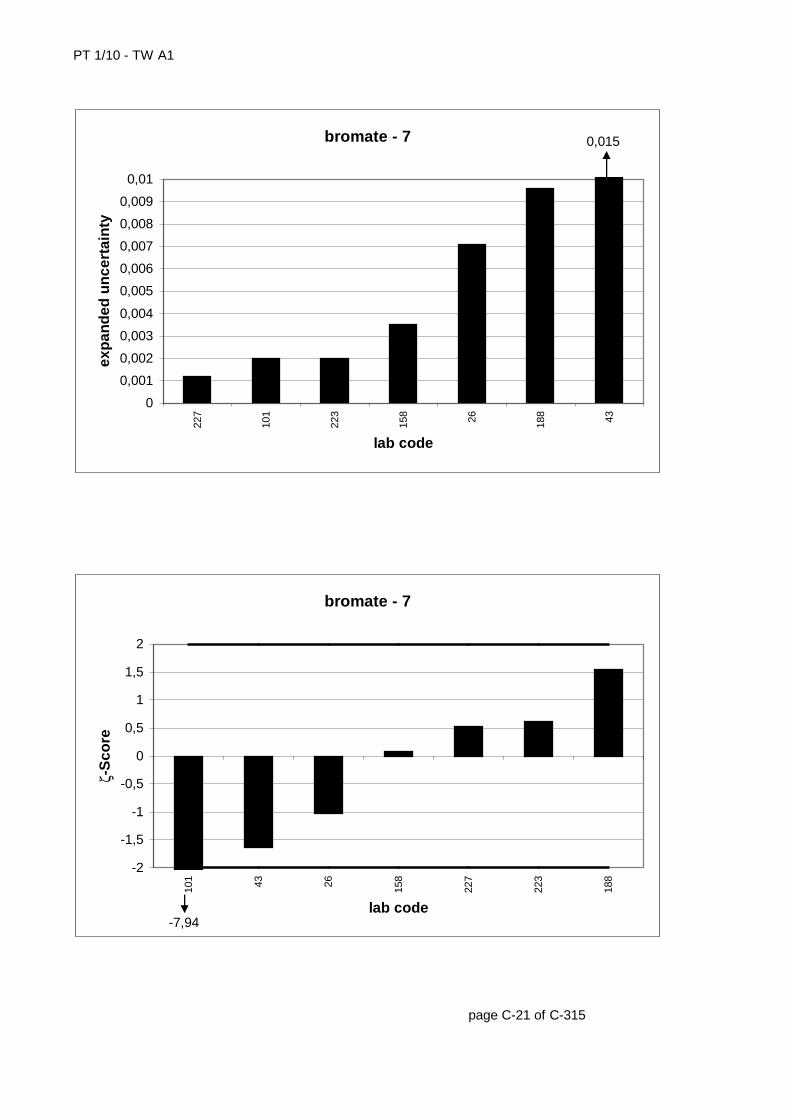
PT 1/10 - TW A1
page C-21 of C-315
bromate - 7
0
0,001
0,002
0,003
0,004
0,005
0,006
0,007
0,008
0,009
0,0122
7
101
223
158 26 188 43
lab code
exp
and
ed u
nce
rtai
nty
0,015
bromate - 7
-2
-1,5
-1
-0,5
0
0,5
1
1,5
2
101 43 26 158
227
223
188
lab code
ζ-S
core
-7,94
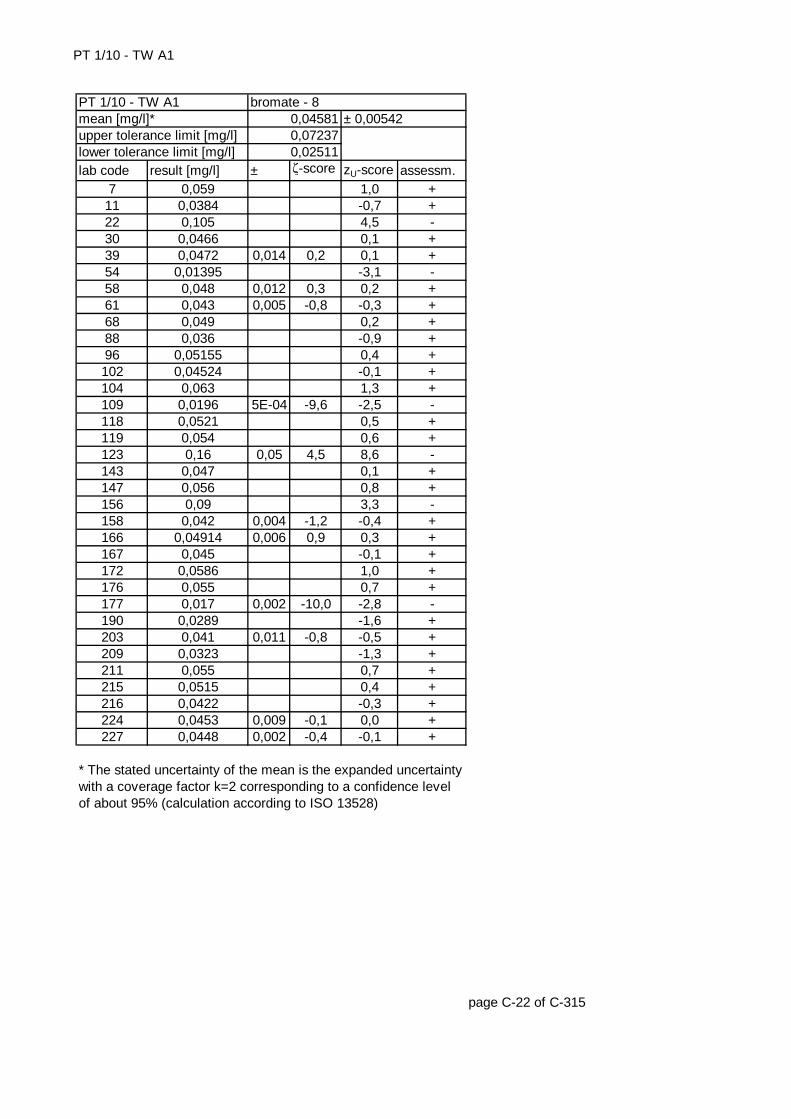
PT 1/10 - TW A1
lab code result [mg/l] ± ζ-score zU-score assessm.7 0,059 1,0 +
11 0,0384 -0,7 +22 0,105 4,5 -30 0,0466 0,1 +39 0,0472 0,014 0,2 0,1 +54 0,01395 -3,1 -58 0,048 0,012 0,3 0,2 +61 0,043 0,005 -0,8 -0,3 +68 0,049 0,2 +88 0,036 -0,9 +96 0,05155 0,4 +102 0,04524 -0,1 +104 0,063 1,3 +109 0,0196 5E-04 -9,6 -2,5 -118 0,0521 0,5 +119 0,054 0,6 +123 0,16 0,05 4,5 8,6 -143 0,047 0,1 +147 0,056 0,8 +156 0,09 3,3 -158 0,042 0,004 -1,2 -0,4 +166 0,04914 0,006 0,9 0,3 +167 0,045 -0,1 +172 0,0586 1,0 +176 0,055 0,7 +177 0,017 0,002 -10,0 -2,8 -190 0,0289 -1,6 +203 0,041 0,011 -0,8 -0,5 +209 0,0323 -1,3 +211 0,055 0,7 +215 0,0515 0,4 +216 0,0422 -0,3 +224 0,0453 0,009 -0,1 0,0 +227 0,0448 0,002 -0,4 -0,1 +
page C-22 of C-315
PT 1/10 - TW A1 bromate - 80,045810,07237
* The stated uncertainty of the mean is the expanded uncertainty with a coverage factor k=2 corresponding to a confidence level of about 95% (calculation according to ISO 13528)
0,02511
± 0,00542mean [mg/l]*upper tolerance limit [mg/l]lower tolerance limit [mg/l]
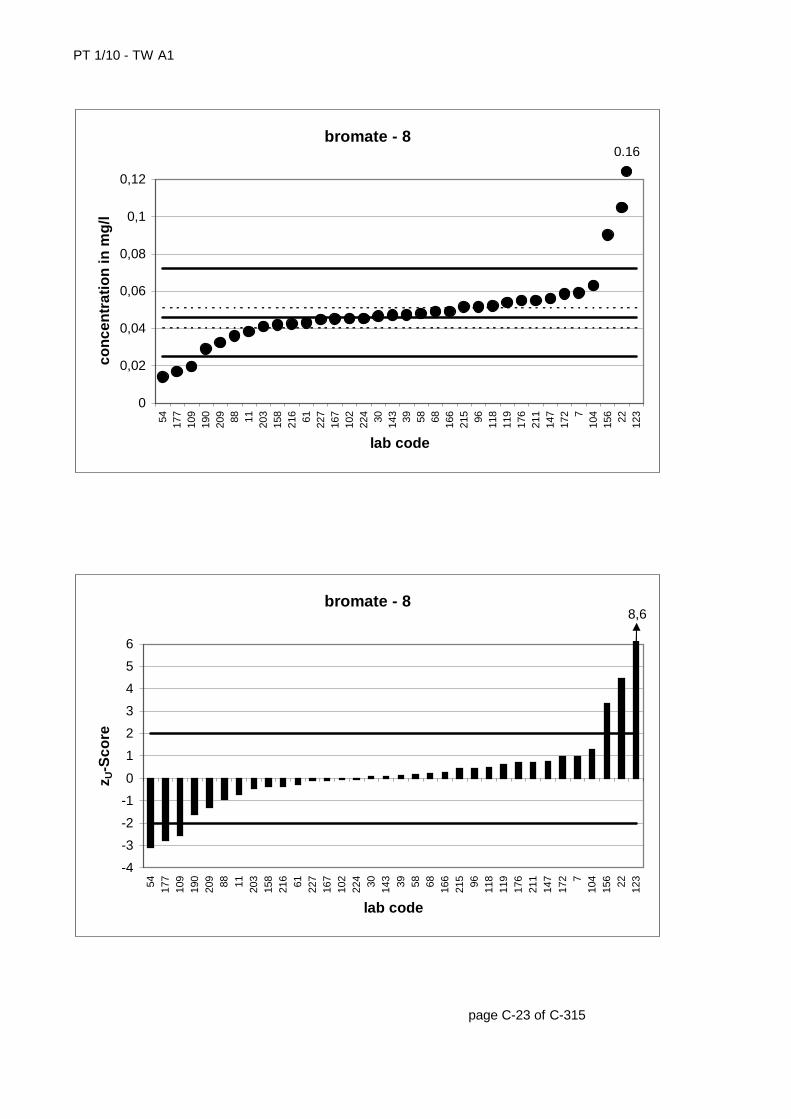
PT 1/10 - TW A1
page C-23 of C-315
bromate - 8
0
0,02
0,04
0,06
0,08
0,1
0,1254 177
109
190
209 88 11 203
158
216 61 227
167
102
224 30 143 39 58 68 166
215 96 118
119
176
211
147
172 7
104
156 22 123
lab code
con
cen
trat
ion
in m
g/l
0,16
bromate - 8
-4
-3
-2
-1
0
1
2
3
4
5
6
54 177
109
190
209 88 11 203
158
216 61 227
167
102
224 30 143 39 58 68 166
215 96 118
119
176
211
147
172 7
104
156 22 123
lab code
z U-S
core
8,6
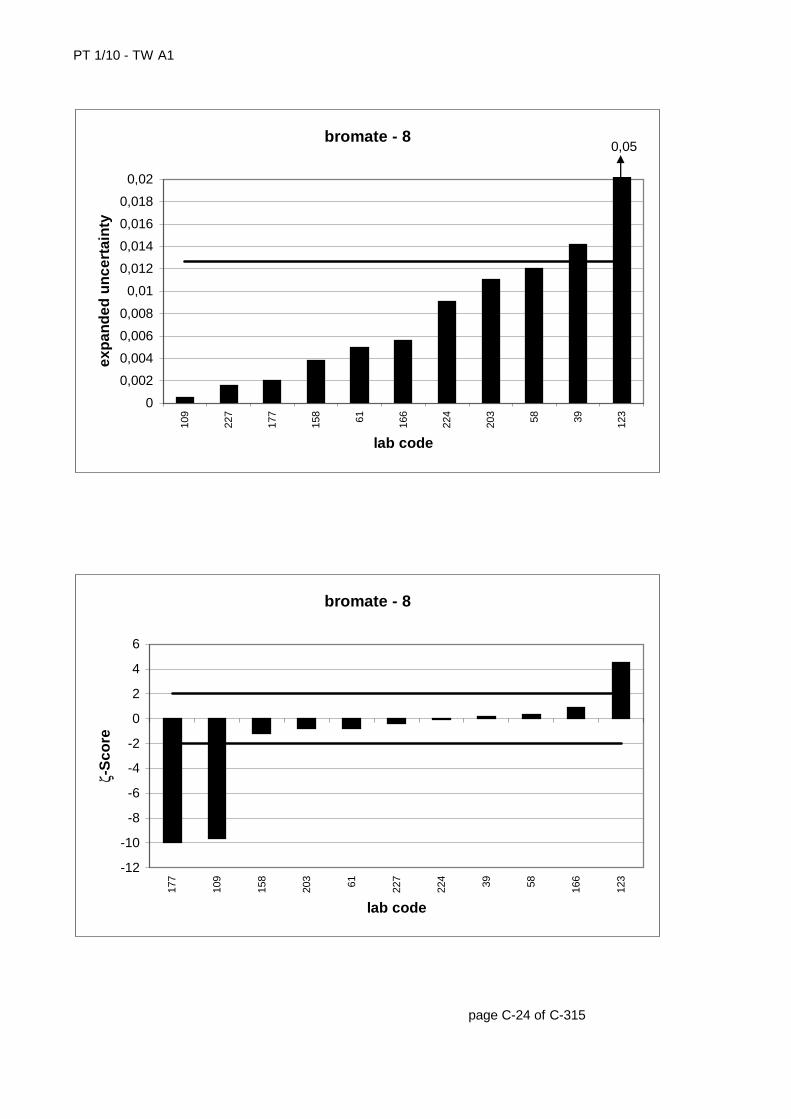
PT 1/10 - TW A1
page C-24 of C-315
bromate - 8
0
0,002
0,004
0,006
0,008
0,01
0,012
0,014
0,016
0,018
0,0210
9
227
177
158 61 166
224
203 58 39 123
lab code
exp
and
ed u
nce
rtai
nty
0,05
bromate - 8
-12
-10
-8
-6
-4
-2
0
2
4
6
177
109
158
203 61 227
224 39 58 166
123
lab code
ζ-S
core
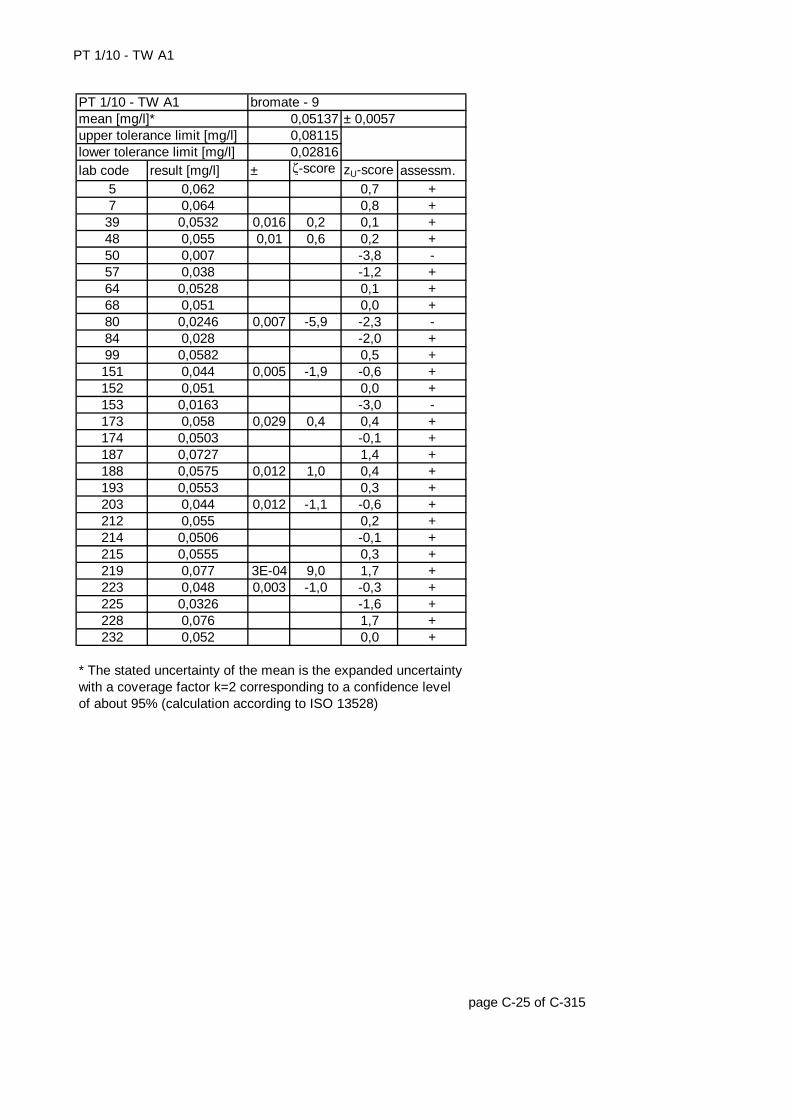
PT 1/10 - TW A1
lab code result [mg/l] ± ζ-score zU-score assessm.5 0,062 0,7 +7 0,064 0,8 +
39 0,0532 0,016 0,2 0,1 +48 0,055 0,01 0,6 0,2 +50 0,007 -3,8 -57 0,038 -1,2 +64 0,0528 0,1 +68 0,051 0,0 +80 0,0246 0,007 -5,9 -2,3 -84 0,028 -2,0 +99 0,0582 0,5 +151 0,044 0,005 -1,9 -0,6 +152 0,051 0,0 +153 0,0163 -3,0 -173 0,058 0,029 0,4 0,4 +174 0,0503 -0,1 +187 0,0727 1,4 +188 0,0575 0,012 1,0 0,4 +193 0,0553 0,3 +203 0,044 0,012 -1,1 -0,6 +212 0,055 0,2 +214 0,0506 -0,1 +215 0,0555 0,3 +219 0,077 3E-04 9,0 1,7 +223 0,048 0,003 -1,0 -0,3 +225 0,0326 -1,6 +228 0,076 1,7 +232 0,052 0,0 +
page C-25 of C-315
PT 1/10 - TW A1 bromate - 90,051370,08115
* The stated uncertainty of the mean is the expanded uncertainty with a coverage factor k=2 corresponding to a confidence level of about 95% (calculation according to ISO 13528)
0,02816
± 0,0057mean [mg/l]*upper tolerance limit [mg/l]lower tolerance limit [mg/l]
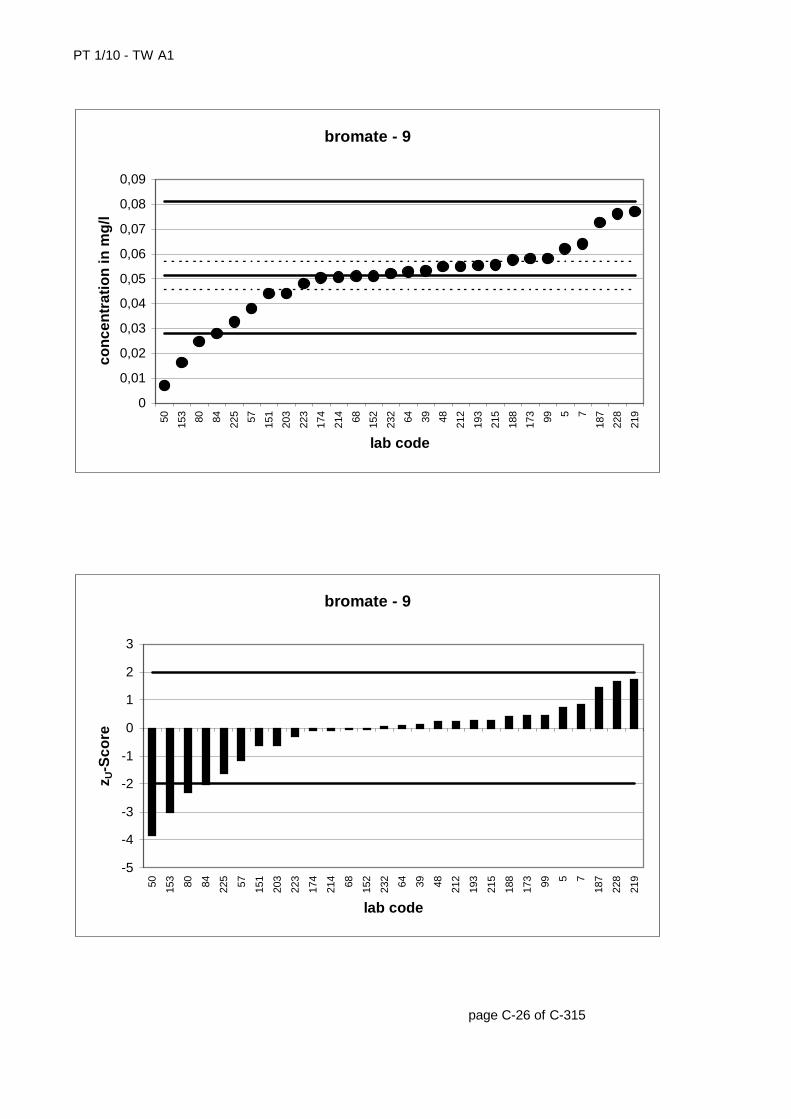
PT 1/10 - TW A1
page C-26 of C-315
bromate - 9
0
0,01
0,02
0,03
0,04
0,05
0,06
0,07
0,08
0,0950 153 80 84 225 57 151
203
223
174
214 68 152
232 64 39 48 212
193
215
188
173 99 5 7
187
228
219
lab code
con
cen
trat
ion
in m
g/l
bromate - 9
-5
-4
-3
-2
-1
0
1
2
3
50 153 80 84 225 57 151
203
223
174
214 68 152
232 64 39 48 212
193
215
188
173 99 5 7
187
228
219
lab code
z U-S
core
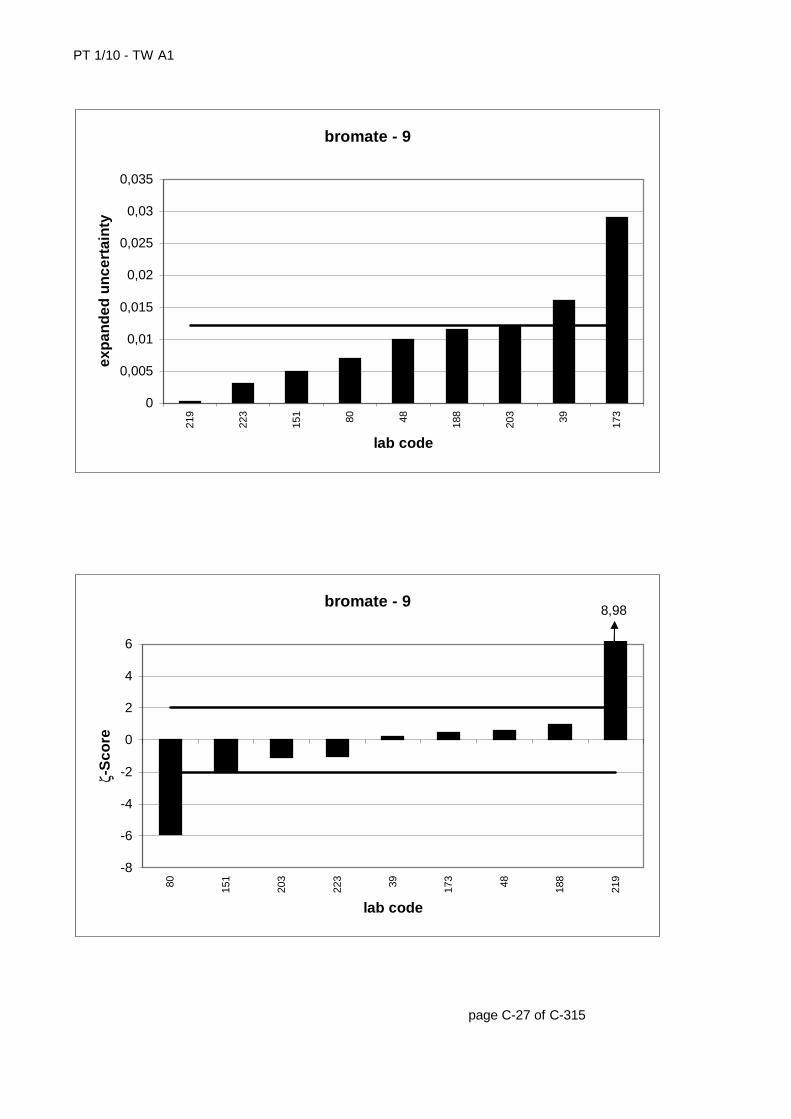
PT 1/10 - TW A1
page C-27 of C-315
bromate - 9
0
0,005
0,01
0,015
0,02
0,025
0,03
0,03521
9
223
151 80 48 188
203 39 173
lab code
exp
and
ed u
nce
rtai
nty
bromate - 9
-8
-6
-4
-2
0
2
4
6
80 151
203
223 39 173 48 188
219
lab code
ζ-S
core
8,98
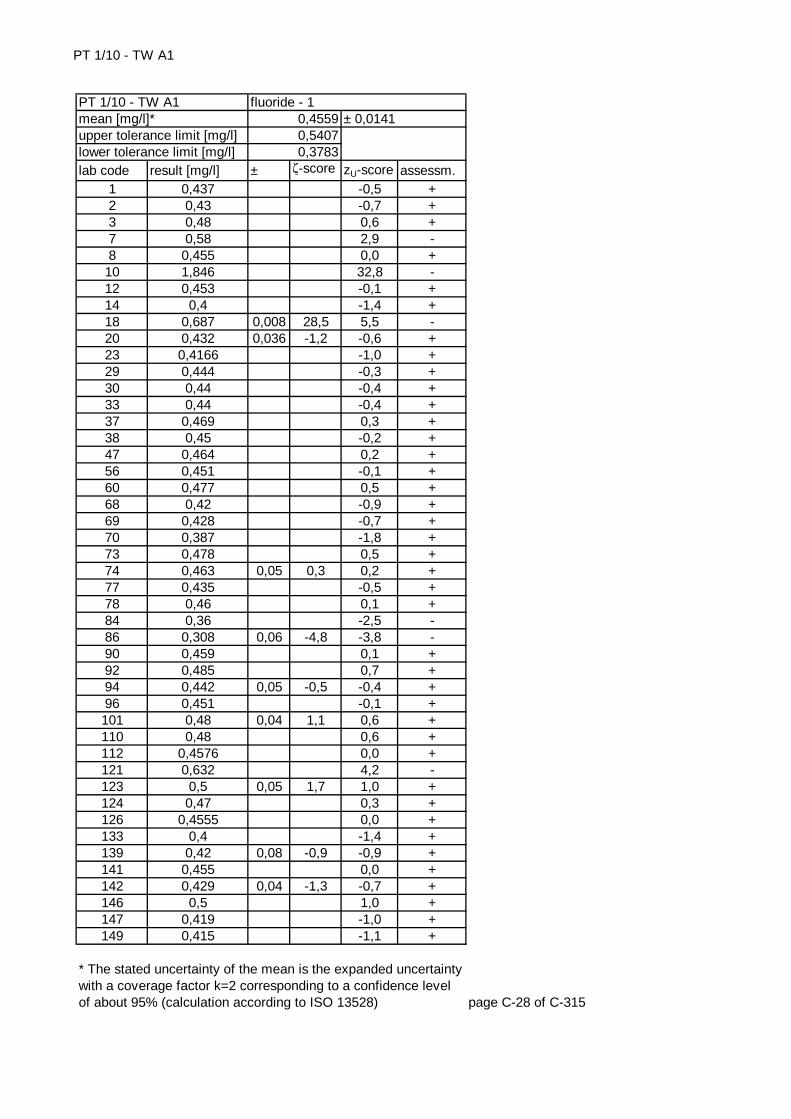
PT 1/10 - TW A1
lab code result [mg/l] ± ζ-score zU-score assessm.1 0,437 -0,5 +2 0,43 -0,7 +3 0,48 0,6 +7 0,58 2,9 -8 0,455 0,0 +
10 1,846 32,8 -12 0,453 -0,1 +14 0,4 -1,4 +18 0,687 0,008 28,5 5,5 -20 0,432 0,036 -1,2 -0,6 +23 0,4166 -1,0 +29 0,444 -0,3 +30 0,44 -0,4 +33 0,44 -0,4 +37 0,469 0,3 +38 0,45 -0,2 +47 0,464 0,2 +56 0,451 -0,1 +60 0,477 0,5 +68 0,42 -0,9 +69 0,428 -0,7 +70 0,387 -1,8 +73 0,478 0,5 +74 0,463 0,05 0,3 0,2 +77 0,435 -0,5 +78 0,46 0,1 +84 0,36 -2,5 -86 0,308 0,06 -4,8 -3,8 -90 0,459 0,1 +92 0,485 0,7 +94 0,442 0,05 -0,5 -0,4 +96 0,451 -0,1 +101 0,48 0,04 1,1 0,6 +110 0,48 0,6 +112 0,4576 0,0 +121 0,632 4,2 -123 0,5 0,05 1,7 1,0 +124 0,47 0,3 +126 0,4555 0,0 +133 0,4 -1,4 +139 0,42 0,08 -0,9 -0,9 +141 0,455 0,0 +142 0,429 0,04 -1,3 -0,7 +146 0,5 1,0 +147 0,419 -1,0 +149 0,415 -1,1 +
page C-28 of C-315
* The stated uncertainty of the mean is the expanded uncertainty with a coverage factor k=2 corresponding to a confidence level of about 95% (calculation according to ISO 13528)
fluoride - 10,45590,54070,3783
± 0,0141PT 1/10 - TW A1mean [mg/l]*upper tolerance limit [mg/l]lower tolerance limit [mg/l]

PT 1/10 - TW A1
lab code result [mg/l] ± ζ-score zU-score assessm.157 0,463 0,046 0,3 0,2 +158 0,415 0,03 -2,5 -1,1 +159 0,526 1,7 +160 0,4924 0,9 +163 0,6 3,4 -168 0,43 -0,7 +171 0,449 -0,2 +173 0,52 0,1 1,3 1,5 +176 0,546 2,1 -177 1,5 0,165 12,6 24,6 -181 0,425 0,04 -1,5 -0,8 +182 0,48 0,6 +195 0,431 -0,6 +197 0,458 0,1 +199 0,51 1,3 +202 0,52 1,5 +207 0,41 -1,2 +211 0,39 -1,7 +212 0,46 0,1 +214 0,437 -0,5 +217 0,452 0,02 -0,3 -0,1 +224 0,59 0,041 6,1 3,2 -225 0,5 1,0 +228 1,31 20,1 -230 0,1 -9,2 -231 0,47 0,3 +
page C-29 of C-315
* The stated uncertainty of the mean is the expanded uncertainty with a coverage factor k=2 corresponding to a confidence level of about 95% (calculation according to ISO 13528)
upper tolerance limit [mg/l] 0,5407lower tolerance limit [mg/l] 0,3783
PT 1/10 - TW A1 fluoride - 1mean [mg/l]* 0,4559 ± 0,0141
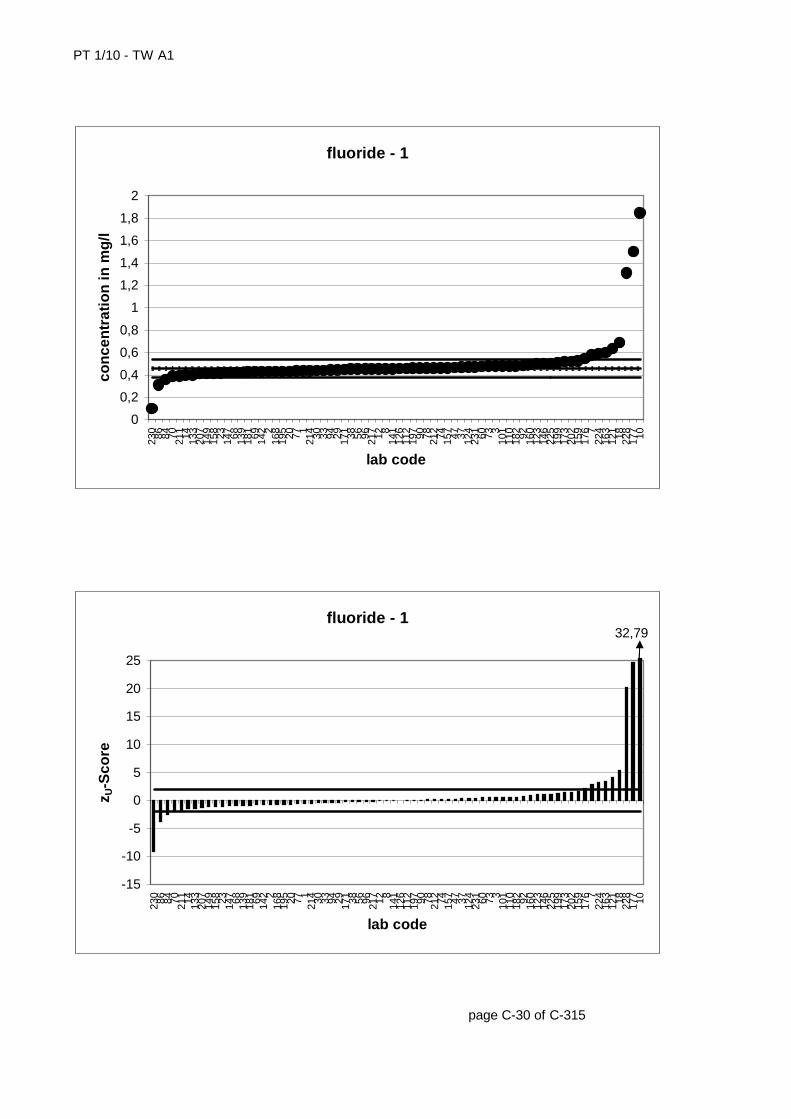
PT 1/10 - TW A1
page C-30 of C-315
fluoride - 1
0
0,2
0,4
0,6
0,8
1
1,2
1,4
1,6
1,8
2
230 86 84 70 211 14 133
207
149
158 23 147 68 139
181 69 142 2
168
195 20 77 1
214 30 33 94 29 171 38 56 96 217 12 8
141
126
112
197 90 78 212 74 157 47 37 124
231 60 73 3
101
110
182 92 160
123
146
225
199
173
202
159
176 7
224
163
121 18 228
177 10
lab code
con
cen
trat
ion
in m
g/l
fluoride - 1
-15
-10
-5
0
5
10
15
20
25
230 86 84 70 211 14 133
207
149
158 23 147 68 139
181 69 142 2
168
195 20 77 1
214 30 33 94 29 171 38 56 96 217 12 8
141
126
112
197 90 78 212 74 157 47 37 124
231 60 73 3
101
110
182 92 160
123
146
225
199
173
202
159
176 7
224
163
121 18 228
177 10
lab code
z U-S
core
32,79
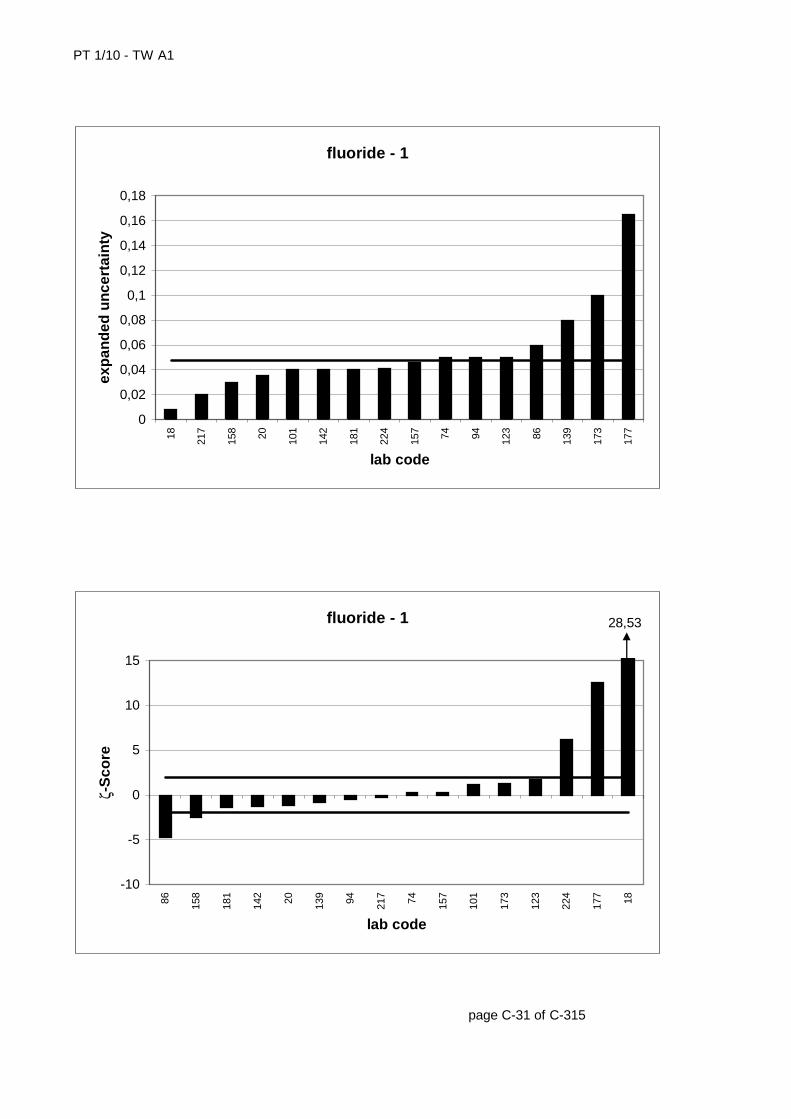
PT 1/10 - TW A1
page C-31 of C-315
fluoride - 1
0
0,02
0,04
0,06
0,08
0,1
0,12
0,14
0,16
0,18
18 217
158 20 101
142
181
224
157 74 94 123 86 139
173
177
lab code
exp
and
ed u
nce
rtai
nty
fluoride - 1
-10
-5
0
5
10
15
86 158
181
142 20 139 94 217 74 157
101
173
123
224
177 18
lab code
ζ-S
core
28,53
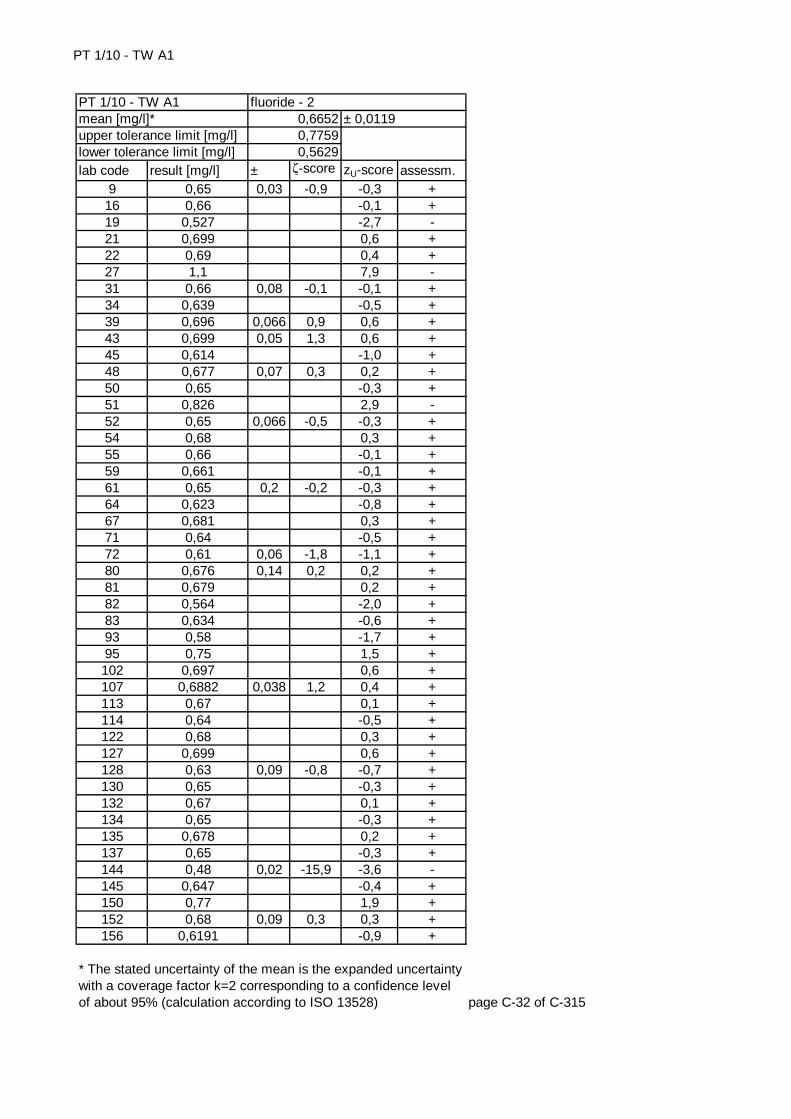
PT 1/10 - TW A1
lab code result [mg/l] ± ζ-score zU-score assessm.9 0,65 0,03 -0,9 -0,3 +
16 0,66 -0,1 +19 0,527 -2,7 -21 0,699 0,6 +22 0,69 0,4 +27 1,1 7,9 -31 0,66 0,08 -0,1 -0,1 +34 0,639 -0,5 +39 0,696 0,066 0,9 0,6 +43 0,699 0,05 1,3 0,6 +45 0,614 -1,0 +48 0,677 0,07 0,3 0,2 +50 0,65 -0,3 +51 0,826 2,9 -52 0,65 0,066 -0,5 -0,3 +54 0,68 0,3 +55 0,66 -0,1 +59 0,661 -0,1 +61 0,65 0,2 -0,2 -0,3 +64 0,623 -0,8 +67 0,681 0,3 +71 0,64 -0,5 +72 0,61 0,06 -1,8 -1,1 +80 0,676 0,14 0,2 0,2 +81 0,679 0,2 +82 0,564 -2,0 +83 0,634 -0,6 +93 0,58 -1,7 +95 0,75 1,5 +102 0,697 0,6 +107 0,6882 0,038 1,2 0,4 +113 0,67 0,1 +114 0,64 -0,5 +122 0,68 0,3 +127 0,699 0,6 +128 0,63 0,09 -0,8 -0,7 +130 0,65 -0,3 +132 0,67 0,1 +134 0,65 -0,3 +135 0,678 0,2 +137 0,65 -0,3 +144 0,48 0,02 -15,9 -3,6 -145 0,647 -0,4 +150 0,77 1,9 +152 0,68 0,09 0,3 0,3 +156 0,6191 -0,9 +
page C-32 of C-315
* The stated uncertainty of the mean is the expanded uncertainty with a coverage factor k=2 corresponding to a confidence level of about 95% (calculation according to ISO 13528)
fluoride - 20,66520,77590,5629
± 0,0119PT 1/10 - TW A1mean [mg/l]*upper tolerance limit [mg/l]lower tolerance limit [mg/l]
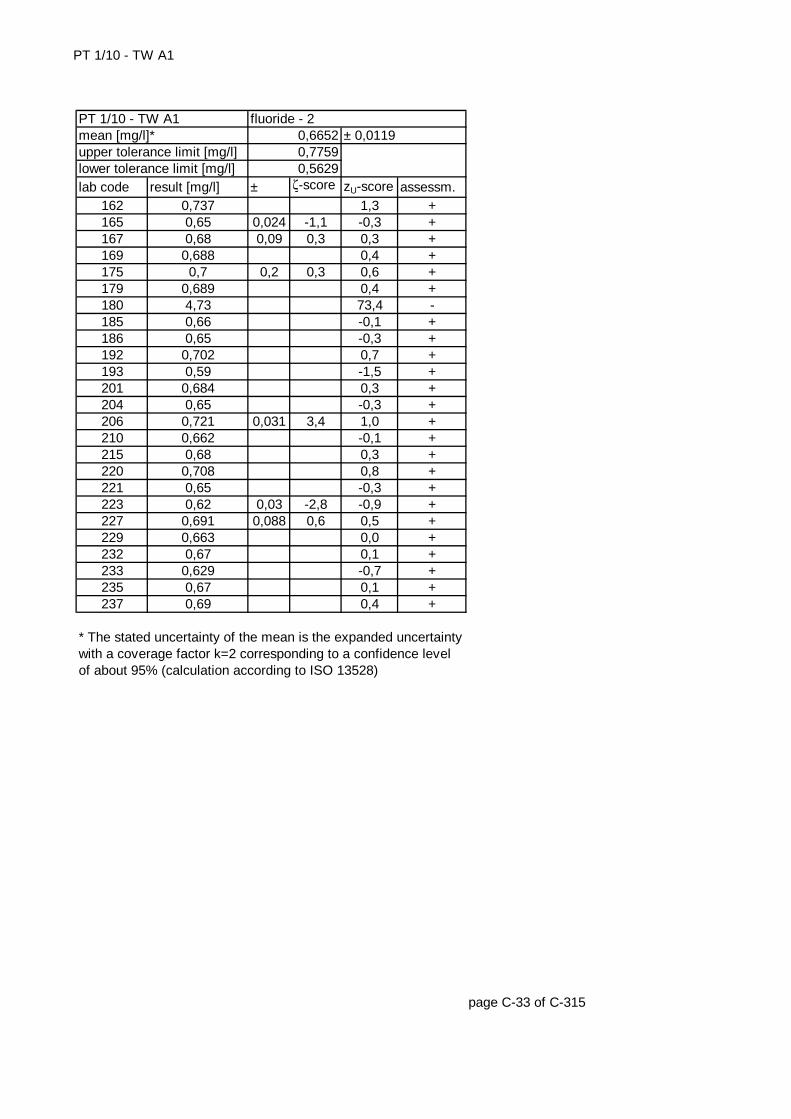
PT 1/10 - TW A1
lab code result [mg/l] ± ζ-score zU-score assessm.162 0,737 1,3 +165 0,65 0,024 -1,1 -0,3 +167 0,68 0,09 0,3 0,3 +169 0,688 0,4 +175 0,7 0,2 0,3 0,6 +179 0,689 0,4 +180 4,73 73,4 -185 0,66 -0,1 +186 0,65 -0,3 +192 0,702 0,7 +193 0,59 -1,5 +201 0,684 0,3 +204 0,65 -0,3 +206 0,721 0,031 3,4 1,0 +210 0,662 -0,1 +215 0,68 0,3 +220 0,708 0,8 +221 0,65 -0,3 +223 0,62 0,03 -2,8 -0,9 +227 0,691 0,088 0,6 0,5 +229 0,663 0,0 +232 0,67 0,1 +233 0,629 -0,7 +235 0,67 0,1 +237 0,69 0,4 +
page C-33 of C-315
* The stated uncertainty of the mean is the expanded uncertainty with a coverage factor k=2 corresponding to a confidence level of about 95% (calculation according to ISO 13528)
upper tolerance limit [mg/l] 0,7759lower tolerance limit [mg/l] 0,5629
PT 1/10 - TW A1 fluoride - 2mean [mg/l]* 0,6652 ± 0,0119
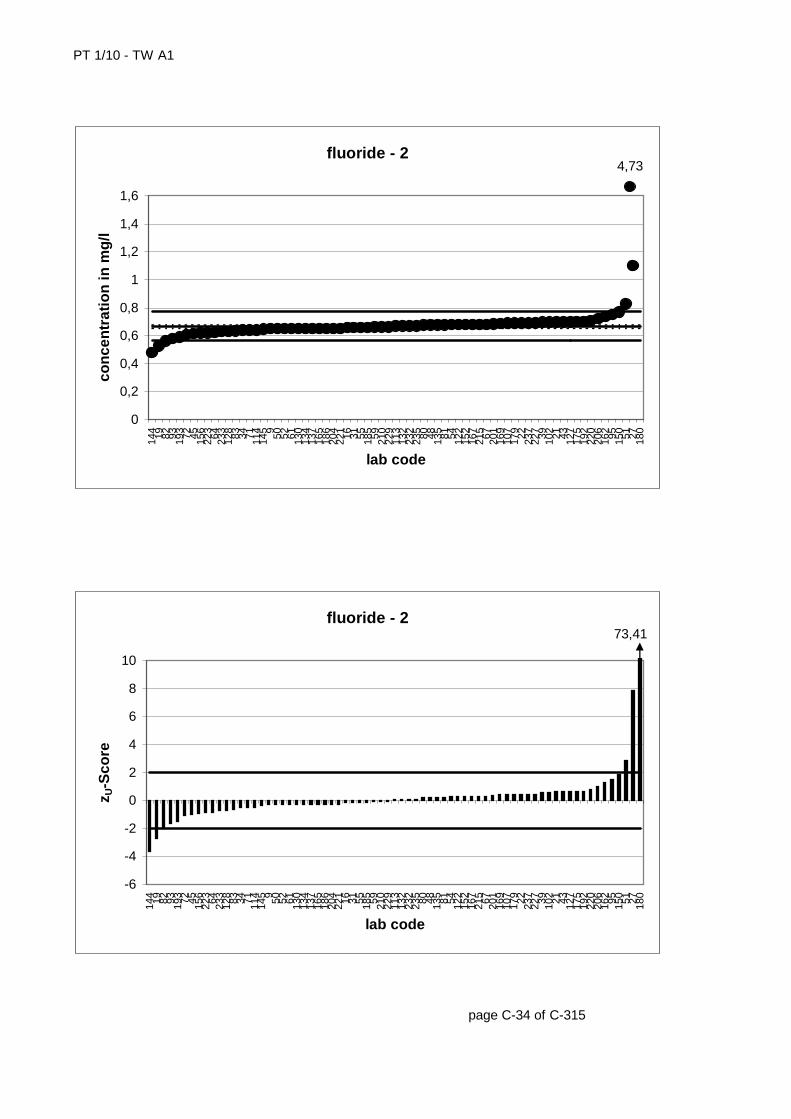
PT 1/10 - TW A1
page C-34 of C-315
fluoride - 2
0
0,2
0,4
0,6
0,8
1
1,2
1,4
1,6
144 19 82 93 193 72 45 156
223 64 233
128 83 34 71 114
145 9 50 52 61 130
134
137
165
186
204
221 16 31 55 185 59 210
229
113
132
232
235 80 48 135 81 54 122
152
167
215 67 201
169
107
179 22 237
227 39 102 21 43 127
175
192
220
206
162 95 150 51 27 180
lab code
con
cen
trat
ion
in m
g/l
4,73
fluoride - 2
-6
-4
-2
0
2
4
6
8
10
144 19 82 93 193 72 45 156
223 64 233
128 83 34 71 114
145 9 50 52 61 130
134
137
165
186
204
221 16 31 55 185 59 210
229
113
132
232
235 80 48 135 81 54 122
152
167
215 67 201
169
107
179 22 237
227 39 102 21 43 127
175
192
220
206
162 95 150 51 27 180
lab code
z U-S
core
73,41
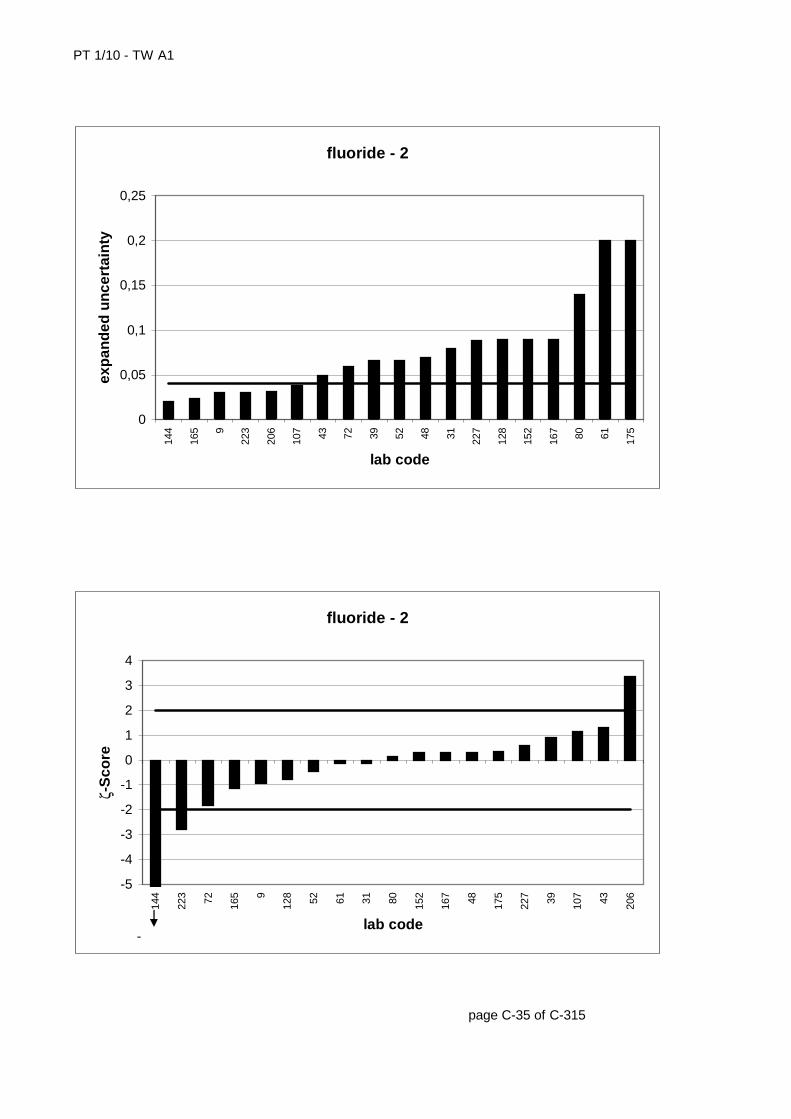
PT 1/10 - TW A1
page C-35 of C-315
fluoride - 2
0
0,05
0,1
0,15
0,2
0,25
144
165 9
223
206
107 43 72 39 52 48 31 227
128
152
167 80 61 175
lab code
exp
and
ed u
nce
rtai
nty
fluoride - 2
-5
-4
-3
-2
-1
0
1
2
3
4
144
223 72 165 9
128 52 61 31 80 152
167 48 175
227 39 107 43 206
lab code
ζ-S
core
-15,91

PT 1/10 - TW A1
lab code result [mg/l] ± ζ-score zU-score assessm.4 0,89 0,2 -0,1 -0,2 +5 1,01 1,6 +
11 0,95 0,11 0,9 0,7 +13 0,864 -0,6 +17 0,942 0,6 +25 0,895 0,098 -0,1 -0,1 +26 0,95 0,07 1,4 0,7 +28 0,963 0,9 +36 0,9 0,0 +41 0,859 -0,7 +42 0,867 0,07 -0,9 -0,5 +44 0,845 -0,9 +46 0,82 -1,3 +49 0,846 -0,9 +57 0,92 0,3 +58 0,883 0,05 -0,7 -0,3 +62 0,938 0,5 +65 0,765 -2,1 -66 1,588 10,0 -75 0,98 1,2 +76 0,87 -0,5 +85 0,919 0,3 +88 0,805 -1,5 +91 0,88 -0,3 +97 0,8281 0,124 -1,2 -1,1 +98 0,861 -0,6 +99 0,93 0,4 +100 0,82 -1,3 +103 0,99 0,08 2,2 1,3 +104 0,9 0,0 +105 0,76 -2,2 -106 0,92 0,3 +109 0,92 0,005 1,9 0,3 +111 0,92 0,3 +116 0,8645 -0,6 +117 0,949 0,7 +118 0,9207 0,3 +119 0,948 0,7 +120 0,84 -1,0 +125 0,91 0,07 0,3 0,1 +129 0,85 -0,8 +136 0,883 -0,3 +138 0,91 0,1 +140 0,912 0,2 +148 0,93 0,4 +151 0,88 0,09 -0,4 -0,3 +
page C-36 of C-315
* The stated uncertainty of the mean is the expanded uncertainty with a coverage factor k=2 corresponding to a confidence level of about 95% (calculation according to ISO 13528)
fluoride - 30,90061,038
0,7731
± 0,0198PT 1/10 - TW A1mean [mg/l]*upper tolerance limit [mg/l]lower tolerance limit [mg/l]
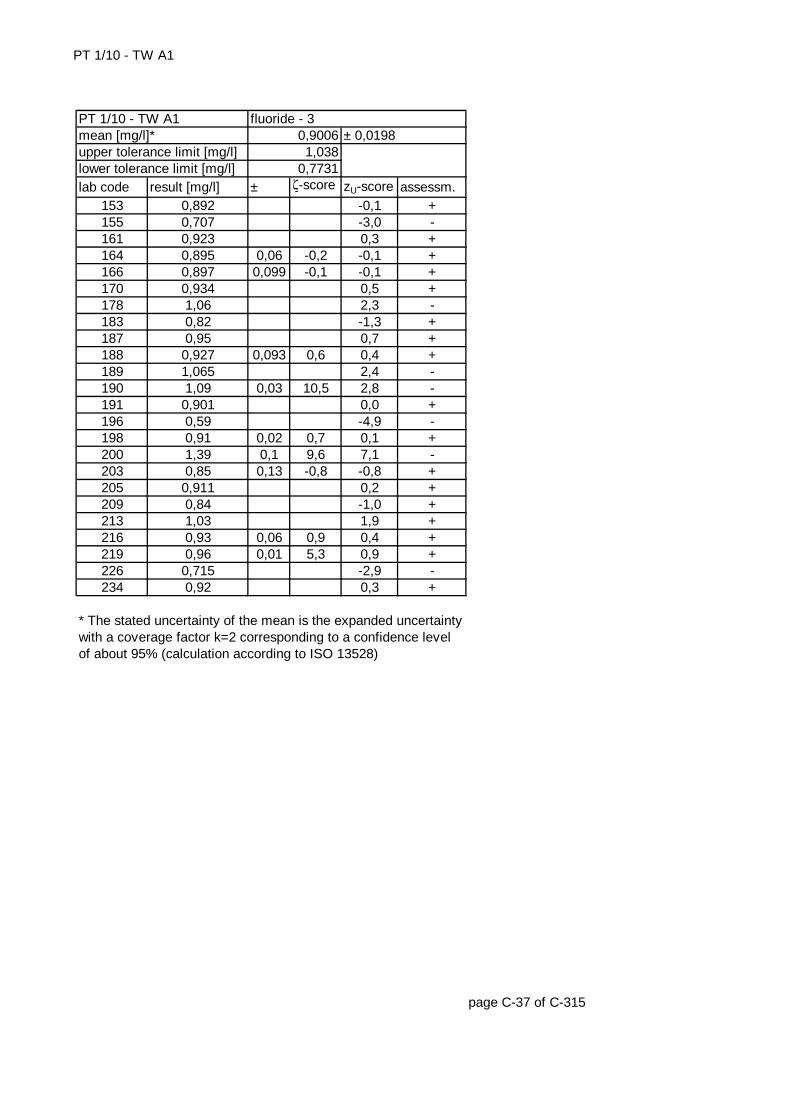
PT 1/10 - TW A1
lab code result [mg/l] ± ζ-score zU-score assessm.153 0,892 -0,1 +155 0,707 -3,0 -161 0,923 0,3 +164 0,895 0,06 -0,2 -0,1 +166 0,897 0,099 -0,1 -0,1 +170 0,934 0,5 +178 1,06 2,3 -183 0,82 -1,3 +187 0,95 0,7 +188 0,927 0,093 0,6 0,4 +189 1,065 2,4 -190 1,09 0,03 10,5 2,8 -191 0,901 0,0 +196 0,59 -4,9 -198 0,91 0,02 0,7 0,1 +200 1,39 0,1 9,6 7,1 -203 0,85 0,13 -0,8 -0,8 +205 0,911 0,2 +209 0,84 -1,0 +213 1,03 1,9 +216 0,93 0,06 0,9 0,4 +219 0,96 0,01 5,3 0,9 +226 0,715 -2,9 -234 0,92 0,3 +
page C-37 of C-315
* The stated uncertainty of the mean is the expanded uncertainty with a coverage factor k=2 corresponding to a confidence level of about 95% (calculation according to ISO 13528)
upper tolerance limit [mg/l] 1,038lower tolerance limit [mg/l] 0,7731
PT 1/10 - TW A1 fluoride - 3mean [mg/l]* 0,9006 ± 0,0198
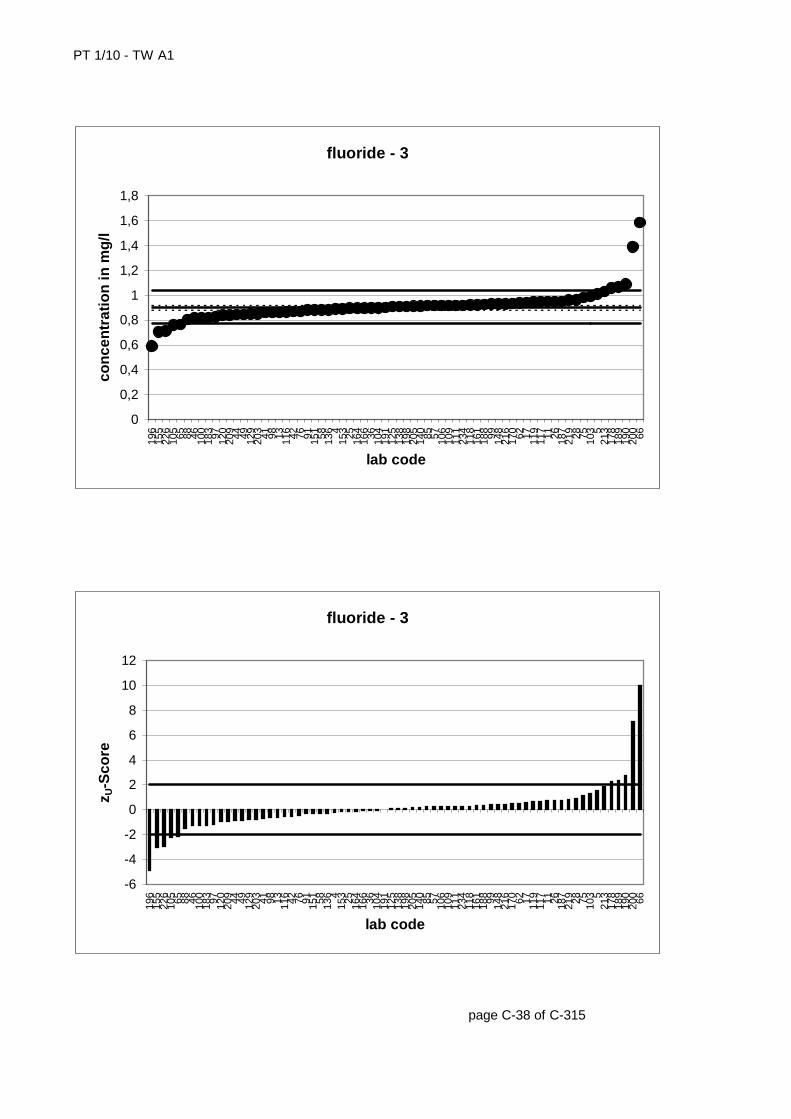
PT 1/10 - TW A1
page C-38 of C-315
fluoride - 3
0
0,2
0,4
0,6
0,8
1
1,2
1,4
1,6
1,8
196
155
226
105 65 88 46 100
183 97 120
209 44 49 129
203 41 98 13 116 42 76 91 151 58 136 4
153 25 164
166 36 104
191
125
138
198
205
140 85 57 106
109
111
234
118
161
188 99 148
216
170 62 17 119
117 11 26 187
219 28 75 103 5
213
178
189
190
200 66
lab code
con
cen
trat
ion
in m
g/l
fluoride - 3
-6
-4
-2
0
2
4
6
8
10
12
196
155
226
105 65 88 46 100
183 97 120
209 44 49 129
203 41 98 13 116 42 76 91 151 58 136 4
153 25 164
166 36 104
191
125
138
198
205
140 85 57 106
109
111
234
118
161
188 99 148
216
170 62 17 119
117 11 26 187
219 28 75 103 5
213
178
189
190
200 66
lab code
z U-S
core
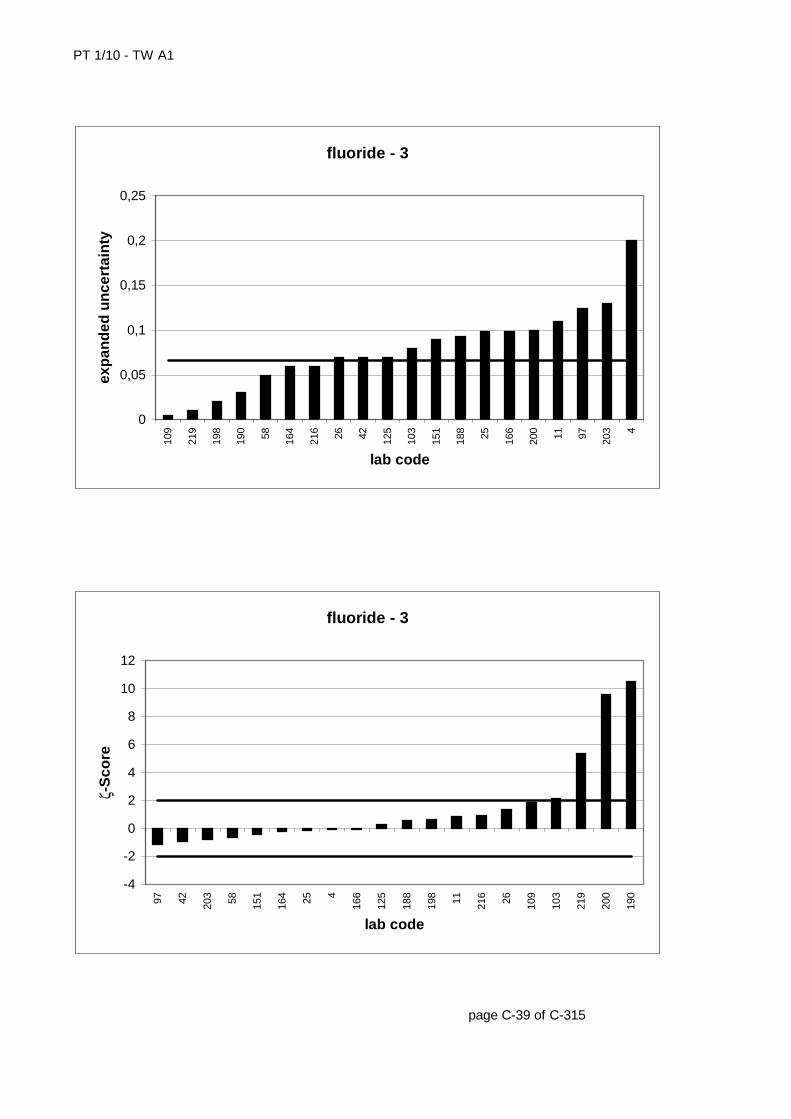
PT 1/10 - TW A1
page C-39 of C-315
fluoride - 3
0
0,05
0,1
0,15
0,2
0,25
109
219
198
190 58 164
216 26 42 125
103
151
188 25 166
200 11 97 203 4
lab code
exp
and
ed u
nce
rtai
nty
fluoride - 3
-4
-2
0
2
4
6
8
10
12
97 42 203 58 151
164 25 4
166
125
188
198 11 216 26 109
103
219
200
190
lab code
ζ-S
core
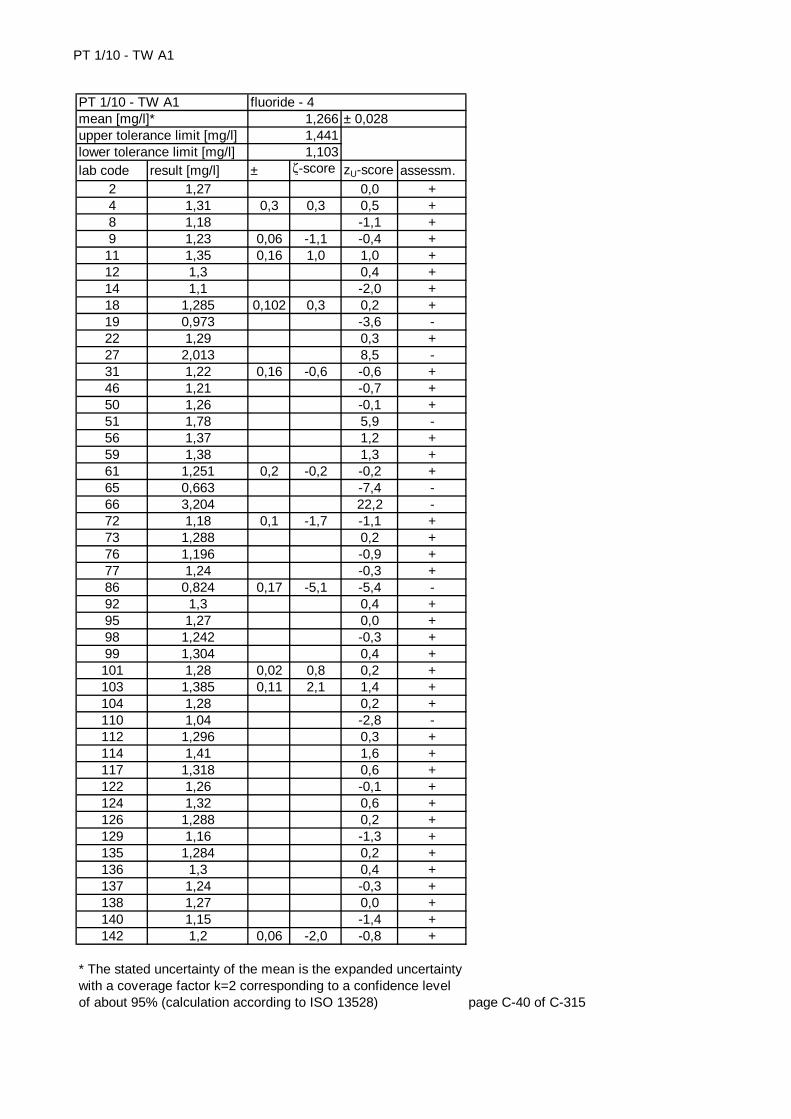
PT 1/10 - TW A1
lab code result [mg/l] ± ζ-score zU-score assessm.2 1,27 0,0 +4 1,31 0,3 0,3 0,5 +8 1,18 -1,1 +9 1,23 0,06 -1,1 -0,4 +
11 1,35 0,16 1,0 1,0 +12 1,3 0,4 +14 1,1 -2,0 +18 1,285 0,102 0,3 0,2 +19 0,973 -3,6 -22 1,29 0,3 +27 2,013 8,5 -31 1,22 0,16 -0,6 -0,6 +46 1,21 -0,7 +50 1,26 -0,1 +51 1,78 5,9 -56 1,37 1,2 +59 1,38 1,3 +61 1,251 0,2 -0,2 -0,2 +65 0,663 -7,4 -66 3,204 22,2 -72 1,18 0,1 -1,7 -1,1 +73 1,288 0,2 +76 1,196 -0,9 +77 1,24 -0,3 +86 0,824 0,17 -5,1 -5,4 -92 1,3 0,4 +95 1,27 0,0 +98 1,242 -0,3 +99 1,304 0,4 +101 1,28 0,02 0,8 0,2 +103 1,385 0,11 2,1 1,4 +104 1,28 0,2 +110 1,04 -2,8 -112 1,296 0,3 +114 1,41 1,6 +117 1,318 0,6 +122 1,26 -0,1 +124 1,32 0,6 +126 1,288 0,2 +129 1,16 -1,3 +135 1,284 0,2 +136 1,3 0,4 +137 1,24 -0,3 +138 1,27 0,0 +140 1,15 -1,4 +142 1,2 0,06 -2,0 -0,8 +
page C-40 of C-315
* The stated uncertainty of the mean is the expanded uncertainty with a coverage factor k=2 corresponding to a confidence level of about 95% (calculation according to ISO 13528)
fluoride - 41,2661,4411,103
± 0,028PT 1/10 - TW A1mean [mg/l]*upper tolerance limit [mg/l]lower tolerance limit [mg/l]

PT 1/10 - TW A1
lab code result [mg/l] ± ζ-score zU-score assessm.144 1,03 0,03 -11,5 -2,9 -146 1,21 -0,7 +150 1,36 1,1 +152 1,3 0,17 0,4 0,4 +157 1,22 0,12 -0,8 -0,6 +159 1,355 1,0 +162 1,41 1,6 +167 1,27 0,17 0,0 0,0 +187 1,32 0,6 +190 1,46 0,03 9,4 2,2 -196 0,86 -5,0 -199 1,39 1,4 +200 2,98 0,1 33,0 19,6 -205 1,25 -0,2 +207 1,2 -0,8 +209 1,253 -0,2 +210 1,275 0,1 +217 1,26 0,08 -0,2 -0,1 +220 1,34 0,8 +225 1,28 0,2 +226 1,048 -2,7 -230 0,9 -4,5 -231 1,27 0,0 +233 1,2 -0,8 +234 1,27 0,0 +235 1,24 -0,3 +237 1,36 1,1 +
page C-41 of C-315
* The stated uncertainty of the mean is the expanded uncertainty with a coverage factor k=2 corresponding to a confidence level of about 95% (calculation according to ISO 13528)
upper tolerance limit [mg/l] 1,441lower tolerance limit [mg/l] 1,103
PT 1/10 - TW A1 fluoride - 4mean [mg/l]* 1,266 ± 0,028

PT 1/10 - TW A1
page C-42 of C-315
fluoride - 4
0
0,5
1
1,5
2
2,5
3
3,5
65 86 196
230 19 144
110
226 14 140
129 8 72 76 142
207
233 46 146 31 157 9 77 137
235 98 205 61 209 50 122
217 2 95 138
167
231
234
210
101
104
225
135 18 73 126 22 112 12 92 136
152 99 4
117
124
187
220 11 159
150
237 56 59 103
199
114
162
190 51 27 200 66
lab code
con
cen
trat
ion
in m
g/l
fluoride - 4
-10
-5
0
5
10
15
20
65 86 196
230 19 144
110
226 14 140
129 8 72 76 142
207
233 46 146 31 157 9 77 137
235 98 205 61 209 50 122
217 2 95 138
167
231
234
210
101
104
225
135 18 73 126 22 112 12 92 136
152 99 4
117
124
187
220 11 159
150
237 56 59 103
199
114
162
190 51 27 200 66
lab code
z U-S
core
22,17
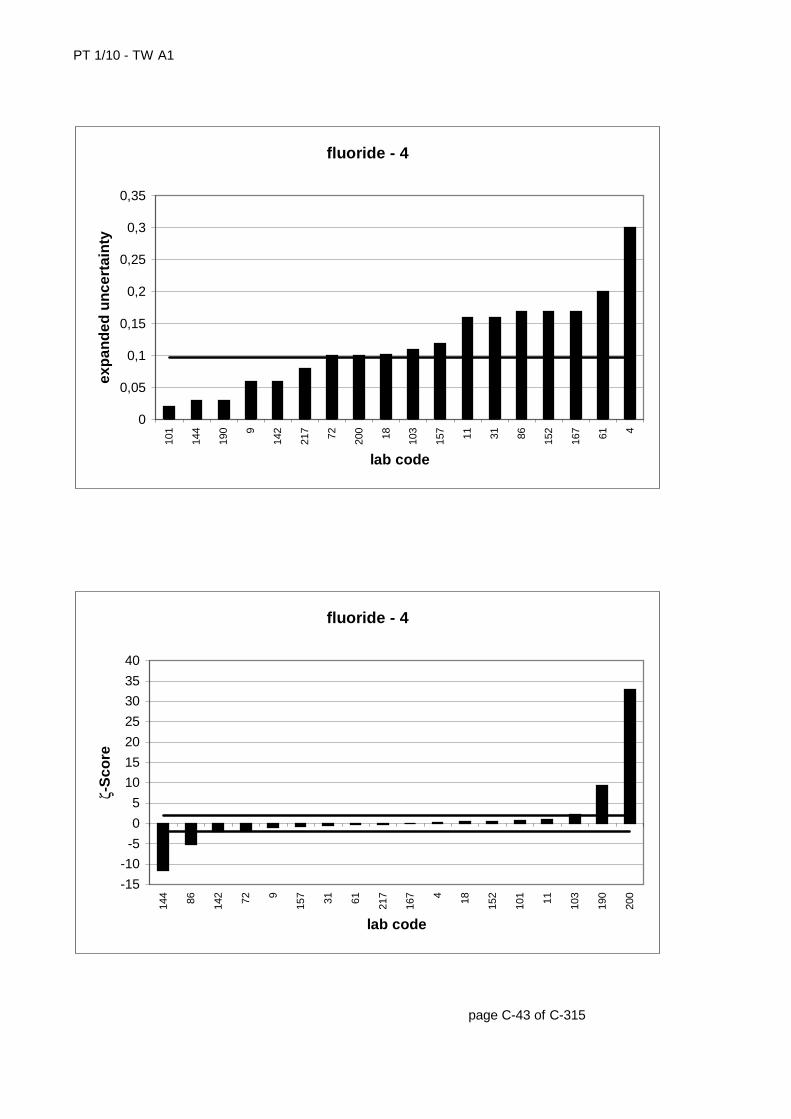
PT 1/10 - TW A1
page C-43 of C-315
fluoride - 4
0
0,05
0,1
0,15
0,2
0,25
0,3
0,35
101
144
190 9
142
217 72 200 18 103
157 11 31 86 152
167 61 4
lab code
exp
and
ed u
nce
rtai
nty
fluoride - 4
-15
-10
-5
0
5
10
15
20
25
30
35
40
144 86 142 72 9
157 31 61 217
167 4 18 152
101 11 103
190
200
lab code
ζ-S
core
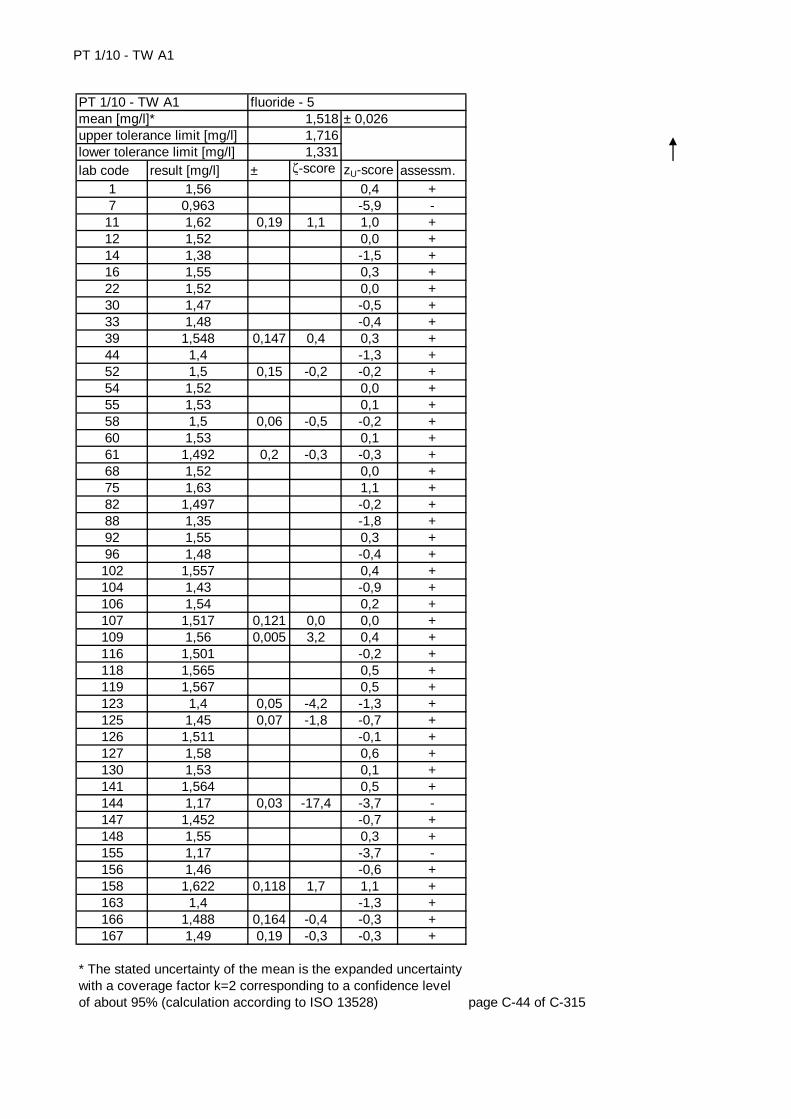
PT 1/10 - TW A1
lab code result [mg/l] ± ζ-score zU-score assessm.1 1,56 0,4 +7 0,963 -5,9 -
11 1,62 0,19 1,1 1,0 +12 1,52 0,0 +14 1,38 -1,5 +16 1,55 0,3 +22 1,52 0,0 +30 1,47 -0,5 +33 1,48 -0,4 +39 1,548 0,147 0,4 0,3 +44 1,4 -1,3 +52 1,5 0,15 -0,2 -0,2 +54 1,52 0,0 +55 1,53 0,1 +58 1,5 0,06 -0,5 -0,2 +60 1,53 0,1 +61 1,492 0,2 -0,3 -0,3 +68 1,52 0,0 +75 1,63 1,1 +82 1,497 -0,2 +88 1,35 -1,8 +92 1,55 0,3 +96 1,48 -0,4 +102 1,557 0,4 +104 1,43 -0,9 +106 1,54 0,2 +107 1,517 0,121 0,0 0,0 +109 1,56 0,005 3,2 0,4 +116 1,501 -0,2 +118 1,565 0,5 +119 1,567 0,5 +123 1,4 0,05 -4,2 -1,3 +125 1,45 0,07 -1,8 -0,7 +126 1,511 -0,1 +127 1,58 0,6 +130 1,53 0,1 +141 1,564 0,5 +144 1,17 0,03 -17,4 -3,7 -147 1,452 -0,7 +148 1,55 0,3 +155 1,17 -3,7 -156 1,46 -0,6 +158 1,622 0,118 1,7 1,1 +163 1,4 -1,3 +166 1,488 0,164 -0,4 -0,3 +167 1,49 0,19 -0,3 -0,3 +
page C-44 of C-315
* The stated uncertainty of the mean is the expanded uncertainty with a coverage factor k=2 corresponding to a confidence level of about 95% (calculation according to ISO 13528)
fluoride - 51,5181,7161,331
± 0,026PT 1/10 - TW A1mean [mg/l]*upper tolerance limit [mg/l]lower tolerance limit [mg/l]

PT 1/10 - TW A1
lab code result [mg/l] ± ζ-score zU-score assessm.176 1,52 0,0 +177 0,449 0,049 -38,4 -11,5 -178 1,69 1,7 +180 4,87 33,7 -182 1,6 0,8 +185 1,27 -2,7 -186 1,8 2,8 -190 1,7 0,03 9,1 1,8 +191 1,62 1,0 +195 1,43 -0,9 +197 1,44 -0,8 +201 1,622 1,1 +203 1,43 0,22 -0,8 -0,9 +204 1,5 -0,2 +209 1,512 -0,1 +211 1,49 -0,3 +215 1,54 0,2 +216 1,55 0,1 0,6 0,3 +220 1,6 0,8 +224 1,57 0,016 3,4 0,5 +226 1,142 -4,0 -227 1,52 0,167 0,0 0,0 +229 1,55 0,3 +230 1 -5,5 -
page C-45 of C-315
* The stated uncertainty of the mean is the expanded uncertainty with a coverage factor k=2 corresponding to a confidence level of about 95% (calculation according to ISO 13528)
upper tolerance limit [mg/l] 1,716lower tolerance limit [mg/l] 1,331
PT 1/10 - TW A1 fluoride - 5mean [mg/l]* 1,518 ± 0,026
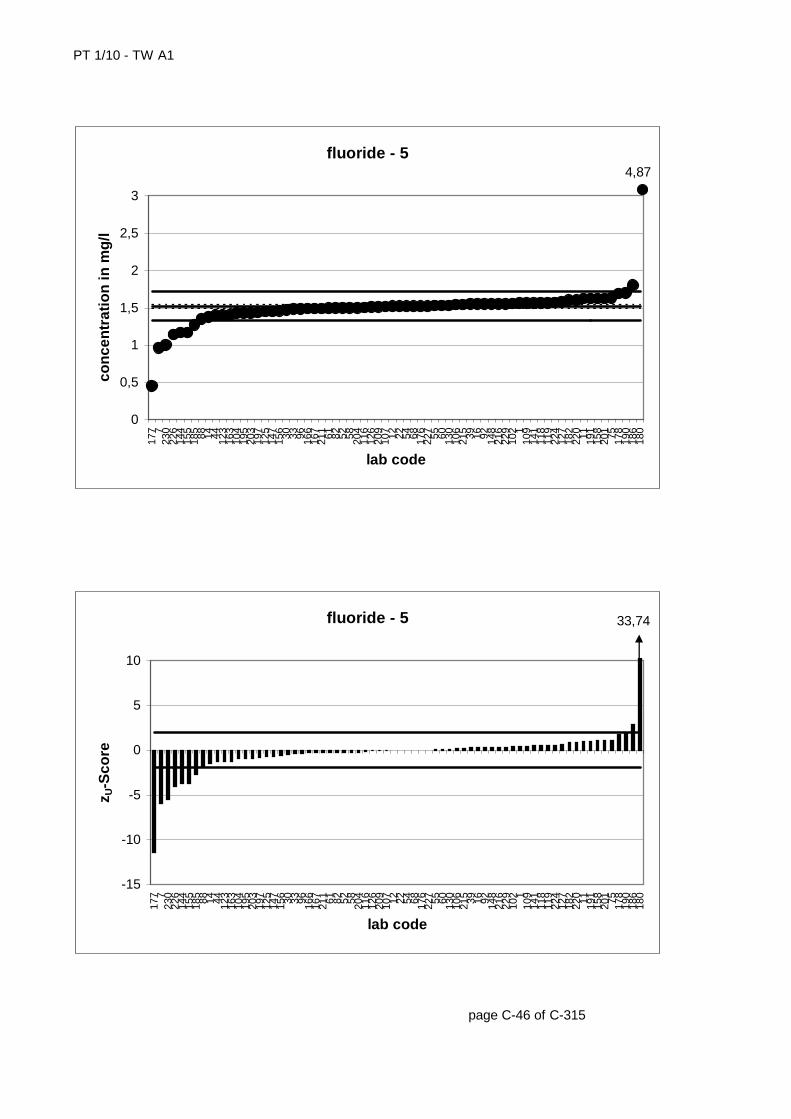
PT 1/10 - TW A1
page C-46 of C-315
fluoride - 5
0
0,5
1
1,5
2
2,5
3
177 7
230
226
144
155
185 88 14 44 123
163
104
195
203
197
125
147
156 30 33 96 166
167
211 61 82 52 58 204
116
126
209
107 12 22 54 68 176
227 55 60 130
106
215 39 16 92 148
216
229
102 1
109
141
118
119
224
127
182
220 11 191
158
201 75 178
190
186
180
lab code
con
cen
trat
ion
in m
g/l
4,87
fluoride - 5
-15
-10
-5
0
5
10
177 7
230
226
144
155
185 88 14 44 123
163
104
195
203
197
125
147
156 30 33 96 166
167
211 61 82 52 58 204
116
126
209
107 12 22 54 68 176
227 55 60 130
106
215 39 16 92 148
216
229
102 1
109
141
118
119
224
127
182
220 11 191
158
201 75 178
190
186
180
lab code
z U-S
core
33,74
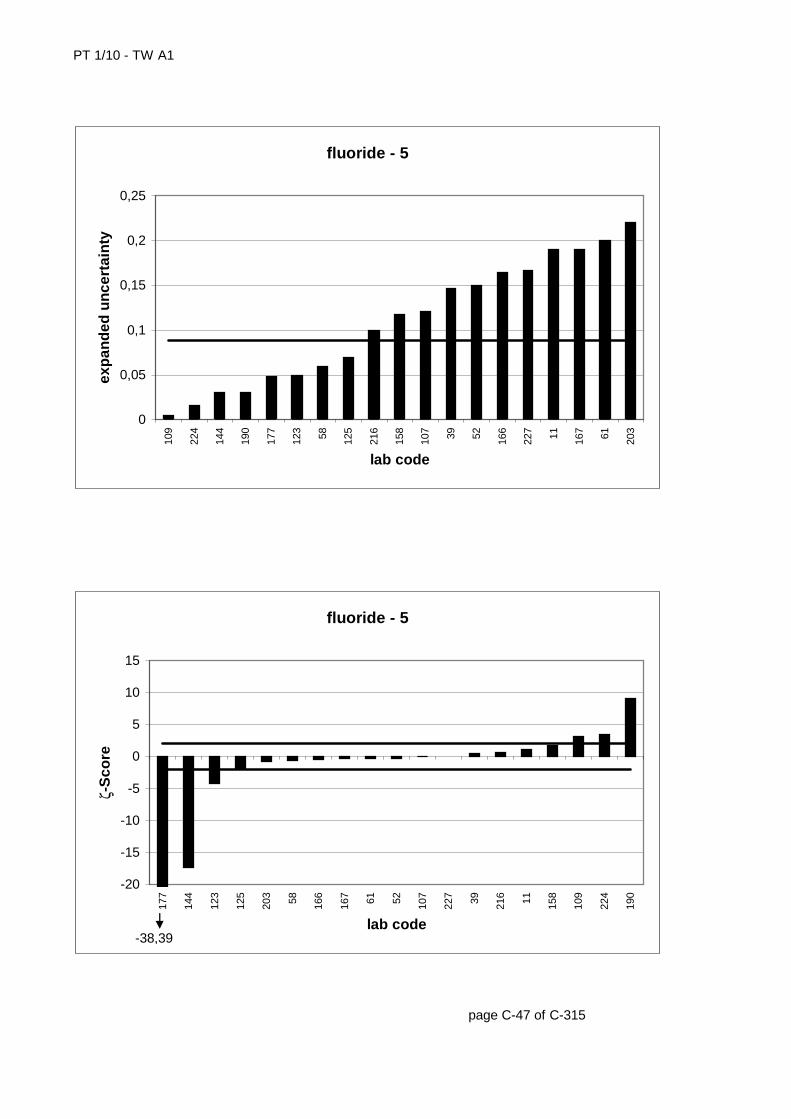
PT 1/10 - TW A1
page C-47 of C-315
fluoride - 5
0
0,05
0,1
0,15
0,2
0,25
109
224
144
190
177
123 58 125
216
158
107 39 52 166
227 11 167 61 203
lab code
exp
and
ed u
nce
rtai
nty
fluoride - 5
-20
-15
-10
-5
0
5
10
15
177
144
123
125
203 58 166
167 61 52 107
227 39 216 11 158
109
224
190
lab code
ζ-S
core
-38,39
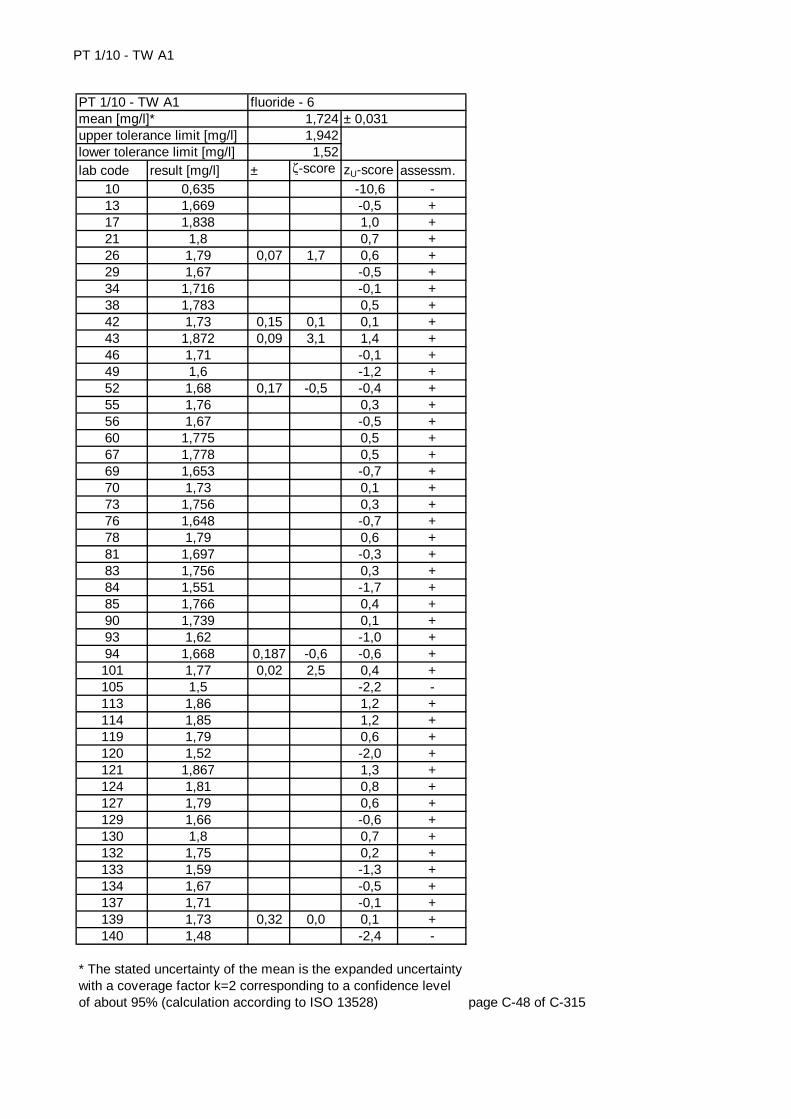
PT 1/10 - TW A1
lab code result [mg/l] ± ζ-score zU-score assessm.10 0,635 -10,6 -13 1,669 -0,5 +17 1,838 1,0 +21 1,8 0,7 +26 1,79 0,07 1,7 0,6 +29 1,67 -0,5 +34 1,716 -0,1 +38 1,783 0,5 +42 1,73 0,15 0,1 0,1 +43 1,872 0,09 3,1 1,4 +46 1,71 -0,1 +49 1,6 -1,2 +52 1,68 0,17 -0,5 -0,4 +55 1,76 0,3 +56 1,67 -0,5 +60 1,775 0,5 +67 1,778 0,5 +69 1,653 -0,7 +70 1,73 0,1 +73 1,756 0,3 +76 1,648 -0,7 +78 1,79 0,6 +81 1,697 -0,3 +83 1,756 0,3 +84 1,551 -1,7 +85 1,766 0,4 +90 1,739 0,1 +93 1,62 -1,0 +94 1,668 0,187 -0,6 -0,6 +101 1,77 0,02 2,5 0,4 +105 1,5 -2,2 -113 1,86 1,2 +114 1,85 1,2 +119 1,79 0,6 +120 1,52 -2,0 +121 1,867 1,3 +124 1,81 0,8 +127 1,79 0,6 +129 1,66 -0,6 +130 1,8 0,7 +132 1,75 0,2 +133 1,59 -1,3 +134 1,67 -0,5 +137 1,71 -0,1 +139 1,73 0,32 0,0 0,1 +140 1,48 -2,4 -
page C-48 of C-315
* The stated uncertainty of the mean is the expanded uncertainty with a coverage factor k=2 corresponding to a confidence level of about 95% (calculation according to ISO 13528)
fluoride - 61,7241,9421,52
± 0,031PT 1/10 - TW A1mean [mg/l]*upper tolerance limit [mg/l]lower tolerance limit [mg/l]
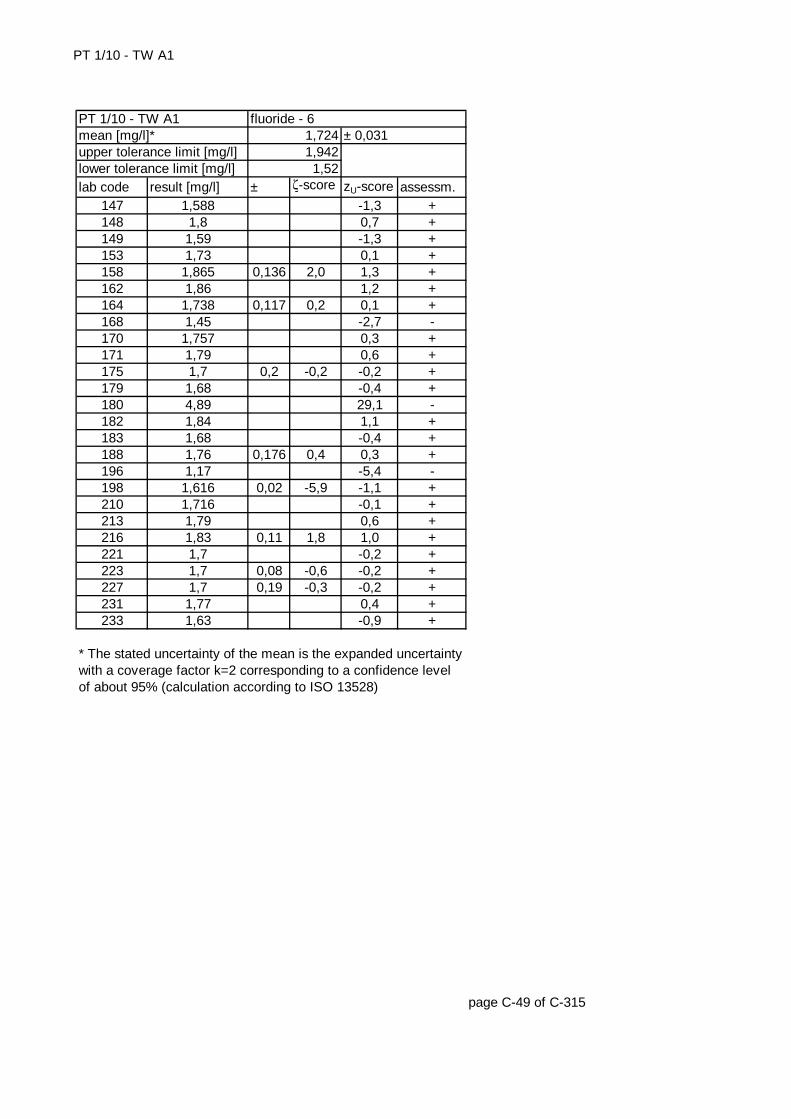
PT 1/10 - TW A1
lab code result [mg/l] ± ζ-score zU-score assessm.147 1,588 -1,3 +148 1,8 0,7 +149 1,59 -1,3 +153 1,73 0,1 +158 1,865 0,136 2,0 1,3 +162 1,86 1,2 +164 1,738 0,117 0,2 0,1 +168 1,45 -2,7 -170 1,757 0,3 +171 1,79 0,6 +175 1,7 0,2 -0,2 -0,2 +179 1,68 -0,4 +180 4,89 29,1 -182 1,84 1,1 +183 1,68 -0,4 +188 1,76 0,176 0,4 0,3 +196 1,17 -5,4 -198 1,616 0,02 -5,9 -1,1 +210 1,716 -0,1 +213 1,79 0,6 +216 1,83 0,11 1,8 1,0 +221 1,7 -0,2 +223 1,7 0,08 -0,6 -0,2 +227 1,7 0,19 -0,3 -0,2 +231 1,77 0,4 +233 1,63 -0,9 +
page C-49 of C-315
* The stated uncertainty of the mean is the expanded uncertainty with a coverage factor k=2 corresponding to a confidence level of about 95% (calculation according to ISO 13528)
upper tolerance limit [mg/l] 1,942lower tolerance limit [mg/l] 1,52
PT 1/10 - TW A1 fluoride - 6mean [mg/l]* 1,724 ± 0,031
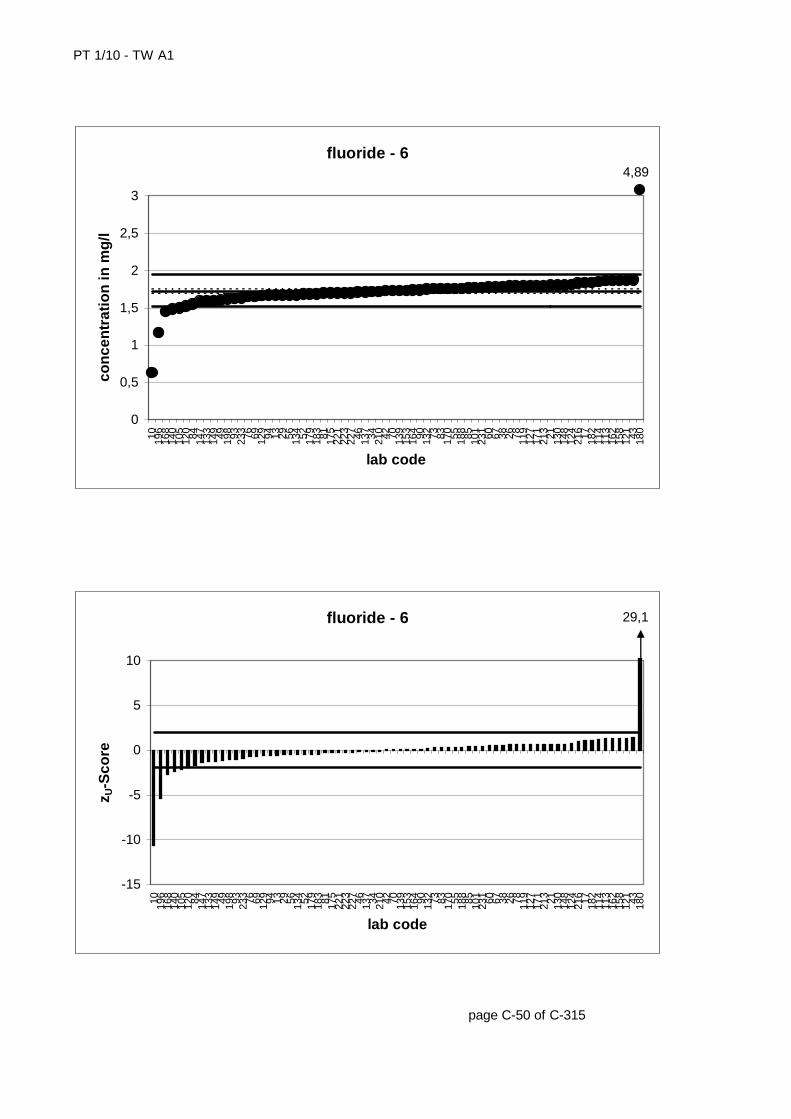
PT 1/10 - TW A1
page C-50 of C-315
fluoride - 6
0
0,5
1
1,5
2
2,5
3
10 196
168
140
105
120 84 147
133
149 49 198 93 233 76 69 129 94 13 29 56 134 52 179
183 81 175
221
223
227 46 137 34 210 42 70 139
153
164 90 132 73 83 170 55 188 85 101
231 60 67 38 26 78 119
127
171
213 21 130
148
124
216 17 182
114
113
162
158
121 43 180
lab code
con
cen
trat
ion
in m
g/l
4,89
fluoride - 6
-15
-10
-5
0
5
10
10 196
168
140
105
120 84 147
133
149 49 198 93 233 76 69 129 94 13 29 56 134 52 179
183 81 175
221
223
227 46 137 34 210 42 70 139
153
164 90 132 73 83 170 55 188 85 101
231 60 67 38 26 78 119
127
171
213 21 130
148
124
216 17 182
114
113
162
158
121 43 180
lab code
z U-S
core
29,1
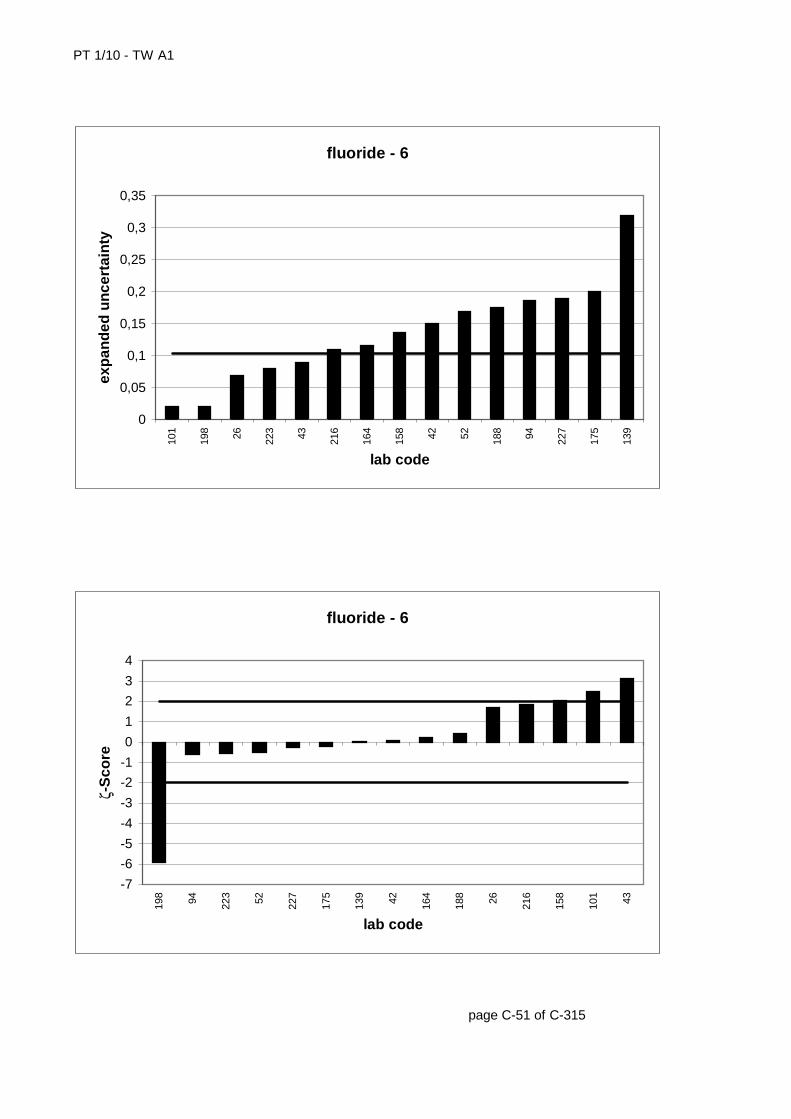
PT 1/10 - TW A1
page C-51 of C-315
fluoride - 6
0
0,05
0,1
0,15
0,2
0,25
0,3
0,35
101
198 26 223 43 216
164
158 42 52 188 94 227
175
139
lab code
exp
and
ed u
nce
rtai
nty
fluoride - 6
-7
-6
-5
-4
-3
-2
-1
0
1
2
3
4
198 94 223 52 227
175
139 42 164
188 26 216
158
101 43
lab code
ζ-S
core

PT 1/10 - TW A1
lab code result [mg/l] ± ζ-score zU-score assessm.2 2,02 0,5 +3 1,98 0,2 +5 2,18 1,9 +
10 2,081 1,0 +20 1,94 0,16 -0,2 -0,2 +21 2,03 0,6 +23 2,041 0,7 +26 2,04 0,07 2,0 0,7 +28 2,015 0,5 +36 2,1 1,2 +37 1,94 -0,2 +41 1,32 -5,7 -43 2,115 0,1 2,9 1,3 +45 1,737 -2,0 +47 2,01 0,4 +49 1,76 -1,8 +58 1,93 0,08 -0,6 -0,3 +59 2,04 0,7 +62 1,846 -1,0 +64 1,91 -0,4 +69 1,916 -0,4 +70 1,82 -1,2 +71 2,21 2,1 -72 1,86 0,2 -1,0 -0,9 +74 1,96 0,1 0,0 0,0 +77 1,98 0,2 +78 2,03 0,6 +80 1,996 0,3 0,2 0,3 +86 1,31 0,27 -4,8 -5,8 -88 1,73 -2,0 +97 1,599 0,234 -3,0 -3,2 -98 1,999 0,3 +100 1,8 -1,4 +102 2,02 0,5 +103 2,01 0,16 0,6 0,4 +105 1,7 -2,3 -111 2,02 0,5 +113 2,08 1,0 +117 2,04 0,7 +118 2,002 0,4 +120 1,77 -1,7 +122 1,97 0,1 +123 1,8 0,05 -5,0 -1,4 +128 2,14 0,18 2,0 1,5 +132 1,98 0,2 +135 2,021 0,5 +
page C-52 of C-315
* The stated uncertainty of the mean is the expanded uncertainty with a coverage factor k=2 corresponding to a confidence level of about 95% (calculation according to ISO 13528)
fluoride - 71,9592,1971,734
± 0,038PT 1/10 - TW A1mean [mg/l]*upper tolerance limit [mg/l]lower tolerance limit [mg/l]

PT 1/10 - TW A1
lab code result [mg/l] ± ζ-score zU-score assessm.138 1,96 0,0 +139 1,94 0,36 -0,1 -0,2 +146 1,9 -0,5 +149 1,79 -1,5 +155 1,5 -4,1 -160 1,9987 0,3 +163 1,79 -1,5 +164 1,96 0,132 0,0 0,0 +165 1,981 0,047 0,7 0,2 +175 1,9 0,2 -0,6 -0,5 +176 1,92 -0,3 +186 2,7 6,2 -189 1,969 0,1 +193 1,87 -0,8 +195 1,87 -0,8 +201 2,158 1,7 +202 2,16 1,7 +204 1,97 0,1 +206 2,15 0,07 4,8 1,6 +211 1,99 0,3 +214 1,923 -0,3 +232 1,91 -0,4 +234 2 0,3 +235 1,918 -0,4 +
page C-53 of C-315
* The stated uncertainty of the mean is the expanded uncertainty with a coverage factor k=2 corresponding to a confidence level of about 95% (calculation according to ISO 13528)
upper tolerance limit [mg/l] 2,197lower tolerance limit [mg/l] 1,734
PT 1/10 - TW A1 fluoride - 7mean [mg/l]* 1,959 ± 0,038
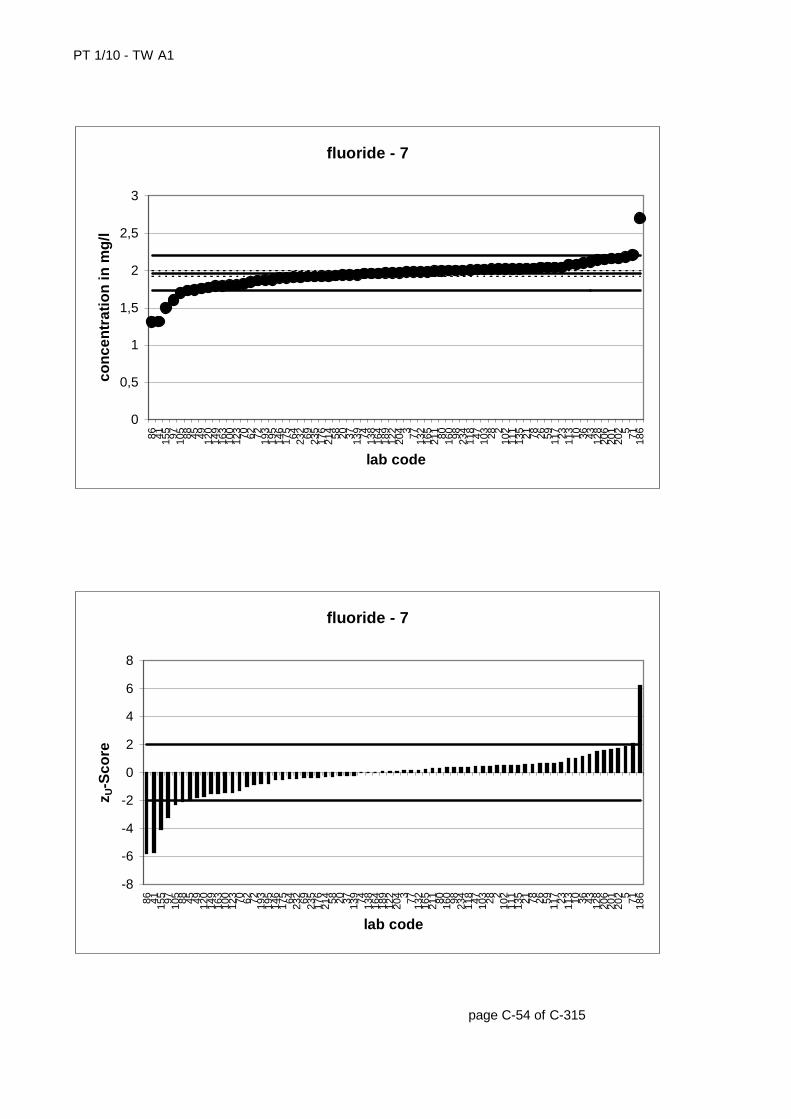
PT 1/10 - TW A1
page C-54 of C-315
fluoride - 7
0
0,5
1
1,5
2
2,5
3
86 41 155 97 105 88 45 49 120
149
163
100
123 70 62 72 193
195
146
175 64 232 69 235
176
214 58 20 37 139 74 138
164
189
122
204 3 77 132
165
211 80 160 98 234
118 47 103 28 2
102
111
135 21 78 26 59 117 23 113 10 36 43 128
206
201
202 5 71 186
lab code
con
cen
trat
ion
in m
g/l
fluoride - 7
-8
-6
-4
-2
0
2
4
6
8
86 41 155 97 105 88 45 49 120
149
163
100
123 70 62 72 193
195
146
175 64 232 69 235
176
214 58 20 37 139 74 138
164
189
122
204 3 77 132
165
211 80 160 98 234
118 47 103 28 2
102
111
135 21 78 26 59 117 23 113 10 36 43 128
206
201
202 5 71 186
lab code
z U-S
core
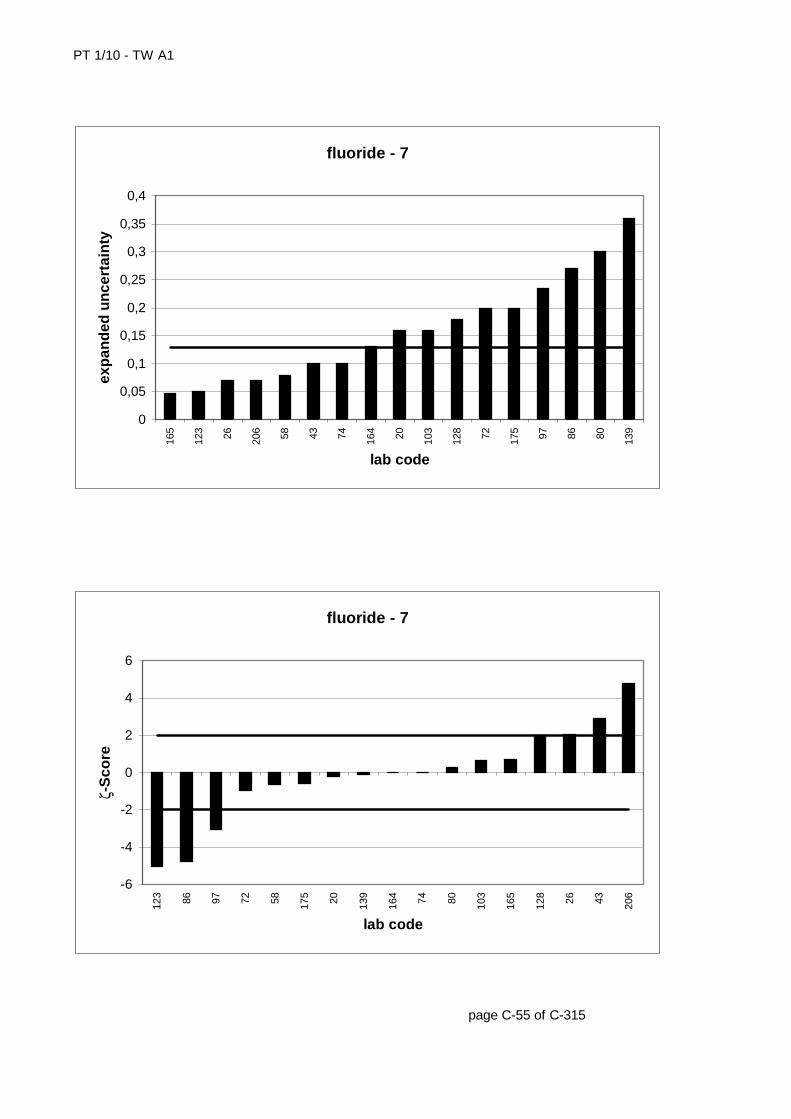
PT 1/10 - TW A1
page C-55 of C-315
fluoride - 7
0
0,05
0,1
0,15
0,2
0,25
0,3
0,35
0,4
165
123 26 206 58 43 74 164 20 103
128 72 175 97 86 80 139
lab code
exp
and
ed u
nce
rtai
nty
fluoride - 7
-6
-4
-2
0
2
4
6
123 86 97 72 58 175 20 139
164 74 80 103
165
128 26 43 206
lab code
ζ-S
core
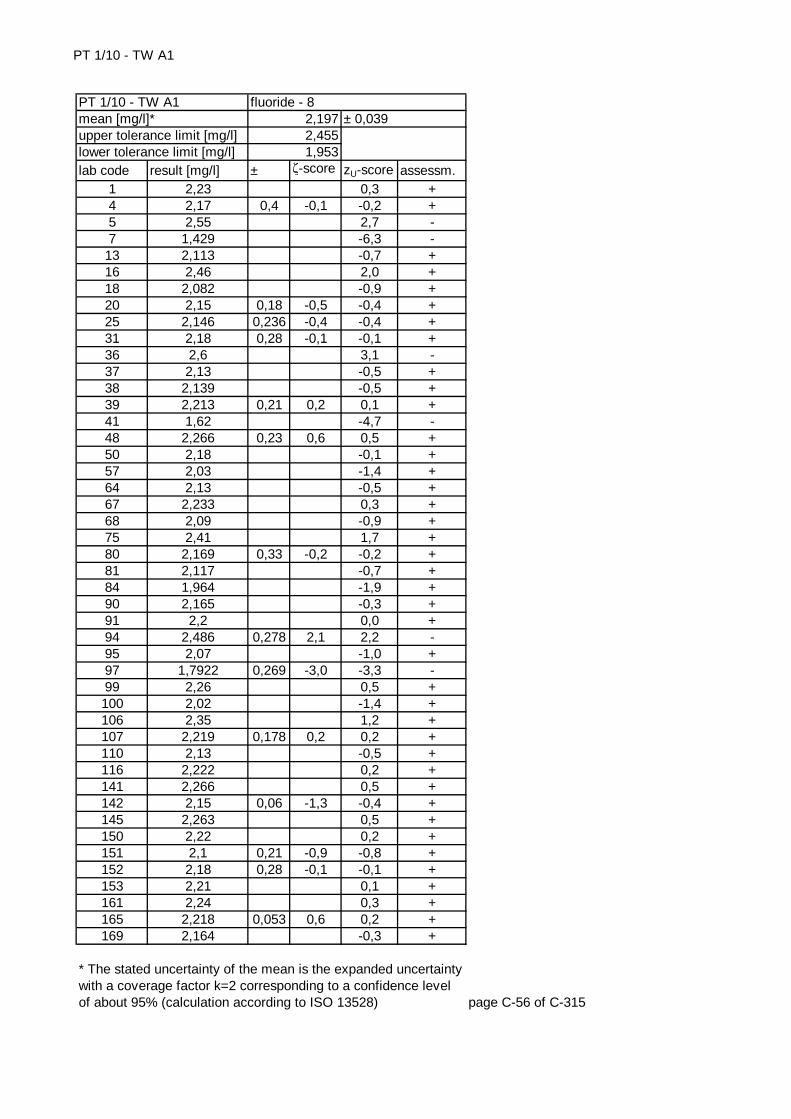
PT 1/10 - TW A1
lab code result [mg/l] ± ζ-score zU-score assessm.1 2,23 0,3 +4 2,17 0,4 -0,1 -0,2 +5 2,55 2,7 -7 1,429 -6,3 -
13 2,113 -0,7 +16 2,46 2,0 +18 2,082 -0,9 +20 2,15 0,18 -0,5 -0,4 +25 2,146 0,236 -0,4 -0,4 +31 2,18 0,28 -0,1 -0,1 +36 2,6 3,1 -37 2,13 -0,5 +38 2,139 -0,5 +39 2,213 0,21 0,2 0,1 +41 1,62 -4,7 -48 2,266 0,23 0,6 0,5 +50 2,18 -0,1 +57 2,03 -1,4 +64 2,13 -0,5 +67 2,233 0,3 +68 2,09 -0,9 +75 2,41 1,7 +80 2,169 0,33 -0,2 -0,2 +81 2,117 -0,7 +84 1,964 -1,9 +90 2,165 -0,3 +91 2,2 0,0 +94 2,486 0,278 2,1 2,2 -95 2,07 -1,0 +97 1,7922 0,269 -3,0 -3,3 -99 2,26 0,5 +100 2,02 -1,4 +106 2,35 1,2 +107 2,219 0,178 0,2 0,2 +110 2,13 -0,5 +116 2,222 0,2 +141 2,266 0,5 +142 2,15 0,06 -1,3 -0,4 +145 2,263 0,5 +150 2,22 0,2 +151 2,1 0,21 -0,9 -0,8 +152 2,18 0,28 -0,1 -0,1 +153 2,21 0,1 +161 2,24 0,3 +165 2,218 0,053 0,6 0,2 +169 2,164 -0,3 +
page C-56 of C-315
* The stated uncertainty of the mean is the expanded uncertainty with a coverage factor k=2 corresponding to a confidence level of about 95% (calculation according to ISO 13528)
fluoride - 82,1972,4551,953
± 0,039PT 1/10 - TW A1mean [mg/l]*upper tolerance limit [mg/l]lower tolerance limit [mg/l]
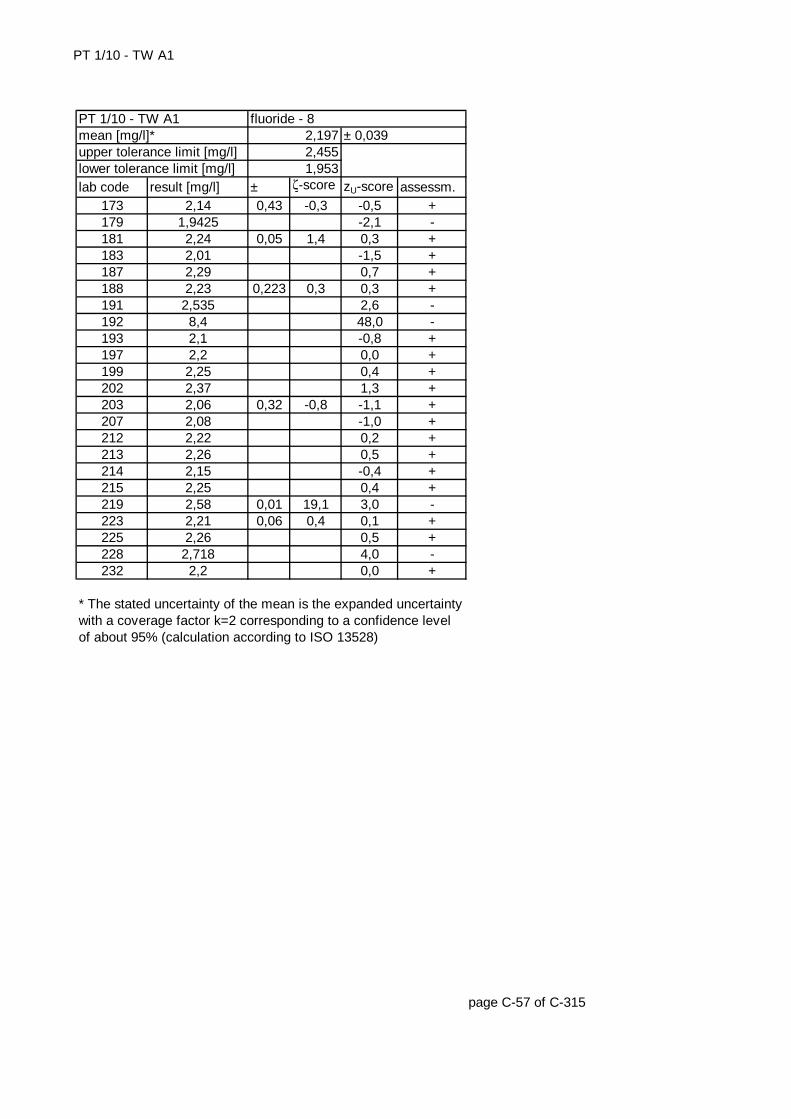
PT 1/10 - TW A1
lab code result [mg/l] ± ζ-score zU-score assessm.173 2,14 0,43 -0,3 -0,5 +179 1,9425 -2,1 -181 2,24 0,05 1,4 0,3 +183 2,01 -1,5 +187 2,29 0,7 +188 2,23 0,223 0,3 0,3 +191 2,535 2,6 -192 8,4 48,0 -193 2,1 -0,8 +197 2,2 0,0 +199 2,25 0,4 +202 2,37 1,3 +203 2,06 0,32 -0,8 -1,1 +207 2,08 -1,0 +212 2,22 0,2 +213 2,26 0,5 +214 2,15 -0,4 +215 2,25 0,4 +219 2,58 0,01 19,1 3,0 -223 2,21 0,06 0,4 0,1 +225 2,26 0,5 +228 2,718 4,0 -232 2,2 0,0 +
page C-57 of C-315
* The stated uncertainty of the mean is the expanded uncertainty with a coverage factor k=2 corresponding to a confidence level of about 95% (calculation according to ISO 13528)
upper tolerance limit [mg/l] 2,455lower tolerance limit [mg/l] 1,953
PT 1/10 - TW A1 fluoride - 8mean [mg/l]* 2,197 ± 0,039
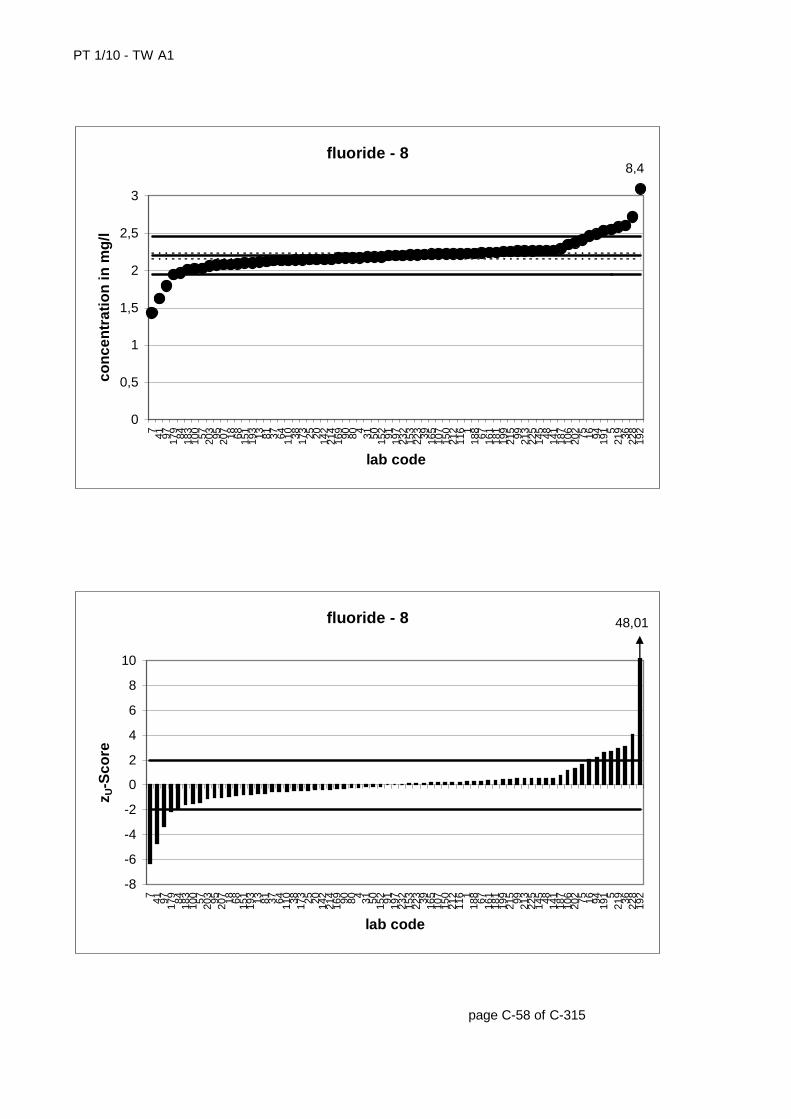
PT 1/10 - TW A1
page C-58 of C-315
fluoride - 8
0
0,5
1
1,5
2
2,5
3
7 41 97 179 84 183
100 57 203 95 207 18 68 151
193 13 81 37 64 110 38 173 25 20 142
214
169 90 80 4 31 50 152 91 197
232
153
223 39 165
107
150
212
116 1
188 67 161
181
199
215 99 213
225
145 48 141
187
106
202 75 16 94 191 5
219 36 228
192
lab code
con
cen
trat
ion
in m
g/l
8,4
fluoride - 8
-8
-6
-4
-2
0
2
4
6
8
10
7 41 97 179 84 183
100 57 203 95 207 18 68 151
193 13 81 37 64 110 38 173 25 20 142
214
169 90 80 4 31 50 152 91 197
232
153
223 39 165
107
150
212
116 1
188 67 161
181
199
215 99 213
225
145 48 141
187
106
202 75 16 94 191 5
219 36 228
192
lab code
z U-S
core
48,01
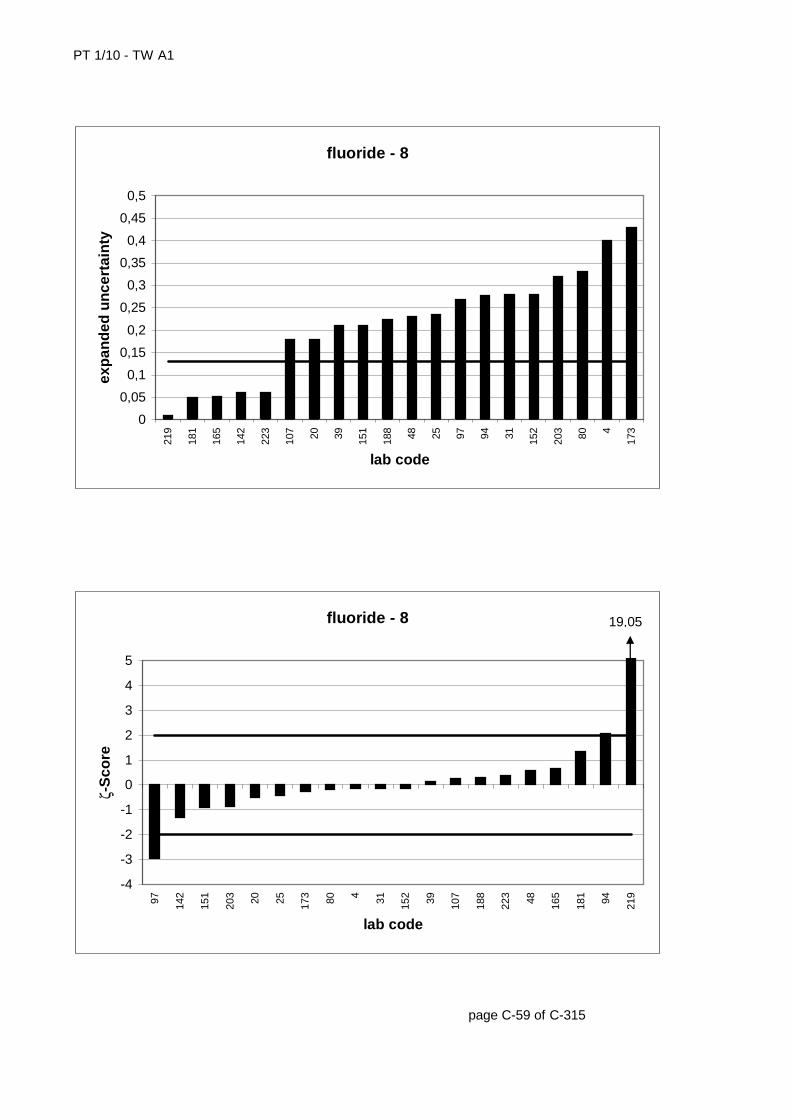
PT 1/10 - TW A1
page C-59 of C-315
fluoride - 8
0
0,05
0,1
0,15
0,2
0,25
0,3
0,35
0,4
0,45
0,5
219
181
165
142
223
107 20 39 151
188 48 25 97 94 31 152
203 80 4
173
lab code
exp
and
ed u
nce
rtai
nty
fluoride - 8
-4
-3
-2
-1
0
1
2
3
4
5
97 142
151
203 20 25 173 80 4 31 152 39 107
188
223 48 165
181 94 219
lab code
ζ-S
core
19,05
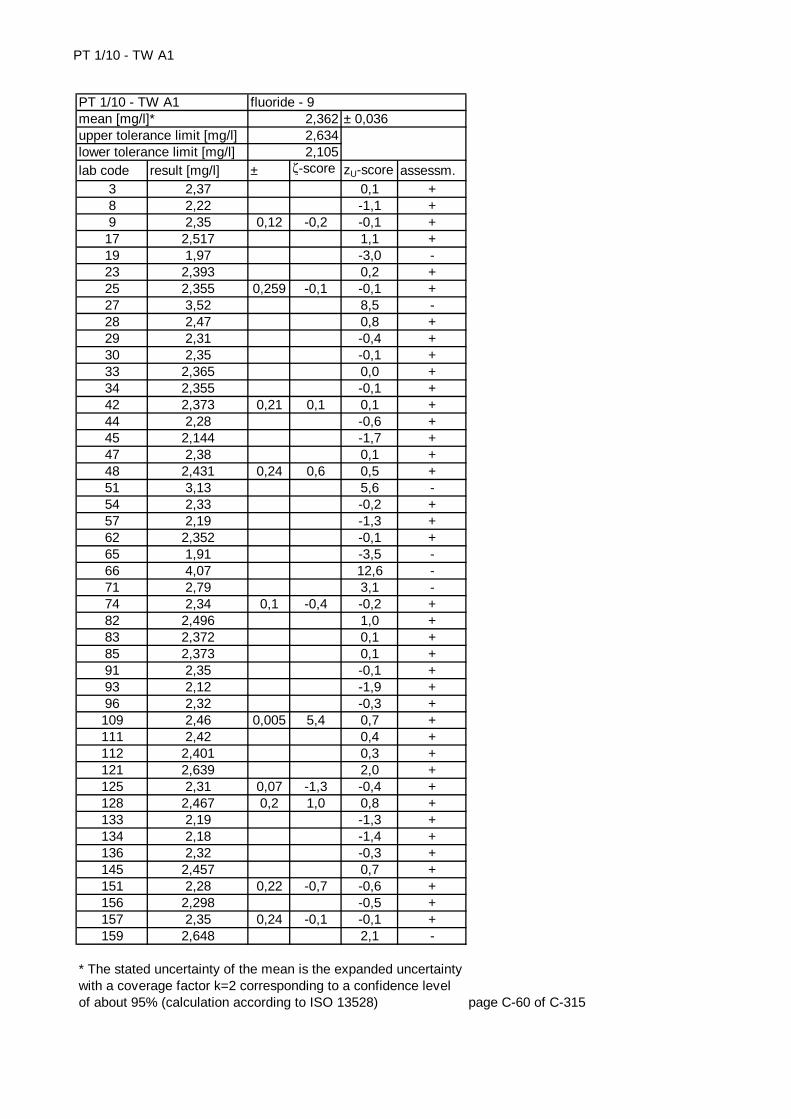
PT 1/10 - TW A1
lab code result [mg/l] ± ζ-score zU-score assessm.3 2,37 0,1 +8 2,22 -1,1 +9 2,35 0,12 -0,2 -0,1 +
17 2,517 1,1 +19 1,97 -3,0 -23 2,393 0,2 +25 2,355 0,259 -0,1 -0,1 +27 3,52 8,5 -28 2,47 0,8 +29 2,31 -0,4 +30 2,35 -0,1 +33 2,365 0,0 +34 2,355 -0,1 +42 2,373 0,21 0,1 0,1 +44 2,28 -0,6 +45 2,144 -1,7 +47 2,38 0,1 +48 2,431 0,24 0,6 0,5 +51 3,13 5,6 -54 2,33 -0,2 +57 2,19 -1,3 +62 2,352 -0,1 +65 1,91 -3,5 -66 4,07 12,6 -71 2,79 3,1 -74 2,34 0,1 -0,4 -0,2 +82 2,496 1,0 +83 2,372 0,1 +85 2,373 0,1 +91 2,35 -0,1 +93 2,12 -1,9 +96 2,32 -0,3 +109 2,46 0,005 5,4 0,7 +111 2,42 0,4 +112 2,401 0,3 +121 2,639 2,0 +125 2,31 0,07 -1,3 -0,4 +128 2,467 0,2 1,0 0,8 +133 2,19 -1,3 +134 2,18 -1,4 +136 2,32 -0,3 +145 2,457 0,7 +151 2,28 0,22 -0,7 -0,6 +156 2,298 -0,5 +157 2,35 0,24 -0,1 -0,1 +159 2,648 2,1 -
page C-60 of C-315
* The stated uncertainty of the mean is the expanded uncertainty with a coverage factor k=2 corresponding to a confidence level of about 95% (calculation according to ISO 13528)
fluoride - 92,3622,6342,105
± 0,036PT 1/10 - TW A1mean [mg/l]*upper tolerance limit [mg/l]lower tolerance limit [mg/l]

PT 1/10 - TW A1
lab code result [mg/l] ± ζ-score zU-score assessm.160 2,3854 0,2 +161 2,45 0,6 +166 2,369 0,261 0,1 0,1 +168 2,11 -2,0 +169 2,4 0,3 +170 2,364 0,0 +171 2,47 0,8 +173 2,33 0,47 -0,1 -0,2 +177 2,39 0,26 0,2 0,2 +178 2,43 0,5 +181 2,35 0,08 -0,3 -0,1 +185 2,07 -2,3 -189 2,133 -1,8 +192 2,601 1,8 +198 2,345 0,02 -0,8 -0,1 +200 4,5 0,1 40,2 15,7 -205 2,407 0,3 +206 2,6 0,09 4,9 1,7 +212 2,41 0,4 +217 2,36 0,16 0,0 0,0 +219 2,79 0,01 22,9 3,1 -221 2,34 -0,2 +224 2,43 0,024 3,1 0,5 +228 2,202 -1,2 +229 2,42 0,4 +237 2,48 0,9 +
page C-61 of C-315
* The stated uncertainty of the mean is the expanded uncertainty with a coverage factor k=2 corresponding to a confidence level of about 95% (calculation according to ISO 13528)
upper tolerance limit [mg/l] 2,634lower tolerance limit [mg/l] 2,105
PT 1/10 - TW A1 fluoride - 9mean [mg/l]* 2,362 ± 0,036
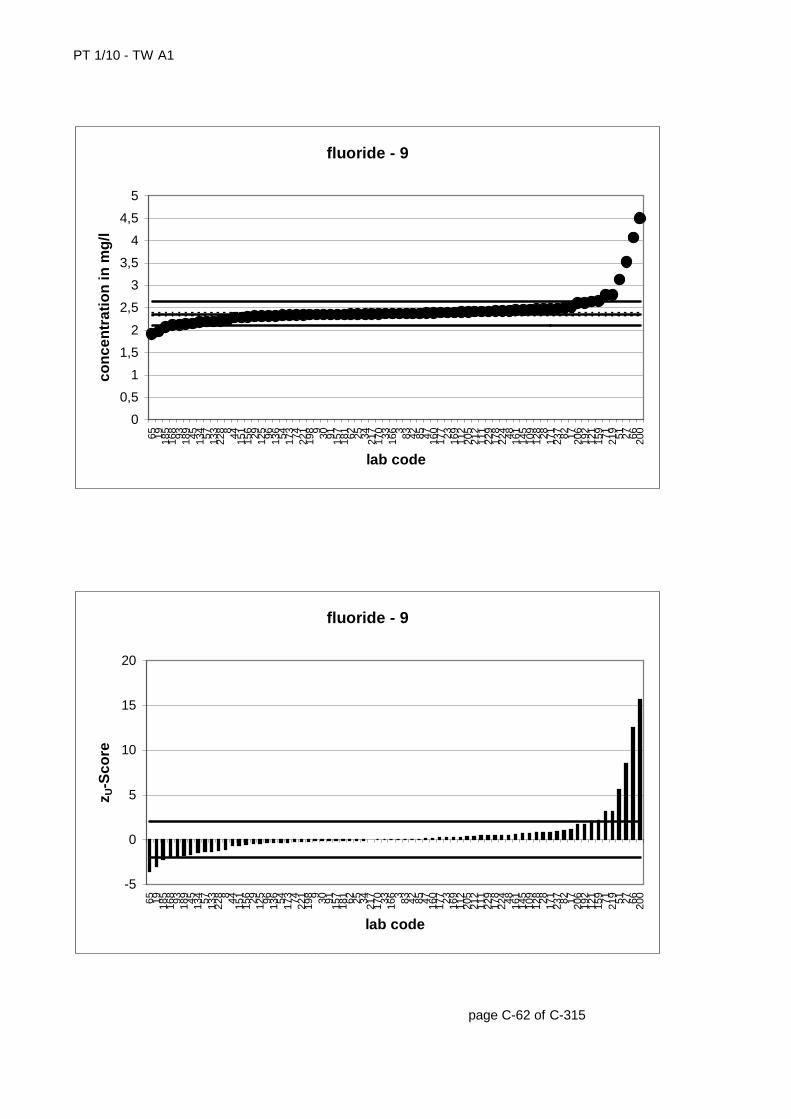
PT 1/10 - TW A1
page C-62 of C-315
fluoride - 9
0
0,5
1
1,5
2
2,5
3
3,5
4
4,5
5
65 19 185
168 93 189 45 134 57 133
228 8 44 151
156 29 125 96 136 54 173 74 221
198 9 30 91 157
181 62 25 34 217
170 33 166 3 83 42 85 47 160
177 23 169
112
205
212
111
229
178
224 48 161
145
109
128 28 171
237 82 17 206
192
121
159 71 219 51 27 66 200
lab code
con
cen
trat
ion
in m
g/l
fluoride - 9
-5
0
5
10
15
20
65 19 185
168 93 189 45 134 57 133
228 8 44 151
156 29 125 96 136 54 173 74 221
198 9 30 91 157
181 62 25 34 217
170 33 166 3 83 42 85 47 160
177 23 169
112
205
212
111
229
178
224 48 161
145
109
128 28 171
237 82 17 206
192
121
159 71 219 51 27 66 200
lab code
z U-S
core
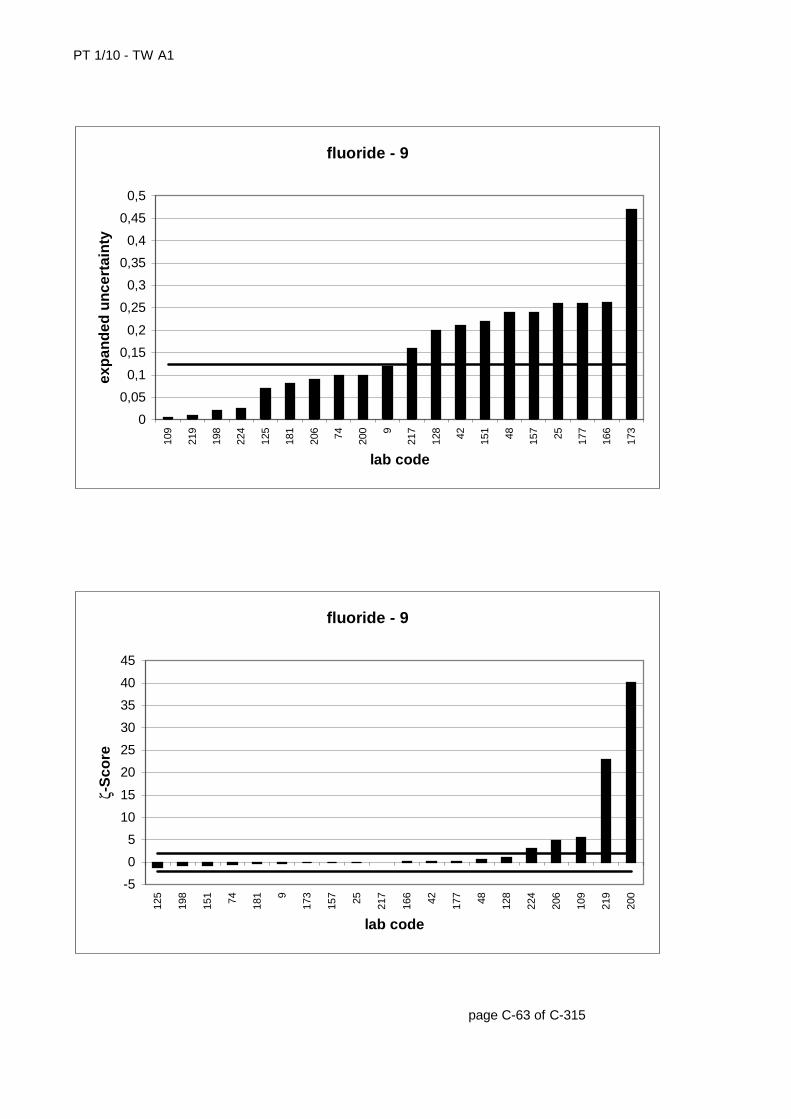
PT 1/10 - TW A1
page C-63 of C-315
fluoride - 9
0
0,05
0,1
0,15
0,2
0,25
0,3
0,35
0,4
0,45
0,5
109
219
198
224
125
181
206 74 200 9
217
128 42 151 48 157 25 177
166
173
lab code
exp
and
ed u
nce
rtai
nty
fluoride - 9
-5
0
5
10
15
20
25
30
35
40
45
125
198
151 74 181 9
173
157 25 217
166 42 177 48 128
224
206
109
219
200
lab code
ζ-S
core
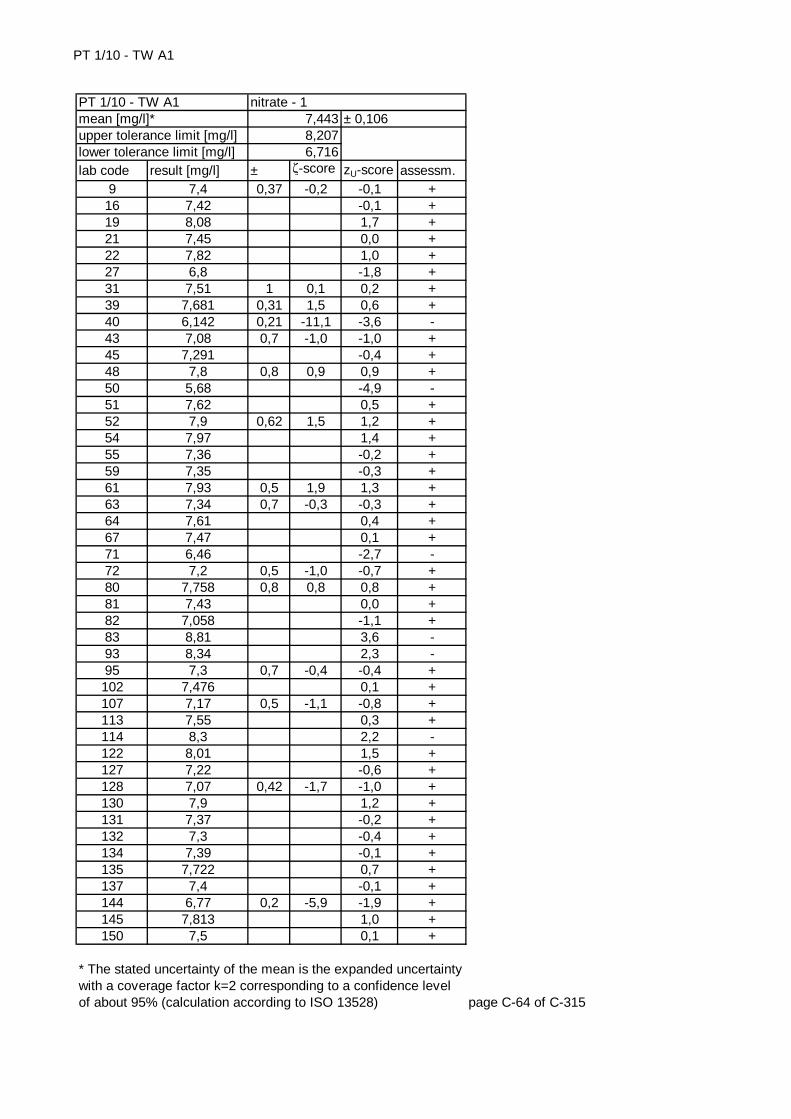
PT 1/10 - TW A1
lab code result [mg/l] ± ζ-score zU-score assessm.9 7,4 0,37 -0,2 -0,1 +
16 7,42 -0,1 +19 8,08 1,7 +21 7,45 0,0 +22 7,82 1,0 +27 6,8 -1,8 +31 7,51 1 0,1 0,2 +39 7,681 0,31 1,5 0,6 +40 6,142 0,21 -11,1 -3,6 -43 7,08 0,7 -1,0 -1,0 +45 7,291 -0,4 +48 7,8 0,8 0,9 0,9 +50 5,68 -4,9 -51 7,62 0,5 +52 7,9 0,62 1,5 1,2 +54 7,97 1,4 +55 7,36 -0,2 +59 7,35 -0,3 +61 7,93 0,5 1,9 1,3 +63 7,34 0,7 -0,3 -0,3 +64 7,61 0,4 +67 7,47 0,1 +71 6,46 -2,7 -72 7,2 0,5 -1,0 -0,7 +80 7,758 0,8 0,8 0,8 +81 7,43 0,0 +82 7,058 -1,1 +83 8,81 3,6 -93 8,34 2,3 -95 7,3 0,7 -0,4 -0,4 +102 7,476 0,1 +107 7,17 0,5 -1,1 -0,8 +113 7,55 0,3 +114 8,3 2,2 -122 8,01 1,5 +127 7,22 -0,6 +128 7,07 0,42 -1,7 -1,0 +130 7,9 1,2 +131 7,37 -0,2 +132 7,3 -0,4 +134 7,39 -0,1 +135 7,722 0,7 +137 7,4 -0,1 +144 6,77 0,2 -5,9 -1,9 +145 7,813 1,0 +150 7,5 0,1 +
page C-64 of C-315
* The stated uncertainty of the mean is the expanded uncertainty with a coverage factor k=2 corresponding to a confidence level of about 95% (calculation according to ISO 13528)
nitrate - 17,4438,2076,716
± 0,106PT 1/10 - TW A1mean [mg/l]*upper tolerance limit [mg/l]lower tolerance limit [mg/l]

PT 1/10 - TW A1
lab code result [mg/l] ± ζ-score zU-score assessm.152 7,29 0,51 -0,6 -0,4 +156 7,443 0,0 +162 7,57 0,3 +165 7,205 0,124 -2,9 -0,7 +167 7,33 0,37 -0,6 -0,3 +169 7,44 0,0 +175 7,5 0,5 0,2 0,1 +179 7,585 0,4 +180 7,91 1,2 +185 7 -1,2 +186 20 32,9 -192 7,735 0,8 +193 7,5 0,1 +201 7,135 -0,8 +204 7,524 0,2 +206 7,13 0,59 -1,0 -0,9 +210 7,181 -0,7 +215 7,25 -0,5 +221 7,46 0,0 +223 7,48 0,3 0,2 0,1 +227 7,29 0,42 -0,7 -0,4 +229 7,17 -0,8 +232 7,1 -0,9 +233 6,13 -3,6 -235 7,318 -0,3 +237 7,22 -0,6 +
page C-65 of C-315
* The stated uncertainty of the mean is the expanded uncertainty with a coverage factor k=2 corresponding to a confidence level of about 95% (calculation according to ISO 13528)
upper tolerance limit [mg/l] 8,207lower tolerance limit [mg/l] 6,716
PT 1/10 - TW A1 nitrate - 1mean [mg/l]* 7,443 ± 0,106
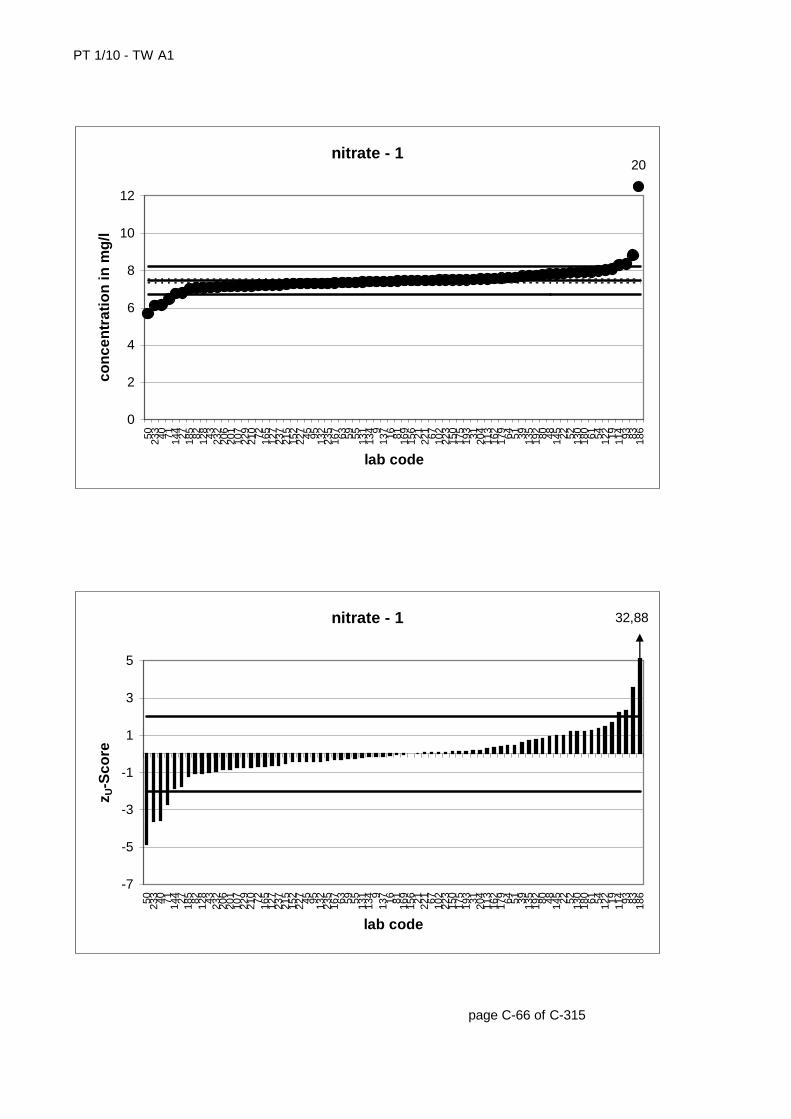
PT 1/10 - TW A1
page C-66 of C-315
nitrate - 1
0
2
4
6
8
10
12
50 233 40 71 144 27 185 82 128 43 232
206
201
107
229
210 72 165
127
237
215
152
227 45 95 132
235
167 63 59 55 131
134 9
137 16 81 169
156 21 221 67 102
223
150
175
193 31 204
113
162
179 64 51 39 135
192 80 48 145 22 52 130
180 61 54 122 19 114 93 83 186
lab code
con
cen
trat
ion
in m
g/l
20
nitrate - 1
-7
-5
-3
-1
1
3
5
50 233 40 71 144 27 185 82 128 43 232
206
201
107
229
210 72 165
127
237
215
152
227 45 95 132
235
167 63 59 55 131
134 9
137 16 81 169
156 21 221 67 102
223
150
175
193 31 204
113
162
179 64 51 39 135
192 80 48 145 22 52 130
180 61 54 122 19 114 93 83 186
lab code
z U-S
core
32,88
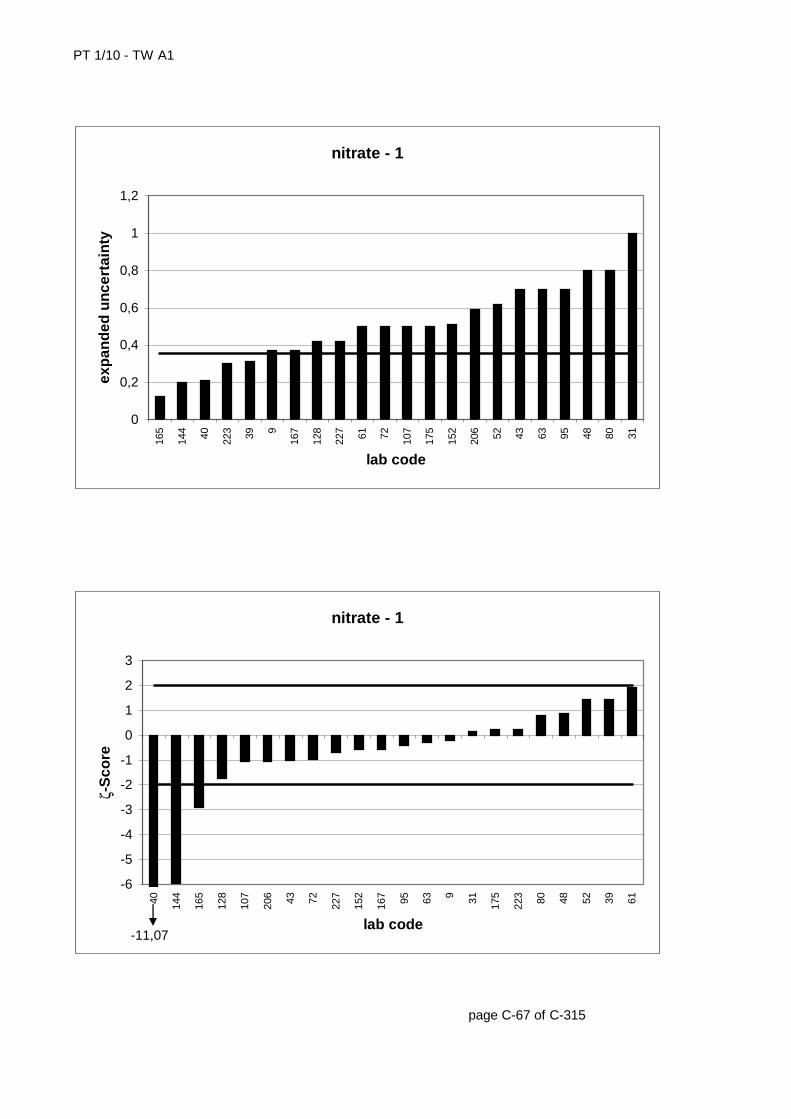
PT 1/10 - TW A1
page C-67 of C-315
nitrate - 1
0
0,2
0,4
0,6
0,8
1
1,2
165
144 40 223 39 9
167
128
227 61 72 107
175
152
206 52 43 63 95 48 80 31
lab code
exp
and
ed u
nce
rtai
nty
nitrate - 1
-6
-5
-4
-3
-2
-1
0
1
2
3
40 144
165
128
107
206 43 72 227
152
167 95 63 9 31 175
223 80 48 52 39 61
lab code
ζ-S
core
-11,07
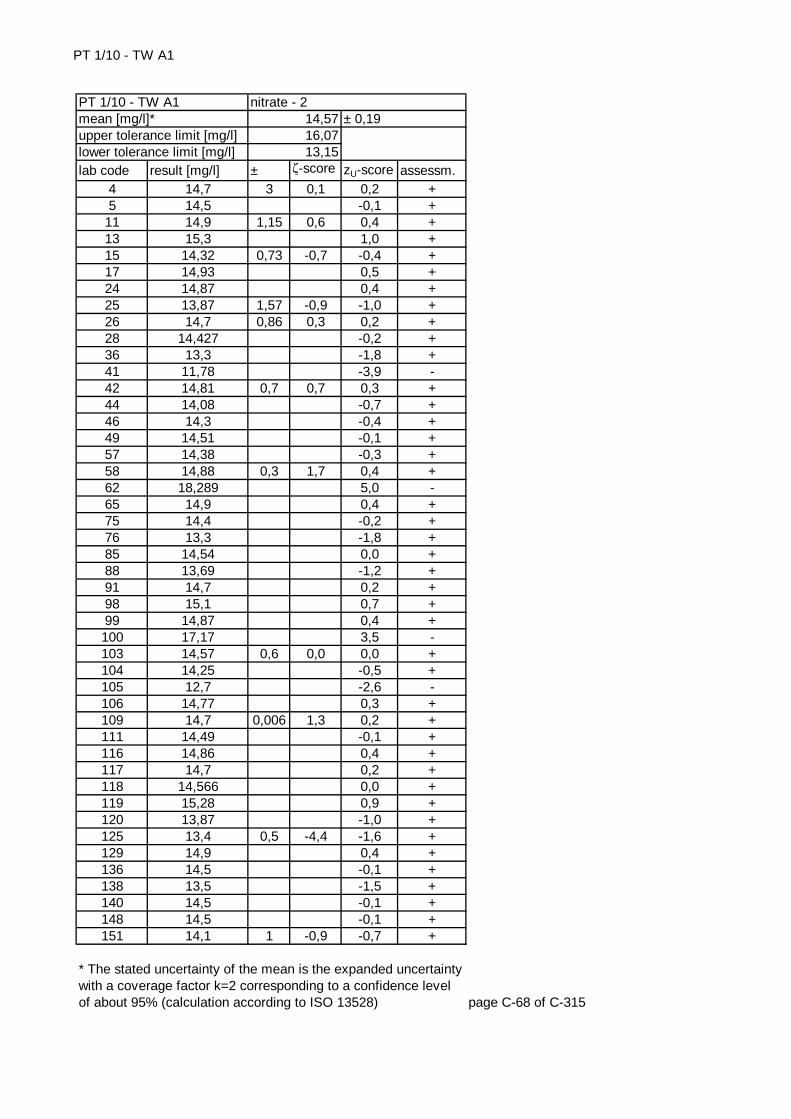
PT 1/10 - TW A1
lab code result [mg/l] ± ζ-score zU-score assessm.4 14,7 3 0,1 0,2 +5 14,5 -0,1 +
11 14,9 1,15 0,6 0,4 +13 15,3 1,0 +15 14,32 0,73 -0,7 -0,4 +17 14,93 0,5 +24 14,87 0,4 +25 13,87 1,57 -0,9 -1,0 +26 14,7 0,86 0,3 0,2 +28 14,427 -0,2 +36 13,3 -1,8 +41 11,78 -3,9 -42 14,81 0,7 0,7 0,3 +44 14,08 -0,7 +46 14,3 -0,4 +49 14,51 -0,1 +57 14,38 -0,3 +58 14,88 0,3 1,7 0,4 +62 18,289 5,0 -65 14,9 0,4 +75 14,4 -0,2 +76 13,3 -1,8 +85 14,54 0,0 +88 13,69 -1,2 +91 14,7 0,2 +98 15,1 0,7 +99 14,87 0,4 +100 17,17 3,5 -103 14,57 0,6 0,0 0,0 +104 14,25 -0,5 +105 12,7 -2,6 -106 14,77 0,3 +109 14,7 0,006 1,3 0,2 +111 14,49 -0,1 +116 14,86 0,4 +117 14,7 0,2 +118 14,566 0,0 +119 15,28 0,9 +120 13,87 -1,0 +125 13,4 0,5 -4,4 -1,6 +129 14,9 0,4 +136 14,5 -0,1 +138 13,5 -1,5 +140 14,5 -0,1 +148 14,5 -0,1 +151 14,1 1 -0,9 -0,7 +
page C-68 of C-315
* The stated uncertainty of the mean is the expanded uncertainty with a coverage factor k=2 corresponding to a confidence level of about 95% (calculation according to ISO 13528)
nitrate - 214,5716,0713,15
± 0,19PT 1/10 - TW A1mean [mg/l]*upper tolerance limit [mg/l]lower tolerance limit [mg/l]

PT 1/10 - TW A1
lab code result [mg/l] ± ζ-score zU-score assessm.153 13,86 -1,0 +155 15,35 1,0 +161 14,92 0,5 +164 14,61 0,73 0,1 0,1 +166 14,615 0,614 0,1 0,1 +170 14,58 0,39 0,0 0,0 +178 13,9 -0,9 +183 15,62 1,4 +187 15 0,6 +188 13,88 0,555 -2,4 -1,0 +189 14,22 -0,5 +190 15 0,3 2,4 0,6 +191 15,21 0,9 +194 3,04 -16,2 -196 15,14 0,8 +198 15,5 1,2 +200 14,4 0,1 -1,6 -0,2 +203 15,8 2,5 1,0 1,6 +205 14,34 -0,3 +209 14,506 -0,1 +213 13,8 -1,1 +216 15,69 1,97 1,1 1,5 +219 12,5 0,05 -20,7 -2,9 -226 14,85 0,4 +234 15,18 0,8 +
page C-69 of C-315
* The stated uncertainty of the mean is the expanded uncertainty with a coverage factor k=2 corresponding to a confidence level of about 95% (calculation according to ISO 13528)
upper tolerance limit [mg/l] 16,07lower tolerance limit [mg/l] 13,15
PT 1/10 - TW A1 nitrate - 2mean [mg/l]* 14,57 ± 0,19
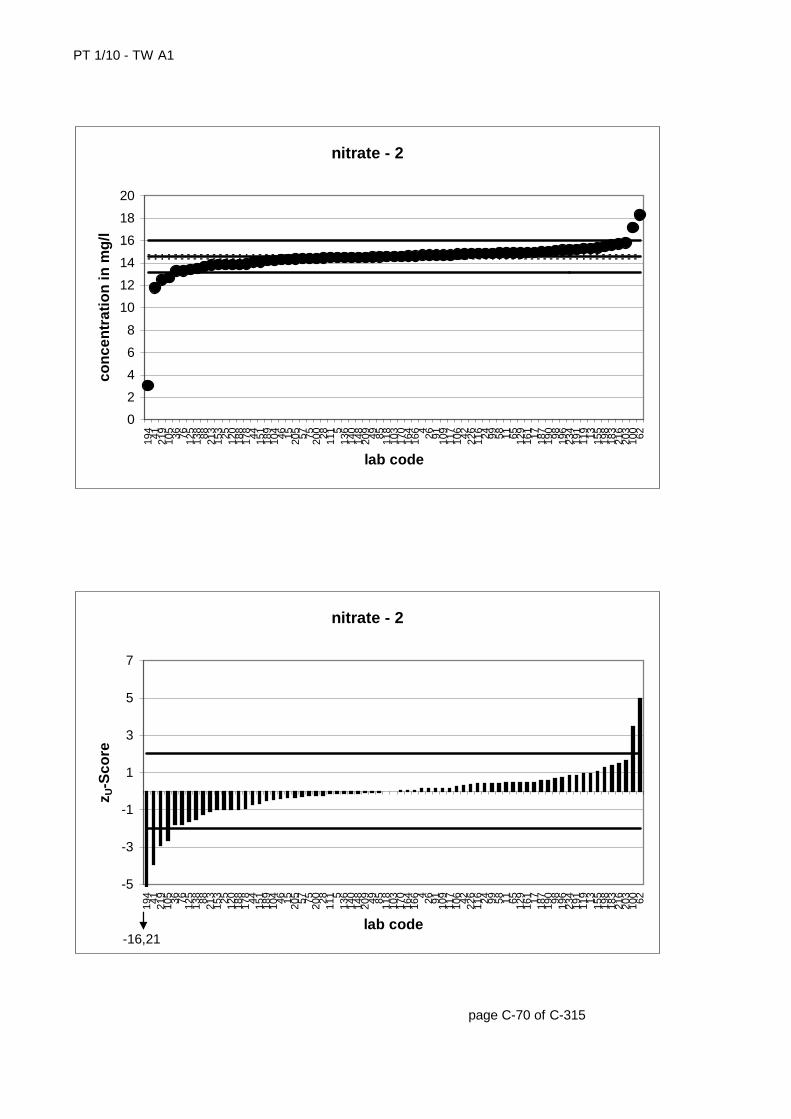
PT 1/10 - TW A1
page C-70 of C-315
nitrate - 2
0
2
4
6
8
10
12
14
16
18
20
194 41 219
105 36 76 125
138 88 213
153 25 120
188
178 44 151
189
104 46 15 205 57 75 200 28 111 5
136
140
148
209 49 85 118
103
170
164
166 4 26 91 109
117
106 42 226
116 24 99 58 11 65 129
161 17 187
190 98 196
234
191
119 13 155
198
183
216
203
100 62
lab code
con
cen
trat
ion
in m
g/l
nitrate - 2
-5
-3
-1
1
3
5
7
194 41 219
105 36 76 125
138 88 213
153 25 120
188
178 44 151
189
104 46 15 205 57 75 200 28 111 5
136
140
148
209 49 85 118
103
170
164
166 4 26 91 109
117
106 42 226
116 24 99 58 11 65 129
161 17 187
190 98 196
234
191
119 13 155
198
183
216
203
100 62
lab code
z U-S
core
-16,21
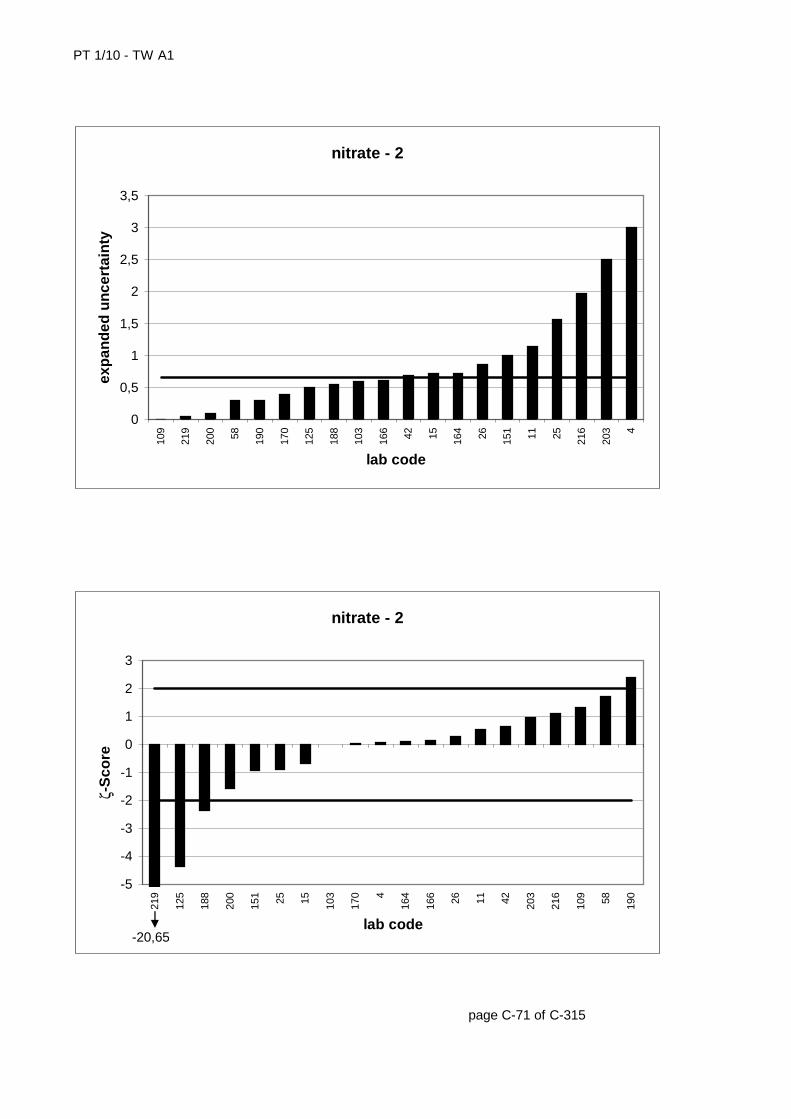
PT 1/10 - TW A1
page C-71 of C-315
nitrate - 2
0
0,5
1
1,5
2
2,5
3
3,5
109
219
200 58 190
170
125
188
103
166 42 15 164 26 151 11 25 216
203 4
lab code
exp
and
ed u
nce
rtai
nty
nitrate - 2
-5
-4
-3
-2
-1
0
1
2
3
219
125
188
200
151 25 15 103
170 4
164
166 26 11 42 203
216
109 58 190
lab code
ζ-S
core
-20,65
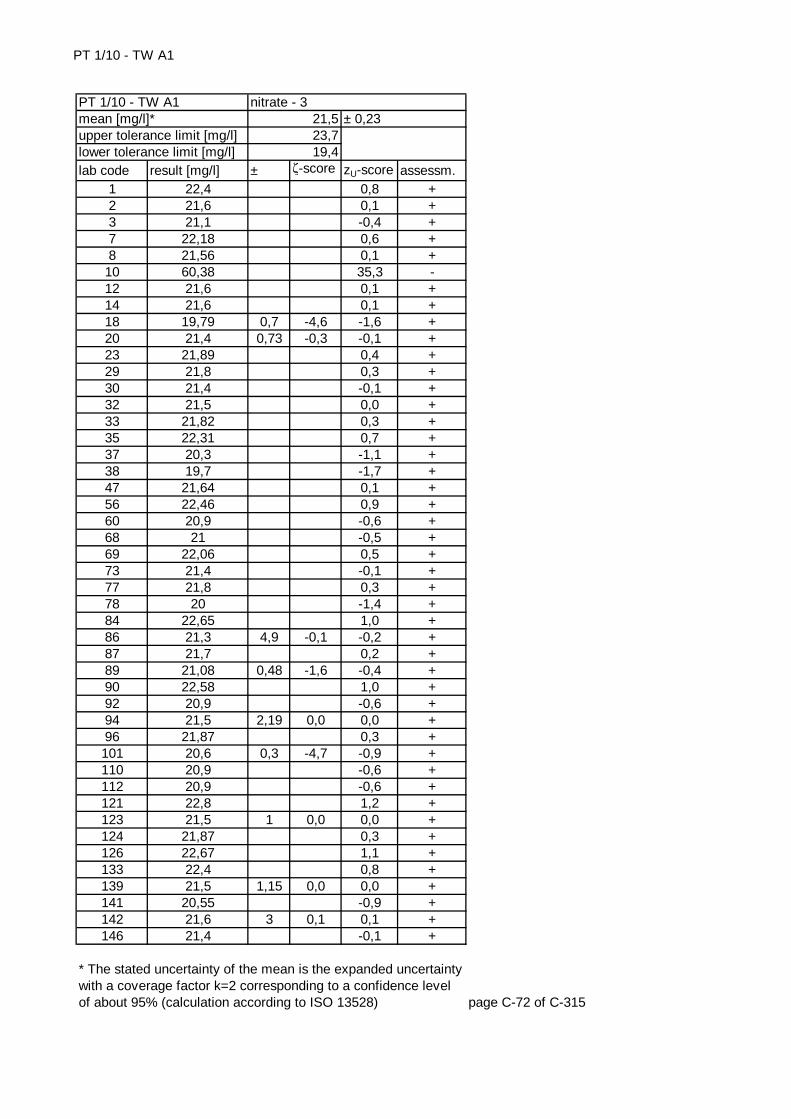
PT 1/10 - TW A1
lab code result [mg/l] ± ζ-score zU-score assessm.1 22,4 0,8 +2 21,6 0,1 +3 21,1 -0,4 +7 22,18 0,6 +8 21,56 0,1 +
10 60,38 35,3 -12 21,6 0,1 +14 21,6 0,1 +18 19,79 0,7 -4,6 -1,6 +20 21,4 0,73 -0,3 -0,1 +23 21,89 0,4 +29 21,8 0,3 +30 21,4 -0,1 +32 21,5 0,0 +33 21,82 0,3 +35 22,31 0,7 +37 20,3 -1,1 +38 19,7 -1,7 +47 21,64 0,1 +56 22,46 0,9 +60 20,9 -0,6 +68 21 -0,5 +69 22,06 0,5 +73 21,4 -0,1 +77 21,8 0,3 +78 20 -1,4 +84 22,65 1,0 +86 21,3 4,9 -0,1 -0,2 +87 21,7 0,2 +89 21,08 0,48 -1,6 -0,4 +90 22,58 1,0 +92 20,9 -0,6 +94 21,5 2,19 0,0 0,0 +96 21,87 0,3 +101 20,6 0,3 -4,7 -0,9 +110 20,9 -0,6 +112 20,9 -0,6 +121 22,8 1,2 +123 21,5 1 0,0 0,0 +124 21,87 0,3 +126 22,67 1,1 +133 22,4 0,8 +139 21,5 1,15 0,0 0,0 +141 20,55 -0,9 +142 21,6 3 0,1 0,1 +146 21,4 -0,1 +
page C-72 of C-315
* The stated uncertainty of the mean is the expanded uncertainty with a coverage factor k=2 corresponding to a confidence level of about 95% (calculation according to ISO 13528)
nitrate - 321,523,719,4
± 0,23PT 1/10 - TW A1mean [mg/l]*upper tolerance limit [mg/l]lower tolerance limit [mg/l]
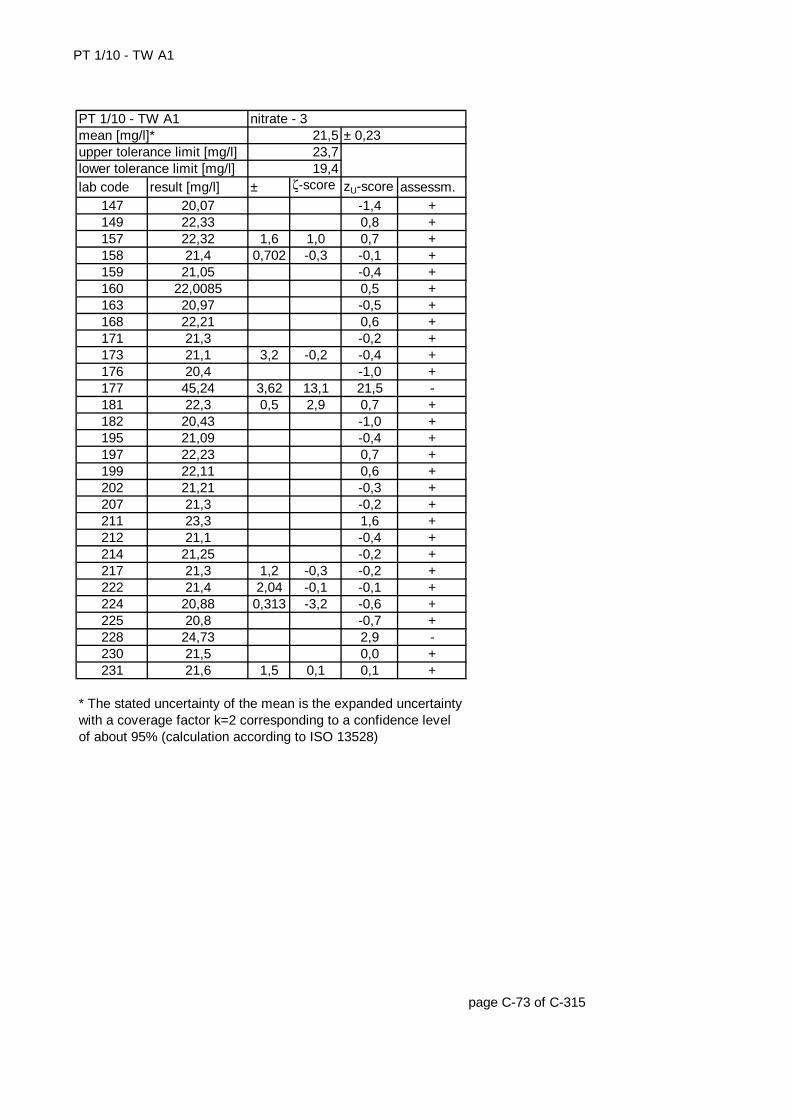
PT 1/10 - TW A1
lab code result [mg/l] ± ζ-score zU-score assessm.147 20,07 -1,4 +149 22,33 0,8 +157 22,32 1,6 1,0 0,7 +158 21,4 0,702 -0,3 -0,1 +159 21,05 -0,4 +160 22,0085 0,5 +163 20,97 -0,5 +168 22,21 0,6 +171 21,3 -0,2 +173 21,1 3,2 -0,2 -0,4 +176 20,4 -1,0 +177 45,24 3,62 13,1 21,5 -181 22,3 0,5 2,9 0,7 +182 20,43 -1,0 +195 21,09 -0,4 +197 22,23 0,7 +199 22,11 0,6 +202 21,21 -0,3 +207 21,3 -0,2 +211 23,3 1,6 +212 21,1 -0,4 +214 21,25 -0,2 +217 21,3 1,2 -0,3 -0,2 +222 21,4 2,04 -0,1 -0,1 +224 20,88 0,313 -3,2 -0,6 +225 20,8 -0,7 +228 24,73 2,9 -230 21,5 0,0 +231 21,6 1,5 0,1 0,1 +
page C-73 of C-315
* The stated uncertainty of the mean is the expanded uncertainty with a coverage factor k=2 corresponding to a confidence level of about 95% (calculation according to ISO 13528)
upper tolerance limit [mg/l] 23,7lower tolerance limit [mg/l] 19,4
PT 1/10 - TW A1 nitrate - 3mean [mg/l]* 21,5 ± 0,23
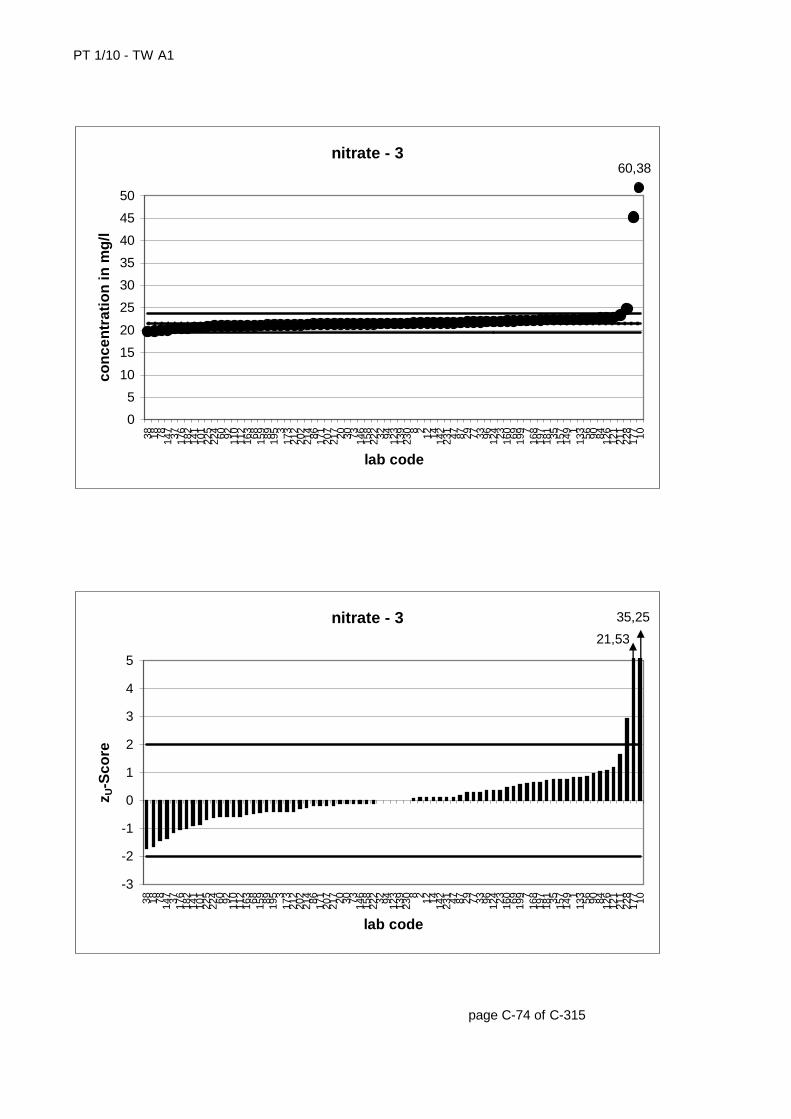
PT 1/10 - TW A1
page C-74 of C-315
nitrate - 3
0
5
10
15
20
25
30
35
40
45
50
38 18 78 147 37 176
182
141
101
225
224 60 92 110
112
163 68 159 89 195 3
173
212
202
214 86 171
207
217 20 30 73 146
158
222 32 94 123
139
230 8 2 12 14 142
231 47 87 29 77 33 96 124 23 160 69 199 7
168
197
181 35 157
149 1
133 56 90 84 126
121
211
228
177 10
lab code
con
cen
trat
ion
in m
g/l
60,38
nitrate - 3
-3
-2
-1
0
1
2
3
4
5
38 18 78 147 37 176
182
141
101
225
224 60 92 110
112
163 68 159 89 195 3
173
212
202
214 86 171
207
217 20 30 73 146
158
222 32 94 123
139
230 8 2 12 14 142
231 47 87 29 77 33 96 124 23 160 69 199 7
168
197
181 35 157
149 1
133 56 90 84 126
121
211
228
177 10
lab code
z U-S
core
21,53
35,25
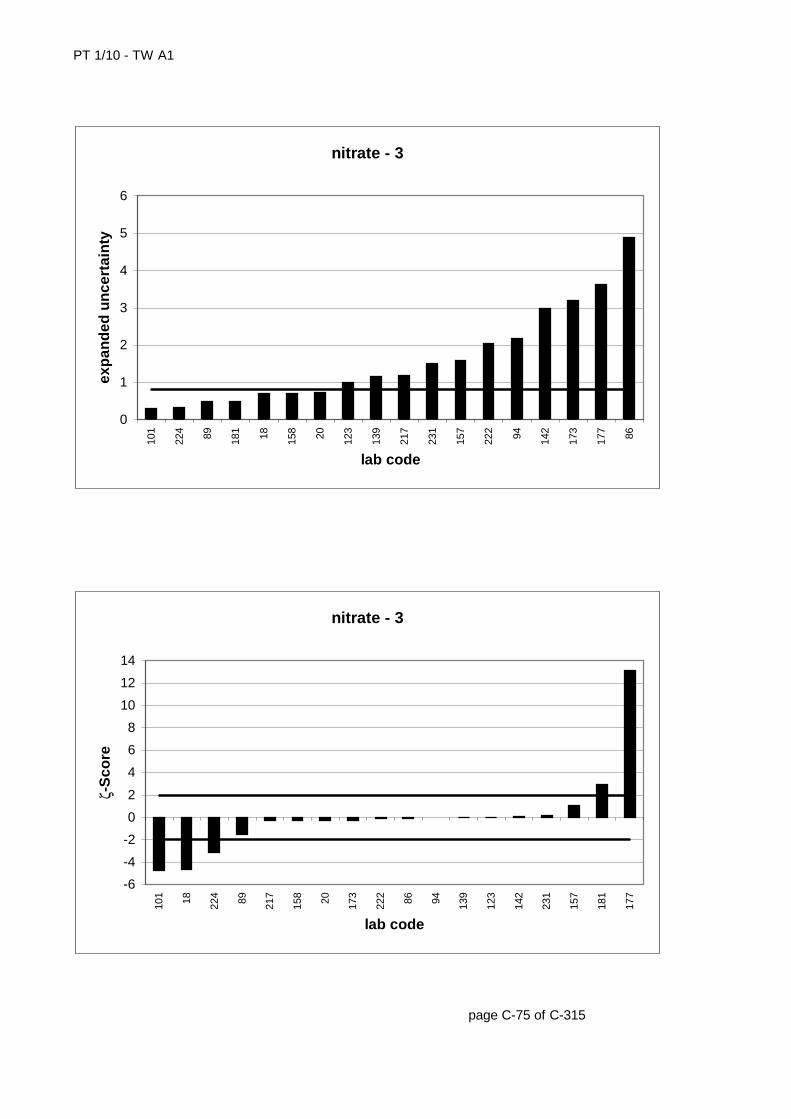
PT 1/10 - TW A1
page C-75 of C-315
nitrate - 3
0
1
2
3
4
5
6
101
224 89 181 18 158 20 123
139
217
231
157
222 94 142
173
177 86
lab code
exp
and
ed u
nce
rtai
nty
nitrate - 3
-6
-4
-2
0
2
4
6
8
10
12
14
101 18 224 89 217
158 20 173
222 86 94 139
123
142
231
157
181
177
lab code
ζ-S
core

PT 1/10 - TW A1
lab code result [mg/l] ± ζ-score zU-score assessm.1 34,8 2,9 -4 30,5 6 0,1 0,1 +5 29,9 -0,3 +7 32,48 1,4 +
13 30,4 0,0 +15 30,57 1,14 0,4 0,1 +16 30,5 0,1 +18 26,36 0,484 -13,0 -2,7 -20 29,9 1,02 -0,8 -0,3 +25 29,598 3,34 -0,4 -0,5 +31 30,1 4,1 -0,1 -0,2 +35 33,4 2,0 +36 29 -0,9 +37 29,2 -0,8 +38 28,95 -0,9 +39 30,4 1,22 0,1 0,0 +41 27,4 -2,0 +48 31,9 3,2 1,0 1,0 +50 26,6 -2,5 -57 30,08 -0,2 +64 31 0,4 +67 30,44 0,1 +68 30,9 0,4 +75 29,9 -0,3 +80 31,53 3 0,8 0,8 +81 29,63 -0,5 +84 31,42 0,7 +87 30,8 0,3 +89 29,27 0,67 -2,8 -0,7 +90 31,62 0,8 +91 30,6 0,2 +94 29,2 2,98 -0,8 -0,8 +95 31 3,1 0,4 0,4 +99 29,94 -0,3 +100 31,05 0,5 +106 32,61 1,5 +107 30,55 2,14 0,2 0,1 +110 30 -0,2 +116 29,02 -0,9 +131 31,78 0,9 +141 29,53 -0,5 +142 28,9 4,9 -0,6 -1,0 +145 31,5 0,7 +150 30,6 0,2 +151 29,1 2,1 -1,2 -0,8 +152 30,1 2,11 -0,2 -0,2 +
page C-76 of C-315
* The stated uncertainty of the mean is the expanded uncertainty with a coverage factor k=2 corresponding to a confidence level of about 95% (calculation according to ISO 13528)
nitrate - 430,3433,4627,38
± 0,38PT 1/10 - TW A1mean [mg/l]*upper tolerance limit [mg/l]lower tolerance limit [mg/l]

PT 1/10 - TW A1
lab code result [mg/l] ± ζ-score zU-score assessm.153 28,5 -1,2 +161 29,58 -0,5 +165 29,67 0,427 -2,4 -0,5 +169 28,2 -1,4 +173 30 4,5 -0,2 -0,2 +179 29,7978 -0,4 +181 32,1 0,58 5,1 1,1 +183 30,52 0,1 +187 30,8 0,3 +188 30,78 1,23 0,7 0,3 +191 31,01 0,4 +192 32,419 1,3 +193 29,3 -0,7 +197 32,1 1,1 +199 31,09 0,5 +202 30,82 0,3 +203 31,6 5 0,5 0,8 +207 30,1 -0,2 +212 30,6 0,2 +213 30,6 0,2 +214 30,26 -0,1 +215 27,42 -2,0 +219 29,7 0,05 -3,4 -0,4 +223 30,33 0,1 -0,1 0,0 +225 29,9 -0,3 +228 33,49 2,0 +232 29,6 -0,5 +
page C-77 of C-315
* The stated uncertainty of the mean is the expanded uncertainty with a coverage factor k=2 corresponding to a confidence level of about 95% (calculation according to ISO 13528)
upper tolerance limit [mg/l] 33,46lower tolerance limit [mg/l] 27,38
PT 1/10 - TW A1 nitrate - 4mean [mg/l]* 30,34 ± 0,38
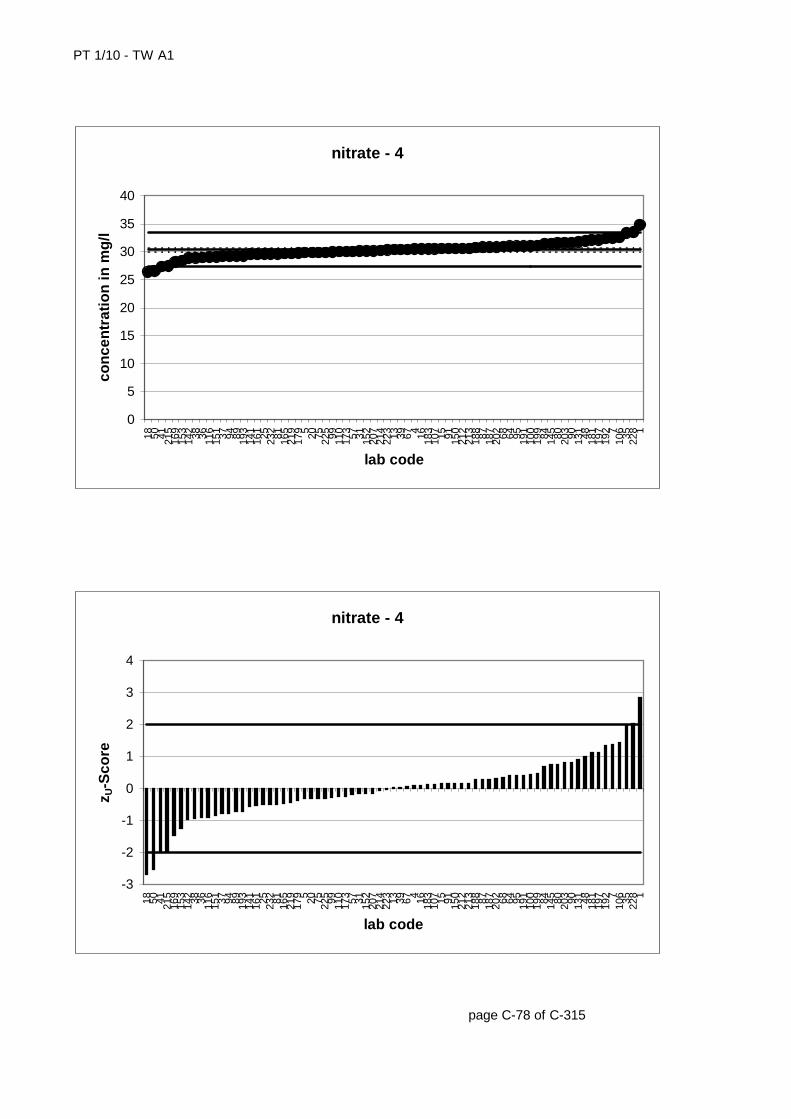
PT 1/10 - TW A1
page C-78 of C-315
nitrate - 4
0
5
10
15
20
25
30
35
40
18 50 41 215
169
153
142 38 36 116
151 37 94 89 193
141
161 25 232 81 165
219
179 5 20 75 225 99 110
173 57 31 152
207
214
223 13 39 67 4 16 183
107 15 91 150
212
213
188 87 187
202 68 64 95 191
100
199 84 145 80 203 90 131 48 181
197
192 7
106 35 228 1
lab code
con
cen
trat
ion
in m
g/l
nitrate - 4
-3
-2
-1
0
1
2
3
4
18 50 41 215
169
153
142 38 36 116
151 37 94 89 193
141
161 25 232 81 165
219
179 5 20 75 225 99 110
173 57 31 152
207
214
223 13 39 67 4 16 183
107 15 91 150
212
213
188 87 187
202 68 64 95 191
100
199 84 145 80 203 90 131 48 181
197
192 7
106 35 228 1
lab code
z U-S
core

PT 1/10 - TW A1
page C-79 of C-315
nitrate - 4
0
1
2
3
4
5
6
7
219
223
165 18 181 89 20 15 39 188
151
152
107 94 80 95 48 25 31 173
142
203 4
lab code
exp
and
ed u
nce
rtai
nty
nitrate - 4
-6
-4
-2
0
2
4
6
18 219 89 165
151 20 94 142 25 152
173 31 223 4 39 107 15 95 203
188 80 48 181
lab code
ζ-S
core
-12,96

PT 1/10 - TW A1
lab code result [mg/l] ± ζ-score zU-score assessm.2 45,1 1,1 +3 42,9 0,1 +5 42,4 -0,2 +
10 40,29 -1,2 +20 42 1,44 -1,0 -0,4 +21 43,24 0,2 +23 42,84 0,0 +24 47,2 2,0 +26 42,87 2,48 0,1 0,0 +28 42,755 0,0 +32 46,7 1,8 +36 41 -0,8 +37 42,1 -0,3 +40 42,76 1,45 0,0 0,0 +41 35,5 -3,5 -43 42,407 2,9 -0,2 -0,2 +45 42,53 -0,1 +47 43,34 0,3 +49 42,62 -0,1 +58 44,28 2 1,5 0,7 +59 43,1 0,2 +62 45,206 1,1 +63 41,2 4,1 -0,8 -0,7 +64 43,33 0,3 +69 43,91 0,5 +71 40,4 -1,1 +72 42,4 2 -0,4 -0,2 +77 44,4 0,7 +78 40,3 -1,2 +80 45,3 4 1,3 1,2 +86 43,8 10,1 0,2 0,5 +87 43,2 0,2 +88 40,85 -0,9 +98 44 0,6 +100 42,6 -0,1 +102 43,22 0,2 +103 43,1 1,7 0,4 0,2 +105 40,7 -1,0 +111 41,74 -0,5 +113 40,92 -0,9 +117 41,4 -0,7 +118 44,803 0,9 +120 41,56 -0,6 +122 44,3 0,7 +123 45,2 1 4,3 1,1 +128 44,4 2,2 1,4 0,7 +
page C-80 of C-315
* The stated uncertainty of the mean is the expanded uncertainty with a coverage factor k=2 corresponding to a confidence level of about 95% (calculation according to ISO 13528)
nitrate - 542,7647,1538,59
± 0,52PT 1/10 - TW A1mean [mg/l]*upper tolerance limit [mg/l]lower tolerance limit [mg/l]

PT 1/10 - TW A1
lab code result [mg/l] ± ζ-score zU-score assessm.132 43 0,1 +135 42,878 0,1 +138 39,3 -1,7 +139 43,2 2,31 0,4 0,2 +146 42,4 -0,2 +149 44,05 0,6 +155 44,12 0,6 +160 43,9323 0,5 +163 44,47 0,8 +164 42,26 2,11 -0,5 -0,2 +165 41,44 0,427 -4,0 -0,6 +175 43,5 1 1,3 0,3 +176 40,1 -1,3 +186 39,8 -1,4 +189 42,16 -0,3 +193 41,3 -0,7 +195 46 1,5 +201 43,36 0,3 +202 36,78 -2,9 -204 43,7 0,4 +206 41,2 1,9 -1,6 -0,7 +211 41,8 -0,5 +214 43,37 0,3 +232 40,2 -1,2 +234 43,38 0,3 +235 42,84 0,0 +
page C-81 of C-315
* The stated uncertainty of the mean is the expanded uncertainty with a coverage factor k=2 corresponding to a confidence level of about 95% (calculation according to ISO 13528)
upper tolerance limit [mg/l] 47,15lower tolerance limit [mg/l] 38,59
PT 1/10 - TW A1 nitrate - 5mean [mg/l]* 42,76 ± 0,52
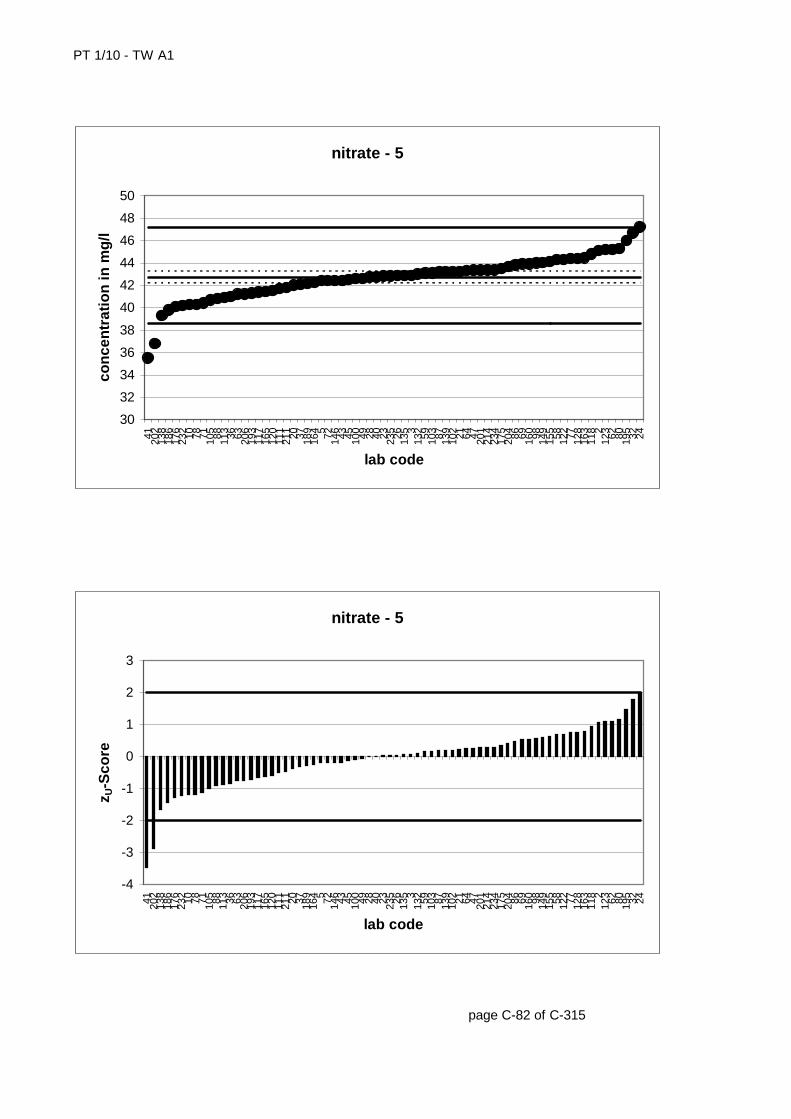
PT 1/10 - TW A1
page C-82 of C-315
nitrate - 5
30
32
34
36
38
40
42
44
46
48
50
41 202
138
186
176
232 10 78 71 105 88 113 36 63 206
193
117
165
120
111
211 20 37 189
164 5 72 146 43 45 100 49 28 40 23 235 26 135 3
132 59 103 87 139
102 21 64 47 201
214
234
175
204 86 69 160 98 149
155 58 122 77 128
163
118 2
123 62 80 195 32 24
lab code
con
cen
trat
ion
in m
g/l
nitrate - 5
-4
-3
-2
-1
0
1
2
3
41 202
138
186
176
232 10 78 71 105 88 113 36 63 206
193
117
165
120
111
211 20 37 189
164 5 72 146 43 45 100 49 28 40 23 235 26 135 3
132 59 103 87 139
102 21 64 47 201
214
234
175
204 86 69 160 98 149
155 58 122 77 128
163
118 2
123 62 80 195 32 24
lab code
z U-S
core
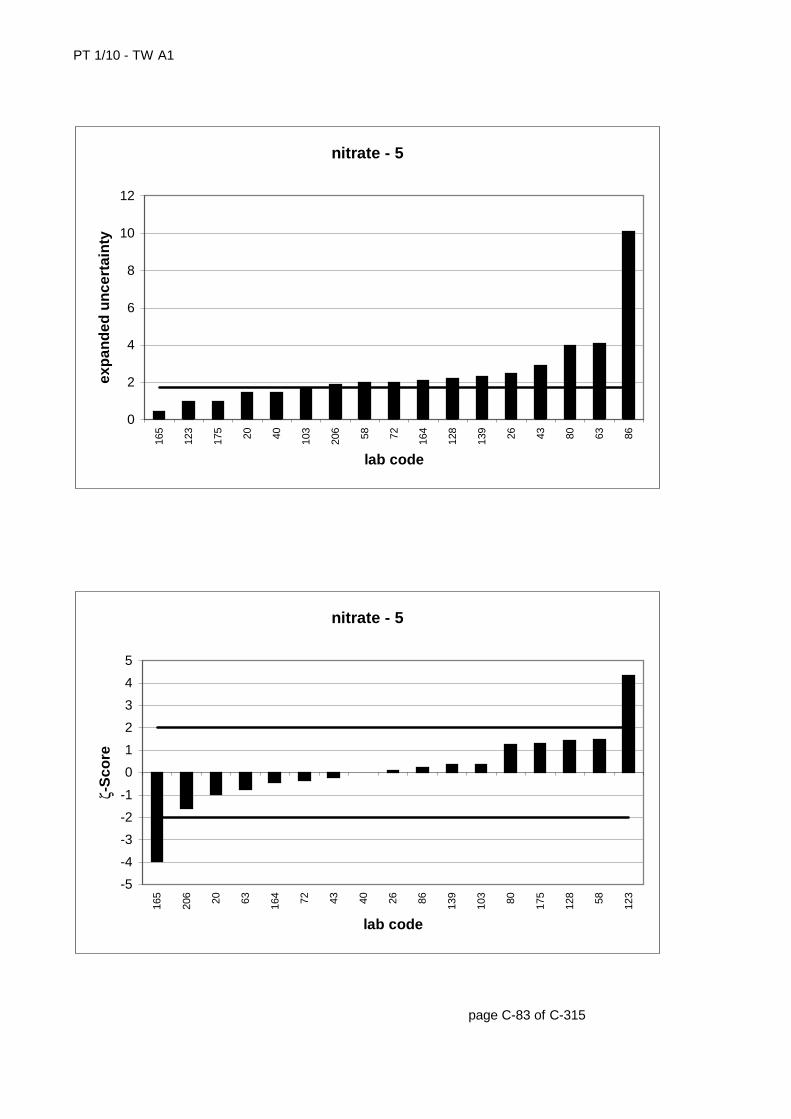
PT 1/10 - TW A1
page C-83 of C-315
nitrate - 5
0
2
4
6
8
10
12
165
123
175 20 40 103
206 58 72 164
128
139 26 43 80 63 86
lab code
exp
and
ed u
nce
rtai
nty
nitrate - 5
-5
-4
-3
-2
-1
0
1
2
3
4
5
165
206 20 63 164 72 43 40 26 86 139
103 80 175
128 58 123
lab code
ζ-S
core
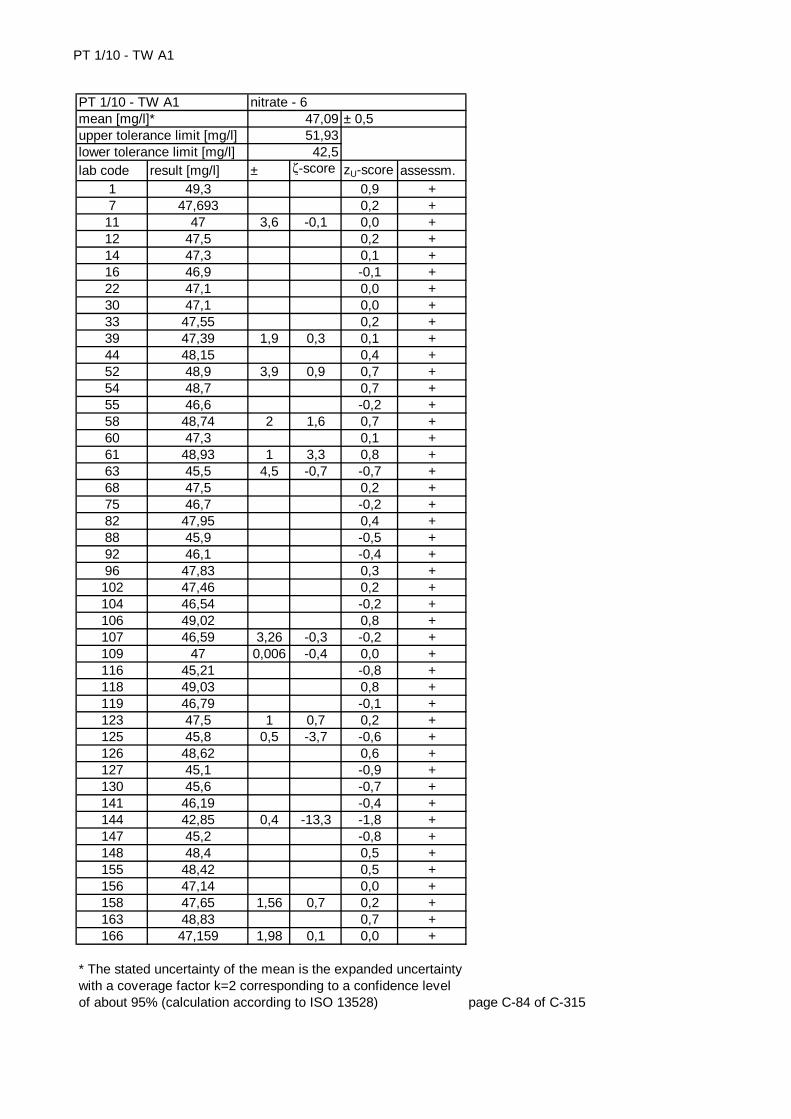
PT 1/10 - TW A1
lab code result [mg/l] ± ζ-score zU-score assessm.1 49,3 0,9 +7 47,693 0,2 +
11 47 3,6 -0,1 0,0 +12 47,5 0,2 +14 47,3 0,1 +16 46,9 -0,1 +22 47,1 0,0 +30 47,1 0,0 +33 47,55 0,2 +39 47,39 1,9 0,3 0,1 +44 48,15 0,4 +52 48,9 3,9 0,9 0,7 +54 48,7 0,7 +55 46,6 -0,2 +58 48,74 2 1,6 0,7 +60 47,3 0,1 +61 48,93 1 3,3 0,8 +63 45,5 4,5 -0,7 -0,7 +68 47,5 0,2 +75 46,7 -0,2 +82 47,95 0,4 +88 45,9 -0,5 +92 46,1 -0,4 +96 47,83 0,3 +102 47,46 0,2 +104 46,54 -0,2 +106 49,02 0,8 +107 46,59 3,26 -0,3 -0,2 +109 47 0,006 -0,4 0,0 +116 45,21 -0,8 +118 49,03 0,8 +119 46,79 -0,1 +123 47,5 1 0,7 0,2 +125 45,8 0,5 -3,7 -0,6 +126 48,62 0,6 +127 45,1 -0,9 +130 45,6 -0,7 +141 46,19 -0,4 +144 42,85 0,4 -13,3 -1,8 +147 45,2 -0,8 +148 48,4 0,5 +155 48,42 0,5 +156 47,14 0,0 +158 47,65 1,56 0,7 0,2 +163 48,83 0,7 +166 47,159 1,98 0,1 0,0 +
page C-84 of C-315
* The stated uncertainty of the mean is the expanded uncertainty with a coverage factor k=2 corresponding to a confidence level of about 95% (calculation according to ISO 13528)
nitrate - 647,0951,9342,5
± 0,5PT 1/10 - TW A1mean [mg/l]*upper tolerance limit [mg/l]lower tolerance limit [mg/l]
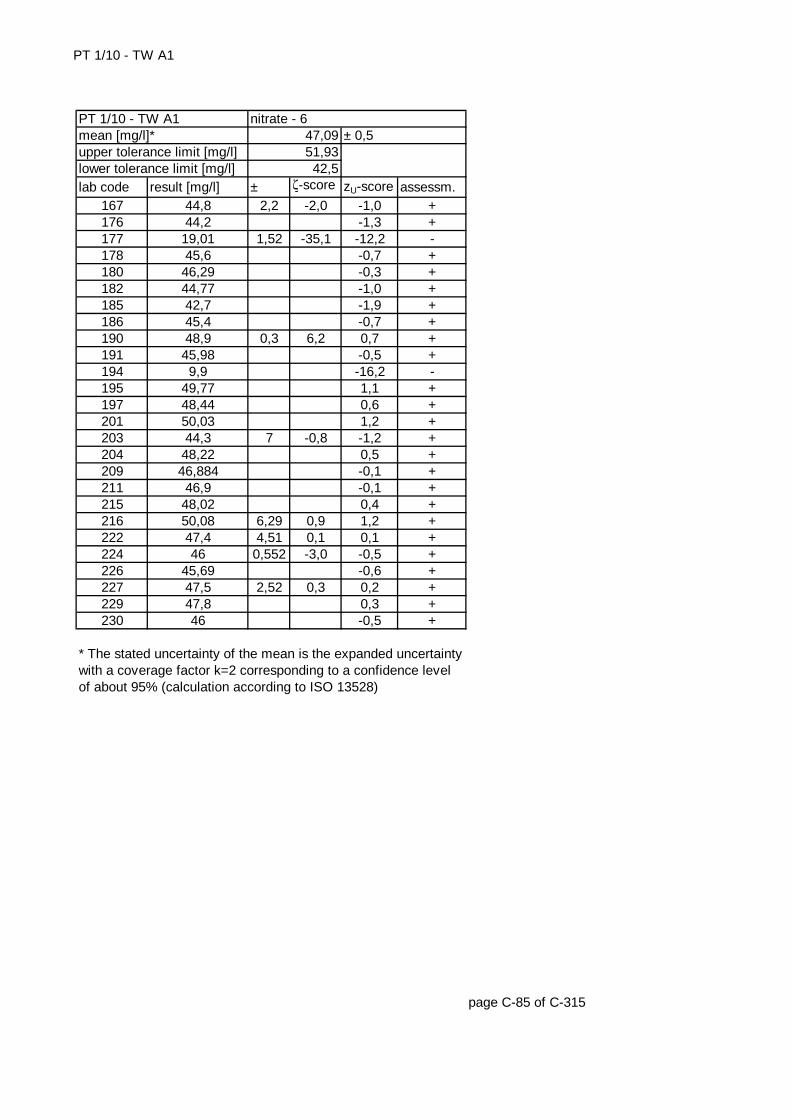
PT 1/10 - TW A1
lab code result [mg/l] ± ζ-score zU-score assessm.167 44,8 2,2 -2,0 -1,0 +176 44,2 -1,3 +177 19,01 1,52 -35,1 -12,2 -178 45,6 -0,7 +180 46,29 -0,3 +182 44,77 -1,0 +185 42,7 -1,9 +186 45,4 -0,7 +190 48,9 0,3 6,2 0,7 +191 45,98 -0,5 +194 9,9 -16,2 -195 49,77 1,1 +197 48,44 0,6 +201 50,03 1,2 +203 44,3 7 -0,8 -1,2 +204 48,22 0,5 +209 46,884 -0,1 +211 46,9 -0,1 +215 48,02 0,4 +216 50,08 6,29 0,9 1,2 +222 47,4 4,51 0,1 0,1 +224 46 0,552 -3,0 -0,5 +226 45,69 -0,6 +227 47,5 2,52 0,3 0,2 +229 47,8 0,3 +230 46 -0,5 +
page C-85 of C-315
* The stated uncertainty of the mean is the expanded uncertainty with a coverage factor k=2 corresponding to a confidence level of about 95% (calculation according to ISO 13528)
upper tolerance limit [mg/l] 51,93lower tolerance limit [mg/l] 42,5
PT 1/10 - TW A1 nitrate - 6mean [mg/l]* 47,09 ± 0,5
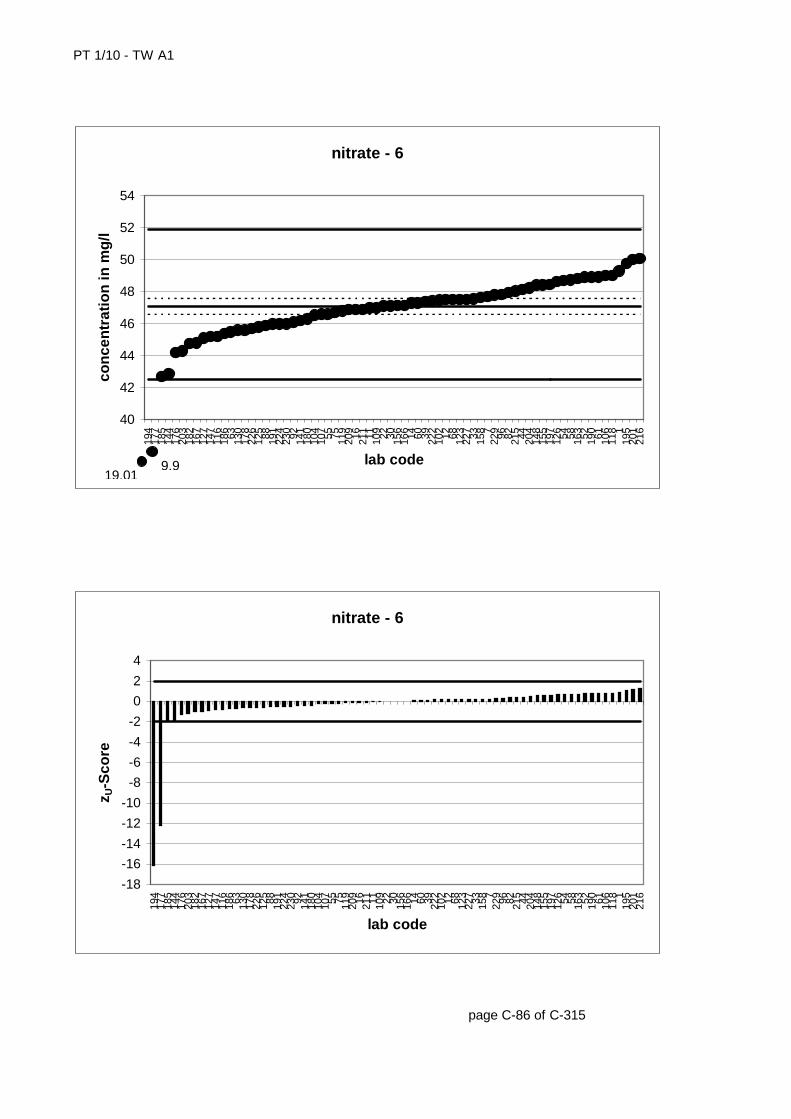
PT 1/10 - TW A1
page C-86 of C-315
nitrate - 6
40
42
44
46
48
50
52
54
194
177
185
144
176
203
182
167
127
147
116
186 63 130
178
226
125 88 191
224
230 92 141
180
104
107 55 75 119
209 16 211 11 109 22 30 156
166 14 60 39 222
102 12 68 123
227 33 158 7
229 96 82 215 44 204
148
155
197
126 54 58 163 52 190 61 106
118 1
195
201
216
lab code
con
cen
trat
ion
in m
g/l
19,019.9
nitrate - 6
-18
-16
-14
-12
-10
-8
-6
-4
-2
0
2
4
194
177
185
144
176
203
182
167
127
147
116
186 63 130
178
226
125 88 191
224
230 92 141
180
104
107 55 75 119
209 16 211 11 109 22 30 156
166 14 60 39 222
102 12 68 123
227 33 158 7
229 96 82 215 44 204
148
155
197
126 54 58 163 52 190 61 106
118 1
195
201
216
lab code
z U-S
core
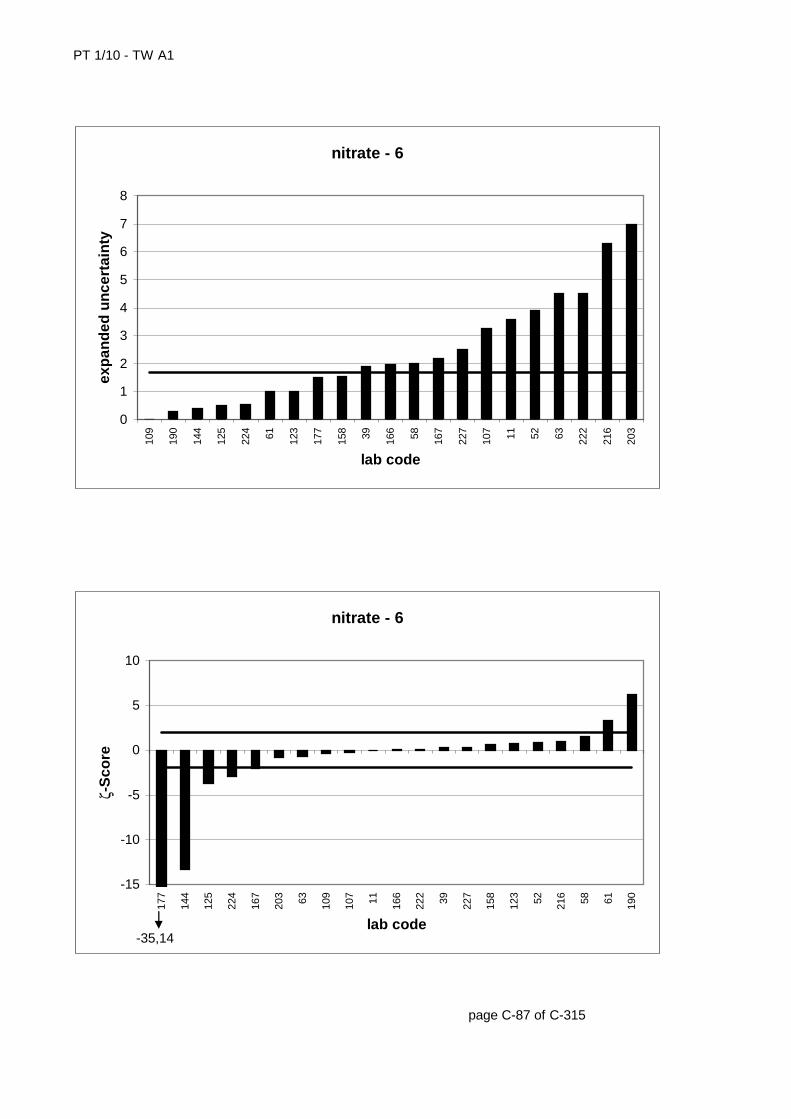
PT 1/10 - TW A1
page C-87 of C-315
nitrate - 6
0
1
2
3
4
5
6
7
8
109
190
144
125
224 61 123
177
158 39 166 58 167
227
107 11 52 63 222
216
203
lab code
exp
and
ed u
nce
rtai
nty
nitrate - 6
-15
-10
-5
0
5
10
177
144
125
224
167
203 63 109
107 11 166
222 39 227
158
123 52 216 58 61 190
lab code
ζ-S
core
-35,14

PT 1/10 - TW A1
lab code result [mg/l] ± ζ-score zU-score assessm.3 51,8 -0,1 +8 52 0,0 +9 51,2 2,6 -0,6 -0,3 +
17 53,2 0,4 +19 55,4 1,3 +23 51,64 -0,1 +24 57,35 2,0 +25 50,769 5,74 -0,4 -0,5 +27 58,61 2,5 -28 50,794 -0,5 +29 52,3 0,1 +30 52,1 0,0 +33 51,78 -0,1 +35 55,45 1,3 +40 53,31 1,81 1,4 0,5 +42 53,81 2,55 1,4 0,7 +44 52,62 0,2 +45 50,88 -0,4 +47 52,36 0,1 +48 52,6 5,3 0,2 0,2 +51 52,3 0,1 +54 53,6 0,6 +57 51,43 -0,2 +62 56,171 1,6 +65 49,2 -1,1 +71 47,7 -1,7 +82 53,4 0,5 +83 50,73 -0,5 +85 51,6 -0,2 +91 52,5 0,2 +93 59,99 3,0 -96 52,4 0,1 +109 51,5 0,006 -2,0 -0,2 +111 51,34 -0,3 +112 51,3 -0,3 +121 54,92 1,1 +125 49,6 0,5 -6,8 -0,9 +128 52,4 2,6 0,3 0,1 +133 53,1 0,4 +134 51,5 -0,2 +136 51,3 -0,3 +145 53,13 0,4 +151 50,4 3,5 -0,9 -0,6 +156 52,44 0,2 +157 50,24 3,5 -1,0 -0,7 +159 50,34 -0,7 +
page C-88 of C-315
* The stated uncertainty of the mean is the expanded uncertainty with a coverage factor k=2 corresponding to a confidence level of about 95% (calculation according to ISO 13528)
nitrate - 752
57,3446,93
± 0,49PT 1/10 - TW A1mean [mg/l]*upper tolerance limit [mg/l]lower tolerance limit [mg/l]

PT 1/10 - TW A1
lab code result [mg/l] ± ζ-score zU-score assessm.160 54,3517 0,9 +161 51,57 -0,2 +166 52,129 2,19 0,1 0,0 +168 53,86 0,7 +169 49,6 -0,9 +170 51,32 1,03 -1,2 -0,3 +171 51,5 -0,2 +173 52 7,8 0,0 0,0 +177 50,21 4,02 -0,9 -0,7 +178 50,8 -0,5 +181 54,7 1,1 4,5 1,0 +185 44,5 -3,0 -189 50,87 -0,4 +192 55,491 1,3 +198 54,3 0,9 +200 51,6 1 -0,7 -0,2 +205 51,9 0,0 +206 49,8 2,3 -1,9 -0,9 +212 50,9 -0,4 +217 52 2 0,0 0,0 +219 50,9 0,05 -4,5 -0,4 +221 52,41 0,2 +224 50,23 1,4 -2,4 -0,7 +228 52,55 0,2 +229 52,1 0,0 +237 50,5 -0,6 +
page C-89 of C-315
* The stated uncertainty of the mean is the expanded uncertainty with a coverage factor k=2 corresponding to a confidence level of about 95% (calculation according to ISO 13528)
upper tolerance limit [mg/l] 57,34lower tolerance limit [mg/l] 46,93
PT 1/10 - TW A1 nitrate - 7mean [mg/l]* 52 ± 0,49
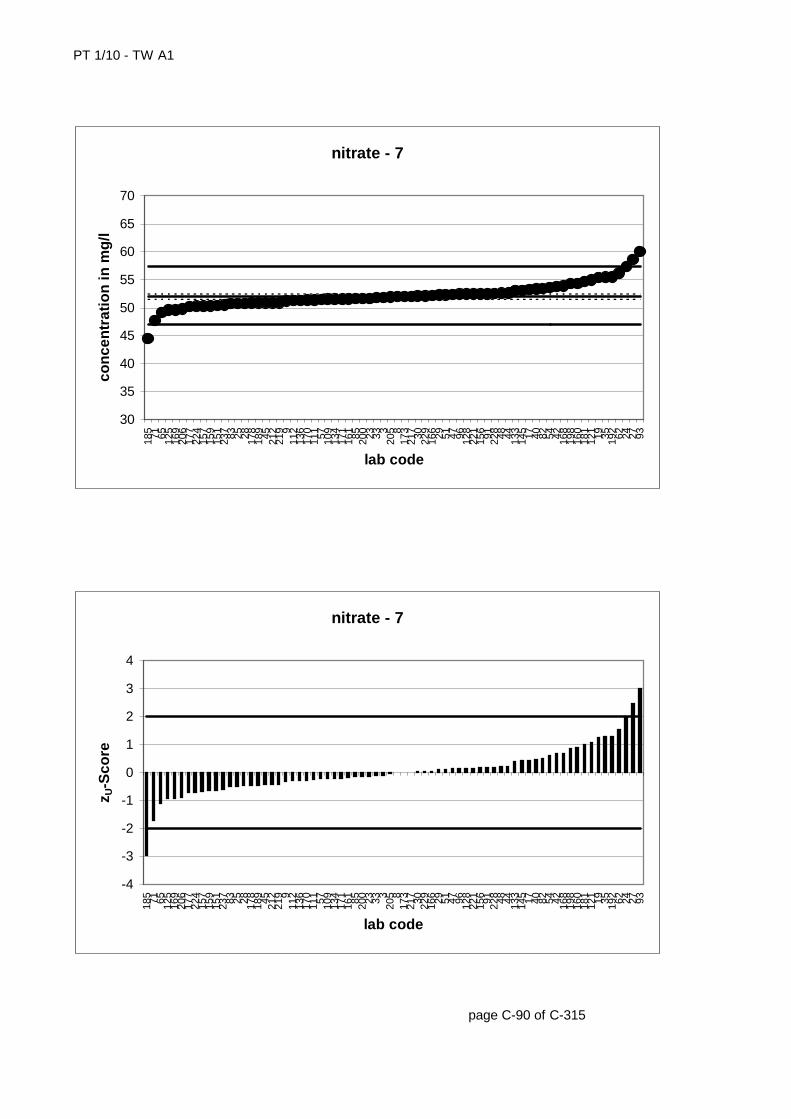
PT 1/10 - TW A1
page C-90 of C-315
nitrate - 7
30
35
40
45
50
55
60
65
70
185 71 65 125
169
206
177
224
157
159
151
237 83 25 28 178
189 45 212
219 9
112
136
170
111 57 109
134
171
161 85 200 23 33 3
205 8
173
217 30 229
166 29 51 47 96 128
221
156 91 228 48 44 133
145 17 40 82 54 42 168
198
160
181
121 19 35 192 62 24 27 93
lab code
con
cen
trat
ion
in m
g/l
nitrate - 7
-4
-3
-2
-1
0
1
2
3
4
185 71 65 125
169
206
177
224
157
159
151
237 83 25 28 178
189 45 212
219 9
112
136
170
111 57 109
134
171
161 85 200 23 33 3
205 8
173
217 30 229
166 29 51 47 96 128
221
156 91 228 48 44 133
145 17 40 82 54 42 168
198
160
181
121 19 35 192 62 24 27 93
lab code
z U-S
core

PT 1/10 - TW A1
page C-91 of C-315
nitrate - 7
0
1
2
3
4
5
6
7
8
9
109
219
125
200
170
181
224 40 217
166
206 42 9
128
151
157
177 48 25 173
lab code
exp
and
ed u
nce
rtai
nty
nitrate - 7
-8
-6
-4
-2
0
2
4
6
125
219
224
109
206
170
157
151
177
200 9 25 217
173
166 48 128 42 40 181
lab code
ζ-S
core
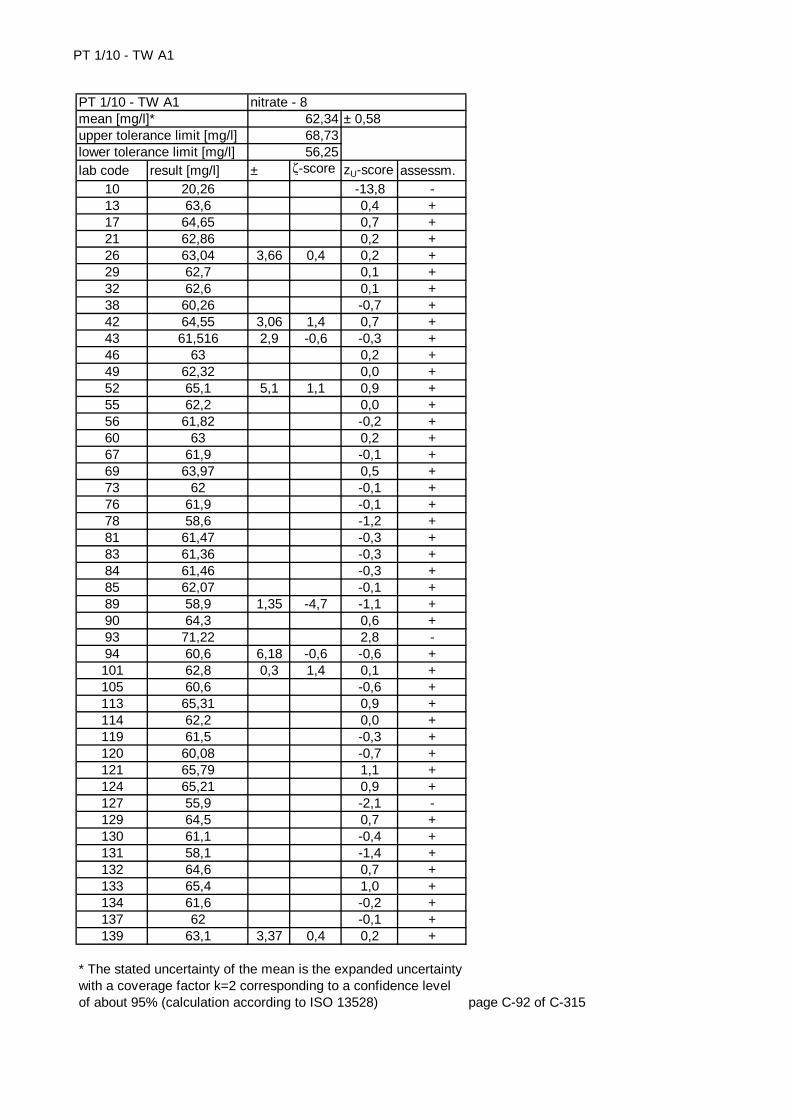
PT 1/10 - TW A1
lab code result [mg/l] ± ζ-score zU-score assessm.10 20,26 -13,8 -13 63,6 0,4 +17 64,65 0,7 +21 62,86 0,2 +26 63,04 3,66 0,4 0,2 +29 62,7 0,1 +32 62,6 0,1 +38 60,26 -0,7 +42 64,55 3,06 1,4 0,7 +43 61,516 2,9 -0,6 -0,3 +46 63 0,2 +49 62,32 0,0 +52 65,1 5,1 1,1 0,9 +55 62,2 0,0 +56 61,82 -0,2 +60 63 0,2 +67 61,9 -0,1 +69 63,97 0,5 +73 62 -0,1 +76 61,9 -0,1 +78 58,6 -1,2 +81 61,47 -0,3 +83 61,36 -0,3 +84 61,46 -0,3 +85 62,07 -0,1 +89 58,9 1,35 -4,7 -1,1 +90 64,3 0,6 +93 71,22 2,8 -94 60,6 6,18 -0,6 -0,6 +101 62,8 0,3 1,4 0,1 +105 60,6 -0,6 +113 65,31 0,9 +114 62,2 0,0 +119 61,5 -0,3 +120 60,08 -0,7 +121 65,79 1,1 +124 65,21 0,9 +127 55,9 -2,1 -129 64,5 0,7 +130 61,1 -0,4 +131 58,1 -1,4 +132 64,6 0,7 +133 65,4 1,0 +134 61,6 -0,2 +137 62 -0,1 +139 63,1 3,37 0,4 0,2 +
page C-92 of C-315
* The stated uncertainty of the mean is the expanded uncertainty with a coverage factor k=2 corresponding to a confidence level of about 95% (calculation according to ISO 13528)
nitrate - 862,3468,7356,25
± 0,58PT 1/10 - TW A1mean [mg/l]*upper tolerance limit [mg/l]lower tolerance limit [mg/l]
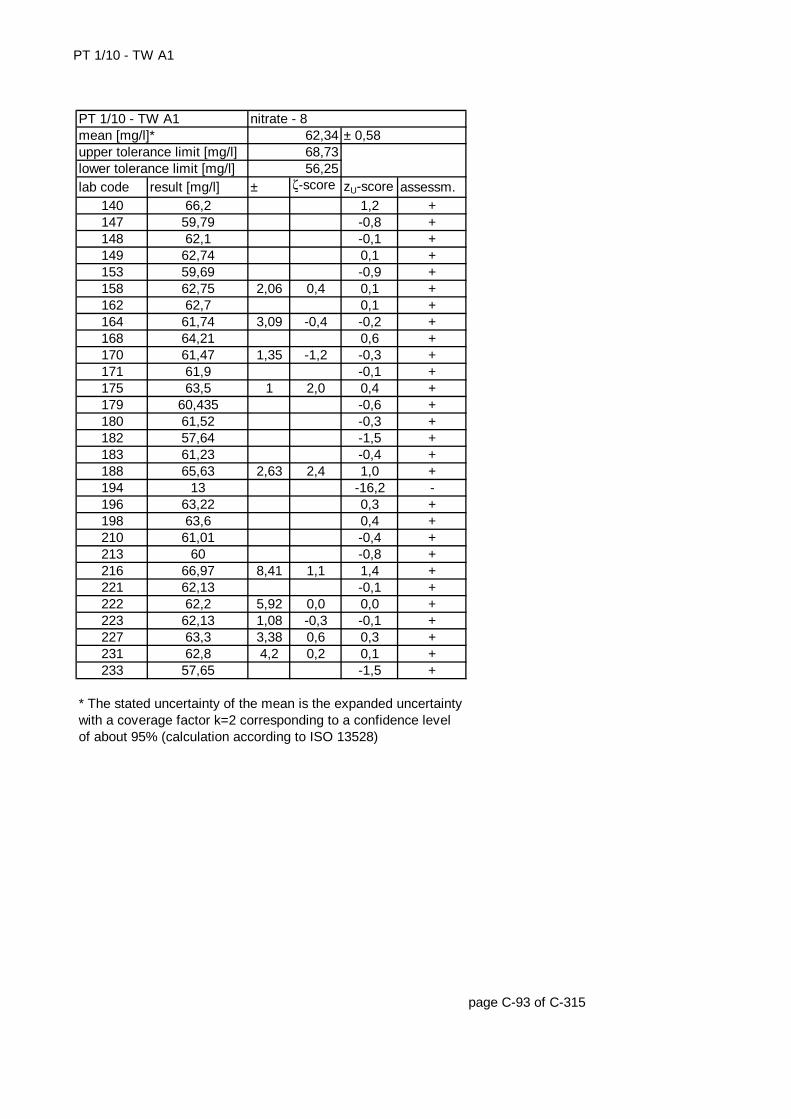
PT 1/10 - TW A1
lab code result [mg/l] ± ζ-score zU-score assessm.140 66,2 1,2 +147 59,79 -0,8 +148 62,1 -0,1 +149 62,74 0,1 +153 59,69 -0,9 +158 62,75 2,06 0,4 0,1 +162 62,7 0,1 +164 61,74 3,09 -0,4 -0,2 +168 64,21 0,6 +170 61,47 1,35 -1,2 -0,3 +171 61,9 -0,1 +175 63,5 1 2,0 0,4 +179 60,435 -0,6 +180 61,52 -0,3 +182 57,64 -1,5 +183 61,23 -0,4 +188 65,63 2,63 2,4 1,0 +194 13 -16,2 -196 63,22 0,3 +198 63,6 0,4 +210 61,01 -0,4 +213 60 -0,8 +216 66,97 8,41 1,1 1,4 +221 62,13 -0,1 +222 62,2 5,92 0,0 0,0 +223 62,13 1,08 -0,3 -0,1 +227 63,3 3,38 0,6 0,3 +231 62,8 4,2 0,2 0,1 +233 57,65 -1,5 +
page C-93 of C-315
* The stated uncertainty of the mean is the expanded uncertainty with a coverage factor k=2 corresponding to a confidence level of about 95% (calculation according to ISO 13528)
upper tolerance limit [mg/l] 68,73lower tolerance limit [mg/l] 56,25
PT 1/10 - TW A1 nitrate - 8mean [mg/l]* 62,34 ± 0,58
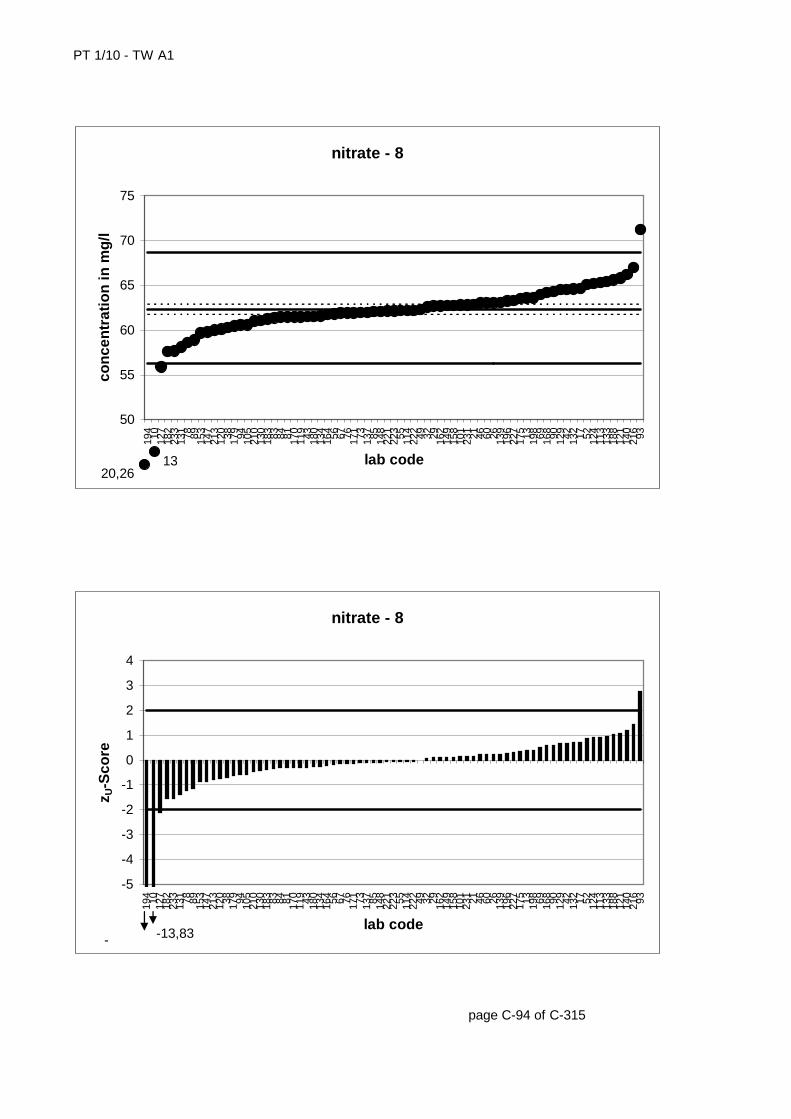
PT 1/10 - TW A1
page C-94 of C-315
nitrate - 8
50
55
60
65
70
75
194 10 127
182
233
131 78 89 153
147
213
120 38 179 94 105
210
130
183 83 84 81 170
119 43 180
134
164 56 67 76 171 73 137 85 148
221
223 55 114
222 49 32 29 162
149
158
101
231 21 46 60 26 139
196
227
175 13 198 69 168 90 129 42 132 17 52 124
113
133
188
121
140
216 93
lab code
con
cen
trat
ion
in m
g/l
20,2613
nitrate - 8
-5
-4
-3
-2
-1
0
1
2
3
4
194 10 127
182
233
131 78 89 153
147
213
120 38 179 94 105
210
130
183 83 84 81 170
119 43 180
134
164 56 67 76 171 73 137 85 148
221
223 55 114
222 49 32 29 162
149
158
101
231 21 46 60 26 139
196
227
175 13 198 69 168 90 129 42 132 17 52 124
113
133
188
121
140
216 93
lab code
z U-S
core
- -13,83
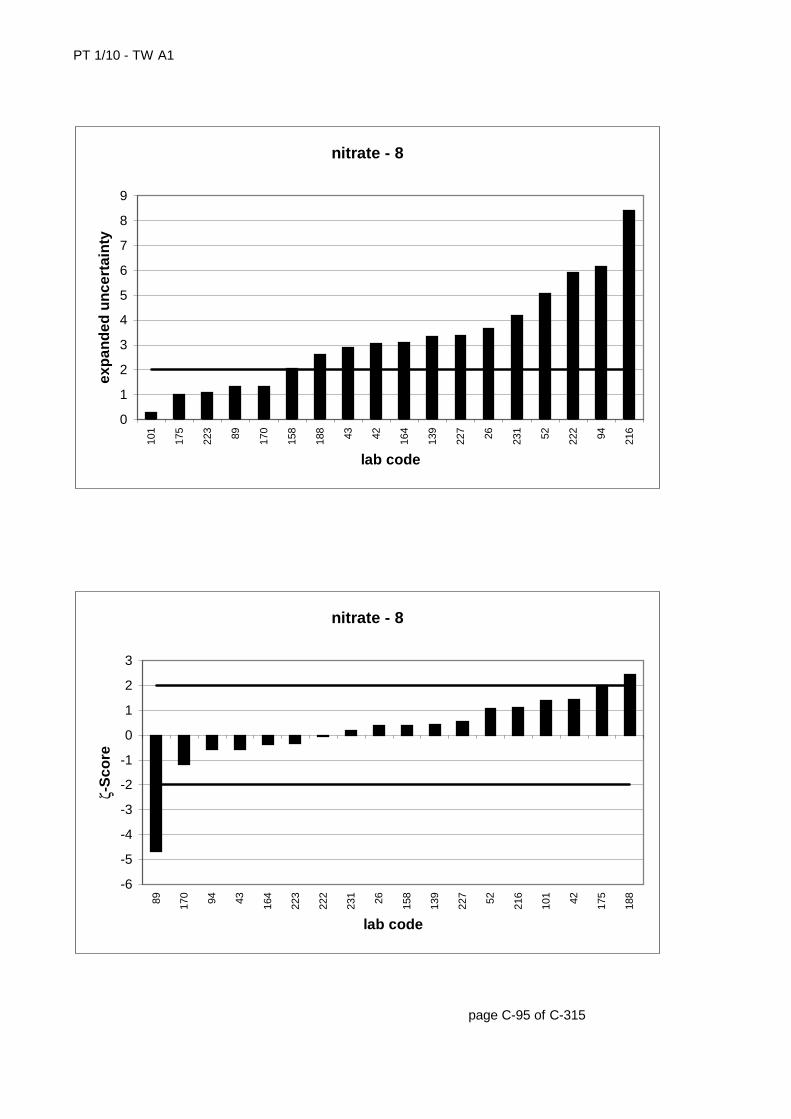
PT 1/10 - TW A1
page C-95 of C-315
nitrate - 8
0
1
2
3
4
5
6
7
8
9
101
175
223 89 170
158
188 43 42 164
139
227 26 231 52 222 94 216
lab code
exp
and
ed u
nce
rtai
nty
nitrate - 8
-6
-5
-4
-3
-2
-1
0
1
2
3
89 170 94 43 164
223
222
231 26 158
139
227 52 216
101 42 175
188
lab code
ζ-S
core

PT 1/10 - TW A1
lab code result [mg/l] ± ζ-score zU-score assessm.2 69,1 0,5 +4 68,1 12 0,1 0,3 +8 67,5 0,1 +9 64,9 3,2 -1,4 -0,7 +
11 66,3 5,1 -0,4 -0,3 +12 68,2 0,3 +14 67,6 0,1 +15 67,9 3,57 0,4 0,2 +18 55,24 8,451 -2,8 -3,7 -19 71,6 1,3 +22 67,8 0,2 +27 80,06 3,7 -31 63,9 8,8 -0,8 -1,0 +46 66,8 -0,1 +50 61,1 -1,9 +51 66,5 -0,2 +56 67,19 0,0 +59 66,9 -0,1 +61 70,17 2,5 2,3 0,9 +65 67,6 0,1 +72 68,4 3,5 0,7 0,3 +73 67,8 0,2 +76 56 -3,4 -77 68,8 0,5 +86 67,9 16 0,1 0,2 +92 66,9 -0,1 +95 65 6,5 -0,7 -0,7 +98 71,02 1,1 +99 63,29 -1,2 +101 67,5 0,3 0,7 0,1 +103 68,6 2,7 1,0 0,4 +104 66,3 -0,3 +110 65,3 -0,6 +112 63,2 -1,2 +114 66,8 -0,1 +117 65,7 -0,5 +122 69,9 0,8 +124 70,9 1,1 +126 67,86 0,2 +129 68,8 0,5 +135 67,321 0,0 +136 66,3 -0,3 +137 66,5 -0,2 +138 65,3 -0,6 +140 70,9 1,1 +142 60 4 -3,6 -2,2 -
page C-96 of C-315
* The stated uncertainty of the mean is the expanded uncertainty with a coverage factor k=2 corresponding to a confidence level of about 95% (calculation according to ISO 13528)
nitrate - 967,2274,1160,65
± 0,7PT 1/10 - TW A1mean [mg/l]*upper tolerance limit [mg/l]lower tolerance limit [mg/l]

PT 1/10 - TW A1
lab code result [mg/l] ± ζ-score zU-score assessm.144 61,89 0,4 -13,3 -1,6 +146 67,1 0,0 +150 67,8 0,2 +152 66,3 4,64 -0,4 -0,3 +157 69,51 4,9 0,9 0,7 +159 64,54 -0,8 +162 67,9 0,2 +167 66,7 3,3 -0,3 -0,2 +187 67,2 0,0 +190 72 0,3 12,6 1,4 +196 69,42 0,6 +199 69,34 0,6 +200 65,8 1 -2,3 -0,4 +205 69,13 0,6 +207 66,8 -0,1 +209 68,518 0,4 +210 65,93 -0,4 +217 68 3,5 0,4 0,2 +225 69,9 0,8 +226 65,49 -0,5 +230 64,7 -0,8 +231 67,6 4,6 0,2 0,1 +233 61,88 -1,6 +234 68,64 0,4 +235 66,08 -0,3 +237 66,1 -0,3 +
page C-97 of C-315
* The stated uncertainty of the mean is the expanded uncertainty with a coverage factor k=2 corresponding to a confidence level of about 95% (calculation according to ISO 13528)
upper tolerance limit [mg/l] 74,11lower tolerance limit [mg/l] 60,65
PT 1/10 - TW A1 nitrate - 9mean [mg/l]* 67,22 ± 0,7
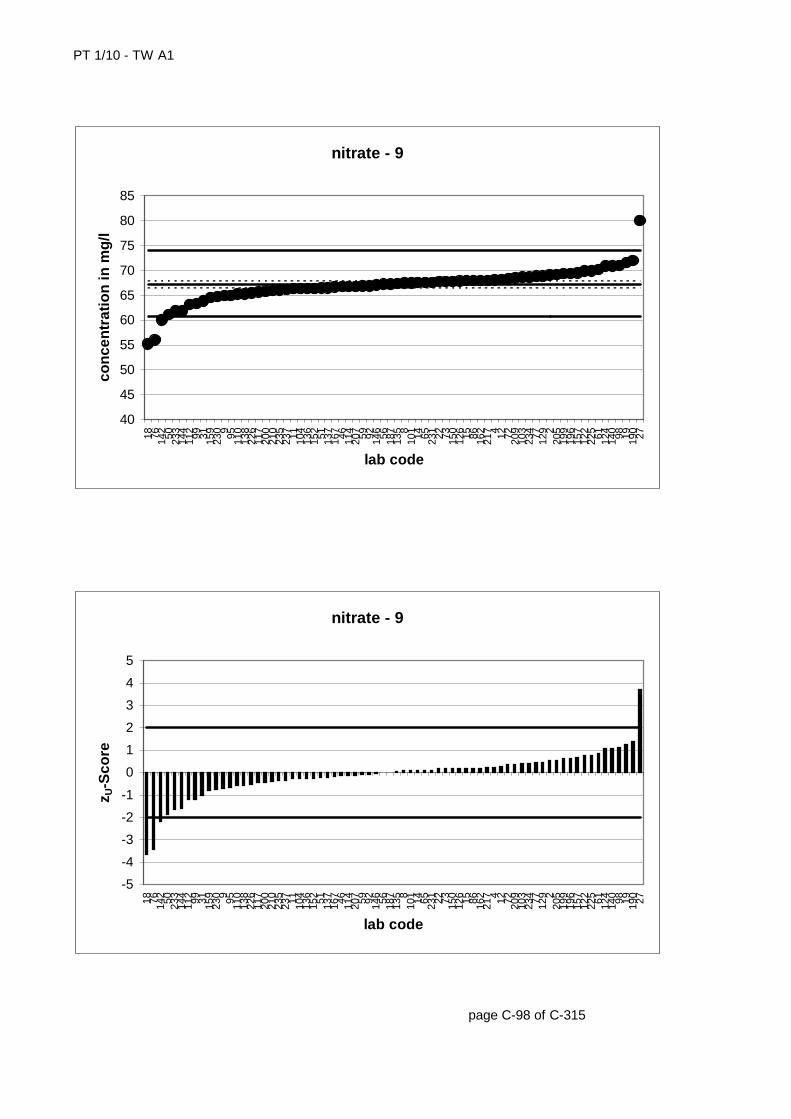
PT 1/10 - TW A1
page C-98 of C-315
nitrate - 9
40
45
50
55
60
65
70
75
80
85
18 76 142 50 233
144
112 99 31 159
230 9 95 110
138
226
117
200
210
235
237 11 104
136
152 51 137
167 46 114
207 59 92 146 56 187
135 8
101 14 65 231 22 73 150
126 15 86 162
217 4 12 72 209
103
234 77 129 2
205
199
196
157
122
225 61 124
140 98 19 190 27
lab code
con
cen
trat
ion
in m
g/l
nitrate - 9
-5
-4
-3
-2
-1
0
1
2
3
4
5
18 76 142 50 233
144
112 99 31 159
230 9 95 110
138
226
117
200
210
235
237 11 104
136
152 51 137
167 46 114
207 59 92 146 56 187
135 8
101 14 65 231 22 73 150
126 15 86 162
217 4 12 72 209
103
234 77 129 2
205
199
196
157
122
225 61 124
140 98 19 190 27
lab code
z U-S
core
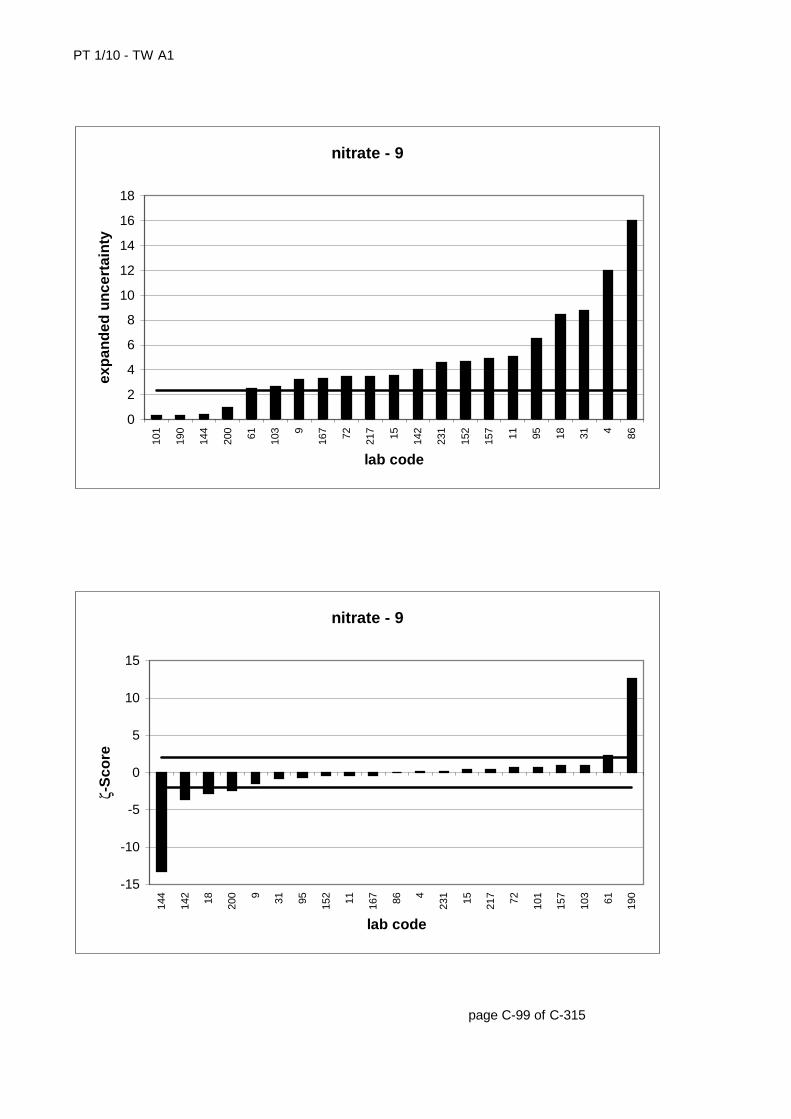
PT 1/10 - TW A1
page C-99 of C-315
nitrate - 9
0
2
4
6
8
10
12
14
16
18
101
190
144
200 61 103 9
167 72 217 15 142
231
152
157 11 95 18 31 4 86
lab code
exp
and
ed u
nce
rtai
nty
nitrate - 9
-15
-10
-5
0
5
10
15
144
142 18 200 9 31 95 152 11 167 86 4
231 15 217 72 101
157
103 61 190
lab code
ζ-S
core
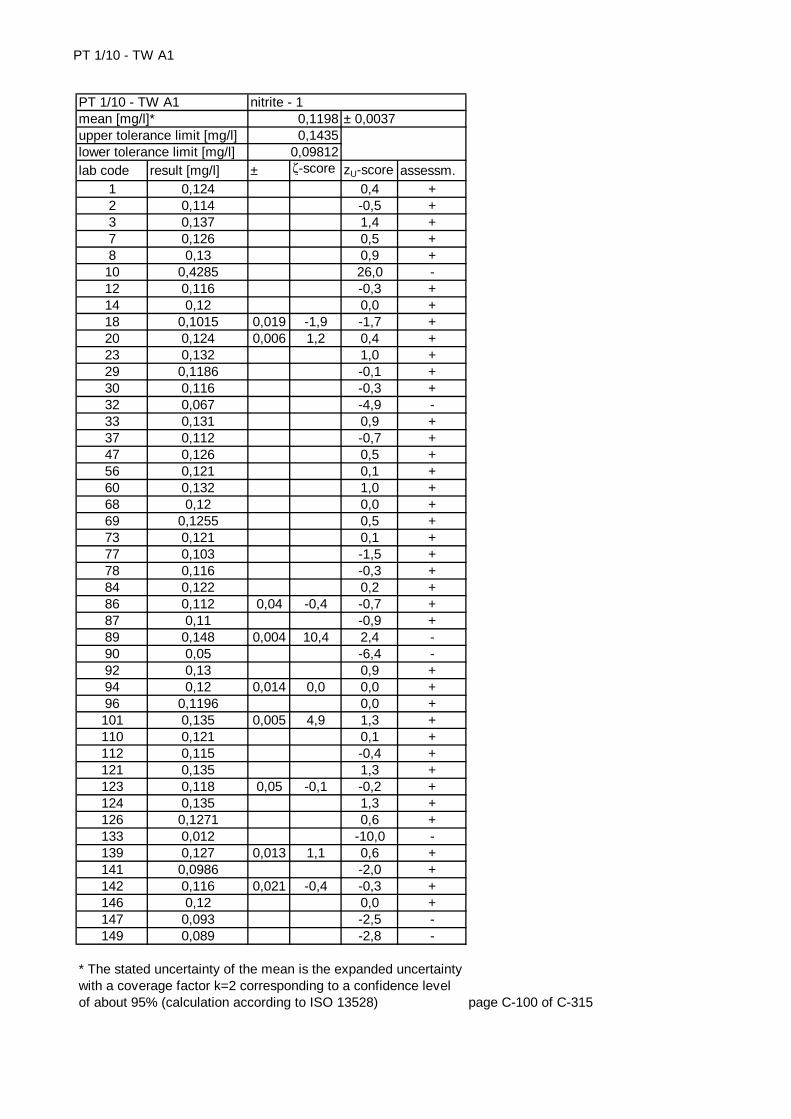
PT 1/10 - TW A1
lab code result [mg/l] ± ζ-score zU-score assessm.1 0,124 0,4 +2 0,114 -0,5 +3 0,137 1,4 +7 0,126 0,5 +8 0,13 0,9 +
10 0,4285 26,0 -12 0,116 -0,3 +14 0,12 0,0 +18 0,1015 0,019 -1,9 -1,7 +20 0,124 0,006 1,2 0,4 +23 0,132 1,0 +29 0,1186 -0,1 +30 0,116 -0,3 +32 0,067 -4,9 -33 0,131 0,9 +37 0,112 -0,7 +47 0,126 0,5 +56 0,121 0,1 +60 0,132 1,0 +68 0,12 0,0 +69 0,1255 0,5 +73 0,121 0,1 +77 0,103 -1,5 +78 0,116 -0,3 +84 0,122 0,2 +86 0,112 0,04 -0,4 -0,7 +87 0,11 -0,9 +89 0,148 0,004 10,4 2,4 -90 0,05 -6,4 -92 0,13 0,9 +94 0,12 0,014 0,0 0,0 +96 0,1196 0,0 +101 0,135 0,005 4,9 1,3 +110 0,121 0,1 +112 0,115 -0,4 +121 0,135 1,3 +123 0,118 0,05 -0,1 -0,2 +124 0,135 1,3 +126 0,1271 0,6 +133 0,012 -10,0 -139 0,127 0,013 1,1 0,6 +141 0,0986 -2,0 +142 0,116 0,021 -0,4 -0,3 +146 0,12 0,0 +147 0,093 -2,5 -149 0,089 -2,8 -
page C-100 of C-315
* The stated uncertainty of the mean is the expanded uncertainty with a coverage factor k=2 corresponding to a confidence level of about 95% (calculation according to ISO 13528)
nitrite - 10,11980,1435
0,09812
± 0,0037PT 1/10 - TW A1mean [mg/l]*upper tolerance limit [mg/l]lower tolerance limit [mg/l]
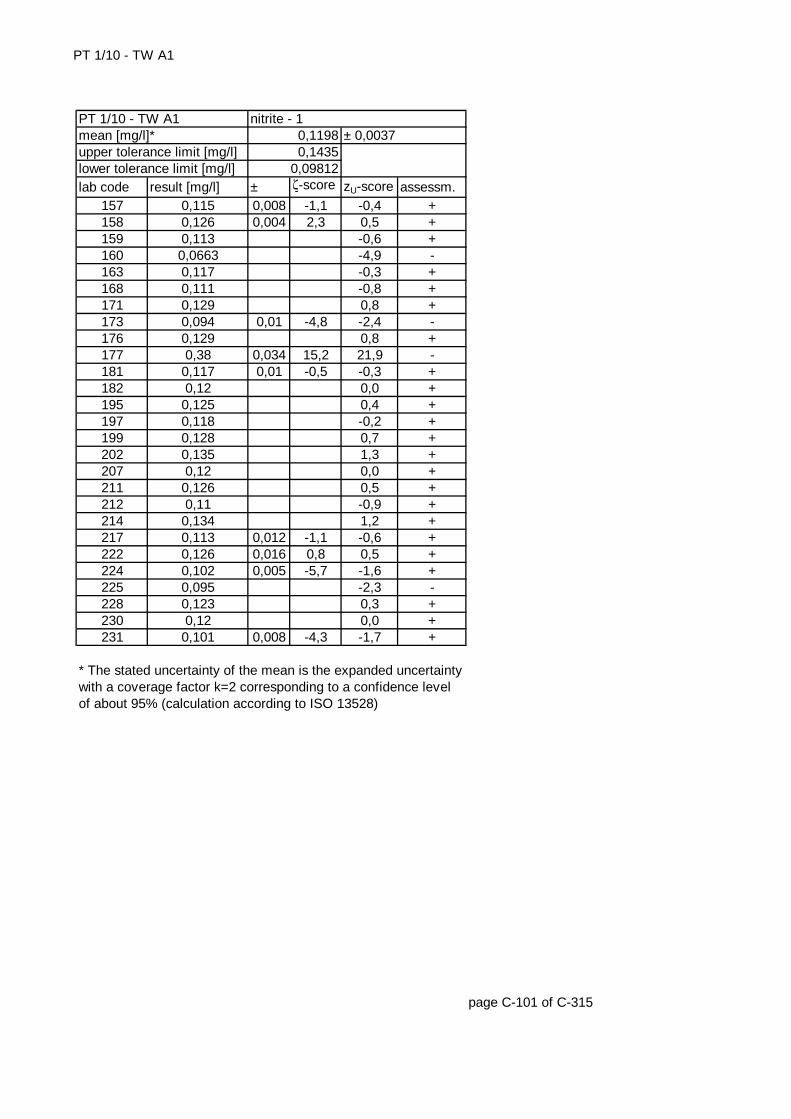
PT 1/10 - TW A1
lab code result [mg/l] ± ζ-score zU-score assessm.157 0,115 0,008 -1,1 -0,4 +158 0,126 0,004 2,3 0,5 +159 0,113 -0,6 +160 0,0663 -4,9 -163 0,117 -0,3 +168 0,111 -0,8 +171 0,129 0,8 +173 0,094 0,01 -4,8 -2,4 -176 0,129 0,8 +177 0,38 0,034 15,2 21,9 -181 0,117 0,01 -0,5 -0,3 +182 0,12 0,0 +195 0,125 0,4 +197 0,118 -0,2 +199 0,128 0,7 +202 0,135 1,3 +207 0,12 0,0 +211 0,126 0,5 +212 0,11 -0,9 +214 0,134 1,2 +217 0,113 0,012 -1,1 -0,6 +222 0,126 0,016 0,8 0,5 +224 0,102 0,005 -5,7 -1,6 +225 0,095 -2,3 -228 0,123 0,3 +230 0,12 0,0 +231 0,101 0,008 -4,3 -1,7 +
page C-101 of C-315
* The stated uncertainty of the mean is the expanded uncertainty with a coverage factor k=2 corresponding to a confidence level of about 95% (calculation according to ISO 13528)
upper tolerance limit [mg/l] 0,1435lower tolerance limit [mg/l] 0,09812
PT 1/10 - TW A1 nitrite - 1mean [mg/l]* 0,1198 ± 0,0037
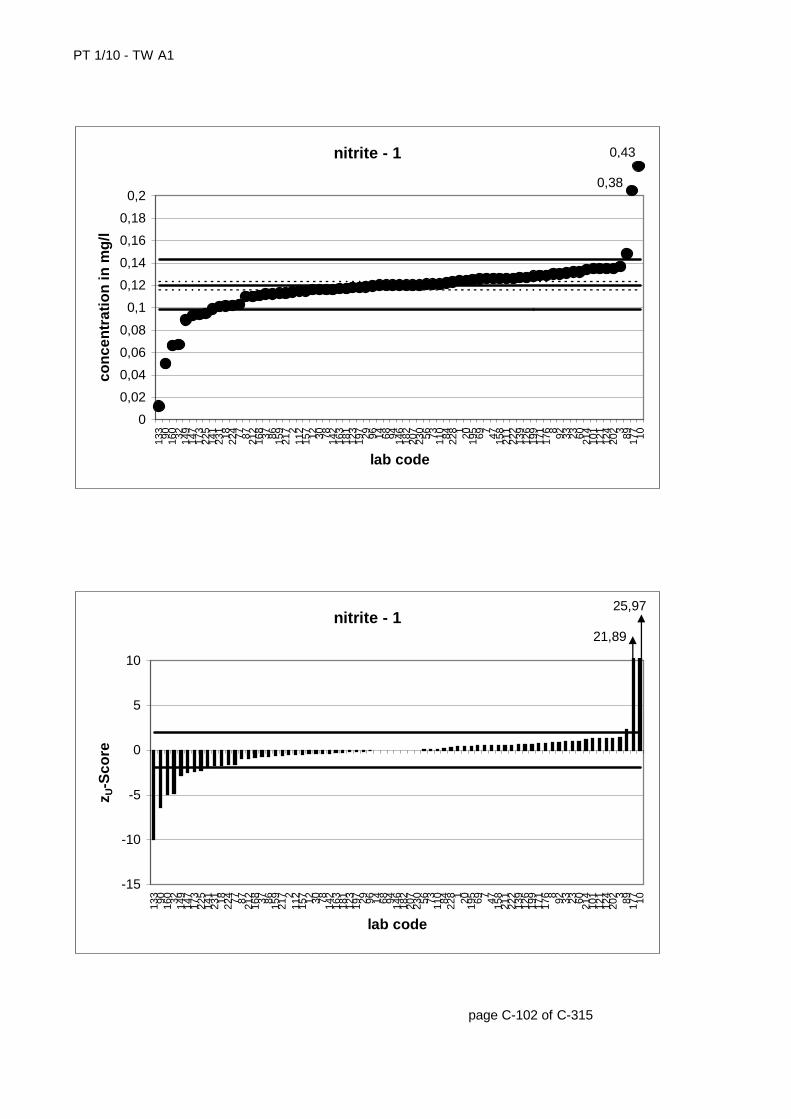
PT 1/10 - TW A1
page C-102 of C-315
nitrite - 1
0
0,02
0,04
0,06
0,08
0,1
0,12
0,14
0,16
0,18
0,2
133 90 160 32 149
147
173
225
141
231 18 224 77 87 212
168 37 86 159
217 2
112
157 12 30 78 142
163
181
123
197 29 96 14 68 94 146
182
207
230 56 73 110 84 228 1 20 195 69 7 47 158
211
222
139
126
199
171
176 8 92 33 23 60 214
101
121
124
202 3 89 177 10
lab code
con
cen
trat
ion
in m
g/l
0,38
0,43
nitrite - 1
-15
-10
-5
0
5
10
133 90 160 32 149
147
173
225
141
231 18 224 77 87 212
168 37 86 159
217 2
112
157 12 30 78 142
163
181
123
197 29 96 14 68 94 146
182
207
230 56 73 110 84 228 1 20 195 69 7 47 158
211
222
139
126
199
171
176 8 92 33 23 60 214
101
121
124
202 3 89 177 10
lab code
z U-S
core
21,89
25,97
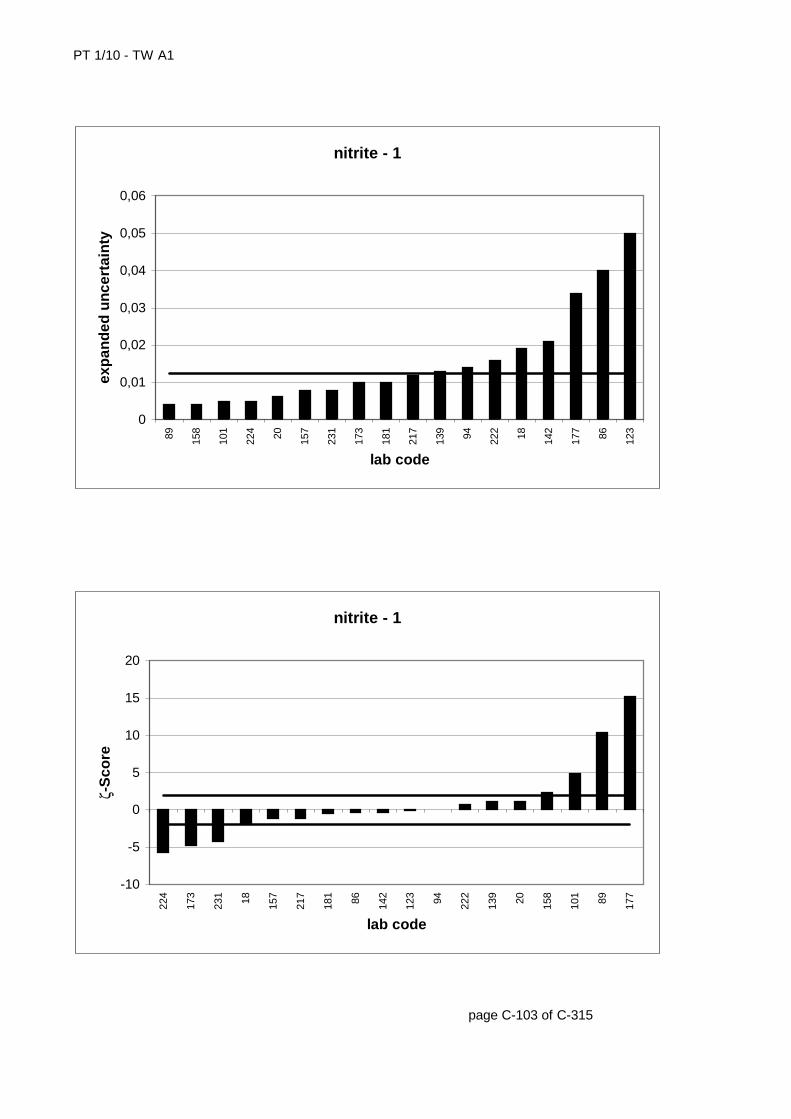
PT 1/10 - TW A1
page C-103 of C-315
nitrite - 1
0
0,01
0,02
0,03
0,04
0,05
0,06
89 158
101
224 20 157
231
173
181
217
139 94 222 18 142
177 86 123
lab code
exp
and
ed u
nce
rtai
nty
nitrite - 1
-10
-5
0
5
10
15
20
224
173
231 18 157
217
181 86 142
123 94 222
139 20 158
101 89 177
lab code
ζ-S
core
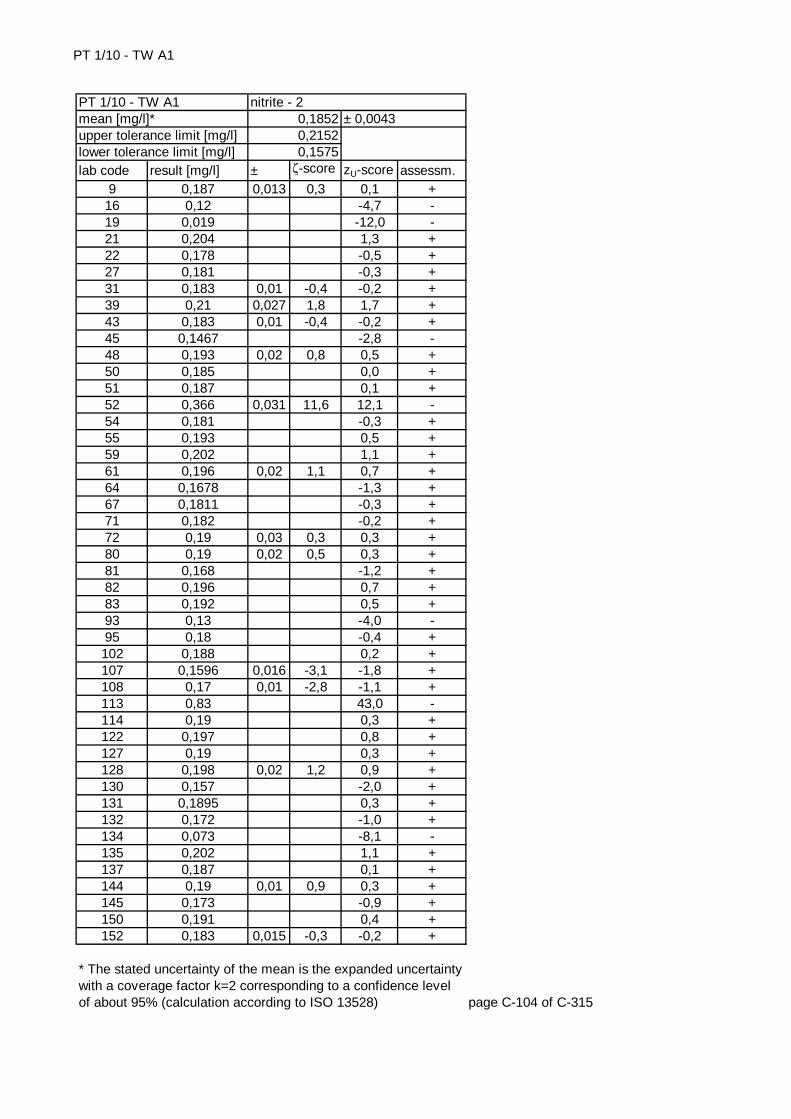
PT 1/10 - TW A1
lab code result [mg/l] ± ζ-score zU-score assessm.9 0,187 0,013 0,3 0,1 +
16 0,12 -4,7 -19 0,019 -12,0 -21 0,204 1,3 +22 0,178 -0,5 +27 0,181 -0,3 +31 0,183 0,01 -0,4 -0,2 +39 0,21 0,027 1,8 1,7 +43 0,183 0,01 -0,4 -0,2 +45 0,1467 -2,8 -48 0,193 0,02 0,8 0,5 +50 0,185 0,0 +51 0,187 0,1 +52 0,366 0,031 11,6 12,1 -54 0,181 -0,3 +55 0,193 0,5 +59 0,202 1,1 +61 0,196 0,02 1,1 0,7 +64 0,1678 -1,3 +67 0,1811 -0,3 +71 0,182 -0,2 +72 0,19 0,03 0,3 0,3 +80 0,19 0,02 0,5 0,3 +81 0,168 -1,2 +82 0,196 0,7 +83 0,192 0,5 +93 0,13 -4,0 -95 0,18 -0,4 +102 0,188 0,2 +107 0,1596 0,016 -3,1 -1,8 +108 0,17 0,01 -2,8 -1,1 +113 0,83 43,0 -114 0,19 0,3 +122 0,197 0,8 +127 0,19 0,3 +128 0,198 0,02 1,2 0,9 +130 0,157 -2,0 +131 0,1895 0,3 +132 0,172 -1,0 +134 0,073 -8,1 -135 0,202 1,1 +137 0,187 0,1 +144 0,19 0,01 0,9 0,3 +145 0,173 -0,9 +150 0,191 0,4 +152 0,183 0,015 -0,3 -0,2 +
page C-104 of C-315
* The stated uncertainty of the mean is the expanded uncertainty with a coverage factor k=2 corresponding to a confidence level of about 95% (calculation according to ISO 13528)
nitrite - 20,18520,21520,1575
± 0,0043PT 1/10 - TW A1mean [mg/l]*upper tolerance limit [mg/l]lower tolerance limit [mg/l]

PT 1/10 - TW A1
lab code result [mg/l] ± ζ-score zU-score assessm.156 0,179 -0,4 +162 0,177 -0,6 +167 0,189 0,008 0,8 0,3 +169 0,172 -1,0 +175 0,2 0,02 1,4 1,0 +179 0,17872 -0,5 +180 0,1 -6,1 -186 0,2 1,0 +192 0,179 -0,4 +193 0,179 -0,4 +201 0,168 -1,2 +204 0,193 0,5 +206 0,194 0,019 0,9 0,6 +210 0,22 2,3 -215 0,178 -0,5 +220 0,19 0,3 +221 0,186 0,1 +223 0,19 0,05 0,2 0,3 +227 0,173 0,002 -4,9 -0,9 +229 0,188 0,2 +232 0,18 -0,4 +233 0,187 0,1 +235 0,184 -0,1 +237 0,19 0,3 +
page C-105 of C-315
* The stated uncertainty of the mean is the expanded uncertainty with a coverage factor k=2 corresponding to a confidence level of about 95% (calculation according to ISO 13528)
upper tolerance limit [mg/l] 0,2152lower tolerance limit [mg/l] 0,1575
PT 1/10 - TW A1 nitrite - 2mean [mg/l]* 0,1852 ± 0,0043
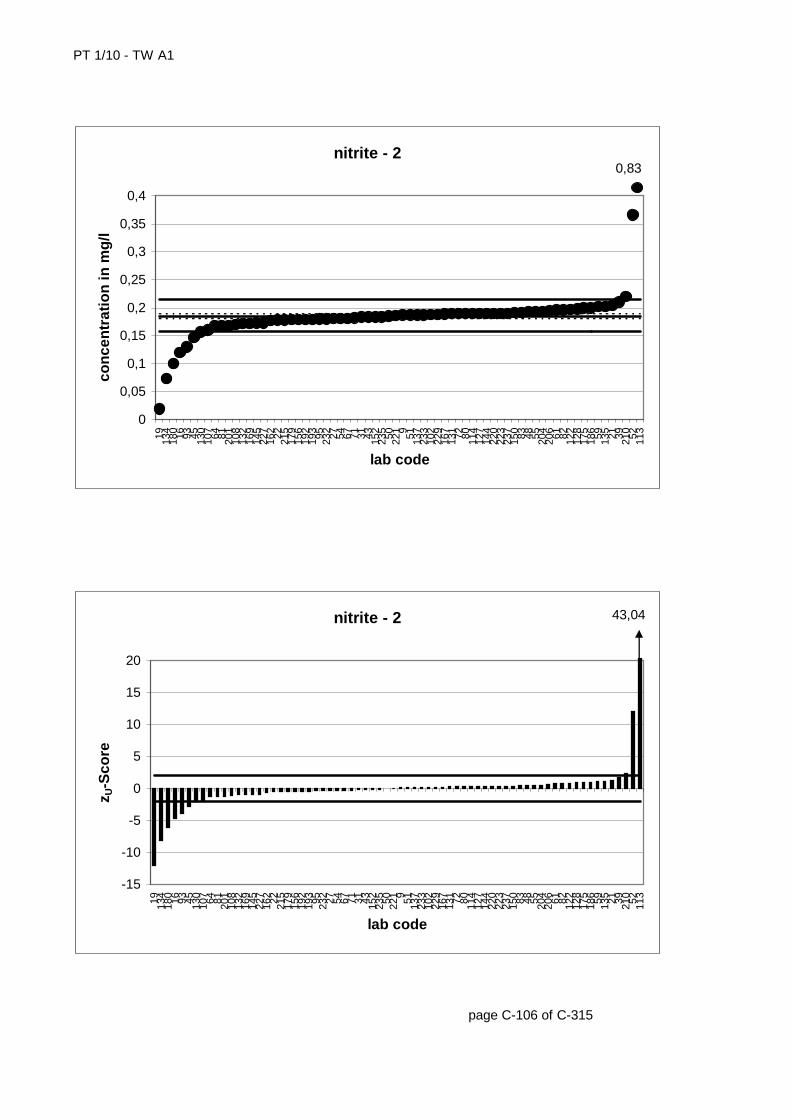
PT 1/10 - TW A1
page C-106 of C-315
nitrite - 2
0
0,05
0,1
0,15
0,2
0,25
0,3
0,35
0,4
19 134
180 16 93 45 130
107 64 81 201
108
132
169
145
227
162 22 215
179
156
192
193 95 232 27 54 67 71 31 43 152
235 50 221 9 51 137
233
102
229
167
131 72 80 114
127
144
220
223
237
150 83 48 55 204
206 61 82 122
128
175
186 59 135 21 39 210 52 113
lab code
con
cen
trat
ion
in m
g/l
0,83
nitrite - 2
-15
-10
-5
0
5
10
15
20
19 134
180 16 93 45 130
107 64 81 201
108
132
169
145
227
162 22 215
179
156
192
193 95 232 27 54 67 71 31 43 152
235 50 221 9 51 137
233
102
229
167
131 72 80 114
127
144
220
223
237
150 83 48 55 204
206 61 82 122
128
175
186 59 135 21 39 210 52 113
lab code
z U-S
core
43,04
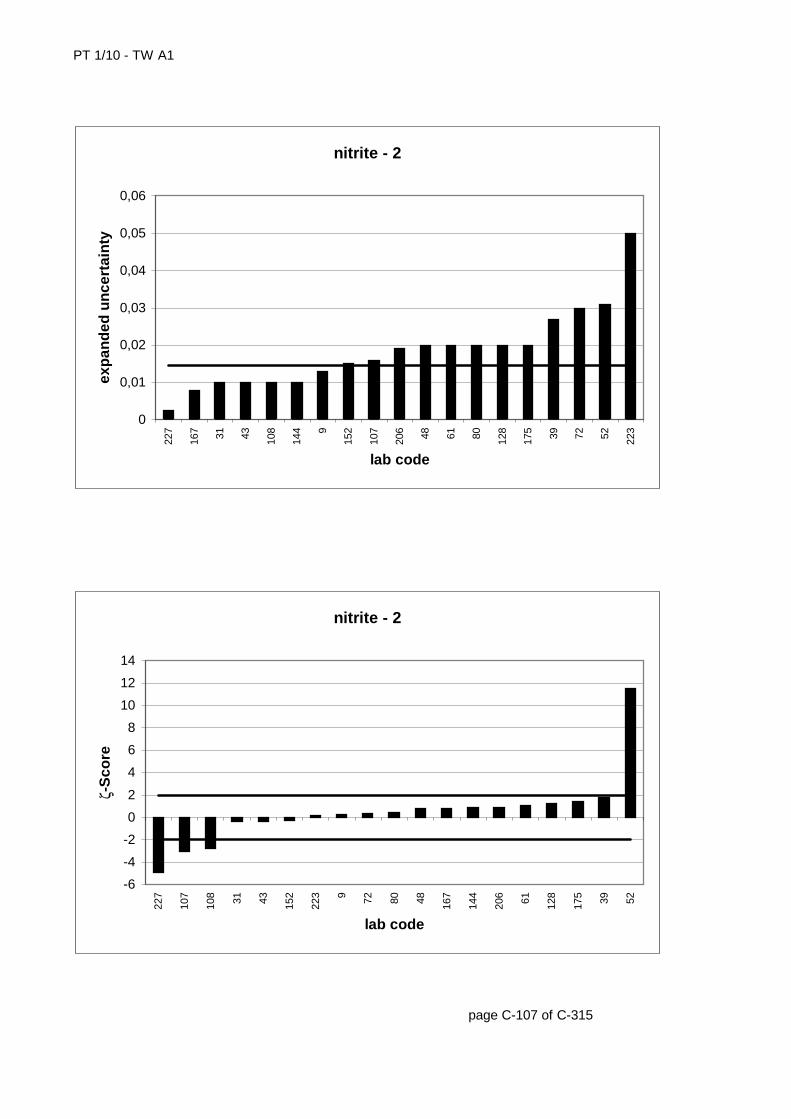
PT 1/10 - TW A1
page C-107 of C-315
nitrite - 2
0
0,01
0,02
0,03
0,04
0,05
0,06
227
167 31 43 108
144 9
152
107
206 48 61 80 128
175 39 72 52 223
lab code
exp
and
ed u
nce
rtai
nty
nitrite - 2
-6
-4
-2
0
2
4
6
8
10
12
14
227
107
108 31 43 152
223 9 72 80 48 167
144
206 61 128
175 39 52
lab code
ζ-S
core

PT 1/10 - TW A1
lab code result [mg/l] ± ζ-score zU-score assessm.4 0,21 0,04 -2,1 -2,6 -5 0,26 0,4 +
11 0,27 0,01 3,1 1,0 +13 0,249 -0,2 +15 0,261 0,02 0,8 0,5 +17 0,224 -1,8 +24 0,126 -7,7 -25 0,245 0,03 -0,5 -0,5 +26 0,248 0,006 -1,3 -0,3 +28 0,26 0,4 +36 0,254 0,1 +41 0,247 -0,4 +42 0,24 0,02 -1,3 -0,8 +44 0,252 -0,1 +46 0,248 -0,3 +49 0,26 0,4 +57 0,248 -0,3 +58 0,235 0,02 -1,8 -1,1 +62 3,03 157,0 -65 0,244 -0,5 +75 0,268 0,8 +76 0,261 0,5 +85 0,252 -0,1 +88 0,256 0,2 +91 0,249 -0,2 +98 0,222 -1,9 +99 0,238 -0,9 +100 0,2646 0,7 +103 0,253 0,013 0,0 0,0 +104 0,262 0,5 +105 0,259 0,3 +106 0,26 0,01 1,3 0,4 +109 0,25 8E-04 -1,3 -0,2 +111 0,245 -0,5 +115 0,1 0,01 -27,9 -9,3 -116 0,251 -0,1 +117 0,26 0,4 +118 0,252 -0,1 +119 0,251 -0,1 +120 0,248 -0,3 +125 0,252 0,008 -0,2 -0,1 +129 0,26 0,4 +136 0,263 0,6 +138 0,27 1,0 +148 0,27 1,0 +151 0,257 0,013 0,6 0,2 +
page C-108 of C-315
* The stated uncertainty of the mean is the expanded uncertainty with a coverage factor k=2 corresponding to a confidence level of about 95% (calculation according to ISO 13528)
nitrite - 30,253
0,28840,2199
± 0,0045PT 1/10 - TW A1mean [mg/l]*upper tolerance limit [mg/l]lower tolerance limit [mg/l]
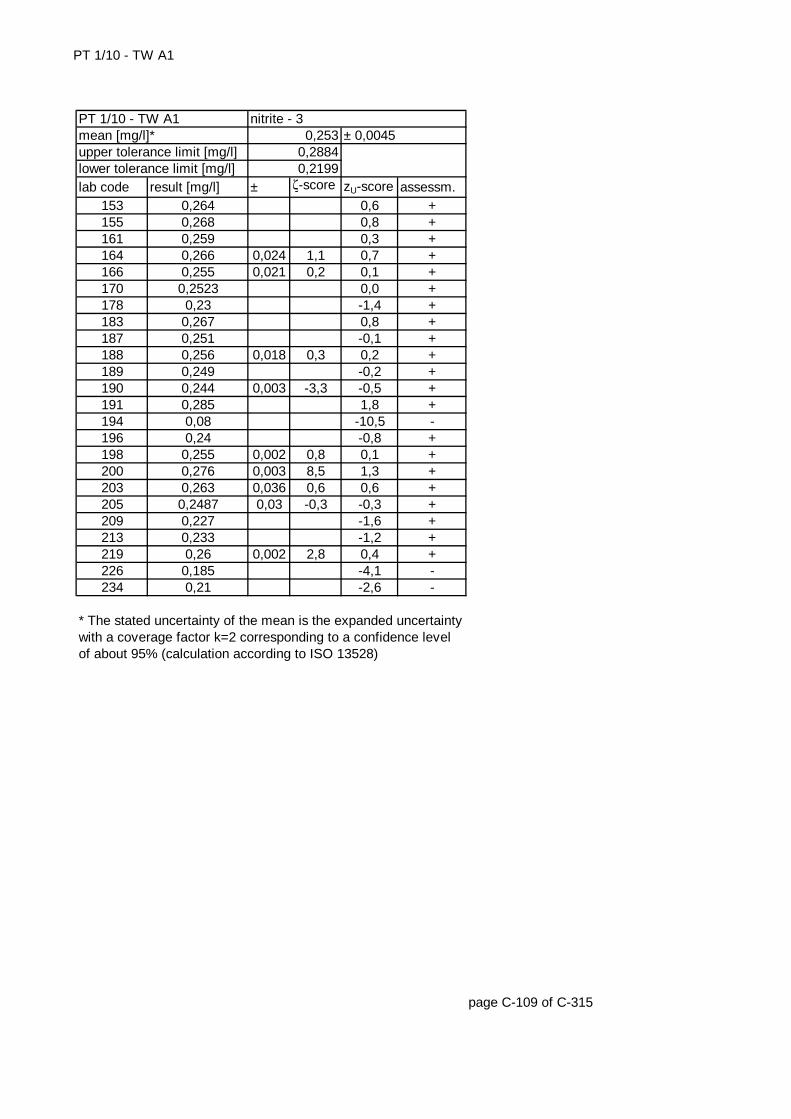
PT 1/10 - TW A1
lab code result [mg/l] ± ζ-score zU-score assessm.153 0,264 0,6 +155 0,268 0,8 +161 0,259 0,3 +164 0,266 0,024 1,1 0,7 +166 0,255 0,021 0,2 0,1 +170 0,2523 0,0 +178 0,23 -1,4 +183 0,267 0,8 +187 0,251 -0,1 +188 0,256 0,018 0,3 0,2 +189 0,249 -0,2 +190 0,244 0,003 -3,3 -0,5 +191 0,285 1,8 +194 0,08 -10,5 -196 0,24 -0,8 +198 0,255 0,002 0,8 0,1 +200 0,276 0,003 8,5 1,3 +203 0,263 0,036 0,6 0,6 +205 0,2487 0,03 -0,3 -0,3 +209 0,227 -1,6 +213 0,233 -1,2 +219 0,26 0,002 2,8 0,4 +226 0,185 -4,1 -234 0,21 -2,6 -
page C-109 of C-315
* The stated uncertainty of the mean is the expanded uncertainty with a coverage factor k=2 corresponding to a confidence level of about 95% (calculation according to ISO 13528)
upper tolerance limit [mg/l] 0,2884lower tolerance limit [mg/l] 0,2199
PT 1/10 - TW A1 nitrite - 3mean [mg/l]* 0,253 ± 0,0045
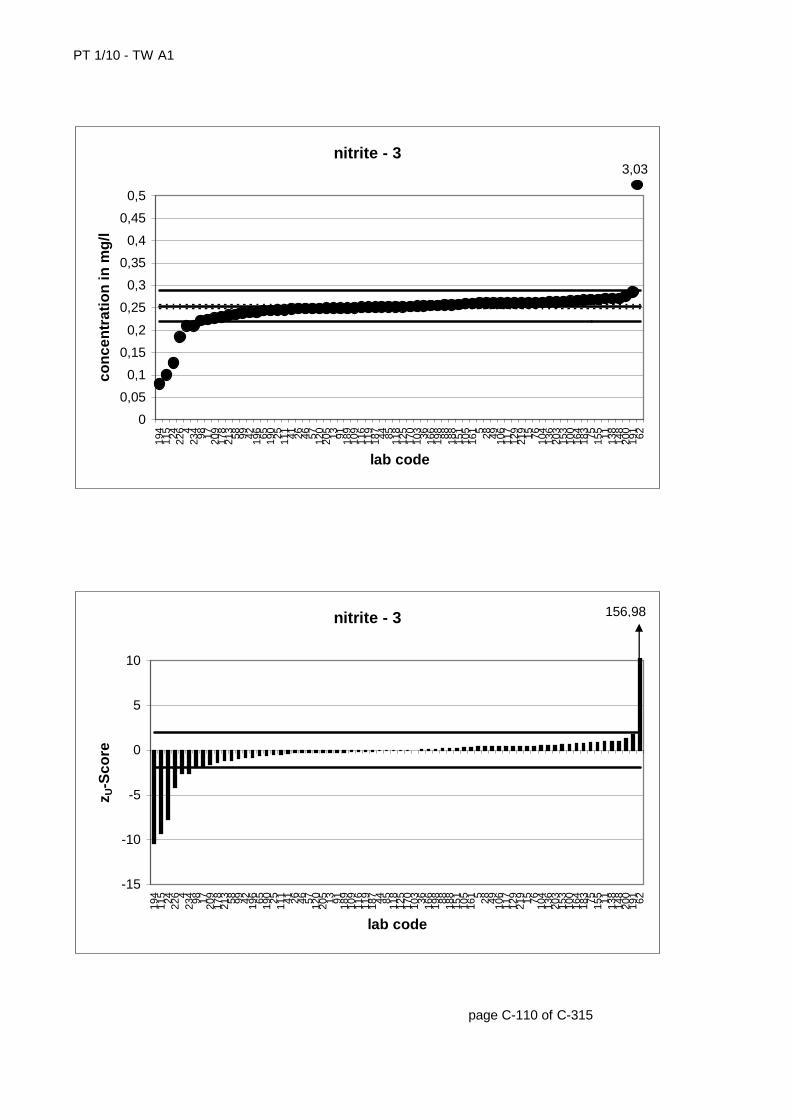
PT 1/10 - TW A1
page C-110 of C-315
nitrite - 3
0
0,05
0,1
0,15
0,2
0,25
0,3
0,35
0,4
0,45
0,5
194
115 24 226 4
234 98 17 209
178
213 58 99 42 196 65 190 25 111 41 26 46 57 120
205 13 91 189
109
116
119
187 44 85 118
125
170
103 36 166
198 88 188
151
105
161 5 28 49 106
117
129
219 15 76 104
136
203
153
100
164
183 75 155 11 138
148
200
191 62
lab code
con
cen
trat
ion
in m
g/l
3,03
nitrite - 3
-15
-10
-5
0
5
10
194
115 24 226 4
234 98 17 209
178
213 58 99 42 196 65 190 25 111 41 26 46 57 120
205 13 91 189
109
116
119
187 44 85 118
125
170
103 36 166
198 88 188
151
105
161 5 28 49 106
117
129
219 15 76 104
136
203
153
100
164
183 75 155 11 138
148
200
191 62
lab code
z U-S
core
156,98
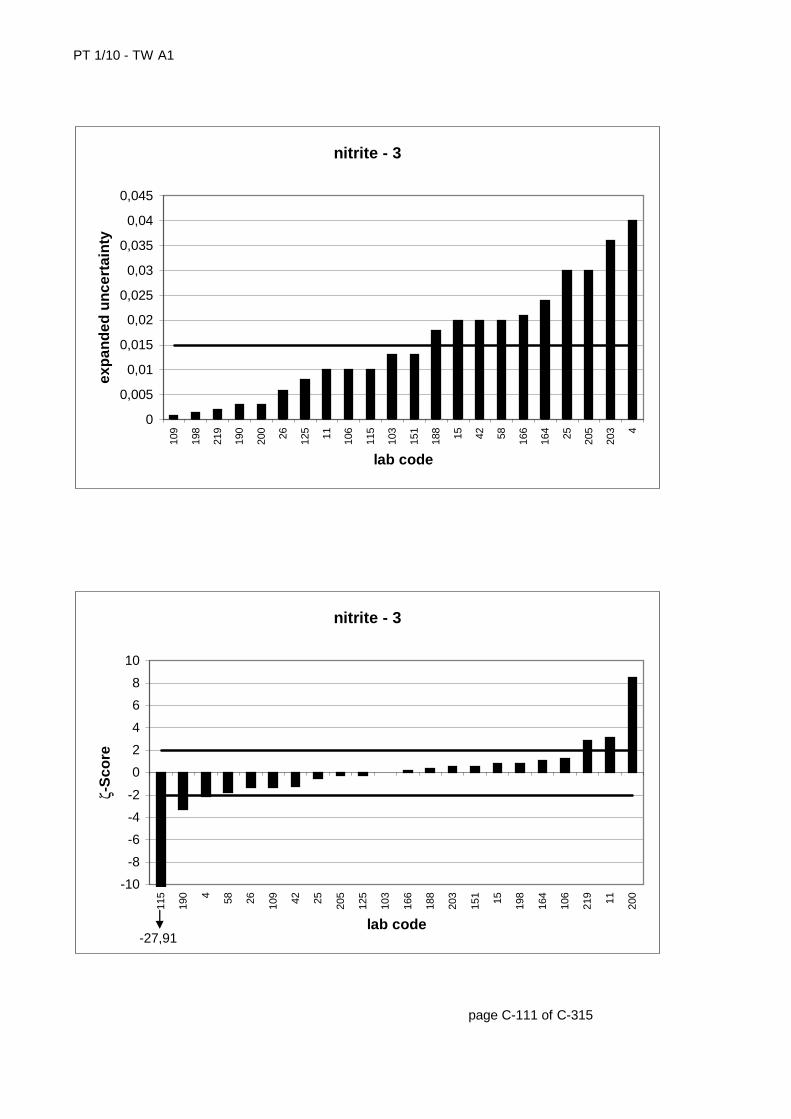
PT 1/10 - TW A1
page C-111 of C-315
nitrite - 3
0
0,005
0,01
0,015
0,02
0,025
0,03
0,035
0,04
0,045
109
198
219
190
200 26 125 11 106
115
103
151
188 15 42 58 166
164 25 205
203 4
lab code
exp
and
ed u
nce
rtai
nty
nitrite - 3
-10
-8
-6
-4
-2
0
2
4
6
8
10
115
190 4 58 26 109 42 25 205
125
103
166
188
203
151 15 198
164
106
219 11 200
lab code
ζ-S
core
-27,91
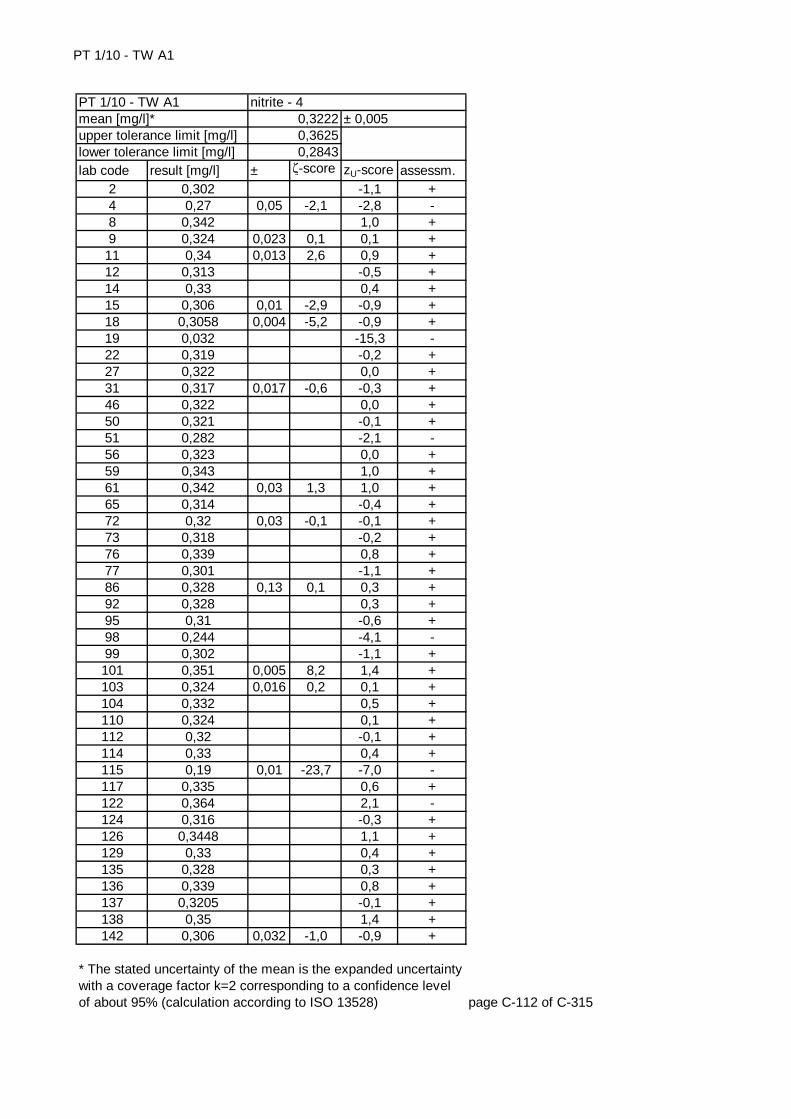
PT 1/10 - TW A1
lab code result [mg/l] ± ζ-score zU-score assessm.2 0,302 -1,1 +4 0,27 0,05 -2,1 -2,8 -8 0,342 1,0 +9 0,324 0,023 0,1 0,1 +
11 0,34 0,013 2,6 0,9 +12 0,313 -0,5 +14 0,33 0,4 +15 0,306 0,01 -2,9 -0,9 +18 0,3058 0,004 -5,2 -0,9 +19 0,032 -15,3 -22 0,319 -0,2 +27 0,322 0,0 +31 0,317 0,017 -0,6 -0,3 +46 0,322 0,0 +50 0,321 -0,1 +51 0,282 -2,1 -56 0,323 0,0 +59 0,343 1,0 +61 0,342 0,03 1,3 1,0 +65 0,314 -0,4 +72 0,32 0,03 -0,1 -0,1 +73 0,318 -0,2 +76 0,339 0,8 +77 0,301 -1,1 +86 0,328 0,13 0,1 0,3 +92 0,328 0,3 +95 0,31 -0,6 +98 0,244 -4,1 -99 0,302 -1,1 +101 0,351 0,005 8,2 1,4 +103 0,324 0,016 0,2 0,1 +104 0,332 0,5 +110 0,324 0,1 +112 0,32 -0,1 +114 0,33 0,4 +115 0,19 0,01 -23,7 -7,0 -117 0,335 0,6 +122 0,364 2,1 -124 0,316 -0,3 +126 0,3448 1,1 +129 0,33 0,4 +135 0,328 0,3 +136 0,339 0,8 +137 0,3205 -0,1 +138 0,35 1,4 +142 0,306 0,032 -1,0 -0,9 +
page C-112 of C-315
* The stated uncertainty of the mean is the expanded uncertainty with a coverage factor k=2 corresponding to a confidence level of about 95% (calculation according to ISO 13528)
nitrite - 40,32220,36250,2843
± 0,005PT 1/10 - TW A1mean [mg/l]*upper tolerance limit [mg/l]lower tolerance limit [mg/l]
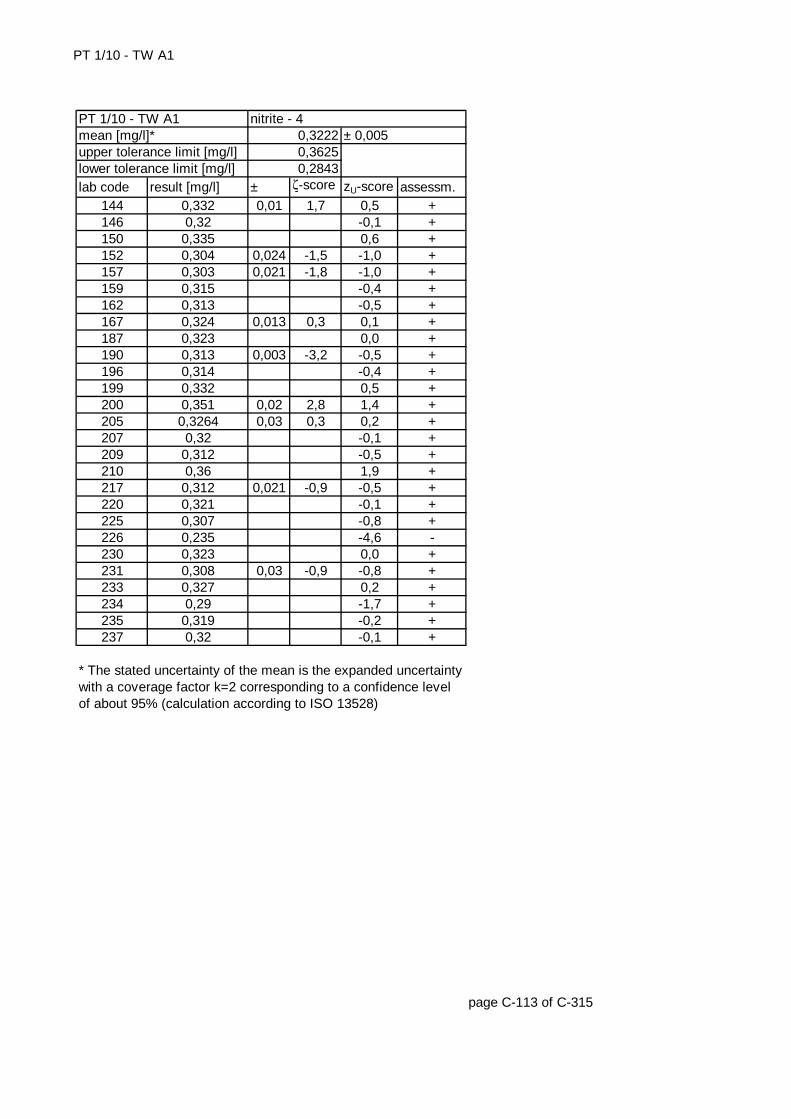
PT 1/10 - TW A1
lab code result [mg/l] ± ζ-score zU-score assessm.144 0,332 0,01 1,7 0,5 +146 0,32 -0,1 +150 0,335 0,6 +152 0,304 0,024 -1,5 -1,0 +157 0,303 0,021 -1,8 -1,0 +159 0,315 -0,4 +162 0,313 -0,5 +167 0,324 0,013 0,3 0,1 +187 0,323 0,0 +190 0,313 0,003 -3,2 -0,5 +196 0,314 -0,4 +199 0,332 0,5 +200 0,351 0,02 2,8 1,4 +205 0,3264 0,03 0,3 0,2 +207 0,32 -0,1 +209 0,312 -0,5 +210 0,36 1,9 +217 0,312 0,021 -0,9 -0,5 +220 0,321 -0,1 +225 0,307 -0,8 +226 0,235 -4,6 -230 0,323 0,0 +231 0,308 0,03 -0,9 -0,8 +233 0,327 0,2 +234 0,29 -1,7 +235 0,319 -0,2 +237 0,32 -0,1 +
page C-113 of C-315
* The stated uncertainty of the mean is the expanded uncertainty with a coverage factor k=2 corresponding to a confidence level of about 95% (calculation according to ISO 13528)
upper tolerance limit [mg/l] 0,3625lower tolerance limit [mg/l] 0,2843
PT 1/10 - TW A1 nitrite - 4mean [mg/l]* 0,3222 ± 0,005
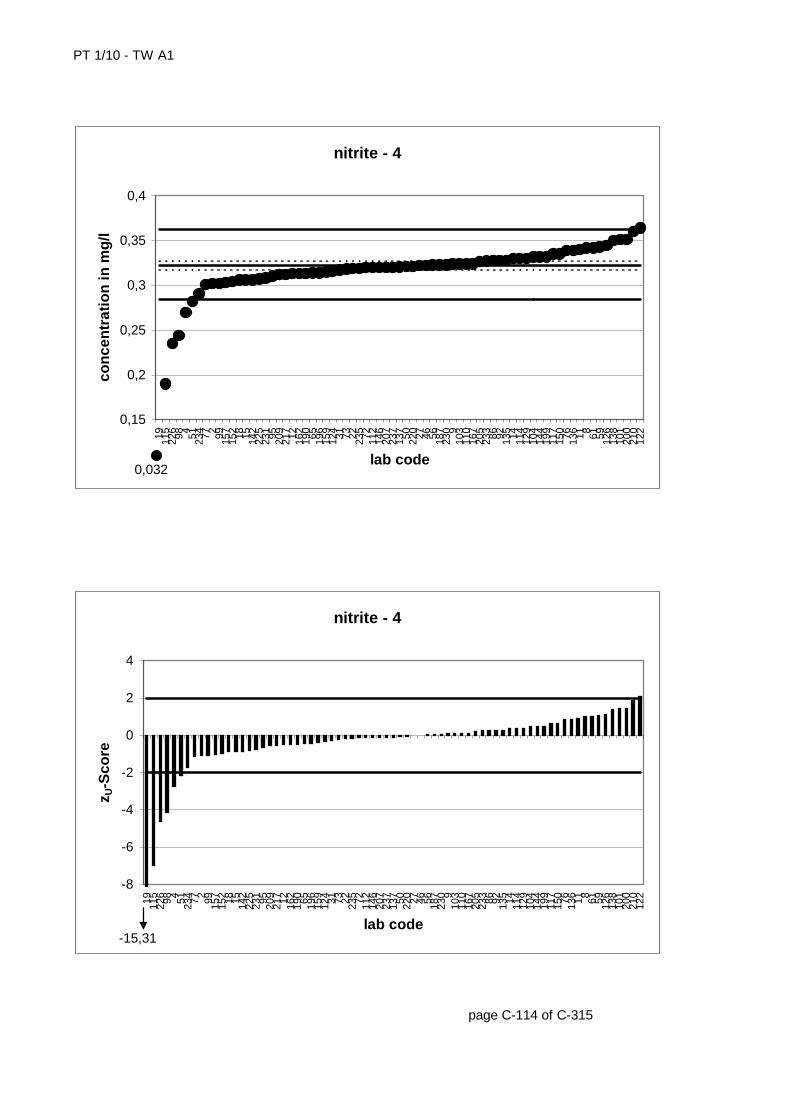
PT 1/10 - TW A1
page C-114 of C-315
nitrite - 4
0,15
0,2
0,25
0,3
0,35
0,4
19 115
226 98 4 51 234 77 2 99 157
152 18 15 142
225
231 95 209
217 12 162
190 65 196
159
124 31 73 22 235 72 112
146
207
237
137 50 220 27 46 56 187
230 9
103
110
167
205
233 86 92 135 14 114
129
104
144
199
117
150 76 136 11 8 61 59 126
138
101
200
210
122
lab code
con
cen
trat
ion
in m
g/l
0,032
nitrite - 4
-8
-6
-4
-2
0
2
4
19 115
226 98 4 51 234 77 2 99 157
152 18 15 142
225
231 95 209
217 12 162
190 65 196
159
124 31 73 22 235 72 112
146
207
237
137 50 220 27 46 56 187
230 9
103
110
167
205
233 86 92 135 14 114
129
104
144
199
117
150 76 136 11 8 61 59 126
138
101
200
210
122
lab code
z U-S
core
-15,31
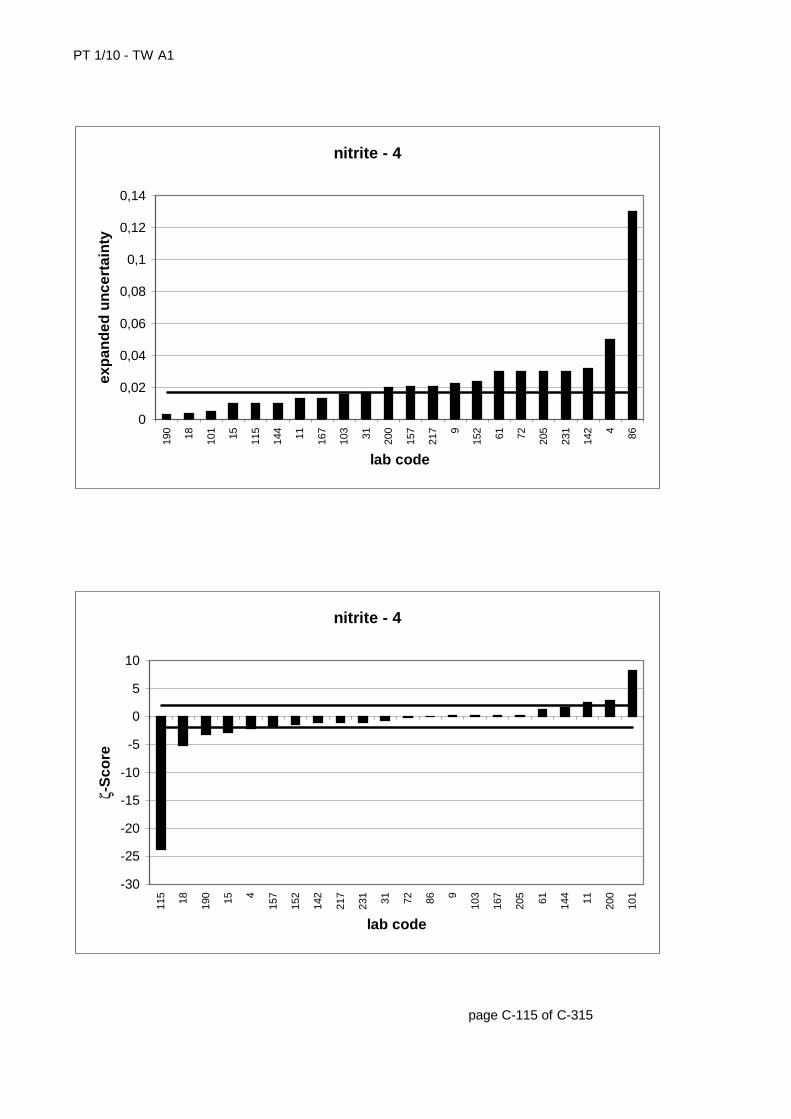
PT 1/10 - TW A1
page C-115 of C-315
nitrite - 4
0
0,02
0,04
0,06
0,08
0,1
0,12
0,14
190 18 101 15 115
144 11 167
103 31 200
157
217 9
152 61 72 205
231
142 4 86
lab code
exp
and
ed u
nce
rtai
nty
nitrite - 4
-30
-25
-20
-15
-10
-5
0
5
10
115 18 190 15 4
157
152
142
217
231 31 72 86 9
103
167
205 61 144 11 200
101
lab code
ζ-S
core

PT 1/10 - TW A1
lab code result [mg/l] ± ζ-score zU-score assessm.1 0,396 -0,1 +7 0,395 -0,1 +
11 0,42 0,016 2,6 1,0 +12 0,389 -0,4 +14 0,4 0,1 +16 0,29 -5,1 -22 0,389 -0,4 +30 0,387 -0,5 +33 0,421 1,0 +39 0,433 0,056 1,2 1,6 +44 0,397 0,0 +52 0,619 0,052 8,4 9,8 -54 0,427 1,3 +55 0,402 0,2 +58 0,372 0,02 -2,5 -1,2 +60 0,416 0,8 +61 0,408 0,04 0,5 0,4 +68 0,41 0,5 +75 0,411 0,6 +82 0,421 1,0 +88 0,409 0,5 +92 0,4 0,1 +96 0,3993 0,1 +102 0,396 -0,1 +104 0,423 1,1 +106 0,41 0,02 1,2 0,5 +107 0,3699 0,037 -1,5 -1,3 +108 0,35 0,02 -4,6 -2,2 -109 0,39 8E-04 -2,5 -0,4 +116 0,39 -0,4 +118 0,396 -0,1 +119 0,395 -0,1 +123 0,47 0,05 2,9 3,2 -125 0,41 0,008 2,4 0,5 +126 0,4187 0,9 +127 0,396 -0,1 +130 0,388 -0,5 +141 0,3467 -2,4 -144 0,406 0,01 1,4 0,4 +147 0,381 -0,8 +148 0,36 -1,8 +155 0,422 1,1 +156 0,377 -1,0 +158 0,405 0,012 1,1 0,3 +163 0,35 -2,2 -166 0,407 0,034 0,5 0,4 +
page C-116 of C-315
* The stated uncertainty of the mean is the expanded uncertainty with a coverage factor k=2 corresponding to a confidence level of about 95% (calculation according to ISO 13528)
nitrite - 50,39790,443
0,3552
± 0,0063PT 1/10 - TW A1mean [mg/l]*upper tolerance limit [mg/l]lower tolerance limit [mg/l]
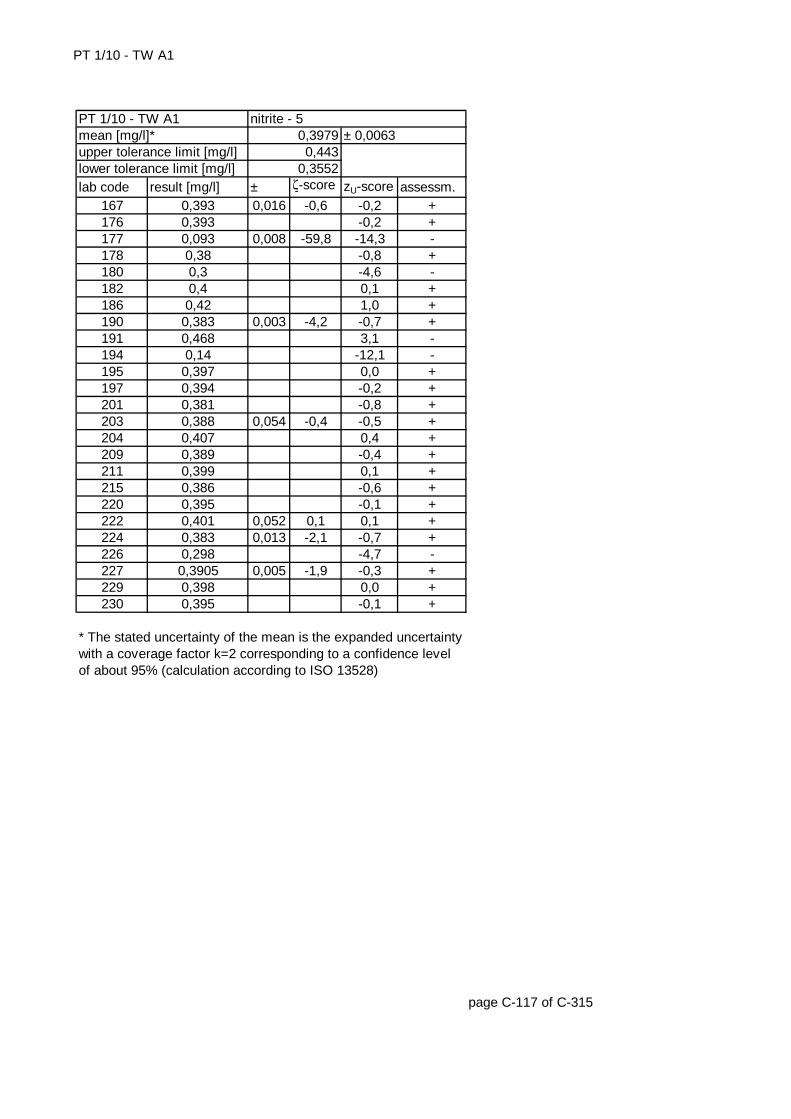
PT 1/10 - TW A1
lab code result [mg/l] ± ζ-score zU-score assessm.167 0,393 0,016 -0,6 -0,2 +176 0,393 -0,2 +177 0,093 0,008 -59,8 -14,3 -178 0,38 -0,8 +180 0,3 -4,6 -182 0,4 0,1 +186 0,42 1,0 +190 0,383 0,003 -4,2 -0,7 +191 0,468 3,1 -194 0,14 -12,1 -195 0,397 0,0 +197 0,394 -0,2 +201 0,381 -0,8 +203 0,388 0,054 -0,4 -0,5 +204 0,407 0,4 +209 0,389 -0,4 +211 0,399 0,1 +215 0,386 -0,6 +220 0,395 -0,1 +222 0,401 0,052 0,1 0,1 +224 0,383 0,013 -2,1 -0,7 +226 0,298 -4,7 -227 0,3905 0,005 -1,9 -0,3 +229 0,398 0,0 +230 0,395 -0,1 +
page C-117 of C-315
* The stated uncertainty of the mean is the expanded uncertainty with a coverage factor k=2 corresponding to a confidence level of about 95% (calculation according to ISO 13528)
upper tolerance limit [mg/l] 0,443lower tolerance limit [mg/l] 0,3552
PT 1/10 - TW A1 nitrite - 5mean [mg/l]* 0,3979 ± 0,0063
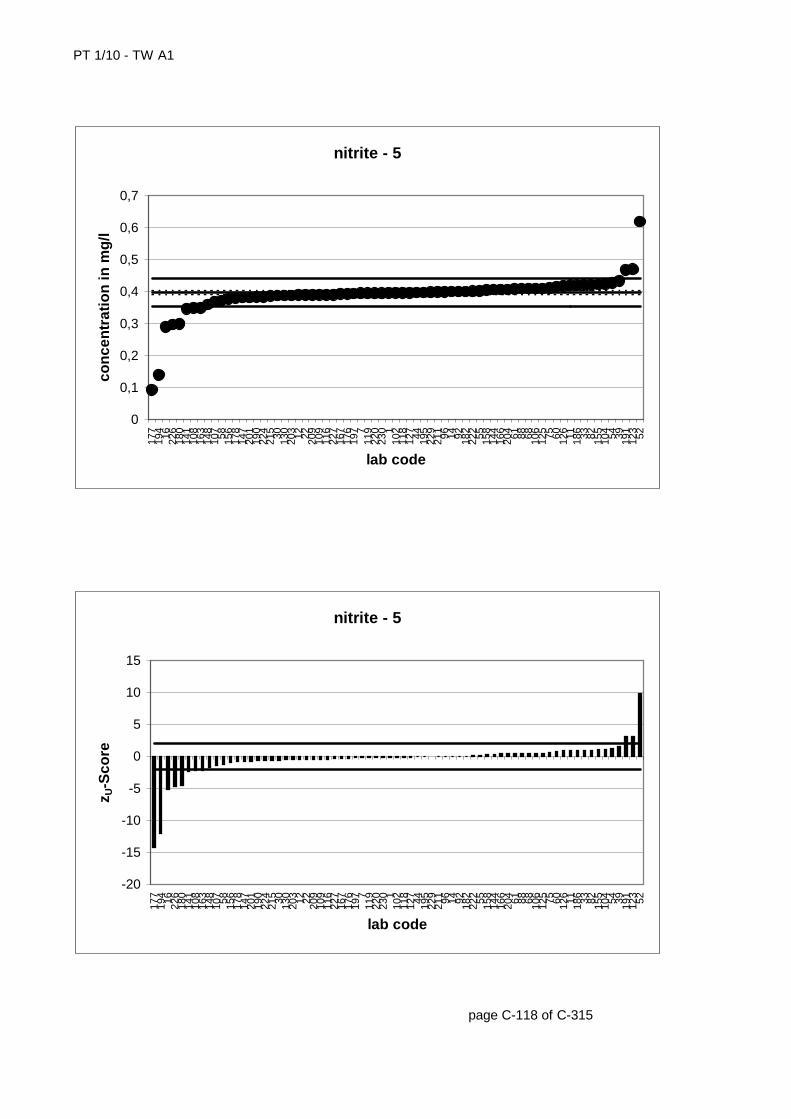
PT 1/10 - TW A1
page C-118 of C-315
nitrite - 5
0
0,1
0,2
0,3
0,4
0,5
0,6
0,7
177
194 16 226
180
141
108
163
148
107 58 156
178
147
201
190
224
215 30 130
203 12 22 209
109
116
227
167
176
197 7
119
220
230 1
102
118
127 44 195
229
211 96 14 92 182
222 55 158
144
166
204 61 88 68 106
125 75 60 126 11 186 33 82 155
104 54 39 191
123 52
lab code
con
cen
trat
ion
in m
g/l
nitrite - 5
-20
-15
-10
-5
0
5
10
15
177
194 16 226
180
141
108
163
148
107 58 156
178
147
201
190
224
215 30 130
203 12 22 209
109
116
227
167
176
197 7
119
220
230 1
102
118
127 44 195
229
211 96 14 92 182
222 55 158
144
166
204 61 88 68 106
125 75 60 126 11 186 33 82 155
104 54 39 191
123 52
lab code
z U-S
core
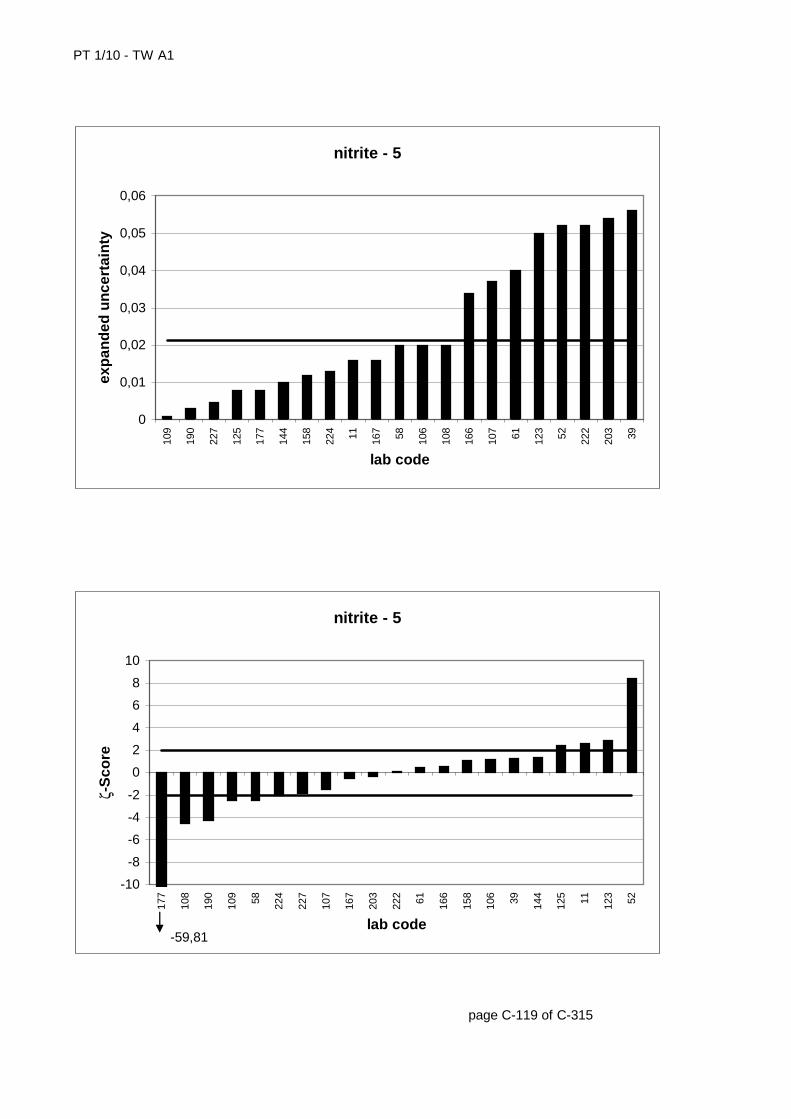
PT 1/10 - TW A1
page C-119 of C-315
nitrite - 5
0
0,01
0,02
0,03
0,04
0,05
0,06
109
190
227
125
177
144
158
224 11 167 58 106
108
166
107 61 123 52 222
203 39
lab code
exp
and
ed u
nce
rtai
nty
nitrite - 5
-10
-8
-6
-4
-2
0
2
4
6
8
10
177
108
190
109 58 224
227
107
167
203
222 61 166
158
106 39 144
125 11 123 52
lab code
ζ-S
core
-59,81
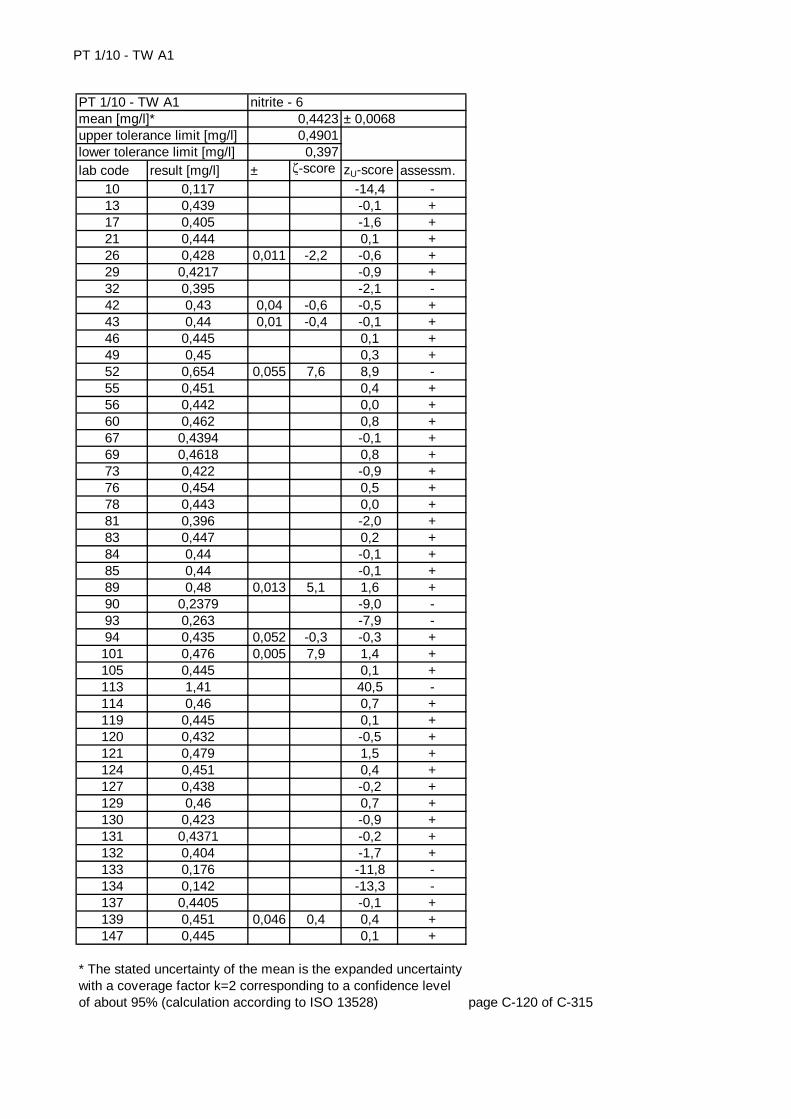
PT 1/10 - TW A1
lab code result [mg/l] ± ζ-score zU-score assessm.10 0,117 -14,4 -13 0,439 -0,1 +17 0,405 -1,6 +21 0,444 0,1 +26 0,428 0,011 -2,2 -0,6 +29 0,4217 -0,9 +32 0,395 -2,1 -42 0,43 0,04 -0,6 -0,5 +43 0,44 0,01 -0,4 -0,1 +46 0,445 0,1 +49 0,45 0,3 +52 0,654 0,055 7,6 8,9 -55 0,451 0,4 +56 0,442 0,0 +60 0,462 0,8 +67 0,4394 -0,1 +69 0,4618 0,8 +73 0,422 -0,9 +76 0,454 0,5 +78 0,443 0,0 +81 0,396 -2,0 +83 0,447 0,2 +84 0,44 -0,1 +85 0,44 -0,1 +89 0,48 0,013 5,1 1,6 +90 0,2379 -9,0 -93 0,263 -7,9 -94 0,435 0,052 -0,3 -0,3 +101 0,476 0,005 7,9 1,4 +105 0,445 0,1 +113 1,41 40,5 -114 0,46 0,7 +119 0,445 0,1 +120 0,432 -0,5 +121 0,479 1,5 +124 0,451 0,4 +127 0,438 -0,2 +129 0,46 0,7 +130 0,423 -0,9 +131 0,4371 -0,2 +132 0,404 -1,7 +133 0,176 -11,8 -134 0,142 -13,3 -137 0,4405 -0,1 +139 0,451 0,046 0,4 0,4 +147 0,445 0,1 +
page C-120 of C-315
* The stated uncertainty of the mean is the expanded uncertainty with a coverage factor k=2 corresponding to a confidence level of about 95% (calculation according to ISO 13528)
nitrite - 60,44230,49010,397
± 0,0068PT 1/10 - TW A1mean [mg/l]*upper tolerance limit [mg/l]lower tolerance limit [mg/l]
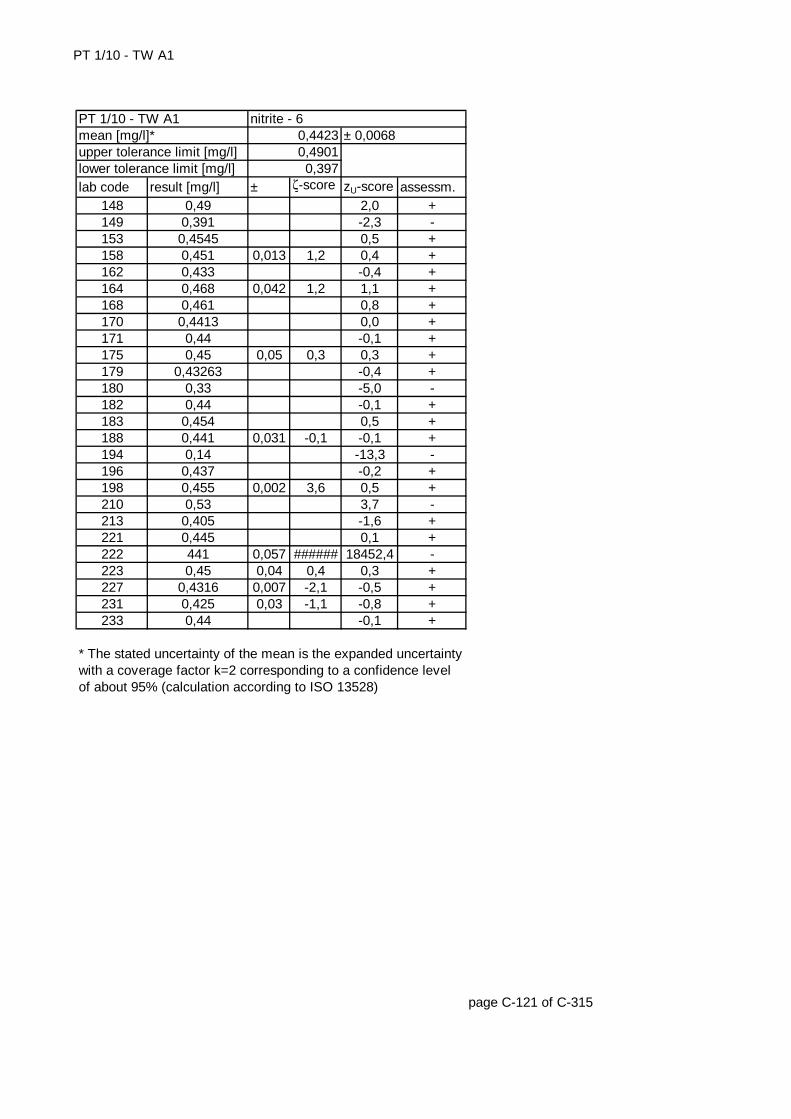
PT 1/10 - TW A1
lab code result [mg/l] ± ζ-score zU-score assessm.148 0,49 2,0 +149 0,391 -2,3 -153 0,4545 0,5 +158 0,451 0,013 1,2 0,4 +162 0,433 -0,4 +164 0,468 0,042 1,2 1,1 +168 0,461 0,8 +170 0,4413 0,0 +171 0,44 -0,1 +175 0,45 0,05 0,3 0,3 +179 0,43263 -0,4 +180 0,33 -5,0 -182 0,44 -0,1 +183 0,454 0,5 +188 0,441 0,031 -0,1 -0,1 +194 0,14 -13,3 -196 0,437 -0,2 +198 0,455 0,002 3,6 0,5 +210 0,53 3,7 -213 0,405 -1,6 +221 0,445 0,1 +222 441 0,057 ###### 18452,4 -223 0,45 0,04 0,4 0,3 +227 0,4316 0,007 -2,1 -0,5 +231 0,425 0,03 -1,1 -0,8 +233 0,44 -0,1 +
page C-121 of C-315
* The stated uncertainty of the mean is the expanded uncertainty with a coverage factor k=2 corresponding to a confidence level of about 95% (calculation according to ISO 13528)
upper tolerance limit [mg/l] 0,4901lower tolerance limit [mg/l] 0,397
PT 1/10 - TW A1 nitrite - 6mean [mg/l]* 0,4423 ± 0,0068
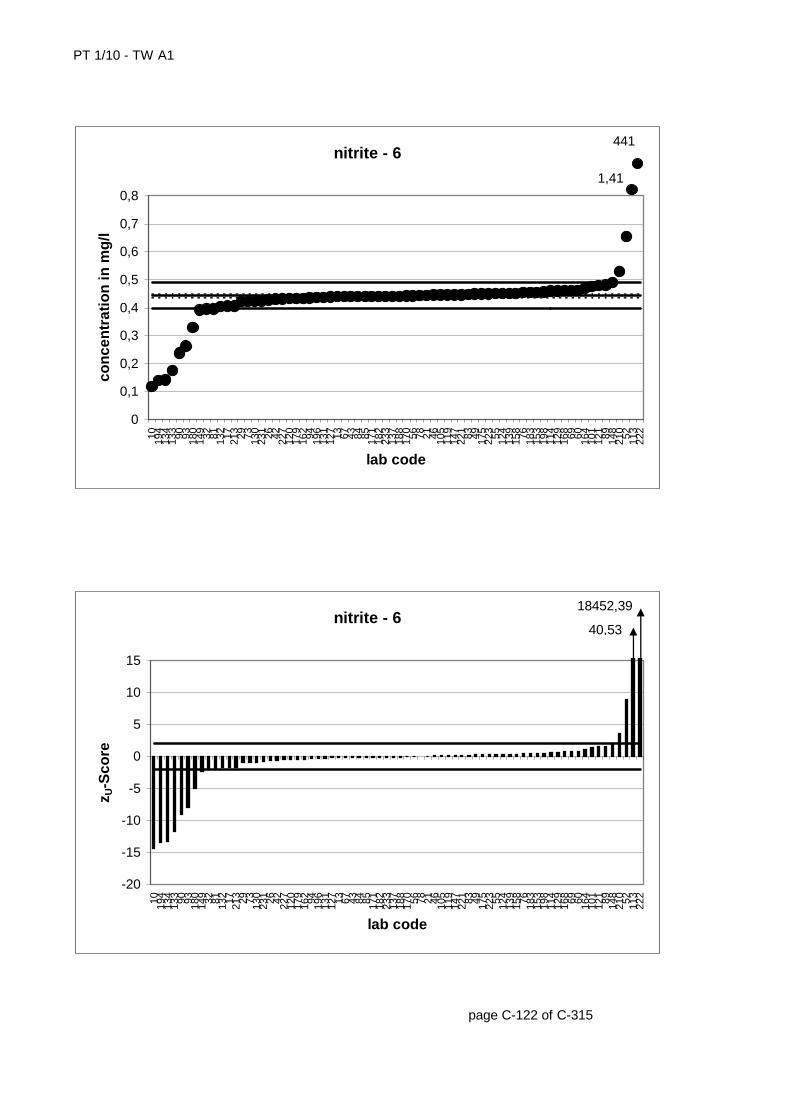
PT 1/10 - TW A1
page C-122 of C-315
nitrite - 6
0
0,1
0,2
0,3
0,4
0,5
0,6
0,7
0,8
10 194
134
133 90 93 180
149 32 81 132 17 213 29 73 130
231 26 42 227
120
179
162 94 196
131
127 13 67 43 84 85 171
182
233
137
188
170 56 78 21 46 105
119
147
221 83 49 175
223 55 124
139
158 76 183
153
198
114
129
168 69 60 164
101
121 89 148
210 52 113
222
lab code
con
cen
trat
ion
in m
g/l
441
1,41
nitrite - 6
-20
-15
-10
-5
0
5
10
15
10 194
134
133 90 93 180
149 32 81 132 17 213 29 73 130
231 26 42 227
120
179
162 94 196
131
127 13 67 43 84 85 171
182
233
137
188
170 56 78 21 46 105
119
147
221 83 49 175
223 55 124
139
158 76 183
153
198
114
129
168 69 60 164
101
121 89 148
210 52 113
222
lab code
z U-S
core
40,53
18452,39
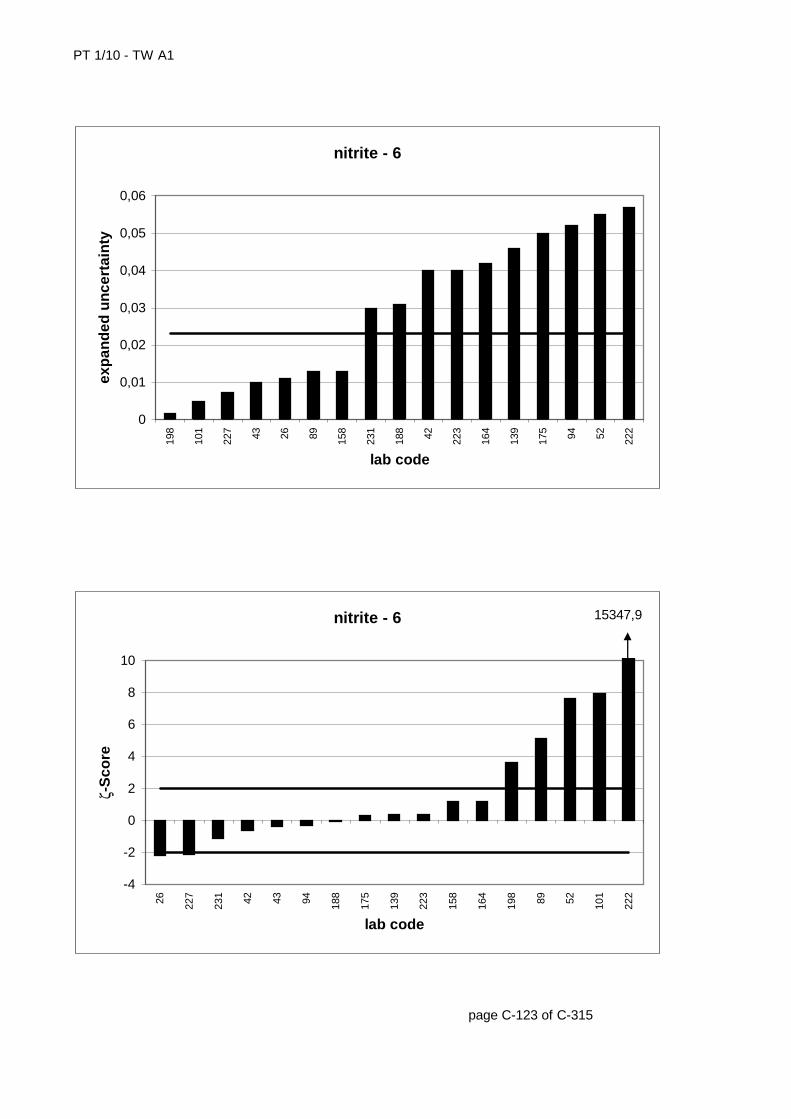
PT 1/10 - TW A1
page C-123 of C-315
nitrite - 6
0
0,01
0,02
0,03
0,04
0,05
0,06
198
101
227 43 26 89 158
231
188 42 223
164
139
175 94 52 222
lab code
exp
and
ed u
nce
rtai
nty
nitrite - 6
-4
-2
0
2
4
6
8
10
26 227
231 42 43 94 188
175
139
223
158
164
198 89 52 101
222
lab code
ζ-S
core
15347,9
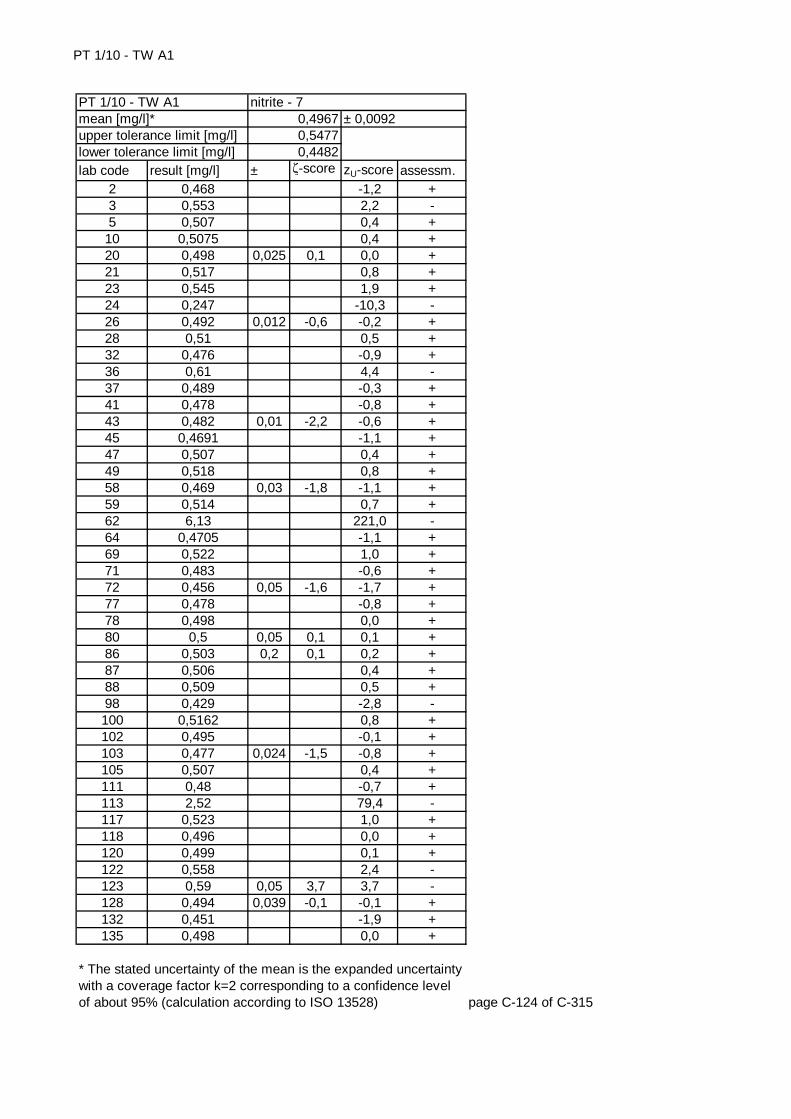
PT 1/10 - TW A1
lab code result [mg/l] ± ζ-score zU-score assessm.2 0,468 -1,2 +3 0,553 2,2 -5 0,507 0,4 +
10 0,5075 0,4 +20 0,498 0,025 0,1 0,0 +21 0,517 0,8 +23 0,545 1,9 +24 0,247 -10,3 -26 0,492 0,012 -0,6 -0,2 +28 0,51 0,5 +32 0,476 -0,9 +36 0,61 4,4 -37 0,489 -0,3 +41 0,478 -0,8 +43 0,482 0,01 -2,2 -0,6 +45 0,4691 -1,1 +47 0,507 0,4 +49 0,518 0,8 +58 0,469 0,03 -1,8 -1,1 +59 0,514 0,7 +62 6,13 221,0 -64 0,4705 -1,1 +69 0,522 1,0 +71 0,483 -0,6 +72 0,456 0,05 -1,6 -1,7 +77 0,478 -0,8 +78 0,498 0,0 +80 0,5 0,05 0,1 0,1 +86 0,503 0,2 0,1 0,2 +87 0,506 0,4 +88 0,509 0,5 +98 0,429 -2,8 -100 0,5162 0,8 +102 0,495 -0,1 +103 0,477 0,024 -1,5 -0,8 +105 0,507 0,4 +111 0,48 -0,7 +113 2,52 79,4 -117 0,523 1,0 +118 0,496 0,0 +120 0,499 0,1 +122 0,558 2,4 -123 0,59 0,05 3,7 3,7 -128 0,494 0,039 -0,1 -0,1 +132 0,451 -1,9 +135 0,498 0,0 +
page C-124 of C-315
* The stated uncertainty of the mean is the expanded uncertainty with a coverage factor k=2 corresponding to a confidence level of about 95% (calculation according to ISO 13528)
nitrite - 70,49670,54770,4482
± 0,0092PT 1/10 - TW A1mean [mg/l]*upper tolerance limit [mg/l]lower tolerance limit [mg/l]
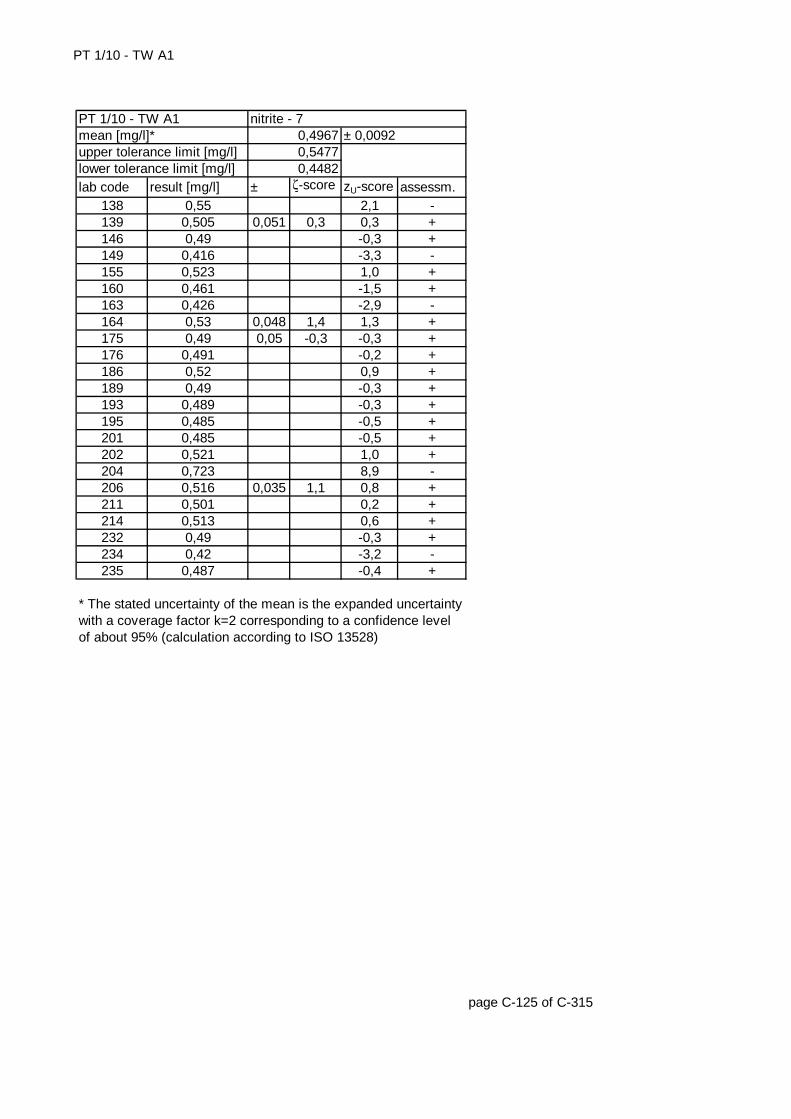
PT 1/10 - TW A1
lab code result [mg/l] ± ζ-score zU-score assessm.138 0,55 2,1 -139 0,505 0,051 0,3 0,3 +146 0,49 -0,3 +149 0,416 -3,3 -155 0,523 1,0 +160 0,461 -1,5 +163 0,426 -2,9 -164 0,53 0,048 1,4 1,3 +175 0,49 0,05 -0,3 -0,3 +176 0,491 -0,2 +186 0,52 0,9 +189 0,49 -0,3 +193 0,489 -0,3 +195 0,485 -0,5 +201 0,485 -0,5 +202 0,521 1,0 +204 0,723 8,9 -206 0,516 0,035 1,1 0,8 +211 0,501 0,2 +214 0,513 0,6 +232 0,49 -0,3 +234 0,42 -3,2 -235 0,487 -0,4 +
page C-125 of C-315
* The stated uncertainty of the mean is the expanded uncertainty with a coverage factor k=2 corresponding to a confidence level of about 95% (calculation according to ISO 13528)
upper tolerance limit [mg/l] 0,5477lower tolerance limit [mg/l] 0,4482
PT 1/10 - TW A1 nitrite - 7mean [mg/l]* 0,4967 ± 0,0092
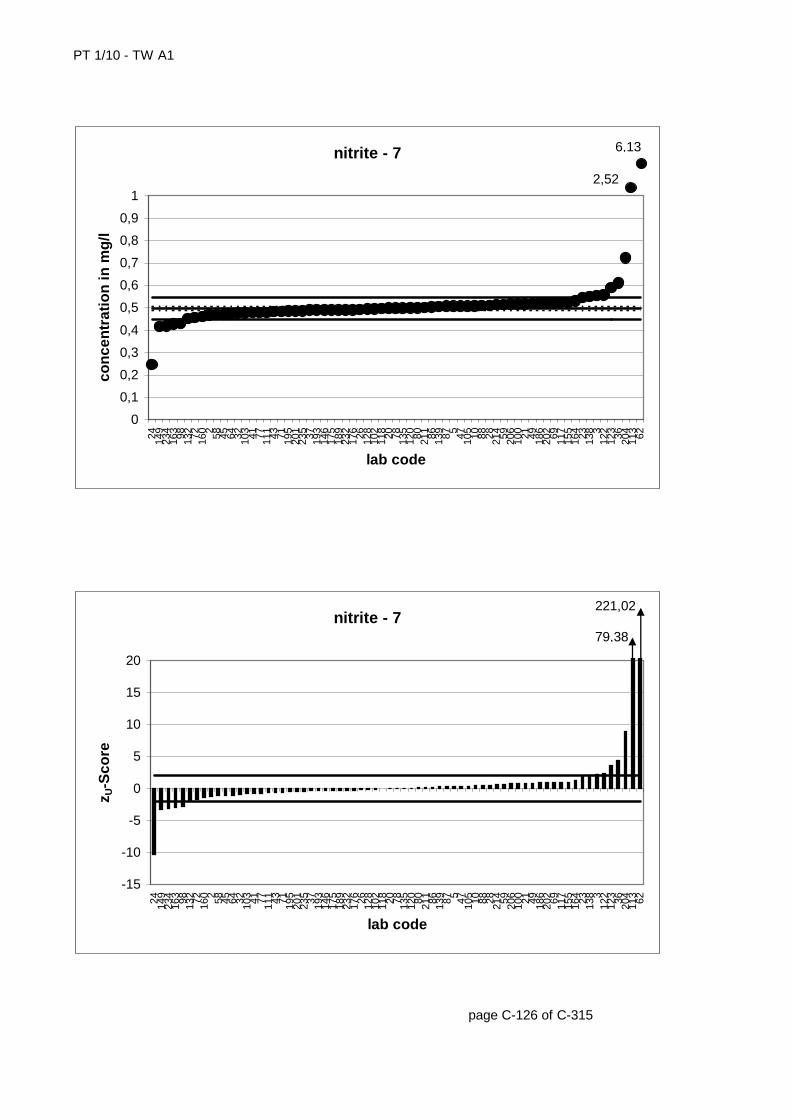
PT 1/10 - TW A1
page C-126 of C-315
nitrite - 7
0
0,1
0,2
0,3
0,4
0,5
0,6
0,7
0,8
0,9
1
24 149
234
163 98 132 72 160 2 58 45 64 32 103 41 77 111 43 71 195
201
235 37 193
146
175
189
232
176 26 128
102
118 20 78 135
120 80 211 86 139 87 5 47 105 10 88 28 214 59 206
100 21 49 186
202 69 117
155
164 23 138 3
122
123 36 204
113 62
lab code
con
cen
trat
ion
in m
g/l
2,52
6,13
nitrite - 7
-15
-10
-5
0
5
10
15
20
24 149
234
163 98 132 72 160 2 58 45 64 32 103 41 77 111 43 71 195
201
235 37 193
146
175
189
232
176 26 128
102
118 20 78 135
120 80 211 86 139 87 5 47 105 10 88 28 214 59 206
100 21 49 186
202 69 117
155
164 23 138 3
122
123 36 204
113 62
lab code
z U-S
core
79,38
221,02
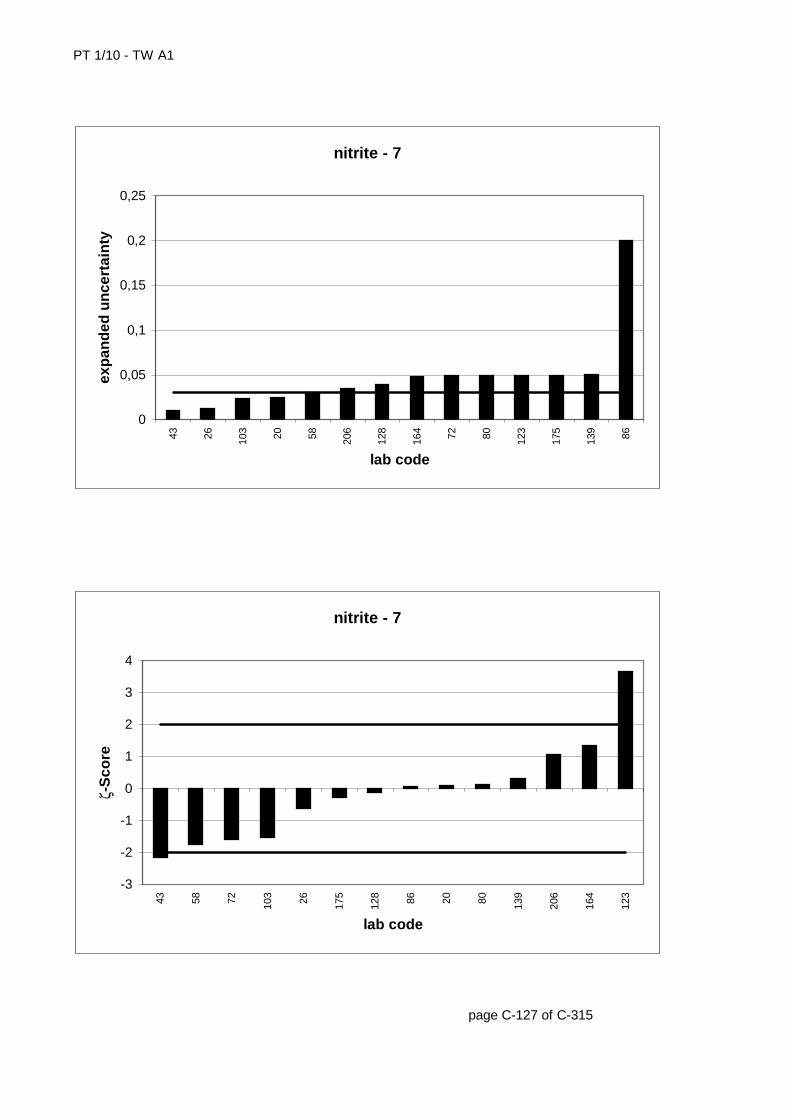
PT 1/10 - TW A1
page C-127 of C-315
nitrite - 7
0
0,05
0,1
0,15
0,2
0,25
43 26 103 20 58 206
128
164 72 80 123
175
139 86
lab code
exp
and
ed u
nce
rtai
nty
nitrite - 7
-3
-2
-1
0
1
2
3
4
43 58 72 103 26 175
128 86 20 80 139
206
164
123
lab code
ζ-S
core
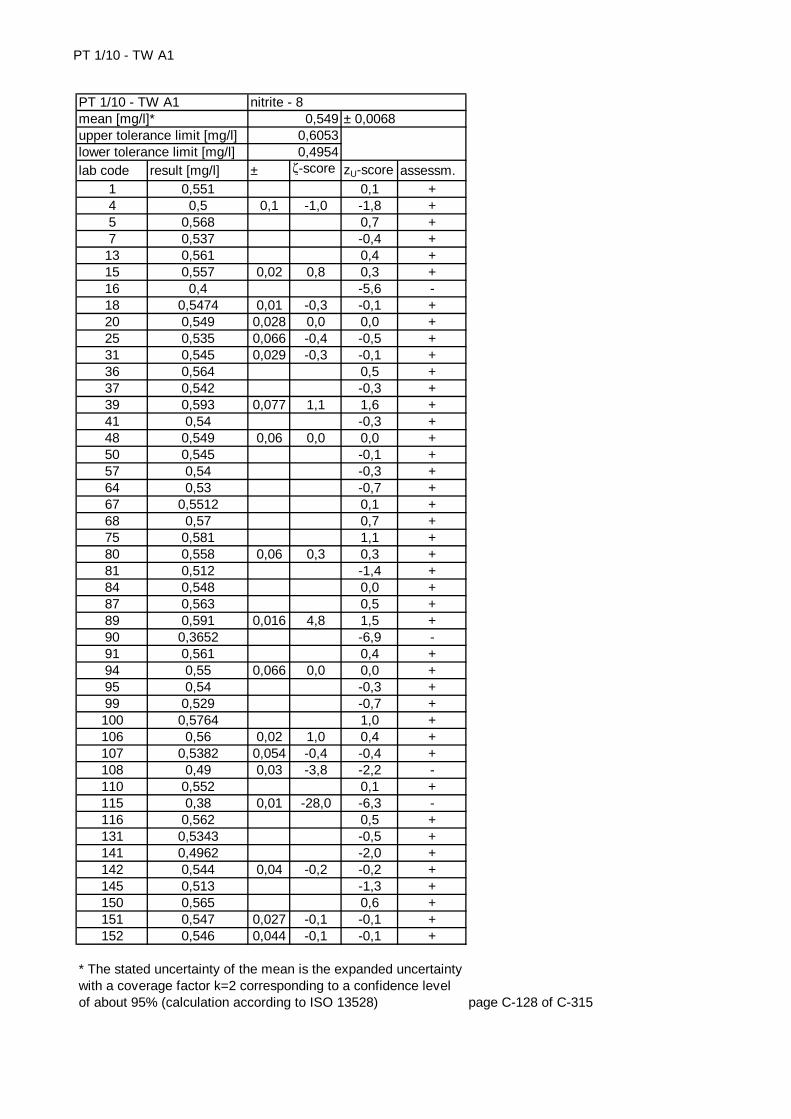
PT 1/10 - TW A1
lab code result [mg/l] ± ζ-score zU-score assessm.1 0,551 0,1 +4 0,5 0,1 -1,0 -1,8 +5 0,568 0,7 +7 0,537 -0,4 +
13 0,561 0,4 +15 0,557 0,02 0,8 0,3 +16 0,4 -5,6 -18 0,5474 0,01 -0,3 -0,1 +20 0,549 0,028 0,0 0,0 +25 0,535 0,066 -0,4 -0,5 +31 0,545 0,029 -0,3 -0,1 +36 0,564 0,5 +37 0,542 -0,3 +39 0,593 0,077 1,1 1,6 +41 0,54 -0,3 +48 0,549 0,06 0,0 0,0 +50 0,545 -0,1 +57 0,54 -0,3 +64 0,53 -0,7 +67 0,5512 0,1 +68 0,57 0,7 +75 0,581 1,1 +80 0,558 0,06 0,3 0,3 +81 0,512 -1,4 +84 0,548 0,0 +87 0,563 0,5 +89 0,591 0,016 4,8 1,5 +90 0,3652 -6,9 -91 0,561 0,4 +94 0,55 0,066 0,0 0,0 +95 0,54 -0,3 +99 0,529 -0,7 +100 0,5764 1,0 +106 0,56 0,02 1,0 0,4 +107 0,5382 0,054 -0,4 -0,4 +108 0,49 0,03 -3,8 -2,2 -110 0,552 0,1 +115 0,38 0,01 -28,0 -6,3 -116 0,562 0,5 +131 0,5343 -0,5 +141 0,4962 -2,0 +142 0,544 0,04 -0,2 -0,2 +145 0,513 -1,3 +150 0,565 0,6 +151 0,547 0,027 -0,1 -0,1 +152 0,546 0,044 -0,1 -0,1 +
page C-128 of C-315
* The stated uncertainty of the mean is the expanded uncertainty with a coverage factor k=2 corresponding to a confidence level of about 95% (calculation according to ISO 13528)
nitrite - 80,549
0,60530,4954
± 0,0068PT 1/10 - TW A1mean [mg/l]*upper tolerance limit [mg/l]lower tolerance limit [mg/l]
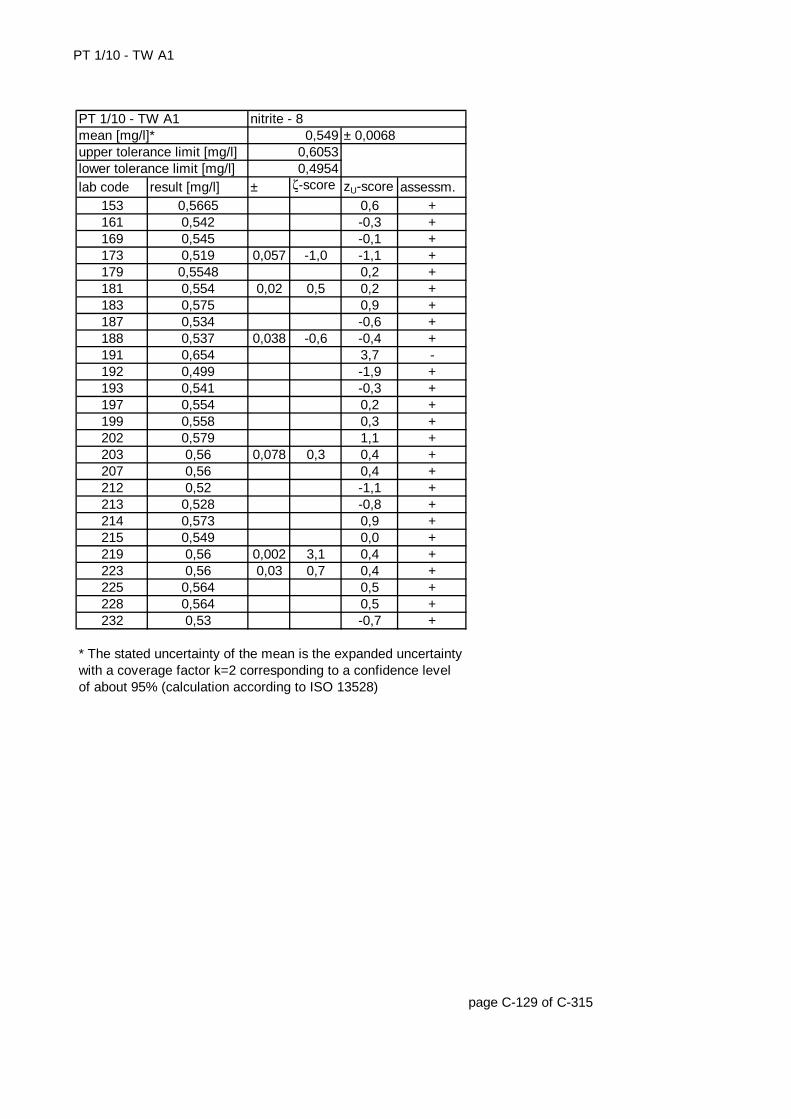
PT 1/10 - TW A1
lab code result [mg/l] ± ζ-score zU-score assessm.153 0,5665 0,6 +161 0,542 -0,3 +169 0,545 -0,1 +173 0,519 0,057 -1,0 -1,1 +179 0,5548 0,2 +181 0,554 0,02 0,5 0,2 +183 0,575 0,9 +187 0,534 -0,6 +188 0,537 0,038 -0,6 -0,4 +191 0,654 3,7 -192 0,499 -1,9 +193 0,541 -0,3 +197 0,554 0,2 +199 0,558 0,3 +202 0,579 1,1 +203 0,56 0,078 0,3 0,4 +207 0,56 0,4 +212 0,52 -1,1 +213 0,528 -0,8 +214 0,573 0,9 +215 0,549 0,0 +219 0,56 0,002 3,1 0,4 +223 0,56 0,03 0,7 0,4 +225 0,564 0,5 +228 0,564 0,5 +232 0,53 -0,7 +
page C-129 of C-315
* The stated uncertainty of the mean is the expanded uncertainty with a coverage factor k=2 corresponding to a confidence level of about 95% (calculation according to ISO 13528)
upper tolerance limit [mg/l] 0,6053lower tolerance limit [mg/l] 0,4954
PT 1/10 - TW A1 nitrite - 8mean [mg/l]* 0,549 ± 0,0068
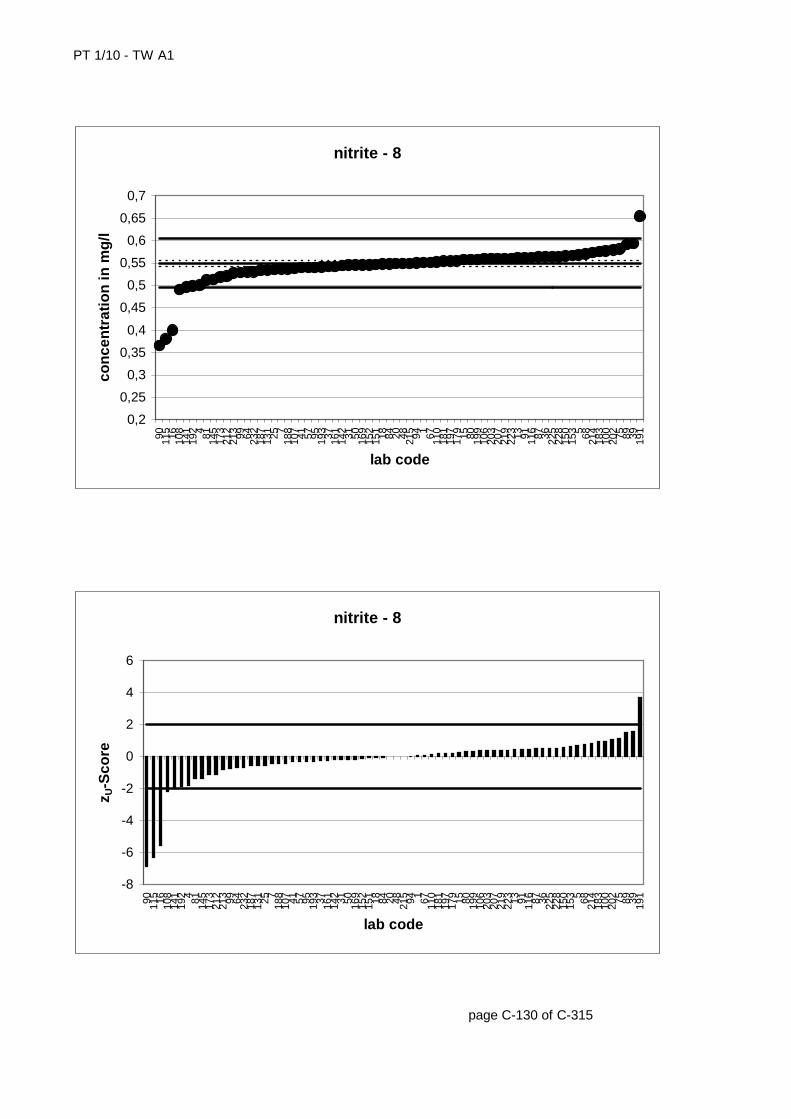
PT 1/10 - TW A1
page C-130 of C-315
nitrite - 8
0,2
0,25
0,3
0,35
0,4
0,45
0,5
0,55
0,6
0,65
0,7
90 115 16 108
141
192 4 81 145
173
212
213 99 64 232
187
131 25 7
188
107 41 57 95 193 37 161
142 31 50 169
152
151 18 84 20 48 215 94 1 67 110
181
197
179 15 80 199
106
203
207
219
223 13 91 116 87 36 225
228
150
153 5 68 214
183
100
202 75 89 39 191
lab code
con
cen
trat
ion
in m
g/l
nitrite - 8
-8
-6
-4
-2
0
2
4
6
90 115 16 108
141
192 4 81 145
173
212
213 99 64 232
187
131 25 7
188
107 41 57 95 193 37 161
142 31 50 169
152
151 18 84 20 48 215 94 1 67 110
181
197
179 15 80 199
106
203
207
219
223 13 91 116 87 36 225
228
150
153 5 68 214
183
100
202 75 89 39 191
lab code
z U-S
core
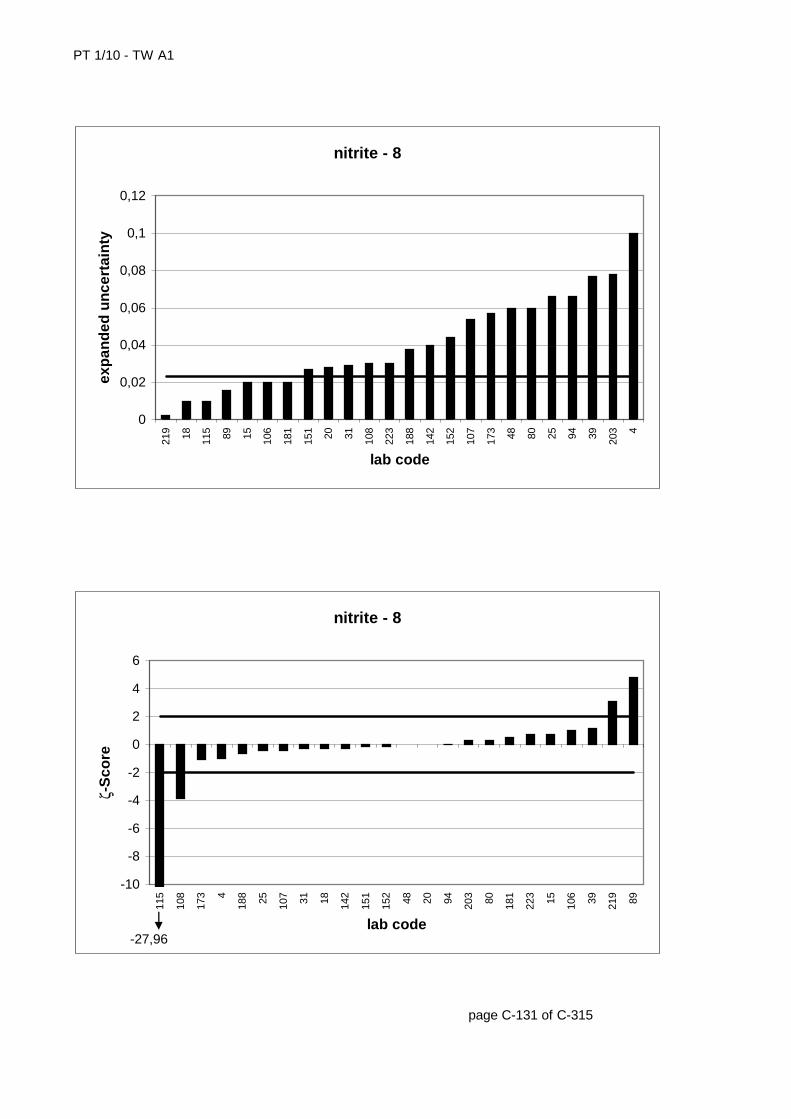
PT 1/10 - TW A1
page C-131 of C-315
nitrite - 8
0
0,02
0,04
0,06
0,08
0,1
0,12
219 18 115 89 15 106
181
151 20 31 108
223
188
142
152
107
173 48 80 25 94 39 203 4
lab code
exp
and
ed u
nce
rtai
nty
nitrite - 8
-10
-8
-6
-4
-2
0
2
4
6
115
108
173 4
188 25 107 31 18 142
151
152 48 20 94 203 80 181
223 15 106 39 219 89
lab code
ζ-S
core
-27,96
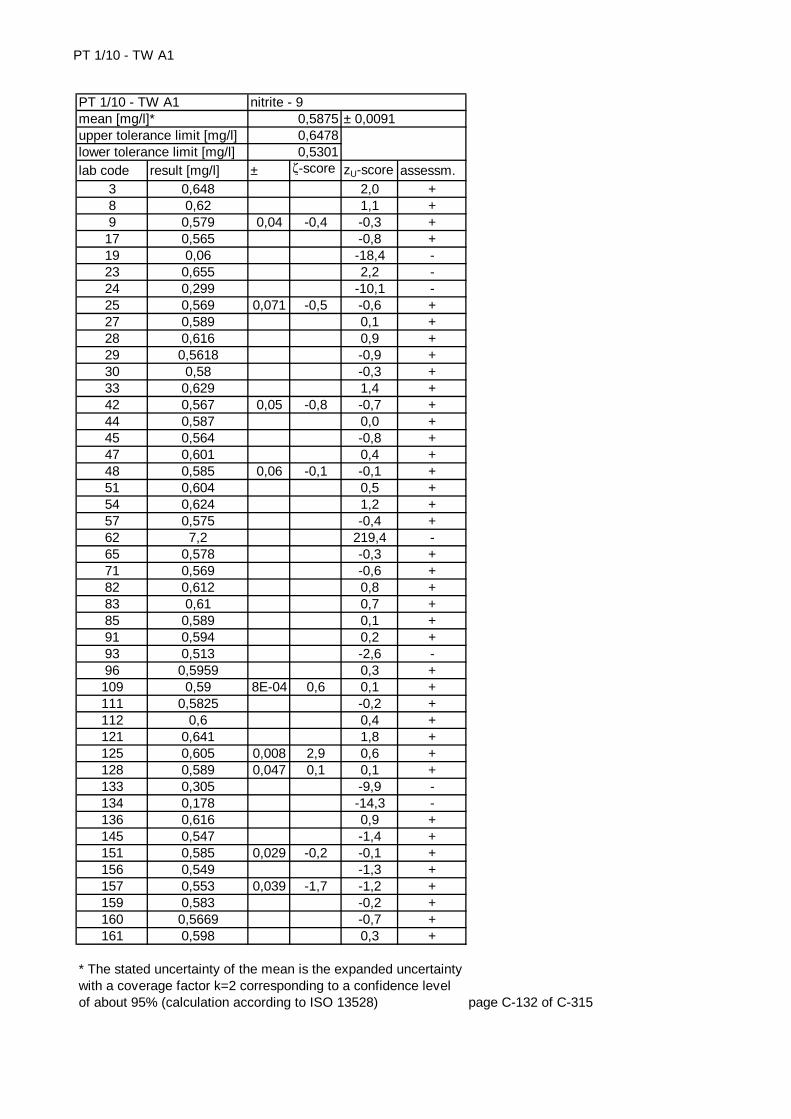
PT 1/10 - TW A1
lab code result [mg/l] ± ζ-score zU-score assessm.3 0,648 2,0 +8 0,62 1,1 +9 0,579 0,04 -0,4 -0,3 +
17 0,565 -0,8 +19 0,06 -18,4 -23 0,655 2,2 -24 0,299 -10,1 -25 0,569 0,071 -0,5 -0,6 +27 0,589 0,1 +28 0,616 0,9 +29 0,5618 -0,9 +30 0,58 -0,3 +33 0,629 1,4 +42 0,567 0,05 -0,8 -0,7 +44 0,587 0,0 +45 0,564 -0,8 +47 0,601 0,4 +48 0,585 0,06 -0,1 -0,1 +51 0,604 0,5 +54 0,624 1,2 +57 0,575 -0,4 +62 7,2 219,4 -65 0,578 -0,3 +71 0,569 -0,6 +82 0,612 0,8 +83 0,61 0,7 +85 0,589 0,1 +91 0,594 0,2 +93 0,513 -2,6 -96 0,5959 0,3 +109 0,59 8E-04 0,6 0,1 +111 0,5825 -0,2 +112 0,6 0,4 +121 0,641 1,8 +125 0,605 0,008 2,9 0,6 +128 0,589 0,047 0,1 0,1 +133 0,305 -9,9 -134 0,178 -14,3 -136 0,616 0,9 +145 0,547 -1,4 +151 0,585 0,029 -0,2 -0,1 +156 0,549 -1,3 +157 0,553 0,039 -1,7 -1,2 +159 0,583 -0,2 +160 0,5669 -0,7 +161 0,598 0,3 +
page C-132 of C-315
* The stated uncertainty of the mean is the expanded uncertainty with a coverage factor k=2 corresponding to a confidence level of about 95% (calculation according to ISO 13528)
nitrite - 90,58750,64780,5301
± 0,0091PT 1/10 - TW A1mean [mg/l]*upper tolerance limit [mg/l]lower tolerance limit [mg/l]
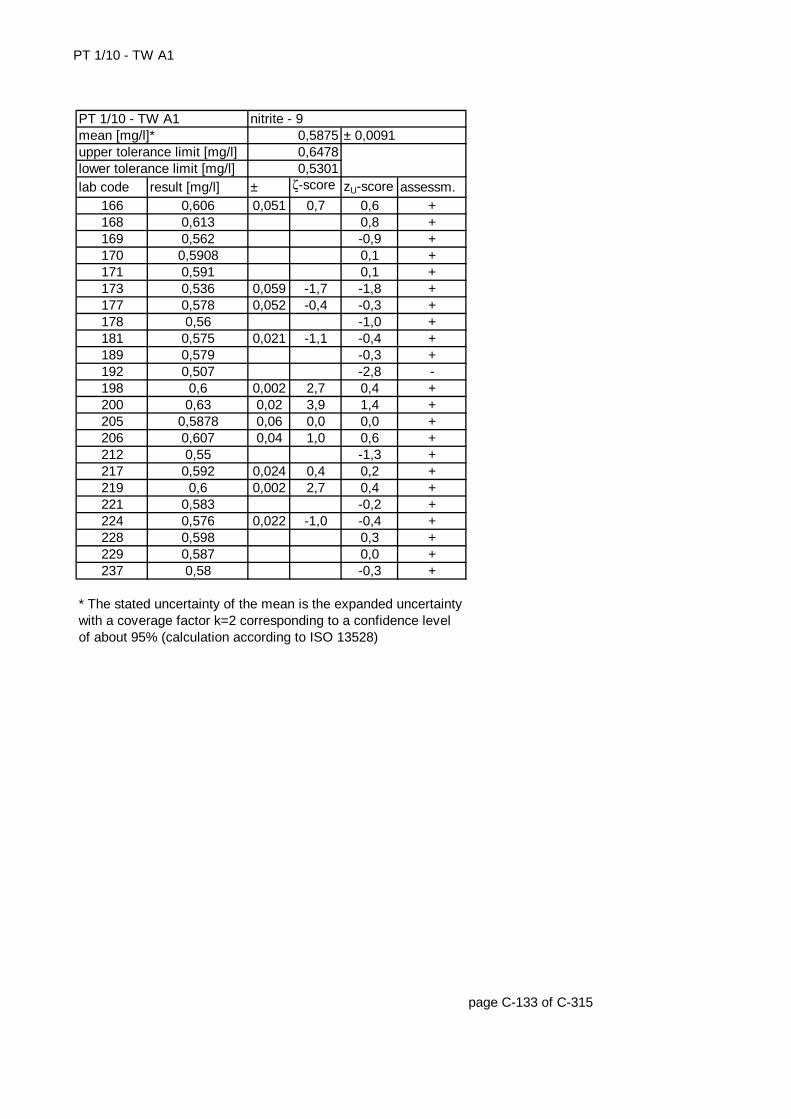
PT 1/10 - TW A1
lab code result [mg/l] ± ζ-score zU-score assessm.166 0,606 0,051 0,7 0,6 +168 0,613 0,8 +169 0,562 -0,9 +170 0,5908 0,1 +171 0,591 0,1 +173 0,536 0,059 -1,7 -1,8 +177 0,578 0,052 -0,4 -0,3 +178 0,56 -1,0 +181 0,575 0,021 -1,1 -0,4 +189 0,579 -0,3 +192 0,507 -2,8 -198 0,6 0,002 2,7 0,4 +200 0,63 0,02 3,9 1,4 +205 0,5878 0,06 0,0 0,0 +206 0,607 0,04 1,0 0,6 +212 0,55 -1,3 +217 0,592 0,024 0,4 0,2 +219 0,6 0,002 2,7 0,4 +221 0,583 -0,2 +224 0,576 0,022 -1,0 -0,4 +228 0,598 0,3 +229 0,587 0,0 +237 0,58 -0,3 +
page C-133 of C-315
* The stated uncertainty of the mean is the expanded uncertainty with a coverage factor k=2 corresponding to a confidence level of about 95% (calculation according to ISO 13528)
upper tolerance limit [mg/l] 0,6478lower tolerance limit [mg/l] 0,5301
PT 1/10 - TW A1 nitrite - 9mean [mg/l]* 0,5875 ± 0,0091
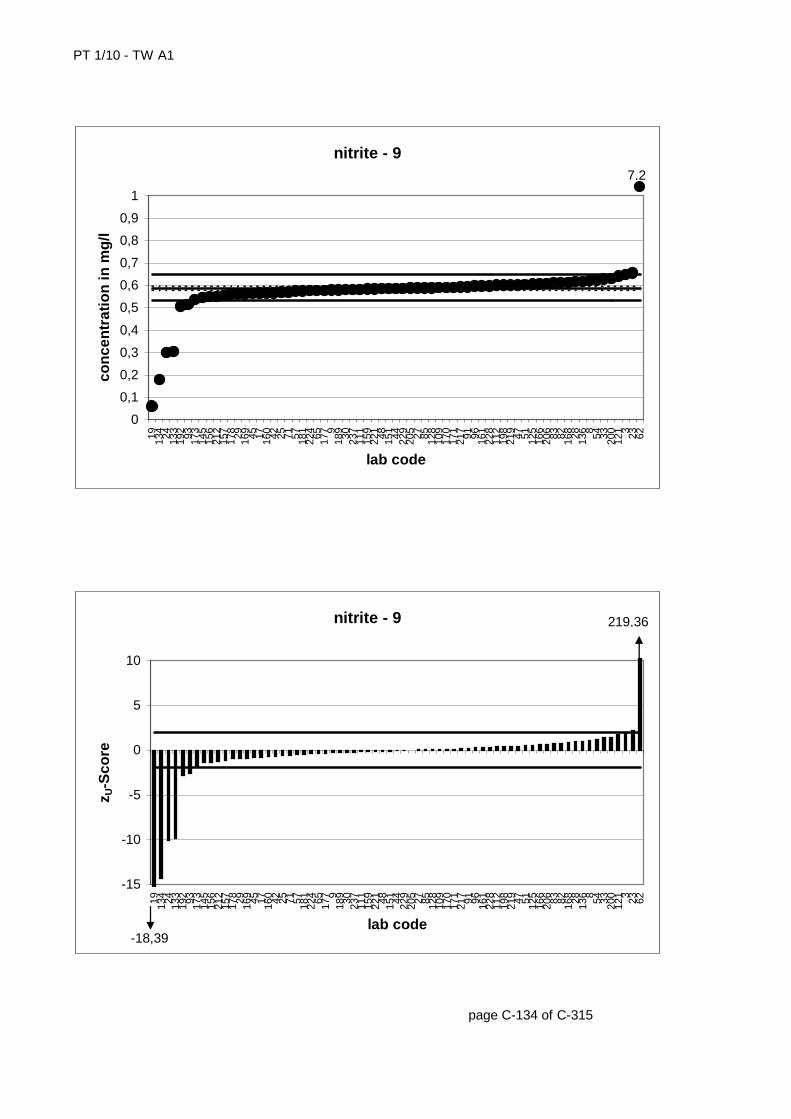
PT 1/10 - TW A1
page C-134 of C-315
nitrite - 9
0
0,1
0,2
0,3
0,4
0,5
0,6
0,7
0,8
0,9
1
19 134 24 133
192 93 173
145
156
212
157
178 29 169 45 17 160 42 25 71 57 181
224 65 177 9
189 30 237
111
159
221 48 151 44 229
205 27 85 128
109
170
171
217 91 96 161
228
112
198
219 47 51 125
166
206 83 82 168 28 136 8 54 33 200
121 3 23 62
lab code
con
cen
trat
ion
in m
g/l
7,2
nitrite - 9
-15
-10
-5
0
5
10
19 134 24 133
192 93 173
145
156
212
157
178 29 169 45 17 160 42 25 71 57 181
224 65 177 9
189 30 237
111
159
221 48 151 44 229
205 27 85 128
109
170
171
217 91 96 161
228
112
198
219 47 51 125
166
206 83 82 168 28 136 8 54 33 200
121 3 23 62
lab code
z U-S
core
219,36
-18,39
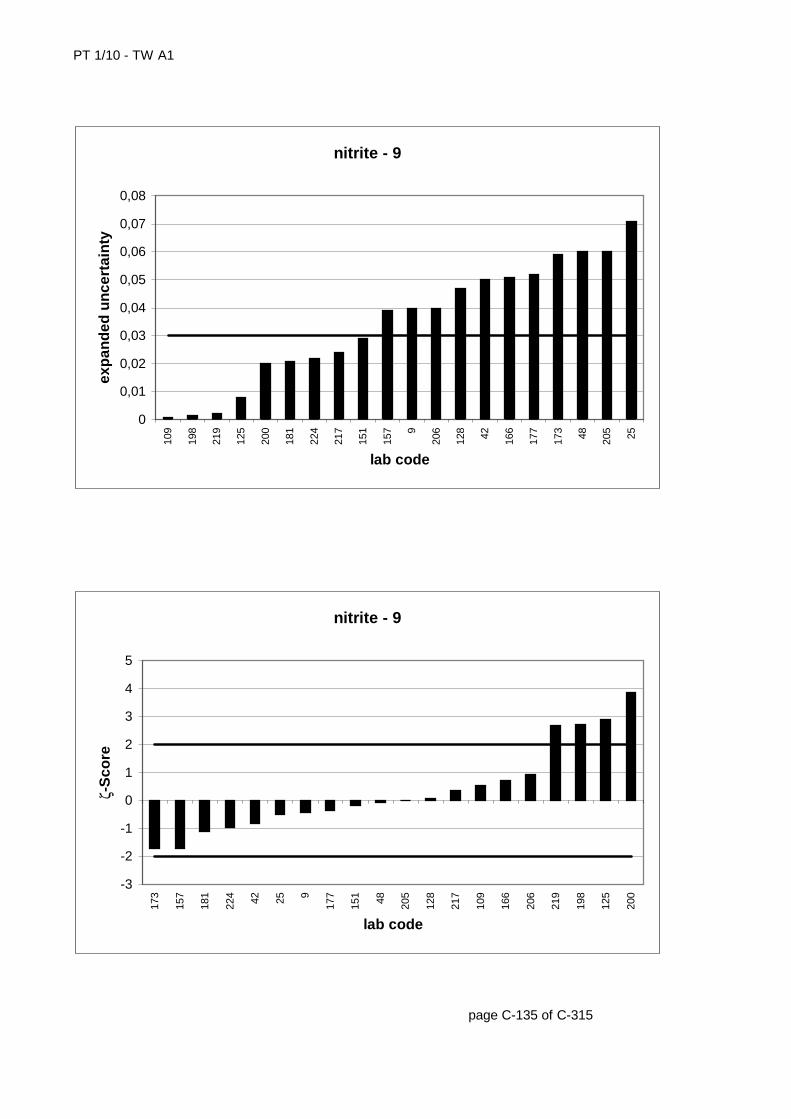
PT 1/10 - TW A1
page C-135 of C-315
nitrite - 9
0
0,01
0,02
0,03
0,04
0,05
0,06
0,07
0,08
109
198
219
125
200
181
224
217
151
157 9
206
128 42 166
177
173 48 205 25
lab code
exp
and
ed u
nce
rtai
nty
nitrite - 9
-3
-2
-1
0
1
2
3
4
5
173
157
181
224 42 25 9
177
151 48 205
128
217
109
166
206
219
198
125
200
lab code
ζ-S
core
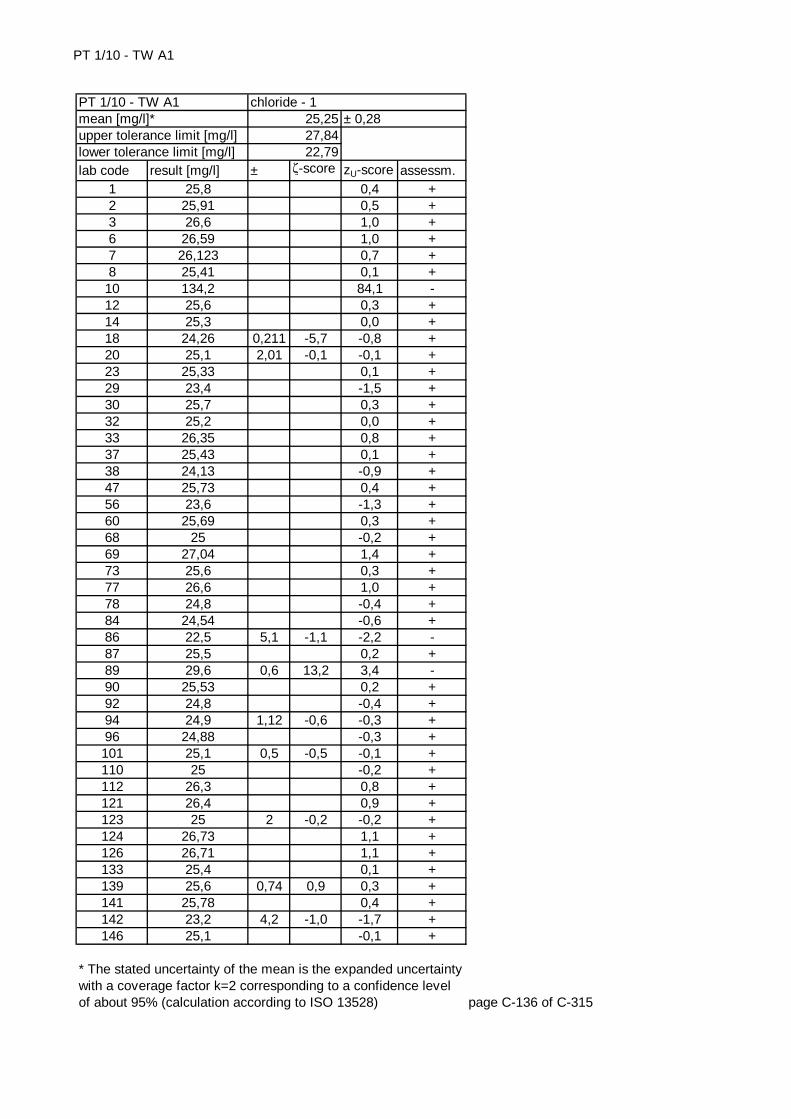
PT 1/10 - TW A1
lab code result [mg/l] ± ζ-score zU-score assessm.1 25,8 0,4 +2 25,91 0,5 +3 26,6 1,0 +6 26,59 1,0 +7 26,123 0,7 +8 25,41 0,1 +
10 134,2 84,1 -12 25,6 0,3 +14 25,3 0,0 +18 24,26 0,211 -5,7 -0,8 +20 25,1 2,01 -0,1 -0,1 +23 25,33 0,1 +29 23,4 -1,5 +30 25,7 0,3 +32 25,2 0,0 +33 26,35 0,8 +37 25,43 0,1 +38 24,13 -0,9 +47 25,73 0,4 +56 23,6 -1,3 +60 25,69 0,3 +68 25 -0,2 +69 27,04 1,4 +73 25,6 0,3 +77 26,6 1,0 +78 24,8 -0,4 +84 24,54 -0,6 +86 22,5 5,1 -1,1 -2,2 -87 25,5 0,2 +89 29,6 0,6 13,2 3,4 -90 25,53 0,2 +92 24,8 -0,4 +94 24,9 1,12 -0,6 -0,3 +96 24,88 -0,3 +101 25,1 0,5 -0,5 -0,1 +110 25 -0,2 +112 26,3 0,8 +121 26,4 0,9 +123 25 2 -0,2 -0,2 +124 26,73 1,1 +126 26,71 1,1 +133 25,4 0,1 +139 25,6 0,74 0,9 0,3 +141 25,78 0,4 +142 23,2 4,2 -1,0 -1,7 +146 25,1 -0,1 +
page C-136 of C-315
* The stated uncertainty of the mean is the expanded uncertainty with a coverage factor k=2 corresponding to a confidence level of about 95% (calculation according to ISO 13528)
chloride - 125,2527,8422,79
± 0,28PT 1/10 - TW A1mean [mg/l]*upper tolerance limit [mg/l]lower tolerance limit [mg/l]

PT 1/10 - TW A1
lab code result [mg/l] ± ζ-score zU-score assessm.147 24,2 -0,9 +149 25,43 0,1 +157 27,05 1,9 1,9 1,4 +158 25 1,06 -0,5 -0,2 +159 24,85 -0,3 +160 24,8536 -0,3 +163 25 -0,2 +168 25,44 0,1 +171 25,7 0,3 +173 24,5 2,1 -0,7 -0,6 +176 22,6 -2,2 -177 89,08 8,9 14,3 49,3 -181 25,3 0,68 0,1 0,0 +182 23,4 -1,5 +195 25,13 -0,1 +197 24,2 -0,9 +199 25,28 0,0 +202 24,1 -0,9 +207 24,55 -0,6 +211 26,8 1,2 +212 25 -0,2 +214 24,34 -0,7 +217 25,3 1,2 0,1 0,0 +222 25,7 2,21 0,4 0,3 +224 25,63 0,15 2,4 0,3 +225 24,9 -0,3 +228 25,88 0,5 +230 23,2 -1,7 +231 25,5 0,2 +
page C-137 of C-315
* The stated uncertainty of the mean is the expanded uncertainty with a coverage factor k=2 corresponding to a confidence level of about 95% (calculation according to ISO 13528)
upper tolerance limit [mg/l] 27,84lower tolerance limit [mg/l] 22,79
PT 1/10 - TW A1 chloride - 1mean [mg/l]* 25,25 ± 0,28
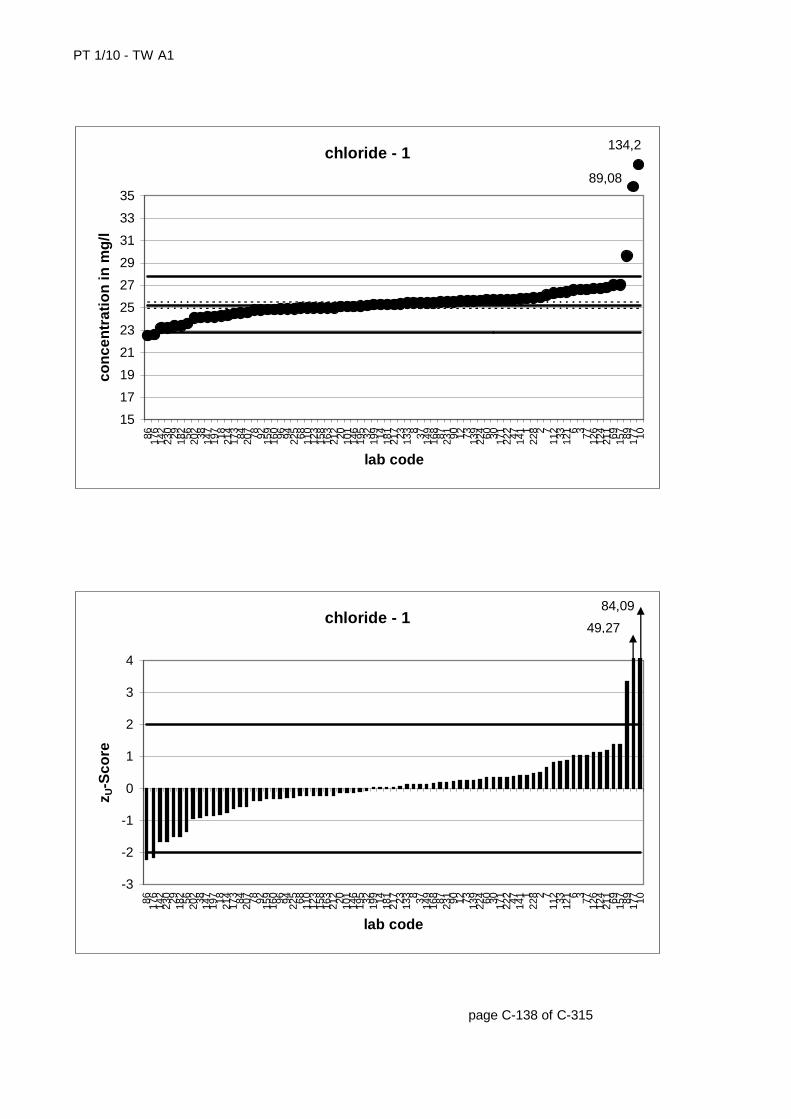
PT 1/10 - TW A1
page C-138 of C-315
chloride - 1
15
17
19
21
23
25
27
29
31
33
35
86 176
142
230 29 182 56 202 38 147
197 18 214
173 84 207 78 92 159
160 96 94 225 68 110
123
158
163
212 20 101
146
195 32 199 14 181
217 23 133 8 37 149
168 87 231 90 12 73 139
224 60 30 171
222 47 141 1
228 2 7
112 33 121 6 3 77 126
124
211 69 157 89 177 10
lab code
con
cen
trat
ion
in m
g/l
89,08
134,2
chloride - 1
-3
-2
-1
0
1
2
3
4
86 176
142
230 29 182 56 202 38 147
197 18 214
173 84 207 78 92 159
160 96 94 225 68 110
123
158
163
212 20 101
146
195 32 199 14 181
217 23 133 8 37 149
168 87 231 90 12 73 139
224 60 30 171
222 47 141 1
228 2 7
112 33 121 6 3 77 126
124
211 69 157 89 177 10
lab code
z U-S
core
49,27
84,09
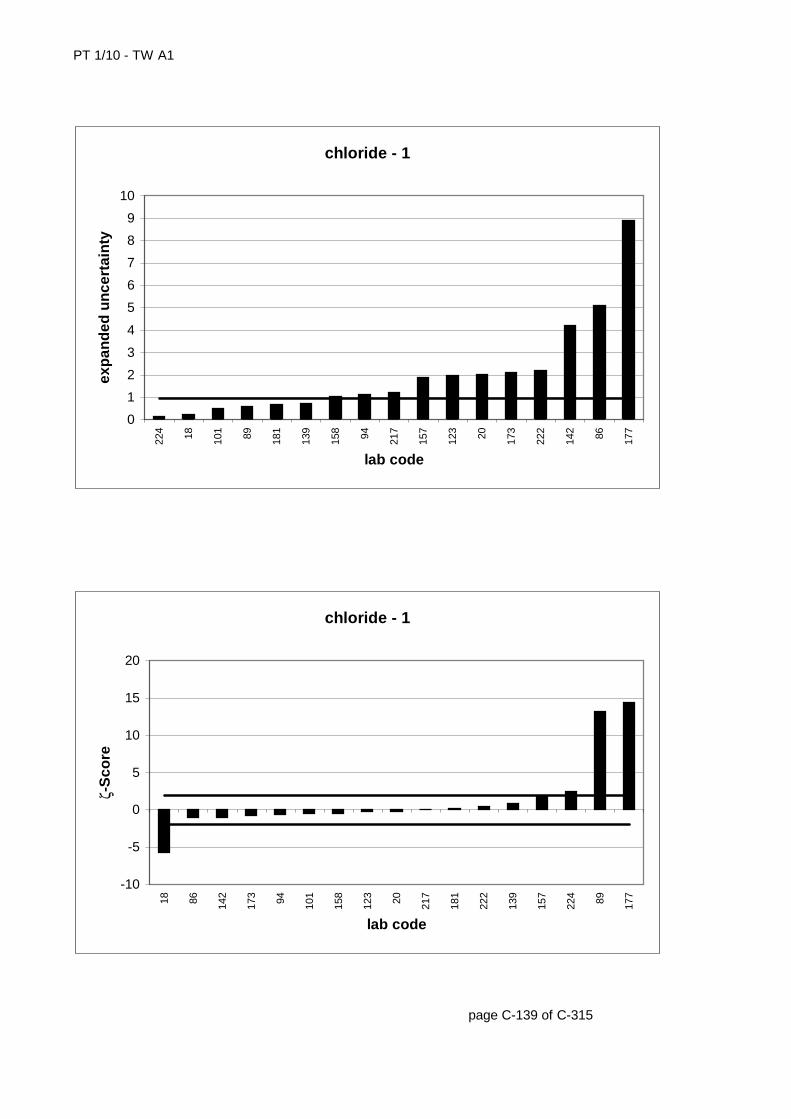
PT 1/10 - TW A1
page C-139 of C-315
chloride - 1
0
1
2
3
4
5
6
7
8
9
10
224 18 101 89 181
139
158 94 217
157
123 20 173
222
142 86 177
lab code
exp
and
ed u
nce
rtai
nty
chloride - 1
-10
-5
0
5
10
15
20
18 86 142
173 94 101
158
123 20 217
181
222
139
157
224 89 177
lab code
ζ-S
core
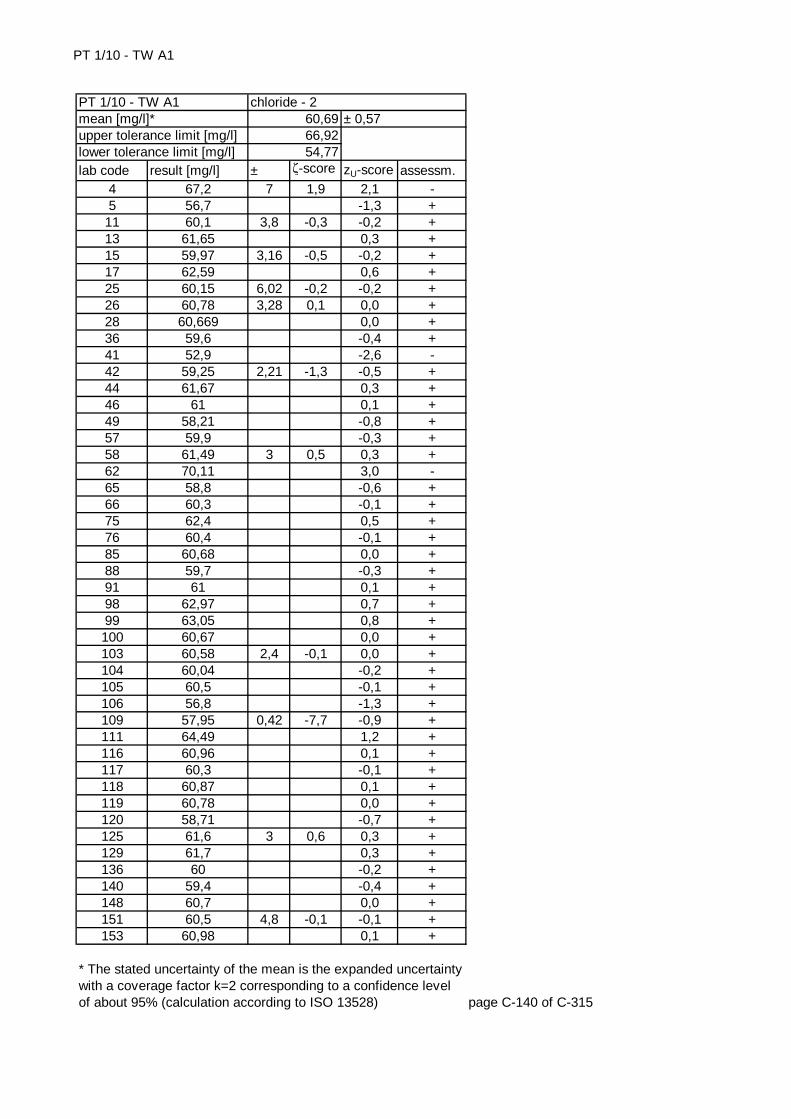
PT 1/10 - TW A1
lab code result [mg/l] ± ζ-score zU-score assessm.4 67,2 7 1,9 2,1 -5 56,7 -1,3 +
11 60,1 3,8 -0,3 -0,2 +13 61,65 0,3 +15 59,97 3,16 -0,5 -0,2 +17 62,59 0,6 +25 60,15 6,02 -0,2 -0,2 +26 60,78 3,28 0,1 0,0 +28 60,669 0,0 +36 59,6 -0,4 +41 52,9 -2,6 -42 59,25 2,21 -1,3 -0,5 +44 61,67 0,3 +46 61 0,1 +49 58,21 -0,8 +57 59,9 -0,3 +58 61,49 3 0,5 0,3 +62 70,11 3,0 -65 58,8 -0,6 +66 60,3 -0,1 +75 62,4 0,5 +76 60,4 -0,1 +85 60,68 0,0 +88 59,7 -0,3 +91 61 0,1 +98 62,97 0,7 +99 63,05 0,8 +100 60,67 0,0 +103 60,58 2,4 -0,1 0,0 +104 60,04 -0,2 +105 60,5 -0,1 +106 56,8 -1,3 +109 57,95 0,42 -7,7 -0,9 +111 64,49 1,2 +116 60,96 0,1 +117 60,3 -0,1 +118 60,87 0,1 +119 60,78 0,0 +120 58,71 -0,7 +125 61,6 3 0,6 0,3 +129 61,7 0,3 +136 60 -0,2 +140 59,4 -0,4 +148 60,7 0,0 +151 60,5 4,8 -0,1 -0,1 +153 60,98 0,1 +
page C-140 of C-315
* The stated uncertainty of the mean is the expanded uncertainty with a coverage factor k=2 corresponding to a confidence level of about 95% (calculation according to ISO 13528)
chloride - 260,6966,9254,77
± 0,57PT 1/10 - TW A1mean [mg/l]*upper tolerance limit [mg/l]lower tolerance limit [mg/l]

PT 1/10 - TW A1
lab code result [mg/l] ± ζ-score zU-score assessm.155 60,08 -0,2 +161 58,08 -0,9 +164 60,6 3,03 -0,1 0,0 +166 60,417 3,02 -0,2 -0,1 +170 58,91 0,94 -3,2 -0,6 +178 60,4 -0,1 +183 53,71 -2,4 -187 58,8 -0,6 +188 62,03 2,48 1,0 0,4 +189 61,64 0,3 +190 63,4 0,51 7,1 0,9 +191 62,7 0,6 +194 59,98 -0,2 +196 63,07 0,8 +198 61 0,1 +200 67 2 6,1 2,0 +203 57,2 2,8 -2,4 -1,2 +205 61,74 3 0,7 0,3 +209 61,654 0,3 +213 63,5 0,9 +216 63,25 6,02 0,8 0,8 +219 53 0,1 -26,6 -2,6 -226 61,76 0,3 +234 60,2 -0,2 +
page C-141 of C-315
* The stated uncertainty of the mean is the expanded uncertainty with a coverage factor k=2 corresponding to a confidence level of about 95% (calculation according to ISO 13528)
upper tolerance limit [mg/l] 66,92lower tolerance limit [mg/l] 54,77
PT 1/10 - TW A1 chloride - 2mean [mg/l]* 60,69 ± 0,57
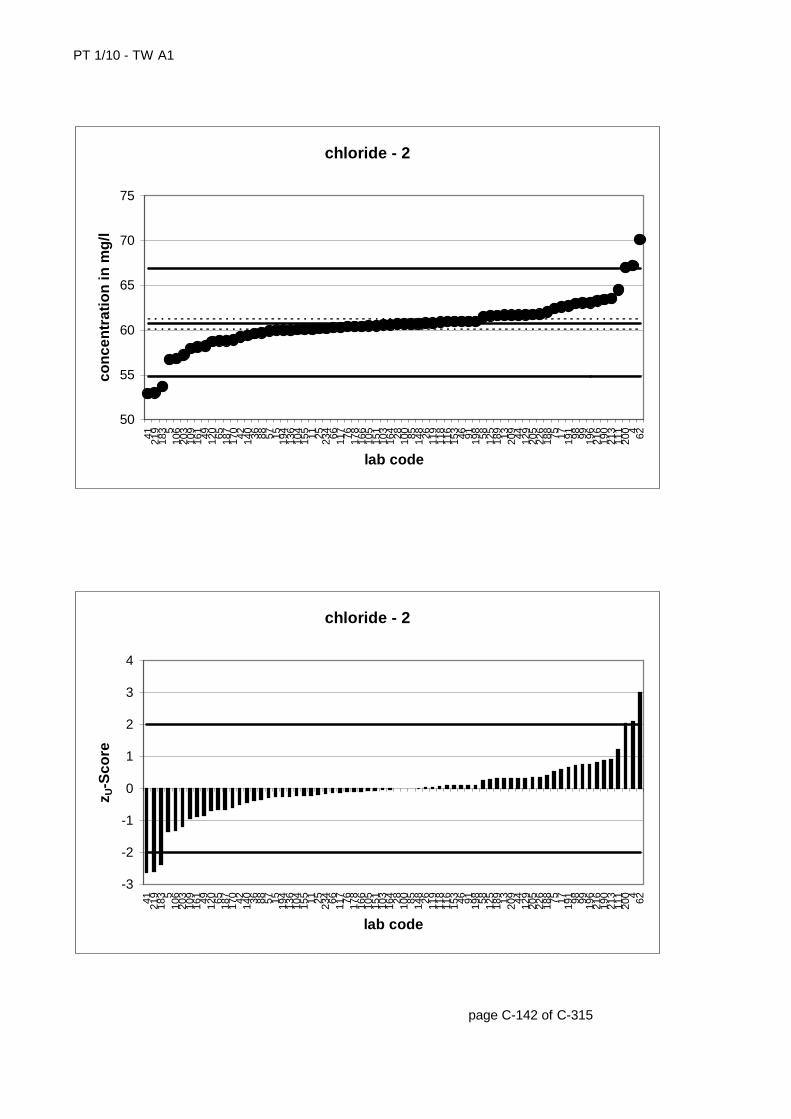
PT 1/10 - TW A1
page C-142 of C-315
chloride - 2
50
55
60
65
70
75
41 219
183 5
106
203
109
161 49 120 65 187
170 42 140 36 88 57 15 194
136
104
155 11 25 234 66 117 76 178
166
105
151
103
164 28 100 85 148 26 119
118
116
153 46 91 198 58 125
189 13 209 44 129
205
226
188 75 17 191 98 99 196
216
190
213
111
200 4 62
lab code
con
cen
trat
ion
in m
g/l
chloride - 2
-3
-2
-1
0
1
2
3
4
41 219
183 5
106
203
109
161 49 120 65 187
170 42 140 36 88 57 15 194
136
104
155 11 25 234 66 117 76 178
166
105
151
103
164 28 100 85 148 26 119
118
116
153 46 91 198 58 125
189 13 209 44 129
205
226
188 75 17 191 98 99 196
216
190
213
111
200 4 62
lab code
z U-S
core

PT 1/10 - TW A1
page C-143 of C-315
chloride - 2
0
1
2
3
4
5
6
7
8
219
109
190
170
200 42 103
188
203 58 125
205
166
164 15 26 11 151 25 216 4
lab code
exp
and
ed u
nce
rtai
nty
chloride - 2
-30
-25
-20
-15
-10
-5
0
5
10
219
109
170
203 42 15 11 166 25 103
151
164 26 58 125
205
216
188 4
200
190
lab code
ζ-S
core
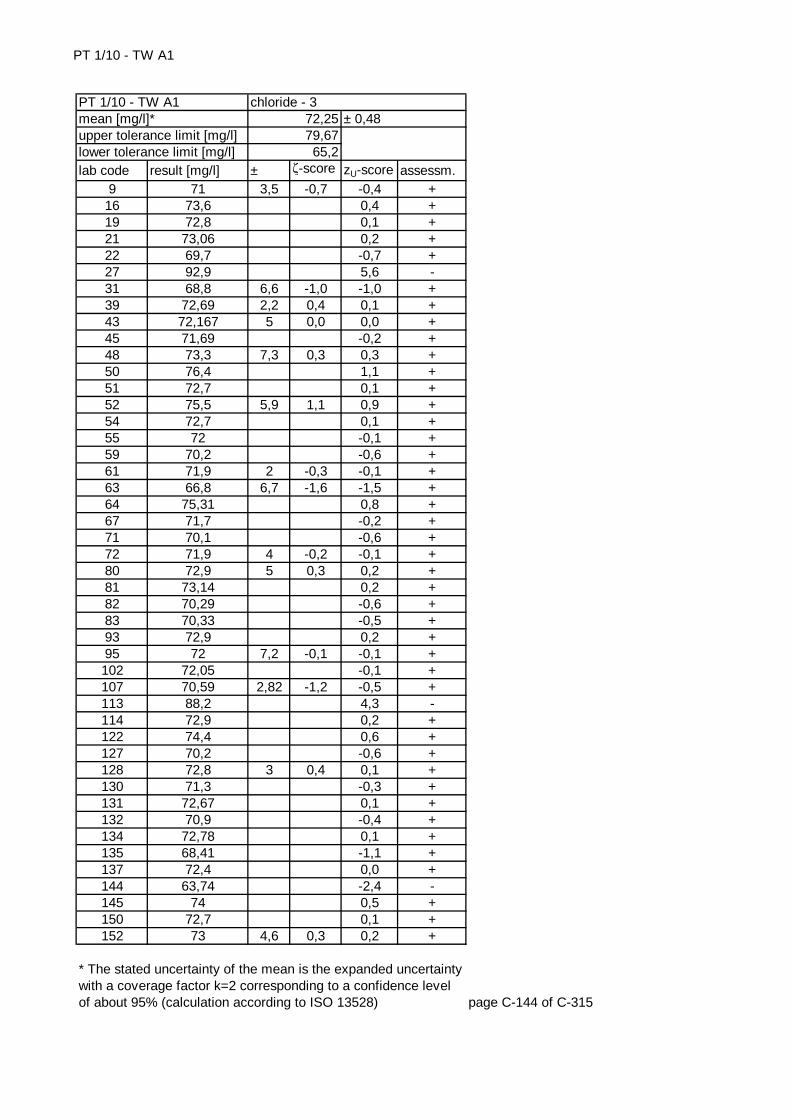
PT 1/10 - TW A1
lab code result [mg/l] ± ζ-score zU-score assessm.9 71 3,5 -0,7 -0,4 +
16 73,6 0,4 +19 72,8 0,1 +21 73,06 0,2 +22 69,7 -0,7 +27 92,9 5,6 -31 68,8 6,6 -1,0 -1,0 +39 72,69 2,2 0,4 0,1 +43 72,167 5 0,0 0,0 +45 71,69 -0,2 +48 73,3 7,3 0,3 0,3 +50 76,4 1,1 +51 72,7 0,1 +52 75,5 5,9 1,1 0,9 +54 72,7 0,1 +55 72 -0,1 +59 70,2 -0,6 +61 71,9 2 -0,3 -0,1 +63 66,8 6,7 -1,6 -1,5 +64 75,31 0,8 +67 71,7 -0,2 +71 70,1 -0,6 +72 71,9 4 -0,2 -0,1 +80 72,9 5 0,3 0,2 +81 73,14 0,2 +82 70,29 -0,6 +83 70,33 -0,5 +93 72,9 0,2 +95 72 7,2 -0,1 -0,1 +102 72,05 -0,1 +107 70,59 2,82 -1,2 -0,5 +113 88,2 4,3 -114 72,9 0,2 +122 74,4 0,6 +127 70,2 -0,6 +128 72,8 3 0,4 0,1 +130 71,3 -0,3 +131 72,67 0,1 +132 70,9 -0,4 +134 72,78 0,1 +135 68,41 -1,1 +137 72,4 0,0 +144 63,74 -2,4 -145 74 0,5 +150 72,7 0,1 +152 73 4,6 0,3 0,2 +
page C-144 of C-315
* The stated uncertainty of the mean is the expanded uncertainty with a coverage factor k=2 corresponding to a confidence level of about 95% (calculation according to ISO 13528)
chloride - 372,2579,6765,2
± 0,48PT 1/10 - TW A1mean [mg/l]*upper tolerance limit [mg/l]lower tolerance limit [mg/l]
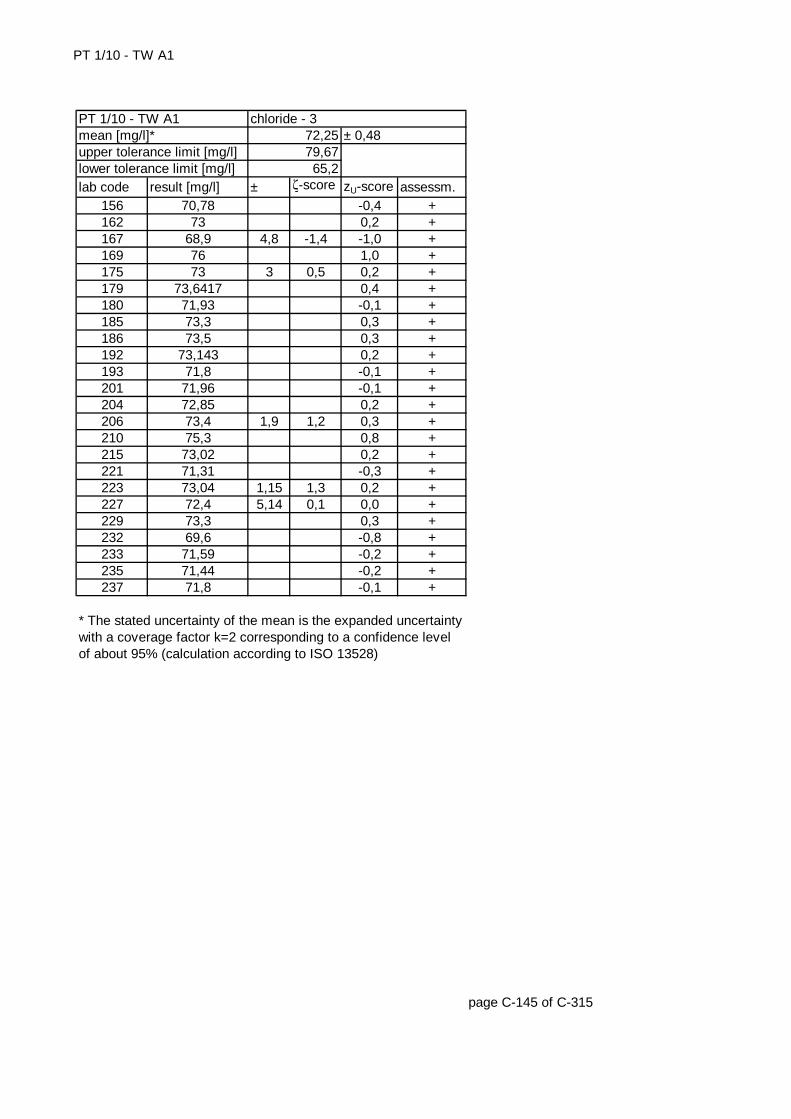
PT 1/10 - TW A1
lab code result [mg/l] ± ζ-score zU-score assessm.156 70,78 -0,4 +162 73 0,2 +167 68,9 4,8 -1,4 -1,0 +169 76 1,0 +175 73 3 0,5 0,2 +179 73,6417 0,4 +180 71,93 -0,1 +185 73,3 0,3 +186 73,5 0,3 +192 73,143 0,2 +193 71,8 -0,1 +201 71,96 -0,1 +204 72,85 0,2 +206 73,4 1,9 1,2 0,3 +210 75,3 0,8 +215 73,02 0,2 +221 71,31 -0,3 +223 73,04 1,15 1,3 0,2 +227 72,4 5,14 0,1 0,0 +229 73,3 0,3 +232 69,6 -0,8 +233 71,59 -0,2 +235 71,44 -0,2 +237 71,8 -0,1 +
page C-145 of C-315
* The stated uncertainty of the mean is the expanded uncertainty with a coverage factor k=2 corresponding to a confidence level of about 95% (calculation according to ISO 13528)
upper tolerance limit [mg/l] 79,67lower tolerance limit [mg/l] 65,2
PT 1/10 - TW A1 chloride - 3mean [mg/l]* 72,25 ± 0,48
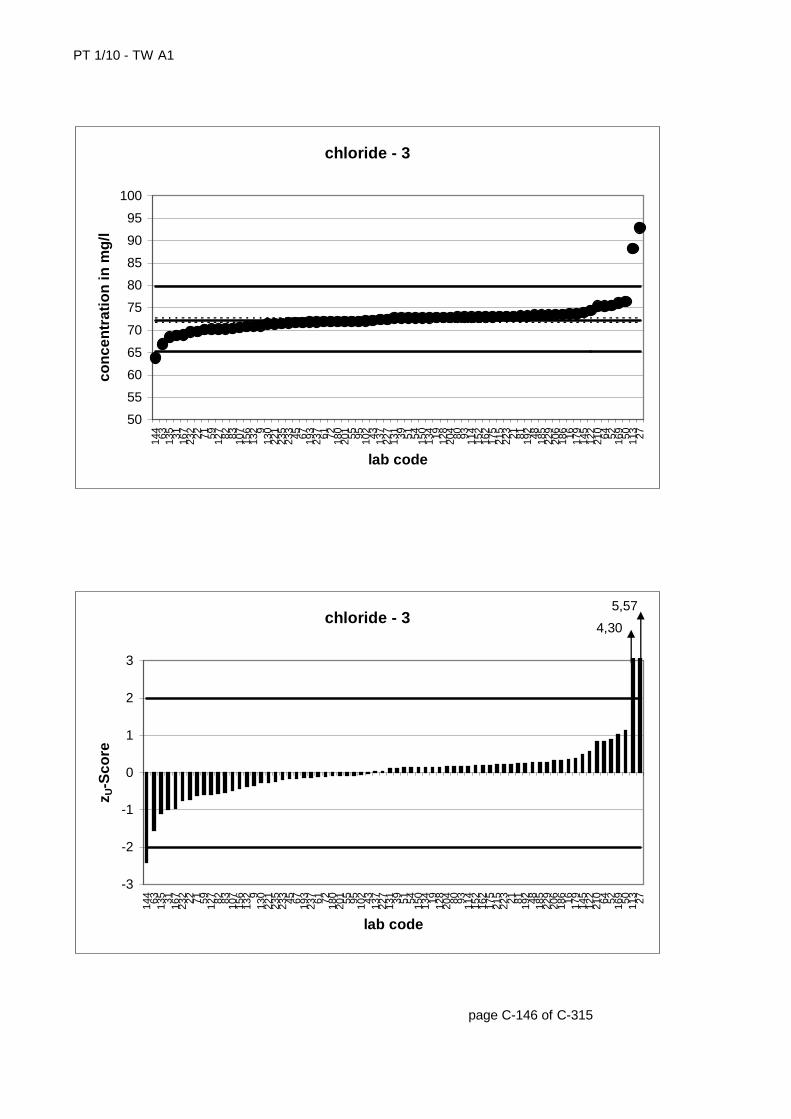
PT 1/10 - TW A1
page C-146 of C-315
chloride - 3
50
55
60
65
70
75
80
85
90
95
100
144 63 135 31 167
232 22 71 59 127 82 83 107
156
132 9
130
221
235
233 45 67 193
237 61 72 180
201 55 95 102 43 137
227
131 39 51 54 150
134 19 128
204 80 93 114
152
162
175
215
223 21 81 192 48 185
229
206
186 16 179
145
122
210 64 52 169 50 113 27
lab code
con
cen
trat
ion
in m
g/l
chloride - 3
-3
-2
-1
0
1
2
3
144 63 135 31 167
232 22 71 59 127 82 83 107
156
132 9
130
221
235
233 45 67 193
237 61 72 180
201 55 95 102 43 137
227
131 39 51 54 150
134 19 128
204 80 93 114
152
162
175
215
223 21 81 192 48 185
229
206
186 16 179
145
122
210 64 52 169 50 113 27
lab code
z U-S
core
4,30
5,57
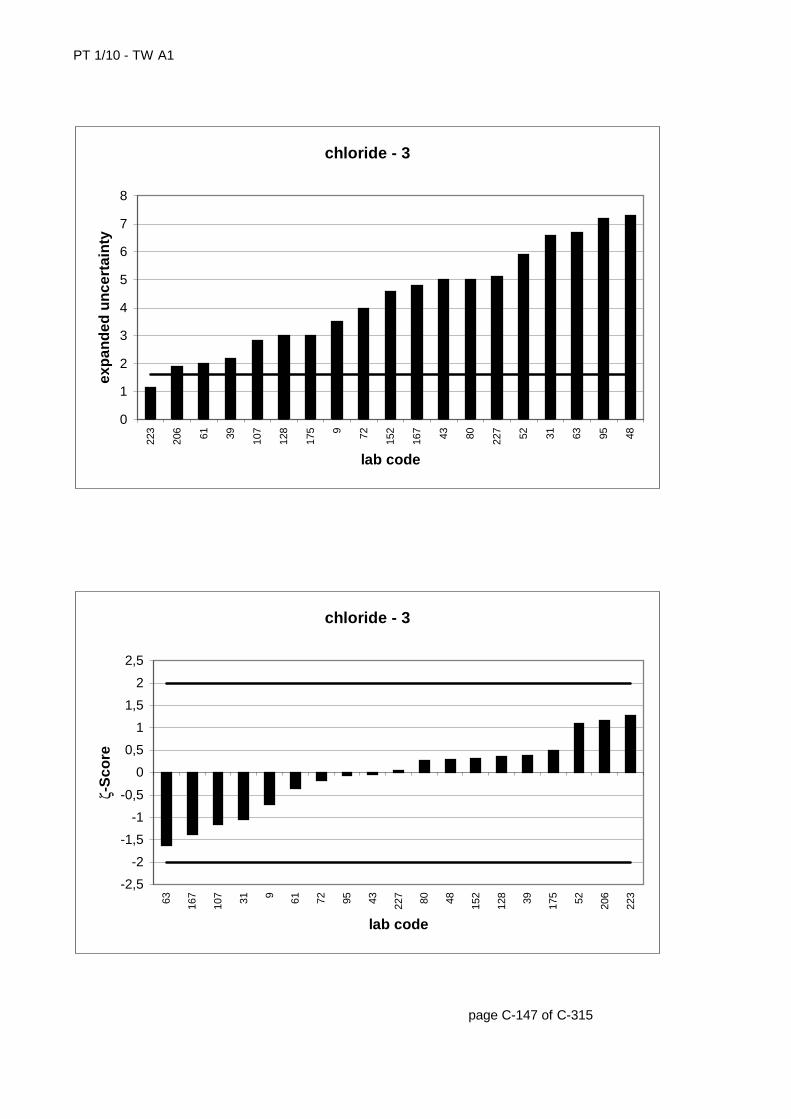
PT 1/10 - TW A1
page C-147 of C-315
chloride - 3
0
1
2
3
4
5
6
7
8
223
206 61 39 107
128
175 9 72 152
167 43 80 227 52 31 63 95 48
lab code
exp
and
ed u
nce
rtai
nty
chloride - 3
-2,5
-2
-1,5
-1
-0,5
0
0,5
1
1,5
2
2,5
63 167
107 31 9 61 72 95 43 227 80 48 152
128 39 175 52 206
223
lab code
ζ-S
core
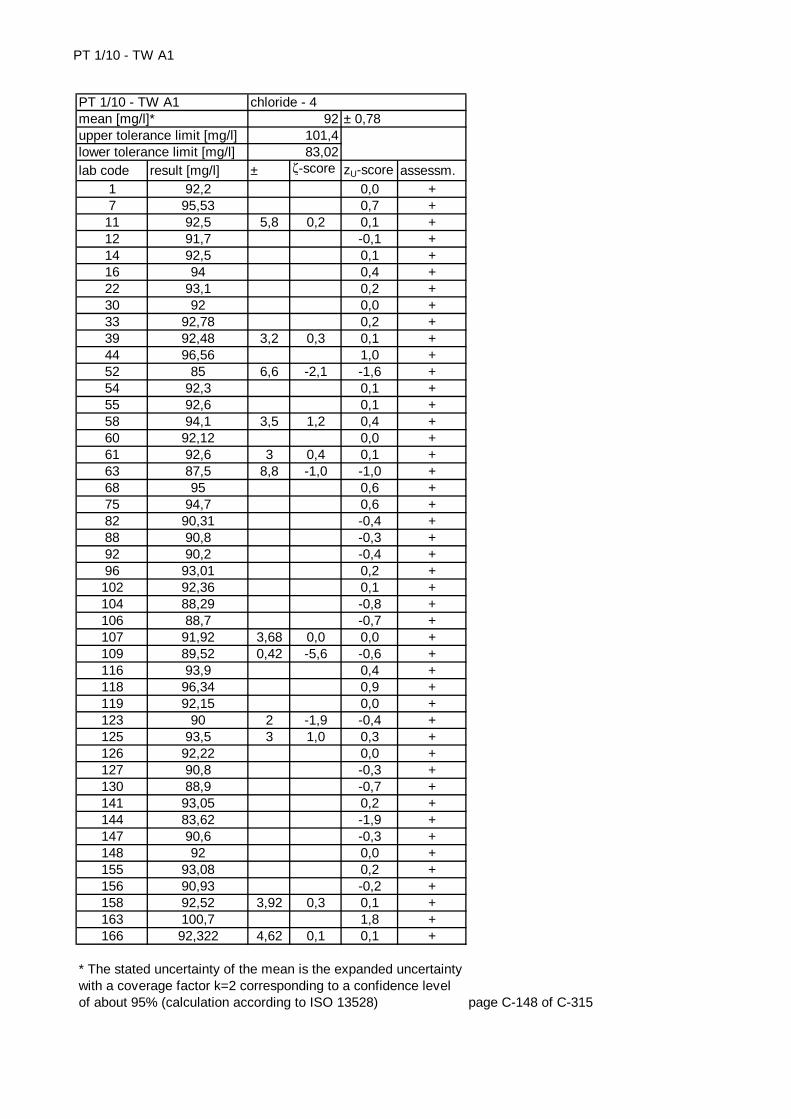
PT 1/10 - TW A1
lab code result [mg/l] ± ζ-score zU-score assessm.1 92,2 0,0 +7 95,53 0,7 +
11 92,5 5,8 0,2 0,1 +12 91,7 -0,1 +14 92,5 0,1 +16 94 0,4 +22 93,1 0,2 +30 92 0,0 +33 92,78 0,2 +39 92,48 3,2 0,3 0,1 +44 96,56 1,0 +52 85 6,6 -2,1 -1,6 +54 92,3 0,1 +55 92,6 0,1 +58 94,1 3,5 1,2 0,4 +60 92,12 0,0 +61 92,6 3 0,4 0,1 +63 87,5 8,8 -1,0 -1,0 +68 95 0,6 +75 94,7 0,6 +82 90,31 -0,4 +88 90,8 -0,3 +92 90,2 -0,4 +96 93,01 0,2 +102 92,36 0,1 +104 88,29 -0,8 +106 88,7 -0,7 +107 91,92 3,68 0,0 0,0 +109 89,52 0,42 -5,6 -0,6 +116 93,9 0,4 +118 96,34 0,9 +119 92,15 0,0 +123 90 2 -1,9 -0,4 +125 93,5 3 1,0 0,3 +126 92,22 0,0 +127 90,8 -0,3 +130 88,9 -0,7 +141 93,05 0,2 +144 83,62 -1,9 +147 90,6 -0,3 +148 92 0,0 +155 93,08 0,2 +156 90,93 -0,2 +158 92,52 3,92 0,3 0,1 +163 100,7 1,8 +166 92,322 4,62 0,1 0,1 +
page C-148 of C-315
* The stated uncertainty of the mean is the expanded uncertainty with a coverage factor k=2 corresponding to a confidence level of about 95% (calculation according to ISO 13528)
chloride - 492
101,483,02
± 0,78PT 1/10 - TW A1mean [mg/l]*upper tolerance limit [mg/l]lower tolerance limit [mg/l]
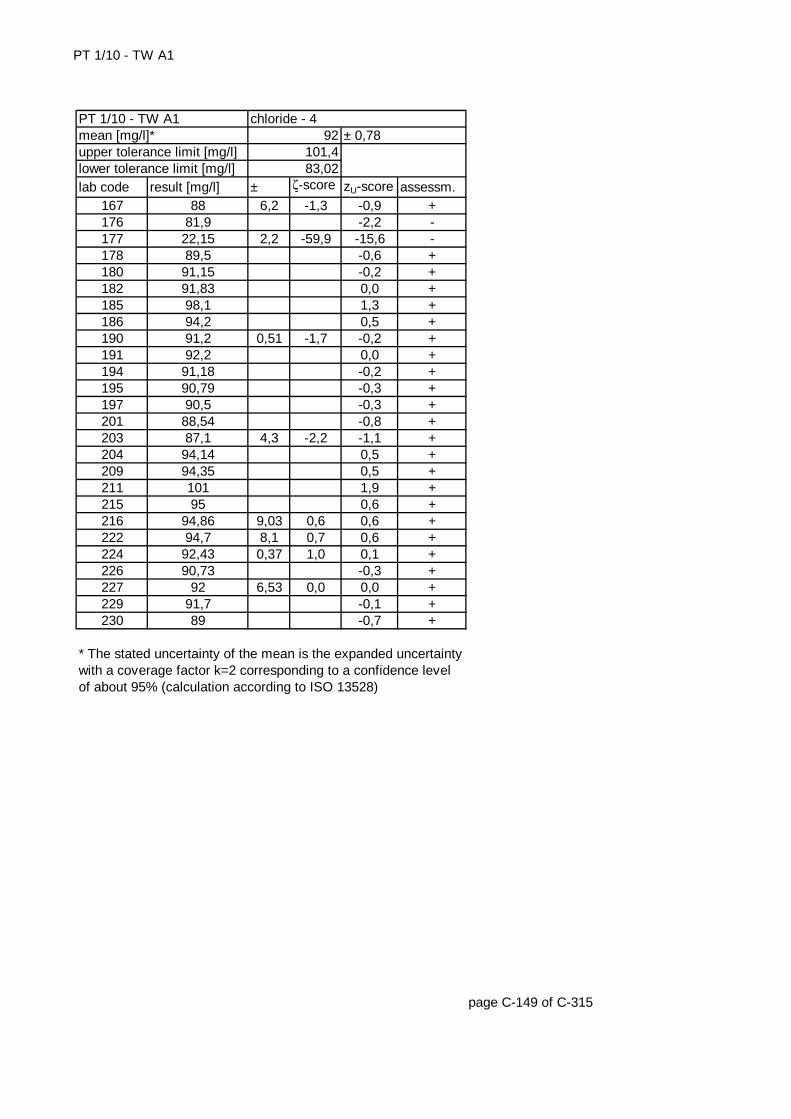
PT 1/10 - TW A1
lab code result [mg/l] ± ζ-score zU-score assessm.167 88 6,2 -1,3 -0,9 +176 81,9 -2,2 -177 22,15 2,2 -59,9 -15,6 -178 89,5 -0,6 +180 91,15 -0,2 +182 91,83 0,0 +185 98,1 1,3 +186 94,2 0,5 +190 91,2 0,51 -1,7 -0,2 +191 92,2 0,0 +194 91,18 -0,2 +195 90,79 -0,3 +197 90,5 -0,3 +201 88,54 -0,8 +203 87,1 4,3 -2,2 -1,1 +204 94,14 0,5 +209 94,35 0,5 +211 101 1,9 +215 95 0,6 +216 94,86 9,03 0,6 0,6 +222 94,7 8,1 0,7 0,6 +224 92,43 0,37 1,0 0,1 +226 90,73 -0,3 +227 92 6,53 0,0 0,0 +229 91,7 -0,1 +230 89 -0,7 +
page C-149 of C-315
* The stated uncertainty of the mean is the expanded uncertainty with a coverage factor k=2 corresponding to a confidence level of about 95% (calculation according to ISO 13528)
upper tolerance limit [mg/l] 101,4lower tolerance limit [mg/l] 83,02
PT 1/10 - TW A1 chloride - 4mean [mg/l]* 92 ± 0,78
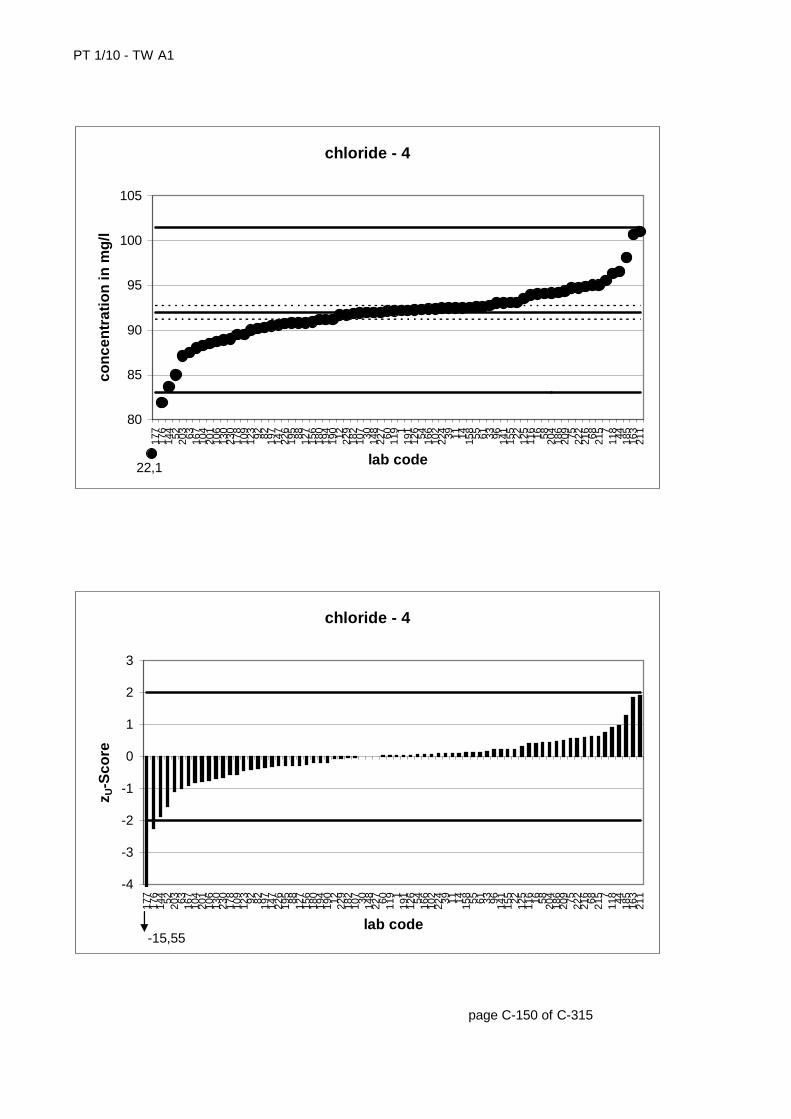
PT 1/10 - TW A1
page C-150 of C-315
chloride - 4
80
85
90
95
100
105
177
176
144 52 203 63 167
104
201
106
130
230
178
109
123 92 82 197
147
226
195 88 127
156
180
194
190 12 229
182
107 30 148
227 60 119 1
191
126 54 166
102
224 39 11 14 158 55 61 33 96 141
155 22 125
116 16 58 204
186
209 75 222
216 68 215 7
118 44 185
163
211
lab code
con
cen
trat
ion
in m
g/l
22,15
chloride - 4
-4
-3
-2
-1
0
1
2
3
177
176
144 52 203 63 167
104
201
106
130
230
178
109
123 92 82 197
147
226
195 88 127
156
180
194
190 12 229
182
107 30 148
227 60 119 1
191
126 54 166
102
224 39 11 14 158 55 61 33 96 141
155 22 125
116 16 58 204
186
209 75 222
216 68 215 7
118 44 185
163
211
lab code
z U-S
core
-15,55
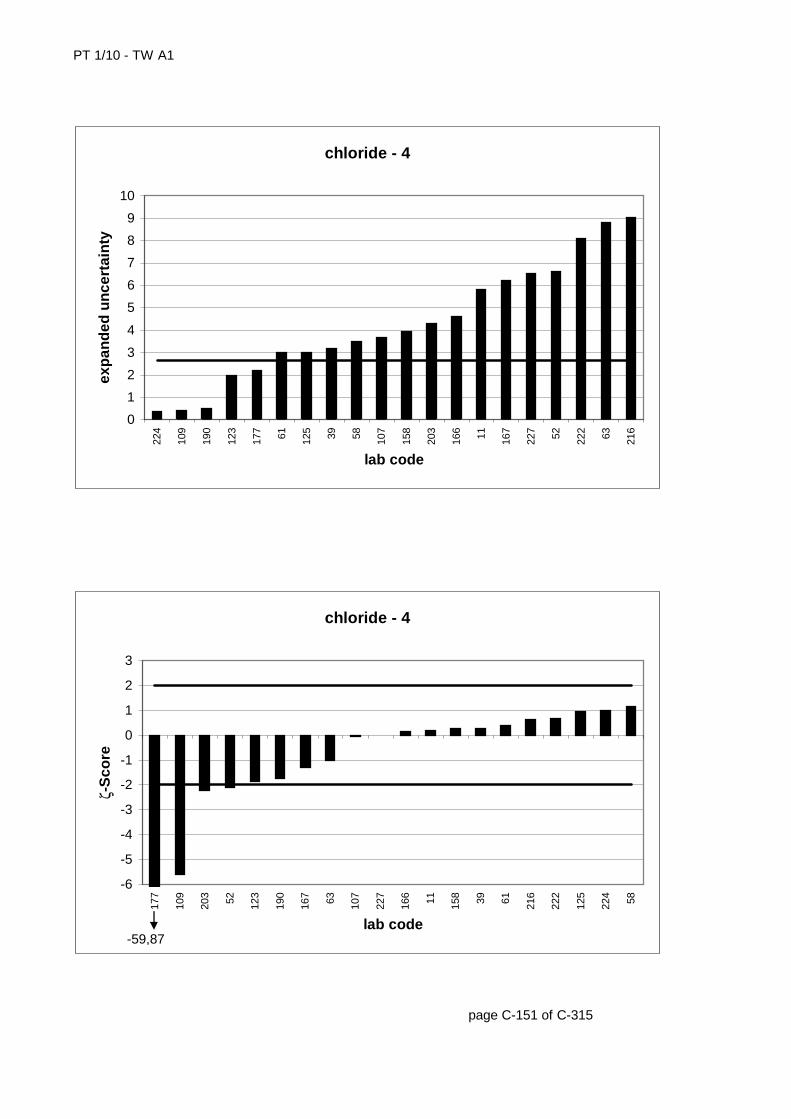
PT 1/10 - TW A1
page C-151 of C-315
chloride - 4
0
1
2
3
4
5
6
7
8
9
10
224
109
190
123
177 61 125 39 58 107
158
203
166 11 167
227 52 222 63 216
lab code
exp
and
ed u
nce
rtai
nty
chloride - 4
-6
-5
-4
-3
-2
-1
0
1
2
3
177
109
203 52 123
190
167 63 107
227
166 11 158 39 61 216
222
125
224 58
lab code
ζ-S
core
-59,87
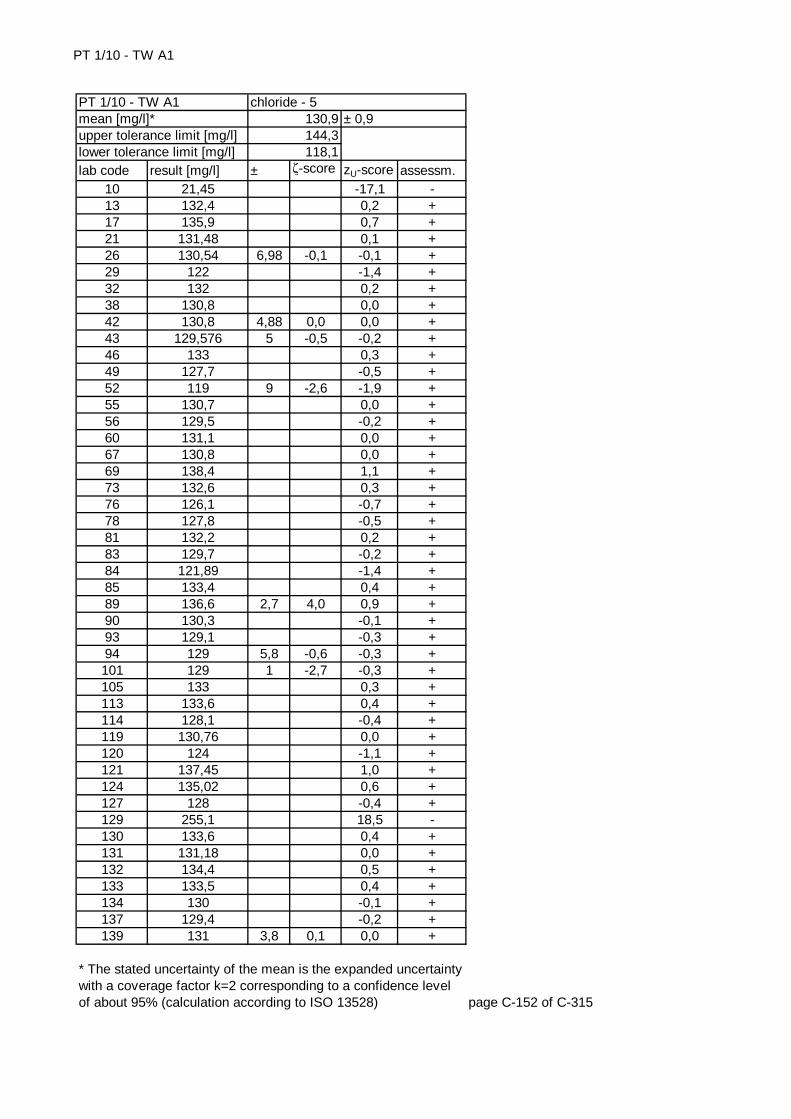
PT 1/10 - TW A1
lab code result [mg/l] ± ζ-score zU-score assessm.10 21,45 -17,1 -13 132,4 0,2 +17 135,9 0,7 +21 131,48 0,1 +26 130,54 6,98 -0,1 -0,1 +29 122 -1,4 +32 132 0,2 +38 130,8 0,0 +42 130,8 4,88 0,0 0,0 +43 129,576 5 -0,5 -0,2 +46 133 0,3 +49 127,7 -0,5 +52 119 9 -2,6 -1,9 +55 130,7 0,0 +56 129,5 -0,2 +60 131,1 0,0 +67 130,8 0,0 +69 138,4 1,1 +73 132,6 0,3 +76 126,1 -0,7 +78 127,8 -0,5 +81 132,2 0,2 +83 129,7 -0,2 +84 121,89 -1,4 +85 133,4 0,4 +89 136,6 2,7 4,0 0,9 +90 130,3 -0,1 +93 129,1 -0,3 +94 129 5,8 -0,6 -0,3 +101 129 1 -2,7 -0,3 +105 133 0,3 +113 133,6 0,4 +114 128,1 -0,4 +119 130,76 0,0 +120 124 -1,1 +121 137,45 1,0 +124 135,02 0,6 +127 128 -0,4 +129 255,1 18,5 -130 133,6 0,4 +131 131,18 0,0 +132 134,4 0,5 +133 133,5 0,4 +134 130 -0,1 +137 129,4 -0,2 +139 131 3,8 0,1 0,0 +
page C-152 of C-315
* The stated uncertainty of the mean is the expanded uncertainty with a coverage factor k=2 corresponding to a confidence level of about 95% (calculation according to ISO 13528)
chloride - 5130,9144,3118,1
± 0,9PT 1/10 - TW A1mean [mg/l]*upper tolerance limit [mg/l]lower tolerance limit [mg/l]
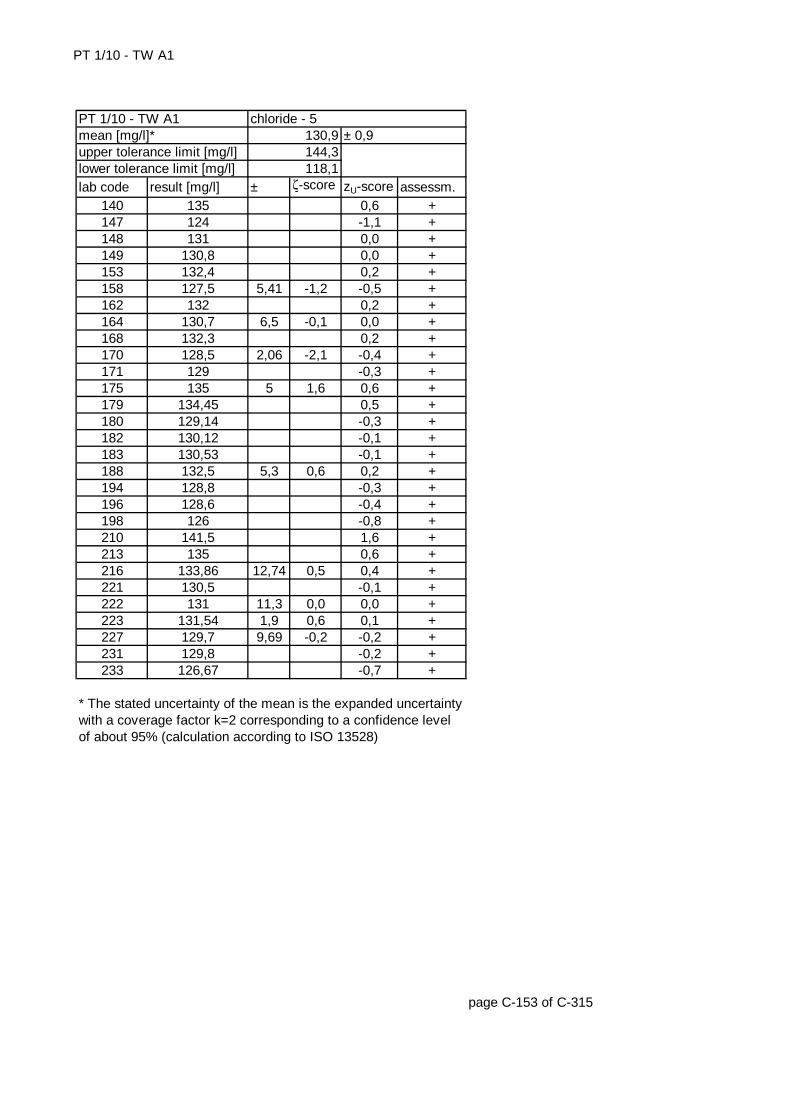
PT 1/10 - TW A1
lab code result [mg/l] ± ζ-score zU-score assessm.140 135 0,6 +147 124 -1,1 +148 131 0,0 +149 130,8 0,0 +153 132,4 0,2 +158 127,5 5,41 -1,2 -0,5 +162 132 0,2 +164 130,7 6,5 -0,1 0,0 +168 132,3 0,2 +170 128,5 2,06 -2,1 -0,4 +171 129 -0,3 +175 135 5 1,6 0,6 +179 134,45 0,5 +180 129,14 -0,3 +182 130,12 -0,1 +183 130,53 -0,1 +188 132,5 5,3 0,6 0,2 +194 128,8 -0,3 +196 128,6 -0,4 +198 126 -0,8 +210 141,5 1,6 +213 135 0,6 +216 133,86 12,74 0,5 0,4 +221 130,5 -0,1 +222 131 11,3 0,0 0,0 +223 131,54 1,9 0,6 0,1 +227 129,7 9,69 -0,2 -0,2 +231 129,8 -0,2 +233 126,67 -0,7 +
page C-153 of C-315
* The stated uncertainty of the mean is the expanded uncertainty with a coverage factor k=2 corresponding to a confidence level of about 95% (calculation according to ISO 13528)
upper tolerance limit [mg/l] 144,3lower tolerance limit [mg/l] 118,1
PT 1/10 - TW A1 chloride - 5mean [mg/l]* 130,9 ± 0,9
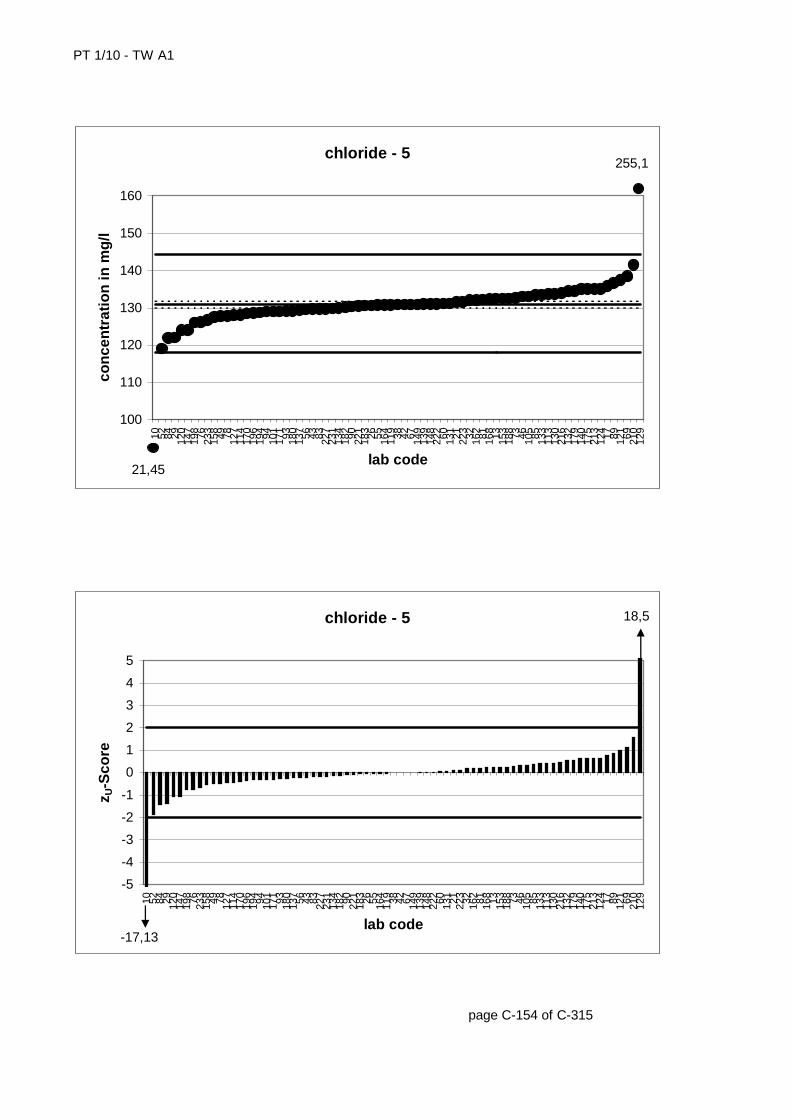
PT 1/10 - TW A1
page C-154 of C-315
chloride - 5
100
110
120
130
140
150
160
10 52 84 29 120
147
198 76 233
158 49 78 127
114
170
196
194 94 101
171 93 180
137 56 43 83 227
231
134
182 90 221
183 26 55 164
119 38 42 67 149
139
148
222 60 131 21 223 32 162 81 168 13 153
188 73 46 105 85 133
113
130
216
132
179
140
175
213
124 17 89 121 69 210
129
lab code
con
cen
trat
ion
in m
g/l
255,1
21,45
chloride - 5
-5
-4
-3
-2
-1
0
1
2
3
4
5
10 52 84 29 120
147
198 76 233
158 49 78 127
114
170
196
194 94 101
171 93 180
137 56 43 83 227
231
134
182 90 221
183 26 55 164
119 38 42 67 149
139
148
222 60 131 21 223 32 162 81 168 13 153
188 73 46 105 85 133
113
130
216
132
179
140
175
213
124 17 89 121 69 210
129
lab code
z U-S
core
18,5
-17,13
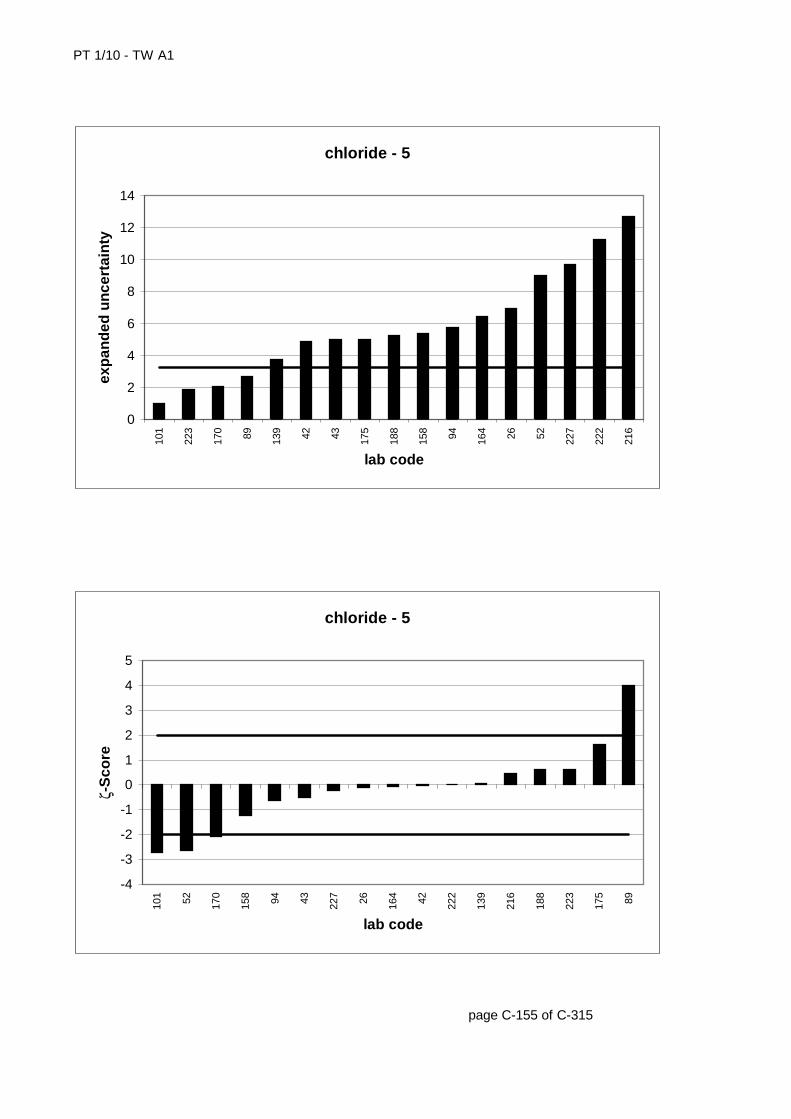
PT 1/10 - TW A1
page C-155 of C-315
chloride - 5
0
2
4
6
8
10
12
14
101
223
170 89 139 42 43 175
188
158 94 164 26 52 227
222
216
lab code
exp
and
ed u
nce
rtai
nty
chloride - 5
-4
-3
-2
-1
0
1
2
3
4
5
101 52 170
158 94 43 227 26 164 42 222
139
216
188
223
175 89
lab code
ζ-S
core

PT 1/10 - TW A1
lab code result [mg/l] ± ζ-score zU-score assessm.2 170,2 0,7 +4 182,1 40 0,9 2,1 -6 166,63 0,3 +8 160,8 -0,4 +9 165 8 0,2 0,1 +
11 166 10,4 0,3 0,2 +12 166 0,2 +14 165,8 0,2 +15 165,4 10,39 0,2 0,1 +18 152,7 0,731 -12,4 -1,4 +19 158 -0,8 +22 165 0,1 +27 192 3,3 -31 155 14,8 -1,2 -1,2 +46 167 0,3 +50 160,4 -0,5 +51 168 0,4 +56 163,2 -0,1 +59 161 -0,4 +61 163,8 5 -0,2 -0,1 +65 175 1,3 +66 159,6 -0,6 +72 170 10 1,1 0,7 +73 165,8 0,2 +76 157,3 -0,9 +77 178 1,6 +86 146 33 -1,1 -2,3 -92 162 -0,3 +95 163 16 -0,2 -0,2 +98 169,4 0,6 +99 170,1 0,7 +101 162 1 -2,3 -0,3 +103 163,4 6,5 -0,2 -0,1 +104 166,46 0,3 +110 170 0,7 +112 167 0,3 +114 160,9 -0,4 +117 164,5 0,0 +122 167 0,3 +124 169,69 0,6 +126 161,7 -0,3 +129 165,9 0,2 +135 162,61 -0,2 +136 160,3 -0,5 +137 162,1 -0,3 +140 178 1,6 +
page C-156 of C-315
* The stated uncertainty of the mean is the expanded uncertainty with a coverage factor k=2 corresponding to a confidence level of about 95% (calculation according to ISO 13528)
chloride - 6164,2181,1148,2
± 1,7PT 1/10 - TW A1mean [mg/l]*upper tolerance limit [mg/l]lower tolerance limit [mg/l]

PT 1/10 - TW A1
lab code result [mg/l] ± ζ-score zU-score assessm.142 158 19 -0,7 -0,8 +144 148,48 -2,0 +146 162,7 -0,2 +150 164,5 0,0 +152 165 10,4 0,1 0,1 +157 174 12,2 1,6 1,2 +159 162,3 -0,2 +162 166 0,2 +167 157 11 -1,3 -0,9 +187 162 -0,3 +190 167 0,51 3,1 0,3 +196 162,8 -0,2 +199 168,1 0,5 +200 213 2 37,1 5,8 -205 170,6 3 3,7 0,8 +207 161 -0,4 +209 171,42 0,9 +210 181,6 2,1 -217 164 7 -0,1 0,0 +225 164 0,0 +226 154,2 -1,3 +230 156 -1,0 +231 164,2 0,0 +233 159,64 -0,6 +234 161,2 -0,4 +235 163,3 -0,1 +237 161 -0,4 +
page C-157 of C-315
* The stated uncertainty of the mean is the expanded uncertainty with a coverage factor k=2 corresponding to a confidence level of about 95% (calculation according to ISO 13528)
upper tolerance limit [mg/l] 181,1lower tolerance limit [mg/l] 148,2
PT 1/10 - TW A1 chloride - 6mean [mg/l]* 164,2 ± 1,7
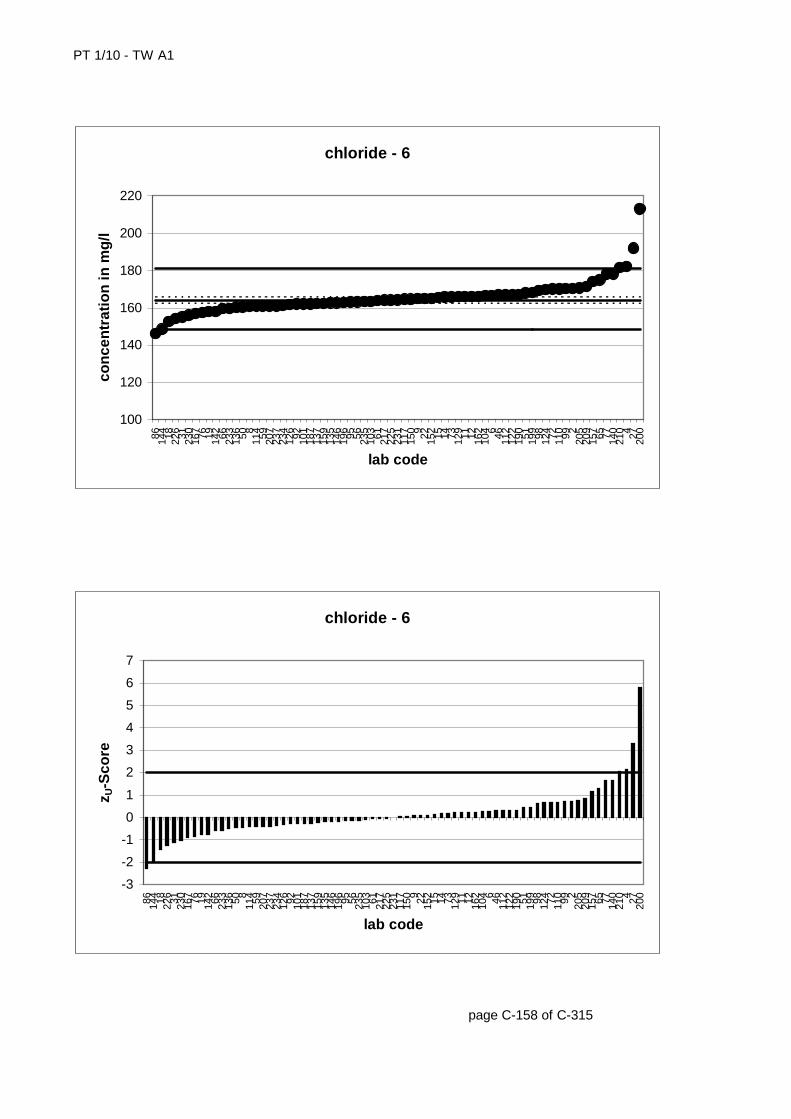
PT 1/10 - TW A1
page C-158 of C-315
chloride - 6
100
120
140
160
180
200
220
86 144 18 226 31 230
167 76 19 142 66 233
136 50 8
114 59 207
237
234
126 92 101
187
137
159
135
146
196 95 56 235
103 61 217
225
231
117
150 9 22 152 15 14 73 129 11 12 162
104 6 46 112
122
190 51 199 98 124 72 110 99 2
205
209
157 65 77 140
210 4 27 200
lab code
con
cen
trat
ion
in m
g/l
chloride - 6
-3
-2
-1
0
1
2
3
4
5
6
7
86 144 18 226 31 230
167 76 19 142 66 233
136 50 8
114 59 207
237
234
126 92 101
187
137
159
135
146
196 95 56 235
103 61 217
225
231
117
150 9 22 152 15 14 73 129 11 12 162
104 6 46 112
122
190 51 199 98 124 72 110 99 2
205
209
157 65 77 140
210 4 27 200
lab code
z U-S
core

PT 1/10 - TW A1
page C-159 of C-315
chloride - 6
0
5
10
15
20
25
30
35
40
45
190 18 101
200
205 61 103
217 9 72 15 11 152
167
157 31 95 142 86 4
lab code
exp
and
ed u
nce
rtai
nty
chloride - 6
-15
-10
-5
0
5
10
18 101
167 31 86 142
103 61 95 217
152 9 15 11 4 72 157
190
205
200
lab code
ζ-S
core
37,08

PT 1/10 - TW A1
lab code result [mg/l] ± ζ-score zU-score assessm.1 195,8 0,0 +4 217,5 40 1,1 2,1 -5 190,5 -0,6 +7 201,487 0,5 +
13 197,5 0,1 +15 197,1 5,51 0,4 0,1 +16 200 0,4 +18 187,4 4,226 -3,9 -0,9 +20 195 15,6 -0,1 -0,1 +25 195,63 19,56 0,0 0,0 +31 185 17,7 -1,2 -1,2 +36 197,5 0,1 +37 203,9 0,8 +38 192,6 -0,4 +39 195,2 6,8 -0,3 -0,1 +41 172,6 -2,5 -48 201 20 0,5 0,5 +50 198 0,2 +57 192,6 -0,4 +64 199,2 0,3 +67 197,2 0,1 +68 221 2,5 -75 197 0,1 +80 197,2 14 0,2 0,1 +81 197,7 0,2 +84 194,46 -0,2 +87 199 0,3 +89 202,2 4 2,9 0,6 +90 193,9 -0,2 +91 196 0,0 +94 195 8,78 -0,2 -0,1 +95 200 20 0,4 0,4 +99 201,5 0,5 +100 193,41 -0,3 +106 191,7 -0,5 +107 201,14 8,05 1,2 0,5 +110 192 -0,4 +116 195,9 0,0 +131 222,65 2,6 -141 197,3 0,1 +142 194 25 -0,2 -0,2 +145 196 0,0 +150 196,6 0,1 +151 189,7 19 -0,7 -0,7 +152 188 11,8 -1,4 -0,8 +153 200 0,4 +
page C-160 of C-315
* The stated uncertainty of the mean is the expanded uncertainty with a coverage factor k=2 corresponding to a confidence level of about 95% (calculation according to ISO 13528)
chloride - 7196,1216,2176,9
± 1,3PT 1/10 - TW A1mean [mg/l]*upper tolerance limit [mg/l]lower tolerance limit [mg/l]

PT 1/10 - TW A1
lab code result [mg/l] ± ζ-score zU-score assessm.161 195,1 -0,1 +169 198,5 0,2 +173 193 17 -0,4 -0,3 +179 197,53 0,1 +181 199 4 1,4 0,3 +183 202,18 0,6 +187 188 -0,8 +188 196,7 7,87 0,2 0,1 +191 195,9 0,0 +192 196,35 0,0 +193 196 0,0 +197 196 0,0 +199 198,6 0,3 +202 192,4 -0,4 +203 187 9,4 -1,9 -0,9 +207 189 -0,7 +212 194 -0,2 +213 204 0,8 +214 202,3 0,6 +215 197,5 0,1 +219 196 0,1 -0,1 0,0 +223 197,19 2 0,9 0,1 +225 198 0,2 +228 195,4 -0,1 +232 186,7 -1,0 +
page C-161 of C-315
* The stated uncertainty of the mean is the expanded uncertainty with a coverage factor k=2 corresponding to a confidence level of about 95% (calculation according to ISO 13528)
upper tolerance limit [mg/l] 216,2lower tolerance limit [mg/l] 176,9
PT 1/10 - TW A1 chloride - 7mean [mg/l]* 196,1 ± 1,3
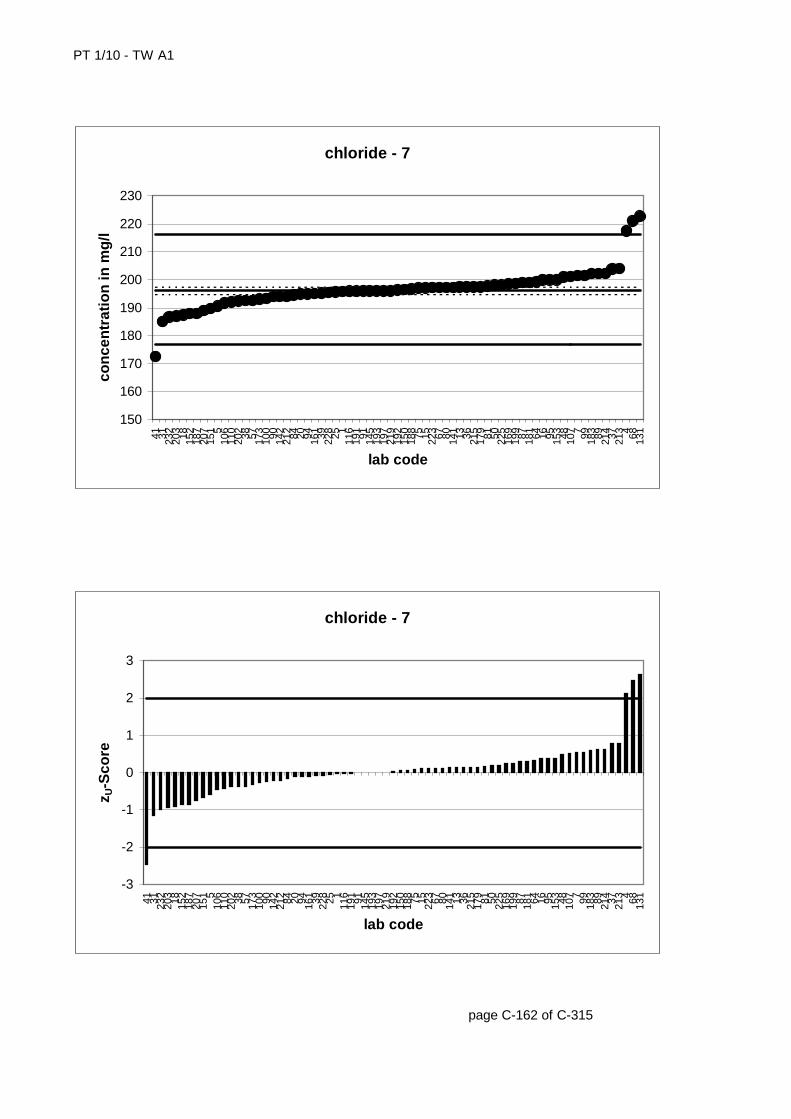
PT 1/10 - TW A1
page C-162 of C-315
chloride - 7
150
160
170
180
190
200
210
220
230
41 31 232
203 18 152
187
207
151 5
106
110
202 38 57 173
100 90 142
212 84 20 94 161 39 228 25 1
116
191 91 145
193
197
219
192
150
188 75 15 223 67 80 141 13 36 215
179 81 50 225
169
199 87 181 64 16 95 153 48 107 7 99 183 89 214 37 213 4 68 131
lab code
con
cen
trat
ion
in m
g/l
chloride - 7
-3
-2
-1
0
1
2
3
41 31 232
203 18 152
187
207
151 5
106
110
202 38 57 173
100 90 142
212 84 20 94 161 39 228 25 1
116
191 91 145
193
197
219
192
150
188 75 15 223 67 80 141 13 36 215
179 81 50 225
169
199 87 181 64 16 95 153 48 107 7 99 183 89 214 37 213 4 68 131
lab code
z U-S
core
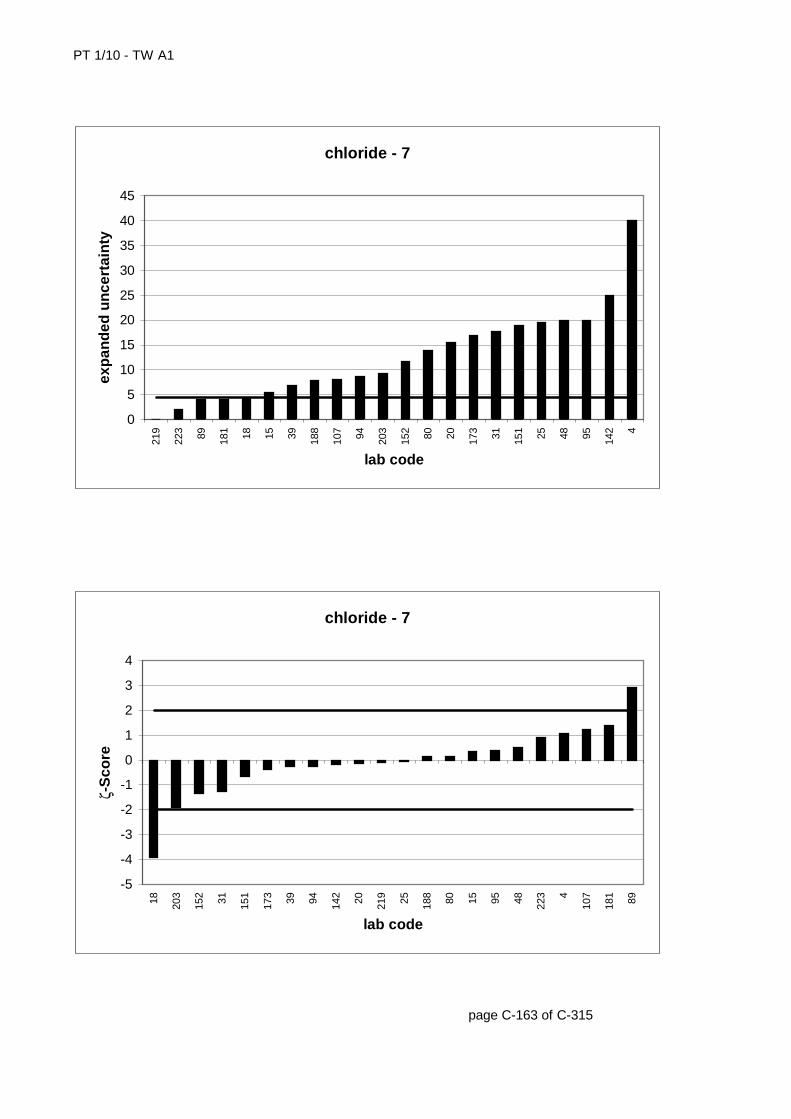
PT 1/10 - TW A1
page C-163 of C-315
chloride - 7
0
5
10
15
20
25
30
35
40
45
219
223 89 181 18 15 39 188
107 94 203
152 80 20 173 31 151 25 48 95 142 4
lab code
exp
and
ed u
nce
rtai
nty
chloride - 7
-5
-4
-3
-2
-1
0
1
2
3
4
18 203
152 31 151
173 39 94 142 20 219 25 188 80 15 95 48 223 4
107
181 89
lab code
ζ-S
core
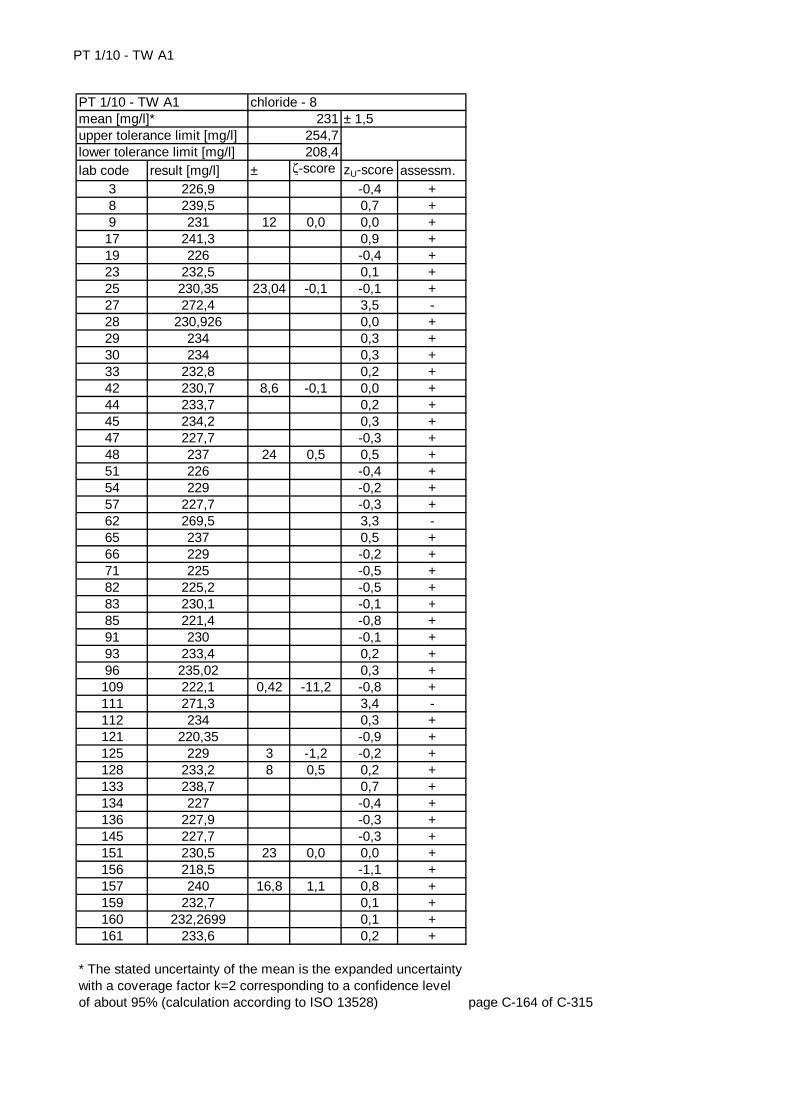
PT 1/10 - TW A1
lab code result [mg/l] ± ζ-score zU-score assessm.3 226,9 -0,4 +8 239,5 0,7 +9 231 12 0,0 0,0 +
17 241,3 0,9 +19 226 -0,4 +23 232,5 0,1 +25 230,35 23,04 -0,1 -0,1 +27 272,4 3,5 -28 230,926 0,0 +29 234 0,3 +30 234 0,3 +33 232,8 0,2 +42 230,7 8,6 -0,1 0,0 +44 233,7 0,2 +45 234,2 0,3 +47 227,7 -0,3 +48 237 24 0,5 0,5 +51 226 -0,4 +54 229 -0,2 +57 227,7 -0,3 +62 269,5 3,3 -65 237 0,5 +66 229 -0,2 +71 225 -0,5 +82 225,2 -0,5 +83 230,1 -0,1 +85 221,4 -0,8 +91 230 -0,1 +93 233,4 0,2 +96 235,02 0,3 +109 222,1 0,42 -11,2 -0,8 +111 271,3 3,4 -112 234 0,3 +121 220,35 -0,9 +125 229 3 -1,2 -0,2 +128 233,2 8 0,5 0,2 +133 238,7 0,7 +134 227 -0,4 +136 227,9 -0,3 +145 227,7 -0,3 +151 230,5 23 0,0 0,0 +156 218,5 -1,1 +157 240 16,8 1,1 0,8 +159 232,7 0,1 +160 232,2699 0,1 +161 233,6 0,2 +
page C-164 of C-315
* The stated uncertainty of the mean is the expanded uncertainty with a coverage factor k=2 corresponding to a confidence level of about 95% (calculation according to ISO 13528)
chloride - 8231
254,7208,4
± 1,5PT 1/10 - TW A1mean [mg/l]*upper tolerance limit [mg/l]lower tolerance limit [mg/l]

PT 1/10 - TW A1
lab code result [mg/l] ± ζ-score zU-score assessm.166 231,12 11,6 0,0 0,0 +168 233,3 0,2 +169 236 0,4 +170 227,2 3,63 -1,9 -0,3 +171 230 -0,1 +173 230 20 -0,1 -0,1 +177 230,7 23 0,0 0,0 +178 230 -0,1 +181 234 6,8 0,9 0,3 +185 214,7 -1,4 +189 232,1 0,1 +192 231,894 0,1 +198 227 -0,4 +200 278 2 37,4 4,0 -205 236,9 3 3,5 0,5 +206 235 5 1,5 0,3 +212 230 -0,1 +217 231 10 0,0 0,0 +219 228 0,1 -3,9 -0,3 +221 234,4 0,3 +224 234,8 1,4 3,7 0,3 +228 232,4 0,1 +229 227 -0,4 +237 232 0,1 +
page C-165 of C-315
* The stated uncertainty of the mean is the expanded uncertainty with a coverage factor k=2 corresponding to a confidence level of about 95% (calculation according to ISO 13528)
upper tolerance limit [mg/l] 254,7lower tolerance limit [mg/l] 208,4
PT 1/10 - TW A1 chloride - 8mean [mg/l]* 231 ± 1,5
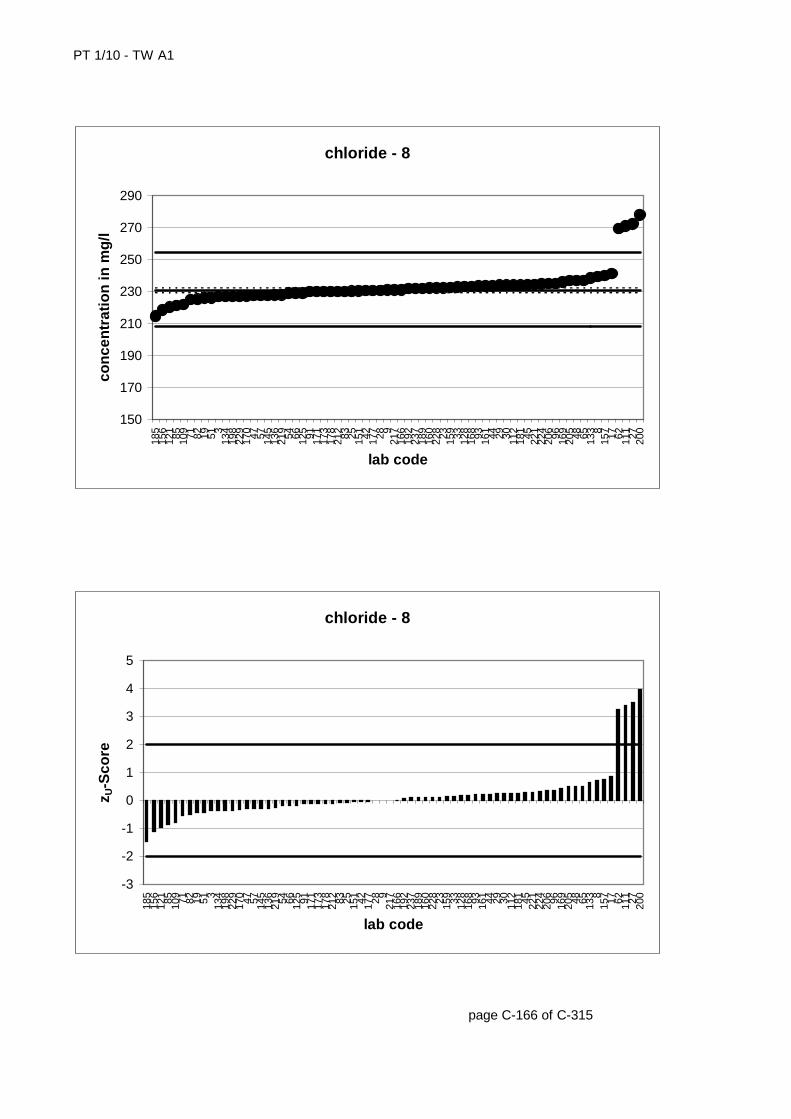
PT 1/10 - TW A1
page C-166 of C-315
chloride - 8
150
170
190
210
230
250
270
290
185
156
121 85 109 71 82 19 51 3
134
198
229
170 47 57 145
136
219 54 66 125 91 171
173
178
212 83 25 151 42 177 28 9
217
166
192
237
189
160
228 23 159 33 128
168 93 161 44 29 30 112
181 45 221
224
206 96 169
205 48 65 133 8
157 17 62 111 27 200
lab code
con
cen
trat
ion
in m
g/l
chloride - 8
-3
-2
-1
0
1
2
3
4
5
185
156
121 85 109 71 82 19 51 3
134
198
229
170 47 57 145
136
219 54 66 125 91 171
173
178
212 83 25 151 42 177 28 9
217
166
192
237
189
160
228 23 159 33 128
168 93 161 44 29 30 112
181 45 221
224
206 96 169
205 48 65 133 8
157 17 62 111 27 200
lab code
z U-S
core
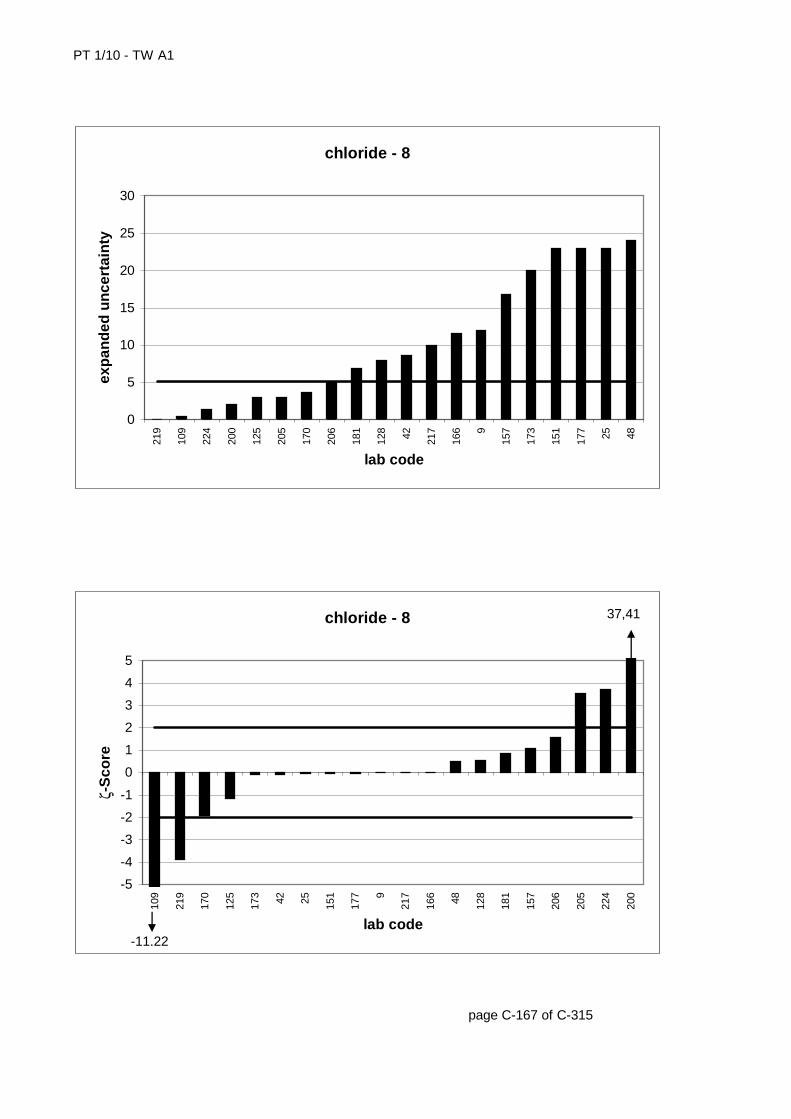
PT 1/10 - TW A1
page C-167 of C-315
chloride - 8
0
5
10
15
20
25
30
219
109
224
200
125
205
170
206
181
128 42 217
166 9
157
173
151
177 25 48
lab code
exp
and
ed u
nce
rtai
nty
chloride - 8
-5
-4
-3
-2
-1
0
1
2
3
4
5
109
219
170
125
173 42 25 151
177 9
217
166 48 128
181
157
206
205
224
200
lab code
ζ-S
core
37,41
-11,22
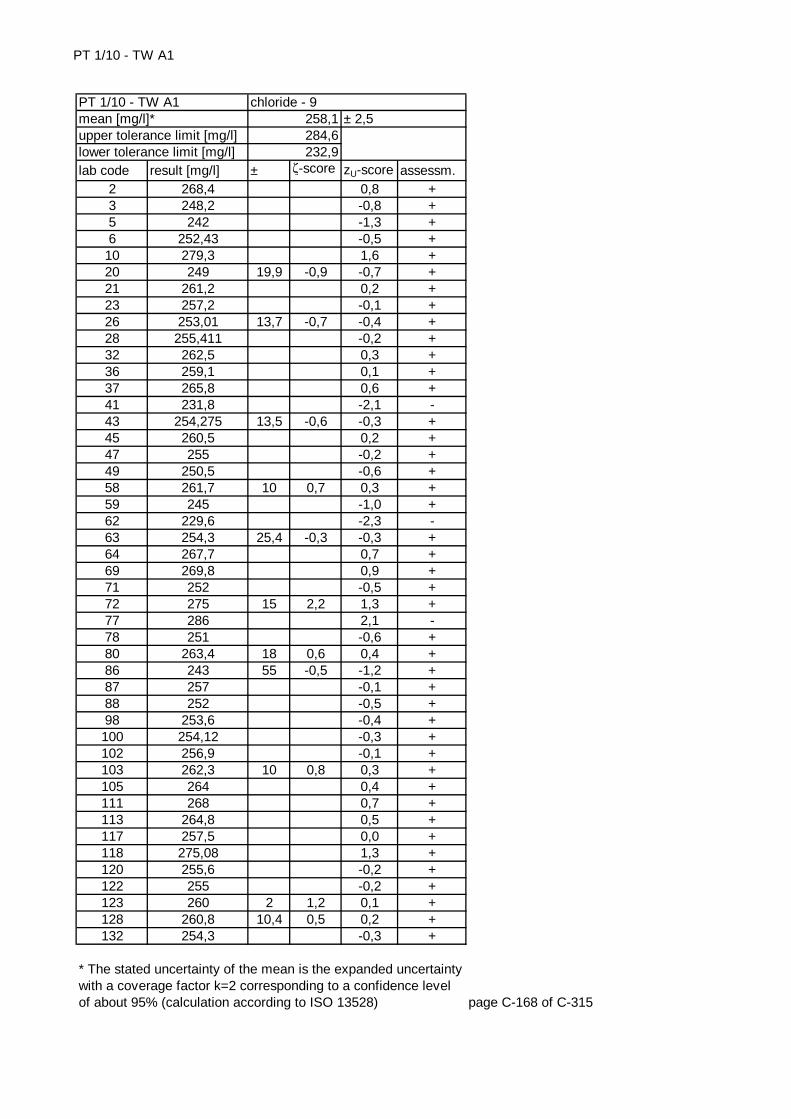
PT 1/10 - TW A1
lab code result [mg/l] ± ζ-score zU-score assessm.2 268,4 0,8 +3 248,2 -0,8 +5 242 -1,3 +6 252,43 -0,5 +
10 279,3 1,6 +20 249 19,9 -0,9 -0,7 +21 261,2 0,2 +23 257,2 -0,1 +26 253,01 13,7 -0,7 -0,4 +28 255,411 -0,2 +32 262,5 0,3 +36 259,1 0,1 +37 265,8 0,6 +41 231,8 -2,1 -43 254,275 13,5 -0,6 -0,3 +45 260,5 0,2 +47 255 -0,2 +49 250,5 -0,6 +58 261,7 10 0,7 0,3 +59 245 -1,0 +62 229,6 -2,3 -63 254,3 25,4 -0,3 -0,3 +64 267,7 0,7 +69 269,8 0,9 +71 252 -0,5 +72 275 15 2,2 1,3 +77 286 2,1 -78 251 -0,6 +80 263,4 18 0,6 0,4 +86 243 55 -0,5 -1,2 +87 257 -0,1 +88 252 -0,5 +98 253,6 -0,4 +100 254,12 -0,3 +102 256,9 -0,1 +103 262,3 10 0,8 0,3 +105 264 0,4 +111 268 0,7 +113 264,8 0,5 +117 257,5 0,0 +118 275,08 1,3 +120 255,6 -0,2 +122 255 -0,2 +123 260 2 1,2 0,1 +128 260,8 10,4 0,5 0,2 +132 254,3 -0,3 +
page C-168 of C-315
* The stated uncertainty of the mean is the expanded uncertainty with a coverage factor k=2 corresponding to a confidence level of about 95% (calculation according to ISO 13528)
chloride - 9258,1284,6232,9
± 2,5PT 1/10 - TW A1mean [mg/l]*upper tolerance limit [mg/l]lower tolerance limit [mg/l]
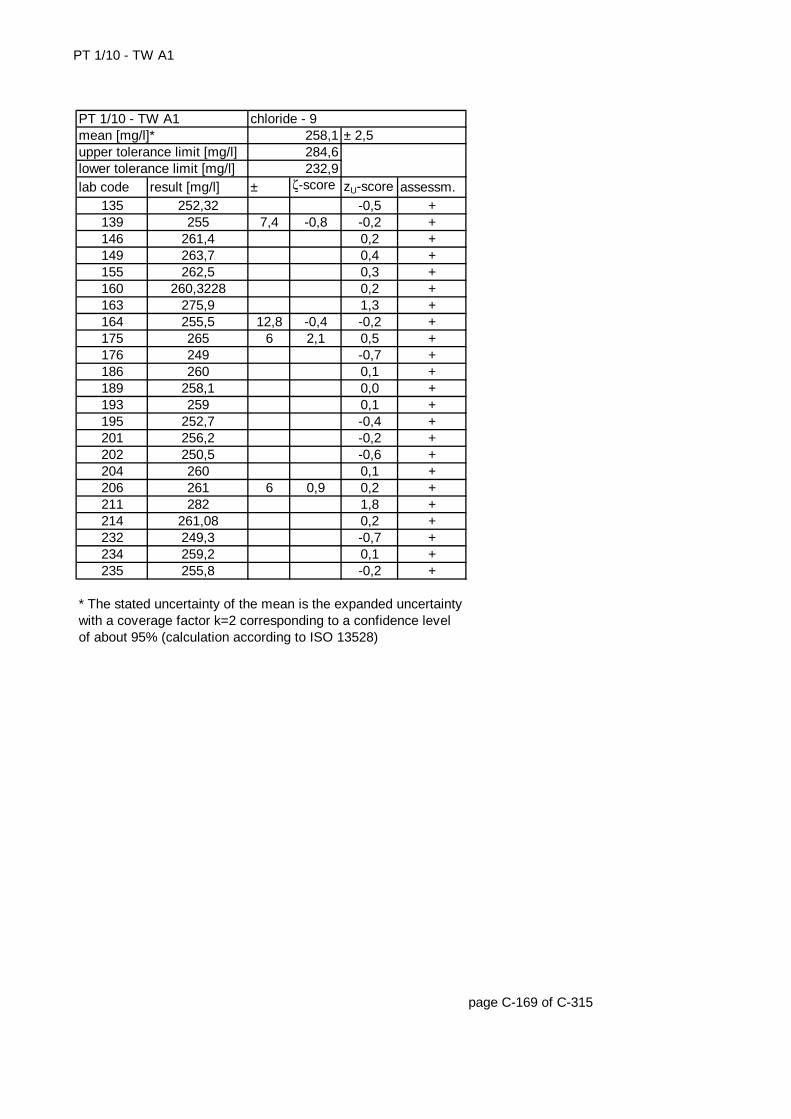
PT 1/10 - TW A1
lab code result [mg/l] ± ζ-score zU-score assessm.135 252,32 -0,5 +139 255 7,4 -0,8 -0,2 +146 261,4 0,2 +149 263,7 0,4 +155 262,5 0,3 +160 260,3228 0,2 +163 275,9 1,3 +164 255,5 12,8 -0,4 -0,2 +175 265 6 2,1 0,5 +176 249 -0,7 +186 260 0,1 +189 258,1 0,0 +193 259 0,1 +195 252,7 -0,4 +201 256,2 -0,2 +202 250,5 -0,6 +204 260 0,1 +206 261 6 0,9 0,2 +211 282 1,8 +214 261,08 0,2 +232 249,3 -0,7 +234 259,2 0,1 +235 255,8 -0,2 +
page C-169 of C-315
* The stated uncertainty of the mean is the expanded uncertainty with a coverage factor k=2 corresponding to a confidence level of about 95% (calculation according to ISO 13528)
upper tolerance limit [mg/l] 284,6lower tolerance limit [mg/l] 232,9
PT 1/10 - TW A1 chloride - 9mean [mg/l]* 258,1 ± 2,5
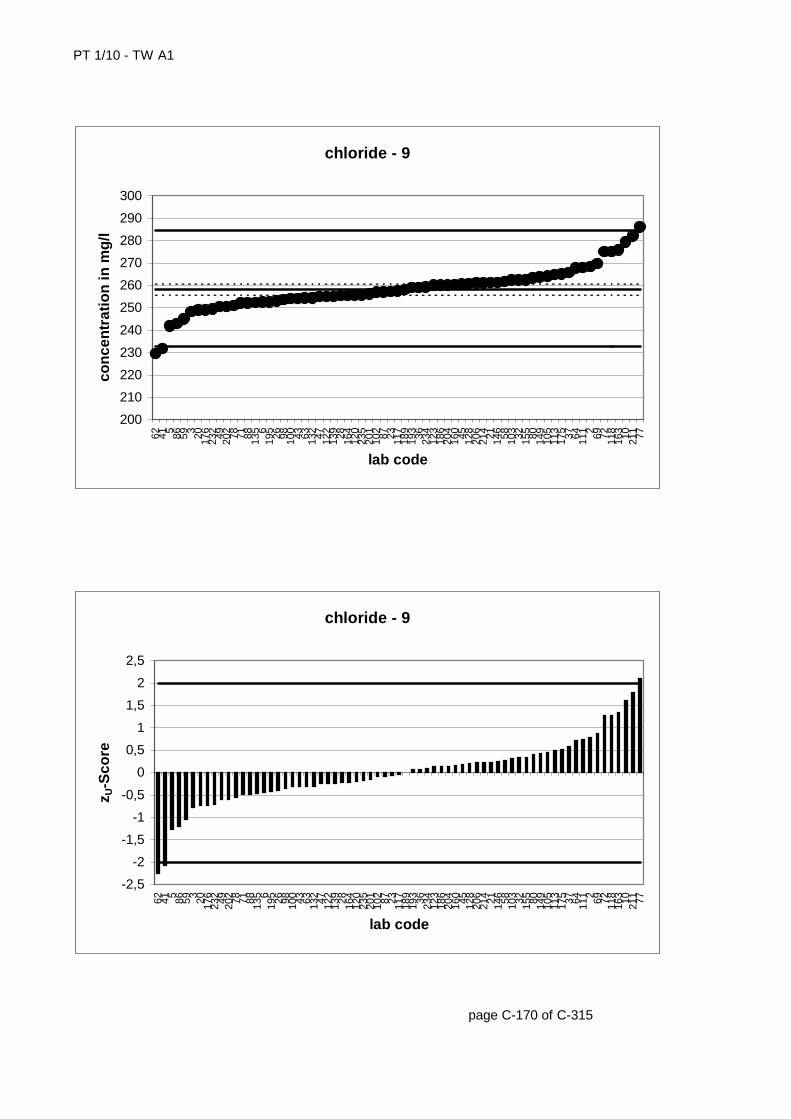
PT 1/10 - TW A1
page C-170 of C-315
chloride - 9
200
210
220
230
240
250
260
270
280
290
300
62 41 5 86 59 3 20 176
232 49 202 78 71 88 135 6
195 26 98 100 43 63 132 47 122
139 28 164
120
235
201
102 87 23 117
189
193 36 234
123
186
204
160 45 128
206
214 21 146 58 103 32 155 80 149
105
113
175 37 64 111 2 69 72 118
163 10 211 77
lab code
con
cen
trat
ion
in m
g/l
chloride - 9
-2,5
-2
-1,5
-1
-0,5
0
0,5
1
1,5
2
2,5
62 41 5 86 59 3 20 176
232 49 202 78 71 88 135 6
195 26 98 100 43 63 132 47 122
139 28 164
120
235
201
102 87 23 117
189
193 36 234
123
186
204
160 45 128
206
214 21 146 58 103 32 155 80 149
105
113
175 37 64 111 2 69 72 118
163 10 211 77
lab code
z U-S
core
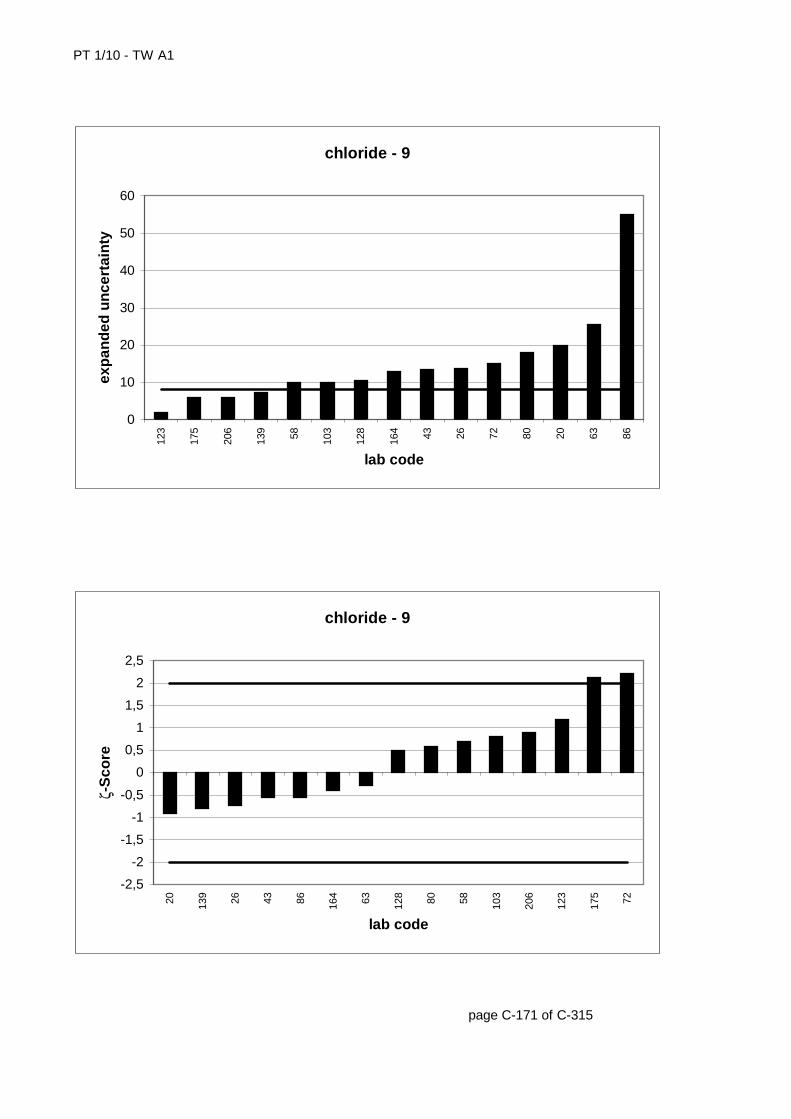
PT 1/10 - TW A1
page C-171 of C-315
chloride - 9
0
10
20
30
40
50
60
123
175
206
139 58 103
128
164 43 26 72 80 20 63 86
lab code
exp
and
ed u
nce
rtai
nty
chloride - 9
-2,5
-2
-1,5
-1
-0,5
0
0,5
1
1,5
2
2,5
20 139 26 43 86 164 63 128 80 58 103
206
123
175 72
lab code
ζ-S
core

PT 1/10 - TW A1
lab code result [mg/l] ± ζ-score zU-score assessm.4 52,5 10 0,2 0,4 +5 51,9 0,2 +
11 52,5 1,9 1,2 0,4 +13 52,33 0,4 +15 49,41 1,16 -3,0 -0,8 +17 50,94 -0,2 +25 50,96 5,1 -0,1 -0,1 +26 51,24 2,97 -0,1 0,0 +28 51,204 0,0 +36 48,4 -1,2 +41 44,3 -2,8 -42 50,17 2,08 -1,1 -0,5 +44 52,9 0,6 +46 50,7 -0,2 +49 50,71 -0,2 +57 51,6 0,1 +58 51,32 2,5 0,0 0,0 +62 52,54 0,5 +65 50,8 -0,2 +75 53,1 0,7 +76 49,8 -0,6 +85 52,03 0,3 +88 47,4 -1,6 +91 52,6 0,5 +98 53,05 0,7 +99 50,94 -0,2 +100 63,38 4,6 -103 52 2 0,7 0,3 +104 50,72 -0,2 +105 48,6 -1,1 +106 51,6 0,1 +109 49,73 0,92 -3,1 -0,6 +111 51,98 0,2 +116 50,7 -0,2 +117 51,7 0,1 +118 50,17 -0,5 +119 52,35 0,4 +120 51,1 -0,1 +125 52,8 4 0,7 0,6 +129 51,3 0,0 +136 50,3 -0,4 +140 51,9 0,2 +148 51,7 0,1 +151 50,4 3,5 -0,5 -0,4 +153 50,7 -0,2 +155 51,88 0,2 +
page C-172 of C-315
* The stated uncertainty of the mean is the expanded uncertainty with a coverage factor k=2 corresponding to a confidence level of about 95% (calculation according to ISO 13528)
sulfate - 151,3256,5946,31
± 0,49PT 1/10 - TW A1mean [mg/l]*upper tolerance limit [mg/l]lower tolerance limit [mg/l]
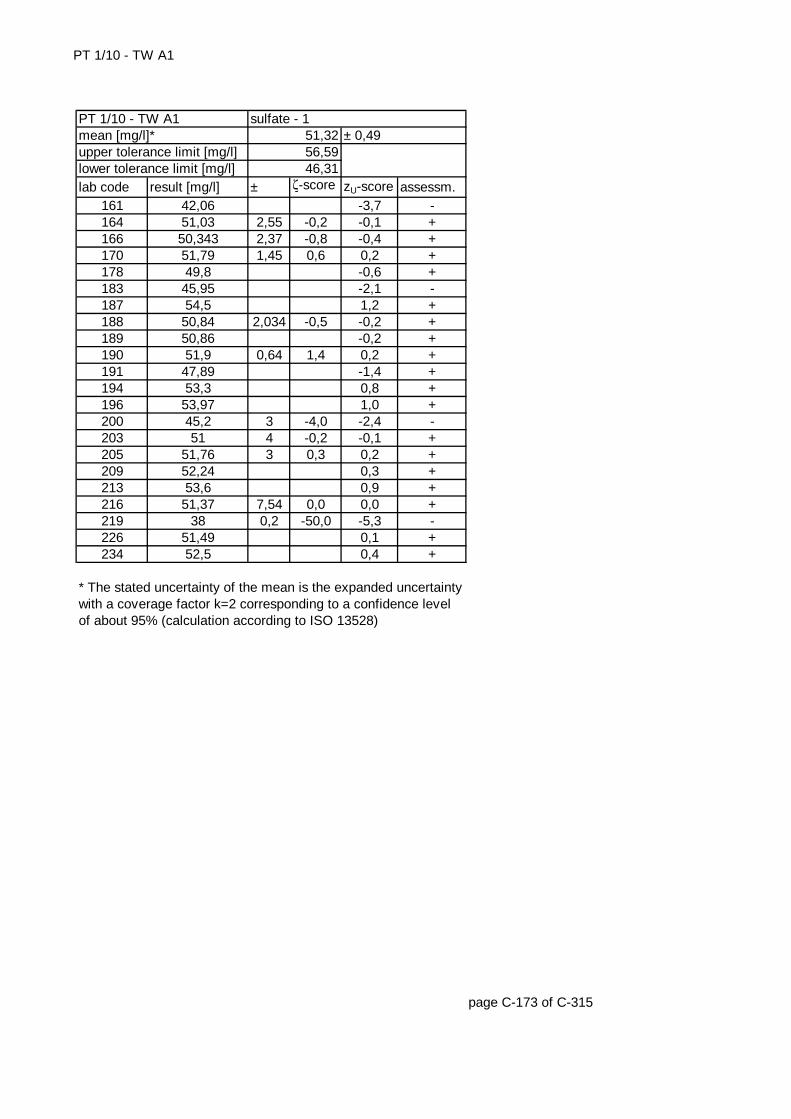
PT 1/10 - TW A1
lab code result [mg/l] ± ζ-score zU-score assessm.161 42,06 -3,7 -164 51,03 2,55 -0,2 -0,1 +166 50,343 2,37 -0,8 -0,4 +170 51,79 1,45 0,6 0,2 +178 49,8 -0,6 +183 45,95 -2,1 -187 54,5 1,2 +188 50,84 2,034 -0,5 -0,2 +189 50,86 -0,2 +190 51,9 0,64 1,4 0,2 +191 47,89 -1,4 +194 53,3 0,8 +196 53,97 1,0 +200 45,2 3 -4,0 -2,4 -203 51 4 -0,2 -0,1 +205 51,76 3 0,3 0,2 +209 52,24 0,3 +213 53,6 0,9 +216 51,37 7,54 0,0 0,0 +219 38 0,2 -50,0 -5,3 -226 51,49 0,1 +234 52,5 0,4 +
page C-173 of C-315
* The stated uncertainty of the mean is the expanded uncertainty with a coverage factor k=2 corresponding to a confidence level of about 95% (calculation according to ISO 13528)
upper tolerance limit [mg/l] 56,59lower tolerance limit [mg/l] 46,31
PT 1/10 - TW A1 sulfate - 1mean [mg/l]* 51,32 ± 0,49
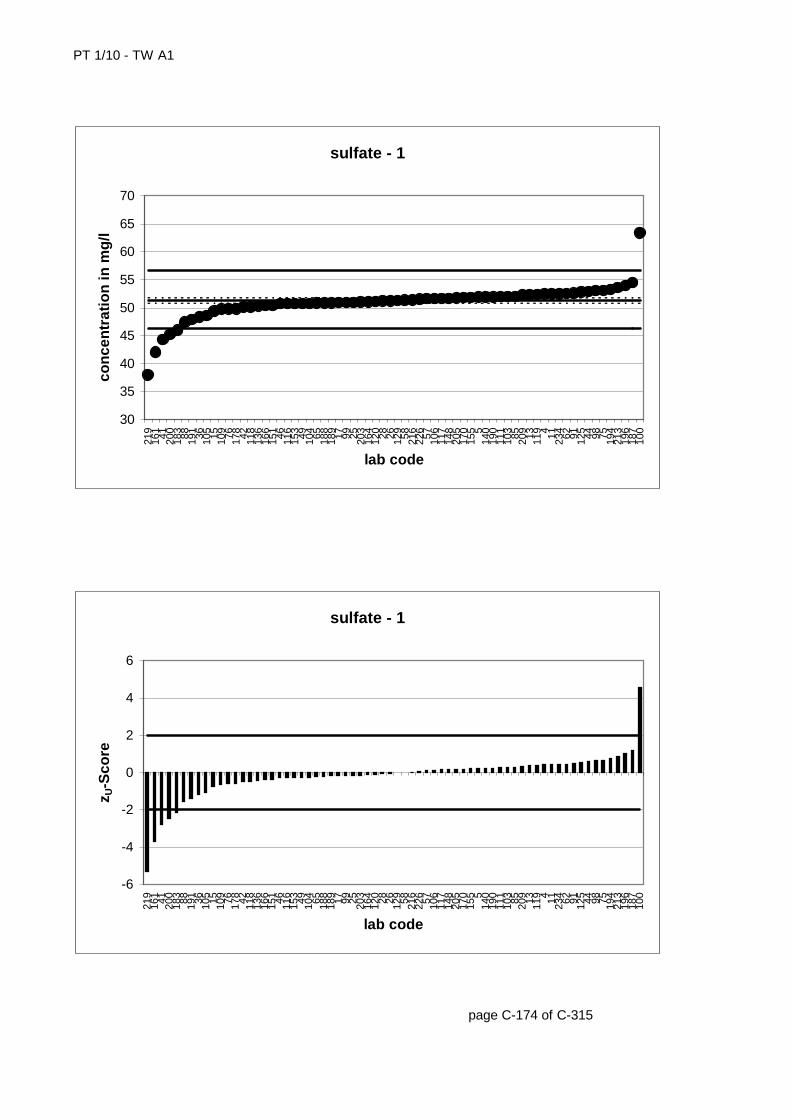
PT 1/10 - TW A1
page C-174 of C-315
sulfate - 1
30
35
40
45
50
55
60
65
70
219
161 41 200
183 88 191 36 105 15 109 76 178 42 118
136
166
151 46 116
153 49 104 65 188
189 17 99 25 203
164
120 28 26 129 58 216
226 57 106
117
148
205
170
155 5
140
190
111
103 85 209 13 119 4 11 234 62 91 125 44 98 75 194
213
196
187
100
lab code
con
cen
trat
ion
in m
g/l
sulfate - 1
-6
-4
-2
0
2
4
6
219
161 41 200
183 88 191 36 105 15 109 76 178 42 118
136
166
151 46 116
153 49 104 65 188
189 17 99 25 203
164
120 28 26 129 58 216
226 57 106
117
148
205
170
155 5
140
190
111
103 85 209 13 119 4 11 234 62 91 125 44 98 75 194
213
196
187
100
lab code
z U-S
core
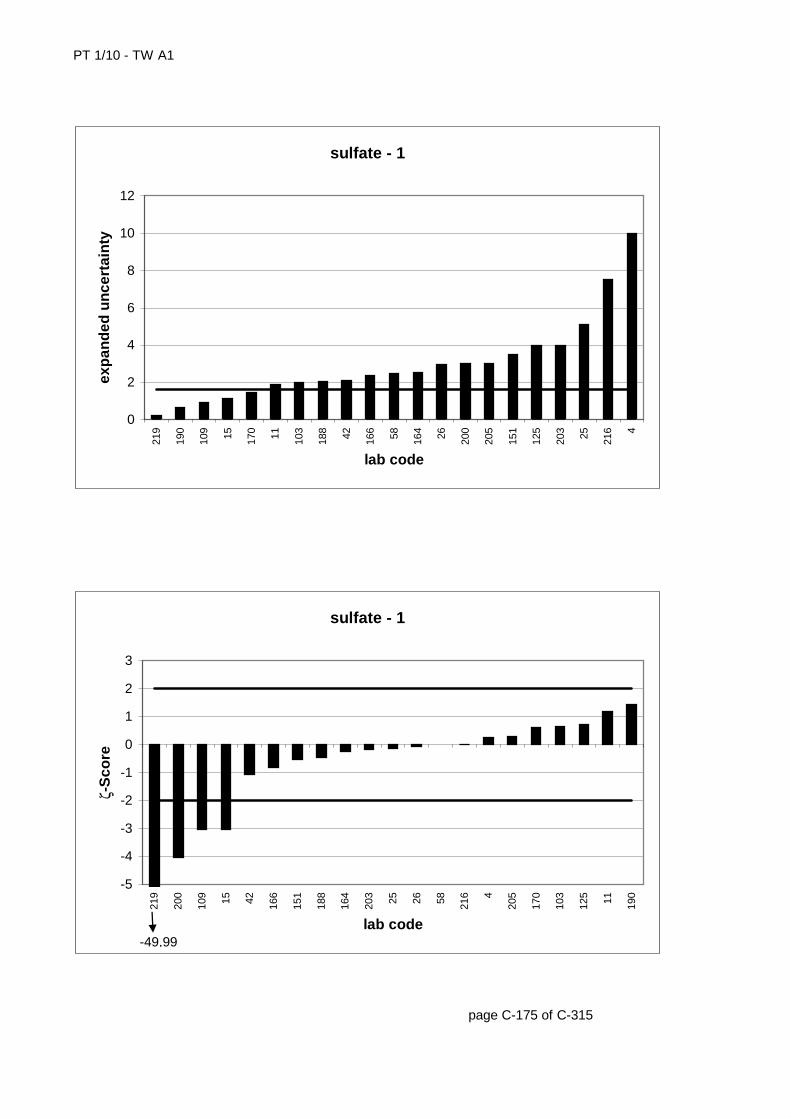
PT 1/10 - TW A1
page C-175 of C-315
sulfate - 1
0
2
4
6
8
10
12
219
190
109 15 170 11 103
188 42 166 58 164 26 200
205
151
125
203 25 216 4
lab code
exp
and
ed u
nce
rtai
nty
sulfate - 1
-5
-4
-3
-2
-1
0
1
2
3
219
200
109 15 42 166
151
188
164
203 25 26 58 216 4
205
170
103
125 11 190
lab code
ζ-S
core
-49,99
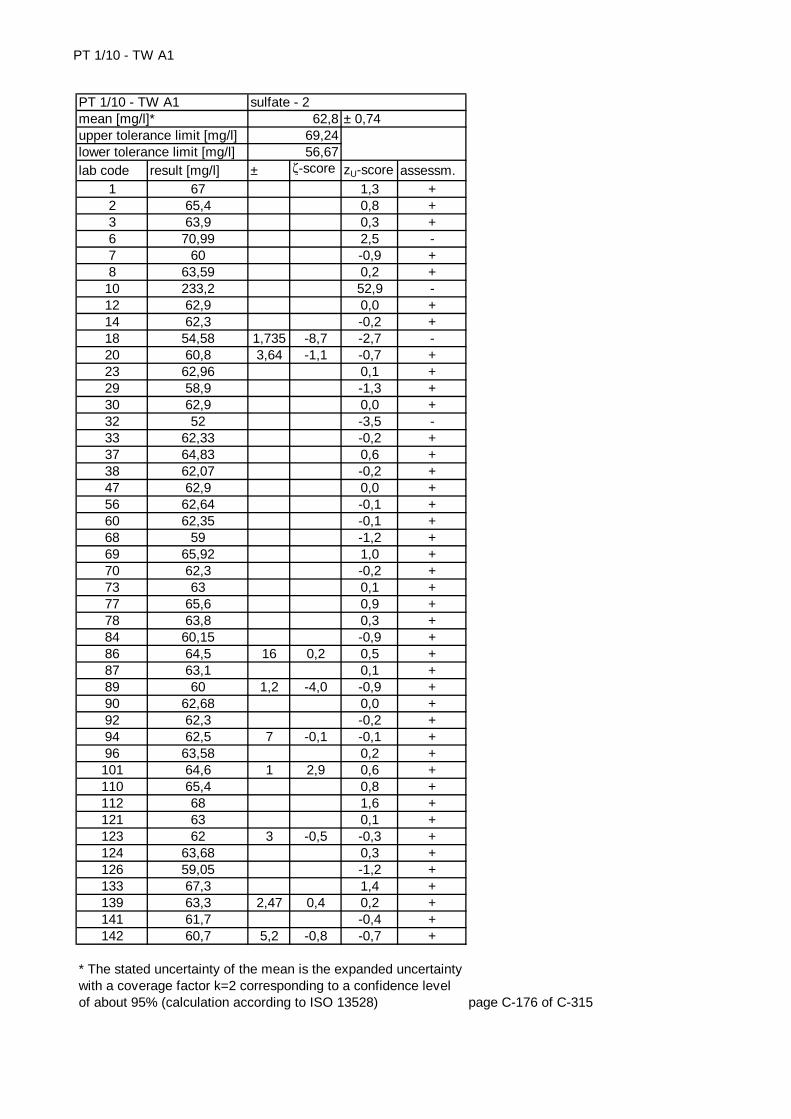
PT 1/10 - TW A1
lab code result [mg/l] ± ζ-score zU-score assessm.1 67 1,3 +2 65,4 0,8 +3 63,9 0,3 +6 70,99 2,5 -7 60 -0,9 +8 63,59 0,2 +
10 233,2 52,9 -12 62,9 0,0 +14 62,3 -0,2 +18 54,58 1,735 -8,7 -2,7 -20 60,8 3,64 -1,1 -0,7 +23 62,96 0,1 +29 58,9 -1,3 +30 62,9 0,0 +32 52 -3,5 -33 62,33 -0,2 +37 64,83 0,6 +38 62,07 -0,2 +47 62,9 0,0 +56 62,64 -0,1 +60 62,35 -0,1 +68 59 -1,2 +69 65,92 1,0 +70 62,3 -0,2 +73 63 0,1 +77 65,6 0,9 +78 63,8 0,3 +84 60,15 -0,9 +86 64,5 16 0,2 0,5 +87 63,1 0,1 +89 60 1,2 -4,0 -0,9 +90 62,68 0,0 +92 62,3 -0,2 +94 62,5 7 -0,1 -0,1 +96 63,58 0,2 +101 64,6 1 2,9 0,6 +110 65,4 0,8 +112 68 1,6 +121 63 0,1 +123 62 3 -0,5 -0,3 +124 63,68 0,3 +126 59,05 -1,2 +133 67,3 1,4 +139 63,3 2,47 0,4 0,2 +141 61,7 -0,4 +142 60,7 5,2 -0,8 -0,7 +
page C-176 of C-315
* The stated uncertainty of the mean is the expanded uncertainty with a coverage factor k=2 corresponding to a confidence level of about 95% (calculation according to ISO 13528)
sulfate - 262,8
69,2456,67
± 0,74PT 1/10 - TW A1mean [mg/l]*upper tolerance limit [mg/l]lower tolerance limit [mg/l]

PT 1/10 - TW A1
lab code result [mg/l] ± ζ-score zU-score assessm.146 62,4 -0,1 +147 60,55 -0,7 +149 64,4 0,5 +157 67,4 4,7 1,9 1,4 +158 63,59 3,38 0,5 0,2 +159 62,4 -0,1 +160 62,1033 -0,2 +163 62,16 -0,2 +168 63,64 0,3 +171 62,2 -0,2 +173 62,4 5,5 -0,1 -0,1 +176 55,9 -2,2 -177 160,4 20 9,8 30,3 -181 62,5 3 -0,2 -0,1 +182 64,61 0,6 +195 50,59 -4,0 -197 70,1 2,3 -199 63,76 0,3 +202 59,48 -1,1 +207 64,5 0,5 +211 63,8 0,3 +212 60 -0,9 +214 58,7 -1,3 +217 63 2,1 0,2 0,1 +222 63,7 6,6 0,3 0,3 +224 63,83 0,64 2,1 0,3 +225 62,4 -0,1 +228 59,64 -1,0 +230 51 -3,8 -231 78,6 4,9 -
page C-177 of C-315
* The stated uncertainty of the mean is the expanded uncertainty with a coverage factor k=2 corresponding to a confidence level of about 95% (calculation according to ISO 13528)
upper tolerance limit [mg/l] 69,24lower tolerance limit [mg/l] 56,67
PT 1/10 - TW A1 sulfate - 2mean [mg/l]* 62,8 ± 0,74
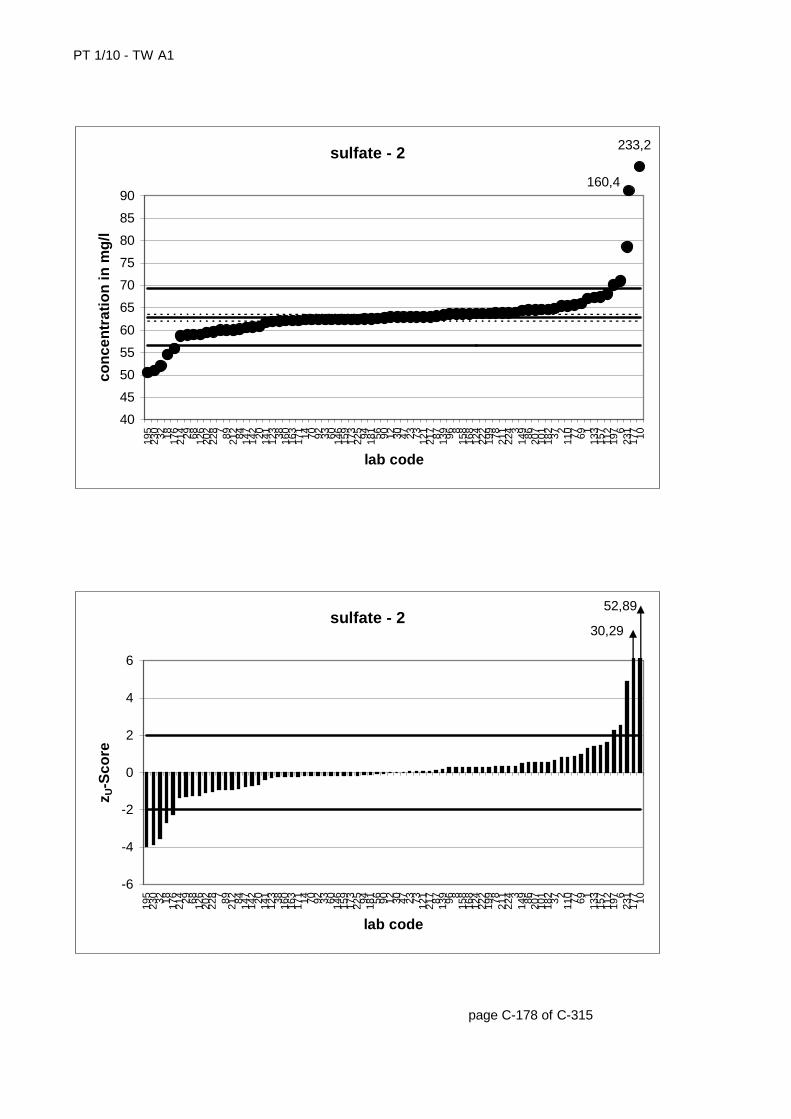
PT 1/10 - TW A1
page C-178 of C-315
sulfate - 2
40
45
50
55
60
65
70
75
80
85
90
195
230 32 18 176
214 29 68 126
202
228 7 89 212 84 147
142 20 141
123 38 160
163
171 14 70 92 33 60 146
159
173
225 94 181 56 90 12 30 47 23 73 121
217 87 139 96 8
158
168
124
222
199 78 211
224 3
149 86 207
101
182 37 2
110 77 69 1
133
157
112
197 6
231
177 10
lab code
con
cen
trat
ion
in m
g/l
160,4
233,2
sulfate - 2
-6
-4
-2
0
2
4
6
195
230 32 18 176
214 29 68 126
202
228 7 89 212 84 147
142 20 141
123 38 160
163
171 14 70 92 33 60 146
159
173
225 94 181 56 90 12 30 47 23 73 121
217 87 139 96 8
158
168
124
222
199 78 211
224 3
149 86 207
101
182 37 2
110 77 69 1
133
157
112
197 6
231
177 10
lab code
z U-S
core
30,29
52,89
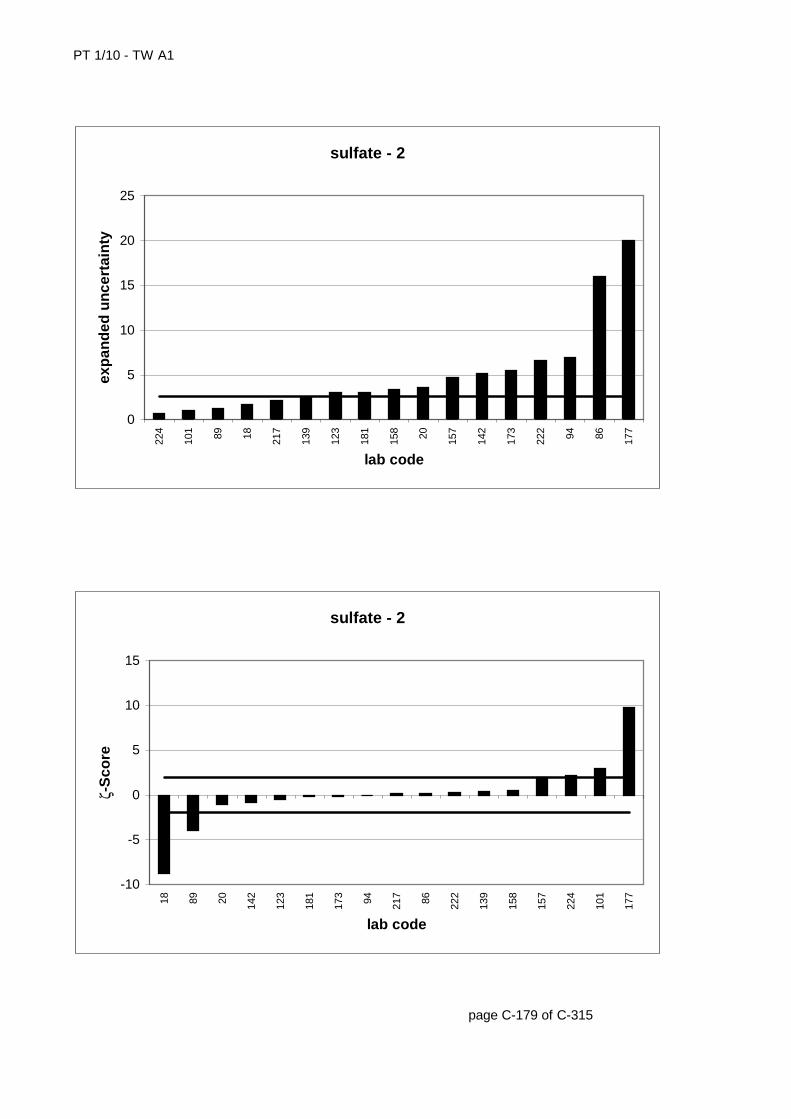
PT 1/10 - TW A1
page C-179 of C-315
sulfate - 2
0
5
10
15
20
25
224
101 89 18 217
139
123
181
158 20 157
142
173
222 94 86 177
lab code
exp
and
ed u
nce
rtai
nty
sulfate - 2
-10
-5
0
5
10
15
18 89 20 142
123
181
173 94 217 86 222
139
158
157
224
101
177
lab code
ζ-S
core
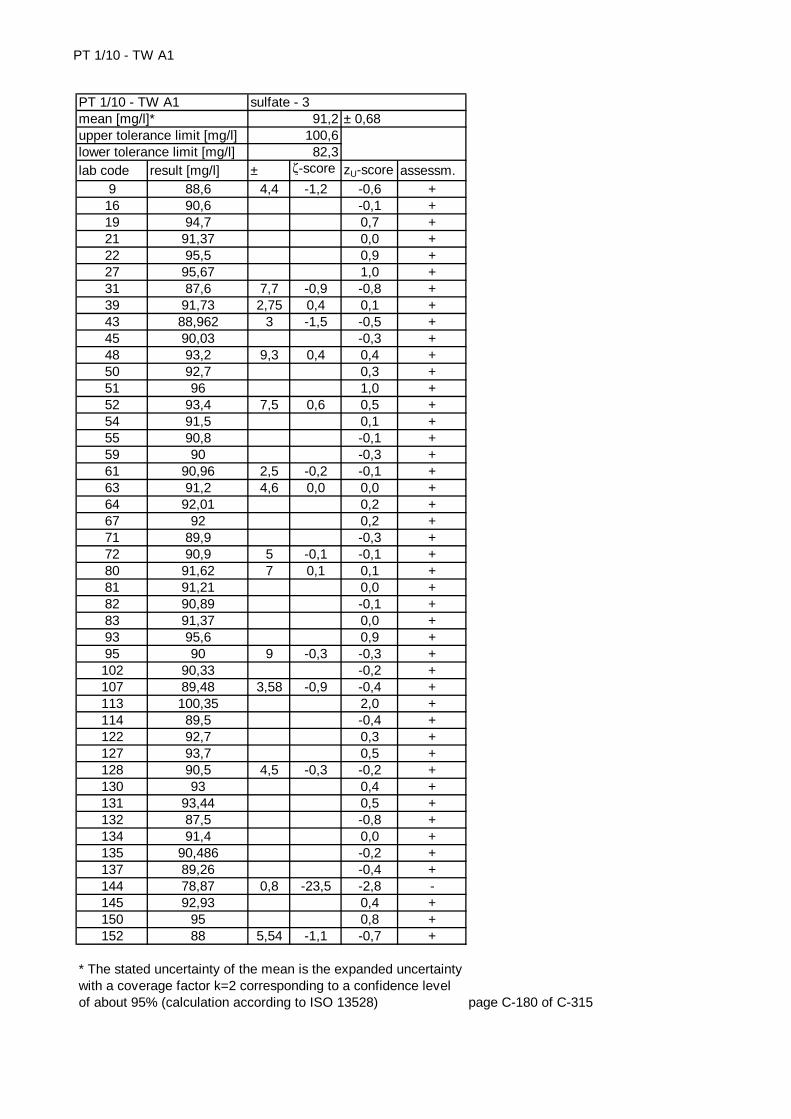
PT 1/10 - TW A1
lab code result [mg/l] ± ζ-score zU-score assessm.9 88,6 4,4 -1,2 -0,6 +
16 90,6 -0,1 +19 94,7 0,7 +21 91,37 0,0 +22 95,5 0,9 +27 95,67 1,0 +31 87,6 7,7 -0,9 -0,8 +39 91,73 2,75 0,4 0,1 +43 88,962 3 -1,5 -0,5 +45 90,03 -0,3 +48 93,2 9,3 0,4 0,4 +50 92,7 0,3 +51 96 1,0 +52 93,4 7,5 0,6 0,5 +54 91,5 0,1 +55 90,8 -0,1 +59 90 -0,3 +61 90,96 2,5 -0,2 -0,1 +63 91,2 4,6 0,0 0,0 +64 92,01 0,2 +67 92 0,2 +71 89,9 -0,3 +72 90,9 5 -0,1 -0,1 +80 91,62 7 0,1 0,1 +81 91,21 0,0 +82 90,89 -0,1 +83 91,37 0,0 +93 95,6 0,9 +95 90 9 -0,3 -0,3 +102 90,33 -0,2 +107 89,48 3,58 -0,9 -0,4 +113 100,35 2,0 +114 89,5 -0,4 +122 92,7 0,3 +127 93,7 0,5 +128 90,5 4,5 -0,3 -0,2 +130 93 0,4 +131 93,44 0,5 +132 87,5 -0,8 +134 91,4 0,0 +135 90,486 -0,2 +137 89,26 -0,4 +144 78,87 0,8 -23,5 -2,8 -145 92,93 0,4 +150 95 0,8 +152 88 5,54 -1,1 -0,7 +
page C-180 of C-315
* The stated uncertainty of the mean is the expanded uncertainty with a coverage factor k=2 corresponding to a confidence level of about 95% (calculation according to ISO 13528)
sulfate - 391,2
100,682,3
± 0,68PT 1/10 - TW A1mean [mg/l]*upper tolerance limit [mg/l]lower tolerance limit [mg/l]

PT 1/10 - TW A1
lab code result [mg/l] ± ζ-score zU-score assessm.156 88,74 -0,6 +162 90,5 -0,2 +167 90,6 5,4 -0,2 -0,1 +169 90,5 -0,2 +175 92 3 0,5 0,2 +179 87,9958 -0,7 +180 89,91 -0,3 +185 89 -0,5 +186 89,4 -0,4 +192 93,534 0,5 +193 89,9 -0,3 +201 92,35 0,2 +204 91,78 0,1 +206 94,4 3,8 1,7 0,7 +210 91,73 0,1 +215 92 0,2 +221 90,12 -0,2 +223 90,38 4,22 -0,4 -0,2 +227 92 5,09 0,3 0,2 +229 89,6 -0,4 +232 88,9 -0,5 +233 80,64 -2,4 -235 88,04 -0,7 +237 93,2 0,4 +
page C-181 of C-315
* The stated uncertainty of the mean is the expanded uncertainty with a coverage factor k=2 corresponding to a confidence level of about 95% (calculation according to ISO 13528)
upper tolerance limit [mg/l] 100,6lower tolerance limit [mg/l] 82,3
PT 1/10 - TW A1 sulfate - 3mean [mg/l]* 91,2 ± 0,68
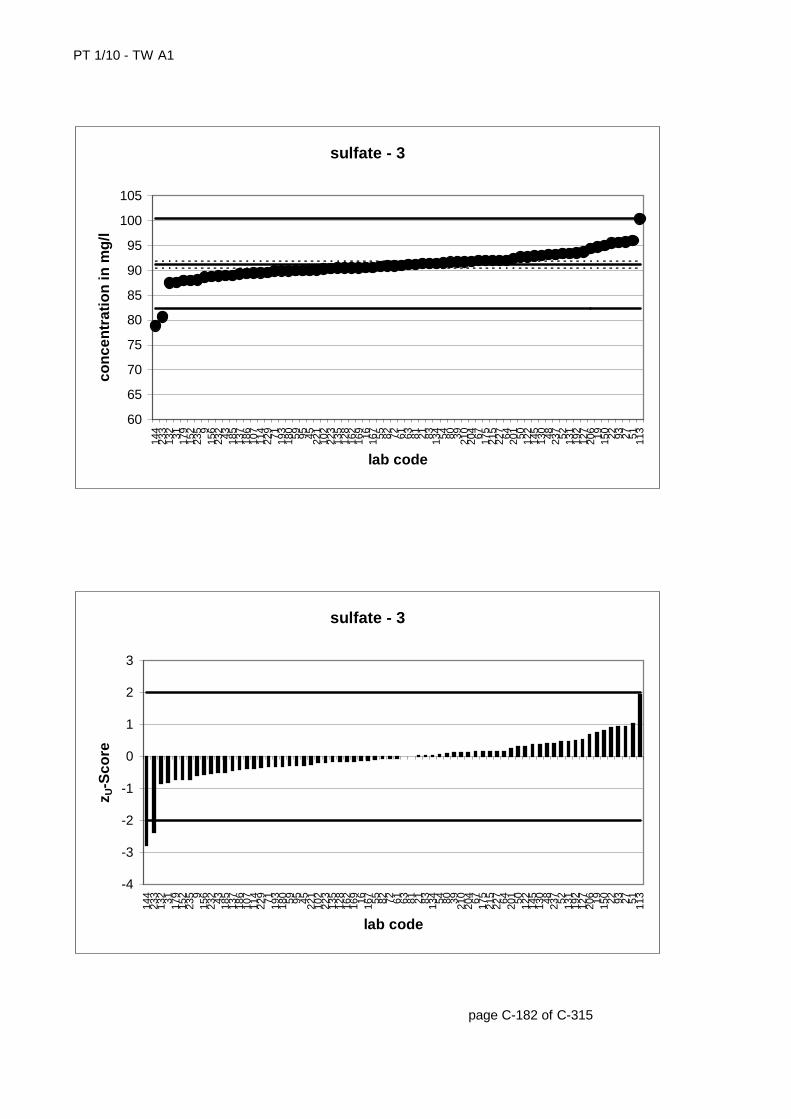
PT 1/10 - TW A1
page C-182 of C-315
sulfate - 3
60
65
70
75
80
85
90
95
100
105
144
233
132 31 179
152
235 9
156
232 43 185
137
186
107
114
229 71 193
180 59 95 45 221
102
223
135
128
162
169 16 167 55 82 72 61 63 81 21 83 134 54 80 39 210
204 67 175
215
227 64 201 50 122
145
130 48 237 52 131
192
127
206 19 150 22 93 27 51 113
lab code
con
cen
trat
ion
in m
g/l
sulfate - 3
-4
-3
-2
-1
0
1
2
3
144
233
132 31 179
152
235 9
156
232 43 185
137
186
107
114
229 71 193
180 59 95 45 221
102
223
135
128
162
169 16 167 55 82 72 61 63 81 21 83 134 54 80 39 210
204 67 175
215
227 64 201 50 122
145
130 48 237 52 131
192
127
206 19 150 22 93 27 51 113
lab code
z U-S
core
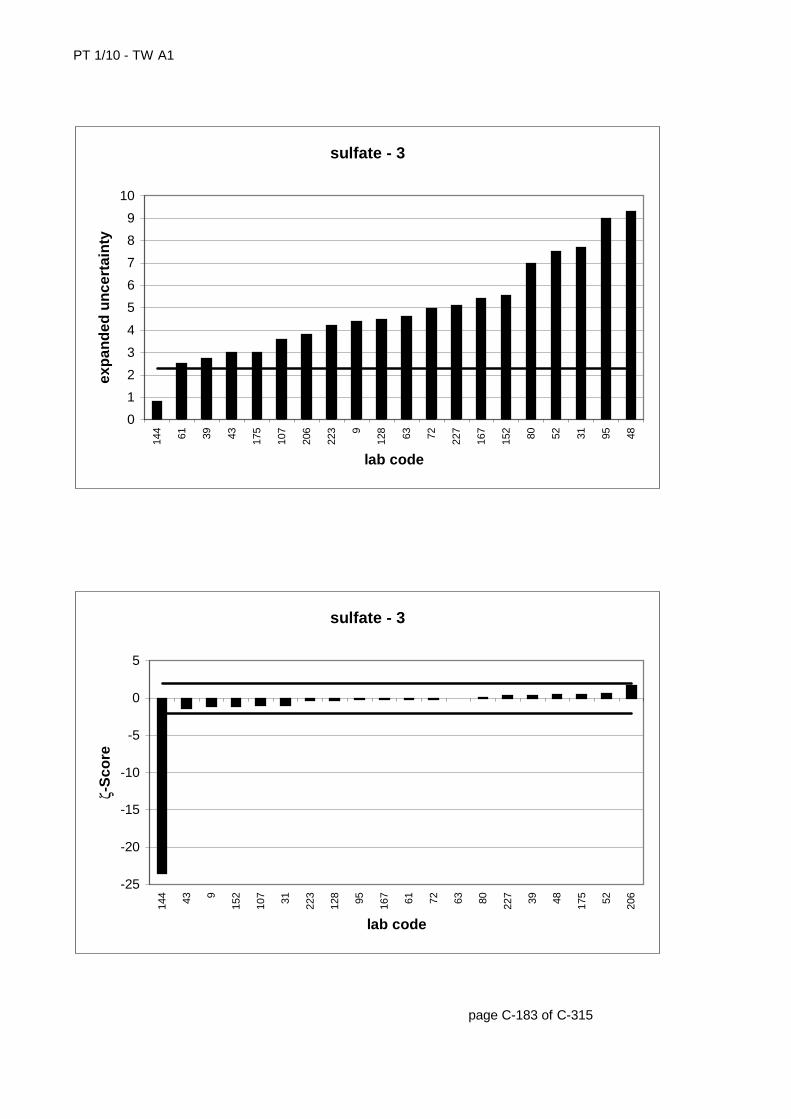
PT 1/10 - TW A1
page C-183 of C-315
sulfate - 3
0
1
2
3
4
5
6
7
8
9
10
144 61 39 43 175
107
206
223 9
128 63 72 227
167
152 80 52 31 95 48
lab code
exp
and
ed u
nce
rtai
nty
sulfate - 3
-25
-20
-15
-10
-5
0
5
144 43 9
152
107 31 223
128 95 167 61 72 63 80 227 39 48 175 52 206
lab code
ζ-S
core

PT 1/10 - TW A1
lab code result [mg/l] ± ζ-score zU-score assessm.3 110 -0,5 +8 112,9 0,1 +9 112 5,6 -0,2 -0,1 +
17 116 0,6 +19 112 -0,1 +23 111,6 -0,2 +25 114,86 11,5 0,4 0,4 +27 120 1,3 +28 111,711 -0,1 +29 103 -1,7 +30 112 -0,1 +33 111,29 -0,2 +42 113,7 4,71 0,5 0,2 +44 122,7 1,8 +45 111,3 -0,2 +47 113,5 0,2 +48 116 12 0,6 0,6 +51 118 1,0 +54 112 -0,1 +57 112,1 -0,1 +62 117 0,8 +65 111 -0,3 +71 113 0,1 +82 113,2 0,1 +83 115,3 0,5 +85 111,86 -0,1 +91 114 0,3 +93 114 0,3 +96 113,89 0,2 +109 111,7 0,92 -1,3 -0,1 +111 113,2 0,1 +112 111 -0,3 +121 108,83 -0,7 +125 117 4 2,2 0,8 +128 112,6 4 0,0 0,0 +133 117,1 0,8 +134 112 -0,1 +136 110,8 -0,3 +145 113,7 0,2 +151 111 7,8 -0,4 -0,3 +156 107,9 -0,8 +157 114 8 0,4 0,3 +159 110,2 -0,4 +160 114,518 0,3 +161 107 -1,0 +166 111,24 5,23 -0,5 -0,2 +
page C-184 of C-315
* The stated uncertainty of the mean is the expanded uncertainty with a coverage factor k=2 corresponding to a confidence level of about 95% (calculation according to ISO 13528)
sulfate - 4112,5124,1101,5
± 0,8PT 1/10 - TW A1mean [mg/l]*upper tolerance limit [mg/l]lower tolerance limit [mg/l]
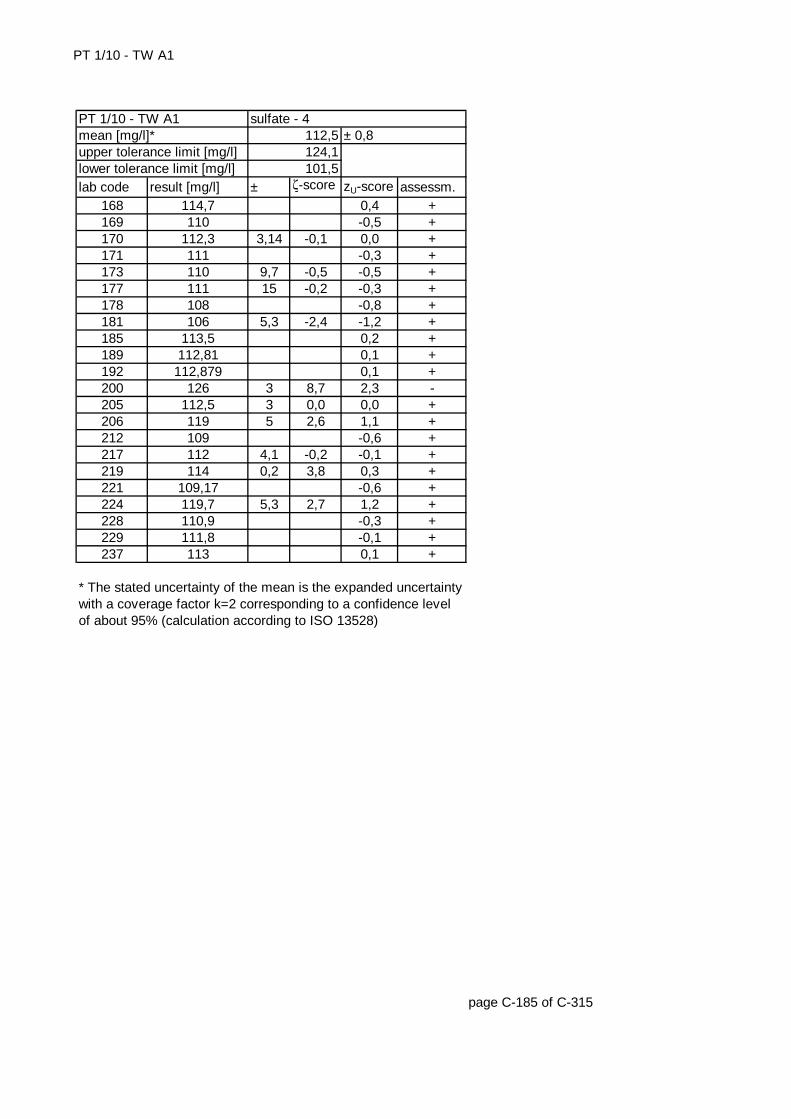
PT 1/10 - TW A1
lab code result [mg/l] ± ζ-score zU-score assessm.168 114,7 0,4 +169 110 -0,5 +170 112,3 3,14 -0,1 0,0 +171 111 -0,3 +173 110 9,7 -0,5 -0,5 +177 111 15 -0,2 -0,3 +178 108 -0,8 +181 106 5,3 -2,4 -1,2 +185 113,5 0,2 +189 112,81 0,1 +192 112,879 0,1 +200 126 3 8,7 2,3 -205 112,5 3 0,0 0,0 +206 119 5 2,6 1,1 +212 109 -0,6 +217 112 4,1 -0,2 -0,1 +219 114 0,2 3,8 0,3 +221 109,17 -0,6 +224 119,7 5,3 2,7 1,2 +228 110,9 -0,3 +229 111,8 -0,1 +237 113 0,1 +
page C-185 of C-315
* The stated uncertainty of the mean is the expanded uncertainty with a coverage factor k=2 corresponding to a confidence level of about 95% (calculation according to ISO 13528)
upper tolerance limit [mg/l] 124,1lower tolerance limit [mg/l] 101,5
PT 1/10 - TW A1 sulfate - 4mean [mg/l]* 112,5 ± 0,8
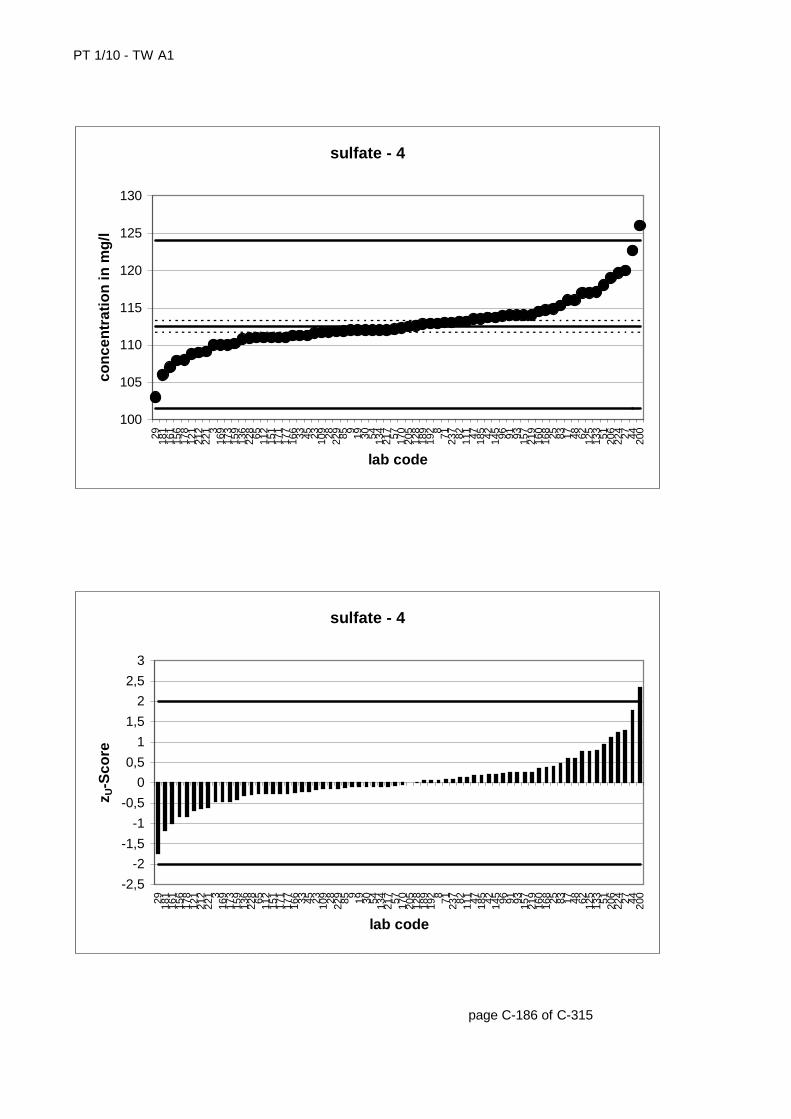
PT 1/10 - TW A1
page C-186 of C-315
sulfate - 4
100
105
110
115
120
125
130
29 181
161
156
178
121
212
221 3
169
173
159
136
228 65 112
151
171
177
166 33 45 23 109 28 229 85 9 19 30 54 134
217 57 170
205
128
189
192 8 71 237 82 111 47 185 42 145 96 91 93 157
219
160
168 25 83 17 48 62 125
133 51 206
224 27 44 200
lab code
con
cen
trat
ion
in m
g/l
sulfate - 4
-2,5
-2
-1,5
-1
-0,5
0
0,5
1
1,5
2
2,5
3
29 181
161
156
178
121
212
221 3
169
173
159
136
228 65 112
151
171
177
166 33 45 23 109 28 229 85 9 19 30 54 134
217 57 170
205
128
189
192 8 71 237 82 111 47 185 42 145 96 91 93 157
219
160
168 25 83 17 48 62 125
133 51 206
224 27 44 200
lab code
z U-S
core
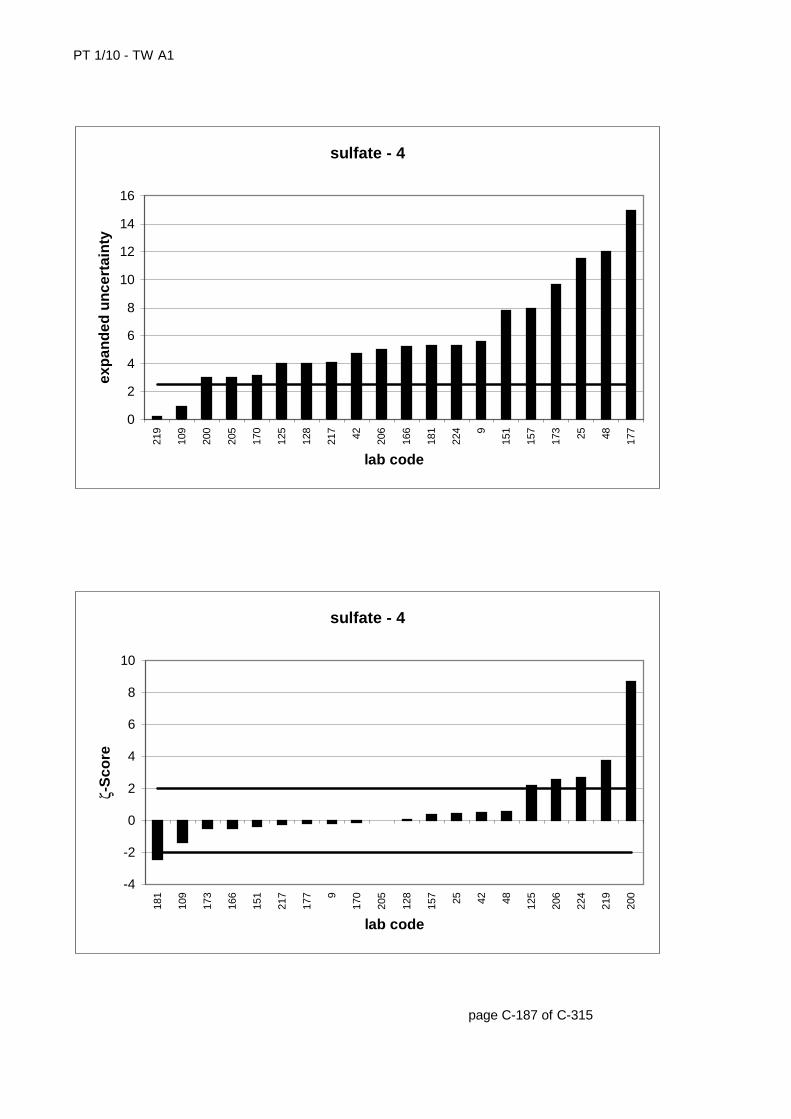
PT 1/10 - TW A1
page C-187 of C-315
sulfate - 4
0
2
4
6
8
10
12
14
16
219
109
200
205
170
125
128
217 42 206
166
181
224 9
151
157
173 25 48 177
lab code
exp
and
ed u
nce
rtai
nty
sulfate - 4
-4
-2
0
2
4
6
8
10
181
109
173
166
151
217
177 9
170
205
128
157 25 42 48 125
206
224
219
200
lab code
ζ-S
core

PT 1/10 - TW A1
lab code result [mg/l] ± ζ-score zU-score assessm.2 148,9 0,8 +3 149,6 0,9 +5 136,6 -0,9 +6 136,1 -1,0 +
10 135,1 -1,1 +20 139 8,31 -1,0 -0,6 +21 145 0,3 +23 139,7 -0,5 +26 141,6 8,22 -0,3 -0,2 +28 141,502 -0,2 +32 147 0,5 +36 140,2 -0,4 +37 144,9 0,3 +41 123,1 -2,9 -43 142,847 5 -0,1 0,0 +45 143,9 0,1 +47 143,5 0,1 +49 142,2 -0,1 +58 145,1 4 1,0 0,3 +59 141 -0,3 +62 144,1 0,1 +63 143,3 7,2 0,1 0,0 +64 144 0,1 +69 148,3 0,7 +70 149,1 0,8 +71 143 0,0 +72 144 8 0,2 0,1 +77 149 0,8 +78 141,8 -0,2 +80 145,3 10 0,4 0,3 +86 130 33 -0,8 -1,9 +87 144,2 0,2 +88 133,3 -1,4 +98 146,9 0,5 +100 144,52 0,2 +102 142,4 -0,1 +103 142,6 6 -0,1 -0,1 +105 140 -0,4 +111 142,9 0,0 +113 144,77 0,2 +117 145 0,3 +118 144,29 0,2 +120 129,2 -2,0 +122 146 0,4 +123 131 3 -7,5 -1,7 +128 143,2 6 0,1 0,0 +
page C-188 of C-315
* The stated uncertainty of the mean is the expanded uncertainty with a coverage factor k=2 corresponding to a confidence level of about 95% (calculation according to ISO 13528)
sulfate - 5143
157,7129,1
± 1,2PT 1/10 - TW A1mean [mg/l]*upper tolerance limit [mg/l]lower tolerance limit [mg/l]

PT 1/10 - TW A1
lab code result [mg/l] ± ζ-score zU-score assessm.132 141,2 -0,3 +135 144,86 0,2 +139 144 5,62 0,3 0,1 +146 140,7 -0,3 +149 146,8 0,5 +155 146,2 0,4 +160 145,2425 0,3 +163 146 0,4 +164 140,7 7 -0,7 -0,3 +175 142 4 -0,5 -0,1 +176 133 -1,4 +186 144,4 0,2 +189 143,23 0,0 +193 141 -0,3 +195 138,7 -0,6 +201 144 0,1 +202 141,6 -0,2 +204 145,3 0,3 +206 147 6 1,3 0,5 +211 149 0,8 +214 140,93 -0,3 +232 137,7 -0,8 +234 148,1 0,7 +235 137,6 -0,8 +
page C-189 of C-315
* The stated uncertainty of the mean is the expanded uncertainty with a coverage factor k=2 corresponding to a confidence level of about 95% (calculation according to ISO 13528)
upper tolerance limit [mg/l] 157,7lower tolerance limit [mg/l] 129,1
PT 1/10 - TW A1 sulfate - 5mean [mg/l]* 143 ± 1,2
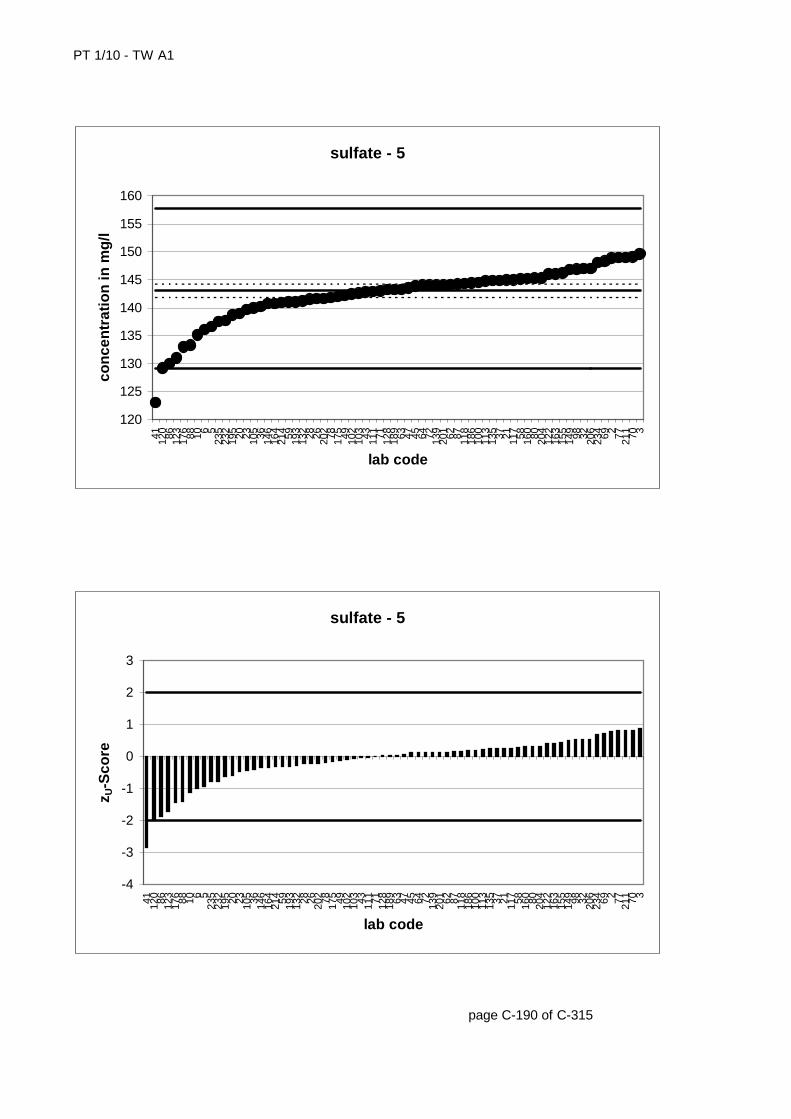
PT 1/10 - TW A1
page C-190 of C-315
sulfate - 5
120
125
130
135
140
145
150
155
160
41 120 86 123
176 88 10 6 5
235
232
195 20 23 105 36 146
164
214 59 193
132 28 26 202 78 175 49 102
103 43 111 71 128
189 63 47 45 64 72 139
201 62 87 118
186
100
113
135 37 21 117 58 160 80 204
122
163
155
149 98 32 206
234 69 2 77 211 70 3
lab code
con
cen
trat
ion
in m
g/l
sulfate - 5
-4
-3
-2
-1
0
1
2
3
41 120 86 123
176 88 10 6 5
235
232
195 20 23 105 36 146
164
214 59 193
132 28 26 202 78 175 49 102
103 43 111 71 128
189 63 47 45 64 72 139
201 62 87 118
186
100
113
135 37 21 117 58 160 80 204
122
163
155
149 98 32 206
234 69 2 77 211 70 3
lab code
z U-S
core
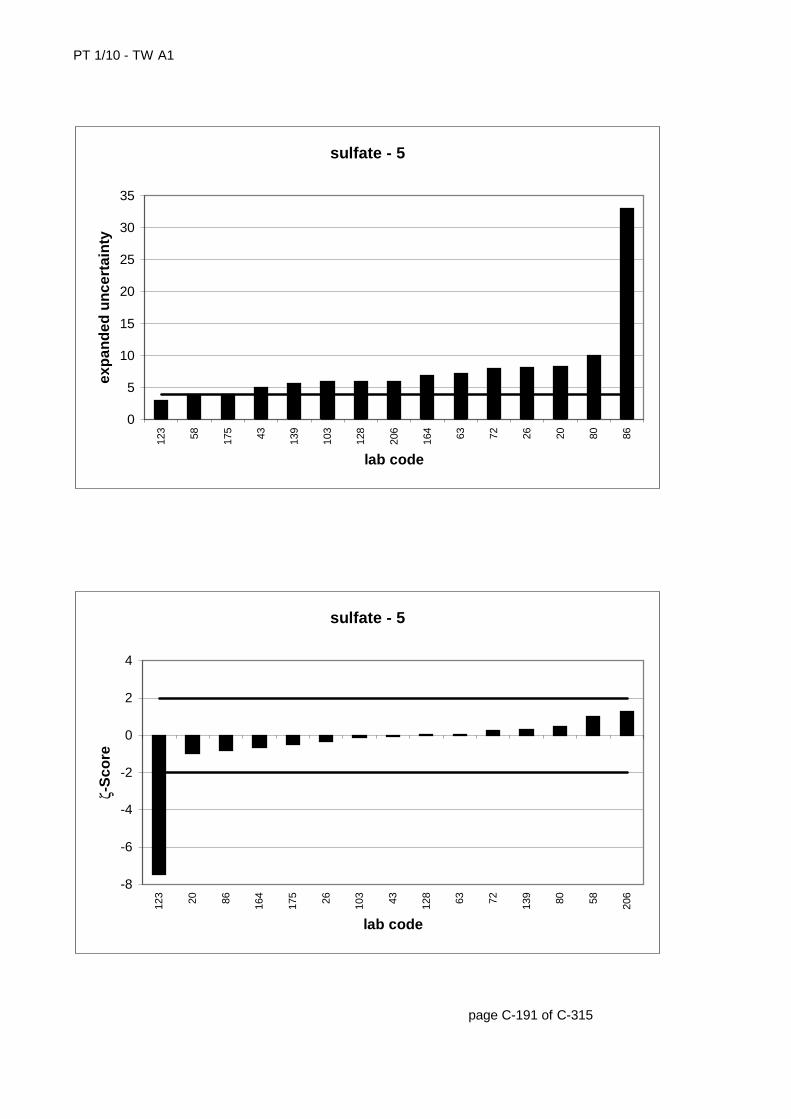
PT 1/10 - TW A1
page C-191 of C-315
sulfate - 5
0
5
10
15
20
25
30
35
123 58 175 43 139
103
128
206
164 63 72 26 20 80 86
lab code
exp
and
ed u
nce
rtai
nty
sulfate - 5
-8
-6
-4
-2
0
2
4
123 20 86 164
175 26 103 43 128 63 72 139 80 58 206
lab code
ζ-S
core
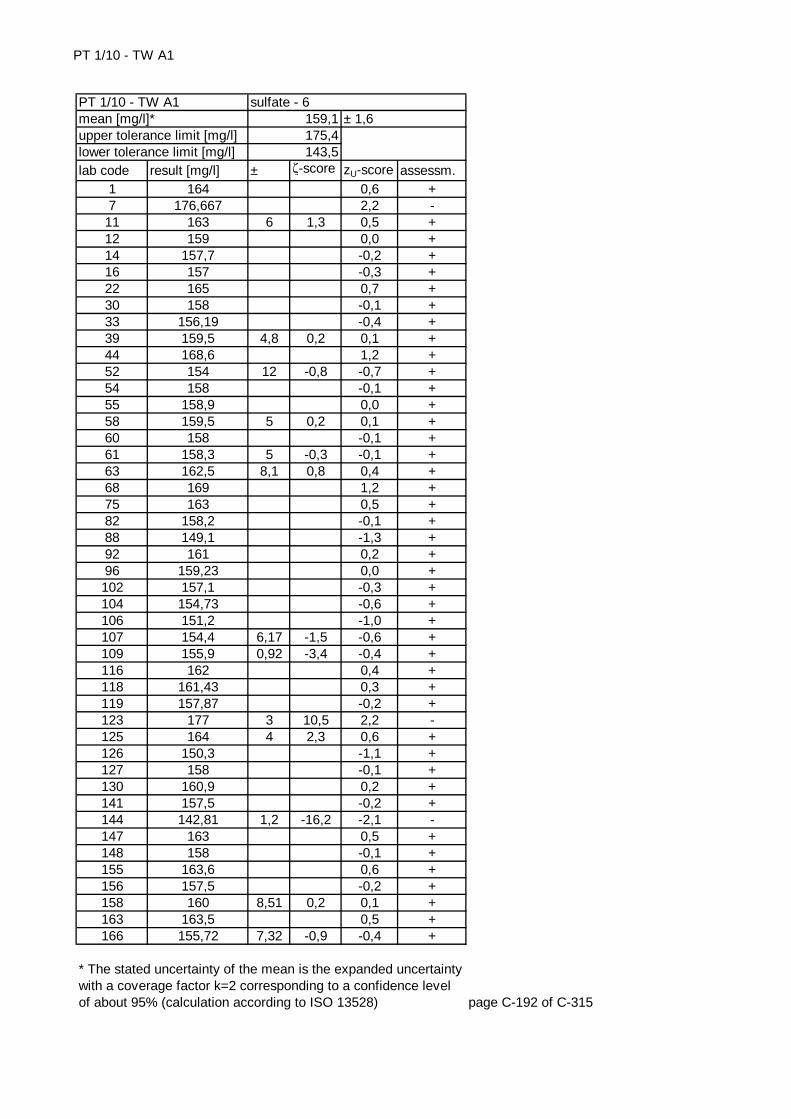
PT 1/10 - TW A1
lab code result [mg/l] ± ζ-score zU-score assessm.1 164 0,6 +7 176,667 2,2 -
11 163 6 1,3 0,5 +12 159 0,0 +14 157,7 -0,2 +16 157 -0,3 +22 165 0,7 +30 158 -0,1 +33 156,19 -0,4 +39 159,5 4,8 0,2 0,1 +44 168,6 1,2 +52 154 12 -0,8 -0,7 +54 158 -0,1 +55 158,9 0,0 +58 159,5 5 0,2 0,1 +60 158 -0,1 +61 158,3 5 -0,3 -0,1 +63 162,5 8,1 0,8 0,4 +68 169 1,2 +75 163 0,5 +82 158,2 -0,1 +88 149,1 -1,3 +92 161 0,2 +96 159,23 0,0 +102 157,1 -0,3 +104 154,73 -0,6 +106 151,2 -1,0 +107 154,4 6,17 -1,5 -0,6 +109 155,9 0,92 -3,4 -0,4 +116 162 0,4 +118 161,43 0,3 +119 157,87 -0,2 +123 177 3 10,5 2,2 -125 164 4 2,3 0,6 +126 150,3 -1,1 +127 158 -0,1 +130 160,9 0,2 +141 157,5 -0,2 +144 142,81 1,2 -16,2 -2,1 -147 163 0,5 +148 158 -0,1 +155 163,6 0,6 +156 157,5 -0,2 +158 160 8,51 0,2 0,1 +163 163,5 0,5 +166 155,72 7,32 -0,9 -0,4 +
page C-192 of C-315
* The stated uncertainty of the mean is the expanded uncertainty with a coverage factor k=2 corresponding to a confidence level of about 95% (calculation according to ISO 13528)
sulfate - 6159,1175,4143,5
± 1,6PT 1/10 - TW A1mean [mg/l]*upper tolerance limit [mg/l]lower tolerance limit [mg/l]

PT 1/10 - TW A1
lab code result [mg/l] ± ζ-score zU-score assessm.167 155 9 -0,9 -0,5 +176 150 -1,2 +177 59,81 7,8 -24,9 -12,8 -178 151 -1,0 +180 156,03 -0,4 +182 163,99 0,6 +185 163,6 0,6 +186 156,2 -0,4 +190 154 0,64 -5,8 -0,7 +191 167,22 1,0 +194 153 -0,8 +195 153,7 -0,7 +197 169 1,2 +201 161,5 0,3 +203 157 12,5 -0,3 -0,3 +204 160,5 0,2 +209 161,44 0,3 +211 166 0,8 +215 162 0,4 +216 162,72 23,87 0,3 0,4 +222 161 16,6 0,2 0,2 +224 164,1 5,1 1,9 0,6 +226 153 -0,8 +227 160,3 8,87 0,3 0,2 +229 156,2 -0,4 +230 147 -1,6 +
page C-193 of C-315
* The stated uncertainty of the mean is the expanded uncertainty with a coverage factor k=2 corresponding to a confidence level of about 95% (calculation according to ISO 13528)
upper tolerance limit [mg/l] 175,4lower tolerance limit [mg/l] 143,5
PT 1/10 - TW A1 sulfate - 6mean [mg/l]* 159,1 ± 1,6
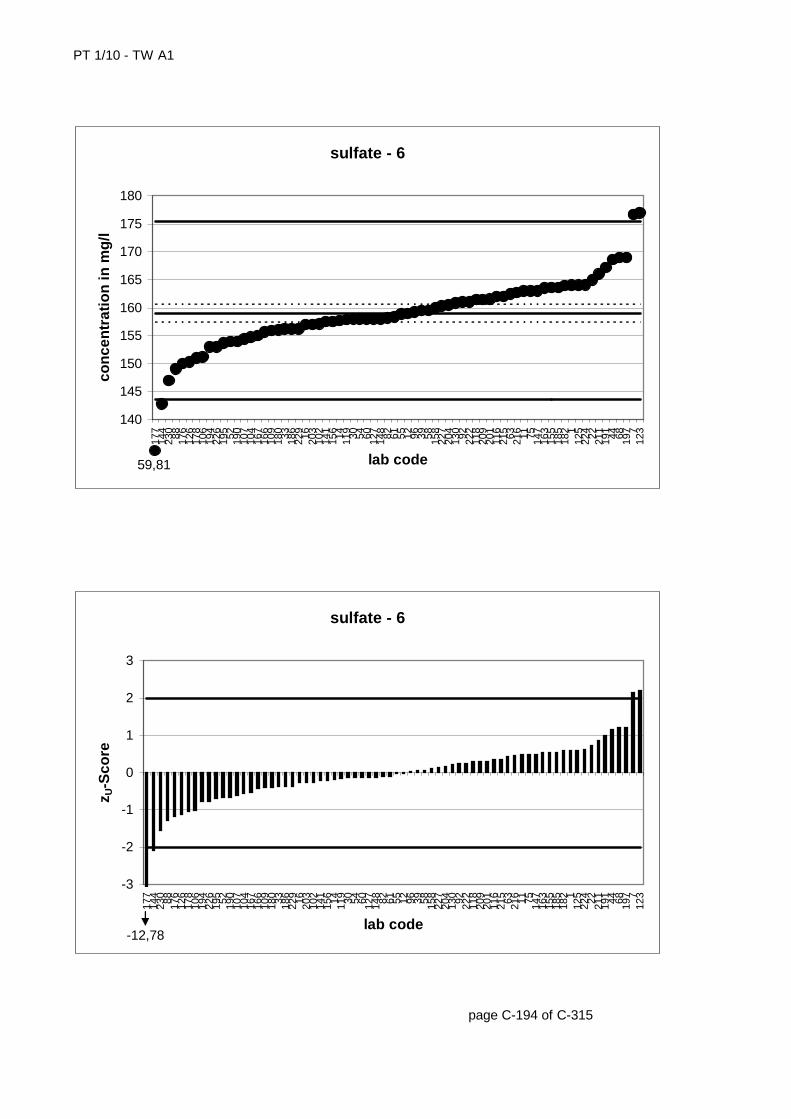
PT 1/10 - TW A1
page C-194 of C-315
sulfate - 6
140
145
150
155
160
165
170
175
180
177
144
230 88 176
126
178
106
194
226
195 52 190
107
104
167
166
109
180 33 186
229 16 203
102
141
156 14 119 30 54 60 127
148 82 61 55 12 96 39 58 158
227
204
130 92 222
118
209
201
116
215 63 216 11 75 147
163
155
185
182 1
125
224 22 211
191 44 68 197 7
123
lab code
con
cen
trat
ion
in m
g/l
59,81
sulfate - 6
-3
-2
-1
0
1
2
3
177
144
230 88 176
126
178
106
194
226
195 52 190
107
104
167
166
109
180 33 186
229 16 203
102
141
156 14 119 30 54 60 127
148 82 61 55 12 96 39 58 158
227
204
130 92 222
118
209
201
116
215 63 216 11 75 147
163
155
185
182 1
125
224 22 211
191 44 68 197 7
123
lab code
z U-S
core
-12,78
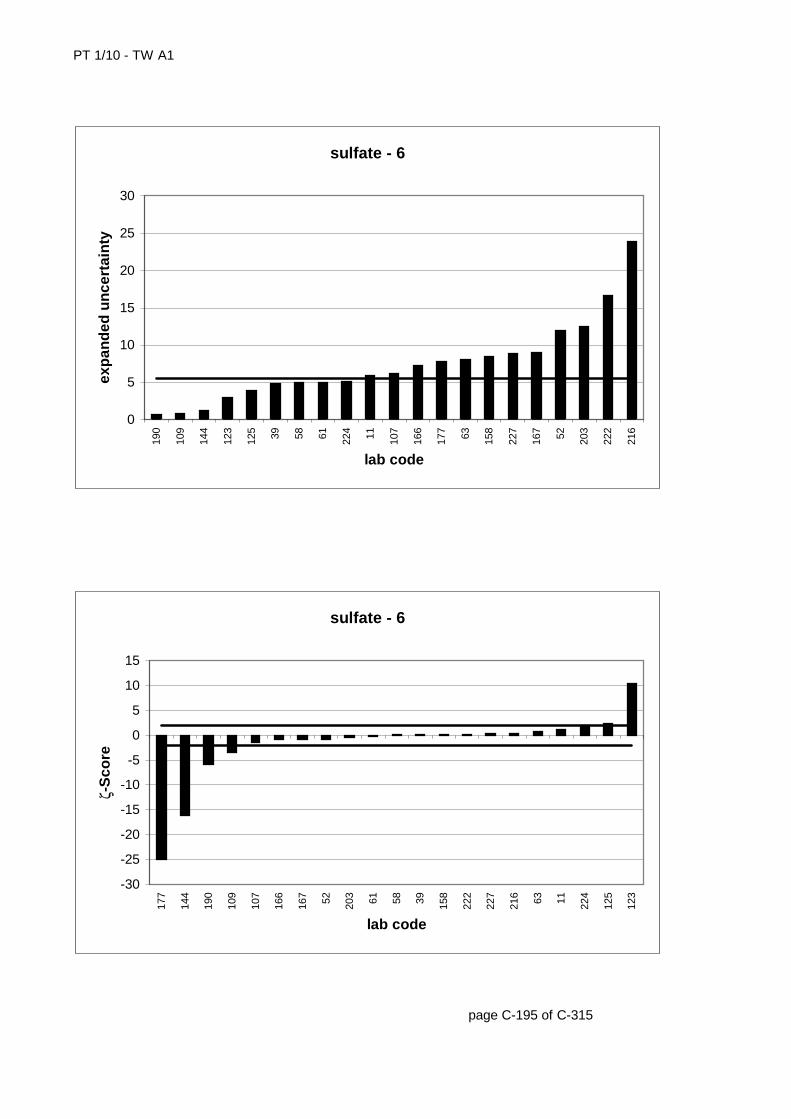
PT 1/10 - TW A1
page C-195 of C-315
sulfate - 6
0
5
10
15
20
25
30
190
109
144
123
125 39 58 61 224 11 107
166
177 63 158
227
167 52 203
222
216
lab code
exp
and
ed u
nce
rtai
nty
sulfate - 6
-30
-25
-20
-15
-10
-5
0
5
10
15
177
144
190
109
107
166
167 52 203 61 58 39 158
222
227
216 63 11 224
125
123
lab code
ζ-S
core
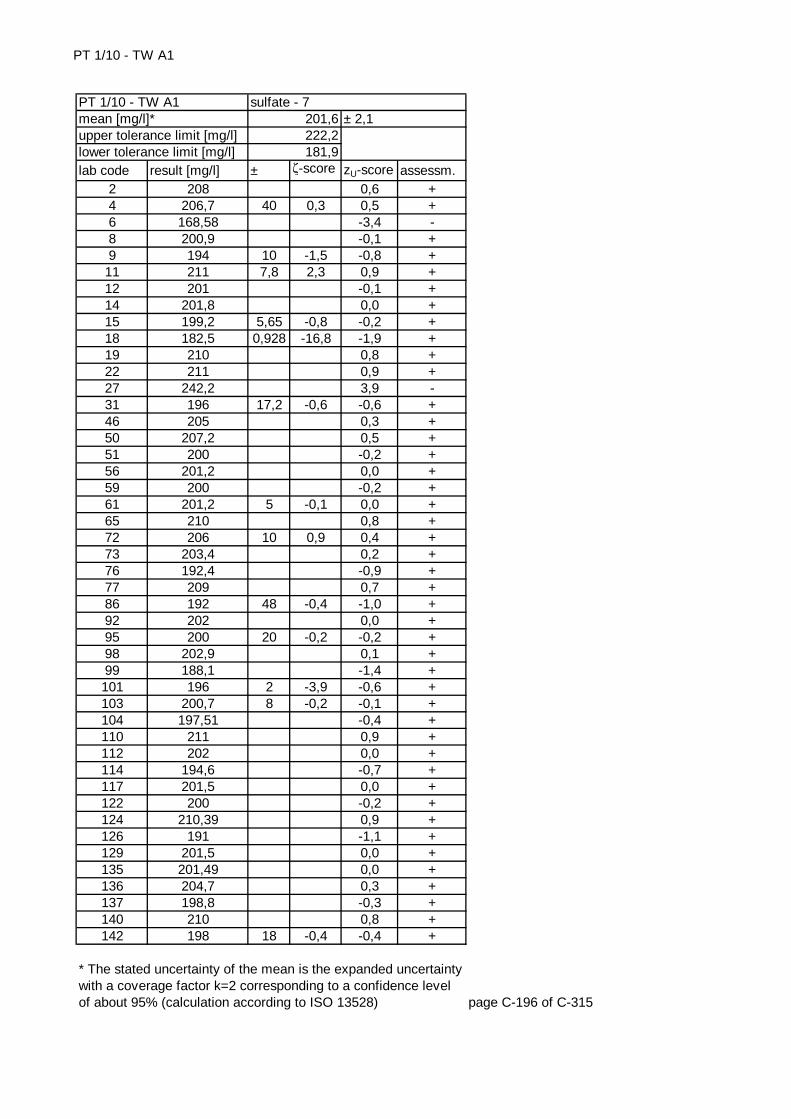
PT 1/10 - TW A1
lab code result [mg/l] ± ζ-score zU-score assessm.2 208 0,6 +4 206,7 40 0,3 0,5 +6 168,58 -3,4 -8 200,9 -0,1 +9 194 10 -1,5 -0,8 +
11 211 7,8 2,3 0,9 +12 201 -0,1 +14 201,8 0,0 +15 199,2 5,65 -0,8 -0,2 +18 182,5 0,928 -16,8 -1,9 +19 210 0,8 +22 211 0,9 +27 242,2 3,9 -31 196 17,2 -0,6 -0,6 +46 205 0,3 +50 207,2 0,5 +51 200 -0,2 +56 201,2 0,0 +59 200 -0,2 +61 201,2 5 -0,1 0,0 +65 210 0,8 +72 206 10 0,9 0,4 +73 203,4 0,2 +76 192,4 -0,9 +77 209 0,7 +86 192 48 -0,4 -1,0 +92 202 0,0 +95 200 20 -0,2 -0,2 +98 202,9 0,1 +99 188,1 -1,4 +101 196 2 -3,9 -0,6 +103 200,7 8 -0,2 -0,1 +104 197,51 -0,4 +110 211 0,9 +112 202 0,0 +114 194,6 -0,7 +117 201,5 0,0 +122 200 -0,2 +124 210,39 0,9 +126 191 -1,1 +129 201,5 0,0 +135 201,49 0,0 +136 204,7 0,3 +137 198,8 -0,3 +140 210 0,8 +142 198 18 -0,4 -0,4 +
page C-196 of C-315
* The stated uncertainty of the mean is the expanded uncertainty with a coverage factor k=2 corresponding to a confidence level of about 95% (calculation according to ISO 13528)
sulfate - 7201,6222,2181,9
± 2,1PT 1/10 - TW A1mean [mg/l]*upper tolerance limit [mg/l]lower tolerance limit [mg/l]

PT 1/10 - TW A1
lab code result [mg/l] ± ζ-score zU-score assessm.144 180,53 2,5 -13,0 -2,1 -146 198,3 -0,3 +150 201,4 0,0 +152 203 12,8 0,2 0,1 +157 213 14,9 1,5 1,1 +159 206,6 0,5 +162 200 -0,2 +167 198 12 -0,6 -0,4 +187 211 0,9 +190 213 0,64 10,6 1,1 +196 199,7 -0,2 +199 204,8 0,3 +200 224 3 12,3 2,2 -205 206,9 3 2,9 0,5 +207 200 -0,2 +209 205,22 0,4 +210 196,7 -0,5 +217 200 8,4 -0,4 -0,2 +225 201 -0,1 +226 193,1 -0,9 +230 190 -1,2 +231 189,4 -1,2 +233 196,57 -0,5 +234 206,2 0,4 +235 196,6 -0,5 +237 203 0,1 +
page C-197 of C-315
* The stated uncertainty of the mean is the expanded uncertainty with a coverage factor k=2 corresponding to a confidence level of about 95% (calculation according to ISO 13528)
upper tolerance limit [mg/l] 222,2lower tolerance limit [mg/l] 181,9
PT 1/10 - TW A1 sulfate - 7mean [mg/l]* 201,6 ± 2,1
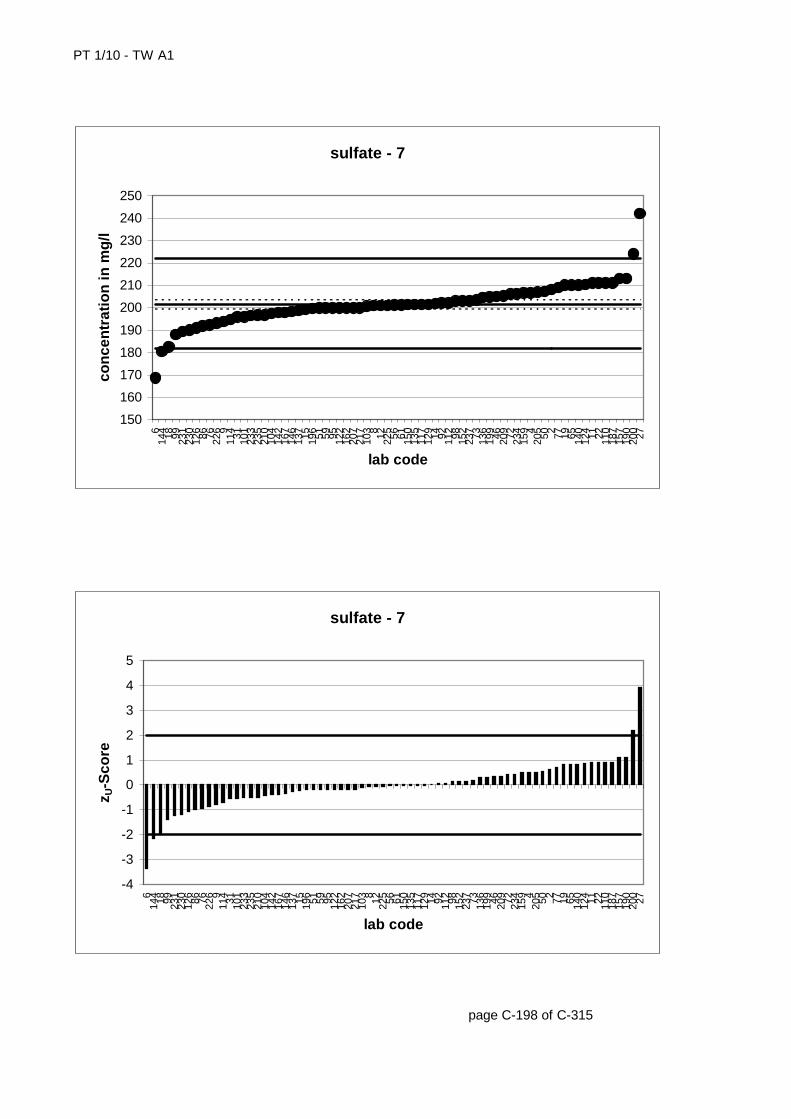
PT 1/10 - TW A1
page C-198 of C-315
sulfate - 7
150
160
170
180
190
200
210
220
230
240
250
614
4 18 99 231
230
126 86 76 226 9
114 31 101
233
235
210
104
142
167
146
137 15 196 51 59 95 122
162
207
217
103 8 12 225 56 61 150
135
117
129 14 92 112 98 152
237 73 136
199 46 209 72 234
159 4
205 50 2 77 19 65 140
124 11 22 110
187
157
190
200 27
lab code
con
cen
trat
ion
in m
g/l
sulfate - 7
-4
-3
-2
-1
0
1
2
3
4
5
614
4 18 99 231
230
126 86 76 226 9
114 31 101
233
235
210
104
142
167
146
137 15 196 51 59 95 122
162
207
217
103 8 12 225 56 61 150
135
117
129 14 92 112 98 152
237 73 136
199 46 209 72 234
159 4
205 50 2 77 19 65 140
124 11 22 110
187
157
190
200 27
lab code
z U-S
core
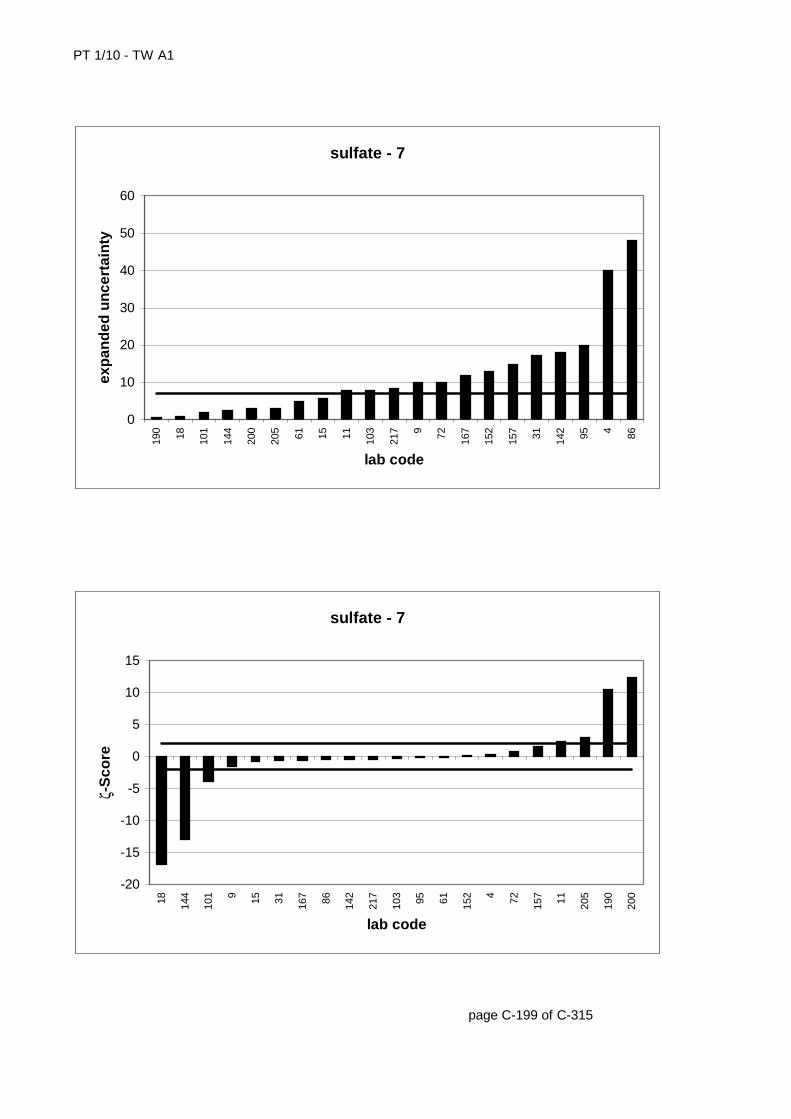
PT 1/10 - TW A1
page C-199 of C-315
sulfate - 7
0
10
20
30
40
50
60
190 18 101
144
200
205 61 15 11 103
217 9 72 167
152
157 31 142 95 4 86
lab code
exp
and
ed u
nce
rtai
nty
sulfate - 7
-20
-15
-10
-5
0
5
10
15
18 144
101 9 15 31 167 86 142
217
103 95 61 152 4 72 157 11 205
190
200
lab code
ζ-S
core

PT 1/10 - TW A1
lab code result [mg/l] ± ζ-score zU-score assessm.10 57,63 -15,3 -13 230,3 0,0 +17 236,8 0,6 +21 229,14 -0,1 +26 229,04 13,3 -0,1 -0,1 +29 214 -1,4 +32 254 2,0 +38 227,5 -0,2 +42 229 9,48 -0,2 -0,1 +43 228,109 7 -0,5 -0,2 +46 235 0,4 +49 231 0,1 +52 221 18 -1,0 -0,8 +55 228 -0,2 +56 229 -0,1 +60 226,5 -0,3 +67 232 0,2 +69 238,6 0,7 +70 225 -0,4 +73 230,7 0,1 +76 216,5 -1,2 +78 227 -0,3 +81 228,1 -0,2 +83 234 0,4 +84 225,95 -0,3 +85 226,8 -0,3 +89 250 5 7,5 1,7 +90 228,7 -0,1 +93 240,2 0,9 +94 220,8 24,73 -0,7 -0,8 +101 226 2 -2,7 -0,3 +105 227 -0,3 +113 236,83 0,6 +114 220,6 -0,8 +119 233,62 0,3 +120 223,8 -0,5 +121 226,2 -0,3 +124 238,17 0,7 +127 227 -0,3 +129 228,3 -0,1 +130 254,3 2,1 -131 244,47 1,2 +132 218,2 -1,0 +133 246,5 1,4 +134 225 -0,4 +137 221,7 -0,7 +
page C-200 of C-315
* The stated uncertainty of the mean is the expanded uncertainty with a coverage factor k=2 corresponding to a confidence level of about 95% (calculation according to ISO 13528)
sulfate - 8229,9253,4207,4
± 2PT 1/10 - TW A1mean [mg/l]*upper tolerance limit [mg/l]lower tolerance limit [mg/l]

PT 1/10 - TW A1
lab code result [mg/l] ± ζ-score zU-score assessm.139 229 8,93 -0,2 -0,1 +140 224 -0,5 +147 221,6 -0,7 +148 230 0,0 +149 231,8 0,2 +153 235,37 0,5 +158 229,5 12,21 -0,1 0,0 +162 226 -0,3 +164 226 11,3 -0,7 -0,3 +168 240,2 0,9 +170 237 6,64 2,1 0,6 +171 227 -0,3 +175 227 5 -1,1 -0,3 +179 231,0467 0,1 +180 224,11 -0,5 +182 238,47 0,7 +183 240,14 0,9 +188 231,4 9,256 0,3 0,1 +194 210 -1,8 +196 225,8 -0,4 +210 223,6 -0,6 +213 239 0,8 +216 240,28 35,25 0,6 0,9 +221 231,81 0,2 +222 232 23,9 0,2 0,2 +223 231,77 4,7 0,8 0,2 +227 232,2 12,54 0,4 0,2 +231 232,2 0,2 +233 227,68 -0,2 +
page C-201 of C-315
* The stated uncertainty of the mean is the expanded uncertainty with a coverage factor k=2 corresponding to a confidence level of about 95% (calculation according to ISO 13528)
upper tolerance limit [mg/l] 253,4lower tolerance limit [mg/l] 207,4
PT 1/10 - TW A1 sulfate - 8mean [mg/l]* 229,9 ± 2
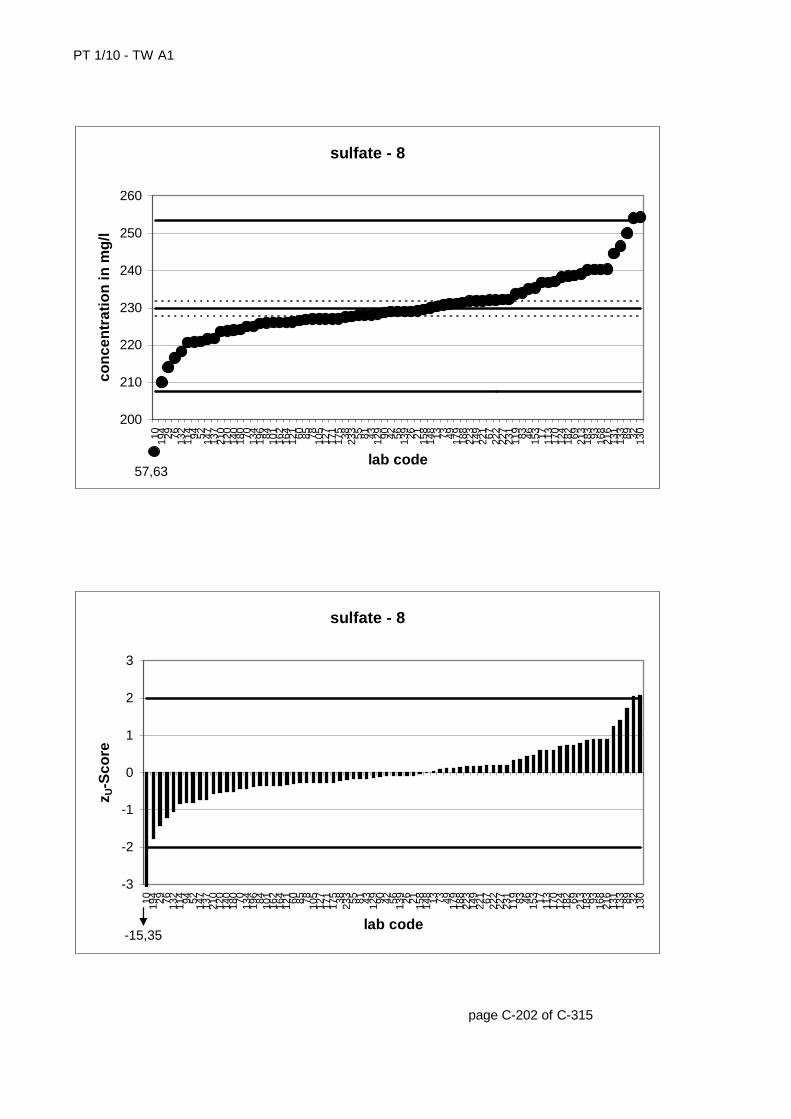
PT 1/10 - TW A1
page C-202 of C-315
sulfate - 8
200
210
220
230
240
250
260
10 194 29 76 132
114 94 52 147
137
210
120
140
180 70 134
196 84 101
162
164
121 60 85 78 105
127
171
175 38 233 55 81 43 129 90 42 56 139 26 21 158
148 13 73 49 179
188
223
149
221 67 222
227
231
119 83 46 153 17 113
170
124
182 69 213
183 93 168
216
131
133 89 32 130
lab code
con
cen
trat
ion
in m
g/l
57,63
sulfate - 8
-3
-2
-1
0
1
2
3
10 194 29 76 132
114 94 52 147
137
210
120
140
180 70 134
196 84 101
162
164
121 60 85 78 105
127
171
175 38 233 55 81 43 129 90 42 56 139 26 21 158
148 13 73 49 179
188
223
149
221 67 222
227
231
119 83 46 153 17 113
170
124
182 69 213
183 93 168
216
131
133 89 32 130
lab code
z U-S
core
-15,35
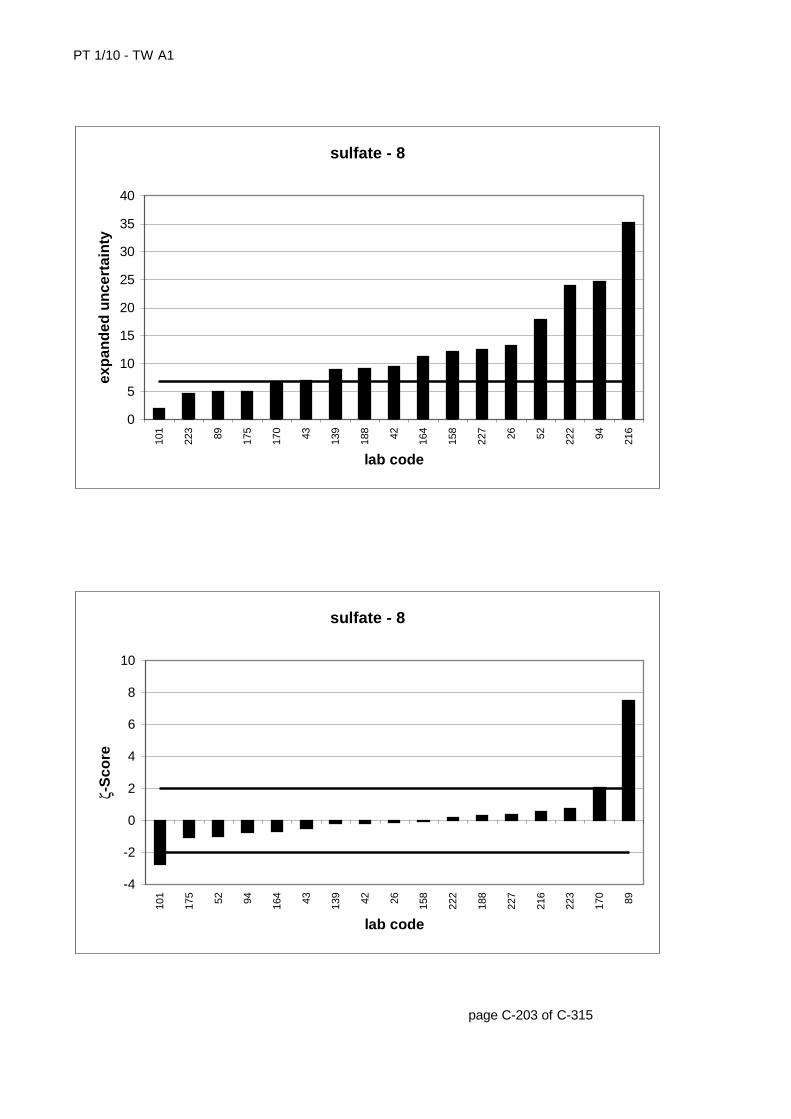
PT 1/10 - TW A1
page C-203 of C-315
sulfate - 8
0
5
10
15
20
25
30
35
40
101
223 89 175
170 43 139
188 42 164
158
227 26 52 222 94 216
lab code
exp
and
ed u
nce
rtai
nty
sulfate - 8
-4
-2
0
2
4
6
8
10
101
175 52 94 164 43 139 42 26 158
222
188
227
216
223
170 89
lab code
ζ-S
core

PT 1/10 - TW A1
lab code result [mg/l] ± ζ-score zU-score assessm.1 259 0,2 +4 256,4 50 0,0 0,0 +5 250 -0,6 +7 272 1,1 +
13 261,5 0,3 +15 251,6 1,91 -3,9 -0,4 +16 254 -0,2 +18 241,5 8,579 -3,5 -1,2 +20 248 14,8 -1,2 -0,7 +25 261,03 26,1 0,3 0,3 +31 248 21,8 -0,8 -0,7 +36 256 -0,1 +37 260,6 0,3 +38 251,9 -0,4 +39 254,6 7,6 -0,6 -0,2 +41 221,1 -2,9 -48 265 27 0,6 0,6 +50 259 0,2 +57 257,2 0,0 +64 258,8 0,1 +67 261 0,3 +68 288 2,4 -75 263 0,5 +80 257,9 16 0,1 0,1 +81 256,6 0,0 +84 250,56 -0,5 +87 258,2 0,1 +89 265 5 3,0 0,6 +90 251,7 -0,4 +91 259 0,2 +94 265,7 29,76 0,6 0,7 +95 258 26 0,1 0,1 +99 248,8 -0,6 +100 255,9 -0,1 +106 253,4 -0,3 +107 248,4 9,94 -1,7 -0,7 +110 271 1,1 +116 259,6 0,2 +131 262,94 0,5 +141 254,6 -0,2 +142 262 20 0,5 0,4 +145 259,7 0,2 +150 253,5 -0,3 +151 250,7 25 -0,5 -0,5 +152 250 15,8 -0,9 -0,6 +153 258,47 0,1 +
page C-204 of C-315
* The stated uncertainty of the mean is the expanded uncertainty with a coverage factor k=2 corresponding to a confidence level of about 95% (calculation according to ISO 13528)
sulfate - 9256,9283,3231,8
± 2PT 1/10 - TW A1mean [mg/l]*upper tolerance limit [mg/l]lower tolerance limit [mg/l]
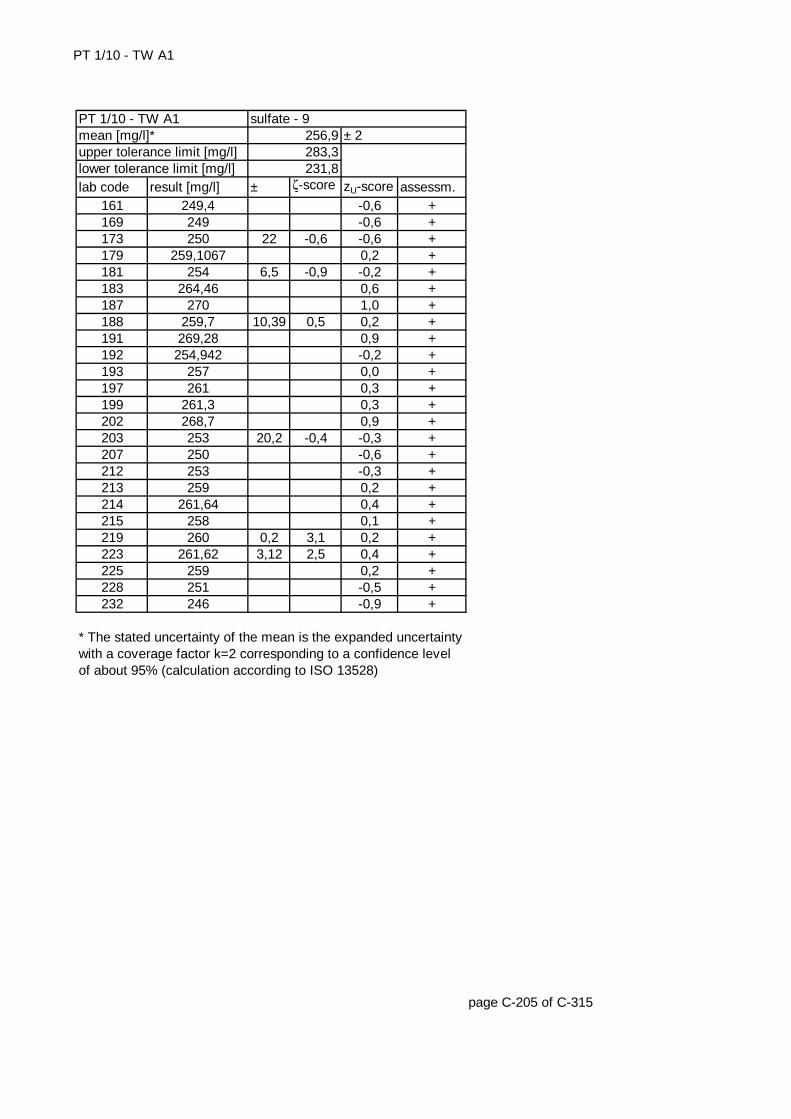
PT 1/10 - TW A1
lab code result [mg/l] ± ζ-score zU-score assessm.161 249,4 -0,6 +169 249 -0,6 +173 250 22 -0,6 -0,6 +179 259,1067 0,2 +181 254 6,5 -0,9 -0,2 +183 264,46 0,6 +187 270 1,0 +188 259,7 10,39 0,5 0,2 +191 269,28 0,9 +192 254,942 -0,2 +193 257 0,0 +197 261 0,3 +199 261,3 0,3 +202 268,7 0,9 +203 253 20,2 -0,4 -0,3 +207 250 -0,6 +212 253 -0,3 +213 259 0,2 +214 261,64 0,4 +215 258 0,1 +219 260 0,2 3,1 0,2 +223 261,62 3,12 2,5 0,4 +225 259 0,2 +228 251 -0,5 +232 246 -0,9 +
page C-205 of C-315
* The stated uncertainty of the mean is the expanded uncertainty with a coverage factor k=2 corresponding to a confidence level of about 95% (calculation according to ISO 13528)
upper tolerance limit [mg/l] 283,3lower tolerance limit [mg/l] 231,8
PT 1/10 - TW A1 sulfate - 9mean [mg/l]* 256,9 ± 2
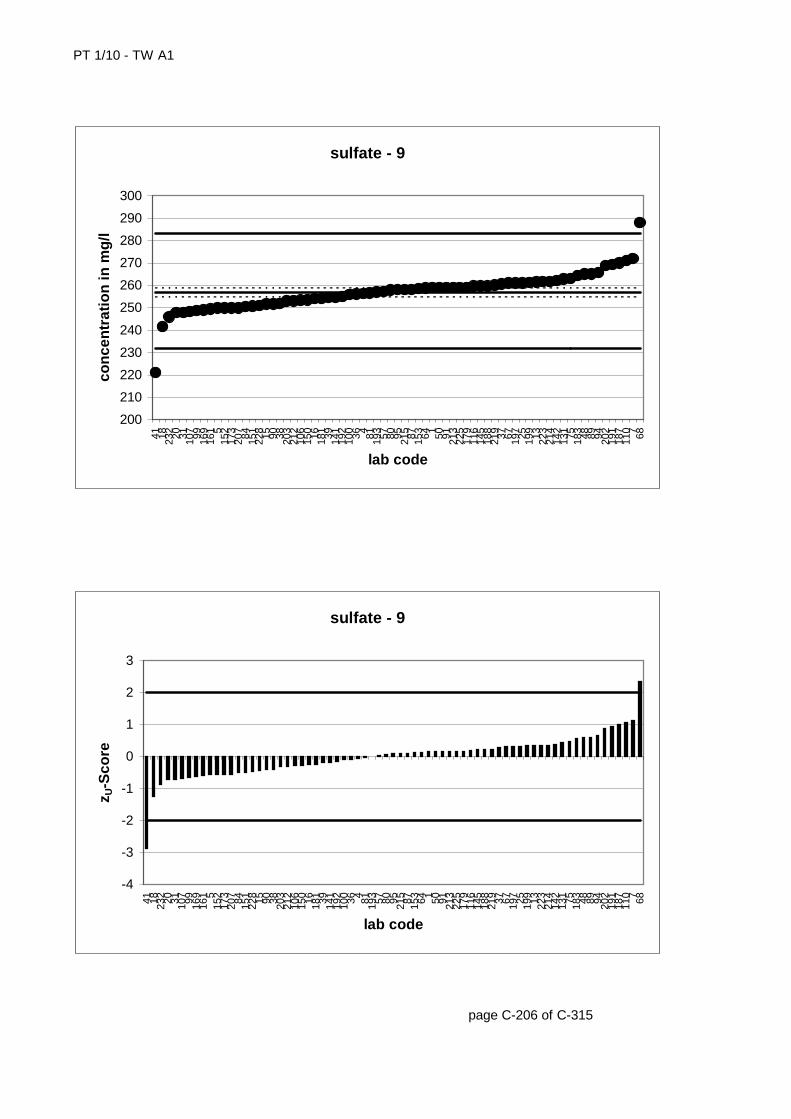
PT 1/10 - TW A1
page C-206 of C-315
sulfate - 9
200
210
220
230
240
250
260
270
280
290
300
41 18 232 20 31 107 99 169
161 5
152
173
207 84 151
228 15 90 38 203
212
106
150 16 181 39 141
192
100 36 4 81 193 57 80 95 215 87 153 64 1 50 91 213
225
179
116
145
188
219 37 67 197 25 199 13 223
214
142
131 75 183 48 89 94 202
191
187
110 7 68
lab code
con
cen
trat
ion
in m
g/l
sulfate - 9
-4
-3
-2
-1
0
1
2
3
41 18 232 20 31 107 99 169
161 5
152
173
207 84 151
228 15 90 38 203
212
106
150 16 181 39 141
192
100 36 4 81 193 57 80 95 215 87 153 64 1 50 91 213
225
179
116
145
188
219 37 67 197 25 199 13 223
214
142
131 75 183 48 89 94 202
191
187
110 7 68
lab code
z U-S
core
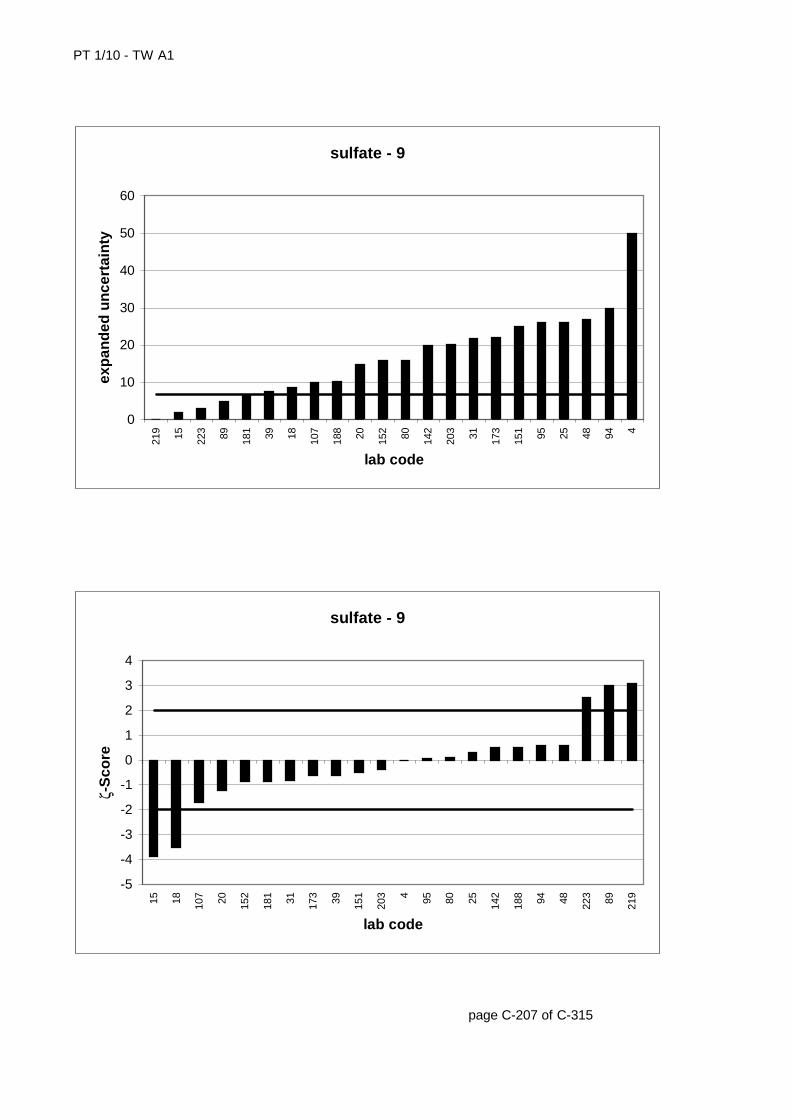
PT 1/10 - TW A1
page C-207 of C-315
sulfate - 9
0
10
20
30
40
50
60
219 15 223 89 181 39 18 107
188 20 152 80 142
203 31 173
151 95 25 48 94 4
lab code
exp
and
ed u
nce
rtai
nty
sulfate - 9
-5
-4
-3
-2
-1
0
1
2
3
4
15 18 107 20 152
181 31 173 39 151
203 4 95 80 25 142
188 94 48 223 89 219
lab code
ζ-S
core
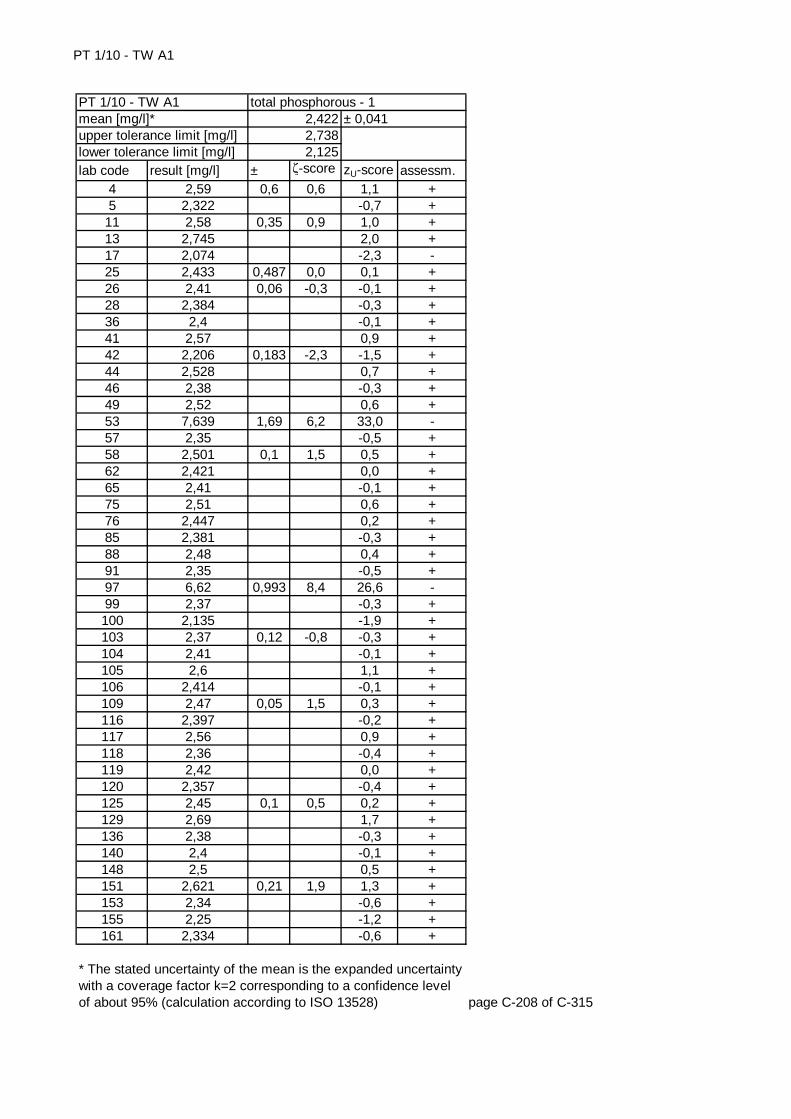
PT 1/10 - TW A1
lab code result [mg/l] ± ζ-score zU-score assessm.4 2,59 0,6 0,6 1,1 +5 2,322 -0,7 +
11 2,58 0,35 0,9 1,0 +13 2,745 2,0 +17 2,074 -2,3 -25 2,433 0,487 0,0 0,1 +26 2,41 0,06 -0,3 -0,1 +28 2,384 -0,3 +36 2,4 -0,1 +41 2,57 0,9 +42 2,206 0,183 -2,3 -1,5 +44 2,528 0,7 +46 2,38 -0,3 +49 2,52 0,6 +53 7,639 1,69 6,2 33,0 -57 2,35 -0,5 +58 2,501 0,1 1,5 0,5 +62 2,421 0,0 +65 2,41 -0,1 +75 2,51 0,6 +76 2,447 0,2 +85 2,381 -0,3 +88 2,48 0,4 +91 2,35 -0,5 +97 6,62 0,993 8,4 26,6 -99 2,37 -0,3 +100 2,135 -1,9 +103 2,37 0,12 -0,8 -0,3 +104 2,41 -0,1 +105 2,6 1,1 +106 2,414 -0,1 +109 2,47 0,05 1,5 0,3 +116 2,397 -0,2 +117 2,56 0,9 +118 2,36 -0,4 +119 2,42 0,0 +120 2,357 -0,4 +125 2,45 0,1 0,5 0,2 +129 2,69 1,7 +136 2,38 -0,3 +140 2,4 -0,1 +148 2,5 0,5 +151 2,621 0,21 1,9 1,3 +153 2,34 -0,6 +155 2,25 -1,2 +161 2,334 -0,6 +
page C-208 of C-315
* The stated uncertainty of the mean is the expanded uncertainty with a coverage factor k=2 corresponding to a confidence level of about 95% (calculation according to ISO 13528)
total phosphorous - 12,4222,7382,125
± 0,041PT 1/10 - TW A1mean [mg/l]*upper tolerance limit [mg/l]lower tolerance limit [mg/l]
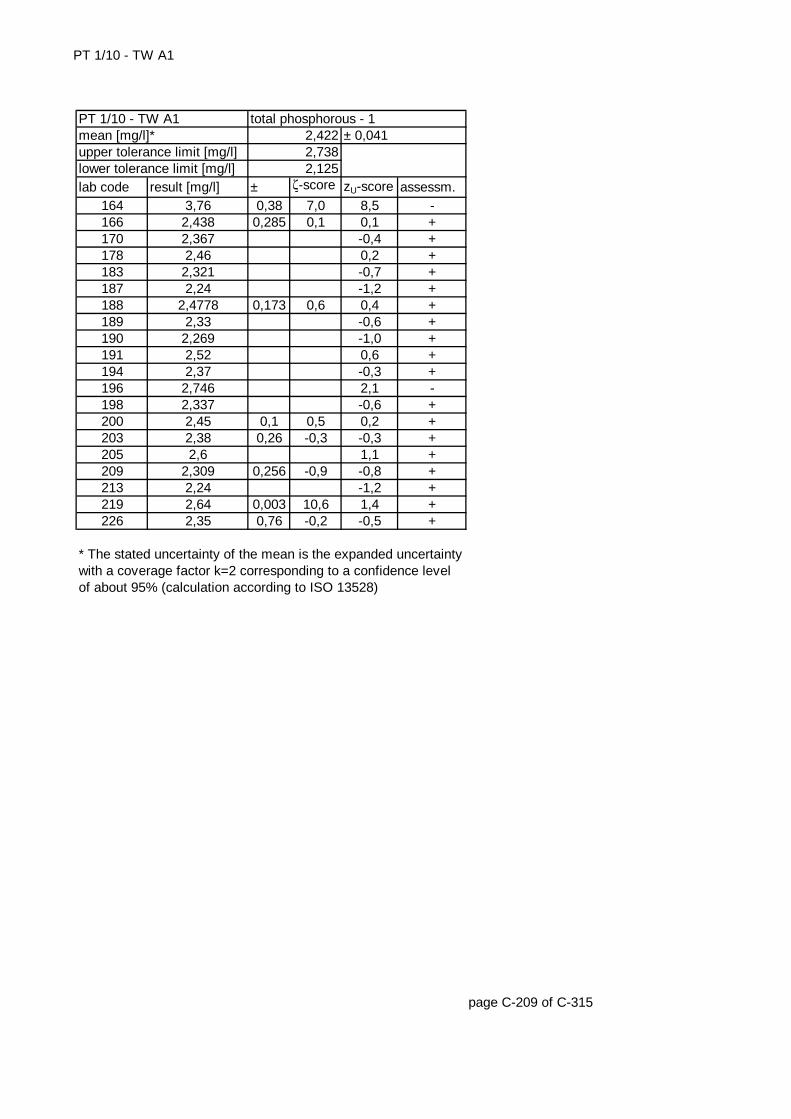
PT 1/10 - TW A1
lab code result [mg/l] ± ζ-score zU-score assessm.164 3,76 0,38 7,0 8,5 -166 2,438 0,285 0,1 0,1 +170 2,367 -0,4 +178 2,46 0,2 +183 2,321 -0,7 +187 2,24 -1,2 +188 2,4778 0,173 0,6 0,4 +189 2,33 -0,6 +190 2,269 -1,0 +191 2,52 0,6 +194 2,37 -0,3 +196 2,746 2,1 -198 2,337 -0,6 +200 2,45 0,1 0,5 0,2 +203 2,38 0,26 -0,3 -0,3 +205 2,6 1,1 +209 2,309 0,256 -0,9 -0,8 +213 2,24 -1,2 +219 2,64 0,003 10,6 1,4 +226 2,35 0,76 -0,2 -0,5 +
page C-209 of C-315
* The stated uncertainty of the mean is the expanded uncertainty with a coverage factor k=2 corresponding to a confidence level of about 95% (calculation according to ISO 13528)
upper tolerance limit [mg/l] 2,738lower tolerance limit [mg/l] 2,125
PT 1/10 - TW A1 total phosphorous - 1mean [mg/l]* 2,422 ± 0,041
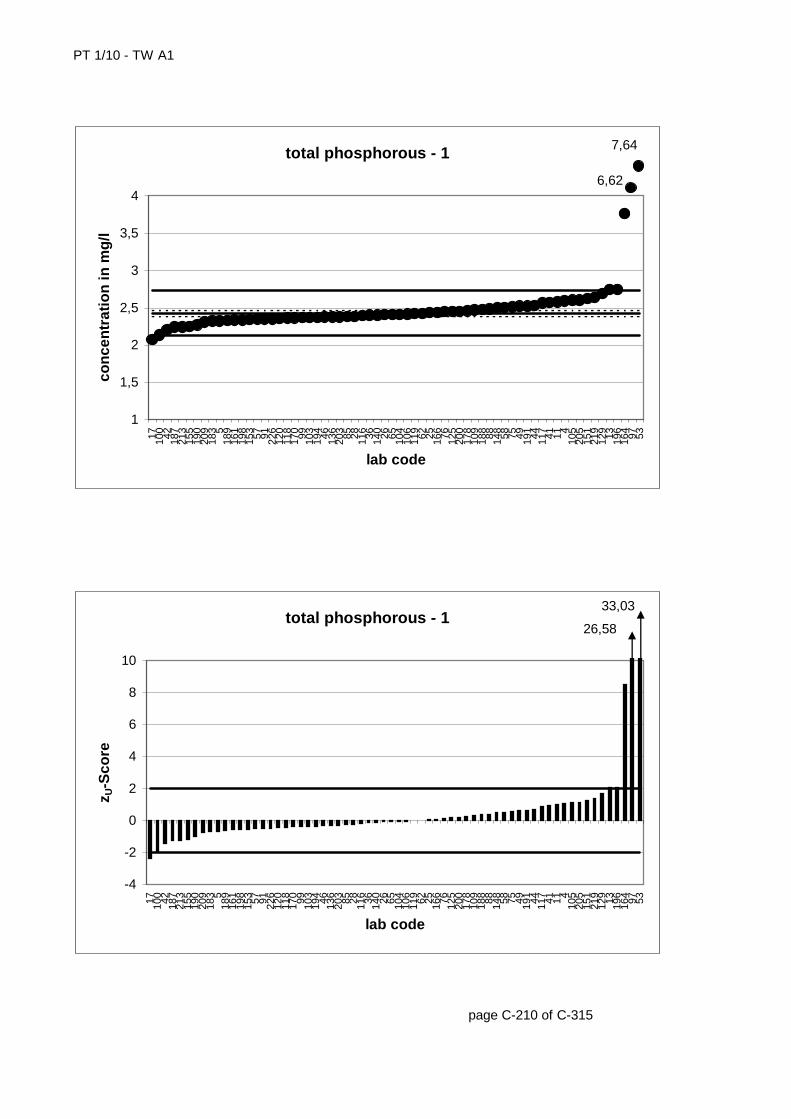
PT 1/10 - TW A1
page C-210 of C-315
total phosphorous - 1
1
1,5
2
2,5
3
3,5
4
17 100 42 187
213
155
190
209
183 5
189
161
198
153 57 91 226
120
118
170 99 103
194 46 136
203 85 28 116 36 140 26 65 104
106
119 62 25 166 76 125
200
178
109
188 88 148 58 75 49 191 44 117 41 11 4
105
205
151
219
129 13 196
164 97 53
lab code
con
cen
trat
ion
in m
g/l
6,62
7,64
total phosphorous - 1
-4
-2
0
2
4
6
8
10
17 100 42 187
213
155
190
209
183 5
189
161
198
153 57 91 226
120
118
170 99 103
194 46 136
203 85 28 116 36 140 26 65 104
106
119 62 25 166 76 125
200
178
109
188 88 148 58 75 49 191 44 117 41 11 4
105
205
151
219
129 13 196
164 97 53
lab code
z U-S
core
26,58
33,03
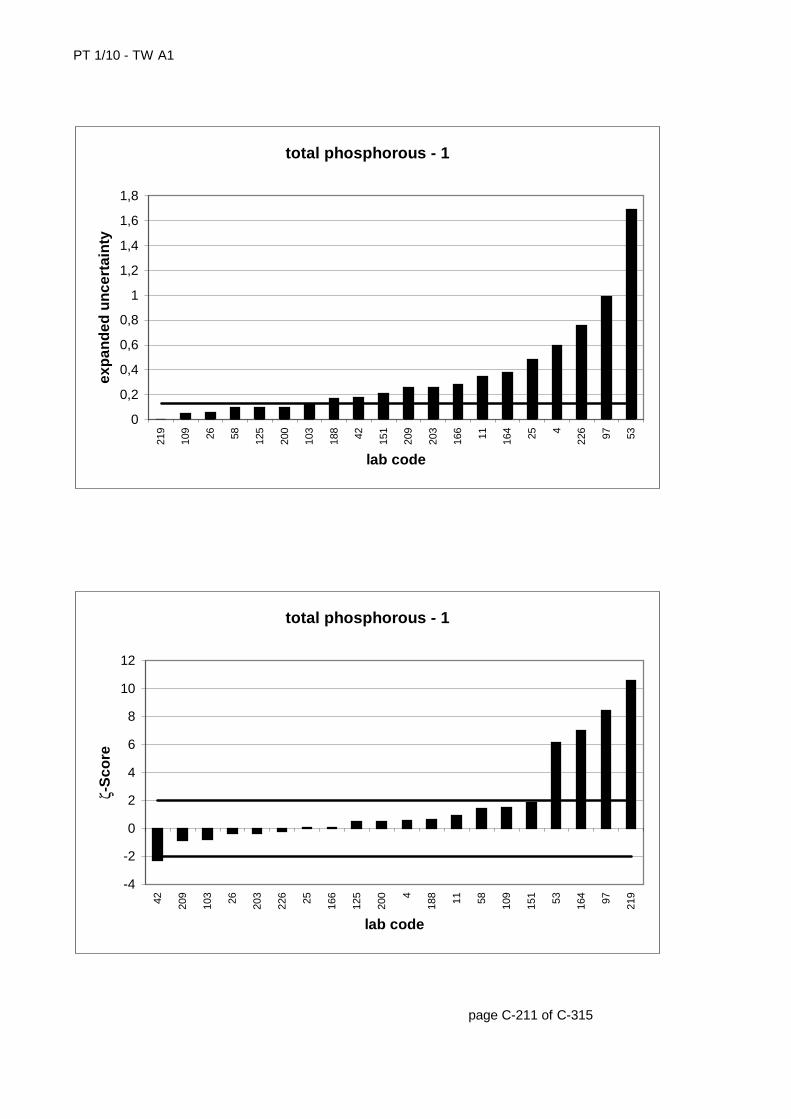
PT 1/10 - TW A1
page C-211 of C-315
total phosphorous - 1
0
0,2
0,4
0,6
0,8
1
1,2
1,4
1,6
1,8
219
109 26 58 125
200
103
188 42 151
209
203
166 11 164 25 4
226 97 53
lab code
exp
and
ed u
nce
rtai
nty
total phosphorous - 1
-4
-2
0
2
4
6
8
10
12
42 209
103 26 203
226 25 166
125
200 4
188 11 58 109
151 53 164 97 219
lab code
ζ-S
core
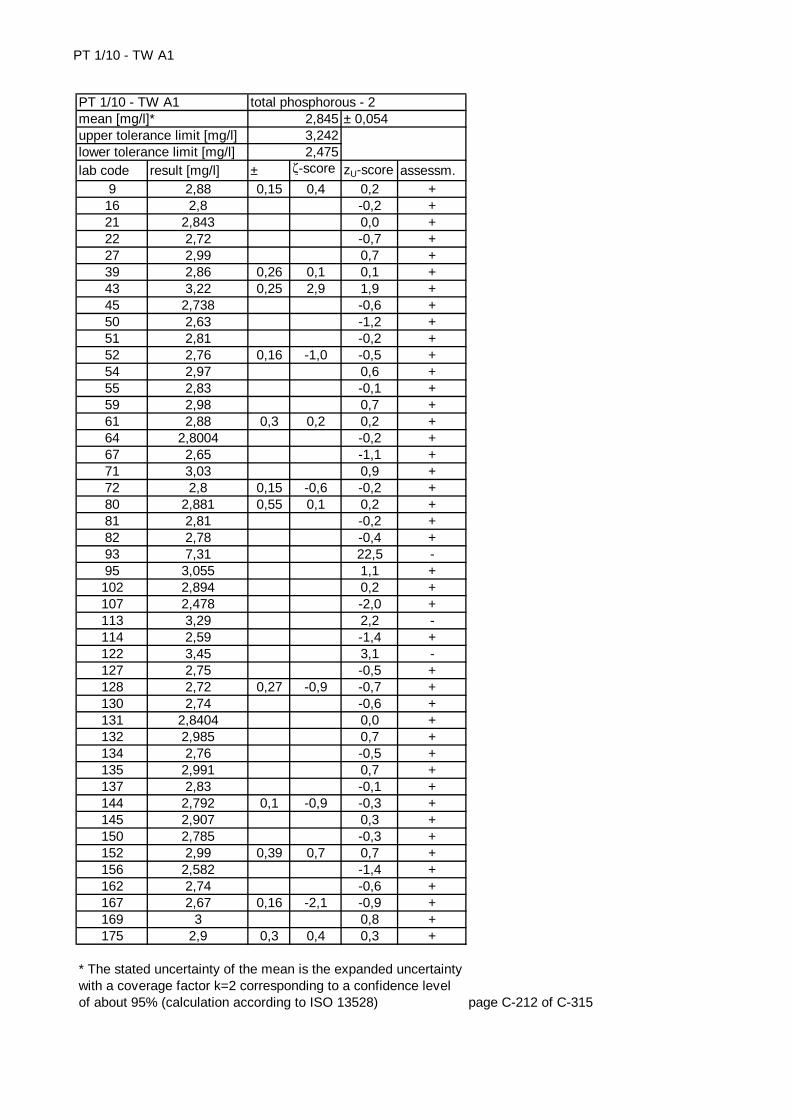
PT 1/10 - TW A1
lab code result [mg/l] ± ζ-score zU-score assessm.9 2,88 0,15 0,4 0,2 +
16 2,8 -0,2 +21 2,843 0,0 +22 2,72 -0,7 +27 2,99 0,7 +39 2,86 0,26 0,1 0,1 +43 3,22 0,25 2,9 1,9 +45 2,738 -0,6 +50 2,63 -1,2 +51 2,81 -0,2 +52 2,76 0,16 -1,0 -0,5 +54 2,97 0,6 +55 2,83 -0,1 +59 2,98 0,7 +61 2,88 0,3 0,2 0,2 +64 2,8004 -0,2 +67 2,65 -1,1 +71 3,03 0,9 +72 2,8 0,15 -0,6 -0,2 +80 2,881 0,55 0,1 0,2 +81 2,81 -0,2 +82 2,78 -0,4 +93 7,31 22,5 -95 3,055 1,1 +102 2,894 0,2 +107 2,478 -2,0 +113 3,29 2,2 -114 2,59 -1,4 +122 3,45 3,1 -127 2,75 -0,5 +128 2,72 0,27 -0,9 -0,7 +130 2,74 -0,6 +131 2,8404 0,0 +132 2,985 0,7 +134 2,76 -0,5 +135 2,991 0,7 +137 2,83 -0,1 +144 2,792 0,1 -0,9 -0,3 +145 2,907 0,3 +150 2,785 -0,3 +152 2,99 0,39 0,7 0,7 +156 2,582 -1,4 +162 2,74 -0,6 +167 2,67 0,16 -2,1 -0,9 +169 3 0,8 +175 2,9 0,3 0,4 0,3 +
page C-212 of C-315
* The stated uncertainty of the mean is the expanded uncertainty with a coverage factor k=2 corresponding to a confidence level of about 95% (calculation according to ISO 13528)
total phosphorous - 22,8453,2422,475
± 0,054PT 1/10 - TW A1mean [mg/l]*upper tolerance limit [mg/l]lower tolerance limit [mg/l]
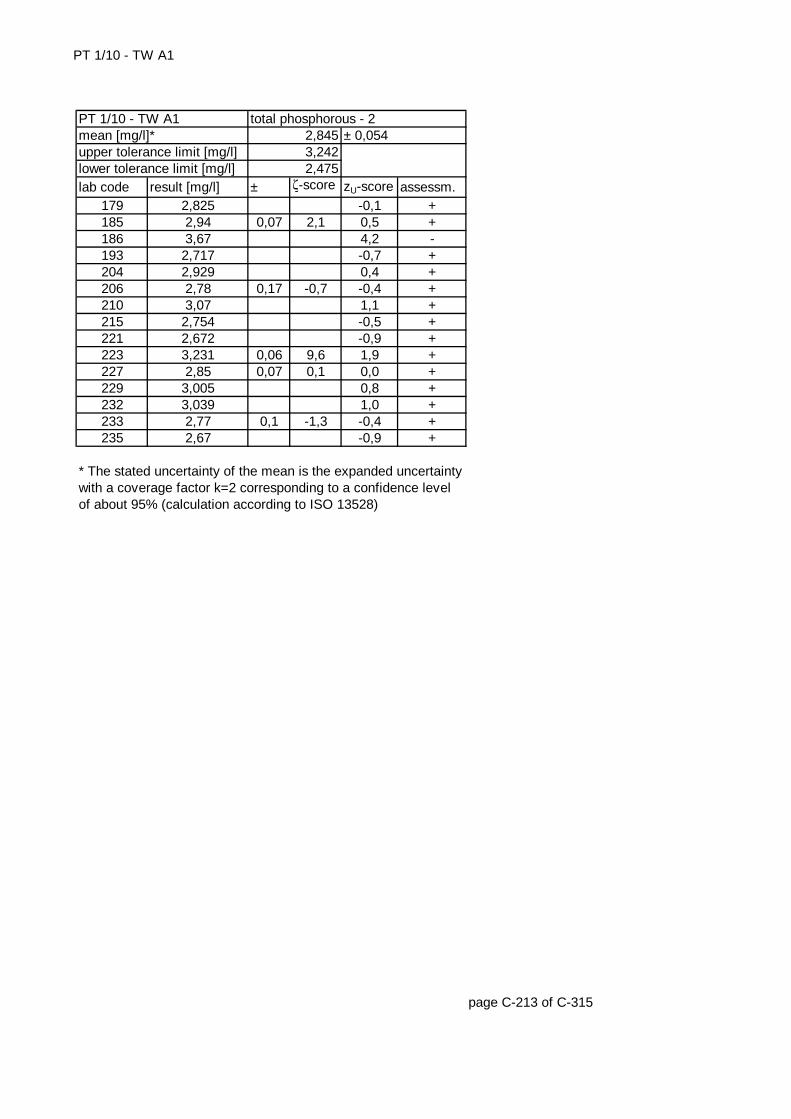
PT 1/10 - TW A1
lab code result [mg/l] ± ζ-score zU-score assessm.179 2,825 -0,1 +185 2,94 0,07 2,1 0,5 +186 3,67 4,2 -193 2,717 -0,7 +204 2,929 0,4 +206 2,78 0,17 -0,7 -0,4 +210 3,07 1,1 +215 2,754 -0,5 +221 2,672 -0,9 +223 3,231 0,06 9,6 1,9 +227 2,85 0,07 0,1 0,0 +229 3,005 0,8 +232 3,039 1,0 +233 2,77 0,1 -1,3 -0,4 +235 2,67 -0,9 +
page C-213 of C-315
* The stated uncertainty of the mean is the expanded uncertainty with a coverage factor k=2 corresponding to a confidence level of about 95% (calculation according to ISO 13528)
upper tolerance limit [mg/l] 3,242lower tolerance limit [mg/l] 2,475
PT 1/10 - TW A1 total phosphorous - 2mean [mg/l]* 2,845 ± 0,054
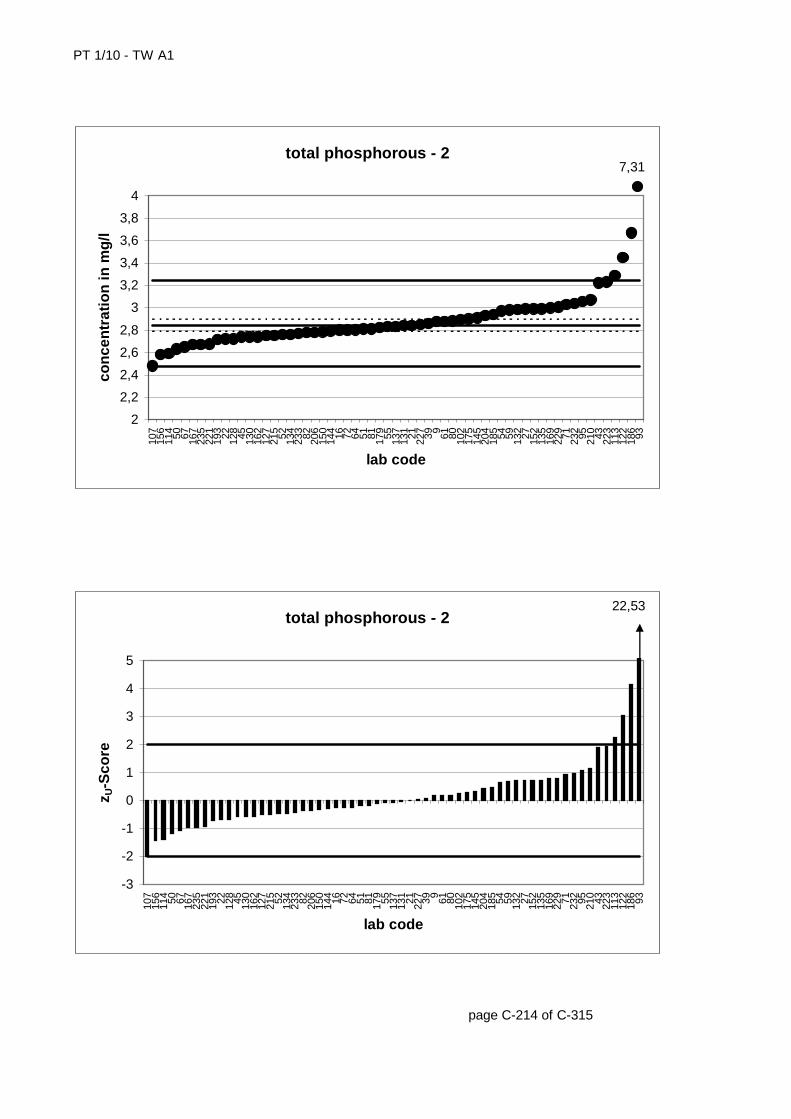
PT 1/10 - TW A1
page C-214 of C-315
total phosphorous - 2
2
2,2
2,4
2,6
2,8
3
3,2
3,4
3,6
3,8
4
107
156
114 50 67 167
235
221
193 22 128 45 130
162
127
215 52 134
233 82 206
150
144 16 72 64 51 81 179 55 137
131 21 227 39 9 61 80 102
175
145
204
185 54 59 132 27 152
135
169
229 71 232 95 210 43 223
113
122
186 93
lab code
con
cen
trat
ion
in m
g/l
7,31
total phosphorous - 2
-3
-2
-1
0
1
2
3
4
5
107
156
114 50 67 167
235
221
193 22 128 45 130
162
127
215 52 134
233 82 206
150
144 16 72 64 51 81 179 55 137
131 21 227 39 9 61 80 102
175
145
204
185 54 59 132 27 152
135
169
229 71 232 95 210 43 223
113
122
186 93
lab code
z U-S
core
22,53
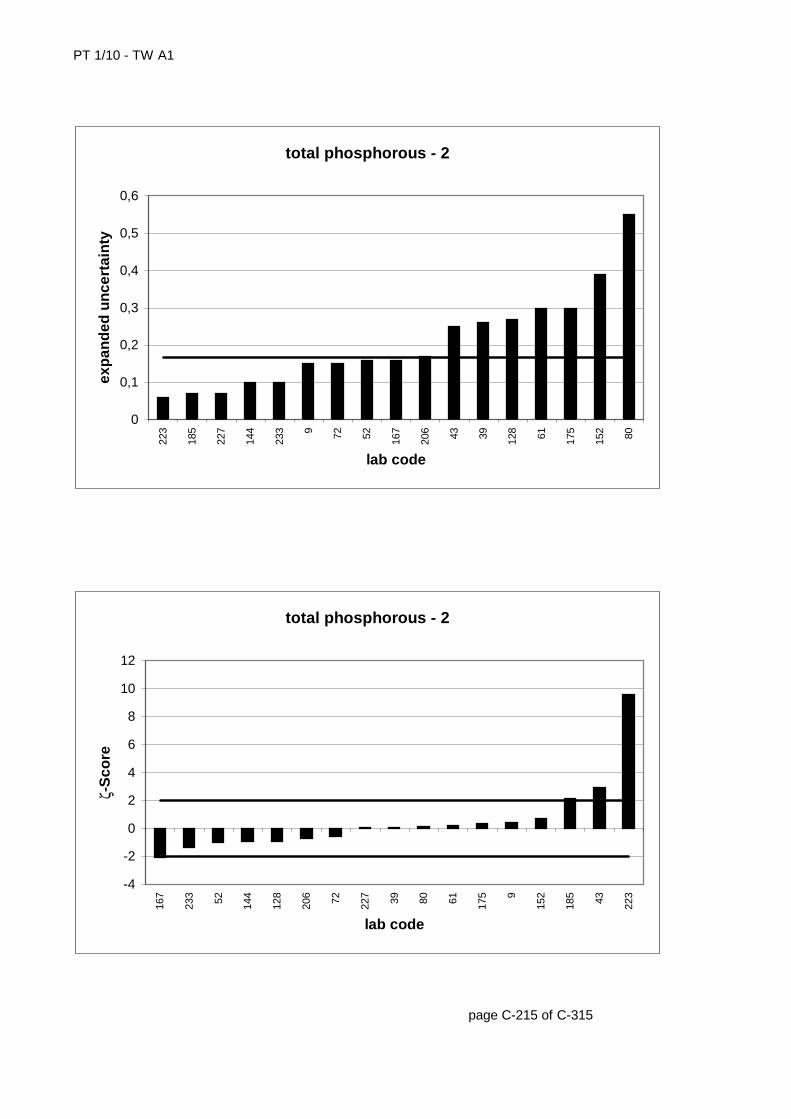
PT 1/10 - TW A1
page C-215 of C-315
total phosphorous - 2
0
0,1
0,2
0,3
0,4
0,5
0,6
223
185
227
144
233 9 72 52 167
206 43 39 128 61 175
152 80
lab code
exp
and
ed u
nce
rtai
nty
total phosphorous - 2
-4
-2
0
2
4
6
8
10
12
167
233 52 144
128
206 72 227 39 80 61 175 9
152
185 43 223
lab code
ζ-S
core
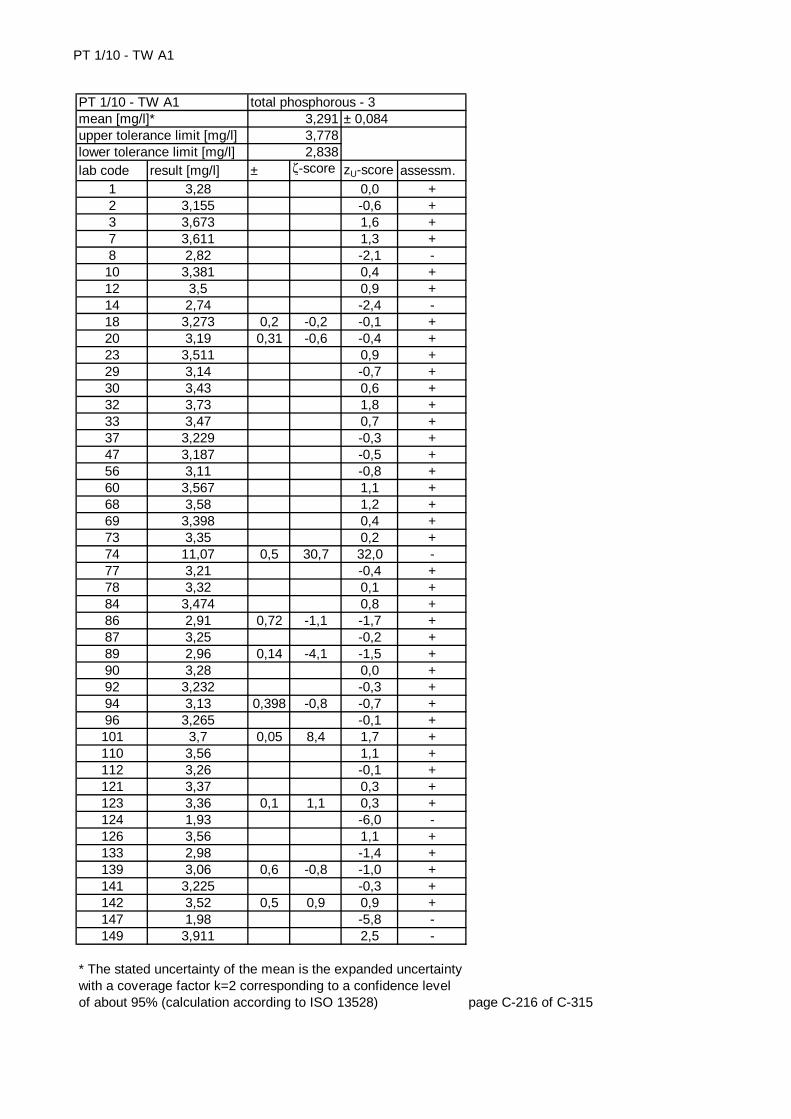
PT 1/10 - TW A1
lab code result [mg/l] ± ζ-score zU-score assessm.1 3,28 0,0 +2 3,155 -0,6 +3 3,673 1,6 +7 3,611 1,3 +8 2,82 -2,1 -
10 3,381 0,4 +12 3,5 0,9 +14 2,74 -2,4 -18 3,273 0,2 -0,2 -0,1 +20 3,19 0,31 -0,6 -0,4 +23 3,511 0,9 +29 3,14 -0,7 +30 3,43 0,6 +32 3,73 1,8 +33 3,47 0,7 +37 3,229 -0,3 +47 3,187 -0,5 +56 3,11 -0,8 +60 3,567 1,1 +68 3,58 1,2 +69 3,398 0,4 +73 3,35 0,2 +74 11,07 0,5 30,7 32,0 -77 3,21 -0,4 +78 3,32 0,1 +84 3,474 0,8 +86 2,91 0,72 -1,1 -1,7 +87 3,25 -0,2 +89 2,96 0,14 -4,1 -1,5 +90 3,28 0,0 +92 3,232 -0,3 +94 3,13 0,398 -0,8 -0,7 +96 3,265 -0,1 +101 3,7 0,05 8,4 1,7 +110 3,56 1,1 +112 3,26 -0,1 +121 3,37 0,3 +123 3,36 0,1 1,1 0,3 +124 1,93 -6,0 -126 3,56 1,1 +133 2,98 -1,4 +139 3,06 0,6 -0,8 -1,0 +141 3,225 -0,3 +142 3,52 0,5 0,9 0,9 +147 1,98 -5,8 -149 3,911 2,5 -
page C-216 of C-315
* The stated uncertainty of the mean is the expanded uncertainty with a coverage factor k=2 corresponding to a confidence level of about 95% (calculation according to ISO 13528)
total phosphorous - 33,2913,7782,838
± 0,084PT 1/10 - TW A1mean [mg/l]*upper tolerance limit [mg/l]lower tolerance limit [mg/l]
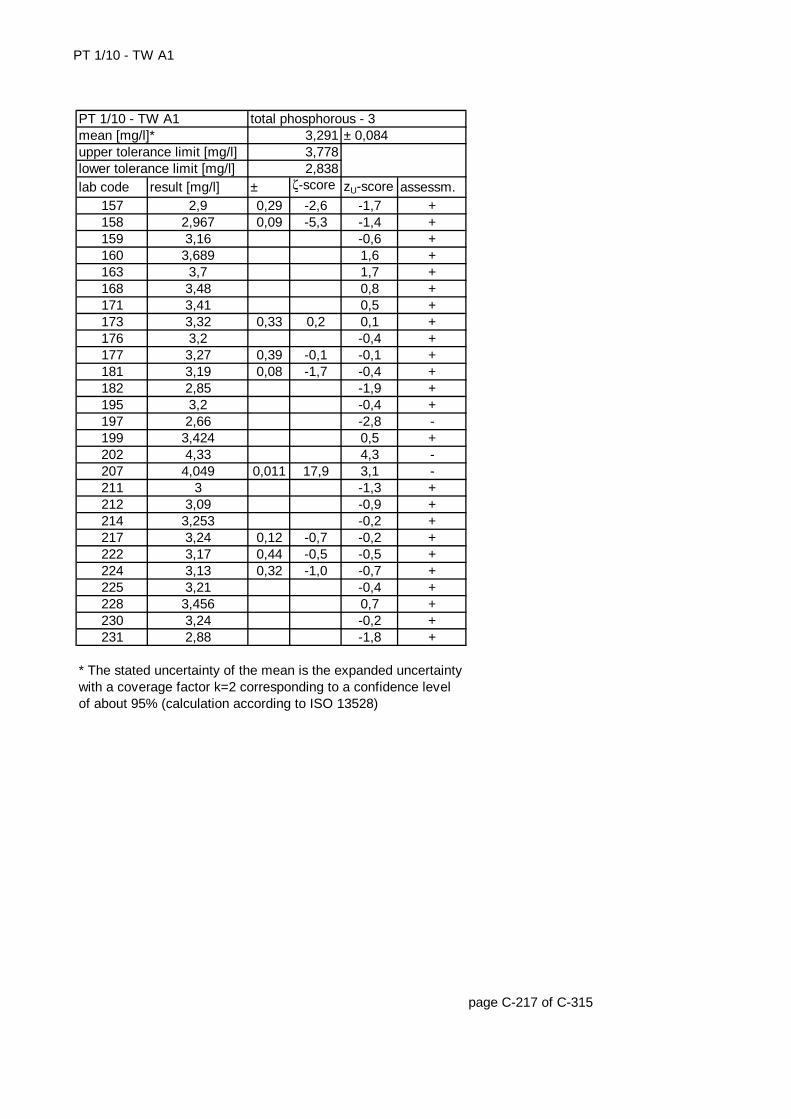
PT 1/10 - TW A1
lab code result [mg/l] ± ζ-score zU-score assessm.157 2,9 0,29 -2,6 -1,7 +158 2,967 0,09 -5,3 -1,4 +159 3,16 -0,6 +160 3,689 1,6 +163 3,7 1,7 +168 3,48 0,8 +171 3,41 0,5 +173 3,32 0,33 0,2 0,1 +176 3,2 -0,4 +177 3,27 0,39 -0,1 -0,1 +181 3,19 0,08 -1,7 -0,4 +182 2,85 -1,9 +195 3,2 -0,4 +197 2,66 -2,8 -199 3,424 0,5 +202 4,33 4,3 -207 4,049 0,011 17,9 3,1 -211 3 -1,3 +212 3,09 -0,9 +214 3,253 -0,2 +217 3,24 0,12 -0,7 -0,2 +222 3,17 0,44 -0,5 -0,5 +224 3,13 0,32 -1,0 -0,7 +225 3,21 -0,4 +228 3,456 0,7 +230 3,24 -0,2 +231 2,88 -1,8 +
page C-217 of C-315
* The stated uncertainty of the mean is the expanded uncertainty with a coverage factor k=2 corresponding to a confidence level of about 95% (calculation according to ISO 13528)
upper tolerance limit [mg/l] 3,778lower tolerance limit [mg/l] 2,838
PT 1/10 - TW A1 total phosphorous - 3mean [mg/l]* 3,291 ± 0,084
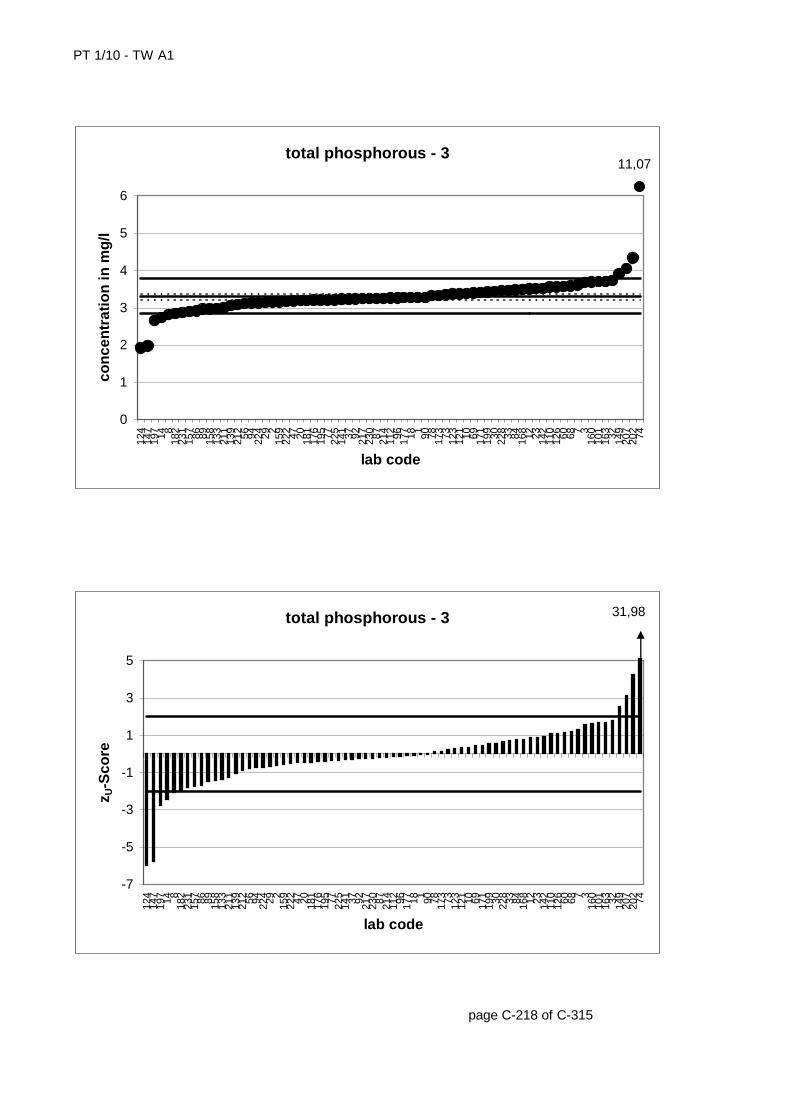
PT 1/10 - TW A1
page C-218 of C-315
total phosphorous - 3
0
1
2
3
4
5
6
124
147
197 14 8
182
231
157 86 89 158
133
211
139
212 56 94 224 29 2
159
222 47 20 181
176
195 77 225
141 37 92 217
230 87 214
112 96 177 18 1 90 78 173 73 123
121 10 69 171
199 30 228 33 84 168 12 23 142
110
126 60 68 7 3
160
101
163 32 149
207
202 74
lab code
con
cen
trat
ion
in m
g/l
11,07
total phosphorous - 3
-7
-5
-3
-1
1
3
5
124
147
197 14 8
182
231
157 86 89 158
133
211
139
212 56 94 224 29 2
159
222 47 20 181
176
195 77 225
141 37 92 217
230 87 214
112 96 177 18 1 90 78 173 73 123
121 10 69 171
199 30 228 33 84 168 12 23 142
110
126 60 68 7 3
160
101
163 32 149
207
202 74
lab code
z U-S
core
31,98
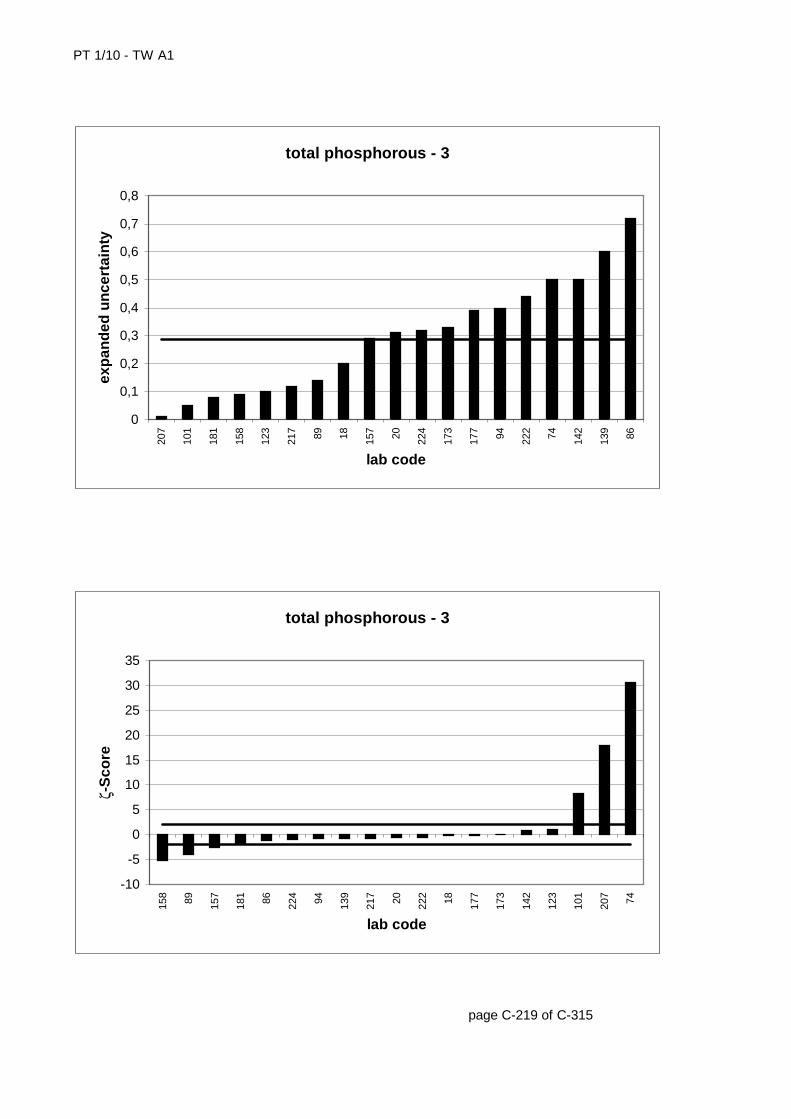
PT 1/10 - TW A1
page C-219 of C-315
total phosphorous - 3
0
0,1
0,2
0,3
0,4
0,5
0,6
0,7
0,8
207
101
181
158
123
217 89 18 157 20 224
173
177 94 222 74 142
139 86
lab code
exp
and
ed u
nce
rtai
nty
total phosphorous - 3
-10
-5
0
5
10
15
20
25
30
35
158 89 157
181 86 224 94 139
217 20 222 18 177
173
142
123
101
207 74
lab code
ζ-S
core
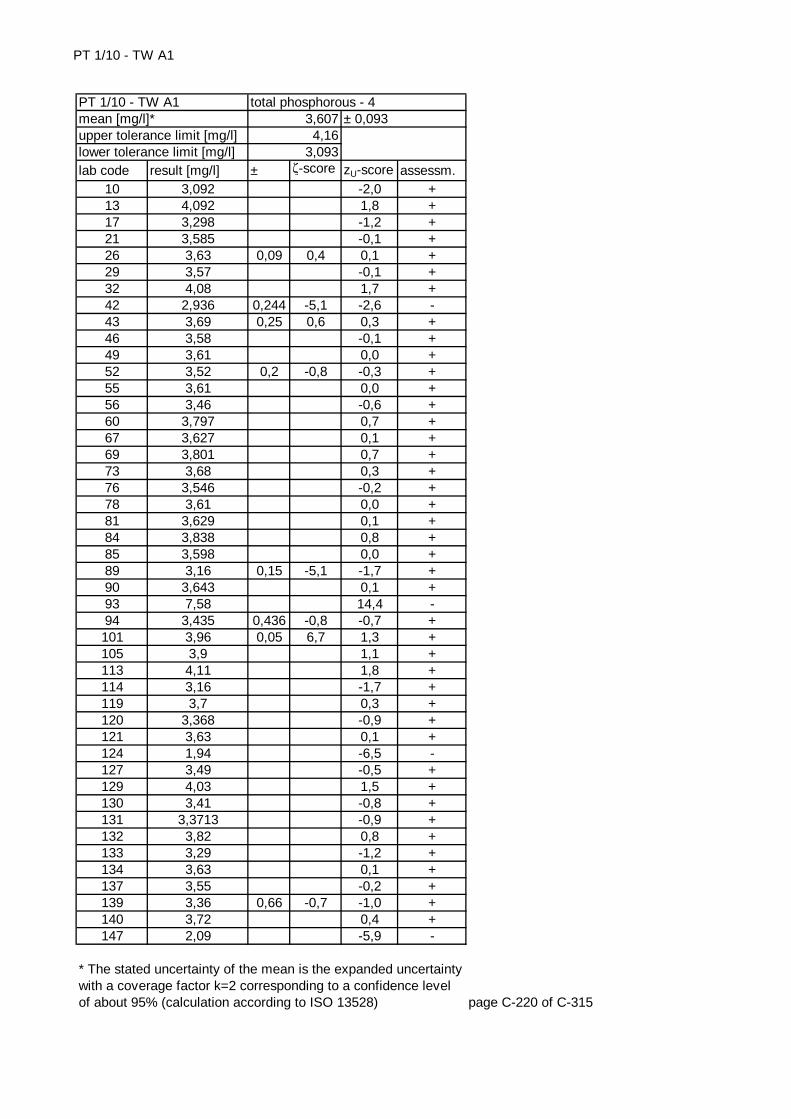
PT 1/10 - TW A1
lab code result [mg/l] ± ζ-score zU-score assessm.10 3,092 -2,0 +13 4,092 1,8 +17 3,298 -1,2 +21 3,585 -0,1 +26 3,63 0,09 0,4 0,1 +29 3,57 -0,1 +32 4,08 1,7 +42 2,936 0,244 -5,1 -2,6 -43 3,69 0,25 0,6 0,3 +46 3,58 -0,1 +49 3,61 0,0 +52 3,52 0,2 -0,8 -0,3 +55 3,61 0,0 +56 3,46 -0,6 +60 3,797 0,7 +67 3,627 0,1 +69 3,801 0,7 +73 3,68 0,3 +76 3,546 -0,2 +78 3,61 0,0 +81 3,629 0,1 +84 3,838 0,8 +85 3,598 0,0 +89 3,16 0,15 -5,1 -1,7 +90 3,643 0,1 +93 7,58 14,4 -94 3,435 0,436 -0,8 -0,7 +101 3,96 0,05 6,7 1,3 +105 3,9 1,1 +113 4,11 1,8 +114 3,16 -1,7 +119 3,7 0,3 +120 3,368 -0,9 +121 3,63 0,1 +124 1,94 -6,5 -127 3,49 -0,5 +129 4,03 1,5 +130 3,41 -0,8 +131 3,3713 -0,9 +132 3,82 0,8 +133 3,29 -1,2 +134 3,63 0,1 +137 3,55 -0,2 +139 3,36 0,66 -0,7 -1,0 +140 3,72 0,4 +147 2,09 -5,9 -
page C-220 of C-315
* The stated uncertainty of the mean is the expanded uncertainty with a coverage factor k=2 corresponding to a confidence level of about 95% (calculation according to ISO 13528)
total phosphorous - 43,6074,16
3,093
± 0,093PT 1/10 - TW A1mean [mg/l]*upper tolerance limit [mg/l]lower tolerance limit [mg/l]
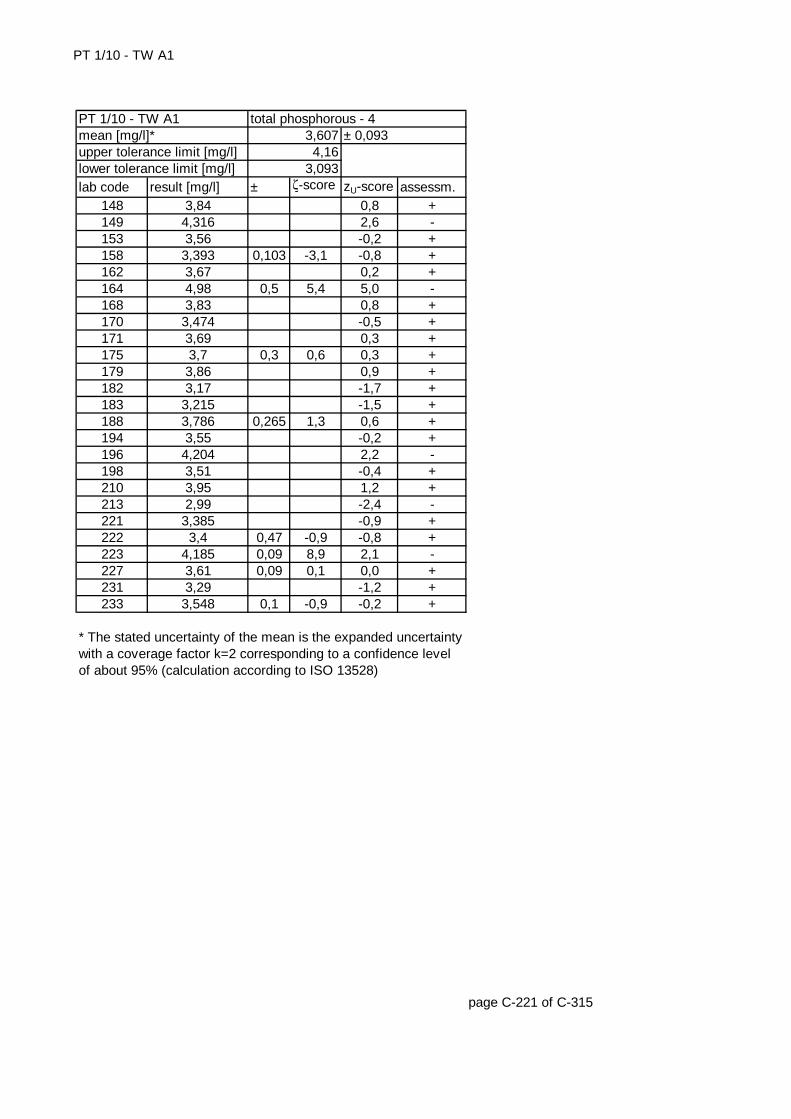
PT 1/10 - TW A1
lab code result [mg/l] ± ζ-score zU-score assessm.148 3,84 0,8 +149 4,316 2,6 -153 3,56 -0,2 +158 3,393 0,103 -3,1 -0,8 +162 3,67 0,2 +164 4,98 0,5 5,4 5,0 -168 3,83 0,8 +170 3,474 -0,5 +171 3,69 0,3 +175 3,7 0,3 0,6 0,3 +179 3,86 0,9 +182 3,17 -1,7 +183 3,215 -1,5 +188 3,786 0,265 1,3 0,6 +194 3,55 -0,2 +196 4,204 2,2 -198 3,51 -0,4 +210 3,95 1,2 +213 2,99 -2,4 -221 3,385 -0,9 +222 3,4 0,47 -0,9 -0,8 +223 4,185 0,09 8,9 2,1 -227 3,61 0,09 0,1 0,0 +231 3,29 -1,2 +233 3,548 0,1 -0,9 -0,2 +
page C-221 of C-315
* The stated uncertainty of the mean is the expanded uncertainty with a coverage factor k=2 corresponding to a confidence level of about 95% (calculation according to ISO 13528)
upper tolerance limit [mg/l] 4,16lower tolerance limit [mg/l] 3,093
PT 1/10 - TW A1 total phosphorous - 4mean [mg/l]* 3,607 ± 0,093
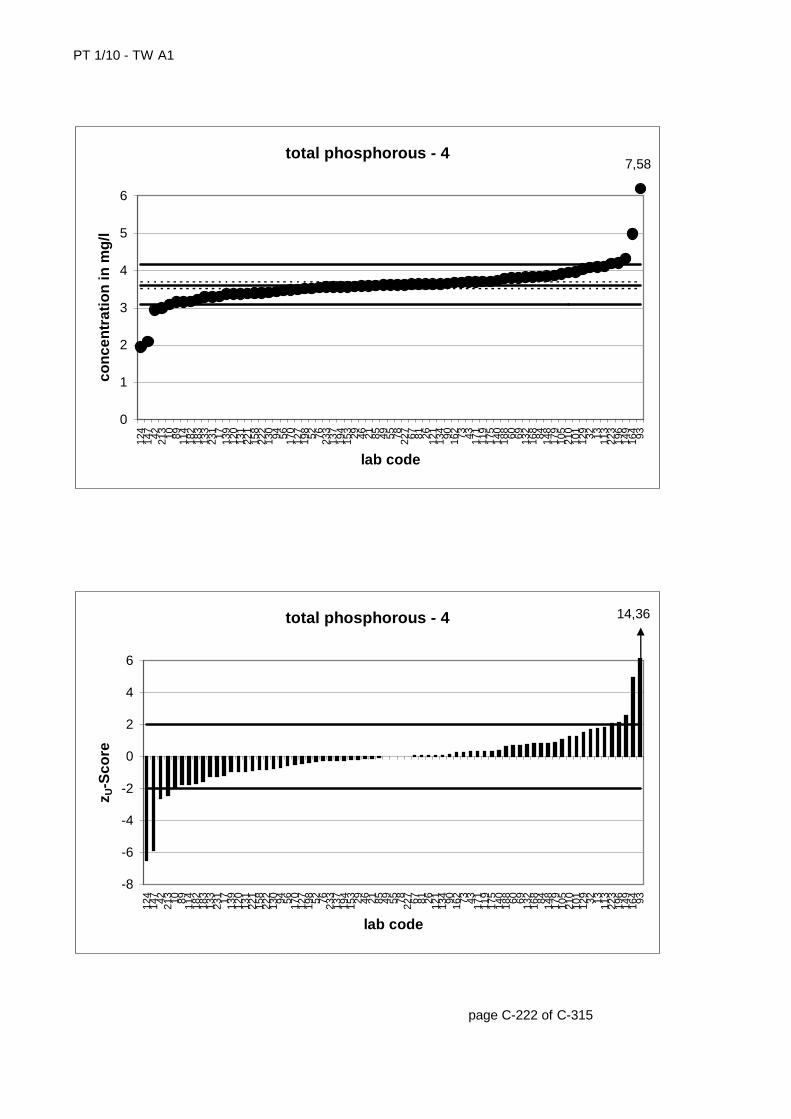
PT 1/10 - TW A1
page C-222 of C-315
total phosphorous - 4
0
1
2
3
4
5
6
124
147 42 213 10 89 114
182
183
133
231 17 139
120
131
221
158
222
130 94 56 170
127
198 52 76 233
137
194
153 29 46 21 85 49 55 78 227 67 81 26 121
134 90 162 73 43 171
119
175
140
188 60 69 132
168 84 148
179
105
210
101
129 32 13 113
223
196
149
164 93
lab code
con
cen
trat
ion
in m
g/l
7,58
total phosphorous - 4
-8
-6
-4
-2
0
2
4
6
124
147 42 213 10 89 114
182
183
133
231 17 139
120
131
221
158
222
130 94 56 170
127
198 52 76 233
137
194
153 29 46 21 85 49 55 78 227 67 81 26 121
134 90 162 73 43 171
119
175
140
188 60 69 132
168 84 148
179
105
210
101
129 32 13 113
223
196
149
164 93
lab code
z U-S
core
14,36
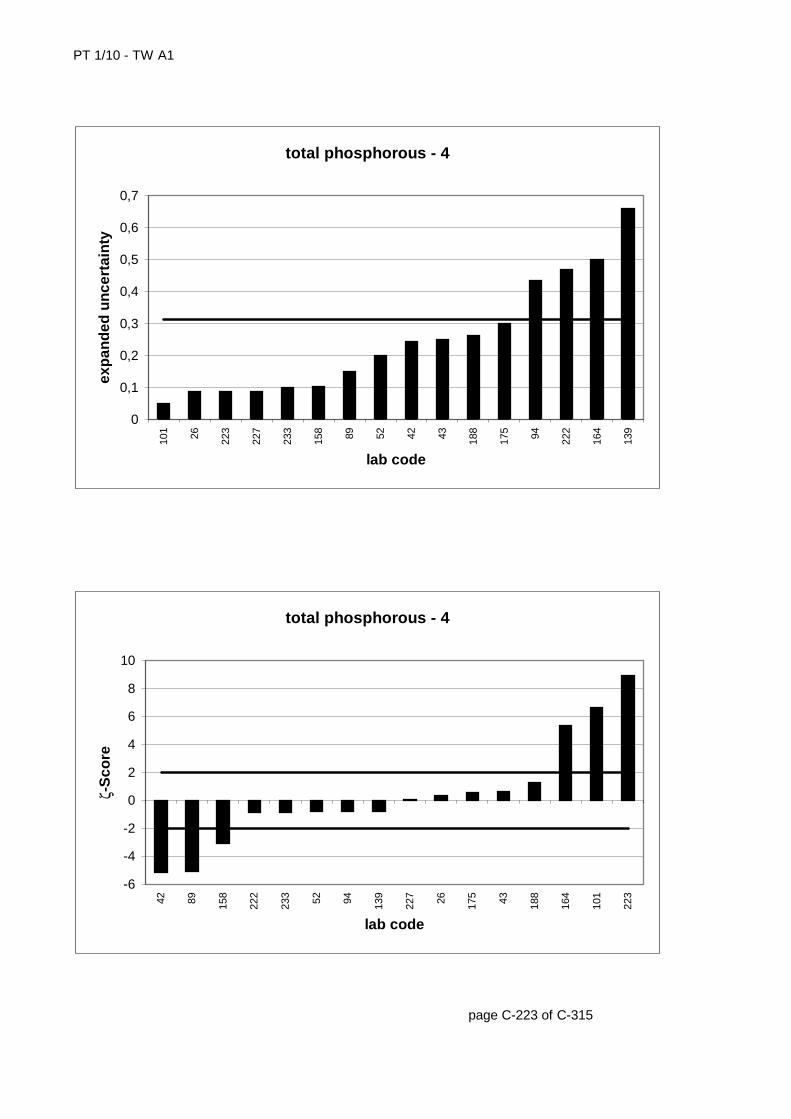
PT 1/10 - TW A1
page C-223 of C-315
total phosphorous - 4
0
0,1
0,2
0,3
0,4
0,5
0,6
0,7
101 26 223
227
233
158 89 52 42 43 188
175 94 222
164
139
lab code
exp
and
ed u
nce
rtai
nty
total phosphorous - 4
-6
-4
-2
0
2
4
6
8
10
42 89 158
222
233 52 94 139
227 26 175 43 188
164
101
223
lab code
ζ-S
core
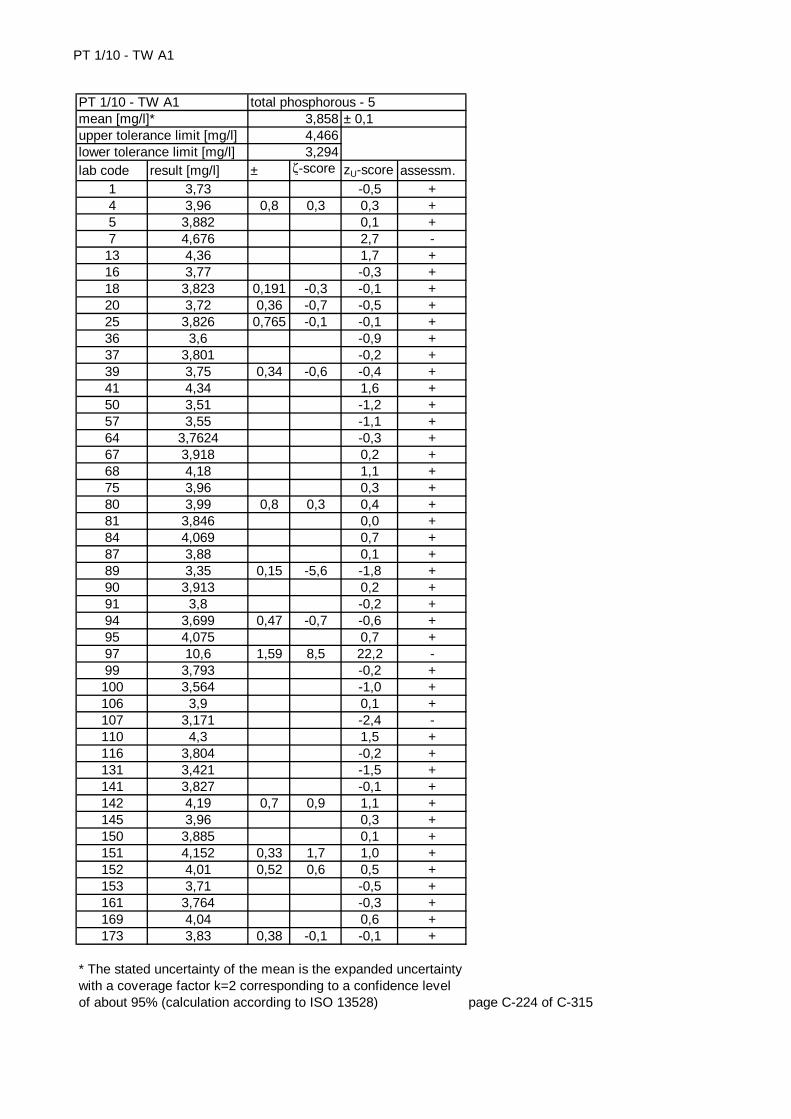
PT 1/10 - TW A1
lab code result [mg/l] ± ζ-score zU-score assessm.1 3,73 -0,5 +4 3,96 0,8 0,3 0,3 +5 3,882 0,1 +7 4,676 2,7 -
13 4,36 1,7 +16 3,77 -0,3 +18 3,823 0,191 -0,3 -0,1 +20 3,72 0,36 -0,7 -0,5 +25 3,826 0,765 -0,1 -0,1 +36 3,6 -0,9 +37 3,801 -0,2 +39 3,75 0,34 -0,6 -0,4 +41 4,34 1,6 +50 3,51 -1,2 +57 3,55 -1,1 +64 3,7624 -0,3 +67 3,918 0,2 +68 4,18 1,1 +75 3,96 0,3 +80 3,99 0,8 0,3 0,4 +81 3,846 0,0 +84 4,069 0,7 +87 3,88 0,1 +89 3,35 0,15 -5,6 -1,8 +90 3,913 0,2 +91 3,8 -0,2 +94 3,699 0,47 -0,7 -0,6 +95 4,075 0,7 +97 10,6 1,59 8,5 22,2 -99 3,793 -0,2 +100 3,564 -1,0 +106 3,9 0,1 +107 3,171 -2,4 -110 4,3 1,5 +116 3,804 -0,2 +131 3,421 -1,5 +141 3,827 -0,1 +142 4,19 0,7 0,9 1,1 +145 3,96 0,3 +150 3,885 0,1 +151 4,152 0,33 1,7 1,0 +152 4,01 0,52 0,6 0,5 +153 3,71 -0,5 +161 3,764 -0,3 +169 4,04 0,6 +173 3,83 0,38 -0,1 -0,1 +
page C-224 of C-315
* The stated uncertainty of the mean is the expanded uncertainty with a coverage factor k=2 corresponding to a confidence level of about 95% (calculation according to ISO 13528)
total phosphorous - 53,8584,4663,294
± 0,1PT 1/10 - TW A1mean [mg/l]*upper tolerance limit [mg/l]lower tolerance limit [mg/l]
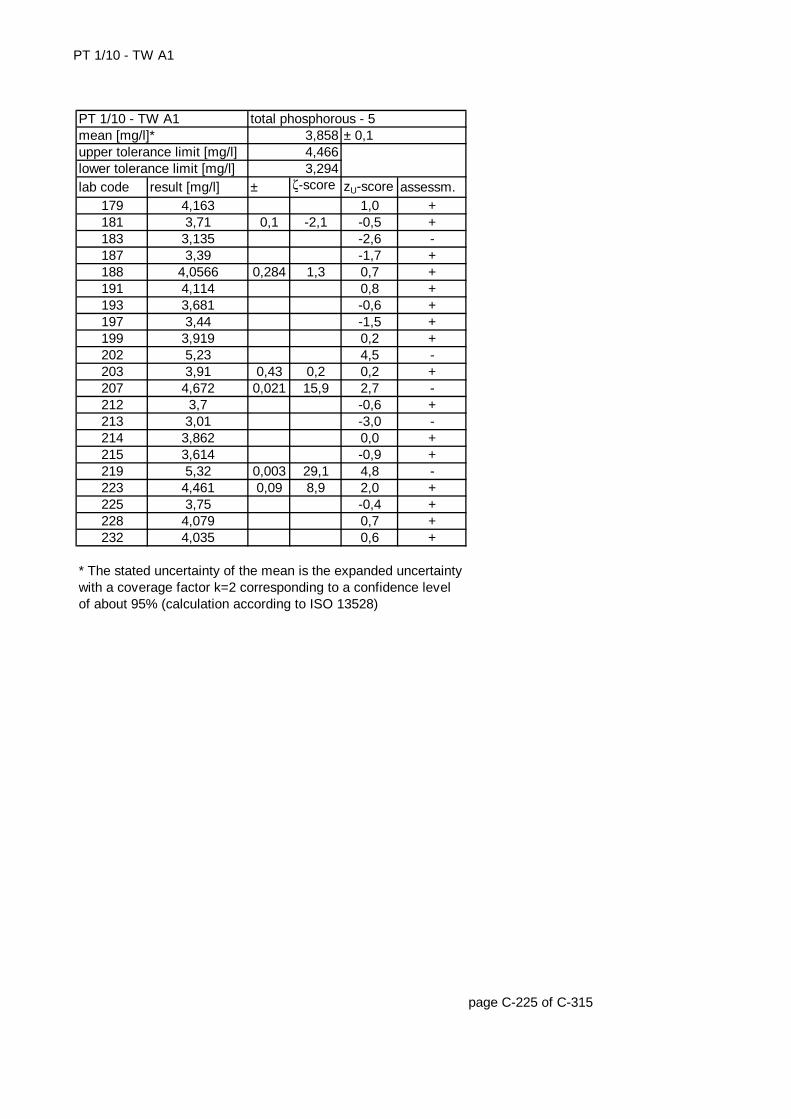
PT 1/10 - TW A1
lab code result [mg/l] ± ζ-score zU-score assessm.179 4,163 1,0 +181 3,71 0,1 -2,1 -0,5 +183 3,135 -2,6 -187 3,39 -1,7 +188 4,0566 0,284 1,3 0,7 +191 4,114 0,8 +193 3,681 -0,6 +197 3,44 -1,5 +199 3,919 0,2 +202 5,23 4,5 -203 3,91 0,43 0,2 0,2 +207 4,672 0,021 15,9 2,7 -212 3,7 -0,6 +213 3,01 -3,0 -214 3,862 0,0 +215 3,614 -0,9 +219 5,32 0,003 29,1 4,8 -223 4,461 0,09 8,9 2,0 +225 3,75 -0,4 +228 4,079 0,7 +232 4,035 0,6 +
page C-225 of C-315
* The stated uncertainty of the mean is the expanded uncertainty with a coverage factor k=2 corresponding to a confidence level of about 95% (calculation according to ISO 13528)
upper tolerance limit [mg/l] 4,466lower tolerance limit [mg/l] 3,294
PT 1/10 - TW A1 total phosphorous - 5mean [mg/l]* 3,858 ± 0,1
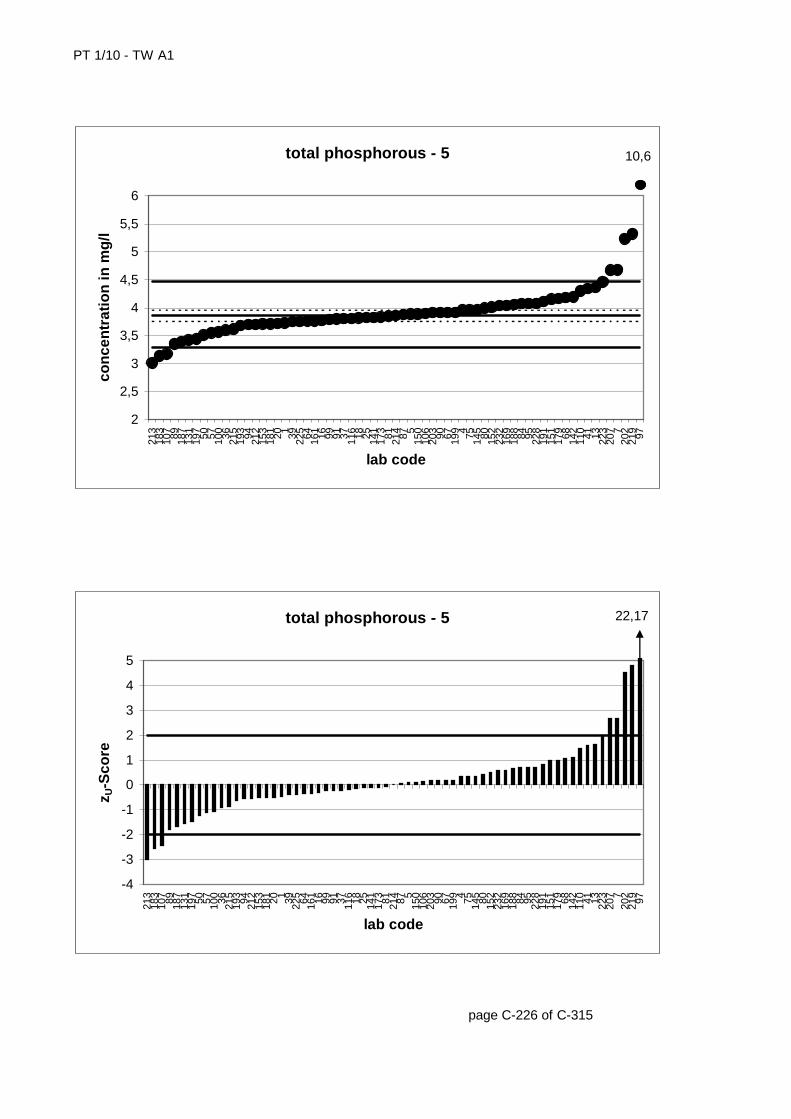
PT 1/10 - TW A1
page C-226 of C-315
total phosphorous - 5
2
2,5
3
3,5
4
4,5
5
5,5
6
213
183
107 89 187
131
197 50 57 100 36 215
193 94 212
153
181 20 1 39 225 64 161 16 99 91 37 116 18 25 141
173 81 214 87 5
150
106
203 90 67 199 4 75 145 80 152
232
169
188 84 95 228
191
151
179 68 142
110 41 13 223
207 7
202
219 97
lab code
con
cen
trat
ion
in m
g/l
10,6
total phosphorous - 5
-4
-3
-2
-1
0
1
2
3
4
5
213
183
107 89 187
131
197 50 57 100 36 215
193 94 212
153
181 20 1 39 225 64 161 16 99 91 37 116 18 25 141
173 81 214 87 5
150
106
203 90 67 199 4 75 145 80 152
232
169
188 84 95 228
191
151
179 68 142
110 41 13 223
207 7
202
219 97
lab code
z U-S
core
22,17
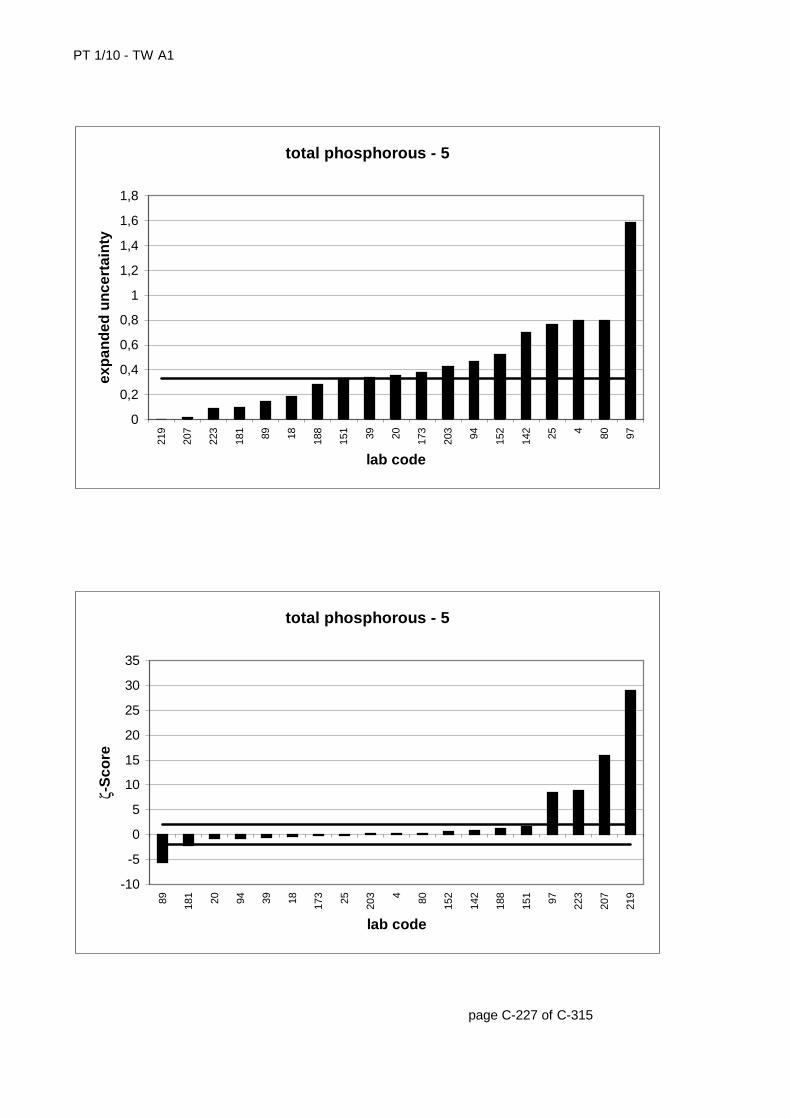
PT 1/10 - TW A1
page C-227 of C-315
total phosphorous - 5
0
0,2
0,4
0,6
0,8
1
1,2
1,4
1,6
1,8
219
207
223
181 89 18 188
151 39 20 173
203 94 152
142 25 4 80 97
lab code
exp
and
ed u
nce
rtai
nty
total phosphorous - 5
-10
-5
0
5
10
15
20
25
30
35
89 181 20 94 39 18 173 25 203 4 80 152
142
188
151 97 223
207
219
lab code
ζ-S
core
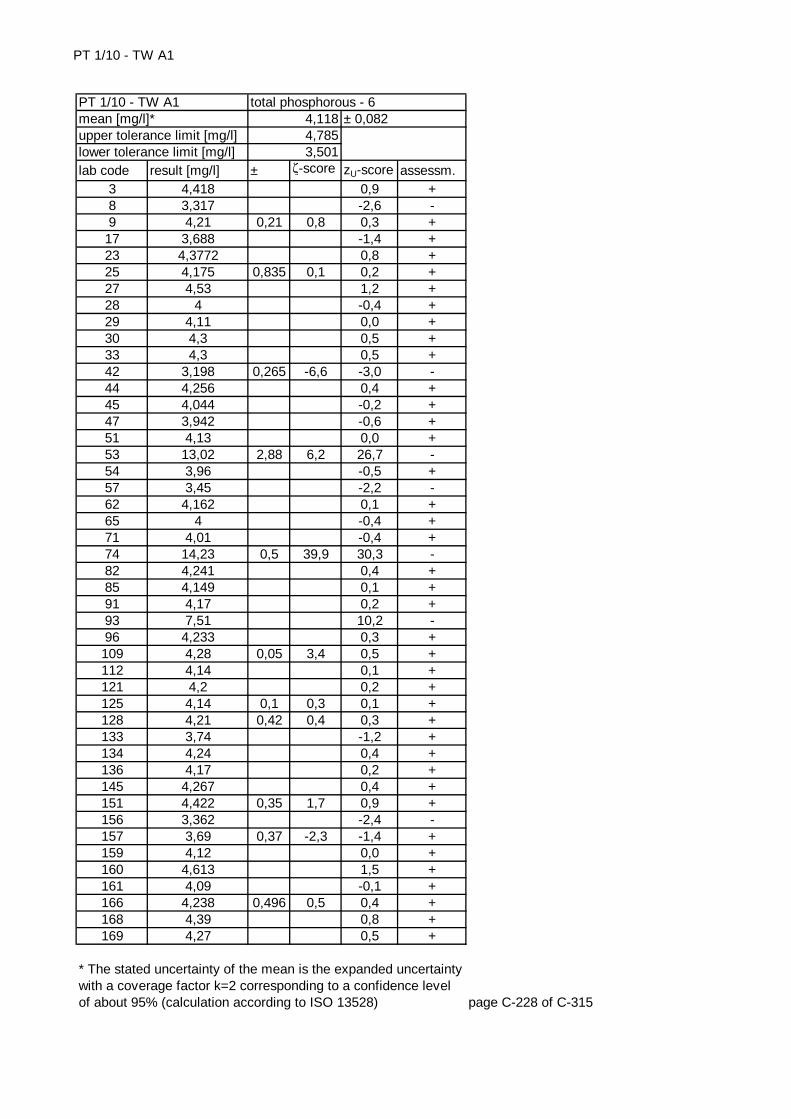
PT 1/10 - TW A1
lab code result [mg/l] ± ζ-score zU-score assessm.3 4,418 0,9 +8 3,317 -2,6 -9 4,21 0,21 0,8 0,3 +
17 3,688 -1,4 +23 4,3772 0,8 +25 4,175 0,835 0,1 0,2 +27 4,53 1,2 +28 4 -0,4 +29 4,11 0,0 +30 4,3 0,5 +33 4,3 0,5 +42 3,198 0,265 -6,6 -3,0 -44 4,256 0,4 +45 4,044 -0,2 +47 3,942 -0,6 +51 4,13 0,0 +53 13,02 2,88 6,2 26,7 -54 3,96 -0,5 +57 3,45 -2,2 -62 4,162 0,1 +65 4 -0,4 +71 4,01 -0,4 +74 14,23 0,5 39,9 30,3 -82 4,241 0,4 +85 4,149 0,1 +91 4,17 0,2 +93 7,51 10,2 -96 4,233 0,3 +109 4,28 0,05 3,4 0,5 +112 4,14 0,1 +121 4,2 0,2 +125 4,14 0,1 0,3 0,1 +128 4,21 0,42 0,4 0,3 +133 3,74 -1,2 +134 4,24 0,4 +136 4,17 0,2 +145 4,267 0,4 +151 4,422 0,35 1,7 0,9 +156 3,362 -2,4 -157 3,69 0,37 -2,3 -1,4 +159 4,12 0,0 +160 4,613 1,5 +161 4,09 -0,1 +166 4,238 0,496 0,5 0,4 +168 4,39 0,8 +169 4,27 0,5 +
page C-228 of C-315
* The stated uncertainty of the mean is the expanded uncertainty with a coverage factor k=2 corresponding to a confidence level of about 95% (calculation according to ISO 13528)
total phosphorous - 64,1184,7853,501
± 0,082PT 1/10 - TW A1mean [mg/l]*upper tolerance limit [mg/l]lower tolerance limit [mg/l]
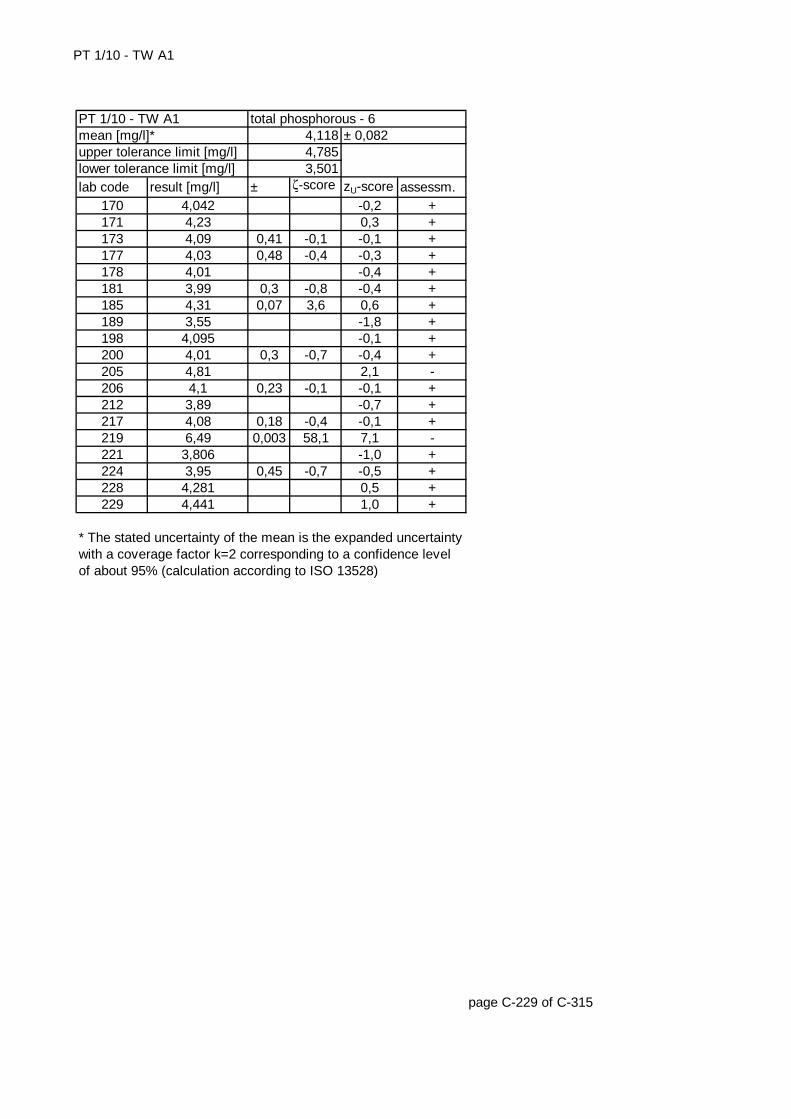
PT 1/10 - TW A1
lab code result [mg/l] ± ζ-score zU-score assessm.170 4,042 -0,2 +171 4,23 0,3 +173 4,09 0,41 -0,1 -0,1 +177 4,03 0,48 -0,4 -0,3 +178 4,01 -0,4 +181 3,99 0,3 -0,8 -0,4 +185 4,31 0,07 3,6 0,6 +189 3,55 -1,8 +198 4,095 -0,1 +200 4,01 0,3 -0,7 -0,4 +205 4,81 2,1 -206 4,1 0,23 -0,1 -0,1 +212 3,89 -0,7 +217 4,08 0,18 -0,4 -0,1 +219 6,49 0,003 58,1 7,1 -221 3,806 -1,0 +224 3,95 0,45 -0,7 -0,5 +228 4,281 0,5 +229 4,441 1,0 +
page C-229 of C-315
* The stated uncertainty of the mean is the expanded uncertainty with a coverage factor k=2 corresponding to a confidence level of about 95% (calculation according to ISO 13528)
upper tolerance limit [mg/l] 4,785lower tolerance limit [mg/l] 3,501
PT 1/10 - TW A1 total phosphorous - 6mean [mg/l]* 4,118 ± 0,082
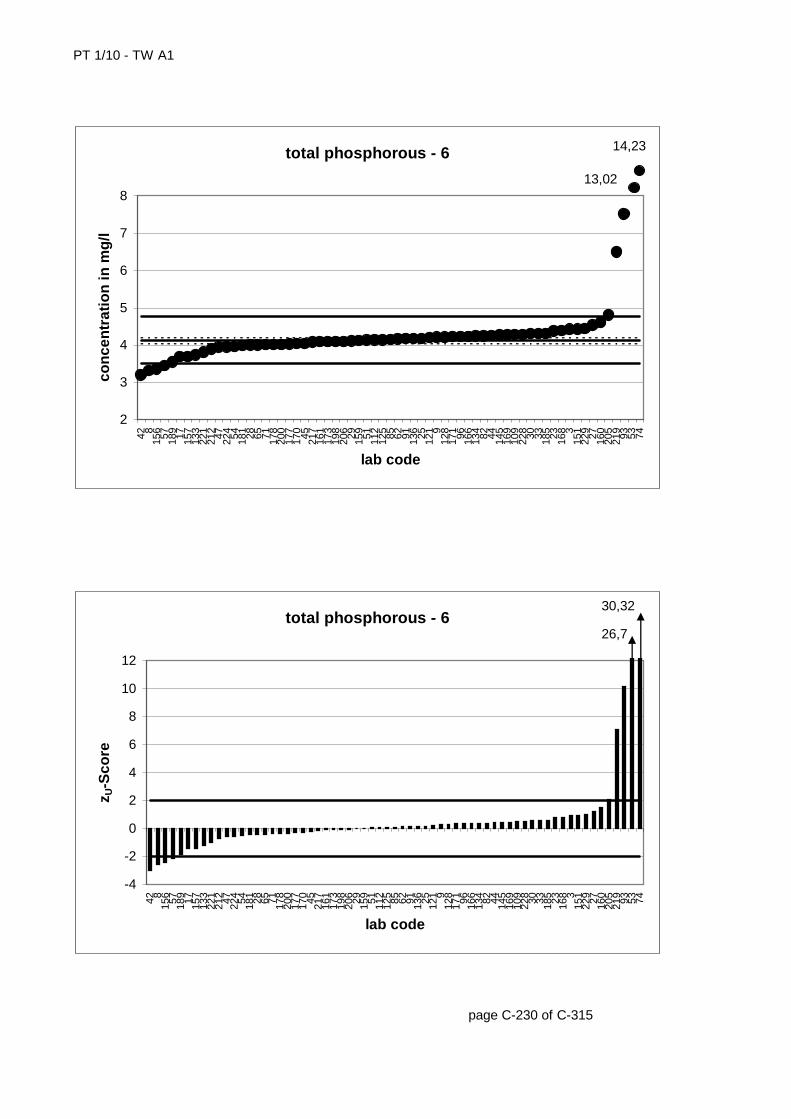
PT 1/10 - TW A1
page C-230 of C-315
total phosphorous - 6
2
3
4
5
6
7
8
42 815
6 57 189 17 157
133
221
212 47 224 54 181 28 65 71 178
200
177
170 45 217
161
173
198
206 29 159 51 112
125 85 62 91 136 25 121 9
128
171 96 166
134 82 44 145
169
109
228 30 33 185 23 168 3
151
229 27 160
205
219 93 53 74
lab code
con
cen
trat
ion
in m
g/l
13,02
14,23
total phosphorous - 6
-4
-2
0
2
4
6
8
10
12
42 815
6 57 189 17 157
133
221
212 47 224 54 181 28 65 71 178
200
177
170 45 217
161
173
198
206 29 159 51 112
125 85 62 91 136 25 121 9
128
171 96 166
134 82 44 145
169
109
228 30 33 185 23 168 3
151
229 27 160
205
219 93 53 74
lab code
z U-S
core
26,7
30,32
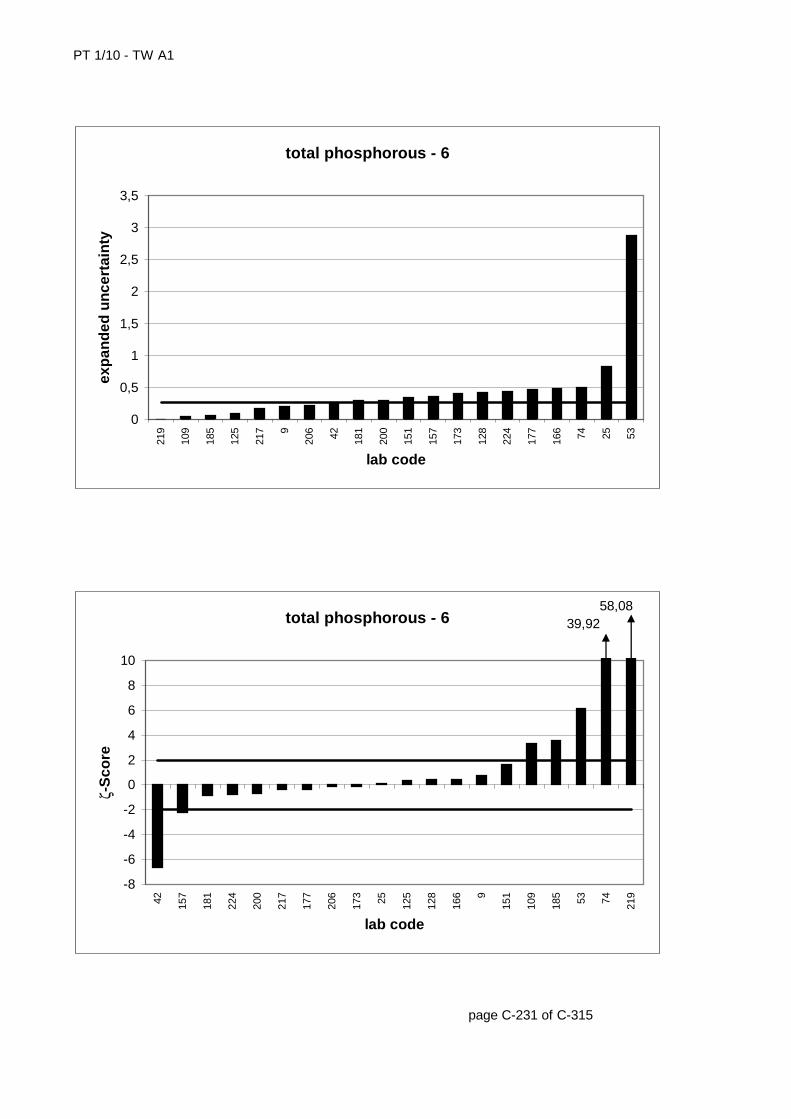
PT 1/10 - TW A1
page C-231 of C-315
total phosphorous - 6
0
0,5
1
1,5
2
2,5
3
3,5
219
109
185
125
217 9
206 42 181
200
151
157
173
128
224
177
166 74 25 53
lab code
exp
and
ed u
nce
rtai
nty
total phosphorous - 6
-8
-6
-4
-2
0
2
4
6
8
10
42 157
181
224
200
217
177
206
173 25 125
128
166 9
151
109
185 53 74 219
lab code
ζ-S
core
39,9258,08
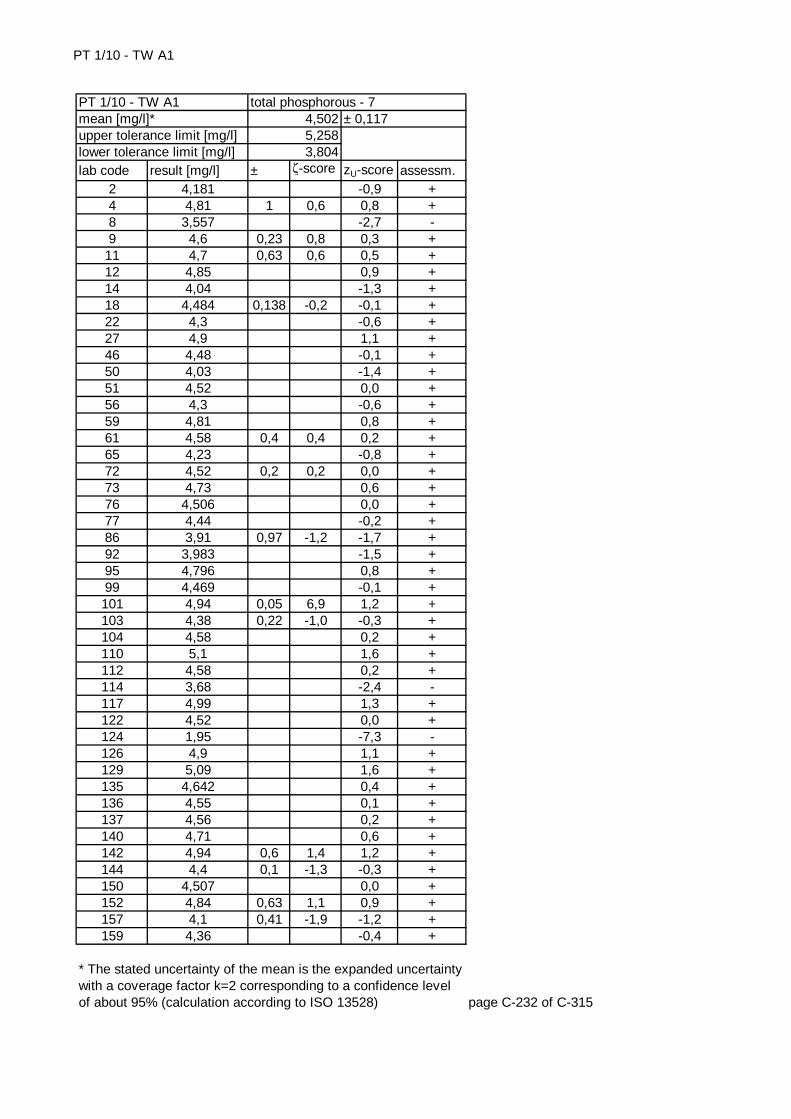
PT 1/10 - TW A1
lab code result [mg/l] ± ζ-score zU-score assessm.2 4,181 -0,9 +4 4,81 1 0,6 0,8 +8 3,557 -2,7 -9 4,6 0,23 0,8 0,3 +
11 4,7 0,63 0,6 0,5 +12 4,85 0,9 +14 4,04 -1,3 +18 4,484 0,138 -0,2 -0,1 +22 4,3 -0,6 +27 4,9 1,1 +46 4,48 -0,1 +50 4,03 -1,4 +51 4,52 0,0 +56 4,3 -0,6 +59 4,81 0,8 +61 4,58 0,4 0,4 0,2 +65 4,23 -0,8 +72 4,52 0,2 0,2 0,0 +73 4,73 0,6 +76 4,506 0,0 +77 4,44 -0,2 +86 3,91 0,97 -1,2 -1,7 +92 3,983 -1,5 +95 4,796 0,8 +99 4,469 -0,1 +101 4,94 0,05 6,9 1,2 +103 4,38 0,22 -1,0 -0,3 +104 4,58 0,2 +110 5,1 1,6 +112 4,58 0,2 +114 3,68 -2,4 -117 4,99 1,3 +122 4,52 0,0 +124 1,95 -7,3 -126 4,9 1,1 +129 5,09 1,6 +135 4,642 0,4 +136 4,55 0,1 +137 4,56 0,2 +140 4,71 0,6 +142 4,94 0,6 1,4 1,2 +144 4,4 0,1 -1,3 -0,3 +150 4,507 0,0 +152 4,84 0,63 1,1 0,9 +157 4,1 0,41 -1,9 -1,2 +159 4,36 -0,4 +
page C-232 of C-315
* The stated uncertainty of the mean is the expanded uncertainty with a coverage factor k=2 corresponding to a confidence level of about 95% (calculation according to ISO 13528)
total phosphorous - 74,5025,2583,804
± 0,117PT 1/10 - TW A1mean [mg/l]*upper tolerance limit [mg/l]lower tolerance limit [mg/l]
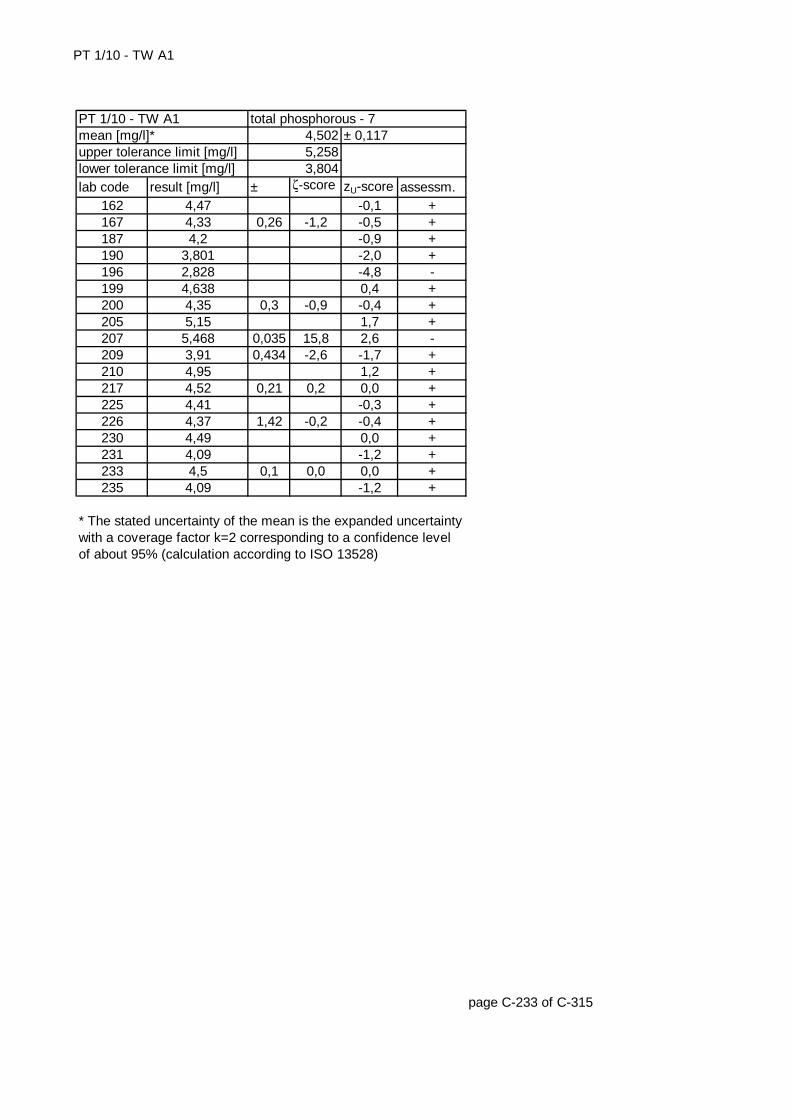
PT 1/10 - TW A1
lab code result [mg/l] ± ζ-score zU-score assessm.162 4,47 -0,1 +167 4,33 0,26 -1,2 -0,5 +187 4,2 -0,9 +190 3,801 -2,0 +196 2,828 -4,8 -199 4,638 0,4 +200 4,35 0,3 -0,9 -0,4 +205 5,15 1,7 +207 5,468 0,035 15,8 2,6 -209 3,91 0,434 -2,6 -1,7 +210 4,95 1,2 +217 4,52 0,21 0,2 0,0 +225 4,41 -0,3 +226 4,37 1,42 -0,2 -0,4 +230 4,49 0,0 +231 4,09 -1,2 +233 4,5 0,1 0,0 0,0 +235 4,09 -1,2 +
page C-233 of C-315
* The stated uncertainty of the mean is the expanded uncertainty with a coverage factor k=2 corresponding to a confidence level of about 95% (calculation according to ISO 13528)
upper tolerance limit [mg/l] 5,258lower tolerance limit [mg/l] 3,804
PT 1/10 - TW A1 total phosphorous - 7mean [mg/l]* 4,502 ± 0,117
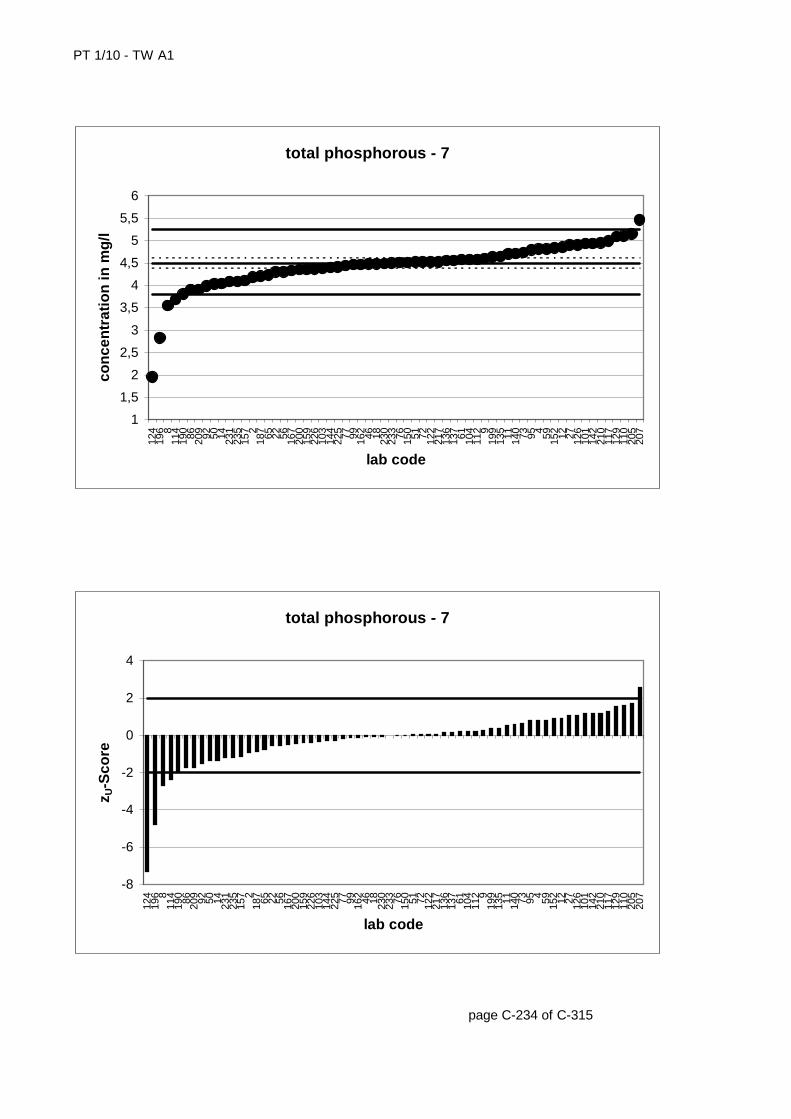
PT 1/10 - TW A1
page C-234 of C-315
total phosphorous - 7
1
1,5
2
2,5
3
3,5
4
4,5
5
5,5
6
124
196 8
114
190 86 209 92 50 14 231
235
157 2
187 65 22 56 167
200
159
226
103
144
225 77 99 162 46 18 230
233 76 150 51 72 122
217
136
137 61 104
112 9
199
135 11 140 73 95 4 59 152 12 27 126
101
142
210
117
129
110
205
207
lab code
con
cen
trat
ion
in m
g/l
total phosphorous - 7
-8
-6
-4
-2
0
2
4
124
196 8
114
190 86 209 92 50 14 231
235
157 2
187 65 22 56 167
200
159
226
103
144
225 77 99 162 46 18 230
233 76 150 51 72 122
217
136
137 61 104
112 9
199
135 11 140 73 95 4 59 152 12 27 126
101
142
210
117
129
110
205
207
lab code
z U-S
core
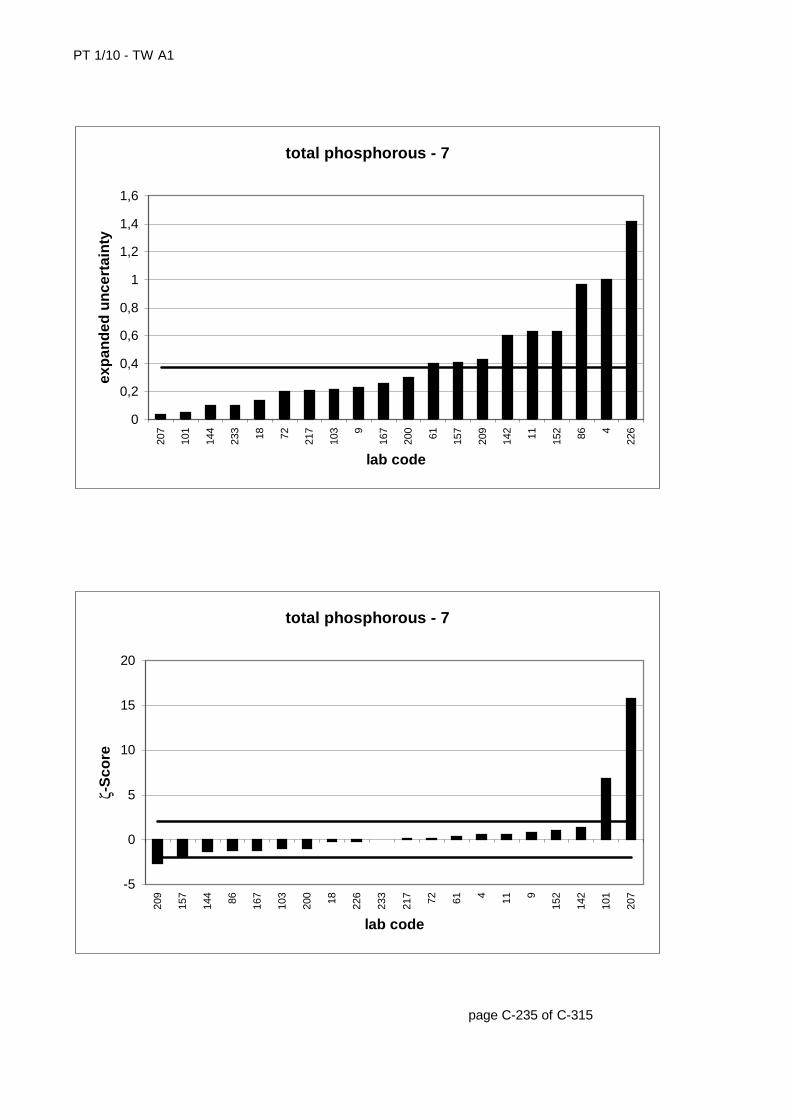
PT 1/10 - TW A1
page C-235 of C-315
total phosphorous - 7
0
0,2
0,4
0,6
0,8
1
1,2
1,4
1,6
207
101
144
233 18 72 217
103 9
167
200 61 157
209
142 11 152 86 4
226
lab code
exp
and
ed u
nce
rtai
nty
total phosphorous - 7
-5
0
5
10
15
20
209
157
144 86 167
103
200 18 226
233
217 72 61 4 11 9
152
142
101
207
lab code
ζ-S
core

PT 1/10 - TW A1
lab code result [mg/l] ± ζ-score zU-score assessm.2 4,571 -0,6 +3 5,223 1,0 +5 4,836 0,1 +
10 4,521 -0,8 +20 4,84 0,47 0,1 0,1 +21 4,76 -0,1 +23 4,9576 0,4 +26 4,82 0,12 0,1 0,0 +28 4,689 -0,3 +32 5,4 1,4 +36 4,7 -0,3 +37 4,831 0,1 +41 5,28 1,1 +43 5,12 0,25 2,2 0,7 +45 4,627 -0,5 +47 4,496 -0,8 +49 4,87 0,1 +53 14,84 3,29 6,1 24,2 -58 5,038 0,2 1,9 0,5 +59 5,13 0,8 +62 4,748 -0,2 +64 4,7922 0,0 +69 5,088 0,7 +71 3,98 -2,2 -72 4,84 0,25 0,2 0,1 +74 16,65 0,5 45,7 28,5 -77 4,7 -0,3 +78 4,87 0,1 +80 4,991 1 0,4 0,4 +86 4,04 0,99 -1,5 -2,0 +87 4,92 0,3 +88 5,05 0,6 +97 13,45 2,018 8,5 20,8 -100 4,661 -0,4 +102 4,742 -0,2 +103 4,89 0,25 0,6 0,2 +105 5,3 1,2 +113 5,22 1,0 +117 5,21 1,0 +118 4,454 -0,9 +120 4,34 -1,2 +122 4,75 -0,2 +123 4,94 0,1 1,6 0,3 +128 5 0,5 0,7 0,5 +132 4,985 0,4 +135 4,905 0,2 +
page C-236 of C-315
* The stated uncertainty of the mean is the expanded uncertainty with a coverage factor k=2 corresponding to a confidence level of about 95% (calculation according to ISO 13528)
total phosphorous - 84,815,64
4,045
± 0,134PT 1/10 - TW A1mean [mg/l]*upper tolerance limit [mg/l]lower tolerance limit [mg/l]
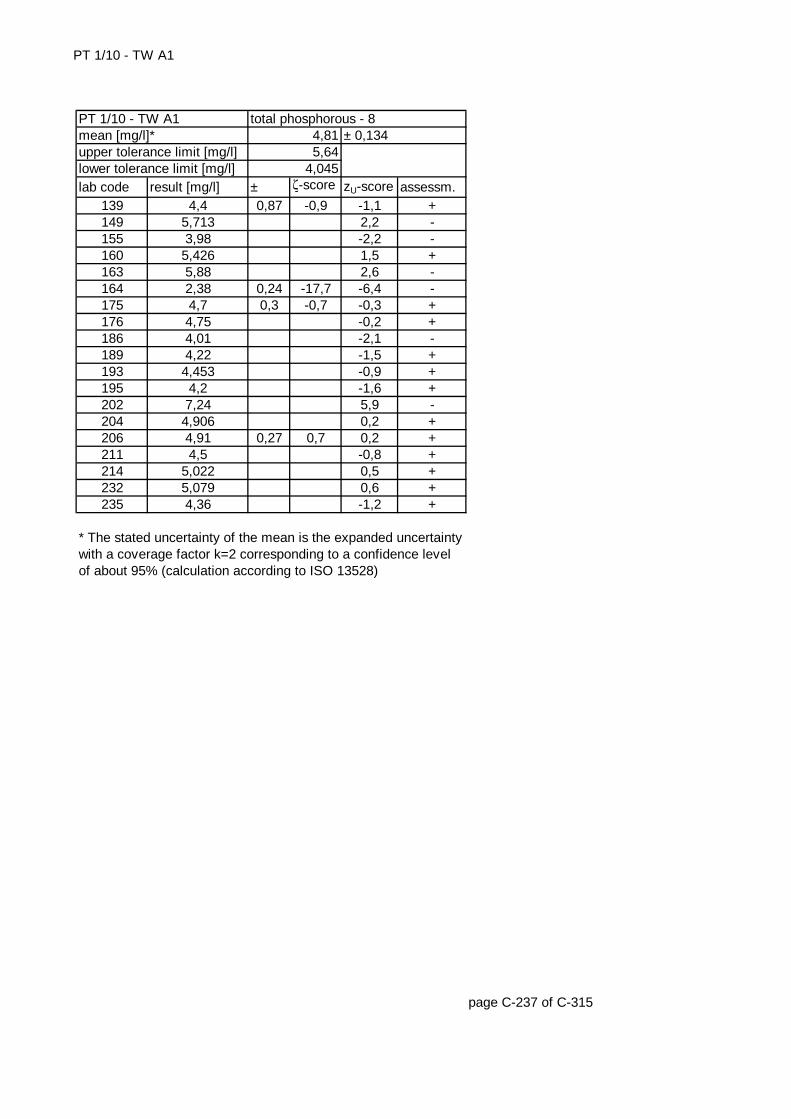
PT 1/10 - TW A1
lab code result [mg/l] ± ζ-score zU-score assessm.139 4,4 0,87 -0,9 -1,1 +149 5,713 2,2 -155 3,98 -2,2 -160 5,426 1,5 +163 5,88 2,6 -164 2,38 0,24 -17,7 -6,4 -175 4,7 0,3 -0,7 -0,3 +176 4,75 -0,2 +186 4,01 -2,1 -189 4,22 -1,5 +193 4,453 -0,9 +195 4,2 -1,6 +202 7,24 5,9 -204 4,906 0,2 +206 4,91 0,27 0,7 0,2 +211 4,5 -0,8 +214 5,022 0,5 +232 5,079 0,6 +235 4,36 -1,2 +
page C-237 of C-315
* The stated uncertainty of the mean is the expanded uncertainty with a coverage factor k=2 corresponding to a confidence level of about 95% (calculation according to ISO 13528)
upper tolerance limit [mg/l] 5,64lower tolerance limit [mg/l] 4,045
PT 1/10 - TW A1 total phosphorous - 8mean [mg/l]* 4,81 ± 0,134
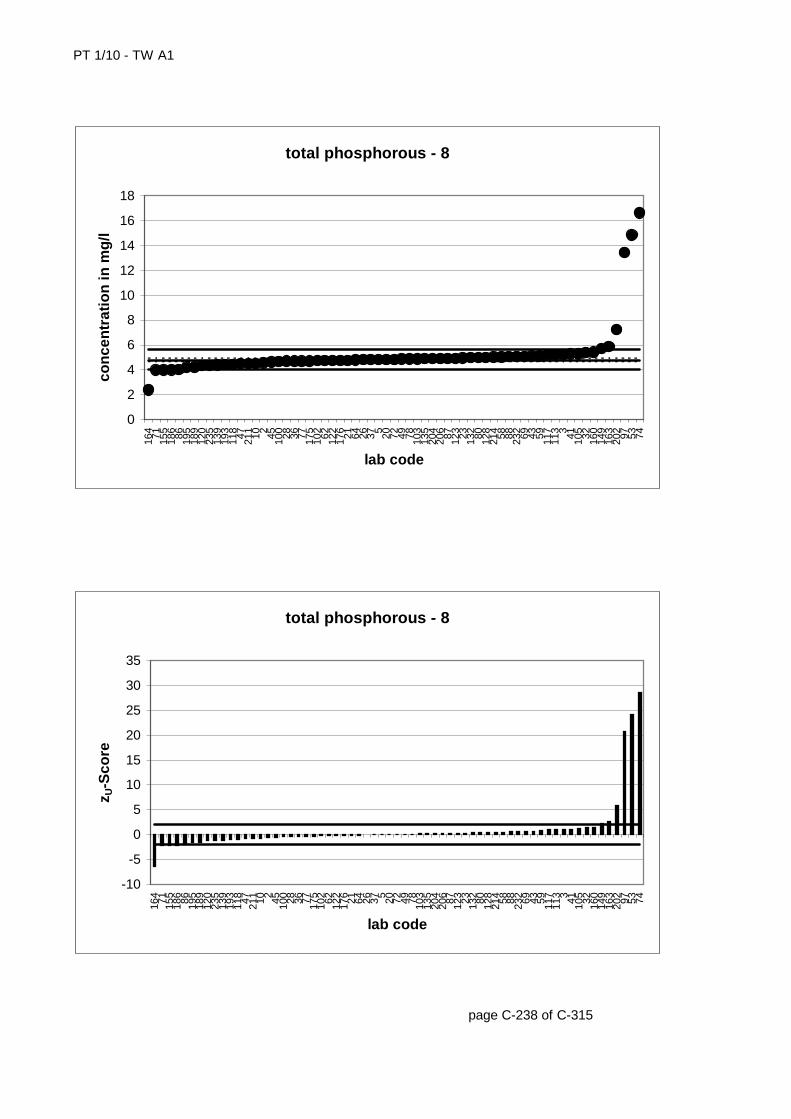
PT 1/10 - TW A1
page C-238 of C-315
total phosphorous - 8
0
2
4
6
8
10
12
14
16
18
164 71 155
186 86 195
189
120
235
139
193
118 47 211 10 2 45 100 28 36 77 175
102 62 122
176 21 64 26 37 5 20 72 49 78 103
135
204
206 87 123 23 132 80 128
214 58 88 232 69 43 59 117
113 3 41 105 32 160
149
163
202 97 53 74
lab code
con
cen
trat
ion
in m
g/l
total phosphorous - 8
-10
-5
0
5
10
15
20
25
30
35
164 71 155
186 86 195
189
120
235
139
193
118 47 211 10 2 45 100 28 36 77 175
102 62 122
176 21 64 26 37 5 20 72 49 78 103
135
204
206 87 123 23 132 80 128
214 58 88 232 69 43 59 117
113 3 41 105 32 160
149
163
202 97 53 74
lab code
z U-S
core
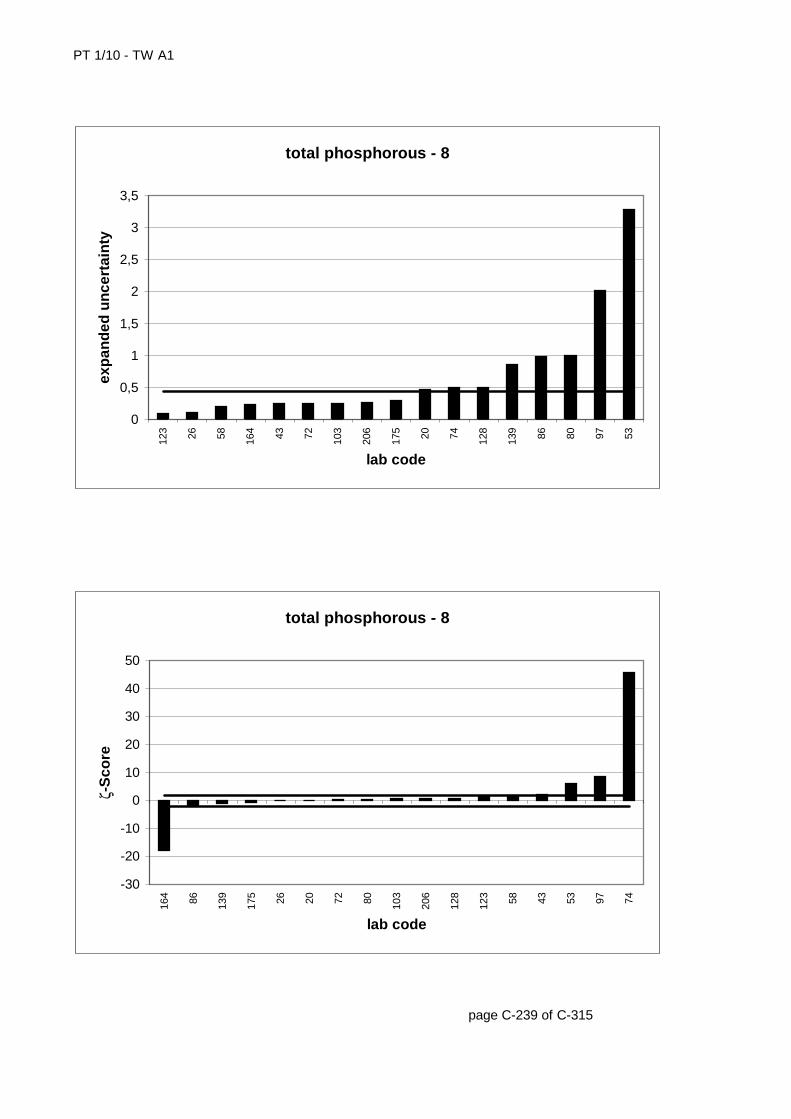
PT 1/10 - TW A1
page C-239 of C-315
total phosphorous - 8
0
0,5
1
1,5
2
2,5
3
3,5
123 26 58 164 43 72 103
206
175 20 74 128
139 86 80 97 53
lab code
exp
and
ed u
nce
rtai
nty
total phosphorous - 8
-30
-20
-10
0
10
20
30
40
50
164 86 139
175 26 20 72 80 103
206
128
123 58 43 53 97 74
lab code
ζ-S
core
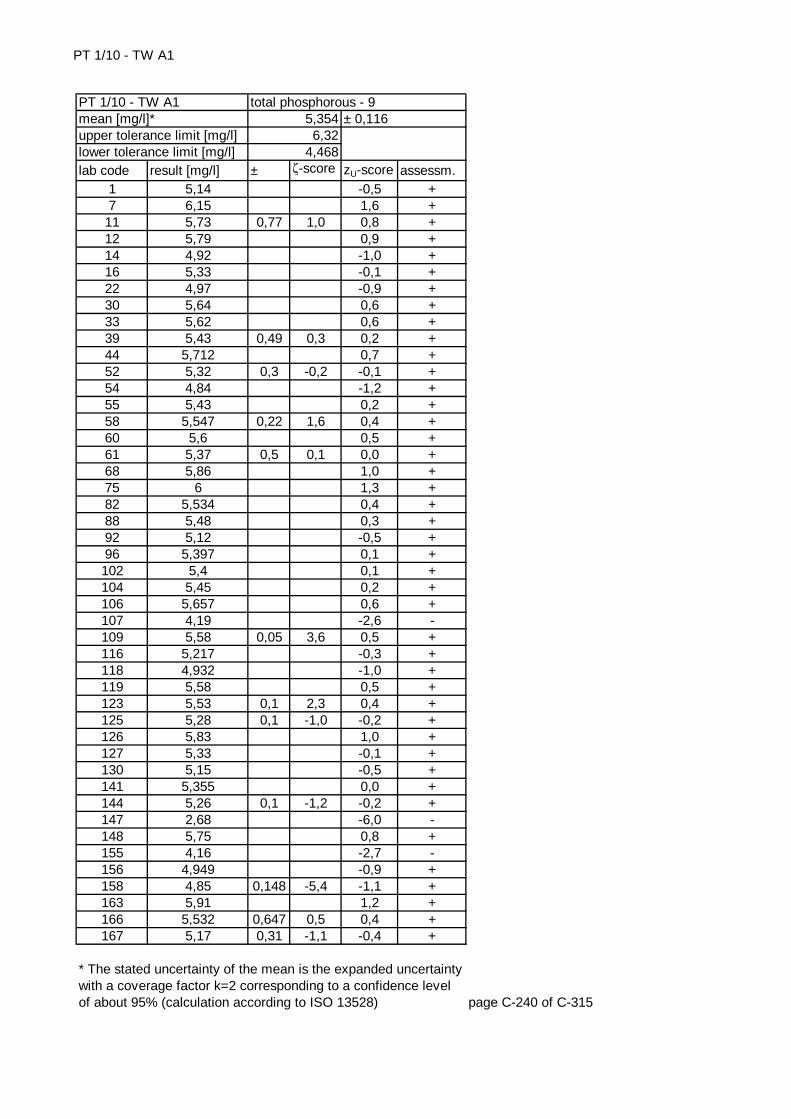
PT 1/10 - TW A1
lab code result [mg/l] ± ζ-score zU-score assessm.1 5,14 -0,5 +7 6,15 1,6 +
11 5,73 0,77 1,0 0,8 +12 5,79 0,9 +14 4,92 -1,0 +16 5,33 -0,1 +22 4,97 -0,9 +30 5,64 0,6 +33 5,62 0,6 +39 5,43 0,49 0,3 0,2 +44 5,712 0,7 +52 5,32 0,3 -0,2 -0,1 +54 4,84 -1,2 +55 5,43 0,2 +58 5,547 0,22 1,6 0,4 +60 5,6 0,5 +61 5,37 0,5 0,1 0,0 +68 5,86 1,0 +75 6 1,3 +82 5,534 0,4 +88 5,48 0,3 +92 5,12 -0,5 +96 5,397 0,1 +102 5,4 0,1 +104 5,45 0,2 +106 5,657 0,6 +107 4,19 -2,6 -109 5,58 0,05 3,6 0,5 +116 5,217 -0,3 +118 4,932 -1,0 +119 5,58 0,5 +123 5,53 0,1 2,3 0,4 +125 5,28 0,1 -1,0 -0,2 +126 5,83 1,0 +127 5,33 -0,1 +130 5,15 -0,5 +141 5,355 0,0 +144 5,26 0,1 -1,2 -0,2 +147 2,68 -6,0 -148 5,75 0,8 +155 4,16 -2,7 -156 4,949 -0,9 +158 4,85 0,148 -5,4 -1,1 +163 5,91 1,2 +166 5,532 0,647 0,5 0,4 +167 5,17 0,31 -1,1 -0,4 +
page C-240 of C-315
* The stated uncertainty of the mean is the expanded uncertainty with a coverage factor k=2 corresponding to a confidence level of about 95% (calculation according to ISO 13528)
total phosphorous - 95,3546,32
4,468
± 0,116PT 1/10 - TW A1mean [mg/l]*upper tolerance limit [mg/l]lower tolerance limit [mg/l]
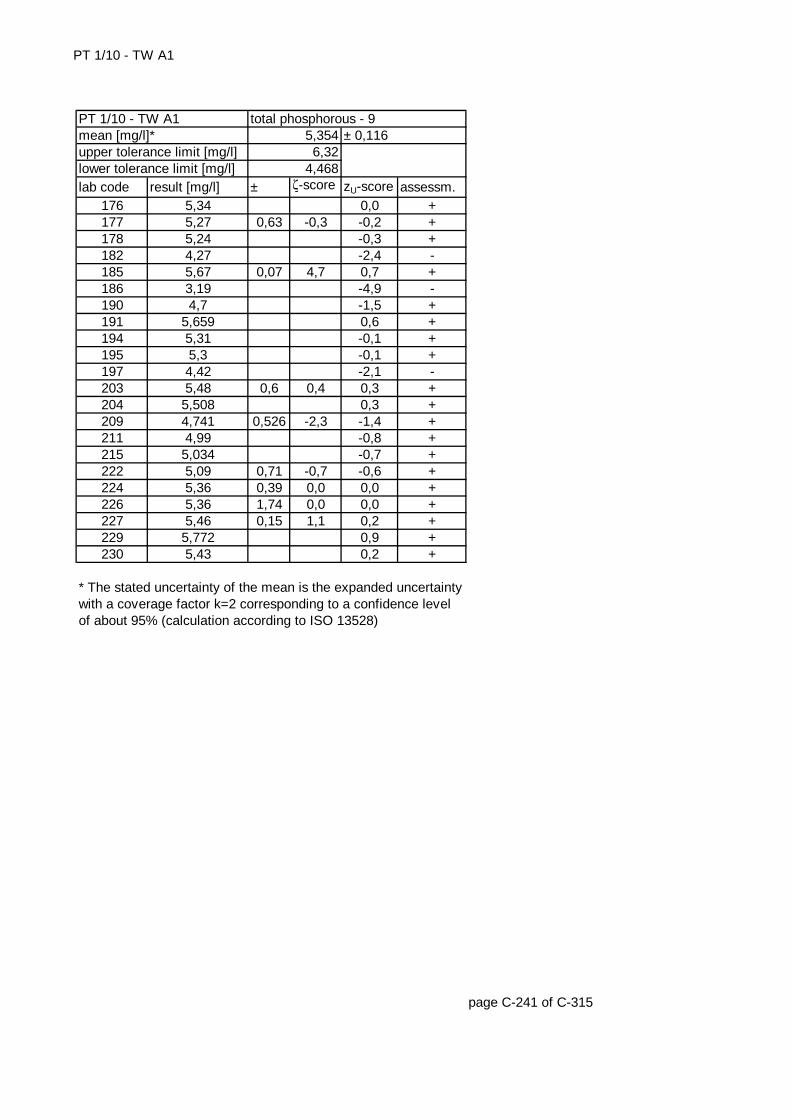
PT 1/10 - TW A1
lab code result [mg/l] ± ζ-score zU-score assessm.176 5,34 0,0 +177 5,27 0,63 -0,3 -0,2 +178 5,24 -0,3 +182 4,27 -2,4 -185 5,67 0,07 4,7 0,7 +186 3,19 -4,9 -190 4,7 -1,5 +191 5,659 0,6 +194 5,31 -0,1 +195 5,3 -0,1 +197 4,42 -2,1 -203 5,48 0,6 0,4 0,3 +204 5,508 0,3 +209 4,741 0,526 -2,3 -1,4 +211 4,99 -0,8 +215 5,034 -0,7 +222 5,09 0,71 -0,7 -0,6 +224 5,36 0,39 0,0 0,0 +226 5,36 1,74 0,0 0,0 +227 5,46 0,15 1,1 0,2 +229 5,772 0,9 +230 5,43 0,2 +
page C-241 of C-315
* The stated uncertainty of the mean is the expanded uncertainty with a coverage factor k=2 corresponding to a confidence level of about 95% (calculation according to ISO 13528)
upper tolerance limit [mg/l] 6,32lower tolerance limit [mg/l] 4,468
PT 1/10 - TW A1 total phosphorous - 9mean [mg/l]* 5,354 ± 0,116
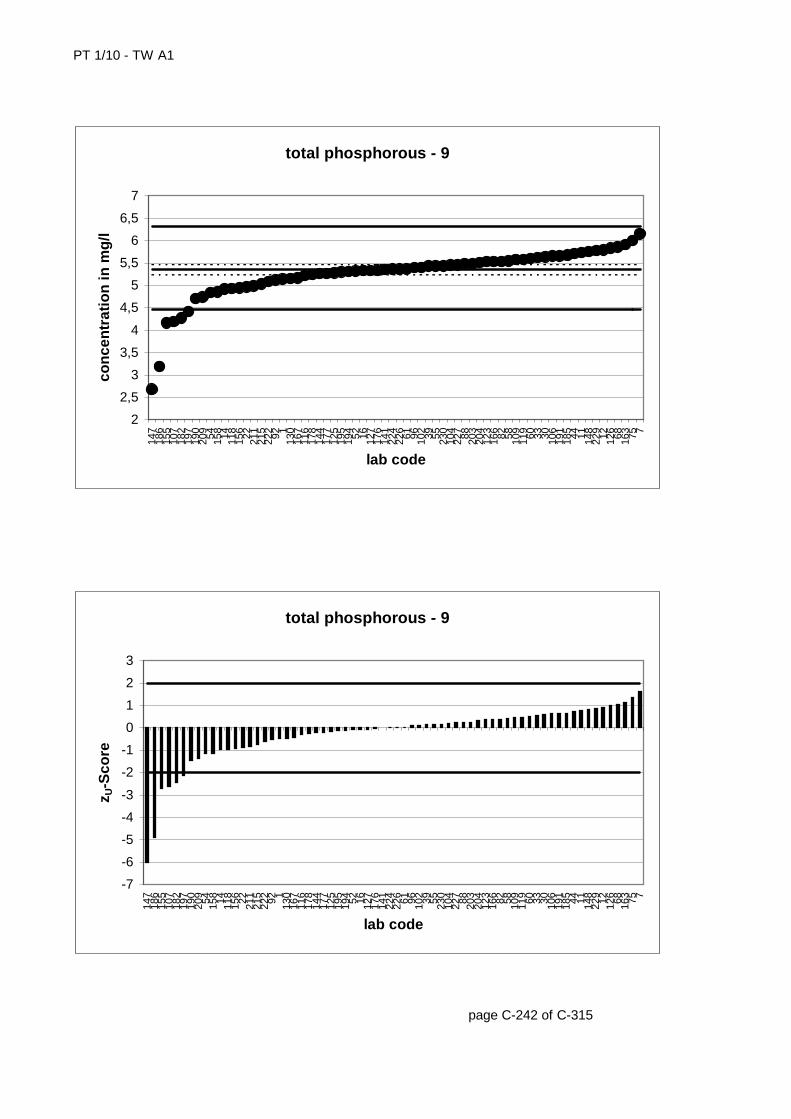
PT 1/10 - TW A1
page C-242 of C-315
total phosphorous - 9
2
2,5
3
3,5
4
4,5
5
5,5
6
6,5
7
147
186
155
107
182
197
190
209 54 158 14 118
156 22 211
215
222 92 1
130
167
116
178
144
177
125
195
194 52 16 127
176
141
224
226 61 96 102 39 55 230
104
227 88 203
204
123
166 82 58 109
119 60 33 30 106
191
185 44 11 148
229 12 126 68 163 75 7
lab code
con
cen
trat
ion
in m
g/l
total phosphorous - 9
-7
-6
-5
-4
-3
-2
-1
0
1
2
3
147
186
155
107
182
197
190
209 54 158 14 118
156 22 211
215
222 92 1
130
167
116
178
144
177
125
195
194 52 16 127
176
141
224
226 61 96 102 39 55 230
104
227 88 203
204
123
166 82 58 109
119 60 33 30 106
191
185 44 11 148
229 12 126 68 163 75 7
lab code
z U-S
core
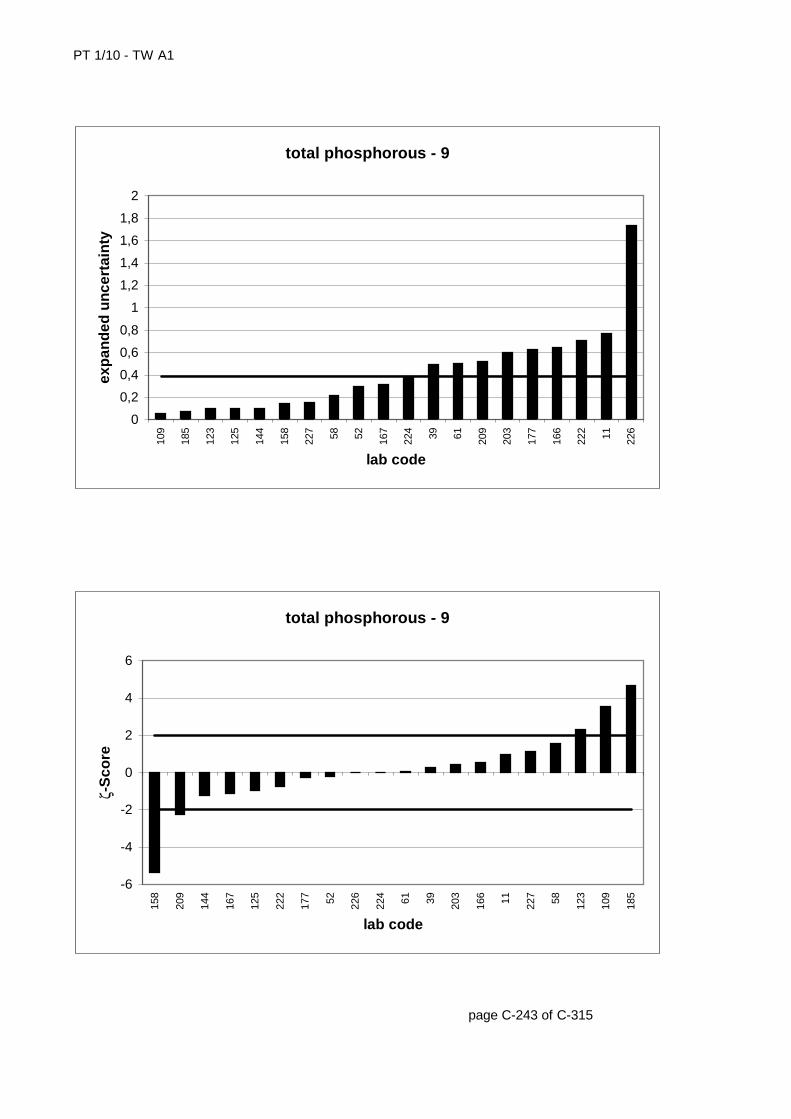
PT 1/10 - TW A1
page C-243 of C-315
total phosphorous - 9
0
0,2
0,4
0,6
0,8
1
1,2
1,4
1,6
1,8
2
109
185
123
125
144
158
227 58 52 167
224 39 61 209
203
177
166
222 11 226
lab code
exp
and
ed u
nce
rtai
nty
total phosphorous - 9
-6
-4
-2
0
2
4
6
158
209
144
167
125
222
177 52 226
224 61 39 203
166 11 227 58 123
109
185
lab code
ζ-S
core
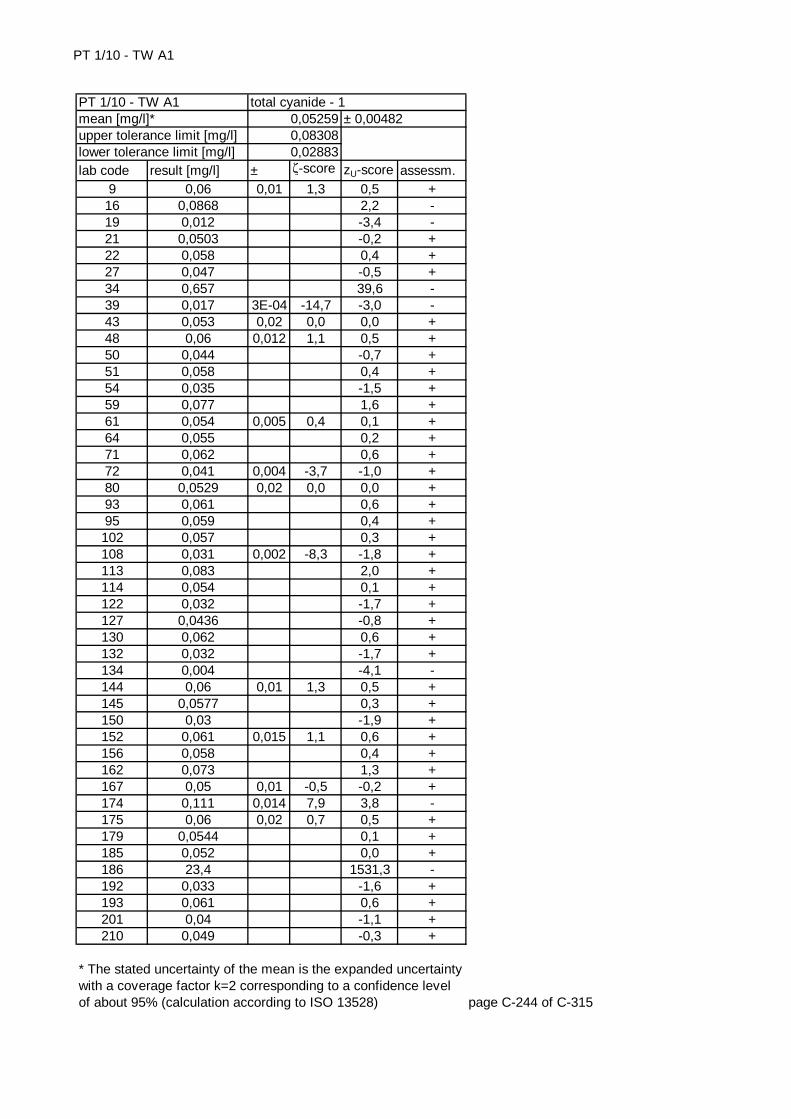
PT 1/10 - TW A1
lab code result [mg/l] ± ζ-score zU-score assessm.9 0,06 0,01 1,3 0,5 +
16 0,0868 2,2 -19 0,012 -3,4 -21 0,0503 -0,2 +22 0,058 0,4 +27 0,047 -0,5 +34 0,657 39,6 -39 0,017 3E-04 -14,7 -3,0 -43 0,053 0,02 0,0 0,0 +48 0,06 0,012 1,1 0,5 +50 0,044 -0,7 +51 0,058 0,4 +54 0,035 -1,5 +59 0,077 1,6 +61 0,054 0,005 0,4 0,1 +64 0,055 0,2 +71 0,062 0,6 +72 0,041 0,004 -3,7 -1,0 +80 0,0529 0,02 0,0 0,0 +93 0,061 0,6 +95 0,059 0,4 +102 0,057 0,3 +108 0,031 0,002 -8,3 -1,8 +113 0,083 2,0 +114 0,054 0,1 +122 0,032 -1,7 +127 0,0436 -0,8 +130 0,062 0,6 +132 0,032 -1,7 +134 0,004 -4,1 -144 0,06 0,01 1,3 0,5 +145 0,0577 0,3 +150 0,03 -1,9 +152 0,061 0,015 1,1 0,6 +156 0,058 0,4 +162 0,073 1,3 +167 0,05 0,01 -0,5 -0,2 +174 0,111 0,014 7,9 3,8 -175 0,06 0,02 0,7 0,5 +179 0,0544 0,1 +185 0,052 0,0 +186 23,4 1531,3 -192 0,033 -1,6 +193 0,061 0,6 +201 0,04 -1,1 +210 0,049 -0,3 +
page C-244 of C-315
* The stated uncertainty of the mean is the expanded uncertainty with a coverage factor k=2 corresponding to a confidence level of about 95% (calculation according to ISO 13528)
total cyanide - 10,052590,083080,02883
± 0,00482PT 1/10 - TW A1mean [mg/l]*upper tolerance limit [mg/l]lower tolerance limit [mg/l]

PT 1/10 - TW A1
lab code result [mg/l] ± ζ-score zU-score assessm.215 0,0555 0,2 +221 0,0765 1,6 +223 0,04 0,01 -2,3 -1,1 +227 0,06 0,004 2,3 0,5 +232 0,061 0,6 +235 0,057 0,3 +
page C-245 of C-315
* The stated uncertainty of the mean is the expanded uncertainty with a coverage factor k=2 corresponding to a confidence level of about 95% (calculation according to ISO 13528)
upper tolerance limit [mg/l] 0,08308lower tolerance limit [mg/l] 0,02883
PT 1/10 - TW A1 total cyanide - 1mean [mg/l]* 0,05259 ± 0,00482
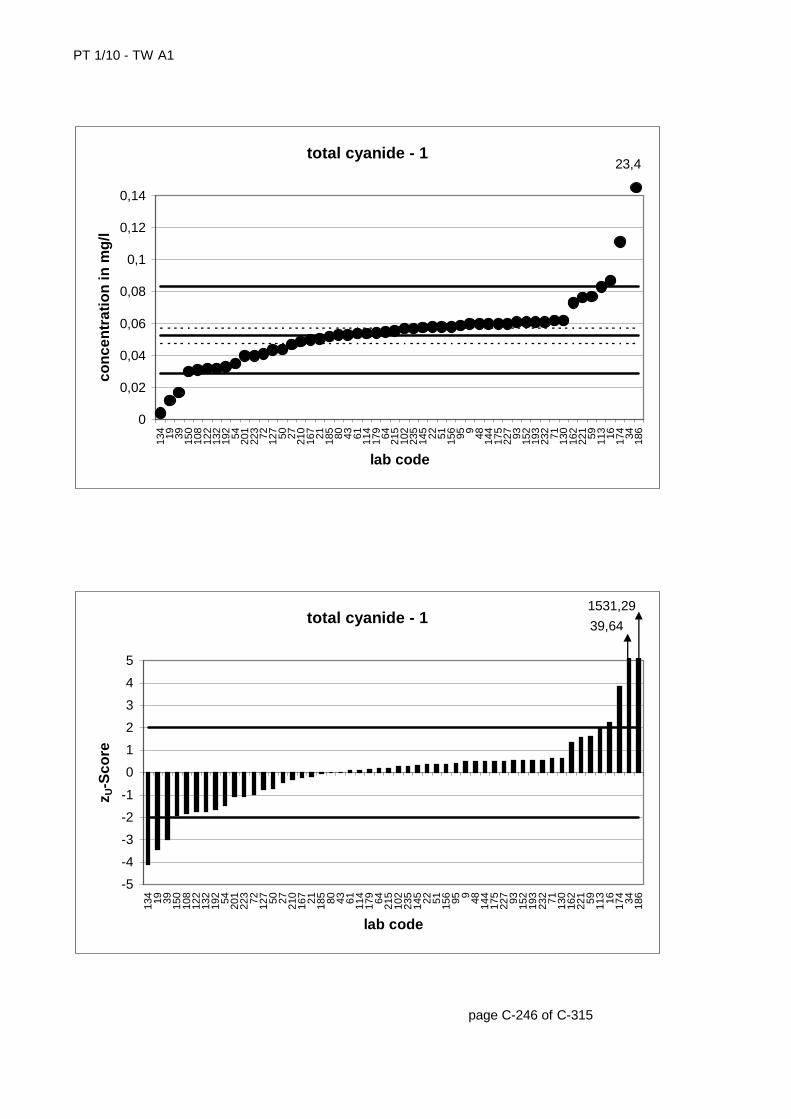
PT 1/10 - TW A1
page C-246 of C-315
total cyanide - 1
0
0,02
0,04
0,06
0,08
0,1
0,12
0,14
134 19 39 150
108
122
132
192 54 201
223 72 127 50 27 210
167 21 185 80 43 61 114
179 64 215
102
235
145 22 51 156 95 9 48 144
175
227 93 152
193
232 71 130
162
221 59 113 16 174 34 186
lab code
con
cen
trat
ion
in m
g/l
23,4
total cyanide - 1
-5
-4
-3
-2
-1
0
1
2
3
4
5
134 19 39 150
108
122
132
192 54 201
223 72 127 50 27 210
167 21 185 80 43 61 114
179 64 215
102
235
145 22 51 156 95 9 48 144
175
227 93 152
193
232 71 130
162
221 59 113 16 174 34 186
lab code
z U-S
core
39,64
1531,29
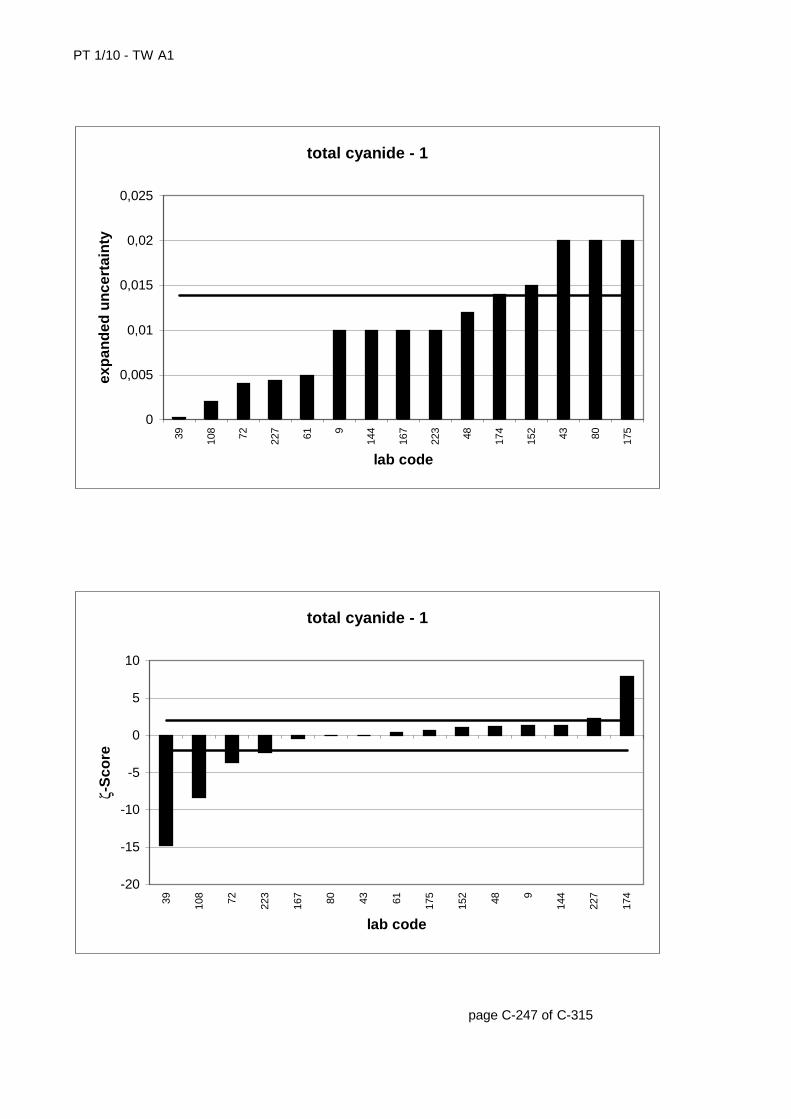
PT 1/10 - TW A1
page C-247 of C-315
total cyanide - 1
0
0,005
0,01
0,015
0,02
0,02539 108 72 227 61 9
144
167
223 48 174
152 43 80 175
lab code
exp
and
ed u
nce
rtai
nty
total cyanide - 1
-20
-15
-10
-5
0
5
10
39 108 72 223
167 80 43 61 175
152 48 9
144
227
174
lab code
ζ-S
core
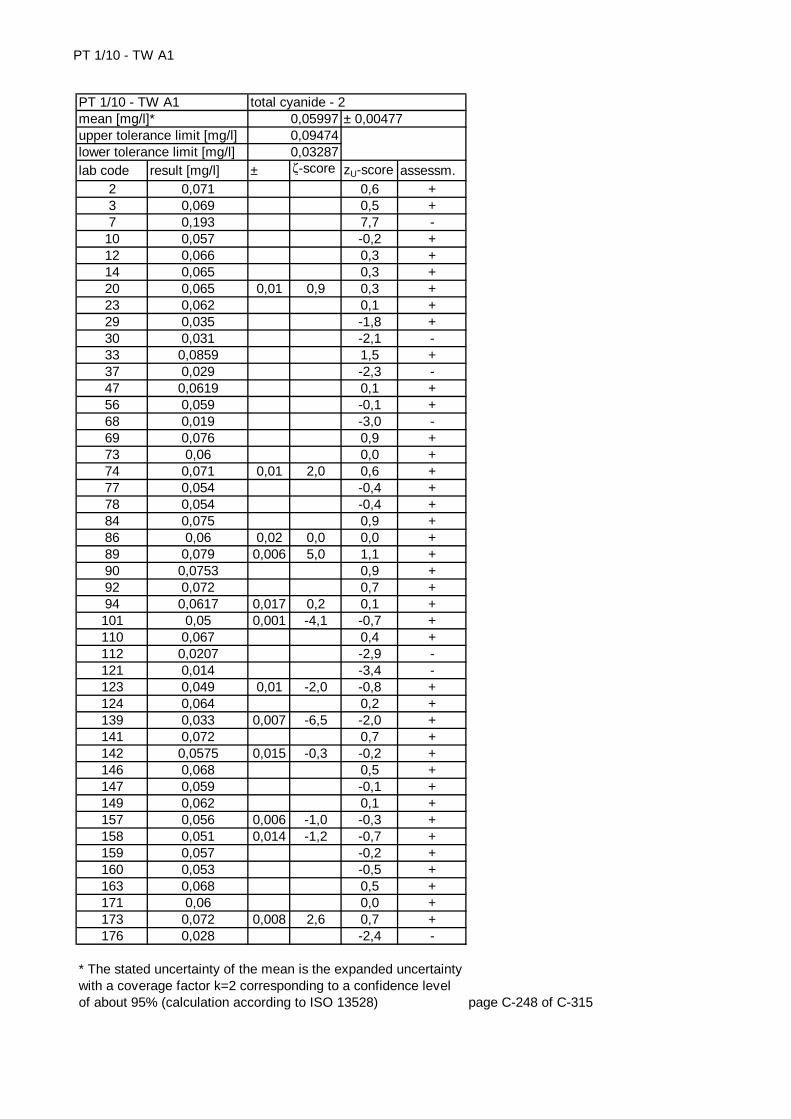
PT 1/10 - TW A1
lab code result [mg/l] ± ζ-score zU-score assessm.2 0,071 0,6 +3 0,069 0,5 +7 0,193 7,7 -
10 0,057 -0,2 +12 0,066 0,3 +14 0,065 0,3 +20 0,065 0,01 0,9 0,3 +23 0,062 0,1 +29 0,035 -1,8 +30 0,031 -2,1 -33 0,0859 1,5 +37 0,029 -2,3 -47 0,0619 0,1 +56 0,059 -0,1 +68 0,019 -3,0 -69 0,076 0,9 +73 0,06 0,0 +74 0,071 0,01 2,0 0,6 +77 0,054 -0,4 +78 0,054 -0,4 +84 0,075 0,9 +86 0,06 0,02 0,0 0,0 +89 0,079 0,006 5,0 1,1 +90 0,0753 0,9 +92 0,072 0,7 +94 0,0617 0,017 0,2 0,1 +101 0,05 0,001 -4,1 -0,7 +110 0,067 0,4 +112 0,0207 -2,9 -121 0,014 -3,4 -123 0,049 0,01 -2,0 -0,8 +124 0,064 0,2 +139 0,033 0,007 -6,5 -2,0 +141 0,072 0,7 +142 0,0575 0,015 -0,3 -0,2 +146 0,068 0,5 +147 0,059 -0,1 +149 0,062 0,1 +157 0,056 0,006 -1,0 -0,3 +158 0,051 0,014 -1,2 -0,7 +159 0,057 -0,2 +160 0,053 -0,5 +163 0,068 0,5 +171 0,06 0,0 +173 0,072 0,008 2,6 0,7 +176 0,028 -2,4 -
page C-248 of C-315
* The stated uncertainty of the mean is the expanded uncertainty with a coverage factor k=2 corresponding to a confidence level of about 95% (calculation according to ISO 13528)
total cyanide - 20,059970,094740,03287
± 0,00477PT 1/10 - TW A1mean [mg/l]*upper tolerance limit [mg/l]lower tolerance limit [mg/l]
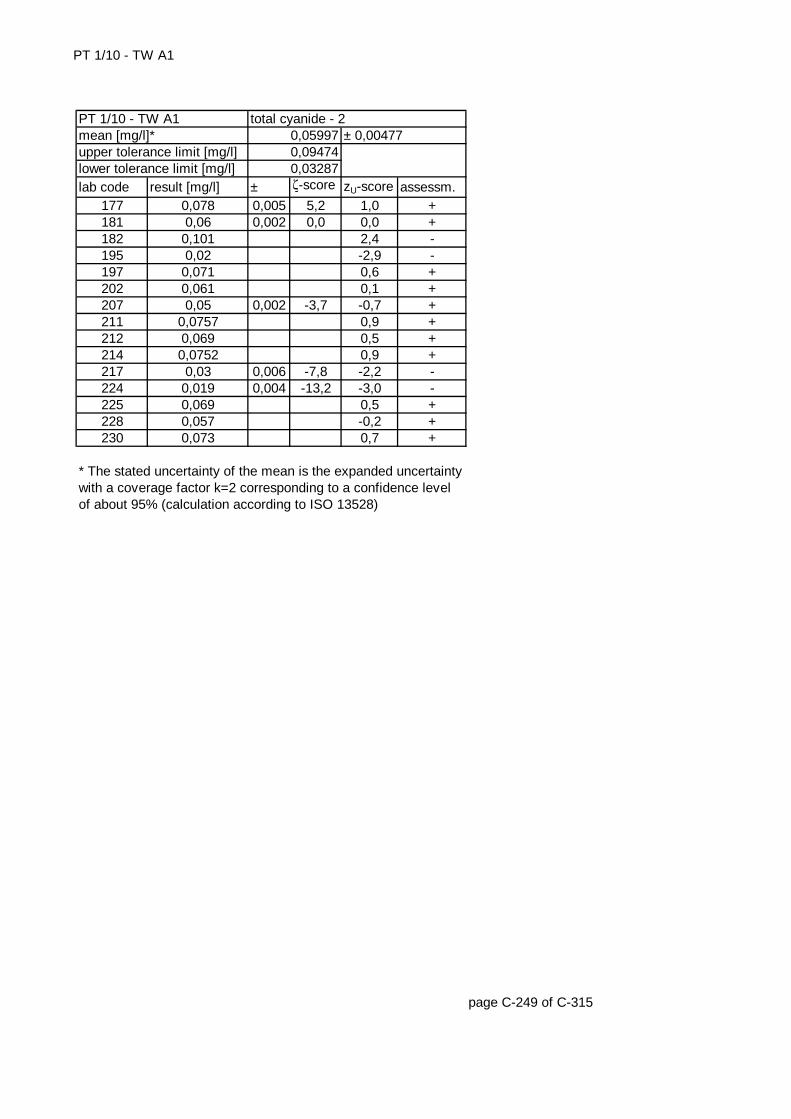
PT 1/10 - TW A1
lab code result [mg/l] ± ζ-score zU-score assessm.177 0,078 0,005 5,2 1,0 +181 0,06 0,002 0,0 0,0 +182 0,101 2,4 -195 0,02 -2,9 -197 0,071 0,6 +202 0,061 0,1 +207 0,05 0,002 -3,7 -0,7 +211 0,0757 0,9 +212 0,069 0,5 +214 0,0752 0,9 +217 0,03 0,006 -7,8 -2,2 -224 0,019 0,004 -13,2 -3,0 -225 0,069 0,5 +228 0,057 -0,2 +230 0,073 0,7 +
page C-249 of C-315
* The stated uncertainty of the mean is the expanded uncertainty with a coverage factor k=2 corresponding to a confidence level of about 95% (calculation according to ISO 13528)
upper tolerance limit [mg/l] 0,09474lower tolerance limit [mg/l] 0,03287
PT 1/10 - TW A1 total cyanide - 2mean [mg/l]* 0,05997 ± 0,00477
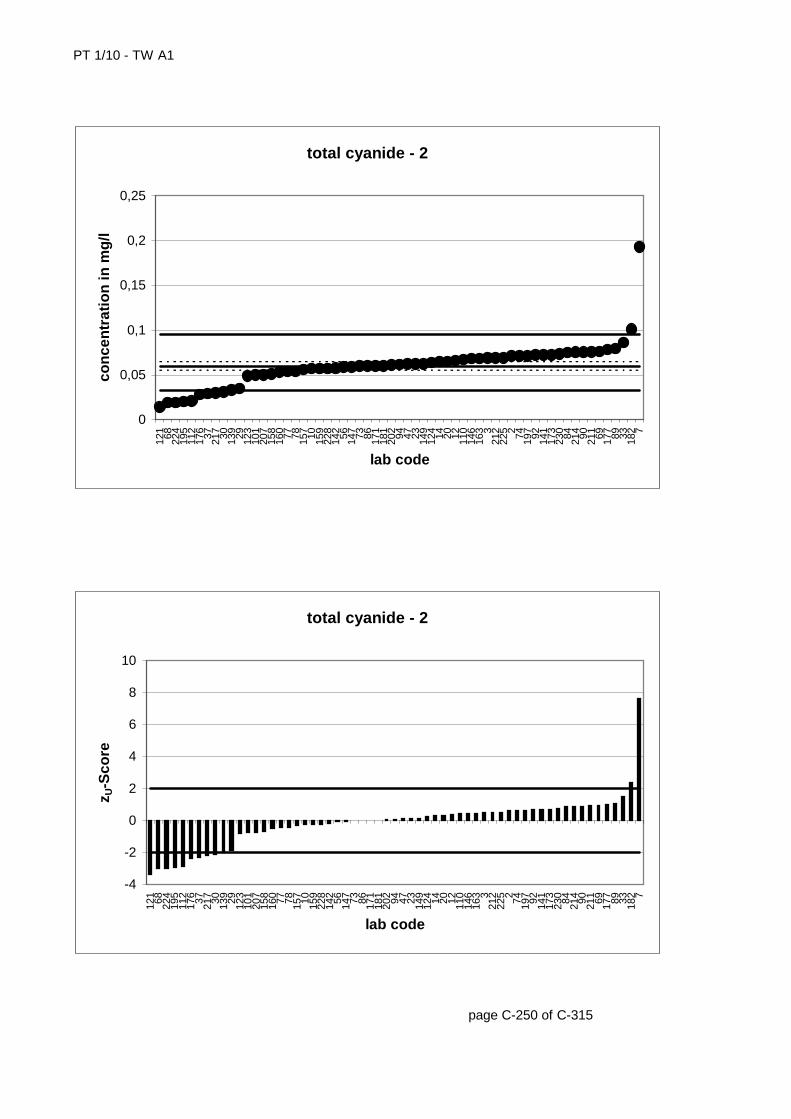
PT 1/10 - TW A1
page C-250 of C-315
total cyanide - 2
0
0,05
0,1
0,15
0,2
0,25
121 68 224
195
112
176 37 217 30 139 29 123
101
207
158
160 77 78 157 10 159
228
142 56 147 73 86 171
181
202 94 47 23 149
124 14 20 12 110
146
163 3
212
225 2 74 197 92 141
173
230 84 214 90 211 69 177 89 33 182 7
lab code
con
cen
trat
ion
in m
g/l
total cyanide - 2
-4
-2
0
2
4
6
8
10
121 68 224
195
112
176 37 217 30 139 29 123
101
207
158
160 77 78 157 10 159
228
142 56 147 73 86 171
181
202 94 47 23 149
124 14 20 12 110
146
163 3
212
225 2 74 197 92 141
173
230 84 214 90 211 69 177 89 33 182 7
lab code
z U-S
core
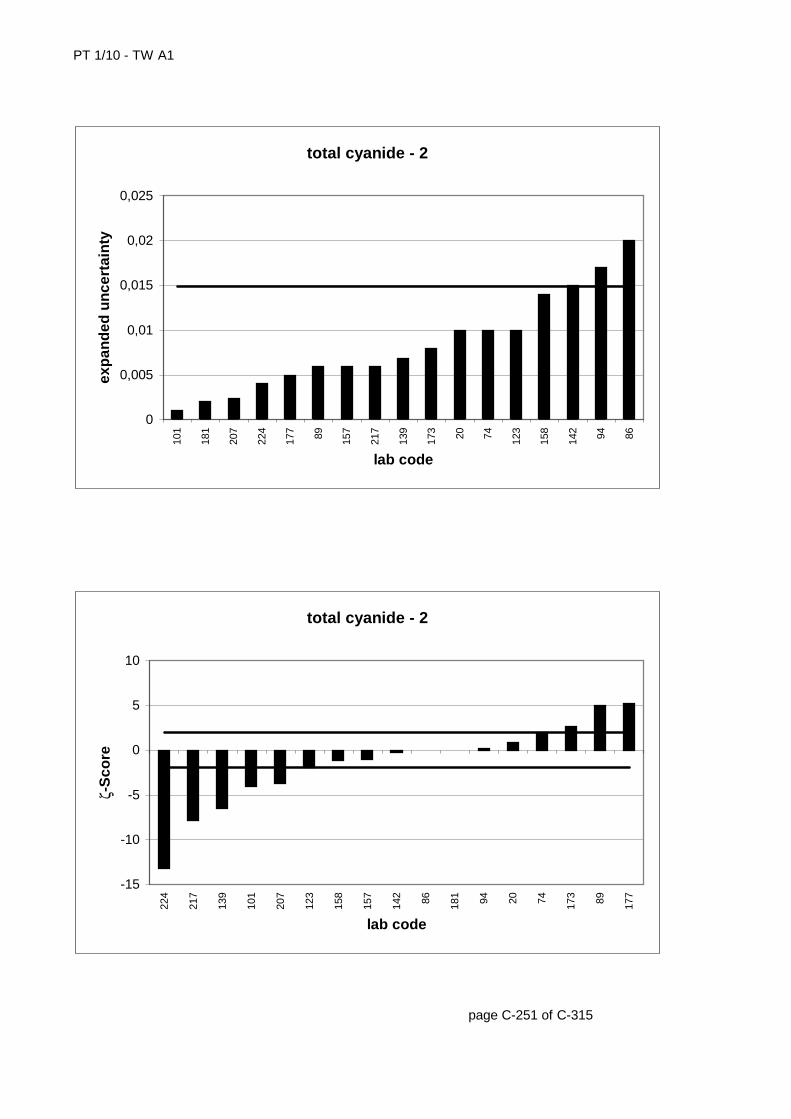
PT 1/10 - TW A1
page C-251 of C-315
total cyanide - 2
0
0,005
0,01
0,015
0,02
0,025
101
181
207
224
177 89 157
217
139
173 20 74 123
158
142 94 86
lab code
exp
and
ed u
nce
rtai
nty
total cyanide - 2
-15
-10
-5
0
5
10
224
217
139
101
207
123
158
157
142 86 181 94 20 74 173 89 177
lab code
ζ-S
core
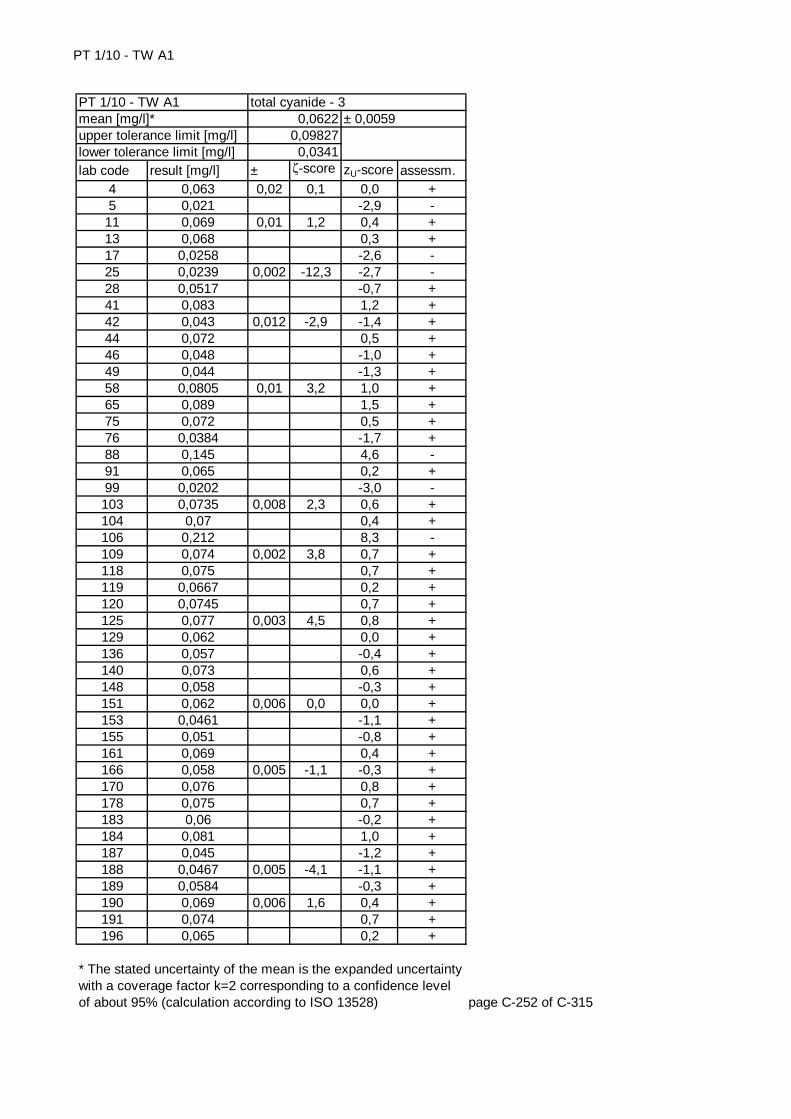
PT 1/10 - TW A1
lab code result [mg/l] ± ζ-score zU-score assessm.4 0,063 0,02 0,1 0,0 +5 0,021 -2,9 -
11 0,069 0,01 1,2 0,4 +13 0,068 0,3 +17 0,0258 -2,6 -25 0,0239 0,002 -12,3 -2,7 -28 0,0517 -0,7 +41 0,083 1,2 +42 0,043 0,012 -2,9 -1,4 +44 0,072 0,5 +46 0,048 -1,0 +49 0,044 -1,3 +58 0,0805 0,01 3,2 1,0 +65 0,089 1,5 +75 0,072 0,5 +76 0,0384 -1,7 +88 0,145 4,6 -91 0,065 0,2 +99 0,0202 -3,0 -103 0,0735 0,008 2,3 0,6 +104 0,07 0,4 +106 0,212 8,3 -109 0,074 0,002 3,8 0,7 +118 0,075 0,7 +119 0,0667 0,2 +120 0,0745 0,7 +125 0,077 0,003 4,5 0,8 +129 0,062 0,0 +136 0,057 -0,4 +140 0,073 0,6 +148 0,058 -0,3 +151 0,062 0,006 0,0 0,0 +153 0,0461 -1,1 +155 0,051 -0,8 +161 0,069 0,4 +166 0,058 0,005 -1,1 -0,3 +170 0,076 0,8 +178 0,075 0,7 +183 0,06 -0,2 +184 0,081 1,0 +187 0,045 -1,2 +188 0,0467 0,005 -4,1 -1,1 +189 0,0584 -0,3 +190 0,069 0,006 1,6 0,4 +191 0,074 0,7 +196 0,065 0,2 +
page C-252 of C-315
* The stated uncertainty of the mean is the expanded uncertainty with a coverage factor k=2 corresponding to a confidence level of about 95% (calculation according to ISO 13528)
total cyanide - 30,0622
0,098270,0341
± 0,0059PT 1/10 - TW A1mean [mg/l]*upper tolerance limit [mg/l]lower tolerance limit [mg/l]

PT 1/10 - TW A1
lab code result [mg/l] ± ζ-score zU-score assessm.203 0,069 0,011 1,1 0,4 +205 0,041 -1,5 +209 0,075 0,016 1,5 0,7 +213 0,119 3,1 -216 0,06 -0,2 +219 0,08 0,003 5,4 1,0 +226 0,022 0,007 -8,8 -2,9 -
page C-253 of C-315
* The stated uncertainty of the mean is the expanded uncertainty with a coverage factor k=2 corresponding to a confidence level of about 95% (calculation according to ISO 13528)
upper tolerance limit [mg/l] 0,09827lower tolerance limit [mg/l] 0,0341
PT 1/10 - TW A1 total cyanide - 3mean [mg/l]* 0,0622 ± 0,0059
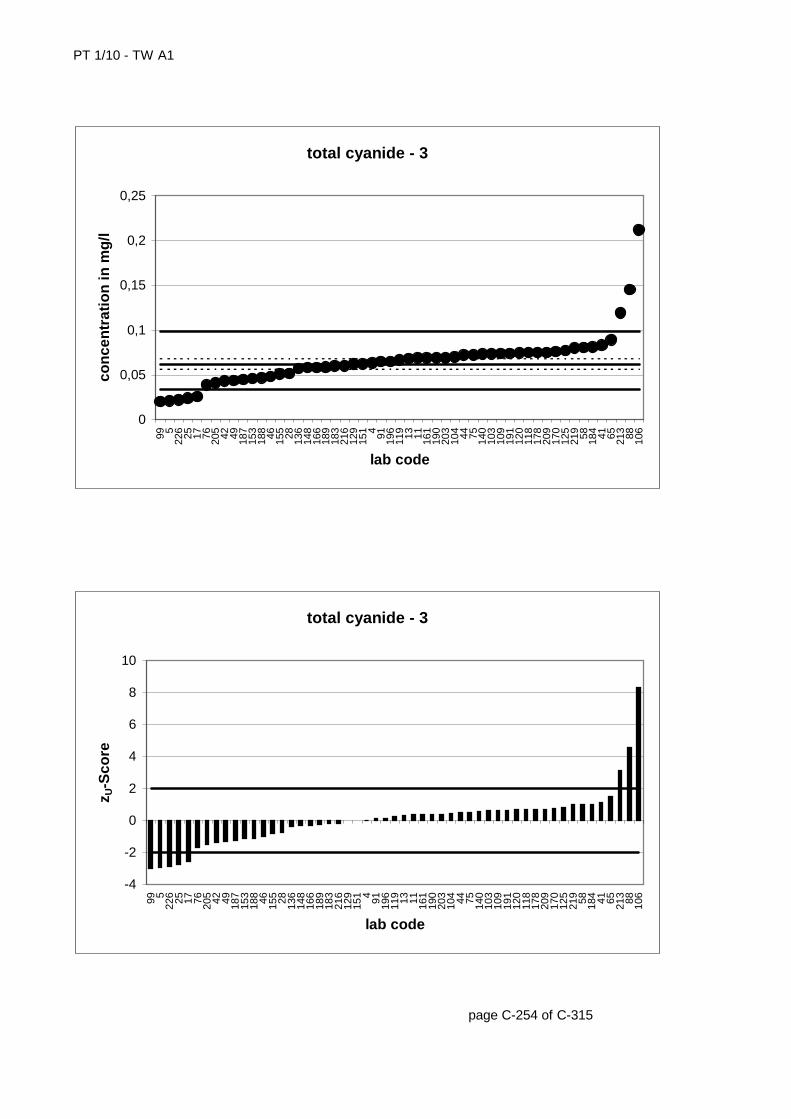
PT 1/10 - TW A1
page C-254 of C-315
total cyanide - 3
0
0,05
0,1
0,15
0,2
0,25
99 522
6 25 17 76 205 42 49 187
153
188 46 155 28 136
148
166
189
183
216
129
151 4 91 196
119 13 11 161
190
203
104 44 75 140
103
109
191
120
118
178
209
170
125
219 58 184 41 65 213 88 106
lab code
con
cen
trat
ion
in m
g/l
total cyanide - 3
-4
-2
0
2
4
6
8
10
99 522
6 25 17 76 205 42 49 187
153
188 46 155 28 136
148
166
189
183
216
129
151 4 91 196
119 13 11 161
190
203
104 44 75 140
103
109
191
120
118
178
209
170
125
219 58 184 41 65 213 88 106
lab code
z U-S
core
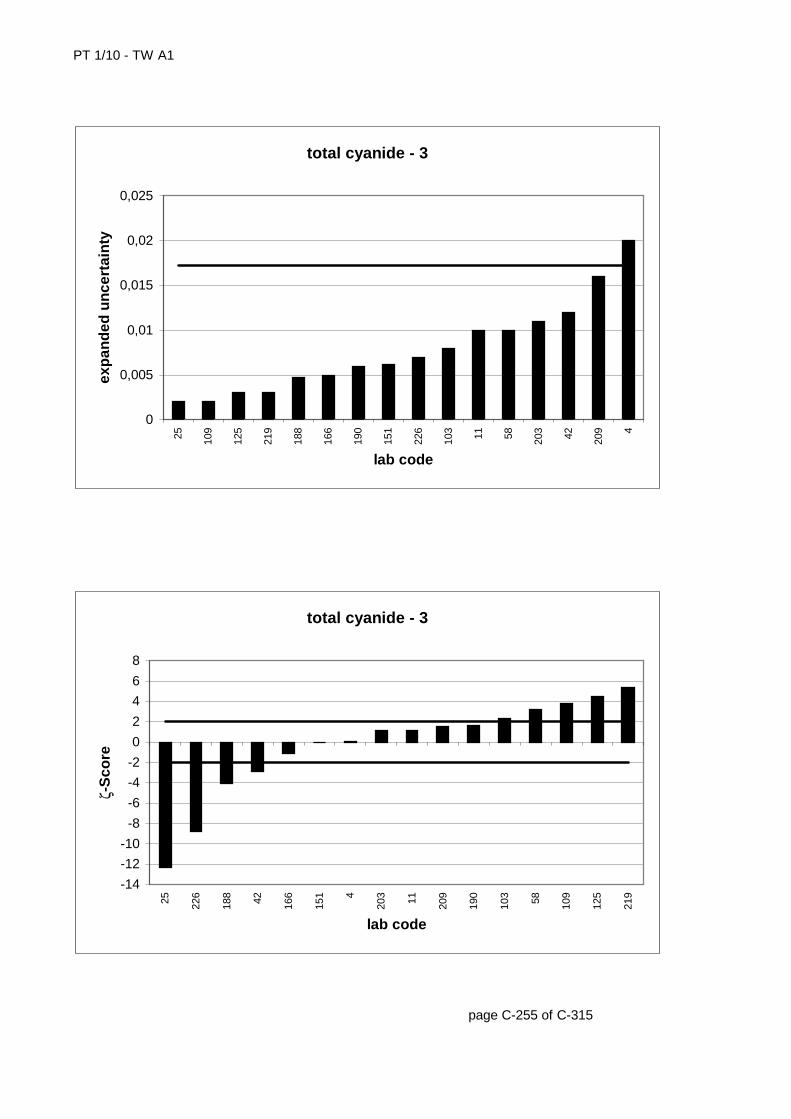
PT 1/10 - TW A1
page C-255 of C-315
total cyanide - 3
0
0,005
0,01
0,015
0,02
0,025
25 109
125
219
188
166
190
151
226
103 11 58 203 42 209 4
lab code
exp
and
ed u
nce
rtai
nty
total cyanide - 3
-14
-12
-10
-8
-6
-4
-2
0
2
4
6
8
25 226
188 42 166
151 4
203 11 209
190
103 58 109
125
219
lab code
ζ-S
core
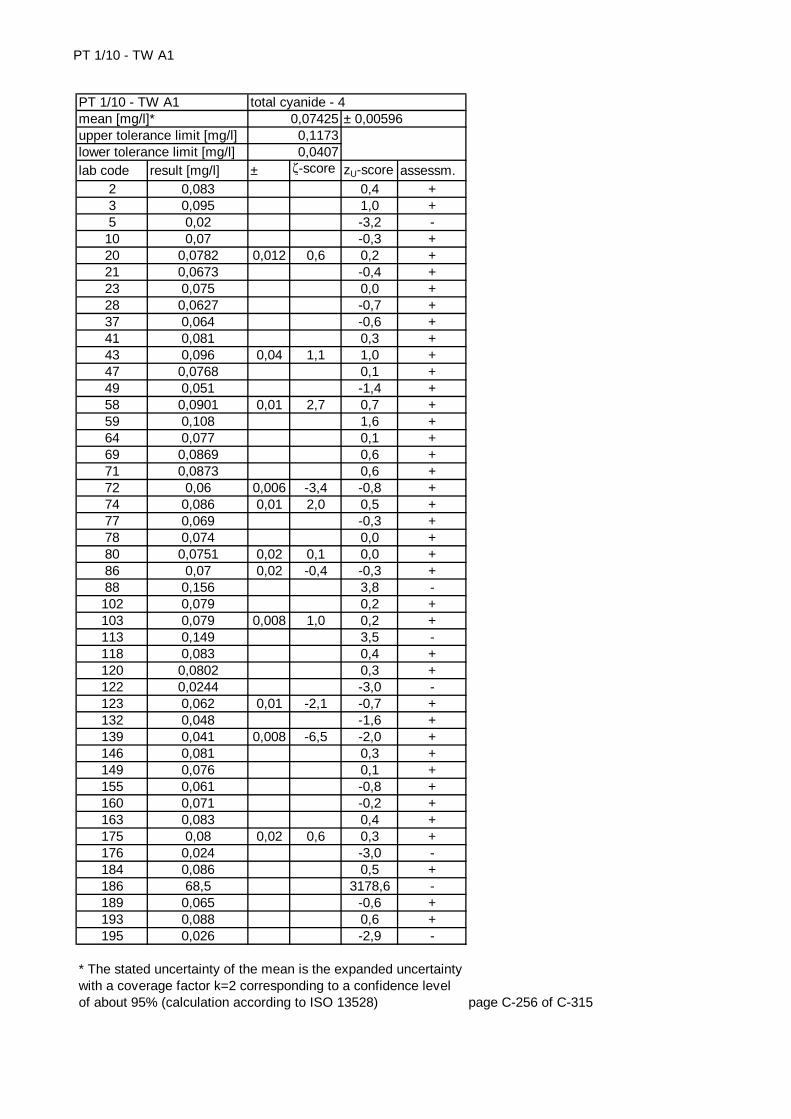
PT 1/10 - TW A1
lab code result [mg/l] ± ζ-score zU-score assessm.2 0,083 0,4 +3 0,095 1,0 +5 0,02 -3,2 -
10 0,07 -0,3 +20 0,0782 0,012 0,6 0,2 +21 0,0673 -0,4 +23 0,075 0,0 +28 0,0627 -0,7 +37 0,064 -0,6 +41 0,081 0,3 +43 0,096 0,04 1,1 1,0 +47 0,0768 0,1 +49 0,051 -1,4 +58 0,0901 0,01 2,7 0,7 +59 0,108 1,6 +64 0,077 0,1 +69 0,0869 0,6 +71 0,0873 0,6 +72 0,06 0,006 -3,4 -0,8 +74 0,086 0,01 2,0 0,5 +77 0,069 -0,3 +78 0,074 0,0 +80 0,0751 0,02 0,1 0,0 +86 0,07 0,02 -0,4 -0,3 +88 0,156 3,8 -102 0,079 0,2 +103 0,079 0,008 1,0 0,2 +113 0,149 3,5 -118 0,083 0,4 +120 0,0802 0,3 +122 0,0244 -3,0 -123 0,062 0,01 -2,1 -0,7 +132 0,048 -1,6 +139 0,041 0,008 -6,5 -2,0 +146 0,081 0,3 +149 0,076 0,1 +155 0,061 -0,8 +160 0,071 -0,2 +163 0,083 0,4 +175 0,08 0,02 0,6 0,3 +176 0,024 -3,0 -184 0,086 0,5 +186 68,5 3178,6 -189 0,065 -0,6 +193 0,088 0,6 +195 0,026 -2,9 -
page C-256 of C-315
* The stated uncertainty of the mean is the expanded uncertainty with a coverage factor k=2 corresponding to a confidence level of about 95% (calculation according to ISO 13528)
total cyanide - 40,074250,11730,0407
± 0,00596PT 1/10 - TW A1mean [mg/l]*upper tolerance limit [mg/l]lower tolerance limit [mg/l]
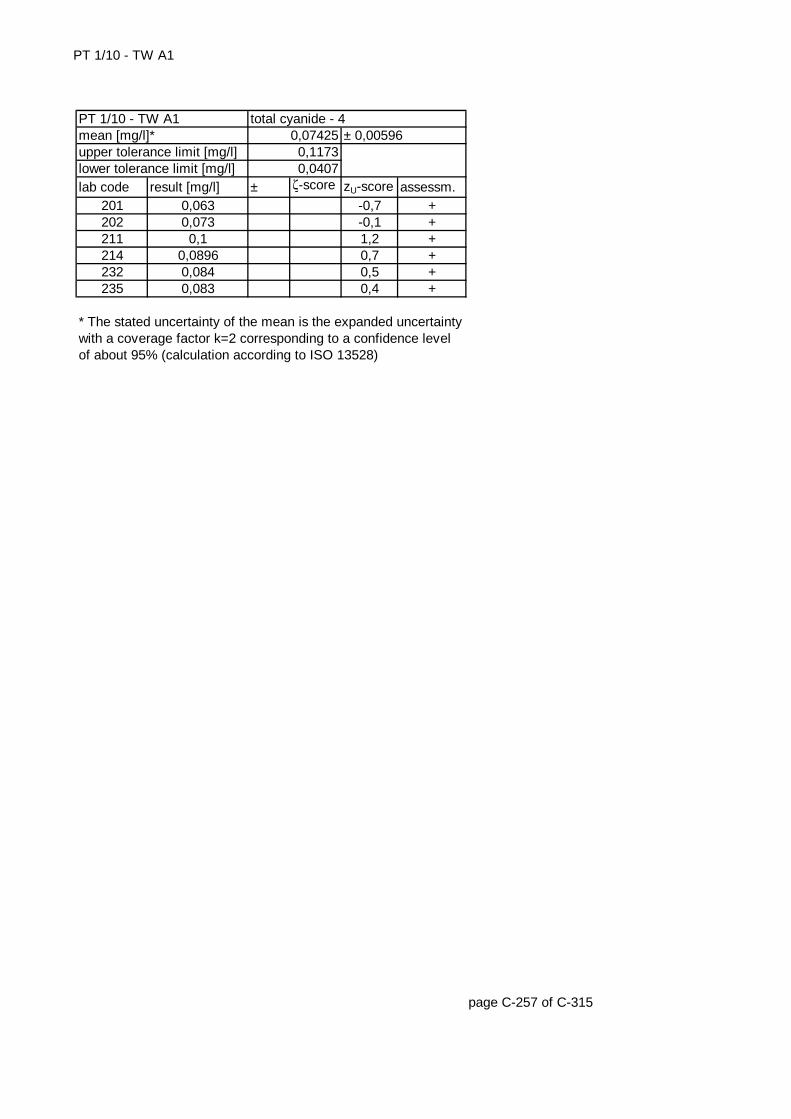
PT 1/10 - TW A1
lab code result [mg/l] ± ζ-score zU-score assessm.201 0,063 -0,7 +202 0,073 -0,1 +211 0,1 1,2 +214 0,0896 0,7 +232 0,084 0,5 +235 0,083 0,4 +
page C-257 of C-315
* The stated uncertainty of the mean is the expanded uncertainty with a coverage factor k=2 corresponding to a confidence level of about 95% (calculation according to ISO 13528)
upper tolerance limit [mg/l] 0,1173lower tolerance limit [mg/l] 0,0407
PT 1/10 - TW A1 total cyanide - 4mean [mg/l]* 0,07425 ± 0,00596
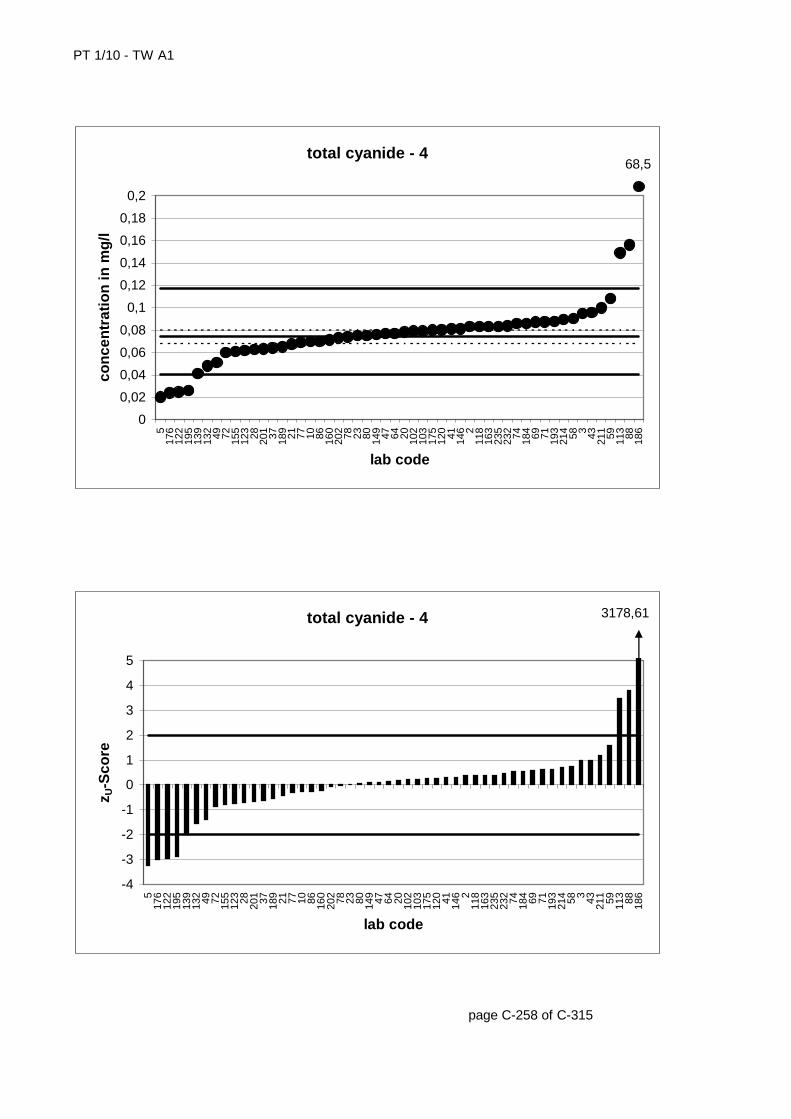
PT 1/10 - TW A1
page C-258 of C-315
total cyanide - 4
0
0,02
0,04
0,06
0,08
0,1
0,12
0,14
0,16
0,18
0,2
517
612
219
513
913
2 49 72 155
123 28 201 37 189 21 77 10 86 160
202 78 23 80 149 47 64 20 102
103
175
120 41 146 2
118
163
235
232 74 184 69 71 193
214 58 3 43 211 59 113 88 186
lab code
con
cen
trat
ion
in m
g/l
68,5
total cyanide - 4
-4
-3
-2
-1
0
1
2
3
4
5
517
612
219
513
913
2 49 72 155
123 28 201 37 189 21 77 10 86 160
202 78 23 80 149 47 64 20 102
103
175
120 41 146 2
118
163
235
232 74 184 69 71 193
214 58 3 43 211 59 113 88 186
lab code
z U-S
core
3178,61
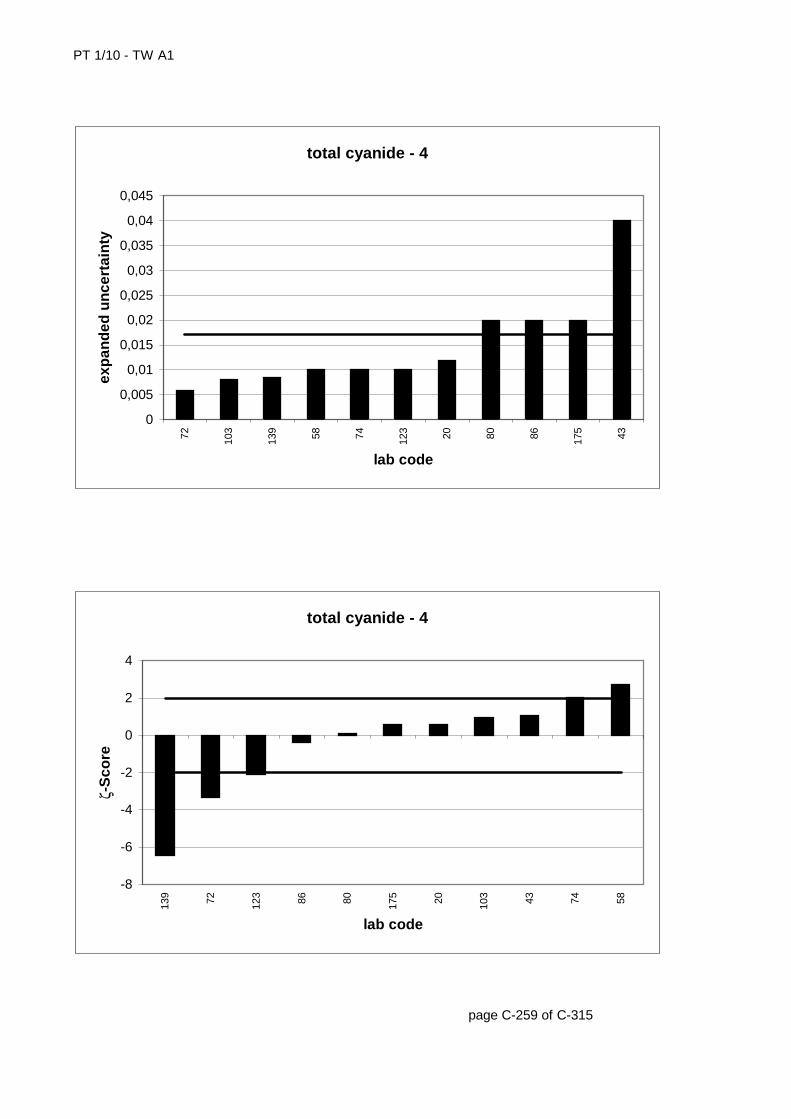
PT 1/10 - TW A1
page C-259 of C-315
total cyanide - 4
0
0,005
0,01
0,015
0,02
0,025
0,03
0,035
0,04
0,04572 103
139 58 74 123 20 80 86 175 43
lab code
exp
and
ed u
nce
rtai
nty
total cyanide - 4
-8
-6
-4
-2
0
2
4
139 72 123 86 80 175 20 103 43 74 58
lab code
ζ-S
core
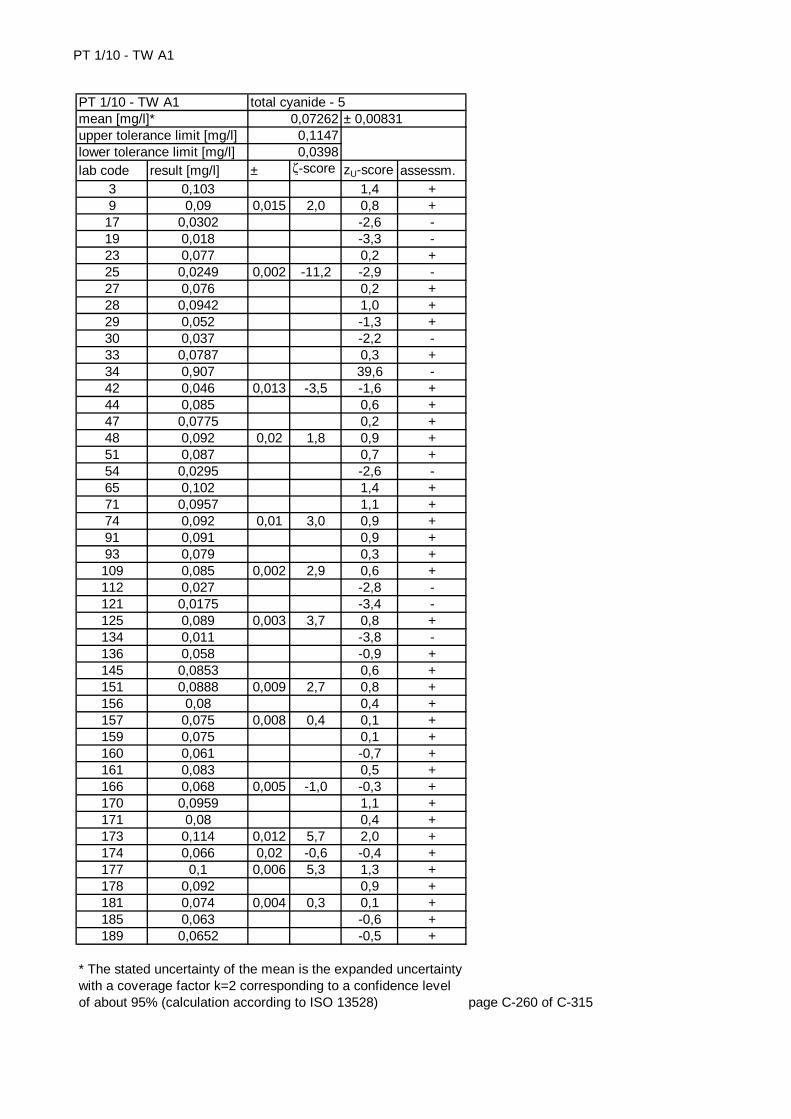
PT 1/10 - TW A1
lab code result [mg/l] ± ζ-score zU-score assessm.3 0,103 1,4 +9 0,09 0,015 2,0 0,8 +
17 0,0302 -2,6 -19 0,018 -3,3 -23 0,077 0,2 +25 0,0249 0,002 -11,2 -2,9 -27 0,076 0,2 +28 0,0942 1,0 +29 0,052 -1,3 +30 0,037 -2,2 -33 0,0787 0,3 +34 0,907 39,6 -42 0,046 0,013 -3,5 -1,6 +44 0,085 0,6 +47 0,0775 0,2 +48 0,092 0,02 1,8 0,9 +51 0,087 0,7 +54 0,0295 -2,6 -65 0,102 1,4 +71 0,0957 1,1 +74 0,092 0,01 3,0 0,9 +91 0,091 0,9 +93 0,079 0,3 +109 0,085 0,002 2,9 0,6 +112 0,027 -2,8 -121 0,0175 -3,4 -125 0,089 0,003 3,7 0,8 +134 0,011 -3,8 -136 0,058 -0,9 +145 0,0853 0,6 +151 0,0888 0,009 2,7 0,8 +156 0,08 0,4 +157 0,075 0,008 0,4 0,1 +159 0,075 0,1 +160 0,061 -0,7 +161 0,083 0,5 +166 0,068 0,005 -1,0 -0,3 +170 0,0959 1,1 +171 0,08 0,4 +173 0,114 0,012 5,7 2,0 +174 0,066 0,02 -0,6 -0,4 +177 0,1 0,006 5,3 1,3 +178 0,092 0,9 +181 0,074 0,004 0,3 0,1 +185 0,063 -0,6 +189 0,0652 -0,5 +
page C-260 of C-315
* The stated uncertainty of the mean is the expanded uncertainty with a coverage factor k=2 corresponding to a confidence level of about 95% (calculation according to ISO 13528)
total cyanide - 50,072620,11470,0398
± 0,00831PT 1/10 - TW A1mean [mg/l]*upper tolerance limit [mg/l]lower tolerance limit [mg/l]
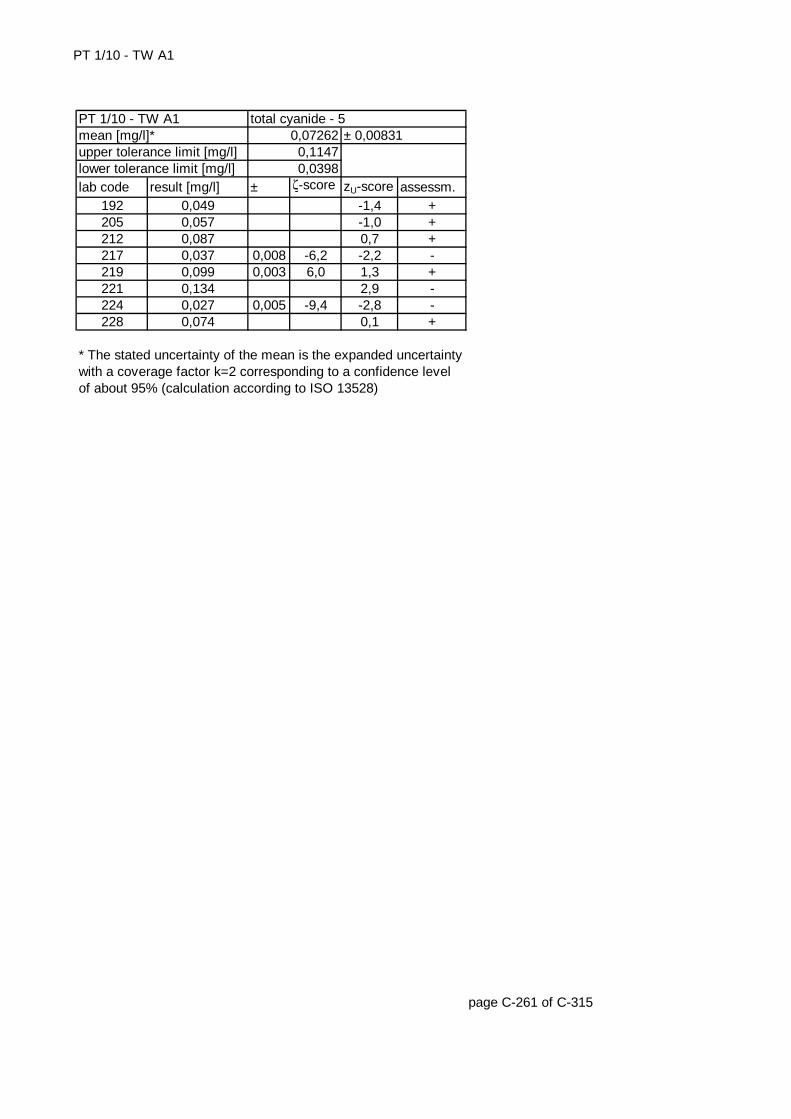
PT 1/10 - TW A1
lab code result [mg/l] ± ζ-score zU-score assessm.192 0,049 -1,4 +205 0,057 -1,0 +212 0,087 0,7 +217 0,037 0,008 -6,2 -2,2 -219 0,099 0,003 6,0 1,3 +221 0,134 2,9 -224 0,027 0,005 -9,4 -2,8 -228 0,074 0,1 +
page C-261 of C-315
* The stated uncertainty of the mean is the expanded uncertainty with a coverage factor k=2 corresponding to a confidence level of about 95% (calculation according to ISO 13528)
upper tolerance limit [mg/l] 0,1147lower tolerance limit [mg/l] 0,0398
PT 1/10 - TW A1 total cyanide - 5mean [mg/l]* 0,07262 ± 0,00831
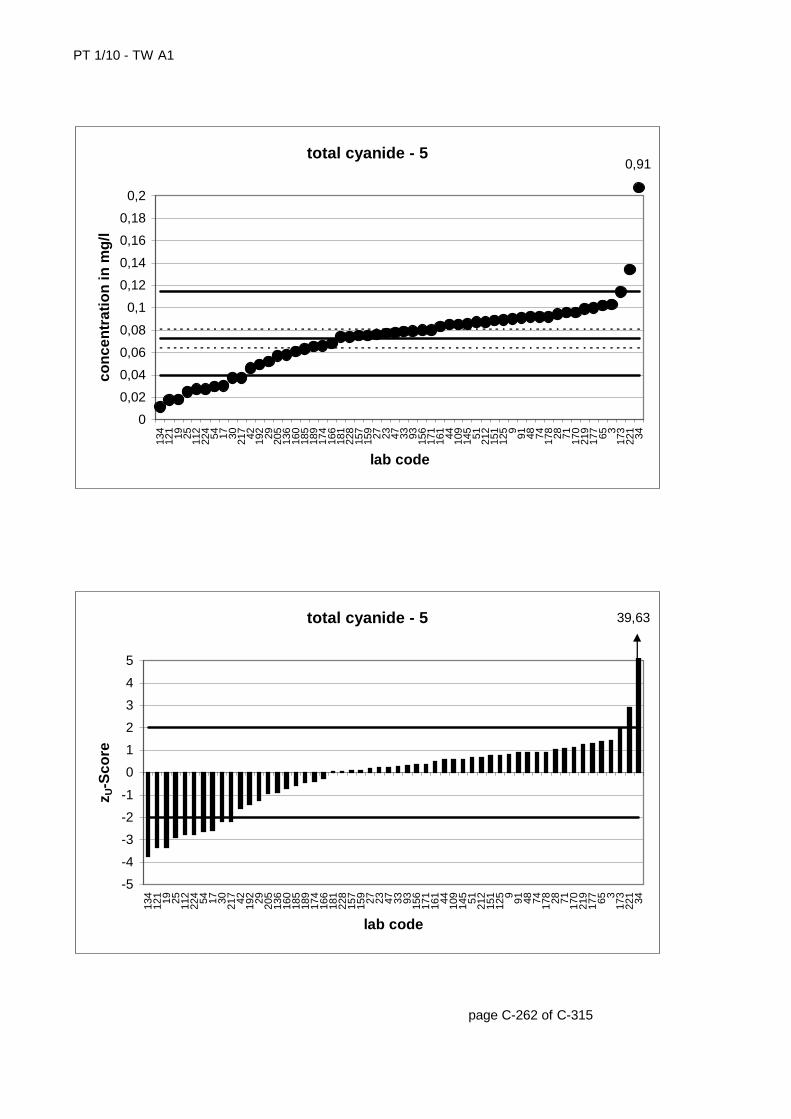
PT 1/10 - TW A1
page C-262 of C-315
total cyanide - 5
0
0,02
0,04
0,06
0,08
0,1
0,12
0,14
0,16
0,18
0,2
134
121 19 25 112
224 54 17 30 217 42 192 29 205
136
160
185
189
174
166
181
228
157
159 27 23 47 33 93 156
171
161 44 109
145 51 212
151
125 9 91 48 74 178 28 71 170
219
177 65 3
173
221 34
lab code
con
cen
trat
ion
in m
g/l
0,91
total cyanide - 5
-5
-4
-3
-2
-1
0
1
2
3
4
5
134
121 19 25 112
224 54 17 30 217 42 192 29 205
136
160
185
189
174
166
181
228
157
159 27 23 47 33 93 156
171
161 44 109
145 51 212
151
125 9 91 48 74 178 28 71 170
219
177 65 3
173
221 34
lab code
z U-S
core
39,63
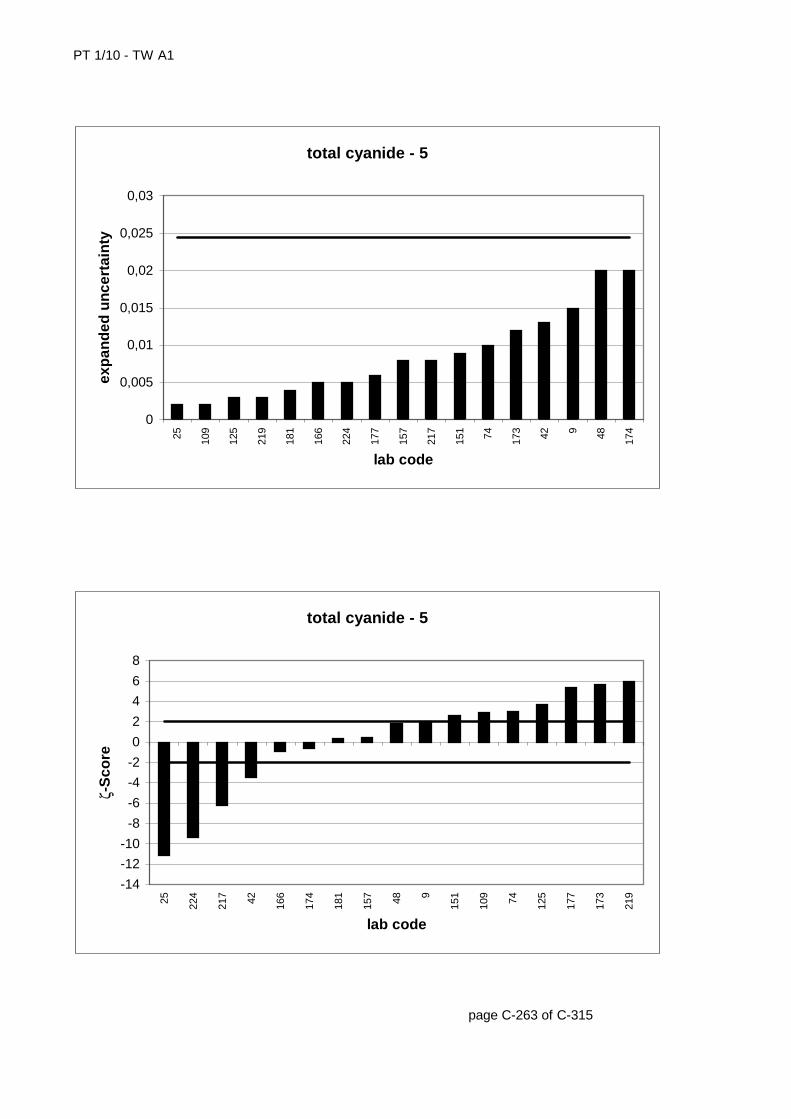
PT 1/10 - TW A1
page C-263 of C-315
total cyanide - 5
0
0,005
0,01
0,015
0,02
0,025
0,03
25 109
125
219
181
166
224
177
157
217
151 74 173 42 9 48 174
lab code
exp
and
ed u
nce
rtai
nty
total cyanide - 5
-14
-12
-10
-8
-6
-4
-2
0
2
4
6
8
25 224
217 42 166
174
181
157 48 9
151
109 74 125
177
173
219
lab code
ζ-S
core
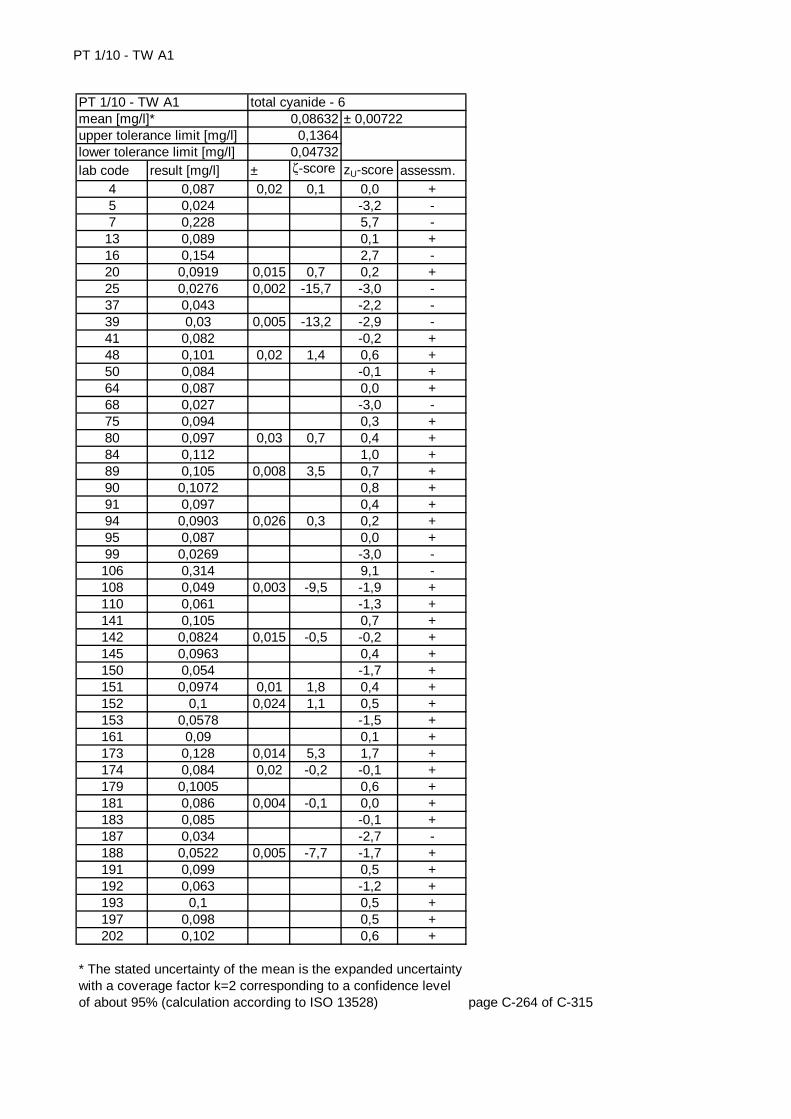
PT 1/10 - TW A1
lab code result [mg/l] ± ζ-score zU-score assessm.4 0,087 0,02 0,1 0,0 +5 0,024 -3,2 -7 0,228 5,7 -
13 0,089 0,1 +16 0,154 2,7 -20 0,0919 0,015 0,7 0,2 +25 0,0276 0,002 -15,7 -3,0 -37 0,043 -2,2 -39 0,03 0,005 -13,2 -2,9 -41 0,082 -0,2 +48 0,101 0,02 1,4 0,6 +50 0,084 -0,1 +64 0,087 0,0 +68 0,027 -3,0 -75 0,094 0,3 +80 0,097 0,03 0,7 0,4 +84 0,112 1,0 +89 0,105 0,008 3,5 0,7 +90 0,1072 0,8 +91 0,097 0,4 +94 0,0903 0,026 0,3 0,2 +95 0,087 0,0 +99 0,0269 -3,0 -106 0,314 9,1 -108 0,049 0,003 -9,5 -1,9 +110 0,061 -1,3 +141 0,105 0,7 +142 0,0824 0,015 -0,5 -0,2 +145 0,0963 0,4 +150 0,054 -1,7 +151 0,0974 0,01 1,8 0,4 +152 0,1 0,024 1,1 0,5 +153 0,0578 -1,5 +161 0,09 0,1 +173 0,128 0,014 5,3 1,7 +174 0,084 0,02 -0,2 -0,1 +179 0,1005 0,6 +181 0,086 0,004 -0,1 0,0 +183 0,085 -0,1 +187 0,034 -2,7 -188 0,0522 0,005 -7,7 -1,7 +191 0,099 0,5 +192 0,063 -1,2 +193 0,1 0,5 +197 0,098 0,5 +202 0,102 0,6 +
page C-264 of C-315
* The stated uncertainty of the mean is the expanded uncertainty with a coverage factor k=2 corresponding to a confidence level of about 95% (calculation according to ISO 13528)
total cyanide - 60,086320,1364
0,04732
± 0,00722PT 1/10 - TW A1mean [mg/l]*upper tolerance limit [mg/l]lower tolerance limit [mg/l]
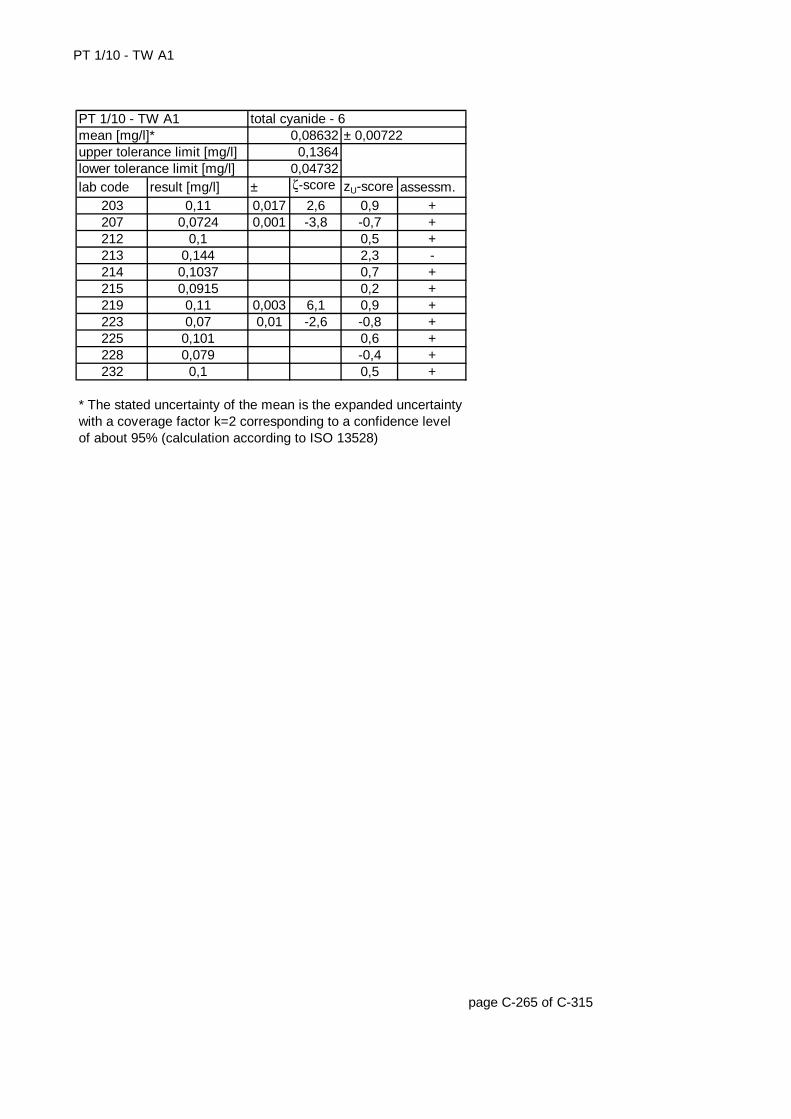
PT 1/10 - TW A1
lab code result [mg/l] ± ζ-score zU-score assessm.203 0,11 0,017 2,6 0,9 +207 0,0724 0,001 -3,8 -0,7 +212 0,1 0,5 +213 0,144 2,3 -214 0,1037 0,7 +215 0,0915 0,2 +219 0,11 0,003 6,1 0,9 +223 0,07 0,01 -2,6 -0,8 +225 0,101 0,6 +228 0,079 -0,4 +232 0,1 0,5 +
page C-265 of C-315
* The stated uncertainty of the mean is the expanded uncertainty with a coverage factor k=2 corresponding to a confidence level of about 95% (calculation according to ISO 13528)
upper tolerance limit [mg/l] 0,1364lower tolerance limit [mg/l] 0,04732
PT 1/10 - TW A1 total cyanide - 6mean [mg/l]* 0,08632 ± 0,00722
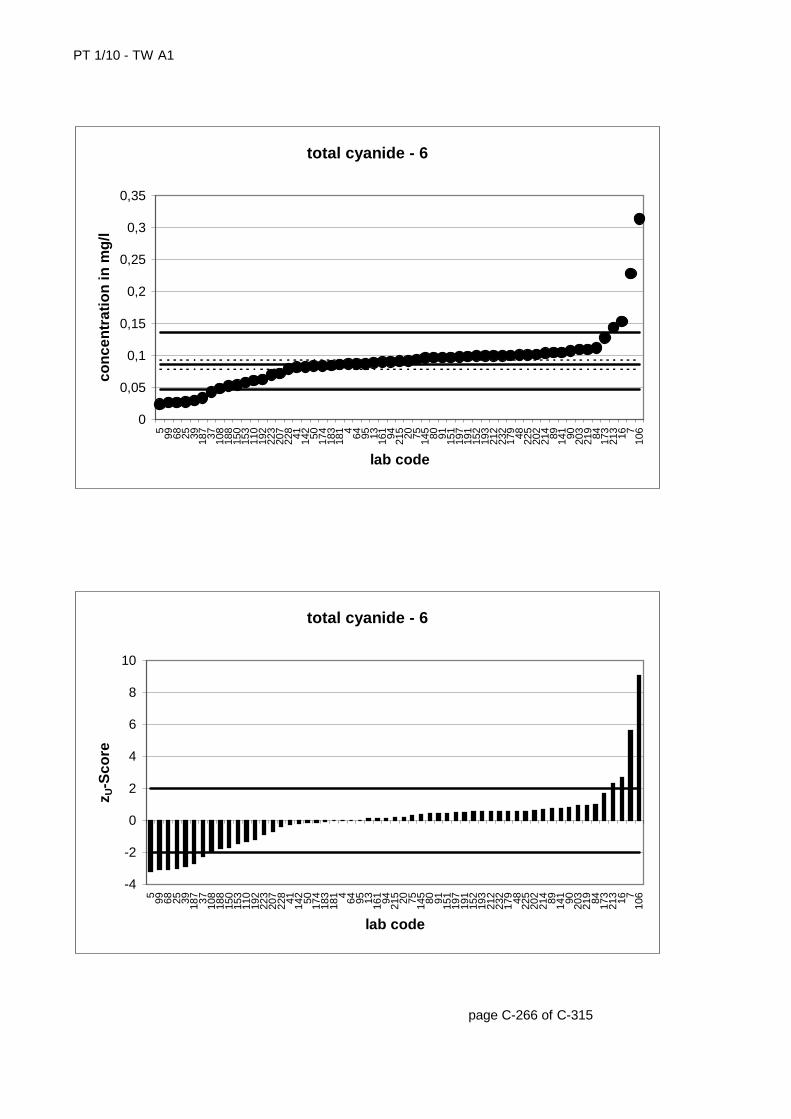
PT 1/10 - TW A1
page C-266 of C-315
total cyanide - 6
0
0,05
0,1
0,15
0,2
0,25
0,3
0,35
5 99 68 25 39 187 37 108
188
150
153
110
192
223
207
228 41 142 50 174
183
181 4 64 95 13 161 94 215 20 75 145 80 91 151
197
191
152
193
212
232
179 48 225
202
214 89 141 90 203
219 84 173
213 16 7
106
lab code
con
cen
trat
ion
in m
g/l
total cyanide - 6
-4
-2
0
2
4
6
8
10
5 99 68 25 39 187 37 108
188
150
153
110
192
223
207
228 41 142 50 174
183
181 4 64 95 13 161 94 215 20 75 145 80 91 151
197
191
152
193
212
232
179 48 225
202
214 89 141 90 203
219 84 173
213 16 7
106
lab code
z U-S
core
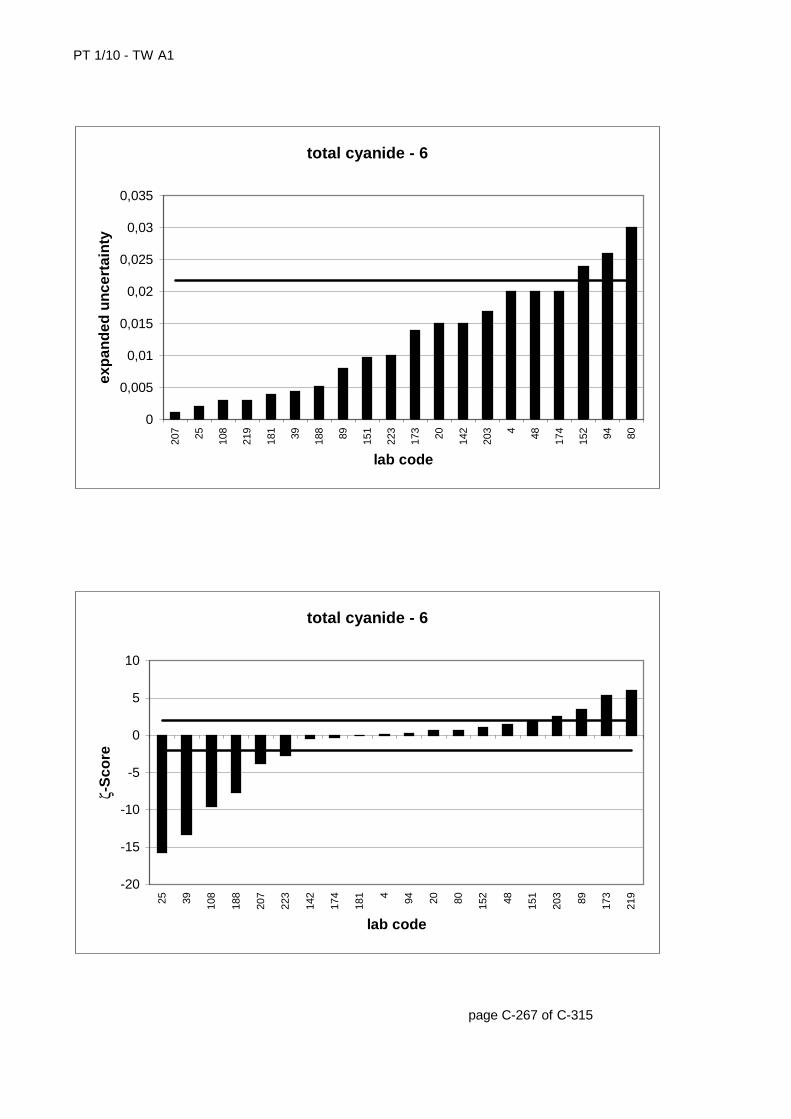
PT 1/10 - TW A1
page C-267 of C-315
total cyanide - 6
0
0,005
0,01
0,015
0,02
0,025
0,03
0,035
207 25 108
219
181 39 188 89 151
223
173 20 142
203 4 48 174
152 94 80
lab code
exp
and
ed u
nce
rtai
nty
total cyanide - 6
-20
-15
-10
-5
0
5
10
25 39 108
188
207
223
142
174
181 4 94 20 80 152 48 151
203 89 173
219
lab code
ζ-S
core
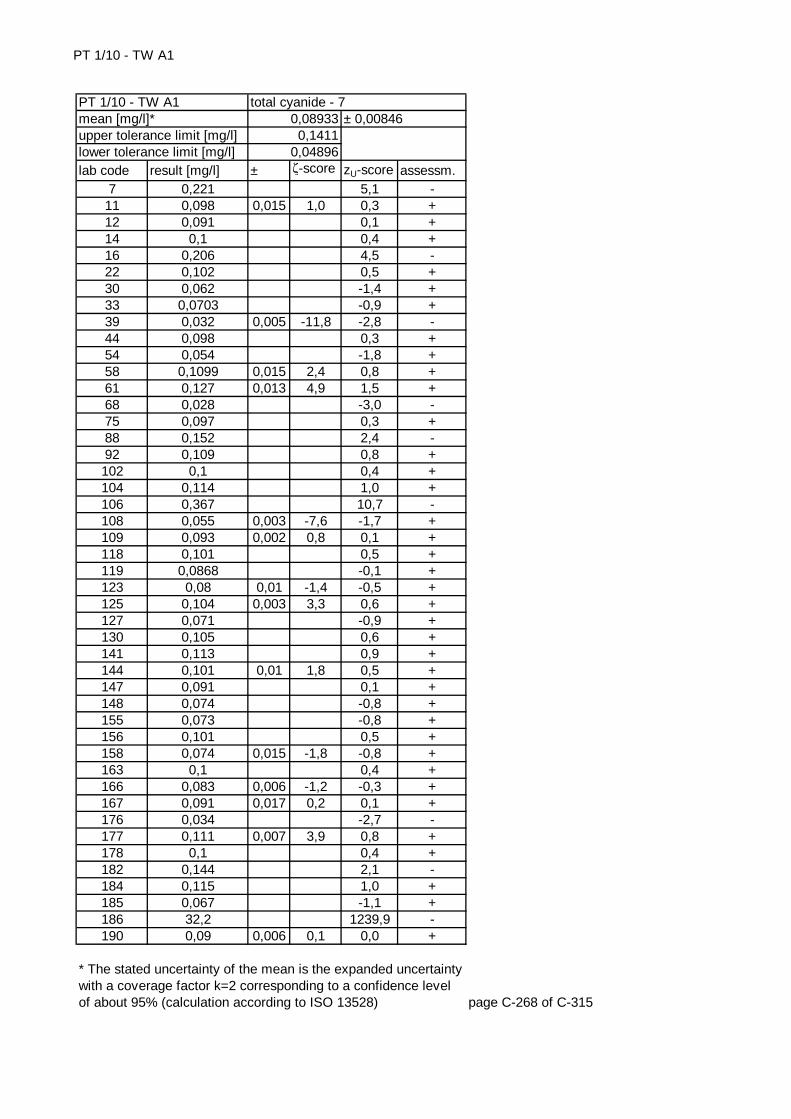
PT 1/10 - TW A1
lab code result [mg/l] ± ζ-score zU-score assessm.7 0,221 5,1 -
11 0,098 0,015 1,0 0,3 +12 0,091 0,1 +14 0,1 0,4 +16 0,206 4,5 -22 0,102 0,5 +30 0,062 -1,4 +33 0,0703 -0,9 +39 0,032 0,005 -11,8 -2,8 -44 0,098 0,3 +54 0,054 -1,8 +58 0,1099 0,015 2,4 0,8 +61 0,127 0,013 4,9 1,5 +68 0,028 -3,0 -75 0,097 0,3 +88 0,152 2,4 -92 0,109 0,8 +102 0,1 0,4 +104 0,114 1,0 +106 0,367 10,7 -108 0,055 0,003 -7,6 -1,7 +109 0,093 0,002 0,8 0,1 +118 0,101 0,5 +119 0,0868 -0,1 +123 0,08 0,01 -1,4 -0,5 +125 0,104 0,003 3,3 0,6 +127 0,071 -0,9 +130 0,105 0,6 +141 0,113 0,9 +144 0,101 0,01 1,8 0,5 +147 0,091 0,1 +148 0,074 -0,8 +155 0,073 -0,8 +156 0,101 0,5 +158 0,074 0,015 -1,8 -0,8 +163 0,1 0,4 +166 0,083 0,006 -1,2 -0,3 +167 0,091 0,017 0,2 0,1 +176 0,034 -2,7 -177 0,111 0,007 3,9 0,8 +178 0,1 0,4 +182 0,144 2,1 -184 0,115 1,0 +185 0,067 -1,1 +186 32,2 1239,9 -190 0,09 0,006 0,1 0,0 +
page C-268 of C-315
* The stated uncertainty of the mean is the expanded uncertainty with a coverage factor k=2 corresponding to a confidence level of about 95% (calculation according to ISO 13528)
total cyanide - 70,089330,1411
0,04896
± 0,00846PT 1/10 - TW A1mean [mg/l]*upper tolerance limit [mg/l]lower tolerance limit [mg/l]
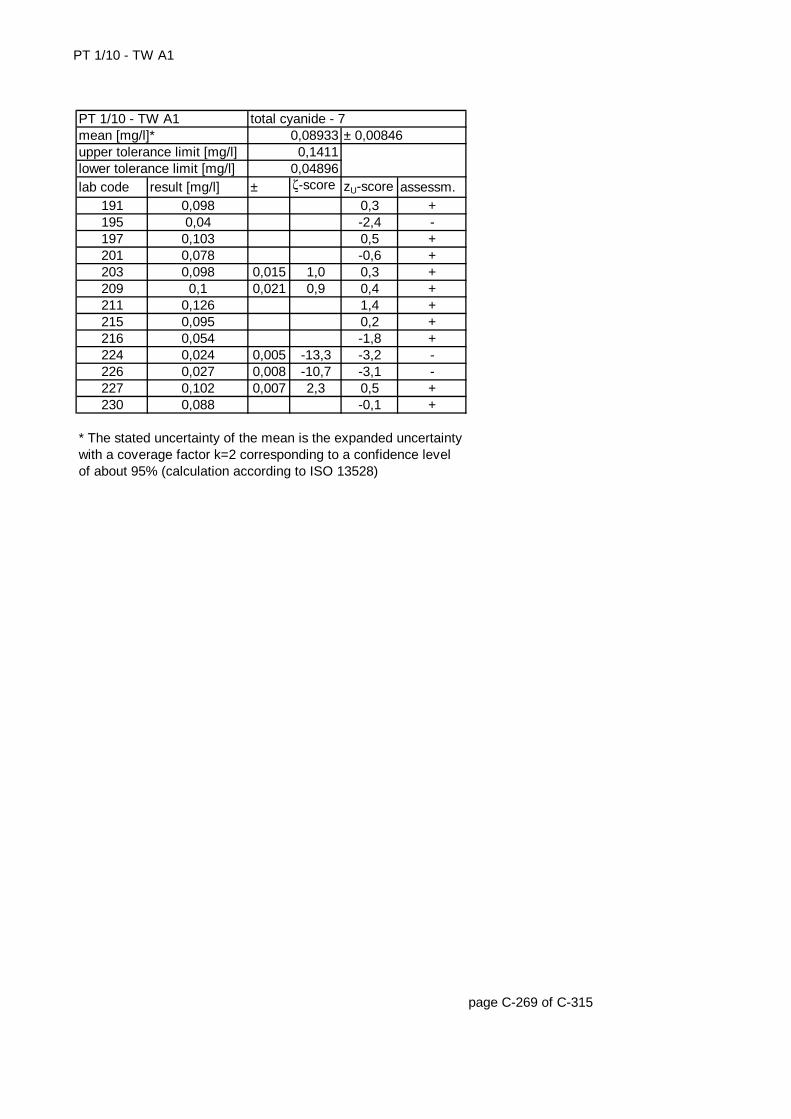
PT 1/10 - TW A1
lab code result [mg/l] ± ζ-score zU-score assessm.191 0,098 0,3 +195 0,04 -2,4 -197 0,103 0,5 +201 0,078 -0,6 +203 0,098 0,015 1,0 0,3 +209 0,1 0,021 0,9 0,4 +211 0,126 1,4 +215 0,095 0,2 +216 0,054 -1,8 +224 0,024 0,005 -13,3 -3,2 -226 0,027 0,008 -10,7 -3,1 -227 0,102 0,007 2,3 0,5 +230 0,088 -0,1 +
page C-269 of C-315
* The stated uncertainty of the mean is the expanded uncertainty with a coverage factor k=2 corresponding to a confidence level of about 95% (calculation according to ISO 13528)
upper tolerance limit [mg/l] 0,1411lower tolerance limit [mg/l] 0,04896
PT 1/10 - TW A1 total cyanide - 7mean [mg/l]* 0,08933 ± 0,00846
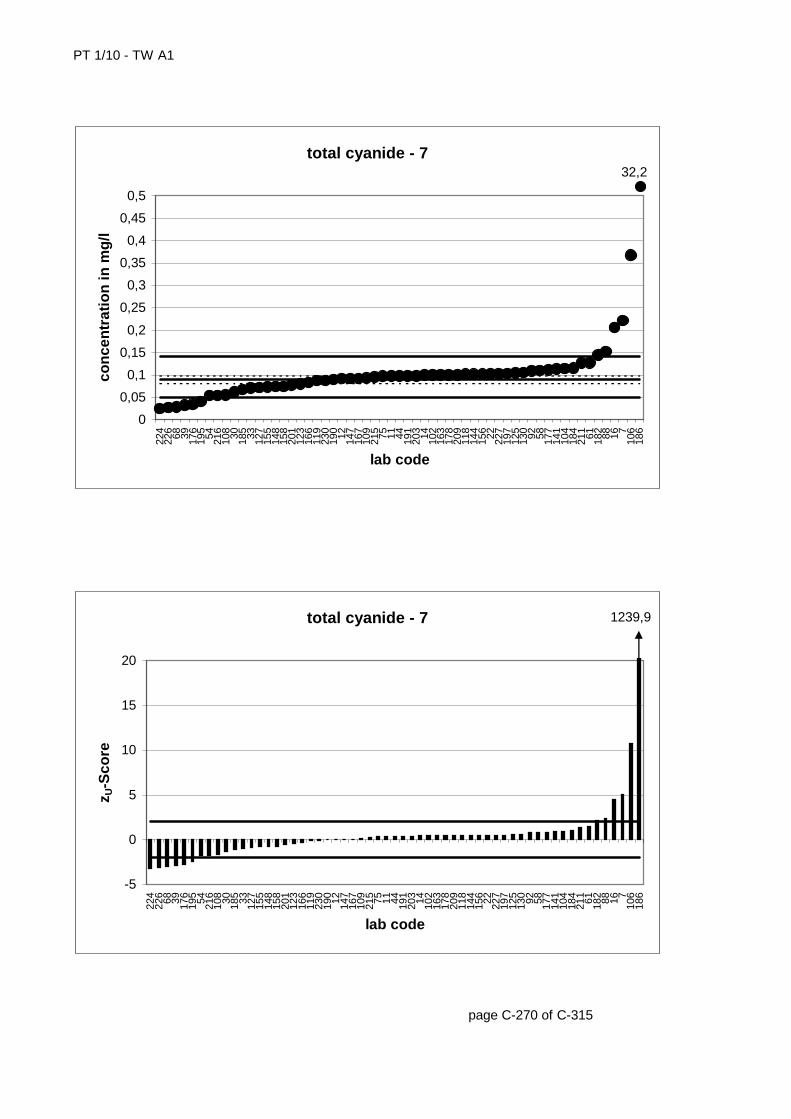
PT 1/10 - TW A1
page C-270 of C-315
total cyanide - 7
0
0,05
0,1
0,15
0,2
0,25
0,3
0,35
0,4
0,45
0,5
224
226 68 39 176
195 54 216
108 30 185 33 127
155
148
158
201
123
166
119
230
190 12 147
167
109
215 75 11 44 191
203 14 102
163
178
209
118
144
156 22 227
197
125
130 92 58 177
141
104
184
211 61 182 88 16 7
106
186
lab code
con
cen
trat
ion
in m
g/l
32,2
total cyanide - 7
-5
0
5
10
15
20
224
226 68 39 176
195 54 216
108 30 185 33 127
155
148
158
201
123
166
119
230
190 12 147
167
109
215 75 11 44 191
203 14 102
163
178
209
118
144
156 22 227
197
125
130 92 58 177
141
104
184
211 61 182 88 16 7
106
186
lab code
z U-S
core
1239,9
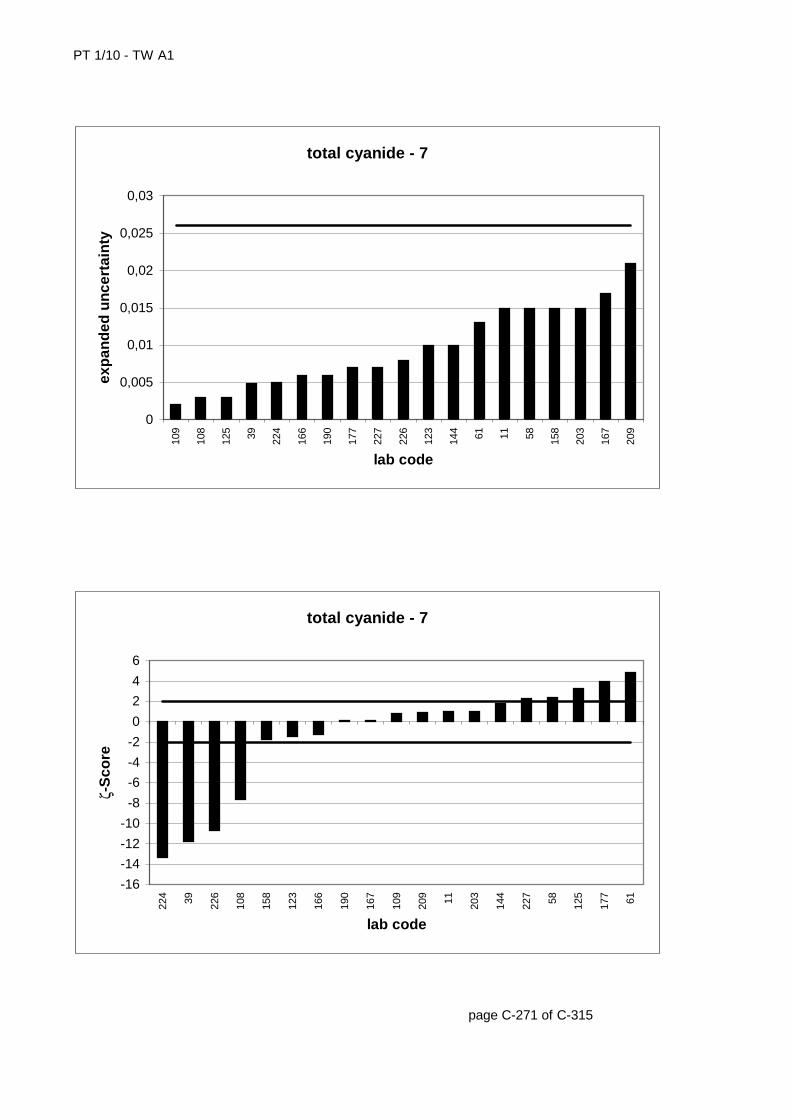
PT 1/10 - TW A1
page C-271 of C-315
total cyanide - 7
0
0,005
0,01
0,015
0,02
0,025
0,03
109
108
125 39 224
166
190
177
227
226
123
144 61 11 58 158
203
167
209
lab code
exp
and
ed u
nce
rtai
nty
total cyanide - 7
-16
-14
-12
-10
-8
-6
-4
-2
0
2
4
6
224 39 226
108
158
123
166
190
167
109
209 11 203
144
227 58 125
177 61
lab code
ζ-S
core
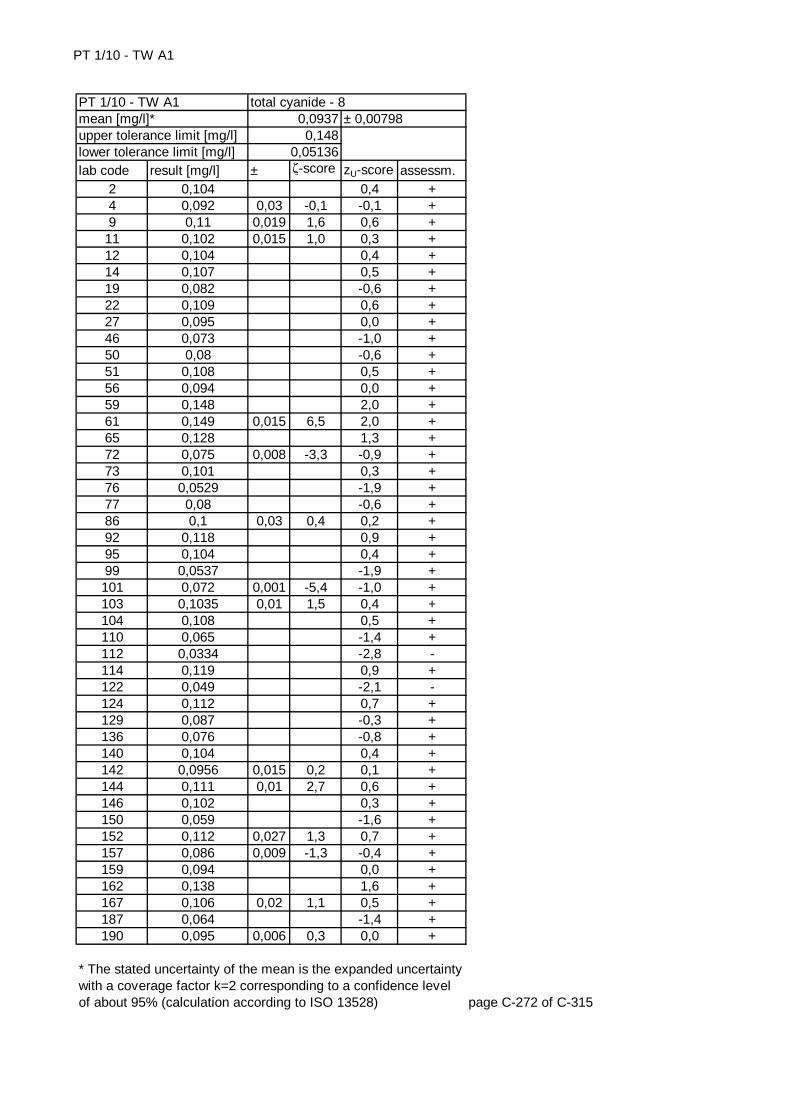
PT 1/10 - TW A1
lab code result [mg/l] ± ζ-score zU-score assessm.2 0,104 0,4 +4 0,092 0,03 -0,1 -0,1 +9 0,11 0,019 1,6 0,6 +
11 0,102 0,015 1,0 0,3 +12 0,104 0,4 +14 0,107 0,5 +19 0,082 -0,6 +22 0,109 0,6 +27 0,095 0,0 +46 0,073 -1,0 +50 0,08 -0,6 +51 0,108 0,5 +56 0,094 0,0 +59 0,148 2,0 +61 0,149 0,015 6,5 2,0 +65 0,128 1,3 +72 0,075 0,008 -3,3 -0,9 +73 0,101 0,3 +76 0,0529 -1,9 +77 0,08 -0,6 +86 0,1 0,03 0,4 0,2 +92 0,118 0,9 +95 0,104 0,4 +99 0,0537 -1,9 +101 0,072 0,001 -5,4 -1,0 +103 0,1035 0,01 1,5 0,4 +104 0,108 0,5 +110 0,065 -1,4 +112 0,0334 -2,8 -114 0,119 0,9 +122 0,049 -2,1 -124 0,112 0,7 +129 0,087 -0,3 +136 0,076 -0,8 +140 0,104 0,4 +142 0,0956 0,015 0,2 0,1 +144 0,111 0,01 2,7 0,6 +146 0,102 0,3 +150 0,059 -1,6 +152 0,112 0,027 1,3 0,7 +157 0,086 0,009 -1,3 -0,4 +159 0,094 0,0 +162 0,138 1,6 +167 0,106 0,02 1,1 0,5 +187 0,064 -1,4 +190 0,095 0,006 0,3 0,0 +
page C-272 of C-315
* The stated uncertainty of the mean is the expanded uncertainty with a coverage factor k=2 corresponding to a confidence level of about 95% (calculation according to ISO 13528)
total cyanide - 80,09370,148
0,05136
± 0,00798PT 1/10 - TW A1mean [mg/l]*upper tolerance limit [mg/l]lower tolerance limit [mg/l]

PT 1/10 - TW A1
lab code result [mg/l] ± ζ-score zU-score assessm.196 0,123 1,1 +205 0,061 -1,5 +207 0,0755 0,003 -4,3 -0,9 +209 0,107 0,022 1,1 0,5 +210 0,09 -0,2 +217 0,046 0,008 -8,4 -2,3 -225 0,113 0,7 +226 0,033 0,01 -9,5 -2,9 -230 0,208 4,2 -235 0,111 0,6 +
page C-273 of C-315
* The stated uncertainty of the mean is the expanded uncertainty with a coverage factor k=2 corresponding to a confidence level of about 95% (calculation according to ISO 13528)
upper tolerance limit [mg/l] 0,148lower tolerance limit [mg/l] 0,05136
PT 1/10 - TW A1 total cyanide - 8mean [mg/l]* 0,0937 ± 0,00798
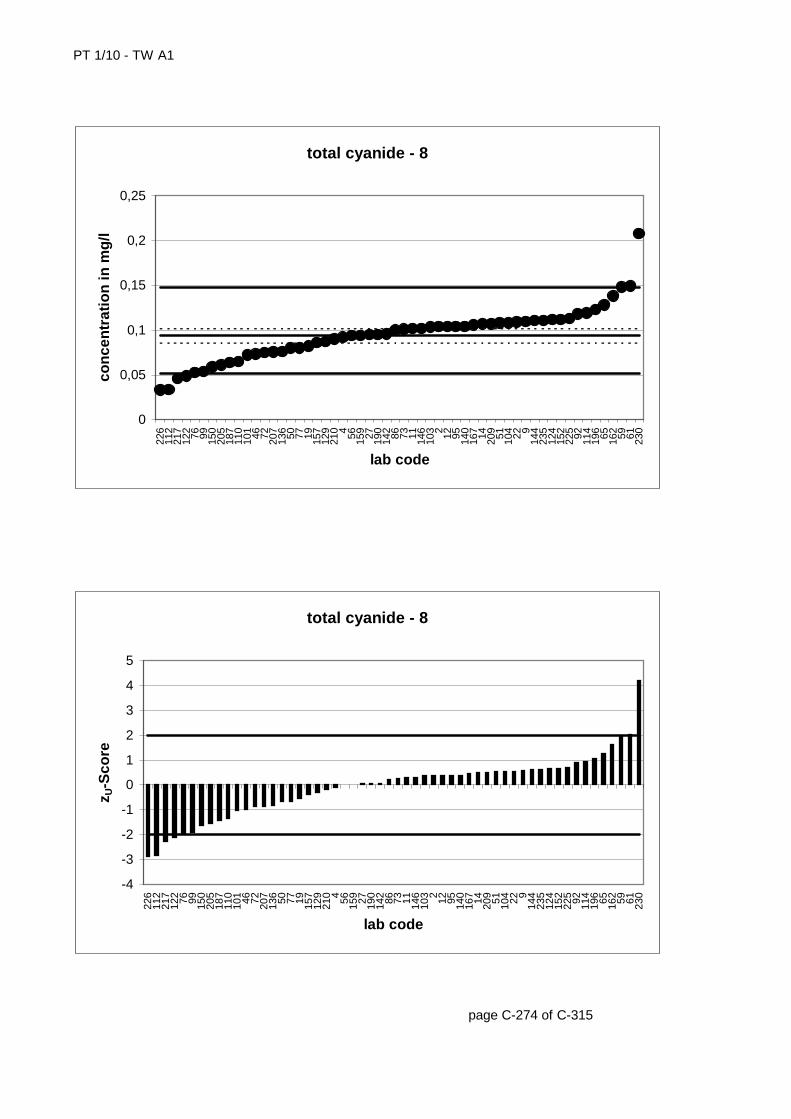
PT 1/10 - TW A1
page C-274 of C-315
total cyanide - 8
0
0,05
0,1
0,15
0,2
0,25
226
112
217
122 76 99 150
205
187
110
101 46 72 207
136 50 77 19 157
129
210 4 56 159 27 190
142 86 73 11 146
103 2 12 95 140
167 14 209 51 104 22 9
144
235
124
152
225 92 114
196 65 162 59 61 230
lab code
con
cen
trat
ion
in m
g/l
total cyanide - 8
-4
-3
-2
-1
0
1
2
3
4
5
226
112
217
122 76 99 150
205
187
110
101 46 72 207
136 50 77 19 157
129
210 4 56 159 27 190
142 86 73 11 146
103 2 12 95 140
167 14 209 51 104 22 9
144
235
124
152
225 92 114
196 65 162 59 61 230
lab code
z U-S
core
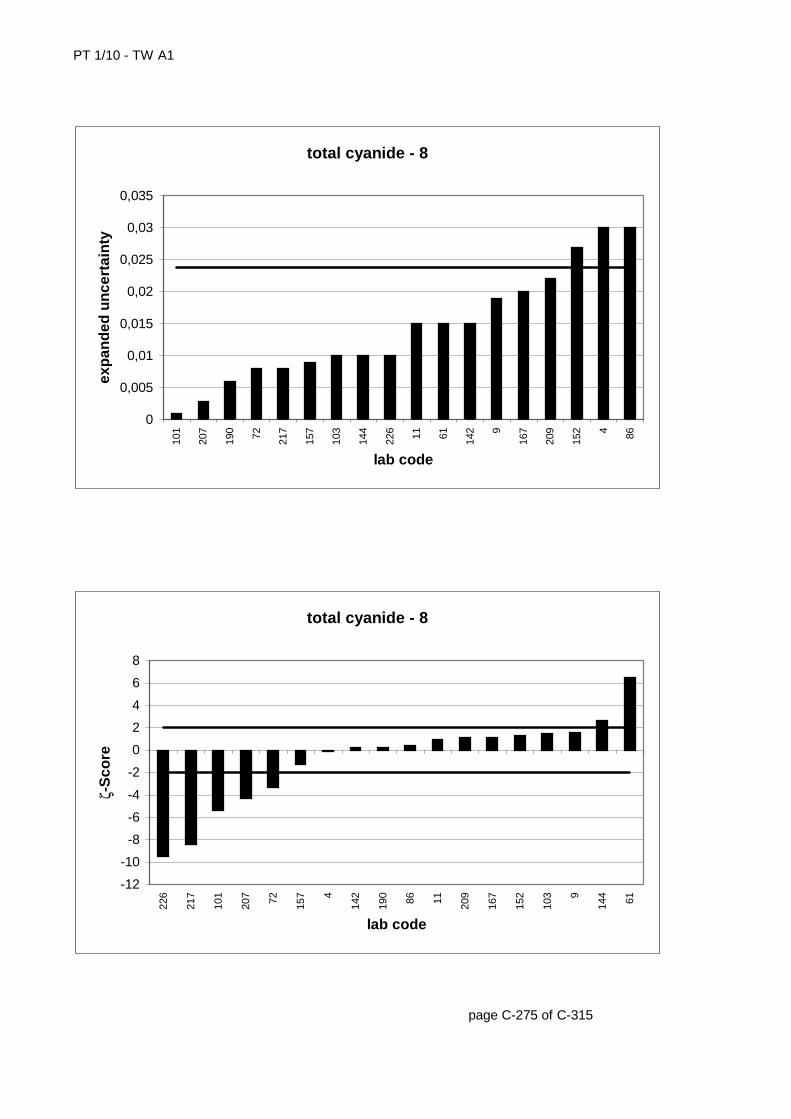
PT 1/10 - TW A1
page C-275 of C-315
total cyanide - 8
0
0,005
0,01
0,015
0,02
0,025
0,03
0,035
101
207
190 72 217
157
103
144
226 11 61 142 9
167
209
152 4 86
lab code
exp
and
ed u
nce
rtai
nty
total cyanide - 8
-12
-10
-8
-6
-4
-2
0
2
4
6
8
226
217
101
207 72 157 4
142
190 86 11 209
167
152
103 9
144 61
lab code
ζ-S
core
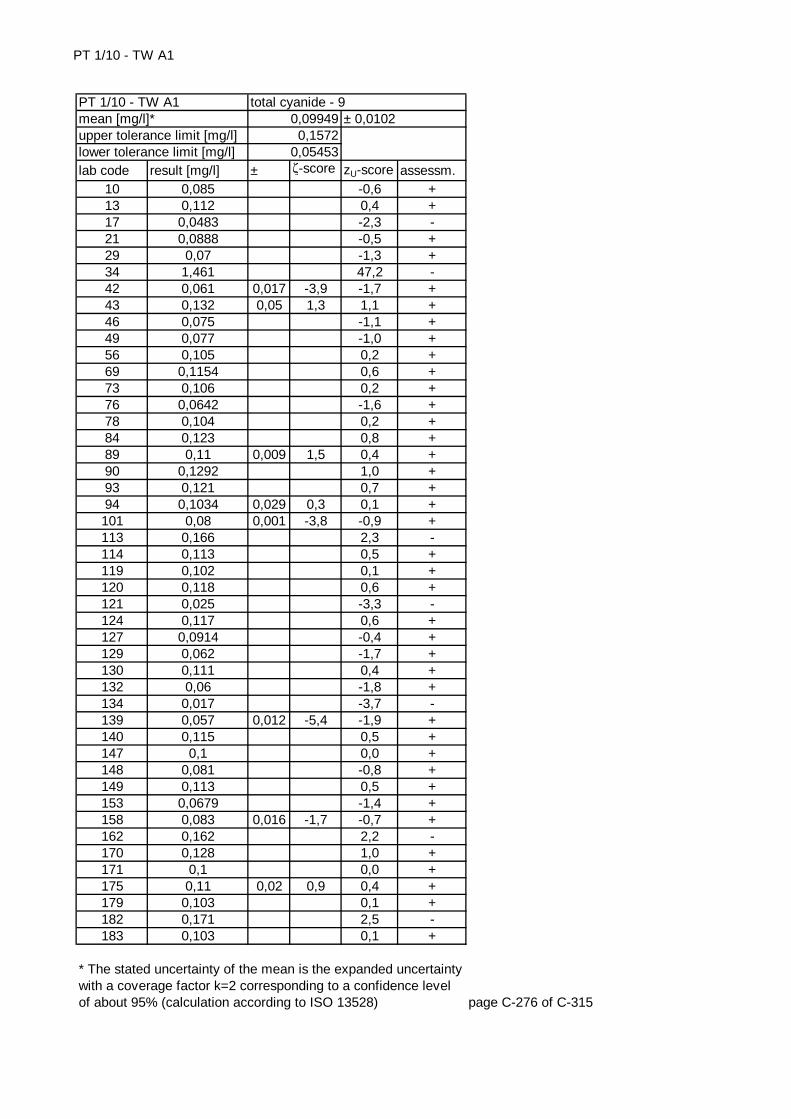
PT 1/10 - TW A1
lab code result [mg/l] ± ζ-score zU-score assessm.10 0,085 -0,6 +13 0,112 0,4 +17 0,0483 -2,3 -21 0,0888 -0,5 +29 0,07 -1,3 +34 1,461 47,2 -42 0,061 0,017 -3,9 -1,7 +43 0,132 0,05 1,3 1,1 +46 0,075 -1,1 +49 0,077 -1,0 +56 0,105 0,2 +69 0,1154 0,6 +73 0,106 0,2 +76 0,0642 -1,6 +78 0,104 0,2 +84 0,123 0,8 +89 0,11 0,009 1,5 0,4 +90 0,1292 1,0 +93 0,121 0,7 +94 0,1034 0,029 0,3 0,1 +101 0,08 0,001 -3,8 -0,9 +113 0,166 2,3 -114 0,113 0,5 +119 0,102 0,1 +120 0,118 0,6 +121 0,025 -3,3 -124 0,117 0,6 +127 0,0914 -0,4 +129 0,062 -1,7 +130 0,111 0,4 +132 0,06 -1,8 +134 0,017 -3,7 -139 0,057 0,012 -5,4 -1,9 +140 0,115 0,5 +147 0,1 0,0 +148 0,081 -0,8 +149 0,113 0,5 +153 0,0679 -1,4 +158 0,083 0,016 -1,7 -0,7 +162 0,162 2,2 -170 0,128 1,0 +171 0,1 0,0 +175 0,11 0,02 0,9 0,4 +179 0,103 0,1 +182 0,171 2,5 -183 0,103 0,1 +
page C-276 of C-315
* The stated uncertainty of the mean is the expanded uncertainty with a coverage factor k=2 corresponding to a confidence level of about 95% (calculation according to ISO 13528)
total cyanide - 90,099490,1572
0,05453
± 0,0102PT 1/10 - TW A1mean [mg/l]*upper tolerance limit [mg/l]lower tolerance limit [mg/l]
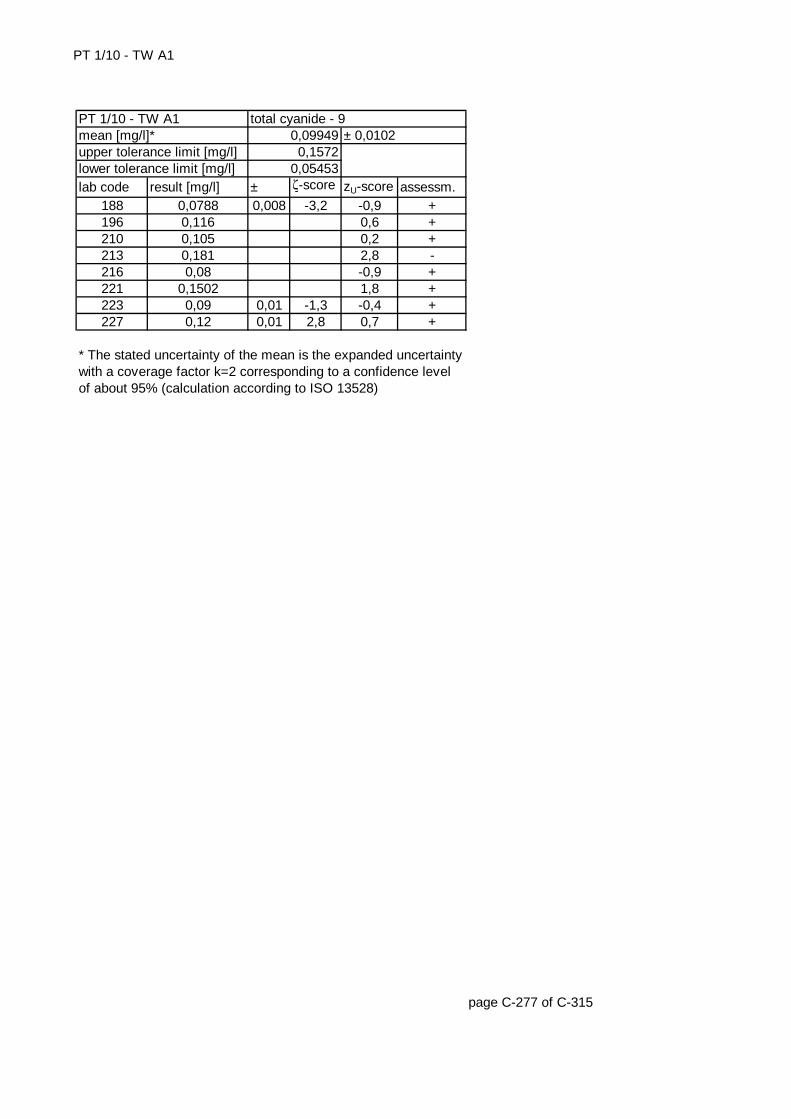
PT 1/10 - TW A1
lab code result [mg/l] ± ζ-score zU-score assessm.188 0,0788 0,008 -3,2 -0,9 +196 0,116 0,6 +210 0,105 0,2 +213 0,181 2,8 -216 0,08 -0,9 +221 0,1502 1,8 +223 0,09 0,01 -1,3 -0,4 +227 0,12 0,01 2,8 0,7 +
page C-277 of C-315
* The stated uncertainty of the mean is the expanded uncertainty with a coverage factor k=2 corresponding to a confidence level of about 95% (calculation according to ISO 13528)
upper tolerance limit [mg/l] 0,1572lower tolerance limit [mg/l] 0,05453
PT 1/10 - TW A1 total cyanide - 9mean [mg/l]* 0,09949 ± 0,0102
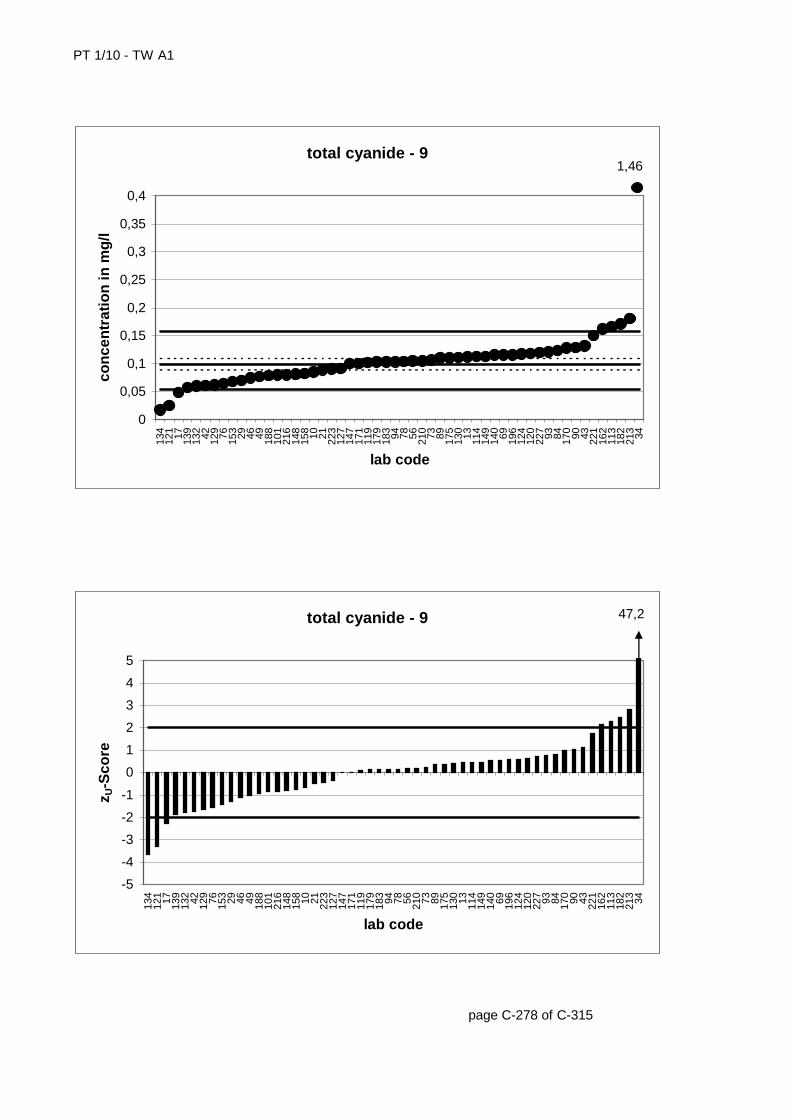
PT 1/10 - TW A1
page C-278 of C-315
total cyanide - 9
0
0,05
0,1
0,15
0,2
0,25
0,3
0,35
0,4
134
121 17 139
132 42 129 76 153 29 46 49 188
101
216
148
158 10 21 223
127
147
171
119
179
183 94 78 56 210 73 89 175
130 13 114
149
140 69 196
124
120
227 93 84 170 90 43 221
162
113
182
213 34
lab code
con
cen
trat
ion
in m
g/l
1,46
total cyanide - 9
-5
-4
-3
-2
-1
0
1
2
3
4
5
134
121 17 139
132 42 129 76 153 29 46 49 188
101
216
148
158 10 21 223
127
147
171
119
179
183 94 78 56 210 73 89 175
130 13 114
149
140 69 196
124
120
227 93 84 170 90 43 221
162
113
182
213 34
lab code
z U-S
core
47,2
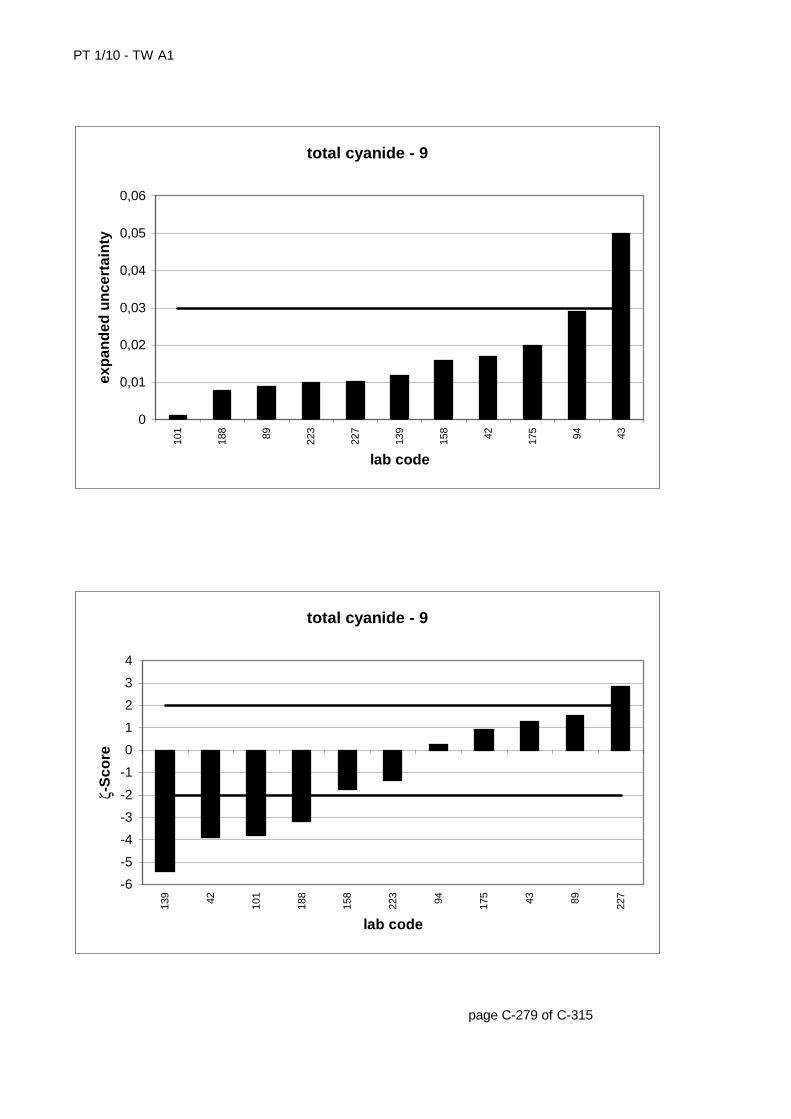
PT 1/10 - TW A1
page C-279 of C-315
total cyanide - 9
0
0,01
0,02
0,03
0,04
0,05
0,06
101
188 89 223
227
139
158 42 175 94 43
lab code
exp
and
ed u
nce
rtai
nty
total cyanide - 9
-6
-5
-4
-3
-2
-1
0
1
2
3
4
139 42 101
188
158
223 94 175 43 89 227
lab code
ζ-S
core
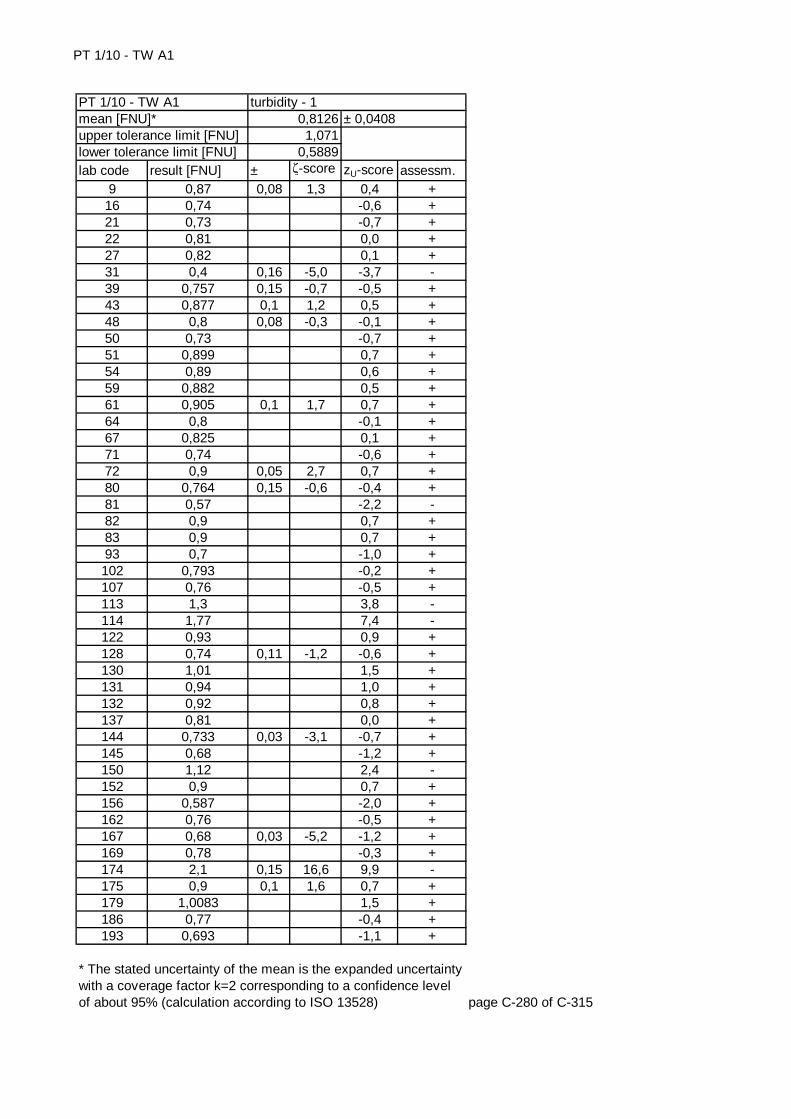
PT 1/10 - TW A1
lab code result [FNU] ± ζ-score zU-score assessm.9 0,87 0,08 1,3 0,4 +
16 0,74 -0,6 +21 0,73 -0,7 +22 0,81 0,0 +27 0,82 0,1 +31 0,4 0,16 -5,0 -3,7 -39 0,757 0,15 -0,7 -0,5 +43 0,877 0,1 1,2 0,5 +48 0,8 0,08 -0,3 -0,1 +50 0,73 -0,7 +51 0,899 0,7 +54 0,89 0,6 +59 0,882 0,5 +61 0,905 0,1 1,7 0,7 +64 0,8 -0,1 +67 0,825 0,1 +71 0,74 -0,6 +72 0,9 0,05 2,7 0,7 +80 0,764 0,15 -0,6 -0,4 +81 0,57 -2,2 -82 0,9 0,7 +83 0,9 0,7 +93 0,7 -1,0 +102 0,793 -0,2 +107 0,76 -0,5 +113 1,3 3,8 -114 1,77 7,4 -122 0,93 0,9 +128 0,74 0,11 -1,2 -0,6 +130 1,01 1,5 +131 0,94 1,0 +132 0,92 0,8 +137 0,81 0,0 +144 0,733 0,03 -3,1 -0,7 +145 0,68 -1,2 +150 1,12 2,4 -152 0,9 0,7 +156 0,587 -2,0 +162 0,76 -0,5 +167 0,68 0,03 -5,2 -1,2 +169 0,78 -0,3 +174 2,1 0,15 16,6 9,9 -175 0,9 0,1 1,6 0,7 +179 1,0083 1,5 +186 0,77 -0,4 +193 0,693 -1,1 +
page C-280 of C-315
* The stated uncertainty of the mean is the expanded uncertainty with a coverage factor k=2 corresponding to a confidence level of about 95% (calculation according to ISO 13528)
turbidity - 10,81261,071
0,5889
± 0,0408PT 1/10 - TW A1mean [FNU]*upper tolerance limit [FNU]lower tolerance limit [FNU]
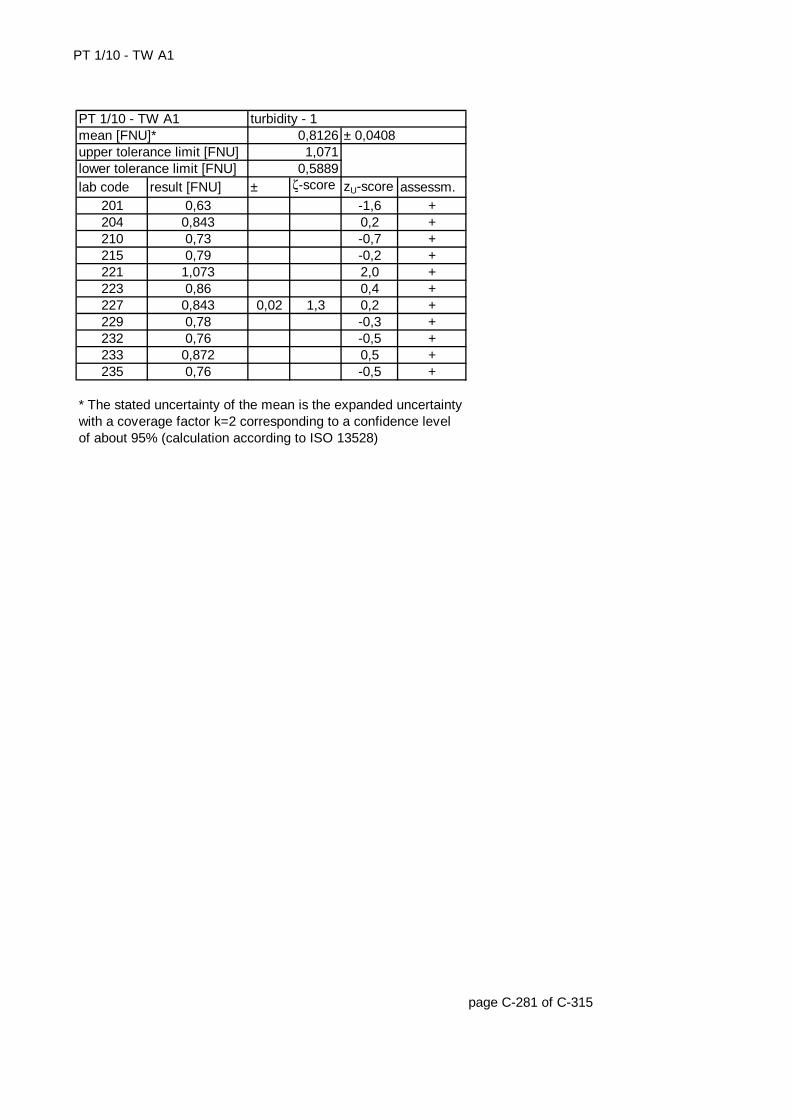
PT 1/10 - TW A1
lab code result [FNU] ± ζ-score zU-score assessm.201 0,63 -1,6 +204 0,843 0,2 +210 0,73 -0,7 +215 0,79 -0,2 +221 1,073 2,0 +223 0,86 0,4 +227 0,843 0,02 1,3 0,2 +229 0,78 -0,3 +232 0,76 -0,5 +233 0,872 0,5 +235 0,76 -0,5 +
page C-281 of C-315
* The stated uncertainty of the mean is the expanded uncertainty with a coverage factor k=2 corresponding to a confidence level of about 95% (calculation according to ISO 13528)
upper tolerance limit [FNU] 1,071lower tolerance limit [FNU] 0,5889
PT 1/10 - TW A1 turbidity - 1mean [FNU]* 0,8126 ± 0,0408
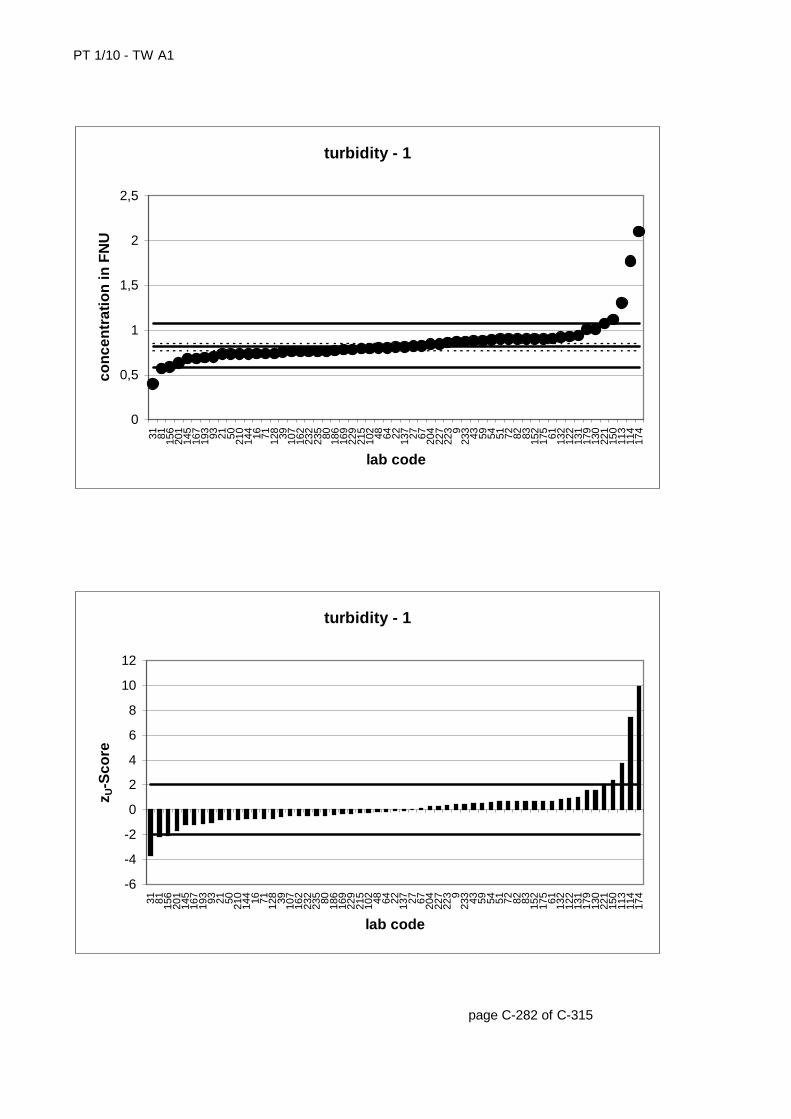
PT 1/10 - TW A1
page C-282 of C-315
turbidity - 1
0
0,5
1
1,5
2
2,5
31 81 156
201
145
167
193 93 21 50 210
144 16 71 128 39 107
162
232
235 80 186
169
229
215
102 48 64 22 137 27 67 204
227
223 9
233 43 59 54 51 72 82 83 152
175 61 132
122
131
179
130
221
150
113
114
174
lab code
con
cen
trat
ion
in F
NU
turbidity - 1
-6
-4
-2
0
2
4
6
8
10
12
31 81 156
201
145
167
193 93 21 50 210
144 16 71 128 39 107
162
232
235 80 186
169
229
215
102 48 64 22 137 27 67 204
227
223 9
233 43 59 54 51 72 82 83 152
175 61 132
122
131
179
130
221
150
113
114
174
lab code
z U-S
core
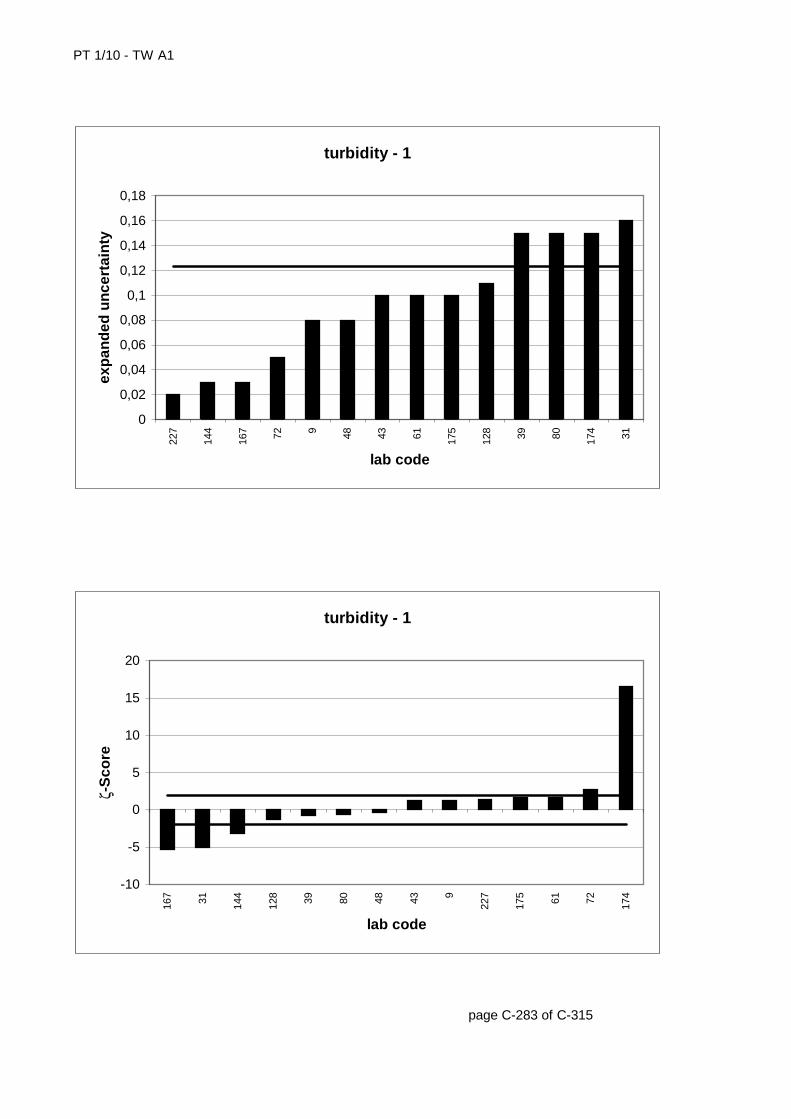
PT 1/10 - TW A1
page C-283 of C-315
turbidity - 1
0
0,02
0,04
0,06
0,08
0,1
0,12
0,14
0,16
0,18
227
144
167 72 9 48 43 61 175
128 39 80 174 31
lab code
exp
and
ed u
nce
rtai
nty
turbidity - 1
-10
-5
0
5
10
15
20
167 31 144
128 39 80 48 43 9
227
175 61 72 174
lab code
ζ-S
core
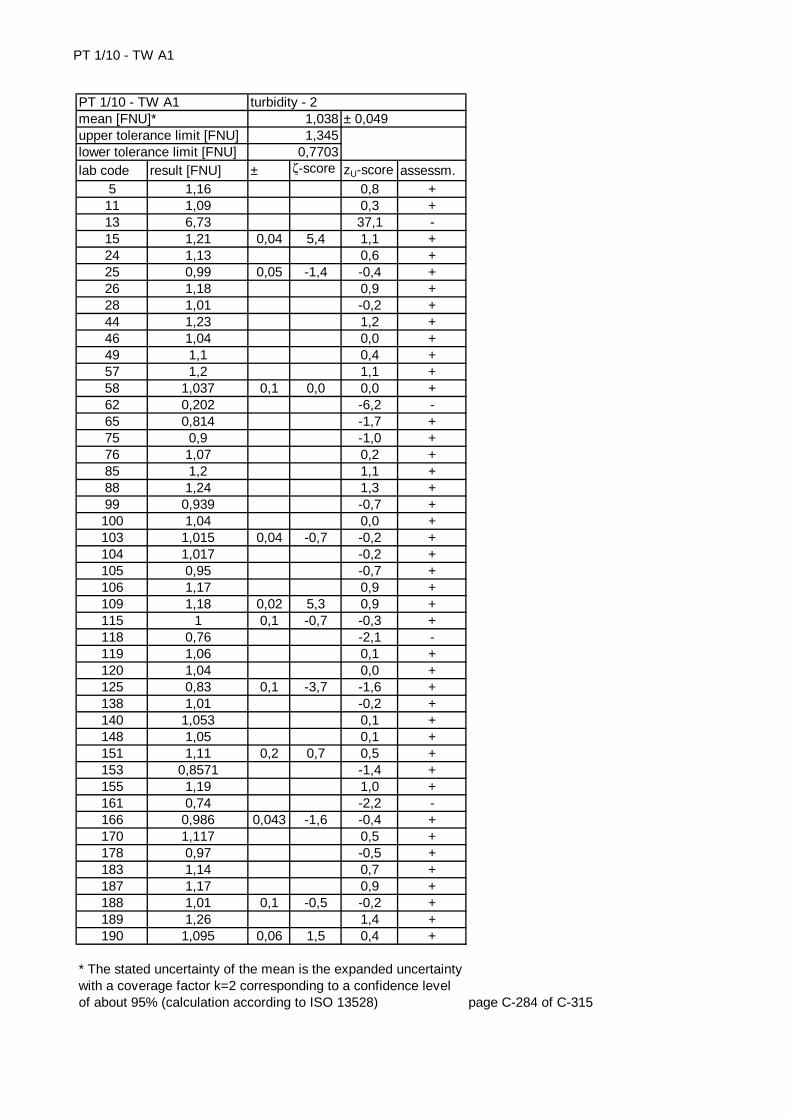
PT 1/10 - TW A1
lab code result [FNU] ± ζ-score zU-score assessm.5 1,16 0,8 +
11 1,09 0,3 +13 6,73 37,1 -15 1,21 0,04 5,4 1,1 +24 1,13 0,6 +25 0,99 0,05 -1,4 -0,4 +26 1,18 0,9 +28 1,01 -0,2 +44 1,23 1,2 +46 1,04 0,0 +49 1,1 0,4 +57 1,2 1,1 +58 1,037 0,1 0,0 0,0 +62 0,202 -6,2 -65 0,814 -1,7 +75 0,9 -1,0 +76 1,07 0,2 +85 1,2 1,1 +88 1,24 1,3 +99 0,939 -0,7 +100 1,04 0,0 +103 1,015 0,04 -0,7 -0,2 +104 1,017 -0,2 +105 0,95 -0,7 +106 1,17 0,9 +109 1,18 0,02 5,3 0,9 +115 1 0,1 -0,7 -0,3 +118 0,76 -2,1 -119 1,06 0,1 +120 1,04 0,0 +125 0,83 0,1 -3,7 -1,6 +138 1,01 -0,2 +140 1,053 0,1 +148 1,05 0,1 +151 1,11 0,2 0,7 0,5 +153 0,8571 -1,4 +155 1,19 1,0 +161 0,74 -2,2 -166 0,986 0,043 -1,6 -0,4 +170 1,117 0,5 +178 0,97 -0,5 +183 1,14 0,7 +187 1,17 0,9 +188 1,01 0,1 -0,5 -0,2 +189 1,26 1,4 +190 1,095 0,06 1,5 0,4 +
page C-284 of C-315
* The stated uncertainty of the mean is the expanded uncertainty with a coverage factor k=2 corresponding to a confidence level of about 95% (calculation according to ISO 13528)
turbidity - 21,0381,345
0,7703
± 0,049PT 1/10 - TW A1mean [FNU]*upper tolerance limit [FNU]lower tolerance limit [FNU]
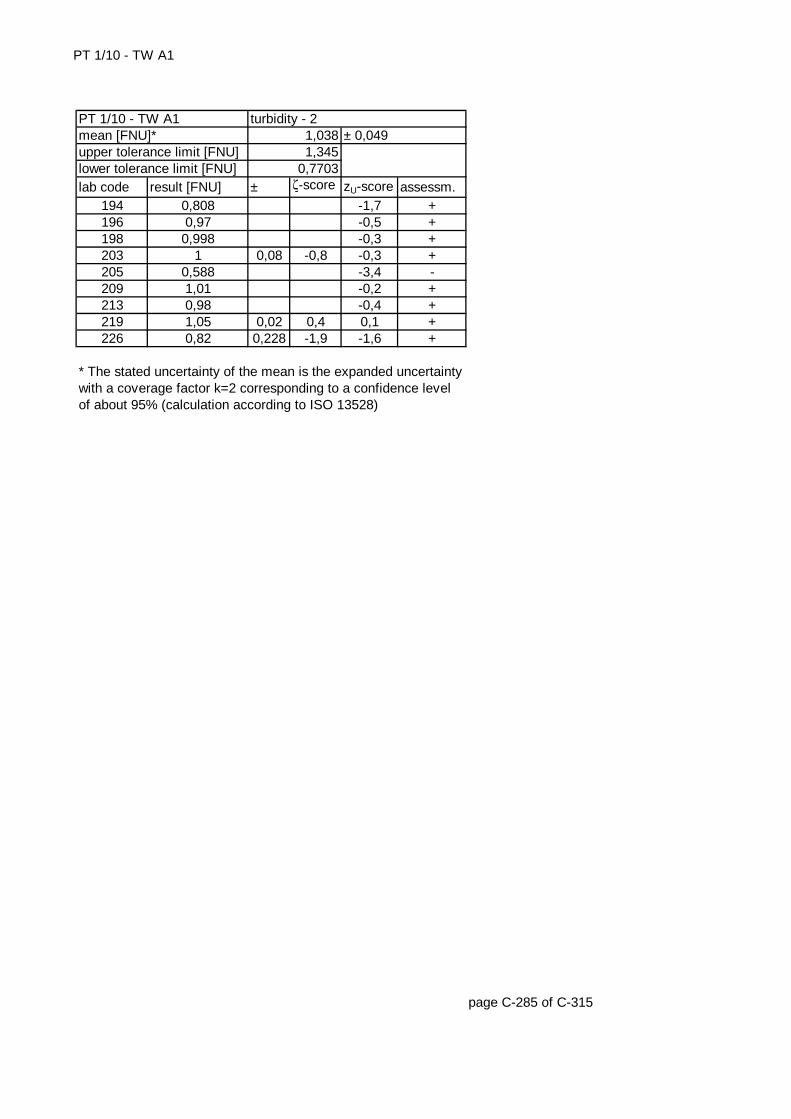
PT 1/10 - TW A1
lab code result [FNU] ± ζ-score zU-score assessm.194 0,808 -1,7 +196 0,97 -0,5 +198 0,998 -0,3 +203 1 0,08 -0,8 -0,3 +205 0,588 -3,4 -209 1,01 -0,2 +213 0,98 -0,4 +219 1,05 0,02 0,4 0,1 +226 0,82 0,228 -1,9 -1,6 +
page C-285 of C-315
* The stated uncertainty of the mean is the expanded uncertainty with a coverage factor k=2 corresponding to a confidence level of about 95% (calculation according to ISO 13528)
upper tolerance limit [FNU] 1,345lower tolerance limit [FNU] 0,7703
PT 1/10 - TW A1 turbidity - 2mean [FNU]* 1,038 ± 0,049
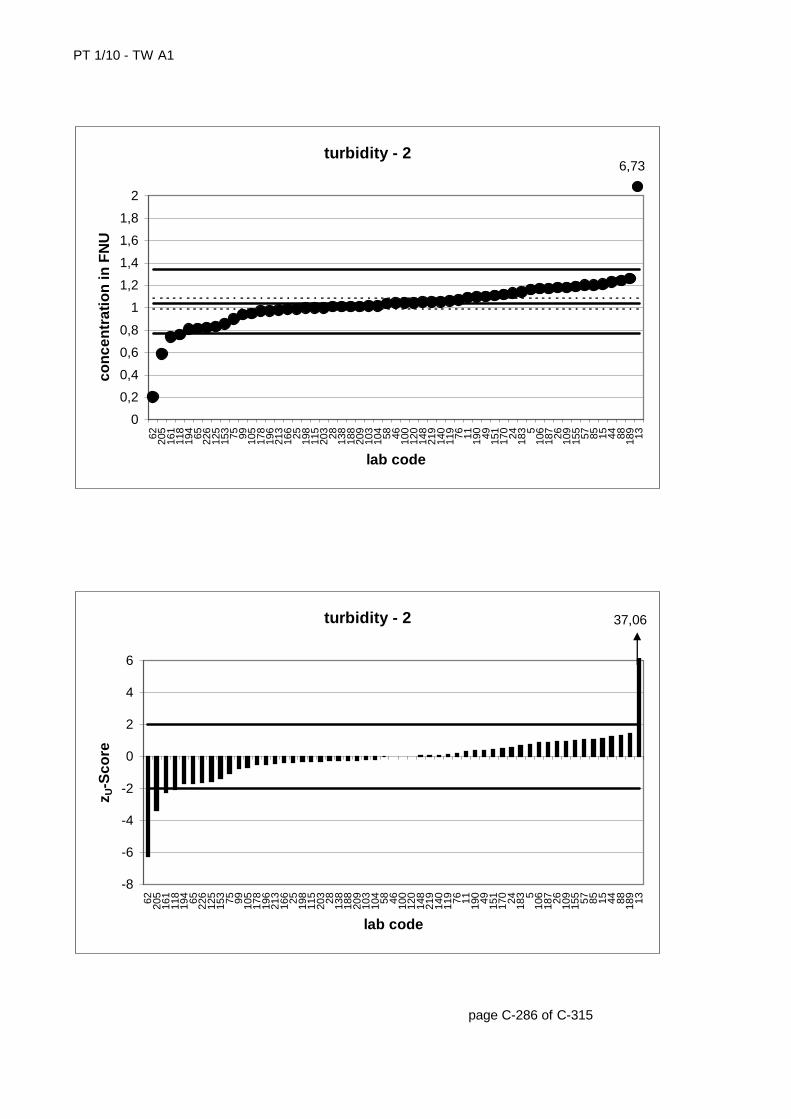
PT 1/10 - TW A1
page C-286 of C-315
turbidity - 2
0
0,2
0,4
0,6
0,8
1
1,2
1,4
1,6
1,8
2
62 205
161
118
194 65 226
125
153 75 99 105
178
196
213
166 25 198
115
203 28 138
188
209
103
104 58 46 100
120
148
219
140
119 76 11 190 49 151
170 24 183 5
106
187 26 109
155 57 85 15 44 88 189 13
lab code
con
cen
trat
ion
in F
NU
6,73
turbidity - 2
-8
-6
-4
-2
0
2
4
6
62 205
161
118
194 65 226
125
153 75 99 105
178
196
213
166 25 198
115
203 28 138
188
209
103
104 58 46 100
120
148
219
140
119 76 11 190 49 151
170 24 183 5
106
187 26 109
155 57 85 15 44 88 189 13
lab code
z U-S
core
37,06
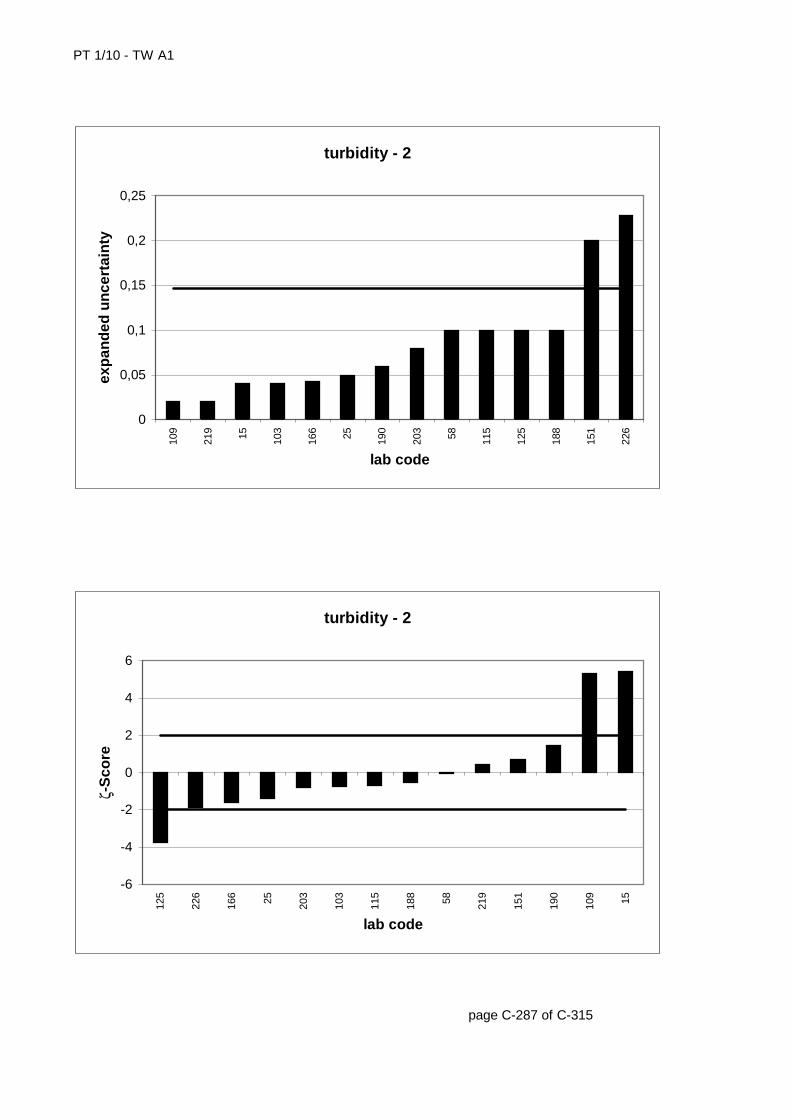
PT 1/10 - TW A1
page C-287 of C-315
turbidity - 2
0
0,05
0,1
0,15
0,2
0,25
109
219 15 103
166 25 190
203 58 115
125
188
151
226
lab code
exp
and
ed u
nce
rtai
nty
turbidity - 2
-6
-4
-2
0
2
4
6
125
226
166 25 203
103
115
188 58 219
151
190
109 15
lab code
ζ-S
core
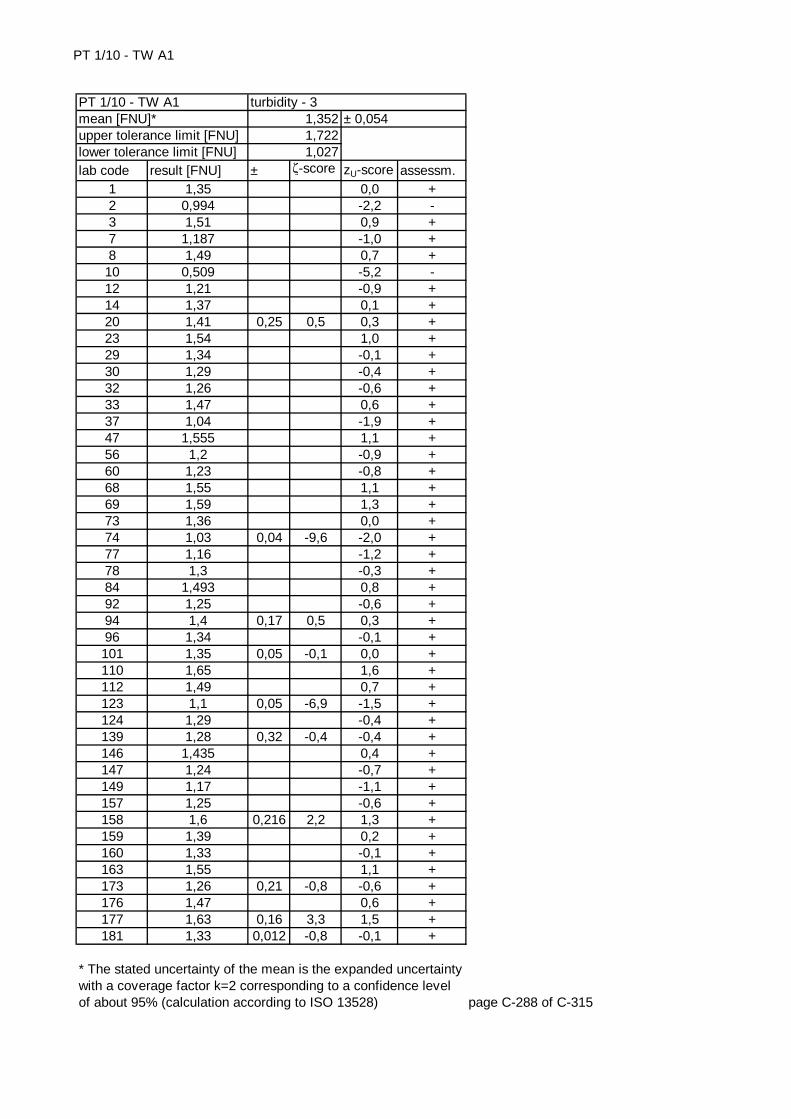
PT 1/10 - TW A1
lab code result [FNU] ± ζ-score zU-score assessm.1 1,35 0,0 +2 0,994 -2,2 -3 1,51 0,9 +7 1,187 -1,0 +8 1,49 0,7 +
10 0,509 -5,2 -12 1,21 -0,9 +14 1,37 0,1 +20 1,41 0,25 0,5 0,3 +23 1,54 1,0 +29 1,34 -0,1 +30 1,29 -0,4 +32 1,26 -0,6 +33 1,47 0,6 +37 1,04 -1,9 +47 1,555 1,1 +56 1,2 -0,9 +60 1,23 -0,8 +68 1,55 1,1 +69 1,59 1,3 +73 1,36 0,0 +74 1,03 0,04 -9,6 -2,0 +77 1,16 -1,2 +78 1,3 -0,3 +84 1,493 0,8 +92 1,25 -0,6 +94 1,4 0,17 0,5 0,3 +96 1,34 -0,1 +101 1,35 0,05 -0,1 0,0 +110 1,65 1,6 +112 1,49 0,7 +123 1,1 0,05 -6,9 -1,5 +124 1,29 -0,4 +139 1,28 0,32 -0,4 -0,4 +146 1,435 0,4 +147 1,24 -0,7 +149 1,17 -1,1 +157 1,25 -0,6 +158 1,6 0,216 2,2 1,3 +159 1,39 0,2 +160 1,33 -0,1 +163 1,55 1,1 +173 1,26 0,21 -0,8 -0,6 +176 1,47 0,6 +177 1,63 0,16 3,3 1,5 +181 1,33 0,012 -0,8 -0,1 +
page C-288 of C-315
* The stated uncertainty of the mean is the expanded uncertainty with a coverage factor k=2 corresponding to a confidence level of about 95% (calculation according to ISO 13528)
turbidity - 31,3521,7221,027
± 0,054PT 1/10 - TW A1mean [FNU]*upper tolerance limit [FNU]lower tolerance limit [FNU]
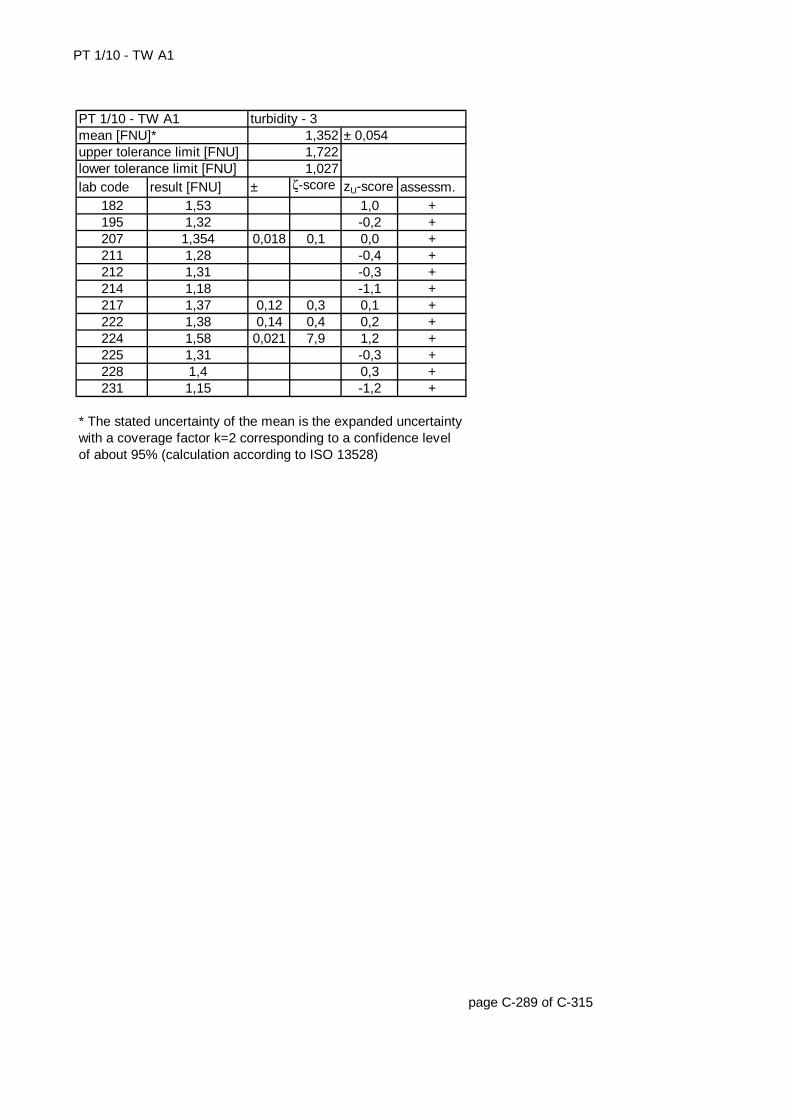
PT 1/10 - TW A1
lab code result [FNU] ± ζ-score zU-score assessm.182 1,53 1,0 +195 1,32 -0,2 +207 1,354 0,018 0,1 0,0 +211 1,28 -0,4 +212 1,31 -0,3 +214 1,18 -1,1 +217 1,37 0,12 0,3 0,1 +222 1,38 0,14 0,4 0,2 +224 1,58 0,021 7,9 1,2 +225 1,31 -0,3 +228 1,4 0,3 +231 1,15 -1,2 +
page C-289 of C-315
* The stated uncertainty of the mean is the expanded uncertainty with a coverage factor k=2 corresponding to a confidence level of about 95% (calculation according to ISO 13528)
upper tolerance limit [FNU] 1,722lower tolerance limit [FNU] 1,027
PT 1/10 - TW A1 turbidity - 3mean [FNU]* 1,352 ± 0,054
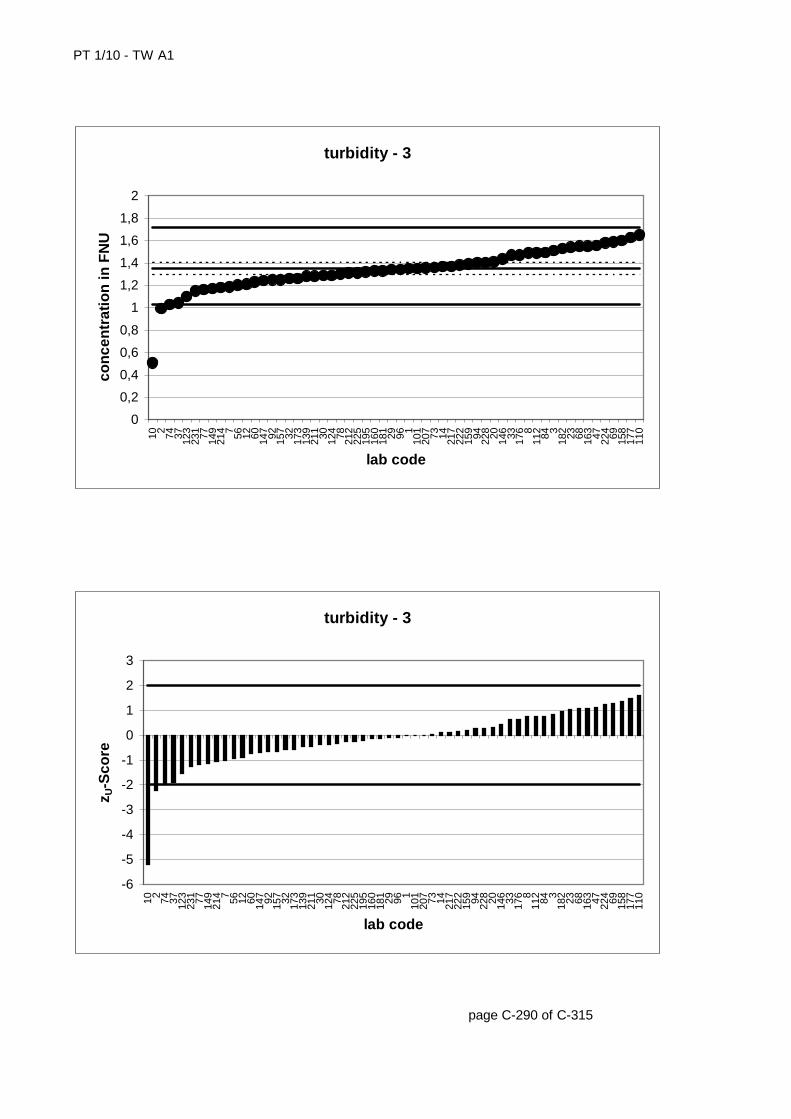
PT 1/10 - TW A1
page C-290 of C-315
turbidity - 3
0
0,2
0,4
0,6
0,8
1
1,2
1,4
1,6
1,8
2
10 2 74 37 123
231 77 149
214 7 56 12 60 147 92 157 32 173
139
211 30 124 78 212
225
195
160
181 29 96 1
101
207 73 14 217
222
159 94 228 20 146 33 176 8
112 84 3
182 23 68 163 47 224 69 158
177
110
lab code
con
cen
trat
ion
in F
NU
turbidity - 3
-6
-5
-4
-3
-2
-1
0
1
2
3
10 2 74 37 123
231 77 149
214 7 56 12 60 147 92 157 32 173
139
211 30 124 78 212
225
195
160
181 29 96 1
101
207 73 14 217
222
159 94 228 20 146 33 176 8
112 84 3
182 23 68 163 47 224 69 158
177
110
lab code
z U-S
core
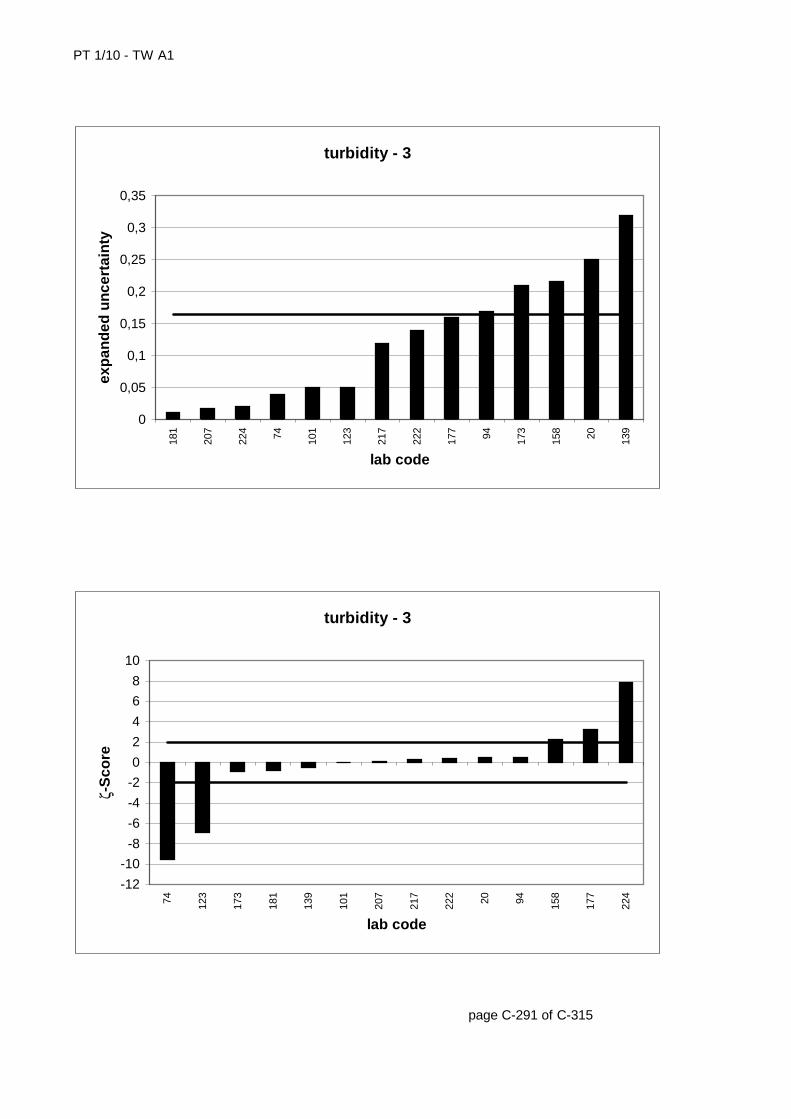
PT 1/10 - TW A1
page C-291 of C-315
turbidity - 3
0
0,05
0,1
0,15
0,2
0,25
0,3
0,35
181
207
224 74 101
123
217
222
177 94 173
158 20 139
lab code
exp
and
ed u
nce
rtai
nty
turbidity - 3
-12
-10
-8
-6
-4
-2
0
2
4
6
8
10
74 123
173
181
139
101
207
217
222 20 94 158
177
224
lab code
ζ-S
core

PT 1/10 - TW A1
lab code result [FNU] ± ζ-score zU-score assessm.1 1,49 -0,1 +7 1,277 -1,3 +
11 1,62 0,6 +12 1,32 -1,1 +14 1,5 0,0 +16 1,4 -0,6 +22 1,54 0,2 +30 1,43 -0,4 +33 1,54 0,2 +39 1,46 0,23 -0,4 -0,3 +44 1,7 1,0 +54 1,71 1,0 +58 1,5 0,15 -0,1 0,0 +60 1,4 -0,6 +61 1,73 0,1 3,9 1,1 +68 1,82 1,6 +75 1,41 -0,6 +82 1,6 0,5 +88 1,79 1,4 +92 1,4 -0,6 +96 1,49 -0,1 +102 1,566 0,3 +104 1,493 -0,1 +106 1,78 1,4 +107 1,473 -0,2 +109 1,75 0,02 8,1 1,2 +118 1,2 -1,7 +119 1,57 0,3 +123 1,3 0,05 -5,5 -1,2 +125 1,25 0,1 -4,5 -1,5 +130 1,75 1,2 +144 1,373 0,05 -3,6 -0,8 +147 1,41 -0,6 +148 1,6 0,5 +155 1,69 0,9 +156 1,17 -1,9 +158 1,74 0,235 1,9 1,2 +163 1,73 1,1 +166 1,483 0,065 -0,6 -0,1 +167 1,33 0,07 -4,0 -1,0 +176 1,56 0,3 +177 2,5 0,25 7,7 5,0 -178 1,36 -0,8 +182 1,71 1,0 +186 1,39 -0,7 +190 1,608 0,06 2,4 0,5 +
page C-292 of C-315
* The stated uncertainty of the mean is the expanded uncertainty with a coverage factor k=2 corresponding to a confidence level of about 95% (calculation according to ISO 13528)
turbidity - 41,5081,9071,156
± 0,056PT 1/10 - TW A1mean [FNU]*upper tolerance limit [FNU]lower tolerance limit [FNU]

PT 1/10 - TW A1
lab code result [FNU] ± ζ-score zU-score assessm.194 1,18 -1,9 +195 1,49 -0,1 +201 1,3 -1,2 +203 1,52 0,12 0,2 0,1 +204 1,473 -0,2 +209 1,47 -0,2 +211 1,45 -0,3 +215 1,545 0,2 +222 1,49 0,15 -0,2 -0,1 +224 1,78 0,03 8,5 1,4 +226 1,26 0,35 -1,4 -1,4 +227 1,484 0,03 -0,8 -0,1 +229 1,53 0,1 +
page C-293 of C-315
* The stated uncertainty of the mean is the expanded uncertainty with a coverage factor k=2 corresponding to a confidence level of about 95% (calculation according to ISO 13528)
upper tolerance limit [FNU] 1,907lower tolerance limit [FNU] 1,156
PT 1/10 - TW A1 turbidity - 4mean [FNU]* 1,508 ± 0,056
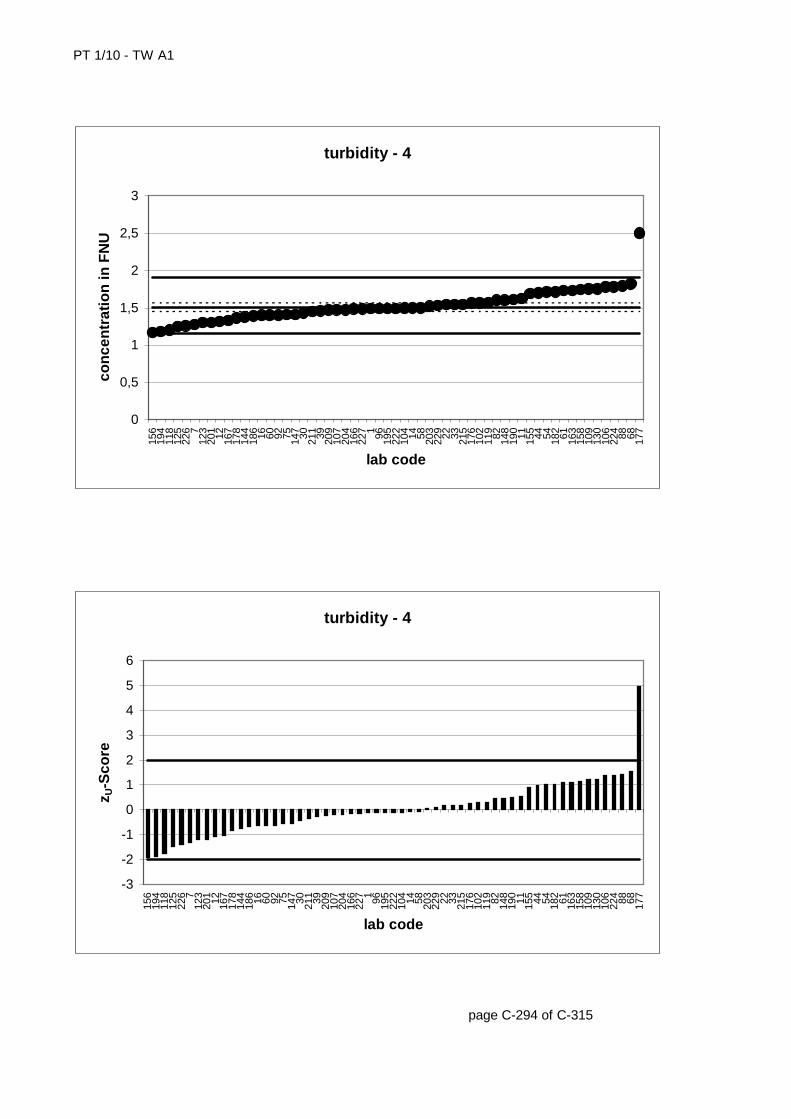
PT 1/10 - TW A1
page C-294 of C-315
turbidity - 4
0
0,5
1
1,5
2
2,5
3
156
194
118
125
226 7
123
201 12 167
178
144
186 16 60 92 75 147 30 211 39 209
107
204
166
227 1 96 195
222
104 14 58 203
229 22 33 215
176
102
119 82 148
190 11 155 44 54 182 61 163
158
109
130
106
224 88 68 177
lab code
con
cen
trat
ion
in F
NU
turbidity - 4
-3
-2
-1
0
1
2
3
4
5
6
156
194
118
125
226 7
123
201 12 167
178
144
186 16 60 92 75 147 30 211 39 209
107
204
166
227 1 96 195
222
104 14 58 203
229 22 33 215
176
102
119 82 148
190 11 155 44 54 182 61 163
158
109
130
106
224 88 68 177
lab code
z U-S
core
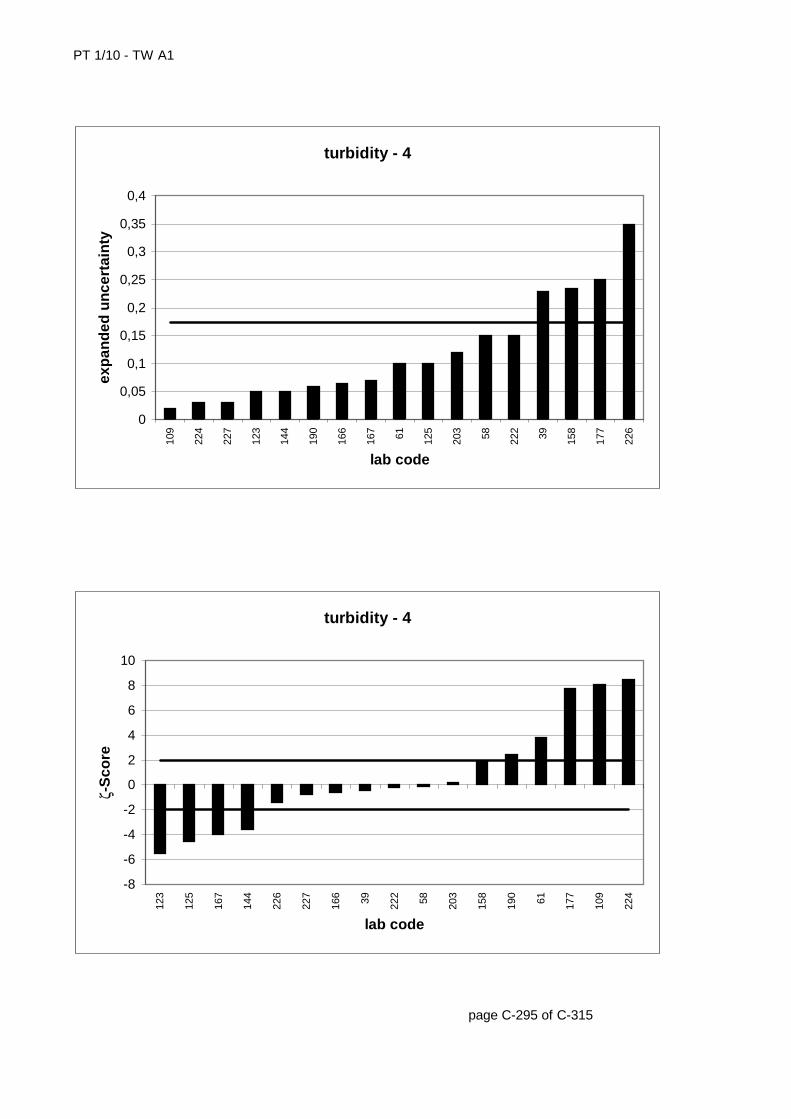
PT 1/10 - TW A1
page C-295 of C-315
turbidity - 4
0
0,05
0,1
0,15
0,2
0,25
0,3
0,35
0,4
109
224
227
123
144
190
166
167 61 125
203 58 222 39 158
177
226
lab code
exp
and
ed u
nce
rtai
nty
turbidity - 4
-8
-6
-4
-2
0
2
4
6
8
10
123
125
167
144
226
227
166 39 222 58 203
158
190 61 177
109
224
lab code
ζ-S
core
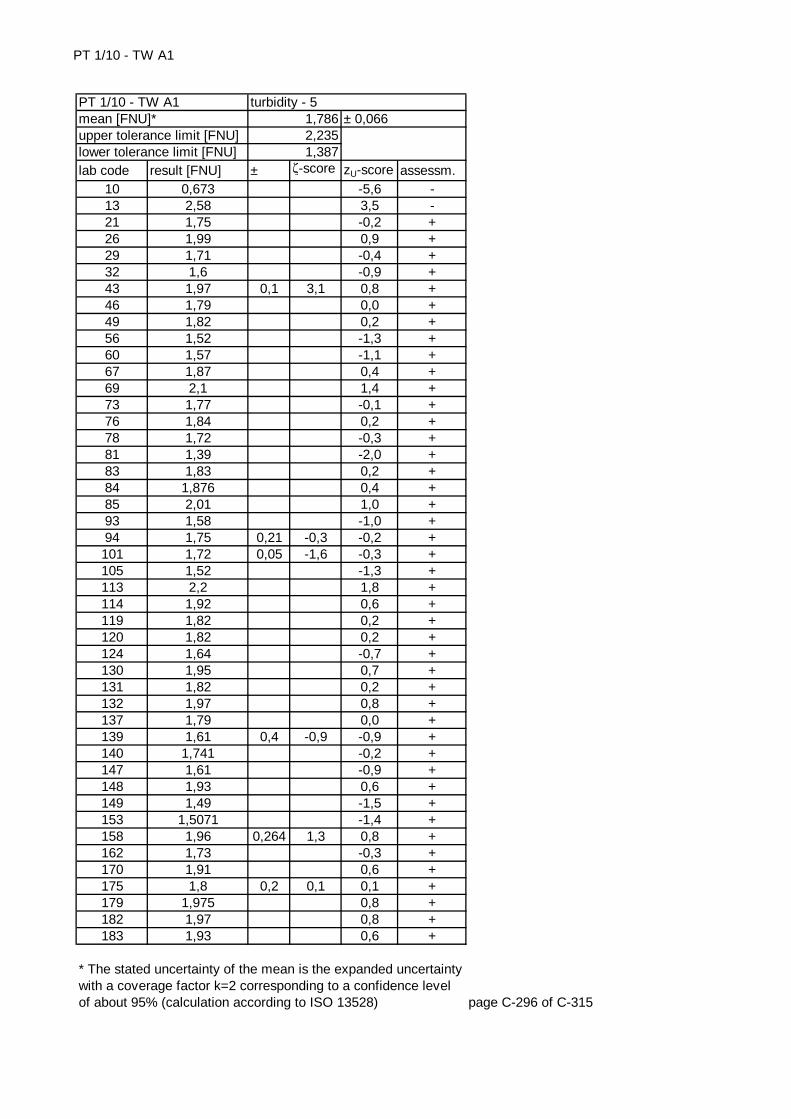
PT 1/10 - TW A1
lab code result [FNU] ± ζ-score zU-score assessm.10 0,673 -5,6 -13 2,58 3,5 -21 1,75 -0,2 +26 1,99 0,9 +29 1,71 -0,4 +32 1,6 -0,9 +43 1,97 0,1 3,1 0,8 +46 1,79 0,0 +49 1,82 0,2 +56 1,52 -1,3 +60 1,57 -1,1 +67 1,87 0,4 +69 2,1 1,4 +73 1,77 -0,1 +76 1,84 0,2 +78 1,72 -0,3 +81 1,39 -2,0 +83 1,83 0,2 +84 1,876 0,4 +85 2,01 1,0 +93 1,58 -1,0 +94 1,75 0,21 -0,3 -0,2 +101 1,72 0,05 -1,6 -0,3 +105 1,52 -1,3 +113 2,2 1,8 +114 1,92 0,6 +119 1,82 0,2 +120 1,82 0,2 +124 1,64 -0,7 +130 1,95 0,7 +131 1,82 0,2 +132 1,97 0,8 +137 1,79 0,0 +139 1,61 0,4 -0,9 -0,9 +140 1,741 -0,2 +147 1,61 -0,9 +148 1,93 0,6 +149 1,49 -1,5 +153 1,5071 -1,4 +158 1,96 0,264 1,3 0,8 +162 1,73 -0,3 +170 1,91 0,6 +175 1,8 0,2 0,1 0,1 +179 1,975 0,8 +182 1,97 0,8 +183 1,93 0,6 +
page C-296 of C-315
* The stated uncertainty of the mean is the expanded uncertainty with a coverage factor k=2 corresponding to a confidence level of about 95% (calculation according to ISO 13528)
turbidity - 51,7862,2351,387
± 0,066PT 1/10 - TW A1mean [FNU]*upper tolerance limit [FNU]lower tolerance limit [FNU]

PT 1/10 - TW A1
lab code result [FNU] ± ζ-score zU-score assessm.188 1,76 0,18 -0,3 -0,1 +194 1,37 -2,1 -196 1,66 -0,6 +198 1,747 -0,2 +210 1,85 0,3 +213 1,68 -0,5 +221 2,122 1,5 +222 1,73 0,17 -0,6 -0,3 +223 1,9 0,5 +227 1,725 0,05 -1,5 -0,3 +231 1,52 -1,3 +233 1,99 0,9 +
page C-297 of C-315
* The stated uncertainty of the mean is the expanded uncertainty with a coverage factor k=2 corresponding to a confidence level of about 95% (calculation according to ISO 13528)
upper tolerance limit [FNU] 2,235lower tolerance limit [FNU] 1,387
PT 1/10 - TW A1 turbidity - 5mean [FNU]* 1,786 ± 0,066
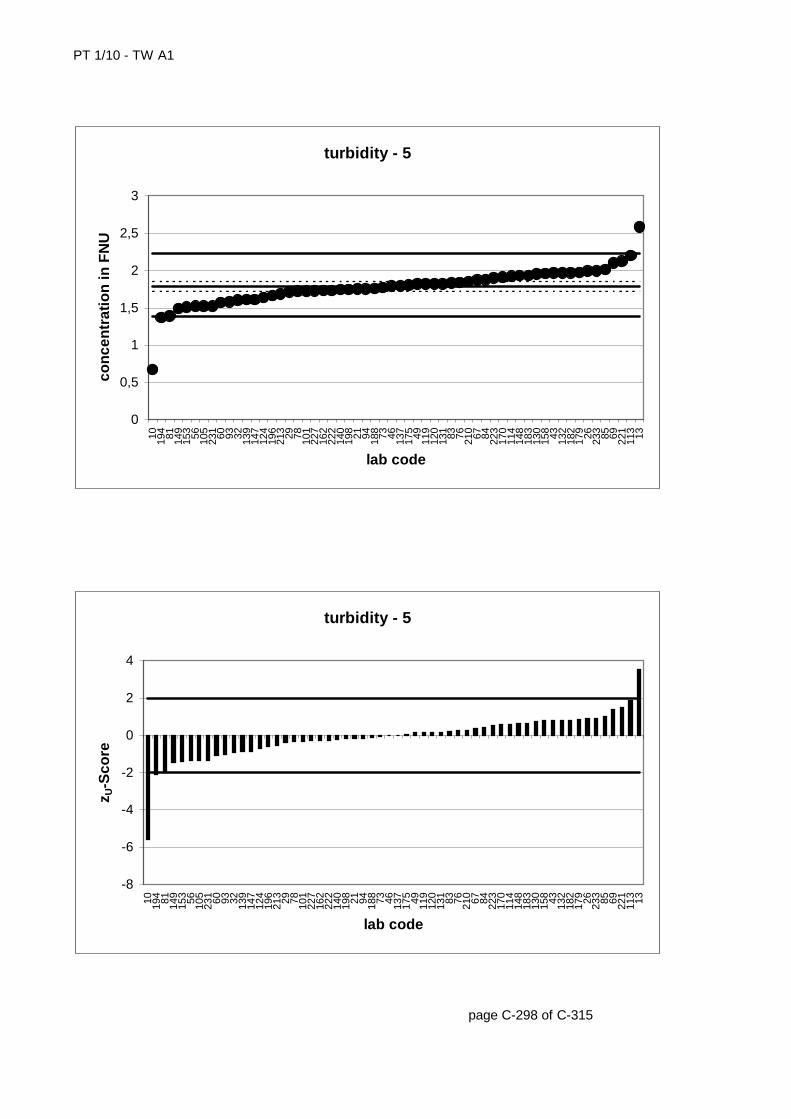
PT 1/10 - TW A1
page C-298 of C-315
turbidity - 5
0
0,5
1
1,5
2
2,5
3
10 194 81 149
153 56 105
231 60 93 32 139
147
124
196
213 29 78 101
227
162
222
140
198 21 94 188 73 46 137
175 49 119
120
131 83 76 210 67 84 223
170
114
148
183
130
158 43 132
182
179 26 233 85 69 221
113 13
lab code
con
cen
trat
ion
in F
NU
turbidity - 5
-8
-6
-4
-2
0
2
4
10 194 81 149
153 56 105
231 60 93 32 139
147
124
196
213 29 78 101
227
162
222
140
198 21 94 188 73 46 137
175 49 119
120
131 83 76 210 67 84 223
170
114
148
183
130
158 43 132
182
179 26 233 85 69 221
113 13
lab code
z U-S
core
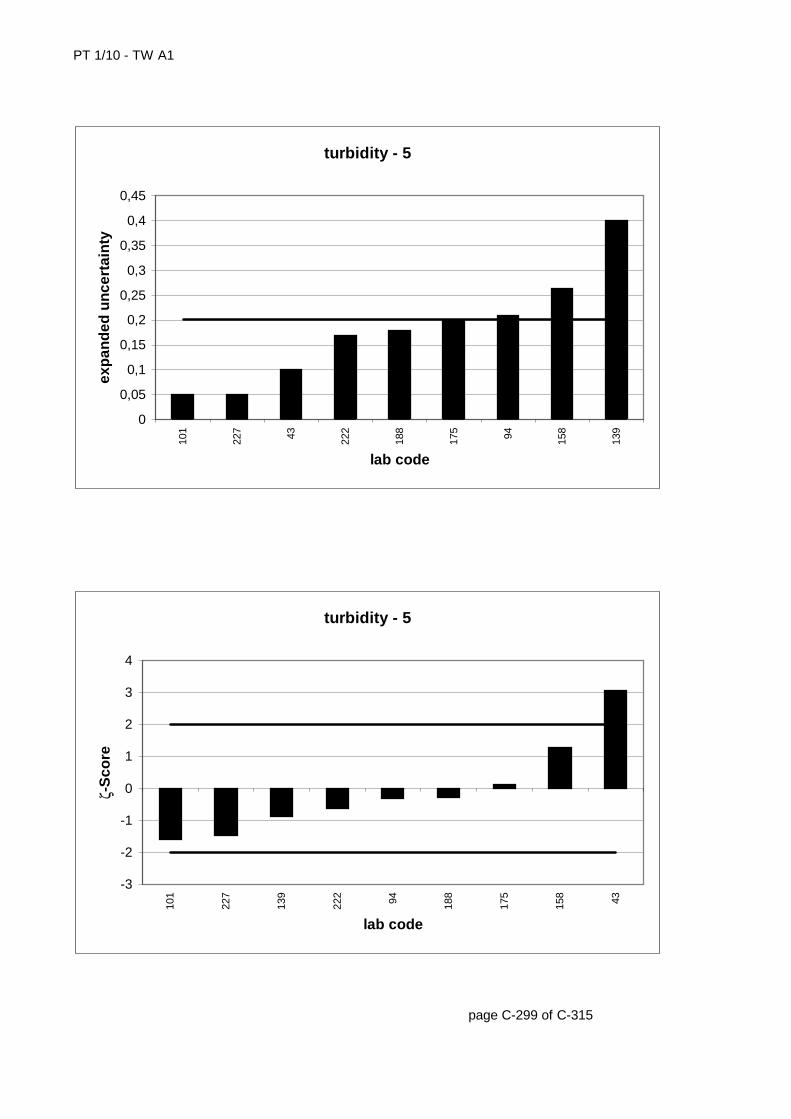
PT 1/10 - TW A1
page C-299 of C-315
turbidity - 5
0
0,05
0,1
0,15
0,2
0,25
0,3
0,35
0,4
0,4510
1
227 43 222
188
175 94 158
139
lab code
exp
and
ed u
nce
rtai
nty
turbidity - 5
-3
-2
-1
0
1
2
3
4
101
227
139
222 94 188
175
158 43
lab code
ζ-S
core

PT 1/10 - TW A1
lab code result [FNU] ± ζ-score zU-score assessm.2 1,426 -2,4 -8 2,05 0,5 +9 2,1 0,19 1,6 0,7 +
11 2,1 0,7 +12 1,69 -1,1 +14 1,91 -0,1 +15 2,2 0,03 6,4 1,1 +22 2,09 0,7 +27 2,04 0,5 +31 1,36 0,56 -2,0 -2,7 -46 1,96 0,1 +50 1,7 -1,1 +51 2,17 1,0 +56 1,74 -0,9 +59 2,17 1,0 +61 2,19 0,1 4,1 1,1 +65 1,91 -0,1 +72 1,98 0,1 0,8 0,2 +73 1,91 -0,1 +76 1,98 0,2 +77 1,66 -1,3 +92 1,78 -0,7 +99 1,736 -0,9 +101 2,08 0,05 3,2 0,6 +103 1,9 0,08 -0,6 -0,2 +104 2,151 0,9 +110 2,26 1,4 +112 2,09 0,7 +114 0,806 -5,3 -115 0,8 0,1 -17,9 -5,4 -122 2,28 1,5 +124 1,78 -0,7 +137 1,96 0,1 +138 2,02 0,4 +140 1,91 -0,1 +144 1,713 0,07 -4,2 -1,0 +146 1,975 0,2 +150 2,08 0,6 +152 2,25 1,3 +157 1,67 -1,2 +159 1,91 -0,1 +162 1,88 -0,2 +167 1,8 0,09 -2,2 -0,6 +187 2,15 0,9 +190 2,02 0,06 1,8 0,4 +196 1,77 -0,8 +
page C-300 of C-315
* The stated uncertainty of the mean is the expanded uncertainty with a coverage factor k=2 corresponding to a confidence level of about 95% (calculation according to ISO 13528)
turbidity - 61,9322,4071,509
± 0,078PT 1/10 - TW A1mean [FNU]*upper tolerance limit [FNU]lower tolerance limit [FNU]
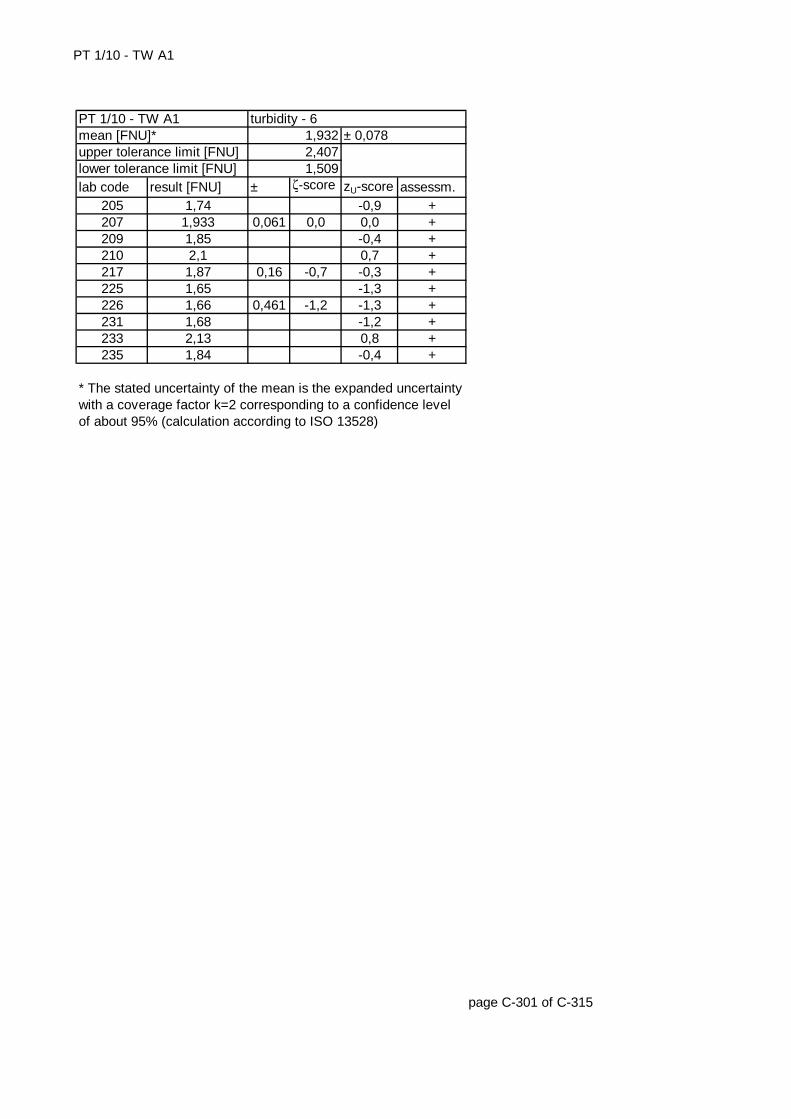
PT 1/10 - TW A1
lab code result [FNU] ± ζ-score zU-score assessm.205 1,74 -0,9 +207 1,933 0,061 0,0 0,0 +209 1,85 -0,4 +210 2,1 0,7 +217 1,87 0,16 -0,7 -0,3 +225 1,65 -1,3 +226 1,66 0,461 -1,2 -1,3 +231 1,68 -1,2 +233 2,13 0,8 +235 1,84 -0,4 +
page C-301 of C-315
* The stated uncertainty of the mean is the expanded uncertainty with a coverage factor k=2 corresponding to a confidence level of about 95% (calculation according to ISO 13528)
upper tolerance limit [FNU] 2,407lower tolerance limit [FNU] 1,509
PT 1/10 - TW A1 turbidity - 6mean [FNU]* 1,932 ± 0,078
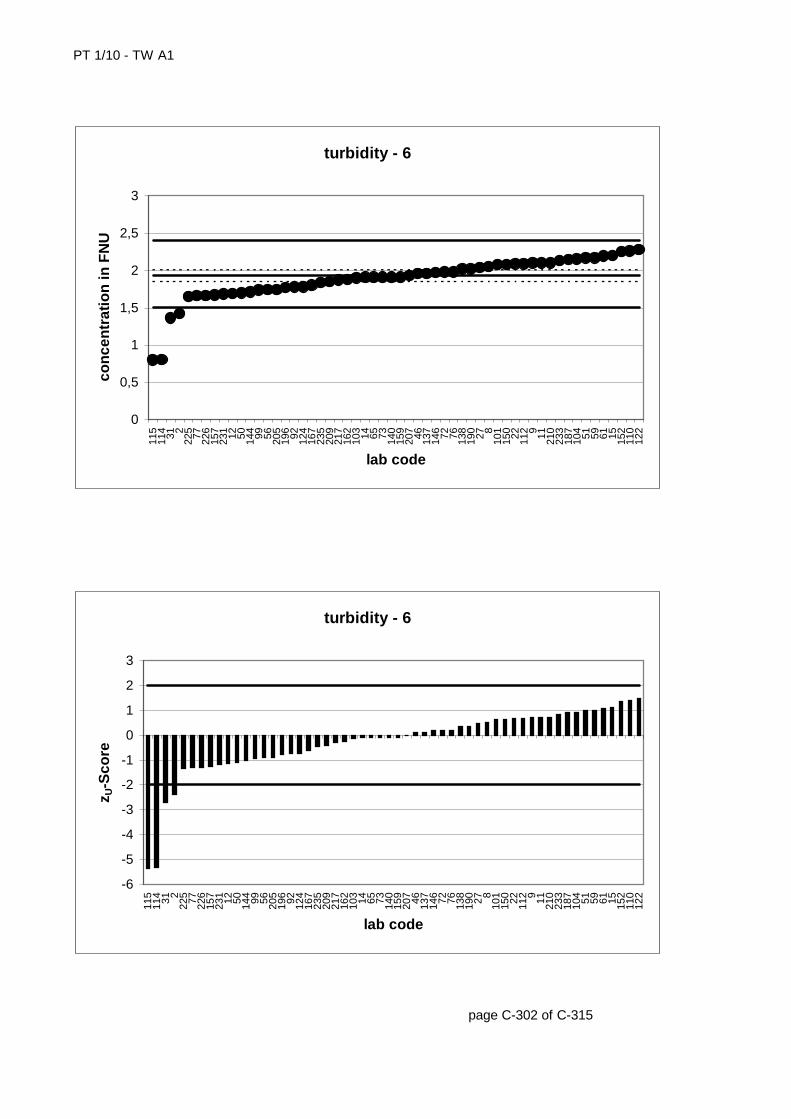
PT 1/10 - TW A1
page C-302 of C-315
turbidity - 6
0
0,5
1
1,5
2
2,5
3
115
114 31 2
225 77 226
157
231 12 50 144 99 56 205
196 92 124
167
235
209
217
162
103 14 65 73 140
159
207 46 137
146 72 76 138
190 27 8
101
150 22 112 9 11 210
233
187
104 51 59 61 15 152
110
122
lab code
con
cen
trat
ion
in F
NU
turbidity - 6
-6
-5
-4
-3
-2
-1
0
1
2
3
115
114 31 2
225 77 226
157
231 12 50 144 99 56 205
196 92 124
167
235
209
217
162
103 14 65 73 140
159
207 46 137
146 72 76 138
190 27 8
101
150 22 112 9 11 210
233
187
104 51 59 61 15 152
110
122
lab code
z U-S
core
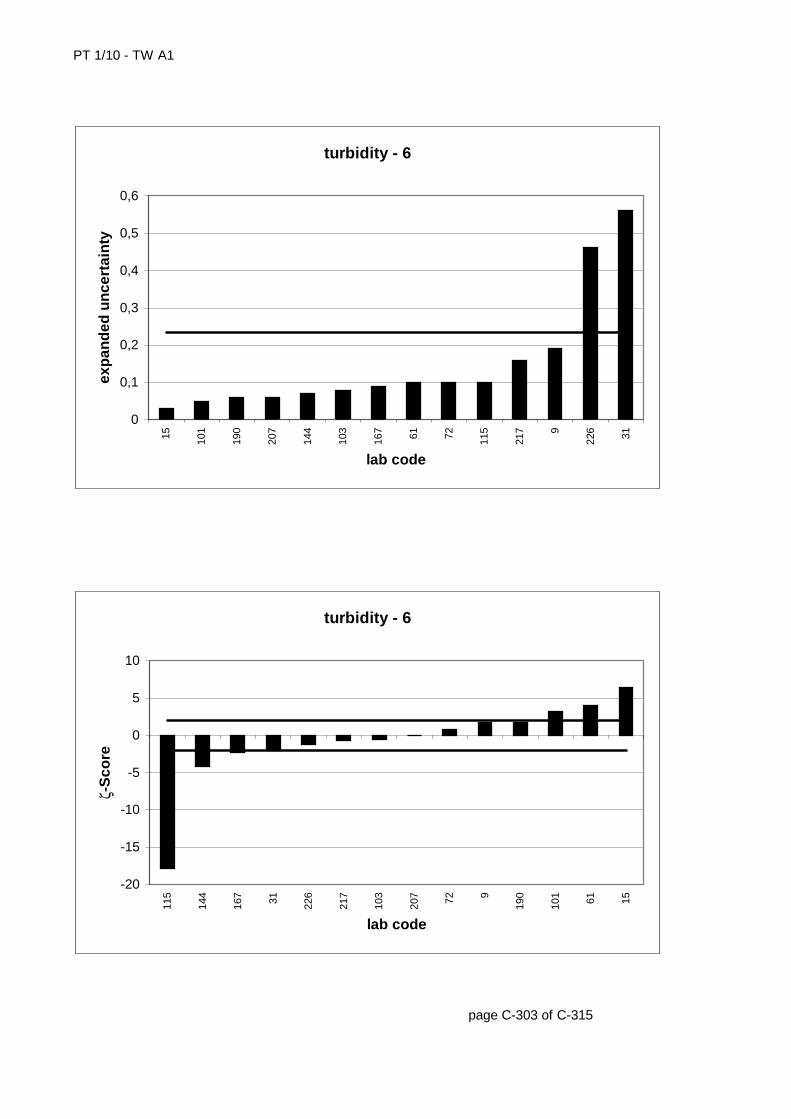
PT 1/10 - TW A1
page C-303 of C-315
turbidity - 6
0
0,1
0,2
0,3
0,4
0,5
0,6
15 101
190
207
144
103
167 61 72 115
217 9
226 31
lab code
exp
and
ed u
nce
rtai
nty
turbidity - 6
-20
-15
-10
-5
0
5
10
115
144
167 31 226
217
103
207 72 9
190
101 61 15
lab code
ζ-S
core
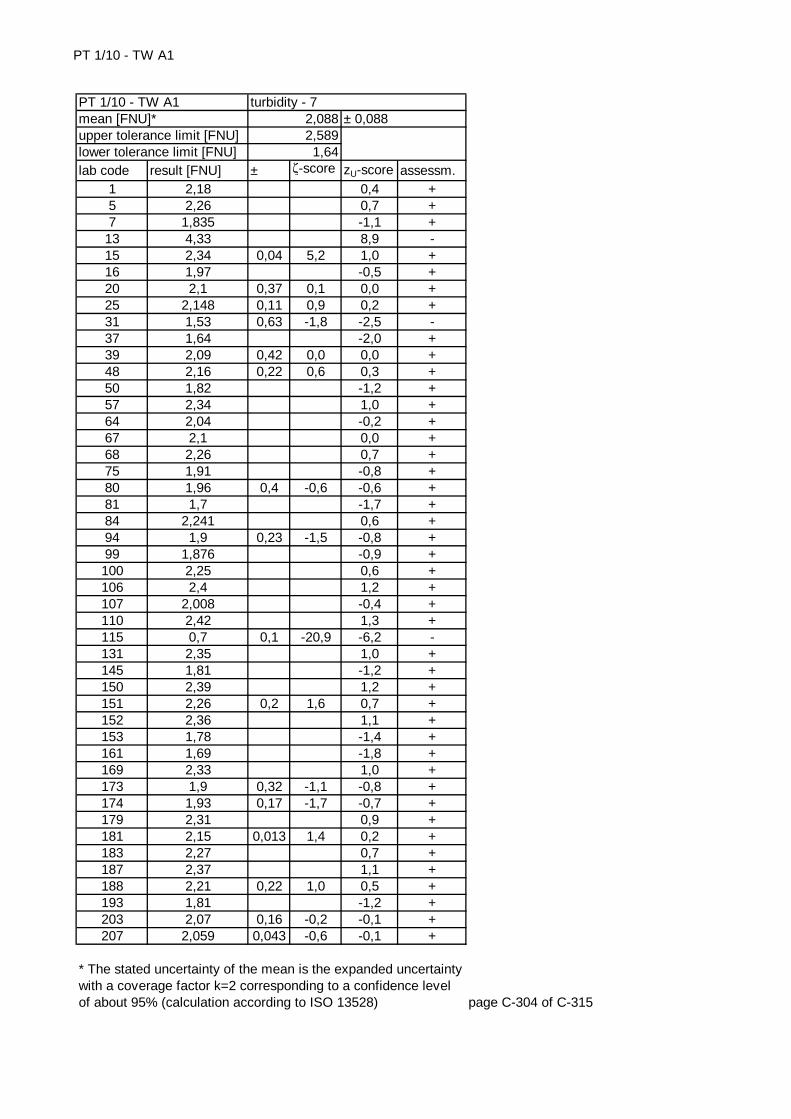
PT 1/10 - TW A1
lab code result [FNU] ± ζ-score zU-score assessm.1 2,18 0,4 +5 2,26 0,7 +7 1,835 -1,1 +
13 4,33 8,9 -15 2,34 0,04 5,2 1,0 +16 1,97 -0,5 +20 2,1 0,37 0,1 0,0 +25 2,148 0,11 0,9 0,2 +31 1,53 0,63 -1,8 -2,5 -37 1,64 -2,0 +39 2,09 0,42 0,0 0,0 +48 2,16 0,22 0,6 0,3 +50 1,82 -1,2 +57 2,34 1,0 +64 2,04 -0,2 +67 2,1 0,0 +68 2,26 0,7 +75 1,91 -0,8 +80 1,96 0,4 -0,6 -0,6 +81 1,7 -1,7 +84 2,241 0,6 +94 1,9 0,23 -1,5 -0,8 +99 1,876 -0,9 +100 2,25 0,6 +106 2,4 1,2 +107 2,008 -0,4 +110 2,42 1,3 +115 0,7 0,1 -20,9 -6,2 -131 2,35 1,0 +145 1,81 -1,2 +150 2,39 1,2 +151 2,26 0,2 1,6 0,7 +152 2,36 1,1 +153 1,78 -1,4 +161 1,69 -1,8 +169 2,33 1,0 +173 1,9 0,32 -1,1 -0,8 +174 1,93 0,17 -1,7 -0,7 +179 2,31 0,9 +181 2,15 0,013 1,4 0,2 +183 2,27 0,7 +187 2,37 1,1 +188 2,21 0,22 1,0 0,5 +193 1,81 -1,2 +203 2,07 0,16 -0,2 -0,1 +207 2,059 0,043 -0,6 -0,1 +
page C-304 of C-315
* The stated uncertainty of the mean is the expanded uncertainty with a coverage factor k=2 corresponding to a confidence level of about 95% (calculation according to ISO 13528)
turbidity - 72,0882,5891,64
± 0,088PT 1/10 - TW A1mean [FNU]*upper tolerance limit [FNU]lower tolerance limit [FNU]
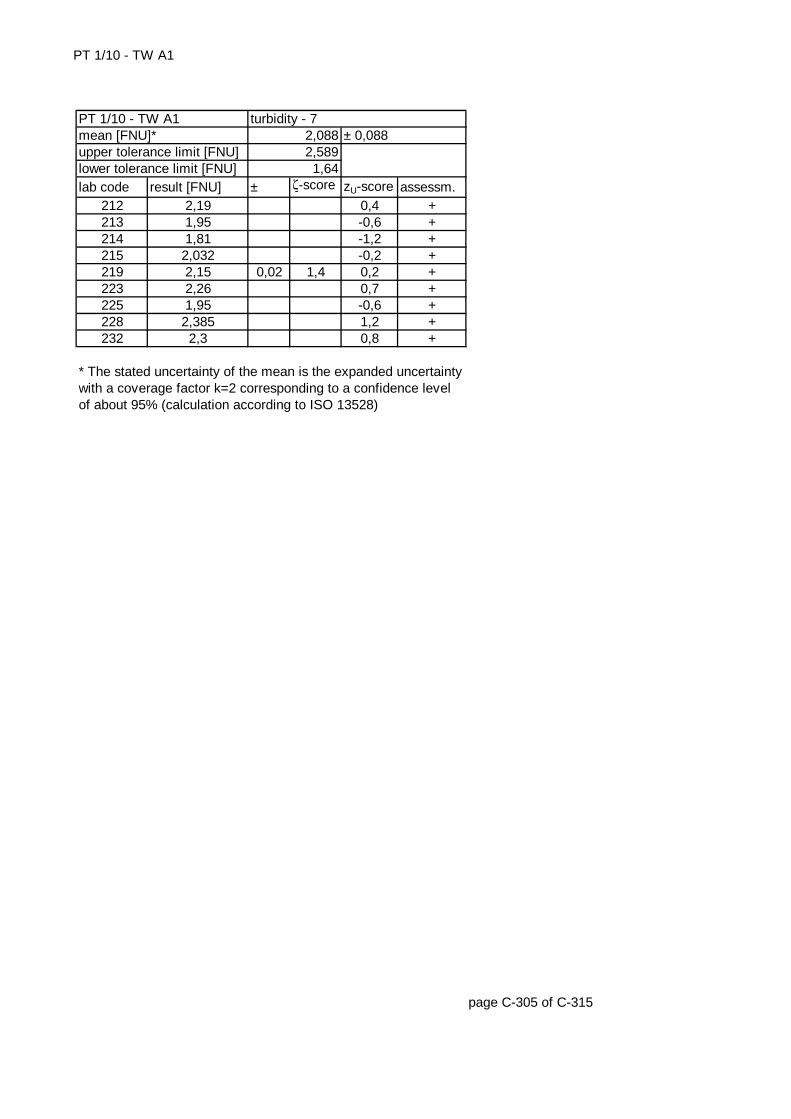
PT 1/10 - TW A1
lab code result [FNU] ± ζ-score zU-score assessm.212 2,19 0,4 +213 1,95 -0,6 +214 1,81 -1,2 +215 2,032 -0,2 +219 2,15 0,02 1,4 0,2 +223 2,26 0,7 +225 1,95 -0,6 +228 2,385 1,2 +232 2,3 0,8 +
page C-305 of C-315
* The stated uncertainty of the mean is the expanded uncertainty with a coverage factor k=2 corresponding to a confidence level of about 95% (calculation according to ISO 13528)
upper tolerance limit [FNU] 2,589lower tolerance limit [FNU] 1,64
PT 1/10 - TW A1 turbidity - 7mean [FNU]* 2,088 ± 0,088
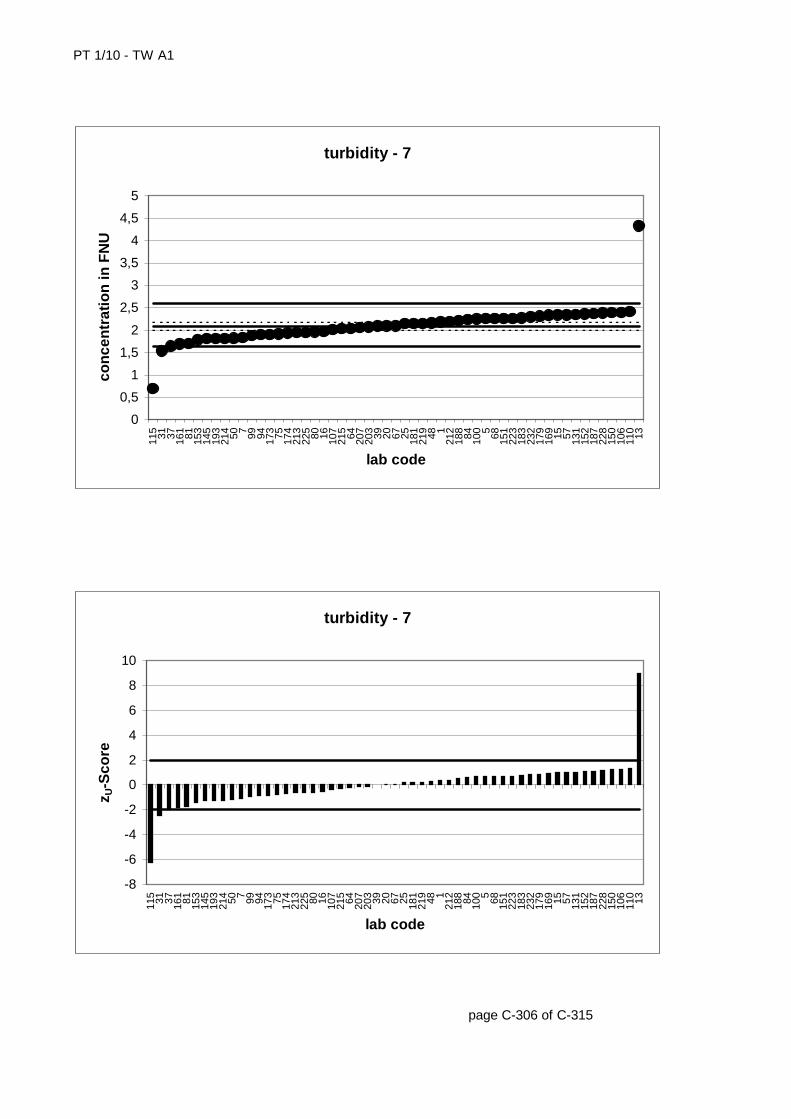
PT 1/10 - TW A1
page C-306 of C-315
turbidity - 7
0
0,5
1
1,5
2
2,5
3
3,5
4
4,5
5
115 31 37 161 81 153
145
193
214 50 7 99 94 173 75 174
213
225 80 16 107
215 64 207
203 39 20 67 25 181
219 48 1
212
188 84 100 5 68 151
223
183
232
179
169 15 57 131
152
187
228
150
106
110 13
lab code
con
cen
trat
ion
in F
NU
turbidity - 7
-8
-6
-4
-2
0
2
4
6
8
10
115 31 37 161 81 153
145
193
214 50 7 99 94 173 75 174
213
225 80 16 107
215 64 207
203 39 20 67 25 181
219 48 1
212
188 84 100 5 68 151
223
183
232
179
169 15 57 131
152
187
228
150
106
110 13
lab code
z U-S
core
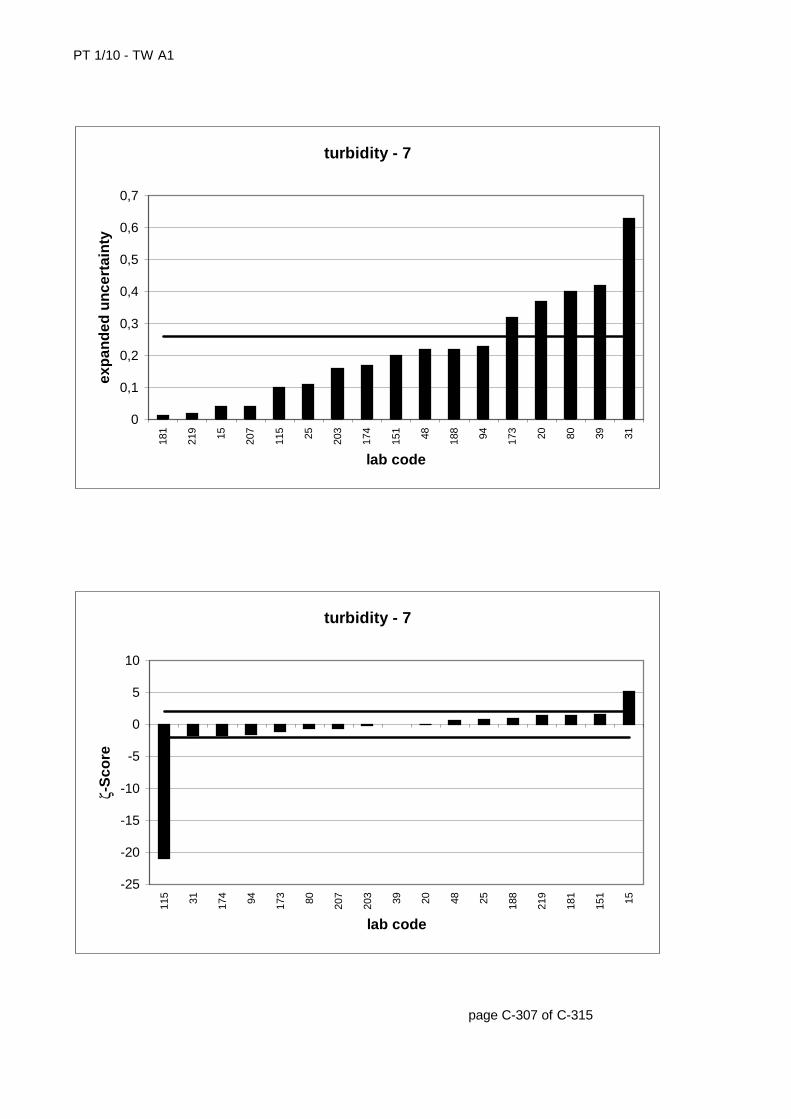
PT 1/10 - TW A1
page C-307 of C-315
turbidity - 7
0
0,1
0,2
0,3
0,4
0,5
0,6
0,7
181
219 15 207
115 25 203
174
151 48 188 94 173 20 80 39 31
lab code
exp
and
ed u
nce
rtai
nty
turbidity - 7
-25
-20
-15
-10
-5
0
5
10
115 31 174 94 173 80 207
203 39 20 48 25 188
219
181
151 15
lab code
ζ-S
core
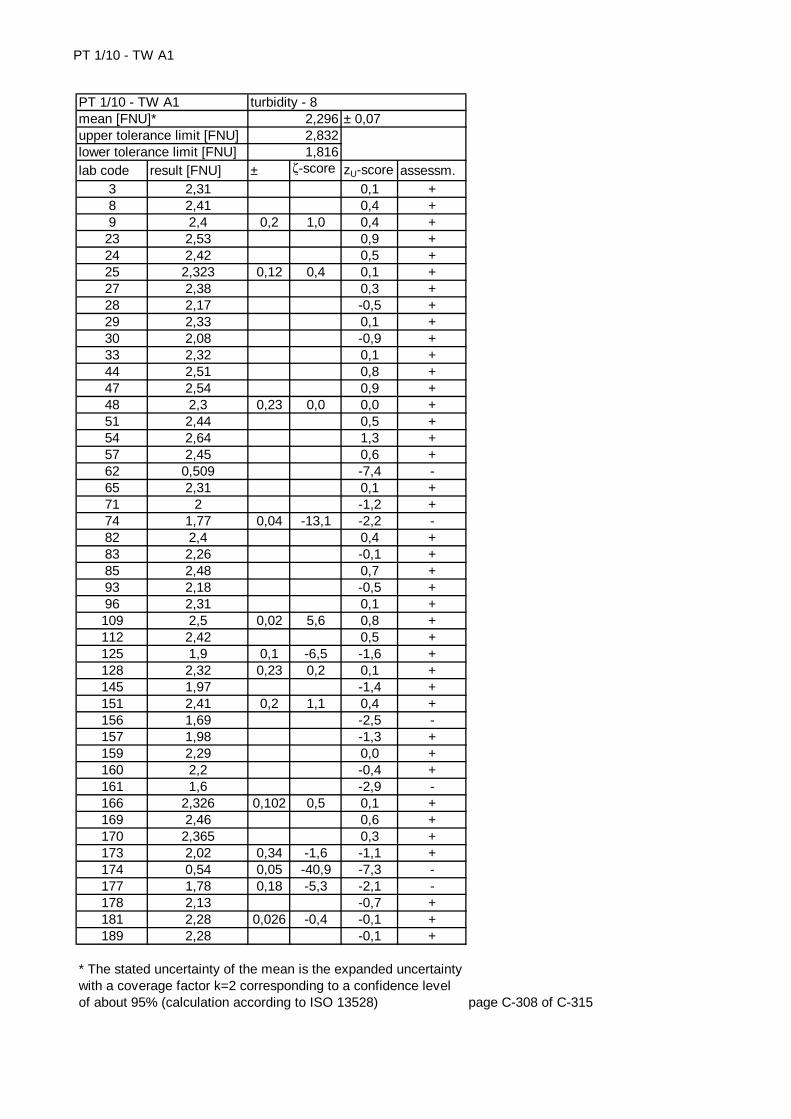
PT 1/10 - TW A1
lab code result [FNU] ± ζ-score zU-score assessm.3 2,31 0,1 +8 2,41 0,4 +9 2,4 0,2 1,0 0,4 +
23 2,53 0,9 +24 2,42 0,5 +25 2,323 0,12 0,4 0,1 +27 2,38 0,3 +28 2,17 -0,5 +29 2,33 0,1 +30 2,08 -0,9 +33 2,32 0,1 +44 2,51 0,8 +47 2,54 0,9 +48 2,3 0,23 0,0 0,0 +51 2,44 0,5 +54 2,64 1,3 +57 2,45 0,6 +62 0,509 -7,4 -65 2,31 0,1 +71 2 -1,2 +74 1,77 0,04 -13,1 -2,2 -82 2,4 0,4 +83 2,26 -0,1 +85 2,48 0,7 +93 2,18 -0,5 +96 2,31 0,1 +109 2,5 0,02 5,6 0,8 +112 2,42 0,5 +125 1,9 0,1 -6,5 -1,6 +128 2,32 0,23 0,2 0,1 +145 1,97 -1,4 +151 2,41 0,2 1,1 0,4 +156 1,69 -2,5 -157 1,98 -1,3 +159 2,29 0,0 +160 2,2 -0,4 +161 1,6 -2,9 -166 2,326 0,102 0,5 0,1 +169 2,46 0,6 +170 2,365 0,3 +173 2,02 0,34 -1,6 -1,1 +174 0,54 0,05 -40,9 -7,3 -177 1,78 0,18 -5,3 -2,1 -178 2,13 -0,7 +181 2,28 0,026 -0,4 -0,1 +189 2,28 -0,1 +
page C-308 of C-315
* The stated uncertainty of the mean is the expanded uncertainty with a coverage factor k=2 corresponding to a confidence level of about 95% (calculation according to ISO 13528)
turbidity - 82,2962,8321,816
± 0,07PT 1/10 - TW A1mean [FNU]*upper tolerance limit [FNU]lower tolerance limit [FNU]
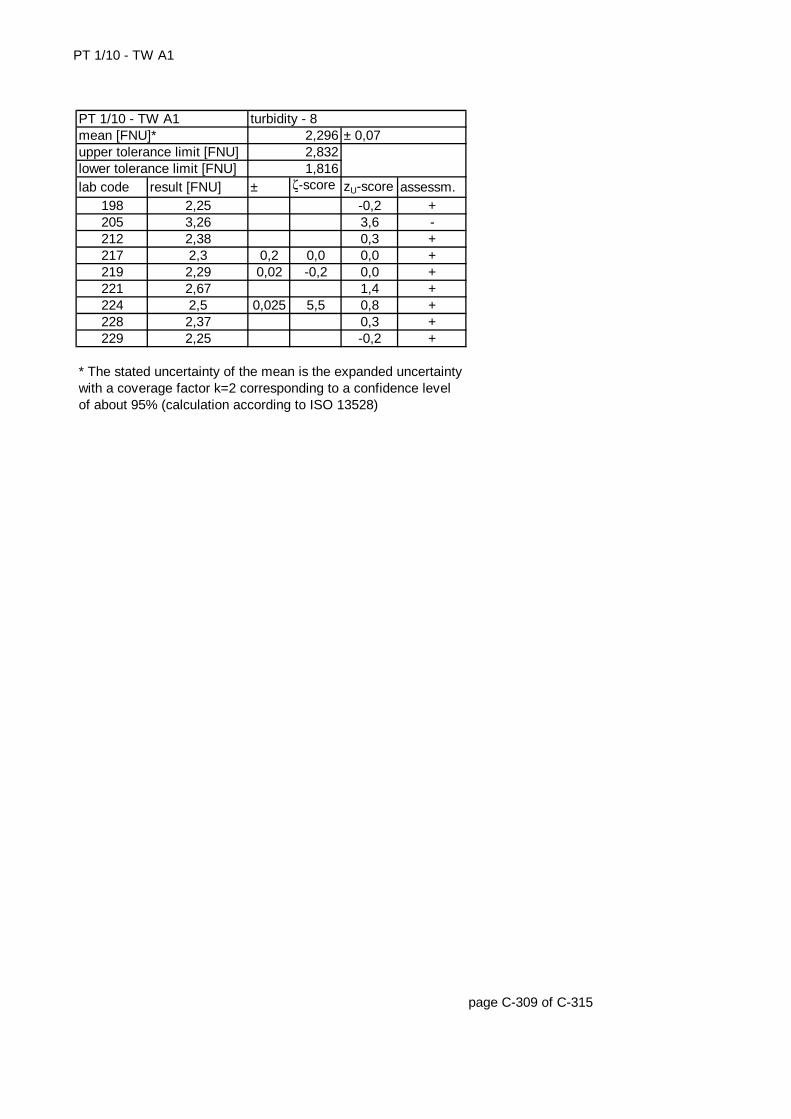
PT 1/10 - TW A1
lab code result [FNU] ± ζ-score zU-score assessm.198 2,25 -0,2 +205 3,26 3,6 -212 2,38 0,3 +217 2,3 0,2 0,0 0,0 +219 2,29 0,02 -0,2 0,0 +221 2,67 1,4 +224 2,5 0,025 5,5 0,8 +228 2,37 0,3 +229 2,25 -0,2 +
page C-309 of C-315
* The stated uncertainty of the mean is the expanded uncertainty with a coverage factor k=2 corresponding to a confidence level of about 95% (calculation according to ISO 13528)
upper tolerance limit [FNU] 2,832lower tolerance limit [FNU] 1,816
PT 1/10 - TW A1 turbidity - 8mean [FNU]* 2,296 ± 0,07
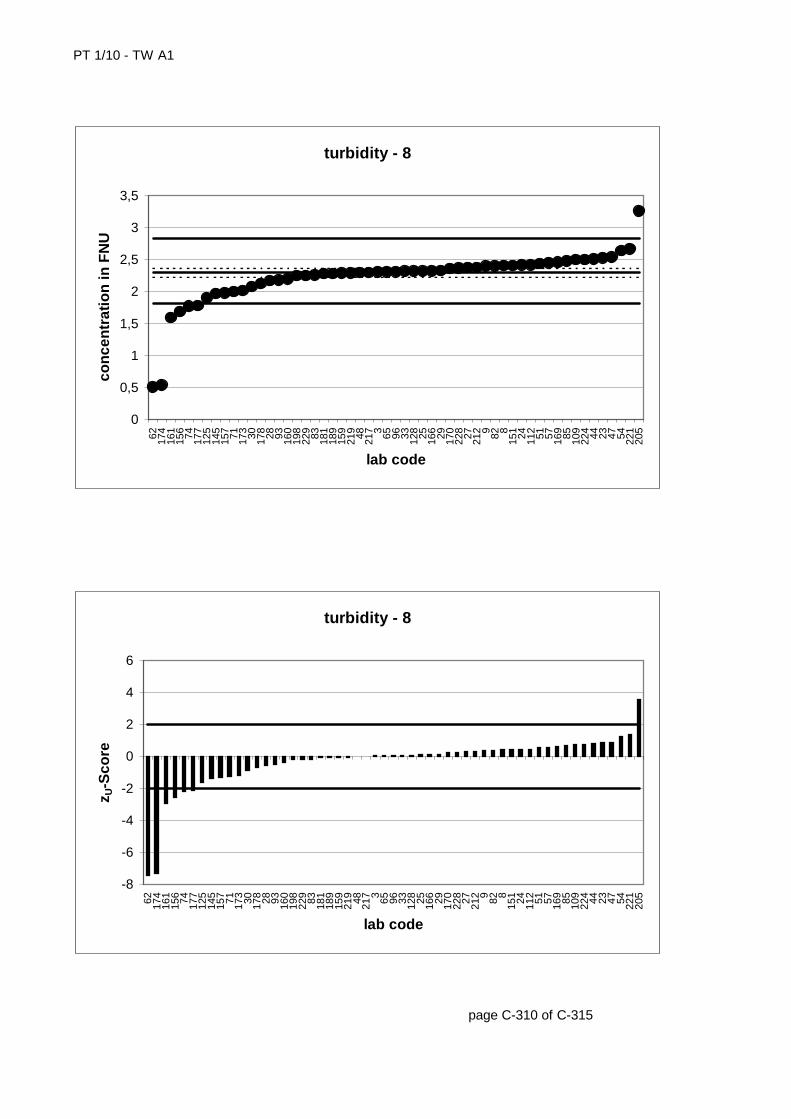
PT 1/10 - TW A1
page C-310 of C-315
turbidity - 8
0
0,5
1
1,5
2
2,5
3
3,5
62 174
161
156 74 177
125
145
157 71 173 30 178 28 93 160
198
229 83 181
189
159
219 48 217 3 65 96 33 128 25 166 29 170
228 27 212 9 82 8
151 24 112 51 57 169 85 109
224 44 23 47 54 221
205
lab code
con
cen
trat
ion
in F
NU
turbidity - 8
-8
-6
-4
-2
0
2
4
6
62 174
161
156 74 177
125
145
157 71 173 30 178 28 93 160
198
229 83 181
189
159
219 48 217 3 65 96 33 128 25 166 29 170
228 27 212 9 82 8
151 24 112 51 57 169 85 109
224 44 23 47 54 221
205
lab code
z U-S
core
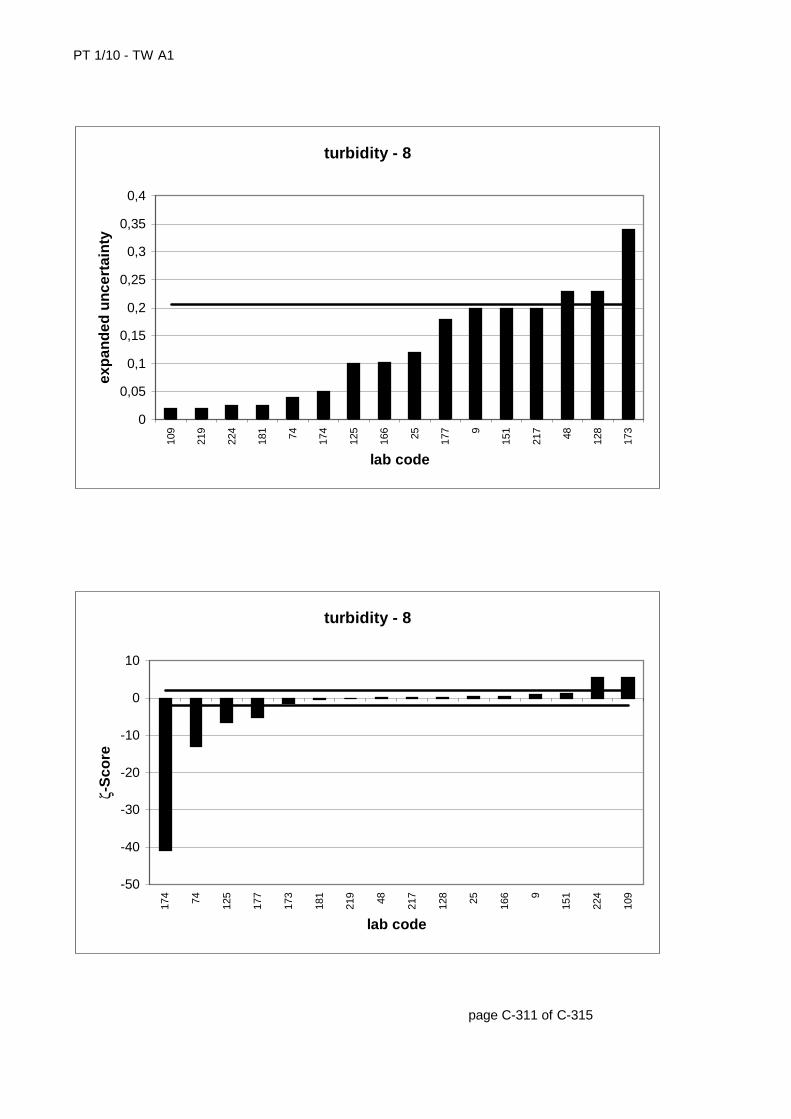
PT 1/10 - TW A1
page C-311 of C-315
turbidity - 8
0
0,05
0,1
0,15
0,2
0,25
0,3
0,35
0,4
109
219
224
181 74 174
125
166 25 177 9
151
217 48 128
173
lab code
exp
and
ed u
nce
rtai
nty
turbidity - 8
-50
-40
-30
-20
-10
0
10
174 74 125
177
173
181
219 48 217
128 25 166 9
151
224
109
lab code
ζ-S
core
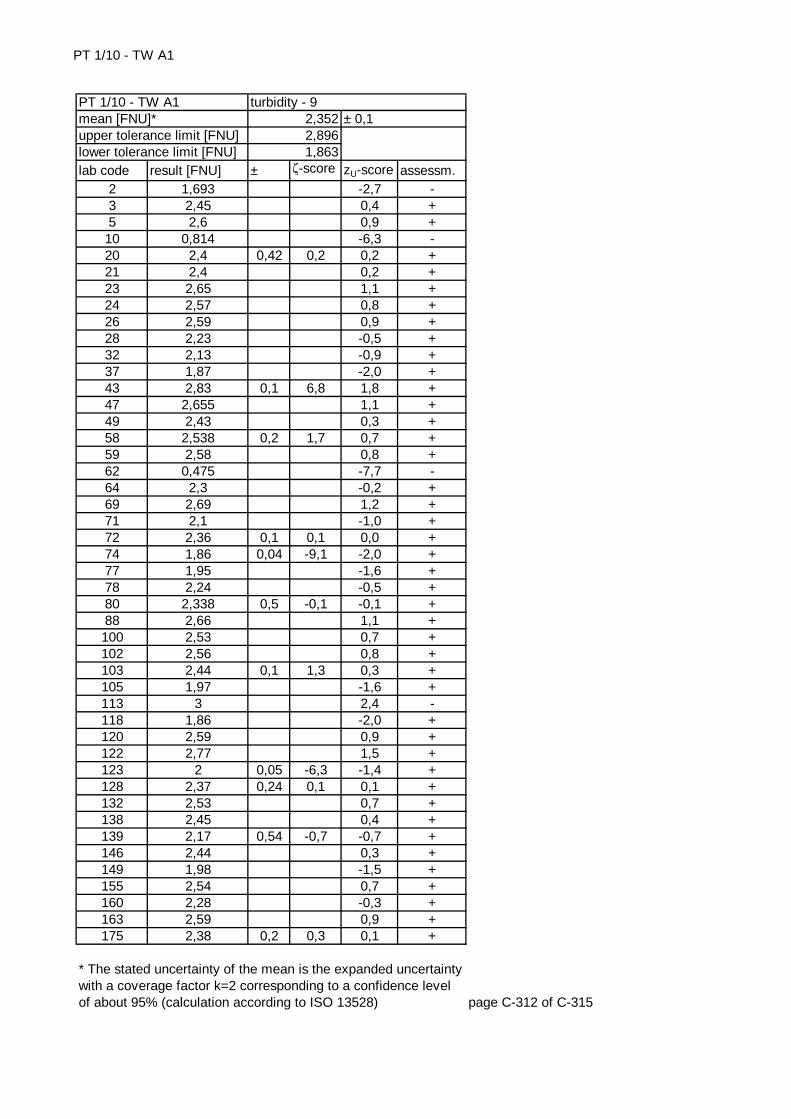
PT 1/10 - TW A1
lab code result [FNU] ± ζ-score zU-score assessm.2 1,693 -2,7 -3 2,45 0,4 +5 2,6 0,9 +
10 0,814 -6,3 -20 2,4 0,42 0,2 0,2 +21 2,4 0,2 +23 2,65 1,1 +24 2,57 0,8 +26 2,59 0,9 +28 2,23 -0,5 +32 2,13 -0,9 +37 1,87 -2,0 +43 2,83 0,1 6,8 1,8 +47 2,655 1,1 +49 2,43 0,3 +58 2,538 0,2 1,7 0,7 +59 2,58 0,8 +62 0,475 -7,7 -64 2,3 -0,2 +69 2,69 1,2 +71 2,1 -1,0 +72 2,36 0,1 0,1 0,0 +74 1,86 0,04 -9,1 -2,0 +77 1,95 -1,6 +78 2,24 -0,5 +80 2,338 0,5 -0,1 -0,1 +88 2,66 1,1 +100 2,53 0,7 +102 2,56 0,8 +103 2,44 0,1 1,3 0,3 +105 1,97 -1,6 +113 3 2,4 -118 1,86 -2,0 +120 2,59 0,9 +122 2,77 1,5 +123 2 0,05 -6,3 -1,4 +128 2,37 0,24 0,1 0,1 +132 2,53 0,7 +138 2,45 0,4 +139 2,17 0,54 -0,7 -0,7 +146 2,44 0,3 +149 1,98 -1,5 +155 2,54 0,7 +160 2,28 -0,3 +163 2,59 0,9 +175 2,38 0,2 0,3 0,1 +
page C-312 of C-315
* The stated uncertainty of the mean is the expanded uncertainty with a coverage factor k=2 corresponding to a confidence level of about 95% (calculation according to ISO 13528)
turbidity - 92,3522,8961,863
± 0,1PT 1/10 - TW A1mean [FNU]*upper tolerance limit [FNU]lower tolerance limit [FNU]
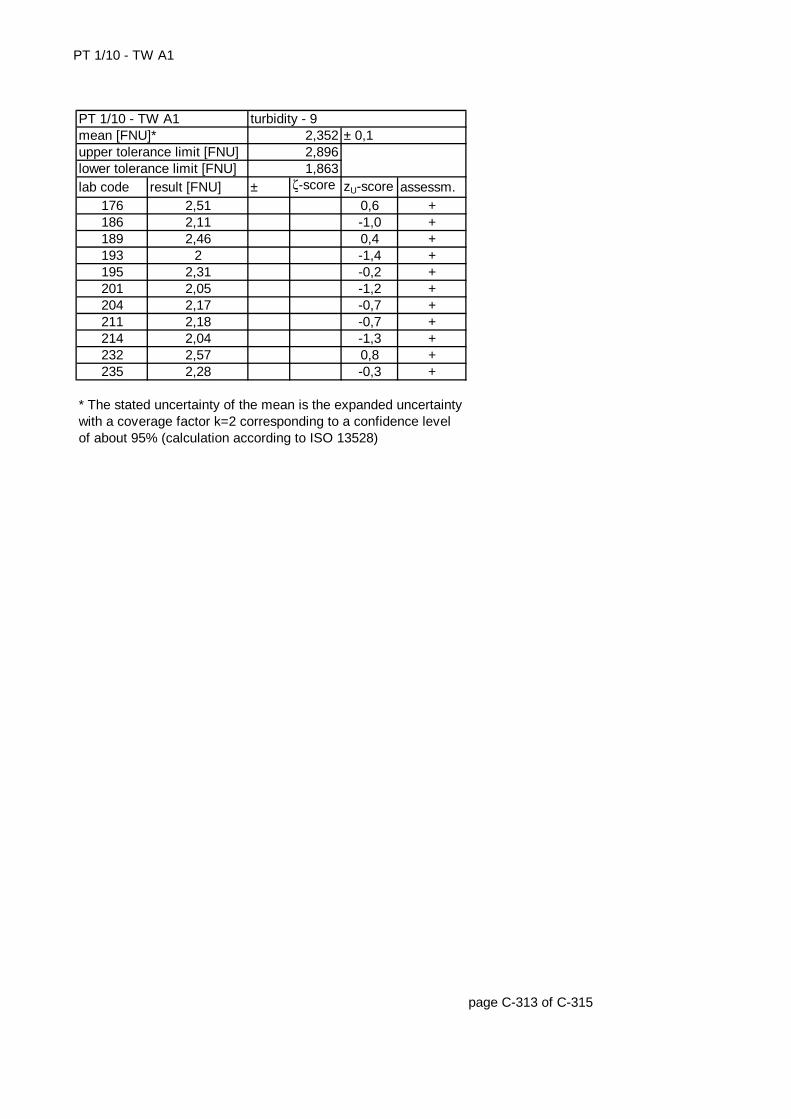
PT 1/10 - TW A1
lab code result [FNU] ± ζ-score zU-score assessm.176 2,51 0,6 +186 2,11 -1,0 +189 2,46 0,4 +193 2 -1,4 +195 2,31 -0,2 +201 2,05 -1,2 +204 2,17 -0,7 +211 2,18 -0,7 +214 2,04 -1,3 +232 2,57 0,8 +235 2,28 -0,3 +
page C-313 of C-315
* The stated uncertainty of the mean is the expanded uncertainty with a coverage factor k=2 corresponding to a confidence level of about 95% (calculation according to ISO 13528)
upper tolerance limit [FNU] 2,896lower tolerance limit [FNU] 1,863
PT 1/10 - TW A1 turbidity - 9mean [FNU]* 2,352 ± 0,1
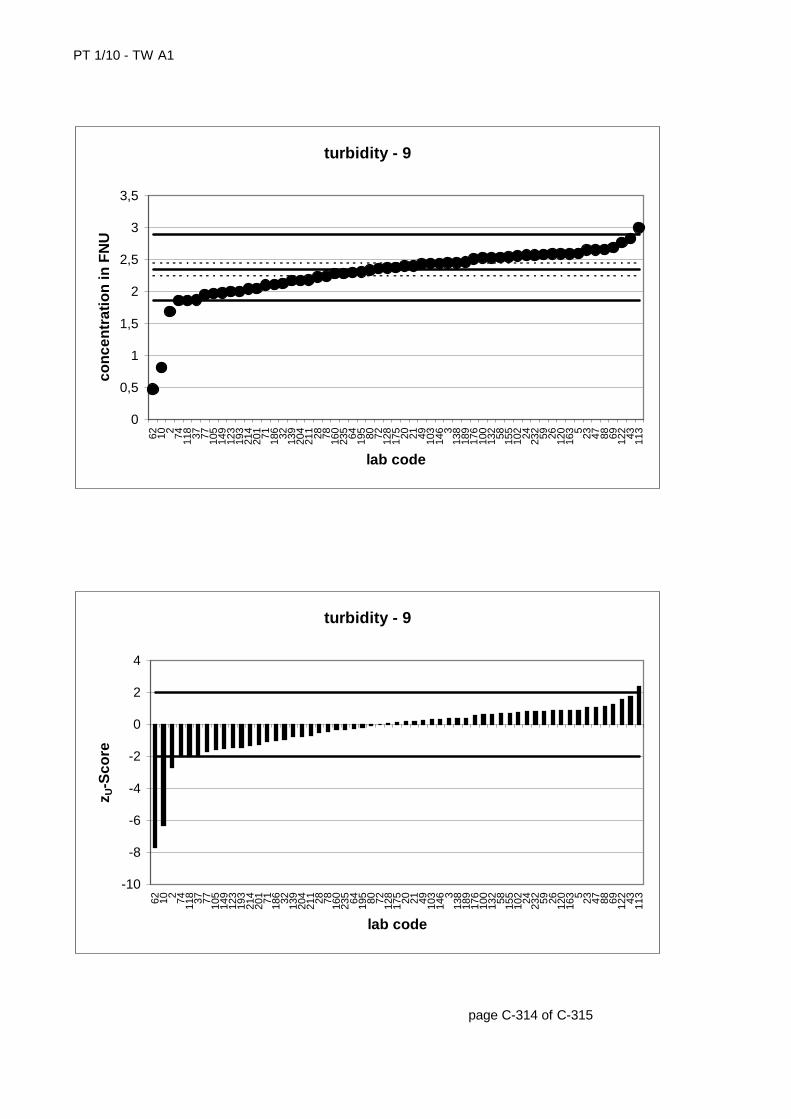
PT 1/10 - TW A1
page C-314 of C-315
turbidity - 9
0
0,5
1
1,5
2
2,5
3
3,5
62 10 2 74 118 37 77 105
149
123
193
214
201 71 186 32 139
204
211 28 78 160
235 64 195 80 72 128
175 20 21 49 103
146 3
138
189
176
100
132 58 155
102 24 232 59 26 120
163 5 23 47 88 69 122 43 113
lab code
con
cen
trat
ion
in F
NU
turbidity - 9
-10
-8
-6
-4
-2
0
2
4
62 10 2 74 118 37 77 105
149
123
193
214
201 71 186 32 139
204
211 28 78 160
235 64 195 80 72 128
175 20 21 49 103
146 3
138
189
176
100
132 58 155
102 24 232 59 26 120
163 5 23 47 88 69 122 43 113
lab code
z U-S
core

PT 1/10 - TW A1
page C-315 of C-315
turbidity - 9
0
0,1
0,2
0,3
0,4
0,5
0,6
74 123 43 72 103 58 175
128 20 80 139
lab code
exp
and
ed u
nce
rtai
nty
turbidity - 9
-10
-8
-6
-4
-2
0
2
4
6
8
74 123
139 80 72 128 20 175
103 58 43
lab code
ζ-S
core