Embed Size (px)
Citation preview

University of Bath
PHD
Analytical and chromatographic studies on aminoglycoside antibiotics.
Lacy, Jonathan Ernest
Award date:1984
Awarding institution:University of Bath
Link to publication
Alternative formatsIf you require this document in an alternative format, please contact:[email protected]
Copyright of this thesis rests with the author. Access is subject to the above licence, if given. If no licence is specified above,original content in this thesis is licensed under the terms of the Creative Commons Attribution-NonCommercial 4.0International (CC BY-NC-ND 4.0) Licence (https://creativecommons.org/licenses/by-nc-nd/4.0/). Any third-party copyrightmaterial present remains the property of its respective owner(s) and is licensed under its existing terms.
Take down policyIf you consider content within Bath's Research Portal to be in breach of UK law, please contact: [email protected] with the details.Your claim will be investigated and, where appropriate, the item will be removed from public view as soon as possible.
Download date: 15. Mar. 2022

ANALYTICAL AND CHROMATOGRAPHIC STUDIES
ON AMINOGLYCOSIDE ANTIBIOTICS
Submitted by Jonathan Ernest Lacy
for the degree of Ph.D.
of the University of Bath
1984
COPYRIGHT
"Attention is drawn to the fact that copyright of this thesis rests
with its author. This copy of the thesis has been supplied on
condition that anyone who consults it is understood to recognise
that its copyright rests with its author and that no quotation from
the thesis and no information derived from it may be published
without the prior written consent of the author".
RESTRICTIONS ON USE
The thesis may be made available for consultation within the
University Library and may be photocopied or lent to other Libraries
for the purpose of consultation. ___

ProQuest Number: U341572
All rights reserved
INFORMATION TO ALL USERS The quality of this reproduction is dependent upon the quality of the copy submitted.
In the unlikely event that the author did not send a complete manuscript and there are missing pages, these will be noted. Also, if material had to be removed,
a note will indicate the deletion.
uest.
ProQuest U341572
Published by ProQuest LLC(2015). Copyright of the Dissertation is held by the Author.
All rights reserved.This work is protected against unauthorized copying under Title 17, United States Code.
Microform Edition © ProQuest LLC.
ProQuest LLC 789 East Eisenhower Parkway
P.O. Box 1346 Ann Arbor, Ml 48106-1346

1 .
ACKNOWLE DGEMENTS
I would like to express my gratitude to Dr. M.G. Rowan for
his excellent supervision and for many informative and fruitful
discussions. I am also indebted to Prof. R.T. Parfitt for his
kind assistance and for providing the gentamicin commercial
samples. I would also like to record my appreciation of the
invaluable help of Mr. R. Sadler and other technical staff of
the Schpol of Pharmacy and Pharmacology.
I wish to thank Dr. D. Scott of the General Hospital,
Birmingham, for providing patient plasma samples and comparative
microbiological assay results, as well as to Mr. M. Rossiter of
the Department of Chemistry, University College, Cardiff for running
numerous compounds by Field Desorption Mass Spectrometry.
Finally, I would most especially like to thank Helen, my
wife, for her tremendous help and patience, in spite of my
preoccupation with this research.

11.
SUMMARY
Minor components of the gentamicin series were isolated
from commercial samples of gentamicin sulphate. Mass spectrometry
and nuclear magnetic resonance (NMR) were applied to elucidate
structures. Total identification was not achieved for all compon
ents though evidence for novel central sub-units was presented.
An unusual site for N-methylation was discovered at the 3-position
on gentamicin •
Reversed phase high performance chromatography (HPLC) with
pre-column derivatisation was used to quantitate gentamicin
component levels in commercial samples from various sources.
A method for the measurement of gentamicin in blood plasma by
HPLC was developed. Methods for extraction of gentamicin from
plasma constituents were evaluated and a chosen method used to
determine levels in over fifty patient samples. These values
were compared with those found by microbiological assay and a
close relationship was observed. Pharmacokinetic parameters
were estimated for the individual gentamicin components (C^,
C_ and C ). Gentamicin C was found to possess a longer la Z laplasma half life than the other two components.
The fluorometric reaction of ortho-phthalaldehyde (OPA)
with the gentamicin components was studied using ^H and
NMR. The reactive intermediate was shown to be a. i dihydro-
isobenzofuran and a reaction pathway proposed. The OPA reagent
was found to react with all the primary amino functions on the

lii.
gentamicin components. Ninhydrin was used to confirm this result.
The retention characteristics of the gentamicin-OPA deriva
tives in the HPLC system used were investigated and an explanation
of the factors governing the observed behaviour, proposed.
Differences in the order of elution of the components, reported
in the literature, were also explained.
IV.
CONTENTS
Page
ACKNOWLEDGEMENTS i
SUMMARY ii
CHAPTER 1. INTRODUCTION 1
CHAPTER 2. ISOLATION AND IDENTIFICATION OF MINOR
COMPONENTS OF THE GENTAMICIN SERIES 35
2.1 Introduction 35
2.2 Materials and Methods
2.2.1 Materials 38
2.2.2 Methods 39
2.3 Results and Discussion 45
2.3.1 HPLC Semi-Preparative Isolation of Minor
Compon ent s 45
2.3.2 Spectral Characteristics of the
Gentamicin C Components 46
2.3.3 Isolation of Minor Components 61
2.3.4 Spectroscopic Study of Netilmicin 86
CHAPTER 3. QUANTITATION OF COMPONENT LEVELS OF GENTAMICIN
IN COMMERCIAL SAMPLES OF GENTAMICIN SULPHATE
AND IN BLOOD PLASMA BY HIGH PERFORMANCE
LIQUID CHROMATOGRAPHY 95
3.1 Introduction 95
3.2 Materials and Methods 98
3.2.1 Materials 98
3.2.2 Methods 99
3.2.2a General HPLC Method 99
3.2.2b Gentamicin component ratio

V.
Page
determinations in commercial
material samples and pharma
ceutical preparations 100
3.3.2.C Assay of Gentamicin levels in
blood plasma 103
3.3 Results and Discussion 106
3.3.1 Determination of Component Levels in
Commercial Material 106
3.3.2 High-performance Liquid Chromatographic
Analysis of Gentamicin in Blood Plasma 127
CHAPTER 4. ORTHO PHTHALALDEHYDE REACTION IN RELATION TO
GENTAMICIN 157
4.1 Introduction 157
4.2 Materials and Methods
4.2.1 Materials 163
4.2.2 Methods 163
4.2.2.a Nuclear Magnetic Resonance
Study of the Reaction 163
4.2.2.b Fluorescence measurement of
Gentamicin-OPA reaction 167
4.2.2.C Ninhydrin reaction with
Gentamicin 167
4.3 Results and Discussion 170
4.3.1 Nuclear Magnetic Resonance Study of
the Reaction Mechanism between o-
phthalaldehyde and Primary Amines 170
VI.
Page
4.3.1.a NMR of Individual Reactants 170
4.3.1.b NMR of o-Phthalaldehyde
Reagent 175
4.3.1.C o-Phthalaldehyde Reaction with
Standard Amines 195
4.3.1.d Quantification of extent of
OPA Reaction by NMR 206
4.3.2 Fluorescence Measurement of o-Phthal-
aldehyde Reaction 212
4.3.3. Combined Ninhydrin/o-Phthalaldehyde
Reaction with Gentamicin 214
CHAPTER 5. HIGH PERFORMANCE LIQUID CHROMATOGRAPHIC
RETENTION CHARACTERISTICS OF GENTAMICIN-
ORTHO-PHTHALALDEHYDE DERIVATIVES 220
5.1 Introduction 220
5.2 Materials and Methods 228
5.2.1 Materials 228
5.2.2 Methods 229
5.2.2.a Effect of Temperature on Retention 229
5.2.2.b Effect of pH on Retention 230
5.2.2.C Addition of Salts to the Mobile
Phase 230
5.3 Results and Discussion 231
5.3.1 Effect of Temperature on Retention 231
5.3.2 Effect of pH on Retention 235
5.3.3 Effect of Salt on Retention 242
Literature Cited 284
CHAPTER 1
INTRODUCTION
The aminoglycoside aminocyclitols are a group of antibiotics1 2which are still clinically very important ' . The first member.
Streptomycin, was isolated from Streptomyces griseus in 1944^.
Thereafter other structurally related antibiotics such as the
neomycins^, the kanamycins^, paramomycins^ and lividomycins^'^
were isolated from other Streptomyces species after an intensive
search of cultures of organisms similar to fungi. In 1963
gentamicin, a complex of three components, was discovered in9 10two species of Micromonospora ' ; M. purpurea (N.R.R.L. 2953)
and M, echinospora (N.R.R.L. 2985). It was the first antibiotic
to be found in this genus and subsequent investigation led to■ ' 11 ■the isolation of the sisomicins from M. inyoensis in 1970 I
Both of these genera, Micromonospora and Streptomyces, belong12to a group of organisms called the Actinomycetes which are
thought to be related to gram positive bacteria^^. Tobramycin,
one of the most recent natural aminoglycosides in clinical use,
was discovered in 1967^^ as nebramycin factor 6 from S. tenebrarius^^.
Sagamicin, introduced into clinical practice in Japan recently,
has been identified as gentamicin Research has also been
directed towards developing semi-synthetic aminoglycosides.17 18Amikacin and Butakacin have both been derived from Kanamycin-
19A, whilst Dibekacin is from Kanamycin B. A more recent synthesis
was Netilmicin from Sisomicin^^.
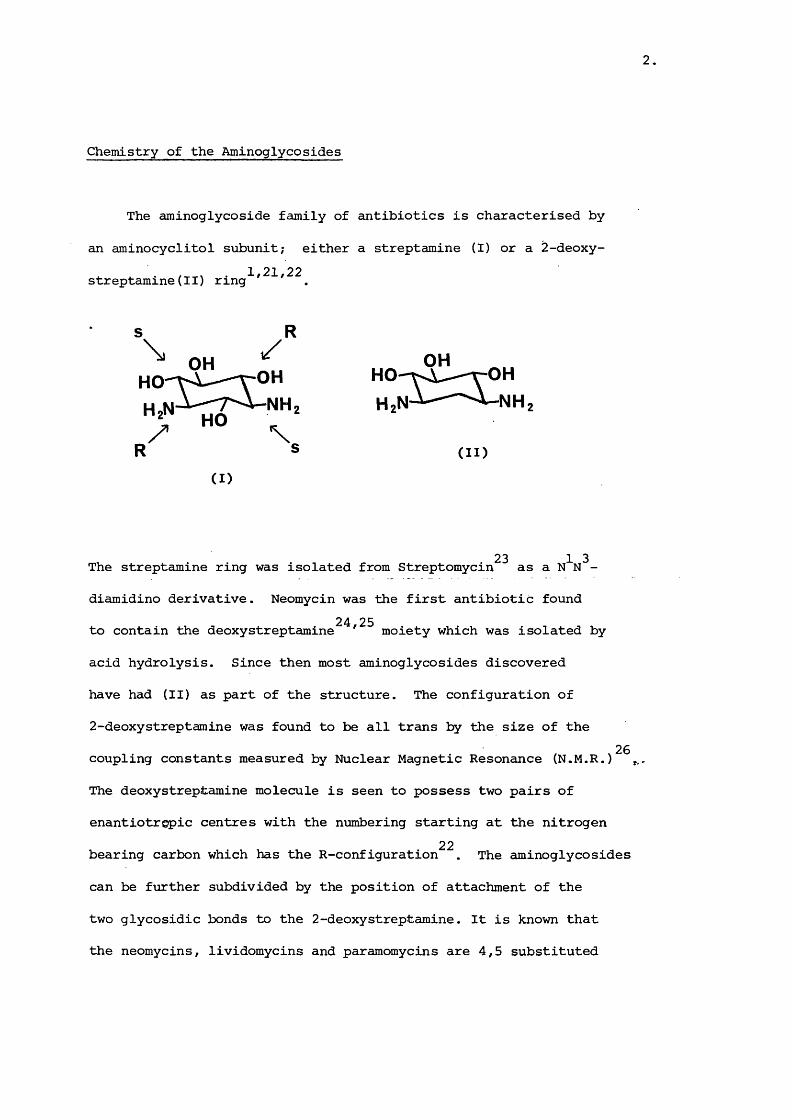
Chemistry of the Aminoglycosides
The aminoglycoside family of antibiotics is characterised by
an aminocyclitol subunit; either a streptamine (I) or a 2-deoxy-1 21 22 streptamine(II) ring ' '
u m A — rA^NHz HzN-^ A-NH’ HO2*/ ■■■ %(I)
(II)
23 1 3The streptamine ring was isolated from Streptomycin as a N N -
diamidino derivative. Neomycin was the first antibiotic found
to contain the deoxystreptamine^^'^^ moiety which was isolated by
acid hydrolysis. Since then most aminoglycosides discovered
have had (II) as part of the structure. The configuration of
2-deoxystreptamine was found to be all trans by the size of the
coupling constants measured by Nuclear Magnetic Resonance (N.M.R.)^^,,
The deoxystreptamine molecule is seen to possess two pairs of
enantiotrgpic centres with the numbering starting at the nitrogen22bearing carbon which has the R-configuration . The aminoglycosides
can be further subdivided by the position of attachment of the
two glycosidic bonds to the 2-deoxystreptamine. It is known that
the neomycins, lividomycins and paramomycins are 4,5 substituted

whilst the kanamycins and gentamicins are 4,6 substituted. The amino-
sugar attached to the 4-position receives primed numbers whilst
that attached to the 5 or 6-carbon receives double primed numbers.
Streptomycin has the structure illustrated in FigurellA with
a streptidine ring linked to L-methylglucosamine by a sugar
moiety called streptose. Dihydrostreptomycin has the reduced
streptose ring present as shown in Figure
Neomycin is a complex of three major components as shown in
Figure Neomycin B is the major component and differs
from Neomycin C only in the stereochemistry of the aminomethyl
group attached to C-5'''. Neamine is a degradation product of25Neomycins B and C as well as a fermentation product . Other
minor components have been found to be co-produced but they28 29possess little biological activity ' ' . I n the United Kingdom
a limit of 2% w/v of neamine in neomycin sulphate is set but
there is no limit on the proportion of neomycin C present^^.
However, Framycetin is classified as being ngomycin B and limits30of 3% w/v neomycin C and 1% w/v neamine are defined
Neomycin C present is measured by ion-exclusion chromatography
with ninhydrin monitoring whilst the neamine level is controlled
ty Thin-Layer Chromatography (TLC) using a reference standard.
The FDA in the United States requires only a potency determination
and no assessment of component composition^^. This is because
neomycin is not administered parenterally, and so less strict limits

Figure 1.1. Structure of Streptomycin.
NH
H
(lA) R = CHO Streptomycin
(IB) R = CH^OH Dihydrostreptomycin

Figure 1.2. Structure of the Neomycins
NH
HO
HO
NeamineH
^2 *5
Neomycin B OH NH2 H H CH2NH2
Neomycin C OH NH^ H CH2NH2 H
Paromomycin I OH OH H H CH2NH2
Paromomycin II OH OH H CH^NH^ H
Lividomycin A H OH Mannose H
Lividomycin B H OH H H CHNH
6,
are required. Other methods have been devised to separate and_ . 32-41^assess component composition
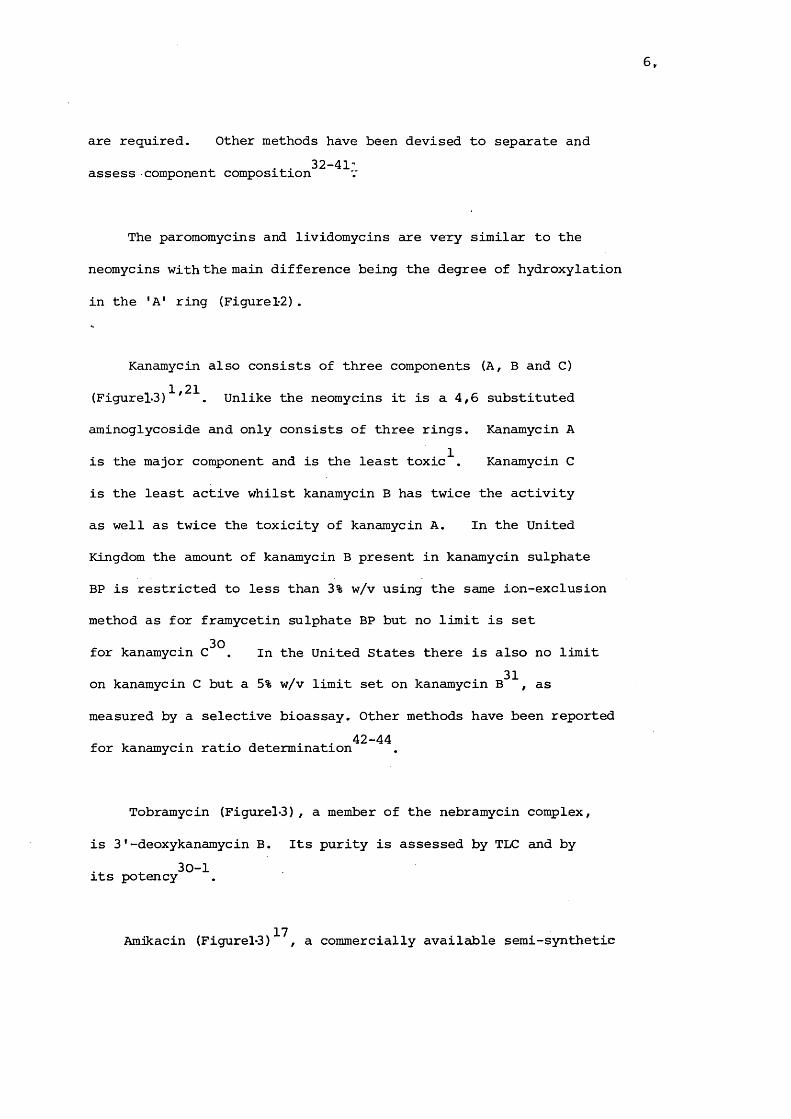
The paromomycins and lividomycins are very similar to the
neomycins with the main difference being the degree of hydroxylation
in the 'A' ring (Figure12).
Kanamycin also consists of three components (A, B and C)1 21(Figurel-S) ' , Unlike the neomycins it is a 4,6 substituted
aminoglycoside and only consists of three rings. Kanamycin A
is the major component and is the least toxic^. Kanamycin C
is the least active whilst kanamycin B has twice the activity
as well as twice the toxicity of kanamycin A. In the United
Kingdom the amount of kanamycin B present in kanamycin sulphate
BP is restricted to less than 3% w/v using the same ion-exclusion
method as for framycetin sulphate BP but no limit is set
for kanamycin In the United States there is also no limit
on kanamycin C but a 5% w/v limit set on kanamycin B^^, as
measured by a selective bioassay. Other methods have been reported42-44for kanamycin ratio determination
Tobramycin (Figurel-3), a member of the nebramycin complex,
is 3'-deoxykanamycin B. Its purity is assessed by TLC and by 30-1its potency
Amikacin (FigureU) , a commercially available semi-synthetic
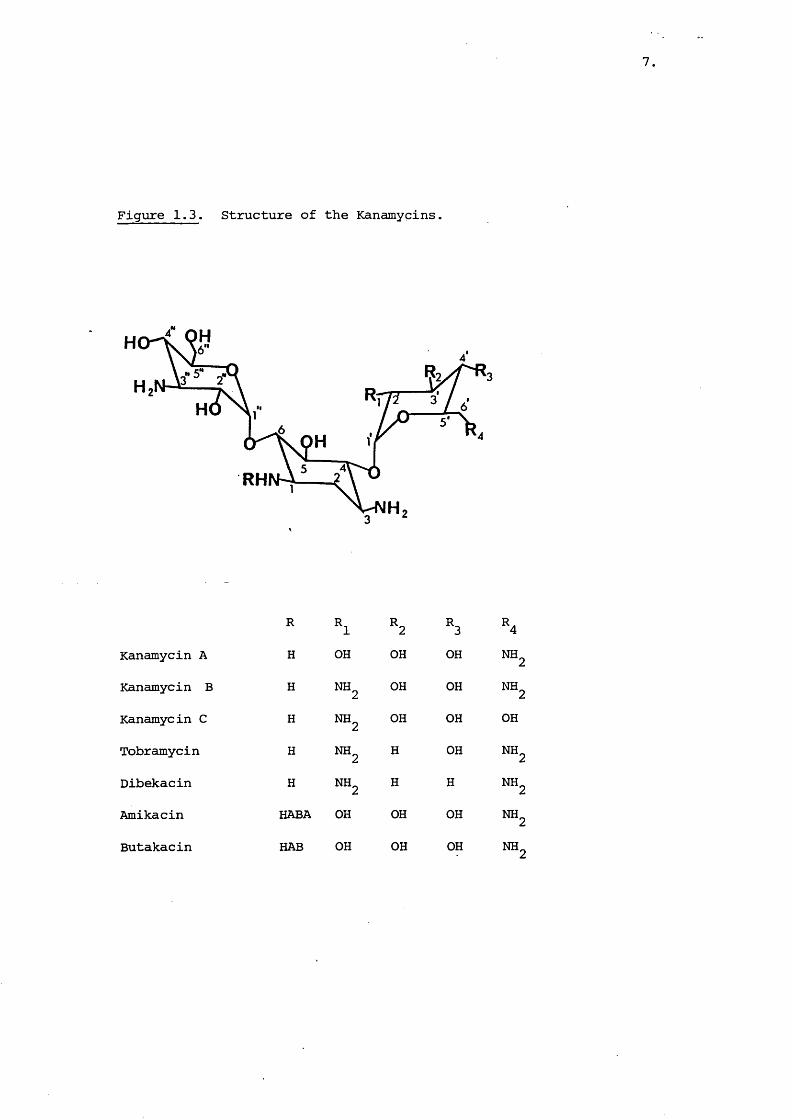
Figure 1.3. Structure of the Kanamycins.
RH
R * 2Kanamycin A H OH OH OH NH2
Kanamycin B H NH2 OH OH NH2
Kanamycin C H NH2 OH OH OH
Tobramycin H NH2 H OH NH2
Dibekacin H NH2 H H NH2
Amikacin HABA OH OH OH NH2
Butakacin HAB OH OH OH NH2

aminoglycoside is based on kanamycin A, having an L (-)-y-amino-a-
hydroxybutyric acid (L-AHBA) side chain attached to the C-1 carbon
atom. This was synthesised because studies showed that the
naturally occurring Butirosins were resistant to many inactivating
enzymes, with the L-AHBA side chain present in that group of45antibiotics being the probable protecting factor . Butakacin
and Dibekacin (Figurel*3) have also been synthesised to improve. 1,22,46,47resistance to inactivating enzymes
The sisomicins are a relatively recent family of amino- 11 21 22glycosides ' ' , with a novel structure (Figurel-4) and show
an antimicrobial spectrum similar to g e n t a m i c i n ^ S i s o m i c i n49is the 4',5' dehydro derivative of gentamicin and
21verdamicin exhibits a similar relationship to gentamicin
By selective N-ethylation of the C-1 amino group under controlled20pH conditions netilmicin (Figurel4) was produced . It shows
a similar potency to gentamicin but the N-ethyl group protectsSO-lit against various important inactivating enzymes . Other
recently discovered aminoglycosides of importance include the
seldomycins and the mutamicins"^^'^^, both of which show beneficial
characteristics.
One of the largest families of aminoglycosides are the 1 9 22 52gentamicins ' ' ' . I n the culture broth are produced many
antibiotics. The gentamicin C complex is separated from other
related compounds by use of a cation exchange resin to extract
the antibiotics, followed by selective precipitation of the c-
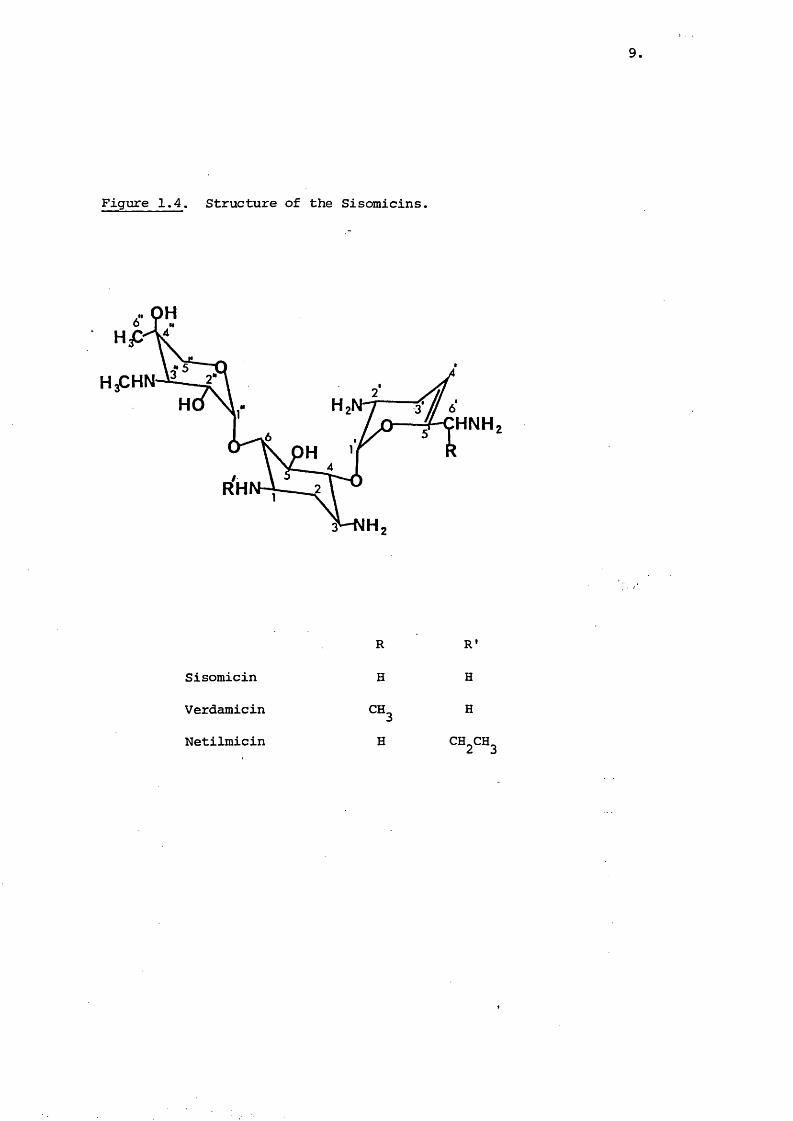
Figure 1.4. Structure of the Sisomicins.
HNH
RH
Sisomicin
Verdamicin
Netilmicin
R
H
CH,
H
R'
H
H
CH2CH3
10.
21 53complex using dodecyl sulphonate ' . Co-produced antibiotics1 52related to the c-complex are shown in Figurel5 ' . They tend
to be more polar and have quite extensive alterations in54-61functional group substitution . Gentamicin A components have
an aminopentose ring instead of the aminohexose (garosamine) sub
unit present in most other g e n t a m i c i n s ^ ^ T h e 'A'-ring is
the main site for the variation in structure of these polar
components in respect to gentamicin C, with hydroxylation
primarily at the 3' and 4' position increasing the polarity.
Although they show lower toxicity than gentamicin C there is46also a corresponding, .reduction in activity
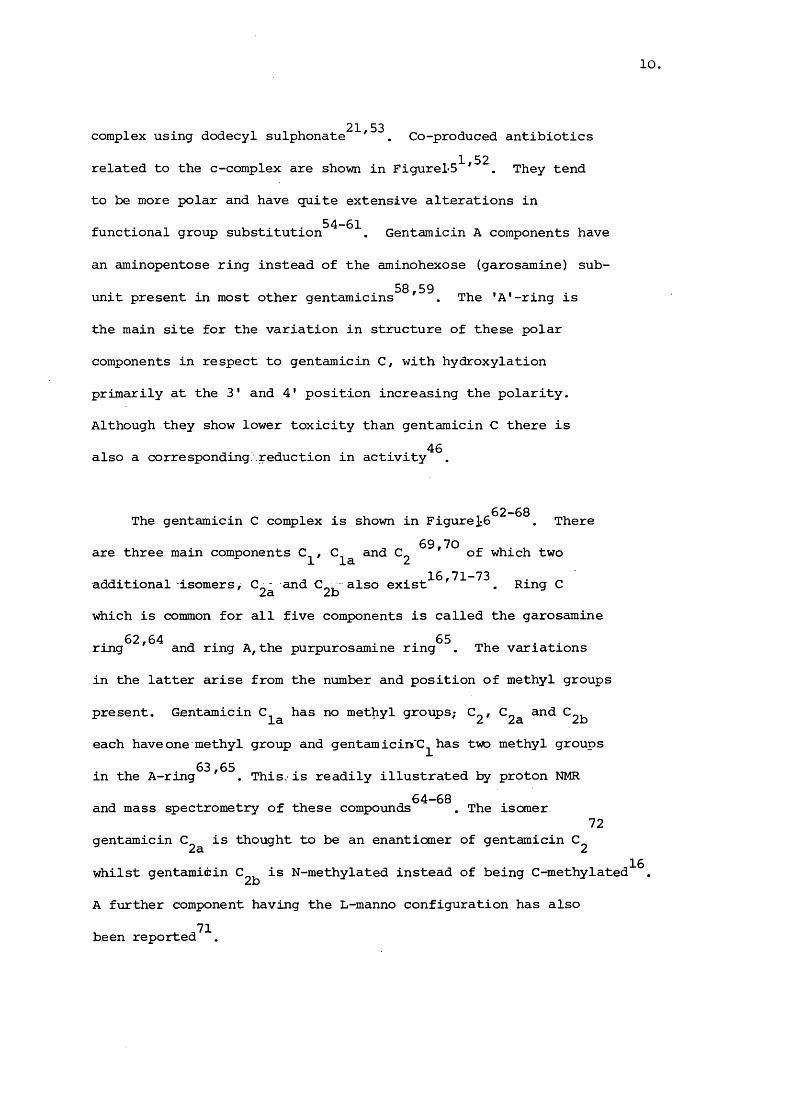
The gentamicin C complex is shown in Figure 1-6 . There
are three main components C^, C^^ and C^ 69,70 which two
additional isomers, C^^ and C j also exist^^'^^ . Ring C
which is common for all five components is called the garosamine
ring^^'^^ and ring A,the purpurosamine ring^^. The variations
in the latter arise from the number and position of methyl groups
present. Gentamicin has no methyl groups; and
each have one methyl group and gentamicin'C^ has two methyl groups
in the A-ring^^,65^ This, is readily illustrated by proton NMR64—68and mass ^ectrometry of these compounds . The isomer
72gentamicin is thought to be an enanticmer of gentamicin
whilst gentamicin is N-methylated instead of being C-methylated^^,
A further component having the L-manno configuration has also .71been reported

Figure 1.5. Structure of Gentamicin Polar Components,
11,
R1 ^2 ^3 "4Gentamicin A NH2 OH OH H OH H
Gentamicin B OH OH OH H NH2 (==3Gentamicin OH OH OH CH3 NH2 CH3
Gentamicin X NH2 OH OH H OH “ 3
12
Figure 1.6. Structure of Gentamicin C Complex
H3OH,CH
Ring C
Ring A
Ring B
^2 ■'s
Gentamicin Cla H H H
Gentamicin CH3 H H
Gentamicin H ^=3 H
Gentamicin H H CH3
Gentamicin CH3 H CH3
13.
Numerous minor components of the gentamicin series have been
discovered with the majority belonging to the polar type
compounds. These unfortunately show lower antimicrobial activity
than the gentamicin C components and are susceptible to 3'-22phosphorylating enzymes . Other components of novel structure
were discovered and interest has arisen as to the antimicrobial74-77action and possible resistance to bacterial enzymes
The proportion of the gentamicin C components and levels
of minor components is difficult to control in the commercial
material. A wide range of geographical sources of the antibiotic
has led to marketed samples showing significant compositional
differences^^ The desirability for a standard of the47,78-9antibiotic is obvious and would restrict potential inequivalences
In the United States, limits are set on all three of the major^ 31 components :-
25 < gentamicin C]_ < 50%
15 < gentamicin 40%
20 < gentamicin < 50%
The analysis of component ratio is achieved by paper chromatography
to separate the components followed by a microbiological assay
to quantitate levels. Thus the component composition is
determined by potency estimation and has been criticised as
being prone to inter-laboratory variation^^'^^. The sample is
also required to pass a potency and specific rotation test but
it is apparent that mixtures with widely differing clinical

14,
properties can be deemed suitable.
In the United Kingdom the component composition is not set
as precisely as in the USA but is controlled within broad limits
by a nuclear magnetic resonance (NMR) measurement of the sulphate
salt in deuterium oxide^^'^^. Quantification is by peak height
measurement of the signals for methyl protons at different
resonances. The mixture exhibits resonances due to two N-methyl
groups, and two C-methyl groups and it is two ratios of these
signals which define the limits. Only gentamicin concentration
can be measured directly by this technique with the other two
components expressed as ratios. This has been used successfully
with commercial samples^^'^^'^^ but is fraught with potential
errors. Gentamicin is not measured directly and the presence
of a component like gentamicin could lead to errors in
gentamicin estimation. Minor components can interfere in the
assay, and the total gentamicin C content is not measured.
A more specific and accurate analysis method for gentamicin
is required especially to cope with the gentamicin isomers
which have been reported in significant concentrations in gentamicin
s a m p l e C o n v e n t i o n a l thin-layer chromatography has84-88been unable to identify these components . High-performance
liquid chromatography (HPLC) has been used in various studies
in determinations of composition of material of varying geographical 78 79 82 89source ' ' ' . It has the advantages of speed, accuracy and

15
79 82the ability to quantitate the gentamicin levels ' . Another
useful method of component determination is field desorption 90mass spectrometry , but this requires specialised instrumentation
which is not generally available.
Other methods have been proposed but are less adaptable than
the HPLC method^^
Structure-Activity Relationship
RHN HRNHNHRRHN
(III) Requirements for activity in 4,6 substituted glycosides
Due to the large number of aminoglycoside compounds discovered
an extensive investigation into the influence of the structure of46the antibiotic on its activity is possible (III) . It is known
that the basic 2-deoxystreptamine subunit is inactive.
Substitutions at the 5 and 6 position produces compounds with
only weak activity whilst substitution at the 4 position also

16,
gives weak activity, although apramycin (IV) has been found to
be highly potent.
CHgOH
OHNH
NHHO(IV) OH
Thus highly active antibiotics in the main can only be obtained
when 2-deoxystreptamine is disubstituted at the 4,5 or the 4,6 46positions. Price has discussed the requirements for activity
in each of the subunits. The presence of amino functions has been
found to be essential and for 4,5 substituted aminoglycosides
the activity is increased by increasing the numbers of amino
groups,in the molecule. For 4,6 glycosides,at least in respect
to the C-4 substituent,the activity is increased by an increase
in amino groups present. Mono-N-alkylation with a small alkyl
group like methyl has minimal effect on activity whilst N-acylation
at any position except the amine at C-1 will reduce the activity.
An amino group is required in the C-4 substituent but not in
the C-5 substituent of deoxystreptamine. A primary or secondary
amine is needed at C-3 and a basic function is required at C-1
in deoxystreptamine (III) . In the C-6 substituent the location

17
of the amino group is essential in determining effectiveness in
antimicrobial action. Information on hydroxyl contribution is
less dependable and varies for different compounds. All
hydroxyls can be modified in some manner yet retain activity,but
various structural changes seen especially in the kanamycins can
have a large influence on potency.
Therapeutic Aspects of Aminoglycosides
The aminoglycosides are active against gram positive and gram
negative organisms as well as Mycobacteria^'^'^^'^^'^^. They are
not against anaerobic bacteria or fungi. Some compounds (paramomycin46and hygromycin B) possess antiprotozoal and anthelmintic activity
but these properties are not common to other aminoglycosides.
Bacteria susceptible to aminoglycosides include Escherichia coli.
Pseudomonas aeruginosa, Proteus sp.,Serrâtia sp., Klebsiella sp.,2and Staphylococcus aureus . They do not possess significant
activity against streptococci or meningococci. Gentamicin is
the principal antibiotic for the treatment of many life-
threatening infections such as septicaemia, neonatal infections,91 93-95endocarditis, infected burns and peritonitis . Tobramycin
is also used in a similar manner to gentamicin but amikacin is
withheld for use against resistant organisms.

18
Mechanism of Action
The aminoglycosides.are bactericidal but cell death is96-98preceded by a marked inhibition of protein biosynthesis
This activity is seen to occur at the 70s ribosomes but is
incompletely understood. Streptomycin is known to bind to
protein S12 of the 30s subunit involving at least four other96ribosomal proteins and possibly 16s RNA . This binding is
thought to induce conformational changes which disturb the97normal functions of the acceptor and donor site . This is
observed as misreading of the genetic code at the ribosome,
inhibition of initiation of peptide chains on the complex,
slowing of elongation of partly completed chains and increased96unusual messenger activity . Gentamicin, neomycin and kanamycin
show three separate concentration dependent effects on isolated96 97ribosomes which suggest multiple binding sites for these drugs '
These observations do not satisfactorily explain the lethal effect96which may also involve damage to the cytoplasmic membrane . It
is known that aminoglycoside uptake into bacterial cells occurs 99,100in three phases . There is an initial energy independent
binding of the compounds to the exterior of the cell. Thisiis
followed by energy-dependent phase 1 in which aminoglycosides
associate with membrane transporters by virtue of their positive
charge and are driven across the membrane by the existing
potential gradient. A faster rate of aminoglycoside uptake
occurs after ribosomal binding. This is called energy dependent
19.
phase II and the rationale behind it is not certain. It could96
either be due to synthesis of a polyamine permease induced
by the aminoglycoside itself or it could be due to an increased
membrane potential associated with loss of potassium ions^^^.
Phase II is essential for the lethal action of the aminoglycosides 100
to be realised , as is the ribosomal binding.
Resistance to Aminoglycosides
The build-up of resistance to the aminoglycosides is a
problem especially associated with inappropriate drug use. It
increased dramatically against streptomycin and kanamycin and
was forseen when gentamicin was introduced^^^. The frequency
of resistant organisms to gentamicin in the United Kingdom has
been comparatively low^'^^^ and careful antibiotic policy in
hospitals has controlled outbreaks^^^, There have been three
possible mechanisms of resistance to aminoglycosides discovered^^
mutational change in ribosomal protein, reduced cell permeability
and inactivating enzymes. The mutational change in the genes
coding for ribosomal protein leads to the drug being unable to
attach to ribosomes^^. This has arisen for streptomycin where
replacement of a single amino acid in the S12 protein of the 30s99ribosomal subunit can cause resistance . This type of resistance
has not been shown to be clinically i m p o r t a n t . A second
resistance mechanism, of gram negative bacteria, is a reduced
20.
uptake of the aminoglycoside^^^. Opinion has differed as to
whether this is due to a change in the cytoplasmic membrane or
due to enzyme production, as inactivated aminoglycosides do not96accumulate in bacterial cells . A compositional change could
involve replacement of magnesium ions by a protein H, preventing99penetration of the membrane by aminoglycosides . This has
been shown to be a clinically important type of resistance
especially for Pseudomonas species and a major type of resistance 50
to amikacin . The third and most important form of resistance
is due to aminoglycoside inactivating enzymes. The enzymes are
classified by type of reaction they catalyze into aminoglycoside
0-phosphotransferases (APH), 0-nucleotidyltransferases, (ANT),100and N-acetyltransferases (AAC) . Enzymes show specific action
at defined sites and can be further classified for affinity for
different substrates. Thus, AAC (3) I acetylates gentamicin readily
at the C-3 amino group, but tobramycin only slightly, whilst
AAC (3) II acetylates both gentamicin and tobramycin easily at 47the same site . Up to twenty one enzymes which modify amino-
47glycosides have been reported . Of these,about half act on
gentamicin with different outcomes. The group of enzymes which
act on gentamicin include AAC(3), AAC(2'), AAC(6'), APH(2")
and ANT(2") . Acétylation is a major route to inactivation due
mainly to the deoxygenated nature of the gentamicin C complex.
A similar number of enzymes inactivate tobramycin but act at
different sites^^^. The N-ethyl side chain of netilmicin is
thought to offer protection against ANT(2"), APH (2") and AAC(3)

21
22 51enzymes ' . Similarly for amikacin the aminobutyric acid
side chain protects the molecule from all enzymes except AAC(6 ')^^,47in contrast to kanamycin A from which it is derived . Bacteria
show variation in the type and number of inactivating enzymes
they possess and this is reflected in the relative susceptibilities
of these bacteria to the different aminoglycosides^^
In gram positive and gram negative bacteria genes coding95for these enzymes are carried on R-plasmids . It is these plasmids
which have been responsible for the rapid growth in resistant
bacteria, due to the ease of gene transfer by transduction 97and conjugation . The origin of R-factor resistant genes
may have been in antibiotic producing organisms and even more
information for aminoglycoside resistance could arise from that 106source
Pharmacokinetics
The aminoglycosides are poorly absorbed by the gastro
intestinal tract and thus are administered parenterally for1 2 92 107systemic infections • • • . Following intra-muscular injection
of an aminoglycoside, peak serum levels are reached in thirty
to ninety minutes depending on circulation and muscle mass^^^
Administration by intravenous injection as a bolus produces
immediate high peak plasma levels which soon r e c e d e ^ B y
22
administering by iv. infusion over twenty to thirty minutes serum
levels comparable to those obtained by intra-muscular injection 2are achieved . The half life of the aminoglycosides shows wide
interpatient response but is about two
A secondary half life has been calculated since it was observed
that after treatment has finished, gentamicin continues to be
excreted in the urine^^^. The existence of a slower elimination
pathway is supported by the lack of complete recovery of the 118dose in urine , which should be possible since the aminoglycosides
are uhmetabolised. This secondary half life has been calculated
to be about one hundred hours and may be due to release of drug118from the renal cortex . in renal failure the primary half life
109of two hours can extend to up to forty hours , since glomerular118filtration is the major elimination mechanism
119Haemodialysis removes the aminoglycoside and shortens
the extended half-life considerably, in such compromised patients,
and thus, care has to be taken to ensure adequate drug levels^^^'^^^.
Protein binding of aminoglycosides is not appreciable with
values of O - 25% reported^^^'^^^'^^^. The volume of distribution
is about 25% indicating distribution of the drug throughout the
extracellular water^^^.
23
Dosages
The dosage interval of aminoglycosides is eight hours due
principally to the two hour half life. The dosages for gentamicin,
tobramycin and netilmicin are similar but amikacin requires much
higher doses because of its lower potency^. In children and
infants a proportionally higher dose is required since amino
glycosides are well tolerated^^^. This may be due to the higher
percentage extracellular fluid volume which occurs in the very 121 122young ' . For gentamicin a dose of 2 - 5 mg/kg daily in
three doses is recommended for an adult with normal kidney 123function . For children aged two weeks to twelve years a
dose of 2 mg/kg is given every eight hours, whilst for infants
less than two weeks old a dose of 3 mg/kg every twelve hours
is recommended. In neonates the half life tends to be longer due
to the lower glomerular filtration rate. In the presence of
renal failure the dosage interval is usually lengthened in
relation to the creatinine clearance^^'^^^'^^^'^^^. Various
nomograms, relating body weight and creatinine clearance to an
appropriate dose, have been proposed and used in clinical
practice^^^'^^^'^^^ They are useful for estimating a dose
bat plasma monitoring should be undertaken to ascertain the 119.attained levels
For gentamicin and tobramycin a peak of 5 - 12 yg/ml and a
trough of 1 - 2 yg/ml is desired for efficient treatment. For
24
amikacin the target peak concentration is 20 - 30 yg/ml and92trough of 5 - 10 yg/ml . Peak serum levels of less than 4 yg/ml
of gentamicin or tobramycin and less than 14 yg/ml for amikacin92 94are unlikely to be effective and could create resistant bacteria '
Therapy with other antibiotics can increase the effectiveness
of the aminoglycosides. Indeed synergy with penicillins is well 127 128reported ' ,such as the combination of gentamicin with
129carbenicillin in Pseudomonas infections . It is thought to
arise from penicillin attack on the cell wall,increasing the
penetration of the aminoglycoside. A secondary effect of the
combined use of these antibiotics is that chemical inactivation
can occur in vivo and in vitro^^^ ^ . This is especially135prevalent in intravenous infusion bottles , and when a high
131concentration of penicillin is present . The reaction is
thought to involve opening of the beta-lactam ring and132 135subsequent reaction with the aminoglycoside '
Toxicity
The major disadvantage of the aminoglycosides is the low
therapeutic index, with overdosage leading to severe side
effects^^^. It is known that the amino groups contribute46significantly to the toxicity of aminoglycosides . Examples
of this are found in the kanamycins. Kanamycin B has one more amino
25
group than kanamycin A and is twice as toxic. N-acetylation of
any of the amino groups decreases the toxicity of the compound.
The gentamicins A, X and B are thought to be less toxic than the
gentamicin C components because they are hydroxylated at the 3'46position. Price related toxicity to antimicrobial activity and
concluded that toxicity to,micro-organisms could not be fully
separated from the toxicity to mammals.
Toxicity is thought to be related to plasma levels although
disagreement exists as to ascribing it to peak or trough levels,137or frequency of dosing . Some studies have shown a significant
correlation of trough levels greater than 4 yg/ml with a rising
creatinine level^^^'^^^. Another proposal is that susceptible
people retain the drug in a three times higher concentration in . - - - 118the tissues than average . For gentamicin it has been
recommended for peak levels to be below 10 - 12 yg/ml and trough
levels below 2 yg/ml.
The main adverse effects of aminoglycosides are nephro-1 2 92toxicity, ototoxicity and neuromuscular blockade ' ' . The
nephrotoxic and neuromuscular effects are usually reversible
but the ototoxic effects are frequently irreversible^^^'^^^.
Aminoglycosides are concentrated in the renal cortex with
accumulation by reabsorption from the proximal tubule^^^'^^^'^^^.
This may arise by pinocytosis as this method is used by the brush

26,
142border cells for other compounds . Alternatively they might
be transported across the membrane by an active transport 118system or by binding to the charged anionic polyphospho-
143inositidies . These phospholipids are present in a relatively
high concentration in the plasma membrane of renal cells and143-4are believed to be involved in calcium transport
Complexation with these molecules could disrupt the membrane and
increase the permeation of the gentamicin into the cell. It is
suggested that 5 - 10% of the population show early and rapid
tissue accumulation of the aminoglycosides, although the mechanism118of this more rapid uptake has not been defined
Nephrotoxicity is gauged by a necrosis of proximal tubular
cells associated with leakage of enzymes and proteins prior to
an increase in serum creatinine^^^ The onset of renal damage
reduces the glomerular filtration rate^^^ and thus leads to an
accumulation of the aminoglycoside. The various aminoglycosides
show differing toxic potentials with neomycin the most nephro- 46toxic . This may arise from the particular cellular toxicity
146of the drug rather than the extent of uptake . It may explain
why netilmicin is considered to be less nephrotoxic than gentamicin146even though rates of uptake are similar . The gentamicin C
components are believed to have different toxicities although
opinion.is not agreed on which is the most n e p h r o t o x i c ^ .
Other factors which can precipitate acute renal failure are
27
dose and duration of therapy, state of hydration and underlying 153-4renal failure . Lack of standards of definition of nephro-
51,118toxicity restricts accurate estimation of occurrence. . It148is believed to occur in 2 - 10% of patients
Ototoxicity, the other serious side effect of aminoglycoside
treatment again is dependent on the particular drug but usually
results in loss of inner ear function^^^ ^ The accumulation
of aminoglycosides in the inner ear with slow elimination precipi-92tates the toxicity . Netilmicin is thought to be virtually
non-ototoxic^^ whereas gentamicin is significantly toxic^^.
Gentamicin has been reported to be less ototoxic than the
gentamicin C complex used as a whole^^^. A theory of interaction
with the phospholipids of the cellular membrane has been proposed]_41 157 —for the toxic effect ' . Vestibular function can also
92become disturbed and is associated with ototoxicity
Neuromuscular blockade has been shown to be reversible with
calcium ions and to be similar to that produced by conventional 98blocking agents . This can induce weakness of skeletal muscle
and respiratory depression.
To minimise toxic effects, careful use in clinical practice,
especially in susceptible patients, is required. Monitoring of
plasma levels is required in these patients to prevent onset 119,137of toxicity

28,
Plasma Analysis of Gentamicin
The assessment of plasma levels of gentamicin to optimise
treatment^^^ has traditionally fallen to the microbiological
assay; either by diffusion or by dilution^^^'^^^ 164^ The dilution
method was shown to be highly inaccurate in a quality control
survey and is little used now^^^'^^^. The plate diffusion method
can use either well or disc for distribution of antibiotic to
the medium
The procedure is subject to large variation due to type of 166-8medium used , concentration of cations, species of organism
tested against, pH^^^ and composition of sample^^^ ^ and137standard solutions and the length of time of incubation . The
time required for an assay is a major disadvantage with twelve
to eighteen hours required for zone diameters of inhibition to 137be measured . Clinical signs of inappropriate treatment
may therefore be available before the plasma concentration is
known^^^'^^^. Faster bioassays were developed to achieve a
measurable zone in three to four hours using a heavy inoculum
of a fast growing species of bacterium^^^' Principal
advantages of the bioassay are that it is a cheap and easy173technique requiring skills readily available in hospitals
It is also very flexible in adaption to size of workload.
A disadvantage is the poor accuracy which was highlighted
in quality control surveys carried out in 1973 and 1974.
29
Only 21% of those tested achieved a ± 25% accuracy^^^. The
presence of other antibiotics in the sample can interfere^with
results especially when the laboratory is not informed of
them^^^'^^^. Some assay media have also shown a tendency to169underestimate gentamicin levels in uraemic sera . in
comparison to other assay methods the bioassay was held to be> 1 7 3 , 1 7 5 - 8 0 ^ . 181clinically acceptable except in one case . They
generally exhibited poorer precision and correlation with other 177,180,182methods was variable
A quick and simple technique utilises gentamicin-sensitised
latex particles which react with anti-gentamicin antiserum to
give an agglutination reaction^^^ It is ideal for low
workloads although performance at plasma concentrations of less184—5than 2 yg/ml is poor
The radioenzymatic method, a much used technique, involves
the acétylation or adénylation of gentamicin by bacterial
enzymes^^^ 190^ coenzyme in either case (ATP or acetyl CoA)159is tagged with a radioactive label , which after reaction
produces a labelled gentamicin derivative. This is adsorbed
onto phosphocellulose discs and counted on a liquid scintillation 137counter . The assay method is quick, requiring two hours
to perform and is relatively easy to use. However stability
problems of enzyme, breakdown of ATP by inherent ATPase in serum
and variations in binding capacity of the phosphocellulose paper

30.
137have been noted . There were reports that plasma constituents 191and tetracyclines have decreased gentamicin readings.
Availability of a scintillation counter is essential and expertise137in the handling of radioactive isotopes is a requisite . In
clinical studies^^^'^^^'^^^'^^^ the radioenzymatic method was
satisfactory except on one occasion where the kit was judged to
be unacceptable
Immunoassays developed for the aminoglycosides use radio
activity, absorbance and fluorescence as an indicator of extent
of binding.
193-4In radioimmunoassays gentamicin frcm the sample competes
with standard labelled gentamicin for antibody binding sites
decreasing thé measured bound activity^^^ ^ . The assay is
specific, sensitive and precise and results are obtained in
two hours^^^. The cost of reagents is high^^^ and is comparable
to those used for fluoroimmunoassays^^^'^^^. In three clinical
studies^^^'^^^'^^^ the readings were found to be consistently
high which has been ascribed to significantly inaccurate 192,198standards . The precision of the assay is, like other
^ ^ I . . .3 176-8,180-2,193,199immunoassays, more than adequate for clinical needs
Similar equipment to that used in the radioenzymatic method is
required.
Enzyme immunoassays^^ ^ generally involve competitive
binding to antibody, of gentamicin in the sample, with

31
gehtamicin-linked enzyme in the standard. The extent of binding
is revealed as a change in the activity of the enzyme. One of
these kits, EMIT (Syva Corporation)utilises a gentamicin-
glucose-6-phosphate-dehydrogenase conjugate (G5PDH) which can
convert nicotinamide adenine dinucleotide (NAD) to NADH, a change
which can be monitored by UV spectrophotometry.. The assay
requires a spectrophotometer with a thermostatted flow cell and
a timer-printer, as readingsare made after 15 and 45 seconds^^^.
Cross reactivity is only a problem with other aminoglycosides
and therefore unlikely to be significant in clinical practice^^^.
The assay is easy and very fast with only thirty minutes required
for a calibration^^^. A loss of precision has been noticed at
the higher end of the concentration range but can be overcome
by diluting the plasma^^^. The EMIT method has been assessed176-9, 181-2, 192, 199 ^ ^ .in various papers .and no detrimental
properties were reported. Precision and specificity were high179although in one paper, recovery was low . The cost of reagents
and equipment was considered to limit the technique to large, 176,182numbers of samples
Fluoroimmunoassays for aminoglycQsides^^^ mainly depend209,213 , . 208,212on quenching or polarisation of fluorescence when
gentamicin labelled with fluoroscein is bound by antibody. The
two methods, as well as EMIT, are termed homogenous because no
separation step is required. An increase in polarisation of
fluorescence results when fluorescent ligand binds to the antibody

32.
2o8 212because of an increase in rotational relaxation time '
Thus gentamicin in the sample will cause an increase in fluorescence
in one assay and a decrease in polarisation in the other.
Standard curves used in these assays were not straight lines
raising the question of accuracy^^^'^^^. Another fluoroimmunoassay
uses an enzyme which reacts with a gentamicin-conjugate to
produce a fluorescent species, which is quenched by binding to... 210-11 antibody
The fluoroimmunoassays, similar in cost to the other immunoe
asays, were generally less precise than EMIT in most studies^^^ 78,180.2
One paper found apparent gentamicin readings due to penicillin in 182one kit . Direct correlation of the results with those obtained
by enzyme immunoassay was good but it was not as fast or as easy 182to use . For both fluorescence and enzyme immunoassays it
is recommended that calibrations be made each day thus adding to
the overall cost^^^.
A potential disadvantage of the immunoassays is the possibility
of non-specific binding of substrate labelled drug to plasma
constituents, such as protein^^^. Experience of the clincal use212of these assays suggests this is of little significance
Background fluorescence of plasma could interfere with fluorescence
measurements but again has not been shown to be important^^^ 180
Another method used for aminoglycoside analysis in plasma

X62 215”8is chromatography ' . Gas-liquid chromatography (GLC)
was used, after derivatisation of gentamicin, but the219components were not separated
High-performance liquid chromatography (HPLC) has been used
experimentally many times for this analysis with many methods
d e v e l o p e d ^ T h e popularity of the technique in relation
to GLC originates from the different conditions used to effect
separation. For HPLC, chromatography of non-volatile compounds
is possible, separations can be varied enormously, sample prep
aration can be easy and specificity of detectors can isolate215drugs from the background matrix . The HPLC technique was
178-80compared in three studies with various other assays . In
one study HPLC was found to have the worst precision when copipared
with the three immunoassays but was still thought to be satis-178 179factory . In another study HPLC showed the best precision
Both these papers noted that the labour intensive nature of
HPLC was a major drawback. The final paper found no specific
advantage for HPLC and indeed precision was poor although the
f luoro immunoassay was equally imprecise^^^. Thus in these
general studies the HPLC method was not found to possess, any
substantial advantages. However they ignore the unique ability
of HPLC to quantitate individual component levels for gentamicin.
This is of potential use if the components are discovered to
differ in pharmacokinetic or toxic properties. The low
comparative cost of the HPLC reagents is counteracted by increased

34
staff cost. The latter could be reduced if automation could be
introduced to the technique.
Thus, there have been many methods developed for the analysis
of aminoglycosides in plasma reflecting the requirement for fast
and accurate measurements. None of these techniques shows over
whelming success and each is satisfactory in some respects.
In the present study it was intended to develop a method
for the accurate analysis of gentamicin levels in plasma using
HPLC. It was proposed to adapt the method for the assay of
gentamicin components in commercial gentamicin sulphate samples
and pharmaceutical preparations. In pursuing this it was found
necessary to investigate an existing inconsistency in the current
literature concerning the HPLC behaviour of gentamicin components.
In addition it was proposed to isolate minor components of
the gentamicin complex frcm commercial gentamicin samples, to
characterise these using spectroscopic and chemical techniques
and to investigate possible antimicrobial activity.

35.
CHAPTER 2
ISOLATION AND IDENTIFICATION OF MINOR COMPONENTS OF THE
GENTAMICIN SERIES
2.1 Introduction
The determination of aminoglycoside structure was, in the past,
accomplished by classical chemical techniques of oligosaccharide
analysis^^' * 244^ Recent improvements in instrumental analysis
have enhanced the structural resolution of mixtures of amino- 49, 62-66, 245glycosides
Carbon-13 nuclear magnetic resonance spectroscopy has proved
to be particularly useful in this respect^^^ ^. The wide range
of chemical shifts and use of off-resonance decoupling enable
individual carbon atoms to be identified. The similarity of the
chemical shifts of the equivalent rings in different amino
glycosides has been considered advantageous, and the use of
protonation shifts for the determination of the stereochemistry
of the sugar groups in relation to the deoxystreptamine ring has247also proved to be useful . However, the ability of aminoglycosides
to absorb carbon dioxide from the atmosphere can produce erroneous14. 246 results
Proton nuclear magnetic resonance spectroscopy (NMR) is less
applicable to the aminoglycosides than carbon-13 NMR because of
the large number of protons resonating in a smaller shift range.
Extensive overlap of proton resonance peaks occurs, masking useful
structural information. Degradation to the single ring moieties

36.
followed by proton NMR has proved very useful in providing
conformational information
Mass spectrometry is an ideal method for size and structure248analysis especially with small amounts of sample . Electron
249impact (E.I.) mass spectrometry has been widely used for the
aminoglycosides. The various fragmentation pathways of the
gentamicins were characterised and these have also been applied
to other aminoglycosides^^' Electron-impact relies on
sample volatisation before ionization by a beam of electrons.
This mechanism produces low ion yields for polar and nonvolatile
compounds such as the aminoglycosides. Adaptations of the basic
technique have been attempted to increase ion yield^^^. Apart
from these methods excessive heating is normally required for
the aminoglycosides and although stru cturally useful fragments
are produced the molecular ion yield is very low^^.
249Chemical Ionization (C.I.) is:a "softer" method of
ionization than E.I., relying on ion-molecule reactions, with
the ions generated from a reactant gas. The particular gas used
can produce an individual fragmentation pattern. The initial energy
content of molecular ions formed by Cl is generally much less
than for El and this results in less fragmentation and a higher
yield of molecular ion. For the aminoglycosides fragmentation
is usually only into the major subunits and a clear indication
of structure is achieved^^'^^.

37
251Field desorption (F.D.) mass spectrometry also uses a
"soft" ionization, where volatilisation of the sample occurs
after ionization and depends on the electrical field strength and249 252 253the emitter anode temperature ' ' . Protonated and
cationized pseudo-molecular ions can form and are.msually more
stable than the molecular ion^^^' 254^ Spectra produced by
F.D. show predominantly such pseudo-molecular ions with very
little fragmentation, and the method is thus suitable for77molecular weight determinations of unknown components . Polarity
and volatility of the sample, is not as critical as E.I. but
molecular ion yield is low and transiently produced
More recently other "soft" ionization methods have been
developed. These include plasma desorption^^^' electro-, _ ; 260-2 - — --- 7 263 . 264-6hydamic ionization , laser desorption , secondary ion
255"8 287“V2and fast atom bombardment mass spectrometry ' A
localised hot spot which enhances desorption of ions has been
proposed to occur with these methods and similar spectra can
be observed between them even though particles of vastly differing energies
are used to achieve ionization^^^'^^^.Both positive and negative ion spectra
can be recorded by these methods which can extend their utility.
Fast atom bombardment (FAB) is a development of secondary
ion mass spectrometry and indeed some suggest there is little
difference between them^^^ Instead of a beam of ions, a beam
of atoms, of usually xenon or argon, is used to produce secondary
ions from the sample. The sample is suspended in a liquid, usually

38,
glycerol, and is bombarded by atoms at about 20° to the horizontal
to give maximal ion yield ' The glycerol phase probably
presents a constantly new surface for bombardment, by diffusion
and thermal currents enabling stable ion production over a270relatively long period of time . Some compounds are enriched
at the surface, whilst others can be completely masked by the
glycerol^^^. Xenon used as a source gas can increase ion yield271probably by virtue of its larger molecular size . FAB has
255“6 272been used for numerous non-volatile compounds ' such
as peptides, and even gentamicin sulphate was measured by this 269method . The combination of high molecular ion yield with
some fragmentation promises the versatility required for
analysing minor components of the gentamicin series.
The minor components were isolated from commercial gentamicin
sulphate of various origins by column chromatography. Characterisation
of these components was primarily achieved by mass spectrometry
with NMR used for larger sample sizes.
2.2 Materials and Methods
2.2.1 Materials
Gentamicin sulphate samples from a variety of geo
graphical sources were donated by Nicholas Laboratories Ltd.
Netilmicin sulphate was supplied by Kirby-Warrick Pharmaceuticals
Ltd. Silica gels for column chromatography of different particle
size were used. Woelm silica gel, less than 63 ym and 100 - 200 ym

39
particle size were obtained from Koch Light Laboratories Ltd.
Silica gel, 15 - 40 ym and silica gel H for thin-layer cliromato-
graphy were from Merck, supplied by BDH Chemicals Ltd. Glass
columns with fixed internal glass sinters and dimensions of
45 X 5^, 40 X 2, 30 X 1*2 and 30 x 1 cm were used. Ninhydrin
and dimethylamine borane were obtained from Aldrich Chemical
Company Ltd. Amberlite IRA 400 (Cl) resin was from BDH Chemicals
Ltd. General purpose grade solvents were redistilled before use.
2.2.2 Methods
Thin-Layer Chromatography (T.L.C.)
Silica gel 60 plates were made as required. They were
spread on 10 x 20 degreased, glass plates with a layer thickness
of 0.25 mm. The developing solvent was the lower layer of a
chloroform/methano1/ammonia (2:1:1 (18 M)) mixture. The tank
was allowed to equilibrate for at least three hours before use.
New mobile phase had to be prepared every four days due to
evaporation of ammonia causing decreased solvent strength.
A sample volume of 5 - 10 y1 was applied for each spot using a micro syringe. Development of the plates was continued until
the solvent had travelled at least 10 cm. Plates were dried
at 110°c for twenty minutes to remove ammonia. Detection was by use of ninhydrin spray, consisting of ninhydrin (1.2 g) dissolved
in pyridine (50 ml) and acetone (50 ml). After spraying the
plates were heated at 110°C for five minutes to produce purple- red spots on a white background.
40.
Paper Chromatography
A descending technique using Whatman No. 1 paper and a
solvent system of the lower phase of a mixture of chloroform/
methanol/ammonia (2:1*1 (9M)) was used. Both upper and lower
phases were allowed to saturate the tank for twelve hours before
development. The solvent took five hours to reach the end of
Üie paper during development, after which, the paper was dried
for twenty minutes at 110°C. Spots were detected with the same
ninhydrin spray used for TLC.
Preparation of Gentamicin Base
Gentamicin base was generated from the sulphate salt
by use of an anion exchange resin. Amberlite IRA 400. Resin
(Cl) (50 g) was converted first to the OH form by passing IM
sodium hydroxide through the resin. Distilled water was used
to wash column free of alkali. Gentamicin sulphate (4 g) was
dissolved in a minimum amount of water, passed ontouthe column
and eluted with water. Alkaline fractions were collected and
lyophilised to yield gentamicin free base. This was stored
(over phosphorous pentoxide) in a desiccator together with
potassium hydroxide pellets to absorb carbon dioxide.
Column Chromatography of Minor Components
Various columns, types and weights of silica gel were
used. In general, silica gel (40 g) was slurried in the mobile

41,
phase and packed into a column of 40 x 2 cm dimensions, with internal
volume of 125 ml.. The column was allowed to stand for twenty four
hours before use to allow trapped air to escape. The initial
eluent was the lower phase of a chloroform/propan-2-ol/2.25 M
ammonia (2:1:1) mixture. Gentamicin base (6 g) was dissolved in
about 10 ml of the eluent and applied directly to the top of the
column. Elution proceeded at about 0.3 ml min for about three
colunn volumes when the eluent was changed to the lower phase of
a (2: 1:1(4.5 M)) mixture of the same solvents. This was continued
until gentamicin was initially detected (by TLC monitoring of
fractions). The solvent polarity was then increased to (2:1:1
(9M)) and continued until gentamicin C^ began to elute. Methanol
was then used to elute the remaining components.
When the major components were to be collected separately,
methanol was not used. Instead, the elution was continued with
a (2:1:1 (18M)) mixture followed by a (1:1:1 (18M)) mixture
after gentamicin C had eluted.2
Fractions were collected in 5 ml aliquots on a LKB 7000
fraction collector, which could be adjusted to step at specific
time intervals as required. Fractions were monitored by
Thin-Layer Chromatography, comparing with a standard 1% w/v
gentamicin sulphate solution, and those of similar composition
were combined and the solvent removed under reduced pressure.
Residues were redissolved in a small amount of distilled water
and then lyophilised. Components collected were stored in

42
desiccators over silica gel or phosphorus pentoxide and potassium
hydroxide.
Semi-Preparative High Performance Liquid Chromatography (H.P.L.C.)
A single run on a Jobin Yvon Mini-Prep system was completed.
The mobile phase used was the same as for column chromatography
except that elution was started with the lower phase of a
(2:1:1 (9M)) mixture. Silica gel used for the stationary phase
was Lichroprep Si 60, 15 - 25 ym. To construct a column of
size 37 X 2 cm, required 50 g of silica. Flow rate was 1.8 ml -1min at a solvent pressure of 8 bar. Fractions of 3 ml were
collected on a fraction collector. Monitoring of the eluate
was performed by TLC.
Hydrolysis:
Hydrolysis^^f major components was accomplished by dissolving
the sample (100 mg) in 6 N hydrochloric acid (20 ml) and refluxing
for six hours. The product, 2-deoxystreptamine dihydrochloride
was isolated by precipitation when the hydrolysate was added,
dropwise, to dry ether (250 ml). The precipitate, isolated by
filtration, was purified and converted to its base form by
passing through an anion exchange column.

43
N-Acetylation : Micro-scale N-acetylation was carried out as
follows. Sample (0.5 - 5 mg) was dissolved in methanol (100 yl)
in a reaction vial. This was placed in ice and acetic anhydride
(50 yl) was added dropwise to the cooled methanolic solution.
After stirring with the needle of the syringe the reaction
was left for three hours at room temperature, Progress of
reaction was followed by the TLC system. On disappearance of
ninhydrin positive spots the reaction was judged to be complete.
The reaction was terminated by adding 18 M ammonia (60 yl).
This solution was passed through a small column (5 g) of
Amberlite IRA (OH) 400 resin, and the eluate lyophilised.
Mercaptolysis;65 . - -The procedure of Cooper et ai. of mercaptolysis of
the N-acetylated components was adopted. In this the compound
(10 mg) was dissolved in ethanethiol (100 yl) and concentrated
hydrochloric acid (100 yl). The reaction was left for 24 hours
at room temperature after which, the thiol was evaporated in
vacuum at 40°C. The remaining solution was diluted with
water (10 ml), neutralised by addition of lead carbonate,
filtered and lyophilised. The residue obtained was dissolved
in methanol (100 yl) and acetic anhydride (50 yl) was added
dropwise. After six hours at room temperature, the solvent
was removed by vacuum and the residue dissolved in chloroform.
The solution was filtered to remove N,N-diacetyl-deoxystrept-
amine and chromatographed on a silica gel column (20 g) using
toluene/methanol (4:1) as the mobile phase. The main component

44
as determined by TLC was collected and the solvent removed by
evaporation. Mass spectromety was used to identify the
fraction as a N-acetylpurpurosamine thioacetal.
Reduction:
The reduction of one of the components suspected of
containing an imino group was also carried out. The sample
(20 mg) was dissolved, in a reaction vial, in glacial acetic
acid (40y1). DImethylamine borane (10 mg) was dissolved in
glacial acetic acid (60 yl) and 20 y1 of this solution was
added to the vial, and the mixture stirred with the needle
of a microsyringe. The reaction was left for two hours at
room temperature, then 18 M ammonia (60 yl) was added. The
solution was passed through a small anion exchange column and
the eluate lyophilised.
Mass Spectrometry:
Field desorption mass spectra were determined by
Mr. M. Rossiter at the Department of Chemistry, University
College, Cardiff using a Varian CH-5D.mass spectrometer.
Chemical Ionization,Electron Impact and Fast Atom Bombardment
mass spectra were determined by Mr. C. Cryer at the Department
of Chemistry, University of Bath, using a V.G. 7070 E mass
spectrometer.
45
Nuclear Magnetic Resonance (N.M.R.)
The 100 MHz proton NMR spectra were determined by Mr. D.
Wood on a JEOL P.S. 100 NMR spectrometer and carbon-13 NMR
spectra were determined by Mr. H. Hartnell onda JEOL FX 90Q
Fourier Transform NMR spectrometer at the School of Pharmacy
and Pharmacology, University of Bath.
2.3 Results and Discussion
2.3.1 HPLC Semi-Preparative Isolation of Minor Components
The separation obtained from one run of a Jobin-Yvon
instrument using 1.5 g of gentamicin base was compared to the
separation of 0.5 g of gentamicin base by a gravity fed column
in Table 2.1.
With both columns some overlap of major components occurs
but the resolution of the Jobin-Yvon column was superior to
that of the ordinary column. The semi-preparative instrument
also used less mobile phase and was more rapid. This advantage
in speed was negated to an extent by the TLC method of column
monitoring which increased the run time of the column consid
erably and was by nature a retrospective check. The UV
monitor of the eluent was inappropriate with gentamicin
because of the poor absorption characteristics. A refractometer
would have been more suitable but was unavailable.
The semi-preparative instrument coupled with an equally
matched detection system would prove to be far superior

46,
Table 2.1. Comparison of Semi-Preparative HPLC with Classical
Column Chromatography
Component Jobin-Yvon Elution volume ( ml)
Gravity Column Elution Volume
(ml)
Minor 105-192 225-390
Gentamicin C^ 204-330 414-660
Gentamicin C^ 315-453 576-750
Gentamicin C, la 480-570 720-900
Mobile phase
2:1:1 (9M) 0-390 0-730
2:1:1 (18M) 391-690 731-1380
to the ordinary classical method, yet the TLC used here decreased
the advantages.
2.3.2 Spectral Characteristics of the Gentamicin C Components
Mass Spectrometry;
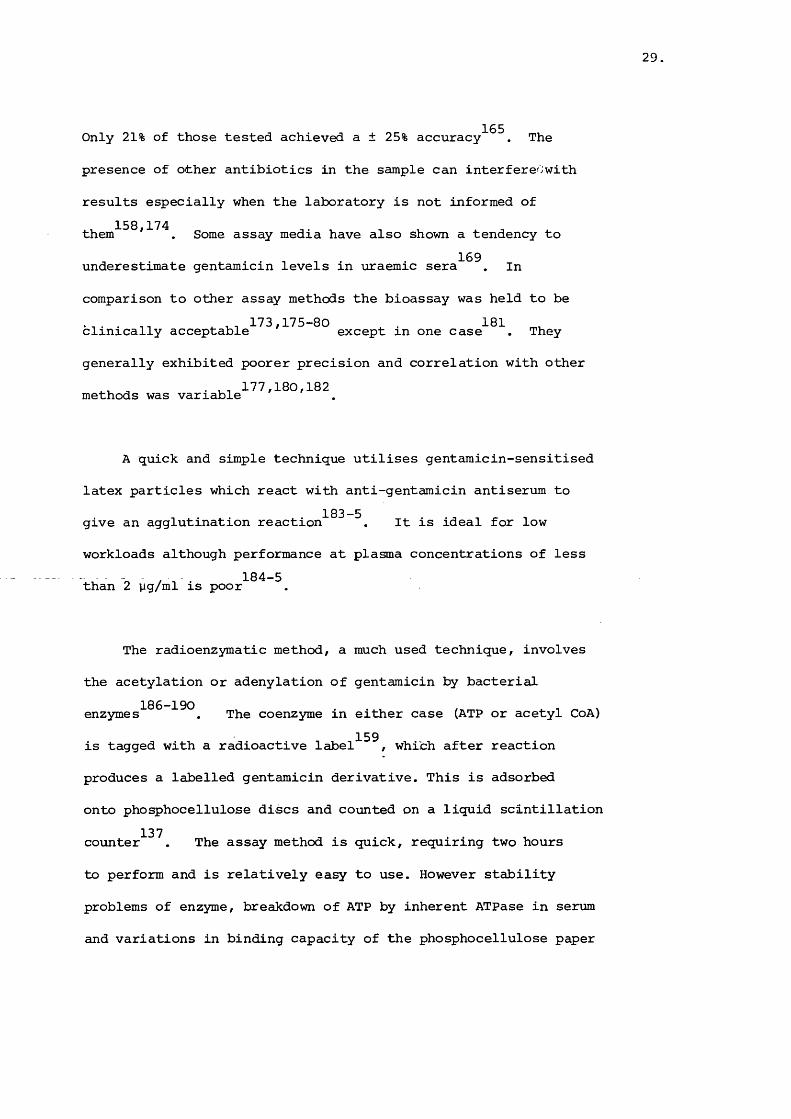
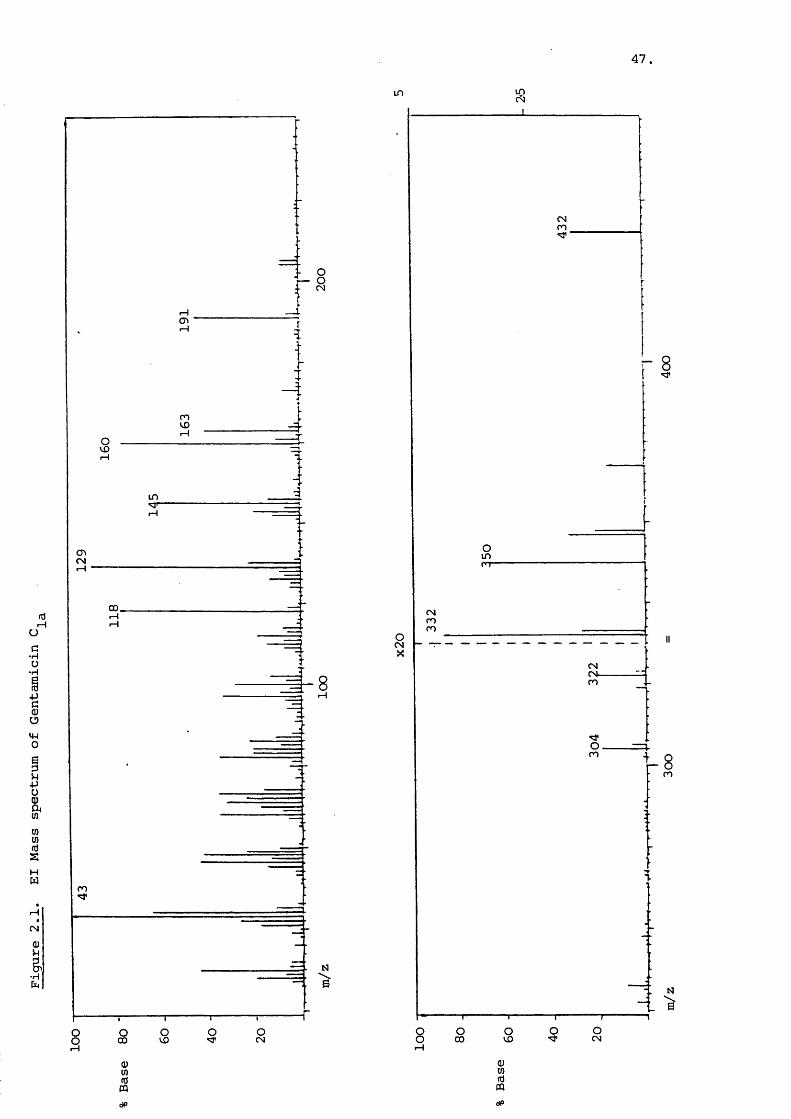
Electron impact spectra of all three major components are
similar to that illustrated in figure 2.1 for gentamicin C^^.
The fragment ions were identified by Daniels et and
are reproduced here.There is no molecular ion in figure 2.1 but
the peak at m/z 432 is probably due to loss of ammonia from
that ion (m/z 449). The peaks at m/z 350 and 322 are highly
characteristic of the gentamicins and represent two ring
47
m 5
O
I—I I— I
fUI— Iuc•HÜ-H
goiw01 IÜ)CO(dSHM
0)Ug.•H
ro
S
in
<T)CNI—1
00. I—II— I 1.a (N
nm
T 1
8 § S § OCM 8 OCO § § oCM(Uw(dmdP

48
fragments:
NH
NHHOHC=0ORHO
-CO
NH
NHORHO
m/z 350 w/z 322
R = Garosamine
The fragment, m/z 322, can further lose water to give another
fragment at m/z 304. These three ring fragments are indicative
of a garosamine-deoxystreptamine combination. The presence of
2-deoxystreptamine can be further verified by the peaks at m/z
191, 163 and 145^^. Garosamine is indicated by a fragment of
m/z 160 which can lose water to give m/z 142. The A-ring of
the gentamicins which is preferentially cleaved off is shown
by a peak at m/z 129 in figure 2.1. Gentamicins and
show corresponding peaks at m/z 157 and 143 respectively, for
the purpurosamine A and B fragments. More extensive frag
mentation of these subunits produces prominent peaks at
m/z 130, 126 and 118. Electron impact spectra can often
provide comprehensive structural data but often at the loss of
the molecular ion. This is disadvantageous when investigating
component of unknown molecular weight.
Chemical ionization spectra show the peaks due to the frag
ments of the three subunits but little other fragmentation.

49.
es
m
tdrH
<T»esT—I
es
in
in
m
esesn
ro
dP
50.
The yield of the pseudo-molecular ion [m +hJ"*" is large as shown
in Figure 2.2 which is the Cl spectrum of gentamicin C^^.
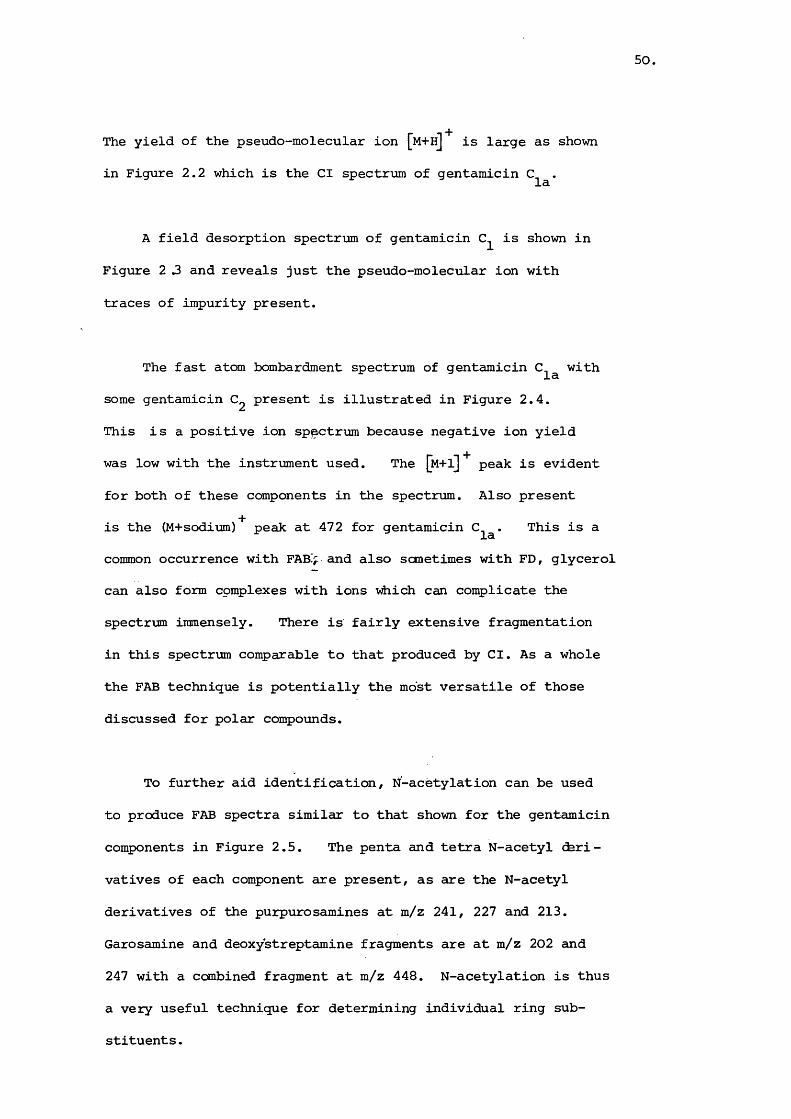
A field desorption spectrum of gentamicin is shown in
Figure 2 3 and reveals just the pseudo-molecular ion with
traces of impurity present.
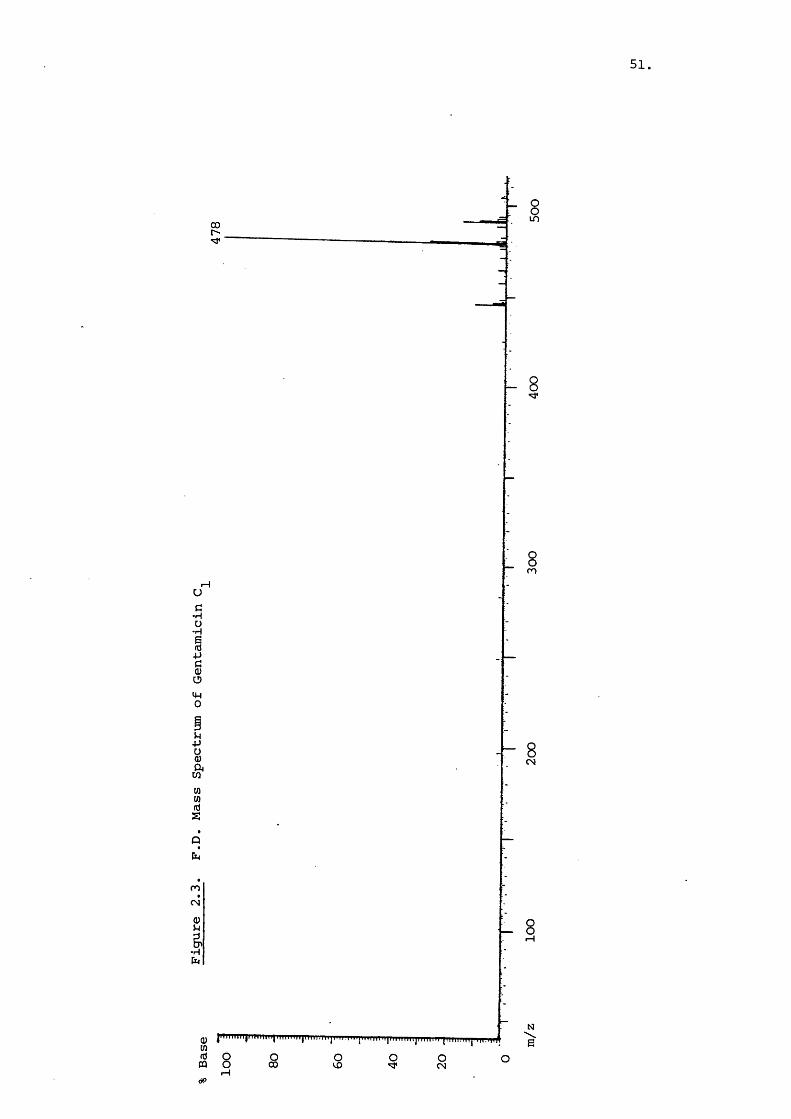
The fast atom bombardment spectrum of gentamicin with
some gentamicin present is illustrated in Figure 2.4.
This is a positive ion spgictrum because negative ion yield
was low with the instrument used. The |m+iJ peak is evidentfor both of these components in the spectrum. Also present
is the (M+sodium)^ peak at 472 for gentamicin This is a
common occurrence with FABly and also sometimes with FD, glycerol
can also form complexes with ions vÆiich can complicate the
spectrum immensely. There is fairly extensive fragmentation
in this spectrum comparable to that produced by Cl. As a whole
the FAB technique is potentially the most versatile of those
discussed for polar compounds.
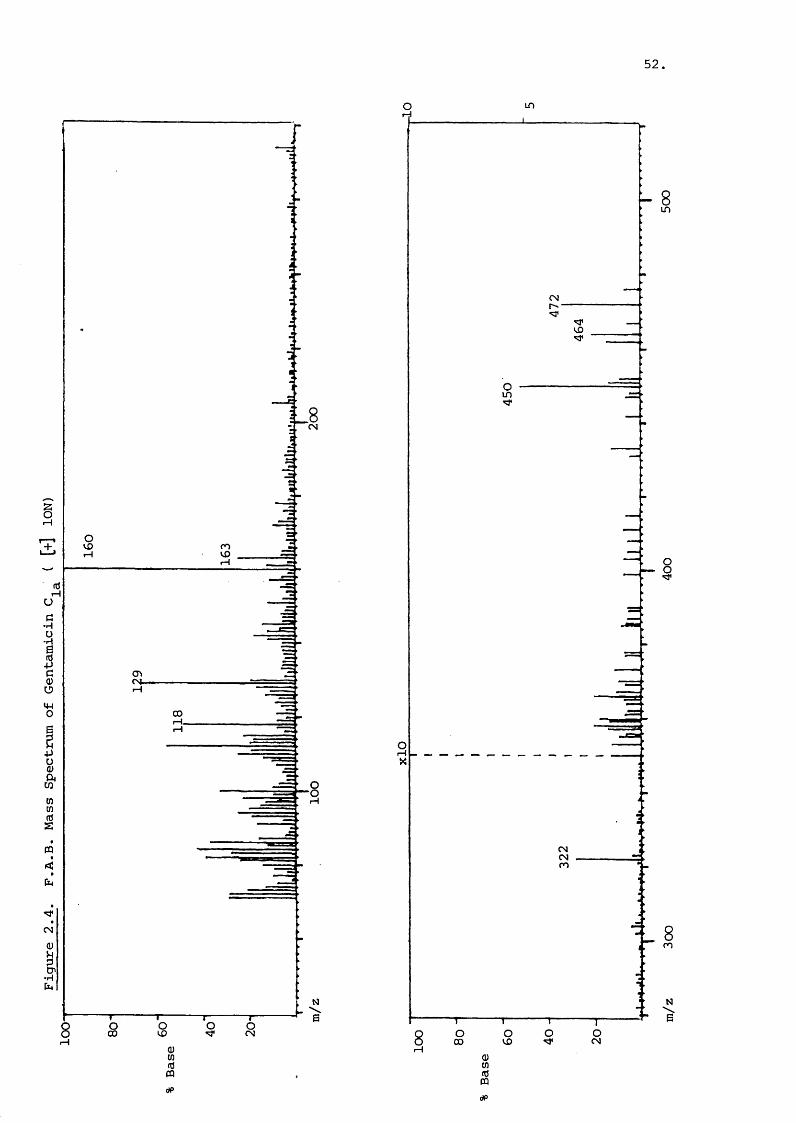
To further aid identification, N-acetylation can be used
to produce FAB spectra similar to that shown for the gentamicin
components in Figure 2.5. The penta and tetra N-acetyl P r i
vatives of each component are present, as are the N-acetyl
derivatives of the purpurosamines at m/z 241, 227 and 213.
Garosamine and deoxystreptamine fragments are at m/z 202 and
247 with a combined fragment at m/z 448. N-acetylation is thus
a very useful technique for determining individual ring sub
stituents .
51
IT)CO
n
CN
nCN
nJ O Q o
52.
es
I—Im
rH
o>CNtrH
00
CS
00 CSrH
- 8
0)m&dP
53.LO
8
8
0000
CMm
If)
8
§
8
Q>inS

54,
Proton and Carbon Nuclear Magnetic Resonance SpectrosTOpy
Proton NMR of the gentamicin C components does not produce
very distinctive results. A 100 MHz spectrum of gentamicin
is illustrated in Figure 2.6. This shows one secondary methyl
group at 61.04 (J = 6 Hz), one tertiary methyl group at 61.18
and two nitrogen substituted methyl groups at 62.32 and 62.51.
The only other readily identifiable protons are the two
anomeric protons appearing as overlapping doublets (J = 4 Hz
for both) at about 65.1. The other components have spectra
with slightly different patterns of methyl groups but no other
discernible features. Hydrolysis of the gentamicins by acid
produced 2-deoxystreptamine (2.1) which has the 100 MHz proton
spectrum shown in Figure 2.7. The protons of C-2 have a shift
of 61.30 for the axial and 61.96 for the equatorial proton.
The J = 12 Hz, J = 4 Hz and the geminal constant was aa ae13 Hz. The 1 and 3 hydrogens form a complex multiplet
at 62.7 and the 4,5 and 6 hydrogens form the complex of
multiplets at, about 63.1. Further information on the
spatial relationship of these protons was gained by Lemieux^^
who used metihylation and acétylation of the functional groups
to separate the protons.
Carbon-13 NMR of the major gentamicin C components shows
virtually identical shifts for the garosamine and deoxystrept-246amine rings in all three . The effect of the varying
degree of méthylation on the aminomethane sidechain at C-5'
leads to slight but significant differences in the chemical
shifts for the C-4' to C-6' carbons. The carbon-13 NMR spectrum

55,
Figure 2.6. loo MHz Proton NMR of Gentamicin C
HDO
O ppm

Figure 2.7. 100 MHz Proton NMR of Deoxystreptamine
56,
HDO
1O ppm

57
of gentamicin is shown in Figure 2.8 with the chemical shifts
denoted in Table 2.2. The chemical shifts of the carbon atoms
of isolated deoxystreptamine are also given as are the shifts
calculated for each carbon atom by the Lindeman and Adams 273equation
The chemical shifts reported here are similar to literature 246-7values . The shifts for the deoxystreptamine moiety are
comparable to those for the free compound and indicate the use
fulness of spectral data of the individual sub-units. It is
interesting to note that glycosidic bond formation at the C-4
and 6 does not have a large effect on the shift values of the
remaining carbon atcxns contrary to the calculated expectation.
The calculations used are based on straight chain paraffins
and extension of their usé to cyclic systems increases the
error. The shift values calculated for the anomeric carbons
show significant error which must bear seme relation to the
glycosidic bond not exerting the expected electronegative pull.
It is noticeable that the C-5' and 5" atoms have shift
values also considerably less than predicted and this function
is therefore inaccurately defined by the equation. Neverthe
less , the use of these equations can prove useful in assigning
peaks and investigating the effect of substitution of functional
groups.OH
(•2.1)

I 58,
OCN
O
S
uGv4USIÜOPi
mHcI5
00CN(Dï•H
O00
8
OCN
§
S
êr4

59.
Table 2.2. Carbon-13 NMR shifts for gentamicin and deoxystreptamine
OH
OHHzN NH
(2.II)
Carbon Observed(ppm)
Calculated(ppm)
Observed(ppm)
Calculated(ppm)
1 51.91 46.92 51.90 51.92
2 36.92 38.98 37.49 40.98
3 50.82 46.92 51.90 51.92
4 88.59 88.53 79.09 81.53
5 75.73 71.46 77.25 77.46
6 87.63 88.53 79.09 81.53
1' 102.88 f 130.53
2' 51.16 55.13
3' 27.28 27.28
4' 26.15 30.22
S' 72.89 84.59
6 ’ 58.40 47.60
7' 14.87 20.14
8' 33.64 36.40
1" 101.68 126.46
2" 70.43 74.53
3" 64.51 59.05
/contd..

60,
Table 2.2 continued
Carbon Observed(ppm)
Calculated(ppm)
4" 73.52 68.51
5" 68.99 79.89
6" 22.87 25.29
7" 38.24 33.50
61.
2.3.3 Isolation of Minor Components
Swiss-Italian Samples:
Swiss (Benzian, BN/G022, GMC-L-8) and Italian
(Pierrel SpA, Lot 064/065) gentamicin sulphate samples were
subjected to coluim chromatography. A total of 9.2 g of
gentamicin base was separated on seven columns with a further
two columns used to purify the isolated minor components. This
second column yielded a fraction (54 - 75 ml) of about 2 mg which
revealed two spots by TLC, with R values of 1.84 and 1.59.^1
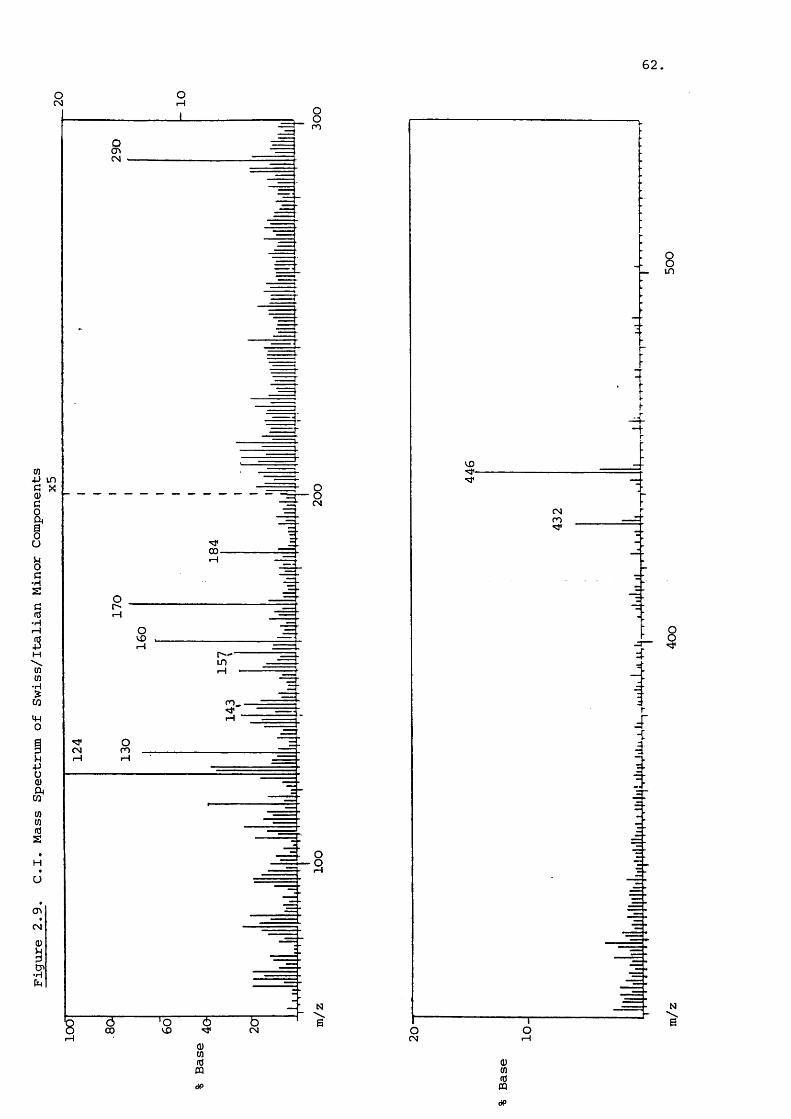
In this system the R_: of gentamicin C and C were 0.79 and2 la.0.39 respectively. The isobutane Cl spectrum of the minor
components is shown in Figure 2.9. The peaks at m/z 446 and
432 are [m +h] signals and the difference of 14 suggests they
are structural homologues. The presence of a garosamine moiety
is suggested hy the peak at m/z 160, but there is no signal at
m/z 163, 191 or 145. The absence of the characteristic peaks
of m/z 350, 322 and 304 further verify the lack of a deoxy
streptamine moiety. These components are thus similar to77those discovered by Krai sin tu . The prominent peak at m/z
290 is possibly due to a two ring fragment equivalent to the
m/z 322 of the gentamicins. This implies a fragment of m/z 131
for the central ring if it behaves similarly to deoxystrept
amine. The ring shows a large signal at m/z 130 which may corre
spond to the ring without a proton addition. The B ring is
thus 32 mass units smaller than 2-deoxystreptamine and various
structural interpretations can be proposed for this loss.
The 'A ' ring in these components is required to be 157 and 143
which are the purpurosamines A and B observed in gentamicins
62.
Ar o
CN
CO
I—I
m,
CNI—I m
iH
CN
CO CNI—I
8
0)w3<JP
OCN 2
dP

63
and C^. These are in fact seen in Figure 2.9 and confirm
the size of the B-ring. Further characterisation of these
components was achieved by N-acetylation with the FAB spectrum
illustrated in Figure 2.10. No clear molecular ions are
visible, probably due to fragment combination. However,peaks
corresponding to tri-N-acetylated compounds plus sodium occur at
m/z 594 and 580 with no greater N-acetylated ions present.
Garosamine is disclosed by the signal at m/z 202, with the
purpurosamines at m/z 241 and 227. There is no peak at m/z 130
or at 172 or 214 (N-acetylated). It is possible that the m/z
130 fragment of the B ring has become associated with glycerol
or some other species 1 The peak at m/z 304 is also present
in the FAB spectrum of the unacetylated minor ccraponents but
absent in the Cl spectrum (Figure 2.9). It may represent a
dimer of ring B and sodium (129 + 23). There is a m/z 152
peak present but this is comparatively small (8%) and there
is a larger peak at m/z 168 which could be ring B plus potassium.
It is therefore likely that the central moiety is not stable in
the FAB conditions employed but there is no indication of N-
acetylation. The uneven molecular weight of the components
indicates an odd number of nitrogen atoms present. The overall
evidence is that there are only three amino groups in the
components and these are distributed in the A and C rings. The
B ring with a weight of 128 and possible molecular formula of
C^HgOg could have a general structure of either (2.Ill)
or (2.IV)
(2.Ill) (2.IV)
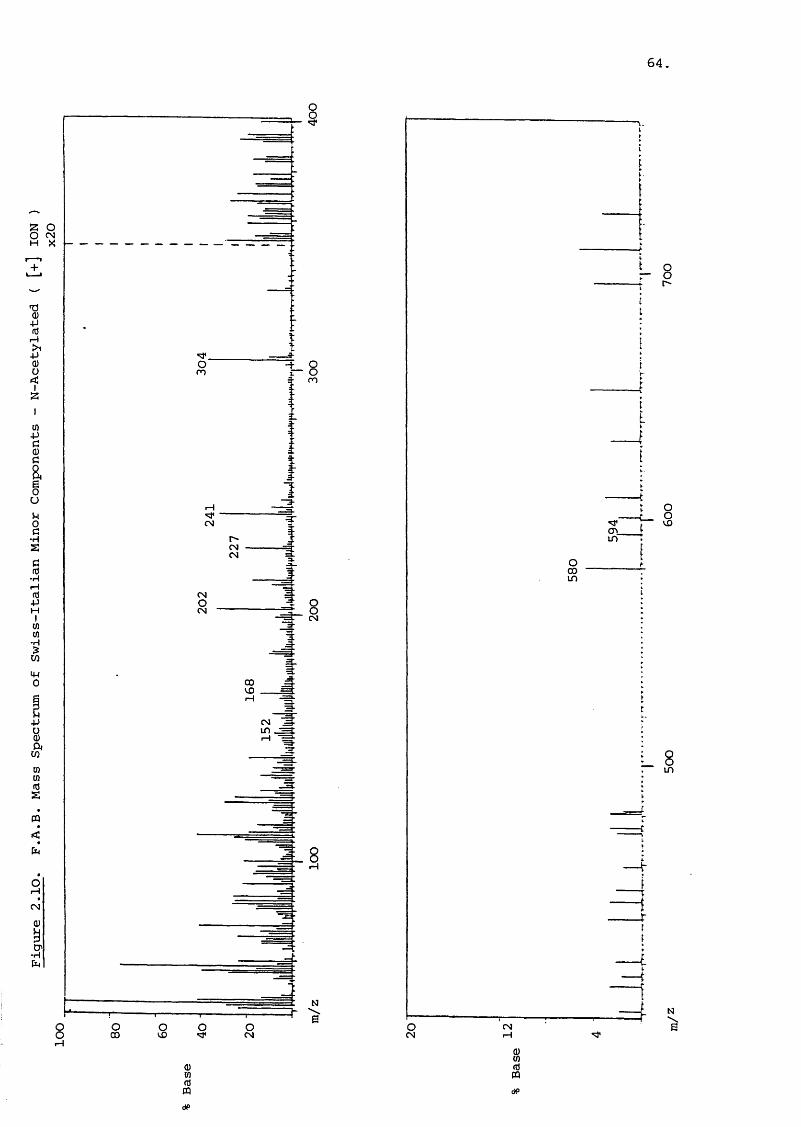
64
m ro
"4"CM
CM
CM
rH
CMin
CM
enm
COin
CM
8
§
in
N'b

65
More specific structural assignments would require additional
sample to enable carbon-13, proton NMR and degradative studies to
be performed.The components, however, appear to represent a
family of gentamicins identical to the C-components, but without
the deoxystreptamine ring. The microbiological activity of these46components would be low according to Price as they lack a basic
77function at the C-1 and 3 positions. However, Kraisintu re
ported similar activity to the C-components. These minor
components would be resistant to micro-organisms which produce
the AAC-3 inactivating enzyme.
Italian Sample
A different batch of Pierrel (BN Genta/121) gentamicin
base (26 gj was chromatographed on a column to isolate more
of the 445/431 components. However mass spectral analysis and
TLC was unable to detect them in appreciable yield. Some of
the fractions of minor components were N-acetylated in an attempt
to identify some of those present. The fractions of F551-90
and F591-630 show peaks at m/z 424 and 410 amongst the numerous
signals present (Figure 2.11). N-acetylation of these fractions
revealed peaks at m/z 452/466, 494/508 and 536/550 (Figure 2.12),
which represent mono, di and tri-acetylated derivatives of the
423/409 components. Garosamine is again present as shown by
the m/z 160 and 202 in the separate spectra. The N-acetylated
spectrum indicates that purpuro samines A and B are present
because of the sizeable m/z 227 and 241 signals. However the
spectra also show that the components of m/z 445/431 are present
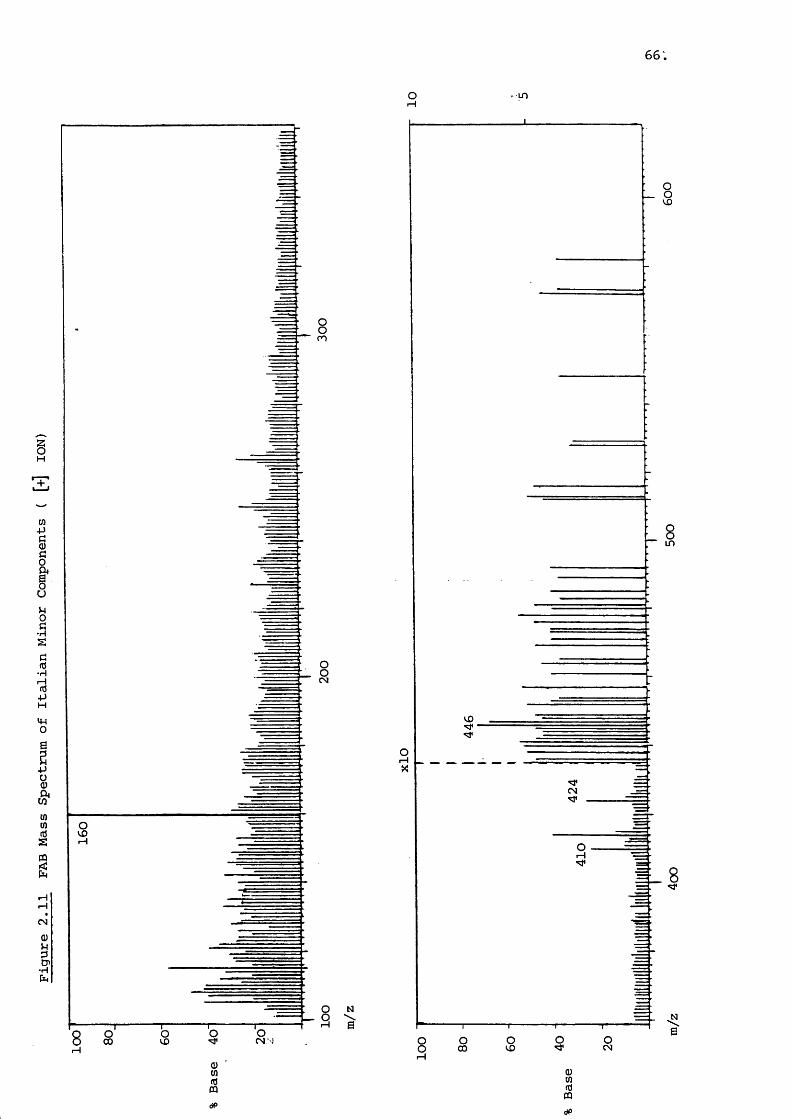
66'.
IT)
I— I
CM
dP

67.in04r—I o 1—1
- I -
in
O'oi04
00X
0)U&•H
g“T"§
1— § g
inm
COin
in
OIin
in(Uw(0
dP
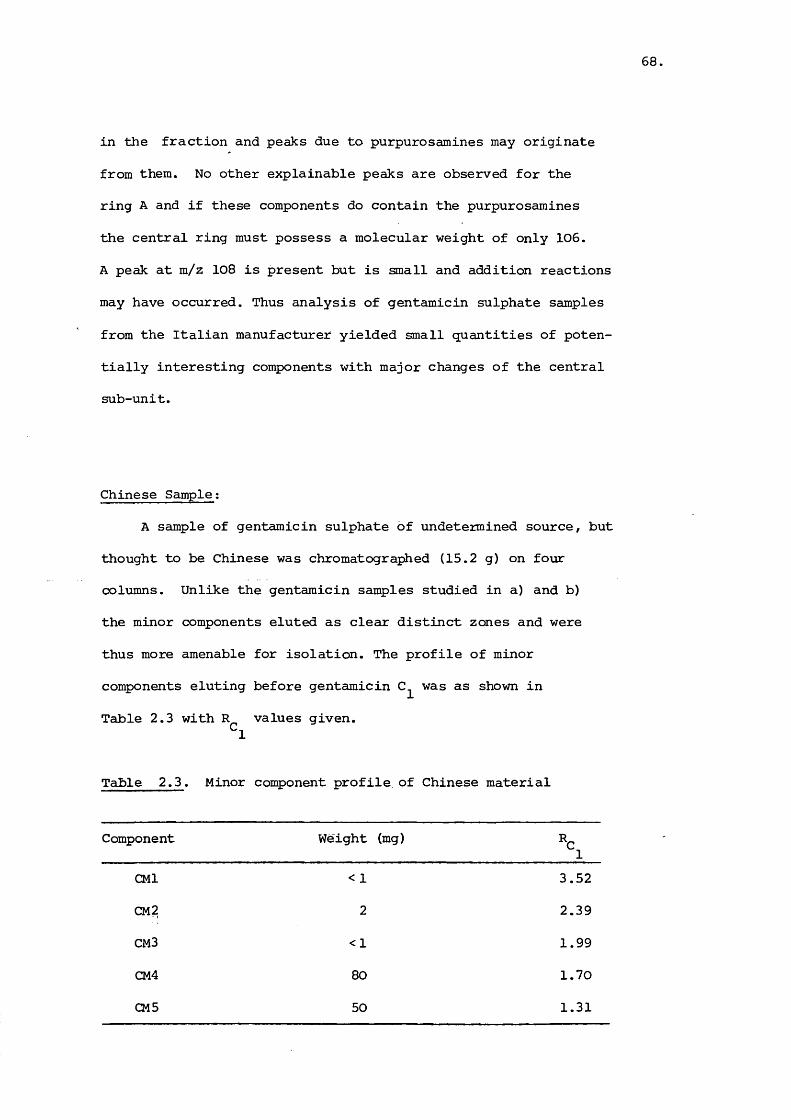
68
in the fraction and peaks due to purpurosamines may originate
from them. No other explainable peaks are observed for the
ring A and if these components do contain the purpurosamines
the central ring must possess a molecular weight of only 106.
A peak at m/z 108 is present but is small and addition reactions
may have occurred. Thus analysis of gentamicin sulphate samples
from the Italian manufacturer yielded small quantities of poten
tially interesting components with major changes of the central
sub-unit.
Chinese Sample;
A sample of gentamicin sulphate of undetermined source, but
thought to be Chinese was chromatographed (15.2 g) on four
columns. Unlike the gentamicin samples studied in a) and b)
the minor components eluted as clear distinct zones and were
thus more amenable for isolation. The profile of minor
components eluting before gentamicin C^ was as shown in
Table 2.3 with R values given.^1
Table 2.3. Minor component profile of Chinese material
Component Weight (mg)'^1
CMl < 1 3.52
c m 2 2 2.39
CM3 <1 1.99
CM4 80 1.70
CMS 50 1.31

69,
The CMl and CM3 components were not isolated in sufficient
yield to achieve any identification. The field desorption,
chemical ionization and FAB spectra all depicted m/z 445 as
the[M+H]* ion. The El spectrum of CM4 is illustrated in
Figure 2.13. Peaks at m/z 350, 322, 191, 163 and 160 all imply
that garosamine and deoxystreptamine are present as the B and
C rings. The remaining A ring has, by subtraction, to be a
fragment of m/z 124 and possess an odd number of nitrogen atons.
There is indeed a peak of m/z 124 present but this is not con
clusive as garosamine can lose water to produce an ion of this
mass.However the peak at m/z 286 is indicative of a 124 subs
tituent joined to deoxystreptamine and it is not usually found
in gentamicin spectra (Figure 2.2). Berdy isolated a
compound of the same molecular weight and assigned a structure
(2.V) to it although he offered no supporting evidence.
The 100 MHz proton NMR spectrum of CM4 is presented in
Figure 2.14 which can be compared with a similar spectrum of
gentamicin in Figure 2.6. The single methyl at 61.20

70.
<N
CM
mCN
Cn
§ S § oCN
in
mn
CNCNm
m
00 CN
%(0m0)(Ag

Figure 2.14. 100 MHz Proton NMR Spectrum of CM4
71,
; HDO
T0 ppm

72,
represents the tertiary methyl at C-4" and compares to 61.18
for gentamicin C^.
No secondary methyl group is evident but two methyls appear
in the 62-3 region. The peak at 62.53 is comparable to 62.50
for gentamicin and represents the amino substituted methyl
in the garosamine ring. The other peak at 62.16 does not corre
spond closely with the 62.32 found for the aminomethyl group
on C-5' in gentamicin . It could plausibly represent a
methyl group adjacent to an imine function but could also
fit other groups. One of the anomeric protons is shifted
to 65.26 and broad peaks appear at 64.35 and 4.51. The latter
may be the C-2' and C-5' deshielded protons.
The carbon-13 NMR spectrum of this compound is reproduced
in Figure 2.15 and assignments of the shifts are made in
Table 2.4, with a comparison to gentamicin C^. Two peaks
representing carbons 3' and 5' were not detected even after a
duplicate run. Otherwise the resonances were very similar to77those reported by Krai sin tu . The shifts of the B and C
rings show a close comparison to those found in gentamicin
confirming mass spectral analysis. For the A-ring, the
C-2' is deshielded by 5.5 ppm and the peak of 181.96 is
the carbon of the imine'function. This is similar to some
literature values of imines and lies outside the normal
aldehyde/ketone region^^^ The shift of the methyl group
(C-7') attached to the C-6' is anomalous since the presence of
the imine function would be expected to deshield greater than

inCMQ)I•H
73
OCM
OTP
oID
S
8
§
•Sr—I
oCO

74.
Table 2.4. Carbon-13 NMR shifts of CM4 and Gentamicin Cg
Carbon CM4 (ppm) Gentamicin C^ (ppm)
1 51.50 51.34
2 35.90 36.07
3 49.83 50.37
4 87.58 88.34
5 74.69 75.07
6 85.53 87.42
1' 101.02 102.43
2' 56.11 50.63
3' - 26.56
4' 24.47 24.47
5' - 74.15
6' 181.96 49.83
7' 18.89 18.51
1" 101.24 101.02
2" 69.82 69.98
3" 64.13 64.02
4" 72.80 72.96
5" 68.40 68.35
6" 22.31 22.37
7" 37.37 37.53
75
0.3 ppm, especially considering the proposed shift in the proton
spectrum (Figure 2.14). Thus the spectroscopic data suggests,
but is not adequate to confirm , structure (2.V) .
In order to confirm the presence of an imine group the275compound was reduced with dimethyl amine borane . This reagent,
will reduce an imine to the amine and carbonyl to the alcohol^^^
and was chosen so that the product could be easily isolated.
The actual reduction can be judged to occur by comparison of
the infra-red spectrum of the CM4 component with that of the
reduced product shown in Figure 2.16. A weak band is visible-1 -1 at 1640 cm on the broader band at 1600 cm due to the N-H
\bending. This is expected for a ^C=N- group and values of
1665-1645 cm ^ of variable bond strength are quoted^^^ for
compounds of the type R-C=N-R. Carbonyl absorption bands tend—1
to be strong and higher in frequency. This band at 1640 cm
is absent from the IR spectrum of the reduced component. The
success of the reduction was confirmed by a FAB spectrum which
showed a ratio of 4:1 of m/z 447 to 445. A peak at m/z 126,
with little m/z 124 present confirmed that the site of reduction
was in the purpurosamine ring and that m/z 124 in Figure 2.13
was due to this ring and did not arise from loss of water
from garosamine. It is concluded that the structure (2.V)
is probably correct and that the amlpiguous NMR data was due
to an insufficiently large sample size.
The CM2 component, only separated in a very small quantity,
produced a [m +h]"* ION OF M/z 459 in a field desorption mass

76,
S0)
in
00
CN
VOI— I
COrH
CN
m
S%05
15O
is
T3IUCH
lO
CN(UuI
in
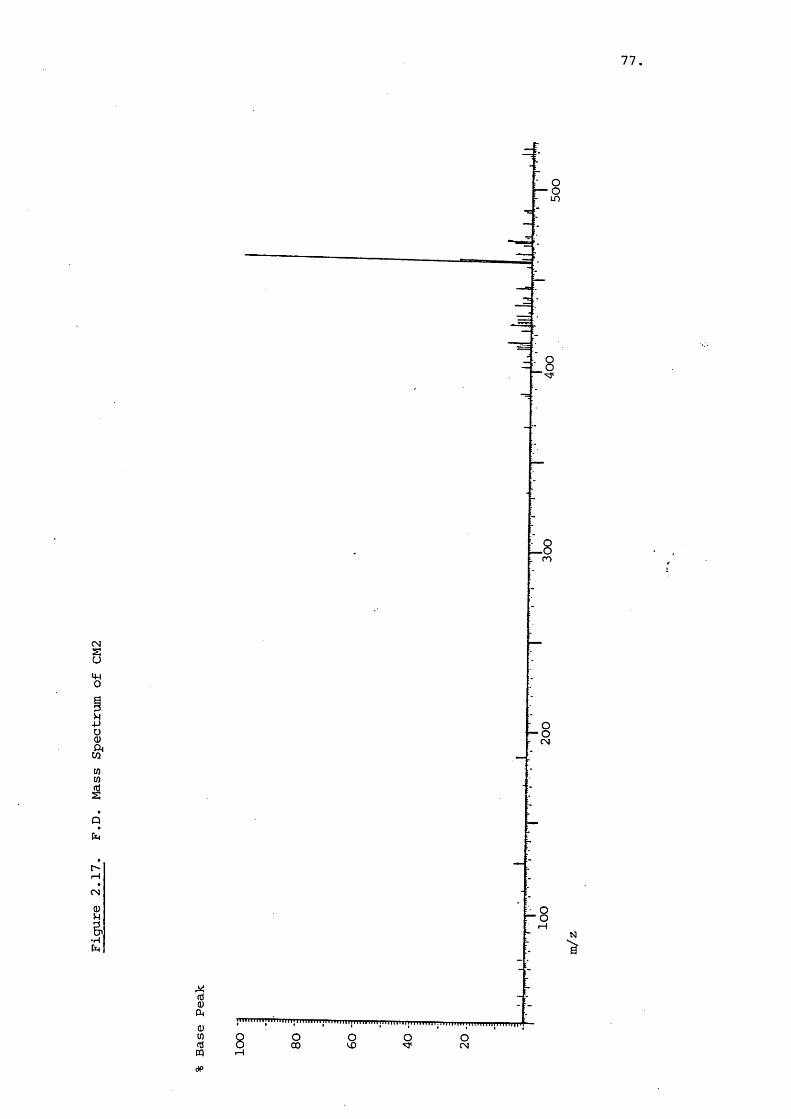
77
CNS%
Ü8Ssenen
â
2&•H|
Sft
^8
•8
.8ro
^ ; T " < i ' i » ; i i i i i r r r i ; i i i i i i i i i j i i i i i i , i i } i i M i i t i i i i i i i i i u i , , i , „ „ | | . , „ i i n i i m i m i i i j i i r r
V) Qd OPQ iH
•8CN
Oco s § oCN
78.
spectrum (Figure 2.17). This is fourteen mass units larger
than CM4 and is possibly a homologue. However the proposed
structure of the A-ring excludes the normal méthylation wit
nessed in the C components. Chemical ionization and FAB
spectra of this component did not produce conclusive grounds
for structural determination.
The CM5 component was procured in a significant yield.
The field desorption mass spectrum of this compound indicated
a molecular weight of 477, equivalent to gentamicin C^. The
proton NMR spectrum of the component showed four methyl groups
at shifts of 62.53, 2.35, 1.20, l.OB ppm compared to shifts
of 62.51, 2.32, 1.18 and 1.04 ppm for gentamicin C^. A carbon-
13 NMR of the component was recorded shown in Figure 2.18,
although one carbon atom could not be detected and splitting
of other resonances also occurred. A comparison of chemical
shift assignments with gentamicin is made in Table 2.5.
There is little evidence of difference except for the splitting
which mainly occurs in the A-ring. This was thought to be due
to a mixture of stereo-isomers about the C-5' position. An
important difference between the spectra is the peak attri
buted to the C-7' methyl which is deshielded by nearly 4 ppm
and is of comparable size to the C-7' in gentamicin (18.51).
This conflicting data was assessed by a Cl spectrum of CM5
shown in Figure 2.19. The molecular weight is confirmed
as 477, and garosamine is present. The signal at m/z 143
suggests that it is purpurosamine B and not A which is a sub
unit of the component. All signs of deoxystreptamine were
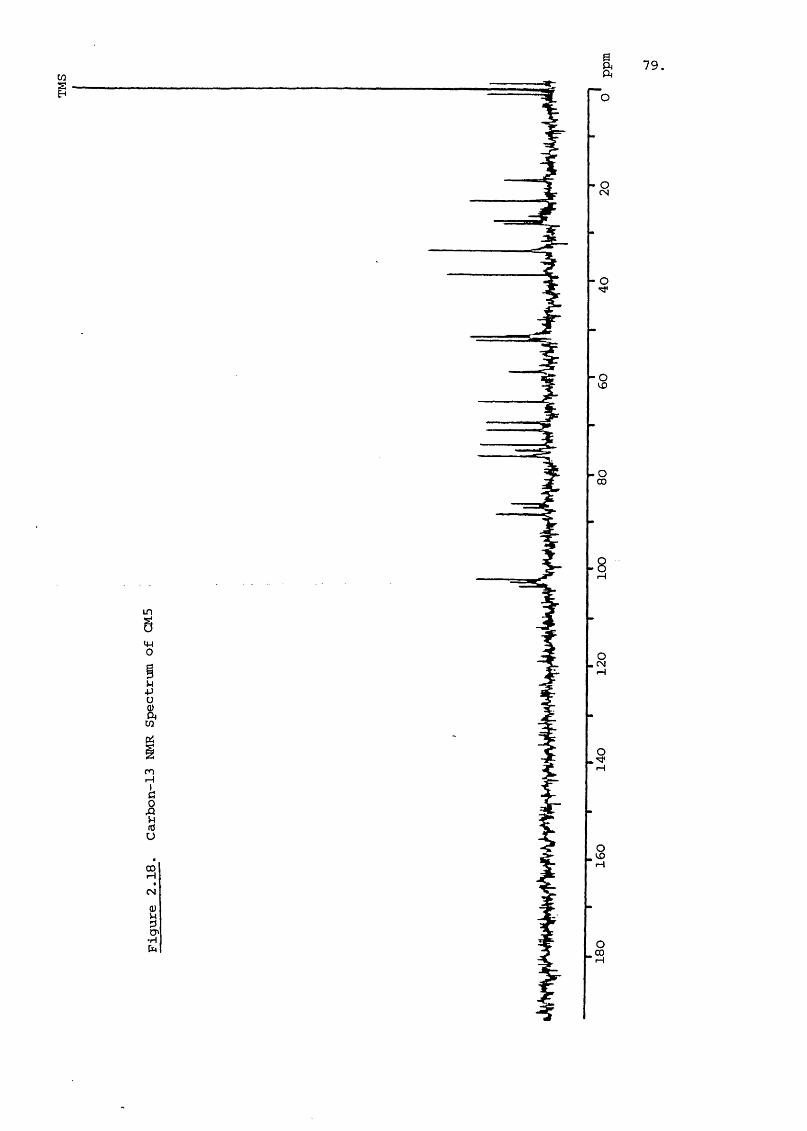
I 79,
S
O
'S
• o co
iw0
u4JO&ft
CIfCu
CN
O, CN 1-4
.§
8iH
;ft o , 00 1-4
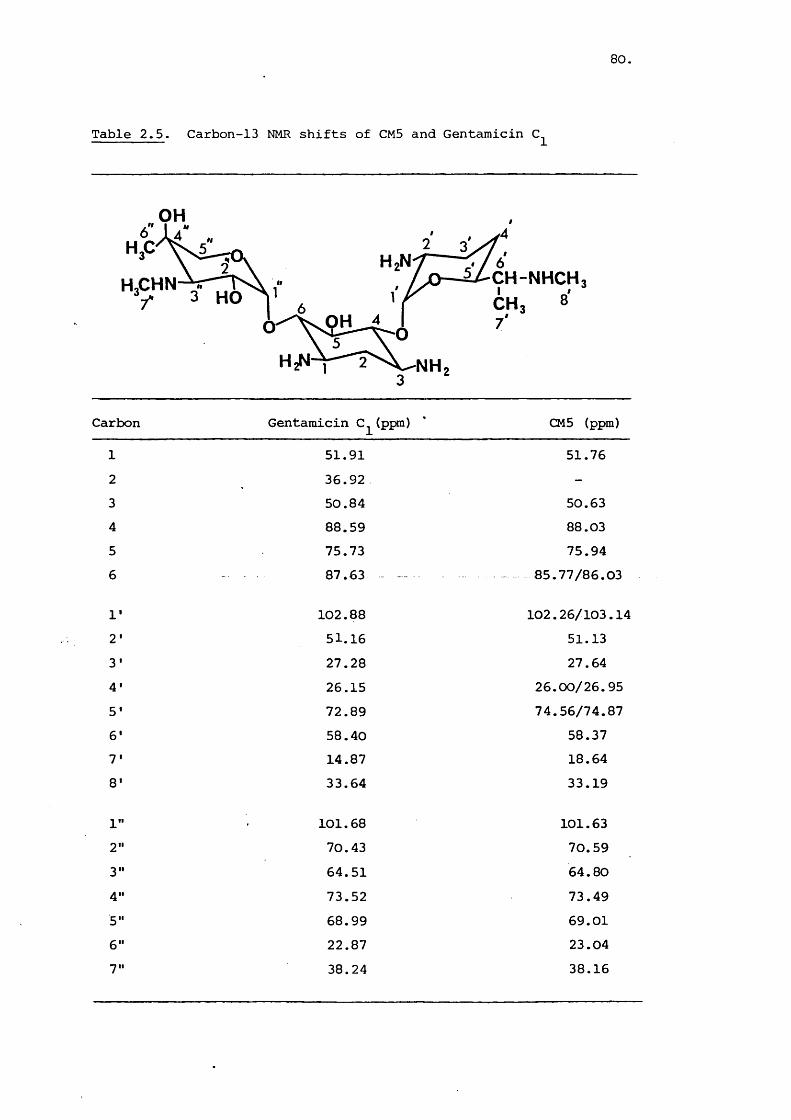
80.
Table 2.5. Carbon-13 NMR shifts of CMS and Gentamicin C,
OH
CH-NHCH C M , 8
HXHN 3 HOOH
NH
Carbon Gentamicin C^ (p£xn) CMS (ppm)
1 SI.91 SI.762 36.92 -
3 SO. 84 SO. 634 88.S9 88.03S 7S.73 7S.946 87.63 - -- - - 8S.77/86.03
1’ 102.88 102.26/103.142' SI.16 SI.133' 27.28 27.644' 26.IS 26.00/26.9SS' 72.89 74.S6/74.876' S8.40 S8.377' 14.87 18.64S' 33.64 33.19
1" 101.68 101.632" 70.43 70.S93" 64.SI 64.804" 73.S2 73.49S" 68.99 69.016" 22.87 23.047" 38.24 38.16
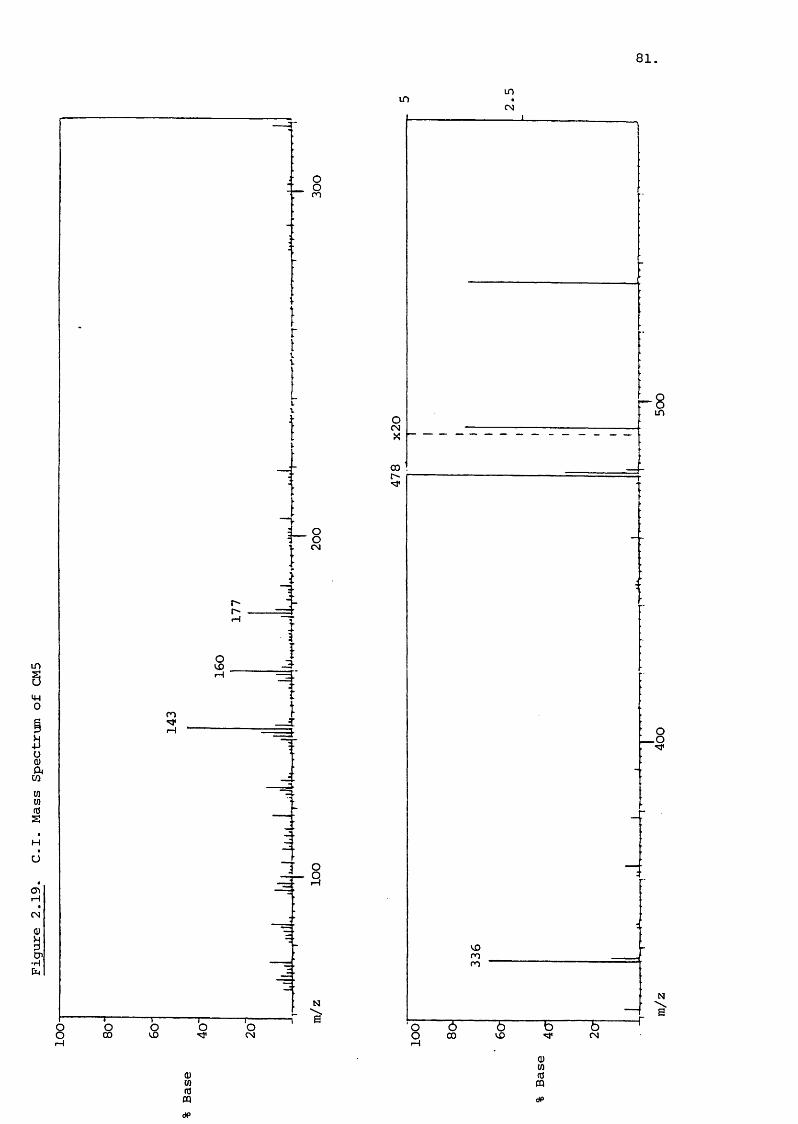
81,
in LOCN
m
o
5%
WV)s
CDCNI•H
m
CN
r—I
m
I—I
CO CNtH
inCN
GO
rom
0)U)(Um
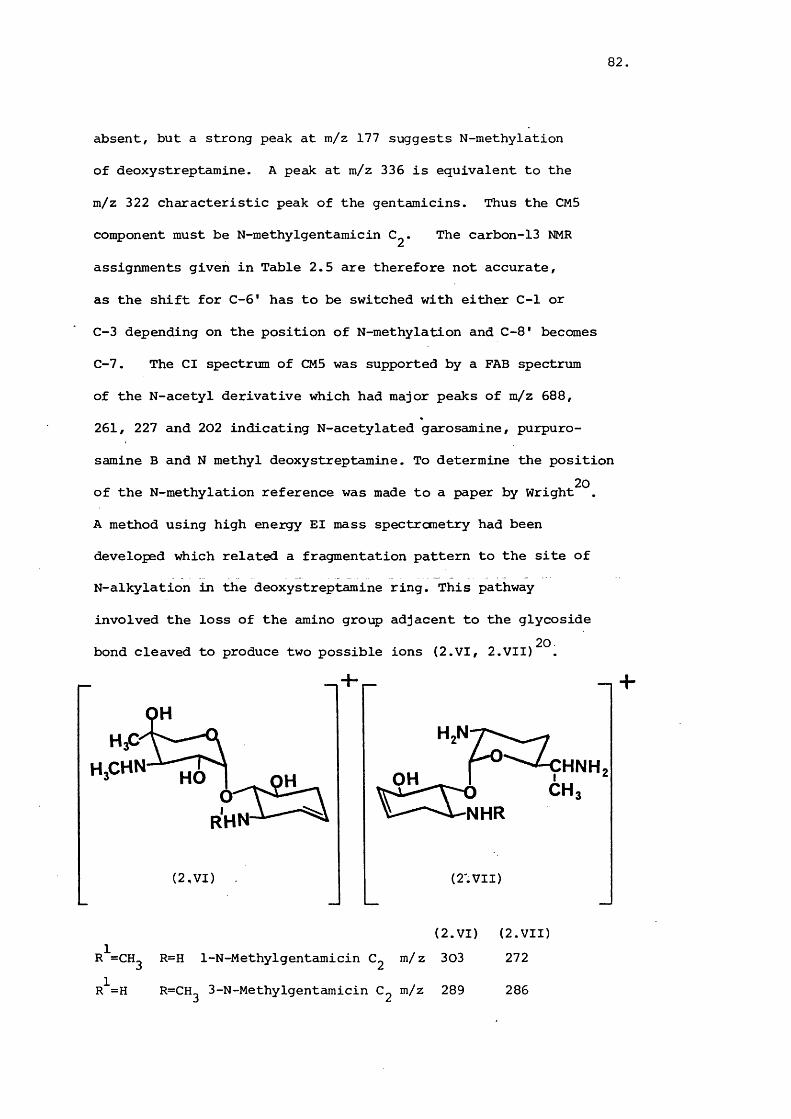
82
absent, but a strong peak at m/z 177 suggests N-methylation
of deoxystreptamine. A peak at m/z 336 is equivalent to the
m/z 322 characteristic peak of the gentamicins. Thus the CM5
component must be N-methylgentamicin . The carbon-13 NMR
assignments given in Table 2.5 are therefore not accurate,
as the shift for C-6' has to be switched with either C-1 or
C-3 depending on the position of N-methylation and C-8' becomes
C-7. The Cl spectrum of CMS was supported by a FAB spectrum
of the N-acetyl derivative which had major peaks of m/z 688,
261, 227 and 202 indicating N-acetylated garosamine, purpuro-
samine B and N methyl deoxystreptamine. To determine the position
of the N-methylation reference was made to a paper by Wright^^.
A method using high energy El mass spectrometry had been
developed which related a fragmentation pattern to the site of
N-alkylation in the deoxystreptamine ring. This pathway
involved the loss of the amino group adjacent to the glycoside
bond cleaved to produce two possible ions (2.VI, 2.VII)^^.
— ,— — I 4 "
(2,VI)
OH CH3NHR
(2 .VII)
(2.VI) (2.VII)R =CHg R=H 1-N-Methylgentamicin C2 m/z 3o3 272
R^=H R=CH2 3-N-Methylgentamicin C^ m/z 289 286
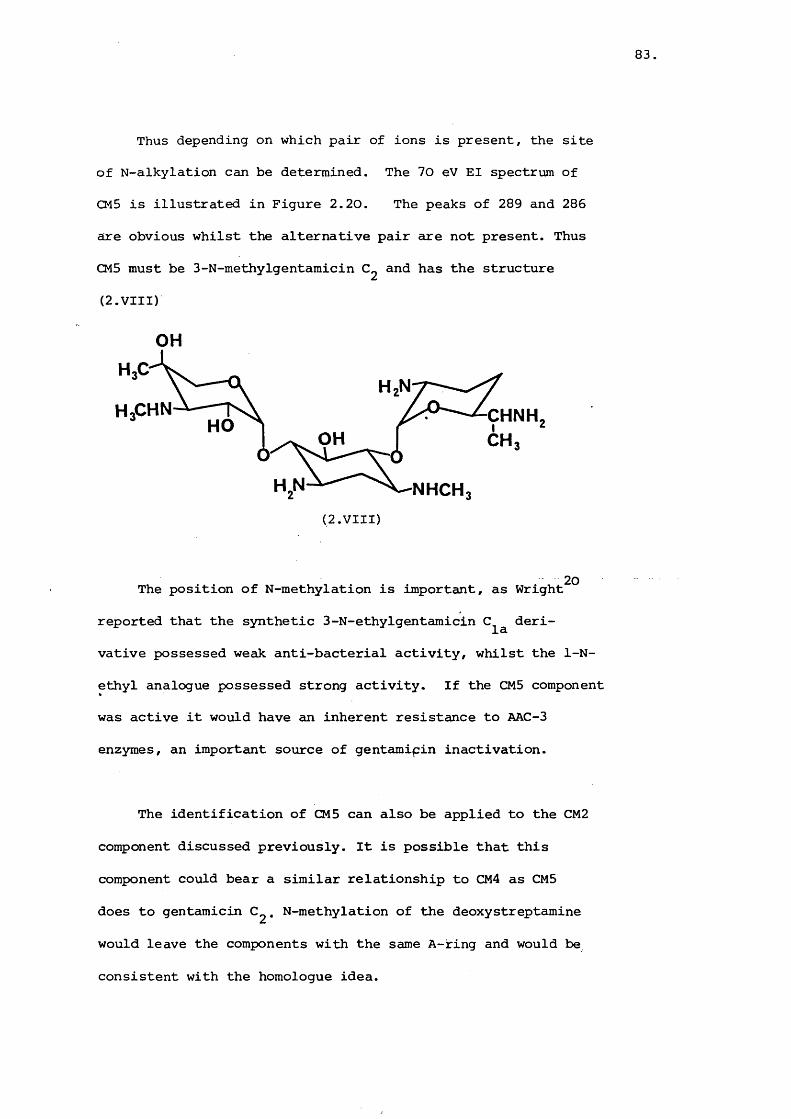
83
Thus depending on which pair of ions is present, the site
of N-alkylation can be determined. The 70 eV El spectrum of
CM5 is illustrated in Figure 2.20. The peaks of 289 and 286
are obvious whilst the alternative pair are not present. Thus
CM5 must be 3-N-methylgentamicin and has the structure
(2.VIII)
OHHX H,N
CHNHCM,HO OH
H.N NHCH(2.VIII)
20The position of N-methylation is important, as Wright
reported that the synthetic 3-N-ethylgentamicin deri
vative possessed weak anti-bacterial activity, whilst the 1-N-
ethyl analogue possessed strong activity. If the CM5 component
was active it would have an inherent resistance to AAC-3
enzymes, an important source of gentamipin inactivation.
The identification of CM5 can also be applied to the CM2
component discussed previously. It is possible that this
component could bear a similar relationship to CM4 as CM5
does to gentamicin C ^ . N-methylation of the deoxystreptamine
would leave the components with the same A-ring and would be
consistent with the homologue idea.
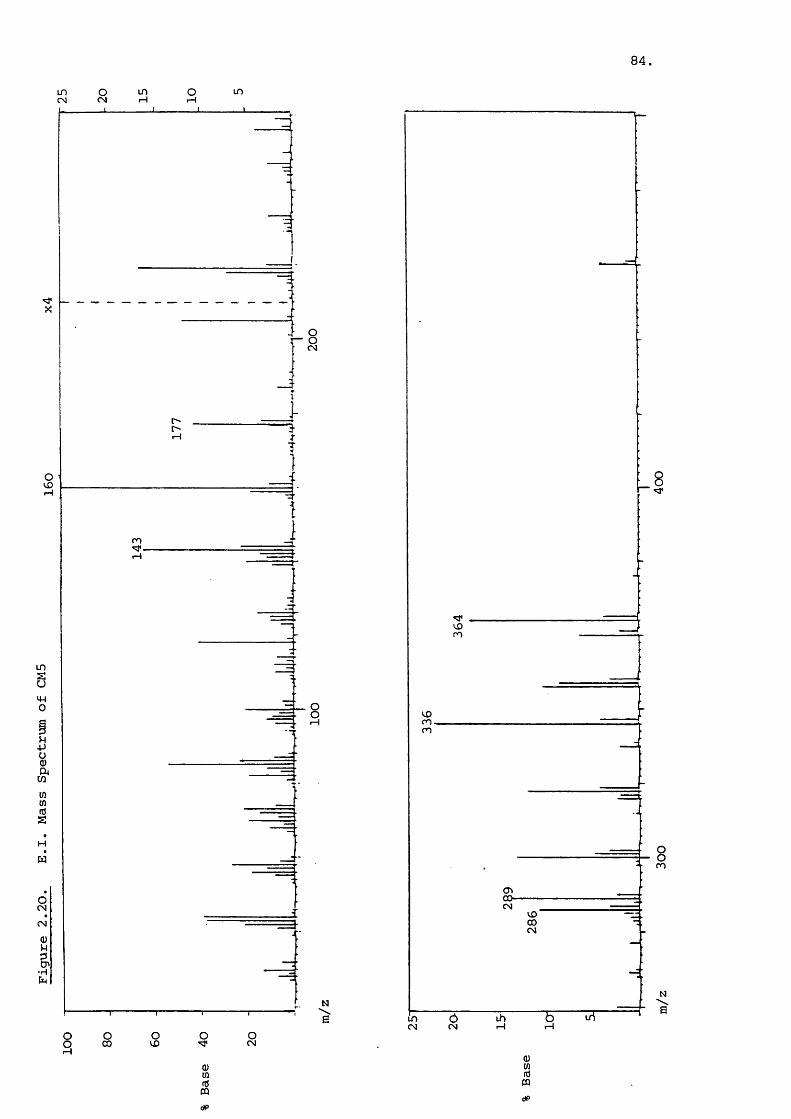
84.LDOJ O(N LO LO
X
r—I
sI—I
ro
LO
0)A0)SHW
oCMCM(UUg.■H
8
ro
ro
CMCOCM
LOCM t— ICM
g s oTP0)CO&
oCM
dP

85
The Chinese sample also produced large amounts of a co
eluting component of gentamicin C^. This was recognised by
unusual Carbon-13 NMR spectra though TLC or paper chromatography
could not separate the components. The component, assumed to
be gentamicin Cg^, was separated analytically by HPLC and
estimated to be in equal proportions to gentamicin C^ (3.3.1)
Other components were eluted after gentamicin C^^ in large77quantities but were likely to be two ring fragments . A field
desorption spectrum did reveal components of m/z 450 and 435
which were possibly the same as the demethyl derivatives isolated 74by Berdy
It is interesting to conclude that the different sources
of gentamicin sulphate reveal varying minor component profiles,
due probably to different conditions of incubation medium or
to different strains of producer organism. These components
exhibit a wide range of structural modification of the genta
micin C nucleus, some of which are promising in terms of en
hancing the aminoglycosides clinical activity. The Chinese
sample seems to have been produced in a culture medium with
an unusual biosynthetic pathway as the deoxystreptamine is
an unorthodox site for N-methylation. Other naturally-occurring
aminoglycosides have been isolated With such N-methylation
such as Hygromycin B and Destomycin A but in these compounds
the deoxystreptamine group is not central and only has one46glycosidic bond attached

86,
2.3.4 Spectroscopic Study of Netilmicin
The observation of two peaks for netilmicin in the
HPLC system (3.3.1) which rendered it unsuitable as a standard
was probably due to a column or reaction effect. However, to
rule out the possibility of a heterogenous compound an investi
gation of its composition was made. The structure of netilmicin
is given as (2.IX)^^. '
OHH,CH,CHN 3 HO
OH
NH
A chemical ionization spectrum is shown in Figure 2.21,
with the [m +1] of m/z 476 agreeing with the molecular formula
of ^21^41^5^7’ Garosamine is present (m/z 160) as is the
4',5'-dehydropurpurosamine C at m/z 127. The N-ethyl deoxy
streptamine is indicated by the signal at m/z 191 and the
peak at m/z 350 vdiich is the N-ethyl deoxystreptamine attached
to garosamine. There is no evidence from this spectrum of
an impurity or that the sample is a mixture. The mercaptolysis49 +of N-acetylated netilmicin , though it provided a [jM+l]
peak of m/z 335 attributable to the 2,6-diacetamido-5-keto-
hexanal, did not exhibit the expected fragmentation pattern.
Hydrolysis and N-acetylation of netilmicin revealed the N,N-
diacetyl, N-ethyldeoxystreptamine by a chemical ionization

87f— I s LO
CM
r— I
CMA
CM
CO CM
lO
LOm
LO
(UU)(dPQdP
0)cn3
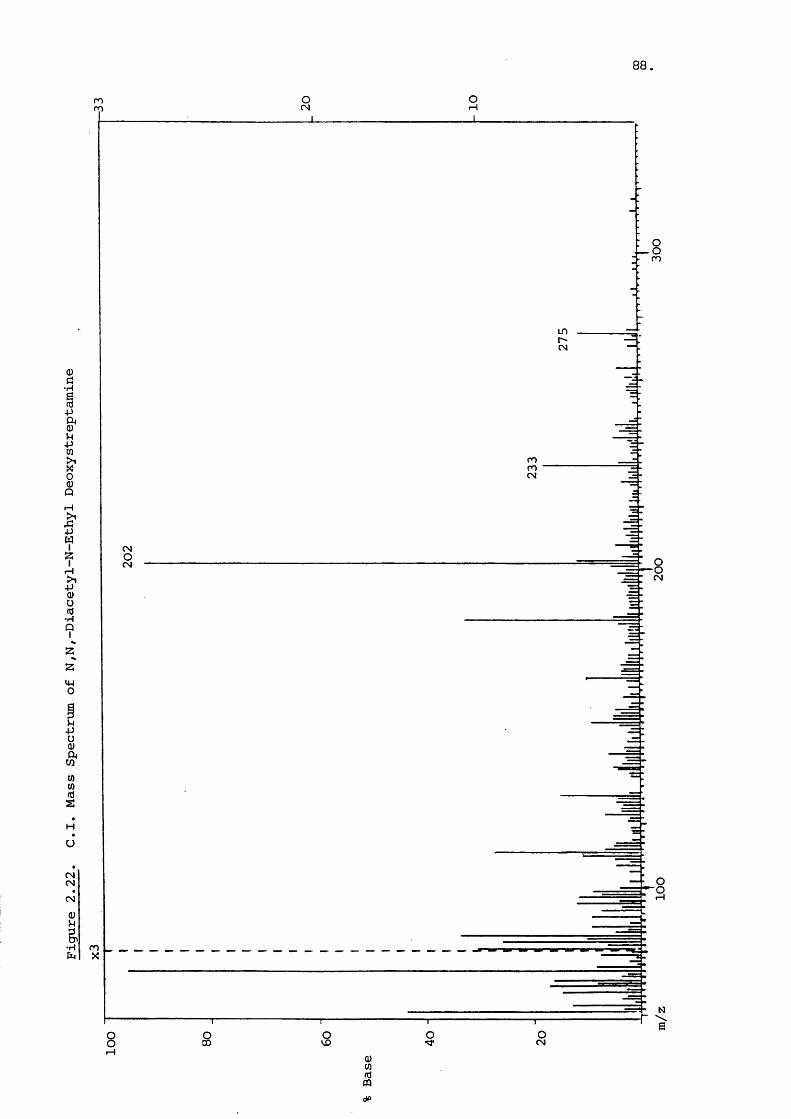
88.
mm CM
n
inCM
nnCM
CM
CMCMCM
Cr> m
CM
dP

89,
spectrum (Figure 2.22). The m/z 275 signal corresponds to the
[m +3] of this fragment and the large m/z 202 peak is due to
an impurity of N-acetylgarosamine.
The carbon-13 NMR spectrum of netilmicin is illustrated in
Figure 2.23 with' chemical shifts assigned in Table 2.6, and
conpared to gentamicin The introduction of unsaturation
to the purpurosamine C ring deshields the C-4' and S' by over
70 ppm which is as expected for such a function. The values
for the A-ring are very similar to those reported for siso- 246micin . The N-ethyl group appears to influence both the B
and C rings. The N-methyl (C-7") is shielded by 6 ppn although
a reason for this is unknown. It is unlikely to be the in
fluence of the unsaturation as sisomicin has been reported to
possess chemical shifts of the C ring the same as the 246gentamicins . It is most likely caused by a steric factor
which may also account for netilmicin's unusual resistance
against bacterial enzymes.
The 100 MHz proton spectrum of netilmicin is shown in
Figure 2.24. The tertiary methyl (6") exhibits a signal
at 61.20 and the N-methyl (7") at 62.52 which are similar to
resonances found in the gentamicins. The methylene group in
the A ring (6') gives a singlet at 63.16 whilst the 4' proton
doublet is not distinguishable. The ethyl protons show as a
triplet (C-8) (J = 7 Hz) at 61.06 and a quartet at about
62.7 (C-7).

90.
I
cU•Ha•H4JZm0I%S'Pi
mCM
s•I
n
S
§
S
s
oCMiH
oTP
s
§
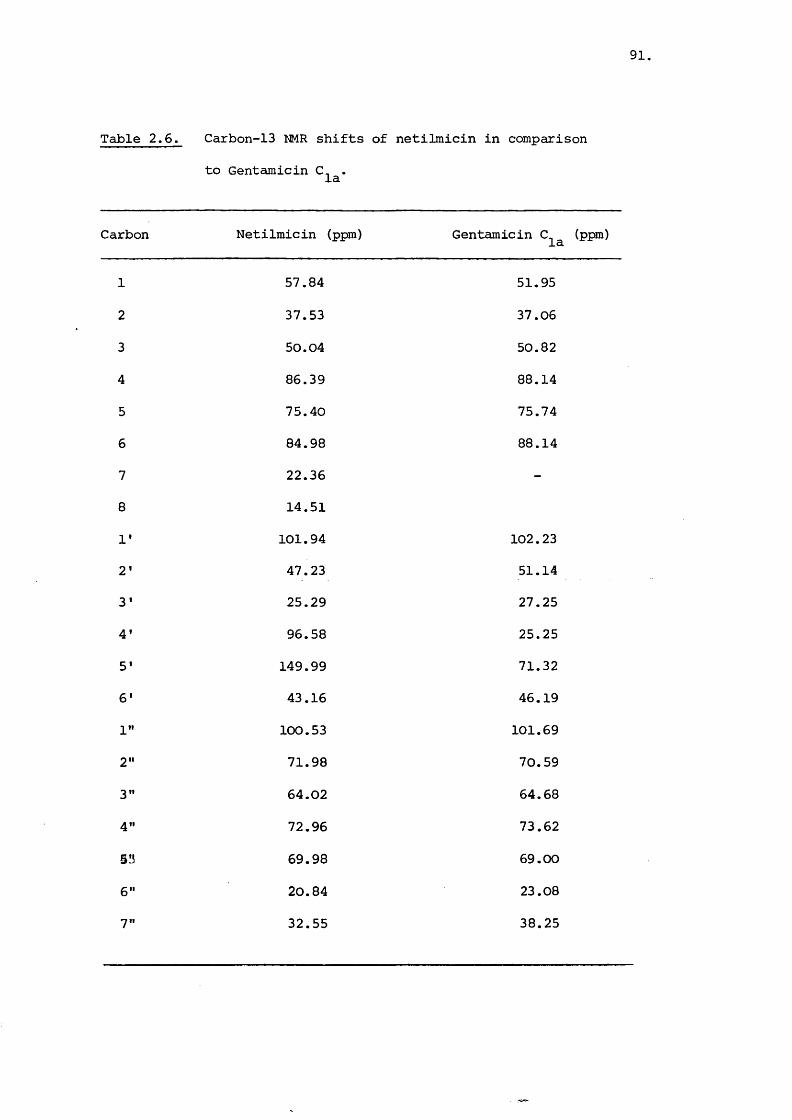
91.
Table 2.6. Carbon-13 NMR shifts of
to Gentamicin C^^.
netilmicin in comparison
Carbon Netilmicin (ppm) Gentamicin C^^ (ppm)
1 57.84 51.95
2 37.53 37.06
3 50.04 50.82
4 86.39 88.14
5 75.40 75.74
6 84.98 88.14
7 22.36 -
8 14.51
1' 101.94 102.23
2' 47.23 51.14
3' 25.29 27.25
4* 96.58 25.25
5' 149.99 71.32
6' 43.16 46.19
1" 100.53 101.69
2" 71.98 70.59
3" 64.02 64.68
4" 72.96 73.62
sy 69.98 69.00
6" 20.84 23.08?.. 32.55 38.25

Figure 2.24. 100 MHz Proton NMR Spectrum of Netilmicin
92
HDO
1O ppm
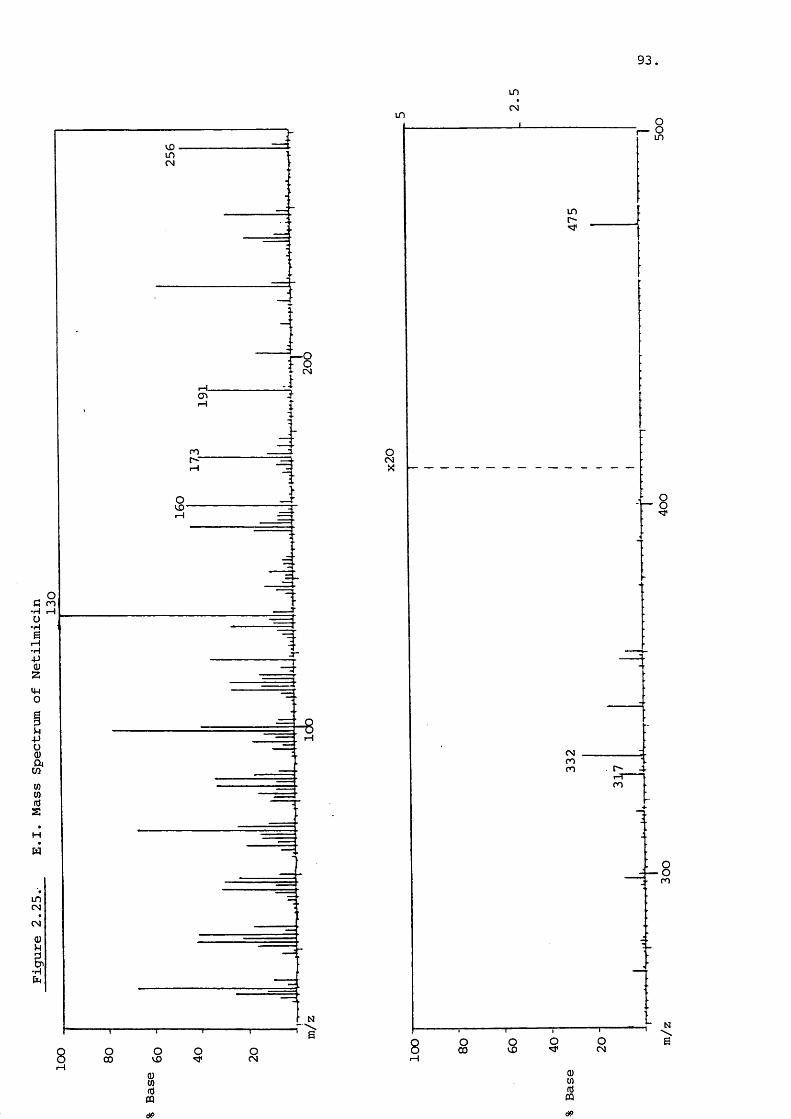
93.
ininCN
inCN
m
C m
I—I
I—I
inCN
OCO OID O oCN
in
m
OCNX
m
ro
CN
%fdPQdP
94
Both the carbon-13 and proton NMR spectra show no sign of
heterogenity. Applying the mass spectral test of position
of N-alkylation^^ used in (2.3.3) for component CM5 would
yield ions of m/z 317/256 for 1-N-ethylation or m/z 289/284
for 3-N-ethylation. The El spectrum. Figure 2.25, has peaks
at m/z 317 and 256 with no peaks visible at the other positions.
It thus demonstrates that the sample was indeed 1-N-ethyl-
sisomicin and no trace of contaminant was detected.
95.
CHAPTER 3
QUANTITATION OF COMPONENT LEVELS OF GENTAMICIN IN COMMERCIAL
SAMPLES OF GENTAMICIN SULPHATE AND IN BLOOD PLASMA BY HIGH
PERFORMANCE LIQUID CHROMATOGRAPHY
3.1 Introduction
High-performance liquid chromatography (HPLC) has been used
in various studies to determine the component ratio of gentamicin78 79 82 89sulphate in commercial samples from a wide range of sources ' ' ' ,
The advantages of this technique are the speed and precision over
more established chromatographic methods such as paper chroma
tography^^, thin-layer chromatography^^ and ion-exchange^^'.
Gentamicin does not possess a chromophore and has to be
derivatised before detection is possible. Fortunately the amino
groups present offer a wide choice of suitable derivatisation 236reactions . The HPLC methods developed for component deter
mination in commercial samples use ortho-phthalaldehyde (OPA)237 238as the derivatising agent, which yields a fluorescent product '
OPA can be reacted with the gentamicin either before or after236passing the sample through the chromatographic column . The
advantages cited for post-column reaction^^^'^^^ are that
formation of artefacts is less likely and product stability is
not important. The pre-column reaction enables greater optimi
sation of the conditions thus allowing a wider choice of reagents
and the formed products can have superior separation. Methods78 82 89which utilise pre- ' and post-column reactions with OPA
for gentamicin have been reported and both types show good precision.
96,
These chromatographic techniques generally separate the
samples into the three major components, gentamicin C , C82and . However, Freeman developed an OPA pre-column deri
vatisation technique which could also separate the gentamicin
component. This was achieved by altering the composition
of the fluorescent reagent and adding an ion-pair compound to79the mobile phase. White et al. used this method to investigate
the relative component composition of gentamicin sulphate from
various geographical sources. The availability of the HPLC
method enables more stringent analysis of samples of different
origin and thus the possibility of a greater standardisation
of the component composition especially in respect to gentamicin
Sa-
The development of methods of plasma analysis of gentamicin
by HPLC has been reported more frequently^^^ 235^ perhaps because
of the more exacting conditions imposed, or because of a more
apparent need. More reagents have been used to derivatise
the amino groups than just OPA,and ultra-violet detection used228 229as well as fluorescence ' . Reagents used for pre-column
235 220—2derivatisation include fluorescamine , dansyl chloride ,229 228benzene sulphonyl chloride and fluorodinitrobenzene
For some of these reactions the individual component deri- ^ , 220,222,228,229vatives were not totally separated by the column
and this could lead to inaccurate results if a mixture of
different composition from that used in the calibrations was
assayed. Only OPA has been used for post-column derivatisation
of gentàmicin^^^ because of the severe constraints imposed
97'
on post-column reactions.
Separation of the gentamicin from the plasma constituents
is an important procedure, as gentamicin is slightly bound to
protein and biogenic amines can readily react with the reagent
and cause interference. Two types of separation can be used;
either adsorption or extraction. The former has been achieved
for gentamicin by use of silicic acid or ion-exchange resins223"22o 233before reaction with the reagent ' . The other type
of separation used was protein precipitation followed by220—2 2TJ7~232solvent extraction with a variety of methods developed '
Many published methods rely on external standardisation because
of the difficulty in obtaining suitable internal standards.
Tobramycin and netilmicin have also been assayed by HPLC using. _ . . 221,224,230—32— - . , ,similar techniques and in some cases can be used
229 233as internal standards in gentamicin assays '
All developed methods claim good precision with values of
less than 10% coefficient of variation^^^. Another advantage
of HPLC is the specificity, since no compounds have been re
ported to overlap with the gentamicin components . The
quantity of plasma required for a single analysis varied from
0.02 to 0.5 ml in the reported assays and thus allows sampling
from infants. The time required for a single assay depends on
the method, but was in a range of about fifteen to seventy
minutes. The absolute time limitation is the retention time
on the column. The sensitivity of the methods extended to
at least 0.5 yg/ml which is adequate for clinical use.
98,
The aim of the work in this chapter was to develop a pre
column OPA derivatisation HPLC method for gentamicin component
analysis and apply it to commercial samples from differing^
sources. Also some of the reported methods of HPLC deter
mination of gentamicin in plasma were investigated. Using a
developed, plasma method, a comparison with the microbiological
assay was made and pharmacokinetic parameters of the three
components calculated.
3.2 Materials and Methods
3.2.1 Materials
Ortho-phthalaldehyde (Sepramar), boric acid, potassium
hydroxide, mercaptoethanol, trichloroacetic acid and anthracene
were all supplied by BDH Chemicals Ltd. Ethylenediaminetetra-
acetic acid (tripotassium salt), tetradecylamine, tridecylamine
and gnlecylamine were supplied by Fluorochem Ltd.. Nonylamine
was obtained from Aldrich Chemical Company Ltd., Dodecylamine
from Eastman Kodak Company and Decylamine from Sigma Chemical
Company. HPLC grade methanol and diethyl ether were obtained
from Fisons Scientific Apparatus Ltd. Filters of 0.45 ym and
prefilters were obtained from Millipore (UK) Ltd. Netilmiciha
sulphate was a gift from Kirby-Warrick Pharmaceuticals Ltd.
Gentamicin components (C^, C^^ and C^) had been isolated by
column chromatography and purity was checked by TLC (2.2.2).
The pump used was a Laboratory Data Control Minipump and the
detector was a LDC Fluoromonitor III (excitation filter 370 nm,
emission filter 418 - 700 nm). The injection valve used was
99,
a Rheodyne 7125 with a 100 yl loop and the recorder was a
Servoscribe RE 541.20. A Hewitt and Packard 3903 integrator
was also used in some component assays. The column used
contained Spherisorb ODS, 5 ym, and had dimensions of 150 x
5 mm.
3.2.2 Methods
3.2.2a General HPLC Method
Chromatographic Conditions :
The mobile phase used was methanol/water (80:20)-1with 2 g/L EDTA, tripotassium salt. The flow rate was 1.3 ml min
and the column temperature was maintained at 30°C.
223Derivatising (OPA) Reagent :
Ortho-phthalaldehyde (OPA) (200 mg) and mercapto
ethanol (0.4 ml) were dissolved in methanol (2 ml). Boric acid
(1 g) was dissolved in distilled water (38 ml) and the pH was
adjusted to 10.4 with 45% w/v potassium hydroxide solution.
The entire buffer solution thus prepared was then added to the
OPA methanolic solution. The reagent was stored under nitrogen
at 4°C and was stable for at least two weeks.
Reaction Conditions:
The basic reaction consisted of adding OPA reagent
(0.5 ml) to an aqueous solution of gentamicin (0.01 mg/ml) (0.5 ml)

loo.
and after vortex mixing for one minute, methanol (2 ml) was
added. The solution was filtered and stored at room temperature,
in the dark until injection.
The reaction conditions were varied to optimise yield. The
length of time of reaction was varied up to 120 minutes for
each of the individual components. The temperature was altered
up to 50°C and the effect of lowering the pH of the reaction
mixture was also investigated.
Internal Standards
Arginine, anthracene, nonylamine, decylamine, unde-
cylamine, dodecylamine, tridecylamine, tetradecylamine and
netilmicin were all examined as possible internal standards.
Kappa' (k ') values were calculated for each from
t - t r oto
where t^ = leading edge of first deflection (unretained)
t^ = centre of peak (retained)
3.2.2.b Gentamicin component ratio determinations in-
commercial material samples and pharmaceutical
preparations
Gentamicin Standard Solutions (Raw Material Analysis)
Each of the three gentamicin C components was dissolved
101,
in water to produce 2 mg/ml standard solutions. These were
kurther diluted with water to give a range of solutions of 20,
30, 40, 50, 60, 70 and 80 yg/ml for each of the components.
Standard Solution for Injection Analysis:
From the 2 mg/ml standard solutions of the components,
0.27 ml of gentamicin 0.33 ml of gentamicin and 0.40 ml
of gentamicin were taken and diluted to 5 ml to give a
0.4 mg/ml solution containing all the components though not
of equal concentration.
Internal Standard Solutions;
Anthracene 0.06 mg/ml in methanol, undecylamine
and tridecylamine 0.1 mg/ml in methanol, solutions were prepared.
Preparation of Commercial Material Samples :
Gentamicin sulphate (25 mg) was dissolved in water
(25 ml). A 1 in 10 dilution of this solution was made and
used in the assay. Duplicate solutions of each sample were
prepared.
Preparation of Injectable Formulation
Gentamicin Injection (80 mg in 2 ml) (0.1 ml) was
diluted to 10 ml with water to give a 0.4 mg/ml solution.

102
Duplicates from the same ampoule were prepared.
Calibration - Gentamicin Commercial Material
Calibration solutions were prepared by adding 0.3 ml
gentamicin C^^ standard solution to 0.36 ml of gentamicin
solution and 0.44 ml of gentamicin C solution, all of the same1
strength (10 - 80 yg/ml). Undecylamine (0.1 ml) and tridecyl
amine (O. 1 ml) were added followed by OPA reagent (0.5 ml)
and methanol (2 ml). The solution was vortex mixed, filtered
and stored in the dark and injected (lOO yl) 60 minutes after
the reaction had started. This was the standard procedure
for the reaction, and kept to unless otherwise stated.
Gentamicin Sulphate Injection: Calibration
Solutions were prepared by adding varying volumes
(60 - 140 yl) of the gentamicin, 0.4 mg/ml standard solution,
to water to produce 0.2 ml. Then undecylamine (0.1 ml), OPA
reagent (0.5 ml) and methanol (2 ml) were added, and the reaction
carried out as above. In most cases a five point calibration
was used.
Gentamicin Commercial Material Assay
Samples were analysed by the standard method using
unknown 0.1 mg/ml solution (1.1 ml), undecylamine (0.1 ml),
tridecylamine (0.1 ml), OPA reagent (0.5 ml) and methanol (2 ml).

103
Gentamicin Injection Assay
Samples were assayed by adding the approximately 0.4 mg/ml
solution of the unknown (0.1 ml) to water (O. 1 ml) and undecyl
amine (0.1 ml). To this OPA reagent (0.5 ml) and methanol (2 ml)
were added and the usual procedure followed.
3.2.2.C Assay of Gentamicin Levels in Blood Plasma
Plasma
Blood plasma used in the development of the method
and for assay calibration was obtained from the Royal United
Hospital, Bath. It was from a pool of healthy subjects with no
drugs present. Plasma was spiked with gentamicin standard
solution, 0.4 mg/ml, the day before use and stored frozen at
-20 C.
Gentamicin Extraction from Plasma onto a Silica Gel^ 1 223Column
A short silica gel column was prepared by blocking a
pasteur pipette with glass wool and filling the pipette with 150 mg
of silica gel (lOO - 200 ym). Water was added to plasma (0.5 ml)
to give a 2 ml volume. This solution was transferred to the
column and washed in with 1 ml of water. OPA reagent (0.5 ml)
was added to the column and the OPA derivative of gentamicin
was eluted with 1.5 ml of ethanol after ten minutes. This
solution was filtered and injected after fifteen minutes.
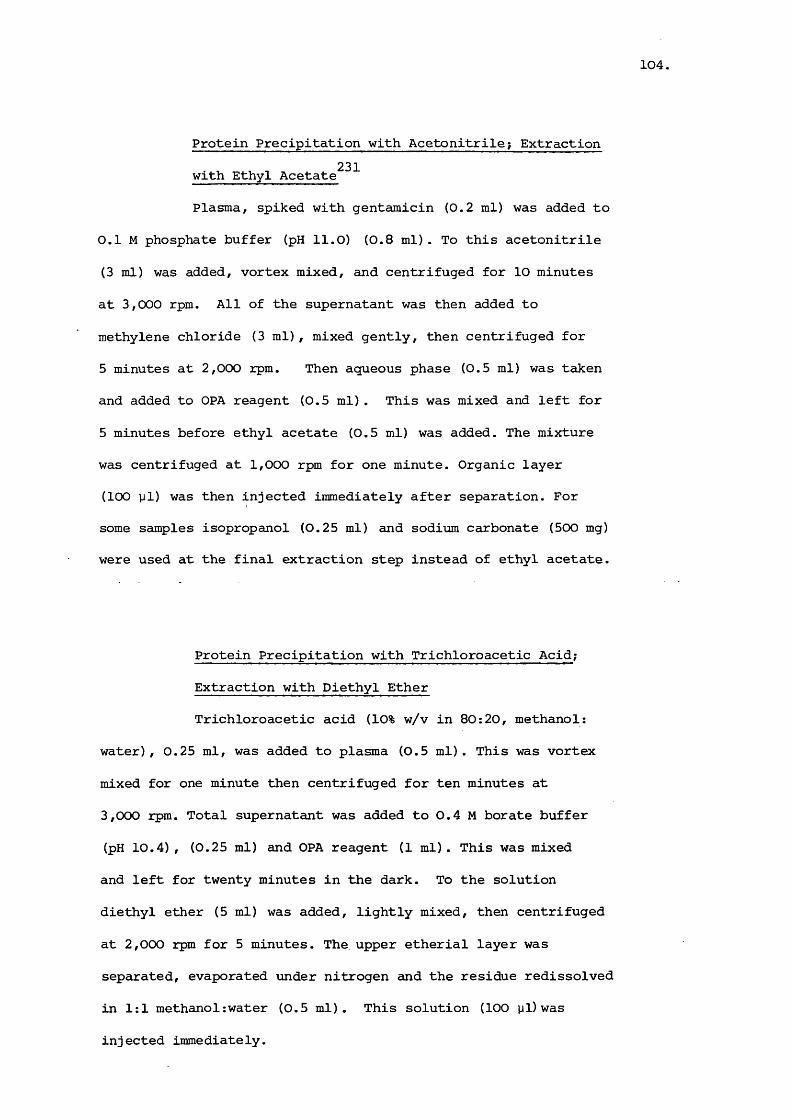
104,
Protein Precipitation with Acetonitrile? Extraction231with Ethyl Acetate
Plasma, spiked with gentamicin (0.2 ml) was added to
0.1 M phosphate buffer (pH 11.0) (0.8 ml). To this acetonitrile
(3 ml) was added, vortex mixed, and centrifuged for 10 minutes
at 3,000 rpm. All of the supernatant was then added to
methylene chloride (3 ml), mixed gently, then centrifuged for
5 minutes at 2,000 rpm. Then aqueous phase (0.5 ml) was taken
and added to OPA reagent (0.5 ml) . This was mixed and left for
5 minutes before ethyl acetate (0.5 ml) was added. The mixture
was centrifuged at 1,000 rpm for one minute. Organic layer
(100 yl) was then injected immediately after separation. For
some samples isopropanol (0.25 ml) and sodium carbonate (500 mg)
were used at the final extraction step instead of ethyl acetate.
Protein Precipitation with Trichloroacetic Acid;
Extraction with Diethyl Ether
Trichloroacetic acid (10% w/v in 80:20, methanol:
water), 0.25 ml, was added to plasma (0.5 ml). This was vortex
mixed for one minute then centrifuged for ten minutes at
3,000 rpm. Total supernatant was added to 0.4 M borate buffer
(pH 10.4) , (0.25 ml) and OPA reagent (1 ml). This was mixed
and left for twenty minutes in the dark. To the solution
diethyl ether (5 ml) was added, lightly mixed, then centrifuged
at 2,000 rpm for 5 minutes. The upper etherial layer was
separated, evaporated under nitrogen and the residue redissolved
in 1:1 methanol:water (0.5 ml). This solution (100 yl) was
injected immediately.

105,
Protein Precipitation with Trichloroacetic Acid -
No Extraction
Trichloroacetic acid (10% w/v in 80 :20;methanol;water),
(0.25 ml), was added to plasma (0.5 ml). This was vortex mixed
for one minute, then centrifuged for ten minutes at 3,000 rpm.
Total supernatant was added to 0.4 M borate buffer (pH 10.4),
0.25 ml, and OPA reagent (0.5 ml). Methanol (0.8 ml) was added
and the solution was prefiltered, filtered and injected (lOO yl)
after sixty minutes.
Plasma Assay Calibration
Blood plasma (2 ml) was spiked with gentamicin
standard solution, 0.4 mg/ml, to give 1, 2.5, 5, 7.5 and lO yg/ml
solutions of gentamicin in plasma. These were processed, in
duplicate, by the method of trichloroacetic acid precipitation
with no extraction except that 4 yl undecylamine (0.1 mg/ml)
as internal standard was added after protein precipitation.
Assay of Plasma Samples
The patient samples were prepared in an identical
fashion to the calibration solutions. To avoid the need for
daily calibrations, standard solutions were assayed after every
two unknown sample injections. About nine samples, each in
duplicate, were analysed every day. In total sixty five samples
from five patients were used and assayed at random. At the end
of each day the HPIX column was eluted with methanol to prevent

106
build-up of contaminants.
3.3 Results and Discussion
3.3.1 Determination of Component Levels in Commercial Material
Optimising Conditions;
The HPLC system used, was based on that reported by 223Maitra et al, with some modifications. The mobile phase
was a 80:20,methanol-water mixture containing 2 g/L ethylene-
diaminetetra-acetic acid, tripotassium salt. This gave a
typical separation such as that illustrated in Figure 3.1.
The retention times of the components were 5, 6 and 12 minutes
for gentamicins and respectively. No buffer was
used as the salt was found to produce a fairly constant pH of
8.5 in the mobile phase. Extensive variation of the mobile
phase is discussed in Chapter 5.
The reaction condi tLons of the derivatising reagent were
studied to optimise the sensitivity. The peak height of the
three components was measured against time of incubation at
room temperature with a graph of the results shown in Figure
3.2. The components showed different reaction kinetics with
the rate possibly influenced by stereochemical factors. Sixty
minutes was taken as the optimal time since two components had
reduced peak height after this juncture. The use of elevated
temperature (50°C) was examined, but the rate of decomposition
of the product was also increased and timing was more critical.
The reaction was thus kept at room temperature to minimise
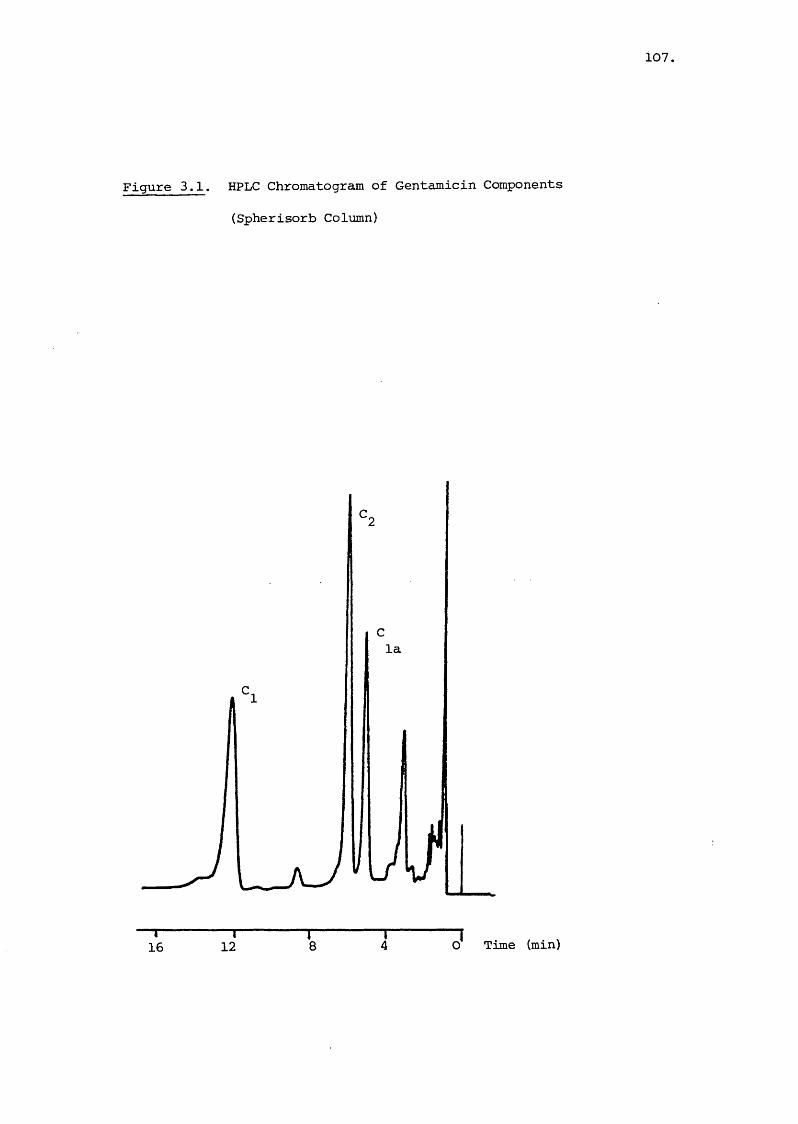
107,
Figure 3.1. HPLC Chromatogram of Gentamicin Components
(Spherisorb Column)
la
~T“16 12 Time (min)
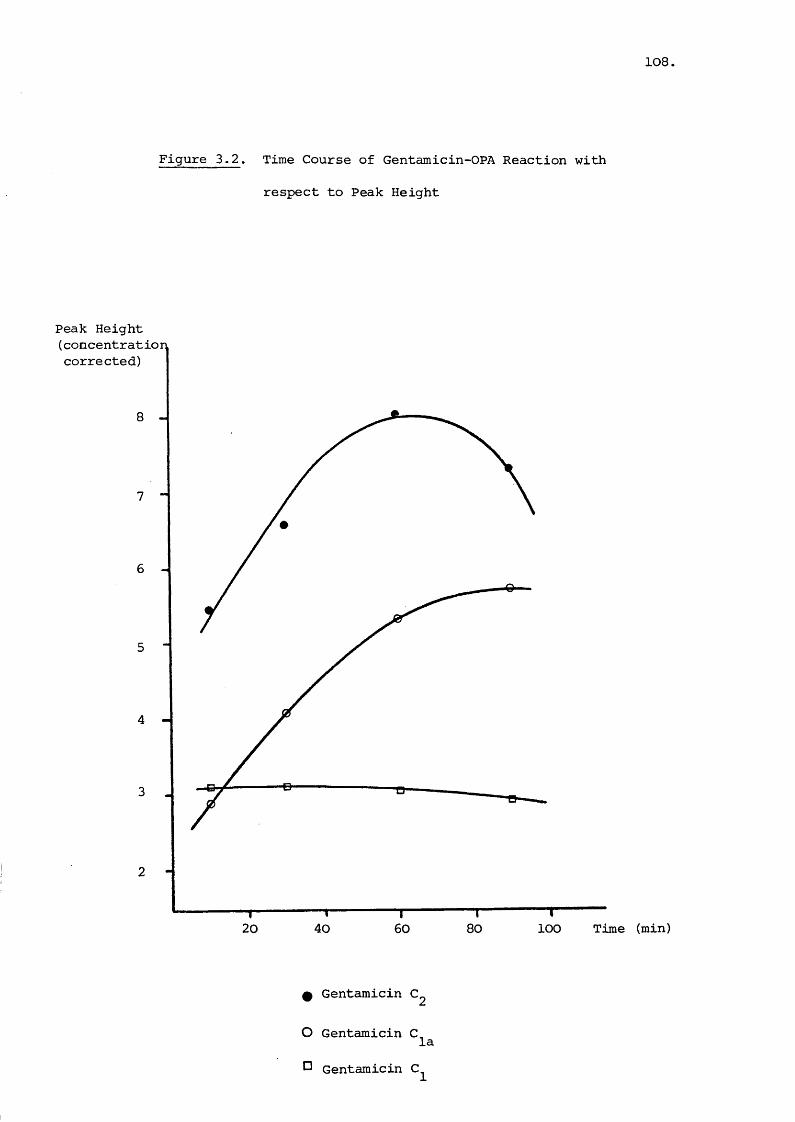
108,
Figure 3.2. Time Course of Gentamicin-OPA Reaction with
respect to Peak Height
Peak Height (concentration corrected)
8 -
7 -
6 -
4 -
—r-20
— P40
“T"60
"T“80
— r-100 Time (min)
Gentamicin C,
O Gentamicin ClaO Gentamicin C,

109,
variation in reaction yields.
The addition of an alcohol to the aqueous reaction mixture
increased the fluorescence produced. The resolution of the
gentamicin and peaks in a chromatogram was 1.2 in a
90% methanol solution as shown in Figure 3.3. This compares
to a resolution of 1.0 in a 90% (methanol/ethanol (1:1))
mixture and 0.7 for 90% ethanol or isopropanol reaction solutions
For methanolic solutions there is less than a 1% overlap of
peaks, if taken as gausian in shape, which is satisfactory for241quantitative determinations . The poor resolution in the
other alcoholic reaction solutions was probably related to the
increase in solvent strength at the head of the column, on
injection, eluting the derivatives slightly faster and with- - 241poorer separation
The pH of the reaction mixture was not found to be critical
so long as conditions remained alkaline and thus the OPA reagent223used was as described by Maitra et al. , with a pH of 10.4.
A pH range of 8 - 12 for the reaction gave peak heights of
similar magnitude but incubation at an acid pH (0.6) only
produced 13% peak size. Alteration of the pH thirty minutes
after reaction was started also showed the derivatives to be
stable if the pH was kept alkaline. Changing the pH to 3.9
decreased peak heights by 14%; and to 2.0 by 49% after thirty
minutes in comparison to the control.
To minimise variation in experimental procedure a set time

110.
Figure 3.3.. Resolution of and components injected
in different reaction mixtures
90% Ethanol90% Methanol
-T—32
- T28
— r24
“T"20 16
— T12
I I8 4
Time (min)
IO

Ill
of sixty minutes at room temperature, with the same pH 10.4
buffer and the same percentage volume of methanol were used in
the reaction.
Internal Standards:77 78The standard used by Kraisintu ' , L-arginine was
tested, but found to elute with a retention time of about two
minutes and overlapped peaks due to the derivatising reagent.
Various aliphatic and aromatic amines and naturally fluorescing
compounds were investigated but most were non-retained. Netilmicin
was also examined but under these conditions it eluted as two
peaks. This was possibly due to a partial reaction as the
relative size of the peaks depended on the age of the reagent.
Other aminoglycosides tried, including neomycin and kanamycin,
were not retained sufficiently in this system to be of use
as standards.
Anthracene was discovered to have an ideal retention time
and have good peak shape in the system used. The chromatogram
of anthracene with the gentamicin components is shown in Figure
3.4. However as a standard this only monitors variations due
to volume of injection. Since it does not react with the deri
vatising reagent it does not control variations due to quality82of reagent or reaction conditions. Freeman used nonylamine
in an assay of gentamicin, but in the conditions used here,
this overlapped with the gentamicin components. A range of
straight chain amines were chromatographed to assess suitable
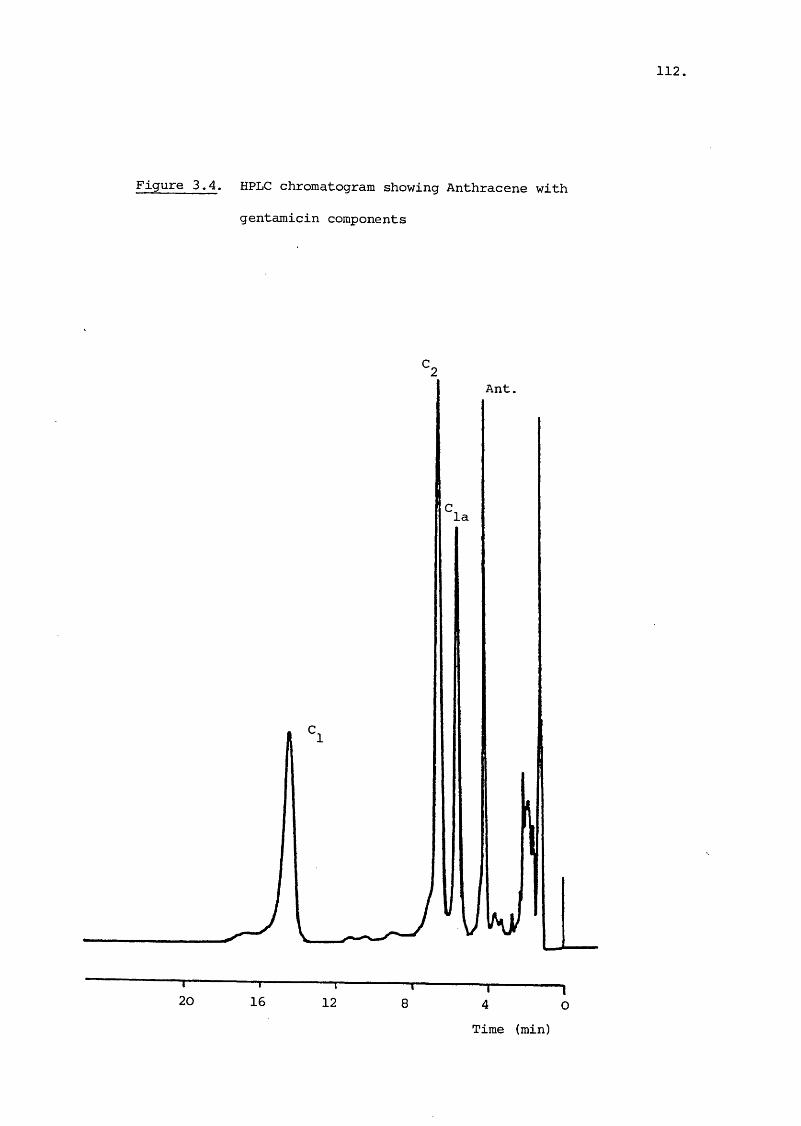
112.
Figure 3.4. HPLC chromatogram showing Anthracene with
gentamicin components
Ant.
la
I20
— T-16 12
Time (min)
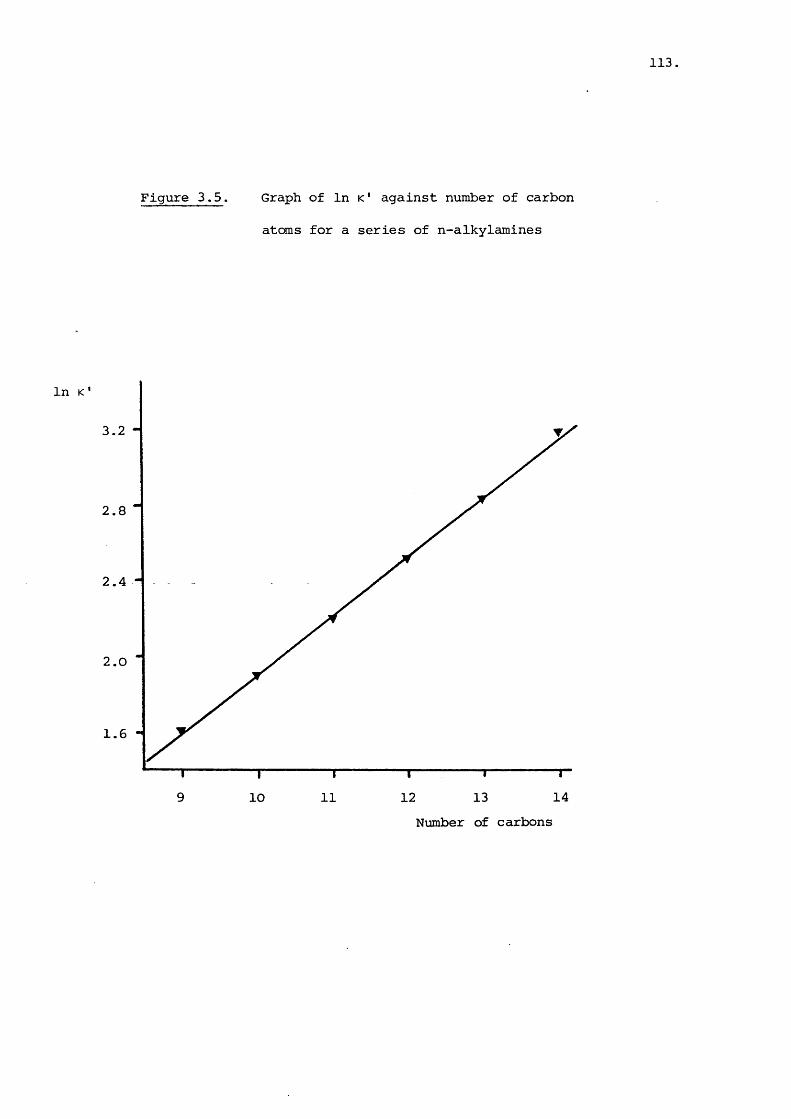
113
Figure 3.5. Graph of In k ' against number of carbon
atoms for a series of n-alkylamines
In
2.4
2.0
1.6
149 131210 11Number of carbons

114,
retention times. A plot of In k' (capacity factor) against
number of carbon atoms is shown in Figure 3.5. It is seen
to follow the Martin rule for a series of structural homo-
logues^^^'^^^. The slope of 0.31 which refers to the increment
of added methylene groups is constant for the given system
and column. It is similar in value to the estimated slope82of 0.40 from a graph presented by Freeman . This illustrates
the similarity of the two systems in terms of chromatographic
response in spite of all the differences in conditions employed.
The amines with retention times different to the gentamicin
components were undecylamine, tridecylamine and tetradecylamine.
Tetradecylamine was considered unsuitable because of the long
retention time (25 minutes) and broader peak shape. The peak
area ratio of gentamicin C component to that of undecylamine,
against time of reaction is shown in Figure 3.6. The plot of
peak height for the same relati^ship resembles that for peak
area. The onset of an approximately constant ratio is ob
tained after sixty minutes. At times less than this the
gentamicin peak heights are increasing whilst that of undecylamine
is decreasing.
Calibrations and Assay;
Anthracene was initially used alone as an internal
standard with the slopes and intercepts of calibrations cal
culated by regression analysis. A calibration graph obtained
using anthracene is illustrated in Figure 3.7, where peak
height ratios were used. Peak area calibrations were also
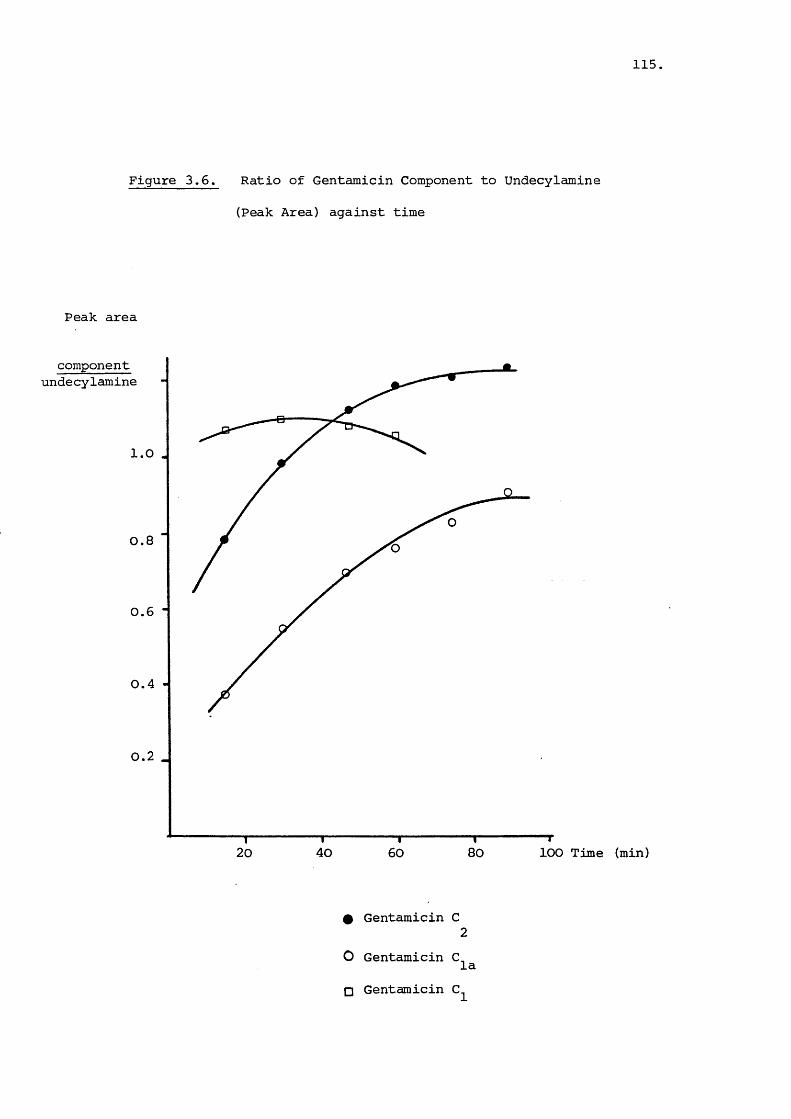
115.
Figure 3.6. Ratio of Gentamicin Component to Undecylamine
(Peak Area) against time
Peak area
componentundecylamine
1.0
0.8
0.6 -
0.4 -
0.2 _
-T-20
— I—40
— r60
—r-80 100 Time (min)
# Gentamicin C
O Gentamicin Cla□ Gentamicin C

116
Figure 3.7. Aqueous Calibration of Gentamicin Components
using Anthracene as Internal Standard
Peak Height
componentanthracene
0.8
0.6
0.4
0.2
8040 6020 concentrâtion
Gentamicin Cla
(yg/ml)
Gentamicin C.O Gentamicin C.
117
simultaneously performed to assess the relative precision of
the two calibration methods. Four calibrations on consecutive
days were compared with the height measurement showing a 7%
variation in the slopes determined whilst the variation was
13% for the area measurement. Despite this area determinations
were continued with in case of an alteration in component
retention. Anthracene, when used in the assay of the genta^
micin sulphate commercial material, produced results with
large standard deviations. This error was thought to arise
because of the absence of reaction of anthracene with the OPA
reagent, limiting the compound to a standard of volume but not
of the reaction. It was therefore apparent that anthracene
was only partially successful as a standard and that an
amine which reacted with OPA was required.
Retention data shown in Figure 3.5 suggested that undecyl-
amine or tridecylamine might be suitable to act as an internal
standard. Accordingly calibrations were carried out with both
these amines present to assess their suitability. A chromatogram
of the two standards with the gentamicin components is shown
in Figure 3.8, with undecylamine eluting as the third'peak
and tridecylamine as the last. Results using tridecylamine
as standard were subject to large coefficients of variation,
but undecylamine showed higher precision, probably because of
its narrower peak width. A peak height calibration using undecyl
amine is shown in Figure 3,9. The mean of four such calibrations
was taken for both peak height and area, and used in the assay
of component ratios. The figures used are shown in Table 3.1.

118,
Figure 3.8. HPLC Chromatogram of Undecylamine and
Tridecylamine with Gentamicin Components
la
UND
TRI
— T24
—r-20
— r16
—T-12 1
G Time (min)

119,
Figure 3.9. Aqueous Calibration of Gentamicin Components
using Undecylamine as Internal Standard
Peak Height
componentundecylamine
1.6
1.2
0.8
0.4
20 6040 80 Concentration
• Gentamicin C, la
O Gentamicin C.
(yg/ml)
□ Gentamicin C.
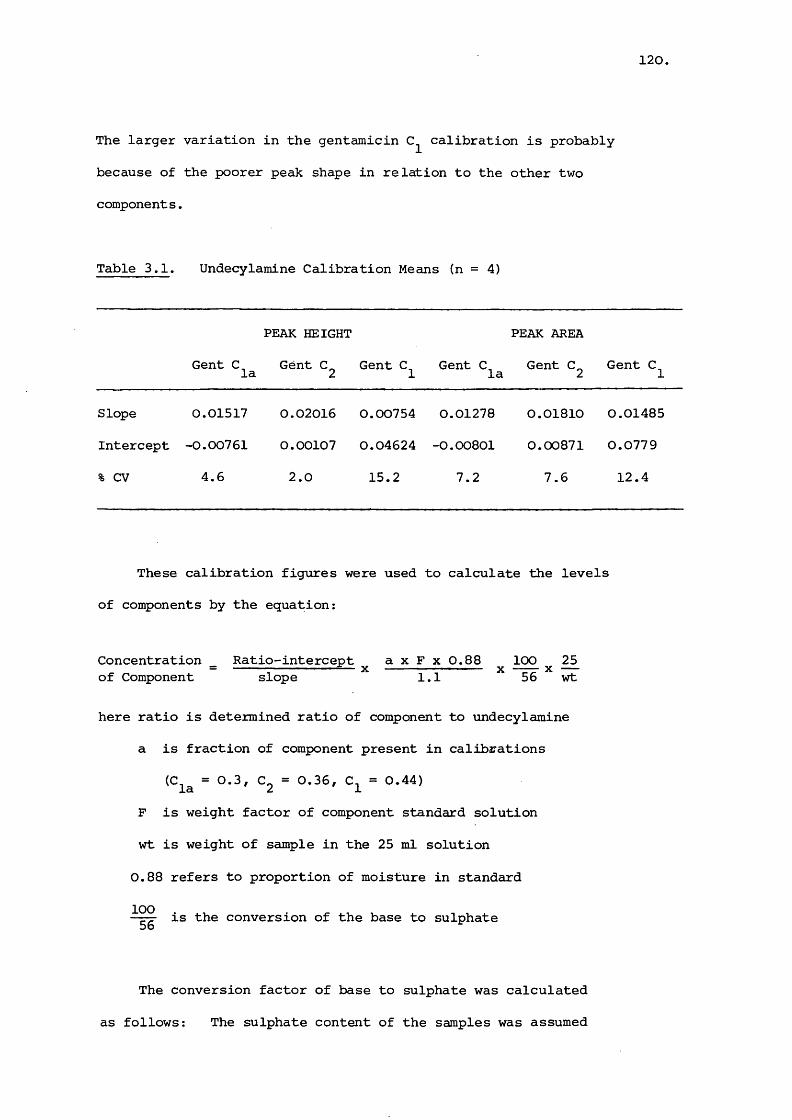
120.
The larger variation in the gentamicin calibration is probably
because of the poorer peak shape in relation to the other two
components.
Table 3.1. Undecylamine Calibration Means (n = 4)
Gent Cla
PEAK HEIGHT
Gent Cg Gent C^ Gent C, la
PEAK AREA
Gent Cg Gent C^
Slope 0.01517 0.02016 0.00754 0.01278 0.01810 0.01485
Intercept -0.00761 0.00107 0.04624 -0.00801 0.00871 0.0779
% CV 4.6 2.0 15.2 7.2 7.6 12.4
These calibration figures were used to calculate the levels
of components by the equation:
Concentration Ratio-intercept a x F x 0.88 100 25= - .......— X ' " " X X —of Component slope 1.1 56 wt
here ratio is determined ratio of component to undecylamine
a is fraction of component present in calibrations
(C^^ = 0.3, C^ = 0.36, C^ = 0.44)
F is weight factor of component standard solution
wt is weight of sample in the 25 ml solution
0.88 refers to proportion of moisture in standard
10056 is the conversion of the base to sulphate
The conversion factor of base to sulphate was calculated
as follows : The sulphate content of the samples was assumed

121
77 78to be 32% w/w from reported results ' . The percentage
moisture content was set at 12% as determined by the supplier
using the Karl-Fischer titration method^^ and confirmed by loss
of weight on drying determination^^. Thus 44% of the sample
was thought to not be gentamicin base. The separate genta
micin components used to produce the standard solutions were
also found to contain about 12% moisture. This could not be
accurately determined because of the low sample weight available
(50 - 150 mg) and also the melting of the individual components
at 105°C presented experimental difficulties.
The component composition of six samples of gentamicin
sulphate powder of two manufacturing sources and one sample of
possible Chinese origin were determined. The former six
materials were assayed on three separate days in duplicate by
peak area and height measurement and all).results combined to
give the mean value. The Chinese material was only assayed
by height measurement, repeated five times. The results
are shown in Table 3.2.
Table 3.2. Component Levels in Gentamicin Sulphate Material
Sample (%) Cg (%) c^ (%) Total C Stand Dev.
A1 26.0 38.9 35.1 100.0 2.4
A2 26.3 40.6 37.3 104.2 3.1
A3 24.3 38.5 35.0 97.8 3.2
B1 27.2 36.2 30.2 93.6 3.8
B2 24.9 40.5 29.3 94.7 4.2
b3 26.9 37.7 28.7 93.3 3.1
Chinese 18.9 37.3 19.7 75.9 2.7
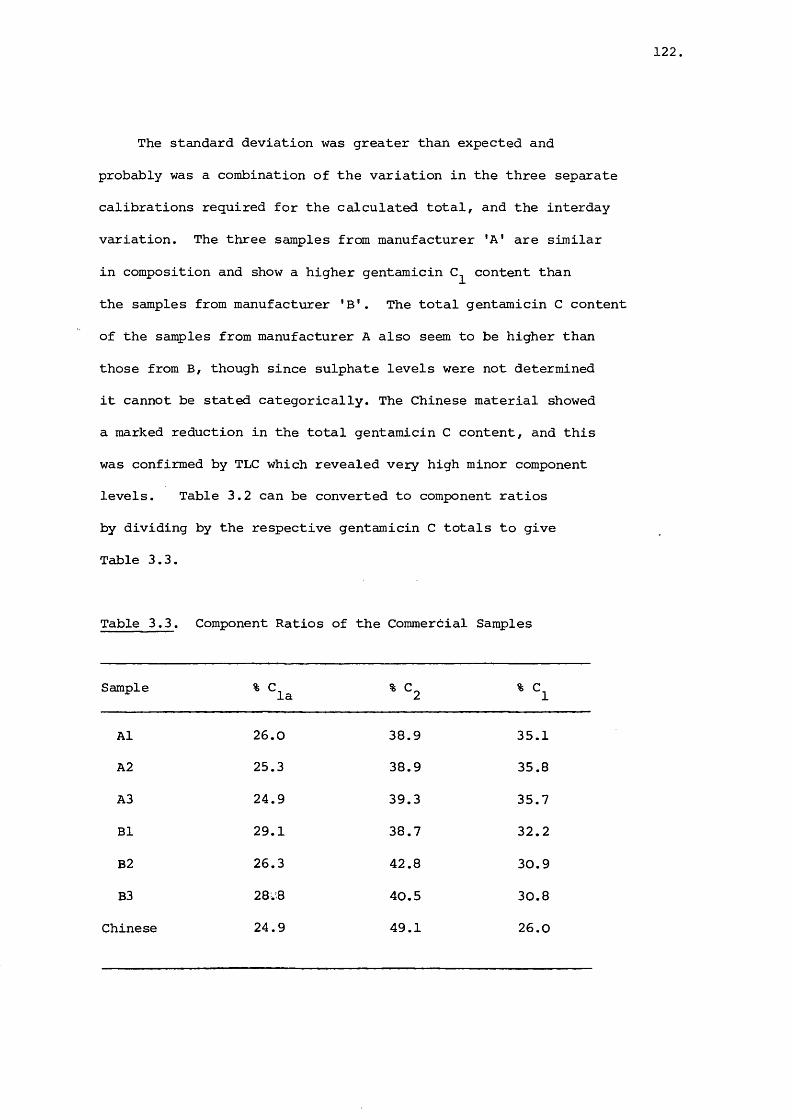
122
The standard deviation was greater than expected and
probably was a combination of the variation in the three separate
calibrations required for the calculated total, and the interday
variation. The three samples from manufacturer 'A' are similar
in composition and show a higher gentamicin content than
the samples from manufacturer 'B'. The total gentamicin C content
of the samples from manufacturer A also seem to be higher than
those from B, though since sulphate levels were not determined
it cannot be stated categorically. The Chinese material showed
a marked reduction in the total gentamicin C content, and this
was confirmed by TLC which revealed very high minor component
levels. Table 3.2 can be converted to component ratios
by dividing by the respective gentamicin C totals to give
Table 3.3.
Table 3.3. Component Ratios of the Commercial Samples
Sample ^la % C 2 % C^
A1 26.0 38.9 35.1
A2 25.3 38.9 35.8
A3 24.9 39.3 35.7
B1 29.1 38.7 32.2
B2 26.3 42.8 30.9
B3 28.8 40.5 30.8
Chinese 24.9 49.1 26.0

123
The samples of manufacturer A show very similar component
profiles illustrating low batch variability. The samples from
manufacturer B do not exhibit such small variation but are
probably within acceptable limits. There is obviously some
difference between the two sources but this is unlikely to
provoke widely differing clinical responses. The Chinese
material, however, is markedly different from the other two
sources, with a very high gentamicin C^ content and low C^
content. If the toxicity profiles of the components are
different then the Chinese material would be likely to have
differing properties to the two other sets of materials.
When a Hypersil column was used instead of a Spherisorb
column, using otherwise identical conditions, the order of
retention was altered with the gentamicin C peak eluting
before the C and C_ peaks. An extra peak was also observed la 2to be partially separated from the gentamicin C^ peak and
this was thought to be due to gentamicin C . This was82reported to be separated by Freeman who also used a Hypersil
column. A chromatogram of the retention of the gentamicin
components on the Hypersil column is given in Figure 3.10.
A full component analysis was not performed on this column
because no standard for gentamicin C^^ was available and
also because of the absence of a baseline separation between
the gentamicin C^^ and C^ components. However an estimation
of the percentages of gentamicin C^ and C^^ was made by ref
erence to the component ratios already found for A1 and Bl,
The approximate levels are given in Thble 3.4.

124.
Figure 3.10. HPLC Chromatogram of Gentamicin Components
on a Hypersil Column
la
2a
— T-----1---- 1-----1---- 1-----110 8 6 4 2 O Time (min)

125,
Table 3.4. Gentamicin and levels in commercial samples
Sample (%) (*) Cza
A1 26 13
B1 25 13
A4 25 11
B4 28 12
Chinese 24 20
Italian /33 12
The relative composition of samples from sources A and B
are similar to each other, but quite different from the other
two sources. The Chinese material had a very high gentamicin
C^^ content especially in comparison to the C^ level. Similar79values have been reported by White in commercial preparations
though none with the same high ratio of C^^ to C^. The Italian
sample, conversely, has a lower C^^ to C^ ratio than that of the
A/B sources. This :^stem is thus useful for estimating the
content of gentamicin C^^ in commercial samples which is
difficult to achieve using other methods.
Assay of Gentamicin Injection
Two ampoules of the same batch of 40 mg/ml gentamicin
injection were analysed for gentamicin C component levels.
The calibration figures of the undecylamine peak height ratio
were used to calculate levels from the equation:
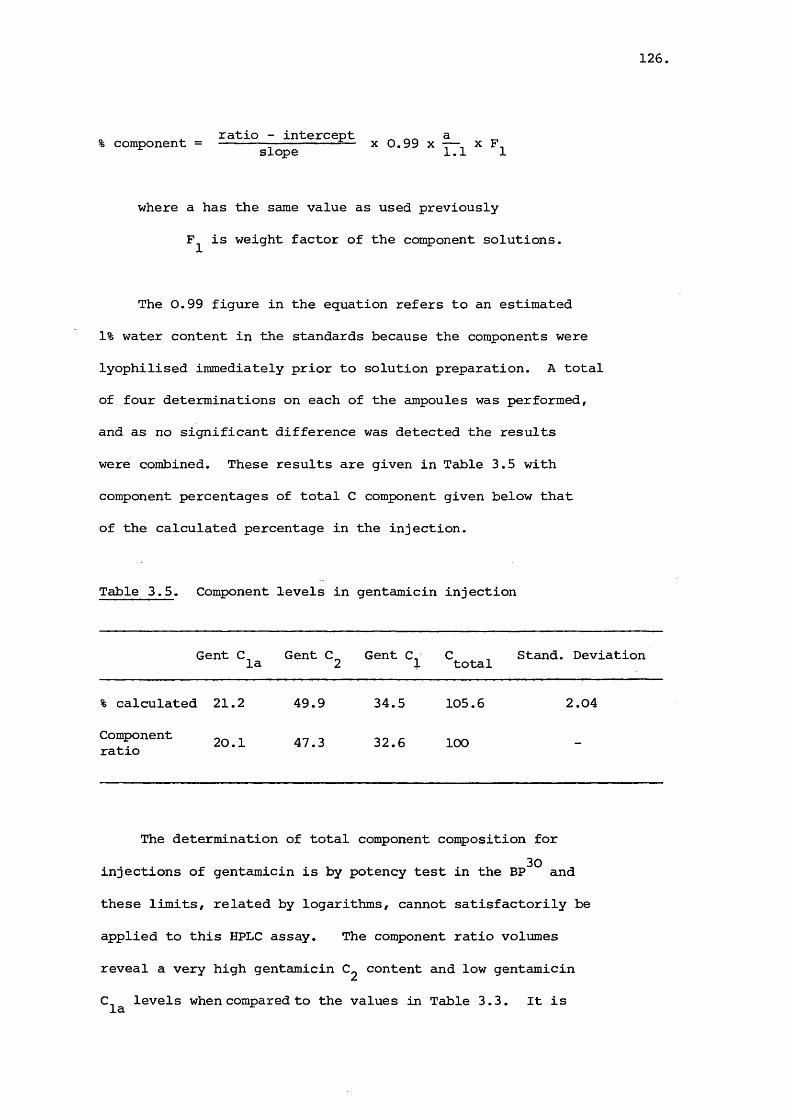
126,
ratio - intercept ^ a „% component = :-------------x 0.99 x x F.slope 1.1 1
where a has the same value as used previously
F^ is weight factor of the component solutions.
The 0.99 figure in the equation refers to an estimated
1% water content in the standards because the components were
lyophilised immediately prior to solution preparation. A total
of four determinations on each of the ampoules was performed,
and as no significant difference was detected the results
were combined. These results are given in Table 3.5 with
component percentages of total C component given below that
of the calculated percentage in the injection.
Table 3.5. Component levels in gentamicin injection
Gent C^^ Gent Cg Gent C^ Ctotal Stand. Deviation
% calculated 21.2 49.9 34.5 105.6 2.04
Component i ratio 47.3 32.6 100 -
The determination of total component composition for
injections of gentamicin is by potency test in the and
these limits, related by logarithms, cannot satisfactorily be
applied to this HPLC assay. The component ratio volumes
reveal a very high gentamicin content and low gentamicin
C^^ levels when compared to the values in Table 3.3. It is
127
another indication of the potential for variation in the compo
sition of gentamicin C samples available commercially.
The HPLC assay used in this quantitative determination of
commercial samples proved to be very useful in discovering the
major component ratios, although definition of total gentamicin
C content in the samples was not as satisfactory, primarily
because of the lack of major components in a pure state. The
use of undecylamine as internal standard was successful, although
no clear advantage of peak area measurement was observed which
may be related to the lack of a total baseline separation of
the gentamicin C^^ and C^ components. The levels of major
components calculated were similar to those reported in the
literature and conformed to the FDA regulations^^ regarding
component composition. The disadvantage of the HPLC system
used, in not separating gentamicin C was not felt to be a2&major drawback. This was because column responses would have
to be estimated in the absence of a C ^ standard and the lack
of literature information on the component would signify
uncertainty as to whether high or low levels were deleterious
to the sample.
3.3.2 High-performance Liquid Chranatographic Analysis of
Gentamicin in Blood Plasma
In order to assess HPLC as an assay technique in the
determination of gentamicin in blood plasma, a suitable separation
method of the drug from constituents of plasma was required.
Various methods from the literature as well as developed

128,
methods were investigated. Certain requirements were set to
ensure relevant clinical performance. The most important
aspect of the techniques used was the precision of the method.
Crude precision tests were performed by comparing peak heights
for replicate assays to give an indication of the variability
and this was reinforced by studying the steps involved in each
method. The sensitivity of the method was also considered to
be very important, especially since it is related to precision
at low concentrations where small measurements of peak height
have to be made. An arbitrary scale of peak heights was
devised to compare the assay methods investigated with the
assay method finally chosen, in terms of sensitivity. Specific
recovery experiments were not performed^because this was con
sidered a less important aspect of the method. One hundred
per cent recoveries were not sought but the variability of the
recovery had to be low, and the sensitivity high. Estimated
recoveries for each method are given, calculated from the
recovery experiment on the chosen assay method and the
sensitivity value with respect to that method. Qualitative
aspects of the methods were also assessed in terms of ease of
use, number of transfers and amount of labour required
The three quantitative parameters used to compare:the
different separation methods are given in Table 3.6.

129,
w05d)SS’(0(0<
0)1aOn
n0) I—I•sEh
>1shQ) CD m ro C" lO> c>P O CN m &0 I—1 rHo0)(z:
>1■p•H>•H x-s o CO in in Q■P dP m O CO m O•H f—1 iH I—1 1—1COC0)W
C0•HCO'H dP o> CSJ cn CO COÜ ^ t—1 ro 1—i(UP04
uQ)"0 n VO Tfg
C0•H■PP H in-P fiC \ o O O o0) to 1—1 1—1 1—1 t—1U P.C0u rH rHa a
c oa in0■H 0■P Xi(d +1-P 0)•H 0 sA•H \ GÜ c G 0)0) 0 G 0 COP 'H 0 ■H O04 ■P Æ(d_ 4-) (d u0) +J U 4J1—1 •H -HrH •P A Jj A G0 P •H •H 0u 4J U Ü -H•H 0) 0 0) +J03 (d G P P Ü0 u 0 A A (d•H +J ni p+J I—1 0) < 5 < +J(1)s -HCO < W K a
130.
Extraction onto a Silica Coluipn
This method summarised in Figure 3.11 was used by 223Maitra et al. to separate gentamicin fron the plasma before
derivatisation with OPA. Table 3.5 shows that although the
sensitivity and recovery were good the precision was low.233This lack of reproducibility was also described by Marples
and may have arisen from differing adsorption of the gentamicin179to the silica column. Delaney et al. used silicic acid
as a suspension to extract gentamicin, but this method was
not examined in this study. A Sephadex column was utilised
in a similar manner as in Figure 3.11, but even lower precision
was achieved. The methodology was promising in terms of
sensitivity and ease of use but the lack of precision appeared
insurmountable.
Acetonitrile Precipitation and Ethyl Acetate Extraction231 232The methods of Back and Haughey for isolating
aminoglycosides were assessed for suitability as a clinical
assay. The extraction procedures for each are comparable with231Back's method shown in Figure 3.12 . Haughey's extraction
procedure differs only in the quantities of solvents used and
the final extraction being into isopropanol instead of ethyl 232acetate . With ethyl acetate extraction only one peak in
the position of gentamicin was distinguishable by HPLC,
though all three components were confirmed to be present, by
evaporating the ethyl acetate and redissolving in methanol.
It seems most likely that the high solvent strength of the ethyl

131
Figure 3.11. Extraction of Gentamicin onto a Silica Gel Column.
ELUATE
DISCARD
PLASMA (0.5 ml)
V2 ml
«2°
SILICA GEL COLUMN (150 mg)
RINSE WITH H^Od ml)
ADD OPA REAGENT (0.5 ml)
ELUTE OPA DERIVATIVEWITH ETHANOL (1.5 ml)
FILTER AND INJECT (100 yl)
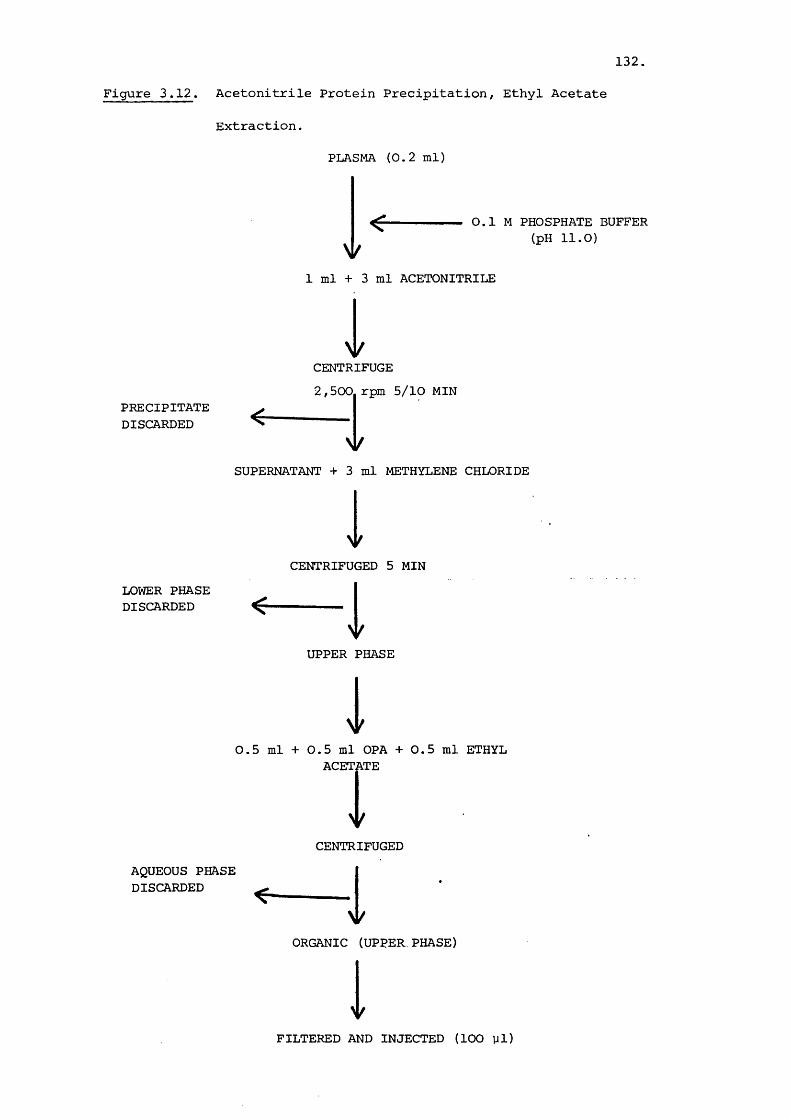
132.
Figure 3.12. Acetonitrile Protein Precipitation, Ethyl Acetate
Extraction.
PLASMA (0.2 ml)
^ 0.1 M PHOSPHATE BUFFER(pH 11.0)
V1 ml + 3 ml ACETONITRILE
iCENTRIFUGE 2,500, rpm 5/10 MIN
PRECIPITATE ^DISCARDED i
SUPERNATANT + 3 ml METHYLENE CHLORIDE1CENTRIFUGED 5 MIN
LOWER PHASE DISCARDED ^ i
UPPER PHASE
i0.5 ml + 0.5 ml OPA + 0.5 ml ETHYL
ACETATE
CENTRIFUGEDAQUEOUS PHASE DISCARDED i
ORGANIC (UPPER. PHASE)IFILTERED AND INJECTED (100 yl)
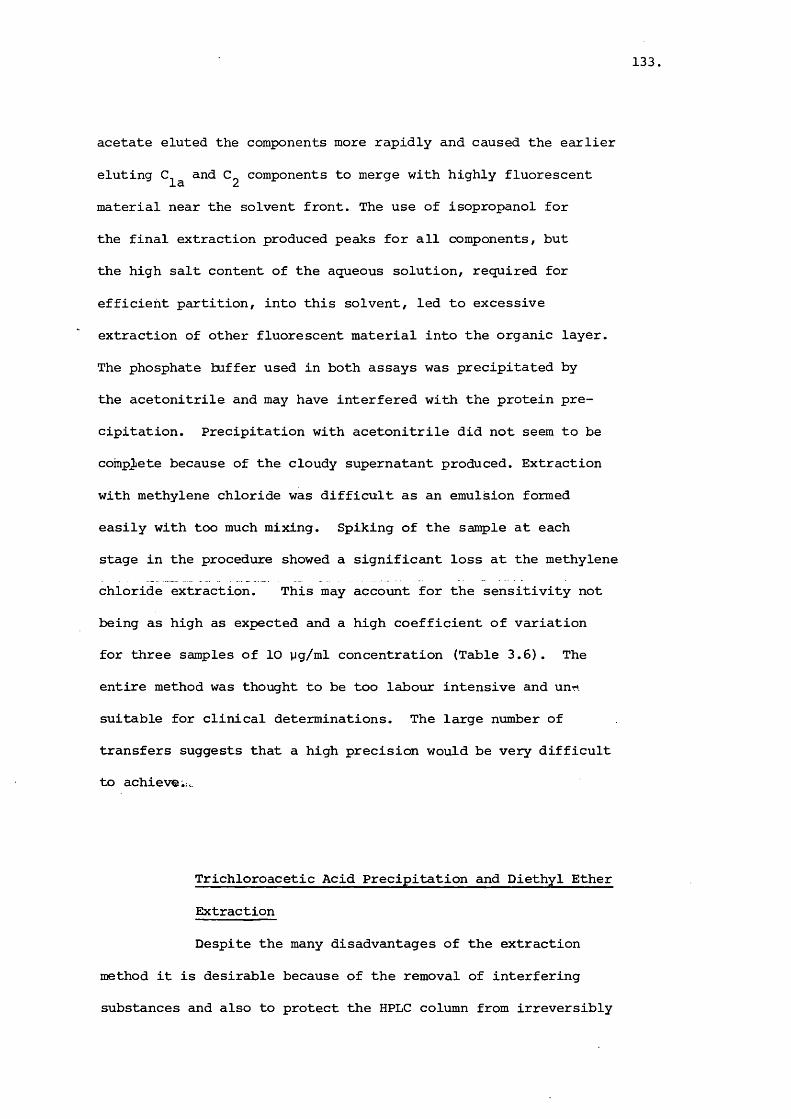
133
acetate eluted the components more rapidly and caused the earlier
eluting and components to merge with highly fluorescent
material near the solvent front. The use of isopropanol for
the final extraction produced peaks for all components, but
the high salt content of the aqueous solution, required for
efficient partition, into this solvent, led to excessive
extraction of other fluorescent material into the organic layer.
The phosphate buffer used in both assays was precipitated by
the acetonitrile and may have interfered with the protein pre
cipitation. Precipitation with acetonitrile did not seem to be
compjiete because of the cloudy supernatant produced. Extraction
with methylene chloride was difficult as an emulsion formed
easily with too much mixing. Spiking of the sample at each
stage in the procedure showed a significant loss at the methylene
chloride extraction. This may account for the sensitivity not
being as high as expected and a high coefficient of variation
for three samples of 10 yg/ml concentration (Table 3.6). The
entire method was thought to be too labour intensive and un-n.
suitable for clinical determinations. The large number of
transfers suggests that a high precision would be very difficult
to achieve;;,.
Trichloroacetic Acid Precipitation and Diethyl Ether
Extraction
Despite the many disadvantages of the extraction
method it is desirable because of the removal of interfering
substances and also to protect the HPLC column from irreversibly
134
Figure 3.13. Trichloroacetic Acid Precipitation, Diethyl Ether Extraction.
PRECIPITATEDISCARDED
AQUEOUS LAYER DISCARDED X
PLASMA (0.5 ml)
< ---------------- 0.25 ml TCA (10% w/v)
CENTRIFUGE 3,000 rpm / 10 min
VSUPERNATANT
LEAVE FOR 20 MIN
BORATE BUFFER (pH 10.4) 0.25 ml
OPA REAGENT (1 ml)
CENTRIFUGE ,000 rpm / 5 MIN
i
ETHER (5 ml)
ETHERIAL LAYER
I
EVAPORATED UNDER NITROGEN
iDISSOLVE IN 0.5 ml METHANOL/WATER(Ifl)IFILTER AND INJECT
(100 yl)
135
bound compounds. Thus a superior protein precipitation tech
nique was required, coupled with a reproducible extraction method
The developed method is shown in Figure 3.13. Trichloroacetic217 218acid (TCA) is a well known precipitating agent ' and has
77been used with gentamicin in a previous study by Kraisintu
The TCA was dissolved in 80% v/v methanol because it en
hanced precipitation over the aqueous analogue and produced a
clear supernatant. Prior to reaction with OPA, borate buffer
(pH 10.4) was added to neutralise excess TCA and maintain an
alkaline pH. The reaction was allowed to continue for only
twenty minutes in order to restrict total assay time to a
minimum. The ether added was easily separated from the aqueous
layer and evaporated by nitrogen within five minutes. Initially
only 2ml of ether was used to extract the gentamicin derivatives
but this gave a low recovery and a large coefficient of variation
at 10 yg/ml (Table 3.6). The reproducibility of ether ex
traction was monitored using aqueous solutions of gentamicin
and larger volumes of ether were found to be required. The 5 ml
of ether finally adopted increased the recovery, with only a
8% coefficient of variation for six samples at 10 yg/ml (Table
3.6). This method was thought suitable for clinical use in
terms of ease of handling and performance. However the ether
extraction seemed to accumulate other constituents of the
plasma as signified by the large, highly fluorescent peak
at the beginning of the chromatogram (Figure 3.14). Thus the
ether extraction was of questionable value in protecting the
column. The extraction step was also thought to be susceptible

136,
Figure 3.14 . HPLC Chromatogram of Gentamicin in plasma using
TCA precipitation and Ether Extraction (Gentamicin
10 pg/ml)
la
r16 12 Time (min)
137,
to environmental changes and interday precision may have
suffered.
Trichloroacetic Acid Precipitation with No Extraction
This was a modification of the scheme shown in Figure
3.13 with the extraction procedure omitted and the volume of
reagents reduced to a minimum to achieve adequate sensitivity.
The method developed for plasma assays was as shown in Figure
3.15. Levels as low as 0.5 yg/ml could be determined although
the precision was poor at this concentration. The average
percentage recovery of the components using this method was
106% as determined by comparison with an aqueous calibration.
The slight excess was probably due to the exact volume of
supernatant produced being unknown, but taken as 0.4 ml. A
good recovery is thus observed, suggesting that if plasma
binding of gentamicin does occur, it does not interfere with
the assay. Undecylamine internal standard had to be added
after protein precipitation because of extensive protein binding
of the compound if added before. This method required about —
1^ hours for a single assay but involved few manipulations and
thus several assays could be performed concurrently. In practice
one worker could complete twenty-five single assays in a day.
A typical chromatogram of a 2.5yg/ml sample is illustrated in
Figure 3.16.
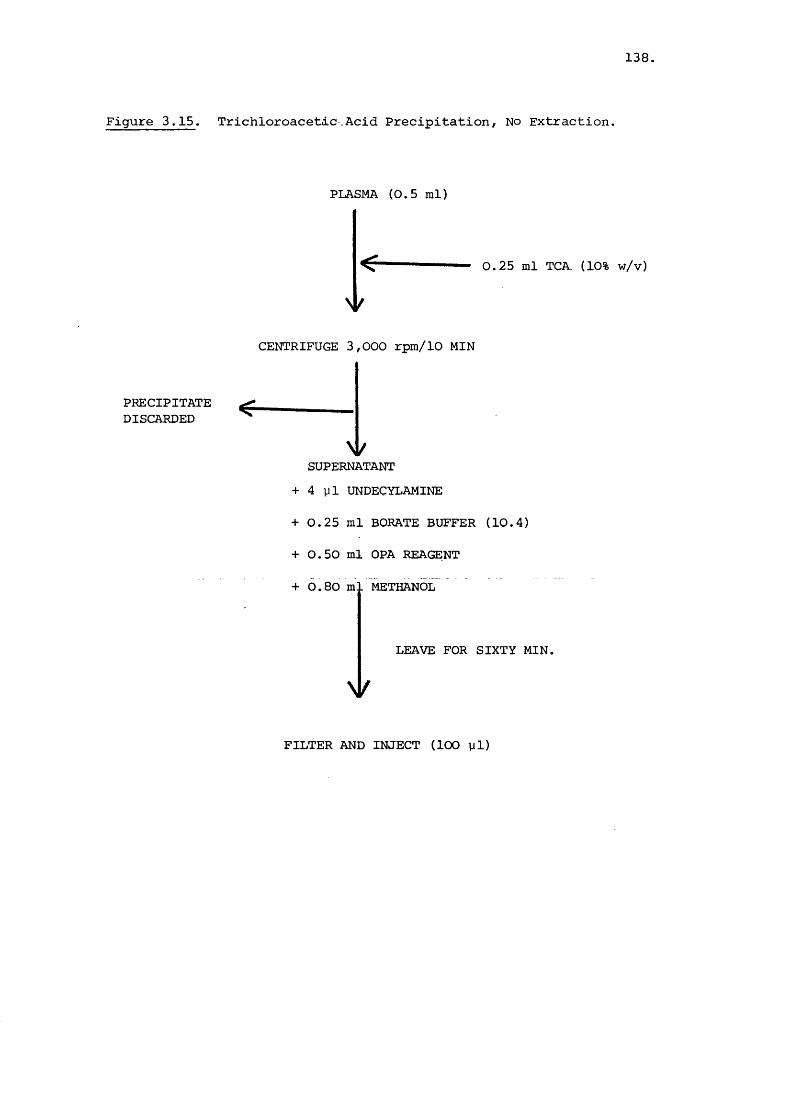
138,
Figure 3.15. Trichloroacetic.Acid Precipitation, No Extraction.
PLASMA (0.5 ml)
0.25 ml TCA. (10% w/v)
CENTRIFUGE 3,000 rpm/10 MIN
PRECIPITATEDISCARDED
wSUPERNATANT
+ 4 yl UNDECYLAMINE
+ 0.25 ml BORATE BUFFER (10.4)
+ 0.50 ml OPA REAGENT
+ 6.80 ml METHANOL
LEAVE FOR SIXTY MIN.
FILTER AND INJECT (100 yl)
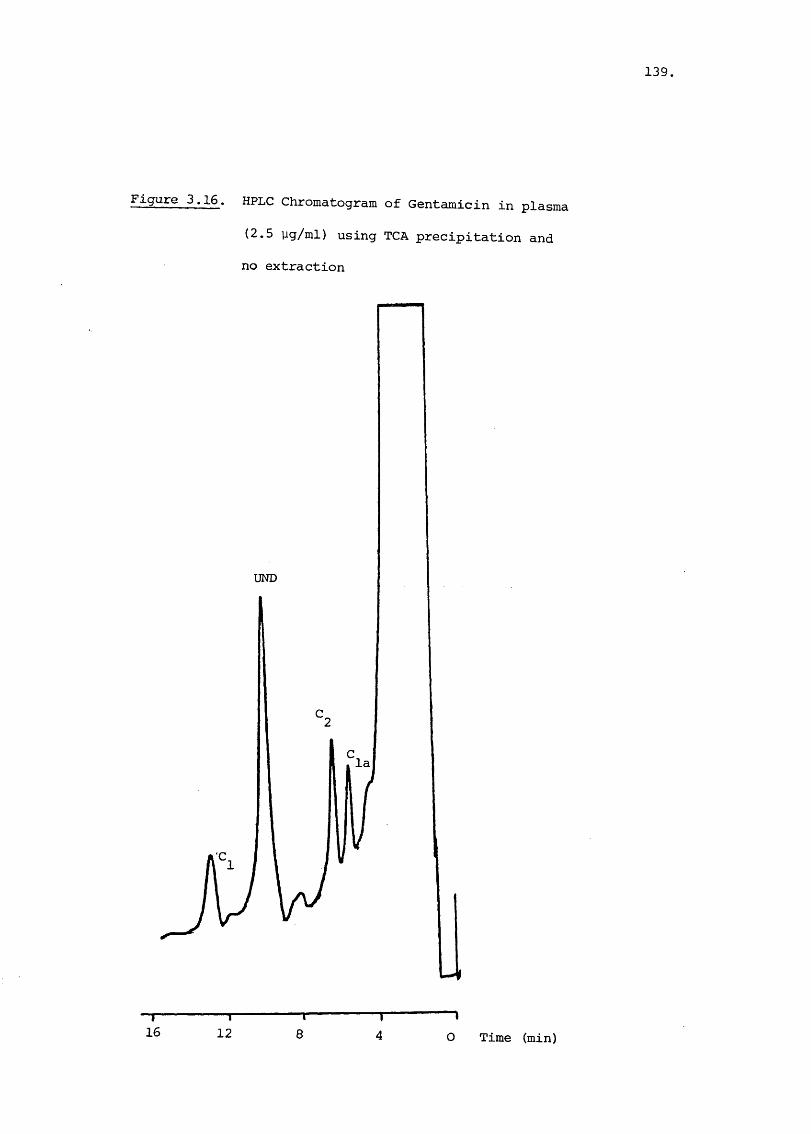
139,
Figure 3.16. HPLC Chromatogram of Gentamicin in plasma
(2.5 yg/ml) using TCA precipitation and
no extraction
UND
la
- I ---------------------r16 12 O Time (min)
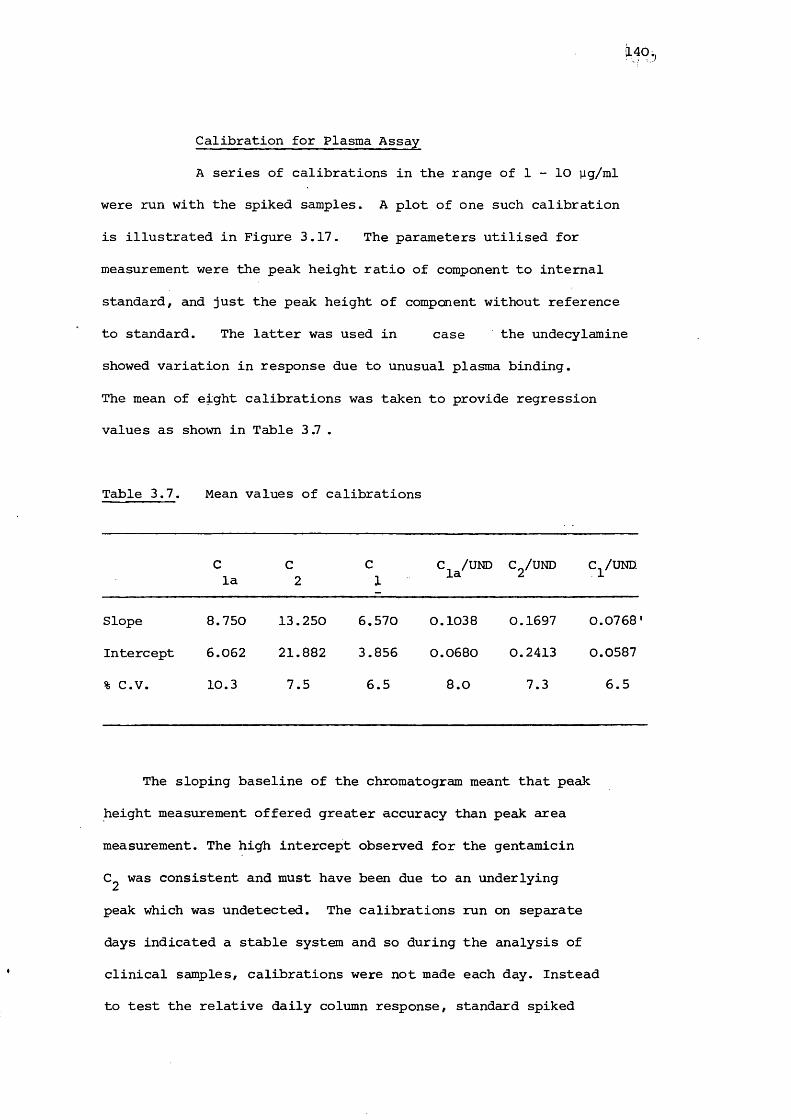
140,
Calibration for Plasma Assay
A series of calibrations in the range of 1 - 10 yg/ml
were run with the spiked samples. A plot of one such calibration
is illustrated in Figure 3.17. The parameters utilised for
measurement were the peak height ratio of component to internal
standard, and just the peak height of component without reference
to standard. The latter was used in case the undecylamine
showed variation in response due to unusual plasma binding.
The mean of eight calibrations was taken to provide regression
values as shown in Table 3.7 .
Table 3.7. Mean values of calibrations
Cla
C2
C1
Ci^/UND Cg/UND c ^/und:
Slope 8.750 13.250 6.570 0.1038 0.1697 0.0768'
Intercept 6.062 21.882 3.856 0.0680 0.2413 0.0587
% C.V. 10.3 7.5 6.5 8.0 7.3 6.5
The sloping baseline of the chromatogram meant that peak
height measurement offered greater accuracy than peak area
measurement. The high intercept observed for the gentamicin
C^ was consistent and must have been due to an underlying
peak which was undetected. The calibrations run on separate
days indicated a stable system and so during the analysis of
clinical samples, calibrations were not made each day. Instead
to test the relative daily column response, standard spiked

141,
Figure 3.17. Calibration of Gentamicin Components in plasma
using undecylamine as internal standard
Peak Heightcomponent
undecylamine
2.0
1.5
1.0
0.5
2.5 7.5 10 Concentration (yg/ml)
Gentamicin C,
Gentamicin C Gentamicin C.
la

142
plasma samples of 2.5 and 7.5 yg/ml were injected after every
two patient samples. The mean of all of the standards used in
a day was 'i compared with the expected value for all components
and both sets of calibrations. The discrepancy of the observed
and expected values was converted to a factor to adjust all of
the days samples to the calibration figures of Table 3.7. This
procedure saved time in performing a single calibration and
was more flexible in that the columns response over a whole day
was averaged. The mean of all of the factors used on the nine
days of plasma sample assays are given in Table 3.8.
Table 3.8. Mean of factors used to correct calibration
^la C1
C^^/UND Cg/UND C^/UND
X 1.051 0.811 1.066 1.580 1.154 1.495
% CV 13.2 21.3 7.7 12.8 16.9 9.3
The factors used are seen to have varied significantly during
the sample analysis, with the gentamicin component experiencing
large changes. In relation to the other two components it had
decreased in size, although the reason for this is unclear.
It is also evident that the undecylamine peak height was reduced
in respect to the gentamicin components from the calibrations.
A cause may have been increased protein binding even though
the methodology was constant throughout. The intra-assay and
inter-assay variance of the injected standards were calculated
to assess the viability of the method, and of the use of factors.
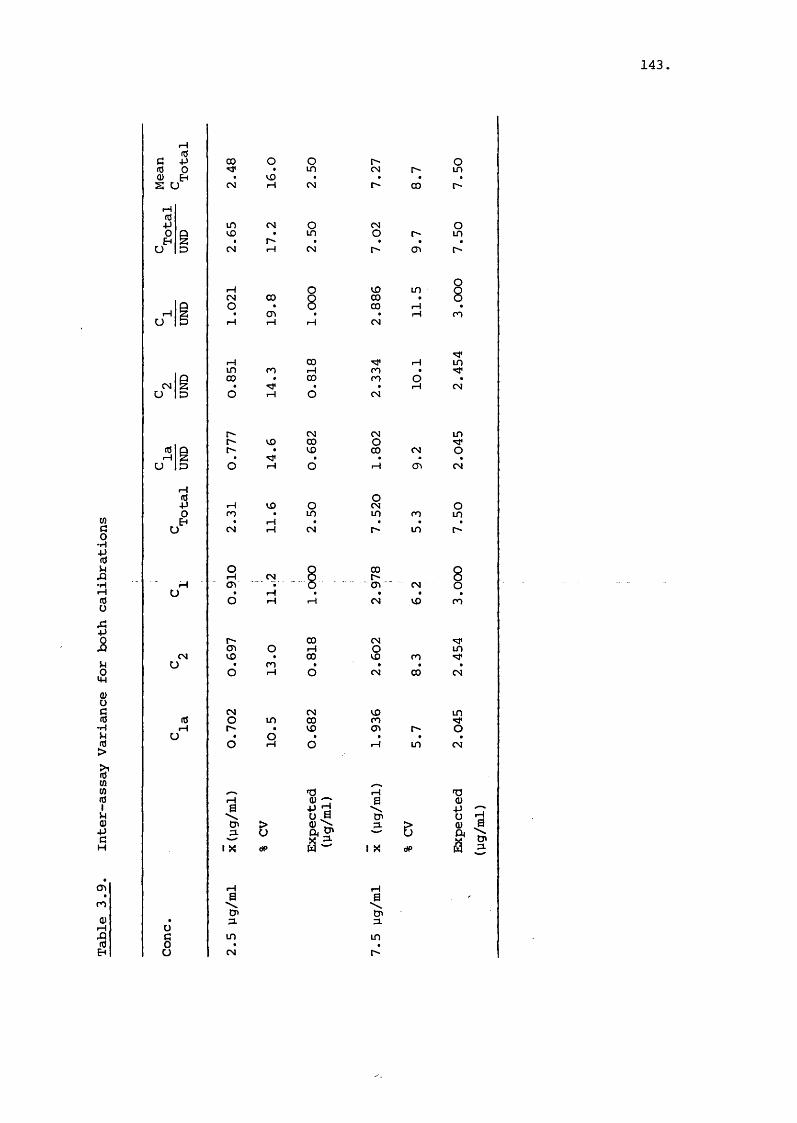
143
CO
§1d.a(0ÜI3g§•HgS ’COCOIdI
S
(T>ro0)I
iHc S 00 O O C" OfCJ 0 m CM ino Eh IDs u CM 1—1 CM 00
1—1fCJ+J in CM O CM O0 ID in o inE4U D CM 1—1 CM cr>
Or—1 O ID in QCM 00 Q 00 OO q 00 rHr—1 cr> 1—I mu I—1 I—1 rH CM
r4 CO rH inin m rH mCO 00 CO oCN rH CM
u O O 1—1 o CM
r* CM CM inID 00 o(0 ID 00 CM OrH
u D O 1—1 O 1—1 CTi CM
r—1(CJ o4J r4 ID o CM o0 ro in in m inEh I—1
U CM 1—1 CM r- in
o 00 Q1—1 CM r~- oa> m ■' CM OU rHO r—1 r—1 CM ID m
r-' 00 CM0» o rH O inCM ID 00 ID mL) n •O rH o CM 00 CM
CM CM ID in(0 O in 00 m1—1 VD CT» oU OO 1—( O rH in CM
rH 13r4 0) — . 8 <U8 +JÜ s O' Ü rjO' > Q) p. > 0) ap- u A Ü A \
X O'1 X dP a ^ 1 X dP W p.
iH rH8 8O' top. p.Ü
G in in0U CM c

144.
The intra-assay coefficient of variation for four samples of 2.5
and 7.5 yg/ml was 5.1% and 8.3% respectively. The coefficient
of variation of the interassay study of twenty determinations
analysed on five consecutive days is given in Table 3.9, for
both sets of calibrations. These figures were taken from the
standards used and thus also include a measure of the precision
throughout the day.
The interday assay figures reflect the variation in response
of the system, with the lower concentration range especially
susceptible. The undecylamine when used as an internal standard
only added to the variation and this was probably related to
the protein binding effect. Table 3.9 also shows the expected
concentration of the individual components calculated from
composition of standard gentamicin solution used. There is no
apparent trend between the observed and expected concentrations
except that the gentamicin component is the most accurately
defined. This is not unexpected because unlike the other two
components the gentamicin peak is not on the tail of the
solvent front peak. The percentage accuracy with 95% confidence
intervals is given in Table 3.10, calculated from the values
obtained in the precision studies.
Table 3.10 Accuracy of assay method
Strength(yg/ml) % Accuracy Confidence Ints.
Interassay 2.5 99 ± 7.5(n=20) 7.5 97 ± 4.1
Intra-assay 2.5 97 ± 7.1(n=4) 7.5 98 ±11.5
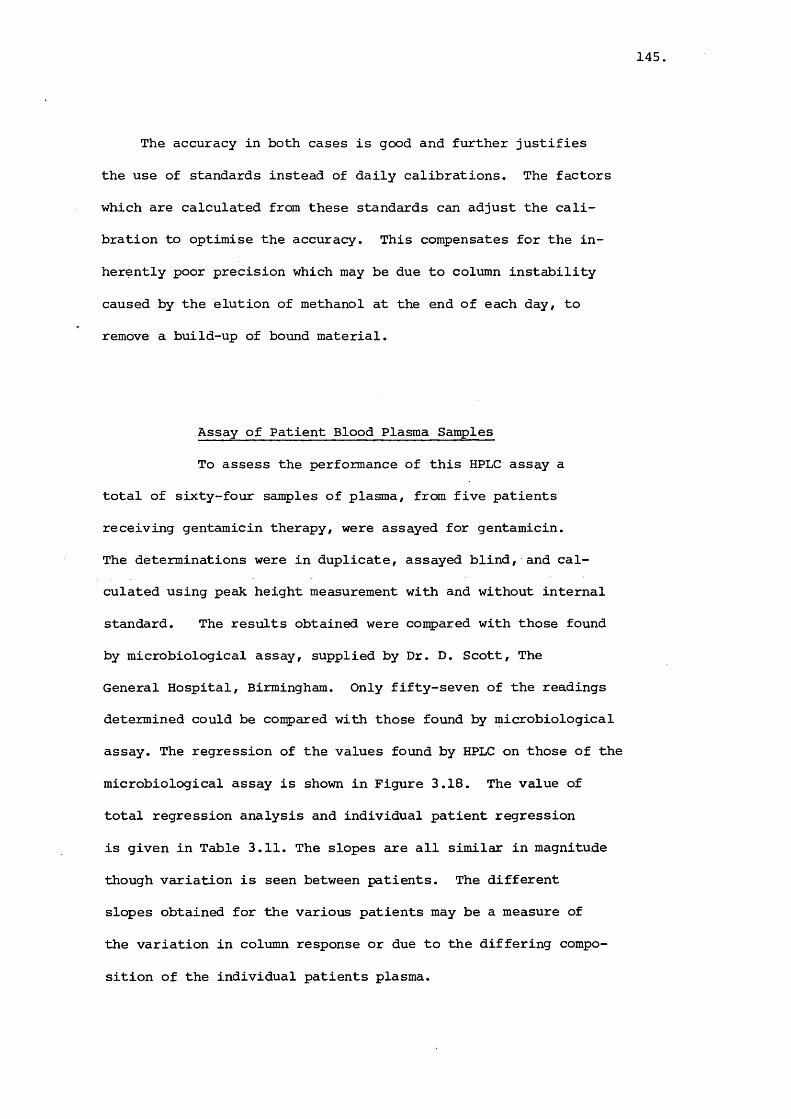
145
The accuracy in both cases is good and further justifies
the use of standards instead of daily calibrations. The factors
which are calculated from these standards can adjust the cali
bration to optimise the accuracy. This compensates for the in
herently poor precision which may be due to column instability
caused by the elution of methanol at the end of each day, to
remove a build-up of bound material.
Assay of Patient Blood Plasma Samples
To assess the performance of this HPLC assay a
total of sixty-four samples of plasma, from five patients
receiving gentamicin therapy, were assayed for gentamicin.
The determinations were in duplicate, assayed blind, and cal
culated using peak height measurement with and without internal
standard. The results obtained were compared with those found
by microbiological assay, supplied by Dr. D. Scott, The
General Hospital, Birmingham. Only fifty-seven of the readings
determined could be compared with those found by microbiological
assay. The regression of the values found by HPLC on those of the
microbiological assay is shown in Figure 3.18. The value of
total regression analysis and individual patient regression
is given in Table 3.11. The slopes are all similar in magnitude
though variation is seen between patients. The different
slopes obtained for the various patients may be a measure of
the variation in column response or due to the differing compo
sition of the individual patients plasma.
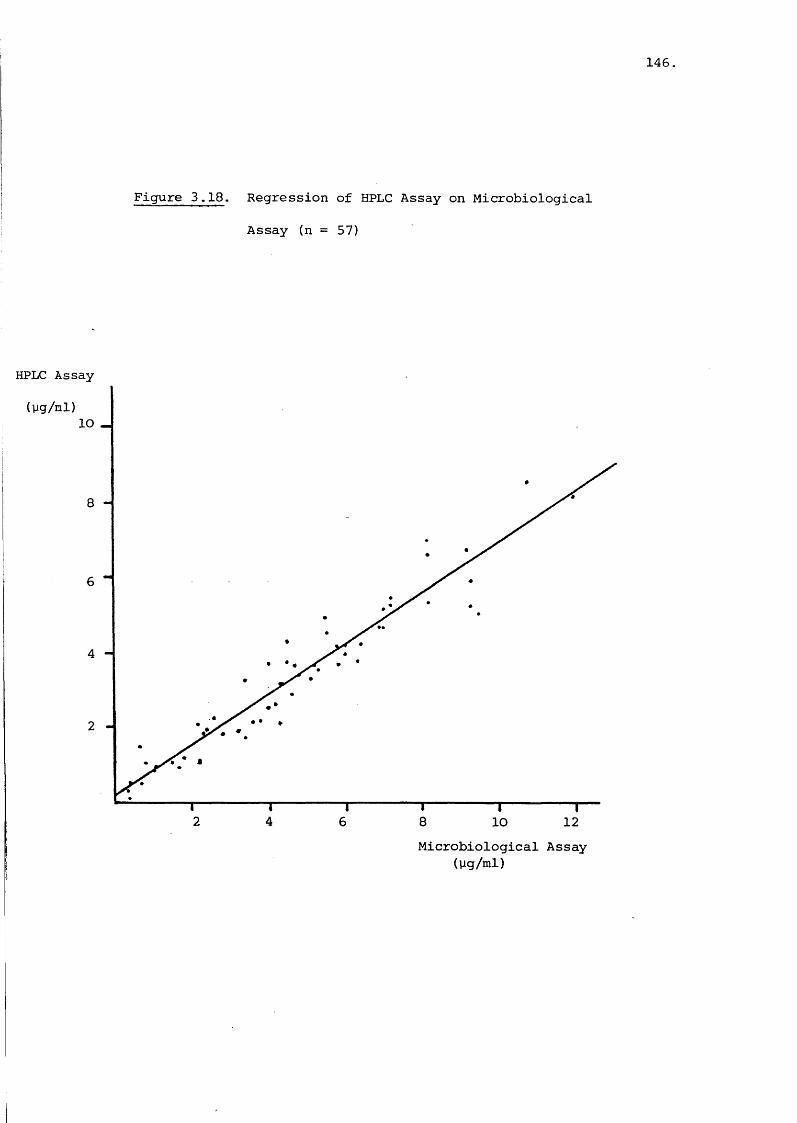
Figure 3.18. Regression of HPLC Assay on Microbiological
Assay (n = 57)
146.
HPLC Assay
(yg/ml)lO
8
6
4
2
2 4 6 8 1210Microbiological Assay
(yg/ml)
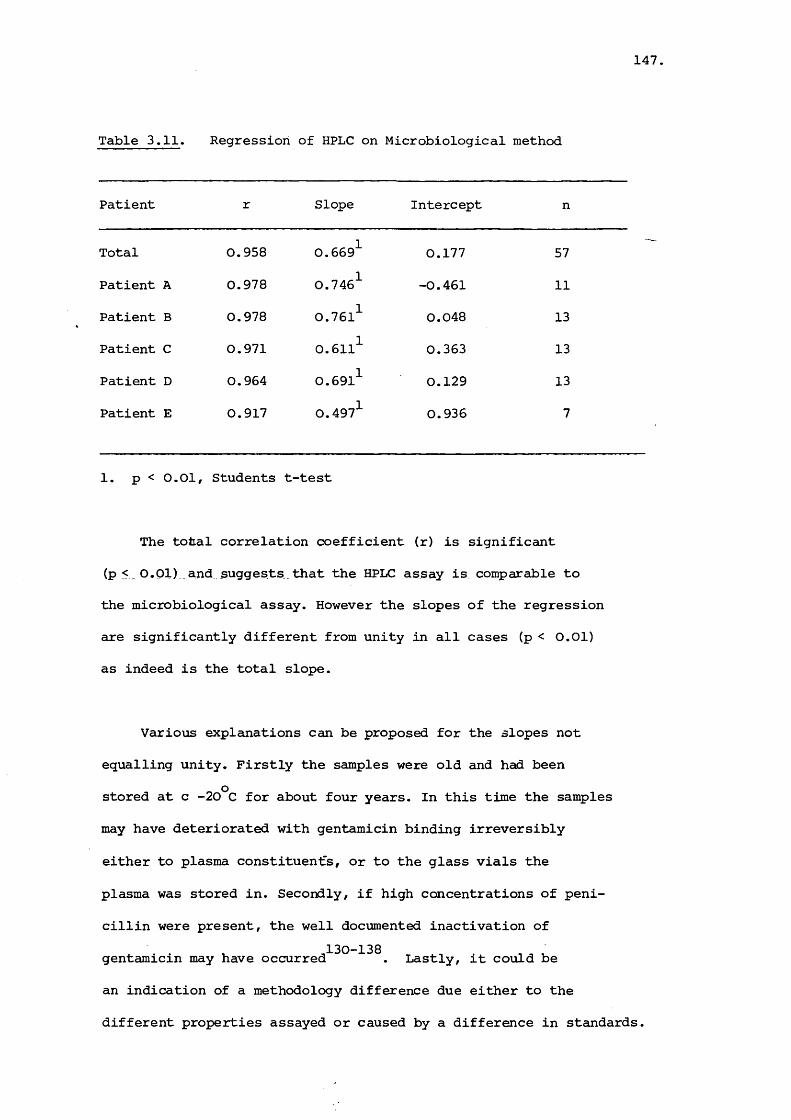
147,
Table 3.11. Regression of HPLC on Microbiological method
Patient r Slope Intercept n
Total 0.958 0.669^ 0.177 57
Patient A 0.978 0.746^ -0.461 11
Patient B 0.978 0.761^ 0.048 13
Patient C 0.971 0.611^ 0.363 13
Patient D 0.964 0.691^ 0.129 13
Patient E 0.917 0.497^ 0.936 7
1. p < 0.01, Students t-test
The total correlation coefficient (r) is significant
(p O.Ol) and suggests that the HPLC assay is comparable to
the microbiological assay. However the slopes of the regression
are significantly different from unity in all cases (p < 0.01)
as indeed is the total slope.
Various explanations can be proposed for the slopes not
equalling unity. Firstly the samples were old and had been
stored at c -20°C for about four years. In this time the samples
may have deteriorated with gentamicin binding irreversibly
either to plasma constituents, or to the glass vials the
plasma was stored in. Secondly, if high concentrations of peni
cillin were present, the well documented inactivation of
gentamicin may have occurred^^^ 138^ Lastly, it could be
an indication of a methodology difference due either to the
different properties assayed or caused by a difference in standards,

148,
It was observed that freezing the plasma, after spiking
with gentamicin standard solution, decreased the peak height
of the components, as measured by HPLC.This may have arisen
from adsorption of gentamicin, but standards used for the
calibration were stored frozen before use to overcome this loss.
No significant loss of gentamicin was observed for frozen
samples in the short term (seven days). However study of
the storage characteristics up to 3 months produced results
too variable to quantitate, but revealed no apparent trend in242deterioration. One study in the literature , using a
bioassay found no loss on storage for two days in plastic or
glass containers at -20°C, 4°C and 25°C. However decrease in
the gentamicin level was observed when carbenicillin was present
(> 500 yg/ml) at all temperatures. A study^^^ comparing the
EMIT method with the bioassay found a relationship with a
correlation of 0.96 and slope of 0.91 when assayed on the
day of collection. However when specimens were stored at -60°C
for one to sixty three days before EMIT measurement the corre
lation was 0.95 with a slope of 0.69. This compares with a
slope of 0.67 for the similar regression of HPLC on the micro
biological results observed here. The authors of the paper
ascribed the loss of gentamicin to a general phenomenon on
freezing and not to a difference in the two techniques. However
some other comparisons in the literature also show similar177differences. In a paper by Mannisto the slope of EMIT
results regressing on the bioassay is 0.67 (r = 0.92, n = 62).
Here the bioassay was performed on the day of collection and
the EMIT methods on samples stored for 1 - 2 months at -27°C.
149,
However the slope of the EMIT results regressing on a fluoro-
immunoassay was only 0.78 (r = 0.86, n = 62) where the samples
were stored identically. This variation in the calibration212of different methods is also shown in another paper where
the regression of a fluoroimmunoassay on a bioassay for amikacin
has a slope of 0.69 (r = 0.81, n = 160). This difference was
attributed to a difference in standards, and although this is
plausible for radioimmunoassays it is less likely here.
Studies in the literature do not report many direct comparisons
of the EMIT method with a bioassay, and although many papers 221 227 231 233of HPLC methods ' ' ' have reported good correlations
with slopes close to unity, in respect to the bioassay, the
discrepancies noted here do cause concern. This was highlighted243in a paper by Faber et al. where the bioassay was found not
to agree with results determined by HPLC. A comparison showed
the HPLC method to agree with the EMIT method and to be highly
specific, especially in the presence of other antibiotics.
It was suggested that, with gentamicin present, the penicillins
were not totally inactivated by penicillinase and gave falsely
high readings for the bioassay.
In this study the difference between the two methods may be
explained in a number of ways, but the most feasible is that
of a loss on freezing as noted in other pepers.
The time course of the gentamicin concentration in plàsma
can be plotted though more results would be required for a
complete analysis. The decay curve is typical for aminoglycoside

150.
administration and is described by a two compartment open model118which accounts for tissue accumulation of gentamicin . However
for simplicity, and insufficient time points it is here119assumed to follow a one compartment model with the equation :
C = Be
where C is concentration in plasma
B is extrapolated concentration at t = O
3 is apparent elimination rate constant
t is time after administration
For patient B a time course curve is shown in Figure 3.19.
This can be translated to a linear format by taking logarithms.
In C = In B - 3t
The plasma half life (t ) and apparent volume of distribution
(V ) can be calculated from:
0.693t, = -3
and
From the plasma concentrations determined by the assay,
estimates of these pharmacokinetic parameters were made as
defined in Table 3.12. As slopes were estimated from three
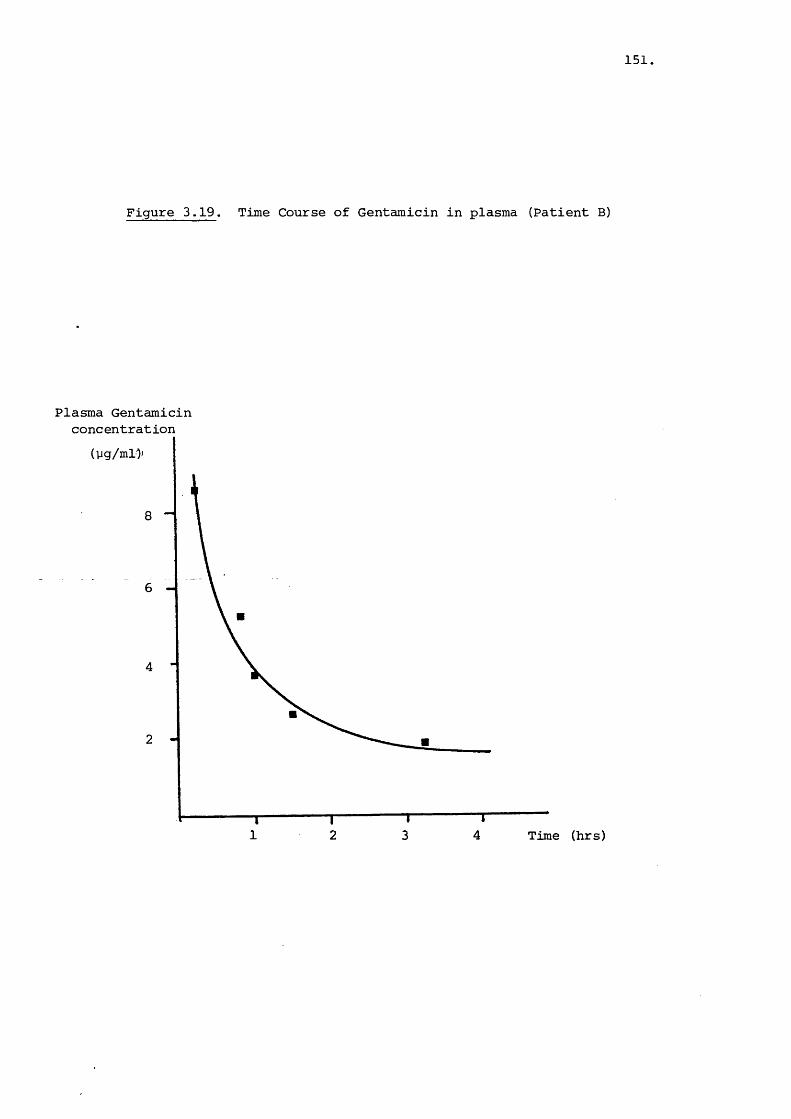
151,
Figure 3.19. Time Course of Gentamicin in plasma (Patient B)
Plasma Gentamicin concentration
(yg/mlO'
8
6
4
2
Time (hrs)
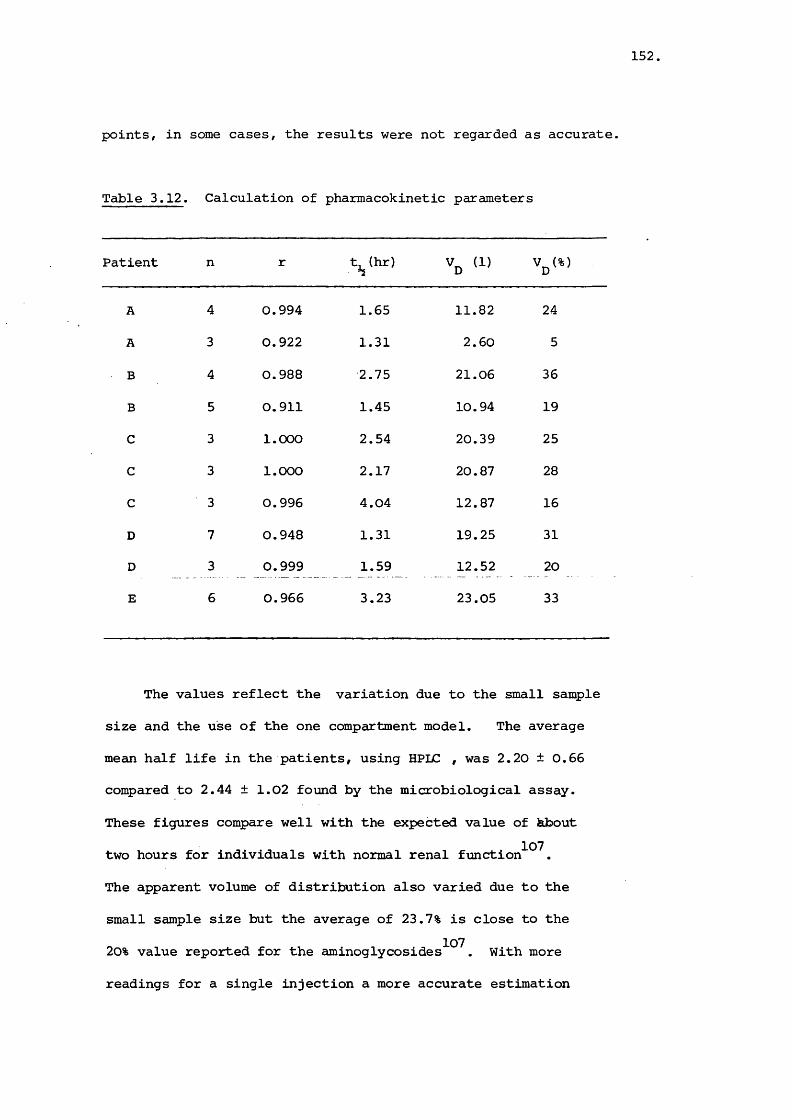
152
points, in some cases, the results were not regarded as accurate.
Table 3.12. Calculation of pharmacokinetic parameters
Patient n r t^(hr) % (1) V^^%)
A 4 0,994 1.65 11,82 24
A 3 0,922 1.31 2,60 5
B 4 0,988 2.75 21.06 36
B 5 0,911 1.45 10.94 19
C 3 1,000 2.54 20,39 25
C 3 1,000 2,17 20,87 28
c 3 0,996 4.04 12,87 16
D 7 0,948 1,31 19,25 31
D 3 0,999 1,59 12,52 20
E 6 0,966 3,23 23.05 33
The values reflect the variation due to the small sample
size and the use of the one compartment model. The average
mean half life in the patients, using HPLC , was 2,20 ± 0.66
compared to 2,44 ± 1,02 found by the microbiological assay.
These figures compare well with the expected value of hbout
two hours for individuals with normal renal function^^^.
The apparent volume of distribution also varied due to the
small sample size but the average of 23,7% is close to the
20% value reported for the aminoglycosides^^^, With more
readings for a single injection a more accurate estimation
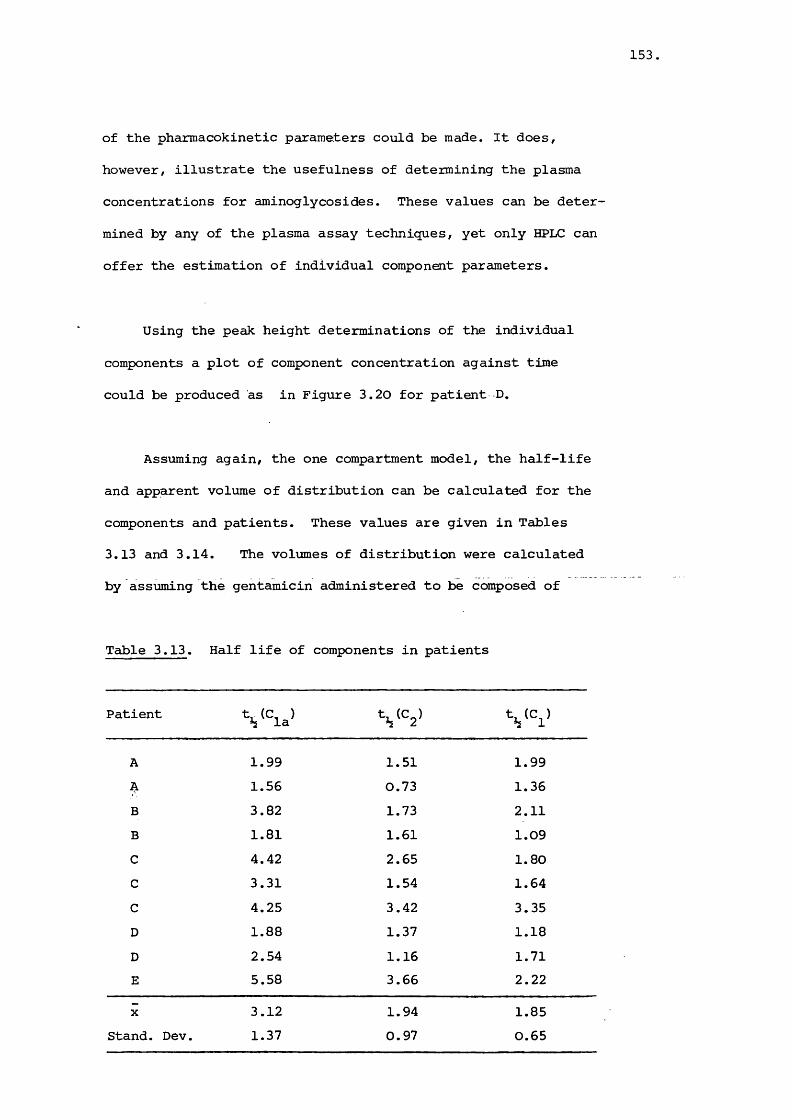
153
of the pharmacokinetic parameters could be made. It does,
however, illustrate the usefulness of determining the plasma
concentrations for aminoglycosides. These values can be deter
mined by any of the plasma assay techniques, yet only HPLC can
offer the estimation of individual component parameters.
Using the peak height determinations of the individual
components a plot of component concentration against time
could be produced as in Figure 3.20 for patient D,
Assuming again, the one compartment model, the half-life
and apparent volume of distribution can be calculated for the
components and patients. These values are given in Tables
3.13 and 3.14. The volumes of distribution were calculated
by assuming the gentamicin administered to be composed of
Table 3.13. Half life of components in patients
Patient t%(Cla)
A 1.99 1.51 1.991.56 0.73 1.36
B 3.82 1.73 2.11B 1.81 1.61 1.09C 4.42 2.65 1.80C 3.31 1.54 1.64C 4.25 3.42 3.35D 1.88 1.37 1.18D 2.54 1.16 1.71E 5.58 3.66 2.22
X 3.12 1.94 1.85Stand. Dev. 1.37 0.97 0.65
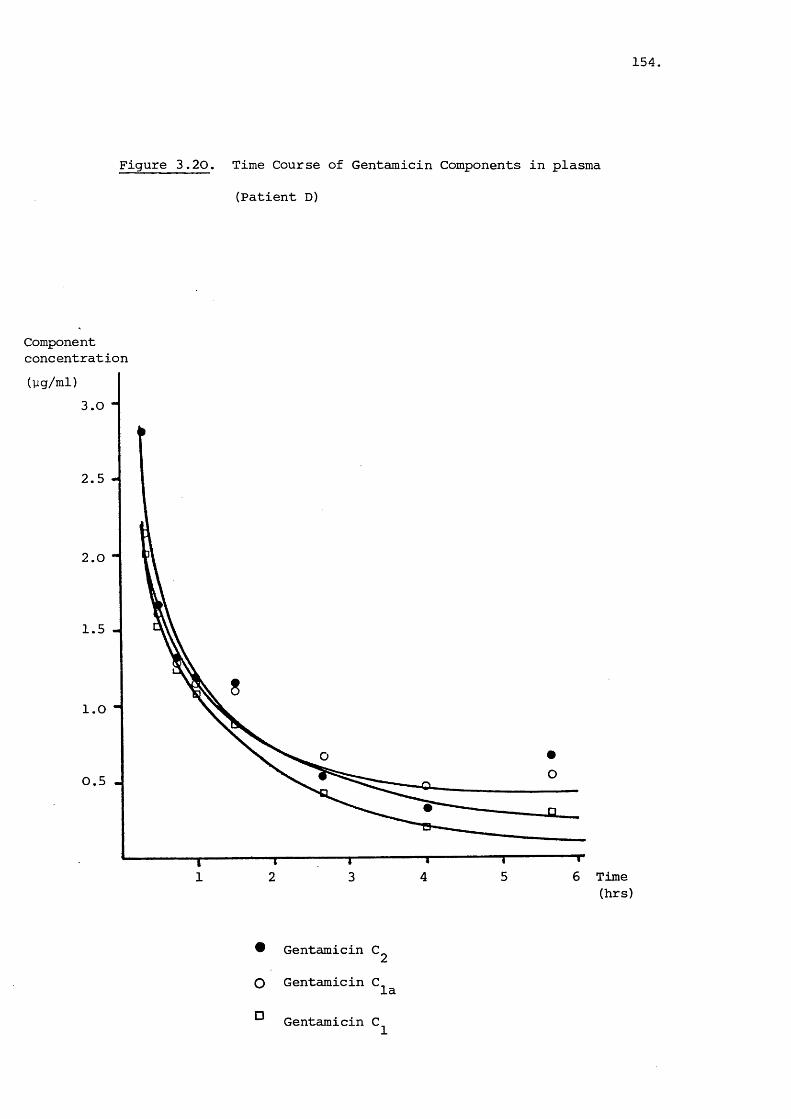
154,
Figure 3.20. Time Course of Gentamicin Components in plasma
(Patient D)
Componentconcentration(yg/ml)
3.0
2.5
2.0
1.5
.0
.5
652 3 41 Time(hrs)
® Gentamicin C.
O Gentamicin Cla
Gentamicin C.
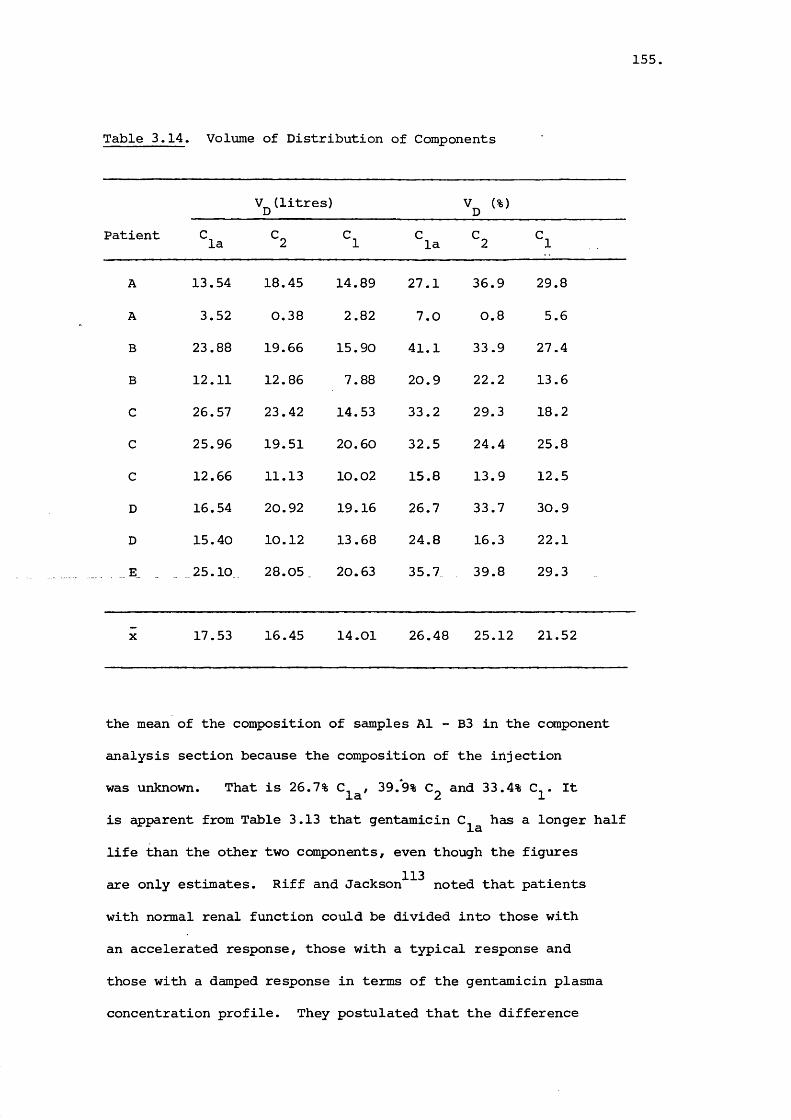
155,
Table 3.14. Volume of Distribution of Components
Patient
(litres)
^la s Cl ^2 Cl
A 13.54 18.45 14.89 27.1 36.9 29.8
A 3.52 0.38 2.82 7.0 0.8 5.6
B 23.88 19.66 15.90 41.1 33.9 27.4
B 12.11 12.86 7.88 20.9 22.2 13.6
C 26.57 23.42 14.53 33.2 29.3 18.2
C 25.96 19.51 20.60 32.5 24.4 25.8
C 12.66 11.13 10.02 15.8 13.9 12.5
D 16.54 20.92 19.16 26.7 33.7 30.9
D 15.40 10.12 13.68 24.8 16.3 22.1
, 25.10 28.05 _ 20.63 35.7 39.8 29.3
X 17.53 16.45 14.01 26.48 25.12 21.52
the mean of the composition of samples A1 - B3 in the component
analysis section because the composition of the injection
was unknown. That is 26.7% C^^y 39.9% C^ and 33.4% C^. It
is apparent from Table 3.13 that gentamicin C^^ has a longer half
life than the other two components, even though the figures
are only estimates. Riff and Jackson^^^ noted that patients
with normal renal function could be divided into those with
an accelerated response, those with a typical response and
those with a damped response in terms of the gentamicin plasma
concentration profile. They postulated that the difference

156.
could be due to a reversible binding of gentamicin by constituents
of blood, possibly the red blood cells. Such binding may also
account for the relative differences in half life of the individual
components.
Lachatre et in experiments on rabbits found that
the cumulative urinary elimination of gentamicin C^^was signi
ficantly lower than for the other two components. This was partly
explained by a greater renal accumulation of the conponent.
The volumes of distribution calculated for the components given
in Table 3.14 are relatively similar with the gentamicin
having the smallest volume. If gentamicin was bound to a
larger extent in another compartment the volume of distribution
should be larger. That this is not the case suggests the
components behave in a comparable manner in terms of tissue
di stribution.
The HPLC method developed for the assay of gentamicin in
plasma proved to have good accuracy with a high correlation with
the microbiological assay. The difference between the two
methods is relevant and the possible loss of gentamicin on
freezing warrants investigation. The HPLC method was found to
be useful in pharmacokinetic studies and pointed to possible
differences in the handling of components which may be of
importance in terms of relative toxicity.

157
CHAPTER 4
ORTHO PHTHALALDEHYDE REACTION IN RELATION TO GENTAMICIN
4.1 Introduction237The ortho-phthalaldehyde reagent (OPA), described by Roth
has proved to be extremely useful in the high-performance liquid279—285chromatography (HPLC) of amines and amino acids . The fast
reaction with such compounds has made it an ideal reagent for
both post- and pre-column derivatisation^^^. The fluorescent
product exhibits an excitation maximum wavelength of 340 nm and283 286—8an emission maximum at about 430 nm ' An excitation
maximum at 229 nm which is reportedly more intense than at 340 nm 282also exists . However problems of interference at the lower
wavelength by constituents of plasma have been envisaged. The
reagent used for derivatisation requires a thiol to be present289with the dicarbonyl aromatic, before an amine is added . If
the amine is added before the thiol, the fluorescent yield is289reduced, probably because of a different reaction pathway
The nature of the thiol used can have a significant effect on
the maximum emission wavelength, whilst the amine is less285critical in this regard . Alcohol has been reported to
enhance the fluorescence produced, whilst a solvent such as
chloroform can quench The pH of the reaction
has also been discovered to be an important determinant of283 286fluorescence yield and stability of the product ' . The
fluorescence produced is diminished below pH 7.5 and boric
acid as a buffer species is thought to promote greater stability
than phosphate^^^'^^^. The amine involved in the reaction
can affect the stability of the product since bulky groups

158,
adjacent to the amino function protect against decomposition289,290
The structure of the fluorescent product was discovered
to be that of a l-alkylthio-2-alkyl substituted isoindole (4.1) 291
(4.1) (4.II)
This structure was postulated by Simons after examination
of the product by high resolution mass spectrometry, proton291nuclear magnetic resonance and infra-red spectroscopy
Mass spectrometry defined the molecular formula, whilst the
infra-red failed to show adsorption bands due to carbonyl or
sulphydryl groups, thus eliminating some structural possibili
ties. The proton NMR spectrum revealed a 2:1:2 proton split
in the aromatic region which was in accord with the spectrum^ ^ , 292-3of isoindole
Isoindole is an unstable compound with a tendency to
form the isoindolenine isomer (4.II) instead of the o-quinoid 293,296form . Substitution at the nitrogen is known to stabil-
293ise the isoindole structure , and substitution of the thiol289at the 1 position probably exerts a similar influence . The
extended conjugation of the molecule (4.1) is responsible
for the observed spectral characteristics.

159,
The fluorescent product of the OPA reaction undergoes
photodecomposition, which may arise from intramolecular attack289by the hydroxy group of the mercaptoethanol , or to inter-
290molecular attack by excess OPA . The mechanism of both
reactions could be by nucleophilic addition.
The gentamicin-o-phthalaldehyde derivatives when assayed223by HPLC have shown different retention orders. Maitra
231 233and others ' , have reported the gentamicin derivative
to elute first, followed by gentamicins C and C . However,7 7 78in the assays reported in Chapter 3 and in a previous study ' ' ,
the order of elution was gentamicin C^^, C^ with C^ last to
elute. Since nearly identical conditions to those of
Maitra were used, it was important to determine the source of
this variation, to ensure integrity of the assay procedure.
The difference in retention order may have arisen from either
distinct reaction products, or frcxn a variation in column
response to the derivatives. Before the latter could be fully
investigated the former potential source of inequivalence
had to be eliminated.
It is known that the OPA reagent will only react with
primary amines to form the fluorescent product; secondary291amines being unsuitable as substrates . The gentamicin C
and C^ components each have four primary amino functions on
each molecule, whilst gentamicin C^ has only three. Thus if
all groups were reacted to form the hydrophobic isoindole
functions, the retention order on a reverse phase column
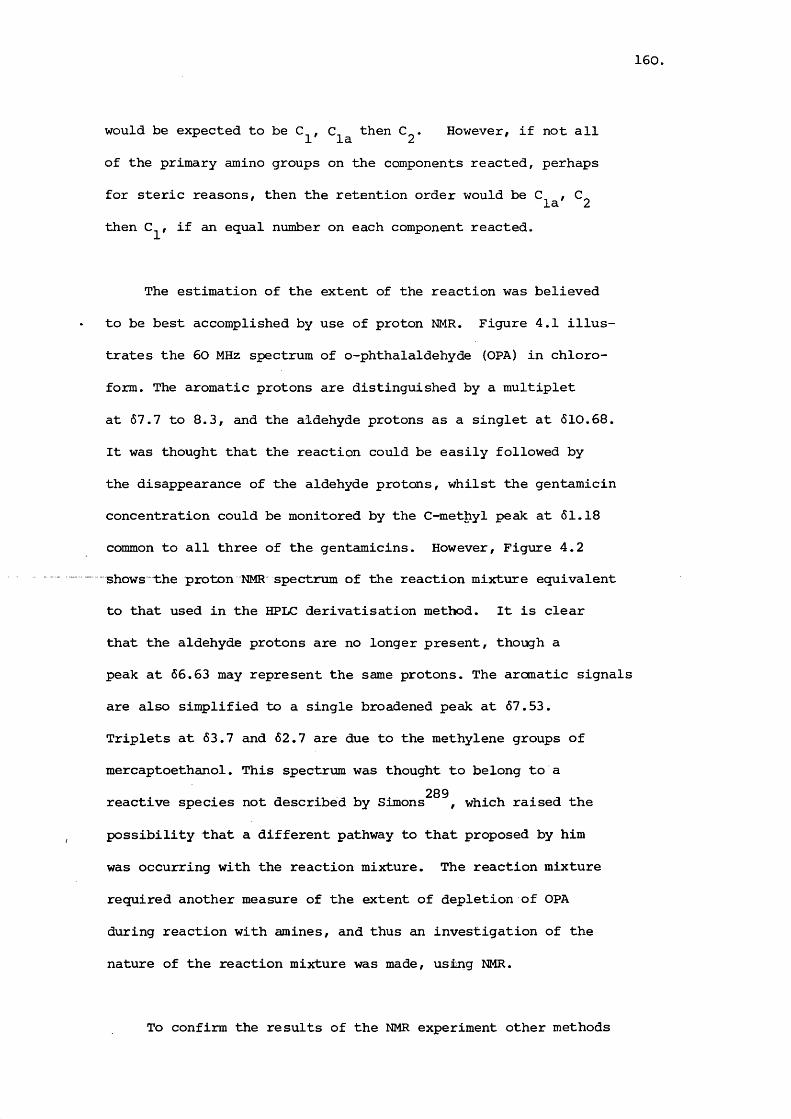
160.
would be expected to be C^, then . However, if not all
of the primary amino groups on the components reacted, perhaps
for steric reasons, then the retention order would be C , C2then C^, if an equal number on each component reacted.
The estimation of the extent of the reaction was believed
to be best accomplished by use of proton NMR. Figure 4.1 illus
trates the 60 MHz spectrum of o-phthalaldehyde (OPA) in chloro
form. The aromatic protons are distinguished by a multiplet
at 67.7 to 8.3, and the aldehyde protons as a singlet at 610.68.
It was thought that the reaction could be easily followed by
the disappearance of the aldehyde protons, whilst the gentamicin
concentration could be monitored by the C-methyl peak at 61.18
common to all three of the gentamicins. However, Figure 4.2
shows the proton NMR spectrum of the reaction mixture equivalent
to that used in the HPLC derivatisation method. It is clear
that the aldehyde protons are no longer present, though a
peak at 66.63 may represent the same protons. The aromatic signals
are also simplified to a single broadened peak at 67.53.
Triplets at 63.7 and 62.7 are due to the methylene groups of
mercaptoethanol. This spectrum was thought to belong to a289reactive species not described by Simons , which raised the
possibility that a different pathway to that proposed by him
was occurring with the reaction mixture. The reaction mixture
required another measure of the extent of depletion of OPA
during reaction with amines, and thus an investigation of the
nature of the reaction mixture was made, using NMR.
To confirm the results of the NMR experiment other methods
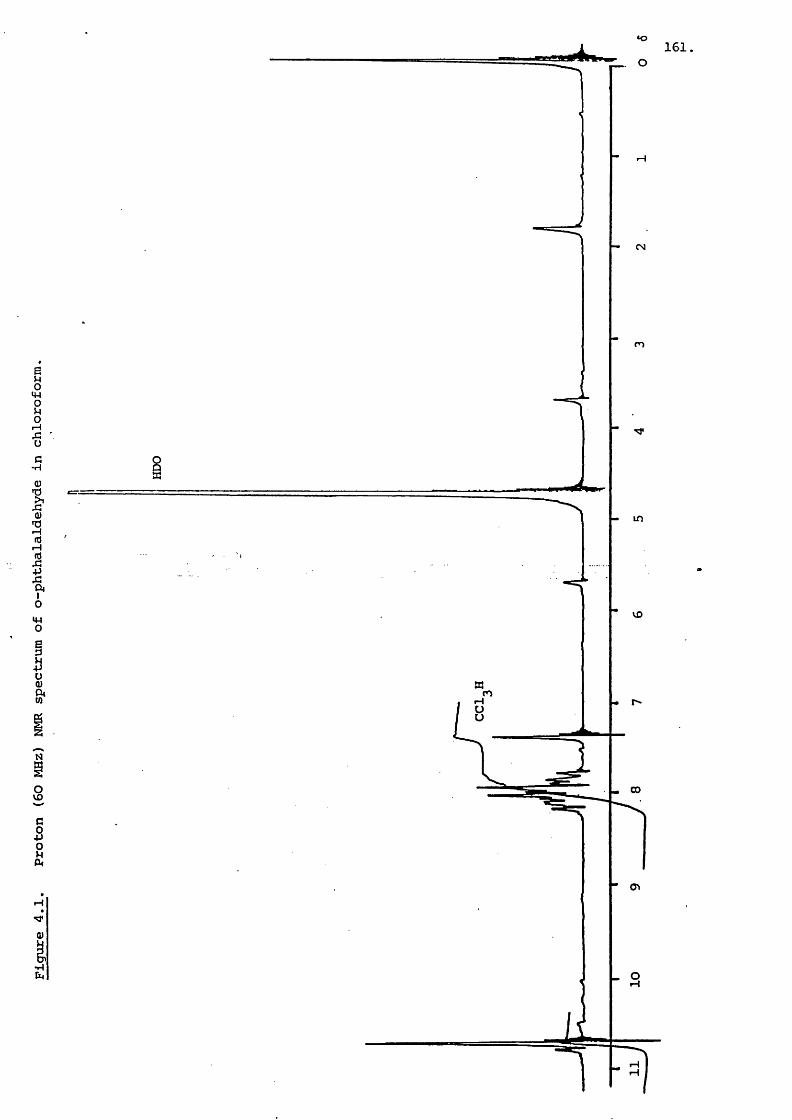
i4-1
S0iH■gG
•H
0)12 cürHIo4-1O
88*
SCS
grH
0)
CM
n
in
m
CD
161

162
CN
m<N
in
CM 00
cr>

16l
of estimating the extent of reaction of gentamicin with OPA
were sought. The feasibility of using fluorescence yield
produced by the individual components as such a measure was
investigated. Another spectroscopic method of assessing the
extent of reaction was to use ninhydrin as a marker of un
reacted amino groups. This presumed that ninhydrin would
react with all of the primary amino groups on the gentamicins
and fail to react with secondary functions.
4.2 Materials and Methods
4.2.1 Materials:
Ortho-phtha1aIdehyde (Sepramar), boric acid,
mercaptoethanol, potassium hydroxide and Zerolit 325 (H )
resin were all obtained from BDH Chemicals Ltd. Deuterium oxide,
methanol-d^, acetonitrile-d^ were supplied by the Aldrich
Chemical Company Ltd. Methoxyethanol was obtained from Koch
Light Laboratories Ltd.
4.2.2 Methods :
4.2.2.a.Nuclear Magnetic Resonance Study of the Reaction
Nuclear Magnetic Resonance
Proton 60 MHz spectra were determined on a JEOL
PMX 60 SI spectrophotometer. Mr. H. Hartnell determined the
carbon-13 NMR spectra on a JEOL FX 90Q Fourier Transform NMR
spectrometer, in the School of Pharmacy and Pharmacology,
University of Bath.
164,
General Reagents and Solutions for NMR
Deuterium Oxide Buffer (pH 10.4)
Boric acid (1 g) was dissolved in distilled water
(38 ml). The pH was adjusted to 10.4 with the use of a 45% w/v
potassium hydroxide solution. Buffer solution (2 ml) was
transferred to a flask and lyophilised. Deuterium oxide (2 ml)
was used to redissolve the residue and the solution was again
lyophilised. Deuterium oxide again was used to effect solution,
which was stored in a desiccator.
Ortho-phthalaldehyde Reagent (OPA)
A general preparation used in the NMR studies
was ortho-phthalaldehyde (35 mg) dissolved in methanol-d^
X150 Tjl) in a UMR tube. To this mercaptoethanol (20 mg) and
deuterium oxide buffer (pH 10.4), 150'-(jl, was added. Stability
was adequate for several hours if protected from iight.
Proton NMR Instrument Settings
Sweep width: O - 600 Hz
Sweep rate: 2.4 Hz/sec
Filter: 20 Hz
H^ Level: 0.5
Phase: Pure Absorption Waveform
Amplitude : X 10
Internal Standards: sodium-3-trimethyl silyl propane
sulphonate (DSS) or tetramethyl-
silane (TMS)
165
Proton NMR Samples
Individual Reactants
Ortho-phthalaldehyde, mercaptoethanol and the amines
used in the reaction were measured in various solvents depending
on solubility. Amines used in the reaction apart from the
gentamicin components were methylamine hydrochloride, butyl-
amine, isopropylamine, glucosamine hydrochloride and ethanolamine.
OPA Reagent
Variations in the concentration and stoicheometry
of the reaction mixture were studied. These included different
ratios of OPA to mercaptoethanol and variation in the composition
of solvents used.
OPA Reaction with Standard Amines
Amines were added to an already prepared OPA reaction
mixture, either by weighing or by volume. Various proportions
of amine to ortho-phthalaldehyde were used and spectra were run
within ten minutes of initiation of reaction.
OPA Reaction with Gentamicin
Gentamicin (40 mg) was dissolved in deuterium
oxide buffer (pH 10.4), 20 yl and methanol-d^ (150 yl) in a NMR
tube. OPA reaction mixture was prepared in a reaction vial
by dissolving o-phthalaldehyde (45 mg) in methanol-d^ (lOO yl)
166
and adding mercaptoethanol (46 yl). The OPA reagent was trans
ferred by microsyringe to the gentamicin solution and the
vial was washed with methanol-d^ (50 yl) and added to the NMR
tube. Spectra were run within ten minutes. Gentamicin was
used in the same fashion except that 29 mg was used.
Carbon-13 NMR spectra
Samples of a similar description to those used in
the PMR study were examined, except that acetonitrile was used
instead of methanol as a co-solvent. Composition of each sample
run is given:
(i) OPA (35 mg) in acetonitrile (200 yl)
(ii) OPA (39 mg) and mercaptoethanol (45 mg) in aceto
nitrile (200y 1)
(iii) OPA (40 mg) and mercaptoethanol (23 mg) in deu-
teriated buffer (120 yl) and acetonitrile (120 yl)
(ivj OPA (89 mg) and mercaptoethanol (52 mg) in
deuteriated buffer (150 yl) and acetonitrile (150 yl)
(v) OPA (30 mg) and mercaptoethanol (18 mg) in
deuteriated buffer (150 yl) and acetonitrile (150 yl)
Ethanolamine (14 mg) was added to the mixture after
solution of initial components was complete.
Internal reference in the spectra was set to acetonitrile
methyl peak taken as 1.07 ppm in respect to TMS by reference
to methanol (49.5 ppm). Proton NMR spectra of these solutions
were recorded first then carbon-13 NMR spectra were run within
one hour of preparation.
167
4.2.2.b Fluorescence Measurement of Gentamicin-OPA Reaction
A Perkin-Elmer 204A spectrofluorimeter was used to
measure the extent of reaction. Excitation wavelength was set
at 345 nm and emission at 440 nm with photomultiplier gain set
at 2, and sensitivity of 1 used. Solutions of gentamicin com--7ponents were prepared in concentrations of 5 x 10 M in 5 ml
of ammonia-free methanol-water mixture (1:1). OPA reagent
in the proportions of 4 molar and 3 molar equivalent with
respect to each gentamicin component was added. The fluorescence
obtained was measured 85, 110 and 120 minutes after the reaction
started.
4.2.2.C Ninhydrin Reaction with Gentamicin
Preparation of Ninhydrin Reagent:
The Ninhydrin Reagent of the British Pharmacopeia
1980^^, was used in this determination. Preparation was as
stated in Appendix lA^^ with the double distilled water used
having first been freshly boiled and cooled.
Preparation of OPA Reagent:
0-phthalaldehyde (50 mg) was dissolved in methanol
(1 ml). To this mercaptoethanol (0.1 ml) was added and the
solution made to 10 ml volume with 0.4 M borate buffer (pH 10.4).
The methanol had been shaken with a Zerolit 325 (H ) resin
and filtered prior to use. The buffer was freshly prepared
using boiled and cooled distilled water.

168,
Preparation of 95% Ammonia-free Ethanol-Water (1:1):
Ethanol, 95% v/v, 50 ml was shaken with a Zerolit
325 (H ) resin for five minutes, then allowed to stand for an
hour with intermittent shaking. Water (50 ml) which had been
double distilled was boiled and allowed to cool before adding to
the filtered ethanol. All solutions were freshly prepared each
day.
Gentamicin Standard Solutions:
Standard solutions for each of the three gentamicin
components (C^^ÿ and C^) were prepared by dissolving base
(20 mg) in water (10 ml) to give 2 mg/ml solutions.
Calibration of Ninhydrin Reaction with Gentamicin:
Five aliquots of gentamicin component standard
solution (15, 30, 45, 60 and 75 yl) were transferred to separate
test tubes and the volumes made up to 1 ml with water. Ninhydrin
reagent (1 ml) was added; the solutions mixed on a vortex
mixer and placed in a boiling water bath for twenty minutes.
At the end of this time the solution was allowed to cool for
five minutes then 5 ml of the 95% ammonia-free ethanol-water
mixture was added. The absorbance was immediately measured on a
Unicam SP 600 spectrophotometer at 565 nm using 1 cm matched
cells against a blank prepared without the gentamicin present.
This was repeated for all three components and a five point
calibration curve was constructed for each.
169,
Ninhydrin reaction with Gentamicin in Presence of
OPA Reagent:
To four test tubes containing 75 yl of the gentamicin
component solutions were added varying amounts of OPA reagent.
For gentamicin volumes of 7, 15, 22 and 30 yl OPA added,
gentamicin volumes of 7, 14, 21 and 29 yl OPA added
gentamicin volumes of 5,10, 16 and 21 yl OPA added.
After addition of the OPA reagent, water was added to give 1 ml
of solution; this was vortex mixed and kept in the dark for
fifteen minutes. At the end of this period, 1 ml of ninhydrin
reagent was added, the solution mixed and put in the boiling
water bath for twenty minutes. Throughout this period the
solution was protected from cilight. After cooling for five
minutes, the 95% ammonia-free ethanol-water mixture (5 ml) was
added.- Absorbance was read at 565 nm against a blank.
A further five test tubes of the gentamicin components
(75 y 1) had the following amounts of OPA reagent added,
gentamicin 11, 22, 30, 34 and 37 yl
gentamicin 11, 21, 29, 32 and 36 yl
gentamicin 8, 16, 21, 23 and 26 yl
These were reacted as previously and the absorbances read at
565 nm.
170.
4.3 Results and Discussion
4.3.1 Nuclear Magnetic Resonance Study of the Reaction
Mechanism between o-Phthalaldehyde and Primary Amines
4.3.1.a NMR of Individual Reactants:
The proton NMR of o-phthalaldehyde is shown in Figure2974.1 and is in accord with published data . The proton spectrum
of mercaptoethanol is illustrated in Figure 4.3. The singlet
at 64.68 is the hydroxy proton whilst the neighbouring methylene
group has a triplet at 63.7 with a coupling constant (J) of
about 7 Hz. The other methylene group exhibits a signal at
62.7 of two overlapping triplets. The thiol proton is seen as a
multiplet at 61.8. In deuterium oxide solutions the thiol and
hydroxyl protons are not observed, and the methylene groups
appear as triplets at the chemical shifts indicated.
Ethanolamine, in acetonitrile/aqueous buffer, is similarly
seen as two triplets at 63.6 and 62.7 (J - 7 Hz), with the
hydroxy bearing methylene group giving the lowest field signal.
The spectrum is shown in Figure 4.4.
Glucosamine gives a proton NMR spectrum as shown in Figure
4.5, with a complicated splitting and overlapping of signals
from 62.8 to 4.8. The anomeric proton is observed as a doublet
(J = 4 Hz) at 65.5
Gentamicin C^, in deuterium oxide, exhibits a spectrum
(Figure 4.6) similar to glucosamine. The large number of protons
in a similar environment defy identification. However the two
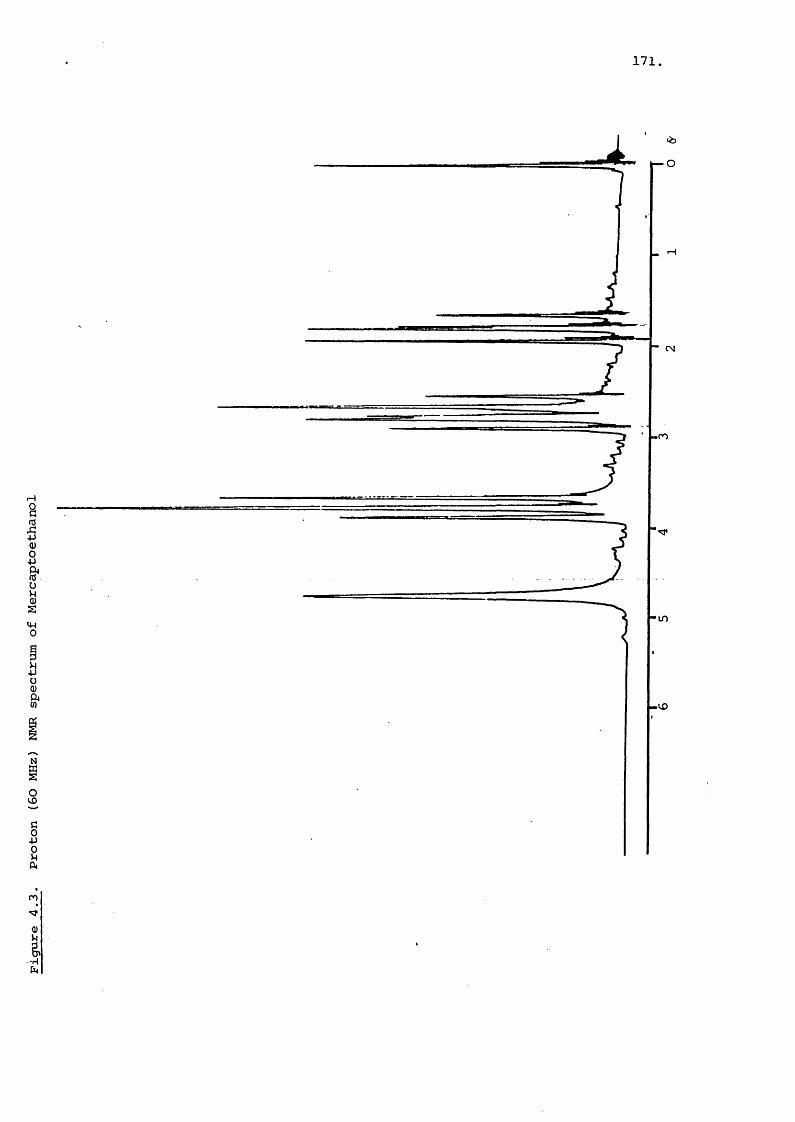
171.
SI0)1uÜ2tw0
auQ)S'
S
-ro
in
m
0)
&•HUi

172.
m1> I— I-H
a'HCS0)o<c
•H
Ü)•S
u4->w&
isIoup40)ï•H
I—I
CN
ro
in
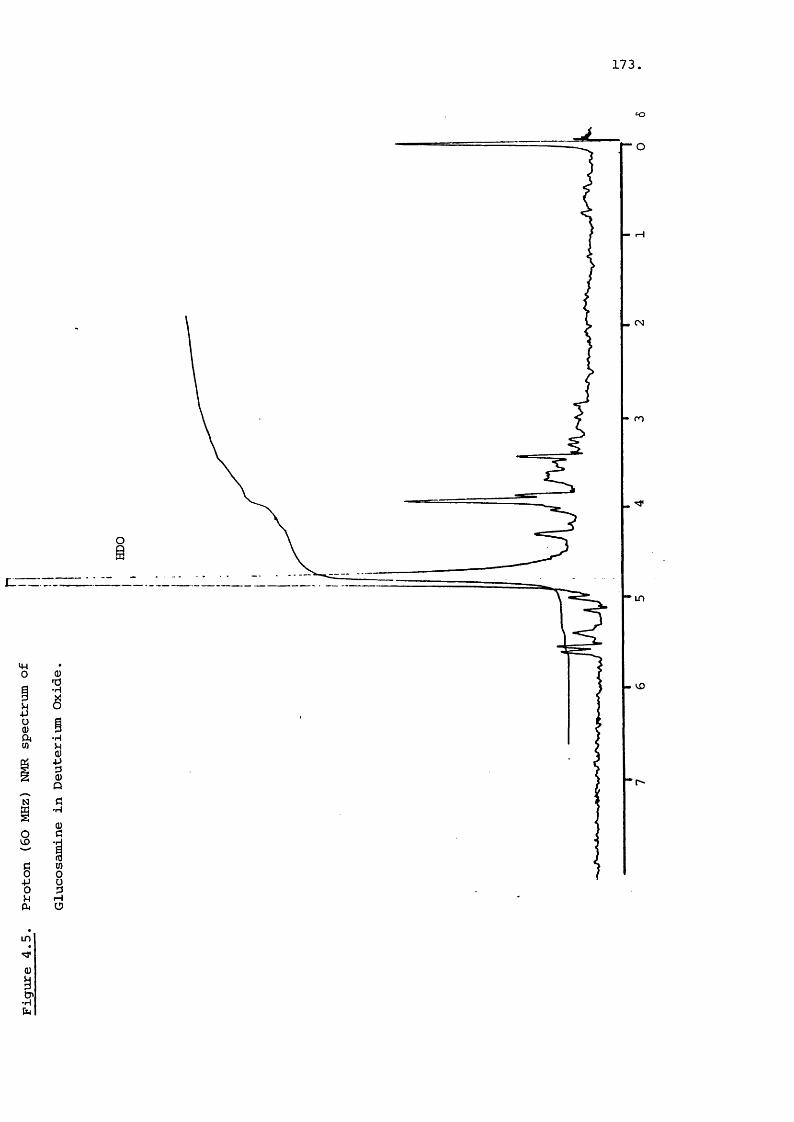
173.
CN
If)
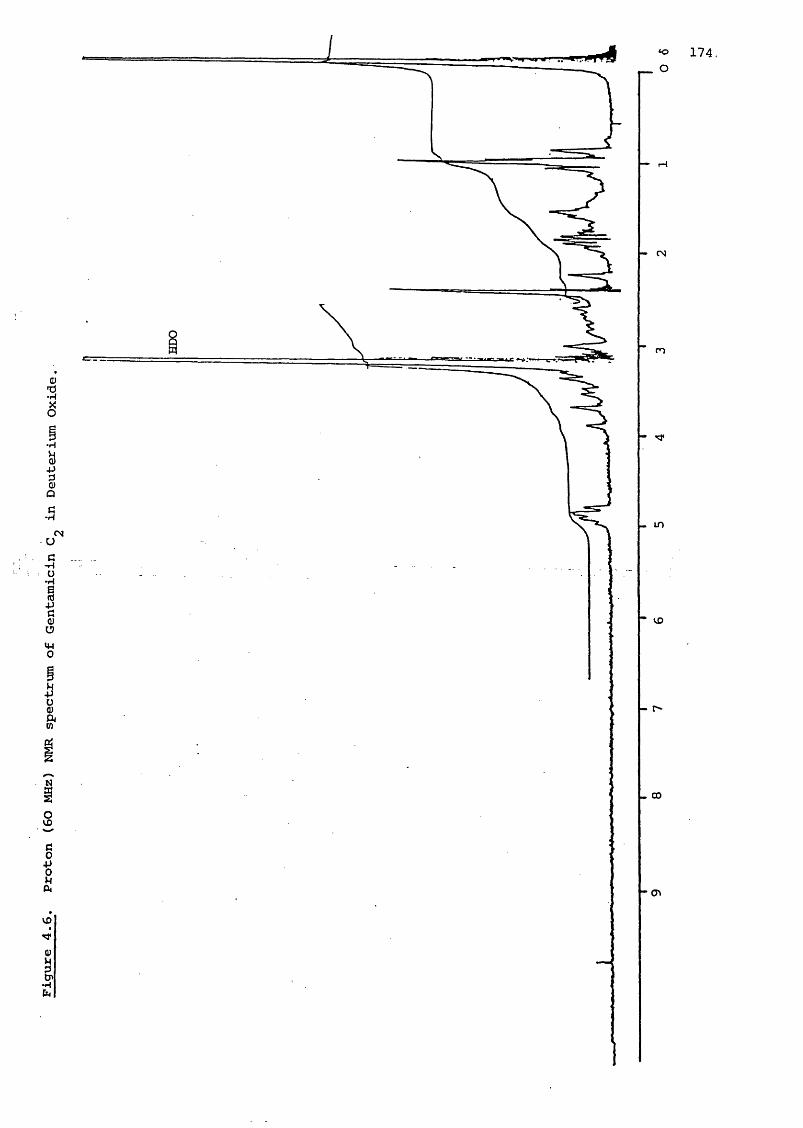
eu
3ë•H
Q)Q
•SCM
U
G•HU•HIÜmo
a%S'
sgIV£>Tf0)I•H
— r4
- CN
- in
vo
. 00
- en
175,
anomeric protons at 64.9 - 5.2 are readily seen, as are the
singlets due to methyl groups at 62.58 and 61.14.
4.3.1.b NMR of o-Phthalaldehyde Reagent:
The composition of the OPA, in the reagent conditions
used for pre-column derivatisation, was studied. The OPA reagent
consists of OPA and mercaptoethanol dissolved in an alkaline
buffer solution with a small amount of methanol also present.
Under reaction conditions the level of methanol is greater,
and approaches 50% v/v. Methanol was not always used in the NMR
experiment because of poor spectra and solubility difficulties.
Acetonitrile was used instead as co-solvent, because of its
polar characteristics and the better solubility of some of the
compo:unds used in the study.
To assess the changes in the OPA in the reaction mixture
the proton and carbon-13 NMR spectra of the dicarbonyl compound
(4.Ill) was taken as standard. The proton spectrum of OPA in
chloroform is given in Figure 4.1, whilst the carbon-13 spectrum
is shown in Figure 4,7 of OPA in acetonitrile. The resonances
obtained from Figure 4.7 are assigned in Table 4.1. In this274table, a comparison with literature values for OPA is
made, with the different solvent perhaps contributing to the
slight difference in chemical shifts. It is readily apparent
from Figures 4.1 and 4.7 that the aldehyde groups are clearly
denoted in both types of NMR spectrum.

0)
•S'
Ir O
176,
OCN
O
s
o00
OCN
O
s
s
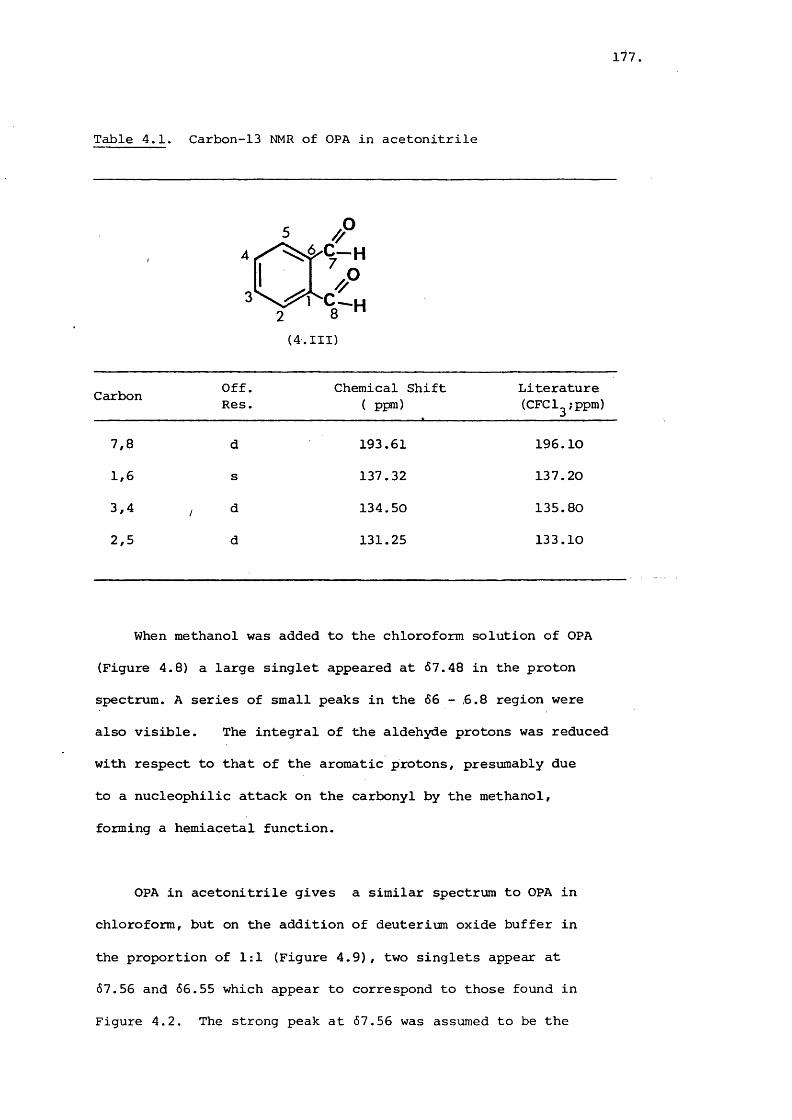
Table 4.1. Carbon-13 NMR of OPA in acetonitrile
117
A y P
V <r°H(4.III)
Carbon Off.Res.
Chemical Shift ( ppm)
Literature(CFCl^;ppm)
7,8 d 193.61 196.10
1,6 s 137.32 137.20
3,4 / d 134.50 135.80
2,5 d 131.25 133.10
When methanol was added to the chloroform solution of OPA
(Figure 4.8) a large singlet appeared at 67.48 in the proton
spectrum. A series of small peaks in the 66 - ,6.8 region were
also visible. The integral of the aldehyde protons was reduced
with respect to that of the aromatic protons, presumably due
to a nucleophilic attack on the carbonyl by the methanol,
forming a hemiacetal function.
OPA in acetonitrile gives a similar spectrum to OPA in
chloroform, but on the addition of deuterium oxide buffer in
the proportion of 1:1 (Figure 4.9), two singlets appear at
67.56 and 66.55 which appear to correspond to those found in
Figure 4.2. The strong peak at 67.56 was assumed to be the
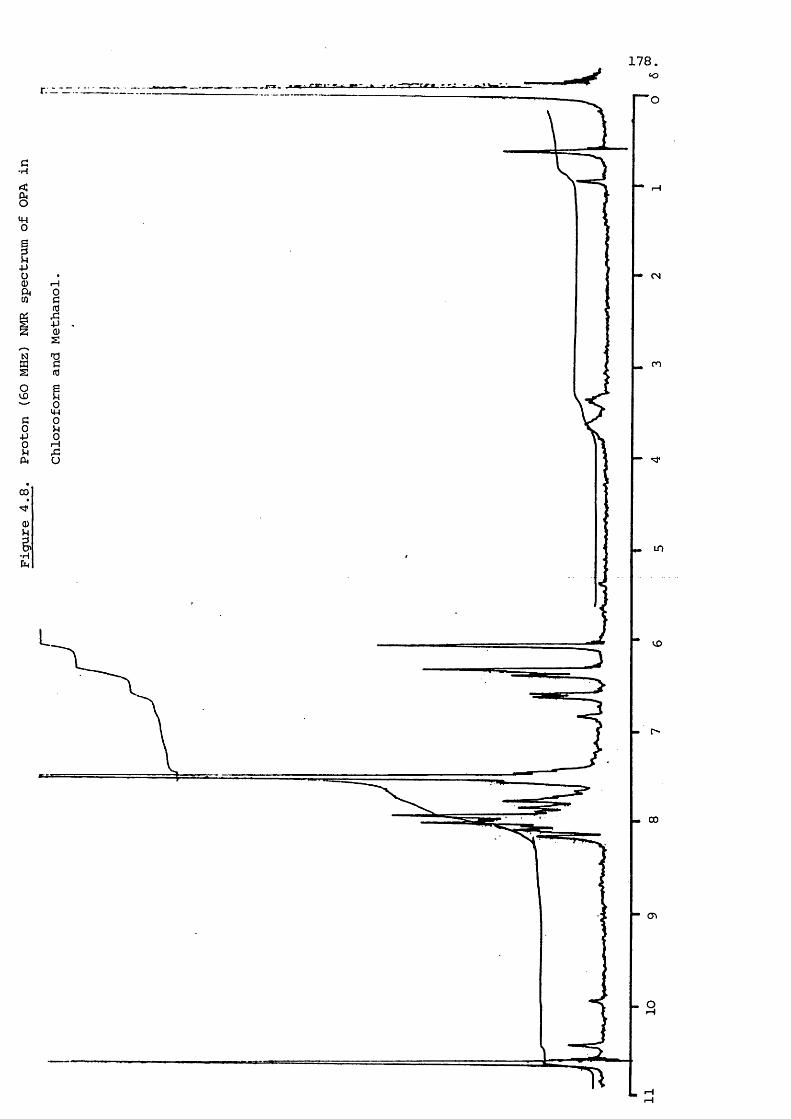
178.«o
C■H
g I— I
io
n
c01co
0)I•H in
I—I
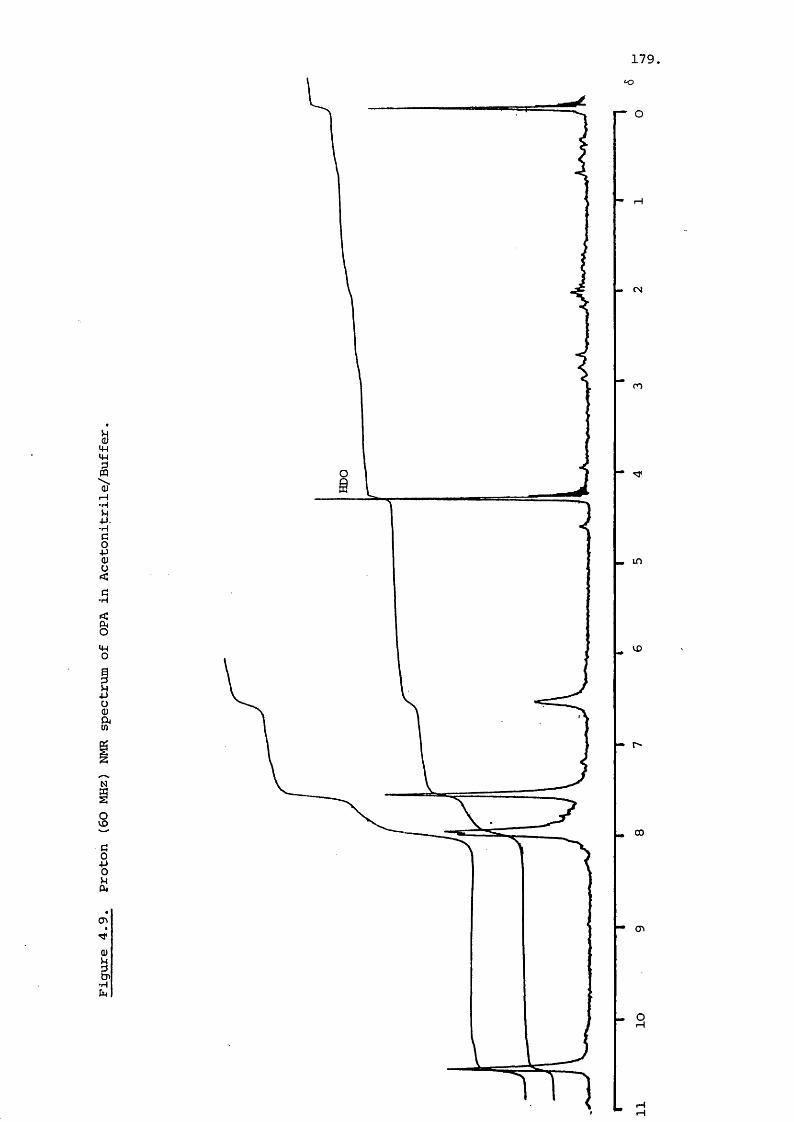
179,
CDW-l(wa
•HÜ.■HCs0)■S
o
2C§a
<y>
Q)
â•H
r— o
m
. . in
- ^
— r~
cn
- O

180.
aromatic protons of a new species of compound present. The
singlet at 6.55 could represent a nucleophilic addition of
hydroxy ions from the base to one or both of the carbonyl
functions.
On addition of mercaptoethanol to OPA dissolved in aceto
nitrile a four proton singlet of aromatic protons is again
formed (Figure 4.10). However, this time a complex splitting
of signals occurs in the 66-7 region. The thiol promoted the
production of the four proton aromatic singlet at 67.5 and a
linear relationship between the integral ratio of "old" to
"new" aromatic signal, and concentration of mercaptoethanol
was seen (Figure 4.11). The correlation coefficient of the
four point plot was 0.9996, with a slope of 1.90 and inter
cept of -0.60. The "new species" is present in a proportion
of over 50% at equal concentrations of mercaptoethanol and
OPA, and 75% when mercaptoethanol is in a two fold excess
of OPA.
Addition of deuterium oxide made no significant difference
to the spectrum of such a mixture containing mercaptoethanol.
However, the addition of deuterium oxide buffer (pH 10.4)
to the solution removed all traces of the aldehyde singlet,
the aromatic multiplet and the various split peaks in the
66.4 - 6.6 region. The proton NMR spectrum of equal concen
trations of OPA and mercaptoethanol in acetonitrile/deuterium
oxide buffer (1:1) is given in Figure 4.12. This can be
directly compared to Figure 4.2 which had exactly the same
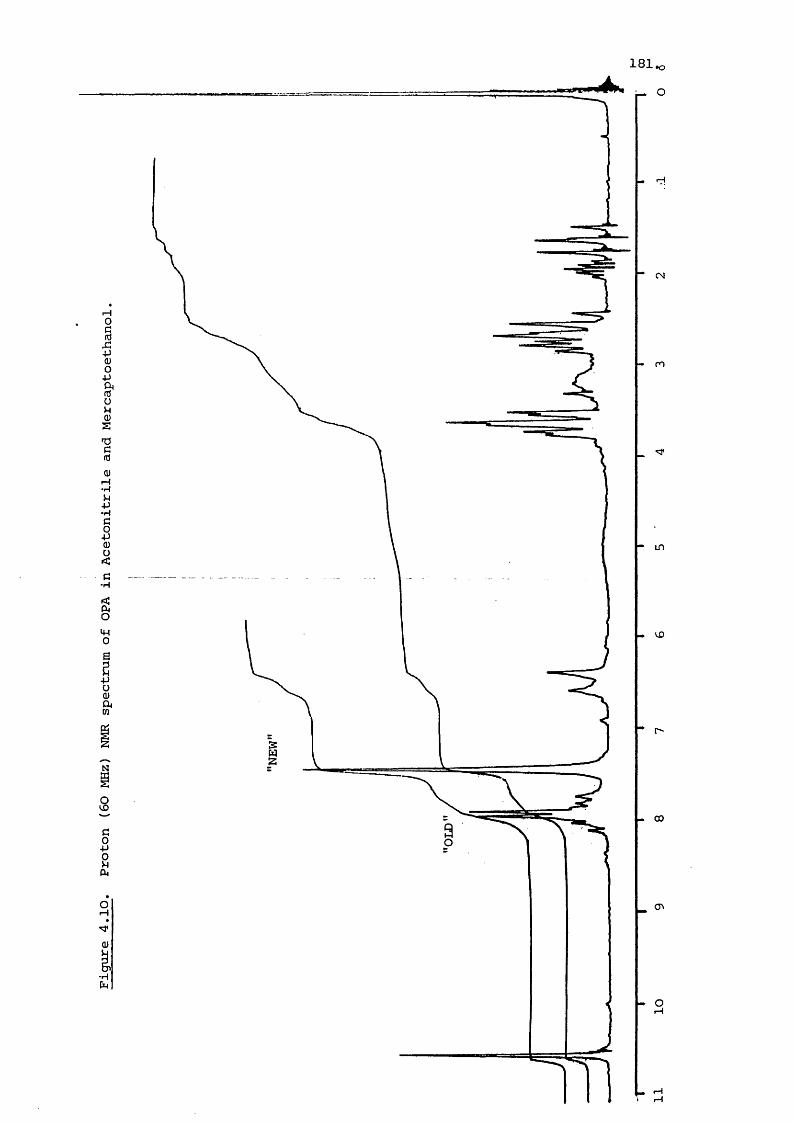
?
J
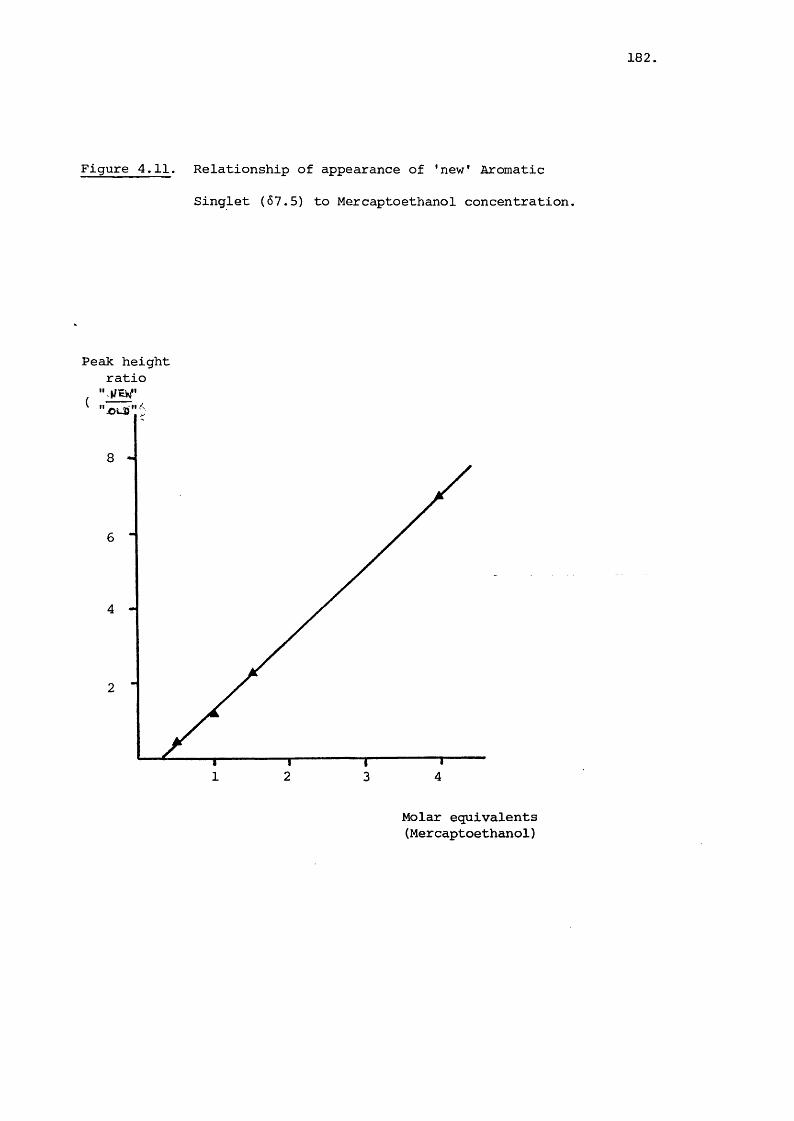
182
Figure 4.11. Relationship of appearance of 'new' Aromatic
Singlet (67.5) to Mercaptoethanol concentration,
Peak height ratio
, " U W
2 3 41
Molar equivalents (Mercaptoethanol)
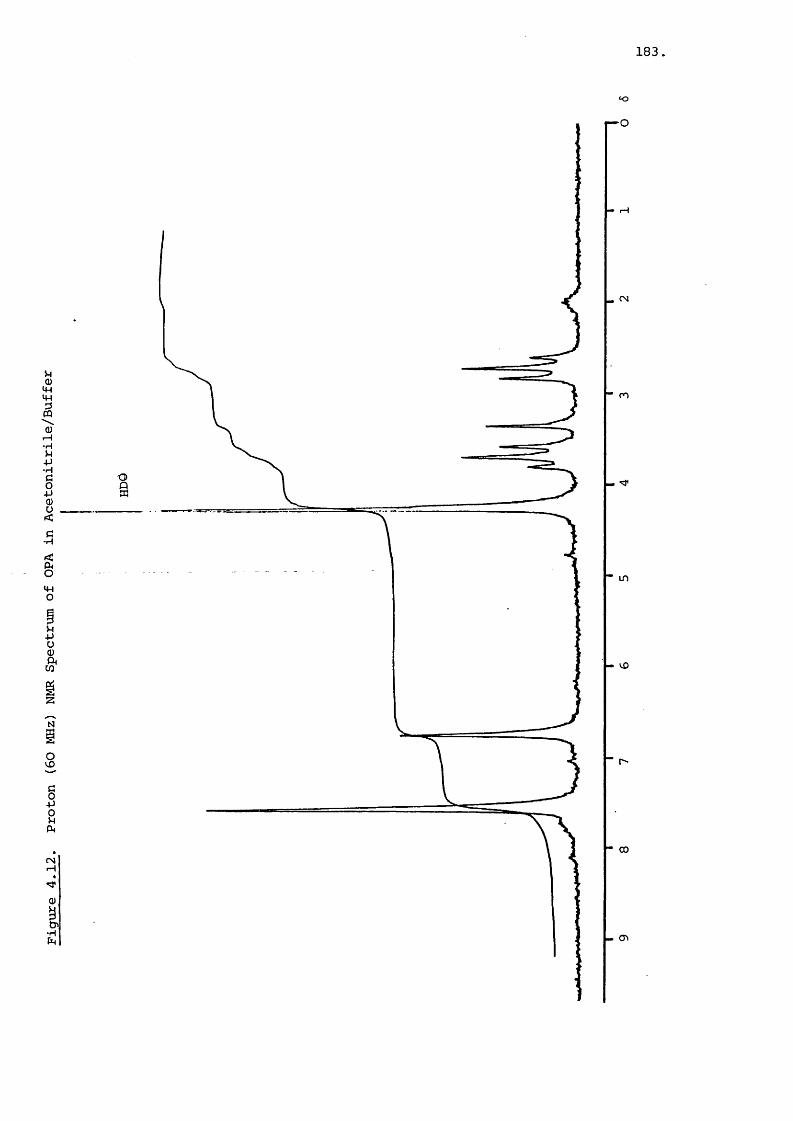
183
uQ)mS-HU+J•Hg+J(DU<c•H
iUHO
>4+JU
S"n
S
Ig(N1-4
0)I
1
<o r-O
- <N
m
in
L. vD
CD
- (7)
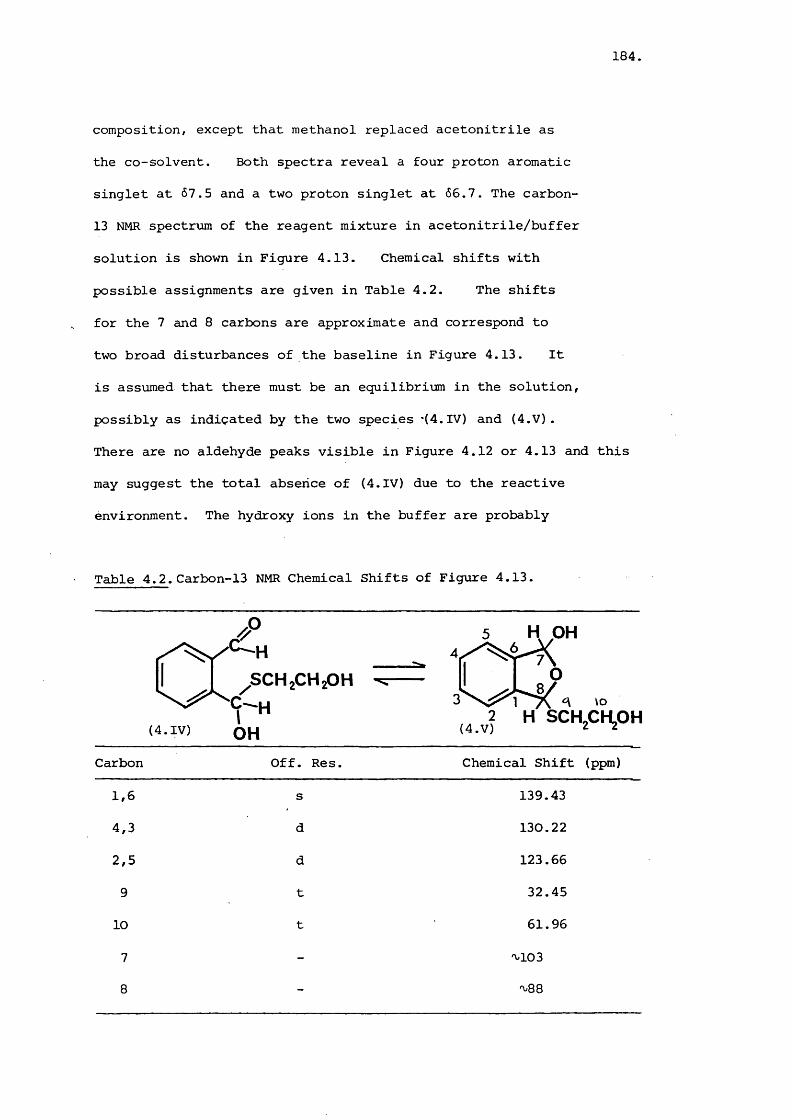
184.
composition, except that methanol replaced acetonitrile as
the co-solvent. Both spectra reveal a four proton aromatic
singlet at 67.5 and a two proton singlet at 65.7. The carbon-
13 NMR spectrum of the reagent mixture in acetonitrile/buffer
solution is shown in Figure 4.13. Chemical shifts with
possible assignments are given in Table 4.2. The shifts
for the 7 and 8 carbons are approximate and correspond to
two broad disturbances of the baseline in Figure 4.13. It
is assumed that there must be an equilibrium in the solution,
possibly as indicated by the two species *(4.IV) and (4.V).
There are no aldehyde peaks visible in Figure 4.12 or 4.13 and this
may suggest the total absence of (4.IV) due to the reactive
environment. The hydroxy ions in the buffer are probably
Table 4.2.Carbon-13 NMR Chemical Shifts of Figure 4.13.
(4.IV)
ySCH^CHzPHC—H
H OH
(4.V)2 H SCHjCHjOHCarbon Off. Res. Chemical Shift (ppm)
1,6 s 139.43
4,3 d 130.22
2,5 d 123.66
9 t 32.45
10 t 61.96
7 - ~103
8 - 'V88

185
S4-14-1
S
-HÜ-HI(U<
•H<O4-1O
ÜüQ)
IU
ro
0)
•H
ro
ro
Ir o
oCM
O<*
O
s
OCMr4
§
srH
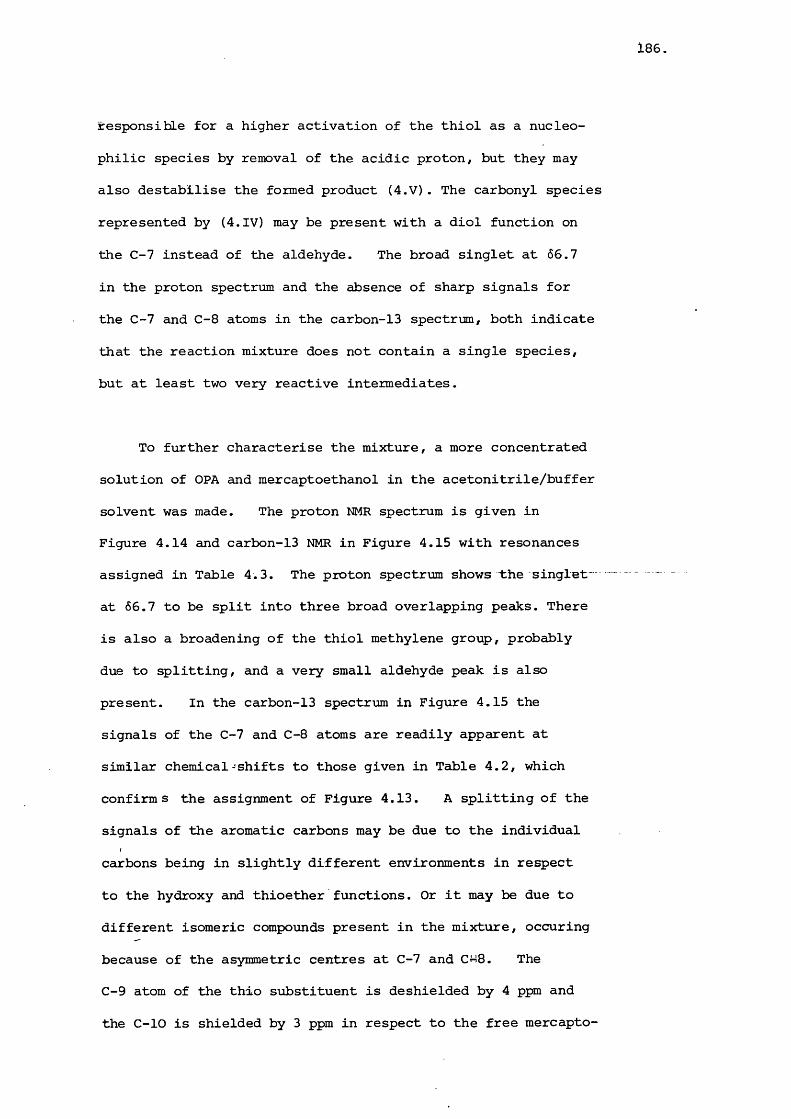
186,
responsible for a higher activation of the thiol as a nucleo
philic species by removal of the acidic proton, but they may
also destabilise the formed product (4.V). The carbonyl species
represented by (4.IV) may be present with a diol function on
the C-7 instead of the aldehyde. The broad singlet at 66.7
in the proton spectrum and the absence of sharp signals for
the C-7 and C-8 atoms in the carbon-13 spectrum, both indicate
that the reaction mixture does not contain a single species,
but at least two very reactive intermediates.
To further characterise the mixture, a more concentrated
solution of OPA and mercaptoethanol in the acetonitrile/buffer
solvent was made. The proton NMR spectrum is given in
Figure 4.14 and carbon-13 NMR in Figure 4.15 with resonances
assigned in Table 4.3. The proton spectrum shows the singlet
at 66.7 to be split into three broad overlapping peaks. There
is also a broadening of the thiol methylene group, probably
due to splitting, and a very small aldehyde peak is also
present. In the carbon-13 spectrum in Figure 4.15 the
signals of the C-7 and C-8 atoms are readily apparent at
similar chemical^shifts to those given in Table 4.2, which
confirms the assignment of Figure 4.13. A splitting of the
signals of the aromatic carbons may be due to the individual
carbons being in slightly different environments in respect
to the hydroxy and thioether functions. Or it may be due to
different isomeric compounds present in the mixture, occuring
because of the asymmetric centres at C-7 and C%8. The
C-9 atom of the thio substituent is deshielded by 4 ppm and
the C-10 is shielded by 3 ppm in respect to the free mercapto-
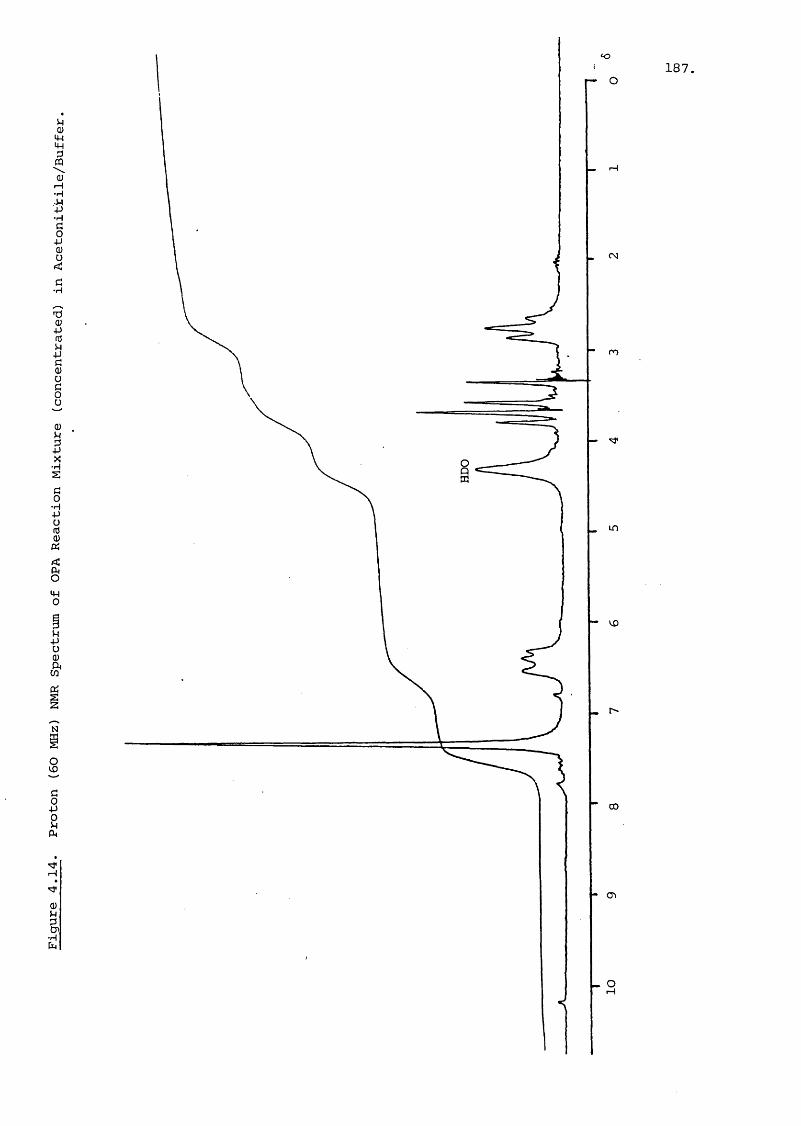
u(UIH44g
•H
•H§+JQ)UCfi•H
SifdUgo§u0)BX■H
S
g•H-PUtd
g44O
aOQ)
S
Q)
I•Hh
187,I— O
_ CM
m
L_ r"
00
- en
_ O

188.I
uQ)
S
-Hi•H§+Jeu
<a•H
gS's’ü<D-P(0
i%
iu&
ror—I
IuIT) I—I
OCM
O
oMU
O00
OCM
O
S
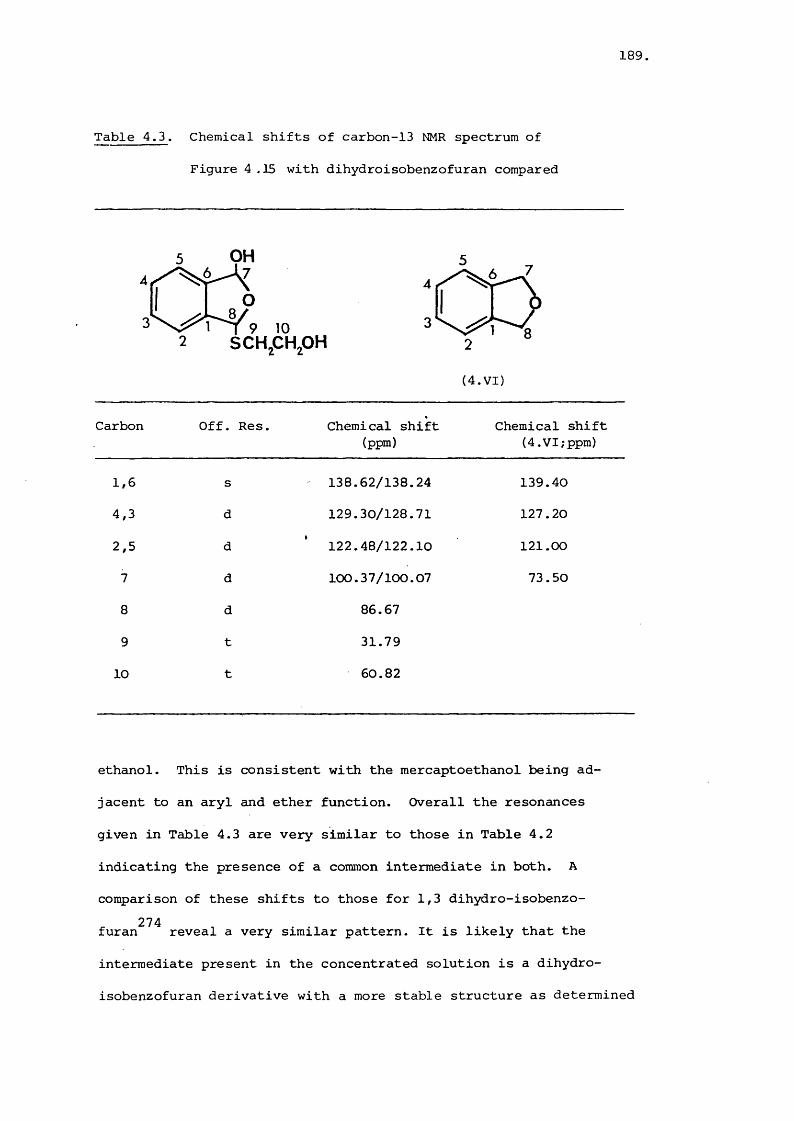
Table 4.3. Chemical shifts of carbon-13 NMR spectrum of
Figure 4 .15 with dihydroisobenzofuran compared
189,
OH4
3
(4.VI)
Carbon Off. Res. Chemical shift (ppm)
Chemical shift (4.VI;ppm)
1,6 s 138.62/138.24 139.40
4,3 d 129.30/128.71 127.20
2,5 d 122.48/122.10 121.00
7 d 100.37/100.07 73.50
a d 86.67
9 t 31.79
10 t 60.82
ethanol. This is consistent with the mercaptoethanol being ad
jacent to an aryl and ether function. Overall the resonances
given in Table 4.3 are very similar to those in Table 4.2
indicating the presence of a common intermediate in both. A
comparison of these shifts to those for 1,3 dihydro-isobenzo- 274furan reveal a very similar pattern. It is likely that the
intermediate present in the concentrated solution is a dihydro
isobenzofuran derivative with a more stable structure as determined

190.
by NMR, due to an effectively lower concentration of hydroxide
ions compared to the concentration of the reagent species.
McDonald^found that 90% of OPA in aqueous solution existed
as the 1,3-phthalandiol (1,3-dihydroxy,1)3 dihydro-isobenzofuran)351 289and this has been observed by other workers . Simons
discovered the 1,3-disubstituted, 1,3-dihydroisobenzofuran
(4.V) intermediate to be present in the OPA/mercaptoethanol
mixture in ethanol, and found it to be in equilibrium with the
starting materials. He described the proton spectrum as having
an aromatic signal at Ô7.33 and the C 7,8 protons as two pairs
of unequal singlets centred at 65.45. However, he considered
this compound to be unimportant in the reaction with amines.
Since the reaction mixture used in the HPLC analysis has
a four-fold molar excess of mercaptoethanol compared to OPA,
the effect of increasing the concentration of mercaptoethanol
over the 1:1 ratio used previously was investigated. An
excess of mercaptoethanol in an acetonitrile or methanol/
deuterium buffer mixture only sharpened the proton spectrum
of Figures 4.2 or 4.12. A two-fold excess of mercaptoethanol
to OPA in pure acetonitrile gave the proton spectrum illus
trated in Figure 4.16, and the carbon-13 NMR spectrum in
Figure 4.17, with shift values assigned in Table 4.4. The
proton spectrum showed aldehyde peaks soon after the
reaction mixture was made up. The signal decreased with time,
and when the carbon-13 spectrum was produced there was little
sign of the aldehydes. The proton spectrum shows the two
oddly split singlets which must be due to the C-7 and C-8
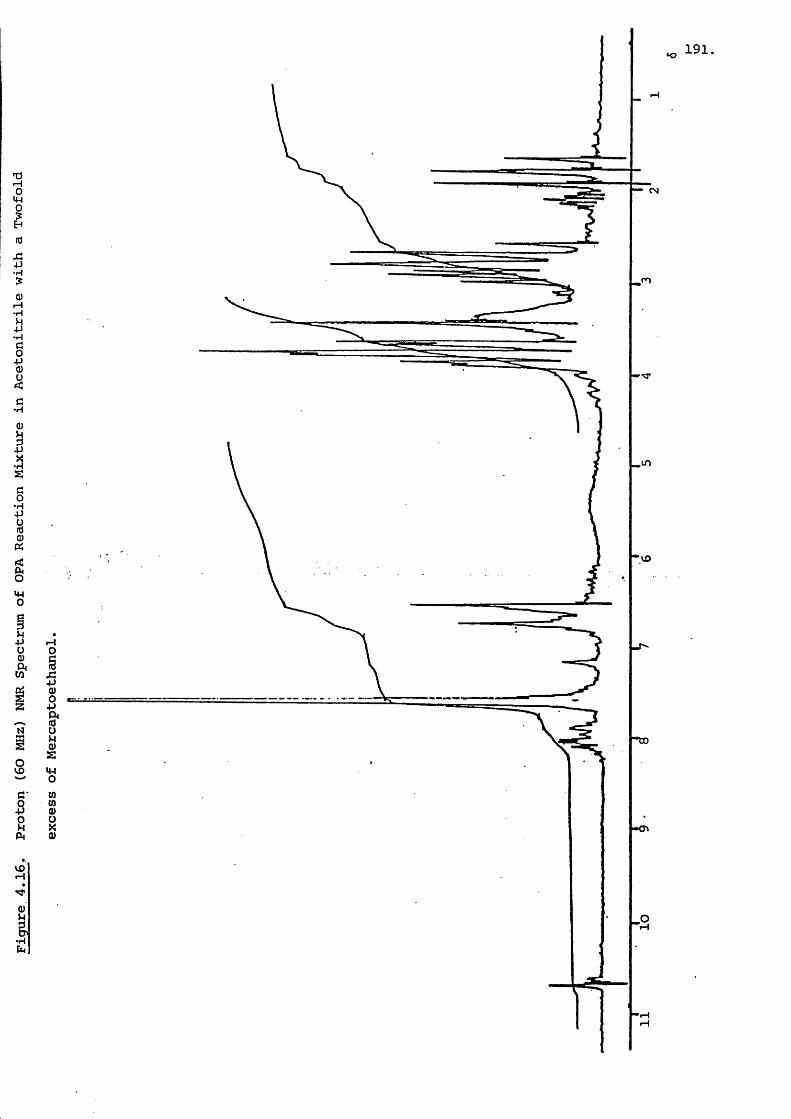
I—I0IH15•H
•H
•HI0)■S0)BI§•H4Jrtf0)«ëmo
aÏSf
sc*28Av£>iH
•H
I— I
rH0§50)
1iHOmto0)i
191,
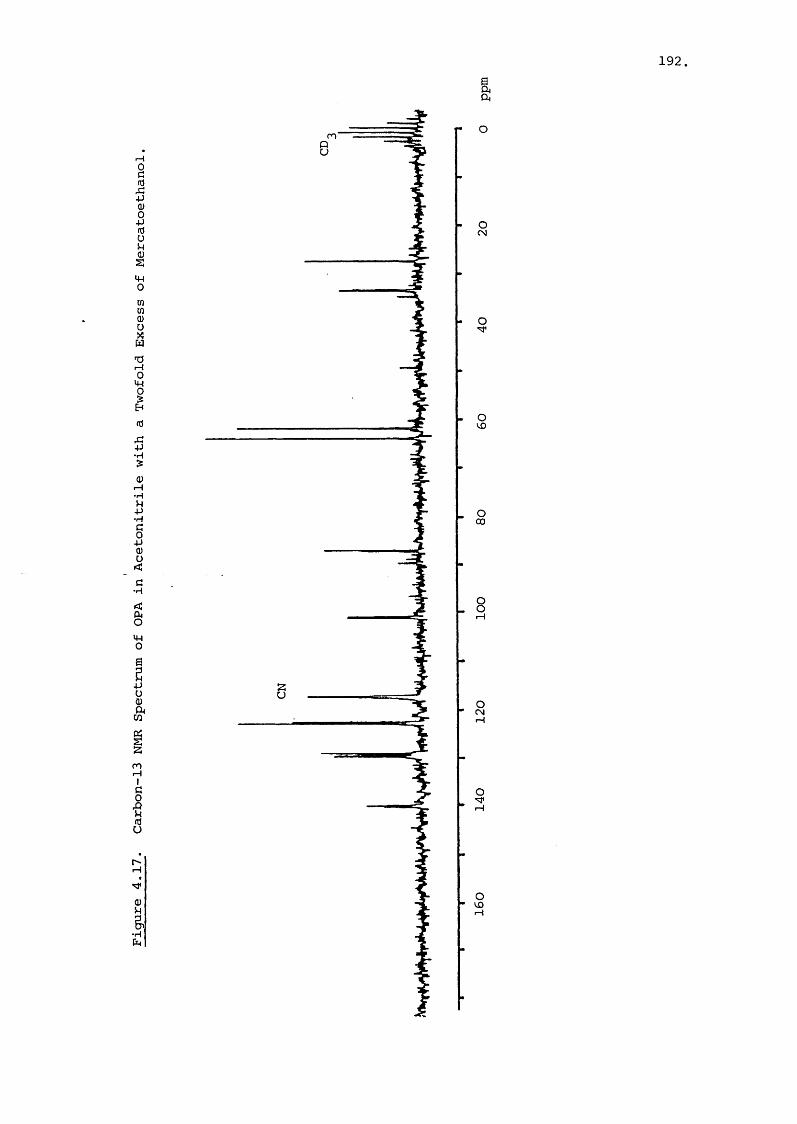
192
§5<USItuusM-l0inin0)aI—I 0 4-115•H•HÜ•HI0)0 <c•H1m0
1 I
IIsQ)U&•H
cn'
Ir o
oCM
o
oID
o03
8
OCM
OTPr4
O
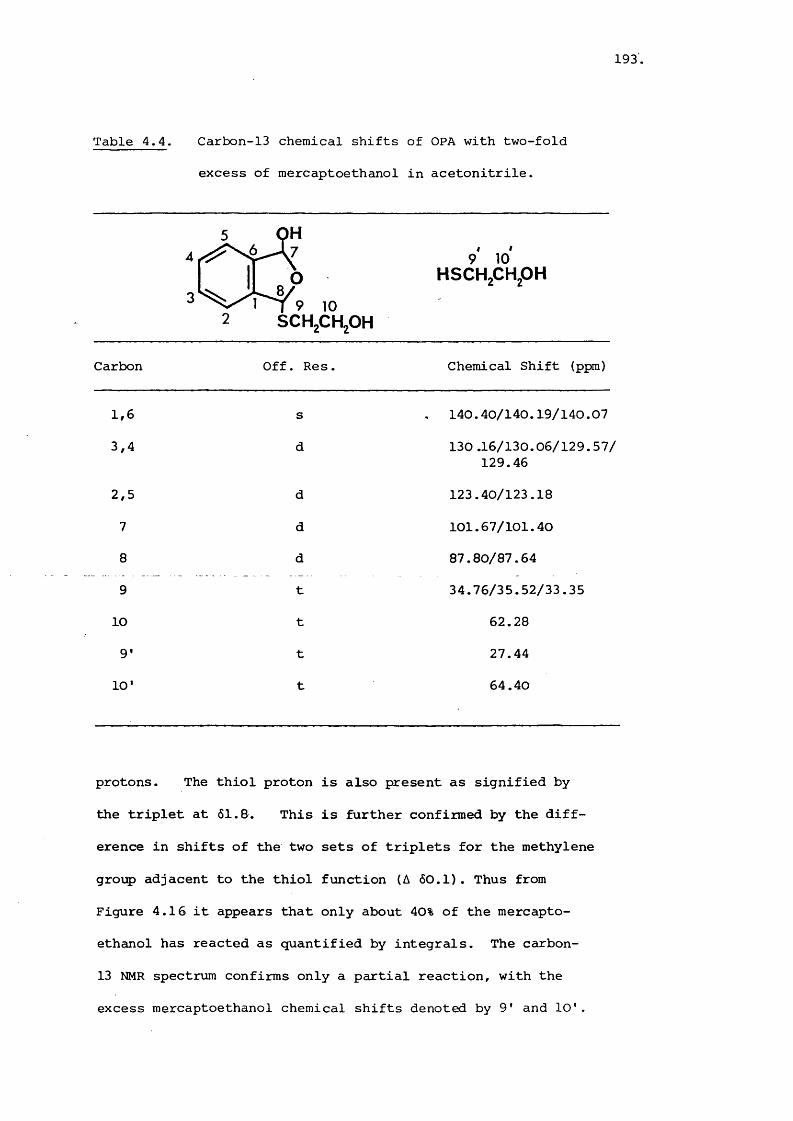
Table 4.4. Carbon-13 chemical shifts of OPA with two-fold
excess of mereaptoethanol in acetonitrile.
193
1,63.4
2.5
7
8 9
10
9'
10 '
4 HSCH,CH,OH3
SCH,CKOHChemical Shift (ppm)Off. Res.Carbon
d
d
d
t
t
t
t
140.40/140.19/140.07
130 .16/130.06/129.57/ 129.46
123.40/123.18
101.67/101.40
87.80/87.64
34.76/35.52/33.35
62.28
27.44
64.40
protons. The thiol proton is also present as signified by
the triplet at 61.8. This is further confirmed by the diff
erence in shifts of the two sets of triplets for the methylene
group adjacent to the thiol function (A 60.1). Thus from
Figure 4.16 it appears that only about 40% of the mercapto-
ethanol has reacted as quantified by integrals. The carbon-
13 NMR spectrum confirms only a partial reaction, with the
excess mercaptoethanol chemical shifts denoted by 9' and 10'.

194,
This figure also shows more splitting of the aromatic carbons
than in Figure 4.15, which could indicate the formation of
more stable compounds than on the acetonitrile/buffer mixture.
If there is an equilibrium present it is very slow and thus
all possible conformations of (4.V) can be registered. The
equivalence of the carbon-13 NMR spectra of these three
mixtures (Figures 4.13, 15 and 17), indicate that the reactive
intermediate is the same for each, with the only difference
being the relative stability of the compound. The excess of
thiol clearly did not produce significant amounts of a
disubstituted intermediate. The reaction mechanism in this
medium may be as shown by:
OH
In acetonitrile there is presumably little reverse reaction,
the aldehyde peaks being produced by unreacted OPA. In methanol
the structure would be more unstable due to nucleophilic
attack by the solvent at the hemiacetal carbon. The presence
of hydroxy ions would exert a similar influence although the
formation of more than transient carbonyl bonds appears to
be highly unlikely. The reaction mixture used in the HPLC
assay is thus considered to be a rapid equilibrium, possibly
of the type shown:
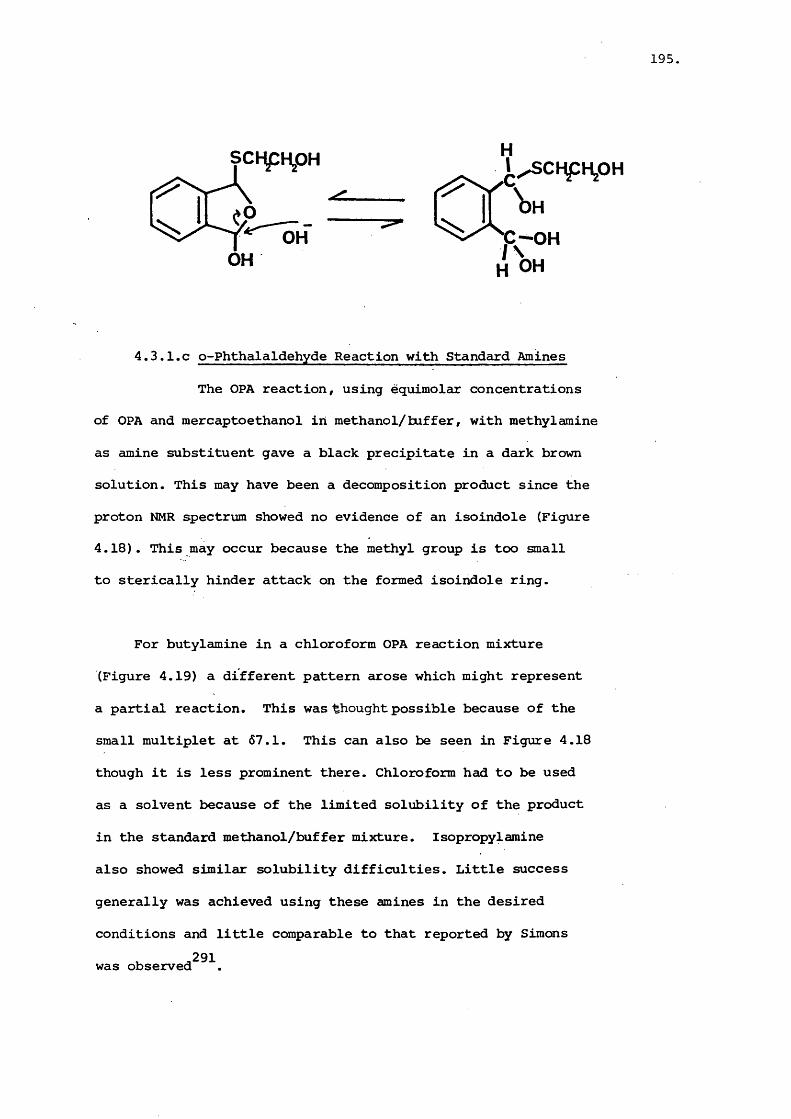
195
SChyZHjOH H
4.3.1.C o-Phthalaldehyde Reaction with Standard Amines
The OPA reaction, using equimolar concentrations
of OPA and mercaptoethanol in methanol/buffer, with methylamine
as amine substituent gave a black precipitate in a dark brown
solution. This may have been a decomposition product since the
proton NMR spectrum showed no evidence of an isoindole (Figure
4.18). This may occur because the methyl group is too small
to sterically hinder attack on the formed isoindole ring.
For butylamine in a chloroform OPA reaction mixture
(Figure 4.19) a different pattern arose which might represent
a partial reaction. This was thought possible because of the
small multiplet at 67.1. This can also be seen in Figure 4.18
though it is less prominent there. Chloroform had to be used
as a solvent because of the limited solubility of the product
in the standard methanol/buffer mixture. Isopropylamine
also showed similar solubility difficulties. Little success
generally was achieved using these amines in the desired
conditions and little comparable to that reported by Simons.291 was observed

(U
5S§•H4-1UfÛ(UDi
g-P'S(DG•H
r H
4JSm0
14-1üI
SGSS0400 I—I
I•H
CNCN
CN ro
in
00
196

197
•H
N
S
Ig
I•H
— CN
ir»
vo
00
• CT»

198.
A potential model compound, glucosamine hydrochloride,
was used in the OPA reaction owing to its structural similarity
to gentamicin. Insolubility in the organic co-solvent was a
major disadvantage especially at the high concentration used.
Spectra produced using this amine were mostly of two types,
although the circumstances for their appearance were not
deduced. One type of proton spectrum was very similar to that
illustrated in Figure 4.18 for methylamine and presumably
represents breakdown of any isoindole formed. The other type
shown in Figure 4.20 is similar to that of Figure 4.19 fcr
butylamine. There is a multiplet at about 67.7, downfield from
the singlet for aromatic protons found in the reaction mixture.
There is another multiplet at 67.1 which may also be due to
aromatic protons. The methylene group adjacent to the thiol
is split which indicates that a partial reaction has occurred.
It is possible that the signals at 6 6.7 represent unreacted
OPA, perhaps in the dihydro-isobenzofuran form. Thus it is
possible that glucosamine did react to an extent with the OPA
reagent, but a total reaction was never recorded, and often
no reaction was adjudged to have occurred.
Ethanolamine was selected as a model for the reaction
because of its suitable solubility properties. Results with
this amine were more successful and reproducible. A proton
NMR spectrum of a mixture of equal concentrations of OPA reagent
and this amine in methanol/buffer is shown in Figure 4.21.
The pattern of splitting of resonances in the aromatic region291is comparable with that reported by Simons , but instead
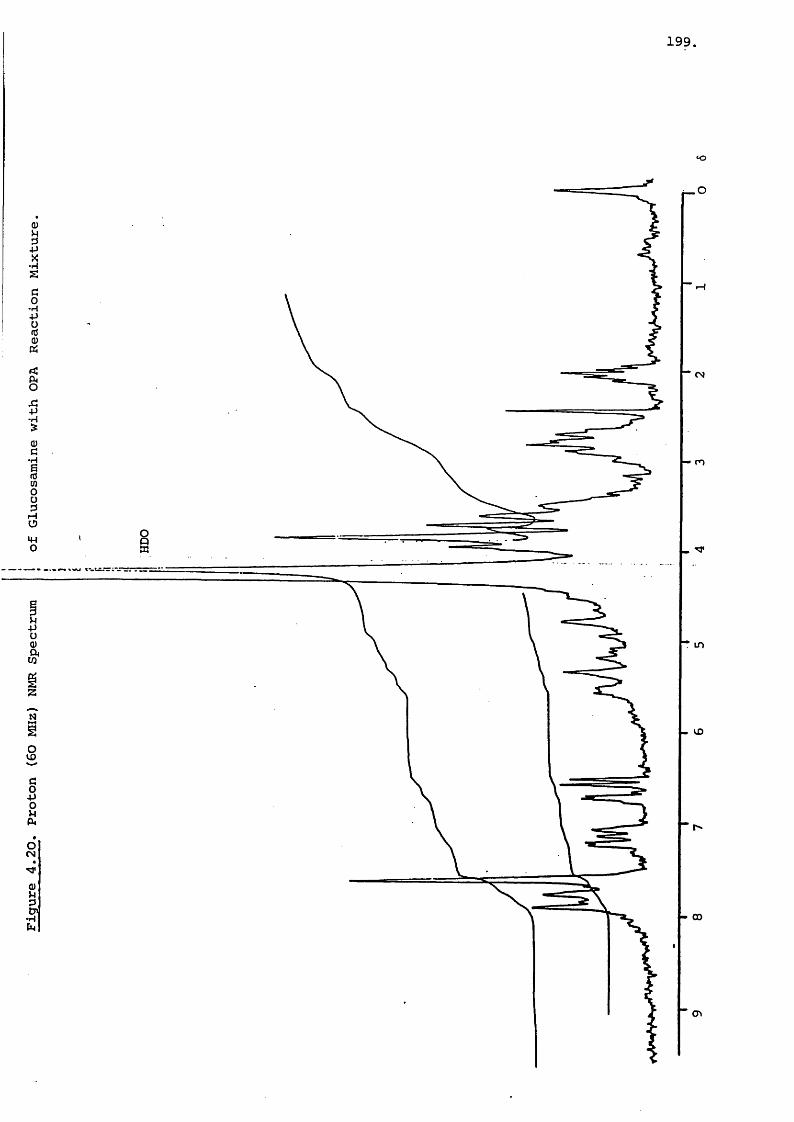
CM
•H
199.
r— O
m
. vo
- 00

200.

201,
of a 2:1:2 split there is a 3:2 split observed. The C-8 proton
appears to have joined the lower field multiplet. The peaks in
this region are also similar to that found for glucosamine
in Figure 4.20, and confirms the assumption that a partial
reaction had occurred. The carbon-13 NMR spectrum of the
ethanolamine-OPA derivative is shown in Figure 4.22 with
the shifts assigned in Table 4.5. The structure of the product
is thought to be as shown in (4.VII),.The high field multiplet289at 66.9 - 7.2 in the proton spectrum was assigned by Simons
to the 3,4 protons (Simons; 66.8 - 7.1), whilst the low field
multiplet at 67.4 - 7.9 (Simons; 67.4 - 7.7) was assigned to289the 2,5 protons. The proton on C-8 was found by Simons
to have a shift of 67.31, but this was thought to be at 67.4
and part of an aromatic multiplet in Figure 4.21.
The assignment of the aromatic carbon atoms in the
carbon-13 spectrum in Figure 4.22 is not absolute because of
the small shift difference between them. The aromatic chemical
shifts are of a similar magnitude to those reported for 298N-methylisoindole , but the 7,8 carbons appear to be in
consistent with those of (4.VII). The thioether substituent
which is electron withdrawing would be expected to deshield
the C-7 carbon and this may be responsible for the peak at
121.55 ppm. However, it is unlikely to shield either the C-1
or C-6 carbon by 14.5 ppm and deshield the other (C-1 or C-6)
by 7.2 ppm. More anomalous is the deshielding of the C-8
carbon by at least 6 ppm when shielding is a more usual long
range effect in benzenes. For mono-substituted benzenes the
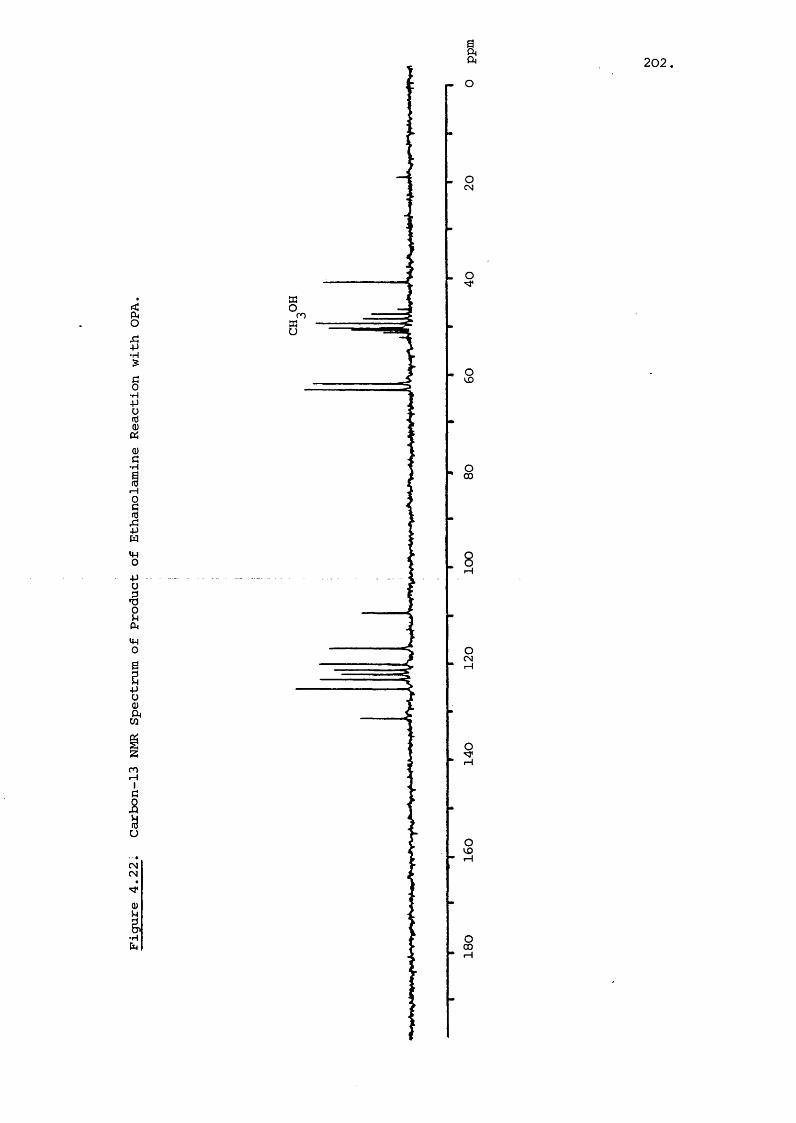
5t§•H+JëS0)•SgIH04J
1 goSgü
z:miHIC5ëuCNCN
-Hh
ro
If- O
202
OCN
O
S
s
oCN
§r4
oVO
s
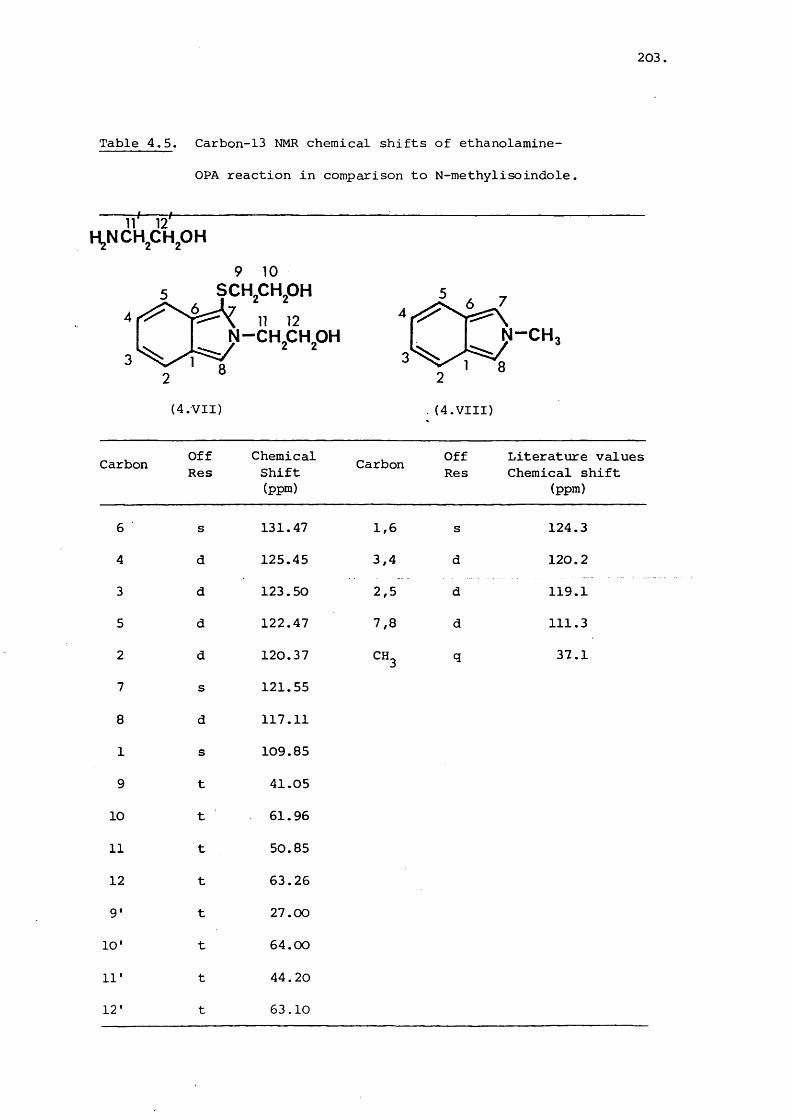
Table 4.5. Carbon-13 NMR chemical shifts of ethanolamine-
OPA reaction in comparison to N-methylisoindole
203
rf--n 12HjNCH CH OH9 10
SCKCH^OH4
N-CKCHOH3
(4.VII)
4N-CH
3
.(4.VIII)
Carbon OffRes
ChemicalShift(ppm)
Carbon OffRes
Literature values Chemical shift
(ppm)
6 s 131.47 1,6 s 124.3
4 d 125.45 3,4 d 120.2
3 d 123.50 2,5 d 119.1
5 d 122.47 7,8 d 111.3
2 d 120.37 CH3 q 37.1
7 s 121.55
8 d 117.11
1 s 109.85
9 t 41.05
10 t 61.96
11 t 50.85
12 t 63.26
9' t 27.00
10' t 64.00
11' t 44.20
12' t 63.10
204
effect of (-S-CH^) is only weak, apart from on the carbon of 273attachment . The difference in shifts between (4.VII)and
(4.VIIX)appears to be too great to be accounted for by the
structure (4.VII) ,although the lack of detailed knowledge
on the effect of substitution in this ring system suggests
that no definite conclusion can be reached.
289Simons did not examine the product by carbon-13 NMR,
but found in the proton NMR spectra of the isoindoles that
the methylene protons of C-11 were considerably shielded.
A similar shielding of 7 ppm was found here for the C-11
carbon in Figure 4.22. However the C-9 carbon is substantially
deshielded by about 14 ppm in respect to the free mercapto
ethanol, whilst Simons found the corresponding protons to
be unaffected.
The reaction of the OPA reagent with amines was considered 289by Simons , to proceed by the thiohemiacetal (4.IV). He
thought the formation of the disubstituted, dihydro-isobenzofuran
(4.V) to be a side reaction, as the concentration of it in
the reagent was dependent on the thiol present. He also con
sidered it to be unreactive towards amines especially in com
parison with (4.IV). However under the conditions studied here
the intermediate was found to be highly unstable and apparently
susceptible to nucleophilic attack. The structure (4.IV) was
not recorded by either of the NMR methods and the possibility
of it reacting with the added amine seems remote.

205,
Simons postulated the following reaction to occur289
H
SR
c 6 " H
CH^OHc=6H
RNH,
-HP
K SR
CH-OHCH=NR
+ H
F .aCH-OH,CH=NR
This reaction is fairly plausible except for the condition that
it usually occurs at a high, alkaline pH.The .primary amine nucleo
philic addition reaction with carbonyl compounds, such as alde
hydes and ketones, is known to produce a Schiff base if one of
the substituents is aryl. However the reaction can be sub- 299divided into two ; the initial addition reaction of the
amine and followed by dehydration of the carbinolamine thus
formed. The latter pathway requires a pH of 2 - 5, and at a
pH of 10, will be very slow. Also if an imine was formed,
it would probably be more liable to nucleophilic attack than
the thiohemiacetal function. The reaction proposed here is:
H SRHN-R
H SR
/ \ HO H

206,
The isobenzofuran derivative is thought to be susceptible
to nucleophilic attack in the conditions prevailing, and in
this regard the primary amine is a more reactive agent than
the thiol or other species present. The carbinolamine formed
is likely to react with the electrophilic centre close to it,
rather than undergo an unfavourable dehydration reaction. Once
the nitrogen-containing ring is formed, dehydration of the
dihydroisoindole to the more aromatic isoindole is favoured.
Without the thiol present a series of decomposition
products form from the dihydroisoindole produced^^^. The
thiol is therefore necessary to ensure stability of the
formed isoindole, presumably because it is a poor "leaving"
group.
4.3.1.d Quantification of Extent of OPA Reaction BY NMR
The formation of the isoindole type product (Figure
4.21) from a reaction mixture (Figure 4.2) shows a dramatic
change in the signal corresponding to the aromatic protons.
A possible marker of the change in species in the reaction
mixture was the two proton singlet at about 66.7 in Figure 4.2.
This signal was undisturbed by the new peaks created by the
formation of the isoindole derivative, unlike the four proton
singlet at 67.5 which was overlain by the new aromatic multi
plets. Quantitation of the reaction could therefore be
achieved by measuring the ratio of the integral of the peak
at 66.7 to that of the newly formed higher field multiplet
at 66.9 - 7.2. In Figure 4.23 is illustrated the proton NMR
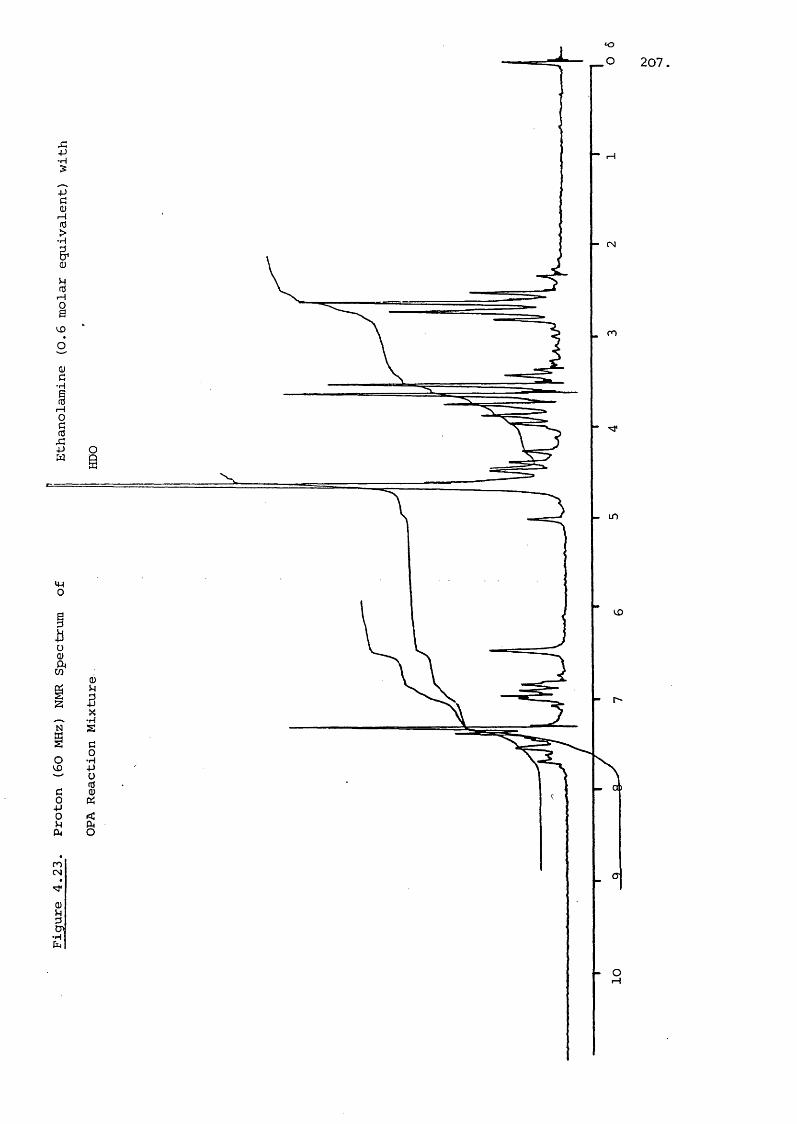
r—i
CN
ro
m
•H
ai
nCN

208,
spectrum of ethanolamine in a 0 .6:1 molar equivalent relationship
with OPA. This shows the singlet of the OPA reaction mixture
and the newly formed multiplet of the isoindole analogue. The
reaction of ethanolamine and the OPA reaction mixture over a
series of concentrations from 0 .2:1 to 0.8:1 molar relationships
was performed to give the ratio of new aromatic multiplet to
reaction mixture singlet. The four point calibration graph
is illustrated in Figure 4.24. The correlation of the line
is 0.9952 which indicates a significant relationship at the
0.1% level as determined by Student t-test. The slope of
the line is 1.09 which is not significantly different from
1 at the 5% level.
Thus using this model, a method of estimating the extent
of reaction of an amine with OPA was discovered, because there
was a direct relationship between appearance of the isoindole
multiplet and disappearance of the reaction mixture singlet.
The reaction of the gentamicin components did not provide
spectra as sharp as those for ethanolamine. The product and
reaction still exhibited the same general characteristics,
but the peaks were considerably broadened. An example of
a 0.75 molar equivalent reaction of gentamicin amino groups
with OPA is illustrated in Figure 4.25. In this mixture the
concentration of OPA was 4 times greater than the concentration
of gentamicin (3 amino groups/molecule). The broadness
of the aromatic peaks may be a reflection of the different
amino functions reacted in the gentamicin compound. For quanti
tative analysis ratios of 5.33:1 and 4:1 OPA to gentamicin

209,
Figure 4.24. Plot of Calibration of Ethanolamine Concentration
to newly formed Multiplet (PMR)
Proportion of 'NEW' Aromatic Signal (66.9-7.2)
1.0
0.8 ■
0.6
0.4
0.2
0.80.2 0.4 0.6 1.0
Molar equivalents of Ethanolamine

-H
-H
-H
n
LD
r— I
in•H
CN
210.
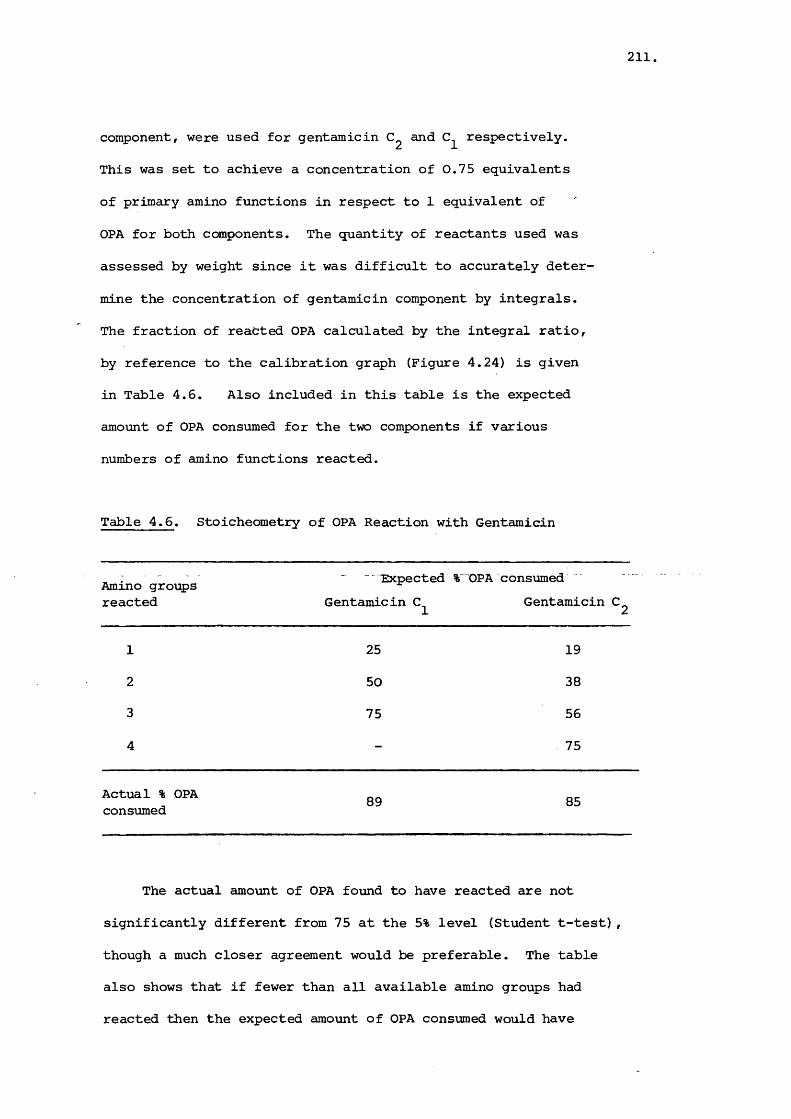
211,
component, were used for gentamicin and respectively.
This was set to achieve a concentration of 0.75 equivalents
of primary amino functions in respect to 1 equivalent of
OPA for both components. The quantity of reactants used was
assessed by weight since it was difficult to accurately deter
mine the concentration of gentamicin component by integrals.
The fraction of reatted OPA calculated by the integral ratio,
by reference to the calibration graph (Figure 4.24) is given
in Table 4.6. Also included in this table is the expected
amount of OPA consumed for the two components if various
numbers of amino functions reacted.
Table 4.6. Stoicheometry of OPA Reaction with Gentamicin
Amino groups reacted
“ExpectedGentamicin
% OPA consumedGentamicin
1 25 19
2 50 38
3 75 56
4 - 75
Actual % OPA consumed 89 85
The actual amount of OPA found to have reacted are not
significantly different from 75 at the 5% level (Student t-test),
though a much closer agreement would be preferable. The table
also shows that if fewer than all available amino groups had
reacted then the expected amount of OPA consumed would have
212
been much smaller. It is fairly conclusive proof that the
OPA reagent does react with all the primary amino groups in
gentamicin. The apparent excess of OPA which reacted can
be explained as loss in transfer of the OPA reagent to the
gentamicin component. The problem of the different solubilities
of the product and reactants was difficult to overcome at the
high concentrations required for NMR analysis, and losses due
to the enforced experimental procedure reduced the accuracy
of the technique.
4.3.2 Fluorescence Measurement of o-Phthalaldehyde Reaction
To provide alternative evidence for the results ob
tained by proton NMR for the stoicheometry of the OPA-gentamicin
reaction, the fluorescence yield obtained for each of the
components was studied. It was discovered that no simple
relationship between the maximum fluorescence yield and numbers
of primary amino groups on the parent gentamicin component
existed. An alternative measure of the reaction was thus
sought. Gentamicins and each possess four primary
amino groups and can theoretically react with four molar
equivalents of OPA, whereas^gentamicin has only three
primary amino groups and can react with three molar equivalents
of OPA. Accordingly an experiment was carried out in which
the fluorescence obtained when OPA was used at a three fold
molar excess was compared with that obtained when OPA was
used at a four fold molar excess. With gentamicins and
the fluoresdence might be expected to fall by 25% whereas

213
the fluorescence of the derivative should remain more or
less constant.
The percentage reduction in fluorescence observed for
three different reaction times is given in Table 4.7.
Table 4.7. Reduction in Fluorescence on Changing OPA Concentration
Time(min)
% Reduction ^la
% ReductionS
% ReductionCl
85 32.6 42.9 35.7
110 30.4 45.2 34.0
120 32.0 48.6 34.8
Mean 31.7% 45.6% 34.8%
It is obvious that the relationship was not observed and
no trend between the components could be detected. A possible
explanation of this is that in the absence of an excess of
OPA reagent the rate of reaction may have been reduced and
may not have gone to completion. In the preparation of OPA
derivatives for HPLC a substantial excess ofOPA reagent is
routinely used.
Due to the susceptibility of the fluorescence determination
to impurities and the interpretational difficulties of results
discussed above, a means of estimating the extent of reaction
of the OPA reagent which was independent of fluorescence measurement
was sought.

214
4.3.3 Combined Ninhydrin/o-Phthalaldehyde Reaction with
Gentamicin
The method developed involved the construction of a
calibration graph of the absorbance obtained on reacting nin
hydrin with varying concentrations of the gentamicin components.
Then OPA was reacted with the components in a range of concen
trations and the primary amino functions left underivatised
were reacted with ninhydrin. From the calibration graph already
made the amount of amino groups reacting with ninhydrin could
be calculated, thus giving the extent of reaction of OPA.
This assumed that all the available primary amino groups would
react with the ninhydrin reagent, which appears reasonable
considering the reaction conditions.
A calibration graph for each component of concentration
against absorbance (565 nm) was made for the reaction with nin
hydrin. This plot is shown in Figure 4.26 with each component
exhibiting a linear relationship of significantly high corre
lation. Regression analysis figures of the plots in Figure
4.26 are given in Table 4.8.
Table 4.8. Regression Analysis of Calibration Lines
S a Clr 0.9996 0.9983 0.9995
slope 0.01703 0.01310 0.00986
intercept -0.0177 -0.0206 0.0098

215,
Figure 4.26. Calibration of Gentamicin Reaction with
Ninhydrin.
565
1.0
0.8
0.6
0.4
0.2
20 40 60 80
• Gentamicin Cla
Volume (pl) Component solution (2 mg/ml)
O Gentamicin C.
Gentamicin C.
216,
A further calibration was made to ensure reproducible
behaviour of the reaction, using identical conditions, but
with a freshly prepared reagent on a different day. Again a
linear relationship for all three components was observed
and a statistically close match of the plots resulted. There
was some variation but nonetheless the hinhydrin reaction was
more stable than the fluorescence reaction. However this
variation required the experimental determination of the com
ponent reaction with OPA to be carried out on the same day
as the calibration.
The initial concentrations of OPA chosen to react with
the gentamicin was in the range of 20 - 80% of total amines
present. The OPA when added, produced a fall in the observed
absorbance vÆien reaction followed with ninhydrin. The per
centage of gentamicin left to react with the ninhydrin was
determined by reference to the constructed calibration graph
(Figure 4.26). A plot of gentamicin component remaining
against the fraction of total OPA used yielded a linear plot
as shown in Figure 4.27. The three components had a signi
ficant high correlation with a slope of about -1.0 for each,
where OPA is expressed in terms of primary amino group equi
valents. This suggests that OPA is reacting with one mole
of primary amino functions per mole of OPA. The reaction
was extended to 100% completion to ensure that all of the
amino groups will react. A further study of the 30 - 100%
concentration was thus made with the results plotted in
Figure 4.28. The slopes shown are linear except when total
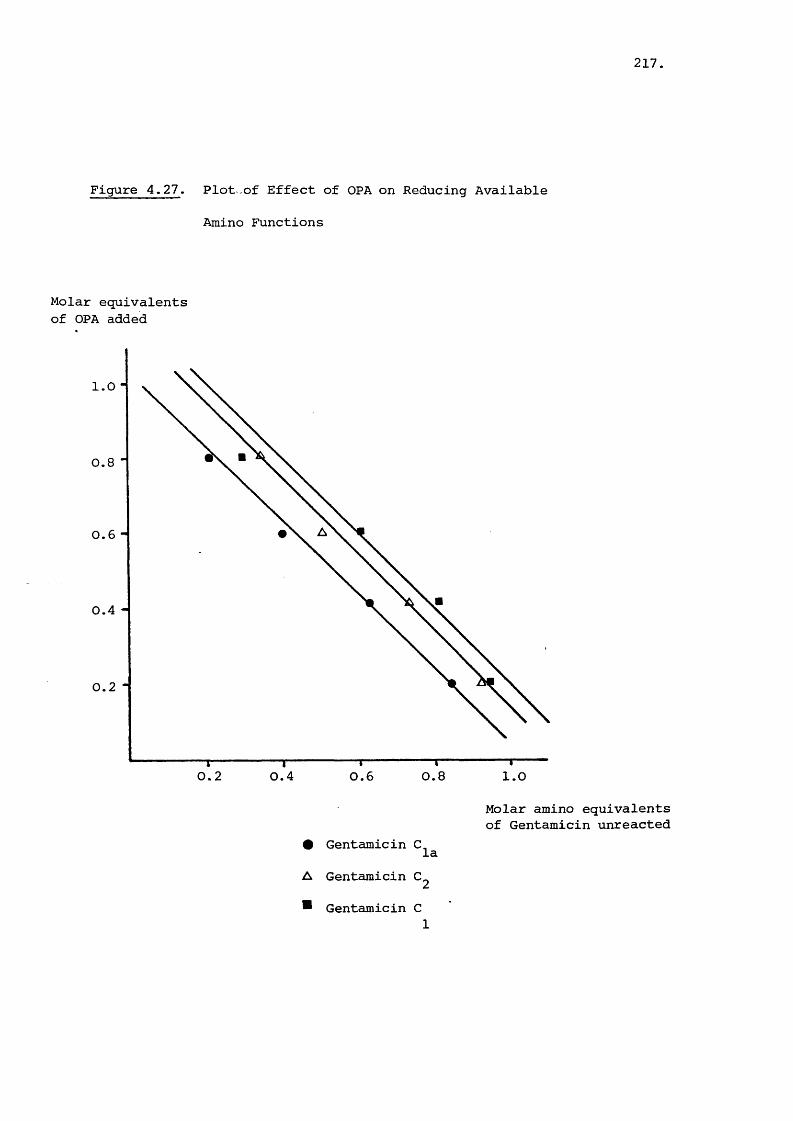
Figure 4.27. Plot,of Effect of OPA on Reducing Available
Amino Functions
Molar equivalents of OPA added
217.
1.0
0.8
0.6
0.4
0.2
0.2 0.4 0.6 0.8 1.0
Gentamicin ClaA Gentamicin C,
Molar amino equivalents of Gentamicin unreacted
Gentamicin C

218,
Figure 4.28. Plot of Effect of OPA on Reducing Available Amino
Functions - extended to Total Reaction.
Molar equivalents of OPA added
Total Reaction1.0
0.8
0« 6
0.4
0.2
0.2 0.4 0.6 0.8 Molar amino equivalents Gentamicin unreacted
# Gentamicin
Q Gentamicin
□ Gentamicin C,

219,
reaction is approached. This was due to the OPA reagent
absorbing slightly at this wavelength. This absorbance was
not important at low concentrations of OPA, but as 100%
reaction was approached it became more dominant because of
the general fall in absorbance. The plots in Figure 4.28
are not significantly different from those in Figure 4.27 at
the 5%. level (Student t-test). The mean of the slope of the
three lines in Figure 4.28 was -0.995 indicating that the
-1.0 relationship still held. Figure 4.27 illustrates that
OPA is able to react with all the primary amino groups
available for reaction with ninhydrin.
Assuming that ninhydrin does react with all primary amino
functions on the component, then OPA can be said to react with
all the primary amino groups for all of the components. This
agrees with the conclusions drawn from the experiments with
NMR considered previously.
220.
CHAPTER 5
HIGH PERFORMANCE LIQUID CHROMATOGRAPHIC RETENTION CHARACTERISTICS
OF GENTAMICIN-ORTHO-PHTHALALDEHYDE DERIVATIVES
5.1 Introduction
The three components of gentamicin have shown different
retention orders using very similar high performance liquid78 223 233 234chromatographic methods ' ' ' . This is not desirable
since a standard-assay technique requires reproducible responses.
The lack of available standards for these components only heightens
this disadvantage. The o-phthalaldehyde derivative of the
gentamicin C^ component has been shown to elute either as the223 233 78 234first ' or the last ' of the components, in HPLC
systems, depending upon the paper consulted. The reaction of
the fluorescent reagent with the primary amino groups,
reported in Chapter 4, was studied to ensure complete and re
peatable derivatisation. The lack of any potential reaction
problem suggested that the anomalous retention behaviour must
have arisen from the conditions used in the chromatographic
stage of the respective assays. To understand the retention
mechanism involved a brief summary of the possible variables
will be made.
The development of HPLC has produced a technique which
is sensitive, versatile, and well adapted to the analysis of
typical biological and pharmaceutical compounds^^^'^^. The
chromatographic processes involved in the separations are heavily
dependent on the type of stationary phase used. These have been
221,
classified as being liquid-solid (LSC), liquid-liquid (LLC),
bonded phase (BPC), ion-exchange (lEC) and gel permeation241chromatography (GPC) . The theory of the retention mechanisms
in LSC, LLC and GPC are fairly well understood but doubt exists
as to the exact mechanism in ion-exchange or bonded phase 241chromatography . In the case of lEC the uncertainty arises
mainly because other factors apart from ion-exchange are thought
to be involved. In BPC the nature of the retaining phase is
the principal source of the ambiguity^^^ 305^
Bonded phases were used in the gentamicin assays, and
indeed BPC is the most widely used method in HPLC and has the
widest range of commercial packings^^^. It cam be termed
either normal or reversed phase chromatography, depending
upon the functional groups which are attached to the silica 241microparticles , Normal phase packings have groups such
as diol, dimethylamino, nitro, cyano and amino bonded to the
silica surface^^^. These groups confer differing properties
to the stationary phase which is used with mobile phases similar
to those used for silica. The groups used for reverse
phase packings are more hydrophobic, being straight chain301paraffins, and include methyl, octyl and octadecyl functions
These groups produce a hydrophobic surface, unlike the highly
polar silica surface, and the solvent strength of eluting
solvents is reversed^^^.
The bonded groups are formed after reaction at surface
silanol groups (SiOH) through a number of bridging functions
222
302,303shown
= SiOH
1) = Si - OR ester type
2) 5 Si - NR^ amino
3) 5 Si - CR3 carbon
4) = Si-O--Si-CRg siloxane
The siloxane type is the most frequently used in reversed
phase BPC and are synthesised using an organohalogenosilane^*^^.
This can be either mono, di, or tri-alkyl substituted and
usually a chlorosilane is used. The monochlorosilanes such
as dimethyloctadecylchlorosilane produce a monomeric bonded
phase on the silica and are the most frequently used^^^. With
di and trichlorosilanes some of the chloro groups will be
unable to react with the surface silanols and are free to react
"with other reagent mblecuTes^^^,306^ A polymerised layer is
thus produced which can shield the silica surface from dissolution
in severe conditions of use, such as high pH. However these
phases exhibit slow mass transfer of solutes which decreases
efficiency^^^. Batch variability is another drawback to
this type of phase^^^.
The actual conformation of the bonded groups will ultimately
depend on the position and number of silanol groups on the silica
surface^^^. These factors are dependent on the manufacturing
process and conditions used to produce the silica microparticles^^^.
The silanols are randomly distributed on the surface and can
be described as being paired or isolated^^^'^^^. The paired
hydroxy groups are hydrogen bonded to each other and are less

223
than 0.31 nm apart. The isolated hydroxyls are separated
by a mean distance of 0.65 nm and are more exposed for
reaction^^^. The ratio of the two types of silanols will
dictate the extent of the reaction with chlorosilane. An
estimate of the surface coverage of free silanols is of about
8 ymol m % 303,309^ Maximum reaction with these groups with-2a mono-chlorosilane has been 4.5 ymol m for trimethyl-
chlorosilane and 2.36 ymol m for n-hexyldecadimethylchloro-
silane^^^. Thus although a 100% coverage of the surface with
the trimethylsilane will have occurred, only 60% of the surface
silanols have reacted. The residual silanols are believed to
be inaccessible to solutes, either from steric hindrance by
the organic layer or due to the location of the silanols in
micropores^^^. The size of the organic bristle is an important
consideration ,especially in relation to pore size, when
contemplating the effect of the bonded p h a s e ^ ^ ^ I t is
the pores of the silica particles which are responsible for
the high specific surface area associated with the packing.
Silica, with a particle size of 10 ym and a specific surface
area of 300 m^g has an external surface of only 0.3 m^g ^
with the remainder residing in the pores^^^. The diameters
of these pores are mainly in the 5 - 12 nm range. The length
of an octyldecyl (ODS) group is about 1 nm^^^, and thus
complete reaction should decrease the diameter by about 2 nm.
This will thus decrease the surface area and pore volume,
depending on the diameter of the pore^^^, and such a reduction 302can be up to 50% . However, this has not always been
confirmed by gas adsorption experiments^^^.

224
Since the large organic reagents do not always react
to completion, a small chlorosilane is often used to cover any
remaining silanols. This procedure is called "endcapping"
and helps produce a more homogenous phase^^^. Tests for
residual silanols are usually carried out either by determining
methyl red adsorption by the support or by measuring the
retention of a polar solute on a column of the support using
a non-polar solvent as eluent^^^'^^^. By the first method
a silanised material shows no red colour and by the second
a capacity factor of less than 0.5 should be observed. Any
residual silanols are believed to decrease the efficiency
and stability of the column^^^'^^^.
General statements on the retention behaviour of compounds
in reversed phase BPC can be made even though the exact mechanism
is not understood. If the length of the hydrocarbon chain
of the bonded phase is increased the retention will also in-
crease^^^'^^^'^^. The solvent strength of the eluent is
the inverse of that found in LSC on silica^^^'^^^. The mobile
phase consists usually of a binary mixture of water and an
organic modifier. A plot of the percentage modifier present
against the logarithm of the capacity factor (%') (3.2.2.a)313,314,307IS usually linear
As with other forms of HPLC an increase in temperature
of the column will reduce the k' value^^^'^^^ . This is
because the thermodynamic distribution constant (k°) is318related to temperature by:
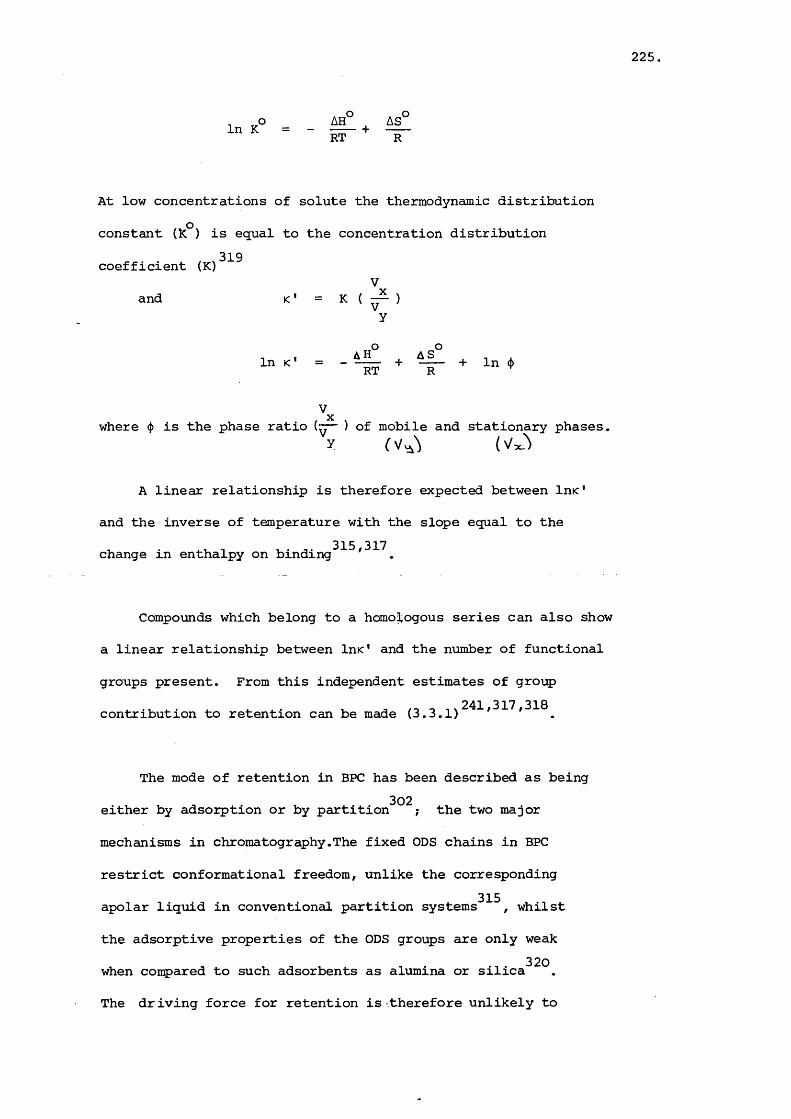
225
At low concentrations of solute the thermodynamic distribution
constant (K°) is equal to the concentration distribution 319coefficient (K)
Vand K ' = K ( ^ )
y
In K' = - + In (J)
Vwhere (j) is the phase ratio (;^ ) of mobile and stationary phases
A linear relationship is therefore expected between Inx'
and the inverse of temperature with the slope equal to the
change in enthalpy on binding^^^'^^^.
Compounds which belong to a homologous series can also show
a linear relationship between Inx' and the number of functional
groups present. From this independent estimates of group
contribution to retention can be made (3.3.1)^^^'^^^'^^^.
The mode of retention in BPC has been described as being302either by adsorption or by partition ; the two major
mechanisms in chromatography.The fixed ODS chains in BPC
restrict conformational freedom, unlike the corresponding
apolar liquid in conventional partition systems^^^, whilst
the adsorptive properties of the ODS groups are only weak
when compared to such adsorbents as alumina or silica^
The driving force for retention is therefore unlikely to
226.
be entirely due to one of these processes solely and some
other factor must be involved. Locke^^^ determined that elution
order in BPC with alkyl side chains was in inverse relation
to the solute solubility in the mobile phase and that selec
tivity was due entirely to the eluent.
A more comprehensive expression of retention has been the
development of the Solvophobic theory by Horvath and co-workers^^gg^^^'
The solute is assumed to bind to the non-polar phase with
a free-energy change associated with the binding. The magnitude
of this change is the difference in energy between bringing
the bound complex into solution and placing the individual com
ponents into the solvent. The main determinants of the free
energy cf binding are the surface tension of the solvent,
the molecular contact area taken up on binding of the solute,
and electrostatic and van der Waals interactions between sol
vent and components of binding. For unionised solutes the
largest effect is due to surface tension; an increase of.321which leads to an increase in retention time . For ionised
solutes there is a more complex relationship since the electro
static terms are more important.
However, anomalous retention of ionic compounds has been
observed which cannot be explained hy the solvophobic ;311 313 322""30theory ' ' . This is readily apparent in a plot of
Inc' against percentage organic modifier in which ionic
compounds often show a curve whereas the theory would predict313 39? 39ft 39Q a linear relationship ' This effect can be

227.
reduced by suppression of ionisation by adjustment of the pH 308of the eluent . However for a base with a pKa of 9 the
pH of the mobile phase would have to be at least 9,5, and
under such conditions the lifetime of the column would be
short. Another method is to use alkylamines which can restore313 326“32regular retention behaviour ' . The apparent discrepancy
with ionic compounds in reversed phase BPC has been attributed
to a dual site mechanism of retention^^^'^^^'^^^. Various models
have been proposed to account for the two sites^^^'^^^'^^^,
which are generally believed to be the ODS chains and the
residual silanols present.
Another method for minimising the possible influence of
the silanols on ionic compounds is to interact the solute
ions with ions of opposite-charge dissolved in the solvent^^^'^^^
These counter ions usually possess hydrocarbon chains and often 339are surfactants . Several mechanisms have been proposed
334to account for this effect
i) Ion-pairing of the ions in solution followed by1 . 317,331,333,336adsorption on the ODS packing
ii) Dynamic ion-exchange of the solute with the
adsorbed counter ion on the ODS phase^^^'^^^'^^^'^^^
iii) Ion-interaction mechanism, with an electrostatic
double layer formed on the surface of the particles
attracting the solute by electrostatic force^^^'^^^'^^^.
It is possible that any or all of these may occur depending

223,
333upon the hydrophobicity of the counter ion . Ion-pairing
may well overlap other forms of BPC since ion-interaction
will occur to some extent with any ions which may be present
in the mobile phase such as buffer ions.
The relationship between retention of a solute in BPC
and its retention on silica is also important in understanding
the chromatographic behaviour of the differing samples. Under
certain conditions the behaviour of amines on unmodified silica
is similar to that observed on ODS bonded silica^^^'^^^'^^^.
Some authors regard this as evidence that silica itself can
behave as a reverse phase material with the hydrophobic
siloxane groups exerting an influence^^^'^^^. On the other
hand others suggest that the mechanism on ODS bonded packings
involves ion-interaction with the silanol groups^^^.
In applying these factors to the separation of gentamicin
components, the nature of the stationary phase is of prime
importance especially with respect to the presence of silanol
groups.
5.2 Materials and Methods
5.2.1 Materials;
Spherisorb ODS, 5 ym packing material was obtained
from Phase Separations Ltd., Zorbax ODS, 7 ym, silica was
from DuPont (UK) Ltd. and Hypersil ODS, 5 ym was obtained
from Shandon Southern Ltd. Gentamicin components had been

229
separated by column chromatography, and netilmicin sulphate was
a gift from Kirby-Warrick Pharmaceuticals Ltd. Potassium
iodide, potassium nitrate, potassium thiocyanate, sodium nitrate,
sodium iodide, barium chloride and lithium chloride were all
supplied by BDH Chemicals Ltd. Acetic acid (glacial) and
ammonia (0.88 gr) were supplied by Fisons Scientific Ltd.
HPLC instrumentation was the same as that used in(3.2.1).
Columns used were all of 150 x 5 mm dimensions.
5.2.2 Methods:
5.2.2.a.Effect of Temperature on Retention;
Reaction mixtures injected contained gentamicin
(0.4 mg/ml) standard solution (50 yl), netilmicin (0.5 mg/ml)I
(20 yl) with OPA reagent (0.5 ml) and methanol (1 ml). Mobile
phase was 80:20, methanol:water with 2 g/L EDTA, tri-potassium
salt. The temperature of the water bath, in which the column
was immersed, was varied in steps of 5° from 20° to 45°C.
At each tenderature at least three determinations of retention
time of the gentamicin components and netilmicin were made.
Individual components were also injected separately to
identify peaks. The position of the non-retained solùte
was taken as the initial leading edge of the solvent front
for all injections.

230.
5.2.2.b Effect of pH on Retention;
Ammonia-Acetic Acid Buffer
Ammonia and acetic acid solutions of concentration
of about 0.017 M were prepared by diluting 1 ml ammonia (0.885g)
and acetic acid (glacial) ( 1 ml) to 1000 ml with distilled
water. The strength of the ammonia solution was determined by
neutralising an aliquot with excess 0.01 M hydrochloric acid
and back titrating with a 0.01 M sodium hydroxide solution
using methyl red as indicator. The strength of the acetic acid
solution was determined by titration of a solution with 0.01 M
sodium hydroxide using phenophthalein as indicator. The strengths
thus found were 0.018 and 0.014 M for acetic acid and ammonia
respectively. Using these solutions a series of buffers were
prepared ranging from pH 3.5 to 10.5 with potassium iodide added
to give a constant ionic strength of 0.075 M for all solutions.
Methanol (80 ml) was added to 20 ml of each of these buffer
solutions and each was used as the mobile phase. The column
was allowed to equilibrate with each mobile phase for fifteen
minutes before injection. At least three injections of all
components were made at each pH.
5.2.2.C. Addition of Salts to the Mobile Phase
Mobile phase (300 ml) of 80:20 methanol:water
composition was prepared with an initial concentration of salt
present. The column was allowed to equilibrate for at least
fifteen minutes before injection of the gentamicin components.
After at least four injections the mobile phase was changed

231,
by dissolving in the same solution a measured quantity of salt.
Volume of mobile phase was determined by measuring cylinder.
Therefore the same mobile phase was used throughout for one
individual salt with up to eight different concentrations of
the salt used. At the end of each day, columns were washed
with methanol to prevent halide attack of stainless steel
fittings. No buffer was used but the pH remained about
6.5. Salts used in these determinations were EDTA, tri
potassium salt; potassium iodide; potassium nitrate; potassium
thiocyanate; sodium iodide ; sodium nitrate; lithium chloride
and barium chloride. The range of concentrations used
depended on the effect on component retention. Three different
reverse phase packing materials were compared in this study;
Zorbax ODS, Hypersil ODS and Spherisorb ODS. The Spherisorb
an d Hypersil columns were thermostatted at 30°C whilst the
Zorbax column was kept at 44°C.
5.3 Results and Discussion'
5.3.1 Effect of Temperature on Retention
The capacity factor (k ') was measured for each of
the gentamicin components (C^, and C^) and netilmicin
at various column temperatures on the Spherisorb column. A
plot of k ' against column temperature is shown in Figure 5.1.
The relative retention of the components does not seem to
be affected by temperature variation and the shape of the
curves is as expected with the distribution coefficient de
creasing with increasing temperature. As the logarithm of
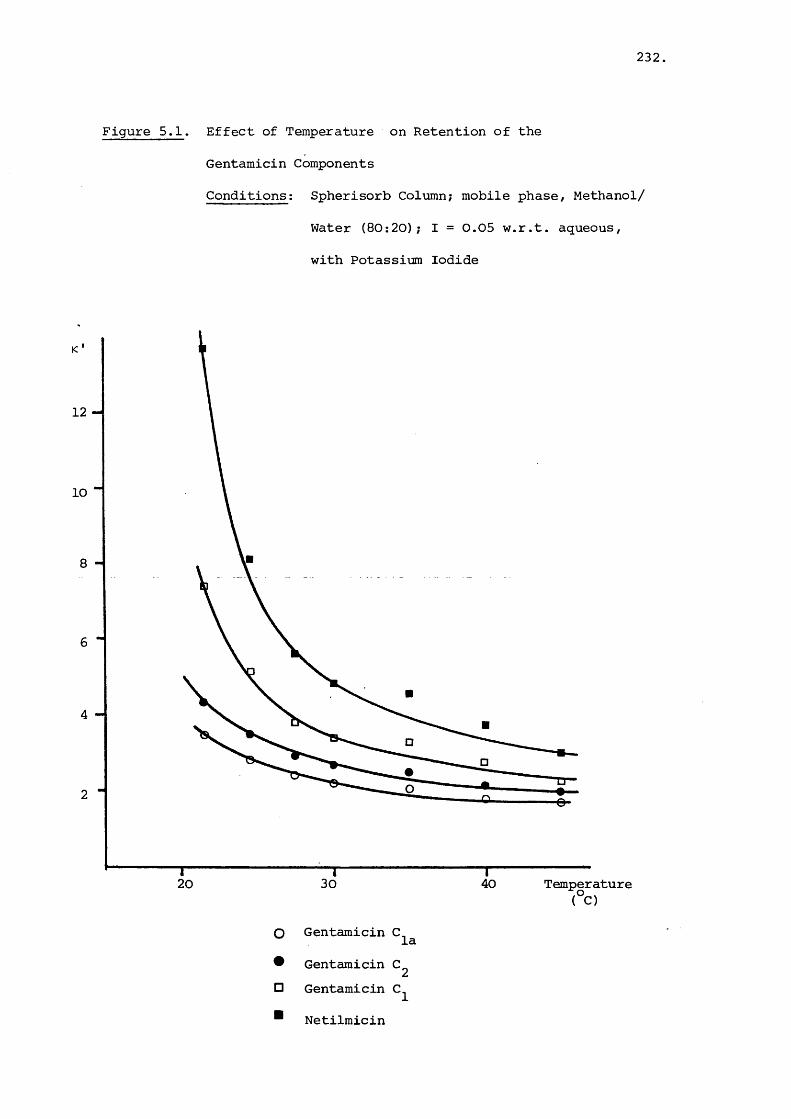
232
Figure 5.1. Effect of Temperature on Retention of the
Gentamicin Components
Conditions : Spherisorb Column; mobile phase, Methanol/
Water (80:20); I = 0.05 w.r.t. aqueous,
with Potassium Iodide
12 -
10
20 30 40 Temperature(°C)
o Gentamicin ^la• Gentamicin□ Gentamicin■ Netilmicin
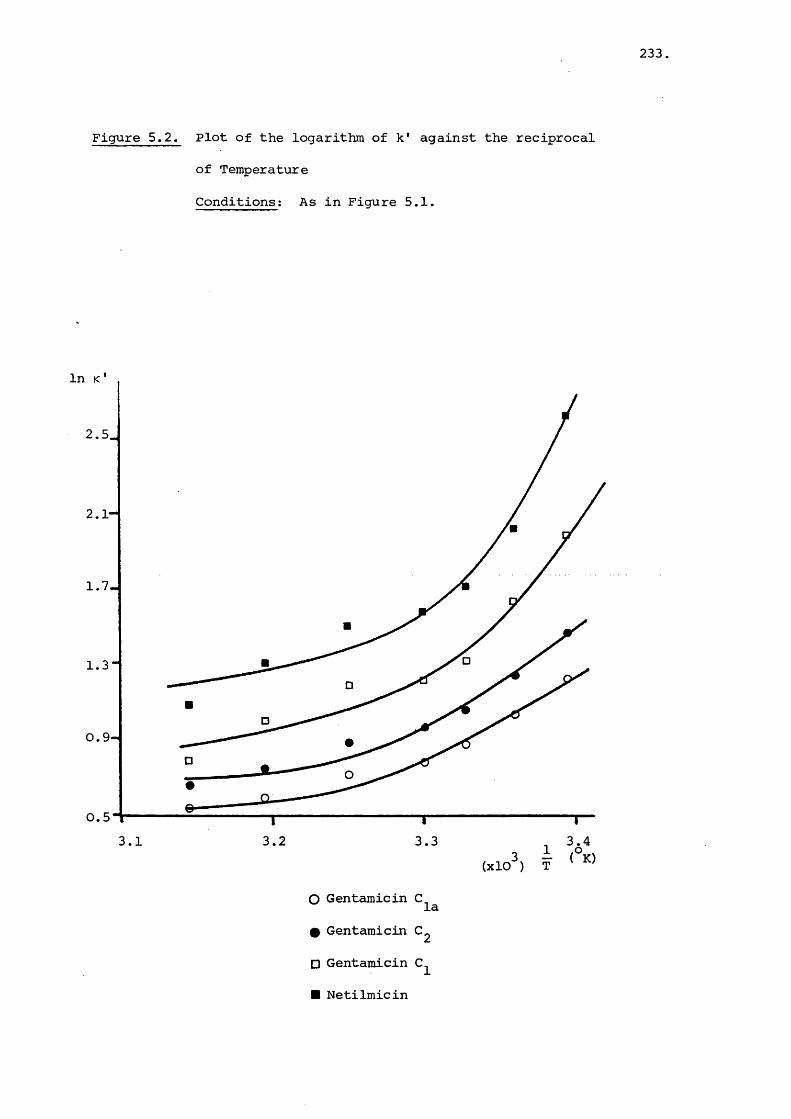
233
Figure 5.2. Plot of the logarithm of k' against the reciprocal
of Temperature
Conditions; As in Figure 5.1.
In
1.7
1.3
0.9
0.53.1 3.2 3.3 3.4
O Gentamicin ClaGentamicin C,
□ Gentamicin C,
Netilmicin
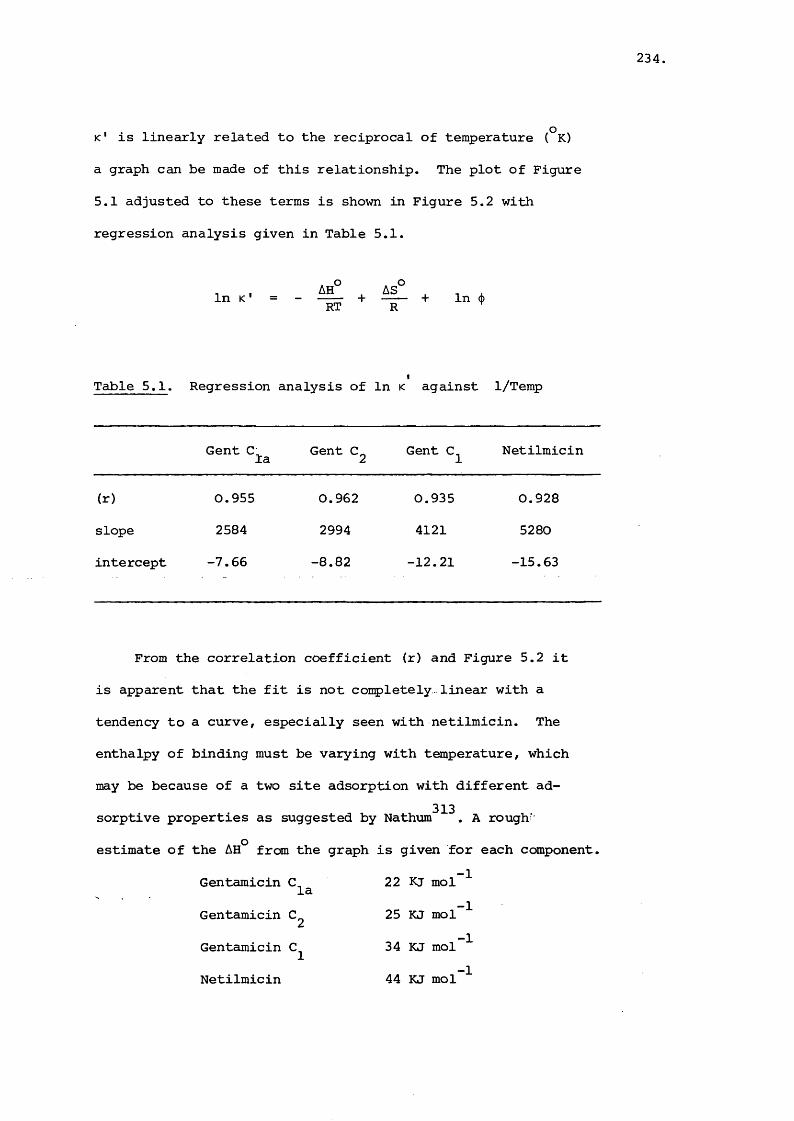
234,
k ' is linearly related to the reciprocal of temperature (°K)
a graph can be made of this relationship. The plot of Figure
5.1 adjusted to these terms is shown in Figure 5.2 with
regression analysis given in Table 5.1.
In K' = - ^ + — + In (j)RT R
Table 5.1. Regression analysis of In K against 1/Temp
Gent Gent Cg Gent Netilmicin
(r) 0.955 0.962 0.935 0.928
slope 2584 2994 4121 5280
intercept -7.66 -8.82 -12.21 -15.63
From the correlation coefficient (r) and Figure 5.2 it
is apparent that the fit is not completely linear with a
tendency to a curve, especially seen with netilmicin. The
enthalpy of binding must be varying with temperature, which
may be because of a two site adsorption with different ad-313sorptive properties as suggested by Nathum . A rough'
estimate of the AH° from the graph is given for each component.-1Gentamicin 22 Kj mol-1Gentamicin 25 KJ mol-1Gentamicin 34 KJ mol-1Netilmicin 44 KJ mol

235
These figures suggest that gentamicin C and C are bound
in a similar fashion whilst the binding of gentamicin and
netilmicin may involve an extra factor since the energies are
higher.
5.3.2 Effect of pH on Retention:
If the gentamicin components exhibited unusual
chromatographic behaviour due to differing ionisation profiles
it would be expected that pH would be an important indicator
of such variation. From studies on the ortho-phthalaldehyde
reaction the primary amino groups were believed to be totally
reacted to form isoindole derivatives and thus not be liable
to protonation (Figure 5.3.) However, the secondary amino
groups should be unaffected hy the reaction and therefore
potential sources of ionisation. The pKas of the primary354amino groups of gentamicin are about 8.2 but those of
the secondary amino groups have not been well established. One 346report gives the value as 6.2 which is markedly different
from the primary amino figure. This may correspond to the
secondary amino function in the garosamine ring Which is
sitii^ted between two carbon atoms bearing hydroxy groups. As
well as inductive effects, hydrogen bonding could occur,
reducing the base strength of this group. In contrast the
additional secondary amino functions in netilmicin and
gentamicin do not possess such neighbouring groups. Thus
a pKa of about 9.0 is envisaged since the basicity of a
secondary amino group is usually slightly greater than that
of a corresponding primary function.
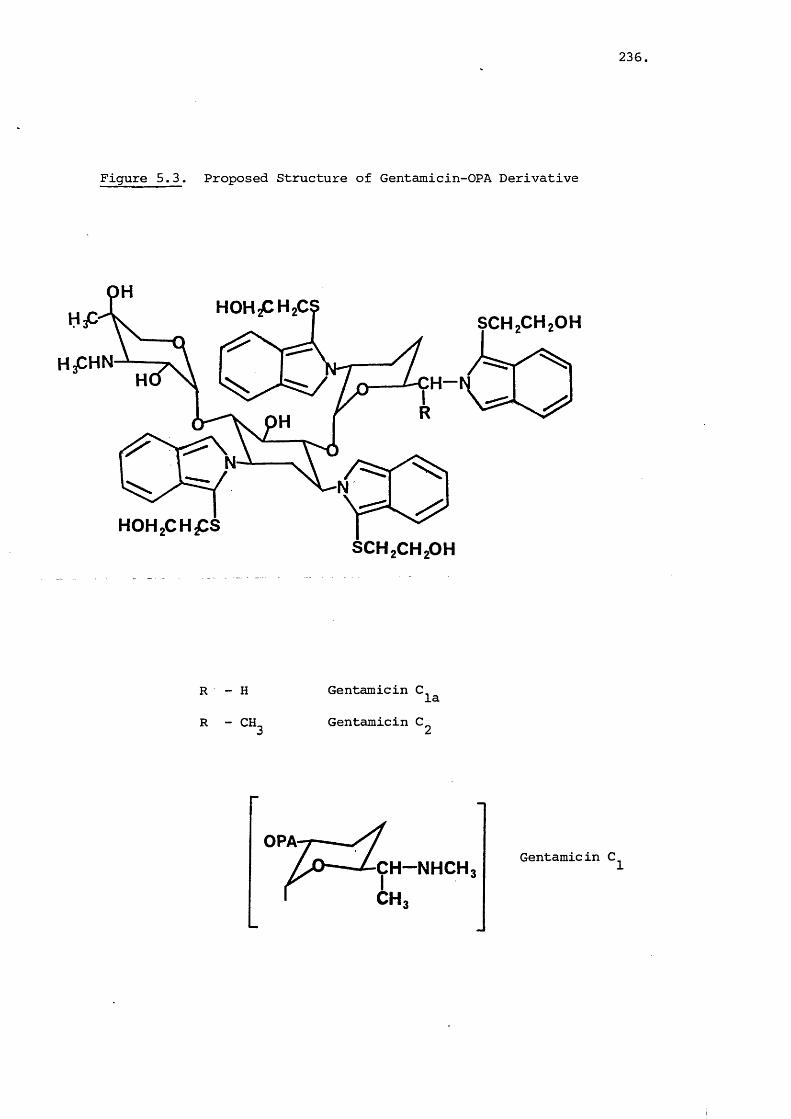
236,
Figure 5.3. Proposed Structure of Gentamicin-OPA Derivative
SCH.CHzOHHOH2Ç **2
HOHgCHpSSCHgCHgOH
R - H
R - CH
Gentamicin Cla Gentamicin
OPA•A?— yfA O LC H-N HCH ,
f CH,Gentamicin C.

237
In this experiment the buffer solution was devised to
have a wide buffering range with low ionic strength and simple
ions in solution. The buffering capacity was low in the middle
of the range (pH 5.5 -8.5) but adequate for the purpose of
investigation. The ionic strength of the buffer was calculated
from the equation:
1 = h E(C^Z^^)
c^is the concentration of each ion
Z^is the valency of each ion
The maximum ionic strength of the buffer, at a pH of 8.5,
was 0.001 and potassium iodide was added to keep the ionic
strength constant at 0.015.' A pH against k * grajh for all
compounds was constructed using a series of 80/20 methanol/
water mobile phases on a Spherisorb column. The graph is
shown in Figure 5.4 and the pH plotted is that measured in
aqueous solution before addition of methanol. This was to
relate all factors to a standard state (aqueous) since the
ionisation behaviour of the amino functions of interest, was un
known, vAien in an environment such as the mobile phase.
From Figure 5.4 it is apparent that the components behave
differently with respect to change in pH. Gentamicins and
show a slight sigmoid curve with increase in pH. The curve
for gentamicin is more pronounced, whilst that for netilmicin
shows a dramatic increase in retention with increase in pH.
The retention characteristics expected for an ionised/unionised
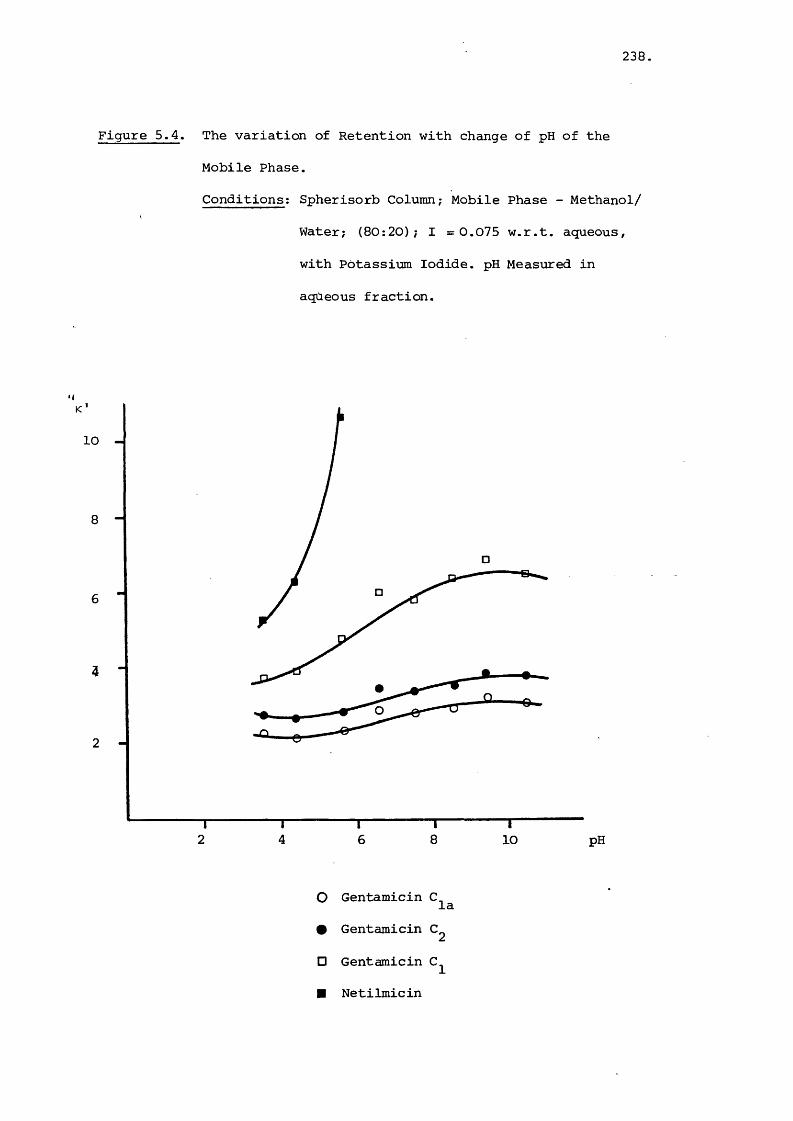
238,
Figure 5.4. The variation of Retention with change of pH of the
Mobile Phase.
Conditions; Spherisorb Column; Mobile Phase - Methanol/
Water; (80:20); I =0.075 w.r.t. aqueous,
with Potassium Iodide. pH Measured in
aqUeous fraction.
10
8
6
4
2
4 82 6 10 pH
O Gentamicin ClaGentamicin C,
□ Gentamicin C.
Netilmicin
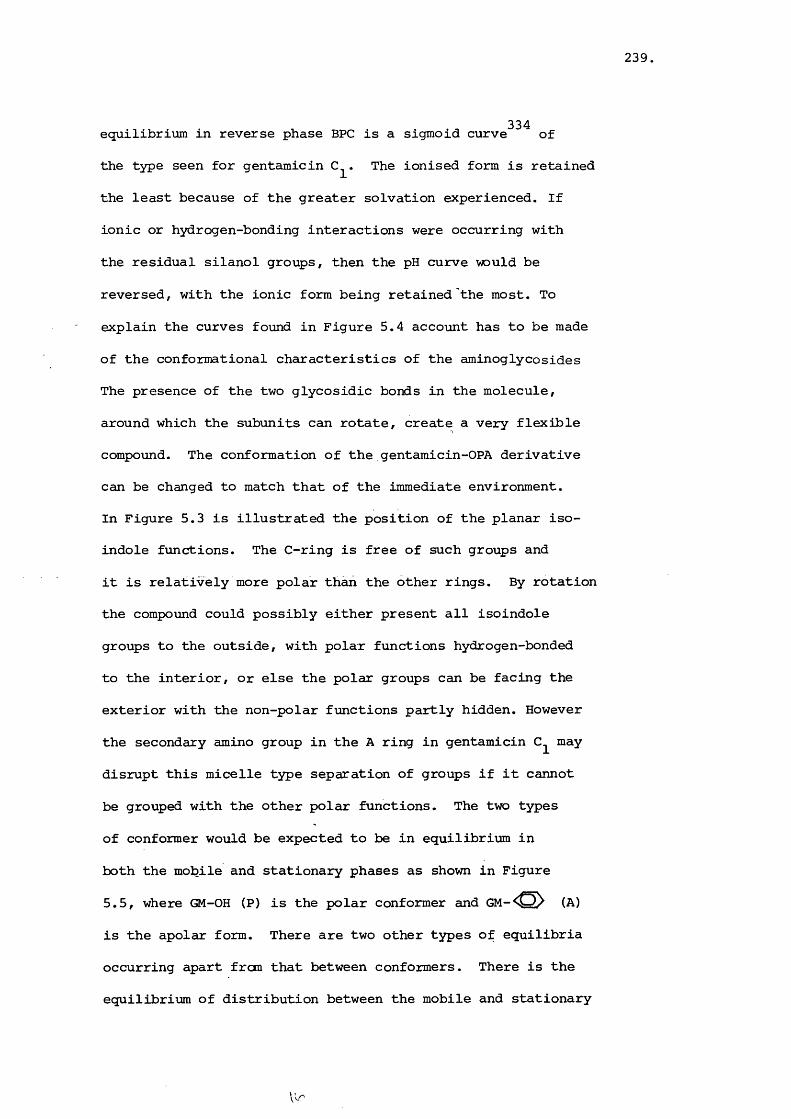
239,
334equilibrium in reverse phase BPC is a sigmoid curve of
the type seen for gentamicin C^. The ionised form is retained
the least because of the greater solvation experienced. If
ionic or hydrogen-bonding interactions were occurring with
the residual silanol groups, then the pH curve would be
reversed, with the ionic form being retained the most. To
explain the curves found in Figure 5.4 account has to be made
of the conformational characteristics of the aminoglycosides
The presence of the two glycosidic bonds in the molecule,
around which the subunits can rotate, create a very flexible
compound. The conformation of the gentamicin-OPA derivative
can be changed to match that of the immediate environment.
In Figure 5.3 is illustrated the position of the planar iso
indole functions. The C-ring is free of such groups and
it is relatively more polar than the other rings. By rotation
the compound could possibly either present all isoindole
groups to the outside, with polar functions hydrogen-bonded
to the interior, or else the polar groups can be facing the
exterior with the non-polar functions partly hidden. However
the secondary amino group in the A ring in gentamicin may
disrupt this micelle type separation of groups if it cannot
be grouped with the other polar functions. The two types
of conformer would be expected to be in equilibrium in
both the mobile and stationary phases as shown in Figure
5.5, where GM-OH (P) is the polar conformer and GM-^3^ (A)
is the apolar form. There are two other types of equilibria
occurring apart from that between conformers. There is the
equilibrium of distribution between the mobile and stationary

240.
Figure 5.5. Equilibrium of Gentamicin-OPA Conformers
in Reversed-Phase Systems
GM-OH (p) ± 7 - G M - ^ ^ (a) Mobile Phase (Polar)
GMGM-OH
stationaryPhase
GM (Non-Polar)
GMGM-OH
Si GM-OHIO rt-0
GM
H -O
Silica
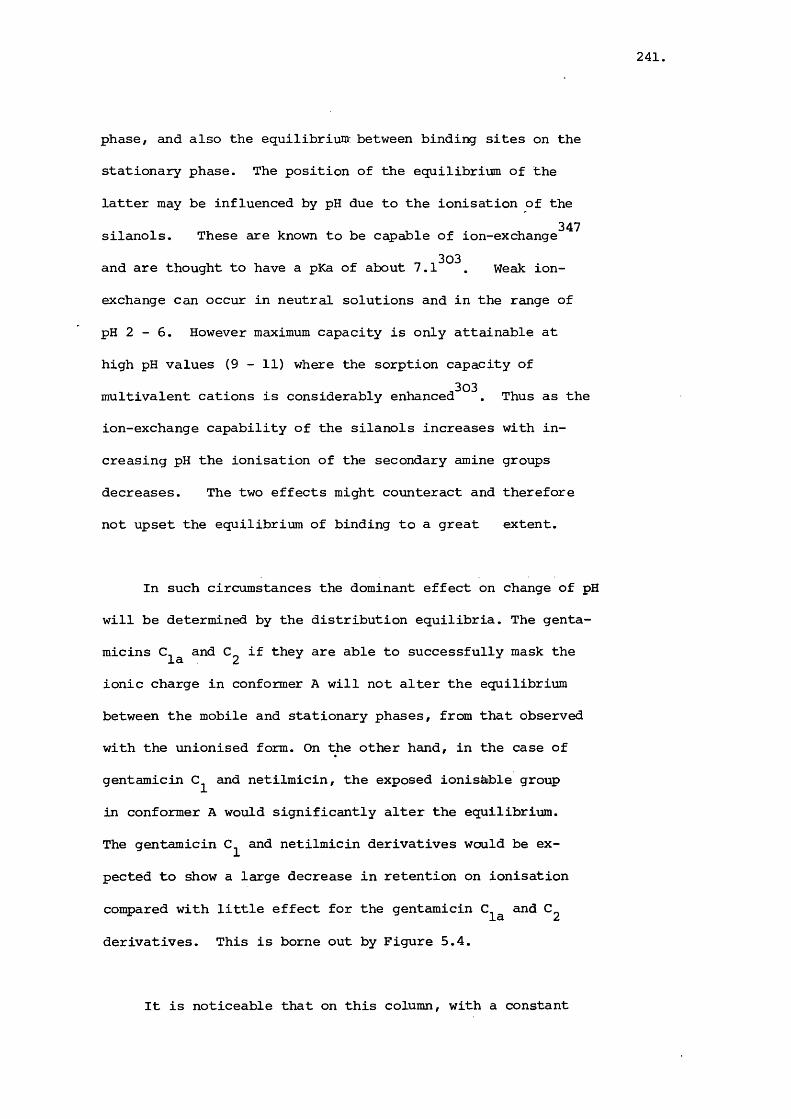
241.
phase, and also the equilibriuiO: between binding sites on the
stationary phase. The position of the equilibrium of the
latter may be influenced by pH due to the ionisation of the347silanols. These are known to be capable of ion-exchange
and are thought to have a pKa of about 7.1^^^. Weak ion-
exchange can occur in neutral solutions and in the range of
pH 2 - 6 . However maximum capacity is only attainable at
high pH values (9 - 11) where the sorption capacity of
multivalent cations is considerably e n h a n c e d ^ . Thus as the
ion-exchange capability of the silanols increases with in
creasing pH the ionisation of the secondary amine groups
decreases. The two effects might counteract and therefore
not upset the equilibrium of binding to a great extent.
In such circumstances the dominant effect on change of pH
will be determined by the distribution equilibria. The genta
micins C- and C if they are able to successfully mask the
ionic charge in conformer A will not alter the equilibrium
between the mobile and stationary phases, from that observed
with the unionised form. On the other hand, in the case of
gentamicin and netilmicin, the exposed ionisàble group
in conformer A would significantly alter the equilibrium.
The gentamicin and netilmicin derivatives would be ex
pected to show a large decrease in retention on ionisation
compared with little effect for the gentamicin and
derivatives. This is borne out by Figure 5.4.
It is noticeable that on this column, with a constant

242
salt concentration, the relative order of retention of the
components did not alter when the pH was varied. It suggests
that the gen tamicin and netilmicin derivatives were more
strongly bound to the stationary phase than either gentamicin
C or C- in both the ionised and unionised form. The most
likely explanation is the greater basicity of the additional
amino groups the components possess.
5.3.3 Effect of Salt on Retention
The effect of salts on the retention of the genta
micin derivatives was investigated because an impure water
source was observed to affect the order of retention vÆien used
in the mobile phase.
312The solvophobic theory predicts a linear increase in
the retention of a neutral solute as the ionic strength increases,
because of the corresponding progression in surface tension.
The surface tension of the eluting solvent is proportional
to the concentration of the electrolyte, and a plot of In k '
against I is linear. With ionised solutes, the electrostatic
effects associated with the salt influences retention as well
as the surface-tension. The reduced electrostatic repulsion
between solutes at low ionic strength dominates over surface
tension and an initial fall in k ' occurs. This is at a mini-321mum at I = 0.3, with about a 25% decrease in retention ,
and after this the retention increases due to the surface
tension effects. The general increase in retention with

243
surface tension can be explained by an increase in the free
energy of cavity formation in the mobile phase.
The concentration of potassium iodide in the mobile phase
was varied from 0.05 to 0.80 M (in respect to the aqueous
fraction) using the 80:20, methanol-water, mobile phase and
a Spherisorb column. A plot of the k ' value for each of the
components against concentration of salt is given in Figure
5.6. In the absence of salt no peaks were observed for
any of the compounds indicating that they were irreversibly
bound in those conditions. The figure shows the retention
behaviour of the gentamicin and components to be similar
yet the netilmicin and gentamicin components show different
curves. The gentamicin derivative elutes after the two
other components at low ionic strength, crosses the deri
vative at about 0.2 M and the derivative at about 0.4 M.
The netilmicin derivative shows a nearly parallel profile to
that of gentamicin C^. The reduction in k' value of the
gentamicin was by about a factor of 16 over this concen
tration range, which cannot be accounted for by the solvophobic
theory. However, the resemblance of Figure 5.6 to retention348behaviour on ion-exchange columns raises the possibility
that ion-exchange is occurring at the silanol groups.
Accordingly, a more thorough investigation of the nature of
the electrolyte species on retention was carried out. For a
cation exchanger the nature of the cation used in the mobile
phase is important, with selectivity dependent on several
factors. The ion-exchanger has a high affinity for ions of
higher valence, with greater polarizability and with a smaller

244
Figure 5.6. Effect of Potassium Iodide on Retention.
Conditions : Spherisorb Column; Mobile Phase as
previous, Salt concentration measured
wrt aqueous fraction.
K16
12
10
0.80.60.2 0.4
O Gentamicin C # Gentamicin C, □ Gentamicin C.
la
Concentration of salt (M) (KI)
Netilmicin

245
319,349solvated equivalent volume . For cation exchange resins319of relatively large fixed site ions the selectivity order is:
2+ + + + + + Ba > Cs > Rb > K > Na > Li
However this is not a general trend and a cation exchanger
with a small fixed ion can show a reversal of this selectivity^ 319order
The. nature of the anion will be unimportant unless ion-
pairing of the solute and salt occurs. The salts used in the
study were limited to those of high methanol solubility and
were univalent unless indicated.
An estimate of the relative strengths of the ions used
could not be based on retention times alone. The variation in
methanol content of the mobile phase due to degassing had a
significant effect on retention times. An internal standard
of the effect of the salt was to take the point when the
retention of the C component equalled that of the C component.
This was termed the crossover point and is used in
comparisons between solvents.
Plots of the retention characteristics of the components
in mobile phases containing sodium iodide, lithium chloride
and barium chloride are shown in Figures 5.7, 5.8, and 5.9
respectively. The crossover points estimated from graphs is
given in Table 5.2 along with values found for other salts.
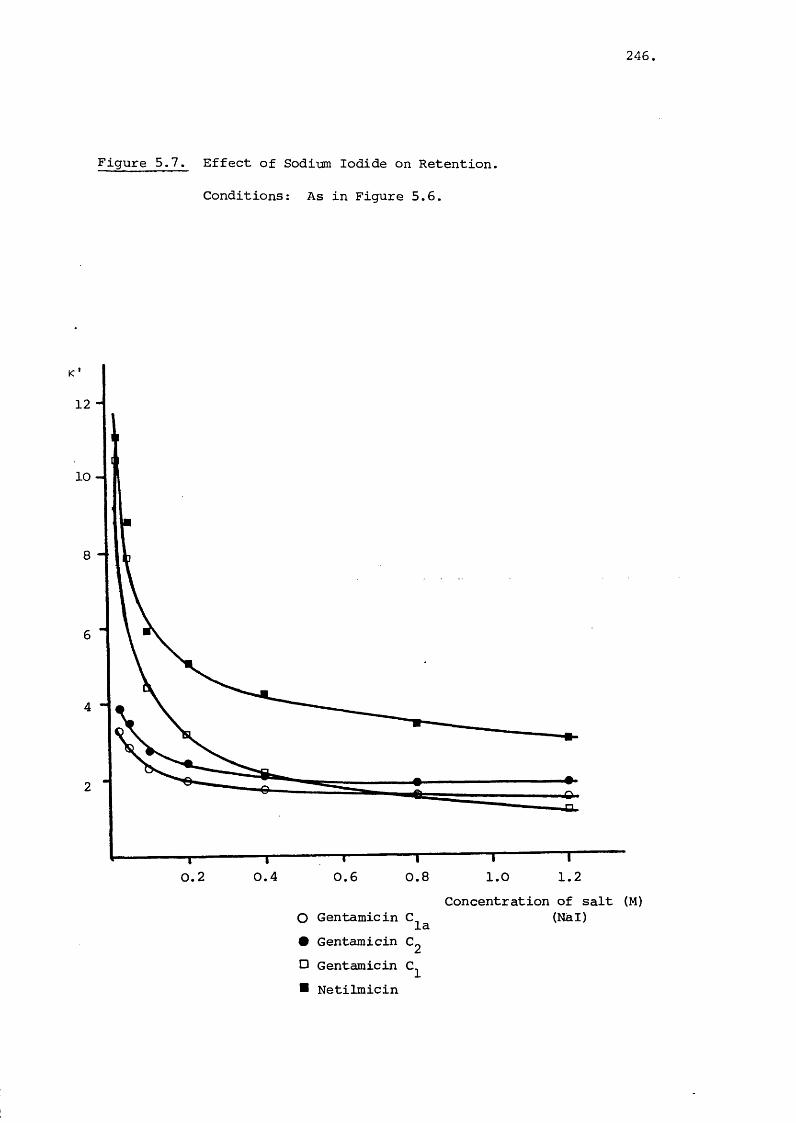
245,
Figure 5.7. Effect of Sodium Iodide on Retention.
Conditions: As in Figure 5.6.
12
10
0.4 0.8 1.20.2 0.6 1.0
O Gentamicin C # Gentamicin C, □ Gentamicin C,
laConcentration of salt (M)
(Nal)
Netilmicin

247
Figure 5.8. Effect of Lithium Chloride on RetentionConditions : As in Figure 5.6
20
15
10
2.4 (M)0.8 1.2 2.00.4 1.6
o Gentamicine Gentamicin□ Gentamicin■ Netilmicin
Concentration of salt LiCl
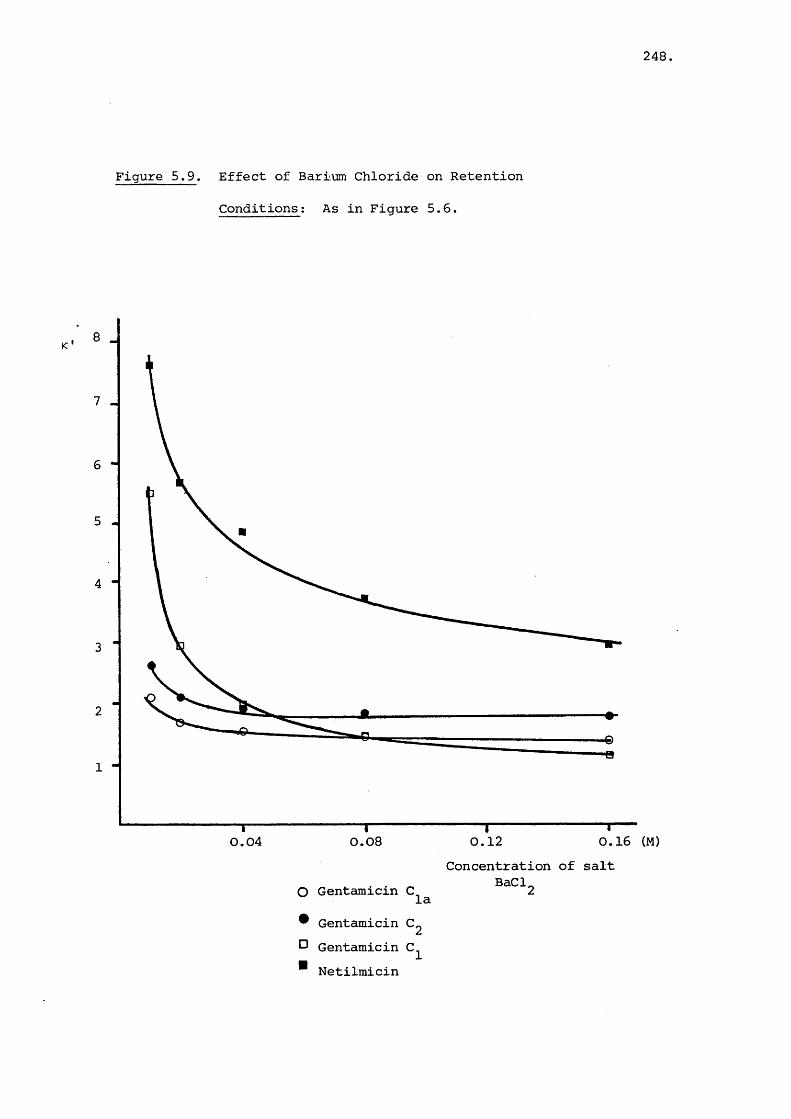
248,
Figure 5.9. Effect of Barium Chloride on Retention
Conditions : As in Figure 5.6.
7 -
6 -
5 -
1 -
— I--------------- 1—0.04 0.08
O Gentamicin C
I0.12 0.16 (M)
Concentration of salt BaCl_
la• Gentamicin C, O Gentamicin C.
Netilmicin

Table 5.2. Cross-over points of gentamicin C^ and C^^ with
different salts; observed and calculated
249
Column Salt Observed (M) Calculated(M) log k ' v s . log [x]
Spherisorb BaClg 0.08 0.09II KI 0.45 0.37II KSCN 0.45 0.39II KNO3 - 0.52II Nal 0.80 0.68It NaNOg 0.80 0.78II LiCl 1.40 2.10II EDTA,K3'*’ - 0.56
Zorbax KI 0.20 0.21
EDTAfKg 0.50 0.45
Hypers i l KI 0.004 0.004
The figures show that the components do behave in a similar
fashion for all four cations,though as can be seen in Table
5.2 there is a significant difference in the respective
eluting strengths. This is indicative that the column does
differentiate between cations, which can only be explained
by an ion-exchange mechanism. The concentrations given in
Table 5.2 are the molar concentrations in the aqueous phase.
However if the ionic strength contribution of barium is compared

250.
to that of potassium the comparison of the cross-over point
is of I = 0.16 to I = 0.20. This is perhaps a better comparison
of the two ions of differing valency, although the barium ion
is still stronger than the sodium and lithium ions. An inter
esting feature of Figure 5.8 is the rise in k ' value for the
gentamicin and components with increasing salt concen
tration. This is as predicted by the solvophobic theory and
reflects the concentration of salt exceeding 1.5 M (0.3 M
mobile phase). The gentamicin and netilmicin curves do not
show a similar increase perhaps reflecting a different mechanism.
The variation in column response to salt concentration was
investigated, using column packings of Zorbax ODS and Hypersil
ODS. The effect of potassium iodide concentration on the
retention of the four compounds on Zorbax is shewn in Figure 5.10.
The column temperature had to be maintained at 44°C to produce
satisfactory retention times and good peak shape. The graph
is very similar to that found for the Spherisorb column (Figure
5.6) except that the intercept of the and lines is
at a lower concentration of 0.2 M. The Zorbax ODS material is
a monolayer coverage of ODS but with a high carbon loading of
about 16% with no endcapping. It was thus expected to behave
similarly to the Spherisorb column. The Hypersil column on
the other hand has a monolayer coverage with a 9% carbon bonding
but it is extensively endcapped with presumably few residual
silanols present. This difference is reflected in Figure 5.11
which illustrates the effect of retention of potassium iodide
on this column. All three components of gentamicin are eluted

251
Figure 5.10. Effect of Potassium Iodide on Retention on
a Zorbax Column
Conditions ; Zorbax column; Mobile phase,
Methanol/Water 80:20, Salt measured w.r.t. aqueous
K
12
10
8
6
4
2
0,60.60.40.2
O Gentamicin C # Gentamicin C O Gentamicin C.
0.6 (M)
Concentration of salt KI
la
Netilmicin

252
Figure 5.11. Effect of Potassium Iodide on Retention on a
Hypersil Column
Conditions : Hypersil column. Mobile Phase,
K'Methanol/Water, 80:20, Salt measured w.r.t. aqueous
7
6
5
4
3
2
1
0.025 0.050 (M)Concentration of salt
KI
O Gentamicin Cla# Gentamicin C^
D Gentamicin C

253
in the absence of salt, which is different frcxn the other two
columns. Also a lower potassium iodide concentration is
required to produce crossover and the gentamicin
derivative is never retained for as long as on the two other
columns. A comparison of retention on the three different
columns with the same salt used indicates a common mechanism
of retention operating, with the salt having an important
role in determining the relative retention.
In published HPK: assays of gentamicin, ethylene-
diaminetetra-acetic acid (EDTA), tripotassium salt is generally
used in the elution solvent^^'^^^. Since the anion is more
complex than the simple electrolytes used in Table 5.2 the
effect of varying its concentration was examined. This is
plotted in Figure 5.12 for the Spherisorb column and the
concentration related to that of the potassium ion. The
retention of the gentamicin and is longer than that
observed in Figure 5.6 using potassium iodide. This may not
be significant as it could be due to variation in the methanol
content. However the difference in the retention of gentamicin
between the two figures is large. There is a maximum
value for k ' at aboiit :a concentration of 0.04 M which is not
seen for any of the other salts. After this peak the k '
decreases at about the same rate as in Figure 5.6. The
reason for this peak is unknown but may be due to the
multivalent, large, organic anion which could be ion-pairing^
or acting in an anomalous fashion at low concentration. The
plot of the effect of EDTA, tri-potassium salt on retention
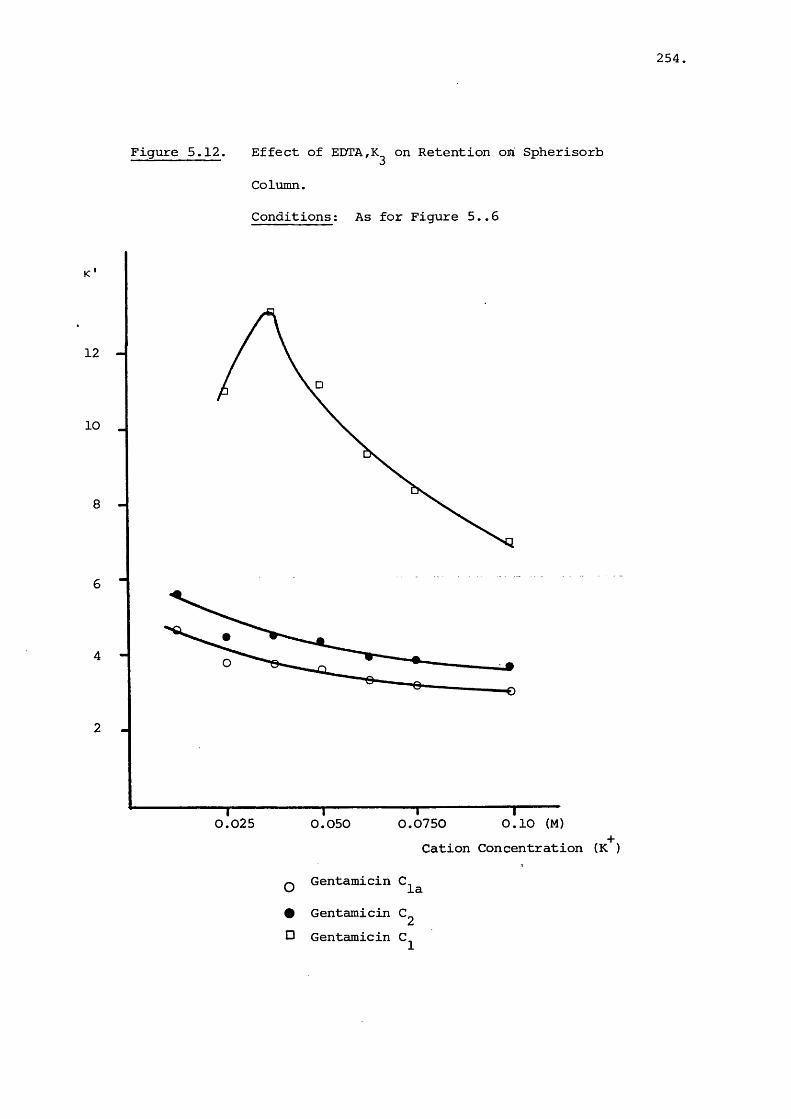
254
Figure 5.12. Effect of E D T A ^ o n Retention on Spherisorb
Column.
Conditions : As for Figure 5..6
12
10
8
6
4
2
0.10 (M)0.025 0.07500.050Cation Concentration (K )
Gentamicin C,U la# Gentamicin C„O Gentamicin C.
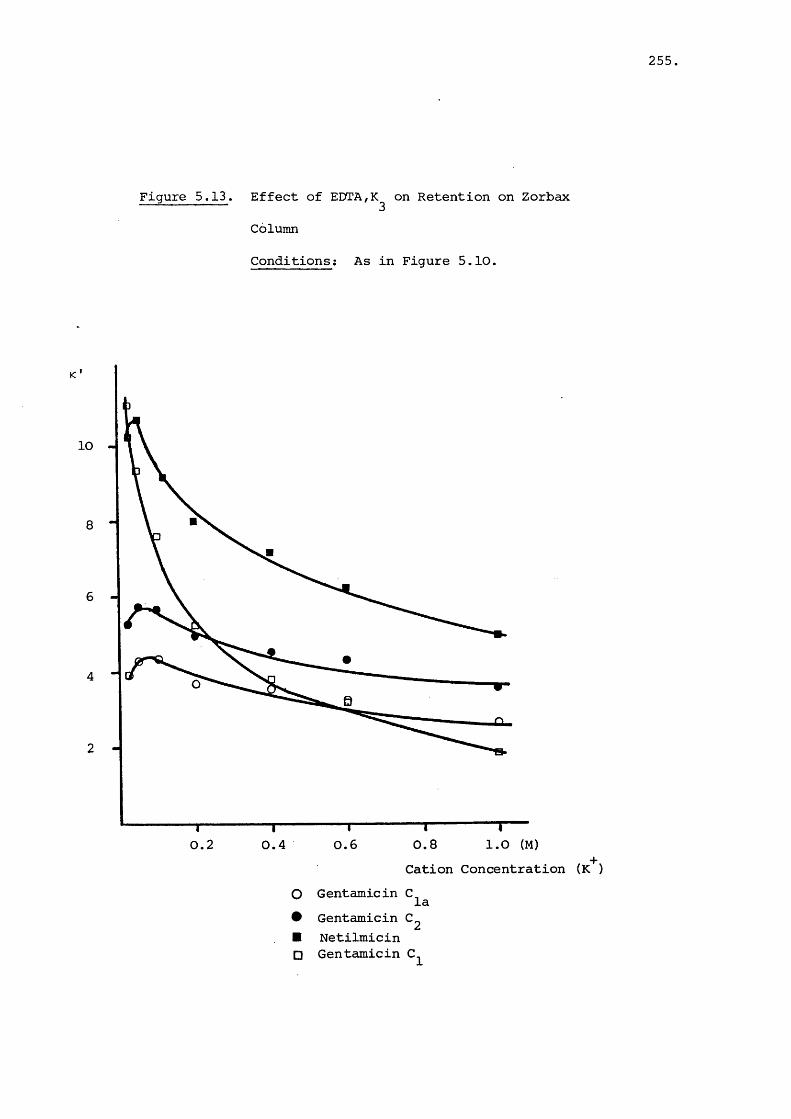
255
Figure 5.13. Effect of E D T A ^ o n Retention on Zorbax
Column
Conditions; As in Figure 5.10.
10
8
6
4
2
1.0 (M)0.80.2 0.60.4
OCation Concentration (K )
Gentamicin C.laGentamicin C^ Netilmicin Gentamicin C.

256,
using a Zorbax column is shown in Figure 5.13. This time it is
all the other components except gentamicin which experience
a maximum k ' value at low salt concentrations (0.05 M). No
plausible reason can be suggested for the effect or why only
some components experience this effect but not consistently.
The cross-over point of the is at 0.5 M indicating
that the EDTA salt is less effective than the simple electrolyte.
This may arise from a low dissociation constant for the salt.
The EDTA salt on both columns has been shown to exhibit the
same pattern of behaviour and a larger effective concentration
of potassium was required to produce similar retention to the
simple electrolytes.
If an ion-exchange process is a major determinant of
retention ±t would be useful to quantifete the amount of silanol
groups present in each stationary phase. Qualitative tests
for silanols were mentioned in the introduction, but a semi-
empirical estimate of silanol groups present can be made from
the surface coverage of the ODS material. This obviously is
limited and cannot take into account coverage by endcapping
reagents. It is assumed that the total amount of residual-2silanols available for reaction is 4.5 ymoles m , and
that the figures taken for surface coverage from manufacturers
data are correct. The coverage of residual silanols is therefore;

257
Table 5.3. Percentage coverage of silanols on different columns
Surface coverage (ymol m )
% coverage (silanols)
Spherisorb 1.36 30
Zorbax 2.50 54
Hypersil 3.52 77
The figures are only intended as a rough guide to polarity
of the phases and not as accurate determinations. Spherisorb
probably has a greater coverage of silanols than shown because
a partial end-capping reaction is performed. However, the
effect of the silanols is likely to be greater than the Zorbax
material because of the lower carbon.loading .shielding the___
groups. Hypersil would have a much smaller influence of
silanols and this is supported by Figure 5.11. The above
order of values is consistent with the need for lower concen
tration of potassium iodide with Zorbax and especially Hypersil
when compared to Spherisorb.
For ion-exchange the capacity factor (k ') is usually
directly proportional to the reciprocal of the concentration
of the metal ion for a univalent solute ion and proportional
to the reciprocal of the square of the concentration of the241metal ion for a divalent solute . The calculated slopes
of K ' against — — and — — for gentamicin C_ in a 2 cone ,---- 1cone vconcpotassium iodide mobile phase are shown in Table 5.4.

Table 5.4. Slopes of possible ion-exchange relationships for
potassium iodide
258
K ' V' Scone
K ' v's cone K'V'S /cone
slope
0.958
0.00134
0.988
0.148
0.995
1.75
A plot of K ' Xr's for all compounds in the/cone
potassium iodide mobile phase on Spherisorb is shown in Figure
5.14. For other salts the same relative correlations are found
for gentamicin with the / relationship giving the mostcone
linear fit. This was used because the k ' against cone graph
gave a curve and it was apparent that would decrease/cone
this tendency, though not entirely eliminate it. The other
components also show the highest correlation with k ' against
^ — , but they are much less significant. The reason whycone/
K ' against is not linear may arise from the retentionconenot being solely governed by ion-exchange.
In ion-exchange the logarithm of the distribution co
efficient (K ) is related to the logarithm of the salt con
centration
to K' by
319,350 The distribution coefficient can be related
= K.Vs
A Vm
Vs is volume of stationary phase
Vm is volume of mobile phase

259.
<u
o•H
•rlcnin
Sâ
'I'Io§u
JT*I
+JrH(0in
IHo
0 u0)1in
(U+JmonJÜ0&u0)u<D5+1inC■rH1o
in
hoo
-CM
CMCNt— I iH
-HÜ-H
•rH■Pa)
rH •uc-HÜIÜ
uti•Hu•HInJfH
uc■HU•H
4J§0
I•H
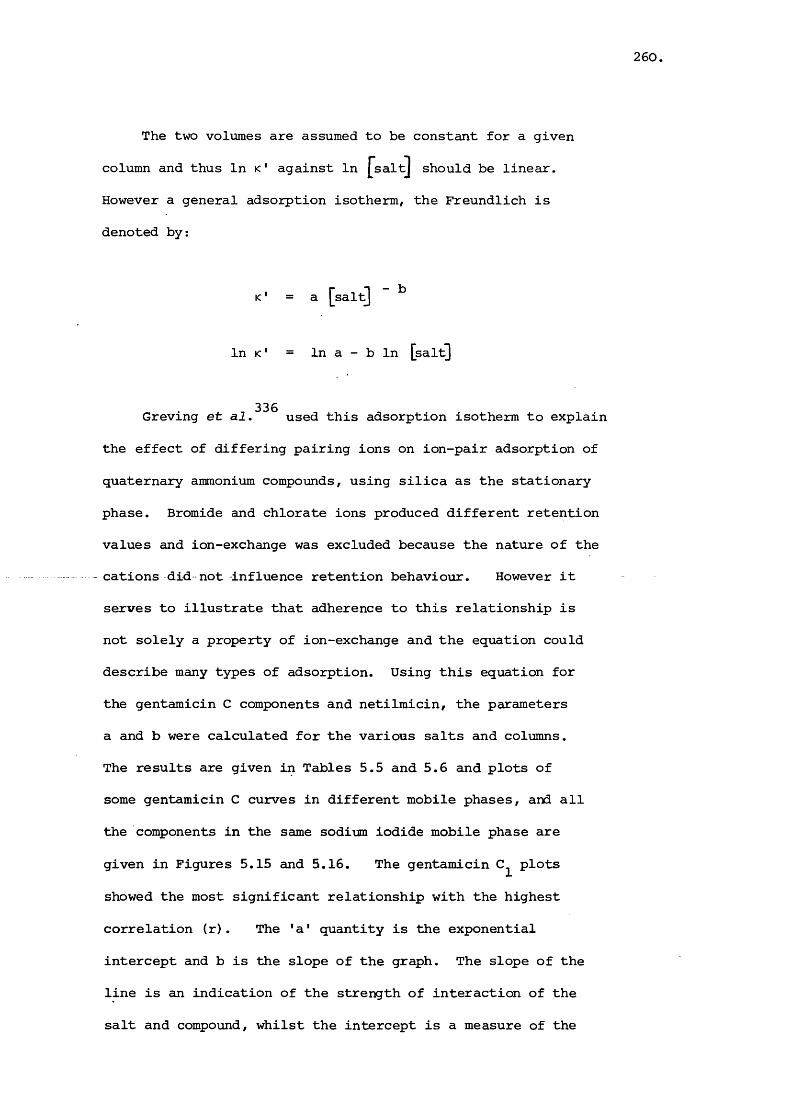
260.
The two volumes are assumed to be constant for a given
column and thus In k ' against In [saltj should be linear.
However a general adsorption isotherm, the Freundlich is
denoted by;
- b= a [salt]
In k ' = In a - b In [salt]
336Graving et al, used this adsorption isotherm to explain
the effect of differing pairing ions on ion-pair adsorption of
quaternary ammonium compounds, using silica as the stationary
phase. Bromide and chlorate ions produced different retention
values and ion-exchange was excluded because the nature of the
cations did not influence retention behaviour. However it
serves to illustrate that adherence to this relationship is
not solely a property of ion-exchange and the equation could
describe many types of adsorption. Using this equation for
the gentamicin C components and netilmicin, the parameters
a and b were calculated for the various salts and columns.
The results are given in Tables 5.5 and 5.6 and plots of
some gentamicin C curves in different mobile phases, and all
the components in the same sodium iodide mobile phase are
given in Figures 5.15 and 5.16. The gentamicin plots
showed the most significant relationship with the highest
correlation (r). The 'a* quantity is the exponential
intercept and b is the slope of the graph. The slope of the
line is an indication of the strength of interaction of the
salt and compound, whilst the intercept is a measure of the
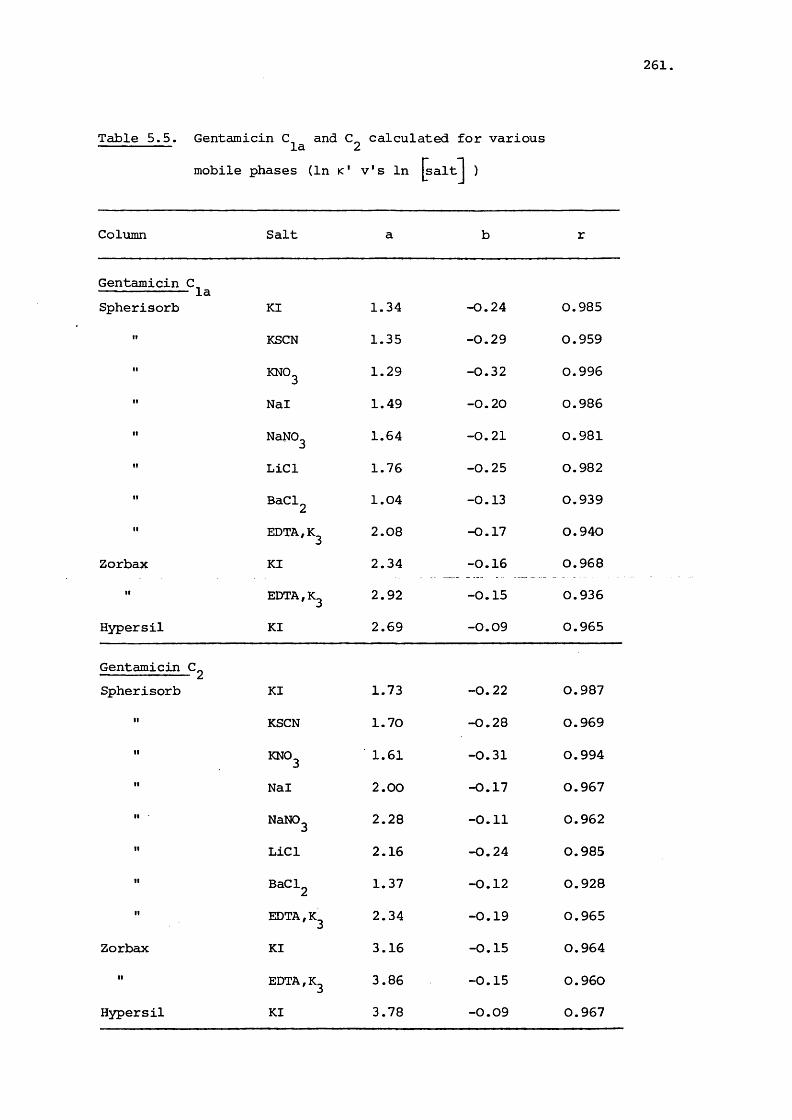
Table 5.5. Gentamicin and calculated for various
mobile phases (In k ' v 's In jsaltj )
261,
Column Sait a b r
Gentamicin C, laSpherisorb Kl 1.34 -0.24 0.985
KSCN 1.35 -0.29 0.959
KNO3 1.29 -0.32 0.996
Nal 1.49 -0.20 0.986
NaNOg 1.64 -0.21 0.981
LiCl 1.76 -0.25 0.982
BaClg 1.04 -0.13 0.939
EDTAfKg 2.08 -0.17 0.940
Zorbax Kl 2.34 -0.16 0.968
EDTAfKg 2.92 -0.15 0.936
Hypersil Kl 2.69 -0.09 0.965
GentamicinSpherisorb Kl 1.73 -0.22 0.987
KSCN 1.70 -0.28 0.969
KNO3 1.61 -0.31 0.994
Nal 2.00 -0.17 0.967
NaN03 2.28 -0.11 0.962
LiCl 2.16 -0.24 0.985
BaClg 1.37 -0.12 0.928
EDTA,K3 2.34 -0.19 0.965
Zorbax Kl 3.16 -0.15 0.964
EDTA,K3 3.86 -0.15 0.960
Hypersil Kl 3.78 -0.09 0.967
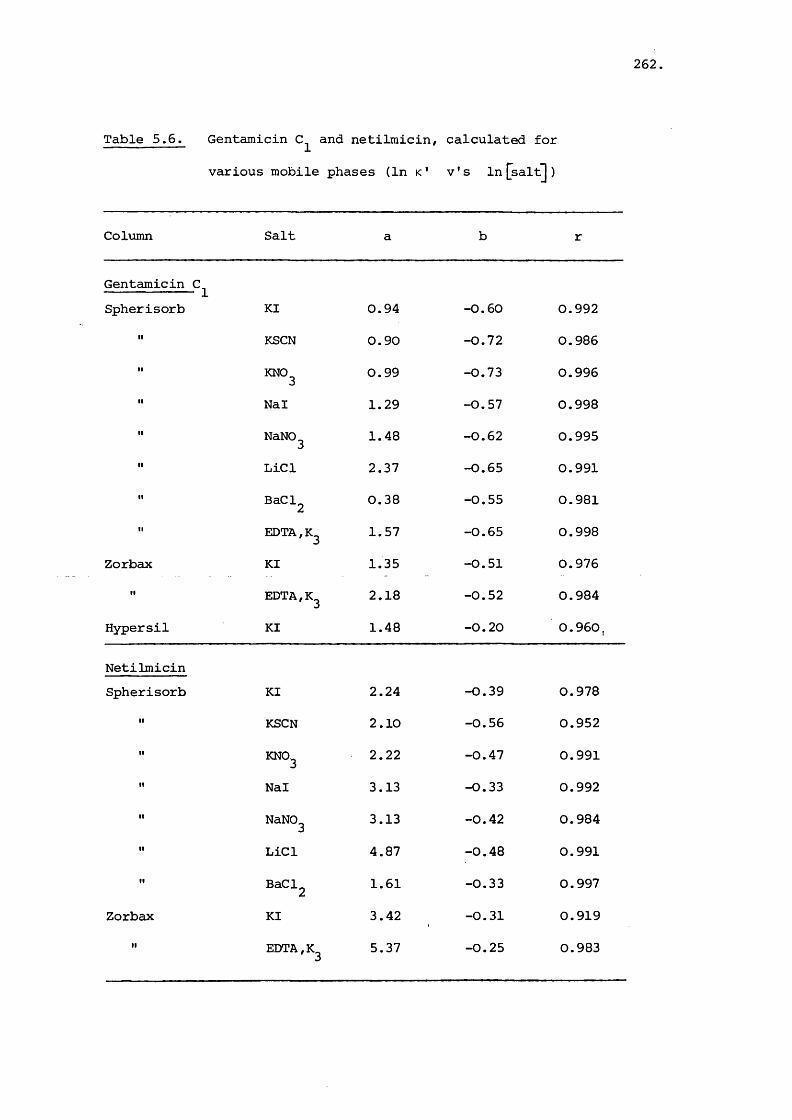
Table 5.6. Gentamicin and netilmicin, calculated for
various mobile phases (In k ' v's In [salt] )
262
Column Salt a b r
Gentamicin C^ Spherisorb KI 0.94 -0.60 0.992
KSCN 0.90 -0.72 0.986
KNO3 0.99 -0.73 0.996
Nal 1.29 -0.57 0.998
NaN03 1.48 -0.62 0.995
LiCl 2.37 -0.65 0.991
BaClg 0.38 -0.55 0.981
EDTA,K3 1.57 -0.65 0.998
Zorbax KI 1.35 -0.51 0.976
EDTA,K3 2.18 -0.52 0.984
Hypersil KI 1.48 -0.20 0.960,
NetilmicinSpherisorb KI 2.24 —0 .39 0.978
KSCN 2.10 -0.56 0.952
KNO3 2.22 -0.47 0.991
Nal 3.13 -0.33 0.992
NaN03 3.13 -0.42 0.984
LiCl 4.87 -0.48 0.991
BaClg 1.61 -0.33 0.997
Zorbax KI 3.42 -0.31 0.919
EDTA,K3 5.37 -0.25 0.983
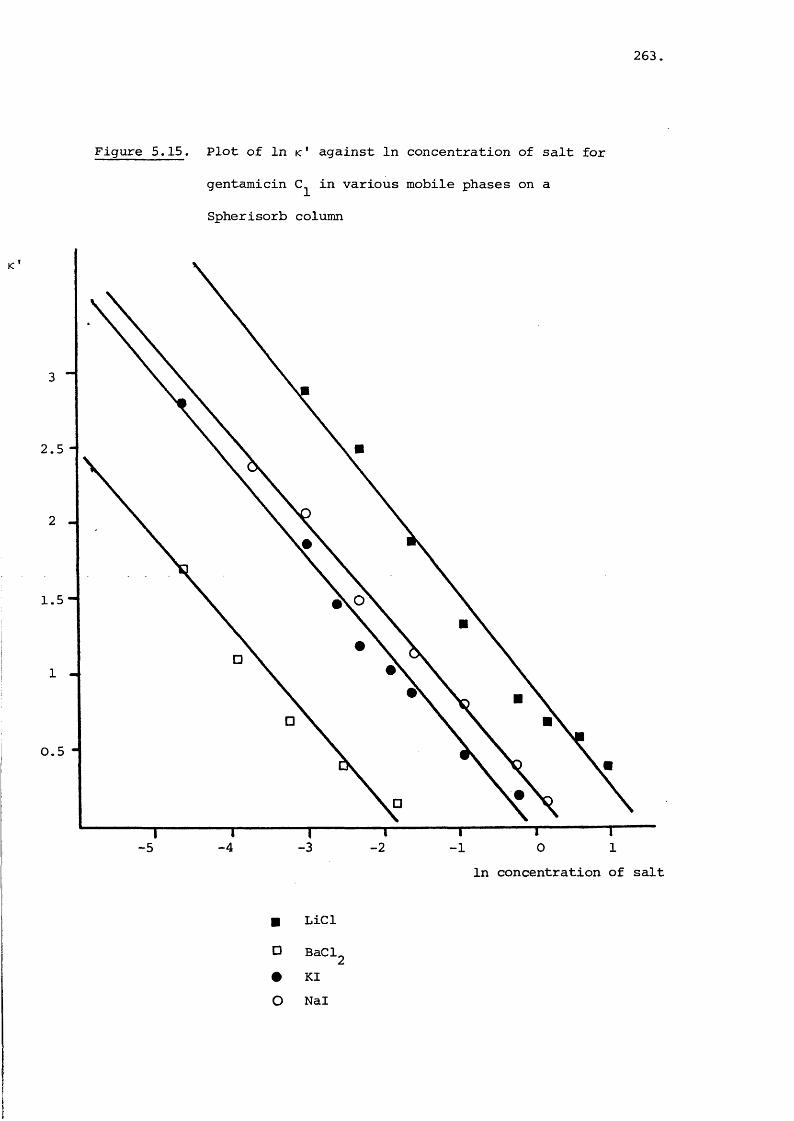
263
Figure 5.15. Plot of In k ' against In concentration of salt for
gentamicin in various mobile phases on a
Spherisorb column
0.5
-3-4 -2-5 1-1 OIn concentration of salt
■ LiCl
O Bad, • KI O Nal
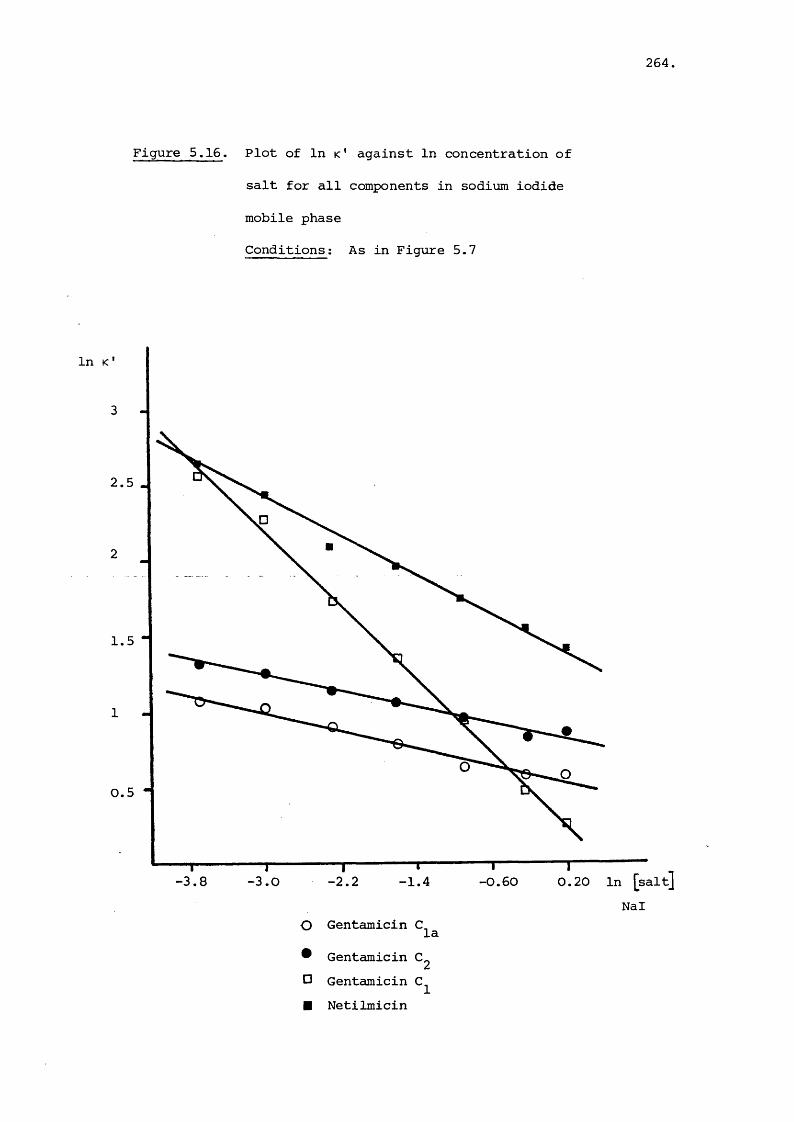
264,
Figure 5.16. Plot of In k ' against In concentration of
salt for all components in sodium iodide
mobile phase
Conditions : As in Figure 5.7
In K '
.5
1.5
1
0.5
0.20 In [salt] Nal
-3.8 -3.0 - 2 . 2 -1.4 -0.60
O Gentamicin Cla• Gentamicin C, O Gentamicin C.■ Netilmicin

265
K' value at unit concentration. The scatter of b values for
one compound in the different mobile phases indicates that b
is a measure of the general adsorption of the solute and is
not a measure of specific interactions arising from the
nature of the cation. The b value on the Hypersil column
is smaller, but the Zorbax column yields similar b values to
the Spherisorb column. The b value for gentamicin is greater
than for any other component, whilst the and components
are nearly identical, showing the same adsorption pattern.
The a values show the relative retention at [salt) = 1.00
and reveal the expected selectivity trend of the cation exchange:
2+ + + + Ba > K > Na > Li
The EDTA, tri potassium salt shows longer retention than
the other potassium salts which, as previously mentioned, is
probably an anion effect.
These results suggest that at least the gentamicin com
ponent may be retained by an ion-exchange mechanism with the
other components having other factors, and possibly another
mechanism, involved. It thus also confirms the non-linear
plot of the temperature dependence of retention (Figure 5,2).
Various authors have reported a two site adsorption
retention model on reverse phase p a c k i n g s ^ ^ ^ a n d equations
have been formulated to express the unusual retention. Two

266
of these models were tested on the data obtained in this study
in an attempt to gain further insight into the effect of salt
on retention of the gentamicin components.
Stranahan^^^ developed a four parameter thermodynamic
model to account for the effect of salts in reversed phase
chromatography with special reference to ion-pair formation.
The distribution coefficient (K) of a solute was related to
the concentration of an "ion-interaction reagent" (HR) with
regard to various physical properties of the solute and system.
The action of the H R was described as comprising of ion-
interaction and interfacial tension effects. In applying
this equation to the present set of data it was decided to
disregard the interfacial tension effect, as the simple
electrolytes used here would influence the tension less than
the surfactants used in the paper. It also simplified calcu
lation as the equation was reduced to three unknown parameters.
The equation devised by Stranahan was:
K = exp (In — g- + In yil +V o RT RTa
where is average molar volume of solute in liquid phase
is average molar volume of solute in adsorbed phase
is activity coefficient of solute in liquid phase
6 is interfacial tension of system
0^° is interfacial tension of pure solute in equilibrium
with solid adsorbent
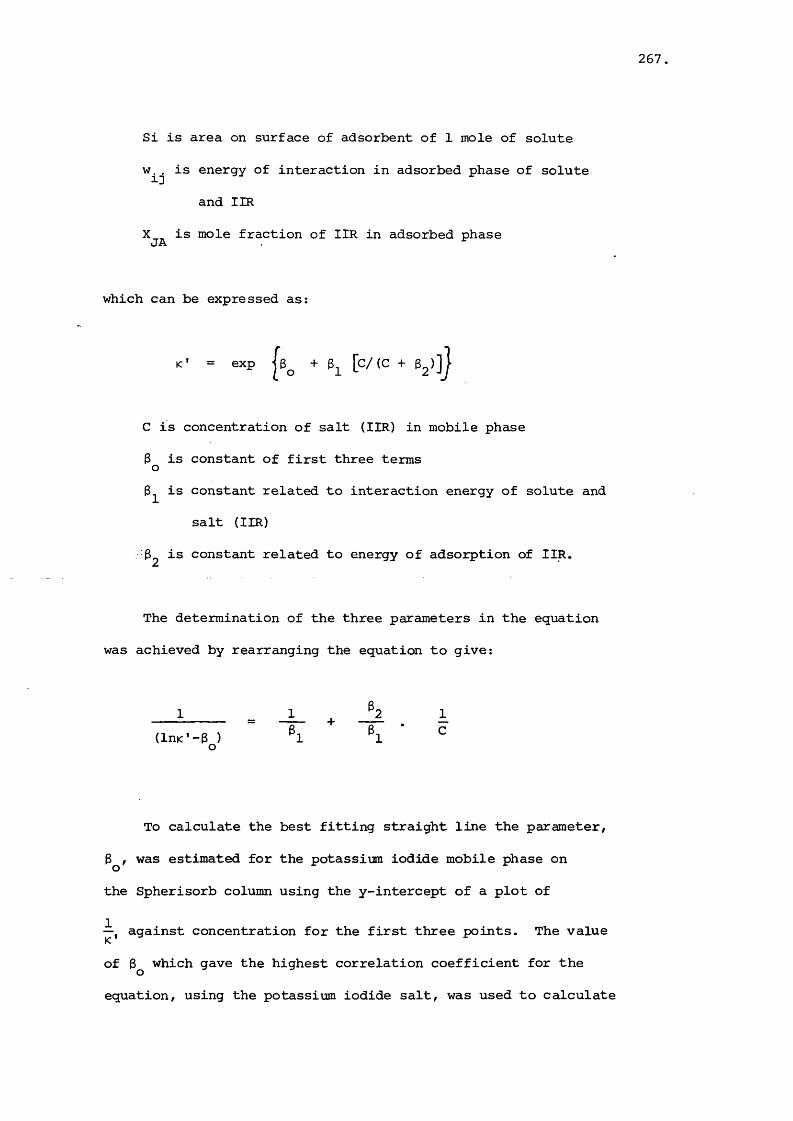
267
Si is area on surface of adsorbent of 1 mole of solute
is energy of interaction in adsorbed phase of solute
and IIR
is mole fraction of IIR in adsorbed phase
which can be expressed as:
K ' = exp [c/ (c + 62)]]
C is concentration of salt (IIR) in mobile phase
3 is constant of first three terms o3^ is constant related to interaction energy of solute and
salt (IIR)
^2 is constant related to energy of adsorption of IIR.
The determination of the three parameters in the equation
was achieved by rearranging the equation to give:
(lnc'-3 ) ^1 1o
To calculate the best fitting straight line the parameter,
3^, was estimated for the potassium iodide mobile phase on
the Spherisorb column using the y-intercept of a plot of
against concentration for the first three points. The value
of 3^ which gave the highest correlation coefficient for the
equation, using the potassium iodide salt, was used to calculate

268,
the other parameters. The logarithm of the capacity factor
at zero salt concentration is equivalent to 3^, so this could
be used for the Hypersil column. For the individual components
on the Spherisorb column the same 3^ value was used wherarer
possible and separate optimum values were found for the Zorbax
column. The values of the three parameters for all salts and
columns are given in Tables 5.7 and 5.8, as are the Gibbs
free energy of adsorption (AG°) calculated from:^^^
AG° = RT In ^277.5
The plot of the three parameter equation applied to the
retention in the potassium iodide mobile phase is shown in
Figure 5.17, and applied to the ordinary k' against concen
tration plot in Figure 5.18. The latter shows that fitting
the parameters can reproduce the k ' values fairly well though
the flattening out of the netilmicin curve is not accounted for.
The term 3^ is a measure of the interaction of the salt
(IIR) with the stationary phase, which is most likely to occur
at the silanol groups. The AG° value calculated should ideally
be the same for all solutes in the mobile phase since it is
independent of solute. The larger the AG° for the salt the
less concentration should be required to elyte the solutes.
The average AG° taken from all four compounds for all the salts
is given in Table 5.9. The pattern of the figures in Table 5.9
is not entirely consistent with experimental observations,
since the sodium salts possess a larger AG° value than the

269,
Table 5.7. stranahan's equation applied to gentamicin and
curves
Column Salt Co 9l r AG°(KJ mol -1)
GentamicinSpherisorb
— laKI 1.53 -1.29 0.09 0.999 -20.24
KSCN -2.17 0.35 0.971 -16.82
KNO3 -1.50 0.19 0.999 -18.36
Nal -1.08 0.05 0.985 -21.72
NaNOg -1.10 0.10 0.999 -19.97
LiCl -1.12 0.22 0.994 -17.99
BaClg -1.25 0.006 0.993 -27.06
EDTA K3 -0.56 0.20 0.888 -18.23
Zorbax KI 1.50 -1.18 0.36 0.955 -17.52
EDTAfKg —0.91 5.34 0.940 (-10.41)
Hypersil KI 1.51 -0.23 0.01 0.890 -25.77
GentamicinSpherisorb KI 1.67 -1.29 0.11 0.999 -19.73
KSCN -2.28 0.44 0.970 -16.24II KNO3 -1.74 0.28 0.992 -17.38II Nal -1.00 0.06 0.993 -21.26II NaN03 -1.02 0.12 0.998 -19.51II LiCl -3.18 1.04 0.939 -14.07
BaCl2 -1.14 0.005 0.986 -27.52
EDTA,K3 -0.90 0.08 0.974 -20.53
Zorbax KI 1.97 —0.86 0.08 0.993 -21.48
EDTA K3 1.79 -0.72 3.04 0.968 (-11.90)
Hypersil KI 1.88 -0.27 0.009 0.886 -26.04

Table 5.8. Stranahan's equation applied to gentamicin C and
netilmicin curves
270.
Coluipn;
Salt ^2 r Ag° (KJ -1mol )
Gentamicin
Spherisorb KI 3.22 -3.21 0.06 0.999 -21.26
KSCN -3.76 0.13 0.995 -19.31
KNO3 -3.23 0.11 0.999 -19.73
Nal -2.83 0.06 0.990 -21.26
NaN03 -2.85 0.10 0.995 -19.97
LiCl -4.20 0.54 0.994 -15.72
B a d 2 -3.28 0.01 0.999 -25.77
EDTA,K3 -3.32 0.62 0.998 -15.38
Zorbax KI 3.22 -3.03 0.07 0.987 -21184
EDTA,K3 —2.03 0.16 0.948 -19.66
Hypersil KI 1.59 -0.53 0.01 0.858 -25.77
Netilmicin
Spherisorb KI 2.77 -2.50 0.15 0.998 -18.95
KSCN 3.55 -3.01 0.10 0.991 -19.97
KNO3 2.77 -1.92 0.12 0.991 -19.51
Nal -1.73 0.09 0.998 -20.24
NaN03 -2.01 0.22 0.996 -17.99
LiCl -1.62 0.45 0.989 -16.18
BaClg -1.70 0.01 0.993 -25.77
Zorbax KI 2.77 -3.37 0.34 0.972 -17.67
EDTA,K3 -1.04 0.34 0.978 -17.67
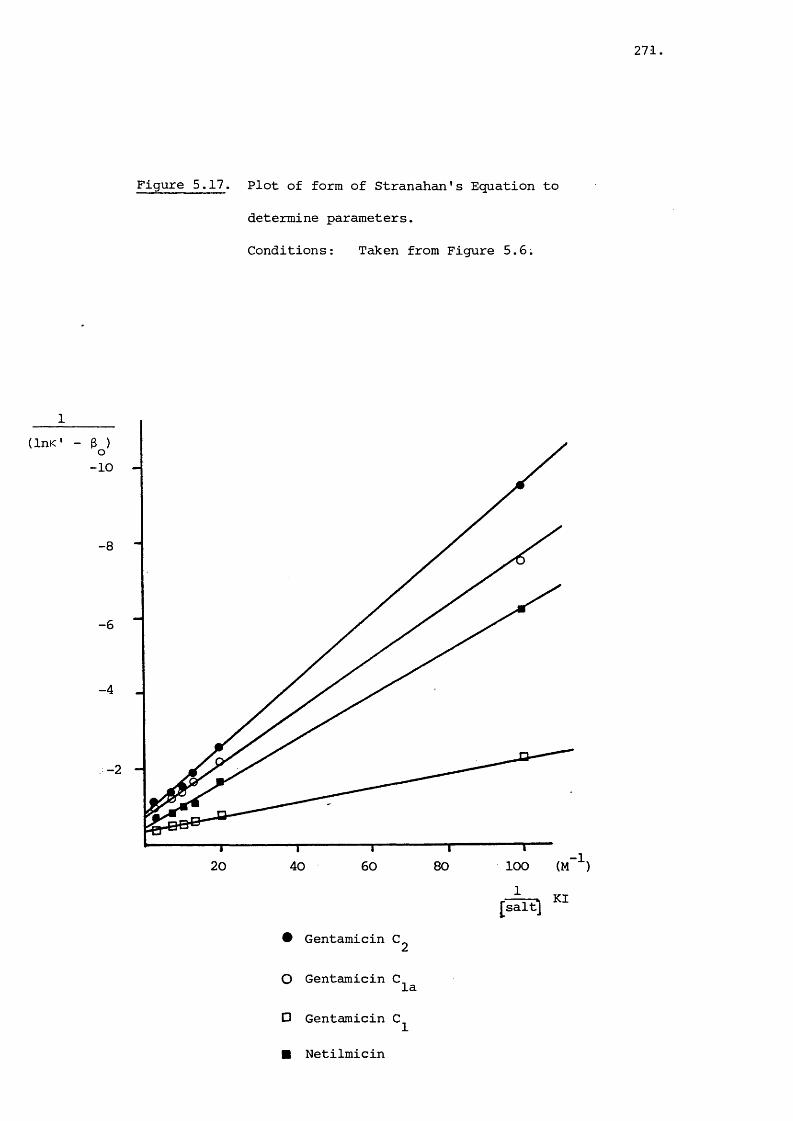
271
Figure 5.17. Plot of form of Stranahan’s Equation to
determine parameters.
Conditions : Taken from Figure 5.6.
(InK-10
-8
-6
-4
2
-1(M20 8040 60 100
# Gentamicin C,
O Gentamicin Cla
□ Gentamicin C.
[salt] KI
Netilmicin
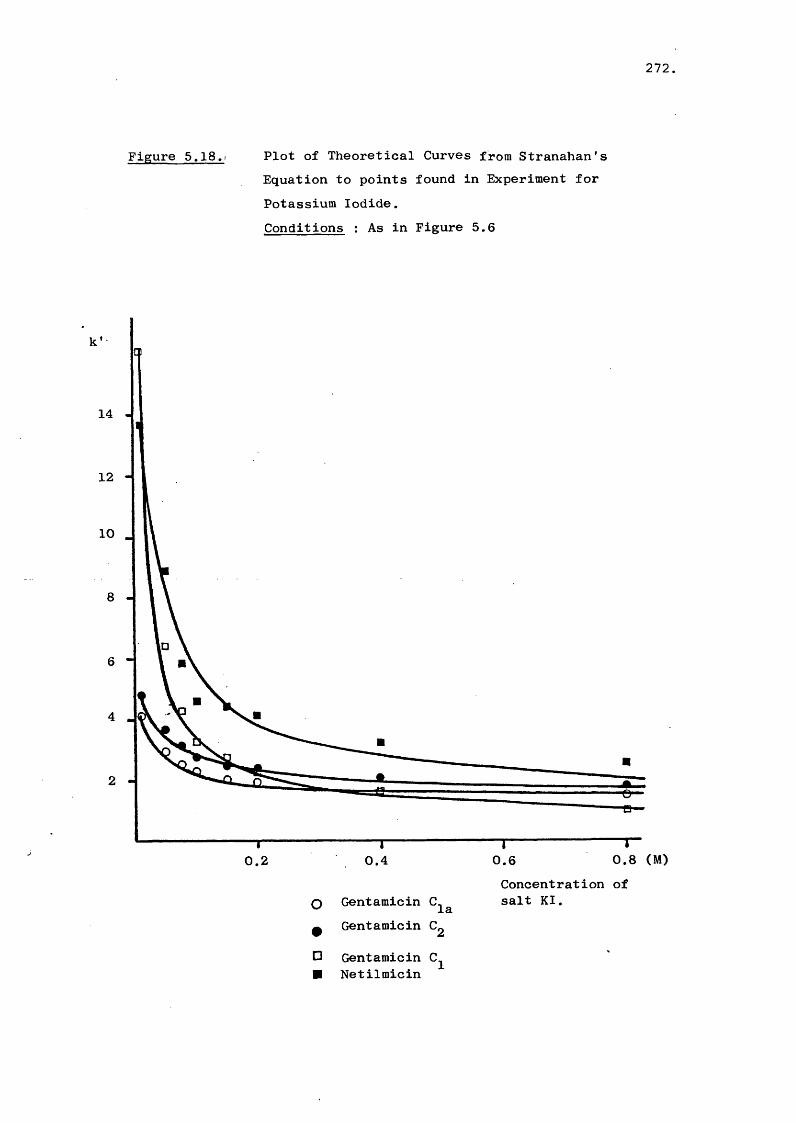
272
Figure 5.18., Plot of Theoretical Curves from Stranahan's Equation to points found in Experiment for Potassium Iodide.Conditions : As in Figure 5.6
k
14
12
10
0.8 (M)0.4 0.60.2
O Gentamicin C^^ A Gentamicin C_
Concentration of salt KI.
□ Gentamicin C ■ Netilmicin

273
potassium salts although the difference is small. The barium
and lithium salts behave as expected whilst the EDTA salt is
close to the value for other potassium salts although it is
subject to large variations. The value of the potassium ion
Table 5.9. Free energy of adsorption of the salts
Column Salt 0 —1 AG (KJ mol ) Standard Deviation
Spherisorb KI -20.04 0.97
KSCN -18.09 1.83It KNO3 -18.75 1.09II Nal -21.12 0.6311 NaNOg -19.36 0.94II LiCl -15.99 1.61II BaClg -26.53 0.90II EDTA,K3 -18.05 2.58
Zorbax KI -19.63 2.35
EDTAfKg -18.67 -
Hypersil KI -25.86 0.16
oh the Hypersil column is significantly larger than for the
other two columns and may indicate that this is not a true
measure of the AG° term. This is probably because the ions
are not following surfactant behaviour, which is a premiss
of the equation for AG°. Stranahan^^^ determined a value of-1 -1 “8.62 KJ mol for octylamine and -4.98 to -16,95 KJ mol
274,
for a series of anionic surfactants. These were most probably
being adsorbed by hydrophobic bonding since there was little
change in AG° between cationic and anionic species. The higher
values of AG° reported here, may reflect the greater energies
of ionic bonding, though comparison with Stranahan's results
cannot be made with confidence.
The 3^ term is related to the interaction energy of the
salt and solute, with the negative sign indicating a repulsive
effect. The size of the repulsion is greatest for the gentamicin
solute, with the netilmicin also larger than the gentamicin
or C3 derivative values. This is possibly due to the
presence of two secondary amino groups on the gentamicin
and netilmicin, or to the greater basicity of the additional
secondary amino groxç». The size of this interaction is variable
and is also different on the individual columns.
A fairly good fit of the data is obtained by this method
despite the IIR used being salts and not surfactants. The
constraint of using the same 3 value reduced the correlation
since there was some variation in the mobile phase composition
in the absence of salt. The thermodynamic quantities obtained
with the equation may not be completely trustworthy for the
reasons mentioned and also because of the omission of the
surface tension term. It does demonstrate that simple electro
lytes can be compared with surfactants, at least in some
applications of BPC.
275
Organic amines have been used in reversed phase BPC
because they are thought to mask silanol groups which:could
influence retention. The theory of dual site adsorption
has produced equations which directly relate the capacity
factors of solute to the concentration of amine used^^^'^^^.
The masking of the silanols, by such amines as dimethyloctylamine
and hexadecyltrimethylammonium bromide, is thought to increase
the regularity of reverse phase characteristics. Bij et
derived an equation, assuming that there are two binding sites
of different affinity available, which are probably the hydro
carbon ligand and the silanol groups. However since similar
behaviour can be observed on silica^^^'^^^'^^^, the equation
has to be considered as a general expression of reverse phase
chromatography. The simple equation derived is:
• 'o <2
where [a] is concentration of masking agent
K^' is capacity factor in absence of agent
is binding constant of agent to silanol groups
<2 is capacity factor due to silanophilic binding in
absence of agent.
Although this equation was devised to account for different
sites of adsorption, where the silanols are thought to adsorb by
hydrogen bonding or electrostatic interactions, it can also
be applied to the ion-exchange/hydrophobic adsorption thought
276,
to be occurring here. The salt concentrations required would
be assumed to be greater than those required by the amine because
of the hydrophobic environment of the silanol site. Since only
the Hypersil column could elute peaks at zero concentration of
salt the K ' values for the other two columns were taken as the oexponential (3 ) values from the Stranaham equation. Using
these figures the plot of — ,against [a ] was made for allo
compounds and salts, with an example shown in Figure 5.19 of
the solutes in potassium iodide mobile phase on the Spherisorb
column. The k^, and values were calculated for each*
salt and column as shown in Tables 5.10 and 5.11. Here C,Arepresents the concentration of salt required to mask 90% of
the silanols present and is useful as a guide to the effective--1ness of the salt. This was calculated from lO K . TheA
figure is a measure of the affinity of the cations for the
silanol groups. This should be independent of solute but it
is obvious from Tables 5.10 and 5.11 that this is not the case.
There is also no real trend apparent in the difference between
salts. Papp et reported the use of this equation for
the effect of sodium and potassium ions on the retention of-1aromatic amines. They reported (mmol ) values of 4.5 and
13.5 for sodium and potassium ions respectively although there
was considerable scatter.’in the data presented. These are about
a hundred times greater than the values found here, and no similar
difference between the sodium and potassium ions is shown by
these figures. The smaller concentrations of ions required to
mask the effect of silanols in that paper may be reflective of
the packing material; Lichrosorb RP-18 which has a high carbon

277
[A]
Figure 5.19. Fitting Bij's equation to points found using
potassium iodide
Conditions: As in Figure 5.6.
K'o- K'
0.3 -
0.2 -
0 .1-
0.2 0.4 0.6 0.8 (M)
O Gentamicin C ^ Netilmicin□ Gentamicin C * Gentamicin C
1
2la
Concentration of salt KI
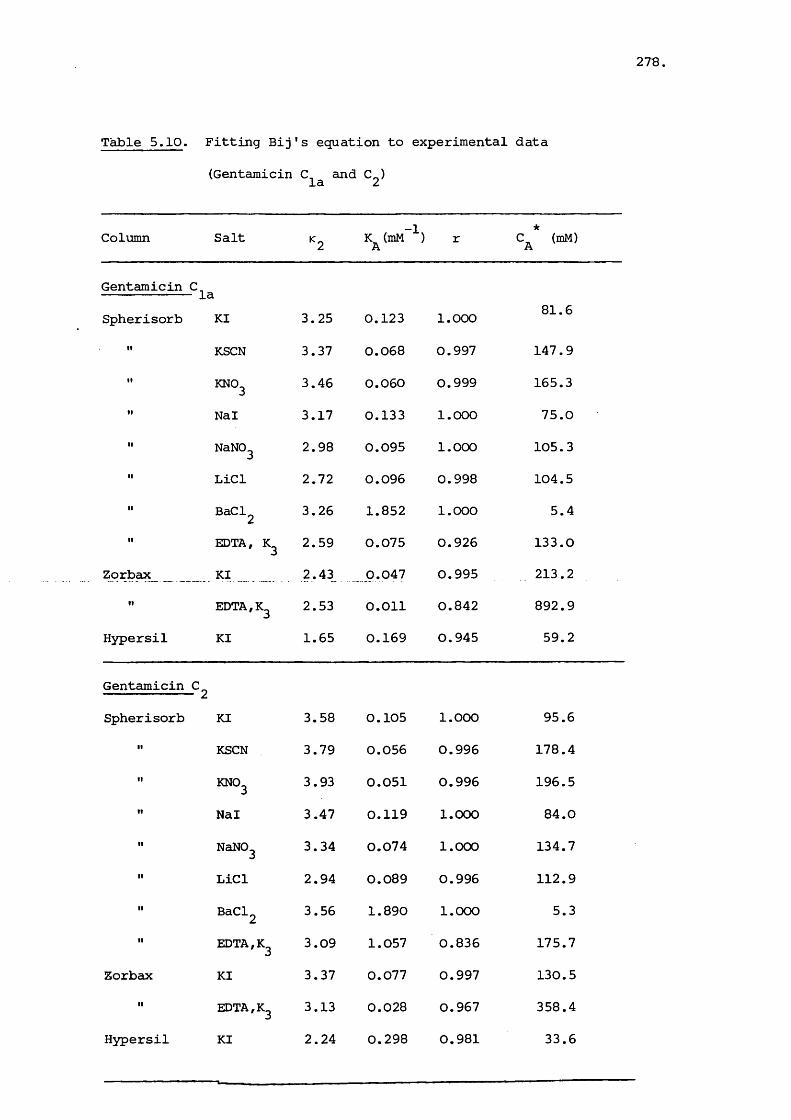
Table 5.10. Fitting Bij's equation to experimental data
278,
(Gentamicin Cia and
Column Salt %2 K^(mM” ) r C^* (mM)
Gentamicin -^laSpherisorb KI 3.25 0.123 1.000 81.6
KSCN 3.37 0.068 0.997 147.9
KNO3 3.46 0.060 0.999 165.3
Nal 3.17 0.133 1.000 75.0
NaNOg 2.98 0.095 1.000 105.3
LiCl 2.72 0.096 0.998 104.5
BaClg 3.26 1.852 1.000 5.4
EDTA, K3 2.59 0.075 0.926 133.0
Zorbax ___KI 2.43 0.047 0.995 213.2
EDTAfK^ 2.53 0.011 0.842 892.9
Hypersil KI 1.65 0.169 0.945 59.2
Gentamicin -^2Spherisorb KI 3.58 0.105 1.000 95.6
II KSCN 3.79 0.056 0.996 178.4It KNO3 3.93 0.051 0.996 196.5II Nal 3.47 0.119 1.000 84.0II NaN03 3.34 0.074 1.000 134.7II LiCl 2.94 0.089 0.996 112.9II BaClg 3.56 1.890 1.000 5.3II edta,K3 3.09 1.057 0.836 175.7
Zorbax KI 3.37 0.077 0.997 130.5
edta,K3 3.13 0.028 0.967 358.4
Hypersil KI 2.24 0.298 0.981 33.6

Table 5.11. Fitting Bij's equation to experimental data
(Gentamicin and netilmicin)
279,
Column Salt ^2 (mM r*
C^ (mM)
Gentamicin C^ Spherisorb KI 24.20 0.355 1.000 28.2
KSCN 24.49 0.236 1.000 42.4
KNO3 24.47 0.200 1.000 50.1
Nal 24.16 0.250 1.000 40.0
NaNOg 24.03 0.177 1.000 56.4
LiCl 24.32 0.064 1.000 155.3
BaCl^ 24.16 2.381 1.000 4.2
EDTA^K^ 21.70 0.215 0.977 46.5
Zorbax KI 23.87 0.331 1.000 30.5
EDTA^K^ 23.52 0.160 0.999 62.4
Hypersil KI 3.07 0.272 0.973 36.7
Netilmicin
Spherisorb KI 14.01 0.135 0.999 73.9
KSCN 15.43 0.045 0.980 224.5
KNO3 12.95 0.388 0.983 25.8
Nal 12.22 0.248 1.000 40.4
NaNOg 13.62 0.064 1.000 156.6
LiCl 12.14 0.036 0.999 280.9
BaCl2 13.55 0.709 1.000 14.1
Zorbax KI 12.28 0.166 0.999 61.6
EDTAfKg 11.41 0.071 1.000 141.6

280.
loading (22%)^^^
The variation in column response dependent on the nature*
of the solute is illustrated by the figures where about a
third of the amount of salt is required to make the equivalent
amount of silanols for gentamicin as for the other two
C-components. In comparison to the long chain amines used by *
Bij the values are about a hundred times greater in this
case. This is as expected since the amines have a hydrophobic
chain which can assist penetration of the stationary phase.
Bij also noted that amines with hydroxy groups adjacent to
the amino function are less effective at masking than the
analogue without a polar function. This may arise fran a
decrease in basicity because of intra-molecular hydrogen
bonding. This can be extended to the gentamicins since the
secondary amino groiç> at C-3" in the garosamine ring is
adjacent to two hydroxy functions. However the secondary amino
in the purpurosamine ring is removed from any polar function.
On this basis the gentamicin would be more likely to
compete with the salt for the silanol than the other two
components.
The <2 term can be used to calculate the amount of silano
philic binding present in the retention mechanism. This is
achieved by comparing to the value used in the calculations
to give the percentage contribution as shown for differeing
components and columns in Table 5.12.

281,
Table 5.12. Silanophilic influence on retention
Column =1 Netilmicin Calculatedsilanols
Spherisorb 70.6 67.5 96.8 87.6 70.4
Zorbax 52.8 51.8 95.5 76.7 45.7
Hypersil 36.5 34.1 62.8 - 23.5
The direct comparison of columns and column response to
the different nature of solutes is interesting. The gentamicin
and components behave in a similar manner and the extent
of silanophilic interaction can be compared with the rough
estimations of residual silanols from Table 5.2. It shows a
direct relationship and justifies the use of the equation
and also the assumption that the silanols are important in
the retention mechanism. For the gentamicin component
there is preferential adsorption of the solute by the silanol
groups of the Zorbax and Spherisorb columns. Netilmicin is
similarly more adsorbed at the silanols but not to such an
extent as gentamicin C^. An explanation for this effect may
be gained by referring to Figure 5.5 and considering the
possible conformers. Conformer A is most likely to be pre
dominant in the stationary phase for all components. However,
as described before, the gentamicin component has an
additional secondary amino function which may not be masked
in this conformation. Thus if ionised it would readily inter
act with the silanols on the surface. The extra secondary
amino group in netilmicin may be partially masked and thus
282,
less able to interact. The presence of a positive charge in
this environment will force the equilibrium to an ion-interaction
with the silanol. The conformer A for gentamicin and C^,
which can reduce the influence of the positive charge shows
less binding to the silanol groups. The driving force is reduced
and hydrogen bonding may be more frequent than ion-exchange.
The silanophilic interaction is only proportional to the amount
of silanol groups which suggests little kinetic advantage
over solvophobic binding. The Hypersil column packing material
has fewer available silanols which may restrict the gentamicin
interaction and reduce retention.
The effect of addition of salt to the system is probably
one of competition at the silanol groups. The greater the
frequency of these groups the higher the salt concentration
required to reduce the effect. The greater a solute interacts
with the groups, the smaller the concentration of salt needed
to reduce retention dramatically. The ion-exchange mechanism
is shown to be a stronger retaining force because of the
longer retention time of gentamicin and netilmicin. When
the ion-exchange interaction is overcome as at high salt
concentration or with small numbers of silanol groups the
elution order of gentamicin then and C^, which would
be expected by a consideration of the polarity of its
derivatives, is found. The Microbondapak C-18 column used323for the gentamicin assays is a similar column to the
Hypersil column used here, with 11% carbon loading and
endcapping. Thus the 'normal' elution order as expected
283.
was observed with the EDTA salt used. The only exception to333the predicted response was in a paper by Marples et al.
where a Spherisorb column produced the 'normal' order whereas
the reverse would be expected. The salt used was EDTA and
at a high concentration,though not high enough to effect
a cross-over of components. The only explanation for this is
that either the column was more extensively endcapped because
of a different batch or a higher ionic strength of the mobile
phase was achieved.

284,
Literature Cited
1. Garrod, L.P., Lambert, H.P., O'Grady, F. and Waterworth,
P.M. Antibiotic and Chemotherapy, Fifth Edition.
Churchill Livingstone, Edinburgh, 1981, 115-154.
2. Kucers, A. and Bennett, N.McK. The Use of Antibiotics,
Third Edition. William Heinemann Ltd., London, 1979, 294-416.
3. Schatz, A., Bugie, E. and Waksman, S.A., Proc. Soc.
Exp. Biol. Med., 1944, 55, 66-69.
4. Waksman, S.A. and Lechevalier, H.A., Science, 1949, 109,
305-307.
5. Umezawa, H., Ueda, M., Maeda, K., Yagishita, K., KOndo,
S., Okami, Y., Utahara, R., Osato, Y., Nitta, K. and
Takeuchi, T.,J. Antibiot. (Tokyo), Series A, 1957, 10,
181-189.
6. Haskell, T.H., French, J.C., and Bartz, Q.R. J. Amer.
Chem. Soc., 1959, 81, 3480-3482.
7. Mori, T., Ichiganagi, T., Kondo, H. and Oda, T. J. Antibiot.,
1971, 24, 339-346.
8. Oda, T., Mori, T., Kyotani, Y. and Nakayam^i, M., J. Antibiot.,
1971, 24, 511-518.
9. Weinstein, M.J., Luedemann, G.M., Oden, E.M., Wagman, G.H.,
Rosselet, J.P., Marquez, J.A., Coniglio, C.T., Charney, W.,
Herzog, H.L. and Black, J., J. Med. Chem., 1963, 6, 463-464.
10. Weinstein, M.J., Luedemann, G.M., Oden, E.M. and Wagman,
G.H. Antimicrobial Agents and Chemotherapy,1963, 1-7.
11. Weinstein, M.J., Marquez, J.A., Testa, R.T., Wagman, G.H.,
Oden, E.M. and Waitz, J.A. J. Antibiot., 1970, 23, 551-554.
285,
12. Waksman, S.A. The Actinomycetes. A Summary of Current
Knowledge. The Ronald Press Company, New York, 1957,
61-74.
13. Stanier, R.Y., Adelberg, E.A. and Ingraham, J.L. General
Microbiology, Fourth Edition, Macmillan Press Ltd., London,
1976, 672-678.
14. Wick, W.E. and Welles, J.S. Antimicrobial Agents and
Chemotherapy, 1967, 341-348.
15. Stark, W.M., Hoehn, M.M. and Knox, N.G. Antimicrobial
Agents and Chemotherapy, 1967, 314-323.
16. Daniels, P.J.L., Luce, C., Nagabhushan, T.L., Jaret, R.S.,
Schumacher, D., Reimann, H. and Ilavsky, J., J. Antibiot.,
1975, 28, 35-41.
17. Kawaguchi, H., Naito, T., Nakagawa, S. and Fujisawa, K.
J. Antibiot., 1972, 25, 695-708.
18. Richardson, K., devons. S., Moore, J.W., Ross, B.C. and
Wright, J.R. J. Antibiot., 1977, 30, 843-846.
19. Umezawa, H., Umezawa, S., Tsuchiya, T. and Okazaki, Y.
J. Antibiot., 1971, 24, 485-487.
20. Wright, Chem. Soc. Chem. Commun., 1976, 206-208.
21. Marquez, J.A. and Kershner, A. in Journal of Chromatography-
Volume 15. Antibiotics - Isolation, Separation and Puri
fication. Edited by Weinstein, M.J. and Wagman, G.H.
Elsevier Scientific, Amsterdam, 1978, 162-213.
22. Nagabhushan, T.L., Miller, G.H. and Weinstein, M.J. in
The Aminoglycosides: Microbiology, Clinical Use and
Toxicology Edited by Whelton, A. and Neu, H.C. Marcel
Dekker Inc., New York, 1982, 3-28.

286,
23. Brink, N.G., Kuehl, Jr., F.A. and Folkers, K. Science,
1945, 102, 506-507.
24. Kuehl Jr., F.A., Bishop, M.N.and Folkers, K. J. Am. Chem.
Soc., 1951, 73, 881-882.
25. Carter, H.E., Dyer, J.R., Shaw, P.D., Rinehart, Jr., K.L.
and Hichens, M. J. Am. Chem. Soc., 1961, 83, 372-373.
26. Lemieux, R.U. and Cushley, R.J. Cand. J. Chem., 1963,
41, 858-862.
27. Rinehart, Jr., K.L. The Neomycins and Related Antibiotics.
John Wiley and Sons Inc., New York, 1964.
28. Chilton, W.S. The Structure of neomycins LP-B and LP-C.
Ph.D. Thesis, University of Illinois, 1963.
29. Claes, P.J., Compernolle, F., and Vanderhaeghe, H.,J.
Antibiot., 1974, 27, 931-942.
30. British Pharmacopeia, 1980. H.M.S.O., London, 1980.
31. Code of Federal Regulations: Food and Drugs 21, Parts
300 to 499. U.S. Government Printing Office, Washington,
1981, Part 444.
32. Decoster, W., Claes, P. and Vanderhaeghe,H,
J. Chromatog.,1981, 211, 223-232.
33. Helboe, P. and Kryger, S., J. Chromatog., 1982, 235, 215-220,
34. Tsuji, K., Goetz, J.F., Van Meter, W. and Gusciora, K.A.
J. Chromatog., 1979, 175, 141-152.
35. Borowiecka, B. Diss. Pharm. Pharmacol., 1972, 24, 209-215.
36. Chatterjee, N.R. Ind. J. Chem., 1975, 13, 1282-1284.
37. Maehr, H. and Schaffner, C.P. Anal. Chem., 1964, 36(1),
104-108.
38. Majumdar, M.K. and Majumdar, S.K. Appl. Microbiol., 1969,
17, 763-764.
287
39. Brodasky, T.F. Anal. Chem., 1963, 35, 343-345.
40. Kaiser, D.G. Anal. Chem., 1963, 35, 552-554.
41. Decoster, W., Claes, P. and Vanderhaeghe, J. Pharm. Sci.,
1982, 71, 987-991.
42. Inouye, S. and Ogawa, H. J. Chromatog., 1964, 13, 536-541.
43. Borowiecka, B. Pol. J. Pharmacol. Pharm., 1976, 28, 353-359.
44. Mays, D.L., Van Apeldoorn, J. and Lauback, R.G. J. Chromatog.,
1976, 120, 93-102.
45. Woo, P.W.K., Dion, W. and Bartz, Q.R. Tetrahedron Lett., 1971,
2625-2628.
46. Price, K.E., Godfrey, J.C. and Kawaguchi, H., in Structure-
Activity Relationships among the Semi-synthetic Antibiotics.-
Edited by Perlman, D. Academic Press, New York, 1977, 239-395.
47. Mitsuhashi, S. and Kawabe, H. in The Aminoglycosides:
Microbiology, Clinical Use and Toxicology. Edited by Whelton,
A. and Neu, H.C. Marcel Dekker Inc., New York, 1982, 97-124.
48. Rossi, A., Branca, G., Manzara, S., Morace, G., Polonelli, L.,
Spagnolo and Ttonci, M. J. Int. Med. Res., 1978, 6, 94-101.
49. Reimann, H., Cooper, D.J., Mailams, A.K., Jaret, R.S.,
Yehaskel, A., Kugelman, M., Vernay, H.F. and Schumacher, D.
J. Org. Chem., 1974, 39, 1451-1457.
50. Moellering, R.C. in The Aminoglycosides: Microbiology, Clinical
Use and Toxicology. Edited by Whelton, A. and Neu, H.C.
Marcel Dekker Inc., New York, 1982, 65-96.
51. Guay, D.R.P. Drug Intell. Clin. Pharm., 1983, 17, 83-91.
52. Cox, D.A., Richardson, K. and Ross, B.C. in Topics in Anti
biotic Chemistry, Volume 1. Aminoglycosides and Ansamycins.
Edited by Sammes, P.G. Ellis Horwood Ltd., England, 1977, 1-90.
288,
53. Rosselet, J.P., Marquez, J., Meseck, E., Murawski, A.,
Hamden, A., Joyner, C., Schmidt, R., Miglion, D. and Herzog,
H.L. Antimicrobial Agents and Chemotherapy-1953, 14-16.
54. Wagman, G.H., Marquez, J.A., Bailey, J.V., Cooper, D., Weinstein,
J., Tkach, R. and Daniels, P. J. Chromatog., 1972, 70, 171-173.
55. Wilson, W.L., Richard G. and Hughes, D.W.,J. Chromatog., 1973,
78, 442-444.
56. Maehr, H. Gentamicin; Separations and Structural Studies PhD
Thesis, Rutgers, The State University, New Brunswick, 1964.
57. Maehr, H. and Schaffner, C.P. J. Chromatog., 1967, 30, 572-578.
58. Nagabhushan, T.L., Turner, W.N., Daniels, P.J.L. and Morton,
J.B. J. Org. Chem., 1975, 40, 2830-2834.
59. Nagabhushan, T.L., Daniels, P.J.L., Jaret, R.S. and Morton, J.B.
J. Org. Chem., 1975, 40, 2835-2836.
60. Lee, B.K., Condon, R.G., Wagman, G.H. and Katz, E. Antimicrob.
Agents Chemother., 1976, 9, 151-159.
61. Lee, B.K., Condon, R.G., Wagman, G.H., Weinstein, M.J. and
Katz, E. J. Antibiot., 1976, 29, 677-84.
62. Cooper, D.J. and ïudis, M.D. J. Chem. Soc. Chem. Commun.,
1967, 821-822.
63. Cooper, D.J., Marigliano, H.M., Yudis, M.D. and Traubal, T.
J. Infect. Dis., 1969, 119, 342-344.
64. Cooper, D.J., Yudis, M.D., Guthrie, R.D. and Prior, A.M.
J. Chem. Soc. (C), 1971, 960-962.
65. Cooper, D.J., Yudis, M.D., Marigliano, H.M. and Traubel, T.
J. Chem. Soc. (C), 1971, 2876-2879.
66. Cooper, D.J., Daniels, P.J.L., Yudis, M.D., Marigliano, H.M. ,
Guthrie, R.D. and Bukhari, S.T.K., J. Chem. Soc. (C), 1971,
3126-3129.
289,
67. Daniels, P.J.L., Kugelman,M., Mallans, A.K., Tkach, R.W.,
Vernay, H.F., Weinstein, J. and Yehaskel, A., J. Chem. Soc.
Chem. Commun., 1971, 1629-1631.
68. Daniels, P.J.L., Mallans, A.K., Weinstein, J., Wright, J.J.
and Milne, G.W.A. J. Chem. Soc. Perkin 1, 1976, 1078-1088.
69. Weinstein, M.J., Wagman, G.H., Oden, E.M. and Marquez, J.A.
J. Bacteriol., 1967, 94, 789-790.
70. Wagman, G.H., Marquez, J.A. and Weinstein, M.J. J. Chromatog.
1968, 34, 210-215.
71. Kershner, A.S. Separation, Structural and Physical Studies on
the Gentamicin C Complex. PhD Thesis, Rutgers, The State
University, New Brunswick, N.J., 1971.
72. Daniels, P.J.L. and Marquez, J.A. United States Patent, 1976,
3,984,395.
73. Byrne, K.M., Kershner, A.S., Maehr, H., Marquez, J.A. and
Schaffner, C.P., J. Chromatog., 1977, 131, 191-203.
74. Berdy, J., Pauncz, J.K., Vajna, Z.M., Horvath, G., Gyimesi,
J. and Koczka, I., J. Antibiot., 1977, 30, 945-954.
75. Berdy, J., Kadâr, I., Horvath, G., Mehesfalvi, C., and
Gyimesi, J. Sejtosztodas Farmakologiava, 1979, 8, 27-70.
76. Kraisintu, K., Parfitt, R.T. and Rowan, M.G., J. Pharm.
Pharmacol,, 1980, 72p.
77. Kraisintu, K. Analytical Studies on Gentamicin. PhD Thesis,
University of Bath, U.K., 1981.
78. Kraisintu,.K., Parfitt, R.T. and Rowan, M.G. Int. J. Pharm.,
1982, 10, 67-75.
79. White, L.O. and Reeves, D.S. Proc. 12th ICC Curr. Chemother.,
1, 1982, 270-271.
290.
80. Thomas, A.H./J. Pharm. Pharmacol., 1978, 30, 378-379.
81. Calam, D.H., Gilbert, J.N.T., Lightbrown, J.W., Powell,
J.W., and Thomas, A.H., J. Pharm. Pharmacol., 1978, 30, 220-232
82. Freeman, M., Hawkins, P.A., Loran, J.S. and Stead, J.A.
J. Liq. Chromatog., 1979, 2, 1305-1317.
83. Thomas, A.H. and Tappin, S.D., J. Chromatog., 1974, 97, 280-283
84. Wagman, G.H., Bailey, J.V. and Miller, M.M.,J. Pharm. Soi.,
1968, 57, 1319-1322.
85. Wagman, G.H., Oden, E.M. and Weinstein, M.J. Appl. Microbiol.
1968, 16, 624-527.
86. Wilson, W.L., Richard G. and Hughes, D.W., J. Pharm. Sci.,
1973, 62, 282-284.
87. TSrdk, I. and Paâl, T.L.,J. Chromatog., 1982, 246, 356-359.
88. Kabasakallan, P., Kalliney, S. and Magatti, A.W. Anal. Chem.,
1977, 49, 953-955.
89. Anhalt, J.P., Sancilio, J.D. and McCorkle, T., J. Chromatog.,
1978, 153, 489-493.
90. Parfitt, R.T., Games, D.E., Rossiter, M., Rogers, M.S. and
Weston, A. Biomed. Mass Spect., 1976, 3, 232-234.
91. Jackson, G.G. The Practitioner, 1967, 198, 855-866.
92. De Torres, O.H. Clin. Ther., 1981, 3, 399-412.
93. Jao, R.L. and Jackson, G.G. Antimicrobial Agents and Chemo
therapy-1963, 148-152.
94. Noone, P., Pattison, J.R. and Davies, D.G. Postgrad. Med. J.
1974, 50 (Suppl. 7), 9-16.
95. Neu, H.C. in The Aminoglycosides; Microbiology, Clinical Use
and Toxicology. Edited by Whelton, A. and Neu, H.C.,Marcel
Dekker Inc., New York, 1982, 611-628.
291,
96. Franklin, T.J. and Snow, G.A. Biochemistry of Antimicrobial
Action, Third Edition, Chapman and Hall, Cambridge, 1981,
118-123.
97. Gale, E.R., Cundliffe, E., Reynolds, P.E., Richmond, M.H.
and Waring, M.J. The Molecular Basis of Antibiotic Action,
Second Edition. John Wiley and Sons, London, 1981, 419-439.
98. Edwards, D. Antimicrobial Drug Action. The Macmillan Press
Ltd., London, 1980, 207-214.
99. Hancock, R.E.W.,J. Antimicrob. Chemother., 1981, 8, 249-276.
100. Shannon, K. and Phillips, I., J. Antimicrob. Chemother., 1982,
9, 91-102.
101. O'Grady, F.W. Postgrad. Med. J., 1974, 50, (Suppl. 7), 7-8.
102. Geddes, A.M. in The Control of Antibiotic-Res 1st ant Bacteria.
Edited by Stuart-Harris, C.H. and Harris, D.M. Academic
Press Inc., London, 1982, 1-16.
103. Phillips, I. and Cooke, D. in The Control of Antibiotic-
Resistant Bacteria.Edited by Stuart-Harris, C.H. and Harris,
D.M. Academic Press Inc., London, 1982, 201-210.
104. Davies, J., J. Infect. Dis., 1971, 124 (Suppl.), 57-100.
105. Weinstein, M.J., Drube, C.G., Moss Jr., E.L. and Waitz, J.A.
J. Infect. Dis., 1971, 124 (Suppl.), 511-17.
106. Reynolds, A.V. and Smith, J.T. in Recent Advances in Infection.
Edited by Reeves, D.S. and Geddes, A.M. Churchill Livingstone,
Edinburgh, 1979, 165-182.
107. Neu, H.C. in The Aminoglycosides : Microbiology, Clinical Use
and Toxicology, Edited by Whelton, A. and Neu, H.C. Marcel
Dekker Inc., New York, 1982, 125-142.
108. Rodriguez, V., Stewart, D. and Bodey, G.P. Clin. Pharmacol.
Ther., 1969, 11, 275-281.

292
109. Gingell, J.C. and Waterworth, P.M. Brit. Med. J., 1968, 2,
19-22.
110. Cutler, R.E., Gyselynck, A.-M., Fleet, P. and Forrey, A.W.
J.A.M.A., 1972, 219, 1037-1041.
111. Dan, M., Halkin, H. and Rubinstein, E., J. Antimicrob. Chemo-
ther., 1981, 7, 551-558.
112. Black, J., Calesnick, B., Williams, D. and Weinstein, M.J.
Antimicrobial Agents and Chemotherapy-1963, 138-147.
113. Riff, L.J. and Jackson, G.G., J. Infect. Dis., 1971, 124
(Suppl.), S98-105.
114. Gyselynck, M., Forrey, A. and Cutler, R.,J. Infect. Dis.,
1971, 124(Suppl.), S70-76.
115. Winters, R.E., Litwack, K.D. and Hewitt, W.L., J. Infect.
Dis., 1971, 124 (Suppl.), S90-95.
116. Schumacher, G.E. Am. J. Hosp. Pbarm., 1975, 32, 299-308.
117. Walker, J.M., Wise, R. and Mitchard, M., J. Antimicrob.
Chemother., 1979, 5, 95-99.
118. Schentag, J.J. in The Aminoglycosides: Microbiology, Clinical
Use and Toxicology. Edited by Whelton, A. and Neu, B.C.
Marcel DekkerInc., New York, 1982, 143-168.
119. Whelton, A, in The Aminoglycosides: Microbiology, Clinical
Use and Toxicology. Edited by Whelton, A. and Neu, H.C.
Marcel Dekker Inc., New York, 1982, 585-609.
120. McAllister, T.A. Postgrad. Med. J., 1974, 50 (Suppl.), 45-52.
121. Siegel, J.D. and McCracken, G.H. in The Aminoglycosides:
Microbiology: Clinical Use and Toxicology. Edited by
Whelton, A, and Neu, H.C. Marcel Dekker Inc., New York,
1982, 527-556.

293
122. Milner, R.D.G. Postgrad. Med. J., 1974, 50 (Suppl.), 40-44.
123. British National Formulary, 1983, Number 5. British Medical
Association and the Pharmaceutical Society of Great Britain,
London, 1983, 188.
124. Kaka, J.S. arid Buchanan, Drug. Intell. Clin. Pharm. ,
1983, 17, 33-38.
125. Mawer, G.E., Dobbs, S.M., Ahmad, R. and Tooth, J.A.
Postgrad. Med. J., 1974, 50 (Suppl.), 31-32.
126. Chan, R.A., Benner, E.J. and Hoeprich, P.P. Ann. Intern.
Med., 1972, 76, 773-778.
127. Klastersky, J., Meunier-Carpenter, F. and Prévost, J.M.
Am. J. Med. Sci., 1977, 273, 157-167.
128. Bodey, Sr., G.P. in The Aminoglycosides: Microbiology, Clinical
Use and Toxicology. Edited by Whelton, A. and Neu, H.C.
Marcel Dekker Inc., New York, 1982, 557-583.
129. Andriole, V.T.,J. Infect. Dis., 1971, 124 (Suppl.), 316-55.
130. Davies, M., Morgan, J.R, and Anand, C. Antimicrob. Agents
Chemother., 1975, 7, 431-434.
131. McLaughlin, J.E. and Reeves, D.S. The Lancet, 1971, 1,
261-264.
132. Kradjan, W.A. and Burger, R. Arch. Intern. Med., 1980, ISO,
1668-1670.
133. Tell, S.M., Arwood, L.L. and Visconti, J.A. Am. J. Hosp.
Pharm., 1982, 39, 485-486.
134. Ervin, F.R., Bullock, Jr., W.E. and Nuttall, C.E. Antimicrob.
Agents Chemother., 1976, 9, 1004-1011.
135. Riff, L.J. and Jackson, G.G . Arch. Intern. Med., 1972, 130,
887-891.
294,
136. Lackner, T.E., Rotschafer, J.C., Crossley, K. and LaBrosse,K.
Am. J. Hosp. Pharm., 1982, 39, 647-648.
137. Lauermann, M.W. and Barza, M. in The Aminoglycosides: Micro
biology, Clinical Use and Toxicology. Edited by Whelton, A.
and Neu, H.C., Marcel Dekker Inc., New York, 1982, 169-190.
138. Dahlgren, J.G., Anderson, E.T. and Hewitt, W.L. Antimicrob.
Agents Chemother., 1975, 8, 58-62.
139. Goodman, E.L., Van Gelder, J., Holmes, R., Hull, A.R. and
Sanford, J.P. Antimicrob. Agents Chemother., 1975, 8, 434-438.
140. Jackson, G.G. and Arcieri, G., J. Infect. Dis., 1971, 124
(Suppl.), S130-137.
141. Harper, E.S. and Davey, P.G., J. Antimicrob. Chemother., 1981
7, 313-317.
142. Whelton, A. in The Aminoglycosides : Microbiology, Clinical Use
and Toxicology, Edited by Whelton, A. and Neu, H.C. Marcel
Dekker Inc., New York, 1982, 191-222.
143. Schibeci, A. and Schacht, J. Biochem.,Pharmacol., 1977,
26, 1769-1774.
144. Gil, D.W., Brown, S.A., Seeholzer, S.H. and Wildey, G.M.
Life Sci., 1983, 32, 2043-2046.
145. Baylis, C.,J. Antimicrob. Chemother. 1980, 6, 381-388.
146. Soberon, L., Bowman, R.L., Pastoriza-Munoz, E., Kaloyanides,
G.J./J. Pharmacol. Exp. Ther., 1979, 210) 334-343.
147. Trollfors, B., Alestig, K., Krantz, I. and Norrby, R.
J. Infect. Dis., 1980, 141, 306-309.
148. Hewitt, W.L. Postgrad. Med. J., 1974, 50 (Suppl.), 55-59.
149. Mitchell, C.J., Bullock, S. and Ross, B.D., J. Antimicrob.
Chemother., 1977, 3, 593-600.

295,
150. Forrey, A.W., Meijsen-Ludwick, B.T., O'Neill, M.A., Maxwell,
B.M., Blair, A.D. and Cutler, R.E. Toxicol. Appl. Pharmacol.
1978, 44, 453-62.
151. Lachatre, G., Merle, L., Valette, J.P., Tronchet, J.,
Charmes, J.P. and Nichot, G. IRCS Med. Sci. Libr. Compend.
1982, 10, 857-8.
152. Kohlhepp, S.J., Loveless, M.O., Kohnen, P.W. and
Gilbert, D.N. Abstract of a Conference, 51.
153. Smith, C.R. and Lietman, P.S. in The Aminoglycosides:
Microbiology, Clinical Use and Toxicology. Edited by
Whelton, A. and Neu, H.C. Marcel Dekker Inc., New York, 1982,
419-452.
154. Bennett, W.M., Plamp, C.E., Gilbert, P.N., Parker, R.A. and
Porter, G.A.,J. Infect. Dis., 1979, 140, 576-580.
155. Fox, K.E., Brummett, R.E., Brown, R. and Himes, D. Arch.
Otolaryngol, 1980, 106, 44-49.
156. Brummett, R.E. and Fox, K.E. in The Aminoglycosides:
Microbiology, Clinical Use and Toxicology. Edited by Whelton,
A. and Neu, H.C. Marcel Dekker Inc., New York, 1982, 419-452.
157. Orsulakova, A., Stockhorst, E. and Schact, J.,J. Neurochem.
1976, 26, 285-290.
158. Anderson, A.C., Hodges, G.R. and Barnes, W.G. Arch. Intern.
Med., 1976, 136, 705-707.
159. Waterworth, P.M., J. Antimicrob. Chemother., 1977, 3, 1-8.
160. Wenk, M., J. Antimicrob. Chemother., 1982, 9, 168-169.
161. Follath, F., Wenk, M. and Vozeh, S.,J. Antimicrob. Chemother.
1981, 8, Suppl. A,*37-43.
162. Maitra, S.K., Yoshikawa, T.T., Guze, L.B. and Schotz, M.C.
Clin. Chem., 1979, 25, 1361-1367.

296,
163. Reeves, D.S. Postgrad. Med. J., 1974, 50 (Suppl. 7), 20-21.
164. Bell, S.M. Med. J. Aust., 1976, 2, 481-484.
165. Reeves, D.S. and Bywater, M.J., J. Antimicrob. Chemother.,
1975, 1, 103-116.
166. Fabius, G.T.J. and Mouton, R.P. in Chemotheraphy, Vol. 2.
Edited by Williams, J.D. and Geddes, A.M. Plenum Press,
New York, 1976, 47-54.
167. Jarvis, J.D. and Leung, T.W.C. in Chemotherapy, Vol. 2.
Edited by Williams, J.D. and Geddes, A.M., Plenum Press, New
York, 1976, 143-145.
168. Sherris, J.C. in Chemotherapy ■ Vol. 2. Edited by Williams,
J.D. and Geddes, A.M., Plenum Press, New York, 1976, 1-6.
169. Stessman, J. , Michel, J. and Sacks, T. Chemotherapy (Basel),
1977, 239, 142-148.
170. Shanson, D C., Hince, C.J. and Daniels, J.V. in Chemotherapy,
Vol. 2, Edited by Williams, J.D. and Geddes, A.M., Plenum
Press, New York, 1976, 147-153.
171. Shanson, D.C. and Hince, C.J.,J. Antimicrob. Chemother., 1977,
3, 563-570.
172. Shanson, D.C. and Hince, C., J. Clin. Path., 1977, 30, 521-525,
173. Giamarellou, H., Zimelis, V.M., Matulionis, D.O. and Jackson,
G.G., J. Infect. Dis., 1975, 132, 399-406.
174. Reeves, D.S. and Holt, H.A. in Chemotheraphy, Vol. 2, Edited
by Williams, J.D. and Geddes, A.M., Plenum Press, New York,
1976, 133-141.
175. Andrews, J., Gillette, P., Williams, J.D. and Mitchard, M.
Postgrad. Med. J., 1974, 50 (Suppl. 7), 17-20.
176. Staneck, J.L., Land, G.A., Cordes, V., Glenn, S. and
297
Resendes, J.P. Clin. Biochem. Anal., 1981, 10, 171-181.
177. Mannisto, P.T. Metlhods Find. Exp. Clin. Pharmacol., 1982,
4, 167-171.
178. Hospes, W., Boskma, R.J. and Brouwers, J.R.B.J. Pharm. Week.
Bl. Sci. Ed., 1982, 4, 32-37.
179. Delaney, C.J., Opheim, K.E., Smith, A.L. and Plorde, J.J.
Antimicrob. Agents Chemother., 1982, 21, 19-25.
180. Stobberingh, E.E., Houben, A.W. , Schwillens, P.L.W.J. and
Van Boven, C.P.A. Antonie van Leeuwenhoek, 1981, 47, 80-81.
181. Acton, W.J., Van Duyn, O.M., Allen, L.V. and Flournoy,D.J.
Clin. Chem., 1982, 28, 177-180.
192. Ratcliff, R.M., Mirelli, C., Moran, E., O'Leary, D. and White,
R. Antimicrob. Agent. Chemother., 1981, 19, 508-512.
183. Reeves, D.S., J. Antimicrob. Chemother., 1981, 8, Suppl. A,
51-54.
184. Qadri, S.M.H., Gillum, R.L. and Boyd, D. Antonie van Leeuwenhoek,
1982, 48, 209-218.
185. Johnson, J.E., Crawford, S. and Jorgensen, J.H.,J. Clin.
Microbiol., 1982, 16, 299-302.
186. Smith, D.H. , Van Otto, B. and Smith, A.L. New Eng. J. Med.,
1972, 286, 583-586.
187. Phillips, I., Warren, C. and Smith, S.E., J. Clin. Path.,
1974, 27, 447-451.
188. Broughall, J.M. and Reeves, D.S. in Chemotherapy, Vol. 2.
Edited by Williams, J.D. and Geddes, A.M. Plenum Press,
New York, 1976, 159-163.
189. Case, R.V. and Mezei, L.M. Clin. Chem., 1978, 24, 2145-2150.
190. Shannon, K.P. and Phillips, I.,J. Antimicrob. Chemother.,
1977, 3, 25-33.
298
191. Daigneault, R., Gagné, M. and Brazeau, M.,J. Infect. Dis.,
1974, 130, 642-645.
192. Matzke, G.R., Gwizdala, C., Wery, J., Ferry, D., and Starnes,
R. Ther. Drug. Monit., 1982, 4, 195-200.
193. Bolton, A.E. and Hunter, W.M. Biochem. J., 1973, 133, 529-539.
194. Jonsson, S. in Chemotherapy, Vol. 2. Edited by Williams, J.D.
and Geddes, A.M. Plenum Press, New York, 1976, 165-168.
195. Watson, R.A.A., Shaw, E.J. and Edwards, C.R.W. in Chemotherapy,
Vol. 2. Edited by Williams, J.D. and Geddes, A.M. Plenum
Press, New York, 1976, 107-110.
196. Ashby, C.D., Lewis, J.E. and Nelson,J.C. Clin. Chem., 1978,
24, 1734-1737.
197. Broughton, A. and Strong, J.E. Clin. Chim. Acta, 1976,
66, 125-129.
198. Matzke, G.R., Hunt, S., Gwizdala, C. and Cronk, J.D. Am. J.
Hosp. Pharm., 1980, 37, 1049-1050.
199. Oeltgen, P.R., Hamann, S.R. and Blouit, R.A. Ther. Drug
Monit., 1980, 2, 423-425.
200. Standefer, J.C. and Saunders, G.C. Clin. Chem., 1978, 24,
1903-1907.
201. Mattiasson, B., Svensson, K. , Borrebaeck, C., Jonsson, S.
and Kronvall, G. Clin. Chem., 1978, 24, 1770-1773.
202. Hooymans, P.M., Cilissen, J. and Merkus, F.W.H.M. Am. J.
Hosp. Pharm., 1982, 39, 784, 787 and 788.
203. Pesce, M.A. and Bodourian, S.H. Clin. Chem., 1981, 27, 1460-1462
204. Cox, C. and Buret, J. Anal. Chem., 1982, 54, 1862-1865.
205. Singh, P., Leung, D.K., Rowley, G.L., Gagne, C. and Ullman,
E.F. Anal.Biochem., 1980, 104, 51-58.
299,
206. Emit-aed Instruction Book. Syva, California, 1978.
207. Carlson, L.G., Delaney, C.J. and Plorde, J.J. Antimicrob.
Agents Chemother., 1982, 21, 192-194.
208. Watson, R.A.A., London, J., Shaw , E.J. and Smith, D.S.
Clin. Chim. Acta, 1976, 73, 51-55.
209. Shaw, E.J., Watson, R.A.A., London, J. and Smith, D.S., J.
Clin. Path., 1977, 30, 526-531.
210. Burd, J.F., Wong, R.C., Feeney, J.E., Carrico, R.J. and
Boguslaski, Clin. Chem., 1977, 23, 1402-1408.
211. Burd, J.F. Method Enzymol., 1981, 74, 79-87.
212. Jolley, M.E., Stroupe, S.D., Wang, C.H.J., Panas, H.N.,
Keegan, C.L., Schmidt, R.L. and Schwenzer, K.S. Clin.
Chem., 1981, 27, 1190-1197.
213. Munro, A,J., Smith, D.S. and Shaw, E.J.,J. Antimicrob .
hemother., 1982, 9, 47-51.
214. Dandliker, W.B., Hsu, M.L., Levin, J. and Rao, B.R.
Method Enzymol., 1981, 74, 3-27.
215. Meffin, P.J. and Miners, J.O. in Progress in Drug Metabolism
Volume 4. Edited by Bridges, J.W. and Chasseaud, L.F. John
Wiley and Sons, New York, 1980, 261-308.
216. Anhalt, J.P. Chromatog. Sci., 1979, 12 (Biol./Biomed 2),
1-16.
217. Reid, E. Analyst, 1976, 101, 1-18.
218. Nilsson-Ehle, I. Chromatog.Sci., 1982, 20, 173-184.
219. Mayhew, J.W. and Gorbach, S.L.,J. Chromatog., 1978, 151, 133-146,
220. Peng, G.W., Gadalla, M.A.F., Peng, A., Smith, V. and Chiou, W.L.
Clin. Chem., 1977, 23, 1838-1844.
221. Peng, G.W., Jackson, G.G. and Chiou, W.L. Antimicrob. Agents

300,
Chemother., 1977, 12, 707-709.
222. Chiou, W.L., Nation, R.L, Peng, G.W. and Huang, S.M. Clin.
Chem., 1978, 24, 1846-1847.
223. Maitra, S.K., Yoshikawa, T.T., Hansen, J.L., Nilsson-Ehle,
I., Palin, W.J., Schotz, M.C. and Guze, L.B. Clin. Chem.,
1977, 23, 2275-2278.
224. Maitra, S.K., Yoshikawa, T.T., Hansen, J.L., Schotz, M.C.
and Guze, L.B. Am. J. Clin. Pathol., 1979, 71, 428-432.
225. Anhalt, J.P. and Brown, S.D. Clin. Chem., 1978, 24, 1940-1947.
226. Anhalt, J.P. Antimicrob. Agents Chemother., 1977, 11, 651-655.
227. Kubo, H., Kinoshita, T., Kobayashi, Y. and Tokunaga, K.
J. Chromatog., 1982, 227, 244-248.
228. Barends, D.M., Van der Sandt, J.S.F. and Hulshoff, A.,J.
Chromatog., 1980, 182, 201-210.
229. Larsen, N.E., Marinelli, K. and Heilesen, A.M., J. Chromatog.,
1980, 221, 182-187.
230. Krugers Dagneaux, P.G.L.C. and Klein Elhorst, J.T. Pharm. Week.
Bl. Sci. Ed., 1981, 3, 66-70.
231. Back, S.E., Nilsson-Ehle, I. and Nilsson-Ehle, P. Clin. Chem.,
1979, 25, 1222-1225.
232. Haughey, D.B., Janicke, D.M., Adelman, M. and Schentag, J.J.
Antimicrob. Agents Chemother., 1980, 17, 649-653.
233. Marples, J. and Oates, M.D.G., J. Antimicrob. Chemother., 1982,
9, 311-318.
234. D'Souza, J. and Ogilvie, R.I., J. Chromatog., 1982, 232, 212-218
235. Walker, S.E. and Coates, P.E., J. Chromatog., 1981, 223,
131-138.
236. Frei, R.W. and Lawrence, J.F. Chemical Derivatisation in

301
Analytical Chemistry, Volume 1: Chromatography. Plenum Press,
New York, 1981, 127-196.
237. Roth, M. Anal. Chem., 1971, 43, 880-882.
238. Lawrence, J.F./J. Chromatog. Sci., 1979, 17, 147-151.
239. Bristow, P.A. Liquid Chromatography in Practise, hetp,
Cheshire, 1976, 179 and 187.
240. Frei, R.W., J. Chromatog., 1979, 165, 75-86.
241. Snyder, L.R. and Kirkland, J.J. Introduction to Modern
Liquid Chromatography, Second Edition. John Wiley and Sons,
New York, 1979, 16-82.
242. Jones, S.M., Blazevic, D.J. and Balfour, Jr., H.H. Antimicrob
Agents Chemother., 1976, 10, 866-867.
243. Faber, D.B., MacLaren, D.M. and De Goede, P.N.F.C. Proc. 12th
ICC Curr. Chemo. Immunotherapy, 1982, 2, 800-802.
244. Reeves, R.E. Adv. Carbohydrate Chem., 1951, 6, 107-134.
245. Maehr, H. and Schaffner, C.P.,J. Am. Chem. Soc., 1967, 89,
6787-6788.
246. Morton, J.B., Long, R.C., Daniels, P.J.L., Tkach, R.W.
and Goldstein, J.H.,J. Ain. Chem. Soc., 1973, 95, 7464-7469.
247. Naito, T., Toda, S., Nakagawa, S. and Kawaguchi, H. ACS Symp.
Ser., 1980, 125, 257-294.
248. Burlingame, A.L., Dell, A. and Russell, D.H. Anal. Chem.,
1982, 54, 363R-409R.
249. Howe, I., Williams, D.H. and Bowen, R.D. Mass Spectrometry,
Principles and Applications, Second Edition, McGraw-Hill,
Inc., New York, 1981, 4-49.
250. Daves, G.D. Acc. Chem. Res., 1979, 12, 359-365.
251. Beckey, H.D. Int. J. Mass Spectrom. Lon Phys., 1969, 2,
500-503.
302
252. Merritt, C. and McEwan, C.N. Mass Spectrcmetry , Part A,
Volume 3. Marcel Dekker Inc., New York, 1979, 145-266.
253. Holland, J.F., Soltmann, B. and Sweeley, C.C. Biomed. Mass
Spectrom. 1976, 3, 340-345.
254. McNeal, C.J. Anal. Chem., 1982, 54, 44A-50A.
255. Dell, A., Morris, H.R., Levin, M.D. and Hecht, S.M. Biochem.
Biophys. Res. Commun., 1981, 102, 730-738.
256. Dell, A., Hider, R.C., Barber, M., Bordoli, R.S., Sedgwick,
R.D., Tyler, A.N. and Neilands, J.B. Biomed. Mass Spectrom.,
1982, 9, 159-161.
257. Williams, D.H., Bradley, C., Bojesen, G., Santikarn, S. and
Taylor, L.C.E.,J. Am. Chem. Soc., 1981, 103, 5700-5704.
258. Fenselau, C. Anal. Chem., 1982 ,54, 105A-116A.
259. Macfarlane, R.D. and Torgerson, D.F. Science, 1976, 191, 920-925
260. Stimpson, B.P. and Evans, C.A. Biomed. Mass Spectrom., 1978,
5, 52-63.
261. Lai, S.T.F. and Evans, C.T.A. Biomed. Mass Spectrom., 1979,
6, 10—14.
262. Lai, S.T.F., Chan, K.W. and Cook, K.W. Macromolecules, 1980,
13, 953-959.
263. Posthumus, M.A., Kistemkker, P.G., Meuzelaar, and Ten Noever
de Brauw, M.C. Anal. Chem., 1978, 50, 985-991.
264. Day, R.J., Unger, S.E, and Cooks, R.G. Anal. Chem., 1980,
52, 557A-572A.
265. Garrison, B.J. and Winograd, N. Science, 1982, 216, 805-812.
266. Aberth, W., Straub, K.M. and Burlingame, A.L. Anal. Chem. ,
1982, 54, 2029-2034.
267. Surman, D.J. and Vickerman, J.C., J. Chem. Soc. Chem. Commun.,

303
1981, 324-325.
268. Barber, M., Bordoli, R.S., Sedgwick, R.D. and Tyler, A.N.
J. Chem. Soc. Chem. Commun., 1981, 325-327.
269. Barber, M., Bordoli, R.S., Sedgwick, R.D. and Tyler, A.N.
Nature, 1981, 293, 270-275.
270. Surman, D.J. and Vickerman, J.C., J. Chem. Res. (S), 1981,
170-171.
271. Martin, S.A., Costello, C.E. and Blemann, K. Anal. Chem.,
1982, 54, 2362-2368.
272. Rinehart, Jr., K.L., Gaudioso, L.A., Moore, M.L., Pandey,
R.C., Cook, J.C., Barber, M., Sedgwick, R.D., Bordoli, R.S.,
Tyler, A.N. and Green, B.N., J. Am. Chem. Soc., 1981, 103,
6517-6520.
273. Levy, G.C. and Nelson, G.L. Carbon-13 Nuclear Magnetic
Resonance for Organic Chemists. John Wiley and Sons, New
York, 1972, 38-49.
274. Bremser, W., Ernst, L., Franke, B., Gerhards, R. and
Hardt, A. Carbon-13 NMR Spectral Data. Verlag Chemie,
Weinheim, 1981.
275. Billman, J.H. and McDowell, J.W., J. Org. Chem., 1961, 26,
1437-1440.
276. Norman, R.O.C. Principles of Organic Synthesis, Second Edition,
Chapman and Hall, London, 1978, 649.
277. Cragg, G.M.L. Organoborcines in Organic Synthesis. Marcel
Dekker Inc., New York, 1973, 319-354.
278. Bellamy, L.J. The Infra-Red Spectra of Complex Molecules,
Third Edition, Chapman and Hall, London, 1975, 294-303.
279. Davis, T.P., Gehrke, C.W., Gehrke, Jr., C.W., Cunningham, T.D.,
304
Kuo, K.C., Gerhardt, K.O., Johnson, H.D. and Williams, C.H.
J. Chromatog., 1979, 162, 293-310.
280. Buteau, C., Duitschaever, C.L. and Ashton, G.C., J. Chromatog.
1981, 212, 23-27.
281. Skadden, T. and Greibrokk, T.,J. Chromatog., 1982, 247, 111-122.
282. Hill, D.W., Walters, F.H.,Wilson, T.D. and Stuart, J.D. Anal.
Chem., 1979, 51, 1338-1341.
283. Carroll, S.F. and Nelson, D.R. Anal. Biochem., 1979, 98, 190-197,
284. Larsen, B.R. and West, F.G.,J. Chromatog. Sci., 1981, 19,
259-265.
285. Lindroth, P. and Mopper, K. Anal. Chem., 1979, 51, 1667-1674.
286. Simons, Jr., S.S. and Johnson, D.F., Anal. Biochem., 1978,
90, 705-725.
287. Simons, Jr., S.S. and Johnson, D.F. Anal.Biochem., 1977,
82, 250-254.
288. Simons, Jr., S.S. and Johnson, D.F., J. Chem. Soc. Chem. Commun.,
1977, 374-375.
289. Simons, Jr., S.S. and Johnson, D.F.,J. Org. Chem., 1978,
43, 2886-2891.
290. Nakamura, H., Matsumoto, A. and Taraura, Z. Anal. Lett.,
1982, 15 (A17), 1393-1410.
291. Simons, Jr., S.S. and Johnson, D.F.,J. Am. Chem. Soc., 1976,
98, 7098-7099.
292. Bonnett, R. and Brown, R.F.C., J. Chem. Soc. ,Chem. Commun.,
1972 ,393-395.
293. Bornstein, J., Remy, D.E. and Shields, J.E. Tetrahedron
Lett., 1974, 48, 4247-4250.
294. Palmer, M.H. and Kennedy, S.M.F., J. Chem. Soc. Perkin II,
1976, 81-89.
305,
295. Black, P.J., Brown, R.D. and Heffernan,M.L. Aust. J. Chem.,
1957, 20, 1305-1323.
295. Remers, W.A. and Brown, R.K. The Chemistry of Heterocyclic
Compounds: Indoles, Part One. Edited by Houlihan, W.J. John
Wiley and Sons New York, 1972, 48-49.
297. Pouchert, C.J. and Campbell, J.R. The Aldrich Library of
NMR Spectra, Volume VI, Aldrich Chemical Company Inc.,
1974, 81.
298. Begtrup,M., Claramunt, R.M. and Elguero, J.^J. Chem. Soc.
Perkin II, 1978, 99-104.
299. Lowry, T.H. and Richardson, K.S. Mechanism and Theory in
Organic Chemistry, Second Edition. Harper and Row, New
York, 1981, 625-640.
300. Majors, R.E., Barth, H.G. and Lochmüller, C.H. Anal. Chem.,
1982, 54, 323R-363R. "
301. Halâsz, I. Anal. Chem., 1980, 52, 1393A-1403A.
302. Colin, H. and Guiochon, G.,J. Chromatog., 1977, 141, 289-312
303. Unger, K.K. Journal of Chromatography Library, Vol. 16;
Porous Silica, Its Properties and Uses as Support in Column
Liquid Chromatography. Elsevier, Amsterdam, 1979.
304. Karch, K., Sebestian, I. and Halâsz, I.,J. Chromatog., 1976,
122, 3-16.
305. Cox, G.B., J. Chromatog. Soil, 1977, 15, 385-392.
306. Majors, R.E., J. Chromatog.,Sci., 1980, 18, 488-511.
307. Horvath, C. Trends Anal. Chem. ERS Ed., 1981, 1, 6-12.
308. Cooke, N.H.C. and Olsen, K., J. Chromatog. Sci., 1980, 18,
512-524.
309. Her, R.K., J. Chromatog., 1981, 209, 341-342.
310. Bush, S.G., Jorgenson, J.W., Miller, M.L. and Linton, R.W.
306,
J. Chromatog., 1983, 260, 1-12.
311. Melander, W., Stoveken, J. and Horvath, C., J. Chromatog.,
1980, 199, 35-56.
312. Horvath, C.and Melander, W., J. Chromatog. Sci., 1977, 15,
393-404.
313. Nahum, A. and Horvâth, C.,J. Chromatog., 1981, 203, 53-63.
314. Tanaka, N., Goodell, H. and Karger, B.L.,J. Chromatog., 1978,
158, 233-248.
315. Colin, H. and Guiochon, G., J. Chromatog., 1978, 158,
183-205.
316. Melander, W. , Chen, B.K. and Horvâth, C.,J. Chromatog.,
1979, 185, 99-109.
317. Riley, C.M., Tomlinson, E. and Jefferies, T.M.,J. Chromatog.
1979, 185, 197-224.
318. Tomlinson, E., Poppe, H. and Kraak, J.C. Int. J. Pharm.,
1981, 7, 225-243.
319. Karger, B.L., Snyder, L.R. and Horvâth, C. An Introduction
to Separation Science. John Wiley and Sons, New York,
1973, 12-61.
320. Locke, D.C., J. Chromatog. Sci., 1974, 12, 433-437.
321. Horvath, C., Melander, W. and Molnâr, I. Anal. Chem., 1977,
49, 142-154.
322. Zakaria, M. and Brown, P.R., J. Chromatog., 1983, 255, 151-162.
323. Zakaria, M., Brown, P.R. and Grushka, E. Anal. Chem., 1983,
55, 457-463.
324. Hansson, C., Agrup, G., Rorsman,H., Rosengren, A.M., Rosengren,
E. and Edholm, L.E., J. Chromatog., 1979, 162, 7-22.
325. Rudzinski, W.E., Bennett, D., Garcia, V. and Seymour, M.
J. Chromatog.-Sci., 1983, 21, 57-61.

307,
326. Van de Venne, J.L.M., Hendrikz and Deelder, R.S., J. Chromatog.,
1978, 167, 1-16.
327. Sokdowski, A. and Wahlund, K.G., J. Chromatog., 1980, 189,
299-316.
328. Eksborg, S. and Ekqvist, B., J. Chromatog., 1981, 209, 161-173.
329. Varga-Puchony, Z. and Vigh, G.,J. Chromatog., 1983, 257,
380-383.
330. Bij, K.E. , Horvâth , C., Melander, W.R. and Nahum, A.
J. Chromatog., 1981, 203, 65-84.
331. Tilly Melin, A., Ljungcrantz, M. and Schill, G., J. Chromatog.,
1979, 185, 225-239.
332. Van der Houwen, O.A.G.J., Sorel, R.H.A., Hulshoff, A., Teeuwsen
J. and Indemans, A.W.M., J. Chromatog., 1981, 209, 393-404.
333. Horvâth, C., Melander, W., Molnar, I. and Molnar, P. Anal.
Chem., 1977, 49, 2295-2305.
334. Bidlingmeyer, B.A.,J. Chromatog., Sci., 1980, 18, 525-539.
335. Tilly Melin, A., Askemark, Y., Wahlund, K-G, and Schill, G.
Anal. Chem., 1979, 51, 976-983.
336. Greving, J.E., Bouman, H., Jonkman, J.H.G., Westenberg, H.G.M.
and De Zeeuw, R.A., J. Chromatog., 1979, 186, 683-690.
337. Bidlingmeyer, B.A, and Warren, Jr., F.V. Anal, Chem., 1982,
54, 2351-2356.
338. Bidlingmeyer, B.A., Deming, S.N., Price, Jr., W.P., Sachok, B.
and Petrusek, M.,J. Chromatog., 1979, 186, 419-434.
339. Knox, J.H. and Jurand, J., J. Chromatog., 1976, 125, 89-101.
340. Hoffman, N.E. and Liao. Anal. Chem., 1977, 49, 2231-2234.
341. Hancock, W.S., Bishop, C.A., Buttersby, J.E., Harding, D.R.K.
and Hearn, M.T.W.,J. Chromatog., 1979, 168, 377-384.
308
342. Kraak, J.C., Jonker, K.M. and Huber, J.F.K.,J. Chromatog.,
1977, 142, 671-688.
343. Kissinger, P.T. Anal.Chem. , 1977, 49, 883.
344. Bidlingmeyer, B.A., Del Rios, J.K. and Korpl, J. Anal. Chem.,
1982, 54, 442-447.
345. Wheals, B.B./J. Chromatog., 1980, 187, 65-85.
346. Zhelyazkov, D., Ivanova, K., Gueorguiev, N., Marinova, R.,
Beltcheva, A., Mangurova, M. and Temnyalov, N. in
Chemotherapy, Vol. 2. Edited by Williams, J.D. and Geddes,
A.M. Plenum Press, New York, 1976, 409-415.
347. Thurman, E.M., J. Chromatog., 1979, 185, 625-634.
348. Nelson, J.J., J. Chromatog., Sci., 1973, 11, 28-35.
349. Benson, Jr., J.V., Gordon, M.J. and Patterson, J.A. Anal.
Biochem., 1967, 18, 228-240.
350. Papp, E. and Vigh, G. J. Chromatog., 1983, 259, 49-58.
351. Stranahan, J.J. and Deming, S.N. Anal. Chem., 1982, 54,
2251-2256.
352. McDonald,R.S. and Martin, E.V. Cand. J. Chem., 1979, 57,
506-516.
353. Dc^inh, T., Johnson, A.L., Jones, J.E. and Senise, P.P. J.
Org. Chem., 1977, 42, 4217-4221.
354. Drug Treatment, 2nd Edition. Edited by Avery, G.S. Churchill
Livingfetone, London, 1980, 1214.