Embed Size (px)
Citation preview

Analysis
f o
n o i t
a c i f i t n e di
a n d
of
Glass

Scenario:A body has been discovered by the side of the
road – it appears to have been struck by a car. Upon closer examination, fragments of glass are found embedded in the skin. It is possible that these fragments may be from the windshield of a vehicle, or could come from another source, such as glass from broken bottles thrown along the roadside.
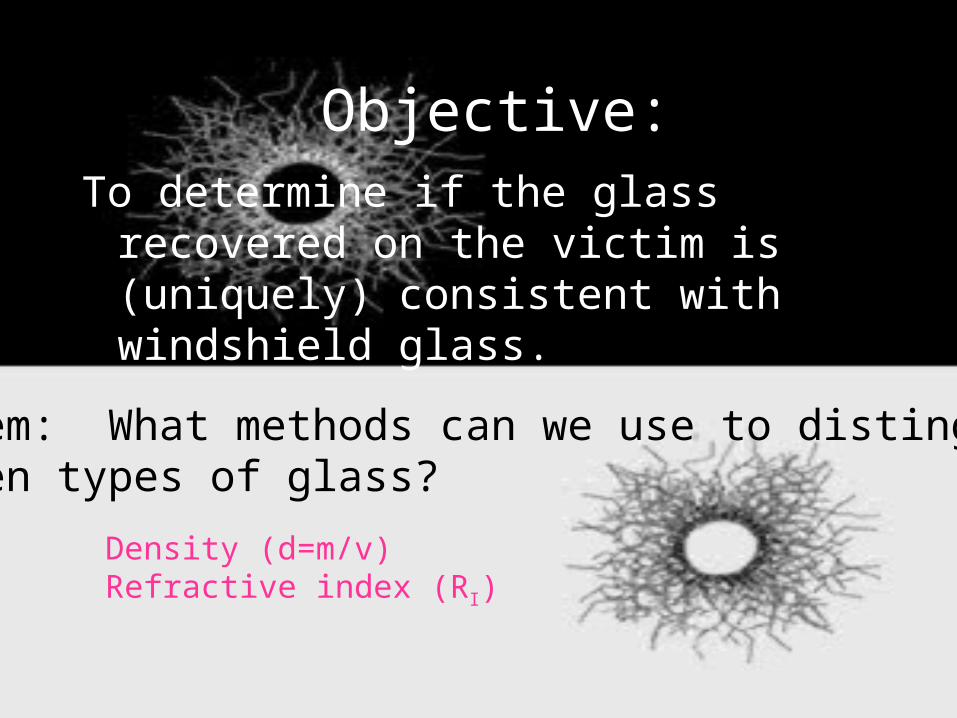
Objective:To determine if the glass recovered on the
victim is (uniquely) consistent with windshield glass.
Problem: What methods can we use to distinguishbetween types of glass?
Density (d=m/v)Refractive index (RI)


Objective:To measure the density of you glass sample
(A, B, C) and see which (if any) correspond to windshield glass (or if we can tell).
Problem: What procedure(s) can we use to measure the density of glass fragments?
Displacement (one or more pieces?)Flotation

Objective:To measure the density of you glass sample
(A, B, C) and see which (if any) correspond to windshield glass (or if we can tell).
Problem: Which density method is best? How can we tell?
PrecisionAccuracy


Accuracy and Precision
• Accuracy can be determined from %error• Precision can be determined from standard deviation, s
100 X Value Accepted
Value Accepted- Value alExperiment Error %
1
)(
s 1i
2
n
xxn
i
points data ofnumber the
data theofmean the x
point data individual
n
xi
Concepts covered/things to consider
• Density• Precision• Mean (average) values• Standard deviation• Accuracy • Percent Accuracy• Significant figures

Writeup (Short written report)
• Objective• Procedure• Results
– table (samples A, B, C)– sample calcs for density (one from each method
with correct sig figs!), stdev (one method, your 3 values), % error (one method, your 3 values)
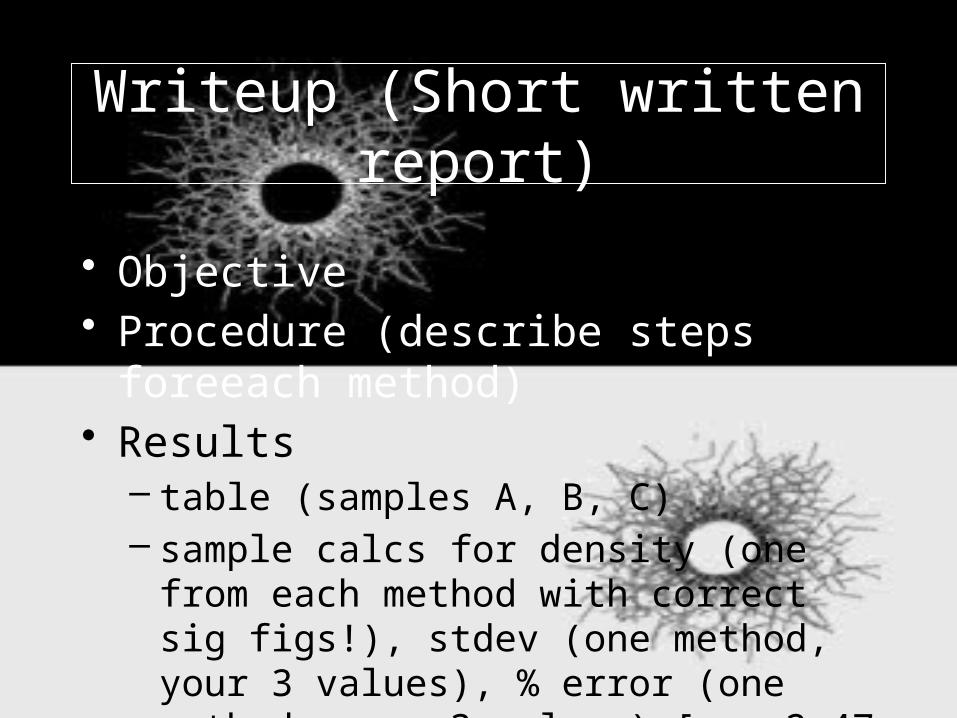
Writeup (Short written report)
• Objective• Procedure (describe steps foreeach method)• Results
– table (samples A, B, C)– sample calcs for density (one from each method
with correct sig figs!), stdev (one method, your 3 values), % error (one method, your 3 values) [use 2.47 g/mL for windshield glass dens.]

• Discussion Conclusion – answer the following questions:– 1. Which method was most precise? How do you
know?– 2. Which method was most accurate? How do you
know?– 3. How does the number of sig. figs. determined for
your density values relate to the accuracy and precision of the method? (see also question 4)
– 3. An analytical balance can measure mass in grams to the fourth decimal place. For which method (if any) might this have been useful? Why or why not?
– 4. What kind of glass was your sample (see table 2.3)? Can you tell which sample is consistent with glass from a car windshield? Why or why not?
– 5. Are there any other variables that you think are important to the lab? How might it be improved?(if something went wrong, what and why)
![arXiv:1911.01040v2 [stat.ME] 18 Dec 2019p n B n( bL 0) + W n (7) where B n p n I p 1 n X i M ix ix T i ; and W n 1 p n X i M ix i" i: Predictability of (M i) i n ensures that W n is](https://img.pdfslide.us/doc/110x75/60f6b745f4ae2e32183880cd/arxiv191101040v2-statme-18-dec-2019-p-n-b-n-bl-0-w-n-7-where-b-n-p-n.jpg)